THE EFFECT OF BRANDING AND FIRM SIZE ON THE RECURRENCE OF FOOD RECALL EVENTS ASSOCIATED WITH PATHOGENIC CONTAMINATION IN THE UNITED STATES A Thesis by MONTALEE KAPILAKANCHANA Submitted to the Office of Graduate Studies of Texas A&M University in partial fulfillment of the requirements for the degree of MASTER OF SCIENCE May 2012 Major Subject: Agricultural Economics

Welcome message from author
This document is posted to help you gain knowledge. Please leave a comment to let me know what you think about it! Share it to your friends and learn new things together.
Transcript

THE EFFECT OF BRANDING AND FIRM SIZE ON THE RECURRENCE OF FOOD
RECALL EVENTS ASSOCIATED WITH PATHOGENIC CONTAMINATION IN
THE UNITED STATES
A Thesis
by
MONTALEE KAPILAKANCHANA
Submitted to the Office of Graduate Studies of Texas A&M University
in partial fulfillment of the requirements for the degree of
MASTER OF SCIENCE
May 2012
Major Subject: Agricultural Economics

The Effect of Branding and Firm Size on the Recurrence of Food Recall Events
Associated with Pathogenic Contamination in the United States
Copyright 2012 Montalee Kapilakanchana

THE EFFECT OF BRANDING AND FIRM SIZE ON THE RECURRENCE OF FOOD
RECALL EVENTS ASSOCIATED WITH PATHOGENIC CONTAMINATION IN
THE UNITED STATES
A Thesis
by
MONTALEE KAPILAKANCHANA
Submitted to the Office of Graduate Studies of Texas A&M University
in partial fulfillment of the requirements for the degree of
MASTER OF SCIENCE
Approved by:
Chair of Committee, Victoria Salin
Committee Members, David A. Bessler Ariun Ishdorj Gary R. Acuff Head of Department, John P. Nichols
May 2012
Major Subject: Agricultural Economics

iii
ABSTRACT
The Effect of Branding and Firm Size on the Recurrence of Food Recall Events
Associated with Pathogenic Contamination in the United States.
(May 2012)
Montalee Kapilakanchana, B.S., Kasetsart University
Chair of Advisory Committee: Dr. Victoria Salin
Food recalls caused by pathogens receive considerable public attention due to
health risk and the potential loss to the companies involved. There are very few studies
analyzing the relationship between food recalls and characteristics of the companies
involved. Because of the significance of the problem and lack of available research, the
association between food recalls caused by pathogen and characteristics of the
companies involved is examined in this thesis.
To address the problem, data on food product recalls in the United States
from January 2000 to October 2009 are used. Only the events caused by pathogens are
analyzed in the thesis. The firms that have multiple recall incidents are the units of
analysis. The study employs an econometric model with discrete choice modeling
approaches: logit and probit.
There are two main hypotheses. Firstly, it is hypothesized that branding
decreases the likelihood of the occurrence of the repeated recall event. Secondly, size of
the firm is hypothesized to be associated with higher likelihood of recurrence. The major
finding is that branding and firm size are associated with higher probability of the

iv
recurrence of food recall events associated with pathogenic contamination. A firm that
produces branded products is around 15 percent more likely to have a recurrence of food
recall events than a firm producing unbranded product. This finding points out the
interesting and unexpected issue that branding is not associated with improved
performance in food safety. Additionally, an increase in firm size has a minute but
significant association with rising likelihood to have a recurrence of a food recall event.
This study is the first concerning the firm level factors that can influence risk of the
recurrence of food recall incidents involving pathogens. Thus, its results are distinctive
and can benefit both government and private sectors with respect to food safety policy or
food safety standards.

v
DEDICATION
I dedicate my dissertation to my beloved parents, Sarinya and Vudtechai
Kapilakanchana and brother, Piyawat Kapilakanchana. I also dedicate my work to my
grandparents, Somsong and Harn Haritavorn, and Pairoh and Aumphorn
Kapilakanchana.

vi
ACKNOWLEDGEMENTS
I would like to express my deepest gratitude and appreciation to Dr. Victoria
Salin, my thesis advisor and Chairman, for her helpful suggestions, guidance, and
constant support that helped me to carry out this study and make this a valuable learning
experience. Without her contribution, this work would not have been completed. I
appreciate and thank to my thesis committee members, Dr. David A. Bessler, Dr. Ariun
Ishdorj, and Dr. Gary R. Acuff, for their useful suggestions and kind support.
I would like to acknowledge and give my heartily thanks to the Ananda Mahidol
Foundation for granting me financial support to complete this thesis. I would like to
express my deepest sense of gratitude to His Majesty King Bhumibol Adulyadej who has
graciously granted me the King’s Scholarship to pursue my Master Degree in
Agricultural Economics.
I also would like to thank the former Thai student of Agricultural Economics, Dr.
Witsanu Attavanich for his advice, kind support, and encouragement. Additionally, I
would like to express my gratitude and thanks to my best friends in Thailand and here in
College Station for their suggestions and sincere support during my difficult times. I
would like to extend my appreciation to the departmental faculty staff and friends for
making my experience at Texas A&M University a memorable one.
Finally, I would like to express my most grateful thanks to my mother, father,
and brother who have inspired and encouraged me to pursue higher study. I am truly
grateful for their love and continuous support.

vii
TABLE OF CONTENTS
Page
ABSTRACT ..................................................................................................................... iii
DEDICATION ................................................................................................................... v
ACKNOWLEDGEMENTS .............................................................................................. vi
TABLE OF CONTENTS .................................................................................................vii
LIST OF FIGURES ........................................................................................................... ix
LIST OF TABLES ............................................................................................................. x
CHAPTER I INTRODUCTION ....................................................................................... 1
Objectives ....................................................................................................................... 3
CHAPTER II LITERATURE REVIEW ............................................................................ 5
Economies of Scale ........................................................................................................ 5 Economies of Scale and Safety ...................................................................................... 9 Food Safety .................................................................................................................. 10
Food Recalls ............................................................................................................. 12 Firm Product-Recall Strategies ................................................................................ 13
Discrete Choice Models ............................................................................................... 15 Binary Choice Models .............................................................................................. 16
Logit and Probit Models ....................................................................................... 16 Comparing between Logit and Probit Models ..................................................... 19
CHAPTER III DATA ....................................................................................................... 22
Food Product Recall Event Information....................................................................... 22 Company Information .................................................................................................. 29
Sales .......................................................................................................................... 30 Number of Employees .............................................................................................. 34 Brand ........................................................................................................................ 37
Analysis of Selected Variables ..................................................................................... 37 Recall Frequency Variables ...................................................................................... 37
Size Categories ......................................................................................................... 40 Correlation between Brands and Firm Size .............................................................. 46

viii
Page Association of Repeated Recalls with Brand ........................................................... 48
Summary of Observations Used in the Models ............................................................ 49
CHAPTER IV METHODOLOGY .................................................................................. 52
Models Specification .................................................................................................... 52 Logit Model .............................................................................................................. 53 Probit Model ............................................................................................................. 54 Interpreting the Logit and Probit Estimates ............................................................. 55
Discussion of Variables ................................................................................................ 56 Consideration on Missing Variables ........................................................................ 61
Hypothesis Tests .......................................................................................................... 62 Variable Specification .................................................................................................. 64 Empirical Model of Repeated Recall Occurrence ........................................................ 65
Model 1 ..................................................................................................................... 65 Model 2 ..................................................................................................................... 66
CHAPTER V ANALYSIS & RESULTS ......................................................................... 68
Main Results ................................................................................................................. 68 Additional Results ........................................................................................................ 73
Discussion .................................................................................................................... 77 Branding ................................................................................................................... 77 Firm Size .................................................................................................................. 81
CHAPTER VI CONCLUSIONS ..................................................................................... 84
REFERENCES ................................................................................................................. 88
APPENDIX A ADDITIONAL TABLES ........................................................................ 95
APPENDIX B ADDITIONAL RESULTS ...................................................................... 99
VITA .............................................................................................................................. 102

ix
LIST OF FIGURES
Page
Figure 1. A U-shaped average cost curve ....................................................................... 6
Figure 2. An L-shaped average cost curve ...................................................................... 7
Figure 3. Model for a probability .................................................................................. 17
Figure 4. Logit and probit CDFs ................................................................................... 20
Figure 5. Trend of number of recall events by year from 2000 to 2009 ....................... 28
Figure 6. The frequency distribution of sales figures (million dollars) presented by a scatter plot ..................................................................................................... 32
Figure 7. A histogram of sales in million dollars distribution ...................................... 33
Figure 8. The frequency distribution of the number of employees presented by a scatter plot ..................................................................................................... 35
Figure 9. A histogram of the number of employees distribution .................................. 36
Figure 10. A histogram of the number of firms in each size group categorized by employee data using several classification methods ...................................... 43
Figure 11. Range of employee values categorized by the Jenks natural breaks method 45
Figure 12. Range of employee values categorized by the Quantile method ................... 46

x
LIST OF TABLES
Page Table 1. Numbers and Percentages of Product Recalls Classified by Types of
Pathogens from the Recall Event Information during 2000-2009 ................... 24
Table 2. Numbers and Percentages of Product Recalls Classified by Types of Products from the Recall Event Information during 2000-2009 ..................... 25
Table 3. Numbers and Percentages of Product Recalls Caused by Listeria spp. and Classified by Types of Products from the Recall Event Information during 2000-2009 ........................................................................................................ 25
Table 4. Numbers and Percentages of Product Recalls Caused by E. coli and Classified by Types of Products from the Recall Event Information during 2000-2009 ........................................................................................................ 26
Table 5. Numbers and Percentages of Product Recalls Caused by Salmonella spp. and Classified by Types of Products from the Recall Event Information during 2000-2009 ............................................................................................. 26
Table 6. Numbers and Percentages of Product Recalls Caused by Other Bacteria and Classified by Types of Products from the Recall Event Information during 2000-2009 ........................................................................................................ 27
Table 7. Occurrences of Product Recall Events by Year from 2000 to 2009 ................ 28
Table 8. Company Information ...................................................................................... 30
Table 9. Descriptive Statistics of Sales Figures ............................................................. 33
Table 10. Descriptive Statistics of Employee Figures ..................................................... 36
Table 11. Descriptive Information on Brand.................................................................... 37
Table 12. Number of Companies by Number of Recall Events ....................................... 38
Table 13. Descriptive Statistics of Recall Frequency....................................................... 39
Table 14. Firm Size Classification by the Number of Employees Using the Jenks Natural Breaks and the Quantile Classification Method ................................. 43
Table 15. Correlation Coefficients between Three Variables: Brand, Employees and Sales (million dollars) ...................................................................................... 47

xi
Page Table 16. Correlation Coefficients between Brand and Sizes by the Quantile Method
based on Employee Data.................................................................................. 47
Table 17. Correlation Coefficients between Brand and Sizes by the Jenks Natural Breaks Method based on Employee Data ........................................................ 48
Table 18. Number of Companies with Brand or No Brand and Statistical Values of the Number of Brands for Branded Companies for Each Number of the Recall Occurrences .......................................................................................... 49
Table 19. Descriptive Information on Brand and Number of Recalls of Only the Observations Used in the Models .................................................................... 50
Table 20. Effect of Brand and Firm Size on the Occurrence of the Repeated Recall Event Using the Logit Model........................................................................... 69
Table 21. Effect of Brand and Firm Size on the Occurrence of the Repeated Recall Event Using the Probit Model ......................................................................... 70
Table 22. Top 39 Companies from All of 1,005 Companies in the Food Recall Event Data Ranked by Number of Recalls ................................................................ 95
Table 23. Top 31 Companies from All of 334 Companies Used in the Models Ranked by Number of Recalls ...................................................................................... 97
Table 24. Effect of Brand and Firm Size on the Occurrence of the Repeated Recall Event Using Size Categorical Variables by the Jenks Natural Breaks Method ............................................................................................................. 99
Table 25. Effect of Brand and Firm Size on the Occurrence of the Repeated Recall Event Using Size Categorical Variables by the Quantile Method ................. 100
Table 26. Effect of Brand and Firm Size on the Occurrence of the Repeated Recall Event Using the Raw Number of Employees ................................................ 100
Table 27. Effect of Brand and Firm Size on the Occurrence of the Repeated Recall Event Using the Number of Employees in Thousand Unit ........................... 101

1
CHAPTER I
INTRODUCTION
While the food supply in the United States is often claimed to be one of the safest
in the world, the Centers for Disease Control and Prevention (CDC) estimates that each
year there are approximately 48 million episodes of foodborne illness-causing sickness
to 1 in 6 Americans annually. The consequence is roughly 128,000 hospitalizations and
3,000 deaths (Scallan et al. 2011a; 2011b). The CDC 2011 estimates highlight the fact
that foodborne illnesses caused by pathogens are the leading reason for foodborne
illnesses in the U.S.
Foodborne illnesses due to pathogen contamination can be closely linked to food
product recall events. For example, in 2009 a severe salmonellosis outbreak in peanut
butter caused approximately 9 deaths and 714 cases of illnesses (CDC 2009). This
incident brought about a vast recall of 3,918 peanut butter related products from 361
brand names across 43 states of the U.S. (FDA 2009b). The latest serious foodborne
illness outbreak in the U.S. is the listeriosis outbreak of whole cantaloupes distributed
from Jensen Farms. As of November 1, 2011, 29 deaths and 139 cases of illnesses have
reportedly been linked to the outbreak (CDC 2011).
It is obvious that food recalls caused by pathogenic contamination are associated
____________ This thesis follows the style of American Journal of Agricultural Economics.

2
with public health problems and even consumers’ deaths. Moreover, the manufacturers
that announce the food recalls also risk financial damage or even a failure that drives the
firms out of business. For example, Peanut Corporation of America (PCA) that
announced a large recall of peanut butter in September, 2011 is undergoing bankruptcy
(FDA 2009b). Due to the possible great loss of consumers, companies and trading
partners, the public and the private sectors pay increasing attention to the recall events
caused by pathogens.
Recently, the food recalls associated with pathogenic contamination have been
growing in a number of events. Furthermore, there are increasingly widespread concerns
for all the agents involved. This has also raised the question about what factors influence
the food recall events associated with pathogenic contamination. The answer to this
question is very helpful for both public and private sectors in order to have a better
understanding on this important problem. Since, food recall problems often result from
the deficiencies of companies themselves, it is important to focus on the private sectors
or companies that produce food products more than the public sectors or the
government. Hence, this thesis will examine firm-level factors that influence the food
recalls caused by pathogens.
A food recall is an undesirable and harmful incident for the food companies
because it implies that firms fail to provide safe and quality foods to consumers. The
firm will not announce the recall unless it needs to. Once a recall occurs, the firm should
try to improve its food safety performance in order to not let the recall happens again.
Thus, the recurrence of a recall event implies that the firm lacks of an ability to provide a

3
sufficient performance in food safety. That is why we decided to use the recurrence of a
recall event as an indicator of food safety performance for the firm.
There are very few research studies about the link between companies and food
recall events. The thesis by Joy (2010) is the most similar research to our main focus.
However, the major difference is that his study used all of the food recall events over
2000 through 2009, but in this thesis we will use only the food recalls caused by
pathogenic contamination. Joy’s findings were that branding and firm size had
significant effects on the hazard of the recurrence of a recall. According to his interesting
findings, the thesis question we will investigate is the effect of branding and firm size on
the food recall recurrence associated with pathogenic contamination.
Objectives
This thesis will pursue two objectives:
To examine how branding and firm size affect the likelihood of the firm’s
recurrence of a recall event caused by pathogenic contamination; and
To estimate the size of the effects of branding and firm size on the probability of
a firm that has the recurrence of a recall event.
To pursue the main objectives, this thesis consists of the next six chapters. The
next chapter (the second chapter), we will provide literature focus on the economic
concept and food safety issues. The third chapter, we will discuss about the data utilized
in this study. The fourth chapter, we will then present the suitable econometric models

4
employed in the study and also the expectations based on the economic and management
frameworks. Next, in the fifth chapter, we will show the major findings and the
additional interesting findings including the discussion from our examination. Finally,
the conclusions including implications, limitations and further research will be presented
in the last chapter.

5
CHAPTER II
LITERATURE REVIEW
This chapter presents information and past research related to food companies
and food recall events in the first two sections: economies of scale and food safety.
Additionally, the last section of the chapter, discrete choice models, also discusses about
the theoretical basis of the econometric models employed in this study.
Economies of Scale
In defining economies of scale and scope, we rely on the explanation of the
theory from Besanko (2010) in chapter 2. Besanko (2010) as well as other
microeconomic textbooks defines economies of scale as the cost advantage when the
average cost of production becomes lower as the producer expands its output. On the
other side, when the average cost of production rises as output increases we say that a
firm experiences diseconomies of scale.
The relation between average costs and output can be represented by an average
cost curve. Typically economists describe average cost curve as U-shaped, as shown in
figure 1. An average cost curve begins with the descent of average costs because of the
spreading of fixed costs over extra units of output. As production grows, average costs
increase as production encounter some difficulties such as capacity constraints,
complexity, and transaction costs. This average cost curve which has a U-shape can be
implied that over the range of different firm sizes, there is a possible for large firms to

6
not have economies of scale or the inefficiency in firm operation can happen due to a
large size.
Figure 1. A U-shaped average cost curve Source: Besanko (2010, p.42)
However, Besanko (2010) states that in reality, large firms infrequently seem to
have huge cost disadvantages compared to smaller competitors. This was based on the
finding from the examination of production costs in many industries by the famous
econometrician Johnston. Johnston determined that, in reality, the cost curves were more
similar to L-shaped curves than to U-shaped curves. An L-shaped cost curve depicted in
figure 2 shows that average costs fall until they meet the minimum efficient scale (MES)
of production. When output goes beyond MES, average costs are the same across
production levels.
Consider a single firm, an average cost curve can be a U-shaped or L-shaped
curve depending on a different time frame of the production. In the short run, production

7
occasionally exhibits U-shaped average cost curve since the firm spread over the same
fixed assets or overheads in the first stage and then face with its capacity limitation in
the second stage. The firm cannot expand its capacity in the short term. While, in the
long run, by constructing new facilities the firm can enlarge its capacity to reach a
production level that keeps its average costs low. Hence, the average cost curve in the
long run is an L shape.
Figure 2. An L-shaped average cost curve Source: Besanko (2010, p.43)
Economies of scale is an important issue in food industries. For example, in meat
and poultry industries, economies of scale is a crucial key to determine a plant cost
structure. This statement is supported by Duewer and Nelson (1991), MacDonald et al.
(2000), and Ward (1993) in cattle slaughter, MacDonald and Ollinger (2000) in hog
slaughter, and Ollinger, MacDonald, and Madison (2000) in poultry slaughter. Each
study is elaborated in the following.

8
MacDonald et al. (2000) found the moderate but widespread existence of
economies of scale in hog and cattle slaughter plants. The cost advantages for the largest
plants were only 1 to 3 percent more than smaller plants; however, the scale economies
existed in all plant sizes in 1992. Moreover, they suggested that the modest economies of
scope might exist in cattle slaughter plants.
Furthermore, for the study of cattle slaughter, Ward (1993) compared the results
from two past studies; the study of Sersland (1985) and the study of Duewer and Nelson
(1991), in the same subject of economies of size of cattle slaughtering and fabrication.
He found that even though the two studies used different data and methods, the results
from both studies were similar. The results show that estimated average cost of both
slaughter and fabrication plants declined as plant size became larger. In other words, the
economies of scale existed in both slaughter and fabrication plants. Ward (1993) also
asserted that firms that were in the beef packing industry had an economic motivation to
operate at a larger plant size in order to keep plants functioning near full-capacity
utilization.
In hog slaughter industry, MacDonald and Ollinger (2000) found the moderate
but widespread existence of economies of scale. In poultry slaughter industry, Ollinger,
MacDonald, and Madison (2000) found the existence of economies of scale as well.
Their results indicated that there is a 15-percent decrease in plant average costs for
chicken slaughter plants that produce at four times greater than the sample mean volume.
Likewise, turkey slaughter plants that manufacture at four times of the sample mean
volume have a 17 percent reduction in average costs compare to turkey plants that

9
produce at the sample mean volume. Ollinger, MacDonald, and Madison (2000) also
stated that poultry plants exploited economies of scale by producing at the larger
volume. This is supported by the fact that in 1992 and 1967, the number of poultry
plants was approximately the same even though the poultry production amount in 1992
was three times larger than in 1967.
Economies of Scale and Safety
In considering food safety control, we expect to have an existing of economies of
scale. For example, the cost of hiring quality assurance (QA) and quality control (QC)
personnel is an indivisible fixed cost, which is one of main sources of scale economies.
“Fixed costs arise when there are indivisibilities in the production process. Indivisibility
simply means that an input cannot be scaled down below a certain minimum size, even
when the level of output is very small” (Besanko 2010, p.45). Thus, if each plant
requires at least one QA and one QC to examine products, the firm can get the financial
benefit from reducing average cost per unit, when it expands its output or we say that the
firm can enjoy economies of scale.
Our expectation is supported by the new standard in food safety management
systems in the food packaging industry that requires each plant that makes food
packaging has to employ one practitioner. This new standard is one of the standards in
the Safe Quality Food (SQF) certification. SQF is one of the leading private-sector
global food safety and quality certifications and is recognized by the Global Food Safety
Initiative (GFSI) as a standard that satisfies its benchmark requirements. The standard is

10
for at least one professional called an SQF practitioner to be employed. An SQF
practitioner is a permanent full time company employee and has training in hazard
analysis and critical control points (HACCP) systems and the SQF auditing standard.
The responsibilities of an SQF practitioner is developing, implementing and maintaining
the safety assurance system of the company. According to the new rule having one
practitioner per plant, the packaging company could have economies of scale in the food
safety control department as described in the previous paragraph.
In addition, another example of economies of scale in food safety control
happens when the machines used for safety control processes such as heating or
steaming are capital-intensive. These machines are viewed as an indivisible fixed cost
and function with scale economies.
In spite of the potential for scale economies, Ollinger and Mueller (2003) found
that the sanitation and process control effort exhibits diseconomies of scale since cost of
sanitation and process control rises as output increases. They argued that however, it
appears to have a diseconomies of scale in food safety process control effort but overall,
the larger plants still benefit from scale economies by lowering total cost of producing
an additional product. This conflicting evidence calls into question whether firms can
achieve the scale economies from food safety control process.
Food Safety
Since, food safety issues are becoming more important worldwide, governments
from many countries including the United States of America (USA) are increasing their
11
attempts to enhance food safety. These attempts are due to an increasing level of
consumer concerns and food safety problems.
In the USA, food safety concerns have considerably increased as meat products
contamination events occurred in the past ten years (Piggott and Marsh 2004). Recently,
the concerns have intensified because of the outbreak of Salmonella spp. in peanut butter
in 2009 and the listeriosis outbreak from cantaloupes in 2011. The concerns result from
many hospitalizations or even deaths of consumers caused by contaminated food
products.
According to Scallan et al. (2011a; 2011b), the estimated number of foodborne
illnesseses that occur each year in the USA is 47.8 million cases of illness, resulting in
127,839 hospitalizations and 3,037 deaths. Among these cases of foodborne illnesses,
the 31 highest risk foodborne pathogens in the USA accounted for 9.4 million illnesses,
leading to 55,961 hospitalizations, and 1,351 deaths for each year. Among the 31 most
important pathogens, leading causes of foodborne illnesses were norovirus (58 percent),
followed by nontyphoidal Salmonella spp. (11 percent), and Campylobacter spp. (9
percent). Most hospitalizations (35 percent) were caused by nontyphoidal Salmonella
spp., followed by norovirus (26 percent), and Campylobacter spp. (15 percent). Most
deaths (28 percent) were caused by nontyphoidal Salmonella spp., followed by
Toxoplasma gondii (24 percent), and Listeria monocytogenes (19 percent).

12
Food Recalls
An important measure in the USA used to prevent the public from consuming
contaminated product is a food recall. Before 2011, the food recall was a voluntary
action implemented by a firm under the provisions of the government agencies. The
intention of a recall is to take away food products that are reasonably believed to be
misbranded or adulterated from commerce to prevent consumers from health problems
or even deaths (FSIS 2011).
Recalls of contaminated food products are increasing in the rate of occurrences
and severity (Skees, Botts, and Zeuli 2001). Meat products had been the major cause of
food product recalls for a decade. However, recently, nut products have been added as a
major cause of food product recalls during the 2000’s as problems occurred in almonds
and peanut products. The consequences of the food recalls not only effect consumers but
also the responsible company.
A large food recall can cause a massive economic loss to a responsible firm. In
the meat and poultry industries, there is a clear evidence of the significant loss for the
processor companies. For example, Hudson Foods, a large beef processor, recalled a
total of 25 million pounds of ground beef in 1997 (Skees, Botts, and Zeuli 2001). The
recall was implemented because of the suspected contamination of E. coli O157:H7 and
the lack of a clear lotting system to clearly separate processing days. The severe
consequence of this recall is that Hudson Foods shut down its plant and exited the
industry. Additionally, Thorn Apple Valley Inc., which was a meat and poultry

13
processor, went bankrupt in 1999 due to the recall of 30 million pounds of its products
contaminated with Listeria (Skees, Botts, and Zeuli 2001).
While Hudson Foods and Thorn Apple Valley Inc. could not deal with the large
expenses from their recalls, some companies are able to overcome the difficulties of
recalls and still move on with their businesses. For example, Sara Lee Corporation
recalled their meat products due to a Listeria contamination at the Bil Mar Foods
subsidiary in 1998 (Skees, Botts, and Zeuli 2001). The company lost approximately $76
million from removing their contaminated products and closing the production lines
during the outbreak (Dwyer 1999 as cited by Skees, Botts, and Zeuli 2001). Even
though, this was a great loss to the company at that time, it still exists in business.
Firm Product-Recall Strategies
The two main strategies that firms apply to manage recall events are proactive
and passive strategies. These strategies are categorized by firms’ reactions to a recall
event (Siomkos and Kurzbard 1994). The firm implementing the proactive or
responsible strategy tends to announce a voluntary recall when the firm realizes a
potentially unsafe product by inspections inside the firm and before any public safety
incidents are reported. Conversely, the firm adopting passive or defensive strategy is
more likely to delay or avoid a product recall. The passive recalls are frequently issued
after severe incidents happen to consumers such as injuries or death (Chen, Ganesan and
Liu 2009).

14
Several researchers have shown that a proactive strategy results in positive
consumer perceptions of firms. Firms are perceived to have a greater quality, if they act
responsibly to the general public (Siegel and Vitaliano 2007). Consumers perceive that a
firm is more responsible if it takes action before required by a government agency (Jolly
and Mowen 1984; Shrivastava and Siomkos 1989). In addition, the negative effect of
product-harm crisis on consumers’ future purchases and their perceptions will be
mitigated if a firm actively responds to a recall (Siomkos and Kurzbard 1994).
Furthermore, a proactive strategy can be perceived as a signal for firm’s reliability and
care of consumers. In general, consumers are likely to interpret these two strategic
alternatives as an indication of firm’s trustworthiness and quality of firm’s products and
services (Chen, Ganesan and Liu 2009).
Even though, some studies showed a firm gets benefits or the positive feedbacks
from consumers by adopting a proactive strategy, Chen, Ganesan and Liu (2009)
proposed that unlike consumers, investors and the stock market might have negative
feedbacks on the proactive approach. Their finding indicated that a firm that uses a
proactive strategy to a recall event has more damage on their financial value than a firm
that uses a passive approach. The explanation is that the investors and the stock market
tend to view firm’s proactive action as an indicator of large financial loss and severe
product danger. Salin and Hooker (2001) studied about the responses of shareholders
returns resulting from food recalls. They found that the returns to shareholders of the
smallest firm, Odwalla, dropped instantaneously after the recall event. This result is
consistent with the findings from Chen, Ganesan and Liu (2009).

15
Because of some advantages and some drawbacks on both product-recall
strategies, firms may choose a different strategy depending on their priority concerns
(consumers or investors) and the severity degree of the food contamination incidents.
Discrete Choice Models
In describing the discrete choice models, the explanation of the models is heavily
based on four books: Greene (2003), Gujarati (1995), Train (2009), and Wooldridge
(2009). Greene’s (2003), Gujarati’s (1995), and Wooldridge’s (2009) books are general
econometric reference works, while, Train’s (2009) is the leading book especially in the
area of the discrete choice models. They defined discrete choice models as the
qualitative response models in which the economic outcome is a discrete choice. The
discrete choice is chosen by a decision maker among a finite set of options. In other
words, the dependent variables in the discrete models are discrete values representing
some qualitative outcome. For example, a yes decision equals one and a no decision
equals zero. The general approach used to analyze the relation between the decision or
the outcome and a set of factors is the probability model (Greene 2003, p.664):
(1) Prob (event j occurs) = Prob (Y=j) = F [relevant effect, parameters].
Discrete choice models can be classified by the number of alternatives. If there
are two available alternatives, the models were called binomial or binary choice models.
For three or more alternatives, the models were known as multinomial choice models.

16
Binary Choice Models
The model for binary choice contains a binary response variable that can only be
either zero or one. For example, suppose we want to study the factors that influence
whether a Ph.D. student passes the qualifying exam. The binary outcome for this
example is that a student passes or fails the exam. The binary dependent variable can be
defined as one for passing and zero for failing.
Two common approaches used to analyze binary choice models are the logit
model and the probit model.
Logit and Probit Models
To explain the logit and probit models, we consider the simple probability model
(1). The outcome is either an event occurs (Y=1) or does not (Y=0). The relevant effects
are represented by a vector x or a set of explanatory variables and the set of parameters
are presented as β. Thus, we obtained the following probability models (Greene 2003).
(2) Prob (Y = 1 | x) = F (x, β)
Prob (Y = 0 | x) = 1 - F (x, β)
The two features needed in the probability models: the probability or response
variable lies between zero and one, and the probability varies nonlinearly with x
(Gujarati 1995). The model for a probability is shown in figure 3. Hence, the cumulative
distribution function (CDF) which has the sigmoid or S-shaped curve is suitable to use in
the probability models.

17
Figure 3. Model for a probability Source: Greene (2003, p.666)
The two CDFs commonly chosen to represent the binary choice models are the
logistic and the standard normal CDFs. The logistic CDF gives rise to the logit model,
while, the standard normal CDF underlies the probit model (Gujarati 1995). The
important point is that these two models are suitable to analyze binary responses,
because they can satisfy the two requirements in the probability model considered
earlier.
Pertaining to Wooldridge (2009), the function in the logit model is a logistic
function, Λ (z):
(3) Λ
z is latent, or unobserved variable, derived from

18
(4) ,
where ε is the error or disturbance term.
ε has the standard logistic distribution which is symmetrically distributed
(Wooldridge 2009). In other words, we would say that the logistic disturbances generate
the logit model (Greene 2003).
Hence, according to Greene (2003), the logit model can be written as
(5)
Λ(.) is the notation for the logistic cumulative distribution function. The logit
model is one of the appropriate models suitable used to analyze binary choice models.
For all real numbers z, the logistic function, Λ (z), is between zero and one (Wooldridge
2009). Hence, it is assured that the probabilities from this model constrained to the 0-1
interval which is the key point of the model for a probability.
The other approach that is widely used for studying binary choice is the probit
model. In the probit model, the cumulative distribution function (cdf) is the standard
normal cumulative distribution function, Φ(.), rather than the logistic function, Λ (.), in
the logit model. According to Greene (2003), the probit model is presented as:
(6)
where is the standard normal density.
or z* is an latent variable, derived from
(7) ,
where represents a set of estimated parameters; u is the error or disturbance term.

19
This is the same concept as presented in the logit model. However, the main
difference from the logit model is that in the probit model, u has the standard normal
distribution. Thus, normally distributed disturbances produce the probit model (Greene
2003).
The probit model as well as the logit model guarantees that the estimated
probabilities lie between zero and one. As, Φ(z*) is a function giving values strictly in
the range between zero and one: 0< Φ(z*) <1, for all real number z*.
Comparing between Logit and Probit Models
The CDFs of logit and probit models are quite similar, however; the main
difference is that the logistic has slightly flatter tails than the normal or probit. In other
words, the logistic curve comes near the axes more slowly than the normal or probit
curve as shown in figure 4 (Gujarati 1995).

20
Figure 4. Logit and probit CDFs Source: Gujarati (1995, p.568)
Because of this similarity of the logit and probit distributions, it is difficult to
choose between these two models. There are many discussions about this issue.
Amemiya (1981) stated that the probit and logit models generally provide similar results
and therefore statistically distinguishing between them is not easy. This discussion is
also supported by Greene (2003) that there does not seem to make much difference of
the selection between the two models.
Although, the preference between logit and probit models is still unclear,
Wooldridge (2009) concluded that in econometrics, the probit model is preferred to logit
because of the popularity of the normal distribution. In the opposite way, Train (2009,
p.34) argued that “By far the easiest and most widely used discrete choice model is logit.
Its popularity is due to the fact that the formula for the choice probabilities takes a closed

21
form and is readily interpretable.” Because of this contradiction, we should look at the
advantages and disadvantages of these two models.
As stated earlier, one of the advantages of the logit model is its convenient form
for the discrete choice probability. Furthermore, the logistic CDF is simpler than the
normal CDF, which is related to an unevaluated integral. For the interpretability, when
one transforms the logit model in to the linear model: Z = a +b X, Z has a direct
interpretation as a log-odds. While, in case of the probit, Z has no direct interpretation.
Besides the log-odds, an odds ratio can be derived from the logit model, while the probit
cannot. Hence, the logit model is better than the probit in the aspect of simplicity, the
mathematical convenience, and the interpretability.
Despite these advantages, the logit model still has disadvantages. The main
disadvantage is that the logit model cannot deal with random taste variation and the
correlations over time (Train 2009). This limitation in the logit model due to its
assumption becomes the important advantage for probit model. The probit model is
flexible to deal with this limitation. Thus, in the aspect of the flexibility in handling
specific problems, the probit model is better.
The probit models are used in many economic studies. In food safety economics,
Ollinger and Mueller (2003) also employed the probit model to study about meat and
poultry plant exits and the food safety control.
In this chapter, we provided major literature involved in the thesis, which are the
economic concept of economies of scale, food safety issues, and the theoretical basis of
discrete choice models. Next chapter, we will discuss about the data utilized in the study.

22
CHAPTER III
DATA
The data used in this thesis are well organized and also obtained from credible
sources. Most of the information in the data sets we used is acquired from Joy (2010);
however, we updated and made some adjustments to the information in order to make it
more suited to our study. In order to acquire the valid outcome from the data, appropriate
software was utilized.
This chapter is separated in to four parts. The first part is the information of food
product recall events caused by pathogens. The second part provided the information of
the companies related to the recall events. The main issues of company are brand
information, the number of employees and sales. The third part is the analysis of selected
variables. In the last part, we will describe for only the observations that are going to be
analyzed in the model in the next chapter.
Food Product Recall Event Information
The study is based on the information of food product recall events in the U.S.
from January 2000 through October 2009. The information of recall events was obtained
from the Food and Drug Administration (FDA) and the Food Safety Inspection Service
(FSIS). Press releases issued by the FDA and the FSIS were collected from Recalls,
Market Withdrawals and Safety Alerts website (FSIS 2009) and Recall Case Archive
website (FDA 2009a) respectively. Each recall event provides the following information:

23
firm name, location of the firm (city and state), recall event date, type of recall product,
recall problem, and firm contact information.
The recall event information were selected only the recall events caused by
pathogens such as Salmonella spp., Listeria spp. We considerably focus on this group of
recall events, since recently there are substantially high concerns on the product recall
resulting in foodborne illnesses in the U.S.
During 2000 to 2009, the total number of recall events caused by pathogens was
1,394. Most product recalls were caused by Salmonella spp. (56.06 percent), followed by
Listeria spp. (27.46 percent), E. coli (10.82 percent), and other bacteria (5.66 percent).
The figures are shown in table 1. Looking at types of product recalls in table 2, we
observe that the most high- risk product for recall events is meat products (32.14
percent), followed by nut products (23.60 percent), and confectionary and bakery
products (16.93 percent). In this case, we defined meat products as the product which
includes at least one of these types of products: beef, poultry, pork, seafood and others
meats. The meat product is also the most high-risk product for all of each type of
pathogen stated above except Salmonella spp. The percentages of meat product recalls
caused by Listeria spp., E. coli, and other bacteria are 66.06 percent, 94.04 percent, and
37.97 percent respectively as given in table 3 to table 6. While, the product recall events
caused by Salmonella spp. were found mostly in the nut products (41.94 percent).
Types of food products have different risk characteristics and profiles. For
example, raw products such as meat has to be cooked before consume. Thus, if a
consumer properly cooks them, foodborne illness problem will not occur even though

24
the raw products may be less safe or low quality products. In the opposite way, the
processed or ready-to-eat products are those that are safe to eat without cooking. Since
the processed products do not need any preparation before consume, any mistake in food
safety of the products can easily cause foodborne illness problem. Table 2 shows that in
the food recall data, the processed products account for 9.47 percent of recall events.
However, the product type is not the main interest in this study so we do not categorize
recall by product type in the analysis.
Table 1. Numbers and Percentages of Product Recalls Classified by Types of
Pathogens from the Recall Event Information during 2000-2009
Pathogen Number Percent Salmonella spp. 782 56.06 Listeria spp. 383 27.46 E. coli 151 10.82 Others Bacteria 79 5.66 Total 1395 100.00 Source: Data from FSIS 2009; FDA 2009a Note: 1) The total number is 1395 because we have one observation that has both of Listeria spp. and Salmonella spp.
2) The total number of observations is 1394.

25
Table 2. Numbers and Percentages of Product Recalls Classified by Types of
Products from the Recall Event Information during 2000-2009
Product Number Percent Meat 448 32.14 Nut 329 23.60 Confectionary-Bakery 236 16.93 Dairy 165 11.84 Others (Not Meats) 88 6.31 Other Fruit- Vegetables 69 4.95 Fresh Fruit 28 2.01 Fresh Vegetables 26 1.87 Beverage 4 0.29 Juice 1 0.07 Total 1394 100.00 Processed 132 9.47 Source: Data from FSIS 2009; FDA 2009a
Table 3. Numbers and Percentages of Product Recalls Caused by Listeria spp. and
Classified by Types of Products from the Recall Event Information during 2000-
2009
Product Number Percent Meat 253 66.06 Dairy 70 18.28 Other Fruit- Vegetables 22 5.74 Others (Not Meats) 20 5.22 Confectionary-Bakery 11 2.87 Fresh Vegetables 4 1.04 Fresh Fruit 2 0.52 Nut 1 0.26 Total 383 100.00 Source: Data from FSIS 2009; FDA 2009a

26
Table 4. Numbers and Percentages of Product Recalls Caused by E. coli and
Classified by Types of Products from the Recall Event Information during 2000-
2009
Product Number Percent Meat 142 94.04 Fresh Fruit 3 1.99 Dairy 2 1.32 Other Fruit- Vegetables 2 0.85 Confectionary-Bakery 1 0.66 Others (Not Meats) 1 0.66 Total 151 100.00 Source: Data from FSIS 2009; FDA 2009a
Table 5. Numbers and Percentages of Product Recalls Caused by Salmonella spp.
and Classified by Types of Products from the Recall Event Information during
2000-2009
Product Number Percent Nut 328 41.94 Confectionary-Bakery 222 28.39 Dairy 90 11.51 Others (Not Meats) 47 6.01 Meat 24 3.07 Other Fruit-Vegetables 26 3.32 Fresh Fruit 22 2.81 Fresh Vegetables 21 2.69 Juice 1 0.13 Beverage 1 0.13 Total 782 100.00 Source: Data from FSIS 2009; FDA 2009a

27
Table 6. Numbers and Percentages of Product Recalls Caused by Other Bacteria
and Classified by Types of Products from the Recall Event Information during
2000-2009
Product Number Percent Subtotal Meat 30 37.97 Others (Not Meats) 20 25.32 Other Fruit- Vegetables 19 24.05 Dairy 3 3.80 Beverage 3 3.80 Confectionary-Bakery 2 2.53 Fresh Fruit 1 1.27 Fresh Vegetables 1 1.27 Total 79 100.00 Source: Data from FSIS 2009; FDA 2009a The data collected are the recall events from 2000 to 2009. Since most of the
recall occurrences took place in 2009, the number of recall occurrences is thus high in
this year compared to other years (see table 7). Also, the graph (shown in figure 5) has
been generated to illustrate the trend of product recall events during 2000 to 2009. It is
noticed that the fluctuation of the recall event numbers in the year of 2000 to 2008 has
caused the wavy pattern in the graph; yet, the number of recall events for each year is
not much different from the others. However, in 2009, the numbers of recall
occurrences spiked dramatically thus, an extremely sharp slope is produced. This rising
of product recall events occurrence in the recent years should, therefore, be given
attention.

28
Table 7. Occurrences of Product Recall Events by Year from 2000 to 2009
Year Number of recall events Percent 2000 82 5.88 2001 73 5.24 2002 98 7.03 2003 60 4.30 2004 99 7.10 2005 77 5.52 2006 51 3.66 2007 93 6.67 2008 89 6.38 2009 672 48.21 Total 1394 100.00
Source: Data from FSIS 2009; FDA 2009a
Figure 5. Trend of number of recall events by year from 2000 to 2009 Source: Data from FSIS 2009; FDA 2009a
0
100
200
300
400
500
600
700
800
1999 2000 2001 2002 2003 2004 2005 2006 2007 2008 2009 2010
Nu
mb
er
of
pro
du
ct r
eca
ll e
ven
ts
Year

29
Company Information
In the study, we defined a company as a corporate parent company. Since, we
would like to see the overall image of the company. Thus, subsidiary companies that
have the same parent company will be presented as the same company.
The company information includes two parts. In the first part, the information
was acquired from Hoover’s Company information Database (2009). This company
information includes financial detailed information of the corporate parent company:
company name, amount of sales in million dollars, number of employees, and type of
company. Sales and employee figures are collected from the newest available
information on the website. Type of company is separated as a manufacturer, retailer, or
food service supplier.
The second part is company information on brand. Numerous individuals put a
lot of effort into the work on the brand information in this study. Thus, the brand
information is very valuable and unique information in this study. The information on
company’s brand includes whether a company has a brand or not represented by brand
binary variable and the number of brands per company for the branded company. Hence,
we created a brand binary variable (BRAND). If a company has a brand, the brand
binary variable equals one, otherwise zero.
We have the company information of a total of 1,005 companies that were
reported on the recall events caused by pathogens during 2000 to 2009. A problem exists
because some company information cannot be obtained. Hence, some companies are
lacking some information such as sales figure or employee figure. According to table 8,

30
all of the companies have information on brand (whether they have their brand or not).
However, only 974 companies have the information on the number of brands. Sales
(million dollars) and the number of employees are two major figures used for company
size grouping. There are only 334 and 310 companies having employee and sales figures
respectively. The reason behind this missing information is that some companies, such
as non-public or very small companies do not expose their financial information to
public. So the information on the number of brands, sales or employees is very difficult
to be obtained. In the next part, we will closely describe the company information on
sales, number of employees, and brand.
Table 8. Company Information
Information Mean Standard deviation
Number of companies with available information
Brand 0.10 0.30 1005 Number of brands 0.53 3.73 974 Number of employees 12,169.66 40,860.22 334 Sales (million dollars) 4,202.54 14,586.27 310 Total number of companies 1005 Total number of recall events 1394 Source: Data from Hoover’s Inc. 2009
Sales
We were able to collect the sales (million dollars) of 310 companies from the
total of 1,005 companies. The distribution of sales data is a right-skewed distribution
shown in figure 6. This means we have many more companies having small sales figures

31
and relatively few companies having high sales values. Actually, the representation in
figure 6 is difficult to comprehend because, on the left of the figure, we have numerous
companies containing small amount of sales figures. These companies pile up so densely
on the left side that the plot seems to have many y-intercepts. However, in fact there is
no y-intercept at all because a company has to have at least a small amount of sales.
This difficulty we faced also results from the characteristics of this sales data as
in the following. First characteristic, as stated earlier, is the data having loads of
companies with small sales figures. Second characteristic is a very broad range of sales
figure (presented in table 9) with a minimum of $200,000 and a maximum of $120.44
billion. That is why it is not easy to make all of the sales levels clearly display in one
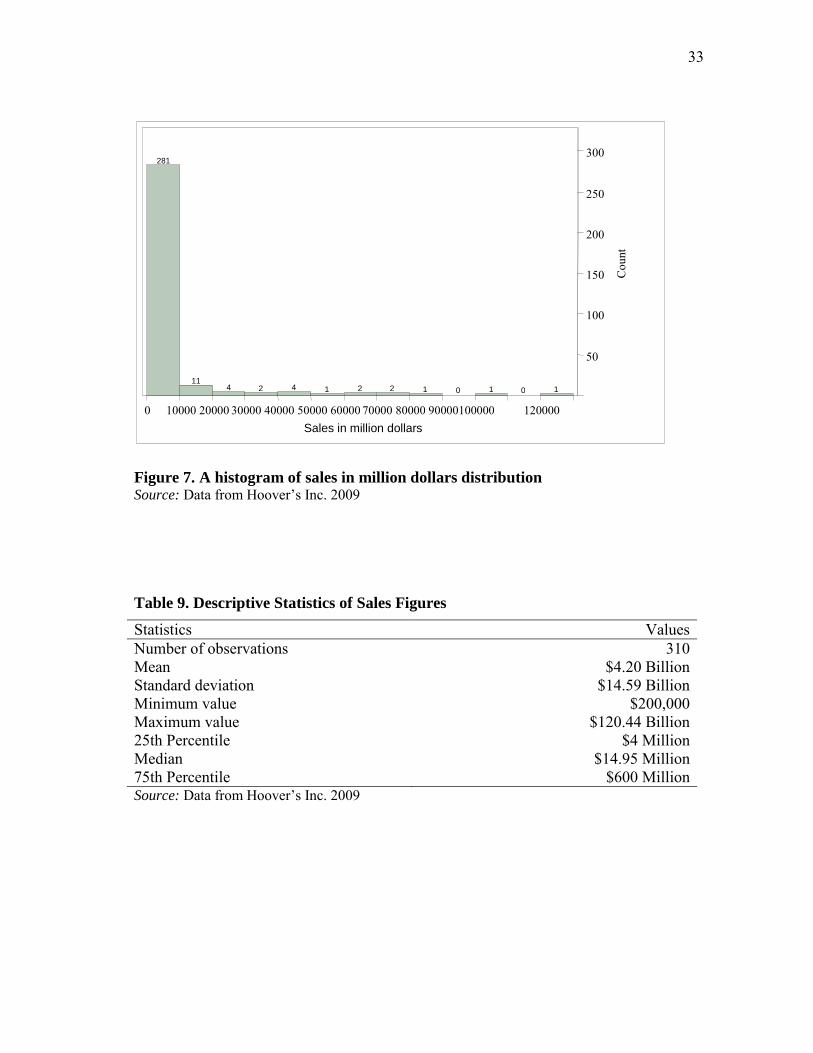
graph. Hence, we transformed the figure 6 to a histogram, shown in figure 7 which is a
better graphical form for understand sales distribution.

32
Figure 6. The frequency distribution of sales figures (million dollars) presented by a
scatter plot Source: Data from Hoover’s Inc. 2009
0
1
2
3
4
5
6
7
0 20000 40000 60000 80000 100000 120000 140000
Nu
mb
er o
f C
om
pa
ny
Sales in million dollars
33
Figure 7. A histogram of sales in million dollars distribution Source: Data from Hoover’s Inc. 2009
Table 9. Descriptive Statistics of Sales Figures
Statistics Values Number of observations 310 Mean $4.20 Billion Standard deviation $14.59 Billion Minimum value $200,000 Maximum value $120.44 Billion 25th Percentile $4 Million Median $14.95 Million 75th Percentile $600 Million Source: Data from Hoover’s Inc. 2009
281
11 4 2 4 1 2 2 1 0 1 0 1
50
100
150
200
250
300
Cou
nt
0 10000 20000 30000 40000 50000 60000 70000 80000 90000 100000 120000 Sales in million dollars

34
Number of Employees
As stated earlier, there are 334 companies from the total 1,005 companies having
employee figures. Consider the distribution on the number of employees; the distribution
provided in figure 8 is also skewed to the right because there is a large share of
companies having a small number of employees. The plot in figure 8 has the same
problem, as in figure 6. So we created a histogram, shown in figure 9, making the data
easier to comprehend.
The range of the number of employees begins with a minimum of 3 employees to
a maximum of 326,000 employees. The values are presented in table 10. Due to the wide
range of the data and many companies having small employees figures, the employee
data set is a right-skewed distribution with most observations compact to the left side.

35
Figure 8. The frequency distribution of the number of employees presented by a
scatter plot Source: Data from Hoover’s Inc. 2009
0
2
4
6
8
10
12
0 50000 100000 150000 200000 250000 300000 350000
Nu
mb
er o
f C
om
pa
ny
Employees

36
Figure 9. A histogram of the number of employees distribution Source: Data from Hoover’s Inc. 2009 Table 10. Descriptive Statistics of Employee Figures
Statistics Values Number of observations 334 Mean 12,169.66 Standard deviation 40,860.22 Minimum value 3 Maximum value 326,000 25th Percentile 25 Median 90 75th Percentile 1,800 Source: Data from Hoover’s Inc. 2009

37
Brand
The information available on brand is provided in table 11. 100 companies from
a total of 1,005 companies have their own brands. In other words, they comprise about
10 percent of all the branded companies. Among all branded companies, 68 companies
released information regarding the number of brands.
Table 11. Descriptive Information on Brand
Information Number of companies Percent Have a brand 100 9.95 Have a number of brands 68 6.77 Total number of companies 1005 100 Source: Data from Hoover’s Inc. 2009
Analysis of Selected Variables
In this part, some important variables are selected to be analyzed. The purpose is
to have more understanding on the variables and get the variables ready to be used in the
model in the next step.
Recall Frequency Variables
From a total of 1,005 companies, most companies (78.91 percent) had only one
recall events (see table 12). Nevertheless, there are 21.09 percent of companies that had
a repeated recall event. The number of recall events for each company ranges from a
minimum of 1 recall to a maximum of 13 recalls. Nevertheless, 13 recalls caused by one
company is an extreme case of recall events and, does not commonly occur. In the data,

38
there is only one company that had 13 recall events. Additionally, the average of the
number of recall events is 1.39 (see table 13) and only 7.16 percent of companies were
reported on the recalls three times or more (see table 12). We also provided a list of 39
company names ranked from the most to the least number of recall events in table 22 in
Appendix A.
Table 12. Number of Companies by Number of Recall Events
Number of recall events Number of companies Percent 1 793 78.91 2 140 13.93 3 33 3.28 4 15 1.49 5 10 1.00 6 5 0.50 7 4 0.40 8 1 0.10 9 1 0.10 12 2 0.20 13 1 0.10
Total 1,005 100.00 ≥2 212 21.09 ≥ 3 72 7.16
Source: Data from FSIS 2009; FDA 2009a; Hoover’s Inc. 2009

39
Table 13. Descriptive Statistics of Recall Frequency
Statistics Values Number of observations 1,005 Mean 1.39 Standard deviation 1.09 Minimum value 1 Maximum value 13 25th Percentile 1 Median 1 75th Percentile 1 Source: Data from FSIS 2009; FDA 2009a Since about one-fifth companies were reported to have a recall event more than
once, we created two main variables for representing the frequency of recalls:
REPEATED and GREPEAT variables
REPEATED is a binary variable indicating whether a company had a repeated
recall event or not. If a company had a repeated recall event (more than one recall
event), this binary variable is equal to one, otherwise zero.
GREPEAT is a categorical variable of the occurrence of recall events. This
variable is created by grouping the number of the recall events into three groups; non-
repeated recall event (one recall event), one repeated recall event (two recall events), and
more than one repeated recall events (more than two recall events). In other words, we
can look at these three levels as low, medium, and high categories of the occurrence of
recall events by frequency order. We assigned the numbers for these three levels as zero,
one, and two, respectively.

40
Size Categories
In order to obtain an accurate interpretation of the outcome, it is important to be
extremely careful of how firms are divided. In this section, the selection of size measure
and method used will be discussed, followed by a description of the firm size grouping
result.
In the U.S., a United States government agency called the Small Business
Administration (SBA) has an authority to define small business. According to the Size
Standards Division Office of Government Contracting & Business Development (2009),
“For the ongoing comprehensive size standards review, SBA has established three
“base” or “anchor” size standards: (1) 500 employees for manufacturing, mining and
other industries with employee based size standards (except for Wholesale Trade); (2)
$7.0 million in average annual receipts for most nonmanufacturing industries with
receipts based size standards; and (3) 100 employees for all Wholesale Trade industries.”
SBA principally uses two criteria for classification on business size, i.e., receipts
and the number of employees. Receipts (average annual receipts) are normally used as a
standard-size measure by SBA since it estimates business’s output value and can be
proved easily. While the number of employees has been mainly utilized for the
manufacturing sector and widely applied by the government such as the Small War
Plants Corporation and the Small Defense Plants Administration. In general, the 500-
employee size standard has gotten recognition in the government (Size Standards
Division Office of Government Contracting & Business Development 2009).

41
According to SBA, we adopted those size standards for determining firm size in
our data. However, we need only one standard-size measure in the study. The number of
employees is preferred because of two main reasons. First, the number of employees has
used as a size standard for the manufacturing industries and also the types of company in
the data mostly are food manufacturers. Second, the number of observations containing
employee data, 334, is larger than the number of observation containing sales data, 310.
Hence, for the size classification analysis, we selected the number of employees as a
standard-size measure.
In selecting the method used for grouping, first we have to understand the
characteristics of our data set. As mentioned in the company information, the employee
data has distinct characteristics that are its non-normal distribution and skewness to the
right. Furthermore, the employee data has a dramatically wide range of value. The range
of number of employees begins with a minimum of 3 employees to a maximum of
326,000 employees (see table 10).
Because of those reasons, we need to find an informative technique to describe
our non-normal distributed data. The two main alternative methods we have considered
are the Jenks natural breaks and the Quantile.
The Jenks natural breaks classification method is a data classification method
that separates the data based on its natural groupings inherent in the data. The criterion
for grouping by this method is minimizing the variance within classes while maximizing
the variance between classes (Jenks 1967). After applying this method to the data, we
will obtain the best similar values in each group and the best relatively different values

42
between groups. Alternatively, the Quantile method groups the data by dividing an equal
number of observations in each category. Thus, class breaks can be considerably
different in range’s size.
Because of the uniqueness of these two classification methods, we utilized both
the Jenks natural breaks and the Quintile methods to group firms by the number of
employees. Thus, we can capture the feasible or appropriate ways to represent the size of
a company. Moreover, we decided to group all of the observations into five sizes from
the smallest-sized firm to the largest-sized firm in an ascending order; size 1, size 2, size
3, size 4, and size 5 respectively.
Within the same size measure, the number of employees, the difference between
methods used for size grouping causes a substantially diverse in the number of
companies for each size class (see table 14). It is clearly that when using the Jenks
natural breaks method, many companies around 87 percent are put in a very small size
(size 1). While, applying the Quantile method gave only about 21 percent of the
companies put in the same size. Furthermore, the number of companies in each group
using the Jenks natural breaks method is getting smaller as the company size is growing
(shown in figure 10). The Quantile method provided an approximately equal number of
firms in each group (66-69).

43
Table 14. Firm Size Classification by the Number of Employees Using the Jenks
Natural Breaks and the Quantile Classification Method
Method Firm Size Range Average value
Frequency Percent
Jenks natural breaks
1 0-10,000 733.22 289 86.5 2 10,001-37,000 22,872.65 17 5.1 3 37,001-91,125 55,139.17 12 3.6 4 91,126-178,000 134,526.10 10 3.0 5 178,001-326,000 242,833.33 6 1.8
Total 334 100 Quantile 1 0-20 13.13 69 20.66
2 21-54 35.04 67 20.06 3 55-178 100.76 66 19.76 4 179-2,986 1,190.85 66 19.76 5 2,987-326,000 60,244.97 66 19.76
Total 334 100
Figure 10. A histogram of the number of firms in each size group categorized by
employee data using several classification methods
289
17 12 10 6
69 67 66 66 66
0
50
100
150
200
250
300
350
Size1 Size2 Size3 Size4 Size5
Num
ber o
f firm
s
Firm sizes
Jenks natural breaksQuantile

44
These dissimilarities stemmed from different ranges of dividing by various
methods and the skewness to the right of the employee data. For example, firm size 1
grouped by the Jenks natural breaks method has a very wide range from 0 to 10,000
employees when compared to the Quantile method which has a narrower range from 0 to
20 employees (see table 14). This example shows that the range in the two methods used
to group the data are unique from each other. While the Jenks natural breaks method is
designed to divide the data into its inherent break based on the skewness, Quantile
method, on the other hand, is intended to provide each group with an equal number of
observations.
The diagrams shown in figure 11 and figure 12 are provided to clarify the
different of range and number of firms in each size group by applying the the Jenks
natural breaks and the Quantile method, respectively. Each figure is a diagram of each
firm’s employee values to illustrate the range, particularly among small firms. The bins
according to the method categories are shown with numbers at the bottom of a diagram.
As shown in the diagrams, there is a large number of very small firms, in other words,
there is a large number of firms with a small number of employees. The diagrams also
demonstrate that the Quantile method separates more groups among small firms while
the Jenks natural breaks method combines all the small firms in to one group. For
example, if we use the 500-employee size standard from SBA, a small business can be
placed in size1 to size 4 for the Quantile method but it is only classified in size 1 for the
Jenks natural breaks method.

45
In conclusion, we decided to use the number of employees as the size measure
and keep both of the firm size classifications by the Jenks natural breaks and the
Quantile methods. Since, there is no universally classification method of firm size.
Figure 11. Range of employee values categorized by the Jenks natural breaks
method
02468
1012
3
12
19
26
38
49
65
80
102
155
180
275
452
724
1000
1600
2200
2800
3900
6500
14000
23000
32400
50000
98000
160000
283000
1 3 4 5
Num
ber o
f firm
s
Employee Values2

46
Figure 12. Range of employee values categorized by the Quantile method
Correlation between Brands and Firm Size
Since, we are interested in both of the brand binary variable and the firm size
variables, we have to consider the possible correlation between the two variables. The
firm size variables that we used are the number of employees and we named it as
EMPLOYEES variable and the size category variables: SIZE 1, SIZE 2, SIZE 3, SIZE 4,
and SIZE 5 (the smallest-sized firm to the largest-sized). Each size category variable is a
binary variable. For example, SIZE 1 equals to one, SIZE 2, SIZE 3, SIZE 4, and SIZE 5
equal to zero, if a company is in the size 1 category. Additionally, the brand binary
variable is named BRAND variable.
According to Devore (2004), we define the correlation (ρ) as follows:
1. A weak correlation:
02468
1012
3
12
19
26
38
49
65
80
102
155
180
275
452
724
1000
1600
2200
2800
3900
6500
14000
23000
32400
50000
98000
160000
283000
1 2 4
Num
ber o
f firm
s
Employee Values3 5

47
2. A moderate correlation: 3. A strong correlation: .
As show in table 15, there is a significantly weak positive correlation between
BRAND and EMPLOYEES (ρ=0.342). For both of the size classification methods, the
correlation between BRAND and each size variable shows the same general result which
is a weak positive correlation (see table 16 and table 17). Thus, the low correlation
would not generate a problem if we include the brand binary variable and the firm size
variables as independent variables in the same model.
Furthermore, consider the sales (million dollars) figure or SALES variable,
EMPLOYEES and SALES are highly correlated (ρ=0.880). This supports the idea that
we should keep only one variable for size measure.
Table 15. Correlation Coefficients between Three Variables: Brand, Employees and
Sales (million dollars)
Variable Correlation Coefficient
Significant Value
Number of Observations
BRAND and EMPLOYEES 0.342 <0.0001 334 EMPLOYEES and SALES 0.880 <0.0001 308 Table 16. Correlation Coefficients between Brand and Sizes by the Quantile
Method based on Employee Data
Variable Correlation Coefficient Significant Value BRAND and SIZE 1 -0.284 <0.0001 BRAND and SIZE 2 -0.226 <0.0001 BRAND and SIZE 3 -0.152 0.0053 BRAND and SIZE 4 0.237 <0.0001 BRAND and SIZE 5 0.432 <0.0001 Note: The total observation number is 334.

48
Table 17. Correlation Coefficients between Brand and Sizes by the Jenks Natural
Breaks Method based on Employee Data
Variable Correlation Coefficient Significant Value BRAND and SIZE 1 -0.461 <0.0001 BRAND and SIZE 2 0.352 <0.0001 BRAND and SIZE 3 0.158 0.0039 BRAND and SIZE 4 0.150 0.0059 BRAND and SIZE 5 0.190 0.0005 Note: The total observation number is 334.
Association of Repeated Recalls with Brand
As shown in table 18, we observed that the proportion of corporate companies
with a brand compared to those with no brand grows with the number of recall
occurrences. For example, the percentages of the number of branded companies had one
recall, two recalls, and three recalls are 6.31, 15.71, and 24.24 respectively. The average
number of brands also increases with the number of the recall events. The average
numbers of brand are 0.17 for the branded companies with one recall, 1.99 for the
branded companies with more than one recall, and 3.98 for the branded companies with
more than two recalls.

49
Table 18. Number of Companies with Brand or No Brand and Statistical Values of
the Number of Brands for Branded Companies for Each Number of the Recall
Occurrences
Number of the recall
occurrences
Number of companies Number of brands Have
Brand No
Brand Total Average Standard
deviation Min Max
1 50(6.31) 743(93.69) 793 0.17 1.36 0 30 2 22(15.71) 118(84.29) 140 1.04 5.76 0 50 3 8(24.24) 25(75.76) 33 2.32 7.00 0 32 4 4(26.67) 11(73.33) 15 2.08 7.19 0 26 5 5(50.00) 5(50.00) 10 9.44 16.73 0 50 6 3(60.00) 2(40.00) 5 14.00 24.17 0 50 7 3(75.00) 1(25.00) 4 0.67 0.58 0 1 8 1(100) 0(0) 1 - - - - 9 1(100) 0(0) 1 - - - - 12 2(100) 0(0) 2 5 - 5 5 13 1(100) 0(0) 1 - - - - ≥2 50(23.58) 162(76.42) 212 1.99 7.79 0 50 ≥ 3 28(38.89) 44(61.11) 72 3.98 10.66 0 50
Source: Data from FSIS 2009; FDA 2009a; Hoover’s Inc. 2009 Note: 1) Numbers in parentheses are row percentage numbers. 2) The total observation number is 1,005.
Summary of Observations Used in the Models
Even though we have a total of 1,005 companies or 1,005 observations to
examine in the study, the number of observations used in the models we are going to
analyze is 334. The reason is that we decided to use the number of employees as a firm
size measure and there were only 334 companies that we were able to obtain the
numbers of employees. Thus, before we move to the methodology chapter, we
summarize the descriptive information on the selected variables of only the observations
used in the analyzed models in table 19.

50
Table 19. Descriptive Information on Brand and Number of Recalls of Only the
Observations Used in the Models
Variable Mean Std. Dev.
Min Max Information Number of Companies
Brand 0.237 0.426 0 1 Have a brand 79 (23.65) Have no brand 255 (76.35)
Number of brands
1.480 6.291 0 50 Have one brand 15(4.49) Have more than one brand 32(9.58)
Number of recalls
1.763 1.635 1 13 Have one recall 221 (66.17) Have more than one recall 113 (33.83) Have more than two recalls 51 (15.27)
Total number of recalls 589 Total number of observations 334 Source: Data from FSIS 2009; FDA 2009a; Hoover’s Inc. 2009
Note: 1) Numbers in parentheses are company percentage numbers. 2) There are 32 companies that have no information on a number of brands. 3) Std. Dev is a standard deviation. According to table 19, the companies that have no brand (255) number greater
than the companies that have a brand (79). Hence, we can say that this data is
unbalanced between the branded companies and unbranded companies. Furthermore, we
also noticed that the numbers of observations are unbalanced between the number of
observations that has one recall event (221) and the number of observations that has a
recurrence of a recall event or more than one recall event (113). Most of the companies,
around 66 percent, have only one recall event. These observations should be considered
when we analyze the data in the next step. Additional, there are only 51 companies or 15
percent of companies that have more than two recall events. We provided a list of 31
company names from all of these 334 companies ranked from the most to the least
number of recall events in table 23 in Appendix A.

51
The description of the data used in the study and the analysis of selected
variables were presented in this chapter. Additionally, we summarized the descriptive
information for only observations that are going to be analyzed by the methodology
explained in the next chapter.

52
CHAPTER IV
METHODOLOGY
The logit and probit models were employed to estimate the effect of company’s
factors: branding and size on the occurrence of a repeated recall event. Thus, we will
have the model with a binary dependent variable and the logit and probit models are
commonly models used when a dependent variable is binary. Moreover, the two models
are suited to predict probabilities since they constrain the response variable to lie
between zero and one.
In order to estimate the logit and probit models, which are nonlinear binary
response models, a maximum likelihood estimation (MLE) is indispensable (Wooldridge
2009). “MLE has some desirable efficiency properties: it is generally the most efficient
estimation procedure in the class of estimators that use information on the distribution of
the endogenous variables given the exogenous variables” (Wooldridge 2002, p.385).
Hence, the estimation method used in this study is MLE.
Models Specification
The models used in the study examine whether the probability that a company
has a repeated recall event, Pi, depends on factors or explanatory variables (Xij)
associated with the company i.

53
Logit Model
First, we provide the main model in the logit approach:
(8)
where
Pi = the probability that a company i has a repeated recall event,
given a set of independent variables(xi) and a set of estimated
parameters ;
= the logistic CDF;
REPEATEDi = the binary variable equals one if company i has a repeated recall
event, otherwise zero;
= a logit latent or logit unobserved variable or the log odds for
company i;
i = the index for companies.
is attained from the underlying latent variable model:
(9)
,
where
βj = logit parameter to be estimated for variable xij;
xij = jth attribute of company i; j = 1, 2, …, k;
εi = the error or disturbance term that has a standard logistic
distribution.

54
Probit Model
The second main model we apply in the probit approach:
(10)
where
Pi = the probability that a company i has a repeated recall event,
given a set of independent variables(xi) and a set of estimated
parameters ;
(.) = the standard normal CDF;
REPEATEDi = the binary variable equals one if company i has a repeated recall
event, otherwise zero;
= a probit latent or probit unobserved variable for company i;
i = the index for companies.
is obtained from the latent variable model:
(11) ,
where
Φ-1(.) = the inverse of the CDF of the standard normal distribution;
j = probit parameter to be estimated for variable xij;
xij = jth attribute of company i; j = 1, 2, …, k;
ui = the error or disturbance term that has a standard normal
distribution.

55
Interpreting the Logit and Probit Estimates
The estimated parameters from logit model in equation (8) and probit model in
equation (10) are not directly the marginal effects of the explanatory variables on the
probability that a company has a repeated recall event (Pi). In order to compute the
marginal effects, we have to consider the characteristic of the explanatory variables.
For a continuous variable like the number of employees (EMPLOYEES), the
marginal effects can be estimated by using the first derivative of the response probability
with respect to the independent variable of interest which is continuous. Thus, in the
logit model, the marginal effect of continuous variable (xij) on the probability Pi would
be
(12)
,
For the probit model, the marginal effect of xij would be
(13)
,
where is the standard normal density.
For both models, the marginal effect of xij on the probability Pi is evaluated at the
means of the other independent variables in the model.
In case that the explanatory variables are dummy variables such as the BRAND
variable, it is not appropriate to obtain the marginal effects by using the first derivative
like we applied with the continuous variables. In this case, the marginal effect of a
binary explanatory variable is acquired by estimating Pi at the two values of the dummy
variable: 0 and 1 while using all of the other variables in the model at the means (Greene

56
2003). The marginal effect of the binary explanatory variable, denoted d, is determined
as:
(14)
where represents the means for all of the other independent variables in the model.
Discussion of Variables
In this section, we identify several factors that we thought might be associated
with food recall events. To explain our thought, we applied economic and management
framework that can link between the factors and the possibility of having a repeated
recall event.
According to the research by Joy (2010), he suggested that branding and firm
size significantly affect the risk of a food recall event by the firm. Hence, branding and
firm size are the two major firm-level factors that we suspect to have an effect on the
recurrence of a recall event associated with pathogenic contamination. We first discuss
about branding and then move to the firm size issue.
Branding is one of the important issues when we discuss about product quality
and safety. Next we will explain about the relation between branding and food quality
and food safety based on the principal-agent theory.
Weiss (1995 p.71) explained about the principal-agent theory as follows, “A
principal-agent relationship is said to hold between two individuals when one (the
principal) provides compensation to the other (the agent) to perform services desired by
the principal but whose successful completion cannot be directly verified by the

57
principal.” In the food safety sector, we can view consumers as principals and producers
as agents. Consumers provide money at the purchased price to producers to supply safe
and wholesome food products; however, consumers cannot directly know whether the
food products are safe and wholesome or not. This principal-agent problem is cause by
the asymmetric information between the producers and consumers and makes it
impossible for consumers to distinguish between low quality or less safe products and
high quality or safe products. Thus firms that produce high quality or safe products will
try to separate themselves from the others with low quality or less safe products by using
branding as a signaling device to their consumers.
Firms also use brand advertising to obtain a positive reputation from consumers.
Nelson (1970 and 1974) suggested that brand advertising could be a signaling device of
high quality products to consumers, even though the advertisements did not carry much
informative content. Milgrom and Roberts (1986) confirmed Nelson’s idea and also
noted that companies invest in brand advertising in the long run to gain a reputation that
they produce quality products. Hence, we would say that branding and brand advertising
are practical signaling devices of high quality products to customers.
Lawrence, Schroeder, and Hayenga (2001) and Ollinger and Mueller (2003) also
support the idea that branding is linked to high product quality. They stated that in the
poultry and meat processing industry, plants usually manufacture branded products the
sources of which can be easily revealed. Hence, the manufacturers must be very active to
maintain product quality.

58
Since branding is an important signal of high quality or safe products, we expect
that a firm that has a brand will have less likelihood of a recurrence of a recall event than
a firm without a brand. However, we have to keep in mind that a firm that has a brand or
more than one brand will have more complexities within the firm rather than a firm
without a brand. Thus, a bounded rationality problem may occur in a firm that has a
brand or an umbrella brand and can lead to an increasing likelihood of having a
recurrence of a recall event.
Besides branding, firm size is also one of the key factors that can be linked to the
quality and safety of products. We will first examine firm size by looking at firm’s
nature. Coase (1937) studied about this issue and he stated that “A firm becomes larger
as additional transactions (which could be exchange transactions co-ordinated through
the price mechanism) are organized by the entrepreneur” (p.393). In the study, Coase
(1937) interpreted the size of firm as employees and sales or volume.
As the additional transactions increases, the transactions would be likely to have
an increase in the dissimilarity and the spatial distribution. This can result in the rising of
the costs of organizing extra transactions and the increasing losses through mistakes by
failing to use the factors of production at their greatest value. At this point, Coase (1937)
argues that the firm becomes less efficient as the firm size gets larger. In other words, he
also stated that the point can be matched with the economic concept of the “diminishing
returns to management.”
In summary, this concept suggests that as a firm becomes larger, it will
experience increasing costs of organizing and the higher losses from mistakes, due to

59
differences in places and in kinds of extra transactions. This is a reason why firm’s
efficiency may decline as the firm increases its size.
Coase’s (1937) argument is also consistent with Williamson’s (1981) assertion.
He stated that when a plant increases in size, its bureaucratic structure becomes more
complex and difficult to be managed. This leads to the higher transaction costs that
finally overcome benefits from economies of scale due to further growth.
The other idea that supports the lower efficiency of a larger firm is based on the
bounded rationality concept. Bounded rationality has been described as a human or an
agent behavior that is "intendedly rational, but only limitedly so” (Simon 1961 as cited
by Williamson 1981, p. 571). In complex environments, boundedly rational agents are
limited by abilities to manage problems and to process information (Williamson 1981).
Even though they attempt to make a rational decision, they only have a second-best
possible solution constrained with the limitations such as available information they
have. Therefore, more complexities within a larger firm make it become less effective in
management.
Since firm management drives quality control, less effective management due to
the growing of firm size may cause problem to the safety of food products. For example,
if the larger firm still uses the same number of employees to work as a quality assurance
(QA) or quality control (QC) personnel, the constraints of their ability to supervise and
examine products in more complex environment such as a variety of products and
processes may lead to difficulty in maintaining product process control. The
consequence is that the less safe products are produced to the market.

60
Furthermore, Ollinger and Mueller (2003) studied about the economics of food
safety in meat and poultry plants. In the study, they used percent critically deficient of
sanitation and process controls practices (SPCPs) to measure for food safety control
effort. “A critical deficiency is a failure to adequately perform an operation that FSIS
deems essential to plant sanitation and process control” (Ollinger and Mueller 2003,
p.21). There are many interesting findings associated with firm size in the study as in the
following. The first finding is that plants with smaller size had a smaller share of
critically deficient SPCPs when comparing to the larger plants. The second finding is
that all processing plants and large slaughter plants in high deficient SPCPs level have a
greater likelihood to exit the industry than other plants. Moreover, the closest study by
Joy (2010) also found that an expansion of firm size will make the risk of the firm that
has a recurrence of a food recall event increase.
In contrast, we have to consider that the larger firms can get more benefits from
economies of scale that lead to more efficiency in production process than smaller ones.
This may assume that the products of large firms will be safe and have a good quality
due to the efficient production process. However, it is not assured that the large firm can
enjoy economies of scale, unless we have the information to calculate average cost of the
firm. Hence, we cannot conclude that the large firms in this study are more efficient than
the smaller firms.
According to the economics concepts and the research findings stated above,
thus, we suspect that as firm size increases, so does firm complexity, and the probability
of the firm has a recurrence of a recall event will also increase. However, another

61
important perspective on the large firms is that the large firms are often linked to more
automation in production that typically makes a safer and more controlled product with
less chance for human error (G. Acuff, personal communication). Due to the
contradiction of these two viewpoints, the two tailed test will be used as the hypothesis
test on the coefficient of firm size variable explained in the Hypothesis Tests section.
Consideration on Missing Variables
Consider multiple variables that are the underlying causal factors in observed
phenomenon. Even if these causal factors are difficult to measure, it is important to
consider them to avoid omitted variable bias in the results. Therefore, in this study, one
needs to understand what causes branding and what causes firm size. It might be the case
that another latent variable that we did not include in the model could have a correlation
with the independent variables in the model (Bessler 2009). This latent variable might
have an effect on either branding or firm size or both of these firm-level factors. The
effects are important to specification of the econometric model. Furthermore, if the food
safety policy has a significant association with the occurrence of a repeated recall event,
the variable that measures this policy must be included in the model to prevent biased
estimation of parameters in the model (Wooldridge 2009).
The food safety policy or standard set by government agencies might be the
factor that should be considered as the latent variable that could manipulate branding and
firm size. If the food safety policy or standard is not very stringent to inspect food
products, with infrequent sampling and testing, the government agencies may not find

62
many problems on the products. When a firm finds no problem with its products such as
no recall, it may want to expand its production to generate more profits. In this example,
it might be possible that the policy can have an influence on firm size.
It is difficult to find the appropriate measure of food safety policy and also the
correlations between food safety policy and the occurrences of a repeated recall event.
Further, the correlation between food safety policy and firm size or branding has been
unclear. Additionally, this study’s unit of analysis is a company and all companies are
subjected to the same policy. Hence, policy is constant across firms. Also, the effect of
policy on firm size needs to be assessed through temporal scale. Since this study does
not include temporal variation in the model, the potential bias of excluding policy as a
variable might not be a problem. Therefore, the variable of food safety policy is not
included in the model.
It is important to consider and be aware of other possible factors that may
become a hidden variable and may cause the bias problem to the model unless they are
included in the model. The bias direction depends on the sign of the estimated parameter
of the interested variable in the model and the sign of the correlation between this
variable and the omitted variable. If the sign of the estimated parameter and the sign of
the correlation are the same, the bias is positive, otherwise negative (Wooldridge 2009).
Hypothesis Tests
According to the study by Joy (2010) that is the most similar research to this
study, he found that branding and firm size significantly affect the risk of food recall

63
event. Thus, in this study, we contend that these two factors: branding and firm size have
an effect on the recurrence of a recall event associated with pathogenic contamination.
Therefore, the first hypothesis we will test is that the estimated coefficient of branding
variable (β B) in the model that controls for the effect of firm size will not be equal to
zero. The proposed hypothesis is:
(1) H0: β B = 0
H1: β B ≠ 0
In the first hypothesis test, the null hypothesis is that the coefficient of branding
variable equals zero. As the expectation stated above, we would like to reject the null
hypothesis by obtaining the small p-value (p < 0.01) in order to conclude that branding
has a significant effect on the recurrence of a recall event.
The second hypothesis we will test is that the estimated coefficient of firm size
variable (β FS) in the model that controls for the effect of branding will not be equal to
zero. This hypothesis is presented as:
(2) H0: β FS = 0
H1: β FS ≠ 0
In the second hypothesis test, the null hypothesis is that the coefficient of firm
size variable equals zero. Using the same concept as discussion in the first hypothesis
test, we would like to reject the null hypothesis by obtaining the small p-value (p < 0.01)
in order to conclude that firm size has significantly effect on the recurrence of a recall
event.

64
Variable Specification
The dependent variable is REPEATED. This binary variable sets at one if a
company has a repeated recall event, otherwise zero.
The independent variables (xij) are the attributes of company that we are
interested. The first attribute is whether a company has a brand or not. Thus, one of the
independent variable is a brand binary variable or BRAND. BRAND was set to one if a
company has a brand, otherwise zero.
The second attribute is the size of a firm that can be determined by size
categorical variables, the number of employees, or the transformation variables of the
number of employees. The size categorical variables are SIZE 1, SIZE 2, SIZE 3, SIZE
4, and SIZE 5, which are all the binary variables. If a company is put in the size 1
category, SIZE 1 equals to one, SIZE 2, SIZE 3, SIZE 4, and SIZE 5 equal to zero. The
variable representing the number of employees in the company is EMPLOYEES. The
transformation variables of the number of employees can be in many forms. One form is
the number of employees in thousands (EMPLOYEES_TH). The form of firm size
variable that we selected is the natural log of the number of employees of the company
and Ln(EMPLOYEES) represents this variable. Due to some limitations from the size
categorical and EMPLOYEES variables, we used only Ln(EMPLOYEES) variable for
representing firm size variable. The limitation issue will be discussed in the next chapter.
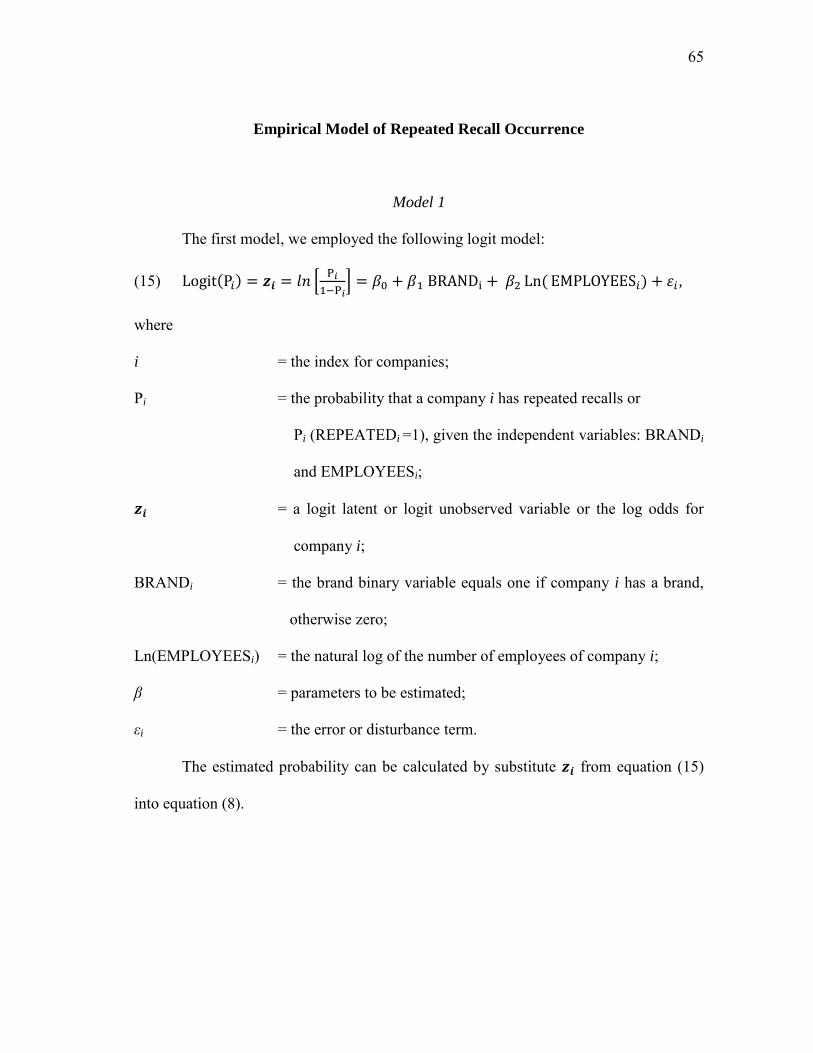
65
Empirical Model of Repeated Recall Occurrence
Model 1
The first model, we employed the following logit model:
(15)
,
where
i = the index for companies;
Pi = the probability that a company i has repeated recalls or
Pi (REPEATEDi =1), given the independent variables: BRANDi
and EMPLOYEESi;
= a logit latent or logit unobserved variable or the log odds for
company i;
BRANDi = the brand binary variable equals one if company i has a brand,
otherwise zero;
Ln(EMPLOYEESi) = the natural log of the number of employees of company i;
β = parameters to be estimated;
εi = the error or disturbance term.
The estimated probability can be calculated by substitute from equation (15)
into equation (8).

66
Model 2
In the second model applied the probit model in the model 1 instead of the logit
model. This second model is given as:
(16) ,
where
i = the index for companies;
Φ-1(.) = the inverse of the CDF of the standard normal distribution;
Pi = the probability that a company i has repeated recalls or
Pi (REPEATEDi =1), given the independent variables: BRANDi
and EMPLOYEESi;
= a probit latent or probit unobserved variable for company i;
BRANDi = the brand binary variable equals one if company i has a brand,
otherwise zero;
Ln(EMPLOYEESi) = the natural log of the number of employees of company i;
α = parameters to be estimated;
ui = the error or disturbance term.
The estimated probability can be calculated by substitute from equation (16)
into equation (10).
In summary, the appropriate models employed to examine the effect of firm’s
factors: branding and firm size on the recurrence of a food recall event associated with
pathogenic contamination are logit and probit probability models. According to
economic and management frameworks and the research involved with a firm and food

67
safety, we make assumptions that larger firm size is associated with greater likelihood of
a recurrence of a recall event and branding is associated with lower likelihood. Then, the
assumptions will be examined and the results will be discussed in the next chapter.

68
CHAPTER V
ANALYSIS & RESULTS
The content in this chapter is separated into three parts. The first part provides
the main results from the estimation of the logit and probit models frameworks that were
shown in the prior chapter. The second part presents the additional results from other
models we tested. The last part is the results discussion and the possible reasons for the
results.
Main Results
The two models: logit and probit models are estimated to clarify and predict how
an occurrence of a repeated recall event varies by branding and company size. The
results for logit and probit regressions illustrated in table 20 and table 21 respectively
contain the estimated coefficients, the associated standard errors, and the marginal
effects of the independent variables. Additionally, the table provides various measures of
goodness of fit for the model including the Likelihood Ratio (LR), the pseudo R-squared
(Pseudo R2), the Akaike information criterion (AIC), and the percent correctly predicted.
The results from the logit regression are consistent with the results derived from
the probit regression. First, look at the main hypothesis tests, for both variables:
branding and firm size (table 20). The null hypothesis that the coefficient of the variables
equals zero was significantly rejected. This indicates that both branding and firm size
have significant effects on the recurrence of a recall event associated with pathogenic

69
contamination. Second, the results indicate how these two factors influence the
recurrence of a recall event. The results suggest that companies having a brand or
branded companies are more likely to have a repeated recall event caused by pathogens
than companies with no brand. Furthermore, the results also suggest that larger
companies are more likely to experience a repeated recall event than the smaller ones.
Table 20. Effect of Brand and Firm Size on the Occurrence of the Repeated Recall
Event Using the Logit Model
Variable Coefficient Marginal Effect
Mean
Estimate Standard error
Intercept*** -1.859 0.287 - - BRAND** 0.645 0.323 0.148 0.237 Ln(EMPLOYEES)*** 0.179 0.051 3.919*10-4 5.4748 Likelihood Ratio*** 36.313 Pseudo R2 0.085 AIC 397.152 Observations 334 Correct Prediction Actual Have repeated recalls 43 (38.05) 113 No repeated recalls 195 (88.24) 221 Total 238 (71.26) 334 Note: 1) ***, **are significant at the 1 and 5 percent level, respectively. 2) Numbers in parentheses are row percents correctly predicted

70
Table 21. Effect of Brand and Firm Size on the Occurrence of the Repeated Recall
Event Using the Probit Model
Variable Coefficient Marginal Effect
Mean
Estimate Standard error
Intercept*** -1.132 0.170 - - BRAND** 0.399 0.201 0.149 0.237 Ln(EMPLOYEES)*** 0.109 0.031 3.932*10-4 5.4748 Likelihood Ratio*** 36.197 Pseudo R2 0.085 AIC 397.267 Observations 334 Correct Prediction Actual Have repeated recalls 44 (38.94) 113 No repeated recalls 195 (88.24) 221 Total 239 (71.56) 334 Note: 1) ***, **are significant at the 1 and 5 percent level, respectively. 2) Numbers in parentheses are row percents correctly predicted As shown in table 20 and table 21, the estimated coefficients of BRAND and
Ln(EMPLOYEES) are positive and statistically significant at the 5 percent level or the
lower level. Hence, these coefficients suggest that a firm having a brand and firm size
have a positive relationship to the probability of the occurrence of the repeated recall
event by the firm. A sign of an effect of an independent variable on a dependent variable
is determined by the sign of the estimated parameter of the independent variable
(Wooldridge 2002). Furthermore, in this study, the positive sign of the estimated
coefficient can be interpreted that the variable is associated with worse performance in
terms of food safety. Although, the sign of the estimated parameter is adequate to define
whether the independent variable has a positive or negative effect on the dependent

71
variable, the magnitude of the parameter is not meaningful to explain about the
magnitude of the effect (Wooldridge 2009).
The estimated marginal effects are especially important for determining the
magnitude of the effects of the explanatory variables on the dependent variable. The
marginal effects indicate how much the probability of the event changes when changing
a given independent variable by one unit and holding the other variables constant. The
results from both probit and logit approaches provided approximately the same values of
the marginal effect of branding and firm size. The marginal effect of BRAND suggests
that companies with a brand or branded companies are around 15 percent more likely to
have a recurrence of a recall event compared to those with no brand.
The estimated marginal effect of Ln(EMPLOYEES) is difficult to interpret. By
definition the marginal effect estimate indicates that a 1-percent increase in company
size or the number of employees increases the likelihood of the occurrence of the
repeated recall event by about 0.04 percent. Even though, the effect of the number of
employees seems to be very small, 0.04 percent, it is still meaningful because it is
statistically significant. For example, consider a single company that doubles employee
number because of double shift or operating a new plant, the 100 percent growth in size
is associated with a 4-percent rise in probability of the recurrence of the recall event.
There are many small firms (around 30 firms) in the dataset for which it is feasible to
double employee number by only hiring 3 to 10 more people.
The goodness of fit for the model can be measured by various statistics;
likelihood ratio (LR), pseudo R2, and AIC. Both of the two approaches: logit and probit

72
have similar values of the statistics for all the goodness of fit measures. The LR statistic
indicates the overall model significance. In the logit and probit model, the LR statistics
are 36.313 and 36.197 respectively. Furthermore, the LR statistics are both significant at
the 1 percent level. This suggests that these two models have a very significant
explanatory power. The pseudo R2 for the two approaches is 0.085. This pseudo R2 is
suggested by McFadden (1974) and also called the likelihood ratio index (LRI). The LRI
indicates a perfect fit. The more LRI increases, the better the model fits (Greene 2003).
The AIC values of the logit and probit models are 397.152 and 397.267, respectively.
The AIC is also a fit measure of the model and can be used as a criterion of a model
selection. Among different models, the smallest AIC value is represented the best.
The last goodness-of-fit measure provided is the percent correctly predicted. The
logit and probit models have the similar percents correctly predicted as well. The overall
percents correctly predicted of the logit and probit models are 71.26 and 71.56 percent,
respectively. These values indicate that the overall models predict well.
However, some questions about correct prediction are remaining. For each of the
outcome, the percents correctly predicted are different within the same model but similar
between the logit and probit models. Both models are more successful in the prediction
of the event that the repeated recall does not occur with 88 percent correctly predicted
than the event that occurs. The percents correctly predicted for the event that the
repeated recall occurs are 38 percent for the logit model and 39 percent for the probit
model. The less correctly predicted for the event that the repeated recall occurs may be
caused by the threshold value of 0.5 that we chose. Greene (2003) asserted that even
73
though the value of 0.5 is a common threshold, it may not always be the good choice to
select in all cases such as the unbalanced data. If the data has many more observations
that the event occurs ( yi = 1), or vice versa ( yi = 0), by using the threshold value of 0.5
the model is hardly to predict the zero outcomes, or vice versa ( the one outcomes).
While our data are not perfectly balanced, the 34-percent ones are sufficient to lead us to
conclude that imbalance is not a severe problem in assessing goodness of fit.
Additional Results
Before we decided to choose the Ln(EMPLOYEES) variables to be a firm size
variable in the model 1 and the model 2, we tested many different forms of size
variables; size categorical variables by the Jenks natural breaks method, size categorical
variables by the Quantile method, the number of employees (EMPLOYEES), and the
number of employees in thousand units (EMPLOYEES_TH). Since the results from
logit regressions and probit regressions are very similar, only the results from logit
regressions are included in this study. The results are shown in table 24 through table 27
in Appendix B.
For all of the models using different forms of firm size variables, the results on
branding are consistent with the results from Model 1 and Model 2 (table 20 and table
21). That is, branded companies are positively and statistically significantly associated
with recurrence of a recall event. In other words, companies with a brand are more likely
to have a recurrence of a recall event compared to those with no brand. The likelihoods

74
are around 18 to 25 percent greater for branded companies than nonbranded, depending
on forms of firm size variables used.
For studying the effect of firm size, first we used the size categorical variables.
The size categorical variables are SIZE 1, SIZE 2, SIZE 3, SIZE 4, and SIZE 5 which
are each binary variables. In the model, since we have 5 categories of firm size, we put
only 4 categorical variables; SIZE 1, SIZE 2, SIZE 3, and SIZE 4 and leave 1 categorical
variable, SIZE 5, out of the model to prevent the perfect multicollinearity problem.
Hence, the interpretation of each size categorical variable is each firm size compared to
firm size of 5 which is the reference size. For example, SIZE 1 represents firm size 1
compare to firm size 5.
Two options of categorizing companies to the 5 size groups were studied: Jenks
natural breaks method and Quantile method. In the model using size categorical
variables by the Jenks natural breaks method, all 4 size categorical variables are not
statistically significant. However, we noticed that SIZE 1, SIZE 2, and SIZE 3 have
negatively nonsignificant effects on the probability that a firm has a recurrence of a
recall event, while SIZE 4 has a positive nonsignificant effect on the probability. Even
though, the firm size categorical variables by the Jenks natural breaks method are not
statistically significant, the coefficient sign indicates that a firm that has a smaller size
compared size of 5 is less likely to have a repeated recall event than a firm of size of 5 .
For the model using the Quantile size categorical variables, the estimated
coefficients of SIZE 1, SIZE 2, and SIZE 3 are negative and statistically significant at
the 5 percent level or the higher level. Nevertheless, the estimated coefficient of SIZE4

75
is negative but not statistically significant. Since, marginal effects are more meaningful
than the estimated coefficients, we must interpret effects of variables from marginal
effects. The marginal effect of SIZE 1 suggests that size 1 companies are about 23
percent less likely to have a recurrence of a recall event compared to size 5 companies.
Similarly, the marginal effect of SIZE 2 and SIZE 3 suggest that compared to size 5
companies, the size 2 and size 3 companies are less likely to have a recurrence of a recall
event by 26 and 23 percent, respectively.
In general, by using size categorical variables to represent firm size, we may
conclude that the smaller firm sizes are less likely to have a repeated recall event than
the largest firm size (size 5). The limitation for using size categorical variables is that the
estimated marginal effects only show a tendency of a probability of smaller firm sizes
comparing to the largest firm size. Hence, it is difficult to find the explanation of a
marginal increasing in firm size. Moreover, since we determined firm size categories by
a range of a number of employees, some size categories have very wide ranges of the
number of employees so they become very difficult to interpret or to find the best
number of employees for representing each size category. Also it is not clear that the two
categorical methods that we used would create the firm size categories that can be the
good representation of firm size.
These are the reasons why we turn back to the raw number of employees in order
to determine firm size. For the model using the number of employees as a firm size
variable, the coefficient of EMPLOYEES variable is positive and statistically
significant. The result of the marginal effect suggests that a one employee increase in
76
firm size raises the probability that the firm has a recurrence of a recall event by about
2*10-6. Because of a very small value of the marginal effect of EMPLOYEES variable,
we tried other transformations of the number of employees variables.
For the model using the number of employees in thousands (EMPLOYEES_TH),
the results are consistent with the model using EMPLOYEES variable. The marginal
effect of EMPLOYEES_TH variable indicates that a one thousand employee increase in
firm size raises the likelihood that the firm has a recurrence of a recall event by about
0.002 percent. In this model, a limitation still exists because an increasing of one
thousand employees in small firms may not be practical. For example, in the data, the
smallest firm has only three employees. An expansion of the firm by one thousand
employees is difficult to be possible. Thus, for small firms, the interpretation of the
marginal effect of EMPLOYEES_TH is not quite useful.
At last we decided to use the natural log of the number of employees to represent
the firm size. This is because the log form allows for possible diminishing marginal
effects. Consider a very small firm in the data set that has only three employees, if the
firm hires one more person, this can lead to a substantial effect on the production or the
complexity within the firm. While considering a very large firm in the data set with a
hundred thousand of employees, hiring one more person will have much less impact to
the firm comparative to the very small firm. Hence, the good way to capture the possible
diminishing effect of additional employee is to use the log transformation of the number
of employees.

77
In summary, even though, there are some limitations exist in the models using
these different forms of size variables, the results of branding and firm size are always
consistent with the models we selected (model 1 and model 2). That is, a firm that has a
brand is more likely to have a repeated recall event than a firm that has no brand. And
the probability that a firm has a recurrence of a recall event increases as firm size
increases.
Discussion
In this part, the two major finding associated with branding and firm size will be
discussed and also the reasonable plausible explanations will be provided.
Branding
The first major finding is that a company that has a brand is more likely to have a
recurrence of a food recall event associated with pathogenic contamination than a
company without a brand. This finding is consistent with the results from Joy (2010).
Joy (2010) found that branding by the firm raises the risk of recurrence of food recall
incidences. However, the finding contradicts to what we expected based on other
literature. Branding is often viewed as a key signal of high quality or safe products
(Lawrence, Schroeder, and Hayenga 2001; Milgrom and Roberts 1986; Ollinger and
Mueller 2003). Thus, the belief that branded products have higher quality and are safer
than non-branded products may be wrong. Several plausible explanations for this result
are provided in the following.
78
The first plausible explanation is that a branded company may have substantial
concern about its brand and reputation, thus the company may adopt a proactive-recall
strategy in order to protect them. The firm may want to accept the recall costs of the
proactive action rather than losing its reputation. “The expenses required to remove the
product from the market may be minor compared to the lost consumer confidence,
damaged brand strength, and reduced sales that follow the bad publicity” (Dwyer 1999
as cited by Skees, Botts, and Zeuli 2001, p. 100).
Furthermore, a support statement why a firm would like to make a proactive
recall is that it can lessen the negative effect from the recall incident by getting positive
perceptions from consumers such as firm’s trustworthiness (Chen, Ganesan and Liu
2009; Siomkos and Kurzbard 1994).
The reason why a firm is very concerned about its reputation is that a positive
reputation can be interpreted as an insurance against problematic incidents. Several
researchers also pointed out that the effect of product-harm crisis is relatively small on a
firm that is well-known and has a positive image when comparing to an unknown firm.
The study by Siomkos and Kurzbard (1994) found that in a product-harm crisis, a well
known and high-reputation firm receives less negative effect from consumers’ future
purchases and their perceptions than a low-reputation firm. Hence, damaging a
reputation can be very costly. It would damage the firm more to delay or avoid a recall
and later be implicated.
Especially, in our study we focused solely on microbiological contamination
recall events that can cause severe health problems to consumers and gain lots of

79
attention in public. Thus, it is possible that if a branded firm suspect contaminated
products, even before any consumers’ health problems have been reported, the firm will
step forward and act responsibly by making a recall in order to minimize the negative
effect from the recall incident and maintain positive consumers’ perceptions and its
positive reputation.
The second plausible explanation is that a firm that produces branded products
can be tracked and identified more easily than a firm that produces unbranded products.
This is caused by the imperfect linkage between the cause of foodborne sickness and the
product. For example, meat and poultry processing plants usually produces branded
products, so the processor is more easily revealed and linked to contaminated products
than meat and poultry slaughter plants. On the other hand, slaughter products are often
unbranded and can be co-mingled with identical products from others suppliers by a
buyer. Hence, the producer’s identity is obscure and difficult to identify by a buyer or
consumer (Lawrence, Schroeder, and Hayenga 2001; Ollinger and Mueller 2003). Thus,
the firm with a brand may have more probability of being reported by consumers for
causing foodborne illness than the firm with no brand.
For the third plausible explanation, if a firm that produces branded products has
more than one brand, the negative effect from a recurrence of a recall event may be
lessened by a broad range of product lines under several brand names. Consumers may
not be aware that the products with different brand names are manufactured by the same
company. Since, the company name is not recognized by customers consuming its
products under several brand names, the negative effect from a recall event from one

80
brand will not affect the other brands within the same company. For example, few
customers recognize that Bisquick, Gold Medal and Betty Crocker are produced by
General Mills. If Gold Medal products have a problem, both products from Bisquick and
Betty Crocker will not have a negative effect associated with Gold Medal’s problem.
This will be possible unless the media brings up the issue about the connection between
these three brand names. Additionally, if the company produces products with different
brand names but in the same product area, customers may think that the different brand
names are competitors (Siomkos and Kurzbard 1994). The result is that a product recall
may not hurt the company because consumers switch to buy the other brands within the
same company.
The final plausible explanation is that the firm may create new additional brand
names in order to offset the negative effect that is caused by the recall problem of the
previous brand name. It may be possible that every time a firm has a recall it may
created a new brand name with a little investment. Hence, a firm with multiple brands
may have more likelihood to have a repeated recall event. This plausible explanation is
also linked to the previous explanation that most of the consumers cannot link between
the difference brand names which are created by the same company. Moreover, the loss
from a product-harm crisis is specific to one brand and does not affects the other brands
within the same company.

81
Firm Size
The second major finding is that a growing of firm size increases the probability
of a recurrence of a food recall event caused by pathogenic contamination. This finding
is consistent with our expectation and Joy (2010). Furthermore, the finding is also in line
with the economic concepts suggested by Coase (1937) and Williamson (1981) and the
bounded rationality concept proposed by Simon (1961). The larger firm size is, the more
inefficient the firm becomes. The greater inefficient stemming from the limitations of the
management’s ability may reduce product safety.
Furthermore, it is more difficult for the larger firm to improve the food safety
control practices compared with the smaller one due to complexities within the larger
firm. Hence, the costs of improvement on the food safety control sector may very
expensive for the larger firm than the smaller one. For example, a large company that
had one recall event may want to improve its performance on food safety control.
However, it may be difficult to achieve the goal. Therefore, a recall event may happen
again. This idea is supported by Ollinger and Mueller (2003) who stated that “larger
plants will find it more costly to reduce percent-deficient of SPCPs than smaller plants”
(p.26). They also asserted that, to comply with quality standards, larger plants may face
a comparatively higher cost than smaller ones. Next, we will propose other feasible
explanations for this major finding in the following.
For the first feasible explanation, since the economies of scale within the firm is
important in food industries, the larger firm may attempt to generate economies of scale
in the food safety process control sector. By not realizing the potential limits of bounded

82
rationality, the firm may face with the food safety problem. For example, if the firm
increases its size but does not hire more QA or QC personnel in order to get benefits
from economies of scale, increasing the amount of products or expanding with
differentiated in product types can limit the worker’s ability toward maintaining safety
of the products. The result is that the less safe products may be produced to the market.
Additionally, the firm succeeds in achieving economies of scale in production operation
through fast or mechanized operation. This produces more at lower average cost but is
more complex to monitor.
The second feasible explanation for risk of recall to increase with size is that
large firms produce very large volumes of products. Hence, the likelihood of an incident
that a consumer gets sick from foodborne illnesses leading to an announcement of a
product recall is a lot greater, holding everything else equal. Therefore, larger firms
producing larger volume of products tend to have more chance to make recalls than
smaller ones.
The final feasible explanation is connected with the previous explanation. That
is, smaller firms produce at a smaller volume of products and the products are consumed
by fewer consumers. Even though, the firms realize that the products are contaminated,
they may not announce a recall if the problem has not been noticed in the public. There
are many possible reasons for small firms to avoid making a recall.
The first reason is that the recall costs including announcing the recall, removing,
and replacing the products are very high. The small firm may unable to handle these
costs, thus they end up with not implementing a recall. The second reason is that there is

83
small likelihood of a consumer to get sick from the contaminated products because small
firms produce a small amount of products which are consumed by a few consumers.
Thus, the small firm may risk on a little chance that food safety problem will occur yet
not be discovered. The third reason is that the small firm may fear to have a large
reduction of returns to shareholders after a recall event. For example, in the study of
Salin and Hooker (2001), they found that the returns to shareholders of the smallest firm,
Odwalla, dropped instantaneously after the recall event.
However, the decision to announce a product recall depends on the severity of
the food contamination problem. If the contamination problem is severe, a firm may
choose to announce a product recall. It will damage the firms’ reputation badly and
create tremendous losses later due to the bad publicity, if they do not take a
responsibility by making a recall.
In the opposite view, an alternative plausible explanation is that smaller firms
may have more safety process control than the larger ones. The reason is that the smaller
firms may have a greater fear to have a recall event so they try the best to prevent or at
least have less of the recurrence of a recall event. The greater fear might be the fear for
the large recall costs that may cause the firm hardly to survive or the fear of a large
reduction of returns to shareholders due to a recall event. This explanation is also
consistent with the finding from Ollinger and Mueller (2003) that the smaller meat and
poultry plants had a lower proportion of critical deficient SPCPs than the larger plants.

84
CHAPTER VI
CONCLUSIONS
This study examined the effect of branding and firm size on the probability that a
firm has a recurrence of a recall event associated with microbiological contamination, in
the U.S. from January, 2000 through October, 2009. The total food recall events
involved with pathogenic contamination in this period is 1,394 recall events that were
issued by 1,005 companies. The number of food recall events associated with pathogenic
contamination has been growing recently. This has resulted in extensive concerns for
consumers, government and food companies.
The first major finding is that firms that produce branded products are associated
with worse performance in terms of food safety. The firms with brand are around 15
percent more likely to have a recurrence of a recall event than firms producing
unbranded product. This finding opposes to what we expected, that branded firm would
perform better than a firm without brand. Branding has been commonly inferred as a key
signal of high quality or safe products (Lawrence, Schroeder, and Hayenga 2001;
Milgrom and Roberts 1986; Ollinger and Mueller 2003). Thus, the confidence that
branded products have higher quality and are safer than nonbranded products may be
mistaken. We provide several possible explanations in the following.
Branded companies may try to protect their brands and positive reputations by
adopting the proactive-recall strategy. Since they depend more on consumers’
perceptions, the brand owner publicly issues a recall to apologize and warn consumers.

85
By quickly responding to the problem the company expects to protect its brands and
return to normal sales more quickly than if the problem is not acknowledged publicly.
Moreover, firms that produce branded products may be more easily tracked and
identified than firms with unbranded products.
Furthermore, firms with more than one brand name may have less negative effect
from a recurrence of a recall event, because of compensation from other branded
products they have. The loss for a product recall event is specific only to that troubled
brand and some consumers cannot link between brand names and the company creating
the brand names. Thus, it will not have a negative effect on other brand names within the
same company and the firm is able to withstand one or more product recalls. In addition,
the firm may create new brand names in order to offset the negative effect due to the
recall incidence of the previous brand name.
Finally, it is possible that branding strategies are more common for the types of
foods at risk for product recall.
The second major finding is that larger firms are associated with worse
performance in terms of food safety comparative to smaller firms. A 1-percent increase
in firm size as measured by the number of employees increases the likelihood of firm to
have the recurrence of a recall event by about 0.04 percent. This worse performance due
to the size of firm is consistent to the expectation based on the bounded rationality
concept. Large firms may face limitations of the management’s ability and more
complexities within the firms. Thus, after a first recall event, improving the food safety

86
control efforts in larger firms may have more difficulties than in the smaller ones. We
proposed several possible explanations for this finding.
The larger firm may attempt to create economies of scale in the overall
production process, but is not able to assure benefits in safety and quality along with the
increased production.
Moreover, very large amount of products are produced by larger firms. For
example, in meat and poultry processing industry, many manufacturers such as Tyson
Foods, Inc. have slaughtering and processing plants that produce products in millions of
pounds. Hence, the likelihood of a consumer getting sick from foodborne illnesses that
lead the firms to announce a product recall is greater. On the other hand, due to the small
volume of products produced by smaller firm, the smaller firm may have an incentive to
not announce a recall if the problem has not been noticed in the public.
The findings from this study can have implications for policy makers and also
managers of private sectors, food companies. The policy makers should not take
branding as an indicator of food safety performance. Since the large company or branded
company tend to have more risk of making a repeated recall event caused by pathogens,
policy makers should pay extra attentions to these types of companies. They may
carefully observe the food safety control efforts of these types of firms by using more
strict regulations or providing alternative standards in order to prevent severe foodborne
illnesses that may happen with their food.
In case of the private sectors or food companies, they should view product recall
as one of many management tools. In addition, if they are large firms or branded firms,
87
the implication may be that they should take the results as guidelines for their food
safety control standards. For example, they may take more precautions or put more
efforts on their safety in the process control sectors since the high comparative
probability of having a recurrence of recall event.
The study also has a limitation on the data resource. We used the data of food
recall events as an inference of food safety quality. Although, this is the best data that we
could obtain, someone may view the food recall events data as inadequate data. The
main weakness is that FSIS or FDA only takes a random sample of food products and
does not examine all products. FDA also rarely samples and tests products. Hence, we
cannot infer that all of the product that has no recall will be safe. Thus, the further
research we suggested is that we may use alternative measure for food quality control
effort.
In addition, further possible research is the developing of the same model used in
this study by including other factors which may be significantly associated with product
recalls such as the product types. Furthermore, future research may employ more
complex models as the alternative model approaches such as ordered logit, ordered
probit, multinomial logit, or multinomial probit. These methods are examples that might
be helpful to understanding about food safety problems.

88
REFERENCES
Amemiya, T. 1981. Qualitative Response Models: A Survey. Journal of Economic
Literature 19 (4) (Dec.): 1483-1536.
Besanko, D. 2010. Economics of Strategy. Hoboken, NJ: John Wiley & Sons.
Bessler, D. A. 2009. Directed Acyclic Graphs and Algorithms of Inductive Causation.
Lecture presented at Texas A&M University, College Station.
Centers for Disease Control and Prevention (CDC). 2011. Investigation Update:
Multistate Outbreak of Listeriosis Linked to Whole Cantaloupes from Jensen
Farms, Colorado. http://www.cdc.gov/listeria/outbreaks/cantaloupes-jensen-
farms/110211/index.html (accessed Nov. 20, 2011).
———. 2009. Investigation Update: Outbreak of Salmonella Typhimurium Infections,
2008–2009. http://www.cdc.gov/salmonella/typhimurium/update.html
(accessed Nov. 20, 2011).
Chen, Y., S. Ganesan, and Y. Liu. 2009. Does a Firm's Product-Recall Strategy Affect
Its Financial Value? An Examination of Strategic Alternatives During Product-
Harm Crises. Journal of Marketing 73 (6) (Nov.): 214-26.
Coase, R. H. 1937. The Nature of the Firm. Economica 4 (16) (Nov.): 386-405.

89
Duewer, L. A. and K. E. Nelson. 1991. Beefpacking and Processing Plants: Computer-
Assisted Cost Analysis. Washington, D.C.: U.S. Department of Agriculture,
Economic Research Service, Staff report AGES 9115.
Dwyer, S. 1999. Is Your Brand Bullet Proof? Prepared Foods. June.
Greene, W. H. 2003. Econometric Analysis. Upper Saddle River, N.J.: Prentice Hall.
Gujarati, D. N. 1995. Basic Econometrics. New York: McGraw-Hill.
Hoover’s Inc. 2009. Business Solutions from Hoovers. 2009. www.hoovers.com
(accessed 2009).
Jenks, G. F. 1967. The Data Model Concept in Statistical Mapping. International
Yearbook of Cartography 7: 186−190.
Jolly, D.W. and J.C. Mowen. 1984. Product Recall Communications: The Effects of
Source, Media, and Social Responsibility Information. Advances in Consumer
Research 12: 471-475.
Joy, N. A. 2010. A Duration Analysis of Food Safety Recall Events in the United States:
January, 2000 to October, 2009. Master's thesis, Texas A&M University.
Lawrence, J. D., T. C. Schroeder, and M. L. Hayenga. 2001. Evolving Producer-Packer-
Customer Linkages in the Beef and Pork Industries. Review of Agricultural
Economics 23 (2) (Autumn - Winter): 370-385.

90
MacDonald, J., M. Ollinger, K. Nelson, and C. Handy. 2000. Consolidation in U.S.
Meatpacking. Washington, D.C.: U.S. Department of Agriculture, Economic
Research Service, Agricultural Economic, Report No. 785.
MacDonald, J. M. and M. E. Ollinger. 2000. Scale Economies and Consolidation in Hog
Slaughter. American Journal of Agricultural Economics 82 (2) (May): 334-
346.
McFadden, D. 1974. The Measurement of Urban Travel Demand. Journal of Public
Economics 3: 303-328
Milgrom, P. and J. Roberts. 1986. Price and Advertising Signals of Product Quality.
Journal of Political Economy 94 (4) (Aug.): 796-821.
Nelson, Phillip. 1974. Advertising As Information. Journal of Political Economy 82 (4)
(Jul. - Aug.): 729-754.
———. 1970. Information and Consumer Behavior. Journal of Political Economy 78
(2) (Mar. - Apr.): 311-329.
Ollinger, M., J. M. MacDonald, and M. Madison. 2000. Structural Change in U.S.
Chicken and Turkey Slaughter. Washington, D.C.: U.S. Department of
Agriculture, Economic Research Service, Report No. 787.

91
Ollinger, M. and V. Mueller. 2003. Managing for Safer Food: The Economics of
Sanitation and Process Controls in Meat and Poultry Plants. Washington,
D.C.: U.S. Dept. of Agriculture, Economic Research Service, Report No. 817.
Piggott, N. E. and T. L. Marsh. 2004. Does Food Safety Information Impact U.S. Meat
Demand? American Journal of Agricultural Economics 86 (1) (Feb.): 154-174.
Salin, V. and N. H. Hooker. 2001. Stock Market Reaction to Food Recalls. Review of
Agricultural Economics 23 (1) (Spring - Summer): 33-46.
Scallan, E., P. M. Griffin, F. J. Angulo, R. V. Tauxe, and R. M. Hoekstra. 2011a.
Foodborne Illness Acquired in the United States--Unspecified Agents.
Emerging Infectious Diseases 17 (1) (Jan): 16-22.
Scallan, E., R. M. Hoekstra, F. J. Angulo, R. V. Tauxe, M. A. Widdowson, S. L. Roy, J.
L. Jones, and P. M. Griffin. 2011b. Foodborne Illness Acquired in the United
States--Major Pathogens. Emerging Infectious Diseases 17 (1) (Jan): 7-15.
Sersland, C. J. 1985. Cost Analysis of the Steer and Heifer Processing Industry and
Implications on Long-Run Industry Structure. Ph.D. Dissertation, Oklahoma
State University, Stillwater, OK.
Shrivastava, P. and G. J. Siomkos. Disaster Containment Strategies. 1989. Journal of
Business Strategy 10 (5): 26-30.

92
Siegel, D. S. and D. F. Vitaliano. 2007. An Empirical Analysis of the Strategic Use of
Corporate Social Responsibility. Journal of Economics & Management
Strategy 16 (3): 773-92.
Simon, H. A. 1955. A Behavioral Model of Rational Choice. The Quarterly Journal of
Economics 69 (1) (Feb.): 99-118.
Siomkos, G. and G. Kurzbard. 1994. The Hidden Crisis in Product-Harm Crisis
Management. European Journal of Marketing 28 (2): 30-41.
Size Standards Division Office of Government Contracting & Business Development.
2009. SBA Size Standards Methodology.
http://www.sba.gov/sites/default/files/size_standards_methodology.pdf
(accessed Jul., 2011).
Skees, J. R., A. Botts, and K. A. Zeuli. 2001. The Potential for Recall Insurance to
Improve Food Safety. The International Food and Agribusiness Management
Review 4 (1): 99-111.
Train, K. 2009. Discrete Choice Methods with Simulation. Cambridge: Cambridge
University Press.
United States Department of Agriculture: Food Safety and Inspection Service (FSIS).
2009. Recall Case Archive.

93
http://www.fsis.usda.gov/Fsis_Recalls/Recall_Case_Archive/index.asp
(accessed 2009).
———. 2011. FSIS Food Recalls.
http://www.fsis.usda.gov/Fact_Sheets/FSIS_Food_Recalls/index.asp (accessed
2011).
United States Food and Drug Administration (FDA). 2009a. Archive for Recalls, Market
Withdrawals & Safety Alerts.
http://www.fda.gov/Safety/Recalls/ArchiveRecalls/default.htm (accessed
2009).
———. 2009b. Peanut Butter and Other Peanut Containing Products Recall List.
http://www.accessdata.fda.gov/scripts/peanutbutterrecall/index.cfm (accessed
Nov. 20, 2011).
Ward, C. E. 1993. Comparative Analysis of Cattle Slaughtering and Fabricating Costs.
Agribusiness 9 (5): 441-51.
Weiss, M. D. 1995. Information Issues for Principals and Agents in the “Market” for
Food Safety and Nutrition. In J. Caswell (Ed.), Valuing Food Safety and
Nutrition., 69-79. Boulder, CO: Westview Press.
Williamson, O. E. 1981. The Economics of Organization: The Transaction Cost
Approach. American Journal of Sociology 87 (3) (Nov.): 548-577.

94
Wooldridge, J. M. 2009. Introductory Econometrics : A Modern Approach. Mason,
Ohio: South-Western Cengage Learning.
———. 2002. Econometric Analysis of Cross Section and Panel Data. Cambridge,
Mass.: MIT Press.

95
APPENDIX A
ADDITIONAL TABLES
Table 22. Top 39 Companies from All of 1,005 Companies in the Food Recall Event
Data Ranked by Number of Recalls
Rank Company Name Number of
Recalls
Product Type of Recalls Brand Binary
Employees Sales (Million Dollars)
1 The Kroger Co. 13 Dairy(5), Nut(3), Meat(2), Others(1), Fruit-Vegetables(1), Confectionary-Bakery(1)
1 32,6000 76,000.0
2 Cargill, Incorporated
12 Meat(12) 1 160,000 120,439.0
2 Whole Foods Market, Inc.
12 Nut(7), Meat(2), Confectionary-Bakery (2), Others(1)
1 52,900 7,953.9
3 Kellogg Company 9 Confectionary-Bakery (6), Nut(3)
1 32,400 12,822.0
4 Supervalu Inc. 8 Meat(4), Dairy(2), Confectionary-Bakery(1), Nut(1)
1 178,000
44,564.0
5 Giant Food Inc. 7 Dairy(5), Meat(1), Nut(1)
1 27,000 N/A
5 Tyson Food, Inc. 7 Meat(7) 1 107,000 26,862.0 5 Harry & David
Holdings, Inc. 7 Meat(3), Confectionary-
Bakery(1) 1 1,321 545.1
5 Peregrina Cheese Corporation
7 Dairy(7) 0 N/A N/A
6 Kraft Foods Inc. 6 Nut(2), Confectionary-Bakery(1), Dairy(1), Others(1), Meat(1)
1 98,000 42,201.0
6 Smithfield Foods, Inc.
6 Meat(6) 1 52,400 11,200.0
6 ALDI Group 6 Confectionary-Bakery (3), Fruit-Vegetables(1), Nut(1), Meat(1)
1 885 65,700.0
6 John B. Sanfilippo & Son, Inc
6 Nut(6) 0 1,350 553.8
6 New Era Canning Company
6 Fruit-Vegetables(6) 0 250 34.1
7 Dean Foods Company
5 Dairy(5) 1 25,820 12,454.6
7 General Mills, Inc. 5 Confectionary-Bakery (2), Fruit-Vegetables(1), Nut(1), Meat(1)
1 30,000 13,652.1

96
Table 22. Continued
Rank Company Name Number of
Recalls
Product Type of Recalls Brand Binary
Employees Sales (Million Dollars)
7 Hanover Foods Corporation
5 Meat(2), Others(2) 1 2,205 290.3
7 Swiss-American, Inc.
5 Dairy(5) 1 100 N/A
7 Betty Lou's, Inc. 5 Confectionary-Bakery (4), Nut(1)
0 75 7.3
7 Palmer Candy Company
5 Nut(4), Confectionary-Bakery(1)
0 130 18.6
7 Ralcorp Holdings, Inc.
5 Confectionary-Bakery (4), Nut(1)
1 9,000 2,824.4
7 Eilleen's Candies, Inc.
5 Confectionary-Bakery(5) 0 N/A N/A
7 GKI Foods Inc. 5 Nut(5) 0 N/A N/A 7 Union International
Food Company 5 Fruit-Vegetables(5) 0 N/A N/A
8 Rosen's Diversified, Inc.
4 Meat(4) 0 8,000 N/A
8 Clearly Canadian Beverage Corporation
4 Confectionary-Bakery (2), Nut(2)
1 36 10.6
8 Kerry Group plc 4 Nut(3), Confectionary-Bakery(1)
1 22,008 6,752.6
8 Publix Super Markets, Inc.
4 Nut(3), Confectionary-Bakery(1)
0 144,000 24,109.6
8 Golden Taste, Inc. 4 Meat(3), Confectionary-Bakery(1)
0 13 1.0
8 Lance, Inc. 4 Confectionary-Bakery(4) 1 4,800 825.5 8 Meijer, Inc. 4 Dairy(2), Meat(1),
Confectionary-Bakery(1) 0 60,000 13,700
8 Nebraska Beef, Ltd 4 Meat(4) 0 1,000 96.3 8 PRG Packing Corp 4 Meat(4) 0 96 15.5 8 Rich Ice Cream Co. 4 Dairy(3), Confectionary-
Bakery(1) 0 134 11.6
8 Walgreen Co. 4 Confectionary-Bakery (2), Nut(2)
1 238,000 63,335
8 House of Flavors Ice Cream Company
4 Dairy(4) 0 N/A N/A
8 Mountain Man Nut & Fruit Co.
4 Nut(4) 0 N/A N/A
8 Peanut Corporation of America
4 Nut(4) 0 N/A N/A
8 Setton International Foods, Inc.
4 Nut(4) 0 N/A N/A
Source: Data from FSIS 2009; FDA 2009a; Hoover’s Inc. 2009
Note: 1) If a company has a brand, Brand Binary equals one, otherwise zero. 2) Numbers in parentheses are numbers of recalls for each product type.

97
Table 23. Top 31 Companies from All of 334 Companies Used in the Models
Ranked by Number of Recalls
Rank Company Name Number of
Recalls
Product Type of Recalls Brand Binary
Employees Sales (Million Dollars)
1 The Kroger Co. 13 Dairy(5),Nut(3), Meat(2),Others(1), Fruit-Vegetables(1), Confectionary-Bakery(1)
1 326,000 76,000.0
2 Cargill, Incorporated
12 Meat(12) 1 160,000 120,439.0
2 Whole Foods Market, Inc.
12 Nut(7), Meat(2), Confectionary-Bakery (2), Others(1)
1 52,900 7,953.9
3 Kellogg Company 9 Confectionary-Bakery (6), Nut(3)
1 32,400 12,822.0
4 Supervalu Inc. 8 Meat(4), Dairy(2), Nut(1), Confectionary-Bakery (1)
1 178,000 44,564.0
5 Giant Food Inc. 7 Dairy(5), Meat(1), Nut(1)
1 27,000 N/A
5 Tyson Foods, Inc. 7 Meats(7) 1 107,000 26,862.0 5 Harry & David
Holdings, Inc. 7 Meat(3), Confectionary-
Bakery(4) 1 1,321 545.1
6 Kraft Foods Inc 6 Nut(2), Dairy(1), Others(1), Meat(1), Confectionary-Bakery(1),
1 98,000 42,201.0
6 Smithfield Foods, Inc.
6 Meat(6) 1 52,400 11,200.0
6 ALDI Group 6 Confectionary-Bakery (3), Fruit-Vegetables(1), Nut(1), Meat(1)
1 885 65,700.0
6 John B. Sanfilippo & Son, Inc.
6 Nut(6) 0 1,350 553.8
6 New Era Canning Company
6 Fruit-Vegetables (6) 0 250 34.1
7 Dean Foods Company
5 Dairy(5) 1 25,820 12,454.6
7 General Mills, Inc 5 Confectionary-Bakery (2), Fruit-Vegetables(1), Nut(1), Meat(1)
1 30,000 13,652.1
7 Hanover Foods Corporation
5 Meat(2), Others(3) 1 2,205 290.3
7 Swiss-American, Inc.
5 Dairy(5) 1 100 N/A
7 Betty Lou's, Inc. 5 Confectionary-Bakery (4), Nut(1)
0 75 7.3
7 Palmer Candy Company
5 Nut(4), Confectionary-Bakery(1)
0 130 18.6

98
Table 23. Continued
Rank Company Name Number of
Recalls
Product Type of Recalls Brand Binary
Employees Sales (Million Dollars)
7 Ralcorp Holdings, Inc.
5 Confectionary-Bakery (4), Nut(1)
1 9,000 2,824.4
8 Rosen's Diversified, Inc.
4 Meats(4) 0 8,000 N/A
8 Clearly Canadian Beverage Corporation
4 Confectionary-Bakery (2), Nut(2)
1 36 10.6
8 Kerry Group plc 4 Nut(3), Confectionary-Bakery(1)
1 22,008 6,752.6
8 Publix Super Markets, Inc.
4 Nut(3), Confectionary-Bakery(1)
0 144,000 24,109.6
8 Golden Taste, Inc. 4 Meat(3), Confectionary-Bakery(1)
0 13 1.0
8 Lance, Inc. 4 Confectionary-Bakery(4) 1 4,800 825.5 8 Meijer, Inc. 4 Dairy(2), Meat(1),
Confectionary-Bakery(1) 0 60,000 13,700
8 Nebraska Beef, Ltd 4 Meat(4) 0 1,000 96.3 8 PRG Packing Corp 4 Meat(4) 0 96 15.5 8 Rich Ice Cream Co. 4 Dairy(3), Confectionary-
Bakery(1) 0 134 11.6
8 Walgreen Co. 4 Confectionary-Bakery (2), Nut(2)
1 238,000 63,335
Source: Data from FSIS 2009; FDA 2009a; Hoover’s Inc. 2009
Note: 1) If a company has a brand, Brand Binary equals one, otherwise zero. 2) Numbers in parentheses are numbers of recalls for each product type.

99
APPENDIX B
ADDITIONAL RESULTS
Table 24. Effect of Brand and Firm Size on the Occurrence of the Repeated Recall
Event Using Size Categorical Variables by the Jenks Natural Breaks Method
Variable Coefficient Marginal Effect
Mean
Estimate Standard error
Intercept -0.080 0.913 - - BRAND** 0.946 0.303 0.224 0.237 SIZE 1 -1.001 0.909 -0.227 0.865 SIZE 2 -0.140 1.019 -0.035 0.051 SIZE 3 -0.120 1.069 -0.030 0.036 SIZE 4 0.963 1.197 0.227 0.030 Likelihood Ratio*** 34.388 Pseudo R2 0.080 AIC 405.077 Observations 334 Correct Prediction Actual Have repeated recalls 26 (23.01) 113 No repeated recalls 210 (95.02) 221 Total 236 (70.66) 334 Note: 1) ***, **are significant at the 1 and 5 percent level, respectively. 2) Numbers in parentheses are row percents correctly predicted

100
Table 25. Effect of Brand and Firm Size on the Occurrence of the Repeated Recall
Event Using Size Categorical Variables by the Quantile Method
Variable Coefficient Marginal Effect
Mean
Estimate Standard error
Intercept -0.139 0.315 - - BRAND** 0.747 0.320 0.182 0.237 SIZE 1** -1.059 0.425 -0.234 0.207 SIZE 2*** -1.233 0.428 -0.263 0.201 SIZE 3** -1.011 0.406 -0.225 0.198 SIZE 4 -0.504 0.360 -0.121 0.198 Likelihood Ratio*** 34.219 Pseudo R2 0.080 AIC 405.245 Observations 334 Correct Prediction Actual Have repeated recalls 43 (38.05) 113 No repeated recalls 195 (88.24) 221 Total 238 (71.26) 334 Note: 1) ***, **are significant at the 1 and 5 percent level, respectively. 2) Numbers in parentheses are row percents correctly predicted Table 26. Effect of Brand and Firm Size on the Occurrence of the Repeated Recall
Event Using the Raw Number of Employees
Variable Coefficient Marginal Effect
Mean
Estimate Standard error
Intercept*** -1.061 0.144 - - BRAND*** 1.043 0.283 0.245 0.237 EMPLOYEES** 9.733*10-6 3.92*10-6 1.967*10-6 12,169.665 Likelihood Ratio*** 31.706 Pseudo R2 0.074 AIC 401.759 Observations 334 Correct Prediction Actual Have repeated recalls 34 (30.09) 113 No repeated recalls 203 (91.86) 221 Total 237 (70.96) 334 Note: 1) ***, **are significant at the 1 and 5 percent level, respectively. 2) Numbers in parentheses are row percents correctly predicted

101
Table 27. Effect of Brand and Firm Size on the Occurrence of the Repeated Recall
Event Using the Number of Employees in Thousand Unit
Variable Coefficient Marginal Effect
Mean
Estimate Standard error
Intercept*** -1.061 0.144 - - BRAND*** 1.043 0.283 0.245 0.237 EMPLOYEES_TH** 0.010 0.004 0.002 12.170 Likelihood Ratio*** 31.706 Pseudo R2 0.074 AIC 401.759 Observations 334 Correct Prediction Actual Have repeated recalls 34 (30.09) 113 No repeated recalls 203 (91.86) 221 Total 237 (70.96) 334 Note: 1) ***, **are significant at the 1 and 5 percent level, respectively. 2) Numbers in parentheses are row percents correctly predicted

102
VITA
Name: Montalee Kapilakanchana Address: Department of Agricultural Economics Texas A&M University 2124 TAMU College Station, Texas 77843-2124 Email Address: [email protected] Education: B.S., Food Science & Technology, Kasetsart University, 2007 M.S., Agricultural Economics, Texas A&M University, 2012
Related Documents