The Economics of Low Carbon Cities Johor Bahru and Pasir Gudang, Malaysia Centre for Climate Change Economics and Policy Andy Gouldson, Sarah Colenbrander, Effie Papargyropoulou and Andrew Sudmant

Welcome message from author
This document is posted to help you gain knowledge. Please leave a comment to let me know what you think about it! Share it to your friends and learn new things together.
Transcript

The Economics of Low Carbon CitiesJohor Bahru and Pasir Gudang, Malaysia
Centre for Climate Change Economics and Policy
Andy Gouldson, Sarah Colenbrander, Effie Papargyropoulou and Andrew Sudmant

After cost-effective investments in the city.
After cost-effective investments in the electricity sector.
After cost-neutral investments in the city.
After cost-neutral investments in the electricity sector.
2000 2025
Potential to reduce CO2 emissions
24.2% CO2 reduction 25.1% CO2 reduction 45.4% CO2 reduction 46.6% CO2 reduction
city-
scale
economy
0.4% of GDP could be profitably invested, every year for ten years, to exploit commercially attractive energy efficiency and low carbon opportunities.
Tomorrow
Investing 0.4% of GDP p.a. Leads to...
15.2% of GDP leaks out of the economy
Energy reductions in the energy bill equalling 1.0% of GDP
Financial viabilityfour years for measures to pay for themselves
Employment more jobs and skills in low carbon goods and services
Wider economic benefitsenergy security, increased competitiveness, extra GDP
Wider social benefitsreductions in fuel poverty, improvements in health
Today15.2% of city-scale GDP leaves the local economy every year through payment of the energy bill. In 2025, energy expenditure will remain substantial at 13.1%
The Economics of Low Carbon Cities
Johor Bahru and Pasir Gudang, Malaysia
The Economics of Low Carbon Cities2
Contents
Foreword 04
Executive Summary 05
Chapter 1. Introduction, Context, Aims and Objectives 09
Chapter 2. Approach to the Analysis 13
Baseline analysis 13
Identification and assessment of measures 13
Assessment of the scope for deployment 15
Aggregation, assessment of investment needs and opportunities. 15
Chapter 3. The Key Findings 16
Chapter 4. Sector Specific Findings 23
Sector Focus – The Electricity Sector 24
Sector Focus – The Commercial Sector 30
Sector Focus – The Domestic Sector 36
Sector Focus – The Industrial Sector 42
Sector Focus – The Transport Sector 48
Sector Focus – The Waste Sector 54
Chapter 5. Discussion 59
Conclusions and Recommendations 61
Appendices
Appendix A: Alignment with Low Carbon 62 Society Blueprint for Iskandar Malaysia 2025
Appendix B: 63 Workshop Participants and Expert Consultants
Appendix C: 65 Data sources, methods and assumptions
Appendix C1: Baseline development 65
Appendix C2: Sectoral approach 68
Appendix D: 78 League Table of the Most Cost-Effective Measures in Johor Bahru and Pasir Gudang (NPV/tCO2-e)
Appendix E: 81 League Table of the Most Carbon-Effective Measures in Johor Bahru and Pasir Gudang (ktCO2-e)
Tables
Table 1: Lists of the low carbon 14 measures considered
Table 2: League table of the most cost-effective 29 low carbon measures for the electricity sector
Table 3: League table of the most carbon-effective 29 low carbon measures for the electricity sector
Table 4: League table of the most cost-effective 34 low carbon measures for the commercial sector
Table 5: League table of the most carbon-effective 35 low carbon measures for the commercial sector
Table 6: League table of the most cost-effective 40 low carbon measures for the domestic sector
Table 7: League table of the most carbon-effective 41 low carbon measures for the domestic sector
Table 8: League table of the most cost-effective 46 low carbon measures for the industrial sector
Table 9: League table of the most carbon-effective 47 low carbon measures for the industrial sector
Table 10: League table of the most cost-effective 52 low carbon measures for the transport sector
Table 11: League Table of the most carbon- 53 effective low carbon measures for the transport sector
Table 11: League table of the most cost-effective 57 low carbon measures for the waste sector
Table 12: League table of the most carbon- 58 effective low carbon measures for the waste sector

3The Economics of Low Carbon Cities
Figures
Figures Pg
1 Indexed total CO2-e emissions per unit of energy, per unit of GDP and per capita.
7
2 CO2-e emissions from Johor Bahru and Pasir Gudang under five different investment scenarios, as a function of 2014 emissions, between 2000 and 2025.
7
3 Indexed energy use per unit of GDP and per capita.
16
4 Indexed energy prices and total energy bill.
17
5 Indexed total emissions per unit of energy, per unit of GDP and per capita.
18
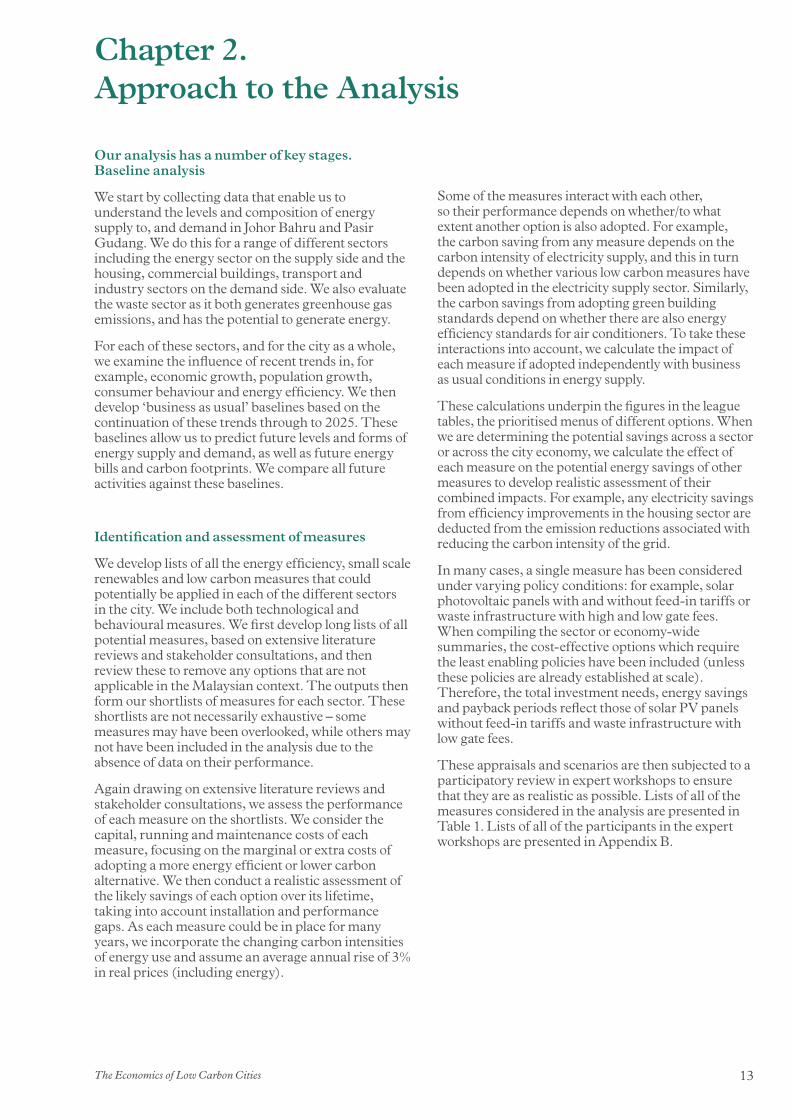
6 Energy consumption in Johor Bahru and Pasir Gudang (TWh) between 2000 and 2025.
19
7 The energy bill for Johor Bahru and Pasir Gudang (RM billions) between 2000 and 2025.
19
8 Emissions from Johor Bahru and Pasir Gudang (MtCO2-e) between 2000 and 2025.
20
9 Emissions from Johor Bahru and Pasir Gudang under six different investment scenarios, as a function of 2014 emissions, between 2000 and 2025.
22
10 Energy bills for Johor Bahru and Pasir Gudang under four different scenarios (excluding investments in the electricity sector), as a function of 2014 emissions, between 2000 and 2025.
22
11 Electricity consumption (TWh) between 2000 and 2025.
25
12 Emissions from the electricity sector (MtCO2-e) between 2000 and 2025.
26
13 Emissions from the electricity sector (MtCO2-e) between 2000 and 2025.
27
14 Carbon intensity of the peninsular Malaysian grid, 2000-2025
28
15 Energy consumption (GWh) by the commercial sector between 2000 and 2025.
31
Figures Pg
16 Energy bills from the commercial sector (RM millions) between 2000 and 2025.
32
17 Emissions from the commercial sector (ktCO2-e) between 2000 and 2025.
32
18 Emissions from the commercial sector under four different scenarios, as a function of 2014 emissions, between 2000 and 2025.
33
19 Energy consumption (TWh) by the domestic sector between 2000 and 2025.
37
20 Energy bills from the domestic sector (RM billions) between 2000 and 2025.
38
21 Emissions from the domestic sector (MtCO2-e) between 2000 and 2025.
38
22 Emissions from the domestic sector under four different scenarios, as a function of 2014 emissions, between 2000 and 2025.
39
23 Energy consumption (TWh) by the industrial sector between 2000 and 2025.
43
24 Energy bills from the industrial sector (RM billions) between 2000 and 2025.
44
25 Emissions from the industrial sector (MtCO2-e) between 2000 and 2025.
44
26 Emissions from the industrial sector under four different scenarios, as a function of 2014 emissions, between 2000 and 2025.
45
27 Energy consumption (TWh) from the transport sector between 2000 and 2025.
49
28 Energy bills for the transport sector (RM billions) between 2000 and 2025.
50
29 Emissions from the transport sector (MtCO2-e) between 2000 and 2025.
50
30 Emissions from the transport sector under four different scenarios, as a function of 2014 emissions, between 2000 and 2025
51
31 Emissions from the waste sector (MtCO2-e) between 2000 and 2025.
55
32 Emissions from the waste sector under four different scenarios, as a function of 2014 emissions, between 2000 and 2025
56
The Economics of Low Carbon Cities4
Foreword
It is with pleasure that I present the study on The Economics of Low Carbon Cities: A Mini-Stern Review for Johor Bahru and Pasir Gudang, Iskandar Malaysia, Johor, Malaysia (“the Report”).
Focusing on Iskandar Malaysia, the Report considers the changes in the relationship between energy and development in a rapidly growing metropolitan region. The main aim of this report is to review the cost and effectiveness of a wide range of efficient, renewable and low carbon energy options that can be applied in different sectors in the two chosen urban centres.
Iskandar Regional Development Authority (IRDA) has always used Johor Bahru and Pasir Gudang as good examples of urban areas undergoing transformation in their economic, social and environment outlook under the Iskandar Malaysia Comprehensive Development Plan 2006-2025. While we actively promote new investments into Iskandar Malaysia, and encourage the community’s participation in the economic growth, it is imperative that this transformation is anchored by sound environmental planning and management policies. The Report is therefore most timely; it provides solutions that the local authorities, businesses and the public can implement in achieving environmental sustainability.
The Report has been prepared within the context of the Low Carbon Society Blueprint for Iskandar Malaysia 2025 (LCSBPIM 2025), which IRDA launched at the United Nations’ Conference on Climate Change (COP18) in Doha, Qatar in November 2012 and subsequently the LCSBPIM 2025 Roadmap and Iskandar Malaysia: Actions for A Low Carbon Future Implementation Booklet introduced at COP19 in Warsaw, Poland in November 2013. These documents, prepared by an international team from Japan and Malaysia, and funded by Japan International Cooperation Agency (JICA) and Japan Science and Technology Agency (JST), list over 280 programmes in twelve Main Actions, and chart
Iskandar Malaysia’s path towards reducing its greenhouse gas emissions by 40% (relative to business as usual levels) by 2025.
The publication of this Mini-Stern Review complements and enhances the programmes in Iskandar Malaysia’s Low Carbon Society Blueprint and the Smart City Framework by adding an economic dimension, and at the same time focusing on specific sectors that IRDA and the local authorities of Johor Bahru and Pasir Gudang can implement expeditiously.
I would like to thank the team from the University of Leeds, via the Centre for Low Carbon Futures, and the project’s funders, the UK Foreign and Commonwealth Office, for their generosity, strong support and commitment to Iskandar Malaysia’s progress. It is my hope that the Report will be the rallying call for the local community, policymakers, implementation agencies and investors to commit themselves to carrying out the recommendations towards establishing Iskandar Malaysia as a sustainable, green economic corridor.
With great appreciation,
Prof. Datuk Ismail Ibrahim
Chief Executive Iskandar Regional Development Authority (IRDA)
5The Economics of Low Carbon Cities
Introduction
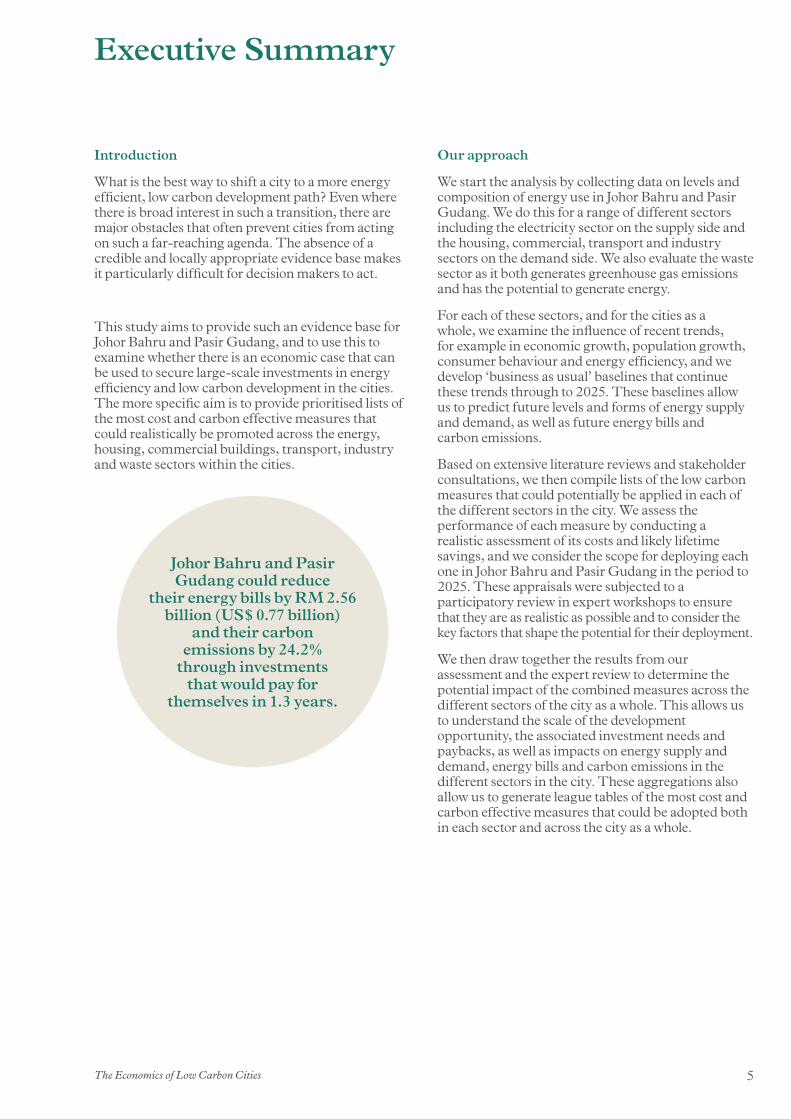
What is the best way to shift a city to a more energy efficient, low carbon development path? Even where there is broad interest in such a transition, there are major obstacles that often prevent cities from acting on such a far-reaching agenda. The absence of a credible and locally appropriate evidence base makes it particularly difficult for decision makers to act.
This study aims to provide such an evidence base for Johor Bahru and Pasir Gudang, and to use this to examine whether there is an economic case that can be used to secure large-scale investments in energy efficiency and low carbon development in the cities. The more specific aim is to provide prioritised lists of the most cost and carbon effective measures that could realistically be promoted across the energy, housing, commercial buildings, transport, industry and waste sectors within the cities.
Our approach
We start the analysis by collecting data on levels and composition of energy use in Johor Bahru and Pasir Gudang. We do this for a range of different sectors including the electricity sector on the supply side and the housing, commercial, transport and industry sectors on the demand side. We also evaluate the waste sector as it both generates greenhouse gas emissions and has the potential to generate energy.
For each of these sectors, and for the cities as a whole, we examine the influence of recent trends, for example in economic growth, population growth, consumer behaviour and energy efficiency, and we develop ‘business as usual’ baselines that continue these trends through to 2025. These baselines allow us to predict future levels and forms of energy supply and demand, as well as future energy bills and carbon emissions.
Based on extensive literature reviews and stakeholder consultations, we then compile lists of the low carbon measures that could potentially be applied in each of the different sectors in the city. We assess the performance of each measure by conducting a realistic assessment of its costs and likely lifetime savings, and we consider the scope for deploying each one in Johor Bahru and Pasir Gudang in the period to 2025. These appraisals were subjected to a participatory review in expert workshops to ensure that they are as realistic as possible and to consider the key factors that shape the potential for their deployment.
We then draw together the results from our assessment and the expert review to determine the potential impact of the combined measures across the different sectors of the city as a whole. This allows us to understand the scale of the development opportunity, the associated investment needs and paybacks, as well as impacts on energy supply and demand, energy bills and carbon emissions in the different sectors in the city. These aggregations also allow us to generate league tables of the most cost and carbon effective measures that could be adopted both in each sector and across the city as a whole.
Executive Summary
Johor Bahru and PasirGudang could reduce
their energy bills by RM 2.56billion (US$ 0.77 billion)
and their carbonemissions by 24.2%
through investmentsthat would pay for
themselves in 1.3 years.
The Economics of Low Carbon Cities6
The economic case for low carbon investment
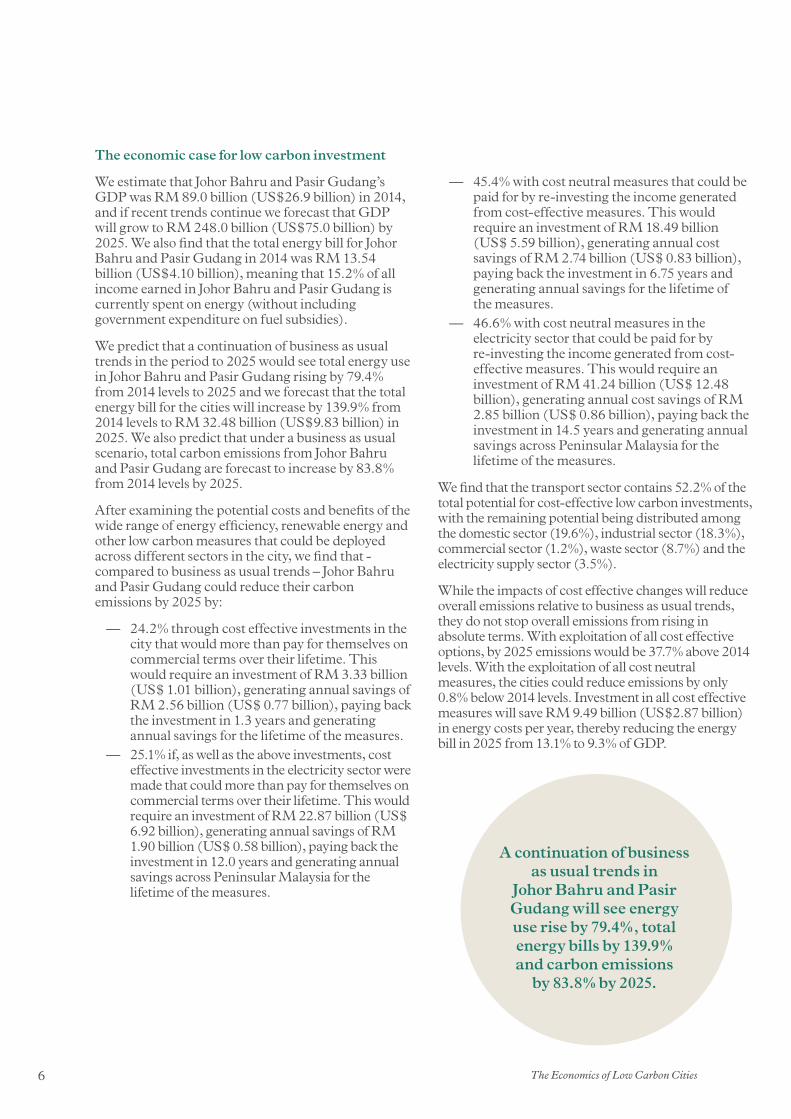
We estimate that Johor Bahru and Pasir Gudang’s GDP was RM 89.0 billion (US$26.9 billion) in 2014, and if recent trends continue we forecast that GDP will grow to RM 248.0 billion (US$75.0 billion) by 2025. We also find that the total energy bill for Johor Bahru and Pasir Gudang in 2014 was RM 13.54 billion (US$4.10 billion), meaning that 15.2% of all income earned in Johor Bahru and Pasir Gudang is currently spent on energy (without including government expenditure on fuel subsidies).
We predict that a continuation of business as usual trends in the period to 2025 would see total energy use in Johor Bahru and Pasir Gudang rising by 79.4% from 2014 levels to 2025 and we forecast that the total energy bill for the cities will increase by 139.9% from 2014 levels to RM 32.48 billion (US$9.83 billion) in 2025. We also predict that under a business as usual scenario, total carbon emissions from Johor Bahru and Pasir Gudang are forecast to increase by 83.8% from 2014 levels by 2025.
After examining the potential costs and benefits of the wide range of energy efficiency, renewable energy and other low carbon measures that could be deployed across different sectors in the city, we find that - compared to business as usual trends – Johor Bahru and Pasir Gudang could reduce their carbon emissions by 2025 by:
— 24.2% through cost effective investments in the city that would more than pay for themselves on commercial terms over their lifetime. This would require an investment of RM 3.33 billion (US$ 1.01 billion), generating annual savings of RM 2.56 billion (US$ 0.77 billion), paying back the investment in 1.3 years and generating annual savings for the lifetime of the measures.
— 25.1% if, as well as the above investments, cost effective investments in the electricity sector were made that could more than pay for themselves on commercial terms over their lifetime. This would require an investment of RM 22.87 billion (US$ 6.92 billion), generating annual savings of RM 1.90 billion (US$ 0.58 billion), paying back the investment in 12.0 years and generating annual savings across Peninsular Malaysia for the lifetime of the measures.
— 45.4% with cost neutral measures that could be paid for by re-investing the income generated from cost-effective measures. This would require an investment of RM 18.49 billion (US$ 5.59 billion), generating annual cost savings of RM 2.74 billion (US$ 0.83 billion), paying back the investment in 6.75 years and generating annual savings for the lifetime of the measures.
— 46.6% with cost neutral measures in the electricity sector that could be paid for by re-investing the income generated from cost-effective measures. This would require an investment of RM 41.24 billion (US$ 12.48 billion), generating annual cost savings of RM 2.85 billion (US$ 0.86 billion), paying back the investment in 14.5 years and generating annual savings across Peninsular Malaysia for the lifetime of the measures.
We find that the transport sector contains 52.2% of the total potential for cost-effective low carbon investments, with the remaining potential being distributed among the domestic sector (19.6%), industrial sector (18.3%), commercial sector (1.2%), waste sector (8.7%) and the electricity supply sector (3.5%).
While the impacts of cost effective changes will reduce overall emissions relative to business as usual trends, they do not stop overall emissions from rising in absolute terms. With exploitation of all cost effective options, by 2025 emissions would be 37.7% above 2014 levels. With the exploitation of all cost neutral measures, the cities could reduce emissions by only 0.8% below 2014 levels. Investment in all cost effective measures will save RM 9.49 billion (US$2.87 billion) in energy costs per year, thereby reducing the energy bill in 2025 from 13.1% to 9.3% of GDP.
A continuation of businessas usual trends in
Johor Bahru and PasirGudang will see energyuse rise by 79.4%, totalenergy bills by 139.9%and carbon emissions
by 83.8% by 2025.

7The Economics of Low Carbon Cities
Figure 2: CO2-e emissions from Johor Bahru and Pasir Gudang under five different investment scenarios, as a function of 2014 emissions, between 2000 and 2025.
Figure 1: Indexed total CO2-e emissions per unit of energy, per unit of GDP and per capita.
183.77%
102.45%
65.94%
120.07%
0.00%
50.00%
100.00%
150.00%
200.00%
250.00%
300.00%
Emissions Per Unit GDP
Total Emissions
Emissions Per Capita
Emissions Per Unit Energy
2000
2002
2004
2006
2008
2010
2012
2014
2016
2018
2020
2022
2024
181.69%
137.71% 136.17%
99.21% 96.95%
0.00%
20.00%
40.00%
60.00%
80.00%
100.00%
120.00%
140.00%
160.00%
180.00%
200.00%
Business as usual
Cost-effective
Cost-effective
(electricity)
Cost-neutral
Cost-neutral (electricity)
2000
2002
2004
2006
2008
2010
2012
2014
2016
2018
2020
2022
2024

The Economics of Low Carbon Cities8
Conclusions and Recommendations
This research reveals that there are many economically attractive opportunities to increase energy efficiency and stimulate renewable energy investment, which would in turn improve the economic competitiveness, energy security and carbon intensity of Johor Bahru and Pasir Gudang. The scale of the opportunities demonstrates that accounting for climate change in urban planning can be attractive in commercial terms, above and beyond the immense benefits of reducing the future impacts of climate change.
The presence of such opportunities does not mean that they will necessarily be exploited. By providing evidence on the scale and composition of these opportunities, we hope that this report will help to build political commitment and institutional capacities for change. We also hope this report will help Johor Bahru and Pasir Gudang to secure the investments and develop the delivery models needed for ambitious climate action. Some of the energy efficiency and low carbon opportunities could be commercially attractive whilst others may only be viable with public investment and/or climate finance. Many of the opportunities would benefit from the support of enabling policies from government.
We also stress that economics is not the only discipline that has something useful to say on the transition to a low carbon development model in urban Malaysia. A wider analysis should also consider the social desirability of the different options, as well as issues relating to the equity, inclusivity and broader sustainability of the different development pathways that could be pursued in Johor Bahru and Pasir Gudang.

9The Economics of Low Carbon Cities
Chapter 1. Introduction, Context, Aims and Objectives
Cities, Energy, Carbon and Climate
The influence and impact of cities cannot be overstated. More than half of the world’s population lives in cities, and up to 70% of production and consumption takes place in cities.1 Cities are the places where many of the world’s institutions and much of its infrastructure are located, and where many of the world’s major social, economic and environmental challenges are created, experienced and sometimes tackled. Cities are also the places where many international and national policies and plans must ultimately take effect. Global action frequently relies on urban action – our common future depends to a large degree on the way that we develop, organise, live and work in cities.
One of the key issues in the future of cities is energy. Currently, activities in cities consume up to 70% of all energy and are responsible for up to 70% of all carbon emissions.2 Some estimates suggest that around 10% of all income that is earned in cities is spent on energy.3 Despite its costs and impacts, modern energy is critical to human wellbeing. It enhances quality of life and enables economic activity. Increasing energy supplies and improving energy access facilitate development. The challenge is achieving sustainable and affordable energy provision – how can cities shift to energy efficient, low carbon development paths?
Cities’ share of global emissions is high and rising fast, but their institutional capacity and socio-economic dynamism also mean that cities are uniquely positioned to tackle climate change. This is particularly true in fast-growing emerging economies where massive investment in infrastructure provides an opportunity to slash the energy and carbon intensity of social and economic activity. It is often suggested that preparing for climate change at an early stage of development is more effective and economically attractive than replacing or upgrading established infrastructure. Mainstreaming energy efficiency and low carbon objectives into planning processes has the potential to reduce energy bills, increase energy access, improve air quality, ease congestion, create jobs and mitigate the impacts of climate change.
Focusing on urban Iskandar Malaysia, this report considers the ways in which the relationship between energy and development in a rapidly growing urban region with pressing development needs could be changed. Although the report considers energy supply, the main aim is to review the cost and carbon effectiveness of a wide range of energy efficient, renewable energy and low carbon options that could be applied in different sectors in the urban regions of Johor Bahru and Pasir Gudang. It then considers whether there is an economic case for major investments in these options, and whether these investments have the potential to shift the cities on to a more energy efficient, low carbon development path.

The Economics of Low Carbon Cities10
Malaysia’s national energy and sustainability strategies are outlined in the Tenth Malaysia Plan: 2010-2015. The government has committed to voluntarily reduce its emissions intensity of GDP by up to 40% based on 2005 levels by 2020, conditional on technology transfer and financial support from Annex I countries.9 However, in the country’s Second National Communication to the UNFCCC, the Malaysian government emphasised that mitigation targets would be balanced with other economic and development goals.10
Unlike OECD or other Asian economies, Malaysia has made little progress towards its climate targets. Energy intensity per unit of GDP has remained roughly constant between 1990 and 2010,11 while the increasing carbon intensity of the electricity grid serving Peninsular Malaysia looks set to continue in a business as usual scenario. There are some renewable energy and energy efficiency programmes in place, but these are insignificant compared to ongoing support for fossil fuel production and consumption.
This broader context on energy and climate in Malaysia is directly relevant to cities. Currently, 73% (21.1 million) of the 29.2 million population of Malaysia lives in cities,12 and there is a strong policy bias towards urban development at the expense of rural areas.13 Malaysia also faces a high level of income inequality compared to either the OECD average or neighbouring countries such as Thailand and Indonesia.14 These considerations mean that energy consumption and greenhouse gas emissions are likely to be concentrated in cities for the foreseeable future.
The Malaysian Context
Malaysia’s energy demand tripled between 1990 and 2010, from 12.9 million tonnes of oil equivalent (Mtoe) to 40.8 Mtoe.4 The composition of energy demand remained largely constant during this period, although the residential and commercial sectors increased their share by about 6% at the expense of the industrial sector. The transport sector continued to have the largest share at 42% of national energy demand (excluding agriculture) in 2010.5 The rapid growth in energy consumption has been enabled by Malaysia’s large oil and natural gas production capacity: the country has the fifth largest oil reserves in the Asia-Pacific and is investing heavily in refining and storage capacities.
Individual energy consumption is relatively high in Malaysia at 2.63 toe per capita, compared to other fast-growing high-middle income countries such as China at 1.7, Brazil at 1.37 or Turkey at 1.54. While Malaysia now has the second highest energy demand per capita in Southeast Asia after Brunei, it remains well below the OECD average of 4.28.6 These levels of energy consumption are significantly enabled by low energy costs. Substantial fossil fuel subsidies in Malaysia lead to artificially low prices for consumers and encourage preferential investment in these energy sources. The subsidies impose a significant burden on government budgets, favour the emerging middle classes at the expense of pro-poor expenditure7 and risk national ‘lock in’ to high carbon, high cost development paths.
High energy consumption per capita combined with relatively carbon-intensive energy means that emissions in Malaysia are about 64% higher than the world average. However, they are only about 76% of the OECD average.8

11The Economics of Low Carbon Cities
The Iskandar Malaysia Context
Iskandar Malaysia is a Special Economic Corridor located in the state of Johor at the southern part of Peninsular Malaysia. The state is part of the SIJORI Growth Triangle, one of the largest hubs in Southeast Asia in terms of population, industry and tourism. The Iskandar Regional Development Authority (IRDA) is therefore strategically positioned to drive the region’s transition to a low carbon growth trajectory.
IRDA aims for Iskandar Malaysia to become a “strong and sustainable metropolis of international standing” that can serve as a regional role model in low carbon development, among other social, economic and environmental goals. IRDA has accordingly prepared the Low Carbon Society (LCS) Blueprint in collaboration with the Universiti Teknologi Malaysia (UTM), Kyoto University, National Institute for Environmental Studies and Okayama University. This project is supported by the Japan Science and Technology Agency and Japan International Cooperation Agency under the Science and Technology Research Partnership Sustainable Development (SATREPS) framework.
The LCS Blueprint calls for a 50% reduction in emission intensity by 2025, relative to a baseline year of 2005, for Iskandar Malaysia.15 This is an exceptionally ambitious target by the measures of non-Annex I countries, and ambitious even by the standards of Annex I countries. The LCS Blueprint outlines twelve actions to achieve this target, including greening physical infrastructure such as buildings, industry and transport; enhancing natural capital such as green corridors, urban forests and wetlands; and promoting behavioural change such as waste minimisation and promotion of walking or cycling instead of motorised transit. The LCS Blueprint offers an integrated and far-sighted approach to urban planning with the goal of decoupling economic growth and carbon emissions. This report complements the LCS Blueprint by calculating the potential investment needs and emission reductions associated with particular measures, and building the economic case for climate action in urban regions.
Johor Bahru and Pasir Gudang
Johor Bahru is the third largest city in Malaysia and the largest in Iskandar Malaysia. The population in the administrative districts of Johor Bahru City Council (MBJB), Johor Bahru Tengah Municipal Council (MPJBT) and Pasir Gudang Municipal Council (MPPG) exceeded 1.5 million people in 2010 and is expected to reach nearly 2.8 million by 2025.16 Johor Bahru’s current GDP per capita (Purchasing Power Parity) is USD 14,790, with a projected growth rate of 7-8% over the next fifteen years.17
Johor Bahru is one of the three main urban centres in Malaysia and serves as an important industrial, logistics and commercial centre. Services contribute approximately US$ 10 billion to the economy, encompassing wholesale and retail trade, tourism and hospitality, professional and business, transport, medical, educational and financial services.18 The key industrial activities carried out in the area of Pasir Gudang include plastics manufacturing, electrical and electronic equipment, petrochemical refining and food processing.19
Johor Bahru and Pasir Gudang are served by the Peninsular Malaysian electricity grid.20 We calculate that the carbon intensity of this grid has increased from 0.56tCO2-e/MWh in 2000 to 0.75tCO2-e/MWh in 2014. In this year, 58% of electricity was generated from coal, 38% from natural gas, 6% from hydropower and 1% from diesel. Installed capacity is expanding by 8-9% per year, largely through the addition of new natural gas and coal-fired power plants that will further increase the city’s dependence on fossil fuels.
If Johor Bahru and Pasir Gudang achieve IRDA’s target growth rate of 8% a year, more than half of the urban economy that will exist in 2025 has not been built yet. Massive additional investment is accordingly planned in the region’s urban infrastructure over the next ten years. While imposing substantial challenges, the inadequacy of established infrastructure and the high growth rates also offer opportunities to influence the cities’ development trajectory to ensure that environmental considerations do not curtail human development or economic growth. The spatial distribution and types of infrastructure will be key to determining energy and carbon trends in the city. Integrating energy efficiency and low carbon goals into urban development therefore offers the chance to shift the city on to a more cost-efficient and sustainable energy trajectory. Initial investment requirements might be higher, but ongoing costs will be lower and the urban economy will be more resilient to volatile fuel prices and climate change impacts.

The Economics of Low Carbon Cities12
Aims and Objectives
What is the best way to shift a city to a more energy efficient, low carbon development path? Even where there is broad interest in such a transition, there are major obstacles that often prevent cities from acting on such a far-reaching agenda. The absence of a credible and locally appropriate evidence base makes it particularly difficult for decision makers to act.
This study aims to provide such an evidence base for Johor Bahru and Pasir Gudang, and to use this to examine whether there is an economic case that can be used to secure large-scale investments in energy efficiency and low carbon development in the cities. The more specific aim is to provide prioritised lists of the most cost and carbon effective measures that could realistically be promoted across the energy, housing, commercial buildings, transport, industry and waste sectors within the cities.
We seek to map broad trends in energy use, energy expenditure and carbon emissions in Johor Bahru and Pasir Gudang, and examine the implications of ‘business as usual’ development in the cities. This macro-level context aims to demonstrate the importance of energy efficiency and energy security at the city scale with the goal of mobilising high-level action around these issues.
The evidence base is intended to inform policymaking and programme design both within individual sectors and at the city scale. By identifying the most cost- and carbon-effective measures, we aim to help development agencies, government, industry and civil society organisations to design low carbon strategies that exploit the most attractive opportunities. Notably, this evidence base has the potential to underpin national applications to international climate funds, development banks and other financial organisations, thereby helping to unlock and direct large-scale investment into energy efficient, low carbon development.
13The Economics of Low Carbon Cities
Our analysis has a number of key stages. Baseline analysis
We start by collecting data that enable us to understand the levels and composition of energy supply to, and demand in Johor Bahru and Pasir Gudang. We do this for a range of different sectors including the energy sector on the supply side and the housing, commercial buildings, transport and industry sectors on the demand side. We also evaluate the waste sector as it both generates greenhouse gas emissions, and has the potential to generate energy.
For each of these sectors, and for the city as a whole, we examine the influence of recent trends in, for example, economic growth, population growth, consumer behaviour and energy efficiency. We then develop ‘business as usual’ baselines based on the continuation of these trends through to 2025. These baselines allow us to predict future levels and forms of energy supply and demand, as well as future energy bills and carbon footprints. We compare all future activities against these baselines.
Identification and assessment of measures
We develop lists of all the energy efficiency, small scale renewables and low carbon measures that could potentially be applied in each of the different sectors in the city. We include both technological and behavioural measures. We first develop long lists of all potential measures, based on extensive literature reviews and stakeholder consultations, and then review these to remove any options that are not applicable in the Malaysian context. The outputs then form our shortlists of measures for each sector. These shortlists are not necessarily exhaustive – some measures may have been overlooked, while others may not have been included in the analysis due to the absence of data on their performance.
Again drawing on extensive literature reviews and stakeholder consultations, we assess the performance of each measure on the shortlists. We consider the capital, running and maintenance costs of each measure, focusing on the marginal or extra costs of adopting a more energy efficient or lower carbon alternative. We then conduct a realistic assessment of the likely savings of each option over its lifetime, taking into account installation and performance gaps. As each measure could be in place for many years, we incorporate the changing carbon intensities of energy use and assume an average annual rise of 3% in real prices (including energy).
Some of the measures interact with each other, so their performance depends on whether/to what extent another option is also adopted. For example, the carbon saving from any measure depends on the carbon intensity of electricity supply, and this in turn depends on whether various low carbon measures have been adopted in the electricity supply sector. Similarly, the carbon savings from adopting green building standards depend on whether there are also energy efficiency standards for air conditioners. To take these interactions into account, we calculate the impact of each measure if adopted independently with business as usual conditions in energy supply.
These calculations underpin the figures in the league tables, the prioritised menus of different options. When we are determining the potential savings across a sector or across the city economy, we calculate the effect of each measure on the potential energy savings of other measures to develop realistic assessment of their combined impacts. For example, any electricity savings from efficiency improvements in the housing sector are deducted from the emission reductions associated with reducing the carbon intensity of the grid.
In many cases, a single measure has been considered under varying policy conditions: for example, solar photovoltaic panels with and without feed-in tariffs or waste infrastructure with high and low gate fees. When compiling the sector or economy-wide summaries, the cost-effective options which require the least enabling policies have been included (unless these policies are already established at scale). Therefore, the total investment needs, energy savings and payback periods reflect those of solar PV panels without feed-in tariffs and waste infrastructure with low gate fees.
These appraisals and scenarios are then subjected to a participatory review in expert workshops to ensure that they are as realistic as possible. Lists of all of the measures considered in the analysis are presented in Table 1. Lists of all of the participants in the expert workshops are presented in Appendix B.
Chapter 2. Approach to the Analysis

The Economics of Low Carbon Cities14
Table 1: Lists of the low carbon measures considered
Sector Mitigation Measures
Electricity Biomass-fired power plants; coal best available technology; coal retrofit; coal replaced with solar photovoltaics; installing smart grids; natural gas best available technology; natural gas retrofit; natural gas replaced by solar photovoltaics; non-technical loss reduction programmes; upgrading grid transmission.
Commercial Air conditioners – energy efficiency standards; banning incandescent light bulbs; computers – energy management; copiers – energy management; elevators and escalators – energy efficiency standards; faxes – turning off; green building standards; monitors – energy management; printers – energy management; raising thermostat 1˚C; retrofitting with mineral wool and fibreglass urethane; setting LED targets; solar photovoltaic panels with and without a feed-in tariff (FiT); turning off lights.
Domestic Air conditioners – energy efficiency standards; banning incandescent light bulbs; biomass boilers; entertainment appliances – standby; green building standards; kitchen appliances – energy efficiency standards; raising thermostat 1˚C; retrofitting with mineral wool and fibreglass urethane; setting LED targets; solar lamps for outdoor lighting; solar photovoltaic panels with and without FiT; solar water heaters with and without FiT; turning off lights; washing machines – energy efficiency standards; water heaters – energy efficiency standards.
Industry Fertiliser industry – ammonia synthesis at lower pressure, hydrogen recovery, improved process control, more efficient CO2 removal from synthesis gas, process integration, steam reforming (large improvements), steam reforming (moderate improvements); fuel switching – coal replaced with grid electricity, coal replaced with natural gas, coal replaced with solar PV with and without FiT, diesel replaced with biofuel; gasoline replaced with bioethanol, petroleum replaced with grid electricity, petroleum replaced with solar PV with and without FiT, petroleum systems replaced with dual fuel systems; petroleum refinery and petrochemical industry – more efficient compressors, more efficient furnaces and boilers, more efficient heat exchangers, more efficient motors, more efficient pumps, more efficient utilities, monitoring and targeting, process integration; rubber industry – adoption of variable speed drive in electric motors, adoption of variable speed drive in pumps, heat recovery, leak prevention, lowering functional pressure, more efficient nozzles, reduction of excess air in boilers, using outside intake air.
Transport B100 fuel with and without fuel subsidies and sales tax relief; B5 fuel with and without fuel subsidy; bicycle lanes; Bus Rapid Transport (BRT) system; electric cars; electric motorbikes; fuel efficient private cars (EURO IV); High Occupancy Vehicle (HOV) lanes; hybrid private cars with and without sales tax relief; Liquefied Petroleum Gas (LPG) buses; Light Rail Transit (LRT) system; parking demand management.
Waste Anaerobic digestion with concentrated heat and power (CHP); anaerobic digestion with electricity recovery; centralised composting; Energy from Waste (EfW) with CHP; EfW with electricity recovery with and without FiT; home composting; landfill gas flaring; landfill gas utilisation with and without FiT; mass burn incinerator; recycling; waste prevention.

15The Economics of Low Carbon Cities
Assessment of the scope for deployment
We evaluate the potential scope for deploying each of the measures in the various sectors in Johor Bahru and Pasir Gudang in the period to 2025. We do this relative to the baselines that include an evaluation of the size and composition of energy supply and demand in different sectors. We calculate deployment not only for the sectors as a whole, but also for sub-sectors, taking into account for example the scope for change in households with different income levels and forms of energy consumption, or the scope for an option to be adopted in a particular industrial sub-sector.
Based on stakeholder consultations, we develop realistic and ambitious rates of deployment – with realistic rates being based on readily achievable levels of up-take, and ambitious rates assuming rates of deployment or take-up that could be achieved with supporting policies and favourable conditions in place. These assessments take into account the lifespans and rates of renewal of existing measures that could be replaced with more energy efficient or lower carbon alternatives, and also rates of change and growth in the relevant sectors of the city.
Again, we subject our assessments of the scope for/rates of deployment to participatory review in expert workshops to ensure that they are as realistic as possible.
Aggregation, assessment of investment needs and opportunities
We draw together the results from our assessment of the performance of each measure, and the scope for deploying each measure, to develop aggregations of the potential influence of each measure across the different sectors of the city as a whole. This allows us to understand overall investment needs and paybacks, as well as impacts on energy supply and demand in the different sectors in the city. It also allows us to generate league tables of the most cost and carbon effective measures that could be adopted both in each sector and across the city as a whole.
More detailed explanations of the data sources, methods and assumptions used for each sector are presented in Appendix B.

The Economics of Low Carbon Cities16
Business as usual trends in Johor Bahru and Pasir Gudang show a rapid decoupling of economic output and energy use between 2000 and 2025 (see Fig. 3). However, GDP and energy demand per capita are both rising steadily, while the population of Johor Bahru and Pasir Gudang is also growing. These effects are offsetting these improvements in energy intensity and leading to a substantial net increase in energy use.
Chapter 3. The Key Findings
Figure 3: Indexed energy use per unit of GDP and per capita.
179%
117%
64%
0.%
50%
100%
150%
200%
250%
300%
Energy Use Per Unit GDP
Energy Use
Energy Use Per Capita
2000
2002
2004
2006
2008
2010
2012
2014
2016
2018
2020
2022
2024

17The Economics of Low Carbon Cities
The electricity grid serving Peninsular Malaysia depends largely on coal and natural gas for generation, with diminishing contributions from hydropower and diesel. Despite the rising cost of natural gas and diesel in international markets, the real price of electricity in Malaysia has fallen significantly since 2000. The peak in the late 2000s reflects an increase in nominal prices, which have not subsequently kept pace with inflation. While the real prices of petrol, diesel and kerosene have also risen over the last two decades, the increases are well below those of international market prices.
We have assumed an increase of 3% per annum for real energy prices. The rising real energy prices combined with increasing energy consumption means that, under business as usual conditions, the total energy bill for Johor Bahru and Pasir Gudang will more than double from its 2014 level in the period to 2025 (see Fig. 4).
Figure 4: Indexed energy prices and total energy bill.
238%
138%
0%
50%
100%
150%
200%
250%
2000
2002
2004
2006
2008
2010
2012
2014
2016
2018
2020
2022
2024
Total energy bill
Electricity
Petrol
Coal
Natural gas

The Economics of Low Carbon Cities18
The Changing Context and the Impacts of ‘Business as Usual’ Trends
For the cities of Johor Bahru and Pasir Gudang, business as usual trends will lead total energy consumption to rise by 79.4% from 59.88 TWh in 2014 to a forecast level of 107.41 TWh in 2025 (see Fig. 6).
When combined with increasing real energy prices, this leads to the total expenditure on energy to increase by 139.9% from RM 13.54 billion (US$4.10 billion) in 2014 to a forecast level of RM 32.48 billion (US$9.83 billion) in 2025 (see Fig. 7).
When combined with relatively stable levels of carbon emissions per unit of energy consumed, this leads to carbon emissions attributed to domestic consumption increasing by 83.8% from 21.0 MtCO2-e in 2014 to a forecast level of 38.6 MtCO2-e in 2025 (see Fig. 8).
The emissions intensity of energy production is projected to remain largely constant until 2025, but increasing energy efficiency in the wider economy means that the emissions produced per unit of GDP will fall substantially between 2000 and 2025. This is significant because this is the index that Malaysia is using in their national carbon targets in international negotiations. It is important to note that, despite declining emission intensity per unit of GDP, rapid economic growth still means that emissions per capita and total emissions are continuing to rise. In a business as usual scenario, total emissions from Johor Bahru and Pasir Gudang are therefore forecast to nearly double on 2014 levels by 2025 (see Fig. 5).
Figure 5: Indexed total emissions per unit of energy, per unit of GDP and per capita.
184%
102%
66%
120%
0%
50%
100%
150%
200%
250%
300%
Emissions Per Unit GDP
Total Emissions
Emissions Per Capita
Emissions Per Unit Energy
2000
2002
2004
2006
2008
2010
2012
2014
2016
2018
2020
2022
2024
19The Economics of Low Carbon Cities
0.00
20.00
40.00
60.00
80.00
100.00
120.00
Ene
rgy
use
(TW
h)
Commercial
Housing
Industry
Transport
2024
2022
2020
2018
2016
2014
2012
2010
2008
2006
2004
2002
2000
Figure 6. Energy consumption in Johor Bahru and Pasir Gudang (TWh) between 2000 and 2025.
0.00
5.00
10.00
15.00
20.00
25.00
30.00
35.00
2000
20
01
2002
20
03
2004
20
05
2006
20
07
2008
20
09
2010
20
11
2012
20
13
2014
20
15
2016
20
17
2018
20
19
2020
20
21
2022
20
23
2024
20
25
Ene
rgy
bills
(R
M b
illio
ns)
Commercial
Housing
Industry
Transport
Figure 7. The energy bill for Johor Bahru and Pasir Gudang (RM billions) between 2000 and 2025.

The Economics of Low Carbon Cities20
Figure 8. Emissions from Johor Bahru and Pasir Gudang (MtCO2-e) between 2000 and 2025.
0.00
5.00
10.00
15.00
20.00
25.00
30.00
35.00
40.00
45.00
2000
20
01
2002
20
03
2004
20
05
2006
20
07
2008
20
09
2010
20
11
2012
20
13
2014
20
15
2016
20
17
2018
20
19
2020
20
21
2022
20
23
2024
20
25
Em
issi
ons
(MtC
O2-
e)
Commercial
Housing
Industry
Transport
Waste

21The Economics of Low Carbon Cities
The Potential for Energy Efficient, Low Carbon Development
We find that - compared to business as usual trends – Johor Bahru and Pasir Gudang could reduce their carbon emissions by 2025 by:
— 24.2% through cost effective investments in the city that would more than pay for themselves on commercial terms over their lifetime. This would require an investment of RM 3.33 billion (US$ 1.01 billion), generating annual savings of RM 2.56 billion (US$ 0.77 billion), paying back the investment in 1.3 years and generating annual savings for the lifetime of the measures.
— 25.1% if, as well as the above investments, cost effective investments in the electricity sector were made that could more than pay for themselves on commercial terms over their lifetime. This would require an investment of RM 22.87 billion (US$ 6.92 billion), generating annual savings of RM 1.90 billion (US$ 0.58 billion), paying back the investment in 12.0 years and generating annual savings for the lifetime of the measures.
— 45.4% with cost neutral measures that could be paid for by re-investing the income generated from cost-effective measures. This would require an investment of RM 18.49 billion (US$ 5.59 billion), generating annual cost savings of RM 2.74 billion (US$ 0.83 billion), paying back the investment in 6.75 years and generating annual savings for the lifetime of the measures.
— 46.6% with cost neutral measures in the electricity sector that could be paid for by re-investing the income generated from cost-effective measures. This would require an investment of RM 41.24 billion (US$ 12.48 billion), generating annual cost savings of RM 2.85 billion (US$ 0.86 billion), paying back the investment in 14.5 years and generating annual savings for the lifetime of the measures.
— 54.3% with the exploitation of all of the realistic potential of the different measures with carbon saving potential. This would require investment of RM 150.46 billion (US$ 45.53 billion), generating annual savings of RM 7.60 billion (US$ 2.30 billion), paying back the investment in 19.8 years and generating annual savings for the lifetime of the measures.
The impacts of all of these levels of change are shown in Figures 9 and 10 opposite.

The Economics of Low Carbon Cities22
181.69%
137.71% 136.17%
99.21% 96.95%
82.99%
0.00%
20.00%
40.00%
60.00%
80.00%
100.00%
120.00%
140.00%
160.00%
180.00%
200.00%
Business as usual
Cost-effective
Cost-effective (electricity)
Cost-neutral
Cost-neutral (electricity)
Technical potential
20
00
20
02
20
04
20
06
20
08
20
10
20
12
20
14
20
16
20
18
20
20
20
22
20
24
20
26
20
28
20
30
Figure 9. Emissions from Johor Bahru and Pasir Gudang under six different investment scenarios, as a function of 2014 emissions, between 2000 and 2025.
Figure 10. Energy bills for Johor Bahru and Pasir Gudang under four different scenarios (excluding investments in the electricity sector), as a function of 2014 emissions, between 2000 and 2025.
237.90%
168.45%
175.92% 174.89%
0.00%
50.00%
100.00%
150.00%
200.00%
250.00%
Business as usual
Cost-effective
Cost-neutral
Technical potential
2000
2002
2004
2006
2008
2010
2012
2014
2016
2018
2020
2022
2024
2026
2028
2030

23The Economics of Low Carbon Cities
Chapter 4. Sector Specific Findings

The Economics of Low Carbon Cities24
Sector Focus
The Electricity Sector
ON
OFF

25The Economics of Low Carbon Cities
The Changing Context and the Impacts of ‘Business as Usual’ Trends
In the electricity sector, background trends suggest substantial growth in electricity consumption from the residential, commercial and industrial sectors. Electricity consumption is projected to rise by 86% from 12.0 TWh in 2014 to a forecast level of 22.4 TWh in 2025 (see Fig. 11).
When combined with rising levels of carbon emissions per unit of energy consumed, carbon emissions attributed to electricity consumption in Johor Bahru are projected to increase by 90% from 8.9 MtCO2-e in 2014 to a forecast level of 17.0 MtCO2-e in 2025 (see Fig. 12).
Malaysia is dramatically increasing its electricity generation in order to support rapid economic growth and meet development targets. The Peninsular Malaysian electricity grid has increased production by 80% between 2000 and 2014. In 2014, generation for the peninsular Malaysian grid was 56% coal, 38% natural gas, 6% hydro and 1% diesel generation. Looking forward to 2025, significant investment in natural gas and coal-fired power plants is planned, which will further increase both the absolute level and relative share of fossil fuels in electricity generation.
12.00
22.40
0.00
5.00
10.00
15.00
20.00
25.00
Ene
rgy
cosn
umpt
ion
(TW
h)
2000
2002
2004
2006
2008
2010
2012
2014
2016
2018
2020
2022
2024
Figure 11. Electricity consumption (TWh) between 2000 and 2025.

The Economics of Low Carbon Cities26
0.0
2.00
4.00
6.00
8.00
10.00
12.00
14.00
16.00
18.00
2000
2002
2004
2006
2008
2010
2012
2014
2016
2018
2020
2022
2024
Em
issi
ons
(MtC
O2-
e)
Commercial
Residential
Industry
Transmission Losses
Figure 12. Emissions from the electricity sector (MtCO2-e) between 2000 and 2025.
27The Economics of Low Carbon Cities
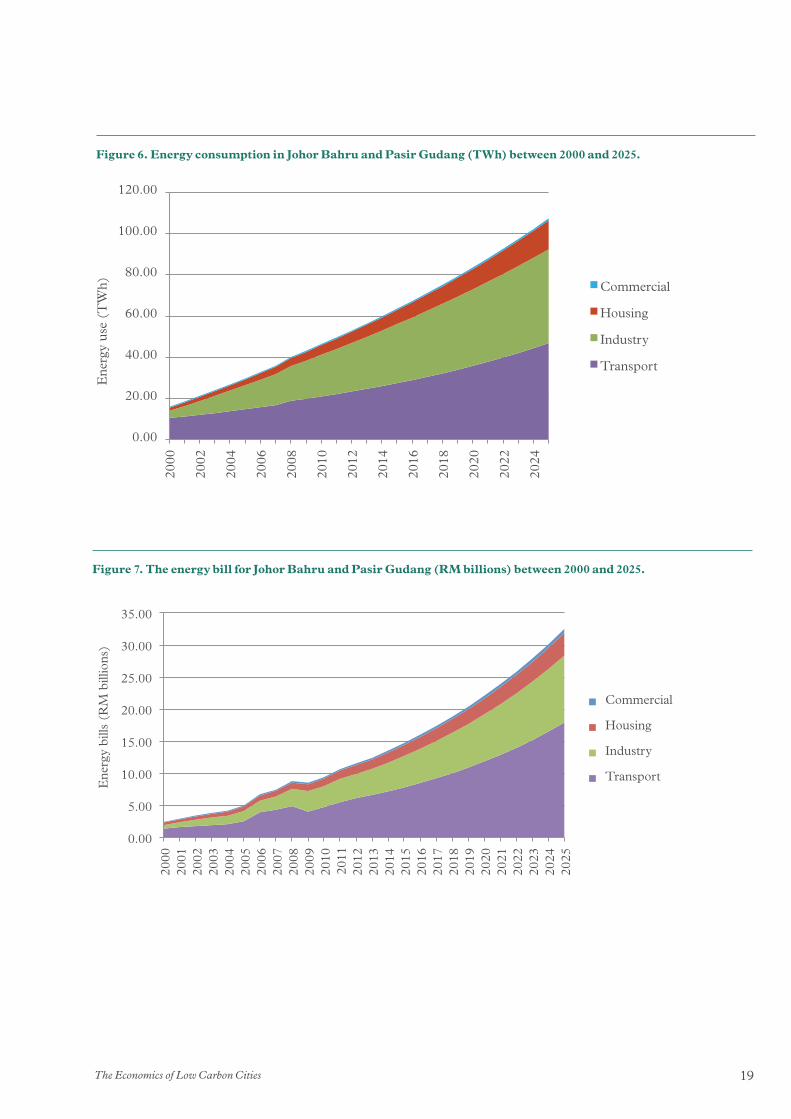
The Potential for Carbon Reduction – Investments and Returns
We find that for the electricity sector business as usual trends in carbon emissions can be reduced by:
— 2% with cost effective measures that would more than pay for themselves on commercial terms over their lifetime. This would require net investment of RM 23 billion (US$ 6.9 billion), generating annual savings of RM 1.9 million (US$ 576 million), paying back the investment in 12.0 years but generating annual savings for the lifetime of the measure.
— 3% with cost neutral measures that could be paid for by re-investing the income generated from cost-effective measures. This would require RM 48 billion (US$ 14.6 billion), generating annual savings of RM 3.2 billion (US$ 978 million), paying back the investment in 14.9 years and generating annual savings for the lifetime of the measures.
— 10% with the exploitation of all of the realistic potential of the different measures with carbon saving potential. This would require investment of RM 107 billion (US$ 32 billion), generating annual savings of RM 4.7 billion (US$ 1.4 billion), paying back the investment in 22.7 years and generating annual savings for the lifetime of the measures.
186.00%
184.00%
167.00%
190.00%
0.00%
20.00%
40.00%
60.00%
80.00%
100.00%
120.00%
140.00%
160.00%
180.00%
200.00%
Cost Effective Measures
Cost Neutral
Technical Potential
Business as usual
20
00
20
02
20
04
20
06
20
08
20
10
20
12
20
14
20
16
20
18
20
20
20
22
20
24
Figure 13: Emissions from the electricity sector (MtCO2-e) between 2000 and 2025.

The Economics of Low Carbon Cities28
0.74
0.76
0.74
0.73
0.67
0.55
0.60
0.65
0.70
0.75
0.80
Car
bon
inte
nsity
of
elec
tric
ity (
tCO
2-e/
MW
h)
Business as usual
Cost-effective
Cost-neutral
Technical potential
20
00
20
02
20
04
20
06
20
08
20
10
20
12
20
14
20
16
20
18
20
20
20
22
20
24
Figure 14: Carbon intensity of the peninsular Malaysian grid, 2000-2025
29The Economics of Low Carbon Cities
Cost effective
Cost neutral
All others including “cost ineffective” and those mutually exclusive with other measures
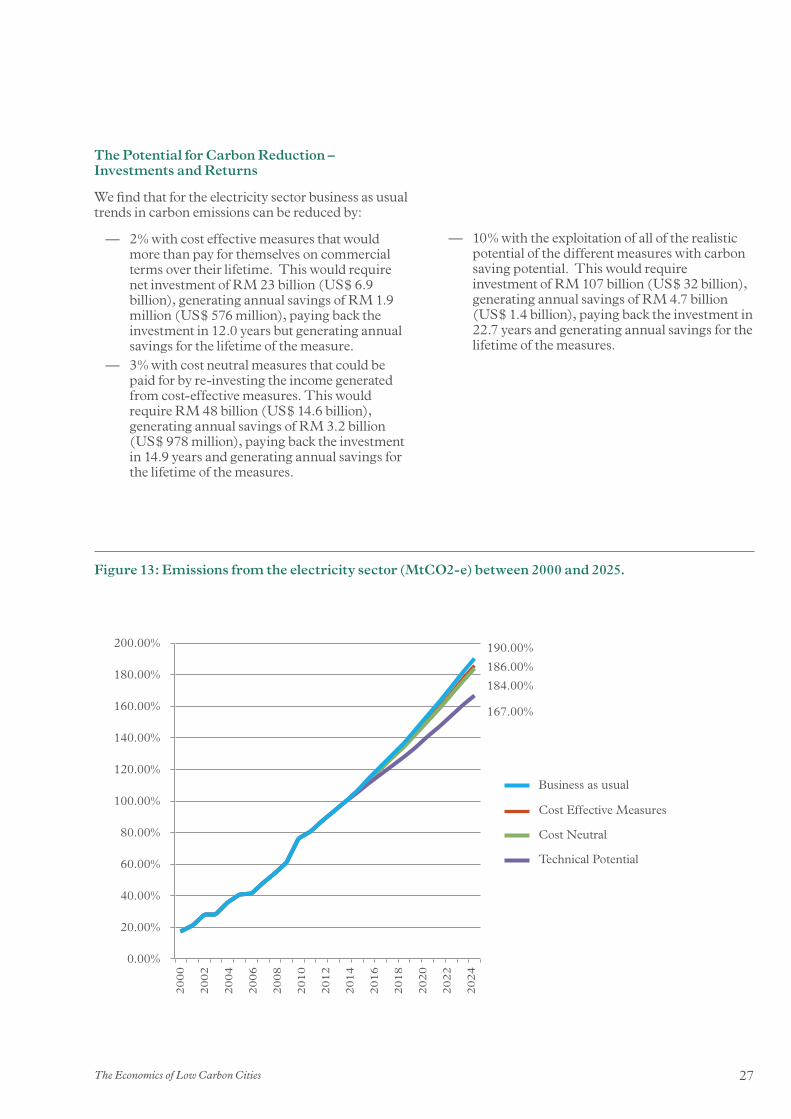
Table 2: League table of the most cost-effective low carbon measures for the electricity sector
Rank: Measure: MYR /tCO2-e
USD /tCO2-e
1 Natural gas BAT (~600 MW) -655 -199
2 Natural gas replaced by solar PV (2000 MW) -404 -123
3 Diesel replaced by solar PV (1200 MW) -5 -2
4 Natural gas retrofit (4200 MW) 238 72
5 Coal replaced with solar PV (1200 MW) 335 101
6 Coal retrofit (~8100 MW) 515 156
7 Coal BAT (4200 MW) 515 156
Rank: Measure: ktCO2-e
1 Coal retrofit (~8100 MW) 32,550
2 Coal best available technology (4200 MW) 16,959
3 Coal replaced with solar PV (1200 MW) 13,001
4 Natural gas replaced by solar PV (2000 MW) 10,173
5 Natural gas retrofit (4200 MW) 7,939
6 Diesel replaced by solar PV (1200 MW) 5,181
7 Natural gas BAT (~600 MW) 849
Table 3: League table of the most carbon-effective low carbon measures for the electricity sector

The Economics of Low Carbon Cities30
Sector Focus
The Commercial Sector
ON
OFF

31The Economics of Low Carbon Cities
The Changing Context and the Impacts of ‘Business as Usual’ Trends
For the commercial sector, background trends suggest substantial growth both in commercial floor space and in the average levels of energy consumption in each commercial building. These combined trends lead commercial sector energy consumption to rise by 49.9% from 618.7 GWh in 2014 to a forecast level of 927.6 GWh in 2025 (see Fig. 15).
When combined with increasing real energy prices, this leads to the total spend from the domestic sector on energy to increase by 107.5% from RM 288.1 million (US$87.2 million) in 2014 to a forecast level of RM 597.9 million (US$180.9 million) in 2025 (see Fig. 16).
When combined with slightly increasing levels of carbon emissions per unit of energy consumed, this leads to carbon emissions attributed to commercial consumption increasing by 53.0% from 465.3 ktCO2-e in 2014 to a forecast level of 712.1 ktCO2-e in 2025 (see Fig. 17).
There is substantial variation in the energy efficiency of commercial and public buildings in Malaysia. Private buildings are typically more modern and efficient. New commercial buildings are required to reduce building energy intensity to at most 136kWH/m2/year, and there is a joint programme conducted by the Ministry of Public Work and the United Nations Development Programme to retrofit older buildings to this standard.
Johor Bahru has a relatively large established stock of commercial and public buildings compared to less developed parts of Iskandar Malaysia. Nonetheless, it is still apparent that energy consumption in commercial and public buildings will still increase dramatically by 2025, dominated by the expansion of shopping complexes.
618.74
927.64
0.00
100.00
200.00
300.00
400.00
500.00
600.00
700.00
800.00
900.00
1,000.00
20
00
20
01
20
02
20
03
20
04
20
05
20
06
20
07
20
08
20
09
20
10
20
11
20
12
20
13
20
14
20
15
20
16
20
17
20
18
20
19
20
20
20
21
20
22
20
23
20
24
20
25
Ene
rgy
cons
umpt
ion
(GW
h)
Figure 15. Energy consumption (GWh) by the commercial sector between 2000 and 2025.

The Economics of Low Carbon Cities32
288.09
597.88
0.00
100.00
200.00
300.00
400.00
500.00
600.00
700.00
20
00
20
01
20
02
20
03
20
04
20
05
20
06
20
07
20
08
20
09
20
10
20
11
20
12
20
13
20
14
20
15
20
16
20
17
20
18
20
19
20
20
20
21
20
22
20
23
20
24
20
25
Ene
rgy
bills
(R
M m
illio
ns)
Figure 16. Energy bills from the commercial sector (RM millions) between 2000 and 2025.
0.00
100.00
200.00
300.00
400.00
500.00
600.00
700.00
800.00
Em
issi
ons
(ktC
O2-
e)
Small shop units
Shopping complexes
Government offices
Private offices
2000
2002
2004
2006
2008
2010
2012
2014
2016
2018
2020
2022
2024
Figure 17. Emissions from the commercial sector (ktCO2-e) between 2000 and 2025.
33The Economics of Low Carbon Cities
The Potential for Carbon Reduction – Investments and Returns
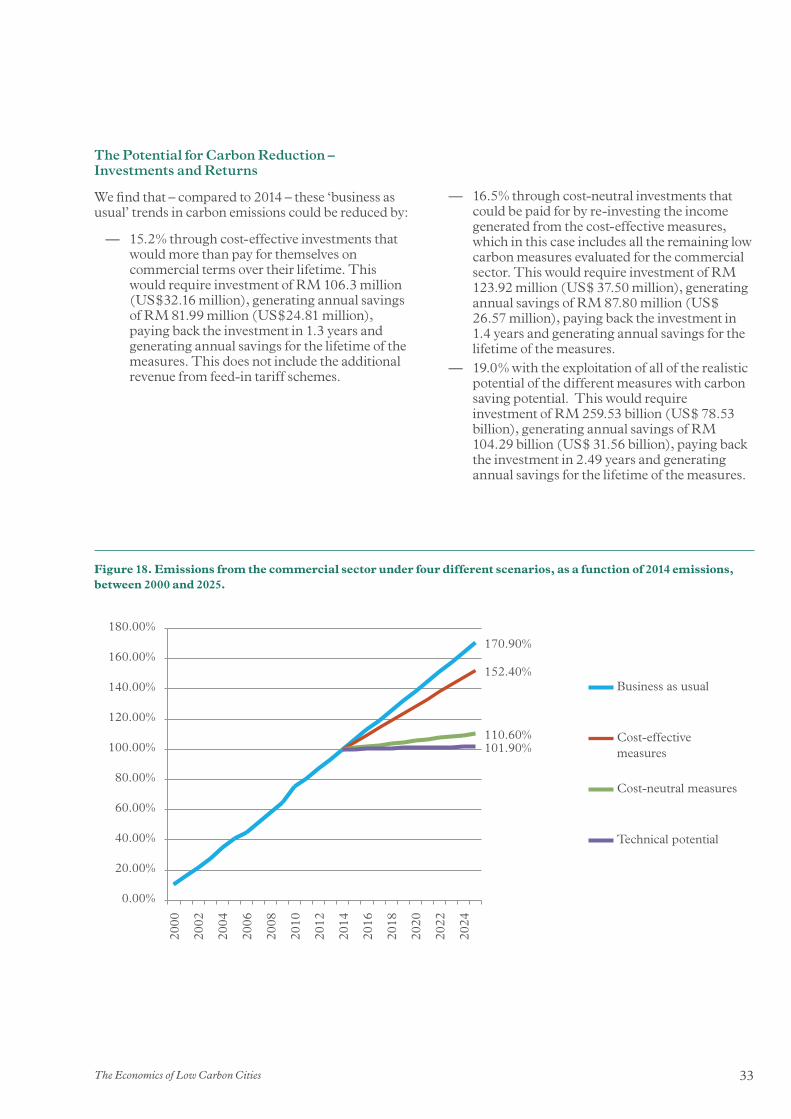
We find that – compared to 2014 – these ‘business as usual’ trends in carbon emissions could be reduced by:
— 15.2% through cost-effective investments that would more than pay for themselves on commercial terms over their lifetime. This would require investment of RM 106.3 million (US$32.16 million), generating annual savings of RM 81.99 million (US$24.81 million), paying back the investment in 1.3 years and generating annual savings for the lifetime of the measures. This does not include the additional revenue from feed-in tariff schemes.
— 16.5% through cost-neutral investments that could be paid for by re-investing the income generated from the cost-effective measures, which in this case includes all the remaining low carbon measures evaluated for the commercial sector. This would require investment of RM 123.92 million (US$ 37.50 million), generating annual savings of RM 87.80 million (US$ 26.57 million), paying back the investment in 1.4 years and generating annual savings for the lifetime of the measures.
— 19.0% with the exploitation of all of the realistic potential of the different measures with carbon saving potential. This would require investment of RM 259.53 billion (US$ 78.53 billion), generating annual savings of RM 104.29 billion (US$ 31.56 billion), paying back the investment in 2.49 years and generating annual savings for the lifetime of the measures.
170.90%
152.40%
110.60% 101.90%
0.00%
20.00%
40.00%
60.00%
80.00%
100.00%
120.00%
140.00%
160.00%
180.00%
Business as usual
Cost-effective measures
Cost-neutral measures
Technical potential
2000
2002
2004
2006
2008
2010
2012
2014
2016
2018
2020
2022
2024
Figure 18. Emissions from the commercial sector under four different scenarios, as a function of 2014 emissions, between 2000 and 2025.

The Economics of Low Carbon Cities34
Table 4. League table of the most cost-effective low carbon measures for the commercial sector
Cost Effectiveness
Rank: Measure: RM/tCO2-eUSD/
tCO2-e
1 Green Buildings Standard 1 -176,683.76 -53,460.27
2 Green Buildings Standard 2 -171,678.44 -51,945.78
3 Banning incandescent light bulbs -542.82 -164.24
4 Computer - energy management -521.51 -157.80
5 Printer - energy management -521.51 -157.80
6 Copier - energy management -521.51 -157.80
7 Monitor - energy management -521.51 -157.80
8 Fax - turning off -521.51 -157.80
9 20kWp solar PV panel with FiT -506.57 -153.28
10 Raising thermostat 1˚C -488.97 -147.95
11 Air conditioner - EE Standard 2 -483.11 -146.18
12 Air conditioner - EE Standard 1 -482.30 -145.93
13 20kWp solar PV panel -420.20 -127.14
14 Elevators and escalators - EE Standard 1 -397.91 -120.40
15 Elevators and escalators - EE Standard 2 -397.91 -120.40
16 Setting LED target of 50% -0.63 -0.19
17 Turning off lights -0.53 -0.16
18 Retrofitting mineral wool insulation 14,093.32 4,264.30
19 Retrofitting fibreglass urethane insulation 15,059.98 4,556.79
Cost effective
Cost neutral
All others including “cost ineffective” and those mutually exclusive with other measures

35The Economics of Low Carbon Cities
Table 5. League table of the most carbon-effective low carbon measures for the commercial sector
Cost effective
Cost neutral
All others including “cost ineffective” and those mutually exclusive with other measures
Carbon Effectiveness
Rank: Measure: ktCO2-e
1 Air conditioner – EE standard 2 199.48
2 Green Buildings Standard 2 (100% of new buildings from 2015) 173.23
3 Turning off lights 145.40
4 Retrofitting fibreglass urethane insulation (20% of existing buildings by 2025) 138.67
5 Air conditioner – EE Standard 1 99.74
6 Green Buildings Standard 1 (100% of new buildings from 2015) 86.61
7 Green Buildings Standard 2 (50% of new buildings from 2015) 86.61
8 Retrofitting mineral wool insulation (20% of existing buildings by 2025) 73.96
9 Retrofitting fibreglass urethane insulation (10% of existing buildings by 2025) 69.34
10 Banning incandescent light bulbs 65.76
11 Setting LED target of 50% 60.64
12 Green Buildings Standard 1 (50% of new buildings from 2015) 43.31
13 Elevators and escalators – EE Standard 2 37.73
14 Retrofitting mineral wool insulation (10% of existing buildings by 2025) 36.98
15 Raising thermostat 1˚C 35.03
16 Elevators and escalators – EE Standard 1 18.87
17 Computer – energy management 16.88
18 20kWp solar PV panel (target of 3MW by 2025) 11.68
19 20kWp solar PV panel with FiT (target of 3MW by 2025) 11.68
20 Monitor – energy management 6.37
21 20kWp solar PV panel (target of 1.5MW by 2025) 5.84
22 20kWp solar PV panel with FiT (target of 1.5MW by 2025) 5.84
23 Printer – energy management 5.06
24 Copier – energy management 0.46
25 Fax – turning off 0.09

The Economics of Low Carbon Cities36
Sector Focus
The Domestic Sector

37The Economics of Low Carbon Cities
Malaysians currently have relatively high energy consumption per capita compared with most emerging or newly industrialised economies.
The low cost of electricity in particular further enables very energy intensive development in the domestic sector. The growing demand for electricity is driven by increasing ownership of air conditioners and, to a lesser extent, rice cookers, refrigerators and entertainment appliances.
The Changing Context and the Impacts of ‘Business as Usual’ Trends
For the domestic sector, background trends suggest substantial growth both in the number of households and in the average levels of energy consumption per household. Domestic sector energy consumption is projected to rise by 122.0% from 6.3 TWh in 2014 to a forecast level of 14.1 TWh in 2025 (see Fig. 19).
When combined with increasing real energy prices, this leads to the total spend from the domestic sector on energy to increase by 121.9% from RM 1.60 billion (US$484.1 million) in 2014 to a forecast level of RM 3.55 billion (US$1.07 billion) in 2025 (see Fig. 20).
Rapid increases in household electricity consumption combined with the increasing carbon intensity of the grid leads to carbon emissions attributed to the domestic sector increasing by 126.0% from 3.7 MtCO2-e in 2014 to a forecast level of 8.4 MtCO2-e in 2025 (see Fig. 21).
6.34
14.09
0.00
2.00
4.00
6.00
8.00
10.00
12.00
14.00
16.00
20
00
20
01
20
02
20
03
20
04
20
05
20
06
20
07
20
08
20
09
20
10
20
11
20
12
20
13
20
14
20
15
20
16
20
17
20
18
20
19
20
20
20
21
20
22
20
23
20
24
20
25
Ene
rgy
cons
umpt
ion
(TW
h)
Figure 19. Energy consumption (TWh) by the domestic sector between 2000 and 2025.

The Economics of Low Carbon Cities38
1.60
3.55
0.00
0.50
1.00
1.50
2.00
2.50
3.00
3.50
4.00
20
00
20
01
20
02
20
03
20
04
20
05
20
06
20
07
20
08
20
09
20
10
20
11
20
12
20
13
20
14
20
15
20
16
20
17
20
18
20
19
20
20
20
21
20
22
20
23
20
24
20
25
Ene
rgy
bills
(R
M b
illio
ns)
Figure 20. Energy bills from the domestic sector (RM billions) between 2000 and 2025.
0.00
1.00
2.00
3.00
4.00
5.00
6.00
7.00
8.00
9.00
2000
2002
2004
2006
2008
2010
2012
2014
2016
2018
2020
2022
2024
Em
issi
ons
(MtC
O2-
e)
Electricity
Natural gas
LPG
Petroleum products
Figure 21. Emissions from the domestic sector (MtCO2-e) between 2000 and 2025.

39The Economics of Low Carbon Cities
The Potential for Carbon Reduction – Investments and Returns
We find that – compared to 2014 – these ‘business as usual’ trends in carbon emissions could be reduced by:
— 21.8% through cost-effective investments that would more than pay for themselves on commercial terms over their lifetime. This would require investment of RM 2.00 billion (US$ 604.46 million), generating annual savings of RM 491.82 million (US$ 148.81 million), paying back the investment in 3.7 years but generating annual savings for the lifetime of the measures. This does not include the additional income from feed-in tariff schemes.
— 22.3% through cost-neutral investments that could be paid for by re-investing the income generated from the cost-effective measures. This would require investment of RM 2.49 billion (US$ 754.43 million), generating annual savings of RM 523.79 million (US$ 158.49 million), paying back the investment in 4.4 years and generating annual savings for the lifetime of the measures.
— 29.5% with the exploitation of all of the realistic potential of the different measures with carbon saving potential. This would require an investment of RM 7.78 billion (US$ 2.35 billion), generating annual savings of RM 720.88 million (US$218.12 million), paying back the investment in 12.9 years and generating annual savings for the lifetime of the measures.
226.00%
176.70% 175.60%
159.30%
0.00%
50.00%
100.00%
150.00%
200.00%
250.00%
20
00
20
02
20
04
20
06
20
08
20
10
20
12
20
14
20
16
20
18
20
20
20
22
20
24
Em
issi
ons
as a
fun
ctio
n of
201
4 le
vels
(%
)
Business as usual
Cost-effective measures
Cost-neutral measures
Cost-neutral measures
Figure 22. Emissions from the domestic sector under four different scenarios, as a function of 2014 emissions, between 2000 and 2025.

The Economics of Low Carbon Cities40
Cost effective
Cost neutral
All others including “cost ineffective” and those mutually exclusive with other measures
Table 6. League table of the most cost-effective low carbon measures for the domestic sector
Cost Effectiveness
Rank: Measure:RM/
tCO2-e USD/tCO2-e
1 4kWp solar PV panel with FiT -505.19 -152.86
2 Solar water heating with FiT -435.20 -131.68
3 Setting LED target of 50% -382.34 -115.69
4 Raising thermostat 1˚C -333.65 -100.95
5 Entertainment appliances - standby -331.92 -100.43
6 Air conditioner - EE Standard 2 -319.87 -96.78
7 Air conditioner - EE Standard 1 -319.51 -96.68
8 Banning incandescent light bulbs -283.02 -85.64
9 Turning off lights -284.25 -86.01
10 Green Building Standard 1 -277.63 -84.01
11 Green Building Standard 2 -277.63 -84.01
12 Water heater - EE Standard 2 -210.18 -63.59
13 Water heater - EE Standard 1 -208.51 -63.09
14 Retrofitting mineral wool insulation -84.06 -25.43
15 Retrofitting fibreglass urethane insulation -61.67 -18.66
16 4kWp solar PV panel -63.27 -19.14
17 Washing machine - EE Standard 1 -44.79 -13.55
18 Entertainment appliances - EE Standard 2 -35.57 -10.76
19 Solar lamps for outdoor lighting -0.30 -0.09
20 Entertainment appliances - EE Standard 1 38.70 11.71
21 Solar water heating 167.71 50.75
22 Washing machine - EE Standard 2 241.28 73.01
23 Kitchen appliances - EE Standard 1 322.92 97.71
24 Kitchen appliances - EE Standard 2 614.24 185.85

41The Economics of Low Carbon Cities
Cost effective
Cost neutral
All others including “cost ineffective” and those mutually exclusive with other measures
Table 7. League table of the most carbon-effective low carbon measures for the domestic sector
Carbon Effectiveness
Rank: Measure: ktCO2-e
1 Air conditioner - EE Standard 2 3,848.682 4kWp solar PV panel (20MW by 2025) 3,423.933 4kWp solar PV panel with FiT (20MW by 2025) 3,423.934 Air conditioner - EE Standard 1 1,836.635 4kWp solar PV panel (10MW by 2025) 1,711.976 4kWp solar PV panel with FiT (10MW by 2025) 1,711.977 Raising thermostat 1˚C 1,582.488 Green Building Standard 2 (100% of new buildings from 2015) 1,428.809 Retrofitting fibreglass urethane insulation (20% of existing buildings by 2025) 990.0310 Solar water heating (30% of households by 2025) 875.9411 Solar water heating with FiT (30% of households by 2025) 875.9412 Green Building Standard 2 (100% of new buildings from 2015) 818.2013 Green Building Standard 2 (50% of new buildings from 2015) 714.4014 Water heater - EE Standard 2 700.2915 Entertainment appliances - standby 649.4916 Retrofitting mineral wool insulation (20% of existing buildings by 2025) 528.0217 Retrofitting fibreglass urethane insulation (10% of existing buildings by 2025) 495.0118 Turning off lights 470.6119 Solar water heating (15% of households by 2025) 437.9720 Solar water heating with FiT (15% of households by 2025) 437.9721 Green Building Standard 1 (50% of new buildings from 2015) 412.9722 Entertainment appliances - EE Standard 2 345.4423 Water heater - EE Standard 1 311.4924 Kitchen appliances - EE Standard 2 277.3125 Retrofitting mineral wool insulation (10% of existing buildings by 2025) 264.0126 Banning incandescent light bulbs 253.9727 Entertainment appliances - EE Standard 1 219.8728 Setting LED target of 50% 104.2329 Washing machine - EE Standard 2 57.9630 Washing machine - EE Standard 1 45.9531 Kitchen appliances - EE Standard 1 14.2832 Solar lamps for outdoor lighting (100% of outdoor lamp sales from 2015) 15.4333 Solar lamps for outdoor lighting (50% of outdoor lamp sales from 2015) 7.71

The Economics of Low Carbon Cities42
Sector Focus
The Industrial Sector

43The Economics of Low Carbon Cities
The Iskandar Regional Development Authority has prepared a Comprehensive Development Plan (CDP) with the aim to provide sustainable and holistic development in five “flagship zones”. Flagship A (Johor Bahru City Centre) and Flagship D (Eastern gate Development including Pasir Gudang Port), are the subject of our analysis. In these areas, development of plastic manufacturing, the electronics industry, food processing and the financial sector will be leading sources of energy demand and additional emissions over the coming decade.
The Changing Context and the Impacts of ‘Business as Usual’ Trends
For the industrial sector, background trends and regional economic policies suggest substantial expansion of industry and consequently, industrial energy use. Industrial sector energy consumption is projected to rise by 69.3% from 26.9 TWh in 2014 to a forecast level of 45.6 TWh in 2025 (see Fig. 23).
When combined with increasing real energy prices, this leads to the total spend from the domestic sector on energy to increase by 135.0% from RM 4.46 billion (US$1.35 billion) in 2014 to a forecast level of RM 10.4 billion (US$3.15 billion) in 2025 (see Fig. 24).
Rapid increases in industrial energy consumption combined with the increasing carbon intensity of the grid leads to carbon emissions attributed to the industrial sector increasing by 70.9% from 9.26 MtCO2-e in 2014 to a forecast level of 15.8 MtCO2-e in 2025 (see Fig. 25).
26.91
45.55
0.00
5.00
10.00
15.00
20.00
25.00
30.00
35.00
40.00
45.00
50.00
20
00
20
01
20
02
20
03
20
04
20
05
20
06
20
07
20
08
20
09
20
10
20
11
20
12
20
13
20
14
20
15
20
16
20
17
20
18
20
19
20
20
20
21
20
22
20
23
20
24
20
25
Ene
rgy
use
(TW
h)
Figure 23. Energy consumption (TWh) by the industrial sector between 2000 and 2025.
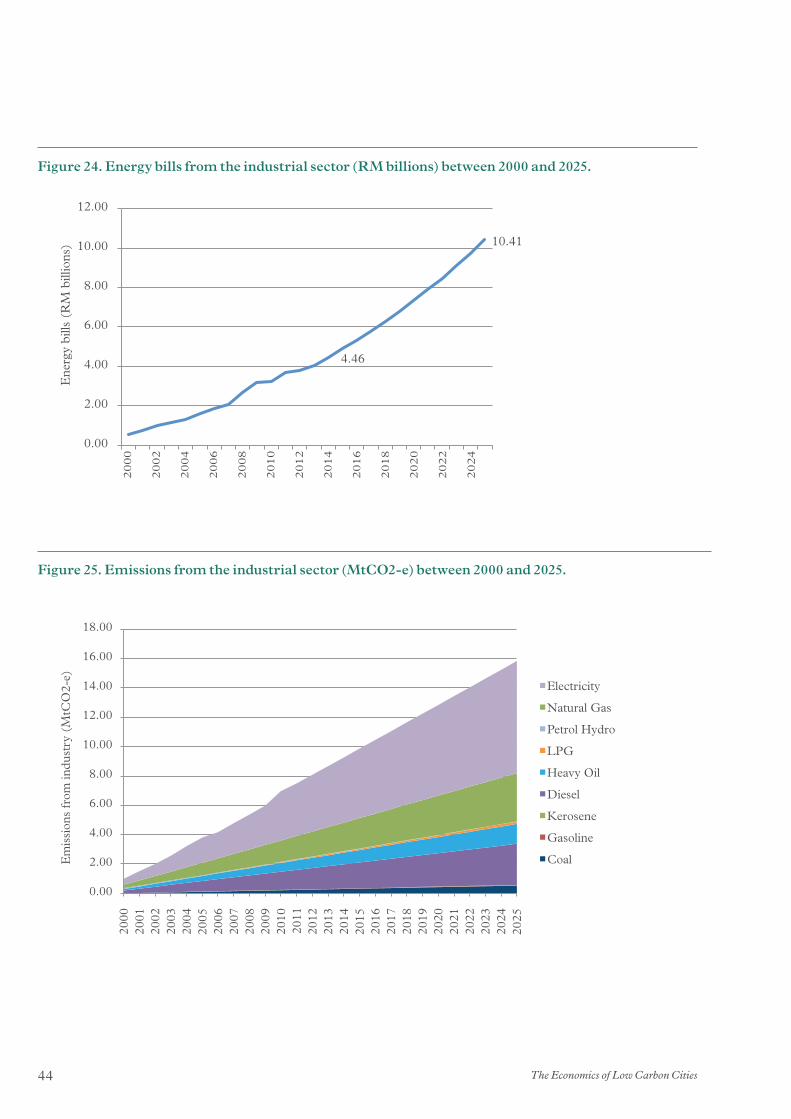
The Economics of Low Carbon Cities44
4.46
10.41
0.00
2.00
4.00
6.00
8.00
10.00
12.00
Ene
rgy
bills
(R
M b
illio
ns)
20
00
20
02
20
04
20
06
20
08
20
10
20
12
20
14
20
16
20
18
20
20
20
22
20
24
Figure 24. Energy bills from the industrial sector (RM billions) between 2000 and 2025.
0.00
2.00
4.00
6.00
8.00
10.00
12.00
14.00
16.00
18.00
2000
20
01
2002
20
03
2004
20
05
2006
20
07
2008
20
09
2010
20
11
2012
20
13
2014
20
15
2016
20
17
2018
20
19
2020
20
21
2022
20
23
2024
20
25
Em
issi
ons
from
indu
stry
(M
tCO
2-e)
Electricity
Natural Gas
Petrol Hydro
LPG
Heavy Oil
Diesel
Kerosene
Gasoline
Coal
Figure 25. Emissions from the industrial sector (MtCO2-e) between 2000 and 2025.

45The Economics of Low Carbon Cities
The Potential for Carbon Reduction – Investments and Returns
We find that – compared to 2014 – these ‘business as usual’ trends in carbon emissions could be reduced by:
— 10.8% through cost-effective investments that would more than pay for themselves on commercial terms over their lifetime. This would require investment of RM 1.25 billion (US$ 377.82 million), generating annual savings of RM 1.31 billion (US$ 396.29 million), paying back the investment in less than one year and generating annual savings for the lifetime of the measures.
— 35.3% through cost-neutral investments that could be paid for by re-investing the income generated from the cost-effective measures. This would require investment of RM 6.64 billion (US$2.01 billion), generating annual savings of RM 1.54 billion (US$465.25 million), paying back the investment in 4.3 years and generating annual savings for the lifetime of the measures.
— 40.4% with the exploitation of all of the realistic potential of the different measures with carbon saving potential. This would require an investment of RM 23.03 billion (US$6.97 billion), generating annual savings of RM 1.54 billion (US$466.57 million), paying back the investment in 14.9 years and generating annual savings for the lifetime of the measures.
170.90%
152.40%
110.60% 101.90%
0.00%
20.00%
40.00%
60.00%
80.00%
100.00%
120.00%
140.00%
160.00%
180.00%
Business as usual
Cost-effective measures
Cost-neutral measures
Technical potential
20
00
20
02
20
04
20
06
20
08
20
10
20
12
20
14
20
16
20
18
20
20
20
22
20
24
Figure 26. Emissions from the industrial sector under four different scenarios, as a function of 2014 emissions, between 2000 and 2025.
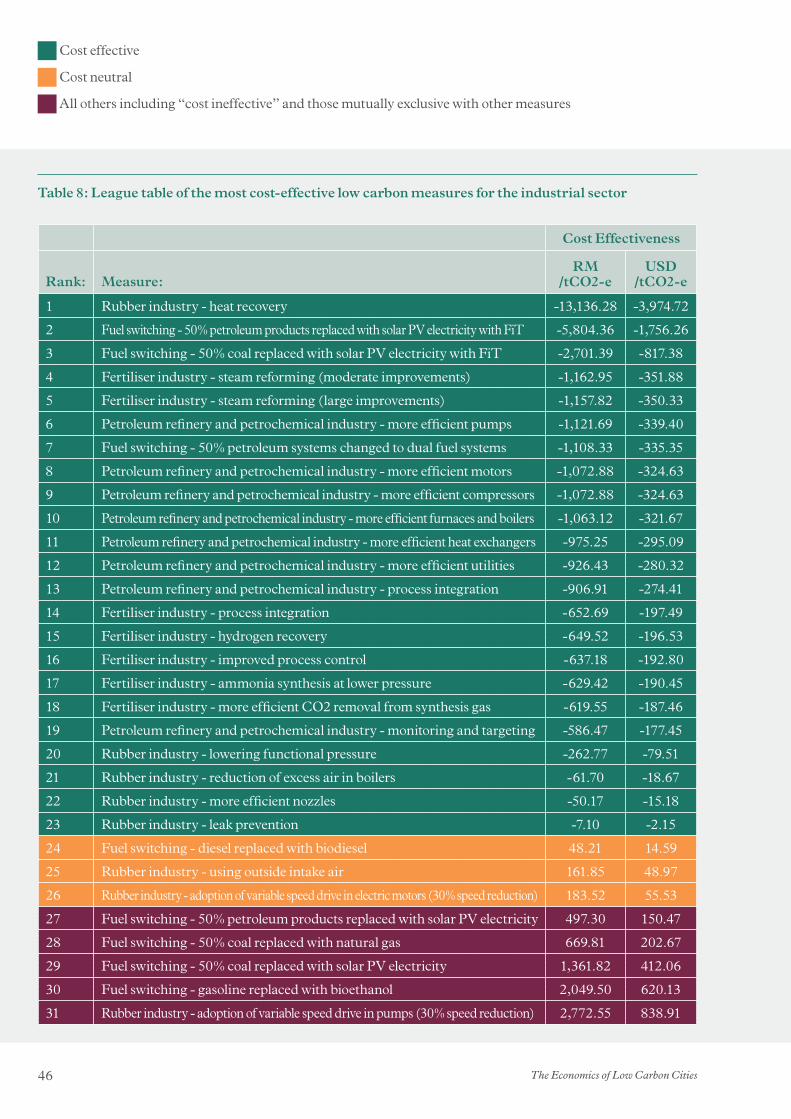
The Economics of Low Carbon Cities46
Table 8: League table of the most cost-effective low carbon measures for the industrial sector
Cost Effectiveness
Rank: Measure:RM
/tCO2-eUSD
/tCO2-e
1 Rubber industry - heat recovery -13,136.28 -3,974.72
2 Fuel switching - 50% petroleum products replaced with solar PV electricity with FiT -5,804.36 -1,756.26
3 Fuel switching - 50% coal replaced with solar PV electricity with FiT -2,701.39 -817.38
4 Fertiliser industry - steam reforming (moderate improvements) -1,162.95 -351.88
5 Fertiliser industry - steam reforming (large improvements) -1,157.82 -350.33
6 Petroleum refinery and petrochemical industry - more efficient pumps -1,121.69 -339.40
7 Fuel switching - 50% petroleum systems changed to dual fuel systems -1,108.33 -335.35
8 Petroleum refinery and petrochemical industry - more efficient motors -1,072.88 -324.63
9 Petroleum refinery and petrochemical industry - more efficient compressors -1,072.88 -324.63
10 Petroleum refinery and petrochemical industry - more efficient furnaces and boilers -1,063.12 -321.67
11 Petroleum refinery and petrochemical industry - more efficient heat exchangers -975.25 -295.09
12 Petroleum refinery and petrochemical industry - more efficient utilities -926.43 -280.32
13 Petroleum refinery and petrochemical industry - process integration -906.91 -274.41
14 Fertiliser industry - process integration -652.69 -197.49
15 Fertiliser industry - hydrogen recovery -649.52 -196.53
16 Fertiliser industry - improved process control -637.18 -192.80
17 Fertiliser industry - ammonia synthesis at lower pressure -629.42 -190.45
18 Fertiliser industry - more efficient CO2 removal from synthesis gas -619.55 -187.46
19 Petroleum refinery and petrochemical industry - monitoring and targeting -586.47 -177.45
20 Rubber industry - lowering functional pressure -262.77 -79.51
21 Rubber industry - reduction of excess air in boilers -61.70 -18.67
22 Rubber industry - more efficient nozzles -50.17 -15.18
23 Rubber industry - leak prevention -7.10 -2.15
24 Fuel switching - diesel replaced with biodiesel 48.21 14.59
25 Rubber industry - using outside intake air 161.85 48.97
26 Rubber industry - adoption of variable speed drive in electric motors (30% speed reduction) 183.52 55.53
27 Fuel switching - 50% petroleum products replaced with solar PV electricity 497.30 150.47
28 Fuel switching - 50% coal replaced with natural gas 669.81 202.67
29 Fuel switching - 50% coal replaced with solar PV electricity 1,361.82 412.06
30 Fuel switching - gasoline replaced with bioethanol 2,049.50 620.13
31 Rubber industry - adoption of variable speed drive in pumps (30% speed reduction) 2,772.55 838.91
Cost effective
Cost neutral
All others including “cost ineffective” and those mutually exclusive with other measures

47The Economics of Low Carbon Cities
Table 9: League table of the most carbon-effective low carbon measures for the industrial sector
Cost Effectiveness
Rank: Measure:RM
/tCO2-eUSD
/tCO2-e
1 Rubber industry - heat recovery -13,136.28 -3,974.72
2 Fuel switching - 50% petroleum products replaced with solar PV electricity with FiT -5,804.36 -1,756.26
3 Fuel switching - 50% coal replaced with solar PV electricity with FiT -2,701.39 -817.38
4 Fertiliser industry - steam reforming (moderate improvements) -1,162.95 -351.88
5 Fertiliser industry - steam reforming (large improvements) -1,157.82 -350.33
6 Petroleum refinery and petrochemical industry - more efficient pumps -1,121.69 -339.40
7 Fuel switching - 50% petroleum systems changed to dual fuel systems -1,108.33 -335.35
8 Petroleum refinery and petrochemical industry - more efficient motors -1,072.88 -324.63
9 Petroleum refinery and petrochemical industry - more efficient compressors -1,072.88 -324.63
10 Petroleum refinery and petrochemical industry - more efficient furnaces and boilers -1,063.12 -321.67
11 Petroleum refinery and petrochemical industry - more efficient heat exchangers -975.25 -295.09
12 Petroleum refinery and petrochemical industry - more efficient utilities -926.43 -280.32
13 Petroleum refinery and petrochemical industry - process integration -906.91 -274.41
14 Fertiliser industry - process integration -652.69 -197.49
15 Fertiliser industry - hydrogen recovery -649.52 -196.53
16 Fertiliser industry - improved process control -637.18 -192.80
17 Fertiliser industry - ammonia synthesis at lower pressure -629.42 -190.45
18 Fertiliser industry - more efficient CO2 removal from synthesis gas -619.55 -187.46
19 Petroleum refinery and petrochemical industry - monitoring and targeting -586.47 -177.45
20 Rubber industry - lowering functional pressure -262.77 -79.51
21 Rubber industry - reduction of excess air in boilers -61.70 -18.67
22 Rubber industry - more efficient nozzles -50.17 -15.18
23 Rubber industry - leak prevention -7.10 -2.15
24 Fuel switching - diesel replaced with biodiesel 48.21 14.59
25 Rubber industry - using outside intake air 161.85 48.97
26 Rubber industry - adoption of variable speed drive in electric motors (30% speed reduction) 183.52 55.53
27 Fuel switching - 50% petroleum products replaced with solar PV electricity 497.30 150.47
28 Fuel switching - 50% coal replaced with natural gas 669.81 202.67
29 Fuel switching - 50% coal replaced with solar PV electricity 1,361.82 412.06
30 Fuel switching - gasoline replaced with bioethanol 2,049.50 620.13
31 Rubber industry - adoption of variable speed drive in pumps (30% speed reduction) 2,772.55 838.91
Cost effective
Cost neutral
All others including “cost ineffective” and those mutually exclusive with other measures
Carbon Effectiveness
Rank: Measure: ktCO2-e
1 Fuel switching - diesel replaced with biodiesel 43,798.24
2 Fuel switching - 50% petroleum products replaced with solar PV electricity with FiT 21,357.43
3 Fuel switching - 50% petroleum products replaced with solar PV electricity 21,357.43
4 Rubber industry - reduction of excess air in boilers 7,991.75
5 Rubber industry - adoption of variable speed drive in electric motors (30% speed reduction) 11,232.08
6 Fuel switching - 50% petroleum systems changed to dual fuel systems 9,724.50
7 Fuel switching - 50% coal replaced with solar PV electricity with FiT 3,703.43
8 Fuel switching - 50% coal replaced with solar PV electricity 3,703.43
9 Rubber industry - leak prevention 1,731.81
10 Rubber industry - more efficient nozzles 616.71
11 Petroleum refinery and petrochemical industry - monitoring and targeting 1,652.40
12 Fuel switching - 50% coal replaced with natural gas 1,582.33
13 Petroleum refinery and petrochemical industry - more efficient utilities 929.47
14 Petroleum refinery and petrochemical industry - more efficient furnaces and boilers 619.65
15 Fuel switching - gasoline replaced with bioethanol 473.15
16 Petroleum refinery and petrochemical industry - process integration 464.74
17 Petroleum refinery and petrochemical industry - more efficient heat exchangers 464.74
18 Rubber industry - adoption of variable speed drive in pumps (30% speed reduction) 108.43
19 Fertiliser industry - steam reforming (large improvements) 266.86
20 Fertiliser industry - process integration 200.15
21 Rubber industry - using outside intake air 41.31
22 Petroleum refinery and petrochemical industry - more efficient pumps 148.72
23 Petroleum refinery and petrochemical industry - more efficient motors 123.93
24 Fertiliser industry - steam reforming (moderate improvements) 93.40
25 Fertiliser industry - more efficient CO2 removal from synthesis gas 60.04
26 Rubber industry - lowering functional pressure 16.78
27 Fertiliser industry - hydrogen recovery 53.37
28 Rubber industry - heat recovery 14.20
29 Fertiliser industry - improved process control 48.03
30 Fertiliser industry - ammonia synthesis at lower pressure 33.36
31 Petroleum refinery and petrochemical industry - more efficient compressors 37.18

The Economics of Low Carbon Cities48
Sector Focus
The Transport Sector

49The Economics of Low Carbon Cities
Malaysia’s transport sector accounted for 36.5% of the total final energy use in 2008. The level of energy use by the sector was high compared to the world average, which was about 20%.21 The sector’s high levels of energy consumption could be attributed to the extensive usage of private cars for passenger transport, even in densely built urban areas. Traffic congestion in major cities is accordingly becoming a serious problem in Malaysia. To ease congestion, the Malaysian government has initiated plans to improve public transport and increase energy efficiency through the Government Transformation Programme (GTP)22 and the Tenth Malaysia Plan (2011-2015.)23
The Changing Context and the Impacts of ‘Business as Usual’ Trends
The projected population growth and the rising private vehicle ownership rate lead to a substantial growth in the number of vehicles in Johor Bahru and Pasir Gudang. Growth in vehicle numbers leads the transport sector energy consumption to rise by 80.0%, from 27.12 TWh per year in 2014 to a forecast level of 48.85 TWh in 2025 (see Fig. 27).
When combined with increasing real energy prices (3% per year), this leads to total spending on energy from the transportation sector to increase by 149% from RM 7.19 billion (US$ 2.23 billion) in 2014 to a forecast level of RM 17.92 billion (US$5.56 billion) in 2025 (see Fig. 28).
Rapid growth in vehicle ownership and population is projected to lead to carbon emissions from the transportation sector increasing by 80.0%, from 6.6 MtCO2-e in 2014 to a forecast level of 12.0 MtCO2-e in 2025 (see Fig. 29).
27.12
48.85
10.00
20.00
30.00
40.00
50.00
60.00
20
00
20
01
20
02
20
03
20
04
20
05
20
06
20
07
20
08
20
09
20
10
20
11
20
12
20
13
20
14
20
15
20
16
20
17
20
18
20
19
20
20
20
21
20
22
20
23
20
24
20
25
Ene
rgy
Con
sum
ptio
n (T
Wh)
0.00
Figure 27: Energy consumption (TWh) from the transport sector between 2000 and 2025.

The Economics of Low Carbon Cities50
7.19
17.92
0.00
2.00
4.00
6.00
8.00
10.00
12.00
14.00
16.00
18.00
20.00
20
00
20
01
20
02
20
03
20
04
20
05
20
06
20
07
20
08
20
09
20
10
20
11
20
12
20
13
20
14
20
15
20
16
20
17
20
18
20
19
20
20
20
21
20
22
20
23
20
24
20
25
Ene
rgy
expe
nditu
re f
or t
rans
port
(R
M b
illio
ns)
Figure 28: Energy bills for the transport sector (RM billions) between 2000 and 2025.
0.00
2.00
4.00
6.00
8.00
10.00
12.00
14.00
2000
2002
2004
2006
2008
2010
2012
2014
2016
2018
2020
2022
2024
Em
issi
ons
from
tra
nspo
rt (
MtC
O2-
e)
Other vehicles
Taxis
Motorbikes
Buses
Freight vehicles
Passenger cars
Figure 29: Emissions from the transport sector (MtCO2-e) between 2000 and 2025.

51The Economics of Low Carbon Cities
The Potential for Carbon Reduction – Investments and Returns
We find that – compared to 2014- these ‘business as usual’ trends in carbon emissions could be reduced by:
— 23% with cost effective measures that would pay for themselves on commercial terms over their lifetime. This would require investment of RM 781 million (US$ 236 million), generating annual savings of RM 454 million (US$ 137 million), paying back the investment in 2 years and generating annual savings for the lifetime of the measures.
— 28% with cost neutral measures that could be paid for by re-investing the income generated from cost-effective measures. This would require investment of RM 5.18 billion (US$ 1.56 billion), generating annual savings of RM 340 million (US$ 103 million), paying back the investment in 15 years and generating annual savings for the lifetime of the measures.
— 37% with the exploitation of all of the realistic potential of the different measures with carbon saving potential. This would require investment of RM 13.35 billion (US$ 4.04 billion), generating annual savings of RM262 million (US$ 79 million), paying back the investment in 51 years and generating annual savings for the lifetime of the measures.
190.01%
147.22%
118.88%
135.91%
0.00%
20.00%
40.00%
60.00%
80.00%
100.00%
120.00%
140.00%
160.00%
180.00%
200.00%
20
00
20
02
20
04
20
06
20
08
20
10
20
12
20
14
20
16
20
18
20
20
20
22
20
24
Business as usual
Cost-effective measures
Cost-neutral measures
Technical Potential
Figure 30: Emissions from the transport sector under four different scenarios, as a function of 2014 emissions, between 2000 and 2025

The Economics of Low Carbon Cities52
Cost effective
Cost neutral
All others including “cost ineffective” and those mutually exclusive with other measures
Table 10: League table of the most cost-effective low carbon measures for the transport sector
Cost Effectiveness
Rank MeasureRM / tCO2-e
USD / tCO2-e
1 Hybrid private cars with current tax incentive -1,441.31 - 436.11
2 Euro IV vehicle standards - cars with sales tax relief -969.46 - 293.34
3 Hybrid private cars -956.00 - 289.26
4 Parking demand management -790.89 - 239.31
5 Euro IV vehicle standards - cars -213.62 - 64.64
6 B5 fuel with fuel subsidy -15.43 -4.67
7 B100 fuel with sales tax relief and fuel subsidy 94.35 28.55
8 B100 fuel with sales tax relief 105.13 31.81
9 B5 fuel 133.00 40.24
10 Bicycle lanes 160.42 48.54
11 B100 fuel with fuel subsidy 197.11 59.64
12 B100 fuel 207.86 62.89
13 BRT (50km) 342.05 103.50
14 LRT (50km) 1,196.58 362.05
15 LRT (100km) 1,196.58 362.05
16 LPG Buses 3,562.54 1,077.94

53The Economics of Low Carbon Cities
Cost effective
Cost neutral
All others including “cost ineffective” and those mutually exclusive with other measures
Table 11: League Table of the most carbon-effective low carbon measures for the transport sector
Carbon Effectiveness
Rank Measure: ktCO2-e
1 B100 fuel with sales tax relief and fuel subsidy 26,980.37
2 B100 fuel with sales tax relief 22,057.51
3 B100 fuel with fuel subsidy 22,050.40
4 B100 fuel 19,873.85
5 Hybrid private cars with current tax incentive 15,051.37
6 Hybrid private cars 12,060.06
7 Euro IV vehicle standards – cars with sales tax relief 9,168.92
8 B5 fuel 6,377.09
9 LRT (100km) 5,680.52
10 B5 fuel with fuel subsidy 5,529.08
11 Euro IV vehicle standards – cars 4,093.03
12 BRT (50km) 3,153.66
13 LRT (50km) 2,784.57
14 Parking demand management 1,406.92
15 LPG Buses 497.02
16 Bicycle lanes 222.04

The Economics of Low Carbon Cities54
Sector Focus
The Waste Sector

55The Economics of Low Carbon Cities
Population growth and the changing consumption patterns in Malaysia lead to an increasing waste generation per capita rate24. According to Malaysia’s Second National Communication to the UNFCCC, the waste sector accounted for 12% of the country’s greenhouse gas emissions in 2000.25 The waste sector was the highest emitter of methane, due to the heavy reliance on landfill and limited landfill gas recovery and utilisation.
The Changing Context and the Impacts of ‘Business as Usual’ Trends
Background trends and the projected population growth lead to a substantial increase in waste generation in Johor Bahru and Pasir Gudang. Waste generation is estimated to increase by 85% between 2014 and 2025 and exceed 2 million tonnes per year in 2025.
This rapid growth is projected to lead to carbon emissions from the waste sector increasing by 85%, from 923 ktCO2-e in 2014 to a forecast level of 1,705 ktCO2-e in 2025 (see Fig. 31).
0.92
1.70
0.00
0.20
0.40
0.60
0.80
1.00
1.20
1.40
1.60
1.80
20
00
20
01
20
02
20
03
20
04
20
05
20
06
20
07
20
08
20
09
20
10
20
11
20
12
20
13
20
14
20
15
20
16
20
17
20
18
20
19
20
20
20
21
20
22
20
23
20
24
20
25
CO
2 em
issi
ons
from
was
te (
MtC
O2-
e)
Year
Figure 31: Emissions from the waste sector (MtCO2-e) between 2000 and 2025.

The Economics of Low Carbon Cities56
The Potential for Carbon Reduction – Investments and Returns
We find that – compared to 2014- these ‘business as usual’ trends in carbon emissions could be reduced by:
— 48% with cost effective measures that would pay for themselves on commercial terms over their lifetime. This would require investment of RM 807million (US$ 244 million), generating annual savings of RM 262 million (US$ 79 million) paying back the investment in 3 years and generating annual savings for the lifetime of the measures.
— 52% with cost neutral measures that could be paid for by re-investing the income generated from cost-effective measures. This would require investment of RM 855million (US$ 259 million), generating annual savings of RM 288 million (US$ 87 million), paying back the investment in 3 years and generating annual savings for the lifetime of the measures.
184.62%
96.33% 88.44%
0.00%
20.00%
40.00%
60.00%
80.00%
100.00%
120.00%
140.00%
160.00%
180.00%
200.00%
Business as usual
20
00
20
02
20
04
20
06
20
08
20
10
20
12
20
14
20
16
20
18
20
20
20
22
20
24
Cost-effective measures
Cost-neutral measures
Figure 32: Emissions from the waste sector under four different scenarios, as a function of 2014 emissions, between 2000 and 2025

57The Economics of Low Carbon Cities
Cost effective
Cost neutral
All others including “cost ineffective” and those mutually exclusive with other measures
Table 11: League table of the most cost-effective low carbon measures for the waste sector
Cost Effectiveness
Rank: Measure: RM/tCO2-eUSD/
tCO2-e
1 Centralised composting – high gate fee - 250.77 - 75.88
2 Waste prevention - 209.59 - 63.42
3 Centralised composting – low gate fee - 194.59 - 58.88
4 LFG utilisation - 128.66 - 38.93
5 Recycling - 24.86 - 7.52
6 Energy from waste (CHP) – high gate fee - 24.11 - 7.30
7 LFG flaring 1.39 0.42
8 Anaerobic digestion (CHP) – high gate fee 45.70 13.83
9 Energy from waste (CHP) – low gate fee 63.87 19.32
10 Home composting 86.29 26.11
11 Anaerobic digestion (electricity recovery) - high gate fee 121.84 36.86
12 Anaerobic digestion (CHP) – low gate fee 162.04 49.03
13 Energy from waste (electricity recovery) – high gate fee 258.53 78.22
14 Anaerobic digestion (electricity recovery) – low gate fee 267.61 80.97
15 Energy from waste (electricity recovery) – low gate fee 561.66 169.95
16 Mass burn incinerator 1,778.13 538.02

The Economics of Low Carbon Cities58
Table 12: League table of the most carbon-effective low carbon measures for the waste sector
Carbon Effectiveness
Rank: Measure: ktCO2-e
1 Energy from waste (CHP) – high gate fee 8,359.23
2 Energy from waste (CHP) – low gate fee 8,359.23
3 LFG utilisation 7,607.21
4 LFG flaring 3,802.15
5 Energy from waste (electricity recovery) – high gate fee 2,426.06
6 Energy from waste (electricity recovery) – low gate fee 2,426.06
7 Anaerobic digestion (CHP) – high gate fee 2,118.73
8 Anaerobic digestion (CHP) – low gate fee 2,118.73
9 Home composting 1,814.89
10 Anaerobic digestion (electricity recovery) - high gate fee 1,690.93
11 Anaerobic digestion (electricity recovery) - low gate fee 1,690.93
12 Recycling 1,488.52
13 Centralised composting – high gate fee 1,462.41
14 Centralised composting – low gate fee 1,462.41
15 Mass burn incinerator 817.01
16 Waste prevention 589.31
Cost effective
Cost neutral
All others including “cost ineffective” and those mutually exclusive with other measures

59The Economics of Low Carbon Cities
Business as usual trends in Johor Bahru and Pasir Gudang show that there is relative decoupling of economic output and energy use between 2000 and 2025. The carbon intensity of GDP is accordingly also decreasing rapidly. In relative terms, the city is already transitioning to a more energy efficient and low carbon development model. The rates of reduction in the carbon intensity of GDP within Johor Bahru and Pasir Gudang are significantly higher than the national targets set by the Malaysian government. This is worth celebrating as it demonstrates that substantial gains in human development can be achieved without a proportionate contribution to climate change.
However, there has not been an equivalent decoupling of energy and emissions. The carbon intensity of energy actually slightly increases over the period from 2000 to 2025. Meanwhile, rapid population and economic growth in Johor Bahru and Pasir Gudang lead to substantial increases in energy demand. These trends offset the improvements in energy and carbon intensity relative to GDP. Therefore, while the cities are in on track to achieve Iskandar Malaysia’s target of a 50% reduction in emission intensity by 2025 (relative to 2005 levels), net greenhouse gas emissions from the urban region will increase more than fivefold over the same period.
Absolute levels of energy use are projected to rise at a rate of 5.28% per annum between 2014 and 2025. This will lead to an increase in real energy bills of 8.67% per annum to RM 32.48 billion ($US 9.83 billion) per year, and an increase of net emissions of 5.76% per annum to 38.6MtCO2-e per year over the same period.
The major increases in energy costs are associated with the transport sector where fuels are relatively expensive. The most significant growth in emissions comes from the industrial and transport sectors, as regional economic policies drive a substantial expansion of energy-intensive industries. These figures suggest that current rates of decoupling between economic output and energy use, while significant, will not realise the city’s full potential to enhance economic competitiveness and energy security or to reduce its contribution to climate change.
This study reveals a compelling economic case for large-scale investment in energy efficiency, renewable energy and other low carbon measures in Johor Bahru and Pasir Gudang above and beyond these background trends. By 2025, the city can cut its emissions by 24.2% of projected emissions in the business as usual scenario through cost-effective investments that would pay for themselves on commercial terms in 1.3 years. If the profits from these investments are re-invested in low carbon measures, Johor Bahru and Pasir Gudang can slash their emissions to 45.4% relative to business as usual trends and recover its investment in 6.8 years. These low carbon measures would continue to generate annual savings throughout their lifetime. At a national level, investments in the electricity sector could reduce the cities’ emissions by a further 1.2% relative to business-as-usual trends (and achieve additional emission reductions across peninsular Malaysia) at no net cost.
In addition to the economic case for low carbon investment, many of these measures support broader economic development goals. The list of the most cost-effective options is dominated by energy efficiency measures in the commercial and industry sectors: widespread adoption of these options would increase the competitiveness of the economy by reducing input costs and increasing resilience to rising fuel prices. There are also significant opportunities for cost-effective infrastructure investments in the transport sectors, which, if adopted, would yield improvements in air quality and congestion in the city. The domestic, commercial and transport sectors also offer a large range of economically attractive and decentralised options such as small-scale solar PV, energy efficient lighting, fuel efficient vehicles and energy management of appliances. Widespread deployment of these measures would ensure that many of the economic benefits are captured by households and small business. The prioritised menus of the most cost-effective measures therefore highlight a wide range of win-win opportunities for different stakeholders across key sectors in Johor Bahru and Pasir Gudang.
Chapter 5. Discussion

The Economics of Low Carbon Cities60
In other cases, this research highlights that the most carbon-effective measures are not necessarily attractive to commercial investors. This is most evident in the electricity sector, where there is no compelling economic case for measures that offer some of the most significant emission reductions. These measures offer opportunities for strategic domestic investments and international climate finance to achieve dramatic improvements in emissions intensity without crowding out private investment.
In the context of the relatively high carbon footprint per capita in Malaysia, the falling energy intensity per unit of GDP highlights that Johor Bahru and Pasir Gudang are only slowly shifting to a lower carbon development trajectory. The transition could be accelerated through strategic investments in energy efficiency, renewable energy and other low carbon measures. The massive population growth and expansion of infrastructure planned in Johor Bahru and Pasir Gudang provides an opportunity to integrate climate considerations into urban planning and industrial development at a relatively early stage. Such an approach improves both the cost- and carbon-effectiveness of most options evaluated in this study, and would significantly enhance Iskandar Malaysia’s efforts to transition to a strong and sustainable metropolis.
61The Economics of Low Carbon Cities
Business as usual trends in Johor Bahru and Pasir Gudang show a steady decline in the energy intensity of economic activity in the city. However, absolute levels of energy use and emissions are continuing to rise steadily due to the effects of rapid population and economic growth. Energy bills are also increasing steadily, which will have significant implications for economic competitiveness and social equity.
This research reveals that there are many economically attractive opportunities to increase energy efficiency and stimulate renewable energy investment, which would in turn improve the economic competitiveness, energy security and carbon intensity of Johor Bahru and Pasir Gudang. The scale of the opportunities demonstrates that accounting for climate change in urban planning can be attractive in commercial terms, above and beyond the immense benefits of reducing the future impacts of climate change.
Clearly the presence of such opportunities does not mean that they will necessarily be exploited. But we hope that by providing evidence on the scale and composition of these opportunities, this report will help to build political commitment and institutional capacities for change. We also hope this report will help Johor Bahru and Pasir Gudang to secure the investments and develop the delivery models needed to pursue climate action. Some of the energy efficiency and low carbon opportunities could be commercially attractive whilst others may only be viable with international climate finance. Many of the opportunities would benefit from the support of enabling policies from government.
And fundamentally, we should recognise that economics is not the only discipline that has something useful to say on the transition to a low carbon economy/society. A wider analysis should also consider the social desirability of the different options, as well as issues relating to the equity, inclusivity and broader sustainability of the different pathways towards a low carbon economy and society in Johor Bahru and Pasir Gudang.
Conclusions and Recommendations

The Economics of Low Carbon Cities62
Appendix A:
Alignment with Low Carbon Society Blueprint for Iskandar Malaysia 2025
Appendices
Sector Measure LCS ActionElectricity The electricity supply in Peninsular Malaysia is the responsibility of the
Economic Planning Unit and the Ministry of Energy, Green Technology and Waster (KeTTHA) rather than the Iskandar Regional Development Authority or city councils.
Domestic Green building standards and retrofit schemes
Action 4: Green Buildings and Construction
Small-scale renewable energy measures Action 5: Green Energy System and Renewable Energy
The energy efficient appliances and behavioural change measures
Action 6: Low Carbon Lifestyles.
Commercial Green building standards and retrofit schemes
Action 4: Green Buildings and Construction
Small-scale renewable energy measures Action 5: Green Energy System and Renewable Energy
The energy efficient appliances and behavioural change measures
Action 6: Low Carbon Lifestyles. Their carbon savings support
Industry Energy efficiency measures Action 2: Green Industry
Fuel switching measures Additional measures worth including in the LCS Blueprint
Transport Bus Rapid Transport system, Light Rail Transit system, LPG buses, parking demand management
Action 1: Integrated Green Transportation
Bicycle lanes Action 8: Walkable, Safe, Liveable City Design
Hybrid private cars, Euro IV vehicle standards
Additional measures worth including in the LCS Blueprint
Waste All measures Action 11: Sustainable Waste Management

63The Economics of Low Carbon Cities
Appendix B:
Workshop Participants and Expert Advisors
Name Position Organisation
Maimunah Jaffar Head, Planning and Compliance Iskandar Regional Development Authority (IRDA)
Boyd Dionysius Joeman Senior Vice-President, Environment Iskandar Regional Development Authority (IRDA)
Mohammad Rosly MD Selamat
Senior Vice-President, Economic Intelligence
Iskandar Regional Development Authority (IRDA)
Gan-Low Mei Leong Senior Vice-President, Economics and Investment
Iskandar Regional Development Authority (IRDA)
Kamisah Mohd Ghazali Senior Vice-President, Economics and Investment
Iskandar Regional Development Authority (IRDA)
Sakurah Jamaluddin Vice-President, Planning and Compliance Iskandar Regional Development Authority (IRDA)
Ahmad Faizal Bin Ismail Vice President, Social Development Iskandar Regional Development Authority (IRDA)
Raja Taufik Azad Vice-President, Strategic Communications
Iskandar Regional Development Authority (IRDA)
Zarina Mohamed Al Assistant Vice-President, Corporate Development and Finance
Iskandar Regional Development Authority (IRDA)
Sharifah Shahidah Syed Ahmad
Assistant Vice-President, Environment Iskandar Regional Development Authority (IRDA)
Choo Hui Hong Associate, Environment Iskandar Regional Development Authority (IRDA)
Affendi Bin Ahmed Director of Planning and Development MB Johor Bahru
Ong Hwa Chong Environmental Officer, Planning and Research
UPEN JOHOR (Johor State Economic Planning Unit)
Zahilah Zahid Vice-President, Market Investment Ministry for Energy, Green Technology and Water (KeTTHA)
Asdirhyme Abdul Rasib Under Secretary (Regulatory and Development), Green Technology Sector
Ministry for Energy, Green Technology and Water (KeTTHA)
Punitha Silivarajoo-James Principal Assistant Secretary, Green Technology Sector
Ministry for Energy, Green Technology and Water (KeTTHA)
Muhammad Fendi Mustafa
Senior Analyst, Built Environment Ministry for Energy, Green Technology and Water (KeTTHA)
Norazean Mohd Nor Analyst, Built Environment Ministry for Energy, Green Technology and Water (KeTTHA)
Maimunah Jaffar Head, Planning and Compliance Iskandar Regional Development Authority (IRDA)
Najib Wahed Analyst, Built Environment Ministry for Energy, Green Technology and Water (KeTTHA)
Ho Chin Siong Professor, Director of International Staff and International Relations
Universiti Teknologi Malaysia
Sune Balle Hansen Director, Sustainability Research Alliance Universiti Teknologi Malaysia

The Economics of Low Carbon Cities64
Name Position Organisation
Mohd Hamdan Bin Ahmad
Professor, Faculty of Built Environment Universiti Teknologi Malaysia
Lee Chew Tin Associate Professor, Department of Bioprocess Engineering
Universiti Teknologi Malaysia
Haslenda Hashim Associate Professor, Department of Chemical Engineering
Universiti Teknologi Malaysia
Rafee Majid Associate Professor, Department of Urban and Regional Planning
Universiti Teknologi Malaysia
Dilshan Remaz Ossen Senior Lecturer, Department of Architecture
Universiti Teknologi Malaysia
Chau Loon Wai Lecturer, Department of Urban and Regional Planning
Universiti Teknologi Malaysia
Norshidah Baharuddin Senior Researcher, Energy and Environment Flagship, Research and technology Innovation Division
SIRIM Bhd
Abdul Halim Bin Ali Hassan
Director Perunding UEP Sdn Bhd
Lucas Chew Director Mega Tebrau Sdn Bhd
Khoo Ah Loi General Manager Pacific Integrated Building System Sdn Bhd
Yew Chor Siong Director Sin Hock Soon Transport Sdn Bhd
John Lee Director JJ Innovation Sdn Bhd
Appendix B:
continued

65The Economics of Low Carbon Cities
Appendix C: Data sources, methods and assumptions
C1 Baseline development
The baseline emissions inventory has been developed in line with the Greenhouse Gas Protocol for Communities (GPC) v0.9, developed by the C40 Cities Climate Leadership Group and ICLEI Local Governments for Sustainability in collaboration with the World Resources Institute, World Bank, UNEP, and UN-HABITAT.26 The use of this open, standardised approach for city-scale accounting and reporting is intended to enable effective communication between different levels of government, financing institutions and the private sector, and to allow a comparison of emissions over time.
In summary, the principles underpinning the GPC are:
— Measurability: At a minimum, data required to perform complete emissions inventories should be readily available.
— Accuracy: The calculation of GHG emissions should not systematically overstate or understate actual GHG emissions.
— Relevance: The reported GHG emissions should reflect emissions occurring as a result of activities and consumption from within the community’s geopolitical boundaries.
— Completeness: All significant emissions sources included should be accounted for. – Our method does not include long-distance rail, air travel or shipping.
— Consistency: Emissions calculations should be consistent in approach.
— Transparency: Activity data, sources, emissions factors and accounting methodologies should be adequately documented and disclosed.
Details on how the baseline has been developed for each of the sectors are summarised in the table below:
Activity Projection method Useful dataPopulation Data on the population was published as
part of the Low Carbon Society Blueprint series for the years 2005 and 2025.27 Further data was provided for 2010 and 2015 by IRDA from the most recent review of the Comprehensive Development Plan. A growth function was used to determine population in the remaining years.
The population is estimated to be: - 2014: 1,820,691 - 2025: 2,786,606
GDP Data on GDP per capita and GDP of the cities was obtained from the Iskandar Regional Development Authority.28 This was backcast and forecast using historical and projected economic growth rates.
GDP per capita is estimated to be: - 2014: US$14,790 - 2025: US$ 26,930
GDP of the city is estimated to be: - 2014: US$ 26.9 billion - 2025: US$ 75.0 billion
US$: Malaysian Ringgit exchange rate
The exchange rate is the average midpoint of bid and ask prices for 2013, using OANDA.29
RM 1.0 = US$ 0.302576
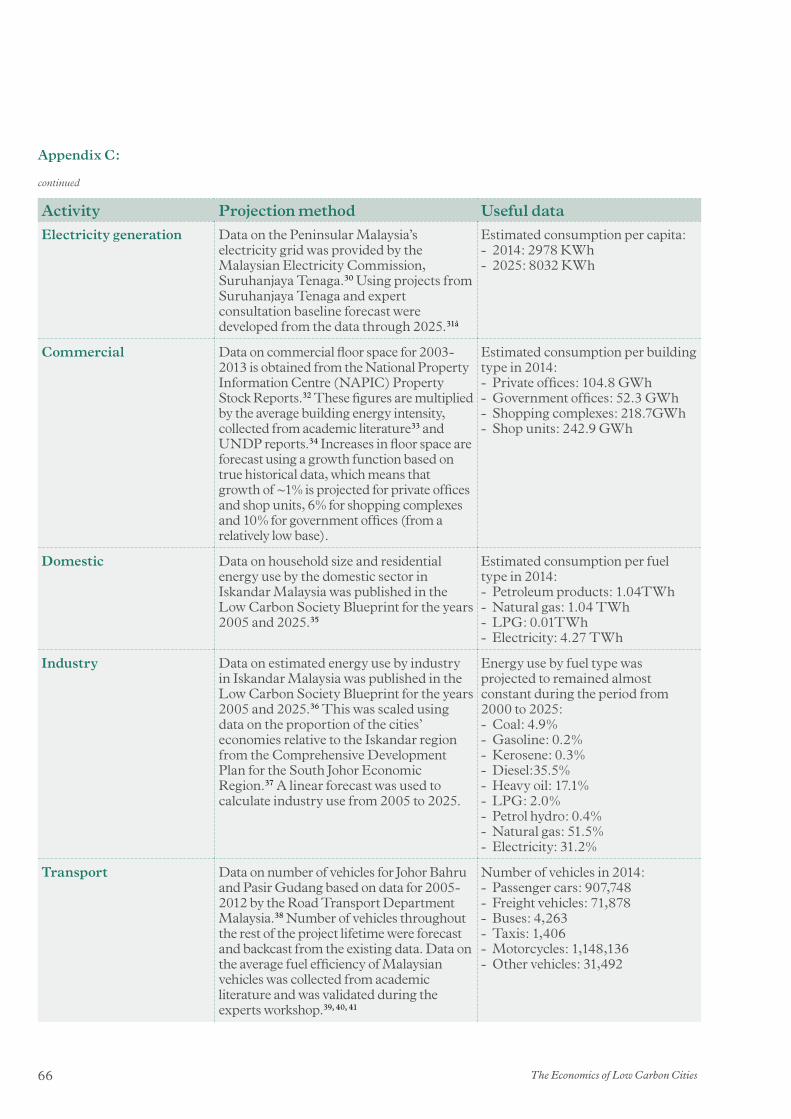
The Economics of Low Carbon Cities66
Activity Projection method Useful dataElectricity generation Data on the Peninsular Malaysia’s
electricity grid was provided by the Malaysian Electricity Commission, Suruhanjaya Tenaga.30 Using projects from Suruhanjaya Tenaga and expert consultation baseline forecast were developed from the data through 2025.31å
Estimated consumption per capita: - 2014: 2978 KWh - 2025: 8032 KWh
Commercial Data on commercial floor space for 2003-2013 is obtained from the National Property Information Centre (NAPIC) Property Stock Reports.32 These figures are multiplied by the average building energy intensity, collected from academic literature33 and UNDP reports.34 Increases in floor space are forecast using a growth function based on true historical data, which means that growth of ~1% is projected for private offices and shop units, 6% for shopping complexes and 10% for government offices (from a relatively low base).
Estimated consumption per building type in 2014: - Private offices: 104.8 GWh - Government offices: 52.3 GWh - Shopping complexes: 218.7GWh - Shop units: 242.9 GWh
Domestic Data on household size and residential energy use by the domestic sector in Iskandar Malaysia was published in the Low Carbon Society Blueprint for the years 2005 and 2025.35
Estimated consumption per fuel type in 2014: - Petroleum products: 1.04TWh - Natural gas: 1.04 TWh - LPG: 0.01TWh - Electricity: 4.27 TWh
Industry Data on estimated energy use by industry in Iskandar Malaysia was published in the Low Carbon Society Blueprint for the years 2005 and 2025.36 This was scaled using data on the proportion of the cities’ economies relative to the Iskandar region from the Comprehensive Development Plan for the South Johor Economic Region.37 A linear forecast was used to calculate industry use from 2005 to 2025.
Energy use by fuel type was projected to remained almost constant during the period from 2000 to 2025: - Coal: 4.9% - Gasoline: 0.2% - Kerosene: 0.3% - Diesel:35.5% - Heavy oil: 17.1% - LPG: 2.0% - Petrol hydro: 0.4% - Natural gas: 51.5% - Electricity: 31.2%
Transport Data on number of vehicles for Johor Bahru and Pasir Gudang based on data for 2005-2012 by the Road Transport Department Malaysia.38 Number of vehicles throughout the rest of the project lifetime were forecast and backcast from the existing data. Data on the average fuel efficiency of Malaysian vehicles was collected from academic literature and was validated during the experts workshop.39, 40, 41
Number of vehicles in 2014: - Passenger cars: 907,748 - Freight vehicles: 71,878 - Buses: 4,263 - Taxis: 1,406 - Motorcycles: 1,148,136 - Other vehicles: 31,492
Appendix C:
continued
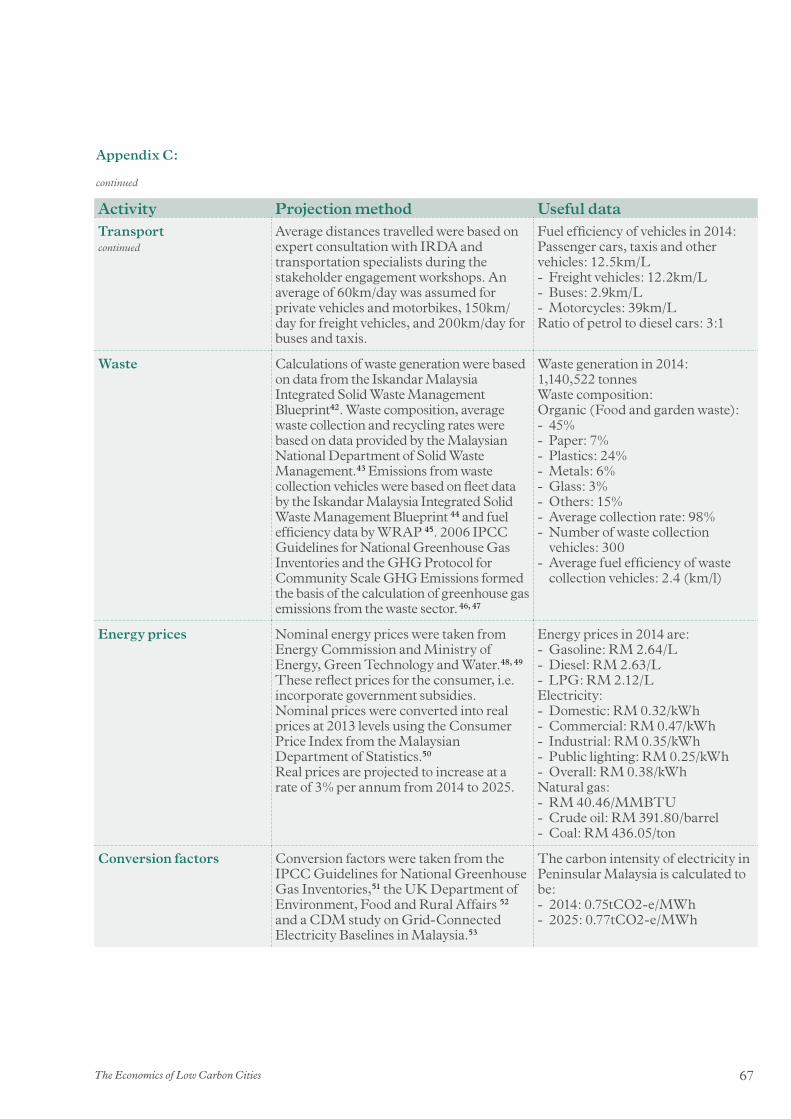
67The Economics of Low Carbon Cities
Activity Projection method Useful dataTransport continued
Average distances travelled were based on expert consultation with IRDA and transportation specialists during the stakeholder engagement workshops. An average of 60km/day was assumed for private vehicles and motorbikes, 150km/day for freight vehicles, and 200km/day for buses and taxis.
Fuel efficiency of vehicles in 2014:Passenger cars, taxis and other vehicles: 12.5km/L - Freight vehicles: 12.2km/L - Buses: 2.9km/L - Motorcycles: 39km/L
Ratio of petrol to diesel cars: 3:1
Waste Calculations of waste generation were based on data from the Iskandar Malaysia Integrated Solid Waste Management Blueprint42. Waste composition, average waste collection and recycling rates were based on data provided by the Malaysian National Department of Solid Waste Management.43 Emissions from waste collection vehicles were based on fleet data by the Iskandar Malaysia Integrated Solid Waste Management Blueprint 44 and fuel efficiency data by WRAP 45. 2006 IPCC Guidelines for National Greenhouse Gas Inventories and the GHG Protocol for Community Scale GHG Emissions formed the basis of the calculation of greenhouse gas emissions from the waste sector. 46, 47
Waste generation in 2014: 1,140,522 tonnesWaste composition: Organic (Food and garden waste): - 45% - Paper: 7% - Plastics: 24% - Metals: 6% - Glass: 3% - Others: 15% - Average collection rate: 98% - Number of waste collection vehicles: 300
- Average fuel efficiency of waste collection vehicles: 2.4 (km/l)
Energy prices Nominal energy prices were taken from Energy Commission and Ministry of Energy, Green Technology and Water.48, 49 These reflect prices for the consumer, i.e. incorporate government subsidies. Nominal prices were converted into real prices at 2013 levels using the Consumer Price Index from the Malaysian Department of Statistics.50
Real prices are projected to increase at a rate of 3% per annum from 2014 to 2025.
Energy prices in 2014 are: - Gasoline: RM 2.64/L - Diesel: RM 2.63/L - LPG: RM 2.12/L
Electricity: - Domestic: RM 0.32/kWh - Commercial: RM 0.47/kWh - Industrial: RM 0.35/kWh - Public lighting: RM 0.25/kWh - Overall: RM 0.38/kWh
Natural gas: - RM 40.46/MMBTU - Crude oil: RM 391.80/barrel - Coal: RM 436.05/ton
Conversion factors Conversion factors were taken from the IPCC Guidelines for National Greenhouse Gas Inventories,51 the UK Department of Environment, Food and Rural Affairs 52 and a CDM study on Grid-Connected Electricity Baselines in Malaysia.53
The carbon intensity of electricity in Peninsular Malaysia is calculated to be: - 2014: 0.75tCO2-e/MWh - 2025: 0.77tCO2-e/MWh
Appendix C:
continued
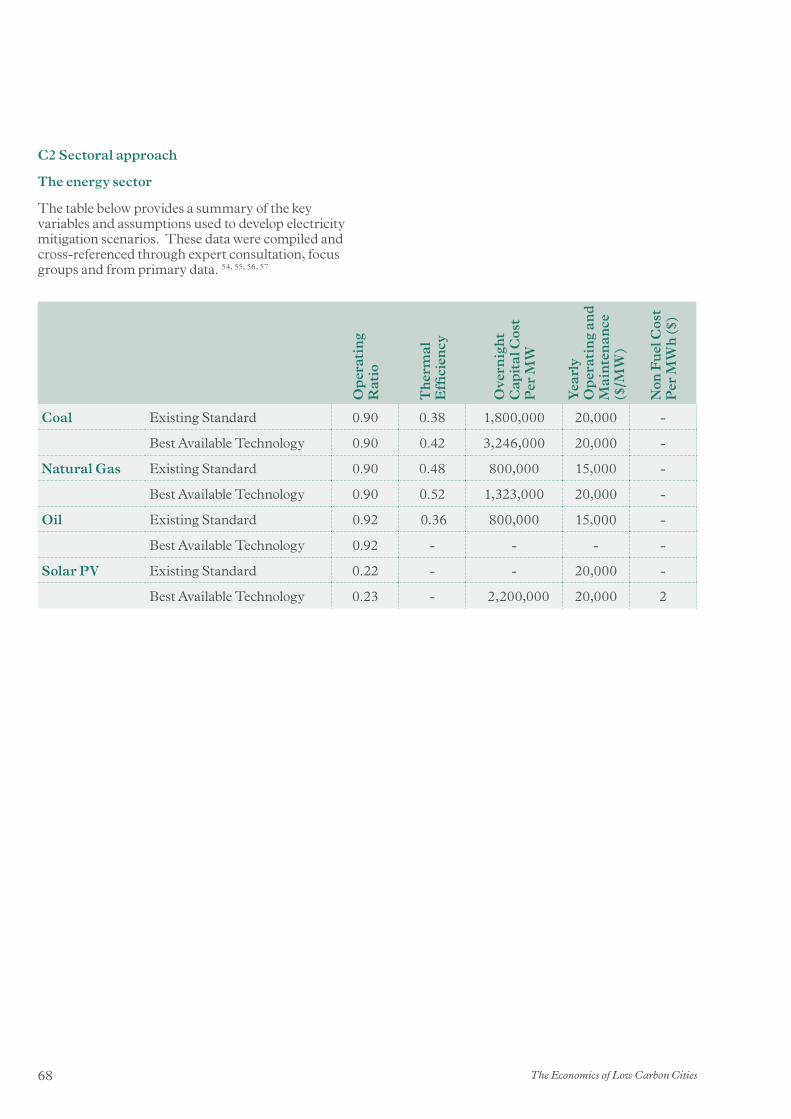
The Economics of Low Carbon Cities68
C2 Sectoral approach
The energy sector
The table below provides a summary of the key variables and assumptions used to develop electricity mitigation scenarios. These data were compiled and cross-referenced through expert consultation, focus groups and from primary data. 54, 55, 56, 57
Op
erat
ing
Rat
io
The
rmal
E
ffici
ency
Ove
rnig
ht
Cap
ital
Cos
t P
er M
W
Yea
rly
Op
erat
ing
and
M
aint
enan
ce
($/M
W)
Non
Fue
l Cos
t P
er M
Wh
($)
Coal Existing Standard 0.90 0.38 1,800,000 20,000 -
Best Available Technology 0.90 0.42 3,246,000 20,000 -
Natural Gas Existing Standard 0.90 0.48 800,000 15,000 -
Best Available Technology 0.90 0.52 1,323,000 20,000 -
Oil Existing Standard 0.92 0.36 800,000 15,000 -
Best Available Technology 0.92 - - - -
Solar PV Existing Standard 0.22 - - 20,000 -
Best Available Technology 0.23 - 2,200,000 20,000 2

69The Economics of Low Carbon Cities
Measure Summary and key assumptions
Banning incandescent lights
Savings consist of saved energy if a ban on incandescent lights becomes effective in 2015, using data from the Association of Water and Energy Research Malaysia.58 The model assumes that a transition away from incandescent bulbs would be complete by 2025 irrespective of policy interventions. The average incandescent light bulb is assumed to be 60W, being replaced a compact fluorescent (CFL) bulb of 12W. Costs for CFL light bulb are based on market prices (around RM 17 more than incandescent light bulbs in 2014).
Electronic appliances – energy management
The breakdown of small power in offices is drawn from academic literature.59 The potential savings from energy management are drawn from energy companies’ efficiency recommendations.60
Energy Efficiency (EE) Standard 1
Savings consist of 10%, 20% and 30% of business-as-usual energy consumption in 2015, 2020 and 2025 respectively. Increase in costs for air conditioners based on current market prices; no increase in costs for more efficient elevators and escalators. Energy savings are calculated over a ten year lifetime for air conditioners and a twenty year lifetime for elevators and escalators.
Energy Efficiency (EE) Standard 2
Savings consist of 20%, 40% and 60% of business-as-usual energy consumption in 2015, 2020 and 2025 respectively. Increase in costs for air conditioners based on current market prices; no increase in costs for more efficient elevators and escalators. Energy savings are calculated over a ten year lifetime for air conditioners and a twenty year lifetime for elevators and escalators.
Green Building Standard 1
Savings consist of 10% of energy consumed by air conditioner and lighting. Building costs increased by 2%. Energy savings are calculated to 2040.
Green Building Standard 2
Savings consist of 20% of energy consumed by air conditioner and lighting. Building costs increased by 5%. Energy savings are calculated to 2040.
Raising thermostat 1˚C Savings consist of 6.14% of the energy used by air conditioners per degree. This figure is drawn from academic literature.61
Retrofitting fibreglass urethane insulation
Savings consist of 40% of energy consumed by air conditioner and lighting. Data on the cost and effectiveness of different insulation types is drawn from the academic literature.62 Energy savings are calculated to 2040.
Retrofitting mineral wool insulation
Savings consist of 75% of energy consumed by air conditioner and lighting. Data on the cost and effectiveness of different insulation types is drawn from the academic literature.63 Energy savings are calculated to 2040.
Setting LED target Savings consist of saved energy if a target of 50% LED lighting is effectively realised by 2025. The model assumes that LED bulbs would achieve25% market penetration irrespective of policy interventions. The average CFL light bulb is assumed to be 12W, being replaced a LED bulb of 7W. Costs for LED light bulb are based on market prices (around RM 30 more than CFL light bulbs in 2014).
Solar PV panel Data on average size and efficiency of solar panels collected from the Malaysian Sustainable Energy Development Authority64 and academic literature.65 An individual commercial building is assumed to have space for four times as many solar panels as an individual domestic building. The FiT is based on the national 2014 rates with an 8% degression.
Turning off lights Savings consist of the energy used for one hour of lighting per day. The average light bulb in the commercial sector is assumed to be used for eight hours per day.
The commercial sector
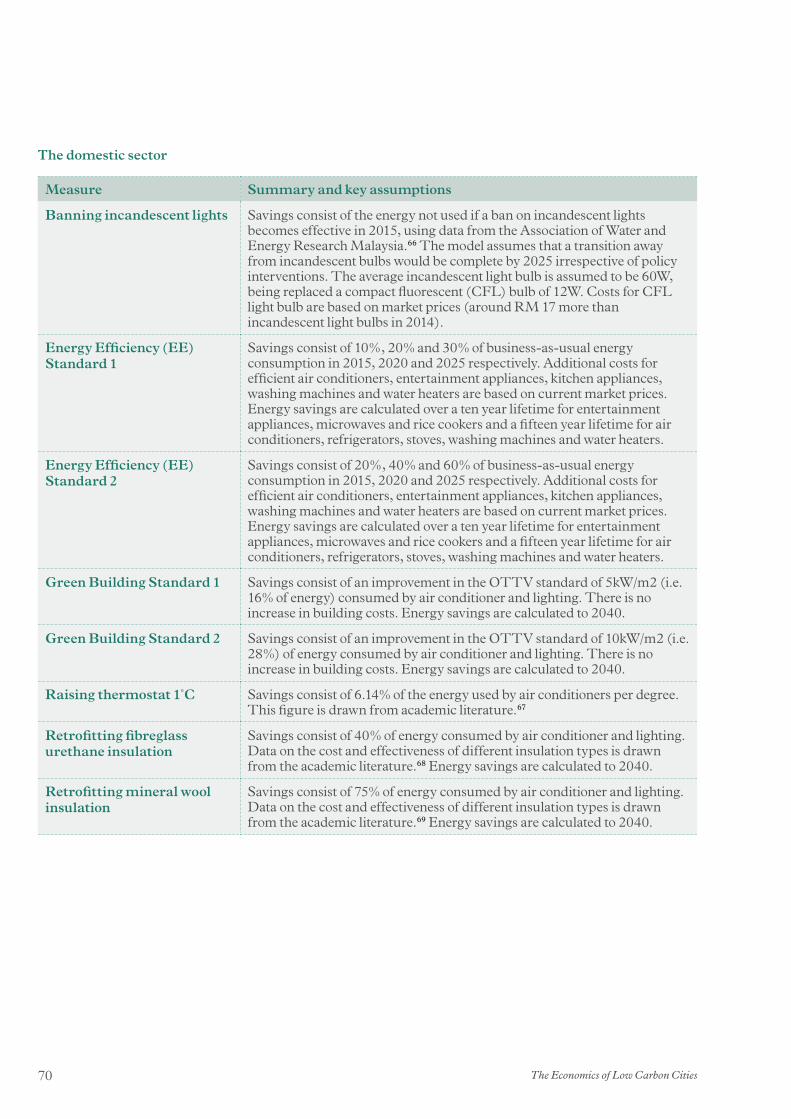
The Economics of Low Carbon Cities70
Measure Summary and key assumptions
Banning incandescent lights Savings consist of the energy not used if a ban on incandescent lights becomes effective in 2015, using data from the Association of Water and Energy Research Malaysia.66 The model assumes that a transition away from incandescent bulbs would be complete by 2025 irrespective of policy interventions. The average incandescent light bulb is assumed to be 60W, being replaced a compact fluorescent (CFL) bulb of 12W. Costs for CFL light bulb are based on market prices (around RM 17 more than incandescent light bulbs in 2014).
Energy Efficiency (EE) Standard 1
Savings consist of 10%, 20% and 30% of business-as-usual energy consumption in 2015, 2020 and 2025 respectively. Additional costs for efficient air conditioners, entertainment appliances, kitchen appliances, washing machines and water heaters are based on current market prices. Energy savings are calculated over a ten year lifetime for entertainment appliances, microwaves and rice cookers and a fifteen year lifetime for air conditioners, refrigerators, stoves, washing machines and water heaters.
Energy Efficiency (EE) Standard 2
Savings consist of 20%, 40% and 60% of business-as-usual energy consumption in 2015, 2020 and 2025 respectively. Additional costs for efficient air conditioners, entertainment appliances, kitchen appliances, washing machines and water heaters are based on current market prices. Energy savings are calculated over a ten year lifetime for entertainment appliances, microwaves and rice cookers and a fifteen year lifetime for air conditioners, refrigerators, stoves, washing machines and water heaters.
Green Building Standard 1 Savings consist of an improvement in the OTTV standard of 5kW/m2 (i.e. 16% of energy) consumed by air conditioner and lighting. There is no increase in building costs. Energy savings are calculated to 2040.
Green Building Standard 2 Savings consist of an improvement in the OTTV standard of 10kW/m2 (i.e. 28%) of energy consumed by air conditioner and lighting. There is no increase in building costs. Energy savings are calculated to 2040.
Raising thermostat 1˚C Savings consist of 6.14% of the energy used by air conditioners per degree. This figure is drawn from academic literature.67
Retrofitting fibreglass urethane insulation
Savings consist of 40% of energy consumed by air conditioner and lighting. Data on the cost and effectiveness of different insulation types is drawn from the academic literature.68 Energy savings are calculated to 2040.
Retrofitting mineral wool insulation
Savings consist of 75% of energy consumed by air conditioner and lighting. Data on the cost and effectiveness of different insulation types is drawn from the academic literature.69 Energy savings are calculated to 2040.
The domestic sector

71The Economics of Low Carbon Cities
Measure Summary and key assumptions
Setting LED target Savings consist of saved energy if a target of 50% LED lighting is effectively realised by 2025. The model assumes that LED bulbs would achieve25% market penetration irrespective of policy interventions. The average CFL light bulb is assumed to be 12W, being replaced a LED bulb of 7W. Costs for LED light bulb are based on market prices (around RM 30 more than CFL light bulbs in 2014).
Solar lamps for outdoor lighting
Costs for solar lamps are based on market prices (around RM23 more than non-solar lamps in 2014).
Solar PV panel Data on average size and efficiency of solar panels collected from the Malaysian Sustainable Energy Development Authority70 and academic literature.71 The FiT is based on 2014 rates with an 8% degression.
Solar water heater Costs for solar water heaters are based on market prices (around RM 4,300 in 2014). It is assumed that households will also need an electric water heater, but that the solar water heater will displace 80% of its electricity consumption. The FiT is based on 2014 rates with an 8% degression.
Turning off lights Savings consist of the energy used for one hour of lighting per day. The average light bulb in the domestic sector is assumed to be used for four hours per day.

The Economics of Low Carbon Cities72
The industrial sector
All academic sources cited in this section were referenced in the IPCC report as examples of the potential efficiency improvements available in their respective industries. Payback periods have been doubled for measures with large capital expenditure
in light of low energy costs in Malaysia.. The research is typically based on US case studies.
Industry Measure Summary and key assumptions
Petroleum refinery and petrochemical industry
More efficient utilities Delivers energy savings of 4.5%%, with investment required of RM 250 million (US$ 76 million) and with a payback period of 5 years. 72
More efficient furnaces and boilers
Delivers energy savings of 3%, with investment required of RM 73 million (US$ 22 million) and a payback period of 2.2 years. 73
Process integration Delivers energy savings of 2.3%, with investment required of RM 135 million (US$ 41 million) and a payback period of 5.4 years. 74
More efficient heat exchangers
Delivers energy savings of 2.3%, with investment required of RM 100 million (US$ 30 million) and a payback period of 4 years. 75
More efficient motors Delivers energy savings of 0.6%, with investment required of RM 13 million (US$ 4 million) and a payback period of 2 years. 76
More efficient pumps Delivers energy savings of 0.75%, with investment required of RM 8 million (US$ 2 million) and a payback period of 1 year. 77
More efficient compressors
Delivers energy savings of 0.15%, with investment required of RM 4 million (US$ 1 million) with a payback period of 2 years. 78
Monitoring and targeting Delivers energy savings of 8%, with investment required of RM 124 million (US$ 38 million) and a payback period of 1.4 years. 79
Fertiliser industry Steam reforming – large improvements
Delivers energy savings of 10.3% with a capital cost of RM 109.5 per ton of fertiliser. 80
Steam reforming – moderate improvements
Delivers energy savings of 3.6% with a capital cost of RM 22.8 per ton of fertiliser. 81
More efficient CO2 removal from synthesis
Delivers energy savings of 2.3% with a capital cost of RM 68.4 per ton of fertiliser. 82
Ammonia synthesis at lower pressure
Delivers energy savings of 1.3% with a capital cost of RM 27.4 per ton of fertiliser. 83
Hydrogen recovery Delivers energy savings of 2.1% with a capital cost of RM 9.1 per ton of fertiliser. 84
Improved process control Delivers energy savings of 1.9% with a capital cost of RM 27.4 per ton of fertiliser. 85
Process integration Delivers energy savings of 7.8% with a capital cost of RM 13.7 per ton of fertiliser. 86
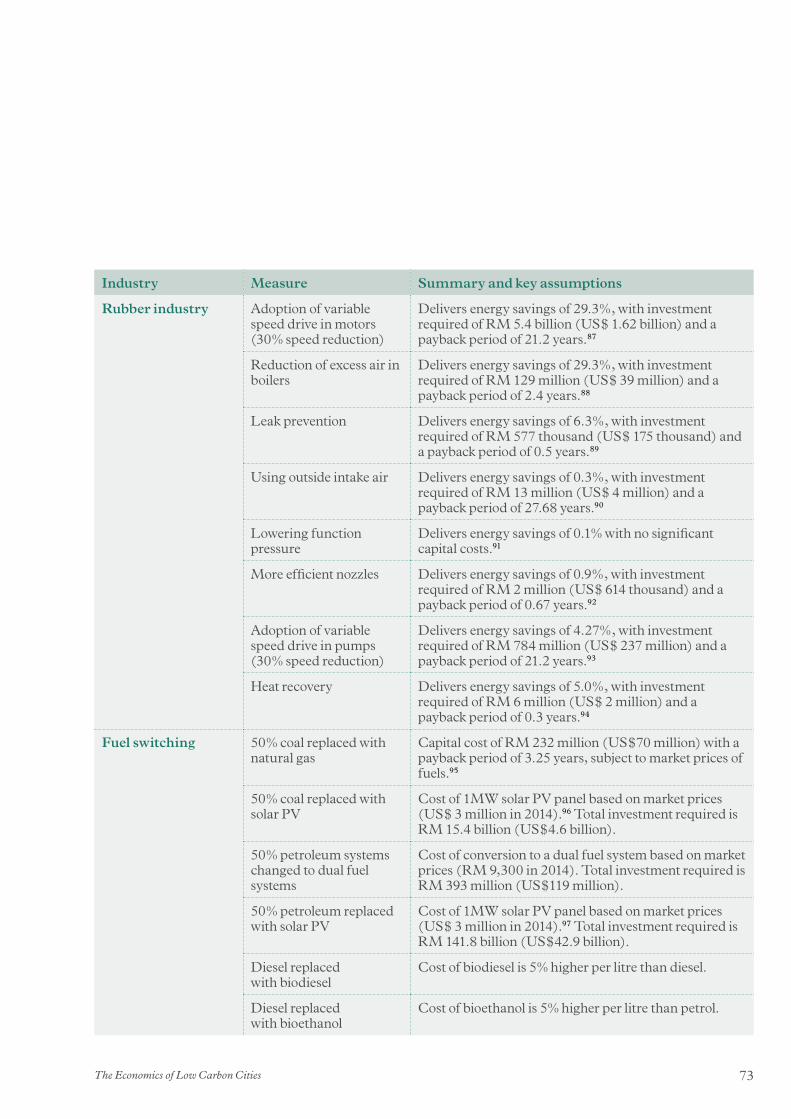
73The Economics of Low Carbon Cities
Industry Measure Summary and key assumptions
Rubber industry Adoption of variable speed drive in motors (30% speed reduction)
Delivers energy savings of 29.3%, with investment required of RM 5.4 billion (US$ 1.62 billion) and a payback period of 21.2 years.87
Reduction of excess air in boilers
Delivers energy savings of 29.3%, with investment required of RM 129 million (US$ 39 million) and a payback period of 2.4 years.88
Leak prevention Delivers energy savings of 6.3%, with investment required of RM 577 thousand (US$ 175 thousand) and a payback period of 0.5 years.89
Using outside intake air Delivers energy savings of 0.3%, with investment required of RM 13 million (US$ 4 million) and a payback period of 27.68 years.90
Lowering function pressure
Delivers energy savings of 0.1% with no significant capital costs.91
More efficient nozzles Delivers energy savings of 0.9%, with investment required of RM 2 million (US$ 614 thousand) and a payback period of 0.67 years.92
Adoption of variable speed drive in pumps (30% speed reduction)
Delivers energy savings of 4.27%, with investment required of RM 784 million (US$ 237 million) and a payback period of 21.2 years.93
Heat recovery Delivers energy savings of 5.0%, with investment required of RM 6 million (US$ 2 million) and a payback period of 0.3 years.94
Fuel switching 50% coal replaced with natural gas
Capital cost of RM 232 million (US$70 million) with a payback period of 3.25 years, subject to market prices of fuels.95
50% coal replaced with solar PV
Cost of 1MW solar PV panel based on market prices (US$ 3 million in 2014).96 Total investment required is RM 15.4 billion (US$4.6 billion).
50% petroleum systems changed to dual fuel systems
Cost of conversion to a dual fuel system based on market prices (RM 9,300 in 2014). Total investment required is RM 393 million (US$119 million).
50% petroleum replaced with solar PV
Cost of 1MW solar PV panel based on market prices (US$ 3 million in 2014).97 Total investment required is RM 141.8 billion (US$42.9 billion).
Diesel replaced with biodiesel
Cost of biodiesel is 5% higher per litre than diesel.
Diesel replaced with bioethanol
Cost of bioethanol is 5% higher per litre than petrol.
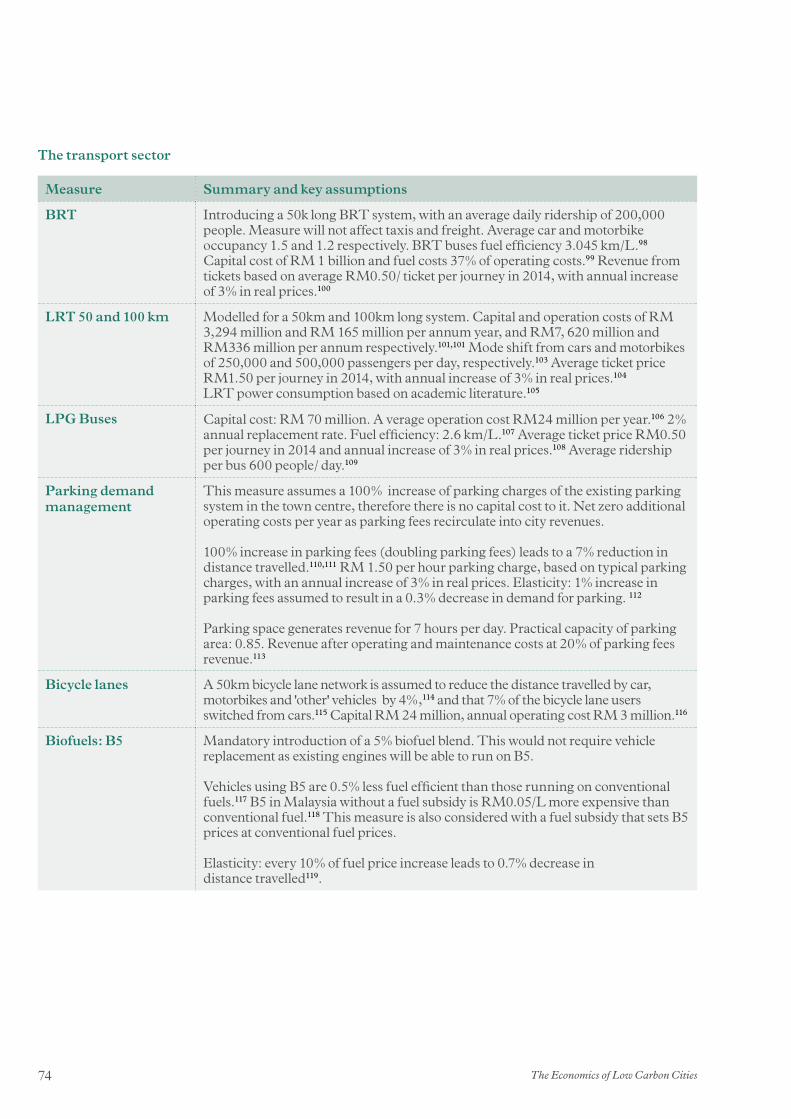
The Economics of Low Carbon Cities74
The transport sector
Measure Summary and key assumptions
BRT Introducing a 50k long BRT system, with an average daily ridership of 200,000 people. Measure will not affect taxis and freight. Average car and motorbike occupancy 1.5 and 1.2 respectively. BRT buses fuel efficiency 3.045 km/L.98 Capital cost of RM 1 billion and fuel costs 37% of operating costs.99 Revenue from tickets based on average RM0.50/ ticket per journey in 2014, with annual increase of 3% in real prices.100
LRT 50 and 100 km Modelled for a 50km and 100km long system. Capital and operation costs of RM 3,294 million and RM 165 million per annum year, and RM7, 620 million and RM336 million per annum respectively.101,101 Mode shift from cars and motorbikes of 250,000 and 500,000 passengers per day, respectively.103 Average ticket price RM1.50 per journey in 2014, with annual increase of 3% in real prices.104 LRT power consumption based on academic literature.105
LPG Buses Capital cost: RM 70 million. A verage operation cost RM24 million per year.106 2% annual replacement rate. Fuel efficiency: 2.6 km/L.107 Average ticket price RM0.50 per journey in 2014 and annual increase of 3% in real prices.108 Average ridership per bus 600 people/ day.109
Parking demand management
This measure assumes a 100% increase of parking charges of the existing parking system in the town centre, therefore there is no capital cost to it. Net zero additional operating costs per year as parking fees recirculate into city revenues.
100% increase in parking fees (doubling parking fees) leads to a 7% reduction in distance travelled.110,111 RM 1.50 per hour parking charge, based on typical parking charges, with an annual increase of 3% in real prices. Elasticity: 1% increase in parking fees assumed to result in a 0.3% decrease in demand for parking. 112
Parking space generates revenue for 7 hours per day. Practical capacity of parking area: 0.85. Revenue after operating and maintenance costs at 20% of parking fees revenue.113
Bicycle lanes A 50km bicycle lane network is assumed to reduce the distance travelled by car, motorbikes and 'other' vehicles by 4%,114 and that 7% of the bicycle lane users switched from cars.115 Capital RM 24 million, annual operating cost RM 3 million.116
Biofuels: B5 Mandatory introduction of a 5% biofuel blend. This would not require vehicle replacement as existing engines will be able to run on B5.
Vehicles using B5 are 0.5% less fuel efficient than those running on conventional fuels.117 B5 in Malaysia without a fuel subsidy is RM0.05/L more expensive than conventional fuel.118 This measure is also considered with a fuel subsidy that sets B5 prices at conventional fuel prices.
Elasticity: every 10% of fuel price increase leads to 0.7% decrease in distance travelled119.
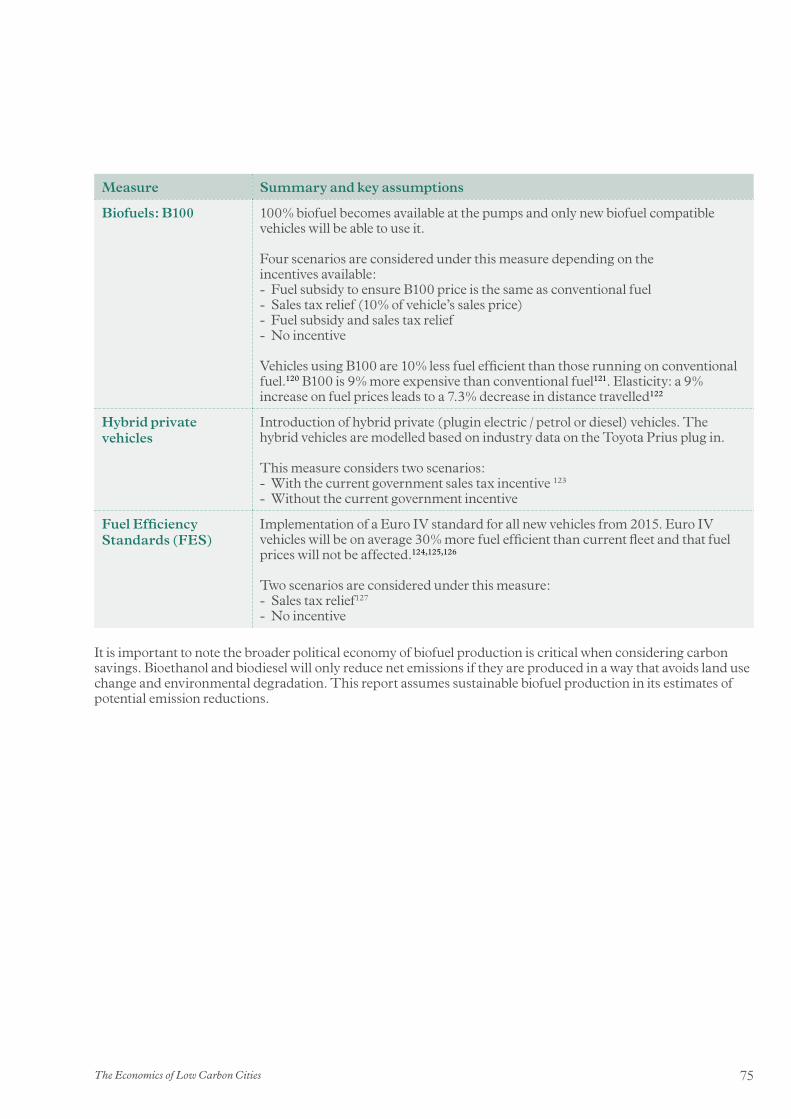
75The Economics of Low Carbon Cities
Measure Summary and key assumptions
Biofuels: B100 100% biofuel becomes available at the pumps and only new biofuel compatible vehicles will be able to use it.
Four scenarios are considered under this measure depending on the incentives available: - Fuel subsidy to ensure B100 price is the same as conventional fuel - Sales tax relief (10% of vehicle’s sales price) - Fuel subsidy and sales tax relief - No incentive
Vehicles using B100 are 10% less fuel efficient than those running on conventional fuel.120 B100 is 9% more expensive than conventional fuel121. Elasticity: a 9% increase on fuel prices leads to a 7.3% decrease in distance travelled122
Hybrid private vehicles
Introduction of hybrid private (plugin electric / petrol or diesel) vehicles. The hybrid vehicles are modelled based on industry data on the Toyota Prius plug in.
This measure considers two scenarios: - With the current government sales tax incentive 123
- Without the current government incentive
Fuel Efficiency Standards (FES)
Implementation of a Euro IV standard for all new vehicles from 2015. Euro IV vehicles will be on average 30% more fuel efficient than current fleet and that fuel prices will not be affected.124,125,126
Two scenarios are considered under this measure: - Sales tax relief127
- No incentive
It is important to note the broader political economy of biofuel production is critical when considering carbon savings. Bioethanol and biodiesel will only reduce net emissions if they are produced in a way that avoids land use change and environmental degradation. This report assumes sustainable biofuel production in its estimates of potential emission reductions.

The Economics of Low Carbon Cities76
The waste sector
Measure Summary and key assumptions
Landfill gas flaring 20% landfill gas collection efficiency128 and 10% oxidation factor due to landfill cover.129 Capital and operational costs are based on Malaysian case studies of CDM projects.130
Landfill gas utilization This measure assumes 60% landfill gas collection efficiency131 and 10% oxidation factor due to landfill cover132. Electricity generation from LFG, its CO2 e and carbon emissions saved by energy displaced calculations are based on academic literature133,134 and IPCC reports.135 10% of the electricity generated in used on site.
The revenue from electricity generation is based on the current FiT.136 Capital and operational costs are based on Malaysian case studies of CDM projects137.
Energy from Waste (EfW) EfW assumes a 450,000 tonnes/ year thermal treatment plant with energy generation potential. One scenario is based on electricity only recovery and another on a Combined Heat and Power (CHP) option. ‘Low gate fee’ is assumed equal to the current landfill tipping fee; ‘high gate fee’ is equal to four times the current landfill tipping fee.138,139 In the case of CHP it is assumed that the heat recovered will receive the same FiT as the electricity.The calculations of electricity and heat generation and the carbon emissions saved by energy displaced are based on IPCC (2006)140 and European Communities (2001).141
The revenue from electricity generation is based on the current FiT.142 Capital and operational costs are based on Malaysian case studies of CDM projects143.
Anaerobic Digestion (AD) AD assumes a 250,000 tonnes/ year biological treatment plant with energy generation potential. One scenario is based on electricity only recovery and another on a Combined Heat and Power (CHP) option. ‘Low gate fee’ is assumed equal to the current landfill tipping fee; ‘high gate fee’ is equal to four times the current landfill tipping fee144,145 In the case of CHP it is assumed that the heat recovered will receive the same FiT as the electricity.
The calculations of electricity and heat generation and the carbon emissions saved by energy displaced are based on IPCC (2006)146 and European Communities (2001)147.
It is assumed that the feedstock to the AD plant will comprise good quality, source separated organic waste (food and garden). The participation and capture rates are based on data from WRAP.148, 149
The revenue from electricity generation is based on the current FiT.150 Capital and operational costs are based on Malaysian and UK case studies of AD projects151.
Mass burn incineration Mass burn incineration assumes a 450,000 tonnes/year thermal treatment plant without energy generation potential. Savings are calculated using the ‘low gate fee’, i.e. equal to the current landfill tipping fee.152,153.
The carbon emissions saved by energy displaced are based on IPCC (2006)154 and European Communities (2001)155. Capital and operational costs are based on Malaysian case studies of CDM projects156.
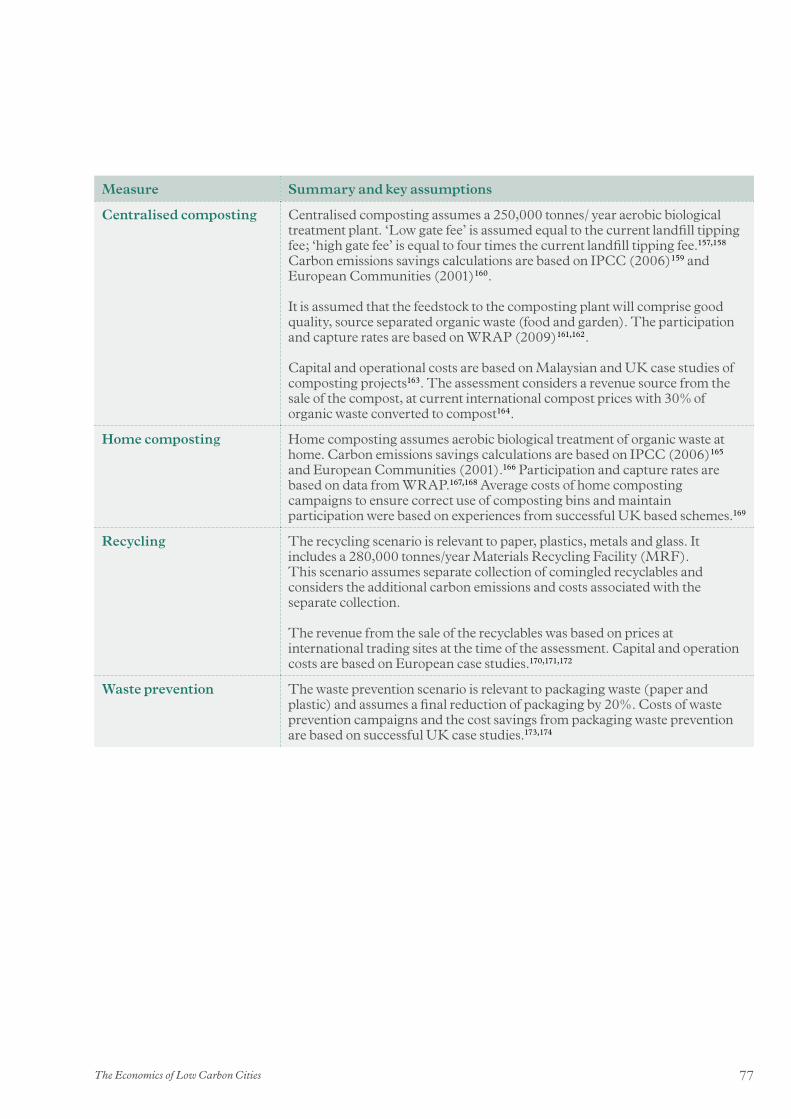
77The Economics of Low Carbon Cities
Measure Summary and key assumptions
Centralised composting Centralised composting assumes a 250,000 tonnes/ year aerobic biological treatment plant. ‘Low gate fee’ is assumed equal to the current landfill tipping fee; ‘high gate fee’ is equal to four times the current landfill tipping fee.157,158 Carbon emissions savings calculations are based on IPCC (2006)159 and European Communities (2001)160.
It is assumed that the feedstock to the composting plant will comprise good quality, source separated organic waste (food and garden). The participation and capture rates are based on WRAP (2009)161,162.
Capital and operational costs are based on Malaysian and UK case studies of composting projects163. The assessment considers a revenue source from the sale of the compost, at current international compost prices with 30% of organic waste converted to compost164.
Home composting Home composting assumes aerobic biological treatment of organic waste at home. Carbon emissions savings calculations are based on IPCC (2006)165 and European Communities (2001).166 Participation and capture rates are based on data from WRAP.167,168 Average costs of home composting campaigns to ensure correct use of composting bins and maintain participation were based on experiences from successful UK based schemes.169
Recycling The recycling scenario is relevant to paper, plastics, metals and glass. It includes a 280,000 tonnes/year Materials Recycling Facility (MRF). This scenario assumes separate collection of comingled recyclables and considers the additional carbon emissions and costs associated with the separate collection.
The revenue from the sale of the recyclables was based on prices at international trading sites at the time of the assessment. Capital and operation costs are based on European case studies.170,171,172
Waste prevention The waste prevention scenario is relevant to packaging waste (paper and plastic) and assumes a final reduction of packaging by 20%. Costs of waste prevention campaigns and the cost savings from packaging waste prevention are based on successful UK case studies.173,174

The Economics of Low Carbon Cities78
Appendix D:
League Table of the Most Cost-Effective Measures in Johor Bahru and Pasir Gudang (NPV/tCO2-e)
Rank Sector Measure: MYR USD
/tCO2-e /tCO2-e
1 Commercial Green Buildings Standard 1 -176683.76 -53460.27
2 Commercial Green Buildings Standard 2 -171678.44 -51945.78
3 Industrial Rubber industry - heat recovery -13136.28 -3974.72
4 Industrial Fuel switching - 50% petroleum products replaced with solar PV electricity with FiT -5804.36 -1756.26
5 Industrial Fuel switching - 50% coal replaced with solar PV electricity with FiT -2701.39 -817.38
6 Transport Hybrid private cars with current tax incentive -1441.31 -436.11
7 Industrial Fertiliser industry - steam reforming (moderate improvements) -1162.95 -351.88
8 Industrial Fertiliser industry - steam reforming (large improvements) -1157.82 -350.33
9 Industrial Petroleum refinery and petrochemical industry - more efficient pumps -1121.69 -339.40
10 Industrial Fuel switching - 50% petroleum systems changed to dual fuel systems -1108.33 -335.35
11 Industrial Petroleum refinery and petrochemical industry - more efficient motors -1072.88 -324.63
12 Industrial Petroleum refinery and petrochemical industry - more efficient compressors -1072.88 -324.63
13 Industrial Petroleum refinery and petrochemical industry - more efficient furnaces and boilers -1063.12 -321.67
14 Industrial Petroleum refinery and petrochemical industry - more efficient heat exchangers -975.25 -295.09
15 Transport Euro IV vehicle standards - cars with sales tax relief -969.46 -293.34
16 Transport Hybrid private cars -956.00 -289.26
17 Industrial Petroleum refinery and petrochemical industry - more efficient utilities -926.43 -280.32
18 Industrial Petroleum refinery and petrochemical industry - process integration -906.91 -274.41
19 Transport Parking demand management -790.89 -239.31
20 Electricity Natural Gas BAT (~600 MW) -655.00 -199.00
21 Industrial Fertiliser industry - process integration -652.69 -197.49
22 Industrial Fertiliser industry - hydrogen recovery -649.52 -196.53
23 Industrial Fertiliser industry - improved process control -637.18 -192.80
24 Industrial Fertiliser industry - ammonia synthesis at lower pressure -629.42 -190.45
25 Industrial Fertiliser industry - more efficient CO2 removal from synthesis gas -619.55 -187.46
26 Industrial Petroleum refinery and petrochemical industry - monitoring and targeting -586.47 -177.45
27 Commercial Banning incandescent light bulbs -542.82 -164.24
28 Commercial Computer - energy management -521.51 -157.80
29 Commercial Printer - energy management -521.51 -157.80
30 Commercial Copier - energy management -521.51 -157.80
31 Commercial Monitor - energy management -521.51 -157.80
32 Commercial Fax - turning off -521.51 -157.80
33 Commercial 20kWp solar PV panel with FiT -506.57 -153.28
34 Domestic 4kWp solar PV panel with FiT -505.19 -152.86
35 Commercial Raising thermostat 1˚C -488.97 -147.95
36 Commercial Air conditioner - EE Standard 2 -483.11 -146.18
37 Commercial Air conditioner - EE Standard 1 -482.30 -145.93
38 Domestic Solar water heating with FiT -435.20 -131.68
Cost effective
Cost neutral
All others including “cost ineffective” and those mutually exclusive with other measures

79The Economics of Low Carbon Cities
Cost effective
Cost neutral
All others including “cost ineffective” and those mutually exclusive with other measures
Rank Sector Measure: MYR USD
/tCO2-e /tCO2-e
39 Commercial 20kWp solar PV panel -420.20 -127.14
40 Electricity Natural Gas replaced by Solar PV (2000 MW) -404.00 -123.00
41 Commercial Elevators and escalators - EE Standard 1 -397.91 -120.40
42 Commercial Elevators and escalators - EE Standard 2 -397.91 -120.40
43 Domestic Setting LED target of 50% -382.34 -115.69
44 Domestic Raising thermostat 1˚C -333.65 -100.95
45 Domestic Entertainment appliances - standby -331.92 -100.43
46 Domestic Air conditioner - EE Standard 2 -319.87 -96.78
47 Domestic Air conditioner - EE Standard 1 -319.51 -96.68
48 Domestic Turning off lights -284.25 -86.01
49 Domestic Banning incandescent light bulbs -283.02 -85.64
50 Domestic Green Building Standard 1 -277.63 -84.01
51 Domestic Green Building Standard 2 -277.63 -84.01
52 Industrial Rubber industry - lowering functional pressure -262.77 -79.51
53 Waste Centralised composting – high gate fee -250.77 -75.88
54 Transport Euro IV vehicle standards - cars -213.62 -64.64
55 Domestic Water heater - EE Standard 2 -210.18 -63.59
56 Waste Waste prevention -209.59 -63.42
57 Domestic Water heater - EE Standard 1 -208.51 -63.09
58 Waste Centralised composting – low gate fee -194.59 -58.88
59 Waste LFG utilisation -128.66 -38.93
60 Domestic Retrofitting mineral wool insulation -84.06 -25.43
61 Domestic 4kWp solar PV panel -63.27 -19.14
62 Industrial Rubber industry - reduction of excess air in boilers -61.70 -18.67
63 Domestic Retrofitting fibreglass urethane insulation -61.67 -18.66
64 Industrial Rubber industry - more efficient nozzles -50.17 -15.18
65 Domestic Washing machine - EE Standard 1 -44.79 -13.55
66 Domestic Entertainment appliances - EE Standard 2 -35.57 -10.76
67 Waste Recycling -24.86 -7.52
68 Waste Energy from waste (CHP) – high gate fee -24.11 -7.30
69 Transport B5 fuel with fuel subsidy -15.43 -4.67
70 Industrial Rubber industry - leak prevention -7.10 -2.15
71 Electricity Diesel replaced by Solar PV (1200 MW) -5.00 -2.00
72 Commercial Setting LED target of 50% -0.63 -0.19
73 Commercial Turning off lights -0.53 -0.16
74 Domestic Solar lamps for outdoor lighting -0.30 -0.09
75 Waste LFG flaring 1.39 0.42
76 Domestic Entertainment appliances - EE Standard 1 38.70 11.71
77 Waste Anaerobic digestion (CHP) – high gate fee 45.70 13.83

The Economics of Low Carbon Cities80
Appendix D:
continued
Cost effective
Cost neutral
All others including “cost ineffective” and those mutually exclusive with other measures
Rank Sector Measure: MYR USD
/tCO2-e /tCO2-e
78 Industrial Fuel switching - diesel replaced with biodiesel 48.21 14.59
79 Waste Energy from waste (CHP) – low gate fee 63.87 19.32
80 Waste Home composting 86.29 26.11
81 Transport B100 fuel with sales tax relief and fuel subsidy 94.35 28.55
82 Transport B100 fuel with sales tax relief 105.13 31.81
83 Waste Anaerobic digestion (electricity recovery) - high gate fee 121.84 36.86
84 Transport B5 fuel 133.00 40.24
85 Transport Bicycle lanes 160.42 48.54
86 Industrial Rubber industry - using outside intake air 161.85 48.97
87 Waste Anaerobic digestion (CHP) – low gate fee 162.04 49.03
88 Domestic Solar water heating 167.71 50.75
89 Industrial Rubber industry - adoption of variable speed drive in electric motors (30% speed reduction) 183.52 55.53
90 Transport B100 fuel with fuel subsidy 197.11 59.64
91 Transport B100 fuel 207.86 62.89
92 Electricity Natural Gas Retrofit (4200 MW) 238.00 72.00
93 Domestic Washing machine - EE Standard 2 241.28 73.01
94 Waste Energy from waste (electricity recovery) – high gate fee 258.53 78.22
95 Waste Anaerobic digestion (electricity recovery) – low gate fee 267.61 80.97
96 Domestic Kitchen appliances - EE Standard 1 322.92 97.71
97 Electricity Coal replaced with Solar PV (1200 MW) 335.00 101.00
98 Transport BRT (50km) 342.05 103.50
99 Industrial Fuel switching - 50% petroleum products replaced with solar PV electricity 497.30 150.47
100 Electricity Coal Retrofit (~8100 MW) 515.00 156.00
101 Electricity Coal Best Available Technology (4200 MW) 515.00 156.00
102 Waste Energy from waste (electricity recovery) – low gate fee 561.66 169.95
103 Domestic Kitchen appliances - EE Standard 2 614.24 185.85
104 Industrial Fuel switching - 50% coal replaced with natural gas 669.81 202.67
105 Transport LRT (50km) 1196.58 362.05
106 Transport LRT (100km) 1196.58 362.05
107 Industrial Fuel switching - 50% coal replaced with solar PV electricity 1361.82 412.06
108 Waste Mass burn incinerator 1778.13 538.02
109 Industrial Fuel switching - gasoline replaced with bioethanol 2049.50 620.13
110 Industrial Rubber industry - adoption of variable speed drive in pumps (30% speed reduction) 2772.55 838.91
111 Transport LPG Buses 3562.54 1077.94
112 Commercial Retrofitting mineral wool insulation 14093.32 4264.30
113 Commercial Retrofitting fibreglass urethane insulation 15059.98 4556.79

81The Economics of Low Carbon Cities
Cost effective
Cost neutral
All others including “cost ineffective” and those mutually exclusive with other measures
Appendix E:
League Table of the Most Carbon-Effective Measures in Johor Bahru and Pasir Gudang (ktCO2-e)
Rank Sector Measure: ktCO2-e
1 Industrial Fuel switching - diesel replaced with biodiesel 43,798
2 Electricity Coal retrofit (~8100 MW) 32,550
3 Transport B100 fuel with sales tax relief and fuel subsidy 26,980
4 Transport B100 fuel with sales tax relief 22,058
5 Transport B100 fuel with fuel subsidy 22,050
6 Industrial Fuel switching - 50% petroleum products replaced with solar PV electricity with FiT 21,357
7 Industrial Fuel switching - 50% petroleum products replaced with solar PV electricity 21,357
8 Transport B100 19,874
9 Electricity Coal BAT (4200 MW) 16,959
10 Transport Hybrid private cars with current tax incentive 15,051
11 Electricity Coal replaced with solar PV (1200 MW) 13,001
12 Transport Hybrid private cars 12,060
13 Industrial Rubber industry - adoption of variable speed drive in electric motors (30% speed reduction) 11,232
14 Electricity Natural Gas replaced by Solar PV (2000 MW) 10,173
15 Industrial Fuel switching - 50% petroleum systems changed to dual fuel systems 9,725
16 Transport Euro IV vehicle standards – cars with sales tax relief 9,169
17 Waste Energy from waste (CHP) – high gate fee 8,359
18 Waste Energy from waste (CHP) – low gate fee 8,359
19 Industrial Rubber industry - reduction of excess air in boilers 7,992
20 Electricity Natural Gas Retrofit (4200 MW) 7,939
21 Waste LFG utilisation 7,607
22 Transport B5 fuel 6,377
23 Transport LRT (100km) 5,681
24 Transport B5 fuel with fuel subsidy 5,529
25 Electricity Diesel replaced by Solar PV (1200 MW) 5,181
26 Transport Euro IV vehicle standards – cars 4,093
27 Domestic Air conditioner - EE Standard 2 3,849
28 Waste LFG flaring 3,802
29 Industrial Fuel switching - 50% coal replaced with solar PV electricity with FiT 3,703
30 Industrial Fuel switching - 50% coal replaced with solar PV electricity 3,703
31 Domestic 4kWp solar PV panel (20MW by 2025) 3,424
32 Domestic 4kWp solar PV panel with FiT (20MW by 2025) 3,424
33 Transport BRT (50km) 3,154
34 Transport LRT (50km) 2,785
35 Waste Energy from waste (electricity recovery) – high gate fee 2,426
36 Waste Energy from waste (electricity recovery) – low gate fee 2,426
37 Waste Anaerobic digestion (CHP) – high gate fee 2,119

The Economics of Low Carbon Cities82
Rank Sector Measure: ktCO2-e
38 Waste Anaerobic digestion (CHP) – low gate fee 2,119
39 Domestic Air conditioner - EE Standard 1 1,837
40 Waste Home composting 1,815
41 Industrial Rubber industry - leak prevention 1,732
42 Domestic 4kWp solar PV panel (10MW by 2025) 1,712
43 Domestic 4kWp solar PV panel with FiT (10MW by 2025) 1,712
44 Waste Anaerobic digestion (electricity recovery) - high gate fee 1,691
45 Waste Anaerobic digestion (electricity recovery) - low gate fee 1,691
46 Industrial Petroleum refinery and petrochemical industry - monitoring and targeting 1,652
47 Domestic Raising thermostat 1˚C 1,582
48 Industrial Fuel switching - 50% coal replaced with natural gas 1,582
49 Waste Recycling 1,489
50 Waste Centralised composting – high gate fee 1,462
51 Waste Centralised composting – low gate fee 1,462
52 Domestic Green Building Standard 2 (100% of new buildings from 2015) 1,429
53 Transport Parking demand management 1,407
54 Domestic Retrofitting fibreglass urethane insulation (20% of existing buildings by 2025) 990
55 Industrial Petroleum refinery and petrochemical industry - more efficient utilities 929
56 Domestic Solar water heating (30% of households by 2025) 876
57 Domestic Solar water heating with FiT (30% of households by 2025) 876
58 Electricity Natural gas BAT (~600 MW) 849
59 Domestic Green Building Standard 2 (100% of new buildings from 2015) 818
60 Waste Mass burn incinerator 817
61 Domestic Green Building Standard 2 (50% of new buildings from 2015) 714
62 Domestic Water heater - EE Standard 2 700
63 Domestic Entertainment appliances - standby 649
64 Industrial Petroleum refinery and petrochemical industry - more efficient furnaces and boilers 620
65 Industrial Rubber industry - more efficient nozzles 617
66 Waste Waste prevention 589
67 Domestic Retrofitting mineral wool insulation (20% of existing buildings by 2025) 528
68 Transport LPG Buses 497
69 Domestic Retrofitting fibreglass urethane insulation (10% of existing buildings by 2025) 495
70 Industrial Fuel switching - gasoline replaced with bioethanol 473
71 Domestic Turning off lights 471
72 Industrial Petroleum refinery and petrochemical industry - process integration 465
73 Industrial Petroleum refinery and petrochemical industry - more efficient heat exchangers 465
Cost effective
Cost neutral
All others including “cost ineffective” and those mutually exclusive with other measures
Appendix E:
continued

83The Economics of Low Carbon Cities
Rank Sector Measure: ktCO2-e
74 Domestic Solar water heating (15% of households by 2025) 438
75 Domestic Solar water heating with FiT (15% of households by 2025) 438
76 Domestic Green Building Standard 1 (50% of new buildings from 2015) 413
77 Domestic Entertainment appliances - EE Standard 2 345
78 Domestic Water heater - EE Standard 1 311
79 Domestic Kitchen appliances - EE Standard 2 277
80 Industrial Fertiliser industry - steam reforming (large improvements) 267
81 Domestic Retrofitting mineral wool insulation (10% of existing buildings by 2025) 264
82 Domestic Banning incandescent light bulbs 254
83 Transport Bicycle lanes 222
84 Domestic Entertainment appliances - EE Standard 1 220
85 Industrial Fertiliser industry - process integration 200
86 Commercial Air conditioner – EE standard 2 199
87 Commercial Green Buildings Standard 2 (100% of new buildings from 2015) 173
88 Industrial Petroleum refinery and petrochemical industry - more efficient pumps 149
89 Commercial Turning off lights 145
90 Commercial Retrofitting fibreglass urethane insulation (20% of existing buildings by 2025) 139
91 Industrial Petroleum refinery and petrochemical industry - more efficient motors 124
92 Industrial Rubber industry - adoption of variable speed drive in pumps (30% speed reduction) 108
93 Domestic Setting LED target of 50% 104
94 Commercial Air conditioner – EE Standard 1 99.74
95 Industrial Fertiliser industry - steam reforming (moderate improvements) 93.4
96 Commercial Green Buildings Standard 1 (100% of new buildings from 2015) 86.61
97 Commercial Green Buildings Standard 2 (50% of new buildings from 2015) 86.61
98 Commercial Retrofitting mineral wool insulation (20% of existing buildings by 2025) 73.96
99 Commercial Retrofitting fibreglass urethane insulation (10% of existing buildings by 2025) 69.34
100 Commercial Banning incandescent light bulbs 65.76
101 Commercial Setting LED target of 50% 60.64
102 Industrial Fertiliser industry - more efficient CO2 removal from synthesis gas 60.04
103 Domestic Washing machine - EE Standard 2 57.96
104 Industrial Fertiliser industry - hydrogen recovery 53.37
105 Industrial Fertiliser industry - improved process control 48.03
106 Domestic Washing machine - EE Standard 1 45.95
107 Commercial Green Buildings Standard 1 (50% of new buildings from 2015) 43.31
108 Industrial Rubber industry - using outside intake air 41.31
109 Commercial Elevators and escalators – EE Standard 2 37.73
Cost effective
Cost neutral
All others including “cost ineffective” and those mutually exclusive with other measures
Appendix E:
continued

The Economics of Low Carbon Cities84
Rank Sector Measure: ktCO2-e
110 Industrial Petroleum refinery and petrochemical industry - more efficient compressors 37.18
111 Commercial Retrofitting mineral wool insulation (10% of existing buildings by 2025) 36.98
112 Commercial Raising thermostat 1˚C 35.03
113 Industrial Fertiliser industry - ammonia synthesis at lower pressure 33.36
114 Commercial Elevators and escalators – EE Standard 1 18.87
115 Commercial Computer – energy management 16.88
116 Industrial Rubber industry - lowering functional pressure 16.78
117 Domestic Solar lamps for outdoor lighting (100% of outdoor lamp sales from 2015) 15.43
118 Domestic Kitchen appliances - EE Standard 1 14.28
119 Industrial Rubber industry - heat recovery 14.2
120 Commercial 20kWp solar PV panel (target of 3MW by 2025) 11.68
121 Commercial 20kWp solar PV panel with FiT (target of 3MW by 2025) 11.68
122 Domestic Solar lamps for outdoor lighting (50% of outdoor lamp sales from 2015) 7.71
123 Commercial Monitor – energy management 6.37
124 Commercial 20kWp solar PV panel (target of 1.5MW by 2025) 5.84
125 Commercial 20kWp solar PV panel with FiT (target of 1.5MW by 2025) 5.84
126 Commercial Printer – energy management 5.06
127 Commercial Copier – energy management 0.46
128 Commercial Fax – turning off 0.09
Cost effective
Cost neutral
All others including “cost ineffective” and those mutually exclusive with other measures
Appendix E:
continued

85The Economics of Low Carbon Cities
1 United Nations University: Institute of Advanced Studies (2013) Cities and Climate Change. 2 International Energy Agency (2009) World Energy Outlook 2008. Available from: <http://www.worldenergyoutlook.org/media/weowebsite/2008-1994/
WEO2008.pdf> [viewed 31/10/2013] 3 Gouldson, A., Kerr, N., Topi, C. Dawkins, E., Kuylenstierna, J. and Pearce, R. (2013) ‘The Economics of Low Carbon Cities: A Mini-Stern Review for Birming-
ham and the Wider Urban Area, published by the Centre for Low Carbon Futures. 4 Energy Commission (2014) Malaysia Energy Information Hub: Final Energy Demand. Available from: <http://meih.st.gov.my/statistics > [viewed 9/04/2014] 5 Ministry of Energy, Green Technology and Water (KeTTHA) (2012 ) National Energy Balance 2011. Available from <http://meih.st.gov.my/
documents/10620/6ee119f3-8bcf-4a7b-930e-ae375dbbc544> [viewed 9/04/2014] 6 World Bank (2014) Energy use (kg of oil equivalent per capita. Available from <http://data.worldbank.org/indicator/EG.USE.PCAP.KG.OE> [viewed
9/04/2014] 7 Indriyanto A, Lontoh L., Pusakantara A, Siahaan N, Vis-Dunbar D (2013) Fossil-Fuel Subsidy Reform in Indonesia: A review of government communications
in 2012, Indonesian Institute for Energy Economics and the International Institute for Sustainable Development. Available from < http://www.iisd.org/gsi/sites/default/files/ffs_indonesia_communications.pdf > [viewed 8/05/2014]
8 United Nations Department of Economic and Social Affairs (2014) Emissions per capita (tCO2-e). Available from <http://unstats.un.org/unsd/default.htm> [viewed 09/04/2014]
9 Ministry of Natural Resources and Environment Malaysia (2010) Second National Communication to the UNFCCC. Available from <http://www.nre.gov.my/Malay/Alam- Sekitar/Documents/Penerbitan/SECOND%20NATIONAL%20COMMUNICATION%20TO%20THE%20UNFCCC%20%28NC 2%29.pdf> [viewed 9/4/2014]
10 Ibid. 11 Enerdata (2012) Global Energy Statistical Yearbook 2011. Available from < http://yearbook.enerdata.net/2010/2010-energy-intensity-GDP-by-region.
html#/2010-energy-intensity-GDP-by- region.html> [viewed 09/04/2014] 12 World Bank (2014) Urban population (% of total). Available from <http://data.worldbank.org/indicator/SP.URB.TOTL.IN.ZS> [viewed 09/04/2014] 13 Pramanik A. H., Abdullah M. A., Derus A. M. & Barom N. (2009) Urban Poverty: A Case Study of Malaysia, IIUM Press. 14 World Bank (2014) GINI Index. Available from <http://data.worldbank.org/indicator/SI.POV.GINI> [viewed 09/04/2014] 75 15 UTM, IRDA, Kyoto University, Okayama University, National Institute for Environmental Studies (2012) Low Carbon Society Blueprint for Iskandar Malaysia.
Available from <http://2050.nies.go.jp/cop/cop18/SPM_LCS%20Blueprint_Iskandar%20Malaysia.pdf> [viewed 14/11/2013] 16 AECOM (2009) Iskandar Malaysia Integrated Solid Waste Management Blueprint. Available at: < http://www.sisa.my/sisanet/1upload/lokasi/Johor/document/me-
syuarat_pengarah_negeri/Arkib/Iskandar%20Malayi sa%20Integrated%20Solid%20Waste%20Management%20Blueprint_Stage%203%20Final%20Report.pdf> 17 Iskandar Development Authority (2013) What is Iskandar Malaysia : Facts & Figures. Available from <http://www.iskandarmalaysia.com.my/what-is-iskandar-
malaysia-fact-figures> [viewed 14/11/2013] 18 Iskandar Development Authority. Op. cit. 19 Iskandkar Development Authority (2008) Pasir Gudang Flagship D. Important facts and details on Eastern Gate Development. Available from: <http://www.
iskandarmalaysia.com.my/pdf/brochures/Flagship-D- EN.pdf> [viewed 9/04/2014] 20 Energy Commission (2014) Malaysia Energy Information Hub: Final Energy Demand. Available from: <http://meih.st.gov.my/statistics > [viewed 9/04/2014] 21 Asia Pacific Economic Cooperation (2011) Peer Review on Energy Efficiency in Malaysia. Report for the APEC Energy Working Group. Available from <apec-
energy.tier.org.tw/.../db/.../Malaysia_PREE_Report_Final_Draft.doc > [viewed 16/04/2014] 22 PEMANDU (Performance Management and Delivery Unit, Prime Minister’s Department) (2010) Government Transformation Programme. Available at
<www.pemandu.gov.my/gtp/ > [viewed 16/02/2014] 23 EPU (Economic Planning Unit, Prime Minister’s Department) (2010) Tenth Malaysia Plan 2011–2015. Available at: <http://www.pmo.gov.my/dokumenat-
tached/RMK/RMK10_Eds.pdf> [viewed 23/04/2014] 24 Moh, Yiing Chiee; Abd Manaf, Latifah (2014) Overview of household solid waste recycling policy status and challenges in Malaysia. Resources, Conservation
and Recycling. 82 50–61 25 Ministry of Natural Resources and Environment. Op. cit. 26 C40 Cities Climate Leadership Group and ICLEI Local Governments for Sustainability (2012) Greenhouse Gas Protocol for Communities v0.9. Available at:
<http://www.ghgprotocol.org/files/ghgp/GPC%20v9%2020120320.pdf> 27 AECOM. Op. cit. 28 Iskandar Development Authority. Op. cit. 29 OANDA (2014) Historical exchange rates. Available from <http://www.oanda.com/currency/historical-rates/> [viewed 16/04/2014] 30 Tenaga, Suruhanjaya (2007) Electricity supply industry in Malaysia. Performance and Statistical Information. 31 Tenaga, Suruhanjaya. (2008-2011) Malaysia energy information hub. Energy balance. 32 NAPIC (2014) Property Stock Reports 2003-2013, National Property Information Centre. Available from <http://napic.jpph.gov.my/portal/portal/eps/
Online+Services/Publication/PublicationPortletWindow?uri=/Publication _EN/ComPSR_EN.htm&action=2> [viewed 16/04/2014] 33 Saidur, R. (2009) Energy consumption, energy savings, and emission analysis in Malaysian office buildings, Energy Policy 37(10) 4104–4113 34 UNDP & Malaysian Public Works Department (2009) Building Sectors Energy Efficiency Project. Available from < http://www.thegef.org/gef/sites/thegef.org/
files/repository/11-30-09%20ID3598%20-%20Council%20letter.pdf > [viewed 16/04/2014] 35 UTM. Op cit. 36 Ibid. 37 Khazanah Nasional (2006) ‘Chapter Four: Economic Development Strategies’, in Comprehensive Development Plan for South Johor Economic Region. Avail-
able from <http://www.iskandarmalaysia.com.my/pdf/cdp/7._Chapter4_- _Economic_Development_Strategies.pdf> [viewed 16/04/2014] 38 The official portal of the Road Transport Department Malaysia: http://www.jpj.gov.my/ 39 A.S. Silitonga, Atabani A.E., Mahlia T.M.I. (2012) Review on fuel economy standard and label for vehicle in selected ASEAN countries, Renewable and Sustain-
able Energy Reviews 16, 1683– 1695 40 Mahlia T. M. I., Tohno S., Tezuka T. (2012) A global review of success story on implementation of fuel economy standard for passenger cars: Lesson for other
countries. Energy Education Science and Technology Part A: Energy Science and Research . Volume 29 issue (2): 947-972 41 Chen K.S, Wang W.C, Chen H.M, Lin C.F,. Hsu H.C, Kao J.H., Hu M.T. (2003). Motorcycle emissions and fuel consumption in urban and ruraldriving condi-
tions.The Science of the Total Environment 312, 113–122 42 42 AECOM. Op. cit. 43 National Department of Solid Waste Management (2014). Available from: http://www.kpkt.gov.my/jpspn_en_2013/main.php?Content=articles&ArticleID=43&I
ID= [viewed 30/04/2014] 44 AECOM. Op. cit. 45 WRAP (2010) Waste Collection Vehicle Fuel Efficiency Trial. Available from: <http://www.wrap.org.uk/sites/files/wrap/WRAP%20FH%20and%20Premier%20
Trial%20Draft%20Report%20Final%2 0for%20approval%2006_07_10%20HG.pdf> [viewed 30/04/2014] 46 IPCC (2006) Guidelines for National Greenhouse Gas Inventories. Volume 5: Waste. Available from http://www.ipcc-nggip.iges.or.jp/public/2006gl/pdf/5_Vol-
ume5/V5_3_Ch3_SWDS.pdf . [viewed 30/04/2014] 76 47 Connor J, Feldon A, Eichel A, Russell B, Dickinson J, Hoornweg D, Bhatia P, Fong WK, Shearer I (2012). GLOBAL PROTOCOL FOR COMMUNITY
-SCALE GHG EMISSIONS (GPC)Version 0.9 – 20 March 2012. Available from http://www.ghgprotocol.org/files/ghgp/GPC%20v9%2020120320.pdf [viewed 30/04/2014]
48 Ministry of Energy, Green Technology and Water. Op. cit. 49 Energy Commission (2012) Electricity Supply in Malaysia: Performance and Statistical Information 2004-2010. Available from <http://meih.st.gov.my/docu-
ments/10620/e92bbc28-ff35-4e80-8981-a849b2fce14b> [viewed 16/04/2014 50 Department of Statistics Malaysia (2014) Consumer Price Index. <http://www.statistics.gov.my/portal/index.php?option=com_content&view=category&id=71%
3Aconsumer-price- index-malaysia-&Itemid=153&lang=en> [viewed 16/04/2014] 51 IPCC (2006) IPCC Guidelines for National Greenhouse Gas Inventories, Volume 2. Available from <http://www.ipcc- nggip.iges.or.jp/public/2006gl/vol2.html>
[viewed 16/04/2014] 52 DEFRA (2012) GHG conversion Factors, Department of Environment, Food and Rural Affairs. Available from < https://www.gov.uk/government/uploads/sys-
tem/uploads/attachment_data/file/69554/pb13773-ghg-conversion- factors-2012.pdf> [viewed 16/04/2014]
References and Footnotes

The Economics of Low Carbon Cities86
53 GreenTech Malaysia (2013) CDM Study on Grid Connected Electricity Baselines in Malaysia, 2010-2011. Available from < http://cdm.greentechmalaysia.my/up_dir/Report_CDM_Baseline_2010&2011.pdf> [viewed 16/04/2014]
54 Ngan, Mei Shan, and Chee Wei Tan (2012) Assessment of economic viability for PV/wind/diesel hybrid energy system in southern Peninsular Malaysia, Renew-able and Sustainable Energy Reviews 16(1) 634-647.
55 A.R. Mohamed, K.T. Lee (2006) Energy for sustainable development in Malaysia: energy policy and alternative energy, Energy Policy, 34 2,388–2,397 56 M.P. Koh, W.K. Hoi Renewable energy in Malaysia: a policy analysis. Energy for Sustainable Development, 6 (3) (2002), pp. 31–39 57 Tenaga, Suruhanjaya (2007) Op. cit. 58 AWER (2012) Switch It Right: Incandescent GLS Phase-Out: Is Malaysia Doing It Right? Association of Water and Energy Research Malaysia. Available from
<http://www.awer.org.my/publication/report/CFL_normal_report-eng- secured.pdf> [viewed 16/09/2014 59 McKenney K., Guernsey M., Ponoum R. & Rosenfeld J. (2010) Energy consumption characterisation and savings potential in 2008 by building type, TIAX Ref.
No. D0498 60 BC Hydro (2014) Turn off computers when not in use. <http://www.bchydro.com/powersmart/business/small_medium_business/green_your_business/office_
guide/Turn_ equipment_off_when_not_in_use_.html> [viewed 16/04/2014] 61 Yamtraipat N., Khedari J., Hirunlabh J. & Kunchornat (2006) Assessment of Thailand indoor set-point impact on energy consumption and environment, Energy
Policy 34(7) 765-770 62 Shekarchian M., Moghavvemi M., Rismanchi B., Mahlia T. M. I. & Olofsson T. (2012) The cost benefit analysis and potential emission reduction evaluation of
applying wall insulation for buildings in Malaysia, Renewable and Sustainable Energy Reviews 16(7) 4708-4718 63 Ibid. 64 SEDA (2013) Quota for 20MW Solar Photovoltaic released by SEDA Malaysia taken up within an hour. Available from <http://seda.gov.my/?omaneg=0001010
0000001010101000100001000000000000000000000&s=2730> [viewed 16/04/2014] 65 Bakhtyar B., Sopian K., Sulaiman M. Y. & Ahmad S. A. (2013) Renewable energy in five South East Asian countries: review on electricity consumption and
economic growth, Renewable and Sustainable Energy Reviews 26 506-514 66 AWER (2012) Switch It Right: Incandescent GLS Phase-Out: Is Malaysia Doing It Right? Association of Water and Energy Research Malaysia. Available from
<http://www.awer.org.my/publication/report/CFL_normal_report-eng- secured.pdf> [viewed 16/09/2014 67 Yamtraipat N.. Op. cit. 68 Shekarchian M. Op. cit. 69 Ibid. 70 SEDA (2013). Op. cit. 71 Mekhilef S., Safari A., Mustaffa W. E. S., Saidur R., Omar R., Younis M. A. A. (2012) Solar energy in Malaysia: current state and prospects, Renewable and
Sustainable Energy Reviews 16 386-396 72 Worrell E. & Galitsky C. (2005) Energy efficiency improvement and cost saving opportunities for petroleum refineries, Lawrence Berkeley National Laboratory. 73 Ibid. 74 Ibid. 75 Ibid. 76 Ibid. 77 Ibid. 78 Ibid. 79 Ibid. 80 Rafiqul I., Weber C., Lehmann B. & Voss A. (2005) Energy efficiency improvements in ammonia production - perspectives and uncertainties, Energy 30(13)
2487-2504 81 Ibid. 82 Ibid. 83 Ibid. 84 Ibid. 85 Ibid. 86 Ibid. 87 Saidura R. & S. Mekhilef (2010) Energy use, energy savings and emission analysis in the Malaysian rubber producing industries, Applied Energy 87(8)
2746–2758 88 Ibid. 89 Ibid. 90 Ibid. 91 Ibid. 92 Ibid. 93 Ibid. 94 Ibid. 95 IFC. Finance for Fuel Switching Available from <http://www.ifc.org/wps/wcm/connect/4e76820049585ecb9d9abd19583b6d16/FMS-EO-EEF-FS.
pdf?MOD=AJPERES> [viewed 16/04/2014] 96 Eichelbrönner IM (2013) A Fuel Saver Concept for Indonesia: How to Roll- out Solar PV on a 100 MW Scale to Substitute Diesel in Island Grids, GIZ. Avail-
able from <http://www.giz.de/fachexpertise/downloads/giz2013-en- eichelbroenner-pep-workshop-indonesien-pv-hybridsysteme.pdf> [viewed 16/09/2014] 97 Ibid. 98 Nicolai JC & Weiss DM (2008) Influences of operational issues on the operational cost of BRT buses and BRT systems. Available from <http://www.gtkp.com/
assets/uploads/20091129-201059-7979-Nicolai.pdf> 99 Ibid. 100 Based on bus prices in Kuala Lumpur. 101 IRDA (2007) Iskandar Malaysia Comprehensive Development Plan. Available from <http://www.iskandarmalaysia.com.my/comprehensive-development-plan-
cdp> [viewed 30/04/2014] 102 Hsu, L. (2013). ”Cost Estimating Model for Mode Choice between Light Rail and Bus Rapid Transit Systems.” J. Transp. Eng., 139(1), 20–29. 103 Calgary Transit (2014) LRT Technical Data. Available from <http://www.calgarytransit.com/html/technical_information.html> [viewed 30/04/2014] 104 Based on ticket prices of LRT system in Kuala Lumpur. 105 Griswold JB et al (2013) Environ. Res. Lett. Tradeoffs between costs and greenhouse gas emissions in the design of urban transit systems. doi:10.1088/1748-
9326/8/4/044046 106 Nicolai. Op. cit. 107 Monitoring Committee of the Alternative Fuel Light Bus Trial (2001) Report on the Alternative Fuel Light Bus Trial. Available from <http://www.epd.gov.hk/
epd/english/environmentinhk/air/studyrpts/files/e_aflb.pdf> [viewed 30/04/2014] 108 Based on ticket prices of current bus system in Malaysia 109 World Bank and PPIAF (2006) Urban Bus Toolkit. Available from <http://www.ppiaf.org/sites/ppiaf.org/files/documents/toolkits/UrbanBusToolkit/assets/CaseS-
tudies/deving.html> [viewed 30/04/2014] 110 Victoria Transport Policy Institute (2013) Understanding Transport Demands and Elasticities. How Prices and Other Factors Affect Travel Behavior.Available
from http://www.vtpi.org/elasticities.pdf . [viewed 30/04/2014] 111 Apogee (1994) Costs and Cost Effectiveness of Transportation Control Measures; A Review and Analysis of the Literature, National Association of Regional
Councils. Available from www.narc.org. [viewed 30/04/2014] 112 Kuzmyak et al. (2003) Parking demand management fees and parking, Chicago Metropolitan Agency for Planning. Available from <http://www.cmap.illinois.
gov/about/2040/supporting-materials/process-archive/strategy- papers/parking/demand-management-strategies> [viewed 30/04/2014 113 San Francisco County Transportation Authority (2009) On-street parking management and pricing study. Available from <http://www.sfcta.org/sites/default/
files/content/Planning/ParkingManagementStudy/pdfs/parking_study_final.pdf> [viewed 30/04/2014
References and Footnotes

87The Economics of Low Carbon Cities
114 C40 Cities (2014) Cicloruta is one of the most comprehensive cycling systems in the world. Available from <http://www.c40cities.org/c40cities/bogot%C3%A1/city_case_studies/bogot%C3%A1%E2%80%99s-cicloruta-is-one- of-the-most-comprehensive-cycling-systems-in-the-world> [viewed 30/04/2014
115 Ibid. 116 Ibid. 78 117 US Department of Energy (2014) Biodiesel. Available from <http://www.fueleconomy.gov/feg/biodiesel.shtml> [viewed 30/04/2014] 118 Chin, M. (2011) Biofuels in Malaysia: An analysis of the legal and institutional framework, Centre for International Forestry Research. Available from <http://
www.cifor.org/publications/pdf_files/WPapers/WP64CIFOR.pdf> [viewed 30/04/2014] 119 Victoria Transport Policy Institute (2013) Understanding Transport Demands and Elasticities. How Prices and Other Factors Affect Travel Behaviour. Available
from <http://www.vtpi.org/elasticities.pdf> [viewed 30/04/2014] 120 US Department of Energy (2014) Op. cit. 121 US Department of Energy (2012) Clean Cities: Alternative Fuel Price Report. Available from <http://www.afdc.energy.gov/pdfs/afpr_jan_12.pdf> [viewed
30/04/2014] 122 Victoria Transport Policy Institute. Op. cit. 123 New Strait Times (2014-01-20) Policy would promote Malaysia as production hub. Available from <http://www.nst.com.my/latest/font-color-red-nap-2014-font-
policy-would-promote-malaysia-as-production-hub- 1.466848> [viewed 30/04/2014] 124 Mahlia TMI, Tohno S, Tezuka T (2012). A global review of success story on implementation of fuel economy standard for passenger cars: Lesson for other coun-
tries. Energy Education Science and Technology Part A: Energy Science and Research.Volume (issues) 29(2):947-972 125 Budget 2013 (2013) Factsheet on Singapore Air Quality. Available from <http://app2.nea.gov.sg/docs/default- source/corporate/cos-2013/factsheet-on-singa-
pore-air-quality.pdf?sfvrsn=2> [viewed 30/04/2014] 126 A.S. Silitonga, Atabani A.E., Mahlia T.M.I. (2012) Review on fuel economy standard and label for vehicle in selected ASEAN countries, Renewable and Sustain-
able Energy Reviews 16, 1683– 1695 127 Malaysian Automative Association (2008). Duties and Taxes on Motor Vehicles. Available from <http://www.maa.org.my/info_duty.htm> [viewed 30/04/2014] 128 Yang N, Zhang H, Shao L.M., Lü F., He P.J (2013) Greenhouse gas emissions during MSW landfilling in China: Influence of waste characteristics and LFG
treatment measures. Journal of Environmental Management Vol 129, p 510-521 129 IPCC (2006a). Op. cit. 130 CDM (2011). Ayer Hitam landfill gas recovery project. Available from <http://cdm.unfccc.int/Projects/DB/RINA1329296417.81/view> [viewed 30/04/2014] 131 Yang N. Op. cit. 132 IPCC (2006a). Op. cit. 133 Manfredi S., Tonini D.,. Christensen T.H. ,Scharff.H. (2009) Waste Management Resources. Landfilling of waste: accounting of greenhouse gases and global
warming contributions. Vol 27: 825 134 Yang N. Op. cit. 135 IPCC (2006a). Op. cit. 136 SEDA (2014) Feed in Tariff rate for electricity from landfill gas in 2014. Available from <http://seda.gov.my/> [viewed 30/04/2014] 137 CDM. Op. cit. 138 Samsudin MDM, Mashitah MD (2013 )Municipal Solid Waste Management in Malaysia: Current Practices, Challenges and Prospect. Jurnal Teknologi.Vol 62,
Issue 1, p 95–101 139 WRAP (2011) Comparing the cost of alternative waste treatment options. Available from <http://www.uel.ac.uk/wwwmedia/uel/migratedcontent/greenthing/
documents/WRAPGateFeesReport2011.pdf> [viewed 30/04/2014] 140 IPCC (2006a). Op. cit. 141 European Communities (2001) Waste Management Options and Climate Change. Available from <http://ec.europa.eu/environment/waste/studies/pdf/climate_
change.pdf> [viewed 30/04/2014] 142 SEDA (2014). Op. cit. 143 http://www.isaet.org/images/extraimages/B1013017.pdf , http://greenbluegroup.blogspot.com/2012/04/incinerator-for-municipal-solid-waste.html 144 Tipping fees in Malaysia and Indonesia are amongst the lowest even between other developing countries. Therefore a gate fee equal to four times the current
landfill tipping fee is a realistic option: Samsudin MDM, Mashitah MD (2013)Municipal Solid Waste Management in Malaysia: Current Practices, Challenges and Prospect. Jurnal Teknologi.Vol 62, Issue 1, p 95–101
145 WRAP (2011) Op. cit. 146 IPCC (2006a). Op. cit. 147 European Communities. Op. cit. 148 WRAP (2009a) Food Waste Collection Guidance. Available from <http://www.wrap.org.uk/sites/files/wrap/food%20waste%20collection%20guidance%20- %20
amended%20Mar%202010_1.pdf> [viewed 30/04/2014] 149 WRAP (2009b) Evaluation of the WRAP Separate Food Waste Collection Trials Available from http://www.wrap.org.uk/sites/files/wrap/Evaluation_of_the_
WRAP_FW_Collection_Trials_Update_June_2009.pdf . . [viewed 30/04/2014] 79 150 SEDA (2014). Op. cit. 151 DEFRA (2007) Mechanical biological treatment of municipal solid waste. Available from <http://archive.defra.gov.uk/environment/waste/residual/newtech/docu-
ments/abt.pdf> [viewed 30/04/2014] 152 Samsudin MDM. Op. cit. 153 WRAP (2011). Op. cit. 154 IPCC (2006a). Op. cit. 155 European Communities. Op. cit. 156 Green & Blue Group (2012) Incinerator for Municipal Sold Waste in Kuala Lumpur. Available from <http://greenbluegroup.blogspot.com/2012/04/incinerator-
for-municipal-solid-waste.html> [viewed 30/04/2014] 157 Samsudin MDM. Op. cit. 158 WRAP (2011) Op. cit. 159 IPCC (2006a). Op. cit. 160 European Communities. Op. cit. 161 WRAP (2009a) Op. cit. 162 WRAP (2009b) Op. cit. 163 CDM. Op. cit. 164 European Communities. Op. cit. 165 IPCC (2006a). Op. cit. 166 European Communities. Op. cit. 167 WRAP (2009a) Op. cit. 168 WRAP (2009b) Op. cit. 169 North London Waste Authority (2012) North London Waste Prevention Plan. Available from http://www.nlwa.gov.uk/docs/nlwa-general-documents-and-
plans/2012-14-waste-prevention-plan-final.pdf [viewed 30/04/2014] 170 DEFRA. Op. cit. 171 WRAP. Recovering value from MRFs. Available from <http://www.wrap.org.uk/sites/files/wrap/RecoveringValueMRFs.3644.pdf> [viewed 30/04/2014] 172 European Communities. Op. cit. 173 North London Waste Authority. Op. cit. 174 WRAP (2013) Waste prevention reviews in the food and drink sector. Available from <http://www.wrap.org.uk/sites/files/wrap/Summary%20report%20- %20
waste%20prevention%20reviews%20in%20the%20food%20and%20drink%20sector.pdf> [viewed 30/04/2014]
References and Footnotes
The Economics of Low Carbon Cities88
The Climate Smart Cities Programme www.climatesmartcities.org
Acknowledgements
This individual study has been supported by the UK Foreign and Commonwealth Office through the British High Commission in Kuala Lumpur. It has also been supported by the Centre for Low Carbon Futures, the ESRC Centre for Climate Change Economics and Policy and the University of Leeds.
This individual study has been conducted and this report is authored by Andy Gouldson, Sarah Colenbrander, Effie Papagyropoulou and Andrew Sudmant.
The study has been conducted as part of the Climate Smart Cities programme that has been underway since 2009. The programme is led by Prof Andy Gouldson at the University of Leeds with support from the Centre for Low Carbon Futures and the ESRC Centre for Climate Change Economics and Policy.
The intellectual property rights for the methodology and approach applied in this report are retained by the University of Leeds. The University of Leeds does not accept any responsibility for the ways in which the report or the data are used.
Centre for Climate Change Economics and Policy
89The Economics of Low Carbon Cities
Climate Smart Citieswww.climatesmartcities.org
Johor Bahru, MalaysiaLima-Callao, Peru Palembang, Indonesia
The Economics of Low Carbon, Climate Resilient CitiesLima-Callao, Peru
Kolkata, India
The Economics of Low Carbon CitiesKolkata, India
The Economics of Low Carbon CitiesPalembang, Indonesia
The Economics of Low Carbon CitiesJohor Bahru, Malaysia
Leeds City Region Birmingham and the Wider Urban Area
The Humber Sheffield City Region
Project Director: Prof Andy Gouldson [email protected]
Project Manager:
Sarah Colenbrander [email protected]
In-country lead:
Boyd Joeman [email protected]
Related Documents


![Majlis Bandaraya Johor Bahru [Sumber Internet].pdf](https://static.cupdf.com/doc/110x72/588c6b891a28ab58218b7f76/majlis-bandaraya-johor-bahru-sumber-internetpdf.jpg)

