The Economic Performance of the EU Aquaculture Sector (STECF 13-29) Scientific, Technical and Economic Committee for Fisheries (STECF) Edited by Jordi Guillen Arina Motova EUR 26366 EN This report was reviewed by the STECF during its’ 44 rd plenary meeting held from 4 to 8 November 2013 in Brussels, Belgium

Welcome message from author
This document is posted to help you gain knowledge. Please leave a comment to let me know what you think about it! Share it to your friends and learn new things together.
Transcript
The Economic Performance of the EU
Aquaculture Sector (STECF 13-29)
Scientific, Technical and Economic
Committee for Fisheries (STECF)
Edited by
Jordi Guillen
Arina Motova
EUR 26366 EN
This report was reviewed by the STECF during its’ 44rd
plenary meeting
held from 4 to 8 November 2013 in Brussels, Belgium
European Commission
Joint Research Centre
Institute for the Protection and Security of the Citizen
Contact information
STECF secretariat
Address: TP 051, 21027 Ispra (VA), Italy
E-mail: [email protected]
Tel.: 0039 0332 789343
Fax: 0039 0332 789658
https://stecf.jrc.ec.europa.eu/home
http://ipsc.jrc.ec.europa.eu/
http://www.jrc.ec.europa.eu/
Legal Notice
Neither the European Commission nor any person acting on behalf of the Commission is responsible for the use which might be made of this
publication.
This report does not necessarily reflect the view of the European Commission and in no way anticipates the Commission’s future policy in
this area.
Europe Direct is a service to help you find answers to your questions about the European Union
Freephone number (*): 00 800 6 7 8 9 10 11
(*) Certain mobile telephone operators do not allow access to 00 800 numbers or these calls may be billed.
A great deal of additional information on the European Union is available on the Internet.
It can be accessed through the Europa server http://europa.eu/
JRC 86671
EUR 26366 EN
ISBN 978-92-79-34809-9
ISSN 1831-9424
doi: 10.2788/41898
Luxembourg: Publications Office of the European Union, 2013
© European Union, 2013
Reproduction is authorised provided the source is acknowledged
How to cite this report:
Scientific, Technical and Economic Committee for Fisheries (STECF) – The Economic Performance Report on the EU Aquaculture sector
(STECF-13-29). 2013. Publications Office of the European Union, Luxembourg, EUR 26336 EN, JRC 86671, 383 pp.
Printed in Italy
1 1
TABLE OF CONTENTS
LIST OF FIGURES ......................................................................................................................................... 5
LIST OF TABLES ......................................................................................................................................... 11
STECF COMMENTS AND CONCLUSIONS ..................................................................................................... 14
1 EXECUTIVE SUMMARY ...................................................................................................................... 19
2 INTRODUCTION ................................................................................................................................ 22
2.1 TERMS OF REFERENCE ................................................................................................................................ 23 2.2 DATA COLLECTED UNDER THE DCF ............................................................................................................... 23 2.3 PARTICIPANTS AT EWG 13-10 .................................................................................................................... 25 2.4 CHAIRMAN’S COMMENTS ............................................................................................................................ 26
3 EU AQUACULTURE SECTOR OVERVIEW ............................................................................................. 27
3.1 INTRODUCTION ......................................................................................................................................... 28 3.2 THE EU AQUACULTURE SECTOR .................................................................................................................... 29 3.3 DATA COVERAGE FOR THE ELABORATION OF THIS REPORT ................................................................................. 31 3.4 ECONOMIC PERFORMANCE OF THE EU AQUACULTURE SECTOR .......................................................................... 33 3.5 THE EU AQUACULTURE BY COUNTRY ............................................................................................................. 41 3.6 TRENDS AND TRIGGERS OF THE EU AQUACULTURE .......................................................................................... 49
3.6.1 Main obstacles for the EU aquaculture to grow ........................................................................... 51 3.6.2 Organic aquaculture...................................................................................................................... 54 3.6.3 Competitive Advantage in European Aquaculture ........................................................................ 55 3.6.4 Trends and triggers by country ..................................................................................................... 64
4 THE STRUCTURE OF THE EU AQUACULTURE SECTOR .......................................................................... 73
4.1 STRUCTURE BY AQUACULTURE SUBSECTOR ..................................................................................................... 73 4.1.1 Shellfish aquaculture ..................................................................................................................... 73 4.1.2 Marine (saltwater) aquaculture .................................................................................................... 76 4.1.3 Freshwater aquaculture ................................................................................................................ 79
4.2 MAIN SPECIES ANALYSED IN EU AQUACULTURE ............................................................................................... 82 4.2.1 Salmon ........................................................................................................................................... 84 4.2.2 Trout .............................................................................................................................................. 88 4.2.3 Seabass & Seabream ..................................................................................................................... 92 4.2.4 Carp ............................................................................................................................................... 97 4.2.5 Mussel ......................................................................................................................................... 101 4.2.6 Oyster .......................................................................................................................................... 105 4.2.7 Clam ............................................................................................................................................ 109 4.2.8 Other marine fish species ............................................................................................................ 113 4.2.9 Other freshwater fish species ...................................................................................................... 113 4.2.10 Other shellfish species ................................................................................................................. 114 4.2.11 Other species ............................................................................................................................... 114
5 NATIONAL CHAPTERS ...................................................................................................................... 115
5.1 AUSTRIA .............................................................................................................................................. 116 5.1.1 Overview of the Austrian aquaculture sector.............................................................................. 116 5.1.2 Data Coverage and Data Quality of the Austrian aquaculture sector ........................................ 117
5.2 BELGIUM ............................................................................................................................................. 118 5.2.1 Overview of the Belgian aquaculture sector ............................................................................... 118 5.2.2 Data Coverage and Data Quality of the Belgian aquaculture sector .......................................... 119
5.3 BULGARIA ............................................................................................................................................ 120
2 2
5.3.1 Overview of the Bulgarian aquaculture sector............................................................................ 120 5.3.2 Structure and economic performance of main Bulgarian aquaculture segments ...................... 125 5.3.3 Trends and triggers of Bulgarian aquaculture sector ................................................................. 126
5.4 CROATIA .............................................................................................................................................. 129 5.4.1 Overview of the Croatian aquaculture sector ............................................................................. 129 5.4.2 Data Coverage and Data Quality of the Croatian aquaculture sector ........................................ 130
5.5 CYPRUS ................................................................................................................................................ 131 5.5.1 Overview of the Cyprian aquaculture sector ............................................................................... 131 5.5.2 Trends and triggers of the Cyprian aquaculture sector ............................................................... 136 5.5.3 Data Coverage and Data Quality of the Cyprian aquaculture sector.......................................... 137
5.6 CZECH REPUBLIC .................................................................................................................................. 139 5.6.1 Overview of the Czech aquaculture sector .................................................................................. 139 5.6.2 Data Coverage and Data Quality of the Czech aquaculture sector............................................. 140
5.7 DENMARK ............................................................................................................................................ 141 5.7.1 Overview of the Danish aquaculture sector ................................................................................ 141 5.7.2 Structure and economic performance of main Danish aquaculture segments ........................... 146 5.7.3 Trends and triggers of the Danish aquaculture sector ................................................................ 152 5.7.4 Data Coverage and Data Quality of the Danish aquaculture sector ........................................... 154
5.8 ESTONIA .............................................................................................................................................. 157 5.8.1 Overview of the Estonian aquaculture sector ............................................................................. 157 5.8.2 Trends and triggers of the Estonian aquaculture sector ............................................................. 158 5.8.3 Data Coverage and Data Quality of the Estonian aquaculture sector ........................................ 159
5.9 FINLAND .............................................................................................................................................. 160 5.9.1 Overview of the Finnish aquaculture sector ................................................................................ 160 5.9.2 Structure and economic performance of main Finnish aquaculture segments .......................... 165 5.9.3 Trends and triggers of the Finnish aquaculture sector................................................................ 169 5.9.4 Data Coverage and Data Quality of the Finnish aquaculture sector .......................................... 171
5.10 FRANCE ................................................................................................................................................ 173 5.10.1 Overview of the French aquaculture sector ................................................................................ 173 5.10.2 Structure and economic performance of main French aquaculture segments ........................... 179 5.10.3 Trends and triggers of the French aquaculture sector ................................................................ 184 5.10.4 Data Coverage and Data Quality of the French aquaculture sector ........................................... 185
5.11 GERMANY ............................................................................................................................................ 188 5.11.1 Overview of the German aquaculture sector .............................................................................. 188 5.11.2 Structure of main German marine aquaculture segments ......................................................... 194 5.11.3 Trends and triggers of the German aquaculture sector .............................................................. 195 5.11.4 Data Coverage and Data Quality of the German aquaculture sector ......................................... 197
5.12 GREECE ................................................................................................................................................ 198 5.12.1 Overview of the Greek aquaculture sector .................................................................................. 198 5.12.2 Trends and triggers of the Greek aquaculture sector ................................................................. 201 5.12.3 Data Coverage and Data Quality of the Greek aquaculture sector ............................................ 201
5.13 HUNGARY ............................................................................................................................................ 203 5.13.1 Overview of the Hungarian aquaculture sector .......................................................................... 203 5.13.2 Data Coverage and Data Quality of the Hungarian aquaculture sector ..................................... 204
5.14 IRELAND .............................................................................................................................................. 205 5.14.1 Overview of the Irish aquaculture sector .................................................................................... 205 5.14.2 Structure and economic performance of main Irish aquaculture segments ............................... 211 5.14.3 Trends and triggers of the Irish aquaculture sector .................................................................... 216 5.14.4 Data Coverage and Data Quality of the Irish aquaculture sector ............................................... 219
5.15 ITALY .................................................................................................................................................... 221 5.15.1 Overview of the Italian aquaculture sector ................................................................................. 221 5.15.2 Structure and economic performance of main Italian aquaculture segments ........................... 227 5.15.3 Trends and triggers of the Italian aquaculture sector ................................................................. 232
3 3
5.15.4 Data Coverage and Data Quality of the Italian aquaculture sector ........................................... 234 5.16 LATVIA ................................................................................................................................................. 237
5.16.1 Overview of the Latvian aquaculture sector ............................................................................... 237 5.16.2 Trends and triggers of the Latvian aquaculture sector ............................................................... 239 5.16.3 Data Coverage and Data Quality of the Latvian aquaculture sector .......................................... 241
5.17 LITHUANIA ........................................................................................................................................... 242 5.17.1 Overview of the Lithuanian aquaculture sector .......................................................................... 242 5.17.2 Data Coverage and Data Quality of the Lithuanian aquaculture sector ..................................... 243
5.18 LUXEMBOURG ..................................................................................................................................... 244 5.19 MALTA ................................................................................................................................................. 245
5.19.1 Overview of the Maltese aquaculture sector .............................................................................. 245 5.19.2 Structure and economic performance of main Maltese aquaculture segments ......................... 250 5.19.3 Trends and triggers of the Maltese aquaculture sector .............................................................. 250 5.19.4 Data Coverage and Data Quality of the Maltese aquaculture sector ......................................... 251
5.20 NETHERLANDS ..................................................................................................................................... 252 5.20.1 Overview of the Dutch aquaculture sector .................................................................................. 252 5.20.2 Structure and economic performance of main Dutch aquaculture segments ............................ 256 5.20.3 Trends and triggers of the Dutch aquaculture sector ................................................................. 260 5.20.4 Data Coverage and Data Quality of the Dutch aquaculture sector ............................................ 262
5.21 POLAND ............................................................................................................................................... 264 5.21.1 Overview of the Polish aquaculture sector .................................................................................. 264 5.21.2 Trends and triggers of the Polish aquaculture sector ................................................................. 269 5.21.3 Data Coverage and Data Quality of the Polish aquaculture sector ............................................ 271
5.22 PORTUGAL ........................................................................................................................................... 273 5.22.1 Overview of the Portuguese aquaculture sector ......................................................................... 273 5.22.2 Structure and economic performance of main Portuguese aquaculture segments ................... 278 5.22.3 Trends and triggers of the Portuguese aquaculture sector ......................................................... 282 5.22.4 Data Coverage and Data Quality of the Portuguese aquaculture sector.................................... 285
5.23 ROMANIA ............................................................................................................................................ 286 5.23.1 Overview of the Romanian aquaculture sector ........................................................................... 286 5.23.2 Structure and economic performance of main Romanian aquaculture segments ..................... 291 5.23.3 Trends and triggers of the Romanian aquaculture sector .......................................................... 295 5.23.4 Data Coverage and Data Quality of the Romanian aquaculture sector ..................................... 296
5.24 SLOVAKIA ............................................................................................................................................ 298 5.24.1 Overview of the Slovakian aquaculture sector ............................................................................ 298 5.24.2 Data Coverage and Data Quality of the Slovakian aquaculture sector ...................................... 299
5.25 SLOVENIA ............................................................................................................................................ 300 5.25.1 Overview of the Slovenian aquaculture sector ............................................................................ 300 5.25.2 Structure and economic performance of main Slovenian marine aquaculture segments .......... 305 5.25.3 Trends and triggers of the Slovenian aquaculture sector ........................................................... 308 5.25.4 Data Coverage and Data Quality of the Slovenian aquaculture sector ...................................... 309
5.26 SPAIN ................................................................................................................................................... 311 5.26.1 Overview of the Spanish aquaculture sector ............................................................................... 311 5.26.2 Structure and economic performance of main Spanish aquaculture segments ......................... 316 5.26.3 Trends and triggers of the Spanish aquaculture sector .............................................................. 320 5.26.4 Data Coverage and Data Quality of the Spanish aquaculture sector ......................................... 323
5.27 SWEDEN .............................................................................................................................................. 326 5.27.1 Overview of the Swedish aquaculture sector .............................................................................. 326 5.27.2 Structure and economic performance of main Swedish aquaculture segments ......................... 332 5.27.3 Trends and triggers of the Swedish aquaculture sector .............................................................. 336 5.27.4 Data Coverage and Data Quality of the Swedish aquaculture sector ......................................... 338
5.28 UNITED KINGDOM ............................................................................................................................... 340 5.28.1 Overview of the United Kingdom’s aquaculture sector ............................................................... 340
4 4
5.28.2 Structure and economic performance of main United Kingdom’s aquaculture segments ......... 347 5.28.3 Trends and triggers of the United kingdom’s aquaculture sector............................................... 350 5.28.4 Data Coverage and Data Quality of the United Kingdom’s aquaculture sector ......................... 351
6 ARE PRODUCTION VOLUME AND VALUE STATISTICS ON EU AQUACULTURE FROM FAO, EUROSTAT AND DCF ALIGNED? ......................................................................................................................................... 353
6.1 INTRODUCTION ....................................................................................................................................... 353 6.2 METHODOLOGY ...................................................................................................................................... 354 6.3 ANALYSIS ............................................................................................................................................... 354 6.4 CONCLUDING REMARKS ............................................................................................................................ 362
7 GLOSSARY ....................................................................................................................................... 363
7.1 GLOSSARY OF DATA REQUESTED AND INDICATORS ......................................................................................... 364 7.1.1 Parameters requested ................................................................................................................. 364 7.1.2 Indicators calculated ................................................................................................................... 370
REFERENCES ............................................................................................................................................ 373
APPENDICES ............................................................................................................................................ 375
1. SEGMENT CODES ......................................................................................................................................... 375 2. COVERAGE.................................................................................................................................................. 376 3. ADDITIONAL TOR: REVIEW OF DC-MAP - PART 2 (STECF-13-12) ................................................................. 378 4. DATA ......................................................................................................................................................... 380 5. LIST OF PARTICIPANTS .................................................................................................................................. 380
5 5
LIST OF FIGURES
Figure 3.1: World and EU-28 seafood production (capture and aquaculture): 1990-2011. ................................. 29
Figure 3.2: Aquaculture in EU per MS in weight terms: 2011............................................................................... 30
Figure 3.3: Aquaculture in EU per MS in value terms: 2011. ................................................................................ 30
Figure 3.4: Total sales volume and turnover in the EU Aquaculture sector per MS: 2011. ................................. 35
Figure 3.5: Total Employment in numbers and FTE in the EU Aquaculture sector per MS: 2011. ....................... 36
Figure 3.6: Average wage in the EU Aquaculture sector per MS: 2011. ............................................................... 37
Figure 3.7: EU Aquaculture economic performance by subsector: 2011. ............................................................ 39
Figure 4.1: EU (28) aquaculture production in weight and value by subsector: 1984-2011. ............................... 73
Figure 4.2: Costs breakdown for the EU shellfish aquaculture subsector: 2011. ................................................. 76
Figure 4.3: Costs breakdown for the EU marine aquaculture subsector: 2011. ................................................... 79
Figure 4.4: Costs breakdown for the EU freshwater aquaculture sub-sector: 2011. ........................................... 82
Figure 4.5: Production weight by species group: 2011. ........................................................................................ 83
Figure 4.6: Production value by species group: 2011. .......................................................................................... 84
Figure 4.7: Economic performance indicators for salmon aquaculture: 2008-2011. ........................................... 86
Figure 4.8: Economic performance indicators for salmon aquaculture: 2011. .................................................... 86
Figure 4.9: Costs breakdown for the EU salmon aquaculture subsector: 2011. .................................................. 87
Figure 4.10: Price evolution of Atlantic salmon: 2008-2011. ................................................................................ 88
Figure 4.11: Economic performance indicators for trout aquaculture: 2008-2011. ............................................ 90
Figure 4.12: Economic performance indicators for trout aquaculture: 2011. ...................................................... 90
Figure 4.13: Costs breakdown for the EU trout aquaculture subsector: 2011. .................................................... 91
Figure 4.14: Price evolution of rainbow trout: 2008-2011. .................................................................................. 92
Figure 4.15: Economic performance indicators for seabass & seabream aquaculture: 2008-2011. .................... 94
Figure 4.16: Economic performance indicators for seabass & seabream aquaculture: 2011. ............................. 94
Figure 4.17: Costs breakdown for the EU seabass & seabream aquaculture subsector: 2011. ........................... 95
Figure 4.18: Price evolution of European seabass & gilthead seabream: 2008-2011. ......................................... 96
Figure 4.19: Economic performance indicators for carp aquaculture: 2008-2011. .............................................. 99
Figure 4.20: Economic performance indicators for carp aquaculture: 2011. ....................................................... 99
Figure 4.21: Costs breakdown for the EU carp aquaculture subsector: 2011. ................................................... 100
Figure 4.22: Price evolution of common carp: 2008-2011. ................................................................................ 100
Figure 4.23: Economic performance indicators for mussel aquaculture: 2008-2011. ....................................... 103
Figure 4.24: Economic performance indicators for mussel aquaculture: 2011. ................................................. 103
Figure 4.25: Costs breakdown for the EU mussel aquaculture subsector: 2011. ............................................... 104
Figure 4.26: Price evolution of blue mussel and Mediterranean mussel: 2008-2011. ....................................... 105
Figure 4.27: Economic performance indicators for oyster aquaculture: 2008-2011.......................................... 107
Figure 4.28: Economic performance indicators for oyster aquaculture: 2011. .................................................. 107
Figure 4.29: Costs breakdown for the EU oyster aquaculture subsector: 2011. ................................................ 108
6 6
Figure 4.30: Price evolution of Pacific cupped oyster and European flat oyster: 2008-2011. ........................... 109
Figure 4.31: Economic performance indicators for clam aquaculture: 2008-2011. ........................................... 111
Figure 4.32: Economic performance indicators for clam aquaculture: 2011. .................................................... 111
Figure 4.33: Costs breakdown for the EU clam aquaculture subsector: 2011. .................................................. 112
Figure 4.34: Price evolution of Japanese carpet shell and grooved carped shell: 2008-2011. ........................... 113
Figure 5.1.1 Top 5 aquaculture species by first-sale weight and value in Austria: 2011. ................................... 117
Figure 5.1.2 Nominal first-sale prices for main 5 aquaculture species in Austria: 2008-2011. .......................... 117
Figure 5.2.1 Top aquaculture species by first-sale weight and value in Belgium: 2011. .................................... 118
Figure 5.2.2 Nominal first-sale prices for main aquaculture species in Belgium: 2008-2011. ........................... 119
Figure 5.3.1 Top 5 aquaculture species by first sale weight and value in Bulgaria: 2011. ................................. 120
Figure 5.3.2 Bulgarian aquaculture sector employment trends: 2008-2011. ..................................................... 122
Figure 5.3.3 Bulgarian income, costs, wages and labour productivity trends for the aquaculture sector: 2008-2011. ................................................................................................................................................................... 122
Figure 5.3.4 Economic performance of the Bulgarian aquaculture sector: 2011. .............................................. 123
Figure 5.3.5 Nominal first-sale prices for main 5 aquaculture species in Bulgaria: 2008-2011. ........................ 125
Figure 5.3.6 Structural development of Bulgarian aquaculture sector: 2008-2011. .......................................... 125
Figure 5.3.9 Comparison of Bulgarian aquaculture data between different data sources: 2008-2011. ............ 128
Figure 5.4.1 Top aquaculture species by first-sale weight and value in Croatia: 2011. ...................................... 130
Figure 5.4.2 Nominal first-sale prices for main 5 aquaculture species in Croatia: 2008-2011. .......................... 130
Figure 5.5.1 Top aquaculture species by first-sale weight and value in Cyprus: 2011. ...................................... 132
Figure 5.5.2 Cyprian aquaculture sector employment trends: 2008-2011. ........................................................ 133
Figure 5.5.3 Cyprian income, costs, wages and labour productivity trends for the aquaculture sector: 2008-2011. ................................................................................................................................................................... 133
Figure 5.5.4 Economic performance of the Cyprian aquaculture sector: 2011. ................................................. 134
Figure 5.5.5 Nominal first-sale prices for main aquaculture species in Cyprus: 2008-2011. ............................. 136
Figure 5.5.6 Comparison of Cyprian aquaculture data between different data sources: 2008-2011. ............... 138
Figure 5.6.1 Top aquaculture species by first-sale weight and value in Czech Republic: 2011. ......................... 139
Figure 5.6.2 Nominal first-sale prices for main 5 aquaculture species in Czech Republic: 2008-2011. ............. 140
Figure 5.7.1 Top aquaculture species by first-sale weight and value in Denmark: 2011. .................................. 142
Figure 5.7.2 Danish aquaculture sector employment trends: 2008-2011. ......................................................... 143
Figure 5.7.3 Danish income, costs, wages and labour productivity trends for the aquaculture sector: 2008-2011. ................................................................................................................................................................... 143
Figure 5.7.4 Economic performance of the Danish aquaculture sector: 2011. .................................................. 144
Figure 5.7.5 Nominal first-sale prices for main aquaculture species in Denmark: 2008-2011. .......................... 146
Figure 5.7.6 Structural development of Danish aquaculture sector: 2008-2011. .............................................. 147
Figure 5.7.7 Economic performance indicators for main Danish aquaculture segments: 2008-2011. .............. 150
Figure 5.7.8 Cost structure of main aquaculture segments for Denmark: 2011. ............................................... 151
Figure 5.7.9 Comparison of Danish aquaculture data between different data sources: 2008-2011. ................ 156
7 7
Figure 5.9.1 Top 5 aquaculture species by first-sale weight and value in Finland: 2011. .................................. 161
Figure 5.9.2 Finnish aquaculture sector employment trends: 2008-2011. ........................................................ 162
Figure 5.9.3 Finnish income, costs, wages and labour productivity trends for the aquaculture sector: 2008-2011. ................................................................................................................................................................... 162
Figure 5.9.4 Economic performance of the Finnish aquaculture sector: 2011. .................................................. 163
Figure 5.9.5 Nominal first-sale prices for main aquaculture species in Finland: 2008-2011. ............................. 165
Figure 5.9.6 Structural development of Finnish aquaculture sector: 2008-2011. .............................................. 165
Figure 5.9.7 Economic performance indicators for main Finnish aquaculture segments: 2008-2011. .............. 168
Figure 5.9.8 Cost structure of main aquaculture segments for Finland: 2011. .................................................. 169
Figure 5.9.9 Comparison of Finnish aquaculture data between different data sources: 2008-2011. ................ 171
Figure 5.10.1 Top 5 aquaculture species by first-sale weight and value in France: 2011. ................................. 174
Figure 5.10.2 French aquaculture sector employment trends: 2008-2011. ....................................................... 176
Figure 5.10.3 French income, costs, wages and labour productivity trends for the aquaculture sector: 2008-2011. ................................................................................................................................................................... 176
Figure 5.10.4 Economic performance of the French aquaculture sector: 2011. ................................................ 177
Figure 5.10.5 Nominal first-sale prices for main 5 aquaculture species in France: 2008-2011. ......................... 179
Figure 5.10.6 Structural development of French aquaculture sector: 2008-2011. ............................................ 180
Figure 5.10.7 Economic performance indicators for main French aquaculture segments: 2008-2011. ............ 182
Figure 5.10.8 Cost structure of main aquaculture segments for France: 2011. ................................................. 183
Figure 5.10.9 Comparison of French aquaculture data between different data sources: 2008-2011. .............. 187
Figure 5.11.1 Top 5 aquaculture species by first-sale weight and value in Germany: 2011. ............................. 191
Figure 5.11.2 German marine aquaculture sector employment trends: 2008-2011. ........................................ 192
Figure 5.11.3 German income, costs, wages and labour productivity trends for the marine aquaculture sector: 2008-2011. .......................................................................................................................................................... 192
Figure 5.11.4 Economic performance of the German marine aquaculture sector: 2011................................... 193
Figure 5.11.5 Comparison of German aquaculture data between different data sources: 2008-2011. ............ 197
Figure 5.12.1 Top aquaculture species by first-sale weight and value in Greece: 2011. .................................... 199
Figure 5.12.2 Nominal first-sale prices for main aquaculture species in Greece: 2008-2011. ........................... 200
Figure 5.12.3 Comparison of Greek aquaculture data between different data sources: 2008-2011. ................ 202
Figure 5.13.1 Top 5 aquaculture species by first-sale weight and value in Hungary: 2011. ............................... 203
Figure 5.13.2 Nominal first-sale prices for main 5 aquaculture species in Hungary: 2008-2011. ...................... 204
Figure 5.14.1 Top 5 aquaculture species by first-sales weight and value in Ireland: 2011. ............................... 206
Figure 5.14.2 Irish aquaculture sector employment trends: 2008-2011. ........................................................... 208
Figure 5.14.3 Irish income, costs, wages and labour productivity trends for the aquaculture sector: 2008-2011.............................................................................................................................................................................. 208
Figure 5.14.4 Economic performance of the Irish aquaculture sector: 2011. .................................................... 209
Figure 5.14.5 Nominal first-sale prices for main 5 aquaculture species in Ireland: 2008-2011. ........................ 211
Figure 5.14.6 Structural development of Irish aquaculture sector: 2008-2011. ................................................ 212
8 8
Figure 5.14.7 Economic performance indicators for main four Irish segments: 2011. ...................................... 214
Figure 5.14.8 Cost structure of main aquaculture segments for Ireland: 2011. ................................................. 215
Figure 5.14.9 Comparison of Irish aquaculture data between different data sources: 2008-2011. .................. 220
Figure 5.15.1 Top aquaculture species by first-sale weight and value in Italy: 2011. ........................................ 222
Figure 5.15.2 Italian aquaculture sector employment trends: 2008-2011. ........................................................ 224
Figure 5.15.3 Italian income, costs, wages and labour productivity trends for the aquaculture sector: 2008-2011. ................................................................................................................................................................... 224
Figure 5.15.4 Economic performance of the Italian aquaculture sector: 2011. ................................................. 225
Figure 5.15.5 Nominal first-sale prices for main aquaculture species in Italy: 2008-2011. ................................ 227
Figure 5.15.6 Structural development of Italian aquaculture sector: 2008-2011. ............................................. 228
Figure 5.15.7 Economic performance indicators for main Italian segments: 2008-2011................................... 230
Figure 5.15.8 Cost structure of main aquaculture segments for Italy: 2011. ..................................................... 231
Figure 5.15.9 Comparison of Italian aquaculture data between different data sources: 2008-2011. ............... 236
Figure 5.16.1 Top 5 aquaculture species by first-sale weight and value in Latvia: 2011. ................................... 238
Figure 5.16.2 Nominal first-sale prices for main 5 aquaculture species in Latvia: 2008-2011. .......................... 239
Figure 5.17.1 Top 5 aquaculture species by first-sale weight and value in Lithuania: 2011. ............................. 242
Figure 5.17.2 Nominal first-sale prices for main 5 aquaculture species in Lithuania: 2008-2011. ..................... 243
Figure 5.19.1 Top 5 aquaculture species by first-sale weight and value in Malta: 2011. ................................... 246
Figure 5.19.2 Maltese aquaculture sector employment trends: 2008-2011. ..................................................... 247
Figure 5.19.3 Maltese income, costs, wages and labour productivity trends for the aquaculture sector: 2008-2011. ................................................................................................................................................................... 247
Figure 5.19.4 Economic performance of the Maltese aquaculture sector: 2011. .............................................. 248
Figure 5.19.5 Nominal first-sale prices for main 5 aquaculture species in Malta: 2008-2011. .......................... 250
Figure 5.19.9 Comparison of Maltese aquaculture data between different data sources: 2008-2011. ............ 251
Figure 5.20.1 Top aquaculture species by first-sale weight and value in the Netherlands: 2010. ..................... 253
Figure 5.20.2 Dutch income, costs, wages and labour productivity trends for the aquaculture sector: 2008-2010. ................................................................................................................................................................... 253
Figure 5.20.3 Economic performance of the Dutch aquaculture sector: 2010. ................................................. 254
Figure 5.20.4 Nominal first-sale prices for main 5 aquaculture species in Netherlands: 2008-2011. ................ 256
Figure 5.20.5 Structural development of Dutch aquaculture sector: 2008-2011. .............................................. 256
Figure 5.20.6 Economic performance indicators for main Dutch aquaculture segments: 2008-2011............... 259
Figure 5.20.7 Cost structure of main aquaculture segments for the Netherlands: 2010. .................................. 260
Figure 5.20.8 Comparison of Dutch aquaculture data between different data sources: 2008-2011. ................ 263
Figure 5.21.1 Top 5 aquaculture species by first-sale weight and value in Poland: 2011. ................................. 265
Figure 5.21.2 Polish marine aquaculture sector employment trends: 2008-2011. ............................................ 266
Figure 5.21.3 Polish income, costs, wages and labour productivity trends for the marine aquaculture sector: 2008-2011. .......................................................................................................................................................... 266
Figure 5.21.4 Economic performance of the Polish marine aquaculture sector: 2011. ..................................... 267
9 9
Figure 5.21.5 Nominal first-sale prices for aquaculture species in Poland: 2008-2011. .................................... 269
Figure 5.21.6 Comparison of Polish aquaculture data between different data sources: 2008-2011. ................ 272
Figure 5.22.1 Top 5 aquaculture species by first-sale weight and value in Portugal: 2011. ............................... 274
Figure 5.22.2 Portuguese aquaculture sector employment trends: 2008-2011. ............................................... 275
Figure 5.22.3 Portuguese income, costs, wages and labour productivity trends for the aquaculture sector: 2008-2011. .......................................................................................................................................................... 275
Figure 5.22.4 Economic performance of the Portugal aquaculture sector: 2011. ............................................. 276
Figure 5.22.5 Nominal first-sale prices for main 5 aquaculture species in Portugal: 2008-2011. ...................... 278
Figure 5.22.6 Structural development of Portuguese aquaculture sector: 2008-2011. ..................................... 278
Figure 5.22.7 Economic performance indicators for main Portuguese segments: 2008-2011. ......................... 281
Figure 5.22.8 Cost structure of main aquaculture segments for Portugal: 2011. .............................................. 281
Figure 5.22.9 Comparison of Portuguese aquaculture data between different data sources: 2008-2011. ....... 285
Figure 5.23.1 Top 5 aquaculture species by first-sale weight and value in Romania: 2011. .............................. 287
Figure 5.23.2 Romanian aquaculture sector employment trends: 2008-2011................................................... 288
Figure 5.23.3 Romanian income, costs, wages and labour productivity trends for the aquaculture sector: 2008-2011. ................................................................................................................................................................... 289
Figure 5.23.4 Economic performance of the Romanian aquaculture sector: 2011. ........................................... 289
Figure 5.23.5 Nominal first-sale prices for main aquaculture species in Romania: 2008-2011. ........................ 291
Figure 5.23.6 Structural development of Romanian aquaculture sector: 2008-2011. ....................................... 291
Figure 5.23.7 Economic performance indicators for main four Romanian segments: 2008-2011..................... 294
Figure 5.23.8 Cost structure of main segments for Romania: 2011. .................................................................. 295
Figure 5.23.9 Comparison of Romanian aquaculture data between different data sources: 2008-2011. ......... 297
Figure 5.24.1 Top 5 aquaculture species by first-sale weight and value in Slovakia: 2011. ............................... 299
Figure 5.24.2 Nominal first-sale prices for main aquaculture species in Slovakia: 2008-2011. ......................... 299
Figure 5.25.1 Top marine aquaculture species by first-sale weight and value in Slovenia: 2011. ..................... 301
Figure 5.25.2 Slovenian marine aquaculture sector employment trends: 2008-2011. ...................................... 302
Figure 5.25.3 Slovenian income, costs, wages and labour productivity trends for the marine aquaculture sector: 2008-2011. .......................................................................................................................................................... 303
Figure 5.25.4 Economic performance of the Slovenian marine aquaculture sector: 2011. ............................... 303
Figure 5.25.5 Nominal first-sale prices for main marine aquaculture species in Slovenia: 2008-2011. ............. 305
Figure 5.25.6 Structural development of Slovenian marine aquaculture sector: 2008-2011. ........................... 306
Figure 5.25.7 Economic performance indicators for main Slovenian marine aquaculture segments: 2008-2011.............................................................................................................................................................................. 307
Figure 5.25.8 Cost structure of main marine aquaculture segments for Slovenia: 2011. .................................. 308
Figure 5.25.9 Comparison of Slovenian aquaculture data between different data sources: 2008-2011. .......... 310
Figure 5.26.1 Top 5 aquaculture species by first-sale weight and value in Spain: 2011. ................................... 312
Figure 5.26.2 Spanish aquaculture sector employment trends: 2008-2011. ..................................................... 313
10 10
Figure 5.26.3 Spanish income, costs, wages and labour productivity trends for the aquaculture sector: 2008-2011. ................................................................................................................................................................... 313
Figure 5.26.4 Economic performance of the Spanish aquaculture sector: 2011................................................ 314
Figure 5.26.5 Nominal first-sale prices for main 5 aquaculture species in Spain: 2008-2011. ........................... 316
Figure 5.26.6 Structural development of Spanish aquaculture sector: 2008-2011. ........................................... 317
Figure 5.26.7 Economic performance indicators for main four Spanish segments: 2008-2011. ....................... 318
Figure 5.26.8 Cost structure of main aquaculture segments for Spain: 2011. ................................................... 320
Figure 5.26.9 Comparison of Spanish aquaculture data between different data sources: 2008-2011. ............. 323
Figure 5.27.1 Top aquaculture species by first-sale weight and value in Sweden: 2011. .................................. 327
Figure 5.27.2 Swedish aquaculture sector employment trends: 2008-2011. ..................................................... 329
Figure 5.27.3 Swedish income, costs, wages and labour productivity trends for the aquaculture sector: 2008-2011. ................................................................................................................................................................... 329
Figure 5.27.4 Economic performance of the Swedish aquaculture sector: 2011. .............................................. 330
Figure 5.27.5 Nominal first-sale prices for main aquaculture species in Sweden: 2008-2011. .......................... 332
Figure 5.27.6 Structural development of Swedish aquaculture sector: 2008-2011. .......................................... 333
Figure 5.27.7 Economic performance indicators for main Swedish segments: 2008-2011. .............................. 335
Figure 5.27.8 Cost structure of main aquaculture segments for Sweden: 2011. ............................................... 336
Figure 5.27.9 Comparison of Swedish aquaculture data between different data sources: 2008-2011. ............ 339
Figure 5.28.1 Top aquaculture species by first-sale weight and value in United Kingdom: 2011. ..................... 342
Figure 5.28.2 United Kingdom aquaculture sector employment trends: 2008-2011. ........................................ 344
Figure 5.28.3 United Kingdom income, costs, wages and labour productivity trends for the aquaculture sector: 2008-2011. .......................................................................................................................................................... 344
Figure 5.28.4 Economic performance of the United Kingdom’s aquaculture sector: 2011. .............................. 345
Figure 5.28.5 Nominal first-sale prices for main aquaculture species in United Kingdom: 2008-2011. ............ 347
Figure 5.28.6 Structural development of United Kingdom’s aquaculture sector: 2008-2011............................ 348
Figure 5.28.7 Economic performance indicators for main United Kingdom’s aquaculture segments: 2008-2011.............................................................................................................................................................................. 349
Figure 5.28.9 Comparison of United Kingdom’s aquaculture data between different data sources: 2008-2011.............................................................................................................................................................................. 352
Figure 6.1: Comparison of FAO and EUROSTAT value data by DCF country ....................................................... 355
Figure 6.2: Comparison of FAO and EUROSTAT value data by non-DCF country ............................................... 356
Figure 6.3: Comparison of DCF and EUROSTAT value data by country .............................................................. 357
Figure 6.4: Comparison of DCF and EUROSTAT volume data by country ........................................................... 358
Figure 6.5: Comparison of FAO and EUROSTAT data for the United Kingdom ................................................... 359
Figure 6.6: Comparison of FAO and EUROSTAT data for Spain .......................................................................... 360
11 11
LIST OF TABLES
Table 2.1: List of economic variables for the aquaculture sector. ........................................................................ 24
Table 3.1: Economic Indicators for the EU (28) aquaculture sector: 2011. .......................................................... 33
Table 3.2: Economic Performance Indicators for the EU aquaculture sector: 2011. ........................................... 38
Table 4.1: Economic indicators for the EU (28) aquaculture shellfish subsector: 2011. ...................................... 74
Table 4.2: Economic Performance indicators for the EU aquaculture shellfish subsector: 2011. ........................ 75
Table 4.3: Economic indicators for the EU (28) aquaculture marine subsector: 2011. ........................................ 77
Table 4.4: Economic Performance indicators for the EU aquaculture marine subsector: 2011. ......................... 78
Table 4.5: Economic indicators for the EU (28) aquaculture freshwater subsector: 2011. .................................. 80
Table 4.6: Economic Performance indicators for the EU aquaculture freshwater subsector: 2011. ................... 81
Table 4.7: Economic indicators for the EU (28) salmon aquaculture subsector: 2011. ........................................ 85
Table 4.8: Economic Performance indicators for the EU salmon aquaculture subsector: 2011. ......................... 87
Table 4.9: Economic indicators for the EU (28) trout aquaculture subsector: 2011. ........................................... 89
Table 4.10: Economic Performance indicators for the trout aquaculture subsector: 2011. ................................ 91
Table 4.11: Economic indicators for the EU (28) seabass & seabream aquaculture subsector: 2011. ................ 93
Table 4.12: Economic Performance indicators for the EU seabass & seabream aquaculture subsector: 2011. .. 95
Table 4.13: Economic indicators for the EU (28) carp aquaculture subsector: 2011. .......................................... 98
Table 4.14: Economic Performance indicators for the EU carp aquaculture subsector: 2011. ............................ 99
Table 4.15: Economic indicators for the EU (28) mussel aquaculture subsector: 2011. .................................... 102
Table 4.16: Economic Performance indicators for the EU mussel aquaculture subsector: 2011. ...................... 104
Table 4.17: Economic indicators for the EU (28) oyster aquaculture subsector: 2011. ..................................... 106
Table 4.18: Economic Performance indicators for the EU oyster aquaculture subsector: 2011. ....................... 108
Table 4.19: Economic indicators for the EU (28) clam aquaculture subsector: 2011. ........................................ 110
Table 4.20: Economic Performance indicators for the EU clam aquaculture subsector: 2011. ......................... 112
Table 5.1.1 Weight and value of Austrian aquaculture sector first-sales: 2008-2011. ....................................... 116
Table 5.2.1 Weight and value of Belgian aquaculture sector first-sales: 2008-2011. ........................................ 118
Table 5.3.1 Weight and value of Bulgarian aquaculture sector first-sales: 2008-2011. ..................................... 120
Table 5.3.2 Aquaculture sector overview for Bulgaria: 2008-2011. ................................................................... 121
Table 5.3.3 Economic performance for the Bulgarian aquaculture sector: 2008-2011. .................................... 124
Table 5.4.1 Weight and value of Croatian aquaculture sector first-sales: 2008-2011. ...................................... 129
Table 5.5.1 Weight and value of Cyprian aquaculture sector first-sales: 2008-2011. ........................................ 131
Table 5.5.2 Aquaculture sector overview for Cyprus: 2008-2011. ..................................................................... 132
Table 5.5.3 Economic performance of the Cyprian aquaculture sector: 2008-2011. ......................................... 135
Table 5.6.1 Weight and value of Czech aquaculture sector first-sales: 2008-2011. ........................................... 139
Table 5.7.1 Weight and value of Danish aquaculture sector first-sales: 2008-2011. ......................................... 141
12 12
Table 5.7.2 Aquaculture sector overview for Denmark: 2008-2011. .................................................................. 142
Table 5.7.3 Economic performance of the Danish aquaculture sector: 2008-2011. .......................................... 145
Table 5.7.4 Economic performance of main Danish aquaculture segments: 2008-2011 (in million €). ............. 149
Table 5.8.1 Weight and value of Estonian aquaculture sector first-sales: 2008-2011. ...................................... 157
Table 5.9.1 Weight and value of Finnish aquaculture sector first-sales: 2008-2011. ......................................... 160
Table 5.9.2 Aquaculture sector overview for Finland: 2008-2011...................................................................... 161
Table 5.9.3 Economic performance of the Finnish aquaculture sector: 2008-2011. ......................................... 164
Table 5.9.4 Economic performance of main Finnish aquaculture segments: 2008-2011 (in million €). ............ 167
Table 5.10.1 Weight and value of French aquaculture sector first-sales: 2008-2011. ....................................... 174
Table 5.10.2 Aquaculture sector overview for France: 2008-2011. ................................................................... 175
Table 5.10.3 Economic performance of the French aquaculture sector: 2008-2011. ........................................ 178
Table 5.10.4 Economic performance of main French aquaculture segments: 2008-2011 (in million €)............ 181
Table 5.11.1 Persons subject to social insurance contributions by gender and full/part time in Germany.. .... 189
Table 5.11.2 Turnover declaration for VAT purposes in the German freshwater aquaculture segment. .......... 190
Table 5.11.3 Weight and value of German aquaculture sector first-sales: 2008-2011. ..................................... 190
Table 5.11.4 Marine aquaculture sector overview for Germany: 2008-2011. ................................................... 191
Table 5.11.5 Economic performance for German marine aquaculture sector: 2008-2011. .............................. 194
Table 5.11.6 Volume of seed mussels and consumption mussels in Lower Saxony. .......................................... 194
Table 5.12.1 Weight and value of Greek aquaculture sector first-sales: 2008-2011. ........................................ 198
Table 5.12.2 Aquaculture sector overview for Greece: 2008-2011. ................................................................... 200
Table 5.13.1 Weight and value of Hungarian aquaculture sector first-sales: 2008-2011. ................................. 203
Table 5.14.1 Weight and value of Irish aquaculture sector first-sales: 2008-2011. ........................................... 205
Table 5.14.2 Aquaculture sector overview for Ireland: 2008-2011. ................................................................... 207
Table 5.14.3 Economic performance of the Irish aquaculture sector: 2008-2011. ............................................ 210
Table 5.14.4 Economic performance of main Irish aquaculture segments: 2008-2011 (in million €). ............... 213
Table 5.15.1 Weight and value of Italian aquaculture sector first-sales: 2008-2011. ........................................ 222
Table 5.15.2 Aquaculture sector overview for Italy: 2008-2011. ....................................................................... 223
Table 5.15.3 Economic performance of the Italian aquaculture sector: 2008-2011. ......................................... 226
Table 5.15.4 Economic performance of main Italian aquaculture segments: 2008-2011, (in million €). .......... 229
Table 5.16.1 Weight and value of Latvian aquaculture sector first-sales: 2008-2011........................................ 238
Table 5.17.1 Weight and value of Lithuanian aquaculture sector first-sales: 2008-2011. ................................. 242
Table 5.19.1 Weight and value of Maltese aquaculture sector first-sales: 2008-2011. ..................................... 245
Table 5.19.2 Aquaculture sector overview for Malta: 2008-2011. ..................................................................... 246
Table 5.19.3 Economic performance of the Maltese aquaculture sector: 2008-2011. ...................................... 249
Table 5.20.1 Weight and value of Dutch aquaculture sector first-sales: 2008-2011. ........................................ 252
Table 5.20.2 Economic performance of the Dutch aquaculture sector: 2008-2011. ......................................... 255
Table 5.20.3 Economic performance of main Dutch aquaculture segments: 2008-2011 (in million €). ............ 258
13 13
Table 5.21.1 Weight and value of Polish aquaculture sector first-sales: 2008-2011.......................................... 264
Table 5.21.2 Marine aquaculture sector overview for Poland: 2008-2011. ....................................................... 265
Table 5.21.3 Economic performance for Polish marine aquaculture sector: 2008-2011. .................................. 268
Table 5.22.1 Weight and value of Portuguese aquaculture sector first-sales: 2008-2011. ................................ 273
Table 5.22.2 Aquaculture sector overview for Portugal: 2008-2011. ................................................................. 274
Table 5.22.3 Economic performance of the Portuguese aquaculture sector: 2008-2011.................................. 277
Table 5.22.4 Economic performance of main Portuguese aquaculture segments: 2008-2011 (in million €). ... 280
Table 5.23.1 Weight and value of Romanian aquaculture sector first-sales: 2008-2011. .................................. 286
Table 5.23.2 Aquaculture sector overview for Romania: 2008-2011. ................................................................ 288
Table 5.23.3 Economic performance of the Romanian aquaculture sector: 2008-2011. ................................... 290
Table 5.23.4 Economic performance of main Romanian aquaculture segments: 2008-2011 (in million €) ...... 293
Table 5.24.1 Weight and value of Slovakian aquaculture sector first-sales: 2008-2011. ................................... 298
Table 5.25.1 Weight and value of Slovenian aquaculture sector first-sales: 2008-2011. .................................. 301
Table 5.25.2 Marine aquaculture sector overview for Slovenia: 2008-2011. ..................................................... 302
Table 5.25.3 Economic performance of the Slovenian marine aquaculture sector: 2008-2011. ....................... 304
Table 5.25.4 Economic performance of main Slovenian marine aquaculture segments: 2008-2011 (in million €).............................................................................................................................................................................. 307
Table 5.26.1 Weight and value of Spanish aquaculture sector first-sales: 2008-2011. ...................................... 311
Table 5.26.2 Aquaculture sector overview for Spain: 2008-2011....................................................................... 312
Table 5.26.3 Economic performance for Spanish aquaculture sector: 2008-2011. ........................................... 315
Table 5.26.4 Economic performance of main Spanish aquaculture segments: 2008-2011 (in million €). ......... 318
Table 5.27.1 Weight and value of Swedish aquaculture sector first-sales: 2008-2011. ..................................... 326
Table 5.27.2 Aquaculture sector overview for Sweden: 2008-2011................................................................... 328
Table 5.27.3 Economic performance of the Swedish aquaculture sector: 2008-2011. ...................................... 331
Table 5.27.4 Economic performance of main Swedish aquaculture segments: 2008-2011 (in million €). ........ 334
Table 5.28.1 Weight and value of United Kingdom aquaculture sector first-sales: 2008-2011. ........................ 340
Table 5.28.2 Aquaculture sector overview for United Kingdom: 2008-2011. .................................................... 343
Table 5.28.3 Economic performance of the British aquaculture sector: 2008-2011. ......................................... 346
Table 5.28.4 Economic performance of main United Kingdom’s aquaculture segments: 2008-2011 (in million €). ........................................................................................................................................................................ 349
Table 6.1: Summary of main quantitative differences between DCF, EUROSTAT, and FAO data on production volume and value for the three main segment of freshwater, marine and shellfish aquaculture ..................... 360
Table 7.1: List of economic variables for the aquaculture sector. ...................................................................... 363
14
SCIENTIFIC, TECHNICAL AND ECONOMIC COMMITTEE FOR FISHERIES (STECF)
THE ECONOMIC PERFORMANCE OF THE EU AQUACULTURE SECTOR (STECF 13-29)
THIS REPORT WAS REVIEWED DURING THE PLENARY MEETING HELD IN BRUSSELS
4-8 NOVEMBER 2013
Background
Following the latest DCF call for economic data on the EU aquaculture, EWG 13-10 was requested to analyse and comment on the economic performance of the EU and national aquaculture sectors between 2008 and 2011. Previous editions of this report have been fundamentally descriptive and have focused more on the presentation of data. The 2013 report should provide a more analytical approach notably on the drivers and aspects of socio-economic relevance in aquaculture. The report should include, at least, the following sections:
1. A summary containing key findings.
2. EU aquaculture economic overview: drivers and main trends. (It must include specific sections on aquaculture employment, economic performance, and productivity at EU level)
3. National chapters on the economic performance of the aquaculture sectors, providing:
o National aquaculture overview
o Description of trends and drivers for change
4. EU analyses of economic performance by aquaculture sub-sector
5. Special topics of applied analysis.
Request to the STECF
STECF is requested to review the report of the STECF Expert Working Group and its summary, evaluate the findings and make any appropriate comments and recommendations.
Introduction
The Expert Working Group 13-10 convened in September 2013 in Ispra (Italy), to produce the 2013 Economic Performance of the European Union Aquaculture sector report. The report reflects the work by 18 external experts and 4 experts of JRC that attended the meeting, but also work by 5 other external experts who participated via email.
15
This is the third report of this type focusing on the performance of the aquaculture sector and providing an overview of the latest available information on the structure, social, economic and competitive performance of the aquaculture sector at national and EU level. The data used in this publication relates from 2008 to 2011, and was collected under the Data Collection Framework (DCF). The call for data was issued by DG MARE on the 13th of May 2013. Member States were requested to submit the data within 1 month of the call, making the submission deadline the 13th of June 2013.
STECF observations
In addition to the ToR to STECF, during the EWG 13-10 meeting the Commission requested that the EWG also comment on aquaculture data issues documented in the Report of the EWG 13-05 on the development of the DC-MAP.
The main issues discussed by EWG 13-10 are related to: 1. the statistical unit to be considered: the company or the farm (production unit) 2. distinguish cost and income items by economic activities (considering those different from farming, e.g. processing, marketing, oil drilling); 3. improving the DCF (future DC-MAP) segmentation by considering new segments (e.g. by environment, more species); 4. inclusion of new variables (e.g. subsidies on investment, livestock, weight and value at the end of the period); 5. renaming of variables that are already collected (e.g. debts and total value of assets).
STECF summary observation in relation to each of points 1-5 above are given below.
1) STECF notes that the choice between the company or the farm (production unit) strongly depends on the requirement of the primary end-user or users, in this case (i.e. DG MARE). The statistical unit should be the enterprise (legal unit) if the end-user is interested in the economic performance of the aquaculture sector. Indeed, all costs and incomes are recorded at the company level. If the end-user is instead interested to know the socio-economic importance from a spatial point of view and a more detailed knowledge of the economic performance of particular aquaculture farming, then there is the need to use the farm (production unit) as the statistical unit. However, if businesses themselves do not record data at a certain level of detail, e.g. production unit level, then it will be impractical to try to collect data at that level.
2) STECF observes that some companies that carry out aquaculture activities also carry out other economic activities (for instance, processing, marketing, oil drilling). Taking into account that, in the present DCF, aquaculture data are collected at company level, STECF notes that if an economic performance or productivity analysis of the aquaculture sector is requested by key end-users, it is important that data related to the aquaculture sector are separated from data relating to other activities. If the main aim is to analyse the economic strength of the companies carrying out aquaculture, then data on all economic activities conducted by such companies are needed.
3) STECF notes that the current segmentation of aquaculture data collection does not permit an evaluation of production in different environments (salt-water, fresh water, brackish, etc.) even though DG-MARE has explicitly requested facts and figures in the report based on such an evaluation. STECF agrees that such an evaluation is required for a more complete analysis and understanding of the sector.
4) and 5) STECF notes that some of the issues associated with variables and conceptual issues are in some cases common to other sectors (fleet and processing).
16
STECF notes that there some confusion remains due to the fact that EU Member States are required to collect and provide data on marine (salt water) aquaculture, whereas the collection and provision of data on inland (freshwater) aquaculture is only voluntary under the DCF. Indeed, some MS submitted freshwater aquaculture data, even if not mandatory, while other MS did not, even if the inland (freshwater) production in these countries is relevant (e.g. Germany). Bearing this in mind, and in order to have a complete picture of the EU aquaculture (including freshwater), DCF data have been complemented by data held by the FAO.
Although there was an improvement in the quality of the data submitted compared to the previous data calls, there are still issues with several parameters that Member States are working to improve. Data checks were performed by the JRC through the analysis of the data submitted and by experts at the EWG meeting to prepare this report. The checks identified some questionable data and resulted in data resubmissions by some MS after the deadline and even after the EWG meeting.
Regarding coverage issues (submission of data), STECF notes that there were a) MSs that did not submit 2011 data (Netherlands, representing 2-3% of the EU production; they have specified in their national programs that aquaculture data is available at the end of the year +2); b) MSs submitting incomplete reports with some parameters missing thereby preventing an assessment economic performance (e.g. Greece and UK, representing 28% of the EU aquaculture sector) and c) MSs not submitting data (or full data) by fleet segment (e.g. Bulgaria, Cyprus).
The EWG 13-10 report provides more qualitative information about the main trends and the drivers of the changes that have occurred in the EU aquaculture industry.
STECF notes that a chapter on data alignment among DCF, FAO and EUROSTAT sources is provided. This chapter highlights why DCF data for MSs do not always match data from FAO and Eurostat and provides reasons why the collection of volume and value of sales should continue to be collected under the DCF (and not replaced by FAO or Eurostat data). In particular, the exercise of comparing the different data sets showed that a cross-check is possible by aggregating the more detailed EUROSTAT and FAO statistics at the level of the main species groups in the DCF. However, this cross-check is more problematic when considering the segmentation by farming technology due to differences between the DCF and EUROSTAT classifications.
STECF conclusions
STECF concludes that the EWG 13-10 report represents the culmination of a considerable amount of work by a numerous dedicated experts and provides a good overview of the economic performance of the EU aquaculture sector. It also represents an improvement in terms of quality and coverage compared to previous reports and puts more emphasis on qualitative knowledge. Despite the effort of individual experts, useful analysis was limited by the coverage and quality of the data submitted by MS and in some cases non submission of the data requested.
STECF concludes that, the collection of economic data disaggregated to farm or production unit level would be very difficult to achieve in practice.
STECF concludes that for companies that undertake both aquaculture and non-aquaculture activities, collection of data disaggregated by activity would be very difficult or impossible and would not be cost-effective. This is because most MSs base the collection of economic data on the official statistics, where companies are classified according to their main economic activity and hence, their incomes and costs relating to secondary activities are not easily distinguishable from those relating to their main activity.
17
STECF agrees with the proposals in Appendix 3 of EWG 13-10 on the issues concerning the need, in the future DCMAP, of further (i.e. new species segments or culture techniques) and more detailed segmentation (i.e. by environment). However, it should be noted that if one company has operations in different types of water, a range of species or culture techniques, then this desired distinction could be very difficult to make because the companies involved in multiple types of production techniques may not produce figures that distinguish between them. If companies themselves do not produce separate figures for different types of aquaculture production then it is not practical to collect data for different techniques of aquaculture production.
STECF concludes that issues relating to the inclusion of new variables as well the renaming of others would best be addressed by the forthcoming EWG 13-18 dealing with the future DCMAP because some of them are also pertinent to the fleet and the processing sectors. EWG 13-18 should also address the issues related to the distinction of income and cost items by economic activity and the feasibility, costs and benefits of including, in the new data collection regulation, a more detailed segmentation, e.g. by farming environment (marine and freshwater) as well as new important species segments, i.e. tuna, eel, others.
STECF concludes that data submission by MS after the deadlines compromises the ability of the EWG to undertake its work effectively and may also compromise the quality of the report.
STECF concludes that the timing of the EWG dealing with the aquaculture report is not optimal (EWG 13-10 was held in the first week of September, just after the summer break for many contributors to the report). It proved impossible to have all national chapters almost ready ahead of the EWG meeting as planned, with the result that there was less time to address more qualitative issues and general discussion on the main findings (e.g.trend and triggers).
STECF also concludes that a feasibility studies will be required if disaggregation of aquaculture production to farm or production unit level, disaggregation of economic data (income and costs) by type of economic activities, or disaggregation according to any other aspects of production are needed. The aim of such studies should be to evaluate if it is possible to collect data at the desired level of aggregation and the associated cost of doing so.
In keeping with the conclusions of EWG 13-05 on DCMAP and EWG 13-10, STECF concludes that that the standardization of the DCF segments on farming technology for finfish with the EUROSTAT classification is desirable. This is considered particularly important since it would allow comparison of economic data in the DCF with EUROSTAT and hence allow the use of some EUROSTAT figures (not collected under DCF), e.g. farm surface areas available since 2012 with the entry into force of Regulation (EC) No 762/2008.
STECF acknowledges that the EWG-13-10 adequately addressed all of the the Terms of Reference and endorses the findings in the report.
18
EXPERT WORKING GROUP EWG-13-10 REPORT
REPORT TO THE STECF
EXPERT WORKING GROUP ON THE ECONOMIC PERFORMANCE OF THE EU AQUACULTURE SECTOR
(EWG 13-10)
ISPRA, ITALY, 2-6 SEPTEMBER 2013
This report does not necessarily reflect the view of the STECF and the European Commission and in no way anticipates the Commission’s future policy in this area.
19
1 EXECUTIVE SUMMARY
The purpose of the EWG 13-10 meeting was to produce the 2013 Economic Report on the Economic Performance of the EU Aquaculture sector. This is the third report of this type, after 2011 and 2012’s report, produced for the aquaculture sector. This report provides a comprehensive overview of the latest information available on the structure, social, economic and competitive performance of the aquaculture sector at national and EU level. The data used in this publication relates from 2008 to 2011, and was collected under the Data Collection Framework (DCF). The report includes an EU overview chapter, detailed analysis by aquaculture subsector (i.e. shellfish, marine and freshwater aquaculture) and main species, as well as, national chapters.
Europe represents the largest market for fish in the world. Over the past decades consumption has increased. However, EU landings of wild fish have been stagnant or even decreasing; while EU aquaculture production has been stagnant. This has lead own production of fish (capture and farmed) not to increase, net fish imports have increased, and self sufficiency has decreased. There are many reasons that have lead to an increase in demand for fish, and there are reasons to believe that same or most reasons will continue to exist in the future. First, population size has increased. Second, overall the real price of fish has come down, making the product more attractive to consumers. Third, real incomes have increased, causing greater demand for fish. Finally, consumers have become more health conscious, causing a positive shift in demand as fish consumption is known to have important health benefits. Therefore, this offers a good possibility for the EU aquaculture sector to grow.
World aquaculture production is led by Asia with 91% of the production in quantity and 79% in value. In contrast, the EU-27 is only a minor player in aquaculture production. The EU (27) contribution to world aquaculture production has been decreasing significantly over time in both volume and value terms, representing 1.5% and 3.5% of global production in 2011. There are some successful stories in the EU aquaculture (STECF, 2012).
Using DCF and FAO data, it has been estimated that the aquaculture sector production in the EU-27 accounted for 1.32 million tonnes, with a turnover estimated at 3.99 billion Euros, in 2011. Spain, with 21% of the total EU production in volume, is the largest aquaculture producer in the EU, followed by France (18%), United Kingdom (14%), Italy (13%) and Greece (11%). These five countries account for more than 75% of the total EU aquaculture production in weight. In terms of value, the United Kingdom is the largest EU producer with 20% of the total EU aquaculture, followed by France (19%), Greece (15%), Spain (12%), and Italy (10%). These five countries are also responsible for more than 3/4 of all the EU aquaculture value. Aquaculture production by the 28 European Union Member States (EU-28) reached 1.28 million tonnes and 3.51 billion Euros in 2011 according to FAO.
EU aquaculture sales data for EU 28 has been analysed by including FAO data to fill in the missing turnover and volume of sales parameters in this report. 2011 data on national level (i.e. number of companies, employees) is available for around 75-90% of total value of EU 28 production. The necessary economic variables for full economic performance of EU aquaculture sector on national level is available for around 70% of value of production, while full economic performance on segment level covering around 50% of EU 28 aquaculture production.
Reported data suggest that in the EU (28) the total number of companies with aquaculture as their main activity is between 14 and 15 thousand in 2011, having produced a Gross Value Added of more than 1.5 billion Euros in 2011. Available data confirms the profitability improvement in 2011 following 2010, after suffering losses in 2008 and 2009. Profitability based on the Return On Investment calculated from the EBIT was 10%. However, it must be noted that the economic performance and the productivity differed enormously across subsectors and segments. The cost structures of the different national segments are
20
presented in detail in the national chapters; while the analysis by subsector (shellfish, marine and freshwater) is presented in chapter 4.
The EU aquaculture sector gave direct employment to more than 80,000 people in Europe, with an annual average wage of around 23 thousand Euros. Women accounted for 27% of these jobs. The large percentage of part-time work in the sector should be highlighted, as can be seen through comparison of the total employment numbers with employment expressed in Full Time Equivalents (FTE is 45% of the total number of employees). Part-time employment is important in the shellfish and freshwater aquaculture subsectors. Price falls of 2008/2009 during the economic crisis forced inefficient firms out of business and reductions in the number of employees leading to a more efficient industry which is now showing a strong recovery.
In 2011, marine fishes accounted for 31% of the EU aquaculture production in weight, freshwater fishes accounted for 20% and shellfish for 49%. While in value terms marine fishes accounted for 52% of the EU aquaculture production, freshwater fishes accounted for 21% and shellfish for 27%.
Shellfish aquaculture is a labour intensive segment, which faces limited environmental concerns. This sector contributes actively to external trade and has a very important social dimension given the high number of employed persons. Total sales volume for the EU (28) aquaculture shellfish sector is estimated to be 0.72 million tonnes and the total value of sales (turnover) is estimated to be 1.12 billion Euros in 2011. The most important costs of the EU shellfish aquaculture sector are labour and livestock costs. A large part of the employment is not performed under a formal contract. The workers are either the owners of the company or family members.
Marine fish aquaculture is characterised by being generally capital intensive, with high input and high labour productivity. This segment has potential to compete on the increasingly globalised market but it faces constrains which hinder further expansion. Its environmental impacts are also generally higher than those of other aquaculture segments. The total sales volume for the EU (28) marine aquaculture sector is estimated to be 0.36 million tonnes and the total value of sales (turnover) is estimated to be 1.77 billion Euros in 2011.
Freshwater aquaculture is often characterized by low labour productivity and low capital intensity, serving mainly local markets (e.g. carp). In this category limited demand and strong international competition is limiting the profitability and growth of production, however the extensive and artisanal production may play a role in environmental and recreational aspects (e.g. regarding biodiversity and preserving cultural landscapes). The total sales volume for the EU (28) freshwater aquaculture sector is estimated to be 0.29 million tonnes and the total value of sales (turnover) is estimated to be 0.89 billion Euros in 2011.
In 2011, the main aquaculture species produced in weight terms in the EU (27) were mussels (456 thousand tonnes, 36% of all production), rainbow trout (177 thousand tonnes, 14% of all production), Atlantic salmon (171 thousand tonnes, 13%), Pacific cupped oysters (104 thousand tonnes, 8%), gilthead seabream (99 thousand tonnes, 8%), European seabass (73 thousand tonnes, 6%) and common carp (62 thousand tonnes, 5%). This species constituted about 90% of the total EU aquaculture production. While the main aquaculture species produced in value in the EU (27) were Atlantic salmon (754 million Euros, 22% of all EU production), rainbow trout (507 million Euros, 15% of all EU production), gilthead seabream (435 million Euros, 13%), European seabass (359 million Euros, 10%), Pacific cupped oysters (357 million Euros, 10%), mussels (289 million Euros, 8%), and common carp (128 million Euros, 4%). This species constituted more than 80% of the total EU (27) aquaculture production in value for 2011.
National chapters for the 28 EU Members States are provided. For those countries where DCF data was not collected or not submitted, the national chapters were completed using FAO data.
21
The report includes an analysis to investigate the origin of main divergences between aquaculture data sources (DCF, EUROSTAT and FAO), and a reflection on the aquaculture data to be collected in the future DC-MAP,
Data for 2011 show an improvement following 2010 results in the economic performance of the EU aquaculture sector from the beginning of the economic crisis (2008-2009). However, the future evolution of the EU aquaculture is rather uncertain. The aquaculture sector has to face a fierce foreign competition that brings market prices down, high labour and capital costs and administrative burdens that slow down investments in the sector, hindering the full potential of the EU aquaculture sector.
There is every indication that the market for farmed fish and shellfish products is capable of continuing the expansion it has shown in the last twenty-five years and that newer products from some of the more traditional wild species could be a source of expansion. Where producers have engaged in organic production and certification they have often benefitted from increased profit margins especially when supported by Member State schemes such as those used in Ireland. However caution is needed to prevent cycles of organic 'rebranding' as a form of product differentiation. In some Member States there is little demand for organic products and suppliers view the subsector as too niche for major investment.
The EU has a competitive advantage in the presence of a well-educated work force. It has space for physical expansion of the industry but often a lack of understanding of the spatial needs and infrastructure for the industry among the planning authorities. An important barrier has been the long license application periods of up to three years which increase uncertainty and risk for start-up businesses. One reason for this is numerous points of governmental contact required for approval. A 'Single Contact System' has shown, in Norway, to reduce application time to 6 months. Most Member States would benefit from a reform in the aquaculture license application process.

22
2 INTRODUCTION
The Expert Working Group 13-10 convened in September 2013 in Ispra (Italy), to produce the 2013 Economic Performance of the European Union Aquaculture sector report. This report reflects the work by the experts attending the meeting, JRC experts and experts by correspondence.
This is the third report of this type, after last year’s report, produced for the aquaculture sector. This report provides a comprehensive overview of the latest information available on the structure, social, economical and competitive performance of the aquaculture sector at the national and at the overall EU level.
Data used in this publication stands from 2008 to 2011, and has been collected within the Data Collection Framework (DCF). The data collected is reported by totals and segments. Aquaculture companies and their data, have been classified into different segments made from the combination of the main species produced (salmon, trout, sea bass and sea bream, carp, other freshwater fish, other marine fish, mussel, oyster, clam and other shellfish) and the main technology employed (hatcheries and nurseries, on growing, combined, cages, rafts, long lines, bottom and others). The data analysed covers Income (turnover, subsidies and other income), Personnel costs (Wages and salaries of staff and Imputed value of unpaid labour), Energy costs, Raw material costs (livestock costs and feed costs), Repair and maintenance costs, Other operational costs, Capital costs (depreciation of capital and financial costs), Extraordinary costs, Capital value, Net Investments, Debt, Raw material volume (livestock and feed), Volume of sales, Employment (Number of persons employed and FTE national) and Number of enterprises for the years 2008 to 2011. Moreover, turnover and volume of sales are detailed by species.
On the DCF regulation concerning the aquaculture sector, the collection of freshwater aquaculture is voluntary, while marine aquaculture is compulsory. Therefore, the DCF data collection is only applied to the 22 EU’s coastal Member States. Belgium, Latvia and Lithuania provided no data under the DCF because most of their aquaculture production is freshwater based. Germany, Poland and Slovenia submitted marine water aquaculture data, but not on the freshwater aquaculture. Estonia did not provide data in this data call. The Netherlands did not provided data for 2011. Greece only provided partial data in this data call, and consequently these data could not be used in this exercise. The United Kingdom provided detailed cost structure only for 2011, however it was impossible to calculate some economic indicators (e.g. net profit) on the aquaculture segment level as the data set was incomplete. Most variables for UK are missing for 2008-2010. France provided a full set of economic variables on aquaculture segment level for 2010-2011, however some variables are missing for some segments.
The 2013 Economic Performance of the European Union Aquaculture sector report is structured as follows. The rest of this section presents the Terms of Reference for this report and lists the experts that participated in its production. It is followed by the overview of the EU aquaculture sector followed by an analysis of the structure of the sector and its subsectors (shellfish, marine and freshwater) that contains an analysis on the main species. Then it contains the 28 national chapters, with the inclusion of Croatia that joined the EU in 2013. It is followed by an analysis of the divergences between the different aquaculture production data sources, and a discussion of several issues concerning the future collection of aquaculture data under the DC-MAP. Finally, there are presented the glossary, the list of references used and the appendices.
23
2.1 Terms of Reference
Following the latest DCF call for economic data on the EU aquaculture, EWG 13-10 is requested to analyse and comment on the economic performance of the EU and national aquaculture sectors between 2008 and 2011.
Previous editions of this report have been fundamentally descriptive and have focused more on the presentation of data. This year's report should provide a more analytical approach notably on the drivers and aspects of policy relevance in aquaculture.
Analysis for variables and indicators not explored in previous reports should be developed (e.g. debts, investments, raw material volume and costs).
Additionally, the issue of data quality remains essential for the 2013 report. Data quality checks and data validation tools will be applied by the JRC. Experts will receive the data tables for the analyses, already validated, on the first day of meeting.
In 2013, the Annual Economic Report on EU aquaculture should have a special chapter designed to analysis on this sector.
STECF is requested to provide the Annual Economic Report on Aquaculture sector for 2013 including, at least, the following sections:
1. A summary containing key findings. 2. EU aquaculture economic overview: drivers and main trends. (It must include specific sections on aquaculture employment, economic performance, and productivity at EU level) 3. National chapters on the economic performance of the aquaculture sectors, providing:
National aquaculture overview Recent developments Employment and average salaries Performance of aquaculture sectors Economic indicators
Description of trends and drivers for change 4. EU analyses of economic performance by aquaculture sub-sector 5. Special topic on analysis of the sector.
2.2 Data collected under the DCF
The economic variables to be collected for the aquaculture industry sector under the Data Collection are specified in section A of the Chapter IV and in Appendix X of Commission Decision 2010/93/EC of the 18th of December 2010, on Adopting a multiannual Community programme pursuant to Council Regulation (EC) No 199/2008 establishing a Community framework for the collection, management and use of data in the fisheries sector and support for scientific advice regarding the common fisheries policy.
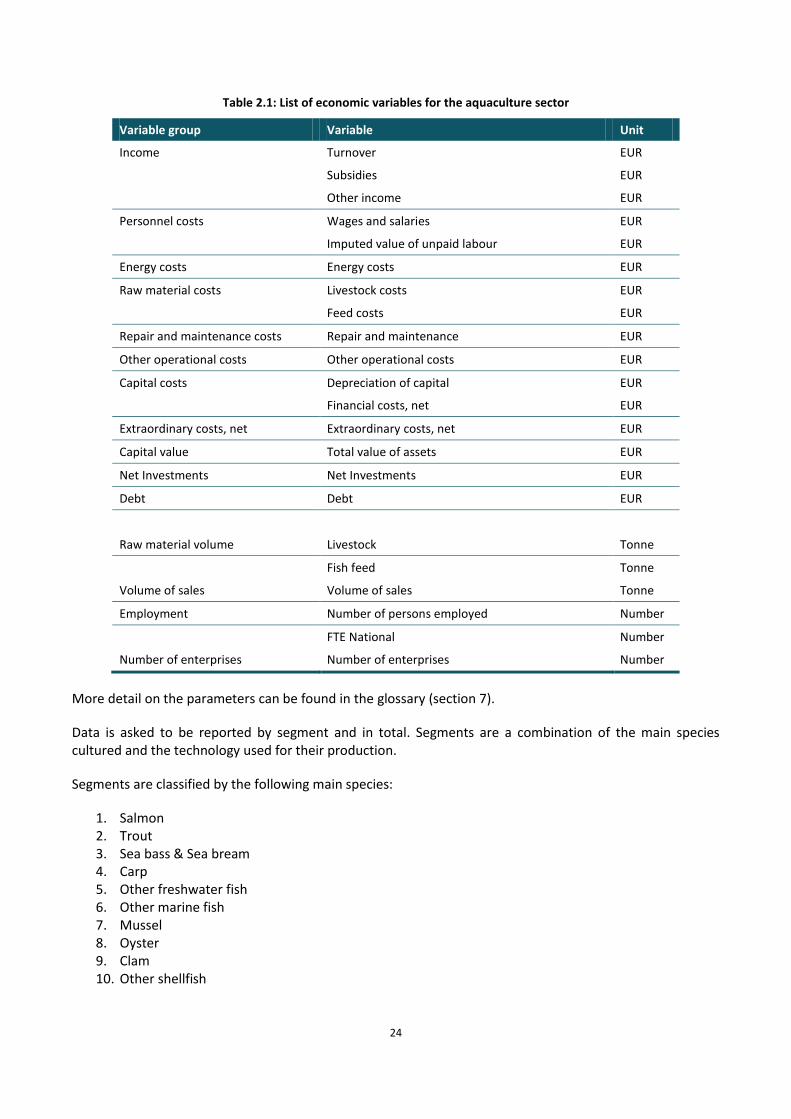
24
Table 2.1: List of economic variables for the aquaculture sector
Variable group Variable Unit
Income Turnover EUR
Subsidies EUR
Other income EUR
Personnel costs Wages and salaries EUR
Imputed value of unpaid labour EUR
Energy costs Energy costs EUR
Raw material costs Livestock costs EUR
Feed costs EUR
Repair and maintenance costs Repair and maintenance EUR
Other operational costs Other operational costs EUR
Capital costs Depreciation of capital EUR
Financial costs, net EUR
Extraordinary costs, net Extraordinary costs, net EUR
Capital value Total value of assets EUR
Net Investments Net Investments EUR
Debt Debt EUR
Raw material volume Livestock Tonne
Fish feed Tonne
Volume of sales Volume of sales Tonne
Employment Number of persons employed Number
FTE National Number
Number of enterprises Number of enterprises Number
More detail on the parameters can be found in the glossary (section 7).
Data is asked to be reported by segment and in total. Segments are a combination of the main species cultured and the technology used for their production.
Segments are classified by the following main species:
1. Salmon 2. Trout 3. Sea bass & Sea bream 4. Carp 5. Other freshwater fish 6. Other marine fish 7. Mussel 8. Oyster 9. Clam 10. Other shellfish
25
Segments are also classified by the technology used:
Fish farming: o Land based:
Hatcheries and nurseries On growing Combined
o Cages
Shellfish farming o Rafts o Long line o Bottom o Other
2.3 Participants at EWG 13-10
STECF Members
Malvarosa, Loretta
External Experts
Avdelas, Lamprakis Avdic-Mravlje, Edo Borges Marques, Ana Cristina Chauviere, Marc Cozzolino, Maria Davidjuka, Irina Ebeling, Michael Fernandez Polanco, Jose M. Gravino, Francesca Guillen, Jordi (chair) Lees, Janek Moura, Carlos Nielsen, Rasmus Pienkowska, Barbara Pokki, Heidi Reese, Allan Rodgers, Phillip Van Den Burg, Sander
Experts by correspondence
Dennis, John Nilsson, Pia Papadopoulos, Vassilis Stroie, Constantin Urumov, Stoyan
26
JRC experts
Borrello, Alessandra Contini, Franca Hofherr, Johann Motova, Arina Natale, Fabrizio
The full list of participants at EWG 13-10 held from the 2 to 6 September 2013 in Ispra, Italy is presented in the Appendices.
2.4 Chairman’s comments
First, I would like to thank all the people involved in the elaboration of this 2013 Economic Performance of the European Union Aquaculture sector report. This report has been prepared by the experts attending the EWG 13-10 meeting in cooperation with the Structural Policy and Economic Analysis Unit of DG Maritime affairs and Fisheries (DG MARE) who commissioned the work, and the Maritime Affairs Unit of the Joint Research Centre (action FISHREG).
This report provides a unique comprehensive overview of the latest information available on the structure, social, economical and competitive performance of the aquaculture sector at the national and at the overall EU level. After last two year’s report, this is the third one of this type, produced for the aquaculture sector.
Data used in this publication stands from 2008 to 2011, and has been collected within the Data Collection Framework (DCF). The collection of freshwater aquaculture is voluntary under the DCF regulation, while marine aquaculture is compulsory. This leads to an important lack of coverage from non-reported freshwater aquaculture. Sadly, there is even a larger lack of coverage from Member States not submitting all the requested data.
Even if data quality and the number of data checks have improved, in some of the reported data there were still remaining quality issues. Considering that it is aimed to reduce the production time of the 2013 aquaculture report and following reports, it is of extreme importance to improve the quality of the data available at the EWG meeting, in order not to diminish the quality of this report. In the best-case scenario, data quality problems lead to data resubmissions and delays on the report production. Considering the reduction in the production time for this report, only limited data checks can be done after the EWG meeting. Moreover, improvements in the quality of the data available at the meeting would let the experts more time to focus on more productive tasks than the data checks. Data quality is responsibility of Member States, and the necessary mechanisms should take in place to avoid delays and further work in the production of this report.
It is our hope that coverage and quality of the EU aquaculture sector data will increase in the next data calls, so that future reports on the Economic Performance of the European Union Aquaculture sector will provide a more accurate image of the EU aquaculture sector and will also be able to provide a much in-depth analysis of the sector.
From this report, I would like to draw your attention to the EU overview (chapter 3) and the structure of the sector (chapter 4) where overall aquaculture data are presented. I’m glad to be able to present results that confirm the recovery of the aquaculture sector as happened in 2010, after two years of losses.
27
3 EU AQUACULTURE SECTOR OVERVIEW
KEY FINDINGS
Aquaculture production by the 28 European Union Member States (EU-28) reached 1.28 million tonnes and 3.51 billion Euros in 2011 according to FAO. Volume and value of sales reached 1.35 million tonnes and 4.02 billion Euros in 2011 (DCF).
EU aquaculture production is mainly concentrated in 5 countries: France, Greece, Italy, Spain and United Kingdom, making up 77% in volume and 76% in value of EU totals.
Production in value increased by 8% while production has been stable (decreased by -0.3%) compared to 2010, according to FAO data.
Price falls of 2008/2009 during the economic crisis forced inefficient firms out of business and lead to mergers and acquisitions resulting in a more efficient industry which is now showing a strong recovery.
Vertical integration into the processing industry has, in some Member States, helped strengthen profits and add value to fish products often through smoking or packaging.
Almost 90% of the companies in the sector are micro-enterprises. Employment decreased by 5 to 10% to reach more than 80,000 people. There is an important significance of part-time labour. Female employment made up 29% of EU aquaculture employment and 23% of total FTE.
Profitability for the EU aquaculture sector was also positive in 2011 (ROI was 10% and EBIT margin 13%), confirming the recovery of the sector already registered in 2010.
The major cost items are feed (31%), livestock (18%), other operational costs (18%) and labour costs (15%) of the total costs. However, there are important variations by sector.
The future evolution of the EU aquaculture sector is uncertain due to the following 3 factors hindering the full potential of the EU aquaculture sector: fierce foreign competition that brings market prices down, high labour and capital costs and administrative burdens that slow down investments in the sector.
There is evidence that the market for farmed fish and shellfish products is capable of continuing the expansion it has shown in the last twenty-five years and that newer products from some of the more traditional wild species could be a source of expansion.
Where producers have engaged in organic production and certification they have often benefitted from increased profit margins especially when supported by Member State schemes such as those used in Ireland. However caution is needed to prevent cycles of organic 'rebranding' as a form of product differentiation. In some Member States there is little demand for organic products and suppliers view the subsector as too niche for major investment.
The requirement for the EU organic aquaculture producers to use at least 50% organic juveniles could cause some problems to obtain organic juveniles for the production of particular species (i.e. trout).
The EU has a competitive advantage in the presence of a well-educated work force. It has space for physical expansion of the industry but often a lack of understanding of the spatial needs and infrastructure for the industry among the planning authorities.
An important barrier has been the long license application periods of up to three years which increase uncertainty and risk for start-up businesses. This is largely due to numerous points of governmental contact required for approval. A 'Single Contact System' has shown, in Norway, to reduce application time to 6 months. Most Member States would benefit from a reform in the aquaculture license application process.
28
This chapter provides an overview of the structure and economic performance of the EU aquaculture sector in 2011 and highlights some key trends between 2008 and 2011, based on data obtained from the latest DCF aquaculture data call and data from FAO.
3.1 Introduction
Aquaculture is the fastest growing animal food producing sector in the world and is an increasingly important contributor to global food supply, food security and economic growth. Capture fisheries production worldwide accounted for 94.6 million tonnes in 2011 (83.5 million tonnes from marine fisheries and 11.1 million tonnes from inland fisheries). Production from world capture fisheries has been fluctuating around 90 million tonnes per year during the last two decades. On the other hand, aquaculture production shows an increasing trend that led to a production of 83.7 million tonnes globally in 2011, as can be seen from figure 3.1. It should be noted that the aquaculture production includes the production of near 21 million tonnes of aquatic plants.
In 2011, aquaculture represented 47% of the total seafood production in the world, valued at 97.7 billion Euros (136 billion USD)1. This is a substantial increase. However, as shown by figure 3.1, this increase has not been facilitated by EU Member States but predominantly by Asia. Asia produces 91% of the world aquaculture production in weight and 79% in terms of value. Europe represents only 3.2% of the world aquaculture production in volume and 8.2% in value. Having said this as EU capture fisheries have reduced in volume, aquaculture has become relatively more important to the seafood production mix over the period from 1990 to 2011.
Capture fisheries production in the EU-28 accounted for 5.1 million tonnes in 2011 (5.0 million tonnes from marine fisheries and 0.1 million tonnes from inland fisheries).
1 The exchange rates used follows the European Central Bank exchange rate data. For 2011: 1 EUR equals to 1.392 USD.
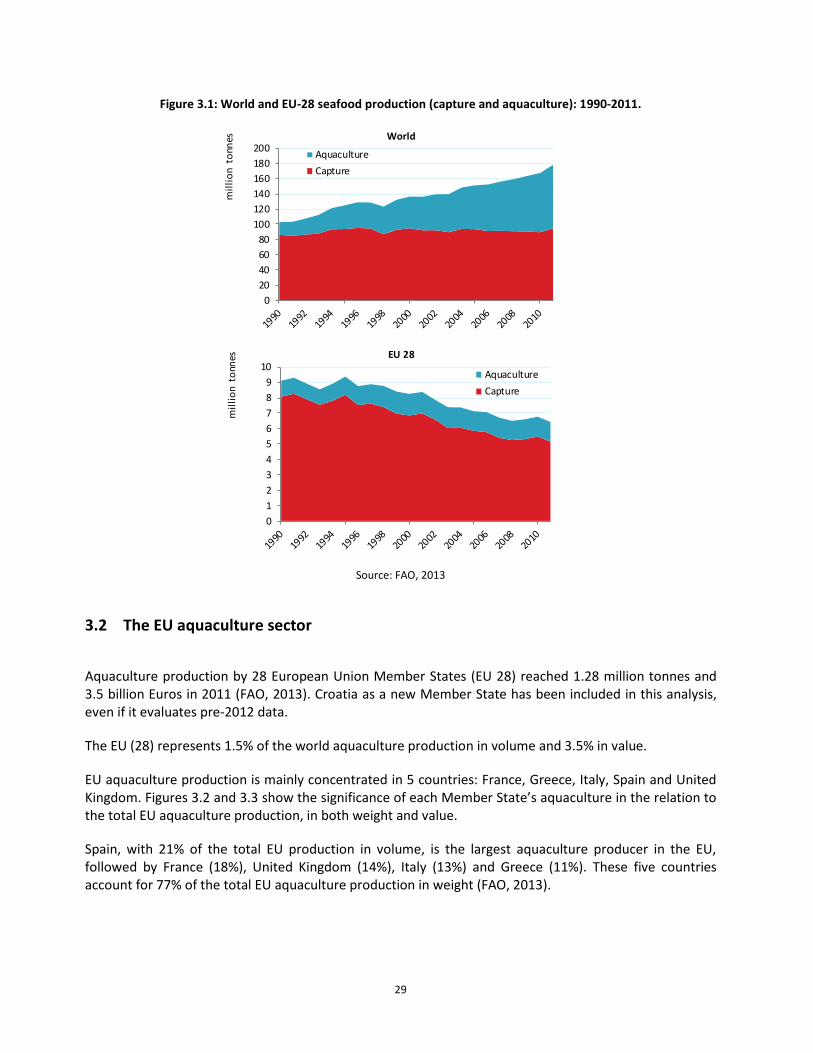
29
Figure 3.1: World and EU-28 seafood production (capture and aquaculture): 1990-2011.
0
20
40
60
80
100
120
140
160
180
200
mil
lio
n t
onn
es World
Aquaculture
Capture
0
1
2
3
4
5
6
7
8
9
10
mil
lio
n t
onn
es EU 28
Aquaculture
Capture
Source: FAO, 2013
3.2 The EU aquaculture sector
Aquaculture production by 28 European Union Member States (EU 28) reached 1.28 million tonnes and 3.5 billion Euros in 2011 (FAO, 2013). Croatia as a new Member State has been included in this analysis, even if it evaluates pre-2012 data.
The EU (28) represents 1.5% of the world aquaculture production in volume and 3.5% in value.
EU aquaculture production is mainly concentrated in 5 countries: France, Greece, Italy, Spain and United Kingdom. Figures 3.2 and 3.3 show the significance of each Member State’s aquaculture in the relation to the total EU aquaculture production, in both weight and value.
Spain, with 21% of the total EU production in volume, is the largest aquaculture producer in the EU, followed by France (18%), United Kingdom (14%), Italy (13%) and Greece (11%). These five countries account for 77% of the total EU aquaculture production in weight (FAO, 2013).
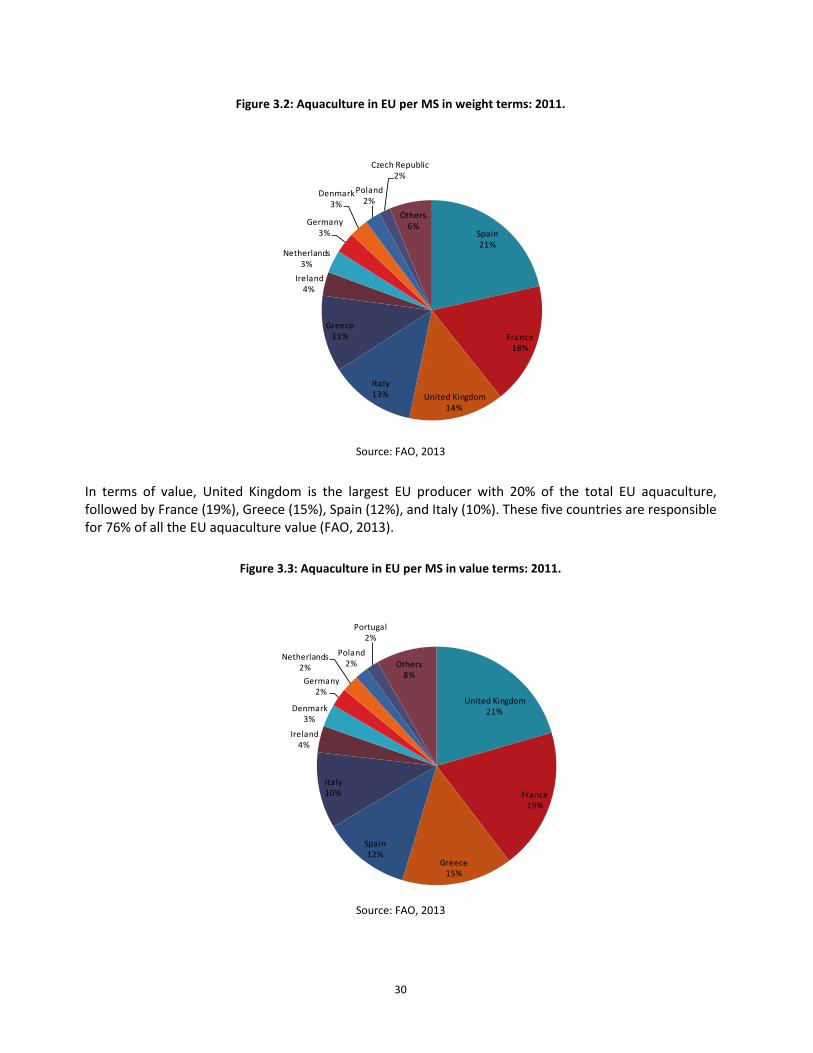
30
Figure 3.2: Aquaculture in EU per MS in weight terms: 2011.
Spain21%
France18%
United Kingdom14%
Italy13%
Greece11%
Ireland4%
Netherlands3%
Germany3%
Denmark3%
Poland2%
Czech Republic2%
Others6%
Source: FAO, 2013
In terms of value, United Kingdom is the largest EU producer with 20% of the total EU aquaculture, followed by France (19%), Greece (15%), Spain (12%), and Italy (10%). These five countries are responsible for 76% of all the EU aquaculture value (FAO, 2013).
Figure 3.3: Aquaculture in EU per MS in value terms: 2011.
United Kingdom21%
France19%
Greece15%
Spain12%
Italy10%
Ireland4%
Denmark3%
Germany2%
Netherlands2%
Poland2%
Portugal2%
Others8%
Source: FAO, 2013
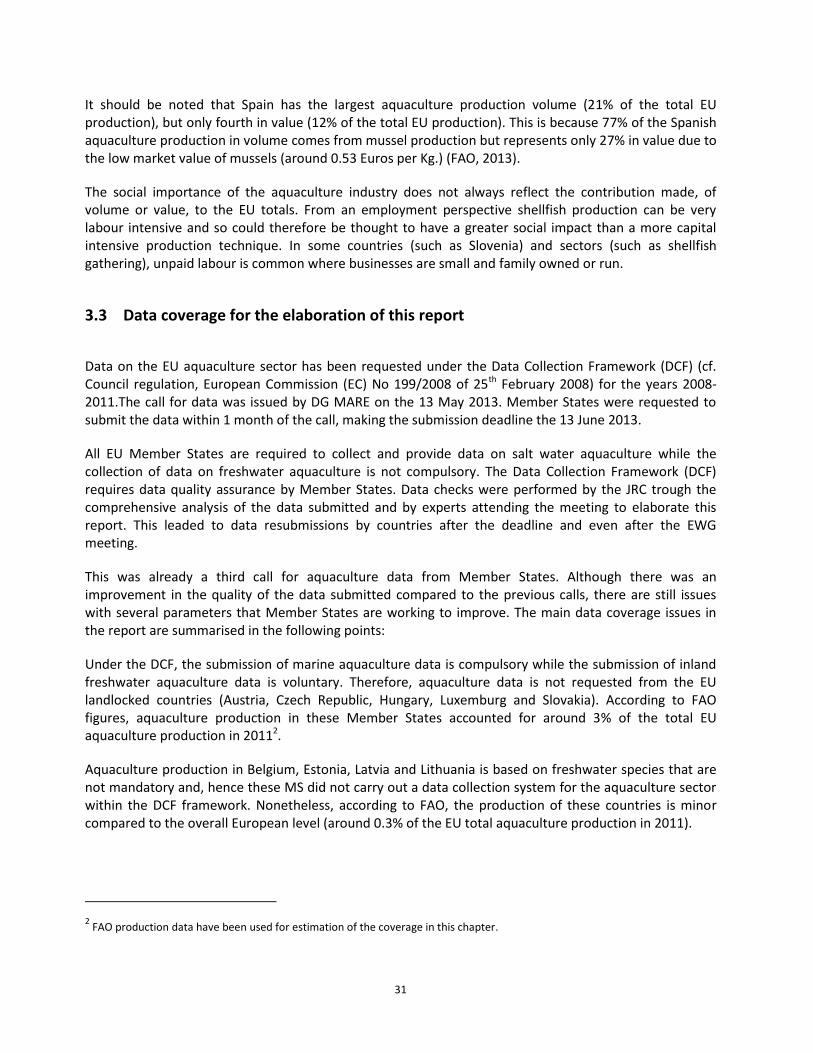
31
It should be noted that Spain has the largest aquaculture production volume (21% of the total EU production), but only fourth in value (12% of the total EU production). This is because 77% of the Spanish aquaculture production in volume comes from mussel production but represents only 27% in value due to the low market value of mussels (around 0.53 Euros per Kg.) (FAO, 2013).
The social importance of the aquaculture industry does not always reflect the contribution made, of volume or value, to the EU totals. From an employment perspective shellfish production can be very labour intensive and so could therefore be thought to have a greater social impact than a more capital intensive production technique. In some countries (such as Slovenia) and sectors (such as shellfish gathering), unpaid labour is common where businesses are small and family owned or run.
3.3 Data coverage for the elaboration of this report
Data on the EU aquaculture sector has been requested under the Data Collection Framework (DCF) (cf. Council regulation, European Commission (EC) No 199/2008 of 25th February 2008) for the years 2008-2011.The call for data was issued by DG MARE on the 13 May 2013. Member States were requested to submit the data within 1 month of the call, making the submission deadline the 13 June 2013.
All EU Member States are required to collect and provide data on salt water aquaculture while the collection of data on freshwater aquaculture is not compulsory. The Data Collection Framework (DCF) requires data quality assurance by Member States. Data checks were performed by the JRC trough the comprehensive analysis of the data submitted and by experts attending the meeting to elaborate this report. This leaded to data resubmissions by countries after the deadline and even after the EWG meeting.
This was already a third call for aquaculture data from Member States. Although there was an improvement in the quality of the data submitted compared to the previous calls, there are still issues with several parameters that Member States are working to improve. The main data coverage issues in the report are summarised in the following points:
Under the DCF, the submission of marine aquaculture data is compulsory while the submission of inland freshwater aquaculture data is voluntary. Therefore, aquaculture data is not requested from the EU landlocked countries (Austria, Czech Republic, Hungary, Luxemburg and Slovakia). According to FAO figures, aquaculture production in these Member States accounted for around 3% of the total EU aquaculture production in 20112.
Aquaculture production in Belgium, Estonia, Latvia and Lithuania is based on freshwater species that are not mandatory and, hence these MS did not carry out a data collection system for the aquaculture sector within the DCF framework. Nonetheless, according to FAO, the production of these countries is minor compared to the overall European level (around 0.3% of the EU total aquaculture production in 2011).
2 FAO production data have been used for estimation of the coverage in this chapter.
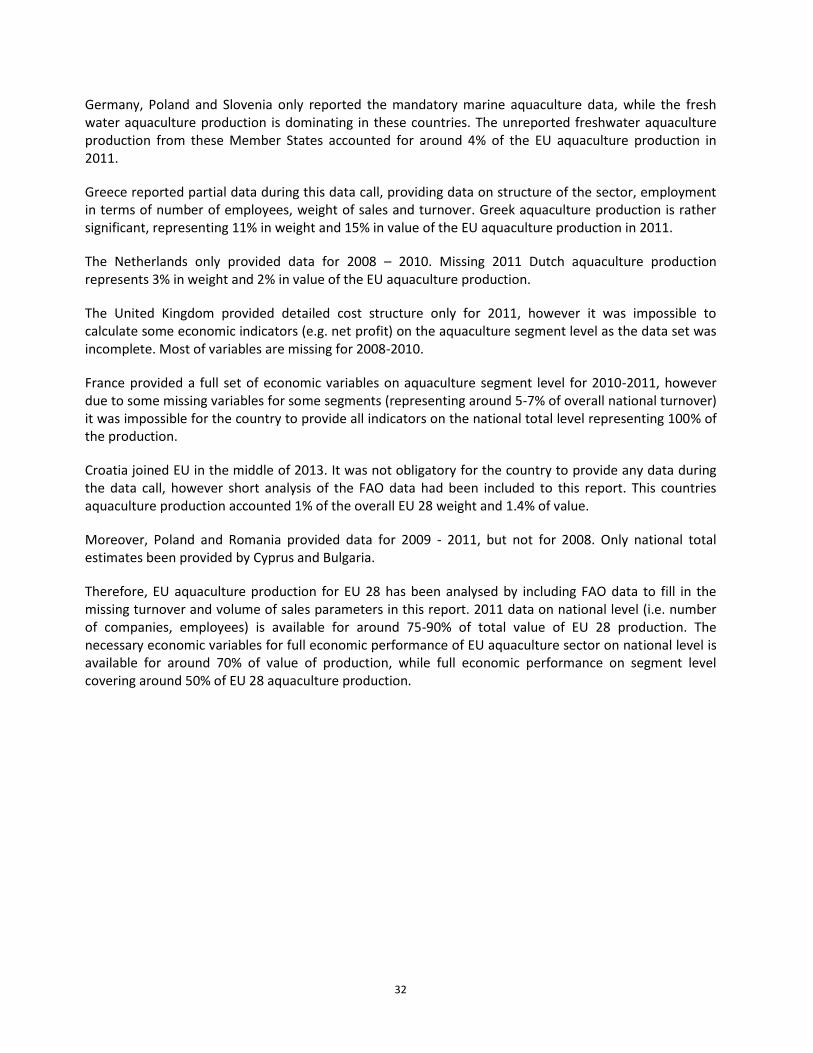
32
Germany, Poland and Slovenia only reported the mandatory marine aquaculture data, while the fresh water aquaculture production is dominating in these countries. The unreported freshwater aquaculture production from these Member States accounted for around 4% of the EU aquaculture production in 2011.
Greece reported partial data during this data call, providing data on structure of the sector, employment in terms of number of employees, weight of sales and turnover. Greek aquaculture production is rather significant, representing 11% in weight and 15% in value of the EU aquaculture production in 2011.
The Netherlands only provided data for 2008 – 2010. Missing 2011 Dutch aquaculture production represents 3% in weight and 2% in value of the EU aquaculture production.
The United Kingdom provided detailed cost structure only for 2011, however it was impossible to calculate some economic indicators (e.g. net profit) on the aquaculture segment level as the data set was incomplete. Most of variables are missing for 2008-2010.
France provided a full set of economic variables on aquaculture segment level for 2010-2011, however due to some missing variables for some segments (representing around 5-7% of overall national turnover) it was impossible for the country to provide all indicators on the national total level representing 100% of the production.
Croatia joined EU in the middle of 2013. It was not obligatory for the country to provide any data during the data call, however short analysis of the FAO data had been included to this report. This countries aquaculture production accounted 1% of the overall EU 28 weight and 1.4% of value.
Moreover, Poland and Romania provided data for 2009 - 2011, but not for 2008. Only national total estimates been provided by Cyprus and Bulgaria.
Therefore, EU aquaculture production for EU 28 has been analysed by including FAO data to fill in the missing turnover and volume of sales parameters in this report. 2011 data on national level (i.e. number of companies, employees) is available for around 75-90% of total value of EU 28 production. The necessary economic variables for full economic performance of EU aquaculture sector on national level is available for around 70% of value of production, while full economic performance on segment level covering around 50% of EU 28 aquaculture production.
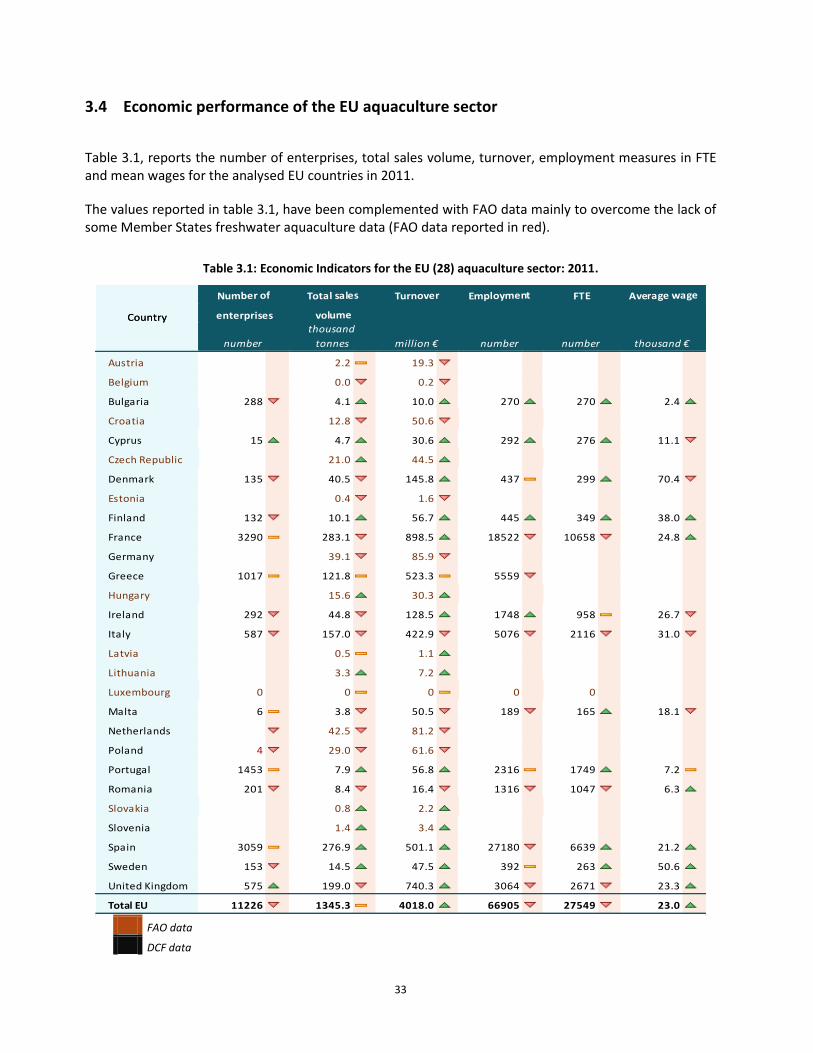
33
3.4 Economic performance of the EU aquaculture sector
Table 3.1, reports the number of enterprises, total sales volume, turnover, employment measures in FTE and mean wages for the analysed EU countries in 2011.
The values reported in table 3.1, have been complemented with FAO data mainly to overcome the lack of some Member States freshwater aquaculture data (FAO data reported in red).
Table 3.1: Economic Indicators for the EU (28) aquaculture sector: 2011.
Average wage
enterprises volumeCountry
Number of Total sales Turnover Employment FTE
enterprises volumeCountry
number
thousand
tonnes million € number number thousand €
Austria 2.2 19.3
Belgium 0.0 0.2
Bulgaria 288 4.1 10.0 270 270 2.4
Croatia 12.8 50.6
Cyprus 15 4.7 30.6 292 276 11.1
Czech Republic 21.0 44.5
Denmark 135 40.5 145.8 437 299 70.4
Estonia 0.4 1.6
Finland 132 10.1 56.7 445 349 38.0
France 3290 283.1 898.5 18522 10658 24.8
Germany 39.1 85.9
Greece 1017 121.8 523.3 5559 ## ##
Hungary 15.6 30.3
Ireland 292 44.8 128.5 1748 958 26.7
Italy 587 157.0 422.9 5076 2116 31.0
Latvia 0.5 1.1
Lithuania 3.3 7.2
Luxembourg 0 0 0 0 0
Malta 6 3.8 50.5 189 165 18.1
Netherlands 42.5 81.2 ## ## ##
Poland 4 29.0 61.6
Portugal 1453 7.9 56.8 2316 1749 7.2
Romania 201 8.4 16.4 1316 1047 6.3
Slovakia 0.8 2.2
Slovenia 1.4 3.4
Spain 3059 276.9 501.1 27180 6639 21.2
Sweden 153 14.5 47.5 392 263 50.6
United Kingdom 575 199.0 740.3 3064 2671 23.3
Total EU 11226 1345.3 4018.0 66905 27549 23.0
Country
number
thousand
tonnes million € number number thousand €
FAO data
DCF data
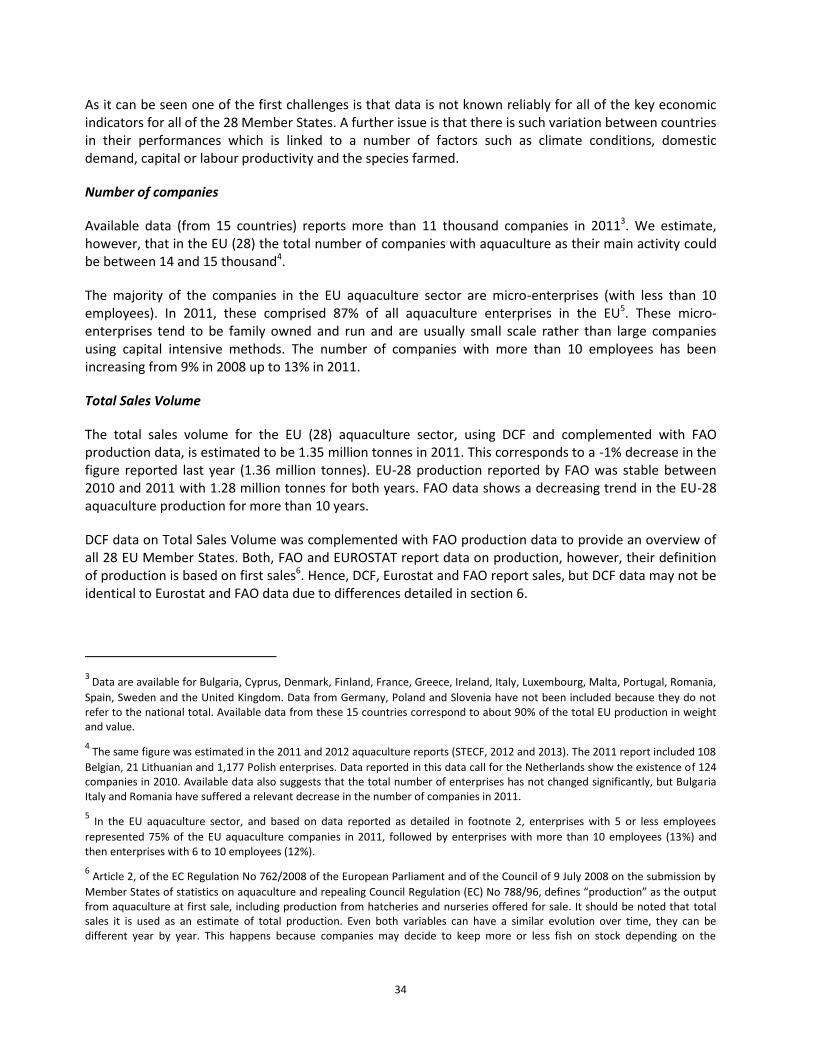
34
As it can be seen one of the first challenges is that data is not known reliably for all of the key economic indicators for all of the 28 Member States. A further issue is that there is such variation between countries in their performances which is linked to a number of factors such as climate conditions, domestic demand, capital or labour productivity and the species farmed.
Number of companies
Available data (from 15 countries) reports more than 11 thousand companies in 20113. We estimate, however, that in the EU (28) the total number of companies with aquaculture as their main activity could be between 14 and 15 thousand4.
The majority of the companies in the EU aquaculture sector are micro-enterprises (with less than 10 employees). In 2011, these comprised 87% of all aquaculture enterprises in the EU5. These micro-enterprises tend to be family owned and run and are usually small scale rather than large companies using capital intensive methods. The number of companies with more than 10 employees has been increasing from 9% in 2008 up to 13% in 2011.
Total Sales Volume
The total sales volume for the EU (28) aquaculture sector, using DCF and complemented with FAO production data, is estimated to be 1.35 million tonnes in 2011. This corresponds to a -1% decrease in the figure reported last year (1.36 million tonnes). EU-28 production reported by FAO was stable between 2010 and 2011 with 1.28 million tonnes for both years. FAO data shows a decreasing trend in the EU-28 aquaculture production for more than 10 years.
DCF data on Total Sales Volume was complemented with FAO production data to provide an overview of all 28 EU Member States. Both, FAO and EUROSTAT report data on production, however, their definition of production is based on first sales6. Hence, DCF, Eurostat and FAO report sales, but DCF data may not be identical to Eurostat and FAO data due to differences detailed in section 6.
3 Data are available for Bulgaria, Cyprus, Denmark, Finland, France, Greece, Ireland, Italy, Luxembourg, Malta, Portugal, Romania,
Spain, Sweden and the United Kingdom. Data from Germany, Poland and Slovenia have not been included because they do not refer to the national total. Available data from these 15 countries correspond to about 90% of the total EU production in weight and value.
4 The same figure was estimated in the 2011 and 2012 aquaculture reports (STECF, 2012 and 2013). The 2011 report included 108
Belgian, 21 Lithuanian and 1,177 Polish enterprises. Data reported in this data call for the Netherlands show the existence of 124 companies in 2010. Available data also suggests that the total number of enterprises has not changed significantly, but Bulgaria Italy and Romania have suffered a relevant decrease in the number of companies in 2011.
5 In the EU aquaculture sector, and based on data reported as detailed in footnote 2, enterprises with 5 or less employees
represented 75% of the EU aquaculture companies in 2011, followed by enterprises with more than 10 employees (13%) and then enterprises with 6 to 10 employees (12%).
6 Article 2, of the EC Regulation No 762/2008 of the European Parliament and of the Council of 9 July 2008 on the submission by
Member States of statistics on aquaculture and repealing Council Regulation (EC) No 788/96, defines “production” as the output from aquaculture at first sale, including production from hatcheries and nurseries offered for sale. It should be noted that total sales it is used as an estimate of total production. Even both variables can have a similar evolution over time, they can be different year by year. This happens because companies may decide to keep more or less fish on stock depending on the
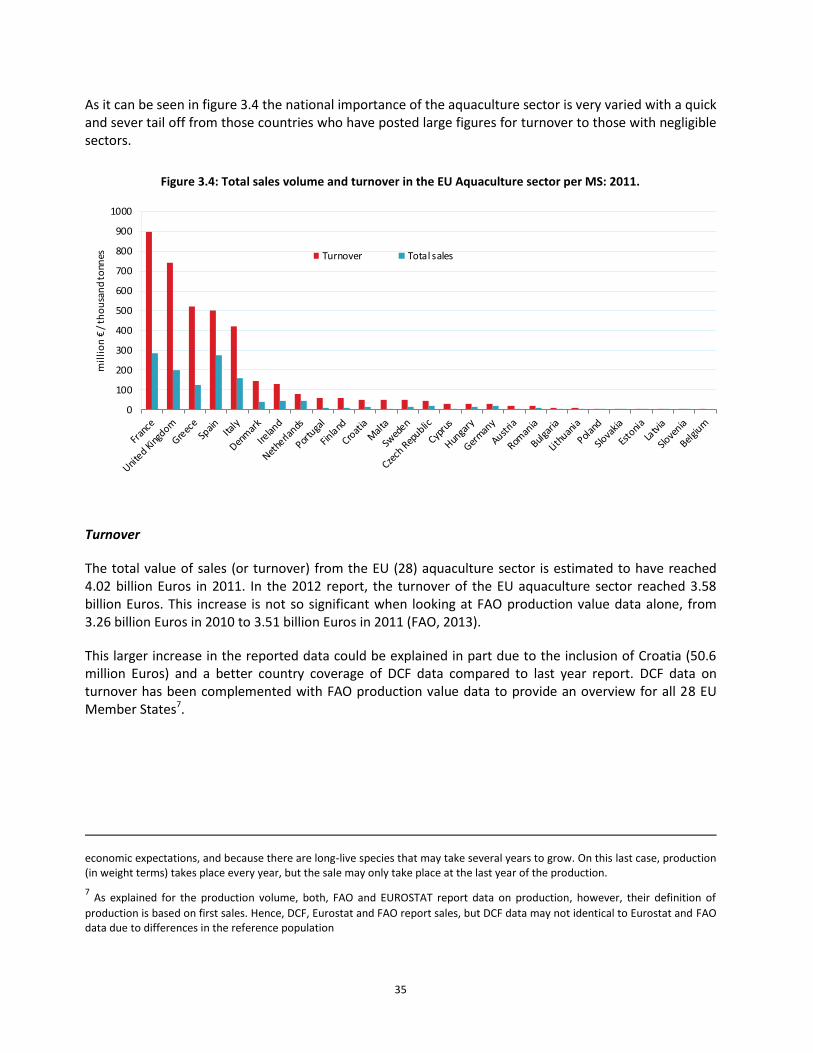
35
As it can be seen in figure 3.4 the national importance of the aquaculture sector is very varied with a quick and sever tail off from those countries who have posted large figures for turnover to those with negligible sectors.
Figure 3.4: Total sales volume and turnover in the EU Aquaculture sector per MS: 2011.
0
100
200
300
400
500
600
700
800
900
1000
mil
lio
n €
/ th
ou
san
d to
nnes Turnover Total sales
Turnover
The total value of sales (or turnover) from the EU (28) aquaculture sector is estimated to have reached 4.02 billion Euros in 2011. In the 2012 report, the turnover of the EU aquaculture sector reached 3.58 billion Euros. This increase is not so significant when looking at FAO production value data alone, from 3.26 billion Euros in 2010 to 3.51 billion Euros in 2011 (FAO, 2013).
This larger increase in the reported data could be explained in part due to the inclusion of Croatia (50.6 million Euros) and a better country coverage of DCF data compared to last year report. DCF data on turnover has been complemented with FAO production value data to provide an overview for all 28 EU Member States7.
economic expectations, and because there are long-live species that may take several years to grow. On this last case, production (in weight terms) takes place every year, but the sale may only take place at the last year of the production.
7 As explained for the production volume, both, FAO and EUROSTAT report data on production, however, their definition of
production is based on first sales. Hence, DCF, Eurostat and FAO report sales, but DCF data may not identical to Eurostat and FAO data due to differences in the reference population
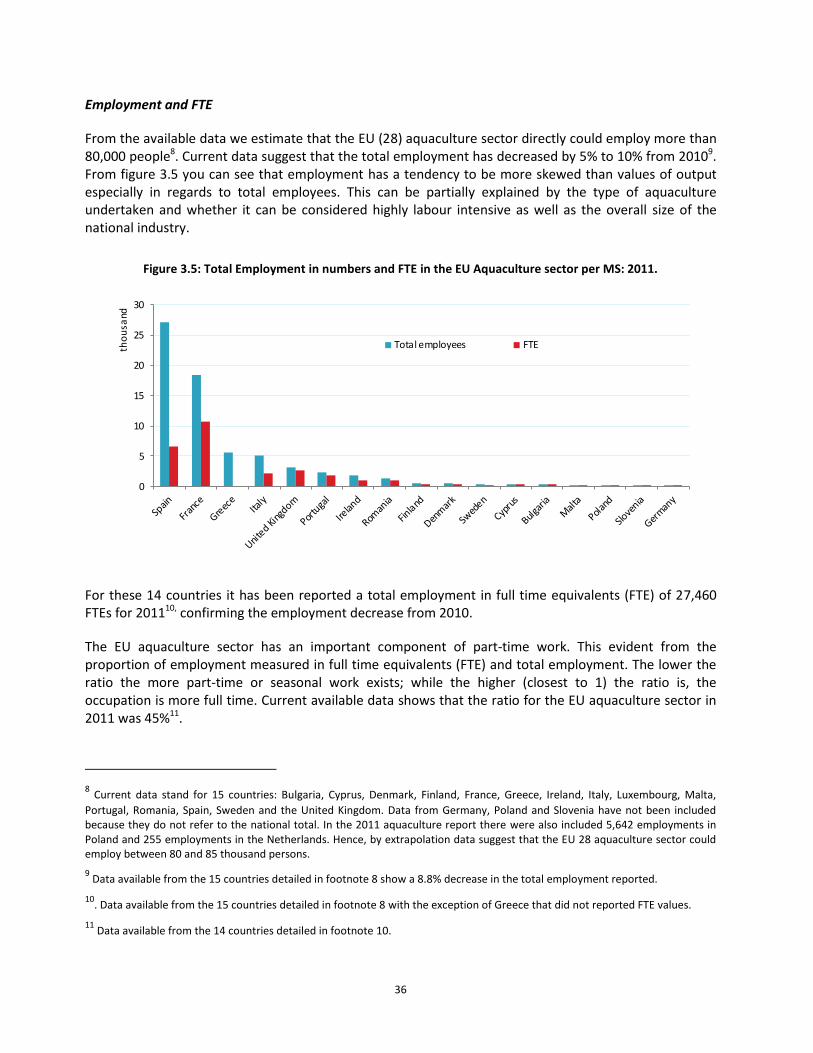
36
Employment and FTE
From the available data we estimate that the EU (28) aquaculture sector directly could employ more than 80,000 people8. Current data suggest that the total employment has decreased by 5% to 10% from 20109. From figure 3.5 you can see that employment has a tendency to be more skewed than values of output especially in regards to total employees. This can be partially explained by the type of aquaculture undertaken and whether it can be considered highly labour intensive as well as the overall size of the national industry.
Figure 3.5: Total Employment in numbers and FTE in the EU Aquaculture sector per MS: 2011.
For these 14 countries it has been reported a total employment in full time equivalents (FTE) of 27,460 FTEs for 201110, confirming the employment decrease from 2010.
The EU aquaculture sector has an important component of part-time work. This evident from the proportion of employment measured in full time equivalents (FTE) and total employment. The lower the ratio the more part-time or seasonal work exists; while the higher (closest to 1) the ratio is, the occupation is more full time. Current available data shows that the ratio for the EU aquaculture sector in 2011 was 45%11.
8 Current data stand for 15 countries: Bulgaria, Cyprus, Denmark, Finland, France, Greece, Ireland, Italy, Luxembourg, Malta,
Portugal, Romania, Spain, Sweden and the United Kingdom. Data from Germany, Poland and Slovenia have not been included because they do not refer to the national total. In the 2011 aquaculture report there were also included 5,642 employments in Poland and 255 employments in the Netherlands. Hence, by extrapolation data suggest that the EU 28 aquaculture sector could employ between 80 and 85 thousand persons.
9 Data available from the 15 countries detailed in footnote 8 show a 8.8% decrease in the total employment reported.
10. Data available from the 15 countries detailed in footnote 8 with the exception of Greece that did not reported FTE values.
11 Data available from the 14 countries detailed in footnote 10.
0
5
10
15
20
25
30
tho
usa
nd
Total employees FTE
37
The importance of this part-time and seasonal employment in the EU aquaculture sector is due to the importance of the shellfish sector that has a significant percentage of part-time and seasonal work.
Data available show that women accounted for the 27% of the EU aquaculture sector employments, but only 23% when measured in FTE in 201112.
Mean wages
Available data (from 13 countries) suggest that the average wage (per FTE) for the EU aquaculture sector in 2011 was about 22,965 Euros per year13. This shows a 9.4% increase in salaries; however, salary increases were not perceived in all countries. In fact, there was a salary increase in 7 of the 13 countries.
Figure 3.6: Average wage in the EU Aquaculture sector per MS: 2011.
0
20
40
60
80
100
120
140
160
tho
usa
nd €
Average wage per FTE Average wage per employee
There is a lot of variability within the salaries paid in each country and subsector. The salaries varied from about 2,360 Euros per year in Bulgaria to 70,373 Euros per year in Denmark. The variability per subsector and country is going to be analysed in more detail in the next chapter.
12 Current data on employment in number by gender stand for 14 countries: Bulgaria, Cyprus, Denmark, Finland, France, Ireland,
Italy, Luxembourg, Malta, Portugal, Romania, Spain, Sweden and the United Kingdom. While employment by gender measured in FTEs corresponds to 13 countries, the previous 14 countries with the exception of the United Kingdom. Data from Germany, Poland and Slovenia have not been included because they do not refer to the national total.
13 The average wage is calculated as the sum of the costs in wages and salaries and the imputed value of unpaid labour divided by
the total number of employees in FTEs. Data are available for Bulgaria, Cyprus, Denmark, Finland, France, Ireland, Italy, Malta, Portugal, Romania, Spain, Sweden and the United Kingdom. Data from Germany, Poland and Slovenia have not been included because they do not refer to the national total.
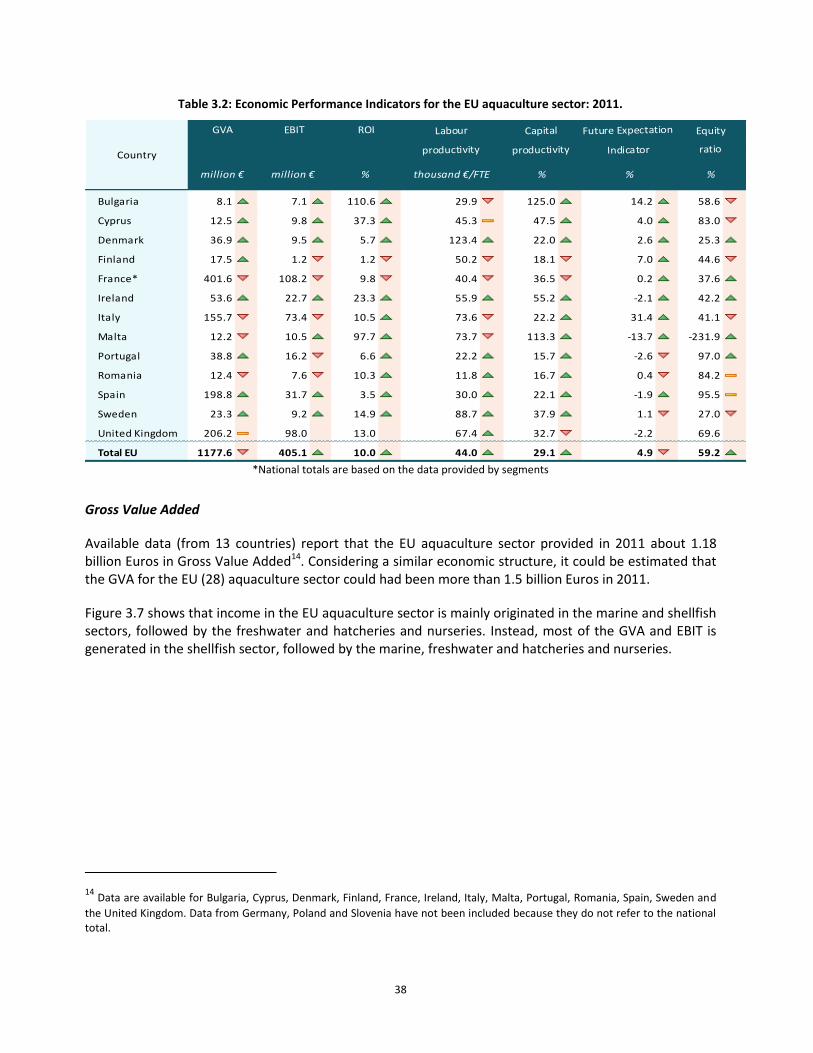
38
Table 3.2: Economic Performance Indicators for the EU aquaculture sector: 2011.
Labour
Country
GVA EBIT ROI Future Expectation Equity
productivity productivity Indicator ratio
Capital
Bulgaria 8.1 7.1 110.6 29.9 125.0 14.2 58.6
Cyprus 12.5 9.8 37.3 45.3 47.5 4.0 83.0
Denmark 36.9 9.5 5.7 123.4 22.0 2.6 25.3
Finland 17.5 1.2 1.2 50.2 18.1 7.0 44.6
France* 401.6 108.2 9.8 40.4 36.5 0.2 37.6
Ireland 53.6 22.7 23.3 55.9 55.2 -2.1 42.2
Italy 155.7 73.4 10.5 73.6 22.2 31.4 41.1
Malta 12.2 10.5 97.7 73.7 113.3 -13.7 -231.9
Portugal 38.8 16.2 6.6 22.2 15.7 -2.6 97.0
Romania 12.4 7.6 10.3 11.8 16.7 0.4 84.2
Spain 198.8 31.7 3.5 30.0 22.1 -1.9 95.5
Sweden 23.3 9.2 14.9 88.7 37.9 1.1 27.0
United Kingdom 206.2 98.0 ## 13.0 ## 67.4 32.7 -2.2 ## 69.6 ##
Total EU 1177.6 405.1 10.0 44.0 29.1 4.9 59.2
million € million € % thousand €/FTE
Country productivity productivity Indicator ratio
% % %
*National totals are based on the data provided by segments
Gross Value Added
Available data (from 13 countries) report that the EU aquaculture sector provided in 2011 about 1.18 billion Euros in Gross Value Added14. Considering a similar economic structure, it could be estimated that the GVA for the EU (28) aquaculture sector could had been more than 1.5 billion Euros in 2011.
Figure 3.7 shows that income in the EU aquaculture sector is mainly originated in the marine and shellfish sectors, followed by the freshwater and hatcheries and nurseries. Instead, most of the GVA and EBIT is generated in the shellfish sector, followed by the marine, freshwater and hatcheries and nurseries.
14 Data are available for Bulgaria, Cyprus, Denmark, Finland, France, Ireland, Italy, Malta, Portugal, Romania, Spain, Sweden and
the United Kingdom. Data from Germany, Poland and Slovenia have not been included because they do not refer to the national total.
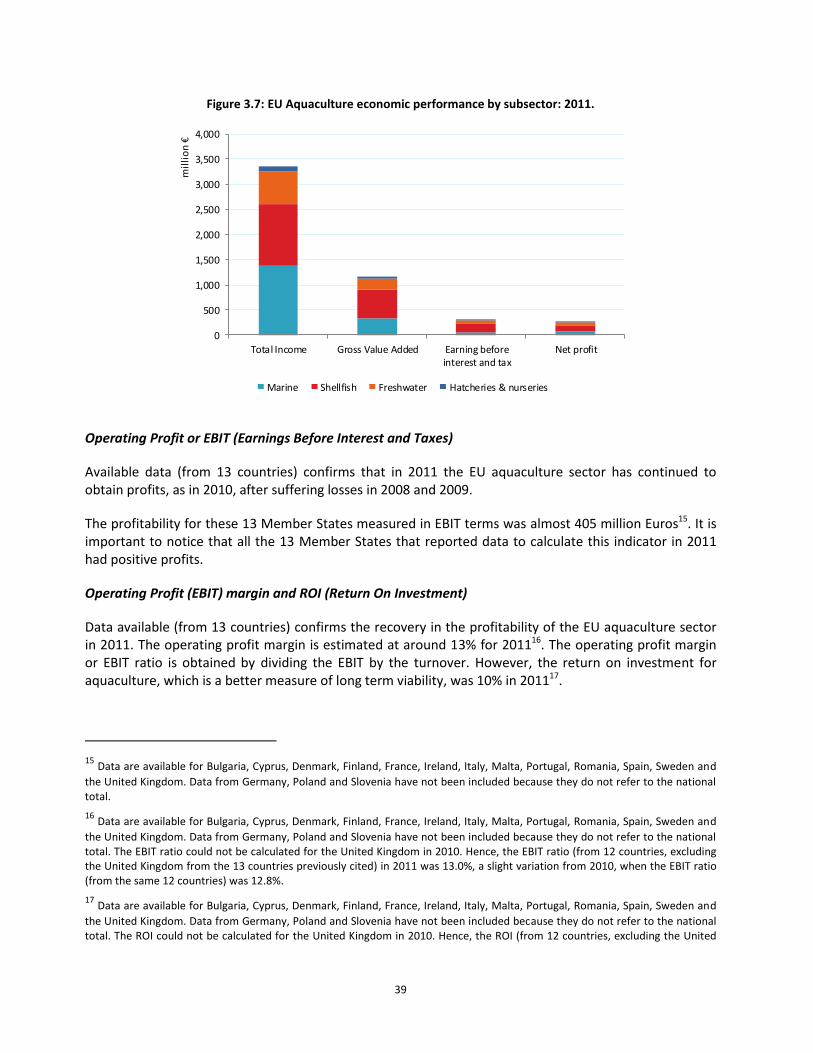
39
Figure 3.7: EU Aquaculture economic performance by subsector: 2011.
Operating Profit or EBIT (Earnings Before Interest and Taxes)
Available data (from 13 countries) confirms that in 2011 the EU aquaculture sector has continued to obtain profits, as in 2010, after suffering losses in 2008 and 2009.
The profitability for these 13 Member States measured in EBIT terms was almost 405 million Euros15. It is important to notice that all the 13 Member States that reported data to calculate this indicator in 2011 had positive profits.
Operating Profit (EBIT) margin and ROI (Return On Investment)
Data available (from 13 countries) confirms the recovery in the profitability of the EU aquaculture sector in 2011. The operating profit margin is estimated at around 13% for 201116. The operating profit margin or EBIT ratio is obtained by dividing the EBIT by the turnover. However, the return on investment for aquaculture, which is a better measure of long term viability, was 10% in 201117.
15 Data are available for Bulgaria, Cyprus, Denmark, Finland, France, Ireland, Italy, Malta, Portugal, Romania, Spain, Sweden and
the United Kingdom. Data from Germany, Poland and Slovenia have not been included because they do not refer to the national total.
16 Data are available for Bulgaria, Cyprus, Denmark, Finland, France, Ireland, Italy, Malta, Portugal, Romania, Spain, Sweden and
the United Kingdom. Data from Germany, Poland and Slovenia have not been included because they do not refer to the national total. The EBIT ratio could not be calculated for the United Kingdom in 2010. Hence, the EBIT ratio (from 12 countries, excluding the United Kingdom from the 13 countries previously cited) in 2011 was 13.0%, a slight variation from 2010, when the EBIT ratio (from the same 12 countries) was 12.8%.
17 Data are available for Bulgaria, Cyprus, Denmark, Finland, France, Ireland, Italy, Malta, Portugal, Romania, Spain, Sweden and
the United Kingdom. Data from Germany, Poland and Slovenia have not been included because they do not refer to the national total. The ROI could not be calculated for the United Kingdom in 2010. Hence, the ROI (from 12 countries, excluding the United
0
500
1,000
1,500
2,000
2,500
3,000
3,500
4,000
Total Income Gross Value Added Earning beforeinterest and tax
Net profit
mil
lio
n €
Marine Shellfish Freshwater Hatcheries & nurseries
40
Labour productivity
Reported data (from 13 countries) shows that the labour productivity for the EU aquaculture sector was about 44 thousand Euros per FTE in 201118. This represents a 14% increase from 2010.
The mean wage (23 thousand Euros) represented in 2011 the 52% of the total labour productivity. There is again a large variation between member states in this regard. Bulgaria had labour productivity of 2.4 thousand Euros whereas Denmark labour productivity was 123.4 thousand Euros.
Capital Productivity
Reported data (from 13 countries) shows that the capital productivity for the EU aquaculture sector was about 29.1% in 201119. This represents a 15.7% increase from 2010.
Equity ratio
The equity ratio is a financial ratio that indicates the relative proportion of own capital in the sector own assets. Available data (from 13 countries) show that the equity ratio was 59.2% in 201120. This ratio is relatively high, in part due to the high equity ratio for the Spanish aquaculture sector (95.6%). This high ratio does not match with reality according to alternative accountancy based sources and the overall ratio is expected to decrease with data quality improvements. Due to high variations on the availability of data by Member State further analysis should be done at a more detailed level.
Future Expectations Indicator (FEI)
The FEI (STECF, 2011) indicates whether the industry in a sector is investing more than the depreciation of their current assets. With data from 13 countries the FEI for the EU aquaculture sector was estimated at 4.9%21. Therefore, the industry is investing itself, and consequently should have positive expectations on
Kingdom from the 13 countries previously cited) in 2011 was 8.8%, an increase from 2010, when the ROI (from the same 12 countries) was 6.9%.
18 Data are available for Bulgaria, Cyprus, Denmark, Finland, France, Ireland, Italy, Malta, Portugal, Romania, Spain, Sweden and
the United Kingdom. Data from Germany, Poland and Slovenia have not been included because they do not refer to the national total.
19 Data are available for Bulgaria, Cyprus, Denmark, Finland, France, Ireland, Italy, Malta, Portugal, Romania, Spain, Sweden and
the United Kingdom. Data from Germany, Poland and Slovenia have not been included because they do not refer to the national total.
20 Data are available for Bulgaria, Cyprus, Denmark, Finland, France, Ireland, Italy, Malta, Portugal, Romania, Spain, Sweden and
the United Kingdom. Data from Germany, Poland and Slovenia have not been included because they do not refer to the national total. The equity ratio could not be calculated for the United Kingdom in 2010. Hence, the ROI (from 12 countries, excluding the United Kingdom from the 13 countries previously cited) in 2011 was 57.5%, an increase from 2010, when the equity ratio (from the same 12 countries) was 55.3%.
21 Data are available for Bulgaria, Cyprus, Denmark, Estonia, Finland, France, Ireland, Malta, Portugal, Romania, Spain, Sweden
and United Kingdom. Data from Germany, Italy, Poland and Slovenia have not been included because they do not refer to the national total. The Future Expectations Indicator could not be calculated for the United Kingdom in 2010. Hence, the ROI (from 12 countries, excluding the United Kingdom from the 13 countries previously cited) in 2011 was 6.0%, a decrease from 2010, when the FEI (from the same 12 countries) was 10.9%.
41
the future development of the sector. However, as it has been said for previous indicators there is the need to look at it at a more detailed level, by sectors, as it is done in next chapter.
3.5 The EU aquaculture by country
Austria
The Austrian aquaculture sector produced 2.2 thousand tonnes of fish in 2011 valued at about 19.3 million Euros (FAO, 2013). Austria produces no marine or shellfish aquaculture. A fall in production weight of less than 1% was displayed from 2010 to 2011 in freshwater aquaculture bringing the total production down from 2,167 tonnes to 2,160 tonnes. This is still 73 tonnes above that of 2008. The value of production has also fallen more sharply over the past year by 5% from € 20,365 thousand to 19,338 thousand Euros. As with weight this figure is larger than pre 2010 figure which, in 2008, was at 12,803 thousand Euros and so production in 2011 were 51% higher than in 2008. In 2011 rainbow trout represented 56% of the weight and 55% of the value, with other important species including common carp and brook trout.
Belgium
The Belgian aquaculture sector only produced 49 tonnes in 2011, valued at about 230 thousand Euros (FAO, 2013). Belgium produces no marine or shellfish aquaculture. Rainbow trout was the main species produced by the Belgian aquaculture sector, representing the 73% in weight and 68% in value of total production. However, production in both weight and value shows significant variations overtime that should be analysed if they are due to real production oscillations or data collection inaccuracies.
Bulgaria
In 2011, the Bulgarian aquaculture sector sales reached 4.1 thousand tonnes, a 10% increase from 2010. In fact, DCF shows a steady increase for the period 2008-2011 (+41%). Sales in 2011 were valued at about 10.04 million Euros, a 4% increase from 2010. However, there is been an important decrease in the sales value since 2008 (-54%). Production trends in both weight and value reported by FAO are different from DCF sales figures and show no significant variations in production between 2008 and 2011. The main species produced are rainbow trouts representing 45% in weight and 76% in value of total Bulgarian production in 2011. Common carp represented the 18% in weight and 8% in value, while Mediterranean mussel represented the 15% in weight and 5% in value of the total Bulgarian production in 2011.
Croatia
The Croatian aquaculture sector produced 22.6 thousand tonnes of produce in 2011. This production was valued at about 50.6 million Euros (FAO, 2013). Within this; marine aquaculture production decreased to 6.1 thousand tonnes and 38 million Euros, while freshwater aquaculture grew to 6.3 thousand tonnes and 12.1 million Euros in 2011 (FAO, 2013). From this we can see that the overall value of marine aquaculture products is much higher than that of freshwater aquaculture products. Total sales weight fell by 8% but this was largely down to an 80% fall in shellfish aquaculture output. Croatia has a diverse and fairly evenly distributed aquaculture sector as demonstrated by the percentages of the top 5 species produced in terms of weight (common carp 22%, European seabass 22%, rainbow trout 19%, gilthead seabream 13%
42
and Atlantic bluefin tuna 13%). The value of produce is slightly less evenly distributed as Atlantic bluefin tuna makes up 38% of output value.
Cyprus
In 2011, marine aquaculture production was 4,592 tonnes with a value of 26.7 million Euros. Also, marine hatcheries produced slightly more than 23 million fingerlings with a value of 3.4 million Euros. Regarding freshwater aquaculture, in 2011 production was 67.5 tonnes valued at 555 thousand Euros. In Cyprus, there are nine marine fattening farms using intensive offshore cage farming techniques. They mainly culture seabream (Sparus aurata), seabass (Dicentrarchus labrax), meagre (Argyrosomus regius), rabbit fish (Siganus rivulatus) and pandora (Pagellus erythrinus). The most important cultured marine fish species are seabream and seabass with 3,000 tonnes and 1,500 tonnes respectively. There are also eight freshwater aquaculture farms mainly constituted of concrete tanks with their water intake coming from neighbouring springs and rivers, all located on Troodos mountains. The fish farms, are mainly focused on the fattening of freshwater fish species such as rainbow trout (Oncorhynchus mykiss) and sturgeon (Acipenser baerii). Some of these farms also operate as fish hatcheries.
Czech Republic
The Czech aquaculture sector produced 21 thousand tonnes in 2011 valued at about 44.5 million Euros (FAO, 2013). The Czech Republic produces no shellfish or marine aquaculture products. Mild growth has been shown both in the weight (21 thousand tonnes) and value (45million Euros) of freshwater produce showing growth of 3% and 10% respectively. Overall this indicates a rise in value of produce holding weight constant. 86% of the weight and 83% of the value of this production is made up of common carp.
Denmark
In total, the Danish aquaculture sector produced 40,454 tonnes in 2011, which corresponded to a decrease of 4% from 2010 to 2011. On the other hand, the total value of the production was 144 million Euros in 2011, which corresponded to an increase of 7% over the same period. From 2008 to 2011, the total volume decreased by 9%, whereas the total value increased by 13%. The main species produced is rainbow trout which comprises 94% of the weight and 91% of the total aquaculture output in Denmark. This is mostly for export and 90% of the trout is exported to Germany meaning 81% of all Danish aquaculture is exported to Germany.
Total employment is virtually unchanged (0.2%) from 2010 to 2011 at 437employess, 393 of which are male. Female total employment has fallen -12% over the same period and female FTE has fallen -9%. In contrast male employment has risen by 2% and male FTE has risen by 4%. 86% of the Danish enterprises had less than 5 employees in 2011. The number of enterprises has fallen -14% following the four year trend.
Profitability shows a marked improvement when compared to 2010 as EBIT rose 89% to reach 9.5million Euros and net profit rose 482% to 5.6million Euros. Having said this only 'trout cages' of the four main segments (trout combined, trout cages, other freshwater fish species combined and mussels long line) returned a positive net profit value.
Estonia
43
The Estonian aquaculture sector produced 388 tonnes in 2011, which was 32% less than the year before. The production was valued about 1.5 million Euros which is a fall of -24% on 2010. Both sales weight and value fell consecutively over the period from 2008 to 2011. There is a small production of fish eggs and juveniles which, in 2011, was 1 million.
The Estonian aquaculture sector is comprised of around 20 companies, the majority of which are family owned and run. This can make investment very challenging especially when the lack of availability of credit is considered. Rainbow trout is the most important species as it represents 86% of the quantity and 84% of the value of Estonian fish stocks. The next most important species is the common carp however this only represents 10% of the total quantity.
Finland
In 2011 total sales volume was 10 thousand tonnes which showed a 20% increase on the 2010 figures whilst sales demonstrated a 13% rise in value from 2010 to reach a value of 57 million Euros. While this is an improvement from 2011 the value is a more than 10 million Euros less than it was in 2008. For both weight and value the main contributor is freshwater aquaculture.
93% of the 132 enterprises engaged in Finish aquaculture have equal or less than 5 employees and overall the number of enterprises shrank by -10%. Total employment however increased by 24% to 445 people with FTE improving for both men (+18%) and women (+27%) whilst at the same time the average wage rose by 2% and the net effect of this is that labour productivity has fallen by -13%.
Overall the aquaculture industry was in net profit of 1.3 million Euros but this was a fall of -71% on the previous year. Almost identical figures were posted for EBIT. Whilst this shows the industry as a whole is narrowly profitable this varies between market segments. The Cages and Hatcheries & Nurseries segments returned profits of € 0.7 million and € 2.2 million respectively while the Combined and On Growing segments made losses of 1.2 million Euros and 0.5 million Euros. As you can see those two segments that posted profits are both still vulnerable at a time of economic uncertainty.
France
The total sales of the French aquaculture sector in 2011 were 283.1 thousand tonnes and 898.5 million Euros as turnover. From 2010 to 2011, the sales volume decreased by 10% but turnover increased by 2%. The French aquaculture sector is largely dominated by bivalve molluscs farming. In weight, shellfish farming ranks first with a production of 240.7 thousand tonnes (85% of national total) and 719.1 million Euros for turnover (80%). The second group is the freshwater fish sector with 36.1 thousand tonnes (13%) and 119.9 million Euros (13%).
All aquaculture sectors made a positive net profit in 2010 but this parameter became negative in 2011 for freshwater farming sector. Three segments have a ratio of net profit to the total income greater than 15%: oyster other (23%), mussel culture on bottom (19%), sea bass and sea bream hatcheries (16%). All segments get a ratio of gross value added to total income higher than 35% except for trout on growing.
Germany
Germany is collecting economic data under the DCF for marine species only (blue mussels). The most recent data are from the Aquaculture survey 2012 (Federal Statistical Office, 2012). 4,762 facilities are reported with a production volume of 39,202 tonnes, including about 21,000 tonnes of marine
44
aquaculture production of blue mussels. About 18,000 tonnes freshwater finfish production consisting of 11,000 tonnes of trout and salmonids and 5,400 tonnes of carps and cyprinids are listed. 100 tonnes are from Crustaceans, roe and caviar and some algae. About 900 tonnes are declared as organic products. 2/3 of the production volume goes to the gross market, about 10% directly to consumers. Production of Blue Mussels is concentrated at the German North Sea Coast with companies in the States of Schleswig-Holstein and Lower Saxony. The volume of production differs from years to year as it very much depends on the natural seed fall, but the increase in 2011 was unusual.
Greece
Total sales weight fell by -1% over the period from 2010 to 2011 to 121 million tonnes. This however does represent a 5.7% increase on the 2008 figure but is the second consecutive annual fall from the peak in 2009. Sales value also fell from 2010 (-2%) to 523 million Euros. Marine finfish aquaculture makes up 80% of the volume and 92% of the total aquaculture value however shellfish and freshwater production are very important as they support rural employment. Shellfish and freshwater farms are mostly small and family owned whereas finfish farms are predominantly large and vertically integrated.
1017 different farming sites existed in 2011 and this number had been stable since 2008. Of these 1017 farms, 704 of them have employment of 5 people or less. The total number of employees however has fallen by -8% reflecting the on-going restructuring and concentrating of the market.
Due to a lack of data it is hard to comprehend the profitability of the market, and market segments, however it is clear that it is going through major changes. The bankruptcy of a large trout producer contributed heavily to the decline in output however this softened a declining sales value to only a -24% fall by restricting supply. The situation is made worse by rising costs of energy, fish feed and financial costs as well as by a shortfall of credit.
Hungary
The Hungarian aquaculture sector produced 15.6 thousand tonnes in 2011. This production was valued at about 30.3 million Euros (FAO, 2013). This represents a rise in volume of 9% from 2010 and is almost equal to the levels reached in 2008 showing good recovery from the economic crisis. Sales value also rose but by 8% and this is still around 1 million Euros under the value of 2008 showing that values have fallen over the time period. Fish eggs and juveniles production fell to zero in 2010 and has not recovered from this.
Common carp was the main species produced by the Hungarian aquaculture sector, representing 69% in both weight and value of total production in 2011. Other important fish species are north African catfish, silver carp, grass carp (=white amur) and wels catfish.
Ireland
In 2011 sales weight had fallen by -4% on the previous year meaning a volume of 45 thousand tonnes was posted. While this was the second consecutive annual fall it is comparable to the figure from 2008. Within this, output from Hatcheries & nurseries, Freshwater and Shellfish segments all increased and it was just the marine sector that shrank (-21%). In contrast, the sales value of the overall market rose by 5% to 128 million Euros with the Shellfish and Hatcheries and nurseries sharing the positive growth between them with growth of 23% and 30% respectively. Blue mussels represented 28% of the sales volume but only 9% of the value whereas Atlantic salmon represented 27% of the volume but 57% of total value.
45
Total enterprises fell by -4% to 292 of which 209 employ 5 people or less. These enterprises employed 1748 people showing a 2% increase on the previous year although between 2008 and 2011 employment fell by -11%. FTE for the period also fell (-26%) and at the end of the period represented 958 employees. The female FTE figure increased by 13% but was still very low. Having said this, labour productivity for the period had risen by 160% to 55 thousand Euros but the average wage fell -10% to 26.7 thousand Euros.
Overall the Irish aquaculture was profitable in 2011 posting net profits of 21.8 million Euros and EBIT of 22.7 million Euros both increasing by 16% on the previous year and looking resilient when considered that both these figures were narrowly negative in 2008. Within this only the mussel long line segment was unprofitable of the 4 major segments. This may partially be down to bay closures due to red tides.
Italy
In total, production fell 114 thousand tonnes in volume (-42%) and 162 million Euros (-25%). Freshwater produce carried the highest sales value at 206 million Euros which is over 50% of overall aquaculture values (-22% on 2010). Whilst sales weight and value fell in all segments (marine, shellfish, freshwater) the marine sector was the worst affected showing a fall of -25% in weight but a fall of -49 in value demonstrating a loss of value of produce. Both industry costs and incomes fell resulting overall in a -34% fall in GVA to 155 million Euros. Total employment in the industry is 5,076 (42% FTE), a fall of -13% on 2010 and average wage has fallen -20% to 31 thousand Euros.
A formal definition of an aquaculture farmer has been introduced by Legislative Decree no. N.228/2001 representing greater social security and legal status for farmers. This is no surprise as the aquaculture sector comprises 43% of the volume of the total Italian fishery production although this has fallen from a 59% share in 2010. It is worth noting that the data from 2008-2011 indicates this fall is due to an unusually good year for Italian aquaculture in 2010.
Overall, employment in the industry has fallen with the number of enterprises decreasing by -15% with this fairly evenly distributed amongst small, medium and large businesses. Female employment has fared better than male employment which have risen by 94% and fallen by -24% respectively. Female FTE has only increased by 25% and overall FTE has fallen -25%. Males make up 90% of the industry FTE.
If we look at the industry over the last 3 years we can see some positive trends. Capital productivity increased from 15 to 22% over the period and return on investments increased from 5 to 10%. The FEI also improved from 19 to 21 indicating the medium to long term confidence in the market as more resources are allocated towards increased production capacity. Having said this, the debt structure worsens over the period.
Latvia
Latvian aquaculture produces only freshwater produce and some fish eggs and juveniles due to the fact that it is landlocked. In 2011 the market produced 545 tonnes of produce which was a fall of -1% on the previous year. The volume of output was very constant over the period of 2008 to 2011. The value of output rose from 2010 to 2011 by 6% to 1.1 million Euros but this represents a fall of -27% from 2008 (FAO, 2013). Fish eggs and juveniles production fell by -67% to 12 million. Common carp is the most important market segment as it represents 82% of the volume and 64% of the total market value.
In 2011 there over 140 aquaculture farms however only 55 of these were registered as economically active. Instead most firms are small with 10 or less employees. This market structure can prevail as there
46
are no quotas or restrictions in place for aquaculture and so there are few entry barriers. Total employment has increased from 326 in 2008 to 341 in 2011 however productivity of labour is very low.
Lithuania
Lithuanian aquaculture sector produced 3.3 thousand tonnes valued about 7.3 million Euros in 2011 (FAO, 2013). Lithuania produces no marine aquaculture. The common carp was the main species produced by the Lithuanian aquaculture sector, representing the 93% in weight and 87% in value of total production in 2011. Other important fish species are: sturgeons, trouts, Northern pike, grass carp and bighead carp.
Malta
The Maltese aquaculture sector sales accounted for 4.16 thousand tonnes of marine fish, with a total value of 53.7 Euros million in 2011. This implies a decrease of 23% from 2010 in weight, but only a 1% decrease in value. Quantity of sales (in terms of weight) showed a gradual decrease over the four years whilst the value was quite stable from 2009 to 2011. No other segments of aquaculture are represented in Malta.
There are only 6 aquaculture enterprises in Malta all of which had more than 10 employees in both 2010 and 2011. Total employment fell -17% in the period from 2010 to 2011 to 189. Of this only 12 employees are female. FTE rose by 3% to reach 165 however this rise was comprised only of male employees and female FTE fell by -24%.
Not only was the industry profitable it also made impressive growth in this regard, with EBIT growing by 104% to 10.5 million Euros and net profit rising by 149%, compared to the previous year, reaching 10 million Euros. This is promising considering that both the EBIT and net profit figures were below -35 million Euros in 2009 and the figures from 2011 are comparable to those from 2008 - before the crisis took hold. The level of net investment fell by -71% which reflects the improved, but still negative, future expectations indicator (-13.7%).
The Netherlands
Total production in 2011 was 43 thousand tonnes representing a fall of -36% on the previous year but showing very little change when compared to 2008. The value of produce was 81 million Euros which again represents a fall from 2010 figures (-24%) (FAO, 2013). The Netherlands has a small marine sector which produced 220 tonnes in 2011 but the largest sector is the shellfish sector which produced 36 thousand tonnes.
Overall the industry has posted impressive data for profitability. EBIT grew 115% to a high of 58.7 million Euros in 2010 and net income grew by 480% to 55.4 million Euros in the same year (data for 2011 is unavailable). This shows resilience to possible effects of the economic crisis. Surprisingly, in spite of these high figures, the future expectation indicator was at -5.1%.
Mussel bottom culture is the most profitable segment of the Dutch aquaculture industry however all large segments are profitable on the whole. Due to the labour intensive nature of mussel culture wages and salaries make up 27% of costs with rent for farmed areas also presenting a major cost.
47
Poland
Polish aquaculture is comprised of several different species all within the freshwater segment. In 2011 the production volume fell by -6% compared to 2010 to a value of 29 thousand tonnes. This is the 3rd annual fall in volume and compared to 2008 figures represents a -21% fall. The total value of the produce fell by 9% over the year from 2010 to 2011 and this took the total value to 61 million Euros (FAO, 2013). This shows that the average price of output has fallen as well as the quantity.
Full data is not available for the Polish aquaculture segment and so in-depth information is only known on those farms that rear and breed Atlantic salmon fry. Within this area there were 4 firms in 2011, one less than the previous years, and these employed 49 people showing a fall of employment of 9 people. Of this 41 were male and 45 out of the 49 were employed full time (FTE). While the average wage rose 12% to 13.1 thousand Euros labour productivity fell -38%.
While profitable, the industry performed relatively poorly falling -83% in terms of EBIT and -85% in terms of net profit from the previous year. This left both figures resting at 0.1 million Euros which is very vulnerable to becoming loss making.
Portugal
The marine and shellfish segments are the main contributors to both the total weight and value of Portuguese aquaculture with freshwater aquaculture contributing a much smaller amount. Total sales weight in 2011 was nearly 8 thousand tonnes which represented a 22% increase from the previous three years when weight had been fairly constant. The value of sales followed a similar pattern increasing of 36% to 57 million Euros after being relatively steady for three years. All three main segments grew in value and only freshwater fell in terms of tonnage.
The number of enterprises had been practically unchanged from 2008 to 2011 at 1,453, and all but 15 of which had equal to or less than 5 employees. The total number of employees was unchanged at 2,316 but the number of female employees within this grew by 11%. The FTE grew by 42% meaning that those employed were working more hours on average. Labour productivity rose by 122% to 22.2 thousand Euros.
Profitability was also strong displaying an EBIT of 16.2 million Euros (+1084%) and net profit of 10.8 million Euros (+684%). No data was available for the clam bottom segment but for the other three main segments the data shows they were all profitable in 2011 apart from other marine fish on growing which, while improved on the previous year, posted a loss of -9.3 million Euros.
Romania
The Romanian aquaculture sector sales reached 8.35 thousand tonnes valued at about 16.38 million Euros in 2011. Most of the Romanian aquaculture sector production comes from the freshwater sector. There are important fluctuations during the period 2009-2011. From 2009 to 2010 aquaculture sales increased by 76% in weight and 124% in value. However, between 2010 and 2011 aquaculture sales in Romania decreased by 35% in weight and 47% in value. Cyprinids family (mainly carps) land base cultured, in an extensive way, represented 79% in weight and 60% in value of total production in 2011; trout represented the 20% in weight and 38% in value.
48
Slovakia
The Slovakian aquaculture sector produced 814 tonnes in 2011. This production was valued at about 2.2 million Euros (FAO, 2013). Slovakia produces no marine or shellfish. The greatest volume of the 4 years shown was in 2008 before two consecutive years of falling output caused a low of 687 tonnes representing a fall of -39% before a more towards recovery (+18%) in 2011.
Whilst no marine or shellfish aquaculture is produced due to the landlocked nature of Slovakia there is a stable production of fish eggs and juveniles. This fluctuated either side of 40 million for the 4 year period with 2011 showing an 11% increase on the previous year.
Slovenia
Total output in 2011 was 502 tonnes which translated into € 5million. The volume of output shows an increase of 303% on the previous year while the value increased by 72%. This is largely due to issues with biotoxins reducing production but even compared to previous years, unaffected by biotoxins, the volume is larger. In terms of value however € 5million is comparable to 2008 but a fall of -25% of 2009.
In total there are 11 enterprises which employ a total of 32 people. This is a -15% fall in the number of enterprises but a 3% rise in employment and both these figures are relatively stable for the period from 2008 to 2011. Female employment is very low at only 66 people but total FTE amounts to 28 people. Labour productivity is very high at € 0.18million and the average wage is € 24.4thousand.
The industry is profitable with EBIT of € 4.0million and net profits of € 3.8million which shows growth of 91% and 104% from the previous year respectively. There are only two main segments which are Sea bass & sea bream cages and Mussel rafts both of which were positive. Having said this, the former only posted net profits of € 0.8million and so is vulnerable to shocks.
Spain
The total sales value of the Spanish aquaculture sector increased by 7% from 2010 to 2011 but this is very varied between the different market segments (marine, shellfish, freshwater, hatcheries & nurseries) due to their differing structures. The greatest increase in sales value was shown by Hatcheries & nurseries which increased 34% to 58 million Euros whilst freshwater aquaculture fell -20% to 39 million Euros. An increase of 36% of feed input may indicate future growth.
Total employment was at 27,108 and was split between 5,343 different farms however this figure represents 6,639 FTE. These figures represent an overall fall of 3% from 2010 but an increase in FTE of 4% indicating an improvement in job stability and skilled labour. This increase in FTE is largely due to an improvement in female employment.
Profitability shows good recovery from the slump in 2009 with EBIT rising 598% from 4.5 million Euros to 31.7 million Euros. Net profit increase by 77% to 44.1 million Euros and these statistics were further supported by recovery in other key indicators. This however varied between market segments as mussels were the most profitable, despite environmental issues, while bass and bream were unprofitable but improving.
Due to the fact that 90% of Spanish aquaculture income is derived from sales turnover profitability relies heavily upon the markets. The mussel segment has very high labour demands and is very regional and so
49
in these areas the market can have a large impact on regional employment. This shows the importance of managing supply and demand to ensure economic success and stable employment.
Sweden
While aquaculture in Sweden may only make up 3-4% of the overall production of fish and shellfish it is still sizeable. In 2011, around 14,510 tonnes of shellfish and freshwater produce was sold at a total value of 47.5 million Euros. Of this 90% of the volume and 98% of the value was from freshwater produce. Overall the weight of aquaculture increased by 24% from 2010 however we can observe an increasing trend since 1998 when weight was only 5,500 tonnes which, over the 13 years, is an increase of 164%. Likewise value has increased by 227% over the same period.
The number of enterprises fell by -13% from 2010 to 2011 but the number of workers fell by -2% implying that the number of workers per enterprise has increased. The number of female employees, and total FTE have both increased by 14%. Labour productivity is up 70% (88.7 thousand Euros) and average wage is up 77% (50.6 thousand Euros). FTE/Enterprise has increased from 1.2 to 1.7 from 2009 to 2011.
Profitability, in terms of EBIT, has improved by 109% to 9.2 million Euros while net profit has increased by 112% to 8.4 million Euros. This large positive improvement is mirrored by all of the other key performance indicators. Broken down by sector we can see that all sectors are profitable but that some have shown a decreasing trend and are very close to becoming loss making. Of the 4 main segments only Other freshwater fish cages has EBIT and net profits above 1 million Euros.
United Kingdom
British aquaculture production accounted in 2011 for over 199 thousand tonnes, valued at 740 million Euros. Salmon, trout and mussels total over 90% by either volume or value. However, smaller segments might be considered for social or regional reasons. The UK is increasingly governed on a regional basis.
Scotland is currently the largest producer of farmed Atlantic salmon in the EU and third largest globally - producing 158,018 tonnes in 2011 with an estimated value of GBP 584.7 million at farm gate prices and accounting for over one-third by value of Scotland's food exports.
3.6 Trends and triggers of the EU aquaculture
Europe represents the largest market for fish in the world. Over the past decades consumption has increased. However, as own production of fish (capture and farmed) has not increased, net fish imports have increased, and self sufficiency has decreased.
The global consumption of seafood is constantly increasing, but there is a limit to what capture fisheries can sustainably produce. Aquaculture may help filling this growing gap and bring safe, healthy and sustainable seafood to the European market.
Today the EU seafood consumption is 13.2 million tonnes; of this, 25% comes from EU fisheries, 65% from imports and 10% from EU aquaculture (European Commission. 2013). Total EU aquaculture production was 1.26 million tonnes, and 3.1 billion Euros. An increasing aquaculture sector can also have a positive impact in terms of job creation in coastal and rural areas. Based on current labour productivity, it is
50
estimated that a percentage point increase in EU consumption of cultured seafood could create between 3,000 and 4,000 full-time jobs if this increase in production was taken place inside EU (European Commission. 2013).
There are many reasons that have lead to an increase in demand for fish. First, population size has increased. Second, overall the real price of fish has come down, making the product more attractive to consumers. Third, real incomes have increased, causing greater demand for fish. Finally, consumers have become more health conscious, causing a positive shift in demand as fish consumption is known to have important health benefits.
EU landings of wild fish have been stagnant or even decreasing; while EU aquaculture production has been stagnant. There are some successful stories in the EU aquaculture (STECF, 2012). However, overall, aquaculture in the European Union has not come up with new species that have “taken off” in the way that was the case, for example, for salmon in Norway and Chile or pangasius in Vietnam. There may be several reasons for that (some of them reviewed by STECF, 2012).
Successful development of aquaculture presupposes control with the biological production process. Beyond that, what may be called economic sustainability, namely profitable production over time, is required. This depends not only on the "sale" price, but also on the cost of production. Considering the fierce competition (foreign but also internal) and high labour and capital costs that the EU aquaculture sector bears, high value species are most relevant for EU producers. More than that, in view of the high costs, species of interest are those where productivity improvements can be achieved over time, giving rise to lower costs of production. This is an absolute necessity, because as production expands, price is likely to come down.
Moreover, governance takes on an important responsibility in the future of aquaculture. Positive important roles for governments include expediting the planning process for new farms (and farm extensions), as well as makings sites available. In addition, there is an important role for governments in terms of R&D.
Data for 2011 show a continuation on the improvement in the economic performance of the EU aquaculture sector from the beginning of the economic crisis (2008-2009). However, the future evolution of the EU aquaculture is rather uncertain. The aquaculture sector has to face a fierce foreign competition that brings market prices down, high labour and capital costs and administrative burdens that slow down investments in the sector, hindering the full potential of the EU aquaculture sector.
The new strategic guidelines are not overruling any existing EU legislation, but the guidelines are seen as a first step in this process of voluntary cooperation between Member States and the Commission to improve the condition for aquaculture production in Europe. The next step is for Member States to prepare their multiannual national plans for the development of sustainable aquaculture. It is up to the Member States to coordinate their efforts and to exchange best practices and know-how.
The EMFF is expected to be the main financial tool to support the development of aquaculture. Thus, it is important that the Operational Plan that each Member State will prepare in the context of the EMFF (currently under negotiation) is consistent with its multiannual national plan for the development of sustainable aquaculture, in order to foster the overall coherence of aquaculture policy. The content of the Operational Plan and the multiannual national plan will be defined by each Member State taking into consideration its specific conditions, starting points and objectives.
51
Giving special consideration to the current period of crisis and austerity it is important that this financial support is used in the most efficient way possible. Therefore, in order to obtain the largest long-term benefits, it would make sense that it is spent in those activities where the EU aquaculture has or can obtain competitive advantage in front of competing third countries.
It is also important to strengthen and improve the image of aquaculture on aspects of environmental, animal welfare and food. Communication efforts shall be promoted to improve the image of aquaculture products in the EU.
Finally, this support to the EU aquaculture needs to be accompanied with measures that try to minimize the current and future obstacles to growth of the EU aquaculture sector.
3.6.1 Main obstacles for the EU aquaculture to grow
EU aquaculture production is stagnating; problems of governance have been identified, resulting in very few authorizations/licenses being issued in the main producing Member States in past years. Factors contributing to this situation include: the competition for space in coastal areas, lack of clear priorities for the development of the sector, fragmentation of competences for the authorization of aquaculture farms and sites, and the way environmental legislation is implemented. Most obstacles identified are in line with the main hindrance for growth identified by the previous STECF reports, European Commission, OECD and JRC (i.e. European Commission. 2013).
Simplify administrative procedures
High costs and lead time can hinder the development of an economic sector, and play an important role in determining the overall competitiveness of a given sector. At the moment, there is only a limited amount of information available on the delays and costs connected to the development of a new aquaculture farm or renewal and rebuilding of existing farms. There is a growing need to identify where bottlenecks are and what factors have the highest impact in terms of administrative burden.
SMEs represent a substantial part of the aquaculture sector, and they are disproportionately affected by red tape and regulation: the relative weight of regulatory and administrative costs compared to turnover and number of employees can be up to ten times higher for SMEs than for large companies.
Fragmentation of competences for the authorization
Aquaculture is a relative small sector in many countries and the decision making process is split both horizontally and vertically in a multiple decision-making process. This creates problems in terms of having experts dealing with aquaculture authorization on all levels, such as handling of different permits and licenses. Experts are needed on all level because the legislation is very complex involving the use of land, water, issues of food security and pollution. This involves many different governmental institutions when a license should be issued. As an example, if a new license or a permit to rebuild an existing farm in Denmark should be approved the following authorities must be involved: The Ministry of Food, Agriculture and Fisheries, The Ministry for Environment and the local municipality. This makes it very difficult for a small enterprise to deal with this bureaucracy and it is very time consuming.
52
The many different institutions involved in the process and lack of expertise on different levels of the governmental institutions is an important reason for the unnecessary long time of treating application for the establishment of new aquaculture production.
Moreover, often these different institutions may have different aims and targets, which some of them could be opposed to the existence of aquaculture exploitations in their area. It could happen that national and regional governments were in favour of aquaculture farms in their area, but locals governments could be against the existence of aquaculture farms in their areas. The position against aquaculture farms of local governments could be explained by the fact that often local governments have more power when the number of inhabitants increases. Moreover, often taxes local governments collect are proportional to the number of inhabitants or visitors they receive and not to the companies taxation. Therefore, local governments may prefer to use their coastal space for the construction of residential areas.
An introduction of a “single contact system” where the applicant only has to be in contact with one authority could be a solution to handle some of the problems described above.
Regulation and implementation of environmental legislation
The existing regulation in most EU countries is based on command and control. This kind of regulation can secure a certain level of environmental impact or that a certain level of pollution is not exceeded, such as the level of nitrogen, phosphorus and organic material. However, when the goals are reached the farmer has no incentive to decrease the environmental impact further.
As an example, under the feed quota system in Denmark, the farmer’s main focus was to optimize production based on the farms feed quota, whilst they has no incentive to reduce the pollution discharged from the farm (Nielsen 2011). A regulatory change to an incentive based regulation system such as pollution rights on nitrogen will give the farmer an incentive to reduce his environmental impact if the farmer in exchange is allowed to raise production (Nielsen 2012). This can potentially increase both production and income in the sector, without increasing pollution. Furthermore, it would provide the farmers with an incentive to reduce pollution even further in order to increase production and profitability, which would lead to further development and the adoption of new environmentally friendly production methods and technologies.
It is very important to identify the possible gains and losses of regulatory changes, because if a regulation is not optimal, it can lead to welfare losses for the society and individual producers.
The conclusion that can be drawn from this, based on economic theory of incentive based regulation and the case study of Danish aquaculture (Nielsen 2012), is that the existing regulation in most EU countries has most likely reduced the potential production and income and postponed the innovation of more environmental friendly and sustainable aquaculture technology.
New licenses are needed
One of the common constraints identified is the lack of new licenses issued. Over the past years very few authorisations/licenses have been issued in the primary aquaculture sector all over Europe. This is a major problem, because the facilities used for aquaculture production today are more or less fully exploited, which means that production cannot increase without more licenses.
53
The available information suggests that in some Member States authorization procedures for new aquaculture farms and for renewal of existing permits or licenses can take up to 2-3 years or more to complete.
In comparison, the average time for completing the authorization procedure for aquaculture farms in Norway is 6 months after the introduction of the "single contact point" approach. Another comparison is the authorization of a new agricultural farm in France which seems to be only 4-6 months.
The aquaculture sector is a sector with high risk (Asche & Bjørndal 2001). The long expedition time for new or renewal of aquaculture production permits and licenses creates even more uncertainty in the sector, which makes the sector less attractive to investors. Furthermore, the willingness to invest in new larger facilities is reduced if you are not certain that they can be used immediately after they are finished and ready to produce.
The competition for space in coastal areas
The issue of space is often perceived as a hindering factor for the expansion of EU marine aquaculture; however, the surface and coastline occupation by aquaculture sites is extremely limited and the availability of space along the coastline in absolute terms seems to be more than adequate to accommodate an expansion of the marine aquaculture sector.
The findings from the spatial analysis of existing sites show that the problem may rather be that there is a need to identify the most suitable sites through an integrated marine spatial planning. This is particularly important for relatively small and new industries like the aquaculture sector, which struggles in competing with larger and more established economic activities in the coastal areas.
Aquaculture interacts with many different interests in the coastal zone and at the moment it seems like Member States weigh other activities higher, because the aquaculture sector in most areas are rather insignificant and there is a general negative perception of aquaculture impact on the surrounding environment. In the end this negative perception and the lack of political determination to promote a higher aquaculture production by increasing the availability of suited aquaculture production sites and licenses are resulting in a stagnation of the sector, because the potential growth cannot be realized.
Small and medium size enterprises (SMEs)
The vast majority of EU aquaculture producers are SMEs; many are family-owned micro enterprises. Data available suggests that microenterprises represent around the 87% of all aquaculture companies in the EU. One of the key barriers to the development of aquaculture is represented by the high administrative costs, long times and uncertainties connected to the licensing process for new farms, and the lack of new licenses; the relative weight of these costs compared to turnover and number of employees can be up to ten times higher for SMEs than for large companies.
Diverging interpretations and applications of legislation in member states
The diverging interpretations and applications of legislation between member states make investments in aquaculture more uncertain. If the investment in new technology can only be used in one country this limits the possible gains from an investment and can limit the available capital for aquaculture investment in the EU. This also limits the possible spill-over effects from technological innovation between the countries in the EU.
54
Lack of clear priorities for the development of the sector
There is a lack of clear priorities in the development of the EU aquaculture sector, in great part due to the existence of different governmental institutions with different levels of spatial representativeness.
3.6.2 Organic aquaculture
In the European context the situation regarding the production of organic aquaculture fish species needs to be distinguished between freshwater and marine species.
3.6.2.1 Freshwater aquaculture
The main species farmed in Europe is the rainbow trout (Oncorhynchus mykiss). This species is widespread and appreciated by European consumers. In particular, organic production has a strong market especially in Central Europe, mainly Germany. Although the price of organic fish is higher, for trout, the consumer price remains an affordable price that consumers are willing to spend to get seafood products certified organic.
To this must be added that the supply chain (from the tank to the consumer) of the trout is very well integrated and developed: the majority of the supply of trout is sold "as is" cool but undergoes a process: it is transformed into fillets, smoked, canned , pre-cooked, etc., it is able to satisfy a wide range of consumers. Analyzing the “situation” on the hand of weakness for rainbow trout segment, it is the lack of fry organic the most important weakness. To get the organic fry (i.e. eggs, fry, juveniles) farmers must use fish caught in the wild (by wild catch), however, the rainbow trout isn’t a native species in Europe , for both the broodstock are wild. Apart from the main weakness represented by the scarcity of wild broodstock, another weakness for the development of organic farming of cultured trout is represented by the operating (production) costs of consumables: feed, in particular, are available, but cost an average of 30% more than the non-organic feed.
Moreover, from experimental tests , the use of organic feed showed greater amounts of PCBs in the flesh of fish sold for human consumption: this aspect is even a threat to organic aquaculture.
Another aspect that could represent a weakness for economic development of organic farming of trout and, in general, of all freshwater species, is represented by the correct control of the density of product per cubic meter of water. This is related to the efficiency of dissolved oxygen: it tends to hold little biomass in the tank so as not to increase consumption and thus the costs linked to oxygen.
At present producers operating in organic trout are:
Italy with amounts of about 200-300 tons,
France which was the first member state to produce 100 tons of organic trout,
Denmark which, however, is able to have fry only for their own consumption but the potential of organic farmers to produce fry is uncertain.
For other species farmed in freshwater the organic fry availability problem of biological is irrelevant: the carp is reared biological especially in Austria and Germany.
55
3.6.2.2 Marine aquaculture
For sea bass and sea bream species is very easy to obtain organic fry, because the broodstock are easily caught in the wild (wild catch). The biggest problem is the weakness of the sector for the development of organic sea bream and sea bass is the disinterest of the market to buy fresh organic product. The main factor that hampers the development is represented by the final consumer price (market/selling price): the price for these species is particularly high and due to a sharp decline in the purchasing power of consumers, is an obstacle to development. In addition to price, one other weakness is the fact that the sea bass and sea bream are purchased mainly fresh and unprocessed, for both the export market is quite close to the production facilities and is primarily aimed at a smaller number of consumers. The higher costs for the Organic Marine Aquaculture are represented by the feed and the ability to plant efficiency.
Many of the organic fry bread in Italy is bound to foreign markets, because in Italy as there is no demand from the market, it is uneconomical to raise organic. In the EU, also France, Greece and Spain produce significant amounts of marine organic eurhyaline species and are able to self procure the fry.
Must be addressed in a different manner, however, the case of salmon farming in Ireland and Scotland, productive areas in which Norway has focused on the production of organic salmon. So, in the EU there is excellent production in organic salmon, however, the funds are Norwegian.
The market potential in organic caviar is very wide, but there is a large initial weakness: the European regulation is not clear on the specific rules for the recognition and, moreover, there is no clarity on the sacrifice of the animal to get the eggs. There is now within the EU only one certified farm that produces organic caviar in Spain.
3.6.3 Competitive Advantage in European Aquaculture
The theory of competitive advantage grew out of concern that the traditional Ricardian theory of comparative advantage was misleading governments to foster industries in their countries in a way that led to them exporting primary products and raw materials. Such a strategy traps them in a commercial environment that could provide only low-value output and the attendant low wages. The low income elasticity of demand frequently associated with these products suppresses growth relative to countries which export products with a higher income elasticity.
Initially, Porter (1985) overthrew the idea that the fundamental unit in trade is a country, recognising instead that trading is undertaken by firms. It was held that their competitive advantage arose from local factor endowment in the form primarily of natural resources, labour and skills. Hence the new theory stressed that the competitive advantage of firms arises from maximising economies of scale in producing goods and services that obtain premium prices.
However, Porter soon recognised that firms are restrained to trade in the environment in which they find themselves and that that environment, while it includes the natural factor endowments, is partly created by government through the regulations, taxes and subsidies that they set.
This led to the notion of the competitive advantage of nations and emphasised the idea that the focus of national strategy should be the promotion of growth in productivity. Competitive advantage is no longer seen as the consequence of endowment in natural resources, labour, interest rates or exchange rates as the classical theory held. The modern view is that it arises from firms determining to keep ahead of rivals,
56
largely by innovation. This is assisted by firms facing a tough commercial environment. Firms benefit from having strong domestic rivals, aggressive home-based suppliers, and demanding local customers (Porter, 1990).
The concept of innovation in its broadest sense is now believed to be pre-eminent in determining competitive advantage, according to theoretical thinking. This means both introducing new products and technologies and improving existing production and use of resources. The remarkable hypothesis within this is that often the innovation is mundane and not even new, involving investment in skill and knowledge as well as in capital assets and brand reputations. Often it depends on the accumulation of small insights rather than major technological advances as firms nudge ahead of their national and international competition.
This insight should be viewed in the context of the development of multi-national corporations whose strategy is to move their production around the world to the most cost-effective locations, locations which provide the factors of production or proximity to markets that enable them to chase their corporate objectives. The footloose nature of the capital infrastructure of these firms and often their size relative to the host national economy enable them to influence the regulatory framework, taxes levied and subsidies available. Hence, identifying the sources of competitive advantage is complex but the continued existence of a firm in a market is evidence that it has a competitive advantage there.
The existence of aquaculture firms in Europe is evidence enough that they enjoy a competitive advantage otherwise they would be unable to survive. In the light of the discussion of theory set out above the purpose of this section is to consider the form that that competitive advantage takes and whether there is an opportunity for the European Union to develop the competitive advantage of its suppliers further, to encourage the growth of the existing firms and the establishment of new ones.
The factors of production can be grouped into natural resources, labour and capital, and the role of suppliers. These describe the supply side. The demand side is a matter of the location of markets, competition and marketing skill.
3.6.3.1 Analysis of the competitive advantage for some EU countries
Denmark
Natural Resources
Natural resources in form of suitable aquaculture sites play an important role in Denmark. On land, the competition for space is extraordinary due to the highly intensive agriculture sector. Furthermore, both sectors are competing for the same rights to discharge negative externalities into the water environment, such as nitrogen, phosphorus and organic materials. On the positive side, the availability of clean freshwater is plenty if productions are allowed.
Sea based aquaculture also faces strong competition for space, especially in the Baltic Sea, competing with traffic, fisheries, windmill parks and recreational activities. The competitive advantage for aquaculture production in the Danish part of the Baltic Sea is that farms are relatively well sheltered against storms, and there are available sites not far from the coast from which the strong current is helping disperse the negative externalities from the production sites.
57
Legal and political bottlenecks
The multilevel decision making process on new licenses, renewal of existing farms, and establishment of new farms is a major problem for all kind of aquaculture activity in Denmark. The approval of new aquaculture activities and renewal of the farms “environmental licenses” can take from 3 to 5 years.
Labour
The technical innovation and implementation of new highly sophisticated recirculation farms is increasing the demand for more skilled labour in the aquaculture sector, whereas the availability of unskilled labour is not considered a bottleneck.
Capital
The Danish Aquaculture sector is becoming more and more capital intensive. The higher competition for available capital and new investment in the sector has led to mergers to take advantages of economics of scale. The 10 largest enterprises now control more than 50% of the total production in both volume and value. The more capital intensive the sector is becoming, the more attention is focused on steady available input for production and that the fish can be sold the moment they are ready.
Other
Some of the leading fish feed companies and technical system manufacturers are located in Denmark. Both feed and technical innovations are sold nationally as well as internationally.
Denmark has more than 100 years of expertise in aquaculture production and an elaborate research infrastructure on aquaculture that in cooperates biologist, economist, and technicians, as well as the producers organisation including producers, feed companies, system manufacturers and fish processing.
Estonia
Availability of natural resources (water and land) and low labour costs are main sources of competitive advantage for the aquaculture in Estonia. However, the lack of investment capital and know-how have been the main factors restricting the development of fish farming in Estonia.
Greece
Sources of competitive advantage for aquaculture in Greece:
availability of suitable environment for marine finfish aquaculture
skilled labour
knowledge of production technology
Italy
Natural Resources
A threat to Italian aquaculture is the lack of definition of spaces (spatial access) to be used for aquaculture and the development of new facilities. Aquaculture, today, is not recognized as an economic activity that
58
uses water resources (freshwater/salt water) on an equal manner with other sectors, such as fisheries, tourism, navigation, agriculture, industry, etc. To this must be added that the existing licenses and authorizations do not consider the carrying capacity, which means that cannot plan for development which is economically and environmentally sustainable. For the future, it will be important to include aquaculture between economic activities currently recognized as a user of the resource "water" (both marine and fresh water"). Such recognition will make aquaculture the same as other economic activities that are potential competitors, ensuring the possibility of access to resources, both as regards the use of inland waters of the salt waters. In addition, many aquaculture farms have had a serious injury caused by new regulations governing the licensing fees for the use of marine and spatial areas. In many cases the annual cost of the license for the use of public marine areas is about 150% more than the annual turnover of each undertaking. This is due to the tariffs charged: competent public bodies have used rates per square meter of area granted to aquaculture companies like the tariffs for recreational activities carried out on the coast, such as private beaches and seaside restaurants. In practical terms, many aquaculture enterprises have not obtained the renewal of licenses and therefore could not even qualify for public funding that would cover costs of investments already made by the same companies. This has paralyzed the aquaculture sector as it is not been able to receive lines of credit from banks.
Labour
Italian aquaculture is labour intensive. Given Italian labour cost, as demonstrated by a study GFCM / FAO, is one of the highest among its competitors Mediterranean countries (in addition to those outside the EU), it certainly is a performance of economic inefficiency.
Having said this, using the same data points, we can see that Italian aquaculture is characterized by a very high level of specialization of labour and, therefore, contains a trained and experienced workforce. Unfortunately, the decline in production, or the sharp reduction in the number of active aquaculture farms, has reduced employment in the sector. In addition to creating unemployment, it also means a reduction of investment in education and training of the employees.
In some segments, however, such as the shellfish segment, there is a phenomenon that is different. As many blocks to the activity of small-scale fisheries exist, fishermen have started to work for seasonal operations in the sector of clams, mussels or oysters. Also in the same sectors some young people, who have lost their jobs, for example, have decided to work to help relatives already employed in that sector.
Capital
The selection phase has affected numerous sea bass and sea bream farms, which were not prepared for the challenges of this period of strong economic and financial instability. These challenges, in fact, require total dedication, high technical capacity and appropriate financial capabilities. In Italy today, companies that have a size suitable for the challenges are few. These companies manage, however, to ensure quality production both as regards the fry, and the products fattened, as well as equipping the companies to withstand the increasing competition with other Mediterranean productions, especially North African.
As for public subsidies, in some regions many subsidies were not assigned, because the existing facilities had failed, closed or been put in stand-by mode (inactive). In other cases it was difficult for companies to apply for subsidies because they had reliable and sound banking, in addition to which was added, in some cases recorded for example in Sicily, the lack of a requirement for aquaculture enterprises and their renewal of their licenses. The problem, as already mentioned, has been a bureaucratic / administrative bottleneck.
59
Malta
Natural Resources
Land availability is a major limiting factor for most Maltese Industries due to the small size of the country and the high population and degree of urbanisation. Nevertheless, the Maltese Aquaculture industry is mostly concentrated at-sea and thus, this is not a major limiting factor for this sector.
The coasts of the Maltese Islands have several different uses ranging from tourism purposes (such as hotels), sport activities, aquaculture, marinas, fishing activities, beaches and port uses amongst others. Heavy competition for space is thus present especially close to the coast. This has led to bottlenecks for fish farm cages permits and most cages are now situated further away from the coast. This incurs higher costs such as that of energy. Water quality is monitored following a compulsory programme for aquaculture fish farms in Malta.
Labour
Aquaculture is labour intensive and it also requires a high degree of specialisation. Experience is rather important. Nowadays, courses at Maltese colleges are being designed to educate more people in this sector and in an effort to have more qualified personnel.
Capital
The Aquaculture Industry in Malta is one of the major national industries and contributes to a significant portion of the Gross Domestic Product (GDP). The investments and financial growth in this segment over the past years have been considerable. Companies have obtained funding mainly through research programs.
Netherlands
Within Holland a distinction can be made between shellfish and freshwater aquaculture and this is detailed below.
For shellfish:
Natural Resources
Natural resources play an important role in creating a competitive advantage for the shellfish sector. The shallow estuaries offer easily accessible production grounds and at the same time are nutrient rich, providing aquaculture with sufficient feed. Trade of shellfish is concentrated in the South-Western province Zeeland where there is sufficient space to “store” the shellfish in the estuaries, waiting to be sold at auction.
Availability of land is of far lesser importance as shellfish production does not require much land.
The geographical location is another advantage. Belgium is a major export market and is located close to Zeeland, easily accessible by road.
60
Legal and political bottlenecks
The performance of the mussel sector is hindered by restrictions on mussel spat collection. Environmental considerations have led to resistance to the traditional ways of collecting mussel spat (bottom trawling in the Wadden Sea). Permits for this method are granted on a year-to-year basis, leading to insecurity among the producers. Experiments with mussel spat collection systems, in the offshore Wadden Sea, that have been underway for a few years show positive results. Commercially mussel spat collection systems are now used.
An important aspect, which is hard to quantify, is the informal relationships with local and regional politicians which is strong in the main production centre Zeeland.
Labour
The shellfish sector requires relatively little labour. Since shellfish are cultivated in areas where there is a history of fishing, there is personnel available who are experienced with working “on water”.
Capital
The main competitive advantage here is presumably the long history of shellfish cultivation. As equipment has been used for many years, resulting costs for depreciation are low. The shellfish entrepreneurs have generally sufficient “good years” in which they have built up capital. This allows them to innovate where necessary (e.g. mussel spat collection).
Subsidies are not of great importance, they are generally limited to research and innovation projects but there is a tendency to ask business for in-kind of cash contributions.
For freshwater fish:
Natural Resources
Natural resources play no important role. Freshwater aquaculture is dispersed throughout the country. Availability of land is of importance but since the spatial claims of freshwater aquaculture are limited this cannot be considered a competitive advantage, nor a competitive disadvantage.
Legal and political bottlenecks
There are no known legal or political bottlenecks.
Labour
Availability of unskilled labour is not considered a bottleneck, nor is it a competitive advantage. Concerning skilled labour, it is noteworthy that universities educate in fish farming. Some of the graduates become involved in commercial aquaculture.
61
Capital
Most freshwater aquaculture companies perform only weakly and do not make large profits. Capital accumulation is difficult. In some cases, the main production facilities are barns that are already paid for (as families have had farms before).
Other
A number of strong fish feed companies and system manufacturers are located in the Netherlands. They are active on the national and international market.
The Netherlands have an elaborate research infrastructure on aquaculture that cooperates with some of the entrepreneurs, as well as fish feed companies and system manufacturers.
United Kingdom
Natural Resources
There are few sites left in the UK coastal areas that would be suitable for use for aquaculture but there may be some smaller opportunities for expansion within the existing sites. Salmon production is in the hands of large multi-national companies and the industry is already quite concentrated. Other aquaculture products are generally the output of small enterprises whose markets offer plenty of opportunity for expansion and which are competitive.
Labour
It is not obvious that the UK enjoys any particular competitive advantage from its labour force, but this may hide careful training and a willingness to allow the flow of information from staff to managers as well as the other way round. On the management side there is clearly a willingness to tackle the immediate problems of marketing which have been addressed and overcome.
Capital
Capital in the salmon industry has been concentrated into a few larger firms. This is much less marked in other areas of the industry. Hence, it is both a source of existing competitive advantage where mergers have already taken place and the potential source of improved competitive advantage among the smaller producers.
Overall, the strength of UK production lies in the existence of competitive advantage derived from factor endowment and other sources which are much less easy to identify. There seems little doubt that production skills have played an important part but business acumen and marketing skills must have played a significant role.
3.6.3.2 Analysis of the competitive advantage of the EU: an overview
There is something of the notion in Porter’s approach that argues that competitive advantage would allow firms to produce anything anywhere so long as they maintain a cost structure which enables them to survive.
62
Porter’s approach suggests that it may be better to encourage existing firms to make incremental improvements, however small and seemingly mundane, to maintain competitive advantage. This would be preferable to encouraging the establishment of new firms which if they are small may be at an immediate disadvantage in terms of economies of scale and which are prey to the high failure rates associated with new businesses. However, the two approaches are not mutually exclusive and the difficulty for policy-makers is that no categorical conclusions can be drawn either way. Indeed, the idea of incremental development has a weakness in that it relies on a relatively stable market. Where an industry is threatened by a shock to its market, for example, a low-priced competitor from a new source abroad, then incremental development may be insufficient to preserve competitive advantage.
Factor Endowment
Natural Resources
European aquaculture rather contradicts the pure theoretical view that factor endowment does not contribute to competitive advantage because farmed fish products gain competitive advantage from the geography of their localities, especially the climate. This can be seen from the variability of production of the main species across Europe. Salmon is largely produced in Scotland and Norway; rainbow trout in Denmark, France and Italy; sea bass in Greece, Italy and Spain; sea bream in Greece, Spain and Turkey; mussels in France, Italy, Netherlands and Spain; oysters in France; and carp in the Czech Republic, Poland, Hungary and Germany. Among these seven main products only France appears more than twice.
Overcoming the cost of establishing capital equipment to replicate climatic conditions elsewhere can be substantial and local producers therefore have a competitive advantage from exploiting local conditions. It would be difficult to produce salmon in the Mediterranean as it would be to grow sea bass in Scotland. This not to deny, of course, that a northern European firm could successfully own and run a sea bass farm in the Mediterranean or that a southern European firm could do likewise with a Scottish salmon farm.
It is normal for small enterprises, whatever their product, to set up their capital equipment in their locality, but competitive advantage is frequently gained by mergers and takeovers. It consolidates markets, serves as a buffer during downturns, and sometimes reduces costs by offering economies of scale – though frequently these do not emerge as hoped. The Scottish salmon industry has survived in the face of intense competition from Norwegian production and the recent economic recession. It has frequently been alleged that the competitor industry has been subsidised and the larger Scottish producers have generally been absorbed by international groups. The holding companies of the top three Scottish producers are Norwegian or Czech. The impact of this is that in the case of Norwegian ownership the return to capital leaves the EU, though not the EEA, while the return to labour remains.
There are two areas where commercial pressures may not be welcomed by industry participants but where according to the received theory the industry and ultimately the consumer may benefit.
The first is pressure from purchasers. The structure of the retail sector in all the larger and many of the smaller EU member states is such that final supply of fish to the consumer largely occurs via oligopolistic multiple stores. Multiple stores in most member states occupy a position in the supply chain relative to
63
their suppliers as oligopsonists22. This gives them the power to drive down the prices they pay and to garner the producer surplus for themselves. A similar position exists in catering. It does not follow that the lower prices will be passed on to the final consumer. This makes investment in small production units unattractive and supplier firms benefit from merging to acquire greater market strength. In so far as EU aquaculture firms are small they might improve their competitive advantage by merging to produce greater industrial concentration.
The second relates to relaxation of legal and political constraints and may serve to offer opportunities to gain competitive advantage. For example, a small increment in the size of cages might enable production to be increased sufficiently to maintain or improve competitiveness. The question of whether the cages are already of an optimal size is one to be asked. Any reaction to legal or political constraints which raises costs or prevents the industry from approaching operational optima reduces any competitive advantage. There may also be competition with alternative uses of the resource. Where such competition is free, aquaculture firms should be strengthened.
Labour
A feature that emerges across the EU aquaculture industry is the view that the competitive advantage of firms relies on skilled labour and knowledge. Skill depends on training and practice. Knowledge is a broader concept and may be related to production, management and marketing.
Capital
Much EU aquaculture has been assisted in its development by subsidies of various forms.
Ideally such subsidies should be gradually removed. They serve in practical terms to overcome barriers to market entry which can obstruct the development of otherwise viable enterprises. However, they may serve as feather-bedding, preventing the development of un-supported competitive advantage. The neo-classical view of subsidies is that they divert profits by taxation from enterprises with a competitive advantage to those without. This effectively lowers production cost and provides the consumer with a product at a lower price resulting in an inefficient mis-allocation of resources and creating economic distortions. Subsidies must be offered, therefore, with great care if they are to promote economic development.
Externalities
There is a growing understanding that the presence of shellfish farms can provide the external benefit of improving water quality by filtering out pollutants and oxygenating water and sediments. Oysters feeding filter between 50 and 100 gallons a day and mussels behave similarly, helping to improve the habitat for other species.
Unfortunately, the public perception of shellfish used for filtration could damage the image of the industry’s product and means that the shellfish when harvested must be directed to animal feeds and
22 Oligopsony is characterised by there being only a few large buyers in a market and a larger number of smaller suppliers.
64
fertiliser. Tests in Sweden have shown promise, but there remains the question of who is the customer for this opportunity.
3.6.3.3 Conclusions and Inferences on competitive advantage
The conclusion of the above discussion is that EU policy-makers could most assist EU aquaculture by encouraging firms to develop incremental changes to keep ahead of their competitors and that encouragement of a strong and intensely competitive home market would foster both domestic supply and exports. Hence, the European consumer would benefit from well-produced, well-marketed products at competitive prices.
The EU has a competitive advantage in the presence of a well-educated work force. It has space for physical expansion of the industry but often a lack of understanding of the spatial needs and infrastructure for the industry among the planning authorities. Other factors like business acumen, political stability, and proximity to wealthier markets, provide for competitive advantage and can benefit from mundane and small improvements.
There is every indication that the market for farmed fish and shellfish products is capable of continuing the expansion it has shown in the last twenty-five years and that newer products from some of the more traditional wild species could be a source of expansion. This is where knowledge comes in. Research into how to grow new products is often expensive, too expensive for the small firms in the industry. Government-funded research may help fill this gap. Government funding is, however, often not driven by a correct appreciation of demand or business pressures. Mergers to create larger firms with the financial strength to fund research and development would no doubt be preferable. This is exactly the kind of incremental change and encouragement of innovation that Porter argues are a means of gaining competitive advantage.
3.6.4 Trends and triggers by country
Austria
The various segments of the Austrian aquaculture sector have followed a very similar trend in the 2008 – 2009 period. Prices of the main 5 species (rainbow trout, brook trout, common carp, wels catfish and sea trout) have seen a rise in the country of 50% before suffering a slight fall in 2011. The price of rainbow trout in Austria was 7.9 €/Kg in 2011. The price for common carp was 6.0 €/Kg, for grass carp 8.9 €/Kg, for brook trout and for northern pike it was 11.9 €/Kg in 2011.
Belgium
Rainbow trout was the main species produced by the Belgian aquaculture sector, representing the 73% in weight and 68% in value of total production in 2011. The average first-sale price for cultured rainbow trout has been stable at 4.3 €/Kg for the period 2008-2011. This could offer a high income stability for the Belgian aquaculture companies. However, production in both weight and value shows significant variations overtime. It should be analysed if these variations are due to real production oscillations or data collection inaccuracies.
65
Bulgaria
There has been an important decrease in the employment in the Bulgarian aquaculture sector between 2009 to 2010 (-84%), even if the number of companies increased by 3% during the same period. From 2010 to 2011, the employment, both measured in number of employees and FTE, has increased in 24%. This important decrease in the employment could be explained by the economic crisis. The evolution of the Bulgarian aquaculture sector is largely affected by the changes occurred between 2009 and 2010. Between 2009 and 2010, turnover decreased by 36%, livestock decreased costs by 98% even if livestock weight increased by 16%, feed costs decreased by 57% even if feed weight increased by 23%, other operational decreased by 90%, financial costs decreased by 87% and total value of assets decreased by 75%. This has produced a reduction in the production accompanied with improvements in the labour productivity and economic performance of the aquaculture sector. If these trends are confirmed, it would be important to see if it is possible to recover the production in the Bulgarian aquaculture sector while maintaining the economic performance.
Croatia
Fish and juveniles production is very volatile for the 4 year period from 2008 – 2011 going from a high of 189 million to a low of zero. From 2010 to 2011 output fell by -18%. Atlantic blue fin tuna prices in Croatia reached around 12 €/kg in 2011, followed by European seabass with 4.4 €/kg, gilthead seabream with 3.7 €/kg, rainbow trout with 2.7 €/kg and common carp with 1.5 €/kg.
Common carp, gilthead seabream, rainbow trout and European seabass have showed a very similar pattern in terms of price changes over the period of 2008-2011. Prices for all four of these species changed relatively little as European seabass and rainbow trout gained some market value and gilthead seabream and common carp both lost some market value. In contrast the value of Atlantic bluefin tuna started the period at a value of around 5.5 €/kg but this rose to 12 €/kg. The majority of this price increase was experienced over the 2008-2009 time period.
Croatia entered in the EU in 2013, so it has not participated in the data collection (DCF). Therefore, FAO and EUROSTAT data have been used in this analysis.
Cyprus
The production in Cyprus is increasing over time mainly due to the opening of new export markets as well as due to the support from the European Fisheries Fund. In the recent years substantial investments were made towards the modernization and expansion of the aquaculture farms which resulted, among others, in the production increase. The production is expected to continue increasing, however the extent of the increase is uncertain since the prospects and the stability of the economic performance depends on the demand from new markets. It is uncertain and difficult to predict if the EU market will be able to absorb further increases in the production of seabass and seabream. Moreover, during recent years the production cost have increased significantly mainly due to the substantial increase of feed prices and the cost of energy, putting pressure in the producers profitability.
Czech Republic
Northern pike prices are the highest of the major species relevant to aquaculture but have also shown the greatest fluctuation from a low of under € 2/Kg in 2008 to over € 8/Kg in 2009. Other species have been more consistent with common carp and grass carp in particular showing little volatility around the € 2/Kg
66
mark. This lack of volatility (although only shown over a small time period) is beneficial as the Czech aquaculture production relies heavily upon it and this will allow for easier investment planning in the medium and long term. A lack of data prevents further analysis.
Denmark
Investment has been increasing for the past three years in the Danish aquaculture sector. Between 2010 and 2011 investment rose by 18%, however, investments are still below the pre-crises level in 2008. The increasing investment might indicate that firms within the sector are expecting a positive income in the future.
Demand for fish within the EU is increasing and yet supply from within the EU is stagnating. The framework condition, such as bureaucracy, administration and environmental regulation, has been the main barrier to growth in the Danish aquaculture sector. The introduction of new technology allowing for an emission reduction of nitrogen, phosphorus and organic material has made it possible to actually increase production without increasing emissions.
To support the implementation of more new technology, the existing feed quota regulation has been changed to an incentive based regulation on farm emissions, in 2012. This change should give the farmers an incentive to reduce emission, by implementing new technology, because if they lower emission they are allowed to produce more. However, the bureaucracy and administration of the new legislation are staggering. A change from the existing feed quota system to an emission permit can take up to 3 years or more and new permit or licenses are not issued.
Estonia
To counter investment funding issues 12 million Euros was allocated from the EFF in order to modernize firms. Further funding of 839 thousand Euros was awarded from the EFF in 2013 to establish a training centre to teach fish farming and in 2012 Estonia started to develop its aquaculture strategy plan.
Estonian aquaculture is categorized by low production volumes which make it impossible to cater to the needs of supermarket chains or large exporters especially given the high production cost of red-flesh trout. This problem is intensified by foreign competition that do not face environmental charges however some manufacturers are succeeding in adding value by processing the fish and cultivating new species.
Medium term production may fall after the heat wave of 2010 caused a great fall in rainbow trout production in that year. The full extent of knock-on effects is still to be calculated.
Finland
The most prominent factor in the Finish aquaculture industry is the presence of environmental permits which are required by almost all producers in order to operate, with the foremost aim of the system to reduce the nutrient load on the Baltic Sea. We have however seen a fundamental imbalance between environmental and economic goals as no new permits have been issued since the 1980s even in the midst of increasing demand however the Government is working to overcome this. Perhaps as a result recirculating aquaculture systems have become more commonplace but will need to be more concentrated on species of high economic value.
67
France
In the oyster sector, the situation of mortalities of spat is continuing on 2012 and 2013. The main concern of oyster farmers is to maintain profitability. This expected level of requirement leads oyster farmers to keep an adequate level of livestock through the number of spat collectors and their purchase in the hatcheries. The situation is more difficult for professionals with no leasehold, the livestock costs item carry weight. Subsidies allow oyster farmers to buy spat. The reduction of oyster quantities leads modifications on market structure. Price of ongrowing and adult oysters continue to increase in 2012 and 2013 between oyster farmers and on the different markets (sell-through, retail-chains, exportation). As a supplement to the direct support for companies, French State made a commitment in the research for runways of release of crisis. One of these approaches appears to be genetic selection to identify resistant oysters. Research results will not be available before 2014-2015.
French mussel production is not enough to meet the national demand. Imports come mainly from Chile, Netherlands and Spain. Since May 2013, “Moules de Bouchot” are a protected name. It’s the first French product to obtain the Traditional Speciality Guaranteed (TSG) designation. With the introduction of a TSG, mussel farmers wish to boost their revenues. It will also increase the market value of the products of economic operators, by guaranteeing that they are distinguishable from other similar products. Hence, the increase of the production remains as a consequence an objective for coming years: the improvement of the productivity of the traditional sites of breeding, the use of new areas, located rather at sea opened, could allow an increase of the mussel production in the next years.
Germany
The German freshwater market is dominated by traditional small producers for the regional market (carp and trout). The competition by trout from Denmark and Turkey is quite heavy in the general retail sector, so most production is sold regionally. For the carp segment, producers are facing declining demand for carp, which is traditionally eaten in some regions at New Year´s Eve. Even if some marketing actions are going on, demand is still quite restricted.
For the carp production sites problems with diseases and cormorans are so significant, that more and more small farmers are going to give up this activity. The trout producers are facing urgent problems with lack of therapeutic options for parasites and bacteria. Cormorans and gray heron are causing less problems than in the carp sector, but in particular some small producers are faced with serious economical impacts of those predatory activities.
Currently different bodies in Germany develop strategies in order to increase the aquaculture production. Unfortunately it is not obvious what the strategic targets and measures will be. From this experts point of view Germany has some strength in providing cultured fish for local and regional market, in particular as the landscape is very much characterised by traditional ponds in some German regions (Franken/Lausitz). This serves also as a touristic attractor, while some concentration in the segment seems to be necessary in order to create economies of scale. In the trout segment it seems to be necessary to create value added for the consumers, e.g. by regional and organic labelling, but obviously the sector can survive with the regional and local markets. Some other currently small segments may increase if more volume is created and supply could be stabilized in higher volumes during the year to be interesting for the big retailers.
In 2008 there was no collection of seed mussels in Lower Saxony possible as there was no seed fall (and very small volume in 2007 already). This was for the first time in the more than 100 years of this business.
68
This explains the sharp decrease in sales volume in 2009, which shows the volume of collected seed mussels and sales volume of blue mussels for the mussel farmers in Lower Saxony. The volume of seed mussels varies from year to year. In some years in the last decade almost no seed fall could be noticed. With a time lag of one to two years the volume of mussels for consumption varies accordingly. This is the main reason for the fluctuation of income in this sector. The number of companies also varies, but this is more due to changing legal structure of the companies, where sometimes a group of affiliated companies is founded and sometimes disintegrated again. The employment is relatively stable.
Greece
The aquaculture sector is characterized by a shortfall of credit however the level of output is very steady largely due to supply side decisions to limit production and the effects of the debt crisis on Southern European demand which is the main source of demand in Greece. Growth and recovery is being further limited by the lack of EFF direct investment subsidies or financial engineering instruments.
In the future it is expected that labelling, including organic labelling, will continue to be a niche market but expansion could happen with investment into processing as well as into research and development of low cost production.
Hungary
Common carp was the main species produced by the Hungarian aquaculture sector, representing 69% in both weight and value of total production in 2011. This high reliance to one particular species could leave the market susceptible to asymmetric shocks and investment in diversification could prove advantageous in the long run.
The average first-sale price for common carp in Hungary was 1.9 €/Kg in 2011. Catfish (north African catfish and wels catfish) prices are higher than carp prices. For carps, common carp is the most expensive one, followed by grass carp and silver carp is the cheapest one. Fish prices across the market show little variation from their 2008 prices. This consistency will help with market confidence as it allows for investment to be planned more appropriately than if prices varied much more. The larges variations shown were in 2009 when common carp and wels catfish in particular lost value.
Ireland
Demand for organic salmon is currently very high and is considered to be outstripping supply. 82% of salmon is produced by ‘organic’ methods but only 75% is marketed as such due to equally high demand for ‘premium’ product. Branding is very prominent in the market as a whole.
There are currently significant challenges posed to the major subsectors by seed supply and juvenile stock mortalities as a result of disease, parasites, red tides and recent weather conditions. These challenges have been made more acute by the location of most producers adjacent to or within Natura 2000 areas and the bureaucracy involved in obtaining or renewing licences. Restrictive licence conditions limit the producers ability to move healthy stock away from areas of high risk at certain times. The lag time in processing licences has also meant that supply has not kept up with increasing market demand. A national approach to identify key areas suitable for aquaculture and relatively free from other sector demand has been suggested, that would be offered to potential applicants with the advantage over the previous individual application process, of being partially assessed/processed by the public sector beforehand.
69
Italy
The most successful Italian aquaculture firms have been those that are highly specialized with high levels of industrialization. In general Italian aquaculture has suffered as a result of competition from other countries such as Greece and Turkey which have been priced 25-35% lower (referring to sea bass and sea bream). The growing coastal cage farming industry in these countries has lower costs than Italian land based aquaculture and so domestic suppliers have been unable to take advantage of the higher propensity to consume fish products which has been brought about by the economic crisis. Italy has been slow to react to foreign competition due to high levels of bureaucracy including the renewal of state concessions, management of health permits and the renewal of operating licenses. Plants have also had difficulty accessing lines of credit as well as government funding. Integrated vertical channels (from cage to table) of production have increased GVA and prices for farmers but this system would benefit from greater sharing of processing platforms by SMEs.
Latvia
There has been little to no development of processing industry in Latvia and so the majority of farmed fish are consumed locally and are sold fresh to customers. It is possible that the processing industry has failed to take off because there is no effective trade system in place for aquaculture and investment such as this is not viable on the individual scale for small producers.
Under the Operational Program for 2007-2013 companies were modernized and new breeding technologies were introduced to help focus more producers on the market and larger scale production.
Lithuania
The common carp was the main species produced by the Lithuanian aquaculture sector, representing the 93% in weight and 87% in value of total production in 2011. The average first-sale price for common carp in Lithuania has been stable around 2 €/Kg during the period 2008-2011. Sturgeon and grass carp prices have been decreasing during the period analysed; while Northern pike have been decreasing but recovered in 2011.
Malta
The relatively small number of companies can explain some of the large variations in data year on year because if there were more enterprises then changes in one firm would be softened in the national data by other firms. This can especially be seen in costs such as repair and maintenance costs as well as energy costs.
The Maltese aquaculture industry has a very sound export base and consumes very little domestically. Its main export partners are Japan, for the export of Atlantic bluefin tuna, and Libya and Italy, for the export of European seabass and gilt-head seabream.
Netherlands
As with many other MS the level of production is limited to a certain extent by the red tape surrounding permits. Permits are needed for the collection of mussel spats and at present permits are at a level such that demand is greater than supply. One upside of this is that the market is relatively stable and predictable at present.
70
Certification has not featured heavily in Dutch aquaculture despite the presence of a number of schemes. The situation is so extreme that no companies in the Netherlands are certified organic producers.
Poland
One particular issue faced is the pressure on the output of both carp and trout which are very susceptible to extreme temperatures. Part of the decline in output in 2011 was caused by adverse weather conditions. Other pressures include the growth in numbers of fish eating animals such as cormorants and otters which are protected by law.
Polish aquafarmers have made efforts to increase their profitability by becoming organic (and being labelled as such) and by increasing their participation in the processing market which adds more value to their products.
Carp production has fallen slowly over past years in reaction to changing tastes of consumers. In response the government has launched publicity campaigns to attempt to boost domestic consumption of trout and carp and to reduce the traditionally skewed consumption patterns centred on Christmas.
Portugal
Portuguese aquaculture is largely offshore and in estuaries with 90% of the sites in public domain areas where business purchase rolling 10 year leases. A particular threat to the polyculture regimes is that of high labour costs however this is slightly mitigated by the high rates of family owned and run businesses in Portuguese aquaculture.
The emergence, in 2009, of a larger company has gone a long way to altering the structure of the industry and this is yet to settle into a discernible and stable pattern. In addition to this considerable investment has been made from 2009 to 2013 in offshore aquafarming and this is expected to pay off over the next two years.
Portugal has not made large inroads into certification as a way of differentiating products but is expected to improve on this with some facilities intending to convert to a bio-ecological model of organic aquaculture production.
Romania
The Romanian aquaculture sector decreased in 2011 due to the economic crisis, after registering a positive trend from 2009. However, the whole Romanian economy has a positive trend, so the domestic demand is also growing, which is encouraging the aquaculture products sells. In fact, 2012 aquaculture production increased. It is expected that this positive trend will continue or even increase for the coming years thanks to the recovery of the sector and the better fructification of the opportunities in the country. Internal demand for aquaculture products is affected by the level of the imported fish and the trading policy of the supermarket chains, present all over the country.
Moreover, the aquaculture sector didn’t and still is not benefiting from a very clear sector policies adopted by the government/national authority responsible for fisheries and aquaculture. No subsidies granted by national authorities, no other simulative support were registered. Only under EFF Program some farmers get European aid on developing their business in the field, specially related to enlarge the
71
production of sturgeon species, or for the investments on modernizing the existing productive units, the main direction for financial support in aquaculture sector.
Slovakia
It can be seen from the sales figures that there is no real discernible patter over the 4 years shown but that a fairly high level of volatility is present. Whilst the 2011 and 2009 figures are comparable for weight the same cannot be said of the value of this output in the same years. This indicates that not only is there a lot of variation in weight but also in value and, perhaps most importantly, that on the face of the data below there may be only fairly weak linkages between weight produced and value per unit.
Slovenia
Due to natural limitations opportunities to expand marine aquaculture are limited. In 2007 three large areas for marine aquaculture were set up however it is unlikely that these will be expanded due to competing needs for the space. There is however a strong possibility of expansion in the freshwater inland sector due to good quality water and its available in large quantities.
In 2010 production value and volume were low due to the prohibition of sales for most of the year due to phytotoxic organisms which prevented the sale of products. The industry bounced back in 2011 however, in part thanks to large investments in Slovenian marine aquaculture facilities.
'Other income' contributed in 79% of the total income. This happens because in many companies analysed, aquaculture is not the main activity of the company. This leads to the situation that subsidies contributed, in 2011, more than aquaculture turnover to the income of the companies.
Spain
The value of assets has fallen by -7% due to a rise of 12% in the depreciation of capital. This is owing to the lack of relevant investment in new equipment and could be a barrier to growth in the medium term.
A notable point is that as production levels in fish farming have fallen firms' performances have improved. In the case of bass and bream, production levels are regulated by prices and demand as they have high demand elasticity and so increasing production may not result in higher profitability.
Certification continues to play a very muted role as production is fuelled by domestic demand and Spanish residents are showing little reaction to certification introduction. Any changes in this sector are being driven by retailers searching for greater market shares. There is also little evidence of an organic aquaculture sector as consumer's income constraints and confusion over industry terminology prove to be bottlenecks. This is compounded by lack of exports.
Any major growth in aquaculture is likely to come from emerging species such as meagre and Atlantic bluefin tuna into which research and investment is being made.
Sweden
Aquaculture in Sweden is widely dispersed across the country and is often very rural but clustered. Output of rainbow trout and arctic char had increased steadily since 1998 and this can be put down to large domestic and foreign demand as well as high prices. Structural changes have also helped to
72
encourage growth through mergers and acquisitions and allowing exploitation of economics of scale. In addition subsidies from the EFF have increased year on year to peak in 2011 at 1.4 million Euros.
The FEI indicator shows that investment is greater than depreciation but that the ratio is decreasing and this could be attributed either to a lack of confidence from farmers or perhaps to a maturing industry.
The outlook, in many ways, is positive as several large firms are currently applying for production licenses which would increase capacity. There is need however to put in place a firm strategy plan to help determine key geographical areas for growth as well as to allow increased focus on organic labelling to increase the value of products.
United Kingdom
According to the Defra consultation on aquaculture strategy, the main factor militating against growth was price competitiveness, since the UK has historically enjoyed a good supply of wild-caught fish. UK consumers are also reluctant to try new species and products, which limits the possibility to develop diversity and hence resilience against diseases.
Against this, salmon production continues to develop and increase, as the product is popular and versatile: it can be sold fresh, frozen or processed and remains highly competitive in price and quality with Atlantic salmon or similar species produced elsewhere whether wild-caught or cultivated. Salmon production in Scotland was boosted when production was reduced by disease in Chile. Scottish farms may operate and report at the site level, but are very largely owned by multinational companies with scope to switch production between countries. This is reflected in the evolution of prices: the series below are prices reported by the SSPO as annual averages. The GBP price for 2012 is virtually identical to the 1989 price, which represents a considerable drop in real terms (more than halved). The very low prices in years after 2000 reflect strong competition from Norway and were drivers toward consolidation.
Given the support in principle for commercial development in rural areas offered by the Scottish Government and by local authorities, and the evidence of continuing growth in demand, barriers to development of new sites fall into two categories. Nationally, there are pressure groups who promote widespread beliefs that salmon farms may be ecologically damaging: the accusations include chemical pollution of surrounding water by surplus food, fish excreta and applied medicines, etc; secondly, that the intensive holding of salmon provides reservoirs of parasites and diseases that affect surrounding wild fish; and thirdly that losses from fish farms (escapees) can interbreed with local stocks and change the genetic make-up. Locally, there may be specific planning objections to each individual application, based on competing economic or aesthetic interests. Production within existing sites is growing, as is productivity. Further increase may be achieved (or may be limited) by site developments (larger cages or more cages), disease control (vaccinations or stock selection), and changes in growth rates through feeds or genetic improvements (selective breeding or GM).
Failure to grow production of trout may reflect failure to develop demand for table fish and a preference to cater more for angling and tourism (e.g. by supplying local restaurants). According to the British Trout Association (BTA), “To support a trout farm a clean river is needed for adequate water supply, which limits expansion possibilities in the UK. The majority of fish farming concerns are small with owners doing much of the work themselves. Production is increasingly concentrated on farms producing 100 tonnes or more. The Industry is moving away from smaller producers, as they are becoming less competitive. Competition from larger trout producers, other fish species and cheaper imported fish are reducing profit margins as prices remain the same or fall.”
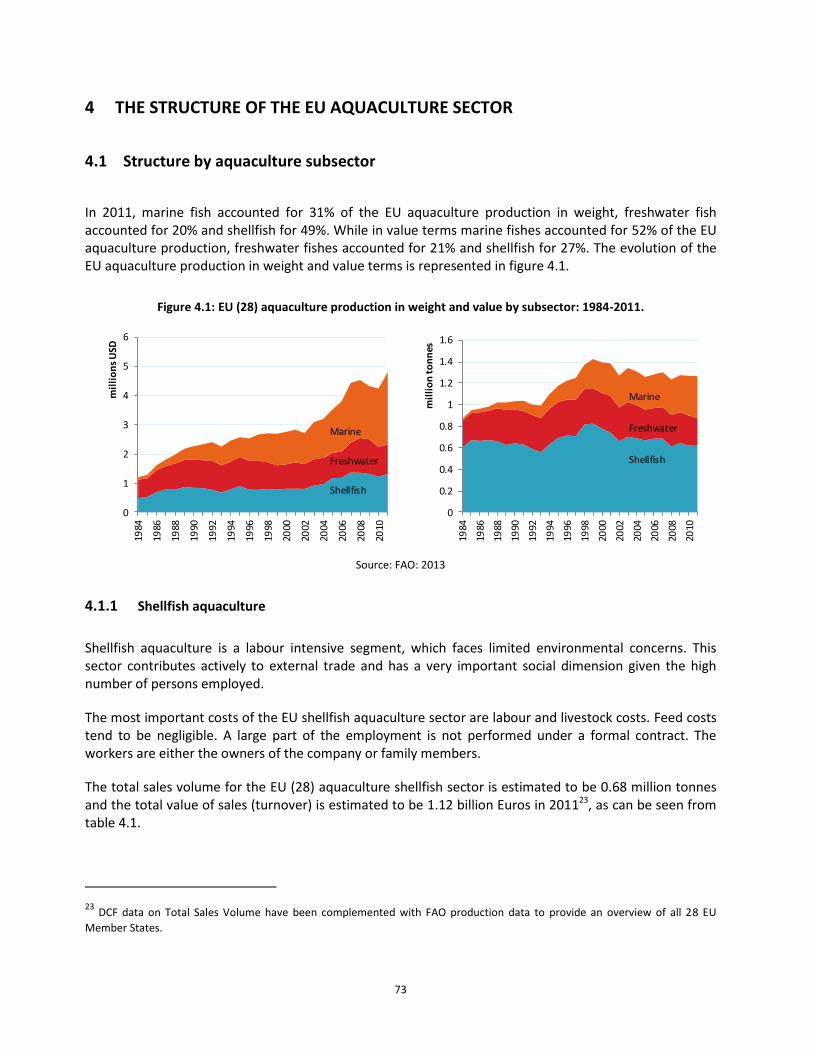
73
4 THE STRUCTURE OF THE EU AQUACULTURE SECTOR
4.1 Structure by aquaculture subsector
In 2011, marine fish accounted for 31% of the EU aquaculture production in weight, freshwater fish accounted for 20% and shellfish for 49%. While in value terms marine fishes accounted for 52% of the EU aquaculture production, freshwater fishes accounted for 21% and shellfish for 27%. The evolution of the EU aquaculture production in weight and value terms is represented in figure 4.1.
Figure 4.1: EU (28) aquaculture production in weight and value by subsector: 1984-2011.
0
1
2
3
4
5
6
1984
1986
1988
1990
1992
1994
1996
1998
2000
2002
2004
2006
2008
2010
mil
lio
ns
USD
Marine
Freshwater
Shellfish
0
0.2
0.4
0.6
0.8
1
1.2
1.4
1.6
1984
1986
1988
1990
1992
1994
1996
1998
2000
2002
2004
2006
2008
2010
mil
lio
n t
on
nes
Marine
Freshwater
Shellfish
Source: FAO: 2013
4.1.1 Shellfish aquaculture
Shellfish aquaculture is a labour intensive segment, which faces limited environmental concerns. This sector contributes actively to external trade and has a very important social dimension given the high number of persons employed.
The most important costs of the EU shellfish aquaculture sector are labour and livestock costs. Feed costs tend to be negligible. A large part of the employment is not performed under a formal contract. The workers are either the owners of the company or family members.
The total sales volume for the EU (28) aquaculture shellfish sector is estimated to be 0.68 million tonnes and the total value of sales (turnover) is estimated to be 1.12 billion Euros in 201123, as can be seen from table 4.1.
23 DCF data on Total Sales Volume have been complemented with FAO production data to provide an overview of all 28 EU
Member States.
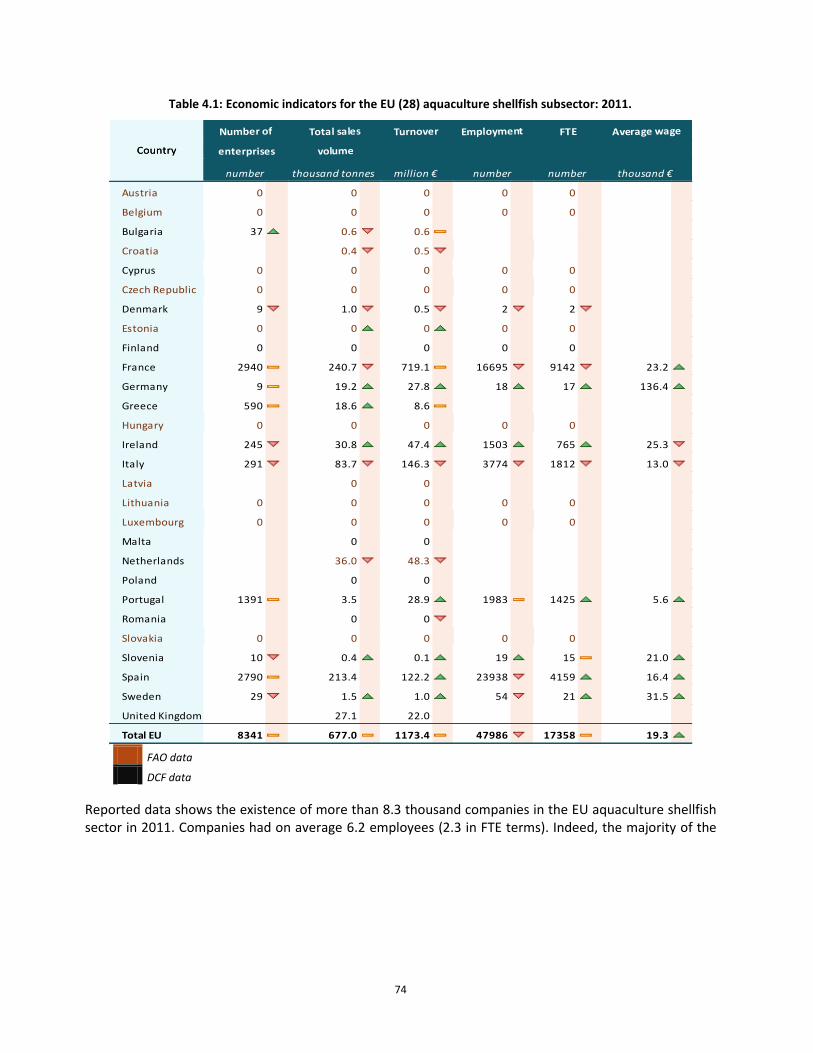
74
Table 4.1: Economic indicators for the EU (28) aquaculture shellfish subsector: 2011.
Employment FTE Average wage
Country
Number of Total sales Turnover
enterprises volume
number number thousand €
Country
number thousand tonnes million €
enterprises volume
Austria 0 0 0 0 0
Belgium 0 0 0 0 0
Bulgaria 37 0.6 0.6 ## ###
Croatia 0.4 0.5
Cyprus 0 ## 0 ## 0 ## 0 ## 0 ###
Czech Republic 0 0 0 0 0
Denmark 9 1.0 0.5 2 2 0.0
Estonia 0 0 0 0 0
Finland 0 ## 0 ## 0 ## 0 ## 0 ###
France 2940 240.7 719.1 16695 9142 23.2
Germany 9 19.2 27.8 18 17 136.4
Greece 590 18.6 8.6 ## ###
Hungary 0 0 0 0 0
Ireland 245 30.8 47.4 1503 765 25.3
Italy 291 83.7 146.3 3774 1812 13.0
Latvia 0 ## 0
Lithuania 0 0 ## 0 0 0
Luxembourg 0 0 0 0 0
Malta ## 0 0 ## ## ###
Netherlands ## 36.0 48.3 ###
Poland ## 0 0 ## ## ###
Portugal 1391 3.5 28.9 1983 1425 5.6
Romania 0 0
Slovakia 0 0 0 0 0
Slovenia 10 0.4 0.1 19 15 21.0
Spain 2790 213.4 ## 122.2 23938 4159 16.4
Sweden 29 1.5 1.0 54 21 31.5
United Kingdom ## 27.1 ## 22.0 ## ## ### #DIV/0!
Total EU 8341 677.0 1173.4 47986 17358 19.3
number number thousand €
Country
number thousand tonnes million €
FAO data
DCF data
Reported data shows the existence of more than 8.3 thousand companies in the EU aquaculture shellfish sector in 2011. Companies had on average 6.2 employees (2.3 in FTE terms). Indeed, the majority of the
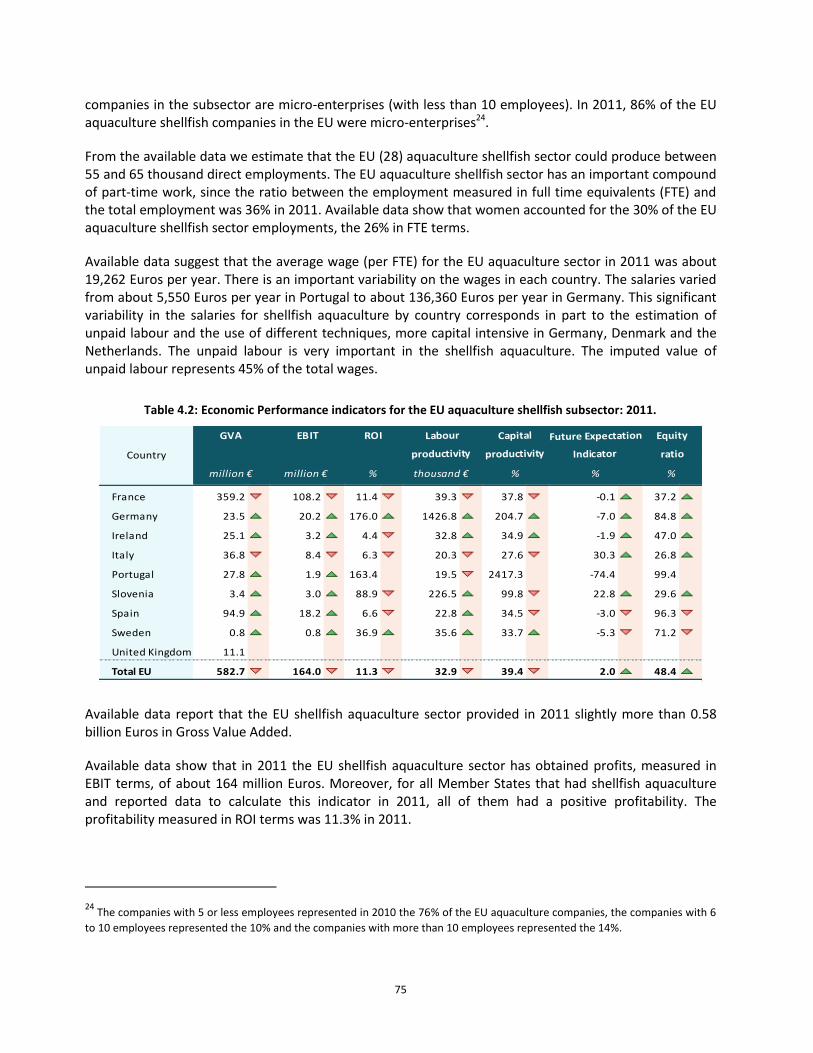
75
companies in the subsector are micro-enterprises (with less than 10 employees). In 2011, 86% of the EU aquaculture shellfish companies in the EU were micro-enterprises24.
From the available data we estimate that the EU (28) aquaculture shellfish sector could produce between 55 and 65 thousand direct employments. The EU aquaculture shellfish sector has an important compound of part-time work, since the ratio between the employment measured in full time equivalents (FTE) and the total employment was 36% in 2011. Available data show that women accounted for the 30% of the EU aquaculture shellfish sector employments, the 26% in FTE terms.
Available data suggest that the average wage (per FTE) for the EU aquaculture sector in 2011 was about 19,262 Euros per year. There is an important variability on the wages in each country. The salaries varied from about 5,550 Euros per year in Portugal to about 136,360 Euros per year in Germany. This significant variability in the salaries for shellfish aquaculture by country corresponds in part to the estimation of unpaid labour and the use of different techniques, more capital intensive in Germany, Denmark and the Netherlands. The unpaid labour is very important in the shellfish aquaculture. The imputed value of unpaid labour represents 45% of the total wages.
Table 4.2: Economic Performance indicators for the EU aquaculture shellfish subsector: 2011.
Equity
ratio
EBIT ROI Labour Capital Future Expectation
productivity productivity IndicatorCountry
GVA
France 359.2 108.2 11.4 39.3 37.8 -0.1 37.2
Germany 23.5 20.2 176.0 1426.8 204.7 -7.0 84.8
Ireland 25.1 3.2 4.4 32.8 34.9 -1.9 47.0
Italy 36.8 8.4 6.3 20.3 27.6 30.3 26.8
Portugal 27.8 1.9 163.4 ## 19.5 2417.3 ## -74.4 ### 99.4 ##
Slovenia 3.4 3.0 88.9 226.5 99.8 22.8 29.6
Spain 94.9 18.2 6.6 22.8 34.5 -3.0 96.3
Sweden 0.8 0.8 36.9 35.6 33.7 -5.3 71.2
United Kingdom 11.1 ## ## ## ## ## ### ##
Total EU 582.7 164.0 11.3 32.9 39.4 2.0 48.4
%million € % thousand € % %
ratioproductivity productivity IndicatorCountry
million €
Available data report that the EU shellfish aquaculture sector provided in 2011 slightly more than 0.58 billion Euros in Gross Value Added.
Available data show that in 2011 the EU shellfish aquaculture sector has obtained profits, measured in EBIT terms, of about 164 million Euros. Moreover, for all Member States that had shellfish aquaculture and reported data to calculate this indicator in 2011, all of them had a positive profitability. The profitability measured in ROI terms was 11.3% in 2011.
24 The companies with 5 or less employees represented in 2010 the 76% of the EU aquaculture companies, the companies with 6
to 10 employees represented the 10% and the companies with more than 10 employees represented the 14%.
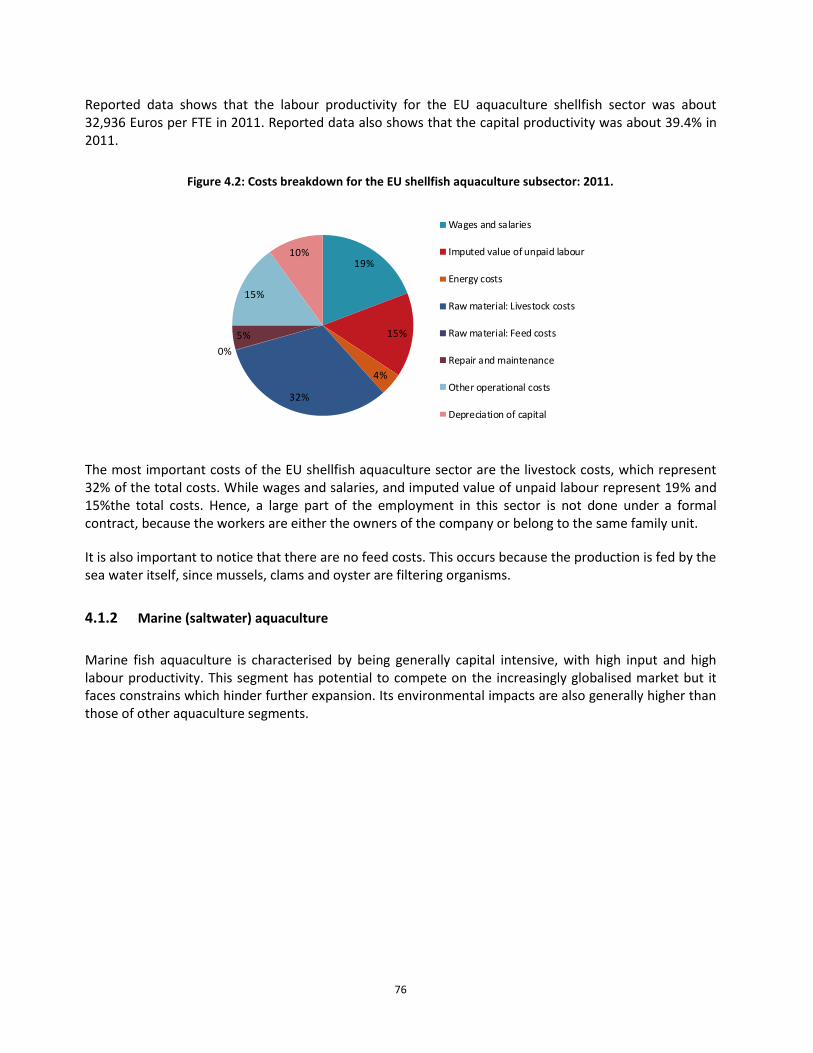
76
Reported data shows that the labour productivity for the EU aquaculture shellfish sector was about 32,936 Euros per FTE in 2011. Reported data also shows that the capital productivity was about 39.4% in 2011.
Figure 4.2: Costs breakdown for the EU shellfish aquaculture subsector: 2011.
The most important costs of the EU shellfish aquaculture sector are the livestock costs, which represent 32% of the total costs. While wages and salaries, and imputed value of unpaid labour represent 19% and 15%the total costs. Hence, a large part of the employment in this sector is not done under a formal contract, because the workers are either the owners of the company or belong to the same family unit.
It is also important to notice that there are no feed costs. This occurs because the production is fed by the sea water itself, since mussels, clams and oyster are filtering organisms.
4.1.2 Marine (saltwater) aquaculture
Marine fish aquaculture is characterised by being generally capital intensive, with high input and high labour productivity. This segment has potential to compete on the increasingly globalised market but it faces constrains which hinder further expansion. Its environmental impacts are also generally higher than those of other aquaculture segments.
19%
15%
4%
32%
0%
5%
15%
10%
Wages and salaries
Imputed value of unpaid labour
Energy costs
Raw material: Livestock costs
Raw material: Feed costs
Repair and maintenance
Other operational costs
Depreciation of capital
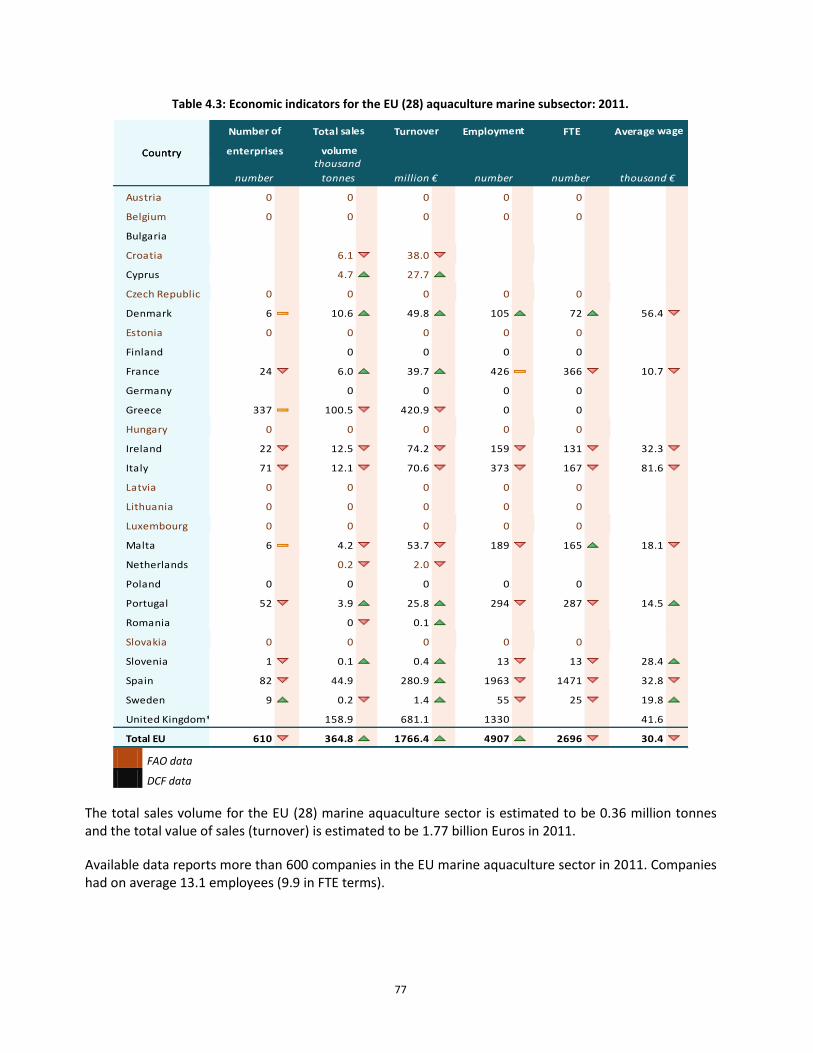
77
Table 4.3: Economic indicators for the EU (28) aquaculture marine subsector: 2011.
Employment FTE Average wage
Country
Number of Total sales Turnover
enterprises volume
number number thousand €
Country
number
thousand
tonnes million €
enterprises volume
Austria 0 0 0 0 0
Belgium 0 0 0 0 0
Bulgaria ### ## ###
Croatia 6.1 38.0
Cyprus ### 4.7 27.7 ## ###
Czech Republic 0 0 0 0 0
Denmark 6 10.6 49.8 105 72 56.4
Estonia 0 0 0 0 0
Finland ### 0 ## 0 ### 0 ## 0 ###
France 24 6.0 39.7 426 366 10.7
Germany ### 0 ## 0 ### 0 ## 0 ###
Greece 337 100.5 420.9 0 ## 0 ###
Hungary 0 0 0 0 0
Ireland 22 12.5 74.2 159 131 32.3
Italy 71 12.1 70.6 373 167 81.6
Latvia 0 0 0 0 0
Lithuania 0 0 0 0 0
Luxembourg 0 0 0 0 0
Malta 6 4.2 53.7 189 165 18.1
Netherlands ### 0.2 2.0 ## ###
Poland 0 ### 0 0 ### 0 ## 0 ###
Portugal 52 3.9 25.8 294 287 14.5
Romania 0 0.1
Slovakia 0 0 0 0 0
Slovenia 1 0.1 0.4 13 13 28.4
Spain 82 44.9 ## 280.9 1963 1471 32.8
Sweden 9 0.2 1.4 55 25 19.8
United Kingdom* ### 158.9 ## 681.1 ### 1330 ## ### 41.6
Total EU 610 364.8 1766.4 4907 2696 30.4
number number thousand €
Country
number
thousand
tonnes million €
FAO data
DCF data
The total sales volume for the EU (28) marine aquaculture sector is estimated to be 0.36 million tonnes and the total value of sales (turnover) is estimated to be 1.77 billion Euros in 2011.
Available data reports more than 600 companies in the EU marine aquaculture sector in 2011. Companies had on average 13.1 employees (9.9 in FTE terms).

78
The majority of the companies in the subsector are micro-enterprises (with less than 10 employees). In 2011, 87% of the EU aquaculture marine companies in the EU were micro-enterprises25.
From the available data we estimate that the EU (28) aquaculture marine sector produces more than 5 thousand direct employments. Part-time work is not so significant in the EU aquaculture marine sector, since the ratio between the employment measured in full time equivalents (FTE) and the total employment was 72% in 2011. The low percentage of imputed value of unpaid labour in the operational costs confirms this fact. Available data show that women accounted for the 14% of the EU aquaculture marine sector employments.
Available data suggest that the average wage (per FTE) for the EU aquaculture sector in 2011 was about 30,432 Euros per year26. There is an important variability on the wages in each country. The salaries varied from about 10,680 Euros per year in France to 81,602 Euros per year in Italy. The variability in the salaries can be explained by differences in the labour productivity and the capital and production intensity of the different techniques. The imputed value of unpaid labour is almost negligible in this sector since it only represents the 1.2% of the total wages.
Table 4.4: Economic Performance indicators for the EU aquaculture marine subsector: 2011.
ROI Labour Capital Future Expectation Equity
productivity productivity Indicator ratio
EBIT
Country
GVA
Denmark 11.5 6.2 17.5 160.0 32.8 5.6 45.4
France 6.7 2.3 103.5 18.2 304.0 -9.4 -199.3
Ireland 24.5 19.4 143.3 187.3 180.7 -6.3 28.0
Italy 35.6 19.5 15.9 213.3 29.0 24.5 32.8
Malta 15.4 10.5 97.6 93.1 143.1 -13.7 -231.9
Portugal 10.3 -2.9 -1.2 35.8 4.2 -2.5 97.6
Romania 0.1 0.0 10.4 ## 78.7
Slovenia 1.5 1.0 27.6 123.4 43.8 10.3 13.9
Spain 67.0 5.2 1.1 45.6 14.4 -0.7 95.2
Sweden 0.7 0.2 23.6 28.5 76.1 3.3 69.6
United Kingdom 155.2 ### ### ## ## ## ### ##
Total EU 328.5 61.3 6.8 64.3 19.4 2.3 79.3
% thousand €/FTE % % %
productivity productivity Indicator ratioCountry
million € million €
Available data report that the EU marine aquaculture sector provided in 2011 more than 328 million Euros in Gross Value Added.
25 The companies with 5 or less employees represented in 2011 the 35.1% of the EU aquaculture companies, companies with 6 to
10 employees represented 36.8% and companies with more than 10 employees represented the 28.1%.
26 The average wage are calculated as the costs in wages and salaries costs plus the imputed value of unpaid labour divided by
the total number of FTEs.
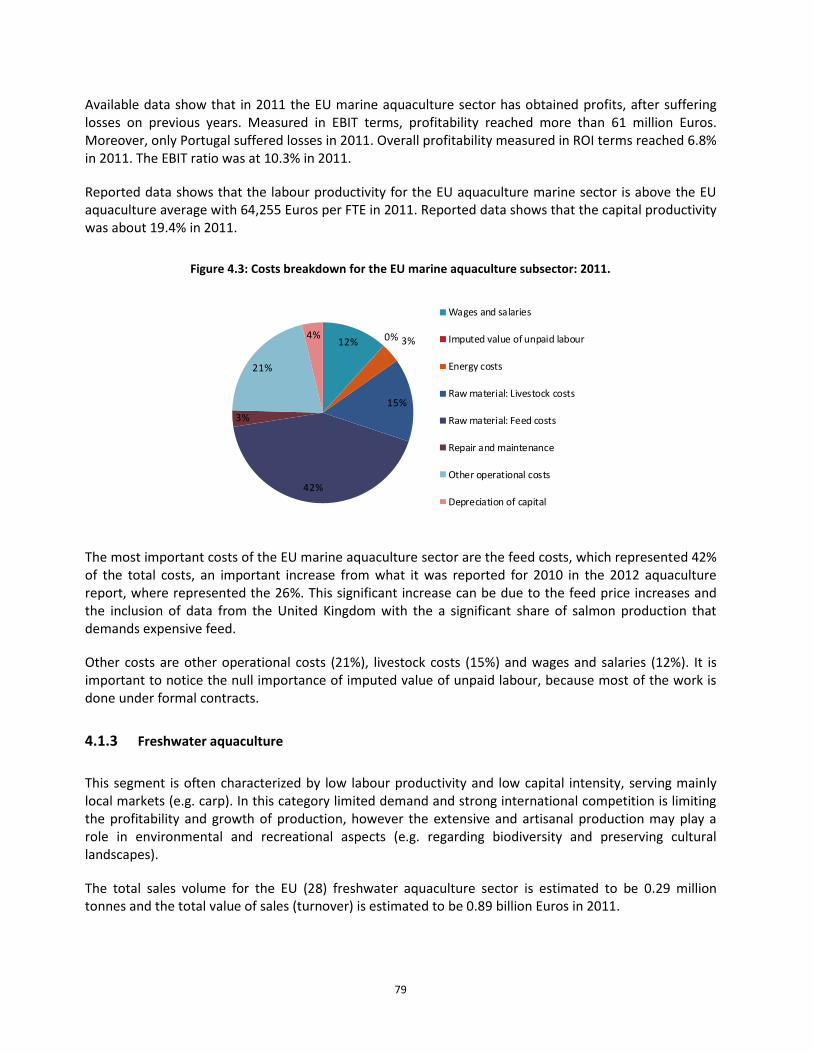
79
Available data show that in 2011 the EU marine aquaculture sector has obtained profits, after suffering losses on previous years. Measured in EBIT terms, profitability reached more than 61 million Euros. Moreover, only Portugal suffered losses in 2011. Overall profitability measured in ROI terms reached 6.8% in 2011. The EBIT ratio was at 10.3% in 2011.
Reported data shows that the labour productivity for the EU aquaculture marine sector is above the EU aquaculture average with 64,255 Euros per FTE in 2011. Reported data shows that the capital productivity was about 19.4% in 2011.
Figure 4.3: Costs breakdown for the EU marine aquaculture subsector: 2011.
The most important costs of the EU marine aquaculture sector are the feed costs, which represented 42% of the total costs, an important increase from what it was reported for 2010 in the 2012 aquaculture report, where represented the 26%. This significant increase can be due to the feed price increases and the inclusion of data from the United Kingdom with the a significant share of salmon production that demands expensive feed.
Other costs are other operational costs (21%), livestock costs (15%) and wages and salaries (12%). It is important to notice the null importance of imputed value of unpaid labour, because most of the work is done under formal contracts.
4.1.3 Freshwater aquaculture
This segment is often characterized by low labour productivity and low capital intensity, serving mainly local markets (e.g. carp). In this category limited demand and strong international competition is limiting the profitability and growth of production, however the extensive and artisanal production may play a role in environmental and recreational aspects (e.g. regarding biodiversity and preserving cultural landscapes).
The total sales volume for the EU (28) freshwater aquaculture sector is estimated to be 0.29 million tonnes and the total value of sales (turnover) is estimated to be 0.89 billion Euros in 2011.
12% 0% 3%
15%
42%
3%
21%
4%
Wages and salaries
Imputed value of unpaid labour
Energy costs
Raw material: Livestock costs
Raw material: Feed costs
Repair and maintenance
Other operational costs
Depreciation of capital
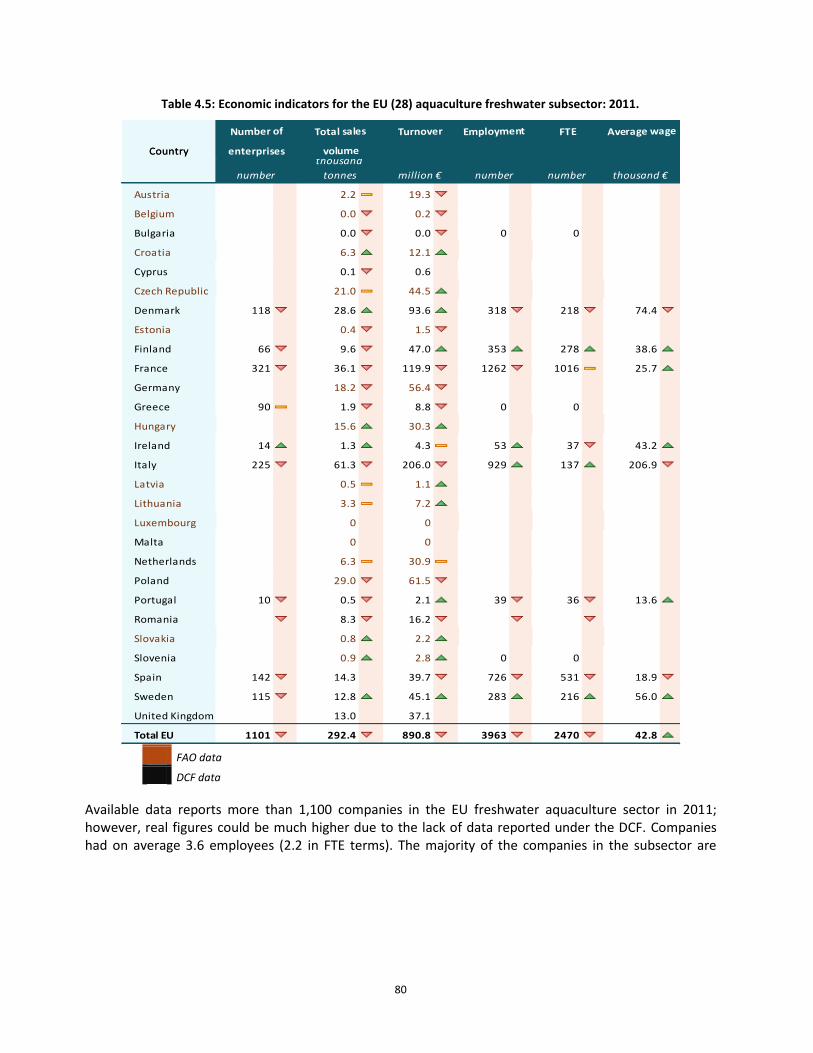
80
Table 4.5: Economic indicators for the EU (28) aquaculture freshwater subsector: 2011.
Employment FTE Average wage
Country
Number of Total sales Turnover
enterprises volume
number number thousand €
Country
number
thousand
tonnes million €
enterprises volume
Austria 2.2 19.3
Belgium 0.0 0.2
Bulgaria ### 0.0 0.0 0 ## 0 ##
Croatia 6.3 12.1
Cyprus ### 0.1 0.6 ### ## ##
Czech Republic 21.0 44.5
Denmark 118 28.6 93.6 318 218 74.4
Estonia 0.4 1.5
Finland 66 9.6 47.0 353 278 38.6
France 321 36.1 119.9 1262 1016 25.7
Germany ### 18.2 56.4 ## ##
Greece 90 1.9 8.8 0 ## 0 ##
Hungary 15.6 30.3
Ireland 14 1.3 4.3 53 37 43.2
Italy 225 61.3 206.0 929 137 206.9
Latvia 0.5 1.1
Lithuania 3.3 7.2
Luxembourg 0 ### 0
Malta ### 0 ### 0 ### ## ##
Netherlands ### 6.3 30.9 ## ##
Poland ### 29.0 61.5 ## ##
Portugal 10 0.5 2.1 39 36 13.6
Romania 8.3 16.2
Slovakia 0.8 2.2
Slovenia ### 0.9 2.8 0 ## 0 ##
Spain 142 14.3 ### 39.7 726 531 18.9
Sweden 115 12.8 45.1 283 216 56.0
United Kingdom ### 13.0 ### 37.1 ### ## ## #DIV/0!
Total EU 1101 292.4 890.8 3963 2470 42.8
number number thousand €
Country
number
thousand
tonnes million €
FAO data
DCF data
Available data reports more than 1,100 companies in the EU freshwater aquaculture sector in 2011; however, real figures could be much higher due to the lack of data reported under the DCF. Companies had on average 3.6 employees (2.2 in FTE terms). The majority of the companies in the subsector are
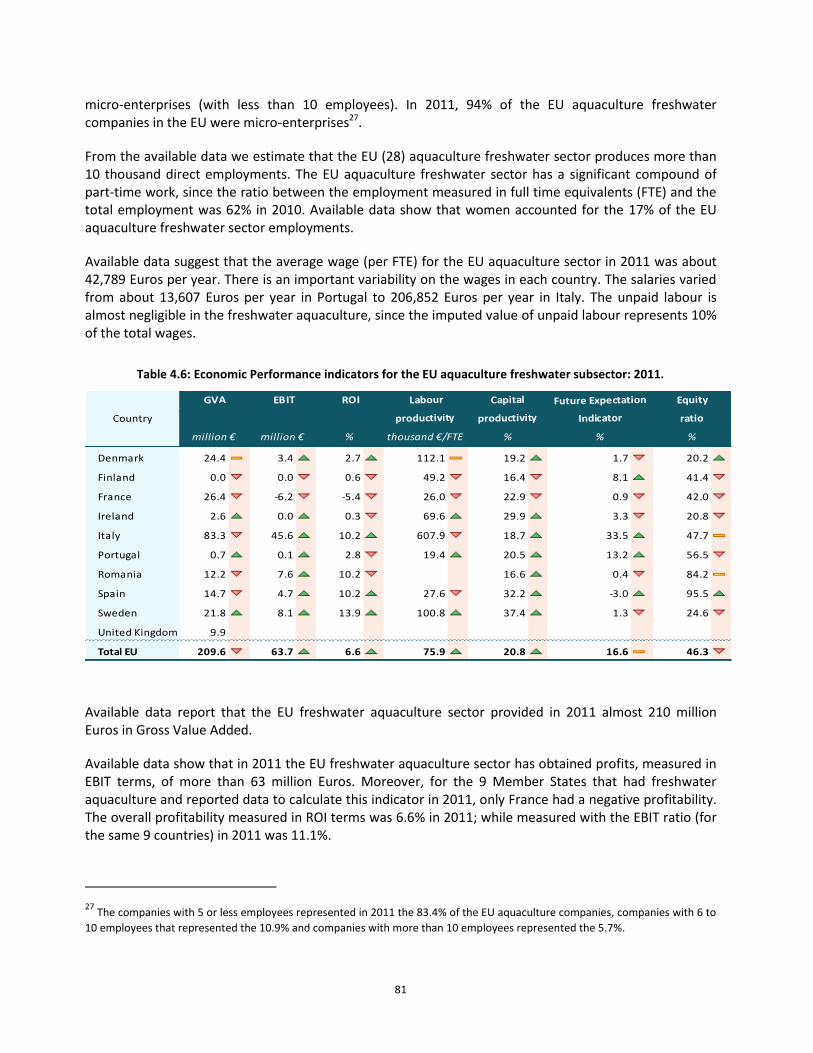
81
micro-enterprises (with less than 10 employees). In 2011, 94% of the EU aquaculture freshwater companies in the EU were micro-enterprises27.
From the available data we estimate that the EU (28) aquaculture freshwater sector produces more than 10 thousand direct employments. The EU aquaculture freshwater sector has a significant compound of part-time work, since the ratio between the employment measured in full time equivalents (FTE) and the total employment was 62% in 2010. Available data show that women accounted for the 17% of the EU aquaculture freshwater sector employments.
Available data suggest that the average wage (per FTE) for the EU aquaculture sector in 2011 was about 42,789 Euros per year. There is an important variability on the wages in each country. The salaries varied from about 13,607 Euros per year in Portugal to 206,852 Euros per year in Italy. The unpaid labour is almost negligible in the freshwater aquaculture, since the imputed value of unpaid labour represents 10% of the total wages.
Table 4.6: Economic Performance indicators for the EU aquaculture freshwater subsector: 2011.
ROI Labour Capital Future Expectation Equity
productivity productivity Indicator ratio
EBIT
Country
GVA
Denmark 24.4 3.4 2.7 112.1 19.2 1.7 20.2
Finland 0.0 0.0 0.6 49.2 16.4 8.1 41.4
France 26.4 -6.2 -5.4 26.0 22.9 0.9 42.0
Ireland 2.6 0.0 0.3 69.6 29.9 3.3 20.8
Italy 83.3 45.6 10.2 607.9 18.7 33.5 47.7
Portugal 0.7 0.1 2.8 19.4 20.5 13.2 56.5
Romania 12.2 7.6 10.2 ## 16.6 0.4 84.2
Spain 14.7 4.7 10.2 27.6 32.2 -3.0 95.5
Sweden 21.8 8.1 13.9 100.8 37.4 1.3 24.6
United Kingdom 9.9 ## ## ## ## ## ## ##
Total EU 209.6 63.7 6.6 75.9 20.8 16.6 46.3
% thousand €/FTE % % %
productivity productivity Indicator ratioCountry
million € million €
Available data report that the EU freshwater aquaculture sector provided in 2011 almost 210 million Euros in Gross Value Added.
Available data show that in 2011 the EU freshwater aquaculture sector has obtained profits, measured in EBIT terms, of more than 63 million Euros. Moreover, for the 9 Member States that had freshwater aquaculture and reported data to calculate this indicator in 2011, only France had a negative profitability. The overall profitability measured in ROI terms was 6.6% in 2011; while measured with the EBIT ratio (for the same 9 countries) in 2011 was 11.1%.
27 The companies with 5 or less employees represented in 2011 the 83.4% of the EU aquaculture companies, companies with 6 to
10 employees that represented the 10.9% and companies with more than 10 employees represented the 5.7%.
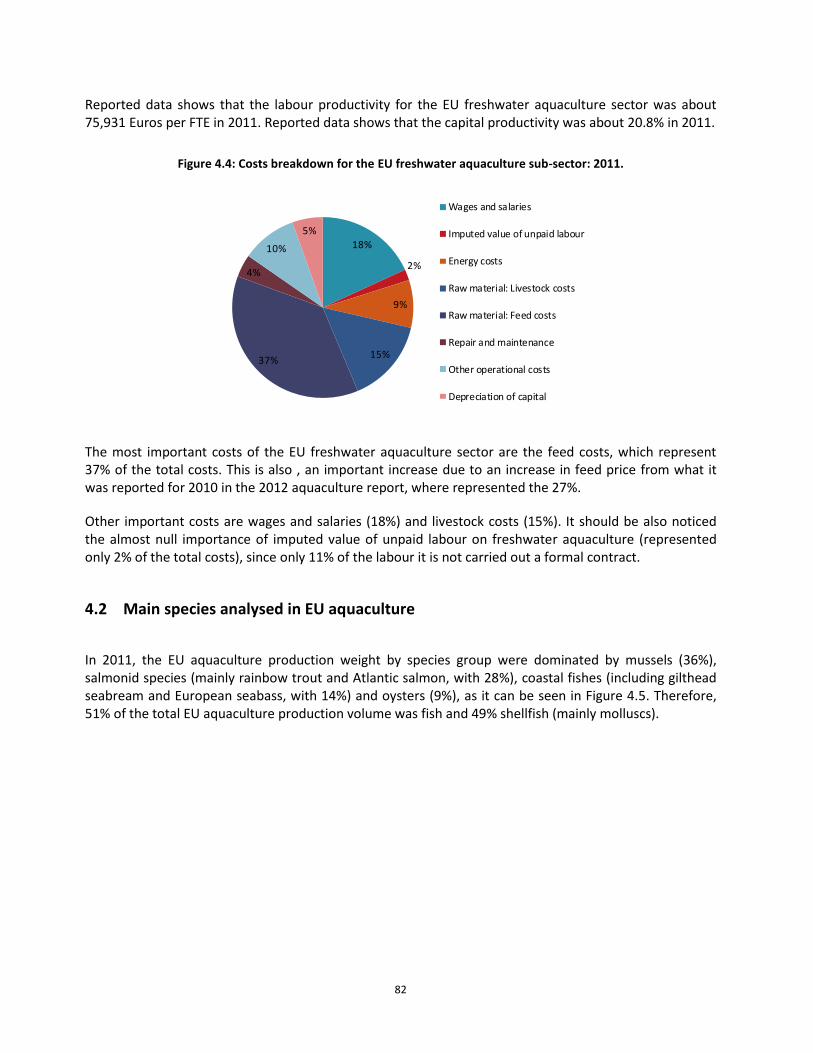
82
Reported data shows that the labour productivity for the EU freshwater aquaculture sector was about 75,931 Euros per FTE in 2011. Reported data shows that the capital productivity was about 20.8% in 2011.
Figure 4.4: Costs breakdown for the EU freshwater aquaculture sub-sector: 2011.
The most important costs of the EU freshwater aquaculture sector are the feed costs, which represent 37% of the total costs. This is also , an important increase due to an increase in feed price from what it was reported for 2010 in the 2012 aquaculture report, where represented the 27%.
Other important costs are wages and salaries (18%) and livestock costs (15%). It should be also noticed the almost null importance of imputed value of unpaid labour on freshwater aquaculture (represented only 2% of the total costs), since only 11% of the labour it is not carried out a formal contract.
4.2 Main species analysed in EU aquaculture
In 2011, the EU aquaculture production weight by species group were dominated by mussels (36%), salmonid species (mainly rainbow trout and Atlantic salmon, with 28%), coastal fishes (including gilthead seabream and European seabass, with 14%) and oysters (9%), as it can be seen in Figure 4.5. Therefore, 51% of the total EU aquaculture production volume was fish and 49% shellfish (mainly molluscs).
18%
2%
9%
15%37%
4%
10%
5%
Wages and salaries
Imputed value of unpaid labour
Energy costs
Raw material: Livestock costs
Raw material: Feed costs
Repair and maintenance
Other operational costs
Depreciation of capital
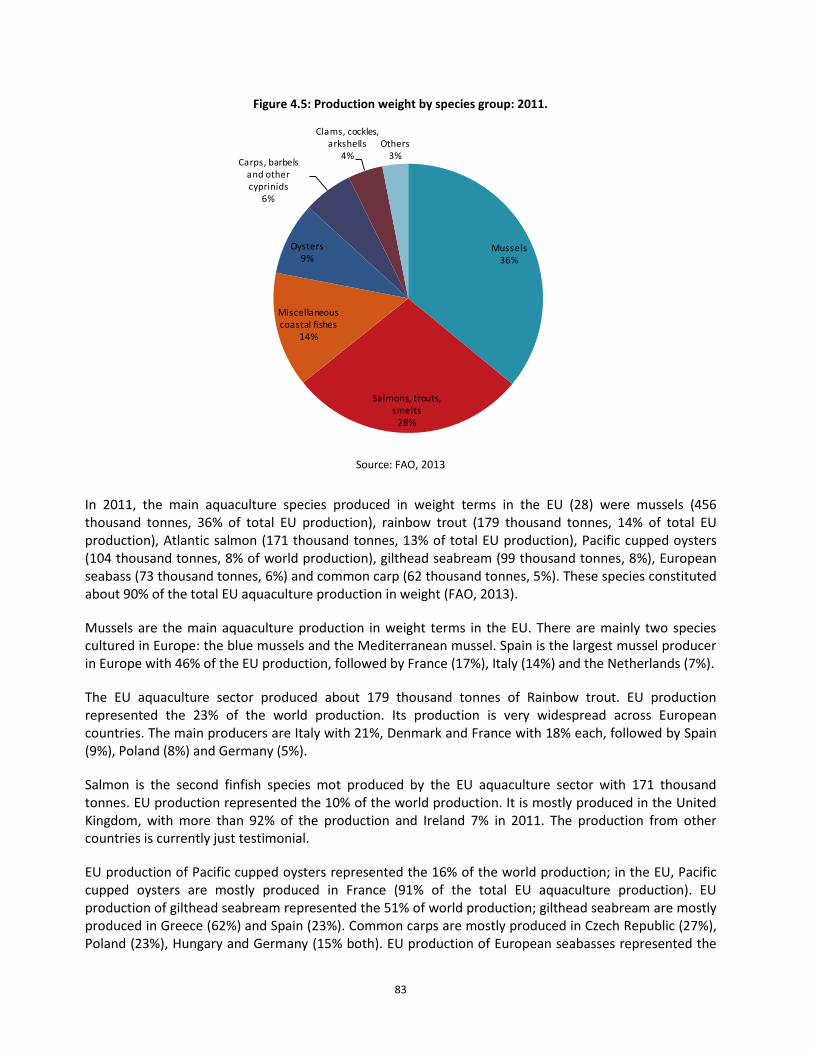
83
Figure 4.5: Production weight by species group: 2011.
Mussels36%
Salmons, trouts, smelts
28%
Miscellaneous coastal fishes
14%
Oysters9%
Carps, barbels and other cyprinids
6%
Clams, cockles, arkshells
4%Others
3%
Source: FAO, 2013
In 2011, the main aquaculture species produced in weight terms in the EU (28) were mussels (456 thousand tonnes, 36% of total EU production), rainbow trout (179 thousand tonnes, 14% of total EU production), Atlantic salmon (171 thousand tonnes, 13% of total EU production), Pacific cupped oysters (104 thousand tonnes, 8% of world production), gilthead seabream (99 thousand tonnes, 8%), European seabass (73 thousand tonnes, 6%) and common carp (62 thousand tonnes, 5%). These species constituted about 90% of the total EU aquaculture production in weight (FAO, 2013).
Mussels are the main aquaculture production in weight terms in the EU. There are mainly two species cultured in Europe: the blue mussels and the Mediterranean mussel. Spain is the largest mussel producer in Europe with 46% of the EU production, followed by France (17%), Italy (14%) and the Netherlands (7%).
The EU aquaculture sector produced about 179 thousand tonnes of Rainbow trout. EU production represented the 23% of the world production. Its production is very widespread across European countries. The main producers are Italy with 21%, Denmark and France with 18% each, followed by Spain (9%), Poland (8%) and Germany (5%).
Salmon is the second finfish species mot produced by the EU aquaculture sector with 171 thousand tonnes. EU production represented the 10% of the world production. It is mostly produced in the United Kingdom, with more than 92% of the production and Ireland 7% in 2011. The production from other countries is currently just testimonial.
EU production of Pacific cupped oysters represented the 16% of the world production; in the EU, Pacific cupped oysters are mostly produced in France (91% of the total EU aquaculture production). EU production of gilthead seabream represented the 51% of world production; gilthead seabream are mostly produced in Greece (62%) and Spain (23%). Common carps are mostly produced in Czech Republic (27%), Poland (23%), Hungary and Germany (15% both). EU production of European seabasses represented the
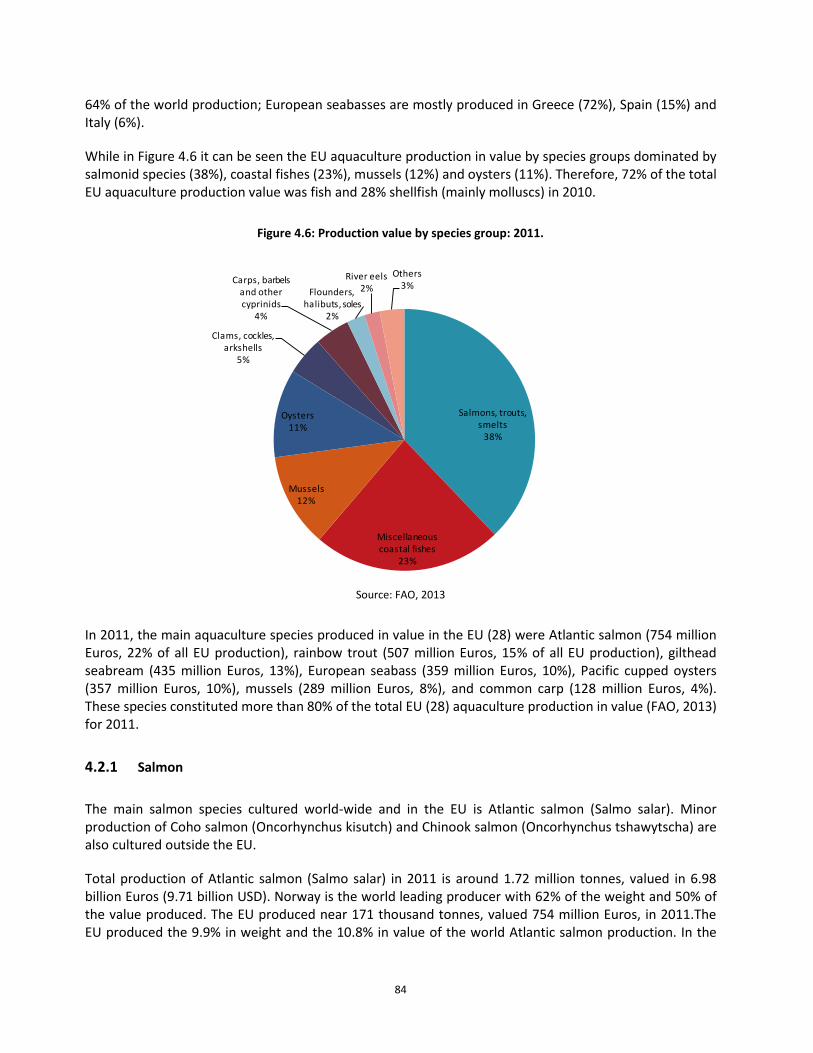
84
64% of the world production; European seabasses are mostly produced in Greece (72%), Spain (15%) and Italy (6%).
While in Figure 4.6 it can be seen the EU aquaculture production in value by species groups dominated by salmonid species (38%), coastal fishes (23%), mussels (12%) and oysters (11%). Therefore, 72% of the total EU aquaculture production value was fish and 28% shellfish (mainly molluscs) in 2010.
Figure 4.6: Production value by species group: 2011.
Salmons, trouts, smelts
38%
Miscellaneous coastal fishes
23%
Mussels12%
Oysters11%
Clams, cockles, arkshells
5%
Carps, barbels and other cyprinids
4%
Flounders, halibuts, soles
2%
River eels2%
Others3%
Source: FAO, 2013
In 2011, the main aquaculture species produced in value in the EU (28) were Atlantic salmon (754 million Euros, 22% of all EU production), rainbow trout (507 million Euros, 15% of all EU production), gilthead seabream (435 million Euros, 13%), European seabass (359 million Euros, 10%), Pacific cupped oysters (357 million Euros, 10%), mussels (289 million Euros, 8%), and common carp (128 million Euros, 4%). These species constituted more than 80% of the total EU (28) aquaculture production in value (FAO, 2013) for 2011.
4.2.1 Salmon
The main salmon species cultured world-wide and in the EU is Atlantic salmon (Salmo salar). Minor production of Coho salmon (Oncorhynchus kisutch) and Chinook salmon (Oncorhynchus tshawytscha) are also cultured outside the EU.
Total production of Atlantic salmon (Salmo salar) in 2011 is around 1.72 million tonnes, valued in 6.98 billion Euros (9.71 billion USD). Norway is the world leading producer with 62% of the weight and 50% of the value produced. The EU produced near 171 thousand tonnes, valued 754 million Euros, in 2011.The EU produced the 9.9% in weight and the 10.8% in value of the world Atlantic salmon production. In the
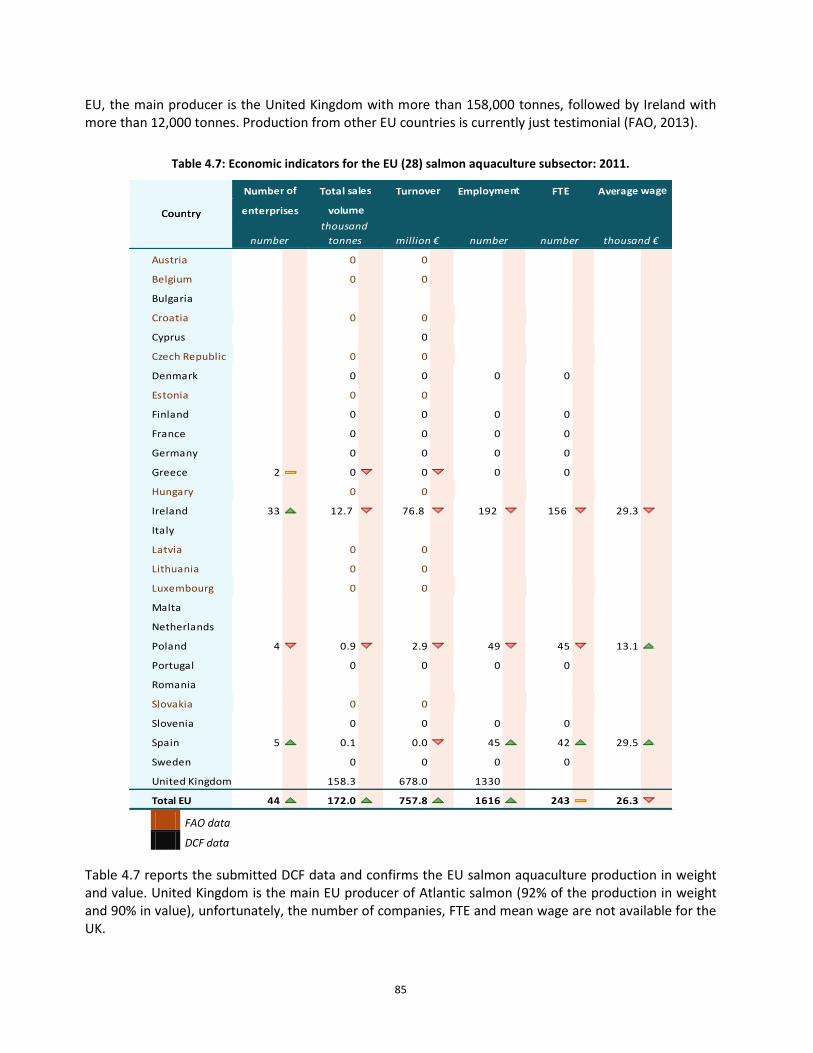
85
EU, the main producer is the United Kingdom with more than 158,000 tonnes, followed by Ireland with more than 12,000 tonnes. Production from other EU countries is currently just testimonial (FAO, 2013).
Table 4.7: Economic indicators for the EU (28) salmon aquaculture subsector: 2011.
FTE Average wage
enterprises volume
Employment
Country
Number of Total sales Turnover
thousand €
enterprises volume
number
thousand
tonnes million € number number
Country
Austria 0 0
Belgium 0 0
Bulgaria ### ### ## ## ####
Croatia 0 ### 0 ###
Cyprus ### ### 0 ### ## ## ####
Czech Republic 0 0
Denmark ### 0 ### 0 ### 0 ## 0 ## ####
Estonia 0 0
Finland ### 0 ### 0 ### 0 ## 0 ## ####
France ### 0 ### 0 ### 0 ## 0 ## ####
Germany ### 0 ### 0 ### 0 ## 0 ## ####
Greece 2 0 0 0 ## 0 ## ####
Hungary 0 0
Ireland 33 12.7 76.8 192 156 29.3 #
Italy ### ### ### ## ## ####
Latvia 0 0
Lithuania 0 0
Luxembourg 0 0
Malta ### ### ### ## ## ####
Netherlands ### ### ### ## ## ####
Poland 4 0.9 2.9 49 45 13.1 #
Portugal ### 0 ### 0 ### 0 ## 0 ## ####
Romania ### ### ### ## ## ####
Slovakia 0 0
Slovenia ### 0 ### 0 ### 0 ## 0 ## ####
Spain 5 0.1 ### 0.0 45 42 29.5 #
Sweden ### 0 ### 0 ### 0 ## 0 ## ####
United Kingdom ### 158.3 ### 678.0 ### 1330 ## ## #DIV/0!
Total EU 44 172.0 757.8 1616 243 26.3 #
thousand €number
thousand
tonnes million € number number
Country
FAO data
DCF data
Table 4.7 reports the submitted DCF data and confirms the EU salmon aquaculture production in weight and value. United Kingdom is the main EU producer of Atlantic salmon (92% of the production in weight and 90% in value), unfortunately, the number of companies, FTE and mean wage are not available for the UK.
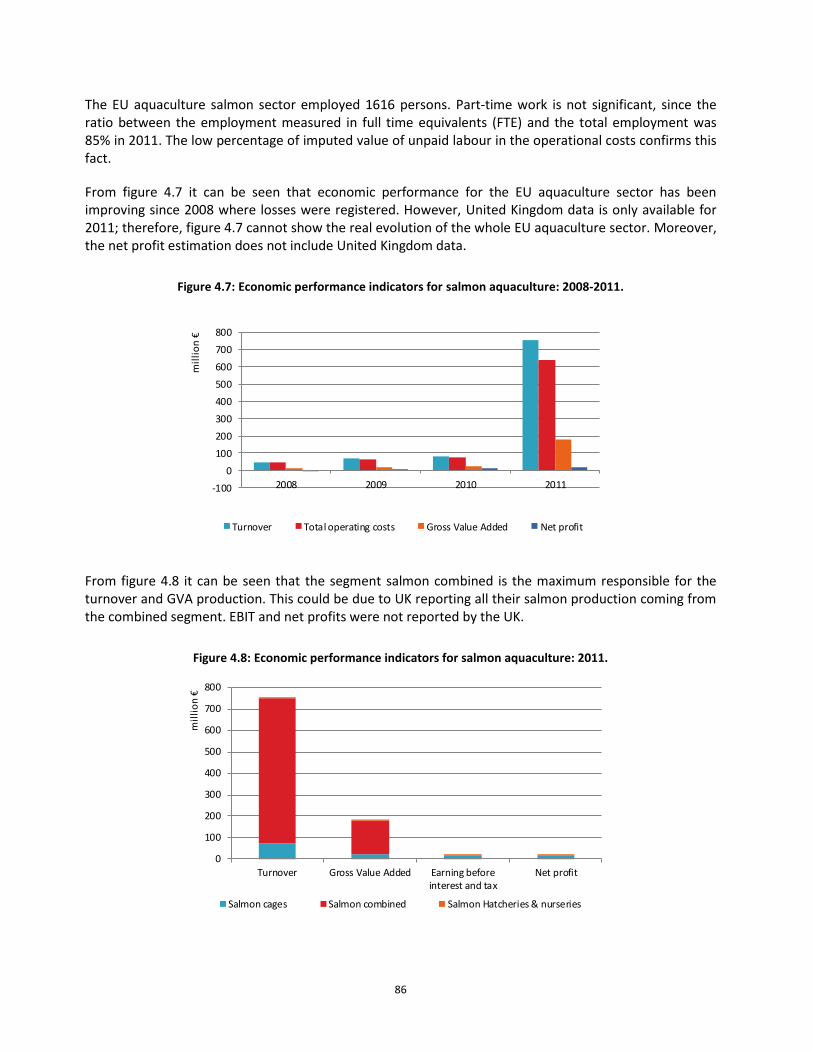
86
The EU aquaculture salmon sector employed 1616 persons. Part-time work is not significant, since the ratio between the employment measured in full time equivalents (FTE) and the total employment was 85% in 2011. The low percentage of imputed value of unpaid labour in the operational costs confirms this fact.
From figure 4.7 it can be seen that economic performance for the EU aquaculture sector has been improving since 2008 where losses were registered. However, United Kingdom data is only available for 2011; therefore, figure 4.7 cannot show the real evolution of the whole EU aquaculture sector. Moreover, the net profit estimation does not include United Kingdom data.
Figure 4.7: Economic performance indicators for salmon aquaculture: 2008-2011.
From figure 4.8 it can be seen that the segment salmon combined is the maximum responsible for the turnover and GVA production. This could be due to UK reporting all their salmon production coming from the combined segment. EBIT and net profits were not reported by the UK.
Figure 4.8: Economic performance indicators for salmon aquaculture: 2011.
-100
0
100
200
300
400
500
600
700
800
2008 2009 2010 2011
mil
lio
n €
Turnover Total operating costs Gross Value Added Net profit
0
100
200
300
400
500
600
700
800
Turnover Gross Value Added Earning beforeinterest and tax
Net profit
mil
lio
n €
Salmon cages Salmon combined Salmon Hatcheries & nurseries
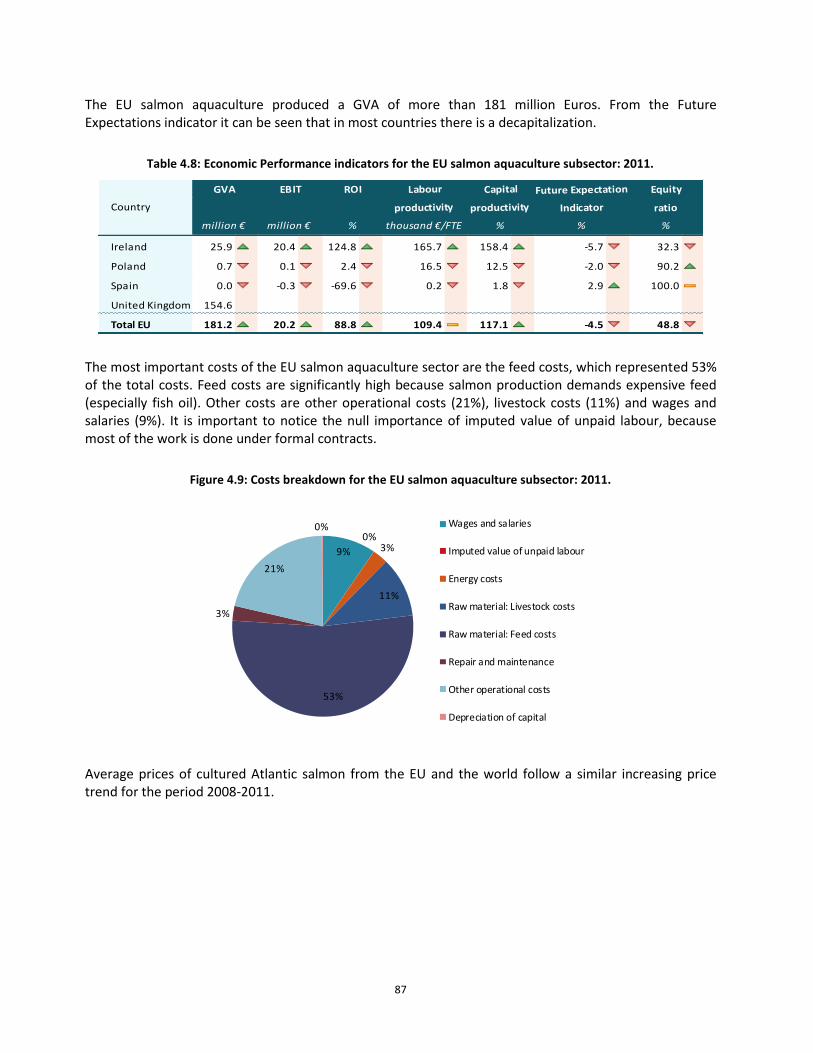
87
The EU salmon aquaculture produced a GVA of more than 181 million Euros. From the Future Expectations indicator it can be seen that in most countries there is a decapitalization.
Table 4.8: Economic Performance indicators for the EU salmon aquaculture subsector: 2011.
Indicator ratioproductivity productivity
ROI Labour Capital Future Expectation EquityEBIT
Country
GVA
Ireland 25.9 20.4 124.8 165.7 158.4 -5.7 32.3
Poland 0.7 0.1 2.4 16.5 12.5 -2.0 90.2
Spain 0.0 -0.3 -69.6 0.2 1.8 2.9 100.0
United Kingdom 154.6 ## ### ### ## ### ### ##
Total EU 181.2 20.2 88.8 109.4 117.1 -4.5 48.8
Indicator ratio
million € million € % thousand €/FTE % % %
productivity productivityCountry
The most important costs of the EU salmon aquaculture sector are the feed costs, which represented 53% of the total costs. Feed costs are significantly high because salmon production demands expensive feed (especially fish oil). Other costs are other operational costs (21%), livestock costs (11%) and wages and salaries (9%). It is important to notice the null importance of imputed value of unpaid labour, because most of the work is done under formal contracts.
Figure 4.9: Costs breakdown for the EU salmon aquaculture subsector: 2011.
Average prices of cultured Atlantic salmon from the EU and the world follow a similar increasing price trend for the period 2008-2011.
9%
0%3%
11%
53%
3%
21%
0% Wages and salaries
Imputed value of unpaid labour
Energy costs
Raw material: Livestock costs
Raw material: Feed costs
Repair and maintenance
Other operational costs
Depreciation of capital
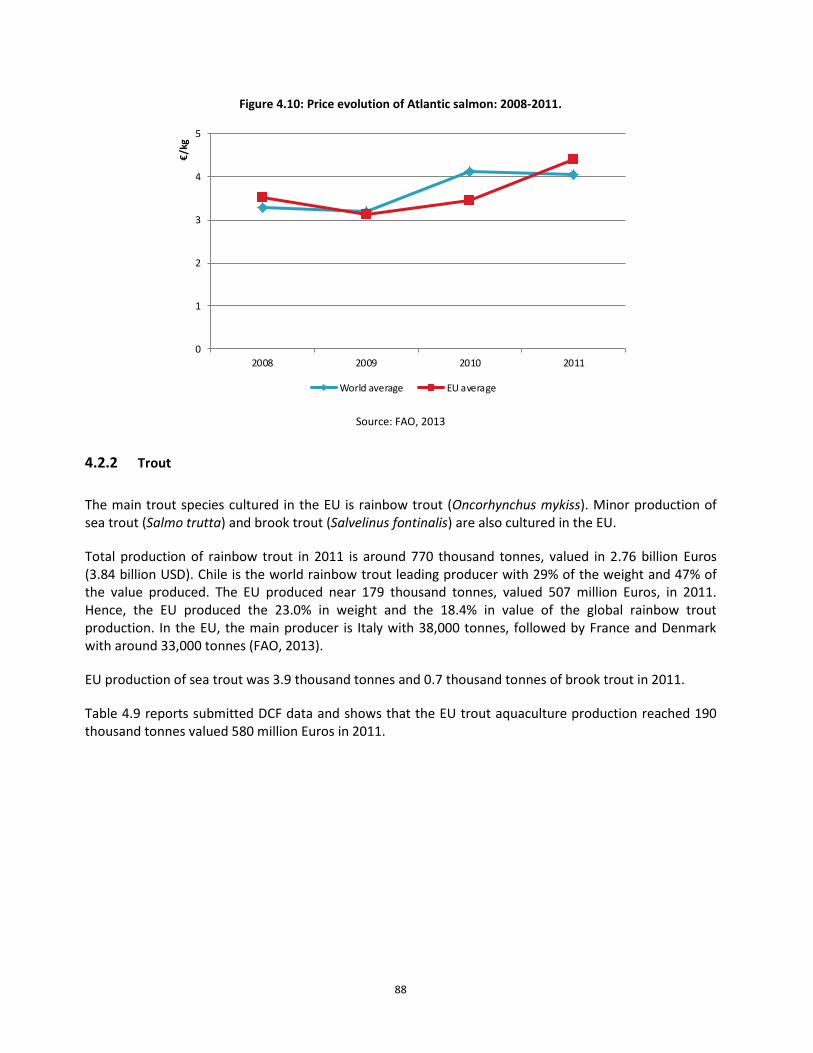
88
Figure 4.10: Price evolution of Atlantic salmon: 2008-2011.
0
1
2
3
4
5
2008 2009 2010 2011
€/k
g
World average EU average
Source: FAO, 2013
4.2.2 Trout
The main trout species cultured in the EU is rainbow trout (Oncorhynchus mykiss). Minor production of sea trout (Salmo trutta) and brook trout (Salvelinus fontinalis) are also cultured in the EU.
Total production of rainbow trout in 2011 is around 770 thousand tonnes, valued in 2.76 billion Euros (3.84 billion USD). Chile is the world rainbow trout leading producer with 29% of the weight and 47% of the value produced. The EU produced near 179 thousand tonnes, valued 507 million Euros, in 2011. Hence, the EU produced the 23.0% in weight and the 18.4% in value of the global rainbow trout production. In the EU, the main producer is Italy with 38,000 tonnes, followed by France and Denmark with around 33,000 tonnes (FAO, 2013).
EU production of sea trout was 3.9 thousand tonnes and 0.7 thousand tonnes of brook trout in 2011.
Table 4.9 reports submitted DCF data and shows that the EU trout aquaculture production reached 190 thousand tonnes valued 580 million Euros in 2011.
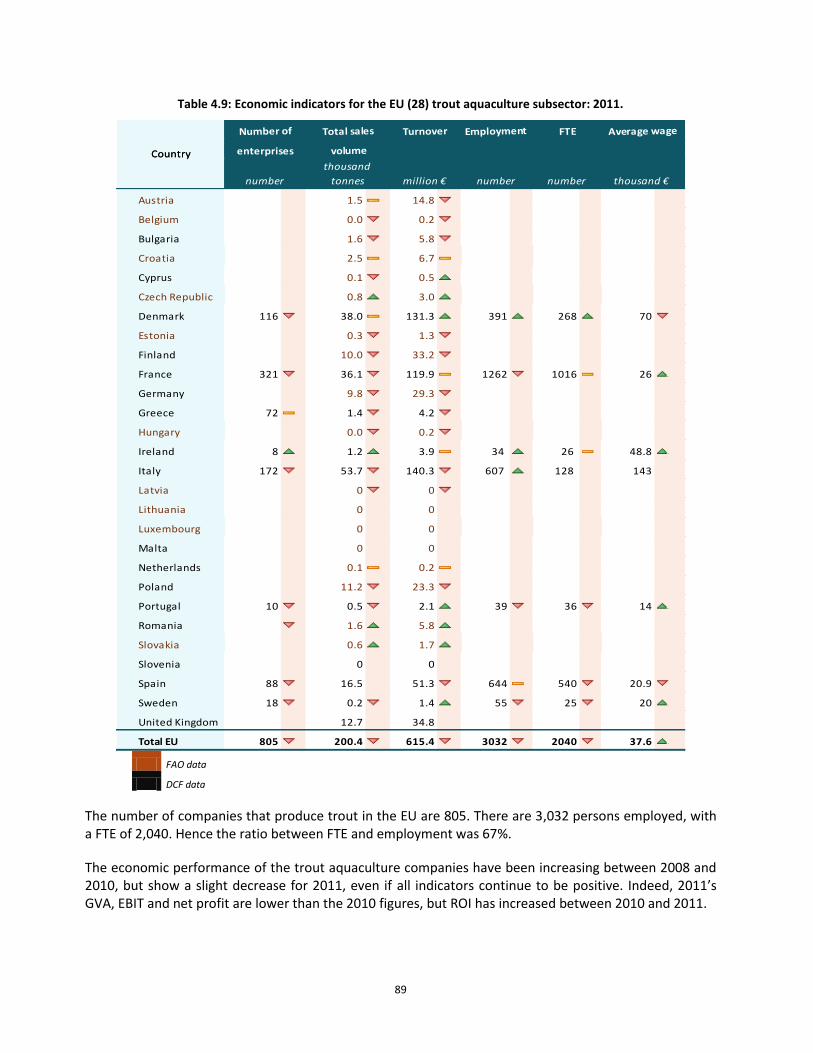
89
Table 4.9: Economic indicators for the EU (28) trout aquaculture subsector: 2011.
FTE Average wage
enterprises volume
Employment
Country
Number of Total sales Turnover
thousand €
enterprises volume
number
thousand
tonnes million € number number
Country
Austria 1.5 14.8
Belgium 0.0 0.2
Bulgaria ### 1.6 5.8 0 ## 0 ## 0 ####
Croatia 2.5 6.7
Cyprus ### 0.1 0.5 ## ## ####
Czech Republic 0.8 3.0
Denmark 116 38.0 131.3 391 268 70 #
Estonia 0.3 1.3
Finland ### 10.0 33.2 0 ## 0 ## 0 ####
France 321 36.1 119.9 1262 1016 26 #
Germany ### 9.8 29.3 ## ## ####
Greece 72 1.4 4.2 0 ## 0 ## 0 ####
Hungary 0.0 0.2
Ireland 8 1.2 3.9 34 26 48.8 #
Italy 172 53.7 140.3 607 128 ## 143 ####
Latvia 0 0
Lithuania 0 ### 0 ###
Luxembourg 0 ### 0 ###
Malta ### 0 ### 0 ### ## ## ####
Netherlands ### 0.1 0.2 ## ## ####
Poland ### 11.2 23.3 ## ## ####
Portugal 10 0.5 2.1 39 36 14 #
Romania 1.6 5.8
Slovakia 0.6 1.7
Slovenia ### 0 ### 0 ### 0 ## 0 ## 0 ####
Spain 88 16.5 ### 51.3 644 540 20.9 #
Sweden 18 0.2 1.4 55 25 20 #
United Kingdom ### 12.7 ### 34.8 ### ## ## #DIV/0!
Total EU 805 200.4 615.4 3032 2040 37.6 #
thousand €number
thousand
tonnes million € number number
Country
FAO data
DCF data
The number of companies that produce trout in the EU are 805. There are 3,032 persons employed, with a FTE of 2,040. Hence the ratio between FTE and employment was 67%.
The economic performance of the trout aquaculture companies have been increasing between 2008 and 2010, but show a slight decrease for 2011, even if all indicators continue to be positive. Indeed, 2011’s GVA, EBIT and net profit are lower than the 2010 figures, but ROI has increased between 2010 and 2011.
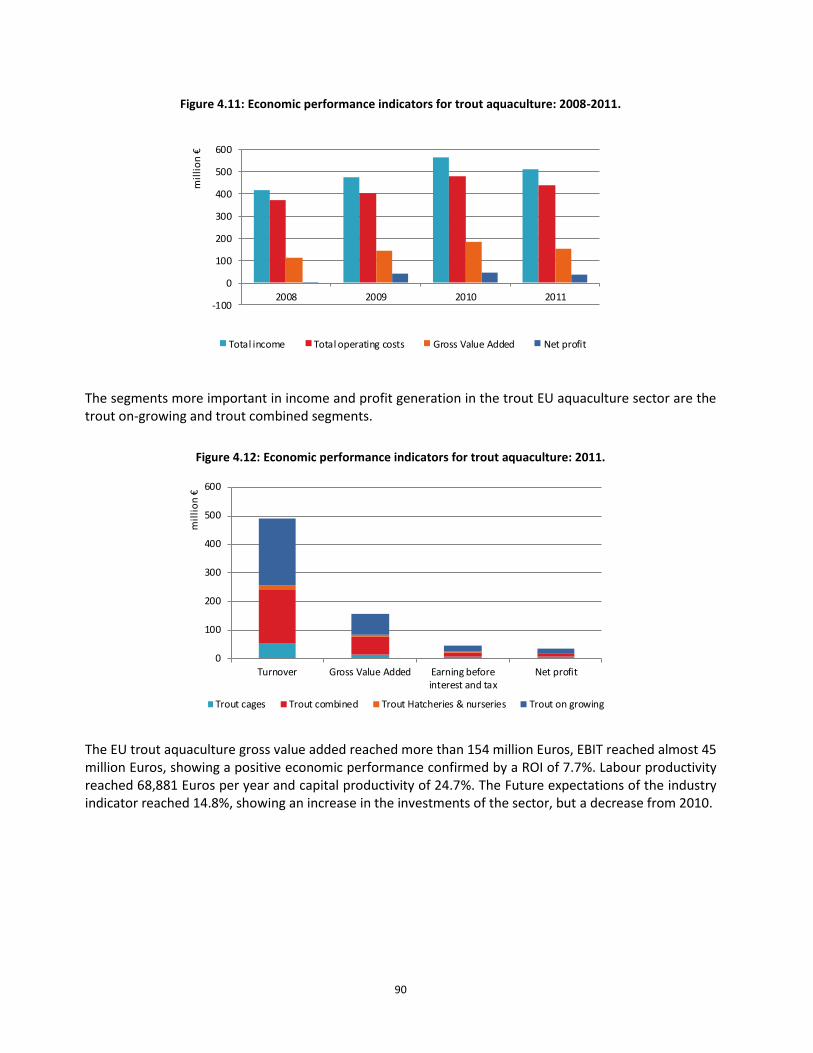
90
Figure 4.11: Economic performance indicators for trout aquaculture: 2008-2011.
The segments more important in income and profit generation in the trout EU aquaculture sector are the trout on-growing and trout combined segments.
Figure 4.12: Economic performance indicators for trout aquaculture: 2011.
The EU trout aquaculture gross value added reached more than 154 million Euros, EBIT reached almost 45 million Euros, showing a positive economic performance confirmed by a ROI of 7.7%. Labour productivity reached 68,881 Euros per year and capital productivity of 24.7%. The Future expectations of the industry indicator reached 14.8%, showing an increase in the investments of the sector, but a decrease from 2010.
-100
0
100
200
300
400
500
600
2008 2009 2010 2011
mil
lio
n €
Total income Total operating costs Gross Value Added Net profit
0
100
200
300
400
500
600
Turnover Gross Value Added Earning beforeinterest and tax
Net profit
mil
lio
n €
Trout cages Trout combined Trout Hatcheries & nurseries Trout on growing

91
Table 4.10: Economic Performance indicators for the trout aquaculture subsector: 2011.
Indicator ratioproductivity productivity
ROI Labour Capital Future Expectation EquityEBIT
Country
GVA
Denmark 33.5 9.1 6.1 125.2 22.5 3.0 25.8
France 26.4 -6.2 -5.4 26.0 22.9 0.9 42.0
Ireland 2.1 0.5 10.0 80.2 38.7 17.8 49.9
Italy 54.6 30.1 12.1 426.5 ### 21.9 32.7 43.4
Portugal 0.7 0.1 2.8 19.4 20.5 13.2 56.5
Romania 4.0 1.8 11.4 ### 25.2 -0.6 78.1
Spain 22.5 9.1 20.5 41.6 50.3 -5.0 98.6
Sweden 0.7 0.2 23.6 28.5 76.1 3.3 69.6
United Kingdom 9.9 ## ### ## ### ### ### ###
Total EU 154.4 44.8 7.7 68.9 24.7 14.8 44.0
Indicator ratio
million € million € % thousand €/FTE % % %
productivity productivityCountry
The most important costs of the EU trout aquaculture sector are the feed costs, which represented 40% of the total costs. Other costs are wages and salaries (16%), livestock costs (14%) and other operational costs (11%). Imputed value of unpaid labour represented just 2% of the total costs, confirming the low importance of unpaid labour in comparison to wages and salaries (16%).
Figure 4.13: Costs breakdown for the EU trout aquaculture subsector: 2011.
Average prices of cultured rainbow trout from the EU and the world show a similar evolution for 2008 and 2009, but for 2010-11 EU prices have decreased compared to previous years while world ones continue the increasing trend.
16%
2%
8%
14%
40%
4%
11%
5%
Wages and salaries
Imputed value of unpaid labour
Energy costs
Raw material: Livestock costs
Raw material: Feed costs
Repair and maintenance
Other operational costs
Depreciation of capital
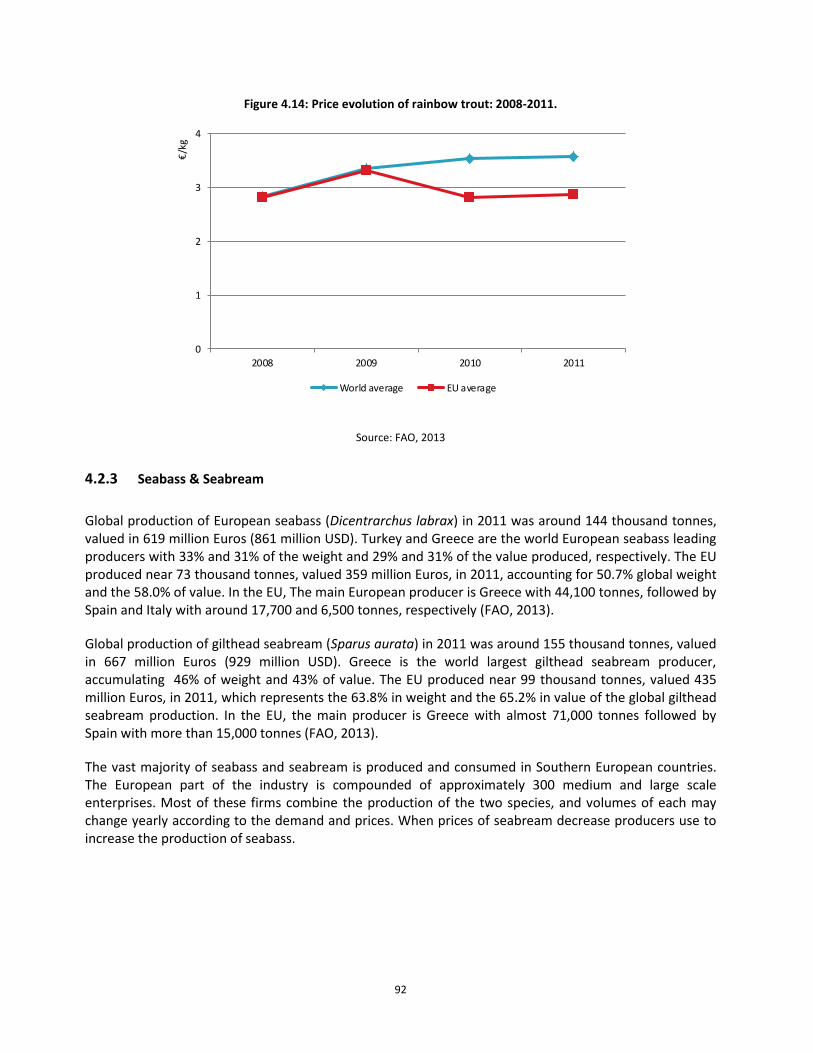
92
Figure 4.14: Price evolution of rainbow trout: 2008-2011.
0
1
2
3
4
2008 2009 2010 2011
€/k
g
World average EU average
Source: FAO, 2013
4.2.3 Seabass & Seabream
Global production of European seabass (Dicentrarchus labrax) in 2011 was around 144 thousand tonnes, valued in 619 million Euros (861 million USD). Turkey and Greece are the world European seabass leading producers with 33% and 31% of the weight and 29% and 31% of the value produced, respectively. The EU produced near 73 thousand tonnes, valued 359 million Euros, in 2011, accounting for 50.7% global weight and the 58.0% of value. In the EU, The main European producer is Greece with 44,100 tonnes, followed by Spain and Italy with around 17,700 and 6,500 tonnes, respectively (FAO, 2013).
Global production of gilthead seabream (Sparus aurata) in 2011 was around 155 thousand tonnes, valued in 667 million Euros (929 million USD). Greece is the world largest gilthead seabream producer, accumulating 46% of weight and 43% of value. The EU produced near 99 thousand tonnes, valued 435 million Euros, in 2011, which represents the 63.8% in weight and the 65.2% in value of the global gilthead seabream production. In the EU, the main producer is Greece with almost 71,000 tonnes followed by Spain with more than 15,000 tonnes (FAO, 2013).
The vast majority of seabass and seabream is produced and consumed in Southern European countries. The European part of the industry is compounded of approximately 300 medium and large scale enterprises. Most of these firms combine the production of the two species, and volumes of each may change yearly according to the demand and prices. When prices of seabream decrease producers use to increase the production of seabass.
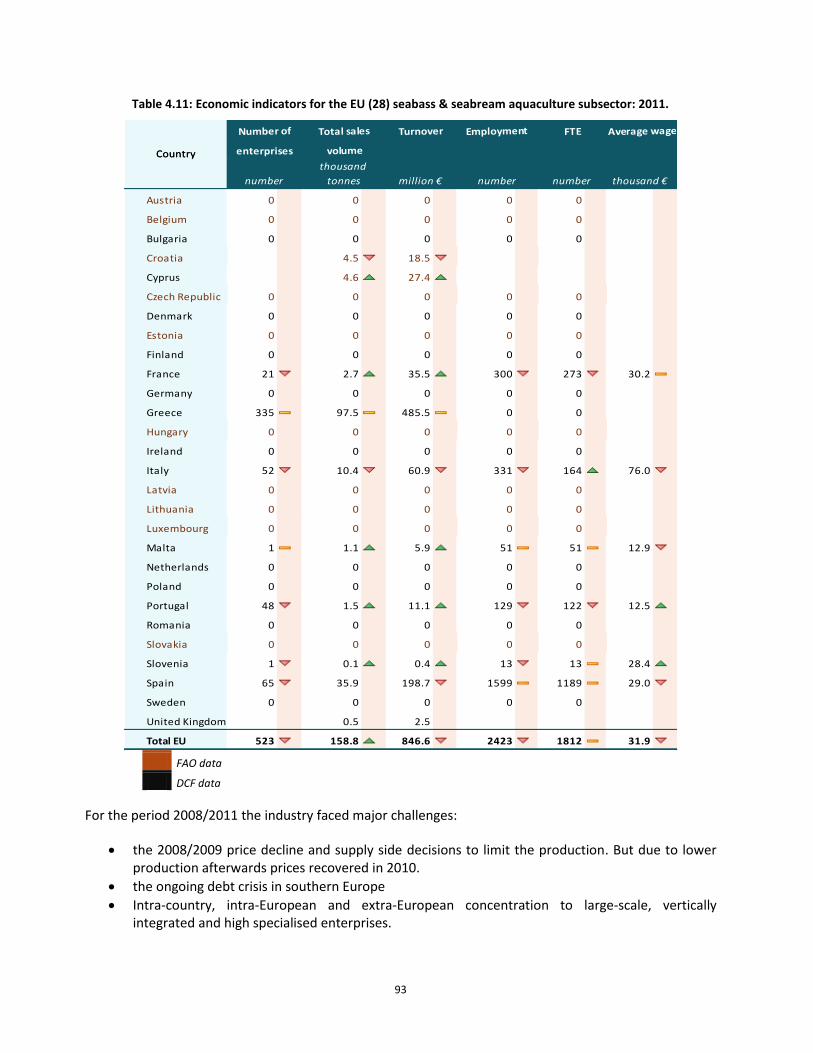
93
Table 4.11: Economic indicators for the EU (28) seabass & seabream aquaculture subsector: 2011.
Country
Number of Total sales Turnover FTE Average wage
enterprises volume
Employment
Country
thousand €
enterprises volume
number
thousand
tonnes million € number number
Austria 0 0 0 0 0
Belgium 0 0 0 0 0
Bulgaria 0 ### 0 0 ### 0 ## 0 ##
Croatia 4.5 18.5
Cyprus ### 4.6 27.4 ## ##
Czech Republic 0 0 0 0 0
Denmark 0 ### 0 ### 0 ### 0 ## 0 ##
Estonia 0 0 0 0 0
Finland 0 ### 0 ### 0 ### 0 ## 0 ##
France 21 2.7 35.5 300 273 30.2
Germany 0 ### 0 ### 0 ### 0 ## 0 ##
Greece 335 97.5 485.5 0 ## 0 ##
Hungary 0 0 0 0 0
Ireland 0 ### 0 ### 0 ### 0 ## 0 ##
Italy 52 10.4 60.9 331 164 76.0
Latvia 0 0 0 0 0
Lithuania 0 0 0 0 0
Luxembourg 0 0 0 0 0
Malta 1 1.1 5.9 51 51 12.9
Netherlands 0 ### 0 ### 0 ### 0 ## 0 ##
Poland 0 ### 0 ### 0 ### 0 ## 0 ##
Portugal 48 1.5 11.1 129 122 12.5
Romania 0 ### 0 ### 0 ### 0 ## 0 ##
Slovakia 0 0 0 0 0
Slovenia 1 0.1 0.4 13 13 28.4
Spain 65 35.9 ### 198.7 1599 1189 29.0
Sweden 0 ### 0 ### 0 ### 0 ## 0 ##
United Kingdom ### 0.5 ### 2.5 ### ## ## #DIV/0!
Total EU 523 158.8 846.6 2423 1812 31.9
Country
thousand €number
thousand
tonnes million € number number
FAO data
DCF data
For the period 2008/2011 the industry faced major challenges:
the 2008/2009 price decline and supply side decisions to limit the production. But due to lower production afterwards prices recovered in 2010.
the ongoing debt crisis in southern Europe
Intra-country, intra-European and extra-European concentration to large-scale, vertically integrated and high specialised enterprises.
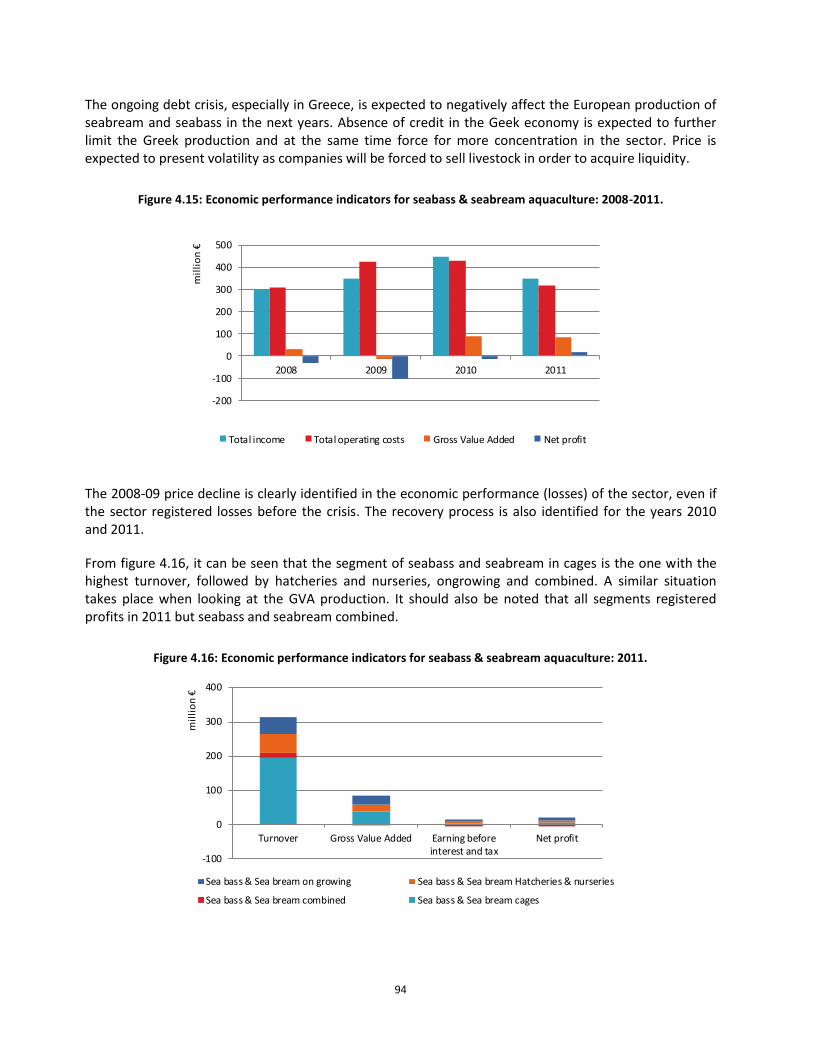
94
The ongoing debt crisis, especially in Greece, is expected to negatively affect the European production of seabream and seabass in the next years. Absence of credit in the Geek economy is expected to further limit the Greek production and at the same time force for more concentration in the sector. Price is expected to present volatility as companies will be forced to sell livestock in order to acquire liquidity.
Figure 4.15: Economic performance indicators for seabass & seabream aquaculture: 2008-2011.
The 2008-09 price decline is clearly identified in the economic performance (losses) of the sector, even if the sector registered losses before the crisis. The recovery process is also identified for the years 2010 and 2011.
From figure 4.16, it can be seen that the segment of seabass and seabream in cages is the one with the highest turnover, followed by hatcheries and nurseries, ongrowing and combined. A similar situation takes place when looking at the GVA production. It should also be noted that all segments registered profits in 2011 but seabass and seabream combined.
Figure 4.16: Economic performance indicators for seabass & seabream aquaculture: 2011.
-200
-100
0
100
200
300
400
500
2008 2009 2010 2011
mil
lio
n €
Total income Total operating costs Gross Value Added Net profit
-100
0
100
200
300
400
Turnover Gross Value Added Earning beforeinterest and tax
Net profit
mil
lio
n €
Sea bass & Sea bream on growing Sea bass & Sea bream Hatcheries & nurseries
Sea bass & Sea bream combined Sea bass & Sea bream cages
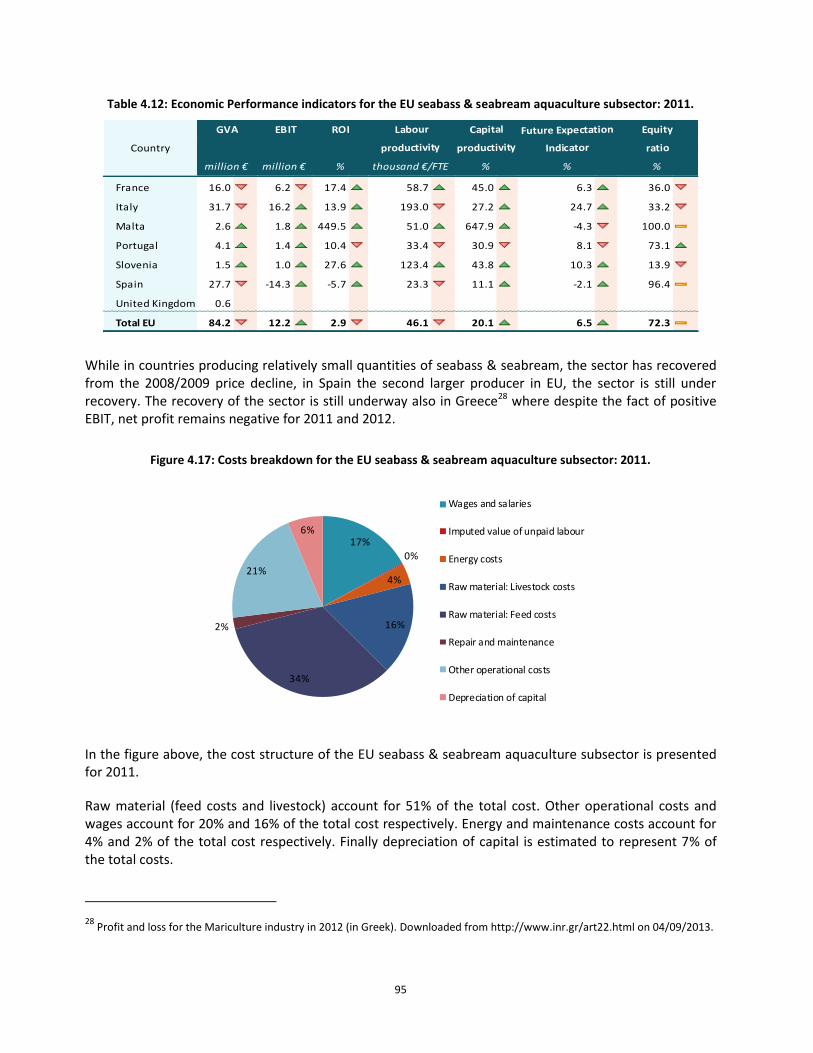
95
Table 4.12: Economic Performance indicators for the EU seabass & seabream aquaculture subsector: 2011.
ratio
ROI Labour Future Expectation Equity
productivity productivity
CapitalEBIT
IndicatorCountry
GVA
France 16.0 6.2 17.4 58.7 45.0 6.3 36.0
Italy 31.7 16.2 13.9 193.0 27.2 24.7 33.2
Malta 2.6 1.8 449.5 51.0 647.9 -4.3 100.0
Portugal 4.1 1.4 10.4 33.4 30.9 8.1 73.1
Slovenia 1.5 1.0 27.6 123.4 43.8 10.3 13.9
Spain 27.7 -14.3 -5.7 23.3 11.1 -2.1 96.4
United Kingdom 0.6 ### ## ## ### ## ## ###
Total EU 84.2 12.2 2.9 46.1 20.1 6.5 72.3
ratio
thousand €/FTE % % %
productivity productivity Indicator
million € %
Country
million €
While in countries producing relatively small quantities of seabass & seabream, the sector has recovered from the 2008/2009 price decline, in Spain the second larger producer in EU, the sector is still under recovery. The recovery of the sector is still underway also in Greece28 where despite the fact of positive EBIT, net profit remains negative for 2011 and 2012.
Figure 4.17: Costs breakdown for the EU seabass & seabream aquaculture subsector: 2011.
In the figure above, the cost structure of the EU seabass & seabream aquaculture subsector is presented for 2011.
Raw material (feed costs and livestock) account for 51% of the total cost. Other operational costs and wages account for 20% and 16% of the total cost respectively. Energy and maintenance costs account for 4% and 2% of the total cost respectively. Finally depreciation of capital is estimated to represent 7% of the total costs.
28 Profit and loss for the Mariculture industry in 2012 (in Greek). Downloaded from http://www.inr.gr/art22.html on 04/09/2013.
17%
0%
4%
16%
34%
2%
21%
6%
Wages and salaries
Imputed value of unpaid labour
Energy costs
Raw material: Livestock costs
Raw material: Feed costs
Repair and maintenance
Other operational costs
Depreciation of capital
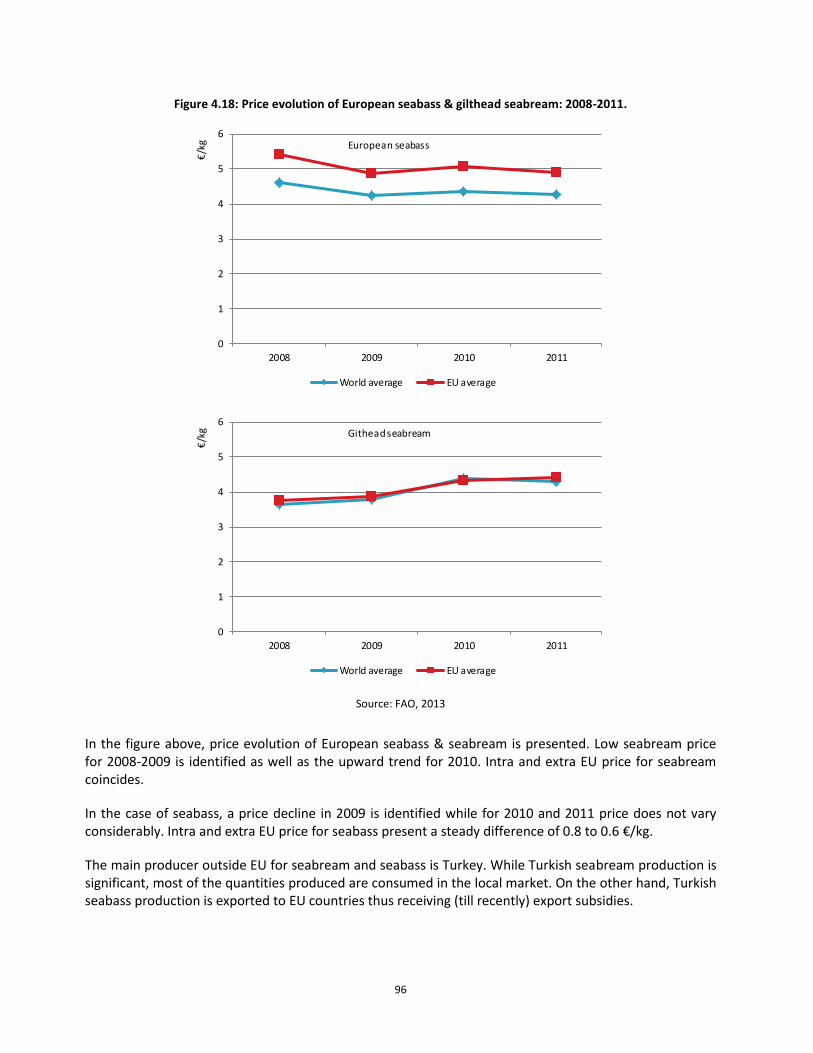
96
Figure 4.18: Price evolution of European seabass & gilthead seabream: 2008-2011.
0
1
2
3
4
5
6
2008 2009 2010 2011
€/k
g European seabass
World average EU average
0
1
2
3
4
5
6
2008 2009 2010 2011
€/k
g Githead seabream
World average EU average
Source: FAO, 2013
In the figure above, price evolution of European seabass & seabream is presented. Low seabream price for 2008-2009 is identified as well as the upward trend for 2010. Intra and extra EU price for seabream coincides.
In the case of seabass, a price decline in 2009 is identified while for 2010 and 2011 price does not vary considerably. Intra and extra EU price for seabass present a steady difference of 0.8 to 0.6 €/kg.
The main producer outside EU for seabream and seabass is Turkey. While Turkish seabream production is significant, most of the quantities produced are consumed in the local market. On the other hand, Turkish seabass production is exported to EU countries thus receiving (till recently) export subsidies.
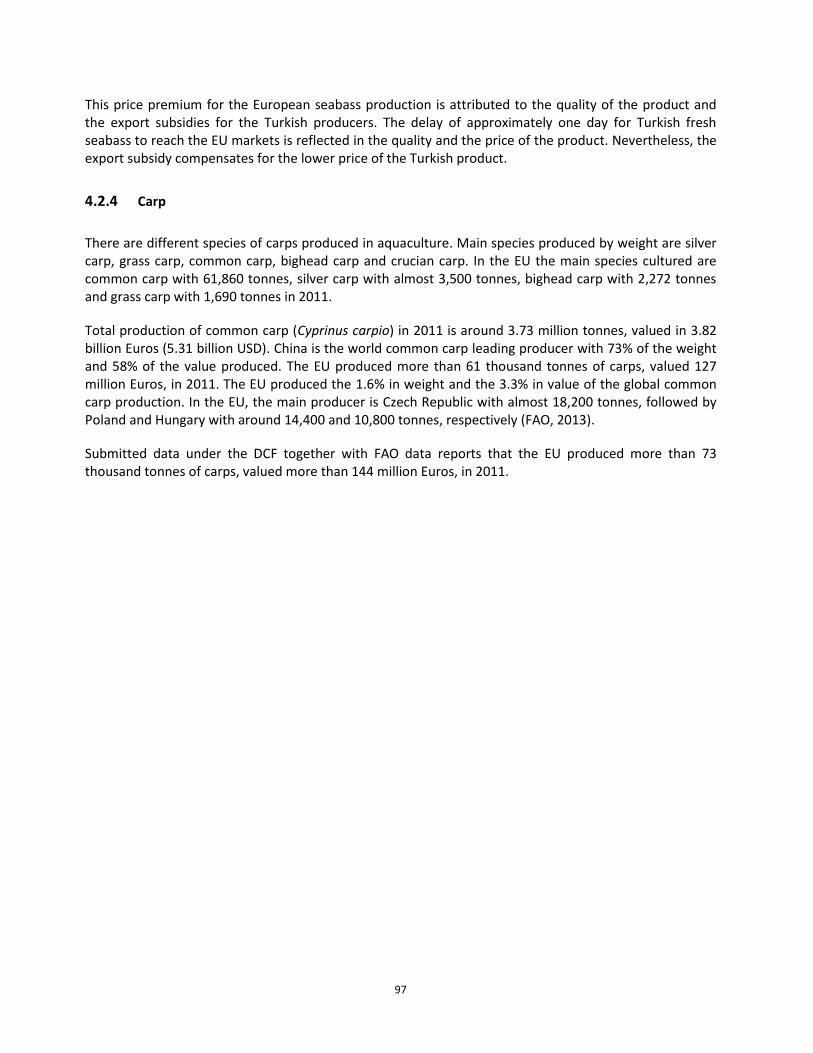
97
This price premium for the European seabass production is attributed to the quality of the product and the export subsidies for the Turkish producers. The delay of approximately one day for Turkish fresh seabass to reach the EU markets is reflected in the quality and the price of the product. Nevertheless, the export subsidy compensates for the lower price of the Turkish product.
4.2.4 Carp
There are different species of carps produced in aquaculture. Main species produced by weight are silver carp, grass carp, common carp, bighead carp and crucian carp. In the EU the main species cultured are common carp with 61,860 tonnes, silver carp with almost 3,500 tonnes, bighead carp with 2,272 tonnes and grass carp with 1,690 tonnes in 2011.
Total production of common carp (Cyprinus carpio) in 2011 is around 3.73 million tonnes, valued in 3.82 billion Euros (5.31 billion USD). China is the world common carp leading producer with 73% of the weight and 58% of the value produced. The EU produced more than 61 thousand tonnes of carps, valued 127 million Euros, in 2011. The EU produced the 1.6% in weight and the 3.3% in value of the global common carp production. In the EU, the main producer is Czech Republic with almost 18,200 tonnes, followed by Poland and Hungary with around 14,400 and 10,800 tonnes, respectively (FAO, 2013).
Submitted data under the DCF together with FAO data reports that the EU produced more than 73 thousand tonnes of carps, valued more than 144 million Euros, in 2011.
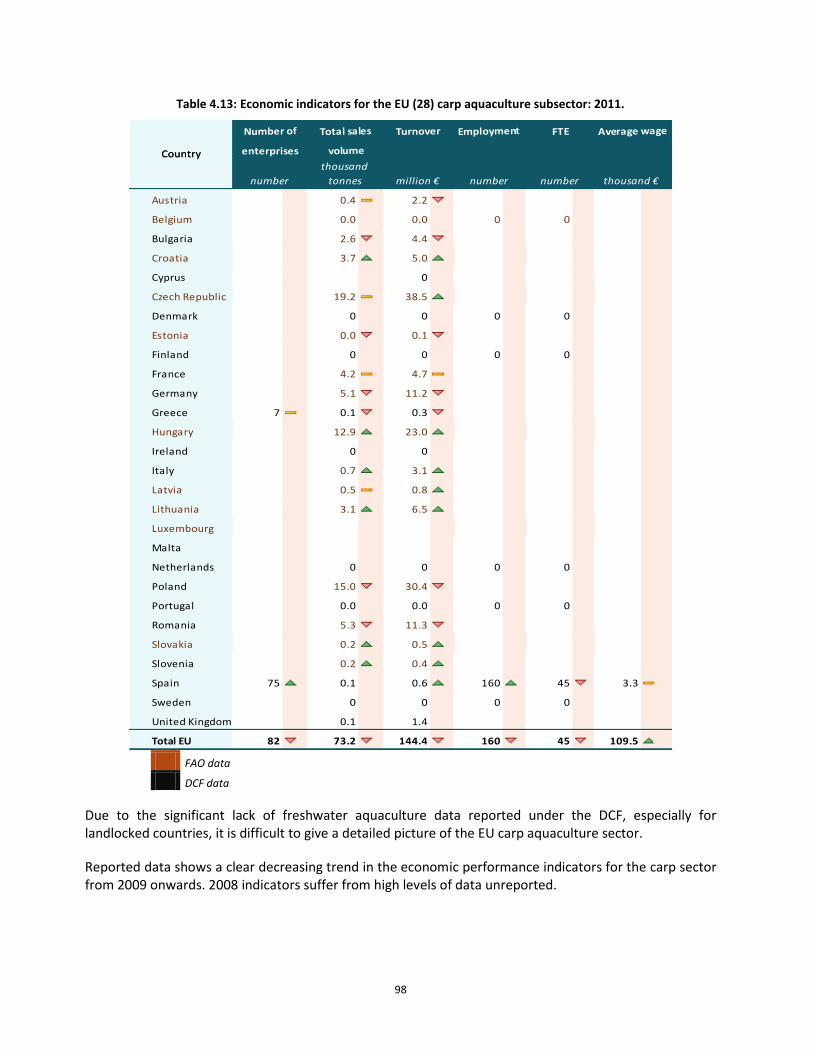
98
Table 4.13: Economic indicators for the EU (28) carp aquaculture subsector: 2011.
Country
Number of Total sales Turnover FTE Average wage
enterprises volume
Employment
Country
thousand €
enterprises volume
number
thousand
tonnes million € number number
Austria 0.4 2.2 0 0
Belgium 0.0 0.0 0 0
Bulgaria ### 2.6 4.4 0 ## 0 ##
Croatia 3.7 5.0
Cyprus ### ### 0 ### ## ##
Czech Republic 19.2 38.5 0 0
Denmark ### 0 ### 0 ### 0 ## 0 ##
Estonia 0.0 0.1 0 0
Finland ### 0 ### 0 ### 0 ## 0 ##
France ### 4.2 4.7 ## ## ####
Germany ### 5.1 11.2 ## ##
Greece 7 0.1 0.3 0 ## 0 ##
Hungary 12.9 23.0 0 0
Ireland ### 0 ### 0 ### 0 ## 0 ##
Italy ### 0.7 3.1 ## ## ####
Latvia ### 0.5 0.8 0 0
Lithuania ### 3.1 6.5 0 0
Luxembourg
Malta ### ### ### ## ## ####
Netherlands ### 0 ### 0 ### 0 ## 0 ##
Poland ### 15.0 30.4 0 ## 0 ##
Portugal ### 0.0 ### 0.0 ### 0 ## 0 ## #DIV/0! ####
Romania 5.3 11.3 #DIV/0!
Slovakia 0.2 0.5 0 0
Slovenia ### 0.2 0.4 0 ## 0 ## #DIV/0! ####
Spain 75 0.1 ### 0.6 160 45 3.3 #
Sweden ### 0 ### 0 ### 0 ## 0 ##
United Kingdom ### 0.1 ### 1.4 ### ## ##
Total EU 82 73.2 144.4 160 45 109.5 #
Country
thousand €number
thousand
tonnes million € number number
FAO data
DCF data
Due to the significant lack of freshwater aquaculture data reported under the DCF, especially for landlocked countries, it is difficult to give a detailed picture of the EU carp aquaculture sector.
Reported data shows a clear decreasing trend in the economic performance indicators for the carp sector from 2009 onwards. 2008 indicators suffer from high levels of data unreported.
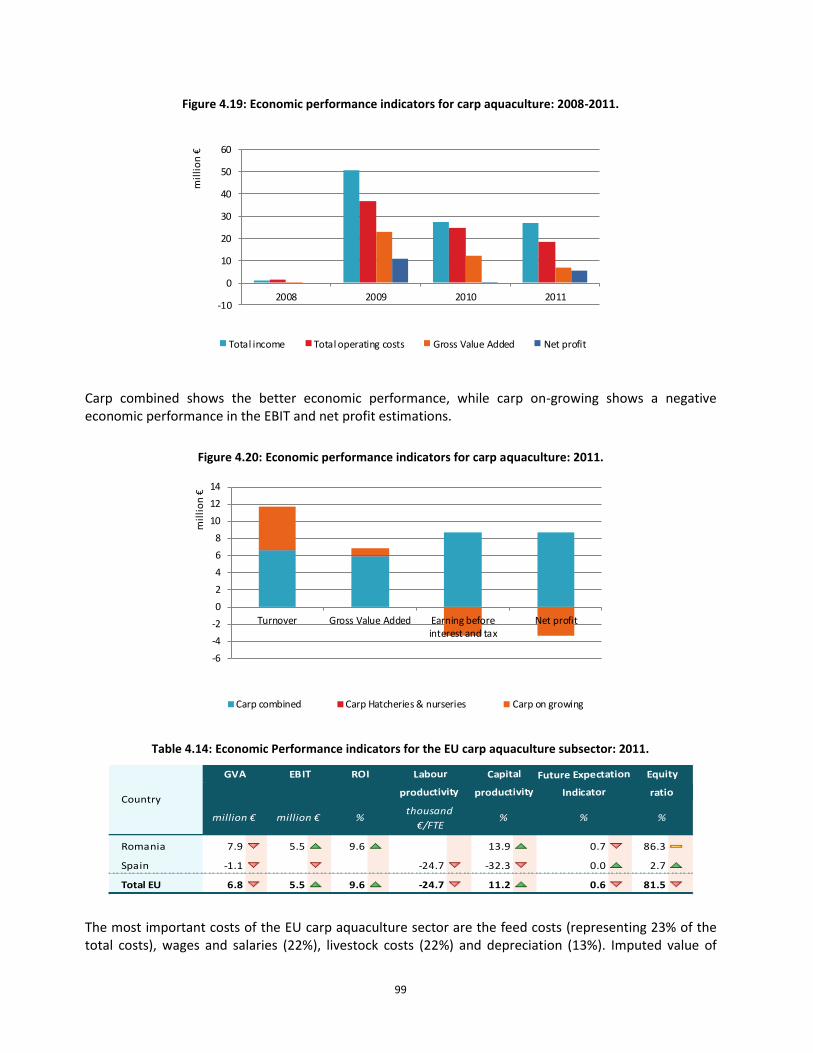
99
Figure 4.19: Economic performance indicators for carp aquaculture: 2008-2011.
Carp combined shows the better economic performance, while carp on-growing shows a negative economic performance in the EBIT and net profit estimations.
Figure 4.20: Economic performance indicators for carp aquaculture: 2011.
Table 4.14: Economic Performance indicators for the EU carp aquaculture subsector: 2011.
EBIT
Country
GVA ROI Labour Capital Future Expectation Equity
Indicator ratioproductivity productivity
Romania 7.9 5.5 9.6 ### 13.9 0.7 86.3
Spain -1.1 ## -24.7 -32.3 0.0 2.7
Total EU 6.8 5.5 9.6 -24.7 11.2 0.6 81.5
CountryIndicator ratio
million € million € %thousand
€/FTE% % %
productivity productivity
The most important costs of the EU carp aquaculture sector are the feed costs (representing 23% of the total costs), wages and salaries (22%), livestock costs (22%) and depreciation (13%). Imputed value of
-10
0
10
20
30
40
50
60
2008 2009 2010 2011
mil
lio
n €
Total income Total operating costs Gross Value Added Net profit
-6
-4
-2
0
2
4
6
8
10
12
14
Turnover Gross Value Added Earning beforeinterest and tax
Net profit
mil
lio
n €
Carp combined Carp Hatcheries & nurseries Carp on growing
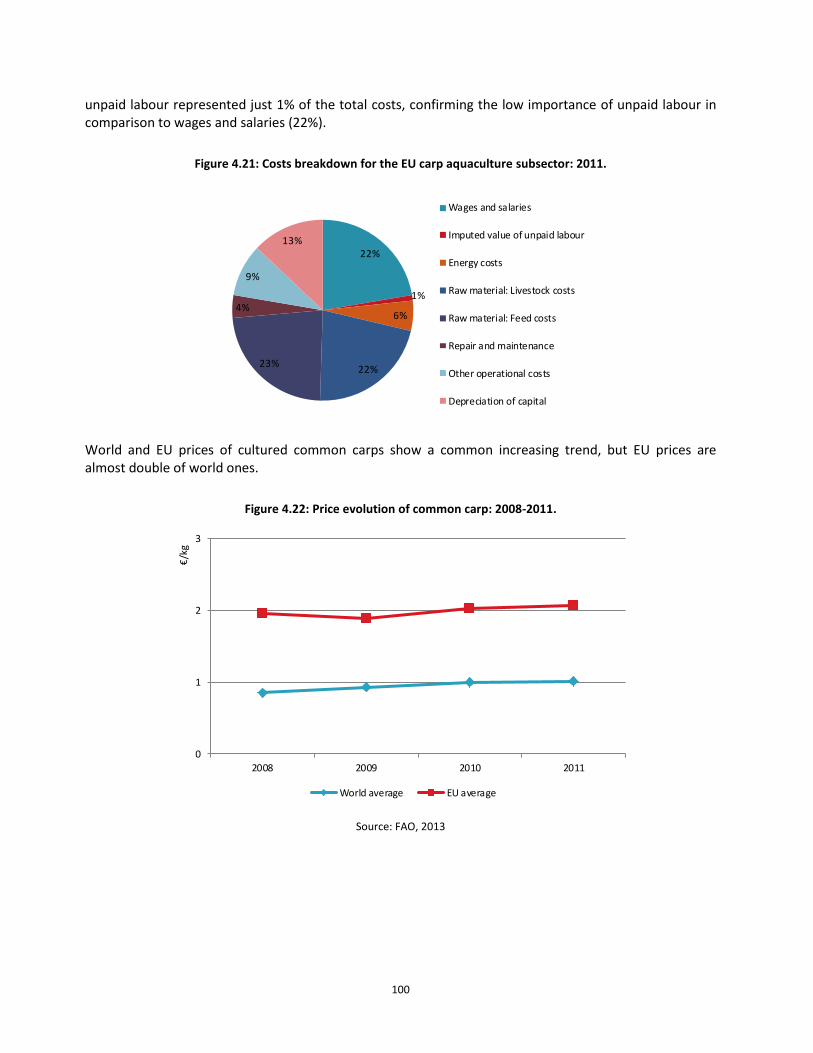
100
unpaid labour represented just 1% of the total costs, confirming the low importance of unpaid labour in comparison to wages and salaries (22%).
Figure 4.21: Costs breakdown for the EU carp aquaculture subsector: 2011.
World and EU prices of cultured common carps show a common increasing trend, but EU prices are almost double of world ones.
Figure 4.22: Price evolution of common carp: 2008-2011.
0
1
2
3
2008 2009 2010 2011
€/k
g
World average EU average
Source: FAO, 2013
22%
1%
6%
22%23%
4%
9%
13%
Wages and salaries
Imputed value of unpaid labour
Energy costs
Raw material: Livestock costs
Raw material: Feed costs
Repair and maintenance
Other operational costs
Depreciation of capital
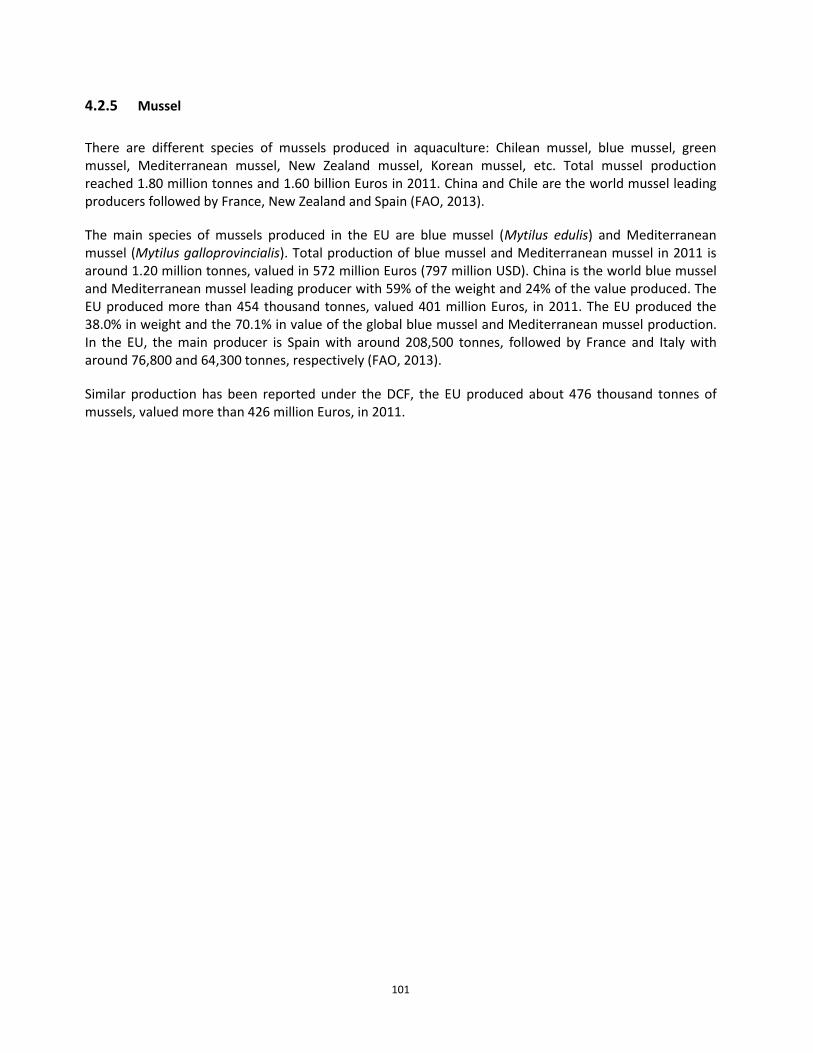
101
4.2.5 Mussel
There are different species of mussels produced in aquaculture: Chilean mussel, blue mussel, green mussel, Mediterranean mussel, New Zealand mussel, Korean mussel, etc. Total mussel production reached 1.80 million tonnes and 1.60 billion Euros in 2011. China and Chile are the world mussel leading producers followed by France, New Zealand and Spain (FAO, 2013).
The main species of mussels produced in the EU are blue mussel (Mytilus edulis) and Mediterranean mussel (Mytilus galloprovincialis). Total production of blue mussel and Mediterranean mussel in 2011 is around 1.20 million tonnes, valued in 572 million Euros (797 million USD). China is the world blue mussel and Mediterranean mussel leading producer with 59% of the weight and 24% of the value produced. The EU produced more than 454 thousand tonnes, valued 401 million Euros, in 2011. The EU produced the 38.0% in weight and the 70.1% in value of the global blue mussel and Mediterranean mussel production. In the EU, the main producer is Spain with around 208,500 tonnes, followed by France and Italy with around 76,800 and 64,300 tonnes, respectively (FAO, 2013).
Similar production has been reported under the DCF, the EU produced about 476 thousand tonnes of mussels, valued more than 426 million Euros, in 2011.
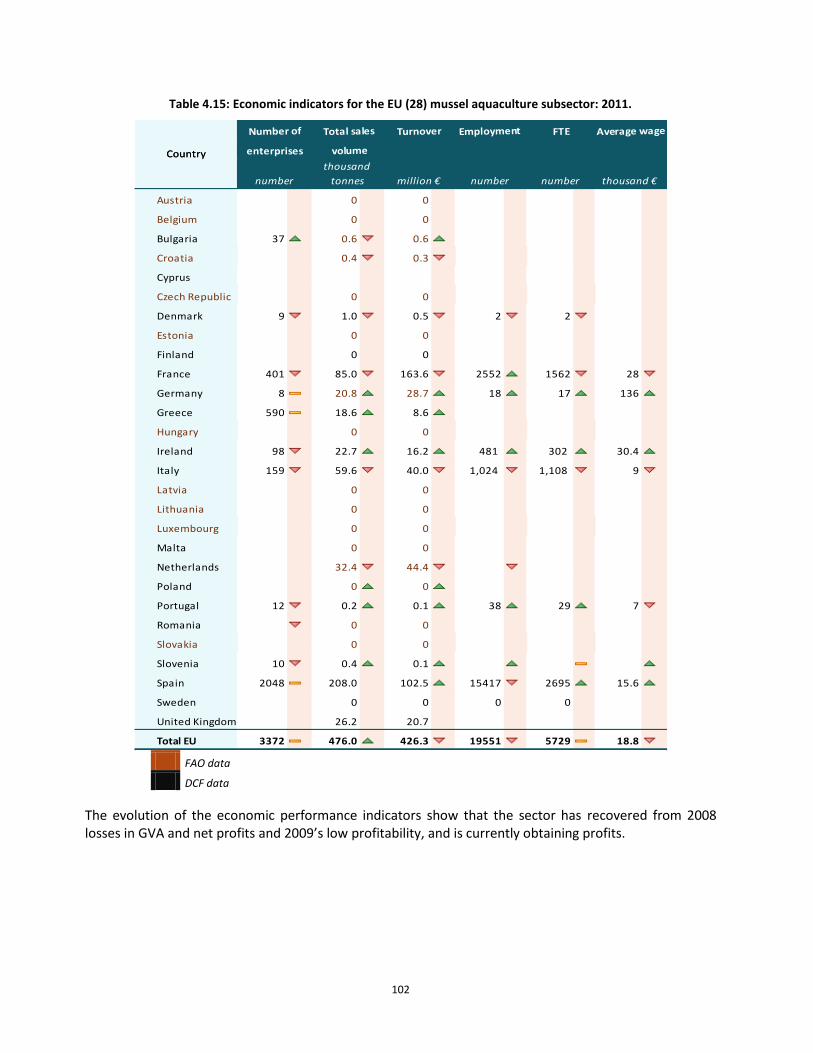
102
Table 4.15: Economic indicators for the EU (28) mussel aquaculture subsector: 2011.
FTE Average wage
enterprises volume
Employment
Country
Number of Total sales Turnover
thousand €
enterprises volume
number
thousand
tonnes million € number number
Country
Austria 0 ### 0 ###
Belgium 0 ### 0 ###
Bulgaria 37 0.6 0.6 ## ## ###
Croatia 0.4 0.3
Cyprus ### ### ### ## ## ###
Czech Republic 0 ### 0 ###
Denmark 9 1.0 0.5 2 2 0
Estonia 0 ### 0 ###
Finland ### 0 ### 0 ### 0 ## 0 ## 0 ###
France 401 85.0 163.6 2552 1562 28
Germany 8 20.8 28.7 18 17 136
Greece 590 18.6 8.6 0 ## 0 ## 0 ###
Hungary 0 ### 0 ###
Ireland 98 22.7 16.2 481 302 30.4
Italy 159 59.6 40.0 1,024 1,108 9
Latvia 0 ### 0 ###
Lithuania 0 ### 0 ###
Luxembourg 0 ### 0 ###
Malta ### 0 ### 0 ### ## ## ###
Netherlands ### 32.4 44.4 ## ###
Poland ### 0 0 ## ## ###
Portugal 12 0.2 0.1 38 29 7
Romania 0 ### 0 ###
Slovakia 0 ### 0 ###
Slovenia 10 0.4 0.1 19 15 21
Spain 2048 208.0 ### 102.5 15417 2695 15.6
Sweden ### 0 ### 0 ### 0 ## 0 ## 0 ###
United Kingdom ### 26.2 ### 20.7 ### ## ## #DIV/0!
Total EU 3372 476.0 426.3 19551 5729 18.8
thousand €number
thousand
tonnes million € number number
Country
FAO data
DCF data
The evolution of the economic performance indicators show that the sector has recovered from 2008 losses in GVA and net profits and 2009’s low profitability, and is currently obtaining profits.
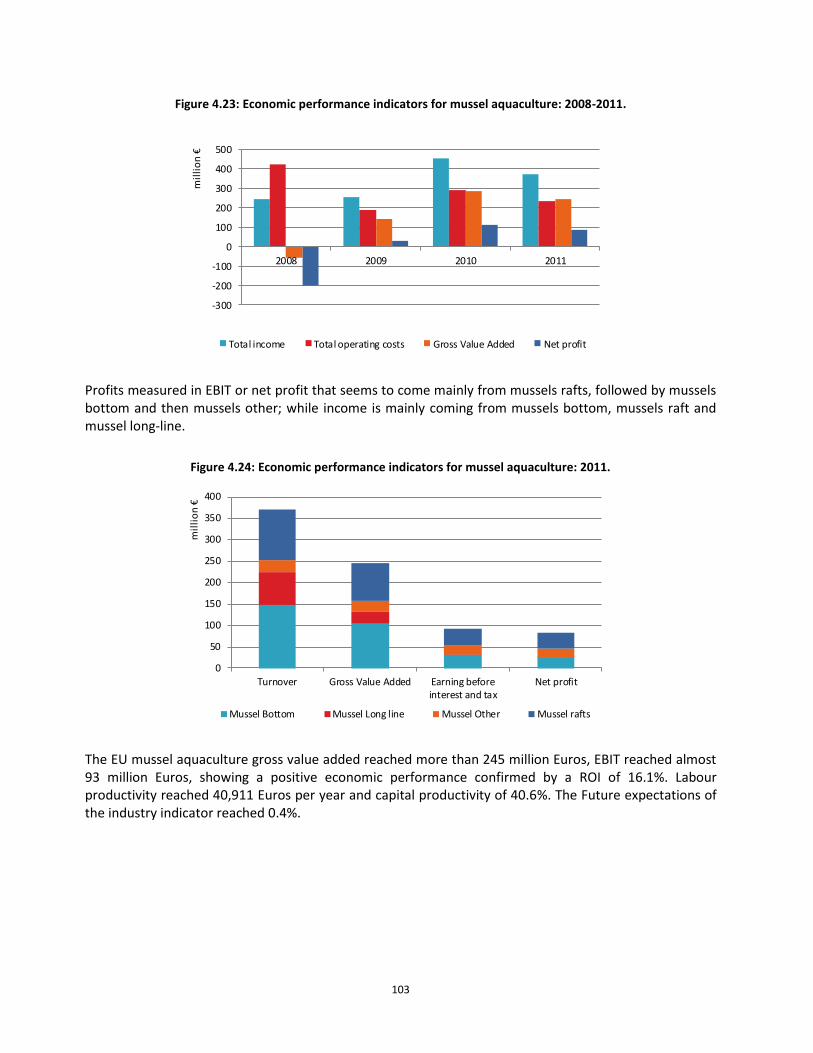
103
Figure 4.23: Economic performance indicators for mussel aquaculture: 2008-2011.
Profits measured in EBIT or net profit that seems to come mainly from mussels rafts, followed by mussels bottom and then mussels other; while income is mainly coming from mussels bottom, mussels raft and mussel long-line.
Figure 4.24: Economic performance indicators for mussel aquaculture: 2011.
The EU mussel aquaculture gross value added reached more than 245 million Euros, EBIT reached almost 93 million Euros, showing a positive economic performance confirmed by a ROI of 16.1%. Labour productivity reached 40,911 Euros per year and capital productivity of 40.6%. The Future expectations of the industry indicator reached 0.4%.
-300
-200
-100
0
100
200
300
400
500
2008 2009 2010 2011
mil
lio
n €
Total income Total operating costs Gross Value Added Net profit
0
50
100
150
200
250
300
350
400
Turnover Gross Value Added Earning beforeinterest and tax
Net profit
mil
lio
n €
Mussel Bottom Mussel Long line Mussel Other Mussel rafts
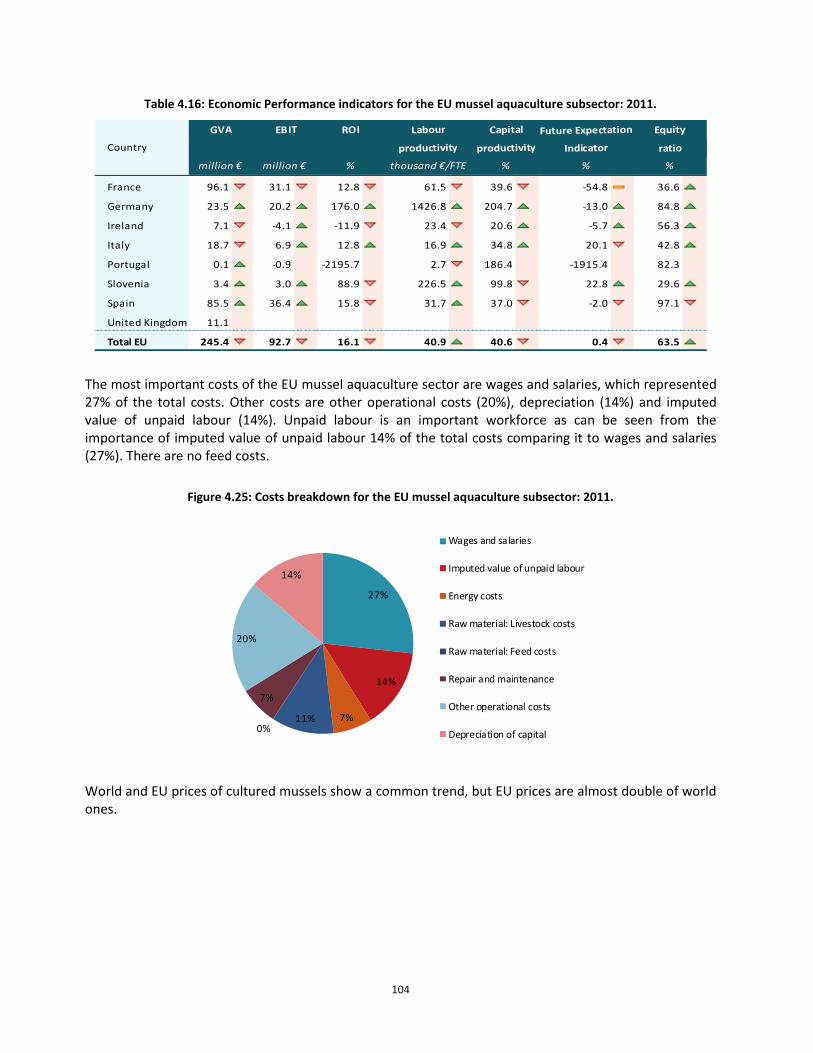
104
Table 4.16: Economic Performance indicators for the EU mussel aquaculture subsector: 2011.
Indicator ratioproductivity productivity
ROI Labour Capital Future Expectation EquityEBIT
Country
GVA
France 96.1 31.1 12.8 61.5 39.6 -54.8 36.6
Germany 23.5 20.2 176.0 1426.8 204.7 -13.0 84.8
Ireland 7.1 -4.1 -11.9 23.4 20.6 -5.7 56.3
Italy 18.7 6.9 12.8 16.9 34.8 20.1 42.8
Portugal 0.1 -0.9 ### -2195.7 ## 2.7 186.4 ### -1915.4 ### 82.3 ###
Slovenia 3.4 3.0 88.9 226.5 99.8 22.8 29.6
Spain 85.5 36.4 15.8 31.7 37.0 -2.0 97.1
United Kingdom 11.1 ## ### ## ### ### ### ###
Total EU 245.4 92.7 16.1 40.9 40.6 0.4 63.5
Indicator ratio
million € million € % thousand €/FTE % % %
productivity productivityCountry
The most important costs of the EU mussel aquaculture sector are wages and salaries, which represented 27% of the total costs. Other costs are other operational costs (20%), depreciation (14%) and imputed value of unpaid labour (14%). Unpaid labour is an important workforce as can be seen from the importance of imputed value of unpaid labour 14% of the total costs comparing it to wages and salaries (27%). There are no feed costs.
Figure 4.25: Costs breakdown for the EU mussel aquaculture subsector: 2011.
World and EU prices of cultured mussels show a common trend, but EU prices are almost double of world ones.
27%
14%
7%11%0%
7%
20%
14%
Wages and salaries
Imputed value of unpaid labour
Energy costs
Raw material: Livestock costs
Raw material: Feed costs
Repair and maintenance
Other operational costs
Depreciation of capital
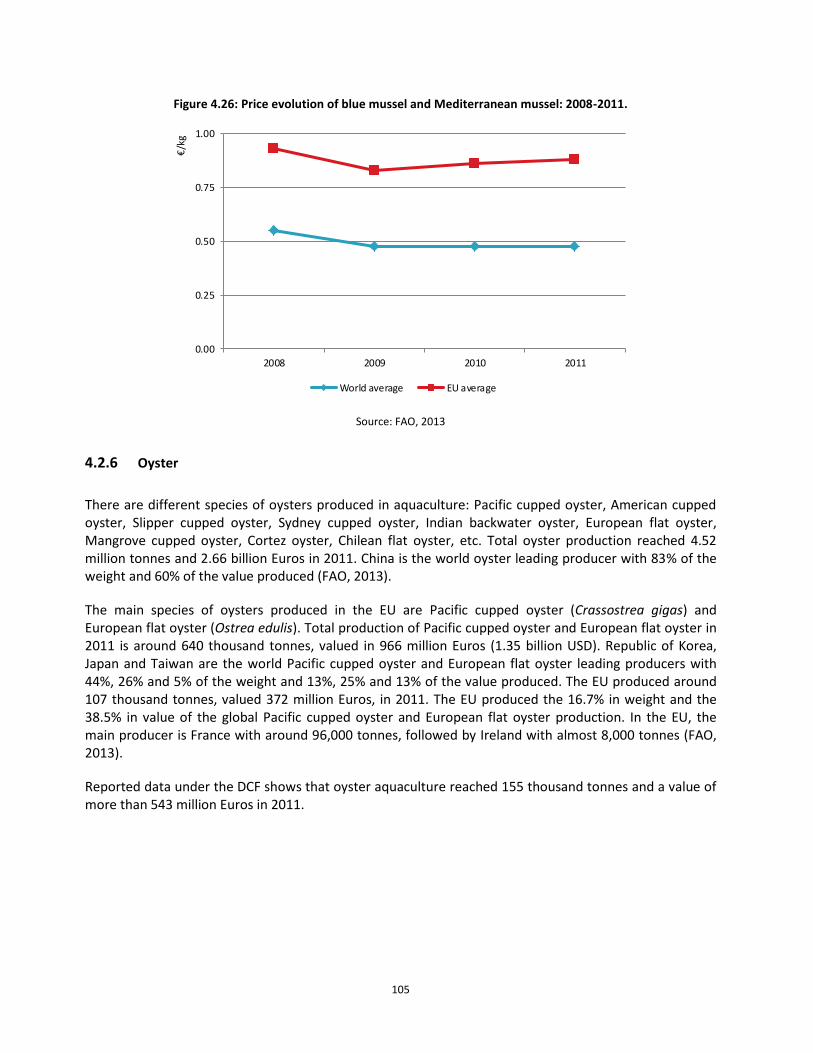
105
Figure 4.26: Price evolution of blue mussel and Mediterranean mussel: 2008-2011.
0.00
0.25
0.50
0.75
1.00
2008 2009 2010 2011
€/k
g
World average EU average
Source: FAO, 2013
4.2.6 Oyster
There are different species of oysters produced in aquaculture: Pacific cupped oyster, American cupped oyster, Slipper cupped oyster, Sydney cupped oyster, Indian backwater oyster, European flat oyster, Mangrove cupped oyster, Cortez oyster, Chilean flat oyster, etc. Total oyster production reached 4.52 million tonnes and 2.66 billion Euros in 2011. China is the world oyster leading producer with 83% of the weight and 60% of the value produced (FAO, 2013).
The main species of oysters produced in the EU are Pacific cupped oyster (Crassostrea gigas) and European flat oyster (Ostrea edulis). Total production of Pacific cupped oyster and European flat oyster in 2011 is around 640 thousand tonnes, valued in 966 million Euros (1.35 billion USD). Republic of Korea, Japan and Taiwan are the world Pacific cupped oyster and European flat oyster leading producers with 44%, 26% and 5% of the weight and 13%, 25% and 13% of the value produced. The EU produced around 107 thousand tonnes, valued 372 million Euros, in 2011. The EU produced the 16.7% in weight and the 38.5% in value of the global Pacific cupped oyster and European flat oyster production. In the EU, the main producer is France with around 96,000 tonnes, followed by Ireland with almost 8,000 tonnes (FAO, 2013).
Reported data under the DCF shows that oyster aquaculture reached 155 thousand tonnes and a value of more than 543 million Euros in 2011.
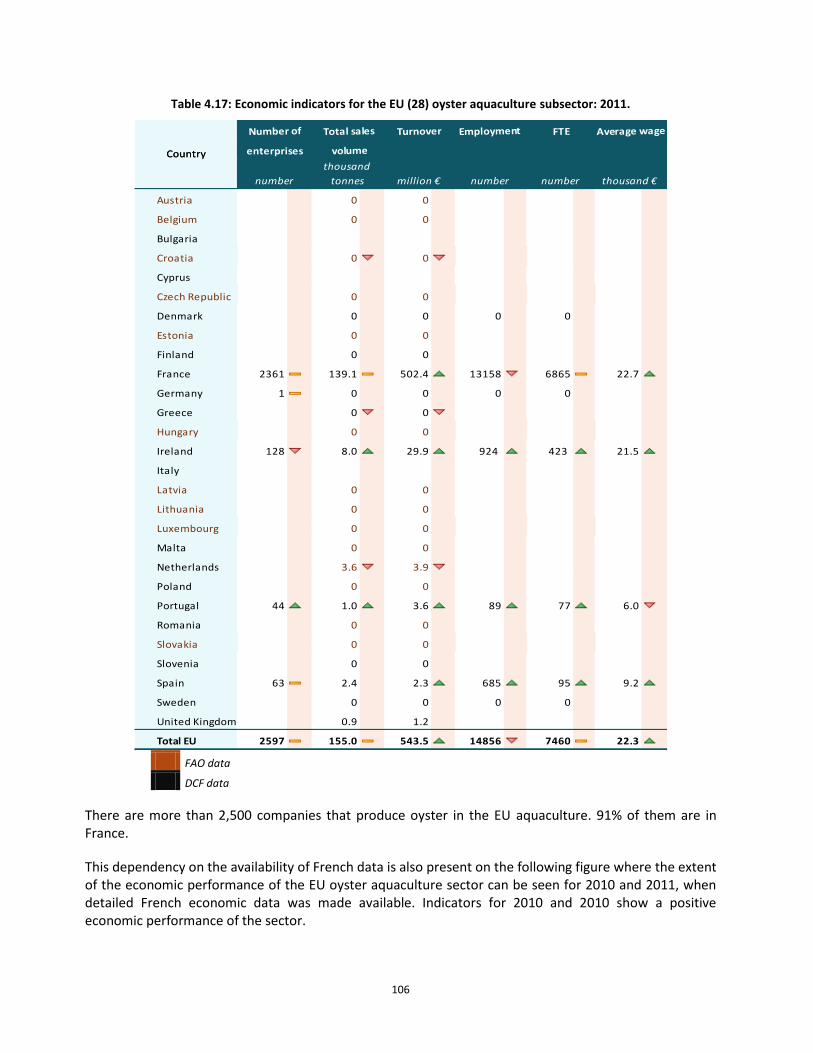
106
Table 4.17: Economic indicators for the EU (28) oyster aquaculture subsector: 2011.
Country
Number of Total sales Turnover FTE Average wage
enterprises volume
Employment
Country
thousand €
enterprises volume
number
thousand
tonnes million € number number
Austria 0 ### 0 ###
Belgium 0 ### 0 ###
Bulgaria ### ### ## ## ###
Croatia 0 0
Cyprus ### ### ### ## ## ###
Czech Republic 0 ### 0 ###
Denmark ### 0 ### 0 ### 0 ## 0 ## 0 ###
Estonia 0 ### 0 ###
Finland ### 0 ### 0 ### 0 ## 0 ## 0 ###
France 2361 139.1 502.4 13158 6865 22.7
Germany 1 0 ### 0 ### 0 ## 0 ## 0 ###
Greece ### 0 0 0 ## 0 ## 0 ###
Hungary 0 ### 0 ###
Ireland 128 8.0 29.9 924 423 21.5
Italy ### ### ### ## ## ###
Latvia 0 ### 0 ###
Lithuania 0 ### 0 ###
Luxembourg 0 ### 0 ###
Malta ### 0 ### 0 ### ## ## ###
Netherlands ### 3.6 3.9 ## ## ###
Poland ### 0 ### 0 ### ## ## ###
Portugal 44 1.0 3.6 89 77 6.0
Romania ### 0 ### 0 ###
Slovakia 0 ### 0 ###
Slovenia ### 0 ### 0 ### 0 ## 0 ## 0 ###
Spain 63 2.4 ### 2.3 685 95 9.2
Sweden ### 0 ### 0 ### 0 ## 0 ## ###
United Kingdom ### 0.9 ### 1.2 ### ## ##
Total EU 2597 155.0 543.5 14856 7460 22.3
Country
thousand €number
thousand
tonnes million € number number
FAO data
DCF data
There are more than 2,500 companies that produce oyster in the EU aquaculture. 91% of them are in France.
This dependency on the availability of French data is also present on the following figure where the extent of the economic performance of the EU oyster aquaculture sector can be seen for 2010 and 2011, when detailed French economic data was made available. Indicators for 2010 and 2010 show a positive economic performance of the sector.
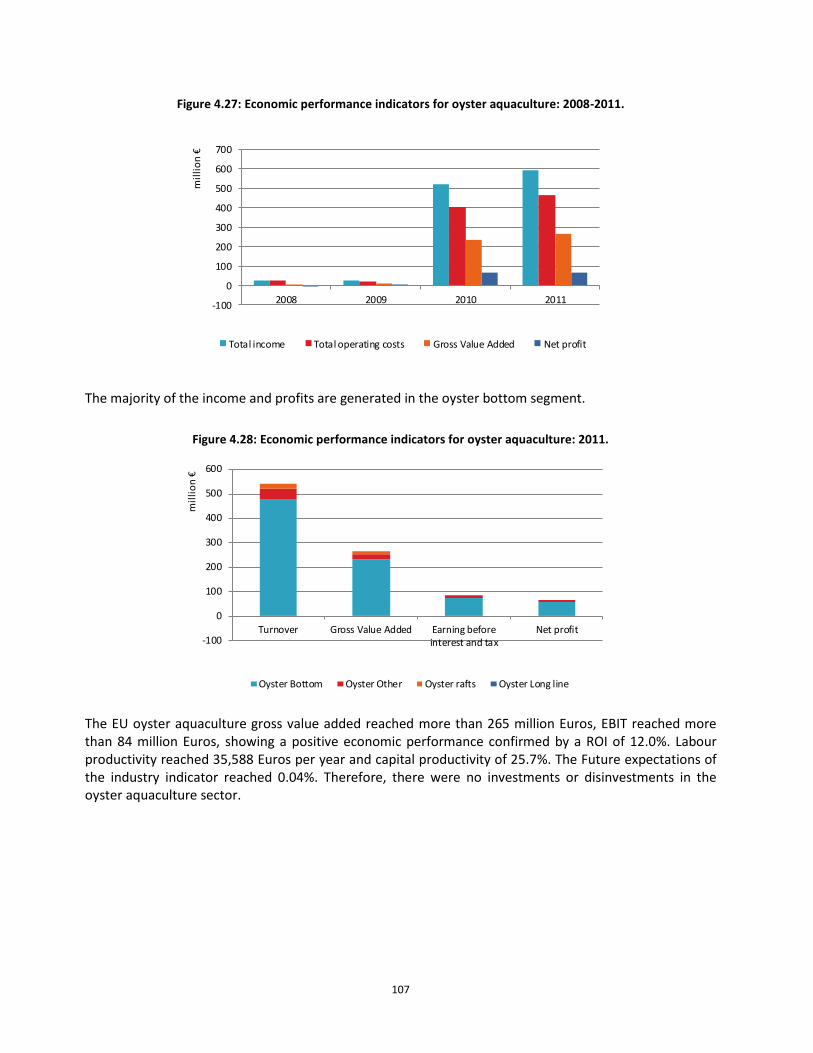
107
Figure 4.27: Economic performance indicators for oyster aquaculture: 2008-2011.
The majority of the income and profits are generated in the oyster bottom segment.
Figure 4.28: Economic performance indicators for oyster aquaculture: 2011.
The EU oyster aquaculture gross value added reached more than 265 million Euros, EBIT reached more than 84 million Euros, showing a positive economic performance confirmed by a ROI of 12.0%. Labour productivity reached 35,588 Euros per year and capital productivity of 25.7%. The Future expectations of the industry indicator reached 0.04%. Therefore, there were no investments or disinvestments in the oyster aquaculture sector.
-100
0
100
200
300
400
500
600
700
2008 2009 2010 2011
mil
lio
n €
Total income Total operating costs Gross Value Added Net profit
-100
0
100
200
300
400
500
600
Turnover Gross Value Added Earning beforeinterest and tax
Net profit
mil
lio
n €
Oyster Bottom Oyster Other Oyster rafts Oyster Long line
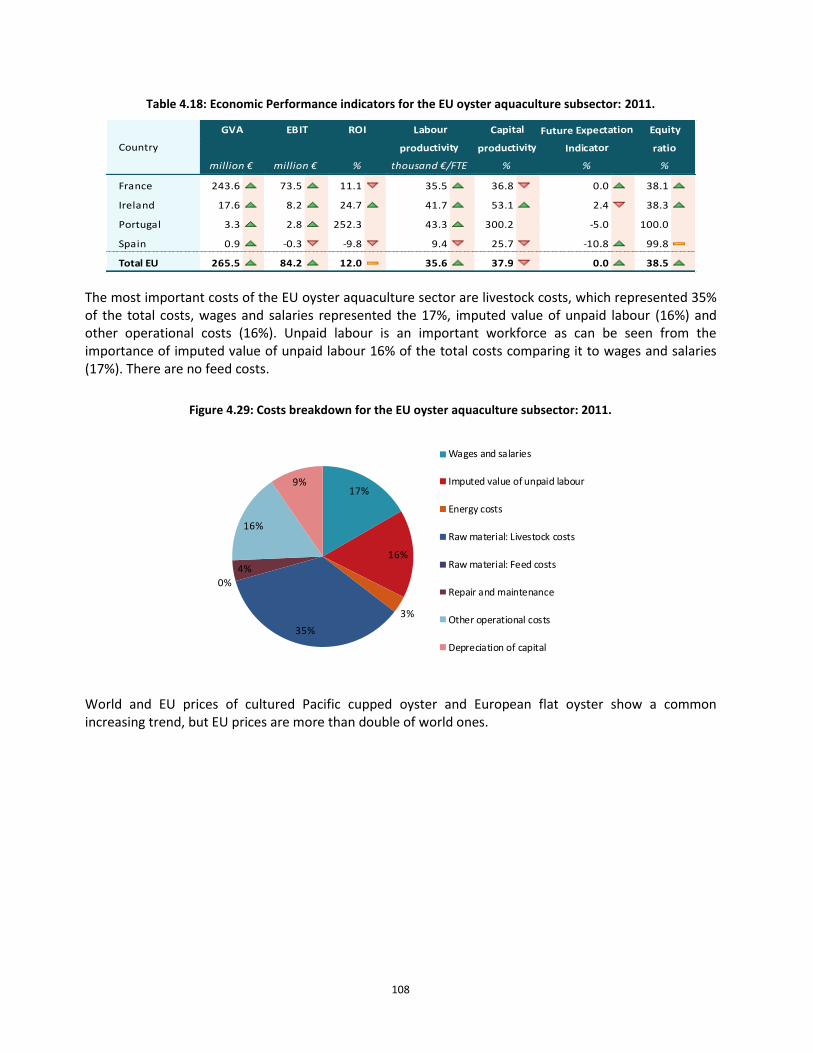
108
Table 4.18: Economic Performance indicators for the EU oyster aquaculture subsector: 2011.
EBIT
Country
GVA ROI Labour Capital Future Expectation Equity
Indicator ratioproductivity productivity
France 243.6 73.5 11.1 35.5 36.8 0.0 38.1
Ireland 17.6 8.2 24.7 41.7 53.1 2.4 38.3
Portugal 3.3 2.8 252.3 ## 43.3 300.2 ### -5.0 ### 100.0 ###
Spain 0.9 -0.3 -9.8 9.4 25.7 -10.8 99.8
Total EU 265.5 84.2 12.0 35.6 37.9 0.0 38.5
Country Indicator ratio
million € million € % thousand €/FTE % % %
productivity productivity
The most important costs of the EU oyster aquaculture sector are livestock costs, which represented 35% of the total costs, wages and salaries represented the 17%, imputed value of unpaid labour (16%) and other operational costs (16%). Unpaid labour is an important workforce as can be seen from the importance of imputed value of unpaid labour 16% of the total costs comparing it to wages and salaries (17%). There are no feed costs.
Figure 4.29: Costs breakdown for the EU oyster aquaculture subsector: 2011.
World and EU prices of cultured Pacific cupped oyster and European flat oyster show a common increasing trend, but EU prices are more than double of world ones.
17%
16%
3%
35%
0%
4%
16%
9%
Wages and salaries
Imputed value of unpaid labour
Energy costs
Raw material: Livestock costs
Raw material: Feed costs
Repair and maintenance
Other operational costs
Depreciation of capital
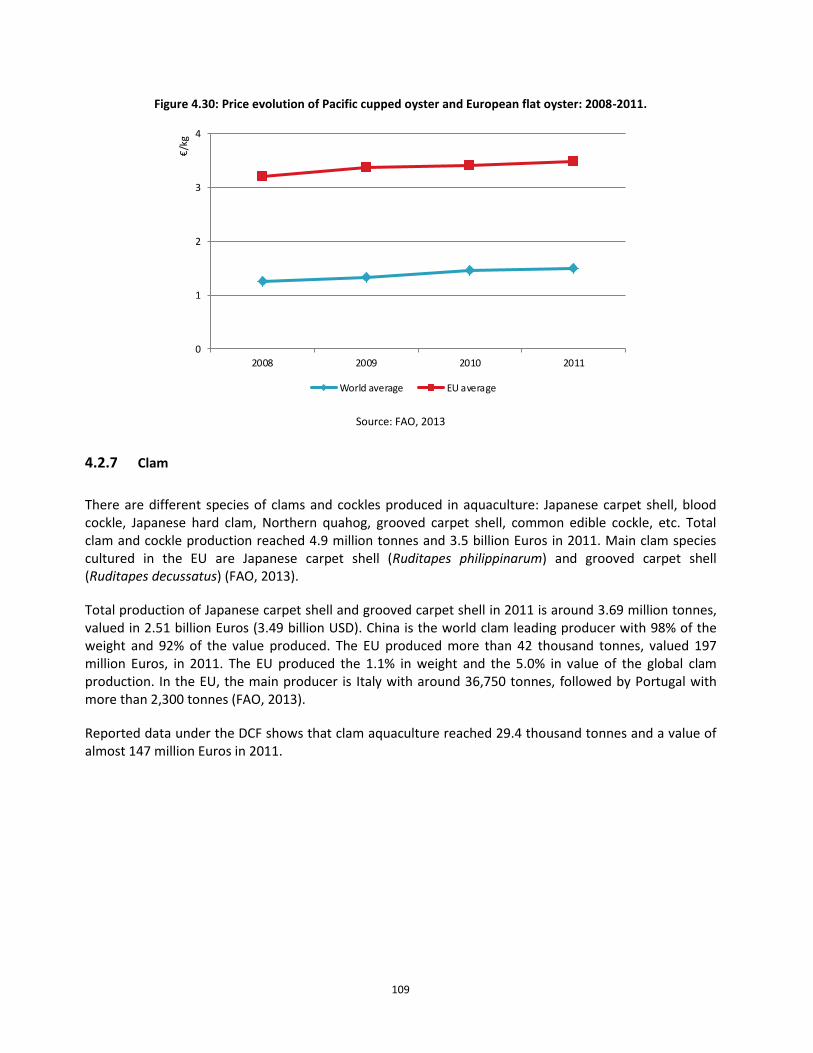
109
Figure 4.30: Price evolution of Pacific cupped oyster and European flat oyster: 2008-2011.
0
1
2
3
4
2008 2009 2010 2011
€/k
g
World average EU average
Source: FAO, 2013
4.2.7 Clam
There are different species of clams and cockles produced in aquaculture: Japanese carpet shell, blood cockle, Japanese hard clam, Northern quahog, grooved carpet shell, common edible cockle, etc. Total clam and cockle production reached 4.9 million tonnes and 3.5 billion Euros in 2011. Main clam species cultured in the EU are Japanese carpet shell (Ruditapes philippinarum) and grooved carpet shell (Ruditapes decussatus) (FAO, 2013).
Total production of Japanese carpet shell and grooved carpet shell in 2011 is around 3.69 million tonnes, valued in 2.51 billion Euros (3.49 billion USD). China is the world clam leading producer with 98% of the weight and 92% of the value produced. The EU produced more than 42 thousand tonnes, valued 197 million Euros, in 2011. The EU produced the 1.1% in weight and the 5.0% in value of the global clam production. In the EU, the main producer is Italy with around 36,750 tonnes, followed by Portugal with more than 2,300 tonnes (FAO, 2013).
Reported data under the DCF shows that clam aquaculture reached 29.4 thousand tonnes and a value of almost 147 million Euros in 2011.
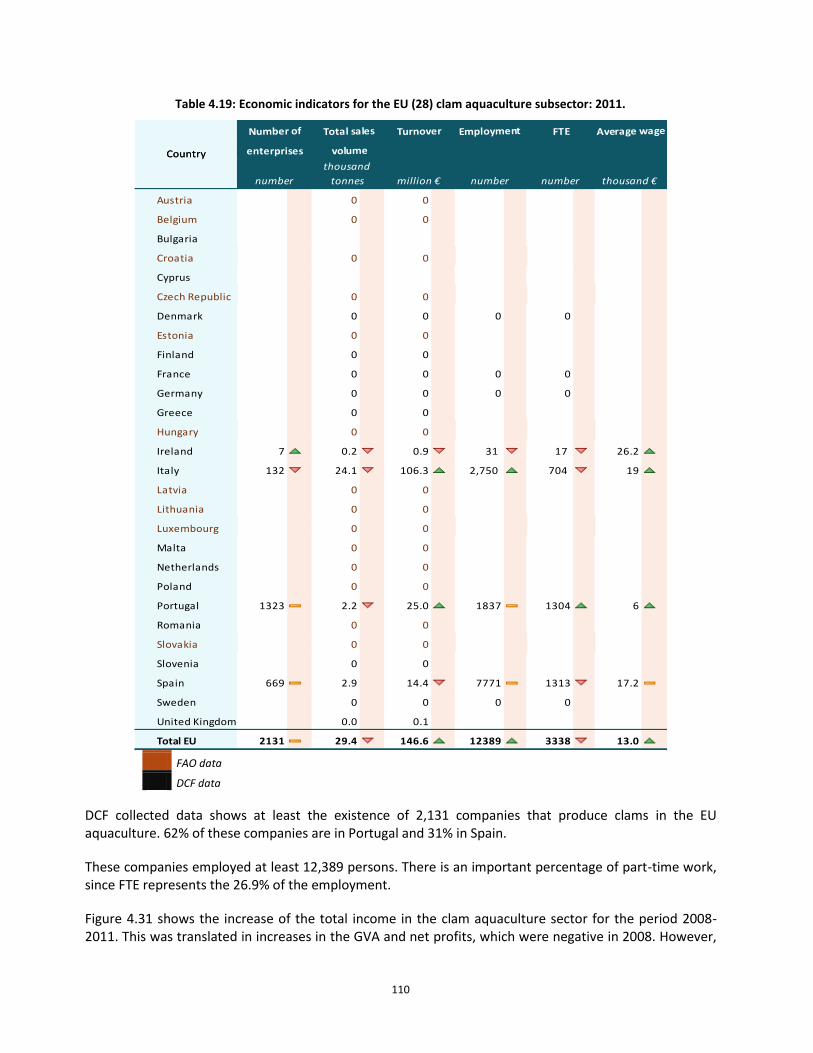
110
Table 4.19: Economic indicators for the EU (28) clam aquaculture subsector: 2011.
FTE Average wage
enterprises volume
Employment
Country
Number of Total sales Turnover
thousand €
enterprises volume
number
thousand
tonnes million € number number
Country
Austria 0 ### 0 ###
Belgium 0 ### 0 ###
Bulgaria ### ### ## ## ###
Croatia 0 ### 0 ###
Cyprus ### ### ### ## ## ###
Czech Republic 0 ### 0 ###
Denmark ### 0 ### 0 ### 0 ## 0 ## 0 ###
Estonia 0 ### 0 ###
Finland ### 0 ### 0 ### 0 ## 0 ## 0 ###
France ### 0 ### 0 ### 0 ## 0 ## 0 ###
Germany ### 0 ### 0 ### 0 ## 0 ## 0 ###
Greece ### 0 ### 0 ### 0 ## 0 ## 0 ###
Hungary 0 ### 0 ###
Ireland 7 0.2 0.9 31 17 26.2
Italy 132 24.1 106.3 2,750 704 19
Latvia 0 ### 0 ###
Lithuania 0 ### 0 ###
Luxembourg 0 ### 0 ###
Malta ### 0 ### 0 ### ## ## ###
Netherlands ### 0 ### 0 ### ## ## ###
Poland ### 0 ### 0 ### ## ## ###
Portugal 1323 2.2 25.0 1837 1304 6
Romania ### 0 ### 0 ###
Slovakia 0 ### 0 ###
Slovenia ### 0 ### 0 ### 0 ## 0 ## 0 ###
Spain 669 2.9 ### 14.4 7771 1313 17.2
Sweden ### 0 ### 0 ### 0 ## 0 ## ###
United Kingdom ### 0.0 ### 0.1 ### ## ##
Total EU 2131 29.4 146.6 12389 3338 13.0
thousand €number
thousand
tonnes million € number number
Country
FAO data
DCF data
DCF collected data shows at least the existence of 2,131 companies that produce clams in the EU aquaculture. 62% of these companies are in Portugal and 31% in Spain.
These companies employed at least 12,389 persons. There is an important percentage of part-time work, since FTE represents the 26.9% of the employment.
Figure 4.31 shows the increase of the total income in the clam aquaculture sector for the period 2008-2011. This was translated in increases in the GVA and net profits, which were negative in 2008. However,
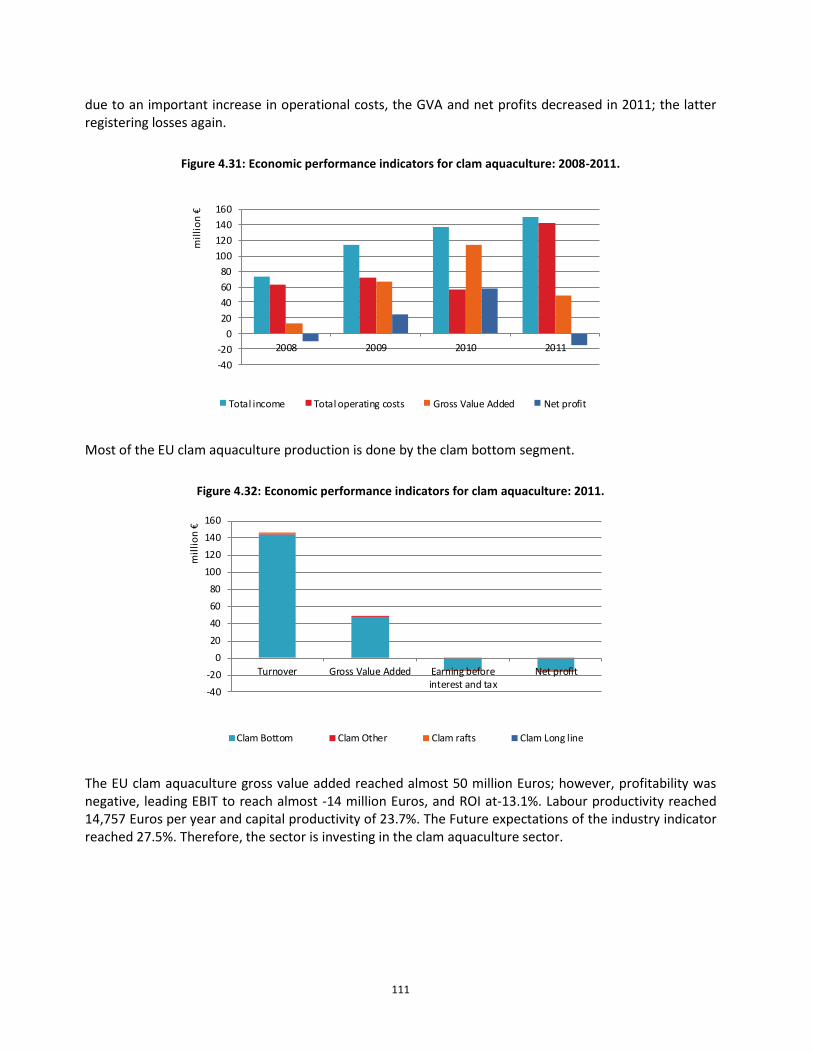
111
due to an important increase in operational costs, the GVA and net profits decreased in 2011; the latter registering losses again.
Figure 4.31: Economic performance indicators for clam aquaculture: 2008-2011.
Most of the EU clam aquaculture production is done by the clam bottom segment.
Figure 4.32: Economic performance indicators for clam aquaculture: 2011.
The EU clam aquaculture gross value added reached almost 50 million Euros; however, profitability was negative, leading EBIT to reach almost -14 million Euros, and ROI at-13.1%. Labour productivity reached 14,757 Euros per year and capital productivity of 23.7%. The Future expectations of the industry indicator reached 27.5%. Therefore, the sector is investing in the clam aquaculture sector.
-40
-20
0
20
40
60
80
100
120
140
160
2008 2009 2010 2011
mil
lio
n €
Total income Total operating costs Gross Value Added Net profit
-40
-20
0
20
40
60
80
100
120
140
160
Turnover Gross Value Added Earning beforeinterest and tax
Net profit
mil
lio
n €
Clam Bottom Clam Other Clam rafts Clam Long line
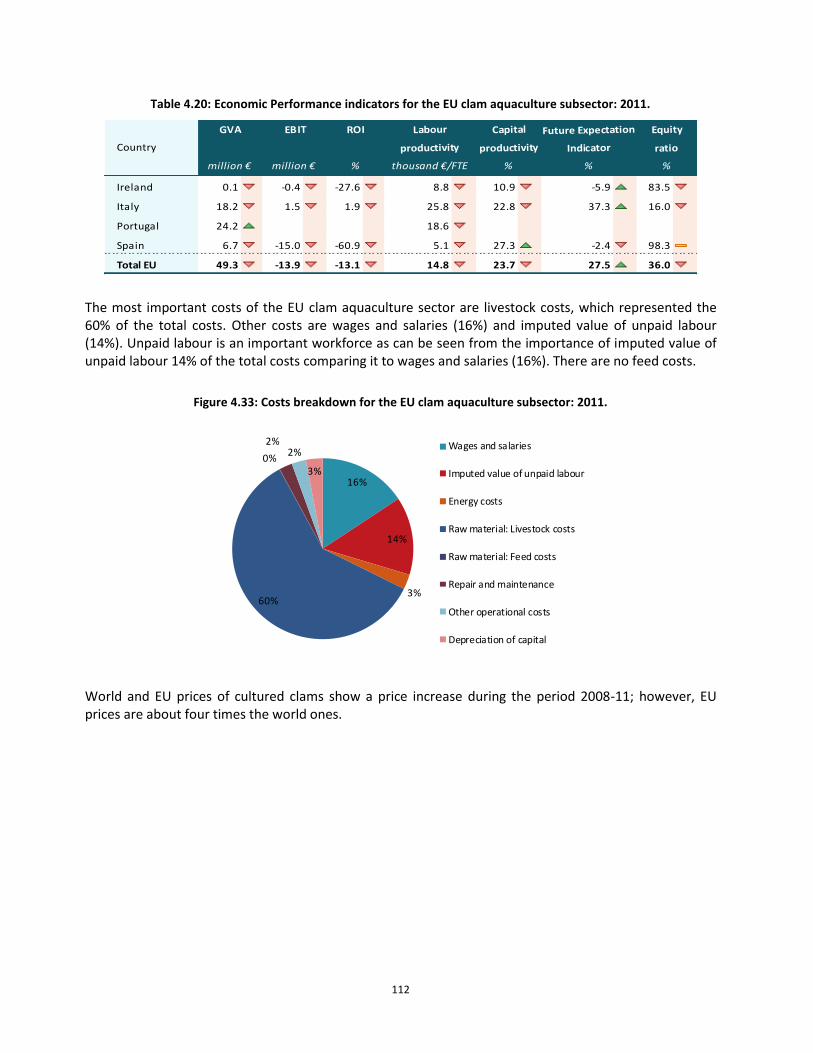
112
Table 4.20: Economic Performance indicators for the EU clam aquaculture subsector: 2011.
EBIT
Country
GVA ROI Labour Capital Future Expectation Equity
Indicator ratioproductivity productivity
Ireland 0.1 -0.4 -27.6 8.8 10.9 -5.9 83.5
Italy 18.2 1.5 1.9 25.8 22.8 37.3 16.0
Portugal 24.2 ### ## 18.6 ###### ### #DIV/0! ### ##### ###
Spain 6.7 -15.0 -60.9 5.1 27.3 -2.4 98.3
Total EU 49.3 -13.9 -13.1 14.8 23.7 27.5 36.0
Country Indicator ratio
million € million € % thousand €/FTE % % %
productivity productivity
The most important costs of the EU clam aquaculture sector are livestock costs, which represented the 60% of the total costs. Other costs are wages and salaries (16%) and imputed value of unpaid labour (14%). Unpaid labour is an important workforce as can be seen from the importance of imputed value of unpaid labour 14% of the total costs comparing it to wages and salaries (16%). There are no feed costs.
Figure 4.33: Costs breakdown for the EU clam aquaculture subsector: 2011.
World and EU prices of cultured clams show a price increase during the period 2008-11; however, EU prices are about four times the world ones.
16%
14%
3%60%
0%
2%2%
3%
Wages and salaries
Imputed value of unpaid labour
Energy costs
Raw material: Livestock costs
Raw material: Feed costs
Repair and maintenance
Other operational costs
Depreciation of capital
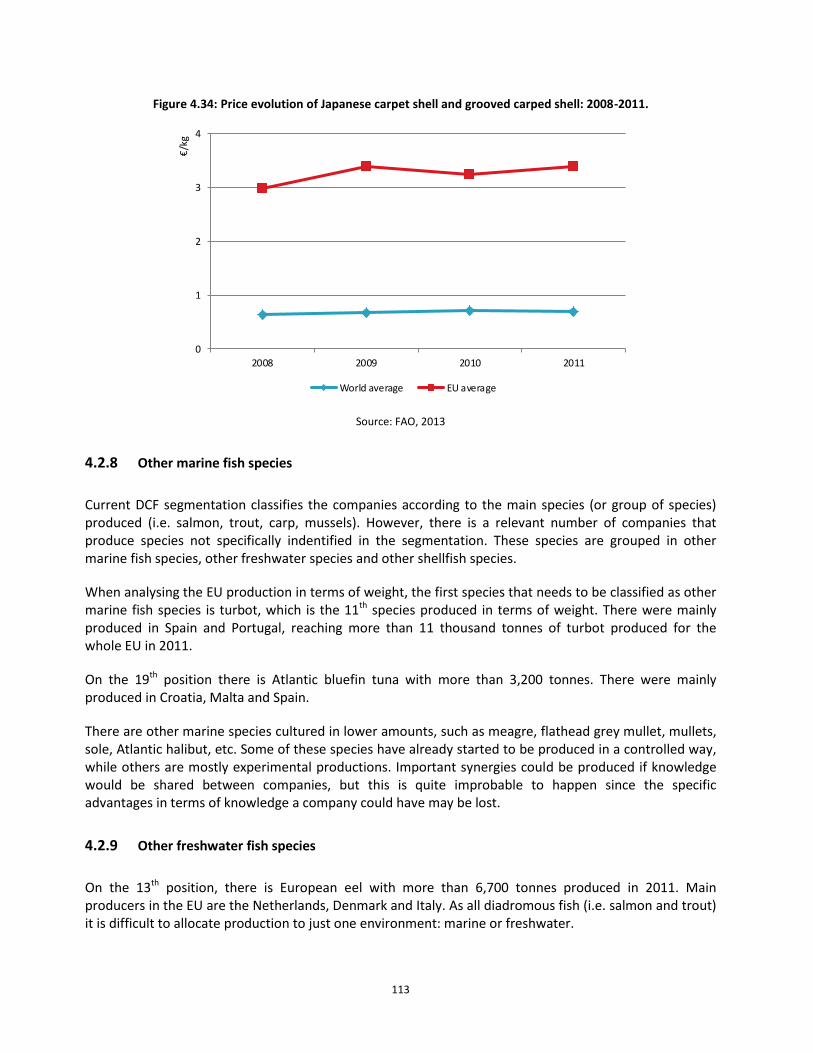
113
Figure 4.34: Price evolution of Japanese carpet shell and grooved carped shell: 2008-2011.
0
1
2
3
4
2008 2009 2010 2011
€/k
g
World average EU average
Source: FAO, 2013
4.2.8 Other marine fish species
Current DCF segmentation classifies the companies according to the main species (or group of species) produced (i.e. salmon, trout, carp, mussels). However, there is a relevant number of companies that produce species not specifically indentified in the segmentation. These species are grouped in other marine fish species, other freshwater species and other shellfish species.
When analysing the EU production in terms of weight, the first species that needs to be classified as other marine fish species is turbot, which is the 11th species produced in terms of weight. There were mainly produced in Spain and Portugal, reaching more than 11 thousand tonnes of turbot produced for the whole EU in 2011.
On the 19th position there is Atlantic bluefin tuna with more than 3,200 tonnes. There were mainly produced in Croatia, Malta and Spain.
There are other marine species cultured in lower amounts, such as meagre, flathead grey mullet, mullets, sole, Atlantic halibut, etc. Some of these species have already started to be produced in a controlled way, while others are mostly experimental productions. Important synergies could be produced if knowledge would be shared between companies, but this is quite improbable to happen since the specific advantages in terms of knowledge a company could have may be lost.
4.2.9 Other freshwater fish species
On the 13th position, there is European eel with more than 6,700 tonnes produced in 2011. Main producers in the EU are the Netherlands, Denmark and Italy. As all diadromous fish (i.e. salmon and trout) it is difficult to allocate production to just one environment: marine or freshwater.
114
On the 14th position, there is the North African catfish with more than 5,300 tonnes produced in 2011. Main producers in the EU are the Netherlands and Hungary.
On the 22nd position there are sturgeons with more than 2,250 tonnes. Main producers in the EU are Italy, France and Poland.
Other freshwater cultured species are chars, tench, goldfish, European whitefish, Northern pike, pike-perch, etc.
4.2.10 Other shellfish species
Under shellfish there are classified molluscs and crustaceans. The main shellfish species are mussels, oysters and clams. Minor productions of Kuruma and common prawns, palaemonid shrimps, great Atlantic scallops, tuberculate abalone, Indian white prawn, Danube crayfish, etc., also take place .
4.2.11 Other species
Even if this group of species is not currently reported under the DCF, it is important to provide some general overview for the sake of consistency when analysing the whole EU aquaculture. Moreover, when discussing the potential segmentation for the future DC-MAP, it is relevant to know the importance of each group of species.
Other species could be further disaggregated between aquatic plants, cephalopods and other aquatic animals. Nowadays, the EU only has minor production of some of the species in these groups.
For aquatic plants, FAO reported only significant production of seaweed in France and Spain for a total of more than 120 tonnes in 2011. There is potential for further development of algae farming. In fact, some initiatives have already been undertaken, as a seaweed production and processing company in Ireland:, expected to expand exponentially from 2013 on. However, one of the main uncertainties is whether demand can absorb relevant increases of algae production.
Only octopus in Spain were produced from the cephalopods group with almost 3 tonnes in 2011. Octopus prices are quite high, between 5 and 6 €/kg. Consequently, octopus production in aquaculture could be interesting; however, there are still some problems in the octopus production from a biological point of view.
For other aquatic animals, FAO only reported 1.5 tonnes of stony sea urchin in Ireland. Aquatic invertebrates and frogs were no longer produced in 2011. Indeed, there is no farming of amphibians for human food consumption (but they may be bred for pet and research trades).

115
5 NATIONAL CHAPTERS
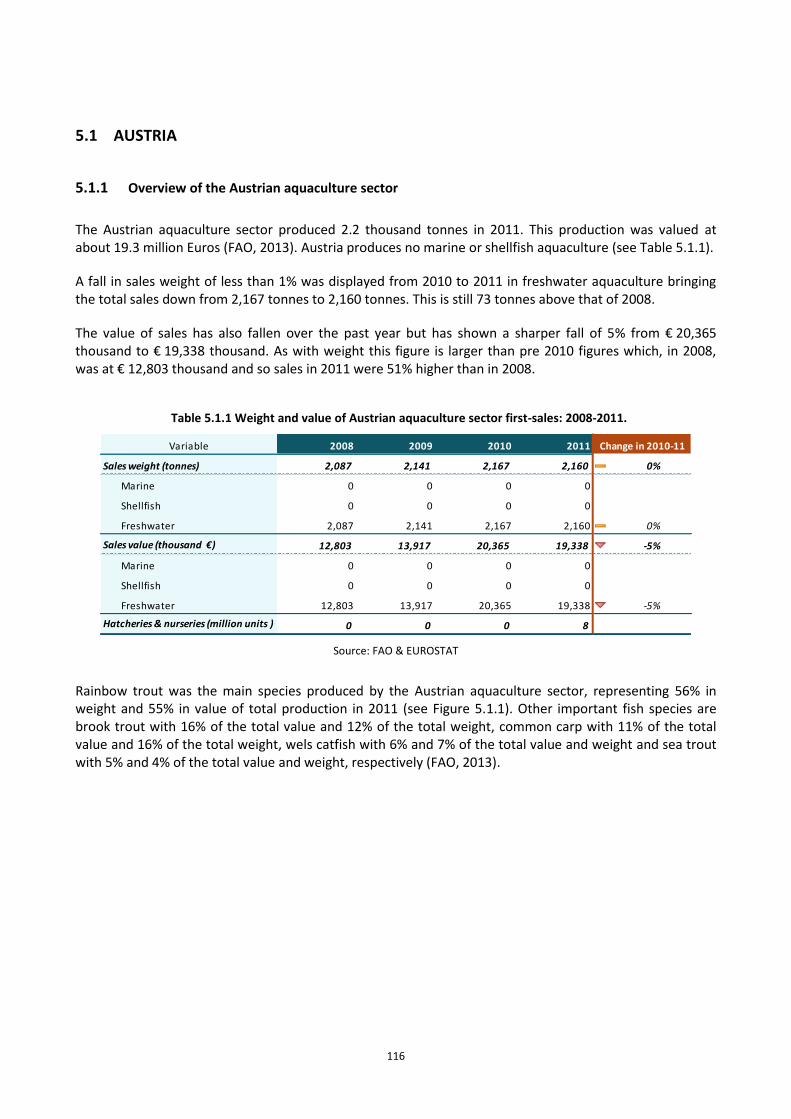
116
5.1 AUSTRIA
5.1.1 Overview of the Austrian aquaculture sector
The Austrian aquaculture sector produced 2.2 thousand tonnes in 2011. This production was valued at about 19.3 million Euros (FAO, 2013). Austria produces no marine or shellfish aquaculture (see Table 5.1.1).
A fall in sales weight of less than 1% was displayed from 2010 to 2011 in freshwater aquaculture bringing the total sales down from 2,167 tonnes to 2,160 tonnes. This is still 73 tonnes above that of 2008.
The value of sales has also fallen over the past year but has shown a sharper fall of 5% from € 20,365 thousand to € 19,338 thousand. As with weight this figure is larger than pre 2010 figures which, in 2008, was at € 12,803 thousand and so sales in 2011 were 51% higher than in 2008.
Table 5.1.1 Weight and value of Austrian aquaculture sector first-sales: 2008-2011.
Variable 2008 2009 2010 2011
Sales weight (tonnes) 2,087 2,141 2,167 2,160 0% ↔
Marine 0 0 0 0
Shellfish 0 0 0 0
Freshwater 2,087 2,141 2,167 2,160 0% ↔
Sales value (thousand €) 12,803 13,917 20,365 19,338 -5% ↘
Marine 0 0 0 0
Shellfish 0 0 0 0
Freshwater 12,803 13,917 20,365 19,338 -5% ↘
Hatcheries & nurseries (million units ) 0 0 0 8
Change in 2010-11
Source: FAO & EUROSTAT
Rainbow trout was the main species produced by the Austrian aquaculture sector, representing 56% in weight and 55% in value of total production in 2011 (see Figure 5.1.1). Other important fish species are brook trout with 16% of the total value and 12% of the total weight, common carp with 11% of the total value and 16% of the total weight, wels catfish with 6% and 7% of the total value and weight and sea trout with 5% and 4% of the total value and weight, respectively (FAO, 2013).
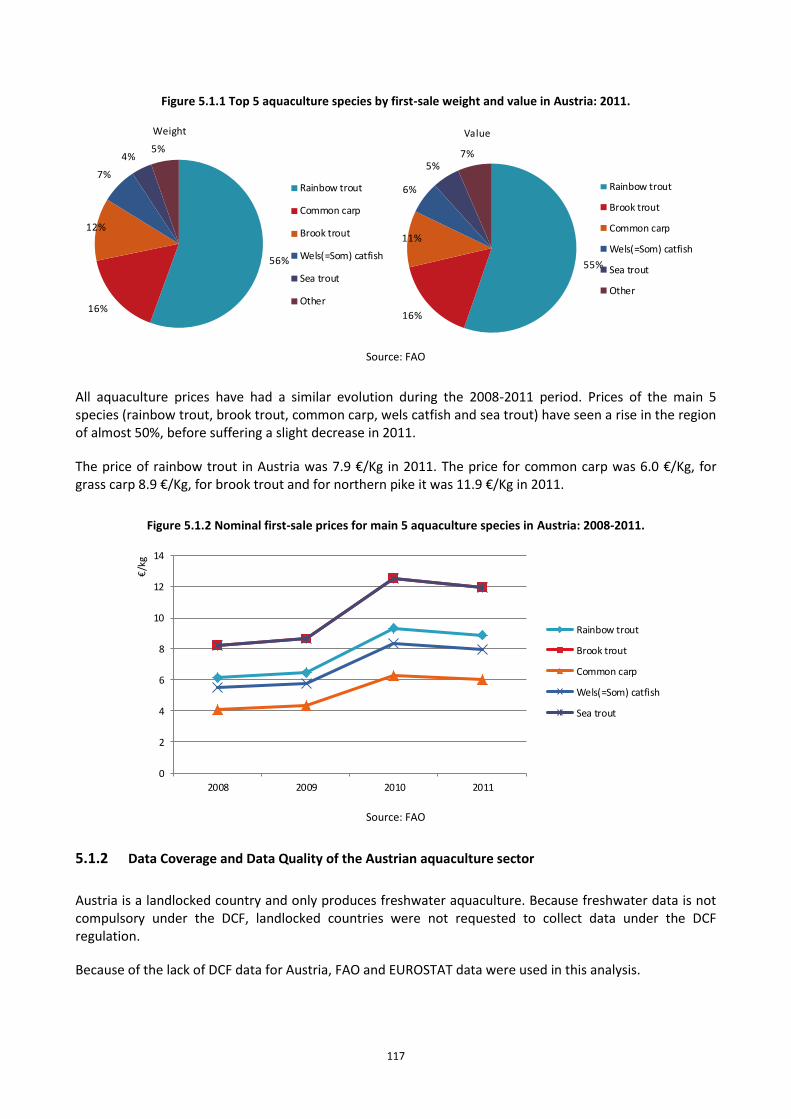
117
Figure 5.1.1 Top 5 aquaculture species by first-sale weight and value in Austria: 2011.
56%
16%
12%
7%
4%5%
Weight
Rainbow trout
Common carp
Brook trout
Wels(=Som) catfish
Sea trout
Other
55%
16%
11%
6%
5%7%
Value
Rainbow trout
Brook trout
Common carp
Wels(=Som) catfish
Sea trout
Other
Source: FAO
All aquaculture prices have had a similar evolution during the 2008-2011 period. Prices of the main 5 species (rainbow trout, brook trout, common carp, wels catfish and sea trout) have seen a rise in the region of almost 50%, before suffering a slight decrease in 2011.
The price of rainbow trout in Austria was 7.9 €/Kg in 2011. The price for common carp was 6.0 €/Kg, for grass carp 8.9 €/Kg, for brook trout and for northern pike it was 11.9 €/Kg in 2011.
Figure 5.1.2 Nominal first-sale prices for main 5 aquaculture species in Austria: 2008-2011.
0
2
4
6
8
10
12
14
2008 2009 2010 2011
€/k
g
Rainbow trout
Brook trout
Common carp
Wels(=Som) catfish
Sea trout
Source: FAO
5.1.2 Data Coverage and Data Quality of the Austrian aquaculture sector
Austria is a landlocked country and only produces freshwater aquaculture. Because freshwater data is not compulsory under the DCF, landlocked countries were not requested to collect data under the DCF regulation.
Because of the lack of DCF data for Austria, FAO and EUROSTAT data were used in this analysis.
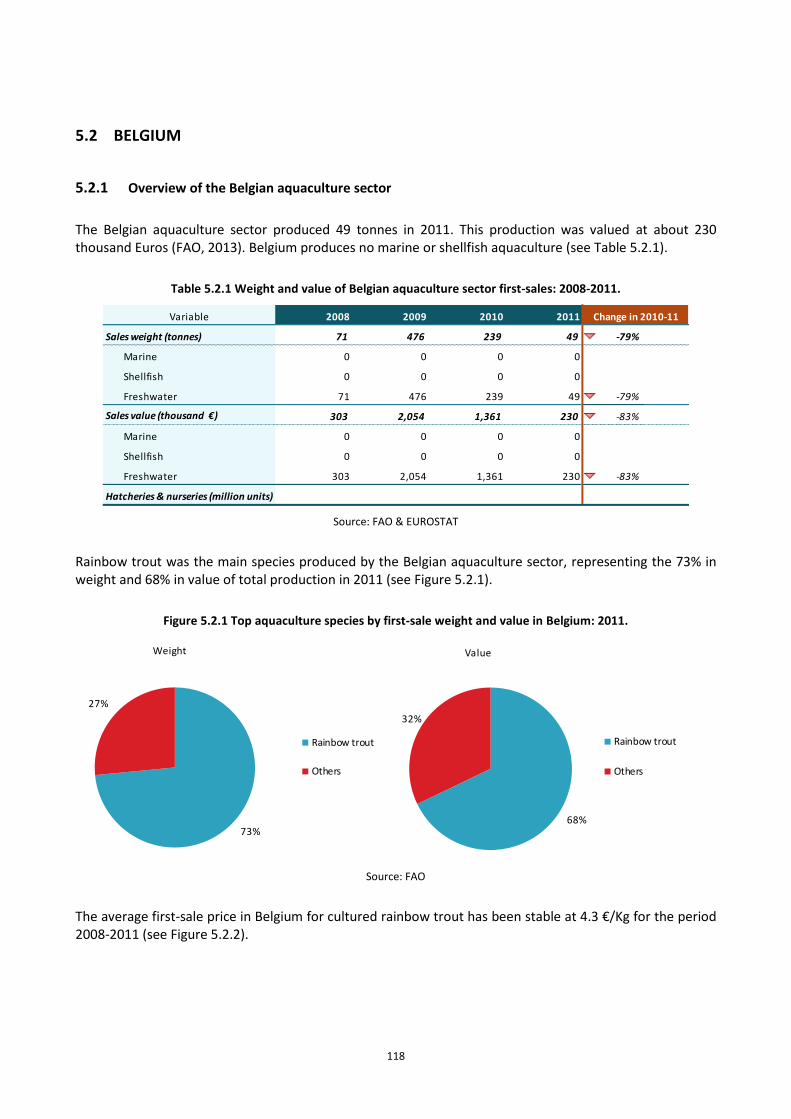
118
5.2 BELGIUM
5.2.1 Overview of the Belgian aquaculture sector
The Belgian aquaculture sector produced 49 tonnes in 2011. This production was valued at about 230 thousand Euros (FAO, 2013). Belgium produces no marine or shellfish aquaculture (see Table 5.2.1).
Table 5.2.1 Weight and value of Belgian aquaculture sector first-sales: 2008-2011.
Variable 2008 2009 2010 2011
Sales weight (tonnes) 71 476 239 49 -79% ↘
Marine 0 0 0 0
Shellfish 0 0 0 0
Freshwater 71 476 239 49 -79% ↘
Sales value (thousand €) 303 2,054 1,361 230 -83% ↘
Marine 0 0 0 0
Shellfish 0 0 0 0
Freshwater 303 2,054 1,361 230 -83% ↘
Hatcheries & nurseries (million units)
Change in 2010-11
Source: FAO & EUROSTAT
Rainbow trout was the main species produced by the Belgian aquaculture sector, representing the 73% in weight and 68% in value of total production in 2011 (see Figure 5.2.1).
Figure 5.2.1 Top aquaculture species by first-sale weight and value in Belgium: 2011.
73%
27%
Weight
Rainbow trout
Others
68%
32%
Value
Rainbow trout
Others
Source: FAO
The average first-sale price in Belgium for cultured rainbow trout has been stable at 4.3 €/Kg for the period 2008-2011 (see Figure 5.2.2).
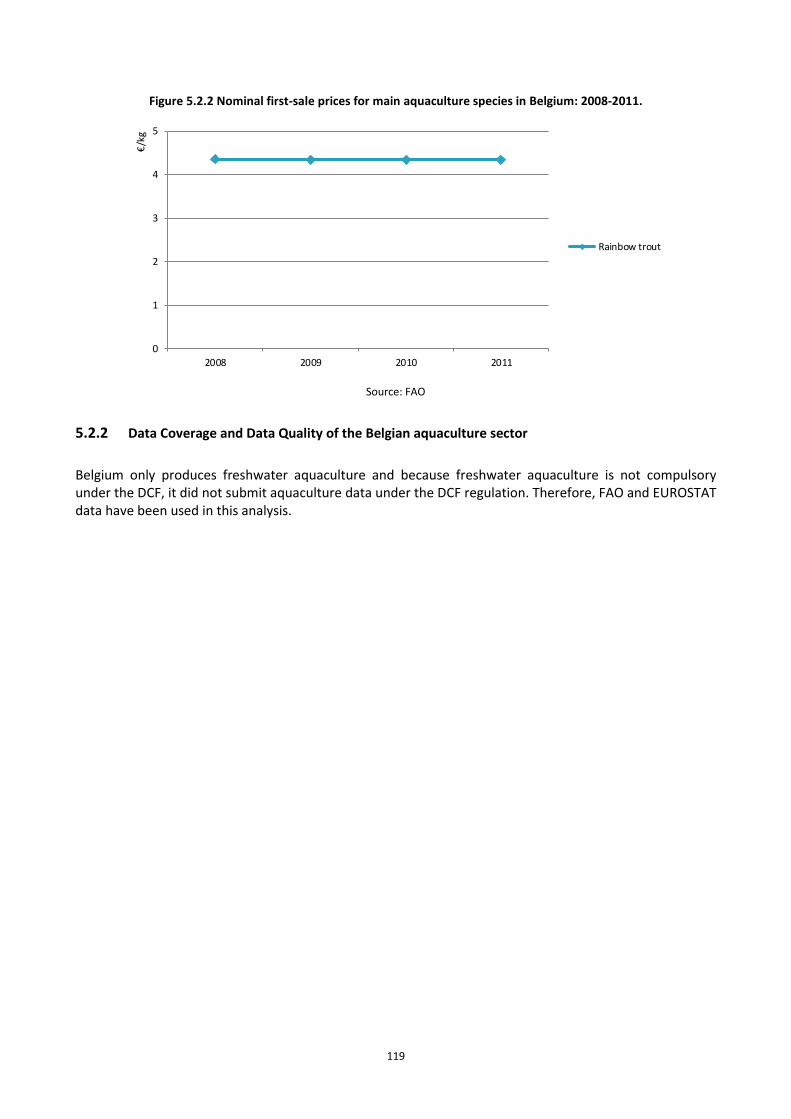
119
Figure 5.2.2 Nominal first-sale prices for main aquaculture species in Belgium: 2008-2011.
0
1
2
3
4
5
2008 2009 2010 2011
€/k
g
Rainbow trout
Source: FAO
5.2.2 Data Coverage and Data Quality of the Belgian aquaculture sector
Belgium only produces freshwater aquaculture and because freshwater aquaculture is not compulsory under the DCF, it did not submit aquaculture data under the DCF regulation. Therefore, FAO and EUROSTAT data have been used in this analysis.
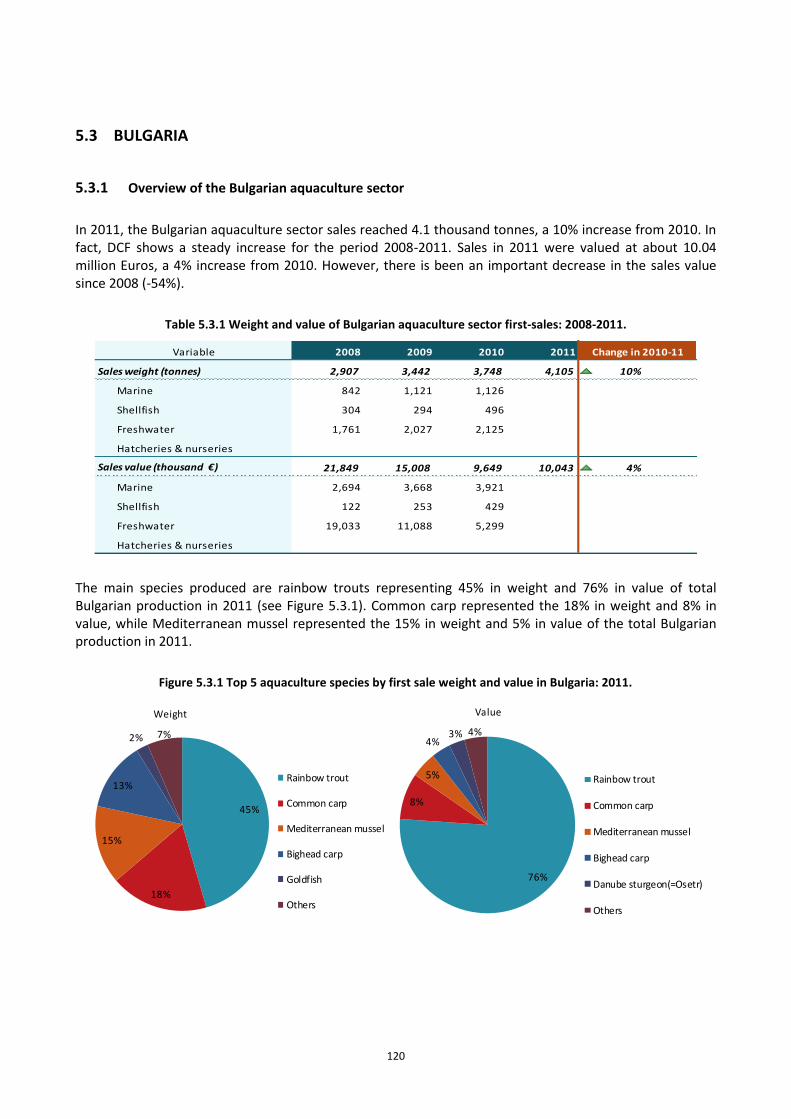
120
5.3 BULGARIA
5.3.1 Overview of the Bulgarian aquaculture sector
In 2011, the Bulgarian aquaculture sector sales reached 4.1 thousand tonnes, a 10% increase from 2010. In fact, DCF shows a steady increase for the period 2008-2011. Sales in 2011 were valued at about 10.04 million Euros, a 4% increase from 2010. However, there is been an important decrease in the sales value since 2008 (-54%).
Table 5.3.1 Weight and value of Bulgarian aquaculture sector first-sales: 2008-2011.
Variable 2008 2009 2010 2011
Sales weight (tonnes) 2,907 3,442 3,748 4,105 10%
Marine 842 1,121 1,126
Shellfish 304 294 496
Freshwater 1,761 2,027 2,125
Hatcheries & nurseries
Sales value (thousand €) 21,849 15,008 9,649 10,043 4% ↗
Marine 2,694 3,668 3,921
Shellfish 122 253 429
Freshwater 19,033 11,088 5,299
Hatcheries & nurseries
Change in 2010-11
The main species produced are rainbow trouts representing 45% in weight and 76% in value of total Bulgarian production in 2011 (see Figure 5.3.1). Common carp represented the 18% in weight and 8% in value, while Mediterranean mussel represented the 15% in weight and 5% in value of the total Bulgarian production in 2011.
Figure 5.3.1 Top 5 aquaculture species by first sale weight and value in Bulgaria: 2011.
45%
18%
15%
13%
2% 7%
Weight
Rainbow trout
Common carp
Mediterranean mussel
Bighead carp
Goldfish
Others
76%
8%
5%
4%3% 4%
Value
Rainbow trout
Common carp
Mediterranean mussel
Bighead carp
Danube sturgeon(=Osetr)
Others
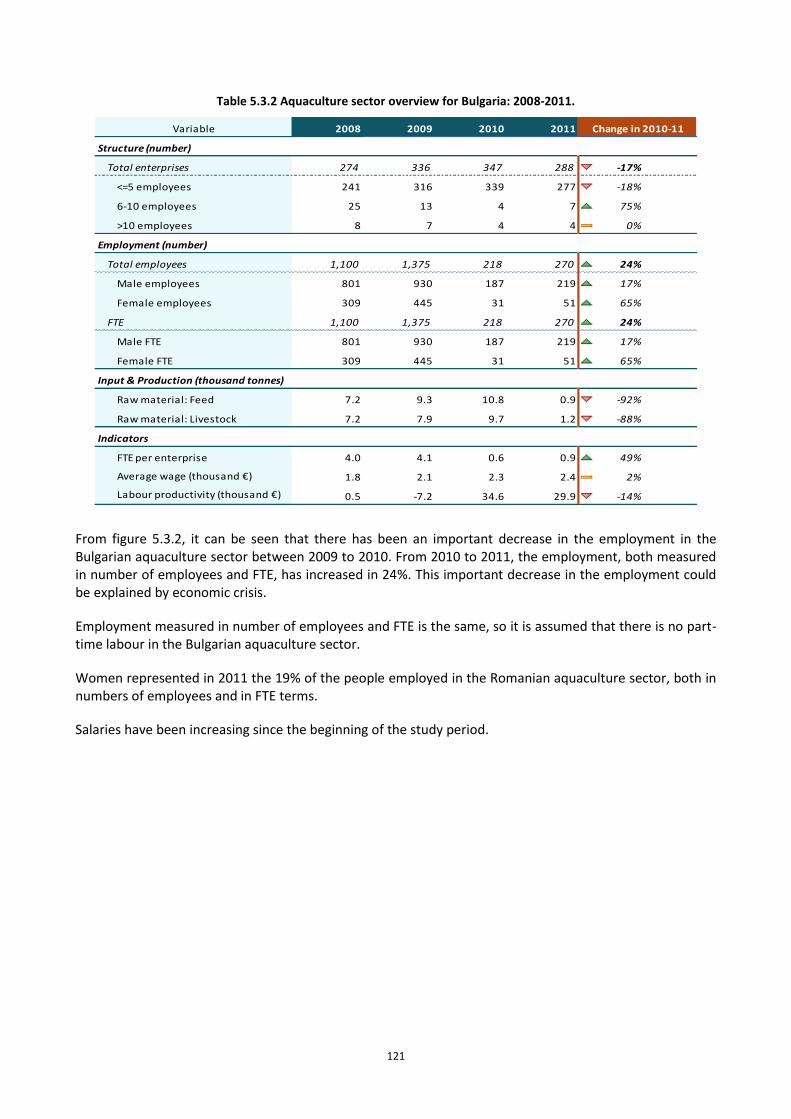
121
Table 5.3.2 Aquaculture sector overview for Bulgaria: 2008-2011.
Variable 2008 2009 2010 2011
Structure (number)
Total enterprises 274 336 347 288 -17% ↔
<=5 employees 241 316 339 277 -18% ↘
6-10 employees 25 13 4 7 75% ↗
>10 employees 8 7 4 4 0% ↔
Employment (number)
Total employees 1,100 1,375 218 270 24% ↗
Male employees 801 930 187 219 17% ↗
Female employees 309 445 31 51 65% ↗
FTE 1,100 1,375 218 270 24% ↗
Male FTE 801 930 187 219 17% ↗
Female FTE 309 445 31 51 65% ↗
Input & Production (thousand tonnes)
Raw material: Feed 7.2 9.3 10.8 0.9 -92% ↘
Raw material: Livestock 7.2 7.9 9.7 1.2 -88%
Indicators
FTE per enterprise 4.0 4.1 0.6 0.9 49% ↗
Average wage (thousand €) 1.8 2.1 2.3 2.4 2% ↗
Labour productivity (thousand €) 0.5 -7.2 34.6 29.9 -14% ↘
Change in 2010-11
From figure 5.3.2, it can be seen that there has been an important decrease in the employment in the Bulgarian aquaculture sector between 2009 to 2010. From 2010 to 2011, the employment, both measured in number of employees and FTE, has increased in 24%. This important decrease in the employment could be explained by economic crisis.
Employment measured in number of employees and FTE is the same, so it is assumed that there is no part-time labour in the Bulgarian aquaculture sector.
Women represented in 2011 the 19% of the people employed in the Romanian aquaculture sector, both in numbers of employees and in FTE terms.
Salaries have been increasing since the beginning of the study period.
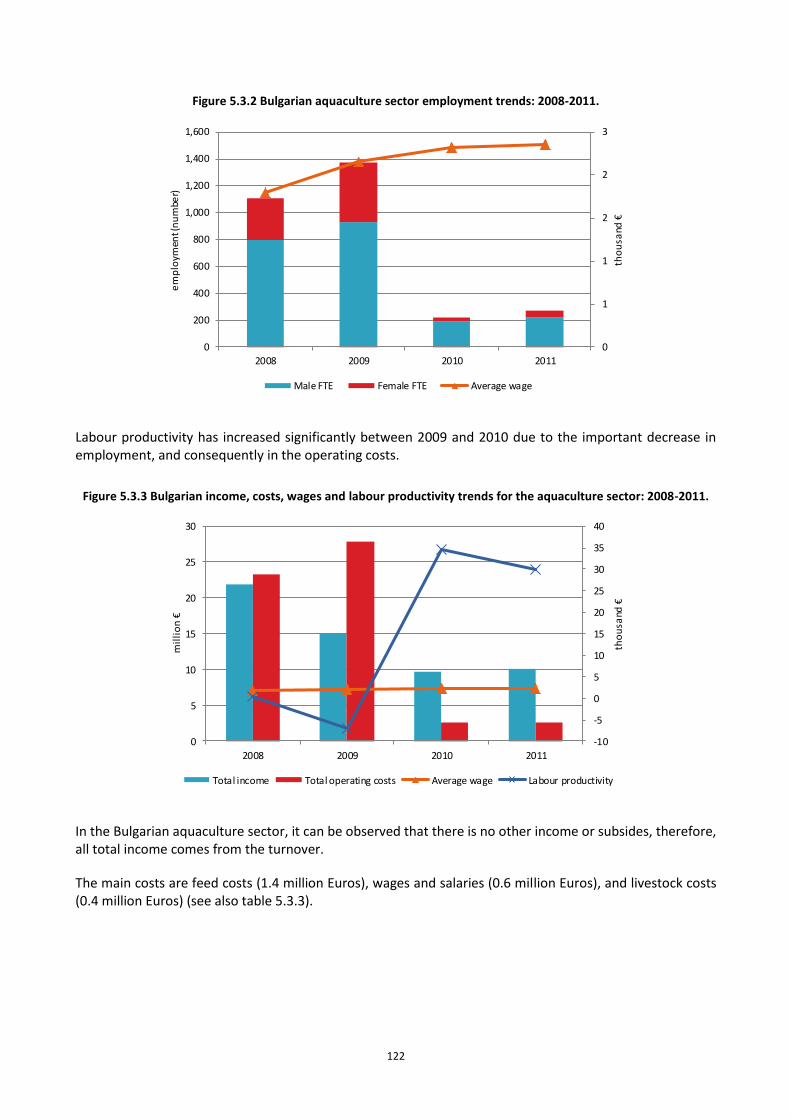
122
Figure 5.3.2 Bulgarian aquaculture sector employment trends: 2008-2011.
0
1
1
2
2
3
0
200
400
600
800
1,000
1,200
1,400
1,600
2008 2009 2010 2011
tho
usa
nd €
em
plo
ymen
t (n
um
ber)
Male FTE Female FTE Average wage
Labour productivity has increased significantly between 2009 and 2010 due to the important decrease in employment, and consequently in the operating costs.
Figure 5.3.3 Bulgarian income, costs, wages and labour productivity trends for the aquaculture sector: 2008-2011.
-10
-5
0
5
10
15
20
25
30
35
40
0
5
10
15
20
25
30
2008 2009 2010 2011
tho
usa
nd €
mil
lio
n €
Total income Total operating costs Average wage Labour productivity
In the Bulgarian aquaculture sector, it can be observed that there is no other income or subsides, therefore, all total income comes from the turnover.
The main costs are feed costs (1.4 million Euros), wages and salaries (0.6 million Euros), and livestock costs (0.4 million Euros) (see also table 5.3.3).
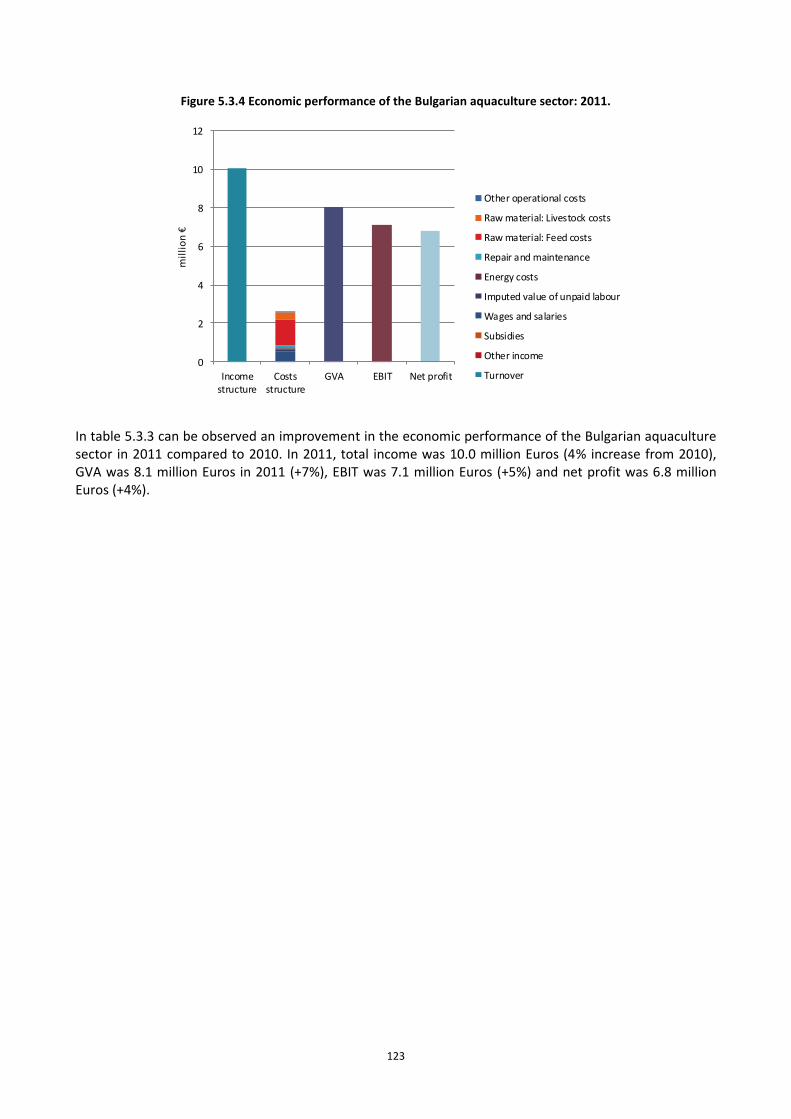
123
Figure 5.3.4 Economic performance of the Bulgarian aquaculture sector: 2011.
0
2
4
6
8
10
12
Incomestructure
Costsstructure
GVA EBIT Net profit
mil
lio
n €
Other operational costs
Raw material: Livestock costs
Raw material: Feed costs
Repair and maintenance
Energy costs
Imputed value of unpaid labour
Wages and salaries
Subsidies
Other income
Turnover
In table 5.3.3 can be observed an improvement in the economic performance of the Bulgarian aquaculture sector in 2011 compared to 2010. In 2011, total income was 10.0 million Euros (4% increase from 2010), GVA was 8.1 million Euros in 2011 (+7%), EBIT was 7.1 million Euros (+5%) and net profit was 6.8 million Euros (+4%).

124
Table 5.3.3 Economic performance for the Bulgarian aquaculture sector: 2008-2011.
Income (million €)
Turnover 21.8 100% 15.0 100% 9.6 100% 10.0 100% 4%
Other income 0.0 0% 0.0 0% 0.0 0% 0.0 0% 0%
Subsidies 0.0 0% 0.0 0% 0.0 0% 0.0 0% 0%
Total income 21.8 100% 15.0 100% 9.6 100% 10.0 100% 4%
Expenditure (million €)
Wages and salaries 1.8 8% 2.5 16% 0.4 4% 0.6 6% 35%
Imputed value of unpaid labour 0.1 1% 0.5 3% 0.1 1% 0.1 1% -18%
Energy costs 0.4 2% 0.4 3% 0.1 1% 0.1 1% -16%
Repair and maintenance 0.4 2% 0.4 3% 0.2 2% 0.1 1% -8%
Raw material: Feed costs 3.0 14% 3.5 23% 1.5 16% 1.4 13% -10%
Raw material: Livestock costs 16.5 76% 19.5 130% 0.3 3% 0.4 4% 26%
Other operational costs 1.0 5% 1.0 7% 0.1 1% 0.0 0% -40%
Total operating costs 23.2 106% 27.8 186% 2.6 27% 2.6 26% 0%
Capital Costs (million €)
Depreciation of capital 0.6 3% 0.7 5% 0.3 3% 0.3 3% 10%
Financial costs, net 1.6 7% 1.5 10% 0.2 2% 0.3 3% 48%
Extraordinary costs, net 0.2 1% 0.2 1% 0.0 0% 0.0 0% 44%
Capital Value (million €)
Total value of assets 38.2 175% 26.0 173% 6.6 69% 6.5 64% -3%
Net Investments 5.3 24% 1.5 10% 0.8 8% 1.2 12% 54%
Debt 28.2 129% 35.9 239% 2.0 21% 2.7 27% 34%
Performance Indicators(million €)
Gross Value Added 0.6 3% -9.9 66% 7.5 78% 8.1 80% 7%
Operating cash flow -1.4 6% -12.8 86% 7.0 73% 7.4 74% 6%
Earning before interest and tax -2.0 9% -13.5 90% 6.8 70% 7.1 71% 5%
Net profit -3.6 17% -15.1 100% 6.6 68% 6.8 68% 4%
Capital productivity (%) 1.5 -38.1 113.9 125.0 10%
Return on Investment (%) -5.3 -52.2 102.2 110.6 8%
Equity ratio (%) 26.4 -38.4 69.9 58.6 -16%
Future Expectation Indicator (%) 12.3 3.2 7.8 14.2 82%
% o
f to
tal
inco
me
2010
2011
Chan
ge in
2010
-11
% o
f to
tal
inco
meVariable
% o
f to
tal
inco
me
2008
2009
% o
f to
tal
inco
me
The average first-sale price for rainbow trout in Bulgaria was 4.1 €/Kg in 2011 (see Figure 5.3.5). Only Danube sturgeon prices were higher (5.7 €/Kg) and had a similar increasing trend. Other prices were lower and had a decreasing or at least a more stable trend; common carp average price in 2011 was 1.1 €/Kg, for Mediterranean mussel was 0.8 €/Kg and for bighead carp was 0.7 €/Kg.
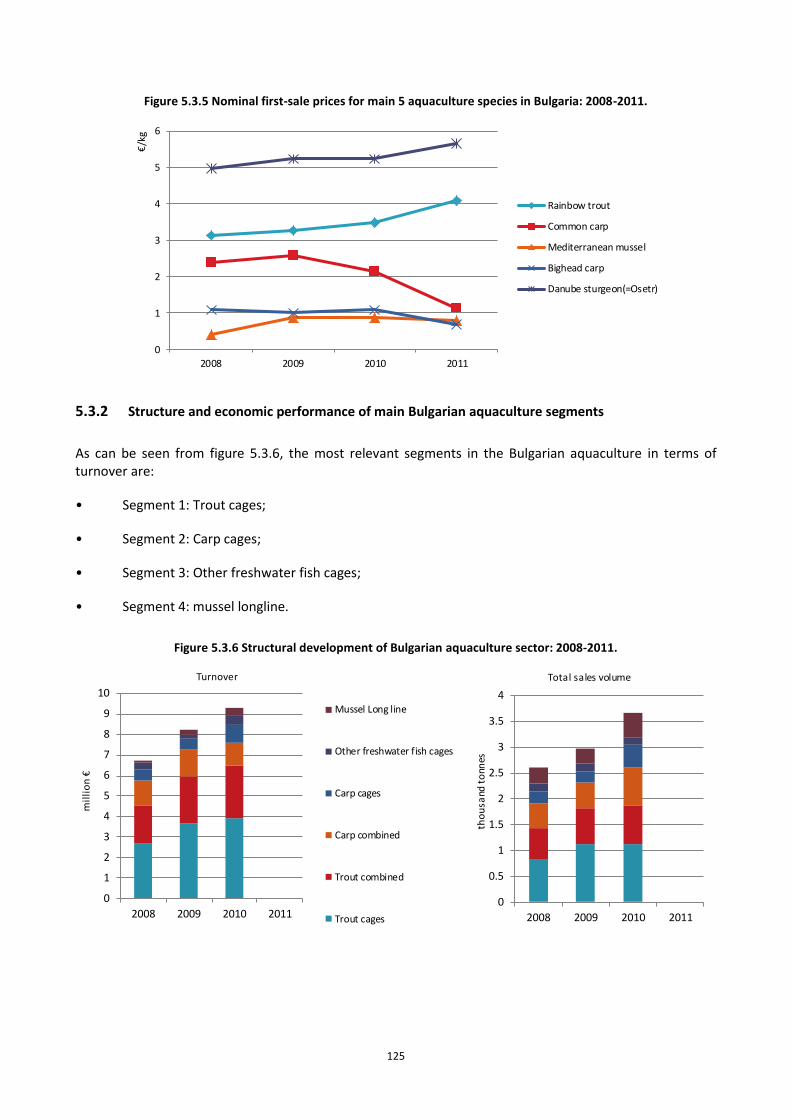
125
Figure 5.3.5 Nominal first-sale prices for main 5 aquaculture species in Bulgaria: 2008-2011.
0
1
2
3
4
5
6
2008 2009 2010 2011
€/k
g
Rainbow trout
Common carp
Mediterranean mussel
Bighead carp
Danube sturgeon(=Osetr)
5.3.2 Structure and economic performance of main Bulgarian aquaculture segments
As can be seen from figure 5.3.6, the most relevant segments in the Bulgarian aquaculture in terms of turnover are:
• Segment 1: Trout cages;
• Segment 2: Carp cages;
• Segment 3: Other freshwater fish cages;
• Segment 4: mussel longline.
Figure 5.3.6 Structural development of Bulgarian aquaculture sector: 2008-2011.
0
1
2
3
4
5
6
7
8
9
10
2008 2009 2010 2011
mil
lio
n €
Turnover
Mussel Long line
Other freshwater fish cages
Carp cages
Carp combined
Trout combined
Trout cages
0
0.5
1
1.5
2
2.5
3
3.5
4
2008 2009 2010 2011
tho
usa
nd t
onn
es
Total sales volume
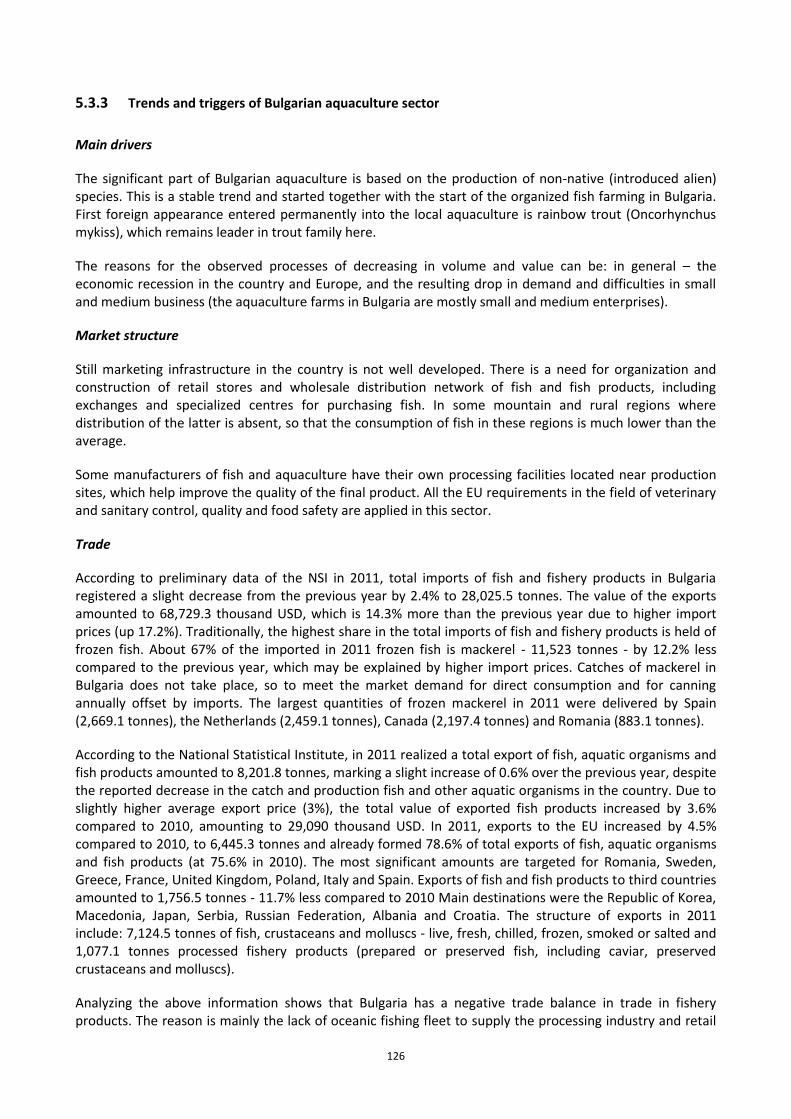
126
5.3.3 Trends and triggers of Bulgarian aquaculture sector
Main drivers
The significant part of Bulgarian aquaculture is based on the production of non-native (introduced alien) species. This is a stable trend and started together with the start of the organized fish farming in Bulgaria. First foreign appearance entered permanently into the local aquaculture is rainbow trout (Oncorhynchus mykiss), which remains leader in trout family here.
The reasons for the observed processes of decreasing in volume and value can be: in general – the economic recession in the country and Europe, and the resulting drop in demand and difficulties in small and medium business (the aquaculture farms in Bulgaria are mostly small and medium enterprises).
Market structure
Still marketing infrastructure in the country is not well developed. There is a need for organization and construction of retail stores and wholesale distribution network of fish and fish products, including exchanges and specialized centres for purchasing fish. In some mountain and rural regions where distribution of the latter is absent, so that the consumption of fish in these regions is much lower than the average.
Some manufacturers of fish and aquaculture have their own processing facilities located near production sites, which help improve the quality of the final product. All the EU requirements in the field of veterinary and sanitary control, quality and food safety are applied in this sector.
Trade
According to preliminary data of the NSI in 2011, total imports of fish and fishery products in Bulgaria registered a slight decrease from the previous year by 2.4% to 28,025.5 tonnes. The value of the exports amounted to 68,729.3 thousand USD, which is 14.3% more than the previous year due to higher import prices (up 17.2%). Traditionally, the highest share in the total imports of fish and fishery products is held of frozen fish. About 67% of the imported in 2011 frozen fish is mackerel - 11,523 tonnes - by 12.2% less compared to the previous year, which may be explained by higher import prices. Catches of mackerel in Bulgaria does not take place, so to meet the market demand for direct consumption and for canning annually offset by imports. The largest quantities of frozen mackerel in 2011 were delivered by Spain (2,669.1 tonnes), the Netherlands (2,459.1 tonnes), Canada (2,197.4 tonnes) and Romania (883.1 tonnes).
According to the National Statistical Institute, in 2011 realized a total export of fish, aquatic organisms and fish products amounted to 8,201.8 tonnes, marking a slight increase of 0.6% over the previous year, despite the reported decrease in the catch and production fish and other aquatic organisms in the country. Due to slightly higher average export price (3%), the total value of exported fish products increased by 3.6% compared to 2010, amounting to 29,090 thousand USD. In 2011, exports to the EU increased by 4.5% compared to 2010, to 6,445.3 tonnes and already formed 78.6% of total exports of fish, aquatic organisms and fish products (at 75.6% in 2010). The most significant amounts are targeted for Romania, Sweden, Greece, France, United Kingdom, Poland, Italy and Spain. Exports of fish and fish products to third countries amounted to 1,756.5 tonnes - 11.7% less compared to 2010 Main destinations were the Republic of Korea, Macedonia, Japan, Serbia, Russian Federation, Albania and Croatia. The structure of exports in 2011 include: 7,124.5 tonnes of fish, crustaceans and molluscs - live, fresh, chilled, frozen, smoked or salted and 1,077.1 tonnes processed fishery products (prepared or preserved fish, including caviar, preserved crustaceans and molluscs).
Analyzing the above information shows that Bulgaria has a negative trade balance in trade in fishery products. The reason is mainly the lack of oceanic fishing fleet to supply the processing industry and retail
127
network primarily in frozen filleted pelagic species (mainly mackerel) as well as lack of cultivating of saltwater fish (fresh sea bass and sea bream) in the Black Sea.
Gross value added of the aquaculture sector in 2012 in BGN is about 5 million BGN, according to the National Program for the collection, management and use of data in the fisheries sector. Number of employees (equivalent full-time) in the sector is 469 people, and the gross value of the employee is 10,594 BGN.
Applied economic analysis
In recent years, 17 million BGN from the Operational Programme for the Development of the "Fisheries" of the Republic of Bulgaria, funded by the European Fisheries Fund, were invested in the EU's promotion of aquaculture production and expect results to be more visible in next programming period. The new types Bulgarian aquaculture produced currently as barramundi, African catfish, remain unknown to the local market.
Outlook and future projects
The Strategic approach to national targets of the Member States is reflected in the preparation of strategic documents from the relevant institutions, responsible for the implementation of sector policies in the country.
The main objectives for the development of Bulgaria are set out in the draft partnership agreement in the Republic of Bulgaria and the EU for the period 2014-2020.
Data Coverage and Data Quality of Bulgarian aquaculture sector
The main reason for the discrepancy between the data on DCF program, FAO and Eurostat is that the data of DCF program is reported as information only for indicators of those farmers, who submitted statistical questionnaires. Achieved sample rate for economic data for 2011 was 29%, in 2010 was 70%, in 2009 was 41% and in 2008 was 50%. Not carried out an approximation of the performance of those who have not filled in statistical form. Achieved sample rate for volume and value of fish species is 100%.
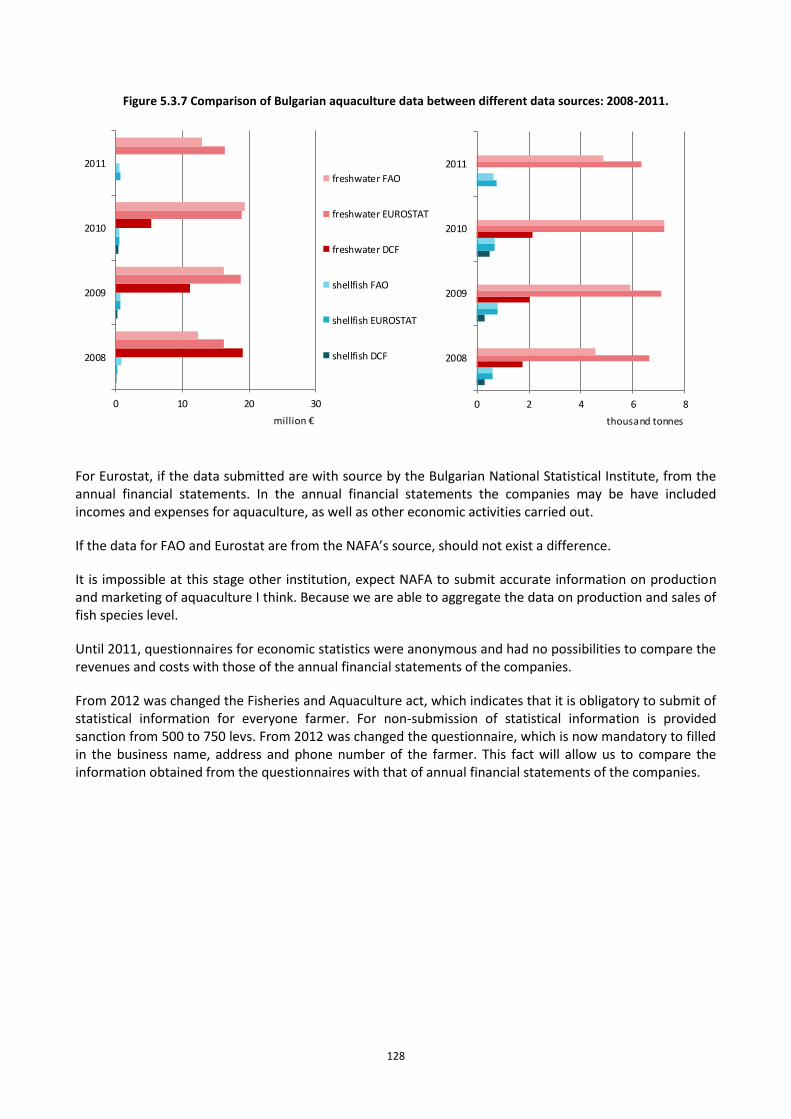
128
Figure 5.3.7 Comparison of Bulgarian aquaculture data between different data sources: 2008-2011.
0 10 20 30
2008
2009
2010
2011
million €
freshwater FAO
freshwater EUROSTAT
freshwater DCF
shellfish FAO
shellfish EUROSTAT
shellfish DCF
0 2 4 6 8
2008
2009
2010
2011
thousand tonnes
For Eurostat, if the data submitted are with source by the Bulgarian National Statistical Institute, from the annual financial statements. In the annual financial statements the companies may be have included incomes and expenses for aquaculture, as well as other economic activities carried out.
If the data for FAO and Eurostat are from the NAFA’s source, should not exist a difference.
It is impossible at this stage other institution, expect NAFA to submit accurate information on production and marketing of aquaculture I think. Because we are able to aggregate the data on production and sales of fish species level.
Until 2011, questionnaires for economic statistics were anonymous and had no possibilities to compare the revenues and costs with those of the annual financial statements of the companies.
From 2012 was changed the Fisheries and Aquaculture act, which indicates that it is obligatory to submit of statistical information for everyone farmer. For non-submission of statistical information is provided sanction from 500 to 750 levs. From 2012 was changed the questionnaire, which is now mandatory to filled in the business name, address and phone number of the farmer. This fact will allow us to compare the information obtained from the questionnaires with that of annual financial statements of the companies.
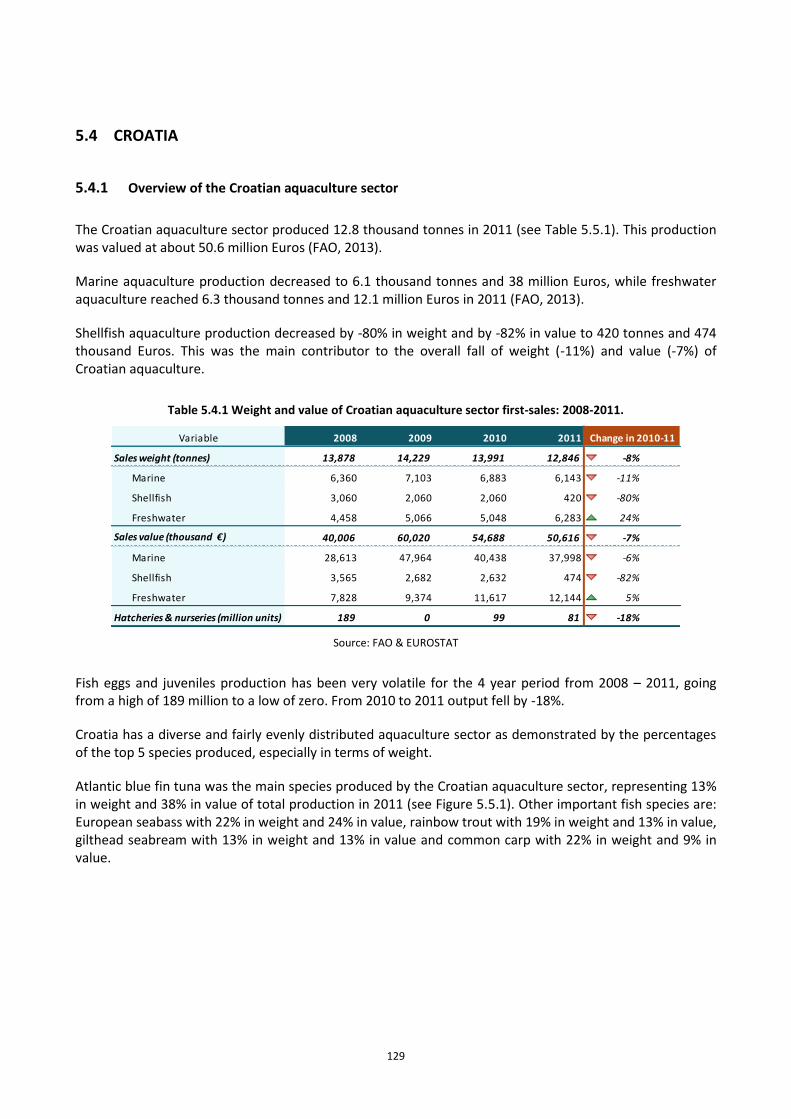
129
5.4 CROATIA
5.4.1 Overview of the Croatian aquaculture sector
The Croatian aquaculture sector produced 12.8 thousand tonnes in 2011 (see Table 5.5.1). This production was valued at about 50.6 million Euros (FAO, 2013).
Marine aquaculture production decreased to 6.1 thousand tonnes and 38 million Euros, while freshwater aquaculture reached 6.3 thousand tonnes and 12.1 million Euros in 2011 (FAO, 2013).
Shellfish aquaculture production decreased by -80% in weight and by -82% in value to 420 tonnes and 474 thousand Euros. This was the main contributor to the overall fall of weight (-11%) and value (-7%) of Croatian aquaculture.
Table 5.4.1 Weight and value of Croatian aquaculture sector first-sales: 2008-2011.
Variable 2008 2009 2010 2011
Sales weight (tonnes) 13,878 14,229 13,991 12,846 -8% ↘
Marine 6,360 7,103 6,883 6,143 -11%
Shellfish 3,060 2,060 2,060 420 -80% ↘
Freshwater 4,458 5,066 5,048 6,283 24% ↗
Sales value (thousand €) 40,006 60,020 54,688 50,616 -7% ↘
Marine 28,613 47,964 40,438 37,998 -6% ↘
Shellfish 3,565 2,682 2,632 474 -82% ↘
Freshwater 7,828 9,374 11,617 12,144 5% ↗
Hatcheries & nurseries (million units) 189 0 99 81 -18% ↘
Change in 2010-11
Source: FAO & EUROSTAT
Fish eggs and juveniles production has been very volatile for the 4 year period from 2008 – 2011, going from a high of 189 million to a low of zero. From 2010 to 2011 output fell by -18%.
Croatia has a diverse and fairly evenly distributed aquaculture sector as demonstrated by the percentages of the top 5 species produced, especially in terms of weight.
Atlantic blue fin tuna was the main species produced by the Croatian aquaculture sector, representing 13% in weight and 38% in value of total production in 2011 (see Figure 5.5.1). Other important fish species are: European seabass with 22% in weight and 24% in value, rainbow trout with 19% in weight and 13% in value, gilthead seabream with 13% in weight and 13% in value and common carp with 22% in weight and 9% in value.
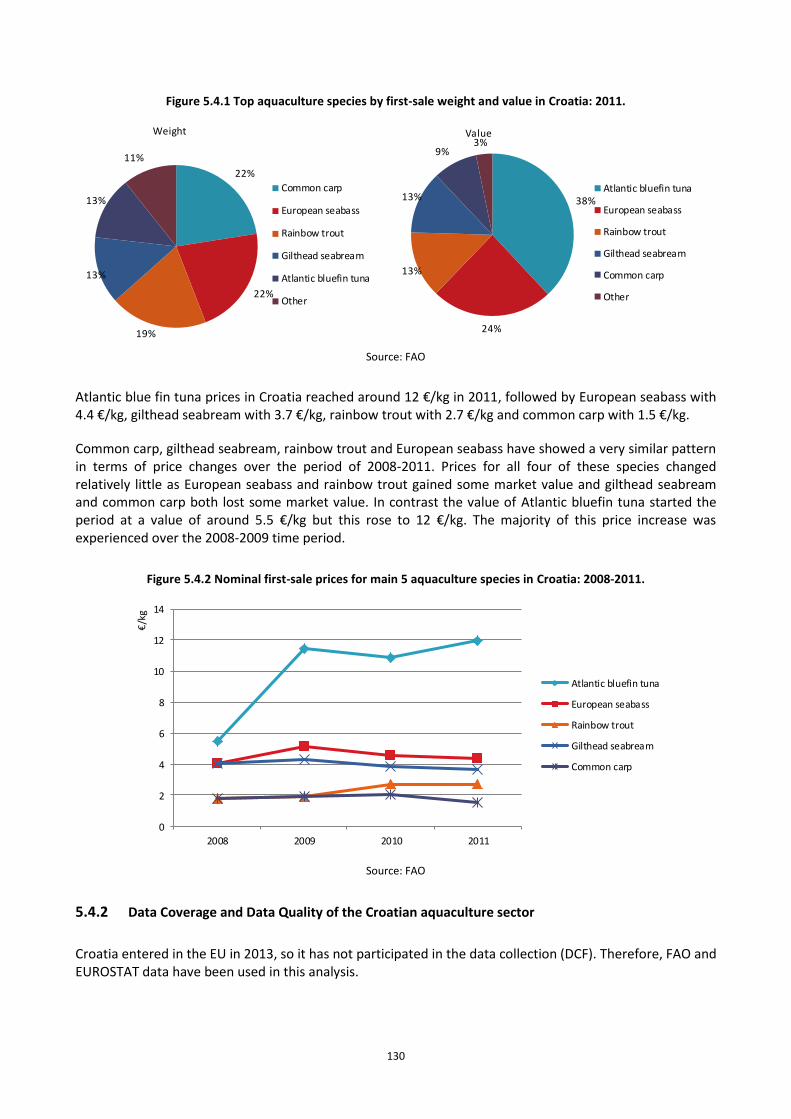
130
Figure 5.4.1 Top aquaculture species by first-sale weight and value in Croatia: 2011.
22%
22%
19%
13%
13%
11%
Weight
Common carp
European seabass
Rainbow trout
Gilthead seabream
Atlantic bluefin tuna
Other
38%
24%
13%
13%
9%3%
Value
Atlantic bluefin tuna
European seabass
Rainbow trout
Gilthead seabream
Common carp
Other
Source: FAO
Atlantic blue fin tuna prices in Croatia reached around 12 €/kg in 2011, followed by European seabass with 4.4 €/kg, gilthead seabream with 3.7 €/kg, rainbow trout with 2.7 €/kg and common carp with 1.5 €/kg.
Common carp, gilthead seabream, rainbow trout and European seabass have showed a very similar pattern in terms of price changes over the period of 2008-2011. Prices for all four of these species changed relatively little as European seabass and rainbow trout gained some market value and gilthead seabream and common carp both lost some market value. In contrast the value of Atlantic bluefin tuna started the period at a value of around 5.5 €/kg but this rose to 12 €/kg. The majority of this price increase was experienced over the 2008-2009 time period.
Figure 5.4.2 Nominal first-sale prices for main 5 aquaculture species in Croatia: 2008-2011.
0
2
4
6
8
10
12
14
2008 2009 2010 2011
€/k
g
Atlantic bluefin tuna
European seabass
Rainbow trout
Gilthead seabream
Common carp
Source: FAO
5.4.2 Data Coverage and Data Quality of the Croatian aquaculture sector
Croatia entered in the EU in 2013, so it has not participated in the data collection (DCF). Therefore, FAO and EUROSTAT data have been used in this analysis.
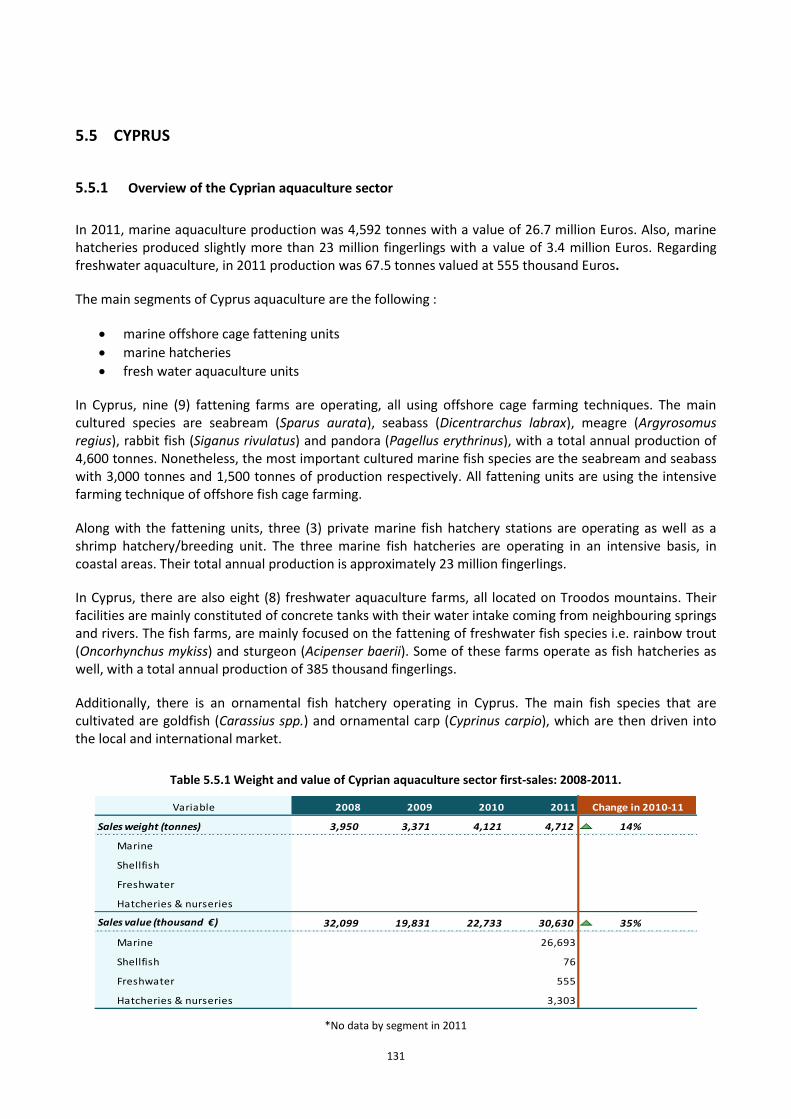
131
5.5 CYPRUS
5.5.1 Overview of the Cyprian aquaculture sector
In 2011, marine aquaculture production was 4,592 tonnes with a value of 26.7 million Euros. Also, marine hatcheries produced slightly more than 23 million fingerlings with a value of 3.4 million Euros. Regarding freshwater aquaculture, in 2011 production was 67.5 tonnes valued at 555 thousand Euros.
The main segments of Cyprus aquaculture are the following :
marine offshore cage fattening units
marine hatcheries
fresh water aquaculture units
In Cyprus, nine (9) fattening farms are operating, all using offshore cage farming techniques. The main cultured species are seabream (Sparus aurata), seabass (Dicentrarchus labrax), meagre (Argyrosomus regius), rabbit fish (Siganus rivulatus) and pandora (Pagellus erythrinus), with a total annual production of 4,600 tonnes. Nonetheless, the most important cultured marine fish species are the seabream and seabass with 3,000 tonnes and 1,500 tonnes of production respectively. All fattening units are using the intensive farming technique of offshore fish cage farming.
Along with the fattening units, three (3) private marine fish hatchery stations are operating as well as a shrimp hatchery/breeding unit. The three marine fish hatcheries are operating in an intensive basis, in coastal areas. Their total annual production is approximately 23 million fingerlings.
In Cyprus, there are also eight (8) freshwater aquaculture farms, all located on Troodos mountains. Their facilities are mainly constituted of concrete tanks with their water intake coming from neighbouring springs and rivers. The fish farms, are mainly focused on the fattening of freshwater fish species i.e. rainbow trout (Oncorhynchus mykiss) and sturgeon (Acipenser baerii). Some of these farms operate as fish hatcheries as well, with a total annual production of 385 thousand fingerlings.
Additionally, there is an ornamental fish hatchery operating in Cyprus. The main fish species that are cultivated are goldfish (Carassius spp.) and ornamental carp (Cyprinus carpio), which are then driven into the local and international market.
Table 5.5.1 Weight and value of Cyprian aquaculture sector first-sales: 2008-2011.
Variable 2008 2009 2010 2011
Sales weight (tonnes) 3,950 3,371 4,121 4,712 14%
Marine
Shellfish
Freshwater
Hatcheries & nurseries
Sales value (thousand €) 32,099 19,831 22,733 30,630 35% ↗
Marine 26,693
Shellfish 76
Freshwater 555
Hatcheries & nurseries 3,303
Change in 2010-11
*No data by segment in 2011
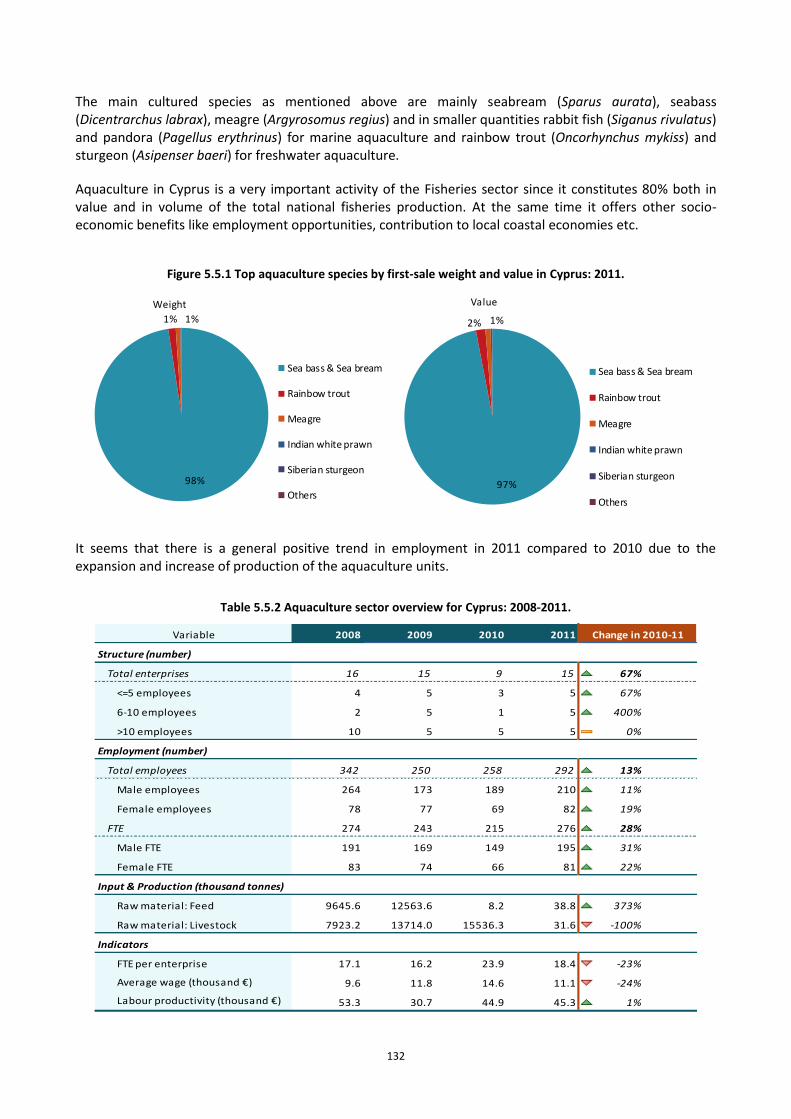
132
The main cultured species as mentioned above are mainly seabream (Sparus aurata), seabass (Dicentrarchus labrax), meagre (Argyrosomus regius) and in smaller quantities rabbit fish (Siganus rivulatus) and pandora (Pagellus erythrinus) for marine aquaculture and rainbow trout (Oncorhynchus mykiss) and sturgeon (Asipenser baeri) for freshwater aquaculture.
Aquaculture in Cyprus is a very important activity of the Fisheries sector since it constitutes 80% both in value and in volume of the total national fisheries production. At the same time it offers other socio-economic benefits like employment opportunities, contribution to local coastal economies etc.
Figure 5.5.1 Top aquaculture species by first-sale weight and value in Cyprus: 2011.
98%
1% 1%
Weight
Sea bass & Sea bream
Rainbow trout
Meagre
Indian white prawn
Siberian sturgeon
Others97%
2% 1%
Value
Sea bass & Sea bream
Rainbow trout
Meagre
Indian white prawn
Siberian sturgeon
Others
It seems that there is a general positive trend in employment in 2011 compared to 2010 due to the expansion and increase of production of the aquaculture units.
Table 5.5.2 Aquaculture sector overview for Cyprus: 2008-2011.
Variable 2008 2009 2010 2011
Structure (number)
Total enterprises 16 15 9 15 67% ↗
<=5 employees 4 5 3 5 67% ↗
6-10 employees 2 5 1 5 400% ↗
>10 employees 10 5 5 5 0% ↔
Employment (number)
Total employees 342 250 258 292 13% ↗
Male employees 264 173 189 210 11% ↗
Female employees 78 77 69 82 19% ↗
FTE 274 243 215 276 28% ↗
Male FTE 191 169 149 195 31% ↗
Female FTE 83 74 66 81 22% ↗
Input & Production (thousand tonnes)
Raw material: Feed 9645.6 12563.6 8.2 38.8 373% ↗
Raw material: Livestock 7923.2 13714.0 15536.3 31.6 -100%
Indicators
FTE per enterprise 17.1 16.2 23.9 18.4 -23% ↘
Average wage (thousand €) 9.6 11.8 14.6 11.1 -24% ↘
Labour productivity (thousand €) 53.3 30.7 44.9 45.3 1% ↗
Change in 2010-11
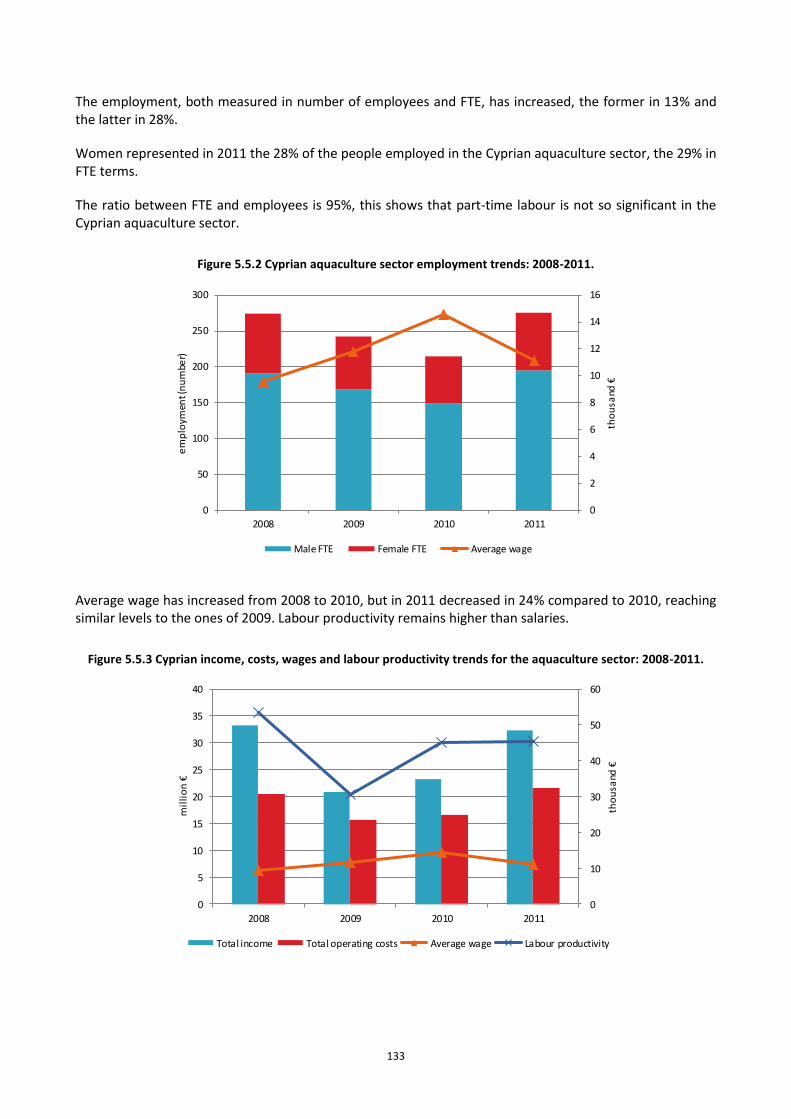
133
The employment, both measured in number of employees and FTE, has increased, the former in 13% and the latter in 28%.
Women represented in 2011 the 28% of the people employed in the Cyprian aquaculture sector, the 29% in FTE terms.
The ratio between FTE and employees is 95%, this shows that part-time labour is not so significant in the Cyprian aquaculture sector.
Figure 5.5.2 Cyprian aquaculture sector employment trends: 2008-2011.
0
2
4
6
8
10
12
14
16
0
50
100
150
200
250
300
2008 2009 2010 2011
tho
usa
nd €
em
plo
ymen
t (n
um
ber)
Male FTE Female FTE Average wage
Average wage has increased from 2008 to 2010, but in 2011 decreased in 24% compared to 2010, reaching similar levels to the ones of 2009. Labour productivity remains higher than salaries.
Figure 5.5.3 Cyprian income, costs, wages and labour productivity trends for the aquaculture sector: 2008-2011.
0
10
20
30
40
50
60
0
5
10
15
20
25
30
35
40
2008 2009 2010 2011
tho
usa
nd €
mil
lio
n €
Total income Total operating costs Average wage Labour productivity
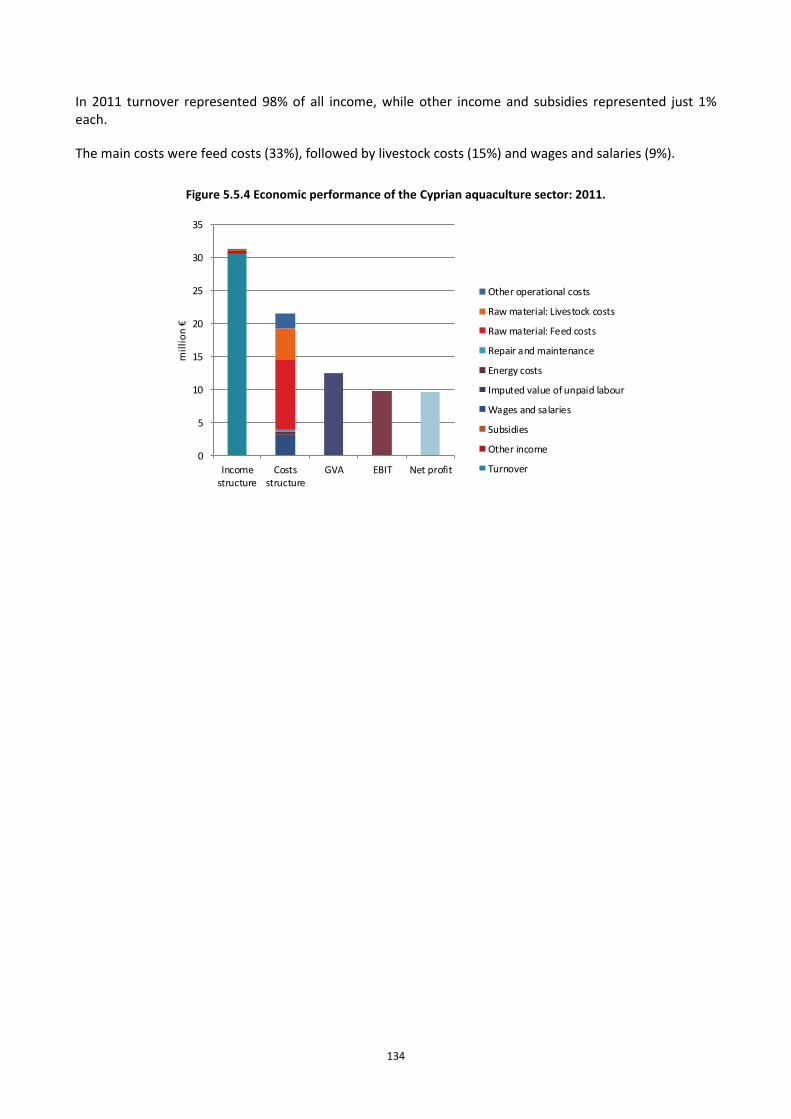
134
In 2011 turnover represented 98% of all income, while other income and subsidies represented just 1% each.
The main costs were feed costs (33%), followed by livestock costs (15%) and wages and salaries (9%).
Figure 5.5.4 Economic performance of the Cyprian aquaculture sector: 2011.
0
5
10
15
20
25
30
35
Incomestructure
Costsstructure
GVA EBIT Net profit
mil
lio
n €
Other operational costs
Raw material: Livestock costs
Raw material: Feed costs
Repair and maintenance
Energy costs
Imputed value of unpaid labour
Wages and salaries
Subsidies
Other income
Turnover
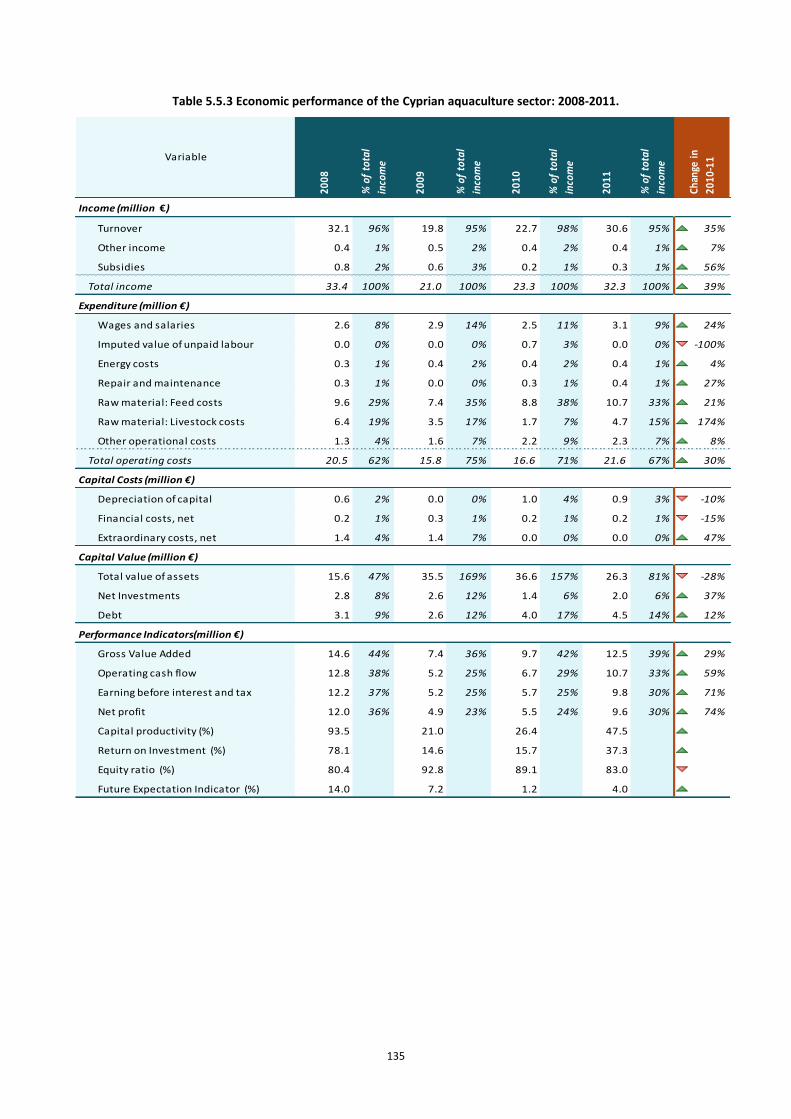
135
Table 5.5.3 Economic performance of the Cyprian aquaculture sector: 2008-2011.
Income (million €)
Turnover 32.1 96% 19.8 95% 22.7 98% 30.6 95% 35%
Other income 0.4 1% 0.5 2% 0.4 2% 0.4 1% 7%
Subsidies 0.8 2% 0.6 3% 0.2 1% 0.3 1% 56%
Total income 33.4 100% 21.0 100% 23.3 100% 32.3 100% 39%
Expenditure (million €)
Wages and salaries 2.6 8% 2.9 14% 2.5 11% 3.1 9% 24%
Imputed value of unpaid labour 0.0 0% 0.0 0% 0.7 3% 0.0 0% -100%
Energy costs 0.3 1% 0.4 2% 0.4 2% 0.4 1% 4%
Repair and maintenance 0.3 1% 0.0 0% 0.3 1% 0.4 1% 27%
Raw material: Feed costs 9.6 29% 7.4 35% 8.8 38% 10.7 33% 21%
Raw material: Livestock costs 6.4 19% 3.5 17% 1.7 7% 4.7 15% 174%
Other operational costs 1.3 4% 1.6 7% 2.2 9% 2.3 7% 8%
Total operating costs 20.5 62% 15.8 75% 16.6 71% 21.6 67% 30%
Capital Costs (million €)
Depreciation of capital 0.6 2% 0.0 0% 1.0 4% 0.9 3% -10%
Financial costs, net 0.2 1% 0.3 1% 0.2 1% 0.2 1% -15%
Extraordinary costs, net 1.4 4% 1.4 7% 0.0 0% 0.0 0% 47%
Capital Value (million €)
Total value of assets 15.6 47% 35.5 169% 36.6 157% 26.3 81% -28%
Net Investments 2.8 8% 2.6 12% 1.4 6% 2.0 6% 37%
Debt 3.1 9% 2.6 12% 4.0 17% 4.5 14% 12%
Performance Indicators(million €)
Gross Value Added 14.6 44% 7.4 36% 9.7 42% 12.5 39% 29%
Operating cash flow 12.8 38% 5.2 25% 6.7 29% 10.7 33% 59%
Earning before interest and tax 12.2 37% 5.2 25% 5.7 25% 9.8 30% 71%
Net profit 12.0 36% 4.9 23% 5.5 24% 9.6 30% 74%
Capital productivity (%) 93.5 21.0 26.4 47.5 80%
Return on Investment (%) 78.1 14.6 15.7 37.3 138%
Equity ratio (%) 80.4 92.8 89.1 83.0 -7%
Future Expectation Indicator (%) 14.0 7.2 1.2 4.0 244%
% o
f to
tal
inco
me
% o
f to
tal
inco
me
2010
2011
Chan
ge in
2010
-11
% o
f to
tal
inco
meVariable
% o
f to
tal
inco
me
2008
2009
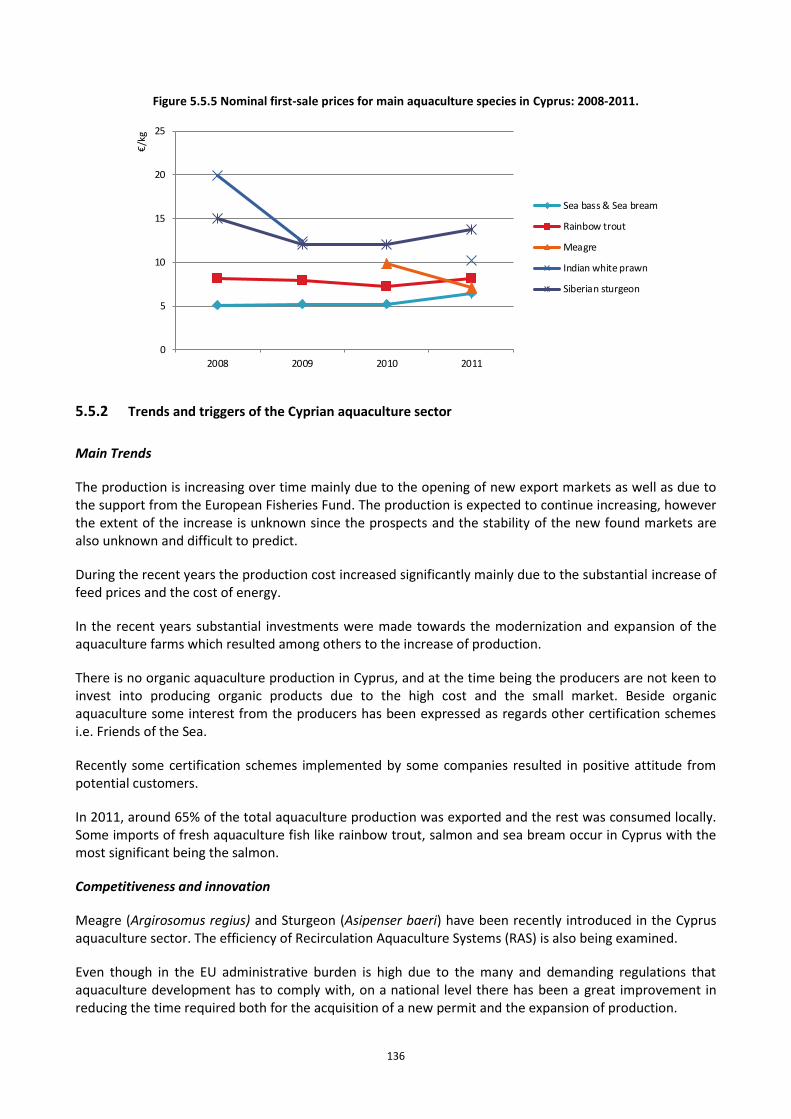
136
Figure 5.5.5 Nominal first-sale prices for main aquaculture species in Cyprus: 2008-2011.
0
5
10
15
20
25
2008 2009 2010 2011
€/k
g
Sea bass & Sea bream
Rainbow trout
Meagre
Indian white prawn
Siberian sturgeon
5.5.2 Trends and triggers of the Cyprian aquaculture sector
Main Trends
The production is increasing over time mainly due to the opening of new export markets as well as due to the support from the European Fisheries Fund. The production is expected to continue increasing, however the extent of the increase is unknown since the prospects and the stability of the new found markets are also unknown and difficult to predict.
During the recent years the production cost increased significantly mainly due to the substantial increase of feed prices and the cost of energy.
In the recent years substantial investments were made towards the modernization and expansion of the aquaculture farms which resulted among others to the increase of production.
There is no organic aquaculture production in Cyprus, and at the time being the producers are not keen to invest into producing organic products due to the high cost and the small market. Beside organic aquaculture some interest from the producers has been expressed as regards other certification schemes i.e. Friends of the Sea.
Recently some certification schemes implemented by some companies resulted in positive attitude from potential customers.
In 2011, around 65% of the total aquaculture production was exported and the rest was consumed locally. Some imports of fresh aquaculture fish like rainbow trout, salmon and sea bream occur in Cyprus with the most significant being the salmon.
Competitiveness and innovation
Meagre (Argirosomus regius) and Sturgeon (Asipenser baeri) have been recently introduced in the Cyprus aquaculture sector. The efficiency of Recirculation Aquaculture Systems (RAS) is also being examined.
Even though in the EU administrative burden is high due to the many and demanding regulations that aquaculture development has to comply with, on a national level there has been a great improvement in reducing the time required both for the acquisition of a new permit and the expansion of production.
137
Aquaculture and especially marine aquaculture is an activity in the sea area that competes for space with other users such as tourism, fishermen, shipping, recreation, etc.
Considering the above integrated marine spatial planning is an important tool for the future development of aquaculture. The national strategy is being prepared and aquaculture will be an integral part of this strategy which should foresee for the establishment of aquaculture zones.
The implementation of the EFF has contributed towards the sustainable development of the sector by providing support for the, establishment of new units as well as the modernization and the expansion of the production of the existing ones.
The Department of Fisheries and Marine Research, operates two research stations which promote scientific research and technological development on aquaculture. These are the Cyprus Marine Aquaculture Research Center (CyMARC) and the Freshwater Aquaculture Research Station at Kalopanayiotis (Troodos).
The research programmes that have been undertaken at CyMARC focused mainly on new candidate species for fish farming, such as rabbit fish (Siganus rivulatus), common pandora (Pagellus erythrinus), greater amberjack (Seriola dumerili) and meagre (Argyrosomus regius). The main objective of research work is the diversification of aquaculture production with new species, a task that will contribute to the sustainability of the sector.
Possible trends 2011-2013
From 2012 onward, the total production of aquaculture products is expected to increase because of the increasing demand due to the opening of new export markets as well as the marketing campaigns undertaken by the producers.
By 2013 it is expected that the production will increase by 10% compared to 2011.
5.5.3 Data Coverage and Data Quality of the Cyprian aquaculture sector
In some occasions before 2009 there were some differences between the data submitted to different institutions. This is due to the fact that the new national data base for aquaculture started to operate in 2009 which clearly shows that the cohesion of data sent from 2009 and onward to the different institutions has been greatly improved. Furthermore some parameters are submitted in different units. For example for FAO and EUROSTAT the amount of fry is submitted in number of individuals while as for the DCF they are submitted in weight. Another problem that is encountered is the fact of double counting some quantities of fish. Specifically some aquaculture companies are supplied fish form other aquaculture companies in order to satisfy the needs of their clients. This quantity is not double counted in the production but is double counted in the sales because both companies issue invoices for the fish so as a result the same fish being counted twice in the turnover of the companies. This the main reason for mismatches in the turnover compared with the value of production.
Furthermore efforts will be made in order to align the data sent to the different institutions for the previous years.
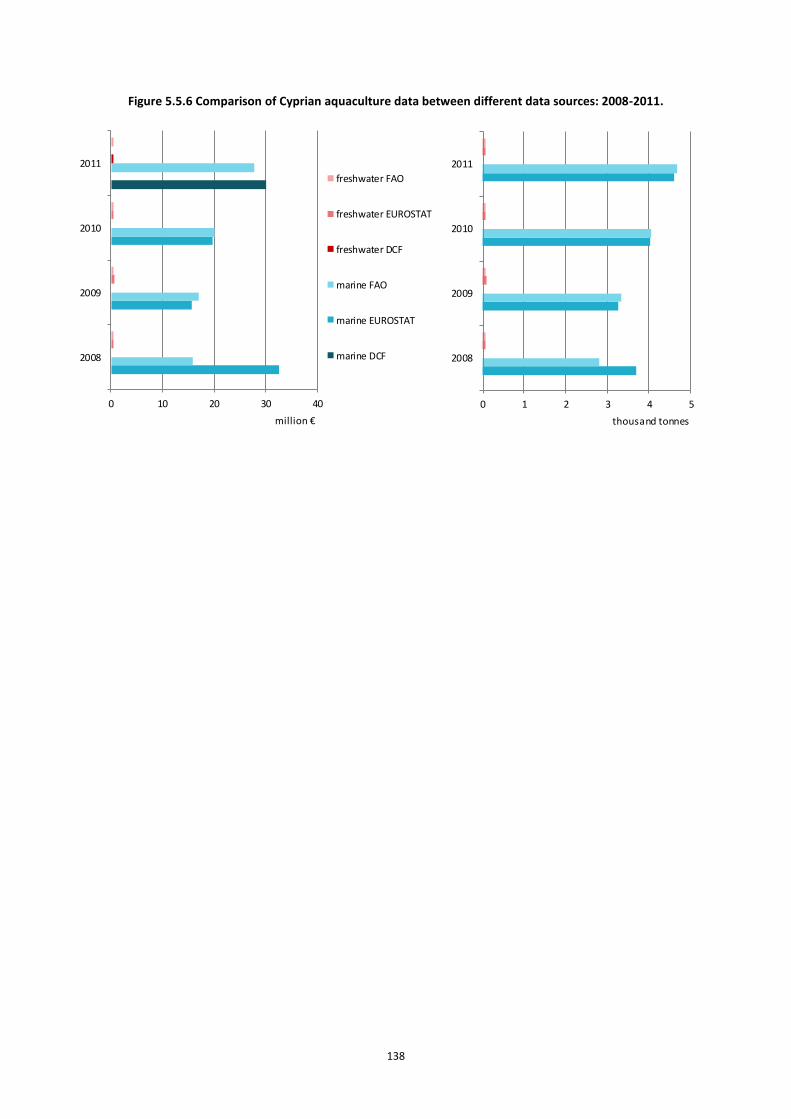
138
Figure 5.5.6 Comparison of Cyprian aquaculture data between different data sources: 2008-2011.
0 10 20 30 40
2008
2009
2010
2011
million €
freshwater FAO
freshwater EUROSTAT
freshwater DCF
marine FAO
marine EUROSTAT
marine DCF
0 1 2 3 4 5
2008
2009
2010
2011
thousand tonnes
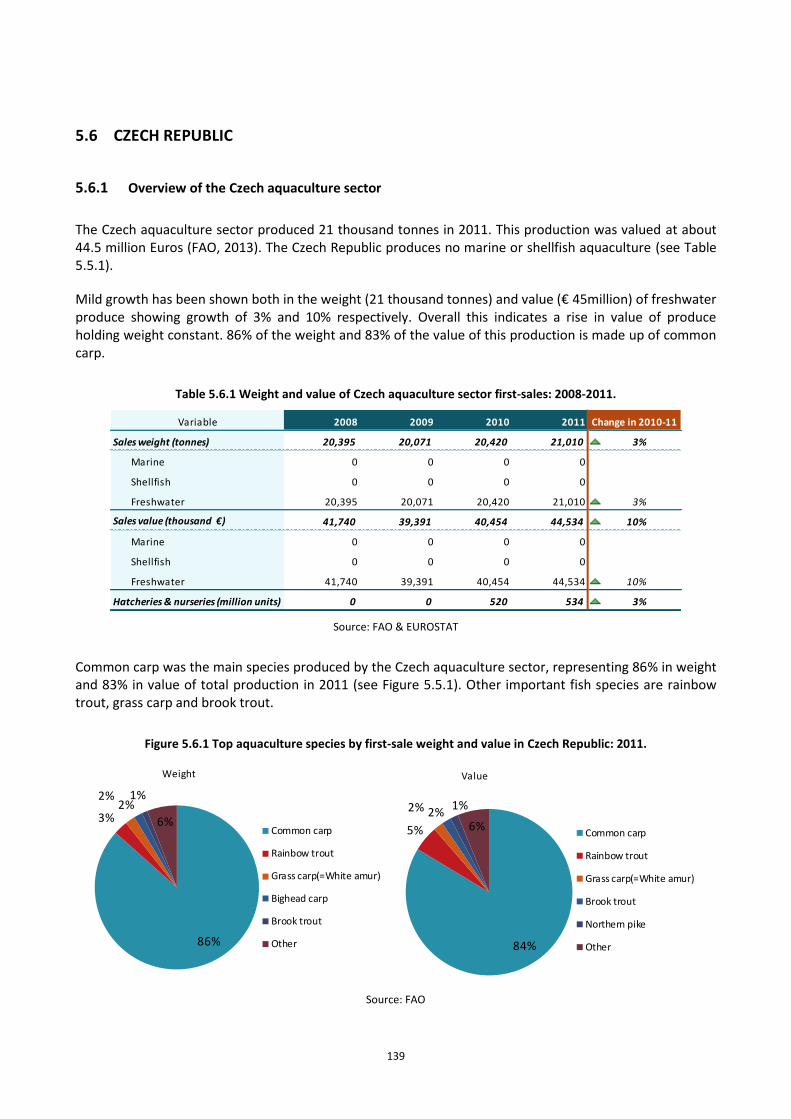
139
5.6 CZECH REPUBLIC
5.6.1 Overview of the Czech aquaculture sector
The Czech aquaculture sector produced 21 thousand tonnes in 2011. This production was valued at about 44.5 million Euros (FAO, 2013). The Czech Republic produces no marine or shellfish aquaculture (see Table 5.5.1).
Mild growth has been shown both in the weight (21 thousand tonnes) and value (€ 45million) of freshwater produce showing growth of 3% and 10% respectively. Overall this indicates a rise in value of produce holding weight constant. 86% of the weight and 83% of the value of this production is made up of common carp.
Table 5.6.1 Weight and value of Czech aquaculture sector first-sales: 2008-2011.
Variable 2008 2009 2010 2011
Sales weight (tonnes) 20,395 20,071 20,420 21,010 3% ↗
Marine 0 0 0 0
Shellfish 0 0 0 0
Freshwater 20,395 20,071 20,420 21,010 3% ↗
Sales value (thousand €) 41,740 39,391 40,454 44,534 10% ↗
Marine 0 0 0 0
Shellfish 0 0 0 0
Freshwater 41,740 39,391 40,454 44,534 10% ↗
Hatcheries & nurseries (million units) 0 0 520 534 3% ↗
Change in 2010-11
Source: FAO & EUROSTAT
Common carp was the main species produced by the Czech aquaculture sector, representing 86% in weight and 83% in value of total production in 2011 (see Figure 5.5.1). Other important fish species are rainbow trout, grass carp and brook trout.
Figure 5.6.1 Top aquaculture species by first-sale weight and value in Czech Republic: 2011.
86%
3%
2%2%
1%
6%
Weight
Common carp
Rainbow trout
Grass carp(=White amur)
Bighead carp
Brook trout
Other 84%
5%
2% 2%1%
6%
Value
Common carp
Rainbow trout
Grass carp(=White amur)
Brook trout
Northern pike
Other
Source: FAO
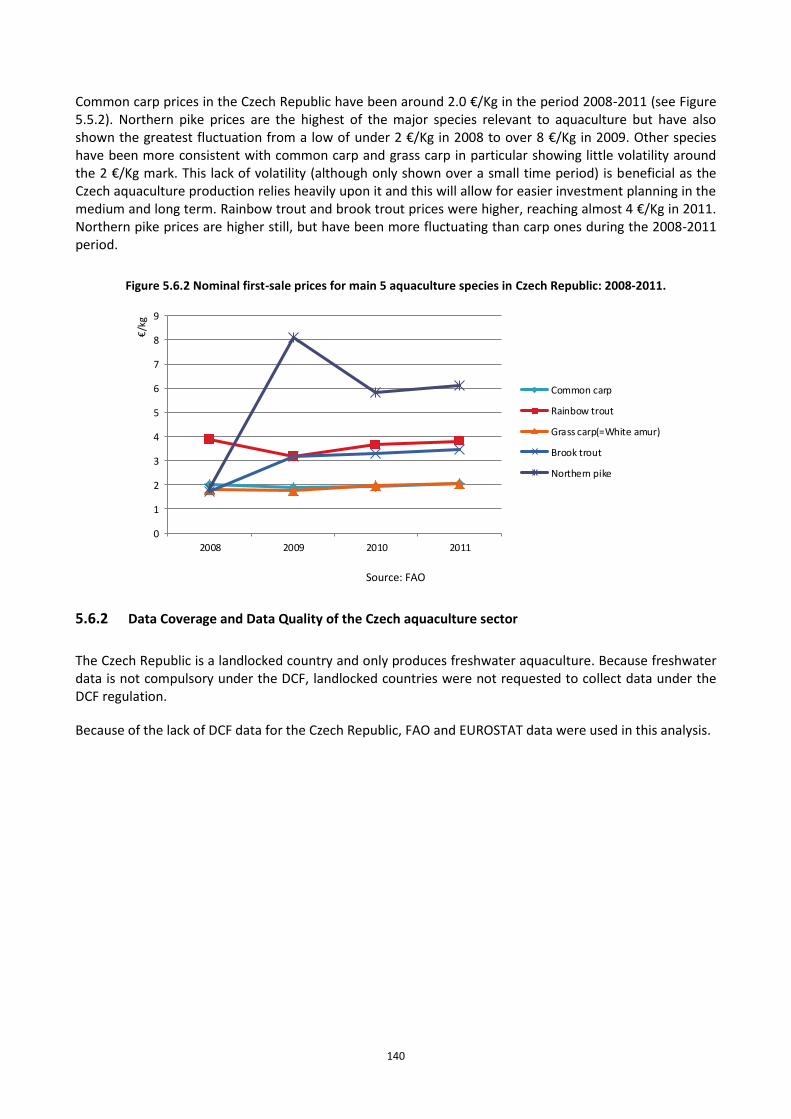
140
Common carp prices in the Czech Republic have been around 2.0 €/Kg in the period 2008-2011 (see Figure 5.5.2). Northern pike prices are the highest of the major species relevant to aquaculture but have also shown the greatest fluctuation from a low of under 2 €/Kg in 2008 to over 8 €/Kg in 2009. Other species have been more consistent with common carp and grass carp in particular showing little volatility around the 2 €/Kg mark. This lack of volatility (although only shown over a small time period) is beneficial as the Czech aquaculture production relies heavily upon it and this will allow for easier investment planning in the medium and long term. Rainbow trout and brook trout prices were higher, reaching almost 4 €/Kg in 2011. Northern pike prices are higher still, but have been more fluctuating than carp ones during the 2008-2011 period.
Figure 5.6.2 Nominal first-sale prices for main 5 aquaculture species in Czech Republic: 2008-2011.
0
1
2
3
4
5
6
7
8
9
2008 2009 2010 2011
€/k
g
Common carp
Rainbow trout
Grass carp(=White amur)
Brook trout
Northern pike
Source: FAO
5.6.2 Data Coverage and Data Quality of the Czech aquaculture sector
The Czech Republic is a landlocked country and only produces freshwater aquaculture. Because freshwater data is not compulsory under the DCF, landlocked countries were not requested to collect data under the DCF regulation.
Because of the lack of DCF data for the Czech Republic, FAO and EUROSTAT data were used in this analysis.
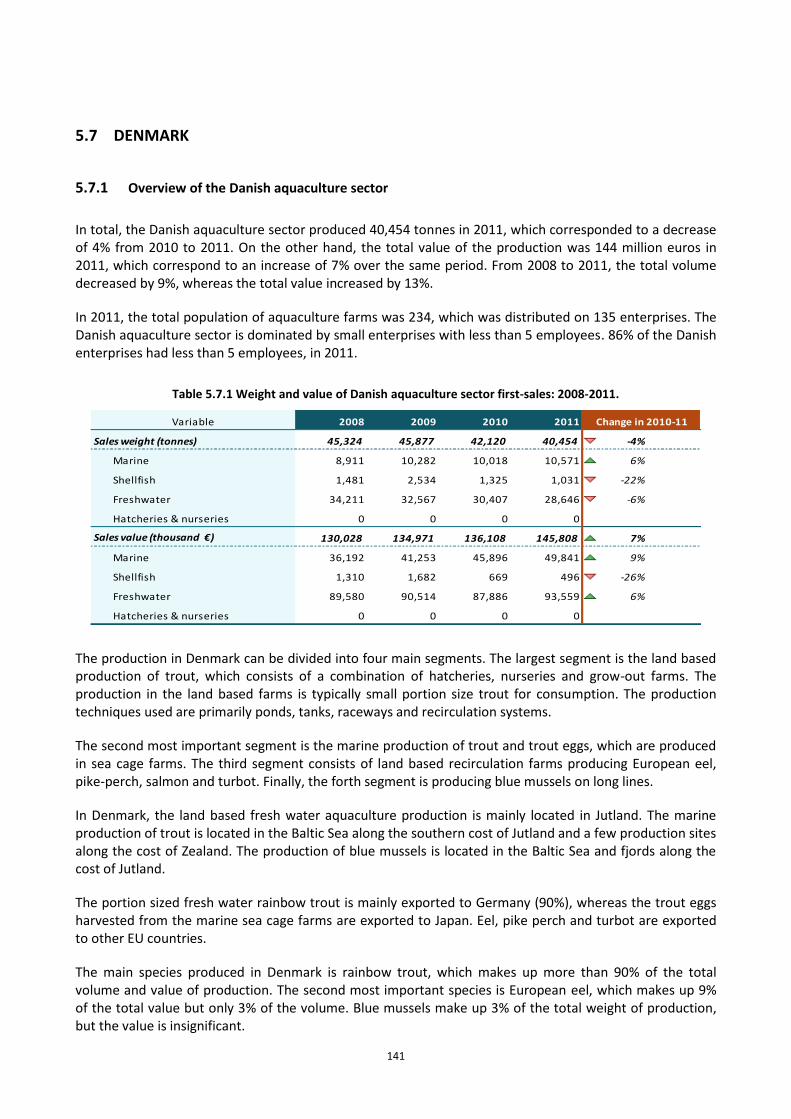
141
5.7 DENMARK
5.7.1 Overview of the Danish aquaculture sector
In total, the Danish aquaculture sector produced 40,454 tonnes in 2011, which corresponded to a decrease of 4% from 2010 to 2011. On the other hand, the total value of the production was 144 million euros in 2011, which correspond to an increase of 7% over the same period. From 2008 to 2011, the total volume decreased by 9%, whereas the total value increased by 13%.
In 2011, the total population of aquaculture farms was 234, which was distributed on 135 enterprises. The Danish aquaculture sector is dominated by small enterprises with less than 5 employees. 86% of the Danish enterprises had less than 5 employees, in 2011.
Table 5.7.1 Weight and value of Danish aquaculture sector first-sales: 2008-2011.
Variable 2008 2009 2010 2011
Sales weight (tonnes) 45,324 45,877 42,120 40,454 -4%
Marine 8,911 10,282 10,018 10,571 6%
Shellfish 1,481 2,534 1,325 1,031 -22% ↘
Freshwater 34,211 32,567 30,407 28,646 -6%
Hatcheries & nurseries 0 0 0 0
Sales value (thousand €) 130,028 134,971 136,108 145,808 7% ↗
Marine 36,192 41,253 45,896 49,841 9% ↗
Shellfish 1,310 1,682 669 496 -26% ↘
Freshwater 89,580 90,514 87,886 93,559 6%
Hatcheries & nurseries 0 0 0 0
Change in 2010-11
The production in Denmark can be divided into four main segments. The largest segment is the land based production of trout, which consists of a combination of hatcheries, nurseries and grow-out farms. The production in the land based farms is typically small portion size trout for consumption. The production techniques used are primarily ponds, tanks, raceways and recirculation systems.
The second most important segment is the marine production of trout and trout eggs, which are produced in sea cage farms. The third segment consists of land based recirculation farms producing European eel, pike-perch, salmon and turbot. Finally, the forth segment is producing blue mussels on long lines.
In Denmark, the land based fresh water aquaculture production is mainly located in Jutland. The marine production of trout is located in the Baltic Sea along the southern cost of Jutland and a few production sites along the cost of Zealand. The production of blue mussels is located in the Baltic Sea and fjords along the cost of Jutland.
The portion sized fresh water rainbow trout is mainly exported to Germany (90%), whereas the trout eggs harvested from the marine sea cage farms are exported to Japan. Eel, pike perch and turbot are exported to other EU countries.
The main species produced in Denmark is rainbow trout, which makes up more than 90% of the total volume and value of production. The second most important species is European eel, which makes up 9% of the total value but only 3% of the volume. Blue mussels make up 3% of the total weight of production, but the value is insignificant.
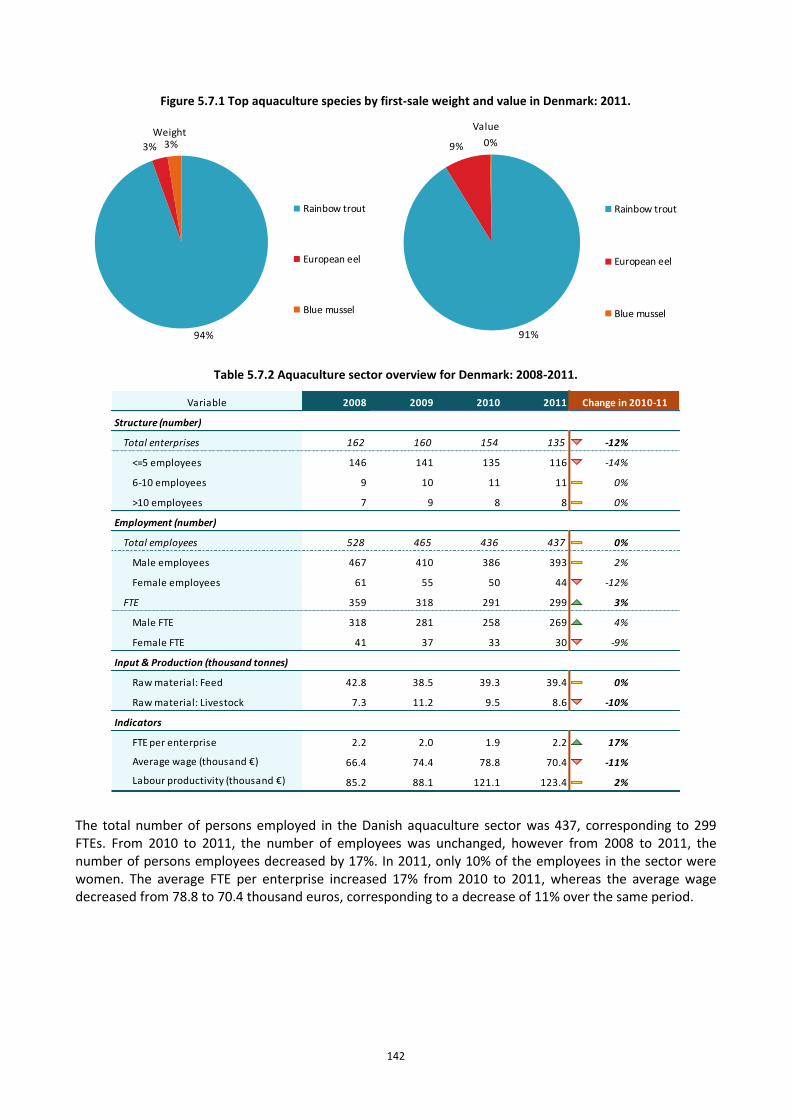
142
Figure 5.7.1 Top aquaculture species by first-sale weight and value in Denmark: 2011.
94%
3% 3%Weight
Rainbow trout
European eel
Blue mussel
91%
9% 0%
Value
Rainbow trout
European eel
Blue mussel
Table 5.7.2 Aquaculture sector overview for Denmark: 2008-2011.
Variable 2008 2009 2010 2011
Structure (number)
Total enterprises 162 160 154 135 -12% ↔
<=5 employees 146 141 135 116 -14% ↘
6-10 employees 9 10 11 11 0% ↔
>10 employees 7 9 8 8 0% ↔
Employment (number)
Total employees 528 465 436 437 0% ↔
Male employees 467 410 386 393 2% ↗
Female employees 61 55 50 44 -12% ↘
FTE 359 318 291 299 3% ↗
Male FTE 318 281 258 269 4% ↗
Female FTE 41 37 33 30 -9% ↘
Input & Production (thousand tonnes)
Raw material: Feed 42.8 38.5 39.3 39.4 0% ↗
Raw material: Livestock 7.3 11.2 9.5 8.6 -10%
Indicators
FTE per enterprise 2.2 2.0 1.9 2.2 17% ↗
Average wage (thousand €) 66.4 74.4 78.8 70.4 -11% ↘
Labour productivity (thousand €) 85.2 88.1 121.1 123.4 2% ↗
Change in 2010-11
The total number of persons employed in the Danish aquaculture sector was 437, corresponding to 299 FTEs. From 2010 to 2011, the number of employees was unchanged, however from 2008 to 2011, the number of persons employees decreased by 17%. In 2011, only 10% of the employees in the sector were women. The average FTE per enterprise increased 17% from 2010 to 2011, whereas the average wage decreased from 78.8 to 70.4 thousand euros, corresponding to a decrease of 11% over the same period.
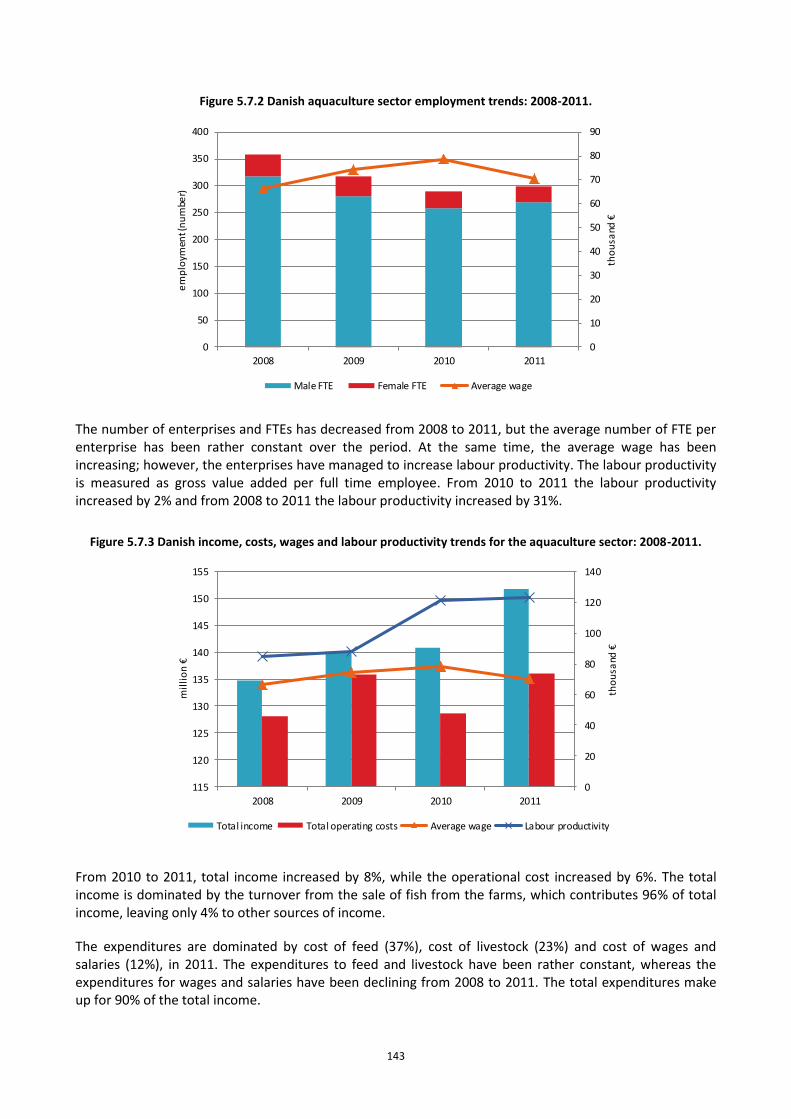
143
Figure 5.7.2 Danish aquaculture sector employment trends: 2008-2011.
0
10
20
30
40
50
60
70
80
90
0
50
100
150
200
250
300
350
400
2008 2009 2010 2011
tho
usa
nd €
em
plo
ymen
t (n
um
ber)
Male FTE Female FTE Average wage
The number of enterprises and FTEs has decreased from 2008 to 2011, but the average number of FTE per enterprise has been rather constant over the period. At the same time, the average wage has been increasing; however, the enterprises have managed to increase labour productivity. The labour productivity is measured as gross value added per full time employee. From 2010 to 2011 the labour productivity increased by 2% and from 2008 to 2011 the labour productivity increased by 31%.
Figure 5.7.3 Danish income, costs, wages and labour productivity trends for the aquaculture sector: 2008-2011.
0
20
40
60
80
100
120
140
115
120
125
130
135
140
145
150
155
2008 2009 2010 2011
tho
usa
nd €
mil
lio
n €
Total income Total operating costs Average wage Labour productivity
From 2010 to 2011, total income increased by 8%, while the operational cost increased by 6%. The total income is dominated by the turnover from the sale of fish from the farms, which contributes 96% of total income, leaving only 4% to other sources of income.
The expenditures are dominated by cost of feed (37%), cost of livestock (23%) and cost of wages and salaries (12%), in 2011. The expenditures to feed and livestock have been rather constant, whereas the expenditures for wages and salaries have been declining from 2008 to 2011. The total expenditures make up for 90% of the total income.
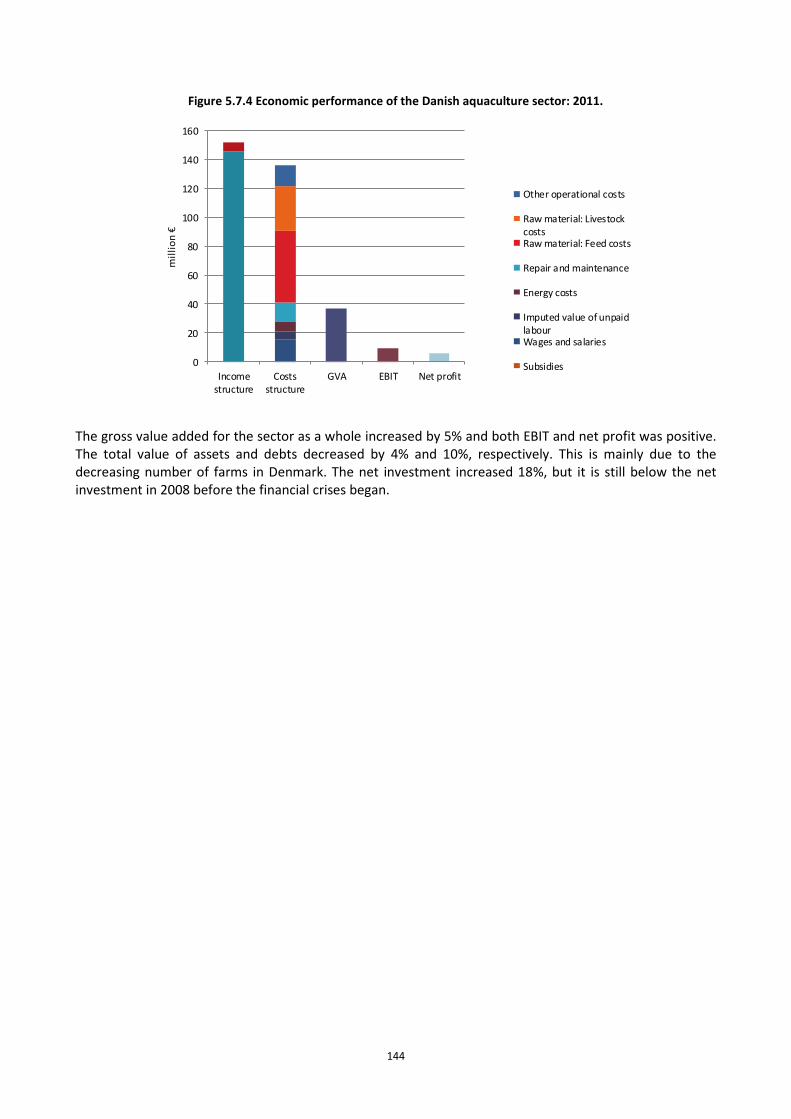
144
Figure 5.7.4 Economic performance of the Danish aquaculture sector: 2011.
0
20
40
60
80
100
120
140
160
Incomestructure
Costsstructure
GVA EBIT Net profit
mil
lio
n €
Other operational costs
Raw material: LivestockcostsRaw material: Feed costs
Repair and maintenance
Energy costs
Imputed value of unpaidlabourWages and salaries
Subsidies
The gross value added for the sector as a whole increased by 5% and both EBIT and net profit was positive. The total value of assets and debts decreased by 4% and 10%, respectively. This is mainly due to the decreasing number of farms in Denmark. The net investment increased 18%, but it is still below the net investment in 2008 before the financial crises began.
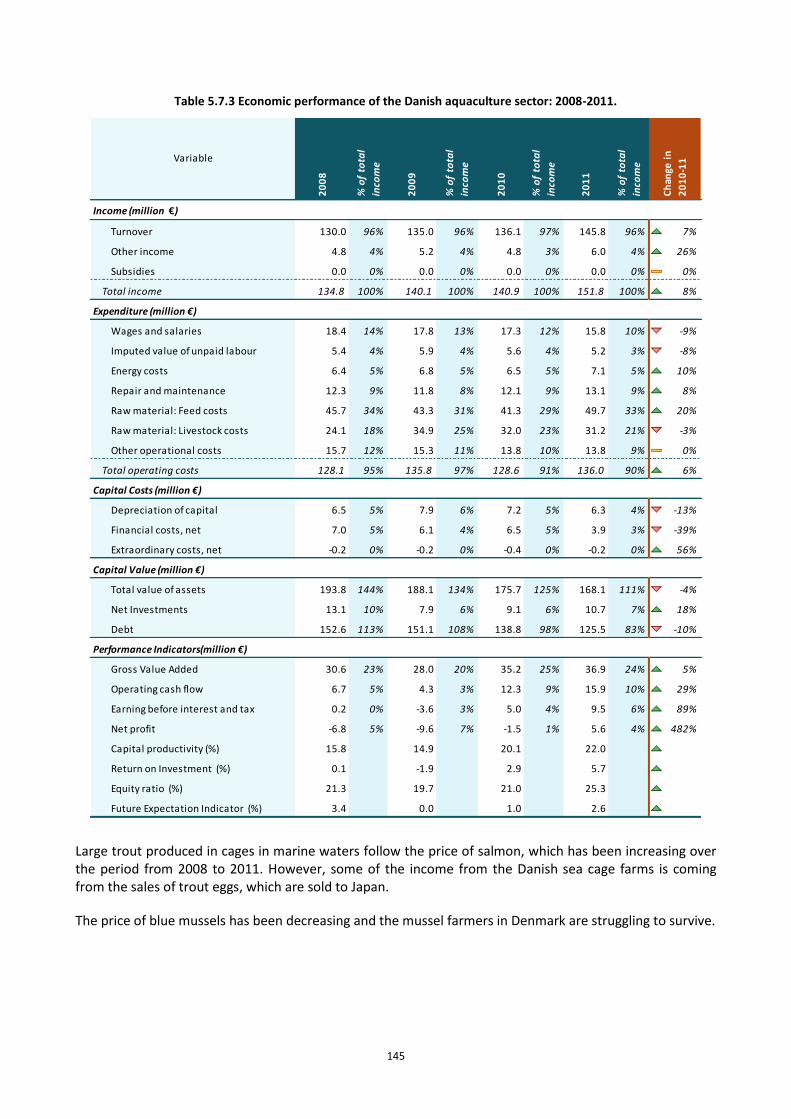
145
Table 5.7.3 Economic performance of the Danish aquaculture sector: 2008-2011.
Income (million €)
Turnover 130.0 96% 135.0 96% 136.1 97% 145.8 96% 7%
Other income 4.8 4% 5.2 4% 4.8 3% 6.0 4% 26%
Subsidies 0.0 0% 0.0 0% 0.0 0% 0.0 0% 0%
Total income 134.8 100% 140.1 100% 140.9 100% 151.8 100% 8%
Expenditure (million €)
Wages and salaries 18.4 14% 17.8 13% 17.3 12% 15.8 10% -9%
Imputed value of unpaid labour 5.4 4% 5.9 4% 5.6 4% 5.2 3% -8%
Energy costs 6.4 5% 6.8 5% 6.5 5% 7.1 5% 10%
Repair and maintenance 12.3 9% 11.8 8% 12.1 9% 13.1 9% 8%
Raw material: Feed costs 45.7 34% 43.3 31% 41.3 29% 49.7 33% 20%
Raw material: Livestock costs 24.1 18% 34.9 25% 32.0 23% 31.2 21% -3%
Other operational costs 15.7 12% 15.3 11% 13.8 10% 13.8 9% 0%
Total operating costs 128.1 95% 135.8 97% 128.6 91% 136.0 90% 6%
Capital Costs (million €)
Depreciation of capital 6.5 5% 7.9 6% 7.2 5% 6.3 4% -13%
Financial costs, net 7.0 5% 6.1 4% 6.5 5% 3.9 3% -39%
Extraordinary costs, net -0.2 0% -0.2 0% -0.4 0% -0.2 0% 56%
Capital Value (million €)
Total value of assets 193.8 144% 188.1 134% 175.7 125% 168.1 111% -4%
Net Investments 13.1 10% 7.9 6% 9.1 6% 10.7 7% 18%
Debt 152.6 113% 151.1 108% 138.8 98% 125.5 83% -10%
Performance Indicators(million €)
Gross Value Added 30.6 23% 28.0 20% 35.2 25% 36.9 24% 5%
Operating cash flow 6.7 5% 4.3 3% 12.3 9% 15.9 10% 29%
Earning before interest and tax 0.2 0% -3.6 3% 5.0 4% 9.5 6% 89%
Net profit -6.8 5% -9.6 7% -1.5 1% 5.6 4% 482%
Capital productivity (%) 15.8 14.9 20.1 22.0 9%
Return on Investment (%) 0.1 -1.9 2.9 5.7 98%
Equity ratio (%) 21.3 19.7 21.0 25.3 21%
Future Expectation Indicator (%) 3.4 0.0 1.0 2.6 151%
Ch
ange
in
20
10
-11
% o
f to
tal
inco
me
Variable
% o
f to
tal
inco
me
20
08
20
09
% o
f to
tal
inco
me
% o
f to
tal
inco
me
20
10
20
11
Large trout produced in cages in marine waters follow the price of salmon, which has been increasing over the period from 2008 to 2011. However, some of the income from the Danish sea cage farms is coming from the sales of trout eggs, which are sold to Japan.
The price of blue mussels has been decreasing and the mussel farmers in Denmark are struggling to survive.
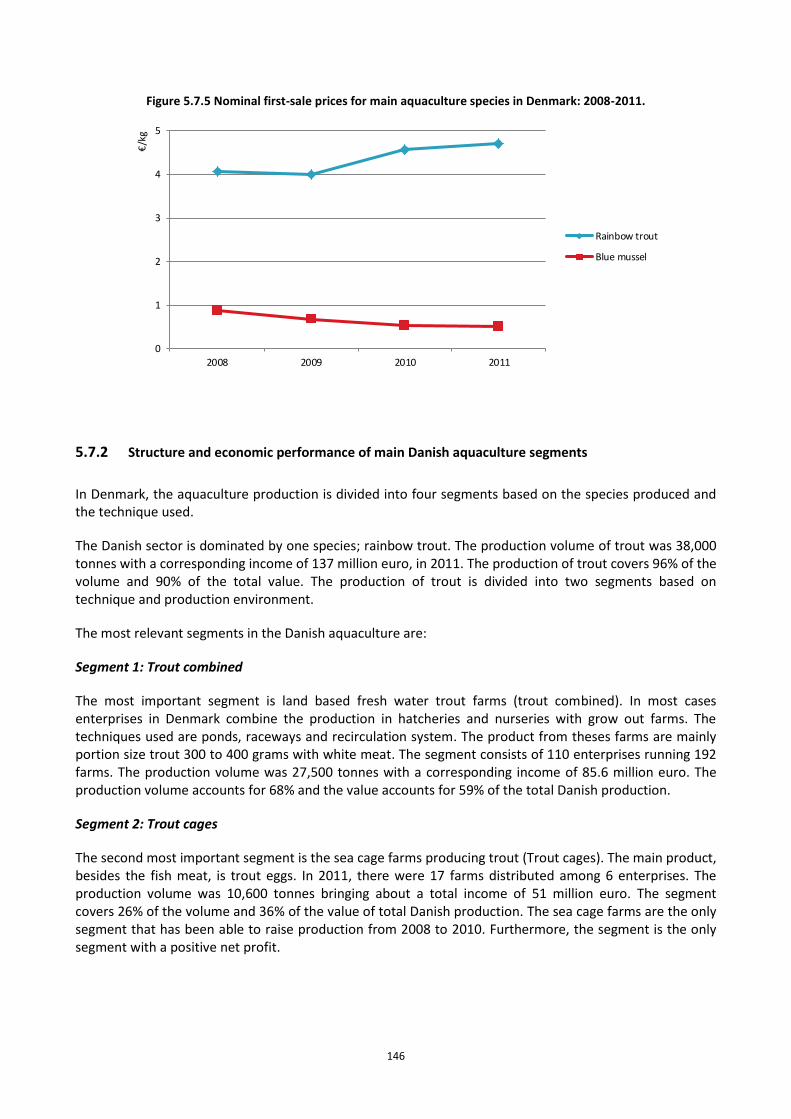
146
Figure 5.7.5 Nominal first-sale prices for main aquaculture species in Denmark: 2008-2011.
0
1
2
3
4
5
2008 2009 2010 2011
€/k
g
Rainbow trout
Blue mussel
5.7.2 Structure and economic performance of main Danish aquaculture segments
In Denmark, the aquaculture production is divided into four segments based on the species produced and the technique used.
The Danish sector is dominated by one species; rainbow trout. The production volume of trout was 38,000 tonnes with a corresponding income of 137 million euro, in 2011. The production of trout covers 96% of the volume and 90% of the total value. The production of trout is divided into two segments based on technique and production environment.
The most relevant segments in the Danish aquaculture are:
Segment 1: Trout combined
The most important segment is land based fresh water trout farms (trout combined). In most cases enterprises in Denmark combine the production in hatcheries and nurseries with grow out farms. The techniques used are ponds, raceways and recirculation system. The product from theses farms are mainly portion size trout 300 to 400 grams with white meat. The segment consists of 110 enterprises running 192 farms. The production volume was 27,500 tonnes with a corresponding income of 85.6 million euro. The production volume accounts for 68% and the value accounts for 59% of the total Danish production.
Segment 2: Trout cages
The second most important segment is the sea cage farms producing trout (Trout cages). The main product, besides the fish meat, is trout eggs. In 2011, there were 17 farms distributed among 6 enterprises. The production volume was 10,600 tonnes bringing about a total income of 51 million euro. The segment covers 26% of the volume and 36% of the value of total Danish production. The sea cage farms are the only segment that has been able to raise production from 2008 to 2010. Furthermore, the segment is the only segment with a positive net profit.

147
Segment 3: Other freshwater fish species combined
Denmark also has a minor land based production of other freshwater species (Other freshwater fish combined). The main species produced in this segment is European eel in land based recirculation farms. The eel production enterprises are dependent on wild caught glass eel for production. There are 8 enterprises producing eel representing one farm each. In this segment there is also a minor production of pike-perch, turbot and salmon. The production technique is intensive recirculation where more than 95% of the water is recirculated. The production volume was 1,200 tonnes with a corresponding income of 12.4 million euro, in 2011.
Segment 4: Mussels long line
The last segment is blue mussels on long lines, which has been introduced in recent years. The production was 1,000 tonnes with a corresponding income of 0.5 million euro, in 2011. The segment had 11 enterprises representing 11 farms. The farms are mostly located in Limfjorden in the northern part of Jutland and in fjords along the Baltic cost of Jutland. Blue mussel farming is a relatively new and small segment both in terms of volume and value in the Danish aquaculture sector. The segment is struggling to increase production and productivity, but so far the conditions and competition in this sector have not been favourable to the Danish producers. The blue mussel farmers have been represented in The Danish Account Statistics for Aquaculture since 2006, but so far without a positive net profit.
From figure 5.7.6 it can be seen that the turnover from the Danish aquaculture sector has been increasing, but the sales volume, the total value of assets and the total number of FTE has been decreasing.
Figure 5.7.6 Structural development of Danish aquaculture sector: 2008-2011.
0
20
40
60
80
100
120
140
160
2008 2009 2010 2011
mil
lio
n €
Turnover
Mussel Long line
Other freshwater fish combined
Trout cages
Trout combined0
5
10
15
20
25
30
35
40
45
50
2008 2009 2010 2011
tho
usa
nd t
onn
es
Total sales volume
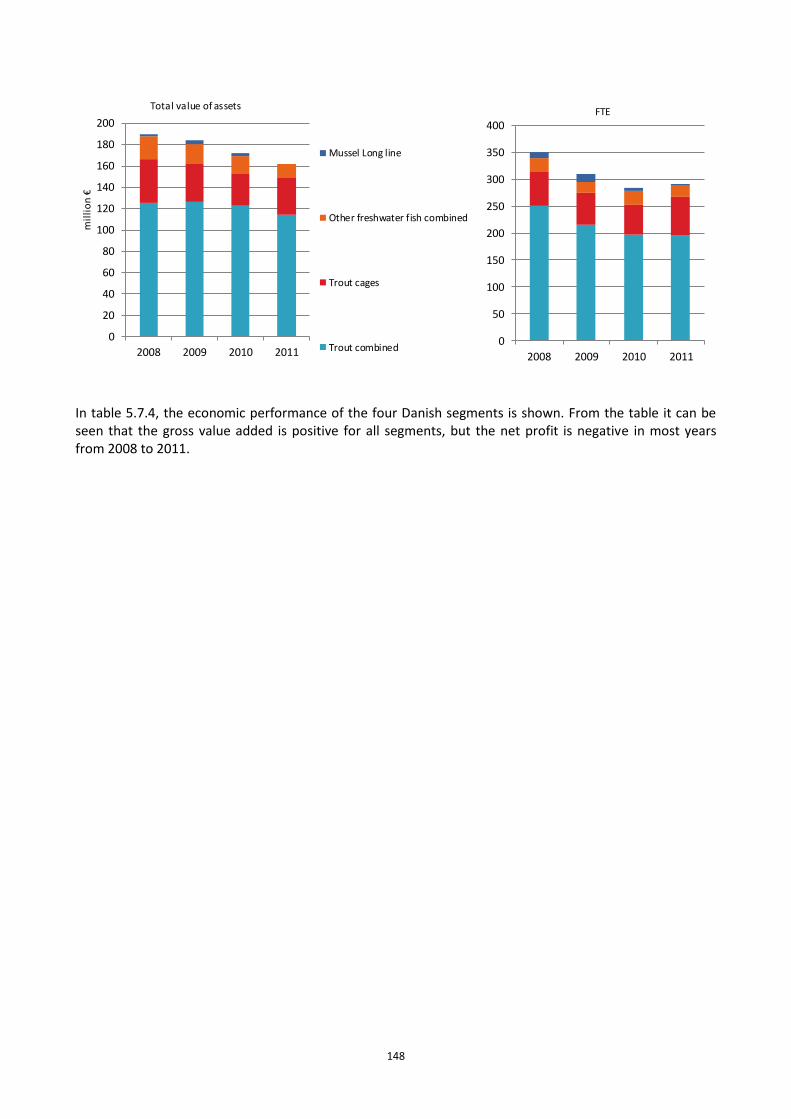
148
0
20
40
60
80
100
120
140
160
180
200
2008 2009 2010 2011
mil
lio
n €
Total value of assets
Mussel Long line
Other freshwater fish combined
Trout cages
Trout combined0
50
100
150
200
250
300
350
400
2008 2009 2010 2011
FTE
In table 5.7.4, the economic performance of the four Danish segments is shown. From the table it can be seen that the gross value added is positive for all segments, but the net profit is negative in most years from 2008 to 2011.
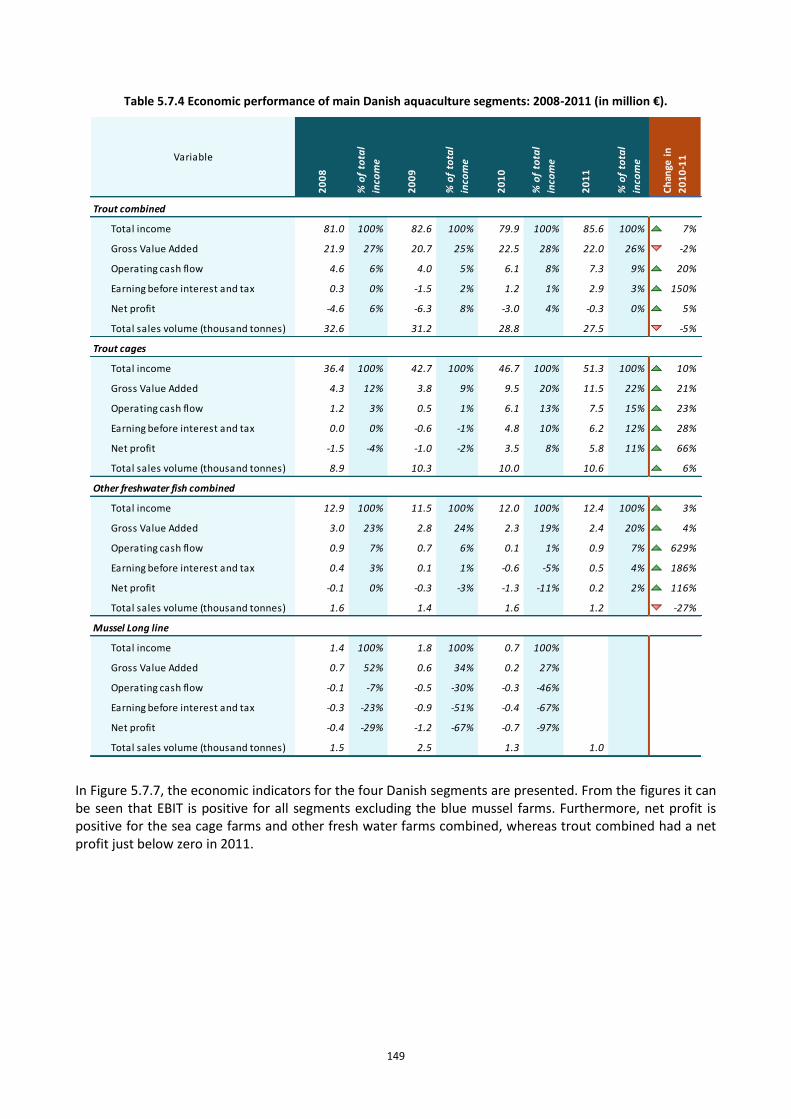
149
Table 5.7.4 Economic performance of main Danish aquaculture segments: 2008-2011 (in million €).
Trout combined
Total income 81.0 100% 82.6 100% 79.9 100% 85.6 100% 7%
Gross Value Added 21.9 27% 20.7 25% 22.5 28% 22.0 26% -2%
Operating cash flow 4.6 6% 4.0 5% 6.1 8% 7.3 9% 20%
Earning before interest and tax 0.3 0% -1.5 2% 1.2 1% 2.9 3% 150%
Net profit -4.6 6% -6.3 8% -3.0 4% -0.3 0% 5%
Total sales volume (thousand tonnes) 32.6 31.2 28.8 27.5 -5%
Trout cages
Total income 36.4 100% 42.7 100% 46.7 100% 51.3 100% 10%
Gross Value Added 4.3 12% 3.8 9% 9.5 20% 11.5 22% 21%
Operating cash flow 1.2 3% 0.5 1% 6.1 13% 7.5 15% 23%
Earning before interest and tax 0.0 0% -0.6 -1% 4.8 10% 6.2 12% 28%
Net profit -1.5 -4% -1.0 -2% 3.5 8% 5.8 11% 66%
Total sales volume (thousand tonnes) 8.9 10.3 10.0 10.6 6%
Other freshwater fish combined
Total income 12.9 100% 11.5 100% 12.0 100% 12.4 100% 3%
Gross Value Added 3.0 23% 2.8 24% 2.3 19% 2.4 20% 4%
Operating cash flow 0.9 7% 0.7 6% 0.1 1% 0.9 7% 629%
Earning before interest and tax 0.4 3% 0.1 1% -0.6 -5% 0.5 4% 186%
Net profit -0.1 0% -0.3 -3% -1.3 -11% 0.2 2% 116%
Total sales volume (thousand tonnes) 1.6 1.4 1.6 1.2 -27%
Mussel Long line
Total income 1.4 100% 1.8 100% 0.7 100%
Gross Value Added 0.7 52% 0.6 34% 0.2 27%
Operating cash flow -0.1 -7% -0.5 -30% -0.3 -46%
Earning before interest and tax -0.3 -23% -0.9 -51% -0.4 -67%
Net profit -0.4 -29% -1.2 -67% -0.7 -97%
Total sales volume (thousand tonnes) 1.5 2.5 1.3 1.0
% o
f to
tal
inco
me
Ch
ange
in
20
10
-11Variable
20
08
% o
f to
tal
inco
me
20
09
% o
f to
tal
inco
me
20
10
% o
f to
tal
inco
me
20
11
In Figure 5.7.7, the economic indicators for the four Danish segments are presented. From the figures it can be seen that EBIT is positive for all segments excluding the blue mussel farms. Furthermore, net profit is positive for the sea cage farms and other fresh water farms combined, whereas trout combined had a net profit just below zero in 2011.
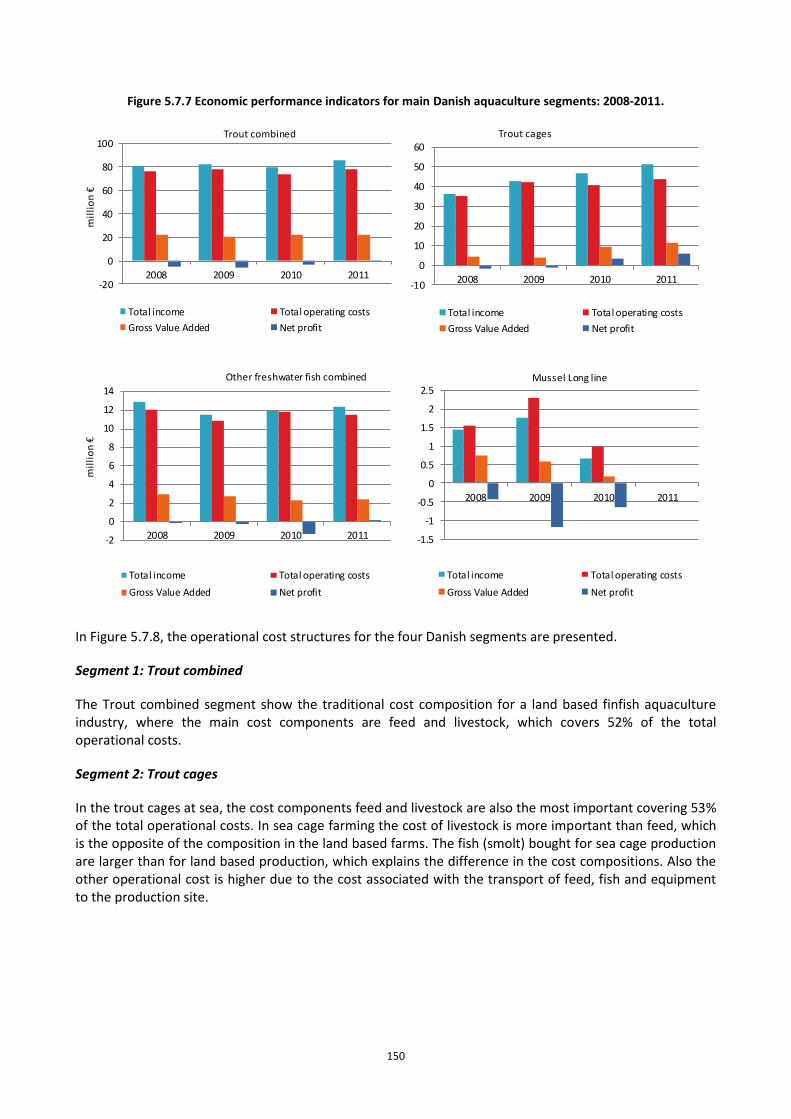
150
Figure 5.7.7 Economic performance indicators for main Danish aquaculture segments: 2008-2011.
-20
0
20
40
60
80
100
2008 2009 2010 2011
mil
lio
n €
Trout combined
Total income Total operating costs
Gross Value Added Net profit
-10
0
10
20
30
40
50
60
2008 2009 2010 2011
Trout cages
Total income Total operating costs
Gross Value Added Net profit
-2
0
2
4
6
8
10
12
14
2008 2009 2010 2011
mil
lio
n €
Other freshwater fish combined
Total income Total operating costs
Gross Value Added Net profit
-1.5
-1
-0.5
0
0.5
1
1.5
2
2.5
2008 2009 2010 2011
Mussel Long line
Total income Total operating costs
Gross Value Added Net profit
In Figure 5.7.8, the operational cost structures for the four Danish segments are presented.
Segment 1: Trout combined
The Trout combined segment show the traditional cost composition for a land based finfish aquaculture industry, where the main cost components are feed and livestock, which covers 52% of the total operational costs.
Segment 2: Trout cages
In the trout cages at sea, the cost components feed and livestock are also the most important covering 53% of the total operational costs. In sea cage farming the cost of livestock is more important than feed, which is the opposite of the composition in the land based farms. The fish (smolt) bought for sea cage production are larger than for land based production, which explains the difference in the cost compositions. Also the other operational cost is higher due to the cost associated with the transport of feed, fish and equipment to the production site.
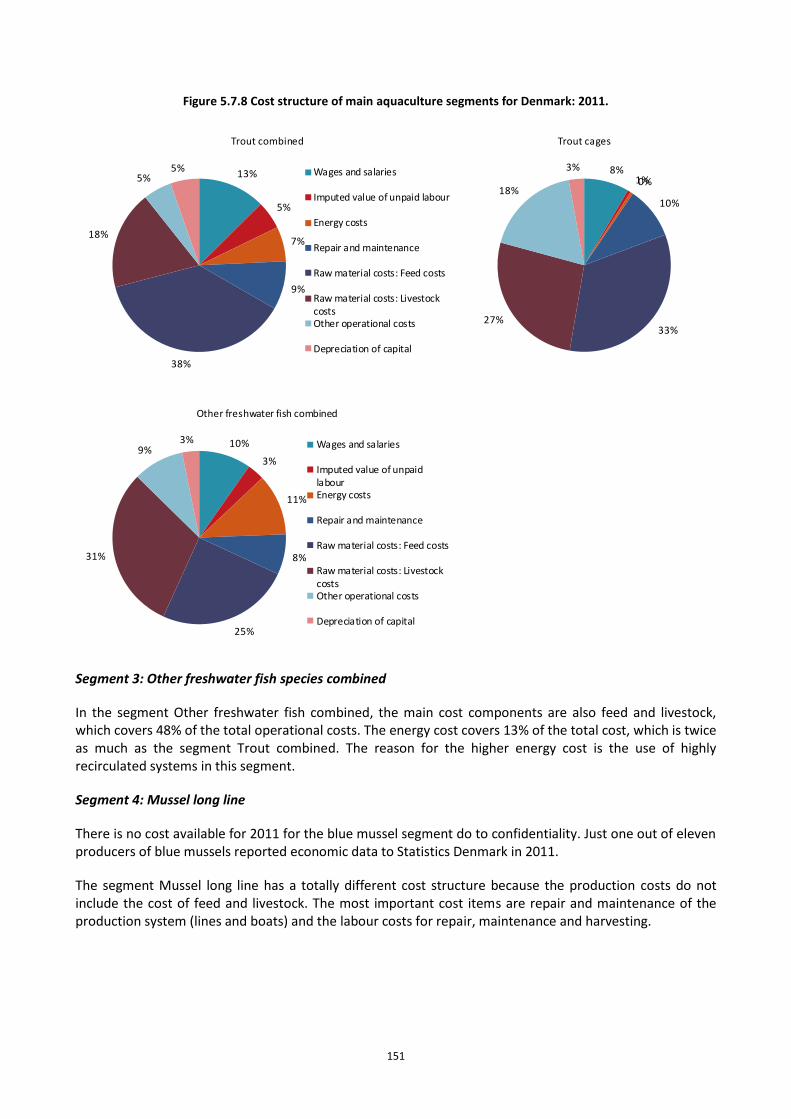
151
Figure 5.7.8 Cost structure of main aquaculture segments for Denmark: 2011.
13%
5%
7%
9%
38%
18%
5%5%
Trout combined
Wages and salaries
Imputed value of unpaid labour
Energy costs
Repair and maintenance
Raw material costs: Feed costs
Raw material costs: LivestockcostsOther operational costs
Depreciation of capital
8%1%0%
10%
33%27%
18%
3%
Trout cages
10%
3%
11%
8%
25%
31%
9%3%
Other freshwater fish combined
Wages and salaries
Imputed value of unpaidlabourEnergy costs
Repair and maintenance
Raw material costs: Feed costs
Raw material costs: LivestockcostsOther operational costs
Depreciation of capital
Segment 3: Other freshwater fish species combined
In the segment Other freshwater fish combined, the main cost components are also feed and livestock, which covers 48% of the total operational costs. The energy cost covers 13% of the total cost, which is twice as much as the segment Trout combined. The reason for the higher energy cost is the use of highly recirculated systems in this segment.
Segment 4: Mussel long line
There is no cost available for 2011 for the blue mussel segment do to confidentiality. Just one out of eleven producers of blue mussels reported economic data to Statistics Denmark in 2011.
The segment Mussel long line has a totally different cost structure because the production costs do not include the cost of feed and livestock. The most important cost items are repair and maintenance of the production system (lines and boats) and the labour costs for repair, maintenance and harvesting.
152
5.7.3 Trends and triggers of the Danish aquaculture sector
Growth in aquaculture has been on the political agenda for a long time in Denmark, the EU and OECD, as a possible solution for increasing the availability of fish for human consumption. In the EU and Denmark, the main goal has been to raise production to become more self-sufficient inside the EU and to create jobs, both in the primary industry and the fish processing sector. However, over the last 20 years growth in Denmark, the EU and most OECD countries has stagnated.
Growth in the aquaculture sector is desirable, because the demand for fish is increasing; the capture fisheries have stagnated and the dependency on imported fish is growing inside the EU. Inside the European Union, attempts have been made to increase aquaculture production in a sustainable way (European Commission 2002, 2009)1, but so far without success. The failed attempts to achieve sustainable growth under the existing regulatory regime based on command and control have increased the need to analyse alternative regulation and management policies of the aquaculture sector if the aim of sustainable growth is to be reached.
Currently, most of the Danish aquaculture sector is regulated by farm specific feed quotas. Feed is the most important input and accounts for more than 40% of the costs. In a specialized aquaculture production, there are only limited or zero substitution possibilities for feed. The use of feed is, therefore, closely linked to the possible production, and thereby to the pollution discharged from the farm. The existing regulation secures that the overall level of nitrogen pollution is not exceeded. However, a new technology introduced in Denmark can reduce nitrogen pollution by 30-50% per kilo of fish produced. Reducing the level of nitrogen is expected to also reduce the levels of other externalities, such as phosphorus and organic material. This technical solution may offer the possibility of realizing growth without increasing existing levels of pollution. Results in Nielsen (2011, 2012)2 suggest that the shift to new environmentally friendly technology has no significant impact on farm efficiency. However, the new technology will only be implemented if farmers have an incentive to do so, which is not present under the existing regulation.
In 2012, a new regulation based on individual quotas on nitrogen was implemented in Denmark, but it is under revision in 2013. The reason is that the changed regulation in 2012 is still focusing on regulating input and how the farmers should produce, instead of focusing on the environmental impact of the farms. Another problem is that the bureaucracy is staggering when the farmers are applying for a transfer from the old to the new system. This means that farmers at the moment actually have to wait 3 to 5 years on getting a new permit.
In Denmark, the ambition is to increase Danish fresh water aquaculture production from about 30,000 to 60,000 tonnes and marine aquaculture production from 10.000 to 40.000 tonnes. Overall, the aquaculture production should increase from 40,000 to 115,000 tonnes.
1 European Commission, 2002. Communication from the Commission on a Strategy for the Sustainable Development
of European Aquaculture – EUR. COM(2002) 511. European Commission, 2009. Communication from the Commission to the European Parliament and Council. Building a sustainable future for aquaculture. A new impetus for the Strategy for the Sustainable Development of European Aquaculture. COM(2009) 162 final.
2 Nielsen, R. (2011) Green and Technical Efficient Growth in Danish Fresh Water Aquaculture. Aquaculture Economics
& Management and Nielsen, R. (2012) Introducing individual transferable quotas on nitrogen in Danish fresh water aquaculture: production and profitability gains. Ecological Economics, vol. 75, s. 83-90.
153
Issues of special interest
In Denmark, a few farms are experimenting on the production of new species and using new technology. So far, the most successful project is the production of pike perch in recirculating systems. Furthermore a minor production of turbot fingerlings exists, where the fingerlings are used for restocking and some are exported to Holland and Spain. Two new large land based recirculation systems have been set up for the production of Atlantic salmon. In a land based facility the control of the production process is higher than in a sea cage farm and there is a better opportunity to control the pollution of nitrogen, phosphorus and organic material etc., on the other hand, the operational cost is expected to be higher than in the sea cage farms. When the two farms are fully operational they will produce up to 8,000 tonnes.
Current production trends and main drivers
The main reason for the increase in the marine production in Denmark is the higher prices on larger trout produced in sea cages. The price is driven by the salmon price, which has been high since the disease crises in Chile. However to expand the production further the industry needs new licenses. If no new licenses are issued the industry production will stay at the current level around 10,000 tonnes.
The land based production has shown a downward trend of production over the years. The production is expected to increase slightly when the new regulation going from feed quotas to nitrogen quotas are fully implemented, however, the transition takes time and the results of the change will most likely first show in a couple of years. Furthermore, if the sector is to expand more than a few thousand tonnes, new licenses have to be given to the farmers.
Mussel farming in Denmark is struggling and the future for this segment is very unpredictable. However, mussel and sea weed farming as a mean to reduce the environmental impact from the sea cage farms are expected to grow, if the farms are allowed to expand production.
Market structure
The Danish aquaculture sector has managed to increasing labour productivity over the period investigated. The labour cost per unit of output is also relatively low compared to other countries producing trout.
The Danish sector consists of many small producers at the primary level, where there is only two enterprises buying and processing the trout. This market structure can be a hindrance because the market is not well functioning and competitive.
In recent years a segment of organic aquaculture producers has been established. In total, there are eight land based farms producing trout, one blue mussel farm and one sea cage farm producing trout. The organic producers have higher costs for feed and fry, but they are also receiving a price premium for their products. However, the segment is producing less than 100 tonnes and it is questionable how large the production volume can grow before the price premium will disappear.
Spatial planning
In Denmark, the spatial planning for sea based aquaculture is placed at national level. A spatial plan for sea based aquaculture has been developed in 2003 and has been reviewed recently taking into account the interactions with other uses of the coastal zones, such as recreational activities, fishing, wind farms, traffic and special protected areas such as Nature 2000. Nevertheless, no new licenses have been issued.
The spatial planning of land based aquaculture is placed at the municipality level. A spatial plan for land based aquaculture has been developed by some municipalities, but also here the use of these plans has been rather limited.
154
Outlook for 2012 and 2013
For the Danish trout producers 2013 is expected to be better than 2011. The reason is that the Danish regulation for aquaculture production has changed in 2012. The change in regulation should provide the producers with an incentive to introduce more environmental friendly technology in order to raise production. However, it is questionable if the production increase will influence on the production in 2012 and 2013.
The eel farmers are expected to decrease production due to the restriction on the harvesting of glass eels. Furthermore, this restriction drives up prices on glass eels making it less profitable to produce eel. The mussel farmers are expected to increase production and turnover, but it is still questionable if the profit will be positive.
5.7.4 Data Coverage and Data Quality of the Danish aquaculture sector
Data quality
The account statistic for 2011 is based on a sample of 120 aquaculture farms, which covers 54% of the total population of 223 farms. The sample covers 78% of the total income of the population. Furthermore, data on sales volume and value, purchase of livestock raw material of fish are available for all farms.
The Danish Directorate of Fisheries has registered the total population of farms and enterprises engaged in aquaculture production in Denmark. It is mandatory for all aquaculture producers in Denmark to report the production in volume and value each year at the farm level. Furthermore, the species produced and the technique used in the production is reported.
The data for The Danish Account Statistics for Aquaculture is collected by Statistics Denmark. The collection is based on the total population of farms provided by The Danish Directorate of Fisheries. The data is collected at farm level, and can be aggregated to the enterprise level. The data is collected at farm level to get the most homogeneous segments in terms of species and technique. The Danish Account Statistics for Aquaculture collects economic data for costs and earnings and balance sheets. Data is collected on a voluntary basis from the owner’s chartered accountant. The accountant’s task is to report the accounts of his aquaculture clients to Statistics Denmark in a special form where the account information is harmonized for statistical use. Statistics Denmark validates the data from each account in a specially designed data system for quality control. The Danish Commerce and Companies Agency (DCCA) also collect account data for enterprises, but not for single holders. For enterprises which are not reported by the chartered accountant, the accounts from DCCA are used.
The extrapolation of the sample to the total population is done in two steps. In the first step all results from the collected accounts are entered into a database containing information on all existing aquaculture producers in Denmark. From the collected accounts an average is calculated for all indicators in each segment. In the second step, an account for the remaining population is estimated based on the average calculated in the first step and the information collected by the Danish Directorate of Fisheries. The underlying assumptions for this calculation are that the production function for each farm is identical within each segment. When the production function is identical, the costs and earnings can be distributed from the sales volume and value in each account.
Data availability
Data for the aquaculture sector is published once a year on both an aggregated farm and enterprise level for each segment. The aquaculture statistics are published on Statistics Denmark’s website approximately 12 months after the end of the reference year.
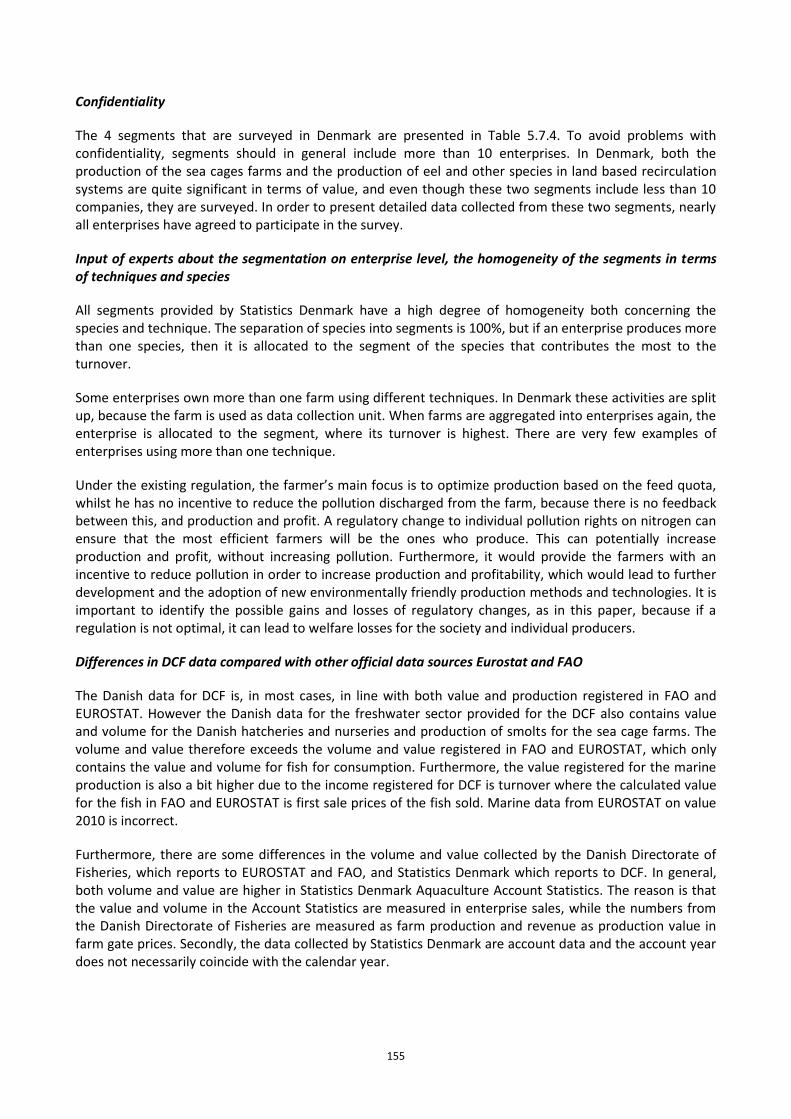
155
Confidentiality
The 4 segments that are surveyed in Denmark are presented in Table 5.7.4. To avoid problems with confidentiality, segments should in general include more than 10 enterprises. In Denmark, both the production of the sea cages farms and the production of eel and other species in land based recirculation systems are quite significant in terms of value, and even though these two segments include less than 10 companies, they are surveyed. In order to present detailed data collected from these two segments, nearly all enterprises have agreed to participate in the survey.
Input of experts about the segmentation on enterprise level, the homogeneity of the segments in terms of techniques and species
All segments provided by Statistics Denmark have a high degree of homogeneity both concerning the species and technique. The separation of species into segments is 100%, but if an enterprise produces more than one species, then it is allocated to the segment of the species that contributes the most to the turnover.
Some enterprises own more than one farm using different techniques. In Denmark these activities are split up, because the farm is used as data collection unit. When farms are aggregated into enterprises again, the enterprise is allocated to the segment, where its turnover is highest. There are very few examples of enterprises using more than one technique.
Under the existing regulation, the farmer’s main focus is to optimize production based on the feed quota, whilst he has no incentive to reduce the pollution discharged from the farm, because there is no feedback between this, and production and profit. A regulatory change to individual pollution rights on nitrogen can ensure that the most efficient farmers will be the ones who produce. This can potentially increase production and profit, without increasing pollution. Furthermore, it would provide the farmers with an incentive to reduce pollution in order to increase production and profitability, which would lead to further development and the adoption of new environmentally friendly production methods and technologies. It is important to identify the possible gains and losses of regulatory changes, as in this paper, because if a regulation is not optimal, it can lead to welfare losses for the society and individual producers.
Differences in DCF data compared with other official data sources Eurostat and FAO
The Danish data for DCF is, in most cases, in line with both value and production registered in FAO and EUROSTAT. However the Danish data for the freshwater sector provided for the DCF also contains value and volume for the Danish hatcheries and nurseries and production of smolts for the sea cage farms. The volume and value therefore exceeds the volume and value registered in FAO and EUROSTAT, which only contains the value and volume for fish for consumption. Furthermore, the value registered for the marine production is also a bit higher due to the income registered for DCF is turnover where the calculated value for the fish in FAO and EUROSTAT is first sale prices of the fish sold. Marine data from EUROSTAT on value 2010 is incorrect.
Furthermore, there are some differences in the volume and value collected by the Danish Directorate of Fisheries, which reports to EUROSTAT and FAO, and Statistics Denmark which reports to DCF. In general, both volume and value are higher in Statistics Denmark Aquaculture Account Statistics. The reason is that the value and volume in the Account Statistics are measured in enterprise sales, while the numbers from the Danish Directorate of Fisheries are measured as farm production and revenue as production value in farm gate prices. Secondly, the data collected by Statistics Denmark are account data and the account year does not necessarily coincide with the calendar year.
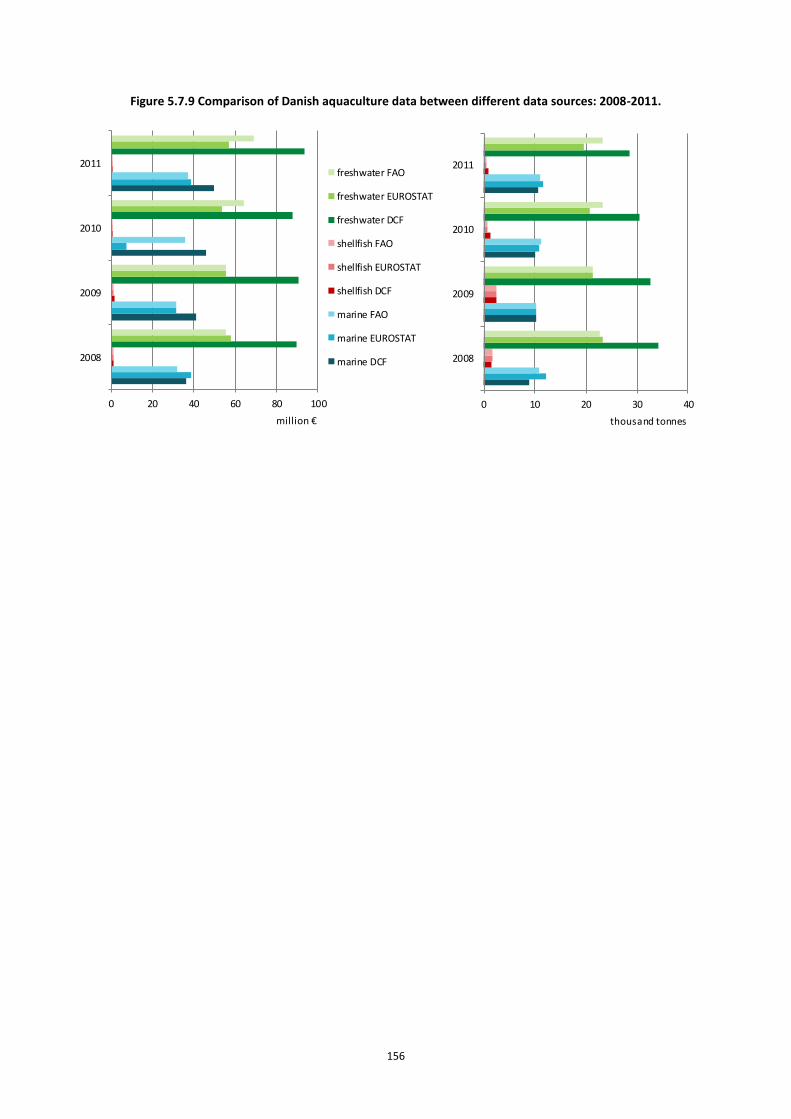
156
Figure 5.7.9 Comparison of Danish aquaculture data between different data sources: 2008-2011.
0 20 40 60 80 100
2008
2009
2010
2011
million €
freshwater FAO
freshwater EUROSTAT
freshwater DCF
shellfish FAO
shellfish EUROSTAT
shellfish DCF
marine FAO
marine EUROSTAT
marine DCF
0 10 20 30 40
2008
2009
2010
2011
thousand tonnes
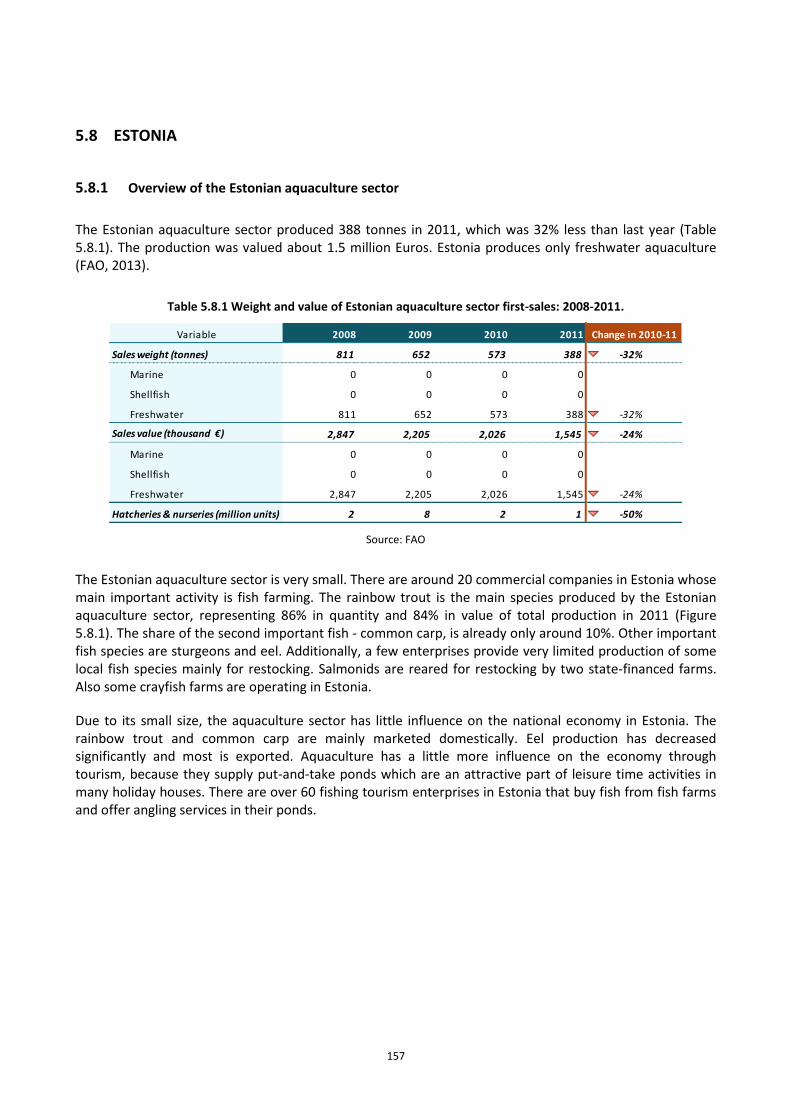
157
5.8 ESTONIA
5.8.1 Overview of the Estonian aquaculture sector
The Estonian aquaculture sector produced 388 tonnes in 2011, which was 32% less than last year (Table 5.8.1). The production was valued about 1.5 million Euros. Estonia produces only freshwater aquaculture (FAO, 2013).
Table 5.8.1 Weight and value of Estonian aquaculture sector first-sales: 2008-2011.
Variable 2008 2009 2010 2011
Sales weight (tonnes) 811 652 573 388 -32% ↘
Marine 0 0 0 0
Shellfish 0 0 0 0
Freshwater 811 652 573 388 -32% ↘
Sales value (thousand €) 2,847 2,205 2,026 1,545 -24% ↘
Marine 0 0 0 0
Shellfish 0 0 0 0
Freshwater 2,847 2,205 2,026 1,545 -24% ↘
Hatcheries & nurseries (million units) 2 8 2 1 -50% ↘
Change in 2010-11
Source: FAO
The Estonian aquaculture sector is very small. There are around 20 commercial companies in Estonia whose main important activity is fish farming. The rainbow trout is the main species produced by the Estonian aquaculture sector, representing 86% in quantity and 84% in value of total production in 2011 (Figure 5.8.1). The share of the second important fish - common carp, is already only around 10%. Other important fish species are sturgeons and eel. Additionally, a few enterprises provide very limited production of some local fish species mainly for restocking. Salmonids are reared for restocking by two state-financed farms. Also some crayfish farms are operating in Estonia.
Due to its small size, the aquaculture sector has little influence on the national economy in Estonia. The rainbow trout and common carp are mainly marketed domestically. Eel production has decreased significantly and most is exported. Aquaculture has a little more influence on the economy through tourism, because they supply put-and-take ponds which are an attractive part of leisure time activities in many holiday houses. There are over 60 fishing tourism enterprises in Estonia that buy fish from fish farms and offer angling services in their ponds.
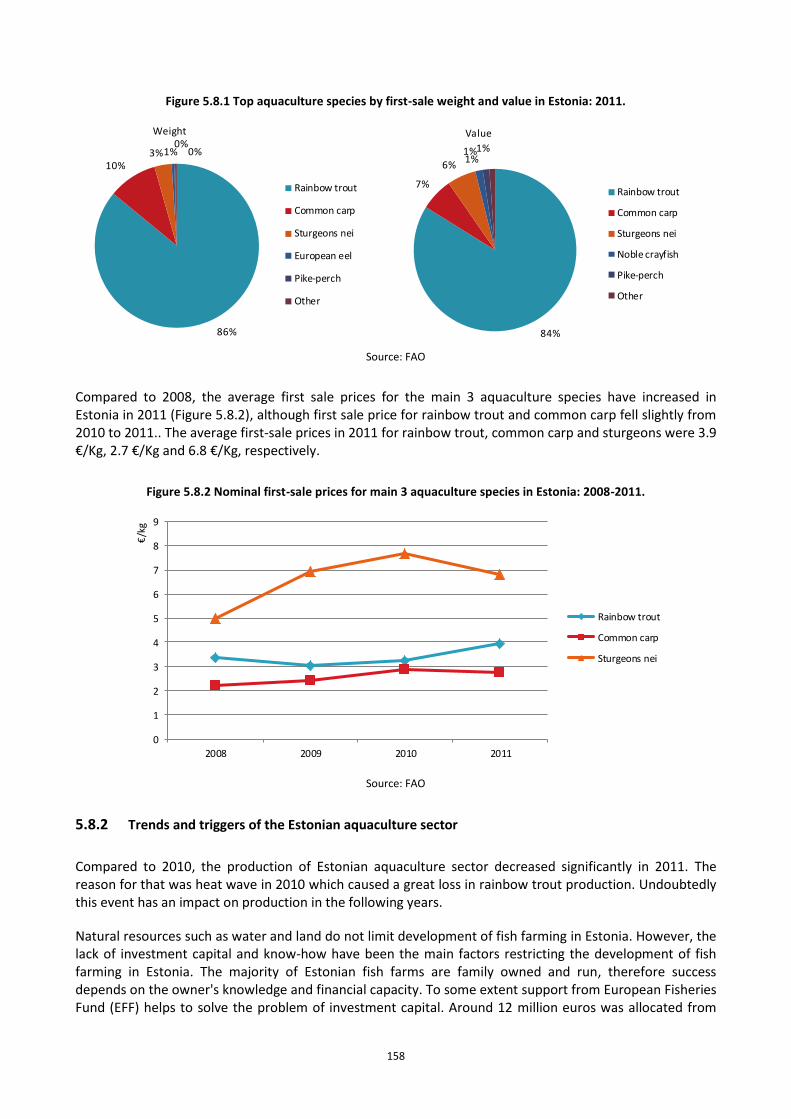
158
Figure 5.8.1 Top aquaculture species by first-sale weight and value in Estonia: 2011.
86%
10%3%1%
0%0%
Weight
Rainbow trout
Common carp
Sturgeons nei
European eel
Pike-perch
Other
84%
7%
6%1%1%1%
Value
Rainbow trout
Common carp
Sturgeons nei
Noble crayfish
Pike-perch
Other
Source: FAO
Compared to 2008, the average first sale prices for the main 3 aquaculture species have increased in Estonia in 2011 (Figure 5.8.2), although first sale price for rainbow trout and common carp fell slightly from 2010 to 2011.. The average first-sale prices in 2011 for rainbow trout, common carp and sturgeons were 3.9 €/Kg, 2.7 €/Kg and 6.8 €/Kg, respectively.
Figure 5.8.2 Nominal first-sale prices for main 3 aquaculture species in Estonia: 2008-2011.
0
1
2
3
4
5
6
7
8
9
2008 2009 2010 2011
€/k
g
Rainbow trout
Common carp
Sturgeons nei
Source: FAO
5.8.2 Trends and triggers of the Estonian aquaculture sector
Compared to 2010, the production of Estonian aquaculture sector decreased significantly in 2011. The reason for that was heat wave in 2010 which caused a great loss in rainbow trout production. Undoubtedly this event has an impact on production in the following years.
Natural resources such as water and land do not limit development of fish farming in Estonia. However, the lack of investment capital and know-how have been the main factors restricting the development of fish farming in Estonia. The majority of Estonian fish farms are family owned and run, therefore success depends on the owner's knowledge and financial capacity. To some extent support from European Fisheries Fund (EFF) helps to solve the problem of investment capital. Around 12 million euros was allocated from
159
EFF Measure 2.1 (investment support for aquaculture) for the establishment and modernization of fish farms until 2012.
Fish farming in Estonia is also characterized by low production volumes and these low production volumes cannot secure year-round supply for large supermarket chains or attract the interest of exporters. The relatively high production cost of red-flesh trout makes it difficult to compete with similar products imported from Norway. However, some fish farms have started to add value for products through processing and increasing the quality (filleting, salting, marinating, smoking) which can help to broaden the market and raise profitability. Some enterprises are testing the cultivation of new fish species which may also expand marketing possibilities (e.g. African catfish, Arctic char, tilapia).
One of the main points that may affect the development of fish farming in Estonia was the introduction of environmental charges in 2011. Although the Environmental Charges Act entered force in 2006, it was not applied to fish farming until 2011. Now Estonian aquaculture production must compete on both the domestic and foreign markets with products from other countries where no pollution charges are applied.
There are also some positive trends in the Estonian aquaculture sector. One of them is that a vocational training centre started teaching fish farming in 2013. For this the Estonian Qualifications Authority prepared the Level 4 Fish Farmer occupational qualification standard and the National Examination and Qualification Centre developed the corresponding curriculum for fish farmers. To ensure a good level of teaching and practice, a training and experiment base established, with 839 thousand euros support from the EFF. Additionally, in 2012 the development of Estonia's aquaculture strategy was started, which should specify the future goals of the aquaculture sector.
5.8.3 Data Coverage and Data Quality of the Estonian aquaculture sector
Estonia did not submit aquaculture data for 2011 due to disagreement between the coordinating institution and institution engaged in economic data collection. The latter was not satisfied with the conditions of the new contract. Therefore FAO data was used in this analysis.
Looking at the FAO data a significant inaccuracy appeared. The total sales weight (811 tonnes) of Estonian aquaculture sector for 2008 is too high in the table 5.8.1. According to the Statistics Estonia and Eurostat this number should be halved (484 tonnes and 477 tonnes, respectively). FAO data for 2008 reflects rather stock weight. The data for the other years are quite similar. Although the DCF data was submitted by Estonia the previous years, they cannot be compared with FAO data presented in the chapter. Due to the small number of commercial fish farming companies it was reasonable to collect DCF data only concerning rainbow trout. For other species, the value of production was too small to justify any sampling activities, as well as problems with confidentiality issues.
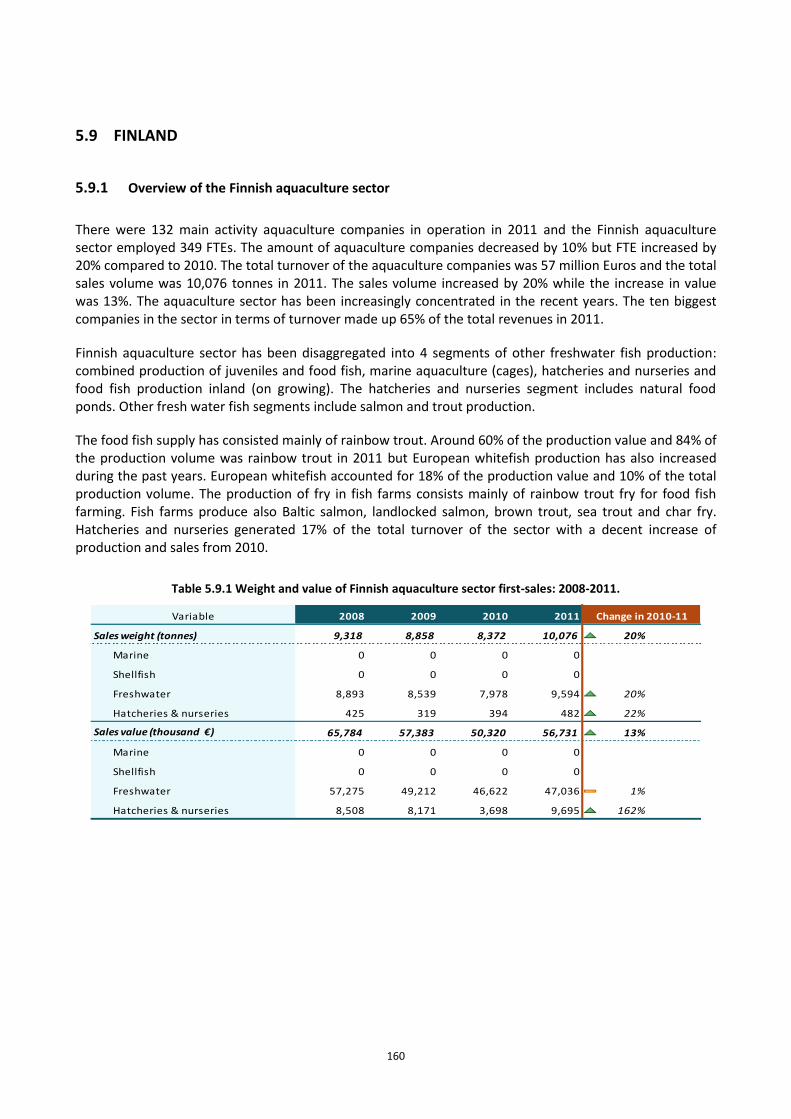
160
5.9 FINLAND
5.9.1 Overview of the Finnish aquaculture sector
There were 132 main activity aquaculture companies in operation in 2011 and the Finnish aquaculture sector employed 349 FTEs. The amount of aquaculture companies decreased by 10% but FTE increased by 20% compared to 2010. The total turnover of the aquaculture companies was 57 million Euros and the total sales volume was 10,076 tonnes in 2011. The sales volume increased by 20% while the increase in value was 13%. The aquaculture sector has been increasingly concentrated in the recent years. The ten biggest companies in the sector in terms of turnover made up 65% of the total revenues in 2011.
Finnish aquaculture sector has been disaggregated into 4 segments of other freshwater fish production: combined production of juveniles and food fish, marine aquaculture (cages), hatcheries and nurseries and food fish production inland (on growing). The hatcheries and nurseries segment includes natural food ponds. Other fresh water fish segments include salmon and trout production.
The food fish supply has consisted mainly of rainbow trout. Around 60% of the production value and 84% of the production volume was rainbow trout in 2011 but European whitefish production has also increased during the past years. European whitefish accounted for 18% of the production value and 10% of the total production volume. The production of fry in fish farms consists mainly of rainbow trout fry for food fish farming. Fish farms produce also Baltic salmon, landlocked salmon, brown trout, sea trout and char fry. Hatcheries and nurseries generated 17% of the total turnover of the sector with a decent increase of production and sales from 2010.
Table 5.9.1 Weight and value of Finnish aquaculture sector first-sales: 2008-2011.
Variable 2008 2009 2010 2011
Sales weight (tonnes) 9,318 8,858 8,372 10,076 20%
Marine 0 0 0 0
Shellfish 0 0 0 0
Freshwater 8,893 8,539 7,978 9,594 20%
Hatcheries & nurseries 425 319 394 482 22%
Sales value (thousand €) 65,784 57,383 50,320 56,731 13% ↗
Marine 0 0 0 0
Shellfish 0 0 0 0
Freshwater 57,275 49,212 46,622 47,036 1%
Hatcheries & nurseries 8,508 8,171 3,698 9,695 162%
Change in 2010-11
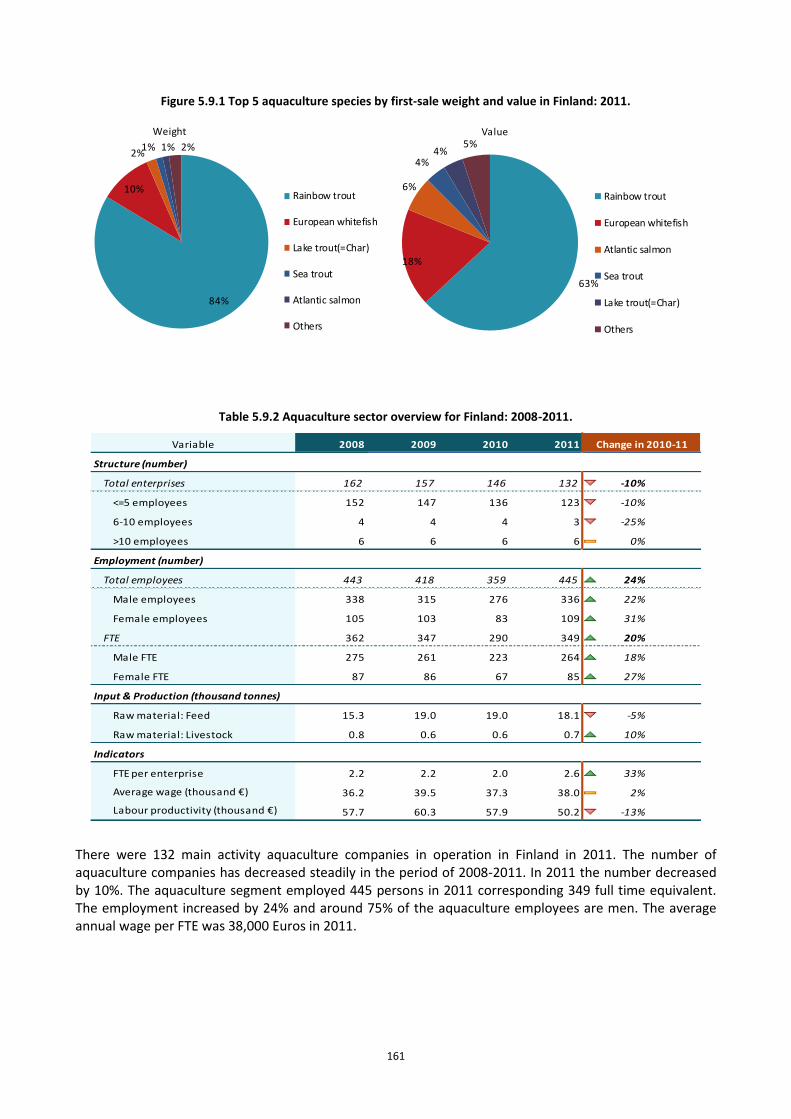
161
Figure 5.9.1 Top 5 aquaculture species by first-sale weight and value in Finland: 2011.
84%
10%
2%1% 1% 2%
Weight
Rainbow trout
European whitefish
Lake trout(=Char)
Sea trout
Atlantic salmon
Others
63%
18%
6%
4%4%
5%Value
Rainbow trout
European whitefish
Atlantic salmon
Sea trout
Lake trout(=Char)
Others
Table 5.9.2 Aquaculture sector overview for Finland: 2008-2011.
Variable 2008 2009 2010 2011
Structure (number)
Total enterprises 162 157 146 132 -10% ↔
<=5 employees 152 147 136 123 -10% ↘
6-10 employees 4 4 4 3 -25% ↘
>10 employees 6 6 6 6 0% ↔
Employment (number)
Total employees 443 418 359 445 24% ↗
Male employees 338 315 276 336 22% ↗
Female employees 105 103 83 109 31% ↗
FTE 362 347 290 349 20% ↗
Male FTE 275 261 223 264 18% ↗
Female FTE 87 86 67 85 27% ↗
Input & Production (thousand tonnes)
Raw material: Feed 15.3 19.0 19.0 18.1 -5% ↘
Raw material: Livestock 0.8 0.6 0.6 0.7 10%
Indicators
FTE per enterprise 2.2 2.2 2.0 2.6 33% ↗
Average wage (thousand €) 36.2 39.5 37.3 38.0 2% ↗
Labour productivity (thousand €) 57.7 60.3 57.9 50.2 -13% ↘
Change in 2010-11
There were 132 main activity aquaculture companies in operation in Finland in 2011. The number of aquaculture companies has decreased steadily in the period of 2008-2011. In 2011 the number decreased by 10%. The aquaculture segment employed 445 persons in 2011 corresponding 349 full time equivalent. The employment increased by 24% and around 75% of the aquaculture employees are men. The average annual wage per FTE was 38,000 Euros in 2011.
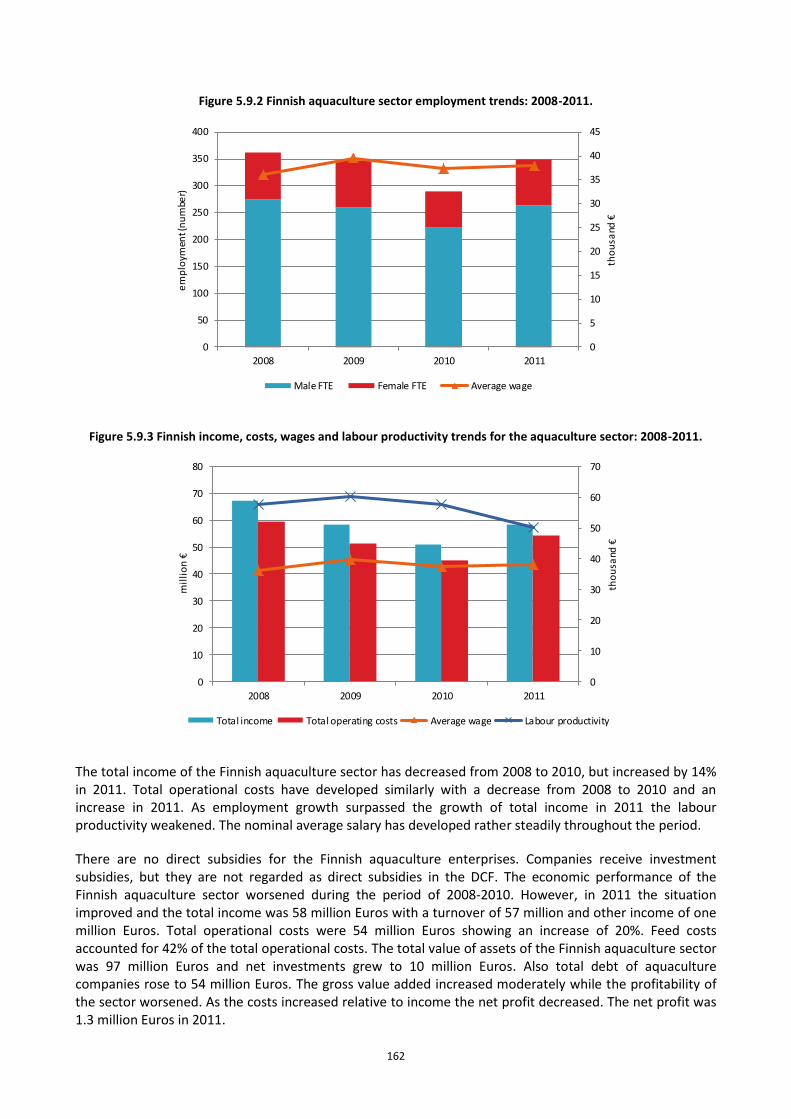
162
Figure 5.9.2 Finnish aquaculture sector employment trends: 2008-2011.
0
5
10
15
20
25
30
35
40
45
0
50
100
150
200
250
300
350
400
2008 2009 2010 2011
tho
usa
nd €
em
plo
ymen
t (n
um
ber)
Male FTE Female FTE Average wage
Figure 5.9.3 Finnish income, costs, wages and labour productivity trends for the aquaculture sector: 2008-2011.
0
10
20
30
40
50
60
70
0
10
20
30
40
50
60
70
80
2008 2009 2010 2011
tho
usa
nd €
mil
lio
n €
Total income Total operating costs Average wage Labour productivity
The total income of the Finnish aquaculture sector has decreased from 2008 to 2010, but increased by 14% in 2011. Total operational costs have developed similarly with a decrease from 2008 to 2010 and an increase in 2011. As employment growth surpassed the growth of total income in 2011 the labour productivity weakened. The nominal average salary has developed rather steadily throughout the period.
There are no direct subsidies for the Finnish aquaculture enterprises. Companies receive investment subsidies, but they are not regarded as direct subsidies in the DCF. The economic performance of the Finnish aquaculture sector worsened during the period of 2008-2010. However, in 2011 the situation improved and the total income was 58 million Euros with a turnover of 57 million and other income of one million Euros. Total operational costs were 54 million Euros showing an increase of 20%. Feed costs accounted for 42% of the total operational costs. The total value of assets of the Finnish aquaculture sector was 97 million Euros and net investments grew to 10 million Euros. Also total debt of aquaculture companies rose to 54 million Euros. The gross value added increased moderately while the profitability of the sector worsened. As the costs increased relative to income the net profit decreased. The net profit was 1.3 million Euros in 2011.
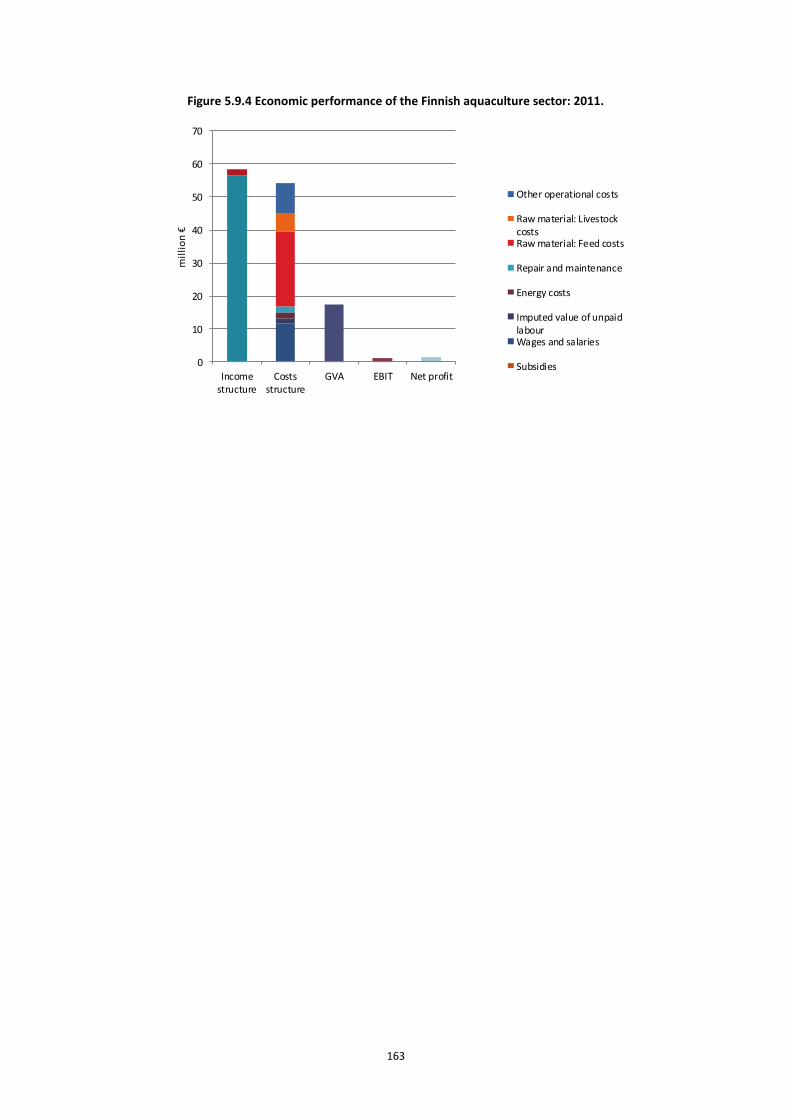
163
Figure 5.9.4 Economic performance of the Finnish aquaculture sector: 2011.
0
10
20
30
40
50
60
70
Incomestructure
Costsstructure
GVA EBIT Net profit
mil
lio
n €
Other operational costs
Raw material: LivestockcostsRaw material: Feed costs
Repair and maintenance
Energy costs
Imputed value of unpaidlabourWages and salaries
Subsidies
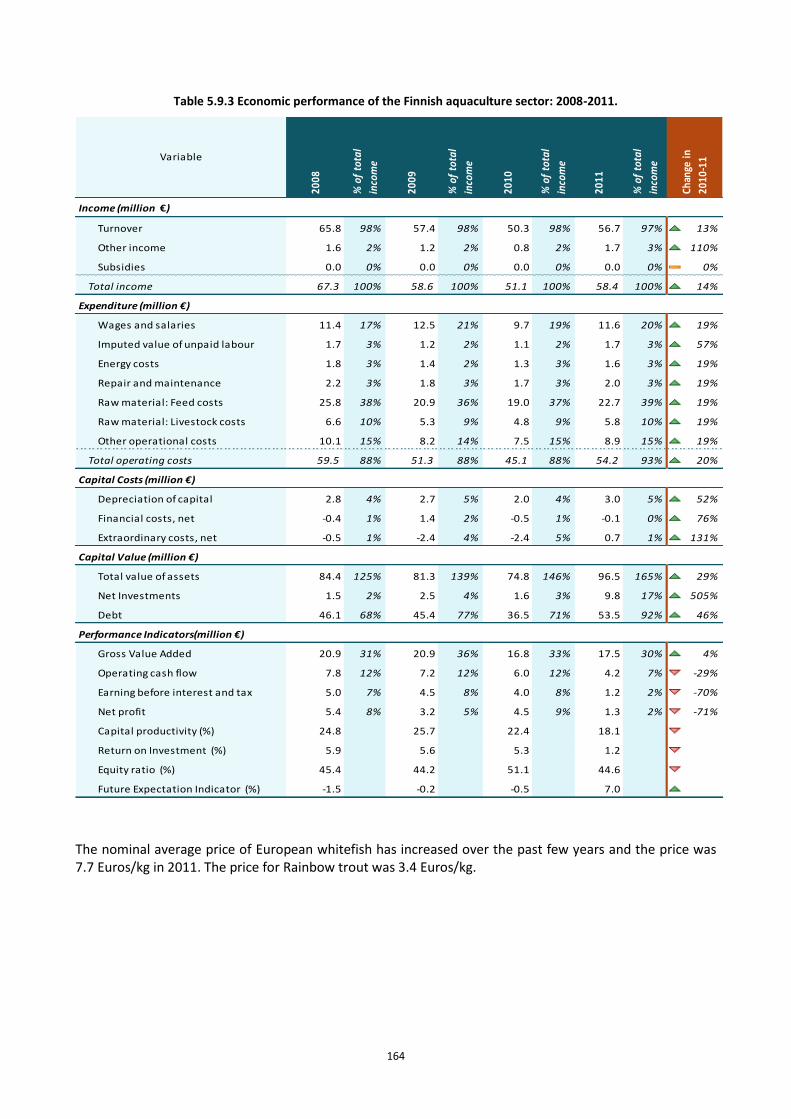
164
Table 5.9.3 Economic performance of the Finnish aquaculture sector: 2008-2011.
Income (million €)
Turnover 65.8 98% 57.4 98% 50.3 98% 56.7 97% 13%
Other income 1.6 2% 1.2 2% 0.8 2% 1.7 3% 110%
Subsidies 0.0 0% 0.0 0% 0.0 0% 0.0 0% 0%
Total income 67.3 100% 58.6 100% 51.1 100% 58.4 100% 14%
Expenditure (million €)
Wages and salaries 11.4 17% 12.5 21% 9.7 19% 11.6 20% 19%
Imputed value of unpaid labour 1.7 3% 1.2 2% 1.1 2% 1.7 3% 57%
Energy costs 1.8 3% 1.4 2% 1.3 3% 1.6 3% 19%
Repair and maintenance 2.2 3% 1.8 3% 1.7 3% 2.0 3% 19%
Raw material: Feed costs 25.8 38% 20.9 36% 19.0 37% 22.7 39% 19%
Raw material: Livestock costs 6.6 10% 5.3 9% 4.8 9% 5.8 10% 19%
Other operational costs 10.1 15% 8.2 14% 7.5 15% 8.9 15% 19%
Total operating costs 59.5 88% 51.3 88% 45.1 88% 54.2 93% 20%
Capital Costs (million €)
Depreciation of capital 2.8 4% 2.7 5% 2.0 4% 3.0 5% 52%
Financial costs, net -0.4 1% 1.4 2% -0.5 1% -0.1 0% 76%
Extraordinary costs, net -0.5 1% -2.4 4% -2.4 5% 0.7 1% 131%
Capital Value (million €)
Total value of assets 84.4 125% 81.3 139% 74.8 146% 96.5 165% 29%
Net Investments 1.5 2% 2.5 4% 1.6 3% 9.8 17% 505%
Debt 46.1 68% 45.4 77% 36.5 71% 53.5 92% 46%
Performance Indicators(million €)
Gross Value Added 20.9 31% 20.9 36% 16.8 33% 17.5 30% 4%
Operating cash flow 7.8 12% 7.2 12% 6.0 12% 4.2 7% -29%
Earning before interest and tax 5.0 7% 4.5 8% 4.0 8% 1.2 2% -70%
Net profit 5.4 8% 3.2 5% 4.5 9% 1.3 2% -71%
Capital productivity (%) 24.8 25.7 22.4 18.1 -19%
Return on Investment (%) 5.9 5.6 5.3 1.2 -77%
Equity ratio (%) 45.4 44.2 51.1 44.6 -13%
Future Expectation Indicator (%) -1.5 -0.2 -0.5 7.0 1446%
% o
f to
tal
inco
me
% o
f to
tal
inco
me
2010
2011
Chan
ge in
2010
-11
% o
f to
tal
inco
meVariable
% o
f to
tal
inco
me
2008
2009
The nominal average price of European whitefish has increased over the past few years and the price was 7.7 Euros/kg in 2011. The price for Rainbow trout was 3.4 Euros/kg.
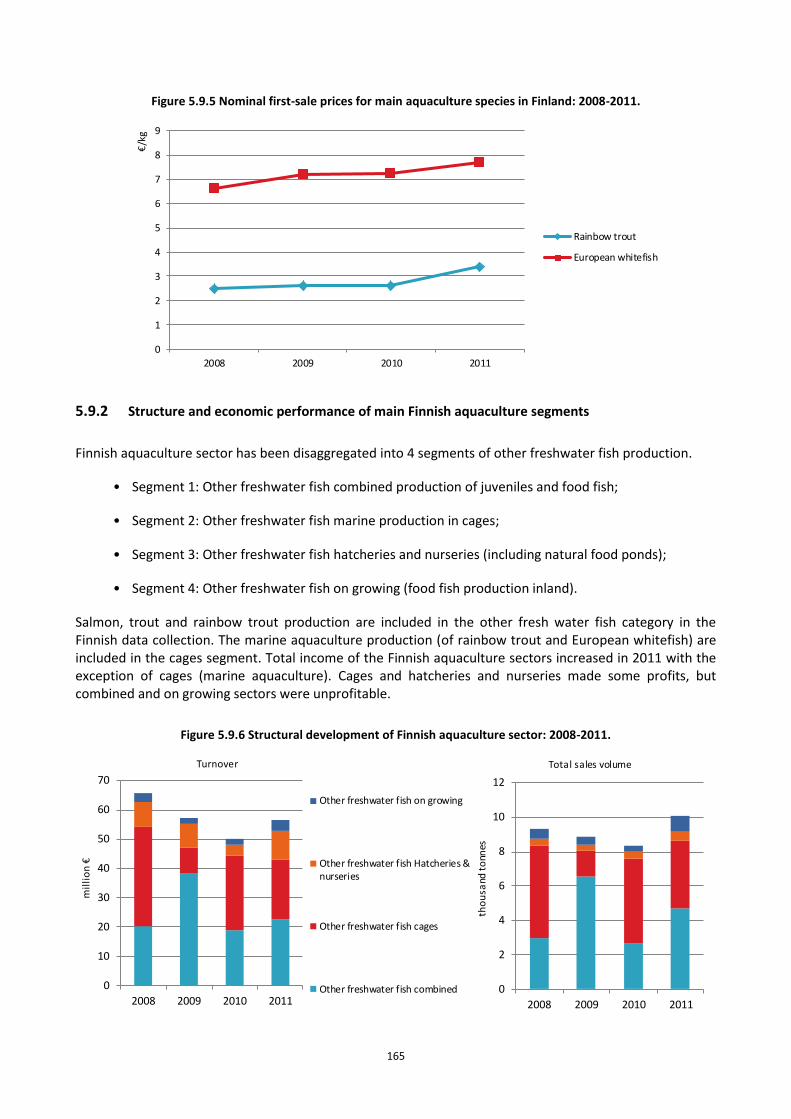
165
Figure 5.9.5 Nominal first-sale prices for main aquaculture species in Finland: 2008-2011.
0
1
2
3
4
5
6
7
8
9
2008 2009 2010 2011
€/k
g
Rainbow trout
European whitefish
5.9.2 Structure and economic performance of main Finnish aquaculture segments
Finnish aquaculture sector has been disaggregated into 4 segments of other freshwater fish production.
• Segment 1: Other freshwater fish combined production of juveniles and food fish;
• Segment 2: Other freshwater fish marine production in cages;
• Segment 3: Other freshwater fish hatcheries and nurseries (including natural food ponds);
• Segment 4: Other freshwater fish on growing (food fish production inland).
Salmon, trout and rainbow trout production are included in the other fresh water fish category in the Finnish data collection. The marine aquaculture production (of rainbow trout and European whitefish) are included in the cages segment. Total income of the Finnish aquaculture sectors increased in 2011 with the exception of cages (marine aquaculture). Cages and hatcheries and nurseries made some profits, but combined and on growing sectors were unprofitable.
Figure 5.9.6 Structural development of Finnish aquaculture sector: 2008-2011.
0
10
20
30
40
50
60
70
2008 2009 2010 2011
mil
lio
n €
Turnover
Other freshwater fish on growing
Other freshwater fish Hatcheries &nurseries
Other freshwater fish cages
Other freshwater fish combined 0
2
4
6
8
10
12
2008 2009 2010 2011
tho
usa
nd t
onn
es
Total sales volume
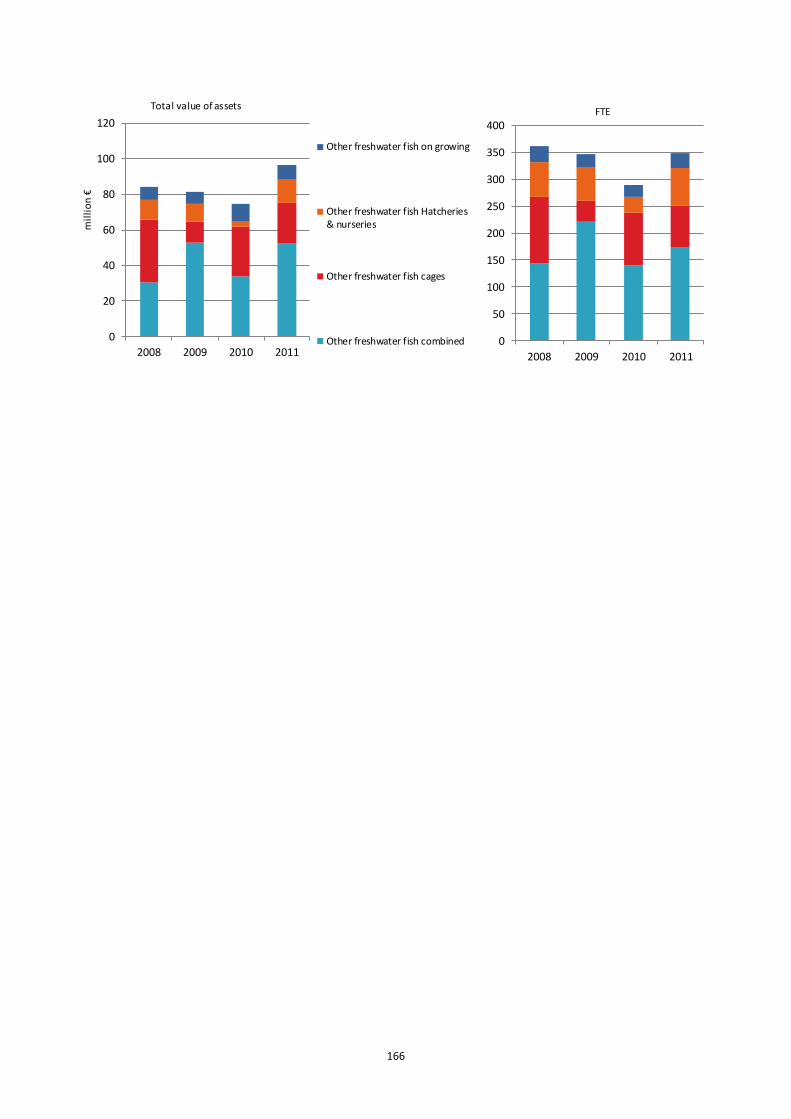
166
0
20
40
60
80
100
120
2008 2009 2010 2011
mil
lio
n €
Total value of assets
Other freshwater fish on growing
Other freshwater fish Hatcheries& nurseries
Other freshwater fish cages
Other freshwater fish combined 0
50
100
150
200
250
300
350
400
2008 2009 2010 2011
FTE
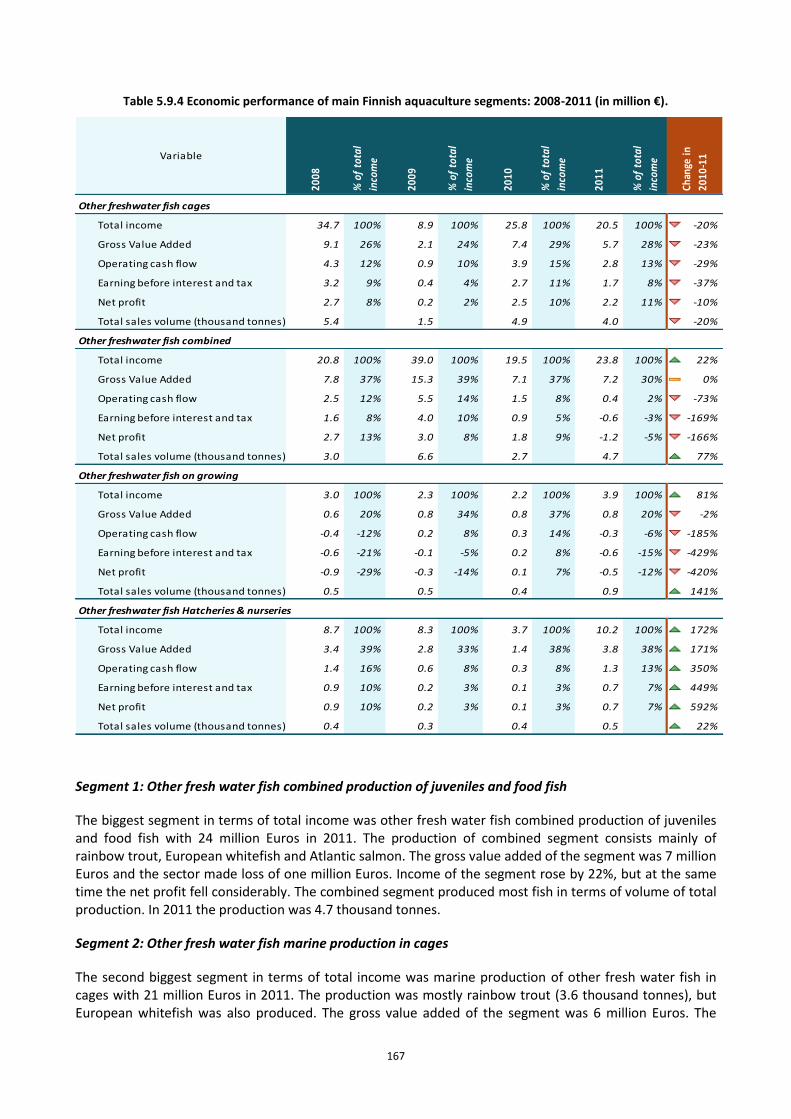
167
Table 5.9.4 Economic performance of main Finnish aquaculture segments: 2008-2011 (in million €).
Other freshwater fish cages
Total income 34.7 100% 8.9 100% 25.8 100% 20.5 100% -20%
Gross Value Added 9.1 26% 2.1 24% 7.4 29% 5.7 28% -23%
Operating cash flow 4.3 12% 0.9 10% 3.9 15% 2.8 13% -29%
Earning before interest and tax 3.2 9% 0.4 4% 2.7 11% 1.7 8% -37%
Net profit 2.7 8% 0.2 2% 2.5 10% 2.2 11% -10%
Total sales volume (thousand tonnes) 5.4 1.5 4.9 4.0 -20%
Other freshwater fish combined
Total income 20.8 100% 39.0 100% 19.5 100% 23.8 100% 22%
Gross Value Added 7.8 37% 15.3 39% 7.1 37% 7.2 30% 0%
Operating cash flow 2.5 12% 5.5 14% 1.5 8% 0.4 2% -73%
Earning before interest and tax 1.6 8% 4.0 10% 0.9 5% -0.6 -3% -169%
Net profit 2.7 13% 3.0 8% 1.8 9% -1.2 -5% -166%
Total sales volume (thousand tonnes) 3.0 6.6 2.7 4.7 77%
Other freshwater fish on growing
Total income 3.0 100% 2.3 100% 2.2 100% 3.9 100% 81%
Gross Value Added 0.6 20% 0.8 34% 0.8 37% 0.8 20% -2%
Operating cash flow -0.4 -12% 0.2 8% 0.3 14% -0.3 -6% -185%
Earning before interest and tax -0.6 -21% -0.1 -5% 0.2 8% -0.6 -15% -429%
Net profit -0.9 -29% -0.3 -14% 0.1 7% -0.5 -12% -420%
Total sales volume (thousand tonnes) 0.5 0.5 0.4 0.9 141%
Other freshwater fish Hatcheries & nurseries
Total income 8.7 100% 8.3 100% 3.7 100% 10.2 100% 172%
Gross Value Added 3.4 39% 2.8 33% 1.4 38% 3.8 38% 171%
Operating cash flow 1.4 16% 0.6 8% 0.3 8% 1.3 13% 350%
Earning before interest and tax 0.9 10% 0.2 3% 0.1 3% 0.7 7% 449%
Net profit 0.9 10% 0.2 3% 0.1 3% 0.7 7% 592%
Total sales volume (thousand tonnes) 0.4 0.3 0.4 0.5 22%
% o
f to
tal
inco
me
Chan
ge in
2010
-11Variable
2008
% o
f to
tal
inco
me
2009
% o
f to
tal
inco
me
2010
% o
f to
tal
inco
me
2011
Segment 1: Other fresh water fish combined production of juveniles and food fish
The biggest segment in terms of total income was other fresh water fish combined production of juveniles and food fish with 24 million Euros in 2011. The production of combined segment consists mainly of rainbow trout, European whitefish and Atlantic salmon. The gross value added of the segment was 7 million Euros and the sector made loss of one million Euros. Income of the segment rose by 22%, but at the same time the net profit fell considerably. The combined segment produced most fish in terms of volume of total production. In 2011 the production was 4.7 thousand tonnes.
Segment 2: Other fresh water fish marine production in cages
The second biggest segment in terms of total income was marine production of other fresh water fish in cages with 21 million Euros in 2011. The production was mostly rainbow trout (3.6 thousand tonnes), but European whitefish was also produced. The gross value added of the segment was 6 million Euros. The
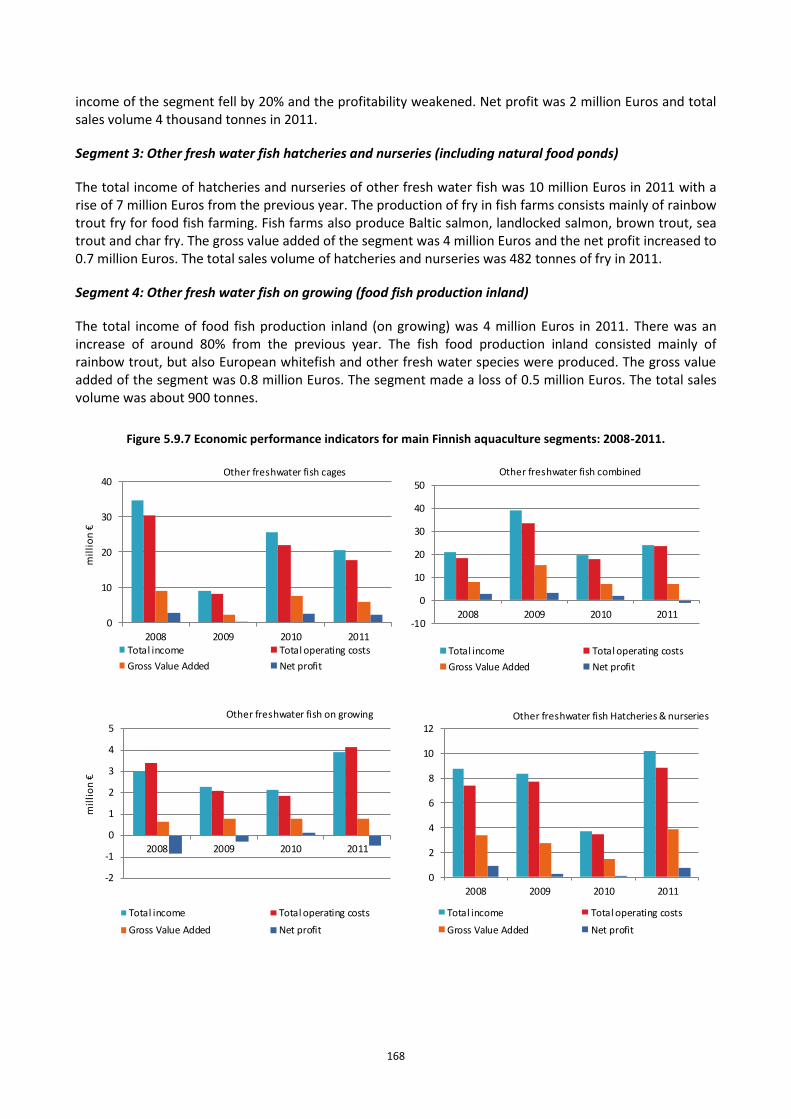
168
income of the segment fell by 20% and the profitability weakened. Net profit was 2 million Euros and total sales volume 4 thousand tonnes in 2011.
Segment 3: Other fresh water fish hatcheries and nurseries (including natural food ponds)
The total income of hatcheries and nurseries of other fresh water fish was 10 million Euros in 2011 with a rise of 7 million Euros from the previous year. The production of fry in fish farms consists mainly of rainbow trout fry for food fish farming. Fish farms also produce Baltic salmon, landlocked salmon, brown trout, sea trout and char fry. The gross value added of the segment was 4 million Euros and the net profit increased to 0.7 million Euros. The total sales volume of hatcheries and nurseries was 482 tonnes of fry in 2011.
Segment 4: Other fresh water fish on growing (food fish production inland)
The total income of food fish production inland (on growing) was 4 million Euros in 2011. There was an increase of around 80% from the previous year. The fish food production inland consisted mainly of rainbow trout, but also European whitefish and other fresh water species were produced. The gross value added of the segment was 0.8 million Euros. The segment made a loss of 0.5 million Euros. The total sales volume was about 900 tonnes.
Figure 5.9.7 Economic performance indicators for main Finnish aquaculture segments: 2008-2011.
0
10
20
30
40
2008 2009 2010 2011
mil
lio
n €
Other freshwater fish cages
Total income Total operating costs
Gross Value Added Net profit
-10
0
10
20
30
40
50
2008 2009 2010 2011
Other freshwater fish combined
Total income Total operating costs
Gross Value Added Net profit
-2
-1
0
1
2
3
4
5
2008 2009 2010 2011
mil
lio
n €
Other freshwater fish on growing
Total income Total operating costs
Gross Value Added Net profit
0
2
4
6
8
10
12
2008 2009 2010 2011
Other freshwater fish Hatcheries & nurseries
Total income Total operating costs
Gross Value Added Net profit
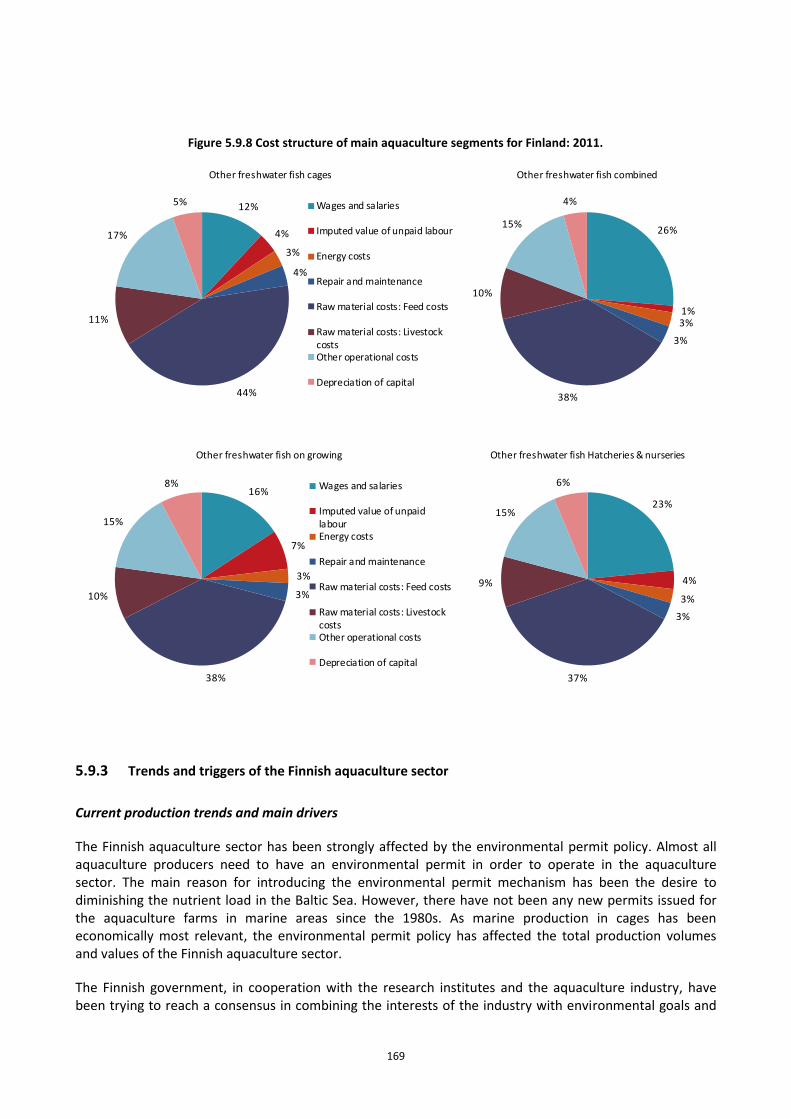
169
Figure 5.9.8 Cost structure of main aquaculture segments for Finland: 2011.
12%
4%
3%
4%
44%
11%
17%
5%
Other freshwater fish cages
Wages and salaries
Imputed value of unpaid labour
Energy costs
Repair and maintenance
Raw material costs: Feed costs
Raw material costs: LivestockcostsOther operational costs
Depreciation of capital
26%
1%3%
3%
38%
10%
15%
4%
Other freshwater fish combined
16%
7%
3%
3%
38%
10%
15%
8%
Other freshwater fish on growing
Wages and salaries
Imputed value of unpaidlabourEnergy costs
Repair and maintenance
Raw material costs: Feed costs
Raw material costs: LivestockcostsOther operational costs
Depreciation of capital
23%
4%
3%
3%
37%
9%
15%
6%
Other freshwater fish Hatcheries & nurseries
5.9.3 Trends and triggers of the Finnish aquaculture sector
Current production trends and main drivers
The Finnish aquaculture sector has been strongly affected by the environmental permit policy. Almost all aquaculture producers need to have an environmental permit in order to operate in the aquaculture sector. The main reason for introducing the environmental permit mechanism has been the desire to diminishing the nutrient load in the Baltic Sea. However, there have not been any new permits issued for the aquaculture farms in marine areas since the 1980s. As marine production in cages has been economically most relevant, the environmental permit policy has affected the total production volumes and values of the Finnish aquaculture sector.
The Finnish government, in cooperation with the research institutes and the aquaculture industry, have been trying to reach a consensus in combining the interests of the industry with environmental goals and
170
the discussion of new sustainable approach proceeds. If the current trend continues, the demand based food fish production might be threatened in the future.
Recirculating aquaculture systems have become more common in Finland in the recent years. With the current production volumes and expenditures of recirculating aquaculture systems the production will need to be concentrated in the more valuable species.
Market structure
The Finnish aquaculture sector has been increasingly concentrated. The ten biggest companies of the sector made up around 65% of the total revenues in 2011. And the concentration seems to continue as existing companies are buying the environmental permits from the farms and companies phasing out. The international competitiveness of the Finnish aquaculture sector has worsened during the past years as the production volumes have been down due to decreases in the environmental permits issued. The companies have been afraid to invest as there is no guarantee of the future developments.
Most investments have been made into recirculating aquaculture systems. However, the production capacity potential of recirculating aquaculture systems has not yet been fully fulfilled and there is an on-going process of research and development of new aquaculture techniques for Northern environments as well as continued testing for new species (eg. different applications of recirculating aquaculture systems).
Interactions with connected markets
There are several projects in action in Finland that are taking into account the benefits of aquaculture production throughout the whole value chain. There projects include, among other things, selective breeding programs and optimal feed programs. There are also innovations on developing environmentally friendlier and healthier feed and improving the feeding practices in general.
Trade
Almost all aquaculture production in Finland is consumed in the domestic market and the demand for domestic aquaculture products is growing even further. Only a few special products (fry and roe) are exported. Imports of aquaculture product account for about 40% of the total fish consumption in Finland. Aquaculture imports consist mostly of Norwegian salmon, Swedish rainbow trout, European whitefish and sea trout.
Developments on competitiveness and market performance of the sector
The competitiveness and performance of the sector is mostly connected to the price developments of fish, mainly rainbow trout and salmon, but also developments of the feed cost play an important role. As investments have been limited mostly to recirculating aquaculture systems the past trends on profitability do not tell the whole story of the competitiveness and the future evolution of the Finnish aquaculture sector.
Impacts of specific public sector initiatives and policies on production
The national spatial planning program of aquaculture is now under approval by the Ministry of the Environment and by the Ministry of Agriculture and Forestry. The national spatial planning program takes account of the different uses of marine areas and new approaches have been developed to plan and to coordinate these uses (e.g. Co-exist and Aguabest projects). However, the government attempts to improve the productivity and operating conditions of aquaculture companies have not yet been into action and it still remains to be seen how these reforms will boost the production.
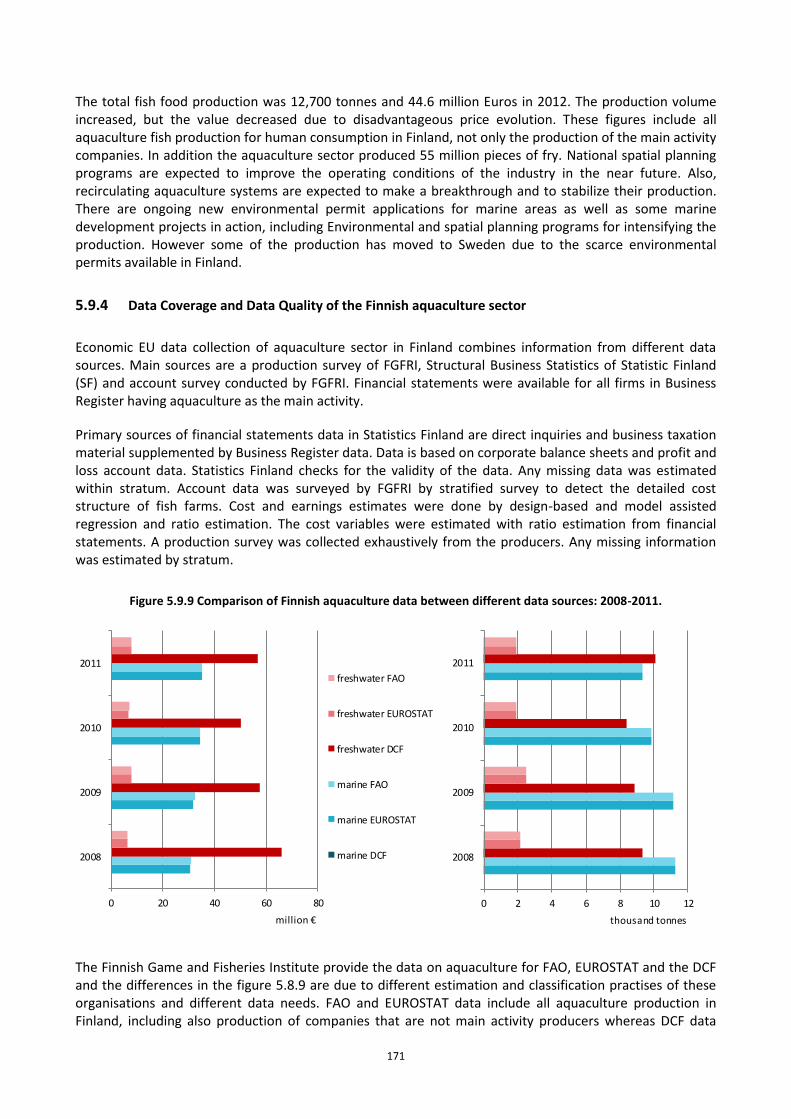
171
The total fish food production was 12,700 tonnes and 44.6 million Euros in 2012. The production volume increased, but the value decreased due to disadvantageous price evolution. These figures include all aquaculture fish production for human consumption in Finland, not only the production of the main activity companies. In addition the aquaculture sector produced 55 million pieces of fry. National spatial planning programs are expected to improve the operating conditions of the industry in the near future. Also, recirculating aquaculture systems are expected to make a breakthrough and to stabilize their production. There are ongoing new environmental permit applications for marine areas as well as some marine development projects in action, including Environmental and spatial planning programs for intensifying the production. However some of the production has moved to Sweden due to the scarce environmental permits available in Finland.
5.9.4 Data Coverage and Data Quality of the Finnish aquaculture sector
Economic EU data collection of aquaculture sector in Finland combines information from different data sources. Main sources are a production survey of FGFRI, Structural Business Statistics of Statistic Finland (SF) and account survey conducted by FGFRI. Financial statements were available for all firms in Business Register having aquaculture as the main activity.
Primary sources of financial statements data in Statistics Finland are direct inquiries and business taxation material supplemented by Business Register data. Data is based on corporate balance sheets and profit and loss account data. Statistics Finland checks for the validity of the data. Any missing data was estimated within stratum. Account data was surveyed by FGFRI by stratified survey to detect the detailed cost structure of fish farms. Cost and earnings estimates were done by design-based and model assisted regression and ratio estimation. The cost variables were estimated with ratio estimation from financial statements. A production survey was collected exhaustively from the producers. Any missing information was estimated by stratum.
Figure 5.9.9 Comparison of Finnish aquaculture data between different data sources: 2008-2011.
0 20 40 60 80
2008
2009
2010
2011
million €
freshwater FAO
freshwater EUROSTAT
freshwater DCF
marine FAO
marine EUROSTAT
marine DCF
0 2 4 6 8 10 12
2008
2009
2010
2011
thousand tonnes
The Finnish Game and Fisheries Institute provide the data on aquaculture for FAO, EUROSTAT and the DCF and the differences in the figure 5.8.9 are due to different estimation and classification practises of these organisations and different data needs. FAO and EUROSTAT data include all aquaculture production in Finland, including also production of companies that are not main activity producers whereas DCF data
172
includes only those companies that have aquaculture as their main business activity. In addition EUROSTAT and FAO data include only food fish production and no juvenile or fry production. Both fish produced for human consumption and fry are included in the DCF data. The DCF data here should be regarded as total aquaculture production of Finland (including both marine and inland production) due to classification by fish species rather than division to marine and inland. In figure 5.8.9 DCF data of production value is based on the turnover of aquaculture companies instead of the sales value of cultured fish and fry. The turnover can include other business activities and is not limited to the pure sales of aquaculture products produced by the company.
173
5.10 FRANCE
5.10.1 Overview of the French aquaculture sector
The total output of the French aquaculture sector in 2011 is 283.1 thousand tonnes and 898.5 million Euros as turnover. From 2010 to 2011, the sales volume decreased by 10% but turnover increased by 2%.
The total number of aquaculture farms is 3,300, nearly constant compared to 2010. Table 5.10.2 shows an increase of the number of aquaculture farms compared to before 2010. This result is due to 4 new segments which are added since 2010 in the global statistics (cf. 5.10.4 Data coverage).
Firms in these 4 segments are very heterogeneous and we do not have enough perspective to interpret economic indicators. Therefore no analysis will be made on these segments. The 9 segments having a full economic data set represent 93% of the total turnover.
The French aquaculture sector is largely dominated by bivalve molluscs farming. In weight, shellfish farming ranks first with a production of 240.7 thousand tonnes (85% of national total) and 719.1 million Euros for turnover (80%). The second group is the freshwater fish sector with 36.1 thousand tonnes (13%) and 119.9 million Euros (13%).
Pacific cupped oysters (Crassostrea gigas) sales nearly represent 48% of the whole aquaculture production in weight and 56% in value. Oysters are mainly produced in intertidal areas by elevated cultivation systems (bags on trestles – segment 8.3). In the Mediterranean, where oyster farming mostly takes place in lagoons, other techniques are used, mainly the culture on rope hung under tables; these farms are included in the oyster raft segment (segment 8.1). Their production reaches 20.5 million Euros and 8.5 thousand tonnes.
Two species of mussels are cultivated in France. Blue mussel (Mytilus edulis) and Mediterranean mussel (Mytilus galloprovincialis) represent 34% in weight, 19% in value of the whole aquaculture production. Mussel farming in the Channel and Atlantic coasts is almost all based on the blue mussel. The predominant cultivation system relies on fixed wooden poles (so‐called “bouchot” technique) used in inter‐tidal areas (segment 7.3). In the Mediterranean, mussels are cultivated in raft (segment 7.1), in fact on ropes suspended below large tables. The long line technique (segment 7.2) is being developed on open sea areas (Atlantic and Mediterranean). For some producers on the Atlantic coast, this technique is complementary to the "bouchot" technique. The long lines are used for catching spatfall and for a part of growing mussels. After 2 or 3 month, mussels are fixed on the "bouchot" in order to finish their growth. In this case, these companies are included in the mussel bottom segment (segment 7.3).
In freshwater fish farming, the main production results from the farming of rainbow trout for 95% and other salmonids (brown trout, Salmo trutta). The segments of trout are still the most important fish production sector in terms of sold volume (36.1 thousand tonnes, 85% of fish farming, excluding pond farming) and value (119.9 million Euros, 67% of fish farming). The saltwater fish farming is a small sector in France. The sales volume of sea bass and sea bream is 3.9 thousand tons with a corresponding turnover of 24.6 million Euros, where production volume and value sharing between hatcheries and nurseries (segment 3.1), cages (segment 3.4) and land‐based facilities.
It should be also highlighted the production of sturgeon caviar, even there were produced 16.8 tonnes from only 4 companies, it achieved a value of almost 9.8 million Euros (statistical survey 2011, DPMA). The sturgeon's activity also includes some companies that are rearing to maturity females and sell to caviar
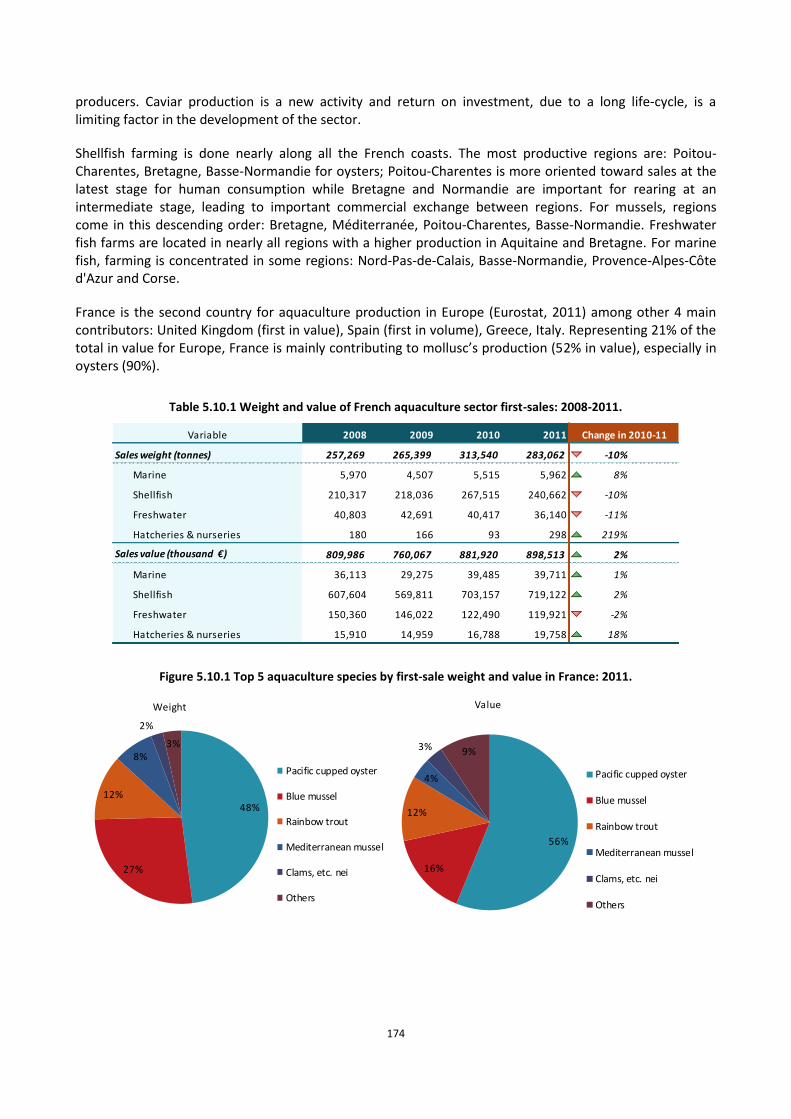
174
producers. Caviar production is a new activity and return on investment, due to a long life‐cycle, is a limiting factor in the development of the sector.
Shellfish farming is done nearly along all the French coasts. The most productive regions are: Poitou-Charentes, Bretagne, Basse-Normandie for oysters; Poitou-Charentes is more oriented toward sales at the latest stage for human consumption while Bretagne and Normandie are important for rearing at an intermediate stage, leading to important commercial exchange between regions. For mussels, regions come in this descending order: Bretagne, Méditerranée, Poitou-Charentes, Basse-Normandie. Freshwater fish farms are located in nearly all regions with a higher production in Aquitaine and Bretagne. For marine fish, farming is concentrated in some regions: Nord-Pas-de-Calais, Basse-Normandie, Provence-Alpes-Côte d'Azur and Corse.
France is the second country for aquaculture production in Europe (Eurostat, 2011) among other 4 main contributors: United Kingdom (first in value), Spain (first in volume), Greece, Italy. Representing 21% of the total in value for Europe, France is mainly contributing to mollusc’s production (52% in value), especially in oysters (90%).
Table 5.10.1 Weight and value of French aquaculture sector first-sales: 2008-2011.
Variable 2008 2009 2010 2011
Sales weight (tonnes) 257,269 265,399 313,540 283,062 -10%
Marine 5,970 4,507 5,515 5,962 8%
Shellfish 210,317 218,036 267,515 240,662 -10% ↘
Freshwater 40,803 42,691 40,417 36,140 -11%
Hatcheries & nurseries 180 166 93 298 219%
Sales value (thousand €) 809,986 760,067 881,920 898,513 2% ↗
Marine 36,113 29,275 39,485 39,711 1% ↗
Shellfish 607,604 569,811 703,157 719,122 2% ↗
Freshwater 150,360 146,022 122,490 119,921 -2%
Hatcheries & nurseries 15,910 14,959 16,788 19,758 18%
Change in 2010-11
Figure 5.10.1 Top 5 aquaculture species by first-sale weight and value in France: 2011.
48%
27%
12%
8%
2%
3%
Weight
Pacific cupped oyster
Blue mussel
Rainbow trout
Mediterranean mussel
Clams, etc. nei
Others
56%
16%
12%
4%
3% 9%
Value
Pacific cupped oyster
Blue mussel
Rainbow trout
Mediterranean mussel
Clams, etc. nei
Others
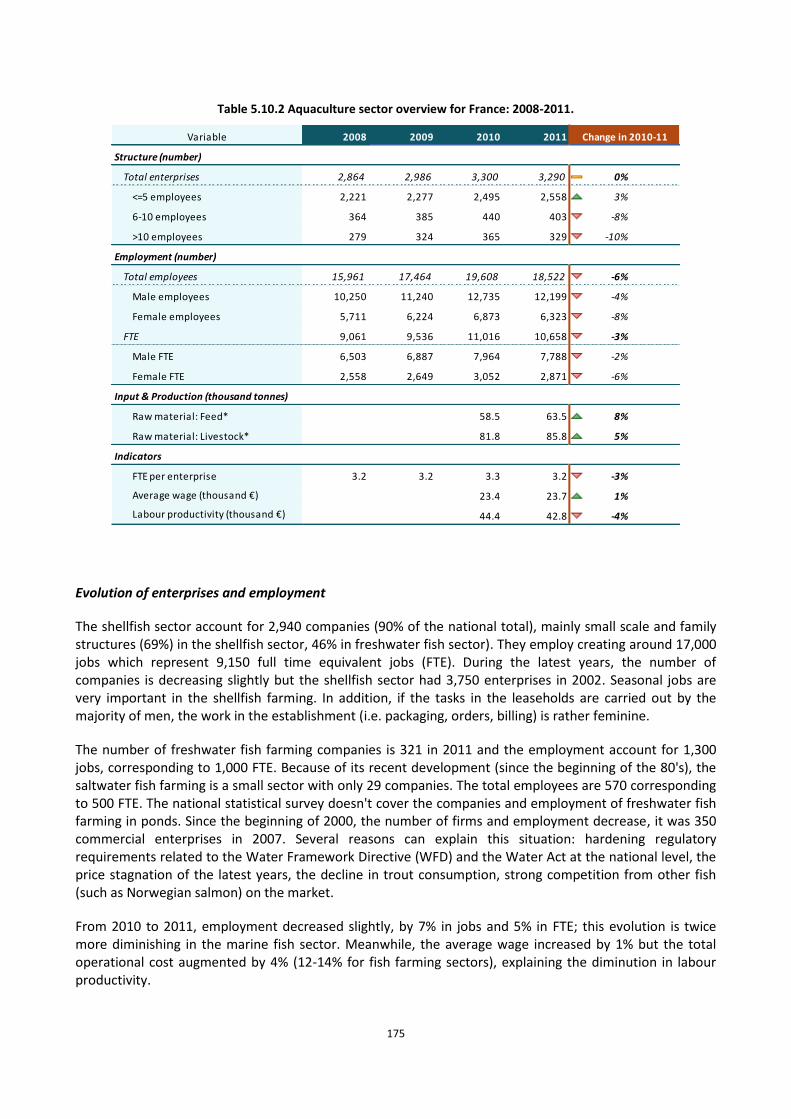
175
Table 5.10.2 Aquaculture sector overview for France: 2008-2011.
Variable 2008 2009 2010 2011
Structure (number)
Total enterprises 2,864 2,986 3,300 3,290 0% ↔
<=5 employees 2,221 2,277 2,495 2,558 3% ↗
6-10 employees 364 385 440 403 -8% ↘
>10 employees 279 324 365 329 -10% ↘
Employment (number)
Total employees 15,961 17,464 19,608 18,522 -6% ↘
Male employees 10,250 11,240 12,735 12,199 -4% ↘
Female employees 5,711 6,224 6,873 6,323 -8% ↘
FTE 9,061 9,536 11,016 10,658 -3% ↘
Male FTE 6,503 6,887 7,964 7,788 -2% ↘
Female FTE 2,558 2,649 3,052 2,871 -6% ↘
Input & Production (thousand tonnes)
Raw material: Feed* 58.5 63.5 8% ↗
Raw material: Livestock* 81.8 85.8 5%
Indicators
FTE per enterprise 3.2 3.2 3.3 3.2 -3% ↘
Average wage (thousand €) 23.4 23.7 1% ↗
Labour productivity (thousand €) 44.4 42.8 -4% ↘
Change in 2010-11
Evolution of enterprises and employment
The shellfish sector account for 2,940 companies (90% of the national total), mainly small scale and family structures (69%) in the shellfish sector, 46% in freshwater fish sector). They employ creating around 17,000 jobs which represent 9,150 full time equivalent jobs (FTE). During the latest years, the number of companies is decreasing slightly but the shellfish sector had 3,750 enterprises in 2002. Seasonal jobs are very important in the shellfish farming. In addition, if the tasks in the leaseholds are carried out by the majority of men, the work in the establishment (i.e. packaging, orders, billing) is rather feminine.
The number of freshwater fish farming companies is 321 in 2011 and the employment account for 1,300 jobs, corresponding to 1,000 FTE. Because of its recent development (since the beginning of the 80's), the saltwater fish farming is a small sector with only 29 companies. The total employees are 570 corresponding to 500 FTE. The national statistical survey doesn't cover the companies and employment of freshwater fish farming in ponds. Since the beginning of 2000, the number of firms and employment decrease, it was 350 commercial enterprises in 2007. Several reasons can explain this situation: hardening regulatory requirements related to the Water Framework Directive (WFD) and the Water Act at the national level, the price stagnation of the latest years, the decline in trout consumption, strong competition from other fish (such as Norwegian salmon) on the market.
From 2010 to 2011, employment decreased slightly, by 7% in jobs and 5% in FTE; this evolution is twice more diminishing in the marine fish sector. Meanwhile, the average wage increased by 1% but the total operational cost augmented by 4% (12-14% for fish farming sectors), explaining the diminution in labour productivity.
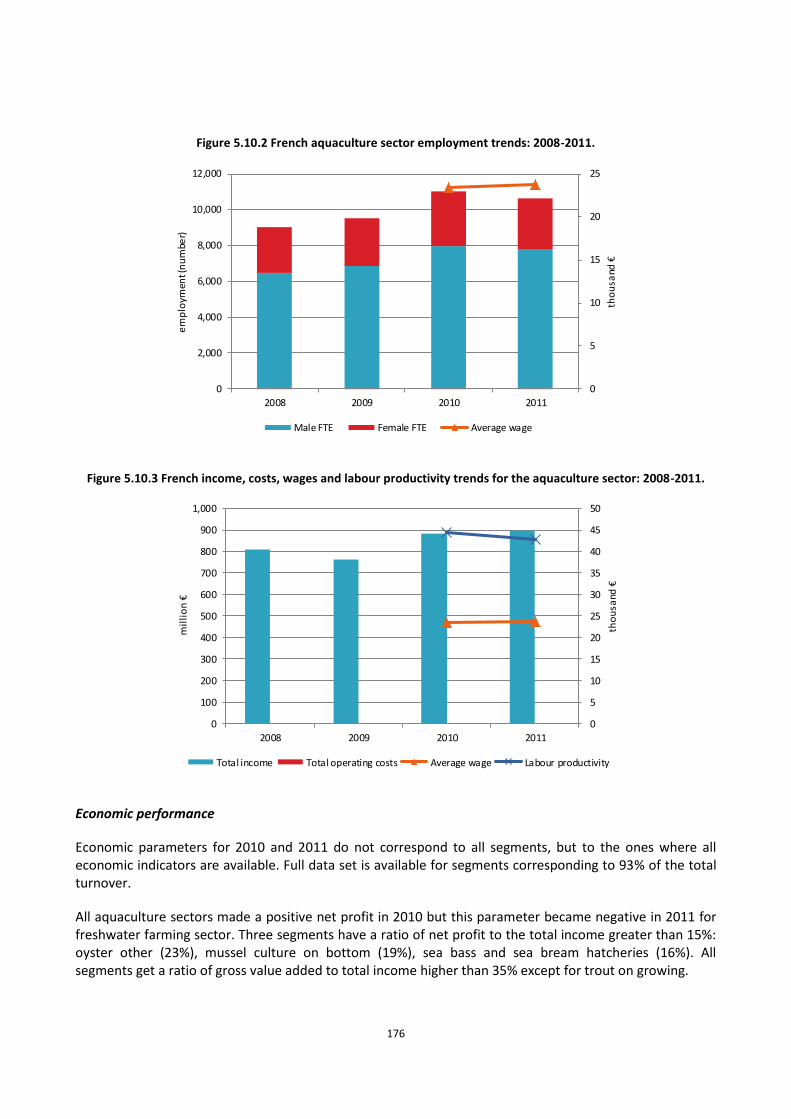
176
Figure 5.10.2 French aquaculture sector employment trends: 2008-2011.
0
5
10
15
20
25
0
2,000
4,000
6,000
8,000
10,000
12,000
2008 2009 2010 2011
tho
usa
nd €
em
plo
ymen
t (n
um
ber)
Male FTE Female FTE Average wage
Figure 5.10.3 French income, costs, wages and labour productivity trends for the aquaculture sector: 2008-2011.
0
5
10
15
20
25
30
35
40
45
50
0
100
200
300
400
500
600
700
800
900
1,000
2008 2009 2010 2011
tho
usa
nd €
mil
lio
n €
Total income Total operating costs Average wage Labour productivity
Economic performance
Economic parameters for 2010 and 2011 do not correspond to all segments, but to the ones where all economic indicators are available. Full data set is available for segments corresponding to 93% of the total turnover.
All aquaculture sectors made a positive net profit in 2010 but this parameter became negative in 2011 for freshwater farming sector. Three segments have a ratio of net profit to the total income greater than 15%: oyster other (23%), mussel culture on bottom (19%), sea bass and sea bream hatcheries (16%). All segments get a ratio of gross value added to total income higher than 35% except for trout on growing.
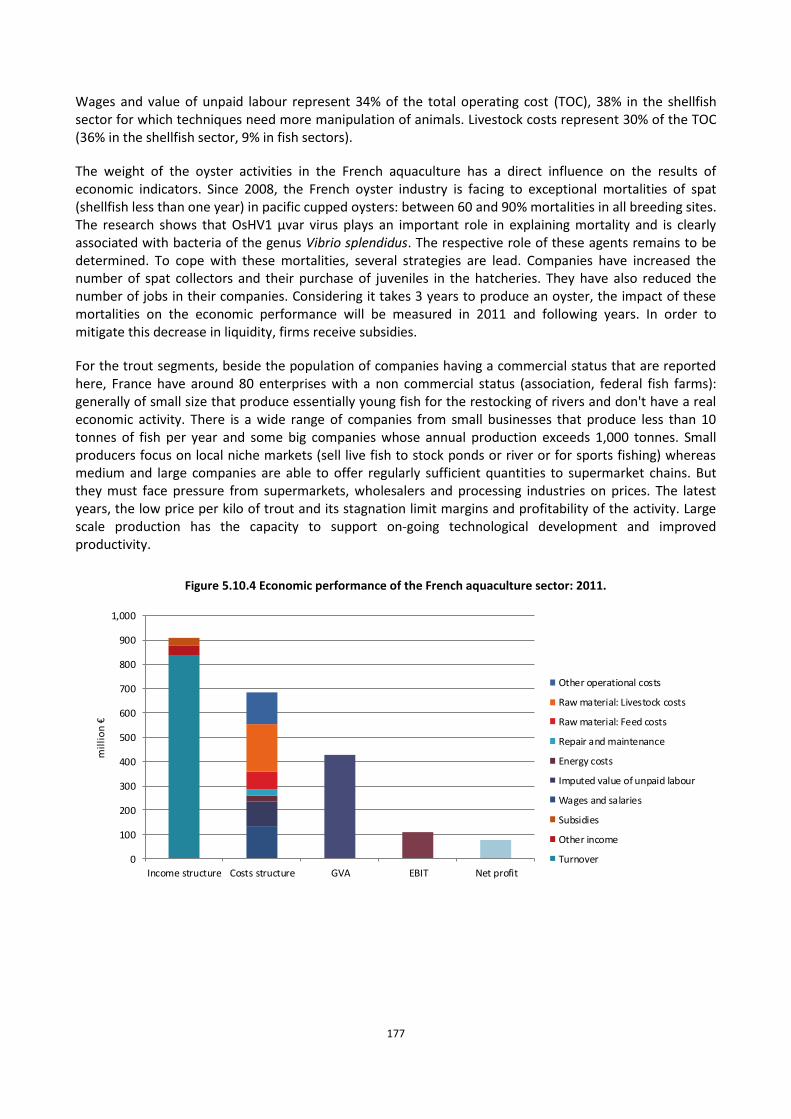
177
Wages and value of unpaid labour represent 34% of the total operating cost (TOC), 38% in the shellfish sector for which techniques need more manipulation of animals. Livestock costs represent 30% of the TOC (36% in the shellfish sector, 9% in fish sectors).
The weight of the oyster activities in the French aquaculture has a direct influence on the results of economic indicators. Since 2008, the French oyster industry is facing to exceptional mortalities of spat (shellfish less than one year) in pacific cupped oysters: between 60 and 90% mortalities in all breeding sites. The research shows that OsHV1 μvar virus plays an important role in explaining mortality and is clearly associated with bacteria of the genus Vibrio splendidus. The respective role of these agents remains to be determined. To cope with these mortalities, several strategies are lead. Companies have increased the number of spat collectors and their purchase of juveniles in the hatcheries. They have also reduced the number of jobs in their companies. Considering it takes 3 years to produce an oyster, the impact of these mortalities on the economic performance will be measured in 2011 and following years. In order to mitigate this decrease in liquidity, firms receive subsidies.
For the trout segments, beside the population of companies having a commercial status that are reported here, France have around 80 enterprises with a non commercial status (association, federal fish farms): generally of small size that produce essentially young fish for the restocking of rivers and don't have a real economic activity. There is a wide range of companies from small businesses that produce less than 10 tonnes of fish per year and some big companies whose annual production exceeds 1,000 tonnes. Small producers focus on local niche markets (sell live fish to stock ponds or river or for sports fishing) whereas medium and large companies are able to offer regularly sufficient quantities to supermarket chains. But they must face pressure from supermarkets, wholesalers and processing industries on prices. The latest years, the low price per kilo of trout and its stagnation limit margins and profitability of the activity. Large scale production has the capacity to support on‐going technological development and improved productivity.
Figure 5.10.4 Economic performance of the French aquaculture sector: 2011.
0
100
200
300
400
500
600
700
800
900
1,000
Income structure Costs structure GVA EBIT Net profit
mil
lio
n €
Other operational costs
Raw material: Livestock costs
Raw material: Feed costs
Repair and maintenance
Energy costs
Imputed value of unpaid labour
Wages and salaries
Subsidies
Other income
Turnover
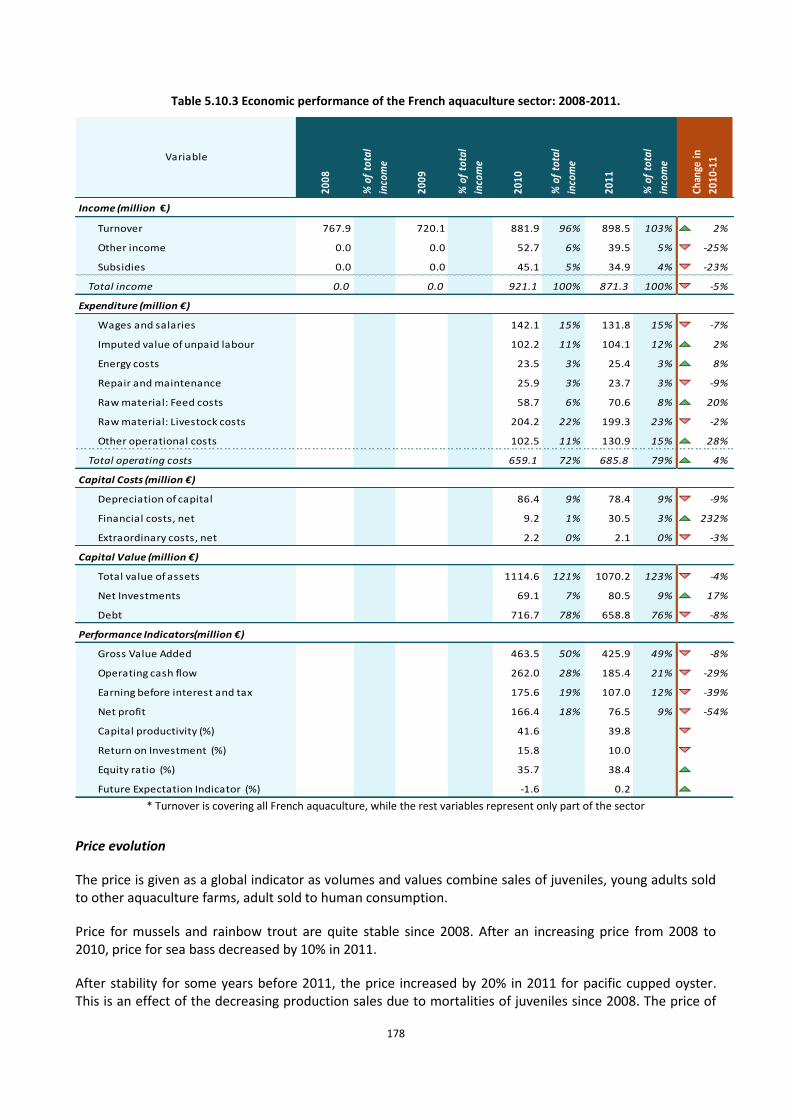
178
Table 5.10.3 Economic performance of the French aquaculture sector: 2008-2011.
Income (million €)
Turnover 767.9 720.1 881.9 96% 898.5 103% 2%
Other income 0.0 0.0 52.7 6% 39.5 5% -25%
Subsidies 0.0 0.0 45.1 5% 34.9 4% -23%
Total income 0.0 0.0 921.1 100% 871.3 100% -5%
Expenditure (million €)
Wages and salaries 142.1 15% 131.8 15% -7%
Imputed value of unpaid labour 102.2 11% 104.1 12% 2%
Energy costs 23.5 3% 25.4 3% 8%
Repair and maintenance 25.9 3% 23.7 3% -9%
Raw material: Feed costs 58.7 6% 70.6 8% 20%
Raw material: Livestock costs 204.2 22% 199.3 23% -2%
Other operational costs 102.5 11% 130.9 15% 28%
Total operating costs 659.1 72% 685.8 79% 4%
Capital Costs (million €)
Depreciation of capital 86.4 9% 78.4 9% -9%
Financial costs, net 9.2 1% 30.5 3% 232%
Extraordinary costs, net 2.2 0% 2.1 0% -3%
Capital Value (million €)
Total value of assets 1114.6 121% 1070.2 123% -4%
Net Investments 69.1 7% 80.5 9% 17%
Debt 716.7 78% 658.8 76% -8%
Performance Indicators(million €)
Gross Value Added 463.5 50% 425.9 49% -8%
Operating cash flow 262.0 28% 185.4 21% -29%
Earning before interest and tax 175.6 19% 107.0 12% -39%
Net profit 166.4 18% 76.5 9% -54%
Capital productivity (%) 41.6 39.8 -4%
Return on Investment (%) 15.8 10.0 -37%
Equity ratio (%) 35.7 38.4 8%
Future Expectation Indicator (%) -1.6 0.2 113%
Chan
ge in
2010
-11
% o
f to
tal
inco
meVariable
% o
f to
tal
inco
me
2008
2009
% o
f to
tal
inco
me
% o
f to
tal
inco
me
2010
2011
* Turnover is covering all French aquaculture, while the rest variables represent only part of the sector
Price evolution
The price is given as a global indicator as volumes and values combine sales of juveniles, young adults sold to other aquaculture farms, adult sold to human consumption.
Price for mussels and rainbow trout are quite stable since 2008. After an increasing price from 2008 to 2010, price for sea bass decreased by 10% in 2011.
After stability for some years before 2011, the price increased by 20% in 2011 for pacific cupped oyster. This is an effect of the decreasing production sales due to mortalities of juveniles since 2008. The price of
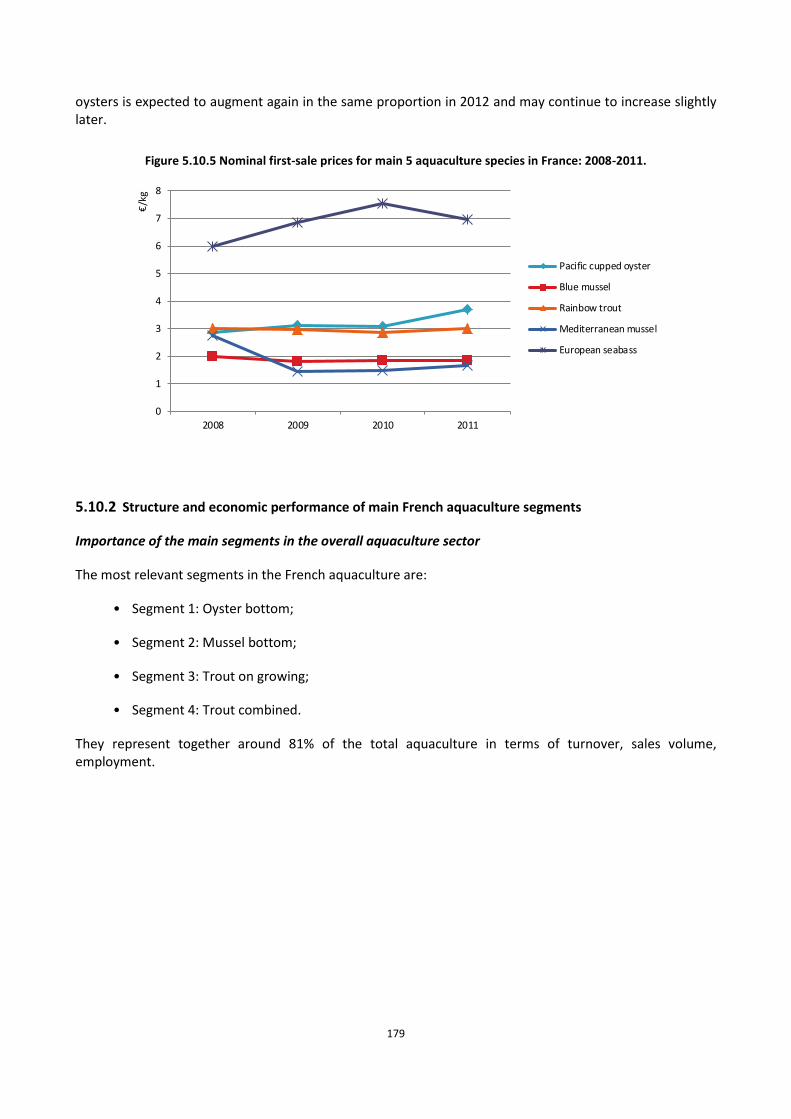
179
oysters is expected to augment again in the same proportion in 2012 and may continue to increase slightly later.
Figure 5.10.5 Nominal first-sale prices for main 5 aquaculture species in France: 2008-2011.
0
1
2
3
4
5
6
7
8
2008 2009 2010 2011
€/k
g
Pacific cupped oyster
Blue mussel
Rainbow trout
Mediterranean mussel
European seabass
5.10.2 Structure and economic performance of main French aquaculture segments
Importance of the main segments in the overall aquaculture sector
The most relevant segments in the French aquaculture are:
• Segment 1: Oyster bottom;
• Segment 2: Mussel bottom;
• Segment 3: Trout on growing;
• Segment 4: Trout combined.
They represent together around 81% of the total aquaculture in terms of turnover, sales volume, employment.
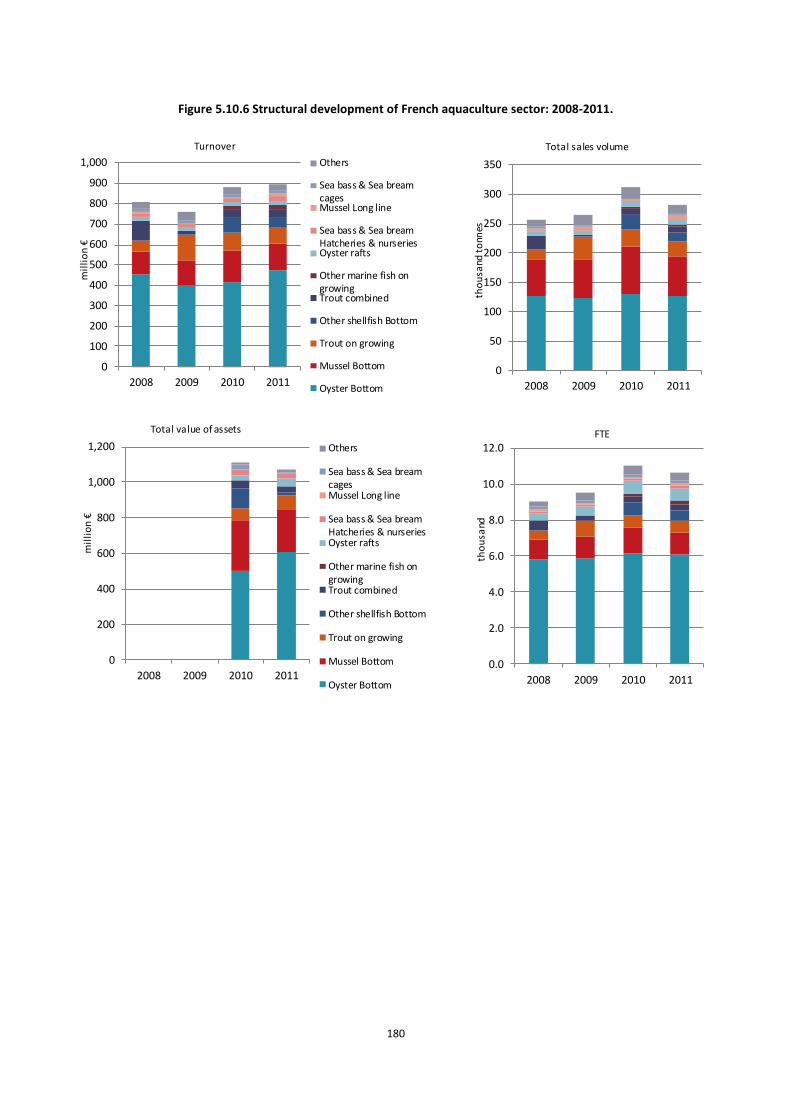
180
Figure 5.10.6 Structural development of French aquaculture sector: 2008-2011.
0
100
200
300
400
500
600
700
800
900
1,000
2008 2009 2010 2011
mil
lio
n €
Turnover
Others
Sea bass & Sea breamcagesMussel Long line
Sea bass & Sea breamHatcheries & nurseriesOyster rafts
Other marine fish ongrowingTrout combined
Other shellfish Bottom
Trout on growing
Mussel Bottom
Oyster Bottom
0
50
100
150
200
250
300
350
2008 2009 2010 2011
tho
usa
nd t
onn
es
Total sales volume
0
200
400
600
800
1,000
1,200
2008 2009 2010 2011
mil
lio
n €
Total value of assets
Others
Sea bass & Sea breamcagesMussel Long line
Sea bass & Sea breamHatcheries & nurseriesOyster rafts
Other marine fish ongrowingTrout combined
Other shellfish Bottom
Trout on growing
Mussel Bottom
Oyster Bottom
0.0
2.0
4.0
6.0
8.0
10.0
12.0
2008 2009 2010 2011
tho
usa
nd
FTE
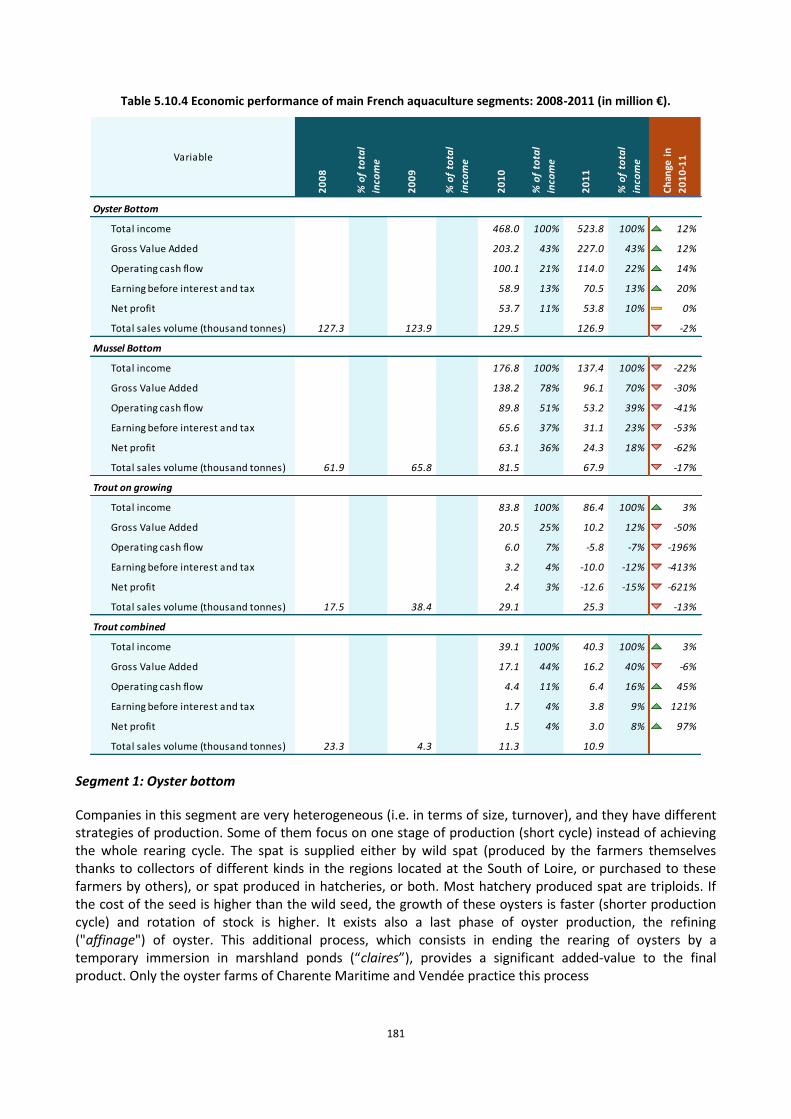
181
Table 5.10.4 Economic performance of main French aquaculture segments: 2008-2011 (in million €).
Oyster Bottom
Total income 468.0 100% 523.8 100% 12%
Gross Value Added 203.2 43% 227.0 43% 12%
Operating cash flow 100.1 21% 114.0 22% 14%
Earning before interest and tax 58.9 13% 70.5 13% 20%
Net profit 53.7 11% 53.8 10% 0%
Total sales volume (thousand tonnes) 127.3 123.9 129.5 126.9 -2%
Mussel Bottom
Total income 176.8 100% 137.4 100% -22%
Gross Value Added 138.2 78% 96.1 70% -30%
Operating cash flow 89.8 51% 53.2 39% -41%
Earning before interest and tax 65.6 37% 31.1 23% -53%
Net profit 63.1 36% 24.3 18% -62%
Total sales volume (thousand tonnes) 61.9 65.8 81.5 67.9 -17%
Trout on growing
Total income 83.8 100% 86.4 100% 3%
Gross Value Added 20.5 25% 10.2 12% -50%
Operating cash flow 6.0 7% -5.8 -7% -196%
Earning before interest and tax 3.2 4% -10.0 -12% -413%
Net profit 2.4 3% -12.6 -15% -621%
Total sales volume (thousand tonnes) 17.5 38.4 29.1 25.3 -13%
Trout combined
Total income 39.1 100% 40.3 100% 3%
Gross Value Added 17.1 44% 16.2 40% -6%
Operating cash flow 4.4 11% 6.4 16% 45%
Earning before interest and tax 1.7 4% 3.8 9% 121%
Net profit 1.5 4% 3.0 8% 97%
Total sales volume (thousand tonnes) 23.3 4.3 11.3 10.9
% o
f to
tal
inco
me
20
10
% o
f to
tal
inco
me
20
11
Variable
20
08
% o
f to
tal
inco
me
20
09
% o
f to
tal
inco
me
Ch
ange
in
20
10
-11
Segment 1: Oyster bottom
Companies in this segment are very heterogeneous (i.e. in terms of size, turnover), and they have different strategies of production. Some of them focus on one stage of production (short cycle) instead of achieving the whole rearing cycle. The spat is supplied either by wild spat (produced by the farmers themselves thanks to collectors of different kinds in the regions located at the South of Loire, or purchased to these farmers by others), or spat produced in hatcheries, or both. Most hatchery produced spat are triploids. If the cost of the seed is higher than the wild seed, the growth of these oysters is faster (shorter production cycle) and rotation of stock is higher. It exists also a last phase of oyster production, the refining ("affinage") of oyster. This additional process, which consists in ending the rearing of oysters by a temporary immersion in marshland ponds (“claires”), provides a significant added‐value to the final product. Only the oyster farms of Charente Maritime and Vendée practice this process
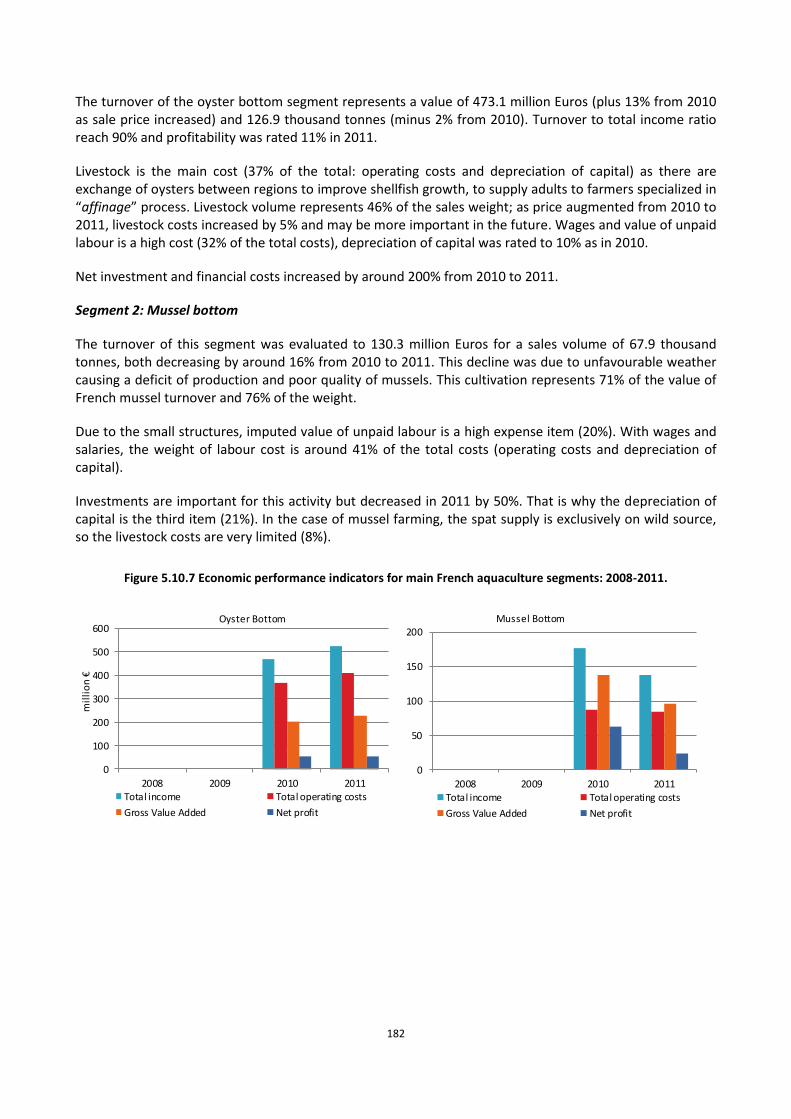
182
The turnover of the oyster bottom segment represents a value of 473.1 million Euros (plus 13% from 2010 as sale price increased) and 126.9 thousand tonnes (minus 2% from 2010). Turnover to total income ratio reach 90% and profitability was rated 11% in 2011.
Livestock is the main cost (37% of the total: operating costs and depreciation of capital) as there are exchange of oysters between regions to improve shellfish growth, to supply adults to farmers specialized in “affinage” process. Livestock volume represents 46% of the sales weight; as price augmented from 2010 to 2011, livestock costs increased by 5% and may be more important in the future. Wages and value of unpaid labour is a high cost (32% of the total costs), depreciation of capital was rated to 10% as in 2010.
Net investment and financial costs increased by around 200% from 2010 to 2011.
Segment 2: Mussel bottom
The turnover of this segment was evaluated to 130.3 million Euros for a sales volume of 67.9 thousand tonnes, both decreasing by around 16% from 2010 to 2011. This decline was due to unfavourable weather causing a deficit of production and poor quality of mussels. This cultivation represents 71% of the value of French mussel turnover and 76% of the weight.
Due to the small structures, imputed value of unpaid labour is a high expense item (20%). With wages and salaries, the weight of labour cost is around 41% of the total costs (operating costs and depreciation of capital).
Investments are important for this activity but decreased in 2011 by 50%. That is why the depreciation of capital is the third item (21%). In the case of mussel farming, the spat supply is exclusively on wild source, so the livestock costs are very limited (8%).
Figure 5.10.7 Economic performance indicators for main French aquaculture segments: 2008-2011.
0
100
200
300
400
500
600
2008 2009 2010 2011
mil
lio
n €
Oyster Bottom
Total income Total operating costs
Gross Value Added Net profit
0
50
100
150
200
2008 2009 2010 2011
Mussel Bottom
Total income Total operating costs
Gross Value Added Net profit
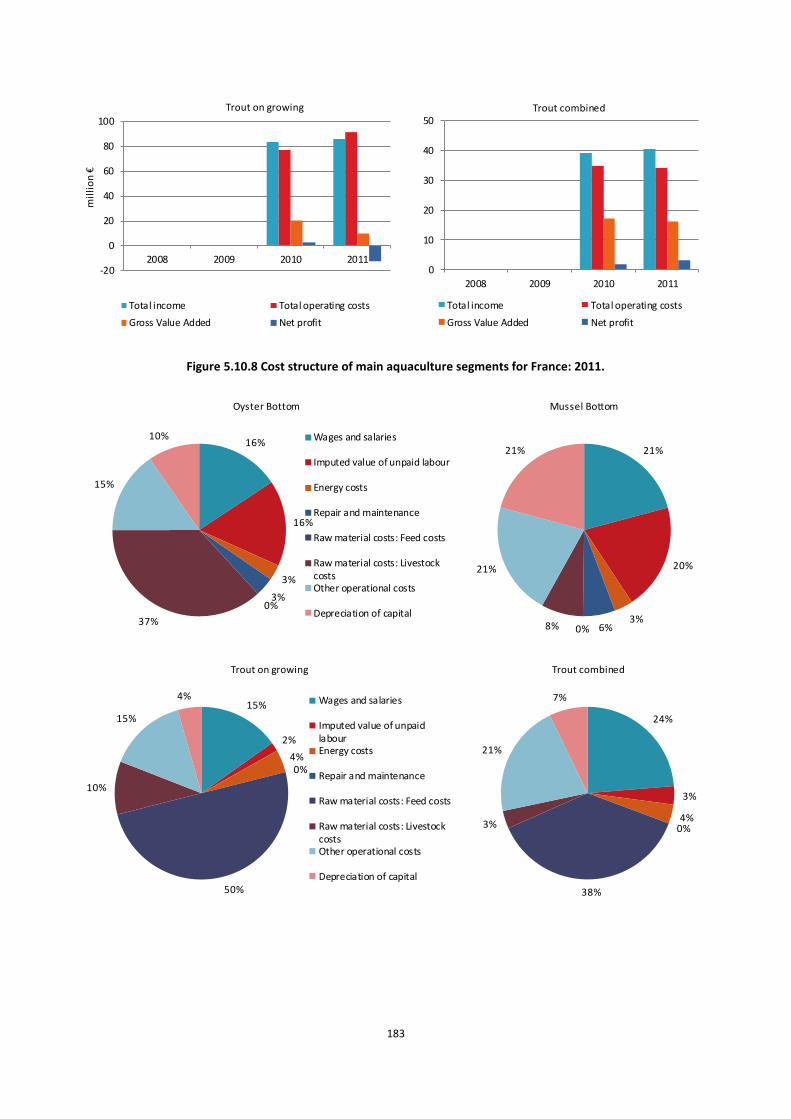
183
-20
0
20
40
60
80
100
2008 2009 2010 2011
mil
lio
n €
Trout on growing
Total income Total operating costs
Gross Value Added Net profit
0
10
20
30
40
50
2008 2009 2010 2011
Trout combined
Total income Total operating costs
Gross Value Added Net profit
Figure 5.10.8 Cost structure of main aquaculture segments for France: 2011.
16%
16%
3%
3%0%
37%
15%
10%
Oyster Bottom
Wages and salaries
Imputed value of unpaid labour
Energy costs
Repair and maintenance
Raw material costs: Feed costs
Raw material costs: LivestockcostsOther operational costs
Depreciation of capital
21%
20%
3%6%0%8%
21%
21%
Mussel Bottom
15%
2%
4%0%
50%
10%
15%
4%
Trout on growing
Wages and salaries
Imputed value of unpaidlabourEnergy costs
Repair and maintenance
Raw material costs: Feed costs
Raw material costs: LivestockcostsOther operational costs
Depreciation of capital
24%
3%
4%0%
38%
3%
21%
7%
Trout combined
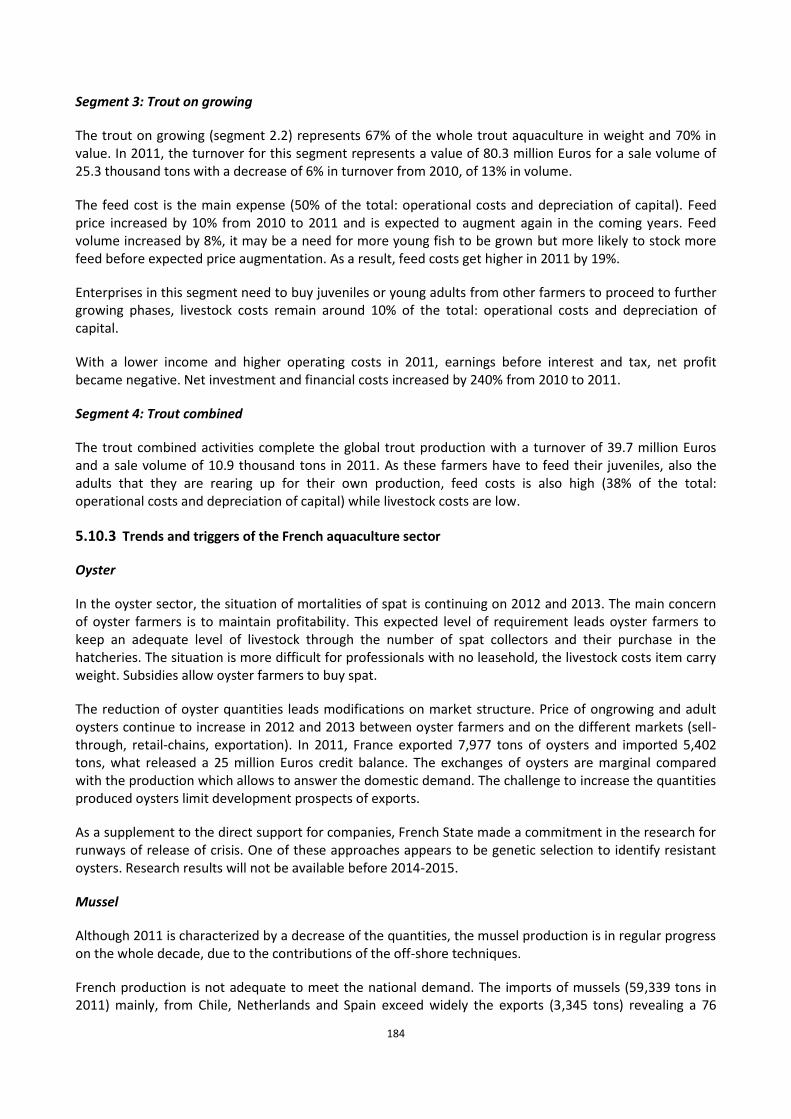
184
Segment 3: Trout on growing
The trout on growing (segment 2.2) represents 67% of the whole trout aquaculture in weight and 70% in value. In 2011, the turnover for this segment represents a value of 80.3 million Euros for a sale volume of 25.3 thousand tons with a decrease of 6% in turnover from 2010, of 13% in volume.
The feed cost is the main expense (50% of the total: operational costs and depreciation of capital). Feed price increased by 10% from 2010 to 2011 and is expected to augment again in the coming years. Feed volume increased by 8%, it may be a need for more young fish to be grown but more likely to stock more feed before expected price augmentation. As a result, feed costs get higher in 2011 by 19%.
Enterprises in this segment need to buy juveniles or young adults from other farmers to proceed to further growing phases, livestock costs remain around 10% of the total: operational costs and depreciation of capital.
With a lower income and higher operating costs in 2011, earnings before interest and tax, net profit became negative. Net investment and financial costs increased by 240% from 2010 to 2011.
Segment 4: Trout combined
The trout combined activities complete the global trout production with a turnover of 39.7 million Euros and a sale volume of 10.9 thousand tons in 2011. As these farmers have to feed their juveniles, also the adults that they are rearing up for their own production, feed costs is also high (38% of the total: operational costs and depreciation of capital) while livestock costs are low.
5.10.3 Trends and triggers of the French aquaculture sector
Oyster
In the oyster sector, the situation of mortalities of spat is continuing on 2012 and 2013. The main concern of oyster farmers is to maintain profitability. This expected level of requirement leads oyster farmers to keep an adequate level of livestock through the number of spat collectors and their purchase in the hatcheries. The situation is more difficult for professionals with no leasehold, the livestock costs item carry weight. Subsidies allow oyster farmers to buy spat.
The reduction of oyster quantities leads modifications on market structure. Price of ongrowing and adult oysters continue to increase in 2012 and 2013 between oyster farmers and on the different markets (sell-through, retail-chains, exportation). In 2011, France exported 7,977 tons of oysters and imported 5,402 tons, what released a 25 million Euros credit balance. The exchanges of oysters are marginal compared with the production which allows to answer the domestic demand. The challenge to increase the quantities produced oysters limit development prospects of exports.
As a supplement to the direct support for companies, French State made a commitment in the research for runways of release of crisis. One of these approaches appears to be genetic selection to identify resistant oysters. Research results will not be available before 2014-2015.
Mussel
Although 2011 is characterized by a decrease of the quantities, the mussel production is in regular progress on the whole decade, due to the contributions of the off-shore techniques.
French production is not adequate to meet the national demand. The imports of mussels (59,339 tons in 2011) mainly, from Chile, Netherlands and Spain exceed widely the exports (3,345 tons) revealing a 76
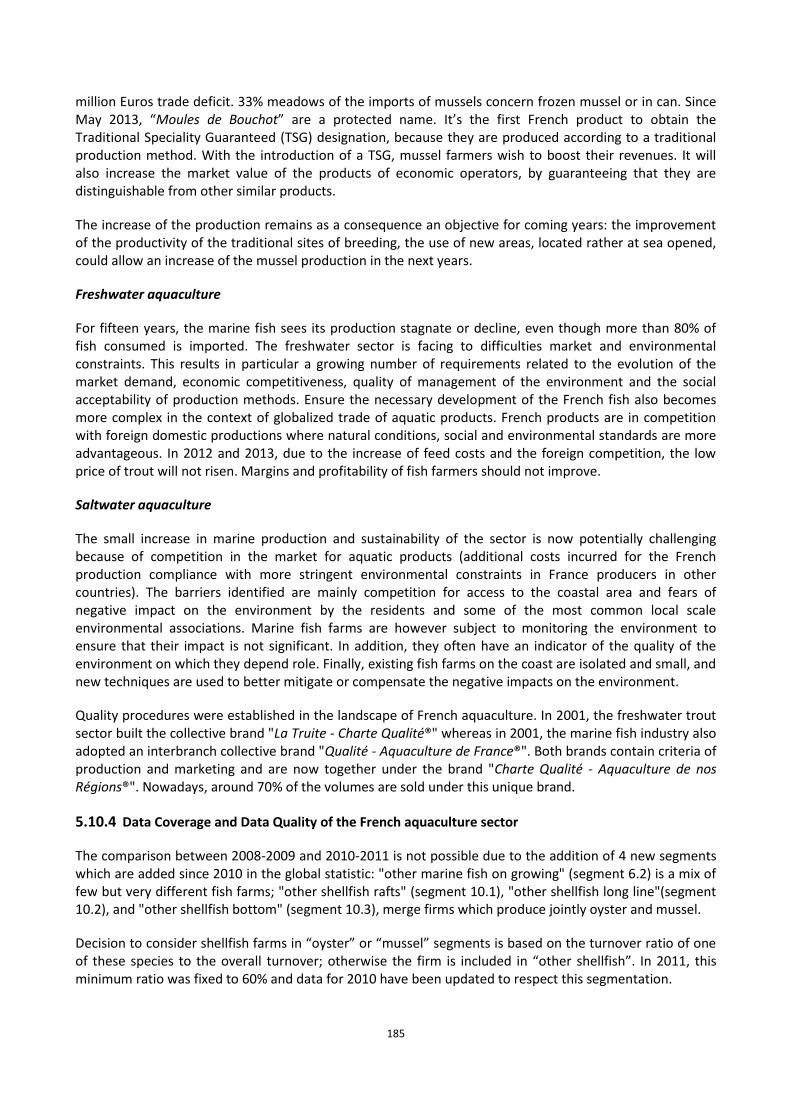
185
million Euros trade deficit. 33% meadows of the imports of mussels concern frozen mussel or in can. Since May 2013, “Moules de Bouchot” are a protected name. It’s the first French product to obtain the Traditional Speciality Guaranteed (TSG) designation, because they are produced according to a traditional production method. With the introduction of a TSG, mussel farmers wish to boost their revenues. It will also increase the market value of the products of economic operators, by guaranteeing that they are distinguishable from other similar products.
The increase of the production remains as a consequence an objective for coming years: the improvement of the productivity of the traditional sites of breeding, the use of new areas, located rather at sea opened, could allow an increase of the mussel production in the next years.
Freshwater aquaculture
For fifteen years, the marine fish sees its production stagnate or decline, even though more than 80% of fish consumed is imported. The freshwater sector is facing to difficulties market and environmental constraints. This results in particular a growing number of requirements related to the evolution of the market demand, economic competitiveness, quality of management of the environment and the social acceptability of production methods. Ensure the necessary development of the French fish also becomes more complex in the context of globalized trade of aquatic products. French products are in competition with foreign domestic productions where natural conditions, social and environmental standards are more advantageous. In 2012 and 2013, due to the increase of feed costs and the foreign competition, the low price of trout will not risen. Margins and profitability of fish farmers should not improve.
Saltwater aquaculture
The small increase in marine production and sustainability of the sector is now potentially challenging because of competition in the market for aquatic products (additional costs incurred for the French production compliance with more stringent environmental constraints in France producers in other countries). The barriers identified are mainly competition for access to the coastal area and fears of negative impact on the environment by the residents and some of the most common local scale environmental associations. Marine fish farms are however subject to monitoring the environment to ensure that their impact is not significant. In addition, they often have an indicator of the quality of the environment on which they depend role. Finally, existing fish farms on the coast are isolated and small, and new techniques are used to better mitigate or compensate the negative impacts on the environment.
Quality procedures were established in the landscape of French aquaculture. In 2001, the freshwater trout sector built the collective brand "La Truite - Charte Qualité®" whereas in 2001, the marine fish industry also adopted an interbranch collective brand "Qualité - Aquaculture de France®". Both brands contain criteria of production and marketing and are now together under the brand "Charte Qualité - Aquaculture de nos Régions®". Nowadays, around 70% of the volumes are sold under this unique brand.
5.10.4 Data Coverage and Data Quality of the French aquaculture sector
The comparison between 2008-2009 and 2010-2011 is not possible due to the addition of 4 new segments which are added since 2010 in the global statistic: "other marine fish on growing" (segment 6.2) is a mix of few but very different fish farms; "other shellfish rafts" (segment 10.1), "other shellfish long line"(segment 10.2), and "other shellfish bottom" (segment 10.3), merge firms which produce jointly oyster and mussel.
Decision to consider shellfish farms in “oyster” or “mussel” segments is based on the turnover ratio of one of these species to the overall turnover; otherwise the firm is included in “other shellfish”. In 2011, this minimum ratio was fixed to 60% and data for 2010 have been updated to respect this segmentation.
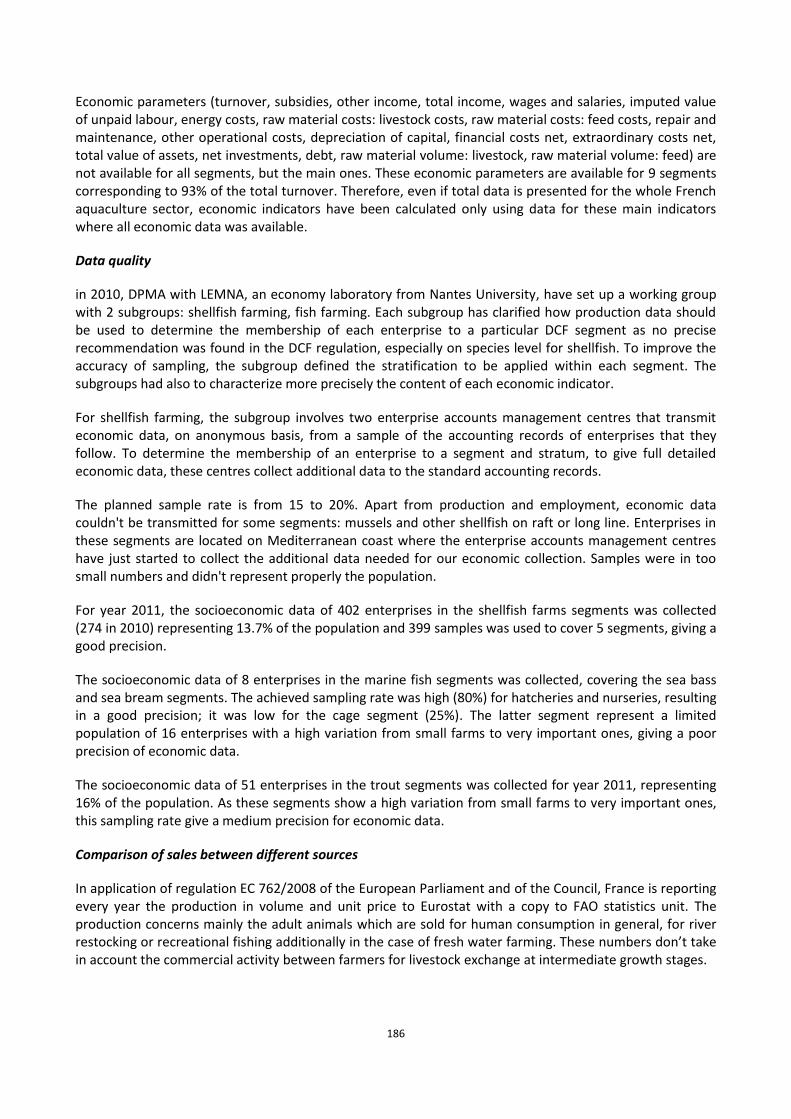
186
Economic parameters (turnover, subsidies, other income, total income, wages and salaries, imputed value of unpaid labour, energy costs, raw material costs: livestock costs, raw material costs: feed costs, repair and maintenance, other operational costs, depreciation of capital, financial costs net, extraordinary costs net, total value of assets, net investments, debt, raw material volume: livestock, raw material volume: feed) are not available for all segments, but the main ones. These economic parameters are available for 9 segments corresponding to 93% of the total turnover. Therefore, even if total data is presented for the whole French aquaculture sector, economic indicators have been calculated only using data for these main indicators where all economic data was available.
Data quality
in 2010, DPMA with LEMNA, an economy laboratory from Nantes University, have set up a working group with 2 subgroups: shellfish farming, fish farming. Each subgroup has clarified how production data should be used to determine the membership of each enterprise to a particular DCF segment as no precise recommendation was found in the DCF regulation, especially on species level for shellfish. To improve the accuracy of sampling, the subgroup defined the stratification to be applied within each segment. The subgroups had also to characterize more precisely the content of each economic indicator.
For shellfish farming, the subgroup involves two enterprise accounts management centres that transmit economic data, on anonymous basis, from a sample of the accounting records of enterprises that they follow. To determine the membership of an enterprise to a segment and stratum, to give full detailed economic data, these centres collect additional data to the standard accounting records.
The planned sample rate is from 15 to 20%. Apart from production and employment, economic data couldn't be transmitted for some segments: mussels and other shellfish on raft or long line. Enterprises in these segments are located on Mediterranean coast where the enterprise accounts management centres have just started to collect the additional data needed for our economic collection. Samples were in too small numbers and didn't represent properly the population.
For year 2011, the socioeconomic data of 402 enterprises in the shellfish farms segments was collected (274 in 2010) representing 13.7% of the population and 399 samples was used to cover 5 segments, giving a good precision.
The socioeconomic data of 8 enterprises in the marine fish segments was collected, covering the sea bass and sea bream segments. The achieved sampling rate was high (80%) for hatcheries and nurseries, resulting in a good precision; it was low for the cage segment (25%). The latter segment represent a limited population of 16 enterprises with a high variation from small farms to very important ones, giving a poor precision of economic data.
The socioeconomic data of 51 enterprises in the trout segments was collected for year 2011, representing 16% of the population. As these segments show a high variation from small farms to very important ones, this sampling rate give a medium precision for economic data.
Comparison of sales between different sources
In application of regulation EC 762/2008 of the European Parliament and of the Council, France is reporting every year the production in volume and unit price to Eurostat with a copy to FAO statistics unit. The production concerns mainly the adult animals which are sold for human consumption in general, for river restocking or recreational fishing additionally in the case of fresh water farming. These numbers don’t take in account the commercial activity between farmers for livestock exchange at intermediate growth stages.
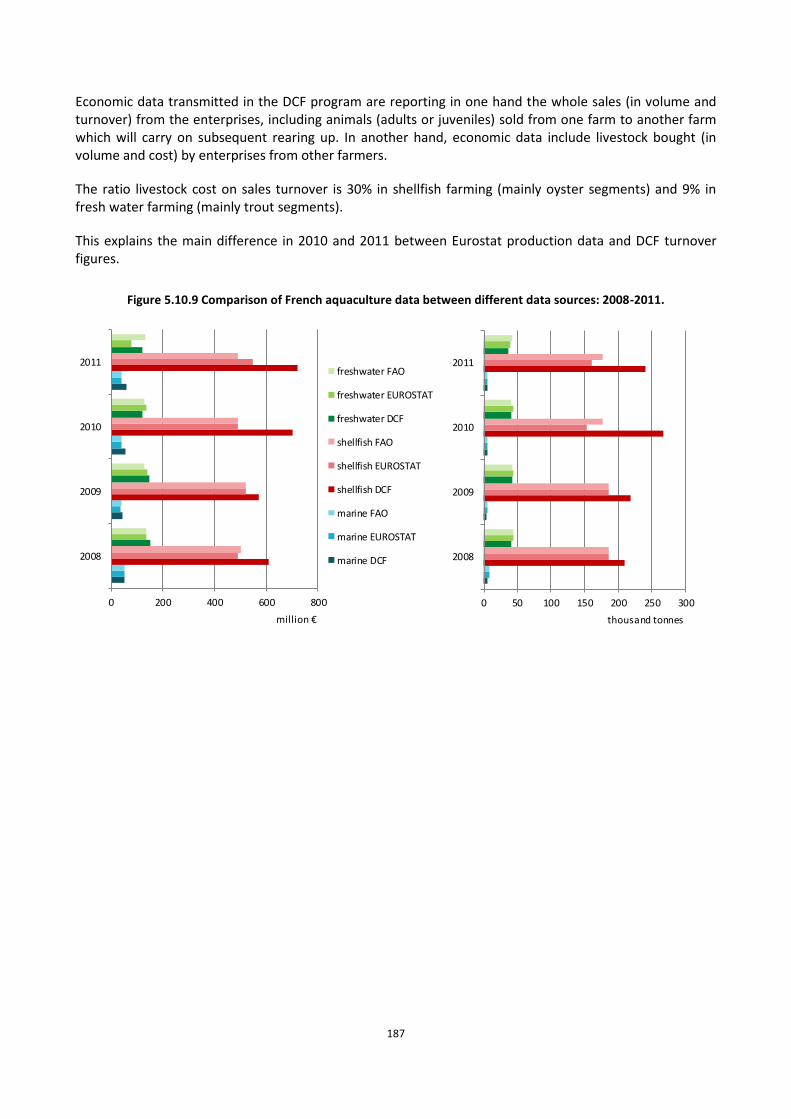
187
Economic data transmitted in the DCF program are reporting in one hand the whole sales (in volume and turnover) from the enterprises, including animals (adults or juveniles) sold from one farm to another farm which will carry on subsequent rearing up. In another hand, economic data include livestock bought (in volume and cost) by enterprises from other farmers.
The ratio livestock cost on sales turnover is 30% in shellfish farming (mainly oyster segments) and 9% in fresh water farming (mainly trout segments).
This explains the main difference in 2010 and 2011 between Eurostat production data and DCF turnover figures.
Figure 5.10.9 Comparison of French aquaculture data between different data sources: 2008-2011.
0 200 400 600 800
2008
2009
2010
2011
million €
freshwater FAO
freshwater EUROSTAT
freshwater DCF
shellfish FAO
shellfish EUROSTAT
shellfish DCF
marine FAO
marine EUROSTAT
marine DCF
0 50 100 150 200 250 300
2008
2009
2010
2011
thousand tonnes
188
5.11 GERMANY
5.11.1 Overview of the German aquaculture sector
Main Issues
For the year 2011 two remarkable issues in the German aquaculture sector occur. Firstly, statistics on production was produced by the Federal Statistical Office for the first time, showing differences in freshwater production volume to the former years of about 50% less than in former reports from other sources. There is a discussion going on in Germany about the reason for that. Secondly, the sales and production of blue mussels has been increased by more than 300%. Under the DCF umbrella Germany submits data only on marine aquaculture economics including marine shellfish and there is almost no problem with the data quality. The problems with data for the freshwater sector are so substantial, that it affects possible analysis significantly. This issue will be raised in the following sub section.
Germany is collecting economic data under the DCF for marine species only. But some data for the freshwater sectors are available and are presented in this overview. For the most figures please have in mind that they only show the performance of one sector, the blue mussel farming in the North Sea. Oysters are produced at one plant in Germany as well. Yet, due to confidentiality reasons economic analysis does not include this specific segment.
Production of Blue Mussels is concentrated at the German North Sea Coast with companies in the States of Schleswig-Holstein and Lower Saxony. The volume of production differs from years to year as it very much depends on the natural seed fall, but the increase in 2011 was unusual. It seemed to be a normal year, but then there was a shortfall in supply during the summer and German mussels due to it high meat content could be sold for a high price of almost 2 Euro at the auction in Yerseke/NL.
The freshwater segment is dominated by trout and carp, with trout counting for more than 50% and carp about 30% of the total production.
Fresh Water Aquaculture: Different sources show different data
The Federal Statistical Office publishes production data in its Aquaculture survey since 2012 with the reporting year 2011, conducted according to the EU regulation 762/2008. Furthermore a yearly report, the "Jahresbericht zur Deutschen Binnenfischerei", is published on behalf of the Federal Ministry for Agriculture, Food, and Consumer Protection which main source are the fishery authorities of the German states. Normally, every 10 years the "Binnenfischereierhebung" is published by the Federal Statistical Office, but it has been skipped for the most recent volume. So the last version is from 2004 with data from 2003, for commercial farms only and applying a threshold of 100 m2 for trout farming, or 5000 m2 for carp production or at least 1 ton of production in technical facilities.
The most recent data are from the Aquaculture survey 20121. According to the quality report of this survey all aquaculture facilities have been included. 4,762 facilities are reported with a production volume of 39,202 tonnes, including about 21,000 tonnes of marine aquaculture production of blue mussels. About 18,000 tonnes freshwater finfish production consisting of 11,000 tonnes of trout and salmonids and 5,400 tonnes of carps and cyprinids are listed. 100 tonnes are from Crustaceans, roe and caviar and some algae.
1 Federal Statistical Office. 2012. Erzeugung in Aquakulturbetrieben. Fachserie 3, Reihe 4.6.
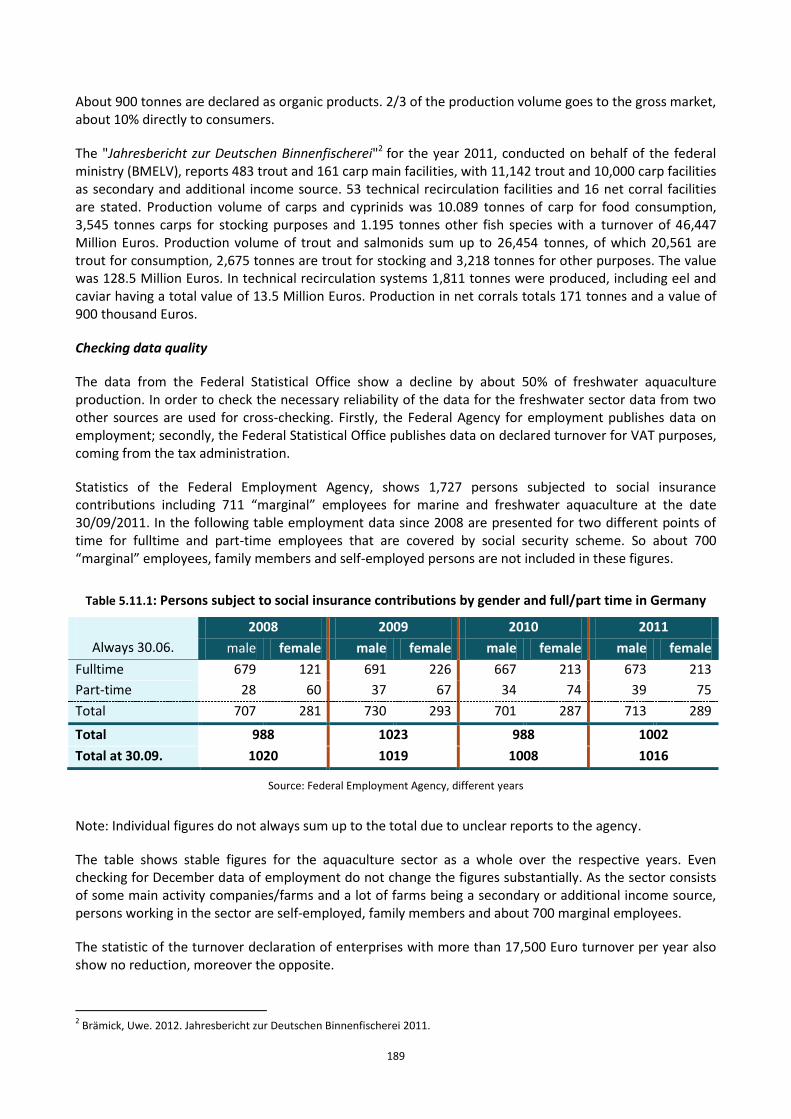
189
About 900 tonnes are declared as organic products. 2/3 of the production volume goes to the gross market, about 10% directly to consumers.
The "Jahresbericht zur Deutschen Binnenfischerei"2 for the year 2011, conducted on behalf of the federal
ministry (BMELV), reports 483 trout and 161 carp main facilities, with 11,142 trout and 10,000 carp facilities as secondary and additional income source. 53 technical recirculation facilities and 16 net corral facilities are stated. Production volume of carps and cyprinids was 10.089 tonnes of carp for food consumption, 3,545 tonnes carps for stocking purposes and 1.195 tonnes other fish species with a turnover of 46,447 Million Euros. Production volume of trout and salmonids sum up to 26,454 tonnes, of which 20,561 are trout for consumption, 2,675 tonnes are trout for stocking and 3,218 tonnes for other purposes. The value was 128.5 Million Euros. In technical recirculation systems 1,811 tonnes were produced, including eel and caviar having a total value of 13.5 Million Euros. Production in net corrals totals 171 tonnes and a value of 900 thousand Euros.
Checking data quality
The data from the Federal Statistical Office show a decline by about 50% of freshwater aquaculture production. In order to check the necessary reliability of the data for the freshwater sector data from two other sources are used for cross-checking. Firstly, the Federal Agency for employment publishes data on employment; secondly, the Federal Statistical Office publishes data on declared turnover for VAT purposes, coming from the tax administration.
Statistics of the Federal Employment Agency, shows 1,727 persons subjected to social insurance contributions including 711 “marginal” employees for marine and freshwater aquaculture at the date 30/09/2011. In the following table employment data since 2008 are presented for two different points of time for fulltime and part-time employees that are covered by social security scheme. So about 700 “marginal” employees, family members and self-employed persons are not included in these figures.
Table 5.11.1: Persons subject to social insurance contributions by gender and full/part time in Germany
Always 30.06.
2008 2009 2010 2011
male female male female male female male female
Fulltime 679 121 691 226 667 213 673 213
Part-time 28 60 37 67 34 74 39 75
Total 707 281 730 293 701 287 713 289
Total 988 1023 988 1002
Total at 30.09. 1020 1019 1008 1016
Source: Federal Employment Agency, different years
Note: Individual figures do not always sum up to the total due to unclear reports to the agency.
The table shows stable figures for the aquaculture sector as a whole over the respective years. Even checking for December data of employment do not change the figures substantially. As the sector consists of some main activity companies/farms and a lot of farms being a secondary or additional income source, persons working in the sector are self-employed, family members and about 700 marginal employees.
The statistic of the turnover declaration of enterprises with more than 17,500 Euro turnover per year also show no reduction, moreover the opposite.
2 Brämick, Uwe. 2012. Jahresbericht zur Deutschen Binnenfischerei 2011.
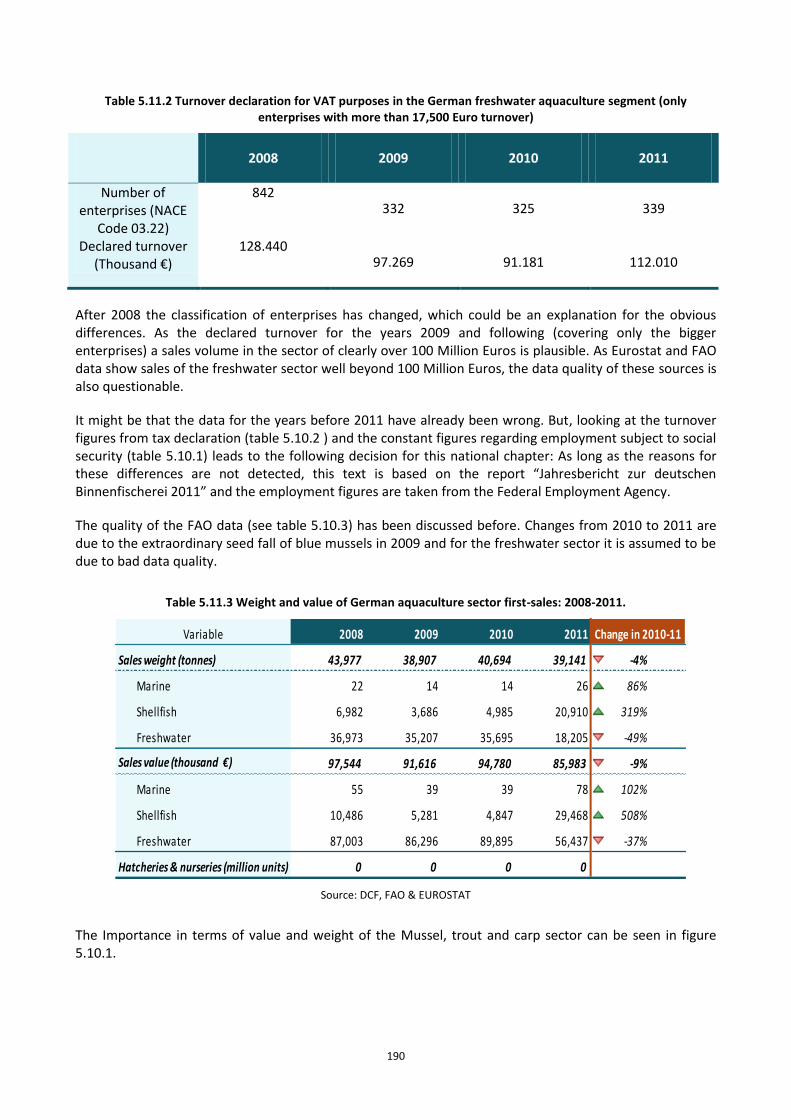
190
Table 5.11.2 Turnover declaration for VAT purposes in the German freshwater aquaculture segment (only enterprises with more than 17,500 Euro turnover)
2008 2009 2010 2011
Number of enterprises (NACE
Code 03.22)
842 332 325 339
Declared turnover (Thousand €)
128.440 97.269 91.181 112.010
After 2008 the classification of enterprises has changed, which could be an explanation for the obvious differences. As the declared turnover for the years 2009 and following (covering only the bigger enterprises) a sales volume in the sector of clearly over 100 Million Euros is plausible. As Eurostat and FAO data show sales of the freshwater sector well beyond 100 Million Euros, the data quality of these sources is also questionable.
It might be that the data for the years before 2011 have already been wrong. But, looking at the turnover figures from tax declaration (table 5.10.2 ) and the constant figures regarding employment subject to social security (table 5.10.1) leads to the following decision for this national chapter: As long as the reasons for these differences are not detected, this text is based on the report “Jahresbericht zur deutschen Binnenfischerei 2011” and the employment figures are taken from the Federal Employment Agency.
The quality of the FAO data (see table 5.10.3) has been discussed before. Changes from 2010 to 2011 are due to the extraordinary seed fall of blue mussels in 2009 and for the freshwater sector it is assumed to be due to bad data quality.
Table 5.11.3 Weight and value of German aquaculture sector first-sales: 2008-2011.
Variable 2008 2009 2010 2011
Sales weight (tonnes) 43,977 38,907 40,694 39,141 -4% ↘
Marine 22 14 14 26 86%
Shellfish 6,982 3,686 4,985 20,910 319%
Freshwater 36,973 35,207 35,695 18,205 -49% ↘
Sales value (thousand €) 97,544 91,616 94,780 85,983 -9% ↘
Marine 55 39 39 78 102% ↗
Shellfish 10,486 5,281 4,847 29,468 508% ↗
Freshwater 87,003 86,296 89,895 56,437 -37% ↘
Hatcheries & nurseries (million units) 0 0 0 0
Change in 2010-11
Source: DCF, FAO & EUROSTAT
The Importance in terms of value and weight of the Mussel, trout and carp sector can be seen in figure 5.10.1.
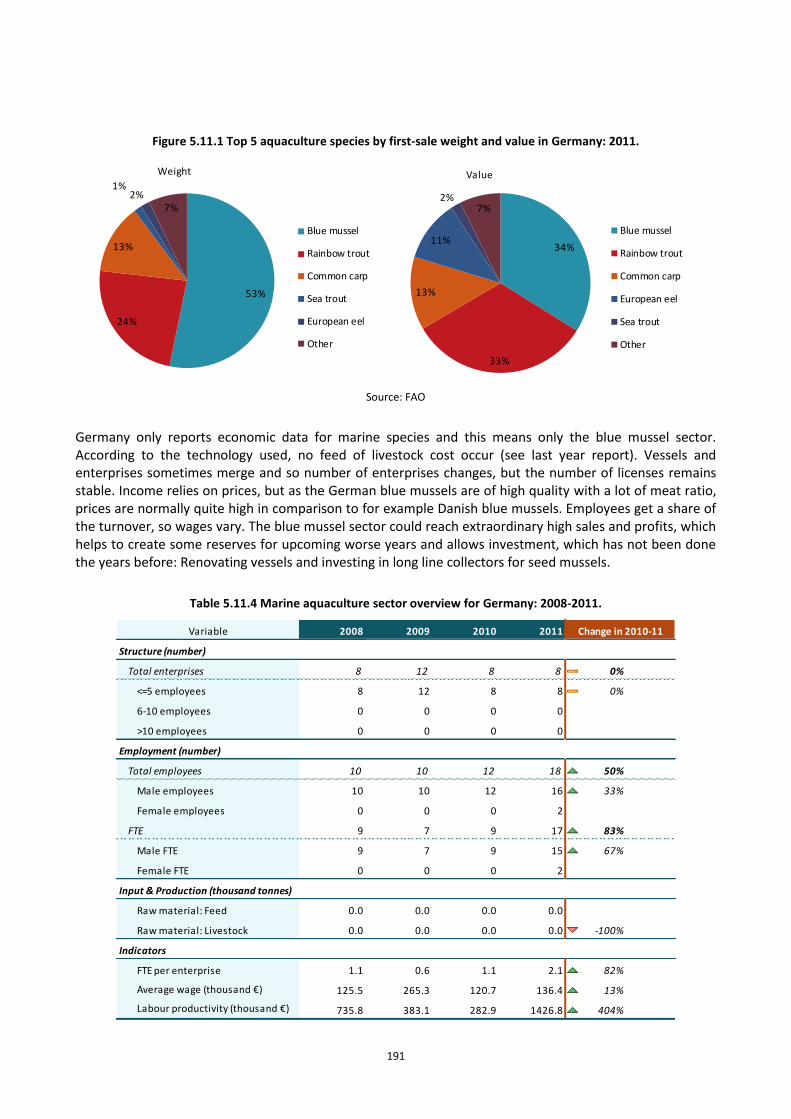
191
Figure 5.11.1 Top 5 aquaculture species by first-sale weight and value in Germany: 2011.
53%
24%
13%
1%2%
7%
Weight
Blue mussel
Rainbow trout
Common carp
Sea trout
European eel
Other
34%
33%
13%
11%
2%7%
Value
Blue mussel
Rainbow trout
Common carp
European eel
Sea trout
Other
Source: FAO
Germany only reports economic data for marine species and this means only the blue mussel sector. According to the technology used, no feed of livestock cost occur (see last year report). Vessels and enterprises sometimes merge and so number of enterprises changes, but the number of licenses remains stable. Income relies on prices, but as the German blue mussels are of high quality with a lot of meat ratio, prices are normally quite high in comparison to for example Danish blue mussels. Employees get a share of the turnover, so wages vary. The blue mussel sector could reach extraordinary high sales and profits, which helps to create some reserves for upcoming worse years and allows investment, which has not been done the years before: Renovating vessels and investing in long line collectors for seed mussels.
Table 5.11.4 Marine aquaculture sector overview for Germany: 2008-2011.
Variable 2008 2009 2010 2011
Structure (number)
Total enterprises 8 12 8 8 0% ↔
<=5 employees 8 12 8 8 0% ↔
6-10 employees 0 0 0 0 ↔
>10 employees 0 0 0 0 ↔
Employment (number)
Total employees 10 10 12 18 50% ↗
Male employees 10 10 12 16 33% ↗
Female employees 0 0 0 2 ↔
FTE 9 7 9 17 83% ↗
Male FTE 9 7 9 15 67% ↗
Female FTE 0 0 0 2 ↔
Input & Production (thousand tonnes)
Raw material: Feed 0.0 0.0 0.0 0.0 ↔
Raw material: Livestock 0.0 0.0 0.0 0.0 -100%
Indicators
FTE per enterprise 1.1 0.6 1.1 2.1 82% ↗
Average wage (thousand €) 125.5 265.3 120.7 136.4 13% ↗
Labour productivity (thousand €) 735.8 383.1 282.9 1426.8 404% ↗
Change in 2010-11
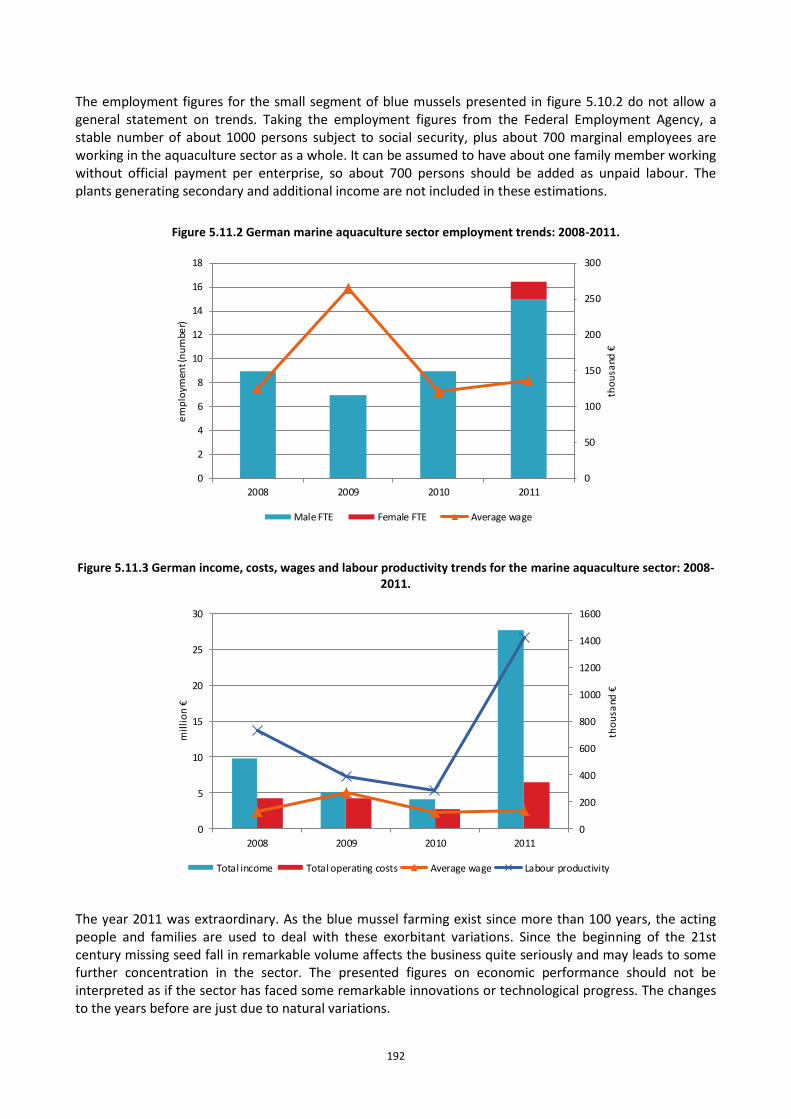
192
The employment figures for the small segment of blue mussels presented in figure 5.10.2 do not allow a general statement on trends. Taking the employment figures from the Federal Employment Agency, a stable number of about 1000 persons subject to social security, plus about 700 marginal employees are working in the aquaculture sector as a whole. It can be assumed to have about one family member working without official payment per enterprise, so about 700 persons should be added as unpaid labour. The plants generating secondary and additional income are not included in these estimations.
Figure 5.11.2 German marine aquaculture sector employment trends: 2008-2011.
0
50
100
150
200
250
300
0
2
4
6
8
10
12
14
16
18
2008 2009 2010 2011
tho
usa
nd €
em
plo
ymen
t (n
um
ber)
Male FTE Female FTE Average wage
Figure 5.11.3 German income, costs, wages and labour productivity trends for the marine aquaculture sector: 2008-2011.
0
200
400
600
800
1000
1200
1400
1600
0
5
10
15
20
25
30
2008 2009 2010 2011
tho
usa
nd €
mil
lio
n €
Total income Total operating costs Average wage Labour productivity
The year 2011 was extraordinary. As the blue mussel farming exist since more than 100 years, the acting people and families are used to deal with these exorbitant variations. Since the beginning of the 21st century missing seed fall in remarkable volume affects the business quite seriously and may leads to some further concentration in the sector. The presented figures on economic performance should not be interpreted as if the sector has faced some remarkable innovations or technological progress. The changes to the years before are just due to natural variations.
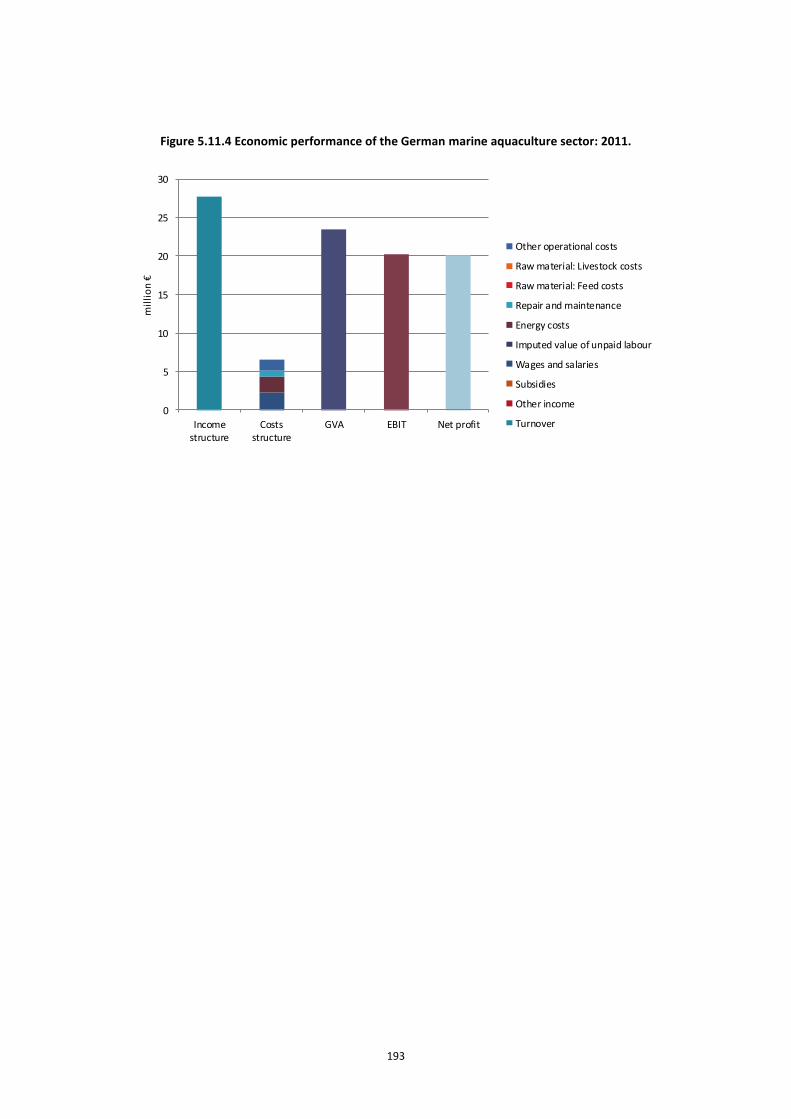
193
Figure 5.11.4 Economic performance of the German marine aquaculture sector: 2011.
0
5
10
15
20
25
30
Incomestructure
Costsstructure
GVA EBIT Net profit
mil
lio
n €
Other operational costs
Raw material: Livestock costs
Raw material: Feed costs
Repair and maintenance
Energy costs
Imputed value of unpaid labour
Wages and salaries
Subsidies
Other income
Turnover
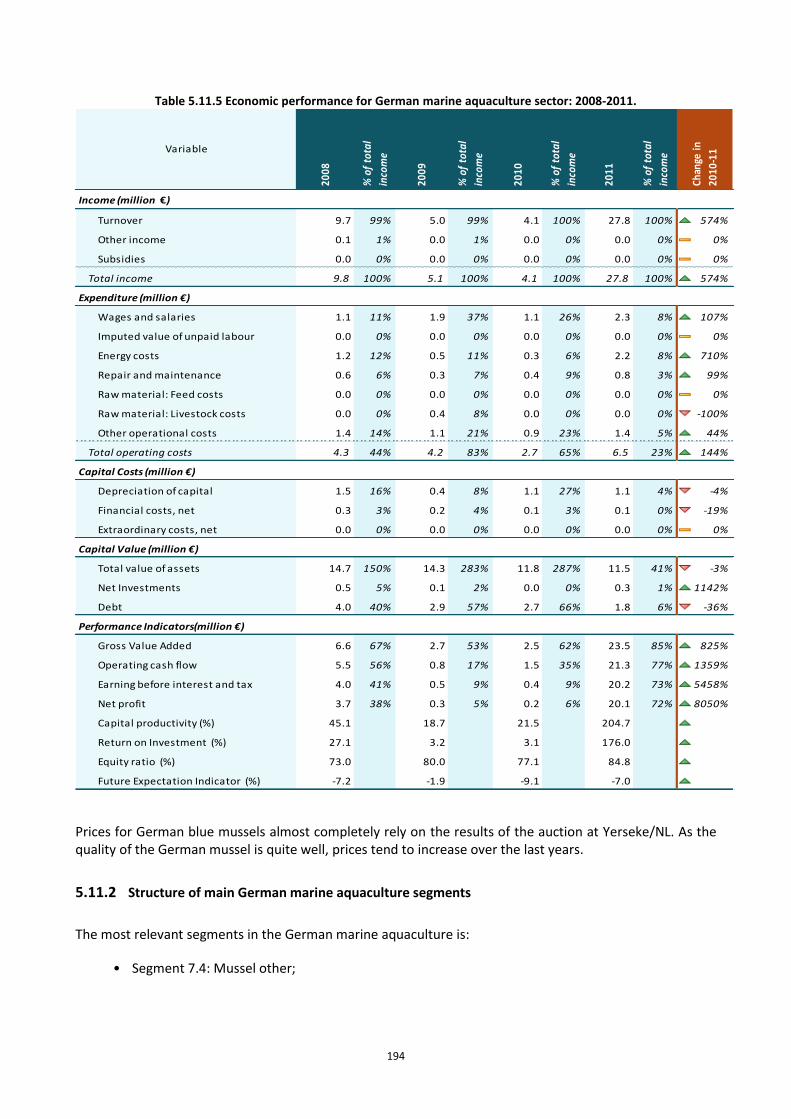
194
Table 5.11.5 Economic performance for German marine aquaculture sector: 2008-2011.
Income (million €)
Turnover 9.7 99% 5.0 99% 4.1 100% 27.8 100% 574%
Other income 0.1 1% 0.0 1% 0.0 0% 0.0 0% 0%
Subsidies 0.0 0% 0.0 0% 0.0 0% 0.0 0% 0%
Total income 9.8 100% 5.1 100% 4.1 100% 27.8 100% 574%
Expenditure (million €)
Wages and salaries 1.1 11% 1.9 37% 1.1 26% 2.3 8% 107%
Imputed value of unpaid labour 0.0 0% 0.0 0% 0.0 0% 0.0 0% 0%
Energy costs 1.2 12% 0.5 11% 0.3 6% 2.2 8% 710%
Repair and maintenance 0.6 6% 0.3 7% 0.4 9% 0.8 3% 99%
Raw material: Feed costs 0.0 0% 0.0 0% 0.0 0% 0.0 0% 0%
Raw material: Livestock costs 0.0 0% 0.4 8% 0.0 0% 0.0 0% -100%
Other operational costs 1.4 14% 1.1 21% 0.9 23% 1.4 5% 44%
Total operating costs 4.3 44% 4.2 83% 2.7 65% 6.5 23% 144%
Capital Costs (million €)
Depreciation of capital 1.5 16% 0.4 8% 1.1 27% 1.1 4% -4%
Financial costs, net 0.3 3% 0.2 4% 0.1 3% 0.1 0% -19%
Extraordinary costs, net 0.0 0% 0.0 0% 0.0 0% 0.0 0% 0%
Capital Value (million €)
Total value of assets 14.7 150% 14.3 283% 11.8 287% 11.5 41% -3%
Net Investments 0.5 5% 0.1 2% 0.0 0% 0.3 1% 1142%
Debt 4.0 40% 2.9 57% 2.7 66% 1.8 6% -36%
Performance Indicators(million €)
Gross Value Added 6.6 67% 2.7 53% 2.5 62% 23.5 85% 825%
Operating cash flow 5.5 56% 0.8 17% 1.5 35% 21.3 77% 1359%
Earning before interest and tax 4.0 41% 0.5 9% 0.4 9% 20.2 73% 5458%
Net profit 3.7 38% 0.3 5% 0.2 6% 20.1 72% 8050%
Capital productivity (%) 45.1 18.7 21.5 204.7 852%
Return on Investment (%) 27.1 3.2 3.1 176.0 5615%
Equity ratio (%) 73.0 80.0 77.1 84.8 10%
Future Expectation Indicator (%) -7.2 -1.9 -9.1 -7.0 23%
% o
f to
tal
inco
me
% o
f to
tal
inco
me
2010
2011
Chan
ge in
2010
-11
% o
f to
tal
inco
meVariable
% o
f to
tal
inco
me
2008
2009
Prices for German blue mussels almost completely rely on the results of the auction at Yerseke/NL. As the quality of the German mussel is quite well, prices tend to increase over the last years.
5.11.2 Structure of main German marine aquaculture segments
The most relevant segments in the German marine aquaculture is:
• Segment 7.4: Mussel other;
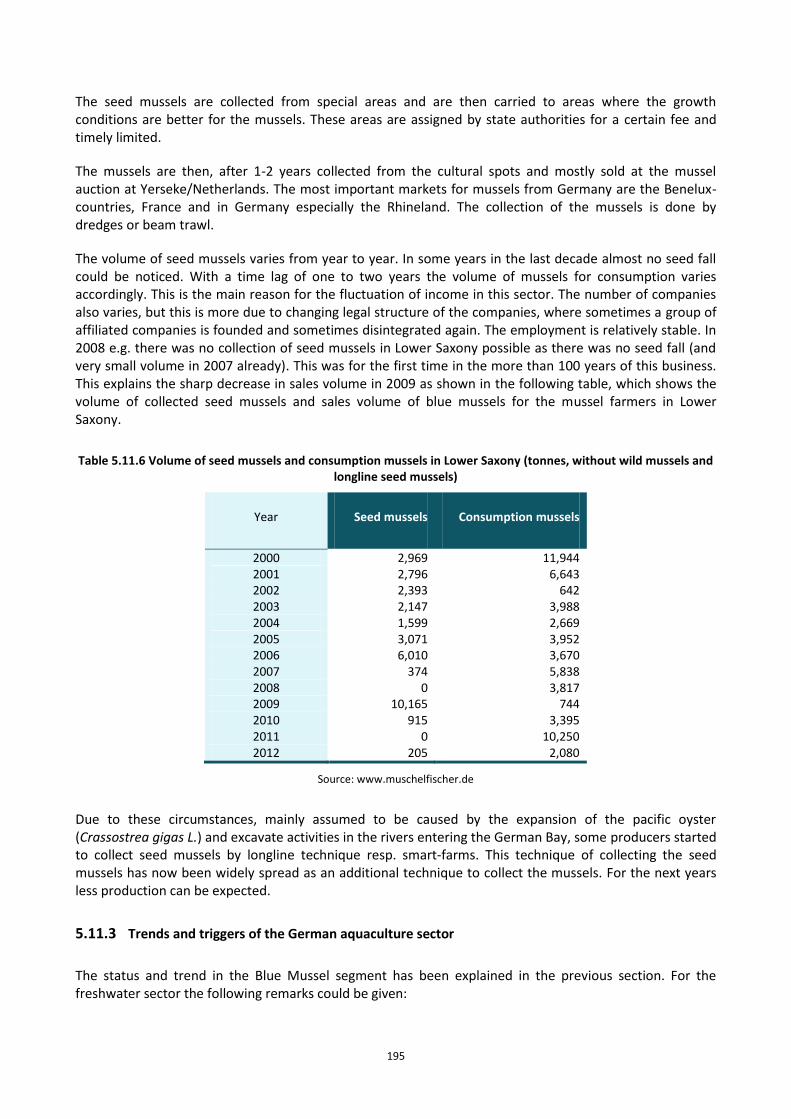
195
The seed mussels are collected from special areas and are then carried to areas where the growth conditions are better for the mussels. These areas are assigned by state authorities for a certain fee and timely limited.
The mussels are then, after 1-2 years collected from the cultural spots and mostly sold at the mussel auction at Yerseke/Netherlands. The most important markets for mussels from Germany are the Benelux-countries, France and in Germany especially the Rhineland. The collection of the mussels is done by dredges or beam trawl.
The volume of seed mussels varies from year to year. In some years in the last decade almost no seed fall could be noticed. With a time lag of one to two years the volume of mussels for consumption varies accordingly. This is the main reason for the fluctuation of income in this sector. The number of companies also varies, but this is more due to changing legal structure of the companies, where sometimes a group of affiliated companies is founded and sometimes disintegrated again. The employment is relatively stable. In 2008 e.g. there was no collection of seed mussels in Lower Saxony possible as there was no seed fall (and very small volume in 2007 already). This was for the first time in the more than 100 years of this business. This explains the sharp decrease in sales volume in 2009 as shown in the following table, which shows the volume of collected seed mussels and sales volume of blue mussels for the mussel farmers in Lower Saxony.
Table 5.11.6 Volume of seed mussels and consumption mussels in Lower Saxony (tonnes, without wild mussels and longline seed mussels)
Year Seed mussels Consumption mussels
2000 2,969 11,944 2001 2,796 6,643 2002 2,393 642 2003 2,147 3,988 2004 1,599 2,669 2005 3,071 3,952 2006 6,010 3,670 2007 374 5,838 2008 0 3,817 2009 10,165 744 2010 915 3,395 2011 0 10,250 2012 205 2,080
Source: www.muschelfischer.de
Due to these circumstances, mainly assumed to be caused by the expansion of the pacific oyster (Crassostrea gigas L.) and excavate activities in the rivers entering the German Bay, some producers started to collect seed mussels by longline technique resp. smart-farms. This technique of collecting the seed mussels has now been widely spread as an additional technique to collect the mussels. For the next years less production can be expected.
5.11.3 Trends and triggers of the German aquaculture sector
The status and trend in the Blue Mussel segment has been explained in the previous section. For the freshwater sector the following remarks could be given:
196
The market is dominated by traditional small producers for the regional market (carp and trout). The competition by trout from Denmark and Turkey is quite heavy in the general retail sector, so most production is sold regionally. For the carp segment, producers are facing declining demand for carp, which is traditionally eaten in some regions at New Year´s Eve. Even if some marketing actions are going on, demand is still quite restricted.
For the carp production sites problems with diseases and cormorans are so significant, that more and more small farmers are going to give up this activity.
The trout producers are facing urgent problems with lack of therapeutic options for parasites and bacteria. Cormorans and gray heron are causing less problems than in the carp sector, but in particular some small producers are faced with serious economical impacts of those predatory activities.
Some new recirculation farms have entered the market, e.g. for African catfish. As the production volume is still low, one has to observe the development if it is a real new trend. Increasing problems are coming up with great white egret, European otter and goosander.
Currently different bodies in Germany develop strategies in order to increase the aquaculture production. Unfortunately it is not obvious what the strategic targets and measures will be. From this experts point of view Germany has some strength in providing cultured fish for local and regional market, in particular as the landscape is very much characterised by traditional ponds in some German regions (Franken/Lausitz). This serves also as a touristic attractor, while some concentration in the segment seems to be necessary in order to create economies of scale. In the trout segment it seems to be necessary to create value added for the consumers, e.g. by regional and organic labelling, but obviously the sector can survive with the regional and local markets. Some other currently small segments may increase if more volume is created and supply could be stabilized in higher volumes during the year to be interesting for the big retailers.
A possible direction of aquaculture in Germany could be the construction of bigger recirculation facilities with significant volumes of production. This should also include development of filter and energy saving technology in order to be able to lower production costs and environmental impact, but also create export opportunities.
Furthermore the optimal use of the ingredients of aquatic animals and plants in general (cascade use) is on the agenda: This could be use for cosmetics, pharmaceuticals, clothing industry, or extraction of specific ingredients for specific uses. Then aquaculture production could serve, beside production for direct human consumption, as another source of raw material for those sectors that use the “waste” by-products of the organism.
If one is interested in additional income opportunities for agricultural farmers, the use of the heat from bioreactors for small warm water recirculation systems could be another strategic target, providing local and stable production of fish. Some farms are already established and it is assumed that this is the reason for the increasing number of recirculation systems in Germany.
Another direction is the co-use of limited marine space by aquaculture facilities, in particular by going offshore into harsh conditions as a partner of the wind farm industry.
But as already two waves of recirculation systems booms have ended more or less unsuccessfully in Germany, a joint action of investors, retailers, marketing experts, administration, scientists from different subjects and other relevant groups are necessary to avoid malinvestment, the choice of wrong species and technology, long and complicated licence procedures, economic not sustainable technologies, and farm sizes or other foreseeable reasons for economic failure of this development.
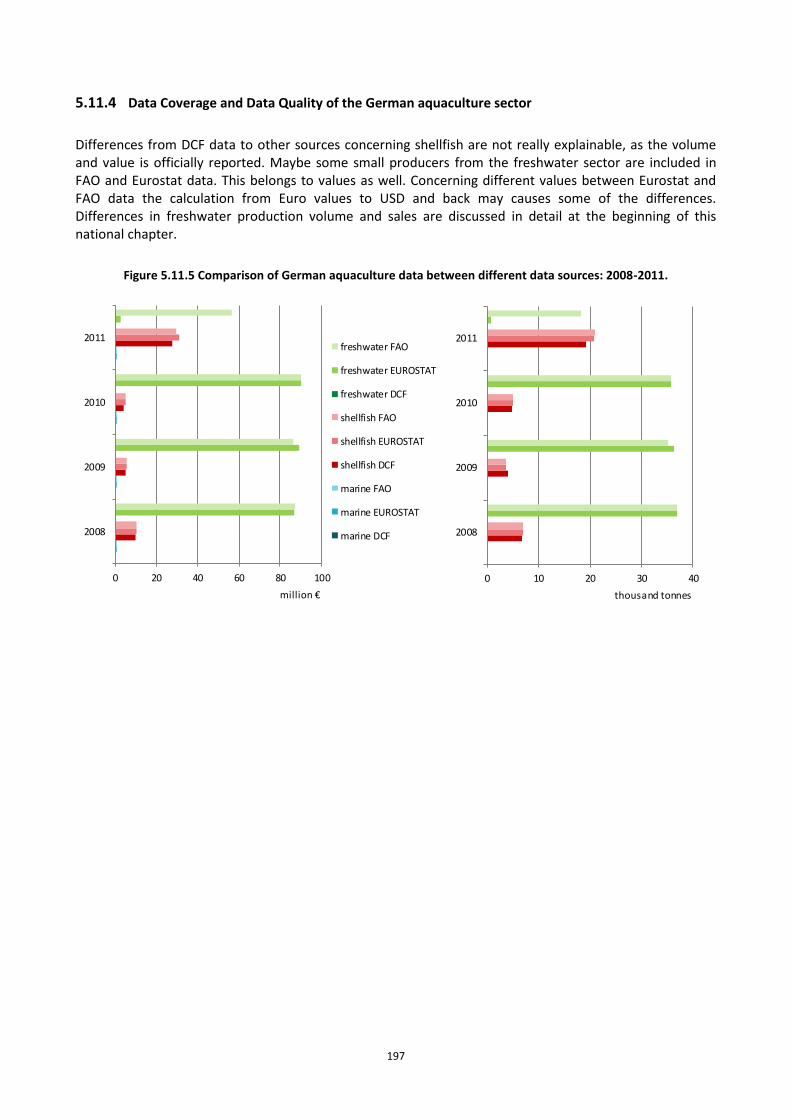
197
5.11.4 Data Coverage and Data Quality of the German aquaculture sector
Differences from DCF data to other sources concerning shellfish are not really explainable, as the volume and value is officially reported. Maybe some small producers from the freshwater sector are included in FAO and Eurostat data. This belongs to values as well. Concerning different values between Eurostat and FAO data the calculation from Euro values to USD and back may causes some of the differences. Differences in freshwater production volume and sales are discussed in detail at the beginning of this national chapter.
Figure 5.11.5 Comparison of German aquaculture data between different data sources: 2008-2011.
0 20 40 60 80 100
2008
2009
2010
2011
million €
freshwater FAO
freshwater EUROSTAT
freshwater DCF
shellfish FAO
shellfish EUROSTAT
shellfish DCF
marine FAO
marine EUROSTAT
marine DCF
0 10 20 30 40
2008
2009
2010
2011
thousand tonnes
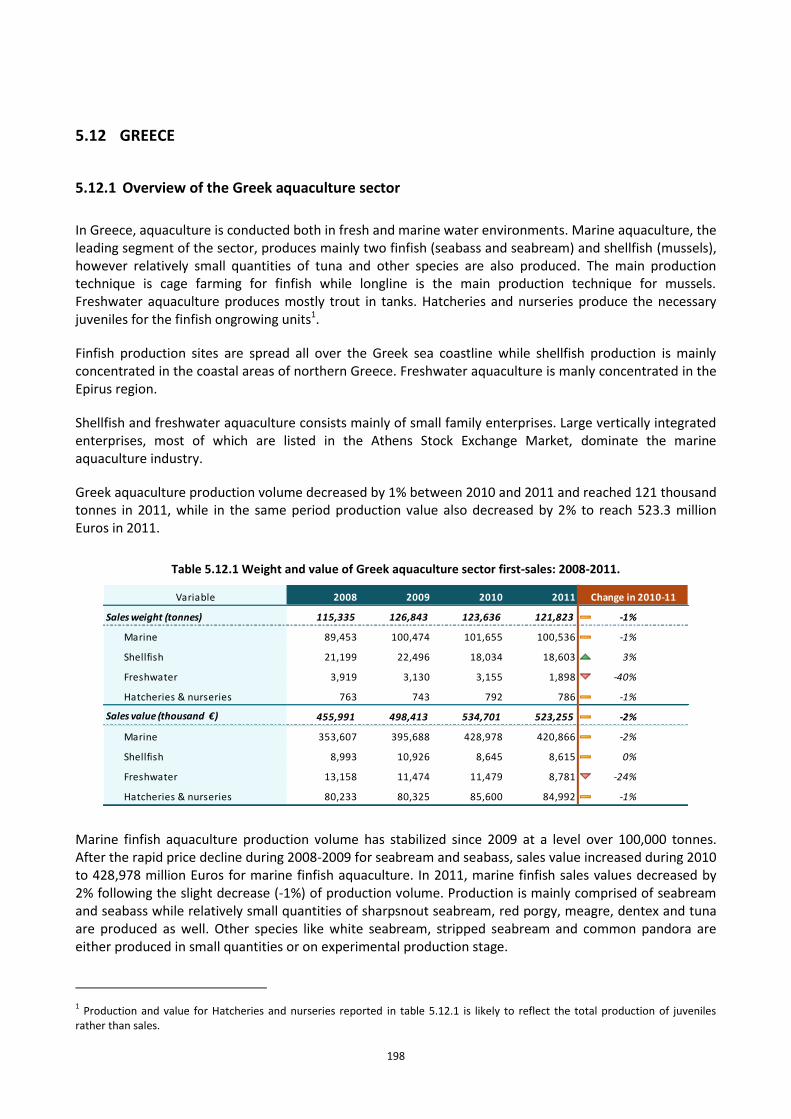
198
5.12 GREECE
5.12.1 Overview of the Greek aquaculture sector
In Greece, aquaculture is conducted both in fresh and marine water environments. Marine aquaculture, the leading segment of the sector, produces mainly two finfish (seabass and seabream) and shellfish (mussels), however relatively small quantities of tuna and other species are also produced. The main production technique is cage farming for finfish while longline is the main production technique for mussels. Freshwater aquaculture produces mostly trout in tanks. Hatcheries and nurseries produce the necessary juveniles for the finfish ongrowing units1.
Finfish production sites are spread all over the Greek sea coastline while shellfish production is mainly concentrated in the coastal areas of northern Greece. Freshwater aquaculture is manly concentrated in the Epirus region.
Shellfish and freshwater aquaculture consists mainly of small family enterprises. Large vertically integrated enterprises, most of which are listed in the Athens Stock Exchange Market, dominate the marine aquaculture industry.
Greek aquaculture production volume decreased by 1% between 2010 and 2011 and reached 121 thousand tonnes in 2011, while in the same period production value also decreased by 2% to reach 523.3 million Euros in 2011.
Table 5.12.1 Weight and value of Greek aquaculture sector first-sales: 2008-2011.
Variable 2008 2009 2010 2011
Sales weight (tonnes) 115,335 126,843 123,636 121,823 -1%
Marine 89,453 100,474 101,655 100,536 -1%
Shellfish 21,199 22,496 18,034 18,603 3% ↗
Freshwater 3,919 3,130 3,155 1,898 -40%
Hatcheries & nurseries 763 743 792 786 -1%
Sales value (thousand €) 455,991 498,413 534,701 523,255 -2% ↘
Marine 353,607 395,688 428,978 420,866 -2% ↘
Shellfish 8,993 10,926 8,645 8,615 0% ↔
Freshwater 13,158 11,474 11,479 8,781 -24%
Hatcheries & nurseries 80,233 80,325 85,600 84,992 -1%
Change in 2010-11
Marine finfish aquaculture production volume has stabilized since 2009 at a level over 100,000 tonnes. After the rapid price decline during 2008-2009 for seabream and seabass, sales value increased during 2010 to 428,978 million Euros for marine finfish aquaculture. In 2011, marine finfish sales values decreased by 2% following the slight decrease (-1%) of production volume. Production is mainly comprised of seabream and seabass while relatively small quantities of sharpsnout seabream, red porgy, meagre, dentex and tuna are produced as well. Other species like white seabream, stripped seabream and common pandora are either produced in small quantities or on experimental production stage.
1 Production and value for Hatcheries and nurseries reported in table 5.12.1 is likely to reflect the total production of juveniles
rather than sales.
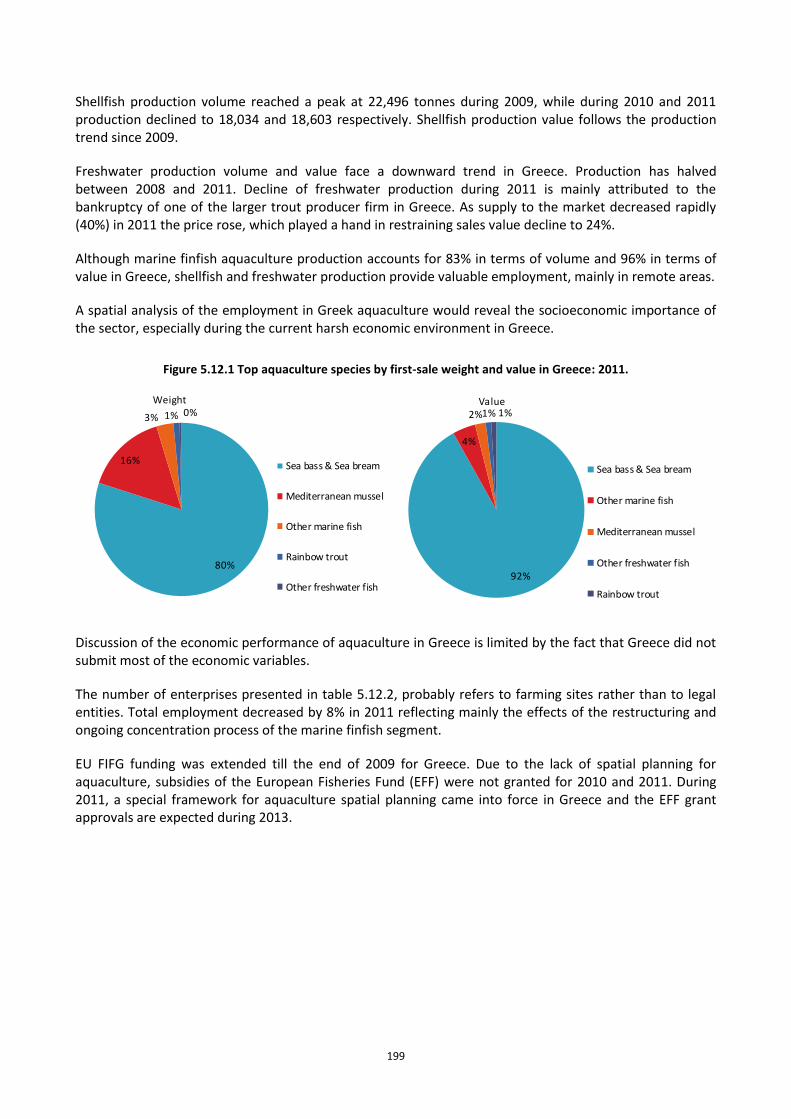
199
Shellfish production volume reached a peak at 22,496 tonnes during 2009, while during 2010 and 2011 production declined to 18,034 and 18,603 respectively. Shellfish production value follows the production trend since 2009.
Freshwater production volume and value face a downward trend in Greece. Production has halved between 2008 and 2011. Decline of freshwater production during 2011 is mainly attributed to the bankruptcy of one of the larger trout producer firm in Greece. As supply to the market decreased rapidly (40%) in 2011 the price rose, which played a hand in restraining sales value decline to 24%.
Although marine finfish aquaculture production accounts for 83% in terms of volume and 96% in terms of value in Greece, shellfish and freshwater production provide valuable employment, mainly in remote areas.
A spatial analysis of the employment in Greek aquaculture would reveal the socioeconomic importance of the sector, especially during the current harsh economic environment in Greece.
Figure 5.12.1 Top aquaculture species by first-sale weight and value in Greece: 2011.
80%
16%
3% 1% 0%Weight
Sea bass & Sea bream
Mediterranean mussel
Other marine fish
Rainbow trout
Other freshwater fish92%
4%
2% 1%1%Value
Sea bass & Sea bream
Other marine fish
Mediterranean mussel
Other freshwater fish
Rainbow trout
Discussion of the economic performance of aquaculture in Greece is limited by the fact that Greece did not submit most of the economic variables.
The number of enterprises presented in table 5.12.2, probably refers to farming sites rather than to legal entities. Total employment decreased by 8% in 2011 reflecting mainly the effects of the restructuring and ongoing concentration process of the marine finfish segment.
EU FIFG funding was extended till the end of 2009 for Greece. Due to the lack of spatial planning for aquaculture, subsidies of the European Fisheries Fund (EFF) were not granted for 2010 and 2011. During 2011, a special framework for aquaculture spatial planning came into force in Greece and the EFF grant approvals are expected during 2013.
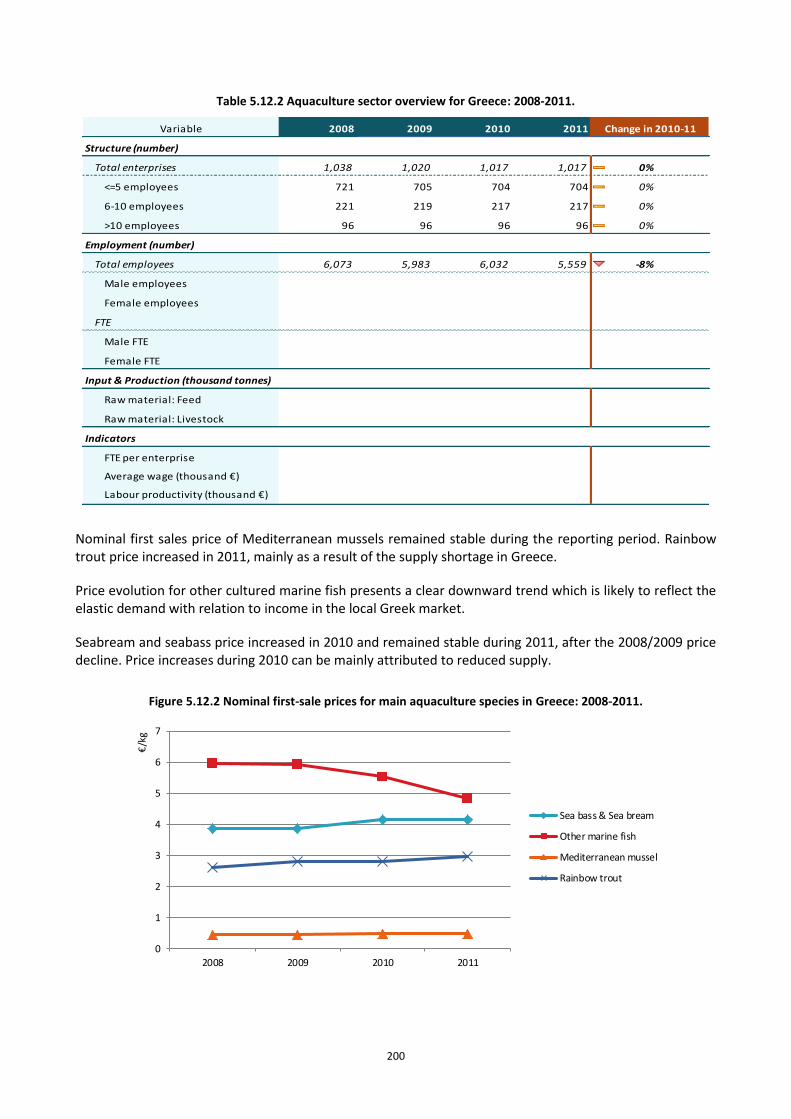
200
Table 5.12.2 Aquaculture sector overview for Greece: 2008-2011.
Variable 2008 2009 2010 2011
Structure (number)
Total enterprises 1,038 1,020 1,017 1,017 0% ↔
<=5 employees 721 705 704 704 0% ↔
6-10 employees 221 219 217 217 0% ↔
>10 employees 96 96 96 96 0% ↔
Employment (number)
Total employees 6,073 5,983 6,032 5,559 -8% ↘
Male employees ↔
Female employees ↔
FTE ↔
Male FTE ↔
Female FTE ↔
Input & Production (thousand tonnes)
Raw material: Feed ↔
Raw material: Livestock
Indicators
FTE per enterprise ↔
Average wage (thousand €) ↔
Labour productivity (thousand €) ↔
Change in 2010-11
Nominal first sales price of Mediterranean mussels remained stable during the reporting period. Rainbow trout price increased in 2011, mainly as a result of the supply shortage in Greece.
Price evolution for other cultured marine fish presents a clear downward trend which is likely to reflect the elastic demand with relation to income in the local Greek market.
Seabream and seabass price increased in 2010 and remained stable during 2011, after the 2008/2009 price decline. Price increases during 2010 can be mainly attributed to reduced supply.
Figure 5.12.2 Nominal first-sale prices for main aquaculture species in Greece: 2008-2011.
0
1
2
3
4
5
6
7
2008 2009 2010 2011
€/k
g
Sea bass & Sea bream
Other marine fish
Mediterranean mussel
Rainbow trout
201
5.12.2 Trends and triggers of the Greek aquaculture sector
Greek marine finfish aquaculture production volume is stabilized since 2009 over 100,000 tonnes. As the vast majority of the production is exported to southern European countries, production volume stabilization is partly attributed to:
supply side decisions to limit production
effects of the recent debt crisis in Southern European demand
Economic performance of the Greek aquaculture sector is affected by the recent debt crisis in Greece. Strangulation of credit, limits further expansion of the sector. Credit absence and rising financial costs are forcing the further concentration of the sector2. For the same reasons production volume is not expected to increase significantly in the near future and capital investment is expected to decline. On top of this, the fact that EFF does not provide direct investment subsidies or relevant financial engineering instruments for large aquaculture companies further limits the expansion of the sector.
The rapid decline of wages in Greece during the 2011/2013 period is not expected to significantly affect the economic performance of aquaculture. On the contrary, rising financial costs, rising energy costs and rising fish feed costs are expected to further deteriorate economic performance of Greek aquaculture. The price of seabass and seabream is expected to decline during 2013 due to liquidity shortages of Greek companies, as an effect of credit absence.
Labelling, and especially organic labelling, that provides the opportunity for higher price premiums is applied by a small number of companies in Greece. Nevertheless, the market segment for organic fish is expected to remain niche.
Freshwater and shellfish expansion is mainly restricted by the unavailability of suitable space in Greece.
Marine aquaculture has the potential to grow farther in the Mediterranean. In the short run, processing of aquaculture products, expansion to new markets and marketing are expected to contribute to a slow expansion rate of the sector. In the long run, in order for marine finfish aquaculture to expand and compete with salmon and pangasius in the global market, research and innovation is crucial. Production cost reduction and production technology of new species needs to be addressed by research. Funding for the research into substitutes of high valued raw material for fish feed, alleviation of technological constrains mainly for new species and improvement of culture techniques will drive the expansion of the sector. Substantial funding for private innovative pilot projects and spinoff companies is also necessary.
5.12.3 Data Coverage and Data Quality of the Greek aquaculture sector
No specific survey for DCF data collection was conducted in Greece for the period of 2008 to 2011, hence the vast majority of the economic variables are not reported.
Official Greek data was often criticised for under-reporting aquaculture production and value for seabream and seabass. A new licensing scheme for Greek finfish aquaculture which came into force in 2009 and the increasing concentration of the sector has significantly improved the quality data since 2010.
2 The merge of the 2
nd and the 4
th largest aquaculture companies in Greece was announced in 2013.
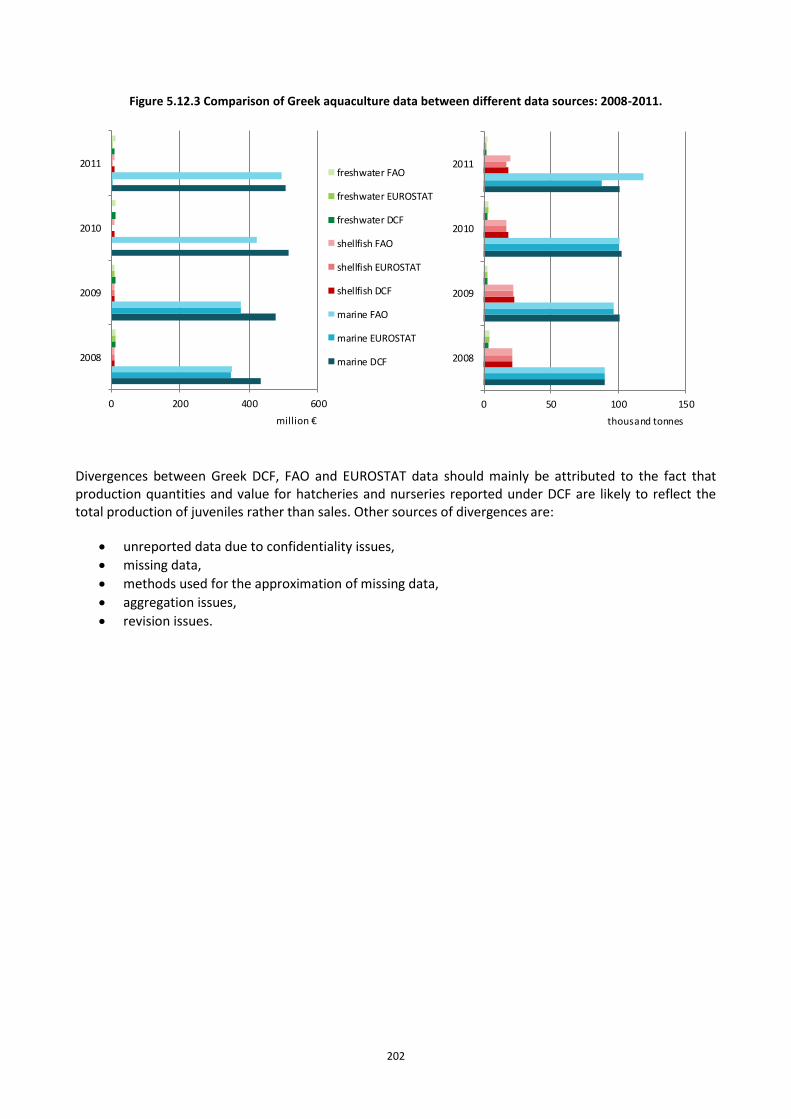
202
Figure 5.12.3 Comparison of Greek aquaculture data between different data sources: 2008-2011.
0 200 400 600
2008
2009
2010
2011
million €
freshwater FAO
freshwater EUROSTAT
freshwater DCF
shellfish FAO
shellfish EUROSTAT
shellfish DCF
marine FAO
marine EUROSTAT
marine DCF
0 50 100 150
2008
2009
2010
2011
thousand tonnes
Divergences between Greek DCF, FAO and EUROSTAT data should mainly be attributed to the fact that production quantities and value for hatcheries and nurseries reported under DCF are likely to reflect the total production of juveniles rather than sales. Other sources of divergences are:
unreported data due to confidentiality issues,
missing data,
methods used for the approximation of missing data,
aggregation issues,
revision issues.
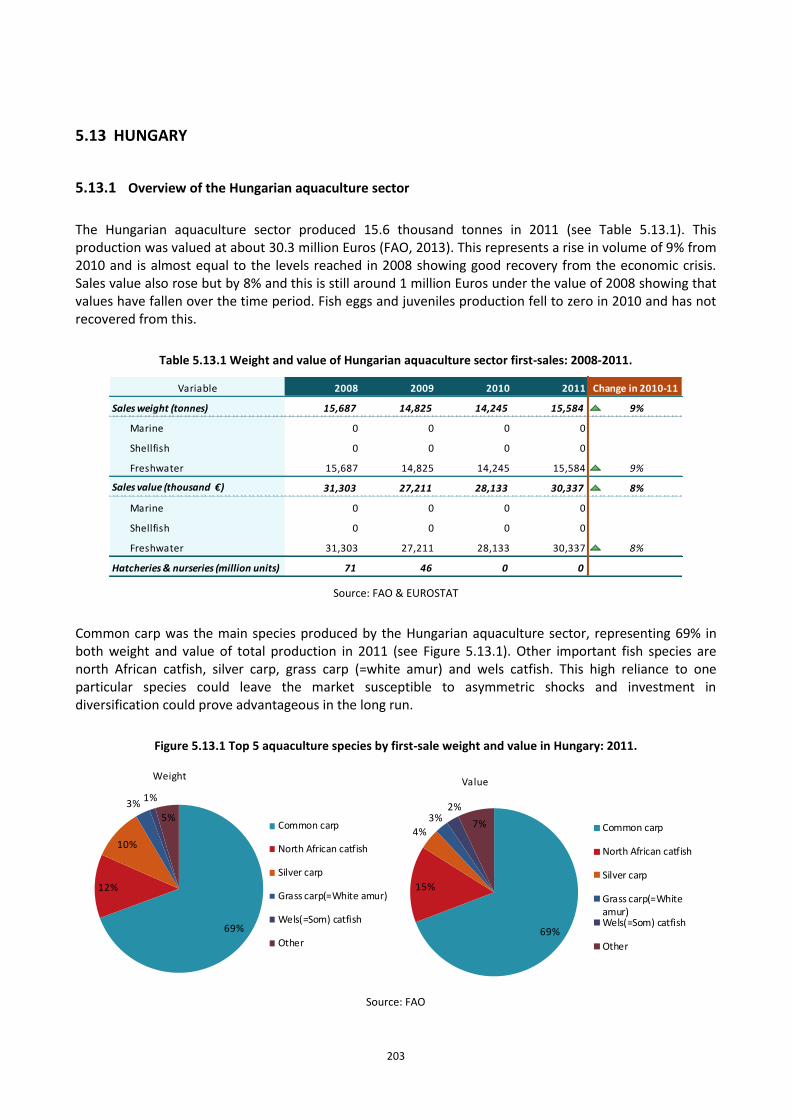
203
5.13 HUNGARY
5.13.1 Overview of the Hungarian aquaculture sector
The Hungarian aquaculture sector produced 15.6 thousand tonnes in 2011 (see Table 5.13.1). This production was valued at about 30.3 million Euros (FAO, 2013). This represents a rise in volume of 9% from 2010 and is almost equal to the levels reached in 2008 showing good recovery from the economic crisis. Sales value also rose but by 8% and this is still around 1 million Euros under the value of 2008 showing that values have fallen over the time period. Fish eggs and juveniles production fell to zero in 2010 and has not recovered from this.
Table 5.13.1 Weight and value of Hungarian aquaculture sector first-sales: 2008-2011.
Variable 2008 2009 2010 2011
Sales weight (tonnes) 15,687 14,825 14,245 15,584 9% ↗
Marine 0 0 0 0
Shellfish 0 0 0 0
Freshwater 15,687 14,825 14,245 15,584 9% ↗
Sales value (thousand €) 31,303 27,211 28,133 30,337 8% ↗
Marine 0 0 0 0
Shellfish 0 0 0 0
Freshwater 31,303 27,211 28,133 30,337 8% ↗
Hatcheries & nurseries (million units) 71 46 0 0
Change in 2010-11
Source: FAO & EUROSTAT
Common carp was the main species produced by the Hungarian aquaculture sector, representing 69% in both weight and value of total production in 2011 (see Figure 5.13.1). Other important fish species are north African catfish, silver carp, grass carp (=white amur) and wels catfish. This high reliance to one particular species could leave the market susceptible to asymmetric shocks and investment in diversification could prove advantageous in the long run.
Figure 5.13.1 Top 5 aquaculture species by first-sale weight and value in Hungary: 2011.
69%
12%
10%
3%1%
5%
Weight
Common carp
North African catfish
Silver carp
Grass carp(=White amur)
Wels(=Som) catfish
Other69%
15%
4%
3%2%
7%
Value
Common carp
North African catfish
Silver carp
Grass carp(=Whiteamur)Wels(=Som) catfish
Other
Source: FAO
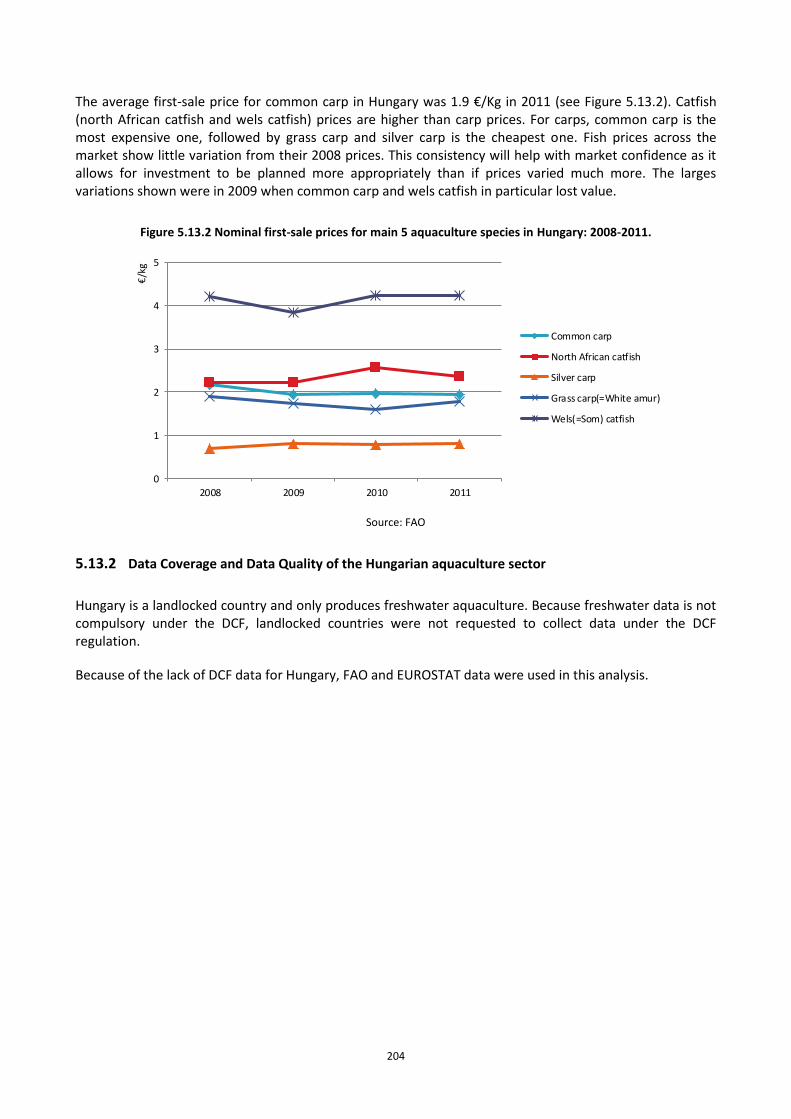
204
The average first-sale price for common carp in Hungary was 1.9 €/Kg in 2011 (see Figure 5.13.2). Catfish (north African catfish and wels catfish) prices are higher than carp prices. For carps, common carp is the most expensive one, followed by grass carp and silver carp is the cheapest one. Fish prices across the market show little variation from their 2008 prices. This consistency will help with market confidence as it allows for investment to be planned more appropriately than if prices varied much more. The larges variations shown were in 2009 when common carp and wels catfish in particular lost value.
Figure 5.13.2 Nominal first-sale prices for main 5 aquaculture species in Hungary: 2008-2011.
0
1
2
3
4
5
2008 2009 2010 2011
€/k
g
Common carp
North African catfish
Silver carp
Grass carp(=White amur)
Wels(=Som) catfish
Source: FAO
5.13.2 Data Coverage and Data Quality of the Hungarian aquaculture sector
Hungary is a landlocked country and only produces freshwater aquaculture. Because freshwater data is not compulsory under the DCF, landlocked countries were not requested to collect data under the DCF regulation.
Because of the lack of DCF data for Hungary, FAO and EUROSTAT data were used in this analysis.
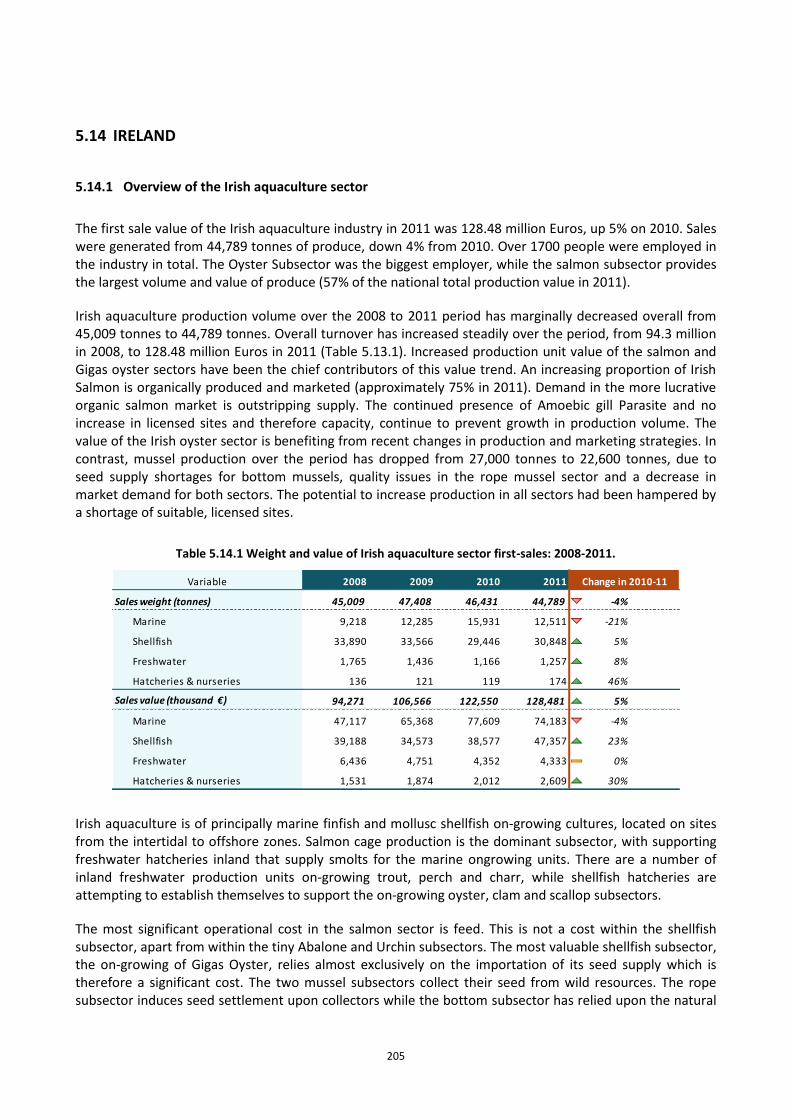
205
5.14 IRELAND
5.14.1 Overview of the Irish aquaculture sector
The first sale value of the Irish aquaculture industry in 2011 was 128.48 million Euros, up 5% on 2010. Sales were generated from 44,789 tonnes of produce, down 4% from 2010. Over 1700 people were employed in the industry in total. The Oyster Subsector was the biggest employer, while the salmon subsector provides the largest volume and value of produce (57% of the national total production value in 2011).
Irish aquaculture production volume over the 2008 to 2011 period has marginally decreased overall from 45,009 tonnes to 44,789 tonnes. Overall turnover has increased steadily over the period, from 94.3 million in 2008, to 128.48 million Euros in 2011 (Table 5.13.1). Increased production unit value of the salmon and Gigas oyster sectors have been the chief contributors of this value trend. An increasing proportion of Irish Salmon is organically produced and marketed (approximately 75% in 2011). Demand in the more lucrative organic salmon market is outstripping supply. The continued presence of Amoebic gill Parasite and no increase in licensed sites and therefore capacity, continue to prevent growth in production volume. The value of the Irish oyster sector is benefiting from recent changes in production and marketing strategies. In contrast, mussel production over the period has dropped from 27,000 tonnes to 22,600 tonnes, due to seed supply shortages for bottom mussels, quality issues in the rope mussel sector and a decrease in market demand for both sectors. The potential to increase production in all sectors had been hampered by a shortage of suitable, licensed sites.
Table 5.14.1 Weight and value of Irish aquaculture sector first-sales: 2008-2011.
Variable 2008 2009 2010 2011
Sales weight (tonnes) 45,009 47,408 46,431 44,789 -4%
Marine 9,218 12,285 15,931 12,511 -21%
Shellfish 33,890 33,566 29,446 30,848 5% ↗
Freshwater 1,765 1,436 1,166 1,257 8%
Hatcheries & nurseries 136 121 119 174 46%
Sales value (thousand €) 94,271 106,566 122,550 128,481 5% ↗
Marine 47,117 65,368 77,609 74,183 -4% ↘
Shellfish 39,188 34,573 38,577 47,357 23% ↗
Freshwater 6,436 4,751 4,352 4,333 0%
Hatcheries & nurseries 1,531 1,874 2,012 2,609 30%
Change in 2010-11
Irish aquaculture is of principally marine finfish and mollusc shellfish on-growing cultures, located on sites from the intertidal to offshore zones. Salmon cage production is the dominant subsector, with supporting freshwater hatcheries inland that supply smolts for the marine ongrowing units. There are a number of inland freshwater production units on-growing trout, perch and charr, while shellfish hatcheries are attempting to establish themselves to support the on-growing oyster, clam and scallop subsectors.
The most significant operational cost in the salmon sector is feed. This is not a cost within the shellfish subsector, apart from within the tiny Abalone and Urchin subsectors. The most valuable shellfish subsector, the on-growing of Gigas Oyster, relies almost exclusively on the importation of its seed supply which is therefore a significant cost. The two mussel subsectors collect their seed from wild resources. The rope subsector induces seed settlement upon collectors while the bottom subsector has relied upon the natural
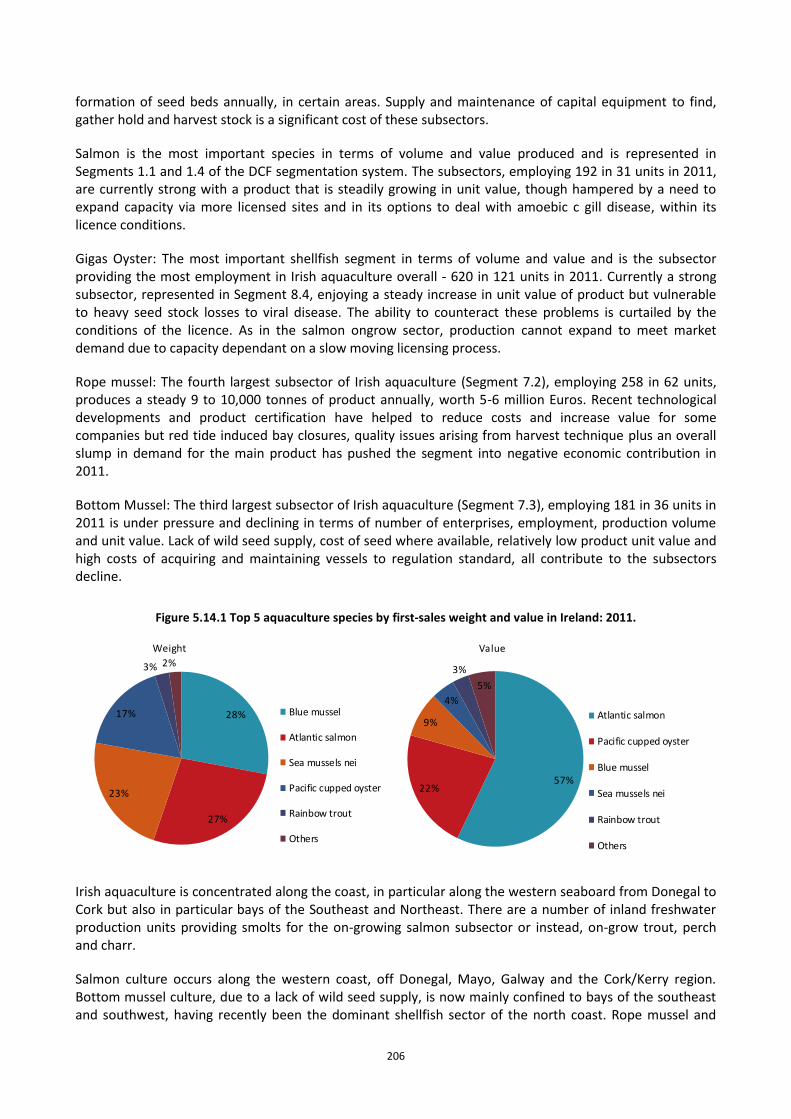
206
formation of seed beds annually, in certain areas. Supply and maintenance of capital equipment to find, gather hold and harvest stock is a significant cost of these subsectors.
Salmon is the most important species in terms of volume and value produced and is represented in Segments 1.1 and 1.4 of the DCF segmentation system. The subsectors, employing 192 in 31 units in 2011, are currently strong with a product that is steadily growing in unit value, though hampered by a need to expand capacity via more licensed sites and in its options to deal with amoebic c gill disease, within its licence conditions.
Gigas Oyster: The most important shellfish segment in terms of volume and value and is the subsector providing the most employment in Irish aquaculture overall - 620 in 121 units in 2011. Currently a strong subsector, represented in Segment 8.4, enjoying a steady increase in unit value of product but vulnerable to heavy seed stock losses to viral disease. The ability to counteract these problems is curtailed by the conditions of the licence. As in the salmon ongrow sector, production cannot expand to meet market demand due to capacity dependant on a slow moving licensing process.
Rope mussel: The fourth largest subsector of Irish aquaculture (Segment 7.2), employing 258 in 62 units, produces a steady 9 to 10,000 tonnes of product annually, worth 5-6 million Euros. Recent technological developments and product certification have helped to reduce costs and increase value for some companies but red tide induced bay closures, quality issues arising from harvest technique plus an overall slump in demand for the main product has pushed the segment into negative economic contribution in 2011.
Bottom Mussel: The third largest subsector of Irish aquaculture (Segment 7.3), employing 181 in 36 units in 2011 is under pressure and declining in terms of number of enterprises, employment, production volume and unit value. Lack of wild seed supply, cost of seed where available, relatively low product unit value and high costs of acquiring and maintaining vessels to regulation standard, all contribute to the subsectors decline.
Figure 5.14.1 Top 5 aquaculture species by first-sales weight and value in Ireland: 2011.
28%
27%
23%
17%
3% 2%
Weight
Blue mussel
Atlantic salmon
Sea mussels nei
Pacific cupped oyster
Rainbow trout
Others
57%22%
9%
4%
3%
5%
Value
Atlantic salmon
Pacific cupped oyster
Blue mussel
Sea mussels nei
Rainbow trout
Others
Irish aquaculture is concentrated along the coast, in particular along the western seaboard from Donegal to Cork but also in particular bays of the Southeast and Northeast. There are a number of inland freshwater production units providing smolts for the on-growing salmon subsector or instead, on-grow trout, perch and charr.
Salmon culture occurs along the western coast, off Donegal, Mayo, Galway and the Cork/Kerry region. Bottom mussel culture, due to a lack of wild seed supply, is now mainly confined to bays of the southeast and southwest, having recently been the dominant shellfish sector of the north coast. Rope mussel and
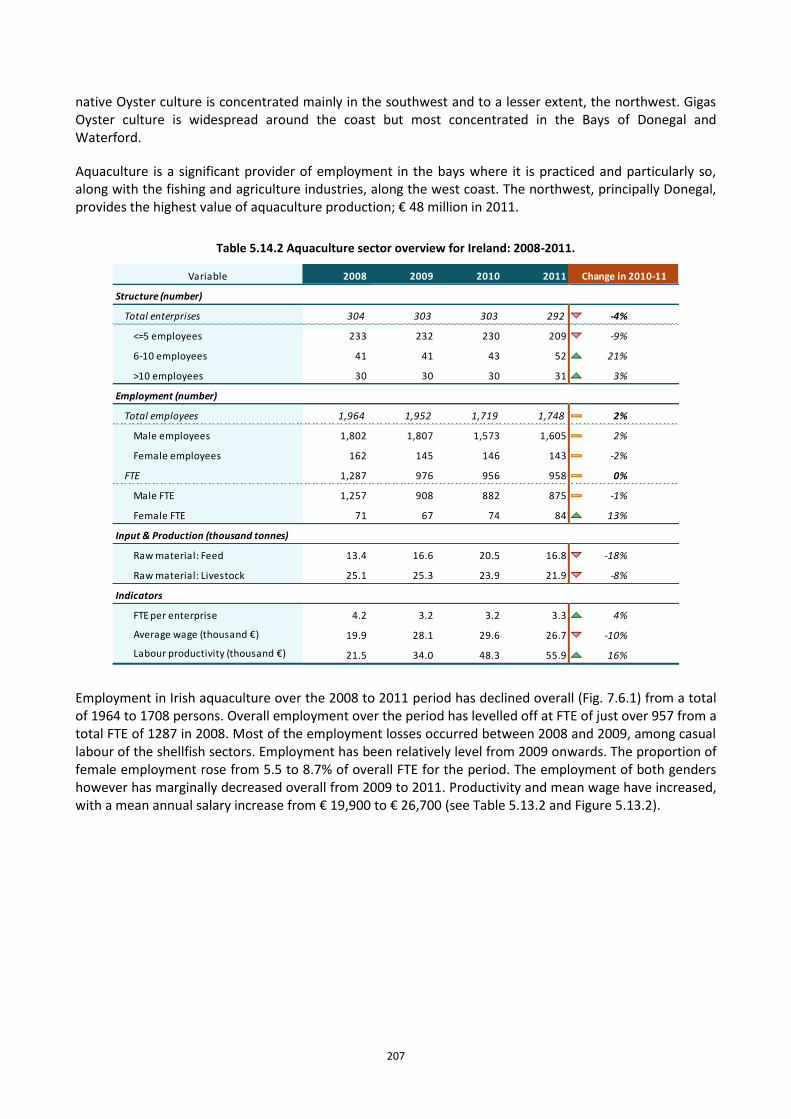
207
native Oyster culture is concentrated mainly in the southwest and to a lesser extent, the northwest. Gigas Oyster culture is widespread around the coast but most concentrated in the Bays of Donegal and Waterford.
Aquaculture is a significant provider of employment in the bays where it is practiced and particularly so, along with the fishing and agriculture industries, along the west coast. The northwest, principally Donegal, provides the highest value of aquaculture production; € 48 million in 2011.
Table 5.14.2 Aquaculture sector overview for Ireland: 2008-2011.
Variable 2008 2009 2010 2011
Structure (number)
Total enterprises 304 303 303 292 -4% ↔
<=5 employees 233 232 230 209 -9% ↘
6-10 employees 41 41 43 52 21% ↗
>10 employees 30 30 30 31 3% ↗
Employment (number)
Total employees 1,964 1,952 1,719 1,748 2% ↗
Male employees 1,802 1,807 1,573 1,605 2% ↗
Female employees 162 145 146 143 -2% ↘
FTE 1,287 976 956 958 0% ↔
Male FTE 1,257 908 882 875 -1% ↘
Female FTE 71 67 74 84 13% ↗
Input & Production (thousand tonnes)
Raw material: Feed 13.4 16.6 20.5 16.8 -18% ↘
Raw material: Livestock 25.1 25.3 23.9 21.9 -8%
Indicators
FTE per enterprise 4.2 3.2 3.2 3.3 4% ↗
Average wage (thousand €) 19.9 28.1 29.6 26.7 -10% ↘
Labour productivity (thousand €) 21.5 34.0 48.3 55.9 16% ↗
Change in 2010-11
Employment in Irish aquaculture over the 2008 to 2011 period has declined overall (Fig. 7.6.1) from a total of 1964 to 1708 persons. Overall employment over the period has levelled off at FTE of just over 957 from a total FTE of 1287 in 2008. Most of the employment losses occurred between 2008 and 2009, among casual labour of the shellfish sectors. Employment has been relatively level from 2009 onwards. The proportion of female employment rose from 5.5 to 8.7% of overall FTE for the period. The employment of both genders however has marginally decreased overall from 2009 to 2011. Productivity and mean wage have increased, with a mean annual salary increase from € 19,900 to € 26,700 (see Table 5.13.2 and Figure 5.13.2).
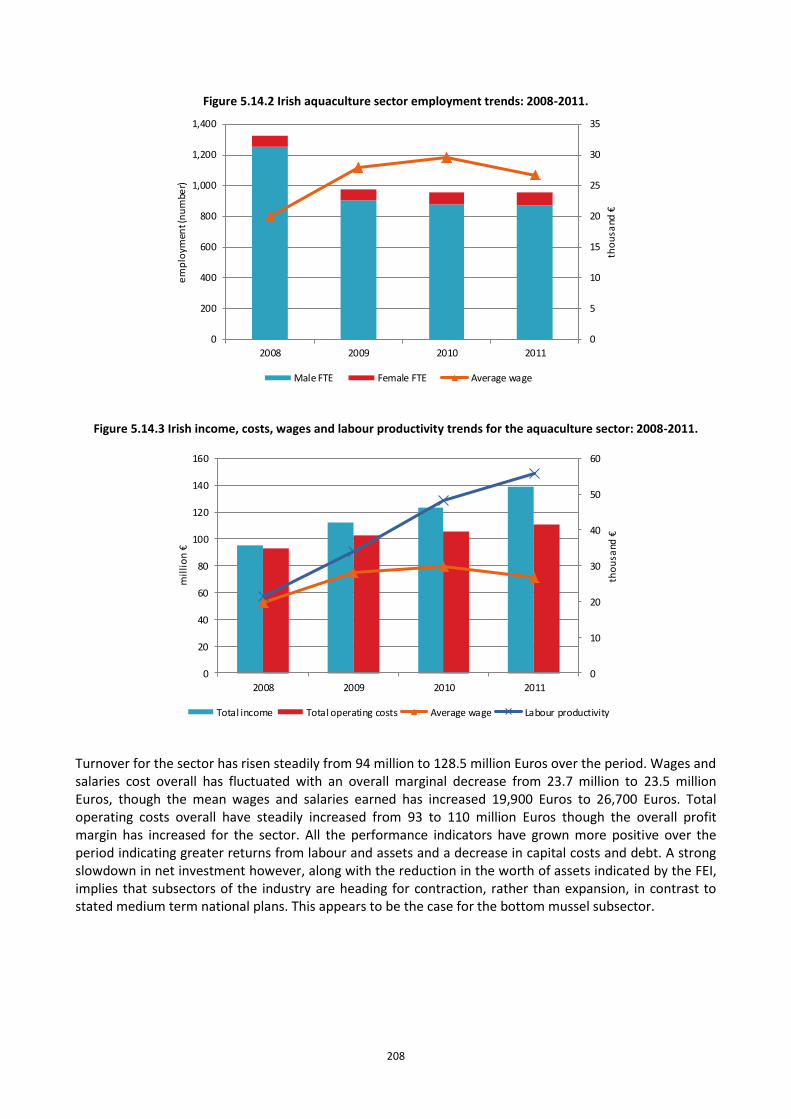
208
Figure 5.14.2 Irish aquaculture sector employment trends: 2008-2011.
0
5
10
15
20
25
30
35
0
200
400
600
800
1,000
1,200
1,400
2008 2009 2010 2011
tho
usa
nd €
em
plo
ymen
t (n
um
ber)
Male FTE Female FTE Average wage
Figure 5.14.3 Irish income, costs, wages and labour productivity trends for the aquaculture sector: 2008-2011.
0
10
20
30
40
50
60
0
20
40
60
80
100
120
140
160
2008 2009 2010 2011
tho
usa
nd €
mil
lio
n €
Total income Total operating costs Average wage Labour productivity
Turnover for the sector has risen steadily from 94 million to 128.5 million Euros over the period. Wages and salaries cost overall has fluctuated with an overall marginal decrease from 23.7 million to 23.5 million Euros, though the mean wages and salaries earned has increased 19,900 Euros to 26,700 Euros. Total operating costs overall have steadily increased from 93 to 110 million Euros though the overall profit margin has increased for the sector. All the performance indicators have grown more positive over the period indicating greater returns from labour and assets and a decrease in capital costs and debt. A strong slowdown in net investment however, along with the reduction in the worth of assets indicated by the FEI, implies that subsectors of the industry are heading for contraction, rather than expansion, in contrast to stated medium term national plans. This appears to be the case for the bottom mussel subsector.
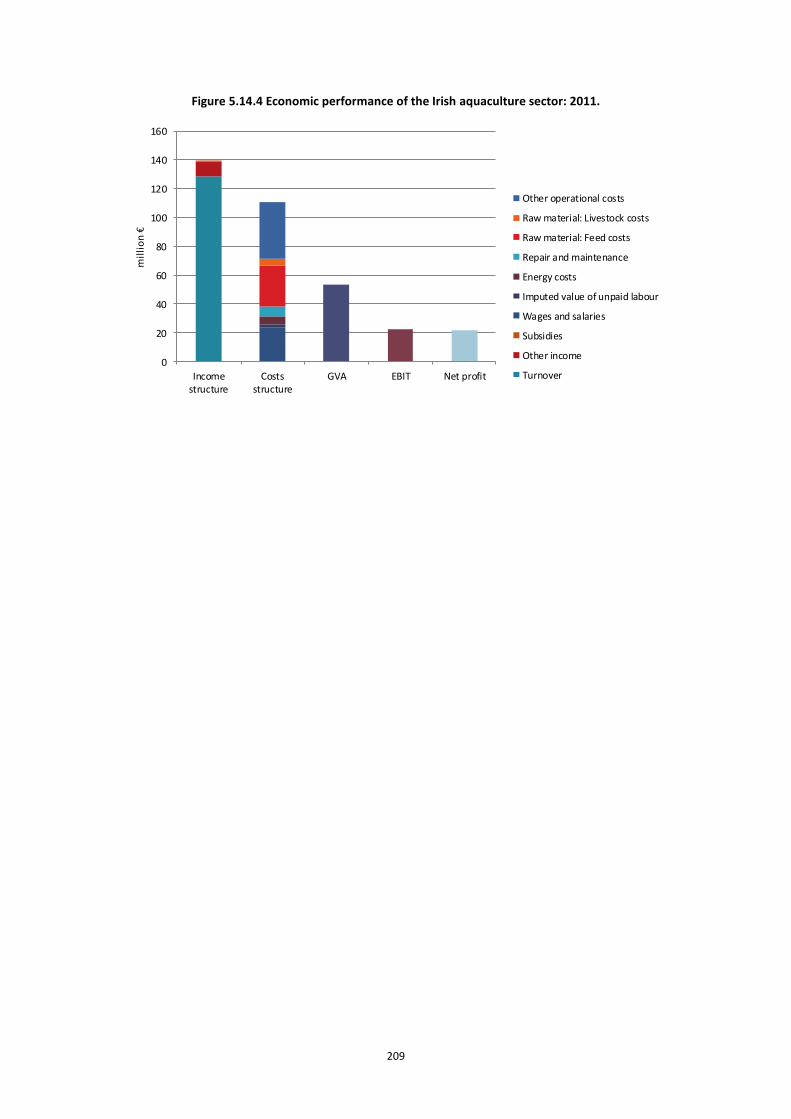
209
Figure 5.14.4 Economic performance of the Irish aquaculture sector: 2011.
0
20
40
60
80
100
120
140
160
Incomestructure
Costsstructure
GVA EBIT Net profit
mil
lio
n €
Other operational costs
Raw material: Livestock costs
Raw material: Feed costs
Repair and maintenance
Energy costs
Imputed value of unpaid labour
Wages and salaries
Subsidies
Other income
Turnover
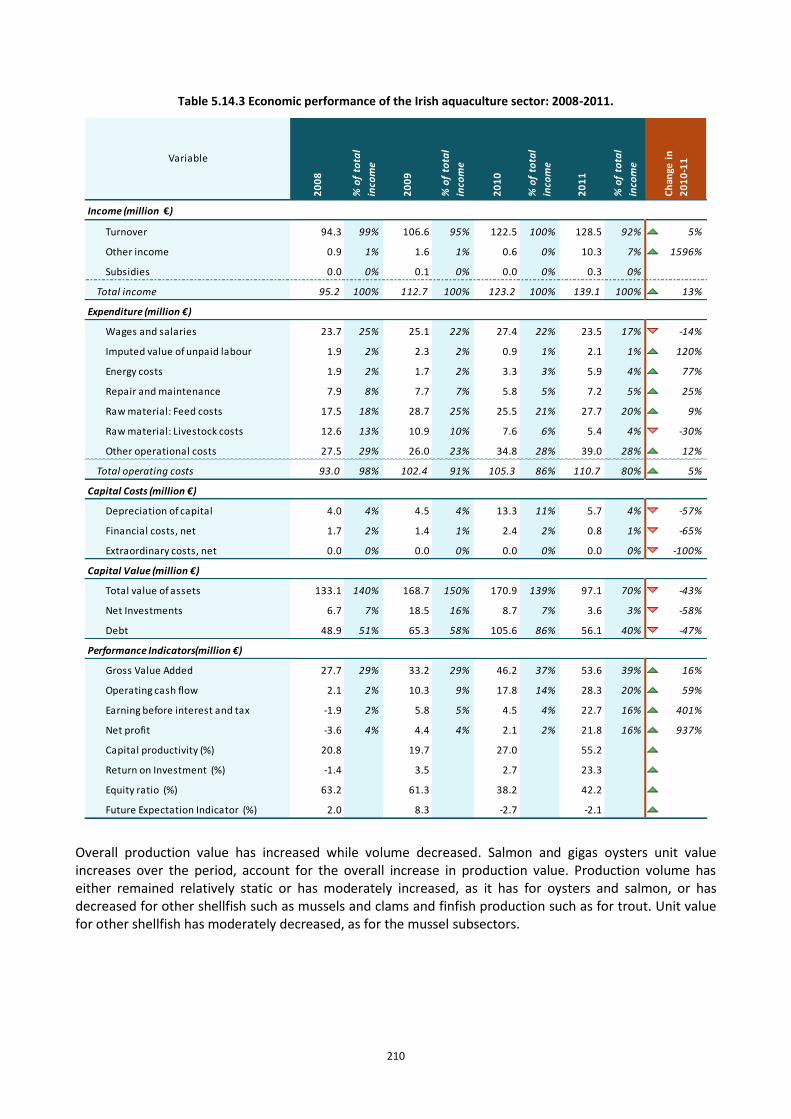
210
Table 5.14.3 Economic performance of the Irish aquaculture sector: 2008-2011.
Income (million €)
Turnover 94.3 99% 106.6 95% 122.5 100% 128.5 92% 5%
Other income 0.9 1% 1.6 1% 0.6 0% 10.3 7% 1596%
Subsidies 0.0 0% 0.1 0% 0.0 0% 0.3 0%
Total income 95.2 100% 112.7 100% 123.2 100% 139.1 100% 13%
Expenditure (million €)
Wages and salaries 23.7 25% 25.1 22% 27.4 22% 23.5 17% -14%
Imputed value of unpaid labour 1.9 2% 2.3 2% 0.9 1% 2.1 1% 120%
Energy costs 1.9 2% 1.7 2% 3.3 3% 5.9 4% 77%
Repair and maintenance 7.9 8% 7.7 7% 5.8 5% 7.2 5% 25%
Raw material: Feed costs 17.5 18% 28.7 25% 25.5 21% 27.7 20% 9%
Raw material: Livestock costs 12.6 13% 10.9 10% 7.6 6% 5.4 4% -30%
Other operational costs 27.5 29% 26.0 23% 34.8 28% 39.0 28% 12%
Total operating costs 93.0 98% 102.4 91% 105.3 86% 110.7 80% 5%
Capital Costs (million €)
Depreciation of capital 4.0 4% 4.5 4% 13.3 11% 5.7 4% -57%
Financial costs, net 1.7 2% 1.4 1% 2.4 2% 0.8 1% -65%
Extraordinary costs, net 0.0 0% 0.0 0% 0.0 0% 0.0 0% -100%
Capital Value (million €)
Total value of assets 133.1 140% 168.7 150% 170.9 139% 97.1 70% -43%
Net Investments 6.7 7% 18.5 16% 8.7 7% 3.6 3% -58%
Debt 48.9 51% 65.3 58% 105.6 86% 56.1 40% -47%
Performance Indicators(million €)
Gross Value Added 27.7 29% 33.2 29% 46.2 37% 53.6 39% 16%
Operating cash flow 2.1 2% 10.3 9% 17.8 14% 28.3 20% 59%
Earning before interest and tax -1.9 2% 5.8 5% 4.5 4% 22.7 16% 401%
Net profit -3.6 4% 4.4 4% 2.1 2% 21.8 16% 937%
Capital productivity (%) 20.8 19.7 27.0 55.2 104%
Return on Investment (%) -1.4 3.5 2.7 23.3 780%
Equity ratio (%) 63.2 61.3 38.2 42.2 10%
Future Expectation Indicator (%) 2.0 8.3 -2.7 -2.1 21%
Ch
ange
in
20
10
-11
% o
f to
tal
inco
me
Variable
% o
f to
tal
inco
me
20
08
20
09
% o
f to
tal
inco
me
% o
f to
tal
inco
me
20
10
20
11
Overall production value has increased while volume decreased. Salmon and gigas oysters unit value increases over the period, account for the overall increase in production value. Production volume has either remained relatively static or has moderately increased, as it has for oysters and salmon, or has decreased for other shellfish such as mussels and clams and finfish production such as for trout. Unit value for other shellfish has moderately decreased, as for the mussel subsectors.
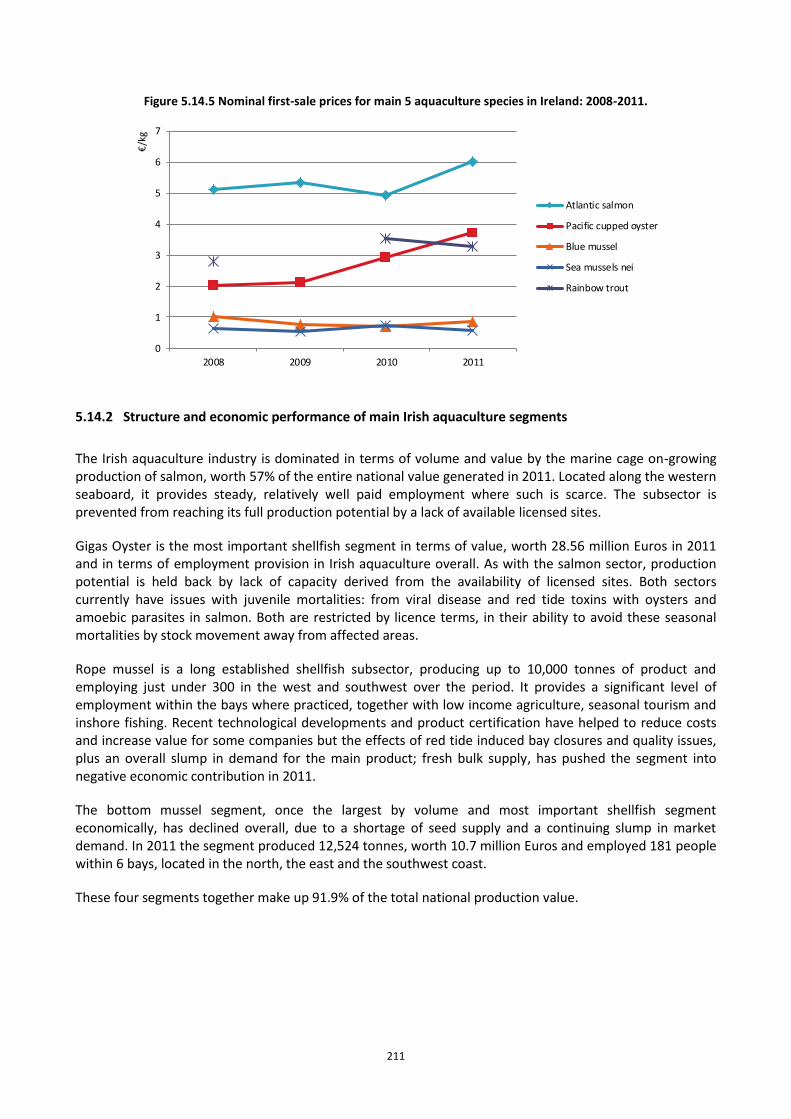
211
Figure 5.14.5 Nominal first-sale prices for main 5 aquaculture species in Ireland: 2008-2011.
0
1
2
3
4
5
6
7
2008 2009 2010 2011
€/k
g
Atlantic salmon
Pacific cupped oyster
Blue mussel
Sea mussels nei
Rainbow trout
5.14.2 Structure and economic performance of main Irish aquaculture segments
The Irish aquaculture industry is dominated in terms of volume and value by the marine cage on-growing production of salmon, worth 57% of the entire national value generated in 2011. Located along the western seaboard, it provides steady, relatively well paid employment where such is scarce. The subsector is prevented from reaching its full production potential by a lack of available licensed sites.
Gigas Oyster is the most important shellfish segment in terms of value, worth 28.56 million Euros in 2011 and in terms of employment provision in Irish aquaculture overall. As with the salmon sector, production potential is held back by lack of capacity derived from the availability of licensed sites. Both sectors currently have issues with juvenile mortalities: from viral disease and red tide toxins with oysters and amoebic parasites in salmon. Both are restricted by licence terms, in their ability to avoid these seasonal mortalities by stock movement away from affected areas.
Rope mussel is a long established shellfish subsector, producing up to 10,000 tonnes of product and employing just under 300 in the west and southwest over the period. It provides a significant level of employment within the bays where practiced, together with low income agriculture, seasonal tourism and inshore fishing. Recent technological developments and product certification have helped to reduce costs and increase value for some companies but the effects of red tide induced bay closures and quality issues, plus an overall slump in demand for the main product; fresh bulk supply, has pushed the segment into negative economic contribution in 2011.
The bottom mussel segment, once the largest by volume and most important shellfish segment economically, has declined overall, due to a shortage of seed supply and a continuing slump in market demand. In 2011 the segment produced 12,524 tonnes, worth 10.7 million Euros and employed 181 people within 6 bays, located in the north, the east and the southwest coast.
These four segments together make up 91.9% of the total national production value.
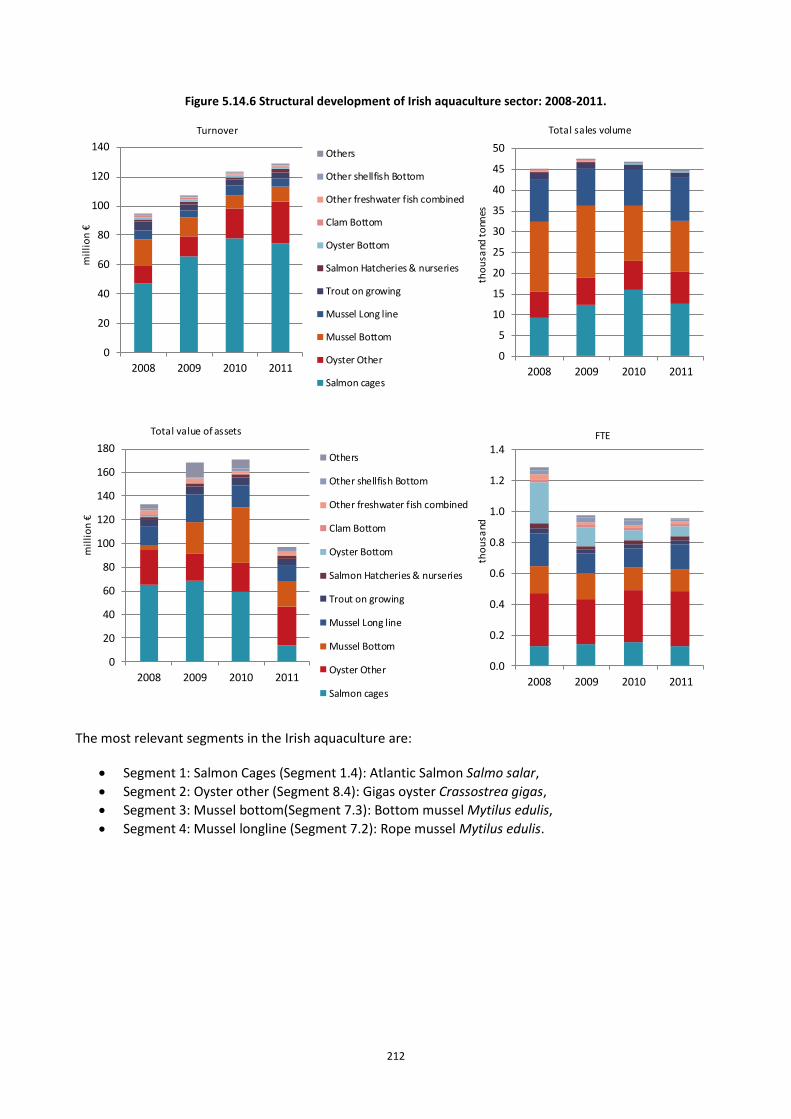
212
Figure 5.14.6 Structural development of Irish aquaculture sector: 2008-2011.
0
20
40
60
80
100
120
140
2008 2009 2010 2011
mil
lio
n €
Turnover
Others
Other shellfish Bottom
Other freshwater fish combined
Clam Bottom
Oyster Bottom
Salmon Hatcheries & nurseries
Trout on growing
Mussel Long line
Mussel Bottom
Oyster Other
Salmon cages
0
5
10
15
20
25
30
35
40
45
50
2008 2009 2010 2011
tho
usa
nd t
onn
es
Total sales volume
0
20
40
60
80
100
120
140
160
180
2008 2009 2010 2011
mil
lio
n €
Total value of assets
Others
Other shellfish Bottom
Other freshwater fish combined
Clam Bottom
Oyster Bottom
Salmon Hatcheries & nurseries
Trout on growing
Mussel Long line
Mussel Bottom
Oyster Other
Salmon cages
0.0
0.2
0.4
0.6
0.8
1.0
1.2
1.4
2008 2009 2010 2011
tho
usa
nd
FTE
The most relevant segments in the Irish aquaculture are:
Segment 1: Salmon Cages (Segment 1.4): Atlantic Salmon Salmo salar,
Segment 2: Oyster other (Segment 8.4): Gigas oyster Crassostrea gigas,
Segment 3: Mussel bottom(Segment 7.3): Bottom mussel Mytilus edulis,
Segment 4: Mussel longline (Segment 7.2): Rope mussel Mytilus edulis.
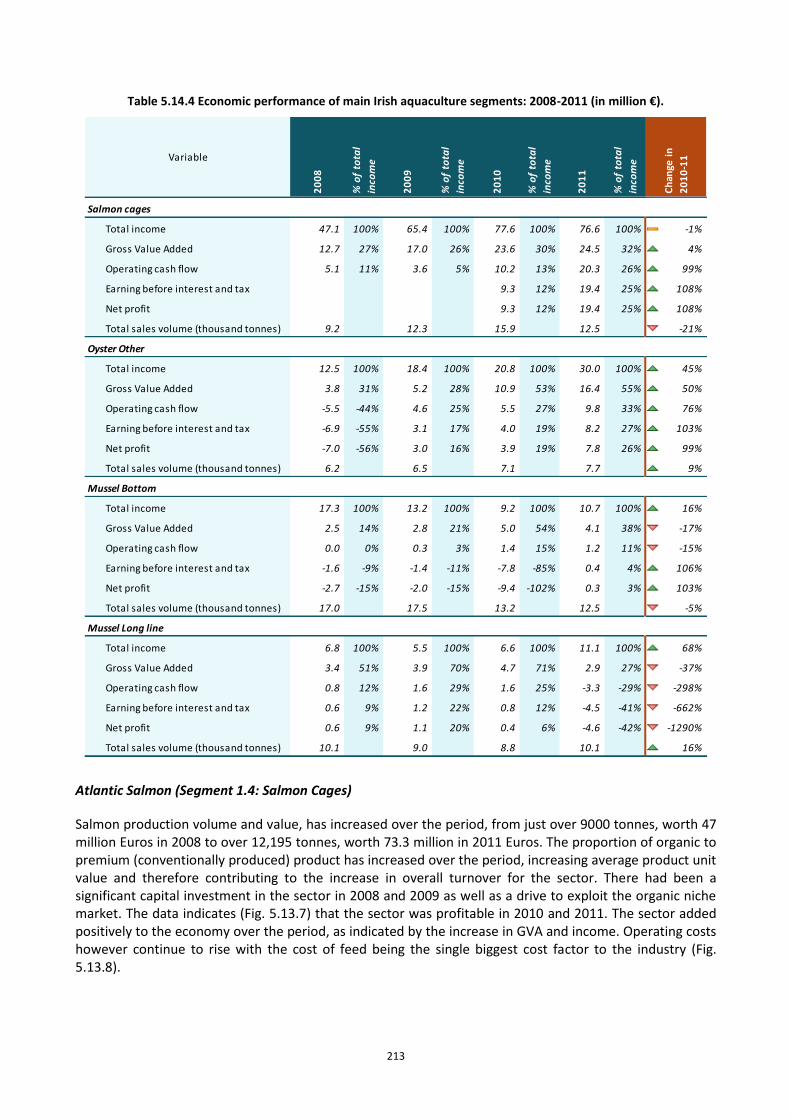
213
Table 5.14.4 Economic performance of main Irish aquaculture segments: 2008-2011 (in million €).
Salmon cages
Total income 47.1 100% 65.4 100% 77.6 100% 76.6 100% -1%
Gross Value Added 12.7 27% 17.0 26% 23.6 30% 24.5 32% 4%
Operating cash flow 5.1 11% 3.6 5% 10.2 13% 20.3 26% 99%
Earning before interest and tax 9.3 12% 19.4 25% 108%
Net profit 9.3 12% 19.4 25% 108%
Total sales volume (thousand tonnes) 9.2 12.3 15.9 12.5 -21%
Oyster Other
Total income 12.5 100% 18.4 100% 20.8 100% 30.0 100% 45%
Gross Value Added 3.8 31% 5.2 28% 10.9 53% 16.4 55% 50%
Operating cash flow -5.5 -44% 4.6 25% 5.5 27% 9.8 33% 76%
Earning before interest and tax -6.9 -55% 3.1 17% 4.0 19% 8.2 27% 103%
Net profit -7.0 -56% 3.0 16% 3.9 19% 7.8 26% 99%
Total sales volume (thousand tonnes) 6.2 6.5 7.1 7.7 9%
Mussel Bottom
Total income 17.3 100% 13.2 100% 9.2 100% 10.7 100% 16%
Gross Value Added 2.5 14% 2.8 21% 5.0 54% 4.1 38% -17%
Operating cash flow 0.0 0% 0.3 3% 1.4 15% 1.2 11% -15%
Earning before interest and tax -1.6 -9% -1.4 -11% -7.8 -85% 0.4 4% 106%
Net profit -2.7 -15% -2.0 -15% -9.4 -102% 0.3 3% 103%
Total sales volume (thousand tonnes) 17.0 17.5 13.2 12.5 -5%
Mussel Long line
Total income 6.8 100% 5.5 100% 6.6 100% 11.1 100% 68%
Gross Value Added 3.4 51% 3.9 70% 4.7 71% 2.9 27% -37%
Operating cash flow 0.8 12% 1.6 29% 1.6 25% -3.3 -29% -298%
Earning before interest and tax 0.6 9% 1.2 22% 0.8 12% -4.5 -41% -662%
Net profit 0.6 9% 1.1 20% 0.4 6% -4.6 -42% -1290%
Total sales volume (thousand tonnes) 10.1 9.0 8.8 10.1 16%
% o
f to
tal
inco
me
Ch
ange
in
20
10
-11Variable
20
08
% o
f to
tal
inco
me
20
09
% o
f to
tal
inco
me
20
10
% o
f to
tal
inco
me
20
11
Atlantic Salmon (Segment 1.4: Salmon Cages)
Salmon production volume and value, has increased over the period, from just over 9000 tonnes, worth 47 million Euros in 2008 to over 12,195 tonnes, worth 73.3 million in 2011 Euros. The proportion of organic to premium (conventionally produced) product has increased over the period, increasing average product unit value and therefore contributing to the increase in overall turnover for the sector. There had been a significant capital investment in the sector in 2008 and 2009 as well as a drive to exploit the organic niche market. The data indicates (Fig. 5.13.7) that the sector was profitable in 2010 and 2011. The sector added positively to the economy over the period, as indicated by the increase in GVA and income. Operating costs however continue to rise with the cost of feed being the single biggest cost factor to the industry (Fig. 5.13.8).
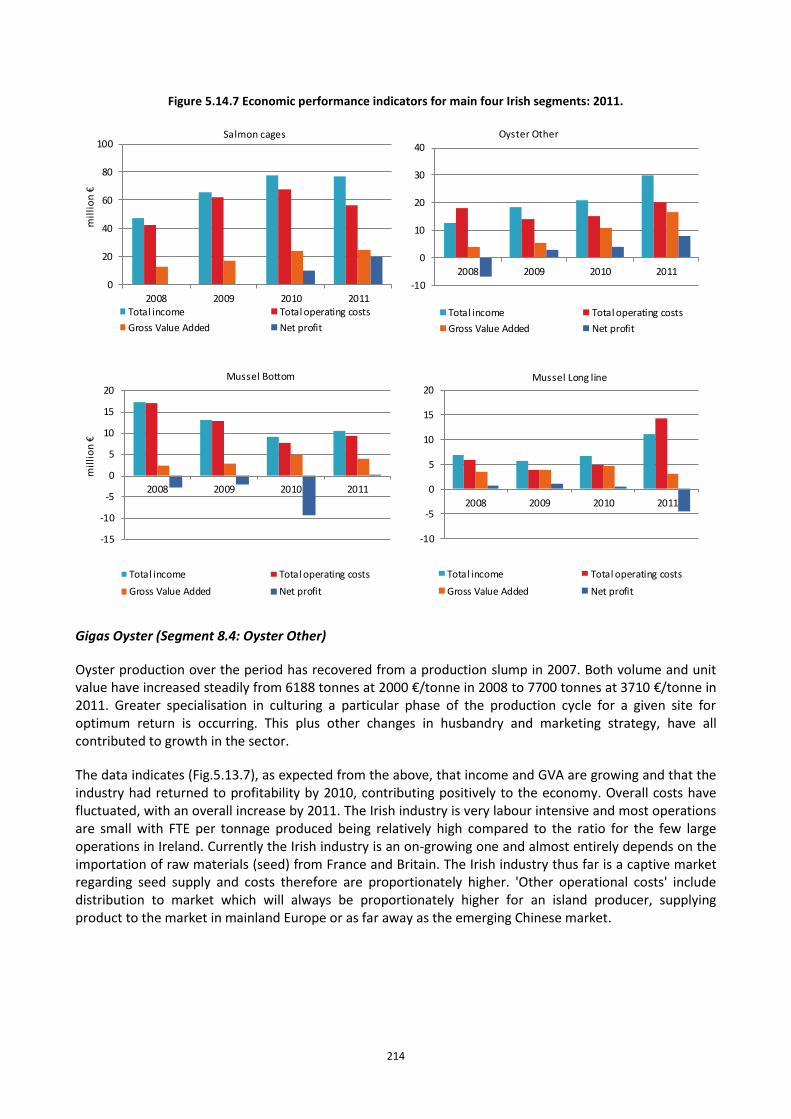
214
Figure 5.14.7 Economic performance indicators for main four Irish segments: 2011.
0
20
40
60
80
100
2008 2009 2010 2011
mil
lio
n €
Salmon cages
Total income Total operating costs
Gross Value Added Net profit
-10
0
10
20
30
40
2008 2009 2010 2011
Oyster Other
Total income Total operating costs
Gross Value Added Net profit
-15
-10
-5
0
5
10
15
20
2008 2009 2010 2011
mil
lio
n €
Mussel Bottom
Total income Total operating costs
Gross Value Added Net profit
-10
-5
0
5
10
15
20
2008 2009 2010 2011
Mussel Long line
Total income Total operating costs
Gross Value Added Net profit
Gigas Oyster (Segment 8.4: Oyster Other)
Oyster production over the period has recovered from a production slump in 2007. Both volume and unit value have increased steadily from 6188 tonnes at 2000 €/tonne in 2008 to 7700 tonnes at 3710 €/tonne in 2011. Greater specialisation in culturing a particular phase of the production cycle for a given site for optimum return is occurring. This plus other changes in husbandry and marketing strategy, have all contributed to growth in the sector.
The data indicates (Fig.5.13.7), as expected from the above, that income and GVA are growing and that the industry had returned to profitability by 2010, contributing positively to the economy. Overall costs have fluctuated, with an overall increase by 2011. The Irish industry is very labour intensive and most operations are small with FTE per tonnage produced being relatively high compared to the ratio for the few large operations in Ireland. Currently the Irish industry is an on-growing one and almost entirely depends on the importation of raw materials (seed) from France and Britain. The Irish industry thus far is a captive market regarding seed supply and costs therefore are proportionately higher. 'Other operational costs' include distribution to market which will always be proportionately higher for an island producer, supplying product to the market in mainland Europe or as far away as the emerging Chinese market.
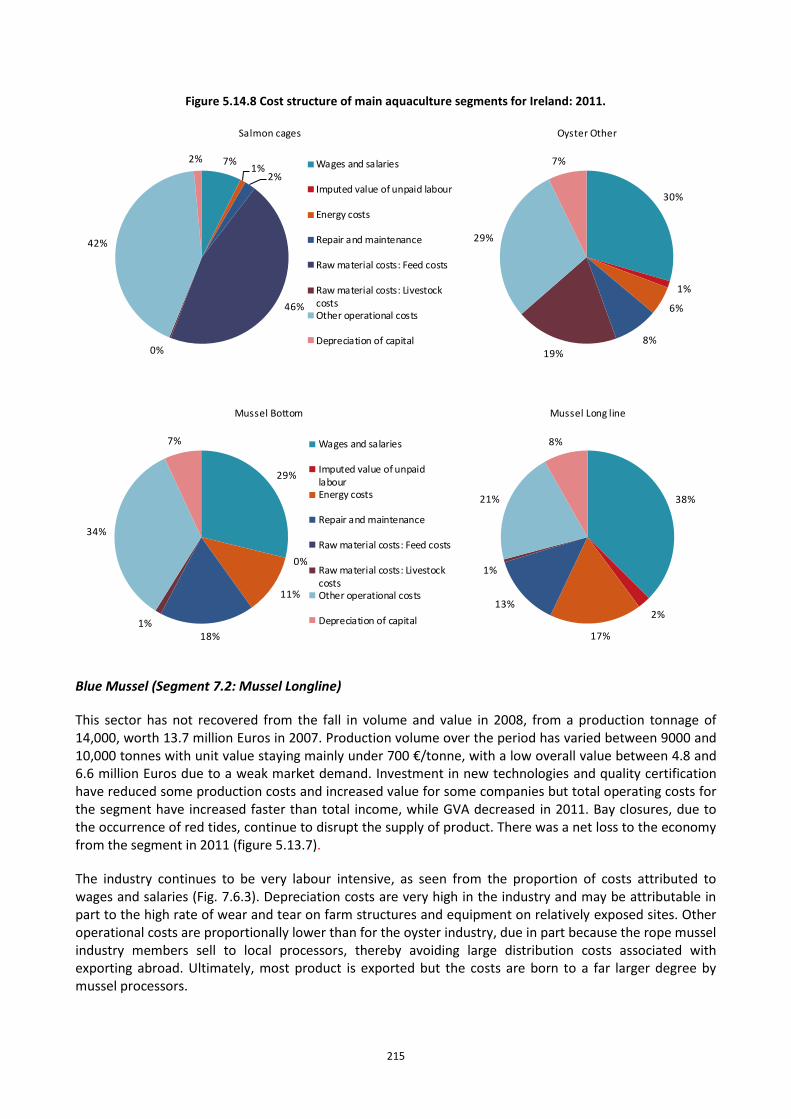
215
Figure 5.14.8 Cost structure of main aquaculture segments for Ireland: 2011.
7%1%
2%
46%
0%
42%
2%
Salmon cages
Wages and salaries
Imputed value of unpaid labour
Energy costs
Repair and maintenance
Raw material costs: Feed costs
Raw material costs: LivestockcostsOther operational costs
Depreciation of capital
30%
1%
6%
8%19%
29%
7%
Oyster Other
29%
0%
11%
18%1%
34%
7%
Mussel Bottom
Wages and salaries
Imputed value of unpaidlabourEnergy costs
Repair and maintenance
Raw material costs: Feed costs
Raw material costs: LivestockcostsOther operational costs
Depreciation of capital
38%
2%
17%
13%
1%
21%
8%
Mussel Long line
Blue Mussel (Segment 7.2: Mussel Longline)
This sector has not recovered from the fall in volume and value in 2008, from a production tonnage of 14,000, worth 13.7 million Euros in 2007. Production volume over the period has varied between 9000 and 10,000 tonnes with unit value staying mainly under 700 €/tonne, with a low overall value between 4.8 and 6.6 million Euros due to a weak market demand. Investment in new technologies and quality certification have reduced some production costs and increased value for some companies but total operating costs for the segment have increased faster than total income, while GVA decreased in 2011. Bay closures, due to the occurrence of red tides, continue to disrupt the supply of product. There was a net loss to the economy from the segment in 2011 (figure 5.13.7).
The industry continues to be very labour intensive, as seen from the proportion of costs attributed to wages and salaries (Fig. 7.6.3). Depreciation costs are very high in the industry and may be attributable in part to the high rate of wear and tear on farm structures and equipment on relatively exposed sites. Other operational costs are proportionally lower than for the oyster industry, due in part because the rope mussel industry members sell to local processors, thereby avoiding large distribution costs associated with exporting abroad. Ultimately, most product is exported but the costs are born to a far larger degree by mussel processors.
216
Blue mussel (Segment 7.1: Mussel bottom)
This segment was recently the most important shellfish sector in terms of production volume and value and provided the greatest proportion of full time employment of any shellfish segment. Due to a lack of wild seed bottom settlement in the Irish Sea for the last few years and an on-going weak market demand, the segment has been declining in production volume, value and numbers employed, down from 17,000 tonnes volume worth 17.2 million Euros in 2008 to 12,500 tonnes of production worth 10.7 million Euros in 2011. Employment has declined from 219 to 181 persons over the period.
Figure 5.13.7 indicates a return to profitability for the segment overall but this masks the liquidation of companies and the loss of employment in the segment, while costs of maintaining remaining crews and vessels and searching for seed are mounting against poor returns. Economic necessity may force companies to purchase or gather seed from suspended culture methods, which were formally considered too costly while natural beds were available to fish.
5.14.3 Trends and triggers of the Irish aquaculture sector
Identification of main drivers
Aquaculture production volume value and employment for the R.O.I. over the period 2011 to 2013 is not likely to grow overall and volume may actually decline for the period. This is due to a number of factors, some peculiar to particular subsectors but the overriding principal issue for most subsectors is licensing; the lack of capacity to expand in the lack of suitable licensed sites available.
Approximately 80% of all current aquaculture licensed sites occur within or adjacent to SACs. The application process for new licensed sites and for licence renewals of existing sites is very slow, taking up to a period of more than 10 years to complete in some cases, within these areas. State investment, in the form of grant aid, is only possible for companies with up to date licences.
The occurrence of disease/parasite induced mortalities in juvenile stock, hamper production volumes of the salmon, oyster and clam segments. Seed supply is the single biggest issue affecting bottom mussels and scallops and to a lesser extent gigas oysters. In the case of the latter, seed supply almost exclusively must come from abroad, thereby opening channels for the importation of disease. Product supply disruption from red tide induced bay closures, a weak market demand, product quality difficulties related to harvest methods and production costs had curtailed the production volume and value of the rope mussel segment.
A continuing strong market for organic salmon and Irish oysters will help offset the challenges facing production volume as a whole, in the 2011 to 2013 period.
There has been a gradual reduction in the total number of companies as well as the total number employed in the sector as a whole. In the case of the rope mussel, gigas oyster, trout and salmon subsectors, there has been a consolidation and reorganisation of businesses and in the ownership and management of production units. In the case of other subsectors such as scallops, clams and bottom mussels, entity population decline has occurred because companies have either wound up or transferred to more economically viable cultures, depending on site suitability and licence conditions
Production Costs rose steadily over the 4 year period, principally in energy, feed and other operational costs, such as the costs of stock healthcare disease and parasite prevention and control. The latter is a significant cost for the salmon and oyster subsectors. Energy costs are an increasing issue in the bottom mussel industry where boats must search harder and longer for increasingly elusive seed mussel beds
217
Funding, under the NDP, the Irish Sea Fishery Board (BIM) programs and the EFF, to the amount of 6.64 million Euros has supported a total investment of 18.74 million Euros in the sector, using several grant schemes, over the 2008 to 2011 period. The uptake on the schemes is limited mainly to businesses outside of Natura 2000 (SAC) areas and whose licences are in date. As mentioned previously many licence renewal applications in SAC areas are tied up in red tape.
There have been investments in the oyster subsector by French and indigenous companies in the last 4 years. The French investment has taken the form of partnerships with local licence holders or the acquisition of sites licensed in their own name. Recently investment has been made in research, in the development of tetraploid stock and in Irish hatcheries to produce local seed. The first Irish produced seed is due in 2013.
Investment in the salmon industry has taken the form of investment in moribund sites and the re-launch of production units under new management or revitalised companies. There has also been investment in new technology, in healthcare, animal welfare, feeding and harvesting technologies.
Investment in new structures for gathering and growing stock and new technology for harvesting and handling of product has been made to some extent, in the rope mussel subsector.
There are individual companies in all sub sectors who have successfully branded their produce, whether in fresh form or value added products as unique to the bays they were produced in or to the companies that grow the product. These companies have moved to sell directly into the consumer market and away from simply selling indistinguishable bulk product to a middleman.
Certification is seen by a growing number Irish producers as necessary to make their produce stand out in an increasingly competitive market. Something comparable to an arms race of branding has been a feature of the Irish seafood sectors for some time, where a new, more elite brand/certification is required every several years to replace the one that all the competition also have. In the primary aquaculture production sector, bottom mussels are being MSC certified currently while rope mussels and salmon have been or are in the process of being organically certified.
In 2012, 82% of salmon was produced by organically compliant methods, though not all of this was sold as ‘organic salmon’ due to demand for premium product. 55.5% of rope mussel and 9% of bottom mussel produced was sold as organic produce in 2012. Both MSC and organic certification is set to increase as a proportion of overall aquaculture production.
Virtually all shellfish and non-salmon finfish produced is exported. A portion of gigas stock produced is sold and or transferred to sites elsewhere for farther on-growing, partially explaining the discrepancy between the production tonnage and the smaller export tonnage. Approximately 20% of salmon produced is for the domestic market. The balance is exported to France, Germany, the UK, Belgium, other European states and to the US. Export of fillets is the fastest expanding export product. Trout are being exported increasingly to the UK. The main destinations of shellfish export are: France, the Netherlands, the UK and Asia.
Imported finfish into Ireland are: salmon, tilapia, cod, seabass and seabream. Imported shellfish are shrimp, oysters and mussels. The supplier countries are mainly: the UK, Germany, France, Canada, Faeroes, Thailand and Vietnam.
The UK was the main supplier of salmon in all product forms, over the period. In 2012 it provided 66% of imports, valued at 23 million Euros. Additionally the UK supplied 1.1 million Euros of seabass in 2012. The import of smoked salmon from Germany has steadily increased to a value of 2.2 million Euros, 50% of the imported total value, in 2012. France supplied 2 million Euros of tilapia product and 3.6 million Euros of sea bass in 2012.
218
Practically all gigas oyster seed is imported either from France or the UK, for on-growing on Irish sites. 2500 tonnes approximately of salmon is imported annually for the processing sector as Irish production is insufficient to meet their demand.
Developments on competitiveness and market performance of the sector
The approval of the Irish Seafood National Programme also enabled the roll out of BIM’s Aquaculture Innovation and Technology Scheme aimed at assisting trials on innovative technology in commercial aquaculture and to improve competitiveness via branding, certification and other product defining strategies. It also aimed to establish the economic and technical feasibility of new sites and species; to assist measures for the improvement of environmental sustainability, fish health and welfare and product quality as well as to promote occupational health, safety and skills and to harmonise aquaculture into coastal and rural communities.
Public Service Initiatives have been limited in effect as many companies find it hard to grant aid because their location within SACs which means difficulties in obtaining licence renewals. While production is generally allowed to continue, pending the outcome, the paperwork must be up to date before a funding application is considered.
The SACs for Natura 2000 areas, were drawn up in haste and in areas containing aquaculture production units. The consequences of that haste are being felt across the industry. There had been confusion and inaction for some time on the appropriate assessments required before production could be allowed to expand or, in some cases, maintain continuous production within these areas.
Spatial Planning: Ireland in principal supports the concept of spatial planning but has been unable to implement it so far, due to outstanding legal issues.
Investment over the period has focussed on the feasibility, expansion and modernisation of small scale projects and with trialling of new species such as perch, abalone and seaweed. In the case of the latter, funding was provided for market research, market capability, manufacturing and processing capability.
In 2011 the state assisted in the set up and equipping of a number of new, innovative export oriented companies. One example is a company now manufacturing cotton mussel socks for the rope mussel industry. Previously this had to be imported from New Zealand. The company now supplies the Irish and other European producers. A second example is a seaweed production and processing company, expected to expand exponentially from 2013 on. A third grant aided company has commenced seed supply for the gigas oyster subsector.
Much work has been done on the feasibility of setting up large scale Irish based, hatchery and nursery units to supply principally the gigas oyster subsector, and other shellfish subsectors also if possible, such as native oyster, and scallop. This is now happening and the first pilot batch of seed from one unit is due late in 2013. Progress has also been made in the development of the Tetraploid gigas oyster stock. Disease control and seed supply solutions are critical technical objectives while market research and capacity, value addition and branding are at the heart of innovation objectives.
Outlook and future projects
Aquaculture production value is expected to increase but volume and employment for the R.O.I. over the period 2011 to 2013 is not likely to grow overall. Volume may actually decline for the period. This is due to factors mentioned previously: licensing (all subsectors), disease/parasite control (salmon, oysters clams), red tides/bay closure management, seed supply, quality issues and weak market demand (mussels).
Amoebic gill disease appeared within the salmon and salmon smolt stock in 2012, seriously affecting juvenile supply to the salmon on-growing sector for 2012 and 2013. Despite intensive research, no pattern

219
has been observed in the viral induced mortality of oyster seed to suggest a control strategy. Seed availability remains very scarce for the mussel bottom sector, while market demand and prices for both bottom and long-line mussel sectors are expected to remain static at best.
The extension of the SAC network into areas traditionally holding wild mussel seed beds potentially mean that future occurring seed beds may not be available to the bottom mussel subsector. Resolution of the seed supply issue is critical to the subsectors survival.
The rope mussel industry historically has operated with limited, if any coordination within as well as between bays which has meant a lack of coordinated response to common issues such as quality losses through production methods, volume and market losses due to Red tide bay closures. Lack of communication between producers and with processors also hampered production continuity, quality and quantity. Steps have been taken to enable producers, processors and traders to communicate, consolidate and coordinate their operations to improve production quality and continuity of supply. In the face of bay closures, a pooling of harvesting effort for the subsector as a whole will be enabled in unaffected bays. The AZIMUTH project is a GIS technology based monitoring system that can be used to predict the likely pattern of red tide occurrence which will enable the industry to respond more effectively in rerouting production effort in the face of impending events and subsequent closures in affected bays.
BIM has launched a 5 year strategy; 2013 to 2017 to deliver Irish Seafood sales of 1 billion Euros and 1200 new jobs across the combined seafood sectors by the end of 2017. This will involve focus on the following key areas: expansion of the raw material base by 45000 tonnes, optimisation of added value to produce, enhancement of industry’s structures, sourcing of new financial and strategic partners, improving the skills of personnel in all seafood sectors, enhancement of the sustainability of Irish seafood. From the perspective of the aquaculture sector, this will require a major initiative to improve the licensing process. One proposal is for the state itself to draw up suitable production areas for appropriate assessment, as part of a spatial planning process and present prospective applicants with a choice of sites to apply for, where some of the process and paperwork has been completed for them.
In 2012 salmon and oyster production has remained level in volume, and has increased in overall value. The two mussel subsectors have decreased in both volume and production value. Overall production volume has decreased, while overall value has increased. The BIM 2013 to 2017 strategy plan aims to reverse the downward trend in production volume output and employment.
5.14.4 Data Coverage and Data Quality of the Irish aquaculture sector
Variables surveyed by census; production and employment data, are based or derived from an 80% return rate or more by entity number of the total population of aquaculture practitioners for the period 2008 to 2011. As the proportion of entities not returning tend to be small producers, the proportion of national tonnage and turnover required to be estimated is therefore smaller again. The 80% return rate from producers has been consistent as has the method of estimating the production of non returnees; either using estimates from the local aquaculture officer or the most recent data of the company held and estimating current production with the general trend.
Operating costs variables have been more difficult to get consistent and reliable data for as these can only be obtained from the producers themselves or from their accountant. The majority of companies are small with just one to two full time staff, including the directors and therefore accountant hire is kept to a minimum. Such Companies are only obliged by law to submit abridged accounts to the Company Registration Office, from whose website and others, abridged accounts can be accessed. Variables concerned with assets, liabilities and depreciation that previously were not available for the first data call, are becoming so and are being fed into the templates. The data for these variables is improving. Currently the percentage return rate for the frame population (commercial entities) of the sample survey (financial
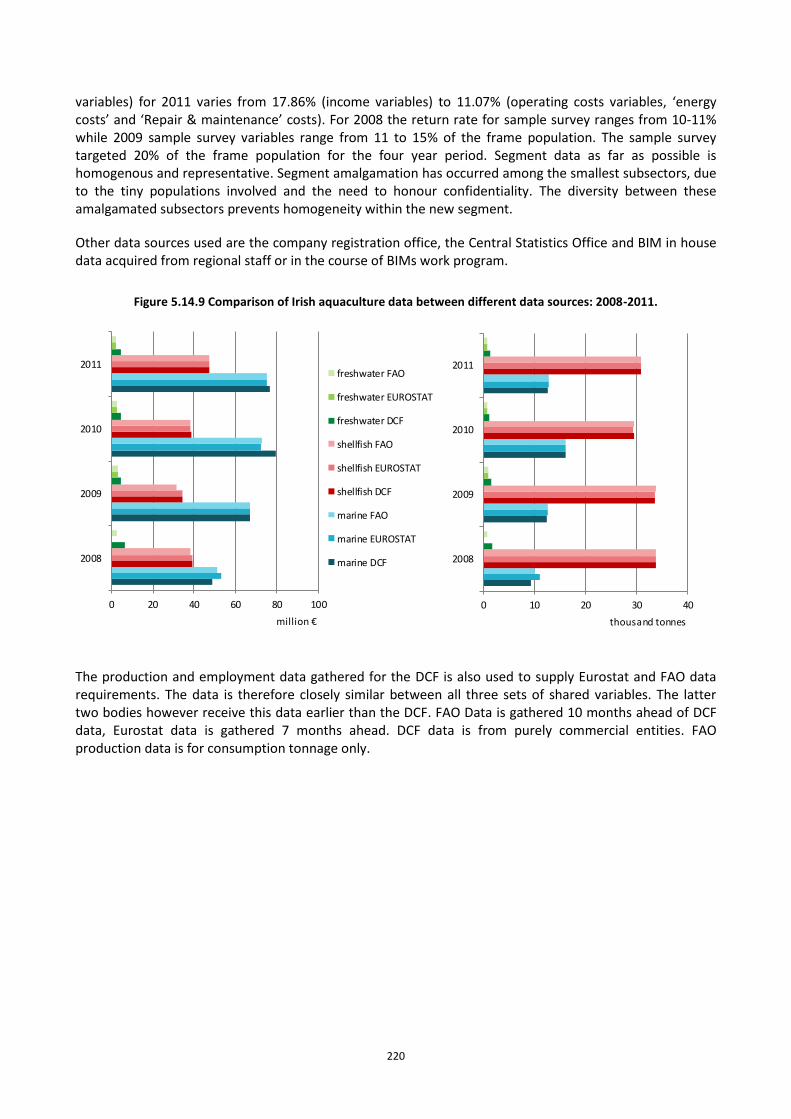
220
variables) for 2011 varies from 17.86% (income variables) to 11.07% (operating costs variables, ‘energy costs’ and ‘Repair & maintenance’ costs). For 2008 the return rate for sample survey ranges from 10-11% while 2009 sample survey variables range from 11 to 15% of the frame population. The sample survey targeted 20% of the frame population for the four year period. Segment data as far as possible is homogenous and representative. Segment amalgamation has occurred among the smallest subsectors, due to the tiny populations involved and the need to honour confidentiality. The diversity between these amalgamated subsectors prevents homogeneity within the new segment.
Other data sources used are the company registration office, the Central Statistics Office and BIM in house data acquired from regional staff or in the course of BIMs work program.
Figure 5.14.9 Comparison of Irish aquaculture data between different data sources: 2008-2011.
0 20 40 60 80 100
2008
2009
2010
2011
million €
freshwater FAO
freshwater EUROSTAT
freshwater DCF
shellfish FAO
shellfish EUROSTAT
shellfish DCF
marine FAO
marine EUROSTAT
marine DCF
0 10 20 30 40
2008
2009
2010
2011
thousand tonnes
The production and employment data gathered for the DCF is also used to supply Eurostat and FAO data requirements. The data is therefore closely similar between all three sets of shared variables. The latter two bodies however receive this data earlier than the DCF. FAO Data is gathered 10 months ahead of DCF data, Eurostat data is gathered 7 months ahead. DCF data is from purely commercial entities. FAO production data is for consumption tonnage only.
221
5.15 ITALY
5.15.1 Overview of the Italian aquaculture sector
Aquaculture represents a system of activities that are not only related to the use of marine, fresh or brackish water basins, and to food production but, whilst heavily affecting the local economy, is of course connected with the development of rural areas and the production of social services. The socio-economic role that the Italian aquaculture sector has played over the years has been recognized in an official way, in the Legislative Decree no. N.228/2001 where a definition of the aquaculture farmer has been made, to include the breeder of animals that use fresh, brackish and marine waters. From an economic point of view, the role goes far beyond the definition ex legem of the farmer, however the definition represents evolution in the legal and social security system. At the same time the spatial role of aquaculture activities has been taking shape: the areas suitable for aquaculture are numerous, but are drastically reduced if we consider the many existing environmental and archaeological constraints. It is for this reason that the aquaculture sector has been recalled in the second and the third Report on Economic and Social Cohesion (2001-2004), where, in addition to the economic and social dimensions, a third dimension is introduced: the territorial or spatial cohesion.
In 2011, total Italian aquaculture production amounted to 157 thousand tonnes in volume, and around 423 million Euros in value. Both volume and value are fluctuating over the period 2008-2011 but considering only the last two reporting periods, the sector shows a decline: -42% and -25%, respectively, in volume and value terms.
In 2011, the aquaculture sector contributed around 43% in volume to the total Italian fishery production (aquaculture and fleet production, according to DCF data). The contribution of the sector to the total seafood domestic production has decreased, from 59% in 2010. Both the harvesting and the farming sector show a decline in 2011 compared to the previous year but for the aquaculture sector the variation is substantially higher (-42% for aquaculture, -6% for the harvesting sector).
On the foreign trade side, there has been a contraction in export volumes (-7%), in contrast to the slight increase in imports (2%), the latter moreover is not supported by domestic demand (-5% and -0.5%, the apparent and the per capita consumption in 2011). The significant decline in national total fish production (wild and aquaculture, -20%), especially of the aquaculture supply, combined with the increase in imports resulted, as expected, in the increase in the propensity to import which was already very high. The degree of self-sufficiency of the overall Italian fishery sector, in turn, has registered a decrease (around -15% compared to 2010) – export, import and consumption data are based on the ISMEA report1.
The higher variation of production, in volume terms, is registered, in 2011 (over 2010), for the shellfish (clams and mussels), decrease of -52%. Actually, the year outside the average seems to be 2010, when the production volume was about two times the value of the previous year. Shellfish production represents the main part of the total production in terms of volume (more than 50%). In value terms the freshwater production is having the main role (about 50%), followed by the shellfish. In value terms the marine aquaculture production has been affected by the biggest decrease (-49%) in 2011, the other two main aggregations declining by around -21%.
1 Report ittico. Analisi e dati di settore 2011 e 2012, ISMEA, Dicembre 2012.
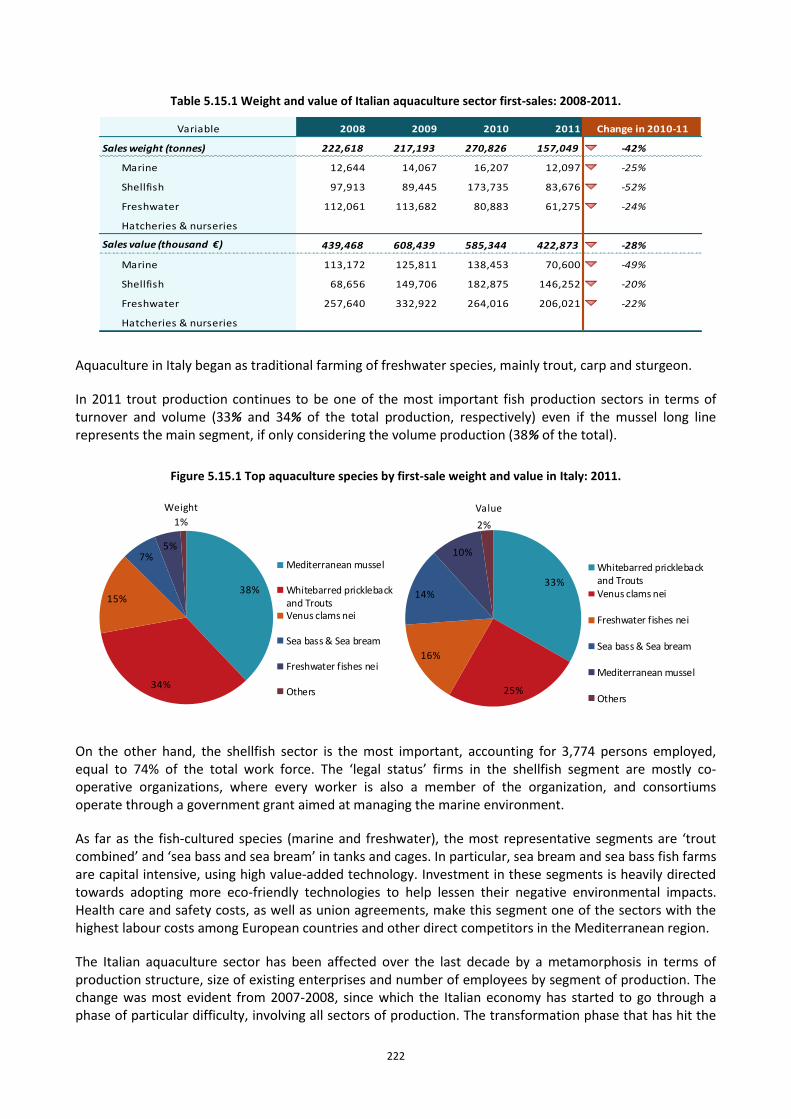
222
Table 5.15.1 Weight and value of Italian aquaculture sector first-sales: 2008-2011.
Variable 2008 2009 2010 2011
Sales weight (tonnes) 222,618 217,193 270,826 157,049 -42%
Marine 12,644 14,067 16,207 12,097 -25%
Shellfish 97,913 89,445 173,735 83,676 -52% ↘
Freshwater 112,061 113,682 80,883 61,275 -24%
Hatcheries & nurseries
Sales value (thousand €) 439,468 608,439 585,344 422,873 -28% ↘
Marine 113,172 125,811 138,453 70,600 -49% ↘
Shellfish 68,656 149,706 182,875 146,252 -20% ↘
Freshwater 257,640 332,922 264,016 206,021 -22%
Hatcheries & nurseries
Change in 2010-11
Aquaculture in Italy began as traditional farming of freshwater species, mainly trout, carp and sturgeon.
In 2011 trout production continues to be one of the most important fish production sectors in terms of turnover and volume (33% and 34% of the total production, respectively) even if the mussel long line represents the main segment, if only considering the volume production (38% of the total).
Figure 5.15.1 Top aquaculture species by first-sale weight and value in Italy: 2011.
38%
34%
15%
7%5%
1%
Weight
Mediterranean mussel
Whitebarred pricklebackand TroutsVenus clams nei
Sea bass & Sea bream
Freshwater fishes nei
Others
33%
25%
16%
14%
10%
2%
Value
Whitebarred pricklebackand TroutsVenus clams nei
Freshwater fishes nei
Sea bass & Sea bream
Mediterranean mussel
Others
On the other hand, the shellfish sector is the most important, accounting for 3,774 persons employed, equal to 74% of the total work force. The ‘legal status’ firms in the shellfish segment are mostly co‐operative organizations, where every worker is also a member of the organization, and consortiums operate through a government grant aimed at managing the marine environment.
As far as the fish‐cultured species (marine and freshwater), the most representative segments are ‘trout combined’ and ‘sea bass and sea bream’ in tanks and cages. In particular, sea bream and sea bass fish farms are capital intensive, using high value‐added technology. Investment in these segments is heavily directed towards adopting more eco‐friendly technologies to help lessen their negative environmental impacts. Health care and safety costs, as well as union agreements, make this segment one of the sectors with the highest labour costs among European countries and other direct competitors in the Mediterranean region.
The Italian aquaculture sector has been affected over the last decade by a metamorphosis in terms of production structure, size of existing enterprises and number of employees by segment of production. The change was most evident from 2007-2008, since which the Italian economy has started to go through a phase of particular difficulty, involving all sectors of production. The transformation phase that has hit the
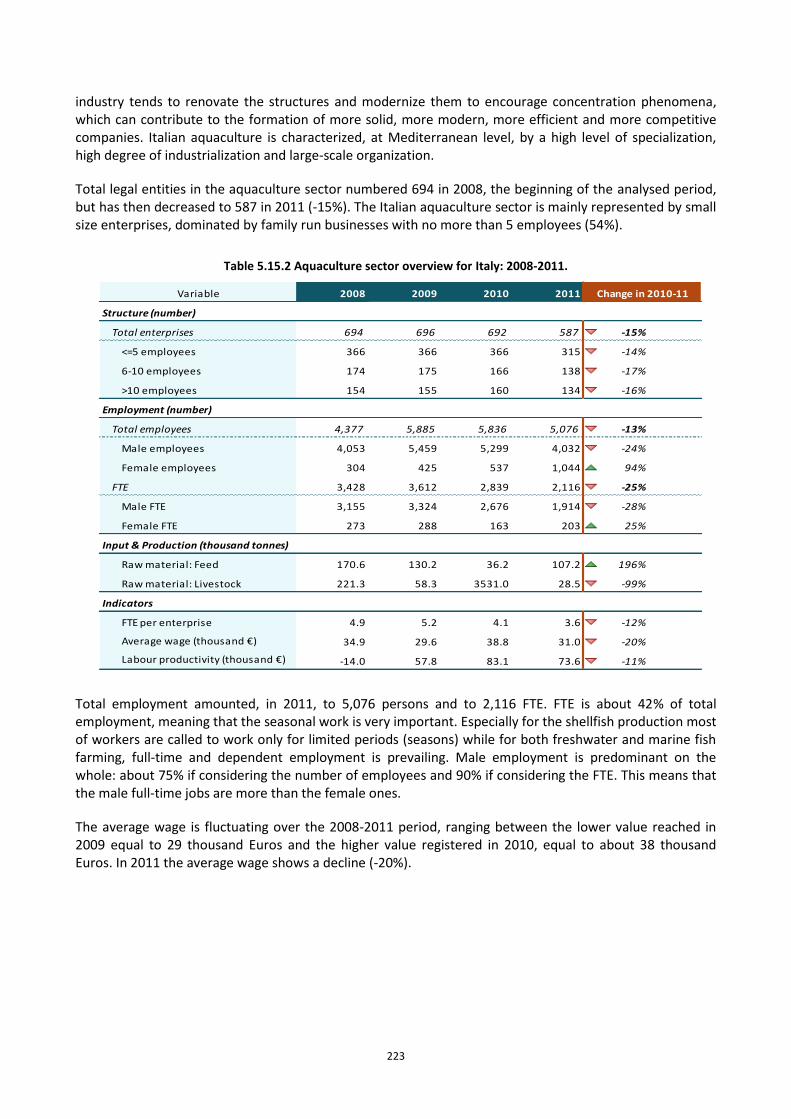
223
industry tends to renovate the structures and modernize them to encourage concentration phenomena, which can contribute to the formation of more solid, more modern, more efficient and more competitive companies. Italian aquaculture is characterized, at Mediterranean level, by a high level of specialization, high degree of industrialization and large-scale organization.
Total legal entities in the aquaculture sector numbered 694 in 2008, the beginning of the analysed period, but has then decreased to 587 in 2011 (-15%). The Italian aquaculture sector is mainly represented by small size enterprises, dominated by family run businesses with no more than 5 employees (54%).
Table 5.15.2 Aquaculture sector overview for Italy: 2008-2011.
Variable 2008 2009 2010 2011
Structure (number)
Total enterprises 694 696 692 587 -15% ↔
<=5 employees 366 366 366 315 -14% ↘
6-10 employees 174 175 166 138 -17% ↘
>10 employees 154 155 160 134 -16% ↘
Employment (number)
Total employees 4,377 5,885 5,836 5,076 -13% ↘
Male employees 4,053 5,459 5,299 4,032 -24% ↘
Female employees 304 425 537 1,044 94% ↗
FTE 3,428 3,612 2,839 2,116 -25% ↘
Male FTE 3,155 3,324 2,676 1,914 -28% ↘
Female FTE 273 288 163 203 25% ↗
Input & Production (thousand tonnes)
Raw material: Feed 170.6 130.2 36.2 107.2 196% ↗
Raw material: Livestock 221.3 58.3 3531.0 28.5 -99%
Indicators
FTE per enterprise 4.9 5.2 4.1 3.6 -12% ↘
Average wage (thousand €) 34.9 29.6 38.8 31.0 -20% ↘
Labour productivity (thousand €) -14.0 57.8 83.1 73.6 -11% ↘
Change in 2010-11
Total employment amounted, in 2011, to 5,076 persons and to 2,116 FTE. FTE is about 42% of total employment, meaning that the seasonal work is very important. Especially for the shellfish production most of workers are called to work only for limited periods (seasons) while for both freshwater and marine fish farming, full-time and dependent employment is prevailing. Male employment is predominant on the whole: about 75% if considering the number of employees and 90% if considering the FTE. This means that the male full-time jobs are more than the female ones.
The average wage is fluctuating over the 2008-2011 period, ranging between the lower value reached in 2009 equal to 29 thousand Euros and the higher value registered in 2010, equal to about 38 thousand Euros. In 2011 the average wage shows a decline (-20%).
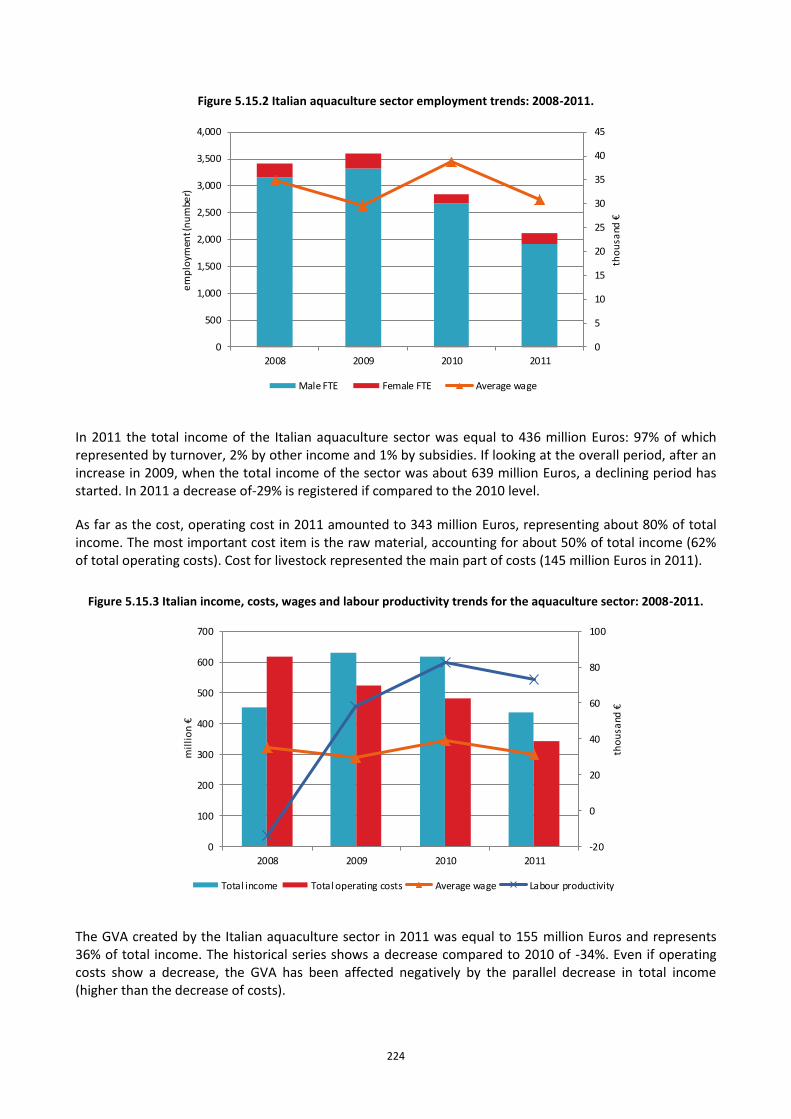
224
Figure 5.15.2 Italian aquaculture sector employment trends: 2008-2011.
0
5
10
15
20
25
30
35
40
45
0
500
1,000
1,500
2,000
2,500
3,000
3,500
4,000
2008 2009 2010 2011
tho
usa
nd €
em
plo
ymen
t (n
um
ber)
Male FTE Female FTE Average wage
In 2011 the total income of the Italian aquaculture sector was equal to 436 million Euros: 97% of which represented by turnover, 2% by other income and 1% by subsidies. If looking at the overall period, after an increase in 2009, when the total income of the sector was about 639 million Euros, a declining period has started. In 2011 a decrease of-29% is registered if compared to the 2010 level.
As far as the cost, operating cost in 2011 amounted to 343 million Euros, representing about 80% of total income. The most important cost item is the raw material, accounting for about 50% of total income (62% of total operating costs). Cost for livestock represented the main part of costs (145 million Euros in 2011).
Figure 5.15.3 Italian income, costs, wages and labour productivity trends for the aquaculture sector: 2008-2011.
-20
0
20
40
60
80
100
0
100
200
300
400
500
600
700
2008 2009 2010 2011
tho
usa
nd €
mil
lio
n €
Total income Total operating costs Average wage Labour productivity
The GVA created by the Italian aquaculture sector in 2011 was equal to 155 million Euros and represents 36% of total income. The historical series shows a decrease compared to 2010 of -34%. Even if operating costs show a decrease, the GVA has been affected negatively by the parallel decrease in total income (higher than the decrease of costs).
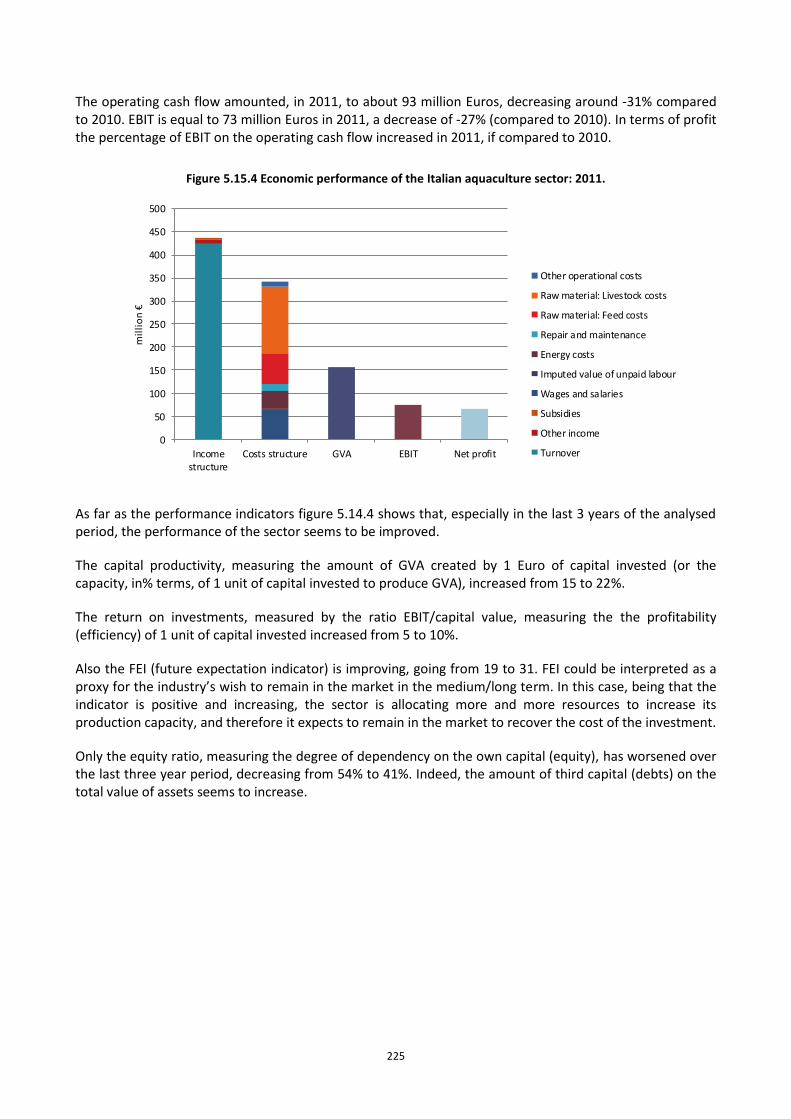
225
The operating cash flow amounted, in 2011, to about 93 million Euros, decreasing around -31% compared to 2010. EBIT is equal to 73 million Euros in 2011, a decrease of -27% (compared to 2010). In terms of profit the percentage of EBIT on the operating cash flow increased in 2011, if compared to 2010.
Figure 5.15.4 Economic performance of the Italian aquaculture sector: 2011.
0
50
100
150
200
250
300
350
400
450
500
Incomestructure
Costs structure GVA EBIT Net profit
mil
lio
n €
Other operational costs
Raw material: Livestock costs
Raw material: Feed costs
Repair and maintenance
Energy costs
Imputed value of unpaid labour
Wages and salaries
Subsidies
Other income
Turnover
As far as the performance indicators figure 5.14.4 shows that, especially in the last 3 years of the analysed period, the performance of the sector seems to be improved.
The capital productivity, measuring the amount of GVA created by 1 Euro of capital invested (or the capacity, in% terms, of 1 unit of capital invested to produce GVA), increased from 15 to 22%.
The return on investments, measured by the ratio EBIT/capital value, measuring the the profitability (efficiency) of 1 unit of capital invested increased from 5 to 10%.
Also the FEI (future expectation indicator) is improving, going from 19 to 31. FEI could be interpreted as a proxy for the industry’s wish to remain in the market in the medium/long term. In this case, being that the indicator is positive and increasing, the sector is allocating more and more resources to increase its production capacity, and therefore it expects to remain in the market to recover the cost of the investment.
Only the equity ratio, measuring the degree of dependency on the own capital (equity), has worsened over the last three year period, decreasing from 54% to 41%. Indeed, the amount of third capital (debts) on the total value of assets seems to increase.
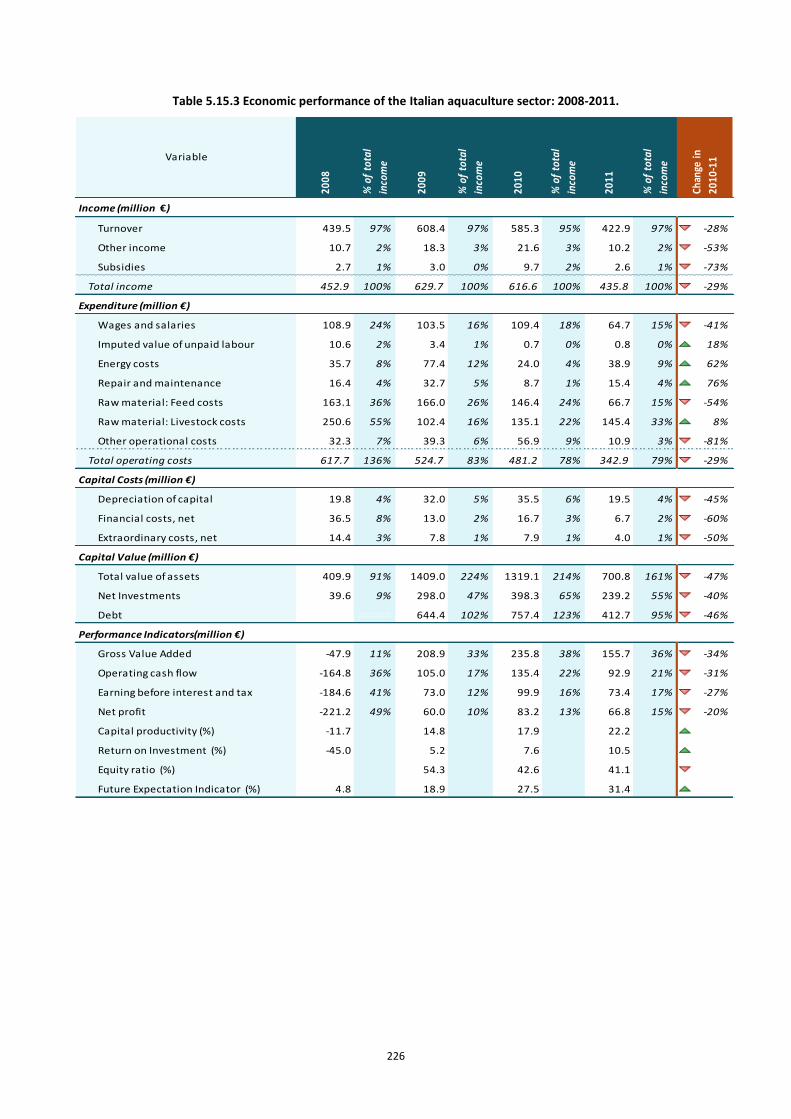
226
Table 5.15.3 Economic performance of the Italian aquaculture sector: 2008-2011.
Income (million €)
Turnover 439.5 97% 608.4 97% 585.3 95% 422.9 97% -28%
Other income 10.7 2% 18.3 3% 21.6 3% 10.2 2% -53%
Subsidies 2.7 1% 3.0 0% 9.7 2% 2.6 1% -73%
Total income 452.9 100% 629.7 100% 616.6 100% 435.8 100% -29%
Expenditure (million €)
Wages and salaries 108.9 24% 103.5 16% 109.4 18% 64.7 15% -41%
Imputed value of unpaid labour 10.6 2% 3.4 1% 0.7 0% 0.8 0% 18%
Energy costs 35.7 8% 77.4 12% 24.0 4% 38.9 9% 62%
Repair and maintenance 16.4 4% 32.7 5% 8.7 1% 15.4 4% 76%
Raw material: Feed costs 163.1 36% 166.0 26% 146.4 24% 66.7 15% -54%
Raw material: Livestock costs 250.6 55% 102.4 16% 135.1 22% 145.4 33% 8%
Other operational costs 32.3 7% 39.3 6% 56.9 9% 10.9 3% -81%
Total operating costs 617.7 136% 524.7 83% 481.2 78% 342.9 79% -29%
Capital Costs (million €)
Depreciation of capital 19.8 4% 32.0 5% 35.5 6% 19.5 4% -45%
Financial costs, net 36.5 8% 13.0 2% 16.7 3% 6.7 2% -60%
Extraordinary costs, net 14.4 3% 7.8 1% 7.9 1% 4.0 1% -50%
Capital Value (million €)
Total value of assets 409.9 91% 1409.0 224% 1319.1 214% 700.8 161% -47%
Net Investments 39.6 9% 298.0 47% 398.3 65% 239.2 55% -40%
Debt ###### 644.4 102% 757.4 123% 412.7 95% -46%
Performance Indicators(million €)
Gross Value Added -47.9 11% 208.9 33% 235.8 38% 155.7 36% -34%
Operating cash flow -164.8 36% 105.0 17% 135.4 22% 92.9 21% -31%
Earning before interest and tax -184.6 41% 73.0 12% 99.9 16% 73.4 17% -27%
Net profit -221.2 49% 60.0 10% 83.2 13% 66.8 15% -20%
Capital productivity (%) -11.7 14.8 17.9 22.2 24%
Return on Investment (%) -45.0 5.2 7.6 10.5 38%
Equity ratio (%) 54.3 42.6 41.1 -3%
Future Expectation Indicator (%) 4.8 18.9 27.5 31.4 14%
Chan
ge in
2010
-11
% o
f to
tal
inco
meVariable
% o
f to
tal
inco
me
2008
2009
% o
f to
tal
inco
me
% o
f to
tal
inco
me
2010
2011
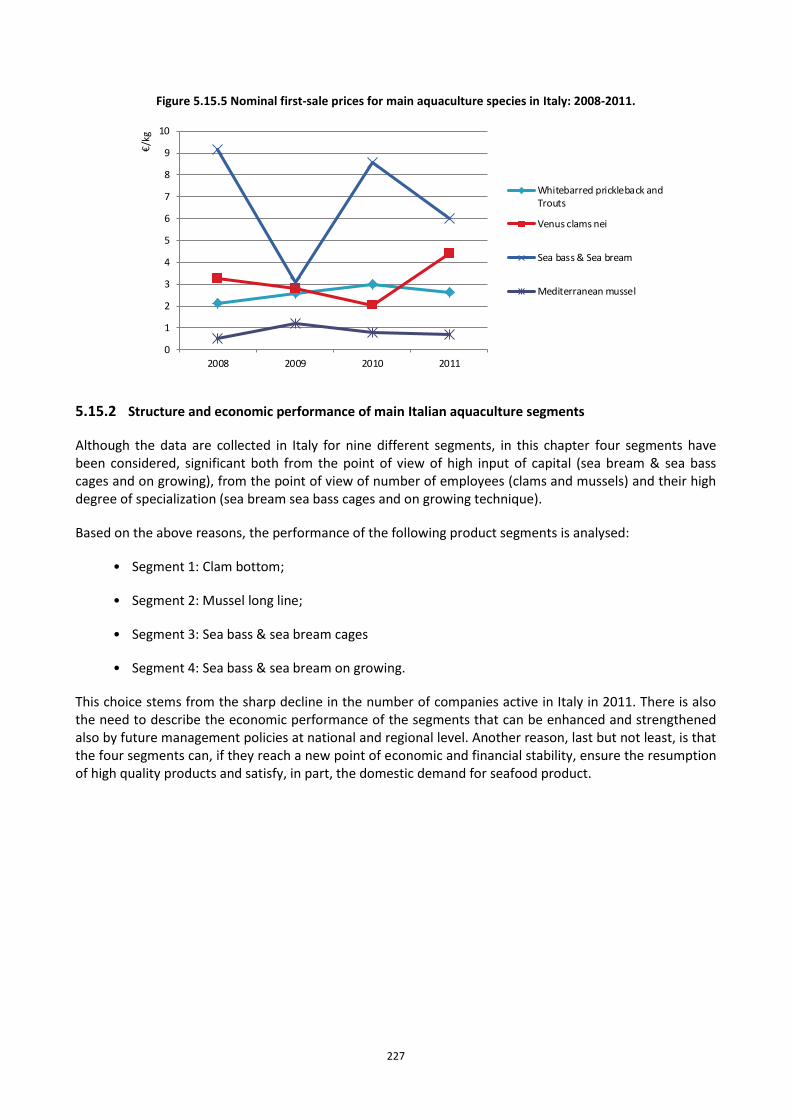
227
Figure 5.15.5 Nominal first-sale prices for main aquaculture species in Italy: 2008-2011.
0
1
2
3
4
5
6
7
8
9
10
2008 2009 2010 2011
€/k
g
Whitebarred prickleback andTrouts
Venus clams nei
Sea bass & Sea bream
Mediterranean mussel
5.15.2 Structure and economic performance of main Italian aquaculture segments
Although the data are collected in Italy for nine different segments, in this chapter four segments have been considered, significant both from the point of view of high input of capital (sea bream & sea bass cages and on growing), from the point of view of number of employees (clams and mussels) and their high degree of specialization (sea bream sea bass cages and on growing technique).
Based on the above reasons, the performance of the following product segments is analysed:
• Segment 1: Clam bottom;
• Segment 2: Mussel long line;
• Segment 3: Sea bass & sea bream cages
• Segment 4: Sea bass & sea bream on growing.
This choice stems from the sharp decline in the number of companies active in Italy in 2011. There is also the need to describe the economic performance of the segments that can be enhanced and strengthened also by future management policies at national and regional level. Another reason, last but not least, is that the four segments can, if they reach a new point of economic and financial stability, ensure the resumption of high quality products and satisfy, in part, the domestic demand for seafood product.
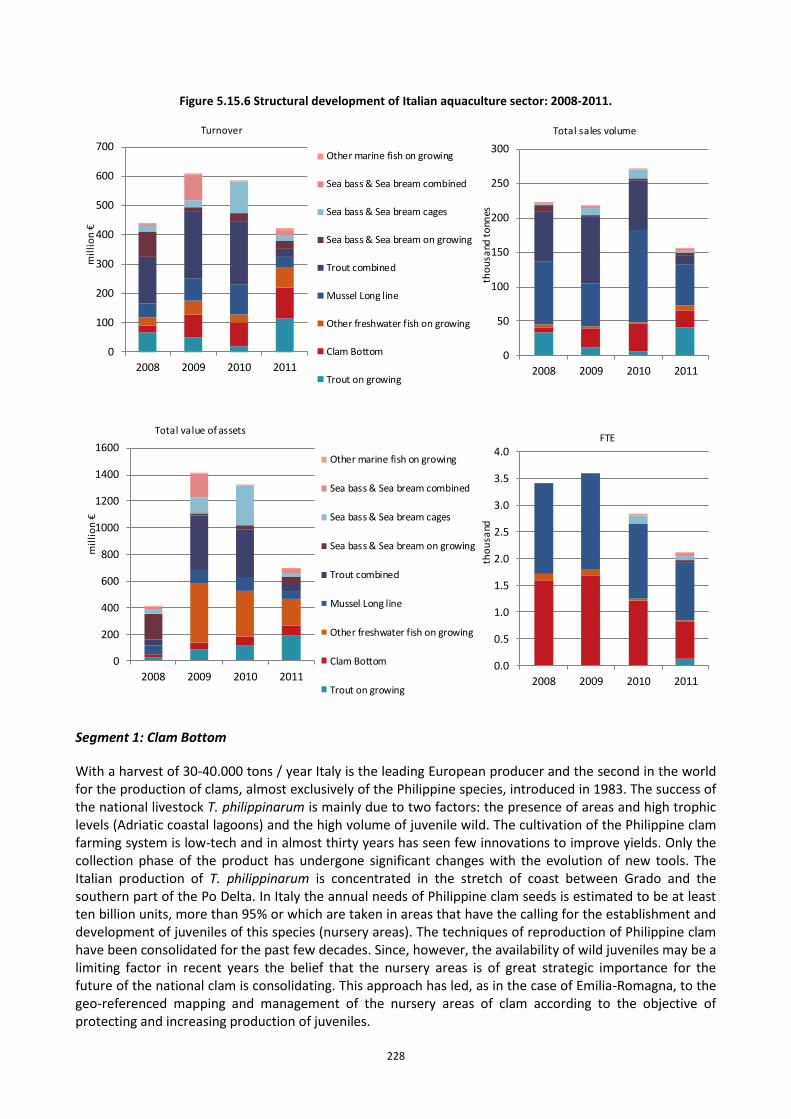
228
Figure 5.15.6 Structural development of Italian aquaculture sector: 2008-2011.
0
100
200
300
400
500
600
700
2008 2009 2010 2011
mil
lio
n €
Turnover
Other marine fish on growing
Sea bass & Sea bream combined
Sea bass & Sea bream cages
Sea bass & Sea bream on growing
Trout combined
Mussel Long line
Other freshwater fish on growing
Clam Bottom
Trout on growing
0
50
100
150
200
250
300
2008 2009 2010 2011
tho
usa
nd t
onn
es
Total sales volume
0
200
400
600
800
1000
1200
1400
1600
2008 2009 2010 2011
mil
lio
n €
Total value of assets
Other marine fish on growing
Sea bass & Sea bream combined
Sea bass & Sea bream cages
Sea bass & Sea bream on growing
Trout combined
Mussel Long line
Other freshwater fish on growing
Clam Bottom
Trout on growing
0.0
0.5
1.0
1.5
2.0
2.5
3.0
3.5
4.0
2008 2009 2010 2011
tho
usa
nd
FTE
Segment 1: Clam Bottom
With a harvest of 30-40.000 tons / year Italy is the leading European producer and the second in the world for the production of clams, almost exclusively of the Philippine species, introduced in 1983. The success of the national livestock T. philippinarum is mainly due to two factors: the presence of areas and high trophic levels (Adriatic coastal lagoons) and the high volume of juvenile wild. The cultivation of the Philippine clam farming system is low-tech and in almost thirty years has seen few innovations to improve yields. Only the collection phase of the product has undergone significant changes with the evolution of new tools. The Italian production of T. philippinarum is concentrated in the stretch of coast between Grado and the southern part of the Po Delta. In Italy the annual needs of Philippine clam seeds is estimated to be at least ten billion units, more than 95% or which are taken in areas that have the calling for the establishment and development of juveniles of this species (nursery areas). The techniques of reproduction of Philippine clam have been consolidated for the past few decades. Since, however, the availability of wild juveniles may be a limiting factor in recent years the belief that the nursery areas is of great strategic importance for the future of the national clam is consolidating. This approach has led, as in the case of Emilia-Romagna, to the geo-referenced mapping and management of the nursery areas of clam according to the objective of protecting and increasing production of juveniles.
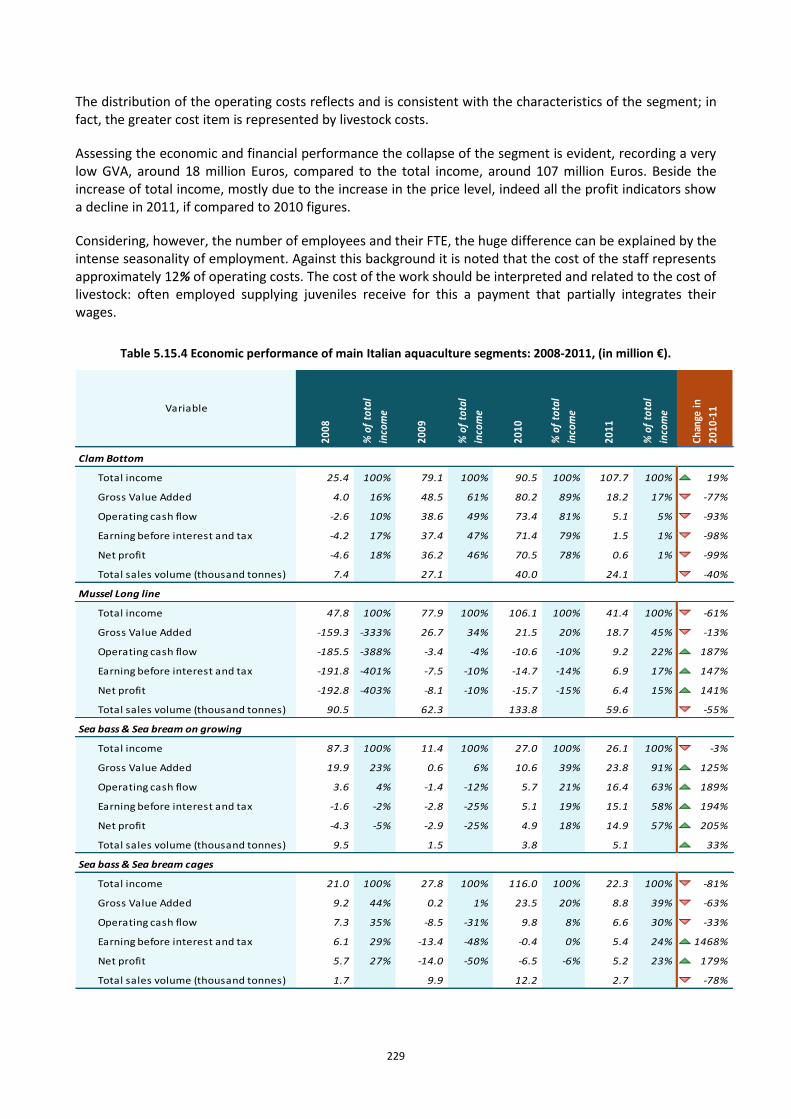
229
The distribution of the operating costs reflects and is consistent with the characteristics of the segment; in fact, the greater cost item is represented by livestock costs.
Assessing the economic and financial performance the collapse of the segment is evident, recording a very low GVA, around 18 million Euros, compared to the total income, around 107 million Euros. Beside the increase of total income, mostly due to the increase in the price level, indeed all the profit indicators show a decline in 2011, if compared to 2010 figures.
Considering, however, the number of employees and their FTE, the huge difference can be explained by the intense seasonality of employment. Against this background it is noted that the cost of the staff represents approximately 12% of operating costs. The cost of the work should be interpreted and related to the cost of livestock: often employed supplying juveniles receive for this a payment that partially integrates their wages.
Table 5.15.4 Economic performance of main Italian aquaculture segments: 2008-2011, (in million €).
Clam Bottom
Total income 25.4 100% 79.1 100% 90.5 100% 107.7 100% 19%
Gross Value Added 4.0 16% 48.5 61% 80.2 89% 18.2 17% -77%
Operating cash flow -2.6 10% 38.6 49% 73.4 81% 5.1 5% -93%
Earning before interest and tax -4.2 17% 37.4 47% 71.4 79% 1.5 1% -98%
Net profit -4.6 18% 36.2 46% 70.5 78% 0.6 1% -99%
Total sales volume (thousand tonnes) 7.4 27.1 40.0 24.1 -40%
Mussel Long line
Total income 47.8 100% 77.9 100% 106.1 100% 41.4 100% -61%
Gross Value Added -159.3 -333% 26.7 34% 21.5 20% 18.7 45% -13%
Operating cash flow -185.5 -388% -3.4 -4% -10.6 -10% 9.2 22% 187%
Earning before interest and tax -191.8 -401% -7.5 -10% -14.7 -14% 6.9 17% 147%
Net profit -192.8 -403% -8.1 -10% -15.7 -15% 6.4 15% 141%
Total sales volume (thousand tonnes) 90.5 62.3 133.8 59.6 -55%
Sea bass & Sea bream on growing
Total income 87.3 100% 11.4 100% 27.0 100% 26.1 100% -3%
Gross Value Added 19.9 23% 0.6 6% 10.6 39% 23.8 91% 125%
Operating cash flow 3.6 4% -1.4 -12% 5.7 21% 16.4 63% 189%
Earning before interest and tax -1.6 -2% -2.8 -25% 5.1 19% 15.1 58% 194%
Net profit -4.3 -5% -2.9 -25% 4.9 18% 14.9 57% 205%
Total sales volume (thousand tonnes) 9.5 1.5 3.8 5.1 33%
Sea bass & Sea bream cages
Total income 21.0 100% 27.8 100% 116.0 100% 22.3 100% -81%
Gross Value Added 9.2 44% 0.2 1% 23.5 20% 8.8 39% -63%
Operating cash flow 7.3 35% -8.5 -31% 9.8 8% 6.6 30% -33%
Earning before interest and tax 6.1 29% -13.4 -48% -0.4 0% 5.4 24% 1468%
Net profit 5.7 27% -14.0 -50% -6.5 -6% 5.2 23% 179%
Total sales volume (thousand tonnes) 1.7 9.9 12.2 2.7 -78%
Chan
ge in
2010
-11Variable
2008
% o
f to
tal
inco
me
2009
% o
f to
tal
inco
me
2010
% o
f to
tal
inco
me
2011
% o
f to
tal
inco
me
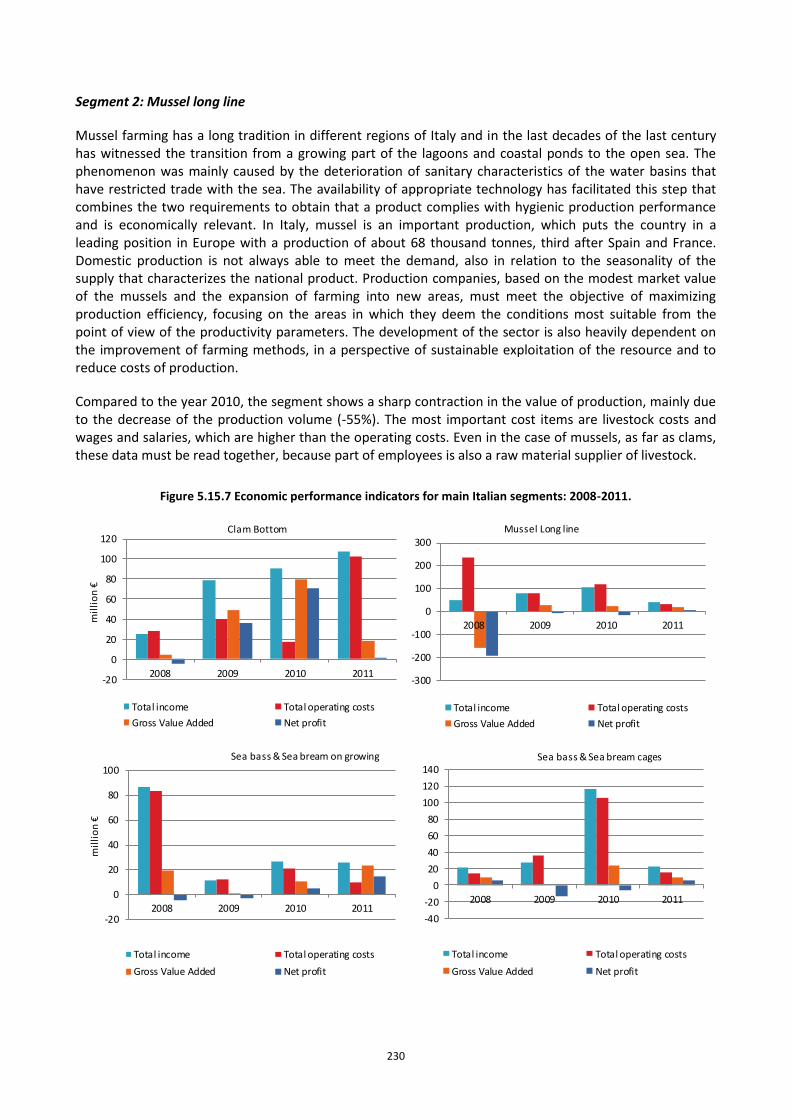
230
Segment 2: Mussel long line
Mussel farming has a long tradition in different regions of Italy and in the last decades of the last century has witnessed the transition from a growing part of the lagoons and coastal ponds to the open sea. The phenomenon was mainly caused by the deterioration of sanitary characteristics of the water basins that have restricted trade with the sea. The availability of appropriate technology has facilitated this step that combines the two requirements to obtain that a product complies with hygienic production performance and is economically relevant. In Italy, mussel is an important production, which puts the country in a leading position in Europe with a production of about 68 thousand tonnes, third after Spain and France. Domestic production is not always able to meet the demand, also in relation to the seasonality of the supply that characterizes the national product. Production companies, based on the modest market value of the mussels and the expansion of farming into new areas, must meet the objective of maximizing production efficiency, focusing on the areas in which they deem the conditions most suitable from the point of view of the productivity parameters. The development of the sector is also heavily dependent on the improvement of farming methods, in a perspective of sustainable exploitation of the resource and to reduce costs of production.
Compared to the year 2010, the segment shows a sharp contraction in the value of production, mainly due to the decrease of the production volume (-55%). The most important cost items are livestock costs and wages and salaries, which are higher than the operating costs. Even in the case of mussels, as far as clams, these data must be read together, because part of employees is also a raw material supplier of livestock.
Figure 5.15.7 Economic performance indicators for main Italian segments: 2008-2011.
-20
0
20
40
60
80
100
120
2008 2009 2010 2011
mil
lio
n €
Clam Bottom
Total income Total operating costs
Gross Value Added Net profit
-300
-200
-100
0
100
200
300
2008 2009 2010 2011
Mussel Long line
Total income Total operating costs
Gross Value Added Net profit
-20
0
20
40
60
80
100
2008 2009 2010 2011
mil
lio
n €
Sea bass & Sea bream on growing
Total income Total operating costs
Gross Value Added Net profit
-40
-20
0
20
40
60
80
100
120
140
2008 2009 2010 2011
Sea bass & Sea bream cages
Total income Total operating costs
Gross Value Added Net profit
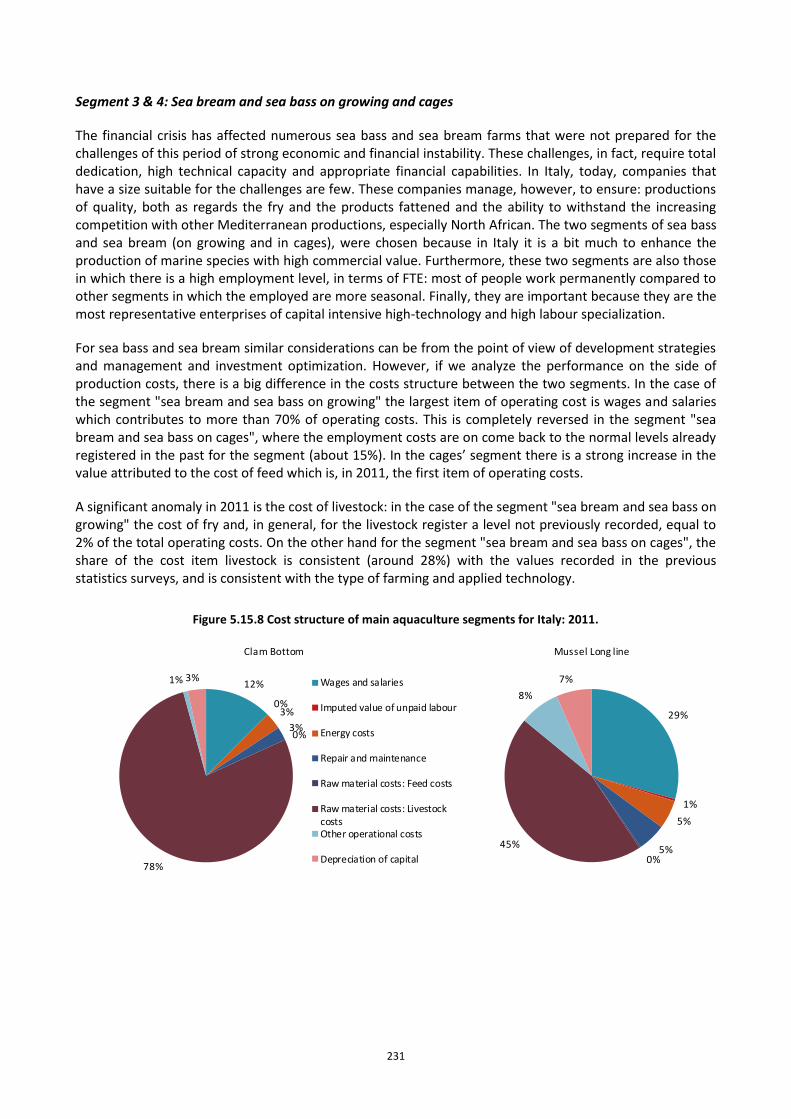
231
Segment 3 & 4: Sea bream and sea bass on growing and cages
The financial crisis has affected numerous sea bass and sea bream farms that were not prepared for the challenges of this period of strong economic and financial instability. These challenges, in fact, require total dedication, high technical capacity and appropriate financial capabilities. In Italy, today, companies that have a size suitable for the challenges are few. These companies manage, however, to ensure: productions of quality, both as regards the fry and the products fattened and the ability to withstand the increasing competition with other Mediterranean productions, especially North African. The two segments of sea bass and sea bream (on growing and in cages), were chosen because in Italy it is a bit much to enhance the production of marine species with high commercial value. Furthermore, these two segments are also those in which there is a high employment level, in terms of FTE: most of people work permanently compared to other segments in which the employed are more seasonal. Finally, they are important because they are the most representative enterprises of capital intensive high-technology and high labour specialization.
For sea bass and sea bream similar considerations can be from the point of view of development strategies and management and investment optimization. However, if we analyze the performance on the side of production costs, there is a big difference in the costs structure between the two segments. In the case of the segment "sea bream and sea bass on growing" the largest item of operating cost is wages and salaries which contributes to more than 70% of operating costs. This is completely reversed in the segment "sea bream and sea bass on cages", where the employment costs are on come back to the normal levels already registered in the past for the segment (about 15%). In the cages’ segment there is a strong increase in the value attributed to the cost of feed which is, in 2011, the first item of operating costs.
A significant anomaly in 2011 is the cost of livestock: in the case of the segment "sea bream and sea bass on growing" the cost of fry and, in general, for the livestock register a level not previously recorded, equal to 2% of the total operating costs. On the other hand for the segment "sea bream and sea bass on cages", the share of the cost item livestock is consistent (around 28%) with the values recorded in the previous statistics surveys, and is consistent with the type of farming and applied technology.
Figure 5.15.8 Cost structure of main aquaculture segments for Italy: 2011.
12%
0%3%
3%0%
78%
1% 3%
Clam Bottom
Wages and salaries
Imputed value of unpaid labour
Energy costs
Repair and maintenance
Raw material costs: Feed costs
Raw material costs: LivestockcostsOther operational costs
Depreciation of capital
29%
1%
5%
5%0%
45%
8%
7%
Mussel Long line
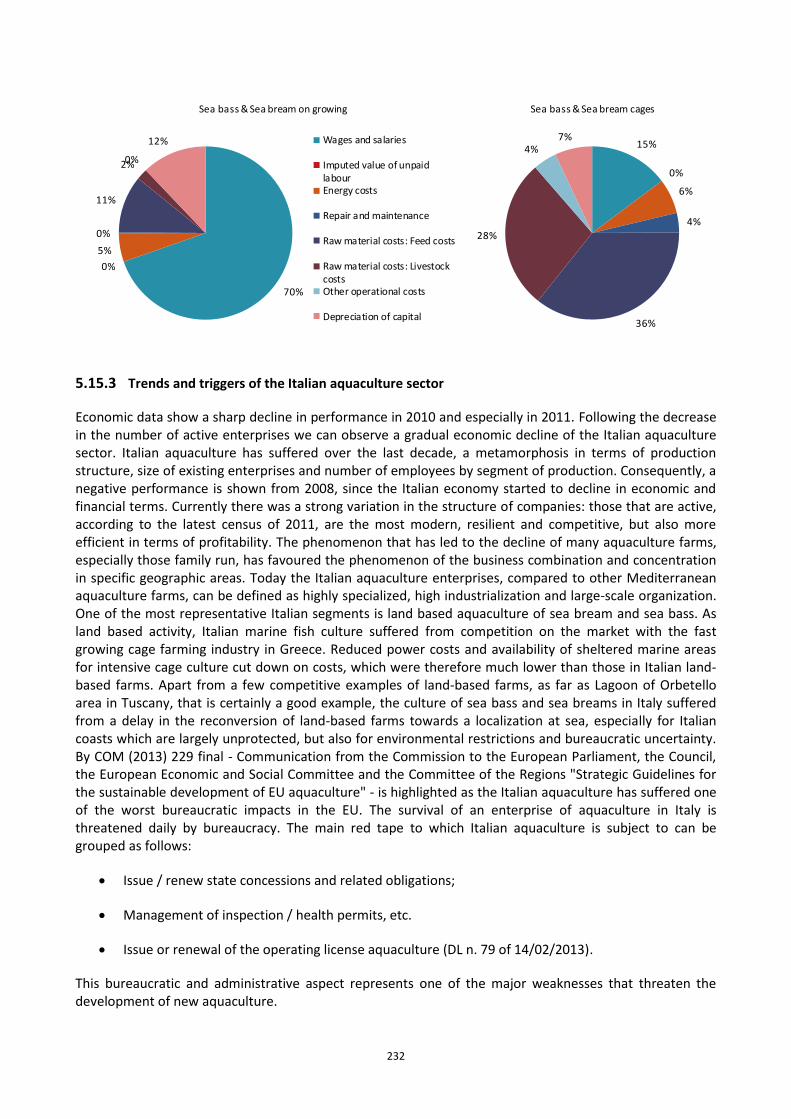
232
70%
0%
5%
0%
11%
2%0%
12%
Sea bass & Sea bream on growing
Wages and salaries
Imputed value of unpaidlabourEnergy costs
Repair and maintenance
Raw material costs: Feed costs
Raw material costs: LivestockcostsOther operational costs
Depreciation of capital
15%
0%
6%
4%
36%
28%
4%7%
Sea bass & Sea bream cages
5.15.3 Trends and triggers of the Italian aquaculture sector
Economic data show a sharp decline in performance in 2010 and especially in 2011. Following the decrease in the number of active enterprises we can observe a gradual economic decline of the Italian aquaculture sector. Italian aquaculture has suffered over the last decade, a metamorphosis in terms of production structure, size of existing enterprises and number of employees by segment of production. Consequently, a negative performance is shown from 2008, since the Italian economy started to decline in economic and financial terms. Currently there was a strong variation in the structure of companies: those that are active, according to the latest census of 2011, are the most modern, resilient and competitive, but also more efficient in terms of profitability. The phenomenon that has led to the decline of many aquaculture farms, especially those family run, has favoured the phenomenon of the business combination and concentration in specific geographic areas. Today the Italian aquaculture enterprises, compared to other Mediterranean aquaculture farms, can be defined as highly specialized, high industrialization and large-scale organization. One of the most representative Italian segments is land based aquaculture of sea bream and sea bass. As land based activity, Italian marine fish culture suffered from competition on the market with the fast growing cage farming industry in Greece. Reduced power costs and availability of sheltered marine areas for intensive cage culture cut down on costs, which were therefore much lower than those in Italian land-based farms. Apart from a few competitive examples of land-based farms, as far as Lagoon of Orbetello area in Tuscany, that is certainly a good example, the culture of sea bass and sea breams in Italy suffered from a delay in the reconversion of land-based farms towards a localization at sea, especially for Italian coasts which are largely unprotected, but also for environmental restrictions and bureaucratic uncertainty. By COM (2013) 229 final - Communication from the Commission to the European Parliament, the Council, the European Economic and Social Committee and the Committee of the Regions "Strategic Guidelines for the sustainable development of EU aquaculture" - is highlighted as the Italian aquaculture has suffered one of the worst bureaucratic impacts in the EU. The survival of an enterprise of aquaculture in Italy is threatened daily by bureaucracy. The main red tape to which Italian aquaculture is subject to can be grouped as follows:
Issue / renew state concessions and related obligations;
Management of inspection / health permits, etc.
Issue or renewal of the operating license aquaculture (DL n. 79 of 14/02/2013).
This bureaucratic and administrative aspect represents one of the major weaknesses that threaten the development of new aquaculture.
233
Another threat to Italian aquaculture is the lack of definition of spaces (spatial access) to be used for aquaculture and the development of new facilities. Aquaculture, today, is not recognized as an economic activity that uses water resources (freshwater/salt water) in an equal manner with other sectors, such as fisheries, tourism, navigation, agriculture, industry, etc. To this must be added that the existing licenses and authorizations do not consider the carry capacity, which means that cannot plan for development which is economically and environmentally sustainable. For the future, it will be important to include aquaculture between economic activities currently recognized as a user of the resource "water" (both marine and fresh water "). Such recognition will make aquaculture comparable to other economic activities that are potential competitors, ensuring the possibility of access to resources, both as regards the use of inland waters of the salt waters.
As regard to the limitations and bureaucratic inefficiencies, it is important to mention the case of Sicily.
Sicily, until three years ago, was the region with the highest concentration of marine aquaculture. Currently in Sicily less than 6 plants operate and not all are productively active.
In addition to financial liquidity problems, many aquaculture farms have had serious injury caused by new regulations governing the licensing fees for the use of marine and spatial areas. In many cases the annual cost of the license for the use of public marine areas is about 150% more than the annual turnover of each undertaking. This is due to the tariffs charged: competent public Bodies have used rates per square meter of area granted to aquaculture companies like the tariffs for recreational activities carried out on the coast, such as private beaches and seaside restaurants. In practical terms, many aquaculture enterprises have not obtained the renewed licenses and therefore could not even qualify for public funding that would cover costs of investments already made by the same companies. This has paralyzed the aquaculture sector that has been unable to receive lines of credit from banks.
In the methodology of Italian data collection, it loses important information regarding one of the segments of greater excellence of Italian aquaculture: nursery and hatchery segment. Normally these companies are aggregated in the segment "Combined". Although it is not possible to highlight the economic data for reference, in general it is important to describe the performance of the hatchery and nursery sector. As for the eggs and fry there is a difference between the production of salt water and fresh water. In the field of marine production eggs and fry are good and of high quality, with exports in EU and North Africa relief. For the segment of fresh water, mainly trout, there is a lack of resources for which are elevated imports by the EU and extra EU countries. Based on consultations with the main stakeholders, some of the requirements it is hoped will be met in the future are:
For the sub-segment "salt water" nursery and hatchery is expected in the future modernization of hatcheries / existing hatcheries in order to improve health status, reduce environmental impact, increase the use of renewable energy, adopt and implement the new technologies available.
For the sub-segment "Fresh Water" nursery and hatchery is expected in the future adaptation of incubators / hatcheries existing and creation of new structures, offsetting the current deficit that generates a lot of imports of fry and eggs.
For the sub-segment "Shellfish" nursery and hatchery is expected for the future process of diversification of new species, but also for an increase in the supply of seed in order to reduce dependence on imported mainly from France.
The economic performance must be analysed by combining with the result of the performance of the market. In the last two years the Italian household purchasing power has decreased. The reduced purchasing power has led to the increase of consumption of products based on fish, such as canned food, but also of products reared. Often the aquaculture product purchased is not Italian, but foreign production,
234
mainly Greek and Turkish. This is because the price of imported products is lower on average by between 25% and 35% compared to the Italian product (referred to prices for sea bass and sea bream).
As regards the structure of the market, Italian aquaculture has been characterized by an integrated vertical channel: "from the cage to the table". About 70% of the product on offer bred in Italy is transformed in the integrated sector. This creates an added value to the final supply and guarantees a higher price to farmers. What is a weakness for companies, both family-run or of another type, but still SME, it is not being able to use a shared platform for the transformation/processing. In fact, much of the most processed aquaculture products, are managed/processed in the same companies that have invested in processing plants. Aquaculture, also to enhance its supply, has invested a lot on quality and environmental certification, until about 2 or 3 years ago. The certification was a good opportunity to increase the added value for those fish productions that have received recognition from Third Independent Body of Certification. The Certification bodies state, with reasonable reliability, if the fish product and, if this is contemplated in the certification, the service, were fully compliant with the international ISO standards and have met the specified requirements. To this must be added the indirect effect of improving communication between the board and the owners and ensuring the traceability of production. For aquaculture fish farms, ISO certification is a "prerequisite" for access to "large-scale retail trade" (GDO), this is shown by the number of companies that, in the first half of 2011, in the records are certified ISO international entities. The percentages of certifications according to ISO Vision 2000 for quality, ISO 14001 for environment, are about 15% of the total medium and large companies operating in Italy. Percentages are modest when compared with those recorded for the companies that have adhered to the specifications of the "large-scale retail trade" GDO, in which case it exceeds 70% of the organizations involved. In the last three years the ISO decreased mainly because it did not allow producers to obtain a premium price. In addition to the wholesale market also important is the application of traceability and procedures set out in the "Regulations" of the commercial chains, such as Carrefour, CONAD, COOP, Bennet, etc. The risk for companies to sell their product under the "brand" of the distribution channel is to lose the identity of its products and not to the loyalty of consumers.
As related to the innovation and pilot activities, a new agreement, signed in July 2013 between the Unindustria and the trade association Legapesca / AMA, will allow Italian shellfish businesses to obtain European carbon credits. For the Italian mussels, clams and oysters there exists a future of active struggle against climate change. It knows that the molluscs have a significant ability to "bio-seizure", i.e. removal of carbon dioxide (CO2) dissolved in water, the carbon being one of the fundamental building blocks for the synthesis of the shell. Their role has also been recognized by the Kyoto Protocol as carbon sinks, thus assigning to CO2 quotas laid down in the national production of shellfish economic value. A thorough scientific study will determine the amount of CO2 fixed and define parameters and certification processes for determining the quantification of credits according to the different production processes. The first phase involved the member companies of the AMA, the Association of Mediterranean Lega Pesca, which covers over 50% of the national production of mussels, 30% of clams reared in Italy, and 100% of the production of oysters.
5.15.4 Data Coverage and Data Quality of the Italian aquaculture sector
The methodology of the system "Probability Sample Survey", was used to draw the sample from the universe of aquaculture companies, for technical and production segment, according to a random selection.
The segments are 9 according to the following criteria: technology / species
Data samples in accordance with Appendix X must be expanded;
Structural data in Volume (tones) and Value (Euro) per segment (and here It must necessarily occur with the consistency of the data collected and sent to Eurostat according to Reg.762/2008).
235
From the analyzes and verifications carried out on the data contained into the report, the consistency between Eurostat data and data DCF is not respected.
Related to estimation, the optimum sample number per stratum is defined according to Bethel’s procedure (1989). Then, for each collected variable, to obtain the estimates of the totals per stratum, the Horvitz-Thompson formula is used, derived for the particular case of the simple random sampling without replacement. According to this particular estimator, the variance and the CV are calculated to evaluate the precision level.
As regards the imputation of non-responses, there is a process of localization of errors . The control procedure of the survey can be considered as interactive graphic micro-editing of the univariate type. The term interaction refers to the fact that, in the procedure of localization of errors, there are not only automatic phases but also phases which require human intervention to investigate the situation and to evaluate the effective presence of the error ( therefore the human intervention regards the localization phase and not that of imputation). The control is mainly of the univariate type because the variables are controlled individually and only in rare cases are suspected relationships existing among them controlled, using suitable synthesis indexes. During the various phases wide use is made of graphic tools to visibly evaluate situations marked as errors. Finally the word micro-editing is used because the data is gathered in suitable domains of study within which the sampling units can be considered very homogenous. For each of these sets of data, suitable control functions are first calculated, and then, for each of them, certain rules of incompatibility are verified. In the case of activation of conditions of error, that is in the case where the observed value does not belong to the region of acceptance, those control functions are then observed individually for all the sampling units forming the single domain. Thus the sample unit, or units, responsible for the activation of conditions of error is localized for the entire domain of study and then the imputation of the erroneous data follows.
The MS has not provided guidance on the methodology to ensure the quality of the expanded data. Furthermore, there was abnormal number of employed (males and especially females) compared to previous years as well as a very clear correspondence between occupied and conversion into Full Time Equivalent (FTE). For example, see for example the segments Seg.5.2 and Seg.7.2.
In Seg.5.2 (Other freshwater fish on growing) to all employees (males plus females) while 1,024 are 1,108 FTE.
In Seg.7.2 (Mussel Long line) are given to all employees and 322 FTE are 9.
Equally important for some items of operating costs there is consistency with the data reported in previous years, the main evidence for the cost of the staff/employee and their affection of other operating costs, but also the costs for energy and maintenance and repairs. Some faults which cause a carelessness data quality concern, moreover, some prices per kilogram reported. The price that most highlights anomaly is reported that is obtained by the clams (greater than 4 Euro per kg).
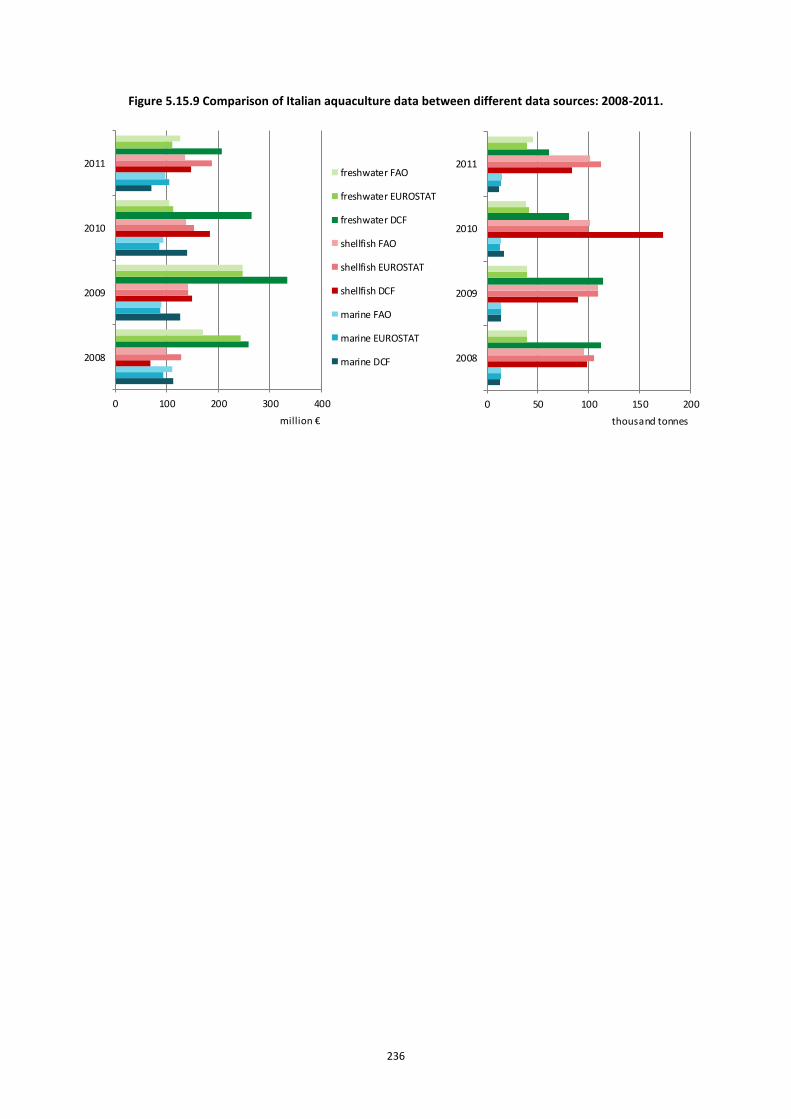
236
Figure 5.15.9 Comparison of Italian aquaculture data between different data sources: 2008-2011.
0 100 200 300 400
2008
2009
2010
2011
million €
freshwater FAO
freshwater EUROSTAT
freshwater DCF
shellfish FAO
shellfish EUROSTAT
shellfish DCF
marine FAO
marine EUROSTAT
marine DCF
0 50 100 150 200
2008
2009
2010
2011
thousand tonnes
237
5.16 LATVIA
5.16.1 Overview of the Latvian aquaculture sector
Latvia has a good location of inland waters and a stable, ecologically pure environment, which facilitates the development of aquaculture. For Latvian countryside aquaculture is an important business activity and is a provider of employment. The aquaculture sector plays an important role in the Latvian regions development. The total number of ponds registered for aquaculture and its area were 728 ponds and 5,707 ha in 2011. There were 1,270 pools with the volume of 17,051 m3 and 13 recirculation systems with volume of 1,184 m3 used for aquaculture production in 2011 (Latvian State Institute of Agrarian Economics, 2013).
During the time period from 2007-2011 the number of economically active aquaculture companies increased on average by 4 companies per year. As the number of aquaculture companies increased, the number of the employees increased as well – on average by 4 persons per year. In 2011 the number of registered aquaculture enterprises was more than 140, however only 55 of them were economically active and farmed market size fish for sale or produced young fish for restocking and on growing. Most of the enterprises were classified as small enterprises where the number of employment was less than 10. Production of aquaculture products is not restricted by quotas or other restrictions and so in comparison to fishing, the initiation of business in this sector is relatively easy.
There are no net-cage farms in sea and fresh water sites in Latvia. The main activities of the Latvian aquaculture enterprises are follows:
Artificial breeding of young fish for restocking in coastal seawater and inland freshwater
Fish cultivation in freshwater earth ponds and land based farms in special tanks and growing up for market sale
Short term fish cultivation in freshwater ponds for commercial angling
Fish cultivation in household ponds for self-consumption or hobby angling.
The aquaculture enterprises mainly concentrated in the regions of Kurzeme and Vidzeme. A considerable number of agricultural holdings have commenced business in aquaculture in addition to their business activity.
During the period from 2004-2011 the aquaculture of Latvia developed in a generally positive direction: the production capacity and productivity increased, but starting from 2008 the level of production output has declined as a result of the economic crisis.
Latvian aquaculture produced 545 tonnes in 2011. This production was valued about 1.1 million Euros (FAO, 2013). Latvia produces no marine or shellfish aquaculture (see Table 5.16.1).
The main production mass in 2011 was provided by open land ponds - 89.72 %, which are suitable under local conditions mainly for the purpose of cyprinid fish farming, 6.14 % of the aquaculture production was obtained from the natural flow water basin, whereas 4.14 % was in recirculation systems (Latvian State Institute of Agrarian Economics, 2013).
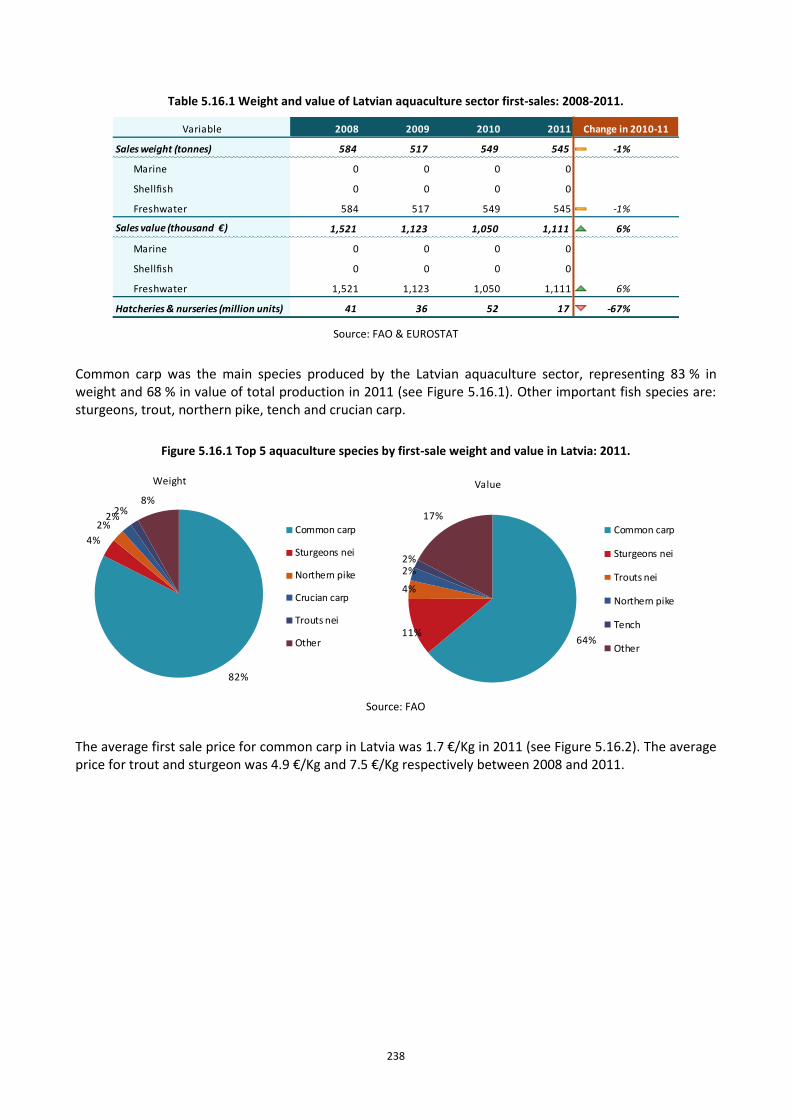
238
Table 5.16.1 Weight and value of Latvian aquaculture sector first-sales: 2008-2011.
Variable 2008 2009 2010 2011
Sales weight (tonnes) 584 517 549 545 -1% ↘
Marine 0 0 0 0
Shellfish 0 0 0 0
Freshwater 584 517 549 545 -1% ↘
Sales value (thousand €) 1,521 1,123 1,050 1,111 6% ↗
Marine 0 0 0 0
Shellfish 0 0 0 0
Freshwater 1,521 1,123 1,050 1,111 6% ↗
Hatcheries & nurseries (million units) 41 36 52 17 -67% ↘
Change in 2010-11
Source: FAO & EUROSTAT
Common carp was the main species produced by the Latvian aquaculture sector, representing 83 % in weight and 68 % in value of total production in 2011 (see Figure 5.16.1). Other important fish species are: sturgeons, trout, northern pike, tench and crucian carp.
Figure 5.16.1 Top 5 aquaculture species by first-sale weight and value in Latvia: 2011.
82%
4%
2%2%
2%8%
Weight
Common carp
Sturgeons nei
Northern pike
Crucian carp
Trouts nei
Other 64%11%
4%
2%2%
17%
Value
Common carp
Sturgeons nei
Trouts nei
Northern pike
Tench
Other
Source: FAO
The average first sale price for common carp in Latvia was 1.7 €/Kg in 2011 (see Figure 5.16.2). The average price for trout and sturgeon was 4.9 €/Kg and 7.5 €/Kg respectively between 2008 and 2011.
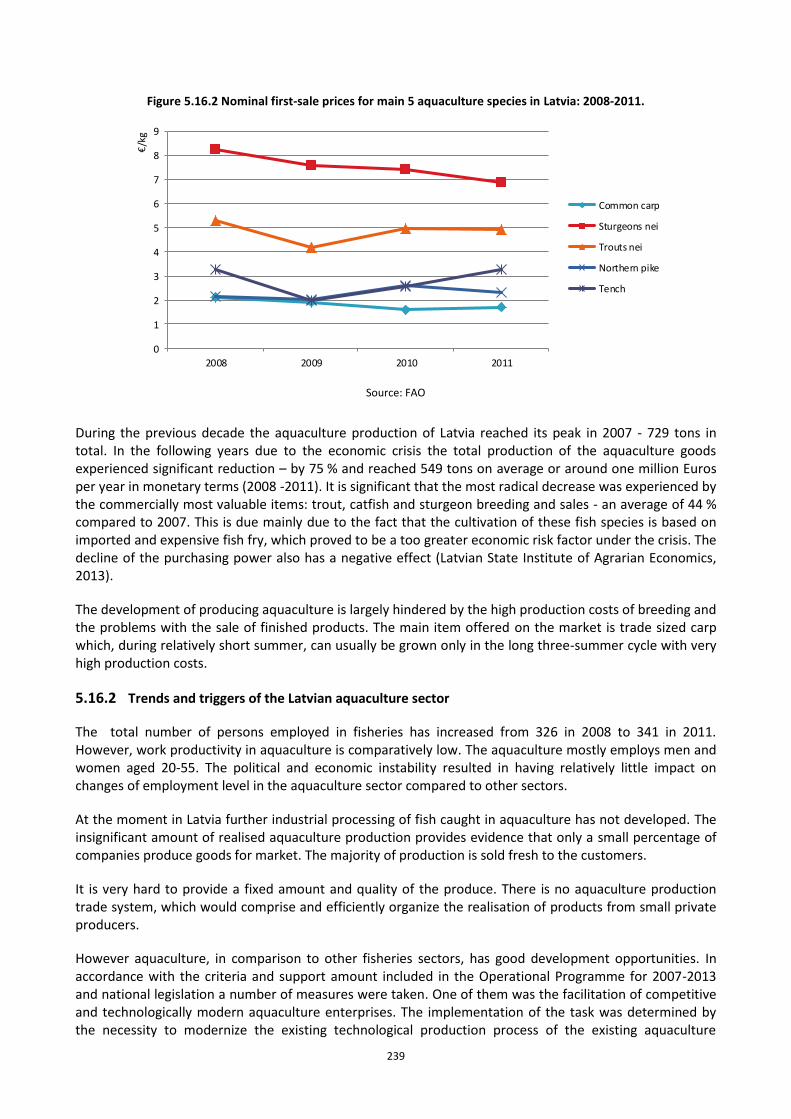
239
Figure 5.16.2 Nominal first-sale prices for main 5 aquaculture species in Latvia: 2008-2011.
0
1
2
3
4
5
6
7
8
9
2008 2009 2010 2011
€/k
g
Common carp
Sturgeons nei
Trouts nei
Northern pike
Tench
Source: FAO
During the previous decade the aquaculture production of Latvia reached its peak in 2007 - 729 tons in total. In the following years due to the economic crisis the total production of the aquaculture goods experienced significant reduction – by 75 % and reached 549 tons on average or around one million Euros per year in monetary terms (2008 -2011). It is significant that the most radical decrease was experienced by the commercially most valuable items: trout, catfish and sturgeon breeding and sales - an average of 44 % compared to 2007. This is due mainly due to the fact that the cultivation of these fish species is based on imported and expensive fish fry, which proved to be a too greater economic risk factor under the crisis. The decline of the purchasing power also has a negative effect (Latvian State Institute of Agrarian Economics, 2013).
The development of producing aquaculture is largely hindered by the high production costs of breeding and the problems with the sale of finished products. The main item offered on the market is trade sized carp which, during relatively short summer, can usually be grown only in the long three-summer cycle with very high production costs.
5.16.2 Trends and triggers of the Latvian aquaculture sector
The total number of persons employed in fisheries has increased from 326 in 2008 to 341 in 2011. However, work productivity in aquaculture is comparatively low. The aquaculture mostly employs men and women aged 20-55. The political and economic instability resulted in having relatively little impact on changes of employment level in the aquaculture sector compared to other sectors.
At the moment in Latvia further industrial processing of fish caught in aquaculture has not developed. The insignificant amount of realised aquaculture production provides evidence that only a small percentage of companies produce goods for market. The majority of production is sold fresh to the customers.
It is very hard to provide a fixed amount and quality of the produce. There is no aquaculture production trade system, which would comprise and efficiently organize the realisation of products from small private producers.
However aquaculture, in comparison to other fisheries sectors, has good development opportunities. In accordance with the criteria and support amount included in the Operational Programme for 2007-2013 and national legislation a number of measures were taken. One of them was the facilitation of competitive and technologically modern aquaculture enterprises. The implementation of the task was determined by the necessity to modernize the existing technological production process of the existing aquaculture
240
companies, increase the number of aquaculture companies focused on the market and extend the range of aquaculture products offered in the market. The following actions were implemented:
1. Modernisation of companies, in order to improve the implementation of work conditions, hygiene requirements, health of aquaculture animals and products, as well as to reduce the impact of the companies' activities on the environment
2. Introduction of new breeding technologies, in order to facilitate the breeding of different fish (crayfish) demanded in the market
3. Provision of protective measures against the harm done by wild predators to hatcheries.
It is anticipated that investments in the modernisation of aquaculture companies and introduction of new technological solutions will increase the total number of aquaculture companies. In addition it should raise the quality and safety of the produced production, as well as will facilitate the extension of the range of produce. Investments in protection measures will compensate losses caused by wild predators, thus the produce will remain competitive in the market (Ministry of Agriculture, Fishery Department, 2013).
Due to decrease of fish researches in the sea, aquaculture shall be developed as an alternative source of fish resource. Latvia has well suited inland waters (lakes, rivers) and a stable, ecologically pure environment. The amount of aquaculture production is not restricted by quotas or other restrictions, thus, in comparison to fishery this sector offers easy business start-up opportunities. But in comparison to neighbouring countries, Latvia does not have the highest quality climatic conditions for the production of aquaculture products (too warm conditions for the fish of cold waters and too cold for the fish of warm waters). In the future it may negatively affect the compatibility of the industry in terms of production costs at the international level.
There are two main directions for fish farming in Latvia which will be developed:
Fish farming for consumption
Fish breeding for fish restocking and reproduction in natural streams and lakes (fish recourses reproduction).
The Institute of Food Safety, Animal Health and Environment "BIOR" is responsible for the implementation of the National Fish resources restocking program. In BIOR there are 5 state-owned fish hatcheries – Tome, Dole, Karli, Brasla, Pelci designated for breeding of salmon and sea trout smolts, pike, pike-perch, river lamprey larvae and juveniles. The program was established in order to make compensatory releases of fish fry to lower the damage to fish resources caused by hydropower stations as well as to counter damages and losses caused by different human activities in public water bodies. Every year they restock up to 20 million fish larvae, juveniles and smolts in public waters, however, it is not sufficient; therefore the private hatcheries should be involved as well. In 2011 state hatcheries released about 15 million fish larvae, juveniles and smolts.
One of the opportunities for private hatcheries is the specialization in fish restocking for public water bodies. Year by year the input of private hatcheries in the restocking program is growing and varies from 10-25 %.
In addition to the National Fish resources restocking program, the Latvian Fisheries Fund also supports fish and crayfish restocking in public waters. In 2011 about 1.5million fish larvae, juveniles and smolts were restocked with the support of the Latvian Fisheries Fund (Ministry of Agriculture, Fishery Department, 2013).
241
5.16.3 Data Coverage and Data Quality of the Latvian aquaculture sector
Latvia only produces freshwater aquaculture and since freshwater aquaculture is not compulsory under the DCF, it did not submit aquaculture data under the DCF regulation. Therefore FAO and Eurostat data was used in this analysis.
The Central Statistical Bureau of Latvia (CSB) carries out general reporting on aquaculture sector by collection some basic data as production by species in tonnes and value, total area of fish ponds, volume of rearing tanks and number of employment. CSB gathers official account reports from enterprises (according to the EUROSTAT definition under NACE Code 05.02: “Fish Farming”), however the coverage rate, segmentation and data quality seems to be uncertain. According to the small number of aquaculture enterprises and to protect the collected data confidentiality, data are clustered for two segments by number of person employed more than 10 and less than 10 people.
All above information regarding aquaculture in Latvia annually is provided to the EUROSTAT in accordance with Regulation (EC) No 762/2008 of the European Parliament and of the Council of 9 July 2008 on the submission by Member States of statistics on aquaculture and repealing Council Regulation (EC) No 788/96.
Other data sources employed are:
Latvian State Institute of Agrarian Economics. 2013. Situācijas analīze akvakultūrā (saistībā ar ZRP 2007-2013 ieviešanu). Available at: http://www.lvaei.lv/upload/Situ%C4%81cijas%20anal%C4%ABze%20akvakultura_2012.pdf
Ministry of Agriculture, Fishery Department. 2013. Available at: http://www.zm.gov.lv/?sadala=2085. Accessed on August 2013.
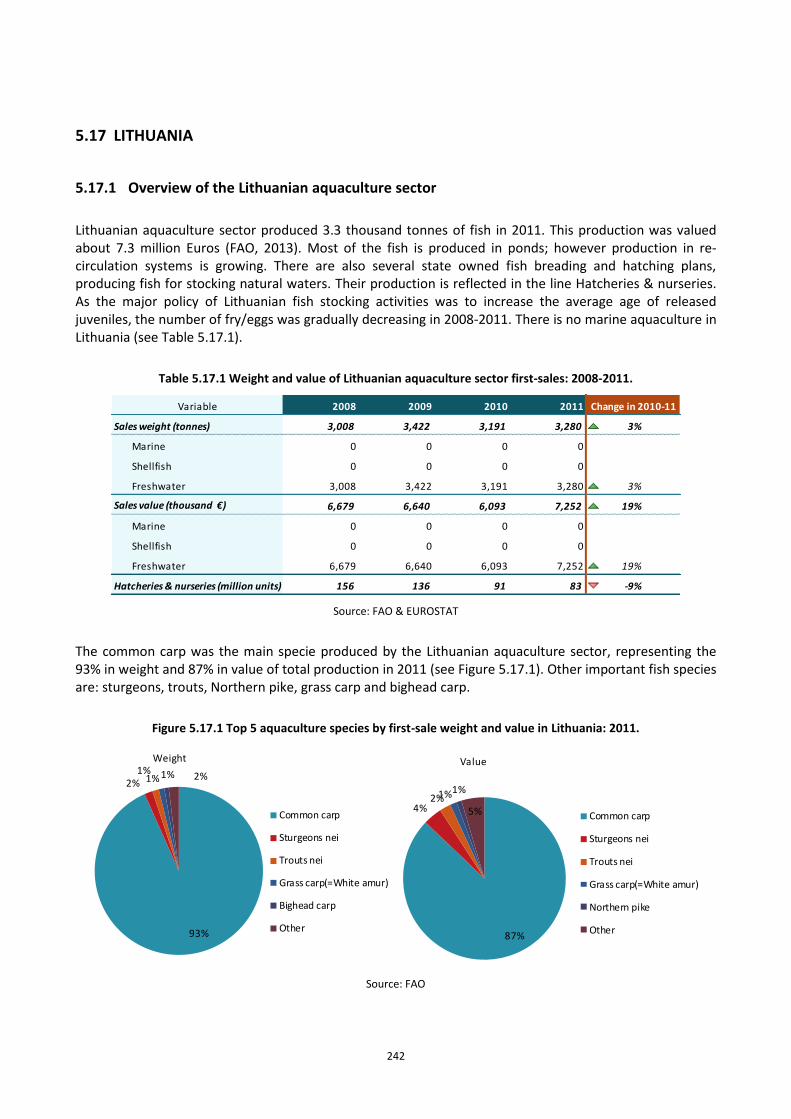
242
5.17 LITHUANIA
5.17.1 Overview of the Lithuanian aquaculture sector
Lithuanian aquaculture sector produced 3.3 thousand tonnes of fish in 2011. This production was valued about 7.3 million Euros (FAO, 2013). Most of the fish is produced in ponds; however production in re-circulation systems is growing. There are also several state owned fish breading and hatching plans, producing fish for stocking natural waters. Their production is reflected in the line Hatcheries & nurseries. As the major policy of Lithuanian fish stocking activities was to increase the average age of released juveniles, the number of fry/eggs was gradually decreasing in 2008-2011. There is no marine aquaculture in Lithuania (see Table 5.17.1).
Table 5.17.1 Weight and value of Lithuanian aquaculture sector first-sales: 2008-2011.
Variable 2008 2009 2010 2011
Sales weight (tonnes) 3,008 3,422 3,191 3,280 3% ↗
Marine 0 0 0 0
Shellfish 0 0 0 0
Freshwater 3,008 3,422 3,191 3,280 3% ↗
Sales value (thousand €) 6,679 6,640 6,093 7,252 19% ↗
Marine 0 0 0 0
Shellfish 0 0 0 0
Freshwater 6,679 6,640 6,093 7,252 19% ↗
Hatcheries & nurseries (million units) 156 136 91 83 -9% ↘
Change in 2010-11
Source: FAO & EUROSTAT
The common carp was the main specie produced by the Lithuanian aquaculture sector, representing the 93% in weight and 87% in value of total production in 2011 (see Figure 5.17.1). Other important fish species are: sturgeons, trouts, Northern pike, grass carp and bighead carp.
Figure 5.17.1 Top 5 aquaculture species by first-sale weight and value in Lithuania: 2011.
93%
2%1%
1% 1% 2%
Weight
Common carp
Sturgeons nei
Trouts nei
Grass carp(=White amur)
Bighead carp
Other87%
4%2%1%1%
5%
Value
Common carp
Sturgeons nei
Trouts nei
Grass carp(=White amur)
Northern pike
Other
Source: FAO
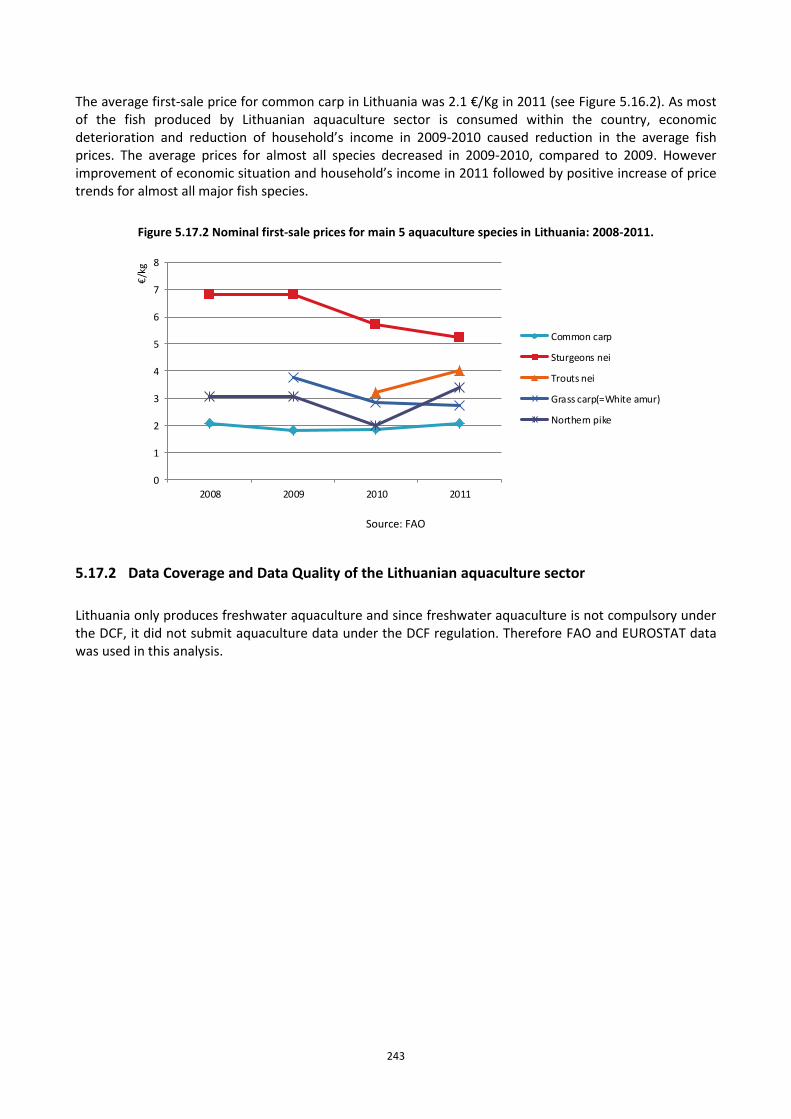
243
The average first-sale price for common carp in Lithuania was 2.1 €/Kg in 2011 (see Figure 5.16.2). As most of the fish produced by Lithuanian aquaculture sector is consumed within the country, economic deterioration and reduction of household’s income in 2009-2010 caused reduction in the average fish prices. The average prices for almost all species decreased in 2009-2010, compared to 2009. However improvement of economic situation and household’s income in 2011 followed by positive increase of price trends for almost all major fish species.
Figure 5.17.2 Nominal first-sale prices for main 5 aquaculture species in Lithuania: 2008-2011.
0
1
2
3
4
5
6
7
8
2008 2009 2010 2011
€/k
g
Common carp
Sturgeons nei
Trouts nei
Grass carp(=White amur)
Northern pike
Source: FAO
5.17.2 Data Coverage and Data Quality of the Lithuanian aquaculture sector
Lithuania only produces freshwater aquaculture and since freshwater aquaculture is not compulsory under the DCF, it did not submit aquaculture data under the DCF regulation. Therefore FAO and EUROSTAT data was used in this analysis.

244
5.18 LUXEMBOURG
Luxembourg has no aquaculture production.
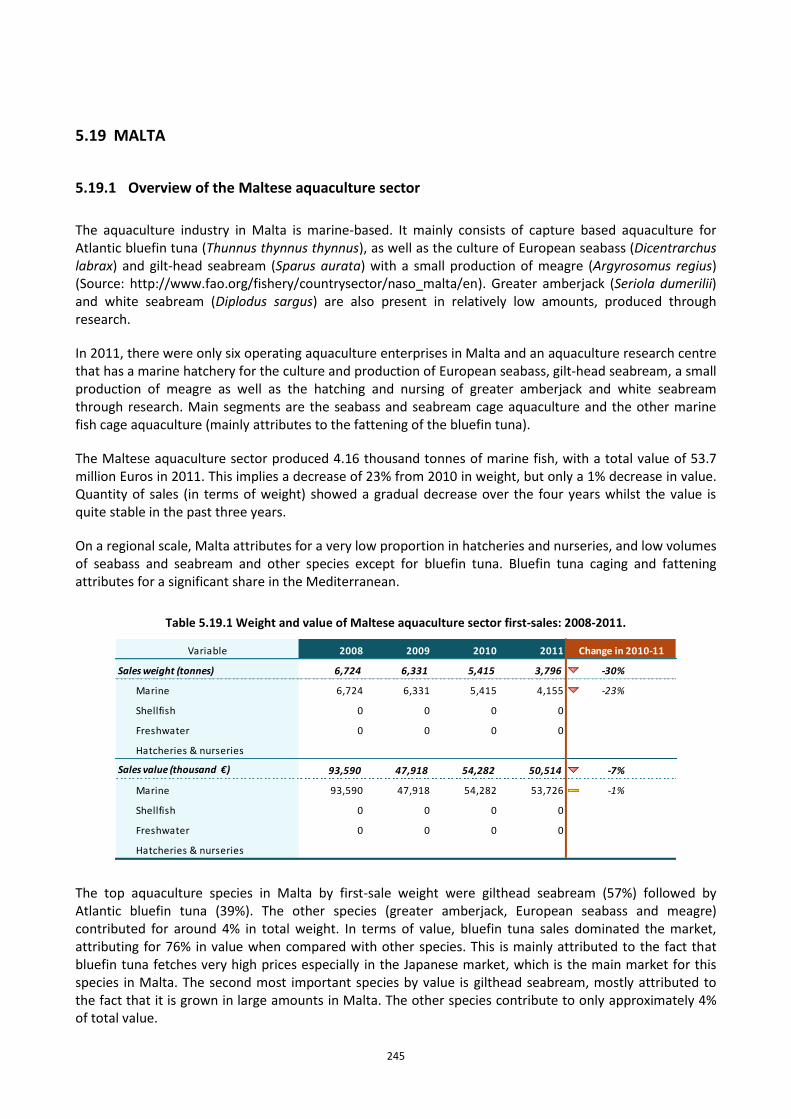
245
5.19 MALTA
5.19.1 Overview of the Maltese aquaculture sector
The aquaculture industry in Malta is marine-based. It mainly consists of capture based aquaculture for Atlantic bluefin tuna (Thunnus thynnus thynnus), as well as the culture of European seabass (Dicentrarchus labrax) and gilt-head seabream (Sparus aurata) with a small production of meagre (Argyrosomus regius) (Source: http://www.fao.org/fishery/countrysector/naso_malta/en). Greater amberjack (Seriola dumerilii) and white seabream (Diplodus sargus) are also present in relatively low amounts, produced through research.
In 2011, there were only six operating aquaculture enterprises in Malta and an aquaculture research centre that has a marine hatchery for the culture and production of European seabass, gilt-head seabream, a small production of meagre as well as the hatching and nursing of greater amberjack and white seabream through research. Main segments are the seabass and seabream cage aquaculture and the other marine fish cage aquaculture (mainly attributes to the fattening of the bluefin tuna).
The Maltese aquaculture sector produced 4.16 thousand tonnes of marine fish, with a total value of 53.7 million Euros in 2011. This implies a decrease of 23% from 2010 in weight, but only a 1% decrease in value. Quantity of sales (in terms of weight) showed a gradual decrease over the four years whilst the value is quite stable in the past three years.
On a regional scale, Malta attributes for a very low proportion in hatcheries and nurseries, and low volumes of seabass and seabream and other species except for bluefin tuna. Bluefin tuna caging and fattening attributes for a significant share in the Mediterranean.
Table 5.19.1 Weight and value of Maltese aquaculture sector first-sales: 2008-2011.
Variable 2008 2009 2010 2011
Sales weight (tonnes) 6,724 6,331 5,415 3,796 -30%
Marine 6,724 6,331 5,415 4,155 -23%
Shellfish 0 0 0 0
Freshwater 0 0 0 0
Hatcheries & nurseries
Sales value (thousand €) 93,590 47,918 54,282 50,514 -7% ↘
Marine 93,590 47,918 54,282 53,726 -1% ↘
Shellfish 0 0 0 0
Freshwater 0 0 0 0
Hatcheries & nurseries
Change in 2010-11
The top aquaculture species in Malta by first-sale weight were gilthead seabream (57%) followed by Atlantic bluefin tuna (39%). The other species (greater amberjack, European seabass and meagre) contributed for around 4% in total weight. In terms of value, bluefin tuna sales dominated the market, attributing for 76% in value when compared with other species. This is mainly attributed to the fact that bluefin tuna fetches very high prices especially in the Japanese market, which is the main market for this species in Malta. The second most important species by value is gilthead seabream, mostly attributed to the fact that it is grown in large amounts in Malta. The other species contribute to only approximately 4% of total value.
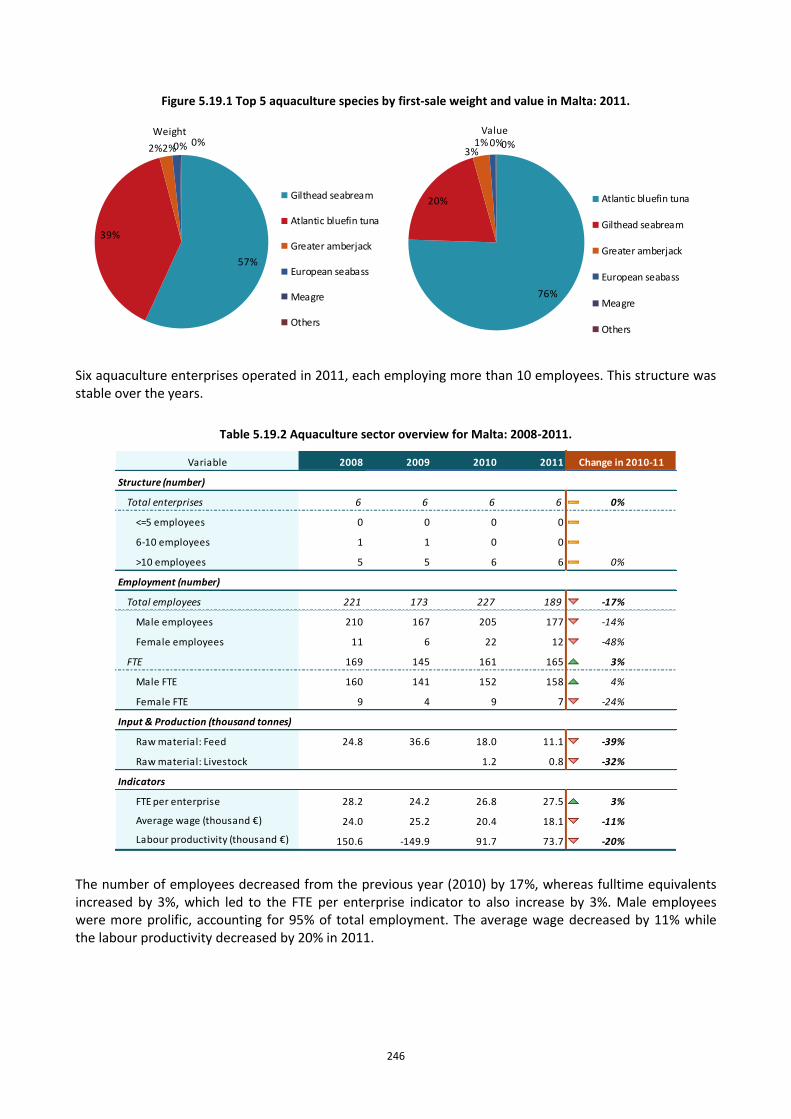
246
Figure 5.19.1 Top 5 aquaculture species by first-sale weight and value in Malta: 2011.
57%
39%
2%2%0% 0%Weight
Gilthead seabream
Atlantic bluefin tuna
Greater amberjack
European seabass
Meagre
Others
76%
20%
3%1% 0%0%
Value
Atlantic bluefin tuna
Gilthead seabream
Greater amberjack
European seabass
Meagre
Others
Six aquaculture enterprises operated in 2011, each employing more than 10 employees. This structure was stable over the years.
Table 5.19.2 Aquaculture sector overview for Malta: 2008-2011.
Variable 2008 2009 2010 2011
Structure (number)
Total enterprises 6 6 6 6 0% ↔
<=5 employees 0 0 0 0 0% ↔
6-10 employees 1 1 0 0 0% ↔
>10 employees 5 5 6 6 0% ↔
Employment (number)
Total employees 221 173 227 189 -17% ↘
Male employees 210 167 205 177 -14% ↘
Female employees 11 6 22 12 -48% ↘
FTE 169 145 161 165 3% ↗
Male FTE 160 141 152 158 4% ↗
Female FTE 9 4 9 7 -24% ↘
Input & Production (thousand tonnes)
Raw material: Feed 24.8 36.6 18.0 11.1 -39% ↘
Raw material: Livestock 1.2 0.8 -32%
Indicators
FTE per enterprise 28.2 24.2 26.8 27.5 3% ↗
Average wage (thousand €) 24.0 25.2 20.4 18.1 -11% ↘
Labour productivity (thousand €) 150.6 -149.9 91.7 73.7 -20% ↘
Change in 2010-11
The number of employees decreased from the previous year (2010) by 17%, whereas fulltime equivalents increased by 3%, which led to the FTE per enterprise indicator to also increase by 3%. Male employees were more prolific, accounting for 95% of total employment. The average wage decreased by 11% while the labour productivity decreased by 20% in 2011.
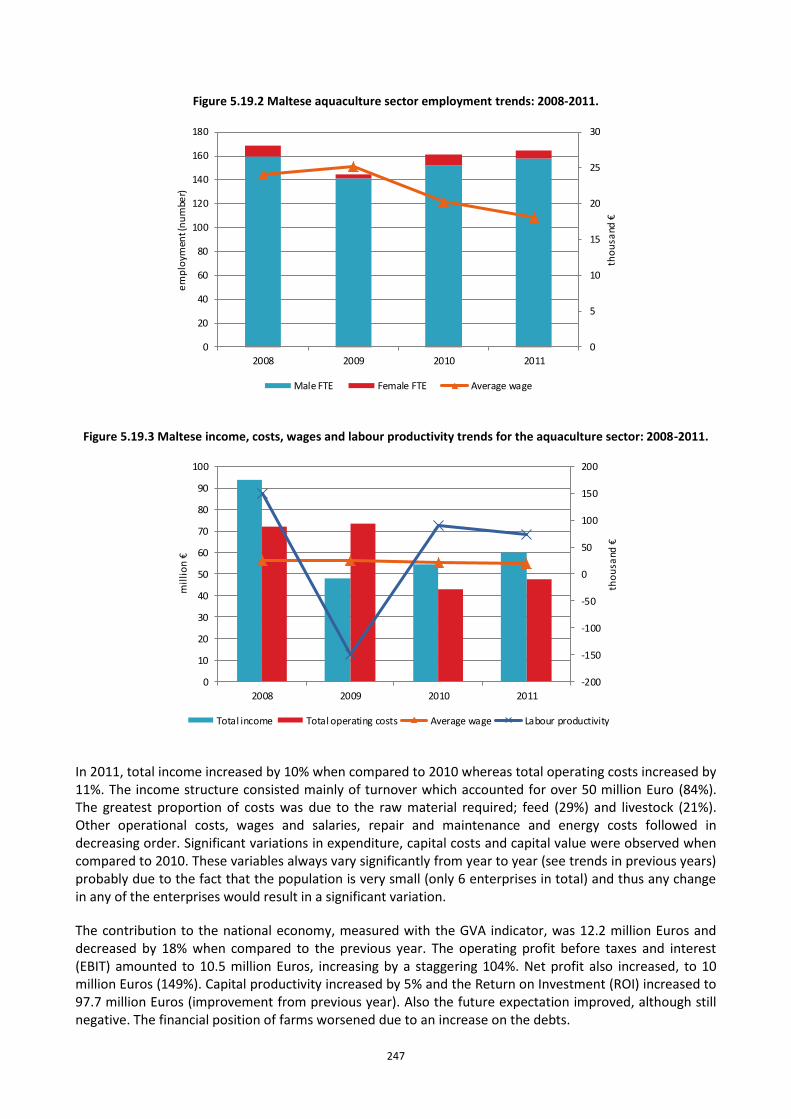
247
Figure 5.19.2 Maltese aquaculture sector employment trends: 2008-2011.
0
5
10
15
20
25
30
0
20
40
60
80
100
120
140
160
180
2008 2009 2010 2011
tho
usa
nd €
em
plo
ymen
t (n
um
ber)
Male FTE Female FTE Average wage
Figure 5.19.3 Maltese income, costs, wages and labour productivity trends for the aquaculture sector: 2008-2011.
-200
-150
-100
-50
0
50
100
150
200
0
10
20
30
40
50
60
70
80
90
100
2008 2009 2010 2011
tho
usa
nd €
mil
lio
n €
Total income Total operating costs Average wage Labour productivity
In 2011, total income increased by 10% when compared to 2010 whereas total operating costs increased by 11%. The income structure consisted mainly of turnover which accounted for over 50 million Euro (84%). The greatest proportion of costs was due to the raw material required; feed (29%) and livestock (21%). Other operational costs, wages and salaries, repair and maintenance and energy costs followed in decreasing order. Significant variations in expenditure, capital costs and capital value were observed when compared to 2010. These variables always vary significantly from year to year (see trends in previous years) probably due to the fact that the population is very small (only 6 enterprises in total) and thus any change in any of the enterprises would result in a significant variation.
The contribution to the national economy, measured with the GVA indicator, was 12.2 million Euros and decreased by 18% when compared to the previous year. The operating profit before taxes and interest (EBIT) amounted to 10.5 million Euros, increasing by a staggering 104%. Net profit also increased, to 10 million Euros (149%). Capital productivity increased by 5% and the Return on Investment (ROI) increased to 97.7 million Euros (improvement from previous year). Also the future expectation improved, although still negative. The financial position of farms worsened due to an increase on the debts.
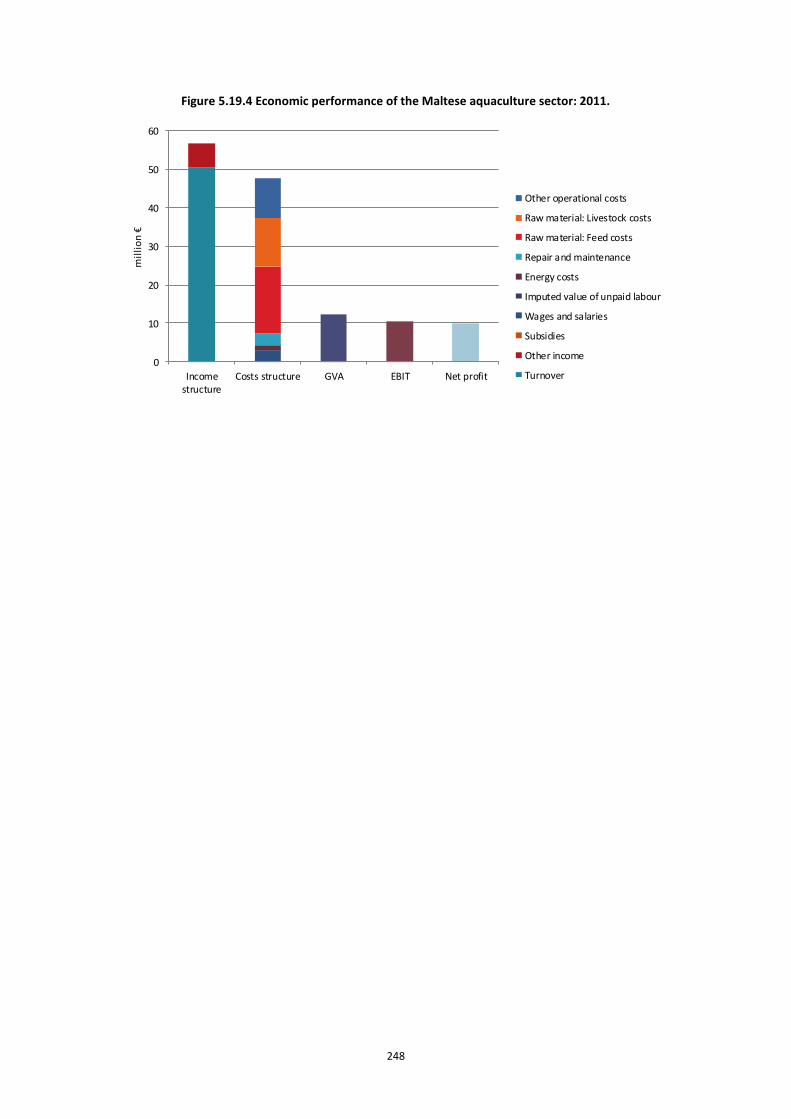
248
Figure 5.19.4 Economic performance of the Maltese aquaculture sector: 2011.
0
10
20
30
40
50
60
Incomestructure
Costs structure GVA EBIT Net profit
mil
lio
n €
Other operational costs
Raw material: Livestock costs
Raw material: Feed costs
Repair and maintenance
Energy costs
Imputed value of unpaid labour
Wages and salaries
Subsidies
Other income
Turnover
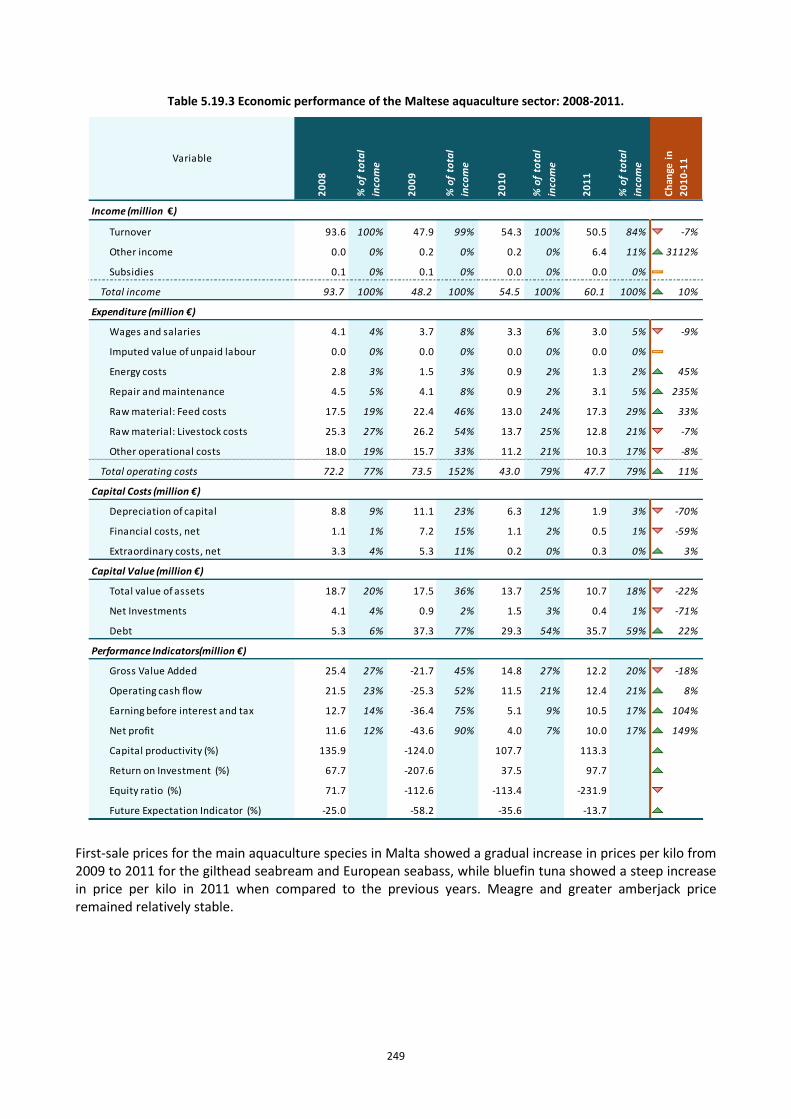
249
Table 5.19.3 Economic performance of the Maltese aquaculture sector: 2008-2011.
Income (million €)
Turnover 93.6 100% 47.9 99% 54.3 100% 50.5 84% -7%
Other income 0.0 0% 0.2 0% 0.2 0% 6.4 11% 3112%
Subsidies 0.1 0% 0.1 0% 0.0 0% 0.0 0% 0%
Total income 93.7 100% 48.2 100% 54.5 100% 60.1 100% 10%
Expenditure (million €)
Wages and salaries 4.1 4% 3.7 8% 3.3 6% 3.0 5% -9%
Imputed value of unpaid labour 0.0 0% 0.0 0% 0.0 0% 0.0 0% 0%
Energy costs 2.8 3% 1.5 3% 0.9 2% 1.3 2% 45%
Repair and maintenance 4.5 5% 4.1 8% 0.9 2% 3.1 5% 235%
Raw material: Feed costs 17.5 19% 22.4 46% 13.0 24% 17.3 29% 33%
Raw material: Livestock costs 25.3 27% 26.2 54% 13.7 25% 12.8 21% -7%
Other operational costs 18.0 19% 15.7 33% 11.2 21% 10.3 17% -8%
Total operating costs 72.2 77% 73.5 152% 43.0 79% 47.7 79% 11%
Capital Costs (million €)
Depreciation of capital 8.8 9% 11.1 23% 6.3 12% 1.9 3% -70%
Financial costs, net 1.1 1% 7.2 15% 1.1 2% 0.5 1% -59%
Extraordinary costs, net 3.3 4% 5.3 11% 0.2 0% 0.3 0% 3%
Capital Value (million €)
Total value of assets 18.7 20% 17.5 36% 13.7 25% 10.7 18% -22%
Net Investments 4.1 4% 0.9 2% 1.5 3% 0.4 1% -71%
Debt 5.3 6% 37.3 77% 29.3 54% 35.7 59% 22%
Performance Indicators(million €)
Gross Value Added 25.4 27% -21.7 45% 14.8 27% 12.2 20% -18%
Operating cash flow 21.5 23% -25.3 52% 11.5 21% 12.4 21% 8%
Earning before interest and tax 12.7 14% -36.4 75% 5.1 9% 10.5 17% 104%
Net profit 11.6 12% -43.6 90% 4.0 7% 10.0 17% 149%
Capital productivity (%) 135.9 -124.0 107.7 113.3 5%
Return on Investment (%) 67.7 -207.6 37.5 97.7 160%
Equity ratio (%) 71.7 -112.6 -113.4 -231.9 -105%
Future Expectation Indicator (%) -25.0 -58.2 -35.6 -13.7 61%
% o
f to
tal
inco
me
% o
f to
tal
inco
me
20
10
20
11
Ch
ange
in
20
10
-11
% o
f to
tal
inco
me
Variable
% o
f to
tal
inco
me
20
08
20
09
First-sale prices for the main aquaculture species in Malta showed a gradual increase in prices per kilo from 2009 to 2011 for the gilthead seabream and European seabass, while bluefin tuna showed a steep increase in price per kilo in 2011 when compared to the previous years. Meagre and greater amberjack price remained relatively stable.
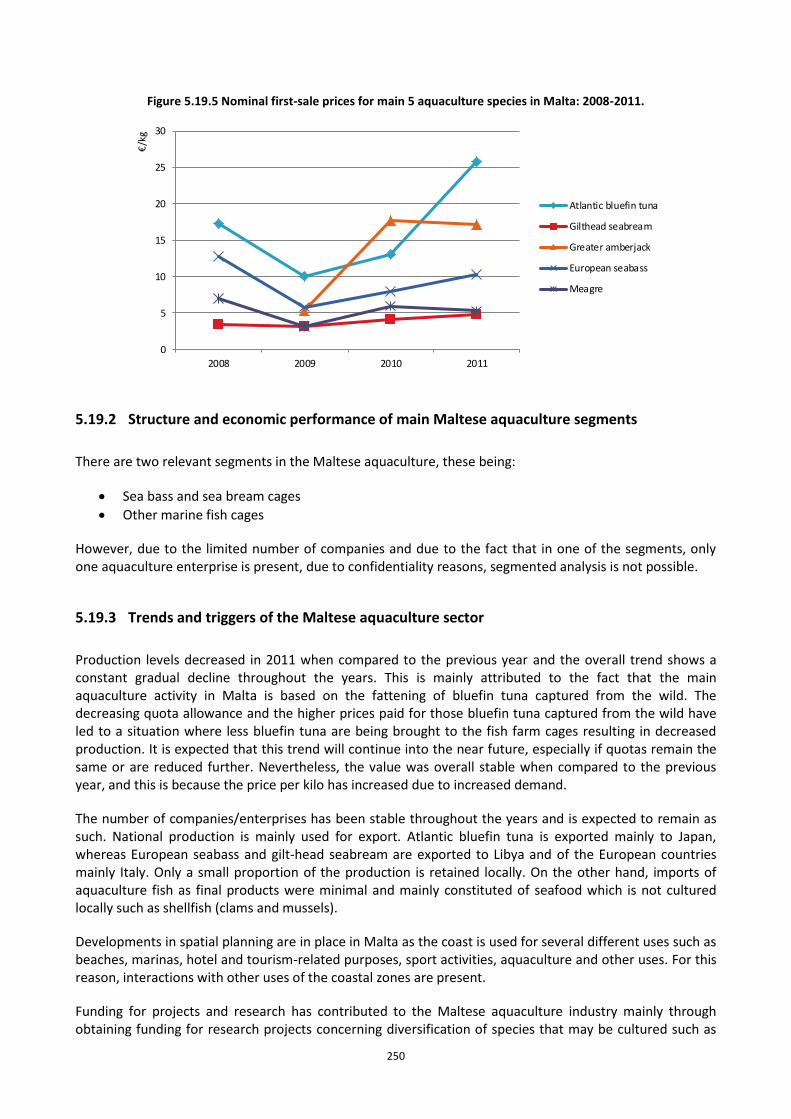
250
Figure 5.19.5 Nominal first-sale prices for main 5 aquaculture species in Malta: 2008-2011.
0
5
10
15
20
25
30
2008 2009 2010 2011
€/k
g
Atlantic bluefin tuna
Gilthead seabream
Greater amberjack
European seabass
Meagre
5.19.2 Structure and economic performance of main Maltese aquaculture segments
There are two relevant segments in the Maltese aquaculture, these being:
Sea bass and sea bream cages
Other marine fish cages
However, due to the limited number of companies and due to the fact that in one of the segments, only one aquaculture enterprise is present, due to confidentiality reasons, segmented analysis is not possible.
5.19.3 Trends and triggers of the Maltese aquaculture sector
Production levels decreased in 2011 when compared to the previous year and the overall trend shows a constant gradual decline throughout the years. This is mainly attributed to the fact that the main aquaculture activity in Malta is based on the fattening of bluefin tuna captured from the wild. The decreasing quota allowance and the higher prices paid for those bluefin tuna captured from the wild have led to a situation where less bluefin tuna are being brought to the fish farm cages resulting in decreased production. It is expected that this trend will continue into the near future, especially if quotas remain the same or are reduced further. Nevertheless, the value was overall stable when compared to the previous year, and this is because the price per kilo has increased due to increased demand.
The number of companies/enterprises has been stable throughout the years and is expected to remain as such. National production is mainly used for export. Atlantic bluefin tuna is exported mainly to Japan, whereas European seabass and gilt-head seabream are exported to Libya and of the European countries mainly Italy. Only a small proportion of the production is retained locally. On the other hand, imports of aquaculture fish as final products were minimal and mainly constituted of seafood which is not cultured locally such as shellfish (clams and mussels).
Developments in spatial planning are in place in Malta as the coast is used for several different uses such as beaches, marinas, hotel and tourism-related purposes, sport activities, aquaculture and other uses. For this reason, interactions with other uses of the coastal zones are present.
Funding for projects and research has contributed to the Maltese aquaculture industry mainly through obtaining funding for research projects concerning diversification of species that may be cultured such as
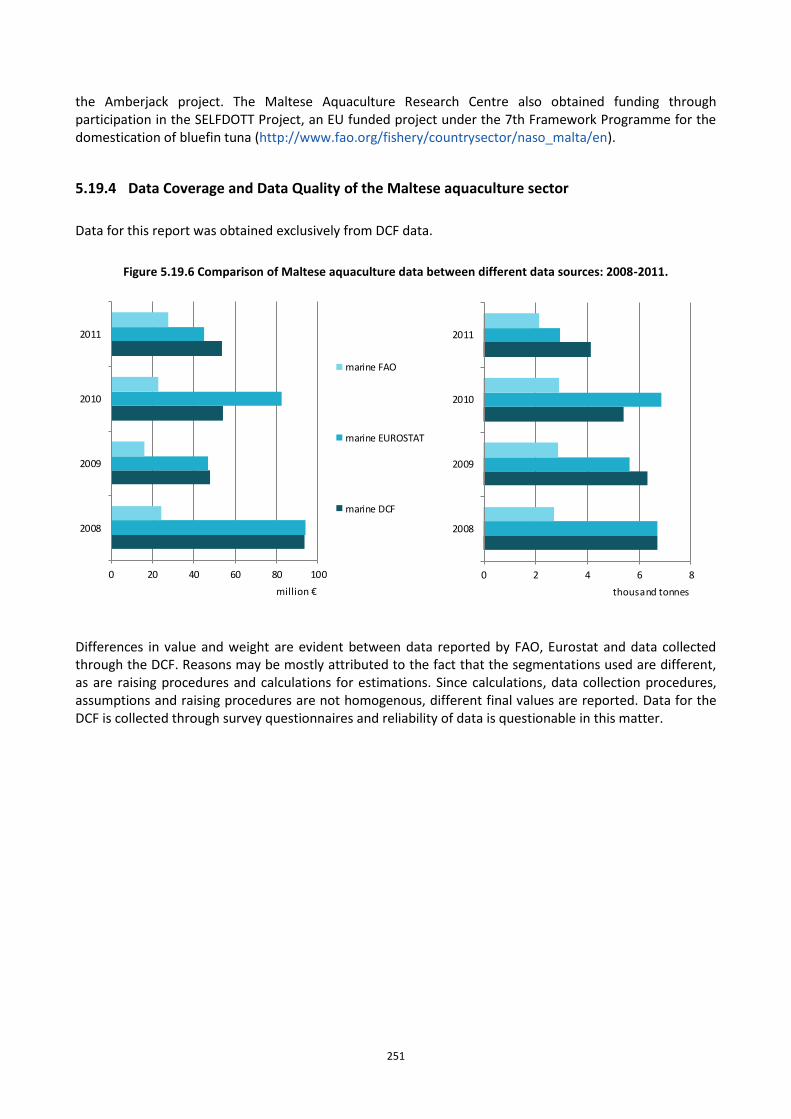
251
the Amberjack project. The Maltese Aquaculture Research Centre also obtained funding through participation in the SELFDOTT Project, an EU funded project under the 7th Framework Programme for the domestication of bluefin tuna (http://www.fao.org/fishery/countrysector/naso_malta/en).
5.19.4 Data Coverage and Data Quality of the Maltese aquaculture sector
Data for this report was obtained exclusively from DCF data.
Figure 5.19.6 Comparison of Maltese aquaculture data between different data sources: 2008-2011.
0 20 40 60 80 100
2008
2009
2010
2011
million €
marine FAO
marine EUROSTAT
marine DCF
0 2 4 6 8
2008
2009
2010
2011
thousand tonnes
Differences in value and weight are evident between data reported by FAO, Eurostat and data collected through the DCF. Reasons may be mostly attributed to the fact that the segmentations used are different, as are raising procedures and calculations for estimations. Since calculations, data collection procedures, assumptions and raising procedures are not homogenous, different final values are reported. Data for the DCF is collected through survey questionnaires and reliability of data is questionable in this matter.
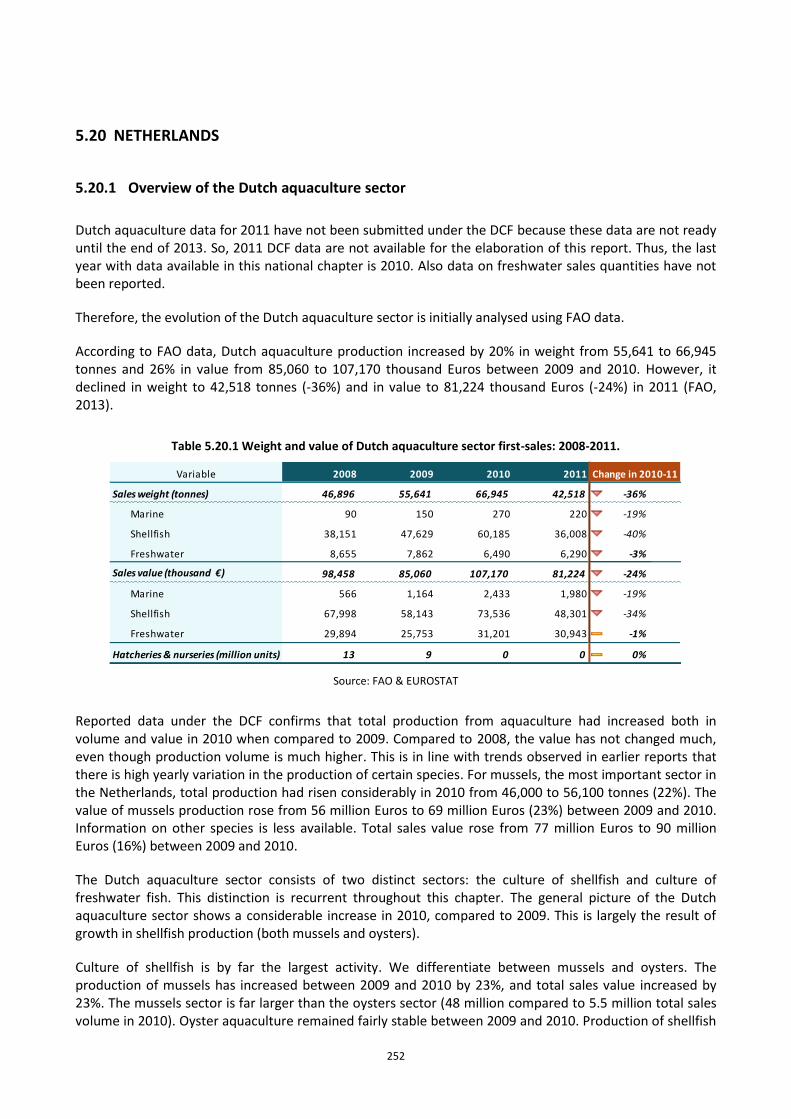
252
5.20 NETHERLANDS
5.20.1 Overview of the Dutch aquaculture sector
Dutch aquaculture data for 2011 have not been submitted under the DCF because these data are not ready until the end of 2013. So, 2011 DCF data are not available for the elaboration of this report. Thus, the last year with data available in this national chapter is 2010. Also data on freshwater sales quantities have not been reported.
Therefore, the evolution of the Dutch aquaculture sector is initially analysed using FAO data.
According to FAO data, Dutch aquaculture production increased by 20% in weight from 55,641 to 66,945 tonnes and 26% in value from 85,060 to 107,170 thousand Euros between 2009 and 2010. However, it declined in weight to 42,518 tonnes (-36%) and in value to 81,224 thousand Euros (-24%) in 2011 (FAO, 2013).
Table 5.20.1 Weight and value of Dutch aquaculture sector first-sales: 2008-2011.
Source: FAO & EUROSTAT
Reported data under the DCF confirms that total production from aquaculture had increased both in volume and value in 2010 when compared to 2009. Compared to 2008, the value has not changed much, even though production volume is much higher. This is in line with trends observed in earlier reports that there is high yearly variation in the production of certain species. For mussels, the most important sector in the Netherlands, total production had risen considerably in 2010 from 46,000 to 56,100 tonnes (22%). The value of mussels production rose from 56 million Euros to 69 million Euros (23%) between 2009 and 2010. Information on other species is less available. Total sales value rose from 77 million Euros to 90 million Euros (16%) between 2009 and 2010.
The Dutch aquaculture sector consists of two distinct sectors: the culture of shellfish and culture of freshwater fish. This distinction is recurrent throughout this chapter. The general picture of the Dutch aquaculture sector shows a considerable increase in 2010, compared to 2009. This is largely the result of growth in shellfish production (both mussels and oysters).
Culture of shellfish is by far the largest activity. We differentiate between mussels and oysters. The production of mussels has increased between 2009 and 2010 by 23%, and total sales value increased by 23%. The mussels sector is far larger than the oysters sector (48 million compared to 5.5 million total sales volume in 2010). Oyster aquaculture remained fairly stable between 2009 and 2010. Production of shellfish
Variable 2008 2009 2010 2011
Sales weight (tonnes) 46,896 55,641 66,945 42,518 -36% ↘
Marine 90 150 270 220 -19%
Shellfish 38,151 47,629 60,185 36,008 -40% ↘
Freshwater 8,655 7,862 6,490 6,290 -3% ↘
Sales value (thousand €) 98,458 85,060 107,170 81,224 -24% ↘
Marine 566 1,164 2,433 1,980 -19% ↘
Shellfish 67,998 58,143 73,536 48,301 -34% ↘
Freshwater 29,894 25,753 31,201 30,943 -1% ↘
Hatcheries & nurseries (million units) 13 9 0 0 0% ↔
Change in 2010-11
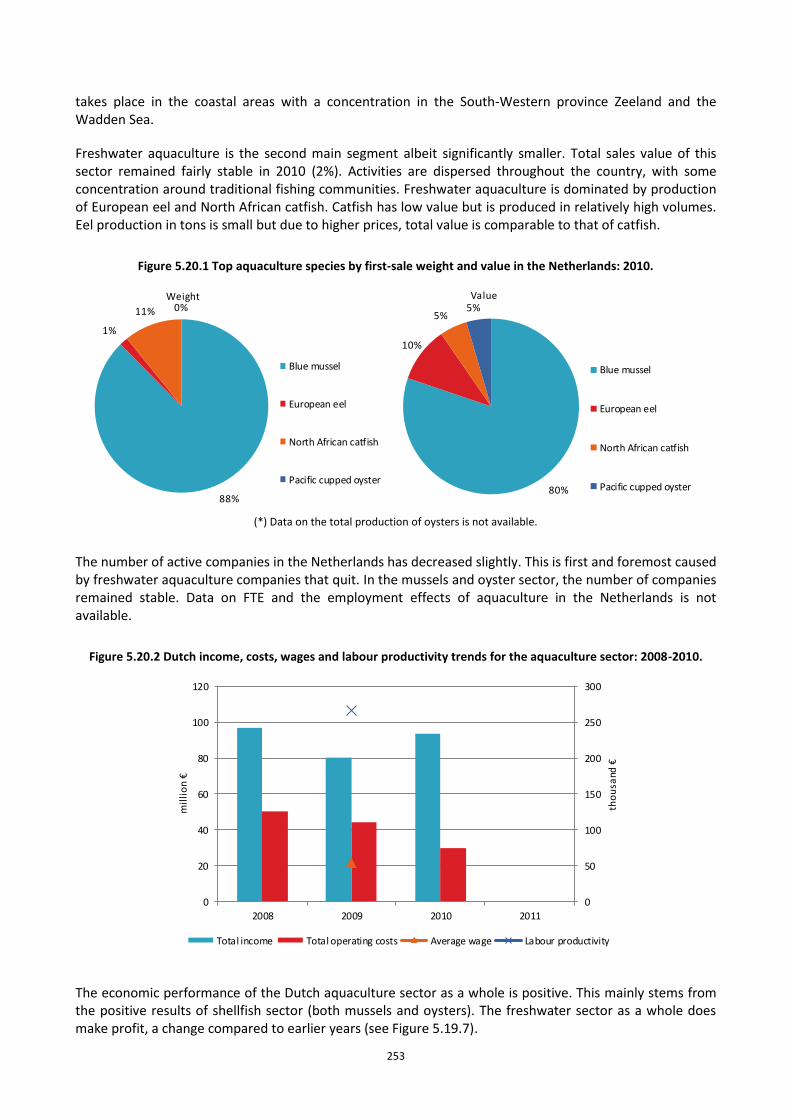
253
takes place in the coastal areas with a concentration in the South-Western province Zeeland and the Wadden Sea.
Freshwater aquaculture is the second main segment albeit significantly smaller. Total sales value of this sector remained fairly stable in 2010 (2%). Activities are dispersed throughout the country, with some concentration around traditional fishing communities. Freshwater aquaculture is dominated by production of European eel and North African catfish. Catfish has low value but is produced in relatively high volumes. Eel production in tons is small but due to higher prices, total value is comparable to that of catfish.
Figure 5.20.1 Top aquaculture species by first-sale weight and value in the Netherlands: 2010.
88%
1%
11% 0%Weight
Blue mussel
European eel
North African catfish
Pacific cupped oyster80%
10%
5%5%Value
Blue mussel
European eel
North African catfish
Pacific cupped oyster
(*) Data on the total production of oysters is not available.
The number of active companies in the Netherlands has decreased slightly. This is first and foremost caused by freshwater aquaculture companies that quit. In the mussels and oyster sector, the number of companies remained stable. Data on FTE and the employment effects of aquaculture in the Netherlands is not available.
Figure 5.20.2 Dutch income, costs, wages and labour productivity trends for the aquaculture sector: 2008-2010.
The economic performance of the Dutch aquaculture sector as a whole is positive. This mainly stems from the positive results of shellfish sector (both mussels and oysters). The freshwater sector as a whole does make profit, a change compared to earlier years (see Figure 5.19.7).
0
50
100
150
200
250
300
0
20
40
60
80
100
120
2008 2009 2010 2011
tho
usa
nd €
mil
lio
n €
Total income Total operating costs Average wage Labour productivity
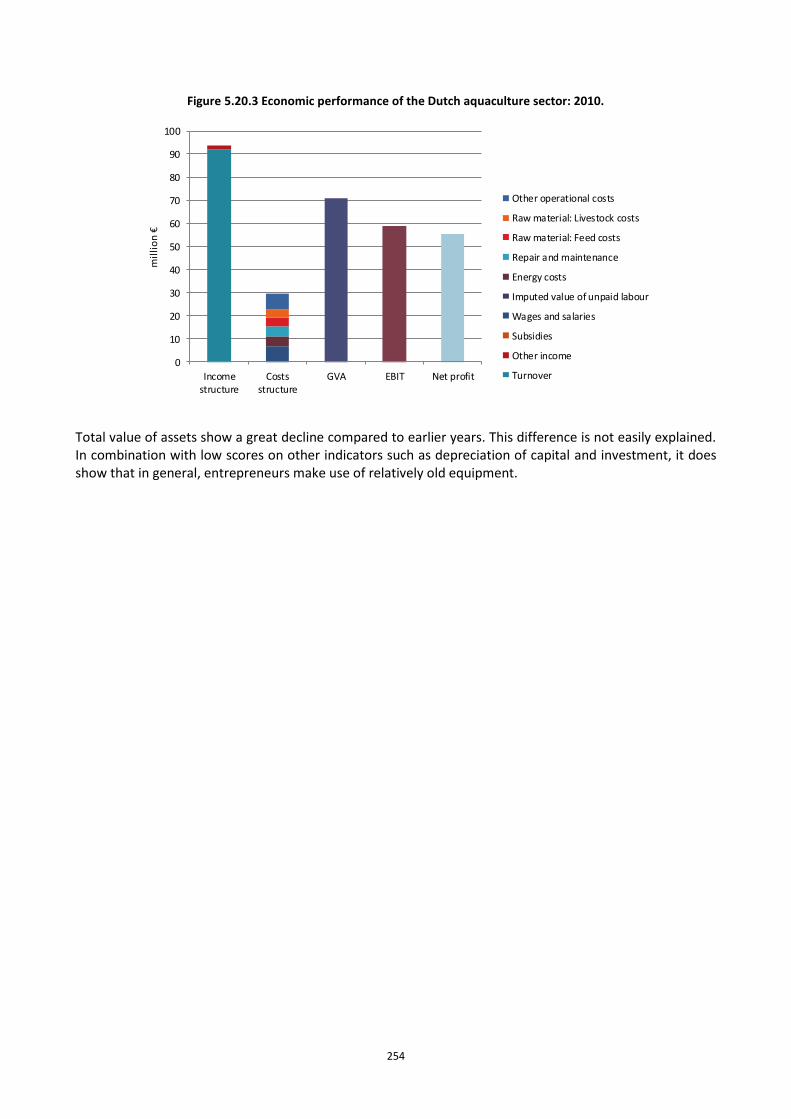
254
Figure 5.20.3 Economic performance of the Dutch aquaculture sector: 2010.
Total value of assets show a great decline compared to earlier years. This difference is not easily explained. In combination with low scores on other indicators such as depreciation of capital and investment, it does show that in general, entrepreneurs make use of relatively old equipment.
0
10
20
30
40
50
60
70
80
90
100
Incomestructure
Costsstructure
GVA EBIT Net profit
mil
lio
n €
Other operational costs
Raw material: Livestock costs
Raw material: Feed costs
Repair and maintenance
Energy costs
Imputed value of unpaid labour
Wages and salaries
Subsidies
Other income
Turnover
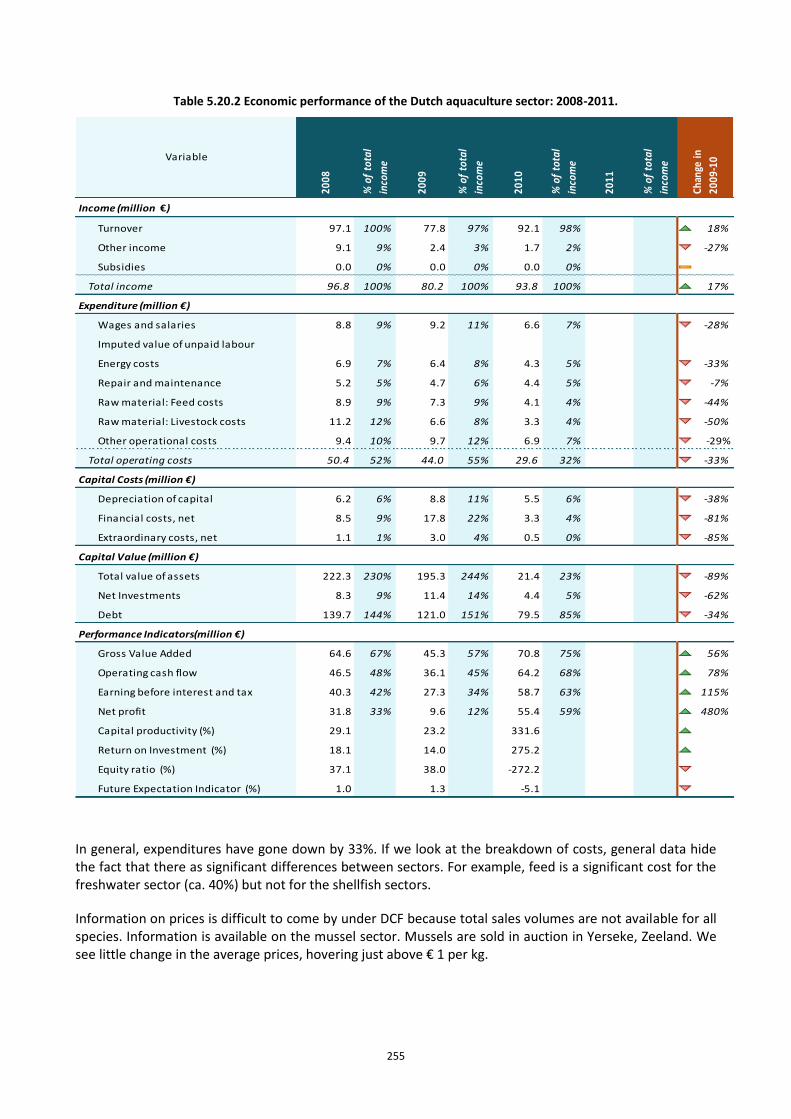
255
Table 5.20.2 Economic performance of the Dutch aquaculture sector: 2008-2011.
Income (million €)
Turnover 97.1 100% 77.8 97% 92.1 98% 18%
Other income 9.1 9% 2.4 3% 1.7 2% -27%
Subsidies 0.0 0% 0.0 0% 0.0 0% 0%
Total income 96.8 100% 80.2 100% 93.8 100% 17%
Expenditure (million €)
Wages and salaries 8.8 9% 9.2 11% 6.6 7% -28%
Imputed value of unpaid labour
Energy costs 6.9 7% 6.4 8% 4.3 5% -33%
Repair and maintenance 5.2 5% 4.7 6% 4.4 5% -7%
Raw material: Feed costs 8.9 9% 7.3 9% 4.1 4% -44%
Raw material: Livestock costs 11.2 12% 6.6 8% 3.3 4% -50%
Other operational costs 9.4 10% 9.7 12% 6.9 7% -29%
Total operating costs 50.4 52% 44.0 55% 29.6 32% -33%
Capital Costs (million €)
Depreciation of capital 6.2 6% 8.8 11% 5.5 6% -38%
Financial costs, net 8.5 9% 17.8 22% 3.3 4% -81%
Extraordinary costs, net 1.1 1% 3.0 4% 0.5 0% -85%
Capital Value (million €)
Total value of assets 222.3 230% 195.3 244% 21.4 23% -89%
Net Investments 8.3 9% 11.4 14% 4.4 5% -62%
Debt 139.7 144% 121.0 151% 79.5 85% -34%
Performance Indicators(million €)
Gross Value Added 64.6 67% 45.3 57% 70.8 75% 56%
Operating cash flow 46.5 48% 36.1 45% 64.2 68% 78%
Earning before interest and tax 40.3 42% 27.3 34% 58.7 63% 115%
Net profit 31.8 33% 9.6 12% 55.4 59% 480%
Capital productivity (%) 29.1 23.2 331.6 1328%
Return on Investment (%) 18.1 14.0 275.2 1865%
Equity ratio (%) 37.1 38.0 -272.2 -816%
Future Expectation Indicator (%) 1.0 1.3 -5.1 -488%
Chan
ge in
2009
-10
% o
f to
tal
inco
meVariable
% o
f to
tal
inco
me
2008
2009
% o
f to
tal
inco
me
% o
f to
tal
inco
me
2010
2011
In general, expenditures have gone down by 33%. If we look at the breakdown of costs, general data hide the fact that there as significant differences between sectors. For example, feed is a significant cost for the freshwater sector (ca. 40%) but not for the shellfish sectors.
Information on prices is difficult to come by under DCF because total sales volumes are not available for all species. Information is available on the mussel sector. Mussels are sold in auction in Yerseke, Zeeland. We see little change in the average prices, hovering just above € 1 per kg.
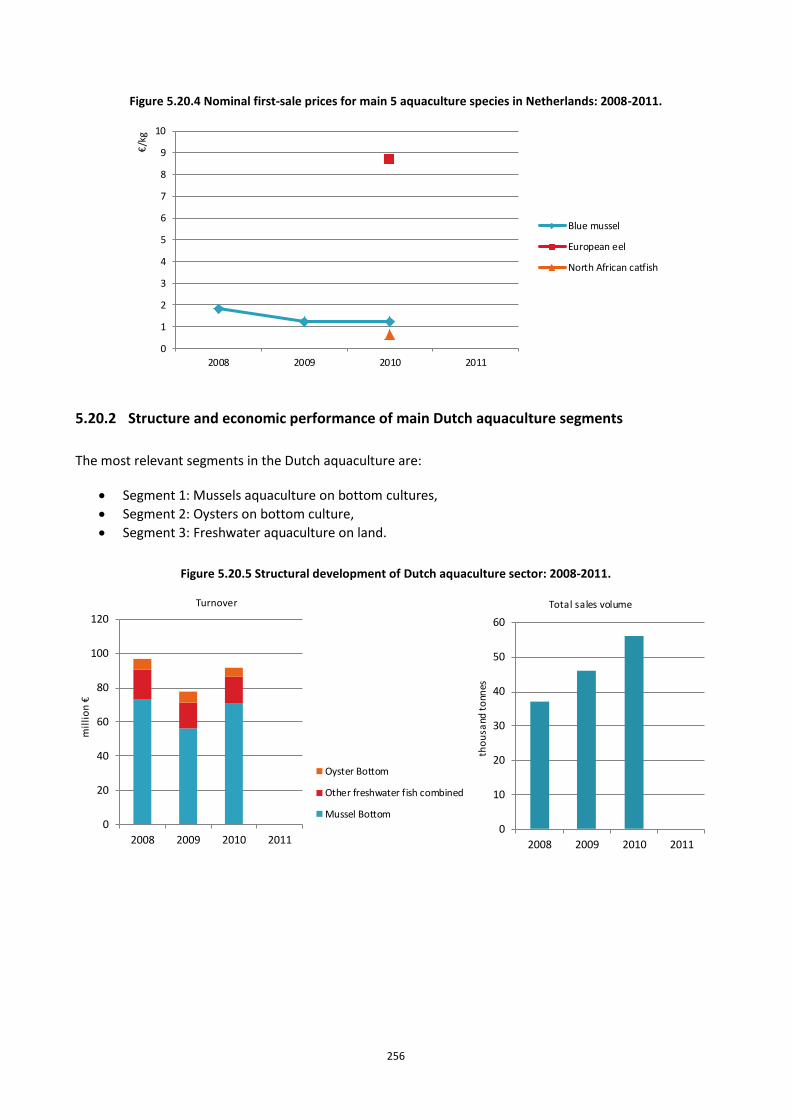
256
Figure 5.20.4 Nominal first-sale prices for main 5 aquaculture species in Netherlands: 2008-2011.
5.20.2 Structure and economic performance of main Dutch aquaculture segments
The most relevant segments in the Dutch aquaculture are:
Segment 1: Mussels aquaculture on bottom cultures,
Segment 2: Oysters on bottom culture,
Segment 3: Freshwater aquaculture on land.
Figure 5.20.5 Structural development of Dutch aquaculture sector: 2008-2011.
0
1
2
3
4
5
6
7
8
9
10
2008 2009 2010 2011
€/k
g
Blue mussel
European eel
North African catfish
0
20
40
60
80
100
120
2008 2009 2010 2011
mil
lio
n €
Turnover
Oyster Bottom
Other freshwater fish combined
Mussel Bottom
0
10
20
30
40
50
60
2008 2009 2010 2011
tho
usa
nd t
onn
es
Total sales volume
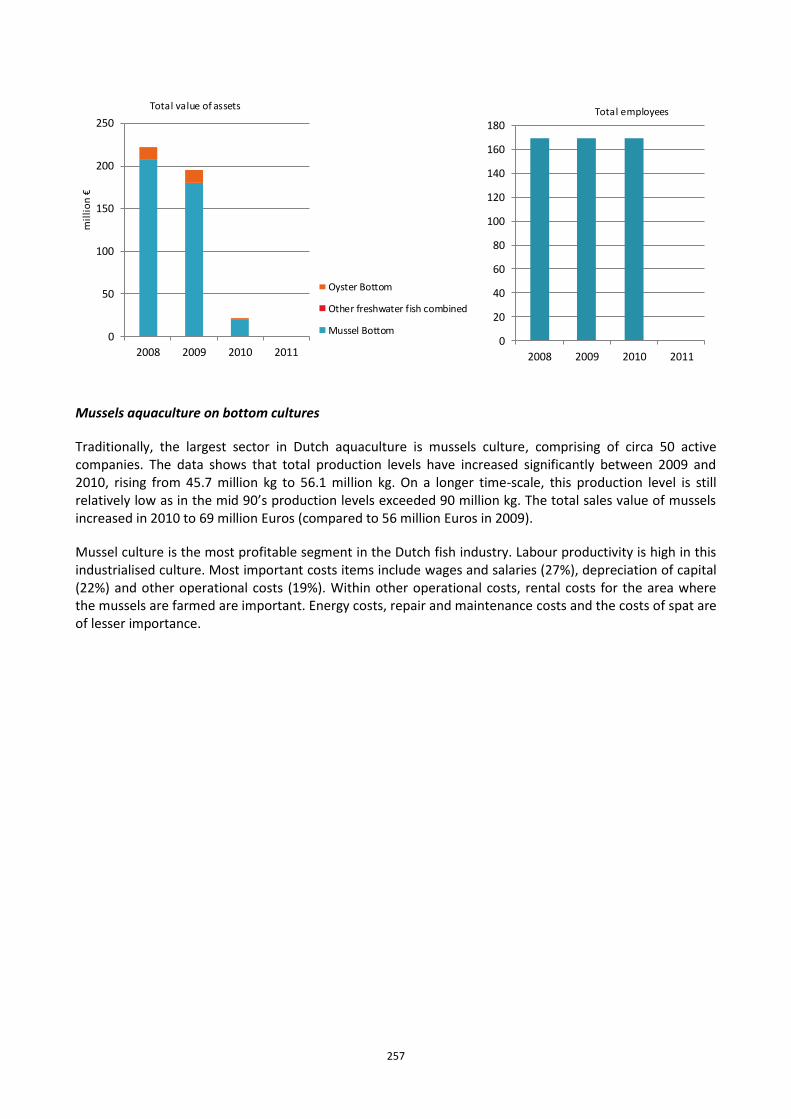
257
Mussels aquaculture on bottom cultures
Traditionally, the largest sector in Dutch aquaculture is mussels culture, comprising of circa 50 active companies. The data shows that total production levels have increased significantly between 2009 and 2010, rising from 45.7 million kg to 56.1 million kg. On a longer time-scale, this production level is still relatively low as in the mid 90’s production levels exceeded 90 million kg. The total sales value of mussels increased in 2010 to 69 million Euros (compared to 56 million Euros in 2009).
Mussel culture is the most profitable segment in the Dutch fish industry. Labour productivity is high in this industrialised culture. Most important costs items include wages and salaries (27%), depreciation of capital (22%) and other operational costs (19%). Within other operational costs, rental costs for the area where the mussels are farmed are important. Energy costs, repair and maintenance costs and the costs of spat are of lesser importance.
0
50
100
150
200
250
2008 2009 2010 2011
mil
lio
n €
Total value of assets
Oyster Bottom
Other freshwater fish combined
Mussel Bottom0
20
40
60
80
100
120
140
160
180
2008 2009 2010 2011
Total employees
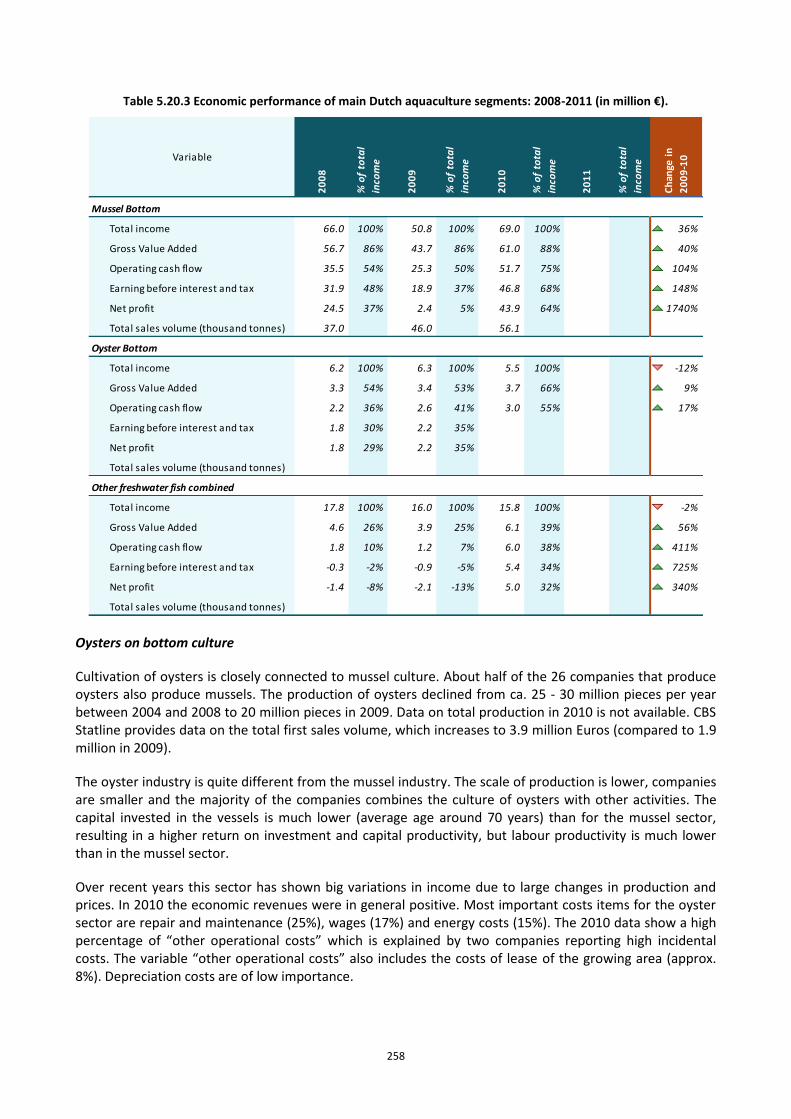
258
Table 5.20.3 Economic performance of main Dutch aquaculture segments: 2008-2011 (in million €).
Oysters on bottom culture
Cultivation of oysters is closely connected to mussel culture. About half of the 26 companies that produce oysters also produce mussels. The production of oysters declined from ca. 25 ‐ 30 million pieces per year between 2004 and 2008 to 20 million pieces in 2009. Data on total production in 2010 is not available. CBS Statline provides data on the total first sales volume, which increases to 3.9 million Euros (compared to 1.9 million in 2009).
The oyster industry is quite different from the mussel industry. The scale of production is lower, companies are smaller and the majority of the companies combines the culture of oysters with other activities. The capital invested in the vessels is much lower (average age around 70 years) than for the mussel sector, resulting in a higher return on investment and capital productivity, but labour productivity is much lower than in the mussel sector.
Over recent years this sector has shown big variations in income due to large changes in production and prices. In 2010 the economic revenues were in general positive. Most important costs items for the oyster sector are repair and maintenance (25%), wages (17%) and energy costs (15%). The 2010 data show a high percentage of “other operational costs” which is explained by two companies reporting high incidental costs. The variable “other operational costs” also includes the costs of lease of the growing area (approx. 8%). Depreciation costs are of low importance.
Mussel Bottom
Total income 66.0 100% 50.8 100% 69.0 100% 36%
Gross Value Added 56.7 86% 43.7 86% 61.0 88% 40%
Operating cash flow 35.5 54% 25.3 50% 51.7 75% 104%
Earning before interest and tax 31.9 48% 18.9 37% 46.8 68% 148%
Net profit 24.5 37% 2.4 5% 43.9 64% 1740%
Total sales volume (thousand tonnes) 37.0 46.0 56.1
Oyster Bottom
Total income 6.2 100% 6.3 100% 5.5 100% -12%
Gross Value Added 3.3 54% 3.4 53% 3.7 66% 9%
Operating cash flow 2.2 36% 2.6 41% 3.0 55% 17%
Earning before interest and tax 1.8 30% 2.2 35%
Net profit 1.8 29% 2.2 35%
Total sales volume (thousand tonnes)
Other freshwater fish combined
Total income 17.8 100% 16.0 100% 15.8 100% -2%
Gross Value Added 4.6 26% 3.9 25% 6.1 39% 56%
Operating cash flow 1.8 10% 1.2 7% 6.0 38% 411%
Earning before interest and tax -0.3 -2% -0.9 -5% 5.4 34% 725%
Net profit -1.4 -8% -2.1 -13% 5.0 32% 340%
Total sales volume (thousand tonnes)
% o
f to
tal
inco
me
Ch
ange
in
20
09
-10Variable
20
08
% o
f to
tal
inco
me
20
09
% o
f to
tal
inco
me
20
10
% o
f to
tal
inco
me
20
11
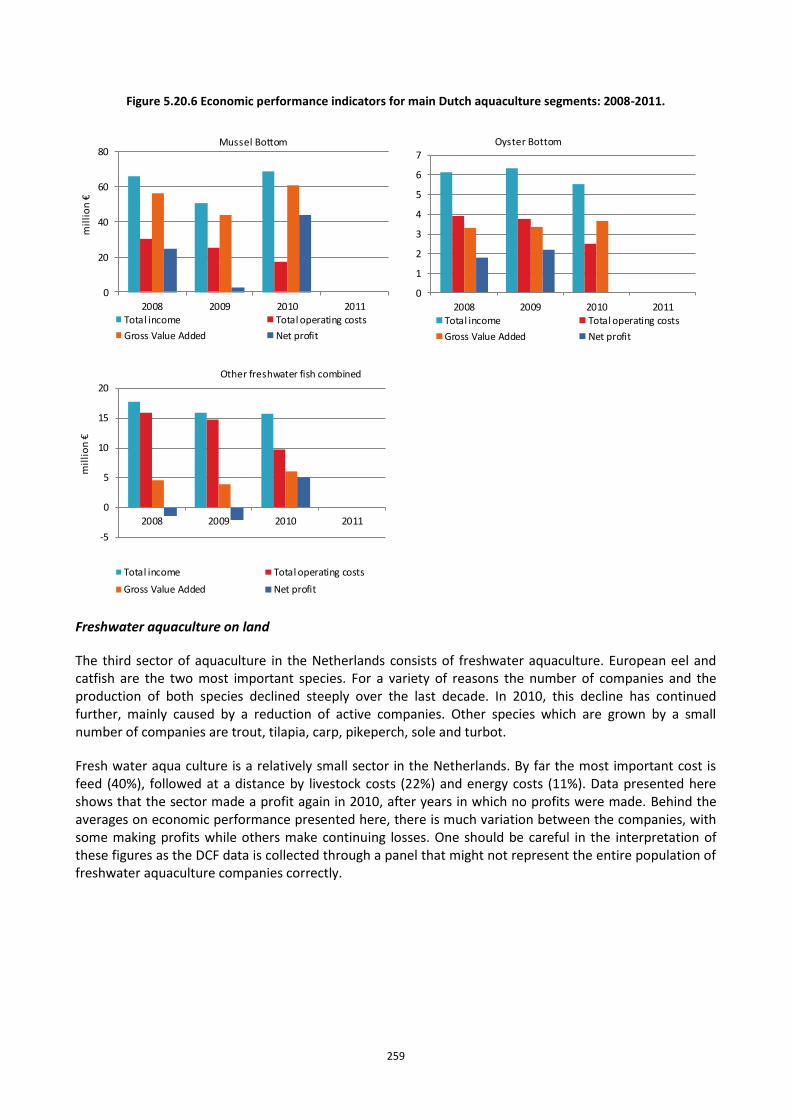
259
Figure 5.20.6 Economic performance indicators for main Dutch aquaculture segments: 2008-2011.
0
1
2
3
4
5
6
7
2008 2009 2010 2011
Oyster Bottom
Total income Total operating costs
Gross Value Added Net profit
Freshwater aquaculture on land
The third sector of aquaculture in the Netherlands consists of freshwater aquaculture. European eel and catfish are the two most important species. For a variety of reasons the number of companies and the production of both species declined steeply over the last decade. In 2010, this decline has continued further, mainly caused by a reduction of active companies. Other species which are grown by a small number of companies are trout, tilapia, carp, pikeperch, sole and turbot.
Fresh water aqua culture is a relatively small sector in the Netherlands. By far the most important cost is feed (40%), followed at a distance by livestock costs (22%) and energy costs (11%). Data presented here shows that the sector made a profit again in 2010, after years in which no profits were made. Behind the averages on economic performance presented here, there is much variation between the companies, with some making profits while others make continuing losses. One should be careful in the interpretation of these figures as the DCF data is collected through a panel that might not represent the entire population of freshwater aquaculture companies correctly.
0
20
40
60
80
2008 2009 2010 2011
mil
lio
n €
Mussel Bottom
Total income Total operating costs
Gross Value Added Net profit
-5
0
5
10
15
20
2008 2009 2010 2011
mil
lio
n €
Other freshwater fish combined
Total income Total operating costs
Gross Value Added Net profit
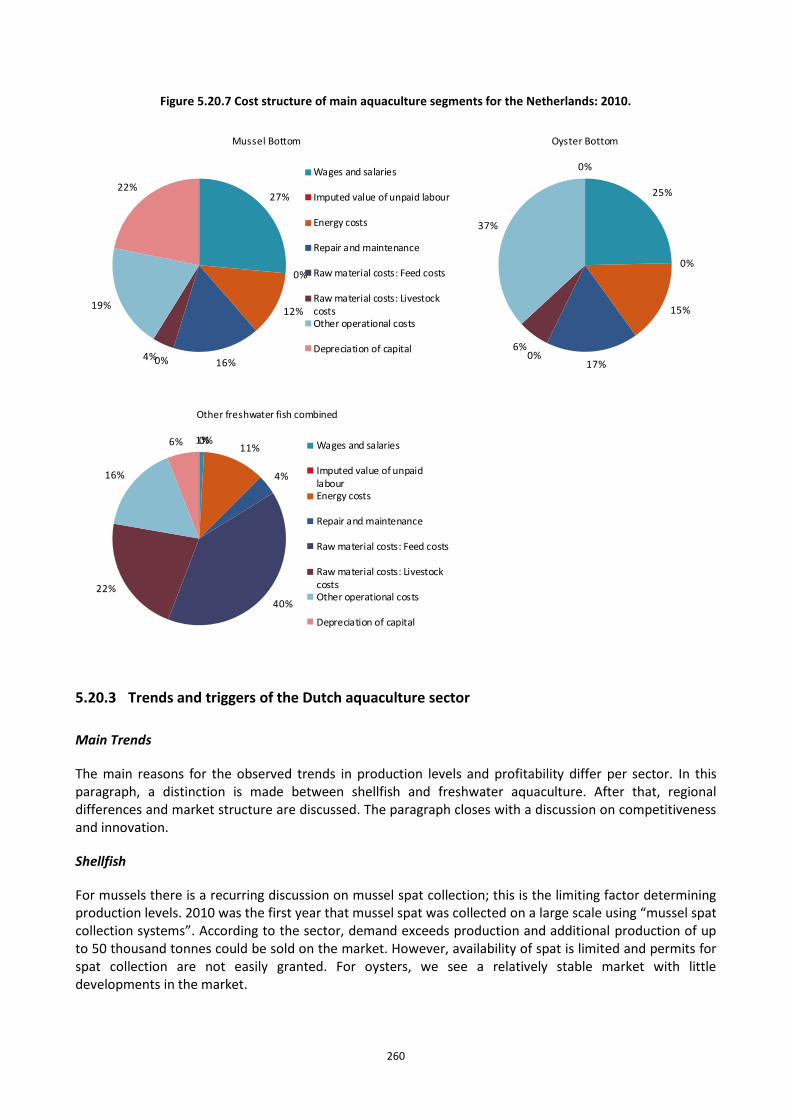
260
Figure 5.20.7 Cost structure of main aquaculture segments for the Netherlands: 2010.
5.20.3 Trends and triggers of the Dutch aquaculture sector
Main Trends
The main reasons for the observed trends in production levels and profitability differ per sector. In this paragraph, a distinction is made between shellfish and freshwater aquaculture. After that, regional differences and market structure are discussed. The paragraph closes with a discussion on competitiveness and innovation.
Shellfish
For mussels there is a recurring discussion on mussel spat collection; this is the limiting factor determining production levels. 2010 was the first year that mussel spat was collected on a large scale using “mussel spat collection systems”. According to the sector, demand exceeds production and additional production of up to 50 thousand tonnes could be sold on the market. However, availability of spat is limited and permits for spat collection are not easily granted. For oysters, we see a relatively stable market with little developments in the market.
27%
0%
12%
16%0%4%
19%
22%
Mussel Bottom
Wages and salaries
Imputed value of unpaid labour
Energy costs
Repair and maintenance
Raw material costs: Feed costs
Raw material costs: LivestockcostsOther operational costs
Depreciation of capital
25%
0%
15%
17%0%
6%
37%
0%
Oyster Bottom
1%0%11%
4%
40%
22%
16%
6%
Other freshwater fish combined
Wages and salaries
Imputed value of unpaidlabourEnergy costs
Repair and maintenance
Raw material costs: Feed costs
Raw material costs: LivestockcostsOther operational costs
Depreciation of capital
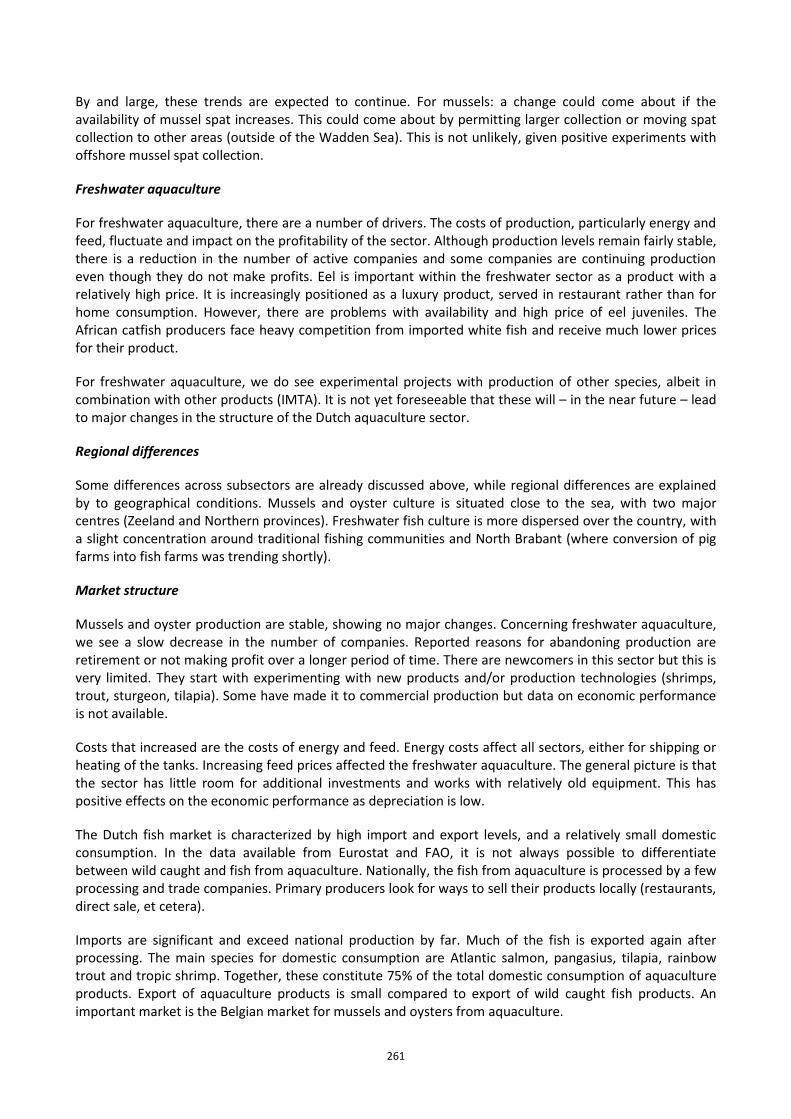
261
By and large, these trends are expected to continue. For mussels: a change could come about if the availability of mussel spat increases. This could come about by permitting larger collection or moving spat collection to other areas (outside of the Wadden Sea). This is not unlikely, given positive experiments with offshore mussel spat collection.
Freshwater aquaculture
For freshwater aquaculture, there are a number of drivers. The costs of production, particularly energy and feed, fluctuate and impact on the profitability of the sector. Although production levels remain fairly stable, there is a reduction in the number of active companies and some companies are continuing production even though they do not make profits. Eel is important within the freshwater sector as a product with a relatively high price. It is increasingly positioned as a luxury product, served in restaurant rather than for home consumption. However, there are problems with availability and high price of eel juveniles. The African catfish producers face heavy competition from imported white fish and receive much lower prices for their product.
For freshwater aquaculture, we do see experimental projects with production of other species, albeit in combination with other products (IMTA). It is not yet foreseeable that these will – in the near future – lead to major changes in the structure of the Dutch aquaculture sector.
Regional differences
Some differences across subsectors are already discussed above, while regional differences are explained by to geographical conditions. Mussels and oyster culture is situated close to the sea, with two major centres (Zeeland and Northern provinces). Freshwater fish culture is more dispersed over the country, with a slight concentration around traditional fishing communities and North Brabant (where conversion of pig farms into fish farms was trending shortly).
Market structure
Mussels and oyster production are stable, showing no major changes. Concerning freshwater aquaculture, we see a slow decrease in the number of companies. Reported reasons for abandoning production are retirement or not making profit over a longer period of time. There are newcomers in this sector but this is very limited. They start with experimenting with new products and/or production technologies (shrimps, trout, sturgeon, tilapia). Some have made it to commercial production but data on economic performance is not available.
Costs that increased are the costs of energy and feed. Energy costs affect all sectors, either for shipping or heating of the tanks. Increasing feed prices affected the freshwater aquaculture. The general picture is that the sector has little room for additional investments and works with relatively old equipment. This has positive effects on the economic performance as depreciation is low.
The Dutch fish market is characterized by high import and export levels, and a relatively small domestic consumption. In the data available from Eurostat and FAO, it is not always possible to differentiate between wild caught and fish from aquaculture. Nationally, the fish from aquaculture is processed by a few processing and trade companies. Primary producers look for ways to sell their products locally (restaurants, direct sale, et cetera).
Imports are significant and exceed national production by far. Much of the fish is exported again after processing. The main species for domestic consumption are Atlantic salmon, pangasius, tilapia, rainbow trout and tropic shrimp. Together, these constitute 75% of the total domestic consumption of aquaculture products. Export of aquaculture products is small compared to export of wild caught fish products. An important market is the Belgian market for mussels and oysters from aquaculture.
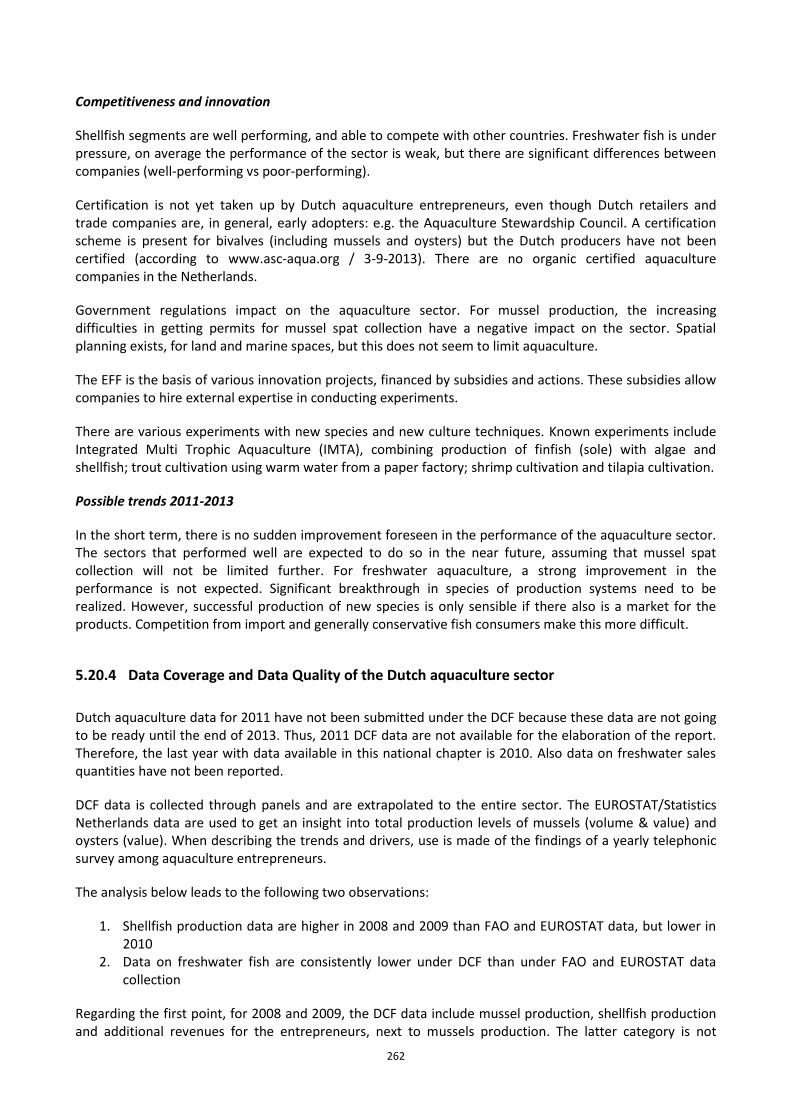
262
Competitiveness and innovation
Shellfish segments are well performing, and able to compete with other countries. Freshwater fish is under pressure, on average the performance of the sector is weak, but there are significant differences between companies (well-performing vs poor-performing).
Certification is not yet taken up by Dutch aquaculture entrepreneurs, even though Dutch retailers and trade companies are, in general, early adopters: e.g. the Aquaculture Stewardship Council. A certification scheme is present for bivalves (including mussels and oysters) but the Dutch producers have not been certified (according to www.asc-aqua.org / 3-9-2013). There are no organic certified aquaculture companies in the Netherlands.
Government regulations impact on the aquaculture sector. For mussel production, the increasing difficulties in getting permits for mussel spat collection have a negative impact on the sector. Spatial planning exists, for land and marine spaces, but this does not seem to limit aquaculture.
The EFF is the basis of various innovation projects, financed by subsidies and actions. These subsidies allow companies to hire external expertise in conducting experiments.
There are various experiments with new species and new culture techniques. Known experiments include Integrated Multi Trophic Aquaculture (IMTA), combining production of finfish (sole) with algae and shellfish; trout cultivation using warm water from a paper factory; shrimp cultivation and tilapia cultivation.
Possible trends 2011-2013
In the short term, there is no sudden improvement foreseen in the performance of the aquaculture sector. The sectors that performed well are expected to do so in the near future, assuming that mussel spat collection will not be limited further. For freshwater aquaculture, a strong improvement in the performance is not expected. Significant breakthrough in species of production systems need to be realized. However, successful production of new species is only sensible if there also is a market for the products. Competition from import and generally conservative fish consumers make this more difficult.
5.20.4 Data Coverage and Data Quality of the Dutch aquaculture sector
Dutch aquaculture data for 2011 have not been submitted under the DCF because these data are not going to be ready until the end of 2013. Thus, 2011 DCF data are not available for the elaboration of the report. Therefore, the last year with data available in this national chapter is 2010. Also data on freshwater sales quantities have not been reported.
DCF data is collected through panels and are extrapolated to the entire sector. The EUROSTAT/Statistics Netherlands data are used to get an insight into total production levels of mussels (volume & value) and oysters (value). When describing the trends and drivers, use is made of the findings of a yearly telephonic survey among aquaculture entrepreneurs.
The analysis below leads to the following two observations:
1. Shellfish production data are higher in 2008 and 2009 than FAO and EUROSTAT data, but lower in 2010
2. Data on freshwater fish are consistently lower under DCF than under FAO and EUROSTAT data collection
Regarding the first point, for 2008 and 2009, the DCF data include mussel production, shellfish production and additional revenues for the entrepreneurs, next to mussels production. The latter category is not
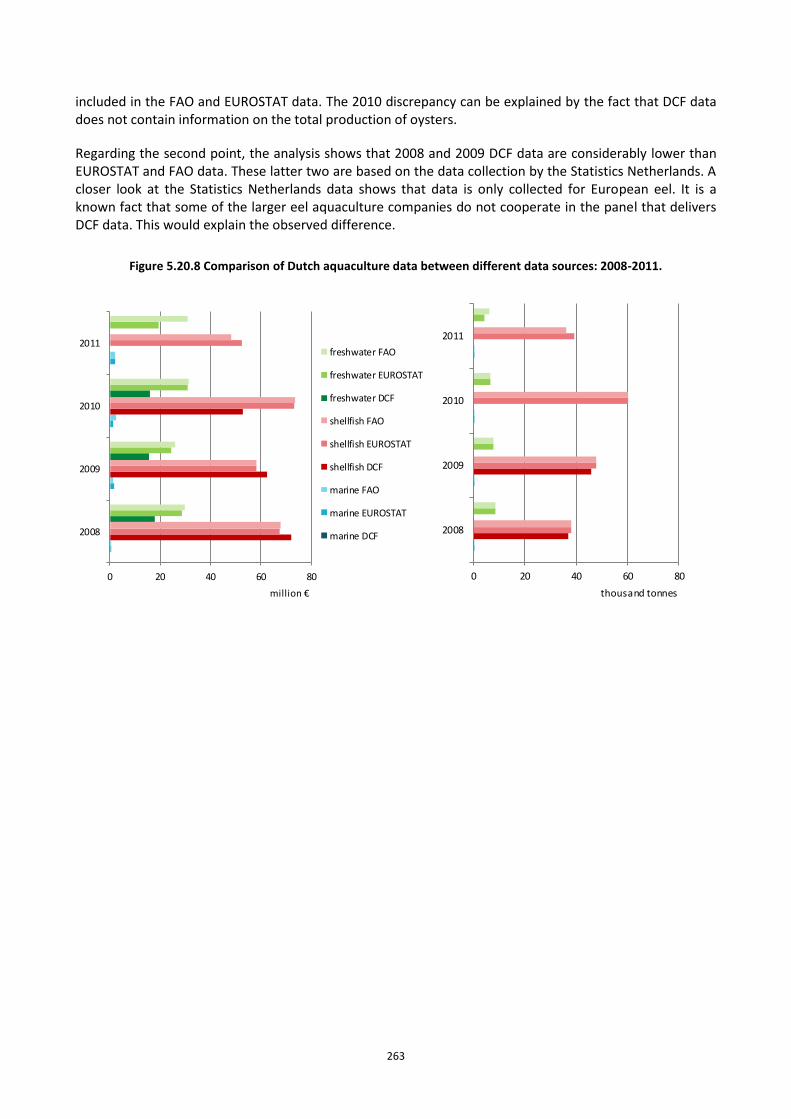
263
included in the FAO and EUROSTAT data. The 2010 discrepancy can be explained by the fact that DCF data does not contain information on the total production of oysters.
Regarding the second point, the analysis shows that 2008 and 2009 DCF data are considerably lower than EUROSTAT and FAO data. These latter two are based on the data collection by the Statistics Netherlands. A closer look at the Statistics Netherlands data shows that data is only collected for European eel. It is a known fact that some of the larger eel aquaculture companies do not cooperate in the panel that delivers DCF data. This would explain the observed difference.
Figure 5.20.8 Comparison of Dutch aquaculture data between different data sources: 2008-2011.
0 20 40 60 80
2008
2009
2010
2011
million €
freshwater FAO
freshwater EUROSTAT
freshwater DCF
shellfish FAO
shellfish EUROSTAT
shellfish DCF
marine FAO
marine EUROSTAT
marine DCF
0 20 40 60 80
2008
2009
2010
2011
thousand tonnes
264
5.21 POLAND
5.21.1 Overview of the Polish aquaculture sector
Aquaculture in Poland consists only of land-based freshwater farms. According to the data submitted by Poland to FAO the total volume of aquaculture production of fish for human consumption was 29.0 thousand tonnes in 2011 and decreased by 6% compared to the previous year. The turnover amounted to 61.6 million Euros and there was also a decrease of 9%. The biggest sector is the production of carp. In 2011 carp stands for 48% of the whole aquaculture turnover and for 50% of the volume of production. The production of carp decreased another year in a row and was 14.4 thousand tonnes (about 6%). Carp farms are widespread but the largest facilities are located in central and southern Poland where climatic conditions are warmer and thus more advantageous to farming. Carp production is carried out in the traditional land-based farms in earth ponds. In 2011, according to the Central Office of Cartography and Geodesy, the surface area of earth ponds was 74.7 thousand ha on which production was conducted on 56.2 thousand ha.
The next sector is harvesting of trout, which contributed 38% both of turnover and the volume of production. Production of trout decreased to 11.2 thousand tonnes (about 13%).Trout farms are located in the north on the Baltic Sea coast and in southern Poland in the Carpathian foothills in rich terrain with clear, cool waters. Trout production is carried out in intensive fish production facilities.
Table 5.21.1 Weight and value of Polish aquaculture sector first-sales: 2008-2011.
Variable 2008 2009 2010 2011
Sales weight (tonnes) 36,807 36,503 30,751 29,037 -6% ↘
Marine 0 0 0 0
Shellfish 0 0 0 0
Freshwater 36,807 36,503 30,751 29,037 -6% ↘
Sales value (thousand €) 73,623 76,583 67,548 61,569 -9% ↘
Marine 0 0 0 0
Shellfish 0 0 0 0
Freshwater 73,623 76,583 67,548 61,569 -9% ↘
Hatcheries & nurseries (million units)
Change in 2010-11
FAO data
Many aquaculture farms produced more than one freshwater species, mainly African and European catfishes, grass carp, silver carp, bighead carp, crucian carp, pike, tench and sturgeon. In 2011 other freshwater species constituted 12% of turnover in aquaculture and have 14% share in volume of production. Production of other freshwater species increased to 8.9 thousand tonnes (about 40%).
In addition to the production of fish for the food market, the sector produced and sold 5.5 thousand tonnes of seed and stocking materials of many species. Among them we can find Atlantic salmon fry for stocking Polish Marine Areas. Total value of sold juveniles amounted to 26.4 million Euros in 2011.
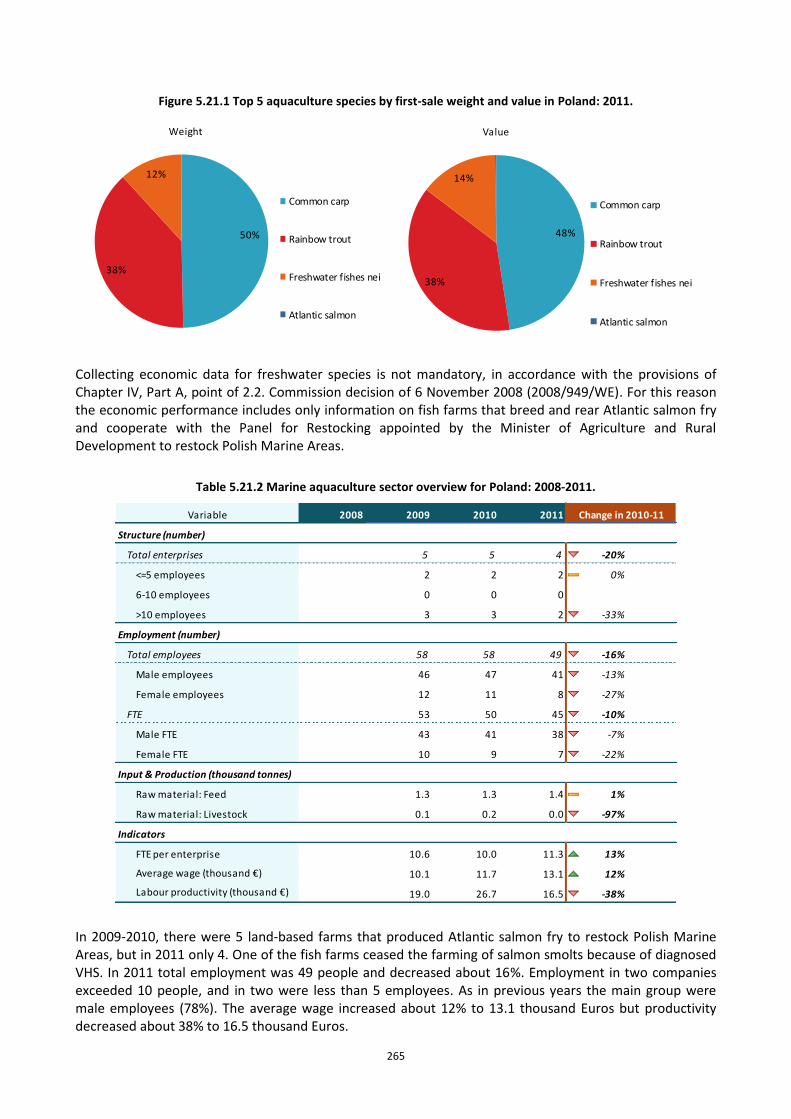
265
Figure 5.21.1 Top 5 aquaculture species by first-sale weight and value in Poland: 2011.
50%
38%
12%
Weight
Common carp
Rainbow trout
Freshwater fishes nei
Atlantic salmon
48%
38%
14%
Value
Common carp
Rainbow trout
Freshwater fishes nei
Atlantic salmon
Collecting economic data for freshwater species is not mandatory, in accordance with the provisions of Chapter IV, Part A, point of 2.2. Commission decision of 6 November 2008 (2008/949/WE). For this reason the economic performance includes only information on fish farms that breed and rear Atlantic salmon fry and cooperate with the Panel for Restocking appointed by the Minister of Agriculture and Rural Development to restock Polish Marine Areas.
Table 5.21.2 Marine aquaculture sector overview for Poland: 2008-2011.
Variable 2008 2009 2010 2011
Structure (number)
Total enterprises 5 5 4 -20% ↔
<=5 employees 2 2 2 0% ↔
6-10 employees 0 0 0 ↔
>10 employees 3 3 2 -33% ↘
Employment (number)
Total employees 58 58 49 -16% ↘
Male employees 46 47 41 -13% ↘
Female employees 12 11 8 -27% ↘
FTE 53 50 45 -10% ↘
Male FTE 43 41 38 -7% ↘
Female FTE 10 9 7 -22% ↘
Input & Production (thousand tonnes)
Raw material: Feed 1.3 1.3 1.4 1% ↗
Raw material: Livestock 0.1 0.2 0.0 -97%
Indicators
FTE per enterprise 10.6 10.0 11.3 13% ↗
Average wage (thousand €) 10.1 11.7 13.1 12% ↗
Labour productivity (thousand €) 19.0 26.7 16.5 -38% ↘
Change in 2010-11
In 2009-2010, there were 5 land-based farms that produced Atlantic salmon fry to restock Polish Marine Areas, but in 2011 only 4. One of the fish farms ceased the farming of salmon smolts because of diagnosed VHS. In 2011 total employment was 49 people and decreased about 16%. Employment in two companies exceeded 10 people, and in two were less than 5 employees. As in previous years the main group were male employees (78%). The average wage increased about 12% to 13.1 thousand Euros but productivity decreased about 38% to 16.5 thousand Euros.
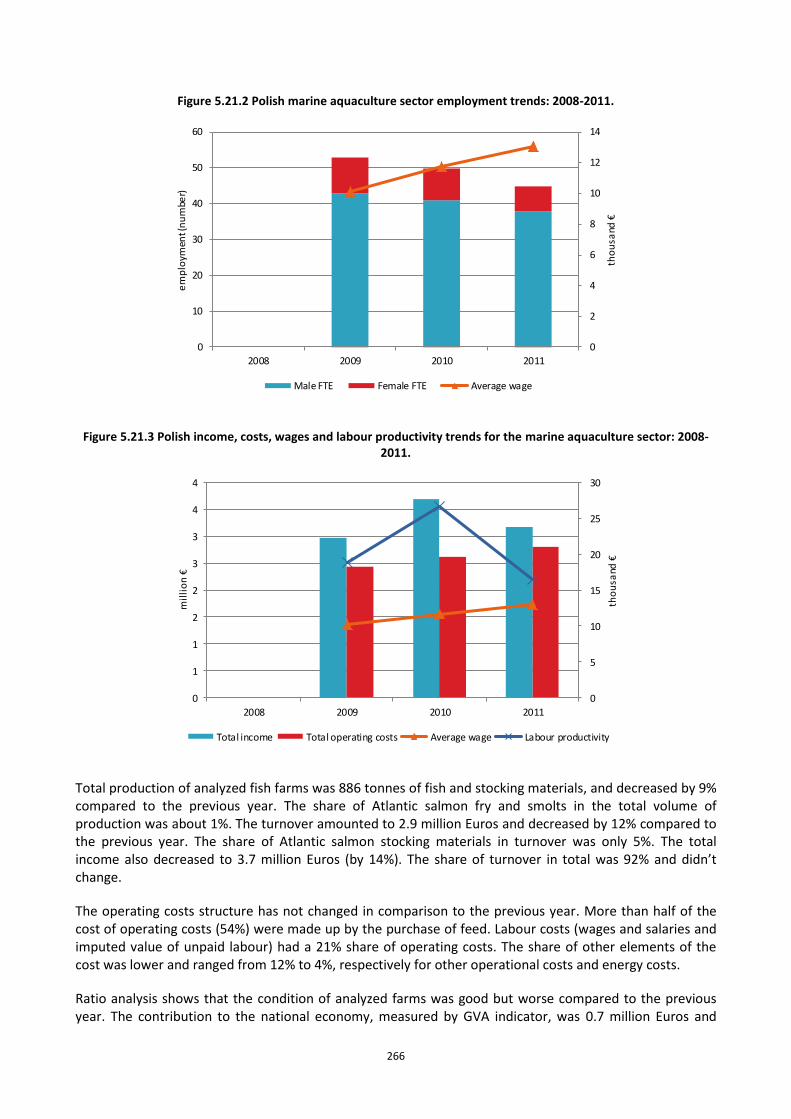
266
Figure 5.21.2 Polish marine aquaculture sector employment trends: 2008-2011.
0
2
4
6
8
10
12
14
0
10
20
30
40
50
60
2008 2009 2010 2011
tho
usa
nd €
em
plo
ymen
t (n
um
ber)
Male FTE Female FTE Average wage
Figure 5.21.3 Polish income, costs, wages and labour productivity trends for the marine aquaculture sector: 2008-2011.
0
5
10
15
20
25
30
0
1
1
2
2
3
3
4
4
2008 2009 2010 2011
tho
usa
nd €
mil
lio
n €
Total income Total operating costs Average wage Labour productivity
Total production of analyzed fish farms was 886 tonnes of fish and stocking materials, and decreased by 9% compared to the previous year. The share of Atlantic salmon fry and smolts in the total volume of production was about 1%. The turnover amounted to 2.9 million Euros and decreased by 12% compared to the previous year. The share of Atlantic salmon stocking materials in turnover was only 5%. The total income also decreased to 3.7 million Euros (by 14%). The share of turnover in total was 92% and didn’t change.
The operating costs structure has not changed in comparison to the previous year. More than half of the cost of operating costs (54%) were made up by the purchase of feed. Labour costs (wages and salaries and imputed value of unpaid labour) had a 21% share of operating costs. The share of other elements of the cost was lower and ranged from 12% to 4%, respectively for other operational costs and energy costs.
Ratio analysis shows that the condition of analyzed farms was good but worse compared to the previous year. The contribution to the national economy, measured by GVA indicator, was 0.7 million Euros and
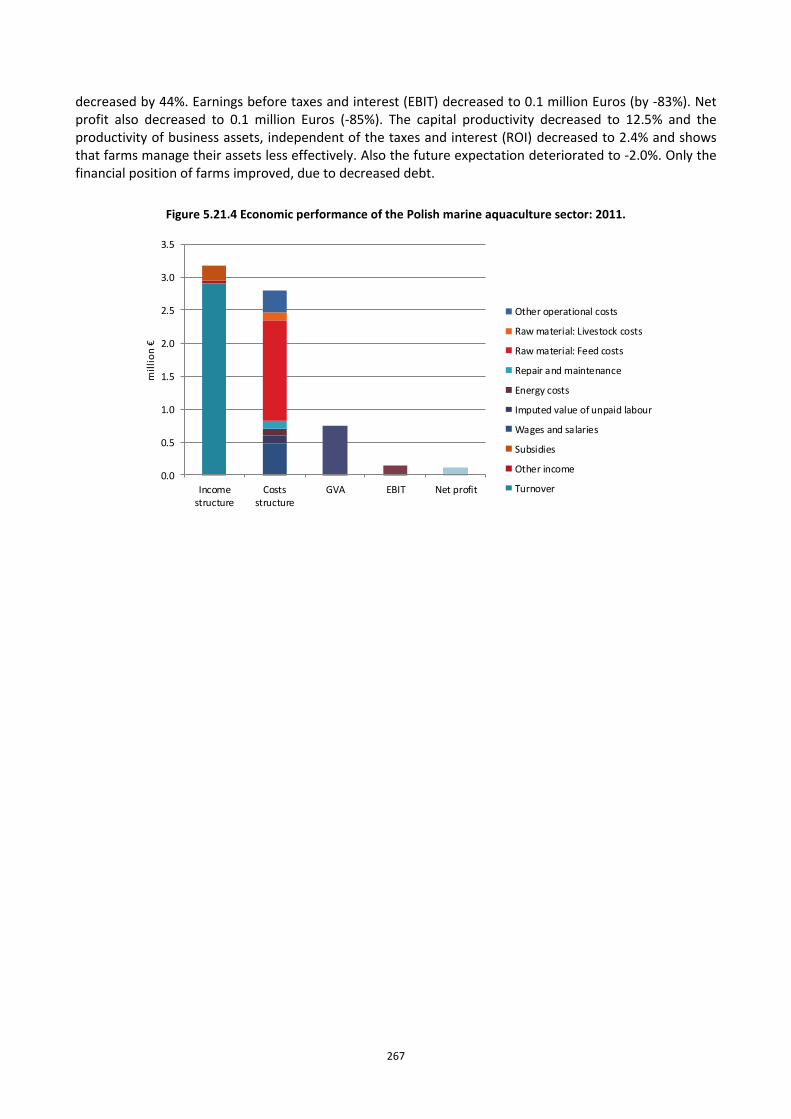
267
decreased by 44%. Earnings before taxes and interest (EBIT) decreased to 0.1 million Euros (by -83%). Net profit also decreased to 0.1 million Euros (-85%). The capital productivity decreased to 12.5% and the productivity of business assets, independent of the taxes and interest (ROI) decreased to 2.4% and shows that farms manage their assets less effectively. Also the future expectation deteriorated to -2.0%. Only the financial position of farms improved, due to decreased debt.
Figure 5.21.4 Economic performance of the Polish marine aquaculture sector: 2011.
0.0
0.5
1.0
1.5
2.0
2.5
3.0
3.5
Incomestructure
Costsstructure
GVA EBIT Net profit
mil
lio
n €
Other operational costs
Raw material: Livestock costs
Raw material: Feed costs
Repair and maintenance
Energy costs
Imputed value of unpaid labour
Wages and salaries
Subsidies
Other income
Turnover

268
Table 5.21.3 Economic performance for Polish marine aquaculture sector: 2008-2011.
Income (million €)
Turnover 2.9 97% 3.3 90% 2.9 92% -12%
Other income 0.0 1% 0.0 1% 0.0 2% 3%
Subsidies 0.1 2% 0.3 9% 0.2 7% -35%
Total income 3.0 100% 3.7 100% 3.2 100% -14%
Expenditure (million €)
Wages and salaries 0.5 16% 0.5 13% 0.5 15% -5%
Imputed value of unpaid labour 0.1 2% 0.1 2% 0.1 4% 34%
Energy costs 0.1 4% 0.1 3% 0.1 3% 0%
Repair and maintenance 0.1 4% 0.1 4% 0.1 4% -16%
Raw material: Feed costs 1.2 39% 1.2 33% 1.5 48% 24%
Raw material: Livestock costs 0.3 11% 0.5 13% 0.1 4% -73%
Other operational costs 0.2 7% 0.1 2% 0.3 11% 301%
Total operating costs 2.4 82% 2.6 71% 2.8 88% 7%
Capital Costs (million €)
Depreciation of capital 0.2 7% 0.2 7% 0.2 7% -6%
Financial costs, net 0.1 2% 0.1 2% 0.0 1% -62%
Extraordinary costs, net 0.0 0% 0.0 1% 0.0 0% -100%
Capital Value (million €)
Total value of assets 7.6 256% 8.3 224% 5.9 187% -28%
Net Investments 0.1 5% 0.4 10% 0.1 3% -71%
Debt 1.2 41% 3.9 104% 0.6 18% -85%
Performance Indicators(million €)
Gross Value Added 1.0 34% 1.3 36% 0.7 23% -44%
Operating cash flow 0.5 18% 1.1 29% 0.4 12% -66%
Earning before interest and tax 0.3 11% 0.8 23% 0.1 5% -83%
Net profit 0.3 9% 0.8 20% 0.1 3% -85%
Capital productivity (%) 13.3 16.1 12.5 -22%
Return on Investment (%) 4.2 10.2 2.4 -76%
Equity ratio (%) 84.1 53.5 90.2 69%
Future Expectation Indicator (%) -0.9 1.7 -2.0 -217%
% o
f to
tal
inco
me
Variable
% o
f to
tal
inco
me
20
08
20
09
% o
f to
tal
inco
me
20
10
20
11
Ch
ange
in
20
10
-11
% o
f to
tal
inco
me
In the years 2008-2011 prices of fish for consumption were stable and remained at a level of about 2 Euros/kg for both carp and trout, and an average of 2.6 Euros/kg in the case of other species of freshwater fish. Prices of Atlantic salmon stocking material remained at a higher level of around 20 Euros/kg.
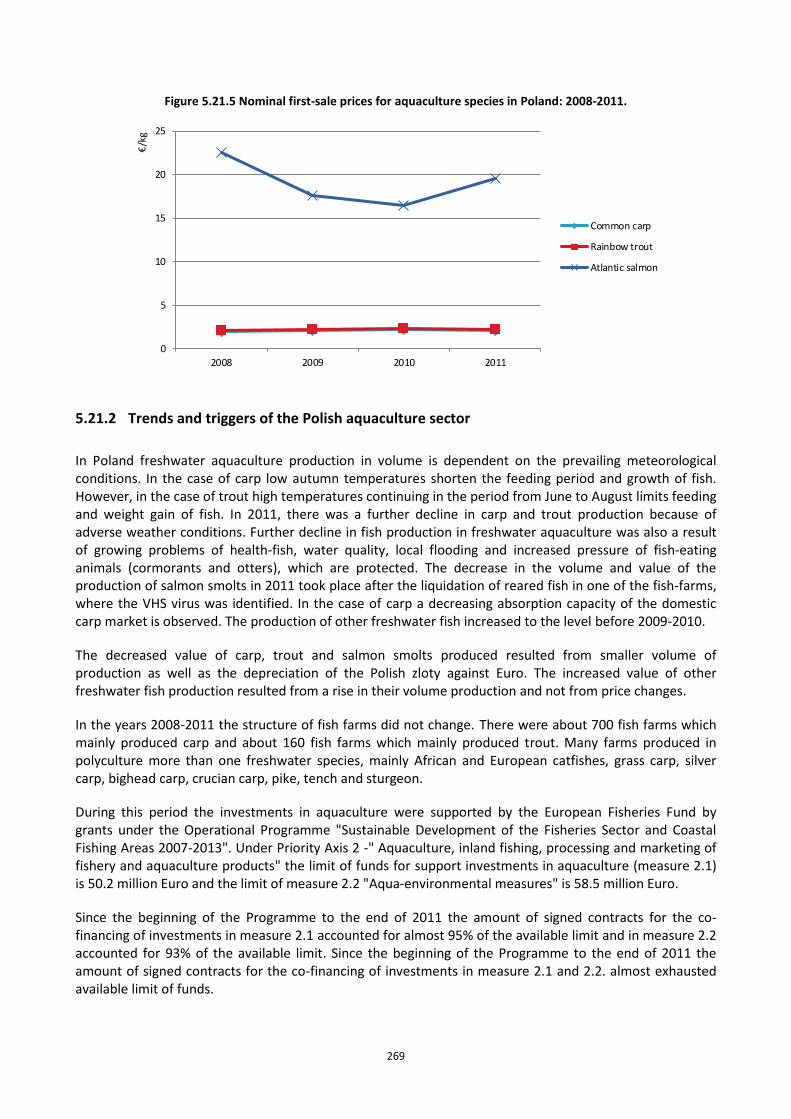
269
Figure 5.21.5 Nominal first-sale prices for aquaculture species in Poland: 2008-2011.
0
5
10
15
20
25
2008 2009 2010 2011
€/k
g
Common carp
Rainbow trout
Atlantic salmon
5.21.2 Trends and triggers of the Polish aquaculture sector
In Poland freshwater aquaculture production in volume is dependent on the prevailing meteorological conditions. In the case of carp low autumn temperatures shorten the feeding period and growth of fish. However, in the case of trout high temperatures continuing in the period from June to August limits feeding and weight gain of fish. In 2011, there was a further decline in carp and trout production because of adverse weather conditions. Further decline in fish production in freshwater aquaculture was also a result of growing problems of health-fish, water quality, local flooding and increased pressure of fish-eating animals (cormorants and otters), which are protected. The decrease in the volume and value of the production of salmon smolts in 2011 took place after the liquidation of reared fish in one of the fish-farms, where the VHS virus was identified. In the case of carp a decreasing absorption capacity of the domestic carp market is observed. The production of other freshwater fish increased to the level before 2009-2010.
The decreased value of carp, trout and salmon smolts produced resulted from smaller volume of production as well as the depreciation of the Polish zloty against Euro. The increased value of other freshwater fish production resulted from a rise in their volume production and not from price changes.
In the years 2008-2011 the structure of fish farms did not change. There were about 700 fish farms which mainly produced carp and about 160 fish farms which mainly produced trout. Many farms produced in polyculture more than one freshwater species, mainly African and European catfishes, grass carp, silver carp, bighead carp, crucian carp, pike, tench and sturgeon.
During this period the investments in aquaculture were supported by the European Fisheries Fund by grants under the Operational Programme "Sustainable Development of the Fisheries Sector and Coastal Fishing Areas 2007-2013". Under Priority Axis 2 -" Aquaculture, inland fishing, processing and marketing of fishery and aquaculture products" the limit of funds for support investments in aquaculture (measure 2.1) is 50.2 million Euro and the limit of measure 2.2 "Aqua-environmental measures" is 58.5 million Euro.
Since the beginning of the Programme to the end of 2011 the amount of signed contracts for the co-financing of investments in measure 2.1 accounted for almost 95% of the available limit and in measure 2.2 accounted for 93% of the available limit. Since the beginning of the Programme to the end of 2011 the amount of signed contracts for the co-financing of investments in measure 2.1 and 2.2. almost exhausted available limit of funds.
270
The majority of operations implemented under measure 2.1 consist of the development and modernisation of the aquaculture production facilities, investment in aquaculture diversification towards prospective or new species and in the development of sustainable aquaculture. Within the measure 2.2 Aqua-environmental measures there are two kinds of actions to be carried out: 1. supporting the use of traditional or environmentally friendly practices and techniques in breeding and farming fish; 2. protecting fish genetic resources. Fish farms located in Nature 2000 areas can get financial assistance under the action 2.2.
The substantial traditional and organic aquaculture sector in Poland is extensive earthen pond farming. The main species grown in earthen ponds is carp, along with a range of herbivorous and carnivorous fish in polyculture. The extensive production of carp has decreased over the past years because as traditional aquaculture slowly adjusts to the changes in consumer preferences and demand as for example the preference to buy fresh carps instead of live carps. Some extensive fish ponds, due to the biological diversity of habitat and animal species of special importance for Poland, were included in the Nature 2000 areas. In this case, many farms are turned into multifunctional pond fish farms, which also offer services in recreation, maintaining biodiversity and improving water management. The promotion of regional and traditional goods may be one of the factors that boost the development of the carp market. So far Karp Zatorski was registered in the Register of Protected Designations of Origin and Protected Geographical Indications maintained by the European Commission.
There is also a new trend in Polish aquaculture: the implementation of certification for product safety and organic production. So far only the barramundi farming near Olsztyn has implemented GLOBAL GAP.
To increase sales fish farmers more often process their products by themselves and offer fresh fillets or smoked fish.
The promotion of inland fish, mainly carp and trout, on the national, regional and local level, is conducted thanks to the financial means meant for fish promotion as part of Operational Programme "Sustainable Development of the Fisheries Sector and Coastal Fishing Areas 2007-2013". The promotional activities covered most of advertising carriers: outdoor, the press, the Internet, radio and television. The aim of “Mr Carp” and “Now the Trout” campaigns is to increase the consumption of trout and carps by Poles.
Carp are produced for the domestic market. Export opportunities are just about hundred tonnes per year. Most carp are sold in December before Christmas Eve in the form of live fish and fresh whole fish.
The main factor which stimulates the production of rainbow trout, in addition to domestic demand, is exports, which in 2011 stands at 7.45- thousand tonnes (66.5% of total production in 2011). About 82% of the export of trout goes to the German market.
The production of the additional fish species is driven by the need to diversify the production to reduce the problems with sales, especially of carp, and also to develop the production of new species as barramundi or tilapia. Also new techniques of production are being introduced, such as closed circuit water systems.
In 2011, Poland imported 460 thousand tonnes of fish and fish products of a total value of 1167.3 million Euros, mainly raw material for well-developed processing industry focused on export. The volume of import was slightly smaller compared to the previous year (about 2%), its value, however, grew about 3%. The species structure of import is very broad and embraces several species but salmon constitutes its majority. In 2011 102.9 thousand tonnes of salmon was imported and its value amounted to 468.7 million Euros, both of which were decreases compared to the previous year: about 3% and 11% respectively. The import of salmon constituted 22% of the whole volume of import and 40% of its value. Salmon is mainly imported from Norway (76% of volume and value).
271
As a result of the decreasing production and increasing export, trout import increased each year, reaching 7.81 thousand tonnes in 2011, which accounted for growth by 19% compared to the previous year. The largest number of trout comes to Poland from Turkey and Norway (respectively 43% and 18% in 2011).
Also the decrease in carp production in 2011 resulted in an increase in the import of carp to 3.6 thousand tonnes, representing an increase of 17% compared to the previous year. The largest number of trout comes to Poland from the Czech Republic (65%).
Poland also imported 26.4 thousand tonnes of other freshwater fish, about 23% less than a year ago. Among them pangasius (65%) was imported mainly from Vietnam and tilapia (19%) from China.
The tradition of serving carp for Christmas Eve results in the concentration of sales only during a couple of days in a year and the domination of sales of live fish. It is a reason why the carp sector does not follow the changing preferences of consumers and market determinants. In order to increase the production and consumption of carp it is necessary to increase its availability and broaden the trade offer so that the products meet the expectations of the most demanding consumers. Live fish are less frequently purchased, as it requires time-consuming eviscerating and initial preparation.
The production in aquaculture is also heavily fragmented and fish farms sell independently. The cooperation in organising common sales would strengthen the position of small producers who individually are not able to stand up to competition with imported fish.
In 2012, there was an increase in fish production in freshwater aquaculture because of favourable weather conditions and improved market conditions. The availability and marketing of fresh aquaculture products improved and developed as a result of permanent offer of sale of MAP packaged fresh fish in discount stores in Biedronka and Lidl and supermarkets (Kaufland). In September 2012 the largest and most modern fish farm in Poland in a closed circuit water system was opened in the village of Bońki near Płońsk . The target production is expected to reach 1.3 thousand tonnes, mainly including new thermophilic species, such as tilapia. The project was financed with the participation of the European Fisheries Fund (EFF).
5.21.3 Data Coverage and Data Quality of the Polish aquaculture sector
Poland is not obliged to collect the freshwater aquaculture economic data in accordance with the provisions of Chapter IV, Part A, point of 2.2. Commission decision of 6 November 2008 (2008/949/WE).
DCF data includes only fish farms that breed and rear Atlantic salmon juveniles and cooperate with the Panel for Restocking appointed by the Minister of Agriculture and Rural Development (MARD) to restocking Polish marine areas and the maintenance and conservation of diadromous fishes in the surface inland waters. In 2011, there were four such farms. A questionnaire was used to collecting all data. In 2011 all completed questionnaires returned.
The economic performance was based on DCF data.
FAO and Eurostat data refers to total volume and value aquaculture production. The overview of the aquaculture sector was based on the volume and value data submitted by Poland to FAO because of larger coverage then Eurostat data. The total employment in the overview was based on the data from questionnaire RRW-22 "Statement of the surface of ponds and the amount of fish produced in fish ponds and other devices used for breeding or rearing in 2011."
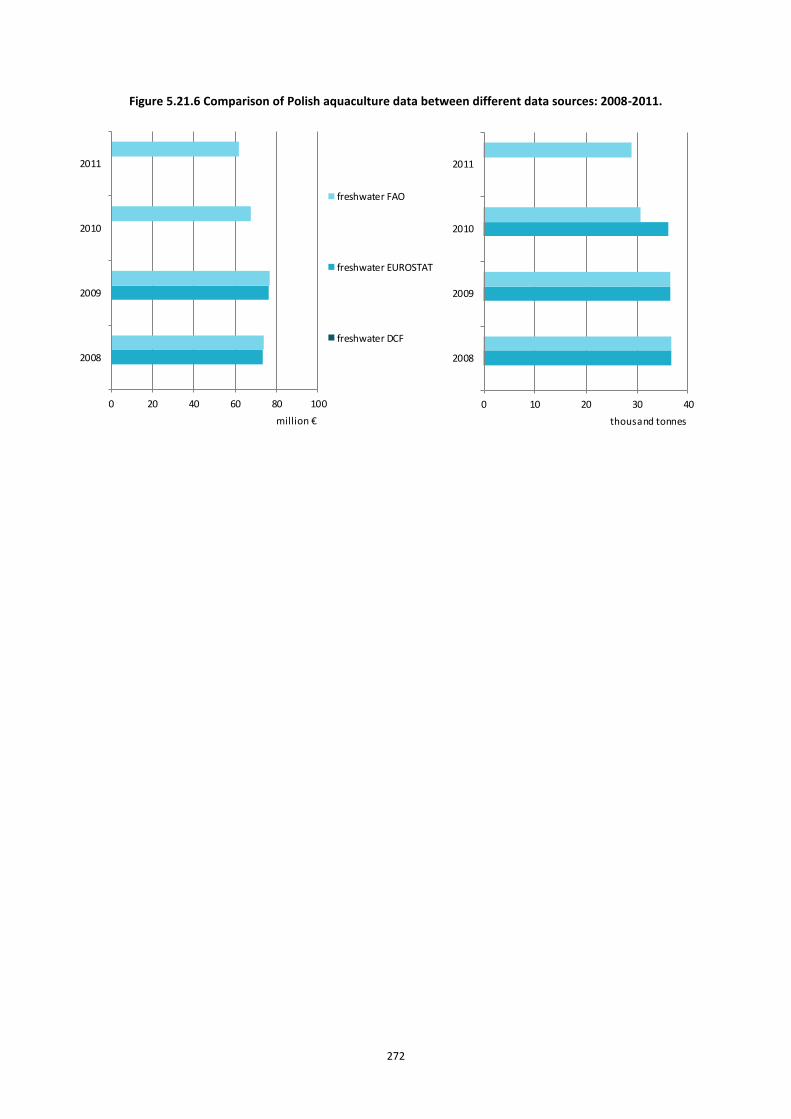
272
Figure 5.21.6 Comparison of Polish aquaculture data between different data sources: 2008-2011.
0 20 40 60 80 100
2008
2009
2010
2011
million €
freshwater FAO
freshwater EUROSTAT
freshwater DCF
0 10 20 30 40
2008
2009
2010
2011
thousand tonnes
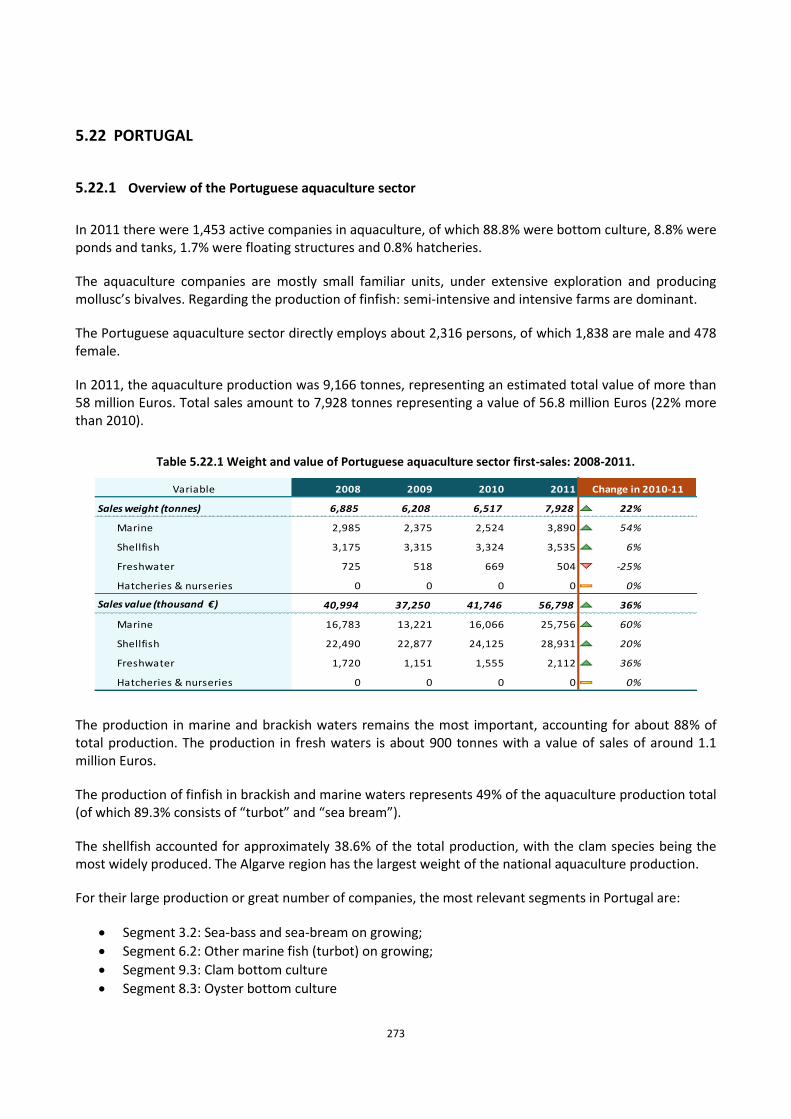
273
5.22 PORTUGAL
5.22.1 Overview of the Portuguese aquaculture sector
In 2011 there were 1,453 active companies in aquaculture, of which 88.8% were bottom culture, 8.8% were ponds and tanks, 1.7% were floating structures and 0.8% hatcheries.
The aquaculture companies are mostly small familiar units, under extensive exploration and producing mollusc’s bivalves. Regarding the production of finfish: semi-intensive and intensive farms are dominant.
The Portuguese aquaculture sector directly employs about 2,316 persons, of which 1,838 are male and 478 female.
In 2011, the aquaculture production was 9,166 tonnes, representing an estimated total value of more than 58 million Euros. Total sales amount to 7,928 tonnes representing a value of 56.8 million Euros (22% more than 2010).
Table 5.22.1 Weight and value of Portuguese aquaculture sector first-sales: 2008-2011.
Variable 2008 2009 2010 2011
Sales weight (tonnes) 6,885 6,208 6,517 7,928 22%
Marine 2,985 2,375 2,524 3,890 54%
Shellfish 3,175 3,315 3,324 3,535 6% ↗
Freshwater 725 518 669 504 -25%
Hatcheries & nurseries 0 0 0 0 0%
Sales value (thousand €) 40,994 37,250 41,746 56,798 36% ↗
Marine 16,783 13,221 16,066 25,756 60% ↗
Shellfish 22,490 22,877 24,125 28,931 20% ↗
Freshwater 1,720 1,151 1,555 2,112 36%
Hatcheries & nurseries 0 0 0 0 0%
Change in 2010-11
The production in marine and brackish waters remains the most important, accounting for about 88% of total production. The production in fresh waters is about 900 tonnes with a value of sales of around 1.1 million Euros.
The production of finfish in brackish and marine waters represents 49% of the aquaculture production total (of which 89.3% consists of “turbot” and “sea bream”).
The shellfish accounted for approximately 38.6% of the total production, with the clam species being the most widely produced. The Algarve region has the largest weight of the national aquaculture production.
For their large production or great number of companies, the most relevant segments in Portugal are:
Segment 3.2: Sea-bass and sea-bream on growing;
Segment 6.2: Other marine fish (turbot) on growing;
Segment 9.3: Clam bottom culture
Segment 8.3: Oyster bottom culture
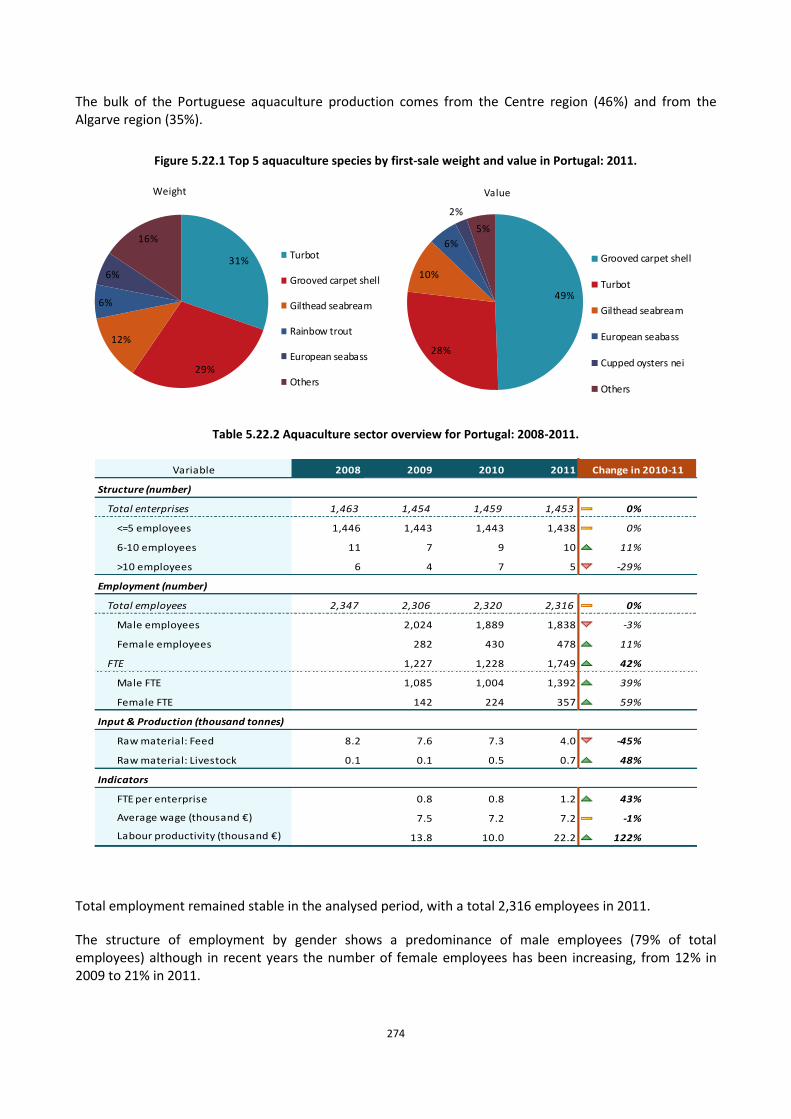
274
The bulk of the Portuguese aquaculture production comes from the Centre region (46%) and from the Algarve region (35%).
Figure 5.22.1 Top 5 aquaculture species by first-sale weight and value in Portugal: 2011.
31%
29%
12%
6%
6%
16%
Weight
Turbot
Grooved carpet shell
Gilthead seabream
Rainbow trout
European seabass
Others
49%
28%
10%
6%
2%
5%
Value
Grooved carpet shell
Turbot
Gilthead seabream
European seabass
Cupped oysters nei
Others
Table 5.22.2 Aquaculture sector overview for Portugal: 2008-2011.
Variable 2008 2009 2010 2011
Structure (number)
Total enterprises 1,463 1,454 1,459 1,453 0% ↔
<=5 employees 1,446 1,443 1,443 1,438 0% ↔
6-10 employees 11 7 9 10 11% ↗
>10 employees 6 4 7 5 -29% ↘
Employment (number)
Total employees 2,347 2,306 2,320 2,316 0% ↔
Male employees 2,024 1,889 1,838 -3% ↘
Female employees 282 430 478 11% ↗
FTE 1,227 1,228 1,749 42% ↗
Male FTE 1,085 1,004 1,392 39% ↗
Female FTE 142 224 357 59% ↗
Input & Production (thousand tonnes)
Raw material: Feed 8.2 7.6 7.3 4.0 -45% ↘
Raw material: Livestock 0.1 0.1 0.5 0.7 48%
Indicators
FTE per enterprise 0.8 0.8 1.2 43% ↗
Average wage (thousand €) 7.5 7.2 7.2 -1% ↘
Labour productivity (thousand €) 13.8 10.0 22.2 122% ↗
Change in 2010-11
Total employment remained stable in the analysed period, with a total 2,316 employees in 2011.
The structure of employment by gender shows a predominance of male employees (79% of total employees) although in recent years the number of female employees has been increasing, from 12% in 2009 to 21% in 2011.
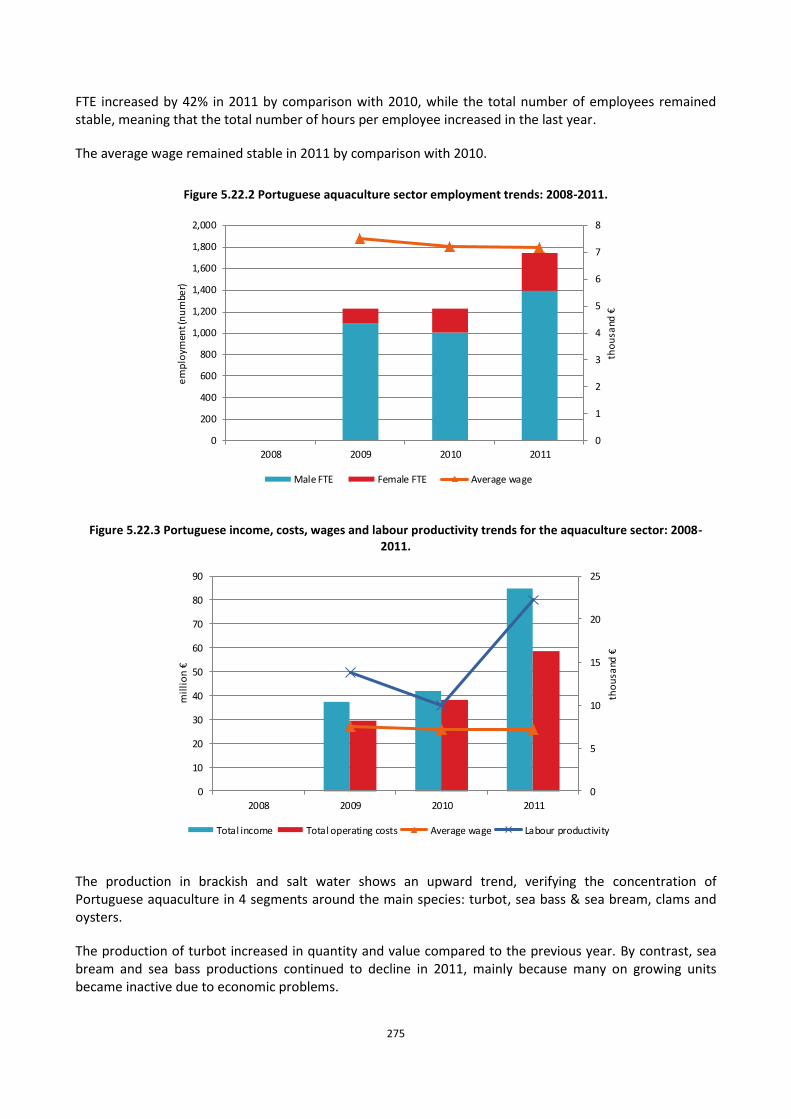
275
FTE increased by 42% in 2011 by comparison with 2010, while the total number of employees remained stable, meaning that the total number of hours per employee increased in the last year.
The average wage remained stable in 2011 by comparison with 2010.
Figure 5.22.2 Portuguese aquaculture sector employment trends: 2008-2011.
0
1
2
3
4
5
6
7
8
0
200
400
600
800
1,000
1,200
1,400
1,600
1,800
2,000
2008 2009 2010 2011
tho
usa
nd €
em
plo
ymen
t (n
um
ber)
Male FTE Female FTE Average wage
Figure 5.22.3 Portuguese income, costs, wages and labour productivity trends for the aquaculture sector: 2008-2011.
0
5
10
15
20
25
0
10
20
30
40
50
60
70
80
90
2008 2009 2010 2011
tho
usa
nd €
mil
lio
n €
Total income Total operating costs Average wage Labour productivity
The production in brackish and salt water shows an upward trend, verifying the concentration of Portuguese aquaculture in 4 segments around the main species: turbot, sea bass & sea bream, clams and oysters.
The production of turbot increased in quantity and value compared to the previous year. By contrast, sea bream and sea bass productions continued to decline in 2011, mainly because many on growing units became inactive due to economic problems.
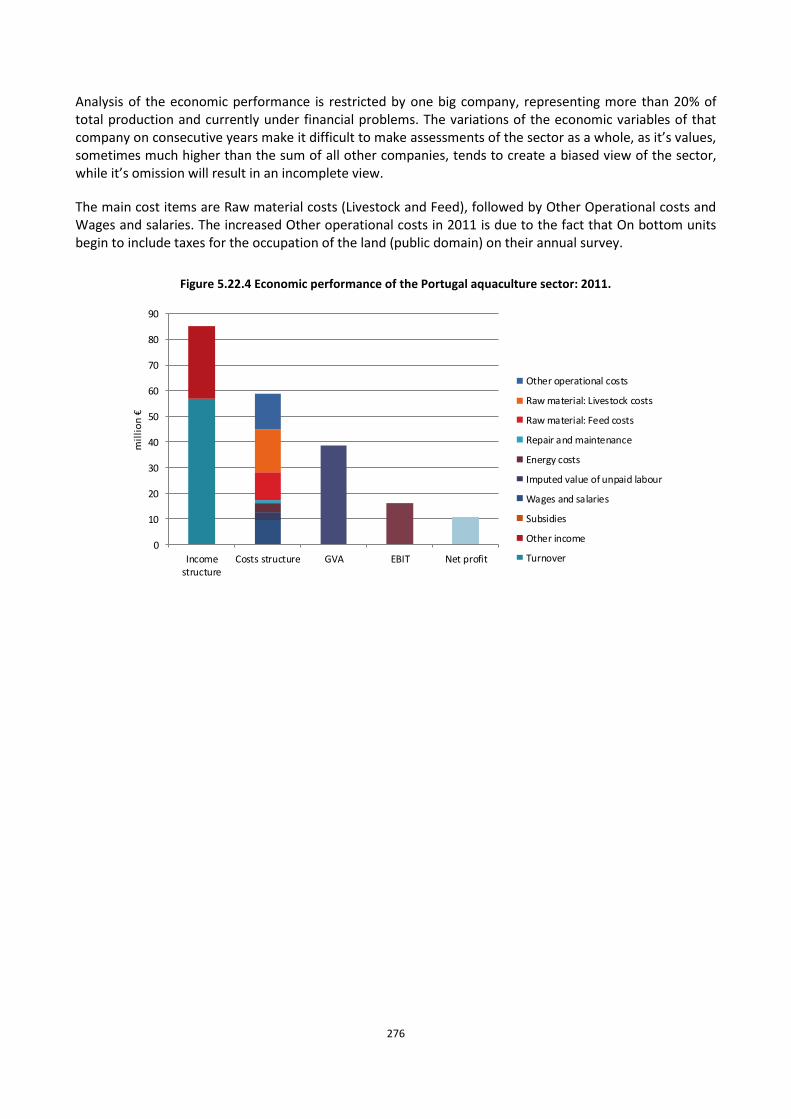
276
Analysis of the economic performance is restricted by one big company, representing more than 20% of total production and currently under financial problems. The variations of the economic variables of that company on consecutive years make it difficult to make assessments of the sector as a whole, as it’s values, sometimes much higher than the sum of all other companies, tends to create a biased view of the sector, while it’s omission will result in an incomplete view.
The main cost items are Raw material costs (Livestock and Feed), followed by Other Operational costs and Wages and salaries. The increased Other operational costs in 2011 is due to the fact that On bottom units begin to include taxes for the occupation of the land (public domain) on their annual survey.
Figure 5.22.4 Economic performance of the Portugal aquaculture sector: 2011.
0
10
20
30
40
50
60
70
80
90
Incomestructure
Costs structure GVA EBIT Net profit
mil
lio
n €
Other operational costs
Raw material: Livestock costs
Raw material: Feed costs
Repair and maintenance
Energy costs
Imputed value of unpaid labour
Wages and salaries
Subsidies
Other income
Turnover
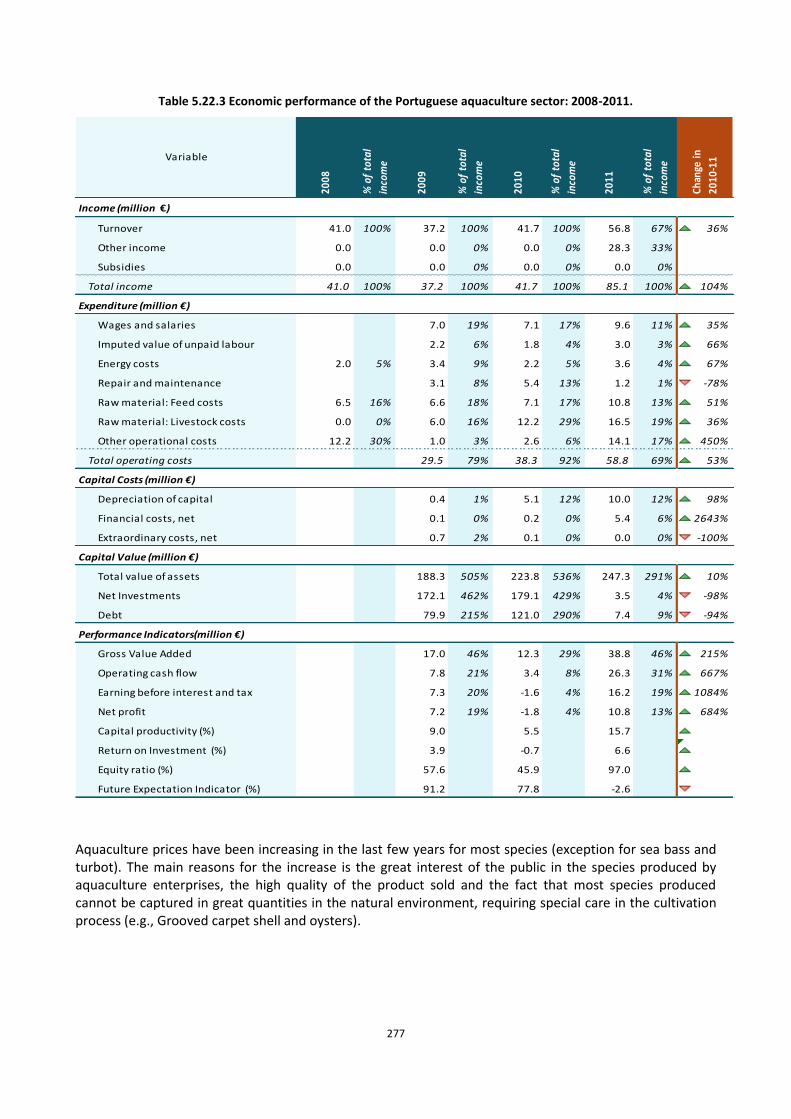
277
Table 5.22.3 Economic performance of the Portuguese aquaculture sector: 2008-2011.
Income (million €)
Turnover 41.0 100% 37.2 100% 41.7 100% 56.8 67% 36%
Other income 0.0 0.0 0% 0.0 0% 28.3 33%
Subsidies 0.0 0.0 0% 0.0 0% 0.0 0%
Total income 41.0 100% 37.2 100% 41.7 100% 85.1 100% 104%
Expenditure (million €)
Wages and salaries 7.0 19% 7.1 17% 9.6 11% 35%
Imputed value of unpaid labour 2.2 6% 1.8 4% 3.0 3% 66%
Energy costs 2.0 5% 3.4 9% 2.2 5% 3.6 4% 67%
Repair and maintenance 3.1 8% 5.4 13% 1.2 1% -78%
Raw material: Feed costs 6.5 16% 6.6 18% 7.1 17% 10.8 13% 51%
Raw material: Livestock costs 0.0 0% 6.0 16% 12.2 29% 16.5 19% 36%
Other operational costs 12.2 30% 1.0 3% 2.6 6% 14.1 17% 450%
Total operating costs 29.5 79% 38.3 92% 58.8 69% 53%
Capital Costs (million €)
Depreciation of capital 0.4 1% 5.1 12% 10.0 12% 98%
Financial costs, net 0.1 0% 0.2 0% 5.4 6% 2643%
Extraordinary costs, net 0.7 2% 0.1 0% 0.0 0% -100%
Capital Value (million €)
Total value of assets 188.3 505% 223.8 536% 247.3 291% 10%
Net Investments 172.1 462% 179.1 429% 3.5 4% -98%
Debt 79.9 215% 121.0 290% 7.4 9% -94%
Performance Indicators(million €)
Gross Value Added 17.0 46% 12.3 29% 38.8 46% 215%
Operating cash flow 7.8 21% 3.4 8% 26.3 31% 667%
Earning before interest and tax 7.3 20% -1.6 4% 16.2 19% 1084%
Net profit 7.2 19% -1.8 4% 10.8 13% 684%
Capital productivity (%) 9.0 5.5 15.7 185%
Return on Investment (%) 3.9 -0.7 6.6 986%
Equity ratio (%) 57.6 45.9 97.0 111%
Future Expectation Indicator (%) 91.2 77.8 -2.6 -103%
% o
f to
tal
inco
meVariable
% o
f to
tal
inco
me
2008
2009
% o
f to
tal
inco
me
2010
2011
Chan
ge in
2010
-11
% o
f to
tal
inco
me
Aquaculture prices have been increasing in the last few years for most species (exception for sea bass and turbot). The main reasons for the increase is the great interest of the public in the species produced by aquaculture enterprises, the high quality of the product sold and the fact that most species produced cannot be captured in great quantities in the natural environment, requiring special care in the cultivation process (e.g., Grooved carpet shell and oysters).
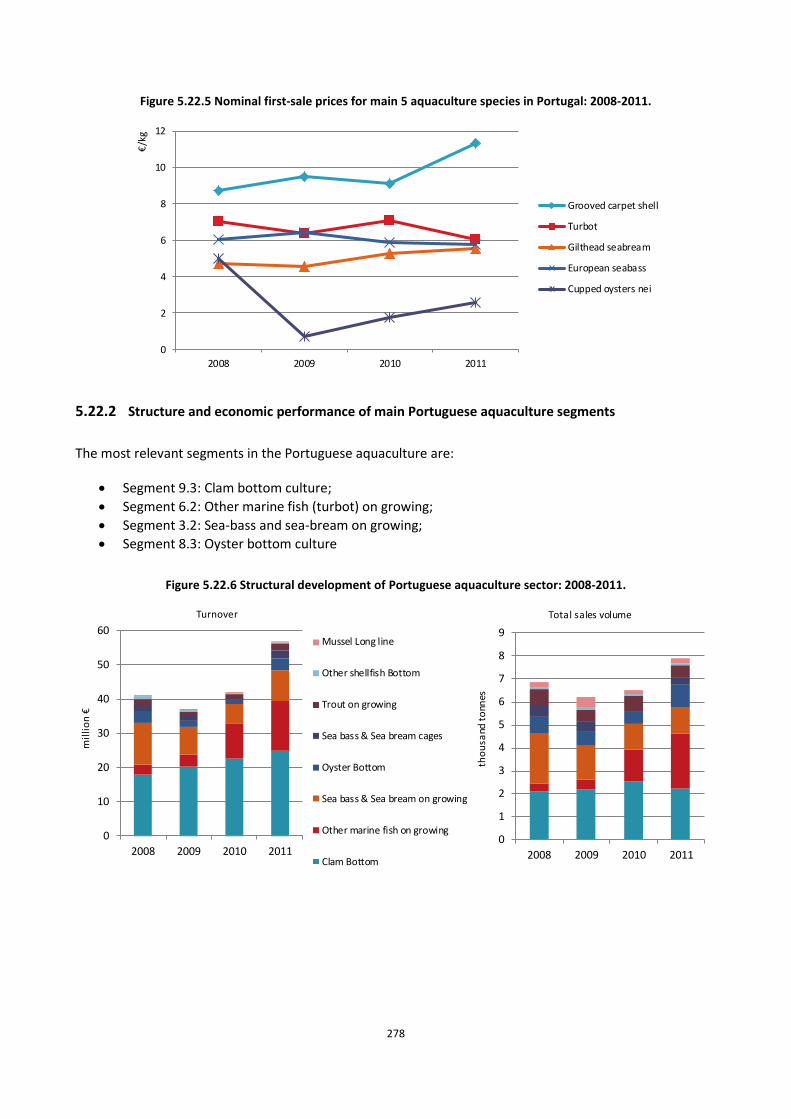
278
Figure 5.22.5 Nominal first-sale prices for main 5 aquaculture species in Portugal: 2008-2011.
0
2
4
6
8
10
12
2008 2009 2010 2011
€/k
g
Grooved carpet shell
Turbot
Gilthead seabream
European seabass
Cupped oysters nei
5.22.2 Structure and economic performance of main Portuguese aquaculture segments
The most relevant segments in the Portuguese aquaculture are:
Segment 9.3: Clam bottom culture;
Segment 6.2: Other marine fish (turbot) on growing;
Segment 3.2: Sea-bass and sea-bream on growing;
Segment 8.3: Oyster bottom culture
Figure 5.22.6 Structural development of Portuguese aquaculture sector: 2008-2011.
0
10
20
30
40
50
60
2008 2009 2010 2011
mil
lio
n €
Turnover
Mussel Long line
Other shellfish Bottom
Trout on growing
Sea bass & Sea bream cages
Oyster Bottom
Sea bass & Sea bream on growing
Other marine fish on growing
Clam Bottom
0
1
2
3
4
5
6
7
8
9
2008 2009 2010 2011
tho
usa
nd t
onn
es
Total sales volume
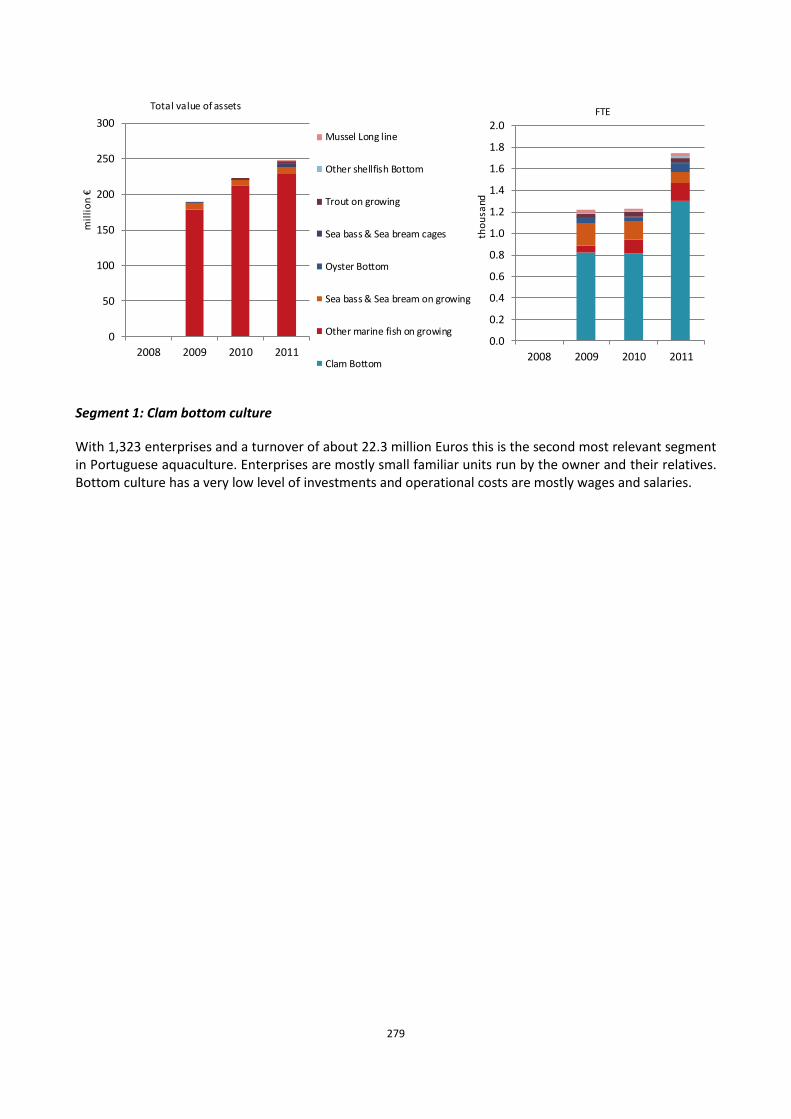
279
0
50
100
150
200
250
300
2008 2009 2010 2011
mil
lio
n €
Total value of assets
Mussel Long line
Other shellfish Bottom
Trout on growing
Sea bass & Sea bream cages
Oyster Bottom
Sea bass & Sea bream on growing
Other marine fish on growing
Clam Bottom
0.0
0.2
0.4
0.6
0.8
1.0
1.2
1.4
1.6
1.8
2.0
2008 2009 2010 2011
tho
usa
nd
FTE
Segment 1: Clam bottom culture
With 1,323 enterprises and a turnover of about 22.3 million Euros this is the second most relevant segment in Portuguese aquaculture. Enterprises are mostly small familiar units run by the owner and their relatives. Bottom culture has a very low level of investments and operational costs are mostly wages and salaries.
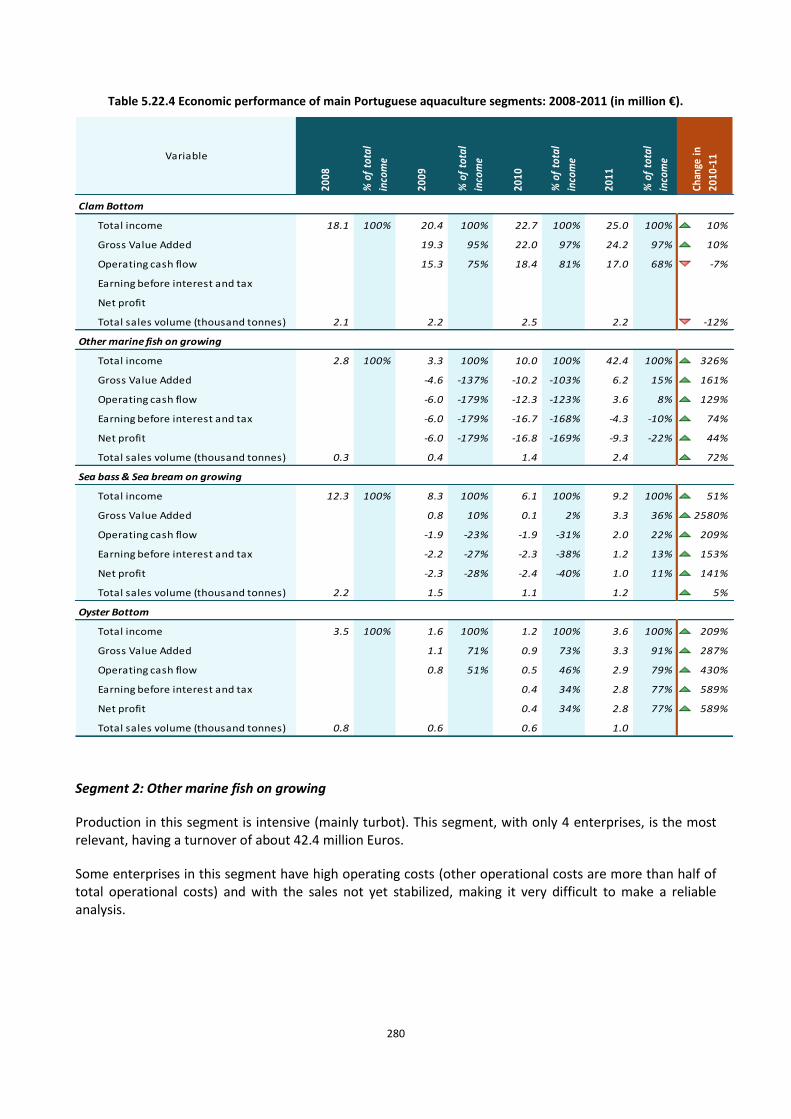
280
Table 5.22.4 Economic performance of main Portuguese aquaculture segments: 2008-2011 (in million €).
Clam Bottom
Total income 18.1 100% 20.4 100% 22.7 100% 25.0 100% 10%
Gross Value Added 19.3 95% 22.0 97% 24.2 97% 10%
Operating cash flow 15.3 75% 18.4 81% 17.0 68% -7%
Earning before interest and tax
Net profit
Total sales volume (thousand tonnes) 2.1 2.2 2.5 2.2 -12%
Other marine fish on growing
Total income 2.8 100% 3.3 100% 10.0 100% 42.4 100% 326%
Gross Value Added -4.6 -137% -10.2 -103% 6.2 15% 161%
Operating cash flow -6.0 -179% -12.3 -123% 3.6 8% 129%
Earning before interest and tax -6.0 -179% -16.7 -168% -4.3 -10% 74%
Net profit -6.0 -179% -16.8 -169% -9.3 -22% 44%
Total sales volume (thousand tonnes) 0.3 0.4 1.4 2.4 72%
Sea bass & Sea bream on growing
Total income 12.3 100% 8.3 100% 6.1 100% 9.2 100% 51%
Gross Value Added 0.8 10% 0.1 2% 3.3 36% 2580%
Operating cash flow -1.9 -23% -1.9 -31% 2.0 22% 209%
Earning before interest and tax -2.2 -27% -2.3 -38% 1.2 13% 153%
Net profit -2.3 -28% -2.4 -40% 1.0 11% 141%
Total sales volume (thousand tonnes) 2.2 1.5 1.1 1.2 5%
Oyster Bottom
Total income 3.5 100% 1.6 100% 1.2 100% 3.6 100% 209%
Gross Value Added 1.1 71% 0.9 73% 3.3 91% 287%
Operating cash flow 0.8 51% 0.5 46% 2.9 79% 430%
Earning before interest and tax 0.4 34% 2.8 77% 589%
Net profit 0.4 34% 2.8 77% 589%
Total sales volume (thousand tonnes) 0.8 0.6 0.6 1.0
% o
f to
tal
inco
me
Chan
ge in
2010
-11Variable
2008
% o
f to
tal
inco
me
2009
% o
f to
tal
inco
me
2010
% o
f to
tal
inco
me
2011
Segment 2: Other marine fish on growing
Production in this segment is intensive (mainly turbot). This segment, with only 4 enterprises, is the most relevant, having a turnover of about 42.4 million Euros.
Some enterprises in this segment have high operating costs (other operational costs are more than half of total operational costs) and with the sales not yet stabilized, making it very difficult to make a reliable analysis.
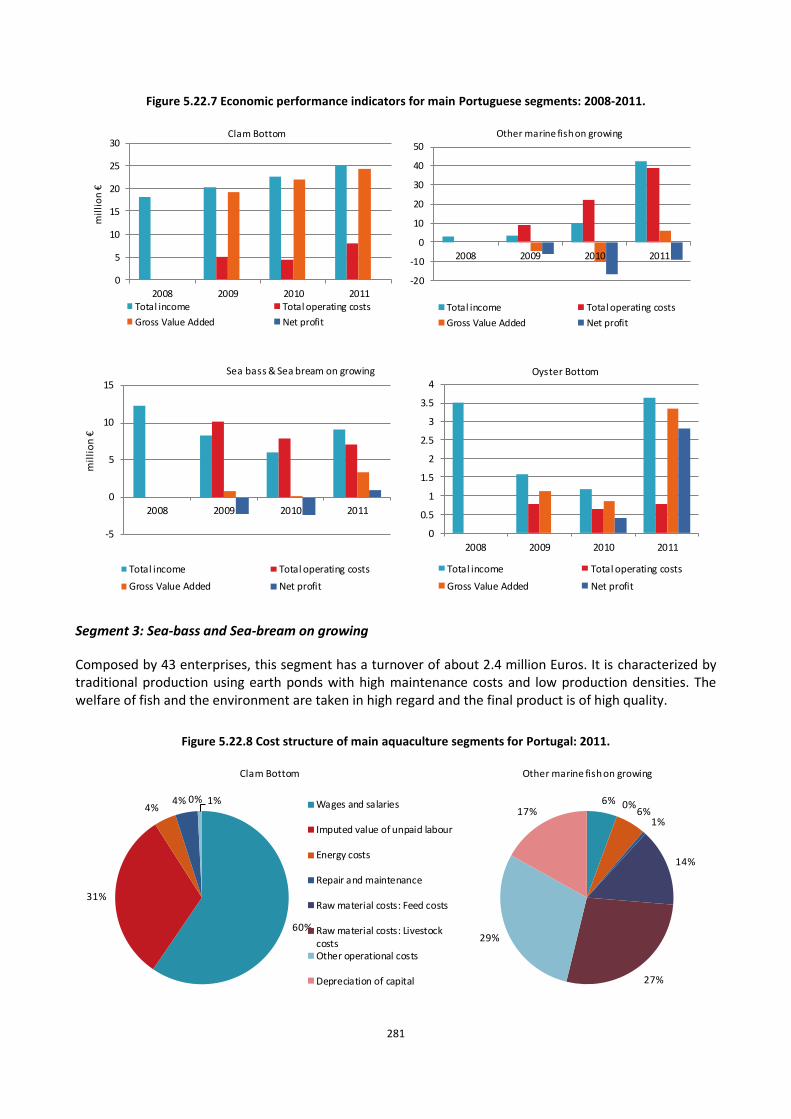
281
Figure 5.22.7 Economic performance indicators for main Portuguese segments: 2008-2011.
0
5
10
15
20
25
30
2008 2009 2010 2011
mil
lio
n €
Clam Bottom
Total income Total operating costs
Gross Value Added Net profit
-20
-10
0
10
20
30
40
50
2008 2009 2010 2011
Other marine fish on growing
Total income Total operating costs
Gross Value Added Net profit
-5
0
5
10
15
2008 2009 2010 2011
mil
lio
n €
Sea bass & Sea bream on growing
Total income Total operating costs
Gross Value Added Net profit
0
0.5
1
1.5
2
2.5
3
3.5
4
2008 2009 2010 2011
Oyster Bottom
Total income Total operating costs
Gross Value Added Net profit
Segment 3: Sea-bass and Sea-bream on growing
Composed by 43 enterprises, this segment has a turnover of about 2.4 million Euros. It is characterized by traditional production using earth ponds with high maintenance costs and low production densities. The welfare of fish and the environment are taken in high regard and the final product is of high quality.
Figure 5.22.8 Cost structure of main aquaculture segments for Portugal: 2011.
60%
31%
4%4% 0% 1%
Clam Bottom
Wages and salaries
Imputed value of unpaid labour
Energy costs
Repair and maintenance
Raw material costs: Feed costs
Raw material costs: LivestockcostsOther operational costs
Depreciation of capital
6% 0%6%
1%
14%
27%
29%
17%
Other marine fish on growing
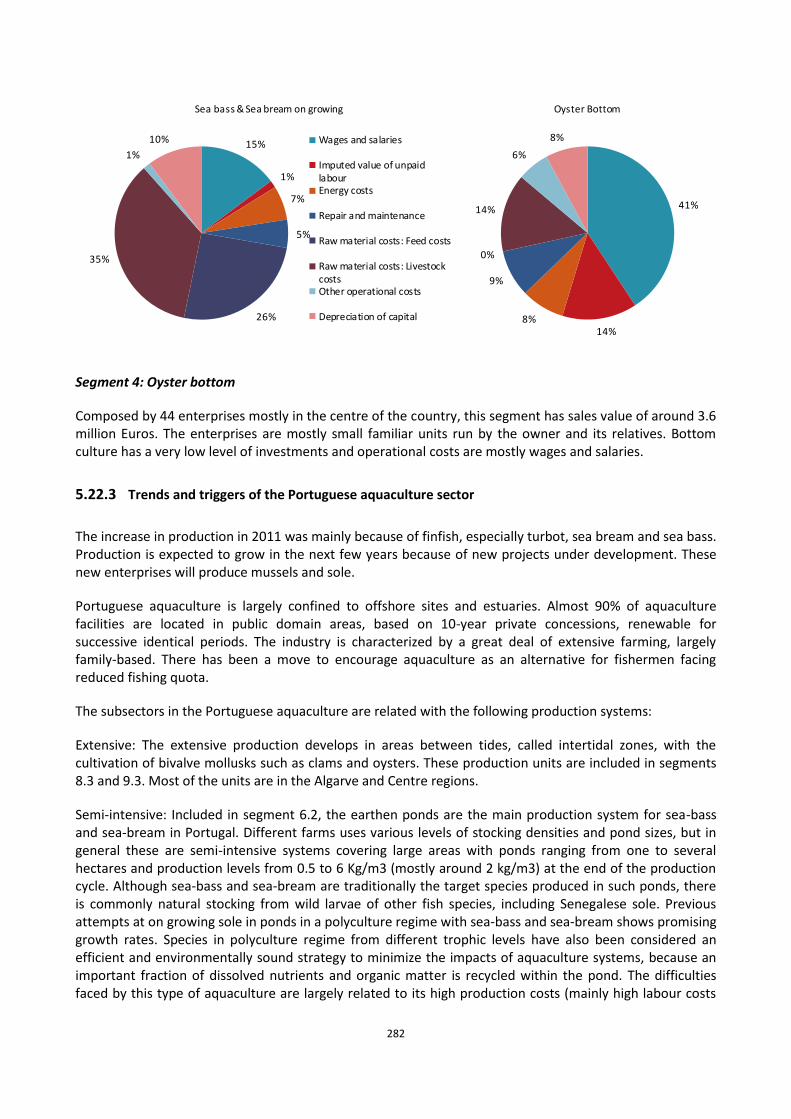
282
15%
1%
7%
5%
26%
35%
1%
10%
Sea bass & Sea bream on growing
Wages and salaries
Imputed value of unpaidlabourEnergy costs
Repair and maintenance
Raw material costs: Feed costs
Raw material costs: LivestockcostsOther operational costs
Depreciation of capital
41%
14%8%
9%
0%
14%
6%
8%
Oyster Bottom
Segment 4: Oyster bottom
Composed by 44 enterprises mostly in the centre of the country, this segment has sales value of around 3.6 million Euros. The enterprises are mostly small familiar units run by the owner and its relatives. Bottom culture has a very low level of investments and operational costs are mostly wages and salaries.
5.22.3 Trends and triggers of the Portuguese aquaculture sector
The increase in production in 2011 was mainly because of finfish, especially turbot, sea bream and sea bass. Production is expected to grow in the next few years because of new projects under development. These new enterprises will produce mussels and sole.
Portuguese aquaculture is largely confined to offshore sites and estuaries. Almost 90% of aquaculture facilities are located in public domain areas, based on 10-year private concessions, renewable for successive identical periods. The industry is characterized by a great deal of extensive farming, largely family-based. There has been a move to encourage aquaculture as an alternative for fishermen facing reduced fishing quota.
The subsectors in the Portuguese aquaculture are related with the following production systems:
Extensive: The extensive production develops in areas between tides, called intertidal zones, with the cultivation of bivalve mollusks such as clams and oysters. These production units are included in segments 8.3 and 9.3. Most of the units are in the Algarve and Centre regions.
Semi-intensive: Included in segment 6.2, the earthen ponds are the main production system for sea-bass and sea-bream in Portugal. Different farms uses various levels of stocking densities and pond sizes, but in general these are semi-intensive systems covering large areas with ponds ranging from one to several hectares and production levels from 0.5 to 6 Kg/m3 (mostly around 2 kg/m3) at the end of the production cycle. Although sea-bass and sea-bream are traditionally the target species produced in such ponds, there is commonly natural stocking from wild larvae of other fish species, including Senegalese sole. Previous attempts at on growing sole in ponds in a polyculture regime with sea-bass and sea-bream shows promising growth rates. Species in polyculture regime from different trophic levels have also been considered an efficient and environmentally sound strategy to minimize the impacts of aquaculture systems, because an important fraction of dissolved nutrients and organic matter is recycled within the pond. The difficulties faced by this type of aquaculture are largely related to its high production costs (mainly high labour costs
283
and high land costs) that compromise its economic sustainability due to the low productivity of these systems. There is currently a trend of reconverting the culture practiced in the earth pounds from a fish culture to a mollusk culture, with the consequent decrease in the volume of sea-bass and sea-bream produced.
Intensive: Corresponding to segment 3.2, the intensive production in Portugal refers to the cultivation of turbot and sole. In 2012 some new developments happened with the production of sole in closed systems and in intensive regime as well as the installation of a maternity of sole. Production costs are high, but the selling price per kg compensates.
The aquaculture sector is mostly based on bottom culture units, about 1300 establishments, with strictly family labour. With the definition of new aquaculture sites in off-shore areas it is expected the emergence of new enterprises with logistical support or even aiming a restructuration in the national sector.
With the emergence in 2009 of a big company, the overall cost structure become greatly altered and irregular as it is not yet stabilized, making it impossible to have a correct cost structure.
Considerable investment was made in 2009 and 2013 (offshore) that will have expected positive impacts in the next 2 years productions.
The need to differentiate Portuguese products acted as a driver to the certification of the national production, with some facilities intended to convert to a bio-ecological model of organic aquaculture production. The goal of national fisheries policy in regard to aquaculture is to increase production and product diversity, but also product quality, so as to improve the sector’s competitiveness. Portugal is taking the first steps in organic certification, and there are on-going analysis of applications for the establishments of bivalves, fish and seaweed currently being made.
There is a bet in the production of sole with a new hatchery currently producing sole using and developing new techniques and diets.
The processing and marketing of fishery products must respond to changing consumer trends and profiles, seeking to expand and diversify its business, adjusting it to market developments, betting on internationalization and joint control of marketing channels in order to enhance the ability to generate added value. To strengthen this capacity is essential to a strong focus on quality and innovation of processes and products, as well as in the introduction of improvements in the management and organization of companies.
Many projects were conducted in order to improve diet formulations (e.g., finding an optimal protein/energy ratio) which also contributes to the increase of the production and to the reduction of environmental impacts of semi-intensive and intensive aquaculture. The proportion of nutrients utilized for fish growth can be maximized, for example by selecting very digestible ingredients that facilitate nutrient assimilation and promote the improvement of FCRs (Feed Conversion Ratios), and at the same time reducing the amount of waste and nutrient output from fish farms (Black 2001, World Bank 2006). Eco-friendly feeds, in which fishmeal protein is replaced by vegetable protein sources, may also contribute to the reduction of aquaculture’s ecological footprint by reducing the pressure on natural fisheries resources).
Most aquaculture products are consumed locally, with export sales making up only 6% of the total. Overall sales figures, when compared to the significant investments in aquaculture in the period prior to 2007, seem rather modest. However, some investments (notably in a turbot farm which is about to begin operations) will bring returns in the longer term.
284
The EMFF is the proposed new fund for the EU's maritime and fisheries policies for the period 2014-2020. In line with the ambitious reform of the common fisheries policy, the Fund will help support coastal communities in diversifying their economies. It will finance projects to create new jobs and improve quality of life along European coasts.
One of the developments on competitiveness is the conversation to eco-management and audit schemes and organic aquaculture.
Administrative costs and the execution time determine to a large extent the overall level of competitiveness and development of an economic sector. Currently, there is little information about the periods and the costs linked to the granting of a licence for a new aquaculture farm and the Commission is not aware of any comprehensive analysis of the main bottlenecks. The aquaculture strategic plan is being developed by the national authorities in order to reduce the impacts of administrative burdens to allow enterprises to obtain new licenses in a shorter period of time and identify new zones suitable for aquaculture production facilities.
Portugal developed a Plan of maritime spatial planning. The implementation of this plan will help reduce uncertainties, facilitate investment and speed up the development of industries such as aquaculture or the production of offshore renewable energy. The lack of space, often cited as an obstacle to the expansion of marine aquaculture in the EU can be overcome with the identification of the most suitable sites for aquaculture as the current occupation of space by aquaculture activities, in and on coast, appears to be limited. In this plan, areas with better suitability for aquaculture development in offshore were identified and conditions for their installation were set. Plans for the estuarine spatial planning are currently under development. These plans will identify the most appropriate areas for aquaculture of brackish water and will contribute to the increase in production and, at the same time, will improve the protection of the landscape, habitats and biodiversity. The main constraints associated with the type of semi-intensive system are the competition for land use with tourism and other activities, legal limitations in protected wetland areas and the higher production costs compared to intensive farming systems.
Investments in aquaculture are based on spatial planning, seeking not only to minimize possible conflicts with other users with an appetite for the same locations, but also compatible with other uses of the same space, in particular those involved in the conservation of ecosystems, with a view to the sustainable development of aquaculture practices. They will privilege environmental standards in the implementation of the physical structures, but, mainly, in the use of aquaculture production methods compatible with the protection and improvement of the environment. Investments to introduce improvements in management practices of production and marketing including through the intensification of new information and communication technologies are also encouraged. Structural modernisation is also being promoted within the current fisheries management plan. These objectives are consistent with those established by the EU in the Common Fisheries Policy, and particularly the 2002 Strategy for the Sustainable Development of European Aquaculture, which promotes environmental, economic and social sustainability. The intervention of the Fund was very important however the fact of not being able to compete for large companies has limited investment, innovation and use of new technologies as well as the presentation of new products for new markets. Reality denotes that SME's have not been able to match the expectations of the Commission nor the demands and market needs in terms of diversification of products and certification of production.
Production of sole with a new hatchery and on growing unit, currently producing sole and using and developing new techniques and diets.
There are some new pilot projects developing new techniques and diets.
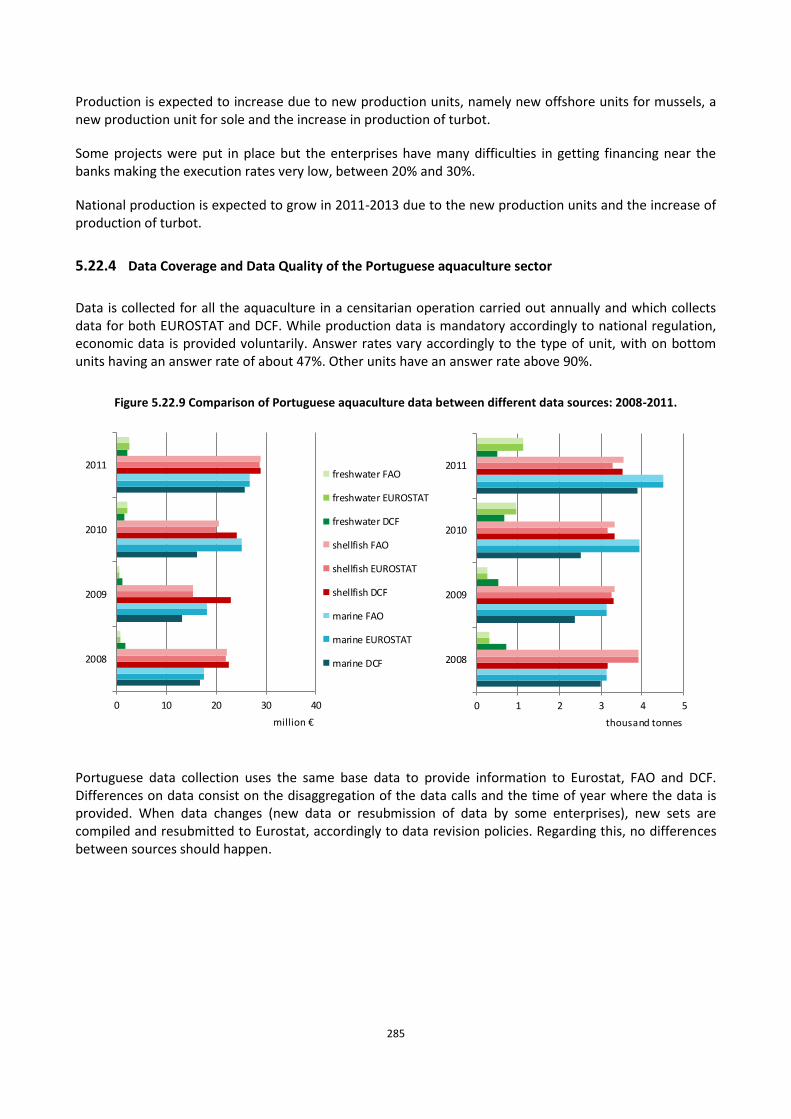
285
Production is expected to increase due to new production units, namely new offshore units for mussels, a new production unit for sole and the increase in production of turbot.
Some projects were put in place but the enterprises have many difficulties in getting financing near the banks making the execution rates very low, between 20% and 30%.
National production is expected to grow in 2011-2013 due to the new production units and the increase of production of turbot.
5.22.4 Data Coverage and Data Quality of the Portuguese aquaculture sector
Data is collected for all the aquaculture in a censitarian operation carried out annually and which collects data for both EUROSTAT and DCF. While production data is mandatory accordingly to national regulation, economic data is provided voluntarily. Answer rates vary accordingly to the type of unit, with on bottom units having an answer rate of about 47%. Other units have an answer rate above 90%.
Figure 5.22.9 Comparison of Portuguese aquaculture data between different data sources: 2008-2011.
0 10 20 30 40
2008
2009
2010
2011
million €
freshwater FAO
freshwater EUROSTAT
freshwater DCF
shellfish FAO
shellfish EUROSTAT
shellfish DCF
marine FAO
marine EUROSTAT
marine DCF
0 1 2 3 4 5
2008
2009
2010
2011
thousand tonnes
Portuguese data collection uses the same base data to provide information to Eurostat, FAO and DCF. Differences on data consist on the disaggregation of the data calls and the time of year where the data is provided. When data changes (new data or resubmission of data by some enterprises), new sets are compiled and resubmitted to Eurostat, accordingly to data revision policies. Regarding this, no differences between sources should happen.
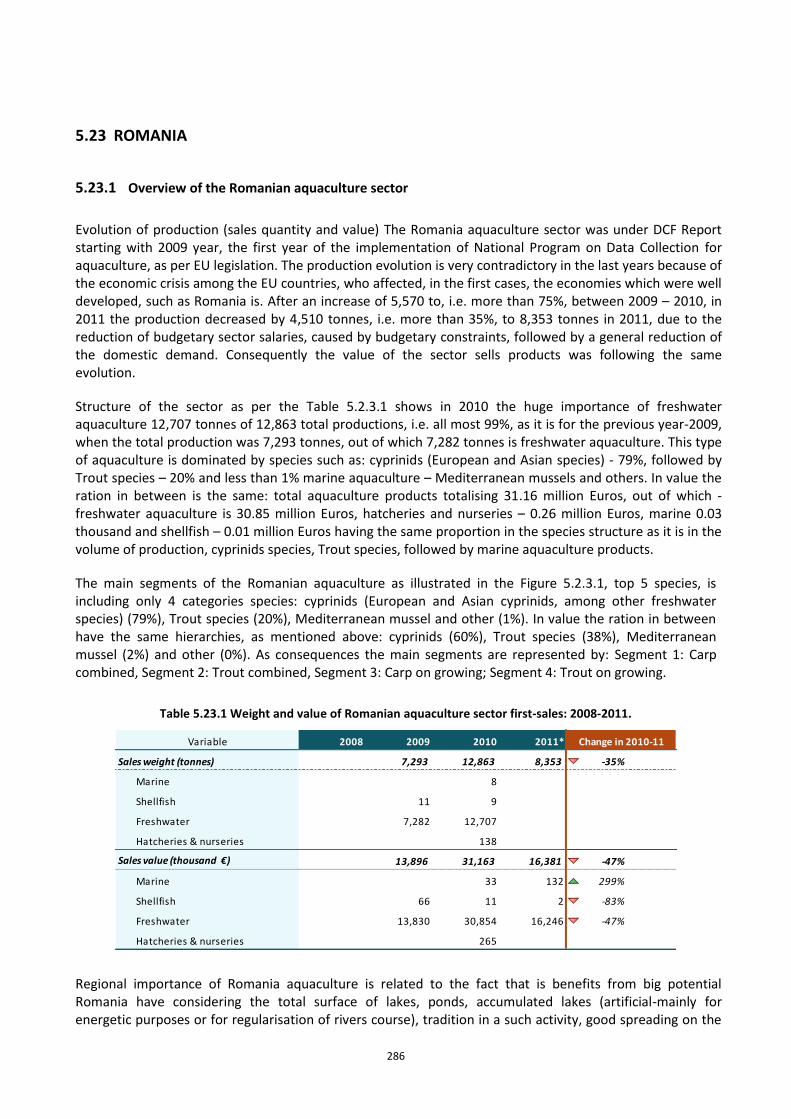
286
5.23 ROMANIA
5.23.1 Overview of the Romanian aquaculture sector
Evolution of production (sales quantity and value) The Romania aquaculture sector was under DCF Report starting with 2009 year, the first year of the implementation of National Program on Data Collection for aquaculture, as per EU legislation. The production evolution is very contradictory in the last years because of the economic crisis among the EU countries, who affected, in the first cases, the economies which were well developed, such as Romania is. After an increase of 5,570 to, i.e. more than 75%, between 2009 – 2010, in 2011 the production decreased by 4,510 tonnes, i.e. more than 35%, to 8,353 tonnes in 2011, due to the reduction of budgetary sector salaries, caused by budgetary constraints, followed by a general reduction of the domestic demand. Consequently the value of the sector sells products was following the same evolution.
Structure of the sector as per the Table 5.2.3.1 shows in 2010 the huge importance of freshwater aquaculture 12,707 tonnes of 12,863 total productions, i.e. all most 99%, as it is for the previous year-2009, when the total production was 7,293 tonnes, out of which 7,282 tonnes is freshwater aquaculture. This type of aquaculture is dominated by species such as: cyprinids (European and Asian species) - 79%, followed by Trout species – 20% and less than 1% marine aquaculture – Mediterranean mussels and others. In value the ration in between is the same: total aquaculture products totalising 31.16 million Euros, out of which - freshwater aquaculture is 30.85 million Euros, hatcheries and nurseries – 0.26 million Euros, marine 0.03 thousand and shellfish – 0.01 million Euros having the same proportion in the species structure as it is in the volume of production, cyprinids species, Trout species, followed by marine aquaculture products.
The main segments of the Romanian aquaculture as illustrated in the Figure 5.2.3.1, top 5 species, is including only 4 categories species: cyprinids (European and Asian cyprinids, among other freshwater species) (79%), Trout species (20%), Mediterranean mussel and other (1%). In value the ration in between have the same hierarchies, as mentioned above: cyprinids (60%), Trout species (38%), Mediterranean mussel (2%) and other (0%). As consequences the main segments are represented by: Segment 1: Carp combined, Segment 2: Trout combined, Segment 3: Carp on growing; Segment 4: Trout on growing.
Table 5.23.1 Weight and value of Romanian aquaculture sector first-sales: 2008-2011.
Variable 2008 2009 2010 2011*
Sales weight (tonnes) 7,293 12,863 8,353 -35%
Marine 8
Shellfish 11 9
Freshwater 7,282 12,707
Hatcheries & nurseries 138
Sales value (thousand €) 13,896 31,163 16,381 -47% ↘
Marine 33 132 299% ↗
Shellfish 66 11 2 -83% ↘
Freshwater 13,830 30,854 16,246 -47%
Hatcheries & nurseries 265
Change in 2010-11
Regional importance of Romania aquaculture is related to the fact that is benefits from big potential Romania have considering the total surface of lakes, ponds, accumulated lakes (artificial-mainly for energetic purposes or for regularisation of rivers course), tradition in a such activity, good spreading on the
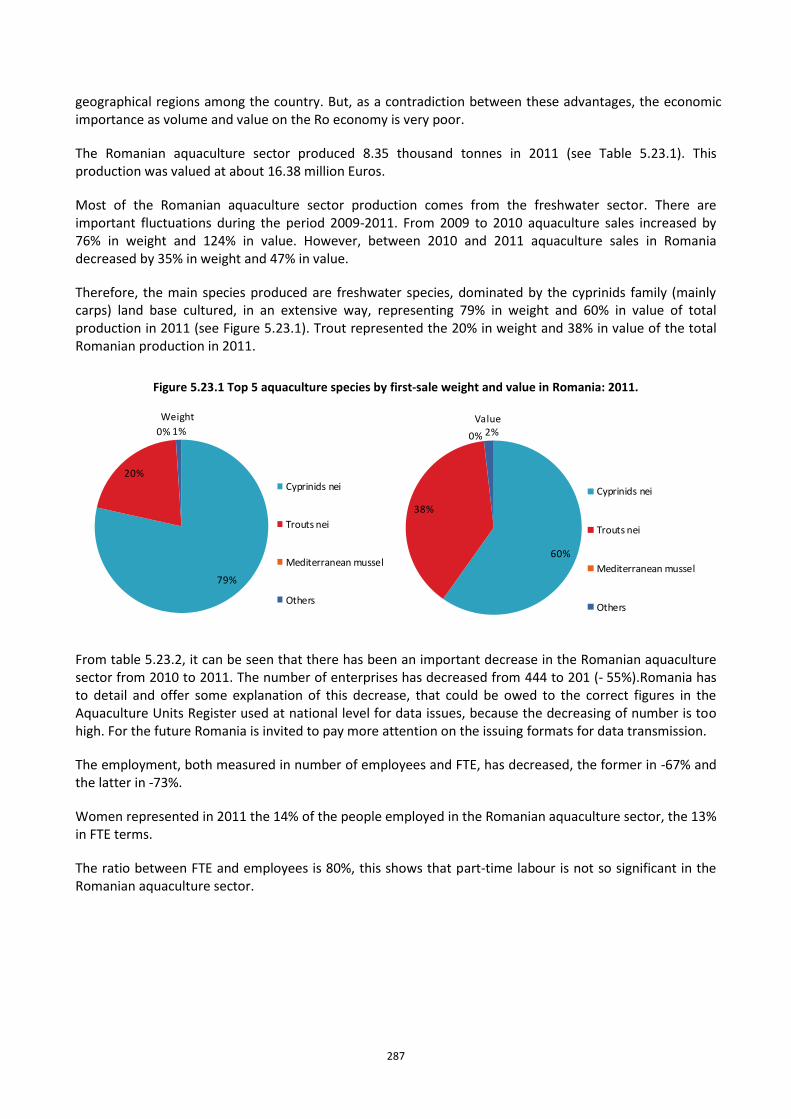
287
geographical regions among the country. But, as a contradiction between these advantages, the economic importance as volume and value on the Ro economy is very poor.
The Romanian aquaculture sector produced 8.35 thousand tonnes in 2011 (see Table 5.23.1). This production was valued at about 16.38 million Euros.
Most of the Romanian aquaculture sector production comes from the freshwater sector. There are important fluctuations during the period 2009-2011. From 2009 to 2010 aquaculture sales increased by 76% in weight and 124% in value. However, between 2010 and 2011 aquaculture sales in Romania decreased by 35% in weight and 47% in value.
Therefore, the main species produced are freshwater species, dominated by the cyprinids family (mainly carps) land base cultured, in an extensive way, representing 79% in weight and 60% in value of total production in 2011 (see Figure 5.23.1). Trout represented the 20% in weight and 38% in value of the total Romanian production in 2011.
Figure 5.23.1 Top 5 aquaculture species by first-sale weight and value in Romania: 2011.
79%
20%
0% 1%
Weight
Cyprinids nei
Trouts nei
Mediterranean mussel
Others
60%
38%
0% 2%Value
Cyprinids nei
Trouts nei
Mediterranean mussel
Others
From table 5.23.2, it can be seen that there has been an important decrease in the Romanian aquaculture sector from 2010 to 2011. The number of enterprises has decreased from 444 to 201 (- 55%).Romania has to detail and offer some explanation of this decrease, that could be owed to the correct figures in the Aquaculture Units Register used at national level for data issues, because the decreasing of number is too high. For the future Romania is invited to pay more attention on the issuing formats for data transmission.
The employment, both measured in number of employees and FTE, has decreased, the former in -67% and the latter in -73%.
Women represented in 2011 the 14% of the people employed in the Romanian aquaculture sector, the 13% in FTE terms.
The ratio between FTE and employees is 80%, this shows that part-time labour is not so significant in the Romanian aquaculture sector.
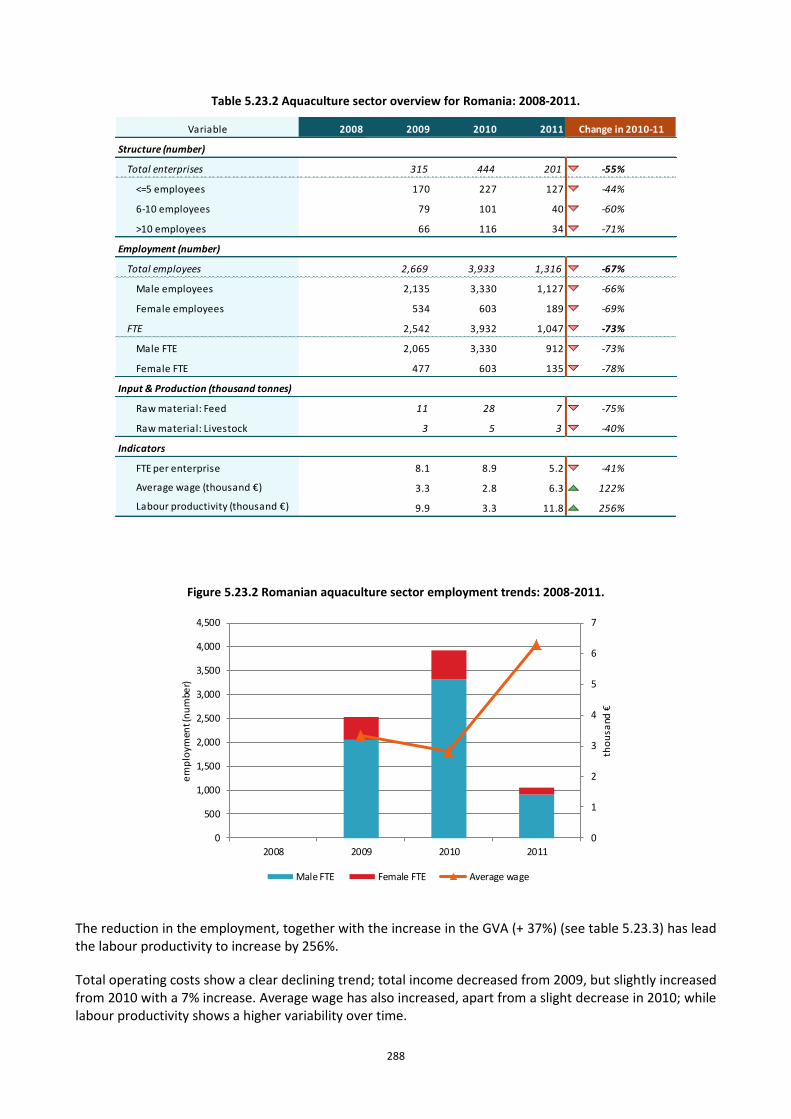
288
Table 5.23.2 Aquaculture sector overview for Romania: 2008-2011.
Variable 2008 2009 2010 2011
Structure (number)
Total enterprises 315 444 201 -55% ↔
<=5 employees 170 227 127 -44% ↘
6-10 employees 79 101 40 -60% ↘
>10 employees 66 116 34 -71% ↘
Employment (number)
Total employees 2,669 3,933 1,316 -67% ↘
Male employees 2,135 3,330 1,127 -66% ↘
Female employees 534 603 189 -69% ↘
FTE 2,542 3,932 1,047 -73% ↘
Male FTE 2,065 3,330 912 -73% ↘
Female FTE 477 603 135 -78% ↘
Input & Production (thousand tonnes)
Raw material: Feed 11 28 7 -75% ↘
Raw material: Livestock 3 5 3 -40%
Indicators
FTE per enterprise 8.1 8.9 5.2 -41% ↘
Average wage (thousand €) 3.3 2.8 6.3 122% ↗
Labour productivity (thousand €) 9.9 3.3 11.8 256% ↗
Change in 2010-11
Figure 5.23.2 Romanian aquaculture sector employment trends: 2008-2011.
0
1
2
3
4
5
6
7
0
500
1,000
1,500
2,000
2,500
3,000
3,500
4,000
4,500
2008 2009 2010 2011
tho
usa
nd €
em
plo
ymen
t (n
um
ber)
Male FTE Female FTE Average wage
The reduction in the employment, together with the increase in the GVA (+ 37%) (see table 5.23.3) has lead the labour productivity to increase by 256%.
Total operating costs show a clear declining trend; total income decreased from 2009, but slightly increased from 2010 with a 7% increase. Average wage has also increased, apart from a slight decrease in 2010; while labour productivity shows a higher variability over time.
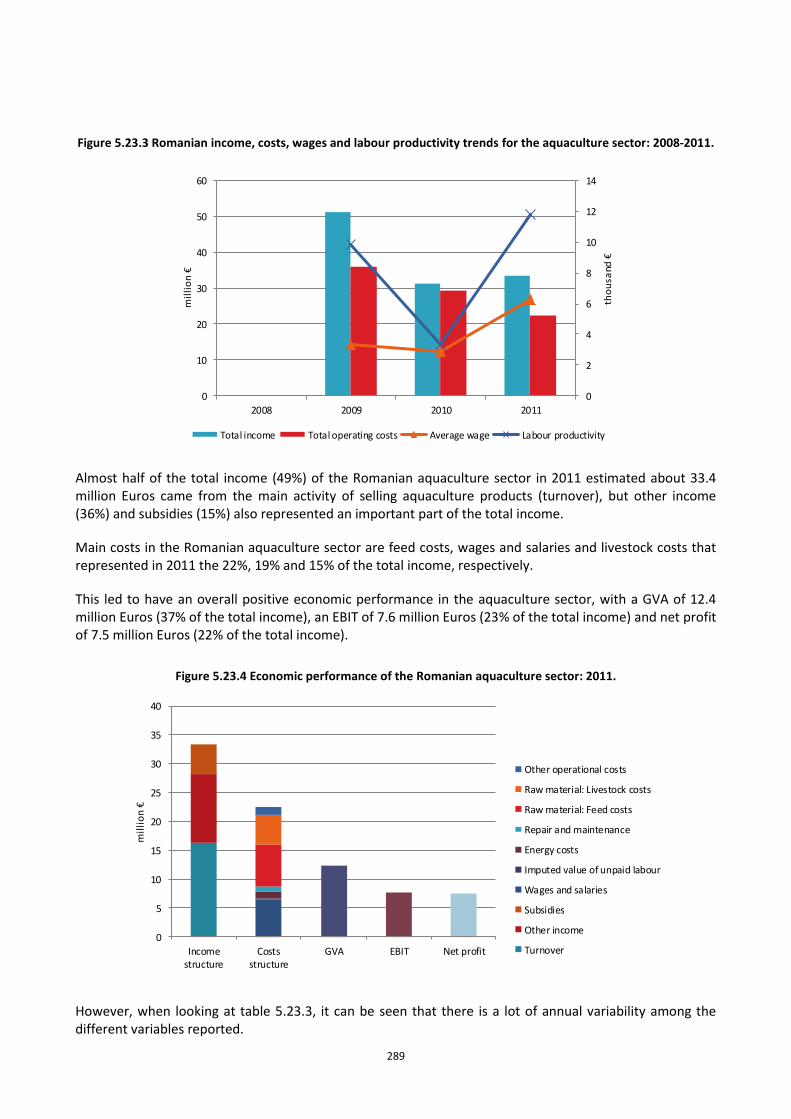
289
Figure 5.23.3 Romanian income, costs, wages and labour productivity trends for the aquaculture sector: 2008-2011.
0
2
4
6
8
10
12
14
0
10
20
30
40
50
60
2008 2009 2010 2011
tho
usa
nd €
mil
lio
n €
Total income Total operating costs Average wage Labour productivity
Almost half of the total income (49%) of the Romanian aquaculture sector in 2011 estimated about 33.4 million Euros came from the main activity of selling aquaculture products (turnover), but other income (36%) and subsidies (15%) also represented an important part of the total income.
Main costs in the Romanian aquaculture sector are feed costs, wages and salaries and livestock costs that represented in 2011 the 22%, 19% and 15% of the total income, respectively.
This led to have an overall positive economic performance in the aquaculture sector, with a GVA of 12.4 million Euros (37% of the total income), an EBIT of 7.6 million Euros (23% of the total income) and net profit of 7.5 million Euros (22% of the total income).
Figure 5.23.4 Economic performance of the Romanian aquaculture sector: 2011.
0
5
10
15
20
25
30
35
40
Incomestructure
Costsstructure
GVA EBIT Net profit
mil
lio
n €
Other operational costs
Raw material: Livestock costs
Raw material: Feed costs
Repair and maintenance
Energy costs
Imputed value of unpaid labour
Wages and salaries
Subsidies
Other income
Turnover
However, when looking at table 5.23.3, it can be seen that there is a lot of annual variability among the different variables reported.
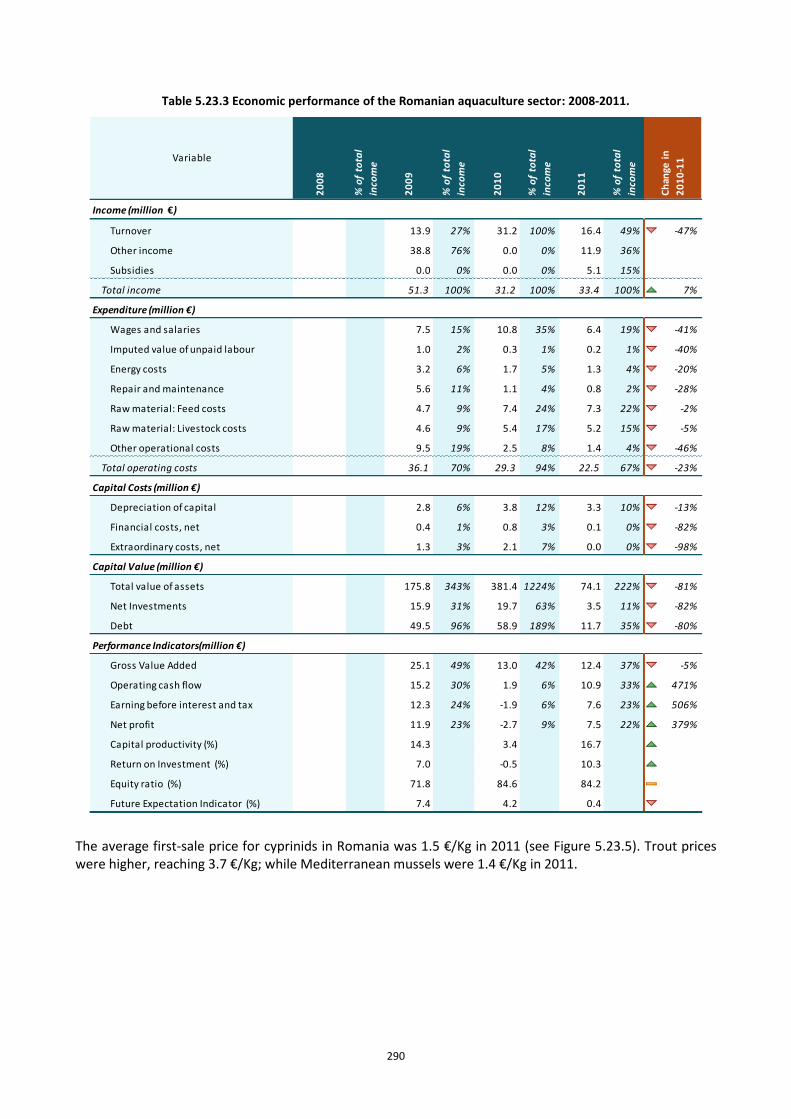
290
Table 5.23.3 Economic performance of the Romanian aquaculture sector: 2008-2011.
Income (million €)
Turnover 13.9 27% 31.2 100% 16.4 49% -47%
Other income 38.8 76% 0.0 0% 11.9 36%
Subsidies 0.0 0% 0.0 0% 5.1 15%
Total income 51.3 100% 31.2 100% 33.4 100% 7%
Expenditure (million €)
Wages and salaries 7.5 15% 10.8 35% 6.4 19% -41%
Imputed value of unpaid labour 1.0 2% 0.3 1% 0.2 1% -40%
Energy costs 3.2 6% 1.7 5% 1.3 4% -20%
Repair and maintenance 5.6 11% 1.1 4% 0.8 2% -28%
Raw material: Feed costs 4.7 9% 7.4 24% 7.3 22% -2%
Raw material: Livestock costs 4.6 9% 5.4 17% 5.2 15% -5%
Other operational costs 9.5 19% 2.5 8% 1.4 4% -46%
Total operating costs 36.1 70% 29.3 94% 22.5 67% -23%
Capital Costs (million €)
Depreciation of capital 2.8 6% 3.8 12% 3.3 10% -13%
Financial costs, net 0.4 1% 0.8 3% 0.1 0% -82%
Extraordinary costs, net 1.3 3% 2.1 7% 0.0 0% -98%
Capital Value (million €)
Total value of assets 175.8 343% 381.4 1224% 74.1 222% -81%
Net Investments 15.9 31% 19.7 63% 3.5 11% -82%
Debt 49.5 96% 58.9 189% 11.7 35% -80%
Performance Indicators(million €)
Gross Value Added 25.1 49% 13.0 42% 12.4 37% -5%
Operating cash flow 15.2 30% 1.9 6% 10.9 33% 471%
Earning before interest and tax 12.3 24% -1.9 6% 7.6 23% 506%
Net profit 11.9 23% -2.7 9% 7.5 22% 379%
Capital productivity (%) 14.3 3.4 16.7 388%
Return on Investment (%) 7.0 -0.5 10.3 2192%
Equity ratio (%) 71.8 84.6 84.2 0%
Future Expectation Indicator (%) 7.4 4.2 0.4 -91%
Ch
ange
in
20
10
-11
% o
f to
tal
inco
me
Variable
% o
f to
tal
inco
me
20
08
20
09
% o
f to
tal
inco
me
% o
f to
tal
inco
me
20
10
20
11
The average first-sale price for cyprinids in Romania was 1.5 €/Kg in 2011 (see Figure 5.23.5). Trout prices were higher, reaching 3.7 €/Kg; while Mediterranean mussels were 1.4 €/Kg in 2011.
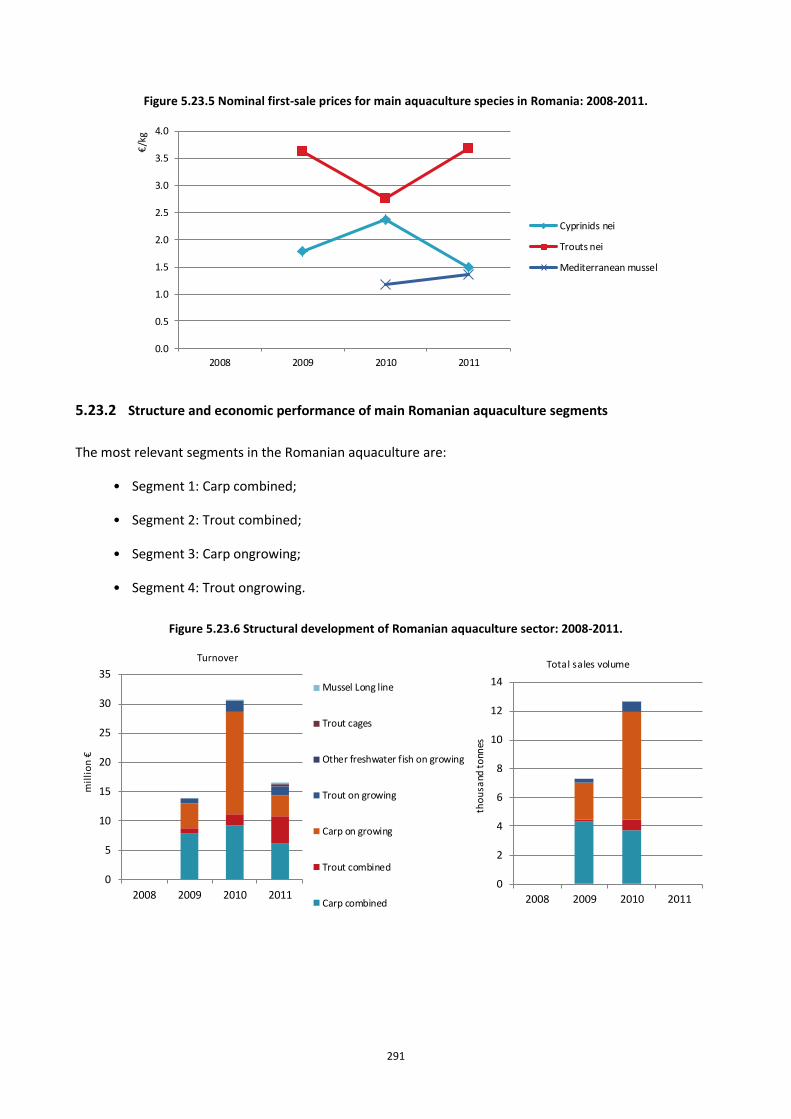
291
Figure 5.23.5 Nominal first-sale prices for main aquaculture species in Romania: 2008-2011.
0.0
0.5
1.0
1.5
2.0
2.5
3.0
3.5
4.0
2008 2009 2010 2011
€/k
g
Cyprinids nei
Trouts nei
Mediterranean mussel
5.23.2 Structure and economic performance of main Romanian aquaculture segments
The most relevant segments in the Romanian aquaculture are:
• Segment 1: Carp combined;
• Segment 2: Trout combined;
• Segment 3: Carp ongrowing;
• Segment 4: Trout ongrowing.
Figure 5.23.6 Structural development of Romanian aquaculture sector: 2008-2011.
0
5
10
15
20
25
30
35
2008 2009 2010 2011
mil
lio
n €
Turnover
Mussel Long line
Trout cages
Other freshwater fish on growing
Trout on growing
Carp on growing
Trout combined
Carp combined
0
2
4
6
8
10
12
14
2008 2009 2010 2011
tho
usa
nd t
onn
es
Total sales volume
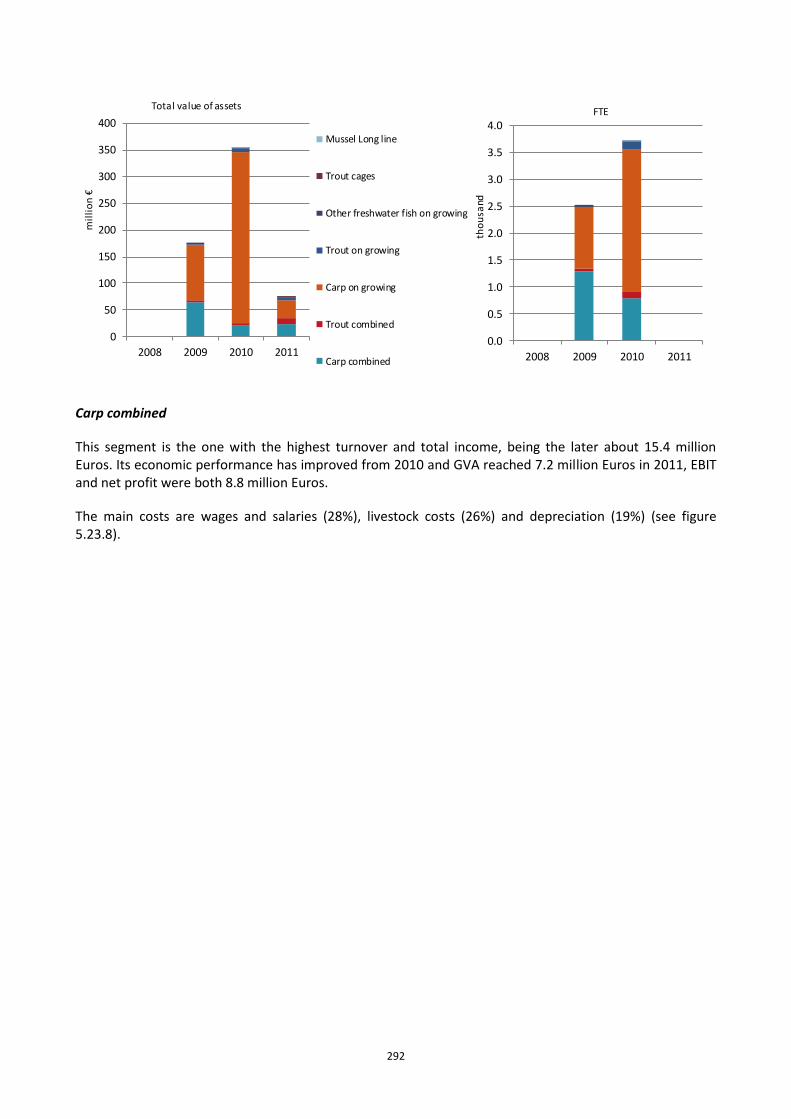
292
0
50
100
150
200
250
300
350
400
2008 2009 2010 2011
mil
lio
n €
Total value of assets
Mussel Long line
Trout cages
Other freshwater fish on growing
Trout on growing
Carp on growing
Trout combined
Carp combined
0.0
0.5
1.0
1.5
2.0
2.5
3.0
3.5
4.0
2008 2009 2010 2011
tho
usa
nd
FTE
Carp combined
This segment is the one with the highest turnover and total income, being the later about 15.4 million Euros. Its economic performance has improved from 2010 and GVA reached 7.2 million Euros in 2011, EBIT and net profit were both 8.8 million Euros.
The main costs are wages and salaries (28%), livestock costs (26%) and depreciation (19%) (see figure 5.23.8).
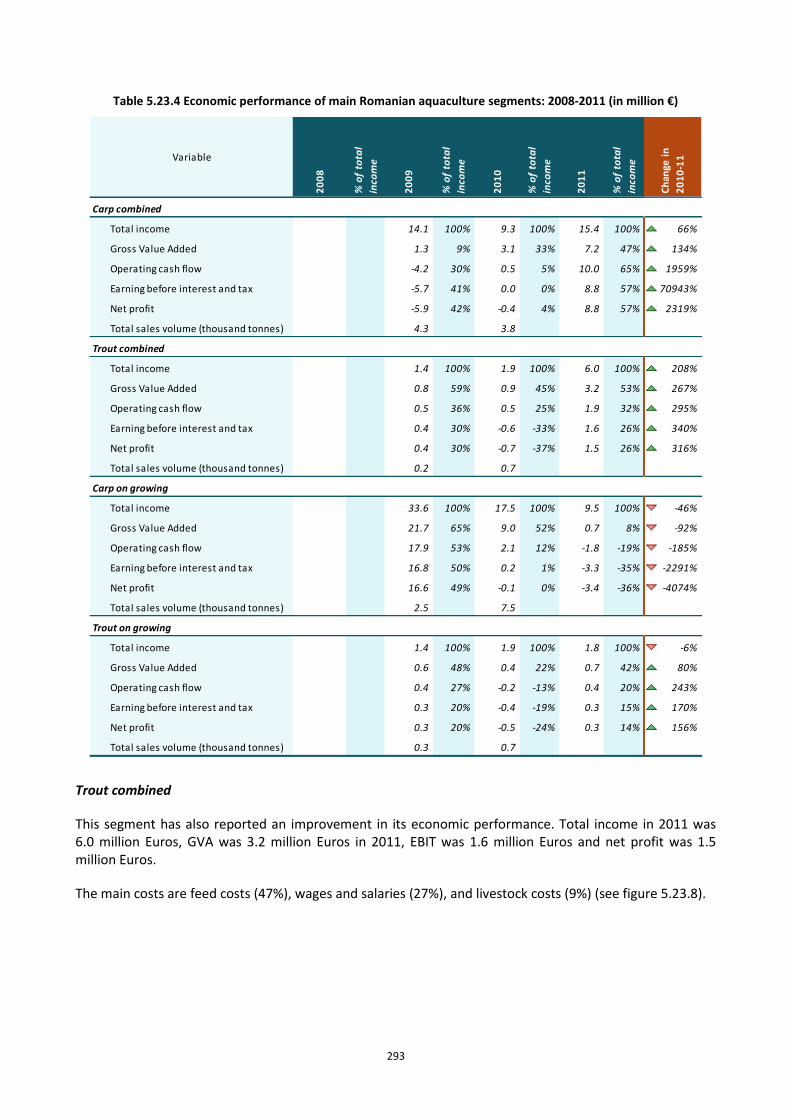
293
Table 5.23.4 Economic performance of main Romanian aquaculture segments: 2008-2011 (in million €)
Carp combined
Total income 14.1 100% 9.3 100% 15.4 100% 66%
Gross Value Added 1.3 9% 3.1 33% 7.2 47% 134%
Operating cash flow -4.2 30% 0.5 5% 10.0 65% 1959%
Earning before interest and tax -5.7 41% 0.0 0% 8.8 57% 70943%
Net profit -5.9 42% -0.4 4% 8.8 57% 2319%
Total sales volume (thousand tonnes) 4.3 3.8
Trout combined
Total income 1.4 100% 1.9 100% 6.0 100% 208%
Gross Value Added 0.8 59% 0.9 45% 3.2 53% 267%
Operating cash flow 0.5 36% 0.5 25% 1.9 32% 295%
Earning before interest and tax 0.4 30% -0.6 -33% 1.6 26% 340%
Net profit 0.4 30% -0.7 -37% 1.5 26% 316%
Total sales volume (thousand tonnes) 0.2 0.7
Carp on growing
Total income 33.6 100% 17.5 100% 9.5 100% -46%
Gross Value Added 21.7 65% 9.0 52% 0.7 8% -92%
Operating cash flow 17.9 53% 2.1 12% -1.8 -19% -185%
Earning before interest and tax 16.8 50% 0.2 1% -3.3 -35% -2291%
Net profit 16.6 49% -0.1 0% -3.4 -36% -4074%
Total sales volume (thousand tonnes) 2.5 7.5
Trout on growing
Total income 1.4 100% 1.9 100% 1.8 100% -6%
Gross Value Added 0.6 48% 0.4 22% 0.7 42% 80%
Operating cash flow 0.4 27% -0.2 -13% 0.4 20% 243%
Earning before interest and tax 0.3 20% -0.4 -19% 0.3 15% 170%
Net profit 0.3 20% -0.5 -24% 0.3 14% 156%
Total sales volume (thousand tonnes) 0.3 0.7
% o
f to
tal
inco
me
Ch
ange
in
20
10
-11Variable
20
08
% o
f to
tal
inco
me
20
09
% o
f to
tal
inco
me
20
10
% o
f to
tal
inco
me
20
11
Trout combined
This segment has also reported an improvement in its economic performance. Total income in 2011 was 6.0 million Euros, GVA was 3.2 million Euros in 2011, EBIT was 1.6 million Euros and net profit was 1.5 million Euros.
The main costs are feed costs (47%), wages and salaries (27%), and livestock costs (9%) (see figure 5.23.8).
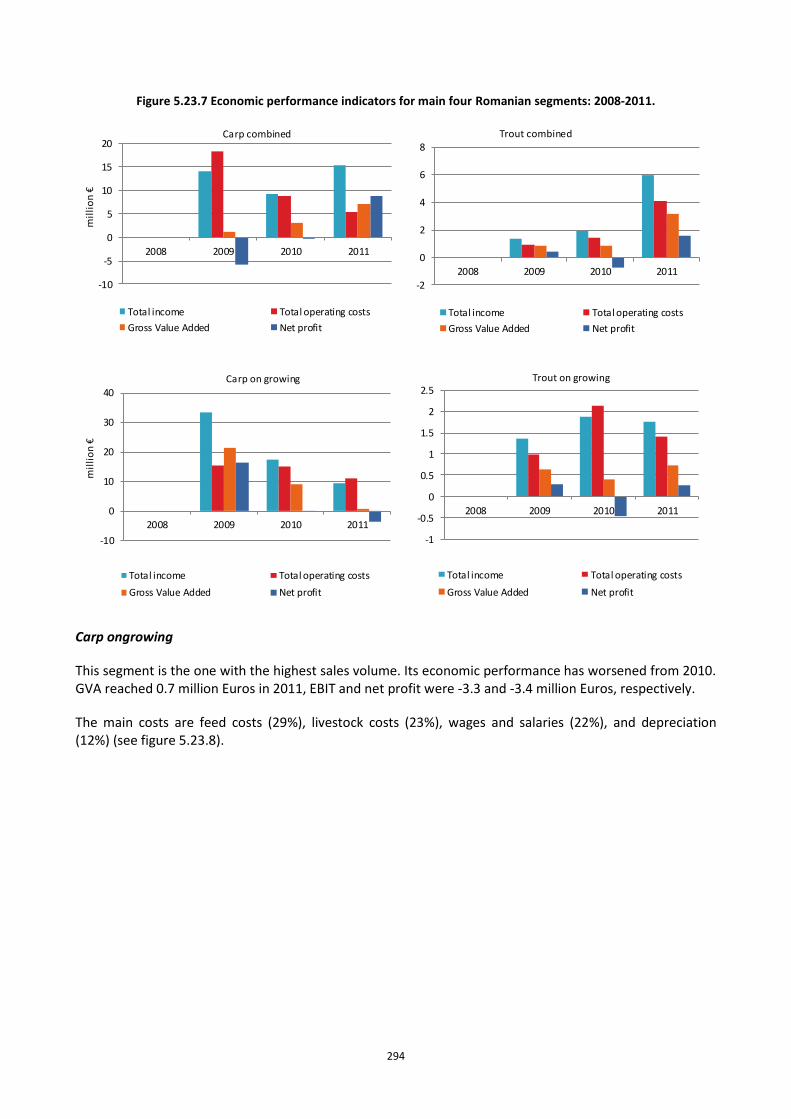
294
Figure 5.23.7 Economic performance indicators for main four Romanian segments: 2008-2011.
-10
-5
0
5
10
15
20
2008 2009 2010 2011
mil
lio
n €
Carp combined
Total income Total operating costs
Gross Value Added Net profit
-2
0
2
4
6
8
2008 2009 2010 2011
Trout combined
Total income Total operating costs
Gross Value Added Net profit
-10
0
10
20
30
40
2008 2009 2010 2011
mil
lio
n €
Carp on growing
Total income Total operating costs
Gross Value Added Net profit
-1
-0.5
0
0.5
1
1.5
2
2.5
2008 2009 2010 2011
Trout on growing
Total income Total operating costs
Gross Value Added Net profit
Carp ongrowing
This segment is the one with the highest sales volume. Its economic performance has worsened from 2010. GVA reached 0.7 million Euros in 2011, EBIT and net profit were -3.3 and -3.4 million Euros, respectively.
The main costs are feed costs (29%), livestock costs (23%), wages and salaries (22%), and depreciation (12%) (see figure 5.23.8).
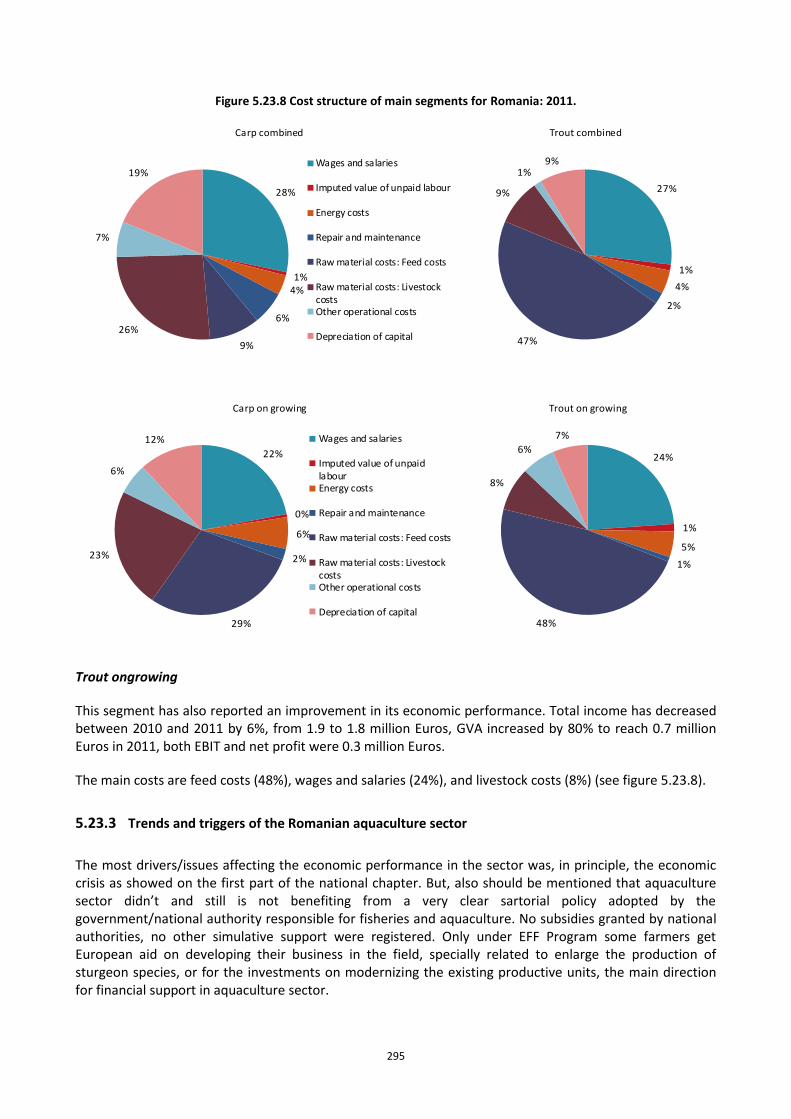
295
Figure 5.23.8 Cost structure of main segments for Romania: 2011.
28%
1%4%
6%
9%
26%
7%
19%
Carp combined
Wages and salaries
Imputed value of unpaid labour
Energy costs
Repair and maintenance
Raw material costs: Feed costs
Raw material costs: LivestockcostsOther operational costs
Depreciation of capital
27%
1%
4%
2%
47%
9%
1%9%
Trout combined
22%
0%
6%
2%
29%
23%
6%
12%
Carp on growing
Wages and salaries
Imputed value of unpaidlabourEnergy costs
Repair and maintenance
Raw material costs: Feed costs
Raw material costs: LivestockcostsOther operational costs
Depreciation of capital
24%
1%
5%
1%
48%
8%
6%
7%
Trout on growing
Trout ongrowing
This segment has also reported an improvement in its economic performance. Total income has decreased between 2010 and 2011 by 6%, from 1.9 to 1.8 million Euros, GVA increased by 80% to reach 0.7 million Euros in 2011, both EBIT and net profit were 0.3 million Euros.
The main costs are feed costs (48%), wages and salaries (24%), and livestock costs (8%) (see figure 5.23.8).
5.23.3 Trends and triggers of the Romanian aquaculture sector
The most drivers/issues affecting the economic performance in the sector was, in principle, the economic crisis as showed on the first part of the national chapter. But, also should be mentioned that aquaculture sector didn’t and still is not benefiting from a very clear sartorial policy adopted by the government/national authority responsible for fisheries and aquaculture. No subsidies granted by national authorities, no other simulative support were registered. Only under EFF Program some farmers get European aid on developing their business in the field, specially related to enlarge the production of sturgeon species, or for the investments on modernizing the existing productive units, the main direction for financial support in aquaculture sector.
296
Actually, the main reason on decreasing production is exceeded (economic crisis effects) the whole economy bringing an increasing trend, so the domestic demand is also growing, which is encouraging the aquaculture products sells. In 2012 the total production was increased recording more than 8,000 tonnes, with a respective value over 16 million Euros. It is expected to maintain this positive course for the coming years this being under recovering trend of the sector and the better fructification of the opportunities in the country. Other important cause for this fluctuant evolution is the level of the imported fish and the trading policy of the supermarket chains, present all over the country. The other subsequent explanation is that one of the activities belonging to the all activities of processing units, as main activity or as secondary activity incorporated as additional source for incomes. This is reflected on the variability of figures depending on the decision of owners to renounce in some periods, during the time period analyzed 2008-2011, to processing as main activity, causing this fluctuation at national level. There are no relevant differences among sub sectors of aquaculture, most of them using the same extensive technology, being old land based farms. The investments are not significant due to the still uncertainties on “ownering” the land on which farms are located, caused by the legal frame on this issue; this is causing also delay in the process of selling the farms by the state authorities to the operators.
The market structure reflects the offer to the consumers, an important role having the supermarkets – importing species such as: marine ones – that are not produced in Romania, ore freshwater species with low prices – creating a very hard competition for local producers. The certification of aquaculture products still don’t play any role in promoting national production, and the organic aquaculture sector is under development under some legal provisions provided by the agriculture ministry. The producers organizations, traditional as well as the organic one, are still under consolidation process haven’t established a forum at national level for both producers’ categories. The new species production occurred in aquaculture is still low, such as sturgeon species production, recently introduced.
The aquaculture products are still not yet strongly linked with domestic fish processing sector, the competition form imported products being very taffy, and the weaknesses of the producer organizations (both aquaculture or processing – the last one is still missing in the country) is advantaging the competition. Mainly the production is offered for the domestic market, export having a low level as ratio in the sailed products. Despite all mentioned above, the perspectives for development of the sector are good due to the increased market demand for such a kind of products, so the trends are expected to continue for the next 2-3 years minimum.
5.23.4 Data Coverage and Data Quality of the Romanian aquaculture sector
Despite the existing Aquaculture Units Register it could be identified a less rate of responds at the questionnaire used for data collection. It is necessary that MS to undertake technical, maybe additional legal measures in order to improve data covering and data quality of the whole process. No other data sources are used for these analyses, a part of Eurostat and FAO data.
There are few explanations for which divergences between DCF and FAO & Eurostat data still appears: first is caused by the incomplete/unsatisfactory coverage rate pending on low level of responses from the producers/providers of statistics figures, as mentioned above; second: the differences on the formats requested by those end users due to the lack of harmonisation on formats data calls. As example should be mentioned that in FAO format they are including differed information on raw material origin, juveniles production-as production, Eurostat started to pay more attention on that in the last two years – still existing a different definition for nurseries and hatcheries production for sale – the national understanding is the following: in different status of “young fishes growth” (first summer material, second summer material, or third one) is still as final product, Eurostat is looking only for juveniles and not for this kind of production) and FAO is doing the same, as in volume and value. A harmonization of indicators used in DCF- next DC MAP, in the regulations of EC should be done and a similar harmonization should follow with EC, as whole, and FAO.
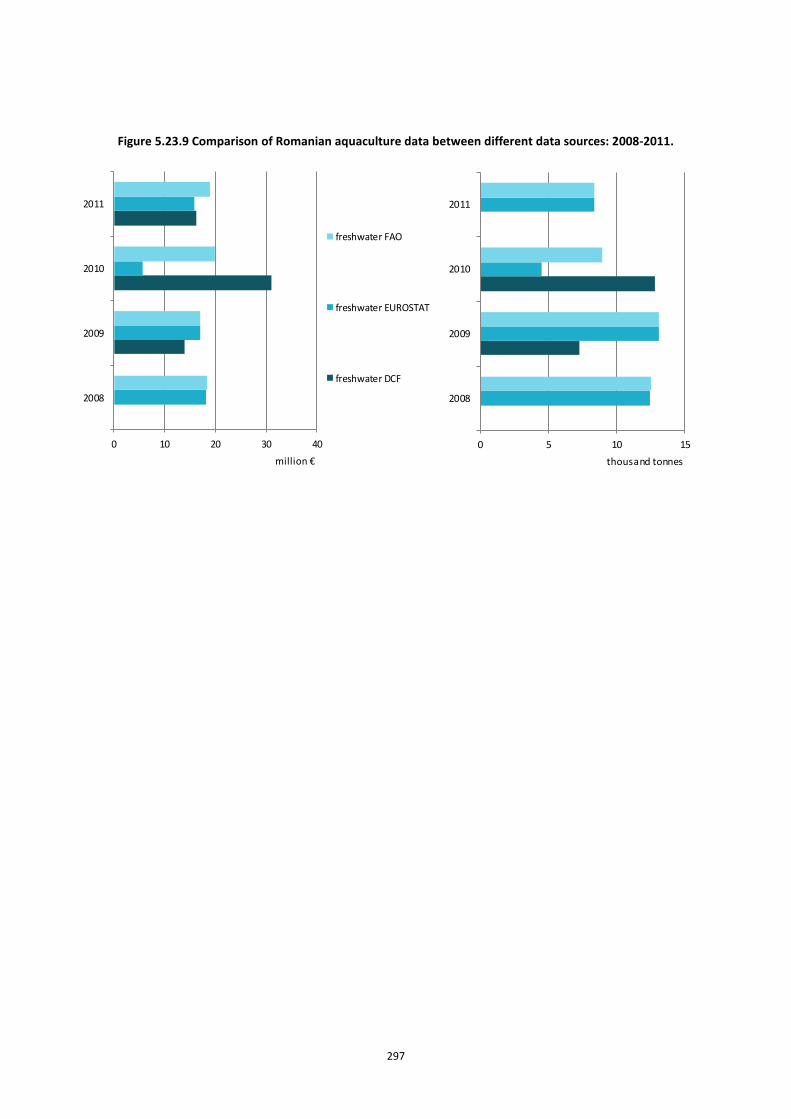
297
Figure 5.23.9 Comparison of Romanian aquaculture data between different data sources: 2008-2011.
0 10 20 30 40
2008
2009
2010
2011
million €
freshwater FAO
freshwater EUROSTAT
freshwater DCF
0 5 10 15
2008
2009
2010
2011
thousand tonnes
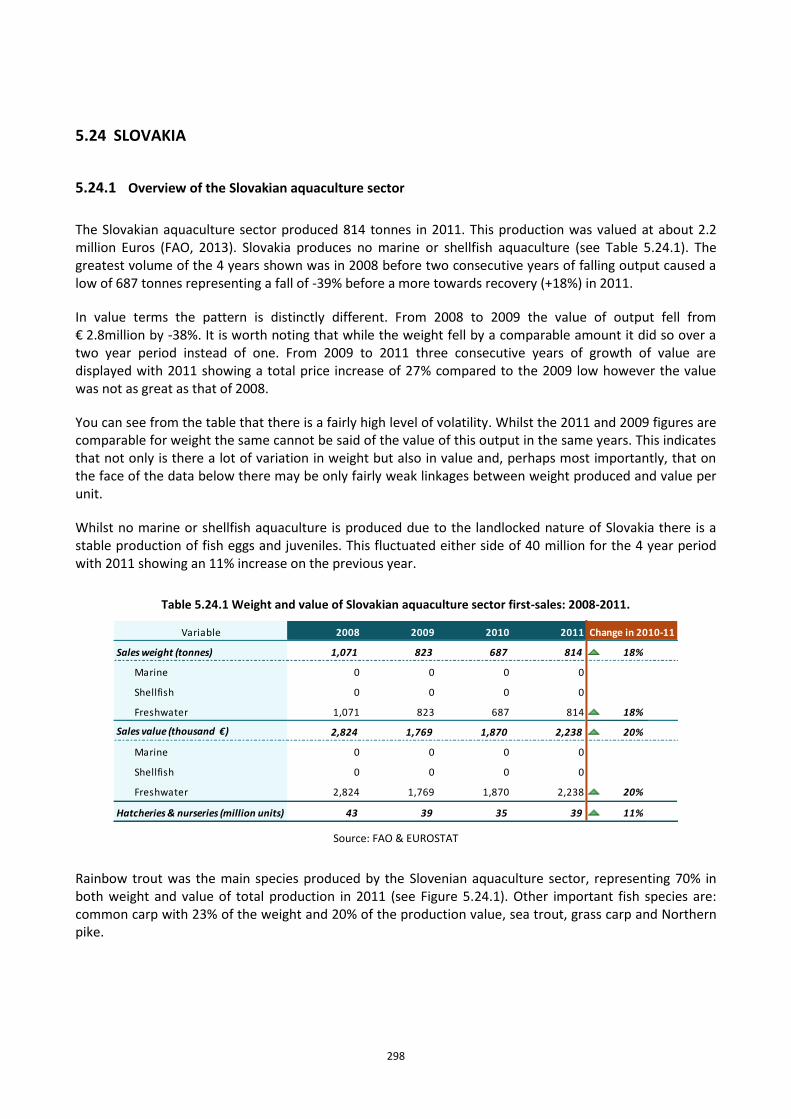
298
5.24 SLOVAKIA
5.24.1 Overview of the Slovakian aquaculture sector
The Slovakian aquaculture sector produced 814 tonnes in 2011. This production was valued at about 2.2 million Euros (FAO, 2013). Slovakia produces no marine or shellfish aquaculture (see Table 5.24.1). The greatest volume of the 4 years shown was in 2008 before two consecutive years of falling output caused a low of 687 tonnes representing a fall of -39% before a more towards recovery (+18%) in 2011.
In value terms the pattern is distinctly different. From 2008 to 2009 the value of output fell from € 2.8million by -38%. It is worth noting that while the weight fell by a comparable amount it did so over a two year period instead of one. From 2009 to 2011 three consecutive years of growth of value are displayed with 2011 showing a total price increase of 27% compared to the 2009 low however the value was not as great as that of 2008.
You can see from the table that there is a fairly high level of volatility. Whilst the 2011 and 2009 figures are comparable for weight the same cannot be said of the value of this output in the same years. This indicates that not only is there a lot of variation in weight but also in value and, perhaps most importantly, that on the face of the data below there may be only fairly weak linkages between weight produced and value per unit.
Whilst no marine or shellfish aquaculture is produced due to the landlocked nature of Slovakia there is a stable production of fish eggs and juveniles. This fluctuated either side of 40 million for the 4 year period with 2011 showing an 11% increase on the previous year.
Table 5.24.1 Weight and value of Slovakian aquaculture sector first-sales: 2008-2011.
Variable 2008 2009 2010 2011
Sales weight (tonnes) 1,071 823 687 814 18% ↗
Marine 0 0 0 0
Shellfish 0 0 0 0
Freshwater 1,071 823 687 814 18% ↗
Sales value (thousand €) 2,824 1,769 1,870 2,238 20% ↗
Marine 0 0 0 0
Shellfish 0 0 0 0
Freshwater 2,824 1,769 1,870 2,238 20% ↗
Hatcheries & nurseries (million units) 43 39 35 39 11% ↗
Change in 2010-11
Source: FAO & EUROSTAT
Rainbow trout was the main species produced by the Slovenian aquaculture sector, representing 70% in both weight and value of total production in 2011 (see Figure 5.24.1). Other important fish species are: common carp with 23% of the weight and 20% of the production value, sea trout, grass carp and Northern pike.
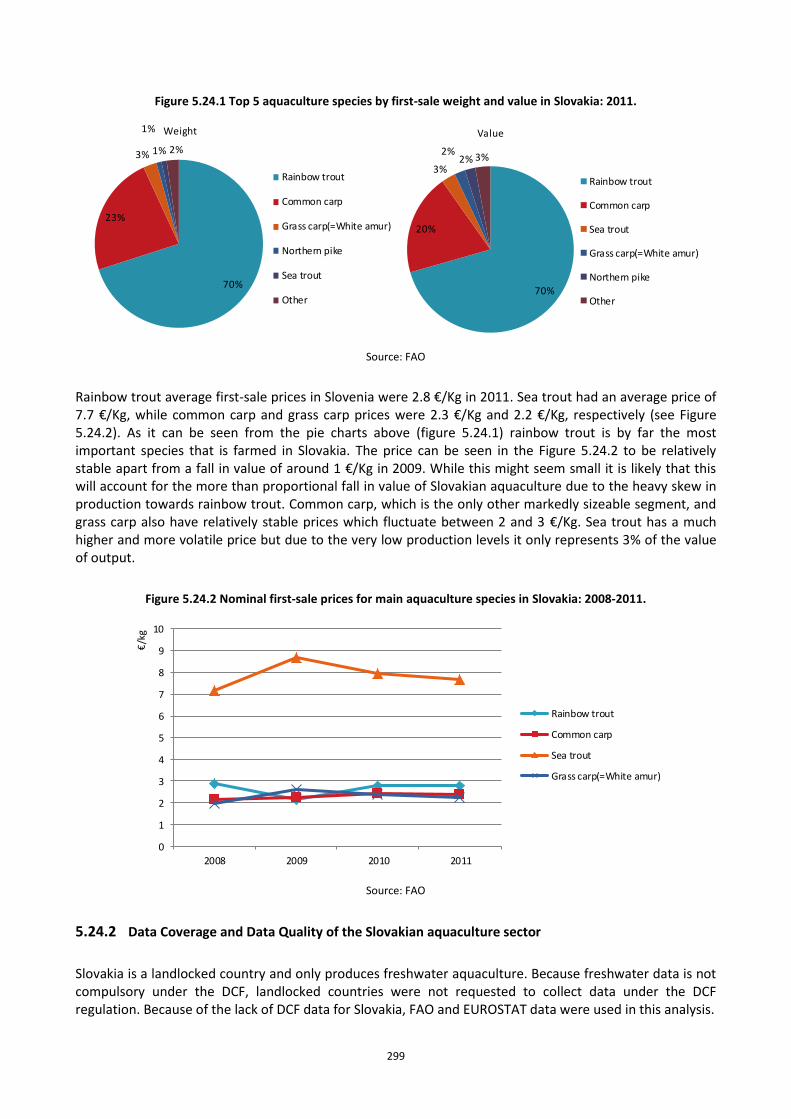
299
Figure 5.24.1 Top 5 aquaculture species by first-sale weight and value in Slovakia: 2011.
70%
23%
3%
1%
1% 2%
Weight
Rainbow trout
Common carp
Grass carp(=White amur)
Northern pike
Sea trout
Other70%
20%
3%
2%2% 3%
Value
Rainbow trout
Common carp
Sea trout
Grass carp(=White amur)
Northern pike
Other
Source: FAO
Rainbow trout average first-sale prices in Slovenia were 2.8 €/Kg in 2011. Sea trout had an average price of 7.7 €/Kg, while common carp and grass carp prices were 2.3 €/Kg and 2.2 €/Kg, respectively (see Figure 5.24.2). As it can be seen from the pie charts above (figure 5.24.1) rainbow trout is by far the most important species that is farmed in Slovakia. The price can be seen in the Figure 5.24.2 to be relatively stable apart from a fall in value of around 1 €/Kg in 2009. While this might seem small it is likely that this will account for the more than proportional fall in value of Slovakian aquaculture due to the heavy skew in production towards rainbow trout. Common carp, which is the only other markedly sizeable segment, and grass carp also have relatively stable prices which fluctuate between 2 and 3 €/Kg. Sea trout has a much higher and more volatile price but due to the very low production levels it only represents 3% of the value of output.
Figure 5.24.2 Nominal first-sale prices for main aquaculture species in Slovakia: 2008-2011.
0
1
2
3
4
5
6
7
8
9
10
2008 2009 2010 2011
€/k
g
Rainbow trout
Common carp
Sea trout
Grass carp(=White amur)
Source: FAO
5.24.2 Data Coverage and Data Quality of the Slovakian aquaculture sector
Slovakia is a landlocked country and only produces freshwater aquaculture. Because freshwater data is not compulsory under the DCF, landlocked countries were not requested to collect data under the DCF regulation. Because of the lack of DCF data for Slovakia, FAO and EUROSTAT data were used in this analysis.
300
5.25 SLOVENIA
5.25.1 Overview of the Slovenian aquaculture sector
Aquaculture in Slovenia comprises freshwater aquaculture (cold-water fish farming of salmonids, warm-water fish farming of cyprinids) and mariculture (fish and shellfish farming). Warm-water and cold-water fish farming has been practiced since the end of nineteenth century, while mariculture has a shorter history: it started at the end of the twentieth century. The major species contributing most of the production value in freshwater fish farming are rainbow trout (Oncorhynchus mykiss) and common carp (Cyprinus carpio), whilst in mariculture it is Mediterranean mussel (Mytilus galloprovincialis) and European seabass (Dicentrarchus labrax).
Mariculture practice is traditional. Fish farming takes place in cages submerged into the sea, while mussel farming takes place in a standard manner in lines of floating buoys linked together, with longline nets hung from them. In 2007, three larger areas were designated for marine aquaculture in Slovenian territorial waters that were subsequently separated into 22 plots, for which concessions were granted for the use of marine water in 2009. It is expected that these plots will not be able to expand, due to the use of Slovenian territorial waters for other purposes. Currently, all the concessions for using marine water for the breeding of marine organisms have been granted, 2 of them for breeding marine fish and 20 for breeding shellfish. The total area for breeding fish at sea (excluding shellfish farming) in 2009 was 5,663 m2 (2 plots). The area of the 20 plots at sea that are used for shellfish farming was 45.1 ha.
Due to natural circumstances, the development of marine fish farming in Slovenia is limited. Mariculture takes place in the Bay of Strunjan, the Bay of Debeli rtič (shell-fish farming) and in the Bay of Piran (fish and shell-fish farming).
Mariculture shellfish farming is more important than fish farming regarding the total volume of sales. The major and the only cultured shellfish species, Mediterranean mussel, accounts for 88% of total mariculture production in 2011. The production of European seabass is more important than the production of gilthead seabream. It contributes with 11% to total mariculture production in 2011.
Slovenia is a net importer of fish and fish products. In 2011 imports were approximately four times larger than exports. There is a continuous import of fresh farmed species: seabream, seabass and salmon. The majority of the imported fish products come mainly from the European Union and are frozen, dried or processed.
Data, presented in this report, were collected only for the marine species, both fishes and shellfish. Data from freshwater species is only reported in the following table, based on FAO data, to present the extent of all the Slovenian aquaculture.
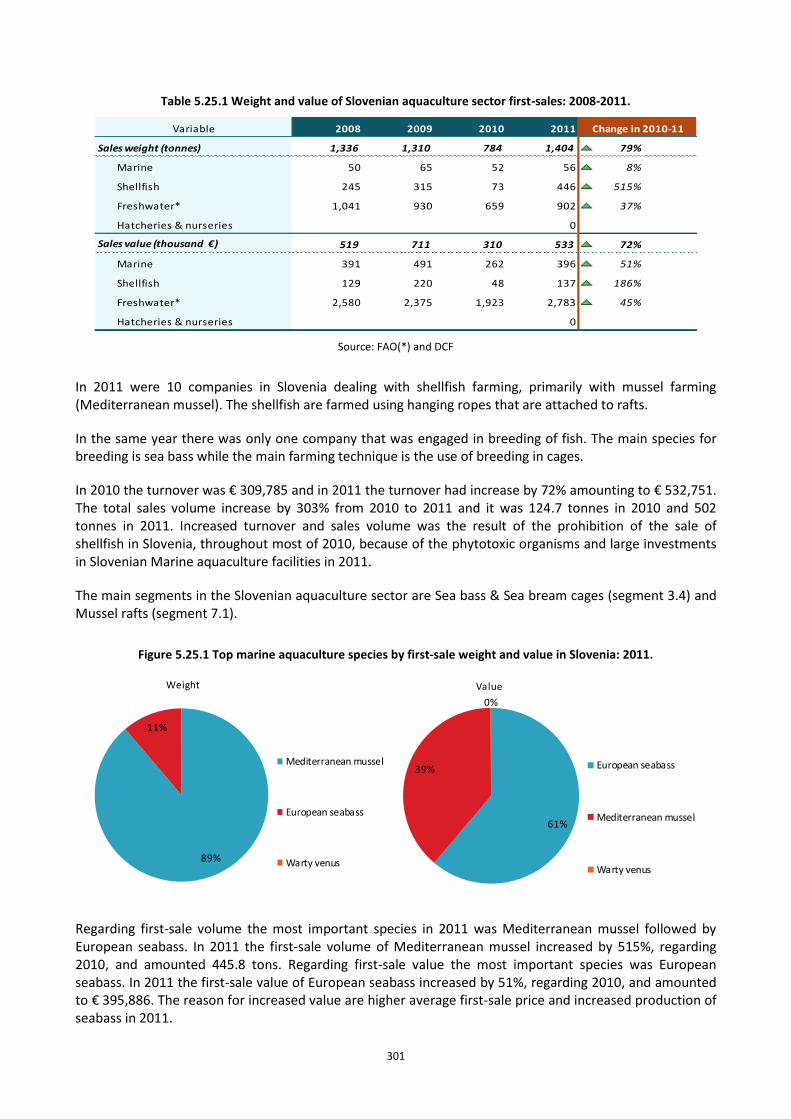
301
Table 5.25.1 Weight and value of Slovenian aquaculture sector first-sales: 2008-2011.
Variable 2008 2009 2010 2011
Sales weight (tonnes) 1,336 1,310 784 1,404 79%
Marine 50 65 52 56 8%
Shellfish 245 315 73 446 515% ↗
Freshwater* 1,041 930 659 902 37%
Hatcheries & nurseries 0
Sales value (thousand €) 519 711 310 533 72% ↗
Marine 391 491 262 396 51% ↗
Shellfish 129 220 48 137 186% ↗
Freshwater* 2,580 2,375 1,923 2,783 45%
Hatcheries & nurseries 0
Change in 2010-11
Source: FAO(*) and DCF
In 2011 were 10 companies in Slovenia dealing with shellfish farming, primarily with mussel farming (Mediterranean mussel). The shellfish are farmed using hanging ropes that are attached to rafts.
In the same year there was only one company that was engaged in breeding of fish. The main species for breeding is sea bass while the main farming technique is the use of breeding in cages.
In 2010 the turnover was € 309,785 and in 2011 the turnover had increase by 72% amounting to € 532,751. The total sales volume increase by 303% from 2010 to 2011 and it was 124.7 tonnes in 2010 and 502 tonnes in 2011. Increased turnover and sales volume was the result of the prohibition of the sale of shellfish in Slovenia, throughout most of 2010, because of the phytotoxic organisms and large investments in Slovenian Marine aquaculture facilities in 2011.
The main segments in the Slovenian aquaculture sector are Sea bass & Sea bream cages (segment 3.4) and Mussel rafts (segment 7.1).
Figure 5.25.1 Top marine aquaculture species by first-sale weight and value in Slovenia: 2011.
89%
11%
Weight
Mediterranean mussel
European seabass
Warty venus
61%
39%
0%
Value
European seabass
Mediterranean mussel
Warty venus
Regarding first-sale volume the most important species in 2011 was Mediterranean mussel followed by European seabass. In 2011 the first-sale volume of Mediterranean mussel increased by 515%, regarding 2010, and amounted 445.8 tons. Regarding first-sale value the most important species was European seabass. In 2011 the first-sale value of European seabass increased by 51%, regarding 2010, and amounted to € 395,886. The reason for increased value are higher average first-sale price and increased production of seabass in 2011.
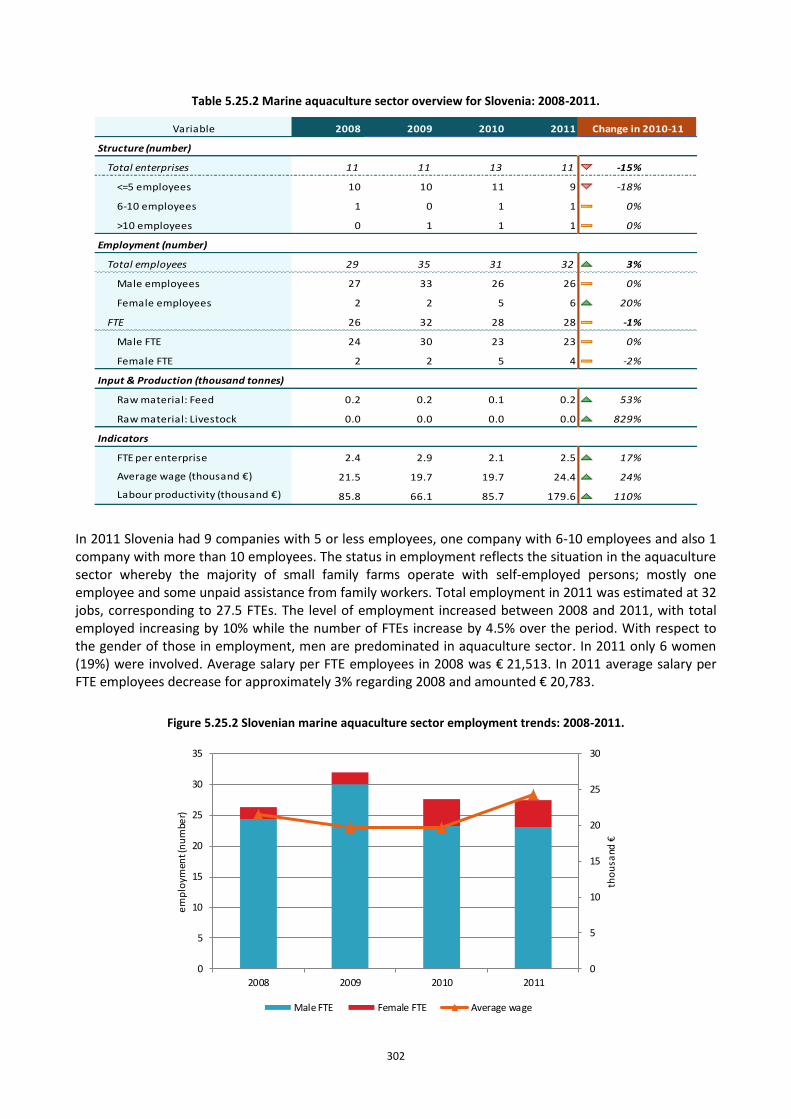
302
Table 5.25.2 Marine aquaculture sector overview for Slovenia: 2008-2011.
Variable 2008 2009 2010 2011
Structure (number)
Total enterprises 11 11 13 11 -15% ↔
<=5 employees 10 10 11 9 -18% ↘
6-10 employees 1 0 1 1 0% ↔
>10 employees 0 1 1 1 0% ↔
Employment (number)
Total employees 29 35 31 32 3% ↗
Male employees 27 33 26 26 0% ↔
Female employees 2 2 5 6 20% ↗
FTE 26 32 28 28 -1% ↘
Male FTE 24 30 23 23 0% ↔
Female FTE 2 2 5 4 -2% ↘
Input & Production (thousand tonnes)
Raw material: Feed 0.2 0.2 0.1 0.2 53% ↗
Raw material: Livestock 0.0 0.0 0.0 0.0 829%
Indicators
FTE per enterprise 2.4 2.9 2.1 2.5 17% ↗
Average wage (thousand €) 21.5 19.7 19.7 24.4 24% ↗
Labour productivity (thousand €) 85.8 66.1 85.7 179.6 110% ↗
Change in 2010-11
In 2011 Slovenia had 9 companies with 5 or less employees, one company with 6-10 employees and also 1 company with more than 10 employees. The status in employment reflects the situation in the aquaculture sector whereby the majority of small family farms operate with self-employed persons; mostly one employee and some unpaid assistance from family workers. Total employment in 2011 was estimated at 32 jobs, corresponding to 27.5 FTEs. The level of employment increased between 2008 and 2011, with total employed increasing by 10% while the number of FTEs increase by 4.5% over the period. With respect to the gender of those in employment, men are predominated in aquaculture sector. In 2011 only 6 women (19%) were involved. Average salary per FTE employees in 2008 was € 21,513. In 2011 average salary per FTE employees decrease for approximately 3% regarding 2008 and amounted € 20,783.
Figure 5.25.2 Slovenian marine aquaculture sector employment trends: 2008-2011.
0
5
10
15
20
25
30
0
5
10
15
20
25
30
35
2008 2009 2010 2011
tho
usa
nd €
em
plo
ymen
t (n
um
ber)
Male FTE Female FTE Average wage
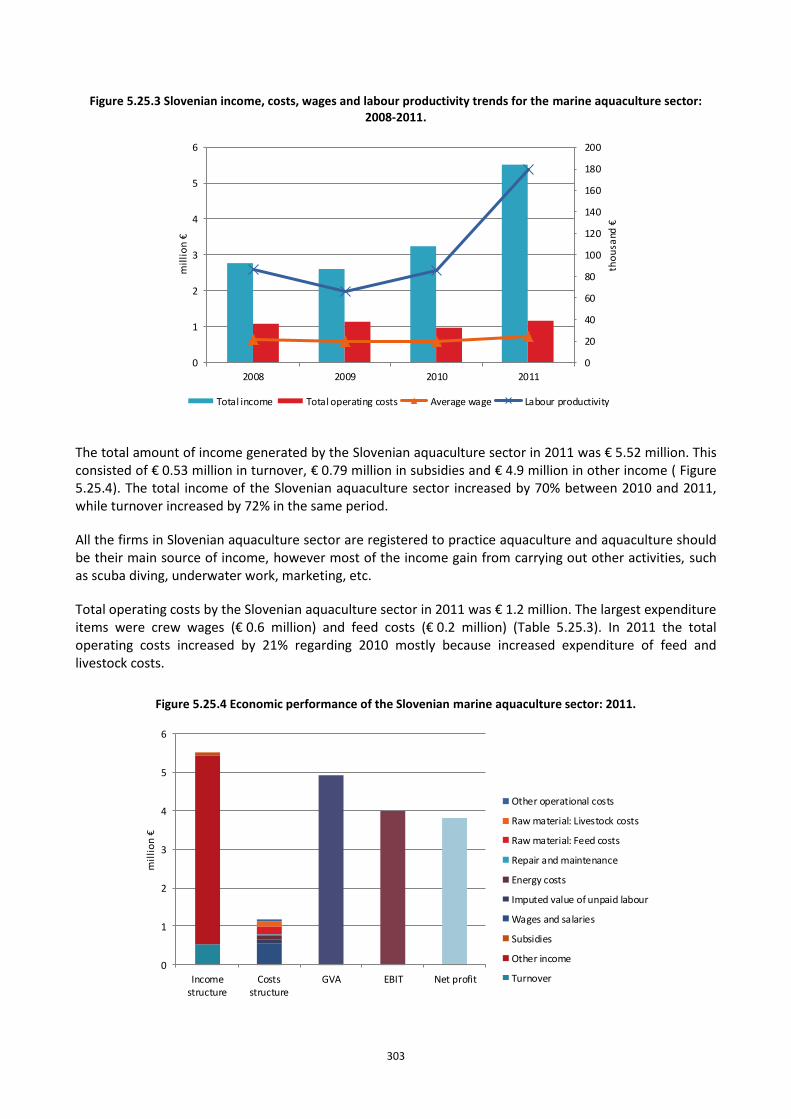
303
Figure 5.25.3 Slovenian income, costs, wages and labour productivity trends for the marine aquaculture sector: 2008-2011.
0
20
40
60
80
100
120
140
160
180
200
0
1
2
3
4
5
6
2008 2009 2010 2011
tho
usa
nd €
mil
lio
n €
Total income Total operating costs Average wage Labour productivity
The total amount of income generated by the Slovenian aquaculture sector in 2011 was € 5.52 million. This consisted of € 0.53 million in turnover, € 0.79 million in subsidies and € 4.9 million in other income ( Figure 5.25.4). The total income of the Slovenian aquaculture sector increased by 70% between 2010 and 2011, while turnover increased by 72% in the same period.
All the firms in Slovenian aquaculture sector are registered to practice aquaculture and aquaculture should be their main source of income, however most of the income gain from carrying out other activities, such as scuba diving, underwater work, marketing, etc.
Total operating costs by the Slovenian aquaculture sector in 2011 was € 1.2 million. The largest expenditure items were crew wages (€ 0.6 million) and feed costs (€ 0.2 million) (Table 5.25.3). In 2011 the total operating costs increased by 21% regarding 2010 mostly because increased expenditure of feed and livestock costs.
Figure 5.25.4 Economic performance of the Slovenian marine aquaculture sector: 2011.
0
1
2
3
4
5
6
Incomestructure
Costsstructure
GVA EBIT Net profit
mil
lio
n €
Other operational costs
Raw material: Livestock costs
Raw material: Feed costs
Repair and maintenance
Energy costs
Imputed value of unpaid labour
Wages and salaries
Subsidies
Other income
Turnover
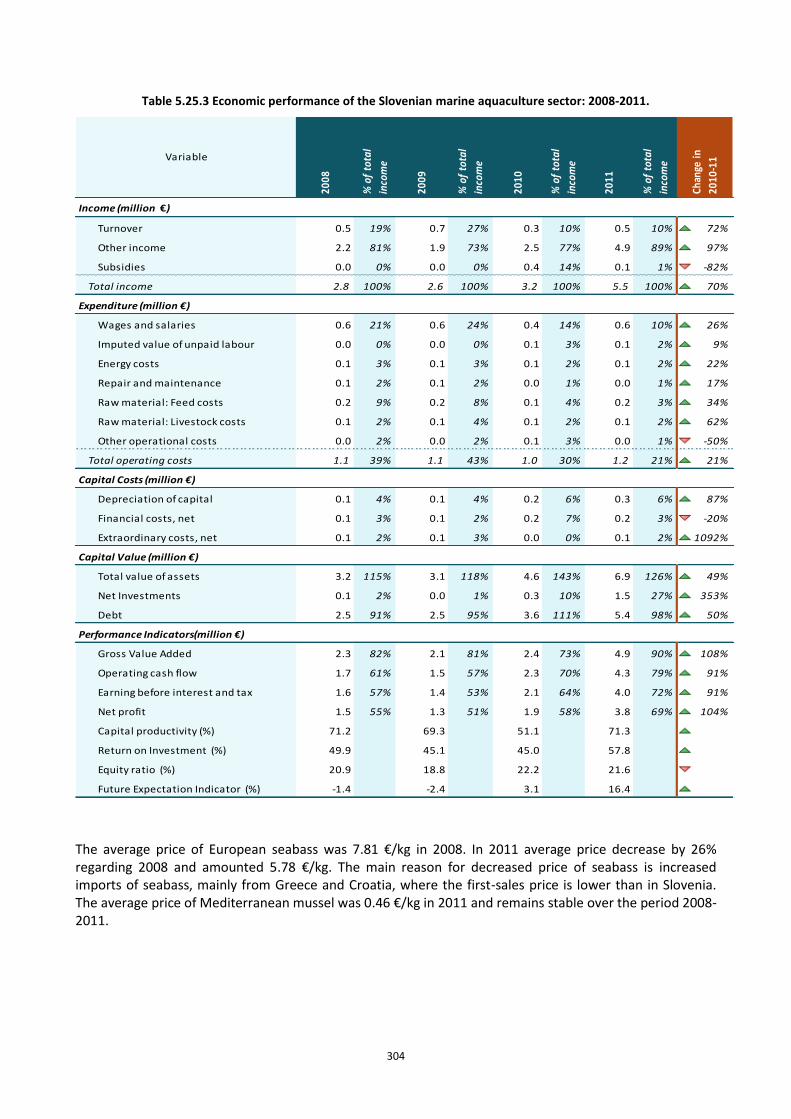
304
Table 5.25.3 Economic performance of the Slovenian marine aquaculture sector: 2008-2011.
Income (million €)
Turnover 0.5 19% 0.7 27% 0.3 10% 0.5 10% 72%
Other income 2.2 81% 1.9 73% 2.5 77% 4.9 89% 97%
Subsidies 0.0 0% 0.0 0% 0.4 14% 0.1 1% -82%
Total income 2.8 100% 2.6 100% 3.2 100% 5.5 100% 70%
Expenditure (million €)
Wages and salaries 0.6 21% 0.6 24% 0.4 14% 0.6 10% 26%
Imputed value of unpaid labour 0.0 0% 0.0 0% 0.1 3% 0.1 2% 9%
Energy costs 0.1 3% 0.1 3% 0.1 2% 0.1 2% 22%
Repair and maintenance 0.1 2% 0.1 2% 0.0 1% 0.0 1% 17%
Raw material: Feed costs 0.2 9% 0.2 8% 0.1 4% 0.2 3% 34%
Raw material: Livestock costs 0.1 2% 0.1 4% 0.1 2% 0.1 2% 62%
Other operational costs 0.0 2% 0.0 2% 0.1 3% 0.0 1% -50%
Total operating costs 1.1 39% 1.1 43% 1.0 30% 1.2 21% 21%
Capital Costs (million €)
Depreciation of capital 0.1 4% 0.1 4% 0.2 6% 0.3 6% 87%
Financial costs, net 0.1 3% 0.1 2% 0.2 7% 0.2 3% -20%
Extraordinary costs, net 0.1 2% 0.1 3% 0.0 0% 0.1 2% 1092%
Capital Value (million €)
Total value of assets 3.2 115% 3.1 118% 4.6 143% 6.9 126% 49%
Net Investments 0.1 2% 0.0 1% 0.3 10% 1.5 27% 353%
Debt 2.5 91% 2.5 95% 3.6 111% 5.4 98% 50%
Performance Indicators(million €)
Gross Value Added 2.3 82% 2.1 81% 2.4 73% 4.9 90% 108%
Operating cash flow 1.7 61% 1.5 57% 2.3 70% 4.3 79% 91%
Earning before interest and tax 1.6 57% 1.4 53% 2.1 64% 4.0 72% 91%
Net profit 1.5 55% 1.3 51% 1.9 58% 3.8 69% 104%
Capital productivity (%) 71.2 69.3 51.1 71.3 39%
Return on Investment (%) 49.9 45.1 45.0 57.8 28%
Equity ratio (%) 20.9 18.8 22.2 21.6 -2%
Future Expectation Indicator (%) -1.4 -2.4 3.1 16.4 438%
% o
f to
tal
inco
meVariable
% o
f to
tal
inco
me
2008
2009
% o
f to
tal
inco
me
2010
2011
Chan
ge in
2010
-11
% o
f to
tal
inco
me
The average price of European seabass was 7.81 €/kg in 2008. In 2011 average price decrease by 26% regarding 2008 and amounted 5.78 €/kg. The main reason for decreased price of seabass is increased imports of seabass, mainly from Greece and Croatia, where the first-sales price is lower than in Slovenia. The average price of Mediterranean mussel was 0.46 €/kg in 2011 and remains stable over the period 2008-2011.
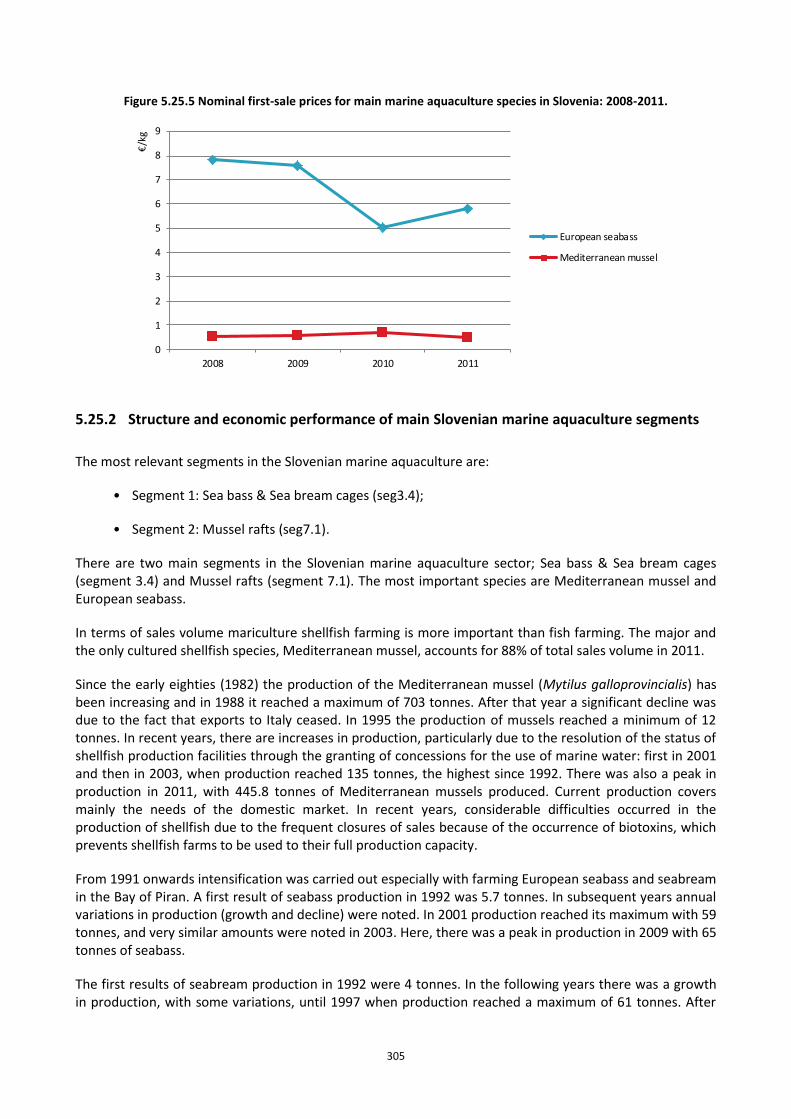
305
Figure 5.25.5 Nominal first-sale prices for main marine aquaculture species in Slovenia: 2008-2011.
0
1
2
3
4
5
6
7
8
9
2008 2009 2010 2011
€/k
g
European seabass
Mediterranean mussel
5.25.2 Structure and economic performance of main Slovenian marine aquaculture segments
The most relevant segments in the Slovenian marine aquaculture are:
• Segment 1: Sea bass & Sea bream cages (seg3.4);
• Segment 2: Mussel rafts (seg7.1).
There are two main segments in the Slovenian marine aquaculture sector; Sea bass & Sea bream cages (segment 3.4) and Mussel rafts (segment 7.1). The most important species are Mediterranean mussel and European seabass.
In terms of sales volume mariculture shellfish farming is more important than fish farming. The major and the only cultured shellfish species, Mediterranean mussel, accounts for 88% of total sales volume in 2011.
Since the early eighties (1982) the production of the Mediterranean mussel (Mytilus galloprovincialis) has been increasing and in 1988 it reached a maximum of 703 tonnes. After that year a significant decline was due to the fact that exports to Italy ceased. In 1995 the production of mussels reached a minimum of 12 tonnes. In recent years, there are increases in production, particularly due to the resolution of the status of shellfish production facilities through the granting of concessions for the use of marine water: first in 2001 and then in 2003, when production reached 135 tonnes, the highest since 1992. There was also a peak in production in 2011, with 445.8 tonnes of Mediterranean mussels produced. Current production covers mainly the needs of the domestic market. In recent years, considerable difficulties occurred in the production of shellfish due to the frequent closures of sales because of the occurrence of biotoxins, which prevents shellfish farms to be used to their full production capacity.
From 1991 onwards intensification was carried out especially with farming European seabass and seabream in the Bay of Piran. A first result of seabass production in 1992 was 5.7 tonnes. In subsequent years annual variations in production (growth and decline) were noted. In 2001 production reached its maximum with 59 tonnes, and very similar amounts were noted in 2003. Here, there was a peak in production in 2009 with 65 tonnes of seabass.
The first results of seabream production in 1992 were 4 tonnes. In the following years there was a growth in production, with some variations, until 1997 when production reached a maximum of 61 tonnes. After
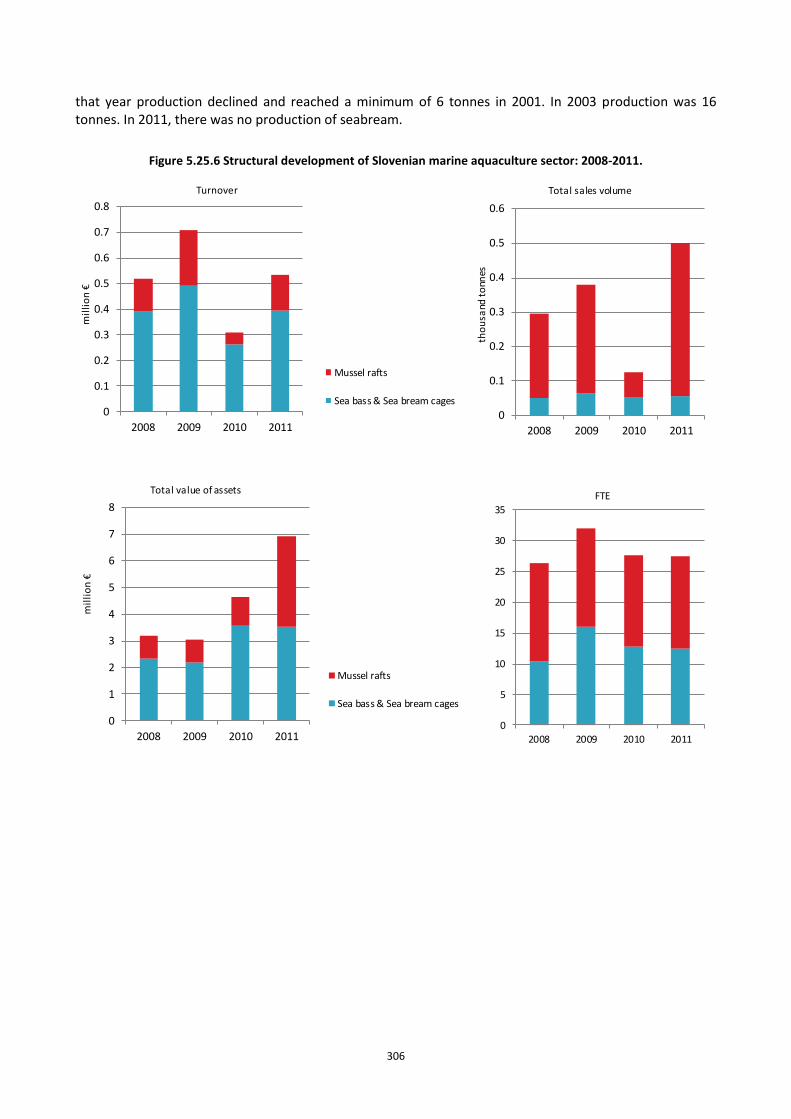
306
that year production declined and reached a minimum of 6 tonnes in 2001. In 2003 production was 16 tonnes. In 2011, there was no production of seabream.
Figure 5.25.6 Structural development of Slovenian marine aquaculture sector: 2008-2011.
0
0.1
0.2
0.3
0.4
0.5
0.6
0.7
0.8
2008 2009 2010 2011
mil
lio
n €
Turnover
Mussel rafts
Sea bass & Sea bream cages
0
0.1
0.2
0.3
0.4
0.5
0.6
2008 2009 2010 2011
tho
usa
nd t
onn
es
Total sales volume
0
1
2
3
4
5
6
7
8
2008 2009 2010 2011
mil
lio
n €
Total value of assets
Mussel rafts
Sea bass & Sea bream cages
0
5
10
15
20
25
30
35
2008 2009 2010 2011
FTE
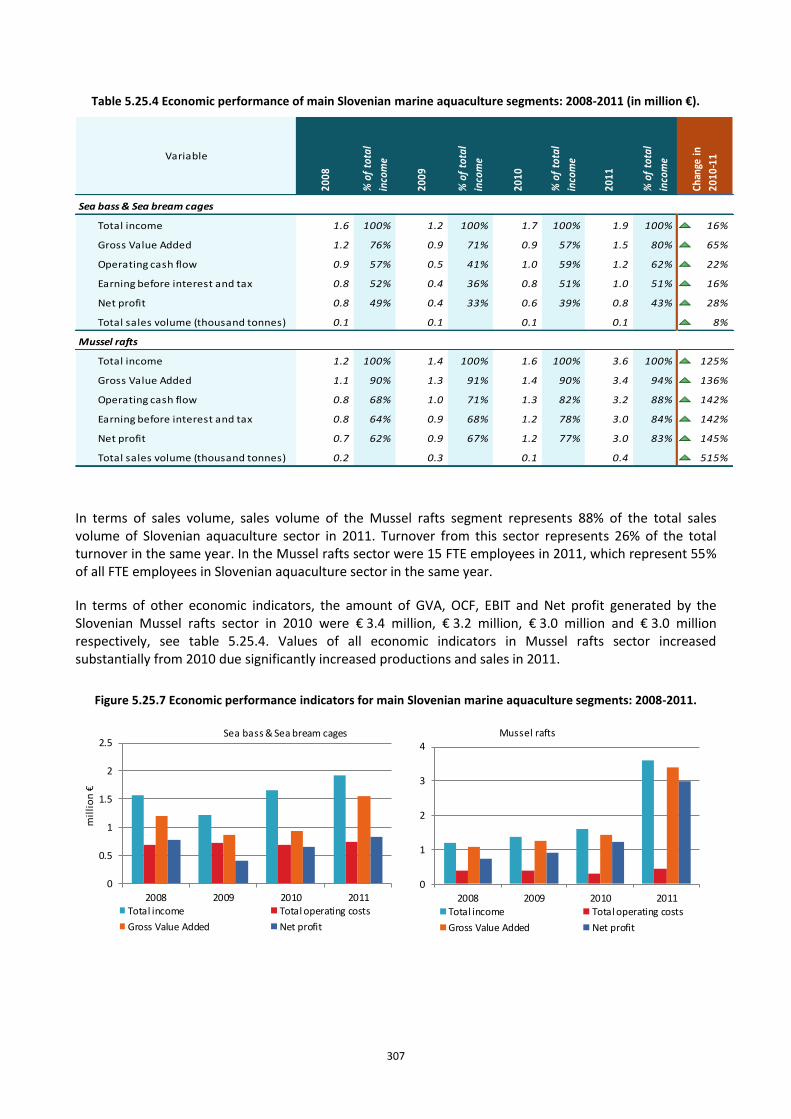
307
Table 5.25.4 Economic performance of main Slovenian marine aquaculture segments: 2008-2011 (in million €).
Sea bass & Sea bream cages
Total income 1.6 100% 1.2 100% 1.7 100% 1.9 100% 16%
Gross Value Added 1.2 76% 0.9 71% 0.9 57% 1.5 80% 65%
Operating cash flow 0.9 57% 0.5 41% 1.0 59% 1.2 62% 22%
Earning before interest and tax 0.8 52% 0.4 36% 0.8 51% 1.0 51% 16%
Net profit 0.8 49% 0.4 33% 0.6 39% 0.8 43% 28%
Total sales volume (thousand tonnes) 0.1 0.1 0.1 0.1 8%
Mussel rafts
Total income 1.2 100% 1.4 100% 1.6 100% 3.6 100% 125%
Gross Value Added 1.1 90% 1.3 91% 1.4 90% 3.4 94% 136%
Operating cash flow 0.8 68% 1.0 71% 1.3 82% 3.2 88% 142%
Earning before interest and tax 0.8 64% 0.9 68% 1.2 78% 3.0 84% 142%
Net profit 0.7 62% 0.9 67% 1.2 77% 3.0 83% 145%
Total sales volume (thousand tonnes) 0.2 0.3 0.1 0.4 515%%
of
tota
l
inco
me
2010
% o
f to
tal
inco
me
2011
Variable
2008
% o
f to
tal
inco
me
2009
% o
f to
tal
inco
me
Chan
ge in
2010
-11
In terms of sales volume, sales volume of the Mussel rafts segment represents 88% of the total sales volume of Slovenian aquaculture sector in 2011. Turnover from this sector represents 26% of the total turnover in the same year. In the Mussel rafts sector were 15 FTE employees in 2011, which represent 55% of all FTE employees in Slovenian aquaculture sector in the same year.
In terms of other economic indicators, the amount of GVA, OCF, EBIT and Net profit generated by the Slovenian Mussel rafts sector in 2010 were € 3.4 million, € 3.2 million, € 3.0 million and € 3.0 million respectively, see table 5.25.4. Values of all economic indicators in Mussel rafts sector increased substantially from 2010 due significantly increased productions and sales in 2011.
Figure 5.25.7 Economic performance indicators for main Slovenian marine aquaculture segments: 2008-2011.
0
0.5
1
1.5
2
2.5
2008 2009 2010 2011
mil
lio
n €
Sea bass & Sea bream cages
Total income Total operating costs
Gross Value Added Net profit
0
1
2
3
4
2008 2009 2010 2011
Mussel rafts
Total income Total operating costs
Gross Value Added Net profit
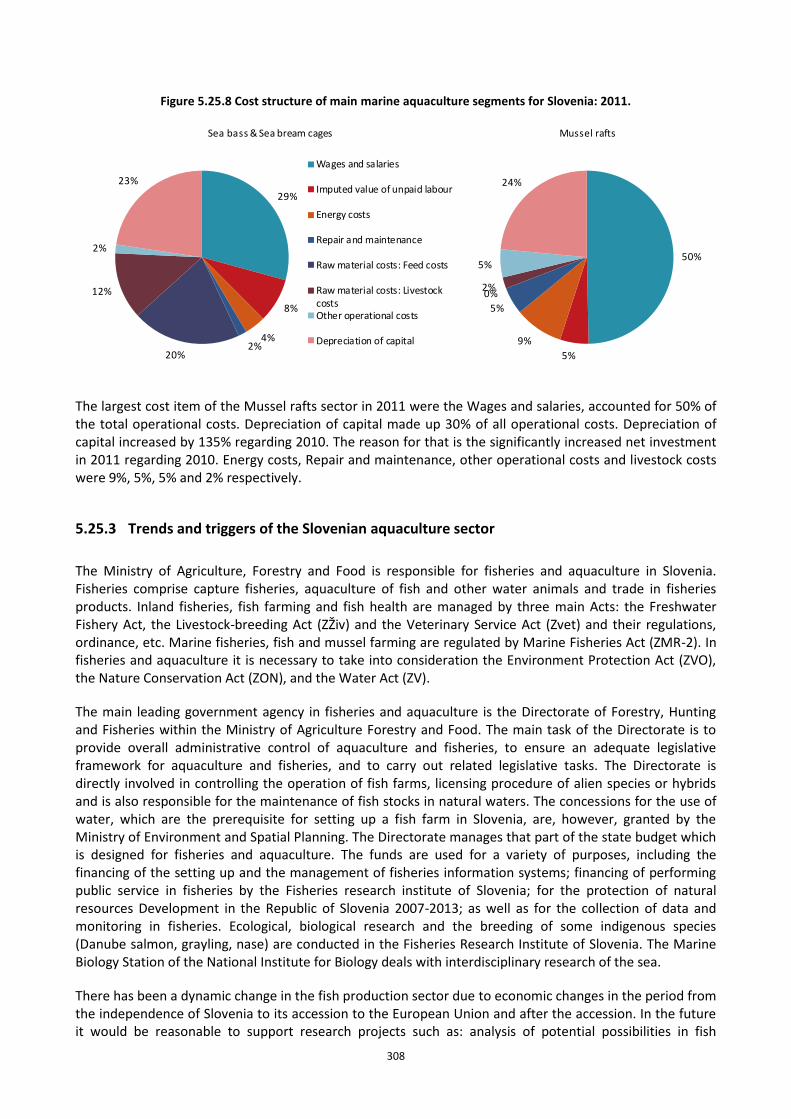
308
Figure 5.25.8 Cost structure of main marine aquaculture segments for Slovenia: 2011.
29%
8%
4%2%
20%
12%
2%
23%
Sea bass & Sea bream cages
Wages and salaries
Imputed value of unpaid labour
Energy costs
Repair and maintenance
Raw material costs: Feed costs
Raw material costs: LivestockcostsOther operational costs
Depreciation of capital
50%
5%
9%
5%
0%2%
5%
24%
Mussel rafts
The largest cost item of the Mussel rafts sector in 2011 were the Wages and salaries, accounted for 50% of the total operational costs. Depreciation of capital made up 30% of all operational costs. Depreciation of capital increased by 135% regarding 2010. The reason for that is the significantly increased net investment in 2011 regarding 2010. Energy costs, Repair and maintenance, other operational costs and livestock costs were 9%, 5%, 5% and 2% respectively.
5.25.3 Trends and triggers of the Slovenian aquaculture sector
The Ministry of Agriculture, Forestry and Food is responsible for fisheries and aquaculture in Slovenia. Fisheries comprise capture fisheries, aquaculture of fish and other water animals and trade in fisheries products. Inland fisheries, fish farming and fish health are managed by three main Acts: the Freshwater Fishery Act, the Livestock-breeding Act (ZŽiv) and the Veterinary Service Act (Zvet) and their regulations, ordinance, etc. Marine fisheries, fish and mussel farming are regulated by Marine Fisheries Act (ZMR-2). In fisheries and aquaculture it is necessary to take into consideration the Environment Protection Act (ZVO), the Nature Conservation Act (ZON), and the Water Act (ZV).
The main leading government agency in fisheries and aquaculture is the Directorate of Forestry, Hunting and Fisheries within the Ministry of Agriculture Forestry and Food. The main task of the Directorate is to provide overall administrative control of aquaculture and fisheries, to ensure an adequate legislative framework for aquaculture and fisheries, and to carry out related legislative tasks. The Directorate is directly involved in controlling the operation of fish farms, licensing procedure of alien species or hybrids and is also responsible for the maintenance of fish stocks in natural waters. The concessions for the use of water, which are the prerequisite for setting up a fish farm in Slovenia, are, however, granted by the Ministry of Environment and Spatial Planning. The Directorate manages that part of the state budget which is designed for fisheries and aquaculture. The funds are used for a variety of purposes, including the financing of the setting up and the management of fisheries information systems; financing of performing public service in fisheries by the Fisheries research institute of Slovenia; for the protection of natural resources Development in the Republic of Slovenia 2007-2013; as well as for the collection of data and monitoring in fisheries. Ecological, biological research and the breeding of some indigenous species (Danube salmon, grayling, nase) are conducted in the Fisheries Research Institute of Slovenia. The Marine Biology Station of the National Institute for Biology deals with interdisciplinary research of the sea.
There has been a dynamic change in the fish production sector due to economic changes in the period from the independence of Slovenia to its accession to the European Union and after the accession. In the future it would be reasonable to support research projects such as: analysis of potential possibilities in fish
309
farming development in Slovenia with regards to spatial and hydrological circumstances and research into the possibility of economic farming of new species. It would also be reasonable to continue with investment in the modernization of older fish farms, especially the improvement of hygienic conditions and the construction of new fish farms which comply with EU legislation technologically and ecologically. It would also be necessary to adopt all outstanding fisheries legislation and encourage the establishment of aquaculture producer organisations with a view to the development of fish farming in terms of small and medium sized family fish husbandry. These measures would facilitate the more competitive position of Slovenian fish farming. Natural circumstances and conservation requirements in Slovenia do not allow the development of large industrial farms. The establishment of producer organisations would make it easier to obtain knowledge, new technology and reduce market costs.
Typical Slovenian maritime enterprise is small family farms with self-employed persons, mostly one employee and some unpaid assistance from family workers. Regarding techniques and species all Slovenian marine segments are very homogeneous. Marine fish farming practice is normally intensive and takes place in floating platforms where the cages are submerged into the sea. They produced mostly European seabass. Shellfish farming practice is extensive and takes place in lines of floating buoys linked together, where longlines with mussels are suspended. The major and the only cultured shellfish species is Mediterranean mussel.
Future development of Slovenian mariculture is strongly conditioned by the small size of the Slovenian Sea. In 2007, three larger areas were designated for marine aquaculture in Slovenian territorial waters that were subsequently separated into 22 plots, for which concessions were granted for the use of marine water in 2009. It is expected that these plots will not be able to expand, due to the use of Slovenian territorial waters for other purposes. All Slovenian maritime fish and shellfish farms currently operating with about 50% capacity. In the future we can expect increasing production to maximum capacity and then stagnation of Slovenian marine aquaculture.
On the other hand, because of the good quality and quantity of inland water, Slovenia has a good chance to increase freshwater aquaculture, particularly salmonid rearing such as rainbow trout, Huchen (Hucho hucho) and brown trout. Today is in Slovenia about 60 trout farms, with a total production of only about 1,000 tonnes per year.
5.25.4 Data Coverage and Data Quality of the Slovenian aquaculture sector
Data were collected only for the marine fish species.
Regards to the data base ‘’The central register of aquaculture and commercial ponds’’ from MAFF, in 2011, there were 10 operators in Slovenia dealing with shellfish farming and one subject that was engaged in breeding of fish. The data for the operators mentioned were collected from multiple sources (AJPES, questionnaire, MAFF), allowing for cross checking. The accounting data, which are collected by the AJPES public agency, are already checked and verified. The data were collected for all 11 subjects.
In July 2012 the questionnaires for 2011 were sent to all 11 operators and all of them also returned the questionnaire. Therefore, there is full coverage.
Economic data on the aquaculture sector were collected from accounting records – AJPES and through questionnaires. The national program for collection of economic data for the aquaculture sector combines information from three main resources:
1. Questionnaire information returned from the aquaculture sector on a voluntary basis, 2. Data base: ‘The central register of aquaculture and commercial ponds’ from MAFF, 3. The annual accounts of business enterprises.
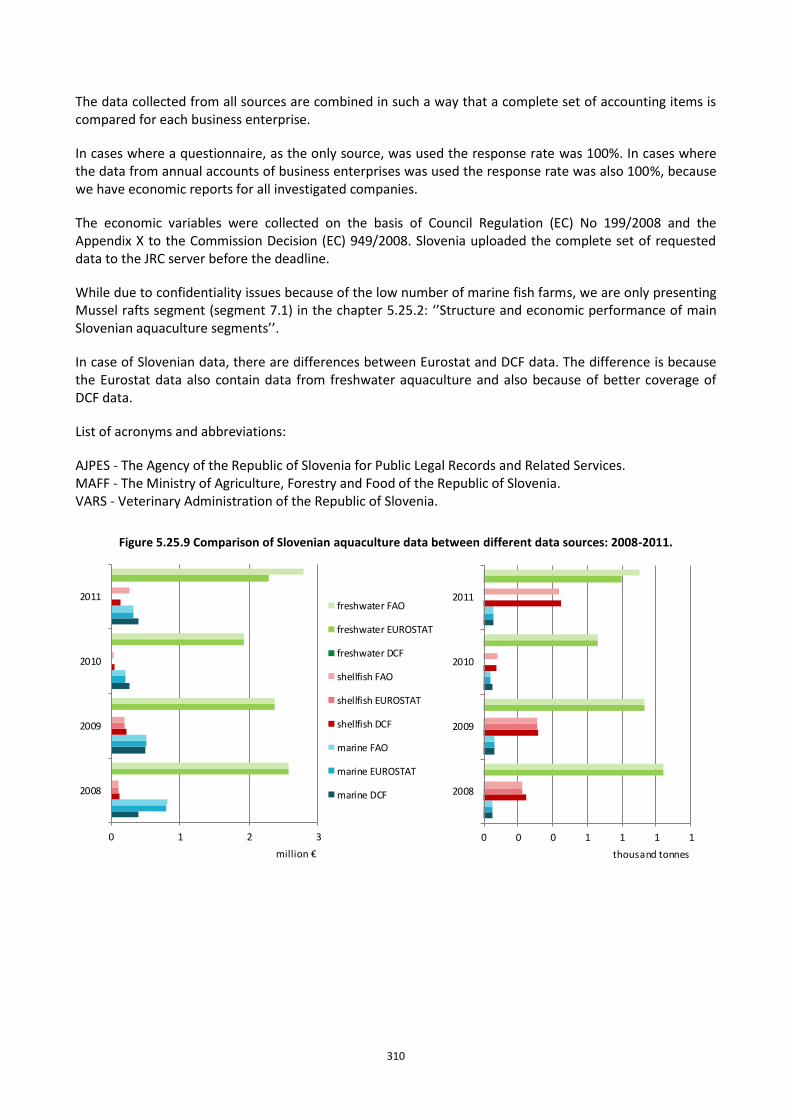
310
The data collected from all sources are combined in such a way that a complete set of accounting items is compared for each business enterprise.
In cases where a questionnaire, as the only source, was used the response rate was 100%. In cases where the data from annual accounts of business enterprises was used the response rate was also 100%, because we have economic reports for all investigated companies.
The economic variables were collected on the basis of Council Regulation (EC) No 199/2008 and the Appendix X to the Commission Decision (EC) 949/2008. Slovenia uploaded the complete set of requested data to the JRC server before the deadline.
While due to confidentiality issues because of the low number of marine fish farms, we are only presenting Mussel rafts segment (segment 7.1) in the chapter 5.25.2: ‘’Structure and economic performance of main Slovenian aquaculture segments’’.
In case of Slovenian data, there are differences between Eurostat and DCF data. The difference is because the Eurostat data also contain data from freshwater aquaculture and also because of better coverage of DCF data.
List of acronyms and abbreviations:
AJPES - The Agency of the Republic of Slovenia for Public Legal Records and Related Services. MAFF - The Ministry of Agriculture, Forestry and Food of the Republic of Slovenia. VARS - Veterinary Administration of the Republic of Slovenia.
Figure 5.25.9 Comparison of Slovenian aquaculture data between different data sources: 2008-2011.
0 1 2 3
2008
2009
2010
2011
million €
freshwater FAO
freshwater EUROSTAT
freshwater DCF
shellfish FAO
shellfish EUROSTAT
shellfish DCF
marine FAO
marine EUROSTAT
marine DCF
0 0 0 1 1 1 1
2008
2009
2010
2011
thousand tonnes
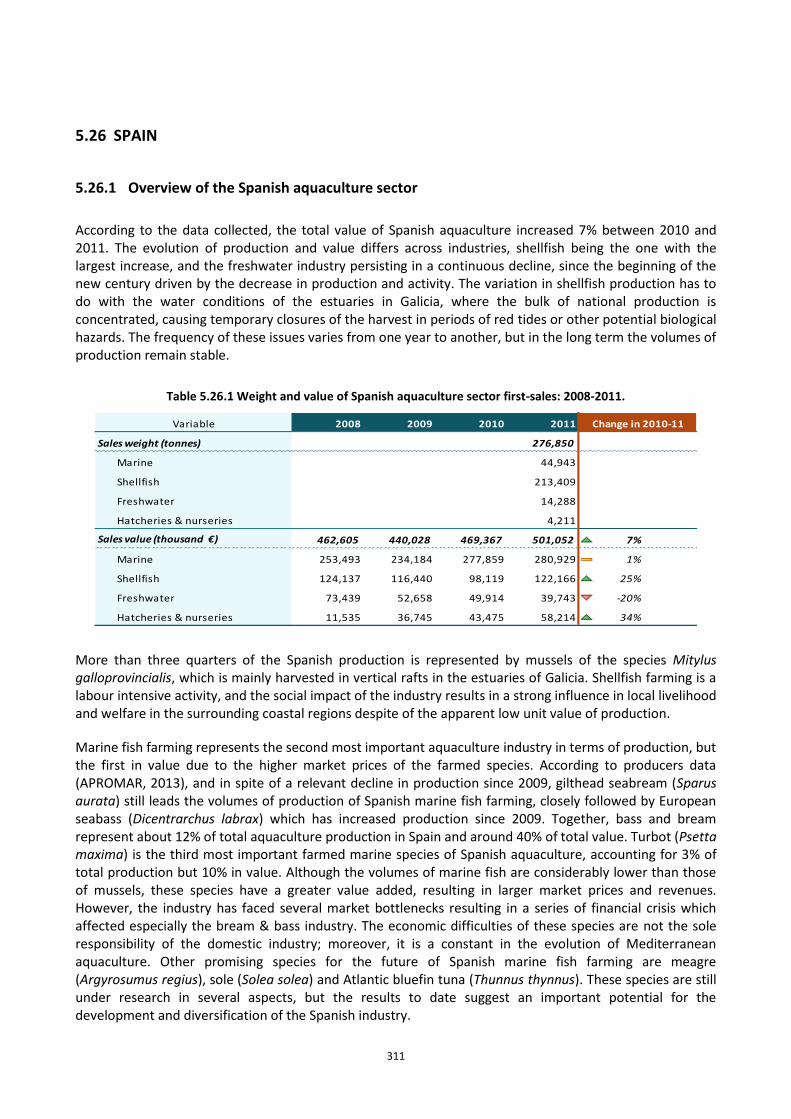
311
5.26 SPAIN
5.26.1 Overview of the Spanish aquaculture sector
According to the data collected, the total value of Spanish aquaculture increased 7% between 2010 and 2011. The evolution of production and value differs across industries, shellfish being the one with the largest increase, and the freshwater industry persisting in a continuous decline, since the beginning of the new century driven by the decrease in production and activity. The variation in shellfish production has to do with the water conditions of the estuaries in Galicia, where the bulk of national production is concentrated, causing temporary closures of the harvest in periods of red tides or other potential biological hazards. The frequency of these issues varies from one year to another, but in the long term the volumes of production remain stable.
Table 5.26.1 Weight and value of Spanish aquaculture sector first-sales: 2008-2011.
Variable 2008 2009 2010 2011
Sales weight (tonnes) 276,850
Marine 44,943
Shellfish 213,409
Freshwater 14,288
Hatcheries & nurseries 4,211
Sales value (thousand €) 462,605 440,028 469,367 501,052 7% ↗
Marine 253,493 234,184 277,859 280,929 1% ↗
Shellfish 124,137 116,440 98,119 122,166 25% ↗
Freshwater 73,439 52,658 49,914 39,743 -20%
Hatcheries & nurseries 11,535 36,745 43,475 58,214 34%
Change in 2010-11
More than three quarters of the Spanish production is represented by mussels of the species Mitylus galloprovincialis, which is mainly harvested in vertical rafts in the estuaries of Galicia. Shellfish farming is a labour intensive activity, and the social impact of the industry results in a strong influence in local livelihood and welfare in the surrounding coastal regions despite of the apparent low unit value of production.
Marine fish farming represents the second most important aquaculture industry in terms of production, but the first in value due to the higher market prices of the farmed species. According to producers data (APROMAR, 2013), and in spite of a relevant decline in production since 2009, gilthead seabream (Sparus aurata) still leads the volumes of production of Spanish marine fish farming, closely followed by European seabass (Dicentrarchus labrax) which has increased production since 2009. Together, bass and bream represent about 12% of total aquaculture production in Spain and around 40% of total value. Turbot (Psetta maxima) is the third most important farmed marine species of Spanish aquaculture, accounting for 3% of total production but 10% in value. Although the volumes of marine fish are considerably lower than those of mussels, these species have a greater value added, resulting in larger market prices and revenues. However, the industry has faced several market bottlenecks resulting in a series of financial crisis which affected especially the bream & bass industry. The economic difficulties of these species are not the sole responsibility of the domestic industry; moreover, it is a constant in the evolution of Mediterranean aquaculture. Other promising species for the future of Spanish marine fish farming are meagre (Argyrosumus regius), sole (Solea solea) and Atlantic bluefin tuna (Thunnus thynnus). These species are still under research in several aspects, but the results to date suggest an important potential for the development and diversification of the Spanish industry.
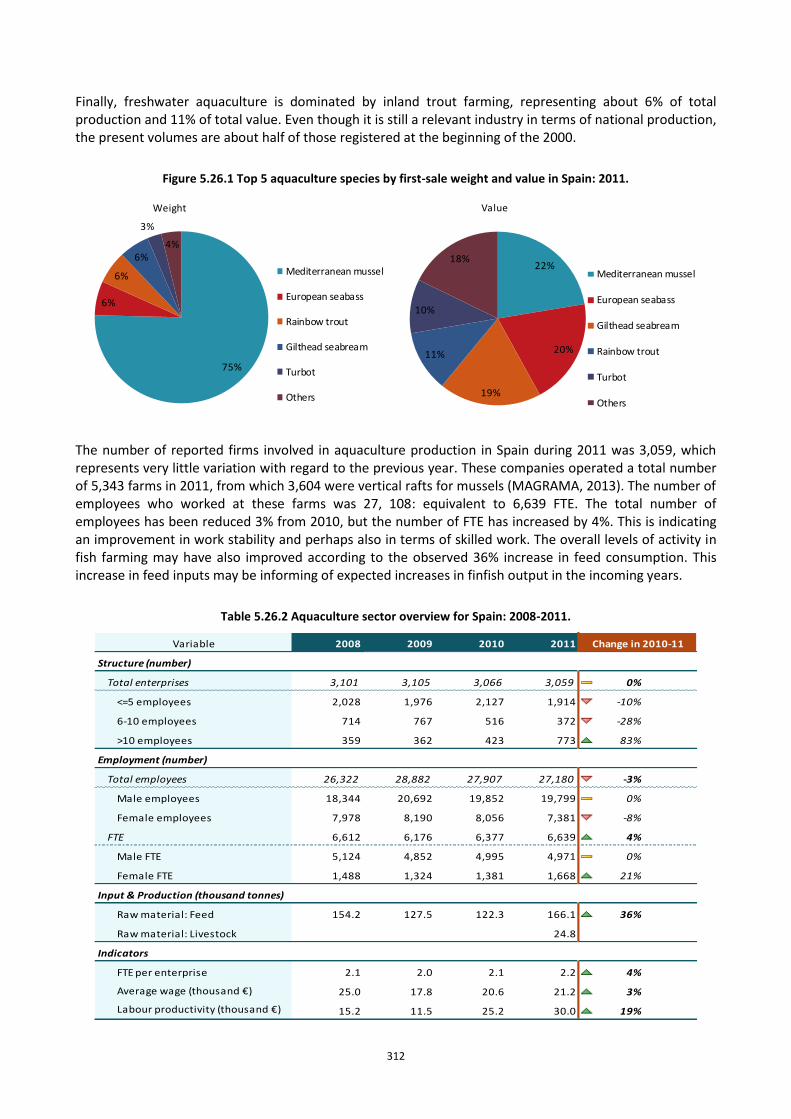
312
Finally, freshwater aquaculture is dominated by inland trout farming, representing about 6% of total production and 11% of total value. Even though it is still a relevant industry in terms of national production, the present volumes are about half of those registered at the beginning of the 2000.
Figure 5.26.1 Top 5 aquaculture species by first-sale weight and value in Spain: 2011.
75%
6%
6%
6%
3%
4%
Weight
Mediterranean mussel
European seabass
Rainbow trout
Gilthead seabream
Turbot
Others
22%
20%
19%
11%
10%
18%
Value
Mediterranean mussel
European seabass
Gilthead seabream
Rainbow trout
Turbot
Others
The number of reported firms involved in aquaculture production in Spain during 2011 was 3,059, which represents very little variation with regard to the previous year. These companies operated a total number of 5,343 farms in 2011, from which 3,604 were vertical rafts for mussels (MAGRAMA, 2013). The number of employees who worked at these farms was 27, 108: equivalent to 6,639 FTE. The total number of employees has been reduced 3% from 2010, but the number of FTE has increased by 4%. This is indicating an improvement in work stability and perhaps also in terms of skilled work. The overall levels of activity in fish farming may have also improved according to the observed 36% increase in feed consumption. This increase in feed inputs may be informing of expected increases in finfish output in the incoming years.
Table 5.26.2 Aquaculture sector overview for Spain: 2008-2011.
Variable 2008 2009 2010 2011
Structure (number)
Total enterprises 3,101 3,105 3,066 3,059 0% ↔
<=5 employees 2,028 1,976 2,127 1,914 -10% ↘
6-10 employees 714 767 516 372 -28% ↘
>10 employees 359 362 423 773 83% ↗
Employment (number)
Total employees 26,322 28,882 27,907 27,180 -3% ↘
Male employees 18,344 20,692 19,852 19,799 0% ↔
Female employees 7,978 8,190 8,056 7,381 -8% ↘
FTE 6,612 6,176 6,377 6,639 4% ↗
Male FTE 5,124 4,852 4,995 4,971 0% ↔
Female FTE 1,488 1,324 1,381 1,668 21% ↗
Input & Production (thousand tonnes)
Raw material: Feed 154.2 127.5 122.3 166.1 36% ↗
Raw material: Livestock 24.8
Indicators
FTE per enterprise 2.1 2.0 2.1 2.2 4% ↗
Average wage (thousand €) 25.0 17.8 20.6 21.2 3% ↗
Labour productivity (thousand €) 15.2 11.5 25.2 30.0 19% ↗
Change in 2010-11
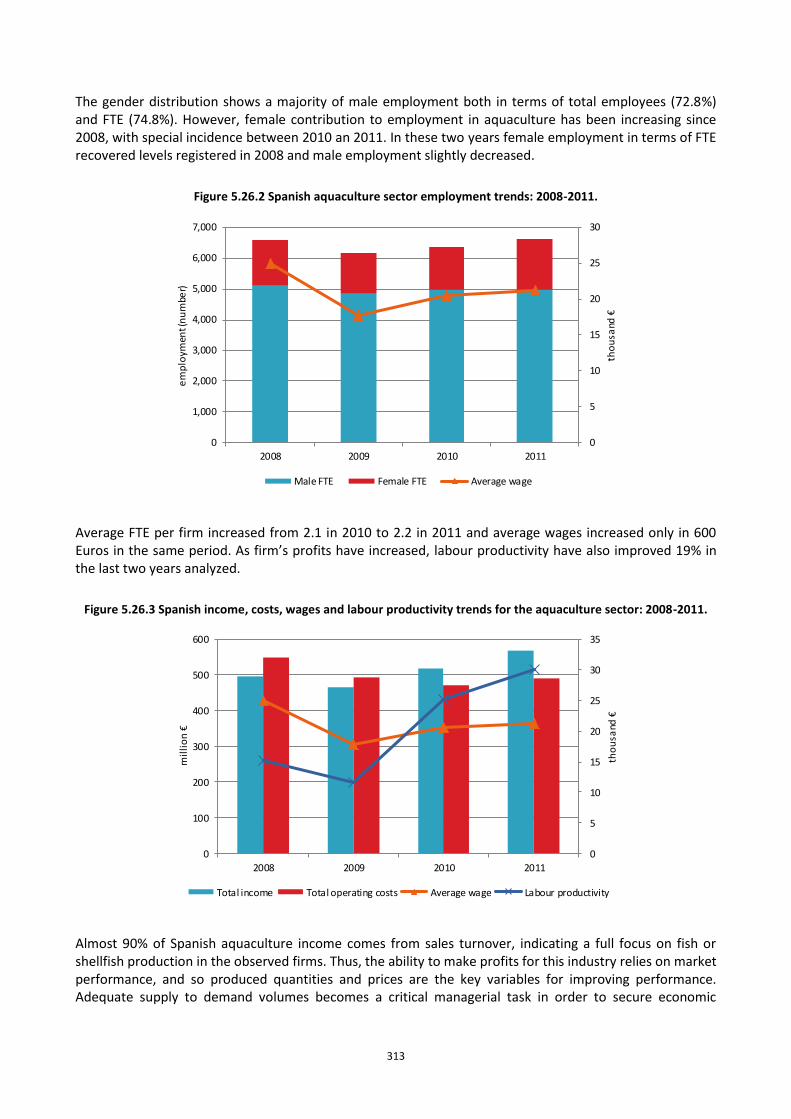
313
The gender distribution shows a majority of male employment both in terms of total employees (72.8%) and FTE (74.8%). However, female contribution to employment in aquaculture has been increasing since 2008, with special incidence between 2010 an 2011. In these two years female employment in terms of FTE recovered levels registered in 2008 and male employment slightly decreased.
Figure 5.26.2 Spanish aquaculture sector employment trends: 2008-2011.
0
5
10
15
20
25
30
0
1,000
2,000
3,000
4,000
5,000
6,000
7,000
2008 2009 2010 2011
tho
usa
nd €
em
plo
ymen
t (n
um
ber)
Male FTE Female FTE Average wage
Average FTE per firm increased from 2.1 in 2010 to 2.2 in 2011 and average wages increased only in 600 Euros in the same period. As firm’s profits have increased, labour productivity have also improved 19% in the last two years analyzed.
Figure 5.26.3 Spanish income, costs, wages and labour productivity trends for the aquaculture sector: 2008-2011.
0
5
10
15
20
25
30
35
0
100
200
300
400
500
600
2008 2009 2010 2011
tho
usa
nd €
mil
lio
n €
Total income Total operating costs Average wage Labour productivity
Almost 90% of Spanish aquaculture income comes from sales turnover, indicating a full focus on fish or shellfish production in the observed firms. Thus, the ability to make profits for this industry relies on market performance, and so produced quantities and prices are the key variables for improving performance. Adequate supply to demand volumes becomes a critical managerial task in order to secure economic
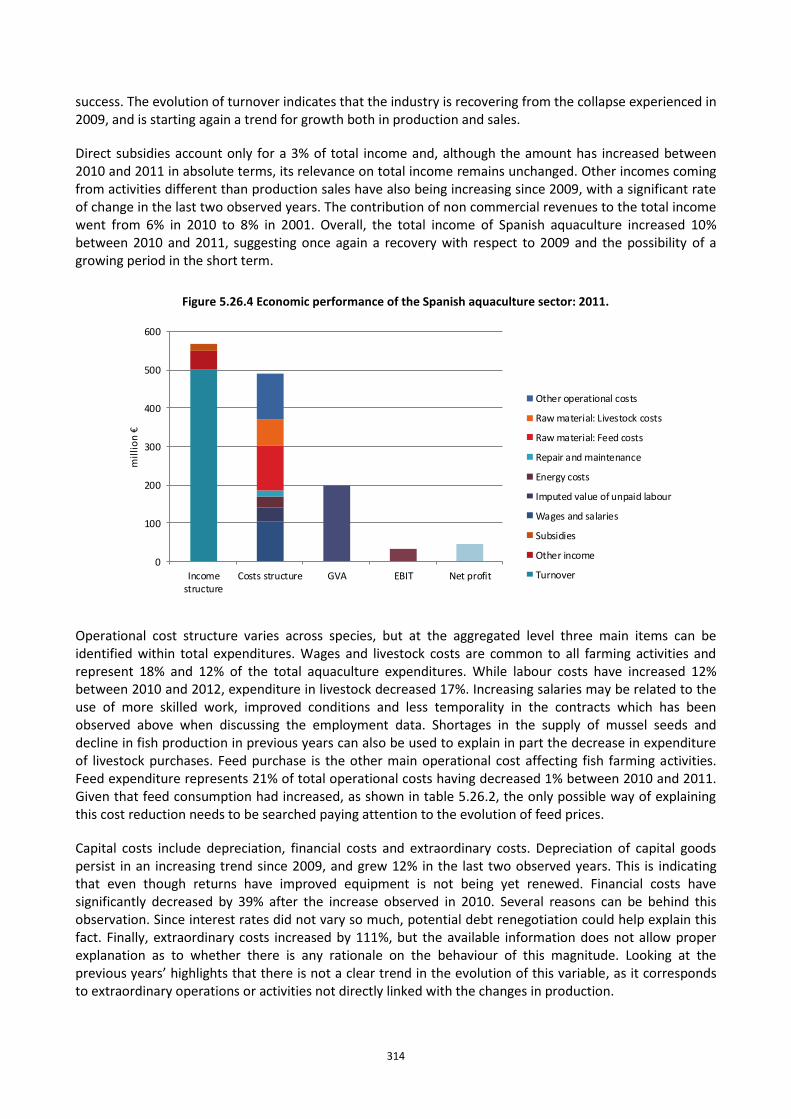
314
success. The evolution of turnover indicates that the industry is recovering from the collapse experienced in 2009, and is starting again a trend for growth both in production and sales.
Direct subsidies account only for a 3% of total income and, although the amount has increased between 2010 and 2011 in absolute terms, its relevance on total income remains unchanged. Other incomes coming from activities different than production sales have also being increasing since 2009, with a significant rate of change in the last two observed years. The contribution of non commercial revenues to the total income went from 6% in 2010 to 8% in 2001. Overall, the total income of Spanish aquaculture increased 10% between 2010 and 2011, suggesting once again a recovery with respect to 2009 and the possibility of a growing period in the short term.
Figure 5.26.4 Economic performance of the Spanish aquaculture sector: 2011.
0
100
200
300
400
500
600
Incomestructure
Costs structure GVA EBIT Net profit
mil
lio
n €
Other operational costs
Raw material: Livestock costs
Raw material: Feed costs
Repair and maintenance
Energy costs
Imputed value of unpaid labour
Wages and salaries
Subsidies
Other income
Turnover
Operational cost structure varies across species, but at the aggregated level three main items can be identified within total expenditures. Wages and livestock costs are common to all farming activities and represent 18% and 12% of the total aquaculture expenditures. While labour costs have increased 12% between 2010 and 2012, expenditure in livestock decreased 17%. Increasing salaries may be related to the use of more skilled work, improved conditions and less temporality in the contracts which has been observed above when discussing the employment data. Shortages in the supply of mussel seeds and decline in fish production in previous years can also be used to explain in part the decrease in expenditure of livestock purchases. Feed purchase is the other main operational cost affecting fish farming activities. Feed expenditure represents 21% of total operational costs having decreased 1% between 2010 and 2011. Given that feed consumption had increased, as shown in table 5.26.2, the only possible way of explaining this cost reduction needs to be searched paying attention to the evolution of feed prices.
Capital costs include depreciation, financial costs and extraordinary costs. Depreciation of capital goods persist in an increasing trend since 2009, and grew 12% in the last two observed years. This is indicating that even though returns have improved equipment is not being yet renewed. Financial costs have significantly decreased by 39% after the increase observed in 2010. Several reasons can be behind this observation. Since interest rates did not vary so much, potential debt renegotiation could help explain this fact. Finally, extraordinary costs increased by 111%, but the available information does not allow proper explanation as to whether there is any rationale on the behaviour of this magnitude. Looking at the previous years’ highlights that there is not a clear trend in the evolution of this variable, as it corresponds to extraordinary operations or activities not directly linked with the changes in production.
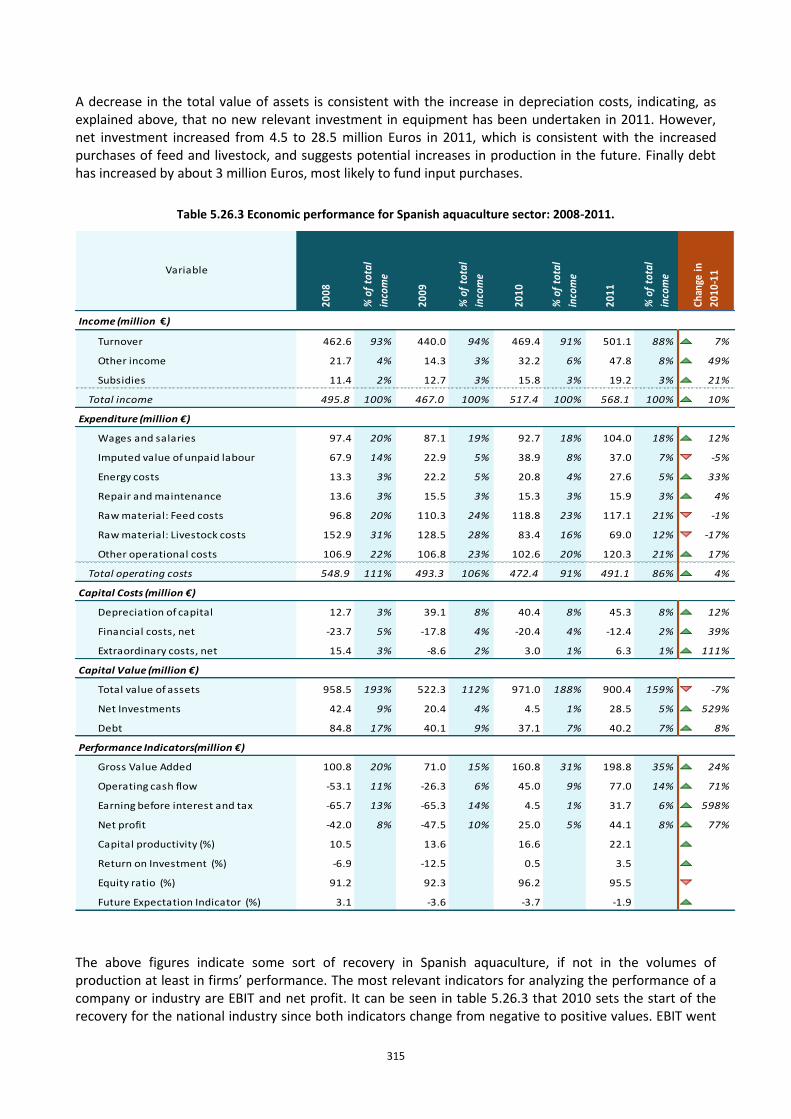
315
A decrease in the total value of assets is consistent with the increase in depreciation costs, indicating, as explained above, that no new relevant investment in equipment has been undertaken in 2011. However, net investment increased from 4.5 to 28.5 million Euros in 2011, which is consistent with the increased purchases of feed and livestock, and suggests potential increases in production in the future. Finally debt has increased by about 3 million Euros, most likely to fund input purchases.
Table 5.26.3 Economic performance for Spanish aquaculture sector: 2008-2011.
Income (million €)
Turnover 462.6 93% 440.0 94% 469.4 91% 501.1 88% 7%
Other income 21.7 4% 14.3 3% 32.2 6% 47.8 8% 49%
Subsidies 11.4 2% 12.7 3% 15.8 3% 19.2 3% 21%
Total income 495.8 100% 467.0 100% 517.4 100% 568.1 100% 10%
Expenditure (million €)
Wages and salaries 97.4 20% 87.1 19% 92.7 18% 104.0 18% 12%
Imputed value of unpaid labour 67.9 14% 22.9 5% 38.9 8% 37.0 7% -5%
Energy costs 13.3 3% 22.2 5% 20.8 4% 27.6 5% 33%
Repair and maintenance 13.6 3% 15.5 3% 15.3 3% 15.9 3% 4%
Raw material: Feed costs 96.8 20% 110.3 24% 118.8 23% 117.1 21% -1%
Raw material: Livestock costs 152.9 31% 128.5 28% 83.4 16% 69.0 12% -17%
Other operational costs 106.9 22% 106.8 23% 102.6 20% 120.3 21% 17%
Total operating costs 548.9 111% 493.3 106% 472.4 91% 491.1 86% 4%
Capital Costs (million €)
Depreciation of capital 12.7 3% 39.1 8% 40.4 8% 45.3 8% 12%
Financial costs, net -23.7 5% -17.8 4% -20.4 4% -12.4 2% 39%
Extraordinary costs, net 15.4 3% -8.6 2% 3.0 1% 6.3 1% 111%
Capital Value (million €)
Total value of assets 958.5 193% 522.3 112% 971.0 188% 900.4 159% -7%
Net Investments 42.4 9% 20.4 4% 4.5 1% 28.5 5% 529%
Debt 84.8 17% 40.1 9% 37.1 7% 40.2 7% 8%
Performance Indicators(million €)
Gross Value Added 100.8 20% 71.0 15% 160.8 31% 198.8 35% 24%
Operating cash flow -53.1 11% -26.3 6% 45.0 9% 77.0 14% 71%
Earning before interest and tax -65.7 13% -65.3 14% 4.5 1% 31.7 6% 598%
Net profit -42.0 8% -47.5 10% 25.0 5% 44.1 8% 77%
Capital productivity (%) 10.5 13.6 16.6 22.1 33%
Return on Investment (%) -6.9 -12.5 0.5 3.5 649%
Equity ratio (%) 91.2 92.3 96.2 95.5 -1%
Future Expectation Indicator (%) 3.1 -3.6 -3.7 -1.9 49%
% o
f to
tal
inco
me
2010
2011
Chan
ge in
2010
-11
% o
f to
tal
inco
meVariable
% o
f to
tal
inco
me
2008
2009
% o
f to
tal
inco
me
The above figures indicate some sort of recovery in Spanish aquaculture, if not in the volumes of production at least in firms’ performance. The most relevant indicators for analyzing the performance of a company or industry are EBIT and net profit. It can be seen in table 5.26.3 that 2010 sets the start of the recovery for the national industry since both indicators change from negative to positive values. EBIT went
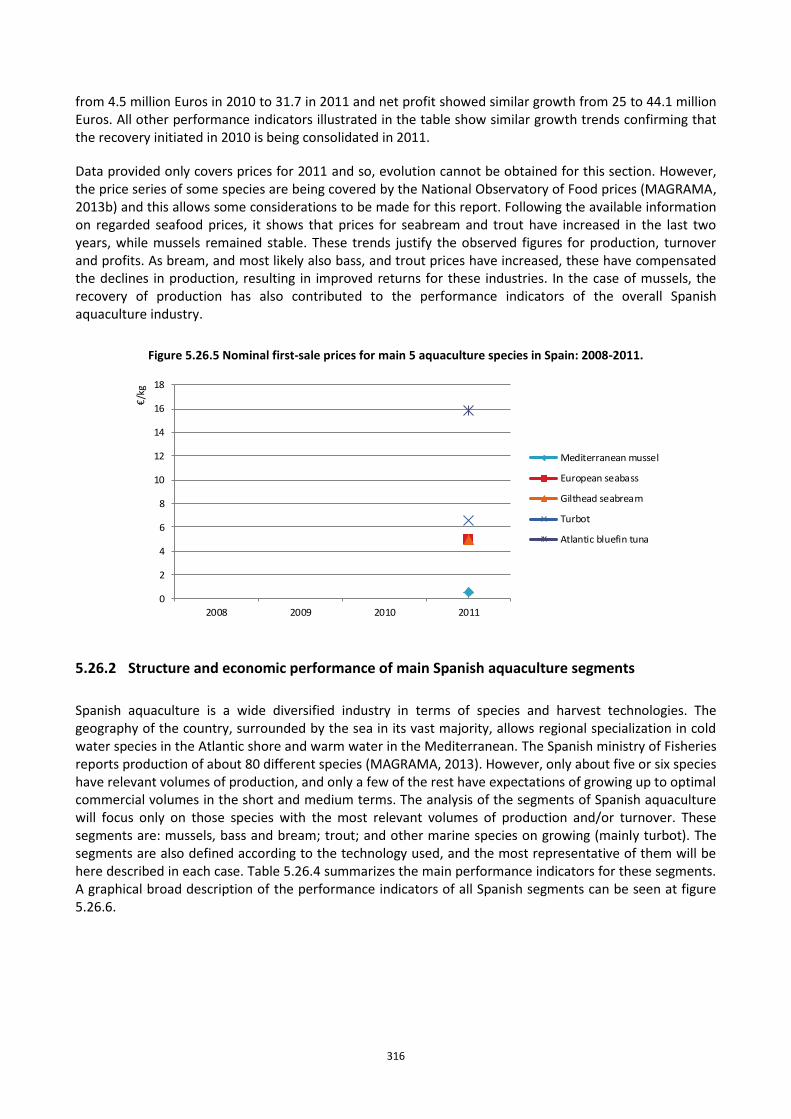
316
from 4.5 million Euros in 2010 to 31.7 in 2011 and net profit showed similar growth from 25 to 44.1 million Euros. All other performance indicators illustrated in the table show similar growth trends confirming that the recovery initiated in 2010 is being consolidated in 2011.
Data provided only covers prices for 2011 and so, evolution cannot be obtained for this section. However, the price series of some species are being covered by the National Observatory of Food prices (MAGRAMA, 2013b) and this allows some considerations to be made for this report. Following the available information on regarded seafood prices, it shows that prices for seabream and trout have increased in the last two years, while mussels remained stable. These trends justify the observed figures for production, turnover and profits. As bream, and most likely also bass, and trout prices have increased, these have compensated the declines in production, resulting in improved returns for these industries. In the case of mussels, the recovery of production has also contributed to the performance indicators of the overall Spanish aquaculture industry.
Figure 5.26.5 Nominal first-sale prices for main 5 aquaculture species in Spain: 2008-2011.
0
2
4
6
8
10
12
14
16
18
2008 2009 2010 2011
€/k
g
Mediterranean mussel
European seabass
Gilthead seabream
Turbot
Atlantic bluefin tuna
5.26.2 Structure and economic performance of main Spanish aquaculture segments
Spanish aquaculture is a wide diversified industry in terms of species and harvest technologies. The geography of the country, surrounded by the sea in its vast majority, allows regional specialization in cold water species in the Atlantic shore and warm water in the Mediterranean. The Spanish ministry of Fisheries reports production of about 80 different species (MAGRAMA, 2013). However, only about five or six species have relevant volumes of production, and only a few of the rest have expectations of growing up to optimal commercial volumes in the short and medium terms. The analysis of the segments of Spanish aquaculture will focus only on those species with the most relevant volumes of production and/or turnover. These segments are: mussels, bass and bream; trout; and other marine species on growing (mainly turbot). The segments are also defined according to the technology used, and the most representative of them will be here described in each case. Table 5.26.4 summarizes the main performance indicators for these segments. A graphical broad description of the performance indicators of all Spanish segments can be seen at figure 5.26.6.
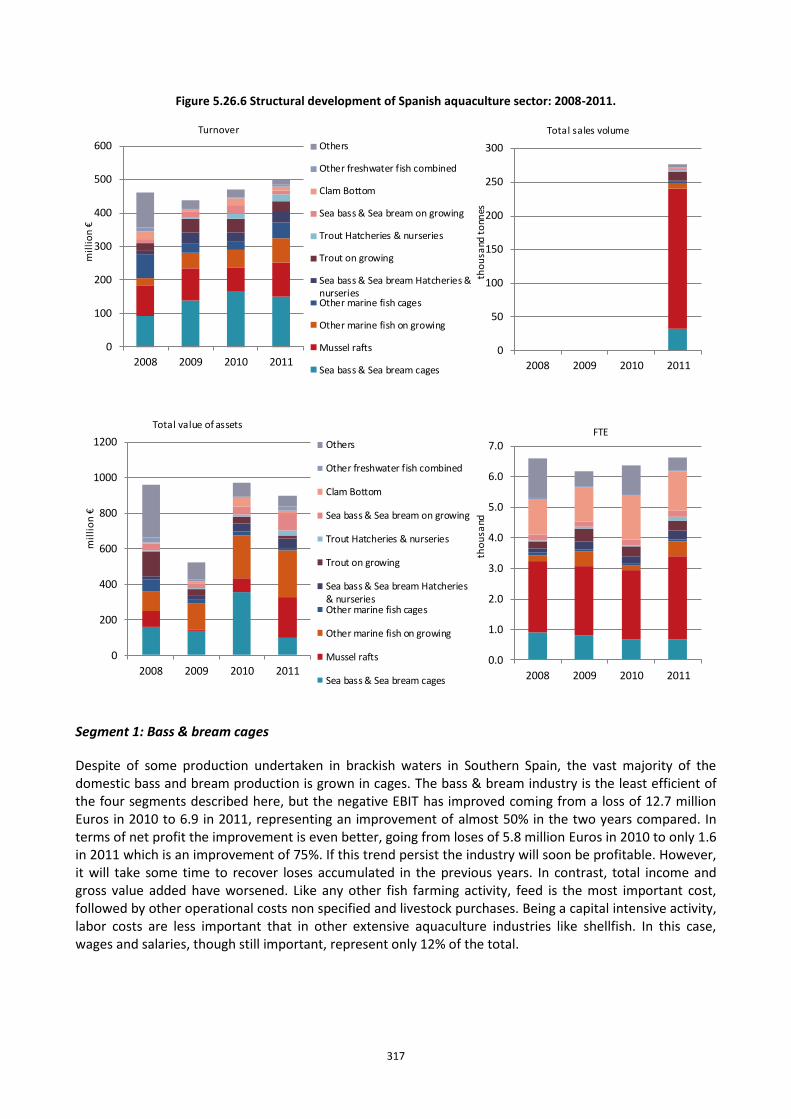
317
Figure 5.26.6 Structural development of Spanish aquaculture sector: 2008-2011.
0
100
200
300
400
500
600
2008 2009 2010 2011
mil
lio
n €
Turnover
Others
Other freshwater fish combined
Clam Bottom
Sea bass & Sea bream on growing
Trout Hatcheries & nurseries
Trout on growing
Sea bass & Sea bream Hatcheries &nurseriesOther marine fish cages
Other marine fish on growing
Mussel rafts
Sea bass & Sea bream cages
0
50
100
150
200
250
300
2008 2009 2010 2011
tho
usa
nd t
onn
es
Total sales volume
0
200
400
600
800
1000
1200
2008 2009 2010 2011
mil
lio
n €
Total value of assets
Others
Other freshwater fish combined
Clam Bottom
Sea bass & Sea bream on growing
Trout Hatcheries & nurseries
Trout on growing
Sea bass & Sea bream Hatcheries& nurseriesOther marine fish cages
Other marine fish on growing
Mussel rafts
Sea bass & Sea bream cages
0.0
1.0
2.0
3.0
4.0
5.0
6.0
7.0
2008 2009 2010 2011
tho
usa
nd
FTE
Segment 1: Bass & bream cages
Despite of some production undertaken in brackish waters in Southern Spain, the vast majority of the domestic bass and bream production is grown in cages. The bass & bream industry is the least efficient of the four segments described here, but the negative EBIT has improved coming from a loss of 12.7 million Euros in 2010 to 6.9 in 2011, representing an improvement of almost 50% in the two years compared. In terms of net profit the improvement is even better, going from loses of 5.8 million Euros in 2010 to only 1.6 in 2011 which is an improvement of 75%. If this trend persist the industry will soon be profitable. However, it will take some time to recover loses accumulated in the previous years. In contrast, total income and gross value added have worsened. Like any other fish farming activity, feed is the most important cost, followed by other operational costs non specified and livestock purchases. Being a capital intensive activity, labor costs are less important that in other extensive aquaculture industries like shellfish. In this case, wages and salaries, though still important, represent only 12% of the total.
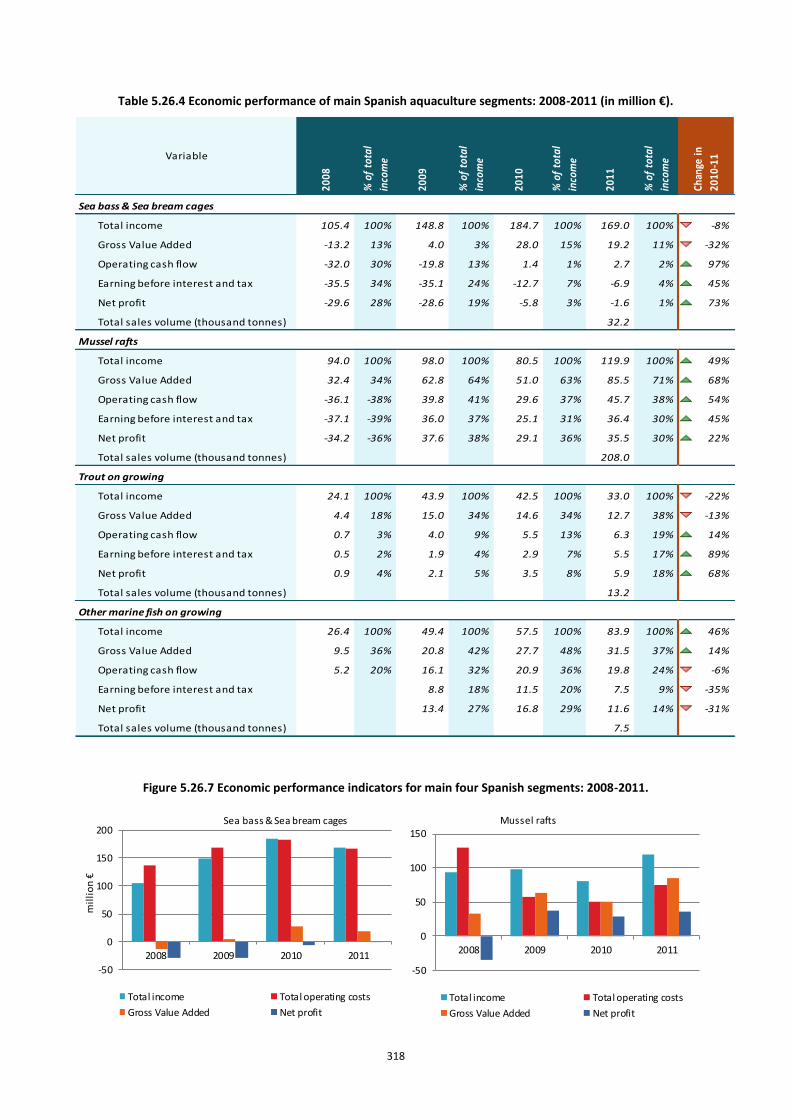
318
Table 5.26.4 Economic performance of main Spanish aquaculture segments: 2008-2011 (in million €).
Sea bass & Sea bream cages
Total income 105.4 100% 148.8 100% 184.7 100% 169.0 100% -8%
Gross Value Added -13.2 13% 4.0 3% 28.0 15% 19.2 11% -32%
Operating cash flow -32.0 30% -19.8 13% 1.4 1% 2.7 2% 97%
Earning before interest and tax -35.5 34% -35.1 24% -12.7 7% -6.9 4% 45%
Net profit -29.6 28% -28.6 19% -5.8 3% -1.6 1% 73%
Total sales volume (thousand tonnes) 32.2
Mussel rafts
Total income 94.0 100% 98.0 100% 80.5 100% 119.9 100% 49%
Gross Value Added 32.4 34% 62.8 64% 51.0 63% 85.5 71% 68%
Operating cash flow -36.1 -38% 39.8 41% 29.6 37% 45.7 38% 54%
Earning before interest and tax -37.1 -39% 36.0 37% 25.1 31% 36.4 30% 45%
Net profit -34.2 -36% 37.6 38% 29.1 36% 35.5 30% 22%
Total sales volume (thousand tonnes) 208.0
Trout on growing
Total income 24.1 100% 43.9 100% 42.5 100% 33.0 100% -22%
Gross Value Added 4.4 18% 15.0 34% 14.6 34% 12.7 38% -13%
Operating cash flow 0.7 3% 4.0 9% 5.5 13% 6.3 19% 14%
Earning before interest and tax 0.5 2% 1.9 4% 2.9 7% 5.5 17% 89%
Net profit 0.9 4% 2.1 5% 3.5 8% 5.9 18% 68%
Total sales volume (thousand tonnes) 13.2
Other marine fish on growing
Total income 26.4 100% 49.4 100% 57.5 100% 83.9 100% 46%
Gross Value Added 9.5 36% 20.8 42% 27.7 48% 31.5 37% 14%
Operating cash flow 5.2 20% 16.1 32% 20.9 36% 19.8 24% -6%
Earning before interest and tax 8.8 18% 11.5 20% 7.5 9% -35%
Net profit 13.4 27% 16.8 29% 11.6 14% -31%
Total sales volume (thousand tonnes) 7.5
% o
f to
tal
inco
me
Chan
ge in
2010
-11Variable
2008
% o
f to
tal
inco
me
2009
% o
f to
tal
inco
me
2010
% o
f to
tal
inco
me
2011
Figure 5.26.7 Economic performance indicators for main four Spanish segments: 2008-2011.
-50
0
50
100
150
200
2008 2009 2010 2011
mil
lio
n €
Sea bass & Sea bream cages
Total income Total operating costs
Gross Value Added Net profit
-50
0
50
100
150
2008 2009 2010 2011
Mussel rafts
Total income Total operating costs
Gross Value Added Net profit
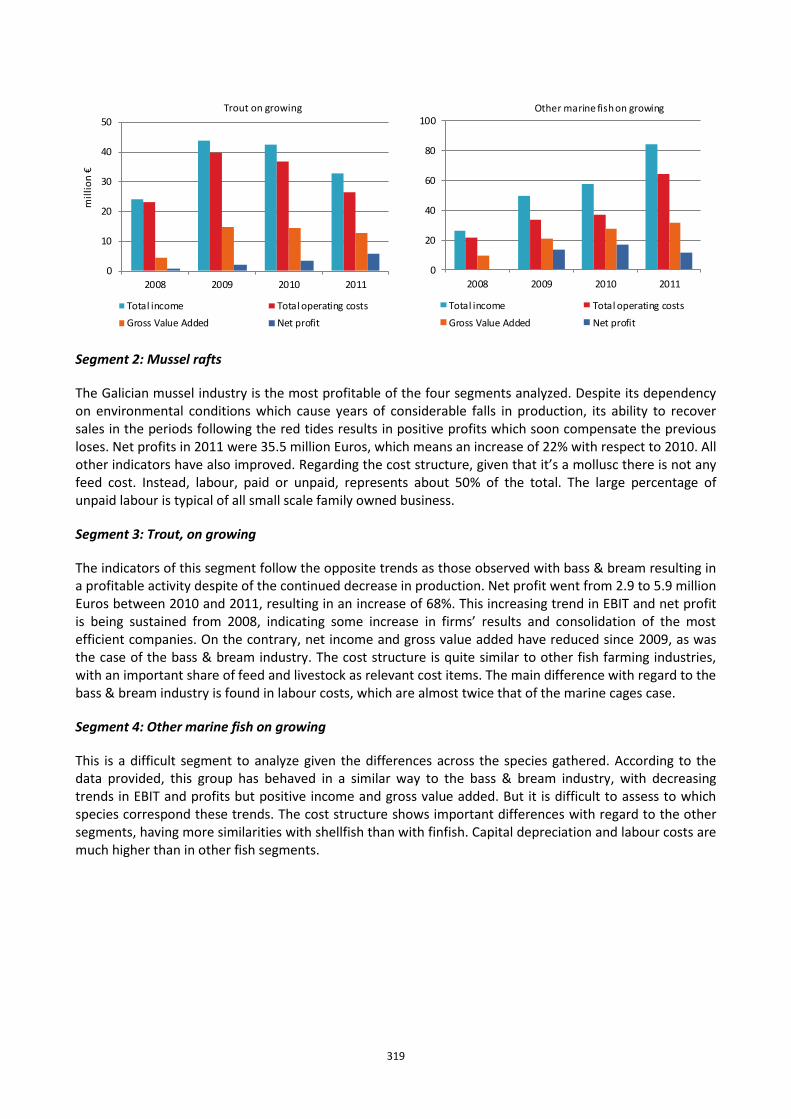
319
0
10
20
30
40
50
2008 2009 2010 2011
mil
lio
n €
Trout on growing
Total income Total operating costs
Gross Value Added Net profit
0
20
40
60
80
100
2008 2009 2010 2011
Other marine fish on growing
Total income Total operating costs
Gross Value Added Net profit
Segment 2: Mussel rafts
The Galician mussel industry is the most profitable of the four segments analyzed. Despite its dependency on environmental conditions which cause years of considerable falls in production, its ability to recover sales in the periods following the red tides results in positive profits which soon compensate the previous loses. Net profits in 2011 were 35.5 million Euros, which means an increase of 22% with respect to 2010. All other indicators have also improved. Regarding the cost structure, given that it’s a mollusc there is not any feed cost. Instead, labour, paid or unpaid, represents about 50% of the total. The large percentage of unpaid labour is typical of all small scale family owned business.
Segment 3: Trout, on growing
The indicators of this segment follow the opposite trends as those observed with bass & bream resulting in a profitable activity despite of the continued decrease in production. Net profit went from 2.9 to 5.9 million Euros between 2010 and 2011, resulting in an increase of 68%. This increasing trend in EBIT and net profit is being sustained from 2008, indicating some increase in firms’ results and consolidation of the most efficient companies. On the contrary, net income and gross value added have reduced since 2009, as was the case of the bass & bream industry. The cost structure is quite similar to other fish farming industries, with an important share of feed and livestock as relevant cost items. The main difference with regard to the bass & bream industry is found in labour costs, which are almost twice that of the marine cages case.
Segment 4: Other marine fish on growing
This is a difficult segment to analyze given the differences across the species gathered. According to the data provided, this group has behaved in a similar way to the bass & bream industry, with decreasing trends in EBIT and profits but positive income and gross value added. But it is difficult to assess to which species correspond these trends. The cost structure shows important differences with regard to the other segments, having more similarities with shellfish than with finfish. Capital depreciation and labour costs are much higher than in other fish segments.
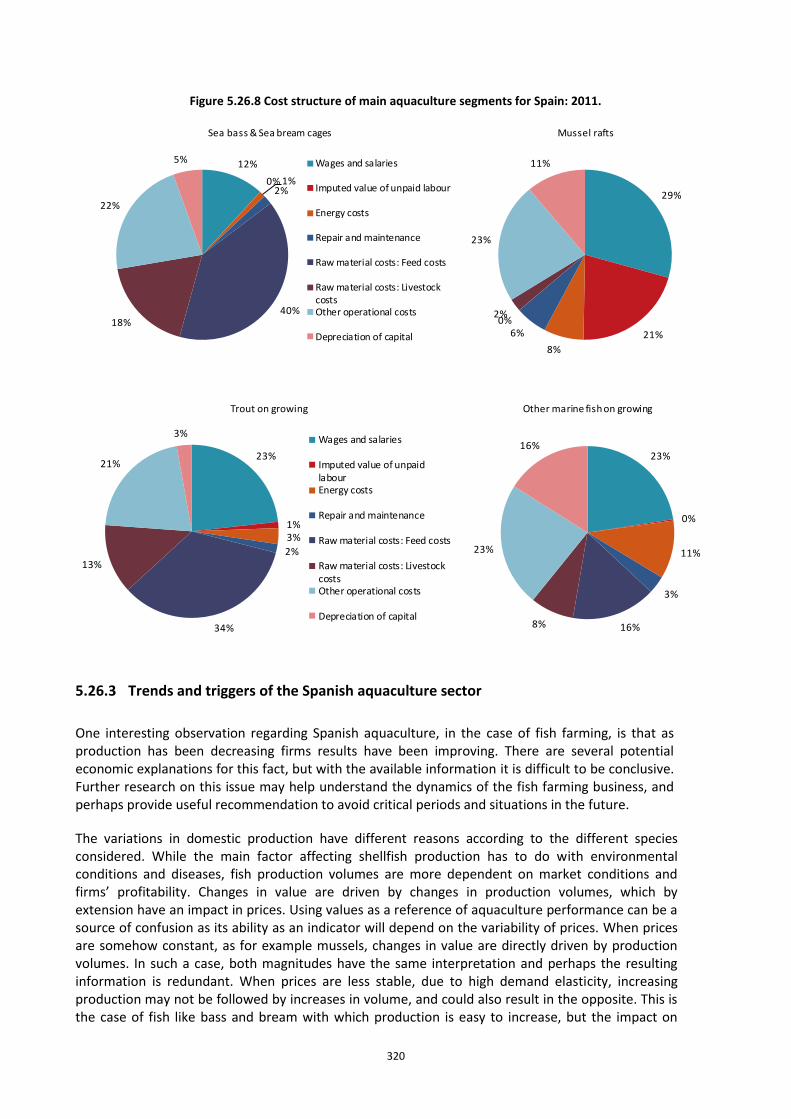
320
Figure 5.26.8 Cost structure of main aquaculture segments for Spain: 2011.
12%
0% 1%2%
40%18%
22%
5%
Sea bass & Sea bream cages
Wages and salaries
Imputed value of unpaid labour
Energy costs
Repair and maintenance
Raw material costs: Feed costs
Raw material costs: LivestockcostsOther operational costs
Depreciation of capital
29%
21%
8%
6%0%
2%
23%
11%
Mussel rafts
23%
1%3%
2%
34%
13%
21%
3%
Trout on growing
Wages and salaries
Imputed value of unpaidlabourEnergy costs
Repair and maintenance
Raw material costs: Feed costs
Raw material costs: LivestockcostsOther operational costs
Depreciation of capital
23%
0%
11%
3%
16%8%
23%
16%
Other marine fish on growing
5.26.3 Trends and triggers of the Spanish aquaculture sector
One interesting observation regarding Spanish aquaculture, in the case of fish farming, is that as production has been decreasing firms results have been improving. There are several potential economic explanations for this fact, but with the available information it is difficult to be conclusive. Further research on this issue may help understand the dynamics of the fish farming business, and perhaps provide useful recommendation to avoid critical periods and situations in the future.
The variations in domestic production have different reasons according to the different species considered. While the main factor affecting shellfish production has to do with environmental conditions and diseases, fish production volumes are more dependent on market conditions and firms’ profitability. Changes in value are driven by changes in production volumes, which by extension have an impact in prices. Using values as a reference of aquaculture performance can be a source of confusion as its ability as an indicator will depend on the variability of prices. When prices are somehow constant, as for example mussels, changes in value are directly driven by production volumes. In such a case, both magnitudes have the same interpretation and perhaps the resulting information is redundant. When prices are less stable, due to high demand elasticity, increasing production may not be followed by increases in volume, and could also result in the opposite. This is the case of fish like bass and bream with which production is easy to increase, but the impact on
321
market prices can reduce the profits and endangered firms’ survival. In these cases, prices and market size act as regulators of production.
According to the figures illustrated in this chapter, overall Spanish aquaculture production is recovering from a recession which recorded a minimum in 2009. However, this recovery is not inclusive of all segments, and bass & bream is still having difficulties resulting in losses. The financial situation of the country is also affecting seafood consumption in general and high value species in particular (Fernández Polanco et al, 2012). Although the bass and bream industry appears to be reducing losses in the last two years, it is difficult to say whether it will be able to be profitable if the prices keep on rising. Despite of this, there are no additional evidences suggesting that these trends will change in the short term. Given this all indications are that there is not much potential of increasing production in the main current segments, any possible growth in the future should come from the development of new and emerging species such as meagre, bluefin tuna or sole.
The differences across subsectors and regions are based on the different species harvested in every case. Mollusc farming is a labour intensive activity, with a strong and positive effect on welfare and economic development of the surrounding areas, derived from the incomes resultant from direct and indirect employment. These are also activities identified by locals as “traditional” and well accepted by the fishermen communities, in which many of them found an alternative occupation and source of income. Finfish production, instead, is capital intensive and in many cases causes conflicts with other activities undertaken in the same coast. As it has been illustrated above, the cost structure of these two main sectors are completely different, since shellfish requires more labour force but has no need of feed supply. Water requirements of the species are also different. Bass and bream are warm water species and efficiency of production significantly decreases when moving north. The same happens to cold water species like turbot when moving south.
Spain is one of the countries with the most complete and reliable fisheries statistics in the world. And the majority of these series are public and freely accessible. The number of companies, employment and wages is periodically collected and recorded by the national, and some regional, authorities. Despite several attempts at concentration, whether under national or foreign control, the number of firms is still high, resulting in a fragmented sector for the majority of the species grown.
Changes in production costs depend mainly on changes in technology or scale, as well as in salaries. There has not been significant investment in the last two years indicating that relevant changes in cost structure will take part.
Like in many other Southern European countries, certifications are still a new concept for Spanish consumers, and it is not expectable that they will be willing to pay any premium under the current economic situation. Given that the majority of the production is being sold within the domestic market, producers haven’t shown much interest on this regard until now. This situation may change, but more as a result of retailers demands than from consumers’ interests. Large retailers are now adopting the major certification schemes for use as a tool for corporate social responsibility (CSR), and as their market share is increasing all over the country (Fernández Polanco et al, 2012), producers may be interested in subscribing to any of these schemes in order not to lose market access.
Regarding organic aquaculture, although Spain is one of the largest organic agriculture producers in the EU, this is not the case with aquaculture. In the present there is not any farm in the country producing any kind of organic seafood. Only some processed and combined products using organic agriculture products such as olive oil in mussels cans can be found in the markets, but this cannot be considered organic aquaculture because the seafood product has been grown under regular procedures. Consumers’ knowledge about organic foods, confusion derived from the names used for these kinds of products (i.e. ecologic, biologic etc) and income constraints are the major bottlenecks
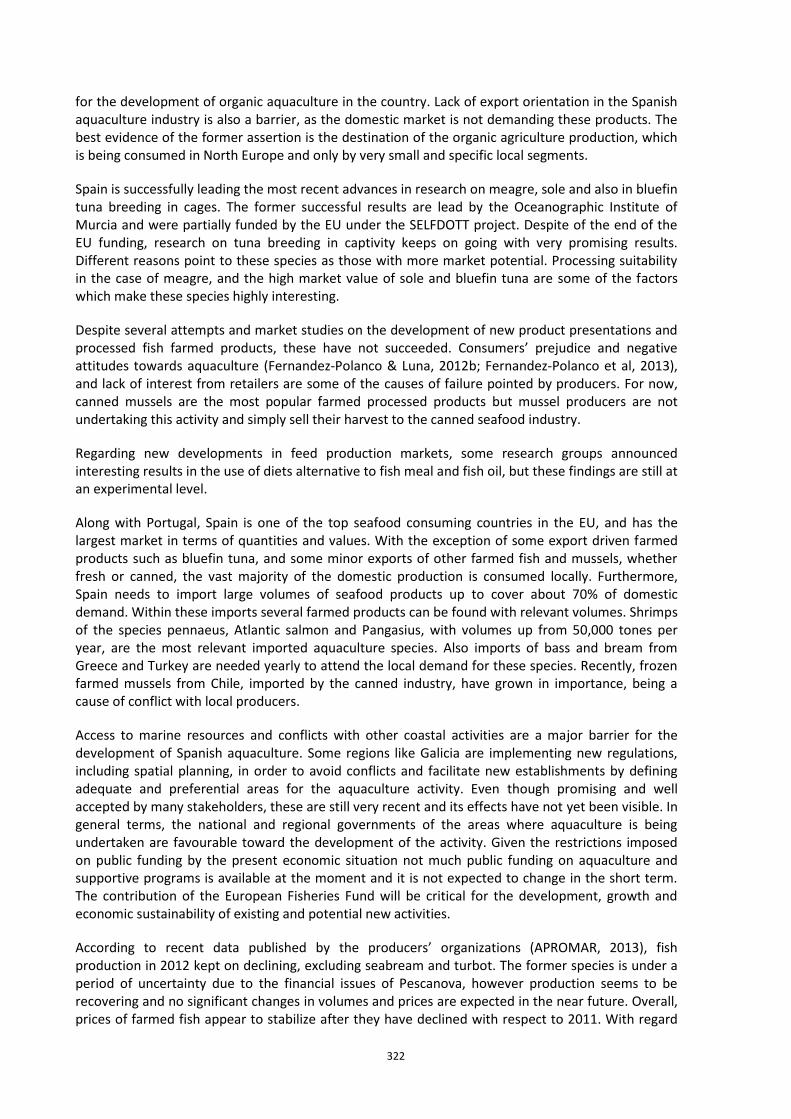
322
for the development of organic aquaculture in the country. Lack of export orientation in the Spanish aquaculture industry is also a barrier, as the domestic market is not demanding these products. The best evidence of the former assertion is the destination of the organic agriculture production, which is being consumed in North Europe and only by very small and specific local segments.
Spain is successfully leading the most recent advances in research on meagre, sole and also in bluefin tuna breeding in cages. The former successful results are lead by the Oceanographic Institute of Murcia and were partially funded by the EU under the SELFDOTT project. Despite of the end of the EU funding, research on tuna breeding in captivity keeps on going with very promising results. Different reasons point to these species as those with more market potential. Processing suitability in the case of meagre, and the high market value of sole and bluefin tuna are some of the factors which make these species highly interesting.
Despite several attempts and market studies on the development of new product presentations and processed fish farmed products, these have not succeeded. Consumers’ prejudice and negative attitudes towards aquaculture (Fernandez-Polanco & Luna, 2012b; Fernandez-Polanco et al, 2013), and lack of interest from retailers are some of the causes of failure pointed by producers. For now, canned mussels are the most popular farmed processed products but mussel producers are not undertaking this activity and simply sell their harvest to the canned seafood industry.
Regarding new developments in feed production markets, some research groups announced interesting results in the use of diets alternative to fish meal and fish oil, but these findings are still at an experimental level.
Along with Portugal, Spain is one of the top seafood consuming countries in the EU, and has the largest market in terms of quantities and values. With the exception of some export driven farmed products such as bluefin tuna, and some minor exports of other farmed fish and mussels, whether fresh or canned, the vast majority of the domestic production is consumed locally. Furthermore, Spain needs to import large volumes of seafood products up to cover about 70% of domestic demand. Within these imports several farmed products can be found with relevant volumes. Shrimps of the species pennaeus, Atlantic salmon and Pangasius, with volumes up from 50,000 tones per year, are the most relevant imported aquaculture species. Also imports of bass and bream from Greece and Turkey are needed yearly to attend the local demand for these species. Recently, frozen farmed mussels from Chile, imported by the canned industry, have grown in importance, being a cause of conflict with local producers.
Access to marine resources and conflicts with other coastal activities are a major barrier for the development of Spanish aquaculture. Some regions like Galicia are implementing new regulations, including spatial planning, in order to avoid conflicts and facilitate new establishments by defining adequate and preferential areas for the aquaculture activity. Even though promising and well accepted by many stakeholders, these are still very recent and its effects have not yet been visible. In general terms, the national and regional governments of the areas where aquaculture is being undertaken are favourable toward the development of the activity. Given the restrictions imposed on public funding by the present economic situation not much public funding on aquaculture and supportive programs is available at the moment and it is not expected to change in the short term. The contribution of the European Fisheries Fund will be critical for the development, growth and economic sustainability of existing and potential new activities.
According to recent data published by the producers’ organizations (APROMAR, 2013), fish production in 2012 kept on declining, excluding seabream and turbot. The former species is under a period of uncertainty due to the financial issues of Pescanova, however production seems to be recovering and no significant changes in volumes and prices are expected in the near future. Overall, prices of farmed fish appear to stabilize after they have declined with respect to 2011. With regard
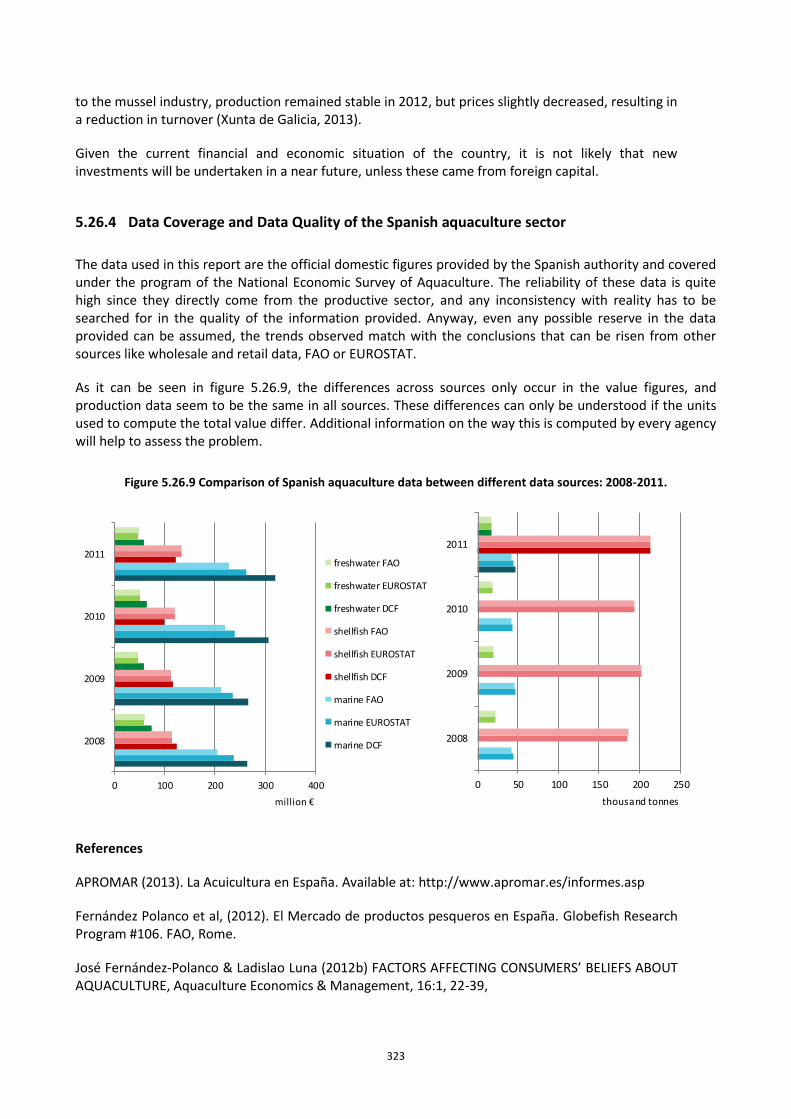
323
to the mussel industry, production remained stable in 2012, but prices slightly decreased, resulting in a reduction in turnover (Xunta de Galicia, 2013).
Given the current financial and economic situation of the country, it is not likely that new investments will be undertaken in a near future, unless these came from foreign capital.
5.26.4 Data Coverage and Data Quality of the Spanish aquaculture sector
The data used in this report are the official domestic figures provided by the Spanish authority and covered under the program of the National Economic Survey of Aquaculture. The reliability of these data is quite high since they directly come from the productive sector, and any inconsistency with reality has to be searched for in the quality of the information provided. Anyway, even any possible reserve in the data provided can be assumed, the trends observed match with the conclusions that can be risen from other sources like wholesale and retail data, FAO or EUROSTAT.
As it can be seen in figure 5.26.9, the differences across sources only occur in the value figures, and production data seem to be the same in all sources. These differences can only be understood if the units used to compute the total value differ. Additional information on the way this is computed by every agency will help to assess the problem.
Figure 5.26.9 Comparison of Spanish aquaculture data between different data sources: 2008-2011.
0 100 200 300 400
2008
2009
2010
2011
million €
freshwater FAO
freshwater EUROSTAT
freshwater DCF
shellfish FAO
shellfish EUROSTAT
shellfish DCF
marine FAO
marine EUROSTAT
marine DCF
0 50 100 150 200 250
2008
2009
2010
2011
thousand tonnes
References
APROMAR (2013). La Acuicultura en España. Available at: http://www.apromar.es/informes.asp
Fernández Polanco et al, (2012). El Mercado de productos pesqueros en España. Globefish Research Program #106. FAO, Rome.
José Fernández-Polanco & Ladislao Luna (2012b) FACTORS AFFECTING CONSUMERS’ BELIEFS ABOUT AQUACULTURE, Aquaculture Economics & Management, 16:1, 22-39,
324
José Fernández-Polanco, Simone Mueller Loose & Ladislao Luna (2013) ARE RETAILERS’PREFERENCES FOR SEAFOOD ATTRIBUTES PREDICTIVE FOR CONSUMER WANTS? RESULTS FROM A CHOICE EXPERIMENT FOR SEABREAM (Sparus aurata), Aquaculture Economics & Management, 17:2, 103-122,
MAGRAMA (2013). Encuesta Económica de la Acuicultura. Available at: http://www.magrama.gob.es/es/estadistica/temas/estadisticas-pesqueras/acuicultura/encuesta-economica-acuicultura/#para3
MAGRAMA (2013b). Observatorio de los Precios de los Alimentos. Available at: http://www.magrama.gob.es/es/alimentacion/servicios/observatorio-de-precios-de-los-alimentos/sistema-de-informacion-de-precios-origen-destino/#para9
MAGRAMA (2013c). Producción de acuicultura. Available at: http://www.magrama.gob.es/es/pesca/temas/acuicultura/produccion-de-acuicultura/
Xunta de Galicia (2013). Anuario de Acuicultura 2012. Available at: http://www.pescadegalicia.com/Publicaciones/AnuarioAcuicultura2012/
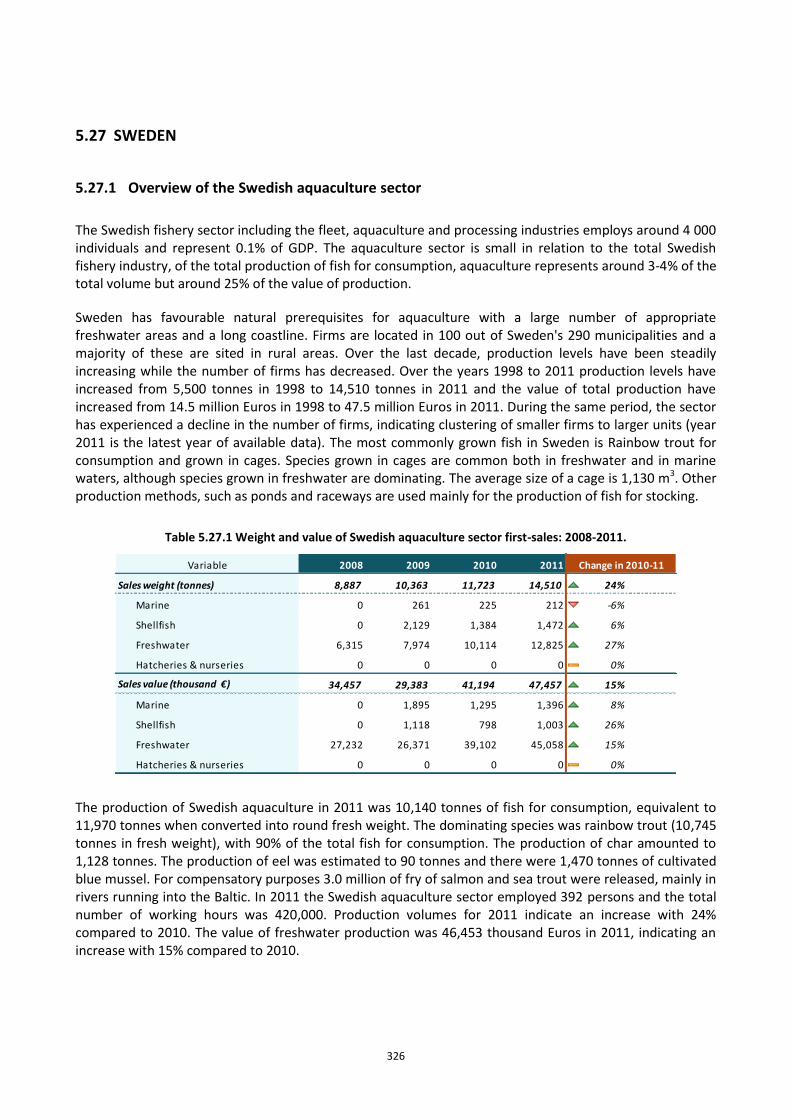
326
5.27 SWEDEN
5.27.1 Overview of the Swedish aquaculture sector
The Swedish fishery sector including the fleet, aquaculture and processing industries employs around 4 000 individuals and represent 0.1% of GDP. The aquaculture sector is small in relation to the total Swedish fishery industry, of the total production of fish for consumption, aquaculture represents around 3‐4% of the total volume but around 25% of the value of production.
Sweden has favourable natural prerequisites for aquaculture with a large number of appropriate freshwater areas and a long coastline. Firms are located in 100 out of Sweden's 290 municipalities and a majority of these are sited in rural areas. Over the last decade, production levels have been steadily increasing while the number of firms has decreased. Over the years 1998 to 2011 production levels have increased from 5,500 tonnes in 1998 to 14,510 tonnes in 2011 and the value of total production have increased from 14.5 million Euros in 1998 to 47.5 million Euros in 2011. During the same period, the sector has experienced a decline in the number of firms, indicating clustering of smaller firms to larger units (year 2011 is the latest year of available data). The most commonly grown fish in Sweden is Rainbow trout for consumption and grown in cages. Species grown in cages are common both in freshwater and in marine waters, although species grown in freshwater are dominating. The average size of a cage is 1,130 m3. Other production methods, such as ponds and raceways are used mainly for the production of fish for stocking.
Table 5.27.1 Weight and value of Swedish aquaculture sector first-sales: 2008-2011.
Variable 2008 2009 2010 2011
Sales weight (tonnes) 8,887 10,363 11,723 14,510 24%
Marine 0 261 225 212 -6%
Shellfish 0 2,129 1,384 1,472 6% ↗
Freshwater 6,315 7,974 10,114 12,825 27%
Hatcheries & nurseries 0 0 0 0 0%
Sales value (thousand €) 34,457 29,383 41,194 47,457 15% ↗
Marine 0 1,895 1,295 1,396 8% ↗
Shellfish 0 1,118 798 1,003 26% ↗
Freshwater 27,232 26,371 39,102 45,058 15%
Hatcheries & nurseries 0 0 0 0 0%
Change in 2010-11
The production of Swedish aquaculture in 2011 was 10,140 tonnes of fish for consumption, equivalent to 11,970 tonnes when converted into round fresh weight. The dominating species was rainbow trout (10,745 tonnes in fresh weight), with 90% of the total fish for consumption. The production of char amounted to 1,128 tonnes. The production of eel was estimated to 90 tonnes and there were 1,470 tonnes of cultivated blue mussel. For compensatory purposes 3.0 million of fry of salmon and sea trout were released, mainly in rivers running into the Baltic. In 2011 the Swedish aquaculture sector employed 392 persons and the total number of working hours was 420,000. Production volumes for 2011 indicate an increase with 24% compared to 2010. The value of freshwater production was 46,453 thousand Euros in 2011, indicating an increase with 15% compared to 2010.
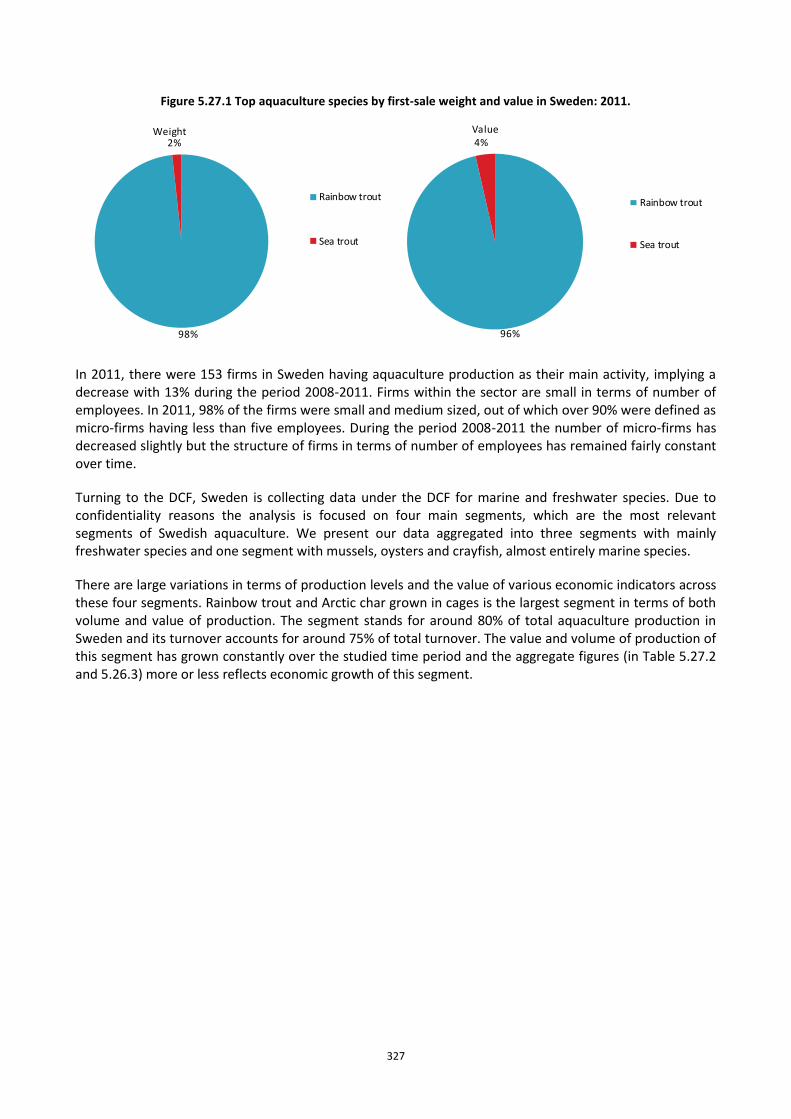
327
Figure 5.27.1 Top aquaculture species by first-sale weight and value in Sweden: 2011.
98%
2%Weight
Rainbow trout
Sea trout
96%
4%Value
Rainbow trout
Sea trout
In 2011, there were 153 firms in Sweden having aquaculture production as their main activity, implying a decrease with 13% during the period 2008-2011. Firms within the sector are small in terms of number of employees. In 2011, 98% of the firms were small and medium sized, out of which over 90% were defined as micro‐firms having less than five employees. During the period 2008-2011 the number of micro‐firms has decreased slightly but the structure of firms in terms of number of employees has remained fairly constant over time.
Turning to the DCF, Sweden is collecting data under the DCF for marine and freshwater species. Due to confidentiality reasons the analysis is focused on four main segments, which are the most relevant segments of Swedish aquaculture. We present our data aggregated into three segments with mainly freshwater species and one segment with mussels, oysters and crayfish, almost entirely marine species.
There are large variations in terms of production levels and the value of various economic indicators across these four segments. Rainbow trout and Arctic char grown in cages is the largest segment in terms of both volume and value of production. The segment stands for around 80% of total aquaculture production in Sweden and its turnover accounts for around 75% of total turnover. The value and volume of production of this segment has grown constantly over the studied time period and the aggregate figures (in Table 5.27.2 and 5.26.3) more or less reflects economic growth of this segment.
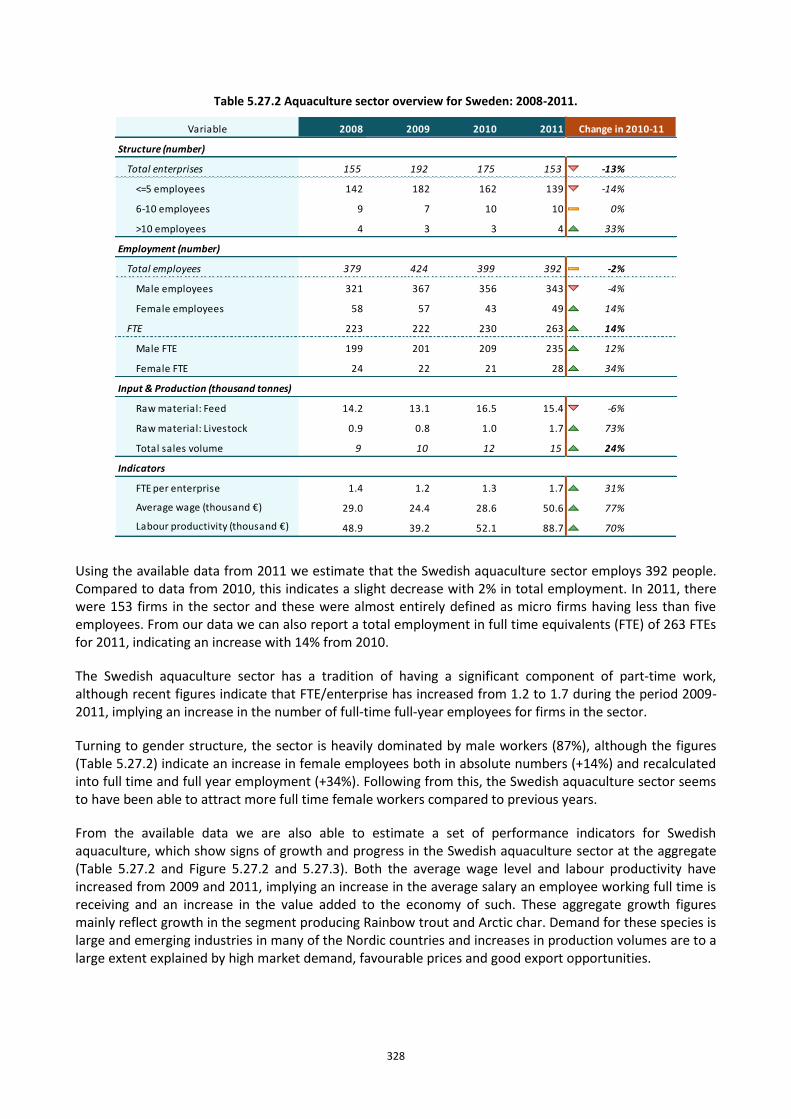
328
Table 5.27.2 Aquaculture sector overview for Sweden: 2008-2011.
Variable 2008 2009 2010 2011
Structure (number)
Total enterprises 155 192 175 153 -13% ↔
<=5 employees 142 182 162 139 -14% ↘
6-10 employees 9 7 10 10 0% ↔
>10 employees 4 3 3 4 33% ↗
Employment (number)
Total employees 379 424 399 392 -2% ↘
Male employees 321 367 356 343 -4% ↘
Female employees 58 57 43 49 14% ↗
FTE 223 222 230 263 14% ↗
Male FTE 199 201 209 235 12% ↗
Female FTE 24 22 21 28 34% ↗
Input & Production (thousand tonnes)
Raw material: Feed 14.2 13.1 16.5 15.4 -6% ↘
Raw material: Livestock 0.9 0.8 1.0 1.7 73%
Total sales volume 9 10 12 15 24%
Indicators
FTE per enterprise 1.4 1.2 1.3 1.7 31% ↗
Average wage (thousand €) 29.0 24.4 28.6 50.6 77% ↗
Labour productivity (thousand €) 48.9 39.2 52.1 88.7 70% ↗
Change in 2010-11
Using the available data from 2011 we estimate that the Swedish aquaculture sector employs 392 people. Compared to data from 2010, this indicates a slight decrease with 2% in total employment. In 2011, there were 153 firms in the sector and these were almost entirely defined as micro firms having less than five employees. From our data we can also report a total employment in full time equivalents (FTE) of 263 FTEs for 2011, indicating an increase with 14% from 2010.
The Swedish aquaculture sector has a tradition of having a significant component of part‐time work, although recent figures indicate that FTE/enterprise has increased from 1.2 to 1.7 during the period 2009-2011, implying an increase in the number of full‐time full‐year employees for firms in the sector.
Turning to gender structure, the sector is heavily dominated by male workers (87%), although the figures (Table 5.27.2) indicate an increase in female employees both in absolute numbers (+14%) and recalculated into full time and full year employment (+34%). Following from this, the Swedish aquaculture sector seems to have been able to attract more full time female workers compared to previous years.
From the available data we are also able to estimate a set of performance indicators for Swedish aquaculture, which show signs of growth and progress in the Swedish aquaculture sector at the aggregate (Table 5.27.2 and Figure 5.27.2 and 5.27.3). Both the average wage level and labour productivity have increased from 2009 and 2011, implying an increase in the average salary an employee working full time is receiving and an increase in the value added to the economy of such. These aggregate growth figures mainly reflect growth in the segment producing Rainbow trout and Arctic char. Demand for these species is large and emerging industries in many of the Nordic countries and increases in production volumes are to a large extent explained by high market demand, favourable prices and good export opportunities.
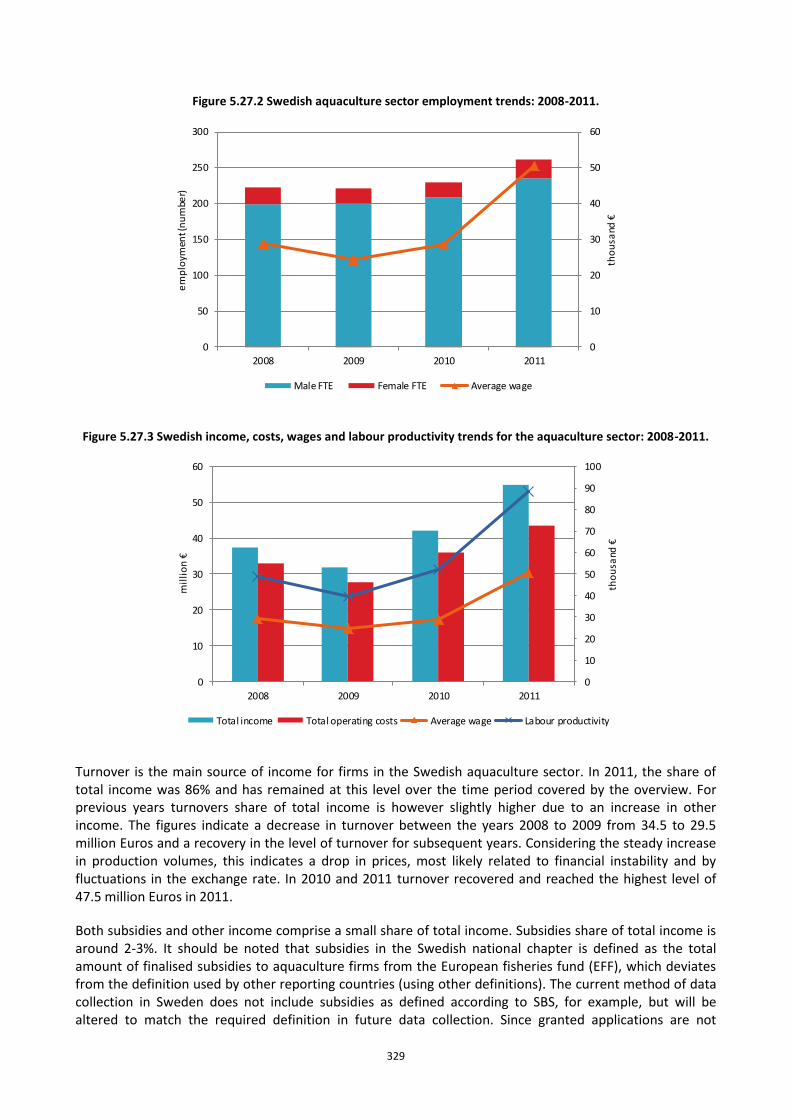
329
Figure 5.27.2 Swedish aquaculture sector employment trends: 2008-2011.
0
10
20
30
40
50
60
0
50
100
150
200
250
300
2008 2009 2010 2011
tho
usa
nd €
em
plo
ymen
t (n
um
ber)
Male FTE Female FTE Average wage
Figure 5.27.3 Swedish income, costs, wages and labour productivity trends for the aquaculture sector: 2008-2011.
0
10
20
30
40
50
60
70
80
90
100
0
10
20
30
40
50
60
2008 2009 2010 2011
tho
usa
nd €
mil
lio
n €
Total income Total operating costs Average wage Labour productivity
Turnover is the main source of income for firms in the Swedish aquaculture sector. In 2011, the share of total income was 86% and has remained at this level over the time period covered by the overview. For previous years turnovers share of total income is however slightly higher due to an increase in other income. The figures indicate a decrease in turnover between the years 2008 to 2009 from 34.5 to 29.5 million Euros and a recovery in the level of turnover for subsequent years. Considering the steady increase in production volumes, this indicates a drop in prices, most likely related to financial instability and by fluctuations in the exchange rate. In 2010 and 2011 turnover recovered and reached the highest level of 47.5 million Euros in 2011.
Both subsidies and other income comprise a small share of total income. Subsidies share of total income is around 2‐3%. It should be noted that subsidies in the Swedish national chapter is defined as the total amount of finalised subsidies to aquaculture firms from the European fisheries fund (EFF), which deviates from the definition used by other reporting countries (using other definitions). The current method of data collection in Sweden does not include subsidies as defined according to SBS, for example, but will be altered to match the required definition in future data collection. Since granted applications are not
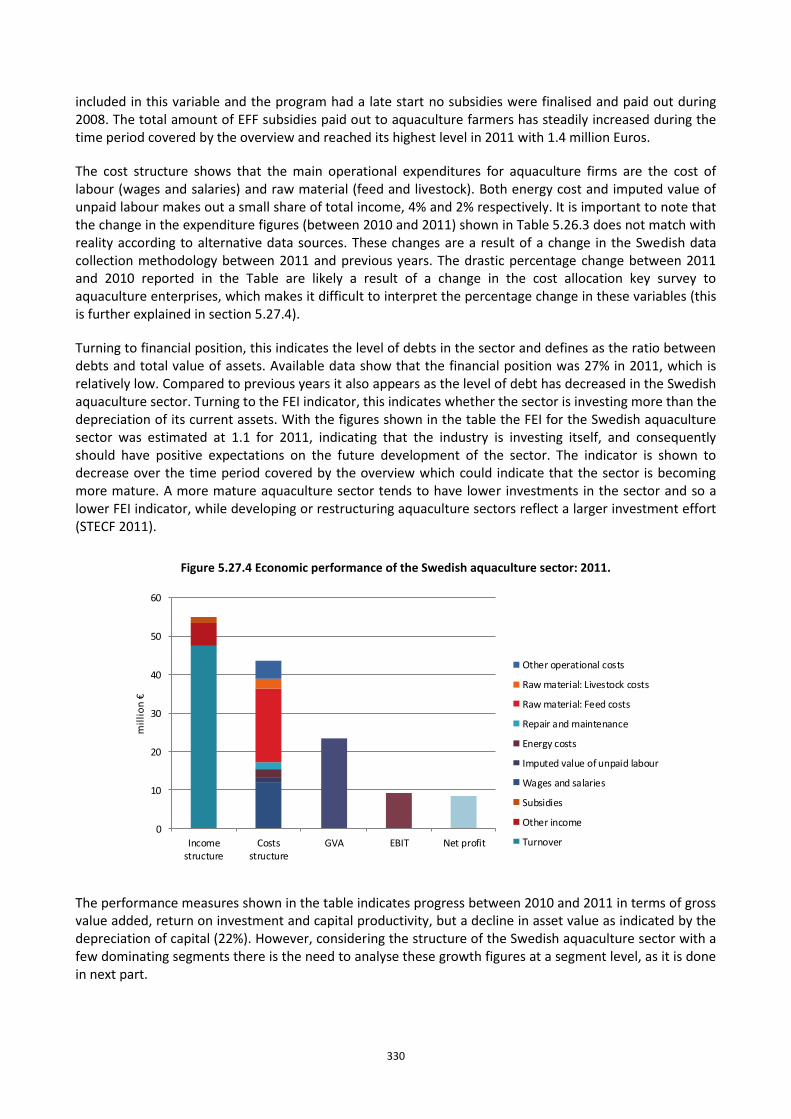
330
included in this variable and the program had a late start no subsidies were finalised and paid out during 2008. The total amount of EFF subsidies paid out to aquaculture farmers has steadily increased during the time period covered by the overview and reached its highest level in 2011 with 1.4 million Euros.
The cost structure shows that the main operational expenditures for aquaculture firms are the cost of labour (wages and salaries) and raw material (feed and livestock). Both energy cost and imputed value of unpaid labour makes out a small share of total income, 4% and 2% respectively. It is important to note that the change in the expenditure figures (between 2010 and 2011) shown in Table 5.26.3 does not match with reality according to alternative data sources. These changes are a result of a change in the Swedish data collection methodology between 2011 and previous years. The drastic percentage change between 2011 and 2010 reported in the Table are likely a result of a change in the cost allocation key survey to aquaculture enterprises, which makes it difficult to interpret the percentage change in these variables (this is further explained in section 5.27.4).
Turning to financial position, this indicates the level of debts in the sector and defines as the ratio between debts and total value of assets. Available data show that the financial position was 27% in 2011, which is relatively low. Compared to previous years it also appears as the level of debt has decreased in the Swedish aquaculture sector. Turning to the FEI indicator, this indicates whether the sector is investing more than the depreciation of its current assets. With the figures shown in the table the FEI for the Swedish aquaculture sector was estimated at 1.1 for 2011, indicating that the industry is investing itself, and consequently should have positive expectations on the future development of the sector. The indicator is shown to decrease over the time period covered by the overview which could indicate that the sector is becoming more mature. A more mature aquaculture sector tends to have lower investments in the sector and so a lower FEI indicator, while developing or restructuring aquaculture sectors reflect a larger investment effort (STECF 2011).
Figure 5.27.4 Economic performance of the Swedish aquaculture sector: 2011.
0
10
20
30
40
50
60
Incomestructure
Costsstructure
GVA EBIT Net profit
mil
lio
n €
Other operational costs
Raw material: Livestock costs
Raw material: Feed costs
Repair and maintenance
Energy costs
Imputed value of unpaid labour
Wages and salaries
Subsidies
Other income
Turnover
The performance measures shown in the table indicates progress between 2010 and 2011 in terms of gross value added, return on investment and capital productivity, but a decline in asset value as indicated by the depreciation of capital (22%). However, considering the structure of the Swedish aquaculture sector with a few dominating segments there is the need to analyse these growth figures at a segment level, as it is done in next part.
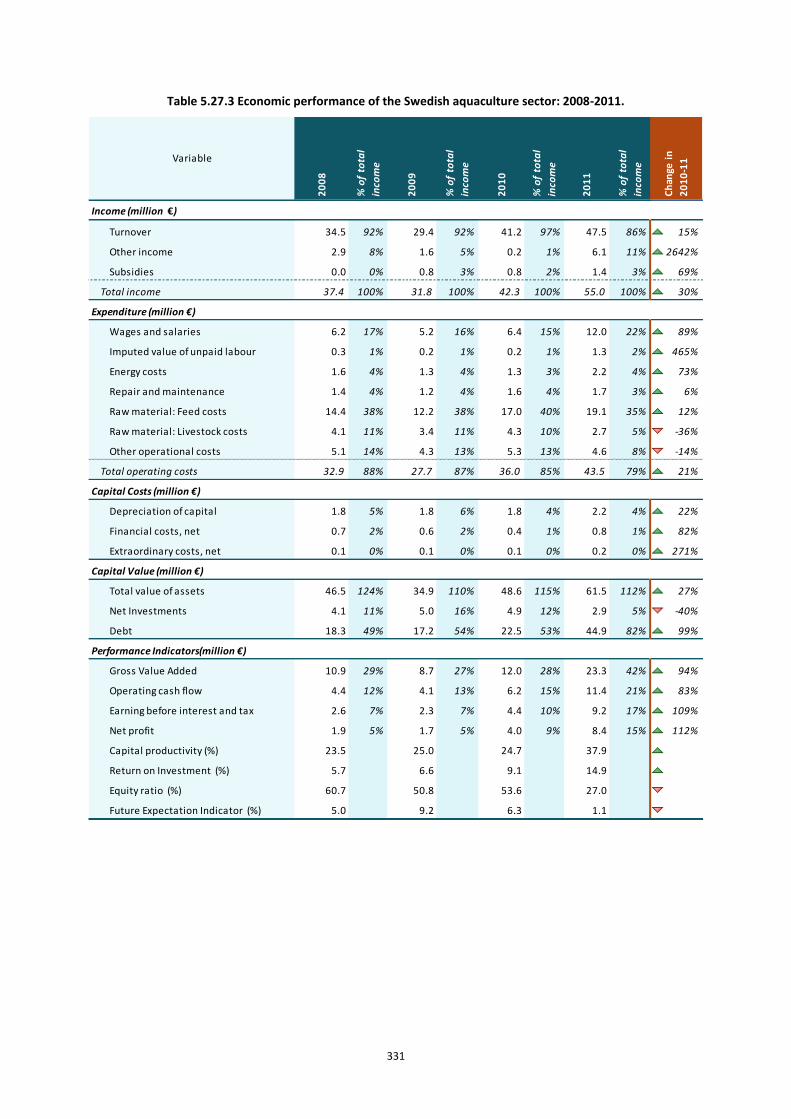
331
Table 5.27.3 Economic performance of the Swedish aquaculture sector: 2008-2011.
Income (million €)
Turnover 34.5 92% 29.4 92% 41.2 97% 47.5 86% 15%
Other income 2.9 8% 1.6 5% 0.2 1% 6.1 11% 2642%
Subsidies 0.0 0% 0.8 3% 0.8 2% 1.4 3% 69%
Total income 37.4 100% 31.8 100% 42.3 100% 55.0 100% 30%
Expenditure (million €)
Wages and salaries 6.2 17% 5.2 16% 6.4 15% 12.0 22% 89%
Imputed value of unpaid labour 0.3 1% 0.2 1% 0.2 1% 1.3 2% 465%
Energy costs 1.6 4% 1.3 4% 1.3 3% 2.2 4% 73%
Repair and maintenance 1.4 4% 1.2 4% 1.6 4% 1.7 3% 6%
Raw material: Feed costs 14.4 38% 12.2 38% 17.0 40% 19.1 35% 12%
Raw material: Livestock costs 4.1 11% 3.4 11% 4.3 10% 2.7 5% -36%
Other operational costs 5.1 14% 4.3 13% 5.3 13% 4.6 8% -14%
Total operating costs 32.9 88% 27.7 87% 36.0 85% 43.5 79% 21%
Capital Costs (million €)
Depreciation of capital 1.8 5% 1.8 6% 1.8 4% 2.2 4% 22%
Financial costs, net 0.7 2% 0.6 2% 0.4 1% 0.8 1% 82%
Extraordinary costs, net 0.1 0% 0.1 0% 0.1 0% 0.2 0% 271%
Capital Value (million €)
Total value of assets 46.5 124% 34.9 110% 48.6 115% 61.5 112% 27%
Net Investments 4.1 11% 5.0 16% 4.9 12% 2.9 5% -40%
Debt 18.3 49% 17.2 54% 22.5 53% 44.9 82% 99%
Performance Indicators(million €)
Gross Value Added 10.9 29% 8.7 27% 12.0 28% 23.3 42% 94%
Operating cash flow 4.4 12% 4.1 13% 6.2 15% 11.4 21% 83%
Earning before interest and tax 2.6 7% 2.3 7% 4.4 10% 9.2 17% 109%
Net profit 1.9 5% 1.7 5% 4.0 9% 8.4 15% 112%
Capital productivity (%) 23.5 25.0 24.7 37.9 53%
Return on Investment (%) 5.7 6.6 9.1 14.9 65%
Equity ratio (%) 60.7 50.8 53.6 27.0 -50%
Future Expectation Indicator (%) 5.0 9.2 6.3 1.1 -83%
Ch
ange
in
20
10
-11
% o
f to
tal
inco
me
Variable
% o
f to
tal
inco
me
20
08
20
09
% o
f to
tal
inco
me
% o
f to
tal
inco
me
20
10
20
11
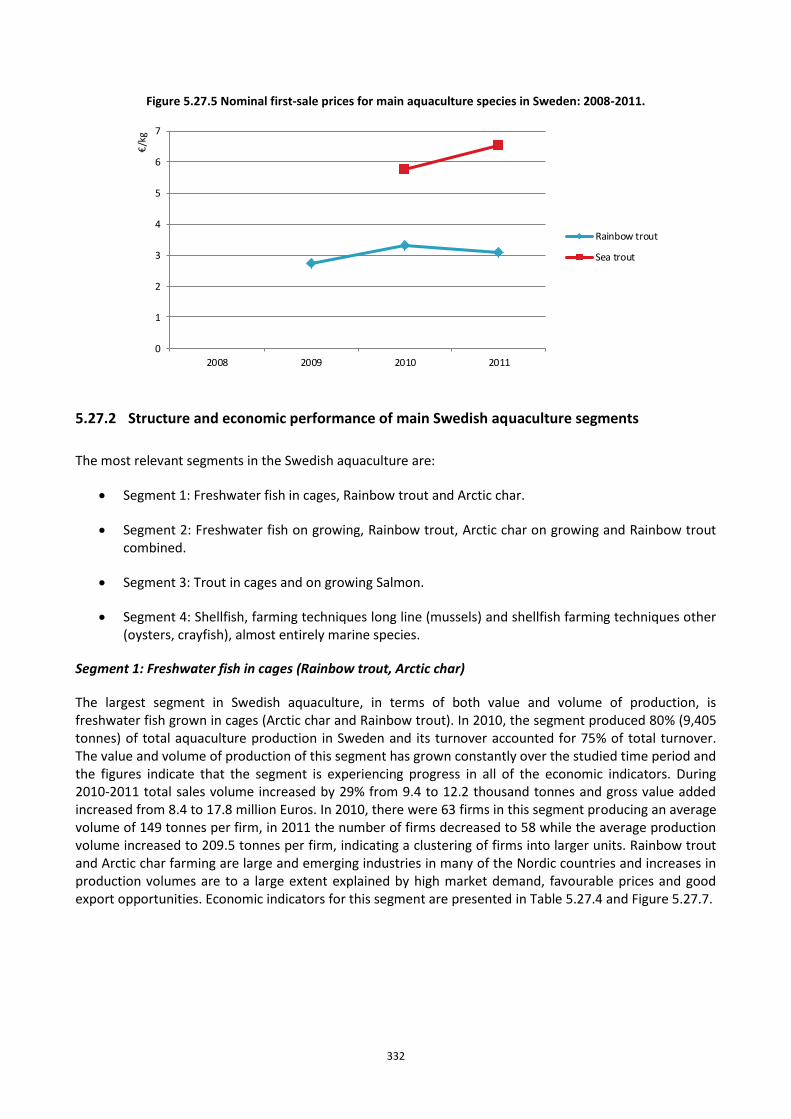
332
Figure 5.27.5 Nominal first-sale prices for main aquaculture species in Sweden: 2008-2011.
0
1
2
3
4
5
6
7
2008 2009 2010 2011
€/k
g
Rainbow trout
Sea trout
5.27.2 Structure and economic performance of main Swedish aquaculture segments
The most relevant segments in the Swedish aquaculture are:
Segment 1: Freshwater fish in cages, Rainbow trout and Arctic char.
Segment 2: Freshwater fish on growing, Rainbow trout, Arctic char on growing and Rainbow trout combined.
Segment 3: Trout in cages and on growing Salmon.
Segment 4: Shellfish, farming techniques long line (mussels) and shellfish farming techniques other (oysters, crayfish), almost entirely marine species.
Segment 1: Freshwater fish in cages (Rainbow trout, Arctic char)
The largest segment in Swedish aquaculture, in terms of both value and volume of production, is freshwater fish grown in cages (Arctic char and Rainbow trout). In 2010, the segment produced 80% (9,405 tonnes) of total aquaculture production in Sweden and its turnover accounted for 75% of total turnover. The value and volume of production of this segment has grown constantly over the studied time period and the figures indicate that the segment is experiencing progress in all of the economic indicators. During 2010-2011 total sales volume increased by 29% from 9.4 to 12.2 thousand tonnes and gross value added increased from 8.4 to 17.8 million Euros. In 2010, there were 63 firms in this segment producing an average volume of 149 tonnes per firm, in 2011 the number of firms decreased to 58 while the average production volume increased to 209.5 tonnes per firm, indicating a clustering of firms into larger units. Rainbow trout and Arctic char farming are large and emerging industries in many of the Nordic countries and increases in production volumes are to a large extent explained by high market demand, favourable prices and good export opportunities. Economic indicators for this segment are presented in Table 5.27.4 and Figure 5.27.7.
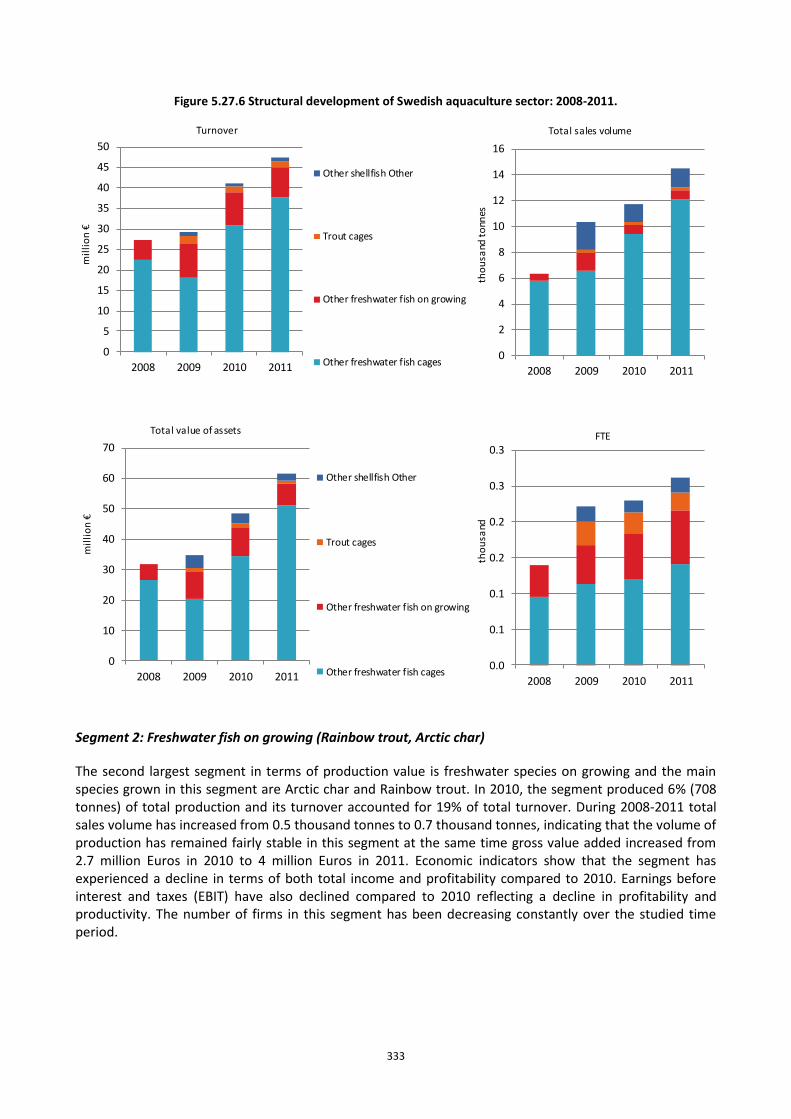
333
Figure 5.27.6 Structural development of Swedish aquaculture sector: 2008-2011.
0
5
10
15
20
25
30
35
40
45
50
2008 2009 2010 2011
mil
lio
n €
Turnover
Other shellfish Other
Trout cages
Other freshwater fish on growing
Other freshwater fish cages0
2
4
6
8
10
12
14
16
2008 2009 2010 2011
tho
usa
nd t
onn
es
Total sales volume
0
10
20
30
40
50
60
70
2008 2009 2010 2011
mil
lio
n €
Total value of assets
Other shellfish Other
Trout cages
Other freshwater fish on growing
Other freshwater fish cages0.0
0.1
0.1
0.2
0.2
0.3
0.3
2008 2009 2010 2011
tho
usa
nd
FTE
Segment 2: Freshwater fish on growing (Rainbow trout, Arctic char)
The second largest segment in terms of production value is freshwater species on growing and the main species grown in this segment are Arctic char and Rainbow trout. In 2010, the segment produced 6% (708 tonnes) of total production and its turnover accounted for 19% of total turnover. During 2008-2011 total sales volume has increased from 0.5 thousand tonnes to 0.7 thousand tonnes, indicating that the volume of production has remained fairly stable in this segment at the same time gross value added increased from 2.7 million Euros in 2010 to 4 million Euros in 2011. Economic indicators show that the segment has experienced a decline in terms of both total income and profitability compared to 2010. Earnings before interest and taxes (EBIT) have also declined compared to 2010 reflecting a decline in profitability and productivity. The number of firms in this segment has been decreasing constantly over the studied time period.

334
Table 5.27.4 Economic performance of main Swedish aquaculture segments: 2008-2011 (in million €).
Other freshwater fish cages
Total income 23.1 100% 19.4 100% 31.1 100% 44.0 100% 41%
Gross Value Added 5.8 25% 4.6 24% 8.4 27% 17.8 40% 113%
Operating cash flow 2.3 10% 1.6 8% 3.8 12% 8.9 20% 136%
Earning before interest and tax 1.3 6% 1.0 5% 2.5 8% 7.3 17% 194%
Net profit 1.1 5% 0.6 3% 2.2 7% 6.7 15% 205%
Total sales volume (thousand tonnes) 5.8 6.6 9.4 12.2 29%
Other freshwater fish on growing
Total income 4.7 100% 8.3 100% 8.5 100% 7.6 100% -11%
Gross Value Added 1.4 29% 2.9 34% 2.7 32% 4.0 53% 47%
Operating cash flow 0.5 10% 1.5 18% 1.9 22% 1.3 17% -31%
Earning before interest and tax 0.2 4% 0.9 11% 1.5 18% 0.8 11% -45%
Net profit 0.0 1% 0.8 10% 1.4 16% 0.7 9% -52%
Total sales volume (thousand tonnes) 0.5 1.4 0.7 0.7 -6%
Trout cages
Total income 2.2 100% 1.6 100% 1.5 100% -4%
Gross Value Added 0.7 32% 0.5 30% 0.7 47% 53%
Operating cash flow 0.3 15% 0.3 17% 0.3 18% 0%
Earning before interest and tax 0.3 13% 0.2 14% 0.2 15% 0%
Net profit 0.3 12% 0.2 14% 0.2 14% 0%
Total sales volume (thousand tonnes) 0.3 0.2 0.2 -6%
Other shellfish Other
Total income 0.0 1.9 100% 1.1 100% 1.9 100% 77%
Gross Value Added 0.6 30% 0.4 42% 0.8 41% 72%
Operating cash flow 0.7 36% 0.3 28% 1.0 51% 220%
Earning before interest and tax 0.1 6% 0.2 18% 0.8 45% 349%
Net profit 0.0 1% 0.2 17% 0.8 43% 363%
Total sales volume (thousand tonnes) 0.0 2.1 1.4 1.5
Ch
ange
in
20
10
-11Variable
20
08
% o
f to
tal
inco
me
20
09
% o
f to
tal
inco
me
20
10
% o
f to
tal
inco
me
20
11
% o
f to
tal
inco
me
Segment 3: Trout in cages (Atlantic salmon and Brown trout)
The third largest segment in terms of production value is trout on growing. The available data shows no significant changes in terms of volume of production or the values of the economic indicators for this segment. Production volume and gross value added has remained fairly constant over the studied time period with volumes around 0.2 thousand tonnes and gross value added around 0.7 million Euros. In 2010, there were 22 firms in this segment producing an average volume of 10 tonnes per firm. Compared to 2011, this implies that the number of firms has decreased while average production volumes have remained fairly constant. Besides an increase in gross value added, economic indicators are unchanged, however compared to the figures for 2009-2010 this could indicate a recovery in the level of gross value added compared to previous years.
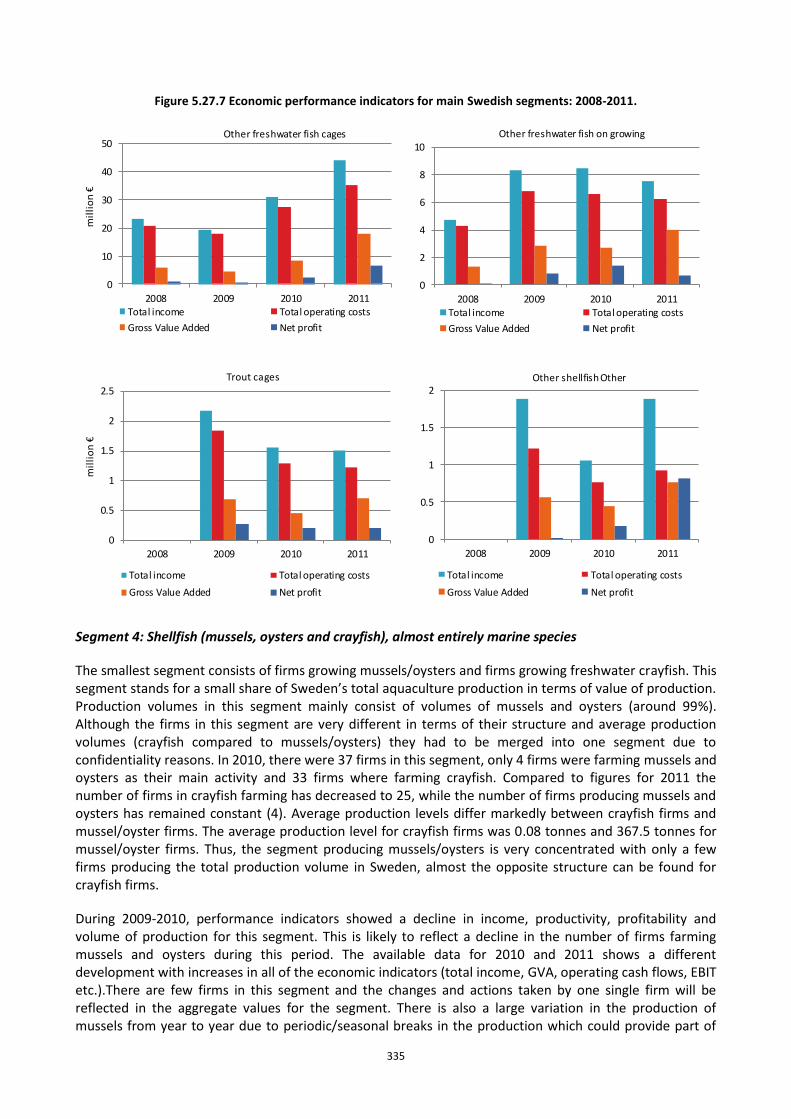
335
Figure 5.27.7 Economic performance indicators for main Swedish segments: 2008-2011.
0
10
20
30
40
50
2008 2009 2010 2011
mil
lio
n €
Other freshwater fish cages
Total income Total operating costs
Gross Value Added Net profit
0
2
4
6
8
10
2008 2009 2010 2011
Other freshwater fish on growing
Total income Total operating costs
Gross Value Added Net profit
0
0.5
1
1.5
2
2.5
2008 2009 2010 2011
mil
lio
n €
Trout cages
Total income Total operating costs
Gross Value Added Net profit
0
0.5
1
1.5
2
2008 2009 2010 2011
Other shellfish Other
Total income Total operating costs
Gross Value Added Net profit
Segment 4: Shellfish (mussels, oysters and crayfish), almost entirely marine species
The smallest segment consists of firms growing mussels/oysters and firms growing freshwater crayfish. This segment stands for a small share of Sweden’s total aquaculture production in terms of value of production. Production volumes in this segment mainly consist of volumes of mussels and oysters (around 99%). Although the firms in this segment are very different in terms of their structure and average production volumes (crayfish compared to mussels/oysters) they had to be merged into one segment due to confidentiality reasons. In 2010, there were 37 firms in this segment, only 4 firms were farming mussels and oysters as their main activity and 33 firms where farming crayfish. Compared to figures for 2011 the number of firms in crayfish farming has decreased to 25, while the number of firms producing mussels and oysters has remained constant (4). Average production levels differ markedly between crayfish firms and mussel/oyster firms. The average production level for crayfish firms was 0.08 tonnes and 367.5 tonnes for mussel/oyster firms. Thus, the segment producing mussels/oysters is very concentrated with only a few firms producing the total production volume in Sweden, almost the opposite structure can be found for crayfish firms.
During 2009-2010, performance indicators showed a decline in income, productivity, profitability and volume of production for this segment. This is likely to reflect a decline in the number of firms farming mussels and oysters during this period. The available data for 2010 and 2011 shows a different development with increases in all of the economic indicators (total income, GVA, operating cash flows, EBIT etc.).There are few firms in this segment and the changes and actions taken by one single firm will be reflected in the aggregate values for the segment. There is also a large variation in the production of mussels from year to year due to periodic/seasonal breaks in the production which could provide part of
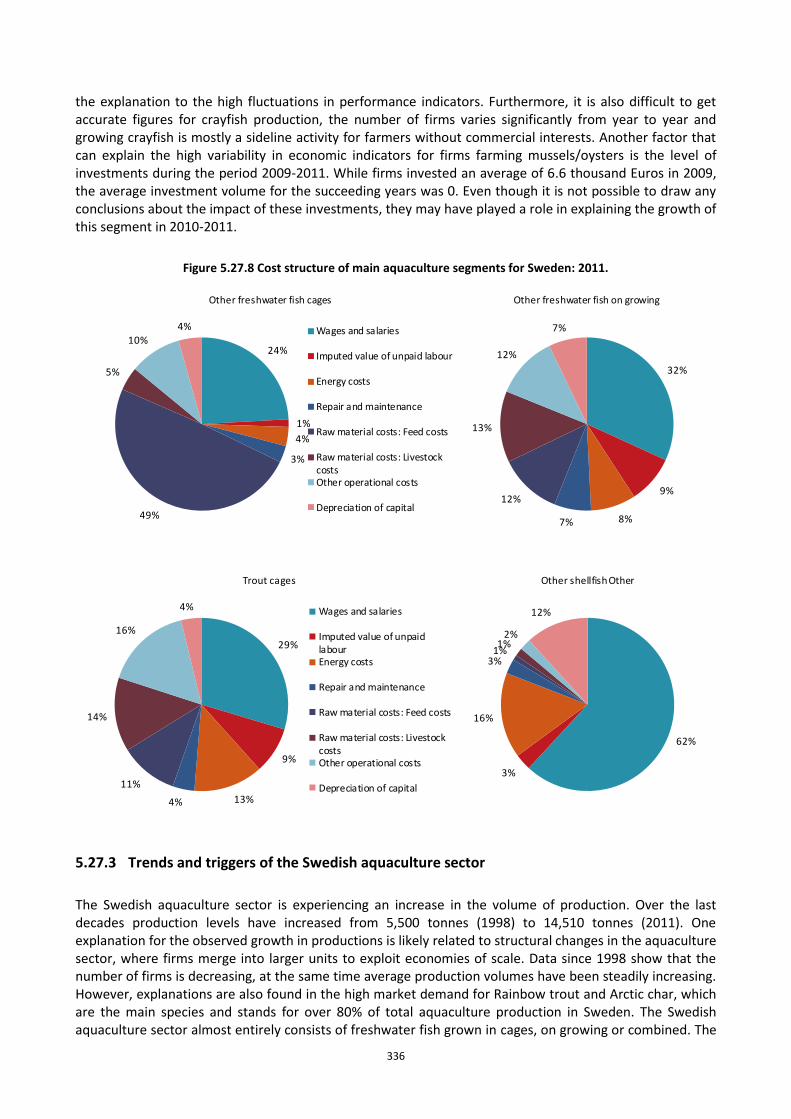
336
the explanation to the high fluctuations in performance indicators. Furthermore, it is also difficult to get accurate figures for crayfish production, the number of firms varies significantly from year to year and growing crayfish is mostly a sideline activity for farmers without commercial interests. Another factor that can explain the high variability in economic indicators for firms farming mussels/oysters is the level of investments during the period 2009-2011. While firms invested an average of 6.6 thousand Euros in 2009, the average investment volume for the succeeding years was 0. Even though it is not possible to draw any conclusions about the impact of these investments, they may have played a role in explaining the growth of this segment in 2010-2011.
Figure 5.27.8 Cost structure of main aquaculture segments for Sweden: 2011.
24%
1%
4%
3%
49%
5%
10%
4%
Other freshwater fish cages
Wages and salaries
Imputed value of unpaid labour
Energy costs
Repair and maintenance
Raw material costs: Feed costs
Raw material costs: LivestockcostsOther operational costs
Depreciation of capital
32%
9%
8%7%
12%
13%
12%
7%
Other freshwater fish on growing
29%
9%
13%4%
11%
14%
16%
4%
Trout cages
Wages and salaries
Imputed value of unpaidlabourEnergy costs
Repair and maintenance
Raw material costs: Feed costs
Raw material costs: LivestockcostsOther operational costs
Depreciation of capital
62%
3%
16%
3%1%1%
2%
12%
Other shellfish Other
5.27.3 Trends and triggers of the Swedish aquaculture sector
The Swedish aquaculture sector is experiencing an increase in the volume of production. Over the last decades production levels have increased from 5,500 tonnes (1998) to 14,510 tonnes (2011). One explanation for the observed growth in productions is likely related to structural changes in the aquaculture sector, where firms merge into larger units to exploit economies of scale. Data since 1998 show that the number of firms is decreasing, at the same time average production volumes have been steadily increasing. However, explanations are also found in the high market demand for Rainbow trout and Arctic char, which are the main species and stands for over 80% of total aquaculture production in Sweden. The Swedish aquaculture sector almost entirely consists of freshwater fish grown in cages, on growing or combined. The
337
high demand for Rainbow trout and Arctic char is largely explained by a high local demand, growth in prices as well as good export opportunities. Significant imports of aquaculture fish mainly concern the import of rainbow trout (spawns).
There are some reasons to expect comparable growth figures in the future. There are currently several firms applying for a license to initiate large scale production units in the northern parts of Sweden. There are also on-going plans to expand the growing of mussels on the Swedish West coast. Another factor that is expected to have a positive influence on future production levels is the increased focus of the new fisheries fund (EHFF) on aquaculture policy schemes. A clear aim of the reformed fund is to develop European aquaculture to achieve sustainable growth in production volumes, improved competitiveness and profitability. Even though it is still unclear how the new policy package will look like in different MS, there will most likely be a larger focus on increasing aquaculture productions volumes. The Swedish Operational Programme will give priority to measures increasing profitability, new production techniques, new techniques that reduce the environmental impact and measures in the field of preventing damage caused by e.g. wild predators.
There are also some incentives for new developments in the aquaculture sector in the framework of the current European Fisheries Fund (EFF). The Swedish Operational Programme gives priority to measures increasing profitability, new production techniques and new techniques that reduce the environmental impact of aquaculture. In the current fund, a majority of applications has concerned freshwater aquaculture (Rainbow trout and Arctic char), but a significant amount of funding has also been directed to the production of blue mussels.
There have also been incentives at the national level to increase the knowledge about the needs for - and the way to reach sustainable production. In line with the suggestion for a new fisheries fund, member states are obliged to develop a national strategy to increase the knowledge about aquaculture and point out future needs to be addressed in order to reach sustainable production and more efficient policies. In 2012, The Swedish Board of Agriculture, among others, developed a strategy document (Svenskt vattenbruk - en grön näring på blå åkrar) with the objective to identify how the Swedish aquaculture sector can grow in the direction of economic and environmental sustainability to 2020, the main challenge being to combine economic, ecologic and social cohesion. Among other things, the strategy points at the importance of cooperation among different actors in the industry and the need of spatial planning and development of new growing techniques, this lays the foundation for the national action plan. The purpose of the action plan, to be developed, is to suggest concrete measures to reach the goals in the strategy, where each measure ties to one or several goals in the strategy. Thus, the development of national strategies and action plans, within the framework of EMFF, is expected to create more targeted and effective policies, formed to meet the needs in each MS. Moving away from demand driven policy schemes to schemes designed to meet actual needs, which are expected to have a positive influence on growth in aquaculture production across member states.
Turning to the difficulties facing the Swedish aquaculture sector, these are mainly related to regulation and difficulties of implementing new growing techniques at a commercial scale. There is an ambition to increase marine aquaculture production and the amount produced using sustainable production techniques, however, this has not yet reached the target or commercial levels. The production of marine and shellfish products is currently small in relation to freshwater production; however we do have a significant production of organic mussels (KRAV, MSC).
Even though aquaculture in Sweden has a large potential/ambition for further development with regards to sustainable production techniques the organic aquaculture sector still has some obstacles and problems to overcome when it comes to expanding the production volumes and scaling up their production to commercial levels (mostly concerning fish production). There are also examples of new species or culture techniques that are under development (i.e. tilapia, pike perch and cod ) and research on developments in
338
the feed market (i.e. new growing techniques, fodder development, reducing nitrogen emissions, phosphorus emissions) however not yet at a commercial level.
Some of the main issues affecting the economic performance of the sector and the development of new growing techniques are related to difficulties in the implementation of new techniques and stringent regulation (e.g. development of organic and certified aquaculture), which are often pointed out significant obstacles of growth in production volumes. The analysis of the impact of administrative burdens and governance has not yet started in Sweden and the development of spatial planning has, in large, not been put in place. The reformed fisheries fund and various schemes designed to meet future demand is expected to play a significant role in the development of the Swedish aquaculture sector.
5.27.4 Data Coverage and Data Quality of the Swedish aquaculture sector
Since 2011, the Swedish Board of Agriculture is responsible for compiling and reporting statistics on the aquaculture sector for the reported period together with the Swedish Agency for Marine Water Management. The Swedish Board of Agriculture in cooperation with Statistics Sweden conducted two questionnaires and a tax declaration survey for each year. Data is collected from both income tax declarations, administrative records and two questionnaires (Q1 and Q2), sent to all aquaculture farmers (Q1) and all aquaculture firms that have aquaculture as their main activity (Q2). In order to identify the segments, companies using more than one farming technique or growing more than one species, all production, incomes and costs were transferred to the main technique and main species based on turnover.
The questionnaire (Q1) is sent out to all aquaculture farm units and farm units are clustered into enterprises. For each enterprise, the value of sales from Q1 is compared to income as reported in the income tax declarations. Enterprises that have aquaculture as their main activity more than 50% (income from tax declarations/sales value from Q1) are considered to have their primary activity in aquaculture. These enterprises represents the population for questionnaire Q2 (the cost allocation key survey), derived from income tax declarations combined with Q2, for all aquaculture activity in Sweden. By comparing the value of sales from Q1, which covers all aquaculture activity in Sweden, with income in tax declarations for the enterprises with aquaculture as their primary activity we obtain a figure, used to scale-up relevant variables. Using this method, variables can be assumed representative of all aquaculture activity in Sweden and comprise the same allocation between variables as for enterprises with aquaculture as their primary activity.
The primarily objective of the second questionnaire (Q2) is to create a cost allocation key for costs that are not specified in income tax declarations. For the years 2008-2010, the sample for the second questionnaire (Q2) was a non-probability sample based on a priori information that came from questionnaire Q1 and income tax declarations, as described above. As a result, it could not be planned before the income tax declarations and the results of the first questionnaire (Q1, covering every farming unit) were compiled. Based on the results of the census data, Statistics Sweden selected a representative number of enterprises from each segment (clustered sample) for the second questionnaire (Q2). In order to ensure representativeness in terms of corporate size, structure and farming technique, Statistics Sweden decided on the appropriate sampling method and sample size for Q2. The survey (Q2) was undertaken in 2008 and the cost allocation key was reused for 2009 and 2010. The population represents all active aquaculture enterprises in 2008 that have aquaculture as their primary activity and the sample for the questionnaire (Q2) represents 46 of these enterprises. The survey had a response rate of 65 per cent.
To ensure high quality of data and to make it more practical for the respondents Q2 will be undertaken on a yearly basis from 2011 and merged with Q1 (from 2012). The improvements in the methodology imply that the Q2 survey undertaken in 2011 is a Census directed to all aquaculture firms, with aquaculture as their main activity, which also explains the high variation in cost allocations compared to prior years. Even
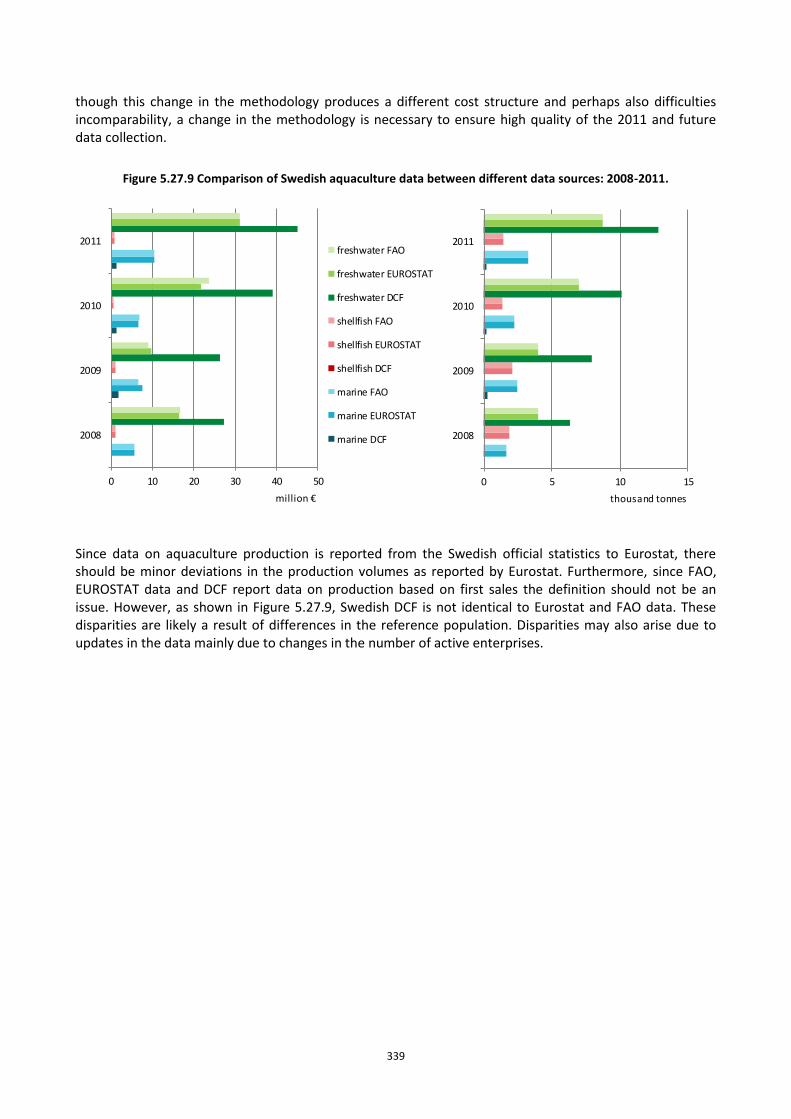
339
though this change in the methodology produces a different cost structure and perhaps also difficulties incomparability, a change in the methodology is necessary to ensure high quality of the 2011 and future data collection.
Figure 5.27.9 Comparison of Swedish aquaculture data between different data sources: 2008-2011.
0 10 20 30 40 50
2008
2009
2010
2011
million €
freshwater FAO
freshwater EUROSTAT
freshwater DCF
shellfish FAO
shellfish EUROSTAT
shellfish DCF
marine FAO
marine EUROSTAT
marine DCF
0 5 10 15
2008
2009
2010
2011
thousand tonnes
Since data on aquaculture production is reported from the Swedish official statistics to Eurostat, there should be minor deviations in the production volumes as reported by Eurostat. Furthermore, since FAO, EUROSTAT data and DCF report data on production based on first sales the definition should not be an issue. However, as shown in Figure 5.27.9, Swedish DCF is not identical to Eurostat and FAO data. These disparities are likely a result of differences in the reference population. Disparities may also arise due to updates in the data mainly due to changes in the number of active enterprises.
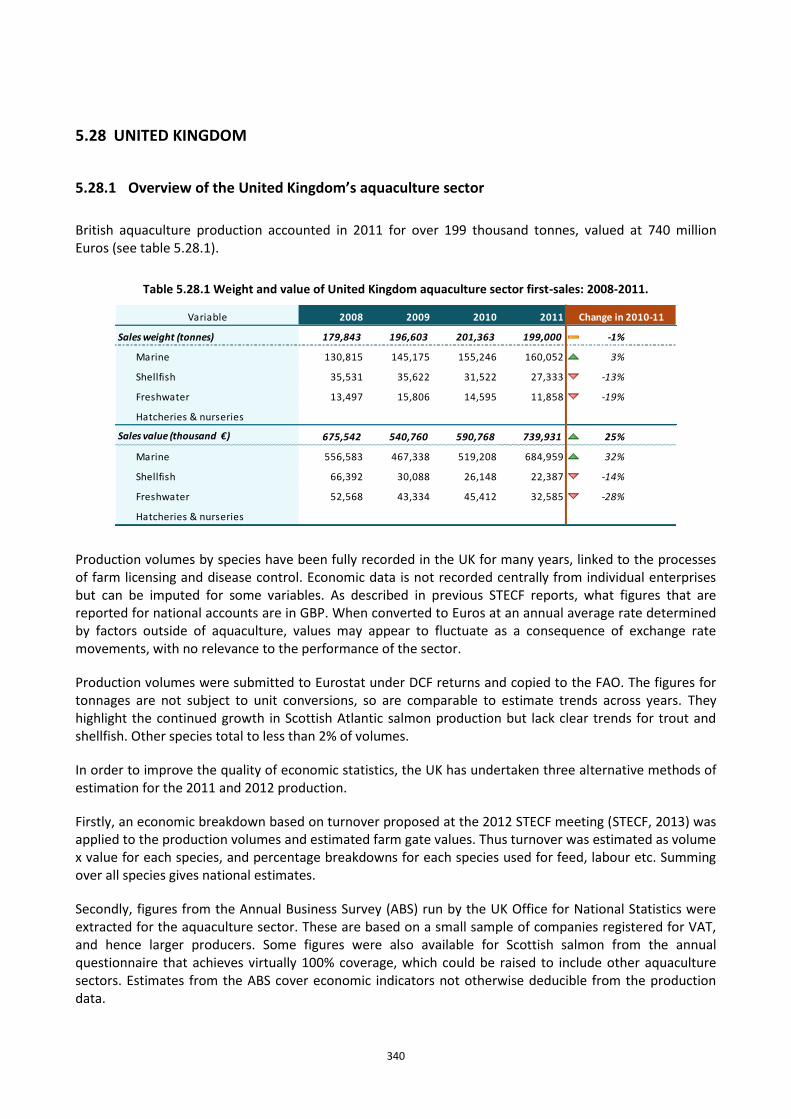
340
5.28 UNITED KINGDOM
5.28.1 Overview of the United Kingdom’s aquaculture sector
British aquaculture production accounted in 2011 for over 199 thousand tonnes, valued at 740 million Euros (see table 5.28.1).
Table 5.28.1 Weight and value of United Kingdom aquaculture sector first-sales: 2008-2011.
Variable 2008 2009 2010 2011
Sales weight (tonnes) 179,843 196,603 201,363 199,000 -1%
Marine 130,815 145,175 155,246 160,052 3%
Shellfish 35,531 35,622 31,522 27,333 -13% ↘
Freshwater 13,497 15,806 14,595 11,858 -19%
Hatcheries & nurseries #VALUE!
Sales value (thousand €) 675,542 540,760 590,768 739,931 25% ↗
Marine 556,583 467,338 519,208 684,959 32% ↗
Shellfish 66,392 30,088 26,148 22,387 -14% ↘
Freshwater 52,568 43,334 45,412 32,585 -28%
Hatcheries & nurseries #VALUE!
Change in 2010-11
Production volumes by species have been fully recorded in the UK for many years, linked to the processes of farm licensing and disease control. Economic data is not recorded centrally from individual enterprises but can be imputed for some variables. As described in previous STECF reports, what figures that are reported for national accounts are in GBP. When converted to Euros at an annual average rate determined by factors outside of aquaculture, values may appear to fluctuate as a consequence of exchange rate movements, with no relevance to the performance of the sector.
Production volumes were submitted to Eurostat under DCF returns and copied to the FAO. The figures for tonnages are not subject to unit conversions, so are comparable to estimate trends across years. They highlight the continued growth in Scottish Atlantic salmon production but lack clear trends for trout and shellfish. Other species total to less than 2% of volumes.
In order to improve the quality of economic statistics, the UK has undertaken three alternative methods of estimation for the 2011 and 2012 production.
Firstly, an economic breakdown based on turnover proposed at the 2012 STECF meeting (STECF, 2013) was applied to the production volumes and estimated farm gate values. Thus turnover was estimated as volume x value for each species, and percentage breakdowns for each species used for feed, labour etc. Summing over all species gives national estimates.
Secondly, figures from the Annual Business Survey (ABS) run by the UK Office for National Statistics were extracted for the aquaculture sector. These are based on a small sample of companies registered for VAT, and hence larger producers. Some figures were also available for Scottish salmon from the annual questionnaire that achieves virtually 100% coverage, which could be raised to include other aquaculture sectors. Estimates from the ABS cover economic indicators not otherwise deducible from the production data.
341
Thirdly, a pilot survey was commissioned from an independent consultancy firm to contact a sample of aquaculture firms with the objectives of (a) ascertaining that the firms were able to provide the data required, and (b) to ask what type of agency and method they would find most appropriate and acceptable – bearing in mind the government policy where possible to reduce burdens on industries.
The economic figures initially submitted to the JRC for 2011 were those arising from the pilot survey. These turned out to be considerably biased by lack of returns from major producers. Hence the assumption that the sample was random and representative was unsafe. Raising from the sample to national totals produced totals well out of agreement with those from methods 1 and 2. Hence the return was revised after the meeting. Although cooperation from respondents was good, there were still found to be problems in interpreting some of the required components.
Discussion of the figures submitted to JRC needs therefore to reflect both the relative values for the economic components but also the effect of the sampling bias on these totals. We suggest, for example, that the responding firms may have been more likely to have received subsidies (not necessarily relating to aquaculture) that non-responding firms. The national total for subsidies is however tiny compared to turnover.
Because economic figures were imputed as proportions of turnover using values reported by JRC research based on data from previous STECF aquaculture reports for other countries, it would not be appropriate to apply the method retrospectively for other years (in Table 5.28.2). This would imply that extra data was available when in fact each component merely follows the pattern of turnover. Some relative costs are known to have changed over the period 2008-2011; for example, volume productivity in the marine salmon sector has increased.
Aquaculture exists in all parts of the UK using both freshwater and seawater. The largest component by far is located in Scotland. Finfish production is focused on Atlantic salmon in the highlands and islands of Scotland. This involves a freshwater stage to breed from eggs to smolts, which are transferred to marine cages for growing up to harvest weight. Trout production is spread more evenly throughout the UK and trout are grown in both freshwater and seawater. Small quantities are grown of carp, brown trout, arctic char for the table. Carp, brown trout and other species are also grown for stocking into recreational fisheries. Sea bass, turbot, halibut, and tilapia are also farmed in small amounts in recirculation systems. Shellfish production is also found on the coast around all administrations, mainly as small enterprises. Crustacean farming is very small, but includes the lobster nurseries that take berried females (i.e. carrying eggs) and raise the young under protection to boost local wild populations. Individual activities may also exist for niche products such as worms for angling bait and rope cultivation of seaweeds as gourmet foods, but by their nature these are unlikely to expand greatly.
Economically, the sector ranges from large salmon farms owned through layers of multinational companies, through SMEs, to single-person occupations and part-time activities within a general farming/tourism lifestyle.
For macro-economic purposes, only salmon, trout and mussels need to be considered, as they total over 90% by either volume or value. However, smaller segments might be considered for social or regional reasons.
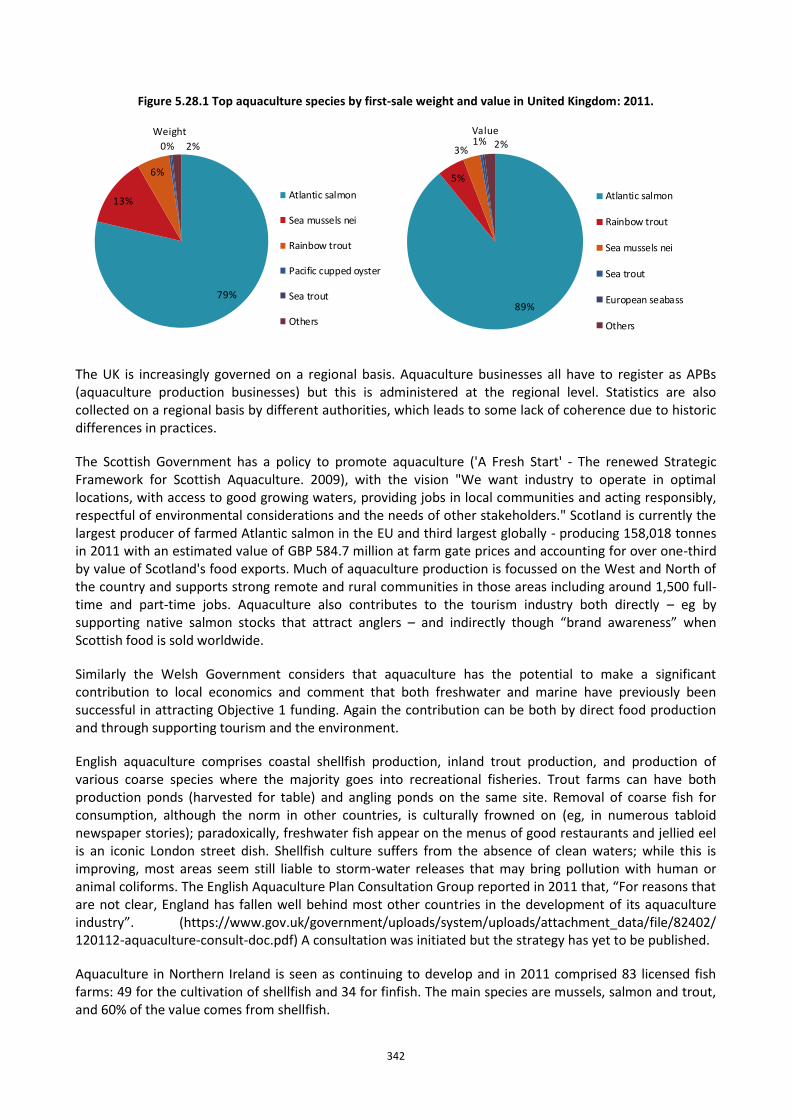
342
Figure 5.28.1 Top aquaculture species by first-sale weight and value in United Kingdom: 2011.
79%
13%
6%
0% 2%
Weight
Atlantic salmon
Sea mussels nei
Rainbow trout
Pacific cupped oyster
Sea trout
Others
89%
5%
3%1% 2%Value
Atlantic salmon
Rainbow trout
Sea mussels nei
Sea trout
European seabass
Others
The UK is increasingly governed on a regional basis. Aquaculture businesses all have to register as APBs (aquaculture production businesses) but this is administered at the regional level. Statistics are also collected on a regional basis by different authorities, which leads to some lack of coherence due to historic differences in practices.
The Scottish Government has a policy to promote aquaculture ('A Fresh Start' - The renewed Strategic Framework for Scottish Aquaculture. 2009), with the vision "We want industry to operate in optimal locations, with access to good growing waters, providing jobs in local communities and acting responsibly, respectful of environmental considerations and the needs of other stakeholders." Scotland is currently the largest producer of farmed Atlantic salmon in the EU and third largest globally - producing 158,018 tonnes in 2011 with an estimated value of GBP 584.7 million at farm gate prices and accounting for over one-third by value of Scotland's food exports. Much of aquaculture production is focussed on the West and North of the country and supports strong remote and rural communities in those areas including around 1,500 full-time and part-time jobs. Aquaculture also contributes to the tourism industry both directly – eg by supporting native salmon stocks that attract anglers – and indirectly though “brand awareness” when Scottish food is sold worldwide.
Similarly the Welsh Government considers that aquaculture has the potential to make a significant contribution to local economics and comment that both freshwater and marine have previously been successful in attracting Objective 1 funding. Again the contribution can be both by direct food production and through supporting tourism and the environment.
English aquaculture comprises coastal shellfish production, inland trout production, and production of various coarse species where the majority goes into recreational fisheries. Trout farms can have both production ponds (harvested for table) and angling ponds on the same site. Removal of coarse fish for consumption, although the norm in other countries, is culturally frowned on (eg, in numerous tabloid newspaper stories); paradoxically, freshwater fish appear on the menus of good restaurants and jellied eel is an iconic London street dish. Shellfish culture suffers from the absence of clean waters; while this is improving, most areas seem still liable to storm-water releases that may bring pollution with human or animal coliforms. The English Aquaculture Plan Consultation Group reported in 2011 that, “For reasons that are not clear, England has fallen well behind most other countries in the development of its aquaculture industry”. (https://www.gov.uk/government/uploads/system/uploads/attachment_data/file/82402/ 120112-aquaculture-consult-doc.pdf) A consultation was initiated but the strategy has yet to be published.
Aquaculture in Northern Ireland is seen as continuing to develop and in 2011 comprised 83 licensed fish farms: 49 for the cultivation of shellfish and 34 for finfish. The main species are mussels, salmon and trout, and 60% of the value comes from shellfish.
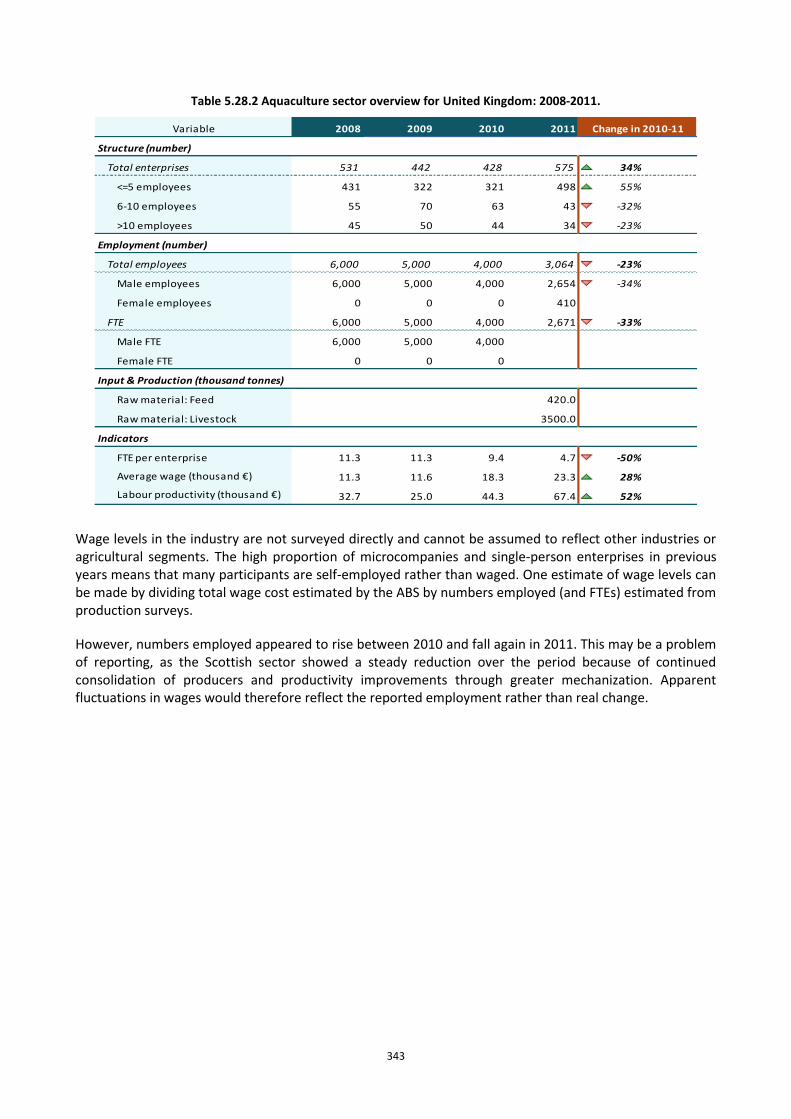
343
Table 5.28.2 Aquaculture sector overview for United Kingdom: 2008-2011.
Variable 2008 2009 2010 2011
Structure (number)
Total enterprises 531 442 428 575 34% ↗
<=5 employees 431 322 321 498 55% ↗
6-10 employees 55 70 63 43 -32% ↘
>10 employees 45 50 44 34 -23% ↘
Employment (number)
Total employees 6,000 5,000 4,000 3,064 -23% ↘
Male employees 6,000 5,000 4,000 2,654 -34% ↘
Female employees 0 0 0 410 #DIV/0! #DIV/0!
FTE 6,000 5,000 4,000 2,671 -33% ↘
Male FTE 6,000 5,000 4,000 #VALUE! #VALUE!
Female FTE 0 0 0 #VALUE! #VALUE!
Input & Production (thousand tonnes)
Raw material: Feed 420.0 #VALUE! #VALUE!
Raw material: Livestock 3500.0 #VALUE!
Indicators
FTE per enterprise 11.3 11.3 9.4 4.7 -50% ↘
Average wage (thousand €) 11.3 11.6 18.3 23.3 28% ↗
Labour productivity (thousand €) 32.7 25.0 44.3 67.4 52% ↗
Change in 2010-11
Wage levels in the industry are not surveyed directly and cannot be assumed to reflect other industries or agricultural segments. The high proportion of microcompanies and single-person enterprises in previous years means that many participants are self-employed rather than waged. One estimate of wage levels can be made by dividing total wage cost estimated by the ABS by numbers employed (and FTEs) estimated from production surveys.
However, numbers employed appeared to rise between 2010 and fall again in 2011. This may be a problem of reporting, as the Scottish sector showed a steady reduction over the period because of continued consolidation of producers and productivity improvements through greater mechanization. Apparent fluctuations in wages would therefore reflect the reported employment rather than real change.
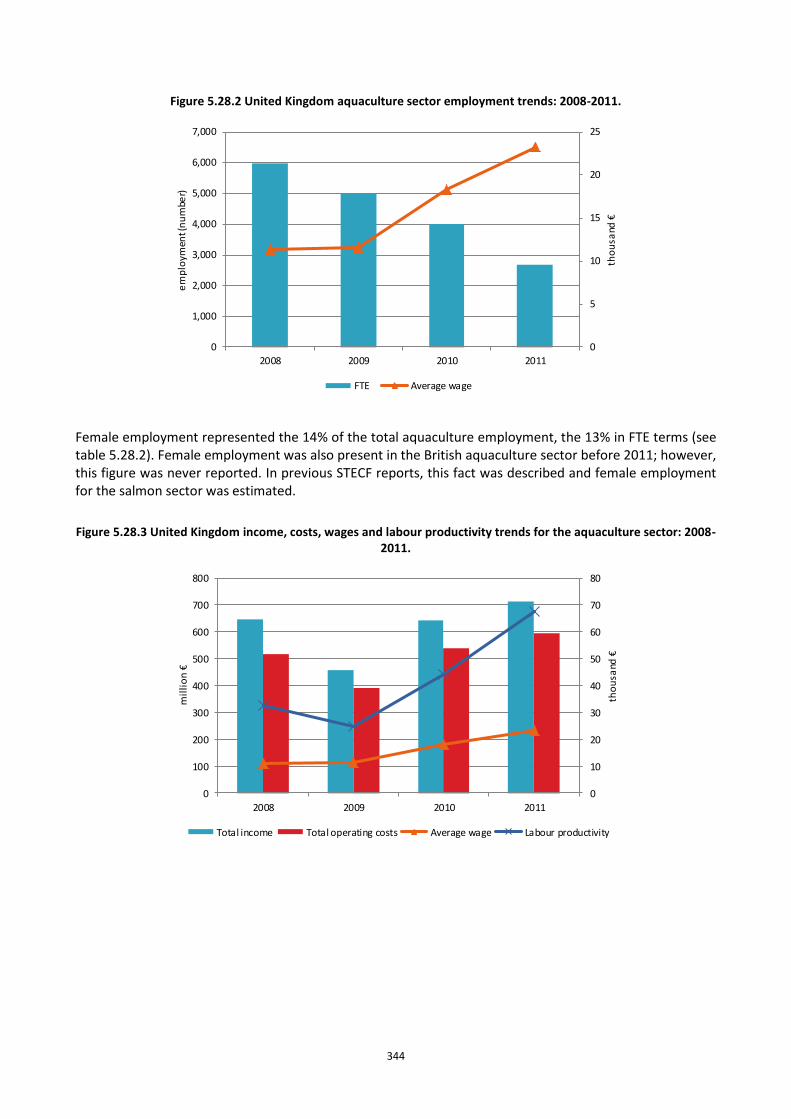
344
Figure 5.28.2 United Kingdom aquaculture sector employment trends: 2008-2011.
Female employment represented the 14% of the total aquaculture employment, the 13% in FTE terms (see table 5.28.2). Female employment was also present in the British aquaculture sector before 2011; however, this figure was never reported. In previous STECF reports, this fact was described and female employment for the salmon sector was estimated.
Figure 5.28.3 United Kingdom income, costs, wages and labour productivity trends for the aquaculture sector: 2008-2011.
0
5
10
15
20
25
0
1,000
2,000
3,000
4,000
5,000
6,000
7,000
2008 2009 2010 2011
tho
usa
nd €
em
plo
ymen
t (n
um
ber)
FTE Average wage
0
10
20
30
40
50
60
70
80
0
100
200
300
400
500
600
700
800
2008 2009 2010 2011
tho
usa
nd €
mil
lio
n €
Total income Total operating costs Average wage Labour productivity
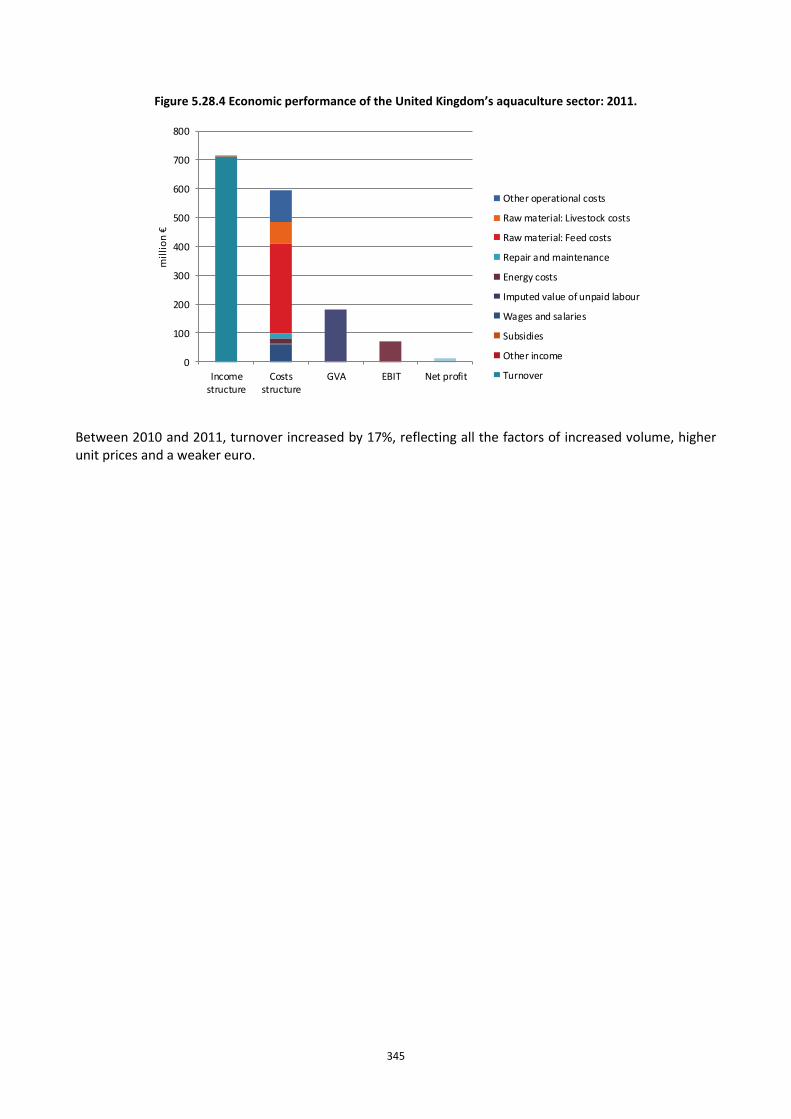
345
Figure 5.28.4 Economic performance of the United Kingdom’s aquaculture sector: 2011.
Between 2010 and 2011, turnover increased by 17%, reflecting all the factors of increased volume, higher unit prices and a weaker euro.
0
100
200
300
400
500
600
700
800
Incomestructure
Costsstructure
GVA EBIT Net profit
mil
lio
n €
Other operational costs
Raw material: Livestock costs
Raw material: Feed costs
Repair and maintenance
Energy costs
Imputed value of unpaid labour
Wages and salaries
Subsidies
Other income
Turnover
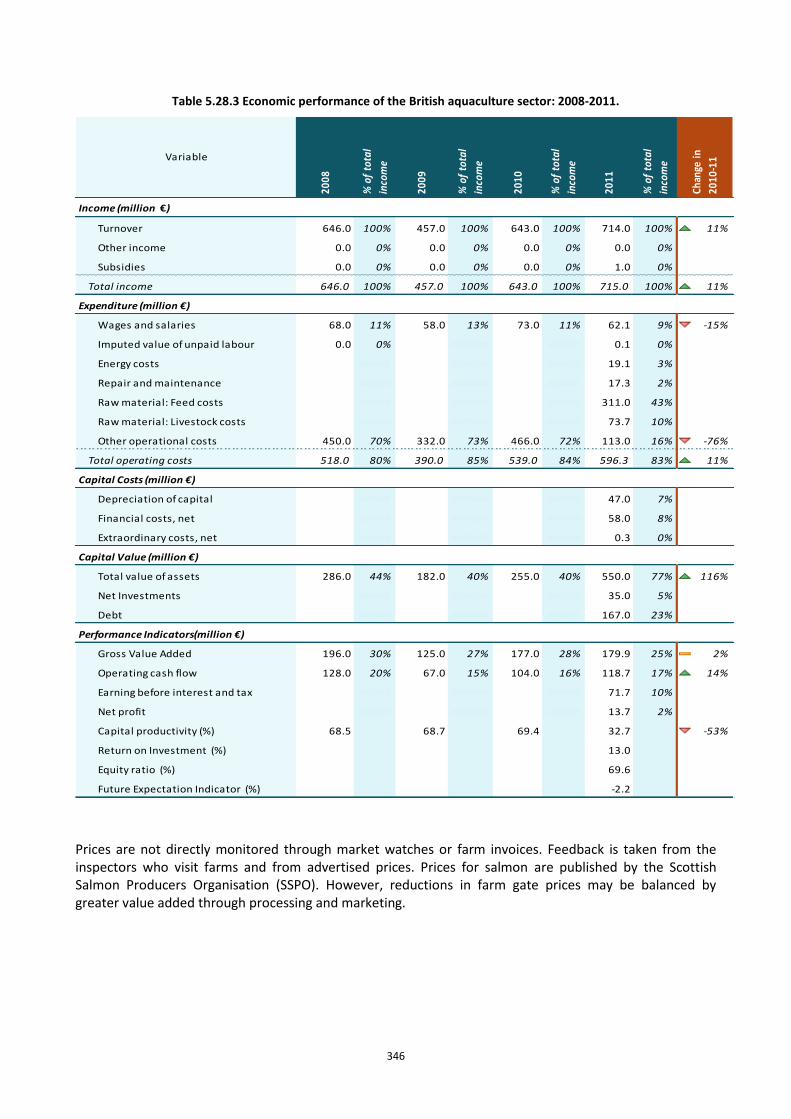
346
Table 5.28.3 Economic performance of the British aquaculture sector: 2008-2011.
Income (million €)
Turnover 646.0 100% 457.0 100% 643.0 100% 714.0 100% 11%
Other income 0.0 0% 0.0 0% 0.0 0% 0.0 0% #DIV/0!
Subsidies 0.0 0% 0.0 0% 0.0 0% 1.0 0% #DIV/0!
Total income 646.0 100% 457.0 100% 643.0 100% 715.0 100% 11%
Expenditure (million €)
Wages and salaries 68.0 11% 58.0 13% 73.0 11% 62.1 9% -15%
Imputed value of unpaid labour 0.0 0% ####### ###### 0.1 0% #VALUE!
Energy costs ###### ####### ###### 19.1 3% #VALUE!
Repair and maintenance ###### ####### ###### 17.3 2% #VALUE!
Raw material: Feed costs ###### ####### ###### 311.0 43% #VALUE!
Raw material: Livestock costs ###### ####### ###### 73.7 10% #VALUE!
Other operational costs 450.0 70% 332.0 73% 466.0 72% 113.0 16% -76%
Total operating costs 518.0 80% 390.0 85% 539.0 84% 596.3 83% 11%
Capital Costs (million €)
Depreciation of capital ###### ####### ###### 47.0 7% #VALUE!
Financial costs, net ###### ####### ###### 58.0 8% #VALUE!
Extraordinary costs, net ###### ####### ###### 0.3 0% #VALUE!
Capital Value (million €)
Total value of assets 286.0 44% 182.0 40% 255.0 40% 550.0 77% 116%
Net Investments ###### ####### ###### 35.0 5% #VALUE!
Debt ###### ####### ###### 167.0 23% #VALUE!
Performance Indicators(million €)
Gross Value Added 196.0 30% 125.0 27% 177.0 28% 179.9 25% 2%
Operating cash flow 128.0 20% 67.0 15% 104.0 16% 118.7 17% 14%
Earning before interest and tax ###### ####### ###### 71.7 10% #VALUE!
Net profit ###### ####### ###### 13.7 2% #VALUE!
Capital productivity (%) 68.5 68.7 69.4 32.7 -53%
Return on Investment (%) 13.0
Equity ratio (%) 69.6
Future Expectation Indicator (%) -2.2
% o
f to
tal
inco
me
2010
2011
Chan
ge in
2010
-11
% o
f to
tal
inco
meVariable
% o
f to
tal
inco
me
2008
2009
% o
f to
tal
inco
me
Prices are not directly monitored through market watches or farm invoices. Feedback is taken from the inspectors who visit farms and from advertised prices. Prices for salmon are published by the Scottish Salmon Producers Organisation (SSPO). However, reductions in farm gate prices may be balanced by greater value added through processing and marketing.
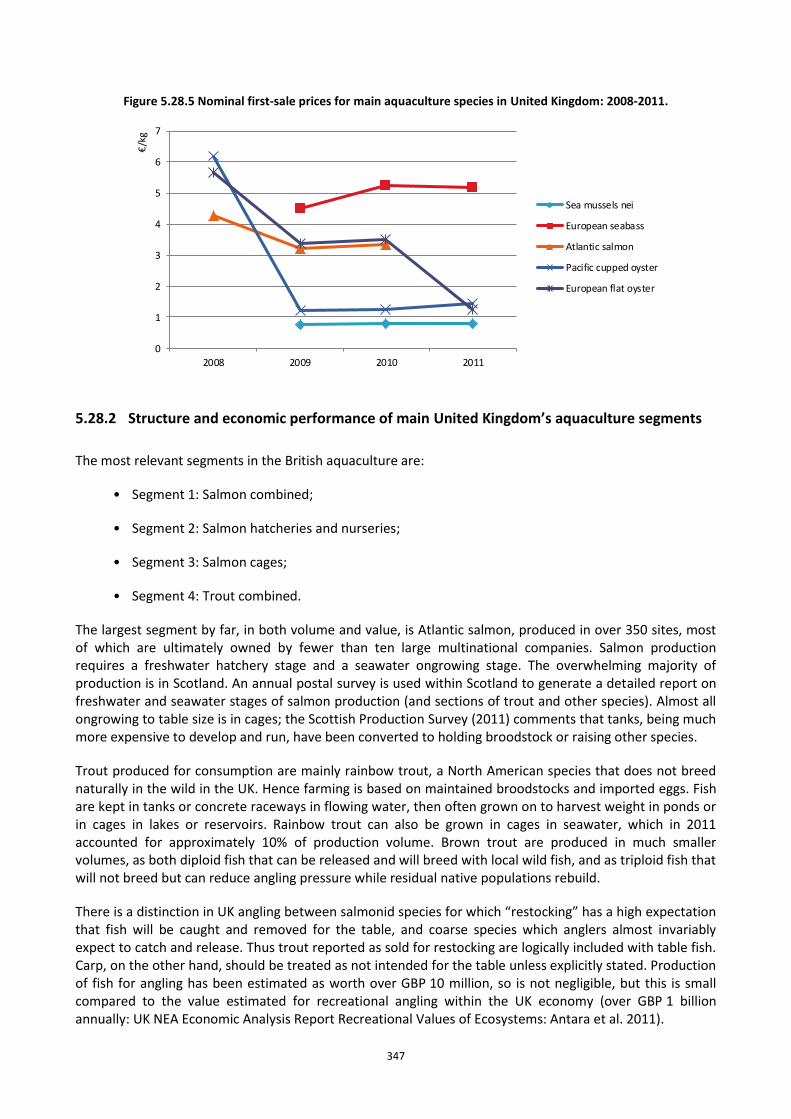
347
Figure 5.28.5 Nominal first-sale prices for main aquaculture species in United Kingdom: 2008-2011.
0
1
2
3
4
5
6
7
2008 2009 2010 2011
€/k
g
Sea mussels nei
European seabass
Atlantic salmon
Pacific cupped oyster
European flat oyster
5.28.2 Structure and economic performance of main United Kingdom’s aquaculture segments
The most relevant segments in the British aquaculture are:
• Segment 1: Salmon combined;
• Segment 2: Salmon hatcheries and nurseries;
• Segment 3: Salmon cages;
• Segment 4: Trout combined.
The largest segment by far, in both volume and value, is Atlantic salmon, produced in over 350 sites, most of which are ultimately owned by fewer than ten large multinational companies. Salmon production requires a freshwater hatchery stage and a seawater ongrowing stage. The overwhelming majority of production is in Scotland. An annual postal survey is used within Scotland to generate a detailed report on freshwater and seawater stages of salmon production (and sections of trout and other species). Almost all ongrowing to table size is in cages; the Scottish Production Survey (2011) comments that tanks, being much more expensive to develop and run, have been converted to holding broodstock or raising other species.
Trout produced for consumption are mainly rainbow trout, a North American species that does not breed naturally in the wild in the UK. Hence farming is based on maintained broodstocks and imported eggs. Fish are kept in tanks or concrete raceways in flowing water, then often grown on to harvest weight in ponds or in cages in lakes or reservoirs. Rainbow trout can also be grown in cages in seawater, which in 2011 accounted for approximately 10% of production volume. Brown trout are produced in much smaller volumes, as both diploid fish that can be released and will breed with local wild fish, and as triploid fish that will not breed but can reduce angling pressure while residual native populations rebuild.
There is a distinction in UK angling between salmonid species for which “restocking” has a high expectation that fish will be caught and removed for the table, and coarse species which anglers almost invariably expect to catch and release. Thus trout reported as sold for restocking are logically included with table fish. Carp, on the other hand, should be treated as not intended for the table unless explicitly stated. Production of fish for angling has been estimated as worth over GBP 10 million, so is not negligible, but this is small compared to the value estimated for recreational angling within the UK economy (over GBP 1 billion annually: UK NEA Economic Analysis Report Recreational Values of Ecosystems: Antara et al. 2011).
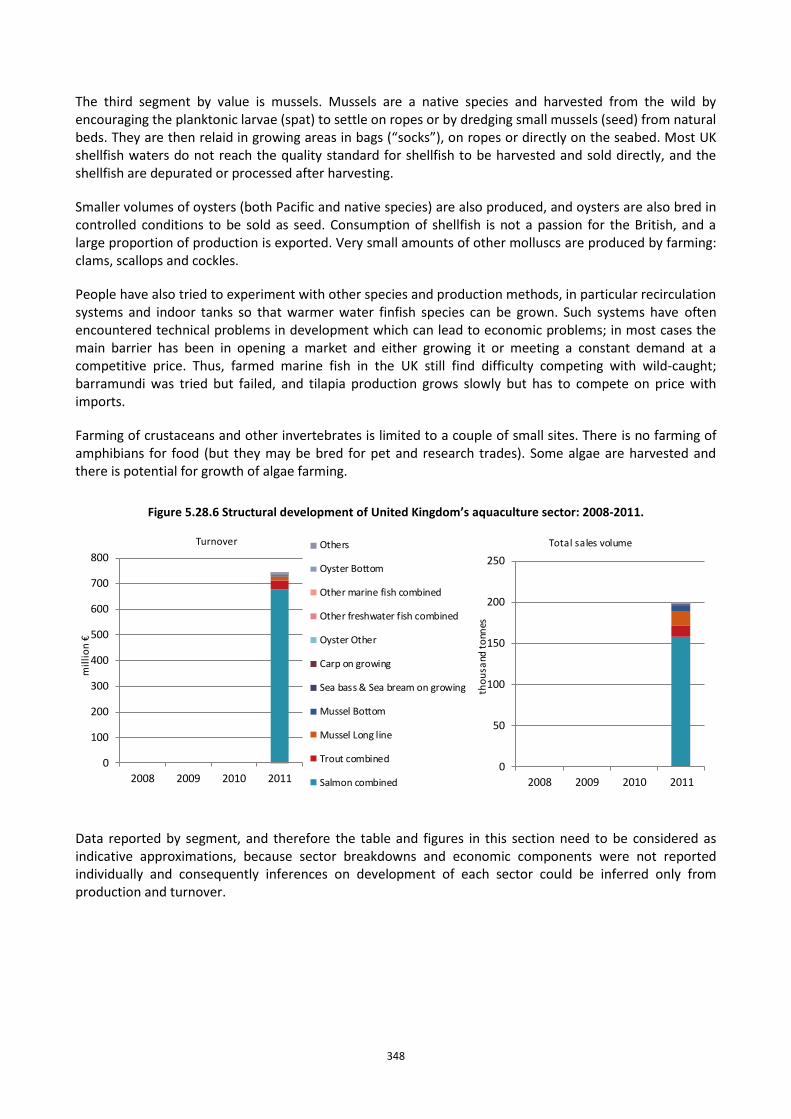
348
The third segment by value is mussels. Mussels are a native species and harvested from the wild by encouraging the planktonic larvae (spat) to settle on ropes or by dredging small mussels (seed) from natural beds. They are then relaid in growing areas in bags (“socks”), on ropes or directly on the seabed. Most UK shellfish waters do not reach the quality standard for shellfish to be harvested and sold directly, and the shellfish are depurated or processed after harvesting.
Smaller volumes of oysters (both Pacific and native species) are also produced, and oysters are also bred in controlled conditions to be sold as seed. Consumption of shellfish is not a passion for the British, and a large proportion of production is exported. Very small amounts of other molluscs are produced by farming: clams, scallops and cockles.
People have also tried to experiment with other species and production methods, in particular recirculation systems and indoor tanks so that warmer water finfish species can be grown. Such systems have often encountered technical problems in development which can lead to economic problems; in most cases the main barrier has been in opening a market and either growing it or meeting a constant demand at a competitive price. Thus, farmed marine fish in the UK still find difficulty competing with wild-caught; barramundi was tried but failed, and tilapia production grows slowly but has to compete on price with imports.
Farming of crustaceans and other invertebrates is limited to a couple of small sites. There is no farming of amphibians for food (but they may be bred for pet and research trades). Some algae are harvested and there is potential for growth of algae farming.
Figure 5.28.6 Structural development of United Kingdom’s aquaculture sector: 2008-2011.
Data reported by segment, and therefore the table and figures in this section need to be considered as indicative approximations, because sector breakdowns and economic components were not reported individually and consequently inferences on development of each sector could be inferred only from production and turnover.
0
100
200
300
400
500
600
700
800
2008 2009 2010 2011
mil
lio
n €
Turnover Others
Oyster Bottom
Other marine fish combined
Other freshwater fish combined
Oyster Other
Carp on growing
Sea bass & Sea bream on growing
Mussel Bottom
Mussel Long line
Trout combined
Salmon combined
0
50
100
150
200
250
2008 2009 2010 2011
tho
usa
nd t
onn
es
Total sales volume
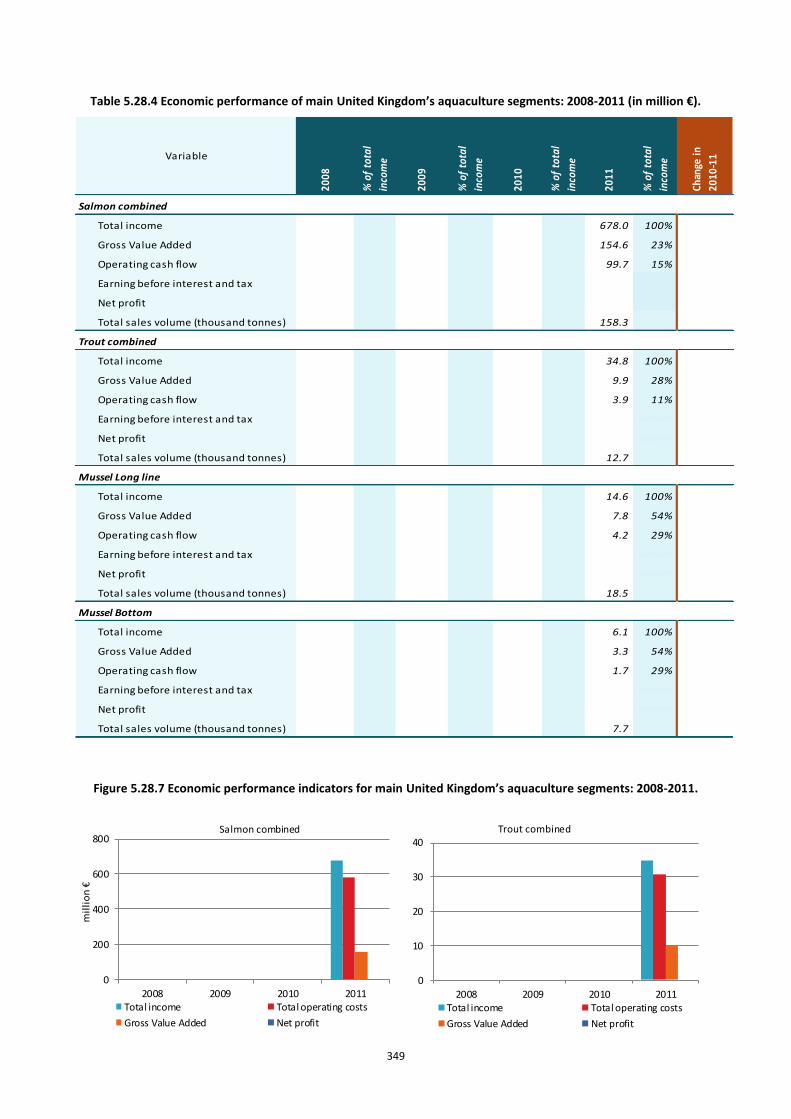
349
Table 5.28.4 Economic performance of main United Kingdom’s aquaculture segments: 2008-2011 (in million €).
Salmon combined
Total income 678.0 100%
Gross Value Added 154.6 23%
Operating cash flow 99.7 15%
Earning before interest and tax ######
Net profit ######
Total sales volume (thousand tonnes) 158.3
Trout combined
Total income 34.8 100%
Gross Value Added 9.9 28%
Operating cash flow 3.9 11%
Earning before interest and tax ######
Net profit ######
Total sales volume (thousand tonnes) 12.7
Mussel Long line
Total income 14.6 100%
Gross Value Added 7.8 54%
Operating cash flow 4.2 29%
Earning before interest and tax ######
Net profit ######
Total sales volume (thousand tonnes) 18.5
Mussel Bottom
Total income 6.1 100%
Gross Value Added 3.3 54%
Operating cash flow 1.7 29%
Earning before interest and tax ######
Net profit ######
Total sales volume (thousand tonnes) 7.7
% o
f to
tal
inco
me
Chan
ge in
2010
-11Variable
2008
% o
f to
tal
inco
me
2009
% o
f to
tal
inco
me
2010
% o
f to
tal
inco
me
2011
Figure 5.28.7 Economic performance indicators for main United Kingdom’s aquaculture segments: 2008-2011.
0
200
400
600
800
2008 2009 2010 2011
mil
lio
n €
Salmon combined
Total income Total operating costs
Gross Value Added Net profit
0
10
20
30
40
2008 2009 2010 2011
Trout combined
Total income Total operating costs
Gross Value Added Net profit
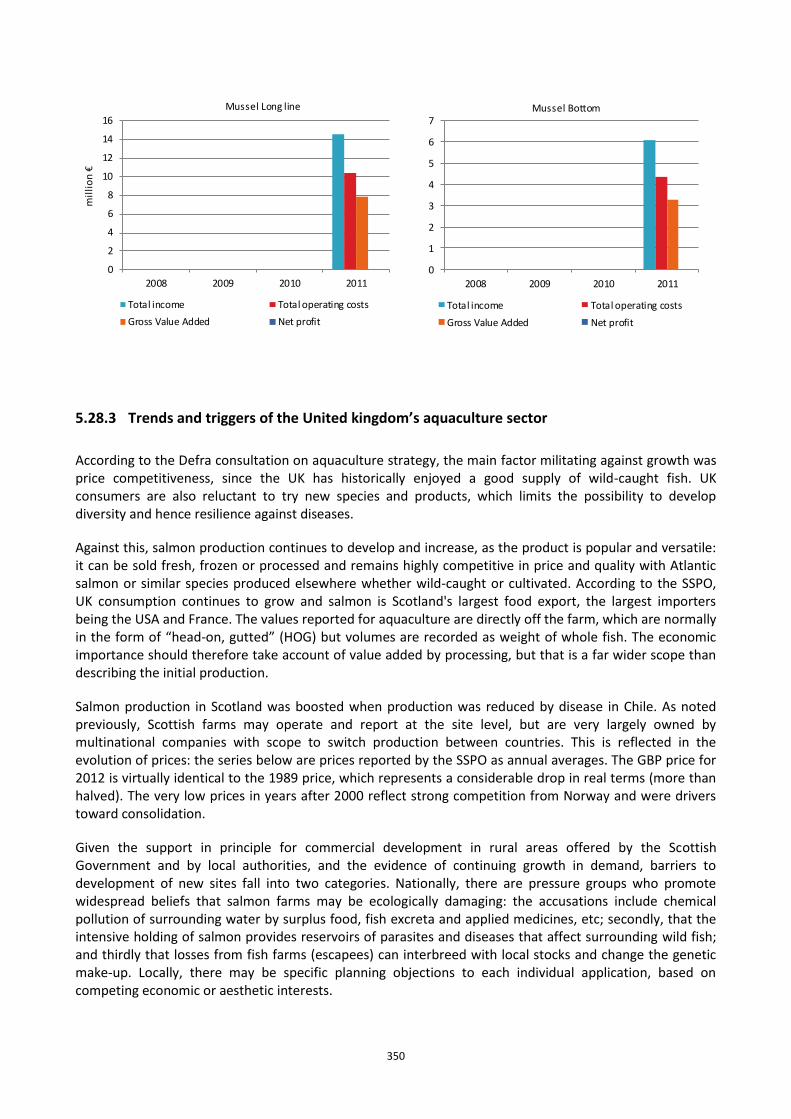
350
5.28.3 Trends and triggers of the United kingdom’s aquaculture sector
According to the Defra consultation on aquaculture strategy, the main factor militating against growth was price competitiveness, since the UK has historically enjoyed a good supply of wild-caught fish. UK consumers are also reluctant to try new species and products, which limits the possibility to develop diversity and hence resilience against diseases.
Against this, salmon production continues to develop and increase, as the product is popular and versatile: it can be sold fresh, frozen or processed and remains highly competitive in price and quality with Atlantic salmon or similar species produced elsewhere whether wild-caught or cultivated. According to the SSPO, UK consumption continues to grow and salmon is Scotland's largest food export, the largest importers being the USA and France. The values reported for aquaculture are directly off the farm, which are normally in the form of “head-on, gutted” (HOG) but volumes are recorded as weight of whole fish. The economic importance should therefore take account of value added by processing, but that is a far wider scope than describing the initial production.
Salmon production in Scotland was boosted when production was reduced by disease in Chile. As noted previously, Scottish farms may operate and report at the site level, but are very largely owned by multinational companies with scope to switch production between countries. This is reflected in the evolution of prices: the series below are prices reported by the SSPO as annual averages. The GBP price for 2012 is virtually identical to the 1989 price, which represents a considerable drop in real terms (more than halved). The very low prices in years after 2000 reflect strong competition from Norway and were drivers toward consolidation.
Given the support in principle for commercial development in rural areas offered by the Scottish Government and by local authorities, and the evidence of continuing growth in demand, barriers to development of new sites fall into two categories. Nationally, there are pressure groups who promote widespread beliefs that salmon farms may be ecologically damaging: the accusations include chemical pollution of surrounding water by surplus food, fish excreta and applied medicines, etc; secondly, that the intensive holding of salmon provides reservoirs of parasites and diseases that affect surrounding wild fish; and thirdly that losses from fish farms (escapees) can interbreed with local stocks and change the genetic make-up. Locally, there may be specific planning objections to each individual application, based on competing economic or aesthetic interests.
0
2
4
6
8
10
12
14
16
2008 2009 2010 2011
mil
lio
n €
Mussel Long line
Total income Total operating costs
Gross Value Added Net profit
0
1
2
3
4
5
6
7
2008 2009 2010 2011
Mussel Bottom
Total income Total operating costs
Gross Value Added Net profit
351
Production within existing sites is growing, as is productivity. Further increase may be achieved (or may be limited) by site developments (larger cages or more cages), disease control (vaccinations or stock selection), and changes in growth rates through feeds or genetic improvements (selective breeding or GM).
Failure to grow production of trout may reflect failure to develop demand for table fish and a preference to cater more for angling and tourism (eg by supplying local restaurants). According to the British Trout Association (BTA), “To support a trout farm a clean river is needed for adequate water supply, which limits expansion possibilities in the UK. The majority of fish farming concerns are small with owners doing much of the work themselves. Production is increasingly concentrated on farms producing 100 tonnes or more. The Industry is moving away from smaller producers, as they are becoming less competitive. Competition from larger trout producers, other fish species and cheaper imported fish are reducing profit margins as prices remain the same or fall.”
Both trout and mussels have become more prominent in UK supermarkets in the past few years, but this requires regular and reliable supplies. Promotions rely on branding and added value, selling a “meal” rather than a raw ingredient. Hence it would be easy for the food processors to switch sources of the aquaculture ingredient. This is comparable with developments in other seafoods, where the traditional cod had been replaced in many freezer products with generic “white fish” with little consumer reaction.
5.28.4 Data Coverage and Data Quality of the United Kingdom’s aquaculture sector
The obvious reasons for DCF, FAO and Eurostat data not to agree is that they are collected at different times of the year in formats that are similar but all showing peculiarities of detail.
Data for calendar year X is requested by FAO by the end of August in year X+1, but by Eurostat by the end of December X+1. DCF data is requested for year X in May of year X+2. Within the UK, data is collected by different methods in the four national regions. Data for England and Wales is collected during inspection visits that are not completed until near the year's end; hence totals are not available before December. Data for Scotland is collected by postal surveys and is published as a report in September. Data for Northern Ireland is also collected by postal surveys and is available earlier in the year.
FAO may therefore have picked up Northern Ireland data and put it in tables as representing the UK. This will not be revised until the next data collection round.
Eurostat returns are based on summed production totals, so should represent the most accurate estimates of production quantities. Coverage is virtually 100% and there is no evidence of non-compliance or bias by respondents. Trade associations and other users of the data seem of the opinion that collecting and publishing this data is a general good that outweighs the burden on industry. Within the UK, more use is made of regional subtotals than of the member state totals.
DCF data has been compiled from a combination of the Eurostat data and UK Office for National Statistics Annual Business Survey (ABS) data. The ABS uses an approximately 4% sample of companies registered for VAT, which is likely to exclude many single-person and part-time enterprises. Nevertheless, it will follow standard accounting practices. However, this does not provide all the DCF indicators and in 2013 a direct survey of aquaculture businesses was attempted. For reasons not known at the time of STECF experts meeting, this approach led to raised estimates that were well out of line with existing turnover estimates, and it was unfortunate this data was uploaded to JRC. The data were subsequently corrected.
Some costs by segment were imputed by applying to turnover the proportions reported in a JRC study that used data from previous STECF aquaculture reports, consequently there was little sense to show the cost structure by segment.
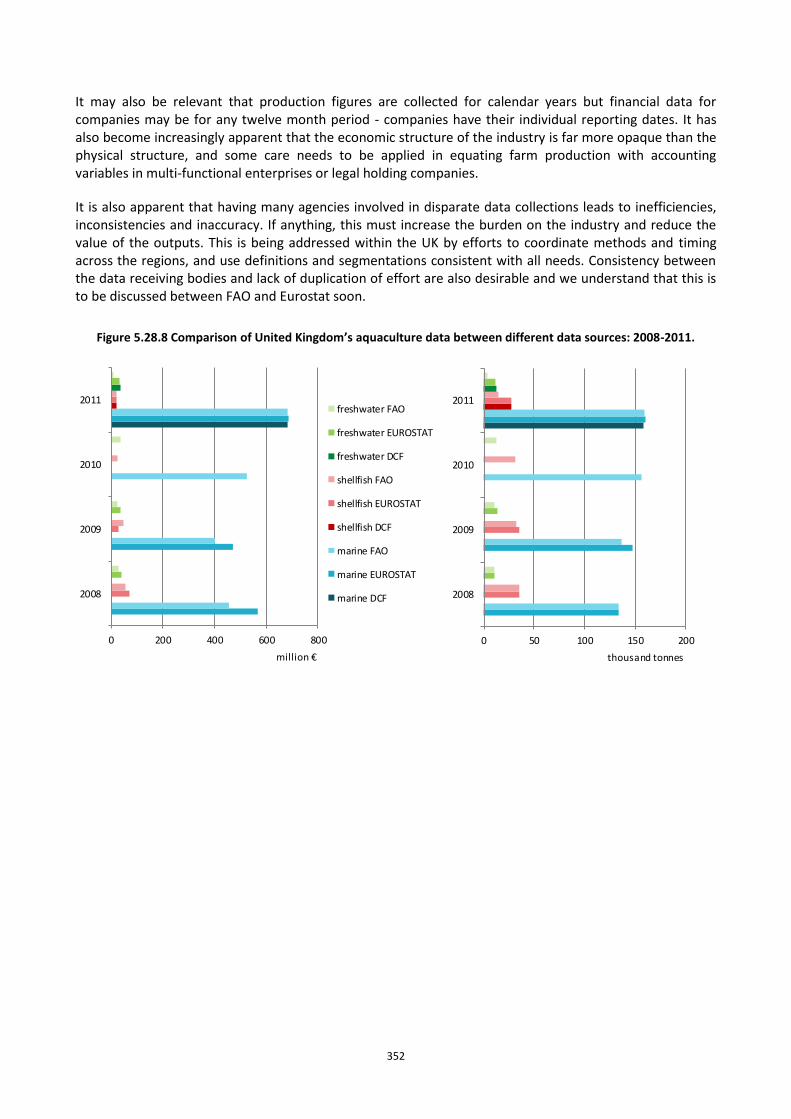
352
It may also be relevant that production figures are collected for calendar years but financial data for companies may be for any twelve month period - companies have their individual reporting dates. It has also become increasingly apparent that the economic structure of the industry is far more opaque than the physical structure, and some care needs to be applied in equating farm production with accounting variables in multi-functional enterprises or legal holding companies.
It is also apparent that having many agencies involved in disparate data collections leads to inefficiencies, inconsistencies and inaccuracy. If anything, this must increase the burden on the industry and reduce the value of the outputs. This is being addressed within the UK by efforts to coordinate methods and timing across the regions, and use definitions and segmentations consistent with all needs. Consistency between the data receiving bodies and lack of duplication of effort are also desirable and we understand that this is to be discussed between FAO and Eurostat soon.
Figure 5.28.8 Comparison of United Kingdom’s aquaculture data between different data sources: 2008-2011.
0 200 400 600 800
2008
2009
2010
2011
million €
freshwater FAO
freshwater EUROSTAT
freshwater DCF
shellfish FAO
shellfish EUROSTAT
shellfish DCF
marine FAO
marine EUROSTAT
marine DCF
0 50 100 150 200
2008
2009
2010
2011
thousand tonnes
353
6 ARE PRODUCTION VOLUME AND VALUE STATISTICS ON EU AQUACULTURE FROM FAO, EUROSTAT AND DCF ALIGNED?
Production data from EUROSTAT and FAO could be considered largely overlapping with the data on turnover and sales volume requested under the DCF. Differences between FAO and EUROSTAT sources are caused in most of the cases by missing data in EUROSTAT, while FAO statistics provide larger coverage since missing values are replaced with estimates. DCF data also suffer from missing data as well as more structural issues.
Despite this overlap the inclusion of turnover and volume of sales data in the DCF is necessary to ensure that these key variables are readily available along the other economic variables, as well as that to know to what production these other economic variables refer to. A comparison with EUROSTAT and FAO is useful to integrate the partial coverage in the DCF for the freshwater segment and avail of longer time series for the analysis of trends.
The exercise of merging and comparing the different data sets showed that a linkage is possible by aggregating the more detailed EUROSTAT and FAO statistics at the level of the main species groups in the DCF. However, this linkage is more problematic when considering the segmentation by farming technology due to differences between the DCF and EUROSTAT classifications. In this respect, the harmonisation of the DCF segments on farming technology towards the EUROSTAT classification, as already recommended by in STECF reports on the new DC MAP, is considered particularly important since it would allow comparing the economic data in the DCF also along this dimension and including additional information on surfaces and volume available at EUROSTAT since 2012 with the entry into force of Regulation (EC) No 762/2008.
6.1 Introduction
Data on the production volume and value for aquaculture are collected by EUROSTAT on the basis of Regulation (EC) No 762/2008. The Regulation foresees a segmentation of data on production value and volume by main farming technology and by species according to ISCAAP codes. The statistics from FAO are fully consistent with EUROSTAT in terms of variables, codes and segmentations.
The Data Collection Framework for aquaculture, among other economic variables, includes data on turnover and total sales volume. Data for all economic variables is collected by segments representing a combination between farming technology and main commercial species. An additional requirement specifically foreseen for the turnover and total sales volume is to provide the data also by species according to the biological ISCAAP classification. This requirement is not always respected in the submission of data and in many cases ad hoc definitions of species are used.
The comparison of EUROSTAT and FAO production data with DCF sales data is possible because FAO and EUROSTAT data refer to sales. Indeed, article 2, of the EC Regulation No 762/2008 defines “production” as the output from aquaculture at first sale, including production from hatcheries and nurseries offered for sale. Therefore, it should be noted that total sales it is used as an approximation of total production. Even if both variables can have a similar evolution over time, they can be different year by year. This happens because companies may decide to keep more or less fish on stock depending on the economic expectations, and because there are long-live species that may take several years to grow. On this last case, production (in weight terms) takes place every year, but the sale may only take place at the last year of the production.
One objective in the new fisheries data collection system for the period 2014-2020 (DC MAP) is to avoid duplications in the collection of data among different sources. In respect of this objective, together with
354
data comparability, it is important to explore the possibilities to improve the harmonization of variables and segmentations between the different data collection systems. STECF and PG ECON made recommendations in this sense in several reports. The latest recommendations are included in the STECF EWG1305 report “Review of DC-MAP Part 2”. The report contains proposals to harmonise economic variables in respect of EUROSTAT statistics. In particular for aquaculture the report indicates the need to harmonise the classification of farming technology in respect of the ones used in EUROSTAT and FAO.
6.2 Methodology
To explore in quantitative terms the alignment between the three data sets and better support this need for harmonization already identified in previous reports, JRC carried out a comparison the data on turnover and volume of sales collected through the DCF for the period 2008 to 2011 with the data on production volume and values published by EUROSTAT and FAO.
This comparison was useful to perform consistency and data quality checks on the data provided through the DCF and to fill gaps in coverage for the freshwater segment which is included in the DCF only on a voluntary basis.
In order to compare data from the three sources and to bridge the differences in segmentation a relation table was built between the 10 main species groupings in the DCF and around 140 aquaculture species included by EUROSTAT and FAO statistics. In the case of diadromous species data on production is reported either under the freshwater or marine environment while in the case of DCF there is no distinction made between the two segments. In these cases all production was attributed to only one segment according to a prevalence criterion (i.e. for trout species all production was attributed to the freshwater segment and for salmon species to the marine segment).
6.3 Analysis
In order to analyse the alignment of data sources, a general comparison of FAO and EUROSTAT data by country (Figure 5.1 for DCF countries and Figure 5.2 for non-DCF countries) shows that EUROSTAT and FAO data are generally comparable but with some anomalies for individual readings and a little random fluctuation between estimates.
From Figure 3,it can be observed that EUROSTAT and DCF data are less consistent, with some countries apparently submitting to one or the other, with the presence of individual anomalies, and some random variation where apparently both sources have an estimate.
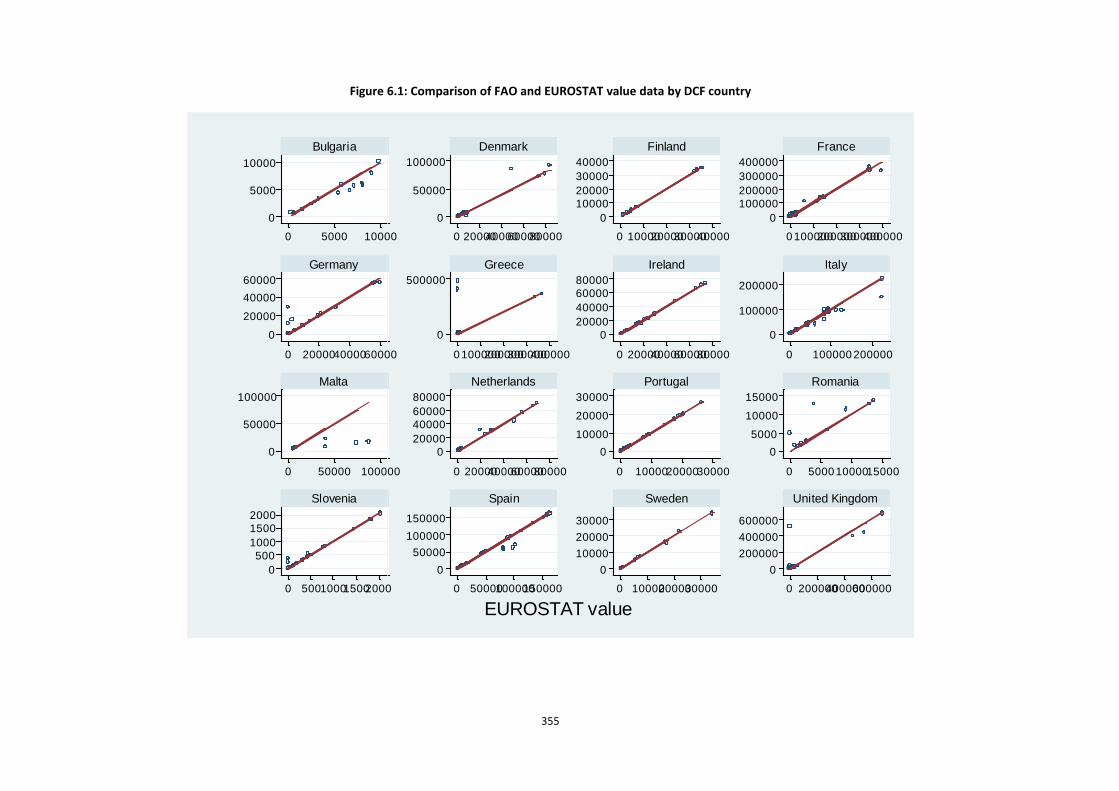
355
Figure 6.1: Comparison of FAO and EUROSTAT value data by DCF country
0
5000
10000
0
50000
100000
0
10000
20000
30000
40000
0
100000
200000
300000
400000
0
20000
40000
60000
0
500000
0
20000
40000
60000
80000
0
100000
200000
0
50000
100000
0
20000
40000
60000
80000
0
10000
20000
30000
0
5000
10000
15000
0
500
1000
1500
2000
0
50000
100000
150000
0
10000
20000
30000
0
200000
400000
600000
0 5000 10000 0 20000400006000080000 0 10000200003000040000 0 100000200000300000400000
0 200004000060000 0 100000200000300000400000 0 20000400006000080000 0 100000 200000
0 50000 100000 0 20000400006000080000 0 100002000030000 0 5000 1000015000
0 500100015002000 0 50000100000150000 0 100002000030000 0 200000400000600000
Bulgaria Denmark Finland France
Germany Greece Ireland Italy
Malta Netherlands Portugal Romania
Slovenia Spain Sweden United Kingdom
FA
O v
alu
e
EUROSTAT value
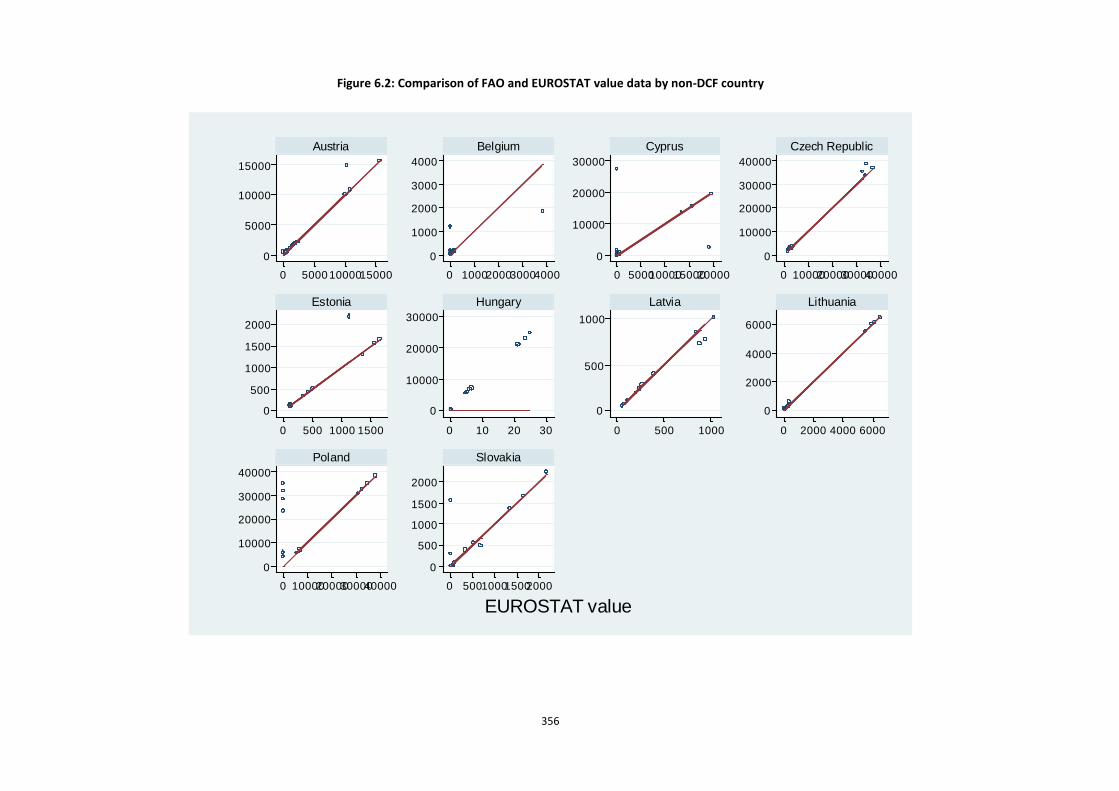
356
Figure 6.2: Comparison of FAO and EUROSTAT value data by non-DCF country
0
5000
10000
15000
0
1000
2000
3000
4000
0
10000
20000
30000
0
10000
20000
30000
40000
0
500
1000
1500
2000
0
10000
20000
30000
0
500
1000
0
2000
4000
6000
0
10000
20000
30000
40000
0
500
1000
1500
2000
0 5000 1000015000 0 1000200030004000 0 5000100001500020000 0 10000200003000040000
0 500 1000 1500 0 10 20 30 0 500 1000 0 2000 4000 6000
0 10000200003000040000 0 500100015002000
Austria Belgium Cyprus Czech Republic
Estonia Hungary Latvia Lithuania
Poland Slovakia
FA
O v
alu
e
EUROSTAT value
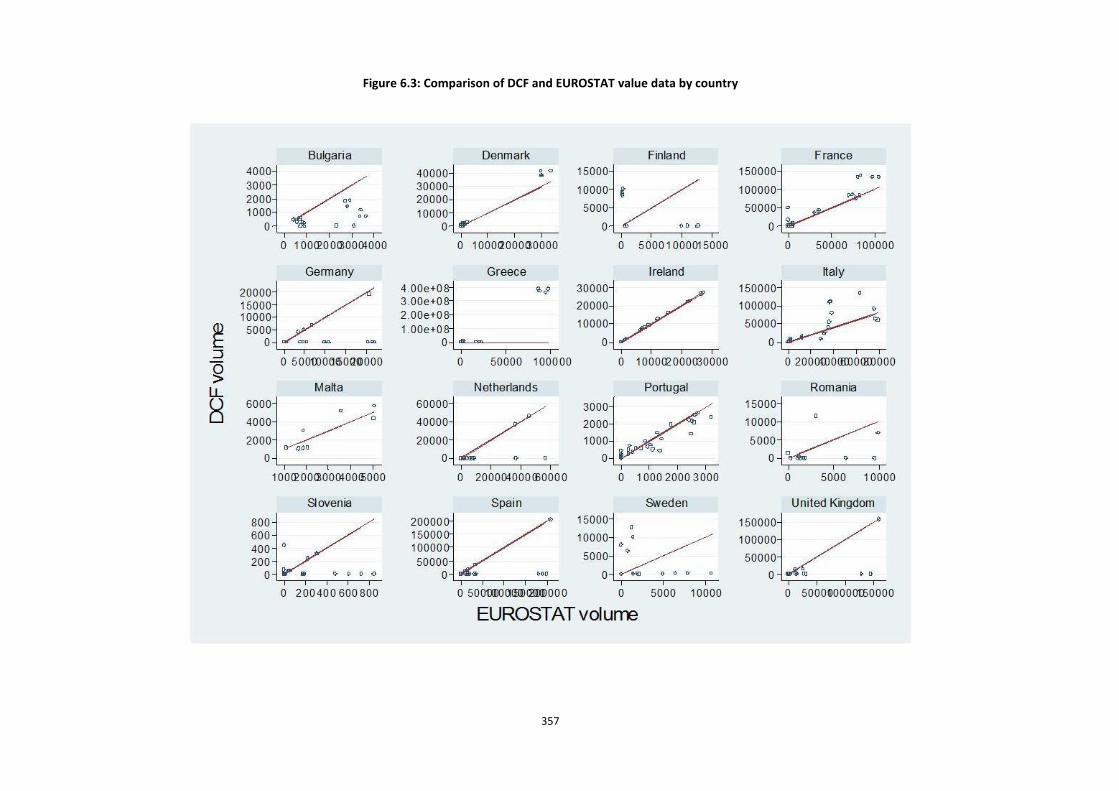
357
Figure 6.3: Comparison of DCF and EUROSTAT value data by country
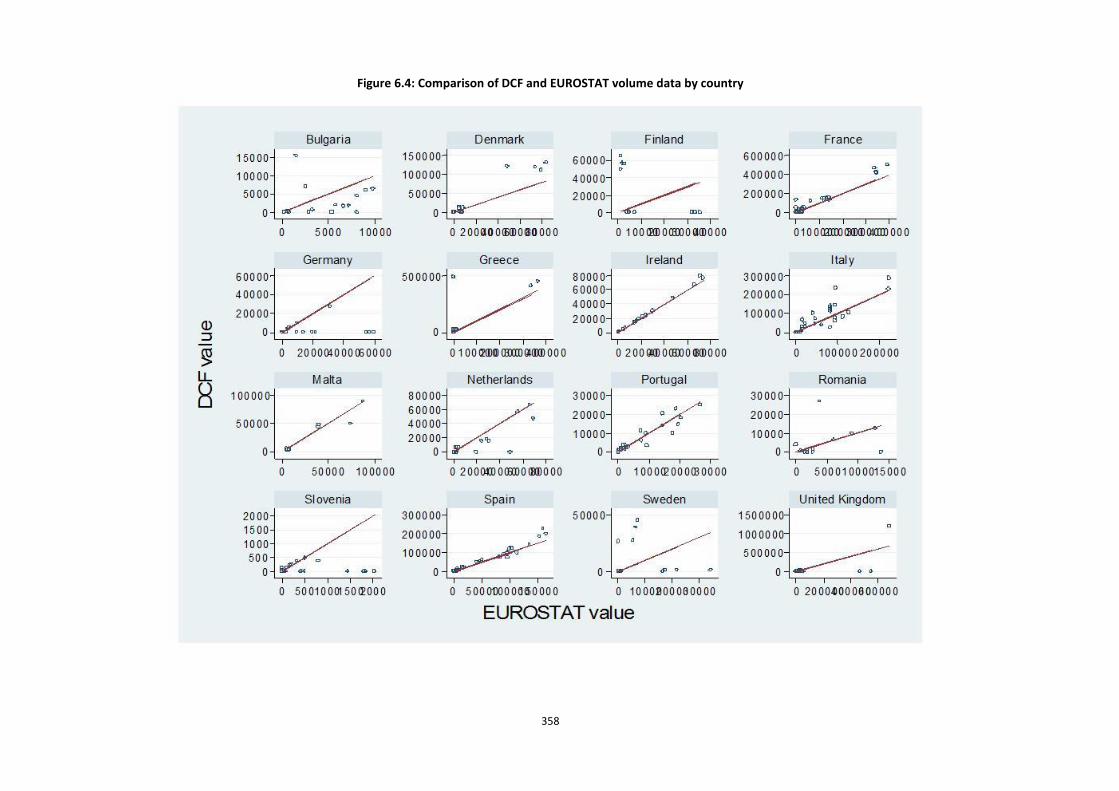
358
Figure 6.4: Comparison of DCF and EUROSTAT volume data by country
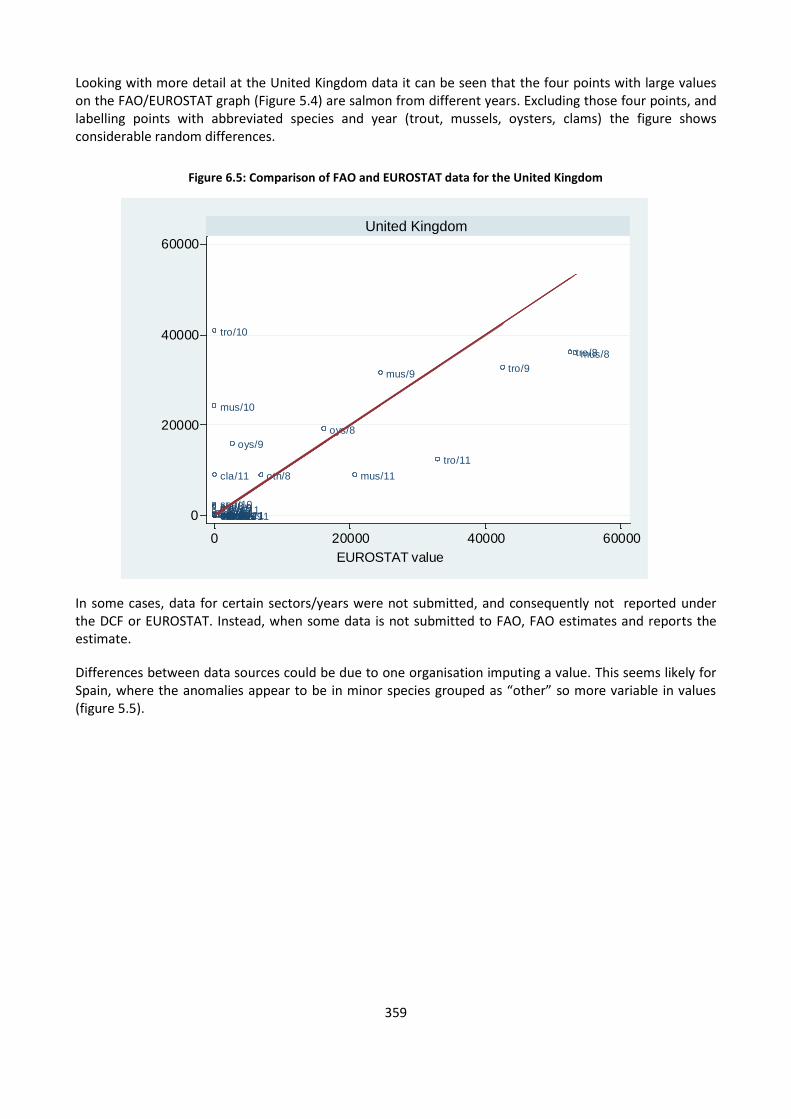
359
Looking with more detail at the United Kingdom data it can be seen that the four points with large values on the FAO/EUROSTAT graph (Figure 5.4) are salmon from different years. Excluding those four points, and labelling points with abbreviated species and year (trout, mussels, oysters, clams) the figure shows considerable random differences.
Figure 6.5: Comparison of FAO and EUROSTAT data for the United Kingdom
In some cases, data for certain sectors/years were not submitted, and consequently not reported under the DCF or EUROSTAT. Instead, when some data is not submitted to FAO, FAO estimates and reports the estimate.
Differences between data sources could be due to one organisation imputing a value. This seems likely for Spain, where the anomalies appear to be in minor species grouped as “other” so more variable in values (figure 5.5).
car/8cla/8
mus/8
oth/8
oth/8
oth/8
oys/8
sea/8
tro/8
car/9cla/9
mus/9
oth/9oth/9
oth/9
oys/9
sea/9
tro/9
car/10cla/10
mus/10
oth/10oth/10oth/10oys/10sea/10
tro/10
car/11
cla/11 mus/11
oth/11oth/11oth/11oys/11
sea/11
tro/11
0
20000
40000
60000
0 20000 40000 60000
United Kingdom
FA
O v
alu
e
EUROSTAT value
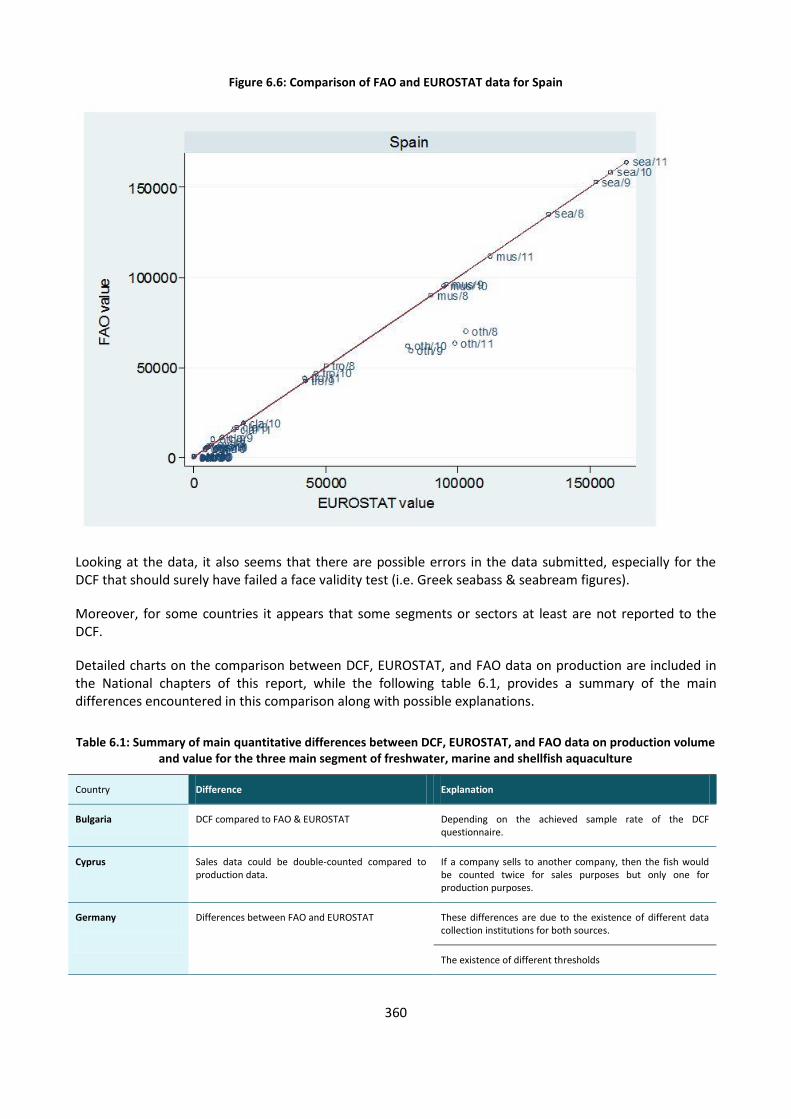
360
Figure 6.6: Comparison of FAO and EUROSTAT data for Spain
Looking at the data, it also seems that there are possible errors in the data submitted, especially for the DCF that should surely have failed a face validity test (i.e. Greek seabass & seabream figures).
Moreover, for some countries it appears that some segments or sectors at least are not reported to the DCF.
Detailed charts on the comparison between DCF, EUROSTAT, and FAO data on production are included in the National chapters of this report, while the following table 6.1, provides a summary of the main differences encountered in this comparison along with possible explanations.
Table 6.1: Summary of main quantitative differences between DCF, EUROSTAT, and FAO data on production volume and value for the three main segment of freshwater, marine and shellfish aquaculture
Country Difference Explanation
Bulgaria DCF compared to FAO & EUROSTAT Depending on the achieved sample rate of the DCF questionnaire.
Cyprus Sales data could be double-counted compared to production data.
If a company sells to another company, then the fish would be counted twice for sales purposes but only one for production purposes.
Germany
Differences between FAO and EUROSTAT
These differences are due to the existence of different data collection institutions for both sources.
The existence of different thresholds
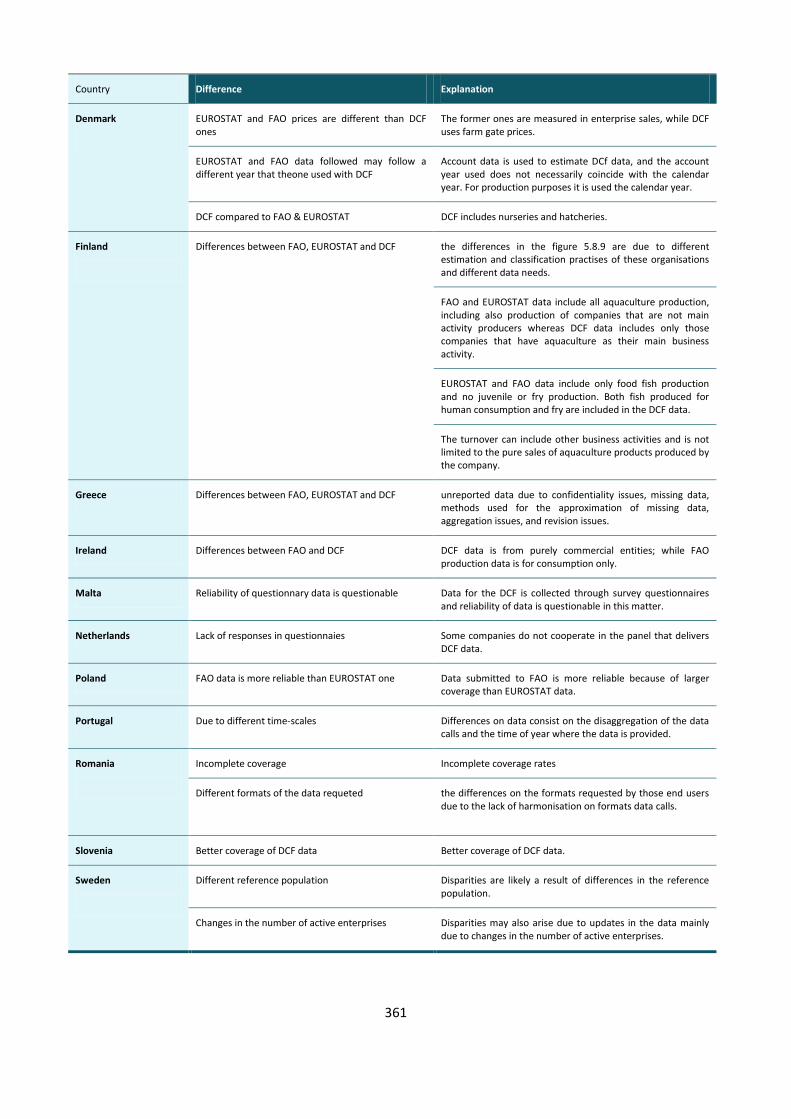
361
Country Difference Explanation
Denmark
EUROSTAT and FAO prices are different than DCF ones
The former ones are measured in enterprise sales, while DCF uses farm gate prices.
EUROSTAT and FAO data followed may follow a different year that theone used with DCF
Account data is used to estimate DCf data, and the account year used does not necessarily coincide with the calendar year. For production purposes it is used the calendar year.
DCF compared to FAO & EUROSTAT DCF includes nurseries and hatcheries.
Finland
Differences between FAO, EUROSTAT and DCF
the differences in the figure 5.8.9 are due to different estimation and classification practises of these organisations and different data needs.
FAO and EUROSTAT data include all aquaculture production, including also production of companies that are not main activity producers whereas DCF data includes only those companies that have aquaculture as their main business activity.
EUROSTAT and FAO data include only food fish production and no juvenile or fry production. Both fish produced for human consumption and fry are included in the DCF data.
The turnover can include other business activities and is not limited to the pure sales of aquaculture products produced by the company.
Greece Differences between FAO, EUROSTAT and DCF unreported data due to confidentiality issues, missing data, methods used for the approximation of missing data, aggregation issues, and revision issues.
Ireland Differences between FAO and DCF DCF data is from purely commercial entities; while FAO production data is for consumption only.
Malta Reliability of questionnary data is questionable Data for the DCF is collected through survey questionnaires and reliability of data is questionable in this matter.
Netherlands Lack of responses in questionnaies Some companies do not cooperate in the panel that delivers DCF data.
Poland FAO data is more reliable than EUROSTAT one Data submitted to FAO is more reliable because of larger coverage than EUROSTAT data.
Portugal Due to different time-scales Differences on data consist on the disaggregation of the data calls and the time of year where the data is provided.
Romania
Incomplete coverage Incomplete coverage rates
Different formats of the data requeted the differences on the formats requested by those end users due to the lack of harmonisation on formats data calls.
Slovenia Better coverage of DCF data Better coverage of DCF data.
Sweden
Different reference population Disparities are likely a result of differences in the reference population.
Changes in the number of active enterprises Disparities may also arise due to updates in the data mainly due to changes in the number of active enterprises.
362
6.4 Concluding remarks
In this chapter there have been identified some of the main divergences between FAO, EUROSTAT and DCF data sources.
General differences can be explained as:
When a country reports no data to EUROSTAT, the data is reported in blank, while FAO statistics provide larger coverage since missing values are replaced with estimates by FAO.
EUROSTAT and FAO data is based on production destined for human consumption, while DCF data is based on all aquaculture product sales made by companies (for human-consumption and other). Because a product can be sold several times (i.e. as fry and as adult), it is possible that there is some double-counting when trying to estimate production.
EUROSTAT and FAO data is based on all aquaculture production, while DCF data is based only on the production from the companies whose main activity is aquaculture.
If DCF data is collected at national level by questionnaires, the quality of the data will depend on the response rate of the survey (achieved sample rate).
Because it may be not straight forward to identify the income from the different activities of a company, few countries are not reporting the value of sales of aquaculture products but the turnover which may include other income sources.
As a conclusion, it should be noticed that EUROSTAT and FAO should be giving a better estimate than the DCF of the total production (sales) of the EU aquaculture sector. However, the aim of reporting sales in weight and value (turnover and volume of sales) under the DCF should not be to better estimate the production of the EU aquaculture sector, but to know the representativeness of the estimated economic performance of the EU aquaculture sector.
From the analysis of these divergences between data sources one would expect that these divergences would decrease as well as data collection costs, if there was only one institution per country in charge of the collection and treatment of the data.
Moreover, it could seem necessary that MS undertake technical, maybe additional legal measures in order to improve data coverage and data quality of the whole process.
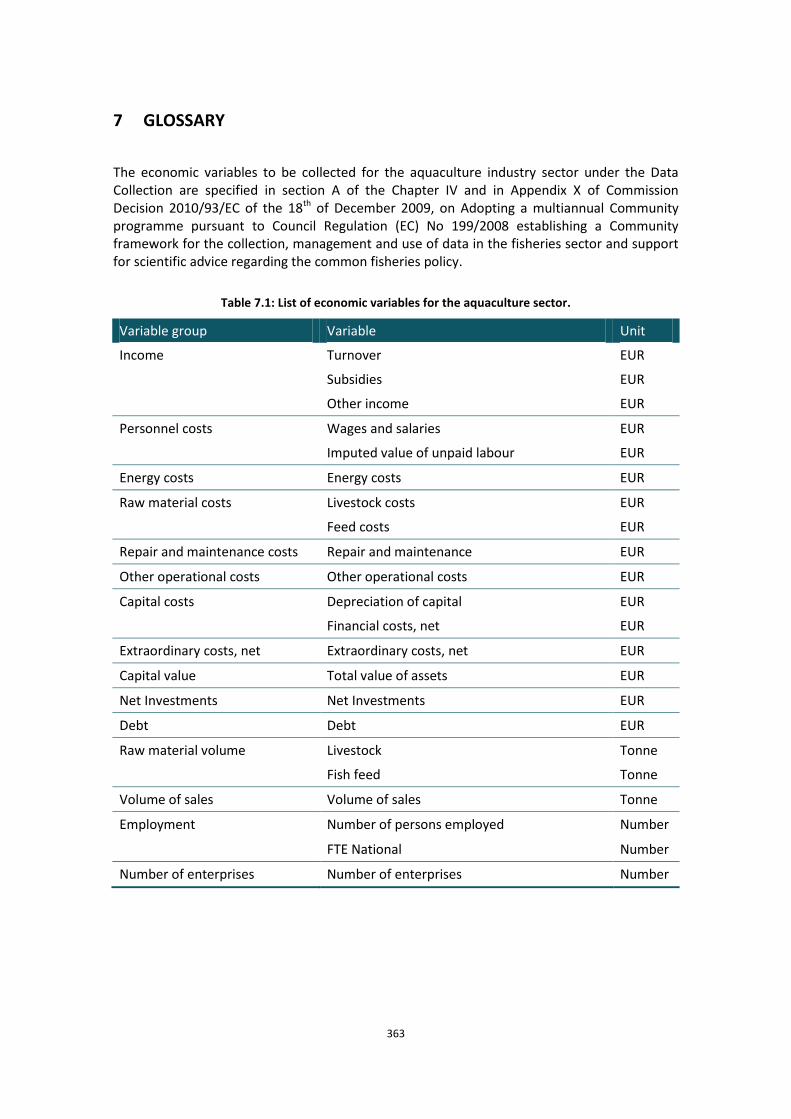
363
7 GLOSSARY
The economic variables to be collected for the aquaculture industry sector under the Data Collection are specified in section A of the Chapter IV and in Appendix X of Commission Decision 2010/93/EC of the 18th of December 2009, on Adopting a multiannual Community programme pursuant to Council Regulation (EC) No 199/2008 establishing a Community framework for the collection, management and use of data in the fisheries sector and support for scientific advice regarding the common fisheries policy.
Table 7.1: List of economic variables for the aquaculture sector.
Variable group Variable Unit
Income Turnover EUR
Subsidies EUR
Other income EUR
Personnel costs Wages and salaries EUR
Imputed value of unpaid labour EUR
Energy costs Energy costs EUR
Raw material costs Livestock costs EUR
Feed costs EUR
Repair and maintenance costs Repair and maintenance EUR
Other operational costs Other operational costs EUR
Capital costs Depreciation of capital EUR
Financial costs, net EUR
Extraordinary costs, net Extraordinary costs, net EUR
Capital value Total value of assets EUR
Net Investments Net Investments EUR
Debt Debt EUR
Raw material volume Livestock Tonne
Fish feed Tonne
Volume of sales Volume of sales Tonne
Employment Number of persons employed Number
FTE National Number
Number of enterprises Number of enterprises Number
364
7.1 Glossary of data requested and indicators
7.1.1 Parameters requested
Turnover:
“Turnover” comprises the totals invoiced by the observation unit during the reference period, and this corresponds to market sales of goods or services supplied to third parties.
Turnover includes all duties and taxes on the goods or services invoiced by the unit with the exception of the VAT invoiced by the unit vis-à-vis its customer and other similar deductible taxes directly linked to turnover.
It also includes all other charges (transport, packaging, etc.) passed on to the customer, even if these charges are listed separately in the invoice. Reduction in prices, rebates and discounts as well as the value of returned packing must be deducted. Income classified as other operating income, financial income and extraordinary income in company accounts is excluded from turnover. Operating subsidies received from public authorities or the institutions of the European Union are also excluded (Structural Business Statistics (SBS) Code 12 11 0, Commission Regulation (EC) No 2700/98).
Subsidies:
“Subsidies” are the financial assistance received from public authorities or the institutions of the European Union which are excluded from turnover.
It includes direct payments, e.g. compensation for stopping trading, refunds of fuel duties or similar lump sum compensation payments; excludes social benefit payments and indirect subsidies, e.g. reduced duty on inputs such as fuel or investment subsidies.
Other income:
“Other income” refers to other operating income included in company accounts which are excluded from turnover; income coming from other activities than aquaculture, e.g. the licensing of ponds for recreational fishery purposes.
Wages and salaries:
“Wages and salaries” is equivalent to “Personnel costs” on the Structural Business Statistics.
“Personnel costs” are defined as the total remuneration, in cash or in kind, payable by an employer to an employee (regular and temporary employees as well as home workers) in return for work done by the latter during the reference period. Personnel costs also include taxes and employees' social security contributions retained by the unit as well as the employer's compulsory and voluntary social contributions.
Personnel costs are made up of:
wages and salaries
employers' social security costs
All remuneration paid during the reference period is included, regardless of whether it is paid on the basis of working time, output or piecework, and whether it is paid regularly or not. Included are all gratuities, workplace and performance bonuses, ex gratia payments, thirteenth month pay (and similar fixed bonuses), payments made to employees in
365
consideration of dismissal, lodging, transport, cost of living and family allowances, commissions, attendance fees, overtime, night work etc. as well as taxes, social security contributions and other amounts owed by the employees and retained at source by the employers. Also included are the social security costs for the employer. These include employer's social security contributions to schemes for retirement pensions, sickness, maternity, disability, unemployment, occupational accidents and diseases, family allowances as well as other schemes. These costs are included regardless of whether they are statutory, collectively agreed, contractual or voluntary in nature. Payments for agency workers are not included in personnel costs. (Structural Business Statistics (SBS) Code 13 31 0, Commission Regulation (EC) No 2700/98).
Wages and salaries: Wages and salaries are defined as "the total remuneration, in cash or in kind, payable to all persons counted on the payroll (including homeworkers), in return for work done during the accounting period." regardless of whether it is paid on the basis of working time, output or piecework and whether it is paid regularly or not. Wages and salaries include the values of any social contributions, income taxes, etc. payable by the employee even if they are actually withheld by the employer and paid directly to social insurance schemes, tax authorities, etc. on behalf of the employee. Wages and salaries do not include social contributions payable by the employer. Wages and salaries include: all gratuities, bonuses, ex gratia payments, "thirteenth month payments", severance payments, lodging, transport, cost-of-living, and family allowances, tips, commission, attendance fees, etc. received by employees, as well as taxes, social security contributions and other amounts payable by employees and withheld at source by the employer. Wages and salaries which the employer continues to pay in the event of illness, occupational accident, maternity leave or short-time working may be recorded here or under social security costs, depending upon the unit's accounting practices. Payments for agency workers are not included in wages and salaries. (Structural Business Statistics (SBS) Code 13 32 0, Commission Regulation (EC) No 2700/98).
Social security costs: Employers' social security costs correspond to an amount equal to the value of the social contributions incurred by employers in order to secure for their employees the entitlement to social benefits. Social security costs for the employer include the employer's social security contributions to schemes for retirement pensions, sickness, maternity, disability, unemployment, occupational accidents and diseases, family allowances as well as other schemes. Included are the costs for all employees including homeworkers and apprentices. Charges are included for all schemes, regardless of whether they are statutory, collectively agreed, contractual or voluntary in nature. Wages and salaries which the employer continues to pay in the event of illness, occupational accident, maternity leave or short-time working may be recorded here or under wages and salaries, dependent upon the unit's accounting practices. (Structural Business Statistics (SBS) Code 13 33 0, Commission Regulation (EC) No 2700/98).
Imputed value of unpaid labour:
Unpaid workers normally refers to persons who live with the proprietor of the unit and work regularly for the unit, but do not have a contract of service and do not receive a fixed sum for the work they perform. This is limited to persons who are not included on the payroll of another unit as their principal occupation.
Thus, imputed value of unpaid labour estimates the value of the salaries that these unpaid workers would have received if their work was remunerated.
The chosen methodology to estimate this imputed value of unpaid labour should be explained by the Member State in their national programme.
366
Energy costs:
“Energy costs” corresponds to the “Purchases of energy products (in value)” on the Structural Business Statistics.
Purchases of all energy products during the reference period should be included in this variable only if they are purchased to be used as fuel. Energy products purchased as a raw material or for resale without transformation should be excluded. This figure should be given in value only. (Structural Business Statistics (SBS) Code 20 11 0, Commission Regulation (EC) No 2700/98).
Livestock costs:
The livestock costs should correspond to the variable livestock volume.
In the Structural Business Statistics it is included inside 13 11 0 “Total purchases of goods and services”.
Feed costs:
Feed costs include the purchasing costs of the feed during the reference period. The feed costs should correspond to feed volume.
In the Structural Business Statistics it is included inside 13 11 0 “Total purchases of goods and services”.
Repair and maintenance:
Under repair and maintenance there should be included the costs incurred to bring an asset back to its earlier condition or to keep the asset operating at its present condition (as opposed to improving the asset).
On the Structural Business Statistics is included inside 13 11 0 “Total purchases of goods and services”.
Other operational costs:
Other operating costs should comprise outsourcing costs, property or equipment rental charges, the cost of raw materials and supplies that cannot be held in the inventory and have not been already specified (i.e. water, small items of equipment, administrative supplies, etc.), insurance premiums, studies and research costs, external personnel charges, fees payable to intermediaries and professional expenses, advertising costs, transportation charges, travel expenses, the costs of meetings and receptions, postal charges, bank charges (but not interest on bank loans) and other items of expenditure.
On the Structural Business Statistics is included inside 13 11 0 “Total purchases of goods and services”.
Depreciation of capital:
Depreciation refers to the decline in value of the assets. In accounting, it is used as the allocation of the cost of tangible assets to periods in which the assets are used, in order to reflect this decline in their value.
367
The chosen methodology to allocate these costs over periods should be explained in the national programme. ESA (6) 6.02 to 6.05 European System of Accounts 1995 (Regulation (EC) No 2223/96, Regulation (EC) No 1267/2003, Eurostat ESA 1995 manual).
Financial costs, net:
“Financial costs, net” should be calculated as costs, coming from financial activity of the enterprise, minus the financial income.
Extraordinary costs, net:
“Extraordinary costs, net” is the difference between “Extraordinary charges” and “Extraordinary income”.
“Extraordinary income” and “Extraordinary charges” are the income and costs that arise otherwise than in the course of the company's ordinary activities (Article 29 of the Fourth Council Directive 78/660/EEC of 25 July 1978).
Total value of assets:
This parameter corresponds to the Balance sheet total of the Structural Business Statistics and the Capital value in the European System of Accounts.
Balance sheet total consists of the sum of items 1 to 16 of the asset side of the balance sheet or of the sum of items 1 to 14 of the liability side of the balance sheet. (Structural Business Statistics (SBS) Code 43 30 0, Commission Regulation (EC) No 2700/98).
Capital value is the total accumulated value of all net investments in the enterprise at the end of the year. ESA 7.09 to 7.24 European System of Accounts 1995 (Regulation (EC) No 2223/96, Regulation (EC) No 1267/2003, Eurostat ESA 1995 manual).
Net Investments:
“Net investments” refers to the difference between Purchase (Gross investment in tangible goods) and Sale (Sales of tangible investment goods) of assets during the year.
Gross investment in tangible goods is the Investment during the reference period in all tangible goods. Included are new and existing tangible capital goods, whether bought from third parties or produced for own use (i.e. Capitalised production of tangible capital goods), having a useful life of more than one year including non-produced tangible goods such as land. The threshold for the useful life of a good that can be capitalised may be increased according to company accounting practices where these practices require a greater expected useful life than the one year threshold indicated above.
All investments are valued prior to (i.e. gross of) value adjustments, and before the deduction of income from disposals. Purchased goods are valued at purchase price, i.e. transport and installation charges, fees, taxes and other costs of ownership transfer are included.
Own produced tangible goods are valued at production cost. Goods acquired through restructurations (such as mergers, take-overs, break-ups, split-off) are excluded. Purchases of small tools which are not capitalised are included under current expenditure. Also included are all additions, alterations, improvements and renovations which prolong the service life or increase the productive capacity of capital goods. Current maintenance costs are excluded as is the value and current expenditure on capital goods used under rental and lease contracts. Investment in intangible and financial assets are excluded. Concerning the recording of
368
investments where the invoicing, delivery, payment and first use of the good may take place in different reference periods, the following method is proposed as an objective:
i) Investments are recorded when the ownership is transferred to the unit that intends to use them. Capitalised production is recorded when produced. Concerning the recording of investments made in identifiable stages, each part-investment should be recorded in the reference period in which they are made.
In practice this may not be possible and company accounting conventions may mean that the following approximations to this method need to be used:
i) investments are recorded in the reference period in which they are delivered,
ii) investments are recorded in the reference period in which they enter into the production process,
iii) investments are recorded in the reference period in which they are invoiced,
iv) investments are recorded in the reference period in which they are paid for.
Gross investment in tangible goods is based on Gross investment in land (15 12 0) + Gross investment in existing buildings and structures (15 13 0) + Gross investment in construction and alteration of buildings (15 14 0) + Gross investment in machinery and equipment (15 15 0). (Structural Business Statistics (SBS) Code 15 11 0, Commission Regulation (EC) No 2700/98).
Sales of tangible goods includes the value of existing tangible capital goods, sold to third parties. Sales of tangible capital goods are valued at the price actually received (excluding VAT), and not at book value, after deducting any costs of ownership transfer incurred by the seller. Value adjustments and disposals other than by sale are excluded. (Structural Business Statistics (SBS) Code 15 21 0. Commission Regulation (EC) No 2700/98).
Debt:
Financial assets created when creditors lend funds to debtors, either directly or through brokers, which are either evidenced by non-negotiable documents or not evidenced by documents.
Short-term loans: loans whose original maturity is normally one year or less, and in exceptional cases two years at the maximum, and loans repayable on demand.
Long-term loans: loans whose original maturity is normally more than one year, and in exceptional cases more than two years at the minimum.
“Debts” account for provisions and long- and short-term debt (STECF meeting SGECA 06-01).
Livestock (volume):
Volume of livestock purchased during the reference period. The livestock volume should correspond to the livestock cost.
Fish feed (volume):
Volume of feed purchased during the reference period. The feed volume should correspond to feed cost.
369
Volume of sales:
The volume of sales should correspond to the variable on turnover value. In case of hatcheries and nurseries conversion factors from numbers to tonnes should be stated in the national programmes.
Number of persons employed (Total employment):
This indicator refers to the number of people employed (including full-time and part-time employees) (SGECA-09-03). It corresponds to the Number of people employed of the Structural Business Statistics.
The number of persons employed is defined as the total number of persons who work in the observation unit (inclusive of working proprietors, partners working regularly in the unit and unpaid family workers), as well as persons who work outside the unit who belong to it and are paid by it (e.g. sales representatives, delivery personnel, repair and maintenance teams). It includes persons absent for a short period (e.g. sick leave, paid leave or special leave), and also persons on strike, but not those absent for an indefinite period. It also includes part-time workers who are regarded as such under the laws of the country concerned and who are on the pay-roll, as well as seasonal workers, apprentices and home workers on the pay-roll. The number of persons employed excludes manpower supplied to the unit by other enterprises, persons carrying out repair and maintenance work in the enquiry unit on behalf of other enterprises, as well as those on compulsory military service. Unpaid family workers refer to persons who live with the proprietor of the unit and work regularly for the unit, but do not have a contract of service and do not receive a fixed sum for the work they perform. This is limited to those persons who are not included on the payroll of another unit as their principal occupation. (Structural Business Statistics (SBS) Code 16 11 0, Commission Regulation (EC) No 2700/98).
The number of employees should be reported by gender.
FTE National:
“FTE national” is the number of employees converted in full time equivalents (calculation methodologies vary between countries).
It corresponds to the “Number of employees in full time equivalent units” of the Structural Business Statistics.
The number of employees converted into full time equivalents (FTE). Figures for the number of persons working less than the standard working time of a full-year full-time worker, should be converted into full time equivalents, with regard to the working time of a full-time full-year employee in the unit. Included in this category are people working less than a standard working day, less than the standard number of working days in the week, or less than the standard number of weeks/months in the year. The conversion should be carried out on the basis of the number of hours, days, weeks or months worked. (Structural Business Statistics (SBS) Code 16 14 0, Commission Regulation (EC) No 2700/98).
Reporting the number of FTE national by gender is optional.
Number of enterprises:
The “Number of enterprises” parameter corresponds to a count of the number of enterprises active during at least a part of the reference period (SGECA-09-03).
370
A count of the number of enterprises registered to the population concerned in the business register corrected for errors, in particular frame errors. Dormant units are excluded. This statistic should include all units active during at least part of the reference period. (Structural Business Statistics (SBS) Code 11 11 0, Commission Regulation (EC) No 2700/98).
Both definitions are similar. However, there are often some divergences with Eurostat data. This is mostly due to the use of the Veterinary list (which is necessary to trade with food products) to update the business register and so companies that are dormant or focusing on other products have been excluded.
Moreover, under the DCF regulation, the number of companies should be disaggregated by the number of persons employed (in ≤5; 6-10 and >10 FTE) (Structural Business Statistics (SBS) Code 16 14 0, Commission Regulation (EC) No 2700/98).
7.1.2 Indicators calculated
Average wage:
The average salary or mean wage estimates the salary an employee working full time is receiving on this sector. It includes the salaries themselves, the social security costs and imputed value of unpaid labour.
Mean wage = (Wages and salaries + Imputed value of unpaid labour) / FTE
Gross Value Added (GVA):
Gross Value Added measures the contribution of the sector to the economy.
The Gross Value Added indicator calculated in this report is similar, but does not fully correspond to the Value added at factor cost of the Structural Business Statistics.
Value added at factor cost as defined in the Structural Business Statistics is the gross income from operating activities after adjusting for operating subsidies and indirect taxes. It can be calculated from turnover, plus capitalised production, plus other operating income, plus or minus the changes in stocks, minus the purchases of goods and services, minus other taxes on products which are linked to turnover but not deductible, minus the duties and taxes linked to production. Alternatively it can be calculated from gross operating surplus by adding personnel costs. Income and expenditure classified as financial or extra-ordinary in company accounts is excluded from value added. Value added at factor costs is calculated "gross" as value adjustments (such as depreciation) are not subtracted. (Structural Business Statistics (SBS) Code 12 15 0, Commission Regulation (EC) No 2700/98).
Thus, Gross Value Added is calculated on this report as:
GVA = Turnover + Other Income – Energy costs – Livestock costs – Feed costs - Repair and maintenance - Other Operational costs.
Earnings Before Interest and Tax (EBIT):
“Earnings before interest and taxes (EBIT)” or “Operating profit” is a measure of a firm's profitability that excludes interest and income tax expenses.
EBIT = Turnover + Other Income + Subsidies – Energy costs – Wages and salaries - Imputed value of unpaid labour - Livestock costs – Feed costs – Repair and maintenance – Other
Operational costs – Depreciation of capital.
371
Net profit:
“Net profit” is a measure of a firm's profitability that includes the results of financial activity of the enterprise.
Net profit = EBIT – Financial_costs_net
Return on Investment (ROI):
Return on investment is a performance measure to evaluate the profitability (efficiency) of an investment.
During the SGECA-10-04 meeting it was decided that it was more appropriate to calculate the Return on Investment using the “Earnings Before Interest and Tax (EBIT)”, rather than the Net profit.
Running Cost to Turnover Ratio (in %):
This indicator shows how much of the turnover (income) is consumed by production costs.
Running cost to turnover ratio = (Energy costs + Wages and salaries + Livestock costs + Feed costs + Repair and maintenance + Other Operational costs) x 100 / Turnover
Earnings Before Interest and Tax (EBIT) to turnover ratio (in %):
“Earnings before interest and taxes (EBIT) to turnover ratio” measures the margin of the companies.
EBIT to turnover ratio = (EBIT / Turnover ) x 100
Labour productivity (by FTE or Employee):
Labour productivity is calculated as the average output per worker or per time unit. For It can be calculated as Gross Value Added (GVA) divided by Full Time Equivalents (FTE). This indicator describes the value added to the economy from the activity, in this case the value added to the economy by one FTE.
When a MS cannot report the level of employment in FTEs, the number of employees is used as a second best alternative. However, this alternative compromises the comparison and should be clearly stated in the report.
Capital productivity:
Capital productivity is calculated as the average output per unit of capital. It can be calculated as Gross Value Added (GVA) divided by Capital value (total value of assets) in percentage. The indicator describes the value added to the economy by one unit of capital.
372
Future Expectations of the Industry indicator:
The indicator “Future Expectations of the Industry” can be interpreted as a proxy for the industry’s intent to remain in the market in the medium/long term. If investment minus depreciation is positive, it has the meaning that the sector is allocating resources to increase its production capacity, and therefore it expects to remain in the market to recover the cost of the investment. If investment minus depreciation is close to zero, it could be interpreted as an indicator that the sector is only wishing to maintain its production capacity in the future, and that it is not planning to expand. The third case is where the sector is not even covering its depreciation costs, thus disinvesting with the possible intention to reduce its presence in the market in the future. Therefore, this indicator would be used to approximate the industry’s investing behaviour in the future and it has been considered useful by the experts.
Equity ratio:
A ratio used to help determine how much shareholders would receive in the event of a company liquidation. The ratio, expressed as a percentage, is calculated by dividing total shareholders' equity by total assets of the firm, and it represents the share of assets on which shareholders have a residual claim.
373
REFERENCES
APROMAR (2013). La Acuicultura en España. Available at: http://www.apromar.es/informes.asp
Asche, F. 2008. Farming the Sea. Marine Resource Economics, 23: 527-547.
Asche, F., Bjorndal, T., and Young, J.A. 2001. Market interactions for aquaculture products. Aquaculture Economics & Management, 5 (5-6): 303-18.
Asche, F., Bremnes, H., and Wessells, C. R. 1999. Product Aggregation, Market Integration and Relationships between Prices: An Application to World Salmon Markets. American Journal of Agricultural Economics, 81(3): 568-581.
Brämick, Uwe. 2012. Jahresbericht zur Deutschen Binnenfischerei 2011.
European Commission. 1998. Commission Regulation (EC) No 2700/98 of the 17 December 1998 concerning the definitions of characteristics for structural business statistics.
European Commission. 2002. Communication from the Commission on a Strategy for the Sustainable Development of European Aquaculture – EUR. COM(2002) 511.
European Commission. 2009. Communication from the Commission to the European Parliament and Council. Building a sustainable future for aquaculture. A new impetus for the Strategy for the Sustainable Development of European Aquaculture. COM(2009) 162 final.
European Commission. 2013. Communication from the Commission to the European Parliament, the Council, the European Economic and Social Committee and the Committee of the Regions. Strategic Guidelines for the sustainable development of EU aquaculture. COM(2013) 229 final.
FAO. 2013. Global Aquaculture Production 1950-2011 database (Release date: March 2013). Electronic address: http://www.fao.org/fishery/statistics/global-aquaculture-production/query/en
FAO. 2013. Global Capture Production 1950-2011 database (Release date: February 2013). Electronic address: http://www.fao.org/fishery/statistics/global-capture-production/query/en
Federal Statistical Office. 2012. Erzeugung in Aquakulturbetrieben. Fachserie 3, Reihe 4.6.
Fernández Polanco et al, (2012). El Mercado de productos pesqueros en España. Globefish Research Program #106. FAO, Rome.
FRAMIAN, 2009. Review of the EU aquaculture sector and results of costs and earnings survey, part 1 of the final report on definition of data collection needs for aquaculture, Ref. No, FISH/2006/15-Lot 6.
INR. Profit and loss for the Mariculture industry in 2012 (in Greek). Downloaded from http://www.inr.gr/art22.html on 04/09/2013.
José Fernández-Polanco & Ladislao Luna (2012b) FACTORS AFFECTING CONSUMERS’ BELIEFS ABOUT AQUACULTURE, Aquaculture Economics & Management, 16:1, 22-39,
374
José Fernández-Polanco, Simone Mueller Loose & Ladislao Luna (2013) ARE RETAILERS’PREFERENCES FOR SEAFOOD ATTRIBUTES PREDICTIVE FOR CONSUMER WANTS? RESULTS FROM A CHOICE EXPERIMENT FOR SEABREAM (Sparus aurata), Aquaculture Economics & Management, 17:2, 103-122,
JRC. 2008a. Prospective analysis of the aquaculture sector in the EU, Part 1: Synthesis report, EUR 23409 EN/12 -2008.
JRC. 2008b. Prospective analysis of the aquaculture sector in the EU, Part 2: Characterisation of emerging aquaculture systems, EUR 23409 EN/2 -2008.
Kristofersson, D. & Anderson, J.L. 2006. Is there a relationship between fisheries and farming? Interdependence of fisheries, animal production and aquaculture. Marine Policy 30, 721-725.
MAGRAMA (2013). Encuesta Económica de la Acuicultura. Available at: http://www.magrama.gob.es/es/estadistica/temas/estadisticas-pesqueras/acuicultura/encuesta-economica-acuicultura/#para3
MAGRAMA (2013b). Observatorio de los Precios de los Alimentos. Available at: http://www.magrama.gob.es/es/alimentacion/servicios/observatorio-de-precios-de-los-alimentos/sistema-de-informacion-de-precios-origen-destino/#para9
MAGRAMA (2013c). Producción de acuicultura. Available at: http://www.magrama.gob.es/es/pesca/temas/acuicultura/produccion-de-acuicultura/
Nielsen, R. 2011. Green and Technical Efficient Growth in Danish Fresh Water Aquaculture. Aquaculture Economics & Management, 15(4): 262-277.
Nielsen, R. 2012. Introducing Individual Transferable Quotas on Nitrogen in Danish Fresh Water Aquaculture: Production and Profitability Gains. Ecological Economics, 75: 83-90.
Porter M.E. 1985. Competitive Advantage, Free Press,
Porter M.E. 1990. The Competitive Advantage of Nations, Harvard Business Review, March.
STECF. 2012. Economic Performance of the EU Aquaculture Sector. EWG 11-14. Luxembourg. Publications Office of the European Union. 337 pp.
STECF. 2013. The Economic Performance of the EU Aquaculture Sector. STECF 12-13. Luxembourg. Publications Office of the European Union. 238 pp.
Valderrama, D., and Anderson, J.L. 2008. Interactions Between Capture Fisheries and Aquaculture. in Offshore Aquaculture in the United States: Economic Considerations, Implications & Opportunities. US DoC, NOAA.
Wijkström, U.N. 2009. The use of wild fish as aquaculture feed and its effects on income and food for the poor and the undernourished. In M.R. Hasanand and M. Halwart (eds). Fish as feed inputs for aquaculture: practices Paper. No. 518. Rome, FAO. pp. 371-407.
Xunta de Galicia (2013). Anuario de Acuicultura 2012. Available at: http://www.pescadegalicia.com/Publicaciones/AnuarioAcuicultura2012/
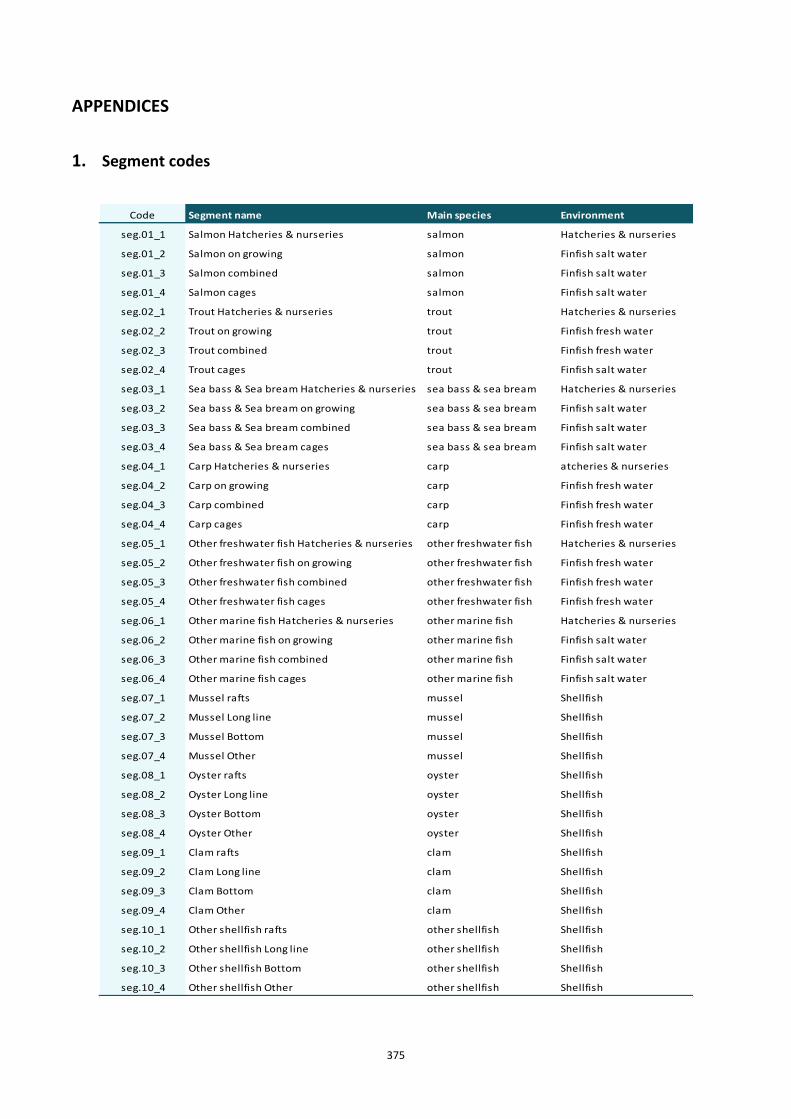
375
APPENDICES
1. Segment codes
Code Segment name Main species Environment
seg.01_1 Salmon Hatcheries & nurseries salmon Hatcheries & nurseries
seg.01_2 Salmon on growing salmon Finfish salt water
seg.01_3 Salmon combined salmon Finfish salt water
seg.01_4 Salmon cages salmon Finfish salt water
seg.02_1 Trout Hatcheries & nurseries trout Hatcheries & nurseries
seg.02_2 Trout on growing trout Finfish fresh water
seg.02_3 Trout combined trout Finfish fresh water
seg.02_4 Trout cages trout Finfish salt water
seg.03_1 Sea bass & Sea bream Hatcheries & nurseries sea bass & sea bream Hatcheries & nurseries
seg.03_2 Sea bass & Sea bream on growing sea bass & sea bream Finfish salt water
seg.03_3 Sea bass & Sea bream combined sea bass & sea bream Finfish salt water
seg.03_4 Sea bass & Sea bream cages sea bass & sea bream Finfish salt water
seg.04_1 Carp Hatcheries & nurseries carp atcheries & nurseries
seg.04_2 Carp on growing carp Finfish fresh water
seg.04_3 Carp combined carp Finfish fresh water
seg.04_4 Carp cages carp Finfish fresh water
seg.05_1 Other freshwater fish Hatcheries & nurseries other freshwater fish Hatcheries & nurseries
seg.05_2 Other freshwater fish on growing other freshwater fish Finfish fresh water
seg.05_3 Other freshwater fish combined other freshwater fish Finfish fresh water
seg.05_4 Other freshwater fish cages other freshwater fish Finfish fresh water
seg.06_1 Other marine fish Hatcheries & nurseries other marine fish Hatcheries & nurseries
seg.06_2 Other marine fish on growing other marine fish Finfish salt water
seg.06_3 Other marine fish combined other marine fish Finfish salt water
seg.06_4 Other marine fish cages other marine fish Finfish salt water
seg.07_1 Mussel rafts mussel Shellfish
seg.07_2 Mussel Long line mussel Shellfish
seg.07_3 Mussel Bottom mussel Shellfish
seg.07_4 Mussel Other mussel Shellfish
seg.08_1 Oyster rafts oyster Shellfish
seg.08_2 Oyster Long line oyster Shellfish
seg.08_3 Oyster Bottom oyster Shellfish
seg.08_4 Oyster Other oyster Shellfish
seg.09_1 Clam rafts clam Shellfish
seg.09_2 Clam Long line clam Shellfish
seg.09_3 Clam Bottom clam Shellfish
seg.09_4 Clam Other clam Shellfish
seg.10_1 Other shellfish rafts other shellfish Shellfish
seg.10_2 Other shellfish Long line other shellfish Shellfish
seg.10_3 Other shellfish Bottom other shellfish Shellfish
seg.10_4 Other shellfish Other other shellfish Shellfish
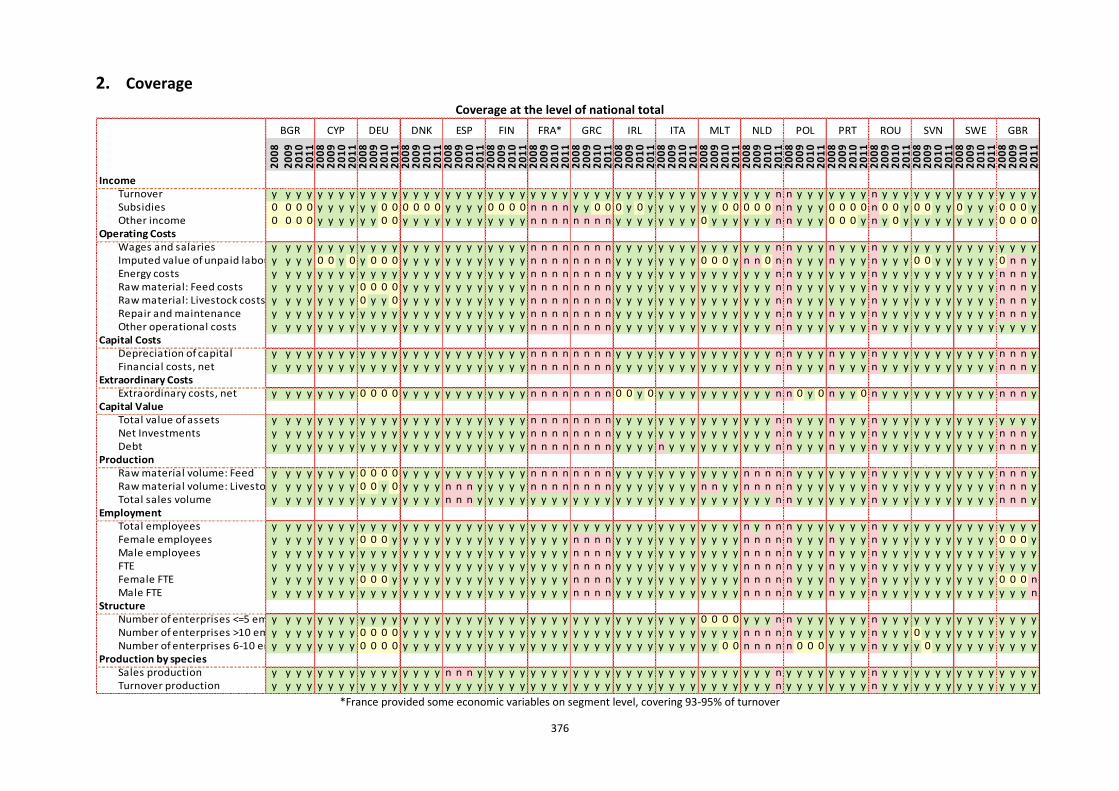
376
2. Coverage
Coverage at the level of national total
20
08
20
09
20
10
20
11
20
08
20
09
20
10
20
11
20
08
20
09
20
10
20
11
20
08
20
09
20
10
20
11
20
08
20
09
20
10
20
11
20
08
20
09
20
10
20
11
20
08
20
09
20
10
20
11
20
08
20
09
20
10
20
11
20
08
20
09
20
10
20
11
20
08
20
09
20
10
20
11
20
08
20
09
20
10
20
11
20
08
20
09
20
10
20
11
20
08
20
09
20
10
20
11
20
08
20
09
20
10
20
11
20
08
20
09
20
10
20
11
20
08
20
09
20
10
20
11
20
08
20
09
20
10
20
11
20
08
20
09
20
10
20
11
IncomeTurnover y y y y y y y y y y y y y y y y y y y y y y y y y y y y y y y y y y y y y y y y y y y y y y y n n y y y y y y y n y y y y y y y y y y y y y y ySubsidies 0 0 0 0 y y y y y y 0 0 0 0 0 0 y y y y 0 0 0 0 n n n n y y 0 0 0 y 0 y y y y y y y 0 0 0 0 0 n n y y y 0 0 0 0 n 0 0 y 0 0 y y 0 y y y 0 0 0 yOther income 0 0 0 0 y y y y y y 0 0 y y y y y y y y y y y y n n n n n n n n y y y y y y y y 0 y y y y y y n n y y y 0 0 0 y n y 0 y y y y y y y y y 0 0 0 0
Operating CostsWages and salaries y y y y y y y y y y y y y y y y y y y y y y y y n n n n n n n n y y y y y y y y y y y y y y y n n y y y n y y y n y y y y y y y y y y y y y y yImputed value of unpaid laboury y y y 0 0 y 0 y 0 0 0 y y y y y y y y y y y y n n n n n n n n y y y y y y y y 0 0 0 y n n 0 n n y y y n y y y n y y y 0 0 y y y y y y 0 n n yEnergy costs y y y y y y y y y y y y y y y y y y y y y y y y n n n n n n n n y y y y y y y y y y y y y y y n n y y y y y y y n y y y y y y y y y y y n n n yRaw material: Feed costs y y y y y y y y 0 0 0 0 y y y y y y y y y y y y n n n n n n n n y y y y y y y y y y y y y y y n n y y y y y y y n y y y y y y y y y y y n n n yRaw material: Livestock costs y y y y y y y y 0 y y 0 y y y y y y y y y y y y n n n n n n n n y y y y y y y y y y y y y y y n n y y y y y y y n y y y y y y y y y y y n n n yRepair and maintenance y y y y y y y y y y y y y y y y y y y y y y y y n n n n n n n n y y y y y y y y y y y y y y y n n y y y n y y y n y y y y y y y y y y y n n n yOther operational costs y y y y y y y y y y y y y y y y y y y y y y y y n n n n n n n n y y y y y y y y y y y y y y y n n y y y y y y y n y y y y y y y y y y y y y y y
Capital CostsDepreciation of capital y y y y y y y y y y y y y y y y y y y y y y y y n n n n n n n n y y y y y y y y y y y y y y y n n y y y n y y y n y y y y y y y y y y y n n n yFinancial costs, net y y y y y y y y y y y y y y y y y y y y y y y y n n n n n n n n y y y y y y y y y y y y y y y n n y y y n y y y n y y y y y y y y y y y n n n y
Extraordinary CostsExtraordinary costs, net y y y y y y y y 0 0 0 0 y y y y y y y y y y y y n n n n n n n n 0 0 y 0 y y y y y y y y y y y n n 0 y 0 n y y 0 n y y y y y y y y y y y n n n y
Capital ValueTotal value of assets y y y y y y y y y y y y y y y y y y y y y y y y n n n n n n n n y y y y y y y y y y y y y y y n n y y y n y y y n y y y y y y y y y y y y y y yNet Investments y y y y y y y y y y y y y y y y y y y y y y y y n n n n n n n n y y y y y y y y y y y y y y y n n y y y n y y y n y y y y y y y y y y y n n n yDebt y y y y y y y y y y y y y y y y y y y y y y y y n n n n n n n n y y y y n y y y y y y y y y y n n y y y n y y y n y y y y y y y y y y y n n n y
ProductionRaw material volume: Feed y y y y y y y y 0 0 0 0 y y y y y y y y y y y y n n n n n n n n y y y y y y y y y y y y n n n n n y y y y y y y n y y y y y y y y y y y n n n yRaw material volume: Livestocky y y y y y y y 0 0 y 0 y y y y n n n y y y y y n n n n n n n n y y y y y y y y n n y y n n n n n y y y y y y y n y y y y y y y y y y y n n n yTotal sales volume y y y y y y y y y y y y y y y y n n n y y y y y y y y y y y y y y y y y y y y y y y y y y y y n n y y y y y y y n y y y y y y y y y y y n n n y
EmploymentTotal employees y y y y y y y y y y y y y y y y y y y y y y y y y y y y y y y y y y y y y y y y y y y y n y n n n y y y y y y y n y y y y y y y y y y y y y y yFemale employees y y y y y y y y 0 0 0 y y y y y y y y y y y y y y y y y n n n n y y y y y y y y y y y y n n n n n y y y n y y y n y y y y y y y y y y y 0 0 0 yMale employees y y y y y y y y y y y y y y y y y y y y y y y y y y y y n n n n y y y y y y y y y y y y n n n n n y y y n y y y n y y y y y y y y y y y y y y yFTE y y y y y y y y y y y y y y y y y y y y y y y y y y y y n n n n y y y y y y y y y y y y n n n n n y y y n y y y n y y y y y y y y y y y y y y yFemale FTE y y y y y y y y 0 0 0 y y y y y y y y y y y y y y y y y n n n n y y y y y y y y y y y y n n n n n y y y n y y y n y y y y y y y y y y y 0 0 0 nMale FTE y y y y y y y y y y y y y y y y y y y y y y y y y y y y n n n n y y y y y y y y y y y y n n n n n y y y n y y y n y y y y y y y y y y y y y y n
StructureNumber of enterprises <=5 employeesy y y y y y y y y y y y y y y y y y y y y y y y y y y y y y y y y y y y y y y y 0 0 0 0 y y y n n y y y y y y y n y y y y y y y y y y y y y y yNumber of enterprises >10 employeesy y y y y y y y 0 0 0 0 y y y y y y y y y y y y y y y y y y y y y y y y y y y y y y y y n n n n n y y y y y y y n y y y 0 y y y y y y y y y y yNumber of enterprises 6-10 employeesy y y y y y y y 0 0 0 0 y y y y y y y y y y y y y y y y y y y y y y y y y y y y y y 0 0 n n n n n 0 0 0 y y y y n y y y y 0 y y y y y y y y y y
Production by speciesSales production y y y y y y y y y y y y y y y y n n n y y y y y y y y y y y y y y y y y y y y y y y y y y y y n y y y y y y y y n y y y y y y y y y y y y y y yTurnover production y y y y y y y y y y y y y y y y y y y y y y y y y y y y y y y y y y y y y y y y y y y y y y y n y y y y y y y y n y y y y y y y y y y y y y y y
BGR CYP DEU DNK ESP MLTFIN FRA* GRC IRL ITA NLD POL PRT GBRROU SVN SWE
*France provided some economic variables on segment level, covering 93-95% of turnover
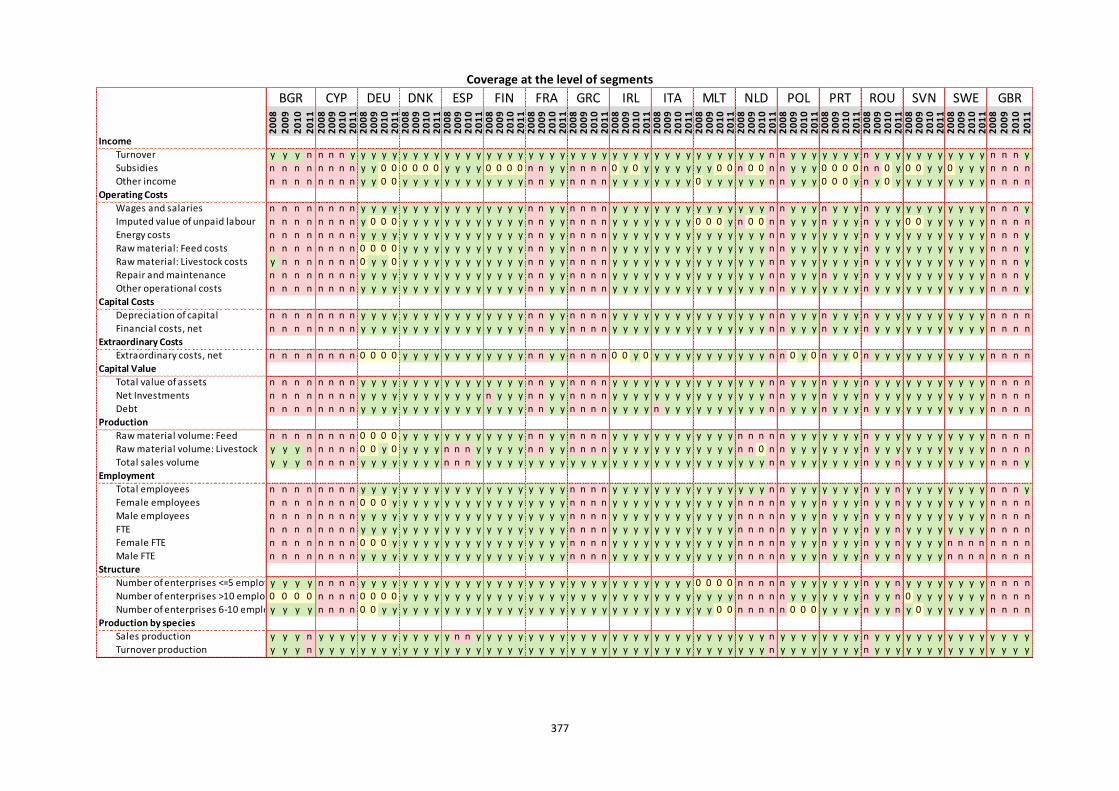
377
Coverage at the level of segments
20
08
20
09
20
10
20
11
20
08
20
09
20
10
20
11
20
08
20
09
20
10
20
11
20
08
20
09
20
10
20
11
20
08
20
09
20
10
20
11
20
08
20
09
20
10
20
11
20
08
20
09
20
10
20
11
20
08
20
09
20
10
20
11
20
08
20
09
20
10
20
11
20
08
20
09
20
10
20
11
20
08
20
09
20
10
20
11
20
08
20
09
20
10
20
11
20
08
20
09
20
10
20
11
20
08
20
09
20
10
20
11
20
08
20
09
20
10
20
11
20
08
20
09
20
10
20
11
20
08
20
09
20
10
20
11
20
08
20
09
20
10
20
11
Income
Turnover y y y n n n n y y y y y y y y y y y y y y y y y y y y y y y y y y y y y y y y y y y y y y y y n n y y y y y y y n y y y y y y y y y y y n n n y
Subsidies n n n n n n n n y y 0 0 0 0 0 0 y y y y 0 0 0 0 n n y y n n n n 0 y 0 y y y y y y y 0 0 n 0 0 n n y y y 0 0 0 0 n n 0 y 0 0 y y 0 y y y n n n n
Other income n n n n n n n n y y 0 0 y y y y y y y y y y y y n n y y n n n n y y y y y y y y 0 y y y y y y n n y y y 0 0 0 y n y 0 y y y y y y y y y n n n n
Operating Costs
Wages and salaries n n n n n n n n y y y y y y y y y y y y y y y y n n y y n n n n y y y y y y y y y y y y y y y n n y y y n y y y n y y y y y y y y y y y n n n y
Imputed value of unpaid labour n n n n n n n n y 0 0 0 y y y y y y y y y y y y n n y y n n n n y y y y y y y y 0 0 0 y n 0 0 n n y y y n y y y n y y y 0 0 y y y y y y n n n n
Energy costs n n n n n n n n y y y y y y y y y y y y y y y y n n y y n n n n y y y y y y y y y y y y y y y n n y y y y y y y n y y y y y y y y y y y n n n y
Raw material: Feed costs n n n n n n n n 0 0 0 0 y y y y y y y y y y y y n n y y n n n n y y y y y y y y y y y y y y y n n y y y y y y y n y y y y y y y y y y y n n n y
Raw material: Livestock costs y n n n n n n n 0 y y 0 y y y y y y y y y y y y n n y y n n n n y y y y y y y y y y y y y y y n n y y y y y y y n y y y y y y y y y y y n n n y
Repair and maintenance n n n n n n n n y y y y y y y y y y y y y y y y n n y y n n n n y y y y y y y y y y y y y y y n n y y y n y y y n y y y y y y y y y y y n n n y
Other operational costs n n n n n n n n y y y y y y y y y y y y y y y y n n y y n n n n y y y y y y y y y y y y y y y n n y y y y y y y n y y y y y y y y y y y n n n y
Capital Costs
Depreciation of capital n n n n n n n n y y y y y y y y y y y y y y y y n n y y n n n n y y y y y y y y y y y y y y y n n y y y n y y y n y y y y y y y y y y y n n n n
Financial costs, net n n n n n n n n y y y y y y y y y y y y y y y y n n y y n n n n y y y y y y y y y y y y y y y n n y y y n y y y n y y y y y y y y y y y n n n n
Extraordinary Costs
Extraordinary costs, net n n n n n n n n 0 0 0 0 y y y y y y y y y y y y n n y y n n n n 0 0 y 0 y y y y y y y y y y y n n 0 y 0 n y y 0 n y y y y y y y y y y y n n n n
Capital Value
Total value of assets n n n n n n n n y y y y y y y y y y y y y y y y n n y y n n n n y y y y y y y y y y y y y y y n n y y y n y y y n y y y y y y y y y y y n n n n
Net Investments n n n n n n n n y y y y y y y y y y y y n y y y n n y y n n n n y y y y y y y y y y y y y y y n n y y y n y y y n y y y y y y y y y y y n n n n
Debt n n n n n n n n y y y y y y y y y y y y y y y y n n y y n n n n y y y y n y y y y y y y y y y n n y y y n y y y n y y y y y y y y y y y n n n n
Production
Raw material volume: Feed n n n n n n n n 0 0 0 0 y y y y y y y y y y y y n n y y n n n n y y y y y y y y y y y y n n n n n y y y y y y y n y y y y y y y y y y y n n n n
Raw material volume: Livestock y y y n n n n n 0 0 y 0 y y y y n n n y y y y y n n y y n n n n y y y y y y y y y y y y n n 0 n n y y y y y y y n y y y y y y y y y y y n n n n
Total sales volume y y y n n n n n y y y y y y y y n n n y y y y y y y y y y y y y y y y y y y y y y y y y y y y n n y y y y y y y n y y n y y y y y y y y n n n y
Employment
Total employees n n n n n n n n y y y y y y y y y y y y y y y y y y y y n n n n y y y y y y y y y y y y y y y n n y y y y y y y n y y n y y y y y y y y n n n y
Female employees n n n n n n n n 0 0 0 y y y y y y y y y y y y y y y y y n n n n y y y y y y y y y y y y n n n n n y y y n y y y n y y n y y y y y y y y n n n n
Male employees n n n n n n n n y y y y y y y y y y y y y y y y y y y y n n n n y y y y y y y y y y y y n n n n n y y y n y y y n y y n y y y y y y y y n n n n
FTE n n n n n n n n y y y y y y y y y y y y y y y y y y y y n n n n y y y y y y y y y y y y n n n n n y y y n y y y n y y n y y y y y y y y n n n n
Female FTE n n n n n n n n 0 0 0 y y y y y y y y y y y y y y y y y n n n n y y y y y y y y y y y y n n n n n y y y n y y y n y y n y y y y n n n n n n n n
Male FTE n n n n n n n n y y y y y y y y y y y y y y y y y y y y n n n n y y y y y y y y y y y y n n n n n y y y n y y y n y y n y y y y n n n n n n n n
Structure
Number of enterprises <=5 employeesy y y y n n n n y y y y y y y y y y y y y y y y y y y y y y y y y y y y y y y y 0 0 0 0 n n n n n y y y y y y y n y y n y y y y y y y y n n n n
Number of enterprises >10 employees0 0 0 0 n n n n 0 0 0 0 y y y y y y y y y y y y y y y y y y y y y y y y y y y y y y y y n n n n n y y y y y y y n y y n 0 y y y y y y y n n n n
Number of enterprises 6-10 employeesy y y y n n n n 0 0 y y y y y y y y y y y y y y y y y y y y y y y y y y y y y y y y 0 0 n n n n n 0 0 0 y y y y n y y n y 0 y y y y y y n n n n
Production by species
Sales production y y y n y y y y y y y y y y y y y n n y y y y y y y y y y y y y y y y y y y y y y y y y y y y n y y y y y y y y n y y y y y y y y y y y y y y y
Turnover production y y y n y y y y y y y y y y y y y y y y y y y y y y y y y y y y y y y y y y y y y y y y y y y n y y y y y y y y n y y y y y y y y y y y y y y y
CYP DEU DNK ESPBGR GBRFRA GRC IRL ITA MLT NLD POL PRT ROU SVN SWEFIN
378
3. Additional TOR: REVIEW OF DC-MAP - PART 2 (STECF-13-12)
The STECF Expert Working Group meeting EWG 13-05, to evaluate Consultation Document proposed by DG MARE on the new EU Multi-annual programme for data collection (DC MAP) 2014-2020 was held from 10 – 14 June 2013 in Varese (Italy). The report was reviewed by the STECF during its spring summer meeting in July 2013.
In particular the group focussed on Block B and D of the Consultation Document and made comments and proposals for amendments to the two Blocks in relation to:
Data required for assessing the level of fishing – transversal data,
Data required for assessing the state of exploited marine biological resources and the impact of fishing activities on the marine biological resources,
Data required for assessing the impact of fishing activities on the marine ecosystem, and
Data required for assessing the social and economic performance of fisheries, aquaculture and processing sector.
However, there were several issues (outstanding issues) that the EWG 13-05 proposed to be discussed at this STECF EWG on the economic performance of the EU aquaculture sector (STECF, 2013, pp. 16-17)
EWG 13-05’s outstanding issues
The EWG 13-10 agreed to propose that the statistical unit should be the enterprise (legal unit). Because at the company level is where all costs and incomes are recorded. When the end-user is interested on the economic performance of the aquaculture sector (e.g. their profitability and economic robustness) then the statistical unit should be the enterprise.
Instead, if the end-user is interested to know the socio-economic importance from a spatial point of view and a more detailed knowledge of the economic performance of particular cultures, then there is the need to have the farm (production unit) as the statistical unit. However, we are not sure if economic data disaggregated by farm could be obtained in all MS. Therefore, a study should be needed to address the feasibility of this data disaggregation.
Considering that aquaculture data collection is done at the company level, it is possible that a company has other economic activities than aquaculture (i.e. processing, marketing, oil drilling). It would be desirable that revenues and costs from other activities of the enterprise that are not related to the aquaculture sector are separated from the aquaculture data collected when possible. Specific categories should be created if these data are collected (i.e. “other activity income” and “other activity costs”), to avoid that these items appear in the economic performance estimation of the aquaculture sector. However, the group considers that the collection of these disaggregated data could be very difficult and not cost-effective. If it is wanted to do an economic performance or productivity analysis of the aquaculture sector, it is important to have aquaculture sector data separated from other activities’ data. Instead, if it is wanted to analyse the economic strength of the companies doing aquaculture, it is needed data of all sectors from those companies.
There is the need to differentiate the environment (marine or freshwater) for all segments. EWG 13-10 recommends that this differentiation by environment should not disaggregate for brackishwater (often considered as marine).
In order to align the current DCF Segmentation with Eurostat segmentation, EWG 13-10 proposes, in accordance with EWG 13-05, to have the segmentation by species further disaggregated to add the following
379
segments “Tuna”, “Eel” and “Others” (including algae and other aquatic organisms). Categories could be further disaggregated in the future if desired (to include for example, turbot, sole, algae, crustaceans, eggs for consumption and other organisms), depending on the evolution of main species in the EU aquaculture.
For all fish species (marine and freshwater), current “farming techniques” (“hatcheries and nurseries”, “on-growing”, “combined” and “cages”) could be replaced by the following “culture techniques” (“hatcheries and nurseries”, “ponds”, “tanks and raceways”, “enclosures and pens”, “cages”, “recirculation systems”, “combined” and “other methods”).
Shellfish segments to be renamed as molluscs segments. So, molluscs species (“mussels”, “oysters”, “clams” and “other molluscs”), current technique segmentation (“raft”, “long-line”, “bottom” and “Other”) could be kept because it is more disaggregated and segments more economic relevant than Eurostat ones (“on bottom”, “off bottom” and “others”). There is the need to define the different culture techniques.
The new segment “Others” would report under the culture technique “all methods”.
The EWG 13-10 agreed that because the variable “Total value of assets” from the “Capital value” variable group includes cash, it needs to be named as “Balance sheet total”, to be in line with the Structural Business Statistics.
The EWG 13-10 agreed to include in the data to be collected the “Livestock weight of stocks” and “Livestock value of stocks” (stock at the end of the period) in order to know the stock variations. Reporting this data would allow to make the link between sales and production. This data may only be relevant for some of the segments. The relevance of collecting these variables and their cost-effectiveness per segment should be studied in a pilot study (The World Organisation for Animal Health – OIE, may also benefit from the results of such study).
The EWG 13-10 agreed that it would be important to collect data on “Subsidies for investments”; because it is the main subsidies item and it is important to track and evaluate the EMFF, among other sources.
The EWG 13-10 considered that it would be more useful to report the sales of the number of individuals for hatcheries and nurseries. This could lead to accept not reporting weight in those segments. This makes sense since weight can change significantly in a short period. Therefore, conversion factors are of reduced use in this particular case.
The EWG 13-10 considered that the current segmentation does not allow for a precise segmentation of the data between marine, freshwater and shellfish aquaculture sectors. This happens mainly because some species (i.e. trout and salmon) can be cultured either in marine or in freshwater environments, and sometimes an individual can be cultured in its early stages in freshwater and later ones in marine water. Therefore, it would be required a more detailed segmentation by environment if it is aimed to have more precise data at the environment level.
Finally, the EWG 13-10 considered that it should be discussed if the term “liabilities” should be used instead of the term “debts” for the variable collected in all economic data calls (fleet, aquaculture and processing). The EWG 13-10 considered that this discussion should involve all economic data calls at the same time, consequently, the next EWG 13-18 on the revision of the DCF.
380
4. Data
The data used to compile this report will be provided at the following address:
http://stecf.jrc.ec.europa.eu/data-reports
5. List of Participants
Information on STECF members and invited experts’ affiliations is displayed for information only. In some instances the details given below for STECF members may differ from that provided in Commission COMMISSION DECISION of 27 October 2010 on the appointment of members of the STECF (2010/C 292/04) as some members’ employment details may have changed or have been subject to organisational changes in their main place of employment. In any case, as outlined in Article 13 of the Commission Decision (2005/629/EU and 2010/74/EU) on STECF, Members of the STECF, invited experts, and JRC experts shall act independently of Member States or stakeholders. In the context of the STECF work, the committee members and other experts do not represent the institutions/bodies they are affiliated to in their daily jobs. STECF members and invited experts make declarations of commitment (yearly for STECF members) to act independently in the public interest of the European Union. STECF members and experts also declare at each meeting of the STECF and of its Expert Working Groups any specific interest which might be considered prejudicial to their independence in relation to specific items on the agenda. These declarations are displayed on the public meeting’s website if experts explicitly authorized the JRC to do so in accordance with EU legislation on the protection of personnel data. For more information:
http://stecf.jrc.ec.europa.eu/adm-declarations
Name Address Telephone no. Email
STECF Members
Malvarosa, Loretta
NISEA, Fishery and Aquaculture Economic Research, Via Irno, 11, 84100 Salerno, Italy
+390899781552
+393332171979
Name Address Telephone no. Email
Invited Experts
Avdelas, Lamprakis
Leoforos Athinon 58 10441 Athens. Greece
+302105275205 +306934781048
Avdic-Mravlje, Edo
Fisheries Research Institute of Slovenia Sp. Gameljne 61a Ljubljana 1211. Slovenia
Borges Marques, Ana Cristina
DGRM Avenida Brasilia 1449-030 Lisboa Portugal
+351 213 035771 [email protected]
.pt
381
Name Address Telephone no. Email
Invited Experts
Chauviere, Marc
DPMA – BSPA Tour Voltaire – 1 Place des Degres – 92055 LA DEFENSE CEDEX - FRANCE
+33 1 40819879 marc.chauviere@devel
oppement-
durable.gouv.fr
Cozzolino, Maria
NISEA, Fishery and Aquaculture Economic Research, Via Irno, 11, 84100 Salerno, Italy
+393384078774 [email protected]
Davidjuka, Irina
Fish Resources Research Department; 8 Davgavgrivas Str. Riga LV1048, Latvia
+371 67612409 [email protected]
ov.lv
Ebeling, Michael W.
Thünen Institute for Sea Fisheries Palmaille 9 22767 Hamburg Germany
+49 (0) 40 38905-186
d.de
Fernandez Polanco, Jose M.
Dpt. Administracion de Empresas Universidad de Cantabria 39001 Santander Spain
+ 34 676 951 286 [email protected]
Spagnol Gravino, Francesca
Independent Expert +356 99499439 francesca.gravino@um.
edu.mt,
francesca.gravino@gm
ail.com
Guillen, Jordi (chair)
Institut de Ciències del Mar - CSIC, Psg Marítim de la Barceloneta 37-49, Barcelona, Spain
om
Lees, Janek Estonian Marine Institute Màealuse 14 12618 Tallinn. Estonia
+37256610999 [email protected]
Moura, Carlos Directorate-General For Natural Resources, Security and Maritime Services Av. Brasilia 1449-030 Lisboa, Portugal
+351 213035811 [email protected]
.pt
Nielsen, Rasmus
Department of Food and Resource Economics University of Copenhagen Rolighedsvej 25 1958 Frederiksberg. Denmark
+45 35 33 22 93 [email protected]
382
Name Address Telephone no. Email
Invited Experts
Pienkowska, Barbara
Morski Instytut Rybacki –Panstwowy Instytut Badawczy National Marine Fisheries Research Institute. Ul. Kollataja 1 81-332 Gdynia. Poland
+48587356115
+48604102639
Pokki, Heidi Finnish Game and Fisheries Research Institute Viikinkaari 4, P.O.Box 2 00790 HELSINKI Finland
+358505903592 [email protected]
Reese, Allan Cefas The Nothe Weymouth DT4 8UB. UK
+44 1305 206614 [email protected]
Rodgers, Philip
Erinshore Economics Ltd 125 Mill Lane Saxilby Lincs LN1 2HN UK
+44 1522 703203 [email protected]
Van Den Burg, Sander
LEI, Wageningen UR Alexanderveld 5 2585 DB Den Haag Netherlands
+ 31 70 3358129 sander.vandenburg@w
ur.nl
Experts by correspondence
Dennis, John BIM Clogheen. Clonakilty. Co. Cork. Ireland
Nilsson, Pia Swedish Board of Agriculture Jonkoping. Sweden
+46730483727 pia.nilsson@jordbruksv
erket.se
Papadopoulos Vassilis
Department of Fisheries and Marine Research. Cyprus
vpapadopoulos@dfmr.
moa.gov.cy
Stroie, Constantin
National Agency for Fishery and Aquaculture of Romania
+4021 634 44 29 constantin.stroie@anpa.
ro
Urumov, Stoyan
National Agency of Fisheries and Aquacuculture (NAFA) 17 Christo Botev Blvd 1606 Sofia Bulgaria
+359 2 805 16 93 [email protected]
vernment.bg
383
Name Address Telephone no. Email
JRC Experts
Borrello, Alessandra
Joint Research Centre (IPSC) Maritime Affairs Unit Via E. Fermi, 2749 21027 Ispra (Varese) Italy
+39 0332 3631 alessandra.borrello@jrc
.ec.europa.eu
Contini, Franca
Joint Research Centre (IPSC) Maritime Affairs Unit Via E. Fermi, 2749 21027 Ispra (Varese) Italy
+39 0332 78 5646 [email protected]
uropa.eu
Hofherr, Johann
Joint Research Centre (IPSC) Maritime Affairs Unit Via E. Fermi, 2749 21027 Ispra (Varese) Italy
+39 0332 78 9053 [email protected].
europa.eu
Motova, Arina Joint Research Centre (IPSC) Maritime Affairs Unit Via E. Fermi, 2749 21027 Ispra (Varese) Italy
+39 0332 78 5253 [email protected]
ropa.eu
Natale, Fabrizio
Joint Research Centre (IPSC) Maritime Affairs Unit Via E. Fermi, 2749 21027 Ispra (Varese) Italy
+39 0332 78 9181 [email protected]
uropa.eu
Name Address Telephone no. Email
European Commission
Calvo Santos, Angel Andres
DG Fisheries and Maritime Affairs
+32 229 93630 [email protected]
Hardy, Oscar DG Fisheries and Maritime Affairs
+32 229 93630
European Commission
EUR 26366 EN – Joint Research Centre – Institute for the Protection and Security of the Citizen
Title: Scientific, Technical and Economic Committee for Fisheries 2013 Economic Performance of the Aquaculture (STECF-13-29).
STECF members: Casey, J., Abella, J. A., Andersen, J., Bailey, N., Bertignac, M., Cardinale, M., Curtis, H., Daskalov, G., Delaney, A., Döring, R.,
Garcia Rodriguez, M., Gascuel, D., Graham, N., Gustavsson, T., Jennings, S., Kenny, A., Kirkegaard, E., Kraak, S., Kuikka, S., Malvarosa, L., Martin,
P., Murua, H., Nord, J., Nowakowski, P., Prellezo, R., Sala, A., Scarcella, G., Somarakis, S., Stransky, C., Theret, F., Ulrich, C., Vanhee, W. & Van
Oostenbrugge, H.
EWG-13-10 members: Guillen, J., Avdelas, L., Avdic-Mravlje, E., Borrello, A., Borges Marques, A. C., Contini, F., Chauviere, M., Cozzolino, M., Davidjuka, I., Dennis, J., Ebeling, M., Fernandez Polanco, J. M., F., Hofherr, J., Lees, J., Malvarosa, L., Motova, A., Moura, C., Natale, F., Nielsen, R., Nilsson, P., Papadopoulos, V., Pienkowska, B., Pokki, H., Reese, A., Rodgers, P., Spagnol Gravino, Stroie, C., Urumov, S., and Van Den Burg, S.
Luxembourg: Publications Office of the European Union
2013 – 383 pp. – 21 x 29.7 cm
EUR – Scientific and Technical Research series – ISSN 1831-9424 (online), ISSN 1018-5593 (print)
ISBN 978-92-79-34809-9
doi:10.2788/41898
Abstract
This report, on the Economic Performance of the European Union (EU) Aquaculture sector, is the third report of this
type produced for the sector. It provides a comprehensive overview of the latest information available on the structure,
social, economic and competitive performance of the aquaculture sector at both national and EU level. The data used in
this publication was collected under the Data Collection Framework (DCF). In 2011, the aquaculture sector production
in the EU-28 accounted for 1.28 million tonnes, with an estimated value of 3.51 billion Euros. In the EU there are about
14 to 15 thousand companies whose main activity is the aquaculture production, producing a Gross Value Added of
more than 1.5 billion Euros. Available data confirms the profitability improvement in 2011 following 2010, after
suffering losses in 2008-9. Profitability based on the Return On Investment calculated from the EBIT was 10%. The EU
aquaculture sector gave direct employment to more than 80,000 people in Europe, with an annual average wage of
around 23 thousand Euros. Women accounted for 27% of these jobs. The large percentage of part-time work in the
sector should be highlighted, as can be seen through comparison of the total employment numbers with employment
expressed in Full Time Equivalents (FTE is 45% of the total number of employees). Part-time employment is important
in the shellfish and freshwater aquaculture subsectors. The economic performance and the productivity differ
enormously by subsector and segment. The cost structures of the different subsectors (i.e. shellfish, marine and
freshwater aquaculture) and species are also analysed on the report.

How to obtain EU publications
Our priced publications are available from EU Bookshop (http://bookshop.europa.eu), where you can place an order
with the sales agent of your choice.
The Publications Office has a worldwide network of sales agents. You can obtain their contact details by sending a fax to
(352) 29 29-42758.
As the Commission’s in-house science service, the Joint Research Centre’s mission is to provide EU policies with independent, evidence-based scientific and technical support throughout the whole policy cycle. Working in close cooperation with policy Directorates-General, the JRC addresses key societal challenges while stimulating innovation through developing new standards, methods and tools, and sharing and transferring its know-how to the Member States and international community. ------------------------------------------------------------------------------------------------------------------------------- The Scientific, Technical and Economic Committee for Fisheries (STECF) has been established by the European Commission. The STECF is being consulted at regular intervals on matters pertaining to the conservation and management of living aquatic resources, including biological, economic, environmental, social and technical considerations.
LB-N
A-2
6366
-EN
-N
Related Documents