The distribution of wages and wage inequality Pedro Portugal Banco de Portugal and NOVA SBE Pedro S. Raposo Católica Lisbon School of Business and Economics Hugo Reis Banco de Portugal and Católica Lisbon School of Business and Economics January 2018 Abstract Over 25 years (1988-2013) the composition of employment and the determinants of wages have changed notably in Portugal. In this essay, the individual records of Quadros de Pessoal/Relatório Único are used to identify the structural and compositional changes in the distribution of wages, in Portugal. The workers’ education level was the variable that most decisively contributed to wage increases over this period. Aggregate compositional effects, influenced by changes in schooling , are seen to be more relevant than the aggregate of the structural effects, which are essentially determined by the secular productivity growth. The horizontal shift of the wage distribution over time did not, however, contaminate the wage inequality indicators, which have remained essentially constant. This indication, is largely due to the fact that worker skills heterogeneity, firm wage policies heterogeneity, and job title heterogeneity have remained surprisingly unchanged. The association between firms with generous wage policies and high-wage workers has weakened significantly over this period, contributing in muted way to lower wage dispersion. (JEL: J24, J31) What we do Over the past 25 years, more explicitly the period between 1988 and 2013, the Portuguese labour market underwent deep changes. These changes reflected, among other things, a marked improvement in schooling for those in employment, a growing proportion of women in work, and the ageing of the working population. This paper explores the wealth of information contained in the individual records of the Quadros de Pessoal/Relatório Único to characterise the changes taking place in wage distribution, with a distinction made between compositional changes, and structural changes in the factors that determine wages. Special emphasis will be given within this Acknowledgements: The authors thank Lucena Vieira for very competent research assistance, and the comments by António Antunes and Nuno Alves. E-mail: [email protected]; [email protected]; [email protected]

Welcome message from author
This document is posted to help you gain knowledge. Please leave a comment to let me know what you think about it! Share it to your friends and learn new things together.
Transcript
The distribution of wages and wage inequality
Pedro PortugalBanco de Portugal and NOVA SBE
Pedro S. RaposoCatólica Lisbon School of Business
and Economics
Hugo ReisBanco de Portugal and CatólicaLisbon School of Business and
Economics
January 2018
AbstractOver 25 years (1988-2013) the composition of employment and the determinants of wageshave changed notably in Portugal. In this essay, the individual records of Quadros dePessoal/Relatório Único are used to identify the structural and compositional changes inthe distribution of wages, in Portugal. The workers’ education level was the variable thatmost decisively contributed to wage increases over this period. Aggregate compositionaleffects, influenced by changes in schooling , are seen to be more relevant than the aggregateof the structural effects, which are essentially determined by the secular productivitygrowth. The horizontal shift of the wage distribution over time did not, however,contaminate the wage inequality indicators, which have remained essentially constant.This indication, is largely due to the fact that worker skills heterogeneity, firm wagepolicies heterogeneity, and job title heterogeneity have remained surprisingly unchanged.The association between firms with generous wage policies and high-wage workershas weakened significantly over this period, contributing in muted way to lower wagedispersion. (JEL: J24, J31)
What we do
Over the past 25 years, more explicitly the period between 1988 and 2013,the Portuguese labour market underwent deep changes. These changesreflected, among other things, a marked improvement in schooling for thosein employment, a growing proportion of women in work, and the ageingof the working population. This paper explores the wealth of informationcontained in the individual records of the Quadros de Pessoal/RelatórioÚnico to characterise the changes taking place in wage distribution, with adistinction made between compositional changes, and structural changes inthe factors that determine wages. Special emphasis will be given within this
Acknowledgements: The authors thank Lucena Vieira for very competent research assistance,and the comments by António Antunes and Nuno Alves.E-mail: [email protected]; [email protected]; [email protected]
2
framework, to move in the indicators of wage inequality, with specific focuson the different reasons underlying wage variations.
What has changed
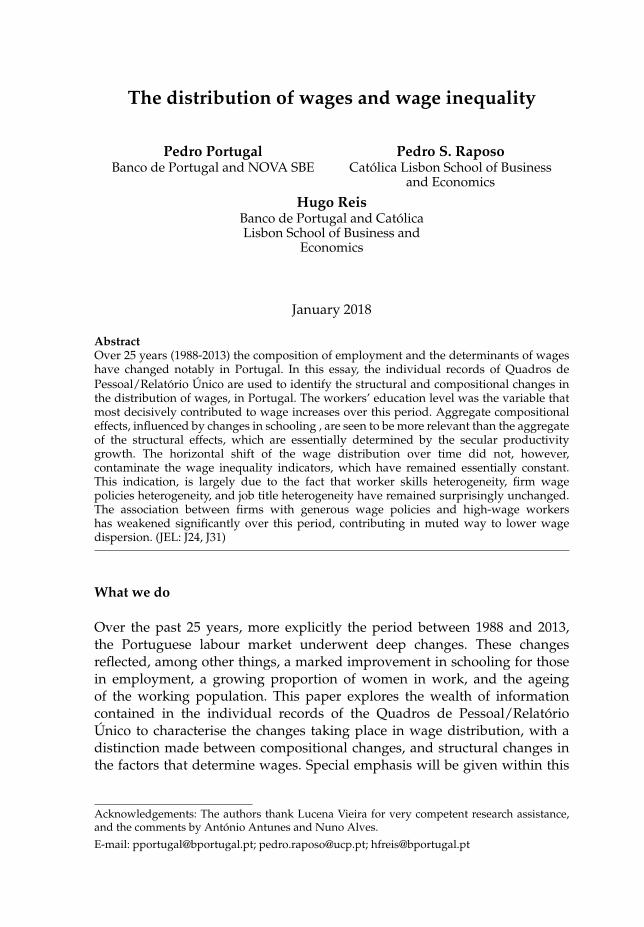
Between 1988 and 2013, the average years of schooling for dependentemployees went up dramatically. The baseline was embarrassingly low (sixyears of schooling) rising to ten years, a figure that was even so less thansatisfactory (see Figure 1). This move reflects on-going changes in compulsoryeducation and a growing feeling among families that formal education was aworthwhile investment.
67
89
10Sc
hool
ing
(in y
ears
)
1988 1990 1992 1994 1996 1998 2000 2002 2004 2006 2008 2010 2012Year
.35
.4.4
5.5
wom
en p
artic
ipat
ion
1988 1990 1992 1994 1996 1998 2000 2002 2004 2006 2008 2010 2012Year
(a) Education (b) Female Participation
3436
3840
42Ag
e (in
year
s)
1988 1990 1992 1994 1996 1998 2000 2002 2004 2006 2008 2010 2012Year
1015
2025
firm
siz
e
1988 1990 1992 1994 1996 1998 2000 2002 2004 2006 2008 2010 2012Year
(c) Age (d) Firm Size
FIGURE 1: Portuguese Labour Market Trends
At the same time, and likely due to the increase in educational levels, therewas a growing participation of women in the labor market, with the femaleparticipation rate increasing from 34.2 per cent to 46.4 per in 2013 (Figure 1).
Two elements here — a rise in the age when youngsters left formaleducation, and an increase in retirement age — played a part in the rapidageing of the active population, with the average age moving from 35.5 to40.8 years (Figure 1). In spite of such a clear rise in the average age of workers,employment stability, measured by job tenure, remained unchanged duringthis period, standing at around 9 years.
3
One trend that does not seem to have been highlighted enough is thesteep fall in the average size of Portuguese firms, with the average numberof workers per firm falling from 23 to 13 during the period under review (seeFigure 1). The fall in firm size came about fundamentally between 1988 and2000, with large firms shedding labour and the number of micro-firms risingsubstantially.
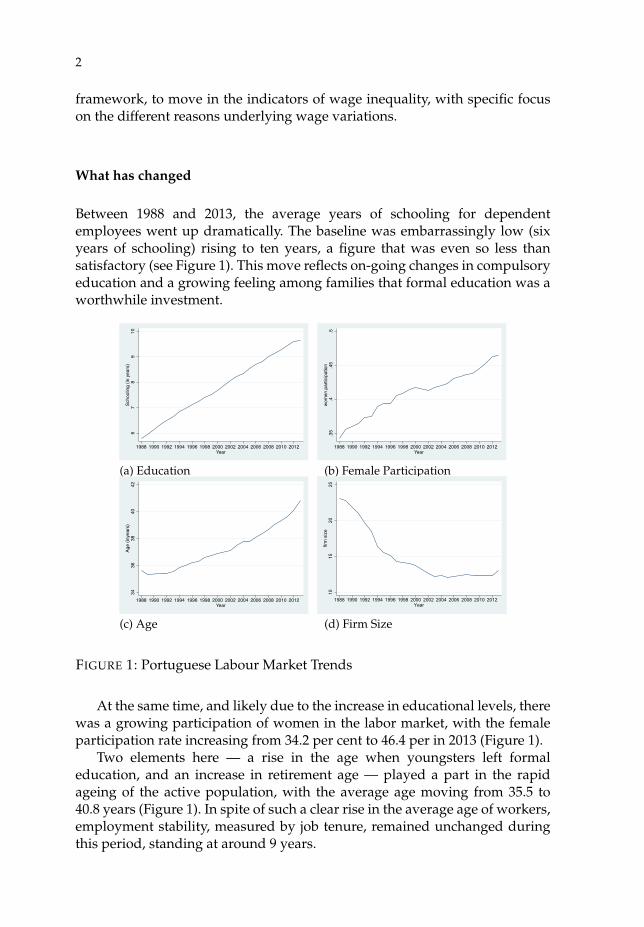
Figure 2 shows the dynamics of base wage distribution through abreakdown into minimum, median and mean wages. The most relevantfeature of this is, quite clearly, the horizontal shift in the distribution. Thiscan be summed up in the real rises in mean wage (56.3 per cent) and inmedian wage (51.5 per cent). The growing density close to the minimumwage stems on the one hand from the elimination of wages paid at a ratebelow the minimum, affecting very young people in work durig 1987 and 1988(Portugal and Cardoso (2006)) and, on the other hand, the growing incidenceof the minimum wage influenced by nominal increases in the minimum wageabove the aggregate figures for nominal wage increases (Martins and Portugal(2014)).
FIGURE 2: Evolution of the Wage Distribution (1988-2013)
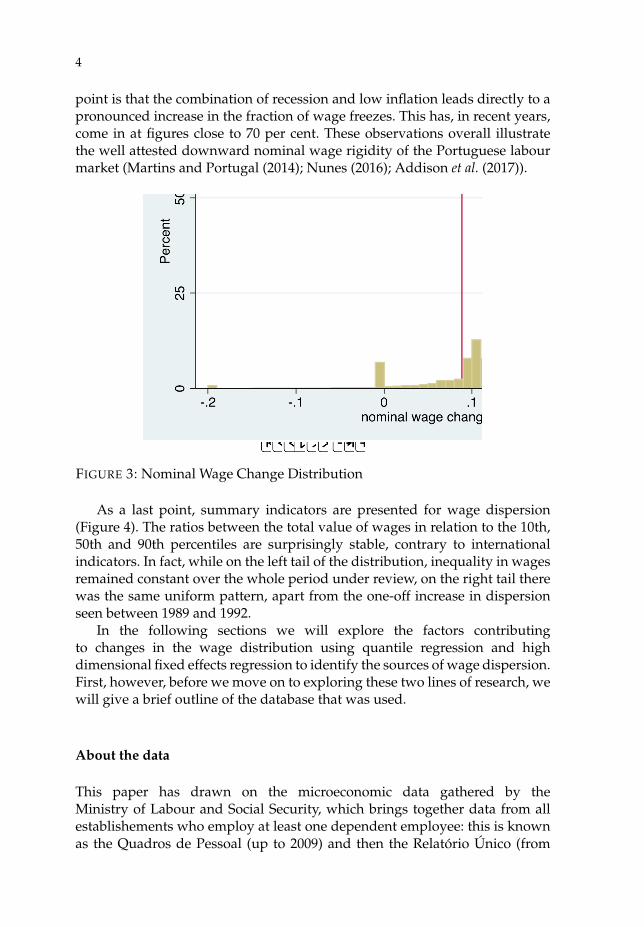
Figure 3 also provides a dynamic indication of the shift in nominal wagechange distribution for workers who hold a job in the same firm for twoconsecutive years (known as ‘stayers’). The first point to make is the factthat nominal wage cuts are rare — indeed exceptional. This stems from thenatural resistance among employers and workers alike to consider negativewage variation, but also, in a decisive way, of the prohibition (set down in thelabour code) of any unilateral imposition of cuts in the base wage. The second
4
point is that the combination of recession and low inflation leads directly to apronounced increase in the fraction of wage freezes. This has, in recent years,come in at figures close to 70 per cent. These observations overall illustratethe well attested downward nominal wage rigidity of the Portuguese labourmarket (Martins and Portugal (2014); Nunes (2016); Addison et al. (2017)).
FIGURE 3: Nominal Wage Change Distribution
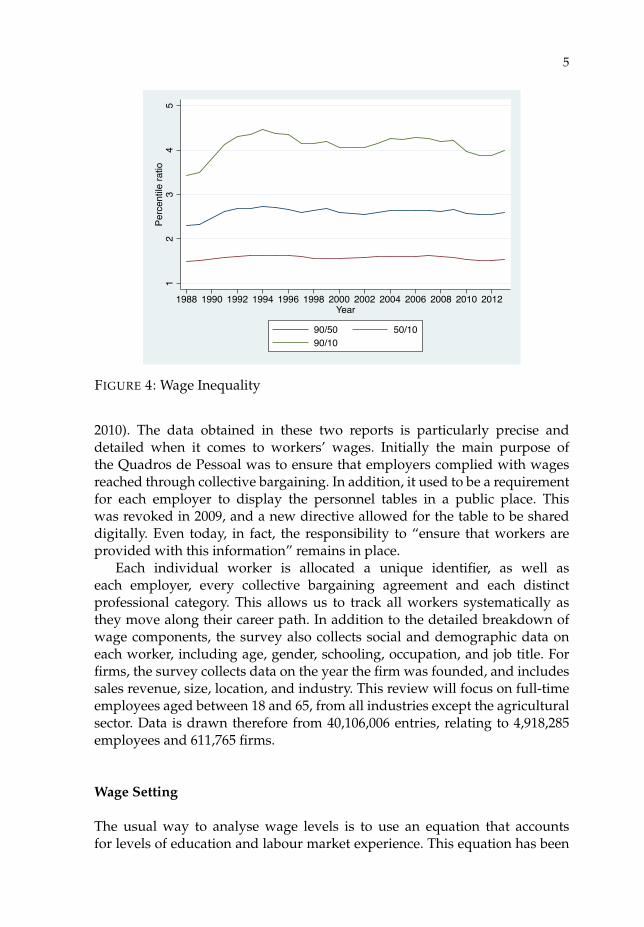
As a last point, summary indicators are presented for wage dispersion(Figure 4). The ratios between the total value of wages in relation to the 10th,50th and 90th percentiles are surprisingly stable, contrary to internationalindicators. In fact, while on the left tail of the distribution, inequality in wagesremained constant over the whole period under review, on the right tail therewas the same uniform pattern, apart from the one-off increase in dispersionseen between 1989 and 1992.
In the following sections we will explore the factors contributingto changes in the wage distribution using quantile regression and highdimensional fixed effects regression to identify the sources of wage dispersion.First, however, before we move on to exploring these two lines of research, wewill give a brief outline of the database that was used.
About the data
This paper has drawn on the microeconomic data gathered by theMinistry of Labour and Social Security, which brings together data from allestablishements who employ at least one dependent employee: this is knownas the Quadros de Pessoal (up to 2009) and then the Relatório Único (from
5
12
34
5Pe
rcen
tile
ratio
1988 1990 1992 1994 1996 1998 2000 2002 2004 2006 2008 2010 2012Year
90/50 50/1090/10
FIGURE 4: Wage Inequality
2010). The data obtained in these two reports is particularly precise anddetailed when it comes to workers’ wages. Initially the main purpose ofthe Quadros de Pessoal was to ensure that employers complied with wagesreached through collective bargaining. In addition, it used to be a requirementfor each employer to display the personnel tables in a public place. Thiswas revoked in 2009, and a new directive allowed for the table to be shareddigitally. Even today, in fact, the responsibility to “ensure that workers areprovided with this information” remains in place.
Each individual worker is allocated a unique identifier, as well aseach employer, every collective bargaining agreement and each distinctprofessional category. This allows us to track all workers systematically asthey move along their career path. In addition to the detailed breakdown ofwage components, the survey also collects social and demographic data oneach worker, including age, gender, schooling, occupation, and job title. Forfirms, the survey collects data on the year the firm was founded, and includessales revenue, size, location, and industry. This review will focus on full-timeemployees aged between 18 and 65, from all industries except the agriculturalsector. Data is drawn therefore from 40,106,006 entries, relating to 4,918,285employees and 611,765 firms.
Wage Setting
The usual way to analyse wage levels is to use an equation that accountsfor levels of education and labour market experience. This equation has been
6
adapted over the years from the now widely known equation initially derivedby Mincer (1958). In this paper, we start off with an extended version of theMincer equation to allow for differing wage levels according to gender (witha binary variable); the return on human capital specific to the firm; and wagelevel differentials linked to the size of the firm (through a logarithm of thenumber of employees).
The use of a linear regression model as a method to determine thefactors linked to changes in wages levels has a number of drawbacks,however. To build a more complete picture, conventional regression analysisis not adequate to fully describe the wage distribution, since it is based onconditional means. In other words, in the regression model, the effect ofa change in an explanatory variable, can always be shown as a horizontalshift of the distribution of a dependent variable. This statistical model is infact unnecessarily restrictive, and in some cases inadequate, if the effect ofan independent variable does not remain uniform across the distribution ofwages. It is more useful to employ a more flexible model, which, in this case,is the quantile regression. This allows us to take into consideration the wholedistribution rather than basing conclusions on the conditional mean.
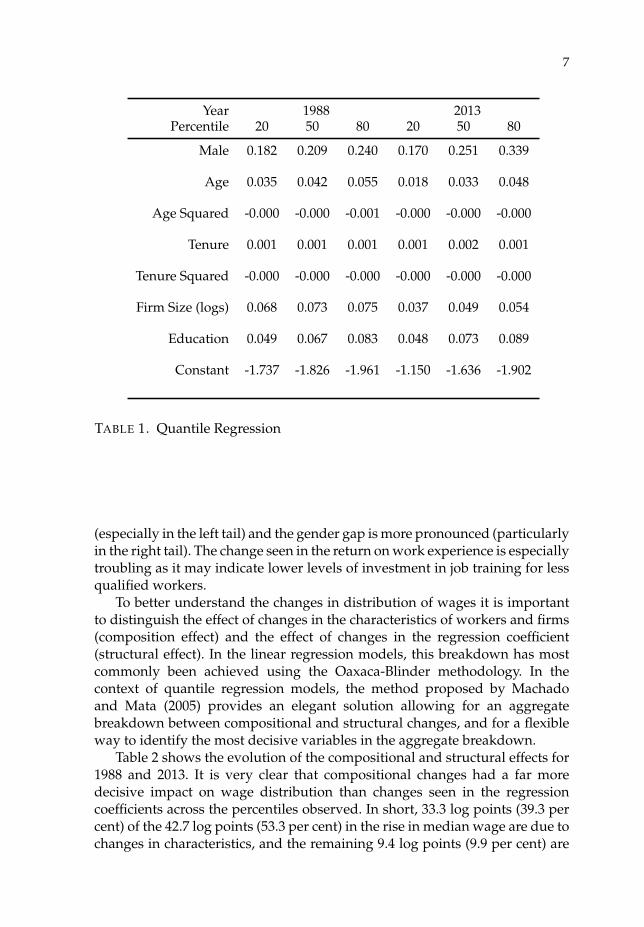
Table 1 shows the results of estimating quantile regression correspondingto the 20th, 50th, and 80th percentiles for 1988 and for 2013. The indicator forgender discrimination is not homogenous across the wage distribution, withthe gap more pronounced at higher wage levels. In this way, the differencebetween wages for men and women found on the 20th percentile is 18.2 logpoints (in 1998), which jumps to 24 log points when comparing wage quantilescorresponding to the 80th percentile. At the (conditional) median, men benefitby 20.9 log points.
One notable finding uncovered in the regression study is the indicationthat return on investment in formal education is significantly higher on theright tail of the distribution of wages. On percentile 20, an additional year offormal education leads to a rise in wages of 4.9 per cent, and at percentile 80a rise of 8.3 per cent. This result suggests a strong complementarity betweenwages and education (Campos and Reis (2017)). The sequence of coefficientsin the regression for the age variable, which is a proxy for the employeework experience, is similar to that seen for education. This also indicates thatthere is a complementarity between experience and more productive jobs. Interms of job tenure and firm size, the effects are relatively uniform across alldistribution markers1.
From 1988 to 2013, the main drivers influencing wages remained the samewhen it comes to education and length of service, but there is a drop ininfluence exerted by the firm size (across the whole distribution) and age
1. Another way to interpret this uniformity across distribution is to consider the fact that thereis no heteroscedasticity (inconstant variance) associated with these variables.
7
Year 1988 2013Percentile 20 50 80 20 50 80
Male 0.182 0.209 0.240 0.170 0.251 0.339
Age 0.035 0.042 0.055 0.018 0.033 0.048
Age Squared -0.000 -0.000 -0.001 -0.000 -0.000 -0.000
Tenure 0.001 0.001 0.001 0.001 0.002 0.001
Tenure Squared -0.000 -0.000 -0.000 -0.000 -0.000 -0.000
Firm Size (logs) 0.068 0.073 0.075 0.037 0.049 0.054
Education 0.049 0.067 0.083 0.048 0.073 0.089
Constant -1.737 -1.826 -1.961 -1.150 -1.636 -1.902
TABLE 1. Quantile Regression
(especially in the left tail) and the gender gap is more pronounced (particularlyin the right tail). The change seen in the return on work experience is especiallytroubling as it may indicate lower levels of investment in job training for lessqualified workers.
To better understand the changes in distribution of wages it is importantto distinguish the effect of changes in the characteristics of workers and firms(composition effect) and the effect of changes in the regression coefficient(structural effect). In the linear regression models, this breakdown has mostcommonly been achieved using the Oaxaca-Blinder methodology. In thecontext of quantile regression models, the method proposed by Machadoand Mata (2005) provides an elegant solution allowing for an aggregatebreakdown between compositional and structural changes, and for a flexibleway to identify the most decisive variables in the aggregate breakdown.
Table 2 shows the evolution of the compositional and structural effects for1988 and 2013. It is very clear that compositional changes had a far moredecisive impact on wage distribution than changes seen in the regressioncoefficients across the percentiles observed. In short, 33.3 log points (39.3 percent) of the 42.7 log points (53.3 per cent) in the rise in median wage are due tochanges in characteristics, and the remaining 9.4 log points (9.9 per cent) are
8
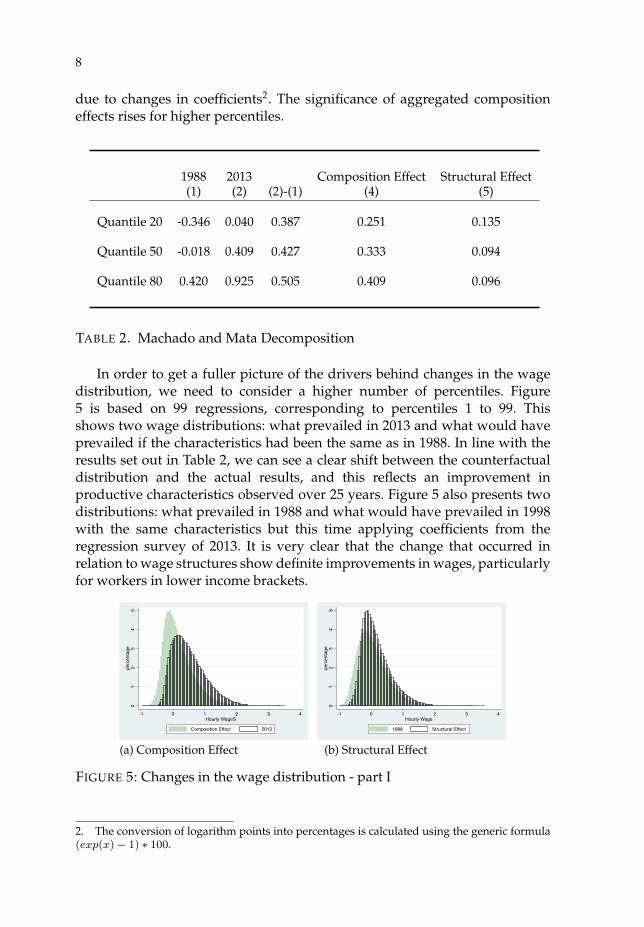
due to changes in coefficients2. The significance of aggregated compositioneffects rises for higher percentiles.
1988 2013 Composition Effect Structural Effect(1) (2) (2)-(1) (4) (5)
Quantile 20 -0.346 0.040 0.387 0.251 0.135
Quantile 50 -0.018 0.409 0.427 0.333 0.094
Quantile 80 0.420 0.925 0.505 0.409 0.096
TABLE 2. Machado and Mata Decomposition
In order to get a fuller picture of the drivers behind changes in the wagedistribution, we need to consider a higher number of percentiles. Figure5 is based on 99 regressions, corresponding to percentiles 1 to 99. Thisshows two wage distributions: what prevailed in 2013 and what would haveprevailed if the characteristics had been the same as in 1988. In line with theresults set out in Table 2, we can see a clear shift between the counterfactualdistribution and the actual results, and this reflects an improvement inproductive characteristics observed over 25 years. Figure 5 also presents twodistributions: what prevailed in 1988 and what would have prevailed in 1998with the same characteristics but this time applying coefficients from theregression survey of 2013. It is very clear that the change that occurred inrelation to wage structures show definite improvements in wages, particularlyfor workers in lower income brackets.
01
23
45
perc
enta
ge
-1 0 1 2 3 4Hourly WageS
Composition Effect 2013
01
23
45
perc
enta
ge
-1 0 1 2 3 4Hourly Wage
1988 Structural Effect
(a) Composition Effect (b) Structural Effect
FIGURE 5: Changes in the wage distribution - part I
2. The conversion of logarithm points into percentages is calculated using the generic formula(exp(x)− 1) ∗ 100.
9
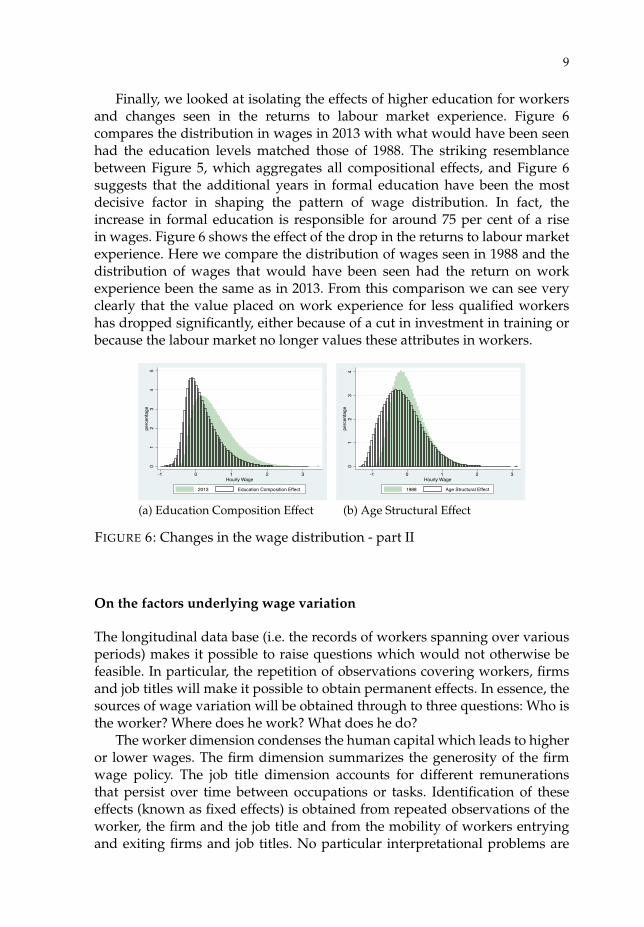
Finally, we looked at isolating the effects of higher education for workersand changes seen in the returns to labour market experience. Figure 6compares the distribution in wages in 2013 with what would have been seenhad the education levels matched those of 1988. The striking resemblancebetween Figure 5, which aggregates all compositional effects, and Figure 6suggests that the additional years in formal education have been the mostdecisive factor in shaping the pattern of wage distribution. In fact, theincrease in formal education is responsible for around 75 per cent of a risein wages. Figure 6 shows the effect of the drop in the returns to labour marketexperience. Here we compare the distribution of wages seen in 1988 and thedistribution of wages that would have been seen had the return on workexperience been the same as in 2013. From this comparison we can see veryclearly that the value placed on work experience for less qualified workershas dropped significantly, either because of a cut in investment in training orbecause the labour market no longer values these attributes in workers.
01
23
45
perc
enta
ge
-1 0 1 2 3Hourly Wage
2013 Education Composition Effect
01
23
4pe
rcen
tage
-1 0 1 2 3Hourly Wage
1988 Age Structural Effect
(a) Education Composition Effect (b) Age Structural Effect
FIGURE 6: Changes in the wage distribution - part II
On the factors underlying wage variation
The longitudinal data base (i.e. the records of workers spanning over variousperiods) makes it possible to raise questions which would not otherwise befeasible. In particular, the repetition of observations covering workers, firmsand job titles will make it possible to obtain permanent effects. In essence, thesources of wage variation will be obtained through to three questions: Who isthe worker? Where does he work? What does he do?
The worker dimension condenses the human capital which leads to higheror lower wages. The firm dimension summarizes the generosity of the firmwage policy. The job title dimension accounts for different remunerationsthat persist over time between occupations or tasks. Identification of theseeffects (known as fixed effects) is obtained from repeated observations of theworker, the firm and the job title and from the mobility of workers entryingand exiting firms and job titles. No particular interpretational problems are
10
posed by the specification of a high dimensional fixed effect regression model(Guimarães and Portugal (2010)). All that is needed is to consider a Mincerregression extended to include 4918285 dummies identifying workers, 611,765identifying firms and 127,021 identifying job titles3.
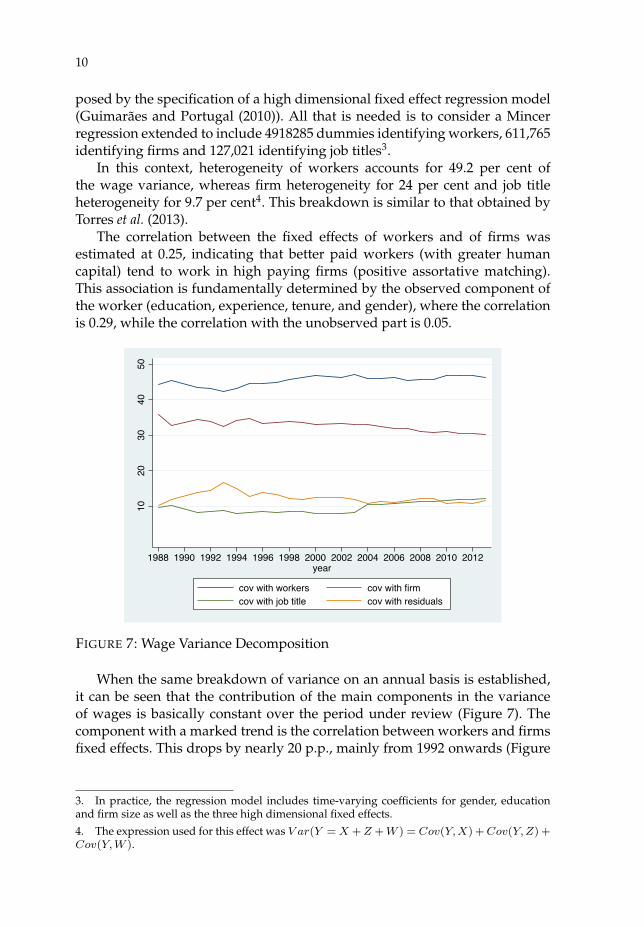
In this context, heterogeneity of workers accounts for 49.2 per cent ofthe wage variance, whereas firm heterogeneity for 24 per cent and job titleheterogeneity for 9.7 per cent4. This breakdown is similar to that obtained byTorres et al. (2013).
The correlation between the fixed effects of workers and of firms wasestimated at 0.25, indicating that better paid workers (with greater humancapital) tend to work in high paying firms (positive assortative matching).This association is fundamentally determined by the observed component ofthe worker (education, experience, tenure, and gender), where the correlationis 0.29, while the correlation with the unobserved part is 0.05.
1020
3040
50
1988 1990 1992 1994 1996 1998 2000 2002 2004 2006 2008 2010 2012year
cov with workers cov with firmcov with job title cov with residuals
FIGURE 7: Wage Variance Decomposition
When the same breakdown of variance on an annual basis is established,it can be seen that the contribution of the main components in the varianceof wages is basically constant over the period under review (Figure 7). Thecomponent with a marked trend is the correlation between workers and firmsfixed effects. This drops by nearly 20 p.p., mainly from 1992 onwards (Figure
3. In practice, the regression model includes time-varying coefficients for gender, educationand firm size as well as the three high dimensional fixed effects.4. The expression used for this effect was V ar(Y = X +Z +W ) = Cov(Y,X) +Cov(Y,Z) +Cov(Y,W ).
11
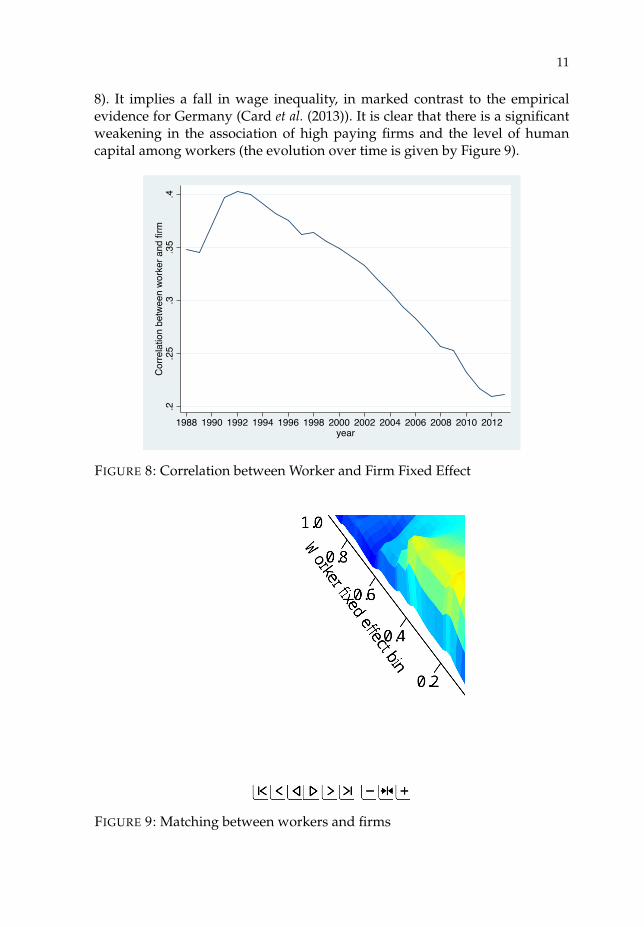
8). It implies a fall in wage inequality, in marked contrast to the empiricalevidence for Germany (Card et al. (2013)). It is clear that there is a significantweakening in the association of high paying firms and the level of humancapital among workers (the evolution over time is given by Figure 9).
.2.2
5.3
.35
.4C
orre
latio
n be
twee
n w
orke
r and
firm
1988 1990 1992 1994 1996 1998 2000 2002 2004 2006 2008 2010 2012year
FIGURE 8: Correlation between Worker and Firm Fixed Effect
FIGURE 9: Matching between workers and firms
12
Summing Up
Over the 25 years from 1988 to 2013, the wage distribution of workersunderwent profound changes. The most important of these was, as might beexpected, the overall rise in wages, with the median wage increase reaching53.3 per cent. Improvements in workers’ qualifications accounted for 78 percent of the increase, with structural changes in the determination of wagesaccounting for the remaining 22 per cent. The most decisive factor underlyingthe wage increase was a pronounced improvement in workers’ educationlevels. According to our calculations, the raising of the school levels accountsfor around three-quarters of the overall wage increase. Against this backdrop,there are indications that the second engine driving the production of humancapital, on job training, slowed markedly during the period under review,mainly for those workers who are less qualified and collect lower wages.
Which of the questions below is the most important to best estimateindividual’s wages? Who are they? Where do they work? What do they do?The information on the worker is in fact the most relevant, since it explainsaround 50 per cent of the wage variation, though the information on the firmand the job is also important, since this explains a quarter and a tenth (for thefirm and the job) of the wage variation.
It is not possible to establish a clear trend for wage dispersion when weconsider each wage component separately. It is not surprising, then, that theindicators of wage dispersion have remained constant for the past 20 years.The correlation between the fixed effect of the worker and the fixed effect ofthe firm, however, has been weakening, which in turn has led to less wageinequality. This finding is in contradiction with most economic literature, andin fact indicates that the sorting of workers among firms is increasingly lessdetermined by the complementarity between the worker’s human capital andthe productivity of the firm.
13
References
Addison, John, Pedro Portugal, and Hugo Vilares (2017). “Unions andCollective Bargaining in the Wake of the Great Recession: Evidence fromPortugal.” British Journal of Industrial Relations, 55(3), 551–576.
Campos, Maria and Hugo Reis (2017). “Uma Reavaliação do Retorno doInvestimento em Educação na Economia Portuguesa.” Revista de EstudosEconómicos Banco de Portugal.
Card, David, Jörg Heining, and Patrick Kline (2013). “Workplace Heterogene-ity and the Rise of West German Wage Inequality," Quarterly Journal ofEconomics.” The Quarterly Journal of Economics, 128.
Guimarães, Paulo and Pedro Portugal (2010). “A simple feasible procedure tofit models with high-dimensional fixed effects.” Stata Journal, 10(4), 628–649.
Machado, José A. F. and José Mata (2005). “Counterfactual decomposition ofchanges in wage distributions using quantile regression.” Journal of AppliedEconometrics, 20(4), 445–465.
Martins, Fernando and Pedro Portugal (2014). “Ajustamentos Salariaisdurante a Grande Recessão.” Boletim Económico do Banco de Portugal.
Mincer, Jacob (1958). “Investment in Human Capital and Personal IncomeDistribution.” Journal of Political Economy, 66, 281–302.
Nunes, André (2016). “Wage Adjustments under Extreme DownwardNominal Wage Rigidity.” NOVA School of Business and Economics - UNL.Master Thesis.
Portugal, Pedro and Ana Rute Cardoso (2006). “Disentangling the MinimumWage Puzzle: An Analysis of Worker Accessions and Separations.” Journalof the European Economic Association, 4(5), 988–1013.
Torres, Sónia, Pedro Portugal, John T. Addison, and Paulo Guimarães (2013).“The sources of wage variation: a three-way high-dimensional fixed effectsregression model.” Working papers, Banco de Portugal, Economics andResearch Department.
Related Documents