3005 30th Street • Boulder, Colorado 80301 www.n‐r‐c.com • 303‐444‐7863 The Denver Regional Council of Governments, CO 2010 Full Report

Welcome message from author
This document is posted to help you gain knowledge. Please leave a comment to let me know what you think about it! Share it to your friends and learn new things together.
Transcript
3005 30th Street • Boulder, Colorado 80301
www.n‐r‐c.com • 303‐444‐7863
The Denver Regional Council of Governments, CO
2010
Full Report
CASOA™ | DRCOG • • •
Community Assessm
ent Survey for Older Adults™
© 2010 National Research Cen
ter, In
c.
C o n t e n t s
Introduction ..................................................................................................................................................1 About CASOA.............................................................................................................................................................2 CASOATM Methods.....................................................................................................................................................2 Structure of the CASOA™ Report...............................................................................................................................4
Key Findings ..................................................................................................................................................5
Recommendations and Conclusions...........................................................................................................10
Age Wave in the DRCOG Region .................................................................................................................17 Demographics..........................................................................................................................................................17 A Profile of Older Adults in the DRCOG Region .......................................................................................................17 Residential Stability .................................................................................................................................................19
The DRCOG Region as a Place for Older Residents ....................................................................................21
A Closer Look at Older Adult Needs............................................................................................................23 Health and Wellness ................................................................................................................................................23 Information and Planning........................................................................................................................................30 Productive Activities ................................................................................................................................................32 Community Design and Land Use............................................................................................................................43
Appendix A: Older Adult Needs ..................................................................................................................48
Appendix B: Complete Set of Survey Frequencies......................................................................................50 Frequencies Excluding Don’t Know Responses........................................................................................................50 Frequencies Including Don’t Know Responses ........................................................................................................60
Appendix C: Survey Methodology...............................................................................................................74 Data Collection Methods Used in the CASOA™.......................................................................................................74 Estimates of the Contribution of Older Adults to the Economy..............................................................................78 Community Summary Scores...................................................................................................................................79 Needs Summary Scores ...........................................................................................................................................81
Appendix D: References..............................................................................................................................84
Appendix E: Survey Materials .....................................................................................................................87
CASOA™ | DRCOG • • 1 • •
Community Assessm
ent Survey for Older Adults™
© 2010 National Research Cen
ter, In
c.
I n t r o d u c t i o n
With more than one-half of the Baby Boom generation now age 50 and older, the nation is increasingly becoming populated by older adults. One-third of the U.S. population will reach this senior milestone by 2010. Aging not only occurs to nations and individuals, it happens to communities. Hoping for healthy older adults cannot transform the inevitable declines that most people face as they age. Even a healthier America will not avert the need to assist older adults who are frail. The Older Americans Act (OAA) currently supports a national aging services network that provides home and community-based services to over eight million older adults. Services provided by the network include home-delivered meals, nutrition education, transportation, adult day care, health promotion and the support of caregivers.1 But the OAA alone cannot ride to the rescue of those among the 75 million aging Baby Boomers who will press unprecedented demands on this country’s social services. And the OAA cannot keep all older adults well and independent. More must be done and done by more actors. The traditional model of government service to needy recipients is unsustainable.
Therefore, much of the planning for this demographic swell must be led not just by Congress and national organizations, but by city councilors, Area Agency on Aging advisory boards, county commissioners, faith communities, service club members, college presidents, hospital administrators, business owners and community members. An aging world need not be a place where human resources diminish and productivity flags. With proper planning, communities filled with older adults can become centers of high quality human scale living, anchored by the contributions of civically engaged older residents.
American communities can choose a future that both protects vulnerable older adults and challenges those who thrive. A well-conceived and updated community will provide care to older adults that need it at the same time empowering older adults with far greater opportunities than exist now to age successfully and contribute. But not every community faces the same future nor do all older residents seek the same services. Whatever the unique needs in each community, one common circumstance will prevail. Resources will have to be reallocated. As populations age there will be changes in taste that will affect local news, arts, politics and even groceries, but needs that require more planning will emerge and anticipation of those needs, rather than surprise confrontation, will lead to communities that prosper because they are comfortable for and attractive to older adults.
This report offers a picture of community need that creates a model of local challenges and priority solutions. This needs assessment will show current and projected shifts in the age profile of older adults living in the DRCOG region. In its monograph, “Active Living for Older Adults,” the International City/County Management Association (ICMA) calls for involving “older residents early in the decision-making process,”2 and to do that with, among other tools, surveys and focus groups of older adults themselves. Older adult needs cannot be understood clearly without talking to older adults, so a statistically valid survey of older residents is essential to hear the voice of the people who are to be served.
CASOA™ | DRCOG • • 2 • •
Community Assessm
ent Survey for Older Adults™
© 2010 National Research Cen
ter, In
c.
About CASOA
The Community Assessment Survey for Older Adults (CASOA™) was developed to provide a statistically valid survey of the strengths and needs of older adults as reported by older adults themselves in communities across America. This report is intended to enable local governments, community-based organizations, the private sector and other community members to understand more accurately and predict more carefully the services and resources required to serve an aging population. With this report, the Denver Regional Council of Governments (DRCOG) region stakeholders can shape public policy, educate the public and assist communities and organizations in their efforts to sustain a high quality of life for older adults. The objectives of the CASOA™ are to:
• Identify community strengths in serving older adults. • Articulate the specific needs of older adults in the region. • Estimate contributions made by older adults to the community. • Develop estimates of and projections of older adult residents’ needs into the future.
The results of this exploration will provide useful information for planning and resource development as well as strengthen advocacy efforts and stakeholder engagement. The ultimate goal of the assessment is to create empowered communities that support vibrant older adult populations.
The CASOA™ questionnaire contains many questions related to the life of older residents in the community. Survey participants were asked to rate their overall quality of life, as well as aspects of quality of life in the DRCOG region. They also evaluated characteristics of the community and gave their perceptions of safety in the DRCOG region. The questionnaire assessed the individual needs of older residents and involvement by respondents in the civic and economic life of the DRCOG region.
CASOATM Methods
The survey and its administration are standardized to assure high quality survey methods and comparable results across CASOA™ jurisdictions. Participating older adult households were selected at random and the household member who responded was selected without bias. Multiple mailings gave each household more than one prompt to participate with a self-addressed and postage-paid envelope to return the survey. Results were statistically weighted to reflect the proper demographic composition of older adults in the entire community.
DRCOG augmented the sample of older adults to provide stand-alone brief reports for each of several geographic areas, including Adams, Arapahoe, Broomfield, Clear Creek, Denver, Douglas and Gilpin counties. Jefferson County (also in the DRCOG region) conducted its own CASOATM project; data from that study is included in DRCOG’s overall results. This full report of results provides expanded analytic detail and descriptive text for the DRCOG region, overall. Another report is provided that compares results of select survey questions by demographics subgroups. Each report is available under separate cover. Also included under separate cover are results by demographic characteristics.
The survey was mailed in June 2010 to a random selection of 7,512 older adult households in the DRCOG region; the Jefferson County surveys were mailed in May 2010 to a random selection of
CASOA™ | DRCOG • • 3 • •
Community Assessm
ent Survey for Older Adults™
© 2010 National Research Cen
ter, In
c.
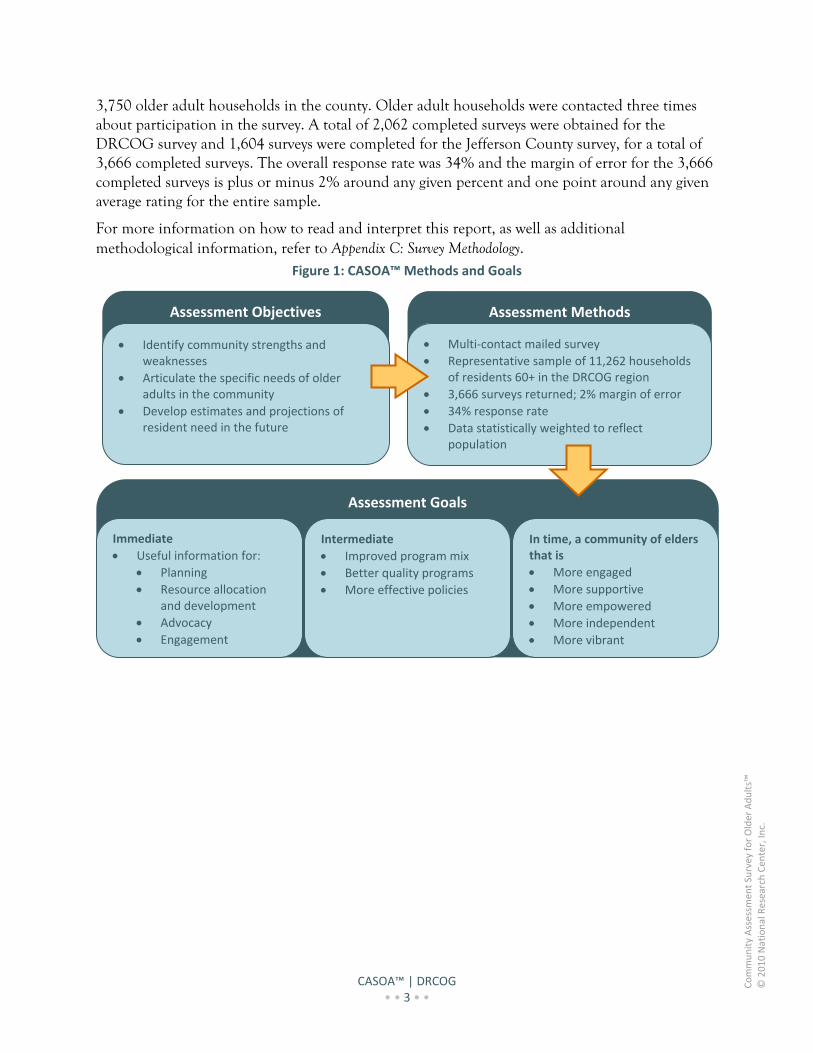
3,750 older adult households in the county. Older adult households were contacted three times about participation in the survey. A total of 2,062 completed surveys were obtained for the DRCOG survey and 1,604 surveys were completed for the Jefferson County survey, for a total of 3,666 completed surveys. The overall response rate was 34% and the margin of error for the 3,666 completed surveys is plus or minus 2% around any given percent and one point around any given average rating for the entire sample.
For more information on how to read and interpret this report, as well as additional methodological information, refer to Appendix C: Survey Methodology.
Figure 1: CASOA™ Methods and Goals
Assessment Goals
Assessment Methods Assessment Objectives
Multi‐contact mailed survey
Representative sample of 11,262 households of residents 60+ in the DRCOG region
3,666 surveys returned; 2% margin of error
34% response rate
Data statistically weighted to reflect population
Identify community strengths and weaknesses
Articulate the specific needs of older adults in the community
Develop estimates and projections of resident need in the future
Immediate
Useful information for:
Planning
Resource allocation and development
Advocacy
Engagement
Intermediate
Improved program mix
Better quality programs
More effective policies
In time, a community of elders that is
More engaged
More supportive
More empowered
More independent
More vibrant
CASOA™ | DRCOG • • 4 • •
Community Assessm
ent Survey for Older Adults™
© 2010 National Research Cen
ter, In
c.
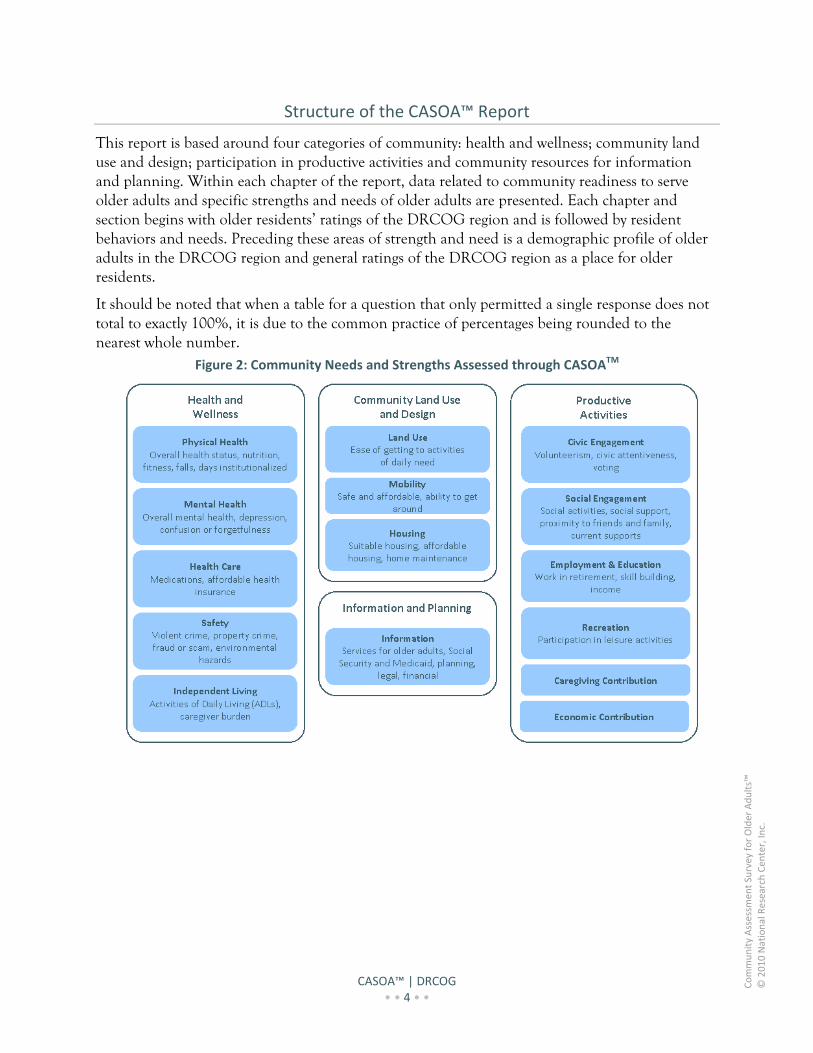
Structure of the CASOA™ Report
This report is based around four categories of community: health and wellness; community land use and design; participation in productive activities and community resources for information and planning. Within each chapter of the report, data related to community readiness to serve older adults and specific strengths and needs of older adults are presented. Each chapter and section begins with older residents’ ratings of the DRCOG region and is followed by resident behaviors and needs. Preceding these areas of strength and need is a demographic profile of older adults in the DRCOG region and general ratings of the DRCOG region as a place for older residents.
It should be noted that when a table for a question that only permitted a single response does not total to exactly 100%, it is due to the common practice of percentages being rounded to the nearest whole number.
Figure 2: Community Needs and Strengths Assessed through CASOATM
CASOA™ | DRCOG • • 5 • •
Community Assessm
ent Survey for Older Adults™
© 2010 National Research Cen
ter, In
c.
K e y F i n d i n g s
The report describes how older residents view the DRCOG region as a community that creates a thriving environment for its 386,000 older adults and then describes residents’ self-reported needs. The CASOA™ assessed the DRCOG region’s needs and strengths through a mailed survey of randomly sampled older adults in the community.
DRCOG Opportunities and Challenges
Older adults may not complain, but not every community leaves older adults raving about the quality of community life or the services available for active living and aging in place. Communities that assist older adults to remain as or become active community participants provide the requisite opportunities for recreation, transportation, culture, education, communication, social connection, spiritual enrichment and health care. It is not a package mix, so each community must identify what its older adults seek and what the community provides. The judgments of the residents for whom community planning takes place, provide the elements of an equation that describes overall community quality in the DRCOG region.
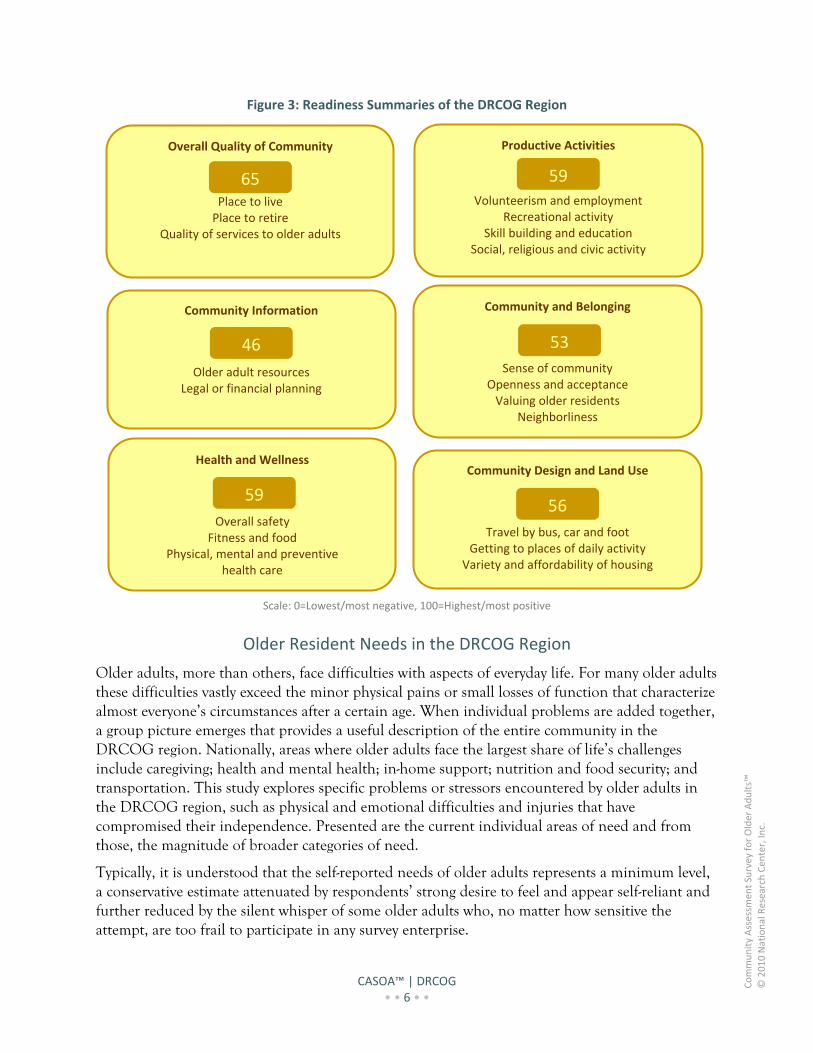
Survey respondents were asked to rate 29 aspects of the community related to six community dimensions. Ratings for individual questions were converted to an average scale of 0 (the lowest rating, e.g., “poor”) to 100 (the highest rating, e.g., “excellent”) and then combined to provide one overall rating (index) for each of the six areas. (For more information on how the summary scores were calculated, see Appendix C: Survey Methodology.)
It was found, overall, that the DRCOG region was rated favorably by its older residents. Most of the DRCOG region’s older residents gave high ratings to the community as a place although ratings of the region as a place for retirement were lower. Summary scores were calculated for categories of community quality to provide a broad picture of the perceived fit between what the community offered to older adults and what older residents needed. Summary ratings for the DRCOG region demonstrated that older resident felt the area of Overall Community Quality was provided best. Opportunities for Community Information was rated less favorably.
CASOA™ | DRCOG • • 6 • •
Community Assessm
ent Survey for Older Adults™
© 2010 National Research Cen
ter, In
c.
Figure 3: Readiness Summaries of the DRCOG Region
Older Resident Needs in the DRCOG Region
Older adults, more than others, face difficulties with aspects of everyday life. For many older adults these difficulties vastly exceed the minor physical pains or small losses of function that characterize almost everyone’s circumstances after a certain age. When individual problems are added together, a group picture emerges that provides a useful description of the entire community in the DRCOG region. Nationally, areas where older adults face the largest share of life’s challenges include caregiving; health and mental health; in-home support; nutrition and food security; and transportation. This study explores specific problems or stressors encountered by older adults in the DRCOG region, such as physical and emotional difficulties and injuries that have compromised their independence. Presented are the current individual areas of need and from those, the magnitude of broader categories of need.
Typically, it is understood that the self-reported needs of older adults represents a minimum level, a conservative estimate attenuated by respondents’ strong desire to feel and appear self-reliant and further reduced by the silent whisper of some older adults who, no matter how sensitive the attempt, are too frail to participate in any survey enterprise.
Community Information
Older adult resources Legal or financial planning
Health and Wellness
Overall safety Fitness and food
Physical, mental and preventive health care
Productive Activities
Volunteerism and employment Recreational activity
Skill building and education Social, religious and civic activity
46
59
Community Design and Land Use
Travel by bus, car and foot Getting to places of daily activity
Variety and affordability of housing
56
59
Community and Belonging
Sense of community Openness and acceptance Valuing older residents
Neighborliness
53
Scale: 0=Lowest/most negative, 100=Highest/most positive
Overall Quality of Community
Place to live Place to retire
Quality of services to older adults
65
CASOA™ | DRCOG • • 7 • •
Community Assessm
ent Survey for Older Adults™
© 2010 National Research Cen
ter, In
c.
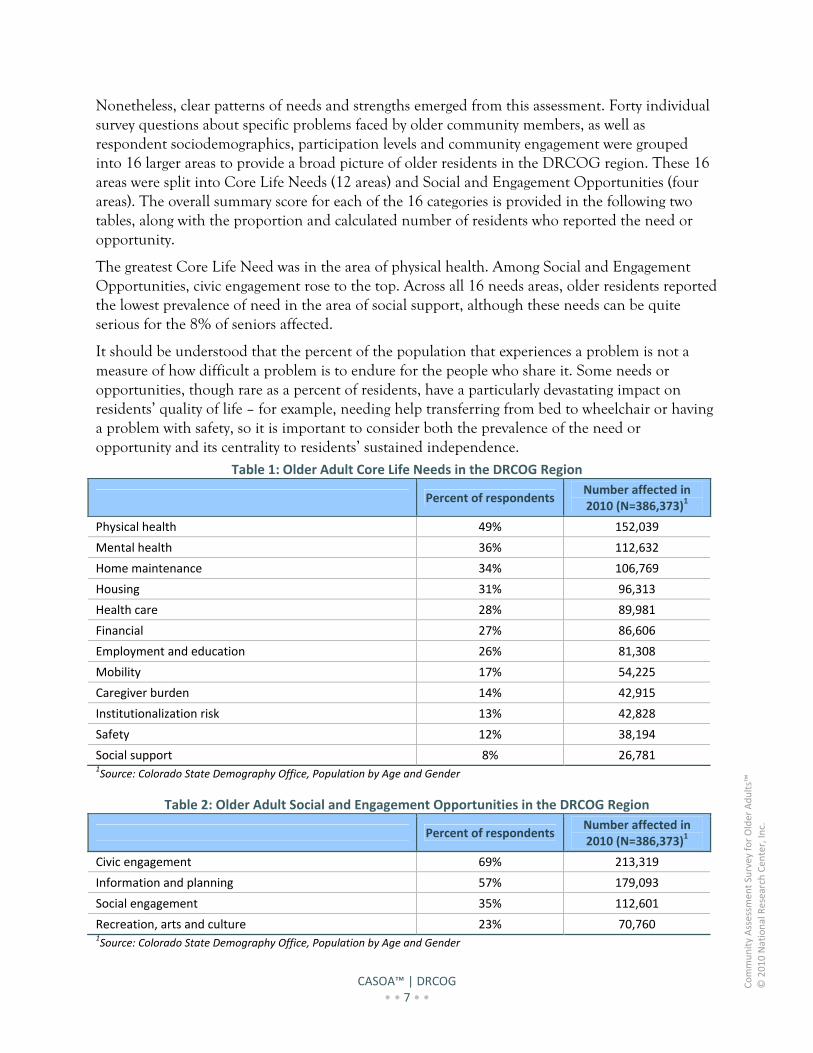
Nonetheless, clear patterns of needs and strengths emerged from this assessment. Forty individual survey questions about specific problems faced by older community members, as well as respondent sociodemographics, participation levels and community engagement were grouped into 16 larger areas to provide a broad picture of older residents in the DRCOG region. These 16 areas were split into Core Life Needs (12 areas) and Social and Engagement Opportunities (four areas). The overall summary score for each of the 16 categories is provided in the following two tables, along with the proportion and calculated number of residents who reported the need or opportunity.
The greatest Core Life Need was in the area of physical health. Among Social and Engagement Opportunities, civic engagement rose to the top. Across all 16 needs areas, older residents reported the lowest prevalence of need in the area of social support, although these needs can be quite serious for the 8% of seniors affected.
It should be understood that the percent of the population that experiences a problem is not a measure of how difficult a problem is to endure for the people who share it. Some needs or opportunities, though rare as a percent of residents, have a particularly devastating impact on residents’ quality of life – for example, needing help transferring from bed to wheelchair or having a problem with safety, so it is important to consider both the prevalence of the need or opportunity and its centrality to residents’ sustained independence.
Table 1: Older Adult Core Life Needs in the DRCOG Region
Percent of respondents Number affected in 2010 (N=386,373)1
Physical health 49% 152,039
Mental health 36% 112,632
Home maintenance 34% 106,769
Housing 31% 96,313
Health care 28% 89,981
Financial 27% 86,606
Employment and education 26% 81,308
Mobility 17% 54,225
Caregiver burden 14% 42,915
Institutionalization risk 13% 42,828
Safety 12% 38,194
Social support 8% 26,781 1Source: Colorado State Demography Office, Population by Age and Gender
Table 2: Older Adult Social and Engagement Opportunities in the DRCOG Region
Percent of respondents Number affected in 2010 (N=386,373)1
Civic engagement 69% 213,319
Information and planning 57% 179,093
Social engagement 35% 112,601
Recreation, arts and culture 23% 70,760 1Source: Colorado State Demography Office, Population by Age and Gender
CASOA™ | DRCOG • • 8 • •
Community Assessm
ent Survey for Older Adults™
© 2010 National Research Cen
ter, In
c.
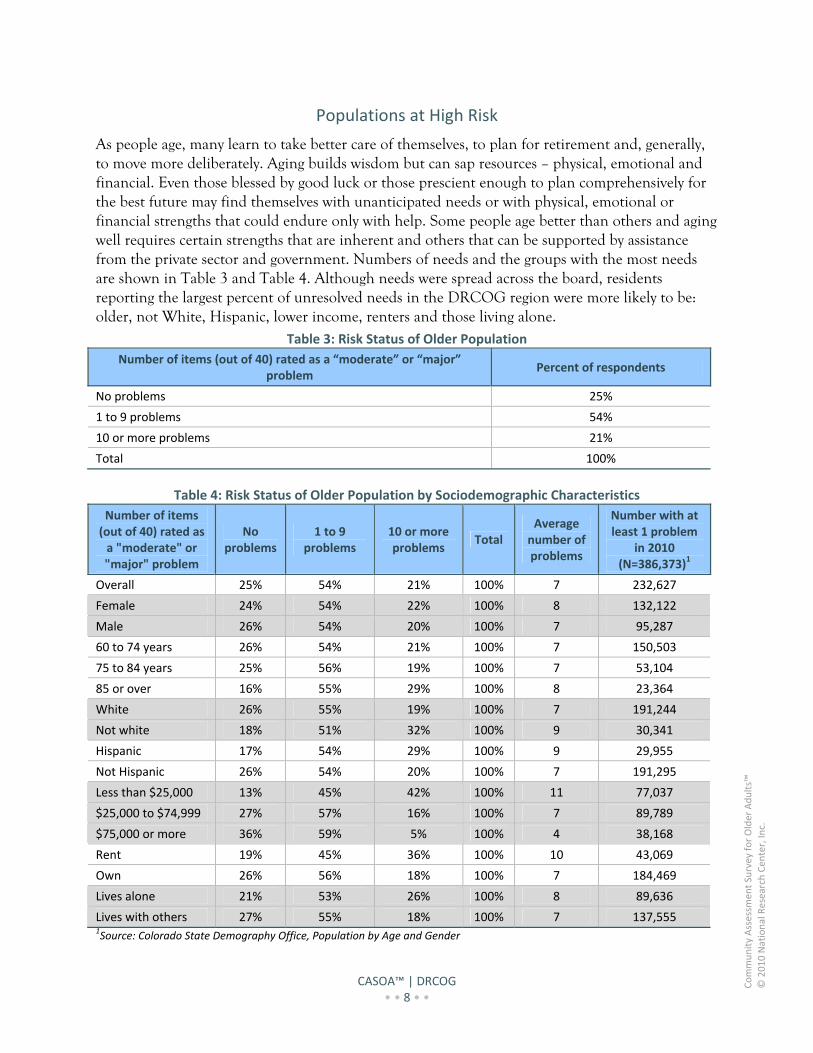
Populations at High Risk
As people age, many learn to take better care of themselves, to plan for retirement and, generally, to move more deliberately. Aging builds wisdom but can sap resources – physical, emotional and financial. Even those blessed by good luck or those prescient enough to plan comprehensively for the best future may find themselves with unanticipated needs or with physical, emotional or financial strengths that could endure only with help. Some people age better than others and aging well requires certain strengths that are inherent and others that can be supported by assistance from the private sector and government. Numbers of needs and the groups with the most needs are shown in Table 3 and Table 4. Although needs were spread across the board, residents reporting the largest percent of unresolved needs in the DRCOG region were more likely to be: older, not White, Hispanic, lower income, renters and those living alone.
Table 3: Risk Status of Older Population
Number of items (out of 40) rated as a “moderate” or “major” problem
Percent of respondents
No problems 25%
1 to 9 problems 54%
10 or more problems 21%
Total 100%
Table 4: Risk Status of Older Population by Sociodemographic Characteristics
Number of items (out of 40) rated as a "moderate" or "major" problem
No problems
1 to 9 problems
10 or more problems
Total Average number of problems
Number with at least 1 problem
in 2010 (N=386,373)1
Overall 25% 54% 21% 100% 7 232,627
Female 24% 54% 22% 100% 8 132,122
Male 26% 54% 20% 100% 7 95,287
60 to 74 years 26% 54% 21% 100% 7 150,503
75 to 84 years 25% 56% 19% 100% 7 53,104
85 or over 16% 55% 29% 100% 8 23,364
White 26% 55% 19% 100% 7 191,244
Not white 18% 51% 32% 100% 9 30,341
Hispanic 17% 54% 29% 100% 9 29,955
Not Hispanic 26% 54% 20% 100% 7 191,295
Less than $25,000 13% 45% 42% 100% 11 77,037
$25,000 to $74,999 27% 57% 16% 100% 7 89,789
$75,000 or more 36% 59% 5% 100% 4 38,168
Rent 19% 45% 36% 100% 10 43,069
Own 26% 56% 18% 100% 7 184,469
Lives alone 21% 53% 26% 100% 8 89,636
Lives with others 27% 55% 18% 100% 7 137,555 1Source: Colorado State Demography Office, Population by Age and Gender
CASOA™ | DRCOG • • 9 • •
Community Assessm
ent Survey for Older Adults™
© 2010 National Research Cen
ter, In
c.
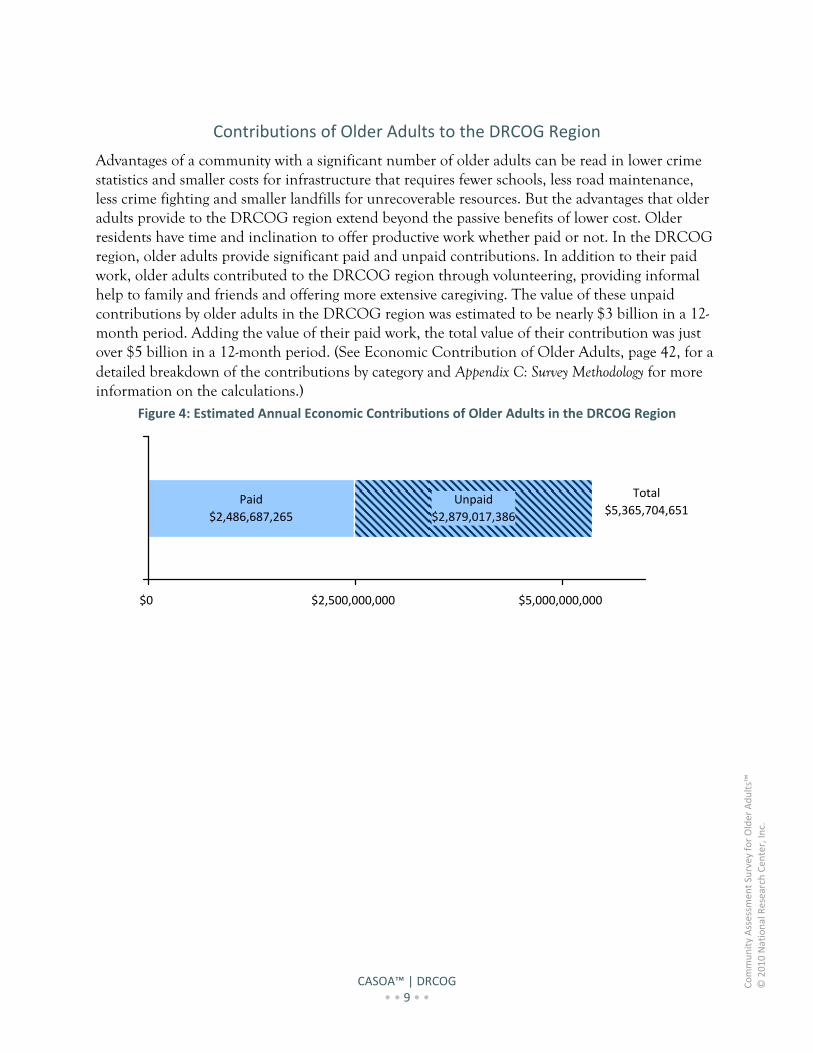
Contributions of Older Adults to the DRCOG Region
Advantages of a community with a significant number of older adults can be read in lower crime statistics and smaller costs for infrastructure that requires fewer schools, less road maintenance, less crime fighting and smaller landfills for unrecoverable resources. But the advantages that older adults provide to the DRCOG region extend beyond the passive benefits of lower cost. Older residents have time and inclination to offer productive work whether paid or not. In the DRCOG region, older adults provide significant paid and unpaid contributions. In addition to their paid work, older adults contributed to the DRCOG region through volunteering, providing informal help to family and friends and offering more extensive caregiving. The value of these unpaid contributions by older adults in the DRCOG region was estimated to be nearly $3 billion in a 12-month period. Adding the value of their paid work, the total value of their contribution was just over $5 billion in a 12-month period. (See Economic Contribution of Older Adults, page 42, for a detailed breakdown of the contributions by category and Appendix C: Survey Methodology for more information on the calculations.)
Figure 4: Estimated Annual Economic Contributions of Older Adults in the DRCOG Region
Paid
$2,486,687,265
Unpaid
$2,879,017,386
$0 $2,500,000,000 $5,000,000,000
Total
$5,365,704,651
CASOA™ | DRCOG • • 10 • •
Community Assessm
ent Survey for Older Adults™
© 2010 National Research Cen
ter, In
c.
R e c o m m e n d a t i o n s a n d C o n c l u s i o n s
The CASOA™ assessment provides a wealth of data about the strengths and needs of the DRCOG region’s older adult population. Most seniors are flourishing in the DRCOG region. By and large, they are mobile, healthy and engaged in a variety of productive activities. Older residents experience a good quality of life in the DRCOG region and most plan to stay in the community.
Nonetheless, there are needs evident in the DRCOG region’s older adult population which are likely to increase dramatically as the population ages over the next decades. Areas where older residents in the DRCOG region demonstrated the highest need included civic engagement, information and planning, physical health and mental health.
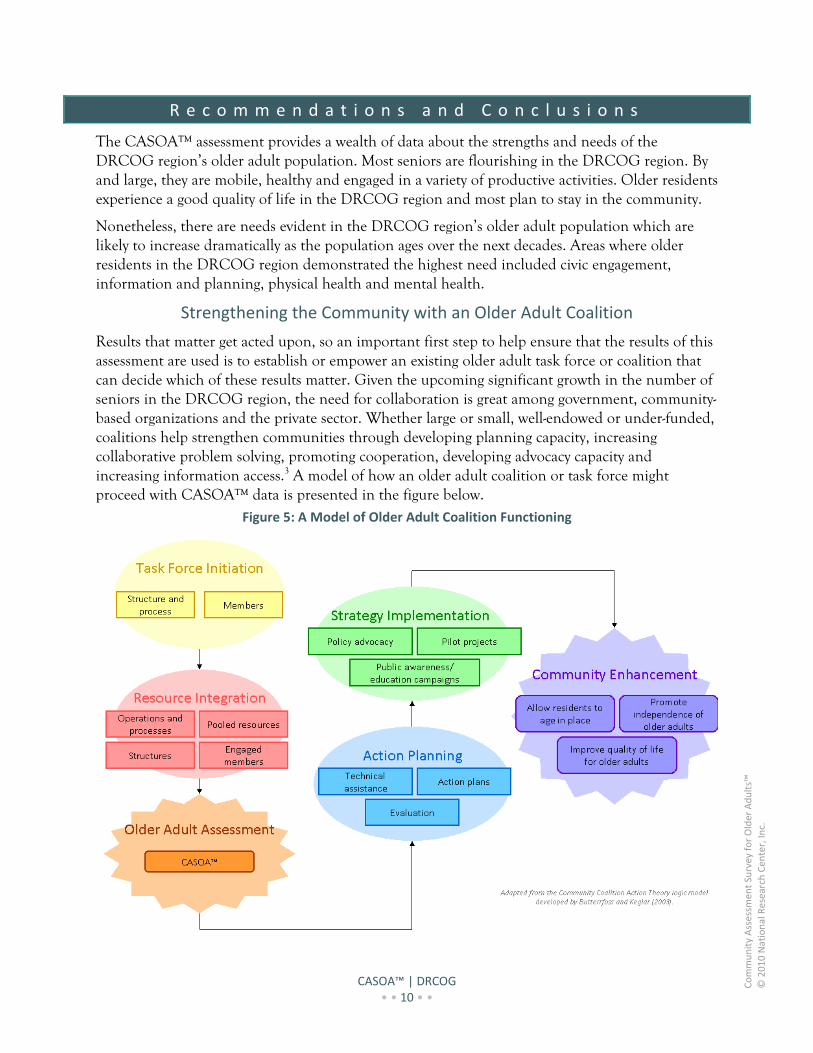
Strengthening the Community with an Older Adult Coalition
Results that matter get acted upon, so an important first step to help ensure that the results of this assessment are used is to establish or empower an existing older adult task force or coalition that can decide which of these results matter. Given the upcoming significant growth in the number of seniors in the DRCOG region, the need for collaboration is great among government, community-based organizations and the private sector. Whether large or small, well-endowed or under-funded, coalitions help strengthen communities through developing planning capacity, increasing collaborative problem solving, promoting cooperation, developing advocacy capacity and increasing information access.3 A model of how an older adult coalition or task force might proceed with CASOA™ data is presented in the figure below.
Figure 5: A Model of Older Adult Coalition Functioning
CASOA™ | DRCOG • • 11 • •
Community Assessm
ent Survey for Older Adults™
© 2010 National Research Cen
ter, In
c.
As presented in the preceding graphic, the coalition could use data from CASOA™ to develop an action plan that would identify areas for policy work, design public information campaigns and strategies to generate resources to fund pilot projects in the community. In addition, the consortium may serve as a “learning group” where various members or outside experts provide periodic lectures or host discussions on issues important to serving older adults, identifying trends in senior programming and the best practices to promote successful aging.
A coalition of older adults not only may serve as the vehicle by which recommendations for action arrive at the desk of staff and elected officials, but such a coalition offers an opportunity for its members to engage in relevant community service. Engaging with neighbors helps knit together a community of individuals, who, without that engagement, could face social isolation and the threat of dependency.
Opportunity 1: Civic Engagement
Similar to residents of the same age in many communities across the nation, older residents in the DRCOG region demonstrated significant needs in the area of civic engagement. Civic activity, whether it is through volunteering or participating in community decision-making, not only provides benefit to communities but also serves seniors themselves. Studies have found that volunteering in later life is associated with physical and functional health, lower injury rates and better psychological well-being. Those who volunteer are less likely to become injured or to die prematurely.4
The power of the next generation of older adults can be harnessed to the benefit of the community in the coming years. The literature on older adult civic activities finds that seniors are very well engaged in electoral participation (i.e., voting) and more engaged, than the average American, in volunteering and community service. It remains to be seen how Baby Boomers will compare to their older counterparts when it comes to making unpaid community contributions to society during their retirements. If DRCOG seeks to increase the civic engagement of older residents in the region, its decision makers may wish to consider a number of the following actions:
1. Increase participation of older residents in local governing and community decision-making
As local governments consider the diversity of their planning boards and oversight committees, the age of participants should become one of the diversity criteria. As communities age, there will be a natural accumulation of older adults who may be interested in serving. Older adults will need to be made aware of the opportunities to contribute. Sometimes special accommodation may need to be made to permit an older adult with the motivation but without the mobility or physical health to become civically engaged.
2. Actively promote senior volunteerism
Opportunities
1. Increase participation of older residents in local governing and community decision‐making
2. Actively promote senior volunteerism
3. Consider community design and land use policy to “build community”
CASOA™ | DRCOG • • 12 • •
Community Assessm
ent Survey for Older Adults™
© 2010 National Research Cen
ter, In
c.
Barriers, both real and perceived, to older adult volunteering include the difficulty of linking supply (volunteers) with demand (volunteer opportunities), insufficient public awareness about volunteer opportunities, workplace policies too inflexible to encourage employees to volunteer, insufficient transportation and ageism.5 One basic and potentially powerful step to get older adults involved is simply to ask them.6 A study found that older adults were five times more likely to volunteer if only they were invited.7 The Corporation for National and Community Service Web site8 lists effective practices on recruiting senior volunteers.
The oncoming wave of baby boomers has the potential to be the backbone of civic activity. The Center for Social Development suggests an “institutional capacity” perspective to leverage older adult engagement:
Access: opportunities must be available that address barriers such as transportation, physical health, need for continued employment, lack of knowledge of a specific issue and lack of technological skills.
Expectations: Community expectations can shape volunteerism. “Norming” can convey civic engagement as a societal obligation.
Information: Public education about needs and contributions of older volunteers can be beneficial and help shape the expectations of younger adults for their retirement years.
Incentives: Older adults are most interested in volunteer work that gives them “a chance to give back,” utilizes skills and shows impact.
Facilitation: A range of activities can help recruit and sustain older volunteers including orientation, readings, computer training and other education. Sometimes financial incentives are used to facilitate volunteerism through minimal stipends or tax credits.
Promising practices to increase older adult volunteerism include offering governments incentive programs such as travel reimbursements9 and tax credits/abatement,10 the development of an on-line clearinghouse of volunteer opportunities11 offering non-cash incentives12 and “time banking” opportunities,13 innovative programs including the Volunteer Generation Fund,14 Encore fellowships,15 Experience Corps15 and Silver Scholarships.15
For more information on senior volunteerism, the New York State Commission on National and Community Service has created a summary of recent literature on the best practices in older adult volunteerism in the white paper: NGA Policy Academy on Civic Engagement Older Adults, Baby Boomers, and Volunteerism Annotated Bibliography.10
3. Consider community design and land use policy to “build community”
New Urbanists and smart growth advocates argue the importance of community planning and land use to provide opportunities for civic life and activity. For more information on urban design guidelines that promote community building, see the Urban Design Advisory Service’s Seniors Living Policy: Urban Design Guidelines for Infill Development,16 Livable Communities for Older People,17 and the Beyond 50.50 Survey.17
CASOA™ | DRCOG • • 13 • •
Community Assessm
ent Survey for Older Adults™
© 2010 National Research Cen
ter, In
c.
Opportunity 2: Information and Planning
The DRCOG region’s older residents expressed needs for general information and planning as well as for specific information about services offered to seniors and help with Social Security and Medicare. Financial and legal planning also were areas where a sizable number of older residents in the DRCOG region could benefit from community assistance. Communities interested in increasing community capacity for information and planning services might consider the following actions:
1. Increase public awareness of programs and services
Increasing older adult awareness of services may help decrease unmet needs as well as frustration when older adults look for information. Better information may promote quality of life when residents learn about opportunities such as health screenings, and physical and social activities.
As local governments act to engage older adults in creating senior-friendly communities, it is essential to understand where residents learn about local affairs. Transmission of information represents half the effort in most successful communication relationships (reception representing the other half), so it is important to reach a large number of readers, viewers and listeners at the media fountain where they typically drink. Maximize communication across a range of media by focusing resources on the outlets that attract the segments of older adults sought and save resources that otherwise would fund less effective sources.
Regional newspapers, the local newspaper, television and local government’s newsletter represent important media for increasing awareness of local service opportunities and relevant policies. Working with employers and faith-based organizations can provide additional outlets for information flow.
2. Develop a clearinghouse for all services offered to seniors in community
There is need not only to increase knowledge about services offered by local government but also information about services provided by other organizations. Valuable services are currently offered by private, public and nonprofit agencies with a lack of centralized location for people to find out about services (or without most local older adults being aware of that central repository). Increasing knowledge about services to older adults may decrease the burdens placed on local government by spreading the demand among government and non-governmental agencies.
This information clearinghouse might be pursued best through the older adult task force or coalition recommended above. The goal would be to assemble an entire resource directory of all services for older adults offered in the DRCOG region and the nearby communities. Once completed, the directory should be available online as well as at each facility offering older adult services.
3. Offer information and planning activities on a large scale
Opportunities
1. Increase public awareness of programs and services
2. Develop an on‐line clearinghouse for all services offered to seniors in community
3. Offer information and planning activities on a large scale
CASOA™ | DRCOG • • 14 • •
Community Assessm
ent Survey for Older Adults™
© 2010 National Research Cen
ter, In
c.
Local governments and community-based nonprofits already offer information seminars, lectures and workshops on a variety of relevant quality of life topics for older adults – like estate planning, dealing with Medicare and improving health. Nevertheless, stepping up the number, frequency and dispersal of these live information offerings will reach more residents in need and help reduce needs in two ways: 1) by driving participants to service providers who can help to mitigate those needs and 2) by educating residents to solve by themselves the manageable problems they confront.
To maximize the dispersion of these information sessions, consider working with employers and faith-based communities to provide seminars and encourage information sharing and planning. “Resource kits” can be printed and distributed through community organizations to increase dissemination.
Opportunity 3: Physical Health and Mental Health
Older residents often cite good health as the key to successful aging.18 The DRCOG region is fortunate that most of its older adult residents report good health. However, health promotion and continued prevention of chronic disease will aid in maintaining the quality of life of older residents in the DRCOG region. Communities seeking to maintain and improve the health of their older residents might consider the following actions:
1. Actively promote good health practices
Awareness of and support for the implementation of four strategies that have proven effective in promoting the health of older adults may continue to help keep older adults in the DRCOG region healthy: 1) Healthy lifestyle promotion (physical activity, eating a healthy diet, not using tobacco, etc.), 2) Early detection of disease (health screenings, regular checkups, immunizations), 3) Injury prevention (e.g., housing modifications) and 4) Promotion of self-management techniques (e.g., arthritis self-help course).19
At least one-third of the DRCOG region’s older respondents reported that the opportunities for affordable quality health care and mental health care as well as preventive health services were “fair” or “poor.” Understanding specifically what older residents see as opportunities missed for their health care needs will provide details about the interventions that will be successful. Are current facilities or preventive services too few, not welcoming, poorly located or too expensive? What kind of preventive services are desired that do not seem to be available – screening fairs, in-office tests? For what kinds of mental health issues do residents encounter barriers to treatment – isolation, depression, anxiety, the costs of treatment, the stigma of care? These are the kinds of questions that can be answered with guided discussions whose purpose is to understand more fully the depth of health problems with which older residents in the DRCOG region cope.
2. Provide attractive fitness opportunities for older residents
Opportunities
1. Actively promote good health practices
2. Provide attractive fitness opportunities for older residents
3. Consider community design features to promote active‐living communities
4. Promote access to fruits, vegetables and healthy eating choices
5. Improve access to screenings and programs for depression, anxiety and Alzheimer’s/dementia
CASOA™ | DRCOG • • 15 • •
Community Assessm
ent Survey for Older Adults™
© 2010 National Research Cen
ter, In
c.
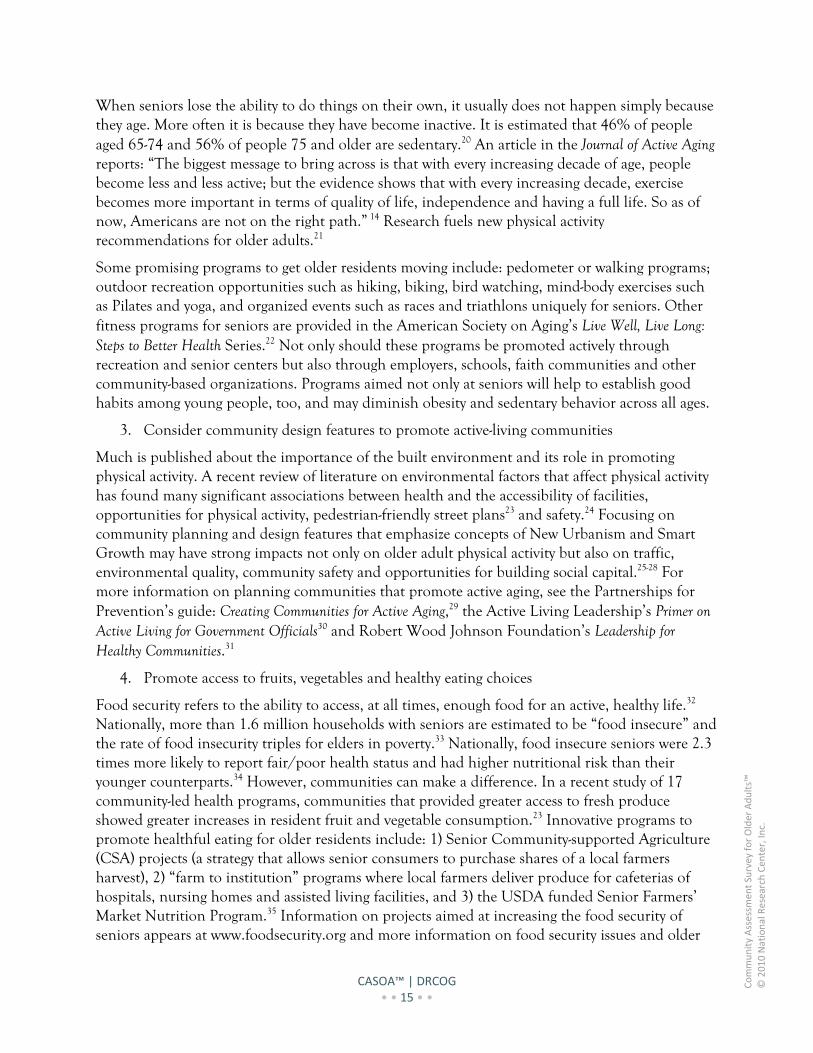
When seniors lose the ability to do things on their own, it usually does not happen simply because they age. More often it is because they have become inactive. It is estimated that 46% of people aged 65-74 and 56% of people 75 and older are sedentary.20 An article in the Journal of Active Aging reports: “The biggest message to bring across is that with every increasing decade of age, people become less and less active; but the evidence shows that with every increasing decade, exercise becomes more important in terms of quality of life, independence and having a full life. So as of now, Americans are not on the right path.” 14 Research fuels new physical activity recommendations for older adults.21
Some promising programs to get older residents moving include: pedometer or walking programs; outdoor recreation opportunities such as hiking, biking, bird watching, mind-body exercises such as Pilates and yoga, and organized events such as races and triathlons uniquely for seniors. Other fitness programs for seniors are provided in the American Society on Aging’s Live Well, Live Long: Steps to Better Health Series.22 Not only should these programs be promoted actively through recreation and senior centers but also through employers, schools, faith communities and other community-based organizations. Programs aimed not only at seniors will help to establish good habits among young people, too, and may diminish obesity and sedentary behavior across all ages.
3. Consider community design features to promote active-living communities
Much is published about the importance of the built environment and its role in promoting physical activity. A recent review of literature on environmental factors that affect physical activity has found many significant associations between health and the accessibility of facilities, opportunities for physical activity, pedestrian-friendly street plans23 and safety.24 Focusing on community planning and design features that emphasize concepts of New Urbanism and Smart Growth may have strong impacts not only on older adult physical activity but also on traffic, environmental quality, community safety and opportunities for building social capital.25-28 For more information on planning communities that promote active aging, see the Partnerships for Prevention’s guide: Creating Communities for Active Aging,29 the Active Living Leadership’s Primer on Active Living for Government Officials30 and Robert Wood Johnson Foundation’s Leadership for Healthy Communities.31
4. Promote access to fruits, vegetables and healthy eating choices
Food security refers to the ability to access, at all times, enough food for an active, healthy life.32 Nationally, more than 1.6 million households with seniors are estimated to be “food insecure” and the rate of food insecurity triples for elders in poverty.33 Nationally, food insecure seniors were 2.3 times more likely to report fair/poor health status and had higher nutritional risk than their younger counterparts.34 However, communities can make a difference. In a recent study of 17 community-led health programs, communities that provided greater access to fresh produce showed greater increases in resident fruit and vegetable consumption.23 Innovative programs to promote healthful eating for older residents include: 1) Senior Community-supported Agriculture (CSA) projects (a strategy that allows senior consumers to purchase shares of a local farmers harvest), 2) “farm to institution” programs where local farmers deliver produce for cafeterias of hospitals, nursing homes and assisted living facilities, and 3) the USDA funded Senior Farmers’ Market Nutrition Program.35 Information on projects aimed at increasing the food security of seniors appears at www.foodsecurity.org and more information on food security issues and older
CASOA™ | DRCOG • • 16 • •
Community Assessm
ent Survey for Older Adults™
© 2010 National Research Cen
ter, In
c.
adults is on America’s Second Harvest Fact sheet on Senior Hunger.34 In addition to these resources, the USDA has produced a food security toolkit that provides a series of tools to help communities assess their food security and target areas and populations in need.36
5. Improve access to screenings and programs for depression, anxiety and Alzheimer’s/dementia
Programs for mental health can be provided not only by mental health centers. Recreation centers, faith-based organizations and the offices of medical doctors offer opportunities to test older adults’ cognitive abilities and symptoms of depression, anxiety, Alzheimer’s/dementia and substance abuse. Health fairs can include written screening tests for signs of dementia and for symptoms of other mental health problems.37 In brochures, on Web sites or in media broadcasts, candid communication from local government and Area Agencies on Aging about the prevalence of mental health problems associated with aging will reduce the stigma associated with admitting problems or reporting them when suspected by friends and family. Where such reporting should occur and the likely steps that follow self report or reporting by others must be widely disseminated to older residents and other adults in the area.38
Conclusions
In summary, this assessment captured the perspective of the DRCOG region’s older residents, demonstrating widespread agreement that seniors are generally satisfied with the current quality of life in the community. Attendant to the older adult residents in the DRCOG region is widespread (albeit not uniform) good health, engagement in social and physical activities and a positive outlook on conditions here. The DRCOG region is doing a good job of providing opportunities for older residents, but there are limitations to continued success that need to be addressed before the full force of the growth in the number of older adults hits.
If no changes occurred in the older adult population, the community would continue to offer a good quality of life for its residents. However, as the aging population vertakes the DRCOG region (as it will in the U.S. and abroad), the current resources available to older adults will not suffice. Services will need to be expanded and re-configured to suit the older-old and the younger-old; new techniques will need to be employed to educate residents about programs and facilities; more effective partnerships and networking will be required to provide integrated service opportunities; and new community land use and design policies will need to be adopted.
A periodic sounding of the DRCOG region’s older adults will provide ongoing assessment of the progress you make as the spring of older adults bubbles into the community. Conducting the CASOA™ puts the DRCOG region vastly ahead of most communities in the U.S. because planning for the coming wave of older adults most often is accomplished by the assertions of hard working service providers, who, despite their commitment to the well-being of older adults, cannot speak as articulately for older adults as older adults can speak for themselves.
An AARP executive noted about America’s aging: “It would be hard to overstate the significance of these shifts… But from here on, every planning decision made in every community must take into account the impact on older residents, who can no longer be an afterthought. The ability of our institutions to adapt to an aging nation will be one of the great American challenges of the 21st century.”39
CASOA™ | DRCOG • • 17 • •
Community Assessm
ent Survey for Older Adults™
© 2010 National Research Cen
ter, In
c.
A g e W a v e i n t h e D R C O G R e g i o n
Demographics
The graying of America can be understood in simple population counts. The number of people in the United States over the age of 65 is projected to more than double from 35 million in 2000, to 71 million in 2030. Additionally, a dramatic increase in the average age of the older population is expected. While 4.2 million persons were age 85 and older in 2000, further declines in mortality could lead to a five-fold increase in the number by 2040.40
This bubble in the demographic charts is largely the Baby Boom generation, the cohort of 75 million Americans born between 1946 and 1964, the largest generation ever, grown in no small part because of the optimism and prosperity that followed WWII. In the year 2006, the first wave of the Baby Boom generation reached the age of 60.
The Baby Boom generation is beginning to enter older adulthood, creating a new disruption in social institutions akin to what occurred when they were younger: crowding hospitals, schools, and colleges, transforming markets, trends and the workplace.41 In their later years, Boomers likely will have a similar impact on retirement, health, housing, transportation, education, community and family life.42
The “demographic revolution” that began in 1946 is expected to result in a broad array of challenges and opportunities in the near future and will create a great shift in national priorities.41 Trends that are apparent include:
• Advances in medical and related sciences, coupled with trends in exercise and healthy lifestyles suggest that people will not only live longer but the number of Americans who live up to and beyond 85 years of age will continue to grow43
• Older adults will be wealthier and better educated than past generations43 • Baby Boom retirees will have a stronger desire to make contributions beyond traditional
retirement44 • People are likely to stay in the workforce longer than ever before45-47 • The older adult population will be more racially and ethnically diverse43 • The epicenter of economic and political power will shift from the young to the old43
How the increase in older Americans fully will affect society largely remains speculation. However, what is clear is that the current demographic trends are likely to change fundamentally the way older adult life is lived.
A Profile of Older Adults in the DRCOG Region
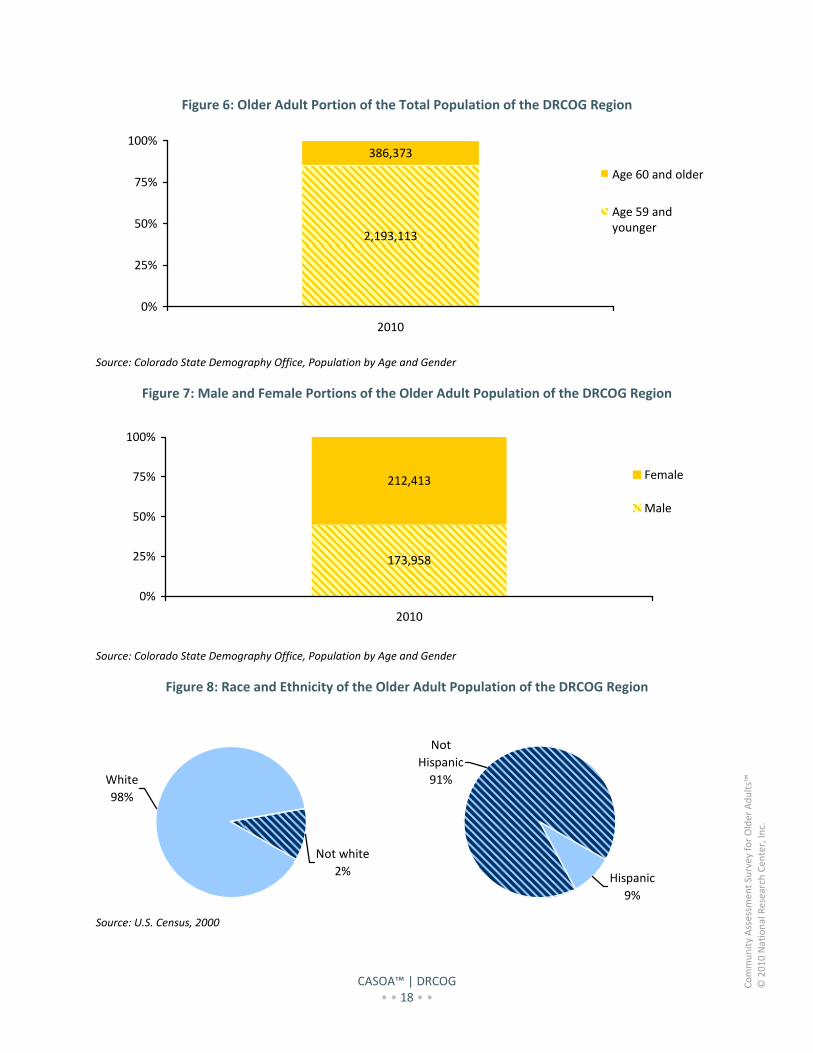
In 2010, there were estimated to be 386,373 older adults (persons 60 and over) living in the DRCOG region. The following charts display the DRCOG region’s older adult demographic profile.
CASOA™ | DRCOG • • 18 • •
Community Assessm
ent Survey for Older Adults™
© 2010 National Research Cen
ter, In
c.
Figure 6: Older Adult Portion of the Total Population of the DRCOG Region
2,193,113
386,373
0%
25%
50%
75%
100%
2010
Age 60 and older
Age 59 andyounger
Source: Colorado State Demography Office, Population by Age and Gender
Figure 7: Male and Female Portions of the Older Adult Population of the DRCOG Region
173,958
212,413
0%
25%
50%
75%
100%
2010
Female
Male
Source: Colorado State Demography Office, Population by Age and Gender
Figure 8: Race and Ethnicity of the Older Adult Population of the DRCOG Region
Not white
2%
White
98%
Not
Hispanic
91%
Hispanic
9%
Source: U.S. Census, 2000
CASOA™ | DRCOG • • 19 • •
Community Assessm
ent Survey for Older Adults™
© 2010 National Research Cen
ter, In
c.
Residential Stability
According to a survey by AARP, more than 8 in 10 adults over age 45 want to live roughly where they live now “as long as possible.”48 That does not necessarily mean the exact same dwelling, but it does mean within only a few miles and in a state of self-sufficiency, if possible. To “age in place” implies both personal strength and provision of community assistance as needed. In different communities, older adults have different intentions, so it is essential to understand what older adults in the DRCOG region are anticipating in their retirement. By learning directly from older adults, planning can begin for the services required for them to remain independent and the community can attract other older adults who are likely to find those kinds of services appealing.
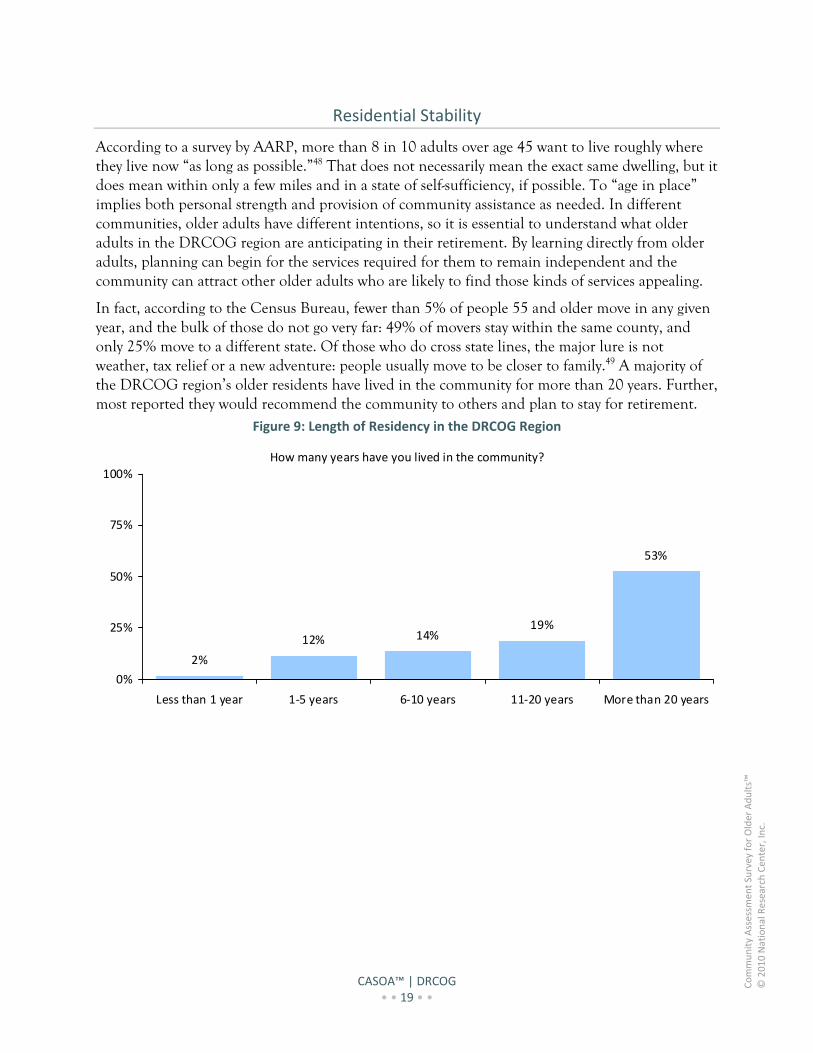
In fact, according to the Census Bureau, fewer than 5% of people 55 and older move in any given year, and the bulk of those do not go very far: 49% of movers stay within the same county, and only 25% move to a different state. Of those who do cross state lines, the major lure is not weather, tax relief or a new adventure: people usually move to be closer to family.49 A majority of the DRCOG region’s older residents have lived in the community for more than 20 years. Further, most reported they would recommend the community to others and plan to stay for retirement.
Figure 9: Length of Residency in the DRCOG Region
How many years have you lived in the community?
2%
12% 14%19%
53%
0%
25%
50%
75%
100%
Less than 1 year 1‐5 years 6‐10 years 11‐20 years More than 20 years
CASOA™ | DRCOG • • 20 • •
Community Assessm
ent Survey for Older Adults™
© 2010 National Research Cen
ter, In
c.
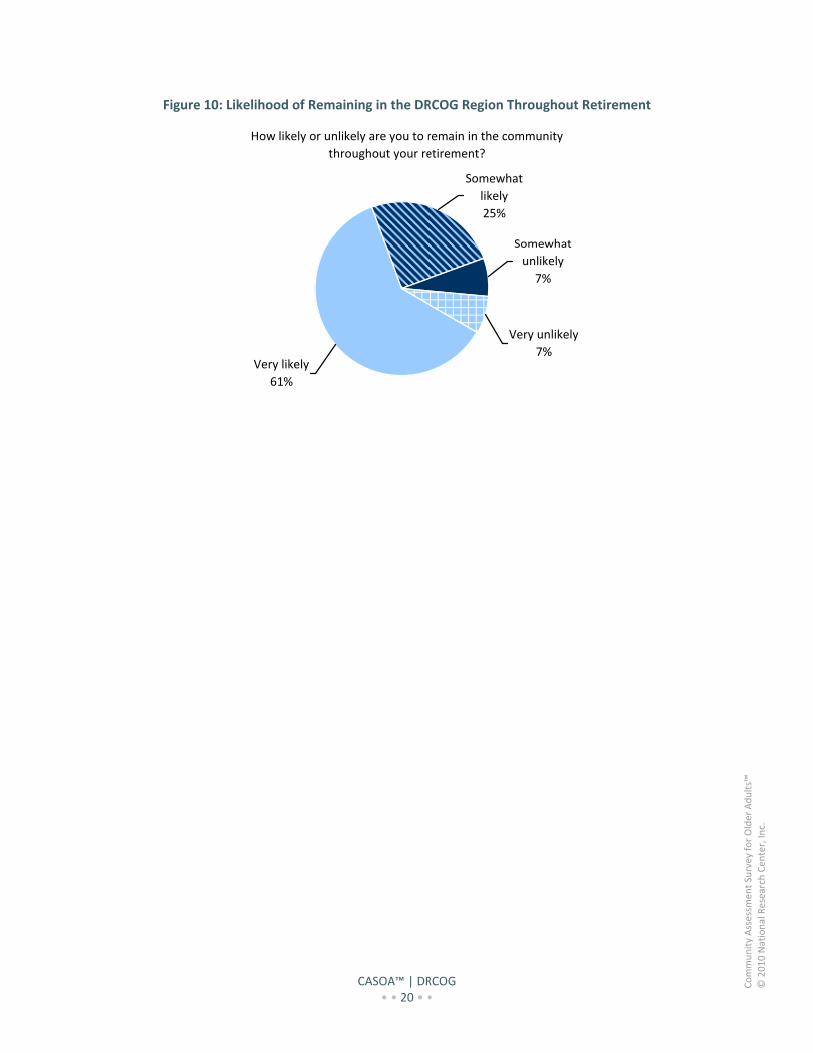
Figure 10: Likelihood of Remaining in the DRCOG Region Throughout Retirement
How likely or unlikely are you to remain in the community
throughout your retirement?
Very unlikely
7%
Somewhat
unlikely
7%
Somewhat
likely
25%
Very likely
61%
CASOA™ | DRCOG • • 21 • •
Community Assessm
ent Survey for Older Adults™
© 2010 National Research Cen
ter, In
c.
T h e D R C O G R e g i o n a s a P l a c e f o r O l d e r R e s i d e n t s
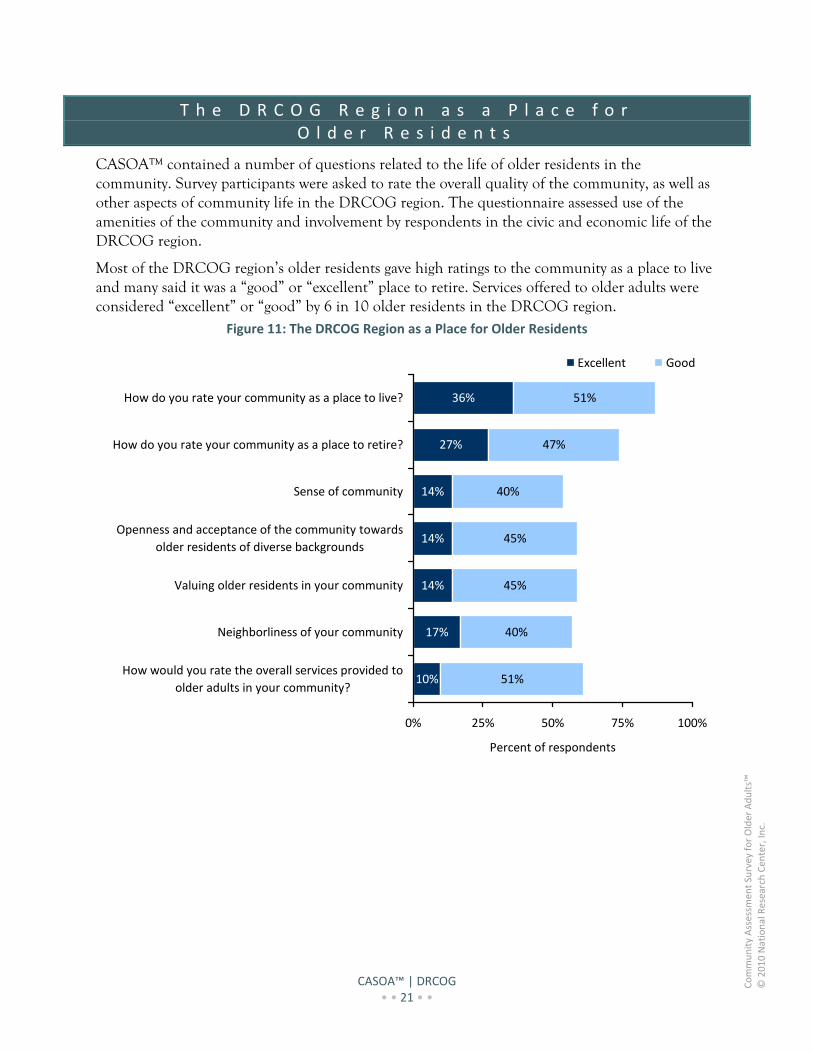
CASOA™ contained a number of questions related to the life of older residents in the community. Survey participants were asked to rate the overall quality of the community, as well as other aspects of community life in the DRCOG region. The questionnaire assessed use of the amenities of the community and involvement by respondents in the civic and economic life of the DRCOG region.
Most of the DRCOG region’s older residents gave high ratings to the community as a place to live and many said it was a “good” or “excellent” place to retire. Services offered to older adults were considered “excellent” or “good” by 6 in 10 older residents in the DRCOG region.
Figure 11: The DRCOG Region as a Place for Older Residents
10%
17%
14%
14%
14%
27%
36%
51%
40%
45%
45%
40%
47%
51%
0% 25% 50% 75% 100%
How would you rate the overall services provided to
older adults in your community?
Neighborliness of your community
Valuing older residents in your community
Openness and acceptance of the community towards
older residents of diverse backgrounds
Sense of community
How do you rate your community as a place to retire?
How do you rate your community as a place to live?
Percent of respondents
Excellent Good
CASOA™ | DRCOG • • 22 • •
Community Assessm
ent Survey for Older Adults™
© 2010 National Research Cen
ter, In
c.
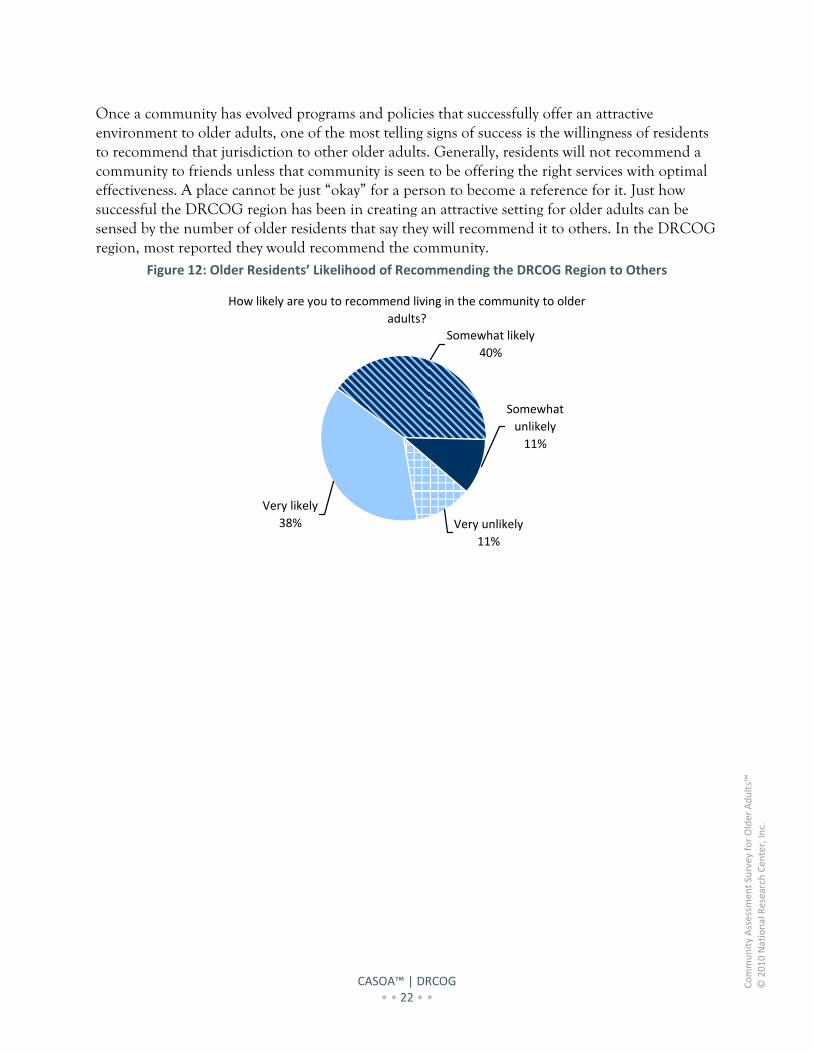
Once a community has evolved programs and policies that successfully offer an attractive environment to older adults, one of the most telling signs of success is the willingness of residents to recommend that jurisdiction to other older adults. Generally, residents will not recommend a community to friends unless that community is seen to be offering the right services with optimal effectiveness. A place cannot be just “okay” for a person to become a reference for it. Just how successful the DRCOG region has been in creating an attractive setting for older adults can be sensed by the number of older residents that say they will recommend it to others. In the DRCOG region, most reported they would recommend the community.
Figure 12: Older Residents’ Likelihood of Recommending the DRCOG Region to Others
How likely are you to recommend living in the community to older
adults?
Very likely
38% Very unlikely
11%
Somewhat
unlikely
11%
Somewhat likely
40%
CASOA™ | DRCOG • • 23 • •
Community Assessm
ent Survey for Older Adults™
© 2010 National Research Cen
ter, In
c.
A C l o s e r L o o k a t O l d e r A d u l t N e e d s
Community areas of health and wellness, community land use and design, productive activities and information and planning contribute significantly to the quality of community life for older residents. Each of these topics is covered in greater detail in the following sections. Within each chapter of the report, data related to specific strengths and needs of older adults are presented. Each chapter, and section within, begins with older residents’ ratings of the DRCOG region and is followed by resident behaviors and needs.
Health and Wellness
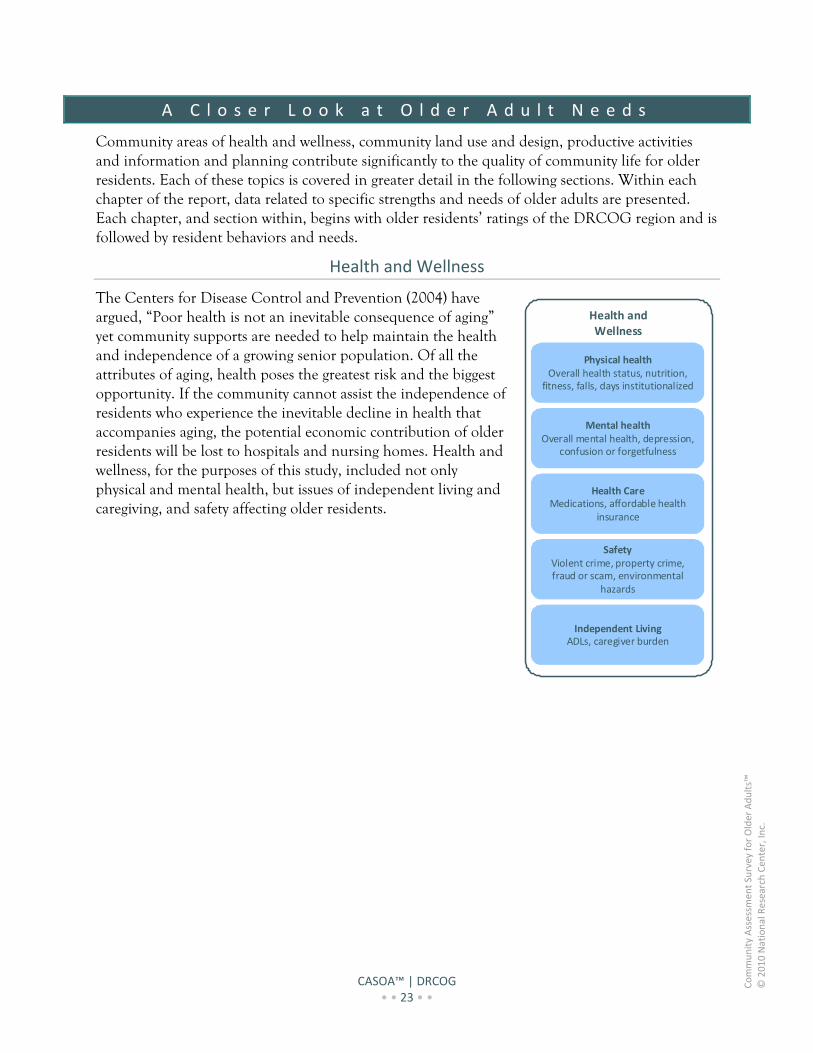
The Centers for Disease Control and Prevention (2004) have argued, “Poor health is not an inevitable consequence of aging” yet community supports are needed to help maintain the health and independence of a growing senior population. Of all the attributes of aging, health poses the greatest risk and the biggest opportunity. If the community cannot assist the independence of residents who experience the inevitable decline in health that accompanies aging, the potential economic contribution of older residents will be lost to hospitals and nursing homes. Health and wellness, for the purposes of this study, included not only physical and mental health, but issues of independent living and caregiving, and safety affecting older residents.
Health and Wellness
Physical healthOverall health status, nutrition,
fitness, falls, days institutionalized
Mental healthOverall mental health, depression,
confusion or forgetfulness
Health CareMedications, affordable health
insurance
Safety Violent crime, property crime, fraud or scam, environmental
hazards
Independent LivingADLs, caregiver burden
CASOA™ | DRCOG • • 24 • •
Community Assessm
ent Survey for Older Adults™
© 2010 National Research Cen
ter, In
c.
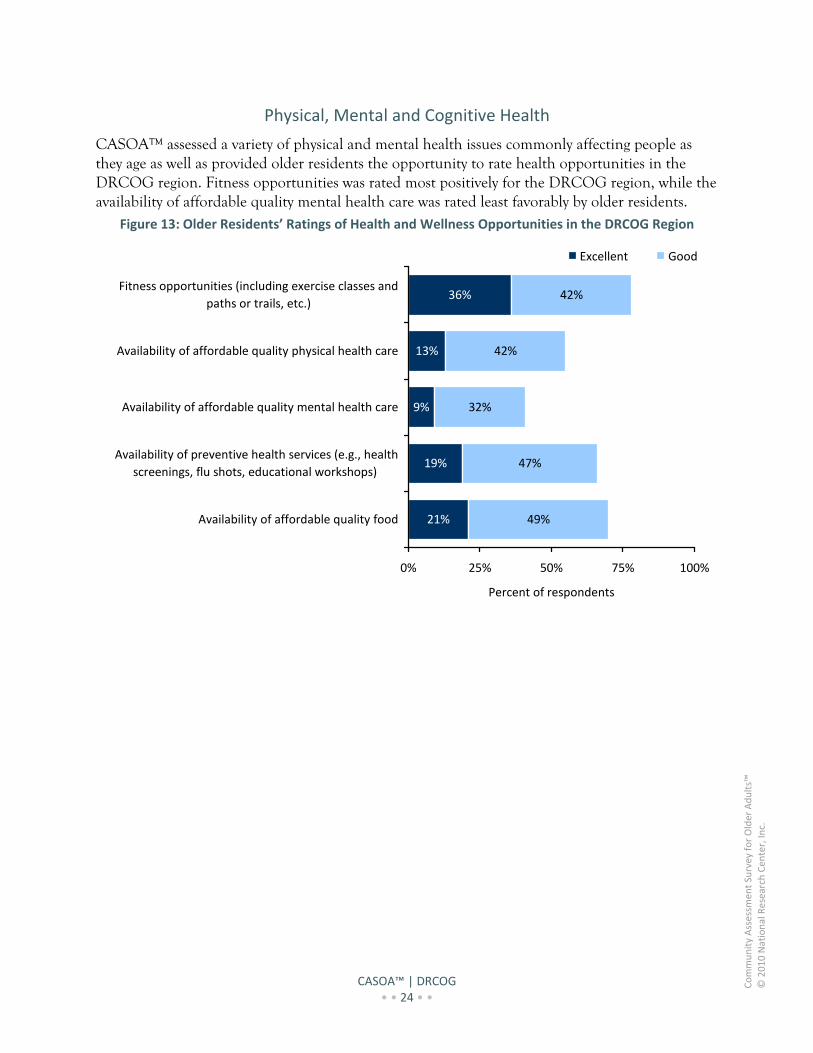
Physical, Mental and Cognitive Health
CASOA™ assessed a variety of physical and mental health issues commonly affecting people as they age as well as provided older residents the opportunity to rate health opportunities in the DRCOG region. Fitness opportunities was rated most positively for the DRCOG region, while the availability of affordable quality mental health care was rated least favorably by older residents.
Figure 13: Older Residents’ Ratings of Health and Wellness Opportunities in the DRCOG Region
21%
19%
9%
13%
36%
49%
47%
32%
42%
42%
0% 25% 50% 75% 100%
Availability of affordable quality food
Availability of preventive health services (e.g., health
screenings, flu shots, educational workshops)
Availability of affordable quality mental health care
Availability of affordable quality physical health care
Fitness opportunities (including exercise classes and
paths or trails, etc.)
Percent of respondents
Excellent Good
CASOA™ | DRCOG • • 25 • •
Community Assessm
ent Survey for Older Adults™
© 2010 National Research Cen
ter, In
c.
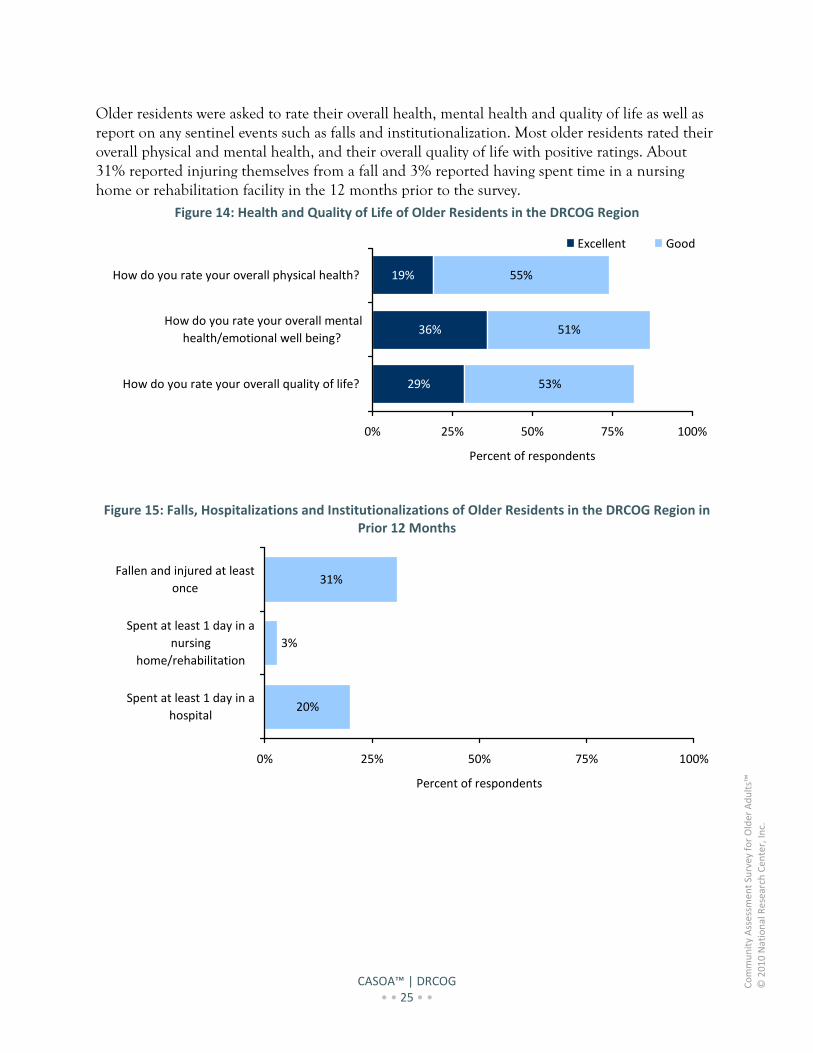
Older residents were asked to rate their overall health, mental health and quality of life as well as report on any sentinel events such as falls and institutionalization. Most older residents rated their overall physical and mental health, and their overall quality of life with positive ratings. About 31% reported injuring themselves from a fall and 3% reported having spent time in a nursing home or rehabilitation facility in the 12 months prior to the survey.
Figure 14: Health and Quality of Life of Older Residents in the DRCOG Region
29%
36%
19%
53%
51%
55%
0% 25% 50% 75% 100%
How do you rate your overall quality of life?
How do you rate your overall mental
health/emotional well being?
How do you rate your overall physical health?
Percent of respondents
Excellent Good
Figure 15: Falls, Hospitalizations and Institutionalizations of Older Residents in the DRCOG Region in Prior 12 Months
20%
31%
3%
0% 25% 50% 75% 100%
Spent at least 1 day in a
hospital
Spent at least 1 day in a
nursing
home/rehabilitation
Fallen and injured at least
once
Percent of respondents
CASOA™ | DRCOG • • 26 • •
Community Assessm
ent Survey for Older Adults™
© 2010 National Research Cen
ter, In
c.
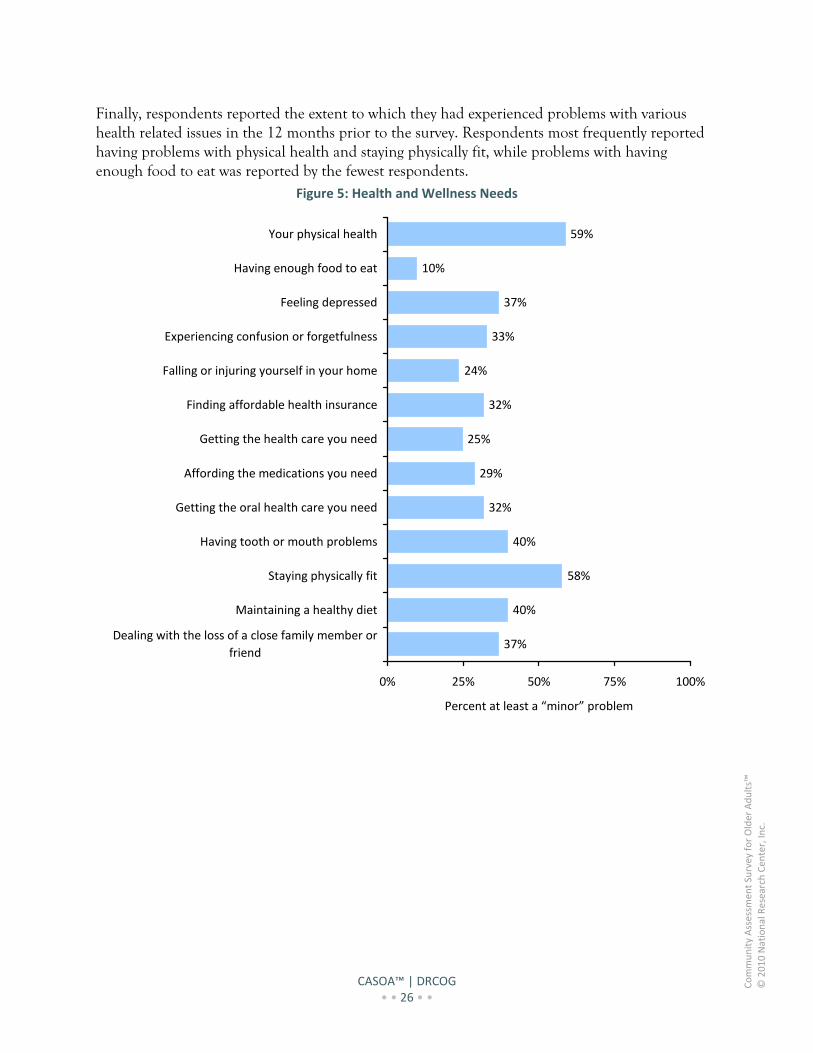
Finally, respondents reported the extent to which they had experienced problems with various health related issues in the 12 months prior to the survey. Respondents most frequently reported having problems with physical health and staying physically fit, while problems with having enough food to eat was reported by the fewest respondents.
Figure 5: Health and Wellness Needs
37%
40%
58%
40%
32%
29%
25%
32%
24%
33%
37%
10%
59%
0% 25% 50% 75% 100%
Dealing with the loss of a close family member or
friend
Maintaining a healthy diet
Staying physically fit
Having tooth or mouth problems
Getting the oral health care you need
Affording the medications you need
Getting the health care you need
Finding affordable health insurance
Falling or injuring yourself in your home
Experiencing confusion or forgetfulness
Feeling depressed
Having enough food to eat
Your physical health
Percent at least a “minor” problem
CASOA™ | DRCOG • • 27 • •
Community Assessm
ent Survey for Older Adults™
© 2010 National Research Cen
ter, In
c.
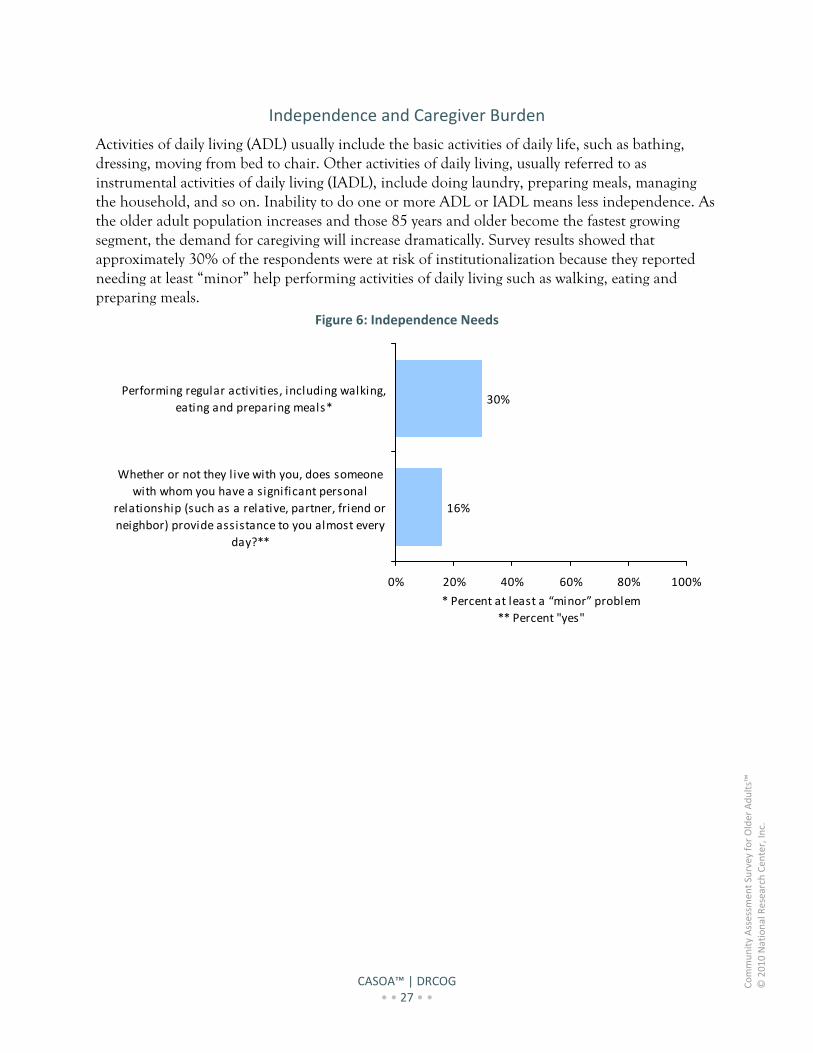
Independence and Caregiver Burden
Activities of daily living (ADL) usually include the basic activities of daily life, such as bathing, dressing, moving from bed to chair. Other activities of daily living, usually referred to as instrumental activities of daily living (IADL), include doing laundry, preparing meals, managing the household, and so on. Inability to do one or more ADL or IADL means less independence. As the older adult population increases and those 85 years and older become the fastest growing segment, the demand for caregiving will increase dramatically. Survey results showed that approximately 30% of the respondents were at risk of institutionalization because they reported needing at least “minor” help performing activities of daily living such as walking, eating and preparing meals.
Figure 6: Independence Needs
16%
30%
0% 20% 40% 60% 80% 100%
Whether or not they l ive with you, does someone
with whom you have a significant personal
relationship (such as a relative, partner, friend or
neighbor) provide assistance to you almost every
day?**
Performing regular activities, including walking,
eating and preparing meals*
* Percent at least a “minor” problem
** Percent "yes"
CASOA™ | DRCOG • • 28 • •
Community Assessm
ent Survey for Older Adults™
© 2010 National Research Cen
ter, In
c.
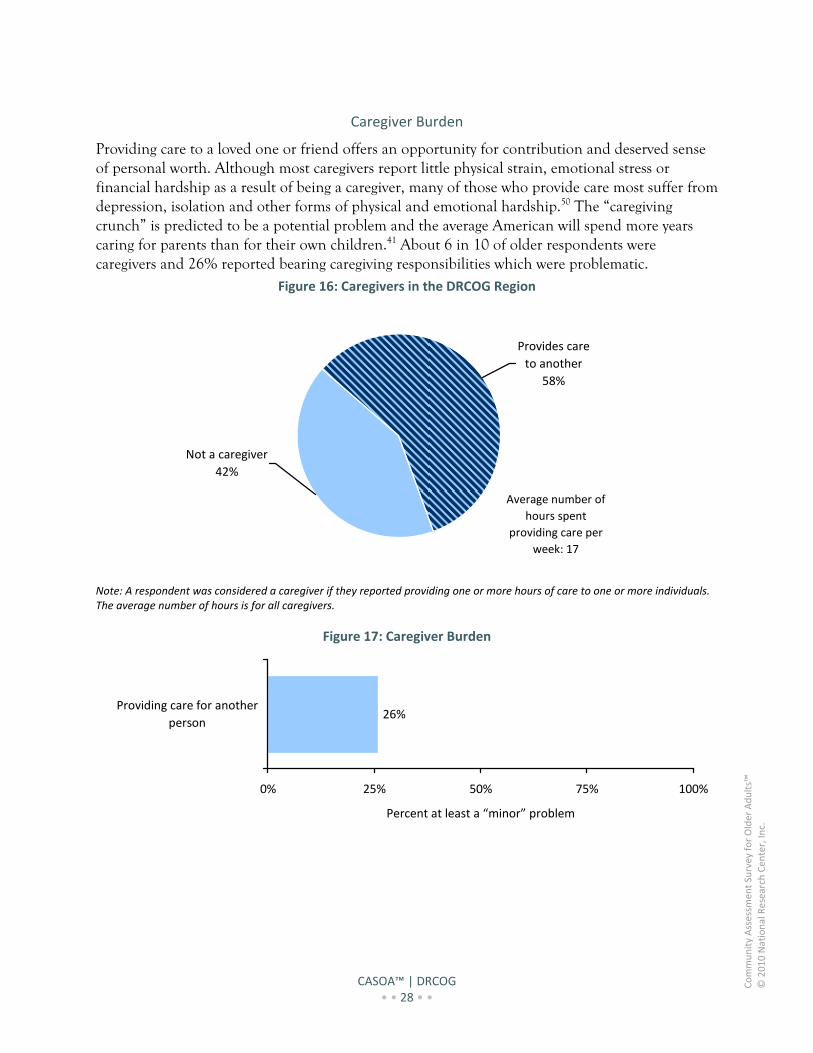
Caregiver Burden
Providing care to a loved one or friend offers an opportunity for contribution and deserved sense of personal worth. Although most caregivers report little physical strain, emotional stress or financial hardship as a result of being a caregiver, many of those who provide care most suffer from depression, isolation and other forms of physical and emotional hardship.50 The “caregiving crunch” is predicted to be a potential problem and the average American will spend more years caring for parents than for their own children.41 About 6 in 10 of older respondents were caregivers and 26% reported bearing caregiving responsibilities which were problematic.
Figure 16: Caregivers in the DRCOG Region
Not a caregiver
42%
Provides care
to another
58%
Average number of
hours spent
providing care per
week: 17
Note: A respondent was considered a caregiver if they reported providing one or more hours of care to one or more individuals. The average number of hours is for all caregivers.
Figure 17: Caregiver Burden
26%
0% 25% 50% 75% 100%
Providing care for another
person
Percent at least a “minor” problem
CASOA™ | DRCOG • • 29 • •
Community Assessm
ent Survey for Older Adults™
© 2010 National Research Cen
ter, In
c.
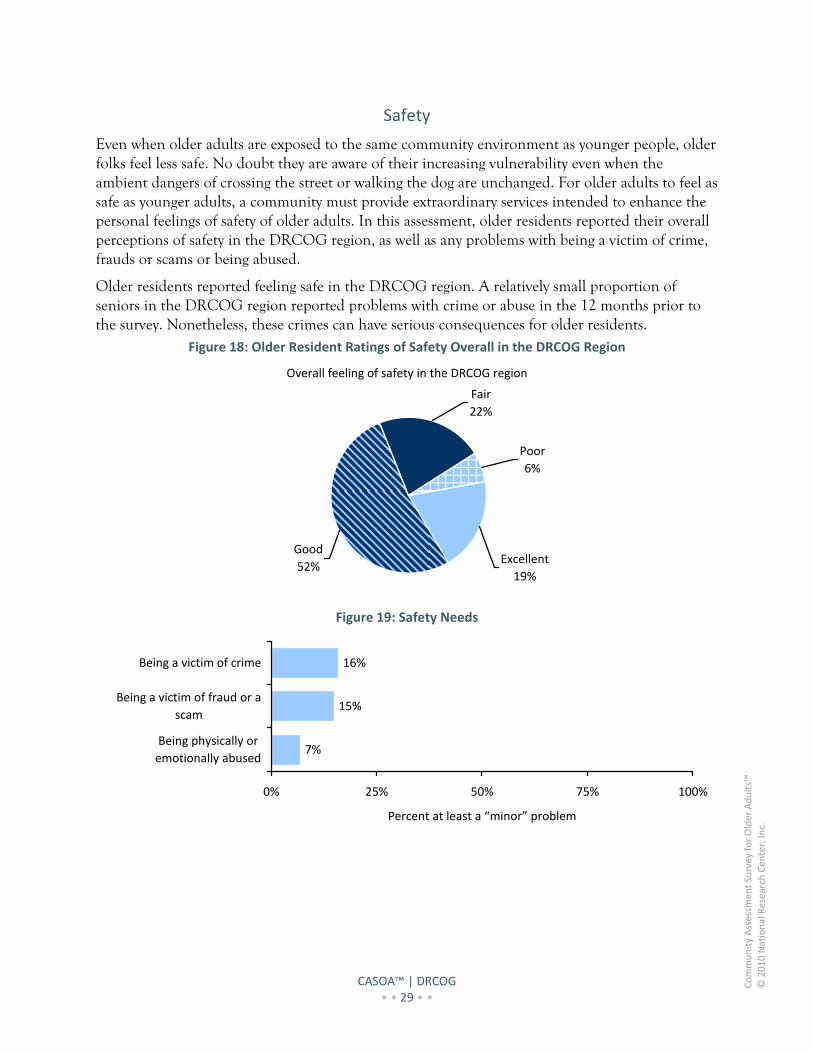
Safety
Even when older adults are exposed to the same community environment as younger people, older folks feel less safe. No doubt they are aware of their increasing vulnerability even when the ambient dangers of crossing the street or walking the dog are unchanged. For older adults to feel as safe as younger adults, a community must provide extraordinary services intended to enhance the personal feelings of safety of older adults. In this assessment, older residents reported their overall perceptions of safety in the DRCOG region, as well as any problems with being a victim of crime, frauds or scams or being abused.
Older residents reported feeling safe in the DRCOG region. A relatively small proportion of seniors in the DRCOG region reported problems with crime or abuse in the 12 months prior to the survey. Nonetheless, these crimes can have serious consequences for older residents.
Figure 18: Older Resident Ratings of Safety Overall in the DRCOG Region
Overall feeling of safety in the DRCOG region
Poor
6%
Fair
22%
Good
52%Excellent
19%
Figure 19: Safety Needs
7%
15%
16%
0% 25% 50% 75% 100%
Being physically or
emotionally abused
Being a victim of fraud or a
scam
Being a victim of crime
Percent at least a “minor” problem
CASOA™ | DRCOG • • 30 • •
Community Assessm
ent Survey for Older Adults™
© 2010 National Research Cen
ter, In
c.
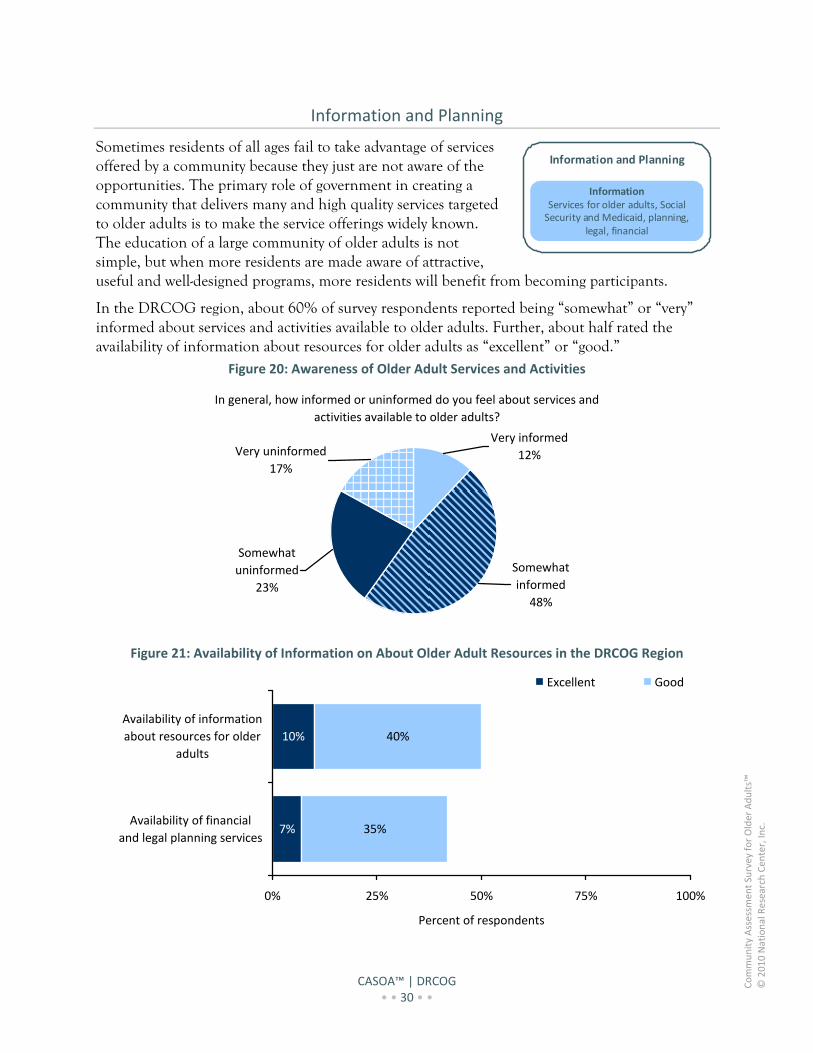
Information and Planning
Sometimes residents of all ages fail to take advantage of services offered by a community because they just are not aware of the opportunities. The primary role of government in creating a community that delivers many and high quality services targeted to older adults is to make the service offerings widely known. The education of a large community of older adults is not simple, but when more residents are made aware of attractive, useful and well-designed programs, more residents will benefit from becoming participants.
In the DRCOG region, about 60% of survey respondents reported being “somewhat” or “very” informed about services and activities available to older adults. Further, about half rated the availability of information about resources for older adults as “excellent” or “good.”
Figure 20: Awareness of Older Adult Services and Activities
In general, how informed or uninformed do you feel about services and
activities available to older adults?
Very uninformed
17%
Very informed
12%
Somewhat
uninformed
23%
Somewhat
informed
48%
Figure 21: Availability of Information on About Older Adult Resources in the DRCOG Region
7%
10%
35%
40%
0% 25% 50% 75% 100%
Availability of financial
and legal planning services
Availability of information
about resources for older
adults
Percent of respondents
Excellent Good
Information and Planning
InformationServices for older adults, Social Security and Medicaid, planning,
legal, financial
CASOA™ | DRCOG • • 31 • •
Community Assessm
ent Survey for Older Adults™
© 2010 National Research Cen
ter, In
c.
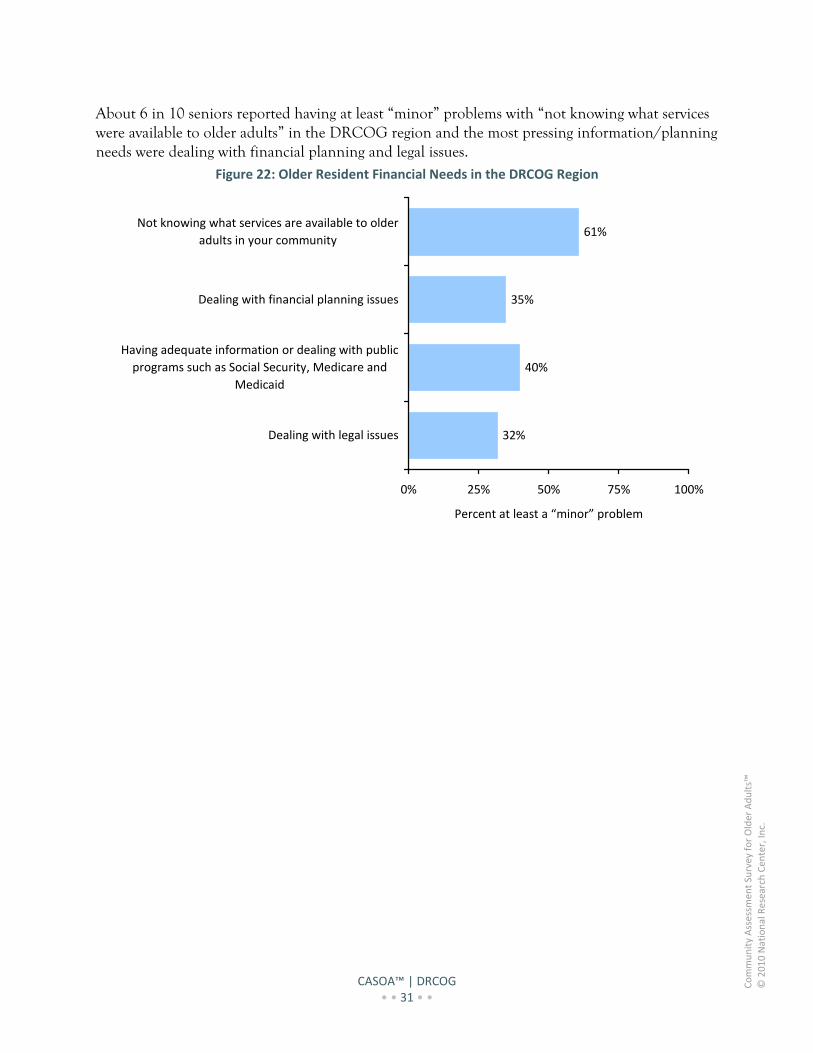
About 6 in 10 seniors reported having at least “minor” problems with “not knowing what services were available to older adults” in the DRCOG region and the most pressing information/planning needs were dealing with financial planning and legal issues.
Figure 22: Older Resident Financial Needs in the DRCOG Region
32%
40%
35%
61%
0% 25% 50% 75% 100%
Dealing with legal issues
Having adequate information or dealing with public
programs such as Social Security, Medicare and
Medicaid
Dealing with financial planning issues
Not knowing what services are available to older
adults in your community
Percent at least a “minor” problem
CASOA™ | DRCOG • • 32 • •
Community Assessm
ent Survey for Older Adults™
© 2010 National Research Cen
ter, In
c.
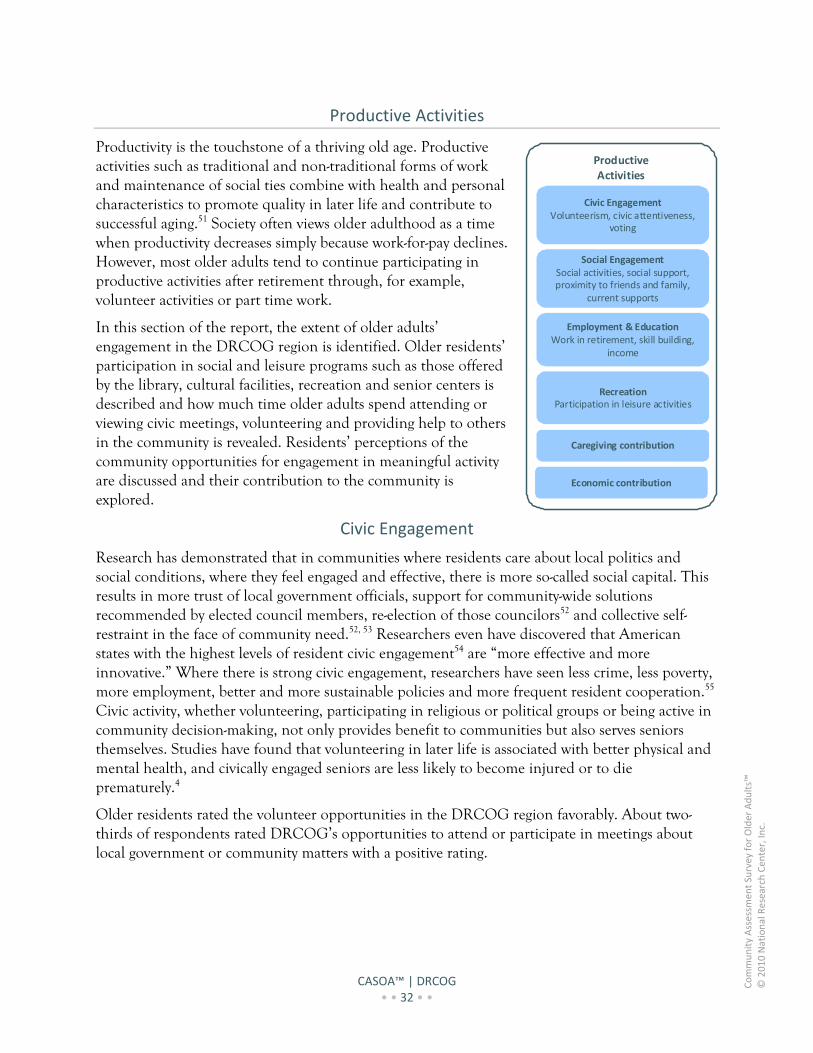
Productive Activities
Productivity is the touchstone of a thriving old age. Productive activities such as traditional and non-traditional forms of work and maintenance of social ties combine with health and personal characteristics to promote quality in later life and contribute to successful aging.51 Society often views older adulthood as a time when productivity decreases simply because work-for-pay declines. However, most older adults tend to continue participating in productive activities after retirement through, for example, volunteer activities or part time work.
In this section of the report, the extent of older adults’ engagement in the DRCOG region is identified. Older residents’ participation in social and leisure programs such as those offered by the library, cultural facilities, recreation and senior centers is described and how much time older adults spend attending or viewing civic meetings, volunteering and providing help to others in the community is revealed. Residents’ perceptions of the community opportunities for engagement in meaningful activity are discussed and their contribution to the community is explored.
Civic Engagement
Research has demonstrated that in communities where residents care about local politics and social conditions, where they feel engaged and effective, there is more so-called social capital. This results in more trust of local government officials, support for community-wide solutions recommended by elected council members, re-election of those councilors52 and collective self-restraint in the face of community need.52, 53 Researchers even have discovered that American states with the highest levels of resident civic engagement54 are “more effective and more innovative.” Where there is strong civic engagement, researchers have seen less crime, less poverty, more employment, better and more sustainable policies and more frequent resident cooperation.55 Civic activity, whether volunteering, participating in religious or political groups or being active in community decision-making, not only provides benefit to communities but also serves seniors themselves. Studies have found that volunteering in later life is associated with better physical and mental health, and civically engaged seniors are less likely to become injured or to die prematurely.4
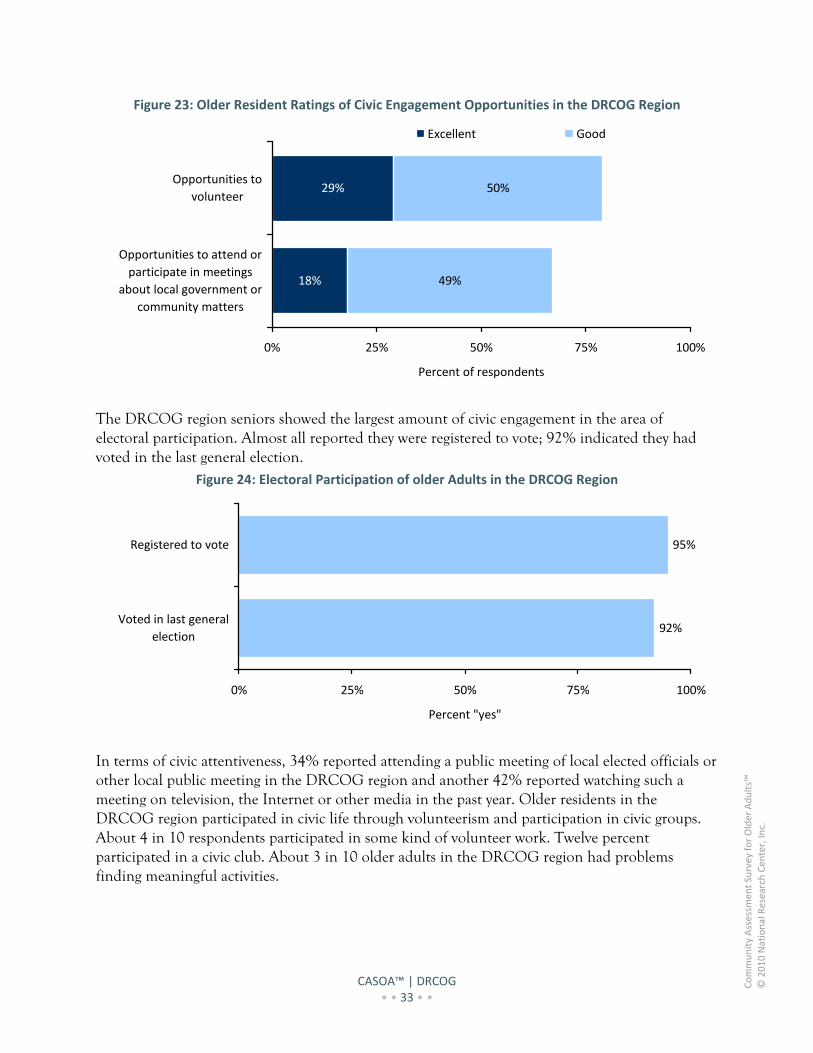
Older residents rated the volunteer opportunities in the DRCOG region favorably. About two-thirds of respondents rated DRCOG’s opportunities to attend or participate in meetings about local government or community matters with a positive rating.
Productive Activities
Civic EngagementVolunteerism, civic attentiveness,
voting
Social EngagementSocial activities, social support, proximity to friends and family,
current supports
Employment & EducationWork in retirement, skill building,
income
RecreationParticipation in leisure activities
Caregiving contribution
Economic contribution
CASOA™ | DRCOG • • 33 • •
Community Assessm
ent Survey for Older Adults™
© 2010 National Research Cen
ter, In
c.
Figure 23: Older Resident Ratings of Civic Engagement Opportunities in the DRCOG Region
18%
29%
49%
50%
0% 25% 50% 75% 100%
Opportunities to attend or
participate in meetings
about local government or
community matters
Opportunities to
volunteer
Percent of respondents
Excellent Good
The DRCOG region seniors showed the largest amount of civic engagement in the area of electoral participation. Almost all reported they were registered to vote; 92% indicated they had voted in the last general election.
Figure 24: Electoral Participation of older Adults in the DRCOG Region
92%
95%
0% 25% 50% 75% 100%
Voted in last general
election
Registered to vote
Percent "yes"
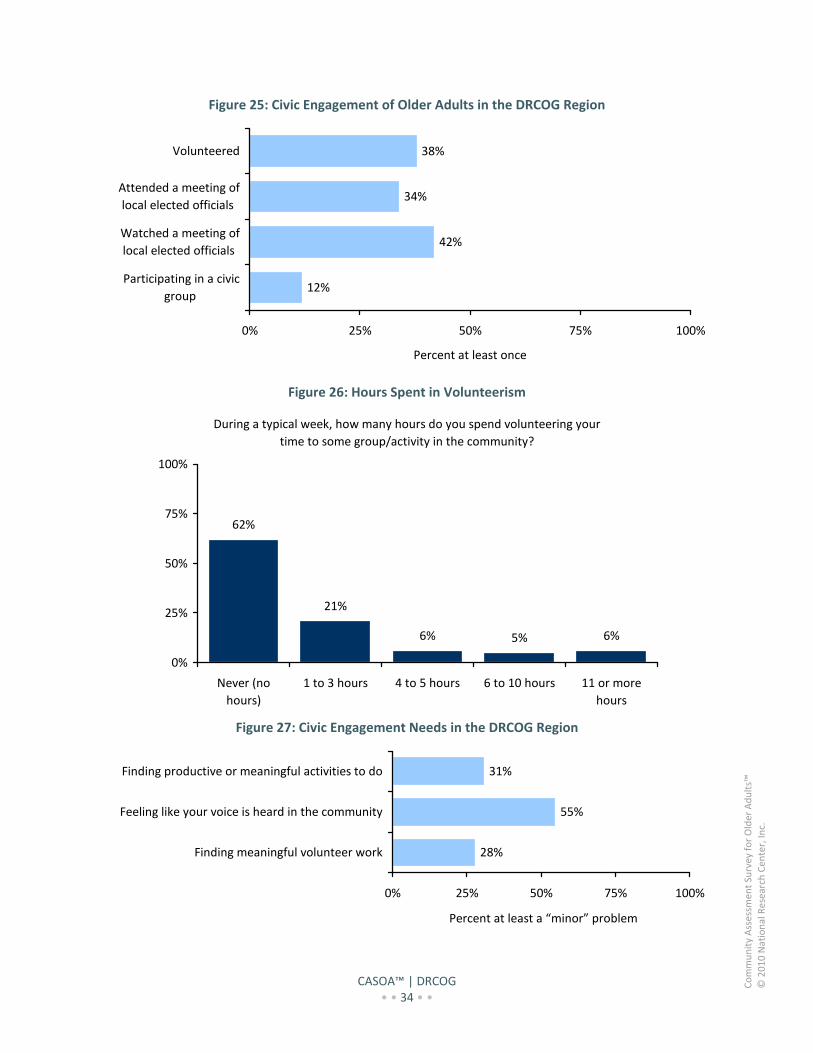
In terms of civic attentiveness, 34% reported attending a public meeting of local elected officials or other local public meeting in the DRCOG region and another 42% reported watching such a meeting on television, the Internet or other media in the past year. Older residents in the DRCOG region participated in civic life through volunteerism and participation in civic groups. About 4 in 10 respondents participated in some kind of volunteer work. Twelve percent participated in a civic club. About 3 in 10 older adults in the DRCOG region had problems finding meaningful activities.
CASOA™ | DRCOG • • 34 • •
Community Assessm
ent Survey for Older Adults™
© 2010 National Research Cen
ter, In
c.
Figure 25: Civic Engagement of Older Adults in the DRCOG Region
12%
42%
34%
38%
0% 25% 50% 75% 100%
Participating in a civic
group
Watched a meeting of
local elected officials
Attended a meeting of
local elected officials
Volunteered
Percent at least once
Figure 26: Hours Spent in Volunteerism
During a typical week, how many hours do you spend volunteering your
time to some group/activity in the community?
21%
6% 5% 6%
62%
0%
25%
50%
75%
100%
Never (no
hours)
1 to 3 hours 4 to 5 hours 6 to 10 hours 11 or more
hours
Figure 27: Civic Engagement Needs in the DRCOG Region
28%
55%
31%
0% 25% 50% 75% 100%
Finding meaningful volunteer work
Feeling like your voice is heard in the community
Finding productive or meaningful activities to do
Percent at least a “minor” problem
CASOA™ | DRCOG • • 35 • •
Community Assessm
ent Survey for Older Adults™
© 2010 National Research Cen
ter, In
c.
Social Engagement and Support
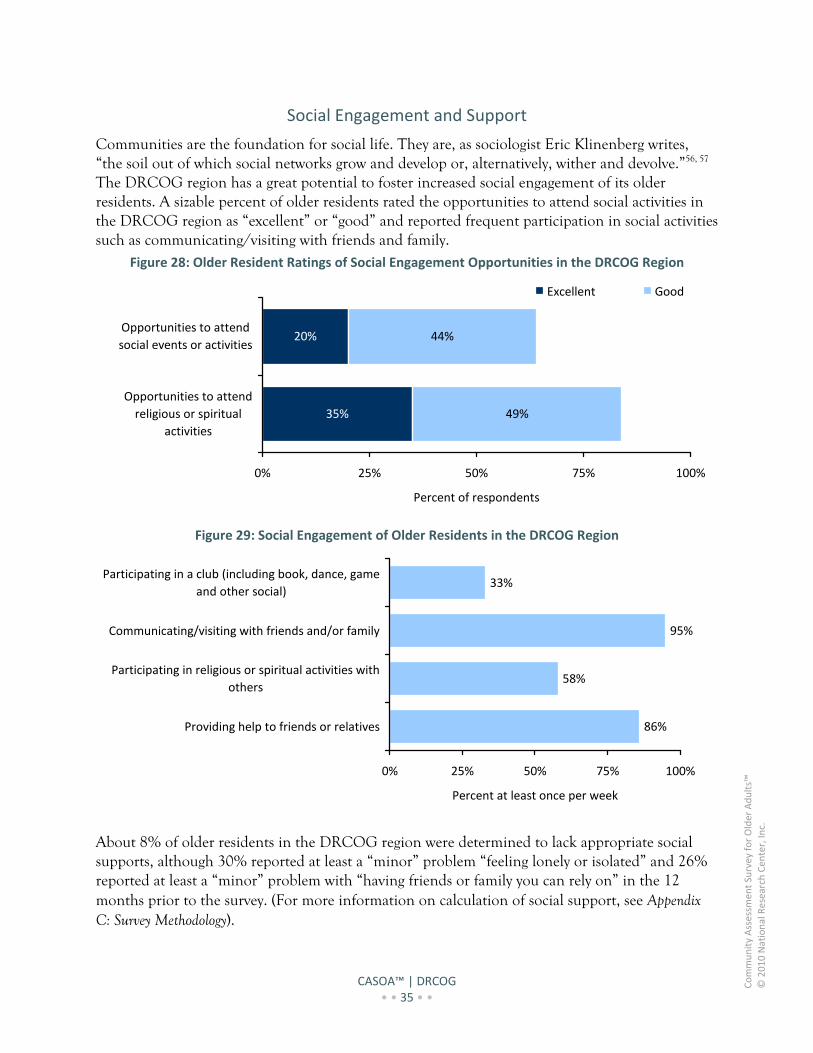
Communities are the foundation for social life. They are, as sociologist Eric Klinenberg writes, “the soil out of which social networks grow and develop or, alternatively, wither and devolve.”56, 57 The DRCOG region has a great potential to foster increased social engagement of its older residents. A sizable percent of older residents rated the opportunities to attend social activities in the DRCOG region as “excellent” or “good” and reported frequent participation in social activities such as communicating/visiting with friends and family.
Figure 28: Older Resident Ratings of Social Engagement Opportunities in the DRCOG Region
35%
20%
49%
44%
0% 25% 50% 75% 100%
Opportunities to attend
religious or spiritual
activities
Opportunities to attend
social events or activities
Percent of respondents
Excellent Good
Figure 29: Social Engagement of Older Residents in the DRCOG Region
86%
58%
95%
33%
0% 25% 50% 75% 100%
Providing help to friends or relatives
Participating in religious or spiritual activities with
others
Communicating/visiting with friends and/or family
Participating in a club (including book, dance, game
and other social)
Percent at least once per week
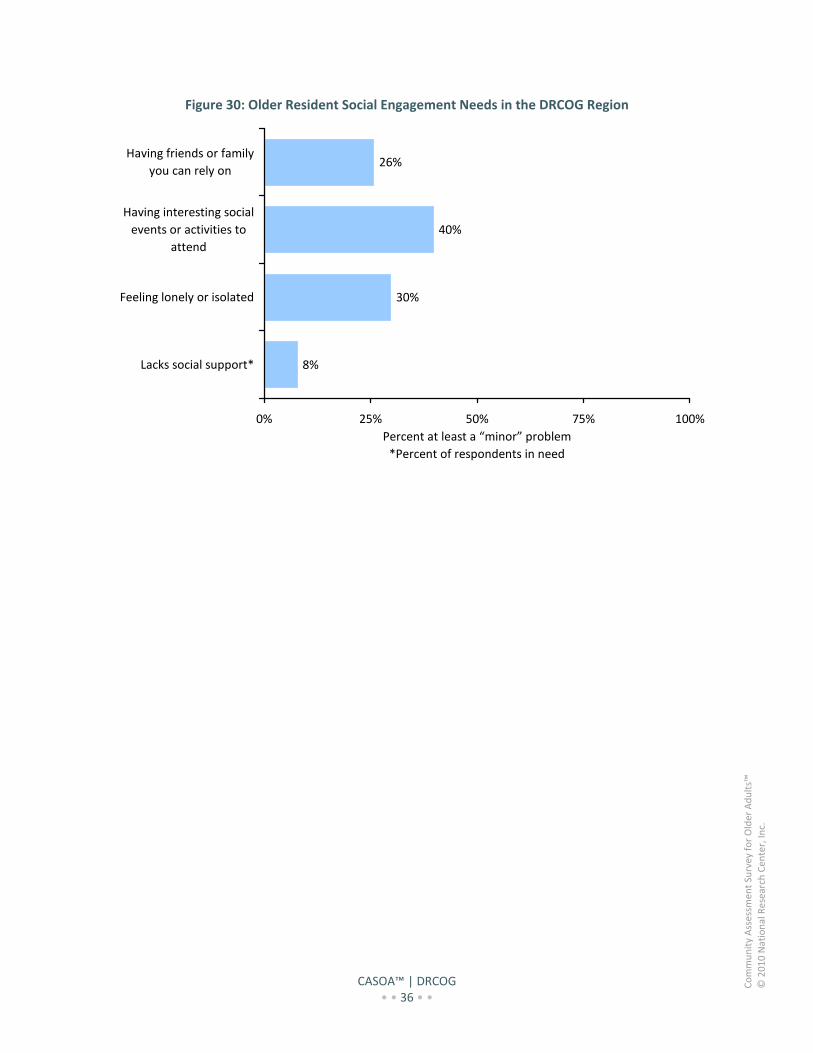
About 8% of older residents in the DRCOG region were determined to lack appropriate social supports, although 30% reported at least a “minor” problem “feeling lonely or isolated” and 26% reported at least a “minor” problem with “having friends or family you can rely on” in the 12 months prior to the survey. (For more information on calculation of social support, see Appendix C: Survey Methodology).
CASOA™ | DRCOG • • 36 • •
Community Assessm
ent Survey for Older Adults™
© 2010 National Research Cen
ter, In
c.
Figure 30: Older Resident Social Engagement Needs in the DRCOG Region
8%
30%
40%
26%
0% 25% 50% 75% 100%
Lacks social support*
Feeling lonely or isolated
Having interesting social
events or activities to
attend
Having friends or family
you can rely on
Percent at least a “minor” problem
*Percent of respondents in need
CASOA™ | DRCOG • • 37 • •
Community Assessm
ent Survey for Older Adults™
© 2010 National Research Cen
ter, In
c.
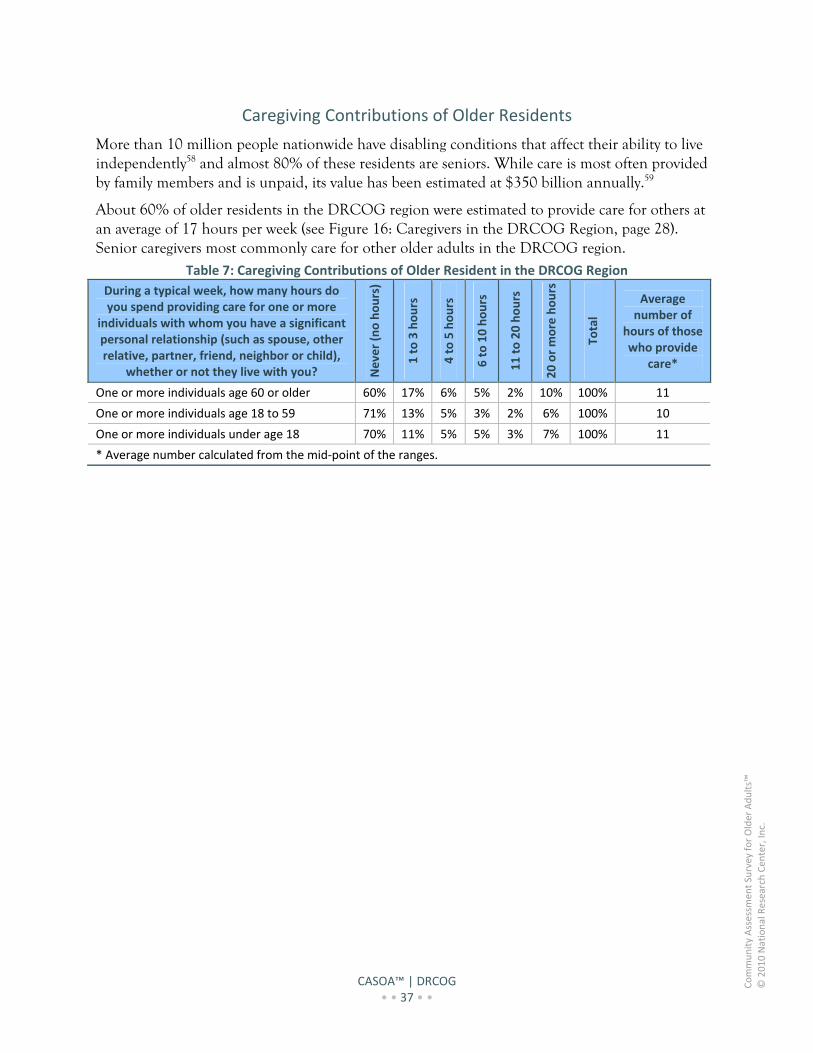
Caregiving Contributions of Older Residents
More than 10 million people nationwide have disabling conditions that affect their ability to live independently58 and almost 80% of these residents are seniors. While care is most often provided by family members and is unpaid, its value has been estimated at $350 billion annually.59
About 60% of older residents in the DRCOG region were estimated to provide care for others at an average of 17 hours per week (see Figure 16: Caregivers in the DRCOG Region, page 28). Senior caregivers most commonly care for other older adults in the DRCOG region.
Table 7: Caregiving Contributions of Older Resident in the DRCOG Region
During a typical week, how many hours do you spend providing care for one or more
individuals with whom you have a significant personal relationship (such as spouse, other relative, partner, friend, neighbor or child),
whether or not they live with you? Never (no hours)
1 to 3 hours
4 to 5 hours
6 to 10 hours
11 to 20 hours
20 or more hours
Total
Average number of
hours of those who provide
care*
One or more individuals age 60 or older 60% 17% 6% 5% 2% 10% 100% 11
One or more individuals age 18 to 59 71% 13% 5% 3% 2% 6% 100% 10
One or more individuals under age 18 70% 11% 5% 5% 3% 7% 100% 11
* Average number calculated from the mid‐point of the ranges.
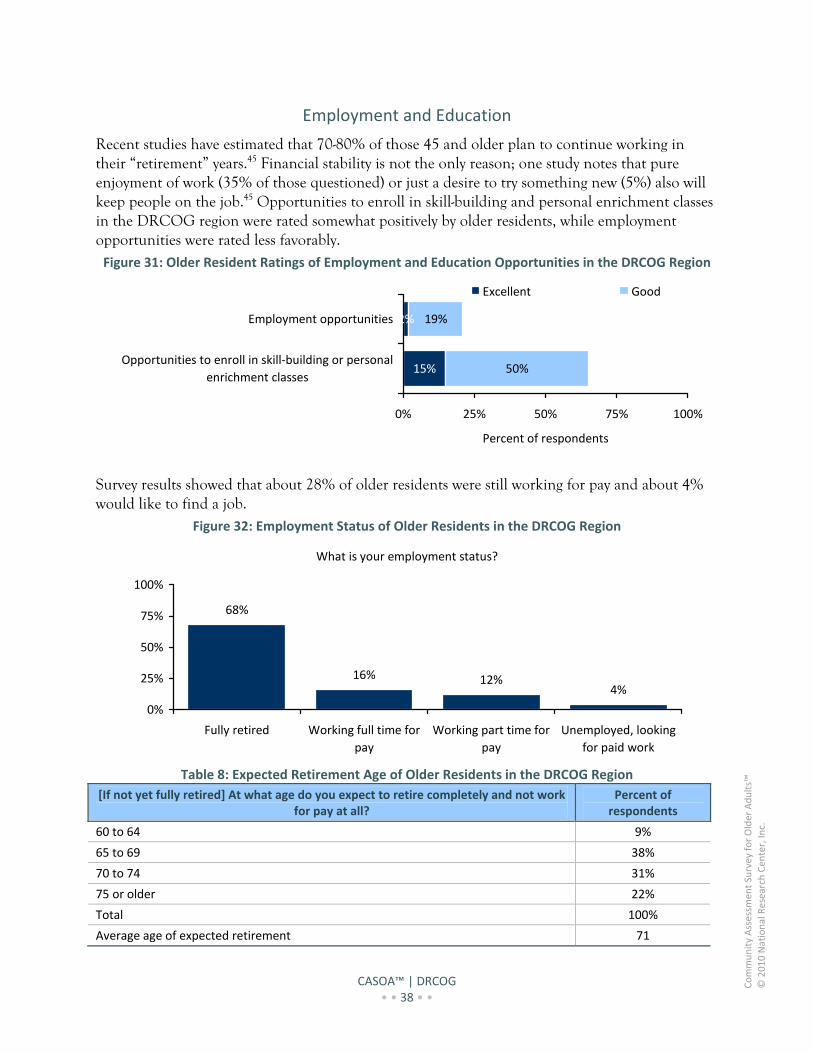
CASOA™ | DRCOG • • 38 • •
Community Assessm
ent Survey for Older Adults™
© 2010 National Research Cen
ter, In
c.
Employment and Education
Recent studies have estimated that 70-80% of those 45 and older plan to continue working in their “retirement” years.45 Financial stability is not the only reason; one study notes that pure enjoyment of work (35% of those questioned) or just a desire to try something new (5%) also will keep people on the job.45 Opportunities to enroll in skill-building and personal enrichment classes in the DRCOG region were rated somewhat positively by older residents, while employment opportunities were rated less favorably. Figure 31: Older Resident Ratings of Employment and Education Opportunities in the DRCOG Region
15%
2%
50%
19%
0% 25% 50% 75% 100%
Opportunities to enroll in skill‐building or personal
enrichment classes
Employment opportunities
Percent of respondents
Excellent Good
Survey results showed that about 28% of older residents were still working for pay and about 4% would like to find a job.
Figure 32: Employment Status of Older Residents in the DRCOG Region
What is your employment status?
4%12%16%
68%
0%
25%
50%
75%
100%
Fully retired Working full time for
pay
Working part time for
pay
Unemployed, looking
for paid work
Table 8: Expected Retirement Age of Older Residents in the DRCOG Region
[If not yet fully retired] At what age do you expect to retire completely and not work for pay at all?
Percent of respondents
60 to 64 9%
65 to 69 38%
70 to 74 31%
75 or older 22%
Total 100%
Average age of expected retirement 71
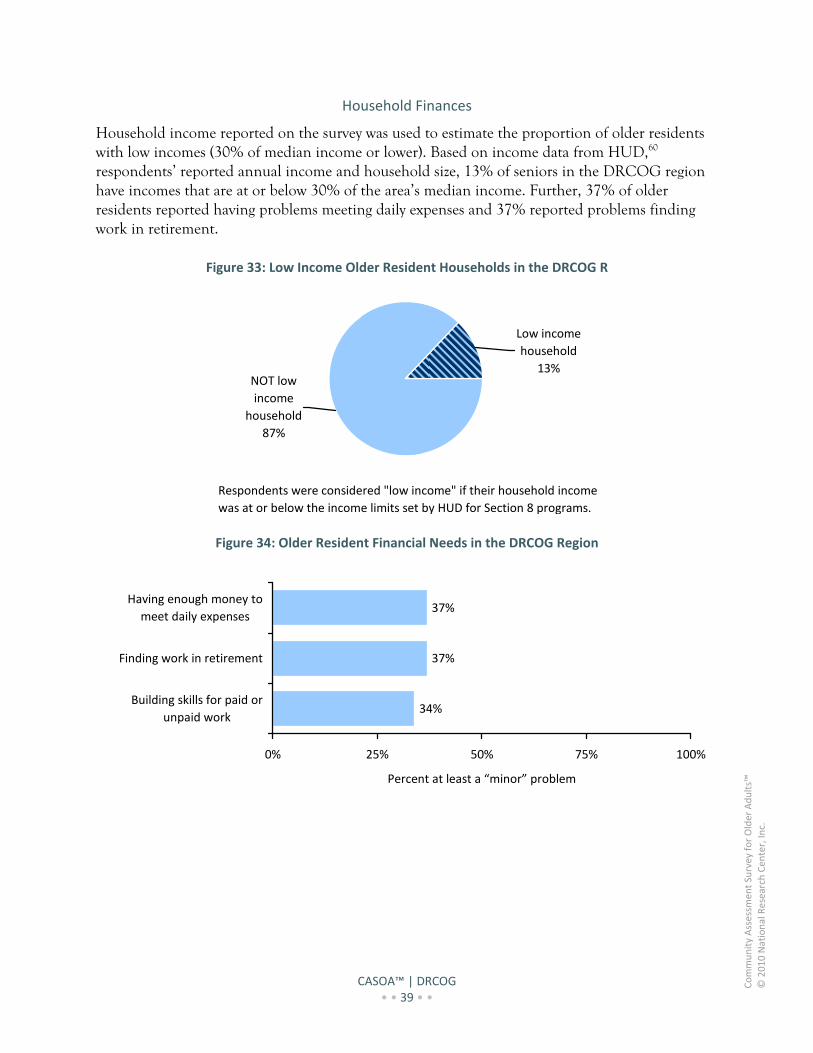
CASOA™ | DRCOG • • 39 • •
Community Assessm
ent Survey for Older Adults™
© 2010 National Research Cen
ter, In
c.
Household Finances
Household income reported on the survey was used to estimate the proportion of older residents with low incomes (30% of median income or lower). Based on income data from HUD,60 respondents’ reported annual income and household size, 13% of seniors in the DRCOG region have incomes that are at or below 30% of the area’s median income. Further, 37% of older residents reported having problems meeting daily expenses and 37% reported problems finding work in retirement.
Figure 33: Low Income Older Resident Households in the DRCOG R
NOT low
income
household
87%
Low income
household
13%
Respondents were considered "low income" if their household income
was at or below the income limits set by HUD for Section 8 programs.
Figure 34: Older Resident Financial Needs in the DRCOG Region
34%
37%
37%
0% 25% 50% 75% 100%
Building skills for paid or
unpaid work
Finding work in retirement
Having enough money to
meet daily expenses
Percent at least a “minor” problem
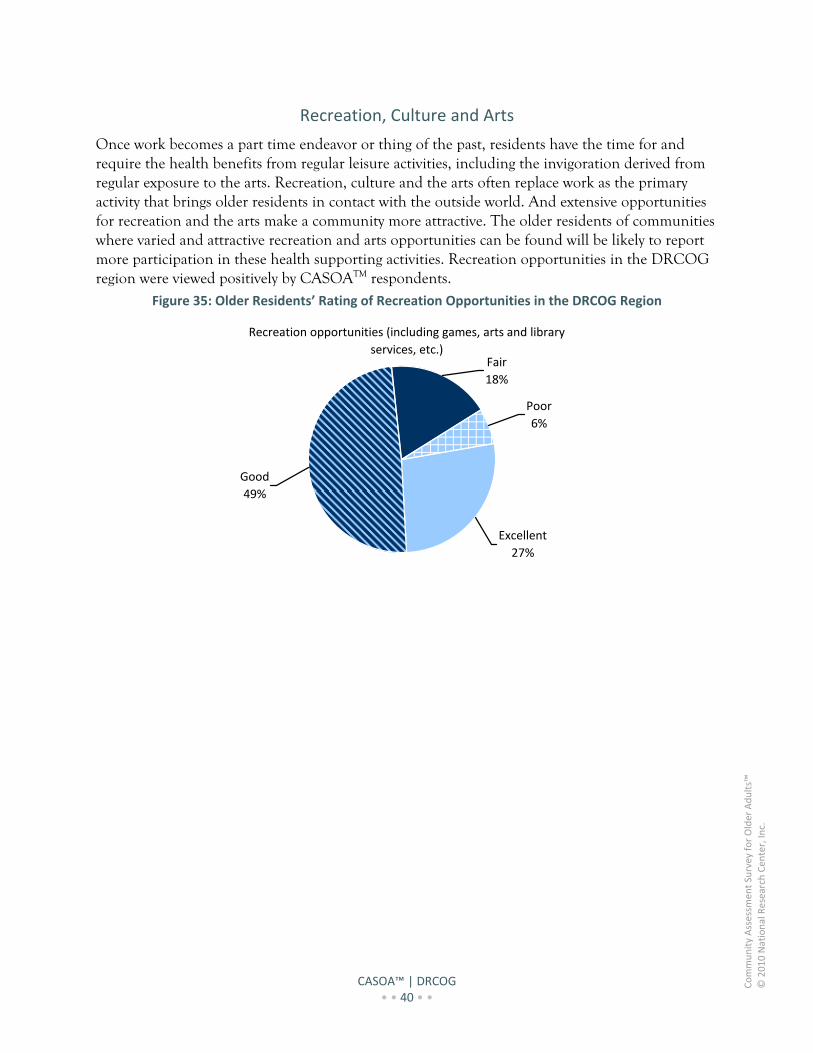
CASOA™ | DRCOG • • 40 • •
Community Assessm
ent Survey for Older Adults™
© 2010 National Research Cen
ter, In
c.
Recreation, Culture and Arts
Once work becomes a part time endeavor or thing of the past, residents have the time for and require the health benefits from regular leisure activities, including the invigoration derived from regular exposure to the arts. Recreation, culture and the arts often replace work as the primary activity that brings older residents in contact with the outside world. And extensive opportunities for recreation and the arts make a community more attractive. The older residents of communities where varied and attractive recreation and arts opportunities can be found will be likely to report more participation in these health supporting activities. Recreation opportunities in the DRCOG region were viewed positively by CASOATM respondents.
Figure 35: Older Residents’ Rating of Recreation Opportunities in the DRCOG Region
Recreation opportunities (including games, arts and library
services, etc.)
Poor
6%
Fair
18%
Good
49%
Excellent
27%
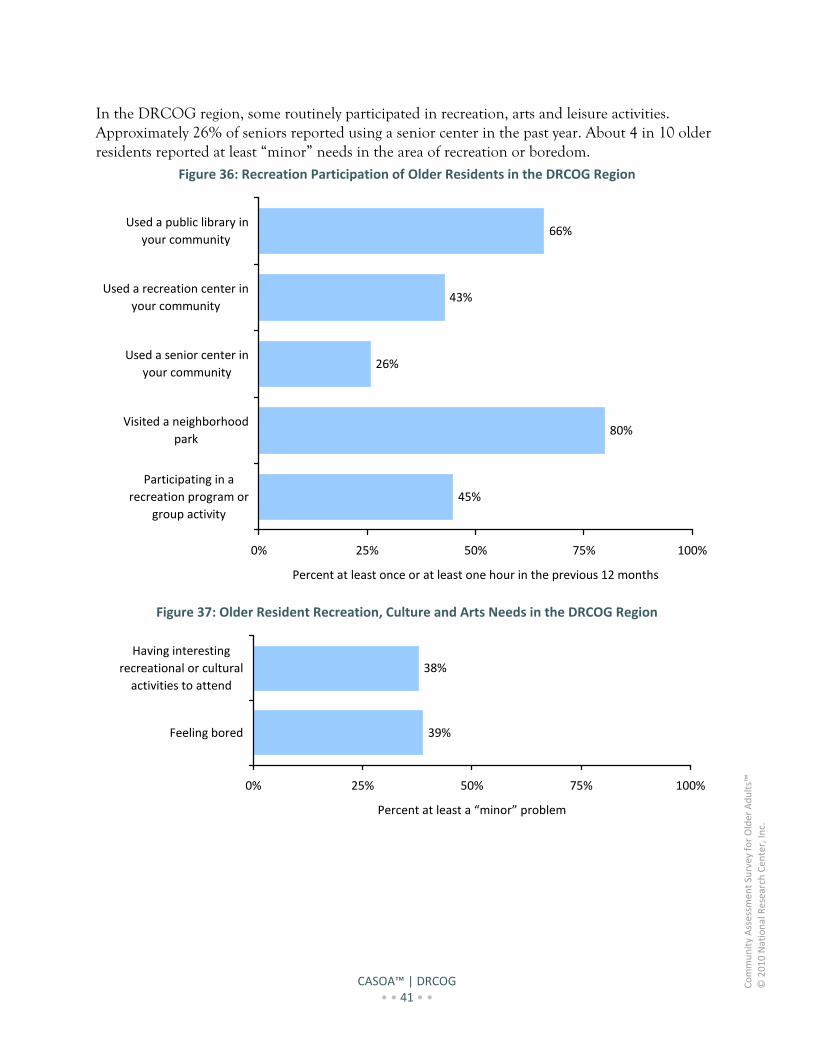
CASOA™ | DRCOG • • 41 • •
Community Assessm
ent Survey for Older Adults™
© 2010 National Research Cen
ter, In
c.
In the DRCOG region, some routinely participated in recreation, arts and leisure activities. Approximately 26% of seniors reported using a senior center in the past year. About 4 in 10 older residents reported at least “minor” needs in the area of recreation or boredom.
Figure 36: Recreation Participation of Older Residents in the DRCOG Region
45%
80%
26%
43%
66%
0% 25% 50% 75% 100%
Participating in a
recreation program or
group activity
Visited a neighborhood
park
Used a senior center in
your community
Used a recreation center in
your community
Used a public library in
your community
Percent at least once or at least one hour in the previous 12 months
Figure 37: Older Resident Recreation, Culture and Arts Needs in the DRCOG Region
39%
38%
0% 25% 50% 75% 100%
Feeling bored
Having interesting
recreational or cultural
activities to attend
Percent at least a “minor” problem
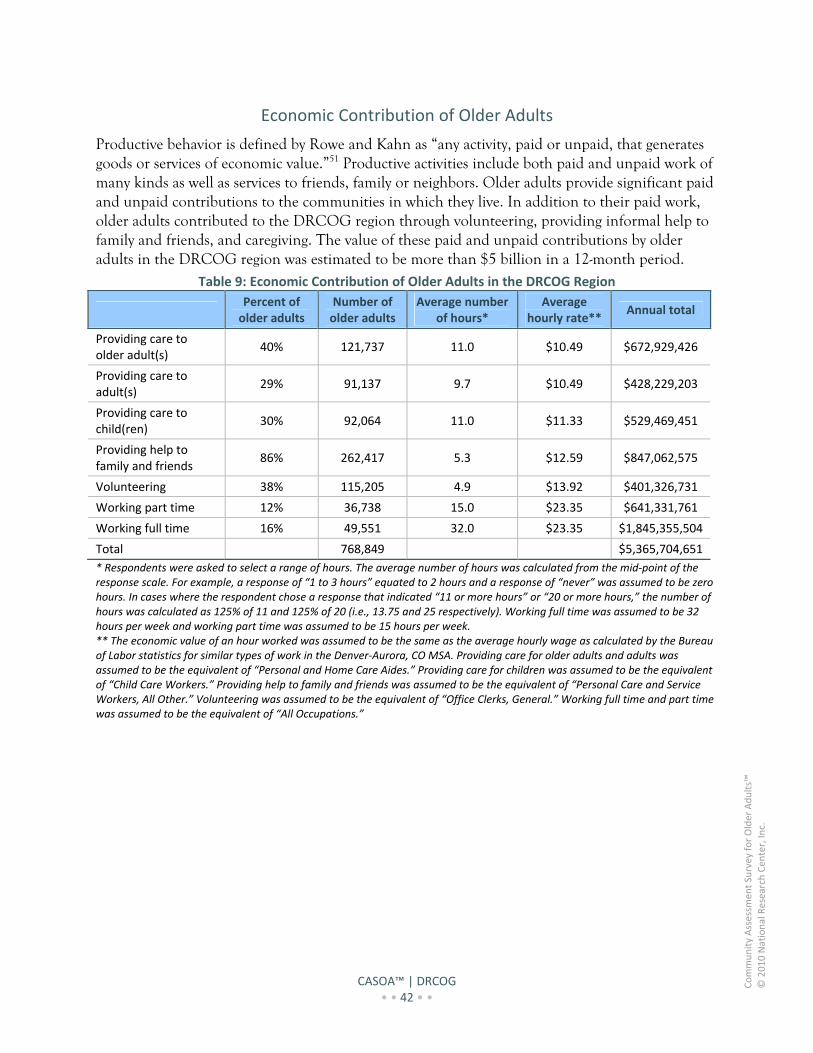
CASOA™ | DRCOG • • 42 • •
Community Assessm
ent Survey for Older Adults™
© 2010 National Research Cen
ter, In
c.
Economic Contribution of Older Adults
Productive behavior is defined by Rowe and Kahn as “any activity, paid or unpaid, that generates goods or services of economic value.”51 Productive activities include both paid and unpaid work of many kinds as well as services to friends, family or neighbors. Older adults provide significant paid and unpaid contributions to the communities in which they live. In addition to their paid work, older adults contributed to the DRCOG region through volunteering, providing informal help to family and friends, and caregiving. The value of these paid and unpaid contributions by older adults in the DRCOG region was estimated to be more than $5 billion in a 12-month period.
Table 9: Economic Contribution of Older Adults in the DRCOG Region
Percent of older adults
Number of older adults
Average number of hours*
Average hourly rate**
Annual total
Providing care to older adult(s)
40% 121,737 11.0 $10.49 $672,929,426
Providing care to adult(s)
29% 91,137 9.7 $10.49 $428,229,203
Providing care to child(ren)
30% 92,064 11.0 $11.33 $529,469,451
Providing help to family and friends
86% 262,417 5.3 $12.59 $847,062,575
Volunteering 38% 115,205 4.9 $13.92 $401,326,731
Working part time 12% 36,738 15.0 $23.35 $641,331,761
Working full time 16% 49,551 32.0 $23.35 $1,845,355,504
Total 768,849 $5,365,704,651
* Respondents were asked to select a range of hours. The average number of hours was calculated from the mid‐point of the response scale. For example, a response of “1 to 3 hours” equated to 2 hours and a response of “never” was assumed to be zero hours. In cases where the respondent chose a response that indicated “11 or more hours” or “20 or more hours,” the number of hours was calculated as 125% of 11 and 125% of 20 (i.e., 13.75 and 25 respectively). Working full time was assumed to be 32 hours per week and working part time was assumed to be 15 hours per week. ** The economic value of an hour worked was assumed to be the same as the average hourly wage as calculated by the Bureau of Labor statistics for similar types of work in the Denver‐Aurora, CO MSA. Providing care for older adults and adults was assumed to be the equivalent of “Personal and Home Care Aides.” Providing care for children was assumed to be the equivalent of “Child Care Workers.” Providing help to family and friends was assumed to be the equivalent of “Personal Care and Service Workers, All Other.” Volunteering was assumed to be the equivalent of “Office Clerks, General.” Working full time and part time was assumed to be the equivalent of “All Occupations.”
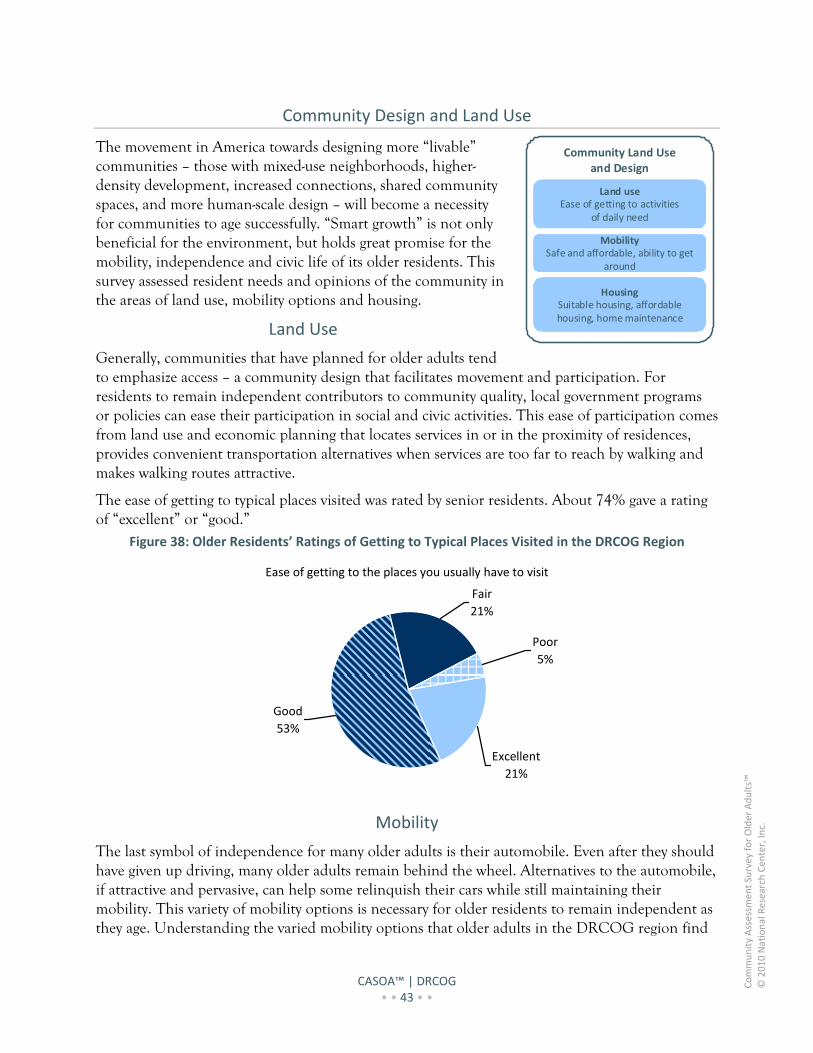
CASOA™ | DRCOG • • 43 • •
Community Assessm
ent Survey for Older Adults™
© 2010 National Research Cen
ter, In
c.
Community Design and Land Use
The movement in America towards designing more “livable” communities – those with mixed-use neighborhoods, higher-density development, increased connections, shared community spaces, and more human-scale design – will become a necessity for communities to age successfully. “Smart growth” is not only beneficial for the environment, but holds great promise for the mobility, independence and civic life of its older residents. This survey assessed resident needs and opinions of the community in the areas of land use, mobility options and housing.
Land Use
Generally, communities that have planned for older adults tend to emphasize access – a community design that facilitates movement and participation. For residents to remain independent contributors to community quality, local government programs or policies can ease their participation in social and civic activities. This ease of participation comes from land use and economic planning that locates services in or in the proximity of residences, provides convenient transportation alternatives when services are too far to reach by walking and makes walking routes attractive.
The ease of getting to typical places visited was rated by senior residents. About 74% gave a rating of “excellent” or “good.”
Figure 38: Older Residents’ Ratings of Getting to Typical Places Visited in the DRCOG Region
Ease of getting to the places you usually have to visit
Poor
5%
Fair
21%
Good
53%
Excellent
21%
Mobility
The last symbol of independence for many older adults is their automobile. Even after they should have given up driving, many older adults remain behind the wheel. Alternatives to the automobile, if attractive and pervasive, can help some relinquish their cars while still maintaining their mobility. This variety of mobility options is necessary for older residents to remain independent as they age. Understanding the varied mobility options that older adults in the DRCOG region find
Community Land Use and Design
Land useEase of getting to activities
of daily need
MobilitySafe and affordable, ability to get
around
HousingSuitable housing, affordable housing, home maintenance
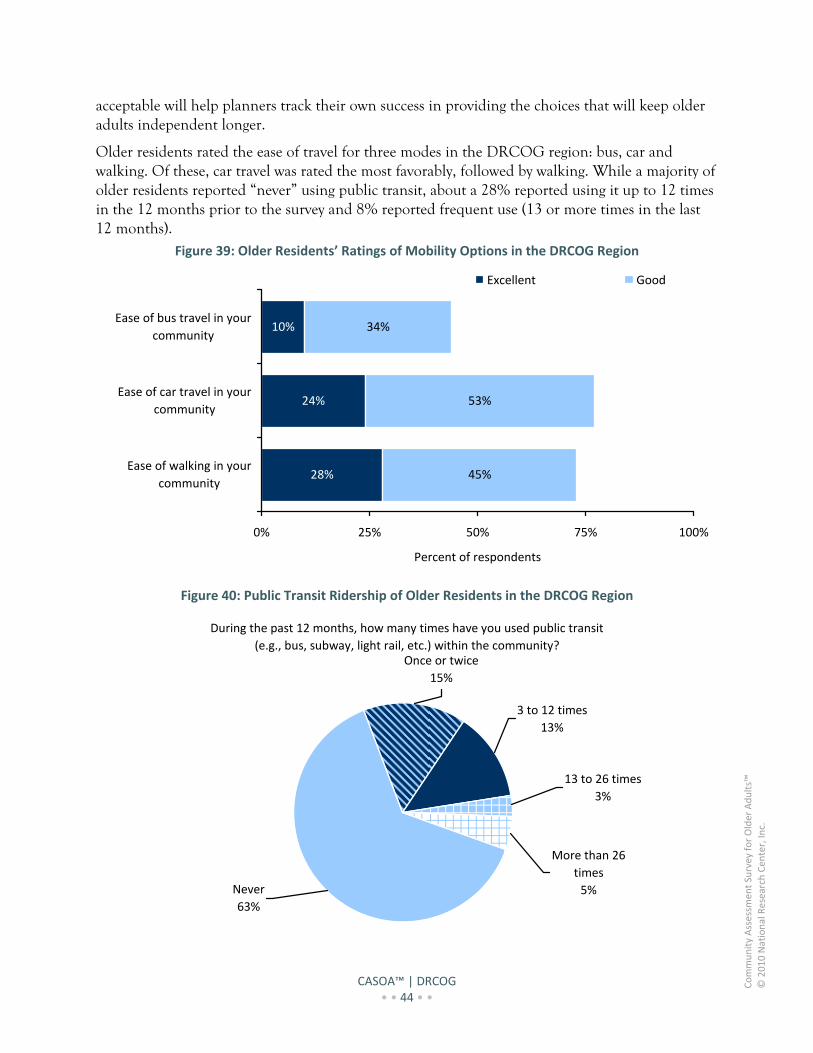
CASOA™ | DRCOG • • 44 • •
Community Assessm
ent Survey for Older Adults™
© 2010 National Research Cen
ter, In
c.
acceptable will help planners track their own success in providing the choices that will keep older adults independent longer.
Older residents rated the ease of travel for three modes in the DRCOG region: bus, car and walking. Of these, car travel was rated the most favorably, followed by walking. While a majority of older residents reported “never” using public transit, about a 28% reported using it up to 12 times in the 12 months prior to the survey and 8% reported frequent use (13 or more times in the last 12 months).
Figure 39: Older Residents’ Ratings of Mobility Options in the DRCOG Region
28%
24%
10%
45%
53%
34%
0% 25% 50% 75% 100%
Ease of walking in your
community
Ease of car travel in your
community
Ease of bus travel in your
community
Percent of respondents
Excellent Good
Figure 40: Public Transit Ridership of Older Residents in the DRCOG Region
During the past 12 months, how many times have you used public transit
(e.g., bus, subway, light rail, etc.) within the community?
Never
63%
Once or twice
15%
3 to 12 times
13%
13 to 26 times
3%
More than 26
times
5%
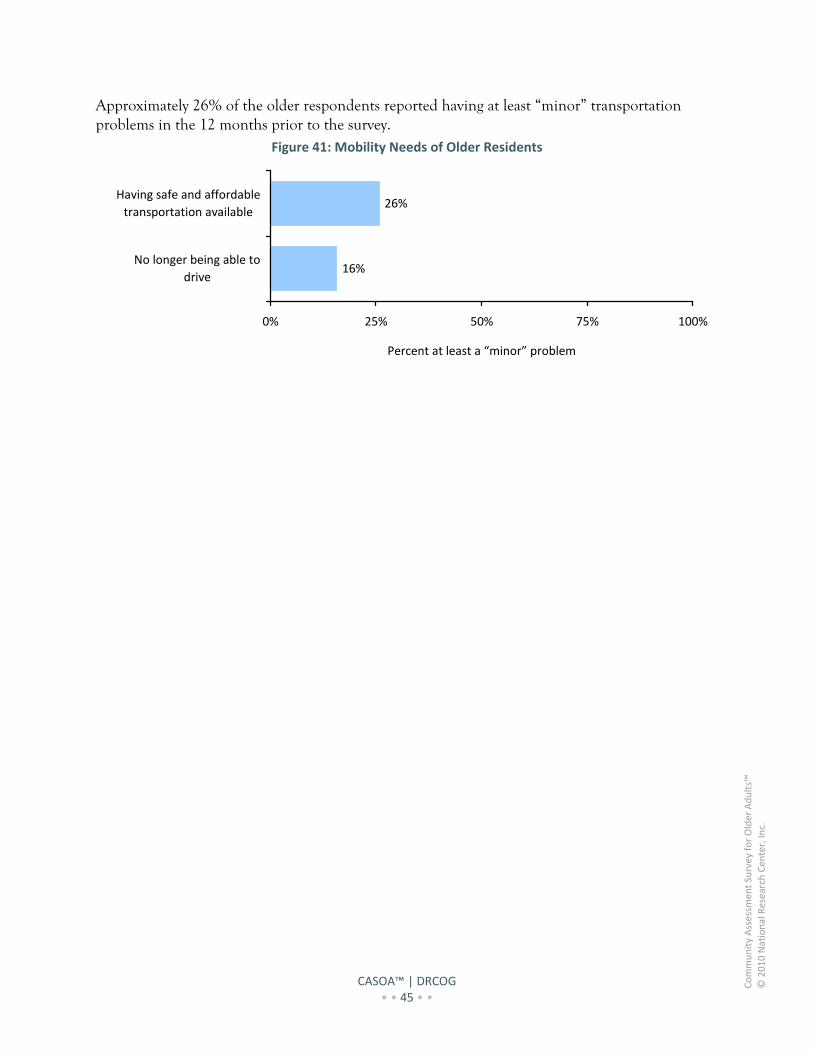
CASOA™ | DRCOG • • 45 • •
Community Assessm
ent Survey for Older Adults™
© 2010 National Research Cen
ter, In
c.
Approximately 26% of the older respondents reported having at least “minor” transportation problems in the 12 months prior to the survey.
Figure 41: Mobility Needs of Older Residents
16%
26%
0% 25% 50% 75% 100%
No longer being able to
drive
Having safe and affordable
transportation available
Percent at least a “minor” problem
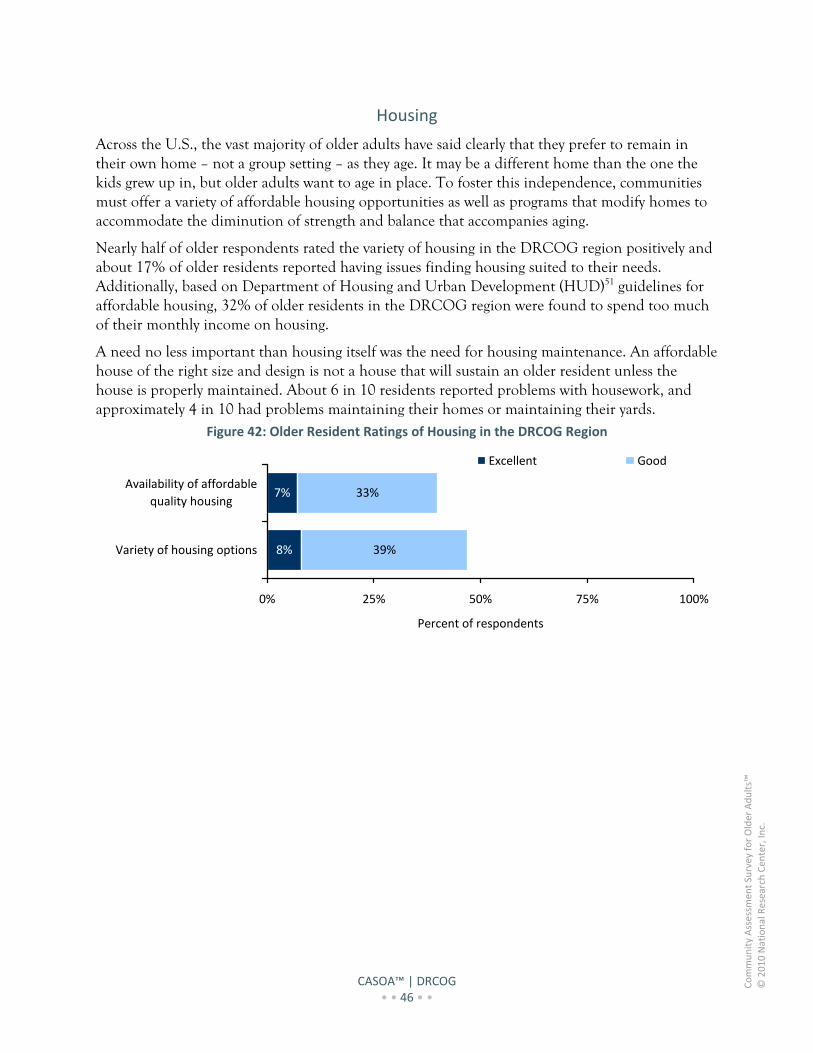
CASOA™ | DRCOG • • 46 • •
Community Assessm
ent Survey for Older Adults™
© 2010 National Research Cen
ter, In
c.
Housing
Across the U.S., the vast majority of older adults have said clearly that they prefer to remain in their own home – not a group setting – as they age. It may be a different home than the one the kids grew up in, but older adults want to age in place. To foster this independence, communities must offer a variety of affordable housing opportunities as well as programs that modify homes to accommodate the diminution of strength and balance that accompanies aging.
Nearly half of older respondents rated the variety of housing in the DRCOG region positively and about 17% of older residents reported having issues finding housing suited to their needs. Additionally, based on Department of Housing and Urban Development (HUD)51 guidelines for affordable housing, 32% of older residents in the DRCOG region were found to spend too much of their monthly income on housing.
A need no less important than housing itself was the need for housing maintenance. An affordable house of the right size and design is not a house that will sustain an older resident unless the house is properly maintained. About 6 in 10 residents reported problems with housework, and approximately 4 in 10 had problems maintaining their homes or maintaining their yards.
Figure 42: Older Resident Ratings of Housing in the DRCOG Region
8%
7%
39%
33%
0% 25% 50% 75% 100%
Variety of housing options
Availability of affordable
quality housing
Percent of respondents
Excellent Good
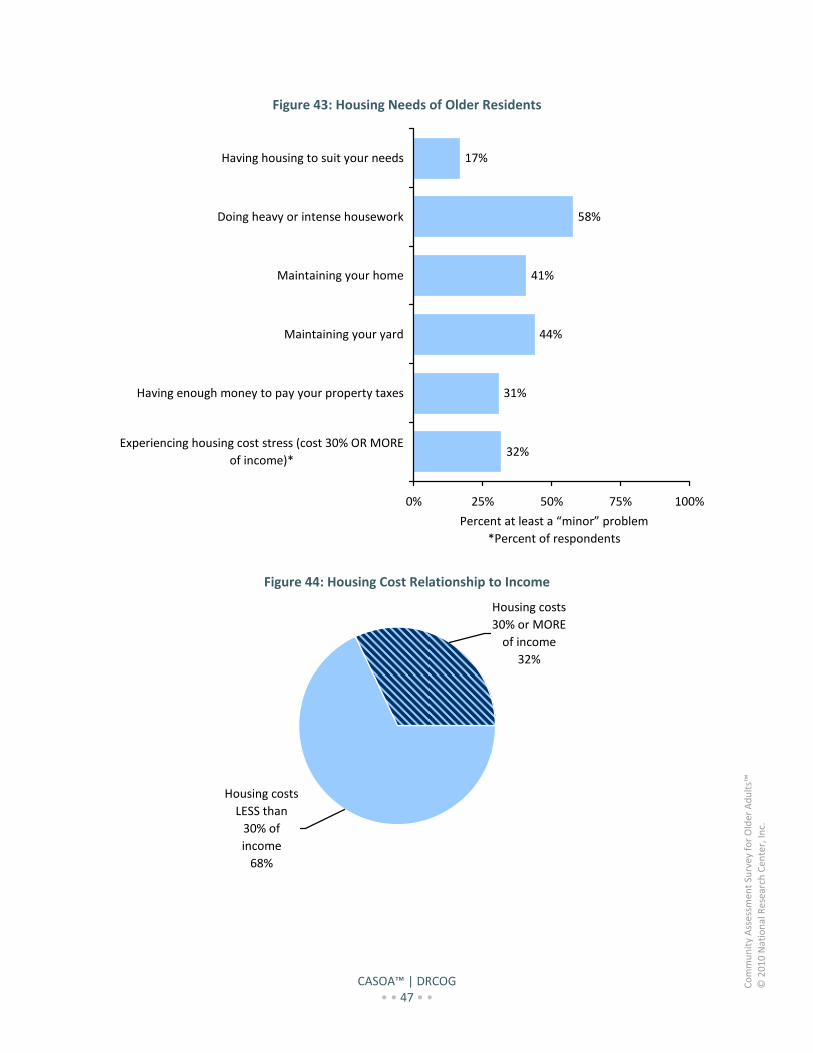
CASOA™ | DRCOG • • 47 • •
Community Assessm
ent Survey for Older Adults™
© 2010 National Research Cen
ter, In
c.
Figure 43: Housing Needs of Older Residents
32%
31%
44%
41%
58%
17%
0% 25% 50% 75% 100%
Experiencing housing cost stress (cost 30% OR MORE
of income)*
Having enough money to pay your property taxes
Maintaining your yard
Maintaining your home
Doing heavy or intense housework
Having housing to suit your needs
Percent at least a “minor” problem
*Percent of respondents
Figure 44: Housing Cost Relationship to Income
Housing costs
LESS than
30% of
income
68%
Housing costs
30% or MORE
of income
32%
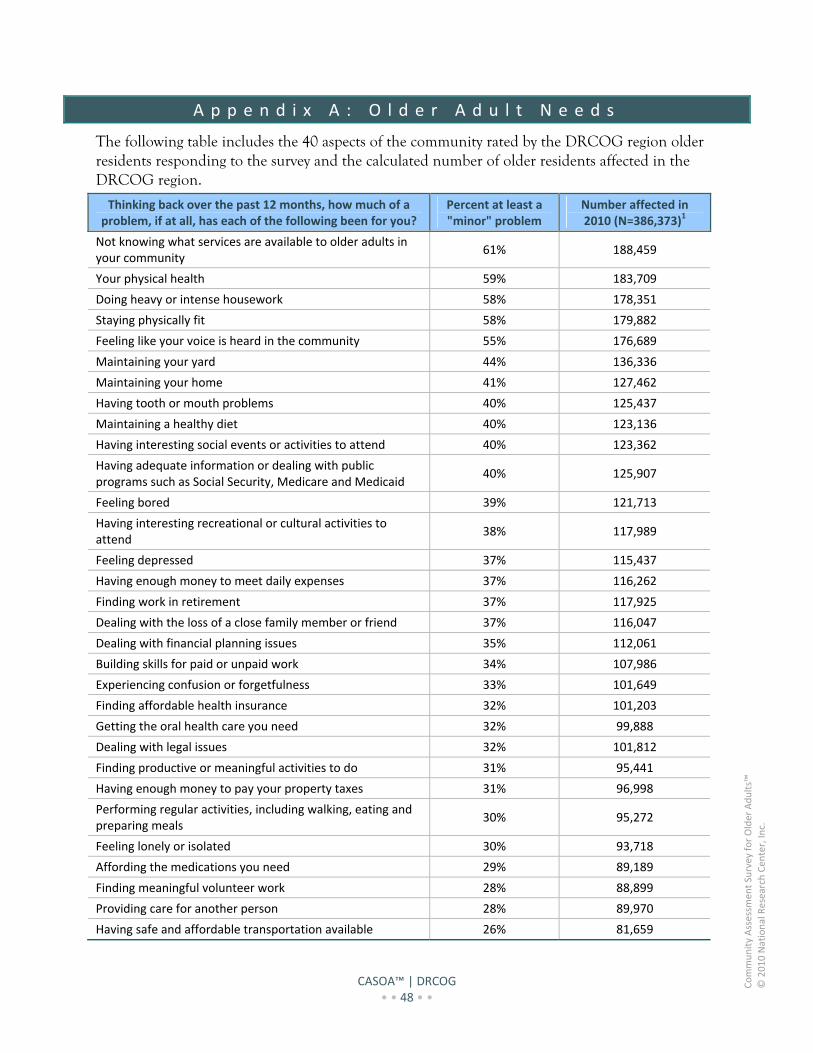
CASOA™ | DRCOG • • 48 • •
Community Assessm
ent Survey for Older Adults™
© 2010 National Research Cen
ter, In
c.
A p p e n d i x A : O l d e r A d u l t N e e d s
The following table includes the 40 aspects of the community rated by the DRCOG region older residents responding to the survey and the calculated number of older residents affected in the DRCOG region.
Thinking back over the past 12 months, how much of a problem, if at all, has each of the following been for you?
Percent at least a "minor" problem
Number affected in 2010 (N=386,373)1
Not knowing what services are available to older adults in your community
61% 188,459
Your physical health 59% 183,709
Doing heavy or intense housework 58% 178,351
Staying physically fit 58% 179,882
Feeling like your voice is heard in the community 55% 176,689
Maintaining your yard 44% 136,336
Maintaining your home 41% 127,462
Having tooth or mouth problems 40% 125,437
Maintaining a healthy diet 40% 123,136
Having interesting social events or activities to attend 40% 123,362
Having adequate information or dealing with public programs such as Social Security, Medicare and Medicaid
40% 125,907
Feeling bored 39% 121,713
Having interesting recreational or cultural activities to attend
38% 117,989
Feeling depressed 37% 115,437
Having enough money to meet daily expenses 37% 116,262
Finding work in retirement 37% 117,925
Dealing with the loss of a close family member or friend 37% 116,047
Dealing with financial planning issues 35% 112,061
Building skills for paid or unpaid work 34% 107,986
Experiencing confusion or forgetfulness 33% 101,649
Finding affordable health insurance 32% 101,203
Getting the oral health care you need 32% 99,888
Dealing with legal issues 32% 101,812
Finding productive or meaningful activities to do 31% 95,441
Having enough money to pay your property taxes 31% 96,998
Performing regular activities, including walking, eating and preparing meals
30% 95,272
Feeling lonely or isolated 30% 93,718
Affording the medications you need 29% 89,189
Finding meaningful volunteer work 28% 88,899
Providing care for another person 28% 89,970
Having safe and affordable transportation available 26% 81,659
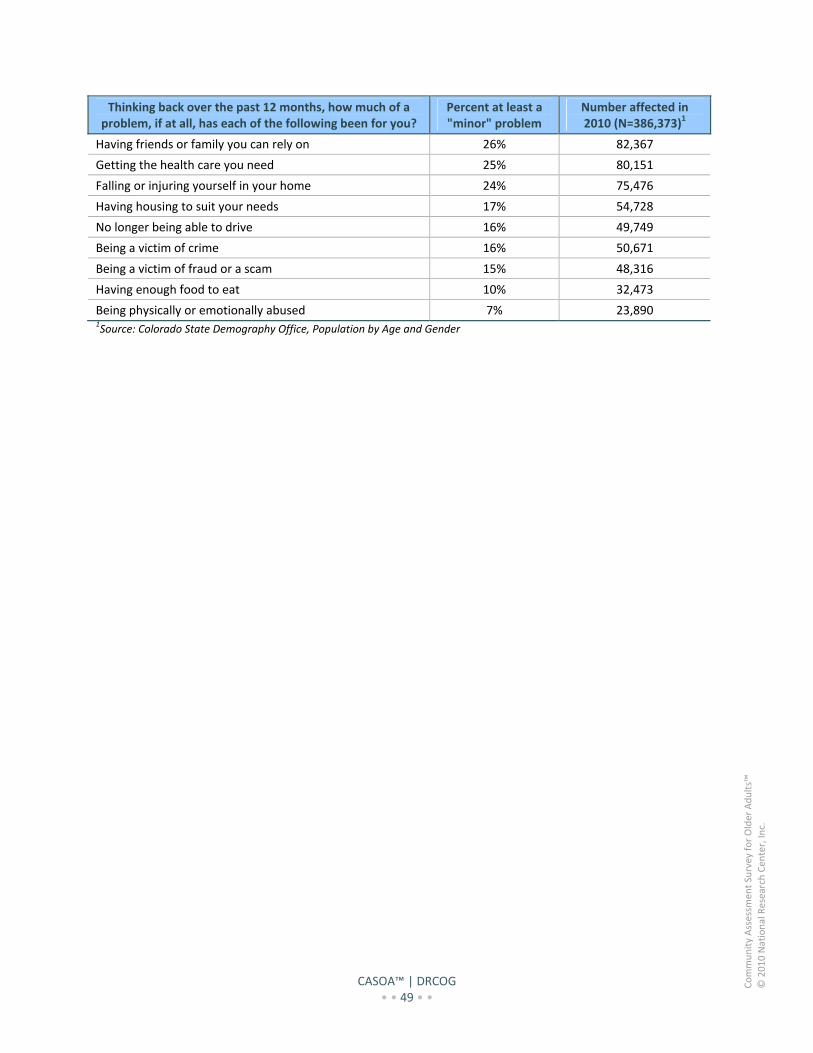
CASOA™ | DRCOG • • 49 • •
Community Assessm
ent Survey for Older Adults™
© 2010 National Research Cen
ter, In
c.
Thinking back over the past 12 months, how much of a problem, if at all, has each of the following been for you?
Percent at least a "minor" problem
Number affected in 2010 (N=386,373)1
Having friends or family you can rely on 26% 82,367
Getting the health care you need 25% 80,151
Falling or injuring yourself in your home 24% 75,476
Having housing to suit your needs 17% 54,728
No longer being able to drive 16% 49,749
Being a victim of crime 16% 50,671
Being a victim of fraud or a scam 15% 48,316
Having enough food to eat 10% 32,473
Being physically or emotionally abused 7% 23,890 1Source: Colorado State Demography Office, Population by Age and Gender
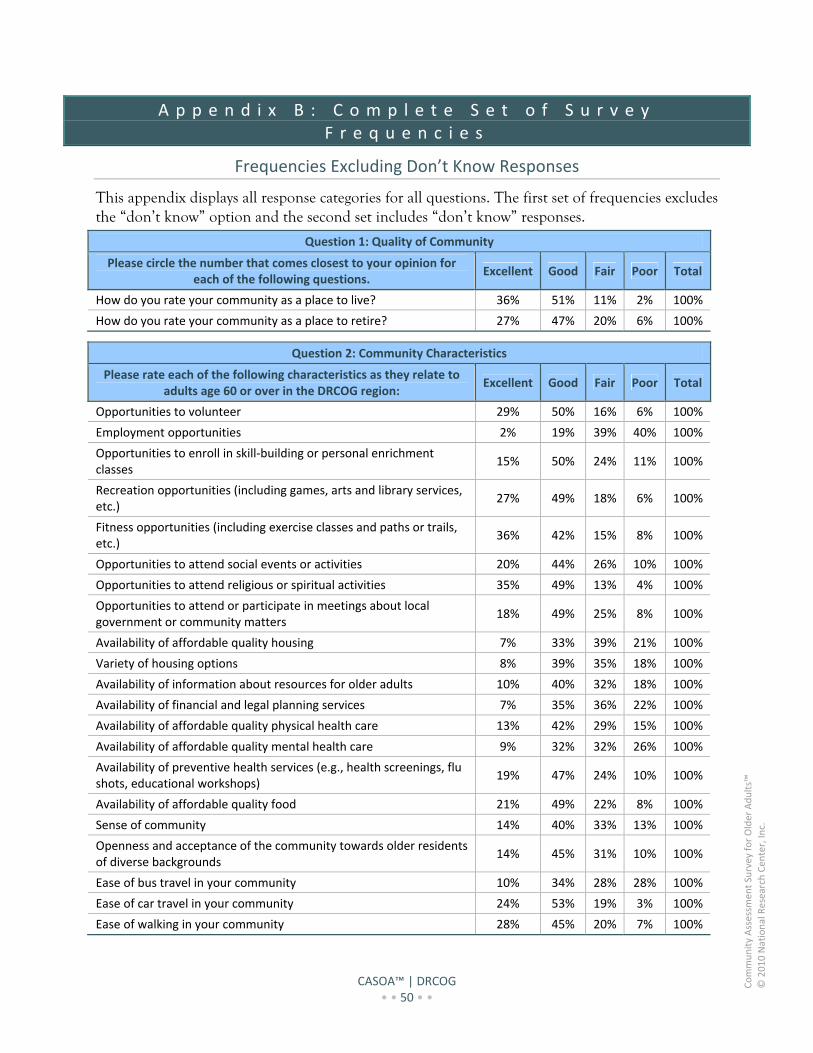
CASOA™ | DRCOG • • 50 • •
Community Assessm
ent Survey for Older Adults™
© 2010 National Research Cen
ter, In
c.
A p p e n d i x B : C o m p l e t e S e t o f S u r v e y F r e q u e n c i e s
Frequencies Excluding Don’t Know Responses
This appendix displays all response categories for all questions. The first set of frequencies excludes the “don’t know” option and the second set includes “don’t know” responses.
Question 1: Quality of Community
Please circle the number that comes closest to your opinion for each of the following questions.
Excellent Good Fair Poor Total
How do you rate your community as a place to live? 36% 51% 11% 2% 100%
How do you rate your community as a place to retire? 27% 47% 20% 6% 100%
Question 2: Community Characteristics
Please rate each of the following characteristics as they relate to adults age 60 or over in the DRCOG region:
Excellent Good Fair Poor Total
Opportunities to volunteer 29% 50% 16% 6% 100%
Employment opportunities 2% 19% 39% 40% 100%
Opportunities to enroll in skill‐building or personal enrichment classes
15% 50% 24% 11% 100%
Recreation opportunities (including games, arts and library services, etc.)
27% 49% 18% 6% 100%
Fitness opportunities (including exercise classes and paths or trails, etc.)
36% 42% 15% 8% 100%
Opportunities to attend social events or activities 20% 44% 26% 10% 100%
Opportunities to attend religious or spiritual activities 35% 49% 13% 4% 100%
Opportunities to attend or participate in meetings about local government or community matters
18% 49% 25% 8% 100%
Availability of affordable quality housing 7% 33% 39% 21% 100%
Variety of housing options 8% 39% 35% 18% 100%
Availability of information about resources for older adults 10% 40% 32% 18% 100%
Availability of financial and legal planning services 7% 35% 36% 22% 100%
Availability of affordable quality physical health care 13% 42% 29% 15% 100%
Availability of affordable quality mental health care 9% 32% 32% 26% 100%
Availability of preventive health services (e.g., health screenings, flu shots, educational workshops)
19% 47% 24% 10% 100%
Availability of affordable quality food 21% 49% 22% 8% 100%
Sense of community 14% 40% 33% 13% 100%
Openness and acceptance of the community towards older residents of diverse backgrounds
14% 45% 31% 10% 100%
Ease of bus travel in your community 10% 34% 28% 28% 100%
Ease of car travel in your community 24% 53% 19% 3% 100%
Ease of walking in your community 28% 45% 20% 7% 100%
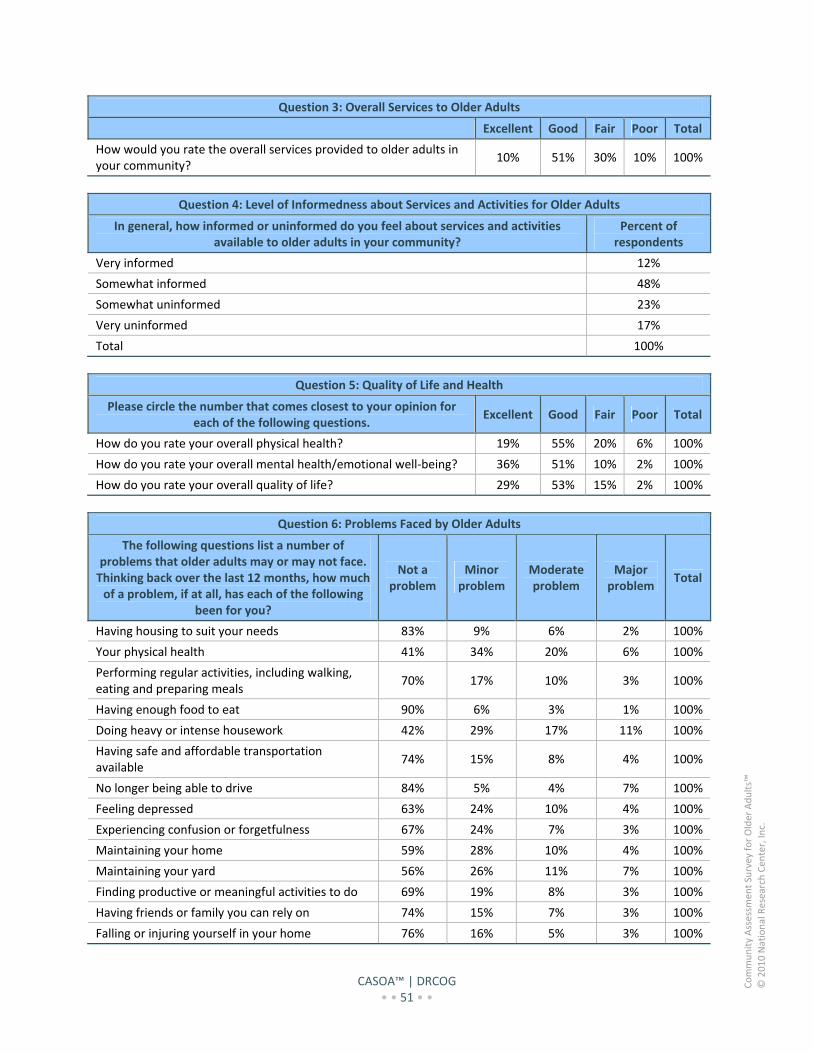
CASOA™ | DRCOG • • 51 • •
Community Assessm
ent Survey for Older Adults™
© 2010 National Research Cen
ter, In
c.
Question 3: Overall Services to Older Adults
Excellent Good Fair Poor Total
How would you rate the overall services provided to older adults in your community?
10% 51% 30% 10% 100%
Question 4: Level of Informedness about Services and Activities for Older Adults
In general, how informed or uninformed do you feel about services and activities available to older adults in your community?
Percent of respondents
Very informed 12%
Somewhat informed 48%
Somewhat uninformed 23%
Very uninformed 17%
Total 100%
Question 5: Quality of Life and Health
Please circle the number that comes closest to your opinion for each of the following questions.
Excellent Good Fair Poor Total
How do you rate your overall physical health? 19% 55% 20% 6% 100%
How do you rate your overall mental health/emotional well‐being? 36% 51% 10% 2% 100%
How do you rate your overall quality of life? 29% 53% 15% 2% 100%
Question 6: Problems Faced by Older Adults
The following questions list a number of problems that older adults may or may not face. Thinking back over the last 12 months, how much of a problem, if at all, has each of the following
been for you?
Not a problem
Minor problem
Moderate problem
Major problem
Total
Having housing to suit your needs 83% 9% 6% 2% 100%
Your physical health 41% 34% 20% 6% 100%
Performing regular activities, including walking, eating and preparing meals
70% 17% 10% 3% 100%
Having enough food to eat 90% 6% 3% 1% 100%
Doing heavy or intense housework 42% 29% 17% 11% 100%
Having safe and affordable transportation available
74% 15% 8% 4% 100%
No longer being able to drive 84% 5% 4% 7% 100%
Feeling depressed 63% 24% 10% 4% 100%
Experiencing confusion or forgetfulness 67% 24% 7% 3% 100%
Maintaining your home 59% 28% 10% 4% 100%
Maintaining your yard 56% 26% 11% 7% 100%
Finding productive or meaningful activities to do 69% 19% 8% 3% 100%
Having friends or family you can rely on 74% 15% 7% 3% 100%
Falling or injuring yourself in your home 76% 16% 5% 3% 100%
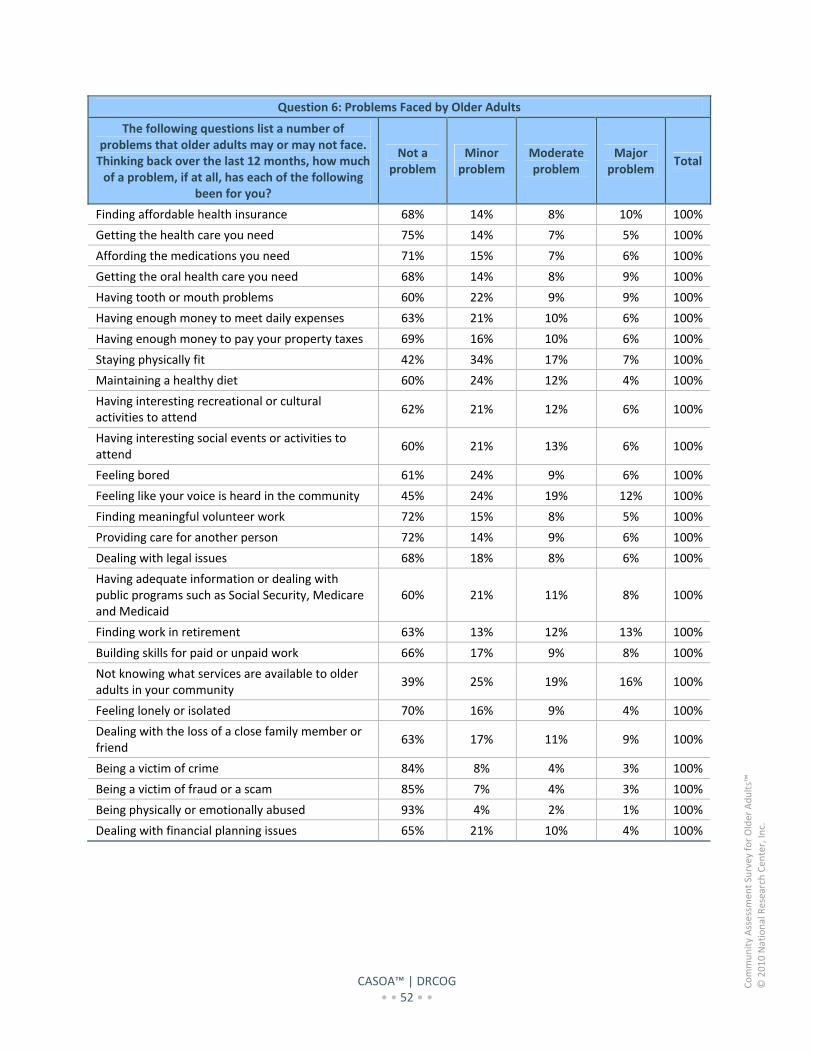
CASOA™ | DRCOG • • 52 • •
Community Assessm
ent Survey for Older Adults™
© 2010 National Research Cen
ter, In
c.
Question 6: Problems Faced by Older Adults
The following questions list a number of problems that older adults may or may not face. Thinking back over the last 12 months, how much of a problem, if at all, has each of the following
been for you?
Not a problem
Minor problem
Moderate problem
Major problem
Total
Finding affordable health insurance 68% 14% 8% 10% 100%
Getting the health care you need 75% 14% 7% 5% 100%
Affording the medications you need 71% 15% 7% 6% 100%
Getting the oral health care you need 68% 14% 8% 9% 100%
Having tooth or mouth problems 60% 22% 9% 9% 100%
Having enough money to meet daily expenses 63% 21% 10% 6% 100%
Having enough money to pay your property taxes 69% 16% 10% 6% 100%
Staying physically fit 42% 34% 17% 7% 100%
Maintaining a healthy diet 60% 24% 12% 4% 100%
Having interesting recreational or cultural activities to attend
62% 21% 12% 6% 100%
Having interesting social events or activities to attend
60% 21% 13% 6% 100%
Feeling bored 61% 24% 9% 6% 100%
Feeling like your voice is heard in the community 45% 24% 19% 12% 100%
Finding meaningful volunteer work 72% 15% 8% 5% 100%
Providing care for another person 72% 14% 9% 6% 100%
Dealing with legal issues 68% 18% 8% 6% 100%
Having adequate information or dealing with public programs such as Social Security, Medicare and Medicaid
60% 21% 11% 8% 100%
Finding work in retirement 63% 13% 12% 13% 100%
Building skills for paid or unpaid work 66% 17% 9% 8% 100%
Not knowing what services are available to older adults in your community
39% 25% 19% 16% 100%
Feeling lonely or isolated 70% 16% 9% 4% 100%
Dealing with the loss of a close family member or friend
63% 17% 11% 9% 100%
Being a victim of crime 84% 8% 4% 3% 100%
Being a victim of fraud or a scam 85% 7% 4% 3% 100%
Being physically or emotionally abused 93% 4% 2% 1% 100%
Dealing with financial planning issues 65% 21% 10% 4% 100%
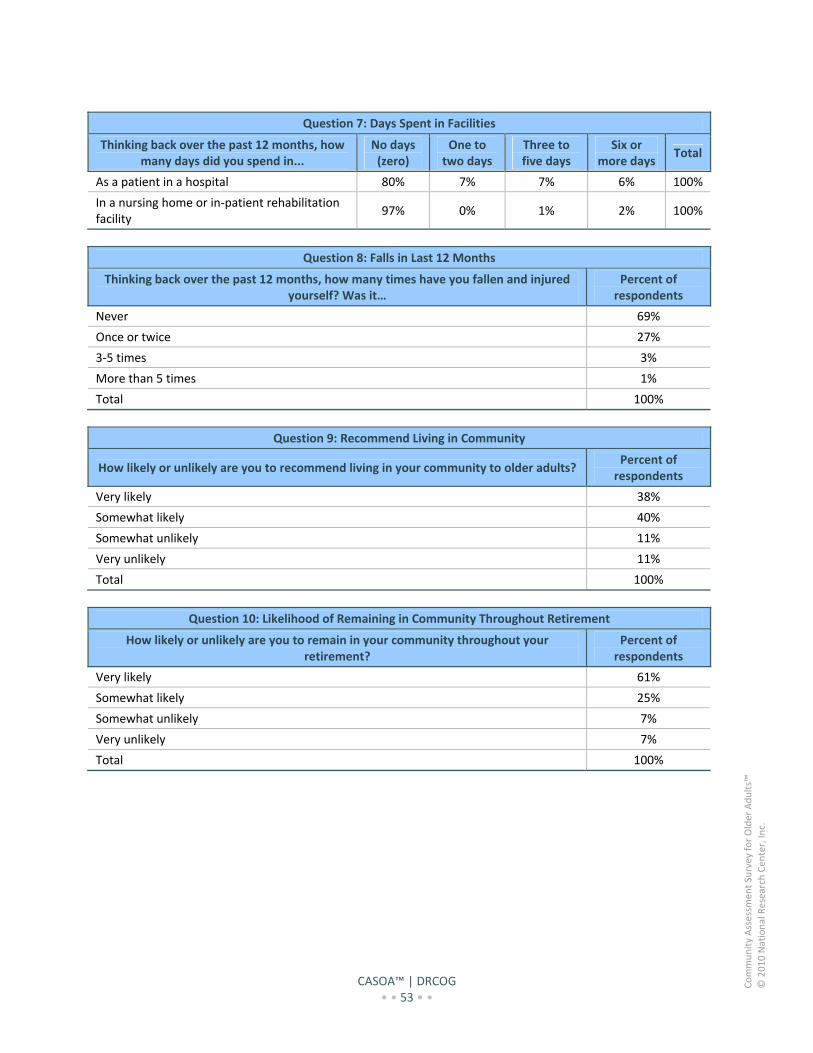
CASOA™ | DRCOG • • 53 • •
Community Assessm
ent Survey for Older Adults™
© 2010 National Research Cen
ter, In
c.
Question 7: Days Spent in Facilities
Thinking back over the past 12 months, how many days did you spend in...
No days (zero)
One to two days
Three to five days
Six or more days
Total
As a patient in a hospital 80% 7% 7% 6% 100%
In a nursing home or in‐patient rehabilitation facility
97% 0% 1% 2% 100%
Question 8: Falls in Last 12 Months
Thinking back over the past 12 months, how many times have you fallen and injured yourself? Was it…
Percent of respondents
Never 69%
Once or twice 27%
3‐5 times 3%
More than 5 times 1%
Total 100%
Question 9: Recommend Living in Community
How likely or unlikely are you to recommend living in your community to older adults? Percent of respondents
Very likely 38%
Somewhat likely 40%
Somewhat unlikely 11%
Very unlikely 11%
Total 100%
Question 10: Likelihood of Remaining in Community Throughout Retirement
How likely or unlikely are you to remain in your community throughout your retirement?
Percent of respondents
Very likely 61%
Somewhat likely 25%
Somewhat unlikely 7%
Very unlikely 7%
Total 100%
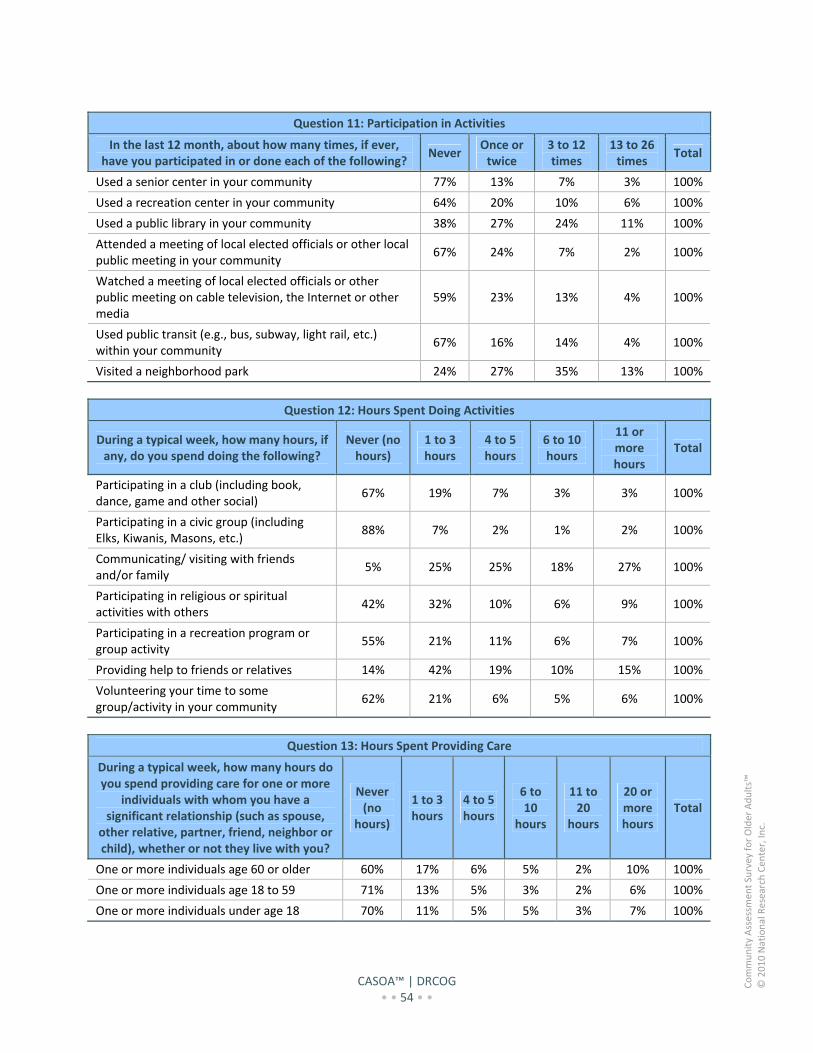
CASOA™ | DRCOG • • 54 • •
Community Assessm
ent Survey for Older Adults™
© 2010 National Research Cen
ter, In
c.
Question 11: Participation in Activities
In the last 12 month, about how many times, if ever, have you participated in or done each of the following?
Never Once or twice
3 to 12 times
13 to 26 times
Total
Used a senior center in your community 77% 13% 7% 3% 100%
Used a recreation center in your community 64% 20% 10% 6% 100%
Used a public library in your community 38% 27% 24% 11% 100%
Attended a meeting of local elected officials or other local public meeting in your community
67% 24% 7% 2% 100%
Watched a meeting of local elected officials or other public meeting on cable television, the Internet or other media
59% 23% 13% 4% 100%
Used public transit (e.g., bus, subway, light rail, etc.) within your community
67% 16% 14% 4% 100%
Visited a neighborhood park 24% 27% 35% 13% 100%
Question 12: Hours Spent Doing Activities
During a typical week, how many hours, if any, do you spend doing the following?
Never (no hours)
1 to 3 hours
4 to 5 hours
6 to 10 hours
11 or more hours
Total
Participating in a club (including book, dance, game and other social)
67% 19% 7% 3% 3% 100%
Participating in a civic group (including Elks, Kiwanis, Masons, etc.)
88% 7% 2% 1% 2% 100%
Communicating/ visiting with friends and/or family
5% 25% 25% 18% 27% 100%
Participating in religious or spiritual activities with others
42% 32% 10% 6% 9% 100%
Participating in a recreation program or group activity
55% 21% 11% 6% 7% 100%
Providing help to friends or relatives 14% 42% 19% 10% 15% 100%
Volunteering your time to some group/activity in your community
62% 21% 6% 5% 6% 100%
Question 13: Hours Spent Providing Care
During a typical week, how many hours do you spend providing care for one or more
individuals with whom you have a significant relationship (such as spouse,
other relative, partner, friend, neighbor or child), whether or not they live with you?
Never (no
hours)
1 to 3 hours
4 to 5 hours
6 to 10
hours
11 to 20
hours
20 or more hours
Total
One or more individuals age 60 or older 60% 17% 6% 5% 2% 10% 100%
One or more individuals age 18 to 59 71% 13% 5% 3% 2% 6% 100%
One or more individuals under age 18 70% 11% 5% 5% 3% 7% 100%
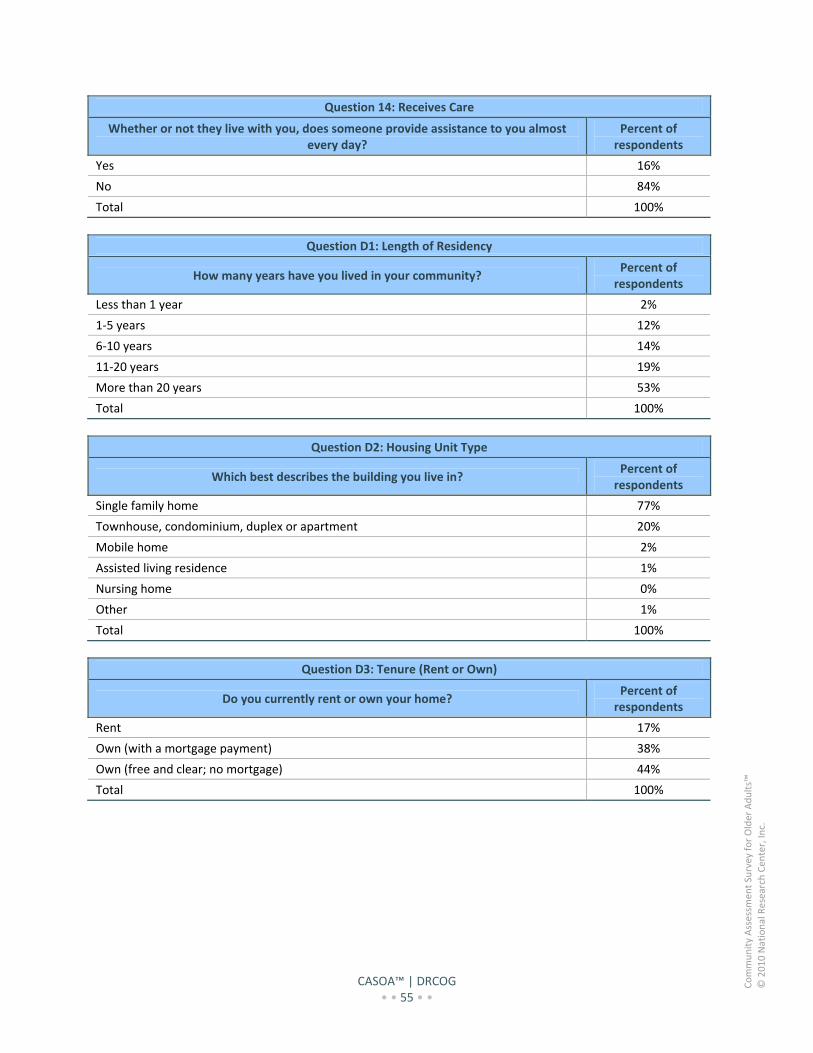
CASOA™ | DRCOG • • 55 • •
Community Assessm
ent Survey for Older Adults™
© 2010 National Research Cen
ter, In
c.
Question 14: Receives Care
Whether or not they live with you, does someone provide assistance to you almost every day?
Percent of respondents
Yes 16%
No 84%
Total 100%
Question D1: Length of Residency
How many years have you lived in your community? Percent of respondents
Less than 1 year 2%
1‐5 years 12%
6‐10 years 14%
11‐20 years 19%
More than 20 years 53%
Total 100%
Question D2: Housing Unit Type
Which best describes the building you live in? Percent of respondents
Single family home 77%
Townhouse, condominium, duplex or apartment 20%
Mobile home 2%
Assisted living residence 1%
Nursing home 0%
Other 1%
Total 100%
Question D3: Tenure (Rent or Own)
Do you currently rent or own your home? Percent of respondents
Rent 17%
Own (with a mortgage payment) 38%
Own (free and clear; no mortgage) 44%
Total 100%
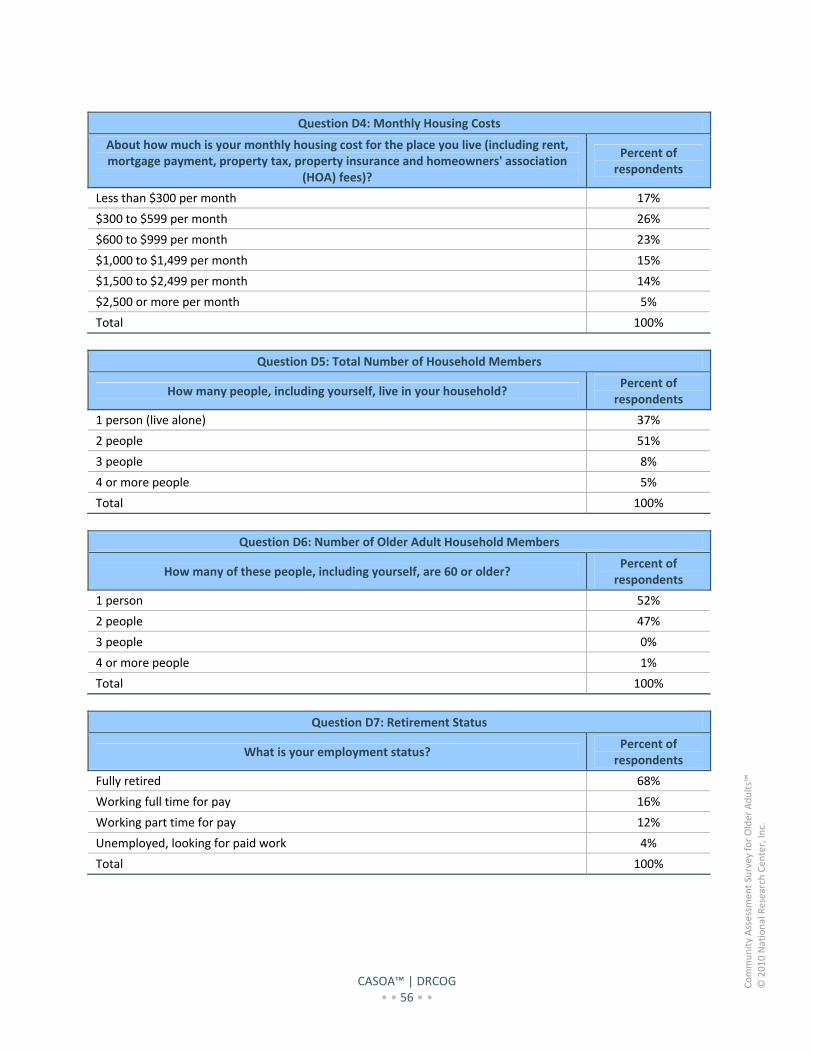
CASOA™ | DRCOG • • 56 • •
Community Assessm
ent Survey for Older Adults™
© 2010 National Research Cen
ter, In
c.
Question D4: Monthly Housing Costs
About how much is your monthly housing cost for the place you live (including rent, mortgage payment, property tax, property insurance and homeowners' association
(HOA) fees)?
Percent of respondents
Less than $300 per month 17%
$300 to $599 per month 26%
$600 to $999 per month 23%
$1,000 to $1,499 per month 15%
$1,500 to $2,499 per month 14%
$2,500 or more per month 5%
Total 100%
Question D5: Total Number of Household Members
How many people, including yourself, live in your household? Percent of respondents
1 person (live alone) 37%
2 people 51%
3 people 8%
4 or more people 5%
Total 100%
Question D6: Number of Older Adult Household Members
How many of these people, including yourself, are 60 or older? Percent of respondents
1 person 52%
2 people 47%
3 people 0%
4 or more people 1%
Total 100%
Question D7: Retirement Status
What is your employment status? Percent of respondents
Fully retired 68%
Working full time for pay 16%
Working part time for pay 12%
Unemployed, looking for paid work 4%
Total 100%
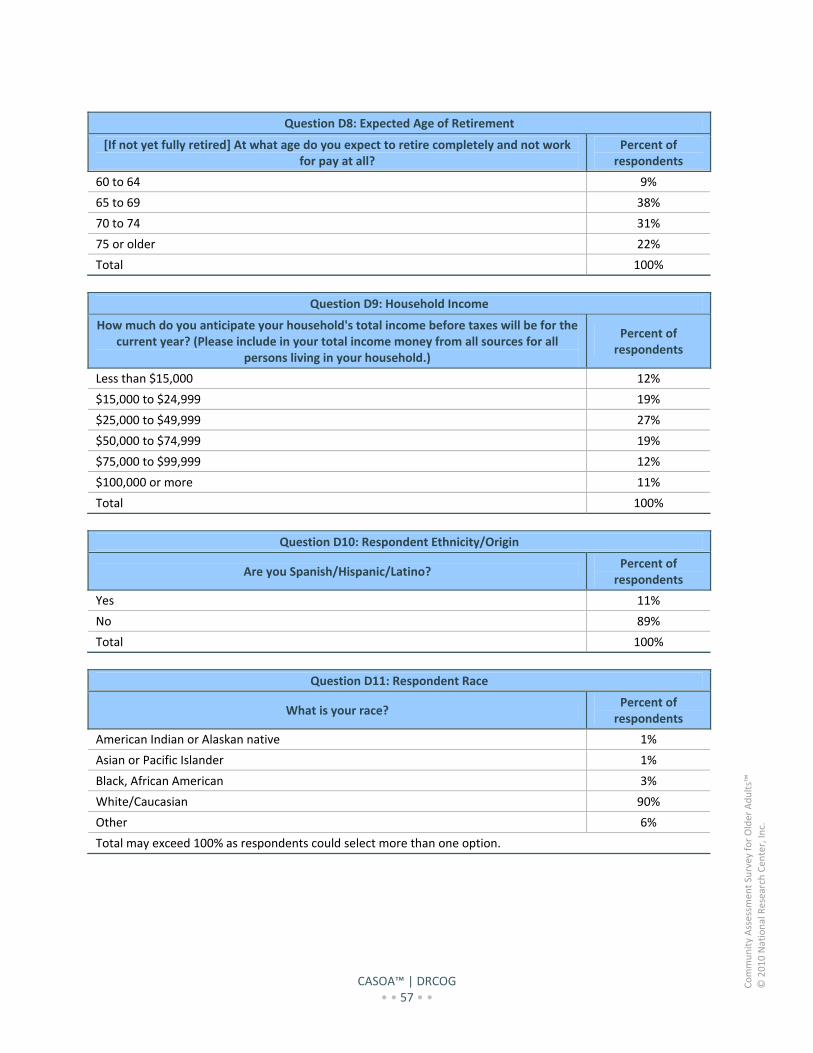
CASOA™ | DRCOG • • 57 • •
Community Assessm
ent Survey for Older Adults™
© 2010 National Research Cen
ter, In
c.
Question D8: Expected Age of Retirement
[If not yet fully retired] At what age do you expect to retire completely and not work for pay at all?
Percent of respondents
60 to 64 9%
65 to 69 38%
70 to 74 31%
75 or older 22%
Total 100%
Question D9: Household Income
How much do you anticipate your household's total income before taxes will be for the current year? (Please include in your total income money from all sources for all
persons living in your household.)
Percent of respondents
Less than $15,000 12%
$15,000 to $24,999 19%
$25,000 to $49,999 27%
$50,000 to $74,999 19%
$75,000 to $99,999 12%
$100,000 or more 11%
Total 100%
Question D10: Respondent Ethnicity/Origin
Are you Spanish/Hispanic/Latino? Percent of respondents
Yes 11%
No 89%
Total 100%
Question D11: Respondent Race
What is your race? Percent of respondents
American Indian or Alaskan native 1%
Asian or Pacific Islander 1%
Black, African American 3%
White/Caucasian 90%
Other 6%
Total may exceed 100% as respondents could select more than one option.
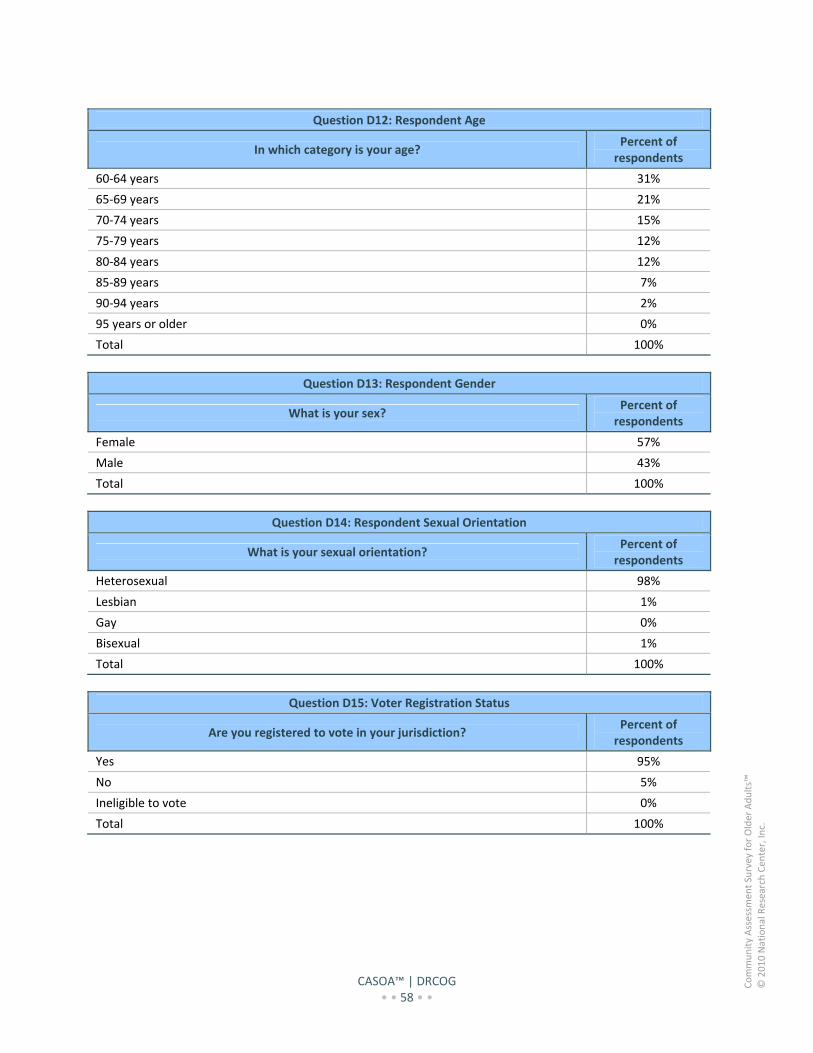
CASOA™ | DRCOG • • 58 • •
Community Assessm
ent Survey for Older Adults™
© 2010 National Research Cen
ter, In
c.
Question D12: Respondent Age
In which category is your age? Percent of respondents
60‐64 years 31%
65‐69 years 21%
70‐74 years 15%
75‐79 years 12%
80‐84 years 12%
85‐89 years 7%
90‐94 years 2%
95 years or older 0%
Total 100%
Question D13: Respondent Gender
What is your sex? Percent of respondents
Female 57%
Male 43%
Total 100%
Question D14: Respondent Sexual Orientation
What is your sexual orientation? Percent of respondents
Heterosexual 98%
Lesbian 1%
Gay 0%
Bisexual 1%
Total 100%
Question D15: Voter Registration Status
Are you registered to vote in your jurisdiction? Percent of respondents
Yes 95%
No 5%
Ineligible to vote 0%
Total 100%
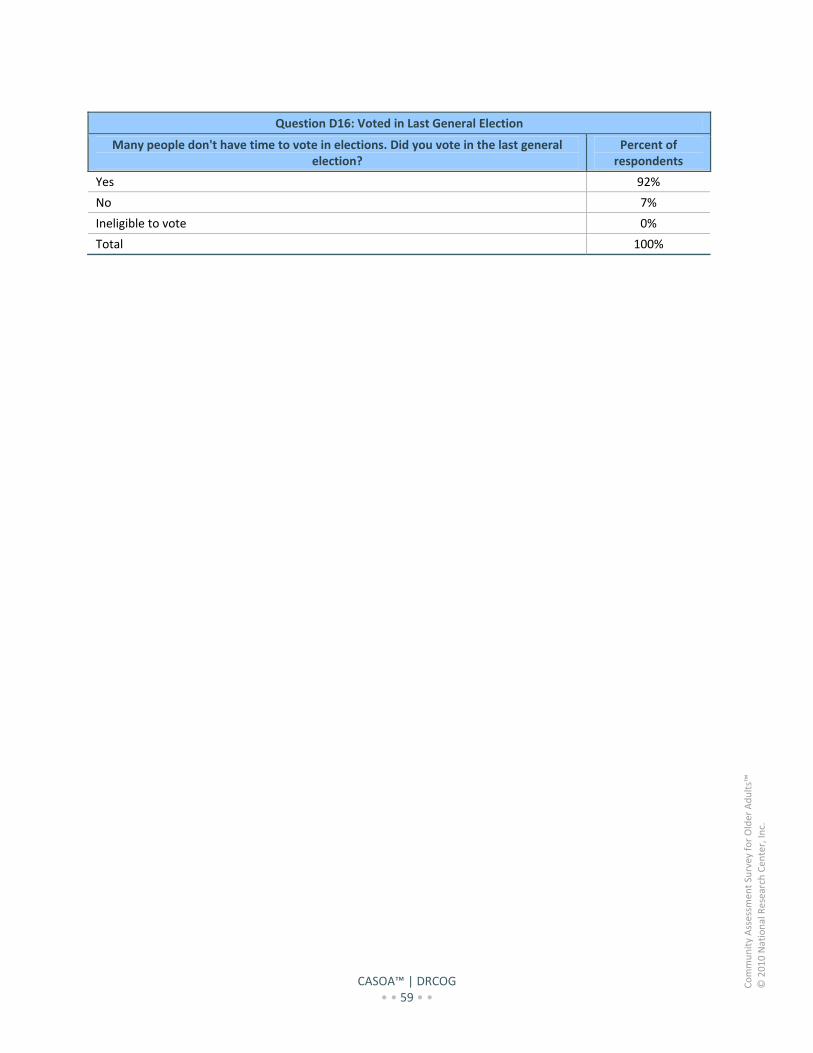
CASOA™ | DRCOG • • 59 • •
Community Assessm
ent Survey for Older Adults™
© 2010 National Research Cen
ter, In
c.
Question D16: Voted in Last General Election
Many people don't have time to vote in elections. Did you vote in the last general election?
Percent of respondents
Yes 92%
No 7%
Ineligible to vote 0%
Total 100%
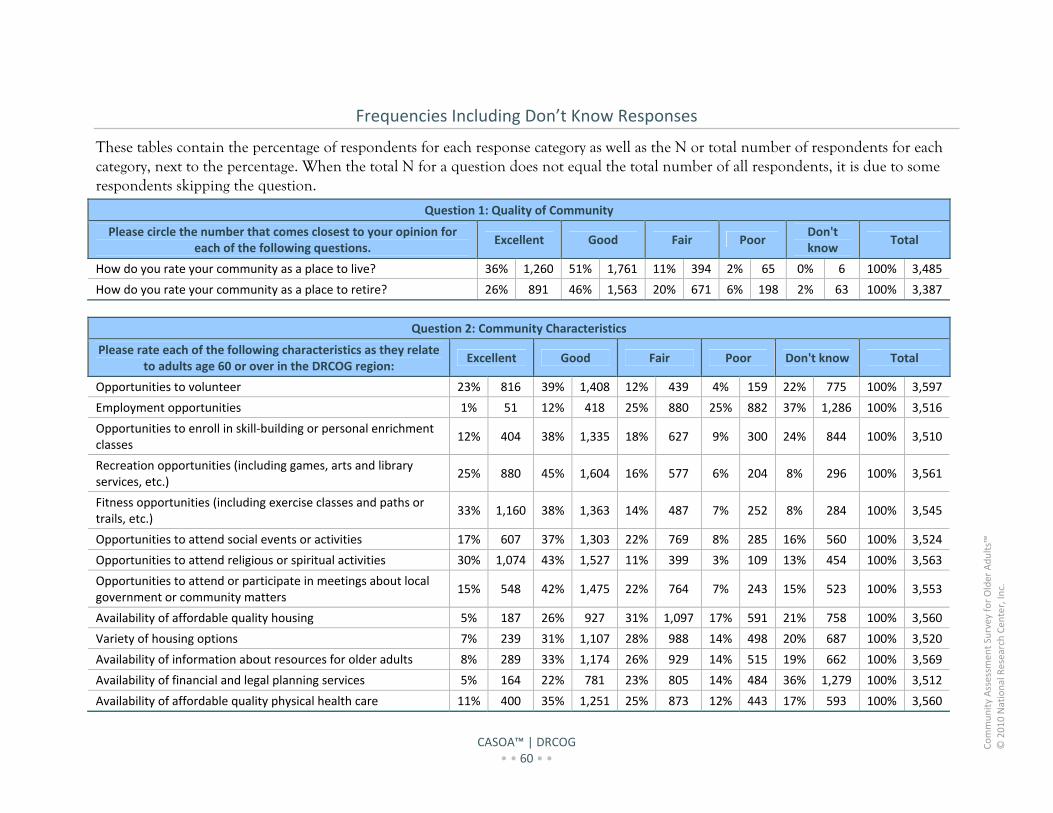
CASOA™ | DRCOG • • 60 • •
Community Assessm
ent Survey for Older Adults™
© 2010 National Research Cen
ter, In
c.
Frequencies Including Don’t Know Responses
These tables contain the percentage of respondents for each response category as well as the N or total number of respondents for each category, next to the percentage. When the total N for a question does not equal the total number of all respondents, it is due to some respondents skipping the question.
Question 1: Quality of Community
Please circle the number that comes closest to your opinion for each of the following questions.
Excellent Good Fair Poor Don't know
Total
How do you rate your community as a place to live? 36% 1,260 51% 1,761 11% 394 2% 65 0% 6 100% 3,485
How do you rate your community as a place to retire? 26% 891 46% 1,563 20% 671 6% 198 2% 63 100% 3,387
Question 2: Community Characteristics
Please rate each of the following characteristics as they relate to adults age 60 or over in the DRCOG region:
Excellent Good Fair Poor Don't know Total
Opportunities to volunteer 23% 816 39% 1,408 12% 439 4% 159 22% 775 100% 3,597
Employment opportunities 1% 51 12% 418 25% 880 25% 882 37% 1,286 100% 3,516
Opportunities to enroll in skill‐building or personal enrichment classes
12% 404 38% 1,335 18% 627 9% 300 24% 844 100% 3,510
Recreation opportunities (including games, arts and library services, etc.)
25% 880 45% 1,604 16% 577 6% 204 8% 296 100% 3,561
Fitness opportunities (including exercise classes and paths or trails, etc.)
33% 1,160 38% 1,363 14% 487 7% 252 8% 284 100% 3,545
Opportunities to attend social events or activities 17% 607 37% 1,303 22% 769 8% 285 16% 560 100% 3,524
Opportunities to attend religious or spiritual activities 30% 1,074 43% 1,527 11% 399 3% 109 13% 454 100% 3,563
Opportunities to attend or participate in meetings about local government or community matters
15% 548 42% 1,475 22% 764 7% 243 15% 523 100% 3,553
Availability of affordable quality housing 5% 187 26% 927 31% 1,097 17% 591 21% 758 100% 3,560
Variety of housing options 7% 239 31% 1,107 28% 988 14% 498 20% 687 100% 3,520
Availability of information about resources for older adults 8% 289 33% 1,174 26% 929 14% 515 19% 662 100% 3,569
Availability of financial and legal planning services 5% 164 22% 781 23% 805 14% 484 36% 1,279 100% 3,512
Availability of affordable quality physical health care 11% 400 35% 1,251 25% 873 12% 443 17% 593 100% 3,560
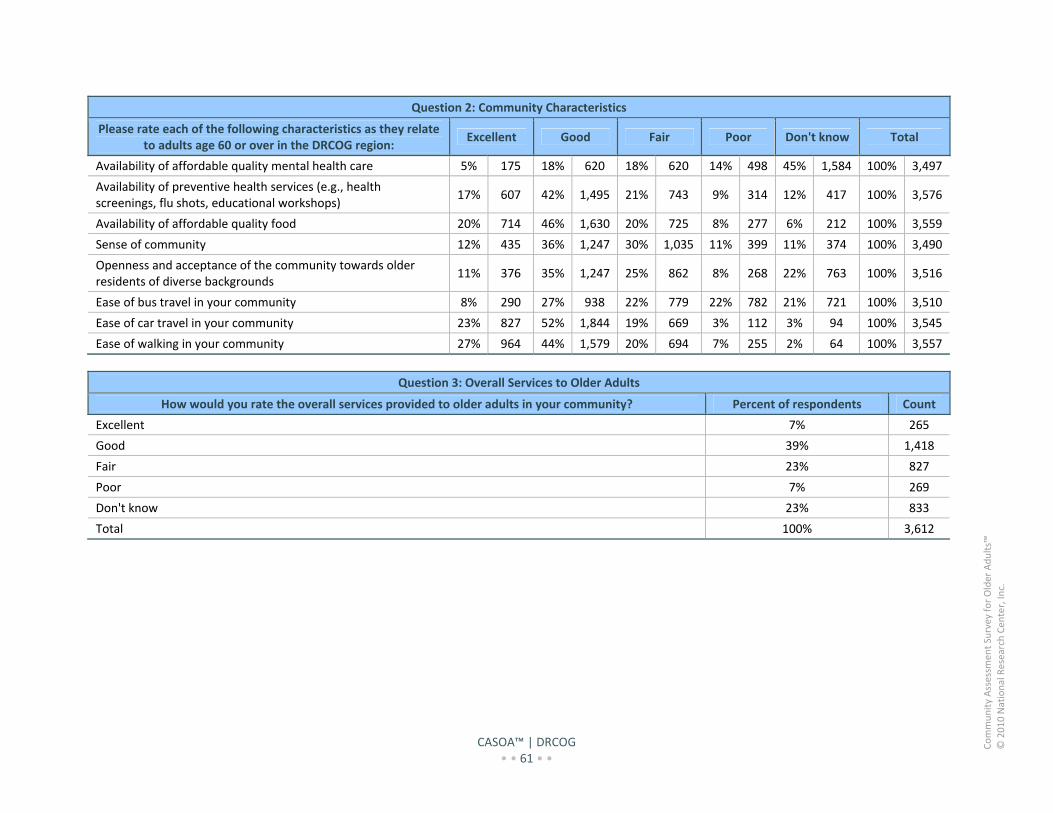
CASOA™ | DRCOG • • 61 • •
Community Assessm
ent Survey for Older Adults™
© 2010 National Research Cen
ter, In
c.
Question 2: Community Characteristics
Please rate each of the following characteristics as they relate to adults age 60 or over in the DRCOG region:
Excellent Good Fair Poor Don't know Total
Availability of affordable quality mental health care 5% 175 18% 620 18% 620 14% 498 45% 1,584 100% 3,497
Availability of preventive health services (e.g., health screenings, flu shots, educational workshops)
17% 607 42% 1,495 21% 743 9% 314 12% 417 100% 3,576
Availability of affordable quality food 20% 714 46% 1,630 20% 725 8% 277 6% 212 100% 3,559
Sense of community 12% 435 36% 1,247 30% 1,035 11% 399 11% 374 100% 3,490
Openness and acceptance of the community towards older residents of diverse backgrounds
11% 376 35% 1,247 25% 862 8% 268 22% 763 100% 3,516
Ease of bus travel in your community 8% 290 27% 938 22% 779 22% 782 21% 721 100% 3,510
Ease of car travel in your community 23% 827 52% 1,844 19% 669 3% 112 3% 94 100% 3,545
Ease of walking in your community 27% 964 44% 1,579 20% 694 7% 255 2% 64 100% 3,557
Question 3: Overall Services to Older Adults
How would you rate the overall services provided to older adults in your community? Percent of respondents Count
Excellent 7% 265
Good 39% 1,418
Fair 23% 827
Poor 7% 269
Don't know 23% 833
Total 100% 3,612
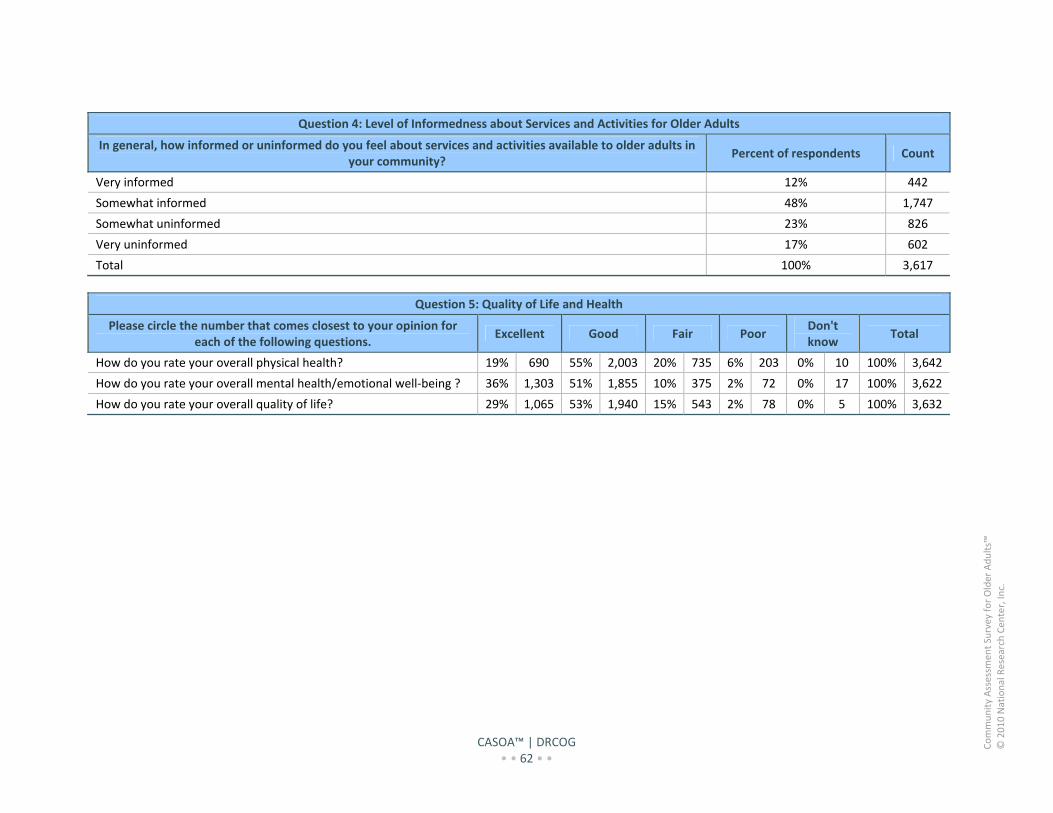
CASOA™ | DRCOG • • 62 • •
Community Assessm
ent Survey for Older Adults™
© 2010 National Research Cen
ter, In
c.
Question 4: Level of Informedness about Services and Activities for Older Adults
In general, how informed or uninformed do you feel about services and activities available to older adults in your community?
Percent of respondents Count
Very informed 12% 442
Somewhat informed 48% 1,747
Somewhat uninformed 23% 826
Very uninformed 17% 602
Total 100% 3,617
Question 5: Quality of Life and Health
Please circle the number that comes closest to your opinion for each of the following questions.
Excellent Good Fair Poor Don't know
Total
How do you rate your overall physical health? 19% 690 55% 2,003 20% 735 6% 203 0% 10 100% 3,642
How do you rate your overall mental health/emotional well‐being ? 36% 1,303 51% 1,855 10% 375 2% 72 0% 17 100% 3,622
How do you rate your overall quality of life? 29% 1,065 53% 1,940 15% 543 2% 78 0% 5 100% 3,632
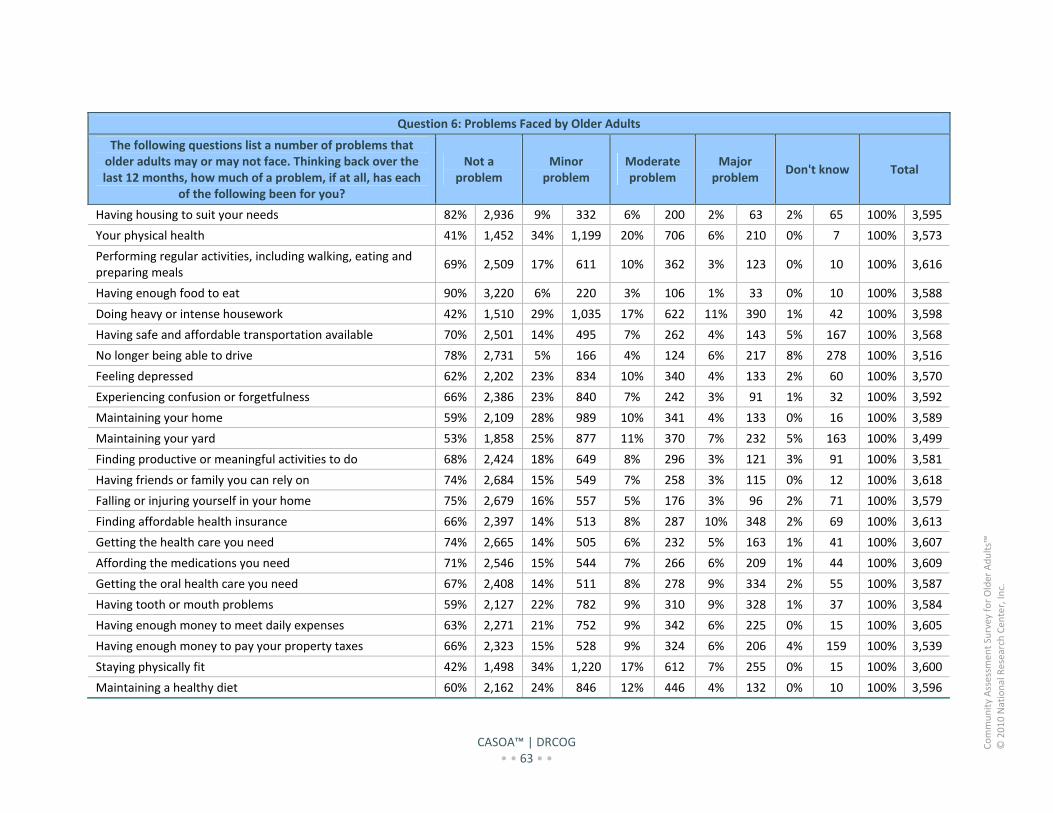
CASOA™ | DRCOG • • 63 • •
Community Assessm
ent Survey for Older Adults™
© 2010 National Research Cen
ter, In
c.
Question 6: Problems Faced by Older Adults
The following questions list a number of problems that older adults may or may not face. Thinking back over the last 12 months, how much of a problem, if at all, has each
of the following been for you?
Not a problem
Minor problem
Moderate problem
Major problem
Don't know Total
Having housing to suit your needs 82% 2,936 9% 332 6% 200 2% 63 2% 65 100% 3,595
Your physical health 41% 1,452 34% 1,199 20% 706 6% 210 0% 7 100% 3,573
Performing regular activities, including walking, eating and preparing meals
69% 2,509 17% 611 10% 362 3% 123 0% 10 100% 3,616
Having enough food to eat 90% 3,220 6% 220 3% 106 1% 33 0% 10 100% 3,588
Doing heavy or intense housework 42% 1,510 29% 1,035 17% 622 11% 390 1% 42 100% 3,598
Having safe and affordable transportation available 70% 2,501 14% 495 7% 262 4% 143 5% 167 100% 3,568
No longer being able to drive 78% 2,731 5% 166 4% 124 6% 217 8% 278 100% 3,516
Feeling depressed 62% 2,202 23% 834 10% 340 4% 133 2% 60 100% 3,570
Experiencing confusion or forgetfulness 66% 2,386 23% 840 7% 242 3% 91 1% 32 100% 3,592
Maintaining your home 59% 2,109 28% 989 10% 341 4% 133 0% 16 100% 3,589
Maintaining your yard 53% 1,858 25% 877 11% 370 7% 232 5% 163 100% 3,499
Finding productive or meaningful activities to do 68% 2,424 18% 649 8% 296 3% 121 3% 91 100% 3,581
Having friends or family you can rely on 74% 2,684 15% 549 7% 258 3% 115 0% 12 100% 3,618
Falling or injuring yourself in your home 75% 2,679 16% 557 5% 176 3% 96 2% 71 100% 3,579
Finding affordable health insurance 66% 2,397 14% 513 8% 287 10% 348 2% 69 100% 3,613
Getting the health care you need 74% 2,665 14% 505 6% 232 5% 163 1% 41 100% 3,607
Affording the medications you need 71% 2,546 15% 544 7% 266 6% 209 1% 44 100% 3,609
Getting the oral health care you need 67% 2,408 14% 511 8% 278 9% 334 2% 55 100% 3,587
Having tooth or mouth problems 59% 2,127 22% 782 9% 310 9% 328 1% 37 100% 3,584
Having enough money to meet daily expenses 63% 2,271 21% 752 9% 342 6% 225 0% 15 100% 3,605
Having enough money to pay your property taxes 66% 2,323 15% 528 9% 324 6% 206 4% 159 100% 3,539
Staying physically fit 42% 1,498 34% 1,220 17% 612 7% 255 0% 15 100% 3,600
Maintaining a healthy diet 60% 2,162 24% 846 12% 446 4% 132 0% 10 100% 3,596
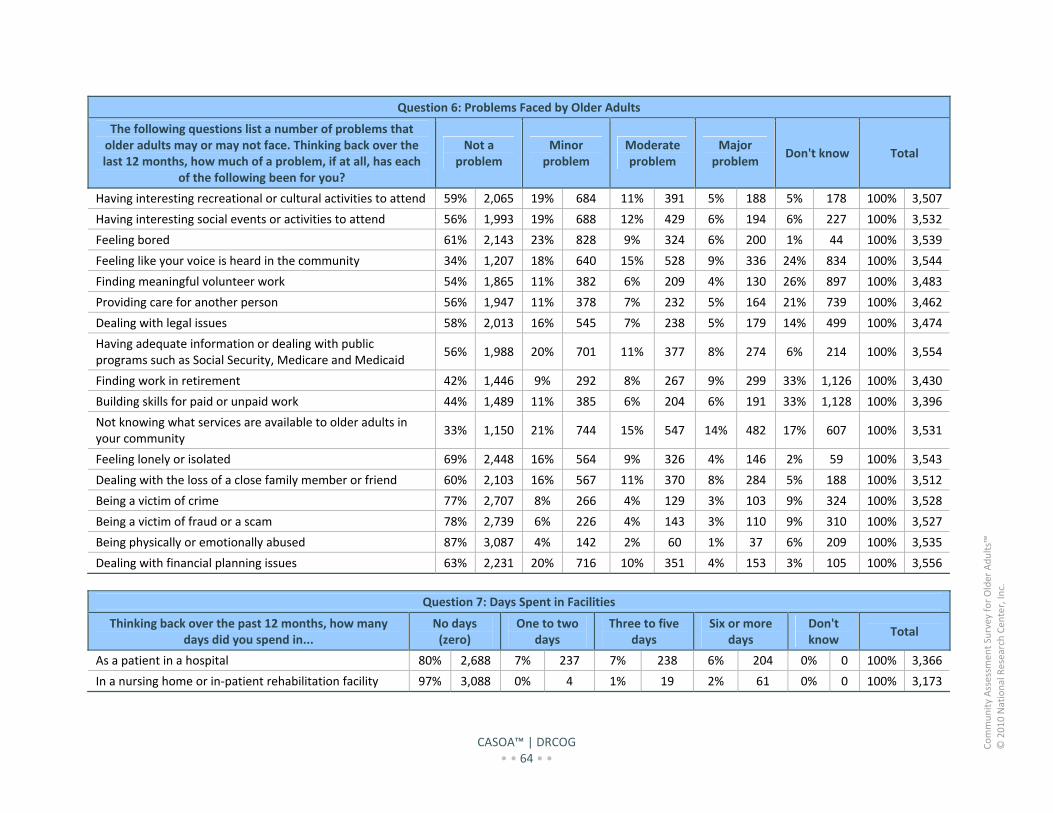
CASOA™ | DRCOG • • 64 • •
Community Assessm
ent Survey for Older Adults™
© 2010 National Research Cen
ter, In
c.
Question 6: Problems Faced by Older Adults
The following questions list a number of problems that older adults may or may not face. Thinking back over the last 12 months, how much of a problem, if at all, has each
of the following been for you?
Not a problem
Minor problem
Moderate problem
Major problem
Don't know Total
Having interesting recreational or cultural activities to attend 59% 2,065 19% 684 11% 391 5% 188 5% 178 100% 3,507
Having interesting social events or activities to attend 56% 1,993 19% 688 12% 429 6% 194 6% 227 100% 3,532
Feeling bored 61% 2,143 23% 828 9% 324 6% 200 1% 44 100% 3,539
Feeling like your voice is heard in the community 34% 1,207 18% 640 15% 528 9% 336 24% 834 100% 3,544
Finding meaningful volunteer work 54% 1,865 11% 382 6% 209 4% 130 26% 897 100% 3,483
Providing care for another person 56% 1,947 11% 378 7% 232 5% 164 21% 739 100% 3,462
Dealing with legal issues 58% 2,013 16% 545 7% 238 5% 179 14% 499 100% 3,474
Having adequate information or dealing with public programs such as Social Security, Medicare and Medicaid
56% 1,988 20% 701 11% 377 8% 274 6% 214 100% 3,554
Finding work in retirement 42% 1,446 9% 292 8% 267 9% 299 33% 1,126 100% 3,430
Building skills for paid or unpaid work 44% 1,489 11% 385 6% 204 6% 191 33% 1,128 100% 3,396
Not knowing what services are available to older adults in your community
33% 1,150 21% 744 15% 547 14% 482 17% 607 100% 3,531
Feeling lonely or isolated 69% 2,448 16% 564 9% 326 4% 146 2% 59 100% 3,543
Dealing with the loss of a close family member or friend 60% 2,103 16% 567 11% 370 8% 284 5% 188 100% 3,512
Being a victim of crime 77% 2,707 8% 266 4% 129 3% 103 9% 324 100% 3,528
Being a victim of fraud or a scam 78% 2,739 6% 226 4% 143 3% 110 9% 310 100% 3,527
Being physically or emotionally abused 87% 3,087 4% 142 2% 60 1% 37 6% 209 100% 3,535
Dealing with financial planning issues 63% 2,231 20% 716 10% 351 4% 153 3% 105 100% 3,556
Question 7: Days Spent in Facilities
Thinking back over the past 12 months, how many days did you spend in...
No days (zero)
One to two days
Three to five days
Six or more days
Don't know
Total
As a patient in a hospital 80% 2,688 7% 237 7% 238 6% 204 0% 0 100% 3,366
In a nursing home or in‐patient rehabilitation facility 97% 3,088 0% 4 1% 19 2% 61 0% 0 100% 3,173
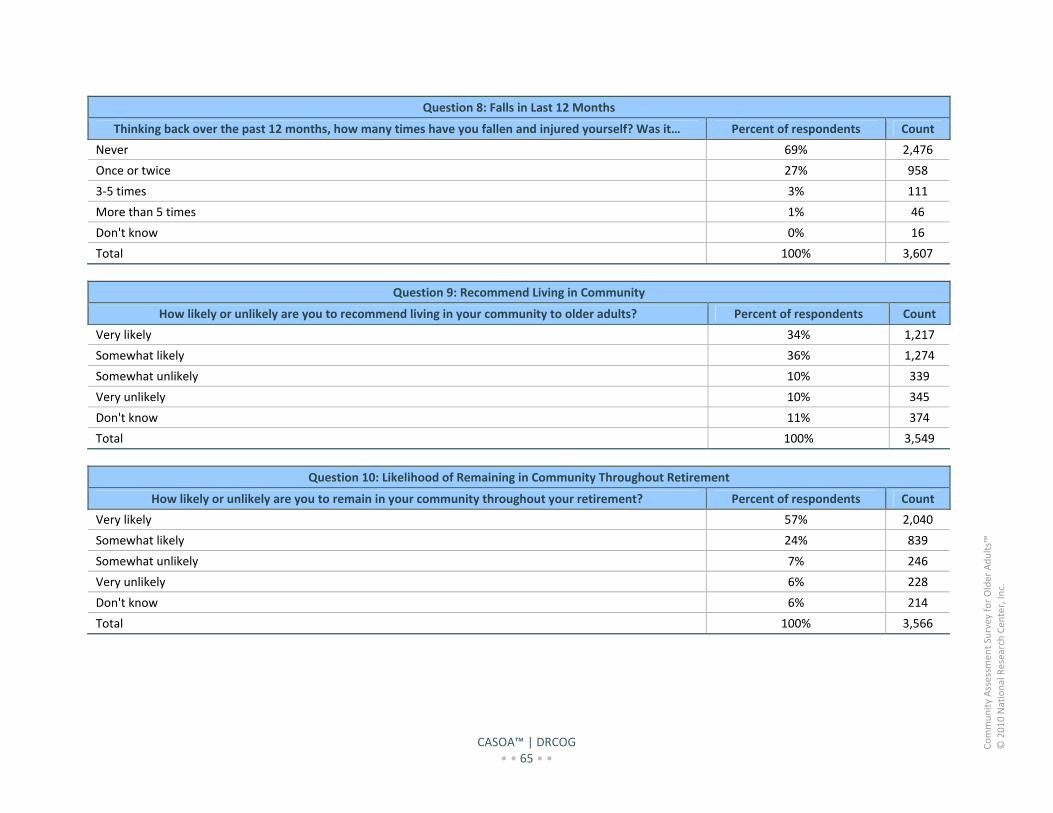
CASOA™ | DRCOG • • 65 • •
Community Assessm
ent Survey for Older Adults™
© 2010 National Research Cen
ter, In
c.
Question 8: Falls in Last 12 Months
Thinking back over the past 12 months, how many times have you fallen and injured yourself? Was it… Percent of respondents Count
Never 69% 2,476
Once or twice 27% 958
3‐5 times 3% 111
More than 5 times 1% 46
Don't know 0% 16
Total 100% 3,607
Question 9: Recommend Living in Community
How likely or unlikely are you to recommend living in your community to older adults? Percent of respondents Count
Very likely 34% 1,217
Somewhat likely 36% 1,274
Somewhat unlikely 10% 339
Very unlikely 10% 345
Don't know 11% 374
Total 100% 3,549
Question 10: Likelihood of Remaining in Community Throughout Retirement
How likely or unlikely are you to remain in your community throughout your retirement? Percent of respondents Count
Very likely 57% 2,040
Somewhat likely 24% 839
Somewhat unlikely 7% 246
Very unlikely 6% 228
Don't know 6% 214
Total 100% 3,566
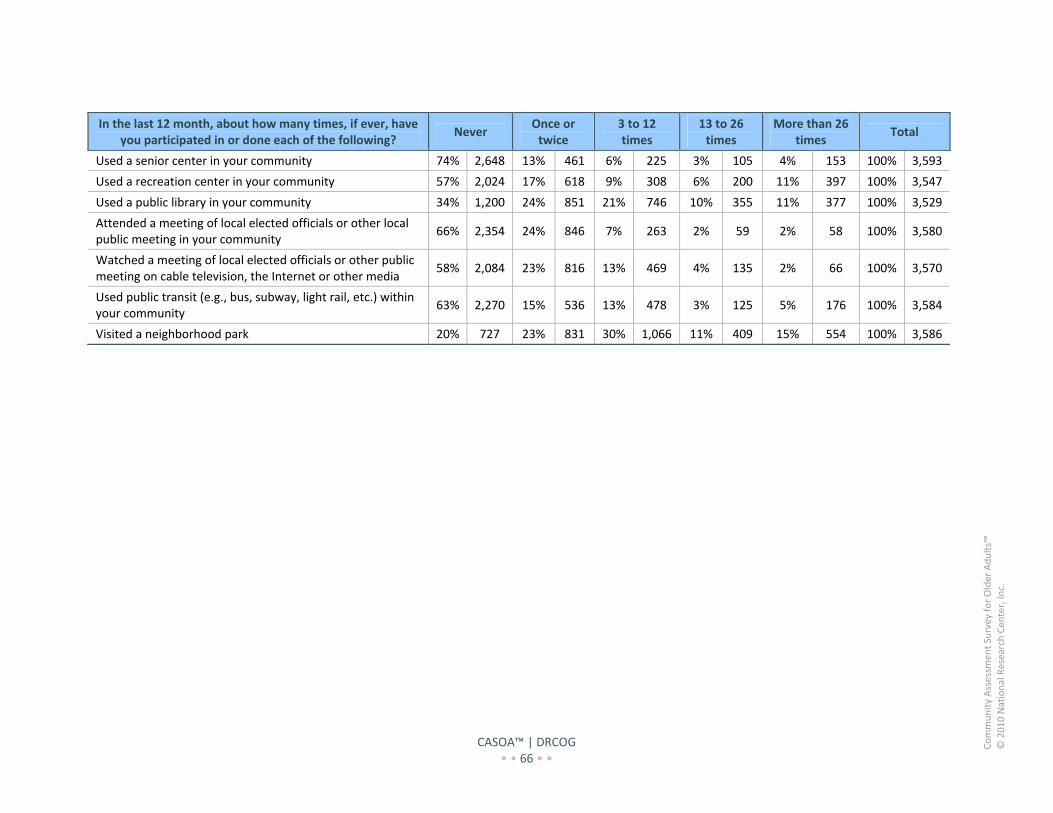
CASOA™ | DRCOG • • 66 • •
Community Assessm
ent Survey for Older Adults™
© 2010 National Research Cen
ter, In
c.
In the last 12 month, about how many times, if ever, have you participated in or done each of the following?
Never Once or twice
3 to 12 times
13 to 26 times
More than 26 times
Total
Used a senior center in your community 74% 2,648 13% 461 6% 225 3% 105 4% 153 100% 3,593
Used a recreation center in your community 57% 2,024 17% 618 9% 308 6% 200 11% 397 100% 3,547
Used a public library in your community 34% 1,200 24% 851 21% 746 10% 355 11% 377 100% 3,529
Attended a meeting of local elected officials or other local public meeting in your community
66% 2,354 24% 846 7% 263 2% 59 2% 58 100% 3,580
Watched a meeting of local elected officials or other public meeting on cable television, the Internet or other media
58% 2,084 23% 816 13% 469 4% 135 2% 66 100% 3,570
Used public transit (e.g., bus, subway, light rail, etc.) within your community
63% 2,270 15% 536 13% 478 3% 125 5% 176 100% 3,584
Visited a neighborhood park 20% 727 23% 831 30% 1,066 11% 409 15% 554 100% 3,586
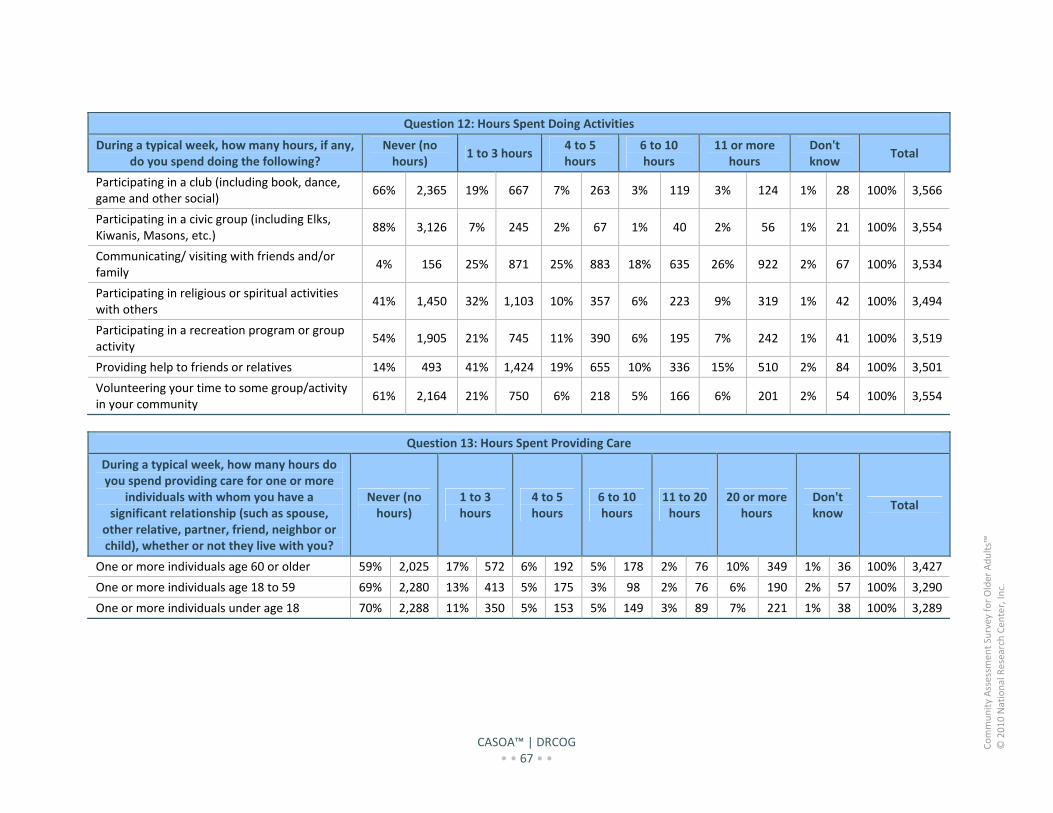
CASOA™ | DRCOG • • 67 • •
Community Assessm
ent Survey for Older Adults™
© 2010 National Research Cen
ter, In
c.
Question 12: Hours Spent Doing Activities
During a typical week, how many hours, if any, do you spend doing the following?
Never (no hours)
1 to 3 hours 4 to 5 hours
6 to 10 hours
11 or more hours
Don't know
Total
Participating in a club (including book, dance, game and other social)
66% 2,365 19% 667 7% 263 3% 119 3% 124 1% 28 100% 3,566
Participating in a civic group (including Elks, Kiwanis, Masons, etc.)
88% 3,126 7% 245 2% 67 1% 40 2% 56 1% 21 100% 3,554
Communicating/ visiting with friends and/or family
4% 156 25% 871 25% 883 18% 635 26% 922 2% 67 100% 3,534
Participating in religious or spiritual activities with others
41% 1,450 32% 1,103 10% 357 6% 223 9% 319 1% 42 100% 3,494
Participating in a recreation program or group activity
54% 1,905 21% 745 11% 390 6% 195 7% 242 1% 41 100% 3,519
Providing help to friends or relatives 14% 493 41% 1,424 19% 655 10% 336 15% 510 2% 84 100% 3,501
Volunteering your time to some group/activity in your community
61% 2,164 21% 750 6% 218 5% 166 6% 201 2% 54 100% 3,554
Question 13: Hours Spent Providing Care
During a typical week, how many hours do you spend providing care for one or more
individuals with whom you have a significant relationship (such as spouse,
other relative, partner, friend, neighbor or child), whether or not they live with you?
Never (no hours)
1 to 3 hours
4 to 5 hours
6 to 10 hours
11 to 20 hours
20 or more hours
Don't know
Total
One or more individuals age 60 or older 59% 2,025 17% 572 6% 192 5% 178 2% 76 10% 349 1% 36 100% 3,427
One or more individuals age 18 to 59 69% 2,280 13% 413 5% 175 3% 98 2% 76 6% 190 2% 57 100% 3,290
One or more individuals under age 18 70% 2,288 11% 350 5% 153 5% 149 3% 89 7% 221 1% 38 100% 3,289
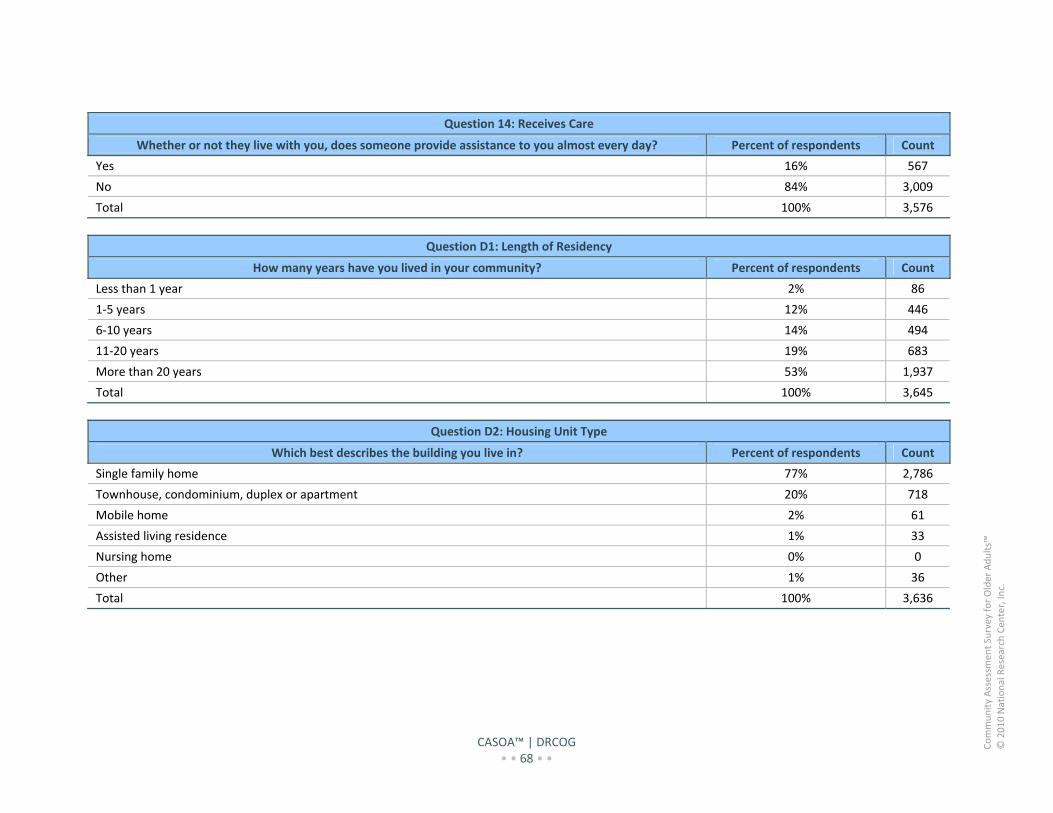
CASOA™ | DRCOG • • 68 • •
Community Assessm
ent Survey for Older Adults™
© 2010 National Research Cen
ter, In
c.
Question 14: Receives Care
Whether or not they live with you, does someone provide assistance to you almost every day? Percent of respondents Count
Yes 16% 567
No 84% 3,009
Total 100% 3,576
Question D1: Length of Residency
How many years have you lived in your community? Percent of respondents Count
Less than 1 year 2% 86
1‐5 years 12% 446
6‐10 years 14% 494
11‐20 years 19% 683
More than 20 years 53% 1,937
Total 100% 3,645
Question D2: Housing Unit Type
Which best describes the building you live in? Percent of respondents Count
Single family home 77% 2,786
Townhouse, condominium, duplex or apartment 20% 718
Mobile home 2% 61
Assisted living residence 1% 33
Nursing home 0% 0
Other 1% 36
Total 100% 3,636
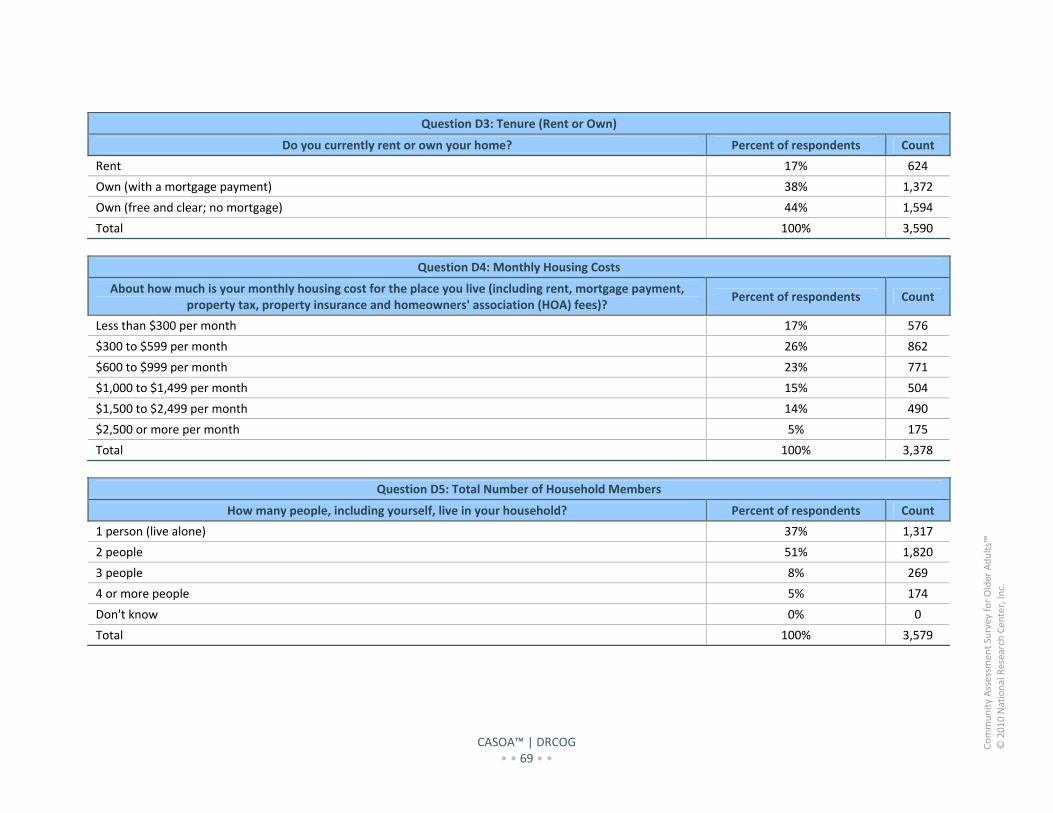
CASOA™ | DRCOG • • 69 • •
Community Assessm
ent Survey for Older Adults™
© 2010 National Research Cen
ter, In
c.
Question D3: Tenure (Rent or Own)
Do you currently rent or own your home? Percent of respondents Count
Rent 17% 624
Own (with a mortgage payment) 38% 1,372
Own (free and clear; no mortgage) 44% 1,594
Total 100% 3,590
Question D4: Monthly Housing Costs
About how much is your monthly housing cost for the place you live (including rent, mortgage payment, property tax, property insurance and homeowners' association (HOA) fees)?
Percent of respondents Count
Less than $300 per month 17% 576
$300 to $599 per month 26% 862
$600 to $999 per month 23% 771
$1,000 to $1,499 per month 15% 504
$1,500 to $2,499 per month 14% 490
$2,500 or more per month 5% 175
Total 100% 3,378
Question D5: Total Number of Household Members
How many people, including yourself, live in your household? Percent of respondents Count
1 person (live alone) 37% 1,317
2 people 51% 1,820
3 people 8% 269
4 or more people 5% 174
Don't know 0% 0
Total 100% 3,579
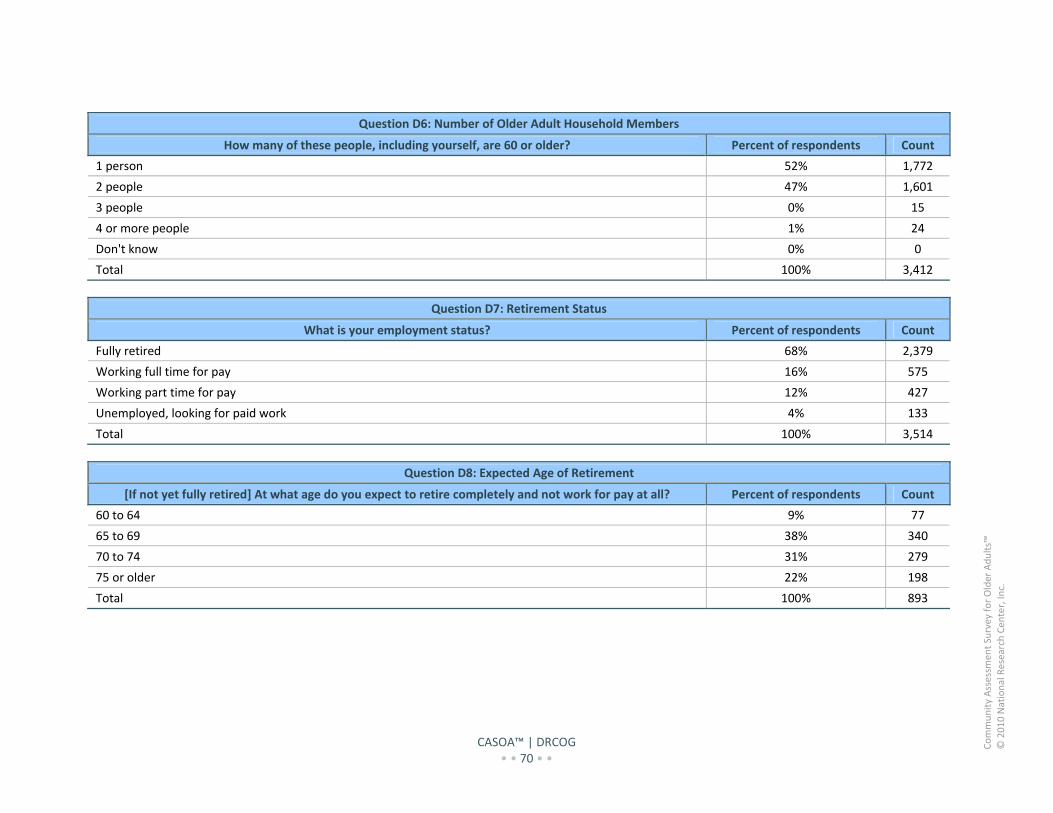
CASOA™ | DRCOG • • 70 • •
Community Assessm
ent Survey for Older Adults™
© 2010 National Research Cen
ter, In
c.
Question D6: Number of Older Adult Household Members
How many of these people, including yourself, are 60 or older? Percent of respondents Count
1 person 52% 1,772
2 people 47% 1,601
3 people 0% 15
4 or more people 1% 24
Don't know 0% 0
Total 100% 3,412
Question D7: Retirement Status
What is your employment status? Percent of respondents Count
Fully retired 68% 2,379
Working full time for pay 16% 575
Working part time for pay 12% 427
Unemployed, looking for paid work 4% 133
Total 100% 3,514
Question D8: Expected Age of Retirement
[If not yet fully retired] At what age do you expect to retire completely and not work for pay at all? Percent of respondents Count
60 to 64 9% 77
65 to 69 38% 340
70 to 74 31% 279
75 or older 22% 198
Total 100% 893
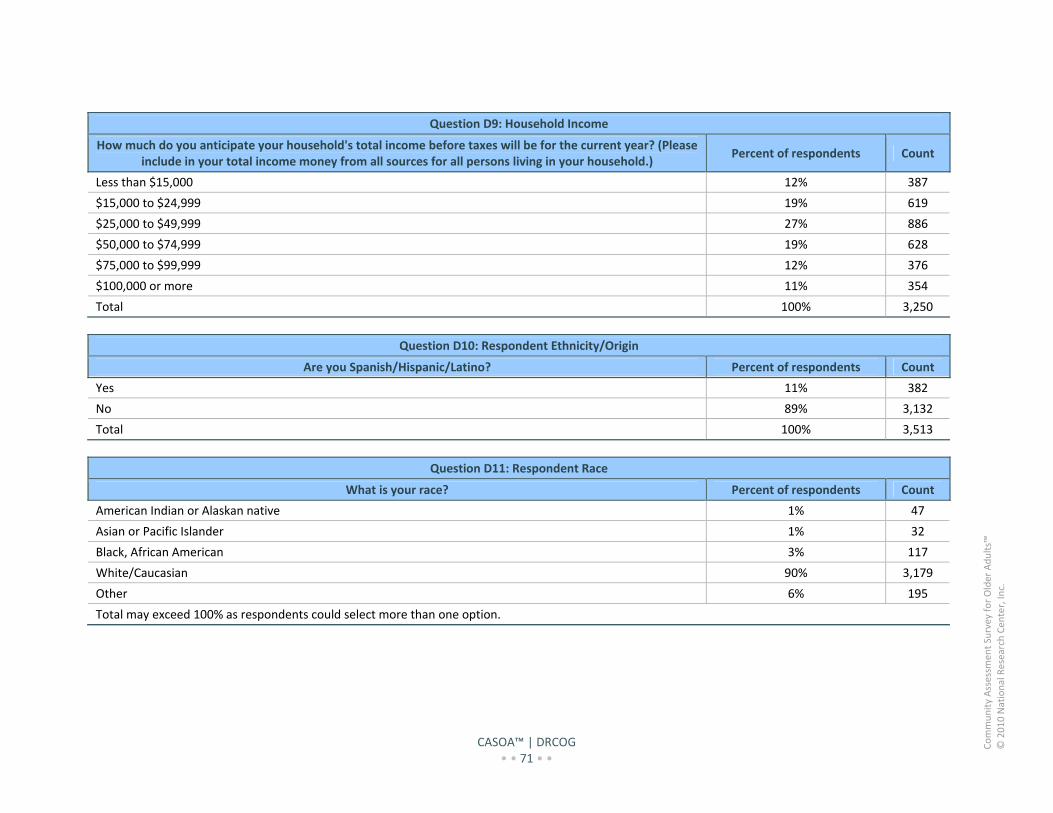
CASOA™ | DRCOG • • 71 • •
Community Assessm
ent Survey for Older Adults™
© 2010 National Research Cen
ter, In
c.
Question D9: Household Income
How much do you anticipate your household's total income before taxes will be for the current year? (Please include in your total income money from all sources for all persons living in your household.)
Percent of respondents Count
Less than $15,000 12% 387
$15,000 to $24,999 19% 619
$25,000 to $49,999 27% 886
$50,000 to $74,999 19% 628
$75,000 to $99,999 12% 376
$100,000 or more 11% 354
Total 100% 3,250
Question D10: Respondent Ethnicity/Origin
Are you Spanish/Hispanic/Latino? Percent of respondents Count
Yes 11% 382
No 89% 3,132
Total 100% 3,513
Question D11: Respondent Race
What is your race? Percent of respondents Count
American Indian or Alaskan native 1% 47
Asian or Pacific Islander 1% 32
Black, African American 3% 117
White/Caucasian 90% 3,179
Other 6% 195
Total may exceed 100% as respondents could select more than one option.
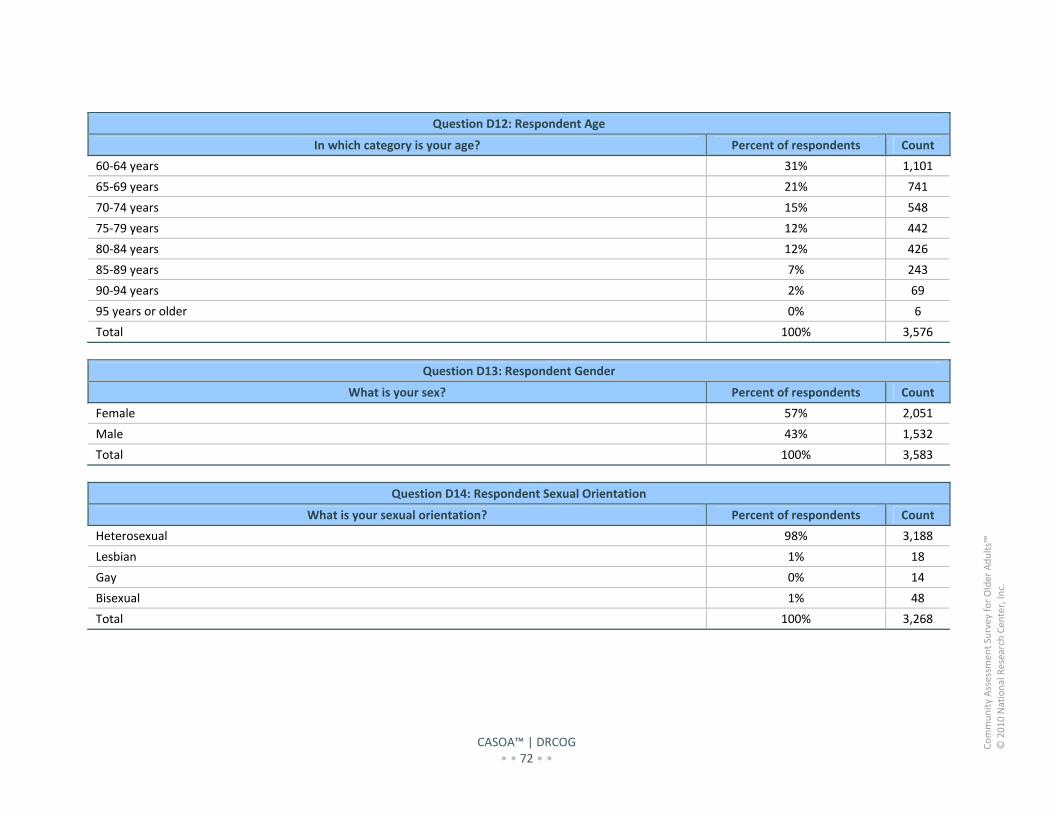
CASOA™ | DRCOG • • 72 • •
Community Assessm
ent Survey for Older Adults™
© 2010 National Research Cen
ter, In
c.
Question D12: Respondent Age
In which category is your age? Percent of respondents Count
60‐64 years 31% 1,101
65‐69 years 21% 741
70‐74 years 15% 548
75‐79 years 12% 442
80‐84 years 12% 426
85‐89 years 7% 243
90‐94 years 2% 69
95 years or older 0% 6
Total 100% 3,576
Question D13: Respondent Gender
What is your sex? Percent of respondents Count
Female 57% 2,051
Male 43% 1,532
Total 100% 3,583
Question D14: Respondent Sexual Orientation
What is your sexual orientation? Percent of respondents Count
Heterosexual 98% 3,188
Lesbian 1% 18
Gay 0% 14
Bisexual 1% 48
Total 100% 3,268
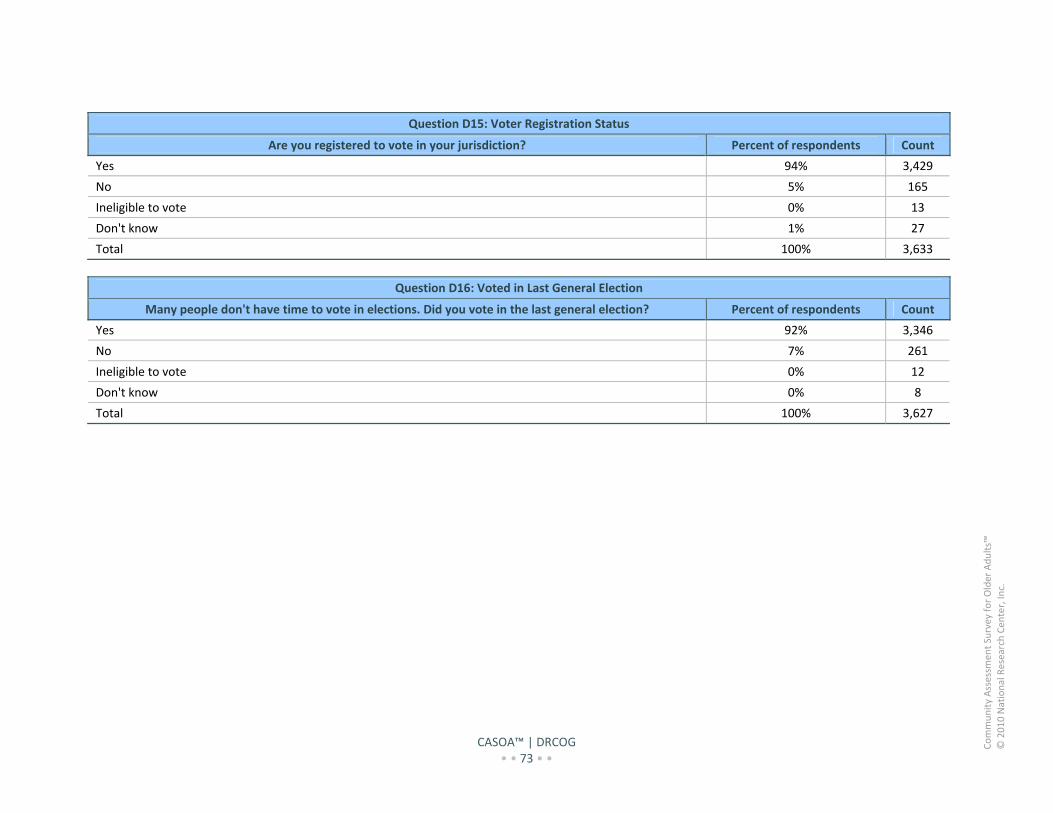
CASOA™ | DRCOG • • 73 • •
Community Assessm
ent Survey for Older Adults™
© 2010 National Research Cen
ter, In
c.
Question D15: Voter Registration Status
Are you registered to vote in your jurisdiction? Percent of respondents Count
Yes 94% 3,429
No 5% 165
Ineligible to vote 0% 13
Don't know 1% 27
Total 100% 3,633
Question D16: Voted in Last General Election
Many people don't have time to vote in elections. Did you vote in the last general election? Percent of respondents Count
Yes 92% 3,346
No 7% 261
Ineligible to vote 0% 12
Don't know 0% 8
Total 100% 3,627
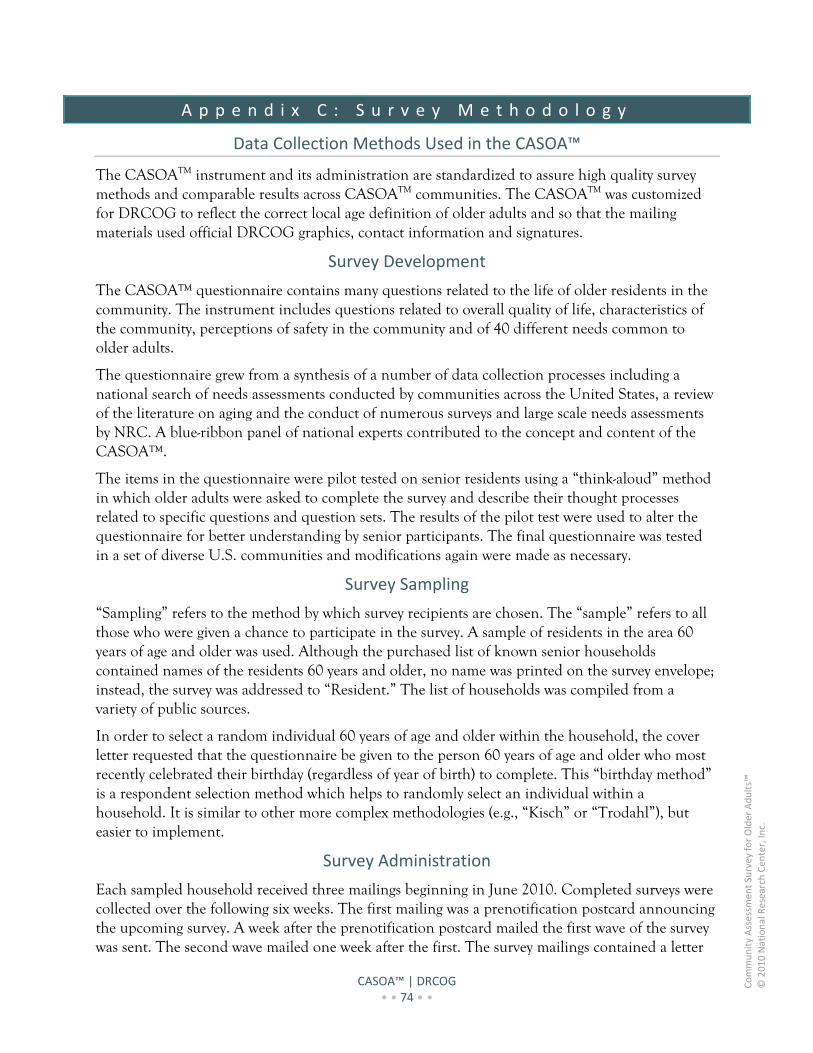
CASOA™ | DRCOG • • 74 • •
Community Assessm
ent Survey for Older Adults™
© 2010 National Research Cen
ter, In
c.
A p p e n d i x C : S u r v e y M e t h o d o l o g y
Data Collection Methods Used in the CASOA™
The CASOATM instrument and its administration are standardized to assure high quality survey methods and comparable results across CASOATM communities. The CASOATM was customized for DRCOG to reflect the correct local age definition of older adults and so that the mailing materials used official DRCOG graphics, contact information and signatures.
Survey Development
The CASOA™ questionnaire contains many questions related to the life of older residents in the community. The instrument includes questions related to overall quality of life, characteristics of the community, perceptions of safety in the community and of 40 different needs common to older adults.
The questionnaire grew from a synthesis of a number of data collection processes including a national search of needs assessments conducted by communities across the United States, a review of the literature on aging and the conduct of numerous surveys and large scale needs assessments by NRC. A blue-ribbon panel of national experts contributed to the concept and content of the CASOA™.
The items in the questionnaire were pilot tested on senior residents using a “think-aloud” method in which older adults were asked to complete the survey and describe their thought processes related to specific questions and question sets. The results of the pilot test were used to alter the questionnaire for better understanding by senior participants. The final questionnaire was tested in a set of diverse U.S. communities and modifications again were made as necessary.
Survey Sampling
“Sampling” refers to the method by which survey recipients are chosen. The “sample” refers to all those who were given a chance to participate in the survey. A sample of residents in the area 60 years of age and older was used. Although the purchased list of known senior households contained names of the residents 60 years and older, no name was printed on the survey envelope; instead, the survey was addressed to “Resident.” The list of households was compiled from a variety of public sources.
In order to select a random individual 60 years of age and older within the household, the cover letter requested that the questionnaire be given to the person 60 years of age and older who most recently celebrated their birthday (regardless of year of birth) to complete. This “birthday method” is a respondent selection method which helps to randomly select an individual within a household. It is similar to other more complex methodologies (e.g., “Kisch” or “Trodahl”), but easier to implement.
Survey Administration
Each sampled household received three mailings beginning in June 2010. Completed surveys were collected over the following six weeks. The first mailing was a prenotification postcard announcing the upcoming survey. A week after the prenotification postcard mailed the first wave of the survey was sent. The second wave mailed one week after the first. The survey mailings contained a letter
CASOA™ | DRCOG • • 75 • •
Community Assessm
ent Survey for Older Adults™
© 2010 National Research Cen
ter, In
c.
from the director of DRCOG’s Area Agency on Aging inviting the household to participate in the CASOA™, a questionnaire and postage-paid envelope in which to return the questionnaire.
The DRCOG region mailing list included an oversampling of surveys sent to households of older adult residents with Hispanic surnames and rural households in Adams and Arapahoe counties. The survey also was translated in Spanish and provided upon request.
Survey Response Rate and Confidence Intervals
Overall, 339 of the 11,262 postcards sent to older residents living in the DRCOG region were returned as undeliverable because they either had addresses that were undeliverable as addressed or were received by vacant housing units. Of the 10,923 households receiving the survey mailings, 3,666 completed the survey, providing a response rate of 34%.
It is customary to describe the precision of estimates made from surveys by a “level of confidence” and accompanying “confidence interval” (or margin of error). A traditional level of confidence, and the one used here, is 95%. The 95% confidence interval can be any size and quantifies the sampling error or imprecision of the survey results because some residents’ opinions are relied on to estimate all residents’ opinions. The confidence interval for the DRCOG CASOATM is no greater than plus or minus two percentage points around any given percent reported for the entire sample and one point around average ratings.
A 95% confidence interval indicates that for every 100 random samples of this many residents, 95 of the confidence intervals created will include the “true” population response. This theory is applied in practice to mean that the “true” perspective of the target population lies within the confidence interval created for a single survey. For example, if 75% of residents rate a service as “excellent” or “good,” then a 4% margin of error (for the 95% confidence interval) indicates that the range of likely responses for the entire community is between 71% and 79%. This source of error is called sampling error. In addition to sampling error, other sources of error may affect any survey, including the non-response of residents with opinions different from survey responders.
For subgroups of responses, the margin of error increases because the sample size for the subgroup is smaller. For subgroups of approximately 100 respondents, the margin of error is plus or minus 10 percentage points.
The practical difficulties of conducting any resident survey may introduce other sources of error in addition to sampling error. Despite best efforts to boost participation and ensure potential inclusion of all older adults, some selected households will decline participation in the survey (potentially introducing non-response error) and some eligible households may be unintentionally excluded from the listed sources for the sample (referred to as coverage error).
Survey Processing (Data Entry)
Completed surveys received were assigned a unique identification number. Additionally, each survey was reviewed and “cleaned” as necessary. For example, a question may have asked a respondent to pick one response, but the respondent checked two; the cleaning process would involve randomly selecting one of the two selected responses to be recorded in the dataset.
Once all surveys were assigned a unique identification number, they were entered into an electronic dataset. This dataset was subject to a data entry protocol of “key and verify,” in which
CASOA™ | DRCOG • • 76 • •
Community Assessm
ent Survey for Older Adults™
© 2010 National Research Cen
ter, In
c.
survey data were entered twice into an electronic dataset and then compared. Discrepancies were evaluated against the original survey form and corrected. “Range checks” (examination of the data for invalid values) as well as other forms of quality control also were performed.
Survey Data Weighting
The demographic characteristics of those completing the survey were compared to those found in the 2000 Census estimates and other population norms for residents age 60 and older living in the DRCOG region because the more current American Community Survey (ACS) estimates were not available for all counties within the region and because ACS data for racial/ethnic information is not broken down by age group. Sample results were weighted using the population norms to reflect the appropriate percent of those residents. Other discrepancies between the whole population and the sample also were aided by the weighting due to the intercorrelation of many socioeconomic characteristics.
The variables used for weighting were sex, age, race, ethnicity, housing tenure (rent/own), housing unit type and geographic area. This decision was based on the disparity between the survey respondent characteristics, the population norms for these variables and the saliency of these variables in detecting differences of opinion among subgroups.
The primary objective of weighting survey data is to make the survey sample reflective of the larger older adult population of the community. This is done by: 1) reviewing the sample demographics and comparing them to the population norms from the most recent Census or other sources and 2) comparing the responses to different questions for demographic subgroups. The demographic characteristics that are least similar to the Census and yield the most different results are the best candidates for data weighting.
A special software program using mathematical algorithms is used to calculate the appropriate weights. Data weighting can adjust multiple demographic variables. Several different weighting “schemes” may be tested to ensure the best fit for the data.
The results of the weighting schemes for the DRCOG region overall are presented in the following table.
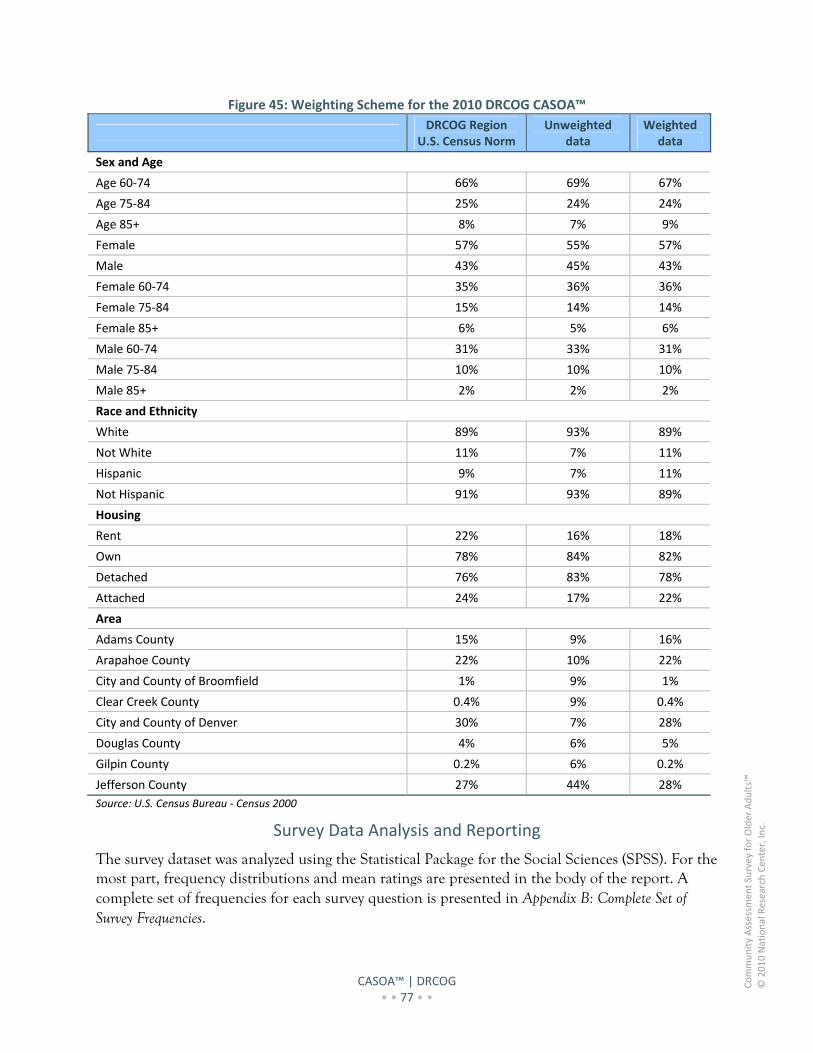
CASOA™ | DRCOG • • 77 • •
Community Assessm
ent Survey for Older Adults™
© 2010 National Research Cen
ter, In
c.
Figure 45: Weighting Scheme for the 2010 DRCOG CASOA™
DRCOG Region
U.S. Census Norm Unweighted
data Weighted
data
Sex and Age
Age 60‐74 66% 69% 67%
Age 75‐84 25% 24% 24%
Age 85+ 8% 7% 9%
Female 57% 55% 57%
Male 43% 45% 43%
Female 60‐74 35% 36% 36%
Female 75‐84 15% 14% 14%
Female 85+ 6% 5% 6%
Male 60‐74 31% 33% 31%
Male 75‐84 10% 10% 10%
Male 85+ 2% 2% 2%
Race and Ethnicity
White 89% 93% 89%
Not White 11% 7% 11%
Hispanic 9% 7% 11%
Not Hispanic 91% 93% 89%
Housing
Rent 22% 16% 18%
Own 78% 84% 82%
Detached 76% 83% 78%
Attached 24% 17% 22%
Area
Adams County 15% 9% 16%
Arapahoe County 22% 10% 22%
City and County of Broomfield 1% 9% 1%
Clear Creek County 0.4% 9% 0.4%
City and County of Denver 30% 7% 28%
Douglas County 4% 6% 5%
Gilpin County 0.2% 6% 0.2%
Jefferson County 27% 44% 28%
Source: U.S. Census Bureau ‐ Census 2000
Survey Data Analysis and Reporting
The survey dataset was analyzed using the Statistical Package for the Social Sciences (SPSS). For the most part, frequency distributions and mean ratings are presented in the body of the report. A complete set of frequencies for each survey question is presented in Appendix B: Complete Set of Survey Frequencies.
CASOA™ | DRCOG • • 78 • •
Community Assessm
ent Survey for Older Adults™
© 2010 National Research Cen
ter, In
c.
A variety of analyses were presented in the body of the report. The following sections summarize how these analyses were conducted or scores calculated.
Included under separate cover are results by demographic characteristics. Chi-square or ANOVA tests of significance were applied to these breakdowns of selected survey questions. A “p-value” of 0.05 or less indicates that there is less than a 5% probability that differences observed between groups are due to chance; in other words, a greater than 95% probability that the differences observed in the selected categories of our sample represent “real” differences among those populations. Where differences between subgroups are statistically significant, they are marked with grey shading in the appendices.
Estimates of the Contribution of Older Adults to the Economy
The calculations of the economic contributions of older adults in the DRCOG region were rough estimates using data from The U.S. Department of Labor Bureau of Labor Statistics (Metropolitan and Nonmetropolitan Area Occupational Employment and Wage Estimates). The source changes from DOLA to Census information when reporting for municipalities; the specific source is noted for each table.
The proportion of older adults who work was estimated by examining the responses to question D7 from the survey (“What is your employment status?”). Those working full time were assumed to work 32 hours per week and those working part time were assumed to work 15 hours per week. The proportion of survey respondents was multiplied by the number of adults 60 and over in community to ascertain the number of employed older adults. To determine the average paid wage, information from the Bureau of Labor Statistics for the Denver-Aurora, CO MSA was examined. Working full time and part time was assumed to be the equivalent of “All Occupations” (occupation code 00-0000).
The proportion of older adults doing volunteer work and providing help to friends and neighbors was determined by looking at the responses to question 14 (“During a typical week, how many hours, if any, do you spend doing the following?”), items f (“providing help to family and friends”) and g (“volunteering your time to some group/activity”). Those responding “1 to 3 hours” were assumed to spend two hours, “4 to 5 hours” were assumed to spend 4.5 hours, those responding “6 to 10 hours” were assumed to spend eight hours, and those responding “11 or more hours” were assumed to spend 13.75 hours (125% of 11). To determine the average hourly wage, “providing help to family and friends” was assumed to be the equivalent of “Personal Care and Service Workers, All Other” (occupation code 39-9099) and volunteering was assumed to be the equivalent of “Office Clerks, General” (occupation code 43-9061).
The proportion of older adults providing care to family and friends was determined by examining the responses to question 16. Those responding “1 to 3 hours” were assumed to spend two hours, “4 to 5 hours” were assumed to spend 4.5 hours, those responding “6 to 10 hours” were assumed to spend eight hours, and those responding “11 to 19 hours” were assumed to spend 15 hours, and those responding “20 or more hours” were assumed to spend 25 hours (125% of 20). To determine the average hourly wage, “providing care for older adults and adults” (items a and b) were assumed to be the equivalent of “Personal and Home Care Aides” (occupation code 39-9021) and “providing care for children” (item c) was assumed to be the equivalent of “Child Care Workers” (occupation code 39-9011).
CASOA™ | DRCOG • • 79 • •
Community Assessm
ent Survey for Older Adults™
© 2010 National Research Cen
ter, In
c.
Community Summary Scores
The community score presented in the body of the report represents the average of the questions included in the index. Although the evaluative or frequency questions were made on 4- or 5- point scales with 1 representing the best rating, the scales had different labels (e.g., “excellent,” “not a problem,” “very likely”). To calculate these average scores, the questions used in the index were converted to a common scale where 0 is the worst possible rating and 100 is the best possible rating. If everyone reported “excellent,” then the result would be 100 on the 0-100 scale. If the average rating for quality of life was right in the middle of the scale (half way between “good” and “fair”), then the result would be 50. The new scale can be thought of like the thermometer used to represent total giving to United Way. The higher the thermometer reading, the closer to the goal of 100 – in this case, the most positive response possible. The following table shows the individual questions comprising each summary score.
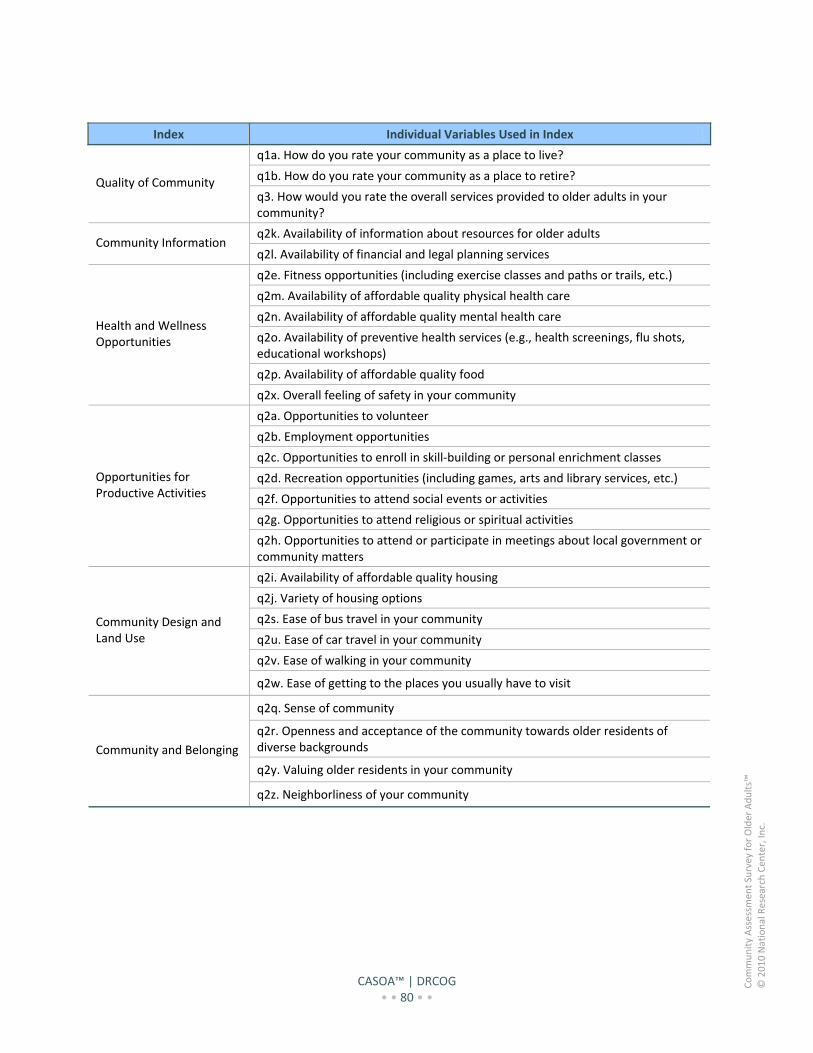
CASOA™ | DRCOG • • 80 • •
Community Assessm
ent Survey for Older Adults™
© 2010 National Research Cen
ter, In
c.
Index Individual Variables Used in Index
q1a. How do you rate your community as a place to live?
q1b. How do you rate your community as a place to retire? Quality of Community
q3. How would you rate the overall services provided to older adults in your community?
q2k. Availability of information about resources for older adults Community Information
q2l. Availability of financial and legal planning services
q2e. Fitness opportunities (including exercise classes and paths or trails, etc.)
q2m. Availability of affordable quality physical health care
q2n. Availability of affordable quality mental health care
q2o. Availability of preventive health services (e.g., health screenings, flu shots, educational workshops)
q2p. Availability of affordable quality food
Health and Wellness Opportunities
q2x. Overall feeling of safety in your community
q2a. Opportunities to volunteer
q2b. Employment opportunities
q2c. Opportunities to enroll in skill‐building or personal enrichment classes
q2d. Recreation opportunities (including games, arts and library services, etc.)
q2f. Opportunities to attend social events or activities
q2g. Opportunities to attend religious or spiritual activities
Opportunities for Productive Activities
q2h. Opportunities to attend or participate in meetings about local government or community matters
q2i. Availability of affordable quality housing
q2j. Variety of housing options
q2s. Ease of bus travel in your community
q2u. Ease of car travel in your community
q2v. Ease of walking in your community
Community Design and Land Use
q2w. Ease of getting to the places you usually have to visit
q2q. Sense of community
q2r. Openness and acceptance of the community towards older residents of diverse backgrounds
q2y. Valuing older residents in your community
Community and Belonging
q2z. Neighborliness of your community
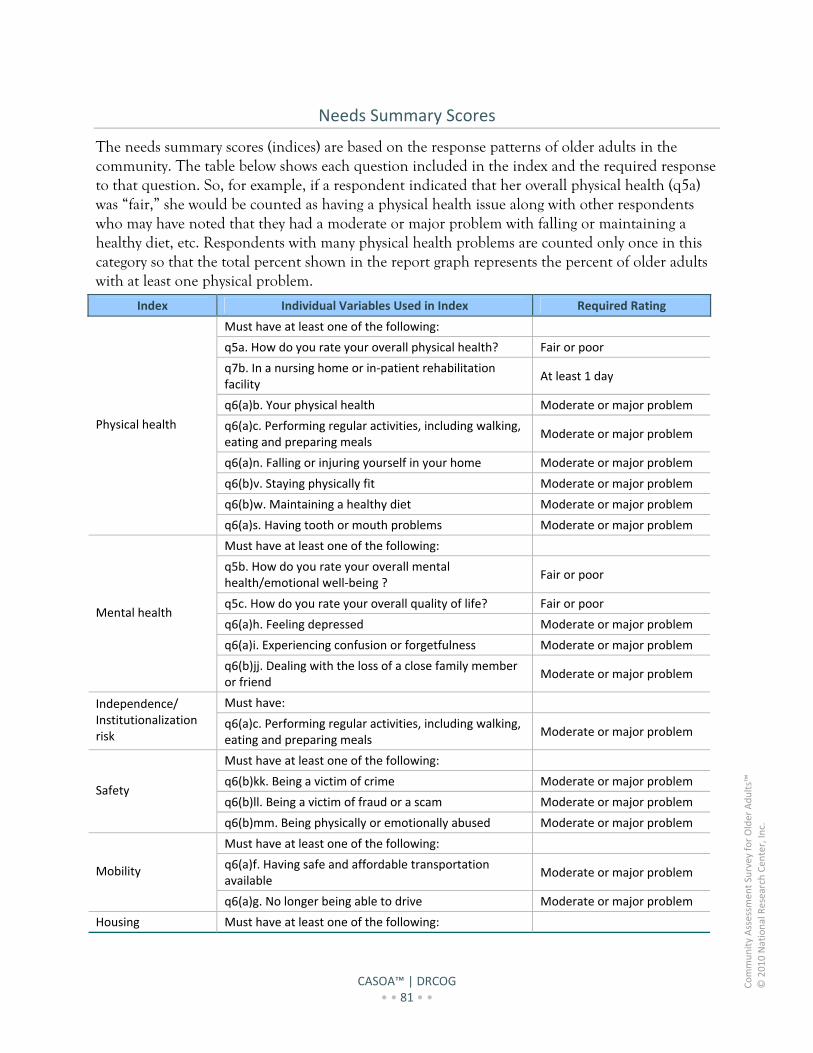
CASOA™ | DRCOG • • 81 • •
Community Assessm
ent Survey for Older Adults™
© 2010 National Research Cen
ter, In
c.
Needs Summary Scores
The needs summary scores (indices) are based on the response patterns of older adults in the community. The table below shows each question included in the index and the required response to that question. So, for example, if a respondent indicated that her overall physical health (q5a) was “fair,” she would be counted as having a physical health issue along with other respondents who may have noted that they had a moderate or major problem with falling or maintaining a healthy diet, etc. Respondents with many physical health problems are counted only once in this category so that the total percent shown in the report graph represents the percent of older adults with at least one physical problem.
Index Individual Variables Used in Index Required Rating
Must have at least one of the following:
q5a. How do you rate your overall physical health? Fair or poor
q7b. In a nursing home or in‐patient rehabilitation facility
At least 1 day
q6(a)b. Your physical health Moderate or major problem
q6(a)c. Performing regular activities, including walking, eating and preparing meals
Moderate or major problem
q6(a)n. Falling or injuring yourself in your home Moderate or major problem
q6(b)v. Staying physically fit Moderate or major problem
q6(b)w. Maintaining a healthy diet Moderate or major problem
Physical health
q6(a)s. Having tooth or mouth problems Moderate or major problem
Must have at least one of the following:
q5b. How do you rate your overall mental health/emotional well‐being ?
Fair or poor
q5c. How do you rate your overall quality of life? Fair or poor
q6(a)h. Feeling depressed Moderate or major problem
q6(a)i. Experiencing confusion or forgetfulness Moderate or major problem
Mental health
q6(b)jj. Dealing with the loss of a close family member or friend
Moderate or major problem
Must have: Independence/ Institutionalization risk
q6(a)c. Performing regular activities, including walking, eating and preparing meals
Moderate or major problem
Must have at least one of the following:
q6(b)kk. Being a victim of crime Moderate or major problem
q6(b)ll. Being a victim of fraud or a scam Moderate or major problem Safety
q6(b)mm. Being physically or emotionally abused Moderate or major problem
Must have at least one of the following:
q6(a)f. Having safe and affordable transportation available
Moderate or major problem Mobility
q6(a)g. No longer being able to drive Moderate or major problem
Housing Must have at least one of the following:
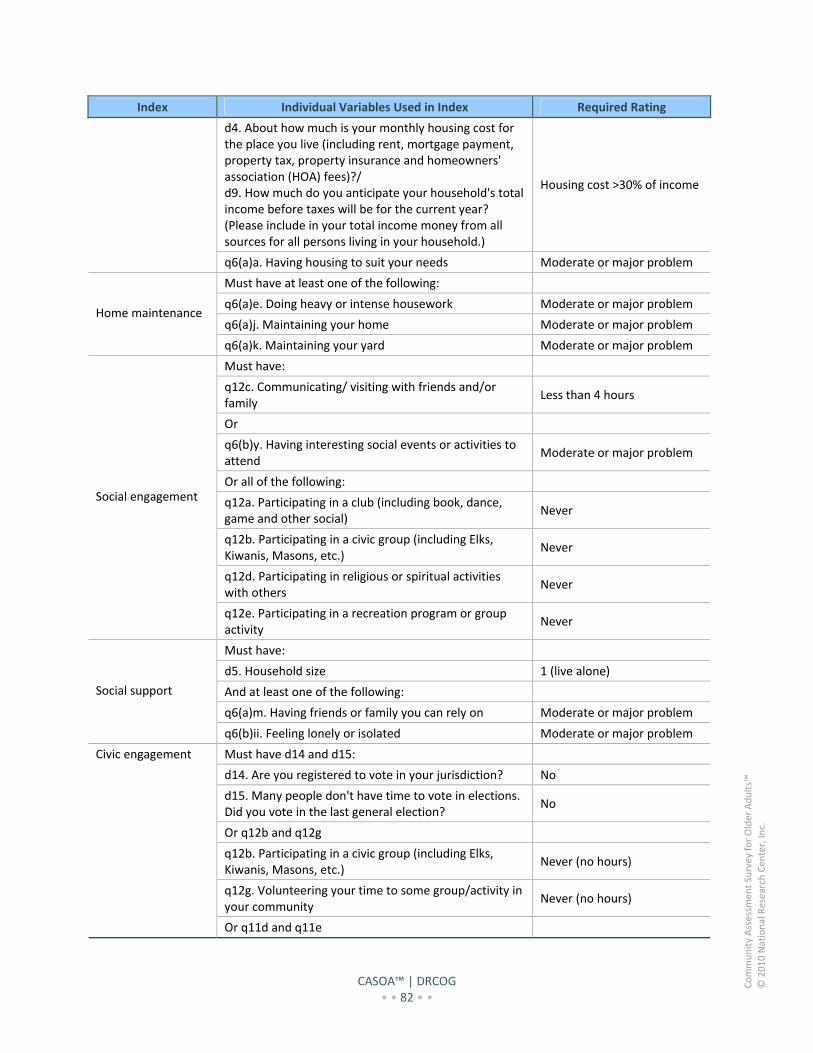
CASOA™ | DRCOG • • 82 • •
Community Assessm
ent Survey for Older Adults™
© 2010 National Research Cen
ter, In
c.
Index Individual Variables Used in Index Required Rating
d4. About how much is your monthly housing cost for the place you live (including rent, mortgage payment, property tax, property insurance and homeowners' association (HOA) fees)?/ d9. How much do you anticipate your household's total income before taxes will be for the current year? (Please include in your total income money from all sources for all persons living in your household.)
Housing cost >30% of income
q6(a)a. Having housing to suit your needs Moderate or major problem
Must have at least one of the following:
q6(a)e. Doing heavy or intense housework Moderate or major problem
q6(a)j. Maintaining your home Moderate or major problem Home maintenance
q6(a)k. Maintaining your yard Moderate or major problem
Must have:
q12c. Communicating/ visiting with friends and/or family
Less than 4 hours
Or
q6(b)y. Having interesting social events or activities to attend
Moderate or major problem
Or all of the following:
q12a. Participating in a club (including book, dance, game and other social)
Never
q12b. Participating in a civic group (including Elks, Kiwanis, Masons, etc.)
Never
q12d. Participating in religious or spiritual activities with others
Never
Social engagement
q12e. Participating in a recreation program or group activity
Never
Must have:
d5. Household size 1 (live alone)
And at least one of the following:
q6(a)m. Having friends or family you can rely on Moderate or major problem
Social support
q6(b)ii. Feeling lonely or isolated Moderate or major problem
Must have d14 and d15:
d14. Are you registered to vote in your jurisdiction? No
d15. Many people don't have time to vote in elections. Did you vote in the last general election?
No
Or q12b and q12g
q12b. Participating in a civic group (including Elks, Kiwanis, Masons, etc.)
Never (no hours)
q12g. Volunteering your time to some group/activity in your community
Never (no hours)
Civic engagement
Or q11d and q11e
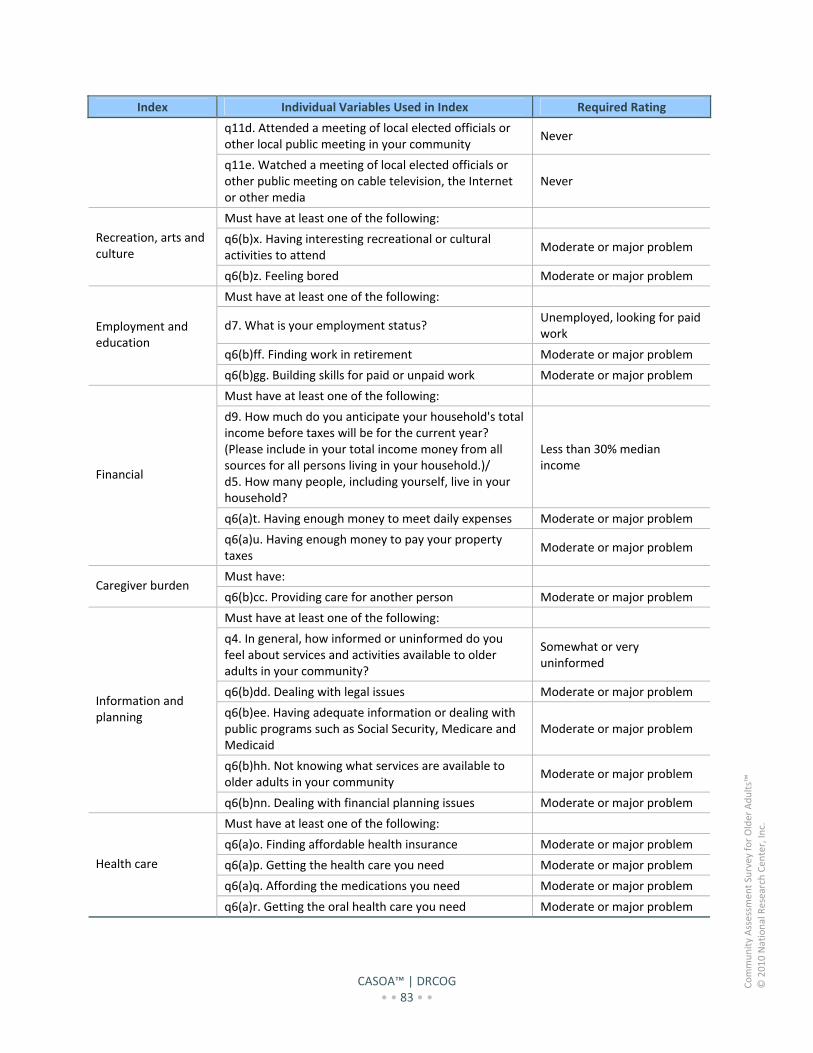
CASOA™ | DRCOG • • 83 • •
Community Assessm
ent Survey for Older Adults™
© 2010 National Research Cen
ter, In
c.
Index Individual Variables Used in Index Required Rating
q11d. Attended a meeting of local elected officials or other local public meeting in your community
Never
q11e. Watched a meeting of local elected officials or other public meeting on cable television, the Internet or other media
Never
Must have at least one of the following:
q6(b)x. Having interesting recreational or cultural activities to attend
Moderate or major problem Recreation, arts and culture
q6(b)z. Feeling bored Moderate or major problem
Must have at least one of the following:
d7. What is your employment status? Unemployed, looking for paid work
q6(b)ff. Finding work in retirement Moderate or major problem
Employment and education
q6(b)gg. Building skills for paid or unpaid work Moderate or major problem
Must have at least one of the following:
d9. How much do you anticipate your household's total income before taxes will be for the current year? (Please include in your total income money from all sources for all persons living in your household.)/ d5. How many people, including yourself, live in your household?
Less than 30% median income
q6(a)t. Having enough money to meet daily expenses Moderate or major problem
Financial
q6(a)u. Having enough money to pay your property taxes
Moderate or major problem
Must have: Caregiver burden
q6(b)cc. Providing care for another person Moderate or major problem
Must have at least one of the following:
q4. In general, how informed or uninformed do you feel about services and activities available to older adults in your community?
Somewhat or very uninformed
q6(b)dd. Dealing with legal issues Moderate or major problem
q6(b)ee. Having adequate information or dealing with public programs such as Social Security, Medicare and Medicaid
Moderate or major problem
q6(b)hh. Not knowing what services are available to older adults in your community
Moderate or major problem
Information and planning
q6(b)nn. Dealing with financial planning issues Moderate or major problem
Must have at least one of the following:
q6(a)o. Finding affordable health insurance Moderate or major problem
q6(a)p. Getting the health care you need Moderate or major problem
q6(a)q. Affording the medications you need Moderate or major problem
Health care
q6(a)r. Getting the oral health care you need Moderate or major problem
CASOA™ | DRCOG • • 84 • •
Community Assessm
ent Survey for Older Adults™
© 2010 National Research Cen
ter, In
c.
A p p e n d i x D : R e f e r e n c e s 1. U.S. Department of Health and Human Services. Choices for Independence: Modernizing the Older Americans Act: U.S.
Administration on Aging; March 9 2006. 2. Feldman E, Mishkovsky N, Kohler C. Active Living for Older Adults: Management Strategies for Healthy and Livable
Communities: International City/County Management Association; September 2003. 3. Wolff T. A practical approach to evaluation coalitions. In: Backer T, ed. Evaluation community collaborations. New
York, NY: Springer Publishing; 2002:95-165. 4. Namkee GC, Burr A, Mutchler JE, Caro FG. Formal and informal volunteer activity and spousal caregiving
among older adults. Research on Aging. 2007;29:99-124. 5. National Governor's Association. Fast facts: Civic engagement and older Americans - volunteerism.
http://www.nga.org/Files/pdf/0607FASTFACTS.pdf. 6. Adler RP, Goggin J. What do we mean by "civic engagement"? . Journal of Transformative Education. 2005;3:236-
253. 7. Saxon-Harrold S, McCormack M, Hume K. America's Senior Volunteers. Washington, DC: Independent Sector;
2000:12. 8. Service CfNaC. Tools and training for volunteer and service programs.
http://www.nationalserviceresources.org/initiatives/boomers/boomers.php. 9. Thompson E, Wilson, L. The Potential Of Older Volunteers In Long-Term Care. The American Society on Aging.
2003;25(1):58-63. 10. Bridgeland JM, Putnam, R.D. and Wofford, H.L. More To Give. Tapping The Talents Of The Baby Boomer,
Silent And Greatest Generations. AARP. 2008:3-35. 11. Hoffman L. Increasing Volunteerism Among Older Adults: Benefits And Strategies For States. NGA Center for
Best Practices. 2008:1-13. 12. Kaskie B, Imhof, S., Cavanaugh, J. & Culp, K. Civic Engagement As A Retirement Role For Aging Americans.
The Gerontologist. 2008;48(3):368-377. 13. Lindblom D. Baby Boomers and The New Age of Volunteerism. . Corporation for National Service. 2001;Senior
Service:ii-30. 14. Service CfNaC. Engaging Persons with Disabilities in National and Community Service Grants. 2010. 15. Careers E. Encore Fellowships. http://www.encore.org/fellowships. 16. Spencer A, Hancock L. Seniors Living Policy: Urban Design Guidelines for Infill Development. Sydney, Australia:
Urban Design Advisory Services, Department of Infrastructure, Planning and Natural Resources; 2004:1-20. 17. LeGates R, Potepan, M., Blash, L., Gilbert, N. LITERATURE REVIEW ON URBAN AND COMMUNITY
DEVELOPMENT: San Francisco State University Public Research Institute; 1996. 18. Boulder County Aging Services Division. Strengths Associated with Aging Well-2004 Update, Synthesis of
Scientific Literature on Aging Well. September 29 2004. 19. Centers for Disease Control and Prevention. Healthy aging: Preserving function and improving quality of life
among older Americans at a glance: National Center for Health Statistics, Department of Health and Human Services; 2007.
20. Centers for Disease Control and Prevention. National health interview survey: National Center for Health Statistics, Department of Health and Human Services; 2005.
21. Larkin M. Active aging professionals urged to implement evidence-based programs that include strength training, aerobics, balance, and flexibility for all populations Journal on Active Aging. 2007;6(5):29-34.
22. Live well, live long: Steps to better health: American Society on Aging; 2005. 23. National Research Center Inc. Colorado Healthy People 2010: Obesity Prevention; Final Evaluation Summary Report:
The Colorado Trust; 2007. 24. Humpel N, Owen N, Leslie E. Environmental factors associated with adults' participation in physical activity: A
review. American Journal of Preventive Medicine. 2002;22(3):188-199. 25. Barclay L. Obesity and the built environment: A newsmaker interview with James O. Hill, PhD. Medscape Medical
News. May 19 2004. 26. Ewing R, Cervero R. Travel and the built environment: A synthesis Journal of Transportation Research Board 1780.
2001:87-114.
CASOA™ | DRCOG • • 85 • •
Community Assessm
ent Survey for Older Adults™
© 2010 National Research Cen
ter, In
c.
27. Greenwald M, Boarnet M. Built environment as determinant of walking behavior: Analyzing nonwork pedestrian travel in Portland, Oregon. Journal of Transportation Research Board 1780. 2001:33-42.
28. Handy S, Boarnet M, Eqing R, Killingsworth R. How the built environment affects physical activity: Views from urban planning. American Journal of Preventive Medicine. 2002;23(2S):64-72.
29. Partnership for Prevention. Creating Communities for Active Aging. Washington, D.C. 2001. 30. Active Living Leadership. A Primer on Active Living for Government Officials. Princeton, NJ: Robert Wood Johnson
Foundation; 2005. 31. Robert Wood Johnson Foundation Leadership for Healthy Communities. Policies for Active Living and
Community Design. Active Living and Community Design [http://www.activelivingleadership.org/ResoComm-3903.html. Accessed November 29, 2007.
32. Nord M, Andrews M, Carlson S. Household food security in the United States: Department of Agriculture/Economic Research Service; 2005.
33. Nord M, Andrews M, Carlson S. Household food security in the United States, 2005. In: Service DoAER, ed; 2006.
34. America's second harvest fact sheet on senior hunger. www.secondharvest.org/learn_about_hunger/fact_sheet/senior_hunger.html.
35. USDA. Elderly Assitance Programs. http://www.nutrition.gov/nal_display/index.php?info_center=11&tax_level=2&tax_subject=394&topic_id=1772&placement_default=0.
36. Economic Research Service. Community food assessment toolkit. Washington, D.C.: U.S. Department of Agriculture; 2002.
37. Mark I. Weinberger AJR, Christian J. Nelson. Untangling the Complexities of Depression Diagnosis in Older Cancer Patients. The Oncologist. January 14, 2009 2009;14(1):60-66.
38. Prevention CfDCa, Network PRC-HAR, Forum aRCGMH. Effective Programs to Treat Depression in Older Adults:
Implementation Strategies for Community Agencies. PRC-HAN Conference. Atlanta, GA; 2008. 39. LeaMond N. Public Policy Challenges to Creating Livable Communities. Paper presented at: Universal village:
Livable communities in the 21st century; June 15, 2005; Washington, D.C. 40. White House Conference on Aging. Report of the 2005 White House Conference on Aging: The Booming Dynamics of
Aging: From Awareness to Action. Washington, DC 2005. 41. Dychtwald KPD. Age Power: How the 21st Century Will Be Ruled By The New Old. New York: Jeremy P.
Tarcher/Penguin Putnam, Inc.; 1999. 42. Generations Policy Initiative and the Harvard Institute for Learning in Retirement. The Age Explosion: Baby
Boomers and Beyond. Harvard Generations Policy Journal. Winter 2004;1:33. 43. He W, Sengupta M, Velkoff VA, DeBarros KA. 65+ in the United States: 2005. Washington, DC: U.S. Census
Bureau; 2005. 44. The Booming Dynamics of Aging: From Awareness to Action. 2005 White House Conference on Aging Final Report
Washington, DC: 2005 White House Conference on Aging: Report to the President and the Congress; 2005. 45. Roper ASW & AARP. Baby Boomers Envision Retirement II: Survey of Baby Boomers' Expectations for Retirement:
AARP; May 2004. 46. Rix SE. Aging and Work -- A View From the United States: AARP; 2004:63. 47. Manteghi L. International Retirement Security Survey: AARP; 2005:27. 48. Harper L. Fixing to Stay: A National Survey of Housing and Home Modification Issues: American Association for
Retired Persons (AARP); May 2000. 49. Kochera A, Straight A, Guterbock T. Beyond 50.05: A Report to the Nation on Livable Communities: Creating
Environments for Successful Aging. Washington, DC: AARP Public Policy Institute; May 2005. 50. Campbell J, Leaver J. Report from NTAC’s National Experts Meeting on Emerging New Practices in Organized Peer
Support. Alexandria, VA: Substance Abuse and Mental Health Services Administration, Association of State Mental Health Program Directors, National Technical Assistance Center for State Mental Health Planning; March 17-18 2003.
51. Rowe JW, Kahn RL. Successful Aging. New York: Pantheon Books; 1998. 52. Rahn WM, Randolph TJ. A Tale of Political Trust in American Cities. Public Opinion Quarterly. Winter
2005;69(4):530-560.
CASOA™ | DRCOG • • 86 • •
Community Assessm
ent Survey for Older Adults™
© 2010 National Research Cen
ter, In
c.
53. Tyler TR, Degoey P. Collective Restraint in Social Dilemmas: Procedural Justice and Social Identification Effects on Support for Authorities. Journal of Personality and Social Psychology. September 1995;69(3):482-497.
54. The American Democracy Project: Civic Engagement, Higher Education, and the 21st Century. http://www.wku.edu/aa/civic%20engagement/adpcompleteproposal.pdf.
55. Putnam RD. Bowling alone: The collapse and revival of American community. New York, NY: Simon and Schuster; 2000.
56. Klinenberg E. Heat Wave: A Social Autopsy of Disaster in Chicago: University of Chicago Press; 2003. 57. Walker J, Herbitter C. Aging in the Shadows: Social Isolation Among Seniors in New York City. New York: United
Neighborhood Houses of New York; 2005. 58. Greene LV. New Directions in Work and Family Policy. APA Briefing Paper on Work and Family Policy [Feburary
2004; http://www.apa.org/ppo/issues/workandfam.html. Accessed Feburary 5, 2008. 59. Gibson MJ, Houser AN. Valuing the Invaluable: A New Look at the Economic Value of Family Caregiving. Washington,
DC: AARP Public Policy Institute; June 2007. 60. FY 2007 Income Limits for Section 8 Programs Washington, D.C.: U.S. Department of Housing and Urban
Development, Office of Policy Development and Research; 2007.
CASOA™ | DRCOG • • 87 • •
Community Assessm
ent Survey for Older Adults™
© 2010 National Research Cen
ter, In
c.
A p p e n d i x E : S u r v e y M a t e r i a l s
The following pages contain copies of the survey materials sent to randomly selected older adult households within the DRCOG region.
Related Documents