Tunis, Awesome June 2009 The DEMETER satellite: Payload, Operations and Data M. Parrot LPC2E/CNRS 3A, Avenue de la Recherche 45071 Orléans cedex 2, France E-mail: [email protected]

Welcome message from author
This document is posted to help you gain knowledge. Please leave a comment to let me know what you think about it! Share it to your friends and learn new things together.
Transcript

Tunis, Awesome June 2009
The DEMETER satellite: Payload, Operations and Data
M. ParrotLPC2E/CNRS
3A, Avenue de la Recherche45071 Orléans cedex 2,
FranceE-mail: [email protected]

Tunis, Awesome June 2009
Outlines
The Project
The hypotheses about the seismo EM effect
Observations during seismic activities
Statistical analysis
Conclusions
Tunis, Awesome June 2009
The Project
The DEMETER micro-satellite has been launched on June 29, 2004 by a Dnepr rocket from Baïkonour.
The plate-form is under the CNES responsibility and the scientific payload was provided by scientific laboratories.

Tunis, Awesome June 2009
The scientific objectives
The scientific objectives of the DEMETER micro-satellite are related to the study of ionosphericperturbations in relation with the seismic and volcanic activities.These perturbations are interesting because they can be considered as short-term precursors (they occur between a few hours and a few days before a quake).
The same payload will allow to survey the ionospheric perturbations in relation with man-made activities.
Tunis, Awesome June 2009
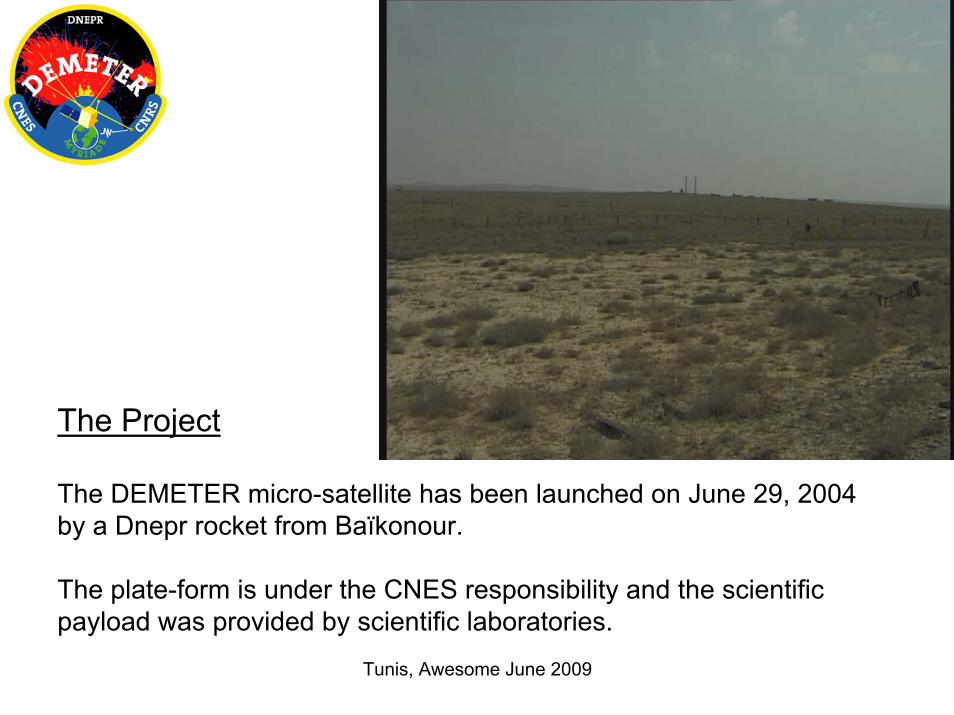
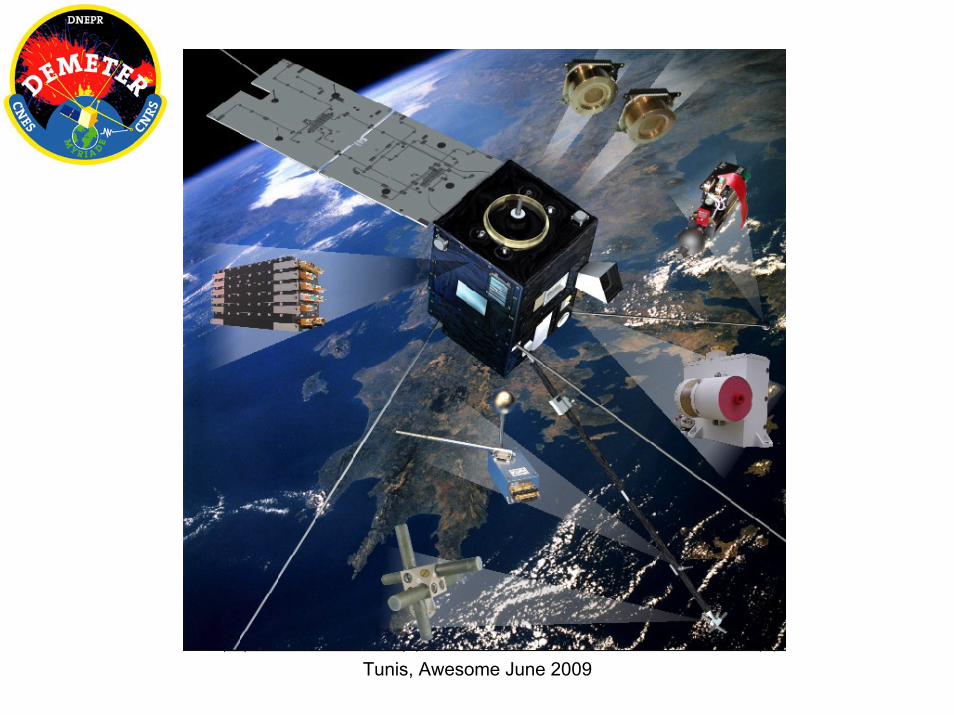
The scientific payload
The scientific payload of theDEMETER micro-satellite has severalexperiments:- A set of electric sensors to measurethe 3 components of the electric fieldfrom DC to 3.5 MHz (CETP),
- A three orthogonal search coil magnetometer to measure the magneticfield from a few Hz up to 20 kHz (LPCE),- Two Langmuir probes to measure the density and the temperature ofthe electrons (ESTEC),- An ion spectrometer to measure ion composition (CETP),- An energetic particle analyzer (CESR).
Tunis, Awesome June 2009

Tunis, Awesome June 2009

Tunis, Awesome June 2009

Tunis, Awesome June 2009
Measured Parameters
• Frequency range, B 10 Hz - 20 kHz• Frequency range, E DC – 3.5 MHz• Sensibility B : 1. 10-5 nT Hz-1/2 at 1 kHz• Sensibility E : 0.2 µV Hz-1/2 at 500 kHz• Particles: electrons 60 keV – 600 keV• Ionic density: 5 102 - 5 106 ions/cm3
• Ionic temperature: 1000 K - 5000 K• Ionic composition: H+, He+, O+
• Electron density: 102 - 5 106 cm-3• Electron temperature: 500 K - 3000 K

Tunis, Awesome June 2009
The operations
The orbit of DEMETER is polar, circular with an altitude of 710 km.DEMETER record data in two modes: a survey mode all around the Earth with low resolution, and a burst mode with high resolution above main seismic zones.The seismic parameters received from IPGP are merged with the orbital parameters in a special file of events.

Tunis, Awesome June 2009
d1d3
d2 d4
Earthquakeepicenter
Conjugate point of the epicenter
South conjugate pointof the epicenter at the satellite altitude
North conjugate point of the epicenter at the satellite altitude
DEMETER orbit
dm
dmcN
dmc
dmcS South conjugate pointof the epicenter at the satellite altitude
North conjugate point of the epicenter at the satellite altitude
DEMETER orbit

Tunis, Awesome June 2009
The wave experiment
• NEURAL NETWORK – number of whistlers and dispersion.
• BURST MODE– waveforms of 3 electric components up to 15 Hz,– waveforms of 6 components of the EM field up to 1.25 kHz,– waveforms of 2 components (1B + 1E) up to 20 kHz,– spectra of one electric component up to 3.5 MHz,– spectra of 2 components (1B + 1E) up to 20 kHz,– waveforms of one electric component up to 3.5 MHz
(snapshots).
• SURVEY MODE– waveforms of 3 electric components up to 15 Hz,– spectra of 2 components (1B + 1E) up to 20 kHz,– spectra of one electric component up to 3.5 MHz.

Tunis, Awesome June 2009

Tunis, Awesome June 2009
LPCE(IMSC, RNF, BANT)
DEMETER DATA ACQUISITION
ARCHIVE(Science data L0, QL, L1; Earthquake data;
Ancillary data)
WEB DATA SERVER(Data L0, QL, L1, L2; Earthquake events; Ancillary data
products; Mission information)
Science PL TM packetsPL TC
PLAN
SCIENCE PL PROGRAMMATION
GENERATION
CONTROL CENTER
PHYSICAL VALUES PROCESSING [L1]
ANCILLARY DATA- Orbit Parameters- TM station Pass-Planning- Events (orbit, satellite)- Attitude- HK
OPERATIONBOARDOPERATION
BOARD
DEMETERMISSION GROUP
(Experimenters,CNES)
DEMETERMISSION GROUP
(Experimenters,CNES)
Scienceoperationcoordination
PL and MCevents
Memoryhandling
BURST zones
LPCE(MC)
CETP(IAP, ICE)
8 GHz
SCIENTIFICUSERSSCIENTIFIC
USERS
Science PLTM packets « back-up »
QUICK-LOOKPROCESSING [L0']
PRE-PROCESSING [L0](Decommutation, Good Health)
TM
CESR(IDP) ESTEC
(ISL)
IPGPSEISMIC DATA
Calibrationvalidation
Instrumentconfiguration
2 GHz
CNES
EXCHANGE FILE SERVICE
ANCILLARY DATAPROCESSING
INSTRUMMENT CALIBRATIONS
High resolutiondisplay [L2]
PL status
OPERATIONCOORDINATION
GROUP
OPERATIONCOORDINATION
GROUP
The DEMETER mission center
Tunis, Awesome June 2009

Tunis, Awesome June 2009
Tunis, Awesome June 2009

Tunis, Awesome June 2009
One day in the DEMETER life (August 12, 2004)
d = 2800 km10 LT22 LT

Tunis, Awesome June 2009
Outlines
The Project
The hypotheses about the seismo EM effect
Observations during seismic activities
Statistical analysis
Conclusions
Tunis, Awesome June 2009
Hypotheses on the generation mechanism of these seismo-electromagnetic perturbations:
•Propagation of EM waves from the ground.–Only ULF waves can appear at the Earth’s surface,–Propagation in a wave guide (the fault) or change in the ground resistivity?–Wave-wave interaction in the ionosphere.
•Propagation of Acoustic-Gravity Waves.–As far as they propagate, the AGW amplitude increases due the decrease of the atmospheric density

Tunis, Awesome June 2009
•The piezo-electric and tribo-electric effects.–Apparition of electric charges at the Earth’s surface,–Change of the atmospheric conductivity,–Change of the atmosphere-ionosphere coupling currents
•The emissions of aerosols (radioactive gas or metallic ions). Transportation to ionospheric layers due to:
–atmospheric turbulence and thermospheric winds,–increase of the atmosphere conductivity, penetration of electric fields and ion acceleration
from Markson, 1978

Tunis, Awesome June 2009
First paper on the seismo-electromagnetic effectsby Milne in 1890

Tunis, Awesome June 2009
Gokhberg et al. (1982)
Tunis, Awesome June 2009
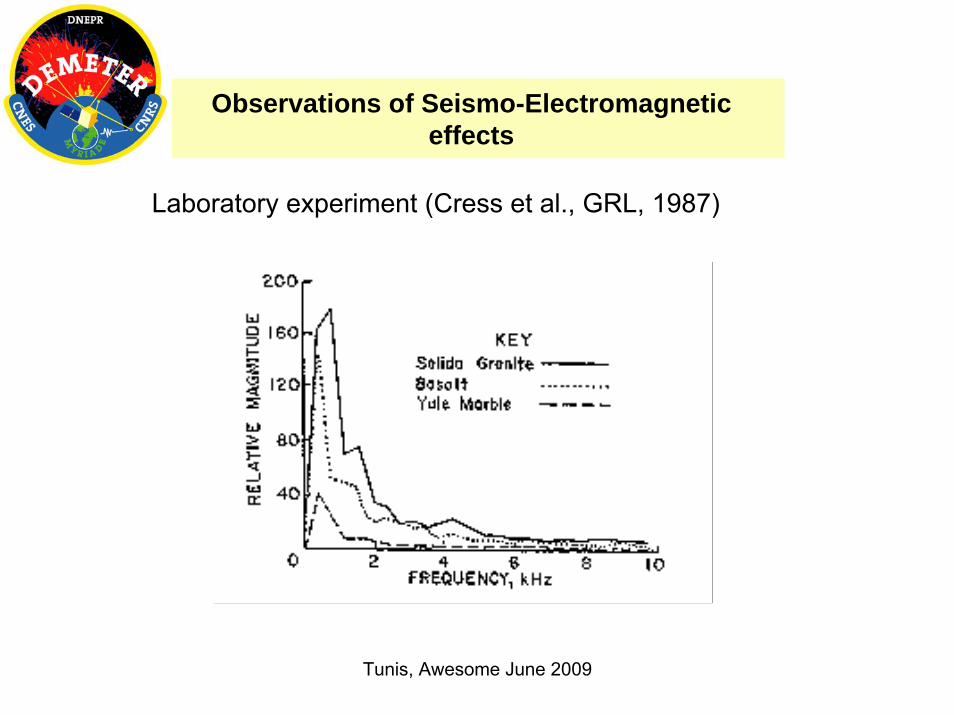
Observations of Seismo-Electromagneticeffects
Laboratory experiment (Cress et al., GRL, 1987)

Tunis, Awesome June 2009
Observations of Seismo-Electromagneticeffects
Radon concentration data in a well close to Kobe

Tunis, Awesome June 2009
(courtesy of P.F. Biagi)

Tunis, Awesome June 2009
Outlines
The Project
The hypotheses about the seismo EM effect
Observations during seismic activities
Statistical analysis
Conclusions

Tunis, Awesome June 2009
Examples of ionospheric perturbations in possible correlationwith seismic activity
Tunis, Awesome June 2009
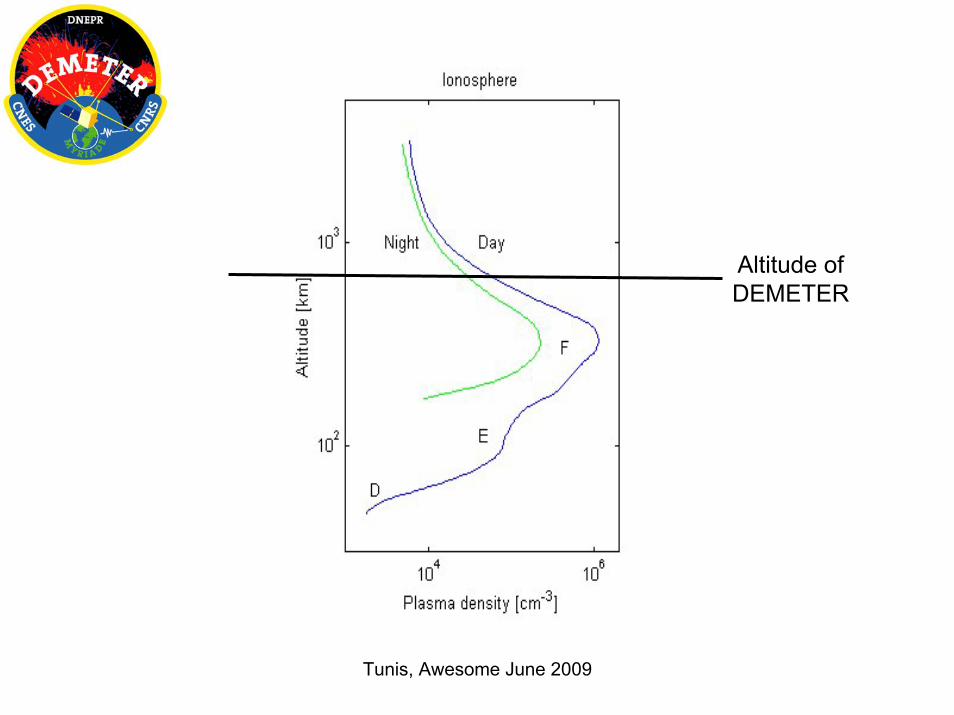
Altitude ofDEMETER

Tunis, Awesome June 2009
13 Juin 200823:43:46 UTLat 39.103°
Long 140.668°d = 10 kmM = 6.8

Tunis, Awesome June 2009
d1d3
d2 d4
Earthquakeepicenter
Conjugate point of the epicenter
South conjugate pointof the epicenter at the satellite altitude
North conjugate point of the epicenter at the satellite altitude
DEMETER orbit
2,5 days before
200 km

Tunis, Awesome June 2009from K. Hattori
Tunis, Awesome June 2009
Outlines
The Project
The hypotheses about the seismo EM effect
Observations during seismic activities
Statistical analysis
Conclusions
Tunis, Awesome June 2009
Statistical analysis with the electric field data

Tunis, Awesome June 2009
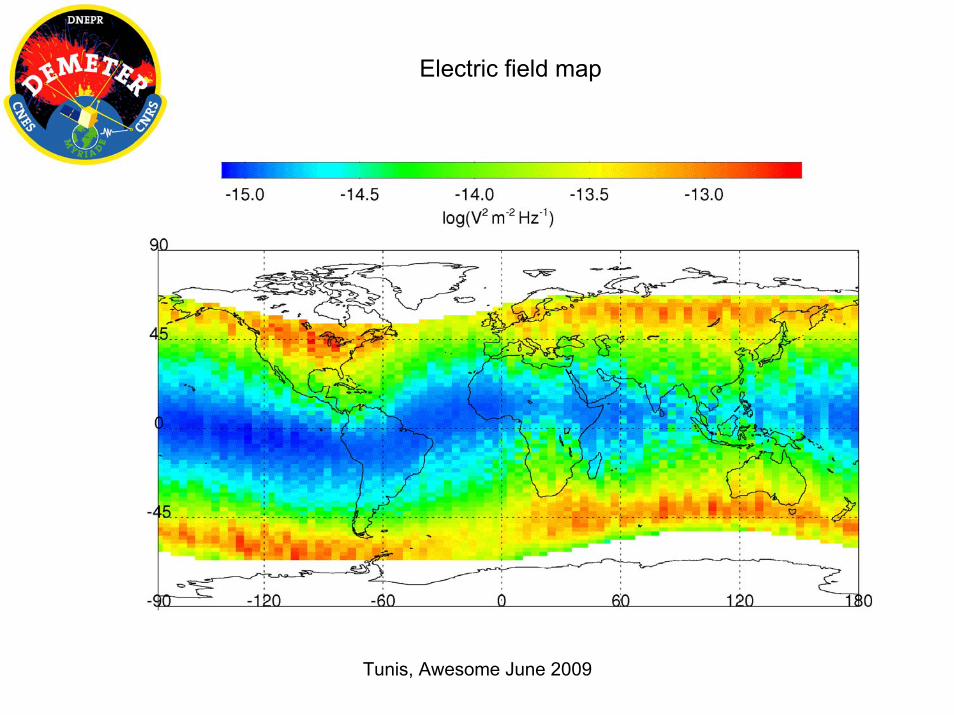
15 months of data4385 hours of measurements
Electric field data organized by
- Frequencies (16) below 10 kHz- Magnetic local time (2)- Geographic positions (bin of 4° in longitude, 2° in latitude)- Kp classes (3)- Seasons (2)
Tunis, Awesome June 2009
Electric field map

Tunis, Awesome June 2009
Application of the central limittherorem
Probability density of the intensityof the waves in a cell
Tunis, Awesome June 2009
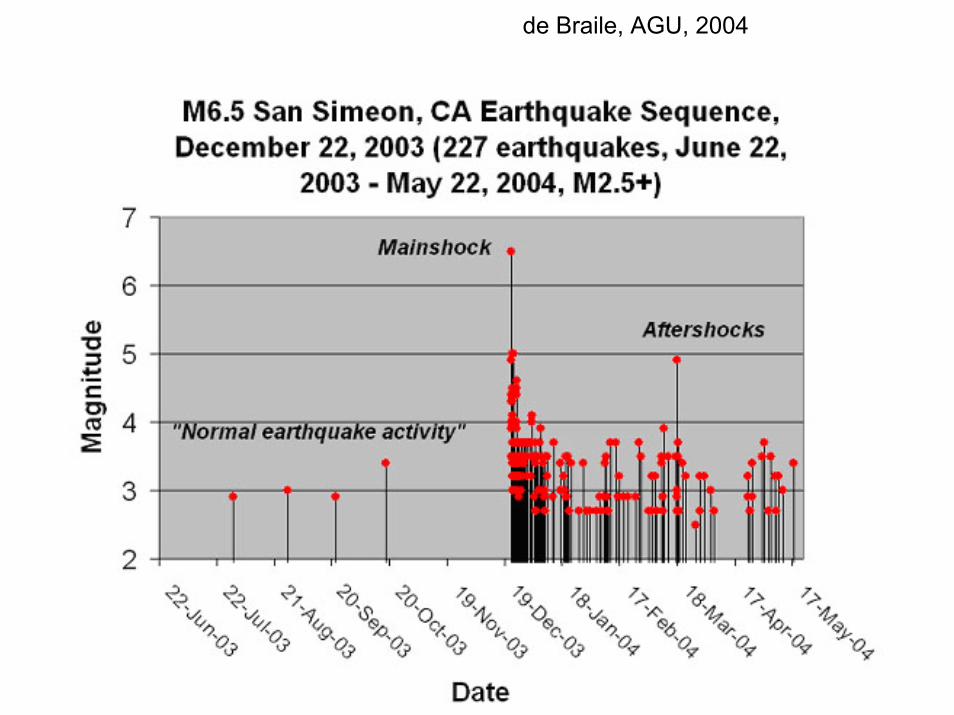
de Braile, AGU, 2004

Tunis, Awesome June 2009
Time of EQ26 June 200700:30:00 UT
10 Hours before
14 Hours 30 after
►
►xx
xxxxxxxx
x
x
x
x
x
xx
xx
xxxxxx
x
x
x
xxx
x
Superposed epoch method

Tunis, Awesome June 2009
2111 EQswith M > 5.0 and d < 40 km
-40 -20 0 20Time (Hours)
0
200
400
600
Dis
tanc
e (k
m)
-4σ -2σ 0σ 2σ 4σNormalized Probabilistic Intensity
Night time VLF Electric field between 1055 – 2383 Hz

Tunis, Awesome June 2009
3346 earthquakeswith M > 4.8 and d < 40 km
-40 -20 0 20Time (Hours)
0
2
4
6
8
Fre
quen
cy (
kHz)
-4σ -2σ 0σ 2σ 4σNormalized Probabilistic Intensity
-40 -20 0 20Time (Hours)
0
2
4
6
8
Fre
quen
cy (
kHz)
-4σ -2σ 0σ 2σ 4σNormalized Probabilistic Intensity
2111 earthquakeswith M > 5.0 and d < 40 km
Night time

Tunis, Awesome June 2009
random 2111 earthquakeswith M > 5.0 and d < 40 km
Night time
-40 -20 0 20Time (Hours)
0
2
4
6
8
Fre
quen
cy (
kHz)
-4σ -2σ 0σ 2σ 4σNormalized Probabilistic Intensity
-40 -20 0 20Time (Hours)
0
2
4
6
8
Fre
quen
cy (
kHz)
-4σ -2σ 0σ 2σ 4σNormalized Probabilistic Intensity

Tunis, Awesome June 2009
We observe a decrease of the electric field at ~ 1.7 kHzduring night time
This is the frequency cutoff of the Earth-ionospherewaveguide (h= 90 km)
Tunis, Awesome June 2009
Conclusions (1/3)
The main points revealed by the statistical studies are:
-The values of the parameters when the satellite is far from the earthquakes are similar to the values obtained when a random data set of events is used. Therefore this study shows that there is an influence of the seismic activity on the ionosphericparameters at an altitude of 700 km before the earthquakes.
-The perturbations are observed a few hours before the earthquakes.
-The perturbations are real but they are weak and only statistically revealed. Up to now nothing can be said about the possibility to predict earthquakes with the analysis of the ionospheric parameters.

Tunis, Awesome June 2009
Conclusions (2/3)
Statistical analysis are in progress with other parameters:
- Electron density- Electrostatic turbulence- Whistler dispersion- Energetic particles- VLF Transmitters

Tunis, Awesome June 2009
Conclusions (3/3)
72 publications (end of May)
The website of the mission: http://demeter.cnrs-orleans.fr
Operations will continue at least until the beginning of 2010.
Related Documents
![DEMETER observations of the ionospheric trough over HAARP ... · [9] DEMETER is a low Earth orbit satellite with an alti-tude of approximately 670 km, inclination of 98.3° and horizontal](https://static.cupdf.com/doc/110x72/5fda6cce888b7679ed176d03/demeter-observations-of-the-ionospheric-trough-over-haarp-9-demeter-is-a-low.jpg)