ARTICLE The Dawn of Human Matrilineal Diversity Doron M. Behar, 1,13, * Richard Villems, 2,13 Himla Soodyall, 3 Jason Blue-Smith, 4 Luisa Pereira, 5,6 Ene Metspalu, 2 Rosaria Scozzari, 7 Heeran Makkan, 3 Shay Tzur, 1 David Comas, 8 Jaume Bertranpetit, 8 Lluis Quintana-Murci, 9 Chris Tyler-Smith, 10 R. Spencer Wells, 4 Saharon Rosset, 11,12 and The Genographic Consortium 14 The quest to explain demographic history during the early part of human evolution has been limited because of the scarce paleoanthro- pological record from the Middle Stone Age. To shed light on the structure of the mitochondrial DNA (mtDNA) phylogeny at the dawn of Homo sapiens, we constructed a matrilineal tree comprised of 624 complete mtDNA genomes from sub-Saharan Hg L lineages. We paid particular attention to the Khoi and San (Khoisan) people of South Africa because they are considered to be a unique relict of hunter- gatherer lifestyle and to carry paternal and maternal lineages belonging to the deepest clades known among modern humans. Both the tree phylogeny and coalescence calculations suggest that Khoisan matrilineal ancestry diverged from the rest of the human mtDNA pool 90–150,000 years before present (ybp) and that at least five additional, currently extant maternal lineages existed during this period in parallel. Furthermore, we estimate that a minimum of 40 other evolutionarily successful lineages flourished in sub-Saharan Africa during the period of modern human dispersal out of Africa approximately 60,000–70,000 ybp. Only much later, at the beginning of the Late Stone Age, about 40,000 ybp, did introgression of additional lineages occur into the Khoisan mtDNA pool. This process was further accelerated during the recent Bantu expansions. Our results suggest that the early settlement of humans in Africa was already matrilineally structured and involved small, separately evolving isolated populations. Introduction Current genetic data support the hypothesis of a predomi- nantly single origin for anatomically modern humans. 1,2 The phylogeny of the maternally inherited mitochondrial DNA (mtDNA) has played a pivotal role in this model by anchoring our most recent maternal common ancestor to sub-Saharan Africa and suggesting a single dispersal wave out of that continent which populated the rest of the world much later. 3–5 However, despite its importance as the cradle of humanity and the main location of anatom- ically modern humans for most of their existence, the ini- tial Homo sapiens population dynamics and dispersal routes remain poorly understood. 6,7 The potential to use present- day genetic patterns to detect the existence, or lack thereof, of matrilineal genetic structure among early Homo sapiens populations in sub-Saharan Africa is therefore of particular interest. The human mtDNA phylogeny can be collapsed into two daughter branches, L0 and L1 0 2 0 3 0 4 0 5 0 6 (L1 0 5), 5 located on opposite sides of its root (Figure 1). 8,9 The L1 0 5 branch is far more widespread and has given rise to almost every mtDNA lineage found today, with two clades on this branch, (L3)M and (L3)N, forming the bulk of worldwide non-African genetic diversity and marking the out-of- Africa dispersal 50,000–65,000 years before present (ybp) 4 (Figure 1). Current models, predating the recogni- tion of L0 as sister to L1 0 5, 9,10 suggest that the contempo- rary sub-Saharan mtDNA gene pool is the result of an early expansion of modern humans from their homeland, often suggested to be East Africa, to most of the African conti- nent by exclusively L1 Hg clades, before being over- whelmed by a later expansion wave of L2 and L3 clades dated to 60,000–80,000 ybp. 11,12 A more recent geograph- ically restricted enrichment of the African maternal gene pool was shown to have occurred during the early Upper Paleolithic, when populations carrying mtDNA clades M1 and U6 arrived to north and northeast Africa from Eurasia, hardly penetrating sub-Saharan portion of the continent, except Ethiopia. 13,14 Therefore, the current sub-Saharan mtDNA gene pool is overwhelmingly a rich mix of L0 and L1 0 5 clades, found at varying frequencies throughout the continent. 15 This entangled pattern of mtDNA variation gives an initial impression of lack of internal maternal genetic structure within the continent. Alternatively, it might indi- cate the elimination of such an early structure because of massive demographic shifts within the continent, the 1 Molecular Medicine Laboratory, Rambam Health Care Campus, Haifa 31096, Israel; 2 Department of Evolutionary Biology, University of Tartu and Estonian Biocentre, Tartu 51010, Estonia; 3 School of Pathology, Division of Human Genetics, National Health Laboratory Service and University of the Witwaters- rand, Johannesburg 2000, South Africa; 4 Mission Programs, National Geographic Society, Washington, D.C. 20036, USA; 5 Instituto de Patologia e Imuno- logia Molecular da Universidade do Porto, Porto 4200-465, Portugal; 6 Medical Faculty, University of Porto, Porto 4200-319, Portugal; 7 Dipartimento di Genetica e Biologia Molecolare, Sapienza Universita ` di Roma, Rome 00185, Italy; 8 Evolutionary Biology Unit, Department of Experimental and Health Sciences, Universitat Pompeu Fabra, Barcelona 08003, Catalonia, Spain; 9 Unit of Human Evolutionary Genetics, CNRS URA3012, Institut Pasteur, Paris 75724, France; 10 The Wellcome Trust Sanger Institute, Wellcome Trust Genome Campus, Hinxton, Cambs CB10 1SA, UK; 11 Data Analytics Research Group, IBM T.J. Watson Research Center, Yorktown Heights, NY 10598, USA; 12 Department of Statistics and Operations Research, School of Mathematical Sciences, Tel Aviv University, Tel Aviv 69978, Israel 13 These authors contributed equally to this work. 14 See Acknowledgments. *Correspondence: [email protected] DOI 10.1016/j.ajhg.2008.04.002. ª2008 by The American Society of Human Genetics. All rights reserved. The American Journal of Human Genetics 82, 1–11, May 2008 1 AJHG 142 Please cite this article in press as: Behar et al., The Dawn of Human Matrilineal Diversity, The American Journal of Human Genetics (2008), doi:10.1016/j.ajhg.2008.04.002

Welcome message from author
This document is posted to help you gain knowledge. Please leave a comment to let me know what you think about it! Share it to your friends and learn new things together.
Transcript
Please cite this article in press as: Behar et al., The Dawn of Human Matrilineal Diversity, The American Journal of Human Genetics (2008),doi:10.1016/j.ajhg.2008.04.002
ARTICLE
The Dawn of Human Matrilineal Diversity
Doron M. Behar,1,13,* Richard Villems,2,13 Himla Soodyall,3 Jason Blue-Smith,4 Luisa Pereira,5,6
Ene Metspalu,2 Rosaria Scozzari,7 Heeran Makkan,3 Shay Tzur,1 David Comas,8 Jaume Bertranpetit,8
Lluis Quintana-Murci,9 Chris Tyler-Smith,10 R. Spencer Wells,4 Saharon Rosset,11,12 and TheGenographic Consortium14
The quest to explain demographic history during the early part of human evolution has been limited because of the scarce paleoanthro-
pological record from the Middle Stone Age. To shed light on the structure of the mitochondrial DNA (mtDNA) phylogeny at the dawn of
Homo sapiens, we constructed a matrilineal tree comprised of 624 complete mtDNA genomes from sub-Saharan Hg L lineages. We paid
particular attention to the Khoi and San (Khoisan) people of South Africa because they are considered to be a unique relict of hunter-
gatherer lifestyle and to carry paternal and maternal lineages belonging to the deepest clades known among modern humans. Both
the tree phylogeny and coalescence calculations suggest that Khoisan matrilineal ancestry diverged from the rest of the human mtDNA
pool 90–150,000 years before present (ybp) and that at least five additional, currently extant maternal lineages existed during this period
in parallel. Furthermore, we estimate that a minimum of 40 other evolutionarily successful lineages flourished in sub-Saharan Africa
during the period of modern human dispersal out of Africa approximately 60,000–70,000 ybp. Only much later, at the beginning of
the Late Stone Age, about 40,000 ybp, did introgression of additional lineages occur into the Khoisan mtDNA pool. This process was
further accelerated during the recent Bantu expansions. Our results suggest that the early settlement of humans in Africa was already
matrilineally structured and involved small, separately evolving isolated populations.
Introduction
Current genetic data support the hypothesis of a predomi-
nantly single origin for anatomically modern humans.1,2
The phylogeny of the maternally inherited mitochondrial
DNA (mtDNA) has played a pivotal role in this model by
anchoring our most recent maternal common ancestor to
sub-Saharan Africa and suggesting a single dispersal wave
out of that continent which populated the rest of the
world much later.3–5 However, despite its importance as
the cradle of humanity and the main location of anatom-
ically modern humans for most of their existence, the ini-
tial Homo sapiens population dynamics and dispersal routes
remain poorly understood.6,7 The potential to use present-
day genetic patterns to detect the existence, or lack thereof,
of matrilineal genetic structure among early Homo sapiens
populations in sub-Saharan Africa is therefore of particular
interest.
The human mtDNA phylogeny can be collapsed into
two daughter branches, L0 and L10203040506 (L105),5 located
on opposite sides of its root (Figure 1).8,9 The L105 branch is
far more widespread and has given rise to almost every
mtDNA lineage found today, with two clades on this
branch, (L3)M and (L3)N, forming the bulk of worldwide
1Molecular Medicine Laboratory, Rambam Health Care Campus, Haifa 31096, I
Biocentre, Tartu 51010, Estonia; 3School of Pathology, Division of Human Gen
rand, Johannesburg 2000, South Africa; 4Mission Programs, National Geograp
logia Molecular da Universidade do Porto, Porto 4200-465, Portugal; 6Medica
Genetica e Biologia Molecolare, Sapienza Universita di Roma, Rome 00185, I
Sciences, Universitat Pompeu Fabra, Barcelona 08003, Catalonia, Spain; 9Uni
75724, France; 10The Wellcome Trust Sanger Institute, Wellcome Trust Genome
IBM T.J. Watson Research Center, Yorktown Heights, NY 10598, USA; 12Departm
Tel Aviv University, Tel Aviv 69978, Israel13These authors contributed equally to this work.14See Acknowledgments.
*Correspondence: [email protected]
DOI 10.1016/j.ajhg.2008.04.002. ª2008 by The American Society of Human
AJHG
non-African genetic diversity and marking the out-of-
Africa dispersal 50,000–65,000 years before present
(ybp)4 (Figure 1). Current models, predating the recogni-
tion of L0 as sister to L105,9,10 suggest that the contempo-
rary sub-Saharan mtDNA gene pool is the result of an early
expansion of modern humans from their homeland, often
suggested to be East Africa, to most of the African conti-
nent by exclusively L1 Hg clades, before being over-
whelmed by a later expansion wave of L2 and L3 clades
dated to 60,000–80,000 ybp.11,12 A more recent geograph-
ically restricted enrichment of the African maternal gene
pool was shown to have occurred during the early Upper
Paleolithic, when populations carrying mtDNA clades
M1 and U6 arrived to north and northeast Africa from
Eurasia, hardly penetrating sub-Saharan portion of the
continent, except Ethiopia.13,14 Therefore, the current
sub-Saharan mtDNA gene pool is overwhelmingly a rich
mix of L0 and L105 clades, found at varying frequencies
throughout the continent.15
This entangled pattern of mtDNA variation gives an
initial impression of lack of internal maternal genetic
structure within the continent. Alternatively, it might indi-
cate the elimination of such an early structure because of
massive demographic shifts within the continent, the
srael; 2Department of Evolutionary Biology, University of Tartu and Estonian
etics, National Health Laboratory Service and University of the Witwaters-
hic Society, Washington, D.C. 20036, USA; 5Instituto de Patologia e Imuno-
l Faculty, University of Porto, Porto 4200-319, Portugal; 7Dipartimento di
taly; 8Evolutionary Biology Unit, Department of Experimental and Health
t of Human Evolutionary Genetics, CNRS URA3012, Institut Pasteur, Paris
Campus, Hinxton, Cambs CB10 1SA, UK; 11Data Analytics Research Group,
ent of Statistics and Operations Research, School of Mathematical Sciences,
Genetics. All rights reserved.
The American Journal of Human Genetics 82, 1–11, May 2008 1
142
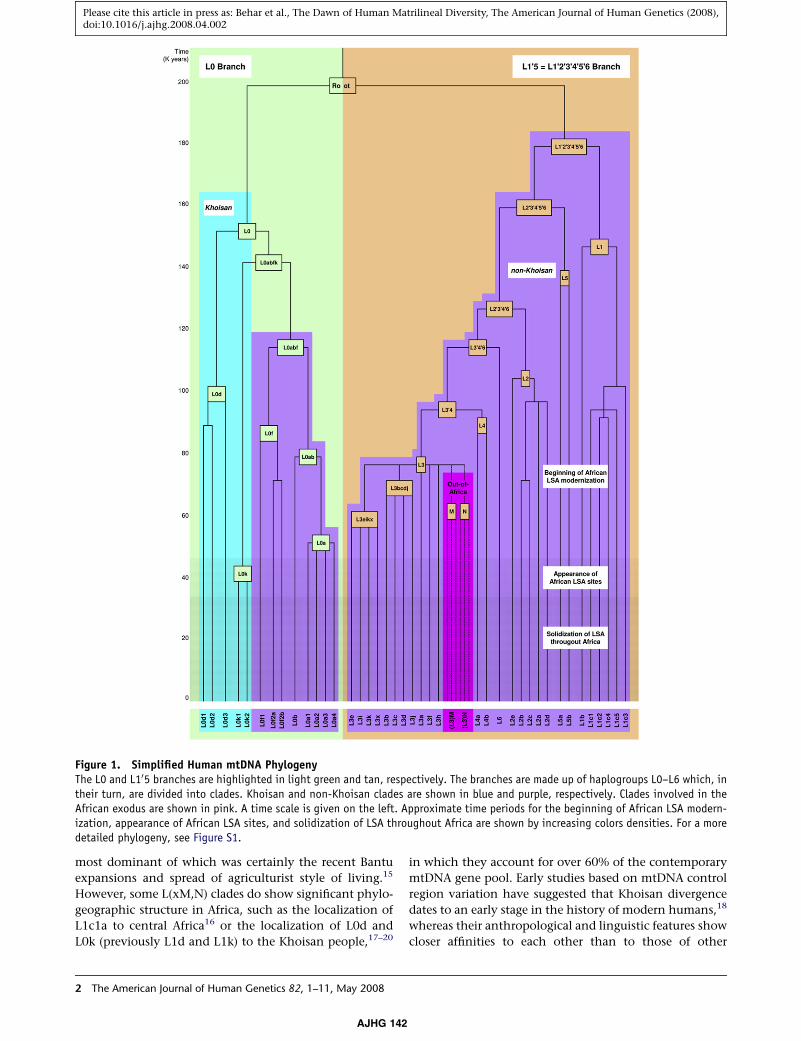
Figure 1. Simplified Human mtDNA PhylogenyThe L0 and L105 branches are highlighted in light green and tan, respectively. The branches are made up of haplogroups L0–L6 which, intheir turn, are divided into clades. Khoisan and non-Khoisan clades are shown in blue and purple, respectively. Clades involved in theAfrican exodus are shown in pink. A time scale is given on the left. Approximate time periods for the beginning of African LSA modern-ization, appearance of African LSA sites, and solidization of LSA throughout Africa are shown by increasing colors densities. For a moredetailed phylogeny, see Figure S1.
Please cite this article in press as: Behar et al., The Dawn of Human Matrilineal Diversity, The American Journal of Human Genetics (2008),doi:10.1016/j.ajhg.2008.04.002
most dominant of which was certainly the recent Bantu
expansions and spread of agriculturist style of living.15
However, some L(xM,N) clades do show significant phylo-
geographic structure in Africa, such as the localization of
L1c1a to central Africa16 or the localization of L0d and
L0k (previously L1d and L1k) to the Khoisan people,17–20
2 The American Journal of Human Genetics 82, 1–11, May 2008
AJHG 142
in which they account for over 60% of the contemporary
mtDNA gene pool. Early studies based on mtDNA control
region variation have suggested that Khoisan divergence
dates to an early stage in the history of modern humans,18
whereas their anthropological and linguistic features show
closer affinities to each other than to those of other
Please cite this article in press as: Behar et al., The Dawn of Human Matrilineal Diversity, The American Journal of Human Genetics (2008),doi:10.1016/j.ajhg.2008.04.002
populations in Africa.21,22 Their distinctiveness is also
supported by phylogenetic studies of the male-specific Y
chromosome that indicate that the most basal branch of
the Y phylogeny is now common among the Khoisan
but is rare or absent in other populations.18
To better understand the reason for the high prevalence
of two basal mtDNA lineages L0d and L0k within Khoisan,
and the possible implications that this pattern might have
on our understanding of early maternal genetic structure
within Homo sapiens populations, we studied, at the level
of complete mtDNA sequences, the variation of 624 Hg
L(xM,N) mtDNA genomes. Our findings allow revealing
different phylogenetic origins for L0d and L0k lineages
versus all other contemporary mtDNA lineages found
within the Khoisan and support a demographic model
with extensive maternal genetic structure during the early
evolutionary history of Homo sapiens. This maternal struc-
ture is likely the result of ancient population splits and
movements and is not consistent with a homogenous
distribution of modern humans throughout sub-Saharan
Africa.
Material and Methods
SamplingTable S1 available online details the information available for
each of the 624 samples included in this study. We evaluated all
315 Hg L(xM,N) complete mtDNA sequences reported in the
literature.5,8–10,16,23–25 Next, we identified all Hg L(xM,N) samples
in all population sample collections available in Haifa (D.M.B.),
Family Tree DNA (D.M.B.), Johannesburg (H.S. and H.M.), Na-
tional Geographic Society (R.S.W. and J.B.S.), Paris (L.Q.M.), Porto
(L.P.), Rome (R.S.), and Tartu (E.M. and R.V.) and chose 309 for
complete mtDNA sequencing. Samples were chosen to include
the widest possible range of Hg L(xM,N) internal variation on
the basis of the previously available sequence analysis of the
mtDNA control region and are, therefore, biased toward rare vari-
ants. In addition, we attempted to focus on branches (e.g., L0d,
L0k), populations (Khoisan), and geographic regions (e.g., Chad)
for which the current data were scant. Last, we preferred to
sequence variants that the current literature suggested to be rare
or anecdotal in any given geographic region (e.g., L0k in the
Near East). All samples reported herein were derived from blood,
buccal swab, or blood cell samples that were collected with
informed consent according to procedures approved by the Insti-
tutional Human Subjects Review Committees in their respective
locations.
Complete mtDNA SequencingDNA was amplified with 18 primers to yield nine overlapping frag-
ments as previously reported.26 After purification, the nine frag-
ments were sequenced by means of 56 internal primers to obtain
the complete mtDNA genome. Sequencing was performed on
a 3730xl DNA Analyzer (Applied Biosystems), and the resulting
sequences were analyzed with the Sequencher software (Gene Co-
des Corporation). Mutations were scored relative to the revised
Cambridge Reference Sequence (rCRS).27 The 309 Hg L(xM,N)
complete mtDNA sequences reported herein have been submitted
AJHG
to GenBank (accession numbers EU092658–EU092966). Sample
quality control was assured as follows:
1. After the primary polymerase chain reaction (PCR) amplifi-
cation of the nine fragments, DNA handling and distribu-
tion to the 56 sequencing reactions was aided by the
Beckman Coulter Biomek FX liquid handler to minimize
the chance for human pipetting errors.
2. All 56 sequencing reactions of each sample were attempted
simultaneously in the same sequencing run and included
resequencing of the control region to assure that the correct
sample was chosen. Therefore, most observed polymor-
phisms were determined by at least two sequences.
However, in the minority of the cases only one sequence
is available because of various technical reasons, usually
related to the amount and quality of the DNA available.
3. Any fragment that failed the first sequencing attempt or any
ambiguous base call was tested by additional and indepen-
dent PCR and sequencing reactions. In these cases, the first
hypervariable segment was again resequenced to assure that
the correct sample was chosen.
4. Table S1 includes for each sample that needed several geno-
typing attempts the information regarding fragments26 that
were resequenced to help in the search for DNA handling
errors and artificial recombination events.
5. All sequences were aligned by the software Sequencher
(Gene Codes Corporation), and all positions with a Phred
score less than 30 were directly inspected by an opera-
tor.28,29 All positions that differed from the revised
Cambridge Reference Sequence (rCRS) were recorded elec-
tronically to minimize typographic errors.
6. Any sample that showed a deviation from the expected
evolutionary hierarchy as suggested by the established Hg
L(xM,N) phylogeny was highlighted and resequenced
when a lab error was suspected.
7. Any comments and remarks raised by external investigators
after release of the data will be addressed by reobservation of
the original sequences for accuracy. After that, any unre-
solved result will be further examined by resequencing
and, if necessary, immediately corrected by publication of
an erratum.
NomenclatureThe term African Hg L(xM,N) is used to describe all mtDNA Hap-
logroups but (L3)M and (L3)N. We reserve the term branch to
describe the two evolving sides of the root and have labeled
them L0 and L10203040506 (L105).5 The two major branches each
composed of one to several haplogroups.30 Note that the L0
branch is made of the L0 Hg alone, whereas the L105 branch
includes haplogroups L1–L6. Haplogroups are composed of clades
(e.g., L0d and L0k), which in their turn are composed of lineages,
which represent an evolving set of closely related haplotypes. The
term haplotype describes the entire combination of substitutions
retrieved from the complete sequence in any given sample and
therefore indicates the tips of the phylogeny, whether a singleton
or not. Numbers 1–16569 refer to the position of the substitution
in the rCRS.27 We followed the consensus nomenclature scheme31
when possible. In many cases, we labeled previously unreported
deep branches (e.g., L1c1c), understanding that these designations
are meant to facilitate reading and future literature comparison
The American Journal of Human Genetics 82, 1–11, May 2008 3
142
Please cite this article in press as: Behar et al., The Dawn of Human Matrilineal Diversity, The American Journal of Human Genetics (2008),doi:10.1016/j.ajhg.2008.04.002
and are prospective candidates of clades to be fully defined in the
future, provided common ancestral substitution motifs could be
identified in complete mtDNA sequences of other samples.
Nomenclature within Hg L(xM,N) has been the subject of some
ambiguity because of the relabeling of some of the clades. The
clades L0d, L0f, L0k, and L5 were previously labeled L1d, L1f,
L1k, and L1e, respectively. We followed the designation
in5,8,15,32 for the definitions of the major branches with a single
exception. We have eliminated the label L7 coined in5 and revert
back to the original label L4a as suggested in13 because of the
following: (1) A large number of samples (17) suggest position
16362 to be at the root of both clades, (2) both clades share similar
distribution in East Africa and in southern West Eurasia, and (3)
coalescence ages and the observed subclade-type architecture
appear to be similar. We have not used the label L1c5 suggested
by33 because our complete mtDNA-based analysis indicates it to
be L1c1a1, as suggested by.15 To avoid confusion, we have skipped
this label and moved from L1c4 to L1c6. We added labeling for
previously unlabeled bifurcations if they became important for
our discussion.
The term Khoisan is used in reference to two major ethnic
groups of Southern Africa, the Khoi and San, though several other
names exist for either one or both of these groups, such as the
Khoi, Khoe, Khoi-San, and Khoe-San.
African Hg L PhylogenyWe generated a maximum-parsimony tree of 624 complete
mtDNA sequences belonging to Hg L(xM,N) (Figure S1). The tree
was rooted according to8 and includes 309 samples reported
herein and 315 previously reported samples: 21 sequences
from,23 six from,10 five from,34 ten from,9 93 from,24 126 from,8
23 from,5 four from,25 and 27 from.16 The genotyping informa-
tion from5,34 included herein corrects several inaccuracies that
were identified during the establishment of the phylogeny.
Sequence data from35 were not incorporated into our summary
tree because we counted at least 25 missing root-defining substitu-
tions in some of the reported complete mtDNA sequences. Until
the reason(s) for such substantial differences can be identified,
we preferred to omit this published database. Mutations are shown
on the branches. Transitions are labeled in capital letters (e.g.,
10420G). Transversions are labeled in lowercase letters (e.g.,
2836a). Sequencing alignment always prefers 30 gap placement
for indels. Deletions are indicated by a ‘‘d’’ after the deleted nucle-
otide position (e.g., 15944d). Insertions are indicated by a dot
followed by the number and type of inserted nucleotide(s) (e.g.,
5899.1C). In cases where an insertion was expected according to
the phylogeny but a reversion of the insertion was observed, we
denoted as in the following example: sample L263, 5899.1Cd.
Underlined nucleotide positions occur at least twice in the tree.
An exclamation mark (!) at the end of a labeled position denotes
a reversion to the ancestral state in the relative pathway to the
rCRS. Sample names are denoted by the letter L followed by a serial
number. The contemporary country in which the sample was
collected (if known) is marked below the serial number, and the
background is colored to grossly divide the samples into the
Near East, Southwest Asia, the Mediterranean, Europe, and South,
North, West, East, and sub-Saharan Africa as denoted in the color
index at the left upper corner of the figure. The ethnicity (if
known) of the individual who donated the sample is further
marked below. When the country from which the sample was
collected is unknown, the gross geographic region is inferred
4 The American Journal of Human Genetics 82, 1–11, May 2008
AJHG 142
from the ethnicity information. The information included herein
from8 includes information from the coding region alone
(435–16023) and is denoted by the letter p at the end of the serial
number.
The tree was first drawn by hand, and its branches were
validated by networks constructed with the program Network
4.2.0.1. We have applied the reduced median algorithm (r¼ 2), fol-
lowed by the median-joining algorithm (epsilon ¼ 2) as described
at the Fluxus Engineering website. The hypervariable indels at
positions 309, 315, and 16189 were excluded from the phylogeny.
The information of the reported samples is presented in Table S1.
Some caveats and possible genotyping or reading errors that might
affect the accuracy of the phylogeny are detailed herein:
1. Many lineages throughout the phylogeny assemble sam-
ples from8 that do not contain the control-region informa-
tion and samples for which the control-region information
is available. In these lineages, we assume that the former
contain the control-region haplotypes of the latter. For
example, sub-Hg L0d1b contains five samples. However,
the control-region information available for only two of
them is placed at the root of this subhaplogroup.
2. The phylogeny assembles control and coding-region poly-
morphisms. Our efforts to follow parsimony principles to
label some of the most mutable control-region positions
should best be treated as heuristic and not as such repre-
senting real evolutionary meaning. For example, posi-
tion 143 under sub-Hg L2a1 is likely not following
the real coalescence flow for this position within this
subhaplogroup.
3. Position 9755 was suggested by8 to be at the root of
L10203040506 when compared with inserts of mtDNA
retrieved from human genomic sequence and the consen-
sus sequence of three chimpanzee mtDNA genomes. How-
ever, the more parsimonious solution inferred from our
extended database for the topological placement of the
9755 substitution suggests its occurrence at the root of the
chimpanzee tree and at the root human L0d102 and L0ab
clades. One less transition event is then needed to explain
the current occurrence of position 9755 among humans
and chimpanzees. The final location of this position may
be further revised as additional knowledge accumulates.
4. We acknowledge that we have no way to accurately count
the number of C insertions in positions known to contain
polymorphisms of this kind. Thus, the number of C inser-
tions in positions 573, 5899, and 16189 suggested for some
of the samples cannot be held as a firm number. Therefore,
all samples containing a poly C stretch at position 573 and
5899 are labeled as having one C insertion (e.g., 5899.1C).
5. The phylogeny contains reticulations that cannot be
resolved without homoplasy or back mutation.
6. L366—The sample information is missing in the region
15380–540.
7. L026—Six coding-region and one control-region back
mutations of higher hierarchic branching positions are
suggested.10
8. L071—Two coding-region back mutations of higher
hierarchic branching positions are suggested.24
9. L002—Three coding-region back mutations of higher
hierarchic branching positions are suggested.23
10. L025—Six coding-region back mutations of higher hierar-
chic branching positions are suggested.10
Please cite this article in press as: Behar et al., The Dawn of Human Matrilineal Diversity, The American Journal of Human Genetics (2008),doi:10.1016/j.ajhg.2008.04.002
11. L248—Two coding-region back mutations of higher hierar-
chic branching positions are suggested.8
12. L029 and L159—The insertions denoted as 8288.6C and
8276.6C might represent the same polymorphism.8,34
13. L039—Three coding-region back mutations of higher
hierarchic branching positions are suggested.9
14. L080—Two coding-region back mutations of higher hierar-
chic branching positions are suggested.24
15. L351—Two coding-region and three control-region back
mutations of higher hierarchic branching positions are
suggested in this study. A sequencing error was not found.
Note that the sample represents a deep split, L1c1, that is
first reported herein.
16. Many samples reported by24 contain the polymorphism
317.1C. We operate under the understanding that this is
the polymorphism usually labeled 315.1C, which is
restricted from the analysis herein.
17. L071, L083, L133, and L135—These four samples reported
by24 contain the polymorphism 317.1A. We operate under
the understanding that this is the polymorphism usually
labeled 316A.
18. L018—The sample was originally reported to harbor poly-
morphisms 16187C! and 16188.1C.23 According to the
phylogeny, polymorphism 16187T is expected.
19. L004—The sample was originally reported to harbor
polymorphisms 16192.1T.23 According to the phylogeny,
polymorphism 16192T is expected and is shown as such
herein.
20. L125—The sample was originally reported to harbor
polymorphisms 960C and 965.1C.24 According to the phy-
logeny, polymorphism 961C is expected and is shown as
such herein.
21. L083, L133, and L134—The samples were originally
reported to harbor the polymorphism 2157.1A. They are
shown herein as 2156.1A.
22. L067—The sample was originally reported to harbor
deletions and insertions in the region of the 9 bp repeat
in position 828024 that are not concordant with a complete
9 bp deletion or insertion. We rejected the original report
because L067 sister lineage demonstrates a 9 bp deletion.
23. L097 and L126—The samples show alternating reports for
transversions and transitions for positions 16114 and
16215,24 which were assumed to represent a typographic
mistake.
24. We deviated from the parsimony principles for position
64T at the root of L0a2a and L0a2b.
25. We deviated from the parsimony principles for position
95c at the root of L0a2c and L0a2d.
26. We deviated from the parsimony principles for position
198T at the root of L1c2 and L1c4.
Age EstimatesFor age estimation of ancestral nodes in our phylogenetic tree, we
applied PAML36 to the coding-region polymorphisms of our
samples, excluding indels, and by using the HKY85 substitution
model. Each tip node of the phylogenetic tree was counted as
one event if shared by a few samples. We eliminated from the
coalescence analysis samples L025, L026, and L039, in which we
observed three or more coding-region back mutations at hap-
logroup-defining positions. We used the rate of 5138 years per
AJHG
coding-region single-nucleotide polymorphism9 to translate the
age estimates in mutations into ages in years. It is worth noting
that age estimates in years should be cautiously interpreted
because the actual mutation rate in years per mutation remains
an open debate in the literature.8,37 The maximum-likelihood
estimate of the transition to transversion rate on the basis of our
data was 19.91, with a standard error of 1.02. It is important to
consider the meaning of the age estimates given herein. Each esti-
mate is a time to the most recent common ancestor of a set of
mtDNA molecules. Thus the age of the L0d clade, defined by the
available sequences, is 101,589 5 10,318 ybp, but it started to
diverge from its sister clade, L0abfk, 143,654 5 11,111 ybp. Muta-
tions defining the L0d clade could have occurred at any time
between these two dates.
Hypothesis Testing of the Time of Isolation
of the KhoisanOur goal here was to evaluate whether it is likely that the phyloge-
netic restriction of Khoisan to lineages in L0d and L0k could result
from an isolation event starting from a single, homogeneous Homo
sapiens population at different points in time. Given a time X (say,
100,000 ybp), we consider three elements:
� Y—The number of lineages extant at time X with surviving
offspring (at 100,000 ybp we get Y ¼ 14—see Figure S1)
� Z—The number of Khoisan ancestral lineages within Y (at
100,000 ybp we get Z ¼ 3, the lineages L0d1, L0d2, L0k)
� L—A measure of the localization of Khoisan ancestors in the
coalescent phylogenetic tree of the Y lineages. We measure
localization by the number of links in the tree that have to
be cut to isolate the Khoisan lineages from all other lineages.
At 100,000 ybp we get L ¼ 2 (because cutting the link to
L0abf and the link between the root and L0 isolates the three
Khoisan lineages from the rest of the tree).
We then perform a permutation test to assess whether a random
selection of Z lineages out of Y (given the phylogenetic tree of the
Y lineages) is likely to have created an isolation measure smaller
than or equal to L. In other words, we count how many groups
of Z lineages can be isolated from the rest of the tree by cutting
L links or less and then divide this number by the total number
of groups of Z lineages (which is choosing Z out of Y). For the ex-
ample of 100,000 ybp, the seven triplets that can be isolated from
the rest of the tree by cutting at most two links are the following:
� L0ab þ L0f þ L0k (by cutting of a single link leading to the
L0abfk ancestor)
� L0k þ L0d1 þ L0d2 (the actual Khoisan lineages)
� L1b þ L1c3 þ L1c124 (by cutting of a single link leading to
the L1 ancestor)
� L2abcdþ L2eþ L34 (by cutting of the link to L6 and the link
leading to the L2-6 ancestor)
� L2abcdþ L2eþ L6 (by cutting of the link to L34 and the link
leading to the L2-6 ancestor)
� L2abcdþ L34þ L6 (by cutting of the link to L2e and the link
leading to the L2-6 ancestor)
� L2e þ L34 þ L6 (by cutting the link to L2abcd and the link
leading to the L2-6 ancestor)
This gives a permutation test p value of 7/(14 choose 3) ¼ 0.019
to the event that an isolation of three lineages by drift would lead
The American Journal of Human Genetics 82, 1–11, May 2008 5
142
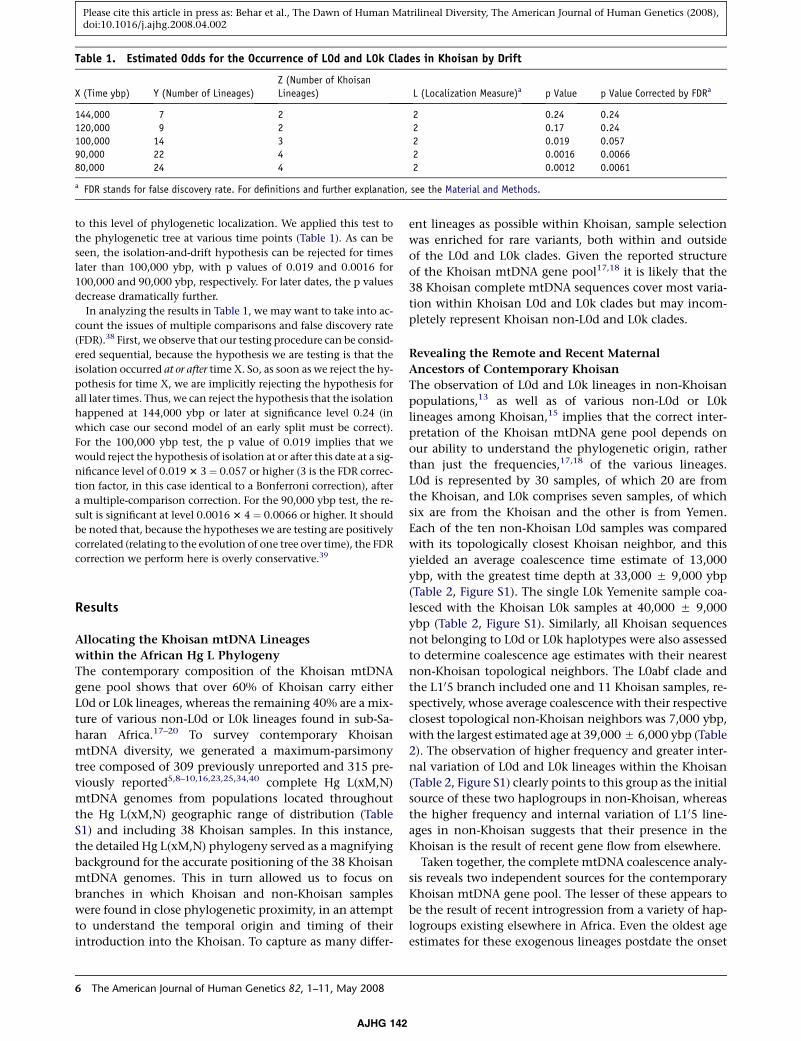
Table 1. Estimated Odds for the Occurrence of L0d and L0k Clades in Khoisan by Drift
X (Time ybp) Y (Number of Lineages)
Z (Number of Khoisan
Lineages) L (Localization Measure)a p Value p Value Corrected by FDRa
144,000 7 2 2 0.24 0.24
120,000 9 2 2 0.17 0.24
100,000 14 3 2 0.019 0.057
90,000 22 4 2 0.0016 0.0066
80,000 24 4 2 0.0012 0.0061
a FDR stands for false discovery rate. For definitions and further explanation, see the Material and Methods.
Please cite this article in press as: Behar et al., The Dawn of Human Matrilineal Diversity, The American Journal of Human Genetics (2008),doi:10.1016/j.ajhg.2008.04.002
to this level of phylogenetic localization. We applied this test to
the phylogenetic tree at various time points (Table 1). As can be
seen, the isolation-and-drift hypothesis can be rejected for times
later than 100,000 ybp, with p values of 0.019 and 0.0016 for
100,000 and 90,000 ybp, respectively. For later dates, the p values
decrease dramatically further.
In analyzing the results in Table 1, we may want to take into ac-
count the issues of multiple comparisons and false discovery rate
(FDR).38 First, we observe that our testing procedure can be consid-
ered sequential, because the hypothesis we are testing is that the
isolation occurred at or after time X. So, as soon as we reject the hy-
pothesis for time X, we are implicitly rejecting the hypothesis for
all later times. Thus, we can reject the hypothesis that the isolation
happened at 144,000 ybp or later at significance level 0.24 (in
which case our second model of an early split must be correct).
For the 100,000 ybp test, the p value of 0.019 implies that we
would reject the hypothesis of isolation at or after this date at a sig-
nificance level of 0.019 3 3 ¼ 0.057 or higher (3 is the FDR correc-
tion factor, in this case identical to a Bonferroni correction), after
a multiple-comparison correction. For the 90,000 ybp test, the re-
sult is significant at level 0.0016 3 4 ¼ 0.0066 or higher. It should
be noted that, because the hypotheses we are testing are positively
correlated (relating to the evolution of one tree over time), the FDR
correction we perform here is overly conservative.39
Results
Allocating the Khoisan mtDNA Lineages
within the African Hg L Phylogeny
The contemporary composition of the Khoisan mtDNA
gene pool shows that over 60% of Khoisan carry either
L0d or L0k lineages, whereas the remaining 40% are a mix-
ture of various non-L0d or L0k lineages found in sub-Sa-
haran Africa.17–20 To survey contemporary Khoisan
mtDNA diversity, we generated a maximum-parsimony
tree composed of 309 previously unreported and 315 pre-
viously reported5,8–10,16,23,25,34,40 complete Hg L(xM,N)
mtDNA genomes from populations located throughout
the Hg L(xM,N) geographic range of distribution (Table
S1) and including 38 Khoisan samples. In this instance,
the detailed Hg L(xM,N) phylogeny served as a magnifying
background for the accurate positioning of the 38 Khoisan
mtDNA genomes. This in turn allowed us to focus on
branches in which Khoisan and non-Khoisan samples
were found in close phylogenetic proximity, in an attempt
to understand the temporal origin and timing of their
introduction into the Khoisan. To capture as many differ-
6 The American Journal of Human Genetics 82, 1–11, May 2008
AJHG 142
ent lineages as possible within Khoisan, sample selection
was enriched for rare variants, both within and outside
of the L0d and L0k clades. Given the reported structure
of the Khoisan mtDNA gene pool17,18 it is likely that the
38 Khoisan complete mtDNA sequences cover most varia-
tion within Khoisan L0d and L0k clades but may incom-
pletely represent Khoisan non-L0d and L0k clades.
Revealing the Remote and Recent Maternal
Ancestors of Contemporary Khoisan
The observation of L0d and L0k lineages in non-Khoisan
populations,13 as well as of various non-L0d or L0k
lineages among Khoisan,15 implies that the correct inter-
pretation of the Khoisan mtDNA gene pool depends on
our ability to understand the phylogenetic origin, rather
than just the frequencies,17,18 of the various lineages.
L0d is represented by 30 samples, of which 20 are from
the Khoisan, and L0k comprises seven samples, of which
six are from the Khoisan and the other is from Yemen.
Each of the ten non-Khoisan L0d samples was compared
with its topologically closest Khoisan neighbor, and this
yielded an average coalescence time estimate of 13,000
ybp, with the greatest time depth at 33,000 5 9,000 ybp
(Table 2, Figure S1). The single L0k Yemenite sample coa-
lesced with the Khoisan L0k samples at 40,000 5 9,000
ybp (Table 2, Figure S1). Similarly, all Khoisan sequences
not belonging to L0d or L0k haplotypes were also assessed
to determine coalescence age estimates with their nearest
non-Khoisan topological neighbors. The L0abf clade and
the L105 branch included one and 11 Khoisan samples, re-
spectively, whose average coalescence with their respective
closest topological non-Khoisan neighbors was 7,000 ybp,
with the largest estimated age at 39,000 5 6,000 ybp (Table
2). The observation of higher frequency and greater inter-
nal variation of L0d and L0k lineages within the Khoisan
(Table 2, Figure S1) clearly points to this group as the initial
source of these two haplogroups in non-Khoisan, whereas
the higher frequency and internal variation of L105 line-
ages in non-Khoisan suggests that their presence in the
Khoisan is the result of recent gene flow from elsewhere.
Taken together, the complete mtDNA coalescence analy-
sis reveals two independent sources for the contemporary
Khoisan mtDNA gene pool. The lesser of these appears to
be the result of recent introgression from a variety of hap-
logroups existing elsewhere in Africa. Even the oldest age
estimates for these exogenous lineages postdate the onset
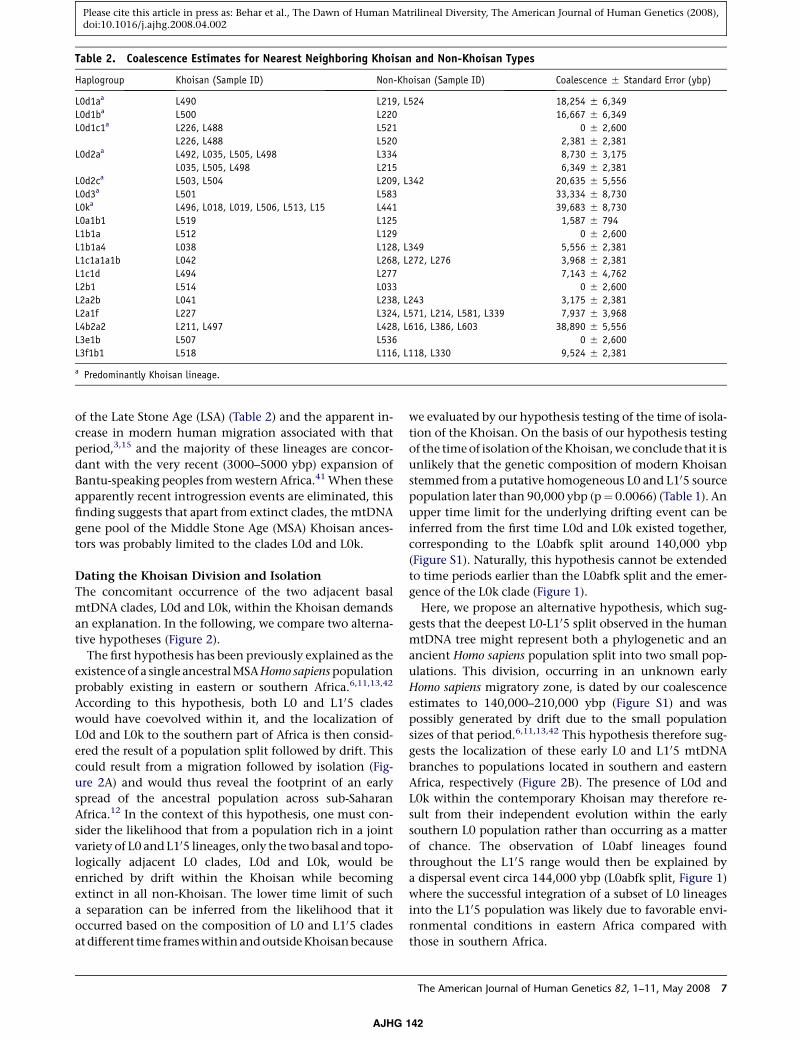
Table 2. Coalescence Estimates for Nearest Neighboring Khoisan and Non-Khoisan Types
Haplogroup Khoisan (Sample ID) Non-Khoisan (Sample ID) Coalescence 5 Standard Error (ybp)
L0d1aa L490 L219, L524 18,254 5 6,349
L0d1ba L500 L220 16,667 5 6,349
L0d1c1a L226, L488 L521 0 5 2,600
L226, L488 L520 2,381 5 2,381
L0d2aa L492, L035, L505, L498 L334 8,730 5 3,175
L035, L505, L498 L215 6,349 5 2,381
L0d2ca L503, L504 L209, L342 20,635 5 5,556
L0d3a L501 L583 33,334 5 8,730
L0ka L496, L018, L019, L506, L513, L15 L441 39,683 5 8,730
L0a1b1 L519 L125 1,587 5 794
L1b1a L512 L129 0 5 2,600
L1b1a4 L038 L128, L349 5,556 5 2,381
L1c1a1a1b L042 L268, L272, L276 3,968 5 2,381
L1c1d L494 L277 7,143 5 4,762
L2b1 L514 L033 0 5 2,600
L2a2b L041 L238, L243 3,175 5 2,381
L2a1f L227 L324, L571, L214, L581, L339 7,937 5 3,968
L4b2a2 L211, L497 L428, L616, L386, L603 38,890 5 5,556
L3e1b L507 L536 0 5 2,600
L3f1b1 L518 L116, L118, L330 9,524 5 2,381
a Predominantly Khoisan lineage.
Please cite this article in press as: Behar et al., The Dawn of Human Matrilineal Diversity, The American Journal of Human Genetics (2008),doi:10.1016/j.ajhg.2008.04.002
of the Late Stone Age (LSA) (Table 2) and the apparent in-
crease in modern human migration associated with that
period,3,15 and the majority of these lineages are concor-
dant with the very recent (3000–5000 ybp) expansion of
Bantu-speaking peoples from western Africa.41 When these
apparently recent introgression events are eliminated, this
finding suggests that apart from extinct clades, the mtDNA
gene pool of the Middle Stone Age (MSA) Khoisan ances-
tors was probably limited to the clades L0d and L0k.
Dating the Khoisan Division and Isolation
The concomitant occurrence of the two adjacent basal
mtDNA clades, L0d and L0k, within the Khoisan demands
an explanation. In the following, we compare two alterna-
tive hypotheses (Figure 2).
The first hypothesis has been previously explained as the
existence of a single ancestral MSA Homo sapiens population
probably existing in eastern or southern Africa.6,11,13,42
According to this hypothesis, both L0 and L105 clades
would have coevolved within it, and the localization of
L0d and L0k to the southern part of Africa is then consid-
ered the result of a population split followed by drift. This
could result from a migration followed by isolation (Fig-
ure 2A) and would thus reveal the footprint of an early
spread of the ancestral population across sub-Saharan
Africa.12 In the context of this hypothesis, one must con-
sider the likelihood that from a population rich in a joint
variety of L0 and L105 lineages, only the two basal and topo-
logically adjacent L0 clades, L0d and L0k, would be
enriched by drift within the Khoisan while becoming
extinct in all non-Khoisan. The lower time limit of such
a separation can be inferred from the likelihood that it
occurred based on the composition of L0 and L105 clades
at different time frames within and outside Khoisan because
AJHG
we evaluated by our hypothesis testing of the time of isola-
tion of the Khoisan. On the basis of our hypothesis testing
of the time of isolation of the Khoisan, we conclude that it is
unlikely that the genetic composition of modern Khoisan
stemmed from a putative homogeneous L0 and L105 source
population later than 90,000 ybp (p¼ 0.0066) (Table 1). An
upper time limit for the underlying drifting event can be
inferred from the first time L0d and L0k existed together,
corresponding to the L0abfk split around 140,000 ybp
(Figure S1). Naturally, this hypothesis cannot be extended
to time periods earlier than the L0abfk split and the emer-
gence of the L0k clade (Figure 1).
Here, we propose an alternative hypothesis, which sug-
gests that the deepest L0-L105 split observed in the human
mtDNA tree might represent both a phylogenetic and an
ancient Homo sapiens population split into two small pop-
ulations. This division, occurring in an unknown early
Homo sapiens migratory zone, is dated by our coalescence
estimates to 140,000–210,000 ybp (Figure S1) and was
possibly generated by drift due to the small population
sizes of that period.6,11,13,42 This hypothesis therefore sug-
gests the localization of these early L0 and L105 mtDNA
branches to populations located in southern and eastern
Africa, respectively (Figure 2B). The presence of L0d and
L0k within the contemporary Khoisan may therefore re-
sult from their independent evolution within the early
southern L0 population rather than occurring as a matter
of chance. The observation of L0abf lineages found
throughout the L105 range would then be explained by
a dispersal event circa 144,000 ybp (L0abfk split, Figure 1)
where the successful integration of a subset of L0 lineages
into the L105 population was likely due to favorable envi-
ronmental conditions in eastern Africa compared with
those in southern Africa.
The American Journal of Human Genetics 82, 1–11, May 2008 7
142
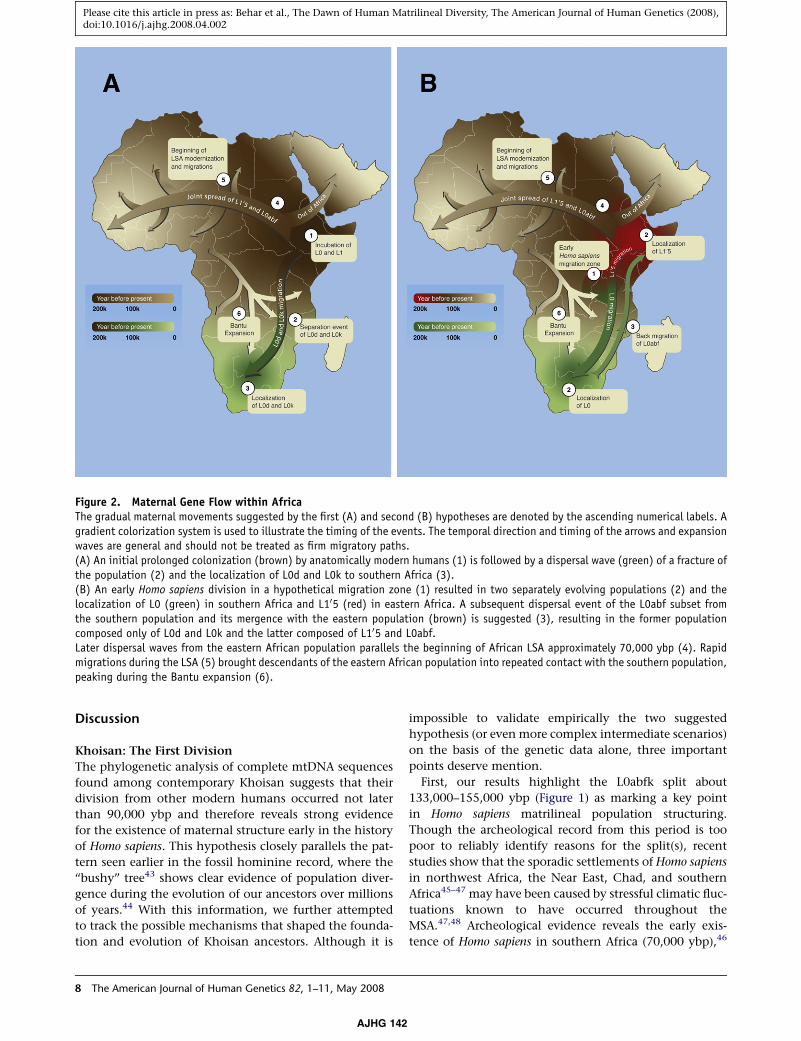
Figure 2. Maternal Gene Flow within AfricaThe gradual maternal movements suggested by the first (A) and second (B) hypotheses are denoted by the ascending numerical labels. Agradient colorization system is used to illustrate the timing of the events. The temporal direction and timing of the arrows and expansionwaves are general and should not be treated as firm migratory paths.(A) An initial prolonged colonization (brown) by anatomically modern humans (1) is followed by a dispersal wave (green) of a fracture ofthe population (2) and the localization of L0d and L0k to southern Africa (3).(B) An early Homo sapiens division in a hypothetical migration zone (1) resulted in two separately evolving populations (2) and thelocalization of L0 (green) in southern Africa and L105 (red) in eastern Africa. A subsequent dispersal event of the L0abf subset fromthe southern population and its mergence with the eastern population (brown) is suggested (3), resulting in the former populationcomposed only of L0d and L0k and the latter composed of L105 and L0abf.Later dispersal waves from the eastern African population parallels the beginning of African LSA approximately 70,000 ybp (4). Rapidmigrations during the LSA (5) brought descendants of the eastern African population into repeated contact with the southern population,peaking during the Bantu expansion (6).
Please cite this article in press as: Behar et al., The Dawn of Human Matrilineal Diversity, The American Journal of Human Genetics (2008),doi:10.1016/j.ajhg.2008.04.002
Discussion
Khoisan: The First Division
The phylogenetic analysis of complete mtDNA sequences
found among contemporary Khoisan suggests that their
division from other modern humans occurred not later
than 90,000 ybp and therefore reveals strong evidence
for the existence of maternal structure early in the history
of Homo sapiens. This hypothesis closely parallels the pat-
tern seen earlier in the fossil hominine record, where the
‘‘bushy’’ tree43 shows clear evidence of population diver-
gence during the evolution of our ancestors over millions
of years.44 With this information, we further attempted
to track the possible mechanisms that shaped the founda-
tion and evolution of Khoisan ancestors. Although it is
8 The American Journal of Human Genetics 82, 1–11, May 2008
AJHG 142
impossible to validate empirically the two suggested
hypothesis (or even more complex intermediate scenarios)
on the basis of the genetic data alone, three important
points deserve mention.
First, our results highlight the L0abfk split about
133,000–155,000 ybp (Figure 1) as marking a key point
in Homo sapiens matrilineal population structuring.
Though the archeological record from this period is too
poor to reliably identify reasons for the split(s), recent
studies show that the sporadic settlements of Homo sapiens
in northwest Africa, the Near East, Chad, and southern
Africa45–47 may have been caused by stressful climatic fluc-
tuations known to have occurred throughout the
MSA.47,48 Archeological evidence reveals the early exis-
tence of Homo sapiens in southern Africa (70,000 ybp),46
Please cite this article in press as: Behar et al., The Dawn of Human Matrilineal Diversity, The American Journal of Human Genetics (2008),doi:10.1016/j.ajhg.2008.04.002
and studies of the mtDNA in contemporary populations
demonstrate convincingly that very deep (50,000–60,000
ybp) autochthonous mtDNA lineages can survive locally
both in isolated habitats49 and open surroundings.4
Although it is tempting to link these early southern African
settlements to ancestors of the Khoisan, our data cannot
prove it, nor can they suggest the cradle of Homo sapiens
to be southern or eastern Africa.
Second, it is evident that since the L0abfk split, the
expansion dynamics of the L0d and L0k clades and that
of the L0abf and L105 clades have proceeded in the most
uneven ways, with one localizing to southern Africa and
giving rise to the matrilineal ancestry of the present-day
Khoisan and the other spreading to all corners of the world
and giving rise to all present-day non-Khoisan popula-
tions, including non-Africans.
Third, it seems that these southern and eastern popula-
tions remained isolated from each other, at least mater-
nally, for an extremely long period of between 50,000
and 100,000 years until the development of LSA technolo-
gies47 which, coupled with more favorable environmental
conditions, may have allowed behaviorally modern Homo
sapiens to expand its range.6 This apparent sign of maternal
isolation and structure in the early settlement dynamics of
Africa implies the formation of small, independent human
communities rather than a uniform early spread of ana-
tomically modern humans as previously suggested.11,12
Early Maternal Genetic Structure among
Modern Humans
The proposed matrilineal sequestration of African MSA
mtDNA into isolated populations does not seem to be
restricted to Khoisan. A recent study showed that ancestors
of contemporary Pygmies diverged from an ancestral Cen-
tral African population no more than 70,000 ybp and that
isolation was breached throughout the LSA.16 Moreover,
this matrilineal sequestration pattern also offers a simple
explanation to the surprising finding that of the more
than 40 mtDNA lineages in Africa at the time modern
humans left Africa3 (Figure S1), only two of the variants,
(L3)M and (L3)N,4 gave rise to the entire wealth of mtDNA
diversity outside of Africa.5,8 Different approaches were
taken in the attempt to estimate the sub-Saharan Homo
sapiens population size in different time frames.7 The un-
derstanding of the minimum number of existing maternal
lineages in different time periods, as far as can be estimated
from their survival to the present day, might benefit our
understanding of the magnitude of Homo sapiens expan-
sion in these periods and shed light on the frequency of
the loss of mtDNA lineages in long time periods.
In summary, the study of extant genetic variation in
African populations with complete mtDNA sequences
provides an insight into past Homo sapiens demographics,
suggesting that small groups of early humans remained
in geographic and genetic isolation until migrations
during the LSA. Studies of additional genomic regions, par-
ticularly of unlinked autosomal regions with their greater
AJHG
effective population size, may reveal additional details
about these early demographic events from a genome-
wide perspective.
Supplemental Data
One figure and one table are available at http://www.ajhg.org/.
Acknowledgments
We thank all individuals that have voluntarily donated their DNA
sample to the study. We also thank Ryan Sprissler and Heather
Issar from the Arizona Research Labs, University of Arizona, and
Connie Bormans and Michal Bronstein from the Genomics
Research Center, Family Tree DNA, for excellent laboratory
services. This study was supported by National Geographic Soci-
ety, IBM, the Waitt Family Foundation, the Seaver Family Founda-
tion, Family Tree DNA, and Arizona Research Labs. R.V. is grateful
to Swedish Collegium of Advanced Studies for fellowship during
the final preparation of the manuscript. S.R. is partially supported
by European Union grant MIRG-CT-2007-208019. C.T.S. is sup-
ported by The Wellcome Trust. Instituto de Patologia e Imunologia
Molecular da Universidade do Porto (IPATIMUP) (L.P.) is supported
by Programa Operacional Ciencia, Tecnologia e Inovacao (POCTI)
and Quadro Comunitario de Apoio III.
The Genographic Consortium includes the following: Theo-
dore G. Schurr, Department of Anthropology, University of
Pennsylvania, Philadelphia, PA 19104-6398, USA; Fabricio R.
Santos, Departamento de Biologia Geral, Universidade Federal
de Minas Gerais, Belo Horizonte, Minas Gerais 31270-010, Brazil;
Lluis Quintana-Murci, Unit of Human Evolutionary Genetics,
Institut Pasteur, Institut Pasteur, 75724 Paris Cedex 15, France;
Jaume Bertranpetit, Evolutionary Biology Unit, Department
of Experimental and Health Sciences, Universitat Pompeu Fabra,
Barcelona 08003, Catalonia, Spain; David Comas, Evolutionary
Biology Unit, Department of Experimental and Health Sciences,
Universitat Pompeu Fabra, Barcelona 08003, Catalonia, Spain;
Chris Tyler-Smith, The Wellcome Trust Sanger Institute, Well-
come Trust Genome Campus, Hinxton, Cambs CB10 1SA, UK;
Elena Balanovska, Research Centre for Medical Genetics,
Russian Academy of Medical Sciences, Moscow 115478, Russia;
Oleg Balanovsky, Research Centre for Medical Genetics, Russian
Academy of Medical Sciences, Moscow 115478, Russia; Doron M.
Behar, Molecular Medicine Laboratory, Rambam Health Care
Campus, Haifa 31096, Israel and Genomics Research Center,
Family Tree DNA, Houston, TX 77008, USA; R. John Mitchell,
Department of Genetics, La Trobe University, Melbourne, Victoria,
3086, Australia; Li Jin, Fudan University, Shanghai, China;
Himla Soodyall, Division of Human Genetics, National Health
Laboratory Service, Johannesburg, 2000, South Africa; Ramas-
amy Pitchappan, Department of Immunology, Madurai
Kamaraj University, Madurai 625021 Tamil Nadu, India; Alan
Cooper, Division of Earth and Environmental Sciences, Univer-
sity of Adelaide, South Australia 5005, Australia; Ajay K.
Royyuru, Computational Biology Center, IBM T.J. Watson Re-
search Center, Yorktown Heights, NY 10598, USA; Saharon
Rosset, Department of Statistics and Operations Research, School
of Mathematical Sciences, Tel Aviv University, Tel Aviv 69978,
Israel and Data Analytics Research Group, IBM T.J. Watson Re-
search Center, Yorktown Heights, NY 10598, USA; Laxmi
Parida, Computational Biology Center, IBM T.J. Watson Research
The American Journal of Human Genetics 82, 1–11, May 2008 9
142
Please cite this article in press as: Behar et al., The Dawn of Human Matrilineal Diversity, The American Journal of Human Genetics (2008),doi:10.1016/j.ajhg.2008.04.002
Center, Yorktown Heights, NY 10598, USA; Jason Blue-Smith,
Mission Programs, National Geographic Society, Washington,
D.C. 20036, USA; David Soria Hernanz, Mission Programs,
National Geographic Society, Washington, D.C. 20036, USA; and
R. Spencer Wells, Mission Programs, National Geographic
Society, Washington, D.C. 20036, USA.
Received: March 11, 2008
Revised: April 1, 2008
Accepted: April 3, 2008
Published online: April 24, 2008
Web Resources
The URLs for data presented herein are as follows:
GenBank, http://www.ncbi.nlm.nih.gov/Genbank/
Fluxus Engineering, http://www.fluxus-engineering.com
Accession Numbers
The 309 Hg L(xM,N) complete mtDNA sequences reported herein
have been submitted to GenBank under accession numbers
EU092658–EU092966.
References
1. Cann, R.L., Stoneking, M., and Wilson, A.C. (1987). Mito-
chondrial DNA and human evolution. Nature 325, 31–36.
2. Underhill, P.A., and Kivisild, T. (2007). Use of Y chromosome
and mitochondrial DNA population structure in tracing
human migrations. Annu. Rev. Genet. 41, 539–564.
3. Mellars, P. (2006). Going east: New genetic and archaeological
perspectives on the modern human colonization of Eurasia.
Science 313, 796–800.
4. Macaulay, V., Hill, C., Achilli, A., Rengo, C., Clarke, D.,
Meehan, W., Blackburn, J., Semino, O., Scozzari, R., Cruciani,
F., et al. (2005). Single, rapid coastal settlement of Asia revealed
by analysis of complete mitochondrial genomes. Science 308,
1034–1036.
5. Torroni, A., Achilli, A., Macaulay, V., Richards, M., and
Bandelt, H.J. (2006). Harvesting the fruit of the human
mtDNA tree. Trends Genet. 22, 339–345.
6. Mellars, P. (2006). Why did modern human populations
disperse from Africa ca. 60,000 years ago? A new model.
Proc. Natl. Acad. Sci. USA 103, 9381–9386.
7. Hawks, J., Wang, E.T., Cochran, G.M., Harpending, H.C., and
Moyzis, R.K. (2007). Recent acceleration of human adaptive
evolution. Proc. Natl. Acad. Sci. USA 104, 20753–20758.
8. Kivisild, T., Shen, P., Wall, D.P., Do, B., Sung, R., Davis, K.,
Passarino, G., Underhill, P.A., Scharfe, C., Torroni, A., et al.
(2006). The role of selection in the evolution of human
mitochondrial genomes. Genetics 172, 373–387.
9. Mishmar, D., Ruiz-Pesini, E., Golik, P., Macaulay, V., Clark,
A.G., Hosseini, S., Brandon, M., Easley, K., Chen, E., Brown,
M.D., et al. (2003). Natural selection shaped regional mtDNA
variation in humans. Proc. Natl. Acad. Sci. USA 100, 171–176.
10. Maca-Meyer, N., Gonzalez, A.M., Larruga, J.M., Flores, C., and
Cabrera, V.M. (2001). Major genomic mitochondrial lineages
delineate early human expansions. BMC Genet. 2, 13.
10 The American Journal of Human Genetics 82, 1–11, May 2008
AJHG 142
11. Forster, P. (2004). Ice Ages and the mitochondrial DNA
chronology of human dispersals: A review. Philos. Trans. R.
Soc. Lond. B Biol. Sci. 359, 255–264.
12. Watson, E., Forster, P., Richards, M., and Bandelt, H.J. (1997).
Mitochondrial footprints of human expansions in Africa. Am.
J. Hum. Genet. 61, 691–704.
13. Kivisild, T., Reidla, M., Metspalu, E., Rosa, A., Brehm, A.,
Pennarun, E., Parik, J., Geberhiwot, T., Usanga, E., and
Villems, R. (2004). Ethiopian mitochondrial DNA heritage:
Tracking gene flow across and around the gate of tears. Am.
J. Hum. Genet. 75, 752–770.
14. Olivieri, A., Achilli, A., Pala, M., Battaglia, V., Fornarino, S., Al-
Zahery, N., Scozzari, R., Cruciani, F., Behar, D.M., Dugoujon,
J.M., et al. (2006). The mtDNA legacy of the Levantine early
Upper Palaeolithic in Africa. Science 314, 1767–1770.
15. Salas, A., Richards, M., De la Fe, T., Lareu, M.V., Sobrino, B.,
Sanchez-Diz, P., Macaulay, V., and Carracedo, A. (2002). The
making of the African mtDNA landscape. Am. J. Hum. Genet.
71, 1082–1111.
16. Quintana-Murci, L., Quach, H., Harmant, C., Luca, F., Masson-
net, B., Patin, E., Sica, L., Mouguiama-Daouda, P., Comas, D.,
Tzur, S., et al. (2008). Maternal traces of deep common ances-
try and asymmetric gene flow between Pygmy hunter-gath-
erers and Bantu-speaking farmers. Proc. Natl. Acad. Sci. USA
105, 1596–1601.
17. Chen, Y.S., Olckers, A., Schurr, T.G., Kogelnik, A.M., Huopo-
nen, K., and Wallace, D.C. (2000). mtDNA variation in the
South African Kung and Khwe-and their genetic relationships
to other African populations. Am. J. Hum. Genet. 66, 1362–
1383.
18. Knight, A., Underhill, P.A., Mortensen, H.M., Zhivotovsky,
L.A., Lin, A.A., Henn, B.M., Louis, D., Ruhlen, M., and Moun-
tain, J.L. (2003). African Y chromosome and mtDNA diver-
gence provides insight into the history of click languages.
Curr. Biol. 13, 464–473.
19. Tishkoff, S.A., Gonder, M.K., Henn, B.M., Mortensen, H.,
Knight, A., Gignoux, C., Fernandopulle, N., Lema, G.,
Nyambo, T.B., Ramakrishnan, U., et al. (2007). History of
click-speaking populations of Africa inferred from mtDNA
and Y chromosome genetic variation. Mol. Biol. Evol. 24,
2180–2195.
20. Vigilant, L., Stoneking, M., Harpending, H., Hawkes, K., and
Wilson, A.C. (1991). African populations and the evolution
of human mitochondrial DNA. Science 253, 1503–1507.
21. Barnard, A. (1992). Hunters and Herders of Southern Africa: A
Comparative Ethnography of the Khoisan Peoples (New York:
Cambridge University Press).
22. Guldemann, T. (2007). Quotative Indexes in African Lan-
guages: A Synchronic and Diachronic Survey (Berlin: Mouton
de Gruyter).
23. Ingman, M., Kaessmann, H., Paabo, S., and Gyllensten, U.
(2000). Mitochondrial genome variation and the origin of
modern humans. Nature 408, 708–713.
24. Howell, N., Elson, J.L., Turnbull, D.M., and Herrnstadt, C.
(2004). African laplogroup L mtDNA sequences show viola-
tions of clock-like evolution. Mol. Biol. Evol. 21, 1843–1854.
25. Behar, D.M., Metspalu, A., Kivisild, T., Rosset, S., Tzur, S., Ha-
did, Y., Yodkovsky, G., Rosengarten, D., Pereira, L., Amorim,
A., et al. (2008). Counting the founders: The matrilineal
genetic ancestry of the Jewish Diaspora. PLoS ONE, in press.
26. Taylor, R.W., Taylor, G.A., Durham, S.E., and Turnbull, D.M.
(2001). The determination of complete human mitochondrial
Please cite this article in press as: Behar et al., The Dawn of Human Matrilineal Diversity, The American Journal of Human Genetics (2008),doi:10.1016/j.ajhg.2008.04.002
DNA sequences in single cells: Implications for the study of
somatic mitochondrial DNA point mutations. Nucleic Acids
Res. 29, E74–E74.
27. Andrews, R.M., Kubacka, I., Chinnery, P.F., Lightowlers, R.N.,
Turnbull, D.M., and Howell, N. (1999). Reanalysis and revi-
sion of the Cambridge reference sequence for human mito-
chondrial DNA. Nat. Genet. 23, 147.
28. Ewing, B., and Green, P. (1998). Base-calling of automated
sequencer traces using phred. II. Error probabilities. Genome
Res. 8, 186–194.
29. Ewing, B., Hillier, L., Wendl, M.C., and Green, P. (1998). Base-
calling of automated sequencer traces using phred. I. Accuracy
assessment. Genome Res. 8, 175–185.
30. Torroni, A., Sukernik, R.I., Schurr, T.G., Starikorskaya, Y.B.,
Cabell, M.F., Crawford, M.H., Comuzzie, A.G., and Wallace,
D.C. (1993). mtDNA variation of aboriginal Siberians reveals
distinct genetic affinities with Native Americans. Am.
J. Hum. Genet. 53, 591–608.
31. Richards, M.B., Macaulay, V.A., Bandelt, H.J., and Sykes, B.C.
(1998). Phylogeography of mitochondrial DNA in western Eu-
rope. Ann. Hum. Genet. 62, 241–260.
32. Salas, A., Richards, M., Lareu, M.V., Scozzari, R., Coppa, A.,
Torroni, A., Macaulay, V., and Carracedo, A. (2004). The
African diaspora: Mitochondrial DNA and the Atlantic slave
trade. Am. J. Hum. Genet. 74, 454–465.
33. Batini, C., Coia, V., Battaggia, C., Rocha, J., Pilkington, M.M.,
Spedini, G., Comas, D., Destro-Bisol, G., and Calafell, F.
(2007). Phylogeography of the human mitochondrial L1c
haplogroup: Genetic signatures of the prehistory of Central
Africa. Mol. Phylogenet. Evol. 43, 635–644.
34. Torroni, A., Rengo, C., Guida, V., Cruciani, F., Sellitto, D.,
Coppa, A., Calderon, F.L., Simionati, B., Valle, G., Richards,
M., et al. (2001). Do the four clades of the mtDNA haplogroup
L2 evolve at different rates? Am. J. Hum. Genet. 69, 1348–
1356.
35. Gonder, M.K., Mortensen, H.M., Reed, F.A., de Sousa, A., and
Tishkoff, S.A. (2007). Whole-mtDNA genome sequence analy-
sis of ancient African lineages. Mol. Biol. Evol. 24, 757–768.
36. Yang, Z. (1997). PAML: A program package for phylogenetic
analysis by maximum likelihood. Comput. Appl. Biosci. 13,
555–556.
37. Bandelt, H.-J., Kong, Q.-P., Richards, M., and Macaulay, V.
(2006). Estimation of mutation rates and coalescence times:
Some caveats. In Human Mitochondrial DNA and the Evolu-
AJHG
tion of Homo sapiens, H.-J. Bandelt, V. Macaulay, and M. Ri-
chards, eds. (Berlin: Springer), pp. 47–90.
38. Benjamini, Y., and Hochberg, Y. (1995). Controlling the false
discovery rate: A practical and powerful approach to multiple
testing. J. R. Stat. Soc. [Ser A] 57, 289–300.
39. Benjamini, Y., and Yekutieli, D. (2001). The control of the false
discovery rate in multiple testing under dependency. Ann.
Statist. 29, 1165–1188.
40. Howell, N., Elson, J.L., Turnbull, D.M., and Herrnstadt, C.
(2004). African Haplogroup L mtDNA sequences show viola-
tions of clock-like evolution. Mol. Biol. Evol. 21, 1843–1854.
41. Oliver, R. (1966). The problem of the Bantu expansion. J. Afr.
Hist. 7, 361–376.
42. Manica, A., Amos, W., Balloux, F., and Hanihara, T. (2007).
The effect of ancient population bottlenecks on human
phenotypic variation. Nature 448, 346–348.
43. Leakey, M.G., Spoor, F., Brown, F.H., Gathogo, P.N., Kiarie, C.,
Leakey, L.N., and McDougall, I. (2001). New hominin genus
from eastern Africa shows diverse middle Pliocene lineages.
Nature 410, 433–440.
44. Klein, R. (1999). The Human Career (Chicago: University of
Chicago Press).
45. Bouzouggar, A., Barton, N., Vanhaeren, M., d’Errico, F.,
Collcutt, S., Higham, T., Hodge, E., Parfitt, S., Rhodes, E.,
Schwenninger, J.L., et al. (2007). 82,000-year-old shell beads
from North Africa and implications for the origins of modern
human behavior. Proc. Natl. Acad. Sci. USA 104, 9964–9969.
46. Henshilwood, C.S., d’Errico, F., Yates, R., Jacobs, Z., Tribolo, C.,
Duller, G.A., Mercier, N., Sealy, J.C., Valladas, H., Watts, I., et al.
(2002). Emergence of modern human behavior: Middle Stone
Age engravings from South Africa. Science 295, 1278–1280.
47. Walter, R.C., Buffler, R.T., Bruggemann, J.H., Guillaume,
M.M., Berhe, S.M., Negassi, B., Libsekal, Y., Cheng, H., Ed-
wards, R.L., von Cosel, R., et al. (2000). Early human occupa-
tion of the Red Sea coast of Eritrea during the last interglacial.
Nature 405, 65–69.
48. Cohen, A.S., Stone, J.R., Beuning, K.R., Park, L.E., Reinthal,
P.N., Dettman, D., Scholz, C.A., Johnson, T.C., King, J.W.,
Talbot, M.R., et al. (2007). Ecological consequences of early
Late Pleistocene megadroughts in tropical Africa. Proc. Natl.
Acad. Sci. USA 104, 16422–16427.
49. Thangaraj, K., Chaubey, G., Kivisild, T., Reddy, A.G., Singh,
V.K., Rasalkar, A.A., and Singh, L. (2005). Reconstructing the
origin of Andaman Islanders. Science 308, 996.
The American Journal of Human Genetics 82, 1–11, May 2008 11
142
Related Documents