arXiv:astro-ph/0504295v1 13 Apr 2005 Mon. Not. R. Astron. Soc. 000, 1–16 (2005) Printed 26 December 2013 (MN L A T E X style file v2.2) The creation of the Helix planetary nebula (NGC 7293) by multiple events J. Meaburn 1 , P. Boumis 2 , J. A. L ´ opez 1 , D. J. Harman 3, 4 , M. Bryce 3 , M.P. Redman 5 and F. Mavromatakis 6 . 1 Instituto de Astronom´ ıa, UNAM, Apdo. Postal 877, Ensenada, B.C. 22800, M´ exico. 2 Institute of Astronomy & Astrophysics, National Observatory of Athens, I. Metaxa & V. Paulou, GR–152 36 P. Penteli, Athens, Greece 3 Jodrell Bank Observatory, Dept of Physics & Astronomy, University of Manchester, Macclesfield, Cheshire SK11 9DL UK. 4 Liverpool John Moores University, Birkenhead, CH41 1LD, UK 5 Department of Physics, National University of Ireland Galway, Galway, Ireland. 6 University of Crete, Physics Department, P.O. Box 2208, 710 03 Heraklion, Crete, Greece. Accepted 2005 April 5. Received 2005 March 25; in original form 2005 January 6 ABSTRACT A deep, continuum–subtracted, image of NGC 7293 has been obtained in the light of the Hα+[N II] emission lines. New images of two filamentary halo stuctures have been obtained and the possible detection of a collimated outflow made. Spatially resolved, longslit profiles of the Hα+[N II] lines have been observed across several of these features with the Manchester echelle spectrometer combined with the San Pedro Martir 2.1–m telescope; these are compared with the [N II] 6584 ˚ A, [O III] 5007 ˚ A, He II 6560 ˚ A and Hα profiles obtained over the nebular core. The central He II emission is originating in a ≈ 0.34 pc diameter spherical volume ex- panding at ≤ 12 km s −1 which is surrounded, and partially coincident with an [O III] 5007 ˚ A emitting inner shell expanding at 12 km s −1 . The bright helical structure surrounding this inner region is modelled as a bi–polar nebula with lobe expansions of 25 km s −1 whose axis is tilted at 37 ◦ to the sight line but with a toroidal waist itself expanding at 14 km s −1 . These observations are compared with the expectations of the interacting two winds model for the formation of PNe. Only after the fast wind has switched off could this global velocity structure be generated. Ablated flows must complicate any interpretation. It is suggested that the clumpy nature of much of the material could play a part in cre- ating the radial ‘spokes’ shown here to be apparently present close to the central star. These ‘spokes’ could in fact be the persistant tails of cometary globules whose heads have now photo–evaporated completely. A halo arc projecting from the north–east of the bright core has a conterpart to the south– east. Anomolies in the position– velocity arrays of line profiles could suggest that these are part of an expanding disc not aligned with the central helical structure though expanding bi– polar lobes along a tilted axis are not ruled out. Key words: circumstellar matter: Helix Nebula: NGC 7293 1 INTRODUCTION The multitude of phenomena in the Helix planetary nebula (NGC 7293, PK 36–57 ◦ 1) at a distance of only 213 pc (Harris et al 1997) can be investigated over a uniquely wide range of spatial scales for at that distance 1 ′′ ≡ 3.19 × 10 15 cm. It is therefore proving to be one of the most important laboratories for the investigation of all aspects of evolved planetary nebulae (PNe). The progenitor star is a low luminosity (L/ L⊙ ≈ 100 Henry, Kwitter & Dufour 1999) white dwarf (WD 2226–210, Mendez et al 1988) with an effective temperature of 117,000 K and mass 0.93 M⊙ (G´ orny, Stasinska & Tylenda 1997) as well as a late–type dMe companion whose halo is responsible for hard X–ray emis- sion (Chu et al 2004; Gruendl et al 2001). Patriarchi & Perinotto (1991) discovered that 60 percent of central stars of PNe emit par- ticle winds from 600 – 3500 km s −1 but failed to detect one from WD 2226–210. In fact, Cerruti–Sola & Perinotto (1985) had given an upper limit to such a wind as ≤ 10 −10 M⊙ yr −1 which has im- plications for the dynamics of NGC 7293 (see Sect. 4.1). The lowly ionised, apparantly helical, structure that gives the nebula its name could be a toroid with bi-polar lobes viewed at ≈ 37 ◦ with respect to the bi–polar axis ( Meaburn et al 1998; Henry, Kwitter & Du-

Welcome message from author
This document is posted to help you gain knowledge. Please leave a comment to let me know what you think about it! Share it to your friends and learn new things together.
Transcript
arX
iv:a
stro
-ph/
0504
295v
1 1
3 A
pr 2
005
Mon. Not. R. Astron. Soc.000, 1–16 (2005) Printed 26 December 2013 (MN LATEX style file v2.2)
The creation of the Helix planetary nebula (NGC 7293) by multipleevents
J. Meaburn1, P. Boumis2, J. A. Lopez1, D. J. Harman3, 4, M. Bryce3,M.P. Redman5 and F. Mavromatakis6.1 Instituto de Astronomıa, UNAM, Apdo. Postal 877, Ensenada, B.C. 22800, Mexico.2Institute of Astronomy & Astrophysics, National Observatory of Athens, I. Metaxa & V. Paulou, GR–152 36 P. Penteli, Athens, Greece3Jodrell Bank Observatory, Dept of Physics & Astronomy, University of Manchester, Macclesfield, Cheshire SK11 9DL UK.4Liverpool John Moores University, Birkenhead, CH41 1LD, UK5 Department of Physics, National University of Ireland Galway, Galway, Ireland.6 University of Crete, Physics Department, P.O. Box 2208, 71003 Heraklion, Crete, Greece.
Accepted 2005 April 5. Received 2005 March 25; in original form 2005 January 6
ABSTRACT
A deep, continuum–subtracted, image of NGC 7293 has been obtained in the light of theHα+[N II ] emission lines. New images of two filamentary halo stuctures have been obtainedand the possible detection of a collimated outflow made.
Spatially resolved, longslit profiles of the Hα+[N II ] lines have been observed acrossseveral of these features with the Manchester echelle spectrometer combined with the SanPedro Martir 2.1–m telescope; these are compared with the [NII ] 6584A, [O III ] 5007A,He II 6560A and Hα profiles obtained over the nebular core.
The central HeII emission is originating in a≈ 0.34 pc diameter spherical volume ex-panding at≤ 12 km s−1 which is surrounded, and partially coincident with an [OIII ] 5007Aemitting inner shell expanding at 12 km s−1. The bright helical structure surrounding thisinner region is modelled as a bi–polar nebula with lobe expansions of 25 km s−1 whose axisis tilted at 37◦ to the sight line but with a toroidal waist itself expanding at 14 km s−1.
These observations are compared with the expectations of the interacting two windsmodel for the formation of PNe. Only after the fast wind has switched off could this globalvelocity structure be generated. Ablated flows must complicate any interpretation.
It is suggested that the clumpy nature of much of the materialcould play a part in cre-ating the radial ‘spokes’ shown here to be apparently present close to the central star. These‘spokes’ could in fact be the persistant tails of cometary globules whose heads have nowphoto–evaporated completely.
A halo arc projecting from the north–east of the bright core has a conterpart to the south–east. Anomolies in the position– velocity arrays of line profiles could suggest that these arepart of an expanding disc not aligned with the central helical structure though expanding bi–polar lobes along a tilted axis are not ruled out.
Key words: circumstellar matter: Helix Nebula: NGC 7293
1 INTRODUCTION
The multitude of phenomena in the Helix planetary nebula (NGC7293, PK 36–57◦1) at a distance of only 213 pc (Harris et al 1997)can be investigated over a uniquely wide range of spatial scales forat that distance 1′′ ≡ 3.19× 1015 cm. It is therefore proving to beone of the most important laboratories for the investigation of allaspects of evolved planetary nebulae (PNe).
The progenitor star is a low luminosity (L/L⊙ ≈ 100 Henry,Kwitter & Dufour 1999) white dwarf (WD 2226–210, Mendez etal 1988) with an effective temperature of 117,000 K and mass
0.93 M⊙ (Gorny, Stasinska & Tylenda 1997) as well as a late–typedMe companion whose halo is responsible for hard X–ray emis-sion (Chu et al 2004; Gruendl et al 2001). Patriarchi & Perinotto(1991) discovered that 60 percent of central stars of PNe emit par-ticle winds from 600 – 3500 km s−1 but failed to detect one fromWD 2226–210. In fact, Cerruti–Sola & Perinotto (1985) had givenan upper limit to such a wind as≤ 10−10
M⊙ yr−1 which has im-plications for the dynamics of NGC 7293 (see Sect. 4.1). The lowlyionised, apparantly helical, structure that gives the nebula its namecould be a toroid with bi-polar lobes viewed at≈ 37◦ with respectto the bi–polar axis ( Meaburn et al 1998; Henry, Kwitter & Du-
2 J. Meaburn et al
four 1999) though O’Dell, McCullough & Meixner (2004) presentan alternative view (Sect. 3.2). Whatever form this helicalstructuretakes it contains an [OIII ] emitting shell on the inside surface ofthe toroid with an inner [OIII ] emitting shell (Meaburn & White1982; O’Dell et al 2004) surrounding a highly ionised HeII emit-ting central spherical volume shown particularly well by O’Dell etal (2004) and considered by Henry et al (1999). This bright centralnebula is surrounded by faint filamentary structure as shownin dif-ferent ways by Malin (1982), Walsh & Meaburn (1987), Speck etal (2002) and O’Dell et al (2004).
The whole ionized nebula is enveloped within a massive en-velope of molecular gas (Storey 1984; Huggins & Healey 1989;Healey & Huggins 1990; Forveille & Huggins 1991; Young et al1999).
Arguably the most interesting feature of the ionised helicalstructure are the multitude of ‘cometary’ knots inhabitingits insidesurface. These have dense neutral cores (Meaburn et al 1992,1998;Huggins et al 1992) with long ionised tails pointing radially awayfrom the central star seen in superb detail in the HST images ofO’Dell & Handron (1996).
In the present paper, spatially resolved profiles of the Hα and[N II ] 6584A emission lines are compared with new continuum–subtracted emission line images of the most prominent halo fea-ture. Furthermore, the kinematics of the nebular core are exploredwith longslit profiles of the [OIII ] 5007A and HeII 6560A emis-sion lines.The central motions are then compared with previouslypublished data and the implications for current dynamical mod-els for the creation of PNe are considered. Furthermore, thebi–polar/toroidal model of the bright helical structure is tested by nu-merical simulations compared in detail with observations.The ori-gin of strange radial ‘spokes’ of enhanced [NII ] emission is alsoexplored.
2 OBSERVATIONS AND RESULTS
2.1 Wide – field imagery
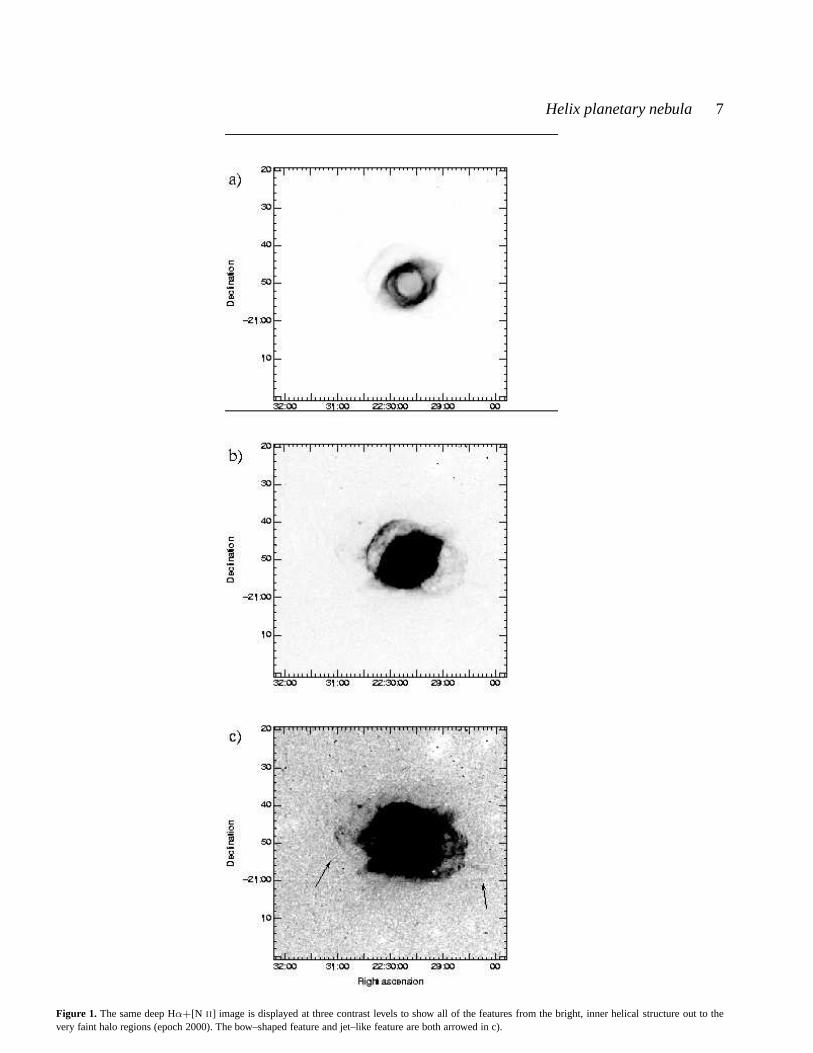
The image of NGC 7293 shown in Figs. 1a–c was obtained withthe 0.3–m (f/3.2) Schmidt-Cassegrain telescope at Skinakas Obser-vatory, Crete, Greece in 2003 July 30. The 1024× 1024 (19×19µm2) pixels Thomson CCD camera was used resulting in a scaleof 4′′.1 pix−1 and a field of view of 70′ × 70′. Five exposuresin Hα+[N II ] of 2400 s each were taken during the observations(resulting in a total integration time of 12000 s), while three ex-posures of 240 s were obtained with the continuum filter. The lat-ter were subtracted from the former to eliminate the confusing starfield (more details of this technique can be found in Boumis etal2002). The image reduction (bias subtraction, flat-field correction)was carried out using the standard IRAF and MIDAS packages. Theastrometry information was calculated using stars from theHubbleSpace Telescope (HST) Guide Star Catalogue (Lasker et al. 1999).Although many of the features shown in Fig. 1 a) & b) are previ-ously known (see refs. in Sect. 1 and particulary O’Dell et al2004)this unique wide–field continuum–subtracted image relatesthem toeach other clearly. The very deep presentation in Fig. 1 c) reveals abow–shaped feature and possible, but tenuous, counter–jetboth ofwhich are arrowed.
2.2 Longslit spectrometry
2.2.1 Hα & [N II ] 6584A profiles from the halo
The longslit observations were obtained with the ManchesterEchelle Spectrometer (MES - Meaburn et al, 1984 & 2003) com-bined with the f/7.9 focus of the 2.1–m San Pedro Martir UNAMtelescope on 28 June 1998. This echelle spectrometer has no cross-dispersion. For the present observations, a filter of 90A bandwidthwas used to isolate the 87th order containing the Hα and [NII ]nebular emission lines.
A Tektronix CCD with 1024× 1024 square pixels, each with24µm sides, was the detector. Two times binning was employed inboth the spatial and spectral dimensions. Consequently 512incre-ments, each 0.60′′ long, gave a total projected slit length of 5.12′
on the sky. ‘Seeing’ varied between 1-2′′ during these observations.The slit was 150µm wide (≡ 11 km s−1 and 1.9′′) and the integra-tion times were 1800 s. The spectra were calibrated in wavelengthto ± 1 km s−1 accuracy against that of a Th/Ar arc lamp andin absolute surface brightness (of the Hα line) to an accuracy of± 20 percent against a slitless spectrum of the ‘standard’ star Feige56.
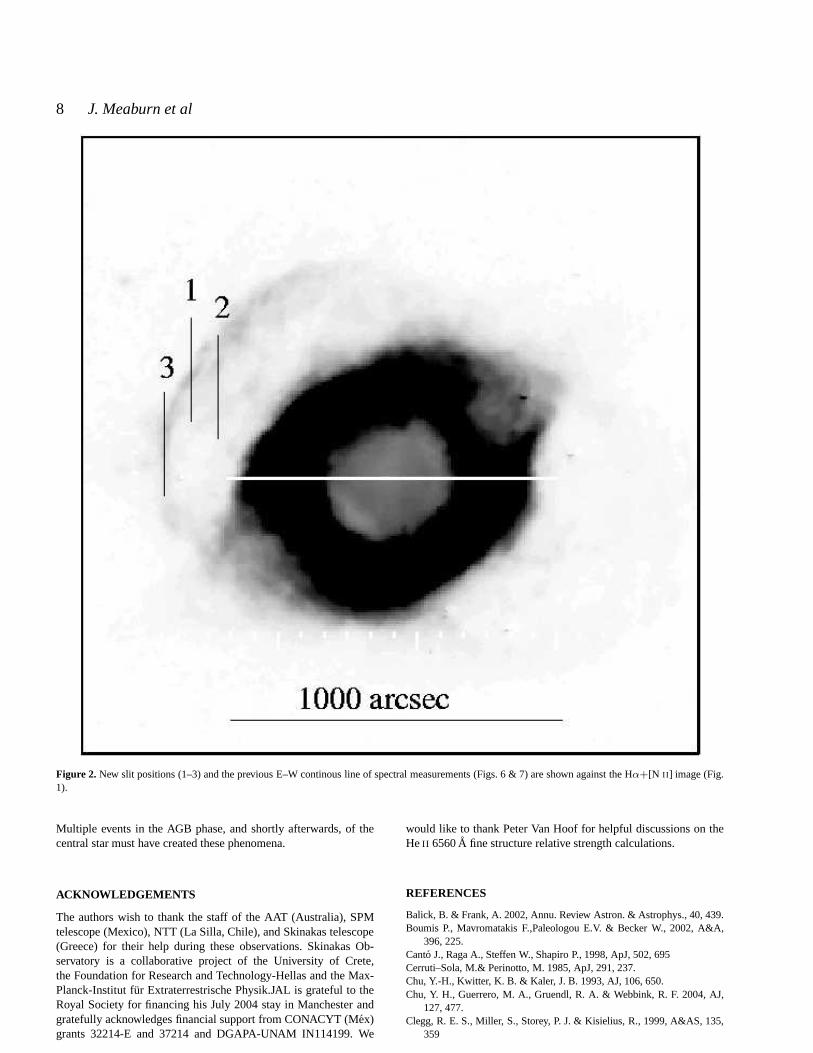
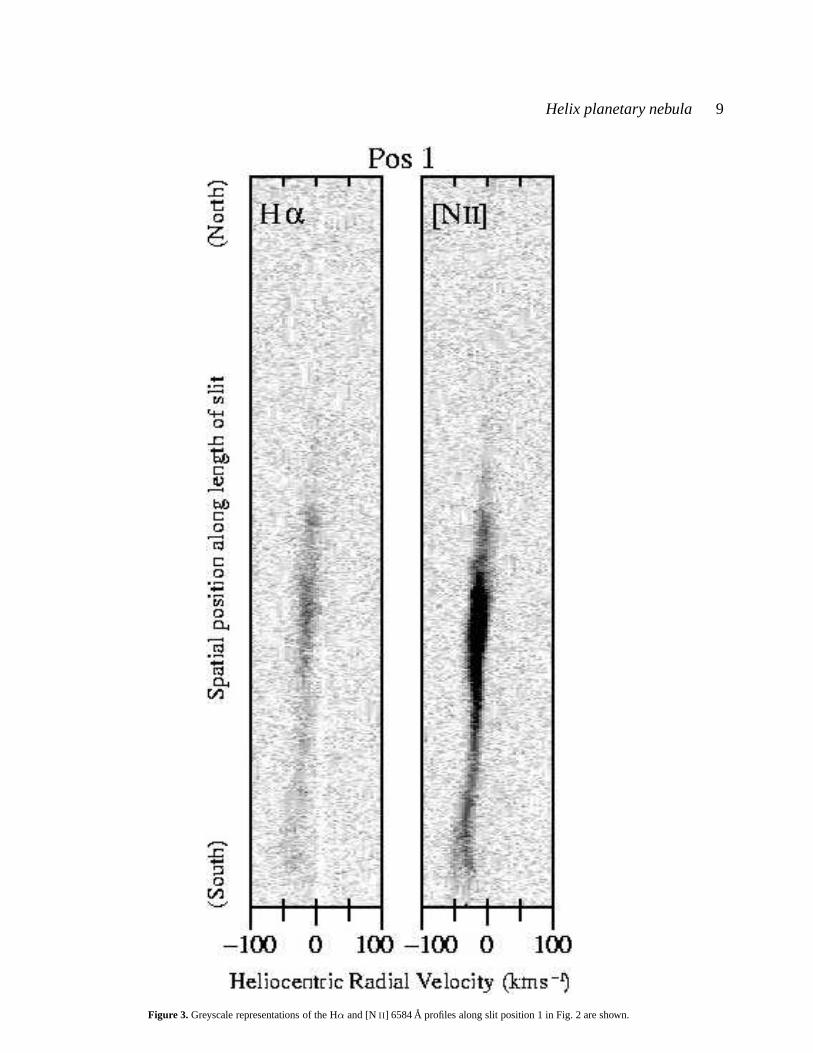
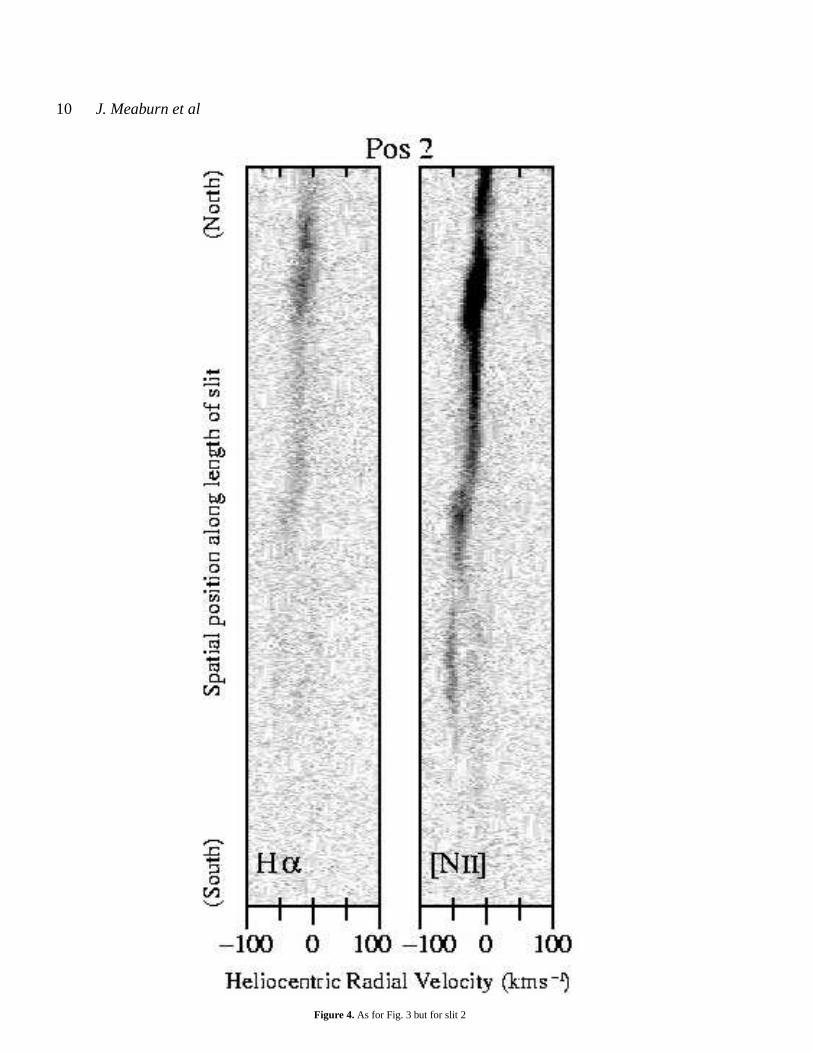
The three slit positions (1–3) over the halo feature ofNGC 7293 are shown in Fig. 2 against part of the image in Fig.1. Greyscale representations of the resultant position–velocity (pv)arrays of Hα and [NII ] profiles are shown in Figs. 3–5 respectively.
2.2.2 HeII 6560A and [OIII ] 5007A profiles from the core
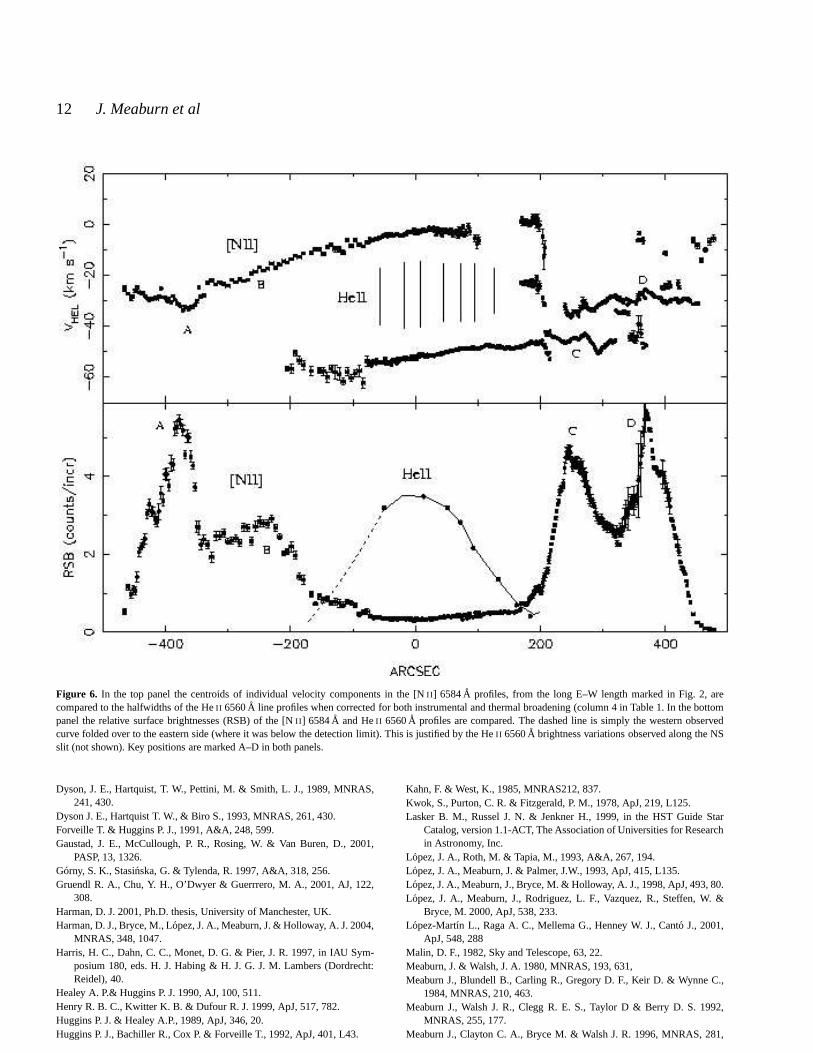
Previously (Meaburn et al 1996, 1998) Hα and [NII ] profiles wereobtained with MES on the Anglo–Australian (3.9–m) telescope(AAT), from NS and EW lines of measurements, each 1000 arcseclong, through the central star of NGC 7293. Spectra from manyslitlengths were combined to cover such large regions (see the abovepapers for all technical details). For comparison with the presentspectral observations the pv array of the individual velocity com-ponents in the [NII ] 6584A profiles along the EW line of measure-ments is shown in Fig. 6 (from Meaburn et al 1996).
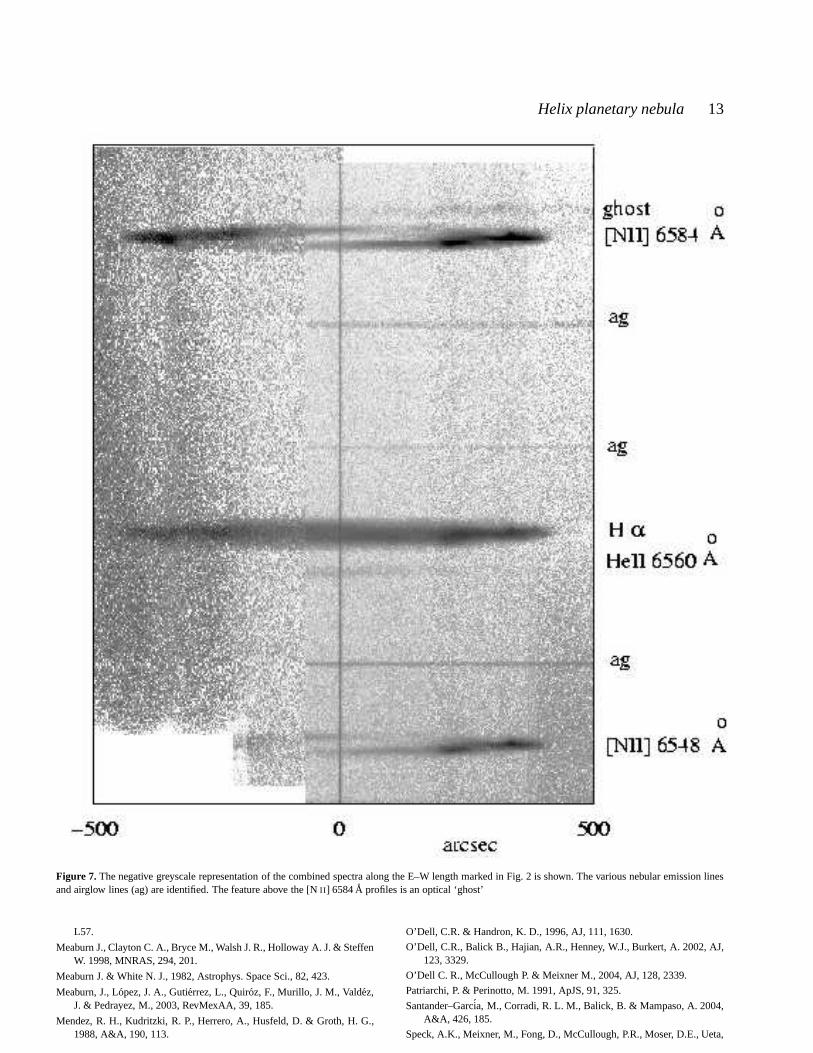
A re-examination of these previous pv arrays revealed that thehigh excitation HeII 6560A emission line, from an area of≈ 200′′
radius around the nebular core, was detected in this previous data.This detection is illustrated in the greyscale representation of thewhole EW longslit spectrum shown in Fig. 7. and the relative sur-face brightness profile of this HeII 6560A emission (see Table 1)compared with that of the [NII ] 6584A emission along the sameEW slit lengths is shown in Fig. 6. The HeII brightness profilefrom O’Dell et al (2004) and that shown here for HeII 6560A inFig. 6 suggests that the HeII emitting region is a roughly sphericalvolume.
Each HeII 6560A profile was extracted for the incremen-tal lengths along the EW slit lengths listed in column 1 of Ta-ble 1. Each profile was simulated by a least squares best fit sin-gle Gaussian profile whose observed centroid, corrected forhelio-centric motion (1994 20 Sept.) is given in column 2 and observedhalfwidth in column 3 of Table 1. These observed profiles are in-trinsically broadened by the 19 fine structural components spreadbetween 6559.769–6560.209A which is≡ 20 km s−1 range (seethe ‘Atomic Line List’ in http://www.pa.uky.edu/∼peter/atomic/).
Following Clegg et al (1999), who calculated the relativebrightnesses for the fine structural components of other HeII lines,the relative brightnesses of the 19 components for HeII 6560A,within Menzel’s Case B, for electron densities of ne = 100 and 1000
Helix planetary nebula 3
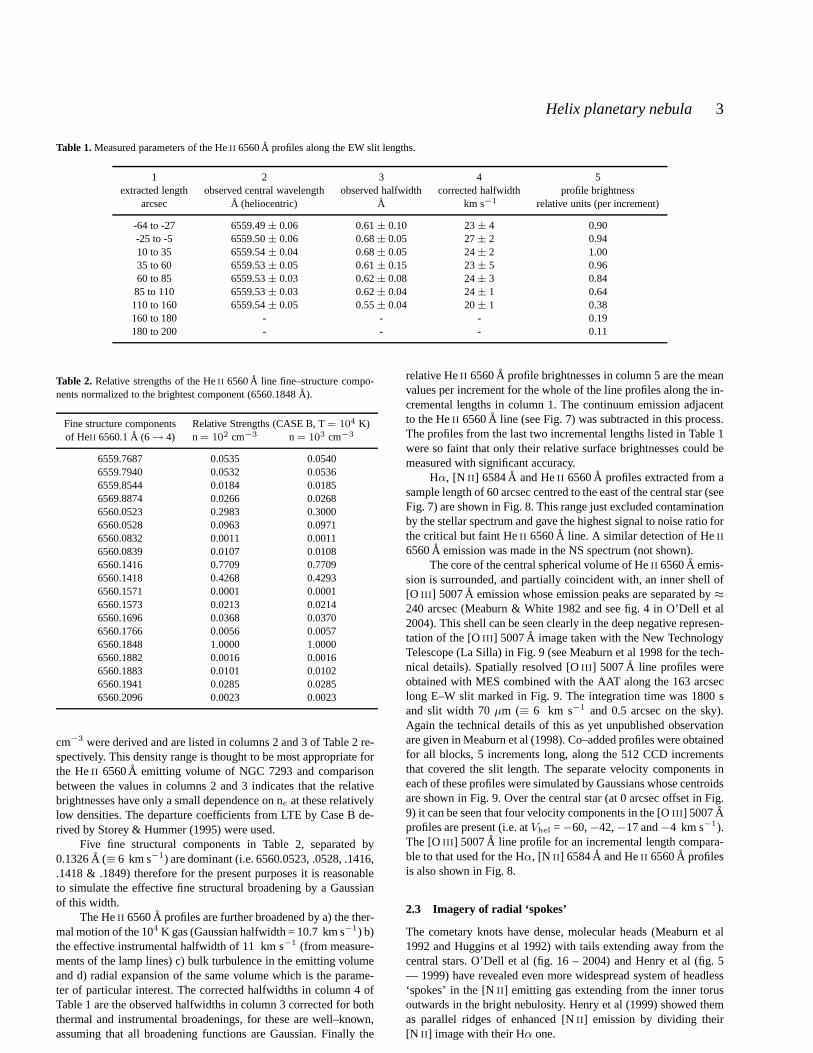
Table 1.Measured parameters of the HeII 6560A profiles along the EW slit lengths.
1 2 3 4 5extracted length observed central wavelength observed halfwidth corrected halfwidth profile brightness
arcsec A (heliocentric) A km s−1 relative units (per increment)
-64 to -27 6559.49± 0.06 0.61± 0.10 23± 4 0.90-25 to -5 6559.50± 0.06 0.68± 0.05 27± 2 0.9410 to 35 6559.54± 0.04 0.68± 0.05 24± 2 1.0035 to 60 6559.53± 0.05 0.61± 0.15 23± 5 0.9660 to 85 6559.53± 0.03 0.62± 0.08 24± 3 0.8485 to 110 6559.53± 0.03 0.62± 0.04 24± 1 0.64110 to 160 6559.54± 0.05 0.55± 0.04 20± 1 0.38160 to 180 - - - 0.19180 to 200 - - - 0.11
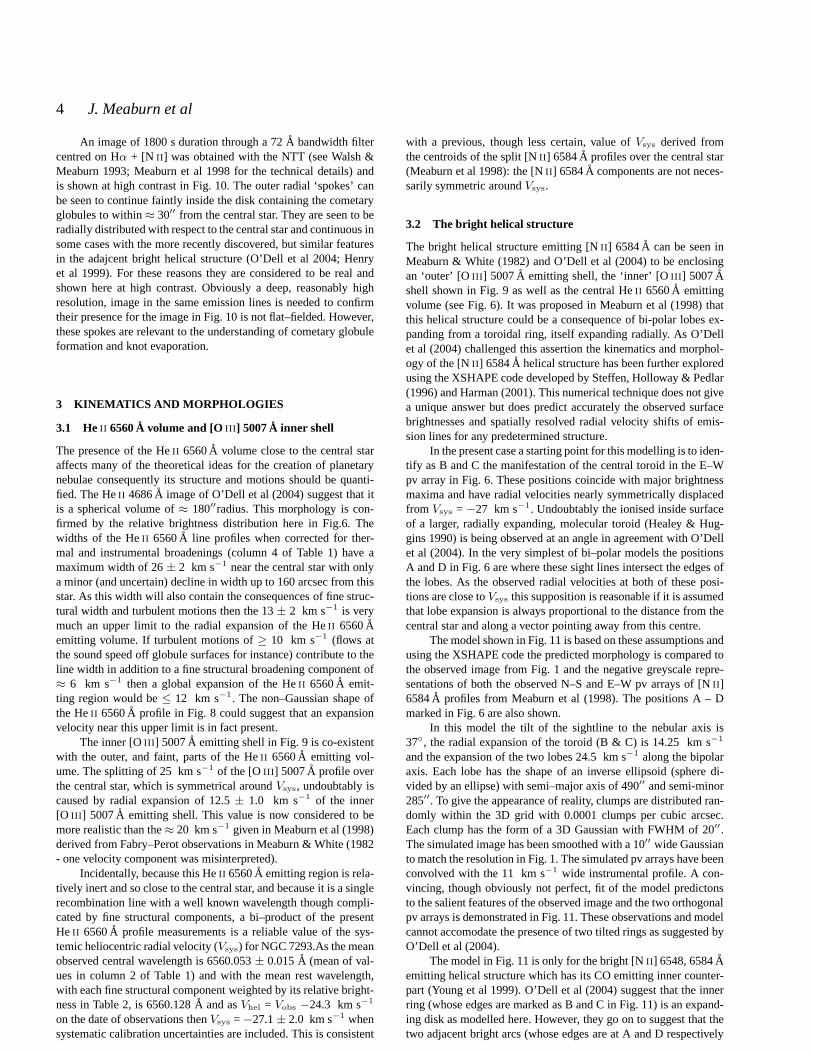
Table 2. Relative strengths of the HeII 6560A line fine–structure compo-nents normalized to the brightest component (6560.1848A).
Fine structure components Relative Strengths (CASE B, T= 104 K)of HeII 6560.1A (6 → 4) n= 102 cm−3 n = 103 cm−3
6559.7687 0.0535 0.05406559.7940 0.0532 0.05366559.8544 0.0184 0.01856569.8874 0.0266 0.02686560.0523 0.2983 0.30006560.0528 0.0963 0.09716560.0832 0.0011 0.00116560.0839 0.0107 0.01086560.1416 0.7709 0.77096560.1418 0.4268 0.42936560.1571 0.0001 0.00016560.1573 0.0213 0.02146560.1696 0.0368 0.03706560.1766 0.0056 0.00576560.1848 1.0000 1.00006560.1882 0.0016 0.00166560.1883 0.0101 0.01026560.1941 0.0285 0.02856560.2096 0.0023 0.0023
cm−3 were derived and are listed in columns 2 and 3 of Table 2 re-spectively. This density range is thought to be most appropriate forthe HeII 6560A emitting volume of NGC 7293 and comparisonbetween the values in columns 2 and 3 indicates that the relativebrightnesses have only a small dependence on ne at these relativelylow densities. The departure coefficients from LTE by Case B de-rived by Storey & Hummer (1995) were used.
Five fine structural components in Table 2, separated by0.1326A (≡ 6 km s−1) are dominant (i.e. 6560.0523, .0528, .1416,.1418 & .1849) therefore for the present purposes it is reasonableto simulate the effective fine structural broadening by a Gaussianof this width.
The HeII 6560A profiles are further broadened by a) the ther-mal motion of the 104 K gas (Gaussian halfwidth = 10.7 km s−1) b)the effective instrumental halfwidth of 11 km s−1 (from measure-ments of the lamp lines) c) bulk turbulence in the emitting volumeand d) radial expansion of the same volume which is the parame-ter of particular interest. The corrected halfwidths in column 4 ofTable 1 are the observed halfwidths in column 3 corrected forboththermal and instrumental broadenings, for these are well–known,assuming that all broadening functions are Gaussian. Finally the
relative HeII 6560A profile brightnesses in column 5 are the meanvalues per increment for the whole of the line profiles along the in-cremental lengths in column 1. The continuum emission adjacentto the HeII 6560A line (see Fig. 7) was subtracted in this process.The profiles from the last two incremental lengths listed in Table 1were so faint that only their relative surface brightnessescould bemeasured with significant accuracy.
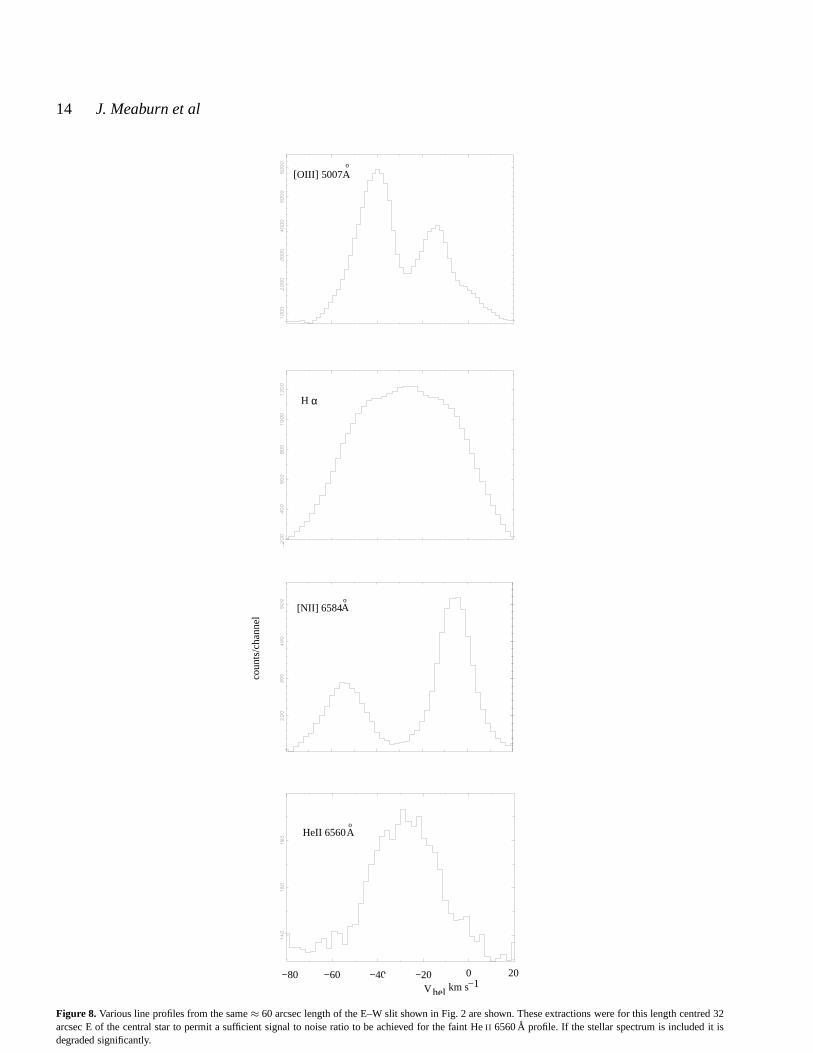
Hα, [N II ] 6584A and HeII 6560A profiles extracted from asample length of 60 arcsec centred to the east of the central star (seeFig. 7) are shown in Fig. 8. This range just excluded contaminationby the stellar spectrum and gave the highest signal to noise ratio forthe critical but faint HeII 6560A line. A similar detection of HeII6560A emission was made in the NS spectrum (not shown).
The core of the central spherical volume of HeII 6560A emis-sion is surrounded, and partially coincident with, an innershell of[O III ] 5007A emission whose emission peaks are separated by≈
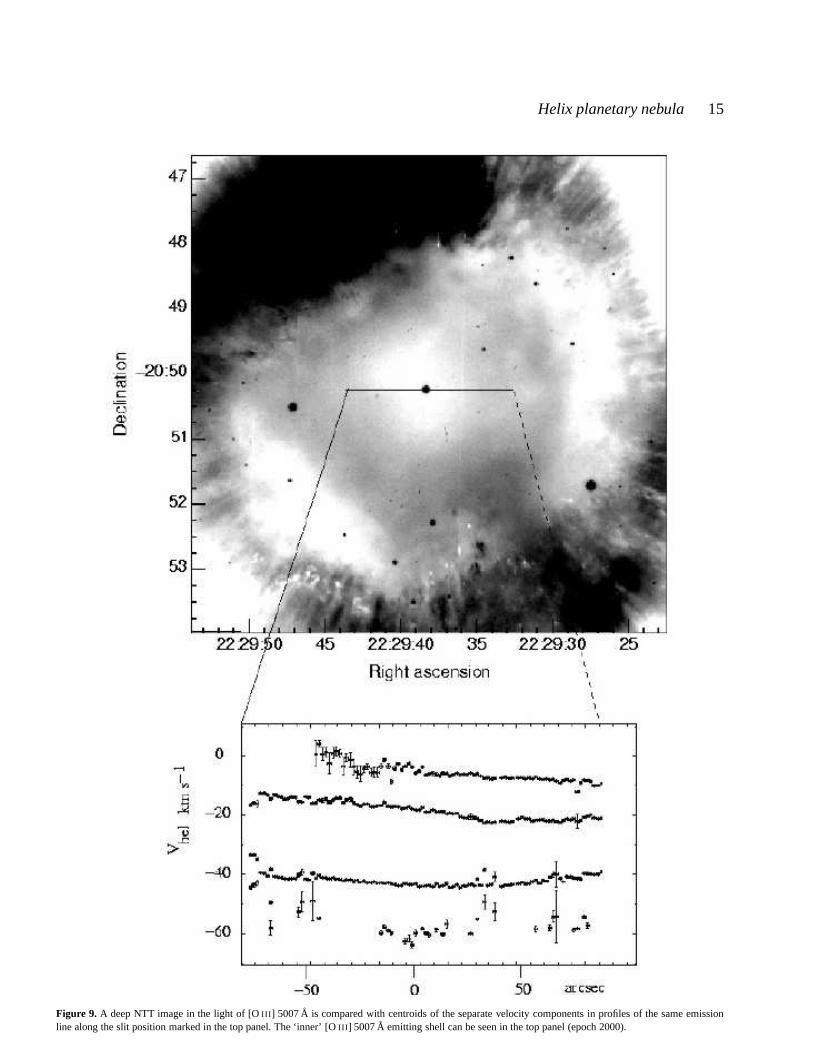
240 arcsec (Meaburn & White 1982 and see fig. 4 in O’Dell et al2004). This shell can be seen clearly in the deep negative represen-tation of the [OIII ] 5007A image taken with the New TechnologyTelescope (La Silla) in Fig. 9 (see Meaburn et al 1998 for the tech-nical details). Spatially resolved [OIII ] 5007A line profiles wereobtained with MES combined with the AAT along the 163 arcseclong E–W slit marked in Fig. 9. The integration time was 1800 sand slit width 70µm (≡ 6 km s−1 and 0.5 arcsec on the sky).Again the technical details of this as yet unpublished observationare given in Meaburn et al (1998). Co–added profiles were obtainedfor all blocks, 5 increments long, along the 512 CCD incrementsthat covered the slit length. The separate velocity components ineach of these profiles were simulated by Gaussians whose centroidsare shown in Fig. 9. Over the central star (at 0 arcsec offset in Fig.9) it can be seen that four velocity components in the [OIII ] 5007Aprofiles are present (i.e. atVhel =−60,−42,−17 and−4 km s−1).The [OIII ] 5007A line profile for an incremental length compara-ble to that used for the Hα, [N II ] 6584A and HeII 6560A profilesis also shown in Fig. 8.
2.3 Imagery of radial ‘spokes’
The cometary knots have dense, molecular heads (Meaburn et al1992 and Huggins et al 1992) with tails extending away from thecentral stars. O’Dell et al (fig. 16 – 2004) and Henry et al (fig.5— 1999) have revealed even more widespread system of headless‘spokes’ in the [NII ] emitting gas extending from the inner torusoutwards in the bright nebulosity. Henry et al (1999) showedthemas parallel ridges of enhanced [NII ] emission by dividing their[N II ] image with their Hα one.
4 J. Meaburn et al
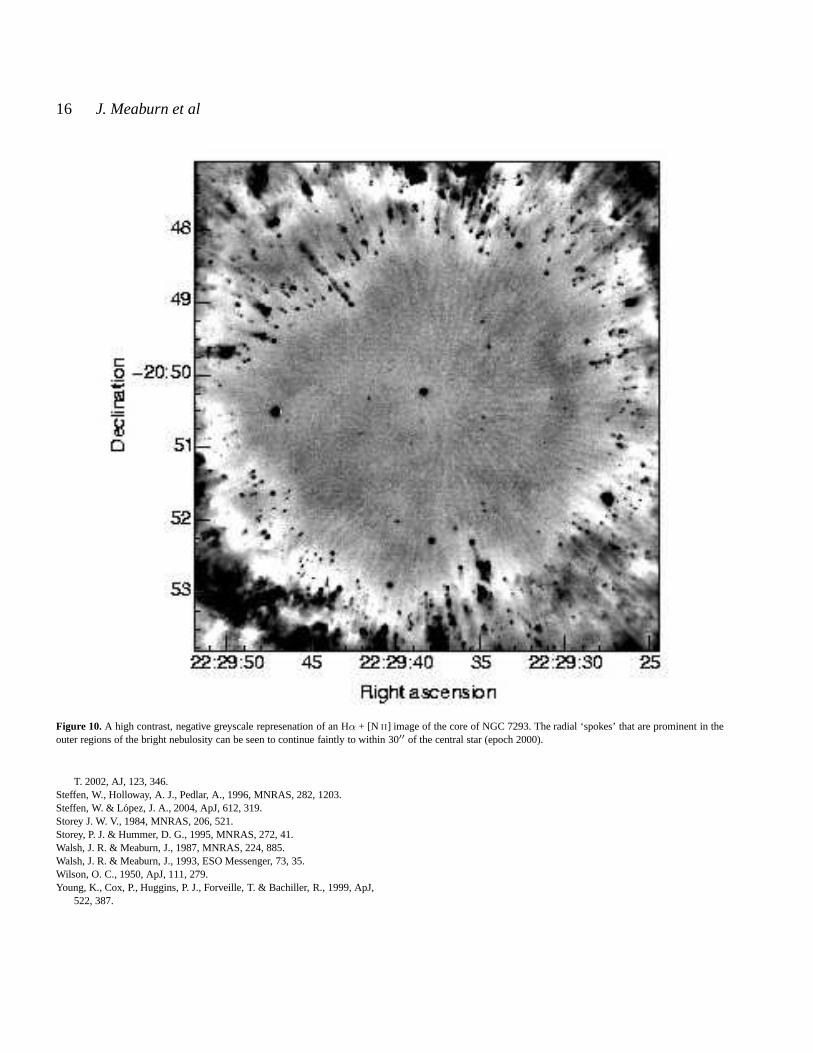
An image of 1800 s duration through a 72A bandwidth filtercentred on Hα + [N II ] was obtained with the NTT (see Walsh &Meaburn 1993; Meaburn et al 1998 for the technical details) andis shown at high contrast in Fig. 10. The outer radial ‘spokes’ canbe seen to continue faintly inside the disk containing the cometaryglobules to within≈ 30′′ from the central star. They are seen to beradially distributed with respect to the central star and continuous insome cases with the more recently discovered, but similar featuresin the adajcent bright helical structure (O’Dell et al 2004;Henryet al 1999). For these reasons they are considered to be real andshown here at high contrast. Obviously a deep, reasonably highresolution, image in the same emission lines is needed to confirmtheir presence for the image in Fig. 10 is not flat–fielded. However,these spokes are relevant to the understanding of cometary globuleformation and knot evaporation.
3 KINEMATICS AND MORPHOLOGIES
3.1 HeII 6560A volume and [O III ] 5007A inner shell
The presence of the HeII 6560A volume close to the central staraffects many of the theoretical ideas for the creation of planetarynebulae consequently its structure and motions should be quanti-fied. The HeII 4686A image of O’Dell et al (2004) suggest that itis a spherical volume of≈ 180′′radius. This morphology is con-firmed by the relative brightness distribution here in Fig.6. Thewidths of the HeII 6560A line profiles when corrected for ther-mal and instrumental broadenings (column 4 of Table 1) have amaximum width of 26± 2 km s−1 near the central star with onlya minor (and uncertain) decline in width up to 160 arcsec fromthisstar. As this width will also contain the consequences of finestruc-tural width and turbulent motions then the 13± 2 km s−1 is verymuch an upper limit to the radial expansion of the HeII 6560Aemitting volume. If turbulent motions of≥ 10 km s−1 (flows atthe sound speed off globule surfaces for instance) contribute to theline width in addition to a fine structural broadening component of≈ 6 km s−1 then a global expansion of the HeII 6560A emit-ting region would be≤ 12 km s−1. The non–Gaussian shape ofthe HeII 6560A profile in Fig. 8 could suggest that an expansionvelocity near this upper limit is in fact present.
The inner [OIII ] 5007A emitting shell in Fig. 9 is co-existentwith the outer, and faint, parts of the HeII 6560A emitting vol-ume. The splitting of 25 km s−1 of the [OIII ] 5007A profile overthe central star, which is symmetrical aroundVsys, undoubtably iscaused by radial expansion of 12.5± 1.0 km s−1 of the inner[O III ] 5007A emitting shell. This value is now considered to bemore realistic than the≈ 20 km s−1 given in Meaburn et al (1998)derived from Fabry–Perot observations in Meaburn & White (1982- one velocity component was misinterpreted).
Incidentally, because this HeII 6560A emitting region is rela-tively inert and so close to the central star, and because it is a singlerecombination line with a well known wavelength though compli-cated by fine structural components, a bi–product of the presentHe II 6560A profile measurements is a reliable value of the sys-temic heliocentric radial velocity (Vsys) for NGC 7293.As the meanobserved central wavelength is 6560.053± 0.015A (mean of val-ues in column 2 of Table 1) and with the mean rest wavelength,with each fine structural component weighted by its relativebright-ness in Table 2, is 6560.128A and asVhel = Vobs −24.3 km s−1
on the date of observations thenVsys = −27.1± 2.0 km s−1 whensystematic calibration uncertainties are included. This is consistent
with a previous, though less certain, value ofVsys derived fromthe centroids of the split [NII ] 6584A profiles over the central star(Meaburn et al 1998): the [NII ] 6584A components are not neces-sarily symmetric aroundVsys.
3.2 The bright helical structure
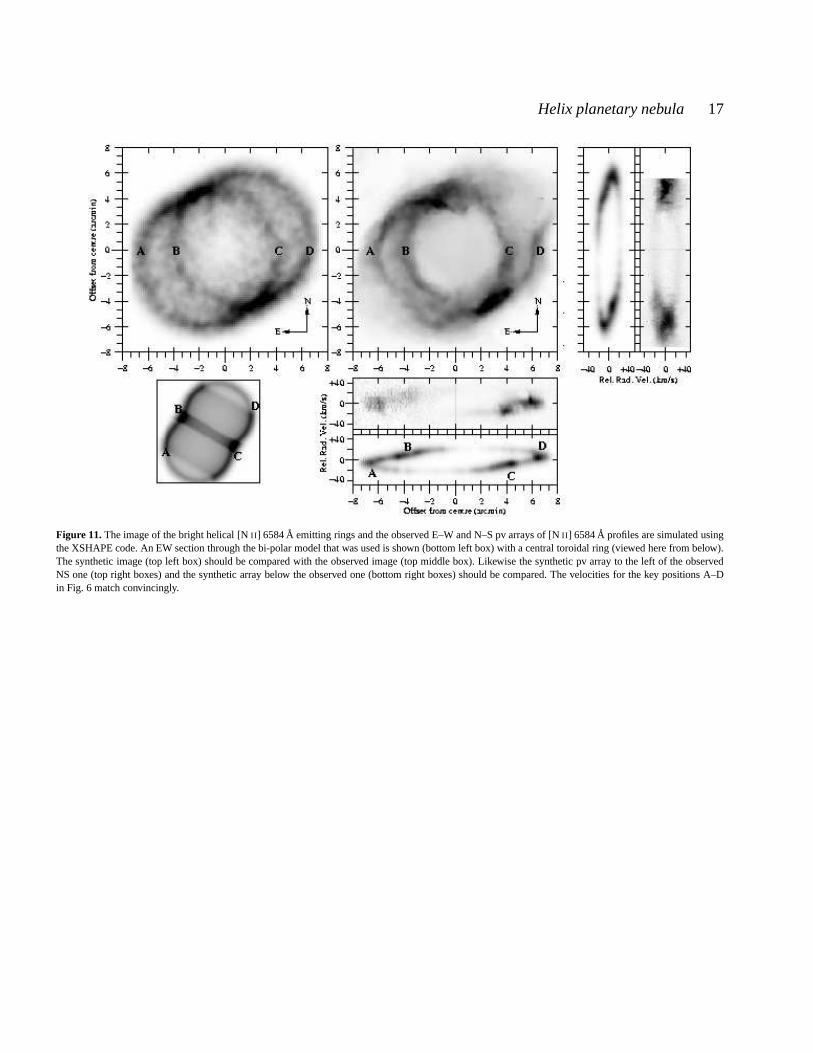
The bright helical structure emitting [NII ] 6584A can be seen inMeaburn & White (1982) and O’Dell et al (2004) to be enclosingan ‘outer’ [OIII ] 5007A emitting shell, the ‘inner’ [OIII ] 5007Ashell shown in Fig. 9 as well as the central HeII 6560A emittingvolume (see Fig. 6). It was proposed in Meaburn et al (1998) thatthis helical structure could be a consequence of bi-polar lobes ex-panding from a toroidal ring, itself expanding radially. AsO’Dellet al (2004) challenged this assertion the kinematics and morphol-ogy of the [NII ] 6584A helical structure has been further exploredusing the XSHAPE code developed by Steffen, Holloway & Pedlar(1996) and Harman (2001). This numerical technique does notgivea unique answer but does predict accurately the observed surfacebrightnesses and spatially resolved radial velocity shifts of emis-sion lines for any predetermined structure.
In the present case a starting point for this modelling is to iden-tify as B and C the manifestation of the central toroid in the E–Wpv array in Fig. 6. These positions coincide with major brightnessmaxima and have radial velocities nearly symmetrically displacedfrom Vsys = −27 km s−1. Undoubtably the ionised inside surfaceof a larger, radially expanding, molecular toroid (Healey &Hug-gins 1990) is being observed at an angle in agreement with O’Dellet al (2004). In the very simplest of bi–polar models the positionsA and D in Fig. 6 are where these sight lines intersect the edges ofthe lobes. As the observed radial velocities at both of theseposi-tions are close toVsys this supposition is reasonable if it is assumedthat lobe expansion is always proportional to the distance from thecentral star and along a vector pointing away from this centre.
The model shown in Fig. 11 is based on these assumptions andusing the XSHAPE code the predicted morphology is compared tothe observed image from Fig. 1 and the negative greyscale repre-sentations of both the observed N–S and E–W pv arrays of [NII ]6584A profiles from Meaburn et al (1998). The positions A – Dmarked in Fig. 6 are also shown.
In this model the tilt of the sightline to the nebular axis is37◦, the radial expansion of the toroid (B & C) is 14.25 km s−1
and the expansion of the two lobes 24.5 km s−1 along the bipolaraxis. Each lobe has the shape of an inverse ellipsoid (spheredi-vided by an ellipse) with semi–major axis of 490′′ and semi-minor285′′. To give the appearance of reality, clumps are distributed ran-domly within the 3D grid with 0.0001 clumps per cubic arcsec.Each clump has the form of a 3D Gaussian with FWHM of 20′′.The simulated image has been smoothed with a 10′′ wide Gaussianto match the resolution in Fig. 1. The simulated pv arrays have beenconvolved with the 11 km s−1 wide instrumental profile. A con-vincing, though obviously not perfect, fit of the model predictonsto the salient features of the observed image and the two orthogonalpv arrays is demonstrated in Fig. 11. These observations andmodelcannot accomodate the presence of two tilted rings as suggested byO’Dell et al (2004).
The model in Fig. 11 is only for the bright [NII ] 6548, 6584Aemitting helical structure which has its CO emitting inner counter-part (Young et al 1999). O’Dell et al (2004) suggest that the innerring (whose edges are marked as B and C in Fig. 11) is an expand-ing disk as modelled here. However, they go on to suggest thatthetwo adjacent bright arcs (whose edges are at A and D respectively
Helix planetary nebula 5
in Fig. 11) are the manifestation of a single expanding disk ex-pandingorthogonallyto the central disk. They base this assertionsoley on fig. 5 of Young et al (1999) where an orthogonal range ofvelocities for a CO ‘outer arc’ is partially detected. The excellentmorphological and kinematical fit of the model in Fig. 11 (andseefig. 9 of Young et al 1999) suggests that this interpretation is incor-rect. An outer partial CO ring, expanding othogonally but faint in[N II ] 6548, 6584A (Young et al 1999) must exist but is not part ofthe bright [NII ] 6548, 6584A emitting helical structure modelledhere.
3.3 The halo
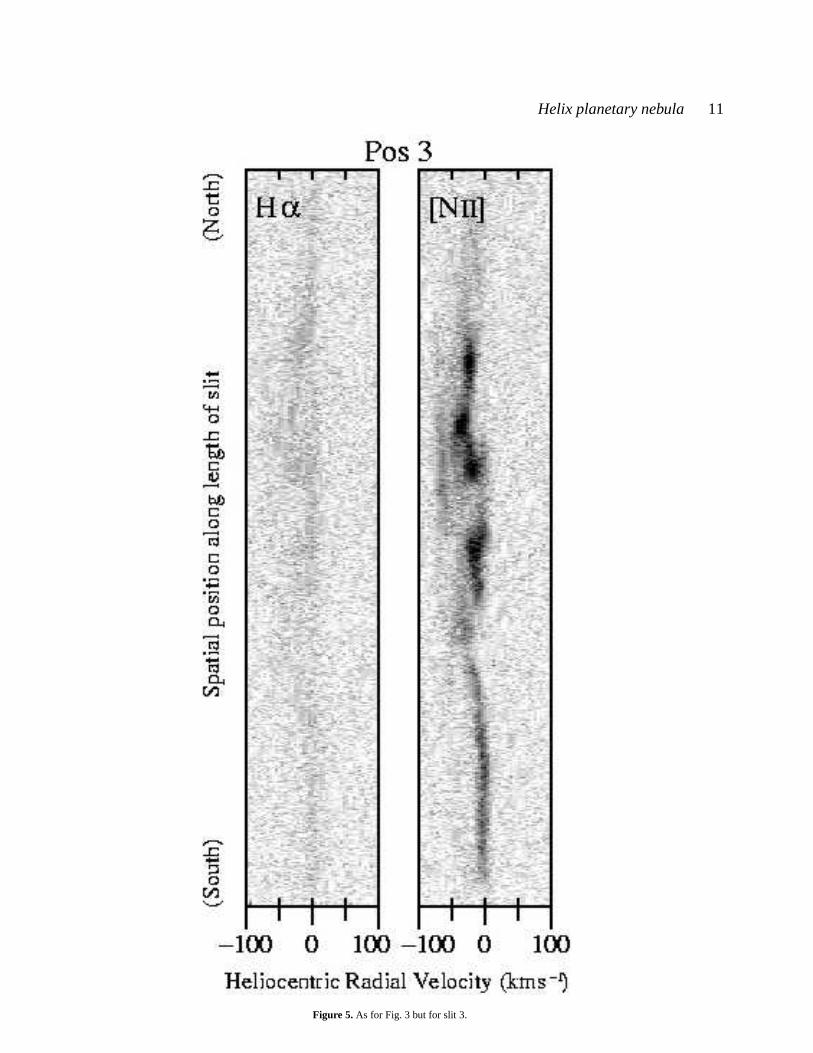
The nebulous N–E halo arc imaged by Malin (1982) and see alsoSpeck et al (2002) and shown in Fig. 1b and Fig. 2 has a S-W coun-terpart which could suggest some form of bi–polar structurewhichis both larger and along a different axis to that proposed forthebright helical nebulosity. However, the pv arrays of [NII ] 6584Aprofiles in Figs. 3–5 along slits 1–3 in Fig. 2, and those of Walsh &Meaburn (1987) reveal behaviour not easily explained in a modelinvolving classical three dimensional bi–polar lobes. Forinstance,although there is a systematic trend in radial velocity fromthe northof slit 2 (Vhel = 0 km s−1) to the southern end whereVhel = −60km s−1, which suggests some form of expansion, the bright north-ern edge would be expected atVsys = −26 km s−1 in a simple bi–polar model.The eastern edge itself was shown to have complex ve-locity structure with an extreme velocity component atVhel = −80km s−1 (slit 3 in Fig. 5 and also see Walsh & Meaburn 1987). Nev-ertheless, line spitting observed in slit positions 2 & 3 (Figs. 4 &5) suggests the interpretation of these features as expanding lobesthough not orthogonal to the central torus which is modelledin Fig.11. A similar case is observed in NGC 2440 (Lopez et al (1998).
An alternative possibility is that both this eastern and westernhalo structure could rather be both parts of a single expanding ringof ionised material. If so it must be oriented at a completelydiffer-ent angle to the central torus (BC) shown in Fig. 11 for the easternedge has predominantly approaching radial velocities withrespectto Vsys. If these reflect the radial expansion of the ring then its ex-pansion could be as high as≈ 70 km s−1 for an arbitary tilt of45◦ to the sight line although the observed radial velocities donotunambiguously favour this ring model.
More observations at similar spectral resolution, particularlyof the south–western halo lobe, are required to investigatethesepropositions more fully.
Other features of the general halo of NGC 7293 have beenseen previously (e.g. O’Dell et al 2004) but of potential interest isthe faint jet–like feature in the SW, along PA 255◦, but project-ing back to the nebular core in the deep image in Fig. 1c. A bow–shaped possible counter feature on the opposite side of the nebulais aligned with it.
4 DISCUSSION
4.1 The interacting winds model
PNe are a consequence of the sequence of events as a star of≤
8 M⊙ evolves through its Red Giant (RG) and Asymptotic GiantBranch (AGB) phases to finally become a White Dwarf (WD). Inthis sequence it is generally accepted that an initial RG wind, isfollowed by the more volatile and many times denser AGB ‘super-wind’ (with sporadic outbursts at 20 of km s−1) which is then sub-
jected to interaction with a high–speed wind (several 1000 km s−1)and becomes photo–ionised as the central star becomes a WD witha high surface temperature. At this point the circumstellarenvelopebecomes the embryo PN. The fast wind could then decline as thestar becomes an older WD and the photoionised circumstellaren-velope would then be described as an evolved PN.
The standard interacting winds (IW) model (Kwok, Purton& Fitzgerald 1978; Khan and West 1985; Chu, Kwitter & Kaler1993; Balick & Frank 2002) makes a theoretical attempt to explainthe formation of the observed nebular structure and kinematics inPNe during the transition of the stellar core from the post-AGB tothe WD stages. Here, with smooth, isotropic, density distributionsthe fast wind forms an expanding pressure driven (energy conserv-ing) bubble in the pre–cursor AGB wind. A central volume of un-shocked fast wind is surrounded by a shell of superheated (106 K)shocked wind which provides the gas pressure to form and accel-erate a shell of shocked AGB wind. Within this model and withphoto–ionisation dominant the latter expanding, low–ionisation,shell is characteristic of young PNe. Balick & Frank (2002) empha-sise that from observations of a large number of PNe this model,although an excellent theoretical starting point, is very idealistic;there are a multitude of phenomena within PNe when the stars arein their post–AGB phases that require more complex explanations;lobes and disks expanding along separate axes being only twoofmany such complexities.
The present kinematical observations of the undoubtablyevolved PN, NGC 7293, reported here could be consistent withthefinal stages of the IW model if it is assumed that the fast wind hasnow switched off. This possibility is made plausible by the absenceof a direct observation of the fast wind in the stellar spectrum (seeSect. 1) and the very presence of an inner HeII 6560A volume and[O III ] 5007A shell would prevent the direct interaction of sucha wind with the outer helical structure. The progression outwardsof the expansion velocities i.e.≤ 12 km s−1 for the HeII 6560Aemitting centre, 13 km s−1 for the surrounding inner [OIII ] 5007Ashell and 25 km s−1 for the [N II ] 6584A emitting outer envelopealbeit inside an outer bi–polar configuration (Fig. 11), could be aconsequence of the sudden pressure decline that would occuras thefast wind switched off leading to acceleration inwards of the nowunsupported inner regions of the previous pressure driven shell (pri-vate comms. by Steffen and Dyson). Incidentally, Wilson (1950)had noticed this increasing velocity from the high–ionisation cen-tres to low–ionisation envelopes of many similarly evolvedPNe.
However, the clumpy nature of most of the circumstellar ma-terial also poses a direct problem for the IW model (see Sect.4.2).
4.2 Cometary knots and [NII ] 6584A ‘spokes’
The radial ‘spokes’ that are prominent in the bright helicalnebulos-ity and shown here to extend, faintly, to within 30′′ of the centralstar are most likely a consequence of the clumpy nature of theneb-ula.
Such a clumpy structure is to be expected when the whole ofNGC 7293 is considered for it is famous for its cometary globulesbeyond a radus of 90′′ from the central star. These were first shownto have dense molecular cores directly by Huggins et al (1992)and by Meaburn et al (1992) when sillouetted against the central[O III ] 5007A emission. Dyson et al (1989) had suggested that thecometary globules were a consequence of the ejection of the RGmaser spots as dense globules later overrun by the faster AGBwind.If this clumpiness extends to the nebular core it would suggest thatclump ejection had occurred with a wide spread of ejection veloc-
6 J. Meaburn et al
ities. The system of well-known cometary globules is expandingradially within the central torus at 14 km s−1 consistent with theirRG origin (Meaburn et al 1998).
The headless radial ‘spokes’ could then all be relics ofcometary tails from globules that have nearly photoevaporated. Theinner ‘spokes’ in Fig. 10 could be elongated enhancements of[N II ]6584A emission either in the torus containing the cometary glob-ules, extending inwards, or in the walls of the lobes in the modelin Fig. 11 but pointing always towards the central star. In the lattercase they are then seen in projection over the inner [OIII ] 5007Aand HeII 6560A emitting core of the nebula.
The recombination time T of hydrogen is≈ 105 ne−1 yr then
for a tail electron density ne = 50 cm−3, T ≈ 5000 yr. A longerrecombination time in the lower density ionised material ofa tail,after the dense head of a cometary globule has evaporated, couldon its own then explain the tail’s persistence. A more detailed ex-planation could be given by Lopez-Martin et al (2001) who havediscussed the evaporation of the cometary globules and their tails(see also Canto et al 1998). The clump heads are exposed to thedirect ionising radiation of the central star while the tails are onlyexposed to the diffuse radiation field. This is typically a few per-cent of the direct field at the location of the bright optical knotsbut is very much less closer to the star because of ther−2 rise inthe direct flux (Lopez-Martin et al 2001). For clumps that are closeto the central star, recombinations in the evaporating headgas cannot significantly absorb the stellar flux. In this case, the evaporationtimescale is approximately (Lopez-Martin et al 2001)
tevap ≃Rcci
c2n
(1)
where ci and cn are the sound speeds in the ionised and neutral gasrespectively. Note especially the dependency in Eq. 1 on clump ra-dius Rc: once a clump begins to shrink the evaporation timescaledrops and the clump will then rapidly disappear. The tail will onlybegin to be exposed to the direct stellar radiation field whentheclump shrinks appreciably. It is thus entirely plausible that the tailmay survive the destruction of its parent clump. It will thenbequickly ionised by the direct field and be very overpressuredbutas is clearly seen in Fig. 10 the clumpless tails have not yet hadtime to mix with the surrounding gas (for a tail of radius10
15 cmthe dynamical timescale is a few thousand years in the ionized gas).
This predominance of clumps in the ionised envelope of NGC7293 also makes it most likely that momentum–conserving, mass–loaded (ablated) flows (Dyson, Hartquist & Biro 1993) have playedan important, even dominant, part in the evolution of this PN. Ahybrid explanation, with the IW model applicable immediately af-ter the onset of the fast wind followed by a domination of ablatedflows up to the switch–off of the fast wind, may be a more appro-priate way of considering the creation of NGC 7293.The velocitystructure of the clumpy PNe such as NGC 7293 has been recentlystudied by Steffen & Lopez (2004) where progressive expansionvelocities with distance from the central star are obtainedin thesimulations.
4.3 The halo features
The extended ionised material beyond the bright inner regions (Fig.1) was detected by Speck et al (2002) using Southern H–AlphaSky Survey Atlas data (SHASSA–Gaustad et al 2001). Meanwhile,O’Dell et al (2002) carried out detailed photoionisation modellingof the bulk of the inner shell usingCLOUDY. The modelling indi-cated that the nebula was ionisation bounded rather than density
bounded yet the presence of the extended ionised gas is confirmedhere and in O’Dell et al (2004). The apparent contradiction betweentheCLOUDY results of O’Dell et al (2002) may be explained in thefollowing qualitative way. The very clumpy nature of the inner ringof NGC 7293 (the majority of the mass of the shell may even re-side as molecules in the clumps– Speck et al 2002) means that itis possible, as long as the volume filling factor of the clumpsisnot too great, for the ionising radiation to escape the innerring.The photoionisation modelling will yield results consistent with anionisation bounded system simply because the bulk of the emis-sion comes from the clump surfaces where the ionisation is locallybounded. Alternatively, O’Dell et al (2004) maintain that the cen-tral torus (BC in Fig. 11) is globally ionisation bounded andthat theextended ionised gas lies above and below the plane of this torous.They also suggest that the extended ionised gas could have beenionised at an earlier epoch and owing to a low density has not yetrecombined.
The possibility that expanding lobes or even a disc of material(Sect. 3.3) exists in the halo of NGC 7293 is not unexpected whenother PNe are considered. Multiple axes of ejection are observedin the PNe NGC 6302 (Meaburn & Walsh 1980), KjPn8 (Lopez etal 2000), NGC 2440 (Lopez et al 1998) and J 320 (Harman et al2004) for example. A similar high–speed disc is observed aroundthe bi-polar lobes of Mz 3 by Santander–Garcıa et al (2004).Thesephenomena are most likely evidence of the volatility, and asyetnot understood behaviour, of the AGB phase in the evolution of thecentral stars of PNe.
The possibility reported here of a jet and counter bow–shapedfeature in the halo of NGC 7293 is again not unexpected when thewhole range of observed phenomena are considered in PNe. Col-limated outflows are seen in many PNe e.g. FG 1 (Lopez, Rothand Tapia 1993, Lopez, Meaburn & Palmer 1993) etc. There is atyet no consensus about their origin though they must be associatedwith the onset of the superwind as the stars enter their post–AGBphase with binarity of the central stellar systems playing some partin their generation.
5 CONCLUSIONS
Progressively increasing expansion velocities are observed fromthe highly ionised core of NGC 7293 to the lobes that constitutethe lowly ionised helical structure.Numerical simulations of the latter structure as bi–polar lobes, ex-panding perpendicularly to a central torus, give a reasonable matchto the observed images and pv arrays of line profiles.The standard interacting winds model for the creation of PNeex-plains this kinematical and morphological structure only if the fastwind has switched off as the central star becomes a WD. Ablatedflows must add a further complication to any dynamical considera-tions.Radial ‘spokes’ of [NII ] emission which are now traced to near thecentral star could be the remnants of the cometary tails of denseglobules that have now photo-evaporated.It is proposed that a prominant halo arc could be part of a singleexpanding disk along a different axis to that of the bright nebulaalthough expanding bi–polar lobes along this same axis remain aninterpretation. More extensive kinematical observationsare neededto distinguish between these possibilities.A jet-like feature and its counter bow-shock are tentatively identi-fied.
Helix planetary nebula 7
Figure 1. The same deep Hα+[N II ] image is displayed at three contrast levels to show all of the features from the bright, inner helical structure out to thevery faint halo regions (epoch 2000). The bow–shaped feature and jet–like feature are both arrowed in c).
8 J. Meaburn et al
Figure 2. New slit positions (1–3) and the previous E–W continous lineof spectral measurements (Figs. 6 & 7) are shown against the Hα+[N II ] image (Fig.1).
Multiple events in the AGB phase, and shortly afterwards, ofthecentral star must have created these phenomena.
ACKNOWLEDGEMENTS
The authors wish to thank the staff of the AAT (Australia), SPMtelescope (Mexico), NTT (La Silla, Chile), and Skinakas telescope(Greece) for their help during these observations. Skinakas Ob-servatory is a collaborative project of the University of Crete,the Foundation for Research and Technology-Hellas and the Max-Planck-Institut fur Extraterrestrische Physik.JAL is grateful to theRoyal Society for financing his July 2004 stay in Manchester andgratefully acknowledges financial support from CONACYT (M´ex)grants 32214-E and 37214 and DGAPA-UNAM IN114199. We
would like to thank Peter Van Hoof for helpful discussions ontheHe II 6560A fine structure relative strength calculations.
REFERENCES
Balick, B. & Frank, A. 2002, Annu. Review Astron. & Astrophys., 40, 439.Boumis P., Mavromatakis F.,Paleologou E.V. & Becker W., 2002, A&A,
396, 225.Canto J., Raga A., Steffen W., Shapiro P., 1998, ApJ, 502, 695Cerruti–Sola, M.& Perinotto, M. 1985, ApJ, 291, 237.Chu, Y.-H., Kwitter, K. B. & Kaler, J. B. 1993, AJ, 106, 650.Chu, Y. H., Guerrero, M. A., Gruendl, R. A. & Webbink, R. F. 2004, AJ,
127, 477.Clegg, R. E. S., Miller, S., Storey, P. J. & Kisielius, R., 1999, A&AS, 135,
359
Helix planetary nebula 9
Figure 3. Greyscale representations of the Hα and [NII ] 6584A profiles along slit position 1 in Fig. 2 are shown.
10 J. Meaburn et al
Figure 4. As for Fig. 3 but for slit 2
Helix planetary nebula 11
Figure 5. As for Fig. 3 but for slit 3.
12 J. Meaburn et al
Figure 6. In the top panel the centroids of individual velocity components in the [NII ] 6584A profiles, from the long E–W length marked in Fig. 2, arecompared to the halfwidths of the HeII 6560A line profiles when corrected for both instrumental and thermal broadening (column 4 in Table 1. In the bottompanel the relative surface brightnesses (RSB) of the [NII ] 6584A and HeII 6560A profiles are compared. The dashed line is simply the westernobservedcurve folded over to the eastern side (where it was below the detection limit). This is justified by the HeII 6560A brightness variations observed along the NSslit (not shown). Key positions are marked A–D in both panels.
Dyson, J. E., Hartquist, T. W., Pettini, M. & Smith, L. J., 1989, MNRAS,241, 430.
Dyson J. E., Hartquist T. W., & Biro S., 1993, MNRAS, 261, 430.Forveille T. & Huggins P. J., 1991, A&A, 248, 599.Gaustad, J. E., McCullough, P. R., Rosing, W. & Van Buren, D.,2001,
PASP, 13, 1326.Gorny, S. K., Stasinska, G. & Tylenda, R. 1997, A&A, 318, 256.Gruendl R. A., Chu, Y. H., O’Dwyer & Guerrrero, M. A., 2001, AJ, 122,
308.Harman, D. J. 2001, Ph.D. thesis, University of Manchester,UK.Harman, D. J., Bryce, M., Lopez, J. A., Meaburn, J. & Holloway, A. J. 2004,
MNRAS, 348, 1047.Harris, H. C., Dahn, C. C., Monet, D. G. & Pier, J. R. 1997, in IAU Sym-
posium 180, eds. H. J. Habing & H. J. G. J. M. Lambers (Dordrecht:Reidel), 40.
Healey A. P.& Huggins P. J. 1990, AJ, 100, 511.Henry R. B. C., Kwitter K. B. & Dufour R. J. 1999, ApJ, 517, 782.Huggins P. J. & Healey A.P., 1989, ApJ, 346, 20.Huggins P. J., Bachiller R., Cox P. & Forveille T., 1992, ApJ,401, L43.
Kahn, F. & West, K., 1985, MNRAS212, 837.Kwok, S., Purton, C. R. & Fitzgerald, P. M., 1978, ApJ, 219, L125.Lasker B. M., Russel J. N. & Jenkner H., 1999, in the HST Guide Star
Catalog, version 1.1-ACT, The Association of Universitiesfor Researchin Astronomy, Inc.
Lopez, J. A., Roth, M. & Tapia, M., 1993, A&A, 267, 194.Lopez, J. A., Meaburn, J. & Palmer, J.W., 1993, ApJ, 415, L135.Lopez, J. A., Meaburn, J., Bryce, M. & Holloway, A. J., 1998,ApJ, 493, 80.Lopez, J. A., Meaburn, J., Rodriguez, L. F., Vazquez, R., Steffen, W. &
Bryce, M. 2000, ApJ, 538, 233.Lopez-Martın L., Raga A. C., Mellema G., Henney W. J., Canto J., 2001,
ApJ, 548, 288Malin, D. F., 1982, Sky and Telescope, 63, 22.Meaburn, J. & Walsh, J. A. 1980, MNRAS, 193, 631,Meaburn J., Blundell B., Carling R., Gregory D. F., Keir D. & Wynne C.,
1984, MNRAS, 210, 463.Meaburn J., Walsh J. R., Clegg R. E. S., Taylor D & Berry D. S. 1992,
MNRAS, 255, 177.Meaburn J., Clayton C. A., Bryce M. & Walsh J. R. 1996, MNRAS, 281,
Helix planetary nebula 13
Figure 7. The negative greyscale representation of the combined spectra along the E–W length marked in Fig. 2 is shown. The variousnebular emission linesand airglow lines (ag) are identified. The feature above the [N II ] 6584A profiles is an optical ‘ghost’
L57.
Meaburn J., Clayton C. A., Bryce M., Walsh J. R., Holloway A. J. & SteffenW. 1998, MNRAS, 294, 201.
Meaburn J. & White N. J., 1982, Astrophys. Space Sci., 82, 423.
Meaburn, J., Lopez, J. A., Gutierrez, L., Quiroz, F., Murillo, J. M., Valdez,J. & Pedrayez, M., 2003, RevMexAA, 39, 185.
Mendez, R. H., Kudritzki, R. P., Herrero, A., Husfeld, D. & Groth, H. G.,1988, A&A, 190, 113.
O’Dell, C.R. & Handron, K. D., 1996, AJ, 111, 1630.
O’Dell, C.R., Balick B., Hajian, A.R., Henney, W.J., Burkert, A. 2002, AJ,123, 3329.
O’Dell C. R., McCullough P. & Meixner M., 2004, AJ, 128, 2339.
Patriarchi, P. & Perinotto, M. 1991, ApJS, 91, 325.
Santander–Garcia, M., Corradi, R. L. M., Balick, B. & Mampaso, A. 2004,A&A, 426, 185.
Speck, A.K., Meixner, M., Fong, D., McCullough, P.R., Moser, D.E., Ueta,
14 J. Meaburn et al
coun
ts/c
hann
el
α
−60−80 0−40V hel km s−1
−20 20
o
A
H
o[NII] 6584
[OIII] 5007Ao
HeII 6560A
Figure 8. Various line profiles from the same≈ 60 arcsec length of the E–W slit shown in Fig. 2 are shown. These extractions were for this length centred 32arcsec E of the central star to permit a sufficient signal to noise ratio to be achieved for the faint HeII 6560A profile. If the stellar spectrum is included it isdegraded significantly.
Helix planetary nebula 15
Figure 9. A deep NTT image in the light of [OIII ] 5007A is compared with centroids of the separate velocity components in profiles of the same emissionline along the slit position marked in the top panel. The ‘inner’ [O III ] 5007A emitting shell can be seen in the top panel (epoch 2000).
16 J. Meaburn et al
Figure 10.A high contrast, negative greyscale represenation of an Hα + [N II ] image of the core of NGC 7293. The radial ‘spokes’ that are prominent in theouter regions of the bright nebulosity can be seen to continue faintly to within 30′′ of the central star (epoch 2000).
T. 2002, AJ, 123, 346.Steffen, W., Holloway, A. J., Pedlar, A., 1996, MNRAS, 282, 1203.Steffen, W. & Lopez, J. A., 2004, ApJ, 612, 319.Storey J. W. V., 1984, MNRAS, 206, 521.Storey, P. J. & Hummer, D. G., 1995, MNRAS, 272, 41.Walsh, J. R. & Meaburn, J., 1987, MNRAS, 224, 885.Walsh, J. R. & Meaburn, J., 1993, ESO Messenger, 73, 35.Wilson, O. C., 1950, ApJ, 111, 279.Young, K., Cox, P., Huggins, P. J., Forveille, T. & Bachiller, R., 1999, ApJ,
522, 387.
Helix planetary nebula 17
Figure 11.The image of the bright helical [NII ] 6584A emitting rings and the observed E–W and N–S pv arrays of [NII ] 6584A profiles are simulated usingthe XSHAPE code. An EW section through the bi-polar model that was used is shown (bottom left box) with a central toroidal ring (viewed here from below).The synthetic image (top left box) should be compared with the observed image (top middle box). Likewise the synthetic pvarray to the left of the observedNS one (top right boxes) and the synthetic array below the observed one (bottom right boxes) should be compared. The velocities for the key positions A–Din Fig. 6 match convincingly.
Related Documents