Mon. Not. R. Astron. Soc. 312, 585–628 (2000) NGC 6153: a super-metal-rich planetary nebula? X.-W. Liu, 1 P. J. Storey, 1 M. J. Barlow, 1 I. J. Danziger, 2 M. Cohen 3 and M. Bryce 4 1 Department of Physics and Astronomy, University College London, Gower Street, London WC1E 6BT 2 Osservatorio Astronomico di Trieste, Via G. B. Tiepolo 11, I-34131 Trieste, Italy 3 Radio Astronomy Laboratory, 601 Campbell Hall, University of California, Berkeley, CA 94720, USA 4 Dept. of Physics and Astronomy, University of Manchester, Oxford Road, Manchester M13 9PL Accepted 1999 October 7. Received 1999 October 4; in original form 1999 July 12 ABSTRACT We have obtained deep optical spectra of the planetary nebula NGC 6153, both along its minor axis and by uniformly scanning a long slit across the whole nebula. The scanned spectra, when combined with the nebular total Hb flux, yield integrated fluxes for all the lines (,400) in our spectra, which are rich in strong recombination lines from C, N, O and Ne ions. A weak O vi l 3811 emission line from the central star has been detected, suggesting that the nucleus of NGC 6153 has a hydrogen-deficient surface. The optical data, together with the ISO LWS 43–197 mm spectrum and the archival IUE and IRAS LRS spectra, are used to study the thermal and density structure and to derive the heavy-element abundances from lines produced by different excitation mechanisms. In all cases, the C 21 =H 1 ; N 21 /H 1 ,O 21 /H 1 and Ne 21 /H 1 abundances derived from multiple optical recombination lines (ORLs) are consistently higher, by about a factor of 10, than the corresponding values deduced from optical, UV or infrared (IR) collisionally excited lines (CELs), regardless of the excitation energies or critical densities of the latter. The agreement between the temperature-sensitive optical forbidden lines and the temperature-insensitive IR fine-structure lines rules out temperature fluctuations as the cause of the large difference between the ORL and CEL abundances. We present the results of a new calculation of recombination coefficients for [O ii] which lead to good agreement between the observed and predicted [O ii] ll 7320, 7330 forbidden line intensities if these lines are solely excited by recombination at the Balmer jump temperature. Recombination excitation is also found to be important in exciting the [N ii] l 5754 line, which, if unaccounted for, would lead to an overestimated [N ii] temperature from the observed (l 65481l 6584)/l 5754 ratio. Analysis of a number of C ii lines arising from levels as high as 7g in the recombination ladder reveals excellent agreement between their reddening-corrected relative intensities and those predicted by recombination theory. Spatial analysis of the long-slit spectra taken along the nebular minor axis yields a varying [O iii] temperature, whereas the hydrogen Balmer jump temperature of 6000 K is approximately constant across the nebula, and is 2000–3000 K lower than the [O iii] temperature. The observed high-n Balmer line decrement indicates that the hydrogen lines arise from material having an electron density of 2000 12000 21000 cm 23 , consistent with the optical and IR forbidden-line density diagnostics, which yield average line-of-sight electron densities along the minor axis varying between 2000 and 4000 cm 23 . While the He/H ratio mapped by He i and He ii recombination lines is constant within 5 per cent across the nebula, the C 21 /H 1 and O 21 /H 1 recombination-line abundances decrease by a factor of 2–3 over a radius of 15 arcsec from the centre, pointing to the presence of abundance gradients. We consider a variety of hypotheses to account for the observed behaviour of the various thermal, density and abundance diagnostics. Empirical nebular models containing two components with differing densities and temperatures are able to account for many of the observed patterns, but only if one of the components is significantly hydrogen-deficient. One such model, which gives a good fit to the observed line intensities and patterns, has 500-K H-depleted material, presumed to be evaporating q 2000 RAS Downloaded from https://academic.oup.com/mnras/article/312/3/585/1023114 by guest on 18 March 2022

Welcome message from author
This document is posted to help you gain knowledge. Please leave a comment to let me know what you think about it! Share it to your friends and learn new things together.
Transcript
Mon. Not. R. Astron. Soc. 312, 585±628 (2000)
NGC 6153: a super-metal-rich planetary nebula?
X.-W. Liu,1 P. J. Storey,1 M. J. Barlow,1 I. J. Danziger,2 M. Cohen3 and M. Bryce4
1Department of Physics and Astronomy, University College London, Gower Street, London WC1E 6BT2Osservatorio Astronomico di Trieste, Via G. B. Tiepolo 11, I-34131 Trieste, Italy3Radio Astronomy Laboratory, 601 Campbell Hall, University of California, Berkeley, CA 94720, USA4Dept. of Physics and Astronomy, University of Manchester, Oxford Road, Manchester M13 9PL
Accepted 1999 October 7. Received 1999 October 4; in original form 1999 July 12
A B S T R A C T
We have obtained deep optical spectra of the planetary nebula NGC 6153, both along its
minor axis and by uniformly scanning a long slit across the whole nebula. The scanned
spectra, when combined with the nebular total Hb flux, yield integrated fluxes for all the
lines (,400) in our spectra, which are rich in strong recombination lines from C, N, O and
Ne ions. A weak O vi l3811 emission line from the central star has been detected,
suggesting that the nucleus of NGC 6153 has a hydrogen-deficient surface. The optical data,
together with the ISO LWS 43±197mm spectrum and the archival IUE and IRAS LRS
spectra, are used to study the thermal and density structure and to derive the heavy-element
abundances from lines produced by different excitation mechanisms. In all cases, the
C21=H1; N21/H1, O21/H1 and Ne21/H1 abundances derived from multiple optical
recombination lines (ORLs) are consistently higher, by about a factor of 10, than the
corresponding values deduced from optical, UV or infrared (IR) collisionally excited lines
(CELs), regardless of the excitation energies or critical densities of the latter. The agreement
between the temperature-sensitive optical forbidden lines and the temperature-insensitive IR
fine-structure lines rules out temperature fluctuations as the cause of the large difference
between the ORL and CEL abundances.
We present the results of a new calculation of recombination coefficients for [O ii] which
lead to good agreement between the observed and predicted [O ii] ll7320, 7330 forbidden
line intensities if these lines are solely excited by recombination at the Balmer jump
temperature. Recombination excitation is also found to be important in exciting the [N ii]
l5754 line, which, if unaccounted for, would lead to an overestimated [N ii] temperature
from the observed (l65481l6584)/l5754 ratio. Analysis of a number of C ii lines arising
from levels as high as 7g in the recombination ladder reveals excellent agreement between
their reddening-corrected relative intensities and those predicted by recombination theory.
Spatial analysis of the long-slit spectra taken along the nebular minor axis yields a varying
[O iii] temperature, whereas the hydrogen Balmer jump temperature of 6000 K is
approximately constant across the nebula, and is 2000±3000 K lower than the [O iii]
temperature. The observed high-n Balmer line decrement indicates that the hydrogen lines
arise from material having an electron density of 20001200021000 cm23, consistent with the optical
and IR forbidden-line density diagnostics, which yield average line-of-sight electron
densities along the minor axis varying between 2000 and 4000 cm23.
While the He/H ratio mapped by He i and He ii recombination lines is constant within
5 per cent across the nebula, the C21/H1 and O21/H1 recombination-line abundances
decrease by a factor of 2±3 over a radius of 15 arcsec from the centre, pointing to the
presence of abundance gradients. We consider a variety of hypotheses to account for the
observed behaviour of the various thermal, density and abundance diagnostics. Empirical
nebular models containing two components with differing densities and temperatures are
able to account for many of the observed patterns, but only if one of the components is
significantly hydrogen-deficient. One such model, which gives a good fit to the observed
line intensities and patterns, has 500-K H-depleted material, presumed to be evaporating
q 2000 RAS
Dow
nloaded from https://academ
ic.oup.com/m
nras/article/312/3/585/1023114 by guest on 18 March 2022
586 X.-W. Liu et al.
from dense neutral inclusions, embedded in 9500-K material with `normal' abundances. An
alternative model, which appears more physically plausible on a number of grounds, has
high-density �2 � 106 cm23�, fully ionized, H-deficient knots embedded in the `normal'
component, although this model fails to account adequately for the observed low (6000 K)
hydrogen Balmer jump temperature. However, the observed fact that the ORLs and CELs
yield heavy-element abundance ratios that are identical within the uncertainties finds no
obvious explanation in the context of H-deficient knot models.
Key words: ISM: abundances ± planetary nebulae: individual: NGC 6153.
1 I N T R O D U C T I O N
The emission-line analysis of photoionized nebulae is one of the
major tools used to obtain knowledge of abundances in our
Galaxy, and is often the sole tool for extragalactic systems. The
technique has been used to study planetary nebulae (PNe;
envelopes ejected by low- and intermediate-mass stars in their
late evolutionary stage), H ii regions surrounding young hot stars,
and envelopes ejected by Of, LBV and Wolf±Rayet stars.
Abundance analyses of these objects have revealed much about
the formation and evolution of stars and of the Galaxy. Analyses
of giant H ii regions in distant galaxies yield elemental
abundances for those systems, particularly those of He, N, O
and Ne, which are otherwise unobtainable. The primordial He
abundance derived for the least chemically evolved extragalactic
H ii regions and dwarf galaxies constrains big bang nucleosynth-
esis and the density of baryonic matter. Emission-line analysis
techniques are also used to study other nebular-type objects,
including novae, supernova remnants and active galactic nuclei.
Until recently, heavy-element abundances of ionized nebulae
have been based on bright optical and UV collisionally excited
lines (CELs), which dominate nebular spectra (e.g. Osterbrock
1989). Abundances thus derived have an exponential (Boltzmann
factor) sensitivity to the adopted electron temperature Te. For
CELs with a low critical density, Ncrit, the results are also sensitive
to the adopted electron density Ne for the emitting regions (Rubin
1989). Alternatively, metal abundances can be derived by
measuring optical recombination lines (ORLs) from heavy-
element ions. Although they are much weaker and more difficult
to measure than CELs, the emissivities of radiative ORLs from
hydrogen, helium and heavy-element ions have only a weak,
similar, power-law dependence on Te, and are essentially
independent of Ne under typical nebular conditions. Thus ionic
abundances derived from the intensities of heavy-element ORLs
relative to a hydrogen recombination line, such as Hb , are almost
independent of the temperature and density structure of the
nebulae under study, and consequently should be more reliable.
A long-standing problem in nebular abundance studies has been
that heavy-element abundances derived from ORLs are often
(though not always) higher than those derived from UV and
optical CELs. In the early 1980s, IUE observations of PNe showed
that the C21/H1 abundances derived from the collisionally excited
C iii] ll1907, 1909 intercombination lines are generally lower
than those derived from the C ii l4267 optical recombination line,
by factors of 3±10 in some cases (e.g. Kaler 1986; Barker 1991,
and references therein). Various explanations have been advanced,
yet no consensus has been reached.
The advent of large-format CCDs, with high quantum
efficiency and large dynamic range, has enabled many weak
lines, previously impossible or difficult to detect, to be measured
with high accuracy. The new measurements, together with the
high-quality effective recombination coefficients now available
for many heavy-element ions (PeÂquignot, Petitjean & Boisson
1991; Storey 1994; Liu et al. 1995a, hereafter LSBC) have opened
up the possibility of obtaining accurate abundances using ORLs
from heavy-element ions. Using line intensities published in the
literature, Peimbert, Storey & Torres-Peimbert (1993) derived
O11/H1 abundances from O ii recombination lines for the H ii
regions M 42 and M 17 and the PN NGC 6572 and found them to
be a factor of 2 higher than those derived from the [O iii]
forbidden lines. In a detailed analysis of recombination lines from
C, N and O ions in the PN NGC 7009, LSBC detected and
measured more than 100 O ii lines. The excellent agreement
between O21/H1 abundances derived from a large number of O ii
transitions with different electron configurations strongly supports
the recombination interpretation of these lines and the reliability
and accuracy of current recombination theory for non-hydrogenic
ions. The recombination line C, N and O abundances, relative to
H, derived for NGC 7009 were all about a factor of 5 higher than
those deduced from the CELs. Similar analysis for a number of
additional PNe (Liu et al. 1999) yielded O/H abundances which
are consistently higher than those from CELs, reaching a factor of
*20 in the extreme case of the Galactic bulge PN M 1-42.
The large discrepancies between the ORL and CEL abundances
observed in many PNe point to the possibility that there are
fundamental flaws in our current understanding of the nebular
thermal and ionization structure. Without a better understanding
of the cause of the discrepancy, nebular abundances cannot be
taken as intrinsically secure. Since the ratios of abundances
derived from these two types of emission line vary from object to
object and cover a wide range of 1±20, the cause is likely to be
found in the nebular physical conditions, rather than in the basic
atomic physics. Peimbert (1967) first discussed the possibility that
the traditional method of abundance determinations, based on the
standard technique of CEL analysis, might underestimate nebular
heavy-element abundances. Given the strong Te-dependence of the
ionic abundances derived from CELs, he showed that in the
presence of temperature fluctuations, standard temperature
diagnostics, such as the [O iii] nebular (ll4959, 5007) to auroral
(l4363) line ratio, will overestimate the electron temperature,
and, as a consequence, ionic abundances of heavy elements
derived from CELs will be underestimated. The first observational
evidence suggesting that PNe and H ii regions may have
significant temperature fluctuations was provided by Peimbert
(1971). He measured the electron temperatures using the ratio of
the nebular continuum Balmer discontinuity to Hb , for three PNe
and several regions of the Orion nebula and found them to be
systematically lower than those derived from the [O iii] forbidden-
line ratio. He interpreted the results as due to the presence of large
temperature fluctuations in the nebulae. On the other hand,
q 2000 RAS, MNRAS 312, 585±628
Dow
nloaded from https://academ
ic.oup.com/m
nras/article/312/3/585/1023114 by guest on 18 March 2022
Planetary nebula NGC 6153 587
Barker (1978) measured Balmer jump temperatures for 19 PNe,
and found them to be in general agreement with those derived
from the [O iii] forbidden lines. More recently, Liu & Danziger
(1993b) measured Balmer jump temperatures for 14 PNe and
found that the new measurements, together with those published
by Peimbert (1971) and Barker (1978), showed that, on average,
the Balmer jump temperatures tend to be lower than the [O iii]
temperatures. Dinerstein, Lester & Werner (1985) measured [O iii]
52- and 88-mm far-IR fine-structure line fluxes for six PNe using
the Kuiper Airborne Observatory (KAO), and found that for four
of them the electron temperatures calculated from the l5007/
52mm ratio were significantly lower than those given by the
l5007/l4363 ratio and concluded that the nebulae were not
isothermal. However, reanalysis of the KAO measurements by
Dinerstein et al. (1995) showed that for NGC 6543 the electron
temperatures derived from these two diagnostics agree within the
errors, contrary to the earlier finding of Dinerstein et al. (1985).
Although temperature fluctuations provide a plausible inter-
pretation for the large discrepancies in abundances derived from
the two types of emission line and for discrepancies in electron
temperatures deduced from the nebular continuum Balmer discon-
tinuity and from the [O iii] forbidden line ratio, the large tem-
perature fluctuations required to reconcile the discrepancies are
not predicted by nebular photoionization modelling (Gruenwald &
Viegas 1995; Kingdon & Ferland 1995b), with the possible
exception of some starburst models examined by PeÂrez (1997),
where some relatively large amplitude of temperature fluctuations
were found. Other proposed mechanisms potentially capable of
producing large temperature fluctuations include extra heating
from shock waves (Peimbert, Sarmiento & Fierro 1991), strong
density inhomogeneities (Viegas & Clegg 1994) or abundance
gradients (Torres-Peimbert, Peimbert & PenÄa 1990). Direct
observational evidence pointing to the operation of such
mechanisms in nebulae has yet to be found.
We have been undertaking a systematic ORL abundance survey
for a large sample of Galactic PNe and H ii regions, using the ESO
1.52-m, the AAT 3.9-m and the WHT 4.2-m telescopes. So far,
about 80 PNe have been observed. For about half of them, we
have also obtained 43±197mm far-IR grating spectra using the
Long Wavelength Spectrometer (LWS) on board the Infrared
Space Observatory (ISO). ISO 2.4±45mm Short Wavelength
Spectrometer (SWS) spectra are also available for the majority of
them. The deep optical observations will deliver for a large sample
of PNe accurate recombination line C, N and O abundances,
which will be compared to those derived from IR, optical and UV
(from the IUE archival data) CELs of different excitation energies
and critical densities. The abundance discrepancies between the
two types of emission lines will be studied in terms of the
excitation energies and the critical densities of CELs, the nebular
properties (morphology, electron temperature and density, and
chemical composition) and the properties of the exciting central
stars (luminosities, effective temperature, evolutionary stage and
surface composition), in order to probe the underlying physical
causes. The mid- and far-IR fine-structure lines observable with
ISO are particularly useful in testing temperature/density fluctua-
tions as the cause of the discrepancies. With excitation energies
Eex & 1000 K, abundances derived from IR fine-structure lines
are insensitive to temperature and temperature fluctuations. In
addition, the IR lines cover a wide range of critical densities and
can be used to quantify density inhomogeneities and their effects
on abundance determinations, without complications from thermal
or ionization stratification.
As the first of a series of papers on abundance determinations in
gaseous nebulae, we present here a detailed case study for the PN
NGC 6153, utilizing UV to far-IR observations. The unusual
nature of NGC 6153 was first noted by Pottasch et al. (1984), from
its strong IRAS LRS infrared emission-line spectrum. Analysis of
the spectrum showed that NGC 6153 probably has the highest
nebular neon abundance known. A subsequent analysis of its UV,
optical and LRS spectra by Pottasch, Dennefield & Mo (1986,
hereafter PDM) showed that NGC 6153 has higher abundances of
almost all measurable elements than any other PN. A more recent
analysis by Kingsburgh & Barlow (1994) however yielded a
significantly higher [O iii] temperature than derived by PDM and
consequently a more or less `normal' chemical composition,
except for Ne and possibly also N, which were still enhanced by a
factor of 2 relative to the average values for PNe. The peculiar
composition of NGC 6153 was reconfirmed during our deep ORL
abundance survey. Its optical spectrum is found to be strikingly
similar to that of NGC 7009 (LSBC), with extremely rich
recombination lines from O ii, N ii, C ii and Ne ii, indicating
extremely high metal abundances. Of the approximately 80 PNe
so far surveyed, only two other objects, M 2-36 and M 1-42, both
bulge PNe, show such a prominent recombination-line spectrum.
The detection in NGC 6153 of a large number of ORLs from a
variety of heavy-element ions provides another opportunity, after
NGC 7009, to test the recombination theories of heavy-element
ions. The availability at the same time of heavy-element abun-
dances from a large number of CELs, spanning wavelengths from
UV to far-IR and covering a wide range in Eex and Ncrit, allows us
to test the prevailing interpretation of temperature/density
fluctuations as the cause of the large abundance discrepancies
between the two types of emission lines. In Section 2 we describe
our new spectroscopic observations of NGC 6153, using the ESO
1.52-m telescope in the optical and the space-borne ISO LWS in
the far-IR, and present line fluxes obtained from the new
observations as well as from newly recalibrated IUE and IRAS
LRS spectra retrieved from the archives. In Section 3 we present
nebular abundance analyses using UV, optical and IR collisionally
excited lines and optical recombination lines. In Section 4 long-
slit spectra obtained along the nebular minor axis are used to map
the extinction, the electron temperature and density, and the ionic
abundances, across the nebular surface. The implications and
possible interpretations of the results from this extensive multi-
waveband analysis are discussed in Sections 5 and 6. A summary
of some results from this study was presented by Liu (1998).
2 O B S E RVAT I O N S
2.1 Optical spectroscopy
2.1.1 Observations
The observations were taken during three runs at the ESO 1.52-m
q 2000 RAS, MNRAS 312, 585±628
Table 1. Journal of ESO 1.52-m telescope observations.
Date l-range FWHM PA Exp. Time(UT) (AÊ ) (AÊ ) (deg) (sec)
30/07/95 3523±7421 4.5 122.8 120, 2 � 60025/07/95 4000±4984 1.5 122.8 3 � 180011/07/96 3040±4050 1.5 122.8 3 � 180010/07/96 4005±4990 1.5 122.8 180008/02/97 3530±7428 4.5 Scanning 40, 66009/02/97 4005±4990 1.5 Scanning 2 � 180011/02/97 4005±4990 1.5 Scanning 1140
Dow
nloaded from https://academ
ic.oup.com/m
nras/article/312/3/585/1023114 by guest on 18 March 2022
588 X.-W. Liu et al.
q 2000 RAS, MNRAS 312, 585±628
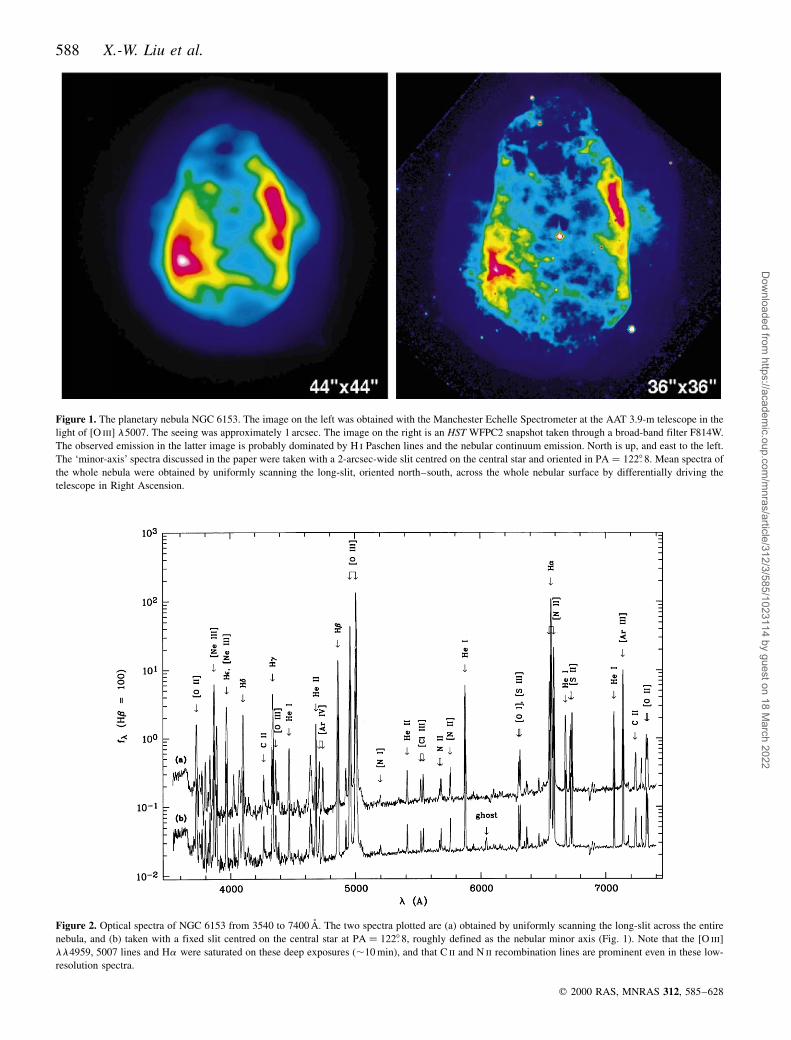
Figure 1. The planetary nebula NGC 6153. The image on the left was obtained with the Manchester Echelle Spectrometer at the AAT 3.9-m telescope in the
light of [O iii] l5007. The seeing was approximately 1 arcsec. The image on the right is an HST WFPC2 snapshot taken through a broad-band filter F814W.
The observed emission in the latter image is probably dominated by H i Paschen lines and the nebular continuum emission. North is up, and east to the left.
The `minor-axis' spectra discussed in the paper were taken with a 2-arcsec-wide slit centred on the central star and oriented in PA � 1228: 8. Mean spectra of
the whole nebula were obtained by uniformly scanning the long-slit, oriented north±south, across the whole nebular surface by differentially driving the
telescope in Right Ascension.
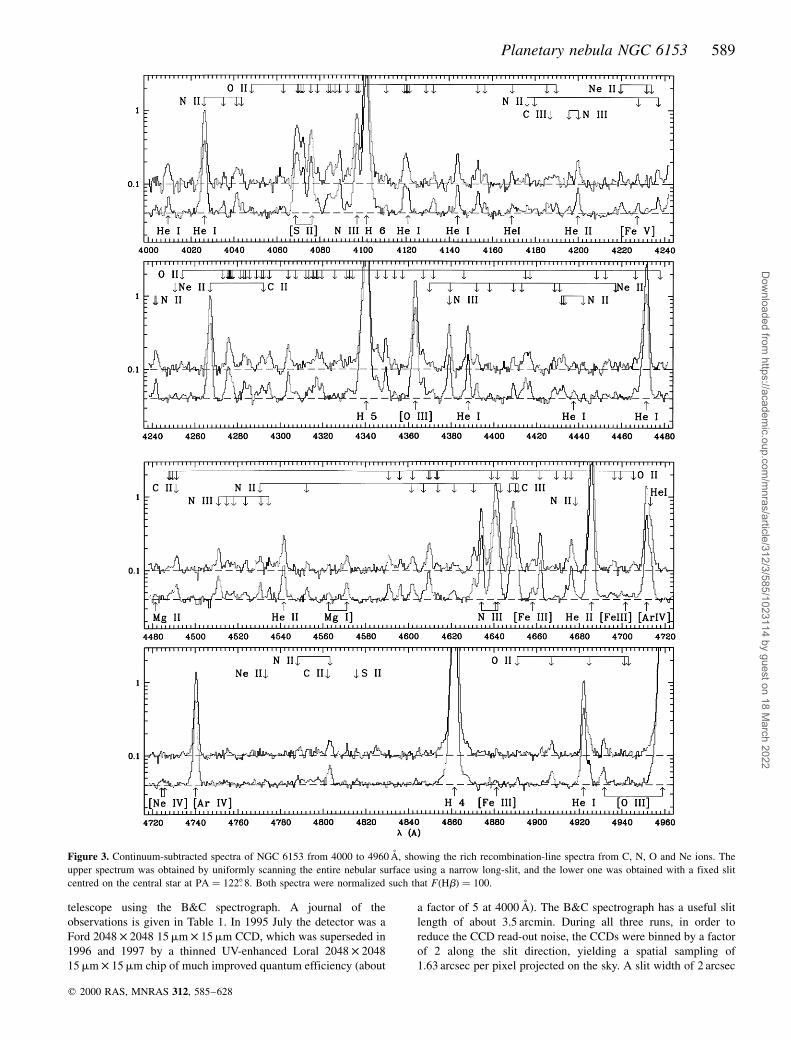
Figure 2. Optical spectra of NGC 6153 from 3540 to 7400 AÊ . The two spectra plotted are (a) obtained by uniformly scanning the long-slit across the entire
nebula, and (b) taken with a fixed slit centred on the central star at PA � 1228: 8, roughly defined as the nebular minor axis (Fig. 1). Note that the [O iii]
ll4959, 5007 lines and Ha were saturated on these deep exposures (,10 min), and that C ii and N ii recombination lines are prominent even in these low-
resolution spectra.
Dow
nloaded from https://academ
ic.oup.com/m
nras/article/312/3/585/1023114 by guest on 18 March 2022
Planetary nebula NGC 6153 589
telescope using the B&C spectrograph. A journal of the
observations is given in Table 1. In 1995 July the detector was a
Ford 2048 � 2048 15mm � 15mm CCD, which was superseded in
1996 and 1997 by a thinned UV-enhanced Loral 2048 � 2048
15mm � 15mm chip of much improved quantum efficiency (about
a factor of 5 at 4000 AÊ ). The B&C spectrograph has a useful slit
length of about 3.5 arcmin. During all three runs, in order to
reduce the CCD read-out noise, the CCDs were binned by a factor
of 2 along the slit direction, yielding a spatial sampling of
1.63 arcsec per pixel projected on the sky. A slit width of 2 arcsec
q 2000 RAS, MNRAS 312, 585±628
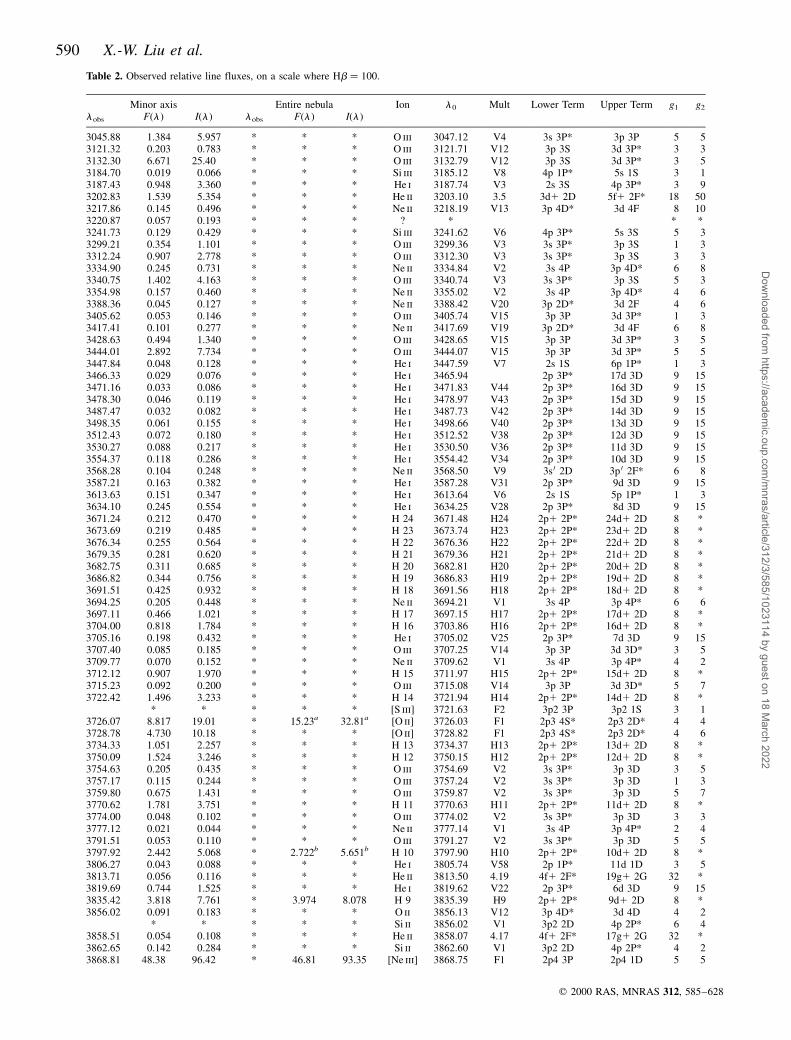
Figure 3. Continuum-subtracted spectra of NGC 6153 from 4000 to 4960 AÊ , showing the rich recombination-line spectra from C, N, O and Ne ions. The
upper spectrum was obtained by uniformly scanning the entire nebular surface using a narrow long-slit, and the lower one was obtained with a fixed slit
centred on the central star at PA � 1228: 8. Both spectra were normalized such that F�Hb� � 100.
Dow
nloaded from https://academ
ic.oup.com/m
nras/article/312/3/585/1023114 by guest on 18 March 2022
590 X.-W. Liu et al.
q 2000 RAS, MNRAS 312, 585±628
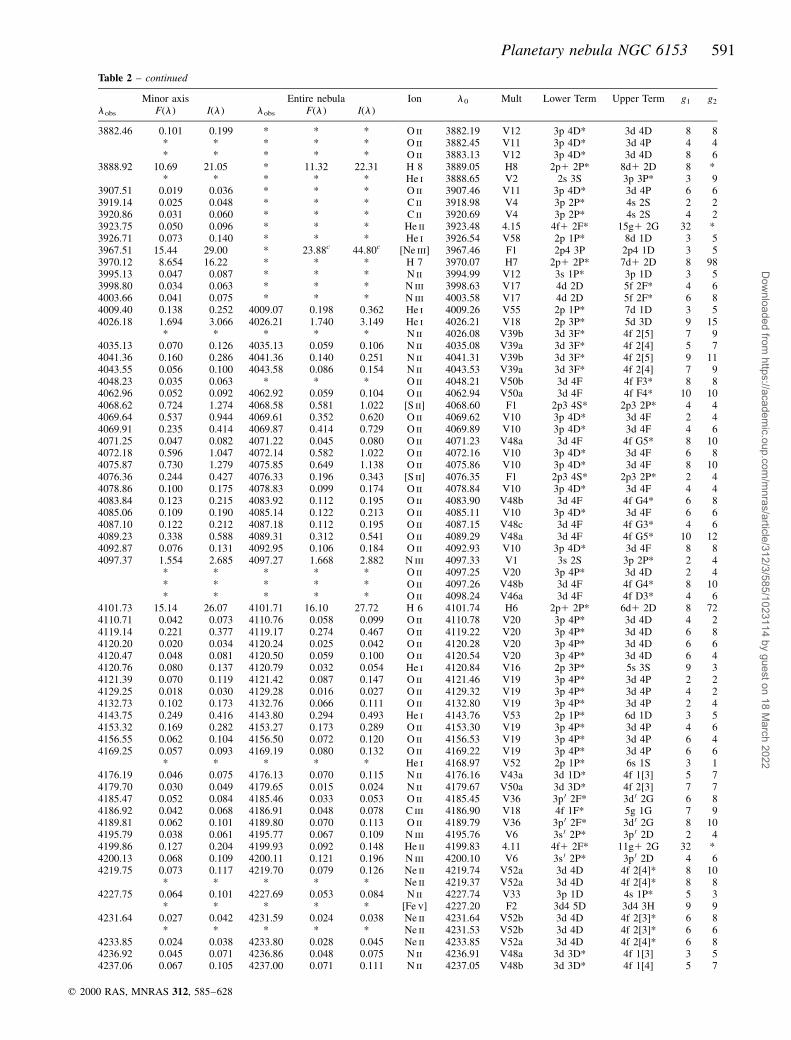
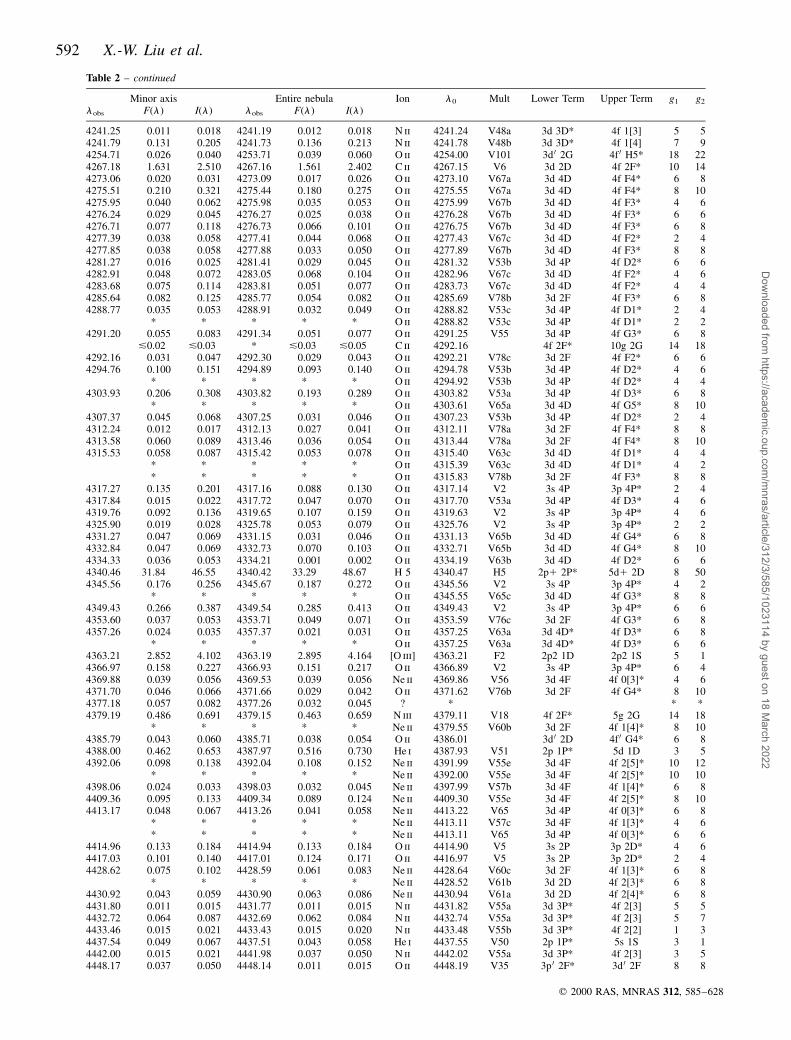
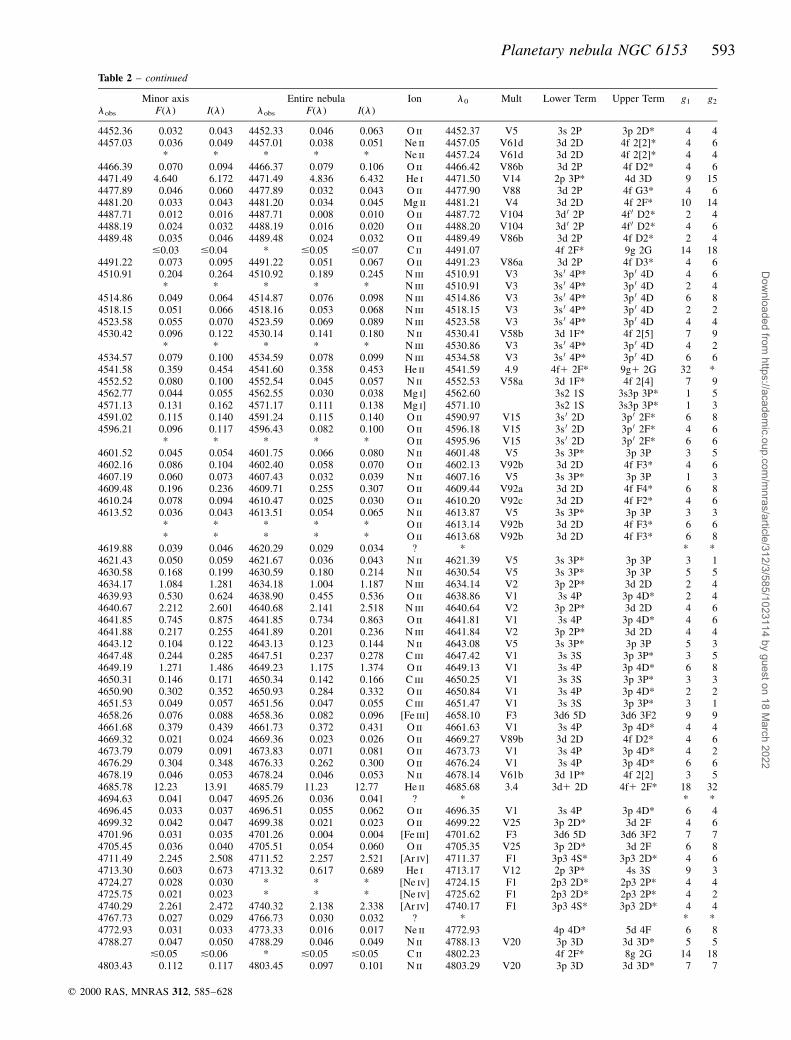
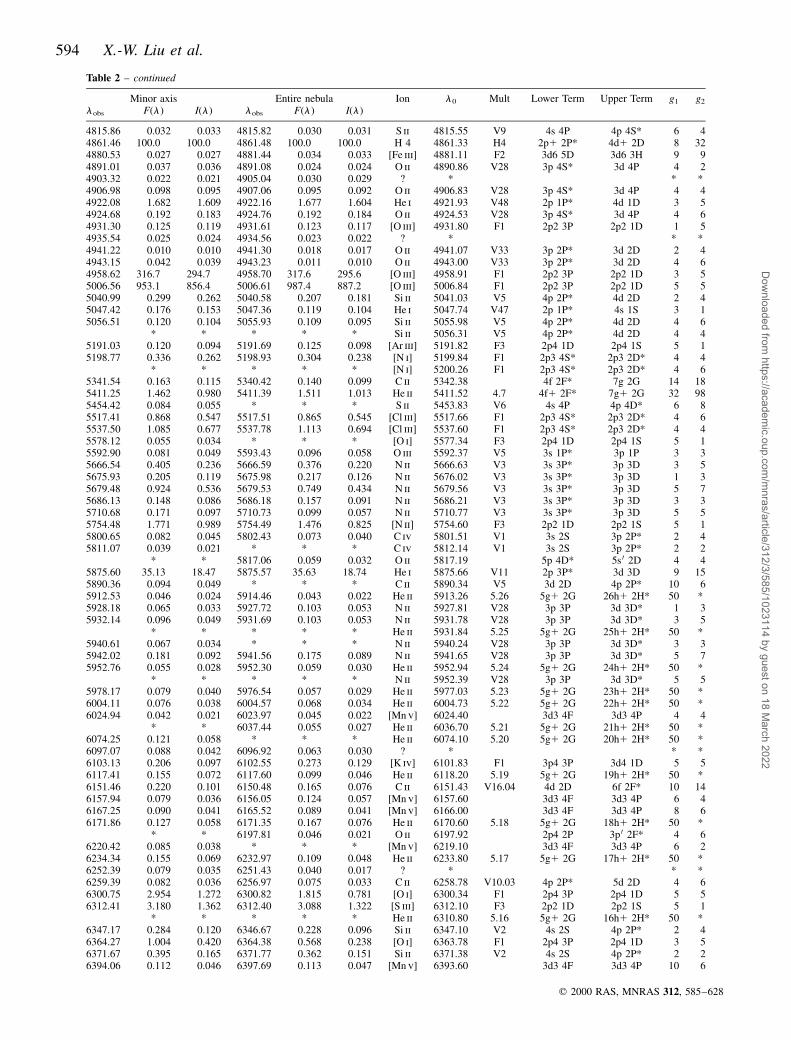
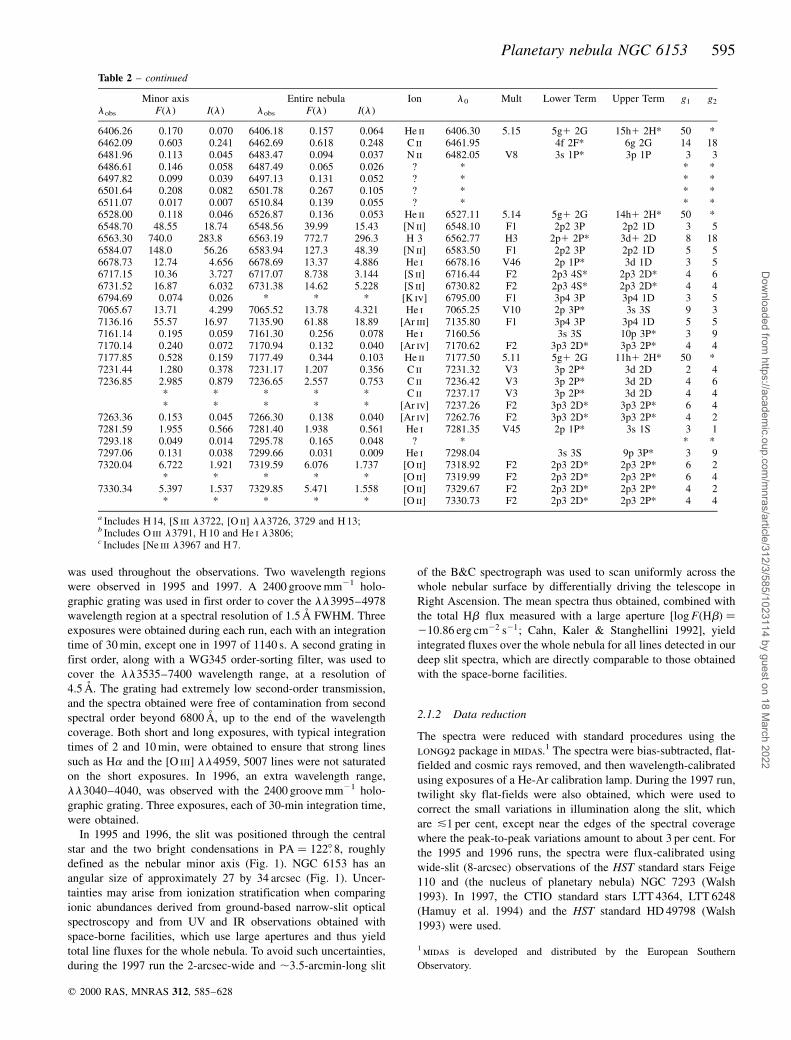
Table 2. Observed relative line fluxes, on a scale where Hb � 100.
Minor axis Entire nebula Ion l0 Mult Lower Term Upper Term g1 g2
lobs F(l) I(l) lobs F(l ) I(l)
3045.88 1.384 5.957 * * * O iii 3047.12 V4 3s 3P* 3p 3P 5 53121.32 0.203 0.783 * * * O iii 3121.71 V12 3p 3S 3d 3P* 3 33132.30 6.671 25.40 * * * O iii 3132.79 V12 3p 3S 3d 3P* 3 53184.70 0.019 0.066 * * * Si iii 3185.12 V8 4p 1P* 5s 1S 3 13187.43 0.948 3.360 * * * He i 3187.74 V3 2s 3S 4p 3P* 3 93202.83 1.539 5.354 * * * He ii 3203.10 3.5 3d1 2D 5f1 2F* 18 503217.86 0.145 0.496 * * * Ne ii 3218.19 V13 3p 4D* 3d 4F 8 103220.87 0.057 0.193 * * * ? * * *3241.73 0.129 0.429 * * * Si iii 3241.62 V6 4p 3P* 5s 3S 5 33299.21 0.354 1.101 * * * O iii 3299.36 V3 3s 3P* 3p 3S 1 33312.24 0.907 2.778 * * * O iii 3312.30 V3 3s 3P* 3p 3S 3 33334.90 0.245 0.731 * * * Ne ii 3334.84 V2 3s 4P 3p 4D* 6 83340.75 1.402 4.163 * * * O iii 3340.74 V3 3s 3P* 3p 3S 5 33354.98 0.157 0.460 * * * Ne ii 3355.02 V2 3s 4P 3p 4D* 4 63388.36 0.045 0.127 * * * Ne ii 3388.42 V20 3p 2D* 3d 2F 4 63405.62 0.053 0.146 * * * O iii 3405.74 V15 3p 3P 3d 3P* 1 33417.41 0.101 0.277 * * * Ne ii 3417.69 V19 3p 2D* 3d 4F 6 83428.63 0.494 1.340 * * * O iii 3428.65 V15 3p 3P 3d 3P* 3 53444.01 2.892 7.734 * * * O iii 3444.07 V15 3p 3P 3d 3P* 5 53447.84 0.048 0.128 * * * He i 3447.59 V7 2s 1S 6p 1P* 1 33466.33 0.029 0.076 * * * He i 3465.94 2p 3P* 17d 3D 9 153471.16 0.033 0.086 * * * He i 3471.83 V44 2p 3P* 16d 3D 9 153478.30 0.046 0.119 * * * He i 3478.97 V43 2p 3P* 15d 3D 9 153487.47 0.032 0.082 * * * He i 3487.73 V42 2p 3P* 14d 3D 9 153498.35 0.061 0.155 * * * He i 3498.66 V40 2p 3P* 13d 3D 9 153512.43 0.072 0.180 * * * He i 3512.52 V38 2p 3P* 12d 3D 9 153530.27 0.088 0.217 * * * He i 3530.50 V36 2p 3P* 11d 3D 9 153554.37 0.118 0.286 * * * He i 3554.42 V34 2p 3P* 10d 3D 9 153568.28 0.104 0.248 * * * Ne ii 3568.50 V9 3s 0 2D 3p 0 2F* 6 83587.21 0.163 0.382 * * * He i 3587.28 V31 2p 3P* 9d 3D 9 153613.63 0.151 0.347 * * * He i 3613.64 V6 2s 1S 5p 1P* 1 33634.10 0.245 0.554 * * * He i 3634.25 V28 2p 3P* 8d 3D 9 153671.24 0.212 0.470 * * * H 24 3671.48 H24 2p1 2P* 24d1 2D 8 *3673.69 0.219 0.485 * * * H 23 3673.74 H23 2p1 2P* 23d1 2D 8 *3676.34 0.255 0.564 * * * H 22 3676.36 H22 2p1 2P* 22d1 2D 8 *3679.35 0.281 0.620 * * * H 21 3679.36 H21 2p1 2P* 21d1 2D 8 *3682.75 0.311 0.685 * * * H 20 3682.81 H20 2p1 2P* 20d1 2D 8 *3686.82 0.344 0.756 * * * H 19 3686.83 H19 2p1 2P* 19d1 2D 8 *3691.51 0.425 0.932 * * * H 18 3691.56 H18 2p1 2P* 18d1 2D 8 *3694.25 0.205 0.448 * * * Ne ii 3694.21 V1 3s 4P 3p 4P* 6 63697.11 0.466 1.021 * * * H 17 3697.15 H17 2p1 2P* 17d1 2D 8 *3704.00 0.818 1.784 * * * H 16 3703.86 H16 2p1 2P* 16d1 2D 8 *3705.16 0.198 0.432 * * * He i 3705.02 V25 2p 3P* 7d 3D 9 153707.40 0.085 0.185 * * * O iii 3707.25 V14 3p 3P 3d 3D* 3 53709.77 0.070 0.152 * * * Ne ii 3709.62 V1 3s 4P 3p 4P* 4 23712.12 0.907 1.970 * * * H 15 3711.97 H15 2p1 2P* 15d1 2D 8 *3715.23 0.092 0.200 * * * O iii 3715.08 V14 3p 3P 3d 3D* 5 73722.42 1.496 3.233 * * * H 14 3721.94 H14 2p1 2P* 14d1 2D 8 *
* * * * * [S iii] 3721.63 F2 3p2 3P 3p2 1S 3 13726.07 8.817 19.01 * 15.23a 32.81a [O ii] 3726.03 F1 2p3 4S* 2p3 2D* 4 43728.78 4.730 10.18 * * * [O ii] 3728.82 F1 2p3 4S* 2p3 2D* 4 63734.33 1.051 2.257 * * * H 13 3734.37 H13 2p1 2P* 13d1 2D 8 *3750.09 1.524 3.246 * * * H 12 3750.15 H12 2p1 2P* 12d1 2D 8 *3754.63 0.205 0.435 * * * O iii 3754.69 V2 3s 3P* 3p 3D 3 53757.17 0.115 0.244 * * * O iii 3757.24 V2 3s 3P* 3p 3D 1 33759.80 0.675 1.431 * * * O iii 3759.87 V2 3s 3P* 3p 3D 5 73770.62 1.781 3.751 * * * H 11 3770.63 H11 2p1 2P* 11d1 2D 8 *3774.00 0.048 0.102 * * * O iii 3774.02 V2 3s 3P* 3p 3D 3 33777.12 0.021 0.044 * * * Ne ii 3777.14 V1 3s 4P 3p 4P* 2 43791.51 0.053 0.110 * * * O iii 3791.27 V2 3s 3P* 3p 3D 5 53797.92 2.442 5.068 * 2.722b 5.651b H 10 3797.90 H10 2p1 2P* 10d1 2D 8 *3806.27 0.043 0.088 * * * He i 3805.74 V58 2p 1P* 11d 1D 3 53813.71 0.056 0.116 * * * He ii 3813.50 4.19 4f1 2F* 19g1 2G 32 *3819.69 0.744 1.525 * * * He i 3819.62 V22 2p 3P* 6d 3D 9 153835.42 3.818 7.761 * 3.974 8.078 H 9 3835.39 H9 2p1 2P* 9d1 2D 8 *3856.02 0.091 0.183 * * * O ii 3856.13 V12 3p 4D* 3d 4D 4 2
* * * * * Si ii 3856.02 V1 3p2 2D 4p 2P* 6 43858.51 0.054 0.108 * * * He ii 3858.07 4.17 4f1 2F* 17g1 2G 32 *3862.65 0.142 0.284 * * * Si ii 3862.60 V1 3p2 2D 4p 2P* 4 23868.81 48.38 96.42 * 46.81 93.35 [Ne iii] 3868.75 F1 2p4 3P 2p4 1D 5 5
Dow
nloaded from https://academ
ic.oup.com/m
nras/article/312/3/585/1023114 by guest on 18 March 2022
Planetary nebula NGC 6153 591
q 2000 RAS, MNRAS 312, 585±628
Table 2 ± continued
Minor axis Entire nebula Ion l0 Mult Lower Term Upper Term g1 g2
lobs F(l) I(l) lobs F(l ) I(l )
3882.46 0.101 0.199 * * * O ii 3882.19 V12 3p 4D* 3d 4D 8 8* * * * * O ii 3882.45 V11 3p 4D* 3d 4P 4 4* * * * * O ii 3883.13 V12 3p 4D* 3d 4D 8 6
3888.92 10.69 21.05 * 11.32 22.31 H 8 3889.05 H8 2p1 2P* 8d1 2D 8 ** * * * * He i 3888.65 V2 2s 3S 3p 3P* 3 9
3907.51 0.019 0.036 * * * O ii 3907.46 V11 3p 4D* 3d 4P 6 63919.14 0.025 0.048 * * * C ii 3918.98 V4 3p 2P* 4s 2S 2 23920.86 0.031 0.060 * * * C ii 3920.69 V4 3p 2P* 4s 2S 4 23923.75 0.050 0.096 * * * He ii 3923.48 4.15 4f1 2F* 15g1 2G 32 *3926.71 0.073 0.140 * * * He i 3926.54 V58 2p 1P* 8d 1D 3 53967.51 15.44 29.00 * 23.88c 44.80c [Ne iii] 3967.46 F1 2p4 3P 2p4 1D 3 53970.12 8.654 16.22 * * * H 7 3970.07 H7 2p1 2P* 7d1 2D 8 983995.13 0.047 0.087 * * * N ii 3994.99 V12 3s 1P* 3p 1D 3 53998.80 0.034 0.063 * * * N iii 3998.63 V17 4d 2D 5f 2F* 4 64003.66 0.041 0.075 * * * N iii 4003.58 V17 4d 2D 5f 2F* 6 84009.40 0.138 0.252 4009.07 0.198 0.362 He i 4009.26 V55 2p 1P* 7d 1D 3 54026.18 1.694 3.066 4026.21 1.740 3.149 He i 4026.21 V18 2p 3P* 5d 3D 9 15
* * * * * N ii 4026.08 V39b 3d 3F* 4f 2[5] 7 94035.13 0.070 0.126 4035.13 0.059 0.106 N ii 4035.08 V39a 3d 3F* 4f 2[4] 5 74041.36 0.160 0.286 4041.36 0.140 0.251 N ii 4041.31 V39b 3d 3F* 4f 2[5] 9 114043.55 0.056 0.100 4043.58 0.086 0.154 N ii 4043.53 V39a 3d 3F* 4f 2[4] 7 94048.23 0.035 0.063 * * * O ii 4048.21 V50b 3d 4F 4f F3* 8 84062.96 0.052 0.092 4062.92 0.059 0.104 O ii 4062.94 V50a 3d 4F 4f F4* 10 104068.62 0.724 1.274 4068.58 0.581 1.022 [S ii] 4068.60 F1 2p3 4S* 2p3 2P* 4 44069.64 0.537 0.944 4069.61 0.352 0.620 O ii 4069.62 V10 3p 4D* 3d 4F 2 44069.91 0.235 0.414 4069.87 0.414 0.729 O ii 4069.89 V10 3p 4D* 3d 4F 4 64071.25 0.047 0.082 4071.22 0.045 0.080 O ii 4071.23 V48a 3d 4F 4f G5* 8 104072.18 0.596 1.047 4072.14 0.582 1.022 O ii 4072.16 V10 3p 4D* 3d 4F 6 84075.87 0.730 1.279 4075.85 0.649 1.138 O ii 4075.86 V10 3p 4D* 3d 4F 8 104076.36 0.244 0.427 4076.33 0.196 0.343 [S ii] 4076.35 F1 2p3 4S* 2p3 2P* 2 44078.86 0.100 0.175 4078.83 0.099 0.174 O ii 4078.84 V10 3p 4D* 3d 4F 4 44083.84 0.123 0.215 4083.92 0.112 0.195 O ii 4083.90 V48b 3d 4F 4f G4* 6 84085.06 0.109 0.190 4085.14 0.122 0.213 O ii 4085.11 V10 3p 4D* 3d 4F 6 64087.10 0.122 0.212 4087.18 0.112 0.195 O ii 4087.15 V48c 3d 4F 4f G3* 4 64089.23 0.338 0.588 4089.31 0.312 0.541 O ii 4089.29 V48a 3d 4F 4f G5* 10 124092.87 0.076 0.131 4092.95 0.106 0.184 O ii 4092.93 V10 3p 4D* 3d 4F 8 84097.37 1.554 2.685 4097.27 1.668 2.882 N iii 4097.33 V1 3s 2S 3p 2P* 2 4
* * * * * O ii 4097.25 V20 3p 4P* 3d 4D 2 4* * * * * O ii 4097.26 V48b 3d 4F 4f G4* 8 10* * * * * O ii 4098.24 V46a 3d 4F 4f D3* 4 6
4101.73 15.14 26.07 4101.71 16.10 27.72 H 6 4101.74 H6 2p1 2P* 6d1 2D 8 724110.71 0.042 0.073 4110.76 0.058 0.099 O ii 4110.78 V20 3p 4P* 3d 4D 4 24119.14 0.221 0.377 4119.17 0.274 0.467 O ii 4119.22 V20 3p 4P* 3d 4D 6 84120.20 0.020 0.034 4120.24 0.025 0.042 O ii 4120.28 V20 3p 4P* 3d 4D 6 64120.47 0.048 0.081 4120.50 0.059 0.100 O ii 4120.54 V20 3p 4P* 3d 4D 6 44120.76 0.080 0.137 4120.79 0.032 0.054 He i 4120.84 V16 2p 3P* 5s 3S 9 34121.39 0.070 0.119 4121.42 0.087 0.147 O ii 4121.46 V19 3p 4P* 3d 4P 2 24129.25 0.018 0.030 4129.28 0.016 0.027 O ii 4129.32 V19 3p 4P* 3d 4P 4 24132.73 0.102 0.173 4132.76 0.066 0.111 O ii 4132.80 V19 3p 4P* 3d 4P 2 44143.75 0.249 0.416 4143.80 0.294 0.493 He i 4143.76 V53 2p 1P* 6d 1D 3 54153.32 0.169 0.282 4153.27 0.173 0.289 O ii 4153.30 V19 3p 4P* 3d 4P 4 64156.55 0.062 0.104 4156.50 0.072 0.120 O ii 4156.53 V19 3p 4P* 3d 4P 6 44169.25 0.057 0.093 4169.19 0.080 0.132 O ii 4169.22 V19 3p 4P* 3d 4P 6 6
* * * * * He i 4168.97 V52 2p 1P* 6s 1S 3 14176.19 0.046 0.075 4176.13 0.070 0.115 N ii 4176.16 V43a 3d 1D* 4f 1[3] 5 74179.70 0.030 0.049 4179.65 0.015 0.024 N ii 4179.67 V50a 3d 3D* 4f 2[3] 7 74185.47 0.052 0.084 4185.46 0.033 0.053 O ii 4185.45 V36 3p 0 2F* 3d 0 2G 6 84186.92 0.042 0.068 4186.91 0.048 0.078 C iii 4186.90 V18 4f 1F* 5g 1G 7 94189.81 0.062 0.101 4189.80 0.070 0.113 O ii 4189.79 V36 3p 0 2F* 3d 0 2G 8 104195.79 0.038 0.061 4195.77 0.067 0.109 N iii 4195.76 V6 3s 0 2P* 3p 0 2D 2 44199.86 0.127 0.204 4199.93 0.092 0.148 He ii 4199.83 4.11 4f1 2F* 11g1 2G 32 *4200.13 0.068 0.109 4200.11 0.121 0.196 N iii 4200.10 V6 3s 0 2P* 3p 0 2D 4 64219.75 0.073 0.117 4219.70 0.079 0.126 Ne ii 4219.74 V52a 3d 4D 4f 2[4]* 8 10
* * * * * Ne ii 4219.37 V52a 3d 4D 4f 2[4]* 8 84227.75 0.064 0.101 4227.69 0.053 0.084 N ii 4227.74 V33 3p 1D 4s 1P* 5 3
* * * * * [Fe v] 4227.20 F2 3d4 5D 3d4 3H 9 94231.64 0.027 0.042 4231.59 0.024 0.038 Ne ii 4231.64 V52b 3d 4D 4f 2[3]* 6 8
* * * * * Ne ii 4231.53 V52b 3d 4D 4f 2[3]* 6 64233.85 0.024 0.038 4233.80 0.028 0.045 Ne ii 4233.85 V52a 3d 4D 4f 2[4]* 6 84236.92 0.045 0.071 4236.86 0.048 0.075 N ii 4236.91 V48a 3d 3D* 4f 1[3] 3 54237.06 0.067 0.105 4237.00 0.071 0.111 N ii 4237.05 V48b 3d 3D* 4f 1[4] 5 7
Dow
nloaded from https://academ
ic.oup.com/m
nras/article/312/3/585/1023114 by guest on 18 March 2022
592 X.-W. Liu et al.
q 2000 RAS, MNRAS 312, 585±628
Table 2 ± continued
Minor axis Entire nebula Ion l0 Mult Lower Term Upper Term g1 g2
lobs F(l) I(l) lobs F(l ) I(l)
4241.25 0.011 0.018 4241.19 0.012 0.018 N ii 4241.24 V48a 3d 3D* 4f 1[3] 5 54241.79 0.131 0.205 4241.73 0.136 0.213 N ii 4241.78 V48b 3d 3D* 4f 1[4] 7 94254.71 0.026 0.040 4253.71 0.039 0.060 O ii 4254.00 V101 3d 0 2G 4f 0 H5* 18 224267.18 1.631 2.510 4267.16 1.561 2.402 C ii 4267.15 V6 3d 2D 4f 2F* 10 144273.06 0.020 0.031 4273.09 0.017 0.026 O ii 4273.10 V67a 3d 4D 4f F4* 6 84275.51 0.210 0.321 4275.44 0.180 0.275 O ii 4275.55 V67a 3d 4D 4f F4* 8 104275.95 0.040 0.062 4275.98 0.035 0.053 O ii 4275.99 V67b 3d 4D 4f F3* 4 64276.24 0.029 0.045 4276.27 0.025 0.038 O ii 4276.28 V67b 3d 4D 4f F3* 6 64276.71 0.077 0.118 4276.73 0.066 0.101 O ii 4276.75 V67b 3d 4D 4f F3* 6 84277.39 0.038 0.058 4277.41 0.044 0.068 O ii 4277.43 V67c 3d 4D 4f F2* 2 44277.85 0.038 0.058 4277.88 0.033 0.050 O ii 4277.89 V67b 3d 4D 4f F3* 8 84281.27 0.016 0.025 4281.41 0.029 0.045 O ii 4281.32 V53b 3d 4P 4f D2* 6 64282.91 0.048 0.072 4283.05 0.068 0.104 O ii 4282.96 V67c 3d 4D 4f F2* 4 64283.68 0.075 0.114 4283.81 0.051 0.077 O ii 4283.73 V67c 3d 4D 4f F2* 4 44285.64 0.082 0.125 4285.77 0.054 0.082 O ii 4285.69 V78b 3d 2F 4f F3* 6 84288.77 0.035 0.053 4288.91 0.032 0.049 O ii 4288.82 V53c 3d 4P 4f D1* 2 4
* * * * * O ii 4288.82 V53c 3d 4P 4f D1* 2 24291.20 0.055 0.083 4291.34 0.051 0.077 O ii 4291.25 V55 3d 4P 4f G3* 6 8
&0.02 &0.03 * &0.03 &0.05 C ii 4292.16 4f 2F* 10g 2G 14 184292.16 0.031 0.047 4292.30 0.029 0.043 O ii 4292.21 V78c 3d 2F 4f F2* 6 64294.76 0.100 0.151 4294.89 0.093 0.140 O ii 4294.78 V53b 3d 4P 4f D2* 4 6
* * * * * O ii 4294.92 V53b 3d 4P 4f D2* 4 44303.93 0.206 0.308 4303.82 0.193 0.289 O ii 4303.82 V53a 3d 4P 4f D3* 6 8
* * * * * O ii 4303.61 V65a 3d 4D 4f G5* 8 104307.37 0.045 0.068 4307.25 0.031 0.046 O ii 4307.23 V53b 3d 4P 4f D2* 2 44312.24 0.012 0.017 4312.13 0.027 0.041 O ii 4312.11 V78a 3d 2F 4f F4* 8 84313.58 0.060 0.089 4313.46 0.036 0.054 O ii 4313.44 V78a 3d 2F 4f F4* 8 104315.53 0.058 0.087 4315.42 0.053 0.078 O ii 4315.40 V63c 3d 4D 4f D1* 4 4
* * * * * O ii 4315.39 V63c 3d 4D 4f D1* 4 2* * * * * O ii 4315.83 V78b 3d 2F 4f F3* 8 8
4317.27 0.135 0.201 4317.16 0.088 0.130 O ii 4317.14 V2 3s 4P 3p 4P* 2 44317.84 0.015 0.022 4317.72 0.047 0.070 O ii 4317.70 V53a 3d 4P 4f D3* 4 64319.76 0.092 0.136 4319.65 0.107 0.159 O ii 4319.63 V2 3s 4P 3p 4P* 4 64325.90 0.019 0.028 4325.78 0.053 0.079 O ii 4325.76 V2 3s 4P 3p 4P* 2 24331.27 0.047 0.069 4331.15 0.031 0.046 O ii 4331.13 V65b 3d 4D 4f G4* 6 84332.84 0.047 0.069 4332.73 0.070 0.103 O ii 4332.71 V65b 3d 4D 4f G4* 8 104334.33 0.036 0.053 4334.21 0.001 0.002 O ii 4334.19 V63b 3d 4D 4f D2* 6 64340.46 31.84 46.55 4340.42 33.29 48.67 H 5 4340.47 H5 2p1 2P* 5d1 2D 8 504345.56 0.176 0.256 4345.67 0.187 0.272 O ii 4345.56 V2 3s 4P 3p 4P* 4 2
* * * * * O ii 4345.55 V65c 3d 4D 4f G3* 8 84349.43 0.266 0.387 4349.54 0.285 0.413 O ii 4349.43 V2 3s 4P 3p 4P* 6 64353.60 0.037 0.053 4353.71 0.049 0.071 O ii 4353.59 V76c 3d 2F 4f G3* 6 84357.26 0.024 0.035 4357.37 0.021 0.031 O ii 4357.25 V63a 3d 4D* 4f D3* 6 8
* * * * * O ii 4357.25 V63a 3d 4D* 4f D3* 6 64363.21 2.852 4.102 4363.19 2.895 4.164 [O iii] 4363.21 F2 2p2 1D 2p2 1S 5 14366.97 0.158 0.227 4366.93 0.151 0.217 O ii 4366.89 V2 3s 4P 3p 4P* 6 44369.88 0.039 0.056 4369.53 0.039 0.056 Ne ii 4369.86 V56 3d 4F 4f 0[3]* 4 64371.70 0.046 0.066 4371.66 0.029 0.042 O ii 4371.62 V76b 3d 2F 4f G4* 8 104377.18 0.057 0.082 4377.26 0.032 0.045 ? * * *4379.19 0.486 0.691 4379.15 0.463 0.659 N iii 4379.11 V18 4f 2F* 5g 2G 14 18
* * * * * Ne ii 4379.55 V60b 3d 2F 4f 1[4]* 8 104385.79 0.043 0.060 4385.71 0.038 0.054 O ii 4386.01 3d 0 2D 4f 0 G4* 6 84388.00 0.462 0.653 4387.97 0.516 0.730 He i 4387.93 V51 2p 1P* 5d 1D 3 54392.06 0.098 0.138 4392.04 0.108 0.152 Ne ii 4391.99 V55e 3d 4F 4f 2[5]* 10 12
* * * * * Ne ii 4392.00 V55e 3d 4F 4f 2[5]* 10 104398.06 0.024 0.033 4398.03 0.032 0.045 Ne ii 4397.99 V57b 3d 4F 4f 1[4]* 6 84409.36 0.095 0.133 4409.34 0.089 0.124 Ne ii 4409.30 V55e 3d 4F 4f 2[5]* 8 104413.17 0.048 0.067 4413.26 0.041 0.058 Ne ii 4413.22 V65 3d 4P 4f 0[3]* 6 8
* * * * * Ne ii 4413.11 V57c 3d 4F 4f 1[3]* 4 6* * * * * Ne ii 4413.11 V65 3d 4P 4f 0[3]* 6 6
4414.96 0.133 0.184 4414.94 0.133 0.184 O ii 4414.90 V5 3s 2P 3p 2D* 4 64417.03 0.101 0.140 4417.01 0.124 0.171 O ii 4416.97 V5 3s 2P 3p 2D* 2 44428.62 0.075 0.102 4428.59 0.061 0.083 Ne ii 4428.64 V60c 3d 2F 4f 1[3]* 6 8
* * * * * Ne ii 4428.52 V61b 3d 2D 4f 2[3]* 6 84430.92 0.043 0.059 4430.90 0.063 0.086 Ne ii 4430.94 V61a 3d 2D 4f 2[4]* 6 84431.80 0.011 0.015 4431.77 0.011 0.015 N ii 4431.82 V55a 3d 3P* 4f 2[3] 5 54432.72 0.064 0.087 4432.69 0.062 0.084 N ii 4432.74 V55a 3d 3P* 4f 2[3] 5 74433.46 0.015 0.021 4433.43 0.015 0.020 N ii 4433.48 V55b 3d 3P* 4f 2[2] 1 34437.54 0.049 0.067 4437.51 0.043 0.058 He i 4437.55 V50 2p 1P* 5s 1S 3 14442.00 0.015 0.021 4441.98 0.037 0.050 N ii 4442.02 V55a 3d 3P* 4f 2[3] 3 54448.17 0.037 0.050 4448.14 0.011 0.015 O ii 4448.19 V35 3p 0 2F* 3d 0 2F 8 8
Dow
nloaded from https://academ
ic.oup.com/m
nras/article/312/3/585/1023114 by guest on 18 March 2022
Planetary nebula NGC 6153 593
q 2000 RAS, MNRAS 312, 585±628
Table 2 ± continued
Minor axis Entire nebula Ion l0 Mult Lower Term Upper Term g1 g2
lobs F(l) I(l) lobs F(l ) I(l )
4452.36 0.032 0.043 4452.33 0.046 0.063 O ii 4452.37 V5 3s 2P 3p 2D* 4 44457.03 0.036 0.049 4457.01 0.038 0.051 Ne ii 4457.05 V61d 3d 2D 4f 2[2]* 4 6
* * * * * Ne ii 4457.24 V61d 3d 2D 4f 2[2]* 4 44466.39 0.070 0.094 4466.37 0.079 0.106 O ii 4466.42 V86b 3d 2P 4f D2* 4 64471.49 4.640 6.172 4471.49 4.836 6.432 He i 4471.50 V14 2p 3P* 4d 3D 9 154477.89 0.046 0.060 4477.89 0.032 0.043 O ii 4477.90 V88 3d 2P 4f G3* 4 64481.20 0.033 0.043 4481.20 0.034 0.045 Mg ii 4481.21 V4 3d 2D 4f 2F* 10 144487.71 0.012 0.016 4487.71 0.008 0.010 O ii 4487.72 V104 3d 0 2P 4f 0 D2* 2 44488.19 0.024 0.032 4488.19 0.016 0.020 O ii 4488.20 V104 3d 0 2P 4f 0 D2* 4 64489.48 0.035 0.046 4489.48 0.024 0.032 O ii 4489.49 V86b 3d 2P 4f D2* 2 4
&0.03 &0.04 * &0.05 &0.07 C ii 4491.07 4f 2F* 9g 2G 14 184491.22 0.073 0.095 4491.22 0.051 0.067 O ii 4491.23 V86a 3d 2P 4f D3* 4 64510.91 0.204 0.264 4510.92 0.189 0.245 N iii 4510.91 V3 3s 0 4P* 3p 0 4D 4 6
* * * * * N iii 4510.91 V3 3s 0 4P* 3p 0 4D 2 44514.86 0.049 0.064 4514.87 0.076 0.098 N iii 4514.86 V3 3s 0 4P* 3p 0 4D 6 84518.15 0.051 0.066 4518.16 0.053 0.068 N iii 4518.15 V3 3s 0 4P* 3p 0 4D 2 24523.58 0.055 0.070 4523.59 0.069 0.089 N iii 4523.58 V3 3s 0 4P* 3p 0 4D 4 44530.42 0.096 0.122 4530.14 0.141 0.180 N ii 4530.41 V58b 3d 1F* 4f 2[5] 7 9
* * * * * N iii 4530.86 V3 3s 0 4P* 3p 0 4D 4 24534.57 0.079 0.100 4534.59 0.078 0.099 N iii 4534.58 V3 3s 0 4P* 3p 0 4D 6 64541.58 0.359 0.454 4541.60 0.358 0.453 He ii 4541.59 4.9 4f1 2F* 9g1 2G 32 *4552.52 0.080 0.100 4552.54 0.045 0.057 N ii 4552.53 V58a 3d 1F* 4f 2[4] 7 94562.77 0.044 0.055 4562.55 0.030 0.038 Mg i] 4562.60 3s2 1S 3s3p 3P* 1 54571.13 0.131 0.162 4571.17 0.111 0.138 Mg i] 4571.10 3s2 1S 3s3p 3P* 1 34591.02 0.115 0.140 4591.24 0.115 0.140 O ii 4590.97 V15 3s 0 2D 3p 0 2F* 6 84596.21 0.096 0.117 4596.43 0.082 0.100 O ii 4596.18 V15 3s 0 2D 3p 0 2F* 4 6
* * * * * O ii 4595.96 V15 3s 0 2D 3p 0 2F* 6 64601.52 0.045 0.054 4601.75 0.066 0.080 N ii 4601.48 V5 3s 3P* 3p 3P 3 54602.16 0.086 0.104 4602.40 0.058 0.070 O ii 4602.13 V92b 3d 2D 4f F3* 4 64607.19 0.060 0.073 4607.43 0.032 0.039 N ii 4607.16 V5 3s 3P* 3p 3P 1 34609.48 0.196 0.236 4609.71 0.255 0.307 O ii 4609.44 V92a 3d 2D 4f F4* 6 84610.24 0.078 0.094 4610.47 0.025 0.030 O ii 4610.20 V92c 3d 2D 4f F2* 4 64613.52 0.036 0.043 4613.51 0.054 0.065 N ii 4613.87 V5 3s 3P* 3p 3P 3 3
* * * * * O ii 4613.14 V92b 3d 2D 4f F3* 6 6* * * * * O ii 4613.68 V92b 3d 2D 4f F3* 6 8
4619.88 0.039 0.046 4620.29 0.029 0.034 ? * * *4621.43 0.050 0.059 4621.67 0.036 0.043 N ii 4621.39 V5 3s 3P* 3p 3P 3 14630.58 0.168 0.199 4630.59 0.180 0.214 N ii 4630.54 V5 3s 3P* 3p 3P 5 54634.17 1.084 1.281 4634.18 1.004 1.187 N iii 4634.14 V2 3p 2P* 3d 2D 2 44639.93 0.530 0.624 4638.90 0.455 0.536 O ii 4638.86 V1 3s 4P 3p 4D* 2 44640.67 2.212 2.601 4640.68 2.141 2.518 N iii 4640.64 V2 3p 2P* 3d 2D 4 64641.85 0.745 0.875 4641.85 0.734 0.863 O ii 4641.81 V1 3s 4P 3p 4D* 4 64641.88 0.217 0.255 4641.89 0.201 0.236 N iii 4641.84 V2 3p 2P* 3d 2D 4 44643.12 0.104 0.122 4643.13 0.123 0.144 N ii 4643.08 V5 3s 3P* 3p 3P 5 34647.48 0.244 0.285 4647.51 0.237 0.278 C iii 4647.42 V1 3s 3S 3p 3P* 3 54649.19 1.271 1.486 4649.23 1.175 1.374 O ii 4649.13 V1 3s 4P 3p 4D* 6 84650.31 0.146 0.171 4650.34 0.142 0.166 C iii 4650.25 V1 3s 3S 3p 3P* 3 34650.90 0.302 0.352 4650.93 0.284 0.332 O ii 4650.84 V1 3s 4P 3p 4D* 2 24651.53 0.049 0.057 4651.56 0.047 0.055 C iii 4651.47 V1 3s 3S 3p 3P* 3 14658.26 0.076 0.088 4658.36 0.082 0.096 [Fe iii] 4658.10 F3 3d6 5D 3d6 3F2 9 94661.68 0.379 0.439 4661.73 0.372 0.431 O ii 4661.63 V1 3s 4P 3p 4D* 4 44669.32 0.021 0.024 4669.36 0.023 0.026 O ii 4669.27 V89b 3d 2D 4f D2* 4 64673.79 0.079 0.091 4673.83 0.071 0.081 O ii 4673.73 V1 3s 4P 3p 4D* 4 24676.29 0.304 0.348 4676.33 0.262 0.300 O ii 4676.24 V1 3s 4P 3p 4D* 6 64678.19 0.046 0.053 4678.24 0.046 0.053 N ii 4678.14 V61b 3d 1P* 4f 2[2] 3 54685.78 12.23 13.91 4685.79 11.23 12.77 He ii 4685.68 3.4 3d1 2D 4f1 2F* 18 324694.63 0.041 0.047 4695.26 0.036 0.041 ? * * *4696.45 0.033 0.037 4696.51 0.055 0.062 O ii 4696.35 V1 3s 4P 3p 4D* 6 44699.32 0.042 0.047 4699.38 0.021 0.023 O ii 4699.22 V25 3p 2D* 3d 2F 4 64701.96 0.031 0.035 4701.26 0.004 0.004 [Fe iii] 4701.62 F3 3d6 5D 3d6 3F2 7 74705.45 0.036 0.040 4705.51 0.054 0.060 O ii 4705.35 V25 3p 2D* 3d 2F 6 84711.49 2.245 2.508 4711.52 2.257 2.521 [Ar iv] 4711.37 F1 3p3 4S* 3p3 2D* 4 64713.30 0.603 0.673 4713.32 0.617 0.689 He i 4713.17 V12 2p 3P* 4s 3S 9 34724.27 0.028 0.030 * * * [Ne iv] 4724.15 F1 2p3 2D* 2p3 2P* 4 44725.75 0.021 0.023 * * * [Ne iv] 4725.62 F1 2p3 2D* 2p3 2P* 4 24740.29 2.261 2.472 4740.32 2.138 2.338 [Ar iv] 4740.17 F1 3p3 4S* 3p3 2D* 4 44767.73 0.027 0.029 4766.73 0.030 0.032 ? * * *4772.93 0.031 0.033 4773.33 0.016 0.017 Ne ii 4772.93 4p 4D* 5d 4F 6 84788.27 0.047 0.050 4788.29 0.046 0.049 N ii 4788.13 V20 3p 3D 3d 3D* 5 5
&0.05 &0.06 * &0.05 &0.05 C ii 4802.23 4f 2F* 8g 2G 14 184803.43 0.112 0.117 4803.45 0.097 0.101 N ii 4803.29 V20 3p 3D 3d 3D* 7 7
Dow
nloaded from https://academ
ic.oup.com/m
nras/article/312/3/585/1023114 by guest on 18 March 2022
594 X.-W. Liu et al.
q 2000 RAS, MNRAS 312, 585±628
Table 2 ± continued
Minor axis Entire nebula Ion l0 Mult Lower Term Upper Term g1 g2
lobs F(l) I(l) lobs F(l ) I(l)
4815.86 0.032 0.033 4815.82 0.030 0.031 S ii 4815.55 V9 4s 4P 4p 4S* 6 44861.46 100.0 100.0 4861.48 100.0 100.0 H 4 4861.33 H4 2p1 2P* 4d1 2D 8 324880.53 0.027 0.027 4881.44 0.034 0.033 [Fe iii] 4881.11 F2 3d6 5D 3d6 3H 9 94891.01 0.037 0.036 4891.08 0.024 0.024 O ii 4890.86 V28 3p 4S* 3d 4P 4 24903.32 0.022 0.021 4905.04 0.030 0.029 ? * * *4906.98 0.098 0.095 4907.06 0.095 0.092 O ii 4906.83 V28 3p 4S* 3d 4P 4 44922.08 1.682 1.609 4922.16 1.677 1.604 He i 4921.93 V48 2p 1P* 4d 1D 3 54924.68 0.192 0.183 4924.76 0.192 0.184 O ii 4924.53 V28 3p 4S* 3d 4P 4 64931.30 0.125 0.119 4931.61 0.123 0.117 [O iii] 4931.80 F1 2p2 3P 2p2 1D 1 54935.54 0.025 0.024 4934.56 0.023 0.022 ? * * *4941.22 0.010 0.010 4941.30 0.018 0.017 O ii 4941.07 V33 3p 2P* 3d 2D 2 44943.15 0.042 0.039 4943.23 0.011 0.010 O ii 4943.00 V33 3p 2P* 3d 2D 4 64958.62 316.7 294.7 4958.70 317.6 295.6 [O iii] 4958.91 F1 2p2 3P 2p2 1D 3 55006.56 953.1 856.4 5006.61 987.4 887.2 [O iii] 5006.84 F1 2p2 3P 2p2 1D 5 55040.99 0.299 0.262 5040.58 0.207 0.181 Si ii 5041.03 V5 4p 2P* 4d 2D 2 45047.42 0.176 0.153 5047.36 0.119 0.104 He i 5047.74 V47 2p 1P* 4s 1S 3 15056.51 0.120 0.104 5055.93 0.109 0.095 Si ii 5055.98 V5 4p 2P* 4d 2D 4 6
* * * * * Si ii 5056.31 V5 4p 2P* 4d 2D 4 45191.03 0.120 0.094 5191.69 0.125 0.098 [Ar iii] 5191.82 F3 2p4 1D 2p4 1S 5 15198.77 0.336 0.262 5198.93 0.304 0.238 [N i] 5199.84 F1 2p3 4S* 2p3 2D* 4 4
* * * * * [N i] 5200.26 F1 2p3 4S* 2p3 2D* 4 65341.54 0.163 0.115 5340.42 0.140 0.099 C ii 5342.38 4f 2F* 7g 2G 14 185411.25 1.462 0.980 5411.39 1.511 1.013 He ii 5411.52 4.7 4f1 2F* 7g1 2G 32 985454.42 0.084 0.055 * * * S ii 5453.83 V6 4s 4P 4p 4D* 6 85517.41 0.868 0.547 5517.51 0.865 0.545 [Cl iii] 5517.66 F1 2p3 4S* 2p3 2D* 4 65537.50 1.085 0.677 5537.78 1.113 0.694 [Cl iii] 5537.60 F1 2p3 4S* 2p3 2D* 4 45578.12 0.055 0.034 * * * [O i] 5577.34 F3 2p4 1D 2p4 1S 5 15592.90 0.081 0.049 5593.43 0.096 0.058 O iii 5592.37 V5 3s 1P* 3p 1P 3 35666.54 0.405 0.236 5666.59 0.376 0.220 N ii 5666.63 V3 3s 3P* 3p 3D 3 55675.93 0.205 0.119 5675.98 0.217 0.126 N ii 5676.02 V3 3s 3P* 3p 3D 1 35679.48 0.924 0.536 5679.53 0.749 0.434 N ii 5679.56 V3 3s 3P* 3p 3D 5 75686.13 0.148 0.086 5686.18 0.157 0.091 N ii 5686.21 V3 3s 3P* 3p 3D 3 35710.68 0.171 0.097 5710.73 0.099 0.057 N ii 5710.77 V3 3s 3P* 3p 3D 5 55754.48 1.771 0.989 5754.49 1.476 0.825 [N ii] 5754.60 F3 2p2 1D 2p2 1S 5 15800.65 0.082 0.045 5802.43 0.073 0.040 C iv 5801.51 V1 3s 2S 3p 2P* 2 45811.07 0.039 0.021 * * * C iv 5812.14 V1 3s 2S 3p 2P* 2 2
* * 5817.06 0.059 0.032 O ii 5817.19 5p 4D* 5s 0 2D 4 45875.60 35.13 18.47 5875.57 35.63 18.74 He i 5875.66 V11 2p 3P* 3d 3D 9 155890.36 0.094 0.049 * * * C ii 5890.34 V5 3d 2D 4p 2P* 10 65912.53 0.046 0.024 5914.46 0.043 0.022 He ii 5913.26 5.26 5g1 2G 26h1 2H* 50 *5928.18 0.065 0.033 5927.72 0.103 0.053 N ii 5927.81 V28 3p 3P 3d 3D* 1 35932.14 0.096 0.049 5931.69 0.103 0.053 N ii 5931.78 V28 3p 3P 3d 3D* 3 5
* * * * * He ii 5931.84 5.25 5g1 2G 25h1 2H* 50 *5940.61 0.067 0.034 * * * N ii 5940.24 V28 3p 3P 3d 3D* 3 35942.02 0.181 0.092 5941.56 0.175 0.089 N ii 5941.65 V28 3p 3P 3d 3D* 5 75952.76 0.055 0.028 5952.30 0.059 0.030 He ii 5952.94 5.24 5g1 2G 24h1 2H* 50 *
* * * * * N ii 5952.39 V28 3p 3P 3d 3D* 5 55978.17 0.079 0.040 5976.54 0.057 0.029 He ii 5977.03 5.23 5g1 2G 23h1 2H* 50 *6004.11 0.076 0.038 6004.57 0.068 0.034 He ii 6004.73 5.22 5g1 2G 22h1 2H* 50 *6024.94 0.042 0.021 6023.97 0.045 0.022 [Mn v] 6024.40 3d3 4F 3d3 4P 4 4
* * 6037.44 0.055 0.027 He ii 6036.70 5.21 5g1 2G 21h1 2H* 50 *6074.25 0.121 0.058 * * * He ii 6074.10 5.20 5g1 2G 20h1 2H* 50 *6097.07 0.088 0.042 6096.92 0.063 0.030 ? * * *6103.13 0.206 0.097 6102.55 0.273 0.129 [K iv] 6101.83 F1 3p4 3P 3d4 1D 5 56117.41 0.155 0.072 6117.60 0.099 0.046 He ii 6118.20 5.19 5g1 2G 19h1 2H* 50 *6151.46 0.220 0.101 6150.48 0.165 0.076 C ii 6151.43 V16.04 4d 2D 6f 2F* 10 146157.94 0.079 0.036 6156.05 0.124 0.057 [Mn v] 6157.60 3d3 4F 3d3 4P 6 46167.25 0.090 0.041 6165.52 0.089 0.041 [Mn v] 6166.00 3d3 4F 3d3 4P 8 66171.86 0.127 0.058 6171.35 0.167 0.076 He ii 6170.60 5.18 5g1 2G 18h1 2H* 50 *
* * 6197.81 0.046 0.021 O ii 6197.92 2p4 2P 3p 0 2F* 4 66220.42 0.085 0.038 * * * [Mn v] 6219.10 3d3 4F 3d3 4P 6 26234.34 0.155 0.069 6232.97 0.109 0.048 He ii 6233.80 5.17 5g1 2G 17h1 2H* 50 *6252.39 0.079 0.035 6251.43 0.040 0.017 ? * * *6259.39 0.082 0.036 6256.97 0.075 0.033 C ii 6258.78 V10.03 4p 2P* 5d 2D 4 66300.75 2.954 1.272 6300.82 1.815 0.781 [O i] 6300.34 F1 2p4 3P 2p4 1D 5 56312.41 3.180 1.362 6312.40 3.088 1.322 [S iii] 6312.10 F3 2p2 1D 2p2 1S 5 1
* * * * * He ii 6310.80 5.16 5g1 2G 16h1 2H* 50 *6347.17 0.284 0.120 6346.67 0.228 0.096 Si ii 6347.10 V2 4s 2S 4p 2P* 2 46364.27 1.004 0.420 6364.38 0.568 0.238 [O i] 6363.78 F1 2p4 3P 2p4 1D 3 56371.67 0.395 0.165 6371.77 0.362 0.151 Si ii 6371.38 V2 4s 2S 4p 2P* 2 26394.06 0.112 0.046 6397.69 0.113 0.047 [Mn v] 6393.60 3d3 4F 3d3 4P 10 6
Dow
nloaded from https://academ
ic.oup.com/m
nras/article/312/3/585/1023114 by guest on 18 March 2022
Planetary nebula NGC 6153 595
was used throughout the observations. Two wavelength regions
were observed in 1995 and 1997. A 2400 groove mm21 holo-
graphic grating was used in first order to cover the ll3995±4978
wavelength region at a spectral resolution of 1.5 AÊ FWHM. Three
exposures were obtained during each run, each with an integration
time of 30 min, except one in 1997 of 1140 s. A second grating in
first order, along with a WG345 order-sorting filter, was used to
cover the ll3535±7400 wavelength range, at a resolution of
4.5 AÊ . The grating had extremely low second-order transmission,
and the spectra obtained were free of contamination from second
spectral order beyond 6800 AÊ , up to the end of the wavelength
coverage. Both short and long exposures, with typical integration
times of 2 and 10 min, were obtained to ensure that strong lines
such as Ha and the [O iii] ll4959, 5007 lines were not saturated
on the short exposures. In 1996, an extra wavelength range,
ll3040±4040, was observed with the 2400 groove mm21 holo-
graphic grating. Three exposures, each of 30-min integration time,
were obtained.
In 1995 and 1996, the slit was positioned through the central
star and the two bright condensations in PA � 1228: 8, roughly
defined as the nebular minor axis (Fig. 1). NGC 6153 has an
angular size of approximately 27 by 34 arcsec (Fig. 1). Uncer-
tainties may arise from ionization stratification when comparing
ionic abundances derived from ground-based narrow-slit optical
spectroscopy and from UV and IR observations obtained with
space-borne facilities, which use large apertures and thus yield
total line fluxes for the whole nebula. To avoid such uncertainties,
during the 1997 run the 2-arcsec-wide and ,3.5-arcmin-long slit
of the B&C spectrograph was used to scan uniformly across the
whole nebular surface by differentially driving the telescope in
Right Ascension. The mean spectra thus obtained, combined with
the total Hb flux measured with a large aperture �log F�Hb� �210:86 erg cm22 s21; Cahn, Kaler & Stanghellini 1992], yield
integrated fluxes over the whole nebula for all lines detected in our
deep slit spectra, which are directly comparable to those obtained
with the space-borne facilities.
2.1.2 Data reduction
The spectra were reduced with standard procedures using the
long92 package in midas.1 The spectra were bias-subtracted, flat-
fielded and cosmic rays removed, and then wavelength-calibrated
using exposures of a He-Ar calibration lamp. During the 1997 run,
twilight sky flat-fields were also obtained, which were used to
correct the small variations in illumination along the slit, which
are &1 per cent, except near the edges of the spectral coverage
where the peak-to-peak variations amount to about 3 per cent. For
the 1995 and 1996 runs, the spectra were flux-calibrated using
wide-slit (8-arcsec) observations of the HST standard stars Feige
110 and (the nucleus of planetary nebula) NGC 7293 (Walsh
1993). In 1997, the CTIO standard stars LTT 4364, LTT 6248
(Hamuy et al. 1994) and the HST standard HD 49798 (Walsh
1993) were used.
q 2000 RAS, MNRAS 312, 585±628
Table 2 ± continued
Minor axis Entire nebula Ion l0 Mult Lower Term Upper Term g1 g2
lobs F(l) I(l) lobs F(l ) I(l )
6406.26 0.170 0.070 6406.18 0.157 0.064 He ii 6406.30 5.15 5g1 2G 15h1 2H* 50 *6462.09 0.603 0.241 6462.69 0.618 0.248 C ii 6461.95 4f 2F* 6g 2G 14 186481.96 0.113 0.045 6483.47 0.094 0.037 N ii 6482.05 V8 3s 1P* 3p 1P 3 36486.61 0.146 0.058 6487.49 0.065 0.026 ? * * *6497.82 0.099 0.039 6497.13 0.131 0.052 ? * * *6501.64 0.208 0.082 6501.78 0.267 0.105 ? * * *6511.07 0.017 0.007 6510.84 0.139 0.055 ? * * *6528.00 0.118 0.046 6526.87 0.136 0.053 He ii 6527.11 5.14 5g1 2G 14h1 2H* 50 *6548.70 48.55 18.74 6548.56 39.99 15.43 [N ii] 6548.10 F1 2p2 3P 2p2 1D 3 56563.30 740.0 283.8 6563.19 772.7 296.3 H 3 6562.77 H3 2p1 2P* 3d1 2D 8 186584.07 148.0 56.26 6583.94 127.3 48.39 [N ii] 6583.50 F1 2p2 3P 2p2 1D 5 56678.73 12.74 4.656 6678.69 13.37 4.886 He i 6678.16 V46 2p 1P* 3d 1D 3 56717.15 10.36 3.727 6717.07 8.738 3.144 [S ii] 6716.44 F2 2p3 4S* 2p3 2D* 4 66731.52 16.87 6.032 6731.38 14.62 5.228 [S ii] 6730.82 F2 2p3 4S* 2p3 2D* 4 46794.69 0.074 0.026 * * * [K iv] 6795.00 F1 3p4 3P 3p4 1D 3 57065.67 13.71 4.299 7065.52 13.78 4.321 He i 7065.25 V10 2p 3P* 3s 3S 9 37136.16 55.57 16.97 7135.90 61.88 18.89 [Ar iii] 7135.80 F1 3p4 3P 3p4 1D 5 57161.14 0.195 0.059 7161.30 0.256 0.078 He i 7160.56 3s 3S 10p 3P* 3 97170.14 0.240 0.072 7170.94 0.132 0.040 [Ar iv] 7170.62 F2 3p3 2D* 3p3 2P* 4 47177.85 0.528 0.159 7177.49 0.344 0.103 He ii 7177.50 5.11 5g1 2G 11h1 2H* 50 *7231.44 1.280 0.378 7231.17 1.207 0.356 C ii 7231.32 V3 3p 2P* 3d 2D 2 47236.85 2.985 0.879 7236.65 2.557 0.753 C ii 7236.42 V3 3p 2P* 3d 2D 4 6
* * * * * C ii 7237.17 V3 3p 2P* 3d 2D 4 4* * * * * [Ar iv] 7237.26 F2 3p3 2D* 3p3 2P* 6 4
7263.36 0.153 0.045 7266.30 0.138 0.040 [Ar iv] 7262.76 F2 3p3 2D* 3p3 2P* 4 27281.59 1.955 0.566 7281.40 1.938 0.561 He i 7281.35 V45 2p 1P* 3s 1S 3 17293.18 0.049 0.014 7295.78 0.165 0.048 ? * * *7297.06 0.131 0.038 7299.66 0.031 0.009 He i 7298.04 3s 3S 9p 3P* 3 97320.04 6.722 1.921 7319.59 6.076 1.737 [O ii] 7318.92 F2 2p3 2D* 2p3 2P* 6 2
* * * * * [O ii] 7319.99 F2 2p3 2D* 2p3 2P* 6 47330.34 5.397 1.537 7329.85 5.471 1.558 [O ii] 7329.67 F2 2p3 2D* 2p3 2P* 4 2
* * * * * [O ii] 7330.73 F2 2p3 2D* 2p3 2P* 4 4
a Includes H 14, [S iii l3722, [O ii] ll3726, 3729 and H 13;b Includes O iii l3791, H 10 and He i l3806;c Includes [Ne iii l3967 and H 7.
1 midas is developed and distributed by the European Southern
Observatory.
Dow
nloaded from https://academ
ic.oup.com/m
nras/article/312/3/585/1023114 by guest on 18 March 2022
596 X.-W. Liu et al.
Shortwards of 3400 AÊ , the spectra are affected by ozone
absorption bands (Schachter 1991). The bands were not resolved
and have a typical width of ,15 AÊ , i.e., much wider than the
nebular emission lines. To remove the ozone absorption, in 1996
the standard stars Feige 110 and the nucleus of NGC 7293 were
also observed with a narrow 2-arcsec slit, i.e., the same as that
used for nebular observations. Both stars have no noticeable
intrinsic absorption features within this wavelength region, except
for a weak He ii line at 3203 AÊ in the spectrum of Feige 110. These
narrow-slit spectra were used to derive the ozone opacity per unit
airmass as a function of wavelength relative to the mean
atmospheric extinction curve of the ESO La Silla site. The
opacity curve, scaled by the airmasses of the nebular exposures,
was then used to divide out the ozone absorption bands. For an
airmass of unity, the peak-to-peak corrections amount to ,10 per
cent.
Fig. 2 shows the medium-resolution spectra of NGC 6153 from
3540 to 7400 AÊ , after integrating along the slit. Both the minor-
axis spectrum and the mean spectrum for the whole nebula
obtained by scanning across the nebular surface are plotted, with
prominent features identified. The spectra have not been corrected
for interstellar dust extinction. Note the remarkable strengths of
the C ii l4267, ll7231, 7237 and N ii l5670 recombination
lines, which stand out clearly even on these spectra of relatively
low resolution. Many of the C, N, O and Ne recombination lines
fall between 4000 and 4960 AÊ . Spectra of this wavelength region
are plotted in Fig. 3. To accommodate the wide range of line
strengths, even amongst the ORLs from heavy-element ions, the
spectra were continuum-subtracted (a first-order polynomial was
sufficient to fit the continuum for the whole wavelength range
plotted), and a constant value of 0.1 added before being plotted in
Fig. 3 on a logarithmic scale. The minor-axis spectrum was further
scaled down by a factor of 2.5 to separate it from the scanned
spectrum for the whole nebula. In Fig. 3, recombination lines from
C, N, O and Ne ions are marked above the spectra, whereas those
from H i, He i and He ii are marked below the spectra along with
CELs. The N iii lines at 4097, 4634 and 4640 AÊ are dominated by
Bowen fluorescence excitation, and are therefore not suitable for
abundance determinations.
A full list of lines and their measured fluxes, detected in the
minor-axis and scanned spectra, are presented in Table 2. Columns
1±3 give respectively the observed wavelengths (after correction
for Doppler shifts using H i Balmer lines) and the observed [F(l)]
and dereddened [I(l )] fluxes from the minor-axis spectrum.
Results from the scanned spectrum are listed in columns 4±6. The
remaining columns of Table 2 give, in sequence, the ionic
identification, laboratory wavelength, multiplet number (with a
prefix `V' for permitted lines and `F' for forbidden lines), the
lower and upper spectral terms of the transition, and the statistical
weights of the lower and upper levels. All fluxes are normalized
such that Hb � 100, with the dereddened flux given by
I�l� � 10c�Hb�f �l�F�l�;
where c�Hb� � 1:30 is the logarithmic extinction at Hb (cf.
Section 3.1), and f (l ) is the standard Galactic extinction curve for
a total-to-selective extinction ratio of R � 3:1 (Howarth 1983).
All the line fluxes tabulated in Table 2 were derived using
Gaussian line profile fitting techniques, except for the strongest
ones for which the fluxes derived by simply integrating over the line
profiles were adopted. NGC 6153 has an [O iii] expansion velocity
of ,22 km s21 (Anandarao & Banerjee 1988; Meatheringham,
Wood & Faulkner 1988), which yields a line profile splitting of
0.66 AÊ at 4500 AÊ , smaller than the spectral resolution of 1.5 AÊ
FWHM of our high-resolution spectra. Thus in all cases, the
observed linewidths are dominated by instrumental broadening.
For blended features, multiple Gaussians of equal linewidths were
used to fit the observed profiles. To further constrain the fits, we
often made use of the laboratory wavelengths, which are
accurately known for nearly all of the identified features, by
assuming that the difference between the observed wavelengths of
any two blended features is the same as for their laboratory
wavelengths. In a few cases where several lines blended closely
together and the data were not sufficient to yield unique fluxes for
the individual components, we proceeded by fixing the relative
intensities of some of the components arising from the same ion
until a reasonable fit was achieved. As an example, the broad
feature near 4275 AÊ is a blend of more than 10 O ii recombination
lines, all from the 3d±4f configuration. After neglecting a few
minor components, this whole feature was fitted by the sum of
seven Gaussians, with their relative intensities fixed as those
predicted by recombination theory (LSBC). Although the fluxes of
individual components thus derived do not contain independent
information, the fit reproduced well the broad asymmetric profile
of the feature. The feature at 4650 AÊ is a blend of two O ii lines at
4649.13 and 4650.84 AÊ (multiplet V 1) and three C iii lines from
multiplet V 1. The whole blend was fitted by assuming that the
C iii ll4647.42, 4650.25 and 4651.47 lines have intensity ratios
of 5:3:1, as predicted for LS-coupling. As a final example, the
intensity ratio of the [S ii] ll4068, 4075 doublet is found to be
nearly independent of Te and Ne for the nebular conditions of
concern here. In fitting the 4065±4082 AÊ region, we have
therefore fixed the intensity ratio to l4075= l4068 � 0:337; the
value predicted for Te � 9100 K and Ne � 3500 cm23 (cf. Section
3.2).
Typical line flux errors are estimated to be less than 5 per cent
for lines with observed fluxes F�l� $ 0:2 [in units of F�Hb� �100�; 10 per cent for those with 0:1 # F�l� , 0:2, 20 per cent for
0:05 # F�l� , 0:1, and 30 per cent or higher for lines with
F�l� , 0:05. For a given flux range, the errors for lines
q 2000 RAS, MNRAS 312, 585±628
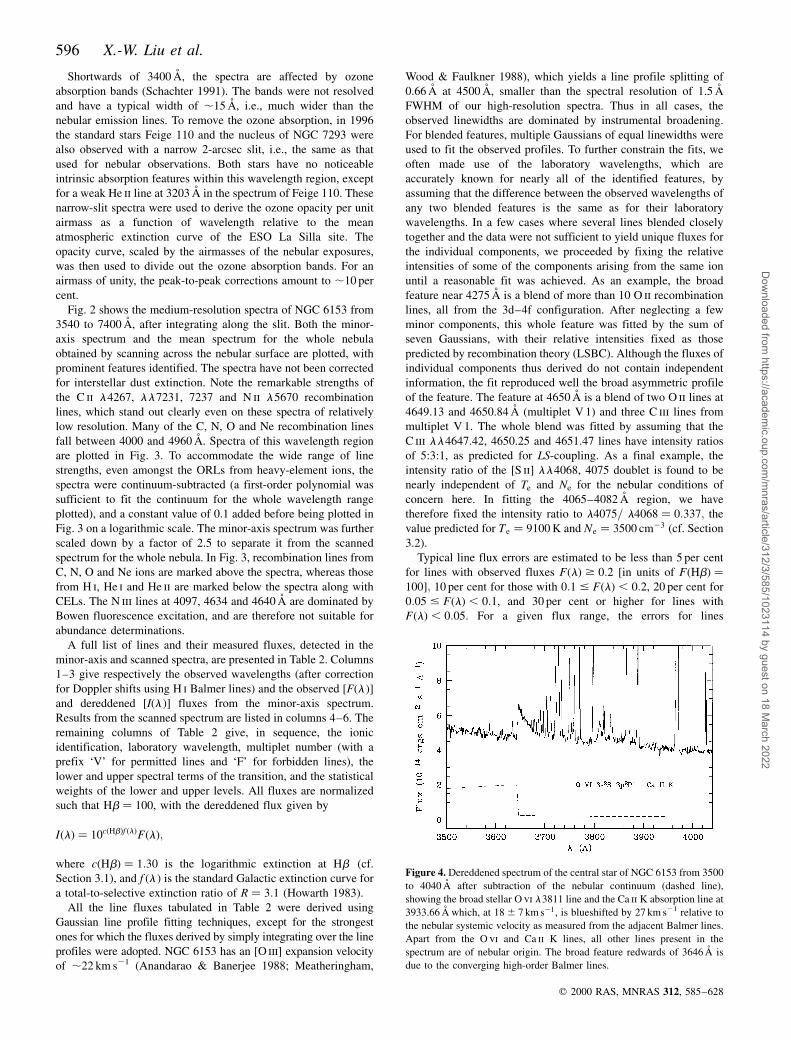
Figure 4. Dereddened spectrum of the central star of NGC 6153 from 3500
to 4040 AÊ after subtraction of the nebular continuum (dashed line),
showing the broad stellar O vi l3811 line and the Ca ii K absorption line at
3933.66 AÊ which, at 18 ^ 7 km s21, is blueshifted by 27 km s21 relative to
the nebular systemic velocity as measured from the adjacent Balmer lines.
Apart from the O vi and Ca ii K lines, all other lines present in the
spectrum are of nebular origin. The broad feature redwards of 3646 AÊ is
due to the converging high-order Balmer lines.
Dow
nloaded from https://academ
ic.oup.com/m
nras/article/312/3/585/1023114 by guest on 18 March 2022
Planetary nebula NGC 6153 597
shortwards of 3400 AÊ are somewhat larger, due to the decreasing
CCD efficiency and the effects of ozone absorption.
2.1.3 O vi emission from the central star
A broad emission line, identified as O vi 3s 2S±3p 2Po l3811.35
(multiplet 1), has been detected from the central star of NGC
6153. Fig. 4 shows the spectrum of the star from 3500 to 4040 AÊ .
The spectrum was extracted from the long-slit minor-axis
spectrum by integrating over a slit length of 4.89 arcsec centred
on the position of the central star. After correcting for extinction
using a reddening constant of c�Hb� � 1:30 (cf. Section 3.1), the
contribution from the nebular continuum was subtracted. The
nebular continuum was calculated from the flux of He at 3970 AÊ ,
using an electron temperature of 6000 K as derived from the ratio
of the nebular continuum Balmer discontinuity to H 11, an
electron density of 3500 cm23, and He ionic abundances of
He1=H1 � 0:118 and He21=H1 � 0:019 (cf. Section 3.2 Tables
6 and 9, and Sections 4.2, 4.3, Figs 14±16). The l3811 feature
has an observed peak wavelength of 3811.36 AÊ , after correcting
for the nebular radial velocity measured from nearby Balmer lines.
This wavelength agrees very well with the rest wavelength of
3811.35 AÊ of the stronger component of the O vi 3s 2S±3p 2Po
ll3811, 3834 doublet. It has a FWHM of 5.7 AÊ , about 4 times
larger than the instrumental width of 1.5 AÊ FWHM, confirming
that it is a stellar emission line. After the nebular continuum
subtraction, the line has an emission equivalent width of
2:3 ^ 0:5 �A. The other component of the O vi doublet, at
3834.24 AÊ , is lost in the strong nebular H 9 line at 3835.35 AÊ .
For optically thin emission, the l3834.24 line should have an
intensity half that of the l3811.35 line. Apart from the O vi l3811
line, no other stellar emission lines are detected, except possibly
the C iv 3s 2S±3p 2Po doublet at 5801 and 5812 AÊ , with estimated
equivalent widths of 1:4 ^ 0:3 and 0:8 ^ 0:2 �A. The lines are not
resolved at the spectral resolution of 4.5 AÊ FWHM available for
this wavelength region. However, nebular emission in these lines
would not be expected from a PN of NGC 6153's excitation class.
The detection of broad O vi l3811.35 emission from the central
star, as well as C iv ll5801,12 emission, implies that it is
hydrogen-deficient (Mendez 1991). Central stars showing these
features in emission were originally classified by Smith & Aller
(1969) as members of an O vi `sequence'. Those which show these
lines strongly in emission have been classified as WO stars by
Crowther, De Marco & Barlow (1998), while those showing them
only weakly in emission have been classified as [WC]±PG1159
WEL (weak emission line) stars by Parthasarathy, Acker &
Stenholm (1998). The relative weakness of its O vi and C iv lines
puts the central star of NGC 6153 in the latter category, similar to
the central stars of Abell 30 and Abell 78, which have well-known
hydrogen-deficient central nebular condensations. We shall return
to the possible significance of this link in Section 6.
2.1.4 Ca ii absorption
The Ca ii 4s 2S1=2±4p 2Po3=2 K line at 3933.66 AÊ is clearly detected
in absorption in our deep spectrum (Fig. 4). The H component of
the Ca ii doublet, at 3968.47 AÊ , is lost in the strong emission from
the [Ne iii] l3967.46 line and He l3970.07. The K line has an
equivalent width of 0:20 ^ 0:04 �A, and is almost certainly
saturated unless it consists of several unresolved components at
different radial velocities. At a radial velocity of VLSR � 18 ^
7 km s21; the absorption line is blueshifted by 27 km s21 relative
to the nebular radial velocity (VLSR � 144:9 km s21; Schneider
et al. 1983), i.e., approximately the same as the nebular expansion
velocity (Anandarao & Banerjee 1988; Meatheringham et al.
1988). The predicted Galactic rotational velocity towards NGC
6153 (l � 3418: 8; b � 58: 4) remains negative out to distances
d . 10 kpc. At the Shklovsky distance of 1.3 kpc for NGC 6153
(Cahn et al. 1992), the Galactic rotation curve predicts a radial
velocity of ,210 km s21 (Fich, Blitz & Stark 1989). Thus,
despite the large interstellar extinction towards NGC 6153
(Section 3.1), the measured radial velocity of the Ca ii K line
suggests that the absorption arises from a neutral envelope around
NGC 6153, rather than from intervening diffuse clouds along the
line of sight towards NGC 6153. On the other hand, the weakness
of the [O i] ll6300, 6363 and [N i] ll5198, 5200 emission lines
from NGC 6153 (Table 2), and the non-detection of the [O i] 63-,
146-mm and [C ii] 158-mm lines after background subtraction
(Table 3), suggest that NGC 6153 has little neutral material and is
probably matter-bounded rather than ionization-bounded. Obser-
vations of higher spectral resolution would be invaluable in
clarifying the origin of the strong Ca ii K line absorption detected
towards NGC 6153.
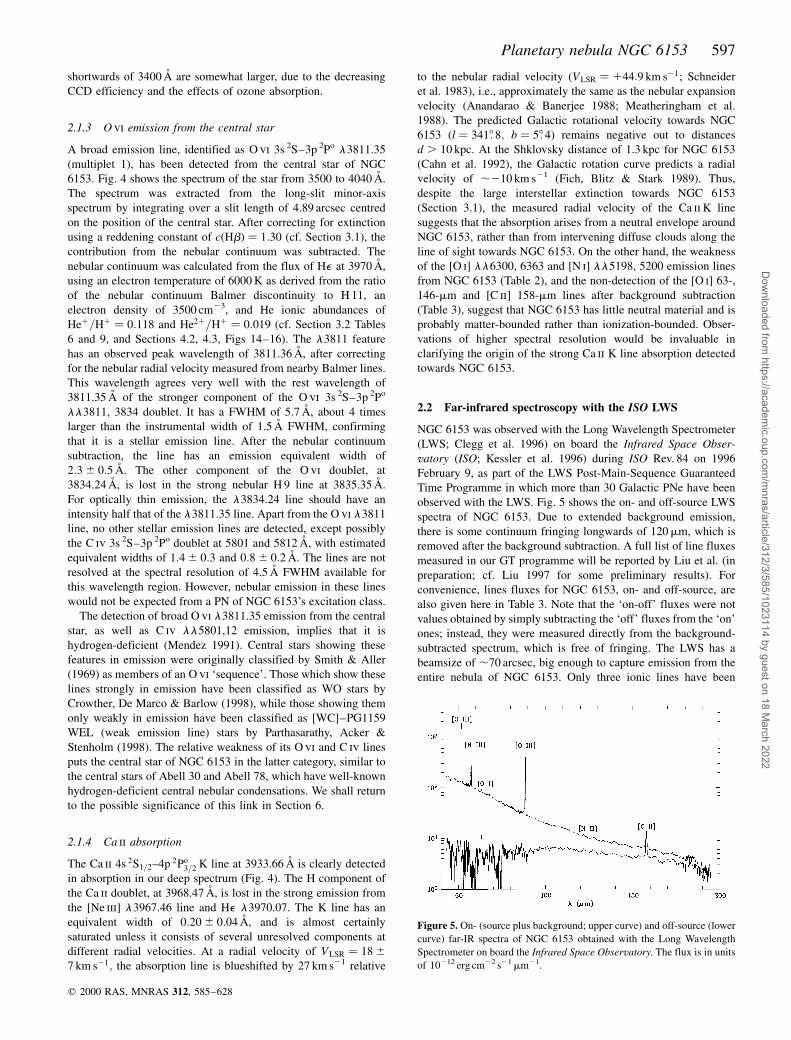
2.2 Far-infrared spectroscopy with the ISO LWS
NGC 6153 was observed with the Long Wavelength Spectrometer
(LWS; Clegg et al. 1996) on board the Infrared Space Obser-
vatory (ISO; Kessler et al. 1996) during ISO Rev. 84 on 1996
February 9, as part of the LWS Post-Main-Sequence Guaranteed
Time Programme in which more than 30 Galactic PNe have been
observed with the LWS. Fig. 5 shows the on- and off-source LWS
spectra of NGC 6153. Due to extended background emission,
there is some continuum fringing longwards of 120mm, which is
removed after the background subtraction. A full list of line fluxes
measured in our GT programme will be reported by Liu et al. (in
preparation; cf. Liu 1997 for some preliminary results). For
convenience, lines fluxes for NGC 6153, on- and off-source, are
also given here in Table 3. Note that the `on-off' fluxes were not
values obtained by simply subtracting the `off' fluxes from the `on'
ones; instead, they were measured directly from the background-
subtracted spectrum, which is free of fringing. The LWS has a
beamsize of ,70 arcsec, big enough to capture emission from the
entire nebula of NGC 6153. Only three ionic lines have been
q 2000 RAS, MNRAS 312, 585±628
Figure 5. On- (source plus background; upper curve) and off-source (lower
curve) far-IR spectra of NGC 6153 obtained with the Long Wavelength
Spectrometer on board the Infrared Space Observatory. The flux is in units
of 10212 erg cm22 s21mm21.
Dow
nloaded from https://academ
ic.oup.com/m
nras/article/312/3/585/1023114 by guest on 18 March 2022
598 X.-W. Liu et al.
detected from NGC 6153, the [O iii] 52- and 88-mm and [N iii] 57-
mm lines. The [O i], [N ii] and [C ii] lines seen in the on-source
spectrum are entirely due to Galactic background emission. The
last three columns of Table 3 give line fluxes after normalization
to Hb � 100, assuming a dereddened total Hb flux of
log I�Hb� � 29:67 erg cm22 s21 (cf. Section 3.1).
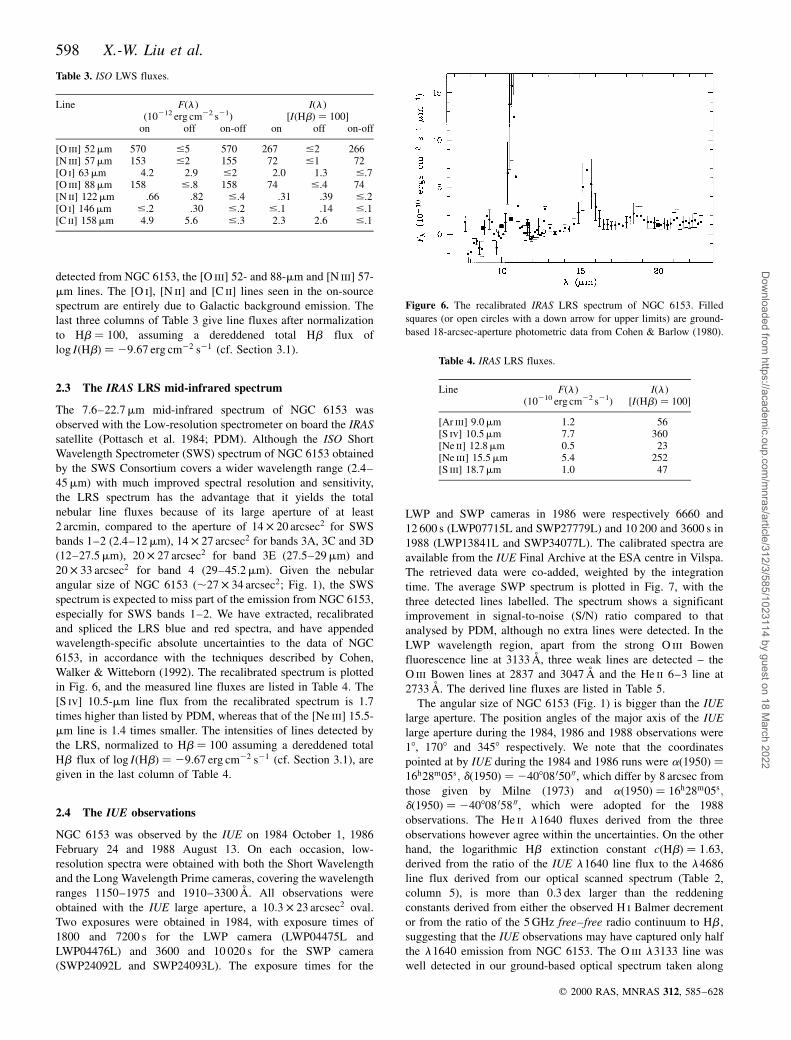
2.3 The IRAS LRS mid-infrared spectrum
The 7.6±22.7mm mid-infrared spectrum of NGC 6153 was
observed with the Low-resolution spectrometer on board the IRAS
satellite (Pottasch et al. 1984; PDM). Although the ISO Short
Wavelength Spectrometer (SWS) spectrum of NGC 6153 obtained
by the SWS Consortium covers a wider wavelength range (2.4±
45mm) with much improved spectral resolution and sensitivity,
the LRS spectrum has the advantage that it yields the total
nebular line fluxes because of its large aperture of at least
2 arcmin, compared to the aperture of 14 � 20 arcsec2 for SWS
bands 1±2 (2.4±12mm), 14 � 27 arcsec2 for bands 3A, 3C and 3D
(12±27.5mm), 20 � 27 arcsec2 for band 3E (27.5±29mm) and
20 � 33 arcsec2 for band 4 (29±45.2mm). Given the nebular
angular size of NGC 6153 (,27 � 34 arcsec2; Fig. 1), the SWS
spectrum is expected to miss part of the emission from NGC 6153,
especially for SWS bands 1±2. We have extracted, recalibrated
and spliced the LRS blue and red spectra, and have appended
wavelength-specific absolute uncertainties to the data of NGC
6153, in accordance with the techniques described by Cohen,
Walker & Witteborn (1992). The recalibrated spectrum is plotted
in Fig. 6, and the measured line fluxes are listed in Table 4. The
[S iv] 10.5-mm line flux from the recalibrated spectrum is 1.7
times higher than listed by PDM, whereas that of the [Ne iii] 15.5-
mm line is 1.4 times smaller. The intensities of lines detected by
the LRS, normalized to Hb � 100 assuming a dereddened total
Hb flux of log I�Hb� � 29:67 erg cm22 s21 (cf. Section 3.1), are
given in the last column of Table 4.
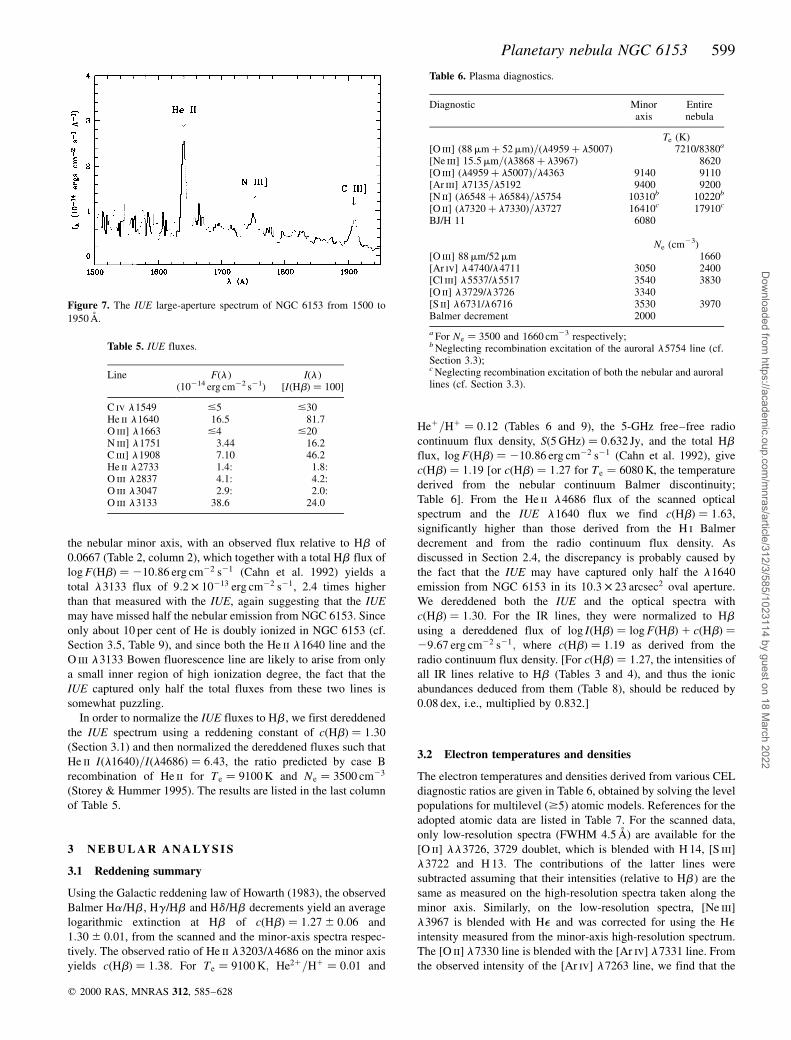
2.4 The IUE observations
NGC 6153 was observed by the IUE on 1984 October 1, 1986
February 24 and 1988 August 13. On each occasion, low-
resolution spectra were obtained with both the Short Wavelength
and the Long Wavelength Prime cameras, covering the wavelength
ranges 1150±1975 and 1910±3300 AÊ . All observations were
obtained with the IUE large aperture, a 10:3 � 23 arcsec2 oval.
Two exposures were obtained in 1984, with exposure times of
1800 and 7200 s for the LWP camera (LWP04475L and
LWP04476L) and 3600 and 10 020 s for the SWP camera
(SWP24092L and SWP24093L). The exposure times for the
LWP and SWP cameras in 1986 were respectively 6660 and
12 600 s (LWP07715L and SWP27779L) and 10 200 and 3600 s in
1988 (LWP13841L and SWP34077L). The calibrated spectra are
available from the IUE Final Archive at the ESA centre in Vilspa.
The retrieved data were co-added, weighted by the integration
time. The average SWP spectrum is plotted in Fig. 7, with the
three detected lines labelled. The spectrum shows a significant
improvement in signal-to-noise (S/N) ratio compared to that
analysed by PDM, although no extra lines were detected. In the
LWP wavelength region, apart from the strong O iii Bowen
fluorescence line at 3133 AÊ , three weak lines are detected ± the
O iii Bowen lines at 2837 and 3047 AÊ and the He ii 6±3 line at
2733 AÊ . The derived line fluxes are listed in Table 5.
The angular size of NGC 6153 (Fig. 1) is bigger than the IUE
large aperture. The position angles of the major axis of the IUE
large aperture during the 1984, 1986 and 1988 observations were
18, 1708 and 3458 respectively. We note that the coordinates
pointed at by IUE during the 1984 and 1986 runs were a�1950� �16h28m05s; d�1950� � 240808 050 00, which differ by 8 arcsec from
those given by Milne (1973) and a�1950� � 16h28m05s;d�1950� � 240808 058 00, which were adopted for the 1988
observations. The He ii l1640 fluxes derived from the three
observations however agree within the uncertainties. On the other
hand, the logarithmic Hb extinction constant c�Hb� � 1:63,
derived from the ratio of the IUE l1640 line flux to the l4686
line flux derived from our optical scanned spectrum (Table 2,
column 5), is more than 0.3 dex larger than the reddening
constants derived from either the observed H i Balmer decrement
or from the ratio of the 5 GHz free±free radio continuum to Hb ,
suggesting that the IUE observations may have captured only half
the l1640 emission from NGC 6153. The O iii l3133 line was
well detected in our ground-based optical spectrum taken along
q 2000 RAS, MNRAS 312, 585±628
Table 3. ISO LWS fluxes.
Line F(l ) I(l )(10212 erg cm22 s21) �I�Hb� � 100�
on off on-off on off on-off
[O iii] 52mm 570 #5 570 267 #2 266[N iii] 57mm 153 #2 155 72 #1 72[O i] 63mm 4.2 2.9 #2 2.0 1.3 #.7[O iii] 88mm 158 #.8 158 74 #.4 74[N ii] 122mm .66 .82 #.4 .31 .39 #.2[O i] 146mm #.2 .30 #.2 #.1 .14 #.1[C ii] 158mm 4.9 5.6 #.3 2.3 2.6 #.1
Figure 6. The recalibrated IRAS LRS spectrum of NGC 6153. Filled
squares (or open circles with a down arrow for upper limits) are ground-
based 18-arcsec-aperture photometric data from Cohen & Barlow (1980).
Table 4. IRAS LRS fluxes.
Line F(l) I(l)(10210 erg cm22 s21) �I�Hb� � 100�
[Ar iii] 9.0mm 1.2 56[S iv] 10.5mm 7.7 360[Ne ii] 12.8mm 0.5 23[Ne iii] 15.5mm 5.4 252[S iii] 18.7mm 1.0 47
Dow
nloaded from https://academ
ic.oup.com/m
nras/article/312/3/585/1023114 by guest on 18 March 2022
Planetary nebula NGC 6153 599
the nebular minor axis, with an observed flux relative to Hb of
0.0667 (Table 2, column 2), which together with a total Hb flux of
log F�Hb� � 210:86 erg cm22 s21 (Cahn et al. 1992) yields a
total l3133 flux of 9:2 � 10213 erg cm22 s21, 2.4 times higher
than that measured with the IUE, again suggesting that the IUE
may have missed half the nebular emission from NGC 6153. Since
only about 10 per cent of He is doubly ionized in NGC 6153 (cf.
Section 3.5, Table 9), and since both the He ii l1640 line and the
O iii l3133 Bowen fluorescence line are likely to arise from only
a small inner region of high ionization degree, the fact that the
IUE captured only half the total fluxes from these two lines is
somewhat puzzling.
In order to normalize the IUE fluxes to Hb , we first dereddened
the IUE spectrum using a reddening constant of c�Hb� � 1:30
(Section 3.1) and then normalized the dereddened fluxes such that
He ii I�l1640�=I�l4686� � 6:43, the ratio predicted by case B
recombination of He ii for Te � 9100 K and Ne � 3500 cm23
(Storey & Hummer 1995). The results are listed in the last column
of Table 5.
3 N E B U L A R A N A LY S I S
3.1 Reddening summary
Using the Galactic reddening law of Howarth (1983), the observed
Balmer Ha /Hb , Hg /Hb and Hd /Hb decrements yield an average
logarithmic extinction at Hb of c�Hb� � 1:27 ^ 0:06 and
1:30 ^ 0:01, from the scanned and the minor-axis spectra respec-
tively. The observed ratio of He ii l3203/l4686 on the minor axis
yields c�Hb� � 1:38. For Te � 9100 K; He21=H1 � 0:01 and
He1=H1 � 0:12 (Tables 6 and 9), the 5-GHz free±free radio
continuum flux density, S�5 GHz� � 0:632 Jy, and the total Hbflux, log F�Hb� � 210:86 erg cm22 s21 (Cahn et al. 1992), give
c�Hb� � 1:19 [or c�Hb� � 1:27 for Te � 6080 K, the temperature
derived from the nebular continuum Balmer discontinuity;
Table 6]. From the He ii l4686 flux of the scanned optical
spectrum and the IUE l1640 flux we find c�Hb� � 1:63,
significantly higher than those derived from the H i Balmer
decrement and from the radio continuum flux density. As
discussed in Section 2.4, the discrepancy is probably caused by
the fact that the IUE may have captured only half the l1640
emission from NGC 6153 in its 10:3 � 23 arcsec2 oval aperture.
We dereddened both the IUE and the optical spectra with
c�Hb� � 1:30. For the IR lines, they were normalized to Hbusing a dereddened flux of log I�Hb� � log F�Hb�1 c�Hb� �29:67 erg cm22 s21; where c�Hb� � 1:19 as derived from the
radio continuum flux density. [For c�Hb� � 1:27, the intensities of
all IR lines relative to Hb (Tables 3 and 4), and thus the ionic
abundances deduced from them (Table 8), should be reduced by
0.08 dex, i.e., multiplied by 0.832.]
3.2 Electron temperatures and densities
The electron temperatures and densities derived from various CEL
diagnostic ratios are given in Table 6, obtained by solving the level
populations for multilevel ($5) atomic models. References for the
adopted atomic data are listed in Table 7. For the scanned data,
only low-resolution spectra (FWHM 4.5 AÊ ) are available for the
[O ii] ll3726, 3729 doublet, which is blended with H 14, [S iii]
l3722 and H 13. The contributions of the latter lines were
subtracted assuming that their intensities (relative to Hb ) are the
same as measured on the high-resolution spectra taken along the
minor axis. Similarly, on the low-resolution spectra, [Ne iii]
l3967 is blended with He and was corrected for using the Heintensity measured from the minor-axis high-resolution spectrum.
The [O ii] l7330 line is blended with the [Ar iv] l7331 line. From
the observed intensity of the [Ar iv] l7263 line, we find that the
q 2000 RAS, MNRAS 312, 585±628
Figure 7. The IUE large-aperture spectrum of NGC 6153 from 1500 to
1950 AÊ .
Table 5. IUE fluxes.
Line F(l ) I(l )(10214 erg cm22 s21) �I�Hb� � 100�
C iv l1549 &5 &30He ii l1640 16.5 81.7O iii] l1663 &4 &20N iii] l1751 3.44 16.2C iii] l1908 7.10 46.2He ii l2733 1.4: 1.8:O iii l2837 4.1: 4.2:O iii l3047 2.9: 2.0:O iii l3133 38.6 24.0
Table 6. Plasma diagnostics.
Diagnostic Minor Entireaxis nebula
Te (K)[O iii] �88mm� 52mm�=�l4959� l5007� 7210/8380a
[Ne iii] 15:5mm=�l3868� l3967� 8620[O iii] �l4959� l5007�=l4363 9140 9110[Ar iii] l7135=l5192 9400 9200[N ii] �l6548� l6584�=l5754 10310b 10220b
[O ii] �l7320� l7330�=l3727 16410c 17910c
BJ/H 11 6080
Ne (cm23)[O iii] 88mm/52mm 1660[Ar iv] l4740/l4711 3050 2400[Cl iii] l5537/l5517 3540 3830[O ii] l3729/l3726 3340[S ii] l6731/l6716 3530 3970Balmer decrement 2000
a For Ne � 3500 and 1660 cm23 respectively;b Neglecting recombination excitation of the auroral l5754 line (cf.Section 3.3);c Neglecting recombination excitation of both the nebular and aurorallines (cf. Section 3.3).
Dow
nloaded from https://academ
ic.oup.com/m
nras/article/312/3/585/1023114 by guest on 18 March 2022
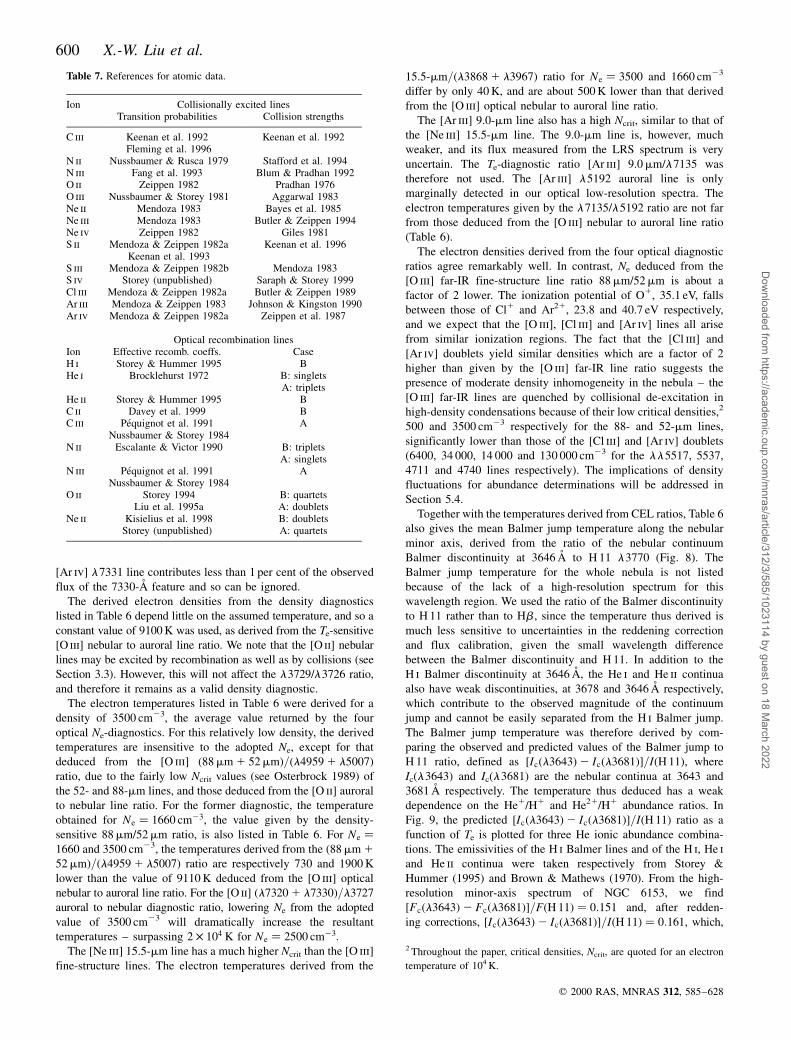
600 X.-W. Liu et al.
[Ar iv] l7331 line contributes less than 1 per cent of the observed
flux of the 7330-AÊ feature and so can be ignored.
The derived electron densities from the density diagnostics
listed in Table 6 depend little on the assumed temperature, and so a
constant value of 9100 K was used, as derived from the Te-sensitive
[O iii] nebular to auroral line ratio. We note that the [O ii] nebular
lines may be excited by recombination as well as by collisions (see
Section 3.3). However, this will not affect the l3729/l3726 ratio,
and therefore it remains as a valid density diagnostic.
The electron temperatures listed in Table 6 were derived for a
density of 3500 cm23, the average value returned by the four
optical Ne-diagnostics. For this relatively low density, the derived
temperatures are insensitive to the adopted Ne, except for that
deduced from the [O iii] �88mm 1 52mm�=�l4959 1 l5007�ratio, due to the fairly low Ncrit values (see Osterbrock 1989) of
the 52- and 88-mm lines, and those deduced from the [O ii] auroral
to nebular line ratio. For the former diagnostic, the temperature
obtained for Ne � 1660 cm23, the value given by the density-
sensitive 88mm/52mm ratio, is also listed in Table 6. For Ne �1660 and 3500 cm23, the temperatures derived from the �88mm 152mm�=�l4959 1 l5007� ratio are respectively 730 and 1900 K
lower than the value of 9110 K deduced from the [O iii] optical
nebular to auroral line ratio. For the [O ii] �l7320 1 l7330�=l3727
auroral to nebular diagnostic ratio, lowering Ne from the adopted
value of 3500 cm23 will dramatically increase the resultant
temperatures ± surpassing 2 � 104 K for Ne � 2500 cm23.
The [Ne iii] 15.5-mm line has a much higher Ncrit than the [O iii]
fine-structure lines. The electron temperatures derived from the
15.5-mm=�l3868 1 l3967� ratio for Ne � 3500 and 1660 cm23
differ by only 40 K, and are about 500 K lower than that derived
from the [O iii] optical nebular to auroral line ratio.
The [Ar iii] 9.0-mm line also has a high Ncrit, similar to that of
the [Ne iii] 15.5-mm line. The 9.0-mm line is, however, much
weaker, and its flux measured from the LRS spectrum is very
uncertain. The Te-diagnostic ratio [Ar iii] 9.0mm/l7135 was
therefore not used. The [Ar iii] l5192 auroral line is only
marginally detected in our optical low-resolution spectra. The
electron temperatures given by the l7135/l5192 ratio are not far
from those deduced from the [O iii] nebular to auroral line ratio
(Table 6).
The electron densities derived from the four optical diagnostic
ratios agree remarkably well. In contrast, Ne deduced from the
[O iii] far-IR fine-structure line ratio 88mm/52mm is about a
factor of 2 lower. The ionization potential of O1, 35.1 eV, falls
between those of Cl1 and Ar21, 23.8 and 40.7 eV respectively,
and we expect that the [O iii], [Cl iii] and [Ar iv] lines all arise
from similar ionization regions. The fact that the [Cl iii] and
[Ar iv] doublets yield similar densities which are a factor of 2
higher than given by the [O iii] far-IR line ratio suggests the
presence of moderate density inhomogeneity in the nebula ± the
[O iii] far-IR lines are quenched by collisional de-excitation in
high-density condensations because of their low critical densities,2
500 and 3500 cm23 respectively for the 88- and 52-mm lines,
significantly lower than those of the [Cl iii] and [Ar iv] doublets
(6400, 34 000, 14 000 and 130 000 cm23 for the ll5517, 5537,
4711 and 4740 lines respectively). The implications of density
fluctuations for abundance determinations will be addressed in
Section 5.4.
Together with the temperatures derived from CEL ratios, Table 6
also gives the mean Balmer jump temperature along the nebular
minor axis, derived from the ratio of the nebular continuum
Balmer discontinuity at 3646 AÊ to H 11 l3770 (Fig. 8). The
Balmer jump temperature for the whole nebula is not listed
because of the lack of a high-resolution spectrum for this
wavelength region. We used the ratio of the Balmer discontinuity
to H 11 rather than to Hb , since the temperature thus derived is
much less sensitive to uncertainties in the reddening correction
and flux calibration, given the small wavelength difference
between the Balmer discontinuity and H 11. In addition to the
H i Balmer discontinuity at 3646 AÊ , the He i and He ii continua
also have weak discontinuities, at 3678 and 3646 AÊ respectively,
which contribute to the observed magnitude of the continuum
jump and cannot be easily separated from the H i Balmer jump.
The Balmer jump temperature was therefore derived by com-
paring the observed and predicted values of the Balmer jump to
H 11 ratio, defined as �Ic�l3643�2 Ic�l3681��=I�H 11�, where
Ic(l3643) and Ic(l3681) are the nebular continua at 3643 and
3681 AÊ respectively. The temperature thus deduced has a weak
dependence on the He1/H1 and He21/H1 abundance ratios. In
Fig. 9, the predicted �Ic�l3643�2 Ic�l3681��=I�H 11� ratio as a
function of Te is plotted for three He ionic abundance combina-
tions. The emissivities of the H i Balmer lines and of the H i, He i
and He ii continua were taken respectively from Storey &
Hummer (1995) and Brown & Mathews (1970). From the high-
resolution minor-axis spectrum of NGC 6153, we find
�Fc�l3643�2 Fc�l3681��=F�H 11� � 0:151 and, after redden-
ing corrections, �Ic�l3643�2 Ic�l3681��=I�H 11� � 0:161, which,
q 2000 RAS, MNRAS 312, 585±628
Table 7. References for atomic data.
Ion Collisionally excited linesTransition probabilities Collision strengths
C iii Keenan et al. 1992 Keenan et al. 1992Fleming et al. 1996
N ii Nussbaumer & Rusca 1979 Stafford et al. 1994N iii Fang et al. 1993 Blum & Pradhan 1992O ii Zeippen 1982 Pradhan 1976O iii Nussbaumer & Storey 1981 Aggarwal 1983Ne ii Mendoza 1983 Bayes et al. 1985Ne iii Mendoza 1983 Butler & Zeippen 1994Ne iv Zeippen 1982 Giles 1981S ii Mendoza & Zeippen 1982a Keenan et al. 1996
Keenan et al. 1993S iii Mendoza & Zeippen 1982b Mendoza 1983S iv Storey (unpublished) Saraph & Storey 1999Cl iii Mendoza & Zeippen 1982a Butler & Zeippen 1989Ar iii Mendoza & Zeippen 1983 Johnson & Kingston 1990Ar iv Mendoza & Zeippen 1982a Zeippen et al. 1987
Optical recombination linesIon Effective recomb. coeffs. CaseH i Storey & Hummer 1995 BHe i Brocklehurst 1972 B: singlets
A: tripletsHe ii Storey & Hummer 1995 BC ii Davey et al. 1999 BC iii PeÂquignot et al. 1991 A
Nussbaumer & Storey 1984N ii Escalante & Victor 1990 B: triplets
A: singletsN iii PeÂquignot et al. 1991 A
Nussbaumer & Storey 1984O ii Storey 1994 B: quartets
Liu et al. 1995a A: doubletsNe ii Kisielius et al. 1998 B: doublets
Storey (unpublished) A: quartets
2 Throughout the paper, critical densities, Ncrit, are quoted for an electron
temperature of 104 K.
Dow
nloaded from https://academ
ic.oup.com/m
nras/article/312/3/585/1023114 by guest on 18 March 2022
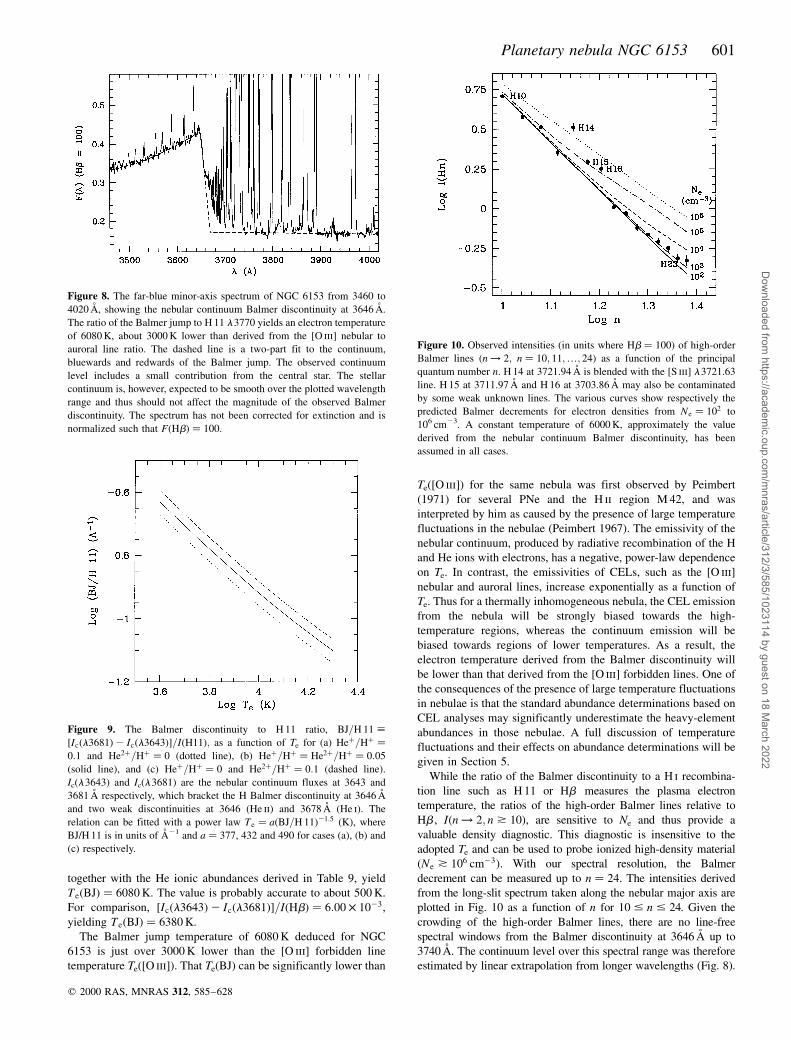
Planetary nebula NGC 6153 601
together with the He ionic abundances derived in Table 9, yield
Te�BJ� � 6080 K. The value is probably accurate to about 500 K.
For comparison, �Ic�l3643�2 Ic�l3681��=I�Hb� � 6:00 � 1023,
yielding Te�BJ� � 6380 K.
The Balmer jump temperature of 6080 K deduced for NGC
6153 is just over 3000 K lower than the [O iii] forbidden line
temperature Te([O iii]). That Te(BJ) can be significantly lower than
Te([O iii]) for the same nebula was first observed by Peimbert
(1971) for several PNe and the H ii region M 42, and was
interpreted by him as caused by the presence of large temperature
fluctuations in the nebulae (Peimbert 1967). The emissivity of the
nebular continuum, produced by radiative recombination of the H
and He ions with electrons, has a negative, power-law dependence
on Te. In contrast, the emissivities of CELs, such as the [O iii]
nebular and auroral lines, increase exponentially as a function of
Te. Thus for a thermally inhomogeneous nebula, the CEL emission
from the nebula will be strongly biased towards the high-
temperature regions, whereas the continuum emission will be
biased towards regions of lower temperatures. As a result, the
electron temperature derived from the Balmer discontinuity will
be lower than that derived from the [O iii] forbidden lines. One of
the consequences of the presence of large temperature fluctuations
in nebulae is that the standard abundance determinations based on
CEL analyses may significantly underestimate the heavy-element
abundances in those nebulae. A full discussion of temperature
fluctuations and their effects on abundance determinations will be
given in Section 5.
While the ratio of the Balmer discontinuity to a H i recombina-
tion line such as H 11 or Hb measures the plasma electron
temperature, the ratios of the high-order Balmer lines relative to
Hb , I�n! 2; n * 10�, are sensitive to Ne and thus provide a
valuable density diagnostic. This diagnostic is insensitive to the
adopted Te and can be used to probe ionized high-density material
�Ne * 106 cm23�. With our spectral resolution, the Balmer
decrement can be measured up to n � 24. The intensities derived
from the long-slit spectrum taken along the nebular major axis are
plotted in Fig. 10 as a function of n for 10 # n # 24. Given the
crowding of the high-order Balmer lines, there are no line-free
spectral windows from the Balmer discontinuity at 3646 AÊ up to
3740 AÊ . The continuum level over this spectral range was therefore
estimated by linear extrapolation from longer wavelengths (Fig. 8).
q 2000 RAS, MNRAS 312, 585±628
Figure 8. The far-blue minor-axis spectrum of NGC 6153 from 3460 to
4020 AÊ , showing the nebular continuum Balmer discontinuity at 3646 AÊ .
The ratio of the Balmer jump to H 11 l3770 yields an electron temperature
of 6080 K, about 3000 K lower than derived from the [O iii] nebular to
auroral line ratio. The dashed line is a two-part fit to the continuum,
bluewards and redwards of the Balmer jump. The observed continuum
level includes a small contribution from the central star. The stellar
continuum is, however, expected to be smooth over the plotted wavelength
range and thus should not affect the magnitude of the observed Balmer
discontinuity. The spectrum has not been corrected for extinction and is
normalized such that F�Hb� � 100.
Figure 9. The Balmer discontinuity to H 11 ratio, BJ=H 11 ;�Ic�l3681�2 Ic�l3643��=I�H11�; as a function of Te for (a) He�=H� �0:1 and He2�=H� � 0 (dotted line), (b) He�=H� � He2�=H� � 0:05
(solid line), and (c) He�=H� � 0 and He2�=H� � 0:1 (dashed line).
Ic(l3643) and Ic(l3681) are the nebular continuum fluxes at 3643 and
3681 AÊ respectively, which bracket the H Balmer discontinuity at 3646 AÊ
and two weak discontinuities at 3646 (He ii) and 3678 AÊ (He i). The
relation can be fitted with a power law Te � a�BJ=H 11�21:5 (K), where
BJ/H 11 is in units of AÊ 21 and a � 377, 432 and 490 for cases (a), (b) and
(c) respectively.
Figure 10. Observed intensities (in units where Hb � 100) of high-order
Balmer lines (n! 2; n � 10; 11;¼; 24) as a function of the principal
quantum number n. H 14 at 3721.94 AÊ is blended with the [S iii] l3721.63
line. H 15 at 3711.97 AÊ and H 16 at 3703.86 AÊ may also be contaminated
by some weak unknown lines. The various curves show respectively the
predicted Balmer decrements for electron densities from Ne � 102 to
106 cm23. A constant temperature of 6000 K, approximately the value
derived from the nebular continuum Balmer discontinuity, has been
assumed in all cases.
Dow
nloaded from https://academ
ic.oup.com/m
nras/article/312/3/585/1023114 by guest on 18 March 2022
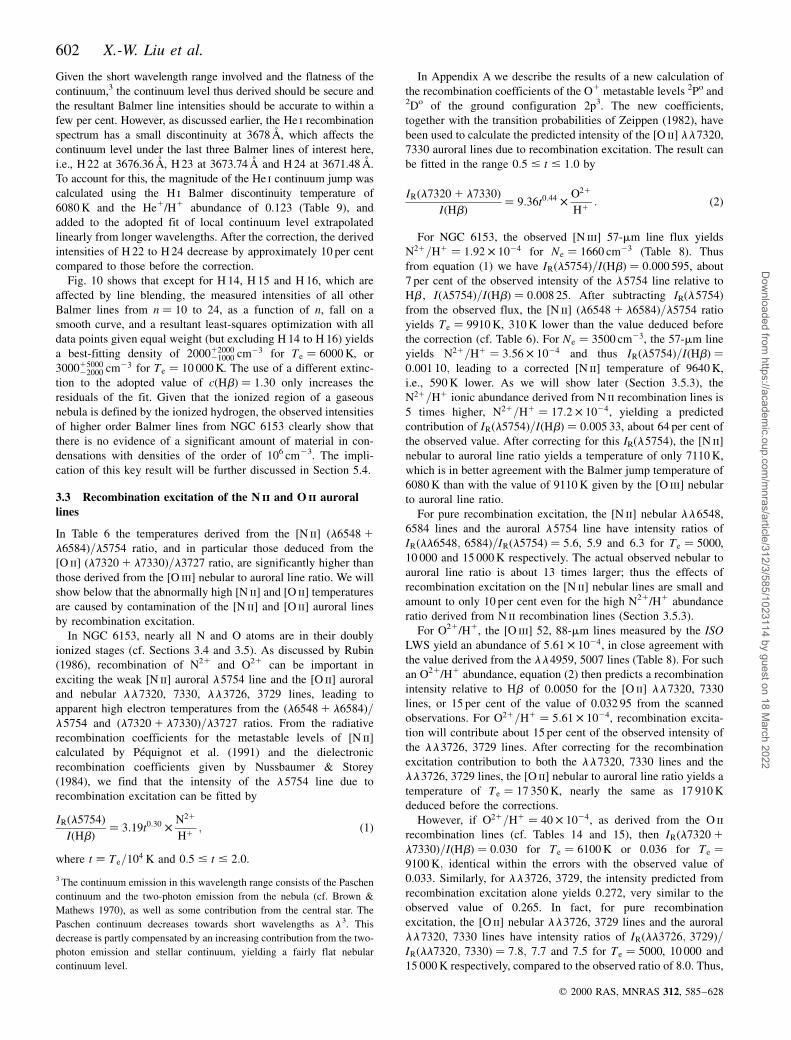
602 X.-W. Liu et al.
Given the short wavelength range involved and the flatness of the
continuum,3 the continuum level thus derived should be secure and
the resultant Balmer line intensities should be accurate to within a
few per cent. However, as discussed earlier, the He i recombination
spectrum has a small discontinuity at 3678 AÊ , which affects the
continuum level under the last three Balmer lines of interest here,
i.e., H 22 at 3676.36 AÊ , H 23 at 3673.74 AÊ and H 24 at 3671.48 AÊ .
To account for this, the magnitude of the He i continuum jump was
calculated using the H i Balmer discontinuity temperature of
6080 K and the He1/H1 abundance of 0.123 (Table 9), and
added to the adopted fit of local continuum level extrapolated
linearly from longer wavelengths. After the correction, the derived
intensities of H 22 to H 24 decrease by approximately 10 per cent
compared to those before the correction.
Fig. 10 shows that except for H 14, H 15 and H 16, which are
affected by line blending, the measured intensities of all other
Balmer lines from n � 10 to 24, as a function of n, fall on a
smooth curve, and a resultant least-squares optimization with all
data points given equal weight (but excluding H 14 to H 16) yields
a best-fitting density of 20001200021000 cm23 for Te � 6000 K, or
30001500022000 cm23 for Te � 10 000 K. The use of a different extinc-
tion to the adopted value of c�Hb� � 1:30 only increases the
residuals of the fit. Given that the ionized region of a gaseous
nebula is defined by the ionized hydrogen, the observed intensities
of higher order Balmer lines from NGC 6153 clearly show that
there is no evidence of a significant amount of material in con-
densations with densities of the order of 106 cm23. The impli-
cation of this key result will be further discussed in Section 5.4.
3.3 Recombination excitation of the N ii and O ii auroral
lines
In Table 6 the temperatures derived from the [N ii] �l6548 1l6584�=l5754 ratio, and in particular those deduced from the
[O ii] �l7320 1 l7330�=l3727 ratio, are significantly higher than
those derived from the [O iii] nebular to auroral line ratio. We will
show below that the abnormally high [N ii] and [O ii] temperatures
are caused by contamination of the [N ii] and [O ii] auroral lines
by recombination excitation.
In NGC 6153, nearly all N and O atoms are in their doubly
ionized stages (cf. Sections 3.4 and 3.5). As discussed by Rubin
(1986), recombination of N21 and O21 can be important in
exciting the weak [N ii] auroral l5754 line and the [O ii] auroral
and nebular ll7320, 7330, ll3726, 3729 lines, leading to
apparent high electron temperatures from the �l6548 1 l6584�=l5754 and �l7320 1 l7330�=l3727 ratios. From the radiative
recombination coefficients for the metastable levels of [N ii]
calculated by PeÂquignot et al. (1991) and the dielectronic
recombination coefficients given by Nussbaumer & Storey
(1984), we find that the intensity of the l5754 line due to
recombination excitation can be fitted by
IR�l5754�I�Hb� � 3:19t0:30 � N21
H1; �1�
where t ; Te=104 K and 0:5 # t # 2:0.
In Appendix A we describe the results of a new calculation of
the recombination coefficients of the O1 metastable levels 2Po and2Do of the ground configuration 2p3. The new coefficients,
together with the transition probabilities of Zeippen (1982), have
been used to calculate the predicted intensity of the [O ii] ll7320,
7330 auroral lines due to recombination excitation. The result can
be fitted in the range 0:5 # t # 1:0 by
IR�l7320 1 l7330�I�Hb� � 9:36t0:44 � O21
H1: �2�
For NGC 6153, the observed [N iii] 57-mm line flux yields
N21=H1 � 1:92 � 1024 for Ne � 1660 cm23 (Table 8). Thus
from equation (1) we have IR�l5754�=I�Hb� � 0:000 595, about
7 per cent of the observed intensity of the l5754 line relative to
Hb , I�l5754�=I�Hb� � 0:008 25. After subtracting IR(l5754)
from the observed flux, the [N ii] �l6548 1 l6584�=l5754 ratio
yields Te � 9910 K, 310 K lower than the value deduced before
the correction (cf. Table 6). For Ne � 3500 cm23, the 57-mm line
yields N21=H1 � 3:56 � 1024 and thus IR�l5754�=I�Hb� �0:001 10; leading to a corrected [N ii] temperature of 9640 K,
i.e., 590 K lower. As we will show later (Section 3.5.3), the
N21=H1 ionic abundance derived from N ii recombination lines is
5 times higher, N21=H1 � 17:2 � 1024, yielding a predicted
contribution of IR�l5754�=I�Hb� � 0:005 33, about 64 per cent of
the observed value. After correcting for this IR(l5754), the [N ii]
nebular to auroral line ratio yields a temperature of only 7110 K,
which is in better agreement with the Balmer jump temperature of
6080 K than with the value of 9110 K given by the [O iii] nebular
to auroral line ratio.
For pure recombination excitation, the [N ii] nebular ll6548,
6584 lines and the auroral l5754 line have intensity ratios of
IR�ll6548; 6584�=IR�l5754� � 5:6, 5.9 and 6.3 for Te � 5000,
10 000 and 15 000 K respectively. The actual observed nebular to
auroral line ratio is about 13 times larger; thus the effects of
recombination excitation on the [N ii] nebular lines are small and
amount to only 10 per cent even for the high N21/H1 abundance
ratio derived from N ii recombination lines (Section 3.5.3).
For O21/H1, the [O iii] 52, 88-mm lines measured by the ISO
LWS yield an abundance of 5:61 � 1024, in close agreement with
the value derived from the ll4959, 5007 lines (Table 8). For such
an O21/H1 abundance, equation (2) then predicts a recombination
intensity relative to Hb of 0.0050 for the [O ii] ll7320, 7330
lines, or 15 per cent of the value of 0.032 95 from the scanned
observations. For O21=H1 � 5:61 � 1024, recombination excita-
tion will contribute about 15 per cent of the observed intensity of
the ll3726, 3729 lines. After correcting for the recombination
excitation contribution to both the ll7320, 7330 lines and the
ll3726, 3729 lines, the [O ii] nebular to auroral line ratio yields a
temperature of Te � 17 350 K, nearly the same as 17 910 K
deduced before the corrections.
However, if O21=H1 � 40 � 1024, as derived from the O ii
recombination lines (cf. Tables 14 and 15), then IR�l7320 1l7330�=I�Hb� � 0:030 for Te � 6100 K or 0.036 for Te �9100 K; identical within the errors with the observed value of
0.033. Similarly, for ll3726, 3729, the intensity predicted from
recombination excitation alone yields 0.272, very similar to the
observed value of 0.265. In fact, for pure recombination
excitation, the [O ii] nebular ll3726, 3729 lines and the auroral
ll7320, 7330 lines have intensity ratios of IR�ll3726; 3729�=IR�ll7320; 7330� � 7:8; 7.7 and 7.5 for Te � 5000, 10 000 and
15 000 K respectively, compared to the observed ratio of 8.0. Thus,
q 2000 RAS, MNRAS 312, 585±628
3 The continuum emission in this wavelength range consists of the Paschen
continuum and the two-photon emission from the nebula (cf. Brown &
Mathews 1970), as well as some contribution from the central star. The
Paschen continuum decreases towards short wavelengths as l3. This
decrease is partly compensated by an increasing contribution from the two-
photon emission and stellar continuum, yielding a fairly flat nebular
continuum level.
Dow
nloaded from https://academ
ic.oup.com/m
nras/article/312/3/585/1023114 by guest on 18 March 2022
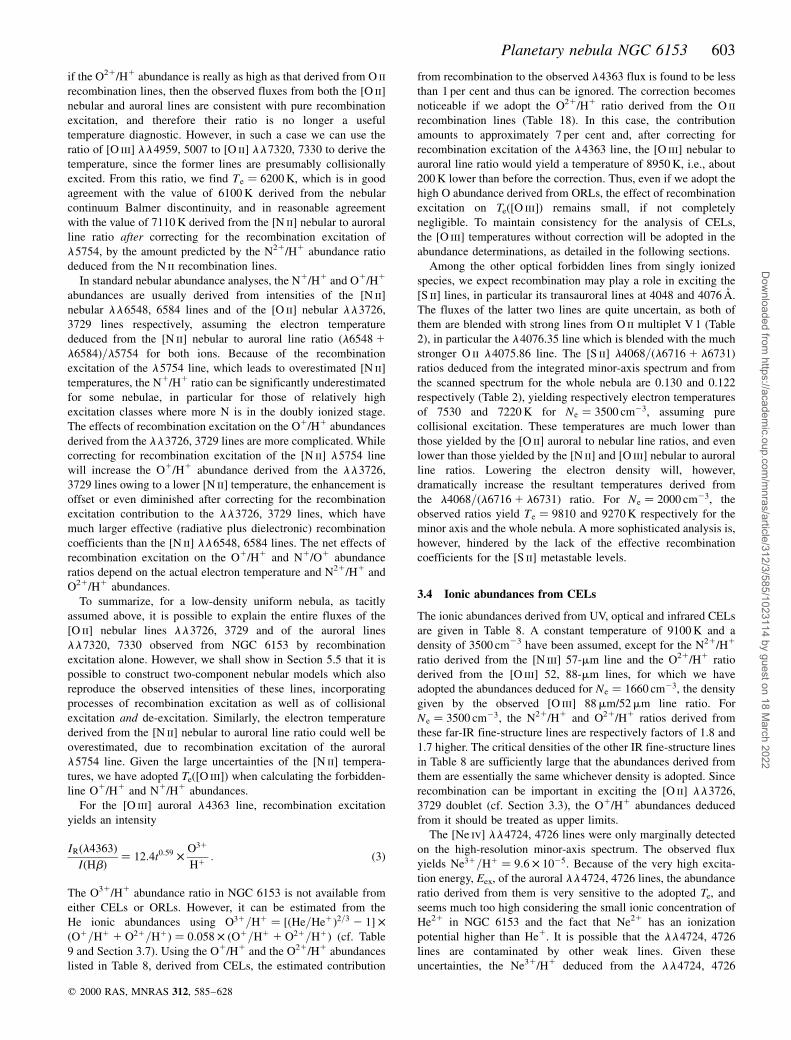
Planetary nebula NGC 6153 603
if the O21/H1 abundance is really as high as that derived from O ii
recombination lines, then the observed fluxes from both the [O ii]
nebular and auroral lines are consistent with pure recombination
excitation, and therefore their ratio is no longer a useful
temperature diagnostic. However, in such a case we can use the
ratio of [O iii] ll4959, 5007 to [O ii] ll7320, 7330 to derive the
temperature, since the former lines are presumably collisionally
excited. From this ratio, we find Te � 6200 K, which is in good
agreement with the value of 6100 K derived from the nebular
continuum Balmer discontinuity, and in reasonable agreement
with the value of 7110 K derived from the [N ii] nebular to auroral
line ratio after correcting for the recombination excitation of
l5754, by the amount predicted by the N21/H1 abundance ratio
deduced from the N ii recombination lines.
In standard nebular abundance analyses, the N1/H1 and O1/H1
abundances are usually derived from intensities of the [N ii]
nebular ll6548, 6584 lines and of the [O ii] nebular ll3726,
3729 lines respectively, assuming the electron temperature
deduced from the [N ii] nebular to auroral line ratio �l6548 1l6584�=l5754 for both ions. Because of the recombination
excitation of the l5754 line, which leads to overestimated [N ii]
temperatures, the N1/H1 ratio can be significantly underestimated
for some nebulae, in particular for those of relatively high
excitation classes where more N is in the doubly ionized stage.
The effects of recombination excitation on the O1/H1 abundances
derived from the ll3726, 3729 lines are more complicated. While
correcting for recombination excitation of the [N ii] l5754 line
will increase the O1/H1 abundance derived from the ll3726,
3729 lines owing to a lower [N ii] temperature, the enhancement is
offset or even diminished after correcting for the recombination
excitation contribution to the ll3726, 3729 lines, which have
much larger effective (radiative plus dielectronic) recombination
coefficients than the [N ii] ll6548, 6584 lines. The net effects of
recombination excitation on the O1/H1 and N1/O1 abundance
ratios depend on the actual electron temperature and N21/H1 and
O21/H1 abundances.
To summarize, for a low-density uniform nebula, as tacitly
assumed above, it is possible to explain the entire fluxes of the
[O ii] nebular lines ll3726, 3729 and of the auroral lines
ll7320, 7330 observed from NGC 6153 by recombination
excitation alone. However, we shall show in Section 5.5 that it is
possible to construct two-component nebular models which also
reproduce the observed intensities of these lines, incorporating
processes of recombination excitation as well as of collisional
excitation and de-excitation. Similarly, the electron temperature
derived from the [N ii] nebular to auroral line ratio could well be
overestimated, due to recombination excitation of the auroral
l5754 line. Given the large uncertainties of the [N ii] tempera-
tures, we have adopted Te([O iii]) when calculating the forbidden-
line O1/H1 and N1/H1 abundances.
For the [O iii] auroral l4363 line, recombination excitation
yields an intensity
IR�l4363�I�Hb� � 12:4t0:59 � O31
H1: �3�
The O31/H1 abundance ratio in NGC 6153 is not available from
either CELs or ORLs. However, it can be estimated from the
He ionic abundances using O31=H1 � ��He=He1�2=3 2 1� ��O1=H1 1 O21=H1� � 0:058 � �O1=H1 1 O21=H1� (cf. Table
9 and Section 3.7). Using the O1/H1 and the O21/H1 abundances
listed in Table 8, derived from CELs, the estimated contribution
from recombination to the observed l4363 flux is found to be less
than 1 per cent and thus can be ignored. The correction becomes
noticeable if we adopt the O21/H1 ratio derived from the O ii
recombination lines (Table 18). In this case, the contribution
amounts to approximately 7 per cent and, after correcting for
recombination excitation of the l4363 line, the [O iii] nebular to
auroral line ratio would yield a temperature of 8950 K, i.e., about
200 K lower than before the correction. Thus, even if we adopt the
high O abundance derived from ORLs, the effect of recombination
excitation on Te([O iii]) remains small, if not completely
negligible. To maintain consistency for the analysis of CELs,
the [O iii] temperatures without correction will be adopted in the
abundance determinations, as detailed in the following sections.
Among the other optical forbidden lines from singly ionized
species, we expect recombination may play a role in exciting the
[S ii] lines, in particular its transauroral lines at 4048 and 4076 AÊ .
The fluxes of the latter two lines are quite uncertain, as both of
them are blended with strong lines from O ii multiplet V 1 (Table
2), in particular the l4076.35 line which is blended with the much
stronger O ii l4075.86 line. The [S ii] l4068=�l6716 1 l6731�ratios deduced from the integrated minor-axis spectrum and from
the scanned spectrum for the whole nebula are 0.130 and 0.122
respectively (Table 2), yielding respectively electron temperatures
of 7530 and 7220 K for Ne � 3500 cm23, assuming pure
collisional excitation. These temperatures are much lower than
those yielded by the [O ii] auroral to nebular line ratios, and even
lower than those yielded by the [N ii] and [O iii] nebular to auroral
line ratios. Lowering the electron density will, however,
dramatically increase the resultant temperatures derived from
the l4068=�l6716 1 l6731� ratio. For Ne � 2000 cm23, the
observed ratios yield Te � 9810 and 9270 K respectively for the
minor axis and the whole nebula. A more sophisticated analysis is,
however, hindered by the lack of the effective recombination
coefficients for the [S ii] metastable levels.
3.4 Ionic abundances from CELs
The ionic abundances derived from UV, optical and infrared CELs
are given in Table 8. A constant temperature of 9100 K and a
density of 3500 cm23 have been assumed, except for the N21/H1
ratio derived from the [N iii] 57-mm line and the O21/H1 ratio
derived from the [O iii] 52, 88-mm lines, for which we have
adopted the abundances deduced for Ne � 1660 cm23, the density
given by the observed [O iii] 88mm/52mm line ratio. For
Ne � 3500 cm23, the N21/H1 and O21/H1 ratios derived from
these far-IR fine-structure lines are respectively factors of 1.8 and
1.7 higher. The critical densities of the other IR fine-structure lines
in Table 8 are sufficiently large that the abundances derived from
them are essentially the same whichever density is adopted. Since
recombination can be important in exciting the [O ii] ll3726,
3729 doublet (cf. Section 3.3), the O1/H1 abundances deduced
from it should be treated as upper limits.
The [Ne iv] ll4724, 4726 lines were only marginally detected
on the high-resolution minor-axis spectrum. The observed flux
yields Ne31=H1 � 9:6 � 1025. Because of the very high excita-
tion energy, Eex, of the auroral ll4724, 4726 lines, the abundance
ratio derived from them is very sensitive to the adopted Te, and
seems much too high considering the small ionic concentration of
He21 in NGC 6153 and the fact that Ne21 has an ionization
potential higher than He1. It is possible that the ll4724, 4726
lines are contaminated by other weak lines. Given these
uncertainties, the Ne31/H1 deduced from the ll4724, 4726
q 2000 RAS, MNRAS 312, 585±628
Dow
nloaded from https://academ
ic.oup.com/m
nras/article/312/3/585/1023114 by guest on 18 March 2022
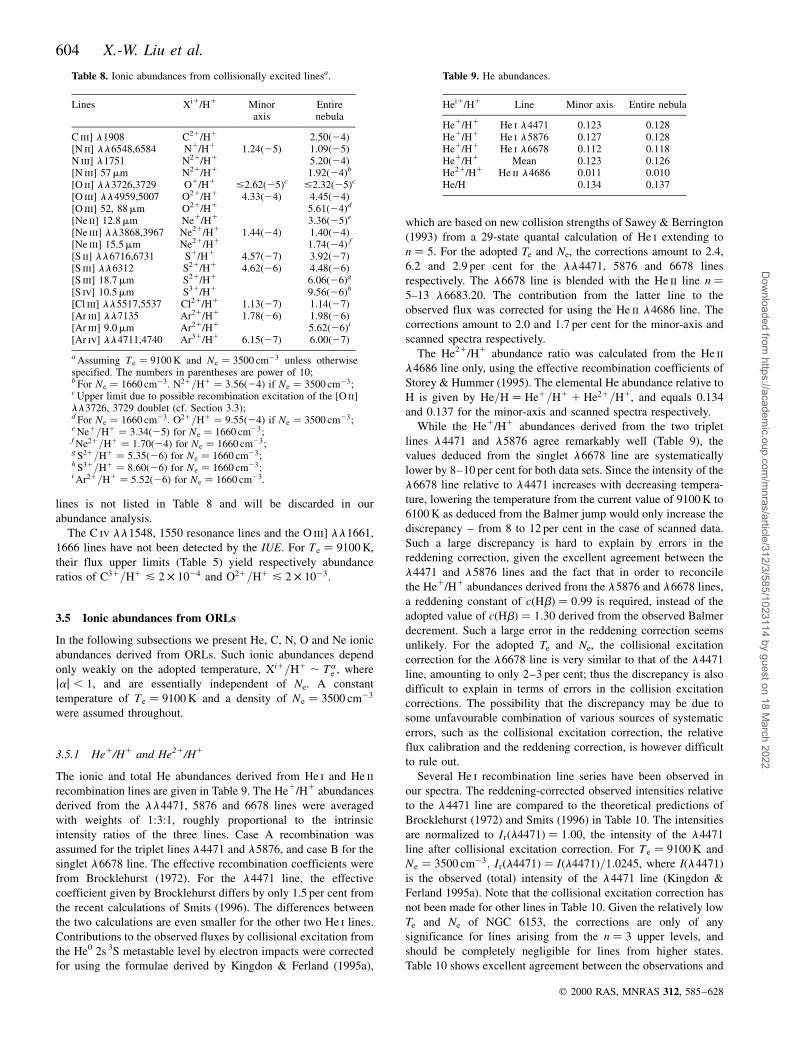
604 X.-W. Liu et al.
lines is not listed in Table 8 and will be discarded in our
abundance analysis.
The C iv ll1548, 1550 resonance lines and the O iii] ll1661,
1666 lines have not been detected by the IUE. For Te � 9100 K,
their flux upper limits (Table 5) yield respectively abundance
ratios of C31=H1 & 2 � 1024 and O21=H1 & 2 � 1023.
3.5 Ionic abundances from ORLs
In the following subsections we present He, C, N, O and Ne ionic
abundances derived from ORLs. Such ionic abundances depend
only weakly on the adopted temperature, Xi1=H1 , Tae , where
jaj , 1, and are essentially independent of Ne. A constant
temperature of Te � 9100 K and a density of Ne � 3500 cm23
were assumed throughout.
3.5.1 He1/H1 and He21/H1
The ionic and total He abundances derived from He i and He ii
recombination lines are given in Table 9. The He1/H1 abundances
derived from the ll4471, 5876 and 6678 lines were averaged
with weights of 1:3:1, roughly proportional to the intrinsic
intensity ratios of the three lines. Case A recombination was
assumed for the triplet lines l4471 and l5876, and case B for the
singlet l6678 line. The effective recombination coefficients were
from Brocklehurst (1972). For the l4471 line, the effective
coefficient given by Brocklehurst differs by only 1.5 per cent from
the recent calculations of Smits (1996). The differences between
the two calculations are even smaller for the other two He i lines.
Contributions to the observed fluxes by collisional excitation from
the He0 2s 3S metastable level by electron impacts were corrected
for using the formulae derived by Kingdon & Ferland (1995a),
which are based on new collision strengths of Sawey & Berrington
(1993) from a 29-state quantal calculation of He i extending to
n � 5. For the adopted Te and Ne, the corrections amount to 2.4,
6.2 and 2.9 per cent for the ll4471, 5876 and 6678 lines
respectively. The l6678 line is blended with the He ii line n �5±13 l6683.20. The contribution from the latter line to the
observed flux was corrected for using the He ii l4686 line. The
corrections amount to 2.0 and 1.7 per cent for the minor-axis and
scanned spectra respectively.
The He21/H1 abundance ratio was calculated from the He ii
l4686 line only, using the effective recombination coefficients of
Storey & Hummer (1995). The elemental He abundance relative to
H is given by He=H � He1=H1 1 He21=H1, and equals 0.134
and 0.137 for the minor-axis and scanned spectra respectively.
While the He1/H1 abundances derived from the two triplet
lines l4471 and l5876 agree remarkably well (Table 9), the
values deduced from the singlet l6678 line are systematically
lower by 8±10 per cent for both data sets. Since the intensity of the
l6678 line relative to l4471 increases with decreasing tempera-
ture, lowering the temperature from the current value of 9100 K to
6100 K as deduced from the Balmer jump would only increase the
discrepancy ± from 8 to 12 per cent in the case of scanned data.
Such a large discrepancy is hard to explain by errors in the
reddening correction, given the excellent agreement between the
l4471 and l5876 lines and the fact that in order to reconcile
the He1/H1 abundances derived from the l5876 and l6678 lines,
a reddening constant of c�Hb� � 0:99 is required, instead of the
adopted value of c�Hb� � 1:30 derived from the observed Balmer
decrement. Such a large error in the reddening correction seems
unlikely. For the adopted Te and Ne, the collisional excitation
correction for the l6678 line is very similar to that of the l4471
line, amounting to only 2±3 per cent; thus the discrepancy is also
difficult to explain in terms of errors in the collision excitation
corrections. The possibility that the discrepancy may be due to
some unfavourable combination of various sources of systematic
errors, such as the collisional excitation correction, the relative
flux calibration and the reddening correction, is however difficult
to rule out.
Several He i recombination line series have been observed in
our spectra. The reddening-corrected observed intensities relative
to the l4471 line are compared to the theoretical predictions of
Brocklehurst (1972) and Smits (1996) in Table 10. The intensities
are normalized to Ir�l4471� � 1:00, the intensity of the l4471
line after collisional excitation correction. For Te � 9100 K and
Ne � 3500 cm23; Ir�l4471� � I�l4471�=1:0245, where I(l4471)
is the observed (total) intensity of the l4471 line (Kingdon &
Ferland 1995a). Note that the collisional excitation correction has
not been made for other lines in Table 10. Given the relatively low
Te and Ne of NGC 6153, the corrections are only of any
significance for lines arising from the n � 3 upper levels, and
should be completely negligible for lines from higher states.
Table 10 shows excellent agreement between the observations and
q 2000 RAS, MNRAS 312, 585±628
Table 8. Ionic abundances from collisionally excited linesa.
Lines Xi1/H1 Minor Entireaxis nebula
C iii] l1908 C21/H1 2.50(24)[N ii] ll6548,6584 N1/H1 1.24(25) 1.09(25)N iii] l1751 N21/H1 5.20(24)[N iii] 57mm N21/H1 1.92(24)b
[O ii] ll3726,3729 O1/H1 #2.62(25)c #2.32(25)c
[O iii] ll4959,5007 O21/H1 4.33(24) 4.45(24)[O iii] 52, 88mm O21/H1 5.61(24)d
[Ne ii] 12.8mm Ne1/H1 3.36(25)e
[Ne iii] ll3868,3967 Ne21/H1 1.44(24) 1.40(24)[Ne iii] 15.5mm Ne21/H1 1.74(24) f
[S ii] ll6716,6731 S1/H1 4.57(27) 3.92(27)[S iii] ll6312 S21/H1 4.62(26) 4.48(26)[S iii] 18.7mm S21/H1 6.06(26)g
[S iv] 10.5mm S31/H1 9.56(26)h
[Cl iii] ll5517,5537 Cl21/H1 1.13(27) 1.14(27)[Ar iii] ll7135 Ar21/H1 1.78(26) 1.98(26)[Ar iii] 9.0mm Ar21/H1 5.62(26)i
[Ar iv] ll4711,4740 Ar31/H1 6.15(27) 6.00(27)
a Assuming Te � 9100 K and Ne � 3500 cm23 unless otherwisespecified. The numbers in parentheses are power of 10;b For Ne � 1660 cm23. N21=H1 � 3:56�24� if Ne � 3500 cm23;c Upper limit due to possible recombination excitation of the [O ii]ll3726, 3729 doublet (cf. Section 3.3);d For Ne � 1660 cm23. O21=H1 � 9:55�24� if Ne � 3500 cm23;e Ne1=H1 � 3:34�25� for Ne � 1660 cm23;f Ne21=H1 � 1:70�24� for Ne � 1660 cm23;g S21=H1 � 5:35�26� for Ne � 1660 cm23;h S31=H1 � 8:60�26� for Ne � 1660 cm23;i Ar21=H1 � 5:52�26� for Ne � 1660 cm23.
Table 9. He abundances.
Hei1/H1 Line Minor axis Entire nebula
He1/H1 He i l4471 0.123 0.128He1/H1 He i l5876 0.127 0.128He1/H1 He i l6678 0.112 0.118He1/H1 Mean 0.123 0.126He21/H1 He ii l4686 0.011 0.010He/H 0.134 0.137
Dow
nloaded from https://academ
ic.oup.com/m
nras/article/312/3/585/1023114 by guest on 18 March 2022
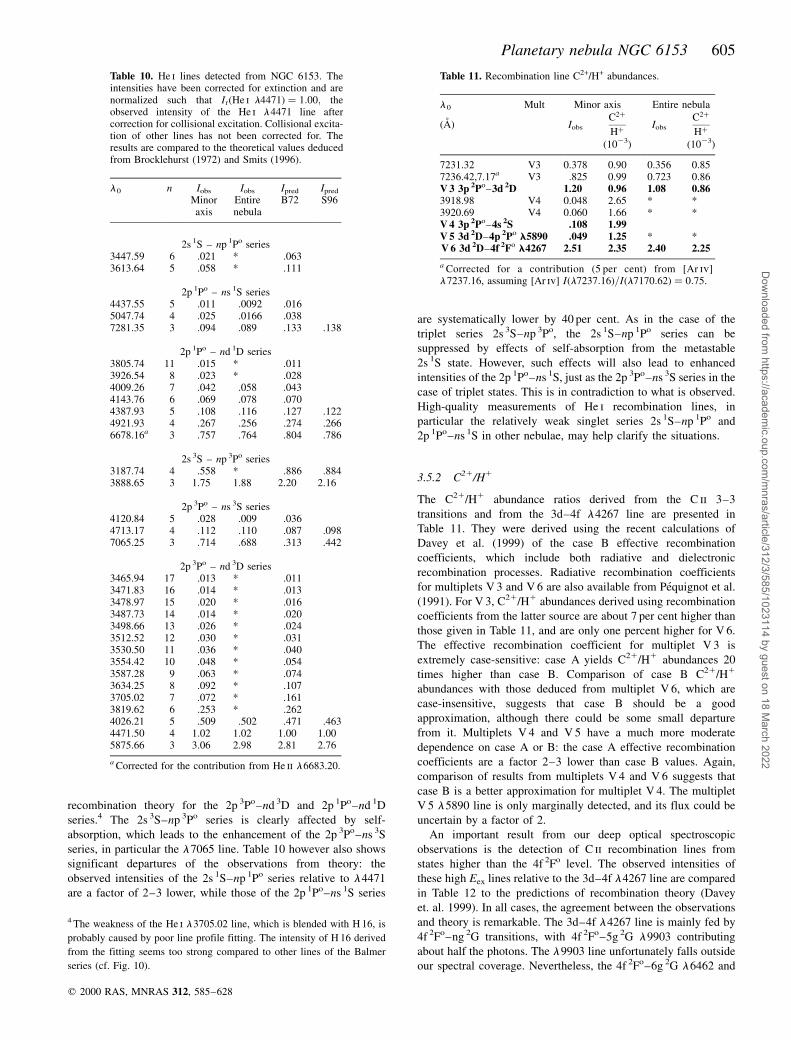
Planetary nebula NGC 6153 605
recombination theory for the 2p 3Po±nd 3D and 2p 1Po±nd 1D
series.4 The 2s 3S±np 3Po series is clearly affected by self-
absorption, which leads to the enhancement of the 2p 3Po±ns 3S
series, in particular the l7065 line. Table 10 however also shows
significant departures of the observations from theory: the
observed intensities of the 2s 1S±np 1Po series relative to l4471
are a factor of 2±3 lower, while those of the 2p 1Po±ns 1S series
are systematically lower by 40 per cent. As in the case of the
triplet series 2s 3S±np 3Po, the 2s 1S±np 1Po series can be
suppressed by effects of self-absorption from the metastable
2s 1S state. However, such effects will also lead to enhanced
intensities of the 2p 1Po±ns 1S, just as the 2p 3Po±ns 3S series in the
case of triplet states. This is in contradiction to what is observed.
High-quality measurements of He i recombination lines, in
particular the relatively weak singlet series 2s 1S±np 1Po and
2p 1Po±ns 1S in other nebulae, may help clarify the situations.
3.5.2 C21/H1
The C21/H1 abundance ratios derived from the C ii 3±3
transitions and from the 3d±4f l4267 line are presented in
Table 11. They were derived using the recent calculations of
Davey et al. (1999) of the case B effective recombination
coefficients, which include both radiative and dielectronic
recombination processes. Radiative recombination coefficients
for multiplets V 3 and V 6 are also available from PeÂquignot et al.
(1991). For V 3, C21/H1 abundances derived using recombination
coefficients from the latter source are about 7 per cent higher than
those given in Table 11, and are only one percent higher for V 6.
The effective recombination coefficient for multiplet V 3 is
extremely case-sensitive: case A yields C21/H1 abundances 20
times higher than case B. Comparison of case B C21/H1
abundances with those deduced from multiplet V 6, which are
case-insensitive, suggests that case B should be a good
approximation, although there could be some small departure
from it. Multiplets V 4 and V 5 have a much more moderate
dependence on case A or B: the case A effective recombination
coefficients are a factor 2±3 lower than case B values. Again,
comparison of results from multiplets V 4 and V 6 suggests that
case B is a better approximation for multiplet V 4. The multiplet
V 5 l5890 line is only marginally detected, and its flux could be
uncertain by a factor of 2.
An important result from our deep optical spectroscopic
observations is the detection of C ii recombination lines from
states higher than the 4f 2Fo level. The observed intensities of
these high Eex lines relative to the 3d±4f l4267 line are compared
in Table 12 to the predictions of recombination theory (Davey
et. al. 1999). In all cases, the agreement between the observations
and theory is remarkable. The 3d±4f l4267 line is mainly fed by
4f 2Fo±ng 2G transitions, with 4f 2Fo±5g 2G l9903 contributing
about half the photons. The l9903 line unfortunately falls outside
our spectral coverage. Nevertheless, the 4f 2Fo±6g 2G l6462 and
q 2000 RAS, MNRAS 312, 585±628
Table 10. He i lines detected from NGC 6153. Theintensities have been corrected for extinction and arenormalized such that Ir�He i l4471� � 1:00; theobserved intensity of the He i l4471 line aftercorrection for collisional excitation. Collisional excita-tion of other lines has not been corrected for. Theresults are compared to the theoretical values deducedfrom Brocklehurst (1972) and Smits (1996).
l0 n Iobs Iobs Ipred Ipred
Minor Entire B72 S96axis nebula
2s 1S ± np 1Po series3447.59 6 .021 * .0633613.64 5 .058 * .111
2p 1Po ± ns 1S series4437.55 5 .011 .0092 .0165047.74 4 .025 .0166 .0387281.35 3 .094 .089 .133 .138
2p 1Po ± nd 1D series3805.74 11 .015 * .0113926.54 8 .023 * .0284009.26 7 .042 .058 .0434143.76 6 .069 .078 .0704387.93 5 .108 .116 .127 .1224921.93 4 .267 .256 .274 .2666678.16a 3 .757 .764 .804 .786
2s 3S ± np 3Po series3187.74 4 .558 * .886 .8843888.65 3 1.75 1.88 2.20 2.16
2p 3Po ± ns 3S series4120.84 5 .028 .009 .0364713.17 4 .112 .110 .087 .0987065.25 3 .714 .688 .313 .442
2p 3Po ± nd 3D series3465.94 17 .013 * .0113471.83 16 .014 * .0133478.97 15 .020 * .0163487.73 14 .014 * .0203498.66 13 .026 * .0243512.52 12 .030 * .0313530.50 11 .036 * .0403554.42 10 .048 * .0543587.28 9 .063 * .0743634.25 8 .092 * .1073705.02 7 .072 * .1613819.62 6 .253 * .2624026.21 5 .509 .502 .471 .4634471.50 4 1.02 1.02 1.00 1.005875.66 3 3.06 2.98 2.81 2.76
a Corrected for the contribution from He ii l6683.20.
4 The weakness of the He i l3705.02 line, which is blended with H 16, is
probably caused by poor line profile fitting. The intensity of H 16 derived
from the fitting seems too strong compared to other lines of the Balmer
series (cf. Fig. 10).
Table 11. Recombination line C2+/H+ abundances.
l0 Mult Minor axis Entire nebula
(AÊ ) Iobs
C2�
H�Iobs
C2�
H�(1023) (1023)
7231.32 V3 0.378 0.90 0.356 0.857236.42,7.17a V3 .825 0.99 0.723 0.86V 3 3p 2Po±3d 2D 1.20 0.96 1.08 0.863918.98 V4 0.048 2.65 * *3920.69 V4 0.060 1.66 * *V 4 3p 2Po±4s 2S .108 1.99V 5 3d 2D±4p 2Po l5890 .049 1.25 * *V 6 3d 2D±4f 2Fo l4267 2.51 2.35 2.40 2.25
a Corrected for a contribution (5 per cent) from [Ar iv]l7237.16, assuming [Ar iv] I�l7237:16�=I�l7170:62� � 0:75.
Dow
nloaded from https://academ
ic.oup.com/m
nras/article/312/3/585/1023114 by guest on 18 March 2022
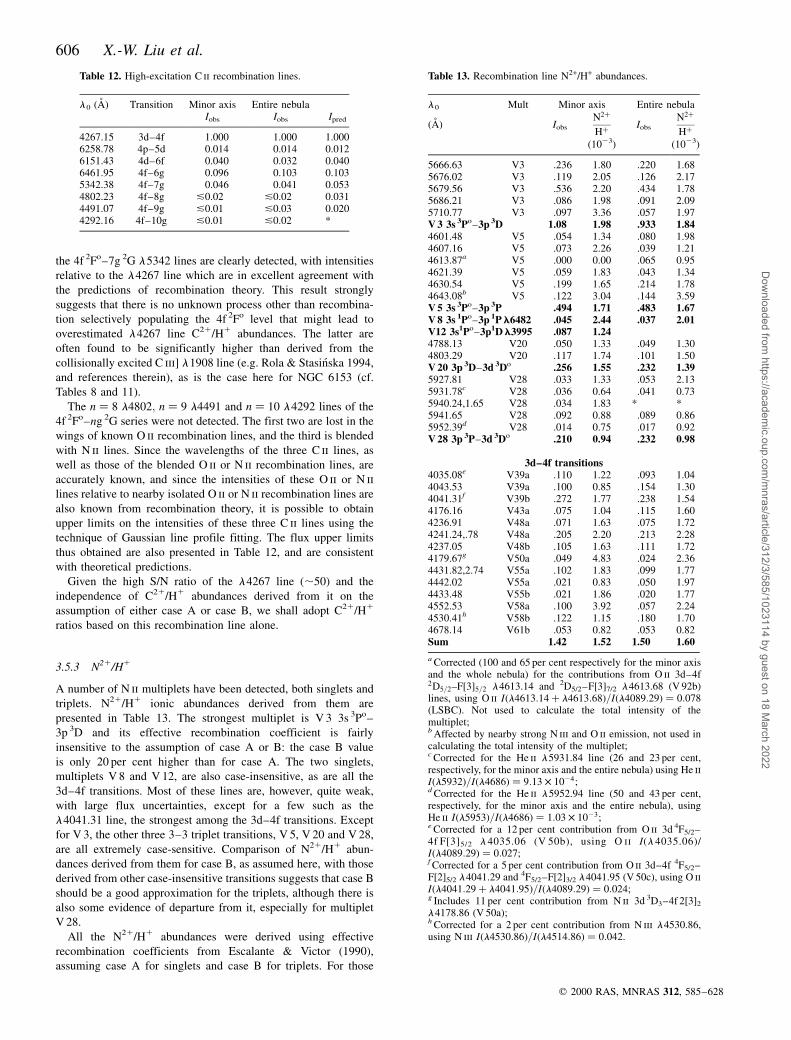
606 X.-W. Liu et al.
the 4f 2Fo±7g 2G l5342 lines are clearly detected, with intensities
relative to the l4267 line which are in excellent agreement with
the predictions of recombination theory. This result strongly
suggests that there is no unknown process other than recombina-
tion selectively populating the 4f 2Fo level that might lead to
overestimated l4267 line C21/H1 abundances. The latter are
often found to be significantly higher than derived from the
collisionally excited C iii] l1908 line (e.g. Rola & StasinÂska 1994,
and references therein), as is the case here for NGC 6153 (cf.
Tables 8 and 11).
The n � 8 l4802; n � 9 l4491 and n � 10 l4292 lines of the
4f 2Fo±ng 2G series were not detected. The first two are lost in the
wings of known O ii recombination lines, and the third is blended
with N ii lines. Since the wavelengths of the three C ii lines, as
well as those of the blended O ii or N ii recombination lines, are
accurately known, and since the intensities of these O ii or N ii
lines relative to nearby isolated O ii or N ii recombination lines are
also known from recombination theory, it is possible to obtain
upper limits on the intensities of these three C ii lines using the
technique of Gaussian line profile fitting. The flux upper limits
thus obtained are also presented in Table 12, and are consistent
with theoretical predictions.
Given the high S/N ratio of the l4267 line (,50) and the
independence of C21/H1 abundances derived from it on the
assumption of either case A or case B, we shall adopt C21/H1
ratios based on this recombination line alone.
3.5.3 N21/H1
A number of N ii multiplets have been detected, both singlets and
triplets. N21/H1 ionic abundances derived from them are
presented in Table 13. The strongest multiplet is V 3 3s 3Po±
3p 3D and its effective recombination coefficient is fairly
insensitive to the assumption of case A or B: the case B value
is only 20 per cent higher than for case A. The two singlets,
multiplets V 8 and V 12, are also case-insensitive, as are all the
3d±4f transitions. Most of these lines are, however, quite weak,
with large flux uncertainties, except for a few such as the
l4041.31 line, the strongest among the 3d±4f transitions. Except
for V 3, the other three 3±3 triplet transitions, V 5, V 20 and V 28,
are all extremely case-sensitive. Comparison of N21/H1 abun-
dances derived from them for case B, as assumed here, with those
derived from other case-insensitive transitions suggests that case B
should be a good approximation for the triplets, although there is
also some evidence of departure from it, especially for multiplet
V 28.
All the N21/H1 abundances were derived using effective
recombination coefficients from Escalante & Victor (1990),
assuming case A for singlets and case B for triplets. For those
q 2000 RAS, MNRAS 312, 585±628
Table 12. High-excitation C ii recombination lines.
l0 (AÊ ) Transition Minor axis Entire nebulaIobs Iobs Ipred
4267.15 3d±4f 1.000 1.000 1.0006258.78 4p±5d 0.014 0.014 0.0126151.43 4d±6f 0.040 0.032 0.0406461.95 4f±6g 0.096 0.103 0.1035342.38 4f±7g 0.046 0.041 0.0534802.23 4f±8g &0.02 &0.02 0.0314491.07 4f±9g &0.01 &0.03 0.0204292.16 4f±10g &0.01 &0.02 *
Table 13. Recombination line N2+/H+ abundances.
l0 Mult Minor axis Entire nebula
(AÊ ) Iobs
N2�
H�Iobs
N2�
H�(1023) (1023)
5666.63 V3 .236 1.80 .220 1.685676.02 V3 .119 2.05 .126 2.175679.56 V3 .536 2.20 .434 1.785686.21 V3 .086 1.98 .091 2.095710.77 V3 .097 3.36 .057 1.97V 3 3s 3Po±3p 3D 1.08 1.98 .933 1.844601.48 V5 .054 1.34 .080 1.984607.16 V5 .073 2.26 .039 1.214613.87a V5 .000 0.00 .065 0.954621.39 V5 .059 1.83 .043 1.344630.54 V5 .199 1.65 .214 1.784643.08b V5 .122 3.04 .144 3.59V 5 3s 3Po±3p 3P .494 1.71 .483 1.67V 8 3s 1Po±3p 1Pl6482 .045 2.44 .037 2.01V12 3s1Po±3p1Dl3995 .087 1.244788.13 V20 .050 1.33 .049 1.304803.29 V20 .117 1.74 .101 1.50V 20 3p 3D±3d 3Do .256 1.55 .232 1.395927.81 V28 .033 1.33 .053 2.135931.78c V28 .036 0.64 .041 0.735940.24,1.65 V28 .034 1.83 * *5941.65 V28 .092 0.88 .089 0.865952.39d V28 .014 0.75 .017 0.92V 28 3p 3P±3d 3Do .210 0.94 .232 0.98
3d±4f transitions4035.08e V39a .110 1.22 .093 1.044043.53 V39a .100 0.85 .154 1.304041.31f V39b .272 1.77 .238 1.544176.16 V43a .075 1.04 .115 1.604236.91 V48a .071 1.63 .075 1.724241.24,.78 V48a .205 2.20 .213 2.284237.05 V48b .105 1.63 .111 1.724179.67g V50a .049 4.83 .024 2.364431.82,2.74 V55a .102 1.83 .099 1.774442.02 V55a .021 0.83 .050 1.974433.48 V55b .021 1.86 .020 1.774552.53 V58a .100 3.92 .057 2.244530.41h V58b .122 1.15 .180 1.704678.14 V61b .053 0.82 .053 0.82Sum 1.42 1.52 1.50 1.60
a Corrected (100 and 65 per cent respectively for the minor axisand the whole nebula) for the contributions from O ii 3d±4f2D5=2±F�3�5=2 l4613.14 and 2D5/2±F[3]7/2 l4613.68 (V 92b)lines, using O ii I�l4613:14� l4613:68�=I�l4089:29� � 0:078(LSBC). Not used to calculate the total intensity of themultiplet;b Affected by nearby strong N iii and O ii emission, not used incalculating the total intensity of the multiplet;c Corrected for the He ii l5931.84 line (26 and 23 per cent,respectively, for the minor axis and the entire nebula) using He iiI�l5932�=I�l4686� � 9:13 � 1024;d Corrected for the He ii l5952.94 line (50 and 43 per cent,respectively, for the minor axis and the entire nebula), usingHe ii I�l5953�=I�l4686� � 1:03 � 1023;e Corrected for a 12 per cent contribution from O ii 3d 4F5/2±4f F[3]5/2 l 4035.06 (V 50b), using O ii I(l 4035.06)/I�l4089:29� � 0:027;f Corrected for a 5 per cent contribution from O ii 3d±4f 4F5/2±F[2]5/2 l4041.29 and 4F5/2±F[2]3/2 l4041.95 (V 50c), using O iiI�l4041:29� l4041:95�=I�l4089:29� � 0:024;g Includes 11 per cent contribution from N ii 3d 3D3±4f 2[3]2
l4178.86 (V 50a);h Corrected for a 2 per cent contribution from N iii l4530.86,using N iii I�l4530:86�=I�l4514:86� � 0:042.
Dow
nloaded from https://academ
ic.oup.com/m
nras/article/312/3/585/1023114 by guest on 18 March 2022
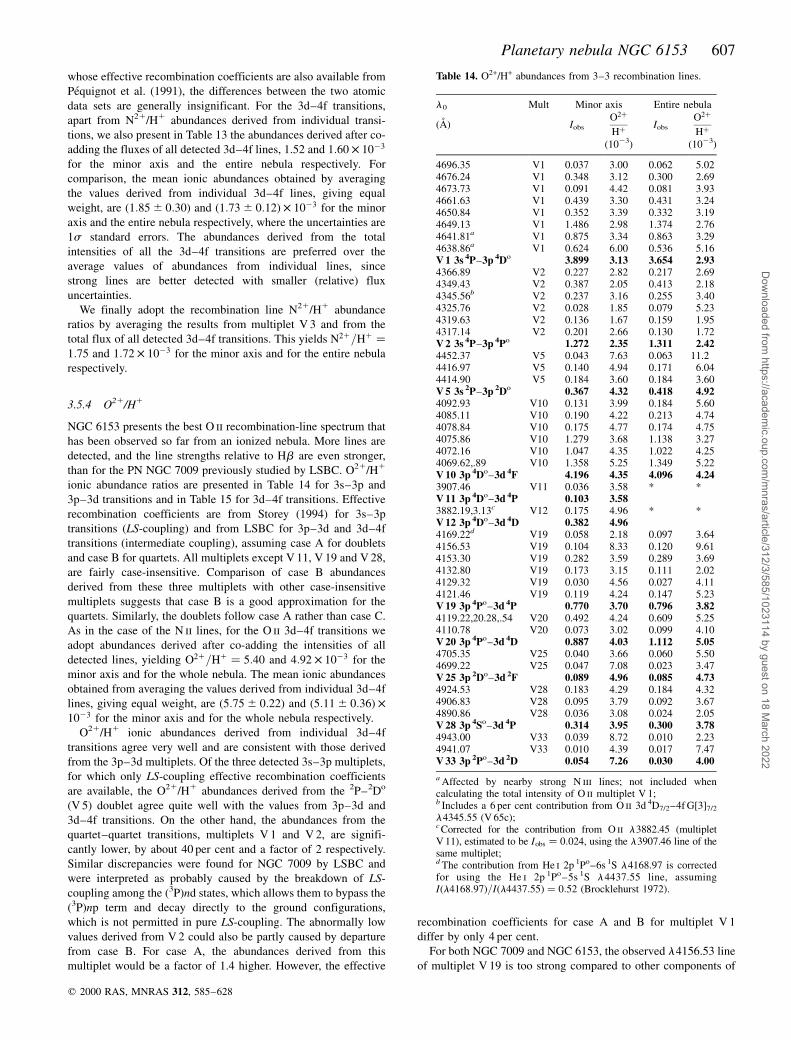
Planetary nebula NGC 6153 607
whose effective recombination coefficients are also available from
PeÂquignot et al. (1991), the differences between the two atomic
data sets are generally insignificant. For the 3d±4f transitions,
apart from N21/H1 abundances derived from individual transi-
tions, we also present in Table 13 the abundances derived after co-
adding the fluxes of all detected 3d±4f lines, 1.52 and 1:60 � 1023
for the minor axis and the entire nebula respectively. For
comparison, the mean ionic abundances obtained by averaging
the values derived from individual 3d±4f lines, giving equal
weight, are �1:85 ^ 0:30� and �1:73 ^ 0:12� � 1023 for the minor
axis and the entire nebula respectively, where the uncertainties are
1s standard errors. The abundances derived from the total
intensities of all the 3d±4f transitions are preferred over the
average values of abundances from individual lines, since
strong lines are better detected with smaller (relative) flux
uncertainties.
We finally adopt the recombination line N21/H1 abundance
ratios by averaging the results from multiplet V 3 and from the
total flux of all detected 3d±4f transitions. This yields N21=H1 �1:75 and 1:72 � 1023 for the minor axis and for the entire nebula
respectively.
3.5.4 O21/H1
NGC 6153 presents the best O ii recombination-line spectrum that
has been observed so far from an ionized nebula. More lines are
detected, and the line strengths relative to Hb are even stronger,
than for the PN NGC 7009 previously studied by LSBC. O21/H1
ionic abundance ratios are presented in Table 14 for 3s±3p and
3p±3d transitions and in Table 15 for 3d±4f transitions. Effective
recombination coefficients are from Storey (1994) for 3s±3p
transitions (LS-coupling) and from LSBC for 3p±3d and 3d±4f
transitions (intermediate coupling), assuming case A for doublets
and case B for quartets. All multiplets except V 11, V 19 and V 28,
are fairly case-insensitive. Comparison of case B abundances
derived from these three multiplets with other case-insensitive
multiplets suggests that case B is a good approximation for the
quartets. Similarly, the doublets follow case A rather than case C.
As in the case of the N ii lines, for the O ii 3d±4f transitions we
adopt abundances derived after co-adding the intensities of all
detected lines, yielding O21=H1 � 5:40 and 4:92 � 1023 for the
minor axis and for the whole nebula. The mean ionic abundances
obtained from averaging the values derived from individual 3d±4f
lines, giving equal weight, are �5:75 ^ 0:22� and �5:11 ^ 0:36� �1023 for the minor axis and for the whole nebula respectively.
O21/H1 ionic abundances derived from individual 3d±4f
transitions agree very well and are consistent with those derived
from the 3p±3d multiplets. Of the three detected 3s±3p multiplets,
for which only LS-coupling effective recombination coefficients
are available, the O21/H1 abundances derived from the 2P±2Do
(V 5) doublet agree quite well with the values from 3p±3d and
3d±4f transitions. On the other hand, the abundances from the
quartet±quartet transitions, multiplets V 1 and V 2, are signifi-
cantly lower, by about 40 per cent and a factor of 2 respectively.
Similar discrepancies were found for NGC 7009 by LSBC and
were interpreted as probably caused by the breakdown of LS-
coupling among the (3P)nd states, which allows them to bypass the
(3P)np term and decay directly to the ground configurations,
which is not permitted in pure LS-coupling. The abnormally low
values derived from V 2 could also be partly caused by departure
from case B. For case A, the abundances derived from this
multiplet would be a factor of 1.4 higher. However, the effective
recombination coefficients for case A and B for multiplet V 1
differ by only 4 per cent.
For both NGC 7009 and NGC 6153, the observed l4156.53 line
of multiplet V 19 is too strong compared to other components of
q 2000 RAS, MNRAS 312, 585±628
Table 14. O2+/H+ abundances from 3±3 recombination lines.
l0 Mult Minor axis Entire nebula
(AÊ ) Iobs
O2�
H�Iobs
O2�
H�(1023) (1023)
4696.35 V1 0.037 3.00 0.062 5.024676.24 V1 0.348 3.12 0.300 2.694673.73 V1 0.091 4.42 0.081 3.934661.63 V1 0.439 3.30 0.431 3.244650.84 V1 0.352 3.39 0.332 3.194649.13 V1 1.486 2.98 1.374 2.764641.81a V1 0.875 3.34 0.863 3.294638.86a V1 0.624 6.00 0.536 5.16V 1 3s 4P±3p 4Do 3.899 3.13 3.654 2.934366.89 V2 0.227 2.82 0.217 2.694349.43 V2 0.387 2.05 0.413 2.184345.56b V2 0.237 3.16 0.255 3.404325.76 V2 0.028 1.85 0.079 5.234319.63 V2 0.136 1.67 0.159 1.954317.14 V2 0.201 2.66 0.130 1.72V 2 3s 4P±3p 4Po 1.272 2.35 1.311 2.424452.37 V5 0.043 7.63 0.063 11.24416.97 V5 0.140 4.94 0.171 6.044414.90 V5 0.184 3.60 0.184 3.60V 5 3s 2P±3p 2Do 0.367 4.32 0.418 4.924092.93 V10 0.131 3.99 0.184 5.604085.11 V10 0.190 4.22 0.213 4.744078.84 V10 0.175 4.77 0.174 4.754075.86 V10 1.279 3.68 1.138 3.274072.16 V10 1.047 4.35 1.022 4.254069.62,.89 V10 1.358 5.25 1.349 5.22V 10 3p 4Do±3d 4F 4.196 4.35 4.096 4.243907.46 V11 0.036 3.58 * *V 11 3p 4Do±3d 4P 0.103 3.583882.19,3.13c V12 0.175 4.96 * *V 12 3p 4Do±3d 4D 0.382 4.964169.22d V19 0.058 2.18 0.097 3.644156.53 V19 0.104 8.33 0.120 9.614153.30 V19 0.282 3.59 0.289 3.694132.80 V19 0.173 3.15 0.111 2.024129.32 V19 0.030 4.56 0.027 4.114121.46 V19 0.119 4.24 0.147 5.23V 19 3p 4Po±3d 4P 0.770 3.70 0.796 3.824119.22,20.28,.54 V20 0.492 4.24 0.609 5.254110.78 V20 0.073 3.02 0.099 4.10V 20 3p 4Po±3d 4D 0.887 4.03 1.112 5.054705.35 V25 0.040 3.66 0.060 5.504699.22 V25 0.047 7.08 0.023 3.47V 25 3p 2Do±3d 2F 0.089 4.96 0.085 4.734924.53 V28 0.183 4.29 0.184 4.324906.83 V28 0.095 3.79 0.092 3.674890.86 V28 0.036 3.08 0.024 2.05V 28 3p 4So±3d 4P 0.314 3.95 0.300 3.784943.00 V33 0.039 8.72 0.010 2.234941.07 V33 0.010 4.39 0.017 7.47V 33 3p 2Po±3d 2D 0.054 7.26 0.030 4.00
a Affected by nearby strong N iii lines; not included whencalculating the total intensity of O ii multiplet V 1;b Includes a 6 per cent contribution from O ii 3d 4D7/2±4f G[3]7/2
l4345.55 (V 65c);c Corrected for the contribution from O ii l3882.45 (multipletV 11), estimated to be Iobs � 0:024, using the l3907.46 line of thesame multiplet;d The contribution from He i 2p 1Po±6s 1S l4168.97 is correctedfor using the He i 2p 1Po±5s 1S l4437.55 line, assumingI�l4168:97�=I�l4437:55� � 0:52 (Brocklehurst 1972).
Dow
nloaded from https://academ
ic.oup.com/m
nras/article/312/3/585/1023114 by guest on 18 March 2022
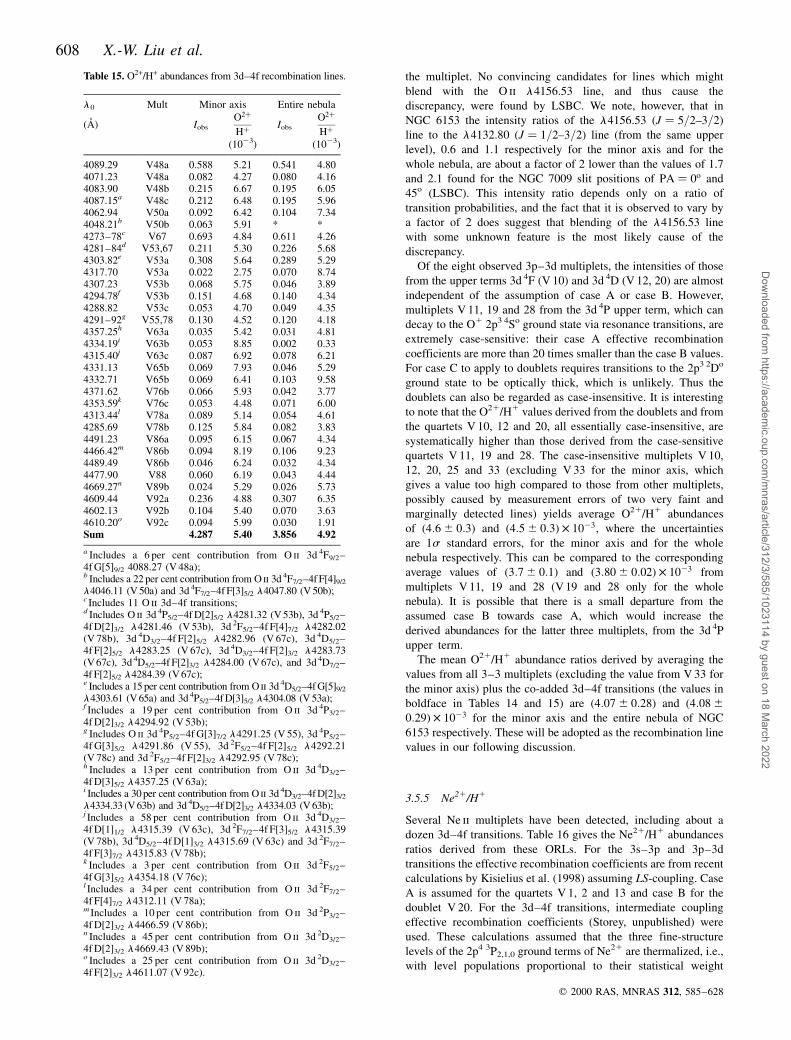
608 X.-W. Liu et al.
the multiplet. No convincing candidates for lines which might
blend with the O ii l4156.53 line, and thus cause the
discrepancy, were found by LSBC. We note, however, that in
NGC 6153 the intensity ratios of the l4156.53 �J � 5=2±3=2�line to the l4132.80 �J � 1=2±3=2� line (from the same upper
level), 0.6 and 1.1 respectively for the minor axis and for the
whole nebula, are about a factor of 2 lower than the values of 1.7
and 2.1 found for the NGC 7009 slit positions of PA � 0o and
45o (LSBC). This intensity ratio depends only on a ratio of
transition probabilities, and the fact that it is observed to vary by
a factor of 2 does suggest that blending of the l4156.53 line
with some unknown feature is the most likely cause of the
discrepancy.
Of the eight observed 3p±3d multiplets, the intensities of those
from the upper terms 3d 4F (V 10) and 3d 4D (V 12, 20) are almost
independent of the assumption of case A or case B. However,
multiplets V 11, 19 and 28 from the 3d 4P upper term, which can
decay to the O1 2p3 4So ground state via resonance transitions, are
extremely case-sensitive: their case A effective recombination
coefficients are more than 20 times smaller than the case B values.
For case C to apply to doublets requires transitions to the 2p3 2Do
ground state to be optically thick, which is unlikely. Thus the
doublets can also be regarded as case-insensitive. It is interesting
to note that the O21/H1 values derived from the doublets and from
the quartets V 10, 12 and 20, all essentially case-insensitive, are
systematically higher than those derived from the case-sensitive
quartets V 11, 19 and 28. The case-insensitive multiplets V 10,
12, 20, 25 and 33 (excluding V 33 for the minor axis, which
gives a value too high compared to those from other multiplets,
possibly caused by measurement errors of two very faint and
marginally detected lines) yields average O21/H1 abundances
of �4:6 ^ 0:3� and �4:5 ^ 0:3� � 1023, where the uncertainties
are 1s standard errors, for the minor axis and for the whole
nebula respectively. This can be compared to the corresponding
average values of �3:7 ^ 0:1� and �3:80 ^ 0:02� � 1023 from
multiplets V 11, 19 and 28 (V 19 and 28 only for the whole
nebula). It is possible that there is a small departure from the
assumed case B towards case A, which would increase the
derived abundances for the latter three multiplets, from the 3d 4P
upper term.
The mean O21/H1 abundance ratios derived by averaging the
values from all 3±3 multiplets (excluding the value from V 33 for
the minor axis) plus the co-added 3d±4f transitions (the values in
boldface in Tables 14 and 15) are �4:07 ^ 0:28� and �4:08 ^
0:29� � 1023 for the minor axis and the entire nebula of NGC
6153 respectively. These will be adopted as the recombination line
values in our following discussion.
3.5.5 Ne21/H1
Several Ne ii multiplets have been detected, including about a
dozen 3d±4f transitions. Table 16 gives the Ne21/H1 abundances
ratios derived from these ORLs. For the 3s±3p and 3p±3d
transitions the effective recombination coefficients are from recent
calculations by Kisielius et al. (1998) assuming LS-coupling. Case
A is assumed for the quartets V 1, 2 and 13 and case B for the
doublet V 20. For the 3d±4f transitions, intermediate coupling
effective recombination coefficients (Storey, unpublished) were
used. These calculations assumed that the three fine-structure
levels of the 2p4 3P2,1,0 ground terms of Ne21 are thermalized, i.e.,
with level populations proportional to their statistical weight
q 2000 RAS, MNRAS 312, 585±628
Table 15. O2+/H+ abundances from 3d±4f recombination lines.
l0 Mult Minor axis Entire nebula
(AÊ ) Iobs
O2�
H�Iobs
O2�
H�(1023) (1023)
4089.29 V48a 0.588 5.21 0.541 4.804071.23 V48a 0.082 4.27 0.080 4.164083.90 V48b 0.215 6.67 0.195 6.054087.15a V48c 0.212 6.48 0.195 5.964062.94 V50a 0.092 6.42 0.104 7.344048.21b V50b 0.063 5.91 * *4273±78c V67 0.693 4.84 0.611 4.264281±84d V53,67 0.211 5.30 0.226 5.684303.82e V53a 0.308 5.64 0.289 5.294317.70 V53a 0.022 2.75 0.070 8.744307.23 V53b 0.068 5.75 0.046 3.894294.78f V53b 0.151 4.68 0.140 4.344288.82 V53c 0.053 4.70 0.049 4.354291±92g V55,78 0.130 4.52 0.120 4.184357.25h V63a 0.035 5.42 0.031 4.814334.19i V63b 0.053 8.85 0.002 0.334315.40j V63c 0.087 6.92 0.078 6.214331.13 V65b 0.069 7.93 0.046 5.294332.71 V65b 0.069 6.41 0.103 9.584371.62 V76b 0.066 5.93 0.042 3.774353.59k V76c 0.053 4.48 0.071 6.004313.44l V78a 0.089 5.14 0.054 4.614285.69 V78b 0.125 5.84 0.082 3.834491.23 V86a 0.095 6.15 0.067 4.344466.42m V86b 0.094 8.19 0.106 9.234489.49 V86b 0.046 6.24 0.032 4.344477.90 V88 0.060 6.19 0.043 4.444669.27n V89b 0.024 5.29 0.026 5.734609.44 V92a 0.236 4.88 0.307 6.354602.13 V92b 0.104 5.40 0.070 3.634610.20o V92c 0.094 5.99 0.030 1.91Sum 4.287 5.40 3.856 4.92
a Includes a 6 per cent contribution from O ii 3d 4F9/2±4f G[5]9/2 4088.27 (V 48a);b Includes a 22 per cent contribution from O ii 3d 4F7/2±4f F[4]9/2
l4046.11 (V 50a) and 3d 4F7/2±4f F[3]5/2 l4047.80 (V 50b);c Includes 11 O ii 3d±4f transitions;d Includes O ii 3d 4P5/2±4f D[2]5/2 l4281.32 (V 53b), 3d 4P5/2±4f D[2]3/2 l4281.46 (V 53b), 3d 2F5/2±4f F[4]7/2 l4282.02(V 78b), 3d 4D3/2±4f F[2]5/2 l4282.96 (V 67c), 3d 4D5/2±4f F[2]5/2 l4283.25 (V 67c), 3d 4D3/2±4f F[2]3/2 l4283.73(V 67c), 3d 4D5/2±4f F[2]3/2 l4284.00 (V 67c), and 3d 4D7/2±4f F[2]5/2 l4284.39 (V 67c);e Includes a 15 per cent contribution from O ii 3d 4D5/2±4f G[5]9/2
l4303.61 (V 65a) and 3d 4P5/2±4f D[3]5/2 l4304.08 (V 53a);f Includes a 19 per cent contribution from O ii 3d 4P3/2±4f D[2]3/2 l4294.92 (V 53b);g Includes O ii 3d 4P5/2±4f G[3]7/2 l4291.25 (V 55), 3d 4P5/2±4f G[3]5/2 l4291.86 (V 55), 3d 2F5/2±4f F[2]5/2 l4292.21(V 78c) and 3d 2F5/2±4f F[2]3/2 l4292.95 (V 78c);h Includes a 13 per cent contribution from O ii 3d 4D3/2±4f D[3]5/2 l4357.25 (V 63a);i Includes a 30 per cent contribution from O ii 3d 4D3/2±4f D[2]3/2
l4334.33 (V 63b) and 3d 4D5/2±4f D[2]3/2 l4334.03 (V 63b);j Includes a 58 per cent contribution from O ii 3d 4D3/2±4f D[1]1/2 l4315.39 (V 63c), 3d 2F7/2±4f F[3]5/2 l4315.39(V 78b), 3d 4D5/2±4f D[1]3/2 l4315.69 (V 63c) and 3d 2F7/2±4f F[3]7/2 l4315.83 (V 78b);k Includes a 3 per cent contribution from O ii 3d 2F5/2±4f G[3]5/2 l4354.18 (V 76c);l Includes a 34 per cent contribution from O ii 3d 2F7/2±4f F[4]7/2 l4312.11 (V 78a);m Includes a 10 per cent contribution from O ii 3d 2P3/2±4f D[2]3/2 l4466.59 (V 86b);n Includes a 45 per cent contribution from O ii 3d 2D3/2±4f D[2]3/2 l4669.43 (V 89b);o Includes a 25 per cent contribution from O ii 3d 2D3/2±4f F[2]3/2 l4611.07 (V 92c).
Dow
nloaded from https://academ
ic.oup.com/m
nras/article/312/3/585/1023114 by guest on 18 March 2022
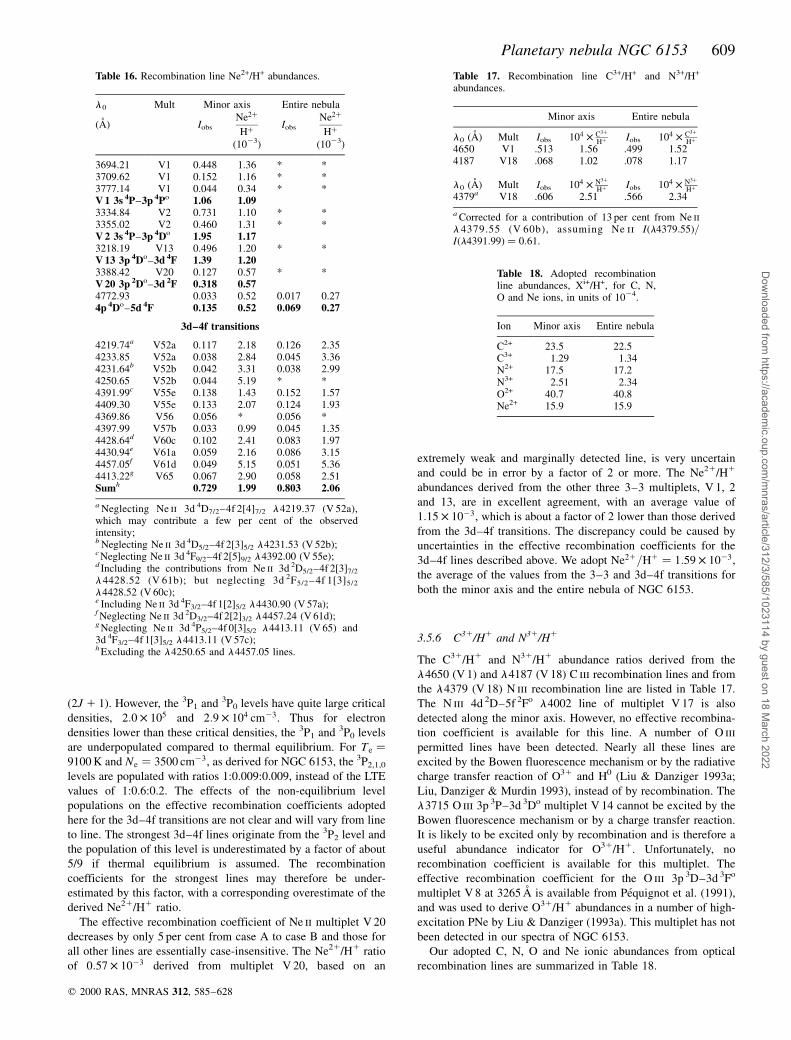
Planetary nebula NGC 6153 609
�2J 1 1�. However, the 3P1 and 3P0 levels have quite large critical
densities, 2:0 � 105 and 2:9 � 104 cm23. Thus for electron
densities lower than these critical densities, the 3P1 and 3P0 levels
are underpopulated compared to thermal equilibrium. For Te �9100 K and Ne � 3500 cm23, as derived for NGC 6153, the 3P2,1,0
levels are populated with ratios 1:0.009:0.009, instead of the LTE
values of 1:0.6:0.2. The effects of the non-equilibrium level
populations on the effective recombination coefficients adopted
here for the 3d±4f transitions are not clear and will vary from line
to line. The strongest 3d±4f lines originate from the 3P2 level and
the population of this level is underestimated by a factor of about
5/9 if thermal equilibrium is assumed. The recombination
coefficients for the strongest lines may therefore be under-
estimated by this factor, with a corresponding overestimate of the
derived Ne21/H1 ratio.
The effective recombination coefficient of Ne ii multiplet V 20
decreases by only 5 per cent from case A to case B and those for
all other lines are essentially case-insensitive. The Ne21/H1 ratio
of 0:57 � 1023 derived from multiplet V 20, based on an
extremely weak and marginally detected line, is very uncertain
and could be in error by a factor of 2 or more. The Ne21/H1
abundances derived from the other three 3±3 multiplets, V 1, 2
and 13, are in excellent agreement, with an average value of
1:15 � 1023, which is about a factor of 2 lower than those derived
from the 3d±4f transitions. The discrepancy could be caused by
uncertainties in the effective recombination coefficients for the
3d±4f lines described above. We adopt Ne21=H1 � 1:59 � 1023,
the average of the values from the 3±3 and 3d±4f transitions for
both the minor axis and the entire nebula of NGC 6153.
3.5.6 C31/H1 and N31/H1
The C31/H1 and N31/H1 abundance ratios derived from the
l4650 (V 1) and l4187 (V 18) C iii recombination lines and from
the l4379 (V 18) N iii recombination line are listed in Table 17.
The N iii 4d 2D±5f 2Fo l4002 line of multiplet V 17 is also
detected along the minor axis. However, no effective recombina-
tion coefficient is available for this line. A number of O iii
permitted lines have been detected. Nearly all these lines are
excited by the Bowen fluorescence mechanism or by the radiative
charge transfer reaction of O31 and H0 (Liu & Danziger 1993a;
Liu, Danziger & Murdin 1993), instead of by recombination. The
l3715 O iii 3p 3P±3d 3Do multiplet V 14 cannot be excited by the
Bowen fluorescence mechanism or by a charge transfer reaction.
It is likely to be excited only by recombination and is therefore a
useful abundance indicator for O31/H1. Unfortunately, no
recombination coefficient is available for this multiplet. The
effective recombination coefficient for the O iii 3p 3D±3d 3Fo
multiplet V 8 at 3265 AÊ is available from PeÂquignot et al. (1991),
and was used to derive O31/H1 abundances in a number of high-
excitation PNe by Liu & Danziger (1993a). This multiplet has not
been detected in our spectra of NGC 6153.
Our adopted C, N, O and Ne ionic abundances from optical
recombination lines are summarized in Table 18.
q 2000 RAS, MNRAS 312, 585±628
Table 16. Recombination line Ne2+/H+ abundances.
l0 Mult Minor axis Entire nebula
(AÊ ) Iobs
Ne2�
H�Iobs
Ne2�
H�(1023) (1023)
3694.21 V1 0.448 1.36 * *3709.62 V1 0.152 1.16 * *3777.14 V1 0.044 0.34 * *V 1 3s 4P±3p 4Po 1.06 1.093334.84 V2 0.731 1.10 * *3355.02 V2 0.460 1.31 * *V 2 3s 4P±3p 4Do 1.95 1.173218.19 V13 0.496 1.20 * *V 13 3p 4Do±3d 4F 1.39 1.203388.42 V20 0.127 0.57 * *V 20 3p 2Do±3d 2F 0.318 0.574772.93 0.033 0.52 0.017 0.274p 4Do±5d 4F 0.135 0.52 0.069 0.27
3d±4f transitions
4219.74a V52a 0.117 2.18 0.126 2.354233.85 V52a 0.038 2.84 0.045 3.364231.64b V52b 0.042 3.31 0.038 2.994250.65 V52b 0.044 5.19 * *4391.99c V55e 0.138 1.43 0.152 1.574409.30 V55e 0.133 2.07 0.124 1.934369.86 V56 0.056 * 0.056 *4397.99 V57b 0.033 0.99 0.045 1.354428.64d V60c 0.102 2.41 0.083 1.974430.94e V61a 0.059 2.16 0.086 3.154457.05f V61d 0.049 5.15 0.051 5.364413.22g V65 0.067 2.90 0.058 2.51Sumh 0.729 1.99 0.803 2.06
a Neglecting Ne ii 3d 4D7/2±4f 2[4]7/2 l4219.37 (V 52a),which may contribute a few per cent of the observedintensity;b Neglecting Ne ii 3d 4D5/2±4f 2[3]5/2 l4231.53 (V 52b);c Neglecting Ne ii 3d 4F9/2±4f 2[5]9/2 l4392.00 (V 55e);d Including the contributions from Ne ii 3d 2D5/2±4f 2[3]7/2
l4428.52 (V 61b); but neglecting 3d 2F5/2±4f 1[3]5/2
l4428.52 (V 60c);e Including Ne ii 3d 4F3/2±4f 1[2]5/2 l4430.90 (V 57a);f Neglecting Ne ii 3d 2D3/2±4f 2[2]3/2 l4457.24 (V 61d);g Neglecting Ne ii 3d 4P5/2±4f 0[3]5/2 l4413.11 (V 65) and3d 4F3/2±4f 1[3]5/2 l4413.11 (V 57c);h Excluding the l4250.65 and l4457.05 lines.
Table 17. Recombination line C3+/H+ and N3+/H+
abundances.
Minor axis Entire nebula
l0 (AÊ ) Mult Iobs 104 � C3�H� Iobs 104 � C3�
H�4650 V1 .513 1.56 .499 1.524187 V18 .068 1.02 .078 1.17
l0 (AÊ ) Mult Iobs 104 � N3�H� Iobs 104 � N3�
H�4379a V18 .606 2.51 .566 2.34
a Corrected for a contribution of 13 per cent from Ne iil 4379.55 (V 60b), assuming Ne ii I�l4379:55�=I�l4391:99� � 0:61.
Table 18. Adopted recombinationline abundances, Xi+/H+, for C, N,O and Ne ions, in units of 1024.
Ion Minor axis Entire nebula
C2+ 23.5 22.5C3+ 1.29 1.34N2+ 17.5 17.2N3+ 2.51 2.34O2+ 40.7 40.8Ne2+ 15.9 15.9
Dow
nloaded from https://academ
ic.oup.com/m
nras/article/312/3/585/1023114 by guest on 18 March 2022
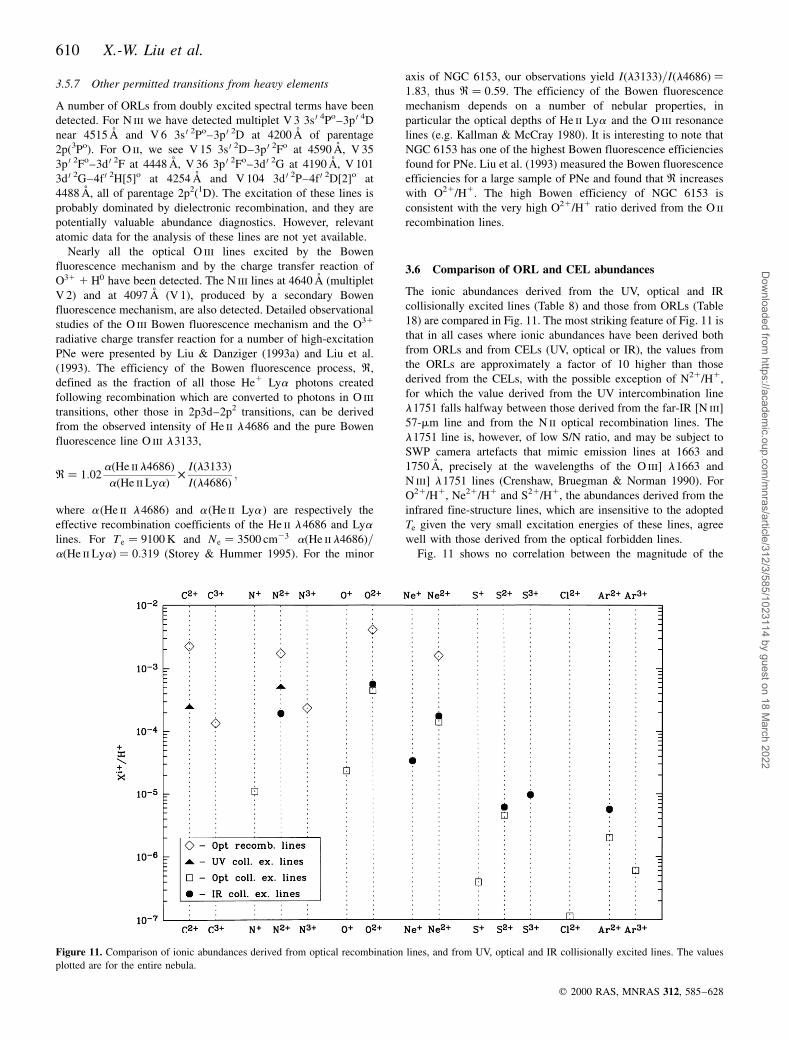
610 X.-W. Liu et al.
3.5.7 Other permitted transitions from heavy elements
A number of ORLs from doubly excited spectral terms have been
detected. For N iii we have detected multiplet V 3 3s 0 4Po±3p 0 4D
near 4515 AÊ and V 6 3s 0 2Po±3p 0 2D at 4200 AÊ of parentage
2p(3Po). For O ii, we see V 15 3s 0 2D±3p 0 2Fo at 4590 AÊ , V 35
3p 0 2Fo±3d 0 2F at 4448 AÊ , V 36 3p 0 2Fo±3d 0 2G at 4190 AÊ , V 101
3d 0 2G±4f 0 2H[5]o at 4254 AÊ and V 104 3d 0 2P±4f 0 2D[2]o at
4488 AÊ , all of parentage 2p2(1D). The excitation of these lines is
probably dominated by dielectronic recombination, and they are
potentially valuable abundance diagnostics. However, relevant
atomic data for the analysis of these lines are not yet available.
Nearly all the optical O iii lines excited by the Bowen
fluorescence mechanism and by the charge transfer reaction of
O31 1 H0 have been detected. The N iii lines at 4640 AÊ (multiplet
V 2) and at 4097 AÊ (V 1), produced by a secondary Bowen
fluorescence mechanism, are also detected. Detailed observational
studies of the O iii Bowen fluorescence mechanism and the O31
radiative charge transfer reaction for a number of high-excitation
PNe were presented by Liu & Danziger (1993a) and Liu et al.
(1993). The efficiency of the Bowen fluorescence process, R,
defined as the fraction of all those He1 Lya photons created
following recombination which are converted to photons in O iii
transitions, other those in 2p3d±2p2 transitions, can be derived
from the observed intensity of He ii l4686 and the pure Bowen
fluorescence line O iii l3133,
R � 1:02a�He iil4686�a�He ii Lya� �
I�l3133�I�l4686� ;
where a (He ii l4686) and a (He ii Lya ) are respectively the
effective recombination coefficients of the He ii l4686 and Lyalines. For Te � 9100 K and Ne � 3500 cm23 a�He iil4686�=a�He ii Lya� � 0:319 (Storey & Hummer 1995). For the minor
axis of NGC 6153, our observations yield I�l3133�=I�l4686� �1:83; thus R � 0:59. The efficiency of the Bowen fluorescence
mechanism depends on a number of nebular properties, in
particular the optical depths of He ii Lya and the O iii resonance
lines (e.g. Kallman & McCray 1980). It is interesting to note that
NGC 6153 has one of the highest Bowen fluorescence efficiencies
found for PNe. Liu et al. (1993) measured the Bowen fluorescence
efficiencies for a large sample of PNe and found that R increases
with O21/H1. The high Bowen efficiency of NGC 6153 is
consistent with the very high O21/H1 ratio derived from the O ii
recombination lines.
3.6 Comparison of ORL and CEL abundances
The ionic abundances derived from the UV, optical and IR
collisionally excited lines (Table 8) and those from ORLs (Table
18) are compared in Fig. 11. The most striking feature of Fig. 11 is
that in all cases where ionic abundances have been derived both
from ORLs and from CELs (UV, optical or IR), the values from
the ORLs are approximately a factor of 10 higher than those
derived from the CELs, with the possible exception of N21/H1,
for which the value derived from the UV intercombination line
l1751 falls halfway between those derived from the far-IR [N iii]
57-mm line and from the N ii optical recombination lines. The
l1751 line is, however, of low S/N ratio, and may be subject to
SWP camera artefacts that mimic emission lines at 1663 and
1750 AÊ , precisely at the wavelengths of the O iii] l1663 and
N iii] l1751 lines (Crenshaw, Bruegman & Norman 1990). For
O21/H1, Ne21/H1 and S21/H1, the abundances derived from the
infrared fine-structure lines, which are insensitive to the adopted
Te given the very small excitation energies of these lines, agree
well with those derived from the optical forbidden lines.
Fig. 11 shows no correlation between the magnitude of the
q 2000 RAS, MNRAS 312, 585±628
Figure 11. Comparison of ionic abundances derived from optical recombination lines, and from UV, optical and IR collisionally excited lines. The values
plotted are for the entire nebula.
Dow
nloaded from https://academ
ic.oup.com/m
nras/article/312/3/585/1023114 by guest on 18 March 2022
Planetary nebula NGC 6153 611
abundance discrepancies for individual ions, derived from ORLs
on the one hand and from CELs on the other, and the excitation
energies of the CELs. Similarly, no correlation is apparent
between the discrepancies and the critical densities of the IR
lines, which vary from less than 3000 cm23 for the [O iii] 52, 88-
mm lines and the [N iii] 57-mm line to 15 000 cm23 for the [S iii]
18.7-mm line and 2 � 105 cm23 for the [Ne iii] 15.5-mm line.
Adopting a higher Ne of 3500 cm23, as derived from the optical
[Ar iv] and [Cl iii] doublet ratios, rather than 1660 cm23 given by
the [O iii] 88mm/52mm ratio, increases the IR fine-structure line
O21/H1 and N21/H1 abundances by approximately 80 per cent,
but hardly affects the IR fine-structure line Ne21/H1 and S21/H1
abundances (Table 8).
Comparison of Table 18 with Table 8 shows that although the
absolute values of the ionic abundances derived from ORLs are
much higher than those derived from CELs, the two techniques
yield identical relative heavy-element ionic abundances. This
constancy of derived ionic ratios has already been commented
upon for other PNe (Barlow 1995; Mathis, Torres-Peimbert &
Peimbert 1998; Liu et al. 1999), with the conclusion that reliable
C/O, N/O, Ne/O, etc., ratios can be derived from nebular
observations, provided that the same type of line is used in
deriving both ionic abundances in a ratio, i.e., both abundances
should be based on ORLs or both should be based on CELs.
Although the absolute magnitude of its discrepancy differs, it is
remarkable to note that for NGC 7009, studied by LSBC, the ORL
abundances for C, N and O were also all higher than the
corresponding CEL values by a uniform amount, a factor of 5 in
that case. The implications of these findings for the various
scenarios proposed to explain the large abundance discrepancies
will be discussed in Section 5.
3.7 Total elemental abundances
The total elemental abundances derived for NGC 6153 from CELs
and ORLs are presented in Table 19, together with those derived
previously by PDM and by Kingsburgh & Barlow (1994). For
He=H; PDM and Kingsburgh & Barlow derive 0.13 and 0.102
respectively. The former is in excellent agreement with our result.
For comparison, also listed in Table 19 are the average abundances
of Galactic PNe derived by Kingsburgh & Barlow and the solar
photospheric abundances compiled by Anders & Grevesse (1989)
and Grevesse & Noels (1993).
Whenever available, the ionization correction factors (ICFs)
given by Kingsburgh & Barlow (1994) were used. The forbidden line
O/H abundance ratio was calculated from the O1/H1 derived from
the [O ii] ll3726, 3729 lines5 and the O21/H1 ratio derived from the
[O iii] ll4959, 5007 lines, correcting for the unseen O31 using,
O
H� ICF�O� � O1
H11
O21
H1
� �
� He1 1 He21
He1
� �2=3
� O1
H11
O21
H1
� �:
From the He1 and He21 abundances given in Table 9, we have
ICF�O� � 1:06 for both the minor axis and the entire nebula of
NGC 6153.
A recombination line O1/H1 abundance is not available, so to
make use of the above equation, we assume that the recombination
line O1/O21 ratio is the same as that derived from the CELs.
Given the small ionic concentration of O1 (about 5 per cent), the
errors introduced should be negligible.
Both C21/H1 and C31/H1 have been derived from recombina-
tion lines. The unseen C1/H1 is corrected for, using
C
H� 1 1
O1
O21
� �� C21
H11
C31
H1
� �:
For the collisionally excited lines, only C21/H1 is available and
we assume C31=C21 � 0:060 for the whole nebula of NGC 6153,
as given by ORLs.
Recombination-line abundances are available for N21/H1 and
N31/H1 ratios but not for N1/H1. The latter is, however, available
from the collisionally excited [N ii] ll6548, 6584 lines. The N21/
H1 ratio derived from the UV collisionally excited N iii] l1751
line is significantly higher than that deduced from the [N iii]
57-mm far-IR fine-structure line. Given the weakness of the l1751
line and the fact that its measured flux could be affected by
camera artefacts, we will adopt the N21/H1 ratio derived from the
far-IR line. N21/H1 from the 57-mm line and N1/H1 from the
ll6548, 6584 lines yield N1=N21 � 0:056 for the whole nebula
of NGC 6153. Assuming that this is also valid for the
corresponding abundances derived from ORLs, the total recombi-
nation line N/H abundance is given by
N
H� 1:056 � N21
H11
N31
H1:
To obtain the collisional line N/H abundance for the whole
nebula, we correct for the unseen N31/H1 assuming N31=N21 �0:136; as given by ORLs, so that
N
H� N1
H11 1:136 � N21
H1:
q 2000 RAS, MNRAS 312, 585±628
Table 19. Elemental abundances by number, derived from CELs andORLs, in units such that log N�H� � 12:0.
Ref He C N O Ne S Cl Ar
Recombination lines
(1) 11.13 9.42 9.32 9.66 9.29(2) 11.14 9.40 9.31 9.66 9.29
Collisionally excited lines
(1) 8.36 8.69 8.25 7.23 5.62 6.40(2) 8.44 8.36 8.70 8.23 7.21 5.62 6.43(3) 8.90 9.30 9.00 8.40 7.57 7.00(4) 8.14 8.72 8.70 8.18
(5) 11.06 8.74 8.35 8.68 8.09 6.92 6.39(6) 10.99 8.55 7.97 8.87 8.09 7.21 5.50 6.56
(1) This work, for the minor axis;(2) This work, for the whole nebula;(3) Pottasch, Dennefield & Mo (1986; PDM);(4) Kingsburgh & Barlow (1994);(5) Average abundances of PN from Kingsburgh & Barlow (1994);(6) Solar photospheric abundances from Anders & Grevesse (1989)and Grevesse & Noels (1993). Grevesse & Sauval (1998) suggestedpreliminary revised values for the solar C, N and O abundances of8.52, 7.92 and 8.83 respectively, slightly lower than the valuesadopted here. The new recommended solar abundances of Ne, S andAr are 8.08, 7.33 and 6.40 respectively, while there is no change forCl.
5 To maintain consistency for the analysis of the CELs and of the ORLs,
recombination excitation of the [O ii] ll3726, 3729 doublet (cf. Section
3.3) will be neglected. Given the small ionic concentration of O+, the errors
introduced to the total O/H elemental abundances deduced below, both
from CELs and from ORLs, should be negligible.
Dow
nloaded from https://academ
ic.oup.com/m
nras/article/312/3/585/1023114 by guest on 18 March 2022
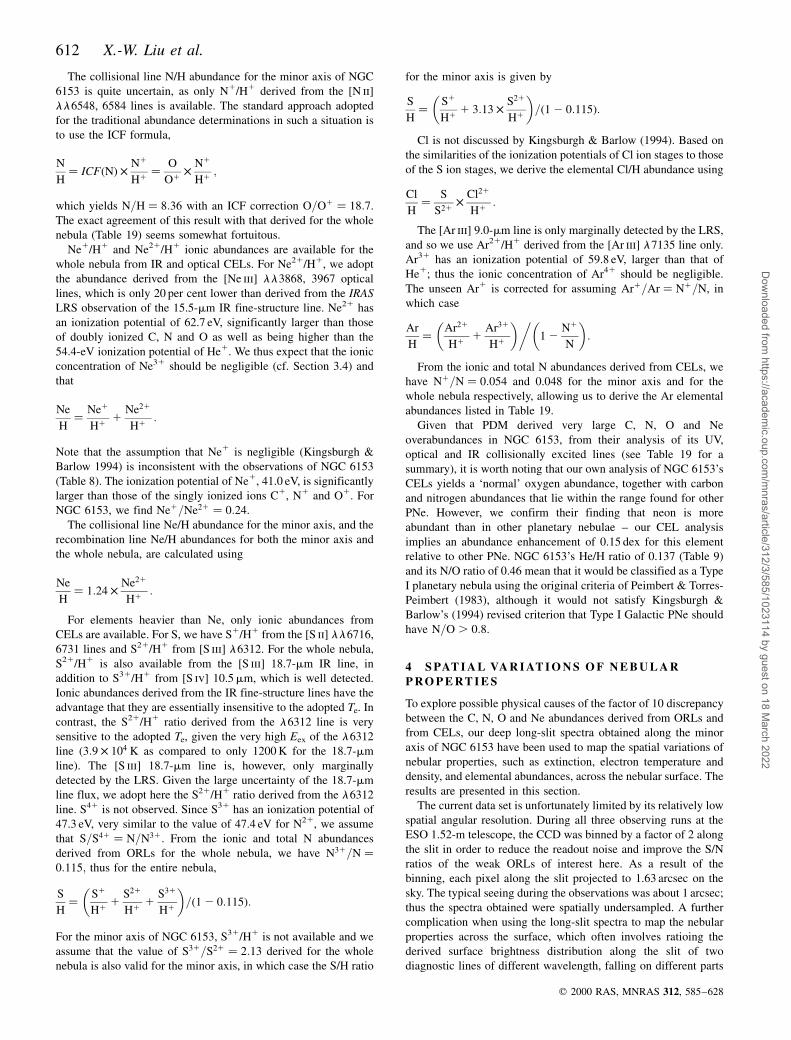
612 X.-W. Liu et al.
The collisional line N/H abundance for the minor axis of NGC
6153 is quite uncertain, as only N1/H1 derived from the [N ii]
ll6548, 6584 lines is available. The standard approach adopted
for the traditional abundance determinations in such a situation is
to use the ICF formula,
N
H� ICF�N� � N1
H1� O
O1� N1
H1;
which yields N=H � 8:36 with an ICF correction O=O1 � 18:7.
The exact agreement of this result with that derived for the whole
nebula (Table 19) seems somewhat fortuitous.
Ne1/H1 and Ne21/H1 ionic abundances are available for the
whole nebula from IR and optical CELs. For Ne21/H1, we adopt
the abundance derived from the [Ne iii] ll3868, 3967 optical
lines, which is only 20 per cent lower than derived from the IRAS
LRS observation of the 15.5-mm IR fine-structure line. Ne21 has
an ionization potential of 62.7 eV, significantly larger than those
of doubly ionized C, N and O as well as being higher than the
54.4-eV ionization potential of He1. We thus expect that the ionic
concentration of Ne31 should be negligible (cf. Section 3.4) and
that
Ne
H� Ne1
H11
Ne21
H1:
Note that the assumption that Ne1 is negligible (Kingsburgh &
Barlow 1994) is inconsistent with the observations of NGC 6153
(Table 8). The ionization potential of Ne1, 41.0 eV, is significantly
larger than those of the singly ionized ions C1, N1 and O1. For
NGC 6153, we find Ne1=Ne21 � 0:24.
The collisional line Ne/H abundance for the minor axis, and the
recombination line Ne/H abundances for both the minor axis and
the whole nebula, are calculated using
Ne
H� 1:24 � Ne21
H1:
For elements heavier than Ne, only ionic abundances from
CELs are available. For S, we have S1/H1 from the [S ii] ll6716,
6731 lines and S21/H1 from [S iii] l6312. For the whole nebula,
S21/H1 is also available from the [S iii] 18.7-mm IR line, in
addition to S31/H1 from [S iv] 10.5mm, which is well detected.
Ionic abundances derived from the IR fine-structure lines have the
advantage that they are essentially insensitive to the adopted Te. In
contrast, the S21/H1 ratio derived from the l6312 line is very
sensitive to the adopted Te, given the very high Eex of the l6312
line (3:9 � 104 K as compared to only 1200 K for the 18.7-mm
line). The [S iii] 18.7-mm line is, however, only marginally
detected by the LRS. Given the large uncertainty of the 18.7-mm
line flux, we adopt here the S21/H1 ratio derived from the l6312
line. S41 is not observed. Since S31 has an ionization potential of
47.3 eV, very similar to the value of 47.4 eV for N21, we assume
that S=S41 � N=N31. From the ionic and total N abundances
derived from ORLs for the whole nebula, we have N31=N �0:115; thus for the entire nebula,
S
H� S1
H11
S21
H11
S31
H1
� �=�1 2 0:115�:
For the minor axis of NGC 6153, S31/H1 is not available and we
assume that the value of S31=S21 � 2:13 derived for the whole
nebula is also valid for the minor axis, in which case the S/H ratio
for the minor axis is given by
S
H� S1
H11 3:13 � S21
H1
� �=�1 2 0:115�:
Cl is not discussed by Kingsburgh & Barlow (1994). Based on
the similarities of the ionization potentials of Cl ion stages to those
of the S ion stages, we derive the elemental Cl/H abundance using
Cl
H� S
S21� Cl21
H1:
The [Ar iii] 9.0-mm line is only marginally detected by the LRS,
and so we use Ar21/H1 derived from the [Ar iii] l7135 line only.
Ar31 has an ionization potential of 59.8 eV, larger than that of
He1; thus the ionic concentration of Ar41 should be negligible.
The unseen Ar1 is corrected for assuming Ar1=Ar � N1=N, in
which case
Ar
H� Ar21
H11
Ar31
H1
� ��1 2
N1
N
� �:
From the ionic and total N abundances derived from CELs, we
have N1=N � 0:054 and 0.048 for the minor axis and for the
whole nebula respectively, allowing us to derive the Ar elemental
abundances listed in Table 19.
Given that PDM derived very large C, N, O and Ne
overabundances in NGC 6153, from their analysis of its UV,
optical and IR collisionally excited lines (see Table 19 for a
summary), it is worth noting that our own analysis of NGC 6153's
CELs yields a `normal' oxygen abundance, together with carbon
and nitrogen abundances that lie within the range found for other
PNe. However, we confirm their finding that neon is more
abundant than in other planetary nebulae ± our CEL analysis
implies an abundance enhancement of 0.15 dex for this element
relative to other PNe. NGC 6153's He/H ratio of 0.137 (Table 9)
and its N/O ratio of 0.46 mean that it would be classified as a Type
I planetary nebula using the original criteria of Peimbert & Torres-
Peimbert (1983), although it would not satisfy Kingsburgh &
Barlow's (1994) revised criterion that Type I Galactic PNe should
have N=O . 0:8.
4 S PAT I A L VA R I AT I O N S O F N E B U L A R
P R O P E RT I E S
To explore possible physical causes of the factor of 10 discrepancy
between the C, N, O and Ne abundances derived from ORLs and
from CELs, our deep long-slit spectra obtained along the minor
axis of NGC 6153 have been used to map the spatial variations of
nebular properties, such as extinction, electron temperature and
density, and elemental abundances, across the nebular surface. The
results are presented in this section.
The current data set is unfortunately limited by its relatively low
spatial angular resolution. During all three observing runs at the
ESO 1.52-m telescope, the CCD was binned by a factor of 2 along
the slit in order to reduce the readout noise and improve the S/N
ratios of the weak ORLs of interest here. As a result of the
binning, each pixel along the slit projected to 1.63 arcsec on the
sky. The typical seeing during the observations was about 1 arcsec;
thus the spectra obtained were spatially undersampled. A further
complication when using the long-slit spectra to map the nebular
properties across the surface, which often involves ratioing the
derived surface brightness distribution along the slit of two
diagnostic lines of different wavelength, falling on different parts
q 2000 RAS, MNRAS 312, 585±628
Dow
nloaded from https://academ
ic.oup.com/m
nras/article/312/3/585/1023114 by guest on 18 March 2022
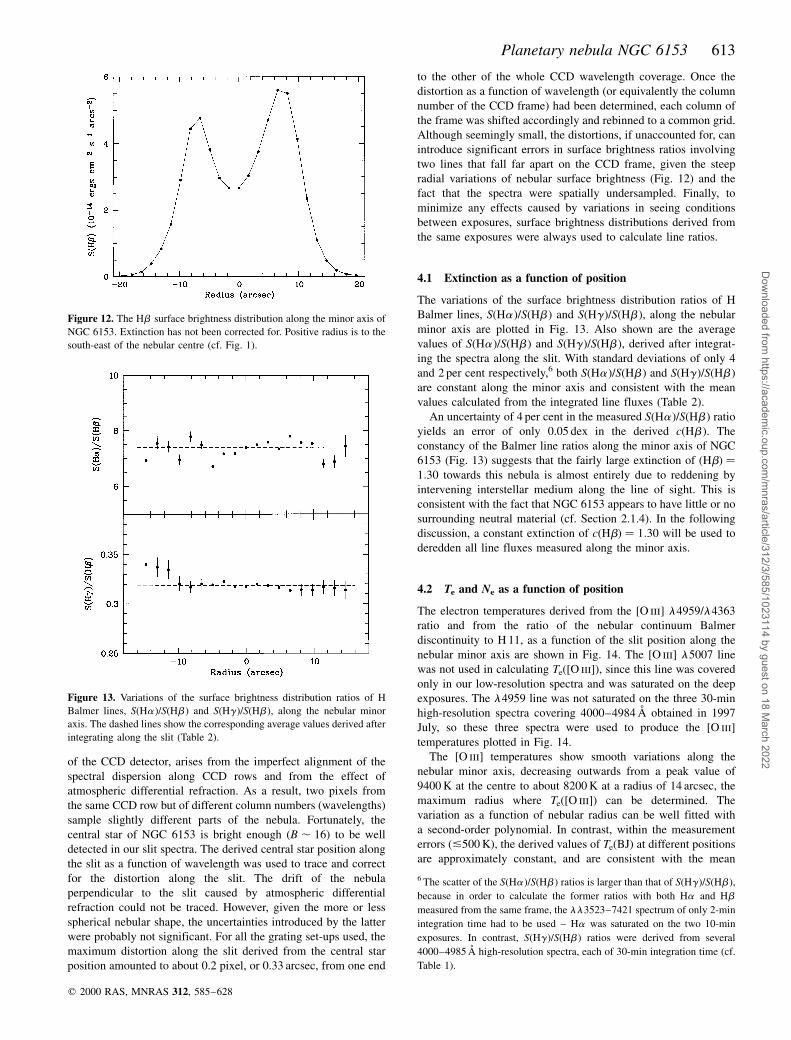
Planetary nebula NGC 6153 613
of the CCD detector, arises from the imperfect alignment of the
spectral dispersion along CCD rows and from the effect of
atmospheric differential refraction. As a result, two pixels from
the same CCD row but of different column numbers (wavelengths)
sample slightly different parts of the nebula. Fortunately, the
central star of NGC 6153 is bright enough �B , 16� to be well
detected in our slit spectra. The derived central star position along
the slit as a function of wavelength was used to trace and correct
for the distortion along the slit. The drift of the nebula
perpendicular to the slit caused by atmospheric differential
refraction could not be traced. However, given the more or less
spherical nebular shape, the uncertainties introduced by the latter
were probably not significant. For all the grating set-ups used, the
maximum distortion along the slit derived from the central star
position amounted to about 0.2 pixel, or 0.33 arcsec, from one end
to the other of the whole CCD wavelength coverage. Once the
distortion as a function of wavelength (or equivalently the column
number of the CCD frame) had been determined, each column of
the frame was shifted accordingly and rebinned to a common grid.
Although seemingly small, the distortions, if unaccounted for, can
introduce significant errors in surface brightness ratios involving
two lines that fall far apart on the CCD frame, given the steep
radial variations of nebular surface brightness (Fig. 12) and the
fact that the spectra were spatially undersampled. Finally, to
minimize any effects caused by variations in seeing conditions
between exposures, surface brightness distributions derived from
the same exposures were always used to calculate line ratios.
4.1 Extinction as a function of position
The variations of the surface brightness distribution ratios of H
Balmer lines, S(Ha )/S(Hb ) and S(Hg)/S(Hb ), along the nebular
minor axis are plotted in Fig. 13. Also shown are the average
values of S(Ha )/S(Hb ) and S(Hg)/S(Hb ), derived after integrat-
ing the spectra along the slit. With standard deviations of only 4
and 2 per cent respectively,6 both S(Ha )/S(Hb ) and S(Hg)/S(Hb )
are constant along the minor axis and consistent with the mean
values calculated from the integrated line fluxes (Table 2).
An uncertainty of 4 per cent in the measured S(Ha )/S(Hb ) ratio
yields an error of only 0.05 dex in the derived c(Hb ). The
constancy of the Balmer line ratios along the minor axis of NGC
6153 (Fig. 13) suggests that the fairly large extinction of �Hb� �1:30 towards this nebula is almost entirely due to reddening by
intervening interstellar medium along the line of sight. This is
consistent with the fact that NGC 6153 appears to have little or no
surrounding neutral material (cf. Section 2.1.4). In the following
discussion, a constant extinction of c�Hb� � 1:30 will be used to
deredden all line fluxes measured along the minor axis.
4.2 Te and Ne as a function of position
The electron temperatures derived from the [O iii] l4959/l4363
ratio and from the ratio of the nebular continuum Balmer
discontinuity to H 11, as a function of the slit position along the
nebular minor axis are shown in Fig. 14. The [O iii] l5007 line
was not used in calculating Te([O iii]), since this line was covered
only in our low-resolution spectra and was saturated on the deep
exposures. The l4959 line was not saturated on the three 30-min
high-resolution spectra covering 4000±4984 AÊ obtained in 1997
July, so these three spectra were used to produce the [O iii]
temperatures plotted in Fig. 14.
The [O iii] temperatures show smooth variations along the
nebular minor axis, decreasing outwards from a peak value of
9400 K at the centre to about 8200 K at a radius of 14 arcsec, the
maximum radius where Te([O iii]) can be determined. The
variation as a function of nebular radius can be well fitted with
a second-order polynomial. In contrast, within the measurement
errors (&500 K), the derived values of Te(BJ) at different positions
are approximately constant, and are consistent with the mean
q 2000 RAS, MNRAS 312, 585±628
Figure 12. The Hb surface brightness distribution along the minor axis of
NGC 6153. Extinction has not been corrected for. Positive radius is to the
south-east of the nebular centre (cf. Fig. 1).
Figure 13. Variations of the surface brightness distribution ratios of H
Balmer lines, S(Ha)/S(Hb) and S(Hg)/S(Hb), along the nebular minor
axis. The dashed lines show the corresponding average values derived after
integrating along the slit (Table 2).
6 The scatter of the S(Ha)/S(Hb) ratios is larger than that of S(Hg)/S(Hb),
because in order to calculate the former ratios with both Ha and Hb
measured from the same frame, the ll3523±7421 spectrum of only 2-min
integration time had to be used ± Ha was saturated on the two 10-min
exposures. In contrast, S(Hg)/S(Hb) ratios were derived from several
4000±4985 AÊ high-resolution spectra, each of 30-min integration time (cf.
Table 1).
Dow
nloaded from https://academ
ic.oup.com/m
nras/article/312/3/585/1023114 by guest on 18 March 2022
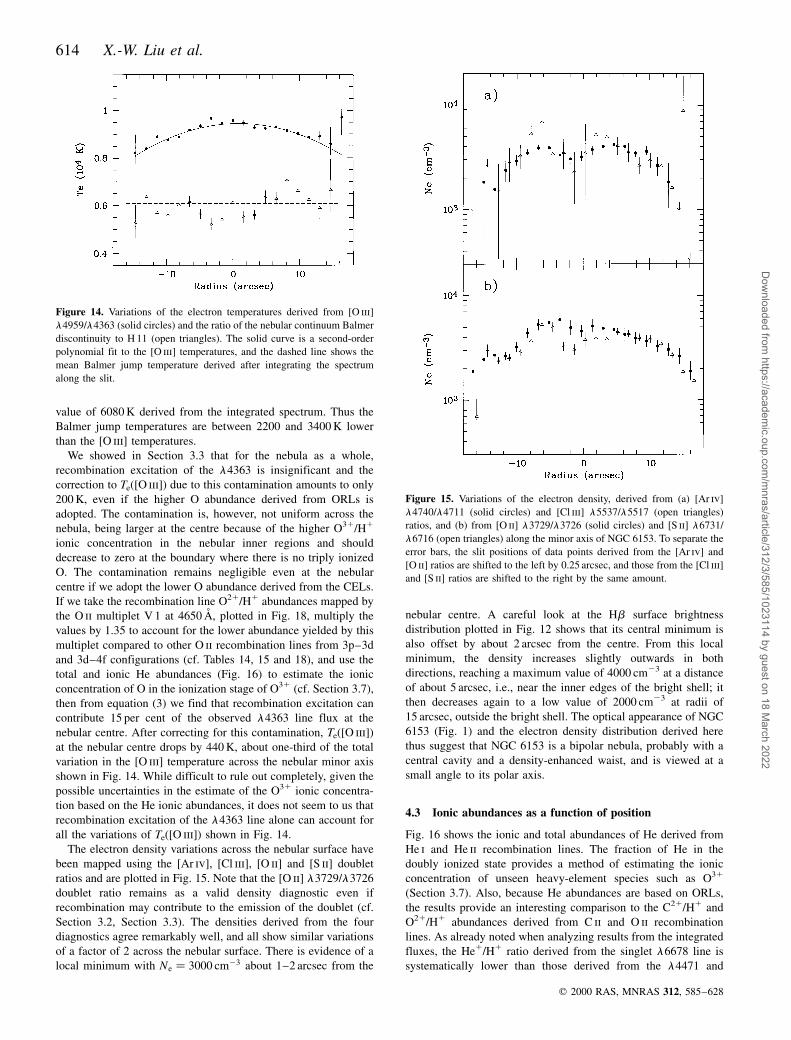
614 X.-W. Liu et al.
value of 6080 K derived from the integrated spectrum. Thus the
Balmer jump temperatures are between 2200 and 3400 K lower
than the [O iii] temperatures.
We showed in Section 3.3 that for the nebula as a whole,
recombination excitation of the l4363 is insignificant and the
correction to Te([O iii]) due to this contamination amounts to only
200 K, even if the higher O abundance derived from ORLs is
adopted. The contamination is, however, not uniform across the
nebula, being larger at the centre because of the higher O31/H1
ionic concentration in the nebular inner regions and should
decrease to zero at the boundary where there is no triply ionized
O. The contamination remains negligible even at the nebular
centre if we adopt the lower O abundance derived from the CELs.
If we take the recombination line O21/H1 abundances mapped by
the O ii multiplet V 1 at 4650 AÊ , plotted in Fig. 18, multiply the
values by 1.35 to account for the lower abundance yielded by this
multiplet compared to other O ii recombination lines from 3p±3d
and 3d±4f configurations (cf. Tables 14, 15 and 18), and use the
total and ionic He abundances (Fig. 16) to estimate the ionic
concentration of O in the ionization stage of O31 (cf. Section 3.7),
then from equation (3) we find that recombination excitation can
contribute 15 per cent of the observed l4363 line flux at the
nebular centre. After correcting for this contamination, Te([O iii])
at the nebular centre drops by 440 K, about one-third of the total
variation in the [O iii] temperature across the nebular minor axis
shown in Fig. 14. While difficult to rule out completely, given the
possible uncertainties in the estimate of the O31 ionic concentra-
tion based on the He ionic abundances, it does not seem to us that
recombination excitation of the l4363 line alone can account for
all the variations of Te([O iii]) shown in Fig. 14.
The electron density variations across the nebular surface have
been mapped using the [Ar iv], [Cl iii], [O ii] and [S ii] doublet
ratios and are plotted in Fig. 15. Note that the [O ii] l3729/l3726
doublet ratio remains as a valid density diagnostic even if
recombination may contribute to the emission of the doublet (cf.
Section 3.2, Section 3.3). The densities derived from the four
diagnostics agree remarkably well, and all show similar variations
of a factor of 2 across the nebular surface. There is evidence of a
local minimum with Ne � 3000 cm23 about 1±2 arcsec from the
nebular centre. A careful look at the Hb surface brightness
distribution plotted in Fig. 12 shows that its central minimum is
also offset by about 2 arcsec from the centre. From this local
minimum, the density increases slightly outwards in both
directions, reaching a maximum value of 4000 cm23 at a distance
of about 5 arcsec, i.e., near the inner edges of the bright shell; it
then decreases again to a low value of 2000 cm23 at radii of
15 arcsec, outside the bright shell. The optical appearance of NGC
6153 (Fig. 1) and the electron density distribution derived here
thus suggest that NGC 6153 is a bipolar nebula, probably with a
central cavity and a density-enhanced waist, and is viewed at a
small angle to its polar axis.
4.3 Ionic abundances as a function of position
Fig. 16 shows the ionic and total abundances of He derived from
He i and He ii recombination lines. The fraction of He in the
doubly ionized state provides a method of estimating the ionic
concentration of unseen heavy-element species such as O31
(Section 3.7). Also, because He abundances are based on ORLs,
the results provide an interesting comparison to the C21/H1 and
O21/H1 abundances derived from C ii and O ii recombination
lines. As already noted when analyzing results from the integrated
fluxes, the He1/H1 ratio derived from the singlet l6678 line is
systematically lower than those derived from the l4471 and
q 2000 RAS, MNRAS 312, 585±628
Figure 14. Variations of the electron temperatures derived from [O iii]
l4959/l4363 (solid circles) and the ratio of the nebular continuum Balmer
discontinuity to H 11 (open triangles). The solid curve is a second-order
polynomial fit to the [O iii] temperatures, and the dashed line shows the
mean Balmer jump temperature derived after integrating the spectrum
along the slit.
Figure 15. Variations of the electron density, derived from (a) [Ar iv]
l4740/l4711 (solid circles) and [Cl iii] l5537/l5517 (open triangles)
ratios, and (b) from [O ii] l3729/l3726 (solid circles) and [S ii] l6731/
l6716 (open triangles) along the minor axis of NGC 6153. To separate the
error bars, the slit positions of data points derived from the [Ar iv] and
[O ii] ratios are shifted to the left by 0.25 arcsec, and those from the [Cl iii]
and [S ii] ratios are shifted to the right by the same amount.
Dow
nloaded from https://academ
ic.oup.com/m
nras/article/312/3/585/1023114 by guest on 18 March 2022
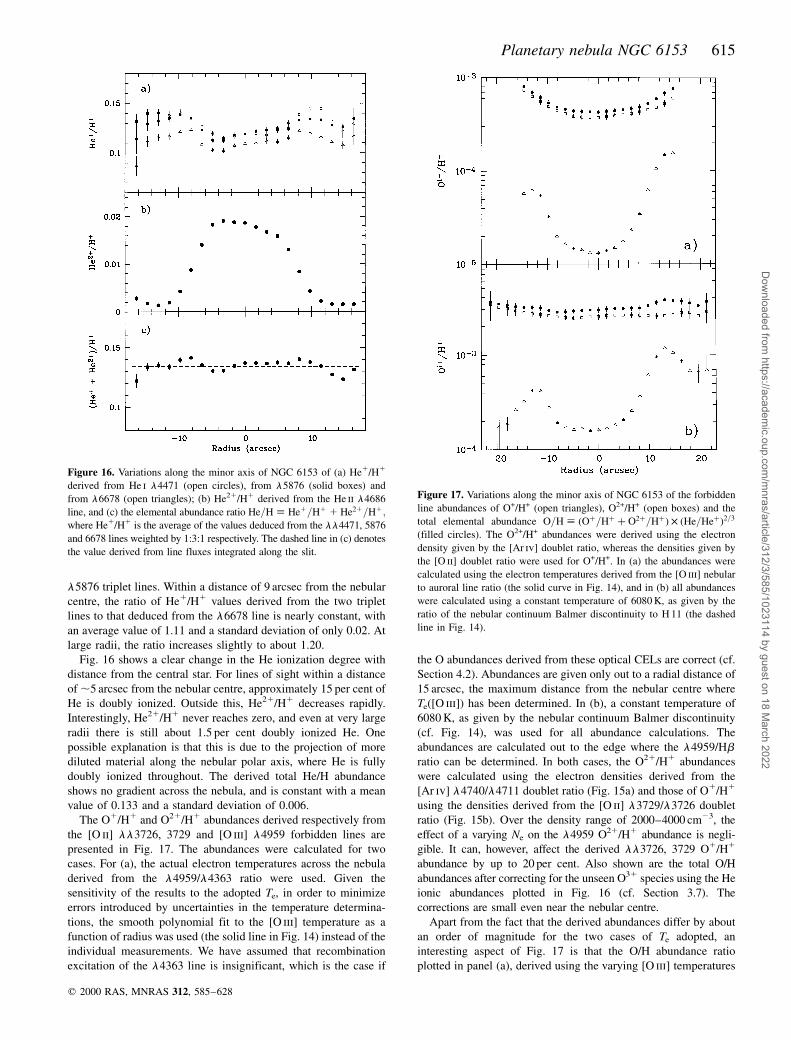
Planetary nebula NGC 6153 615
l5876 triplet lines. Within a distance of 9 arcsec from the nebular
centre, the ratio of He1/H1 values derived from the two triplet
lines to that deduced from the l6678 line is nearly constant, with
an average value of 1.11 and a standard deviation of only 0.02. At
large radii, the ratio increases slightly to about 1.20.
Fig. 16 shows a clear change in the He ionization degree with
distance from the central star. For lines of sight within a distance
of ,5 arcsec from the nebular centre, approximately 15 per cent of
He is doubly ionized. Outside this, He21/H1 decreases rapidly.
Interestingly, He21/H1 never reaches zero, and even at very large
radii there is still about 1.5 per cent doubly ionized He. One
possible explanation is that this is due to the projection of more
diluted material along the nebular polar axis, where He is fully
doubly ionized throughout. The derived total He/H abundance
shows no gradient across the nebula, and is constant with a mean
value of 0.133 and a standard deviation of 0.006.
The O1/H1 and O21/H1 abundances derived respectively from
the [O ii] ll3726, 3729 and [O iii] l4959 forbidden lines are
presented in Fig. 17. The abundances were calculated for two
cases. For (a), the actual electron temperatures across the nebula
derived from the l4959/l4363 ratio were used. Given the
sensitivity of the results to the adopted Te, in order to minimize
errors introduced by uncertainties in the temperature determina-
tions, the smooth polynomial fit to the [O iii] temperature as a
function of radius was used (the solid line in Fig. 14) instead of the
individual measurements. We have assumed that recombination
excitation of the l4363 line is insignificant, which is the case if
the O abundances derived from these optical CELs are correct (cf.
Section 4.2). Abundances are given only out to a radial distance of
15 arcsec, the maximum distance from the nebular centre where
Te([O iii]) has been determined. In (b), a constant temperature of
6080 K, as given by the nebular continuum Balmer discontinuity
(cf. Fig. 14), was used for all abundance calculations. The
abundances are calculated out to the edge where the l4959/Hbratio can be determined. In both cases, the O21/H1 abundances
were calculated using the electron densities derived from the
[Ar iv] l4740/l4711 doublet ratio (Fig. 15a) and those of O1/H1
using the densities derived from the [O ii] l3729/l3726 doublet
ratio (Fig. 15b). Over the density range of 2000±4000 cm23, the
effect of a varying Ne on the l4959 O21/H1 abundance is negli-
gible. It can, however, affect the derived ll3726, 3729 O1/H1
abundance by up to 20 per cent. Also shown are the total O/H
abundances after correcting for the unseen O31 species using the He
ionic abundances plotted in Fig. 16 (cf. Section 3.7). The
corrections are small even near the nebular centre.
Apart from the fact that the derived abundances differ by about
an order of magnitude for the two cases of Te adopted, an
interesting aspect of Fig. 17 is that the O/H abundance ratio
plotted in panel (a), derived using the varying [O iii] temperatures
q 2000 RAS, MNRAS 312, 585±628
Figure 16. Variations along the minor axis of NGC 6153 of (a) He1/H1
derived from He i l4471 (open circles), from l5876 (solid boxes) and
from l6678 (open triangles); (b) He21/H1 derived from the He ii l4686
line, and (c) the elemental abundance ratio He=H ; He1=H1 1 He21=H1;where He1/H1 is the average of the values deduced from the ll4471, 5876
and 6678 lines weighted by 1:3:1 respectively. The dashed line in (c) denotes
the value derived from line fluxes integrated along the slit.
Figure 17. Variations along the minor axis of NGC 6153 of the forbidden
line abundances of O+/H+ (open triangles), O2+/H+ (open boxes) and the
total elemental abundance O=H ; �O�=H� � O2�=H�� � �He=He��2=3
(filled circles). The O2+/H+ abundances were derived using the electron
density given by the [Ar iv] doublet ratio, whereas the densities given by
the [O ii] doublet ratio were used for O+/H+. In (a) the abundances were
calculated using the electron temperatures derived from the [O iii] nebular
to auroral line ratio (the solid curve in Fig. 14), and in (b) all abundances
were calculated using a constant temperature of 6080 K, as given by the
ratio of the nebular continuum Balmer discontinuity to H 11 (the dashed
line in Fig. 14).
Dow
nloaded from https://academ
ic.oup.com/m
nras/article/312/3/585/1023114 by guest on 18 March 2022
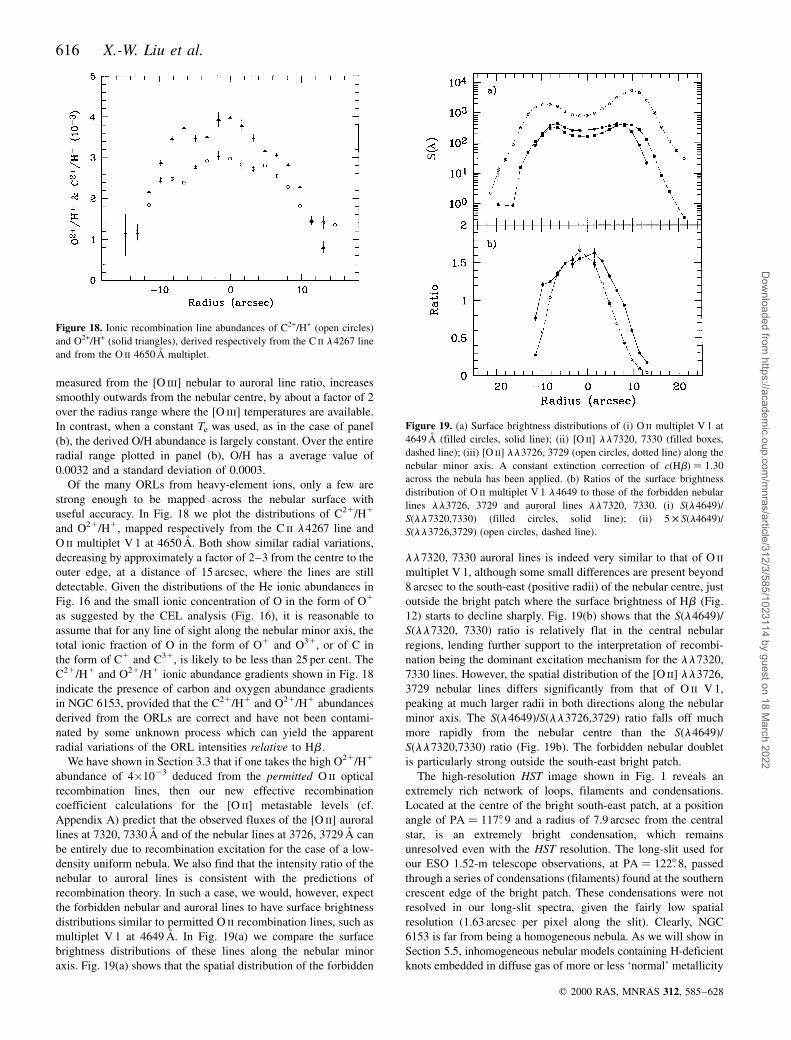
616 X.-W. Liu et al.
measured from the [O iii] nebular to auroral line ratio, increases
smoothly outwards from the nebular centre, by about a factor of 2
over the radius range where the [O iii] temperatures are available.
In contrast, when a constant Te was used, as in the case of panel
(b), the derived O/H abundance is largely constant. Over the entire
radial range plotted in panel (b), O/H has a average value of
0.0032 and a standard deviation of 0.0003.
Of the many ORLs from heavy-element ions, only a few are
strong enough to be mapped across the nebular surface with
useful accuracy. In Fig. 18 we plot the distributions of C21/H1
and O21/H1, mapped respectively from the C ii l4267 line and
O ii multiplet V 1 at 4650 AÊ . Both show similar radial variations,
decreasing by approximately a factor of 2±3 from the centre to the
outer edge, at a distance of 15 arcsec, where the lines are still
detectable. Given the distributions of the He ionic abundances in
Fig. 16 and the small ionic concentration of O in the form of O1
as suggested by the CEL analysis (Fig. 16), it is reasonable to
assume that for any line of sight along the nebular minor axis, the
total ionic fraction of O in the form of O1 and O31, or of C in
the form of C1 and C31, is likely to be less than 25 per cent. The
C21/H1 and O21/H1 ionic abundance gradients shown in Fig. 18
indicate the presence of carbon and oxygen abundance gradients
in NGC 6153, provided that the C21/H1 and O21/H1 abundances
derived from the ORLs are correct and have not been contami-
nated by some unknown process which can yield the apparent
radial variations of the ORL intensities relative to Hb .
We have shown in Section 3.3 that if one takes the high O21/H1
abundance of 4�1023 deduced from the permitted O ii optical
recombination lines, then our new effective recombination
coefficient calculations for the [O ii] metastable levels (cf.
Appendix A) predict that the observed fluxes of the [O ii] auroral
lines at 7320, 7330 AÊ and of the nebular lines at 3726, 3729 AÊ can
be entirely due to recombination excitation for the case of a low-
density uniform nebula. We also find that the intensity ratio of the
nebular to auroral lines is consistent with the predictions of
recombination theory. In such a case, we would, however, expect
the forbidden nebular and auroral lines to have surface brightness
distributions similar to permitted O ii recombination lines, such as
multiplet V 1 at 4649 AÊ . In Fig. 19(a) we compare the surface
brightness distributions of these lines along the nebular minor
axis. Fig. 19(a) shows that the spatial distribution of the forbidden
ll7320, 7330 auroral lines is indeed very similar to that of O ii
multiplet V 1, although some small differences are present beyond
8 arcsec to the south-east (positive radii) of the nebular centre, just
outside the bright patch where the surface brightness of Hb (Fig.
12) starts to decline sharply. Fig. 19(b) shows that the S(l4649)/
S(ll7320, 7330) ratio is relatively flat in the central nebular
regions, lending further support to the interpretation of recombi-
nation being the dominant excitation mechanism for the ll7320,
7330 lines. However, the spatial distribution of the [O ii] ll3726,
3729 nebular lines differs significantly from that of O ii V 1,
peaking at much larger radii in both directions along the nebular
minor axis. The S(l4649)/S(ll3726,3729) ratio falls off much
more rapidly from the nebular centre than the S(l4649)/
S(ll7320,7330) ratio (Fig. 19b). The forbidden nebular doublet
is particularly strong outside the south-east bright patch.
The high-resolution HST image shown in Fig. 1 reveals an
extremely rich network of loops, filaments and condensations.
Located at the centre of the bright south-east patch, at a position
angle of PA � 1178: 9 and a radius of 7.9 arcsec from the central
star, is an extremely bright condensation, which remains
unresolved even with the HST resolution. The long-slit used for
our ESO 1.52-m telescope observations, at PA � 1228: 8, passed
through a series of condensations (filaments) found at the southern
crescent edge of the bright patch. These condensations were not
resolved in our long-slit spectra, given the fairly low spatial
resolution (1.63 arcsec per pixel along the slit). Clearly, NGC
6153 is far from being a homogeneous nebula. As we will show in
Section 5.5, inhomogeneous nebular models containing H-deficient
knots embedded in diffuse gas of more or less `normal' metallicity
q 2000 RAS, MNRAS 312, 585±628
Figure 18. Ionic recombination line abundances of C2+/H+ (open circles)
and O2+/H+ (solid triangles), derived respectively from the C ii l4267 line
and from the O ii 4650 AÊ multiplet.
Figure 19. (a) Surface brightness distributions of (i) O ii multiplet V 1 at
4649 AÊ (filled circles, solid line); (ii) [O ii] ll7320, 7330 (filled boxes,
dashed line); (iii) [O ii] ll3726, 3729 (open circles, dotted line) along the
nebular minor axis. A constant extinction correction of c�Hb� � 1:30
across the nebula has been applied. (b) Ratios of the surface brightness
distribution of O ii multiplet V 1 l4649 to those of the forbidden nebular
lines ll3726, 3729 and auroral lines ll7320, 7330. (i) S(l4649)/
S(ll7320,7330) (filled circles, solid line); (ii) 5 � S�l4649�/S(ll3726,3729) (open circles, dashed line).
Dow
nloaded from https://academ
ic.oup.com/m
nras/article/312/3/585/1023114 by guest on 18 March 2022
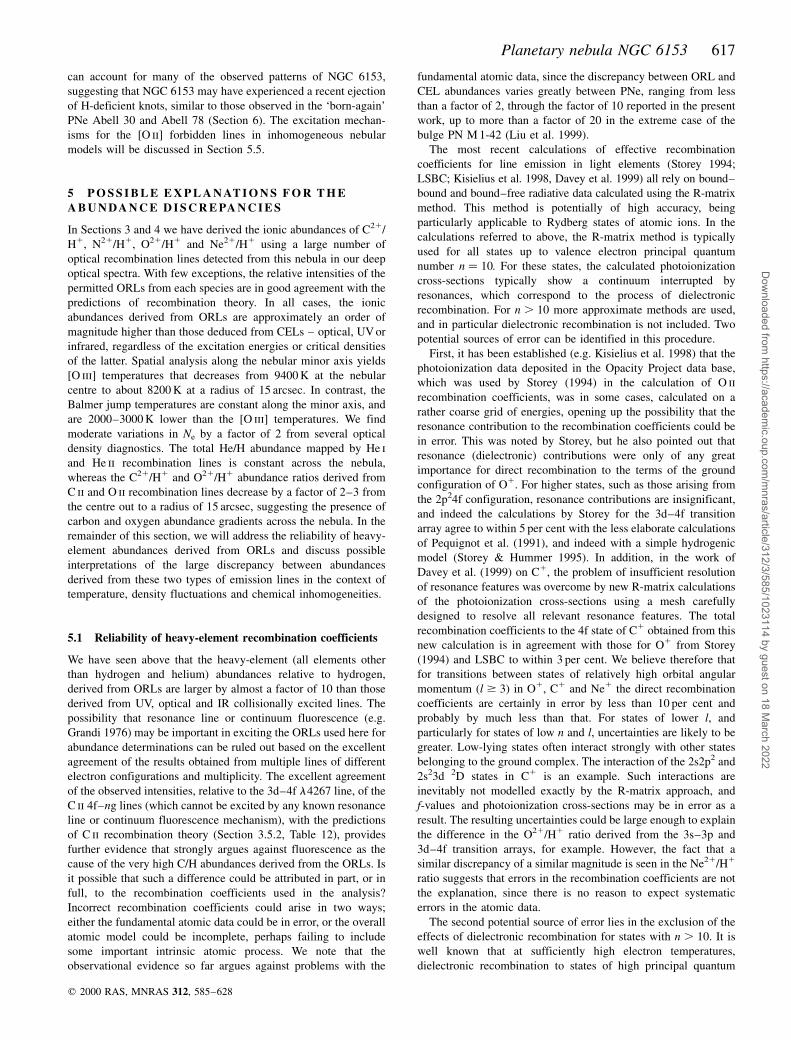
Planetary nebula NGC 6153 617
can account for many of the observed patterns of NGC 6153,
suggesting that NGC 6153 may have experienced a recent ejection
of H-deficient knots, similar to those observed in the `born-again'
PNe Abell 30 and Abell 78 (Section 6). The excitation mechan-
isms for the [O ii] forbidden lines in inhomogeneous nebular
models will be discussed in Section 5.5.
5 P O S S I B L E E X P L A N AT I O N S F O R T H E
A B U N DA N C E D I S C R E PA N C I E S
In Sections 3 and 4 we have derived the ionic abundances of C21/
H1, N21/H1, O21/H1 and Ne21/H1 using a large number of
optical recombination lines detected from this nebula in our deep
optical spectra. With few exceptions, the relative intensities of the
permitted ORLs from each species are in good agreement with the
predictions of recombination theory. In all cases, the ionic
abundances derived from ORLs are approximately an order of
magnitude higher than those deduced from CELs ± optical, UV or
infrared, regardless of the excitation energies or critical densities
of the latter. Spatial analysis along the nebular minor axis yields
[O iii] temperatures that decreases from 9400 K at the nebular
centre to about 8200 K at a radius of 15 arcsec. In contrast, the
Balmer jump temperatures are constant along the minor axis, and
are 2000±3000 K lower than the [O iii] temperatures. We find
moderate variations in Ne by a factor of 2 from several optical
density diagnostics. The total He/H abundance mapped by He i
and He ii recombination lines is constant across the nebula,
whereas the C21/H1 and O21/H1 abundance ratios derived from
C ii and O ii recombination lines decrease by a factor of 2±3 from
the centre out to a radius of 15 arcsec, suggesting the presence of
carbon and oxygen abundance gradients across the nebula. In the
remainder of this section, we will address the reliability of heavy-
element abundances derived from ORLs and discuss possible
interpretations of the large discrepancy between abundances
derived from these two types of emission lines in the context of
temperature, density fluctuations and chemical inhomogeneities.
5.1 Reliability of heavy-element recombination coefficients
We have seen above that the heavy-element (all elements other
than hydrogen and helium) abundances relative to hydrogen,
derived from ORLs are larger by almost a factor of 10 than those
derived from UV, optical and IR collisionally excited lines. The
possibility that resonance line or continuum fluorescence (e.g.
Grandi 1976) may be important in exciting the ORLs used here for
abundance determinations can be ruled out based on the excellent
agreement of the results obtained from multiple lines of different
electron configurations and multiplicity. The excellent agreement
of the observed intensities, relative to the 3d±4f l4267 line, of the
C ii 4f±ng lines (which cannot be excited by any known resonance
line or continuum fluorescence mechanism), with the predictions
of C ii recombination theory (Section 3.5.2, Table 12), provides
further evidence that strongly argues against fluorescence as the
cause of the very high C/H abundances derived from the ORLs. Is
it possible that such a difference could be attributed in part, or in
full, to the recombination coefficients used in the analysis?
Incorrect recombination coefficients could arise in two ways;
either the fundamental atomic data could be in error, or the overall
atomic model could be incomplete, perhaps failing to include
some important intrinsic atomic process. We note that the
observational evidence so far argues against problems with the
fundamental atomic data, since the discrepancy between ORL and
CEL abundances varies greatly between PNe, ranging from less
than a factor of 2, through the factor of 10 reported in the present
work, up to more than a factor of 20 in the extreme case of the
bulge PN M 1-42 (Liu et al. 1999).
The most recent calculations of effective recombination
coefficients for line emission in light elements (Storey 1994;
LSBC; Kisielius et al. 1998, Davey et al. 1999) all rely on bound±
bound and bound±free radiative data calculated using the R-matrix
method. This method is potentially of high accuracy, being
particularly applicable to Rydberg states of atomic ions. In the
calculations referred to above, the R-matrix method is typically
used for all states up to valence electron principal quantum
number n � 10. For these states, the calculated photoionization
cross-sections typically show a continuum interrupted by
resonances, which correspond to the process of dielectronic
recombination. For n . 10 more approximate methods are used,
and in particular dielectronic recombination is not included. Two
potential sources of error can be identified in this procedure.
First, it has been established (e.g. Kisielius et al. 1998) that the
photoionization data deposited in the Opacity Project data base,
which was used by Storey (1994) in the calculation of O ii
recombination coefficients, was in some cases, calculated on a
rather coarse grid of energies, opening up the possibility that the
resonance contribution to the recombination coefficients could be
in error. This was noted by Storey, but he also pointed out that
resonance (dielectronic) contributions were only of any great
importance for direct recombination to the terms of the ground
configuration of O1. For higher states, such as those arising from
the 2p24f configuration, resonance contributions are insignificant,
and indeed the calculations by Storey for the 3d±4f transition
array agree to within 5 per cent with the less elaborate calculations
of Pequignot et al. (1991), and indeed with a simple hydrogenic
model (Storey & Hummer 1995). In addition, in the work of
Davey et al. (1999) on C1, the problem of insufficient resolution
of resonance features was overcome by new R-matrix calculations
of the photoionization cross-sections using a mesh carefully
designed to resolve all relevant resonance features. The total
recombination coefficients to the 4f state of C1 obtained from this
new calculation is in agreement with those for O1 from Storey
(1994) and LSBC to within 3 per cent. We believe therefore that
for transitions between states of relatively high orbital angular
momentum �l $ 3� in O1, C1 and Ne1 the direct recombination
coefficients are certainly in error by less than 10 per cent and
probably by much less than that. For states of lower l, and
particularly for states of low n and l, uncertainties are likely to be
greater. Low-lying states often interact strongly with other states
belonging to the ground complex. The interaction of the 2s2p2 and
2s23d 2D states in C1 is an example. Such interactions are
inevitably not modelled exactly by the R-matrix approach, and
f-values and photoionization cross-sections may be in error as a
result. The resulting uncertainties could be large enough to explain
the difference in the O21/H1 ratio derived from the 3s±3p and
3d±4f transition arrays, for example. However, the fact that a
similar discrepancy of a similar magnitude is seen in the Ne21/H1
ratio suggests that errors in the recombination coefficients are not
the explanation, since there is no reason to expect systematic
errors in the atomic data.
The second potential source of error lies in the exclusion of the
effects of dielectronic recombination for states with n . 10. It is
well known that at sufficiently high electron temperatures,
dielectronic recombination to states of high principal quantum
q 2000 RAS, MNRAS 312, 585±628
Dow
nloaded from https://academ
ic.oup.com/m
nras/article/312/3/585/1023114 by guest on 18 March 2022
618 X.-W. Liu et al.
number becomes the dominant recombination mechanism. For
once-ionized species of light elements, temperatures of 20 000 K
or higher are needed for this process to become effective, and
consequently it has been neglected in all calculations of
recombination line intensities carried out for nebular plasmas.
High-temperature dielectronic recombination causes a local
maximum in the recombination coefficient at temperatures for
which mean free electron energies are a significant fraction of the
excitation energies of the ion resonance lines. For once-ionized C,
N, O and Ne, temperatures of �2±5� � 104 K are required. The
effect of high-temperature dielectronic recombination is to
populate high Rydberg states of the recombined ion, and unlike
low-temperature dielectronic recombination, the resulting cascade
processes strongly enhance the populations of states of the
principal series of the ion. The process can therefore increase the
recombination coefficient of an ionic line relative to that of a
hydrogen line. This opens up the possibility of a nebular model in
which pockets of gas which are much hotter than the measured
mean temperature of the nebula are responsible for the strong
emission in the heavy-element recombination lines, while
hydrogen emission would come predominantly from the
cooler background gas. Such regions would also be strong
emitters of high-excitation CELs, leading to the CEL tem-
perature being higher than measured by other means. This is
exactly what is observed, but a detailed evaluation of such a
model cannot be made at present, since no calculations of
line recombination coefficients have yet been made which
correctly and fully incorporate high-temperature dielectronic
recombination.
The question of recombination excitation of the [O ii] auroral
lines ll7320, 7330 has been discussed in Section 3.3. Using the
new recombination coefficients described in Appendix A and the
O21/H1 abundance derived from permitted O ii recombination
lines, we find good agreement between the observed and expected
intensities of these lines. We note that this good agreement is not
found if the earlier radiative recombination data of Pequignot et al.
(1991) are combined with the dielectronic recombination coef-
ficients of Nussbaumer & Storey (1984). Using those recombina-
tion coefficients, the predicted intensity of these lines from
recombination alone exceeds the observed intensity by 70 per
cent.
5.2 Temperature fluctuations
Given the exponential sensitivity to Te of the ionic abundances
derived from UV or optical CELs, the large discrepancies between
heavy-element abundances derived from ORLs on the one hand,
and from UV and optical CELs on the other, have generally been
interpreted as being caused by the presence of large temperature
fluctuations (cf. Peimbert 1994 for a recent review). The concept
of significant temperature fluctuations and their effects on
abundance determinations was first explored by Peimbert
(1967). As an example, in traditional nebular abundance analyses
the O21/H1 abundance is derived from the �l4959 1 l5007�=Hbintensity ratio, using the electron temperature derived from the
[O iii] �l4959 1 l5007�=l4363 ratio (e.g. Osterbrock 1989).
However, in a thermally inhomogeneous nebula, because of the
much higher Eex of the l4363 line (62 000 K) compared to that of
the ll4959, 5007 lines (29 000 K), the emission of the l4363 line
is much more strongly biased towards the warmer regions than the
ll4959, 5007 lines. As a result, the electron temperature derived
from their ratio overestimates the average temperature of the
ll4959, 5007 emission region, leading to an overestimated
emissivity for the latter two lines. This error is further augmented
by the application of the same [O iii] temperature to Hb , resulting
an underestimated average Hb emissivity because of the decrease
of the Hb emissivity with increasing Te. The combined effect of
the errors leads to a grossly underestimated O21/H1 abundance
ratio. For ionic abundances derived from the intensity of a
recombination line relative to Hb , the result is proportional to
aeff�Hb�=aeff�l� / Tbe , where aeff are the effective recombination
coefficients. In general, jbj ! 1, and the abundances derived from
ORLs are essentially independent of the adopted temperature and
the presence of temperature fluctuations.
To characterize temperature fluctuations and their effects on
forbidden-line abundance determination, Peimbert (1967) intro-
duced the concepts of the mean ionic temperature T0 and the
temperature fluctuation parameter t2, which for a given ion species
Xi1 can be defined as
T0�Xi1� ��
TeNeN�Xi1� dV�NeN�Xi1� dV
; �4�
t2�Xi1� ;� �Te 2 T0�2NeN�Xi1� dV
T20
�NeN�Xi1� dV
: �5�
The observed flux from a line emitted by ion stage Xi1 is given by
I�Xi1; l� ��
NeN�Xi1�e�Te� dV; �6�
where e (Te) is the line emissivity. e(Te) can be expanded in a
Taylor series about a mean temperature T0. If the temperature
variation over the volume considered in the integral above is
relatively small, then we can truncate this series and retain only
terms up to second order:
e�Te� � e�T0�1 e 0�Te 2 T0�1e 00
2�Te 2 T0�2: �7�
Then
I�Xi1; l� ��
e�T0�1T2
0e00�T0�2
t2
� �NeN�Xi1� dV : �8�
Equation (8) can be used to calculate the average temperature
T(l) of the emitting region of a given line l . For a CEL with
critical density Ncrit�l� @ Ne (which is usually true for UV and
optical CELs under typical nebular conditions), collisional de-
excitation can be neglected and we have
e�l� / T21=2e exp�2DE=kTe�; �9�
T21=2e �l� exp
2DE
kTe�l�� �
� T21=20 exp
2DE
kT0
� �
� 1 1DE
kT0
� �2
23DE
kT0
13
4
" #t 2
2
( !:
�10�For the [O iii] ll4959, 5007 lines, DE � 28 800 K.
The emissivity of an ORL is proportional to its effective
recombination coefficient a eff. For lines dominated by radiative
recombination, aeff can be fitted (e.g. PeÂquignot et al. 1991) by
aeff � 10213ZATB
4
1 1 CTD4
cm3 s21; T4 ;Te
104Z2:
q 2000 RAS, MNRAS 312, 585±628
Dow
nloaded from https://academ
ic.oup.com/m
nras/article/312/3/585/1023114 by guest on 18 March 2022
Planetary nebula NGC 6153 619
Thus we have
T2ae �l�
1 1 gTbe �l�
� T2a0
1 1 gTb0
1t2
2�1 1 gT
b0 �23
� �a�a 1 1�T2a0 1 �a 1 b��a 1 b 1 1�g2T
2b2a0
1 �2a2 1 2a 1 2ab 2 b2 1 b�gTb2a0 �; �11�
where
a � 2B; b � D; g � CZ22D1024D:
For case B Hb recombination, Z � 1; A � 0:668; B � 20:507;C � 1:221 and D � 0:653.
Peimbert (1971) measured the nebular continuum Balmer jump
temperatures in three PNe and for several regions of the Orion
nebula, and found them to be systematically lower than the [O iii]
temperatures. He interpreted the result as indicating the presence
of temperature fluctuations. The [O iii] and Balmer jump
temperatures are given by (Peimbert 1967)
Te��O iii�na� � T0�O21� 1 11
2
91380
T0�O21� 2 3
� �t2�O21�
� �; �12�
Te�BJ� � T0�H1��1 2 1:67t2�H1��: �13�Thus, if T0�O21� � T0�H1� and t2�O21� � t2�H1�, the values of
T0 and t2 can be derived by measuring Te([O iii]na) and Te(BJ). For
example, Peimbert (1971) found t2 < 0:04 for the nebulae he
observed. That Te(BJ) tends to be lower than Te([O iii]na) for the
same nebula is supported by recent measurements of Te(BJ) in a
number of PNe by Liu & Danziger (1993b). They found that on
average t2 < 0:03. On the other hand, deep spectroscopic
observations (Liu et al. 1995b) disproved claims by Walter &
Dufour (1994) of very low Balmer jump temperatures in the Orion
nebula, and showed excellent agreement between Balmer jump
and [O iii] forbidden-line temperatures.
The large temperature fluctuations suggested by Te(BJ)
measurements of PNe are not predicted by photoionization
models. Several mechanisms capable of producing large tempera-
ture fluctuations have been proposed, such as extra heating from
shocks, density fluctuations and chemical abundance gradients,
but direct observational evidence to support these suggestions has
yet to be found (cf. Section 1 for references). In addition, the
assumption that T0�O21� � T0�H1� and t2�O21� � t2�H1�,required to derive T0 and t2 from equations (12) and (13), have
been shown to be invalid by photoionization modeling in most
cases (Kingdon & Ferland 1995b). In a typical photoionized
nebula, H1 is present in the whole ionized region while,
depending on the nebular ionization structure, O21 exists only
in a limited zone. Thus, in general, T0�O21� ± T0�H1� and
t2�O21� & t2�H1�. On the other hand, the large-scale temperature
variations predicted by photoionization models, caused by
changes in the ionization and thermal equilibrium as a function
of nebular radius, are not fluctuations which, in the strict sense,
refer only to localized, small-scale thermal inhomogeneities,
caused by, say, shock waves or density condensations. Nebular
models that deal with such localized inhomogeneities are not yet
available.
An alternative method to estimate values of t2 in PNe avoids the
above-mentioned complications by using two Te diagnostics from
the same ion species, as has been proposed by Dinerstein et al.
(1985). By comparing electron temperatures derived from the
[O iii] l5007/l4363 ratio with those from the l5007/52mm ratio,
for several PNe, they derived t2 values between 0.04 and 0.06. A
reanalysis of the data for NGC 6543 by Dinerstein et al. (1995),
however, contradicts the earlier results of Dinerstein et al. (1985)
by finding no evidence for temperature fluctuations. A potential
difficulty in using this method to estimate the t2 parameter is the
relatively low Ncrit of the [O iii] 52-mm line, Ncrit � 3400 cm23.
As a result, the electron temperature derived from the l5007/
52mm ratio is sensitive to the adopted Ne and to the presence of
density inhomogeneities (cf. Table 6, Section 3.2). A recent study
by Liu (1997) of a large sample of PNe observed with the ISO
LWS has shown that the electron densities derived from the [O iii]
52mm/88mm ratio are systematically lower than those derived
from the optical [Ar iv] and [Cl iii] doublet ratios, which have
higher critical densities, indicating the presence of moderate
density inhomogeneities in the nebulae. The same result is
apparent here for NGC 6153 (Section 3.2). Probably a better
approach would be to estimate t2 by comparing the electron
temperatures given by the [Ne iii] l3868/l3342 and l3868/15.5-
mm ratios, since the 15.5-mm line has a much higher critical
density, 2:0 � 105 cm23. The [Ne iii] 3342.42-AÊ line is unfortu-
nately lost in the nearby strong O iii Bowen fluorescence line at
3340.74 AÊ in our spectra. Deep spectroscopy, of much higher
resolution than obtained here, is needed to detect this line.
5.3 Temperature fluctuations as the cause of abundance
discrepancies
Fig. 14 shows that the electron temperature derived from the
[O iii] nebular to auroral line ratio varies by ,1200 K along
the nebular minor axis and is more than 2000 K higher than the
Balmer jump temperature, which is constant across the nebula,
suggesting the presence of temperature fluctuations in NGC 6153.
Consistent with this, the temperature derived from the [O iii]
optical nebular to auroral line ratio is higher than that deduced
from the ratio of the optical nebular lines to the far-IR fine-
structure lines (cf. Table 6). On the other hand, the temperature
yielded by the [Ne iii] �l3868 1 l3967�=15:5-mm ratio agrees
reasonably well with that deduced from the [O iii] nebular to
auroral line ratio. In the remainder of this section, we examine the
possibility that the factor of 10 discrepancy between the heavy-
element abundances derived for NGC 6153 from ORLs and from
CELs can be explained by assuming large temperature fluctua-
tions, without identifying their physical causes.
We assume that T0�O21� � T0�H1�; t2�O21� � t2�H1�, and that
the Balmer jump temperature has a constant value of
Te�BJ� � 6080 K. Then, taking Te([O iii]na) to have the minimum
and maximum measured values of 8200 and 9400 K, we obtain
from equations (12) and (13) T0 � 6580 K; t2 � 0:045 and T0 �6900 K; t2 � 0:071 respectively.
For T0 � 6580 K and t2 � 0:045, equations (11) and (10) yield
average line-emitting temperatures of Te�ll4959; 5007� �6830 K and Te�Hb� � 6340 K, which when used to calculate the
average emissivities of the [O iii] ll4959, 5007 lines and Hb ,
respectively, yield an O21/H1 ionic abundance ratio that is 2.4
times higher than the value that would be obtained if
Te��O iii�na� � 8200 K were to used to calculate the emissivities
of all lines. Similarly, for T0 � 6900 K and t2 � 0:071, one finds
that Te�ll4959; 5007� � 7260 K and Te�Hb� � 6500 K, and that
the O21/H1 ionic abundance would be 3.1 times higher than if
Te��O iii�na� � 9400 K were to be used for all lines. Thus the
temperature fluctuations derived from the measured [O iii] and
q 2000 RAS, MNRAS 312, 585±628
Dow
nloaded from https://academ
ic.oup.com/m
nras/article/312/3/585/1023114 by guest on 18 March 2022
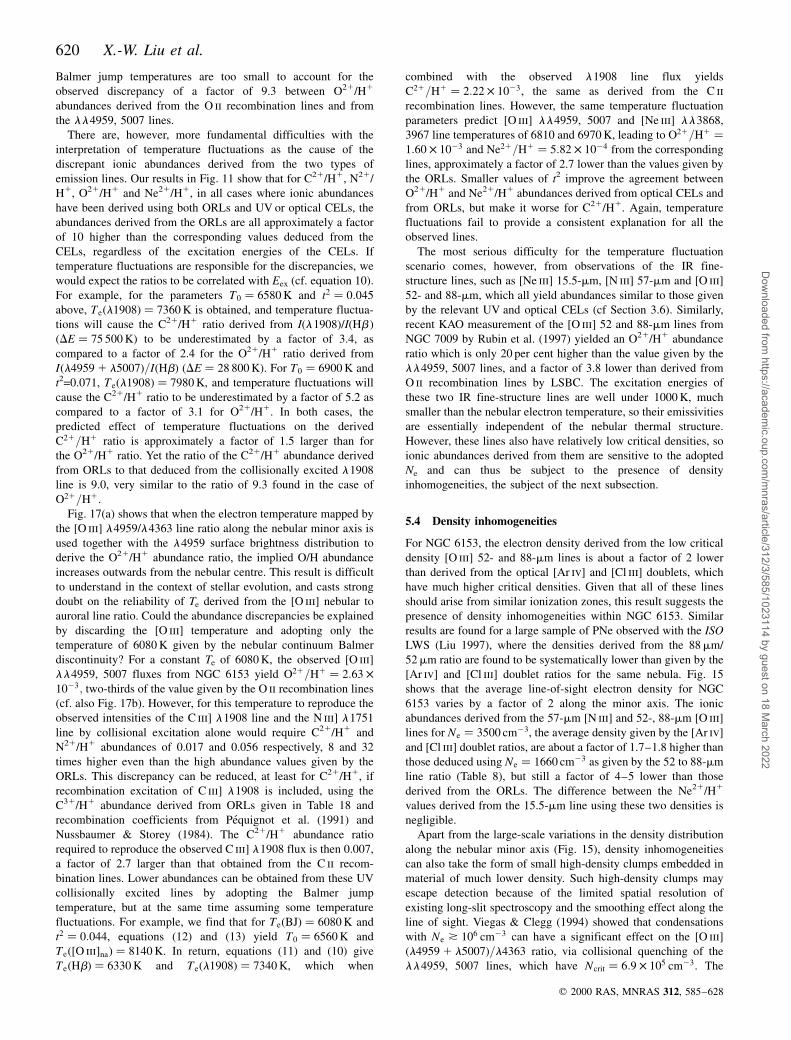
620 X.-W. Liu et al.
Balmer jump temperatures are too small to account for the
observed discrepancy of a factor of 9.3 between O21/H1
abundances derived from the O ii recombination lines and from
the ll4959, 5007 lines.
There are, however, more fundamental difficulties with the
interpretation of temperature fluctuations as the cause of the
discrepant ionic abundances derived from the two types of
emission lines. Our results in Fig. 11 show that for C21/H1, N21/
H1, O21/H1 and Ne21/H1, in all cases where ionic abundances
have been derived using both ORLs and UV or optical CELs, the
abundances derived from the ORLs are all approximately a factor
of 10 higher than the corresponding values deduced from the
CELs, regardless of the excitation energies of the CELs. If
temperature fluctuations are responsible for the discrepancies, we
would expect the ratios to be correlated with Eex (cf. equation 10).
For example, for the parameters T0 � 6580 K and t2 � 0:045
above, Te�l1908� � 7360 K is obtained, and temperature fluctua-
tions will cause the C21/H1 ratio derived from I(l1908)/I(Hb )
�DE � 75 500 K� to be underestimated by a factor of 3.4, as
compared to a factor of 2.4 for the O21/H1 ratio derived from
I�l4959 1 l5007�=I�Hb� �DE � 28 800 K�. For T0 � 6900 K and
t2=0.071, Te�l1908� � 7980 K, and temperature fluctuations will
cause the C21/H1 ratio to be underestimated by a factor of 5.2 as
compared to a factor of 3.1 for O21/H1. In both cases, the
predicted effect of temperature fluctuations on the derived
C21=H1 ratio is approximately a factor of 1.5 larger than for
the O21/H1 ratio. Yet the ratio of the C21/H1 abundance derived
from ORLs to that deduced from the collisionally excited l1908
line is 9.0, very similar to the ratio of 9.3 found in the case of
O21=H1.
Fig. 17(a) shows that when the electron temperature mapped by
the [O iii] l4959/l4363 line ratio along the nebular minor axis is
used together with the l4959 surface brightness distribution to
derive the O21/H1 abundance ratio, the implied O/H abundance
increases outwards from the nebular centre. This result is difficult
to understand in the context of stellar evolution, and casts strong
doubt on the reliability of Te derived from the [O iii] nebular to
auroral line ratio. Could the abundance discrepancies be explained
by discarding the [O iii] temperature and adopting only the
temperature of 6080 K given by the nebular continuum Balmer
discontinuity? For a constant Te of 6080 K, the observed [O iii]
ll4959, 5007 fluxes from NGC 6153 yield O21=H1 � 2:63 �1023; two-thirds of the value given by the O ii recombination lines
(cf. also Fig. 17b). However, for this temperature to reproduce the
observed intensities of the C iii] l1908 line and the N iii] l1751
line by collisional excitation alone would require C21/H1 and
N21/H1 abundances of 0.017 and 0.056 respectively, 8 and 32
times higher even than the high abundance values given by the
ORLs. This discrepancy can be reduced, at least for C21/H1, if
recombination excitation of C iii] l1908 is included, using the
C31/H1 abundance derived from ORLs given in Table 18 and
recombination coefficients from PeÂquignot et al. (1991) and
Nussbaumer & Storey (1984). The C21/H1 abundance ratio
required to reproduce the observed C iii] l1908 flux is then 0.007,
a factor of 2.7 larger than that obtained from the C ii recom-
bination lines. Lower abundances can be obtained from these UV
collisionally excited lines by adopting the Balmer jump
temperature, but at the same time assuming some temperature
fluctuations. For example, we find that for Te�BJ� � 6080 K and
t2 � 0:044, equations (12) and (13) yield T0 � 6560 K and
Te��O iii�na� � 8140 K. In return, equations (11) and (10) give
Te�Hb� � 6330 K and Te�l1908� � 7340 K, which when
combined with the observed l1908 line flux yields
C21=H1 � 2:22 � 1023, the same as derived from the C ii
recombination lines. However, the same temperature fluctuation
parameters predict [O iii] ll4959, 5007 and [Ne iii] ll3868,
3967 line temperatures of 6810 and 6970 K, leading to O21=H1 �1:60 � 1023 and Ne21=H1 � 5:82 � 1024 from the corresponding
lines, approximately a factor of 2.7 lower than the values given by
the ORLs. Smaller values of t2 improve the agreement between
O21/H1 and Ne21/H1 abundances derived from optical CELs and
from ORLs, but make it worse for C21/H1. Again, temperature
fluctuations fail to provide a consistent explanation for all the
observed lines.
The most serious difficulty for the temperature fluctuation
scenario comes, however, from observations of the IR fine-
structure lines, such as [Ne iii] 15.5-mm, [N iii] 57-mm and [O iii]
52- and 88-mm, which all yield abundances similar to those given
by the relevant UV and optical CELs (cf Section 3.6). Similarly,
recent KAO measurement of the [O iii] 52 and 88-mm lines from
NGC 7009 by Rubin et al. (1997) yielded an O21/H1 abundance
ratio which is only 20 per cent higher than the value given by the
ll4959, 5007 lines, and a factor of 3.8 lower than derived from
O ii recombination lines by LSBC. The excitation energies of
these two IR fine-structure lines are well under 1000 K, much
smaller than the nebular electron temperature, so their emissivities
are essentially independent of the nebular thermal structure.
However, these lines also have relatively low critical densities, so
ionic abundances derived from them are sensitive to the adopted
Ne and can thus be subject to the presence of density
inhomogeneities, the subject of the next subsection.
5.4 Density inhomogeneities
For NGC 6153, the electron density derived from the low critical
density [O iii] 52- and 88-mm lines is about a factor of 2 lower
than derived from the optical [Ar iv] and [Cl iii] doublets, which
have much higher critical densities. Given that all of these lines
should arise from similar ionization zones, this result suggests the
presence of density inhomogeneities within NGC 6153. Similar
results are found for a large sample of PNe observed with the ISO
LWS (Liu 1997), where the densities derived from the 88mm/
52mm ratio are found to be systematically lower than given by the
[Ar iv] and [Cl iii] doublet ratios for the same nebula. Fig. 15
shows that the average line-of-sight electron density for NGC
6153 varies by a factor of 2 along the minor axis. The ionic
abundances derived from the 57-mm [N iii] and 52-, 88-mm [O iii]
lines for Ne � 3500 cm23, the average density given by the [Ar iv]
and [Cl iii] doublet ratios, are about a factor of 1.7±1.8 higher than
those deduced using Ne � 1660 cm23 as given by the 52 to 88-mm
line ratio (Table 8), but still a factor of 4±5 lower than those
derived from the ORLs. The difference between the Ne21/H1
values derived from the 15.5-mm line using these two densities is
negligible.
Apart from the large-scale variations in the density distribution
along the nebular minor axis (Fig. 15), density inhomogeneities
can also take the form of small high-density clumps embedded in
material of much lower density. Such high-density clumps may
escape detection because of the limited spatial resolution of
existing long-slit spectroscopy and the smoothing effect along the
line of sight. Viegas & Clegg (1994) showed that condensations
with Ne * 106 cm23 can have a significant effect on the [O iii]
�l4959 1 l5007�=l4363 ratio, via collisional quenching of the
ll4959, 5007 lines, which have Ncrit � 6:9 � 105 cm23. The
q 2000 RAS, MNRAS 312, 585±628
Dow
nloaded from https://academ
ic.oup.com/m
nras/article/312/3/585/1023114 by guest on 18 March 2022
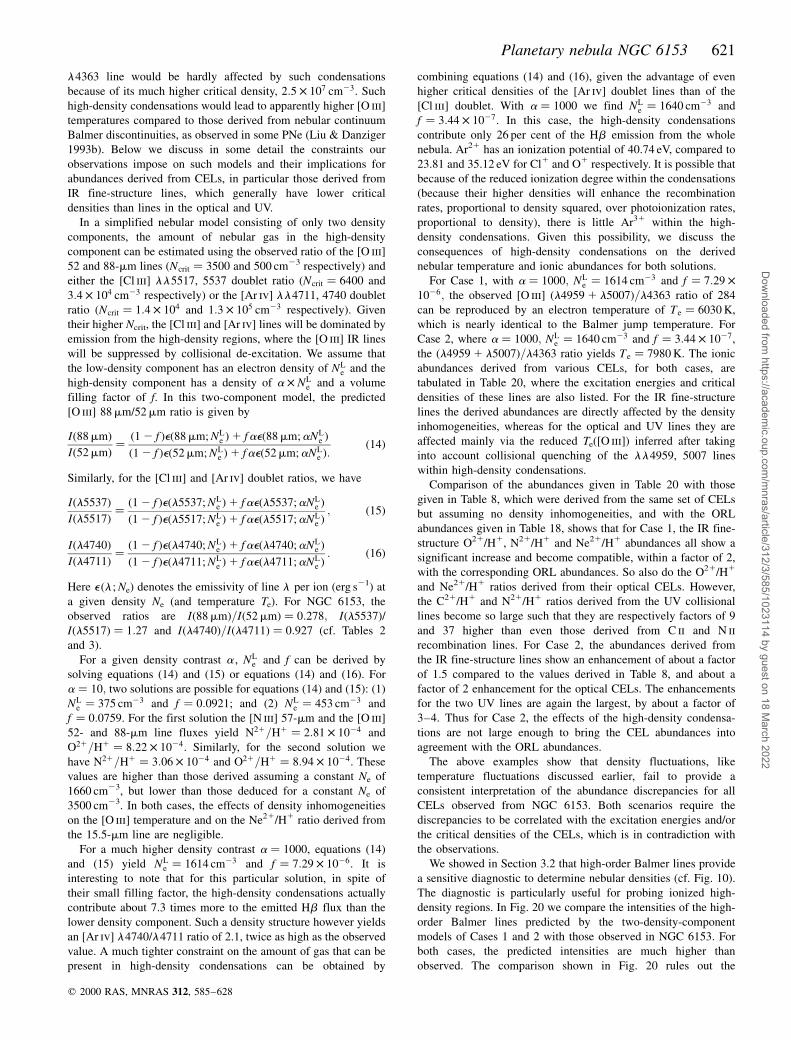
Planetary nebula NGC 6153 621
l4363 line would be hardly affected by such condensations
because of its much higher critical density, 2:5 � 107 cm23. Such
high-density condensations would lead to apparently higher [O iii]
temperatures compared to those derived from nebular continuum
Balmer discontinuities, as observed in some PNe (Liu & Danziger
1993b). Below we discuss in some detail the constraints our
observations impose on such models and their implications for
abundances derived from CELs, in particular those derived from
IR fine-structure lines, which generally have lower critical
densities than lines in the optical and UV.
In a simplified nebular model consisting of only two density
components, the amount of nebular gas in the high-density
component can be estimated using the observed ratio of the [O iii]
52 and 88-mm lines (Ncrit � 3500 and 500 cm23 respectively) and
either the [Cl iii] ll5517, 5537 doublet ratio (Ncrit � 6400 and
3:4 � 104 cm23 respectively) or the [Ar iv] ll4711, 4740 doublet
ratio (Ncrit � 1:4 � 104 and 1:3 � 105 cm23 respectively). Given
their higher Ncrit, the [Cl iii] and [Ar iv] lines will be dominated by
emission from the high-density regions, where the [O iii] IR lines
will be suppressed by collisional de-excitation. We assume that
the low-density component has an electron density of NLe and the
high-density component has a density of a � NLe and a volume
filling factor of f. In this two-component model, the predicted
[O iii] 88mm/52mm ratio is given by
I�88mm�I�52mm� �
�1 2 f �e�88mm;NLe �1 fae�88mm;aNL
e ��1 2 f �e�52mm;NL
e �1 fae�52mm;aNLe �:
�14�
Similarly, for the [Cl iii] and [Ar iv] doublet ratios, we have
I�l5537�I�l5517� �
�1 2 f �e�l5537;NLe �1 fae�l5537;aNL
e ��1 2 f �e�l5517;NL
e �1 fae�l5517;aNLe �; �15�
I�l4740�I�l4711� �
�1 2 f �e�l4740;NLe �1 fae�l4740;aNL
e ��1 2 f �e�l4711;NL
e �1 fae�l4711;aNLe �: �16�
Here e(l ; Ne) denotes the emissivity of line l per ion (erg s21) at
a given density Ne (and temperature Te). For NGC 6153, the
observed ratios are I�88mm�=I�52mm� � 0:278; I�l5537�/I�l5517� � 1:27 and I�l4740�=I�l4711� � 0:927 (cf. Tables 2
and 3).
For a given density contrast a , NLe and f can be derived by
solving equations (14) and (15) or equations (14) and (16). For
a � 10; two solutions are possible for equations (14) and (15): (1)
NLe � 375 cm23 and f � 0:0921; and (2) NL
e � 453 cm23 and
f � 0:0759. For the first solution the [N iii] 57-mm and the [O iii]
52- and 88-mm line fluxes yield N21=H1 � 2:81 � 1024 and
O21=H1 � 8:22 � 1024. Similarly, for the second solution we
have N21=H1 � 3:06 � 1024 and O21=H1 � 8:94 � 1024. These
values are higher than those derived assuming a constant Ne of
1660 cm23, but lower than those deduced for a constant Ne of
3500 cm23. In both cases, the effects of density inhomogeneities
on the [O iii] temperature and on the Ne21/H1 ratio derived from
the 15.5-mm line are negligible.
For a much higher density contrast a � 1000, equations (14)
and (15) yield NLe � 1614 cm23 and f � 7:29 � 1026. It is
interesting to note that for this particular solution, in spite of
their small filling factor, the high-density condensations actually
contribute about 7.3 times more to the emitted Hb flux than the
lower density component. Such a density structure however yields
an [Ar iv] l4740/l4711 ratio of 2.1, twice as high as the observed
value. A much tighter constraint on the amount of gas that can be
present in high-density condensations can be obtained by
combining equations (14) and (16), given the advantage of even
higher critical densities of the [Ar iv] doublet lines than of the
[Cl iii] doublet. With a � 1000 we find NLe � 1640 cm23 and
f � 3:44 � 1027. In this case, the high-density condensations
contribute only 26 per cent of the Hb emission from the whole
nebula. Ar21 has an ionization potential of 40.74 eV, compared to
23.81 and 35.12 eV for Cl1 and O1 respectively. It is possible that
because of the reduced ionization degree within the condensations
(because their higher densities will enhance the recombination
rates, proportional to density squared, over photoionization rates,
proportional to density), there is little Ar31 within the high-
density condensations. Given this possibility, we discuss the
consequences of high-density condensations on the derived
nebular temperature and ionic abundances for both solutions.
For Case 1, with a � 1000; NLe � 1614 cm23 and f � 7:29 �
1026; the observed [O iii] �l4959 1 l5007�=l4363 ratio of 284
can be reproduced by an electron temperature of Te � 6030 K,
which is nearly identical to the Balmer jump temperature. For
Case 2, where a � 1000; NLe � 1640 cm23 and f � 3:44 � 1027,
the �l4959 1 l5007�=l4363 ratio yields Te � 7980 K. The ionic
abundances derived from various CELs, for both cases, are
tabulated in Table 20, where the excitation energies and critical
densities of these lines are also listed. For the IR fine-structure
lines the derived abundances are directly affected by the density
inhomogeneities, whereas for the optical and UV lines they are
affected mainly via the reduced Te([O iii]) inferred after taking
into account collisional quenching of the ll4959, 5007 lines
within high-density condensations.
Comparison of the abundances given in Table 20 with those
given in Table 8, which were derived from the same set of CELs
but assuming no density inhomogeneities, and with the ORL
abundances given in Table 18, shows that for Case 1, the IR fine-
structure O21/H1, N21/H1 and Ne21/H1 abundances all show a
significant increase and become compatible, within a factor of 2,
with the corresponding ORL abundances. So also do the O21/H1
and Ne21/H1 ratios derived from their optical CELs. However,
the C21/H1 and N21/H1 ratios derived from the UV collisional
lines become so large such that they are respectively factors of 9
and 37 higher than even those derived from C ii and N ii
recombination lines. For Case 2, the abundances derived from
the IR fine-structure lines show an enhancement of about a factor
of 1.5 compared to the values derived in Table 8, and about a
factor of 2 enhancement for the optical CELs. The enhancements
for the two UV lines are again the largest, by about a factor of
3±4. Thus for Case 2, the effects of the high-density condensa-
tions are not large enough to bring the CEL abundances into
agreement with the ORL abundances.
The above examples show that density fluctuations, like
temperature fluctuations discussed earlier, fail to provide a
consistent interpretation of the abundance discrepancies for all
CELs observed from NGC 6153. Both scenarios require the
discrepancies to be correlated with the excitation energies and/or
the critical densities of the CELs, which is in contradiction with
the observations.
We showed in Section 3.2 that high-order Balmer lines provide
a sensitive diagnostic to determine nebular densities (cf. Fig. 10).
The diagnostic is particularly useful for probing ionized high-
density regions. In Fig. 20 we compare the intensities of the high-
order Balmer lines predicted by the two-density-component
models of Cases 1 and 2 with those observed in NGC 6153. For
both cases, the predicted intensities are much higher than
observed. The comparison shown in Fig. 20 rules out the
q 2000 RAS, MNRAS 312, 585±628
Dow
nloaded from https://academ
ic.oup.com/m
nras/article/312/3/585/1023114 by guest on 18 March 2022
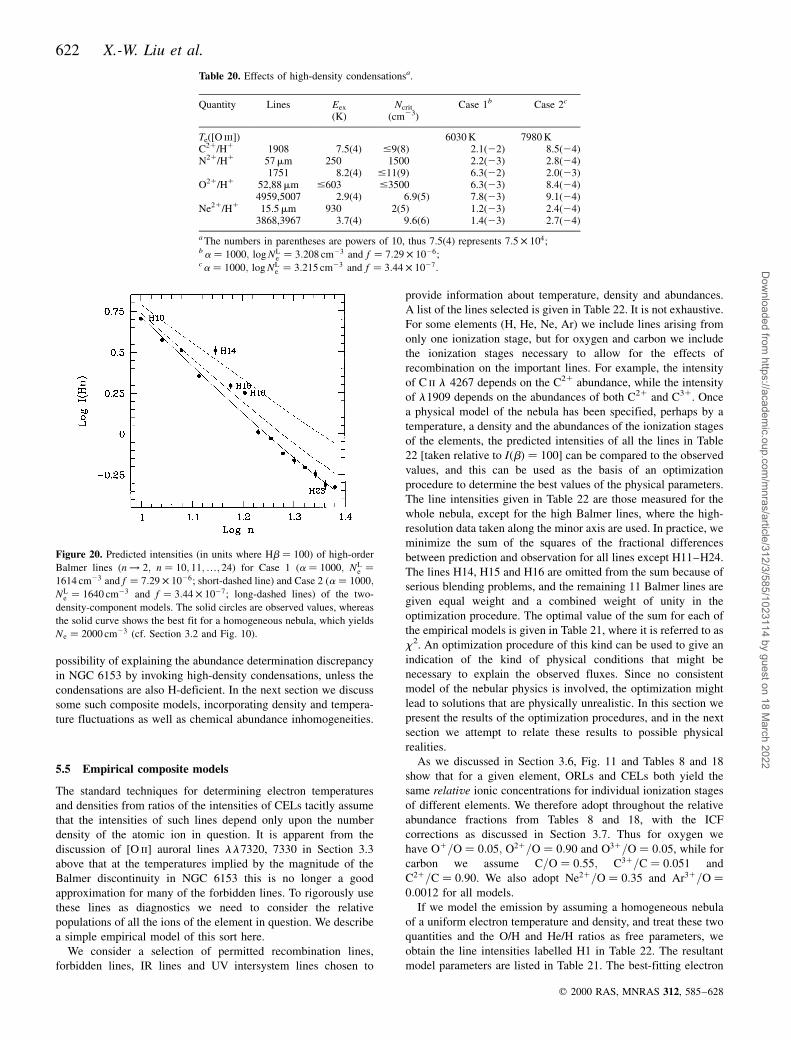
622 X.-W. Liu et al.
possibility of explaining the abundance determination discrepancy
in NGC 6153 by invoking high-density condensations, unless the
condensations are also H-deficient. In the next section we discuss
some such composite models, incorporating density and tempera-
ture fluctuations as well as chemical abundance inhomogeneities.
5.5 Empirical composite models
The standard techniques for determining electron temperatures
and densities from ratios of the intensities of CELs tacitly assume
that the intensities of such lines depend only upon the number
density of the atomic ion in question. It is apparent from the
discussion of [O ii] auroral lines ll7320, 7330 in Section 3.3
above that at the temperatures implied by the magnitude of the
Balmer discontinuity in NGC 6153 this is no longer a good
approximation for many of the forbidden lines. To rigorously use
these lines as diagnostics we need to consider the relative
populations of all the ions of the element in question. We describe
a simple empirical model of this sort here.
We consider a selection of permitted recombination lines,
forbidden lines, IR lines and UV intersystem lines chosen to
provide information about temperature, density and abundances.
A list of the lines selected is given in Table 22. It is not exhaustive.
For some elements (H, He, Ne, Ar) we include lines arising from
only one ionization stage, but for oxygen and carbon we include
the ionization stages necessary to allow for the effects of
recombination on the important lines. For example, the intensity
of C ii l 4267 depends on the C21 abundance, while the intensity
of l1909 depends on the abundances of both C21 and C31. Once
a physical model of the nebula has been specified, perhaps by a
temperature, a density and the abundances of the ionization stages
of the elements, the predicted intensities of all the lines in Table
22 [taken relative to I�b� � 100] can be compared to the observed
values, and this can be used as the basis of an optimization
procedure to determine the best values of the physical parameters.
The line intensities given in Table 22 are those measured for the
whole nebula, except for the high Balmer lines, where the high-
resolution data taken along the minor axis are used. In practice, we
minimize the sum of the squares of the fractional differences
between prediction and observation for all lines except H11±H24.
The lines H14, H15 and H16 are omitted from the sum because of
serious blending problems, and the remaining 11 Balmer lines are
given equal weight and a combined weight of unity in the
optimization procedure. The optimal value of the sum for each of
the empirical models is given in Table 21, where it is referred to as
x2. An optimization procedure of this kind can be used to give an
indication of the kind of physical conditions that might be
necessary to explain the observed fluxes. Since no consistent
model of the nebular physics is involved, the optimization might
lead to solutions that are physically unrealistic. In this section we
present the results of the optimization procedures, and in the next
section we attempt to relate these results to possible physical
realities.
As we discussed in Section 3.6, Fig. 11 and Tables 8 and 18
show that for a given element, ORLs and CELs both yield the
same relative ionic concentrations for individual ionization stages
of different elements. We therefore adopt throughout the relative
abundance fractions from Tables 8 and 18, with the ICF
corrections as discussed in Section 3.7. Thus for oxygen we
have O1=O � 0:05; O21=O � 0:90 and O31=O � 0:05, while for
carbon we assume C=O � 0:55; C31=C � 0:051 and
C21=C � 0:90. We also adopt Ne21=O � 0:35 and Ar31=O �0:0012 for all models.
If we model the emission by assuming a homogeneous nebula
of a uniform electron temperature and density, and treat these two
quantities and the O/H and He/H ratios as free parameters, we
obtain the line intensities labelled H1 in Table 22. The resultant
model parameters are listed in Table 21. The best-fitting electron
q 2000 RAS, MNRAS 312, 585±628
Table 20. Effects of high-density condensationsa.
Quantity Lines Eex Ncrit Case 1b Case 2c
(K) (cm23)
Te([O iii]) 6030 K 7980 KC21/H1 1908 7.5(4) #9(8) 2.1(22) 8.5(24)N21/H1 57mm 250 1500 2.2(23) 2.8(24)
1751 8.2(4) #11(9) 6.3(22) 2.0(23)O21/H1 52,88mm #603 #3500 6.3(23) 8.4(24)
4959,5007 2.9(4) 6.9(5) 7.8(23) 9.1(24)Ne21/H1 15.5mm 930 2(5) 1.2(23) 2.4(24)
3868,3967 3.7(4) 9.6(6) 1.4(23) 2.7(24)
a The numbers in parentheses are powers of 10, thus 7.5(4) represents 7:5 � 104;ba � 1000; log NL
e � 3:208 cm23 and f � 7:29 � 1026;ca � 1000; log NL
e � 3:215 cm23 and f � 3:44 � 1027.
Figure 20. Predicted intensities (in units where Hb � 100) of high-order
Balmer lines (n! 2; n � 10; 11;¼; 24) for Case 1 (a � 1000; NLe �
1614 cm23 and f � 7:29 � 1026; short-dashed line) and Case 2 (a � 1000;
NLe � 1640 cm23 and f � 3:44 � 1027; long-dashed lines) of the two-
density-component models. The solid circles are observed values, whereas
the solid curve shows the best fit for a homogeneous nebula, which yields
Ne � 2000 cm23 (cf. Section 3.2 and Fig. 10).
Dow
nloaded from https://academ
ic.oup.com/m
nras/article/312/3/585/1023114 by guest on 18 March 2022
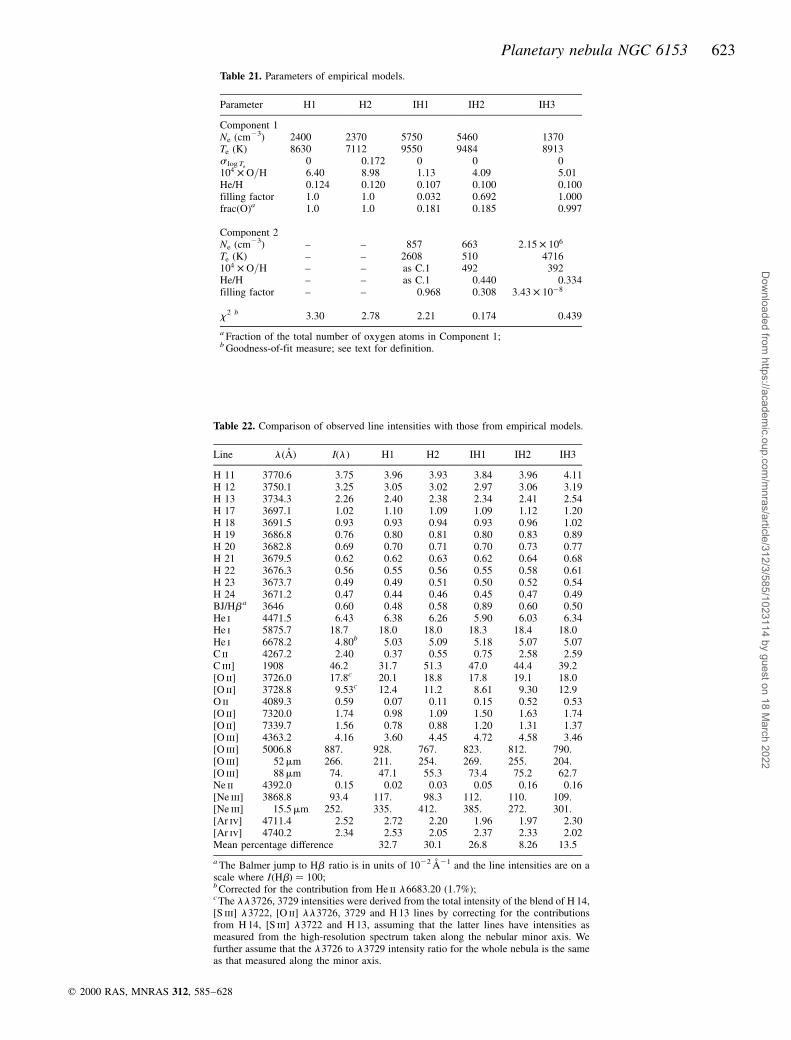
Planetary nebula NGC 6153 623
q 2000 RAS, MNRAS 312, 585±628
Table 22. Comparison of observed line intensities with those from empirical models.
Line l(AÊ ) I(l) H1 H2 IH1 IH2 IH3
H 11 3770.6 3.75 3.96 3.93 3.84 3.96 4.11H 12 3750.1 3.25 3.05 3.02 2.97 3.06 3.19H 13 3734.3 2.26 2.40 2.38 2.34 2.41 2.54H 17 3697.1 1.02 1.10 1.09 1.09 1.12 1.20H 18 3691.5 0.93 0.93 0.94 0.93 0.96 1.02H 19 3686.8 0.76 0.80 0.81 0.80 0.83 0.89H 20 3682.8 0.69 0.70 0.71 0.70 0.73 0.77H 21 3679.5 0.62 0.62 0.63 0.62 0.64 0.68H 22 3676.3 0.56 0.55 0.56 0.55 0.58 0.61H 23 3673.7 0.49 0.49 0.51 0.50 0.52 0.54H 24 3671.2 0.47 0.44 0.46 0.45 0.47 0.49BJ/Hba 3646 0.60 0.48 0.58 0.89 0.60 0.50He i 4471.5 6.43 6.38 6.26 5.90 6.03 6.34He i 5875.7 18.7 18.0 18.0 18.3 18.4 18.0He i 6678.2 4.80b 5.03 5.09 5.18 5.07 5.07C ii 4267.2 2.40 0.37 0.55 0.75 2.58 2.59C iii] 1908 46.2 31.7 51.3 47.0 44.4 39.2[O ii] 3726.0 17.8c 20.1 18.8 17.8 19.1 18.0[O ii] 3728.8 9.53c 12.4 11.2 8.61 9.30 12.9O ii 4089.3 0.59 0.07 0.11 0.15 0.52 0.53[O ii] 7320.0 1.74 0.98 1.09 1.50 1.63 1.74[O ii] 7339.7 1.56 0.78 0.88 1.20 1.31 1.37[O iii] 4363.2 4.16 3.60 4.45 4.72 4.58 3.46[O iii] 5006.8 887. 928. 767. 823. 812. 790.[O iii] 52mm 266. 211. 254. 269. 255. 204.[O iii] 88mm 74. 47.1 55.3 73.4 75.2 62.7Ne ii 4392.0 0.15 0.02 0.03 0.05 0.16 0.16[Ne iii] 3868.8 93.4 117. 98.3 112. 110. 109.[Ne iii] 15.5mm 252. 335. 412. 385. 272. 301.[Ar iv] 4711.4 2.52 2.72 2.20 1.96 1.97 2.30[Ar iv] 4740.2 2.34 2.53 2.05 2.37 2.33 2.02Mean percentage difference 32.7 30.1 26.8 8.26 13.5
a The Balmer jump to Hb ratio is in units of 1022 AÊ 21 and the line intensities are on ascale where I�Hb� � 100;b Corrected for the contribution from He ii l6683.20 (1.7%);c The ll3726, 3729 intensities were derived from the total intensity of the blend of H 14,[S iii] l3722, [O ii] ll3726, 3729 and H 13 lines by correcting for the contributionsfrom H 14, [S iii] l3722 and H 13, assuming that the latter lines have intensities asmeasured from the high-resolution spectrum taken along the nebular minor axis. Wefurther assume that the l3726 to l3729 intensity ratio for the whole nebula is the sameas that measured along the minor axis.
Table 21. Parameters of empirical models.
Parameter H1 H2 IH1 IH2 IH3
Component 1Ne (cm23) 2400 2370 5750 5460 1370Te (K) 8630 7112 9550 9484 8913s log Te
0 0.172 0 0 0104 � O=H 6.40 8.98 1.13 4.09 5.01He/H 0.124 0.120 0.107 0.100 0.100filling factor 1.0 1.0 0.032 0.692 1.000frac(O)a 1.0 1.0 0.181 0.185 0.997
Component 2Ne (cm23) ± ± 857 663 2:15 � 106
Te (K) ± ± 2608 510 4716104 � O=H ± ± as C.1 492 392He/H ± ± as C.1 0.440 0.334filling factor ± ± 0.968 0.308 3:43 � 1028
x2 b 3.30 2.78 2.21 0.174 0.439
a Fraction of the total number of oxygen atoms in Component 1;b Goodness-of-fit measure; see text for definition.
Dow
nloaded from https://academ
ic.oup.com/m
nras/article/312/3/585/1023114 by guest on 18 March 2022
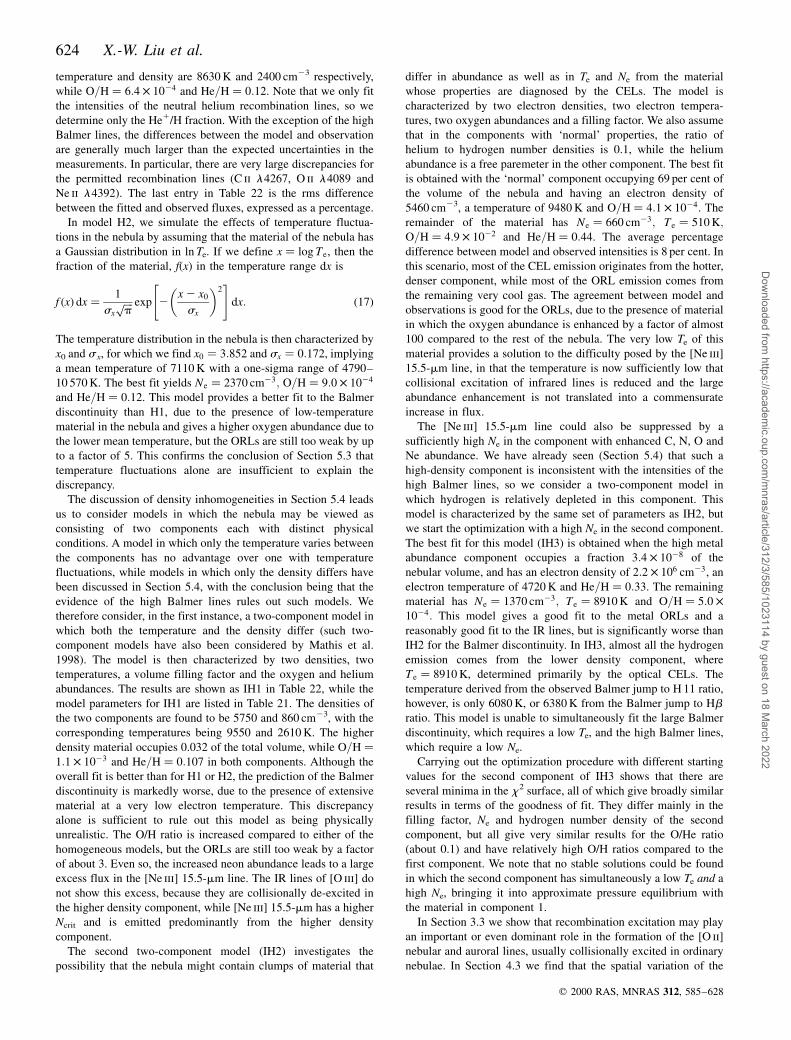
624 X.-W. Liu et al.
temperature and density are 8630 K and 2400 cm23 respectively,
while O=H � 6:4 � 1024 and He=H � 0:12. Note that we only fit
the intensities of the neutral helium recombination lines, so we
determine only the He1/H fraction. With the exception of the high
Balmer lines, the differences between the model and observation
are generally much larger than the expected uncertainties in the
measurements. In particular, there are very large discrepancies for
the permitted recombination lines (C ii l4267, O ii l4089 and
Ne ii l4392). The last entry in Table 22 is the rms difference
between the fitted and observed fluxes, expressed as a percentage.
In model H2, we simulate the effects of temperature fluctua-
tions in the nebula by assuming that the material of the nebula has
a Gaussian distribution in ln Te. If we define x � log Te, then the
fraction of the material, f(x) in the temperature range dx is
f �x� dx � 1
sx
����pp exp 2
x 2 x0
sx
� �2" #
dx: �17�
The temperature distribution in the nebula is then characterized by
x0 and s x, for which we find x0 � 3:852 and sx � 0:172, implying
a mean temperature of 7110 K with a one-sigma range of 4790±
10 570 K. The best fit yields Ne � 2370 cm23; O=H � 9:0 � 1024
and He=H � 0:12. This model provides a better fit to the Balmer
discontinuity than H1, due to the presence of low-temperature
material in the nebula and gives a higher oxygen abundance due to
the lower mean temperature, but the ORLs are still too weak by up
to a factor of 5. This confirms the conclusion of Section 5.3 that
temperature fluctuations alone are insufficient to explain the
discrepancy.
The discussion of density inhomogeneities in Section 5.4 leads
us to consider models in which the nebula may be viewed as
consisting of two components each with distinct physical
conditions. A model in which only the temperature varies between
the components has no advantage over one with temperature
fluctuations, while models in which only the density differs have
been discussed in Section 5.4, with the conclusion being that the
evidence of the high Balmer lines rules out such models. We
therefore consider, in the first instance, a two-component model in
which both the temperature and the density differ (such two-
component models have also been considered by Mathis et al.
1998). The model is then characterized by two densities, two
temperatures, a volume filling factor and the oxygen and helium
abundances. The results are shown as IH1 in Table 22, while the
model parameters for IH1 are listed in Table 21. The densities of
the two components are found to be 5750 and 860 cm23, with the
corresponding temperatures being 9550 and 2610 K. The higher
density material occupies 0.032 of the total volume, while O=H �1:1 � 1023 and He=H � 0:107 in both components. Although the
overall fit is better than for H1 or H2, the prediction of the Balmer
discontinuity is markedly worse, due to the presence of extensive
material at a very low electron temperature. This discrepancy
alone is sufficient to rule out this model as being physically
unrealistic. The O/H ratio is increased compared to either of the
homogeneous models, but the ORLs are still too weak by a factor
of about 3. Even so, the increased neon abundance leads to a large
excess flux in the [Ne iii] 15.5-mm line. The IR lines of [O iii] do
not show this excess, because they are collisionally de-excited in
the higher density component, while [Ne iii] 15.5-mm has a higher
Ncrit and is emitted predominantly from the higher density
component.
The second two-component model (IH2) investigates the
possibility that the nebula might contain clumps of material that
differ in abundance as well as in Te and Ne from the material
whose properties are diagnosed by the CELs. The model is
characterized by two electron densities, two electron tempera-
tures, two oxygen abundances and a filling factor. We also assume
that in the components with `normal' properties, the ratio of
helium to hydrogen number densities is 0.1, while the helium
abundance is a free paremeter in the other component. The best fit
is obtained with the `normal' component occupying 69 per cent of
the volume of the nebula and having an electron density of
5460 cm23, a temperature of 9480 K and O=H � 4:1 � 1024. The
remainder of the material has Ne � 660 cm23; Te � 510 K;O=H � 4:9 � 1022 and He=H � 0:44. The average percentage
difference between model and observed intensities is 8 per cent. In
this scenario, most of the CEL emission originates from the hotter,
denser component, while most of the ORL emission comes from
the remaining very cool gas. The agreement between model and
observations is good for the ORLs, due to the presence of material
in which the oxygen abundance is enhanced by a factor of almost
100 compared to the rest of the nebula. The very low Te of this
material provides a solution to the difficulty posed by the [Ne iii]
15.5-mm line, in that the temperature is now sufficiently low that
collisional excitation of infrared lines is reduced and the large
abundance enhancement is not translated into a commensurate
increase in flux.
The [Ne iii] 15.5-mm line could also be suppressed by a
sufficiently high Ne in the component with enhanced C, N, O and
Ne abundance. We have already seen (Section 5.4) that such a
high-density component is inconsistent with the intensities of the
high Balmer lines, so we consider a two-component model in
which hydrogen is relatively depleted in this component. This
model is characterized by the same set of parameters as IH2, but
we start the optimization with a high Ne in the second component.
The best fit for this model (IH3) is obtained when the high metal
abundance component occupies a fraction 3:4 � 1028 of the
nebular volume, and has an electron density of 2:2 � 106 cm23, an
electron temperature of 4720 K and He=H � 0:33. The remaining
material has Ne � 1370 cm23; Te � 8910 K and O=H � 5:0 �1024: This model gives a good fit to the metal ORLs and a
reasonably good fit to the IR lines, but is significantly worse than
IH2 for the Balmer discontinuity. In IH3, almost all the hydrogen
emission comes from the lower density component, where
Te � 8910 K, determined primarily by the optical CELs. The
temperature derived from the observed Balmer jump to H 11 ratio,
however, is only 6080 K, or 6380 K from the Balmer jump to Hbratio. This model is unable to simultaneously fit the large Balmer
discontinuity, which requires a low Te, and the high Balmer lines,
which require a low Ne.
Carrying out the optimization procedure with different starting
values for the second component of IH3 shows that there are
several minima in the x2 surface, all of which give broadly similar
results in terms of the goodness of fit. They differ mainly in the
filling factor, Ne and hydrogen number density of the second
component, but all give very similar results for the O/He ratio
(about 0.1) and have relatively high O/H ratios compared to the
first component. We note that no stable solutions could be found
in which the second component has simultaneously a low Te and a
high Ne, bringing it into approximate pressure equilibrium with
the material in component 1.
In Section 3.3 we show that recombination excitation may play
an important or even dominant role in the formation of the [O ii]
nebular and auroral lines, usually collisionally excited in ordinary
nebulae. In Section 4.3 we find that the spatial variation of the
q 2000 RAS, MNRAS 312, 585±628
Dow
nloaded from https://academ
ic.oup.com/m
nras/article/312/3/585/1023114 by guest on 18 March 2022
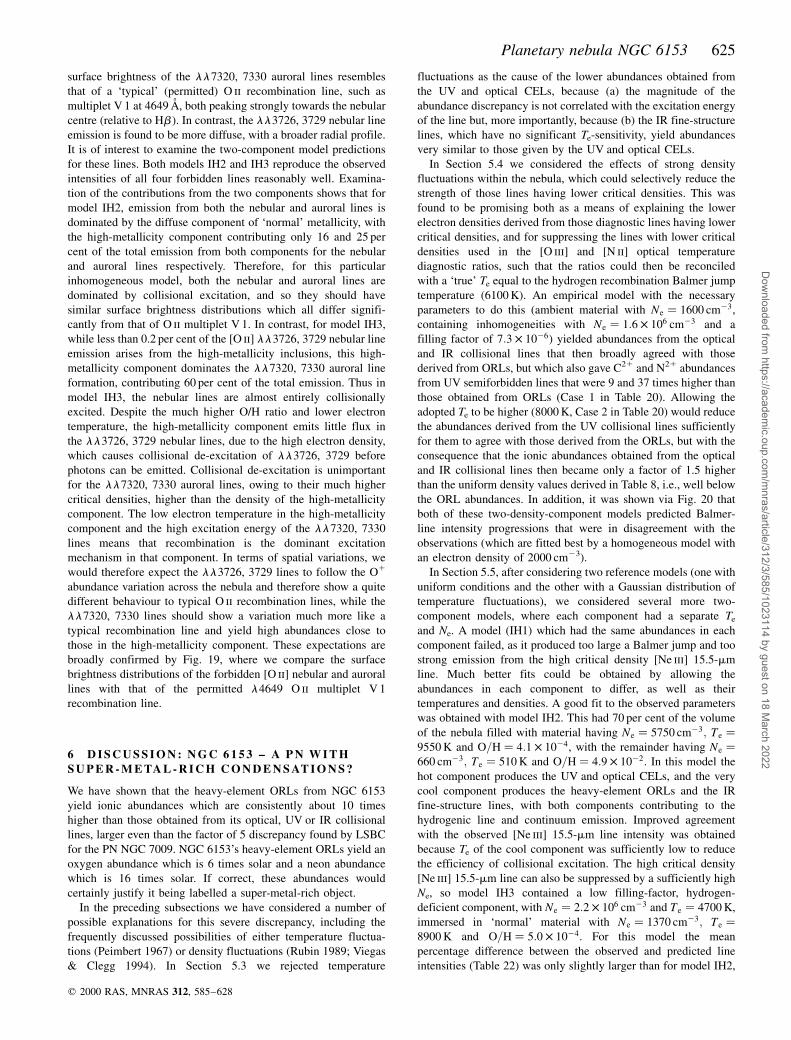
Planetary nebula NGC 6153 625
surface brightness of the ll7320, 7330 auroral lines resembles
that of a `typical' (permitted) O ii recombination line, such as
multiplet V 1 at 4649 AÊ , both peaking strongly towards the nebular
centre (relative to Hb ). In contrast, the ll3726, 3729 nebular line
emission is found to be more diffuse, with a broader radial profile.
It is of interest to examine the two-component model predictions
for these lines. Both models IH2 and IH3 reproduce the observed
intensities of all four forbidden lines reasonably well. Examina-
tion of the contributions from the two components shows that for
model IH2, emission from both the nebular and auroral lines is
dominated by the diffuse component of `normal' metallicity, with
the high-metallicity component contributing only 16 and 25 per
cent of the total emission from both components for the nebular
and auroral lines respectively. Therefore, for this particular
inhomogeneous model, both the nebular and auroral lines are
dominated by collisional excitation, and so they should have
similar surface brightness distributions which all differ signifi-
cantly from that of O ii multiplet V 1. In contrast, for model IH3,
while less than 0.2 per cent of the [O ii] ll3726, 3729 nebular line
emission arises from the high-metallicity inclusions, this high-
metallicity component dominates the ll7320, 7330 auroral line
formation, contributing 60 per cent of the total emission. Thus in
model IH3, the nebular lines are almost entirely collisionally
excited. Despite the much higher O/H ratio and lower electron
temperature, the high-metallicity component emits little flux in
the ll3726, 3729 nebular lines, due to the high electron density,
which causes collisional de-excitation of ll3726, 3729 before
photons can be emitted. Collisional de-excitation is unimportant
for the ll7320, 7330 auroral lines, owing to their much higher
critical densities, higher than the density of the high-metallicity
component. The low electron temperature in the high-metallicity
component and the high excitation energy of the ll7320, 7330
lines means that recombination is the dominant excitation
mechanism in that component. In terms of spatial variations, we
would therefore expect the ll3726, 3729 lines to follow the O1
abundance variation across the nebula and therefore show a quite
different behaviour to typical O ii recombination lines, while the
ll7320, 7330 lines should show a variation much more like a
typical recombination line and yield high abundances close to
those in the high-metallicity component. These expectations are
broadly confirmed by Fig. 19, where we compare the surface
brightness distributions of the forbidden [O ii] nebular and auroral
lines with that of the permitted l4649 O ii multiplet V 1
recombination line.
6 D I S C U S S I O N : N G C 6 1 5 3 ± A P N W I T H
S U P E R - M E TA L - R I C H C O N D E N S AT I O N S ?
We have shown that the heavy-element ORLs from NGC 6153
yield ionic abundances which are consistently about 10 times
higher than those obtained from its optical, UV or IR collisional
lines, larger even than the factor of 5 discrepancy found by LSBC
for the PN NGC 7009. NGC 6153's heavy-element ORLs yield an
oxygen abundance which is 6 times solar and a neon abundance
which is 16 times solar. If correct, these abundances would
certainly justify it being labelled a super-metal-rich object.
In the preceding subsections we have considered a number of
possible explanations for this severe discrepancy, including the
frequently discussed possibilities of either temperature fluctua-
tions (Peimbert 1967) or density fluctuations (Rubin 1989; Viegas
& Clegg 1994). In Section 5.3 we rejected temperature
fluctuations as the cause of the lower abundances obtained from
the UV and optical CELs, because (a) the magnitude of the
abundance discrepancy is not correlated with the excitation energy
of the line but, more importantly, because (b) the IR fine-structure
lines, which have no significant Te-sensitivity, yield abundances
very similar to those given by the UV and optical CELs.
In Section 5.4 we considered the effects of strong density
fluctuations within the nebula, which could selectively reduce the
strength of those lines having lower critical densities. This was
found to be promising both as a means of explaining the lower
electron densities derived from those diagnostic lines having lower
critical densities, and for suppressing the lines with lower critical
densities used in the [O iii] and [N ii] optical temperature
diagnostic ratios, such that the ratios could then be reconciled
with a `true' Te equal to the hydrogen recombination Balmer jump
temperature (6100 K). An empirical model with the necessary
parameters to do this (ambient material with Ne � 1600 cm23,
containing inhomogeneities with Ne � 1:6 � 106 cm23 and a
filling factor of 7:3 � 1026) yielded abundances from the optical
and IR collisional lines that then broadly agreed with those
derived from ORLs, but which also gave C21 and N21 abundances
from UV semiforbidden lines that were 9 and 37 times higher than
those obtained from ORLs (Case 1 in Table 20). Allowing the
adopted Te to be higher (8000 K, Case 2 in Table 20) would reduce
the abundances derived from the UV collisional lines sufficiently
for them to agree with those derived from the ORLs, but with the
consequence that the ionic abundances obtained from the optical
and IR collisional lines then became only a factor of 1.5 higher
than the uniform density values derived in Table 8, i.e., well below
the ORL abundances. In addition, it was shown via Fig. 20 that
both of these two-density-component models predicted Balmer-
line intensity progressions that were in disagreement with the
observations (which are fitted best by a homogeneous model with
an electron density of 2000 cm23).
In Section 5.5, after considering two reference models (one with
uniform conditions and the other with a Gaussian distribution of
temperature fluctuations), we considered several more two-
component models, where each component had a separate Te
and Ne. A model (IH1) which had the same abundances in each
component failed, as it produced too large a Balmer jump and too
strong emission from the high critical density [Ne iii] 15.5-mm
line. Much better fits could be obtained by allowing the
abundances in each component to differ, as well as their
temperatures and densities. A good fit to the observed parameters
was obtained with model IH2. This had 70 per cent of the volume
of the nebula filled with material having Ne � 5750 cm23; Te �9550 K and O=H � 4:1 � 1024, with the remainder having Ne �660 cm23; Te � 510 K and O=H � 4:9 � 1022. In this model the
hot component produces the UV and optical CELs, and the very
cool component produces the heavy-element ORLs and the IR
fine-structure lines, with both components contributing to the
hydrogenic line and continuum emission. Improved agreement
with the observed [Ne iii] 15.5-mm line intensity was obtained
because Te of the cool component was sufficiently low to reduce
the efficiency of collisional excitation. The high critical density
[Ne iii] 15.5-mm line can also be suppressed by a sufficiently high
Ne, so model IH3 contained a low filling-factor, hydrogen-
deficient component, with Ne � 2:2 � 106 cm23 and Te � 4700 K,
immersed in `normal' material with Ne � 1370 cm23; Te �8900 K and O=H � 5:0 � 1024. For this model the mean
percentage difference between the observed and predicted line
intensities (Table 22) was only slightly larger than for model IH2,
q 2000 RAS, MNRAS 312, 585±628
Dow
nloaded from https://academ
ic.oup.com/m
nras/article/312/3/585/1023114 by guest on 18 March 2022
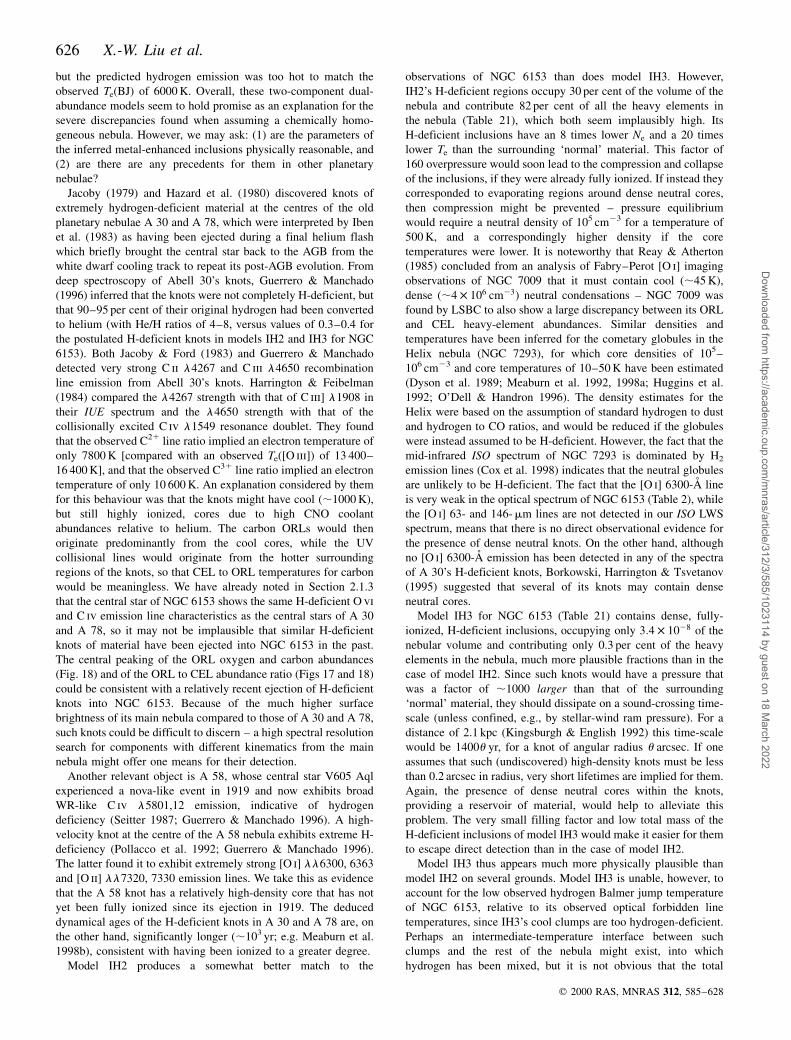
626 X.-W. Liu et al.
but the predicted hydrogen emission was too hot to match the
observed Te(BJ) of 6000 K. Overall, these two-component dual-
abundance models seem to hold promise as an explanation for the
severe discrepancies found when assuming a chemically homo-
geneous nebula. However, we may ask: (1) are the parameters of
the inferred metal-enhanced inclusions physically reasonable, and
(2) are there are any precedents for them in other planetary
nebulae?
Jacoby (1979) and Hazard et al. (1980) discovered knots of
extremely hydrogen-deficient material at the centres of the old
planetary nebulae A 30 and A 78, which were interpreted by Iben
et al. (1983) as having been ejected during a final helium flash
which briefly brought the central star back to the AGB from the
white dwarf cooling track to repeat its post-AGB evolution. From
deep spectroscopy of Abell 30's knots, Guerrero & Manchado
(1996) inferred that the knots were not completely H-deficient, but
that 90±95 per cent of their original hydrogen had been converted
to helium (with He/H ratios of 4±8, versus values of 0.3±0.4 for
the postulated H-deficient knots in models IH2 and IH3 for NGC
6153). Both Jacoby & Ford (1983) and Guerrero & Manchado
detected very strong C ii l4267 and C iii l4650 recombination
line emission from Abell 30's knots. Harrington & Feibelman
(1984) compared the l4267 strength with that of C iii] l1908 in
their IUE spectrum and the l4650 strength with that of the
collisionally excited C iv l1549 resonance doublet. They found
that the observed C21 line ratio implied an electron temperature of
only 7800 K [compared with an observed Te([O iii]) of 13 400±
16 400 K], and that the observed C31 line ratio implied an electron
temperature of only 10 600 K. An explanation considered by them
for this behaviour was that the knots might have cool (,1000 K),
but still highly ionized, cores due to high CNO coolant
abundances relative to helium. The carbon ORLs would then
originate predominantly from the cool cores, while the UV
collisional lines would originate from the hotter surrounding
regions of the knots, so that CEL to ORL temperatures for carbon
would be meaningless. We have already noted in Section 2.1.3
that the central star of NGC 6153 shows the same H-deficient O vi
and C iv emission line characteristics as the central stars of A 30
and A 78, so it may not be implausible that similar H-deficient
knots of material have been ejected into NGC 6153 in the past.
The central peaking of the ORL oxygen and carbon abundances
(Fig. 18) and of the ORL to CEL abundance ratio (Figs 17 and 18)
could be consistent with a relatively recent ejection of H-deficient
knots into NGC 6153. Because of the much higher surface
brightness of its main nebula compared to those of A 30 and A 78,
such knots could be difficult to discern ± a high spectral resolution
search for components with different kinematics from the main
nebula might offer one means for their detection.
Another relevant object is A 58, whose central star V605 Aql
experienced a nova-like event in 1919 and now exhibits broad
WR-like C iv l5801,12 emission, indicative of hydrogen
deficiency (Seitter 1987; Guerrero & Manchado 1996). A high-
velocity knot at the centre of the A 58 nebula exhibits extreme H-
deficiency (Pollacco et al. 1992; Guerrero & Manchado 1996).
The latter found it to exhibit extremely strong [O i] ll6300, 6363
and [O ii] ll7320, 7330 emission lines. We take this as evidence
that the A 58 knot has a relatively high-density core that has not
yet been fully ionized since its ejection in 1919. The deduced
dynamical ages of the H-deficient knots in A 30 and A 78 are, on
the other hand, significantly longer (,103 yr; e.g. Meaburn et al.
1998b), consistent with having been ionized to a greater degree.
Model IH2 produces a somewhat better match to the
observations of NGC 6153 than does model IH3. However,
IH2's H-deficient regions occupy 30 per cent of the volume of the
nebula and contribute 82 per cent of all the heavy elements in
the nebula (Table 21), which both seem implausibly high. Its
H-deficient inclusions have an 8 times lower Ne and a 20 times
lower Te than the surrounding `normal' material. This factor of
160 overpressure would soon lead to the compression and collapse
of the inclusions, if they were already fully ionized. If instead they
corresponded to evaporating regions around dense neutral cores,
then compression might be prevented ± pressure equilibrium
would require a neutral density of 105 cm23 for a temperature of
500 K, and a correspondingly higher density if the core
temperatures were lower. It is noteworthy that Reay & Atherton
(1985) concluded from an analysis of Fabry±Perot [O i] imaging
observations of NGC 7009 that it must contain cool (,45 K),
dense (,4 � 106 cm23� neutral condensations ± NGC 7009 was
found by LSBC to also show a large discrepancy between its ORL
and CEL heavy-element abundances. Similar densities and
temperatures have been inferred for the cometary globules in the
Helix nebula (NGC 7293), for which core densities of 105±
106 cm23 and core temperatures of 10±50 K have been estimated
(Dyson et al. 1989; Meaburn et al. 1992, 1998a; Huggins et al.
1992; O'Dell & Handron 1996). The density estimates for the
Helix were based on the assumption of standard hydrogen to dust
and hydrogen to CO ratios, and would be reduced if the globules
were instead assumed to be H-deficient. However, the fact that the
mid-infrared ISO spectrum of NGC 7293 is dominated by H2
emission lines (Cox et al. 1998) indicates that the neutral globules
are unlikely to be H-deficient. The fact that the [O i] 6300-AÊ line
is very weak in the optical spectrum of NGC 6153 (Table 2), while
the [O i] 63- and 146-mm lines are not detected in our ISO LWS
spectrum, means that there is no direct observational evidence for
the presence of dense neutral knots. On the other hand, although
no [O i] 6300-AÊ emission has been detected in any of the spectra
of A 30's H-deficient knots, Borkowski, Harrington & Tsvetanov
(1995) suggested that several of its knots may contain dense
neutral cores.
Model IH3 for NGC 6153 (Table 21) contains dense, fully-
ionized, H-deficient inclusions, occupying only 3:4 � 1028 of the
nebular volume and contributing only 0.3 per cent of the heavy
elements in the nebula, much more plausible fractions than in the
case of model IH2. Since such knots would have a pressure that
was a factor of ,1000 larger than that of the surrounding
`normal' material, they should dissipate on a sound-crossing time-
scale (unless confined, e.g., by stellar-wind ram pressure). For a
distance of 2.1 kpc (Kingsburgh & English 1992) this time-scale
would be 1400u yr, for a knot of angular radius u arcsec. If one
assumes that such (undiscovered) high-density knots must be less
than 0.2 arcsec in radius, very short lifetimes are implied for them.
Again, the presence of dense neutral cores within the knots,
providing a reservoir of material, would help to alleviate this
problem. The very small filling factor and low total mass of the
H-deficient inclusions of model IH3 would make it easier for them
to escape direct detection than in the case of model IH2.
Model IH3 thus appears much more physically plausible than
model IH2 on several grounds. Model IH3 is unable, however, to
account for the low observed hydrogen Balmer jump temperature
of NGC 6153, relative to its observed optical forbidden line
temperatures, since IH3's cool clumps are too hydrogen-deficient.
Perhaps an intermediate-temperature interface between such
clumps and the rest of the nebula might exist, into which
hydrogen has been mixed, but it is not obvious that the total
q 2000 RAS, MNRAS 312, 585±628
Dow
nloaded from https://academ
ic.oup.com/m
nras/article/312/3/585/1023114 by guest on 18 March 2022
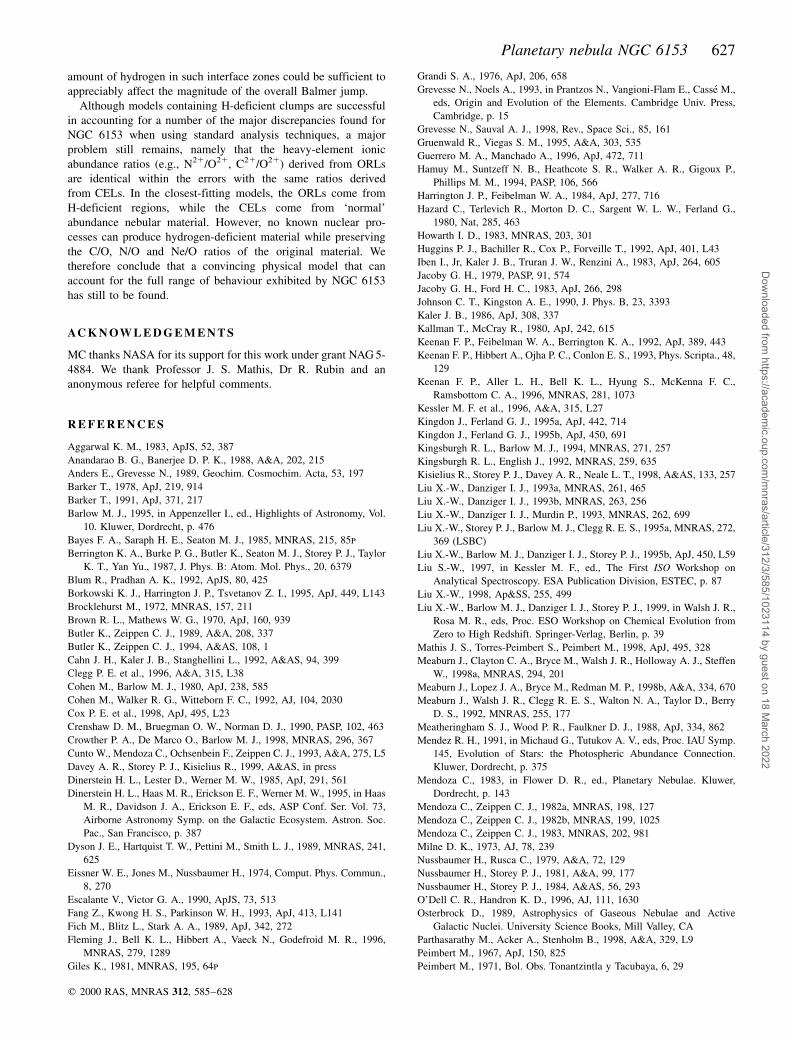
Planetary nebula NGC 6153 627
amount of hydrogen in such interface zones could be sufficient to
appreciably affect the magnitude of the overall Balmer jump.
Although models containing H-deficient clumps are successful
in accounting for a number of the major discrepancies found for
NGC 6153 when using standard analysis techniques, a major
problem still remains, namely that the heavy-element ionic
abundance ratios (e.g., N21/O21, C21/O21) derived from ORLs
are identical within the errors with the same ratios derived
from CELs. In the closest-fitting models, the ORLs come from
H-deficient regions, while the CELs come from `normal'
abundance nebular material. However, no known nuclear pro-
cesses can produce hydrogen-deficient material while preserving
the C/O, N/O and Ne/O ratios of the original material. We
therefore conclude that a convincing physical model that can
account for the full range of behaviour exhibited by NGC 6153
has still to be found.
AC K N OW L E D G E M E N T S
MC thanks NASA for its support for this work under grant NAG 5-
4884. We thank Professor J. S. Mathis, Dr R. Rubin and an
anonymous referee for helpful comments.
R E F E R E N C E S
Aggarwal K. M., 1983, ApJS, 52, 387
Anandarao B. G., Banerjee D. P. K., 1988, A&A, 202, 215
Anders E., Grevesse N., 1989, Geochim. Cosmochim. Acta, 53, 197
Barker T., 1978, ApJ, 219, 914
Barker T., 1991, ApJ, 371, 217
Barlow M. J., 1995, in Appenzeller I., ed., Highlights of Astronomy, Vol.
10. Kluwer, Dordrecht, p. 476
Bayes F. A., Saraph H. E., Seaton M. J., 1985, MNRAS, 215, 85p
Berrington K. A., Burke P. G., Butler K., Seaton M. J., Storey P. J., Taylor
K. T., Yan Yu., 1987, J. Phys. B: Atom. Mol. Phys., 20, 6379
Blum R., Pradhan A. K., 1992, ApJS, 80, 425
Borkowski K. J., Harrington J. P., Tsvetanov Z. I., 1995, ApJ, 449, L143
Brocklehurst M., 1972, MNRAS, 157, 211
Brown R. L., Mathews W. G., 1970, ApJ, 160, 939
Butler K., Zeippen C. J., 1989, A&A, 208, 337
Butler K., Zeippen C. J., 1994, A&AS, 108, 1
Cahn J. H., Kaler J. B., Stanghellini L., 1992, A&AS, 94, 399
Clegg P. E. et al., 1996, A&A, 315, L38
Cohen M., Barlow M. J., 1980, ApJ, 238, 585
Cohen M., Walker R. G., Witteborn F. C., 1992, AJ, 104, 2030
Cox P. E. et al., 1998, ApJ, 495, L23
Crenshaw D. M., Bruegman O. W., Norman D. J., 1990, PASP, 102, 463
Crowther P. A., De Marco O., Barlow M. J., 1998, MNRAS, 296, 367
Cunto W., Mendoza C., Ochsenbein F., Zeippen C. J., 1993, A&A, 275, L5
Davey A. R., Storey P. J., Kisielius R., 1999, A&AS, in press
Dinerstein H. L., Lester D., Werner M. W., 1985, ApJ, 291, 561
Dinerstein H. L., Haas M. R., Erickson E. F., Werner M. W., 1995, in Haas
M. R., Davidson J. A., Erickson E. F., eds, ASP Conf. Ser. Vol. 73,
Airborne Astronomy Symp. on the Galactic Ecosystem. Astron. Soc.
Pac., San Francisco, p. 387
Dyson J. E., Hartquist T. W., Pettini M., Smith L. J., 1989, MNRAS, 241,
625
Eissner W. E., Jones M., Nussbaumer H., 1974, Comput. Phys. Commun.,
8, 270
Escalante V., Victor G. A., 1990, ApJS, 73, 513
Fang Z., Kwong H. S., Parkinson W. H., 1993, ApJ, 413, L141
Fich M., Blitz L., Stark A. A., 1989, ApJ, 342, 272
Fleming J., Bell K. L., Hibbert A., Vaeck N., Godefroid M. R., 1996,
MNRAS, 279, 1289
Giles K., 1981, MNRAS, 195, 64p
Grandi S. A., 1976, ApJ, 206, 658
Grevesse N., Noels A., 1993, in Prantzos N., Vangioni-Flam E., Casse M.,
eds, Origin and Evolution of the Elements. Cambridge Univ. Press,
Cambridge, p. 15
Grevesse N., Sauval A. J., 1998, Rev., Space Sci., 85, 161
Gruenwald R., Viegas S. M., 1995, A&A, 303, 535
Guerrero M. A., Manchado A., 1996, ApJ, 472, 711
Hamuy M., Suntzeff N. B., Heathcote S. R., Walker A. R., Gigoux P.,
Phillips M. M., 1994, PASP, 106, 566
Harrington J. P., Feibelman W. A., 1984, ApJ, 277, 716
Hazard C., Terlevich R., Morton D. C., Sargent W. L. W., Ferland G.,
1980, Nat, 285, 463
Howarth I. D., 1983, MNRAS, 203, 301
Huggins P. J., Bachiller R., Cox P., Forveille T., 1992, ApJ, 401, L43
Iben I., Jr, Kaler J. B., Truran J. W., Renzini A., 1983, ApJ, 264, 605
Jacoby G. H., 1979, PASP, 91, 574
Jacoby G. H., Ford H. C., 1983, ApJ, 266, 298
Johnson C. T., Kingston A. E., 1990, J. Phys. B, 23, 3393
Kaler J. B., 1986, ApJ, 308, 337
Kallman T., McCray R., 1980, ApJ, 242, 615
Keenan F. P., Feibelman W. A., Berrington K. A., 1992, ApJ, 389, 443
Keenan F. P., Hibbert A., Ojha P. C., Conlon E. S., 1993, Phys. Scripta., 48,
129
Keenan F. P., Aller L. H., Bell K. L., Hyung S., McKenna F. C.,
Ramsbottom C. A., 1996, MNRAS, 281, 1073
Kessler M. F. et al., 1996, A&A, 315, L27
Kingdon J., Ferland G. J., 1995a, ApJ, 442, 714
Kingdon J., Ferland G. J., 1995b, ApJ, 450, 691
Kingsburgh R. L., Barlow M. J., 1994, MNRAS, 271, 257
Kingsburgh R. L., English J., 1992, MNRAS, 259, 635
Kisielius R., Storey P. J., Davey A. R., Neale L. T., 1998, A&AS, 133, 257
Liu X.-W., Danziger I. J., 1993a, MNRAS, 261, 465
Liu X.-W., Danziger I. J., 1993b, MNRAS, 263, 256
Liu X.-W., Danziger I. J., Murdin P., 1993, MNRAS, 262, 699
Liu X.-W., Storey P. J., Barlow M. J., Clegg R. E. S., 1995a, MNRAS, 272,
369 (LSBC)
Liu X.-W., Barlow M. J., Danziger I. J., Storey P. J., 1995b, ApJ, 450, L59
Liu S.-W., 1997, in Kessler M. F., ed., The First ISO Workshop on
Analytical Spectroscopy. ESA Publication Division, ESTEC, p. 87
Liu X.-W., 1998, Ap&SS, 255, 499
Liu X.-W., Barlow M. J., Danziger I. J., Storey P. J., 1999, in Walsh J. R.,
Rosa M. R., eds, Proc. ESO Workshop on Chemical Evolution from
Zero to High Redshift. Springer-Verlag, Berlin, p. 39
Mathis J. S., Torres-Peimbert S., Peimbert M., 1998, ApJ, 495, 328
Meaburn J., Clayton C. A., Bryce M., Walsh J. R., Holloway A. J., Steffen
W., 1998a, MNRAS, 294, 201
Meaburn J., Lopez J. A., Bryce M., Redman M. P., 1998b, A&A, 334, 670
Meaburn J., Walsh J. R., Clegg R. E. S., Walton N. A., Taylor D., Berry
D. S., 1992, MNRAS, 255, 177
Meatheringham S. J., Wood P. R., Faulkner D. J., 1988, ApJ, 334, 862
Mendez R. H., 1991, in Michaud G., Tutukov A. V., eds, Proc. IAU Symp.
145, Evolution of Stars: the Photospheric Abundance Connection.
Kluwer, Dordrecht, p. 375
Mendoza C., 1983, in Flower D. R., ed., Planetary Nebulae. Kluwer,
Dordrecht, p. 143
Mendoza C., Zeippen C. J., 1982a, MNRAS, 198, 127
Mendoza C., Zeippen C. J., 1982b, MNRAS, 199, 1025
Mendoza C., Zeippen C. J., 1983, MNRAS, 202, 981
Milne D. K., 1973, AJ, 78, 239
Nussbaumer H., Rusca C., 1979, A&A, 72, 129
Nussbaumer H., Storey P. J., 1981, A&A, 99, 177
Nussbaumer H., Storey P. J., 1984, A&AS, 56, 293
O'Dell C. R., Handron K. D., 1996, AJ, 111, 1630
Osterbrock D., 1989, Astrophysics of Gaseous Nebulae and Active
Galactic Nuclei. University Science Books, Mill Valley, CA
Parthasarathy M., Acker A., Stenholm B., 1998, A&A, 329, L9
Peimbert M., 1967, ApJ, 150, 825
Peimbert M., 1971, Bol. Obs. Tonantzintla y Tacubaya, 6, 29
q 2000 RAS, MNRAS 312, 585±628
Dow
nloaded from https://academ
ic.oup.com/m
nras/article/312/3/585/1023114 by guest on 18 March 2022
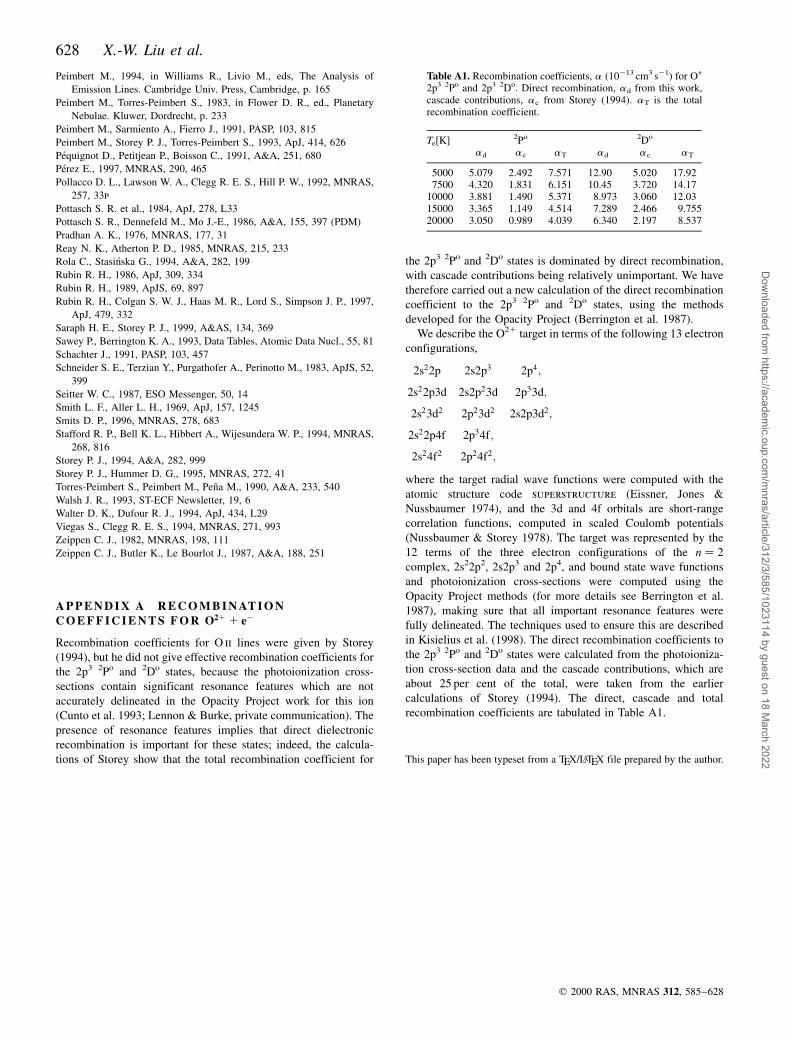
628 X.-W. Liu et al.
Peimbert M., 1994, in Williams R., Livio M., eds, The Analysis of
Emission Lines. Cambridge Univ. Press, Cambridge, p. 165
Peimbert M., Torres-Peimbert S., 1983, in Flower D. R., ed., Planetary
Nebulae. Kluwer, Dordrecht, p. 233
Peimbert M., Sarmiento A., Fierro J., 1991, PASP, 103, 815
Peimbert M., Storey P. J., Torres-Peimbert S., 1993, ApJ, 414, 626
PeÂquignot D., Petitjean P., Boisson C., 1991, A&A, 251, 680
PeÂrez E., 1997, MNRAS, 290, 465
Pollacco D. L., Lawson W. A., Clegg R. E. S., Hill P. W., 1992, MNRAS,
257, 33p
Pottasch S. R. et al., 1984, ApJ, 278, L33
Pottasch S. R., Dennefeld M., Mo J.-E., 1986, A&A, 155, 397 (PDM)
Pradhan A. K., 1976, MNRAS, 177, 31
Reay N. K., Atherton P. D., 1985, MNRAS, 215, 233
Rola C., StasinÂska G., 1994, A&A, 282, 199
Rubin R. H., 1986, ApJ, 309, 334
Rubin R. H., 1989, ApJS, 69, 897
Rubin R. H., Colgan S. W. J., Haas M. R., Lord S., Simpson J. P., 1997,
ApJ, 479, 332
Saraph H. E., Storey P. J., 1999, A&AS, 134, 369
Sawey P., Berrington K. A., 1993, Data Tables, Atomic Data Nucl., 55, 81
Schachter J., 1991, PASP, 103, 457
Schneider S. E., Terzian Y., Purgathofer A., Perinotto M., 1983, ApJS, 52,
399
Seitter W. C., 1987, ESO Messenger, 50, 14
Smith L. F., Aller L. H., 1969, ApJ, 157, 1245
Smits D. P., 1996, MNRAS, 278, 683
Stafford R. P., Bell K. L., Hibbert A., Wijesundera W. P., 1994, MNRAS,
268, 816
Storey P. J., 1994, A&A, 282, 999
Storey P. J., Hummer D. G., 1995, MNRAS, 272, 41
Torres-Peimbert S., Peimbert M., PenÄa M., 1990, A&A, 233, 540
Walsh J. R., 1993, ST-ECF Newsletter, 19, 6
Walter D. K., Dufour R. J., 1994, ApJ, 434, L29
Viegas S., Clegg R. E. S., 1994, MNRAS, 271, 993
Zeippen C. J., 1982, MNRAS, 198, 111
Zeippen C. J., Butler K., Le Bourlot J., 1987, A&A, 188, 251
A P P E N D I X A R E C O M B I N AT I O N
C O E F F I C I E N T S F O R O21 1 e2
Recombination coefficients for O ii lines were given by Storey
(1994), but he did not give effective recombination coefficients for
the 2p3 2Po and 2Do states, because the photoionization cross-
sections contain significant resonance features which are not
accurately delineated in the Opacity Project work for this ion
(Cunto et al. 1993; Lennon & Burke, private communication). The
presence of resonance features implies that direct dielectronic
recombination is important for these states; indeed, the calcula-
tions of Storey show that the total recombination coefficient for
the 2p3 2Po and 2Do states is dominated by direct recombination,
with cascade contributions being relatively unimportant. We have
therefore carried out a new calculation of the direct recombination
coefficient to the 2p3 2Po and 2Do states, using the methods
developed for the Opacity Project (Berrington et al. 1987).
We describe the O21 target in terms of the following 13 electron
configurations,
2s22p 2s2p3 2p4;
2s22p3d 2s2p23d 2p33d;
2s23d2 2p23d2 2s2p3d2;
2s22p4f 2p34f;
2s24f2 2p24f2;
where the target radial wave functions were computed with the
atomic structure code superstructure (Eissner, Jones &
Nussbaumer 1974), and the 3d and 4f orbitals are short-range
correlation functions, computed in scaled Coulomb potentials
(Nussbaumer & Storey 1978). The target was represented by the
12 terms of the three electron configurations of the n � 2
complex, 2s22p2, 2s2p3 and 2p4, and bound state wave functions
and photoionization cross-sections were computed using the
Opacity Project methods (for more details see Berrington et al.
1987), making sure that all important resonance features were
fully delineated. The techniques used to ensure this are described
in Kisielius et al. (1998). The direct recombination coefficients to
the 2p3 2Po and 2Do states were calculated from the photoioniza-
tion cross-section data and the cascade contributions, which are
about 25 per cent of the total, were taken from the earlier
calculations of Storey (1994). The direct, cascade and total
recombination coefficients are tabulated in Table A1.
This paper has been typeset from a TEX/LATEX file prepared by the author.
q 2000 RAS, MNRAS 312, 585±628
Table A1. Recombination coefficients, a (10213 cm3 s21) for O+
2p3 2Po and 2p3 2Do. Direct recombination, ad from this work,cascade contributions, ac from Storey (1994). aT is the totalrecombination coefficient.
Te[K] 2Po 2Do
ad ac aT ad ac aT
5000 5.079 2.492 7.571 12.90 5.020 17.927500 4.320 1.831 6.151 10.45 3.720 14.17
10000 3.881 1.490 5.371 8.973 3.060 12.0315000 3.365 1.149 4.514 7.289 2.466 9.75520000 3.050 0.989 4.039 6.340 2.197 8.537
Dow
nloaded from https://academ
ic.oup.com/m
nras/article/312/3/585/1023114 by guest on 18 March 2022
Related Documents