THE CONTINUING CONCERN WITH TB TUBERCULOSIS (ICD-9 01 0-018) L atest data on tuberculosis (Myrobacterium tuberculosis, "TB") notifications for 1989 and 1990 show that TB continues to be a prob'em in NSW and maybe increasing. The rate of new cases of tuberculosis in NSW in 1989 was 4.89/100,000, and 5.80/100,000 in 1990. The number of total mycobacteria notifications (including atypical mycobacteria) in 1990 was the highest for at least eight years (see Figure 3). The number of annual new TB cases over this period has not been determined; mainframe records containing these data will be analysed at a later stage. There were 17 deaths from tuberculosis in 1989 (annual rate of 0.30/100,000 population) and 20 deaths in 1990 (annual rate of 0.35/100,000). There were 14 reactivations of M tuberculosis in 1989 (4.5 per cent of notifications) and six reactivations in 1990 (1.7 per cent of notifications). In addition, there was one case reactivated atypical mycobacteria in each of the two years that we report. There were 59 cases denotifiec in both 1989 and 1990. This reflects the situation that tuberculosis notifactions are made provisionally, with microbiological confirmation coming up to two months later. Total notifications reflect the workload of the tuberculosis service with regard to contact tracing. Case definitions used in this report are: New TB: •A patient who has a diagnosis of TB with culture confirmation of Mycobacterium tuberculosis, or • A patient diagnosed as having active TB on clinical and/or radiological grounds, in the absence of bacteriological evidence, and who is receiving a course of anti-tuberculous chemotherapy. TB reactivation: • A patient diagnosed again as having active TB who has previously been notified in NSW and had received a recognised course of anti- tuberculous chemotherapy. (Patients with a history of TB and/or treatment prior to coming to NSW are classified as new cases.) "Atypical" mycobacterial infection: • A patient with a clinically apparent infection caused by bacteriologically confirmed "atypical" mycobacteria, or • A patient from whom bacteriologically confirmed "atypical" mycobacteria are recovered from sites which are normally sterile, or • A patient from whom the same "atypical" mycobacterium has been isolated in moderate amounts from the same site. The figures relate to new cases unless otherwise stated. Table 3 presents more details on the 1989 and 1990 TB data. The table shows that new TB cases made up fewer than 60 per cent of all mycobacteria notifications during these years. More than three-quarters of new TB cases were pulmonary in site. Total new TB cases rose 20 per cent from 1989 to 1990, although this may be within normal year-to-year variability. - Y.. :] I * MYCOBACTERIA NOTIFICATIONS, NSW, 1989 AND 1990 1989 1990 No. % No. % Total mycobacteria notifications 515 100 584 100 Cases denotified 59 11.5 59 10.1 New TB cases total 310 60.2 346 59.2 New TB cates pulmonary 241 (77.7) 263 (76.0) NewTBcase5-extrapulmonar 69 (22.3) 83 (23.9) Atypical mycobacteria 14.6 26.3 179 30.7 Figure 4 shows new reported cases of tuberculosis for 1990 by age and sex. There is a male preponderance of cases (199 of 338 - 59 per cent). The highest incidence occurred in the 20-39 years and 60 years and over age groups The 1989 data also demonstrate a male preponderance and peak incidences in these age groups. This is consistent with previous age distribution patterns for tuberculosis in NSW Rates for new cases by Area/Region in 1990 are shown in Figure 5. Note that the data for Wentworth and Western Sydney Areas have been combined to produce a single rate. The Areas predominate, particularly those of the Sydney metropolitan region, with the highest rate in the Central Sydney Area. This distribution may be explained by greater population densities and high numbers of overseas-born residents in these areas. It is of note that Central Sydney has an incidence of TB more than twice that of the overall NSW rate, and that all Sydney metropolitan Areas except Northern Sydney have incidence rates above the State average. However these rates have not been adjusted for age or sex. Table 4 provides a breakdown by region of birthl Aboriginality. Of note is the very low rate among Australian Aborigines, and a high rate among Asian- born immigrants, reflecting the endemicity of TB in that region. Y1 :31 NEW TB CASES BY BIRTHPLACE AND ABORIGINALITY. NSW, 1989 AND 1990 1989 1990 No. ^ No. ^ Australia (caucasian) 83 26.8 90 26.0 Australia (Aboriginal) 4 1.3 3 0.9 Asia 135 43.5 158 45.7 Europe 34 11.0 38 11.0 Oceania 11 3.5 16 4.6 Others 43 13.9 41 11.8 In 1990 there was no clear temporal or seasonal occurrence of new TB cases (Figure 6). Reports may be low in December due to low patient attendance or reporting activity in that month. Overall, the data show that TB continues to be a problem in NSW, and may be increasing. Considerable variation exists in TB rates across Areas/Regions of the State, with the highest rates occurring in the Central, Eastern and Southern Sydney Areas. Prevention of tuberculosis will continue to depend on early detection (including investigation of contacts and, where appropriate, screening of high-risk groups), effective treatment and adequate follow-up of both treated and suspected cases. VoI.2lNo.1O 103

Welcome message from author
This document is posted to help you gain knowledge. Please leave a comment to let me know what you think about it! Share it to your friends and learn new things together.
Transcript

THE CONTINUING CONCERN WITH TBTUBERCULOSIS (ICD-9 01 0-018)
L atest data on tuberculosis (Myrobacteriumtuberculosis, "TB") notifications for 1989 and 1990
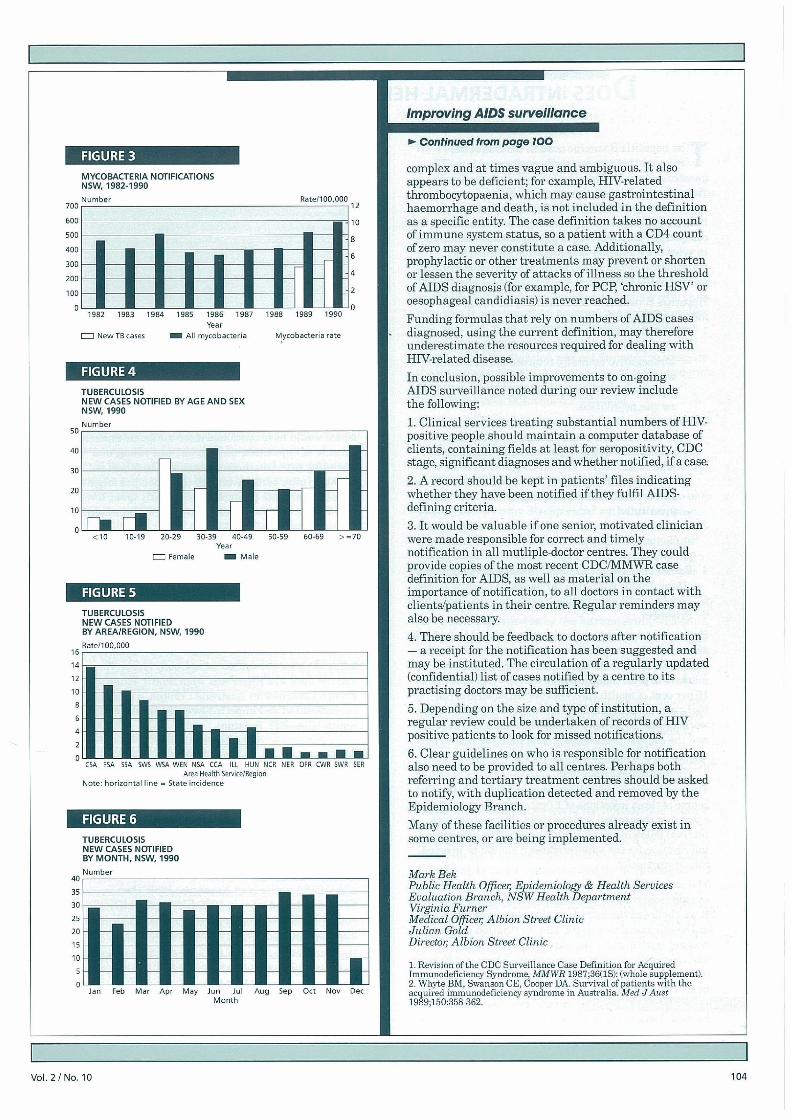
show that TB continues to be a prob'em in NSW andmaybe increasing. The rate of new cases of tuberculosisin NSW in 1989 was 4.89/100,000, and 5.80/100,000 in1990. The number of total mycobacteria notifications(including atypical mycobacteria) in 1990 was thehighest for at least eight years (see Figure 3). Thenumber of annual new TB cases over this period has notbeen determined; mainframe records containing thesedata will be analysed at a later stage.
There were 17 deaths from tuberculosis in 1989 (annualrate of 0.30/100,000 population) and 20 deaths in 1990(annual rate of 0.35/100,000).
There were 14 reactivations of M tuberculosis in 1989(4.5 per cent of notifications) and six reactivations in1990 (1.7 per cent of notifications). In addition, there wasone case reactivated atypical mycobacteria in each of thetwo years that we report.
There were 59 cases denotifiec in both 1989 and 1990.This reflects the situation that tuberculosis notifactionsare made provisionally, with microbiologicalconfirmation coming up to two months later. Totalnotifications reflect the workload of the tuberculosisservice with regard to contact tracing.
Case definitions used in this report are:
New TB:•A patient who has a diagnosis of TB with culture
confirmation of Mycobacterium tuberculosis, or• A patient diagnosed as having active TB on
clinical and/or radiological grounds, in theabsence of bacteriological evidence, and whois receiving a course of anti-tuberculouschemotherapy.
TB reactivation:• A patient diagnosed again as having active TB
who has previously been notified in NSW andhad received a recognised course of anti-tuberculous chemotherapy. (Patients with ahistory of TB and/or treatment prior to comingto NSW are classified as new cases.)
"Atypical" mycobacterial infection:• A patient with a clinically apparent infection
caused by bacteriologically confirmed "atypical"mycobacteria, or
• A patient from whom bacteriologicallyconfirmed "atypical" mycobacteria are recoveredfrom sites which are normally sterile, or
• A patient from whom the same "atypical"mycobacterium has been isolated in moderateamounts from the same site.
The figures relate to new cases unless otherwise stated.Table 3 presents more details on the 1989 and 1990 TBdata. The table shows that new TB cases made up fewerthan 60 per cent of all mycobacteria notifications duringthese years. More than three-quarters of new TB caseswere pulmonary in site. Total new TB cases rose 20 percent from 1989 to 1990, although this may be withinnormal year-to-year variability.
- Y.. :] I*
MYCOBACTERIA NOTIFICATIONS,NSW, 1989 AND 1990
1989 1990
No. % No. %
Total mycobacteria notifications 515 100 584 100Cases denotified 59 11.5 59 10.1New TB cases total 310 60.2 346 59.2
New TB cates pulmonary 241 (77.7) 263 (76.0)NewTBcase5-extrapulmonar 69 (22.3) 83 (23.9)
Atypical mycobacteria 14.6 26.3 179 30.7
Figure 4 shows new reported cases of tuberculosis for1990 by age and sex. There is a male preponderance ofcases (199 of 338 - 59 per cent). The highest incidenceoccurred in the 20-39 years and 60 years and over agegroups The 1989 data also demonstrate a malepreponderance and peak incidences in these age groups.This is consistent with previous age distributionpatterns for tuberculosis in NSWRates for new cases by Area/Region in 1990 are shown inFigure 5. Note that the data for Wentworth and WesternSydney Areas have been combined to produce a singlerate. The Areas predominate, particularly those of theSydney metropolitan region, with the highest rate inthe Central Sydney Area. This distribution may beexplained by greater population densities and highnumbers of overseas-born residents in these areas. It isof note that Central Sydney has an incidence of TB morethan twice that of the overall NSW rate, and that allSydney metropolitan Areas except Northern Sydneyhave incidence rates above the State average. Howeverthese rates have not been adjusted for age or sex.Table 4 provides a breakdown by region of birthlAboriginality. Of note is the very low rate amongAustralian Aborigines, and a high rate among Asian-born immigrants, reflecting the endemicity of TB in thatregion.
Y1 :31
NEW TB CASES BYBIRTHPLACE AND ABORIGINALITY.NSW, 1989 AND 1990
1989 1990
No. ^ No. ^
Australia (caucasian) 83 26.8 90 26.0
Australia (Aboriginal) 4 1.3 3 0.9
Asia 135 43.5 158 45.7Europe 34 11.0 38 11.0Oceania 11 3.5 16 4.6Others 43 13.9 41 11.8
In 1990 there was no clear temporal or seasonaloccurrence of new TB cases (Figure 6). Reports maybe low in December due to low patient attendanceor reporting activity in that month.Overall, the data show that TB continues to be aproblem in NSW, and may be increasing. Considerablevariation exists in TB rates across Areas/Regions of theState, with the highest rates occurring in the Central,Eastern and Southern Sydney Areas.Prevention of tuberculosis will continue to depend onearly detection (including investigation of contacts and,where appropriate, screening of high-risk groups),effective treatment and adequate follow-up of bothtreated and suspected cases.
VoI.2lNo.1O 103
Improving AIDS surveillance
- Continued from page 100
MYCOBACTERIA NOTIFICATIONSNSW, 1982-1990Number
700
600
500
400
300
200
100
FlatellOO000 -
982 1983 1984 1985 1985 1987 988 1989 1990
Year
New TB cases All rnycobacteria Mycobacteria rate
TUBERCULOSISNEW CASES NOTIFIED BY AGE AND SEXNSW, 1990Number
50
10
8
6
4
2
0
40
30
23
10
<10 10-19 20-29 30-39 40-49 50-59 60-69 0=70Year
Fmal Male
CtA EtA SIA EWE WSA WEt NSA CCA ILL HUN NCR NEt OFE CWR SWR SEPArea Health Serve1Reyion
Note: horizontal line = State incidence
14
12
10
B
6
4
2n
TUBERCULOSLSNEW CASES NOTIFIEDBY AREA/REGION, NSW. 1990
HvteIlOO 000
Jan Feb Mar Apr May Jun Jo] AUg Sep Ott Nov DecMonth
35
30
25
20
15
10
I)
TUBERCULOSISNEW CASES NOTIFIEDBY MONTH, NSW, 1990
Number
complex and at times vague and ambiguous. It alsoappears to be deficient; for example, FIIV-relatedthrombocytopaenia, which may cause gastrointestinalhaemorrhage and death, is not included in the definitionas a specific entity. The case definition takes no accountof immune system status, so a patient with a CD4 countof zero may never constitute a case. Additionally,prophylactic or other treatments may prevent or shortenor lessen the severity of attacks of illness so the thresholdof AIDS diagnosis (for example, for PCP, 'chronic HSV' oroesophageal candidiasis) is never reached.
Funding formulas that rely on numbers of AIDS casesdiagnosed, using the current definition, may thereforeunderestimate the resources required for dealing withHIV-related disease.
In conclusion, possible improvements to on-goingAIDS surveillance noted during our review includethe following:
1. Clinical services treating substantial numbers of HIV-positive people should maintain a computer database ofclients, containing fields at least for seropositivity, CDCstage, significant diagnoses and whether notified, if a case.
2. A record should be kept in patients' files indicatingwhether they have been notified if they fulfil AIDS-defining criteria.
3. It would be valuable if one senio1 motivated clinicianwere made responsible for correct and timelynotification in all mutliple-doctor centres. They couldprovide copies of the most recent CDC(MMWB casedefinition for AIDS, as well as material on theimportance of notification, to all doctors in contact withclients/patients in their centre. Regular reminders mayalso be necessary.
4. There should be feedback to doctors after notification- a receipt for the notification has been suggested andmay be instituted. The circulation of a regularly updated(confidential) list of cases notified by a centre to itspractising doctors may be sufficient.
5. Depending on the size and type of institution, aregular review could be undertaken of records of HWpositive patients to look for missed notifications.
6. Clear guidelines on who is responsible for notificationalso need to be provided to all centres. Perhaps bothreferring and tertiary treatment centres should be askedto notify, with duplication detected and removed by theEpidemiology Branch.
Many of these facilities or procedures already exist insome centres, or are being implemented.
Mark BekPublic Health Office,; Epidemiology & Health ServicesEvaluation Branch, NSW Health DepartmentVirginia FurnerMedical Qfficer Aibion Street ClinicJulian GoldDirecto,; Aibion Street Clinic
5. Revision of the CDC Surveillance Case Definition for AcquiredIinmunodeficiency Syndrome, MMWR 1987 36/iS): (whole supplement).2. Whyte BM, Swanson CE, Cooper DA. Survival of patients wlth theacquired immunedeliciency syndrome in Australia. Med JAvst1989;liiO:358-362.
I IVoI.2/No.1O 104
Related Documents