Technological University Dublin Technological University Dublin ARROW@TU Dublin ARROW@TU Dublin Articles Directorate of Research and Enterprise 2017 The Compartmented Alginate Fibres Optimisation for Bitumen The Compartmented Alginate Fibres Optimisation for Bitumen Rejuvenator Encapsulation Rejuvenator Encapsulation Amir Tabakovic Technological University Dublin, [email protected] Dirk Braak Delft University of Technology Mark van Gerwen Delft University of Technology See next page for additional authors Follow this and additional works at: https://arrow.tudublin.ie/resdirart Part of the Construction Engineering and Management Commons Recommended Citation Recommended Citation Tabaković, A.; McNally, C.; Fallon, E., 2016, “Specification development for cold in-situ recycling of asphalt”, Journal of Construction and Building Materials, Vol.102, 1, pp.318 – 328. doi.org/10.1016/ j.conbuildmat.2015.10.154 This Article is brought to you for free and open access by the Directorate of Research and Enterprise at ARROW@TU Dublin. It has been accepted for inclusion in Articles by an authorized administrator of ARROW@TU Dublin. For more information, please contact [email protected], [email protected]. This work is licensed under a Creative Commons Attribution-Noncommercial-Share Alike 4.0 License

Welcome message from author
This document is posted to help you gain knowledge. Please leave a comment to let me know what you think about it! Share it to your friends and learn new things together.
Transcript

Technological University Dublin Technological University Dublin
ARROW@TU Dublin ARROW@TU Dublin
Articles Directorate of Research and Enterprise
2017
The Compartmented Alginate Fibres Optimisation for Bitumen The Compartmented Alginate Fibres Optimisation for Bitumen
Rejuvenator Encapsulation Rejuvenator Encapsulation
Amir Tabakovic Technological University Dublin, [email protected]
Dirk Braak Delft University of Technology
Mark van Gerwen Delft University of Technology
See next page for additional authors
Follow this and additional works at: https://arrow.tudublin.ie/resdirart
Part of the Construction Engineering and Management Commons
Recommended Citation Recommended Citation Tabaković, A.; McNally, C.; Fallon, E., 2016, “Specification development for cold in-situ recycling of asphalt”, Journal of Construction and Building Materials, Vol.102, 1, pp.318 – 328. doi.org/10.1016/j.conbuildmat.2015.10.154
This Article is brought to you for free and open access by the Directorate of Research and Enterprise at ARROW@TU Dublin. It has been accepted for inclusion in Articles by an authorized administrator of ARROW@TU Dublin. For more information, please contact [email protected], [email protected].
This work is licensed under a Creative Commons Attribution-Noncommercial-Share Alike 4.0 License

Authors Authors Amir Tabakovic, Dirk Braak, Mark van Gerwen, Oguzhan Copuroglu, Wouter Post, Santiago J. Garcia, and Erik Schlangen
This article is available at ARROW@TU Dublin: https://arrow.tudublin.ie/resdirart/2

1
The compartmented alginate fibres optimisation for bitumen rejuvenator 1
encapsulation 2
Abstract 3
This article presents development of a novel self-healing technology for asphalt pavements, 4
where asphalt binder rejuvenator is encapsulated within the compartmented alginate fibres. 5
The key objective of the study was to optimise the compartmented alginate fibre design, i.e. 6
maximise amount of rejuvenator encapsulated within the fibre. The results demonstrate that 7
optimum rejuvenator content in the alginate fibre is of 70:30 rejuvenator/alginate ratio. The 8
fibres are of sufficient thermal and mechanical strength to survive harsh asphalt mixing and 9
compaction processes. Furthermore, results illustrated that Zeer Open Asfalt Beton (ZOAB) 10
asphalt mix containing 5% of 70:30 rejuvenator/alginate ratio compartmented alginate fibres 11
has higher strength, stiffness and better healing properties in comparison to the control asphalt 12
mix, i.e. mix without fibres, and mixtures containing fibres with lower rejuvenator content. 13
These results show that compartmented alginate fibres encapsulating bitumen rejuvenator 14
present a promising new approach for the development of self-healing asphalt pavement 15
systems. 16
17
Key Words: Self-healing, Asphalt pavements, Compartmented fibres, Calcium Alginate, 18
Rejuvenation. 19
Highlights: 20
i. 70:30 rejuvenator/alginate ratio is an optimal fibre design mix. 21
ii. Fibres successfully heals the damage (closes the crack) in asphalt bitumen and mortar 22
mix. 23
iii. ZOAB asphalt mix containing fibres outperforms the control asphalt mix. 24
iv. Higher amount of fibres in the mix (>10%) reduce ZOAB asphalt mix stiffness and 25
strength recovery. 26
1. Introduction 27
The emergence of self-healing technologies [1] for asphalt pavements signified a turning 28
point in the 250 year evolution of the road (see Figure 1). Previously, changes in road design 29
were driven by industrial innovation (e.g. the invention and mass production of the motor 30
car), to facilitate trade or in response to environmental concerns. The drive to incorporate self-31
healing technology into road design stems from the concept of the ‘Forever Open Road’, the 32

2
need to avoid the traffic disruption caused by road maintenance activities on busy roads. The 1
globally road network spans 16.3 million km [2], of which 5million km is in EU, 4.4milion 2
km is in USA and 3.1million km is in China. These road networks fulfil major economic and 3
social goals by facilitating the movement of goods and people across the globe. The 4
operational health of the road network is of the utmost importance for economic and social 5
life of every region of the globe [3]. As a result governments invest heavily in the 6
development of national road networks, e.g. in 2011 EU governments collectively invested 7
€20billion in the development and maintenance of the EU road network [4]. The ongoing 8
importance of roads as a means of transportation, drives the need for improved road materials 9
and road pavement design. 10
11
Figure 1 The development of road materials: past, present and future[5-8]. 12
13
Modern roads are sophisticated engineering creations. Despite this, the materials used to 14
construct them, (bitumen and rock aggregate), haven’t changed in over a century. Figure 2 15
shows the heterogeneous composition of the asphalt pavement mix commonly used today. 16
17

3
1
Figure 2 Composition of an asphalt test sample. 2
3
The mix is comprised of rock aggregate and binding material or ‘mastic’ which is composed 4
of fine aggregates (sand and filler) and bitumen , a crude oil (fossil fuel) by-product. Mastic 5
plays an important role in this system as it binds the rock skeleton in place, thereby preventing 6
its disintegration. Unfortunately, environmental factors (rain, snow and ice) and traffic 7
loading conditions can cause bitumen, the main ingredient of the mastic, to age and lose its 8
flexibility. This enables cracks to form within the road pavement and ultimately results in the 9
failure of the pavement system. To the naked eye this would appear as a pothole which at 10
present would require on-site maintenance and disruption to traffic flow. 11
The challenge for road engineers is to develop a sustainable asphalt mixtures that reduce the 12
likelihood of pavement system failure by developing new road materials and new methods of 13
road construction and maintenance. Progress in the road material science has lagged behind 14
materials, such as concrete and composite materials, likely as a result of the continued 15
availability of low cost materials and due to the functional design of asphalt pavements. 16
Since the 1970s, the focus of the road innovation was to develop more sustainable 17
technologies, for road pavements, e.g. recycled asphalt pavements [9]. Although these 18
innovations served to reuse construction aggregate and old bitumen and reduce the CO2 19
footprint of road construction [10], road material design remained unchanged. Other 20
innovative technologies have had unanticipated side effects, so warm asphalt recycling and 21
cold emulsion recycling technologies involve adding chemical additives to lower the asphalt 22

4
mixing temperature [9]. Although they reduce the amount of CO2 in atmosphere, leaching 1
has occurred, where pollutants leach into the ground, posing a contamination threat to soil and 2
to groundwater. Trombulak and Frissell [11] published a damning report on the ecological 3
effects of road construction on terrestrial and aquatic communities. There is growing pressure 4
on the road industry to minimise its environmental impact. There is also a desire to adopt 5
‘Forever Open Road’ concept, i.e. improve pavement materials and design in order to reduce 6
road maintenance and improve safety levels for road users. Since 2008, the incorporation of 7
self-healing technology into asphalt pavements has been advancing. Self-healing technology 8
offers an alternative method for road maintenance, where the damage is repaired by an 9
internal (implanted) healing system. The objective of self-healing technology is to 10
enable/assist material systems to heal after damage on a local or global scale. It aims to reduce 11
the local or global level of damage and to extend or to renew the functionality and life-time of 12
the damaged part, system or device. Fisher [12] defines the self-healing and self-repair of a 13
material or system as: “the ability to substantially return to an initial, proper operating state 14
or condition prior exposure to a dynamic environment by making the necessary adjustments 15
to restore to normality and/or the ability to resist the formation of irregularities and/or 16
defects”. 17
To date researchers have tested two self-healing methods for asphalt pavements [13-15, 5, 6, 18
16-19]: 19
i) Induction heating, electrically conductive fillers (steel fibres and steel wool) were added 20
to the asphalt mix. Healing is initiated within the asphalt by sending an alternating current 21
through the coil and generating an alternating electromagnetic field. When the conductive 22
asphalt specimen is placed beneath the coil, this electromagnetic field induces currents 23
flowing along the conductive loops formed by steel fibres [13]. The current causes steel fibres 24
to heat up which heats the aged bitumen and softens it, allowing it to flow and close the 25
cracks, and to repair the damage. This method can be repeated if damage returns. 26
ii) Rejuvenation, an encapsulated healing agent (rejuvenator) is added into the asphalt mix to 27
restore the original binder properties. When micro cracks begins to form within the pavement 28
system, they encounter a capsule in the crack propagation path. The fracture energy at the tip 29
of the crack opens the capsule, releasing the healing agent which then diffuses within the 30
asphalt binder to seal the crack. 31
The rejuvenator encapsulation approach represents a more favourable method of self-healing 32
as it allows for the rejuvenation of aged binder, i.e. enables it to return it to its original 33

5
chemical, physical and mechanical properties. Researchers have demonstrated[20, 15-18, 21-1
23] that various types of capsules containing rejuvenator can be produced and that these 2
capsules are sufficiently thermally and mechanically stable to survive the asphalt production 3
process. However, a difficulty with this approach is that large amounts of microcapsules are 4
needed to make the process effective. The addition of large quantities of microcapsules into 5
the asphalt mix can reduce the quality of the pavement which itself may cause premature 6
pavement failure. Garcia et al. [23, 24] and Sun et al. [22] reported that asphalt stiffness was 7
reduced when microcapsules were added. They explained that softening of asphalt binder 8
(viscosity reduction) was caused by the rejuvenator release. However, it is well documented 9
[25, 26] that deformation in the asphalt mix is caused by sand granulates. It is possible that the 10
inclusion of microcapsules, sand like particles, has also contributed to increased asphalt mix 11
deformation, i.e. rutting. Furthermore, the chemical compounds used in the production of 12
microcapsules, such as melamine–formaldehyde [27], in large quantities could pose an 13
environmental threat via leaching. 14
The encapsulation of rejuvenator in alginate-based compartmented fibres is explored here as a 15
solution to these problems in asphalt mixtures. Authors previously reported a concept where 16
compartmented alginate fibres encapsulating rejuvenator was tested as self-healing 17
technology for asphalt pavements [8]. The study showed that alginate fibres have great 18
potential as self-healing technique for asphalt pavements, i.e. they can be inserted into the 19
asphalt mastic mix (fibres can survive asphalt mixing and compaction process) and can 20
increase asphalt mastic mix strength by 36%. However, the study showed that fibres have 21
limited healing capacity. The fibres are effective in healing of micro cracks, however the 22
system is less efficient in healing of large cracks. This is due to the small amount of 23
rejuvenator encapsulated in the fibres and available for the healing process. Therefore this 24
study has focused on the optimisation of the compartmented alginate fibre encapsulating the 25
asphalt binder rejuvenator. The study aimed to increase rejuvenator content in the fibre 26
without compromising its physiological, thermal and mechanical properties. A series of 27
compartmented alginate fibres containing varying rejuvenator content has been produced and 28
tested. A special testing programme was designed where physiological properties of the fibres 29
were investigated. The size and volume of encapsulated rejuvenator in each compartment was 30
determined, and as such amount, volume, of rejuvenator per gram of fibre is calculated. These 31
findings allow determination of the exact amount of rejuvenator available for bitumen damage 32
(crack) healing in the test specimen. The effect of the temperature (both low and high) on the 33
mechanical properties of the fibre is investigated. Furthermore, the ability of the self-healing 34

6
system to release rejuvenator and heal the crack was investigated by imbedding the fibres in 1
microscopic bitumen and mastic test specimens in which artificial cracks were inserted using 2
a surgical knife. The healing process was recorded using the optical microscope technique. 3
Finally, effect of the fibre in an asphalt mix (Zeer Open Asfalt Beton - ZOAB) was studied, 4
for this study standard Indirect Tensile Stiffness Modulus (ITSM) and Indirect Tensile 5
Strength (ITS) tests were implemented. self-healing 6
2. Materials and Methods 7
2.1 Materials and production processes 8
2.1.1 Compartmented Alginate Fibres Production 9
The compartmented fibres were spun from an emulsion of rejuvenator suspended in a water 10
solution of sodium alginate. To this aim a 6 wt.% solution of sodium alginate in de-ionized 11
water was prepared. At the same time a 2.5 wt.% poly(ethylene-alt-maleic-anhydride) 12
(PEMA) polymeric surfactant solution was prepared by dissolving the copolymer in water at 13
70oC and mixing it for 60min. After the PEMA has been dissolved in the water it was allowed 14
to cool to room temperature (20±2oC) and was combined with rejuvenator, forming a healing 15
agent solution, in PEMA/rejuvenator 1/1.5 proportion. Sodium alginate and 16
PEMA/rejuvenator solutions were then combined in six varying rejuvenator/alginate 17
proportions, the proportions are given in the Table 1. All of the solutions were mixed at 18
200rpm for 60 seconds. It is important to note that the stirring rate and stirring time can be 19
used to control the size of the rejuvenator droplets in the solution and thus the size of the 20
rejuvenator compartments [6, 28, 8]. If the stirring rate is low and stirring time is short, the 21
droplets will be larger, but if the stirring rate is high and the stirring time is long, the droplets 22
will be smaller. 23
24
Table 1 Summary of the rejuvenator/alginate ratios 25
Material Ratios (%)
0:100 40:60 50:50 60:40 70:30 80:20
Rejuvenator (g) 0 1.5 2.2 3.1 4.5 6.9
Alginate (g) 2.4 2.5 2.2 2.1 1.9 1.7
26
The emulsions were spun with a plunger-based lab scale wet spinning line in a conventional 27
wet spinning process [28, 29, 8] to form the rejuvenator-filled compartmented fibres. More 28
details on the fibre preparation and spinning process can be found elsewhere [29]. All 29

7
chemicals used in the process were purchased from Sigma Aldrich, The Netherlands, except 1
rejuvenator, Modesel R20, which was provided by Latexfalt B.V.. 2
2.1.2 Porous Asphalt mastic mix design and mixing procedure 3
In an effort to evaluate the efficiency of rejuvenator encapsulated in compartmented aclcium 4
alginate fibres, a ZOAB asphalt mix was designed. The grading envelope according to the 5
Rationalisatie en Automatisering Grond-, Water- en Wegenbouw (RAW) 2015 was used in 6
effort to produce ZOAB asphalt mix typically used as asphalt wearing courses used in the 7
Netherlands [30, 31]. Limestone originates from a quarry in Norway, the filler material is 8
hydrated lime (Wigro 60K) and for bitumen, pen 70/100 was used in this research. Figure 3 9
illustrates the mix grading curve, the figure shows good fit of the mix with in grading 10
envelope. The figure shows slightly higher passing of the fin material than required by the 11
grading limits, however as the aggregate contained high content of dust it was impossible to 12
achieve 100% fit. Further consultations with industrial partners confirmed that the fit is 13
suitable for ZOAB mix production. Table 2 summarises these mix constituents and shows 14
their proportions in the mix with and without fibres. The fibre are added in amount of 5% and 15
10% of total bitumen content in the mix, which in total mix volume it represents 0.23% and 16
0.45% respectively. The aggregate mix constituent content was not changed with insertion of 17
the fibres in the mix. 18
19
Table 2 ZOAB mix design, (percentage constituent content is given by weight). 20
Mix Constituent % content in mix
without fibres 5% fibres 10% fibres
C22.4 20.1 20.1 20.1
C16.0 25.6 25.6 25.6
C11.2 34.8 34.8 34.8
C8.0 7.4 7.4 7.4
C6.0 6.7 6.7 6.7
Sand (2.0) 0.5 0.5 0.5
Filler (<0.063) 0.5 0.5 0.5
Bitumen 4.5 4.3 4.1
Fibre 0 0.23 0.45
21

8
1
Figure 3 Porous asphalt mix grading, grading envelope RAW 2015 [32]. 2
3
The porous asphalt mix was prepared using a 5l Hobart mixer. Prior to mixing, all mix 4
constituents were preheated to 160oC for 2 hours. During the mixing process sand, filler and 5
bitumen were mixed first, fibres were gradually added to the mix in order to avoid 6
conglomeration of fibres within the mix. The fibres were gradually inserted into the mastic 7
mix which resulted prolonged asphalt mixing period causing the mix to cool down and reduce 8
its workability. Therefore, the mix had to be reheated several times at 160oC. The final mixing 9
was performed by hand, in order to ensure that the mix constituents (sand, filler and fibres) 10
were fully and evenly coated by the bitumen. 11
In order to account for the asphalt field ageing effect an ageing programme was developed. 12
The ageing programme consisted of a protocol: 13
• Long term; 15 years filed ageing 4 hours at 135oC followed by 4 days at 85oC in forced air 14
draft oven. 15
The ageing protocol was adopted from Kliewer et. al. [33]. Recently Tabaković et al. [8] and 16
Casado Barrasa et. al. [34] successfully used a similar protocol to investigate the effect of 17
short and long term ageing of the asphalt mix containing alginate capsules and microcapsules 18
encapsulating asphalt binder rejuvenator. 19
After asphalt ageing procedure the fibre were added to the mix. Prior to the fibre inclusion 20
into the mix, the mix was preheated to the standard asphalt mixing/compaction temperature 21
0
20
40
60
80
100
0,01 0,10 1,00 10,00 100,00
Perc
enta
ge p
assin
g
Sieve size (mm)
Lower limit
Mix
Upper limit

9
160oC [35]. The fibres were then gradually added to the mix in order to avoid conglomeration 1
of fibres within the mix. After the fibre inclusion into the mix the test specimens were 2
prepared. 3
The test specimens were compacted in accordance with IS EN 12697-31:2007 using a 4
SERVOPAC gyratory compactor. The static compaction pressure was set at 0.6MPa with an 5
angular velocity of 30 gyrations per minute and the gyratory angle set at 1.25o. A set number 6
of gyrations are used as the compaction control target, in this case 100 gyrations. For this 7
study the cylindrical test specimens are compacted to target dimensions of 100mm in diameter 8
and 50mm in height. After compaction, test specimens are left in the mould to cure for 2 9
hours. The test specimens are then extruded, and their dimensions and weight recorded. 10
2.2 Fibre and composite characterization 11
2.2.1 Optical microscopy 12
A Leica 2500P polarised light microscope was used to observe the rejuvenator release from 13
the fibre compartments, its capillary flow and consequent damage repair (crack closure) over 14
time. A microscopic image of each fibre test sample was acquired with a Leica DFC310FX 15
digital camera at 1392 × 1040 uninterpolated resolution for image analysis and publication. 16
Following the previous work done by [8], a sample was prepared by placing an alginate fibre 17
containing rejuvenator capsules onto the object glass. The bitumen and asphalt mastic mix 18
was placed on top of the fibres An artificial incision was made in the binder/asphalt mastic 19
matrix and fibre using a surgical scalpel. The software Leica LAS Live Image Builder was used to 20
record the rejuvenator release and its capillary flow. 21
2.2.2 Environmental Scanning Electron Microscope (ESEM) 22
The Environmental Scanning Electron Microscope (ESEM) was used to evaluate the 23
morphology of the rejuvenator compartments within the sodium alginate fibres. For this 24
purpose, a Philips XL30 ESEM system was employed. Low accelerating voltage of 10kV and 25
a beam current of less than 1nA were used to limit the electron beam damage on the heat 26
sensitive polymeric fibres. 27
2.2.3 Fibre thermal conditioning 28
In order to investigate temperature effect on the mechanical properties, tensile strength, of the 29
fibres a special thermal conditioning tests was developed. Where the fibres were subjected to 30
a thermal conditioning at varying temperatures, of: 20oC and between 80oC – 160oC, in steps 31
of 20oC, using standard draft oven. Fibre samples were placed in the oven at set temperature 32
for duration of 15minutes. After thermal conditioning fibres were taken out of the oven and 33

10
left to condition to the test temperature of 20 ± 3oC for additional 15 minutes. Due to the low 1
mass of the fibre samples it has been assumed that 15 minutes would be sufficient time for the 2
fibre to condition to the desired temperature. As well as high temperature, fibres were 3
subjected to the low (8.5oC) and freezing (-18.5oC) temperature. For cold fibre conditioning, 4
laboratory fridge and freezer were used. The conditioning and test pre-conditioning times 5
were also 15 minutes. 6
2.2.4 Uniaxial Tensile Test (UTT) 7
The tensile strength of the rejuvenator-containing alginate fibres was determined using a 8
micro tensile testing machine with 500N load cell and at a cross-head speed of 0.01mm/s. 9
Fibres (cut from a continuous filament of approximately 20m long) were glued onto 10
supporting brass plates with a gauge length of 10mm accordingly. A batch of 10 fibres of each 11
mix ratio were tested successfully. The fibre strain was measured from the machine cross-12
head displacement taking into account the system compliance. 13
2.2.5 Thermogravimetric analysis (TGA) 14
The thermal stability characterizations of Sodium Alginate fibres containing varying 15
rejuvenator/alginate ratios were performed using NETZSCH STA 449 F3 Jupiter TGA 16
system, at a scanning rate of 6.5oC/min in Argon gas (Ar) at flow of 50 ml/min. 17
2.3 Porous asphalt performance 18
2.3.1 Indirect Tensile Stiffness Modulus (ITSM) test 19
The non-destructive ITSM test is conducted, which complied with IS EN 12697-26: 2012. 20
The Universal Testing Machine (UTM) with a pneumatic close loop control system is used. 21
Two linear variable differential transformers (LVDT) were used to measure the horizontal 22
deformation. The specimens were conditioned at 20oC, for four hours prior to testing. The 23
stiffness value was recorded on two diameters orientated at 90o to each other, and an average 24
of these two values was reported as the specimen stiffness. 25
2.3.2 Indirect tensile strength test 26
On completion of the ITSM test, the specimens were stored in a temperature control chamber 27
at 20oC and left to condition for an hour prior to testing. The UTM testing system is employed 28
to complete the Indirect Tensile Strength Test (ITS) in accordance with EN 12697-23: 2003. 29
The ITS test is conducted by applying a vertical compressive strip load at a constant loading 30
rate, in this case 0.1mm/s, to a cylindrical specimen. The load is distributed over the thickness 31

11
of the specimen through two loading strips at the top and bottom of the test specimen. The 1
tests were conducted at a temperature of 20oC. 2
2.3.3 Healing efficiency of the ZOAB asphalt mix containing fibres 3
In order to investigate effect of the fibres on mechanical properties of the asphalt mix and 4
evaluate the healing efficiency of the compartmented fibres encapsulating the rejuvenator, a 5
special testing programme was designed: 6
1. Two fibre amounts 5% and 10%, 7
2. Tests, ITSM and ITS, 8
3. Test temperature 20oC, 9
4. Healing temperature 20oC, 10
5. Healing time 20 hours and 40 hours after initial test. 11
12
The testing protocol was to as follows: 13
1. Test samples test temperature pre-conditioning, 14
2. ITSM test diameter I followed by diameter II, 15
3. Test specimen relaxation 2h, followed by 1st ITS test, 16
4. Positioning test specimen into healing ring and healing for 2h, 17
5. ITSM repeat – post ITS test, 18
6. Positioning test specimen into healing ring and healing for additional 18h, 19
7. ITSM test - pre 2nd ITS test, 20
8. 2nd ITS test, 21
9. Positioning test specimen into healing ring and healing for additional 20h, 22
10. ITSM test - pre 3rd ITS test, 23
11. 3rd ITS test. 24
3. Results and Discussion 25
3.1 Fibre Composition and morphology 26
The optical light microscope and ESEM technique were employed in order to conduct 27
volumetric analysis of the fibres. Using the light microscope, thelongitudinal size of the fibre 28
compartments were measured. Figure 4 shows the image of all six fibre rejuvenator/alginate 29
ratios, with a field of view of approximately 3mm. In the Figure 4 the increase of the 30
compartment size can be observed with increase of the rejuvenator volume in the fibre. Here, 31
the ratio 80:20 shows near hollow fibres, i.e. fibre with very large rejuvenator compartments. 32
33

12
1
Figure 4 Light optical microscope images of compartmented fibres of varying rejuvenator/alginate ratios; 2 a) 0:100, b) 40:60, c) 50:50, d) 60:40, e) 70:30 and f) 80:20. 3
4
The ESEM microscopic analysis technique was employed to analyse cross sectional area of 5
the fibres. The ESEM allows larger magnification of the fibres, which is necessary for the 6
observation of the fibre walls. For this analysis three test samples of each fibre 7
rejuvenator/alginate ratio were used. Figure 5 shows the cross sectional area of the two fibres 8
samples, a)40:60 and b) 60:40 – rejuvenator/alginate ratio, viewed through the ESEM. 9
10
a)
b)
Figure 5 ESEM images of the fibre compartment cross section, rejuvenator/alginate ratio; a) 40:60 and b) 11 60:40. 12
13
Volumetric analysis of the fibre compartments were conducted by analysing the microscopic 14
images. The microscopic images were further studied using the ImageJ software [36]. For this 15
analysis it was assumed that all compartments resemble an ellipsoid. The images were 16
imported into the ImageJ software and using its geometry tools, the geometry of the 17

13
compartments, the minimum and maximum diameters of all ellipsoids, were recorded. Next 1
step in the volumetric analysis of the fibres was the fibre compartment wall/shell thickness 2
analysis. For this, the images of the fibre cross section were taken with the ESEM and were 3
then analysed with ImageJ using the BoneJ plugin [37]. This plugin has been developed and 4
used for the bone structure analysis. However, it can also be employed for analysis of 5
different structures, in this case of the alginate fibres compartment walls/shell. Using BoneJ 6
the mean wall thickness of every fibre was determined and a thickness map, displaying the 7
thickness throughout the cross-section, was computed. Figure 6 shows an ESEM image of a 8
cross-section and the BoneJ thickness map. 9
10
a)
b)
Figure 6 Fibre compartment cross sectional analysis; rejuvenator/alginate ratio 70:30. a) ESEM image of 11 the fibre compartment cross section and b) BoneJ fibre compartment wall/shell thickness map. 12
13
The results presented in Table 3 show large standard deviations for fibre types except the fibre 14
with a 70:30 rejuvenator/alginate ratio. This was expected because of the relatively small 15
number of samples analysed. These, results show that the wall thickness of the 70:30 ratio is 16
very consistent which is positive and also leads to more accurate volume calculations. The 17
results further show that the 60:40 ratio has the thickest walls which is not expected as it 18
contains less alginate than the ratios 40:60 and 50:50. The thinnest walls are found in the 19
70:30 ratio. 20
Table 3 Fibre wall/shell thickness 21
Ratio Mean wall
thickness (µm)
Wall thickness standard
deviation (µm)
Median of compartment volume
corrected for wall thickness (µL)
40:60 36.23 10.40 0.0037
50:50 42.84 7.01 0.0014
60:40 55.38 9.01 0.0024
70:30 33.05 1.82 0.0162
80:20 36.13 14.72 0.0139

14
To calculate the volume of the compartments the mean wall thickness is subtracted from the 1
previously determined ellipse volume. The median is calculated for all the volumes of every 2
fibre ratio. The median is used in order to obtain more accurate results for the fibre 3
compartment volume. Where test sample, using the median to obtain average value of the 4
fibre compartment wall thickness extreme values have less of an effect on the average volume 5
size then using the mean value. As the sample size was small in comparison to the fibre 6
length the extremes have a significant effect on the calculated volume if the mean is used. The 7
medians of the volume of rejuvenator per ratio are presented in Table 4. The lowest volume is 8
found in the 50:50 samples and the highest volume is found in the 70:30 samples. A 9
substantial difference is observed for the fibre volumes of the 70:30 and 80:20 ratios, in 10
comparison to the other ratios. It was expected that the 80:20 ratio would contain the most 11
rejuvenator but results indicated otherwise. This can be explained by the fact that the 80:20 12
batch is the max rejuvenator/alginate ratio for the fibre production, as such there was not 13
enough alginate within the solution to encapsulate all the rejuvenator and also post fibre 14
production it was observed that rejuvenator was leaking from the fibre indicating the collapse 15
of the fibre compartments. 16
17
In order to calculate the volume of rejuvenator per unit length of fibre the median number of 18
compartments is calculated, for each fibre type (rejuvenator/alginate ratio) from the optical 19
microscope images. This data was combined with the median volumes of the compartments 20
and results in a volume of rejuvenator per unit length of fibre, the results are presented in 21
Table 4. The results show that the 50:50 fibre contains the most compartments per 10mm, but 22
since it contains only a low volume per compartment the total volume per 10mm is still the 23
lowest of all the fibre types. The ratio 70:30 contains the most rejuvenator per 10mm closely 24
followed by the 80:20 fibre type. The differences between these two fibre types compared to 25
the other ones are substantial as the compartments are approximately 3-6 times bigger. 26
27
In order to relate the fibre compartment volume to the weight of the fibres samples with a 28
length of one meter have been weighed and the average weight per 10mm was calculated. 29
Subsequently the volume per gram of fibre could be calculated using the results in Table 4. 30
The results show that the 70:30 ratios contain the most rejuvenator per gram. The 50:50 fibre 31
contains the least amount of rejuvenator. 32
33
34

15
Table 4 Compartmented alginate fibre volumetric data. 1
Ratio
Median number
of compartments
per 10mm
Compartment
volume per 10mm
of fibre (µL)
Weight of
fibre per
10mm (mg)
Volume of compartment
(rejuvenator) per gram
of fibre (µL)
40:60 13.90 0.052 0.354 145.7
50:50 20.62 0.028 0.440 64.5
60:40 15.67 0.037 0.487 75.8
70:30 10.47 0.170 0.444 382.9
80:20 10.47 0.146 0.594 245.7
2
3.2 Thermo-mechanical stability of the fibres 3
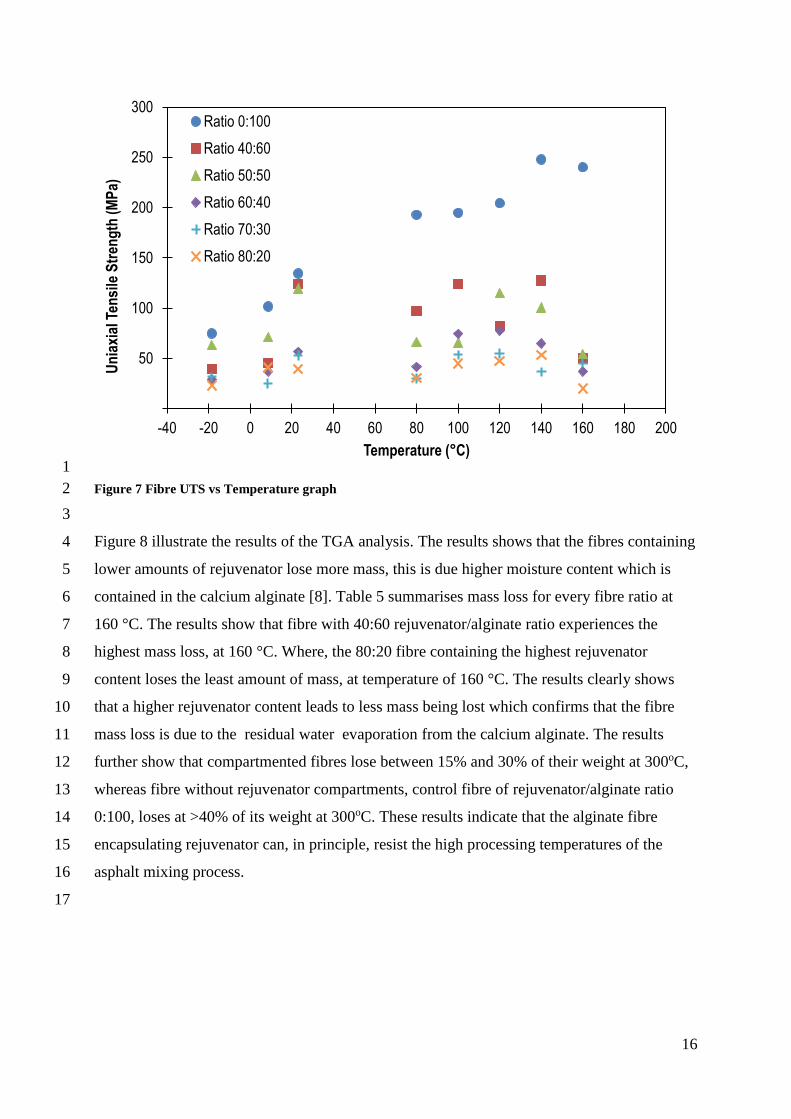
Figure 7 summarises the results of the uniaxial tensile strength (UTS) test used to investigate 4
temperature effect on the fibre strength. The results from the graph show that fibres with 5
higher rejuvenator and lower alginate content have lower values for UTS. Whereas control 6
fibres, without rejuvenator (rejuvenator/alginate ratio of 0:100), have the highest UTS for all 7
temperatures tested. This could be due to the two reasons: i) the pure alginate fibre does not 8
contain large rejuvenator compartments, i.e. it has uniform cross section area, which results in 9
higher strength and ii) loss in moisture in the fibre making it more brittle, so the stress 10
increases but the strain decreases. The UTS of the 70:30 fibres shows to be at the lower end, 11
in the range between 20 and 53 MPa depending on the conditioning temperature. However, its 12
linearity, small change in UTS across the thermal range, indicates the small effect of 13
temperature (high and low) on the fibre properties. From the results it can be seen that a 14
higher rejuvenator content produces a more linear distribution of the UTS, due to the 15
uniformity of the compartment geometry. 16
17
16
1
Figure 7 Fibre UTS vs Temperature graph 2
3
Figure 8 illustrate the results of the TGA analysis. The results shows that the fibres containing 4
lower amounts of rejuvenator lose more mass, this is due higher moisture content which is 5
contained in the calcium alginate [8]. Table 5 summarises mass loss for every fibre ratio at 6
160 °C. The results show that fibre with 40:60 rejuvenator/alginate ratio experiences the 7
highest mass loss, at 160 °C. Where, the 80:20 fibre containing the highest rejuvenator 8
content loses the least amount of mass, at temperature of 160 °C. The results clearly shows 9
that a higher rejuvenator content leads to less mass being lost which confirms that the fibre 10
mass loss is due to the residual water evaporation from the calcium alginate. The results 11
further show that compartmented fibres lose between 15% and 30% of their weight at 300oC, 12
whereas fibre without rejuvenator compartments, control fibre of rejuvenator/alginate ratio 13
0:100, loses at >40% of its weight at 300oC. These results indicate that the alginate fibre 14
encapsulating rejuvenator can, in principle, resist the high processing temperatures of the 15
asphalt mixing process. 16
17
50
100
150
200
250
300
-40 -20 0 20 40 60 80 100 120 140 160 180 200
Un
iaxi
al T
ensi
le S
tren
gth
(M
Pa)
Temperature (°C)
Ratio 0:100
Ratio 40:60
Ratio 50:50
Ratio 60:40
Ratio 70:30
Ratio 80:20

17
1
Figure 8 Alginate compartmented fibre at varying rejuvenator/ alginate ratio, TGA results. 2
3
Table 5 Total mass lost at 160°C 4
Ratio Total mass lost at 160°C
(%)
0:100 8.67
40:60 8.82
50:50 8.00
60:40 6.46
70:30 5.25
80:20 4.74
5
3.3 Healing efficiency of alginate compartmented fibres encapsulating the rejuvenator 6
3.3.1 microscopic crack healing in bitumen and asphalt mastic 7
Tabaković et al. [8] reported successful rejuvenator release from the compartmented fibre into 8
artificially induced crack. However, they found that fibres were embedded in the epoxy resin 9
and therefore no crack healing was reported. In this study, in order to investigate rejuvenator 10
release and binder healing the fibres were embedded into the bitumen and artificial cracks 11
were induced into the bitumen and healing efficiency was measured against a control sample 12
without fibres. The fibres of 70:30 (rejuvenator/alginate) ratio were selected for this exercise 13
because in the volumetric analysis, thermal and strength test, they showed to be most suitable 14
fibres for inclusion into the bitumen binder. The healing effect of bitumen with and without 15
the fibres the healing effect of bitumen with and without the fibres is shown in Figure 9 . 16
Figure 9 a – d show healing of a bitumen test sample with fibres. Position of the fibres in the 17
test specimen is marked with a double broken red line. Figure 9 e – h shows healing of a 18
60
65
70
75
80
85
90
95
100
40 60 80 100 120 140 160 180 200 220 240 260 280 300
Tota
l Mas
s (%
)
Temperature (°C)
Ratio 0:100
Ratio 40:60
Ratio 50:50
Ratio 60:40
Ratio 70:30
Ratio 80:20

18
bitumen test sample without fibre. The test sample with the fibres (Figure 9 a – d) was tested 1
by multi crack healing (3 cracks) in which each crack is induced in order to crack separate 2
fibre compartment encapsulating the bitumen rejuvenator. Figure 9 a and e show undamaged 3
test specimens. Figure 9 b and f show the test specimen immediately after the cracks are 4
induced and the fibre compartments are broken (Figure 9 b). The positions of the cracks in the 5
test specimen are marked with double broken white lines. Figure 9 b shows the rejuvenator 6
release from the compartments into the cracks. Figure 9 c shows healing of all three cracks, 7
containing rejuvenator, 1 hour after the crack insertion. Figure 9 g shows crack healing, of the 8
bitumen test sample without rejuvenator, 3 hours after crack insertion. Both figures show 9
progress in the damage repair, i.e. crack healing. Figure 9 d and h complete damage repair, i.e. 10
crack closure, in both test samples. The results showed bitumen can close the crack (repair the 11
damage) without rejuvenator. However, samples with fibres, i.e. rejuvenator, showed three 12
times faster crack repair (healing). Sample without rejuvenator sealed the crack within 6h 13
where the sample with the fibres (rejuvenator), healed the crack within 2h. These results show 14
that rejuvenator can significantly improve healing ability of the bitumen binders. However, 15
these tests were conducted on the pure bitumen material. In situ, it is expected that the crack 16
will occur in the asphalt mastic (asphalt and fine aggregate mix) [8]. Therefore, it was decided 17
to perform the same test where the healing effect of the encapsulated rejuvenator was tested in 18
the asphalt mastic mix. The information about the asphalt mastic mix design can be found 19
elsewhere [8]. Figure 10 illustrates the healing effect of the alginate fibres encapsulating 20
rejuvenator on the asphalt mastic mix. The position of the fibre in the test sample is marked 21
with double broken red lines and cracks by double broken white line. Figure 10 a shows the 22
test specimen without damage, i.e. cracks. Figure 10 b – d shows test specimen with inserted 23
cracks. Figure 10 b shows rejuvenator release from the fibre compartments into the crack. 24
Figure 10 c and d shows the damage repair, i.e. crack closure, in in the asphalt mastic mix 25
over time. The results show that the self-healing system can repair crack damage, i.e. close the 26
crack, however it does not achieve full crack closure. This finding is in agreement with Garcia 27
et al. [38], who explained that microcapsules, in this case compartmented fibres, cannot fully 28
repair crack damage due to the limited healing agent volume in comparison to the crack 29
volume, however the self-healing system does allow for multiple (partial) crack healing as it 30
is illustrated in the Figure 10, where two cracks are being repaired. Further examination of the 31
crack in ImageJ revealed a volume of the crack is 0,648 μl, whereas a single compartment in 32
the 70:30 fibre contains on an average 0,0162 μl, as shown in Table 4, i.e. 1/40th (2.5%) of 33
the crack volume has been filled with the rejuvenator. Furthermore, in the mastic mix 34

19
rejuvenator – bitumen contact surface area is much lower, due to the aggregates, in 1
comparison to the pure bitumen test sample. This indicates that the compartmented fibre self-2
healing system would perform better within the high bitumen content asphalt mix. These 3
findings show that compartment fibres encapsulating rejuvenator asphalt self-healing system 4
has great potential to repair the crack damage within asphalt pavement system. However, 5
further analysis on a full asphalt pavement mix is required. 6

20
Figure 9 Bitumen crack healing, with (a-d) and without fibres (e-h). 1

21
1
Figure 10 Asphalt mastic crack healing, with fibres (a-d). 2
3
3.3.2 Healing efficiency of the compartmented fibres encapsulating rejuvenator self-4
healing system on the porous asphalt mix. 5
Following the results from the artificial crack healing experiment, explained above, effect of 6
fibre on the porous asphalt mix stiffness, strength and damage repair (stiffness and strength 7
recovery) has been studied. Figure 11and Figure 12 show the effect of fibres on the stiffness, 8
strength and their healing (strength and stiffness recovery) abilities. The results from the test 9
support authors statement in their previous publication [8] “fibres increase the asphalt mix 10

22
strength and stiffness”. However, the results from this study show that higher fibre content 1
does not necessarily improve asphalt mix healing properties. From the test results is clear that 2
mixtures with lower amount of fibres (5%) and higher rejuvenator/alginate ratio (70:30) have 3
best ability to recover its original stiffness and strength. The asphalt mixtures with higher 4
fibre content (10%) had lower stiffness and strength recovery, between 10% - 20%. This 5
could be simply due to the fact that fibres once broken cannot be repaired and thus the 6
strength is not recovered. Therefore, samples with higher fibre content experience higher 7
stiffness and strength loss. However, the test sample (asphalt mix) recovery efficiency might 8
have depended on the test sample damage. During the test it was observed that some samples 9
were damaged more than others perhaps this played a role in asphalt mix strength recovery. 10
Therefore, further studies are needed in order to optimise asphalt mix design containing the 11
compartmented alginate fibres encapsulating the bitumen rejuvenator. Nevertheless, these 12
results confirm that compartmented fibres encapsulating the bitumen rejuvenator is viable 13
self-healing technology for asphalt mix crack/damage repair. 14
15
16
Figure 11 Effect of fibres on asphalt mix stiffness. 17
18
0
200
400
600
800
1,000
1,200
Control 5% (0:100) 5%(40:60) 5%(70:30) 10%(0:100) 10%(40:60) 10%(70:30)
Initial Stiffness
2h after 1st ITS test
20h after 1st ITS test
20h after 2nd ITS test
Sti
ffn
es (
MP
a)
Fibre type

23
1
2
Figure 12 Effect of fibres on asphalt mix strength. 3
4. Conclusions 4
The key objective of this study was to optimise design of the compartmented alginate fibre 5
encapsulating rejuvenator, i.e. to determine maximum amount of the rejuvenator that can be 6
encapsulated without compromising the fibre thermal and mechanical properties but 7
improving the system healing efficiency. The results have shown that fibre optimum 8
rejuvenator/alginate ratio is 70:30. This is due to the high volume of the compartments and 9
the stability at different temperatures, while retaining a sufficient mechanical strength for 10
application in asphalt mixes. The results showed that increase in rejuvenator content within 11
the fibre, results in the reduction the fibre mechanical strength. However, the resulting fibre 12
mechanical strength, of the fibres with higher rejuvenator content, is sufficient for its 13
utilisation in asphalt. The fibres will survive the asphalt mixing process and construction and 14
will break due to a crack propagating into the fibre. Insertion of the 70:30 fibres in a bitumen 15
and mastic mix and subsequently introducing artificial cracks demonstrated that the 16
rejuvenator was released from the compartments and filled the crack. Healing of the crack 17
was observed for mixes containing bitumen. The results showed that fibres can increase the 18
bitumen healing rate by three times. However, in an asphalt mastic mix (bitumen and fine 19
aggregate mix) the system has some limited healing capacity. The tip of the crack is sealed, 20
however crack scars are left behind, i.e. full crack healing is not achieved. This is due to the 21
fact that crack volume was 40 times larger than rejuvenator volume released from the 22
0.0
0.1
0.1
0.2
0.2
0.3
0.3
Control 5% (0:100) 5%(40:60) 5%(70:30) 10%(0:100) 10%(40:60) 10%(70:30)
ITS
(M
Pa)
Fibre type
Initial strength2nd ITS3rd ITS

24
compartment and reduced diffusion area due to the aggregate presence in the asphalt mastic 1
mix. Despite this limitation the system demonstrated that it has the ability to heal the damage 2
as expected, i.e. the tip of the crack is sealed and stress/energy that propagates crack is 3
removed. The study further investigated fibre effect on the ZOAB asphalt mix mechanical 4
properties and self-healing efficiency. The results confirmed earlier findings, that the fibre has 5
good thermal and mechanical strength to survive asphalt mixing and compaction process. The 6
fibre of 70:30 rejuvenator/alginate ratio outperformed the control mix (the mix without fibres) 7
and mixtures containing fibres with lower amounts of rejuvenator. The results also showed 8
that mixtures with higher fibre content have improved initial strength but reduced healing, 9
damage recovery, capacity. The optimisation of the fibre content in the mix will be focus of 10
future work However based on results from this work optimum fibre content in the ZOAB 11
asphalt mix is 5% for compartmented fibres of 70:30 rejuvenator/alginate ratio. 12
5. Acknowledgements 13
The authors wish to thank: Dr. Bert Jan Lommerts and Dr. Irina Catiugă, Latexfalt BV, for 14
their support to the project. Authors would also like to thank Mr. Arjan Thijssen for his 15
assistance with the environmental scanning electron microscope. This research was conducted 16
under the Marie Curie IEF research funding, research project Self-healing Asphalt for Road 17
Pavements (SHARP), project number 622863. 18
6. References 19
1. Schlangen, E., Other Materials, Applications and Future Developments, in Self-20
Healing Phenomena in Cement-Based Materials, M. e Rooij, et al., Editors. 2013, 21
RILEM Series: State-of-the-Art Reports. p. 241 – 256. 22
2. (OECD), O.o.E.C.a.D., Road traffic, vehicles and networks. 2013 in Environment at a 23
Glance 2013: OECD Indicators, OECD Publishing. 24
3. Vita, L. and M.C. Marolda, Road Infrastructure – the backbone of transport system. 25
2008, EU Directorate General for Research and Sustainable Surface Transport, 26
Brussels, Belgium, EU. 27
4. European Union Road Federation (ERF), European road statistics 2012. 2012: 28
European Union Road Federation Publications. 29
5. García, A. et al. , Induction heating of mastic containing conductive fibers and fillers. 30
Materials and Structures, 2011. 44(2): p. 499–508. 31
6. Su, J.F. and E. Schlangen, Synthesis and physicochemical properties of high compact 32
microcapsules containing rejuvenator applied in asphalt. Chemical Engineering 33
Journal, 2012. 198-199: p. 289-300. 34
7. Hindley, G., History of Roads. 1971: The Chaucer Press Ltd. 35
8. Tabaković, A., et al., The reinforcement and healing of asphalt mastic mixtures by 36
rejuvenator encapsulation in alginate compartmented fibres. Smart Materials and 37
Structures, 2016. 25(8). 38

25
9. Tabaković, A., Recycled Asphalt (RA) for Pavements, in Handbook of Recycled 1
Concrete and Demolition Waste, F. Pacheco-Torgal, et al., Editors. 2013, Woodhead 2
Publishing. p. 394 – 419. 3
10. Nicholas, J.C., et al. Effects of using reclaimed asphalt and/or lower temperature 4
asphalt on availability of road network. in of 6th International Conference Bituminous 5
Mixtures and Pavements. 2015. Thessaloniki, Greece. 6
11. Trombulak, S.C.a.F., C.A., Review of ecological effects of roads on terrestrial and 7
aquatic communities. Conservation Biology, 2000. 14(1): p. 13. 8
12. Fisher, H., Self repairing materials – dream or reality. Natural Science, 2010. 2 (8): p. 9
873 – 901. 10
13. García, A., et al., A simple model to define induction heating in asphalt mastic. 11
Construction and Building Materials, 2012. 31: p. 38 - 46. 12
14. García, A., et al., Electrical conductivity of asphalt mortar containing conductive 13
fibers and fillers. Construction and Building Materials, 2009. 21(10): p. 3175–3181. 14
15. García, Á., E. Schlangen, and M. van de Ven, Two ways of closing cracks on asphalt 15
concrete pavements: Microcapsules and Induction Heating. Key Enginering 16
Materials, 2010. 417-418: p. 573-576. 17
16. Su, J.F., J. Qiu, and E. Schlangen, Stability investigation of self-healing microcapsules 18
containing rejuvenator for bitumen. Polymer Degradation and Stability, 2013. 98(6): 19
p. 1205-1212. 20
17. Su, J.F., et al., Investigation the possibility of a new approach of using microcapsules 21
containing waste cooking oil; in-situ rejuvenation. Construction and Building 22
Materials, 2015. 74: p. 83–92. 23
18. Su, J.F., et al., Experimental investigation of self healing behaviour of 24
bitumen/microcapsule composites by modified beam on elastic foundation method. 25
Materials and Structures, Springer publication, RILEM, 2014. 26
19. Tabaković, A., et al. The use of compartmented Sodium-Alginate fibres as healing 27
agent delivery system for asphalt pavements. in Proceedings of European Materials 28
Research Society Fall Meeting 2015. Warsaw, Poland. 29
20. García, A., Self-healing of open cracks in asphalt mastic. Fuel, 2012. 93: p. 264 – 272. 30
21. Su, J.F., et al., Interface stability behaviors of methanol– melamine–formaldehyde 31
shell microPCMs/epoxy matrix composites. Polymer Composites, 2011. 32: p. 810–32
820. 33
22. Sun, D., et al., Size optimization and self-healing evaluation of microcapsules in 34
asphalt binder. Colloid Polymer Science, 2015. 293: p. 12. 35
23. Garcia, A., et al., Internal asphalt mixture rejuvenation using capsules. Construction 36
and Building Materials, 2015. 101: p. 8. 37
24. Garcia, A., et al., Mechanical properties of asphalt mixture containing sunflower oil 38
capsules. Journal of Cleaner Production, 2016. 118: p. 9. 39
25. Gibney, A., Analysis of Permanent Deformation of Hot Rolled Asphalt in Civil 40
Engineering. 2002, University College Dublin. 41
26. Gibney, A. Prediction of rutting resistance of hot rolled asphalt’. in 3rd Eurasphalt & 42
Eurobitume Congress. 2004. Vienna, Austria: Foundation Eurasphalt. 43
27. Anderson, F.A., Final Report on the Safety Assessment of Melamine/Formaldehyde 44
Resin. Journal of the American College of Toxicology, 1995. 14(5): p. 373-385. 45
28. Prajer, M., et al., Direct and indirect observation of multiple local healing events in 46
successively loaded fibre reinforced polymer model composites using healing agent-47
filled compartmented fibres. Composites Science and Technology, 2015. 106: p. 7. 48

26
29. Mookhoek, S.D., et al., Alginate fibres containing discrete liquid filled vacuoles for 1
controlled delivery of healing agents in fibre reinforced composites. Composites Part 2
A: Applied Science and Manufacturing, 2012. 43(12): p. 7. 3
30. Kringos, N., et al., On the development of a new test methodology for moisture 4
damage susceptibility of asphalt concrete, in 5th International Conference 5
‘Bituminous Mixtures and Pavements’. 2011: Thessaloniki, Greece. p. 857 - 867. 6
31. Tabaković, A., et al, The influence of recycled asphalt pavement on the fatigue 7
performance of asphalt concrete base courses. ASCE Journal of Materials in Civil 8
Engineering, 2010. 22(6): p. 643 - 650. 9
32. Liu, Q., Induction healing of porous asphalt concrete, in Faculty of Civil Engineering 10
and Geosciences. 2012, TU Delft, The Netherlands. 11
33. Kliewer, et al., Investigation of the relationship between field performance and 12
laboratory ageing properties of asphalt mixtures, in Engineering Properties of 13
Asphalt Mixtures and the Relationship to their Performance, G.A. Huber and D.S. 14
Decker, Editors. 1995. 15
34. Casado Barrasaa, R., et al., Addressing durability of asphalt concrete by self-healing 16
mechanism. Procedia - Social and Behavioral Sciences, 2014. 162: p. 188. 17
35. Tabaković, A., et al., The reinforcement and healing of asphalt mastic mixtures by 18
rejuvenator encapsulation in alginate compartmented fibres. Smart Materials and 19
Structures, 2016. 20
36. Schneider, C.A., et al., NIH Image to ImageJ: 25 years of image analysis. Nature 21
methods, 2012. 9(7): p. 5. 22
37. Doube, M., et al., BoneJ: Free and extensible bone image analysis in ImageJ. Bone, 23
2010. 47(6): p. 1076-1079. 24
38. Garcia, S.J. and H.R. Fischer, Self-healing polymer systems: Properties, synthesis and 25
applications, in Smart polymers and their applications, M. Rosa Aguilar and J. San 26
Roman, Editors. 2014, Woodhead Publishing Limited. p. 271-298. 27
28
Related Documents