Journal ofPaleolimnology 16: 227-238, 1996. 227 1996 Kluwer Academic Publishers. Printed in Belgium. The climatic signal in varved sediments from Lake C2, northern Ellesmere Island, Canada * Douglas R. Hardy l, Raymond S. Bradley 1 & Bernd Zolitschka 2 1Dept. of Geosciences, University of Massachusetts, Amherst, MA 01003, USA 2Geology Department, Trier University, Trier University, Trier, Germany Received 15 March 1995; accepted 28 August 1995 Key words: varves, paleoclimate, climate, hydrology, Arctic, Ellesmere Island Abstract Annually-laminated clastic sediments preserve a high resolution proxy record of paleoclimate, provided that allochthonous sedimentation represents a response to meteorological forcing of watershed sediment transfer. Here, we demonstrate this linkage, and illustrate a calibration process using the most recent 40 years of a varve record from Lake C2 (82~ t N; 78000 ' W), three years of field measurements, and meteorological data for 1951-92 from nearby AES weather station Alert. Field measurements were used to correlate proxies of the energy available for snowmelt (e.g. air temperature) and daily suspended sediment discharge (SSQ). Our calibration was extended through use of weather data from Alert. Both mean daily air temperature at Echo, and daily SSQ, were well correlated with air temperature at 600 m above Alert, as obtained from the 1200 Z (0800 LST) rawinsonde sounding. Accordingly, we used pooled 1990 and 1992 Alert 600 m data to predict the lagged daily sediment discharge into Lake C2 (adj. r 2 = 0.43). Daily values were summed each year in order to produce an annual series of predicted sediment transfer to the lake. The original varve chronology was based on eight sediment cores recovered from the deep basin of the lake (>80 m). Although low-frequency fluctuations of the varve and predicted SSQ series agree, slight tuning of the varve record optimizes the correlation between them. Adjustments were based on examination of weather data for specific years, reexamination of sediment core thin sections, and by aligning fluctuations in the two series which closely matched. Although the original chronology is reasonably well correlated with 600 m temperatures at Alert (for JJA mean, r= 0.41, significant at 0.01), the adjusted chronology is both better correlated and contains a more precise climate signal (r = 0.54 for July mean, significant at 0.01). This is the first calibrated varve record produced from Arctic lake sediments, and demonstrates that varves from Lake C2 contain a paleoclimatic record. We believe the post-facto manipulations required to produce the adjusted varve chronology are reasonable given the uncertainties inherent in varve counting, and the lack of any independent corroborating chronostratigraphic markers. Introduction Varved clastic sediments preserve an annual-resolution record of sediment transfer from a watershed. When the factors controlling sediment flux into a lake or estuary are understood, varves provide a proxy of the paleoenvironmental conditions governing the process- es involved. However, the significance of interannual * This is the ninth in a series of papers published in this issue on the Taconite Inlet Lakes Project. These papers were collected by Dr R. S. Bradley. variability has been clearly recognized in only a rela- tively few varved records (e.g. Granar, 1956; Gilbert, 1975; Leonard, 1985; Deslodges, 1994; Leemann & Niessen, 1994), all from midlatitude sites. In order to realize the full potential of varves, a calibration must be made between lamination thickness and the con- temporary controlling factors. In addition, the errors and assumptions associated with this procedure must be explicitly recognized. At Lake C2 (unofficial name), on the north coast of Ellesmere Island (82o50 ' N; 78000 ' W) (Figure I), a

Welcome message from author
This document is posted to help you gain knowledge. Please leave a comment to let me know what you think about it! Share it to your friends and learn new things together.
Transcript

Journal ofPaleolimnology 16: 227-238, 1996. 227 �9 1996 Kluwer Academic Publishers. Printed in Belgium.
The climatic signal in varved sediments from Lake C2, northern Ellesmere Island, Canada *
D o u g l a s R. H a r d y l, R a y m o n d S. B r a d l e y 1 & B e r n d Z o l i t s c h k a 2 1Dept. of Geosciences, University of Massachusetts, Amherst, MA 01003, USA 2Geology Department, Trier University, Trier University, Trier, Germany
Received 15 March 1995; accepted 28 August 1995
Key words: varves, paleoclimate, climate, hydrology, Arctic, Ellesmere Island
Abstract
Annually-laminated clastic sediments preserve a high resolution proxy record of paleoclimate, provided that allochthonous sedimentation represents a response to meteorological forcing of watershed sediment transfer. Here, we demonstrate this linkage, and illustrate a calibration process using the most recent 40 years of a varve record from Lake C2 (82~ t N; 78000 ' W), three years of field measurements, and meteorological data for 1951-92 from nearby AES weather station Alert. Field measurements were used to correlate proxies of the energy available for snowmelt (e.g. air temperature) and daily suspended sediment discharge (SSQ). Our calibration was extended through use of weather data from Alert. Both mean daily air temperature at Echo, and daily SSQ, were well correlated with air temperature at 600 m above Alert, as obtained from the 1200 Z (0800 LST) rawinsonde sounding. Accordingly, we used pooled 1990 and 1992 Alert 600 m data to predict the lagged daily sediment discharge into Lake C2 (adj. r 2 = 0.43). Daily values were summed each year in order to produce an annual series of predicted sediment transfer to the lake. The original varve chronology was based on eight sediment cores recovered from the deep basin of the lake (>80 m). Although low-frequency fluctuations of the varve and predicted SSQ series agree, slight tuning of the varve record optimizes the correlation between them. Adjustments were based on examination of weather data for specific years, reexamination of sediment core thin sections, and by aligning fluctuations in the two series which closely matched. Although the original chronology is reasonably well correlated with 600 m temperatures at Alert (for JJA mean, r= 0.41, significant at 0.01), the adjusted chronology is both better correlated and contains a more precise climate signal (r = 0.54 for July mean, significant at 0.01). This is the first calibrated varve record produced from Arctic lake sediments, and demonstrates that varves from Lake C2 contain a paleoclimatic record. We believe the post-facto manipulations required to produce the adjusted varve chronology are reasonable given the uncertainties inherent in varve counting, and the lack of any independent corroborating chronostratigraphic markers.
Introduction
Varved clastic sediments preserve an annual-resolution record of sediment transfer from a watershed. When the factors controlling sediment flux into a lake or estuary are understood, varves provide a proxy of the paleoenvironmental conditions governing the process- es involved. However, the significance of interannual
* This is the ninth in a series of papers published in this issue on the Taconite Inlet Lakes Project. These papers were collected by Dr R. S. Bradley.
variability has been clearly recognized in only a rela- tively few varved records (e.g. Granar, 1956; Gilbert, 1975; Leonard, 1985; Deslodges, 1994; Leemann & Niessen, 1994), all from midlatitude sites. In order to realize the full potential of varves, a calibration must be made between lamination thickness and the con- temporary controlling factors. In addition, the errors and assumptions associated with this procedure must be explicitly recognized.
At Lake C2 (unofficial name), on the north coast of Ellesmere Island (82o50 ' N; 78000 ' W) (Figure I), a

228
comprehensive three-year program of field studies was undertaken, in conjunction with analysis of sediment cores recovered from the lake (Bradley et al., 1996). The lake is 84 m deep, 1.8 km 2 in area, and perennially ice covered. Nine percent of the watershed is cov- ered by cold-based glaciers. Fieldwork concentrated on understanding the meteorological and hydrological factors controlling sediment transfer from the 21 km 2 mountainous watershed (Hardy, 1996), and on process- es of sediment distribution and deposition within the lake (Retelle & Child, 1996; Zolitschka, 1996). Analy- ses of the sediment cores have revealed the presence of annually laminated sediments (Zolitschka, 1996) and provided a 3300 year record of environmental change (Lamoureux & Bradley, 1996).
Here, we discuss the climate signal recorded by the allochthonous varves of Lake C2. Previously, we have demonstrated that mean daily temperature, at the median watershed elevation of 520 m a.s.l., quite accu- rately predicted daily sediment transfer (adj. r 2 = 0.85, 1992), calculated using a nine hour lag (Hardy, 1996). In addition, Retelle & Child (1996) have demonstrat- ed that the contemporary deposition of sediment in the lake: (1) responds to sediment flux variability, and (2) follows the spatial patterns revealed by intercom- parison of cores. Using these empirical relationships, we now calibrate normalized varve thickness from c. 1951 onwards, against air temperature at 600 m altitude, as measured by rawinsonde at weather station Alert (Figure 1).
Watershed, daily timescale calibration: Lake C2
Through three field seasons (1990-92), streamflow into Lake C2 was continuously monitored following commencement each June. Suspended sediment con- centration was determined from depth-integrated sam- ples collected at intervals as short as one hour. Hourly time series of suspended sediment discharge (SSQ) were produced for each season from the stage record, measured discharge, and both measured and interpo- lated suspended sediment concentration. Details of the hydrological methodology are described in Hardy (1996). A fully-equipped automated weather station called the Delta site was installed 150 m from the lake, at an elevation of 7 m a.s.1. An identical station was also operated during 1991 and 1992 on Echo Peak (unofficial name; henceforth Echo site) at 520 m a.s.l. and 1800 m horizontally from Delta. Details of the
meteorological instrumentation and measurement are provided in Hardy (1996).
The local scale calibration of SSQ against the mete- orological data was accomplished in a series of steps. Cross-correlation functions were used to examine the strength of association between hourly time series of meteorological variables and discharge, at various time shifts. Discharge was selected as the output series, rather than suspended sediment concentration or SSQ, because streamflow was almost exclusively the result of snowmelt, in response to inputs of atmospheric energy, and therefore better represents the underlying physical processes. Discharge was most strongly asso- ciated with Echo air temperature (Hardy, 1996), and the response was typically lagged by nine hours. Dis- charge and suspended sediment concentration fluctuat- ed simultaneously. Daily SSQ was therefore calculated by applying a nine hour lag to the hourly values.
Sea-level air temperature (Delta) was relatively weakly associated with streamflow during all three years. Operation of the Echo station in 1991 and 1992 revealed frequent temperature inversions, which per- sisted for between one and nine days (Figure 2). These inversions, in conjunction with the hypsometry of the Lake C2 watershed, reduced the strength of associa- tion between sea-level temperature and streamflow. On several occasions during both field seasons, the mean daily temperature at Echo was more than 4 ~ higher than at Delta. The well exposed Echo site was more sensitive to the advection of warm air masses, which increased turbulent heat transfer and snowmelt.
The daily timescale, watershed calibration revealed that mean air temperature at Echo was strongly asso- ciated with total daily SSQ (Figure 3), especially dur- ing 1992 (adj. r 2 =0.85). The difference between the regression line slopes in Figure 3 is in part an arti- fact of an incomplete 1991 field season. As evidence in the next section supports, the 1991 season appears to have ended prior to the period of peak discharge. There are several reasons that the two years would probably appear more comparable in Figure 3 if the 1991 record was complete. Only four days of the 1991 field season were warmer than 3 ~ at Echo; these plot among the 1992 values (Figure 3), but did not signifi- cantly influence the regression. Prior to the snowmelt runoff peak, daily discharge is often greater than that at the same temperature later, when some of the source areas have become depleted. Lastly, suspended sedi- ment concentration tends to be higher pre-peak, at any given discharge (i.e. seasonal hysteresis; see Figure 7 in Hardy, 1996).

8 3 ~
, , , , 83ON
229
8 2 ~
8 2 ~
81ON
8 1 ~
80ON 80ON
88 ~ W 80 ~ W 72 ~ W 64 ~ W
Figure 1. Location of the Taconite Inlet study area (820501 N; 780001 W). The distance from Lake C2 to Alert is c. 250 kin.
Regional, daily to decadal timescale calibration: weather station Alert
The location of a Canadian Atmospheric Environment Service (AES) weather station 250 km east of Lake C2 provided the opportunity to extend our calibration pro- cess. First, the regional validity of our watershed cali- bration could be tested against Alert data from the same years. Second, the timescale of calibration could poten- tially be expanded by predicting annual SSQ from Alert meteorological observations, which began in 1950. The approach we took, as discussed below, was three- fold: (1) to establish that Alert and the Lake C2 water- shed were both influenced by the same synoptic-scale atmospheric dynamics; (2) to demonstrate that daily SSQ was associated with the same meteorological ele- ment, measured at Alert and Lake C2 (i.e. air tempera- ture); and most important, (3) to predict daily sediment transfer to the lake, based on Alert data. Annual totals of predicted SSQ, over 40 years, could then be com- pared with the varve record.
Meteorological data acquired at Alert includes both surface observations and upper-air soundings. Surface weather observations and radiation measurements are
recorded at an elevation of 63 m a.s.1. Rawinsonde launchings are made from the same station at 0000 h and 1200 h UT (2000 h and 0800 h LST). This study took mean daily air temperature at the surface as the average of the daily maximum and minimum (AES data), while daily air temperature at 600 m was deter- mined from the 0800 h LST sounding (AES data), by interpolation between the closest recorded measure- ments. (During the period 1951-56, temperatures are from mandatory level soundings made 1100-1300 LST (varies); after July 1 1957, both significant and manda- tory level data were used.)
Both Lake C2 and Alert are situated on the north coast of Ellesmere Island, adjacent to the Arctic Ocean. During the summer months of 1990-92 both sites were influenced by similar synoptic-scale weather, as demonstrated by the accordance of sea-level pressure variations (Figure 4). In addition, mean daily global solar irradiance at Delta and Alert was fairly well cor- related through the three field seasons (r= 0.69, 0.57, 0.81). Allowing for local effects, the two locations appear to have been influenced by similar air masses and cloudiness.

(..)
" 4 "<3
Ca -3
-6
6
1991
230
~ 0 ~
-6 . 2 . . , . . . . . . . . . , . . . . . . . . . , . . . . . . . . . , . . . . . . . . . , . . . . . . . . . , . . . . . . . . . ~ . . . . . . . . . , May 20 May 30 Jun 9 Jun 19 J u n 2 9 J u l 9 Jul 19 Jul 29 Aug
Figure 2. Mean daily temperature difference between weather stations Delta (sea level) and Echo (520 m) (i.e. Delta- Echo). Positive differences indicate Delta was warmer (expected difference, given a 'normal lapse rate' would be + 3.4 ~
Th rough the s u m m e r months (JJA) of 1990-92, the
Aler t mean daily surface and 0800 h 600 m air temper-
atures were modera te ly wel l associated (r = 0.62, 0.79,
0.87); however , dai ly d i f ferences as large as 13.0 ~
and invers ions as large as 9.4 ~ were recorded. Tem-
perature invers ions o f 4 - 5 ~ were also observed in
the Aler t data dur ing the per iod o f each field season.
Ai r tempera tures at the two levels were more strongly
corre la ted dur ing 1992 than 1991, which was also the
case at Lake C2 (Figure 5). Assoc ia t ions be tween the var ious daily air temper-
ature measu remen t s through the field season each year
are shown as scat terplots (Figure 5). Ai r temperatures at Del ta were better associated with Aler t surface tem-
peratures than those aloft. In contrast , the associat ion
was s t ronger dur ing both years be tween Echo and Aler t
600 m temperatures , than be tween Echo and Aler t sur-
face readings. No t surprisingly, the mean daily air tem- perature at Echo was genera l ly sl ightly warmer than at
600 m in the 0800 h sounding. These results support
our f inding that Echo tempera tures demonst ra te a sig- nificantly more sensi t ive response to the advect ion o f
Table 1. Correlation coefficients between measured daily suspended sed- iment discharge (SSQ), and various daily temperature values, Lake C2 and Alert. Logl0 values of SSQ were used because the transformed distribution was significantly more normally distributed
Temperature measurement Loglo Daily SSQ (kg) lagged 9 hours 1990 1991 1992
Delta mean daily (7 m) 0.10 -0.16 0.59 Echo mean daily (520 m) 0.70 0.92 Alert mean daily (63 m) 0.22 -0.02 0.53 Alert 0800 LST (600 m) 0.59 0.15 0.68
air masses (i.e. a tmospher ic energy) , than Del ta or Aler t surface measurements .
Since Echo mean daily air temperature provided the
best c l imat ic measure o f daily S S Q into Lake C2, and
Echo temperatures were responding to changes in air
mass (as measured by the f ree-air t empera ture at 600 m
above Alert) , an associat ion is sugges ted be tween the
Aler t sounding tempera ture and daily SSQ. Table 1
illustrates that daily SSQ, through all three years, was

231
1000000
100000
10000 o
1000
m 100
10
0 / / ( . ~ 92
r . /o / o
g o
0
91 ..~e~" A AO / A a e~o / o
A
/ 0 0 ~ )
O / ( ] ( ~ D 0 0
I ! I I I
-4 -2 0 2 4
A 1991 �9 1992
I I I I I
-8 -6 6 8 10 12 14
Echo mean daily temperature (~ at 520 m)
Figure 3, The relationship between mean daily temperature at Echo and measured daily suspended sediment discharge. Equations and coeffi- cients of determination for the lines indicated are:
1991 Daily SSQ = 320.47 e (0'390•176 Ta) r 2 = 0.77
1992 Daily SSQ = 63.84 e (~176176 Ta) r 2 = 0.68
50
1040
1030
1020
1010
1000
990
980
May 20
, , , , , , , , , I , . . . . . . . . I . . . . . . . . , I . . . . . . . . ~1 . . . . . . . . . I . . . . . . . . . I . . . . . . . . I . . . . . . . . . I
L a k e C 2
Alert . . . . . . . . . ] . . . . . . . . . f . . . . . . . . . I . . . . . . . . . I . . . . . . . . . I . . . . . . . . . I . . . . . . . . . I . . . . . . . 1 ' 1
May 30 Jun 9 Jun 19 Jun 29 Jul 9 Jul 19 Jul 29 Aug 8
Figure 4. Lake C2 and Alert sea level pressure (SLP) through the 1992 field season. Data from Lake C2 are mean hourly values; data from Alert are hourly readings (49 percent missing values). The accordance of measurements through 1990 and 1991 was similar.

232
10
(]
- 5
1 0
0
- I
-5
- 1 0
-15
o a ~o
o
0.40 0.46 0.87
d . . . .
, e , �9
@ o a O o ar
oC 8 * o
o o o ~
0 . 6 1 0 . 6 9 0 .87 o
- 1 5 - 1 0 -5 0 5
o o b o o
o o 6 6
o
oO~ ~ o
O~ ~ o o
o 0 . 5 8 o 0 8 5
i ~ , O I . . . . I . . . . I . . . . I , , ,
, J . . . . i . . . . i . . . . i .
e ~ B o o ~
n n6 o
o OoO ~~176 ~ o % ~ ,~
0 ,45 0.81
- 1 0 - 5 0 5 I 0
o o+
0 . 6 6
o ~ 0 , 7 6 o ~ 0 ,89
- 1 0 - 5 0 5
A L E R T 5
�9 0 .w c_)
-5
-10
" 1 5
1 9 9 0 1 9 9 1
o 1 9 9 2
o o o o o ~
~176 o o ~ o o
�9 o ~ o o o
0 . 2 1
0.85
- 1 5 - 1 0 - 5 0 5 1 0
D E L T A E C H O D E L T A
Figure 5. Scatterplot matrix of mean daily air temperature at Alert, Delta and Echo, and Alert 0800 LST sounding temperature at 600 m. Data plotted from all locations are for the same time period each year (n = 49, 40 and 75 days). Correlation coefficients are indicated within each plot, for individual years ( 1991 and 1992 only in plots b, e and f).
Table 2. Correlation coefficients between either the adjusted varve thickness (1951- 89, without 1964 and 1965), or the original series, and various measures of Alert summer temperature (T)
Variable Correlation coefficient (r) Adjusted series Original
series
July mean T, 600 m 0.54* 0.37 Maximum daily T (single day), 600 m 0.52* 0.16 Cumulative degree-days >0~ (MDD), surface 0.50* 0.25
July mean T, surface 0A9* 0.24 June - August (JJA) mean T, 600 m 0.45* 0~41" JJA mean T, surface 0.36+ 0.25
June mean T, 600 m 0.22 0.39+ June mean T, surface 0.17 0.17 August mean T, 600 m 0.16 0.03 August mean T, surface 0.00 0.04
correlation significant at 0.01 level + correlation significant at 0.05 level
in fact better assoc iated with the Alert sounding tem-
perature at 6 0 0 m than surface temperature at either
De l ta or Alert. The 1991 S S Q - 600 m air temperature correlation is pos i t ive yet w e a k , for the same reasons
presented in the d i scuss ion of Figure 3. F o l l o w i n g the
1 9 9 l field season (i.e. after July 12), near-record sur-
face and 6 0 0 m temperatures were measured at Alert.
Se d ime nt traps de p loye d in Lake C2, and recovered
prior to s treamflow in 1992, revealed ex tens ive sedi-
ment transfer associated with these warmer tempera-
tures (Retel le & Child, 1996). These addit ional data
w o u l d have improved the correlation, over that s h o w n
in Table 1 for the partial season ( r = 0 . 1 5 ) . A l though
the 1990 relationship be tw e e n dai ly S S Q and E c h o

temperatures is unknown, the relatively strong associ- ation with those at 600 m supports the 1991 and 1992 results, indicating that daily SSQ is a function of the atmospheric energy available for snowmelt, at upper elevations of the watershed.
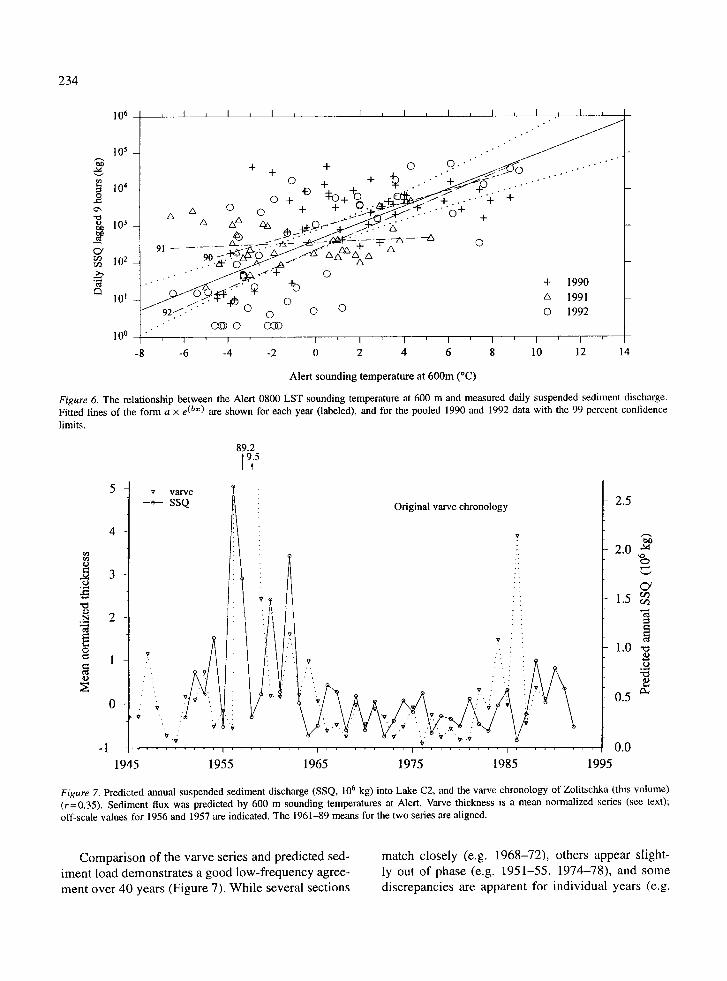
Daily SSQ through each field season is shown with the corresponding Alert 600 m temperatures in Fig- ure 6. The relative accordance of regression lines pre- dicting SSQ from Echo (cf. Figure 3) and Alert 600 m temperatures again confirms the validity of using Alert sounding data. The subparallel lines for predicted 1990 and 1992 SSQ, based on Alert 600 m temperatures, suggests reasonable stability in the relationship for the two years.
To provide a calibration of daily SSQ based on Alert 600 m temperatures, 1990 and 1992 daily SSQ values were pooled, yielding the following relationship:
Daily SSQ = 400.0xe (0"541 xAlert 6(Xl m Ta) adj.r z = 0.43 (1)
The line described by the equation above (Figure 6) has been extended beyond 1990-92 data to indicate the predicted response to higher temperatures. The 1991 measurements were not utilized in the above calibra- tion, because they represent only a portion of the full streamflow period. (Total measured SSQ for the years on which the equation is based were ten times greater than the measured 1991 load. When equation 1 is applied to Alert 600 m temperatures through the 1991 field period, the total is 48 percent higher than that measured; predicted SSQ for the full year is over 20 times higher than the measured field season load.)
Annual predicted sediment load, 1951 to 1989
From the Alert rawinsonde data period of record, the 600 m temperatures were interpolated for each day, May I to August 31. Interpolation was carried out for the May through August period only, as all other months average < - 1 0 ~ For the months of August 1986 and May 1991, substitution of mean values for each day was required (based on 1967-92). Eight days during 1952 were filled in the same way. Otherwise, only 1.0 percent of the data were missing, for which interpolated values were substituted.
The calibration equation presented above predicts the daily SSQ into Lake C2, as an exponential function of the Alert 0800 h sounding temperature at 600 m. A benefit of this equation form is that because the pre- dicted daily SSQ is insignificantly small at low temper- atures, equation 1 can be applied to a raw series of dai-
233
ly temperature measurements, rather than a processed subset such as melting degree-days. Similarly, inter- vals of warm temperatures will profoundly affect the predicted sediment transfer, regardless of their season- al timing. The annual sediment transfer through the period 1951 to 1992 was predicted using equation 1 to calculate the daily SSQ, then the daily loads were accu- mulated each year. The predicted annual totals illus- trate an interannual variability of greater than twenty- fold (Figure 7). Predicted 1990-92 SSQ falls within the middle two quartiles of the 40-year distribution, sug- gesting that these years were representative of 'aver- age' conditions through the period.
Predicted sediment flux and the varve record, 1951 to 1989
In order to compare predicted annual SSQ with that recorded in Lake C2 as lamination thickness, we used the measurements and stratigraphic correlations of Zolitschka (1996). Eight sediment cores were used in this analysis, all of which were recovered from the deep basin of the lake (> 80 m), at locations 250-750 m from the stream delta, along a transect toward the lake outlet (Zolitschka, 1993 v. 2, Table 9; cores 15, 33, 16, 17, 18, 19, 21 and 25). Zolitschka (1996) demon- strated that the laminae are true varves. Difficulties associated with defining individual varves in each core inevitably lead to uncertainties in the chronology of single cores. However, by comparing and cross-dating all the cores, a more precise composite series can be obtained with minimal (but probably not zero) errors. Had only one core been used, the estimated chrono- logical error would have been 10 percent (Zolitschka et al., in prep.).
We calculated normalized annual thickness values (Zn) in each core for the period 1945-89 as:
Zn (annual thickness - (196t - 89 mean)) = 1961 - 89SD (2)
A mean normalized thickness series was then com- piled, which prevented distal thinning of lamination thickness from skewing the mean annual thickness val- ues, through short time intervals when laminae were missing in one or more cores. The resultant annual thickness series should therefore be representative of interannual sedimentation variability within the lake, for the period 1945-89. If this is correct, then the variation in thickness should also reflect interannual
234
106 ~ I ~ I ~ I ~ I t I ~ I ~ [ i * I ~ I L
10 ~ -
"~ + + + o Q . "
,0, ~ + +. + ~ . " ~ < . - . - " " o . o 4-_ 0 &Ax~_.~'i / . i . ' , ' " + = o + - - o + ^ ~ - - - . - - - + . . . . . . . + *
~" ,, o + ~ ~ + ' . - - " o * + A ^ O ^ +..
- - 9 0 ~ ~ = s ~ * ~ ~ ~ o ~ ~ ~ r~r'~ 102 . . ~ - : ' 0 ' ~ . . . . ~ ' ~ . . ~ - '" ~ A- -
" " ~ . ~ " Q " ~ ' + +0 0 + 1990
~ 0 ,99, 0 ~ 0 , 9 9 :
- ' C ~ � 9 C(]D 1 0 o � 9
I I q I ' I I I ' I ' b ' I '
-8 -6 -4 -2 0 2 4 6 8 10 12 14
Aler t sound ing t empera tu re at 6 0 0 m (~
Figure 6. The relationship between the Alert 0800 LST sounding temperature at 600 m and measured daily suspended sediment discharge. Fitted lines of the form a • e (b~) are shown for each year (labeled), and for the pooled 1990 and 1992 data with the 99 percent confidence
limits.
89.2 195
5 - ~ varve
--~--- SSQ Original varve chronology
4
i 3
~ 2
" v '
' ' , V
0 i * �9 * " "v ~ y : "o :
~.,'
- I . . . . . . . . . . . . . . . . . . I . . . . . . . . . I . . . . . . . . . 1 . . . . . . . . .
1945 1955 1965 1975 1985
2.5
eaO 2.0 f f
o
1.5 m "a
1.0 -o
0.5 ~
0.0 1995
Figure 7. Predicted annual suspended sediment discharge (SSQ, 106 kg) into Lake C2, and the varve chronology of Zoli tschka (this volume) ( r=0.35) . Sediment flux was predicted by 600 m sounding temperatures at Alert. Varve thickness is a mean normalized series (see text); off-scale values for 1956 and 1957 are indicated�9 The 1961-89 means for the two series are aligned�9
Comparison of the varve series and predicted sed- iment load demonstrates a good low-frequency agree- ment over 40 years (Figure 7). While several sections
match closely (e.g. 1968-72), others appear slight- ly out of phase (e.g. 1951-55, 1974-78), and some discrepancies are apparent for individual years (e.g.
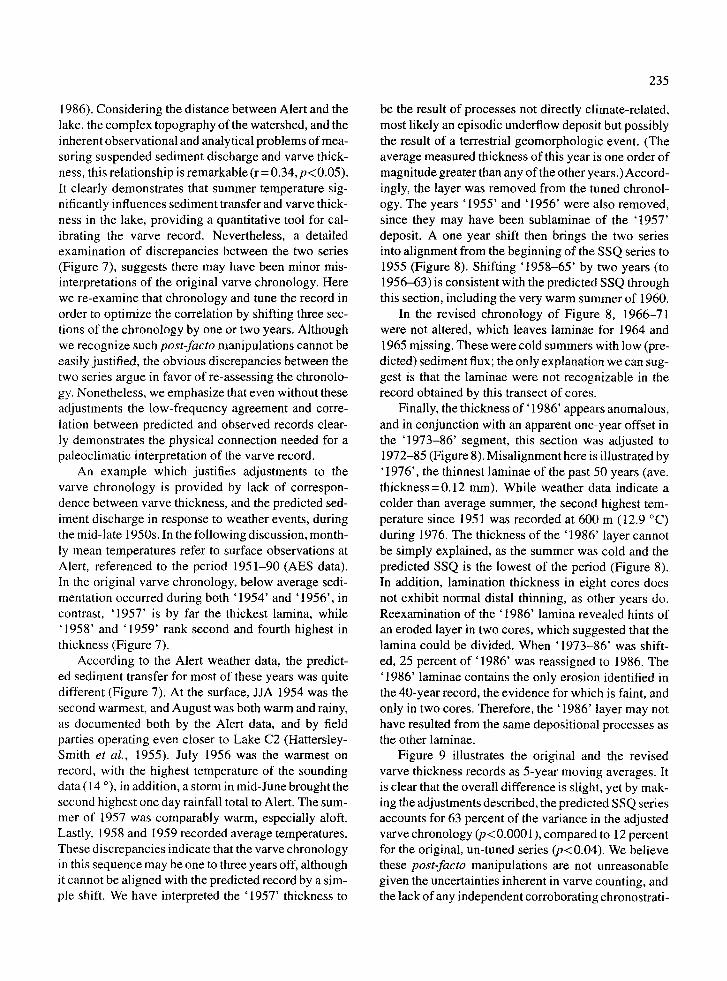
1986). Considering the distance between Alert and the lake, the complex topography of the watershed, and the inherent observational and analytical problems of mea- suring suspended sediment discharge and varve thick- ness, this relationship is remarkable (r = 0.34, p<0.05). It clearly demonstrates that summer temperature sig- nificantly influences sediment transfer and varve thick- ness in the lake, providing a quantitative tool for cal- ibrating the varve record. Nevertheless, a detailed examination of discrepancies between the two series (Figure 7), suggests there may have been minor mis- interpretations of the original varve chronology. Here we re-examine that chronology and tune the record in order to optimize the correlation by shifting three sec- tions of the chronology by one or two years. Although we recognize such post-facto manipulations cannot be easily justified, the obvious discrepancies between the two series argue in favor of re-assessing the chronolo- gy. Nonetheless, we emphasize that even without these adjustments the low-frequency agreement and corre- lation between predicted and observed records clear- ly demonstrates the physical connection needed for a paleoclimatic interpretation of the varve record.
An example which justifies adjustments to the varve chronology is provided by lack of correspon- dence between varve thickness, and the predicted sed- iment discharge in response to weather events, during the mid-late 1950s. In the following discussion, month- ly mean temperatures refer to surface observations at Alert, referenced to the period 1951-90 (AES data). In the original varve chronology, below average sedi- mentation occurred during both '1954' and '1956', in contrast, '1957' is by far the thickest lamina, while '1958' and '1959' rank second and fourth highest in thickness (Figure 7).
According to the Alert weather data, the predict- ed sediment transfer for most of these years was quite different (Figure 7). At the surface, JJA 1954 was the second warmest, and August was both warm and rainy, as documented both by the Alert data, and by field parties operating even closer to Lake C2 (Hattersley- Smith et al., 1955). July 1956 was the warmest on record, with the highest temperature of the sounding data (14 ~ in addition, a storm in mid-June brought the second highest one day rainfall total to Alert. The sum- mer of 1957 was comparably warm, especially aloft. Lastly, 1958 and 1959 recorded average temperatures. These discrepancies indicate that the varve chronology in this sequence may be one to three years off, although it cannot be aligned with the predicted record by a sim- ple shift. We have interpreted the '1957' thickness to
235
be the result of processes not directly climate-related, most likely an episodic underflow deposit but possibly the result of a terrestrial geomorphologic event. (The average measured thickness of this year is one order of magnitude greater than any of the other years.) Accord- ingly, the layer was removed from the tuned chronol- ogy. The years '1955' and '1956' were also removed, since they may have been sublaminae of the '1957' deposit. A one year shift then brings the two series into alignment from the beginning of the SSQ series to 1955 (Figure 8). Shifting '1958-65' by two years (to 1956-63) is consistent with the predicted SSQ through this section, including the very warm summer of 1960.
In the revised chronology of Figure 8, 1966-71 were not altered, which leaves laminae for 1964 and 1965 missing. These were cold summers with low (pre- dicted) sediment flux; the only explanation we can sug- gest is that the laminae were not recognizable in the record obtained by this transect of cores.
Finally, the thickness o f ' 1986' appears anomalous, and in conjunction with an apparent one-year offset in the '1973-86' segment, this section was adjusted to 1972-85 (Figure 8). Misalignment here is illustrated by '1976', the thinnest laminae of the past 50 years (ave. thickness = 0.12 mm). While weather data indicate a colder than average summer, the second highest tem- perature since 1951 was recorded at 600 m (12.9 ~ during 1976. The thickness of the '1986' layer cannot be simply explained, as the summer was cold and the predicted SSQ is the lowest of the period (Figure 8). In addition, lamination thickness in eight cores does not exhibit normal distal thinning, as other years do. Reexamination of the '1986' lamina revealed hints of an eroded layer in two cores, which suggested that the lamina could be divided. When '1973-86' was shift- ed, 25 percent of '1986' was reassigned to 1986. The '1986' laminae contains the only erosion identified in the 40-year record, the evidence for which is faint, and only in two cores. Therefore, the ' 1986' layer may not have resulted from the same depositional processes as the other laminae.
Figure 9 illustrates the original and the revised varve thickness records as 5-year moving averages. It is clear that the overall difference is slight, yet by mak- ing the adjustments described, the predicted SSQ series accounts for 63 percent of the variance in the adjusted varve chronology (p<0.0001), compared to 12 percent for the original, un-tuned series (p<0.04). We believe these post-facto manipulations are not unreasonable given the uncertainties inherent in varve counting, and the lack of any independent corroborating chronostrati-

236
9.5
- -(3- - v a r v e 2.5 ----0-- SSQ Adjusted varve chronology
4 ,-M
T 2.0
0 { t ' ~
"~ ~ 1.5 m
s 2 ,',
o 1.o
0dr *
0 , , 0.5 ~'
- 1 . . . . . . . . . , . . . . . . . . . , . . . . . . . . . , . . . . . . . . . , . . . . . . . . . 0 . 0
1945 1955 1965 1975 1985 1995
Figure 8. Predicted annual suspended sediment discharge (SSQ, 106 kg) into Lake C2, and the adjusted, or tuned, varve chronology. If correct, SSQ based on the 600 m sounding temperature at Alert is able to account for 63 percent of the Lake C2 varve thickness variance (r 2 = 0.7 l, if 1983 and t985 varves are deleted).
graphic markers. We note that no adjustment altered the chronology by more than two years. Indeed, we feel that the very significant correlation between SSQ pre- dicted from the Alert data and the varve thickness in our revised chronology provides strong support for those revisions, since it is extremely difficult to unequivo- cally date a specific varve.
The climate signal
At Lake C2, this study has demonstrated a nonlinear relationship between air mass temperature and daily sediment discharge to the lake, which indicates that most of the annual sediment transfer occurs in asso- ciation with the weather of only a relatively few days each summer. Equipped with annual summations of the predicted daily sediment load, we were able to adjust the original Lake C2 composite core varve chronolo- gy. The result is the first calibrated varve record ever established from the High Arctic.
This calibrated record has important implica- tions for the interpretation of varve chronologies. At Lake C2, varves are extremely thin, yet laminae are distinct, laterally traceable between cores, and can be
shown to be annual (Zolitschka, 1996). Nonetheless, according to these results, the chronology may still be subject to minor errors in the assignment of a specific year to an individual varve. This does not invalidate the overall process of varve chronometry, since, in the aggregate, such minor adjustments are unlikely to be cumulative (cf. Figure 8). Rather, our study confirms the difficulties inherent in accurately determining clas- tic varve chronologies (Zolitschka e t a l . , in prep.).
Previous studies have demonstrated that summer precipitation events within a watershed can degrade the association between air temperature and varve thick- ness (e.g. Leemann & Niessen, 1994). Even for basins at the highest latitudes, although the magnitude of sum- mer precipitation events is generally small, there has been speculation that summer rain produces the most extreme runoff Church (1988). To date, however, no rainfall-runoff event has yet been documented, from unglacierized basins in the Queen Elizabeth Islands, in which peak discharge exceeded that of the same year 's snowmelt runoff (Hardy, 1995). This study, spanning a 40 year period, provides no (indirect) evidence to dispute this. In 1968, for example, rainfall on July 26, 27 and 28 established records for the greatest one, two and three-day rainfall totals at Alert (18.8, 33.5,

237
~ 4
"-" 3
2
! . )
t ~
0
~ 0
-1
20.1 19.5 ~ 20.1 1 711 203,
i i i i i . . . . I , , , T 3 I i I i I i r l r l l r l l P I i l l l i l A l l l l l l l l l l l
. . . . . Original - ~ - Adjusted
JJA 600 m
" / I "
I " I '
,; ~ '.
i ]: J
~.~-~..~,~;~,~, , �9 t .
Q - . - 'M,; V I ~ Y ' V
. . . . . . . . . J . . . . . . . . . I . . . . . . . . . I . . . . . . . . . I . . . . . . . . .
O
-1 ,,O <
-2
-3 1945 1955 1965 1975 1985 1995
Figure 9. Five-year moving averages of original and adjusted mean normalized varve thicknesses, and of Alert mean summer temperature (JJA) at 600 m.
34.3 ram, respectively). The July mean temperature was well below average, which would have promoted rainfall runoff by limiting the active layer thaw (and hence rainfall storage capacity). Despite record rain- fall, the varve thickness for 1968 in Figure 8 is very thin, and would remain so even if minor chronological errors remain. Rainfall at Alert may have occurred as snowfall at Lake C2; however, it appears that a large precipitation event did not alter the temperature-varve thickness relationship in 1968. The two other years with large rainfall events (1954 and 1956) were both unusually warm, possibly masking the effect of rain- fall runoff, and thus providing no clear evidence for rainfall-induced sediment transfer. While the possibil- ity of extreme rainfall-runoff floods during this time period cannot be ruled out, we feel that mixed pop- ulations of floods have not significantly affected the Lake C2 varve record.
Using the calibrated varve record (Figure 8), we may now examine the Alert weather station data fur- ther, in order to determine which single climate mea- sure may be extracted from the thickness of Lake C2 varves. Table 2 is a summary of correlations (r), obtained by unweighted least-squares linear regres- sion. We took varve thickness to be the independent
variable in all cases (n = 37 and 39 years, for the adjust- ed and original thickness series).
Several important points are illustrated. First, Lake C2 varves appear to record interannual variabili- ty in the temperature of the warmest air mass advected to that latitude each summer. This is because 600 m temperatures are generally better correlated with varve thickness than those at the surface, and because thick- ness is better correlated with short intervals (e.g. the warmest single day, warmest month) than longer aver- aging periods (i.e. JJA).
A second point is that the detailed process study conducted as part of this investigation was essential to providing the physical basis for calibration of the varve record. Simple attempts to correlate the orig- inal varve chronology and surface temperature data achieve less conclusive results, in that the highest coef- ficient ( r= 0.25 for mean JJA temperature or cumula- tive MDD), is only significant at the 0.1 level. Howev- er, from our understanding of the processes involved in sediment flux to Lake C2, we were able to 'predict ' the expected sediment discharge and thereby adjust the varve chronology. In this way, the very strong climate signal in the data was more clearly identified.
238
Last , we no t e tha t e v e n w i t h o u t ad jus tmen t s , the
original v a r v e c h r o n o l o g y exh ib i t s b o t h l ow- f r equency
a g r e e m e n t (F igu re 9), and is re la t ive ly wel l corre-
la ted ( r = 0 . 4 1 to 0 .37) wi th 600 m m e a n t empera -
tures for JJA, J u n e a nd July, all o f w h i c h are s ignif -
i can t at the 0 .05 level or better. T h u s e v e n accep t ing
s l igh t c h r o n o l o g i c a l er rors , th is s tudy ind ica tes tha t the
L a k e C2 v a r v e r e c o r d can p r o v i d e a h i g h - r e s o l u t i o n
p roxy r e c o r d o f s u m m e r w a r m t h at 83 ~ la t i tude (cf.
L a m o u r e u x & Brad ley , 1996).
Acknowledgments
T h e au tho r s are e x t r e m e l y g ra te fu l for s uppo r t f r o m the
N a t i o n a l S c i e n c e F o u n d a t i o n . T h e Pola r Con t i nen t a l
S h e l f P ro j ec t o f E n e r g y M i n e s and R e s o u r c e s C a n a d a
p r o v i d e d e x c e l l e n t log is t ica l suppor t . D R H t h a n k s the
G e o l o g i c a l Soc ie ty o f A m e r i c a for a R o b e r t K. F a h n e -
s tock M e m o r i a l R e s e a r c h Award , and B Z acknowl -
edges the N A T O Sc i ence F e l l o w s h i p s P rog ram. W e
also t h a n k M. J, Re te l l e and J. K. Ch i ld for co re r ecov-
ery, and E T. K e i m i g for d i s cus s ion and p r o g r a m -
ming . E x t r e m e l y he lp fu l r e v i e w s were p r o v i d e d by
E. M. L e o n a r d and P. E. O ' S u l l i v a n . Th i s is PALE
c o n t r i b u t i o n n u m b e r 41.
References
Bradley, R. S., M. J. Retelle, S. D. Ludlam, D. R. Hardy, B. Zolitsch- ka, & S. F. Lamoureux, 1996. The Taconite Inlet Lakes Project: A systems approach to paleoclimatic reconstruction. J. Paleolimnol. 16: 97-110.
Church, M., 1988. Floods in cold climates. In V. R. Baker, R. C. Kochel & P. C. Patton (eds), Flood geomorphology, Wiley, N.Y.: 205-229.
Deslodges, J. R., 1994. Varve deposition and the sediment yield record at three small lakes of the southern Canadian Cordillera. Arc. Alp. Res. 26: 130-140.
Gilbert, R., 1975. Sedimentation in Lillooet Lake, British Columbia. Can. J. Earth Sci. 12: 1697-1711.
Granar, L., 1956. Dating of recent fluvial sediments from the estu- ary of the .~ngerman river (The period 1850-1950 A.D.). Geol. F6ren. F6rhandl. 78: 654-658.
Hardy, D. R., 1996. Climatic influences on streamflow and sedi- ment flux into Lake C2, northern Ellesmere Island, Canada. J. Paleolimnol. 16: 133-149.
Hardy, D. R., 1995. Streamflow and sediment transfer from a moun- tainous High Arctic watershed, northern Ellesmere Island, Cana- da. Ph.D. diss., Univ. Massachusetts, Amherst: 267 pp.
Hattersley-Smith, G., A. P. Crary & R. L. Christie, 1955. Northern Ellesmere Island, 1953 and 1954. Arctic 8: 1-36.
Lamoureux, S. F. & R. S. Bradley, 1996. A late Holocene varved sed- iment record of environmental change from northern Ellesmere Island, Canada. J. Paleolimnol. 16: 239-255.
Leemann, A. & F. Niessen, 1994. Varve formation and the eli- matie record in an Alpine proglacial lake: calibrating annually- laminated sediments against hydrological and meteorological data. The Holocene 4: 1-8.
Leonard, E. M., 1985. Glaciological and climatic controls on lake sedimentation, Canadian Roeky Mountains. Z. Gletsch. Glacizial. 21: 35-42.
Retelie, M. J. & J. Child, 1996. Suspended sediment transport and deposition in a High Arctic meromictic lake, northern Ellesmere Island, Canada. J. Paleolimnol. 16: 151-167.
Zolitschka, B., 1993. Sedimentation in nonglacial arctic lakes at Taconite Inlet, Ellesmere Island, Canada. NATO Science Fel- lowships Program, Final Report, vol. 2, 85 pp.
Zolitschka, B., 1996. Recent sedimentation in a High Arctic lake, northern Ellesmere Island, Canada. J. Paleolimnol. 16: 169-186.
Zolitschka, B., S. F. Lamoureux & R. S. Bradley, in prep., Potential chronological errors in clastic varved sediments.
Related Documents