NAST.0008S8 NASA - ,TPL S$IC No. 9661 PILOT PLANT EVALUATION OF THEEFFECTIVENESS OF UV/OZONE OXIDATION FOR THE REMOVAL OF VOLATILE ORGANIC CHEMICALS REPORT TO THE CITY OF PASADENA MARCH, 1988 Jl_1 JamesM.Montgomery Consulting Engineers Inc.

Welcome message from author
This document is posted to help you gain knowledge. Please leave a comment to let me know what you think about it! Share it to your friends and learn new things together.
Transcript
For more information, please contact: Merrilee Fellows NASA Water Cleanup Outreach Manager NASA Management Office Jet Propulsion Laboratory M/S 180-801 4800 Oak Grove Drive Pasadena, CA 91109 Phone: (818) 393-0754 Email: [email protected]
NAST.0008S8NASA - ,TPLS$IC No. 9661
PILOT PLANT EVALUATION
OF
THE EFFECTIVENESS OFUV/OZONE OXIDATION
FOR
THE REMOVAL OFVOLATILE ORGANIC CHEMICALS
REPORT TO
THE CITY OF PASADENA
MARCH, 1988
Jl_1 JamesM.MontgomeryConsulting Engineers Inc.

JAMES M. MONTGOMERY, CONSULTING ENGINEERS, INC.
""""' 250 Nor[n Madison Avenue RO. Box 7009 Pasadena California 91109-7009 / (818) 796-9141 / f213) 681-4255
Cable Address: Montgomery Pasadena California Telex: 67-5420
_' March 9, 1988
Mr. Thomas K. UnderbrinkWater Engineering ManagerCity of Pasadena
- Water and Power Department150 South Los Robles Avenue, Suite 200Pasadena. CA 91101
Dear Mr. Underbrink:
,, In accordance with our amended contract (Contract Amendment No. 12,978) datedDecember 23, 1986, James M. Montgomery Consulting Engineers, Inc. (JMM) is pleasedto submit this final report entitled "Pilot Plant Evaluation of the Effectiveness ofUV/Ozone Oxidation for the Removal of Organic Chemicals." This report summarizes
'-- the results of the pilot study which evaluated the overall effectiveness of two commerciallyavailable UV/Ozone oxidation systems in removing trichloroethylene (TCE),tetrachioroethylene (PCE), and carbon tetrachloride (CTC) from contaminated Pasadena
-- groundwater. Aside from the UV/ozone tests, a few "special" studies were performed toprovide a cursory evaluation of the comparative effectiveness of two alternative advancedoxidation processes (AOP): ozone/peroxide and UV/ozone/peroxide.
Results of this study indicated, when treating for volatile organic chemicals (VOCs) in theliquid-phase (i.e., contaminated well water), that the UV/ozone oxidation process waseffective at destroying TCE and PCE but was not effective at destroying CTC. As a
-- result, a new treatment alternative which couples air stripping with an AOP air pollutioncontrol system is proposed. Oxidation of VOCs in the gas-phase, as opposed to theliquid-phase, theoretically should be more efficient.
Finally, using the pilot study results, revised capital and O&M cost estimates forUr/ozone treatment (achieving 99%, 95%, and approximately 50% removals of TCE,PCE, and CTC, respectively) were prepared. The preliminary UV/ozone cost estimateswere determined prior to the pilot study and were reported in the previously submittedTreatability/Feasibility report. In addition, the revised UV/ozone estimates are comparedwith cost estimates for other treatment alternatives deemed viable.
JAMES M. MONTGOMERY, CONSULTING ENGINEERS, INC. 250 North Madison Avenue, BO. Box 7009, Pasadena, California 91109.7009 (818) 796-9141 (213) 681-4255
It has been a great pleasure working with you and the other participants during this pilot· study. We look forward to continuing to work with you during the next phase of our
contract.
Respectfully yours,
-. JAMES M. MONTGOMERY
Consulting Engineers, lnc3,_ .,,
E. Marco Aieta, Ph.D.Manager of Applied Research Department
_ Carol H. Tale, D.Env.Vice President
flew
J
CITY OF PASADENA
WATER AND POWER DEPARTMENT
-- City Management
Edward K. Aghjayan - Deputy City Manager
David C. Plumb - General Manager
Administration and Staff
Willard O. Bangha m - Manager of Water Systems
Thomas K. Underbrink - Water EngineeringManager
_, L
W
PROJECT STAFF
Engineering,._,
,.. CarolH. Tate- ProjectManager
E. Marco Aieta - Project Engineer
JohnS,Lang
Paul E. Sedory
I. Elaine Wallace
Bruce M. Chow
Elizabeth Wong
i
'w i
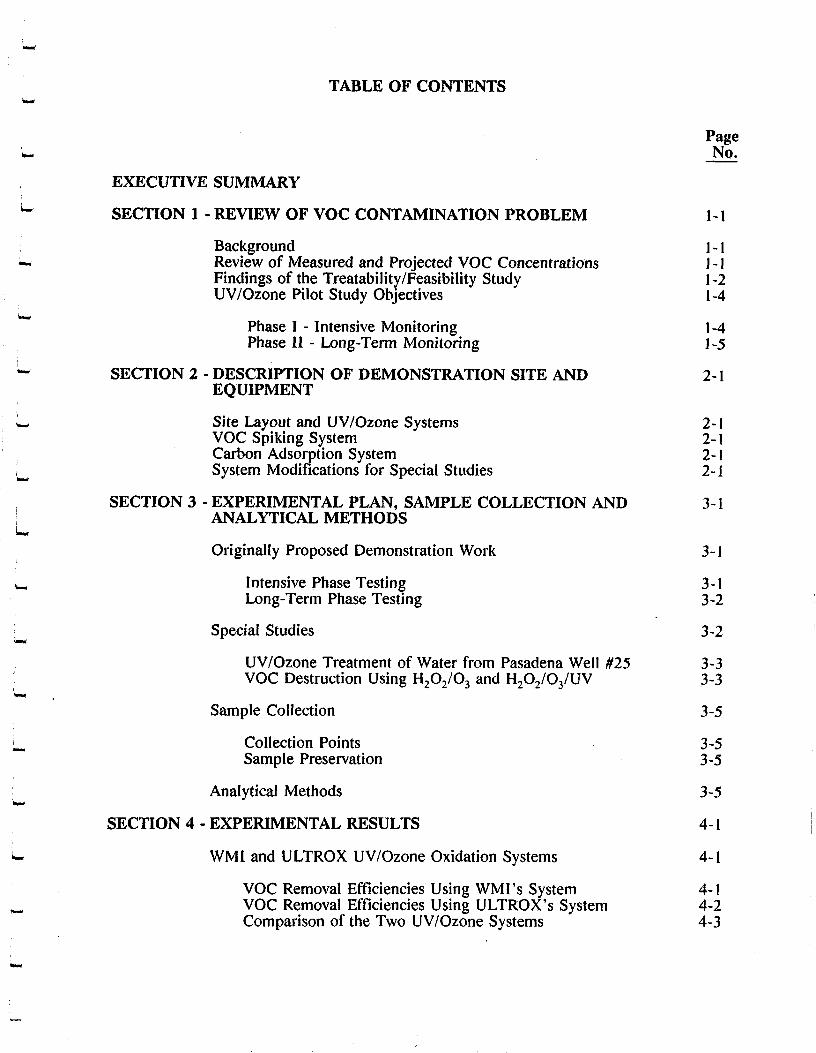
TABLE OF CONTENTS
PageNo.
EXECUTIVE SUMMARY
"' SECTION 1 - REVIEW OF VOC CONTAMINATION PROBLEM 1~1
Background l-I-.- Review of Measured and Projected VOC Concentrations I- I
Findings of the Treatability/Feasibility Study 1-2UV/Ozone Pilot Study Objectives 1-4
Phase I - Intensive Monitoring I-4Phase 1I - Long-Term Monitoring 1-5
;" SECTION 2 -DESCRIPTION OF DEMONSTRATION SITE AND 2-1EQUIPMENT
,., Site Layout and UV/Ozone Systems 2-1VOCSpikingSystem 2-1Carbon Adsorption System 2-ISystemModificationsforSpecialStudies 2-1
SECTION 3 - EXPERIMENTAL PLAN, SAMPLE COLLECTION AND 3-1_. ANALYTICAL METHODS
Originally Proposed Demonstration Work 3-1
_ IntensivePhaseTesting 3-ILong-Term Phase Testing 3-2
Special Studies 3-2
UV/Ozone Treatment of Water from Pasadena Well//25 3-3VOC Destruction Using H202/O 3 and H202/O3/UV 3-3
Sample Collection 3-5
Collection Points 3-5SamplePreservation 3-5
AnalyticalMethods 3-5
SECTION4 -EXPERIMENTALRESULTS 4-1
WMI and ULTROX UV/Ozone Oxidation Systems 4-l
VOC Removal Efficiencies Using WMI's System 4-1,.. VOC Removal Efficiencies Using ULTROX's System 4-2
Comparison of the Two UV/Ozone Systems 4-3
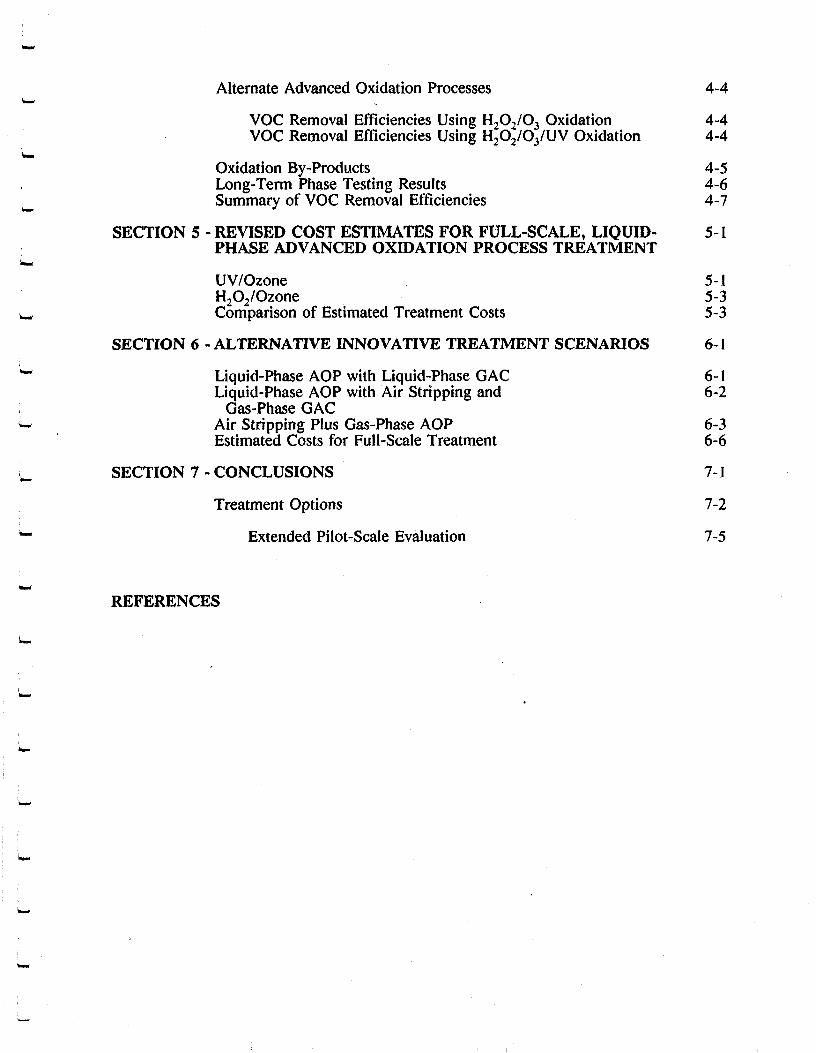
Alternate AdvancedOxidation Processes 4-4
VOC Removal Efficiencies Using H202/O 3 Oxidation 4-4VOC Removal Efficiencies USing H202/O3/UV Oxidation 4-4
Oxidation By-Products 4-5Long-TermPhaseTestingResults 4-6
... Summary of VOC Removal Efficiencies 4-7
SECTION 5 -REVISED COST ESTIMATES FOR FULL-SCALE, LIQUID- 5-1PHASE ADVANCED OXIDATION PROCESS TREATMENT
UV/Ozone 5- IH202/Ozone · 5-3Comparison of Estimated Treatment Costs 5-3
SECTION 6 -ALTERNATIVE INNOVATIVE TREATMENT SCENARIOS 6-1
"' Liquid-PhaseAOPwithLiquid-PhaseGAC 6-ILiquid-PhaseAOPwith Air Stripping and 6-2
i Gas-PhaseGAC_- Air Stripping Plus Gas-Phase AOP 6-3
Estimated Costs for Full-Scale Treatment 6-6
SECTION 7 - CONCLUSIONS 7- l
Treatment Options 7-2
'" Extended Pilot-Scale Evaluation 7-5
REFERENCES
F

_w
LIST OF TABLES
Table FOllowing,.., No. Title Page No.
E-1 Comparison of Estimated Treatment Costs for E-4Ail Alternative Treatment Processes Considered
I Intensive Phase Operating Conditions 3-1
2 Summary of Intensive-Phase Testing 3-1
3a Summary of Long-Term Testing Uitrox 3-2
,- 3b Summary of Long-Term Testing WMI 3-2
4 Attainable Treatment Levels for Current 4-3
Contaminant Levels
5 Comparison of H203/Ozone and UV/Ozone VOC 4-4Removal Efficiencies
6 VOC Removals Attained Using H:02/Ozone Oxidation 4-5
in Conjunction With Varying UV Dosages
'"' 7 Assumptions and Design Criteria Used for 5-1Cost Estimations
8 Cost Estimate for Full-Scale UV/Ozone Treatment 5-l
Using the ULTROX Treatment System
,- 9 Cost Estimate for Full-Scale Peroxide/Ozone 5-3
Treatment
10 Pros and Cons of the Two AOP Treatment 5-3
System (UV/Ozone vs. Peroxide/Ozone)
I l Comparison of Estimated Treatment Costs for 5-3
Several Alternative Treatment Processes
12 Qualitative Summaryof the Feasibilityof 5-3SeveralVOCTreatmentProcesses
13 Assumptions and Design Criteria Used for 6-6
Estimating the Costs for the AlternativeTreatment Scenarios
14 Comparison of Estimated Treatment Costs for 6-6
All Alternative Treatment Processes Considered
15 Accuracy of Cost Estimates for Viable Alternatives 6-6
w
i'
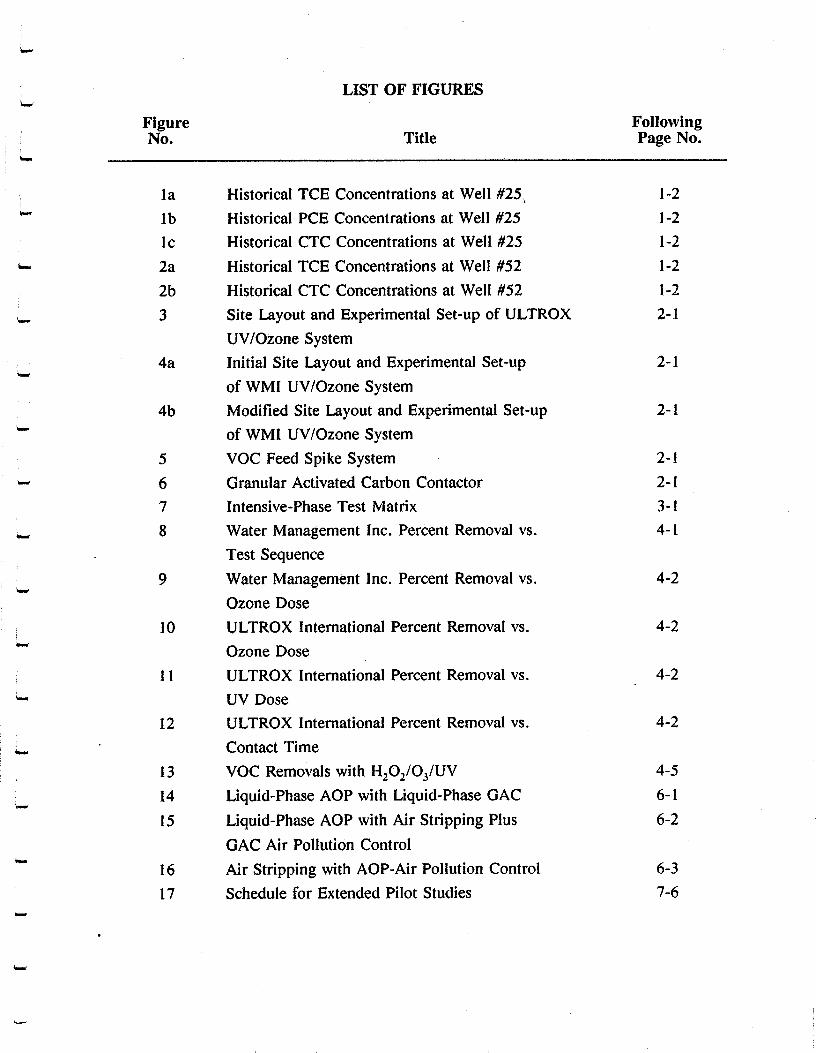
LIST OF FIGURES
Figure FollowingNo. Title Page No.
, la Historical TCE Concentrations at Well #25_ 1-2lb Historical PCE Concentrations at Well #25 1-2
lc Historical CTC Concentrationsat Well #25 1-2
*- 2a Historical TCE Concentrations at Well #52 1-2
2b Historical CTC Concentrations at Well #52 1-2
3 Site Layoutand ExperimentalSet-upof ULTROX 2-1
UV/Ozone System
4a Initial Site Layout and Experimental Set-up 2-1
of WMI UV/Ozone System
4b Modified Site Layout and Experimental Set-up 2-1
of WMI UV/Ozone System
5 VOCFeedSpikeSystem 2-I
6 GranularActivatedCarbonContactor 2-I
7 Intensive-PhaseTestMatrix 3-l
,- 8 Water Management Inc. Percent Removal vs. 4-l
Test Sequence
9 Water Management Inc. Percent Removalvs. 4-2
Ozone Dose
10 ULTROX International Percent Removal vs. 4-2
OzoneDose
I l ULTROX International Percent Removalvs. 4-2
UVDose
12 ULTROX International Percent Removal vs. 4-2
ContactTime
13 VOC Removals with H202/O3/UV 4-5
14 Liquid-Phase AOP with Liquid-Phase GAC 6-1
15 Liquid-PhaseAOP with Air Stripping Plus 6-2
GAC Air Pollution Control
16 Air Stripping with AOP-Air Pollution Control 6-3
17 Schedule for Extended Pilot Studies 7-6

o
EXECUTIVE SUMMARY
EXECUTIVE SUMMARY
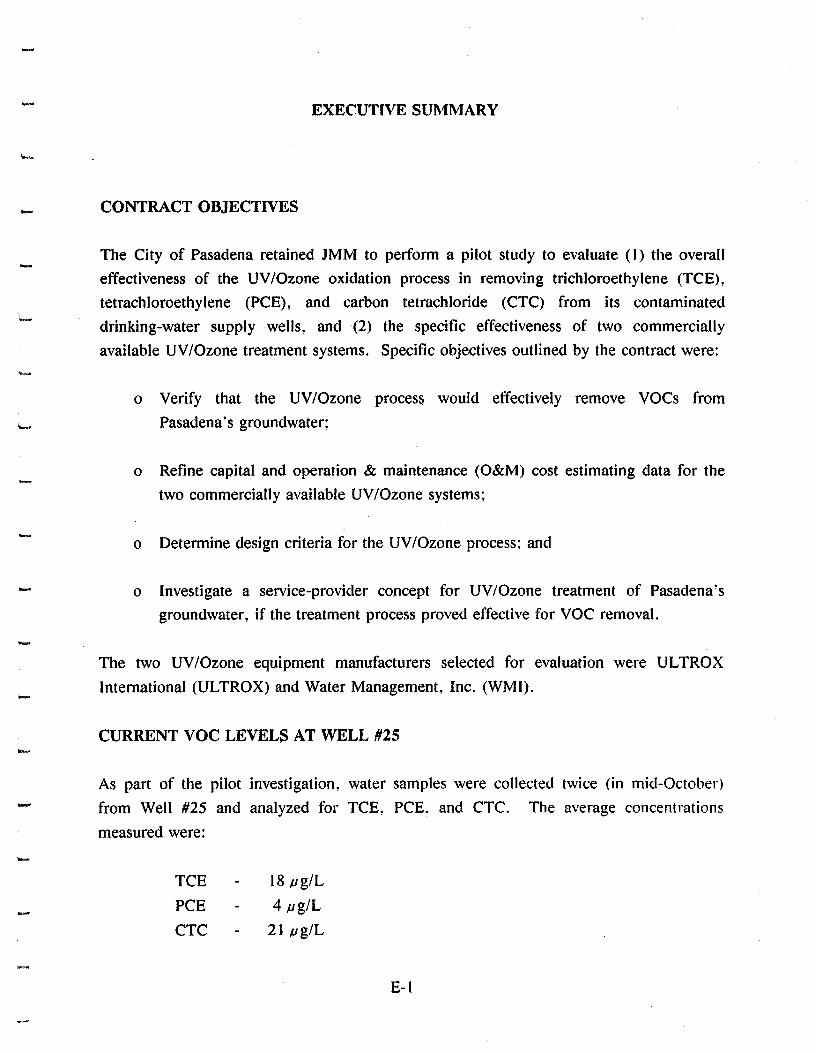
.__ CONTRACT OBJECTIVES
The City of Pasadena retained JMM to perform a pilot study to evaluate (I) the overall
effectiveness of the UV/Ozone oxidation process in removing trichloroethylene (TCE),
tetrachloroethylene (PCE), and carbon tetrachloride (CTC) from its contaminated
_ drinking-water supply wells, and (2) the specific effectiveness of two commercially
available UV/Ozone treatment systems. Specific objectives outlined by the contract were:
o Verify that the UV/Ozone process would effectively remove VOCs from
,_ Pasadena's groundwater;
o Refine capital and operation & maintenance (O&M) cost estimating data for the
two commercially available UV/Ozone systems;
o Determine design criteria for the UV/Ozone process; and
·-' o Investigate a service-provider concept for UV/Ozone treatment of Pasadena's
groundwater, if the treatment process proved effective for VOC removal.
The two UV/Ozone equipment manufacturers selected for evaluation were ULTROX
International (ULTROX) and Water Management, Inc. (WMI).
CURRENT VOC LEVELS AT WELL #25
As part of the pilot investigation, water samples were collected twice (in mid-October)
"_ from Well #25 and analyzed for TCE, PCE, and CTC. The average concentrations
measured were:
TCE 18 #g/L
PCE 4 # g/L
CTC 21 # g/L
E-l
The earlier Hydrogeologic Investigation Report projected the maximum TCE
concentration (at Well //25) to reach 170 #g/L in the next 20- to 30-years and remain
detectable for 40 years after the peak. Historical data from Well//25 indicate a trend of
'_ increasing concentration over time, for each of the three VOCs. During the past two to
three years, the greatest increase in concentration has been for CTC. The maximum
_.. concentrations measured to date are: TCE = 32 #g/L; PCE = 6.3 #g/L; CTC = 23
#g/L.
TREATED WATER GOALS
The current State of California action levels for TCE, CTC, and PCE are 5-, 5-, and 4-
#g/L, respectively. These State regulations for TCE and CTC are the same as the
_' national primary drinking water regulations, promulgated by the USEPA in July, 1987
(Federal Register, July 8, 1987). The USEPA's final regulation for PCE is scheduled for
,-. promulgation by June, 1988.
In light of these regulations, and to allow a margin of safety, the treated water goals were
set at 2 #g/L for each VOC. The approximate maximum concentrations tested in this
pilot study were 200 #g/L for TCE and CTC, and 20 #g/L for PCE. Thus, translating
the treated water goal into terms of percent removal, the treatment goals were 99%
removal of TCE and CTC, and 90 % removal of PCE.
VOC REMOVAL EFFICIENCIES USING UV/OZONE
The ULTROX and WMI UV/Ozone treatment systems were subjected to extensive testing
,.. to determine the effectiveness of each system in removing TCE, PCE, and CTC from
drinking water when initial VOC concentrations ranged from 2- to 200-#g/L. The
drinking water used for these tests was uncontaminated water from Windsor Reservoir
which had been spiked with VOCs just before going through the UV/ozone systems. A
limited number of experiments were performed with water from Well #25. The results
were similar for both water supplies. The best removals demonstrated by each system, in
comparison with the treatment goals, Were:
E-2
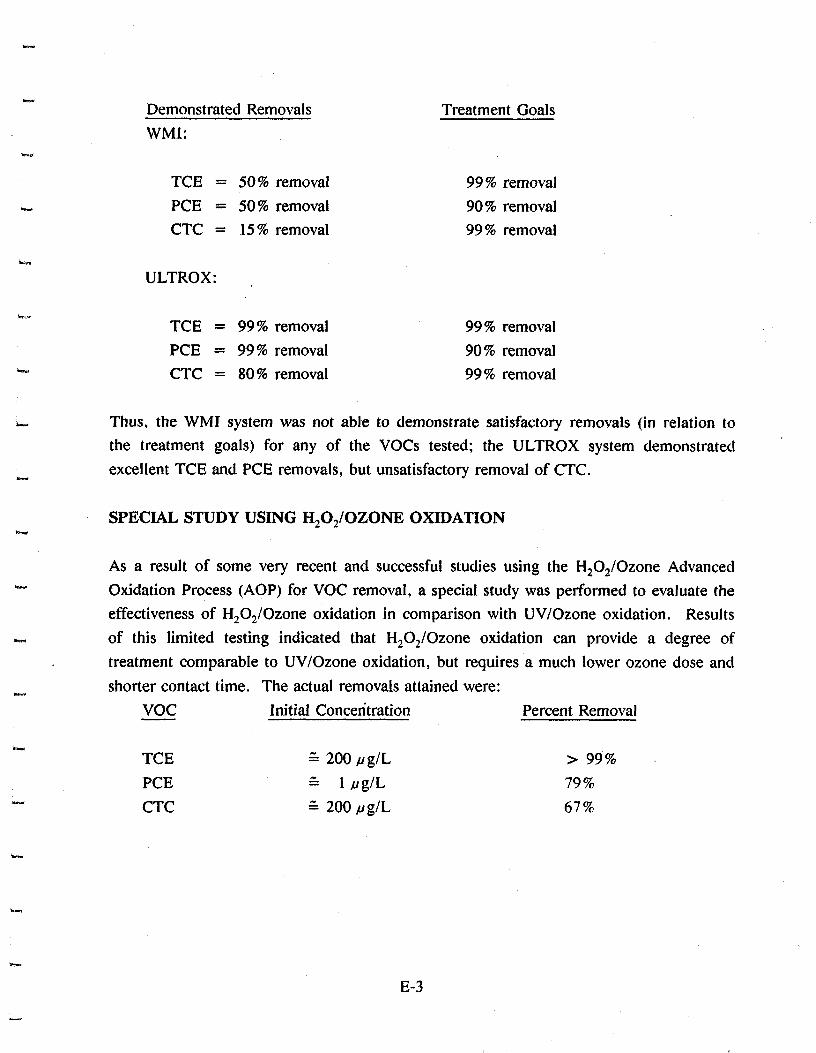
Demonstrated Removals Treatment Goals
WMI:
TCE = 50% removal 99% removal
.- PCE = 50% removal 90% removal
CTC = 15% removal 99% removal
ULTROX:
TCE = 99% removal 99% removal
PCE - 99% removal 90% removal
_' CTC = 80%removal 99%removal
.- Thus, the WMI system was not able to demonstrate satisfactory removals (in relation to
the treatment goals) for any of the VOCs tested; the ULTROX system demonstrated
excellent TCE and PCE removals, but unsatisfactory removal of CTC.
SPECIAL STUDY USING H202/OZONE OXIDATION
As a result of some very recent and successful studies using the H202/Ozone Advanced
_" Oxidation Process (AOP) for VOC removal, a special study was performed to evaluate the
effectiveness of H202/Ozone oxidation in comparison with UV/Ozone oxidation. Results
·._ of this limited testing indicated that H202/Ozone oxidation can provide a degree of
treatment comparable to UV/Ozone oxidation, but requires a much lower ozone dose and
shorter contact time. The actual removals attained were:
VOC Initial Concer/tration Percent Removal
TCE --- 200 # g/L > 99 %
PCE --- l#g/L 79%
CTC '-- 200 #g/L 67%
E-3
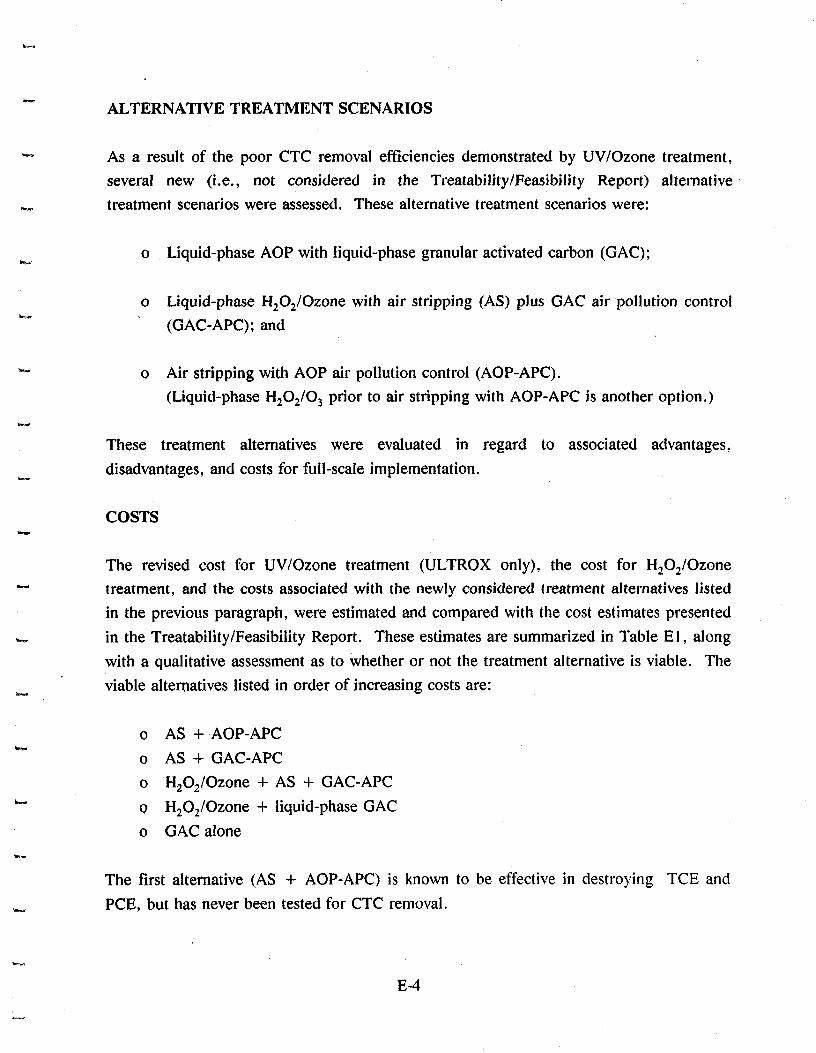
ALTERNATIVE TREATMENT SCENARIOS
'-' As a result of the poor CTC removal efficiencies demonstrated by UV/Ozone treatment,
several new (i.e., not considered in the Treatability/Feasibility Report) alternative
._ treatment scenarios were assessed. These alternative treatment scenarios were:
o Liquid-phase AOP with liquid-phase granular activated carbon (GAC);
o Liquid-phase H202/Ozone with air stripping (AS) plus GAC air pollution control
(GAC-APC); and
o Air stripping with AOP air pollution control (AOP-APC).
(Liquid-phase H:O2/O 3 prior to air stripping with AOP-APC is another option.)
These treatment alternatives were evaluated in regard to associated advantages,
disadvantages, and costs for full-scale implementation,
COSTS
The revised cost for UV/Ozone treatment (ULTROX only), the cost for H:O2/Ozone
·- treatment, and the costs associated with the newly considered Ireatment alternatives listed
in the previous paragraph, were estimated and compared with the cost estimates presented
_., in the Treatability/Feasibility Report. These estimates are summarized in Table El, along
with a qualitative assessment as to whether or not the treatment alternative is viable. The
viable alternatives listed in order of increasing costs are:
o AS + AOP-APC
o AS + GAC-APC
0 H20:/Ozone + AS + GAC-APC
_- o H202/Ozone + liquid-phase GACo GAC alone
The first alternative (AS + AOP-APC) is known to be effective in destroying TCE and
PCE, but has never been tested for CTC removal.
E-4
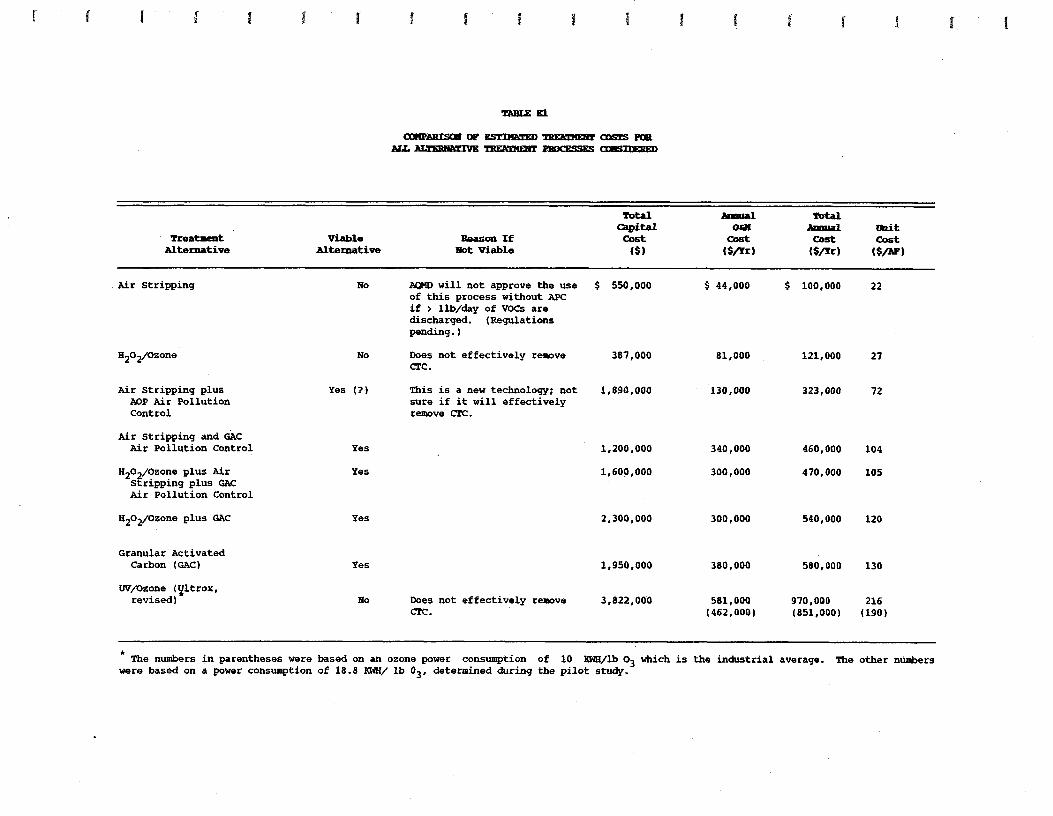
'n_ax,.E E1
AT./. _ _[_,F.A,,_ETgi_gT.1PR0r'_-_'_-'I_r.rmc:vrJm,_
Total Pamual Total
Capital O_ Aroma1 UaitTreat]ent Viable l_a_on If Cost Cost Cost Cost
Alternative Alternative lot Viable ($) (Stir) (Stir) (S/Er)
_Air stripping No _ will not approve the use $ 550,000 $ 44,000 $ 100,000 22of this process without APCif > llb/day of VOCs aredischarged. (Regulationspending.)
H202/Ozone No Does not effectively remove 387,000 81,000 121,000 27CTC.
Air Stripping plus Yes (?) This is a new technology; not 1,890,000 130,000 323,000 72AOP Air Pollution sure if it will effectivelyControl remove CTC.
Air Stripping and GAcAir Pollution Control Yes 1,200,000 340,000 460,000 104
H202/Ozone plus Air Yes 1,600,000 300,000 470,000 105Stripping plus GACAir Pollution Control
H202/Ozone plus GAC Yes 2,300,000 300,000 540,000 120
Granular Activated
Carbon (GAC) Yes 1,950,000 380,000 580,000 130
Ur/Ozone ( ltrox,
revised)_ No Does not effectively remove 3,822,000 581,000 970,000 216CTC. (462,000) (851,000) (190)
The numbers in parentheses were based on an ozone power consumption of 10 _l/Lb 03 which is the industrial average. The other nttmberswere based on a power consumption of 18.0 KWH/ lb 03, determined during the pilot study.
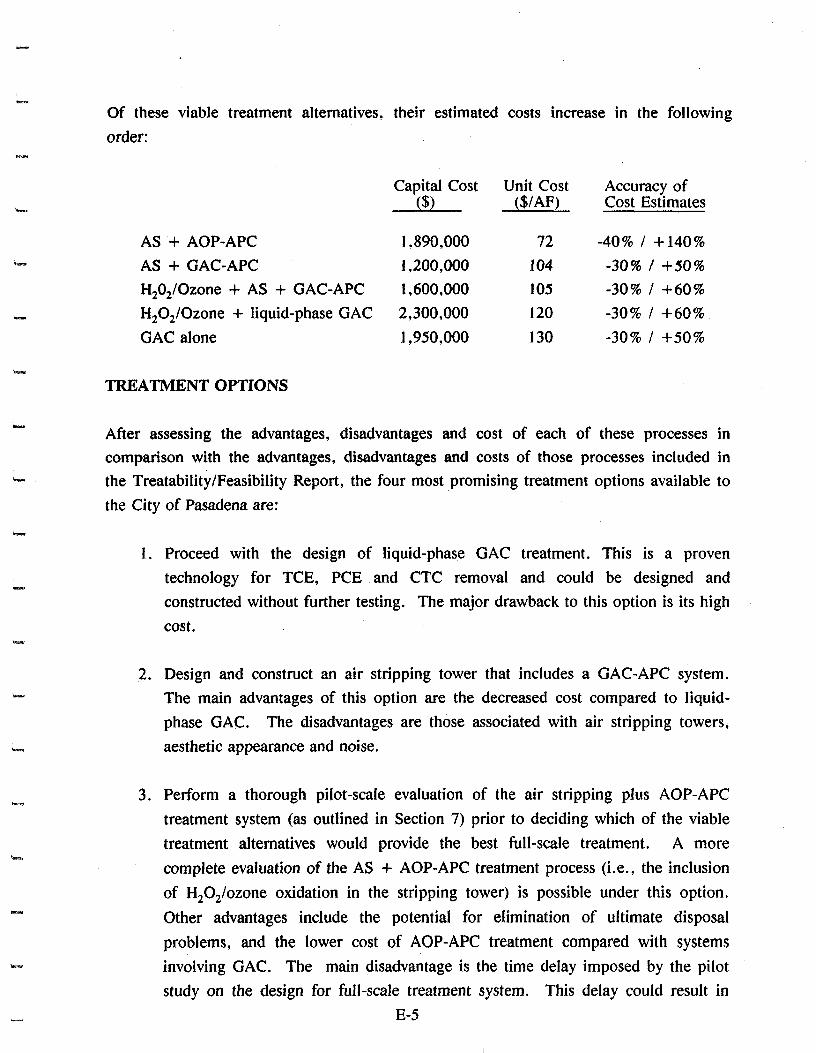
Of these viable treatment alternatives, their estimated costs increase in the following
order:
Capital Cost Unit Cost Accuracy of_. ($) ($/AF) CostEstimates
AS + AOP-APC 1.890,000 72 -40% / + 140%
_' AS + GAC-APC !,200,000 104 -30% / +50%
He02/Ozone + AS + GAC-APC 1,600,000 105 -30% / +60%
__ H202/Ozone + liquid-phase GAC 2,300,000 120 -30% / +60%
GAC alone 1,950,000 130 -30% / +50%
TREATMENT OPTIONS
After assessing the advantages, disadvantages and cost of each of these processes in
comparison with the advantages, disadvantages and costs of those processes included in
the Treatability/Feasibility Report, the four most promising treatment options available to
the City of Pasadena are:
1. Proceed with the design of liquid-phase GAC treatment. This is a proven
technology for TCE, PCE and CTC removal and could be designed and
constructed without further testing. The major drawback to this option is its high
cost.
2. Design and construct an air stripping tower that includes a GAC-APC system.
The main advantages of this option are the decreased cost compared to liquid-
phase GAC. The disadvantages are those associated with air stripping towers,
aesthetic appearance and noise.
3. Perform a thorough pilot-scale evaluation of the air stripping plus AOP-APC
treatment system (as outlined in Section 7) prior to deciding which of the viable
treatment alternatives would provide the best full-scale treatment. A more
complete evaluation of the AS + AOP-APC treatment process (i.e., the inclusion
of H202/ozone oxidation in the stripping tower) is possible under this option.
Other advantages include the potential for elimination of ultimate disposal
problems, and the lower cost of AOP-APC treatment compared with systems
involving GAC. The main disadvantage is the time delay imposed by the pilot
study on the design for full-scale treatment system. This delay could result in
E-5
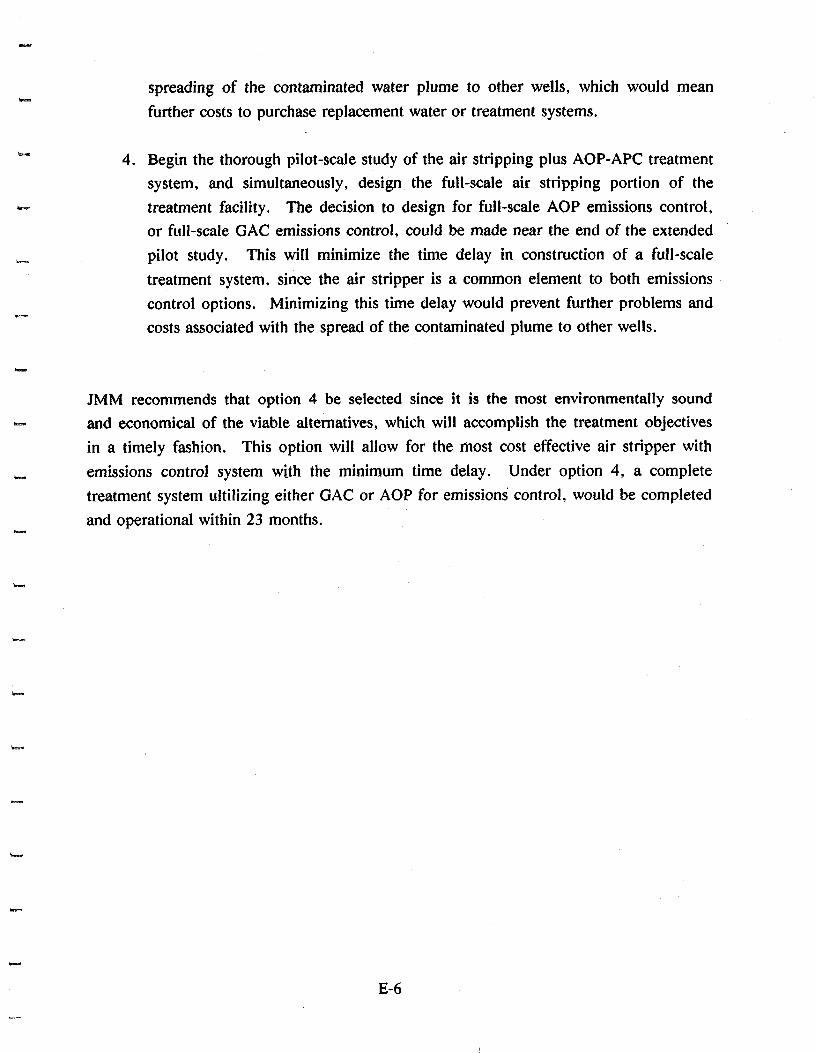
spreading of the contaminated Water plume to other wells, which would mean
further costs to purchase replacement water or treatment systems.
4. Begin the thorough pilOt-scale study of the air stripping plus AOP-APC treatment
system, and simultaneously, design the full-scale air stripping portion of the
treatment facility. The decision to design for full-scale AOP emissions control,or full-scale GAC emissions control, could be made near the end of the extended
_ pilot study. This will minimize the time delay in construction of a full-scale
treatment system, since the air stripper is a common element to both emissions
control options. Minimizing this time delay would prevent further problems and
costs associated with the spread of the contaminated plume to other wells.
_mw
JMM recommends that option 4 be selected Since it is the most environmentally sound
_. and economical of the viable alternatives, Which will accomplish the treatment objectives
in a timely fashion. This option will allow for the most cost effective air stripper with
,_ emissions control system with the minimum time delay. Under option 4, a complete
treatment system ultilizing either GAC or AOP for emissions control, would be completed
and operational within 23 months.
E-6
I
- SECTION 1
SECTION 1
INTRODUCTION '
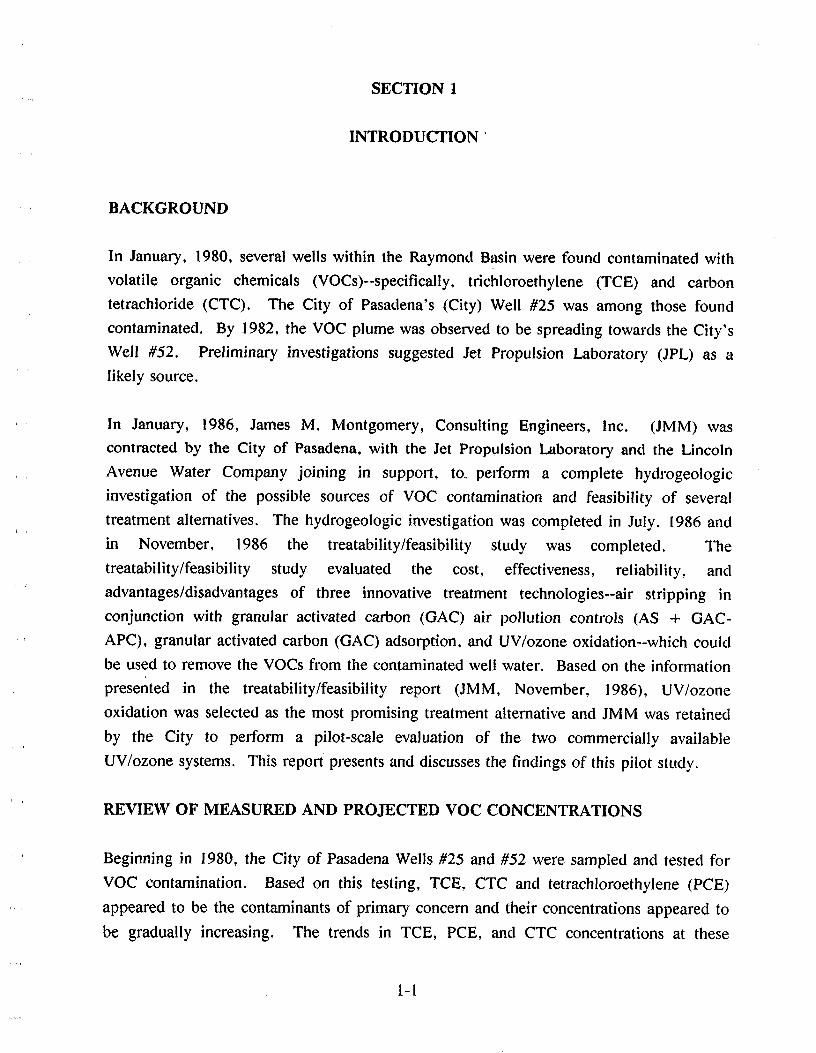
' ' BACKGROUND
In January, 1980, several wells within the Raymond Basin were found contaminated with
volatile organic chemicals (VOCs)--specifically, trichloroethylene (TCE) and carbon
tetrachloride (CTC). The City of Pasadena's (City) Well //25 was among those found
contaminated. By 1982, the VOC plume was observed to be spreading towards the City's
Well //52. Preliminary investigations suggested Jet Propulsion Laboratory (JPL) as a
likely source.
In January, 1986, James M. Montgomery, Consulting Engineers, Inc. (JMM) was
contracted by the City of Pasadena, with the Jet Propulsion Laboratory and the Lincoln
Avenue Water Company joining in support, to_ perform a complete hydrogeologic
investigation of the possible sources of VOC contamination and feasibility of Several
treatment alternatives. The hydrogeologic investigation was completed in July, 1986 and
in November, 1986 the treatability/feasibility study was completed. The
treatability/feasibility study evaluated the cost, effectiveness, reliability, and
advantages/disadvantages of three innovative treatment technologies--air stripping in
conjunction with granular activated carbon (GAC) air pollution controls (AS + GAC-
APC), granular activated carbon (GAC) adsorption, and UV/ozone oxidation--which could
be used to remove the VOCs from the contaminated well water. Based on the information
, presented in the treatability/feasibility report (JMM, November, 1986), UV/ozone
oxidation was selected as the most promising treatment alternative and JMM was retained
by the City to perform a pilot-scale evaluation of the two commercially available
UV/ozone systems. This report presents and discusses the findings of this pilot study.
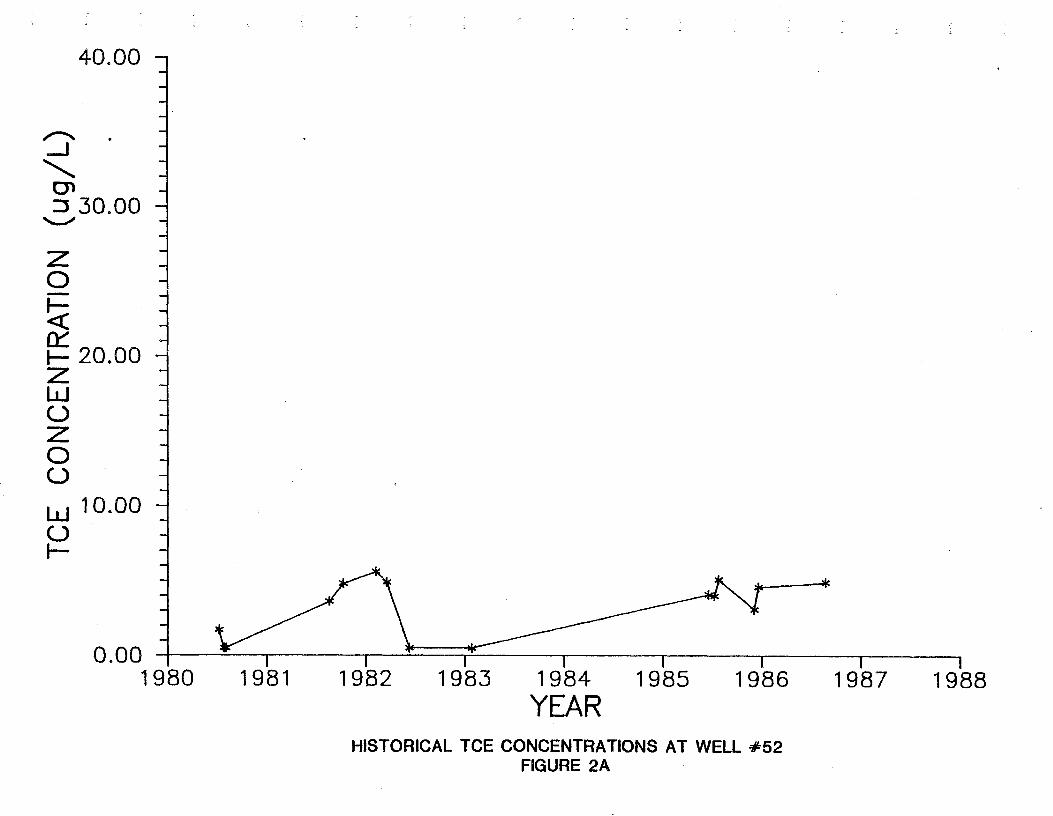
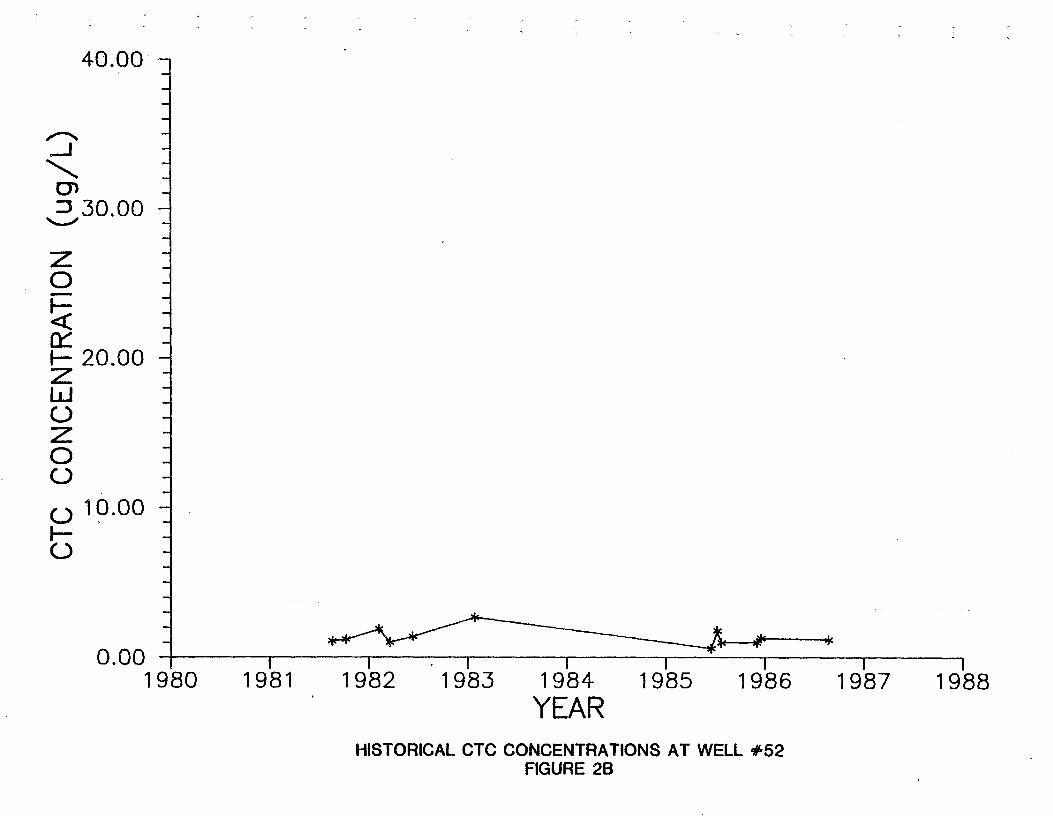
REVIEW OF MEASURED AND PROJECTED VOC CONCENTRATIONS
Beginning in 1980, the City of Pasadena Wells//25 and//52 were sampled and tested for
VOC contamination. Based on this testing, TCE, CTC and tetrachloroethylene (PCE)
appeared to be the contaminants of primary concern and their concentrations appeared to
be gradually increasing. The trends in TCE, PCE, and CTC concentrations at these
1-1
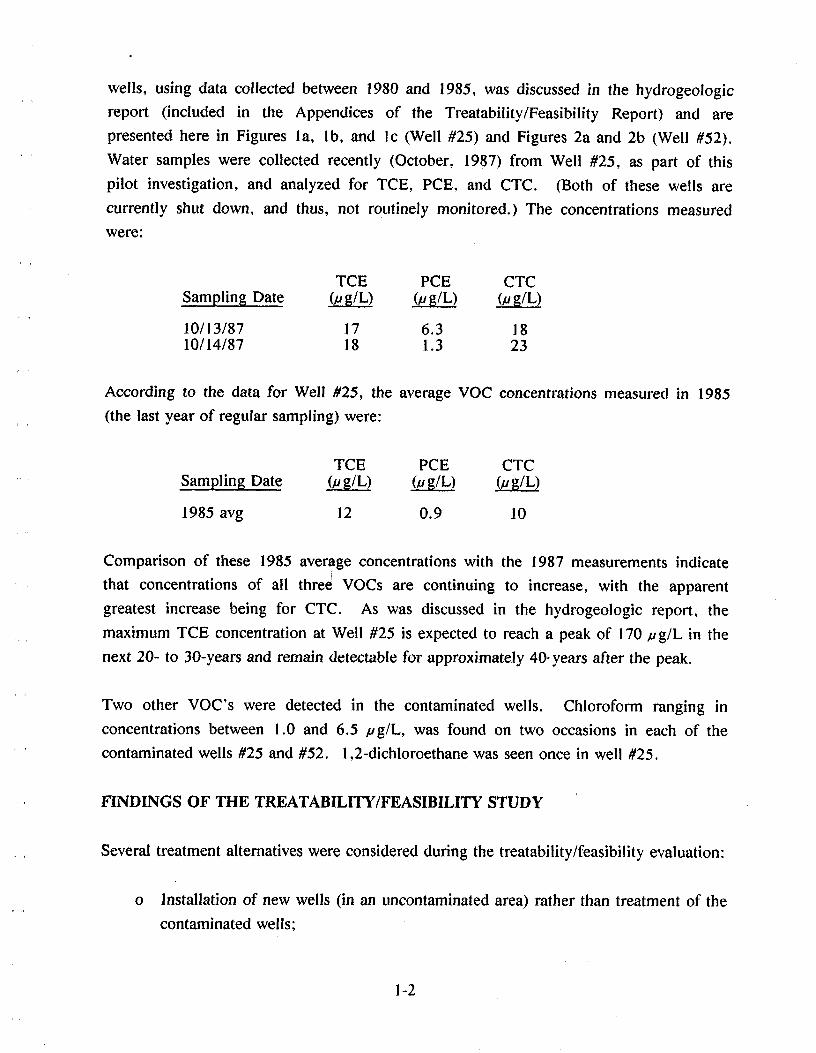
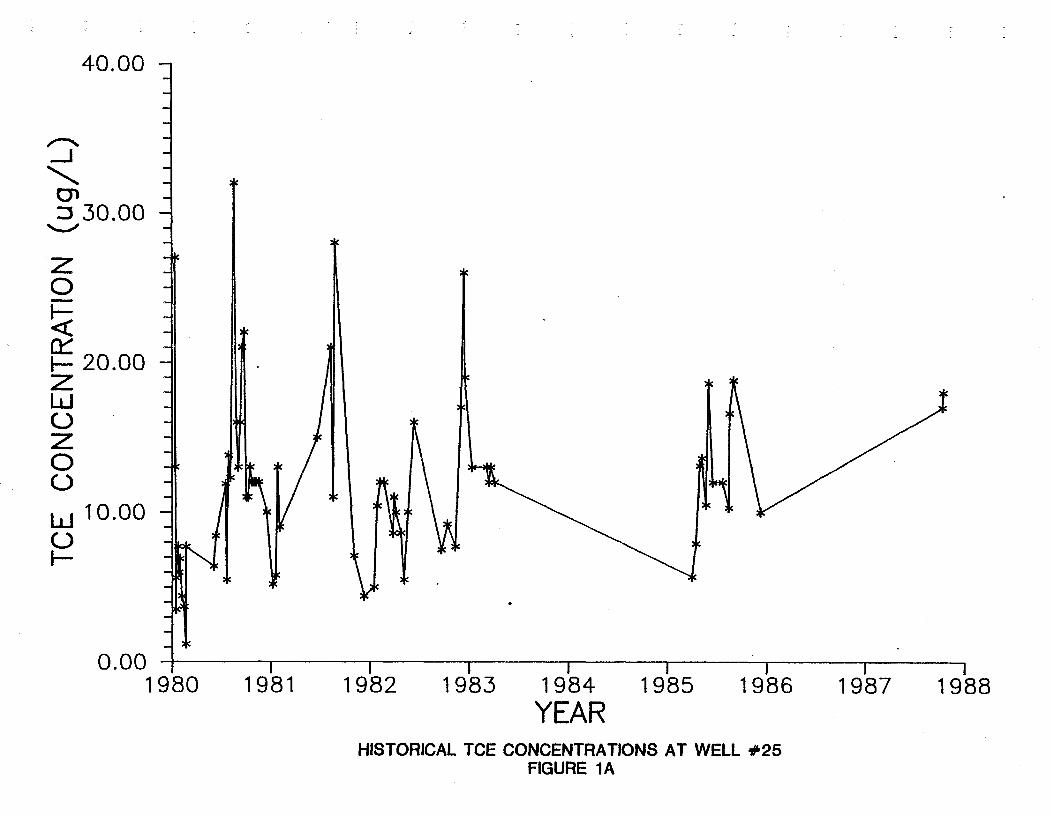
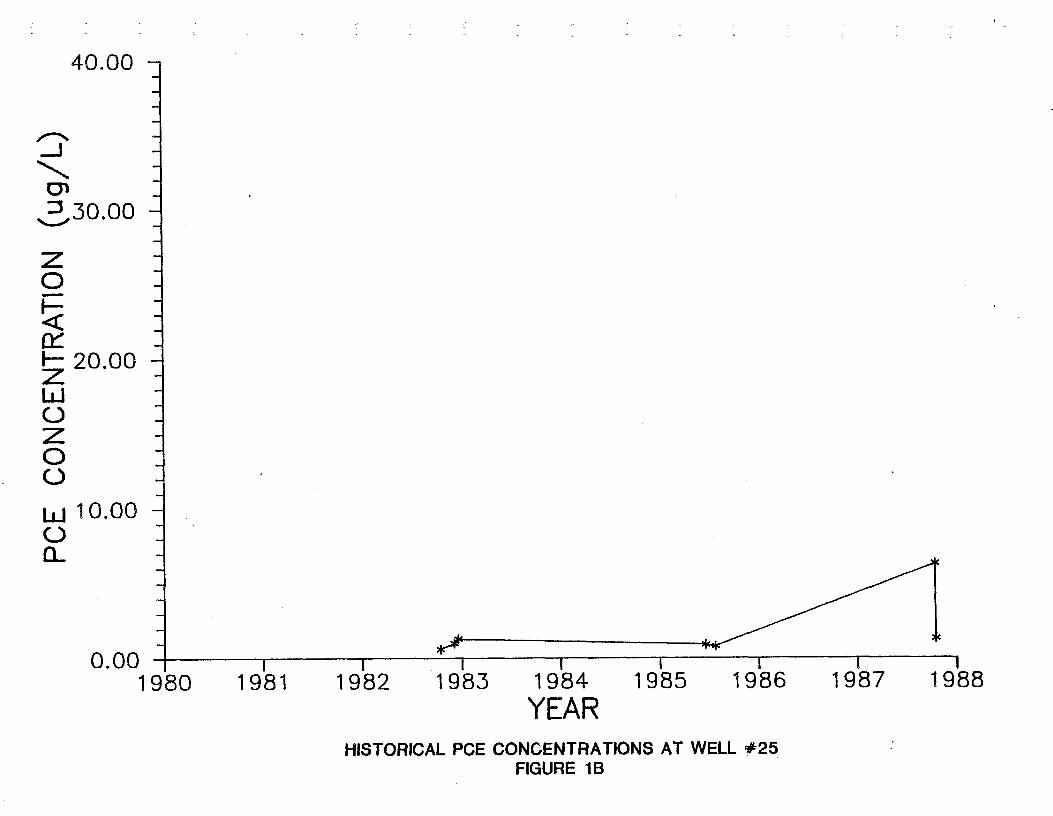
wells, using data collected between 1980 and 1985, was discussed in the hydrogeologic
report (included in the Appendices of the Treatability/Feasibility Report) and are
presented here in Figures la, lb, and lc (Well //25) and Figures 2a and 2b (Well //52).
Water samples were collected recently (October, 1987) from Well //25, as part of this
pilot investigation, and analyzed for TCE, PCE, and CTC. (Both of these wells are
currently shut down, and thus, not routinely monitored.) The concentrations measured
we re ·
TCE PCE CTCSampling Date _ (# g/L) (# g/L)
10/13/87 17 6.3 1810/14/87 18 1.3 23
According to the data for Well //25, the average VOC concentrations measured in 1985
(the last year of regular sampling) were:
TCE PCE CTC· ' Sampling Date (_/Jg/L) (_g/L) (#g/L)
1985 avg 12 0.9 10
Comparison of these 1985 average concentrations with the 1987 measurements indicate
that concentrations of all three VOCs are continuing to increase, with the apparent
greatest increase being for CTC. As was discussed in the hydrogeologic report, the
maximum TCE concentration at Well //25 is expected to reach a peak of 170 #g/L in the
next 20- to 30-years and remain detectable for approximately 40-years after the peak.
Two other VOC's were detected in the contaminated wells. Chloroform ranging in
concentrations between 1.0 and 6.5 #g/L, was found on two occasions in each of the
contaminated wells//25 and//52. 1,2-dichloroethane was seen once in well//25.
, , FINDINGS OF THE TREATABILITY/FEASIBILITY STUDY
Several treatment alternatives were considered during the treatability/feasibility evaluation:
o Installation of new wells (in an uncontaminated area) rather than treatment of the
contaminated wells;
1-2
40.00
I
30.00
Z0ff'fl,"' 20.00I
7I,I070eO
!,l 10.000lI
0.00 I I i I J I i !1980 1981 1982 1983 1984 1985 1986 1987 1988
YEARHISTORICALTOE CONCENTRATIONSAT WELL .¢25
FIGURE iA
t
40.00 -m
m
_..I
EY_
,_,_30.00 -
Z0b--
FYI--- 20.00 -Z _Ill
0I
00
I,!10.00 -
N
0.00 I ] [ [ I I I [1980 1981 1982 1983 1984 1985 1986 1987 1988
YEARHISTORICAL POE CONCENTRATIONS AT WELL '_25
FIGURE lB
(
40.00 -
I
-_ .
30.00 -
Z ]C)
I
fYI-- 20.00 -ZIllCDZ0CD
CD 10.00 ]ICD
0.00 I I I I I i i I1980 1981 1982 1983 1984 1985 1986 1987 1988
YEARHISTORICAL OTC CONCE;NTRATIONSAT WELL _25
FIGURE 1C
40.00 -m
g
__1 g:
30.00 -
Z [.0
' 20.00 -I
Zl_1(0Z0(,9
m
Ld 10.00 -]0I--
m
0.00 I i i i i i i 11980 1981 1982 1983 1984 1985 1986 1987 1988
YEARHISTORICAL TOE CONCENTRATIONS AT WELL .,¢52
FIGURE2A
2
40.00 -
._1
30.00 -
70I--,<rwI-.. 20.O0 -ZIiiC)70 "0
cO 10.00 -_
C..)
0.00 _ I i i i I I I1980 1981 1982 1983 1984 1985 1986 1987 1988
YEARHISTORICAL CTC CONCENTRATIONS AT WELL '_52
FIGURE2B
/
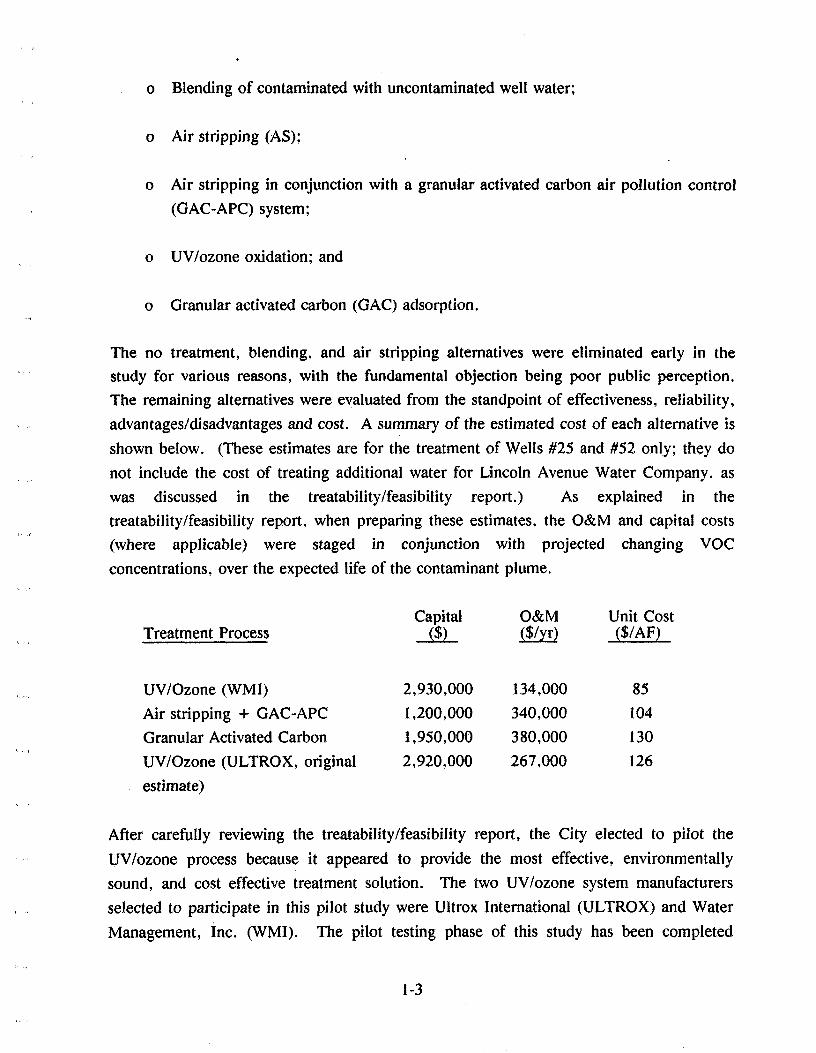
o Blending of contaminated with uncontaminated well water;
o Air stripping (AS);
o Air stripping in conjunction with a granular activated carbon air pollution control
_ (GAC-APC)system;
o UV/ozone oxidation; and
o Granular activated carbon (GAC) adsorption.:J
The no treatment, blending, and air stripping alternatives were eliminated early in the
study for various reasons, with the fundamental objection being poor public perception.
The remaining alternatives were evaluated from the standpoint of effectiveness, reliability,
advantages/disadvantages and cost. A summary of the estimated cost of each alternative is
shown below. (These estimates are for the treatment of Wells #25 and #52 only; they do
not include the cost of treating additional water for Lincoln Avenue Water Company, as
was discussed in the treatability/feasibility report.) As explained in the
treatability/feasibility report, when preparing these estimates, the O&M and capital costs
(where applicable) were staged in conjunction with projected changing VOC
concentrations, over the expected life of the contaminant plume.
Capital O&M Unit CostTreatmentProcess ($) ($/yr) ($/AF)
, UV/Ozone (WMI) 2,930,000 134,000 85
Air stripping + GAC-APC 1,200,000 340,000 104
Granular Activated Carbon 1,950,000 380,000 130
UV/Ozone (ULTROX, original 2,920,000 267,000 126
estimate)
After carefully reviewing the treatability/feasibility report, the City elected to pilot the
UV/ozone process because it appeared to provide the most effective, environmentally
sound, and cost effective treatment solution. The two UV/ozone system manufacturers
, selected to participate in this pilot study were Ultrox International (ULTROX) and Water
Management, inc. (WMI). The pilot testing phase of this study has been completed
1-3
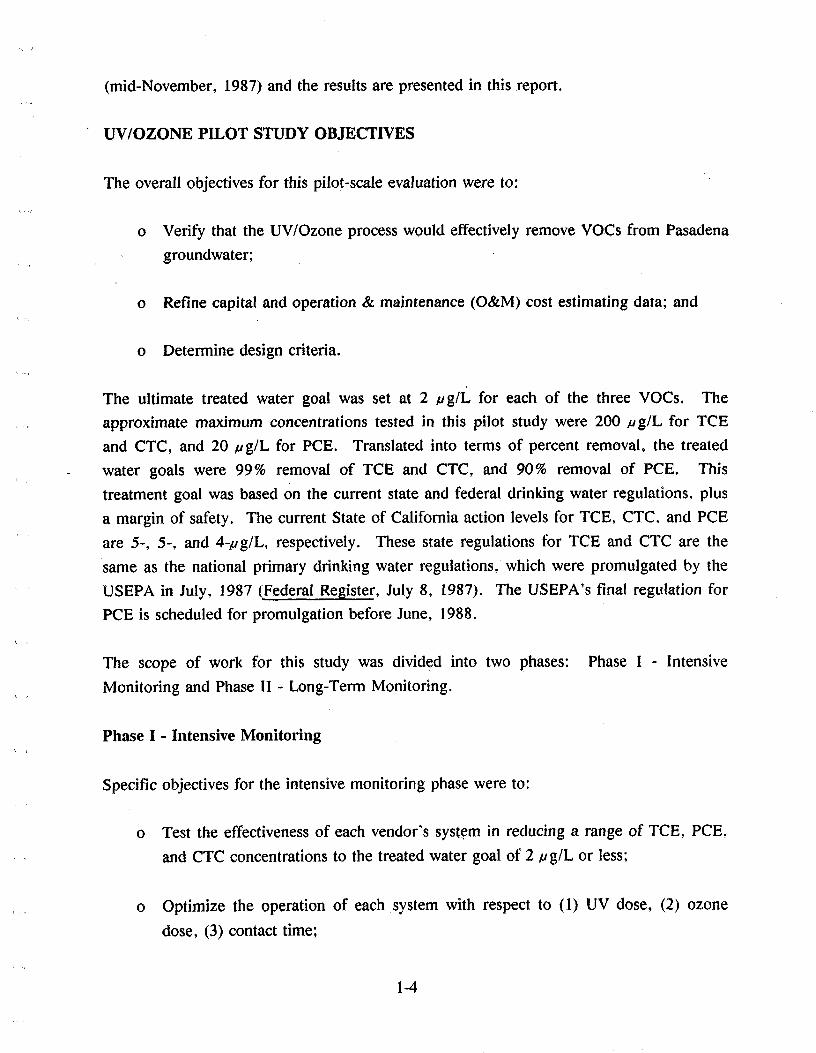
(mid-November, 1987) and the results are presented in this report.
UV/OZONE PILOT STUDY OBJECTIVES
The overall objectives for this pilot-scale evaluation were to:
J
o Verify that the UV/Ozone process would effectively remove VOCs from Pasadena
groundwater;
o Refine capital and operation & maintenance (O&M) cost estimating data; and
o Determine design criteria.
The ultimate treated water goal was set at 2 _tg/L for each of the three VOCs. The
, approximate maximum concentrations tested in this pilot study were 200 #g/L for TCE
and CTC, and 20 #g/L for PCE. Translated into terms of percent removal, the treated
water goals were 99% removal of TCE and CTC, and 90% removal of PCE. This
treatment goal was based on the current state and federal drinking water regulations, plus
a margin of safety. The current State of California action levels for TCE, CTC. and PCE
are 5-, 5-, and 4-#g/L, respectively. These state regulations for TCE and CTC are the
same as the national primary drinking water regulations, which were promulgated by the
USEPA in July, 1987 (Federal Register, July 8, 1987). The USEPA's final regulation for
PCE is scheduled for promulgation before June, 1988.
The scope of work for this study was divided into two phases: Phase I - Intensive
Monitoring and Phase II - Long-Term Monitoring.
Phase I - Intensive Monitoring
Specific objectives for the intensive monitoring phase were to:
o Test the effectiveness of each vendor's system in reducing a range of TCE, PCE,
and CTC concentrations to the treated water goal of 2 #g/L or less;
o Optimize the operation of each system with respect to (1) UV dose, (2) ozone
dose, (3) contact time;
1-4
r
o Ensure that little or no VOCs were being stripped and vented directly to the
atmosphere(WMIonly);and
, o Verify that harmful oxidation by-products were not being generated, in either the
water or exhaust gas, as a result of the UV/ozone oxidation process.
The third objective, regarding the venting of VOCs, is applicable to WMI's system only;
ULTROX's equipment employed a recirculating air system which meant that no gases
were vented to the atmosphere.
Phase II - Long-Term Monitoring
The long-term monitoring phase was designed to identify O&M requirements and refine
the O&M cost estimates for each system. During this phase of testing, the equipment was
to operate continually for a period of two months. As will be discussed, actual testing
performed under this phase differed somewhat from What was originally envisioned.
1-5

SECTION 2
SECTION 2
DESCRIPTION OF DEMONSTRATION SITE AND EQUIPMENTJ
_ SITE LAYOUT AND UV/OZONE SYSTEMS
Site preparation was carried out by the City of Pasadena under the direction of JMM.The site was located at Windsor Reservoir and water from the reservoir was used for the
pilot testing. The two UV/ozone system manufacturers selected to participate in this pilot
study were ULTROX International (ULTROX) and Water Management, Inc. (WMI).
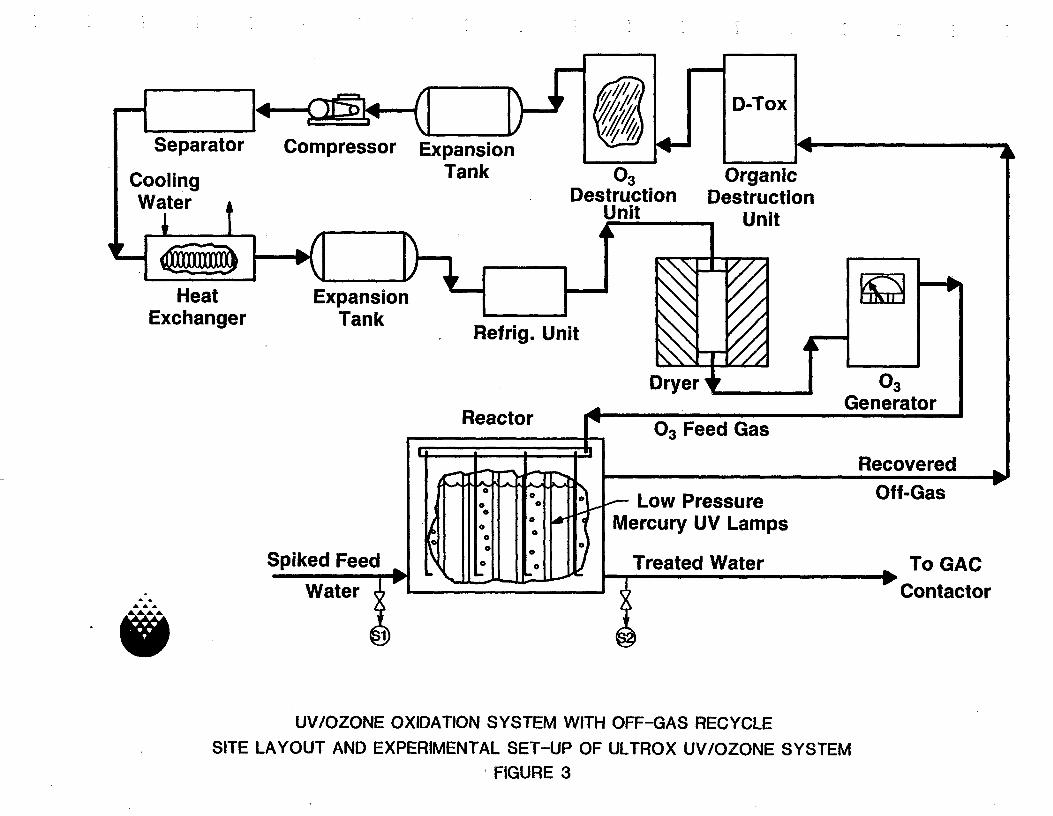
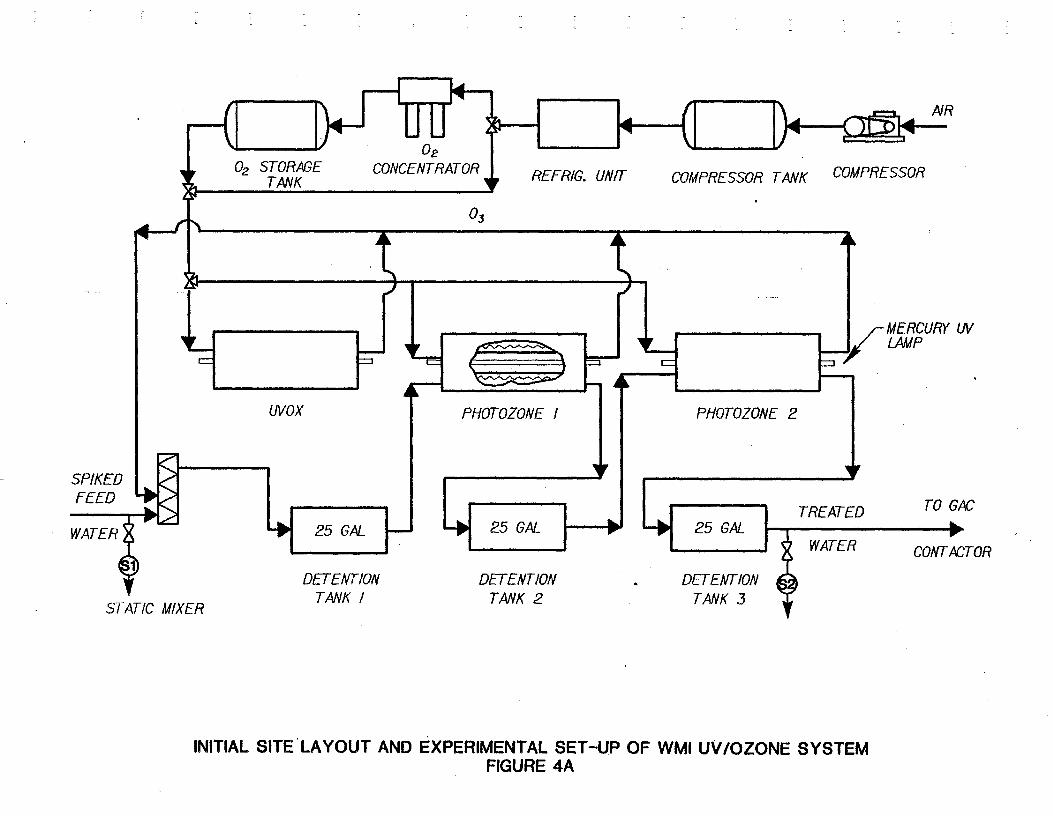
The site layout for the ULTROX UV/ozone system is shown in Figure 3 and is self-
explanatory. The initial Site layout for the WMI UV/ozone system is depicted in Figure
4a. As will be discussed in more detail under Section 3, the WMI system was modified
later in the testing to improve VOC removal efficiencies. The modified system is shown
in Figure 4b.
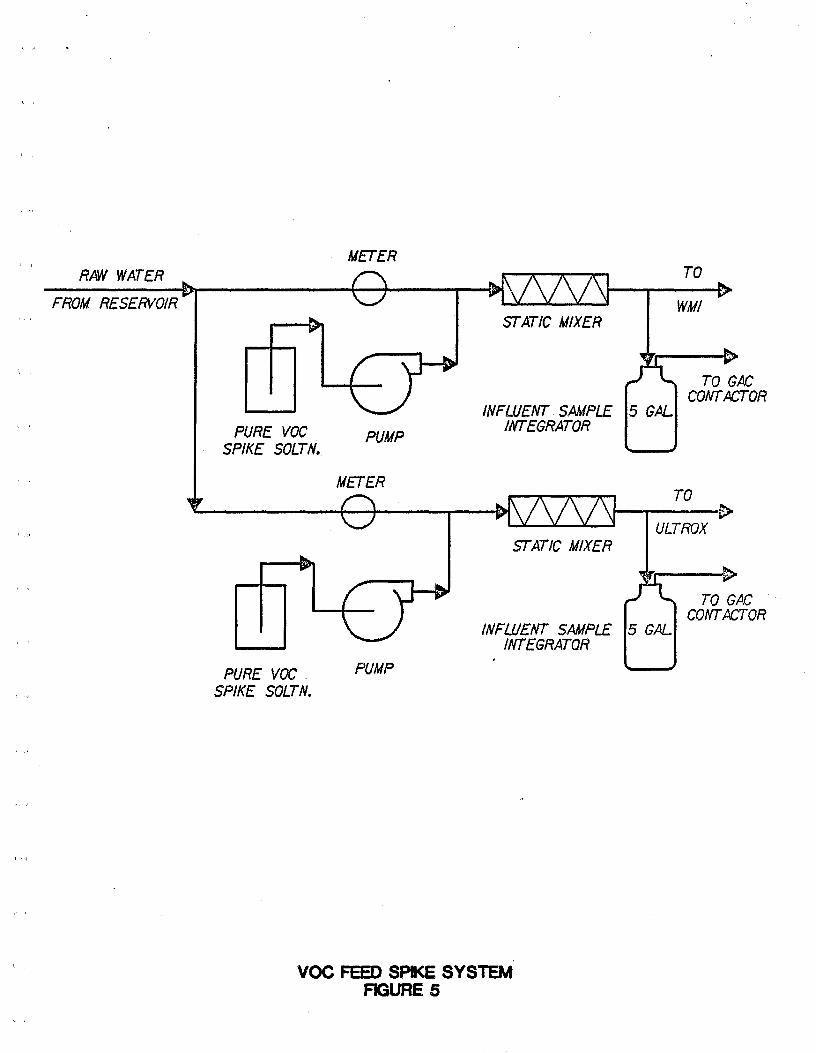
VOC SPIKING SYSTEM
VOCs were spiked into the influent line as shown in Figure 5. Water from Windsor
Reservoir was used for the major part of the study. Later, several tests were performed
with water from Pasadena Well //25, to determine whether any differences in general
water quality between the two water sources, would affect the VOC removal efficiencies
of the UV/Ozone treatment.
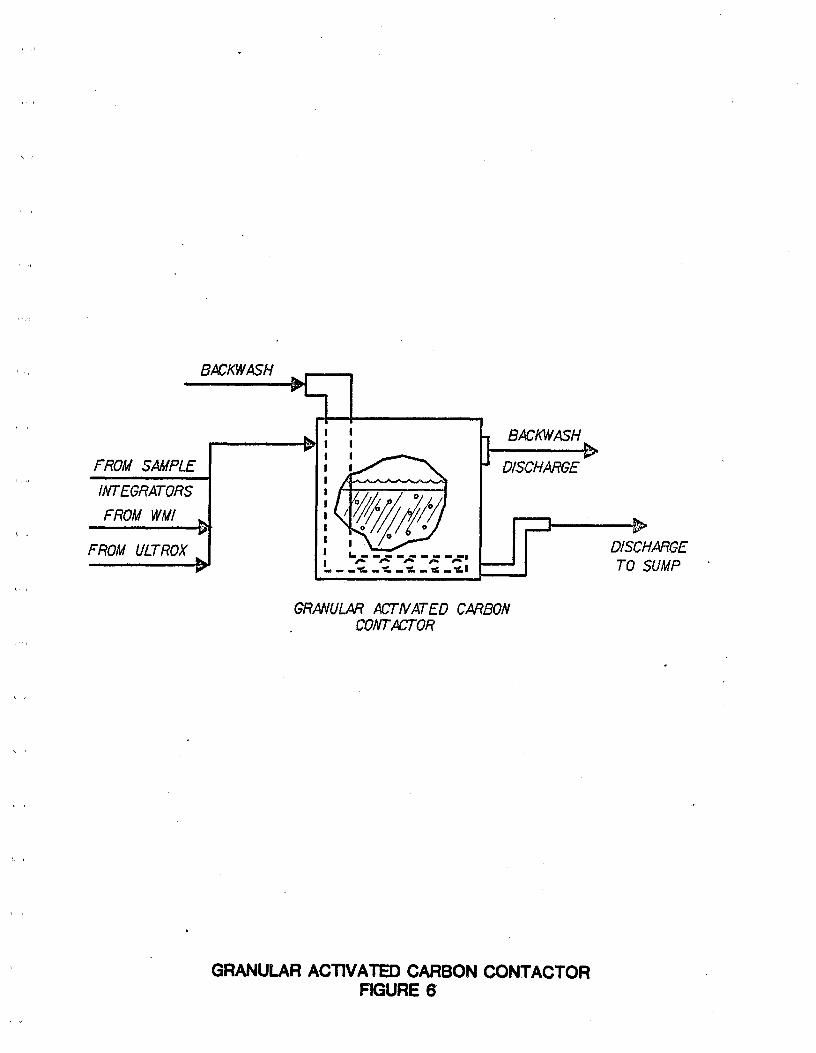
CARBON ADSORPTION SYSTEM
, i
After UV/ozone treatment, the effluent water was passed through a granular activated
carbon contactor (Figure 6) to remove any VOCs remaining after treatment, prior to
' discharge in the Arroyo spreading grounds.
. SYSTEM MODIFICATIONS FOR SPECIAL STUDIES
, Towards the end of Phase II, several "special studies" were performed which involved
modifications of the WMI system in an effort to improve VOC removals. Another part of
the "special studies" evaluated the treatment performance using actual contaminated water
from well //25 as compared with treatment performance using water from Windsor
2-1
i .-Tox.Separator pansio _ _ '
Coolin Tank 03 Organicg . .· . . Destruction Destruction
Hemg. unit _ 1_Dryer 03
Generator
MIII11.1JJ!;JHer°u":srep=u,T-uas
Spiked Feed I_ II1oil I1:11IUI Treated Water ,, _.. To GAC
· Wate-__'_iJ'_LL-l'_="_'_...__J _ ,, 7-Contactor
UV/OZONE OXIDATION SYSTEM WITH OFF-GAS'RECYCLE
SITE LAYOUT AND EXPERIMENTAL SET-UP OF ULTROX UV/OZONE SYSTEM' FIGURE 3
7
7
-4 D--02 STORAGE CONCENTRATOR REFRIG. UNIT COMPRESSORTANK COMPRESSOR...... TANK , '_
03
_1-'--/' .... ,' ' , _- ...... , ,_
SPIKED
FEED ,, TO GAd'
I t--. I,. WATER CoICrACTOR
DETENTION DETENTION . DETENTION
.STATICMIXER TANK I TANK 2 TANK5
INITIAL SITE'LAYOUT AND EXPERIMENTAL SET-UP OF WMI UV/OZONE SYSTEMFIGURE 4A
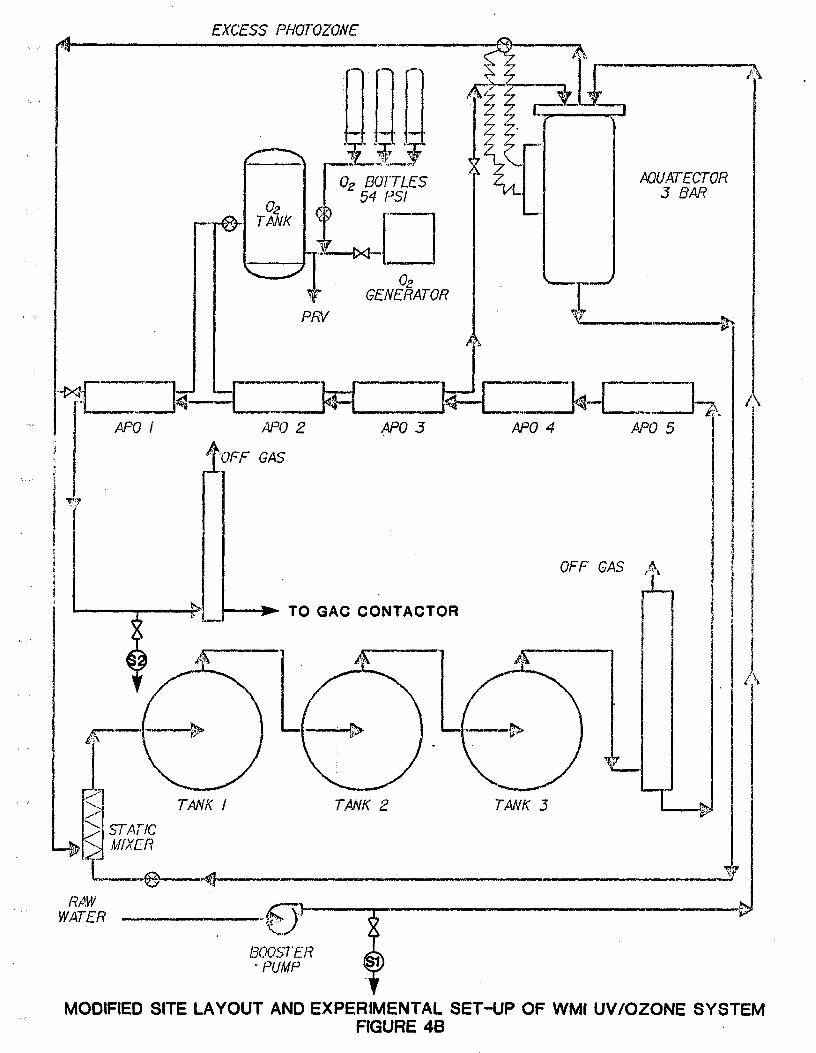
EXCESS PHOTOZONE
' ' _ [ '__E AQUATECTOR5 BAR
--O- TANK j
",_J_-=L___._ 1_-! -k-i ¼, ,¥' APO I APO 2 APO 5 APO 4 APO 5 ]
i2."OFF GAS
77
OFF GAS ,,.,_,,,_..
' ,J. ' _,_L _ TO GAO CONTACTOR
")_ . A .... ...,"['
U,, '_ . _, ,,
_'"J TANK I TANK 2 TANK 3 "-J' ._
_ 5TA?IC
__-._.._._ ....................................... . _RAW
BOOSI'ER' · PUMP
MODIFIED SITE LAYOUT AND EXPERIMENTAL SET--UP OF WMI UV/OZONE SYSTEMFIGURE4B
METER
FROM I WM/
TO GACCONTACTOR
, INFLUEIVTSAMPIF
'_ PURE VOC PUMP !/V7'EGRATORSPIKESOLTN.
' _ METERTO
'" I STATIC MIXER
TO GAC ·CONTACTOR
INFLUEN-/'SAMPLE' ' INTEGRATOR
PURE VOC. PUMP,, SPIKE SOLTN.
' ' VOC FEEDSPIKESYSTEMFIGURE 5
, BACi_/AZH
' i ii r
,SACtONASH
, FROM SAMPLE _ DISCHARGE
INTEGRATORS t,, FROM WMI _ _ , _,,
DISCHARGEFROM ULTROX k,_ __ __ -r. -,--,.... _ _ _ _,_._,.,_. _ . _ _,-.i TO SUMP
i i ii
J
GRANULARACTIVATEDCARBONCO_OR
GRANULAR ACTIVATED CARBON CONTACTORFIGURE 6
Reservoir. More details are provided in Section 3. In addition, two other advanced
oxidation processes, H202/ozone and H202/ozone/UV, were studied using the ULTROX
system. In these studies, H202 was added after the VOC spike and the static mixer.
2-2
SECTION 3
SECTION 3
EXPERIMENTAL PLAN, SAMPLE COLLECTION AND
ANALYTICAL METHODS
The scope of work for this study was divided into two phases: an intensive monitoring
phase (Phase I) and a long-term monitoring phase (Phase Il). Phase I ran from the end
of June through mid-July and Phase II from the beginning of September through mid-
November.
ORIGINALLY PROPOSED DEMONSTRATION WORK
The experimental plan originally proposed for this study was described in detail in the (1)
February 2, 1987 JMM Memorandum (from Elaine Wallace), (2) March 31, 1987 JMM
Memorandum (from Marco Aieta and Elaine Wallace), and (3) May 29, 1987 letter to
Tom Underbrink (from Marco Aieta). The actual experimental plan which was followed
was modified somewhat from the proposed plan. The proposed experimental plan, and
all modifications from this plan are described briefly in the following paragraphs.t
Intensive Phase Testing
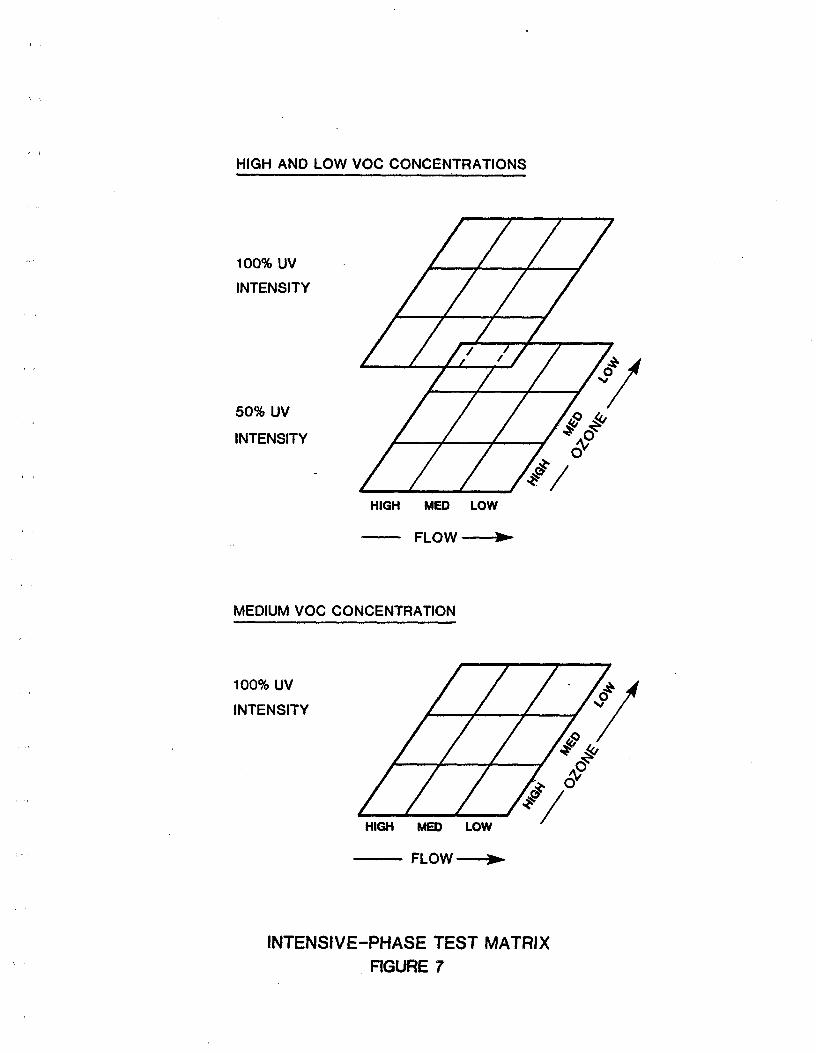
The intensive monitoring phase was designed to evaluate VOC removal efficiencies for
several VOC concentrations, water flow rates (or contact times), ozone dosages, and UV
dosages. The experimental plan was set up according to the matrix shown in Figure 7
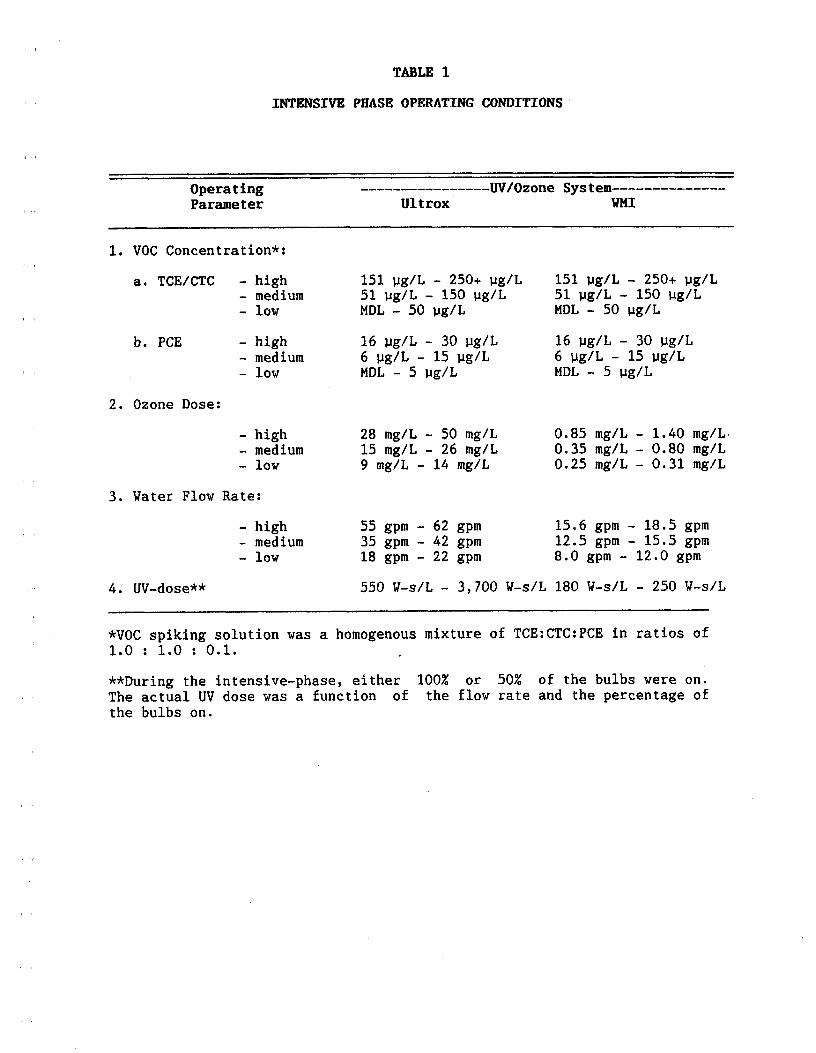
and was applied to both manufacturer's systems. Actual operating conditions,
corresponding to the high-, medium-, and low-dosages shown in Figure 7, are provided in
Table 1. As a result of delays experienced in getting the equipment set up and operating
properly, sufficient time was not available to perform all experiments identified in the
sampling matrix and the experimental plan was modified to accommodate as many of the
originally proposed tests as possible.
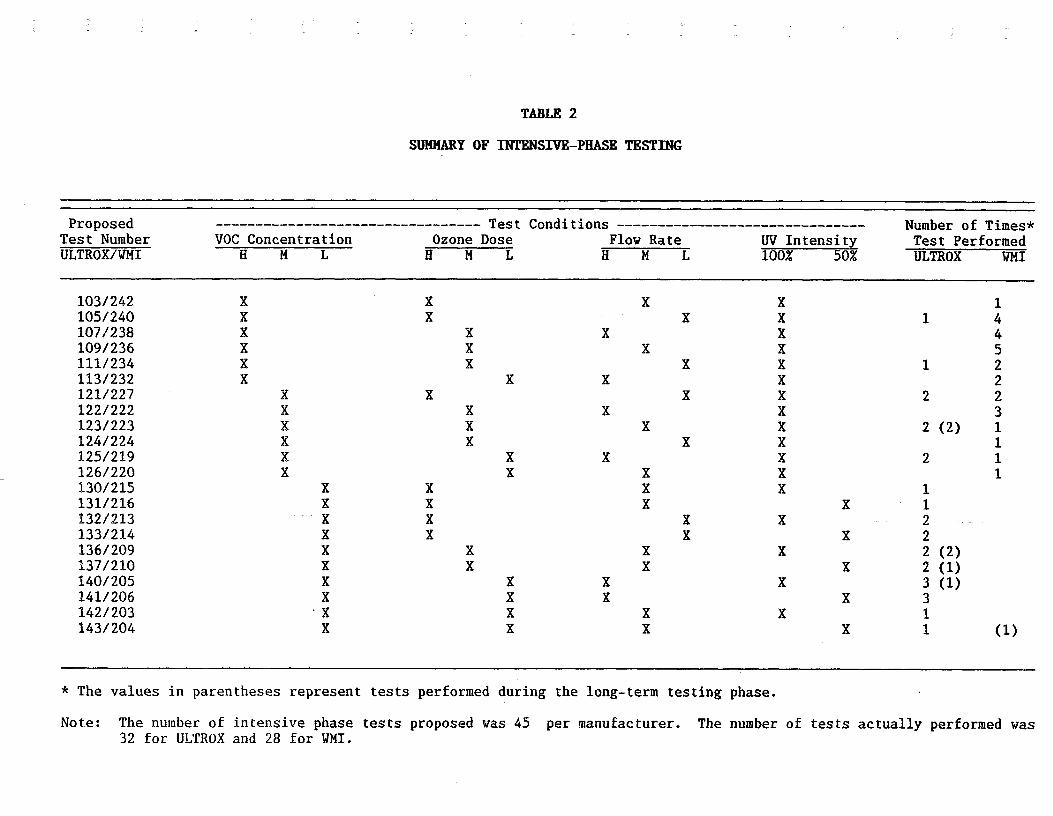
The number of tests completed during the intensive phase are shown in Table 2. For
these tests, the equipment was operated for a period of time sufficient to allow the system
to come to equilibrium. Generally, two or three separate tests were performed in a single
day. Experiments performed during the long-term phase were similar to those performed
3-1
HIGH AND LOW VOC CONCENTRATIONS
"' 100% UV
INTENSITY
INTENSITY
,, //HIGH MED LOW
FLOW
MEDIUM VOC CONCENTRATION
INTENSITY
HIGH _ LOW
' FLOW
INTENSIVE-PHASE TEST MATRIXFIGURE 7
, r
TABLE 1
, INTENSIVE PHASE OPERATING CONDITIONS
Operating .UV/Ozone SystemParameter Ultrox MI
1. VOC Concentration*:
a. TCE/CTC - high 151 _g/L - 250+ _g/L 151 _g/L - 250+ _g/L- medium 51 pg/L - 150 _g/L 51 _g/L - 150 _g/L- low MDL - 50 pg/L MDL - 50 _g/L
b. PCE - high 16 _g/L - 30 _g/L 16 _g/L - 30 ug/L- medium 6 _g/L - 15 _g/L 6 _g/L - 15 _g/L- iow MDL - 5 _g/L MDL - 5 _g/L
2. Ozone Dose:
- high 28 mg/L - 50 mg/L 0.85 mg/L - 1.40 mg/L- medium 15 mg/L - 26 mg/L 0.35 mg/L - 0.80 mg/L- iow 9 mg/L - 14 mg/L 0.25 mg/L - 0.31 mg/L
3. Water Flow Rate:
- high 55 gpm - 62 gpm 15.6gpm - 18.5gpm- medium 35 gpm - 42 gpm 12.5 gpm - 15.5 gpm- iow 18 gpm - 22 gpm 8.0 gpm - 12.0 gpm
4. UV-dose** 550 W-s/L - 3,700 W-s/L 180 W-s/L - 250 W-s/L
*VOC spiking solution was a homogenous mixture of TCE:CTC:PCE in ratios of1.0 : 1.0 · 0.1.
**During the intensive-phase, either 100% or 50% of the bulbs were on.The actual UV dose was a function of the flow rate and the percentage ofthe bulbs on.
i
TABLE 2
SUIfl'iARY OF INTENSIVE-PHASE TESTING
Proposed Test Conditions Number of Times*
Test Number VOC Concentration Ozone Dose Flow Rate [IVIntensity Test PerformedULTROX/WMI H M L H M L H M L 100% 50% ULTROX WMI
103/242 X X X X 1
105/240 X X X X 1 4107/238 X X X X 4
109/236 X X X X 5111/234 X X X X 1 2
113/232 X X X X 2
121/227 X X X X 2 2
122/222 X X X X 3
123/223 X X X X 2 (2) 1124/224 X X X X 1125/219 X X X X 2 1
126/220 X X X X 1
130/215 X X X X 1
131/216 X X X X 1132/213 _ 'X X X X 2
133/214 X X X X 2
136/209 X X X X 2 (2)
137/210 X X X X 2 (1)
140/205 X X X X 3 (1)141/206 X X X X 3
142/203 _X X X X 1
143/204 X X X X 1 (1)
* The values in parentheses represent tests performed during the long-term testing phase.
Note: The number of intensive phase tests proposed was 45 per manufacturer. The number of tests actually performed was32 for ULTROX and 28 for WMI.
during the intensive phase, except, during long-term monitoring the equipment was left
' operating (for a specific set of operating conditions) for a much longer period of time
(e.g., days), The number of Phase il tests which were completed, and fit into the Phase !
._ test matrix, have been included in parentheses in Table 2. Although all of the originally
proposed tests could not be performed, results indicate that the number and variety of
tests performed were sufficient to satisfactorily evaluate the capabilities and limitations of
both UV/ozone system.
Long-Term Phase Testing
The purpose of the long-term phase of this pilot study was to obtain O&M information
about both UV/ozone systems. During this period, several individual tests were
,, performed under various operating conditions. These operating conditions are
summarized in Tables 3a and 3b. Each long-term test lasted for a period ranging from l
to 10 days--sufficient time to generate O&M data. Original plans were to select the
optimal operating conditions and allow the UV/ozone systems to run, under those
conditions, for approximately two months. However, because of the delays experienced
in starting the intensive-phase and lower than expected contaminant removals, it was
decided that the long-term experimental plan could be modified to accomplish the
' objectives of (1) obtaining reliable O&M data and (2) performing as many of the
proposed intensive-phase tests as possible with equipment and process modifications.
Towards the end of Phase II, several "special studies" were performed. These tests are
denoted in Tables 3a and 3b. For WMI, preliminary results from Phase I indicated low
VOC removal efficiencies. Rather than devoting time to gathering detailed O&M costs
for their system, WMI was given the opportunity to modify their equipment in hopes of
improving its operation. For ULTROX, most of Phase Il was spent generating O&M
data, but a portion of the time was spent evaluating (l) VOC removal from water pumped
by Well /?25 (one of the contaminated wells) and (2) the use of hydrogen peroxide in the
Ultrox equipment as described below. The setup for the "special studies" are discussed
, briefly in the following subsection.
SPECIAL STUDIES
As mentioned, several "special studies" were performed with both the WMI and
ULTROX UV/ozone systems. Tests performed with WMI's system were very equipment ,
3-2
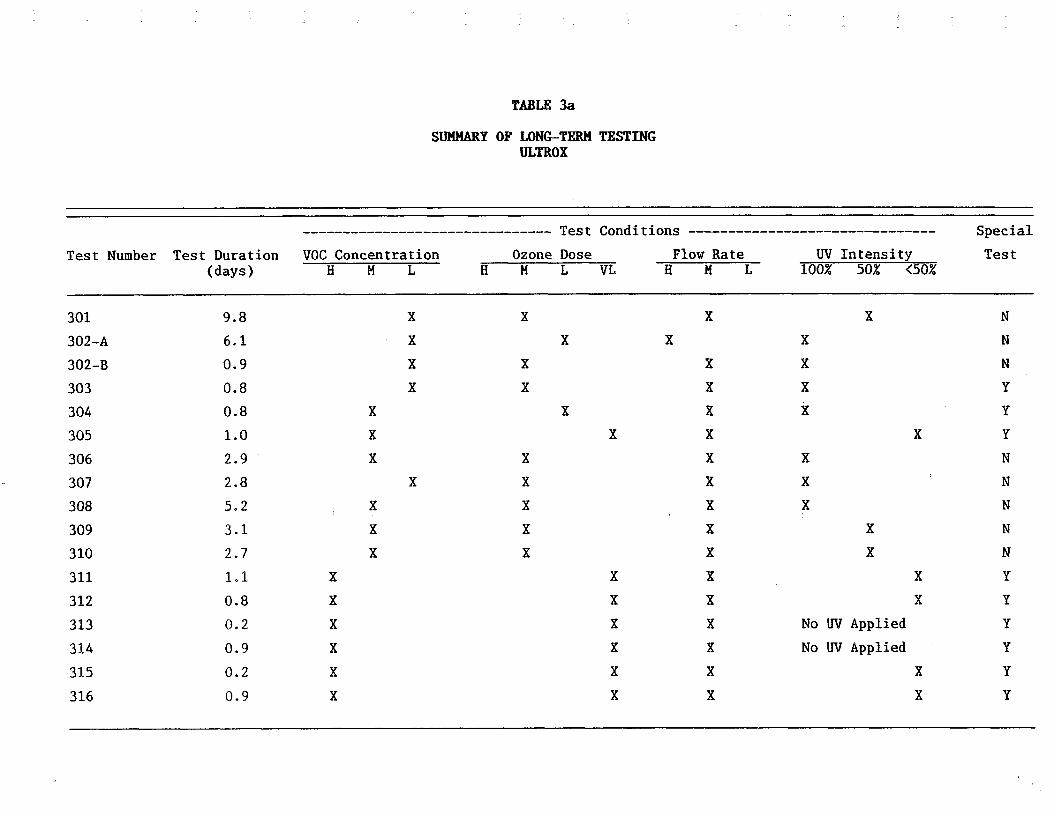
TABLE 3a
SUMMARYOF LONG-TERH TESTINGULTROX
Test Conditions Special
Test Number Test Duration VOC Concentration Ozone Dose Flow Rate [IVIntensity Test(days) H M L H M L VL H M L 100% 50Z <50Z
301 9.8 X X X X N
302-A 6.1 X X X X N
302-B 0.9 X X X X N
303 0.8 X X X X ¥
304 0.8 X X X X Y
305 1.0 X X X X ¥
306 2.9 X X X X N
307 2.8 X X X X N
308 5.2 X X X X N
309 3.1 X X X X N
310 2.7 X X X X N
311 1ol X X X X Y
312 0.8 X X X X Y
313 0.2 X X X No_ Applied Y
314 0.9 X X X NoUVApplied Y
315 0.2 X X X X Y
316 0.9 X X X X Y
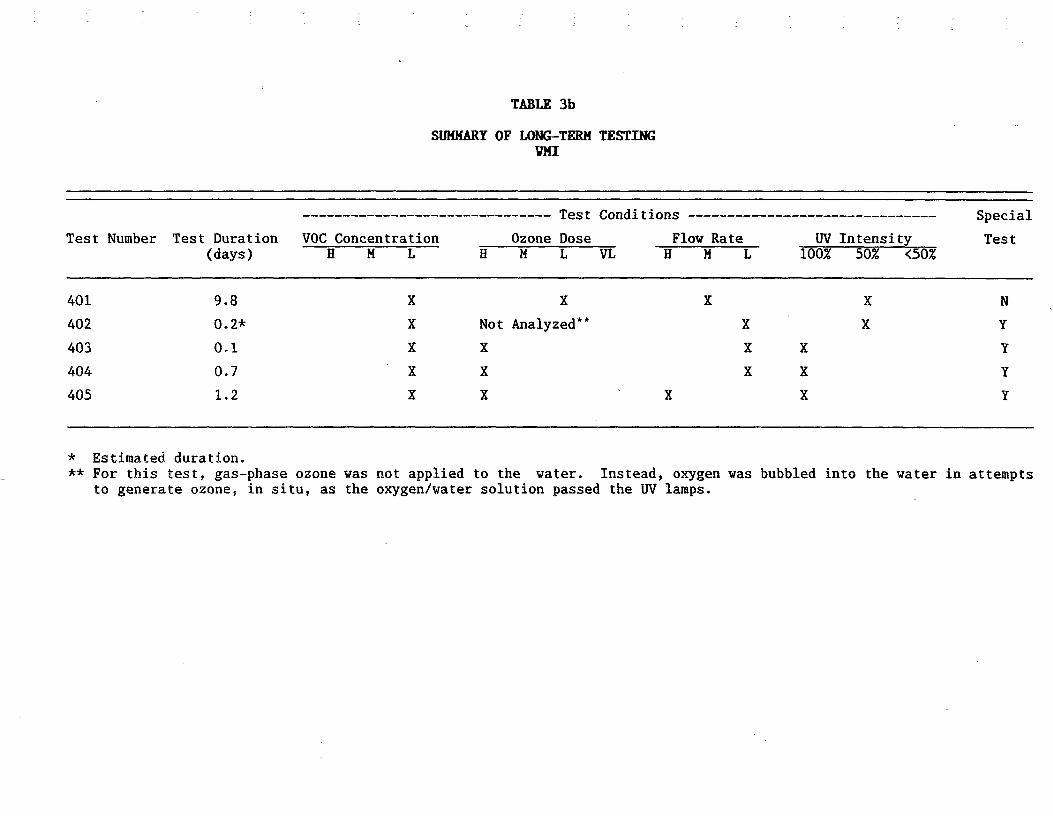
TABLE 3b
SUMMARYOF LONG-TERN TESTING
Test Conditions Special
Test Number Test Duration VOC Concentration Ozone Dose Flow Rate [IVIntensity Test(days) H M L H M L VL H M L 100% 50% <50%
401 9.8 X X X X N
402 0.2* X Not Analyzed** X X Y
403 0.1 X X X X Y
404 0.7 X X X X Y
405 1.2 X X X X Y
* Estimated duration.
** For this test, gas-phase ozone was not applied to the water. Instead, oxygen was bubbled into the water in attemptsto generate ozone, in situ, as the oxygen/water solution passed the UV lamps.

, !
specific and were geared towards improving the performance of their treatment system.
' They were designed primarily to evaluate equipment modifications which were hoped
would increase the feed-gas ozone concentrations and improve the ozone mass transler
efficiency through their system. The special studies performed using ULTROX's
equipment were more process specific than they were equipment specific. They were
designed to (1) compare treatment performance using actual contaminated well water with
treatment performance using water from Windsor Reservoir and (2) evaluate overall
process performance using other AOPs. Since performance was not greatly improved,
equipment modifications made by WMI will not be discussed further.
UV/Ozone Treatment of Water from Pasadena Well//25
Two UV/ozone treatment tests were performed on water pumped by Pasadena's Well #25.
(Windsor Reservoir supplied the water for all other tests.) Their purpose was to
determine if differences in general water quality between Windsor Reservoir water and
water from Well #25 would alter (improve or worsen) previously measured VOC removal
efficiencies. Water quality parameters of particular concern were alkalinity, pH, and total
organic carbon (TOC); previous AOP research indicated that changes in these parameters
can change the UV/ozone processes' ability to destroy synthetic organic chemicals (Glaze,
et al., 1987).
Two experin_ents were performed using water from Well #25. For the first test (#303),
no VOCs were spiked into the water and the UV/ozone process was used to treat the
actual VOC concentrations in the well water. During the second test, a medium level of
VOCs concentrations (TCE & 100 #g/L; CTC --- 100 #g/L; PCE & 15 #g/L) were spiked
into the water.
VOC Destruction Using H202/O 3 and H202/O3/UV
In addition to testing the UV/ozone advanced oxidation process (AOP), two other AOPs
were tested--H202/ozone and H202/ozone/UV. The reasons for testing these other two
AOPs were twofold: unsatisfactory CTC removals using UV/ozone alone and economics.
First, preliminary results from Phase I of this study indicated the UV/ozone process was
not effective in reducing CTC concentrations to the desired level (_< 2/_g/L). It was
thought that another of the AOPs might be able to effectively destroy CTC. In other pilot
3-3
investigations (Aieta, et al., 1987), HeO2/ozone was shown to effectively remove both
TCE and PCE; however, it is not known to have been tested for CTC removal. The
H2Oz/ozone/UV AOP process is not known to have been tested prior to this study.
Second, results from a recent H202/OzOne pilot work showed the H2Oe/ozone process
could provide high percent removals of TCE and PCE from a groundwater using relatively
low dosages of peroxide and ozone, and a very short contact time (Aieta, et al., 1987).
From an economics standpoint, the lower chemical usage and shorter contact time
associated with H:O:/ozone treatment could mean substantial savings for the City of
Pasadena, in both capital and O&M expenses, for a potentially equal (or perhaps greater)
percentage removal of PCE and TCE obtained with UV/ozone treatment. The
effectiveness of HeO2/ozone oxidation in removing CTC was not known.
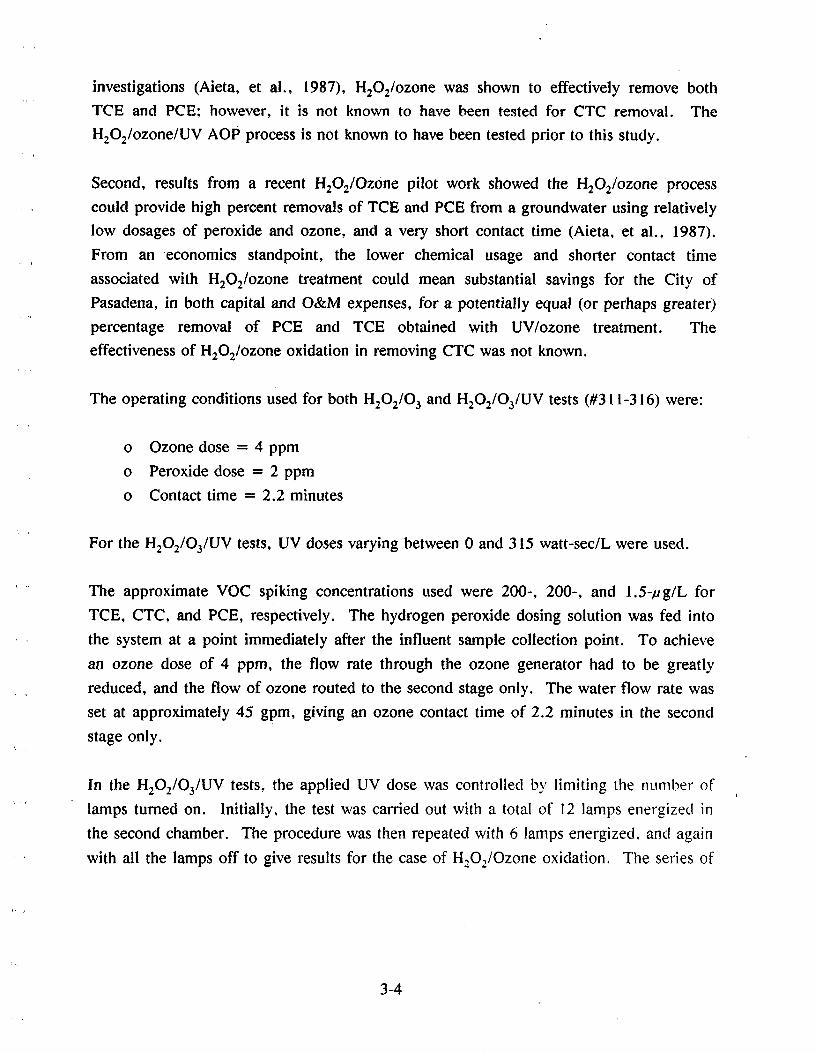
The operating conditions used for both H20:/O 3 and H2Oe/O3/UV tests (#311-316) were:
o Ozone dose = 4 ppm
o Peroxide dose = 2 ppm
o Contact time = 2.2 minutes
For the H20:/O3/UV tests, UV doses varying between 0 and 315 watt-sec/L were used.
' The approximate VOC spiking concentrations used were 200-, 200-, and 1.5-#g/L for
TCE, CTC, and PCE, respectively. The hydrogen peroxide dosing solution was fed into
the system at a point immediately after the influent sample collection point. To achieve
an ozone dose of 4 ppm, the flow rate through the ozone generator had to be greatly
_ reduced, and the flow of ozone routed to the second stage only. The water flow rate was
set at approximately 45 gpm, giving an ozone contact time of 2.2 minutes in the second
stage only.
In the H202/O3/UV tests, the applied UV dose was controlled by limiting the number of
lamps turned on. Initially, the test was carried out with a total of 12 lamps energized in
the second chamber. The procedure was then repeated with 6 lamps energized, and again
, with all the lamps off to give results for the case of H202/Ozone oxidation. The series of
3-4
three tests just described, were then repeated under the same conditions.
SAMPLE COLLECTION
Collection Points
For all tests done with the ULTROX equipment, the influent and effluent liquid sample
collection points were SI and S2, as shown in Figure 3, respectively. In the WMI
UV/ozone studies, the influent and effluent sampling points were SI and S2, respectively,
for both the initial site layout (Figure 4a) and the modified site layout (Figure 4b).
Sample Preservation
Upon collection, liquid samples taken for VOC analyses and oxidation by-products
. , analyses were preserved through the addition of sodium thiosulfate. Samples for TOC
analyses were preserved with sulfuric acid. No sample preservation was needed for
, alkalinity analysis. Ozone, hydrogen peroxide and pH were determined in the field.
ANALYTICAL METHODS
VOCs, TOC, pH, and alkalinity analyses were done on both the influent and effluent
samples. Effluent samples were also analysed for residual H20: and residual ozone. A
few selected effluent samples were analyzed for oxidation by-products. Both feed gas and
, off gas were monitored for ozone concentrations.
Standard Methods (16th edition) were used for the determination of pH, alkalinity, and
TOC. The EPA gas chromatography/mass spectrometry (GC/MS) method 524.2 for
Volatile Organics Analysis was used to determine the VOCs and the oxidation by-
products. Due to their unstable nature, H:O 2 and ozone were analyzed immediately at
the field site after collection. H202 was determined by a fluorometric technique in which
a fluorescent compound was formed between H202, horseradish peroxidase and p-
hydroxyphenylacetic acid (Lazrus et al., 1985). The indigo method was used for the
' analysis of ozone (Bader and Hoigne, 1982),
3-5

._ SECTION4
SECTION 4
EXPERIMENTAL RESULTS
in order to understand the results presented in this section, a brief explanation is provided
to describe the chemistry driving the advanced oxidation.processes.
The oxidation of organics in the presence of ozone occurs via two pathways--one
involving molecular ozone and the other involving the hydroxyl radical which is formed
during the decomposition of ozone. Oxidation via molecular ozone is a highly selective,
relatively slow, reaction. Oxidation via the hydroxyl radical, however, is a very rapid and
less selective process (Hoigne and Bader, 1983a and 1983b). The advanced oxidation
processes promote the formation of hydroxyl radicals. The processes generally considered
· AOPs include: ozone in a high pH solution, H:O:/ozone, UV/ozone, and H:O:/UV.
Results of the UV/ozone pilot-scale evaluations, along with results of the few H20:/ozone
and H202/ozone/UV tests, are discussed in this section.
WMI AND ULTROX UV/OZONE OXIDATION SYSTEMS
VOC Removal Efficiencies Obtained Using WMI's UV/Ozone System
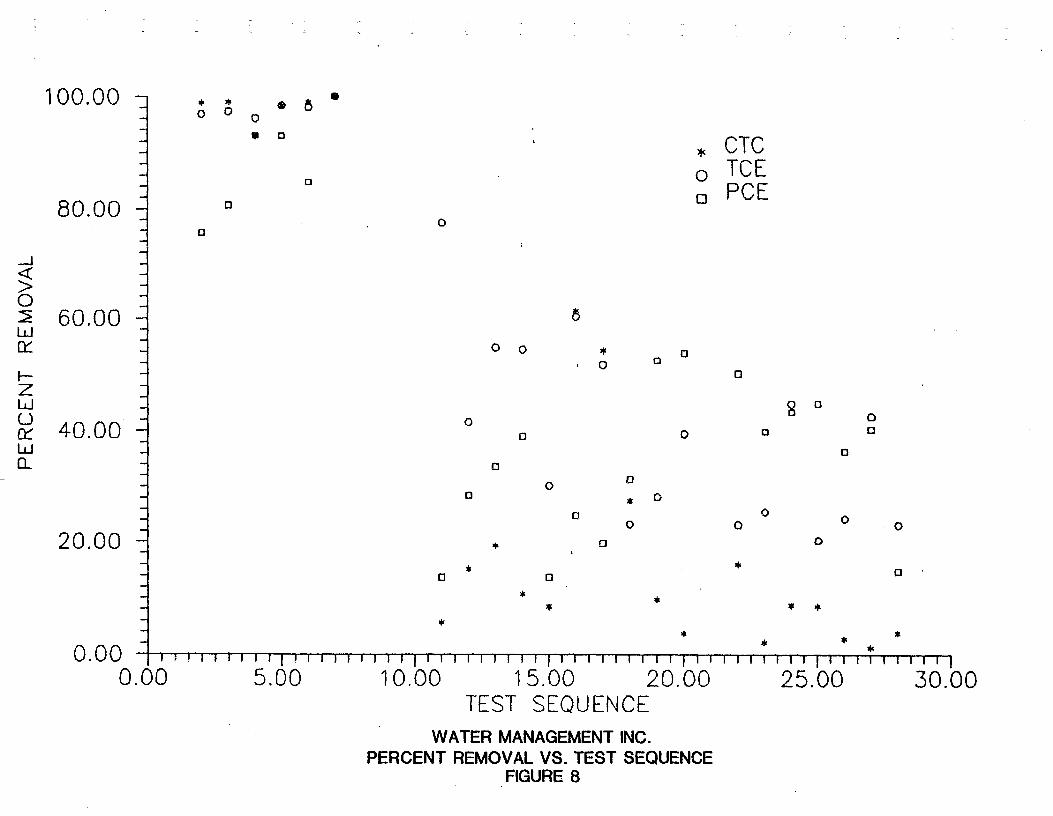
Results from the first series of tests performed on WMl's system indicated excellent VOC
removals (80% - 100% for TCE, PCE, and CTC). However, after completion of these
first tests, VOC removal efficiencies dropped off significantly and the high removals could
not be reproduced over the duration of the intensive monitoring phase. This trend is
depicted in Figure 8 which is a plot of VOC percent removals versus the order in which
the tests were performed, or test sequence. Since the high VOC removals seen during the
first part of the study could not be repeated during later testing, even under essentially
' identical operating conditions, these data points were considered erroneous and eliminated
from further analysis. Although it is possible that these exceptionally high removals are
_, valid results (because no reasonable explanation for the sudden change in treatment
efficiencies can be offered and because the results could not be repeated) it was decided
4-1
100.00_ * * · _ ·_ 0 0 0
_ III 0_ , OTC- ,-, o TCE: u PCE
80.00 - °- 0- ri
__..I
¢ :0 _.:_ 60.00 -LLI
_ O O ,, o- , O O
t-- - OZLa _ § oC) - o oa::40.00 ,-, o o oLLI - 0fl - r,
0- 0- 0 _ 0
- o o0 0 0 0
20.00 · o o-- l
- O O 0
_ ·
000 *· "l _ I'l i I I I i I J i J"'"j i J J 'l F""I i i j i'l '_ I i i I'l'l I i i'_"l'l i I i ,' f"'"l I ! i i'l i' _ i i i I _ l'i i I
0.00 5.00 10.00 15.00 20.00 25.00 30.00TEST SEQUENCE
WATER MANAGEMENT INC.PERCENT REMOVAL VS. TEST SEQUENCE
FIGURE 8
that conclusions about the overall performance of WMl's system should not be based on
these numbers alone.
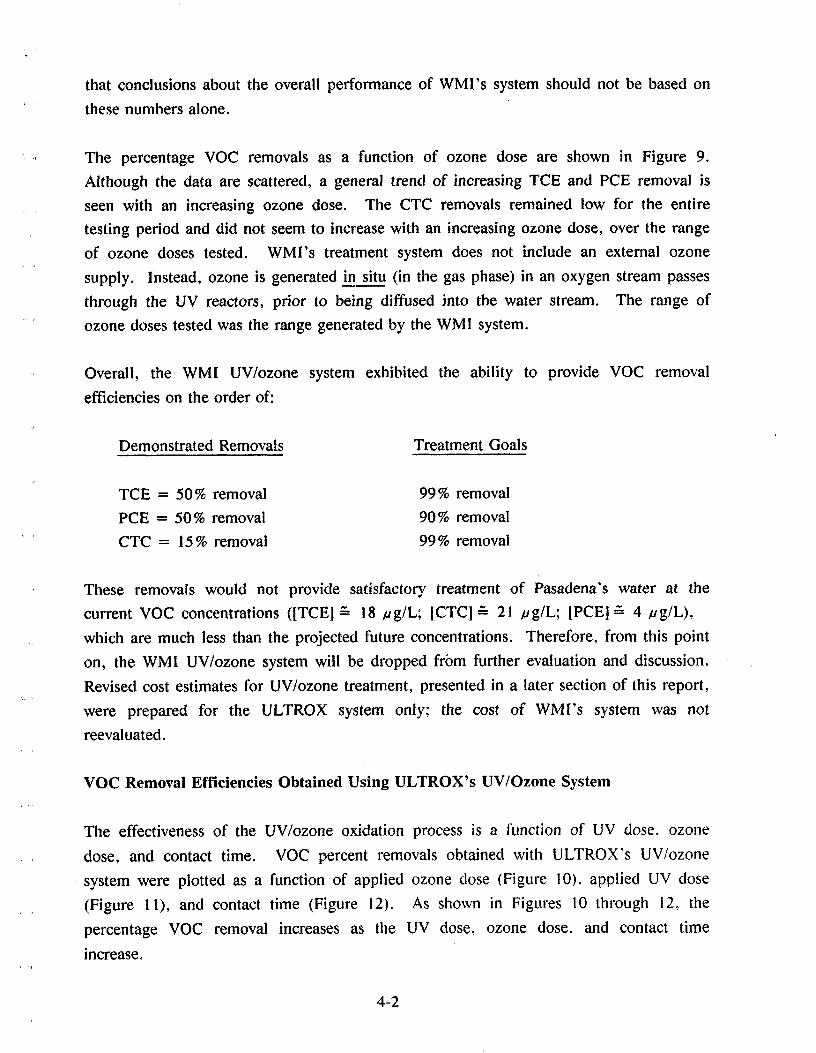
The percentage VOC removals as a function of ozone dose are shown in Figure 9.
Although the data are scattered, a general trend of increasing TCE and PCE removal is
seen with an increasing ozone dose. The CTC removals remained !ow for the entire
testing period and did not seem to increase with an increasing ozone dose, over the range
of ozone doses tested. WMI's treatment system does not include an external ozone
supply. Instead, ozone is generated in situ (in the gas phase) in an oxygen stream passes
through the UV reactors, prior to being diffused into the water stream. The range of
ozone doses tested was the range generated by the WMI system.
Overall, the WMI UV/ozone system exhibited the ability to provide VOC removal
efficiencies on the order of:
, !
Demonstrated Removals Treatment Goals
TCE = 50% removal 99% removal
PCE = 50% removal 90% removal
CTC = 15 % removal 99 % removal
These removals would not provide satisfactory treatment of Pasadena's water at the
current VOC concentrations ([TCE] '-- 18 /ag/L; [CTC] '-- 21 /ag/L; [PCEJ '-- 4 #g/L),
which are much less than the projected future concentrations. Therefore, from this point
on, the WMI UV/ozone system will be dropped from further evaluation and discussion.
Revised cost estimates for UV/ozone treatment, presented in a later section of this report,
were prepared for the ULTROX system only; the cost of WMI's system was not
reevaluated.
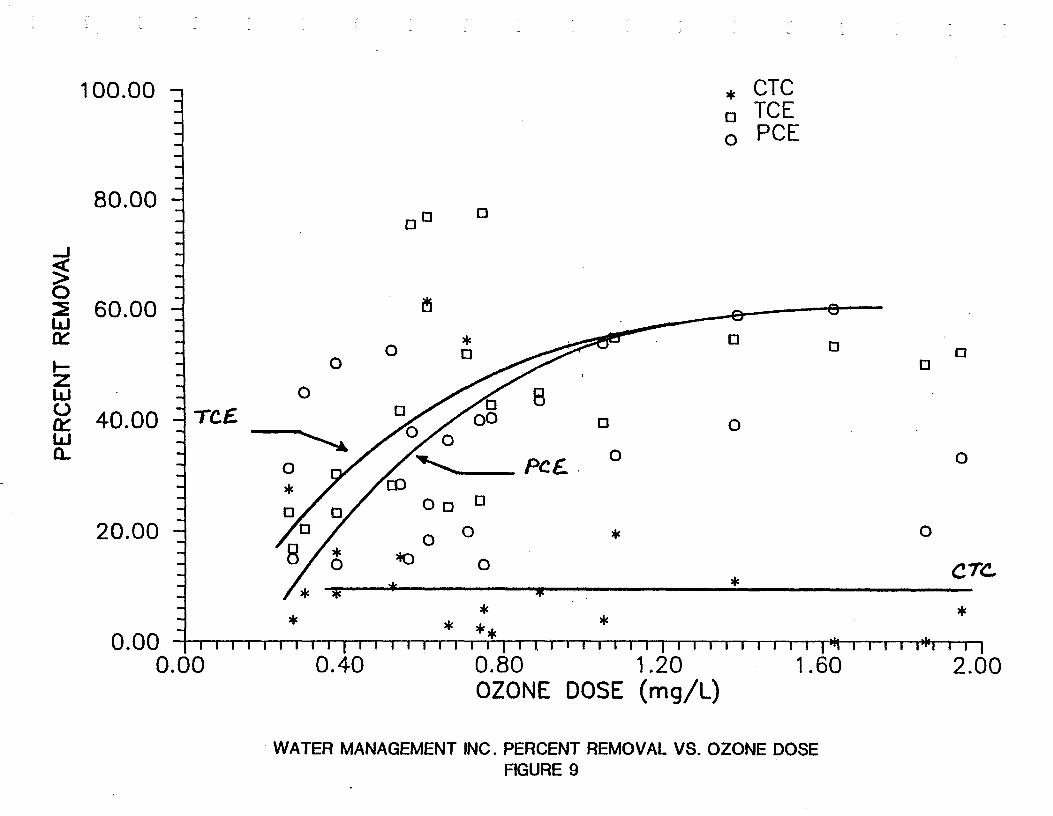
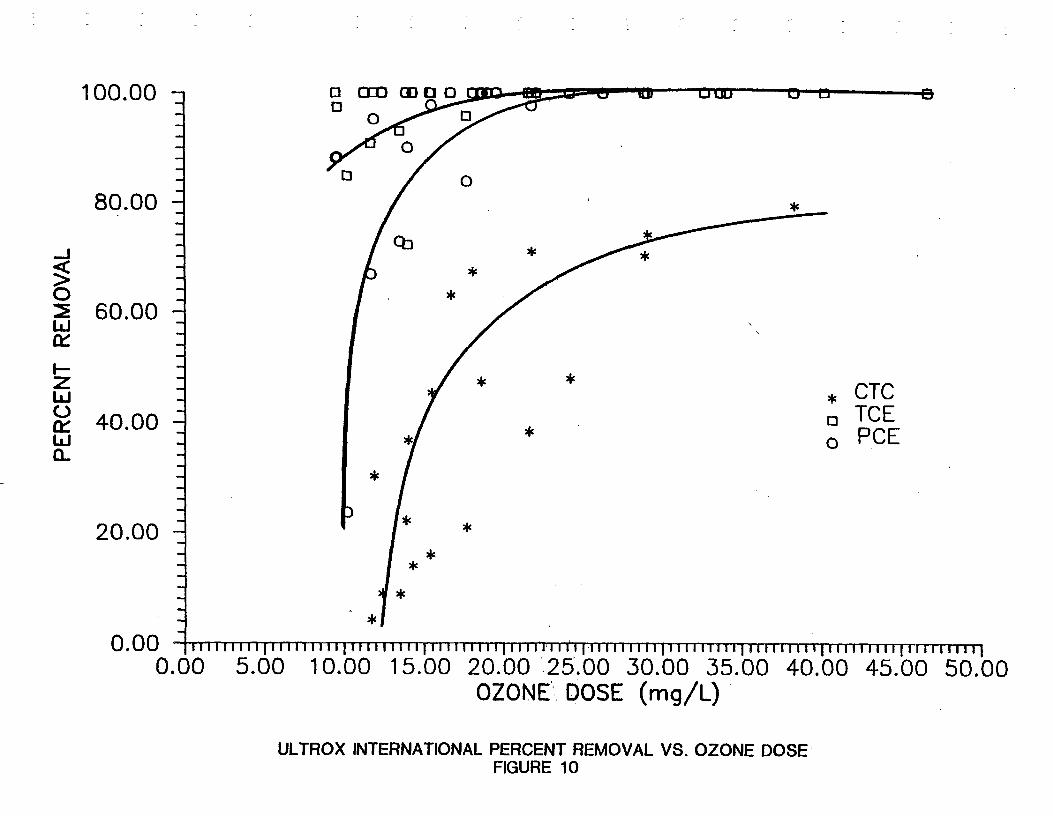
VOC Removal Efficiencies Obtained Using ULTROX's UV/Ozone System
The effectiveness of the UV/ozone oxidation process is a function of UV dose. ozone
dose, and contact time. VOC percent removals obtained with ULTROX's UV/ozone
system were plotted as a function of applied ozone dose (Figure 10). applied UV dose
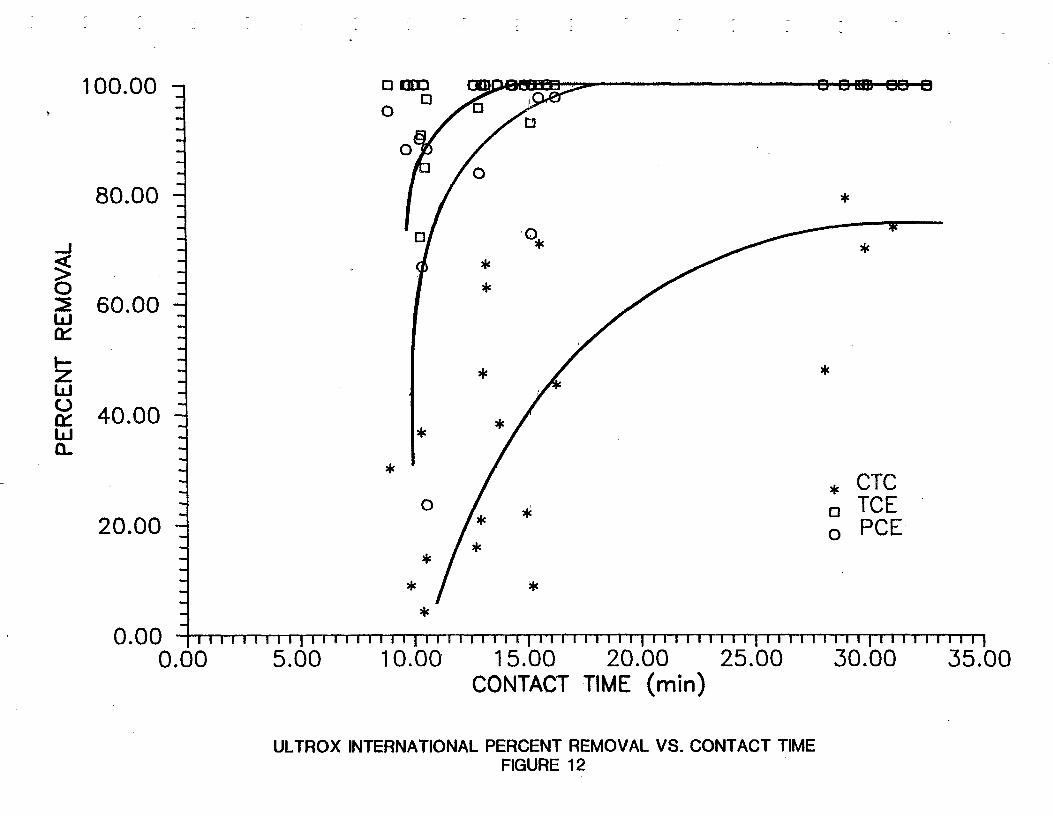
(Figure l l), and contact time (Figure 12). As shown in Figures 10 through 12. the
percentage VOC removal increases as the UV dose, ozone dose. and contact time
increase.
4-2
l
100.00- , CTCm
: [] TCE: o PCE
I
80.00- [] []- []
0 -:_ 60.0O- aI,a
- , ri []11,' _ o o []I-- - 0 []Z lIai - 0r_ - []m: 40.00 Tgi: oo [] o,,, - '_--._ o13- - 0 o- o "'.,- PoE.
- _ 13D
_ [] OD []
20.00 _ o o , o
: o _ o C_- . · ..........., ........... · ......
_- , , _0O0 ......... '" -'-. I I I i"'lI I I I I I I I I I I I I I'"'t I I,t i I I I I I I I I I I I I I I ! I'n I I ! I I'"li I I
0.00 0.40 0.80 1.20 1.60 2.00OZONE DOSE (mg/L)
WATER MANAGEMENTINC. PERCENTREMOVALVS. OZONE DOSEFIGURE 9
100.00 -
80.00_
:..J -_ cb ,
.._ ' **0:! 60.00 --W
I--Z _- * *w - , CTC(.)Q: 40.00 o TCEuJ : o PCEn
: *
20.00 - * *~ ,
~
0.00 .... Illlll I ;Il _li ili"i Il I I I; I I I I I II Im il-i Iii Fi II I itl I f ll,lllll i'i'l"l'l I'l II Illll I Illl Ii i i i! it i illl ii i'll ill i i IBi
0.00 5.00 10.00 15.00 20.00 25.00 50.00 55.00 40.00 45.00 50.00OZONE', DOSE (rog/L)
ULTROX INTERNATIONALPERCENTREMOVAL VS. OZONE DOSE!FIGURE 10
%80£ / / o ·
o ;.__1<r>©:E 60--LdEE
p-A ·
LEI *
CDcE 40--I.lJ *13_.
'* / * , cie
20: / , o PCE
,/ * ,I
0 ' I I I'1'11 I"l'/ I I I I I I I i I I I I I I I'""11 I I I I I I I I I I I i I I I I I I I I I I'i I I I I I I"11 I I ! I I I t'"l"l I I I I I I I"1"'1' I'1'11 I
0 500 1000 1500 2000 2500 3000 3500 4000
UV DOSE (W-s/L)
ULTROX INTERNATIONAL PERCENT REMOVAL VS. UV DOSEFIGURE 11
100.00 - a mo- E!
, - 0
80.00 ·
Z n ,o,_J - *
60.00W
I--- -ZW0,¥ 40.00_ .W - *
fl.. 2- *
_ , CTC- o , oTCE
20.00_ o PCE
- ,
0.00 I I i I I i I I / I I ,'l'l I I ', I I I I I I I I I I Il I Il I ' I I I I'l Il I I I ' I I ' i' I I fl I I'll I I I I i l'l I Il I I I0.00 5.00 10.00 15.00 20.00 25.00 30.00 55.00
CONTACT TIME (min)
ULTROX INTERNATIONALPERCENTREMOVALVS. CONTACT.TIMEFIGURE 12
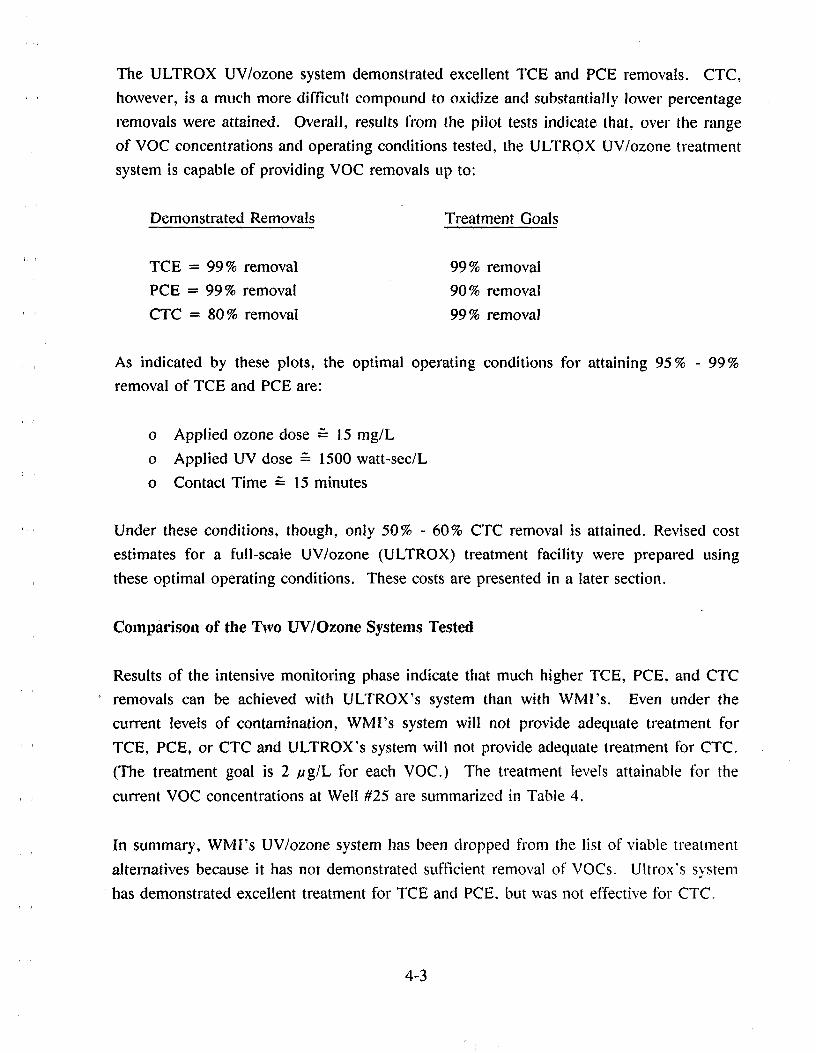
The ULTROX UV/ozone system demonstrated excellent TCE and PCE removals. CTC,
' however, is a much more difficult compotmd to oxidize and substantially lower percentage
removals were attained. Overall, results from the pilot tests indicate that, over the range
of VOC concentrations and operating conditions tested, the ULTROX UV/ozone treatment
system is capable of providing VOC removals up to:
Demonstrated Removals Treatment Goals
TCE = 99% removal 99% removal
PCE = 99% removal 90% removal
' CTC = 80 % removal 99% removal
As indicated by these plots, the optimal operating conditions for attaining 95% - 99%removal of TCE and PCE are:
o Applied ozone dose '= 15 mg/L
o Applied UV dose --- 1500 watt-sec/L
o Contact Time & 15 minutes
' , Under these conditions, though, only 50% - 60% CTC removal is attained. Revised cost
estimates for a full-scale UV/ozone (ULTROX) treatment facility were prepared using
these optimal operating conditions. These costs are presented in a later section.
Comparison of the Two UV/Ozone Systems Tested
Results of the intensive monitoring phase indicate that much higher TCE, PCE, and CTC
removals can be achieved with ULTROX's system than with WMI's. Even under the
current levels of contamination, WMI's system will not provide adequate treatment for
TCE, PCE, or CTC and ULTROX's system will not provide adequate treatment for CTC.
(The treatment goal is 2 #g/L for each VOC.) The treatment levels attainable for the
current VOC concentrations at Well #25 are summarized in Table 4.
In summary, WMI's UV/ozone system has been dropped from the list of viable treatment
alternatives because it has not demonstrated sufficient removal of VOCs. Ultrox's system
has demonstrated excellent treatment for TCE and PCE. but was not effective for CTCo
4-3
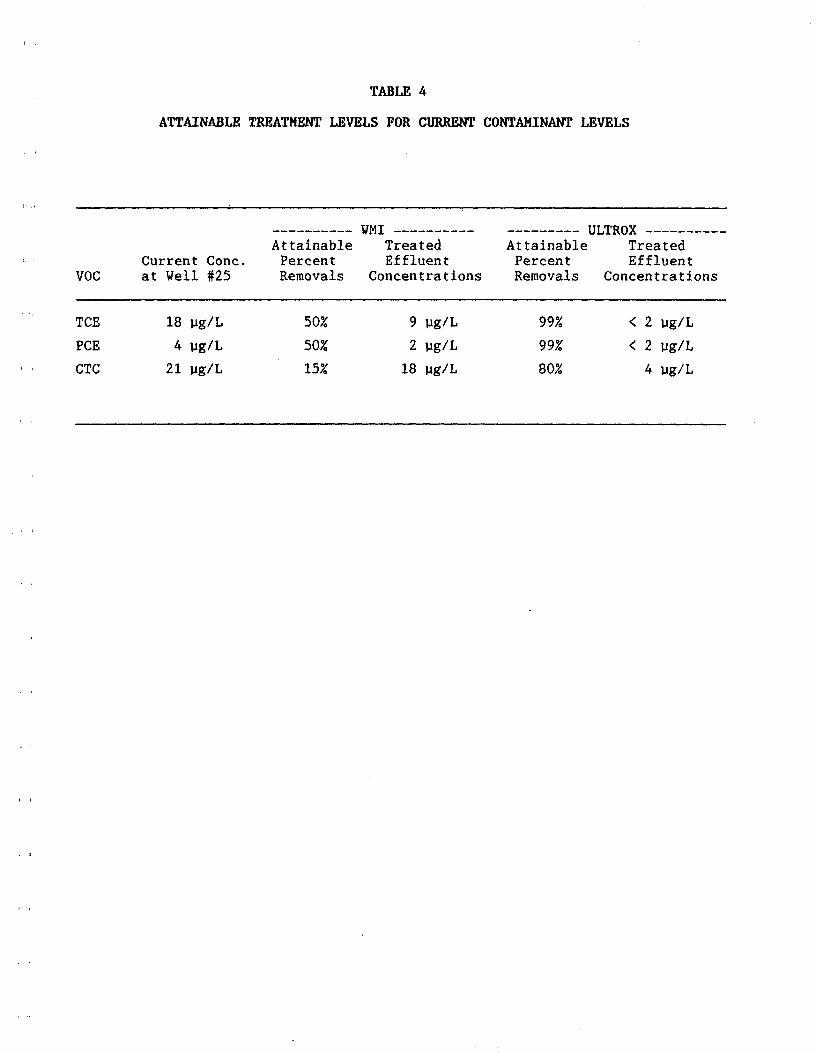
TABLE 4
ATTAINABLE TREATMENT LEVELS FOR CURRENT CONTAMINANT LEVELS
WMI ULTROXAttainable Treated Attainable Treated
_ Current Conc. Percent Effluent Percent EffluentV0C at Well _25 Removals Concentrations Removals Concentrations
TCE 18 _g/L 50% 9 _g/L 99% < 2 ug/L
PCE 4 _g/L 50% 2 _g/L 99% < 2 ug/L
_ _ CTC 21 _g/L 15% 18 _g/L 80% 4 ug/L
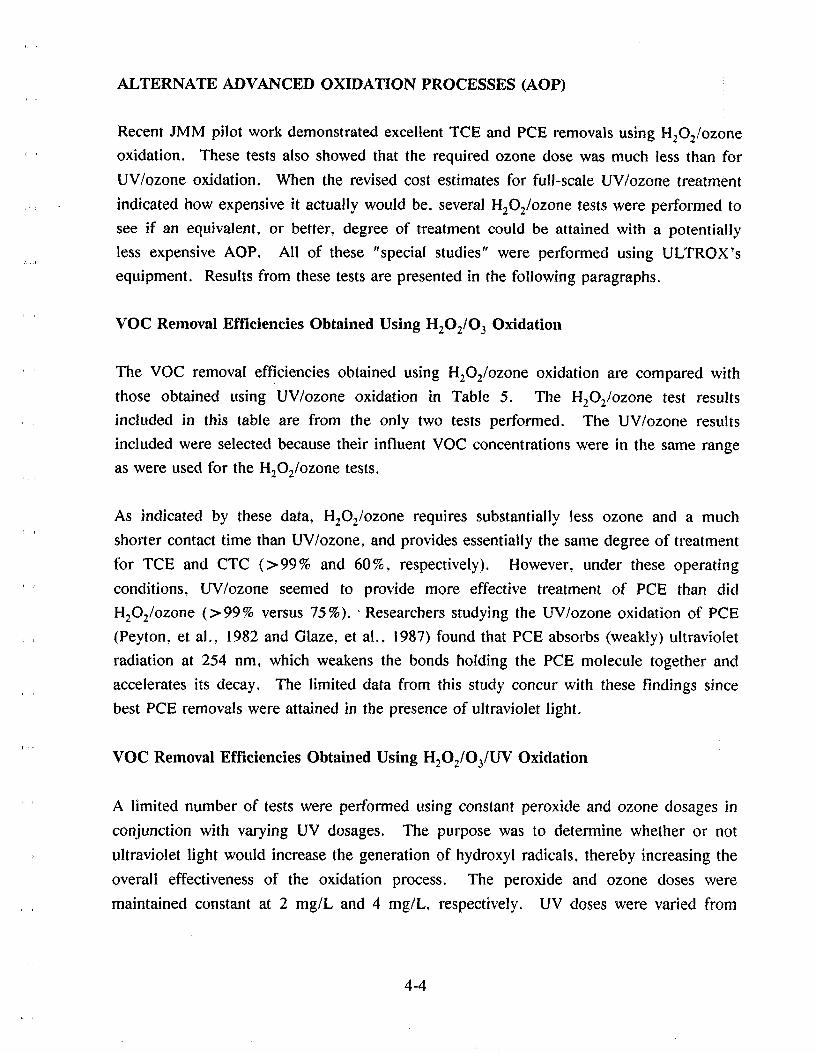
ALTERNATE ADVANCED OXIDATION PROCESSES (AOP)
Recent JMM pilot work demonstrated excellent TCE and PCE removals using H202/ozone
, ' oxidation. These tests also showed that the required ozone dose was much less than for
UV/ozone oxidation. When the revised cost estimates for full-scale UV/ozone treatment
indicated how expensive it actually would be, several H202/ozone tests were performed to
see if an equivalent, or better, degree of treatment could be attained with a potentially
!ess expensive AOP. All of these "special studies" were performed using ULTROX'si
equipment. Results from these tests are presented in the following paragraphs.
f
VOC Removal Efficiencies Obtained Using H202/O 3 Oxidation
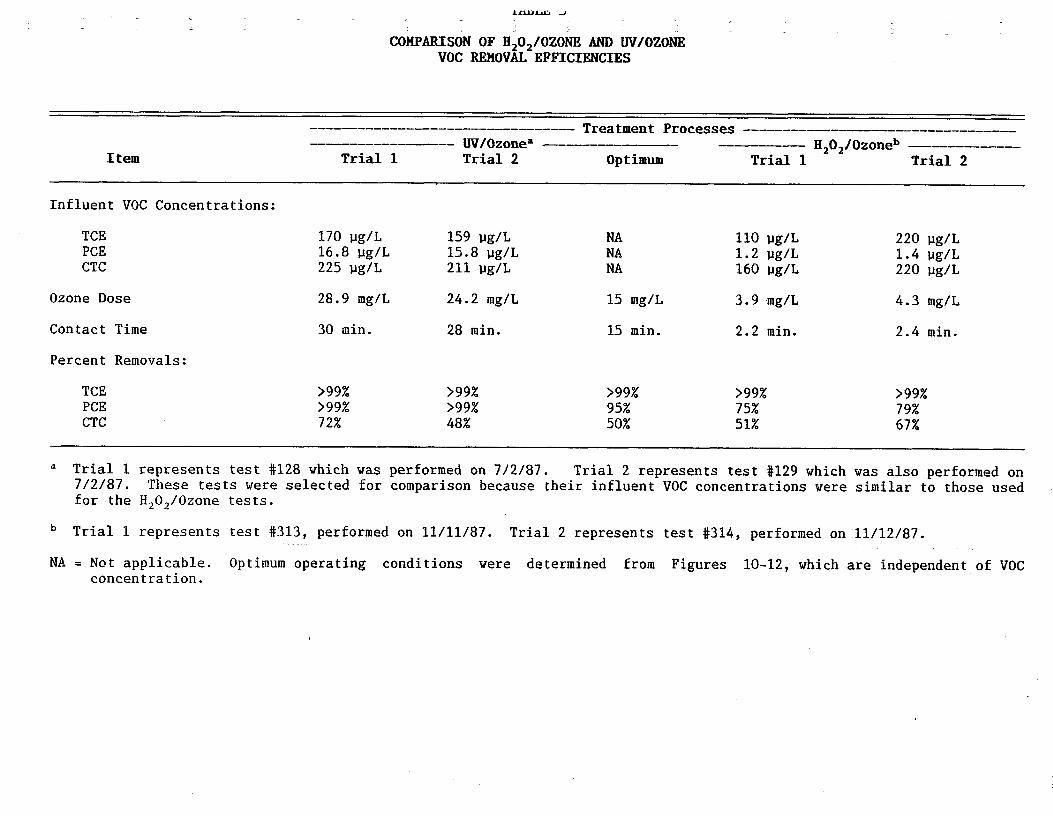
'' The VOC removal efficiencies obtained using H202/ozone oxidation ale compared with
those obtained using UV/ozone oxidation in Table 5. The H202/ozone test results
. included in this table are from the only two tests performed. The UV/ozone results
included were selected because their influent VOC concentrations were in the same range
as were used for the H202/ozone tests.
As indicated by these data, H202/ozone requires substantially less ozone and a much
shorter contact time than UV/ozone, and provides essentially the stone degree of treatment
for TCE and CTC (>99% and 60%, respectively). However, under these operating
'_ conditions, UV/ozone seemed to provide more effective treatment of PCE than did
H202/ozone (>-99% versus 75%). 'Researchers studying the UV/ozone oxidation of PCE
(Peyton, et al., 1982 and Glaze, et al., 1987) found that PCE absorbs (weakly) ultraviolet
radiation at 254 nm, which weakens the bonds holding the PCE molecule together and
accelerates its decay. The limited data from this study concur with these findings since:f
best PCE removals were attained in the presence of ultraviolet light.
VOC Removal Efficiencies Obtained Using H202/O3/UV Oxidation
A limited number of tests were performed using constant peroxide and ozone dosages in
conjunction with varying UV dosages. The purpose was to determine whether or not
ultraviolet light would increase the generation of hydroxyl radicals, thereby increasing the
overall effectiveness of the oxidation process. The peroxide and ozone doses were
maintained constant at 2 mg/L and 4 mg/L, respectively. UV doses were varied from
4-4
coMPaiS0NOFH2o,,,ozo/ Uv,,oZONEvoc .FFXCNCXRS
Treatment Processes
UV/Ozone a H202/OzonebItem Trial 1 Trial 2 Optimum Trial 1 Trial 2
Influent VOC Concentrations:
TCE 170 _g/L 159 _g/L NA 110 _g/L 220 _g/L
PCE 16.8 _g/L 15.8 _g/L NA 1.2 _g/L 1.4 _g/L
CTC 225 _g/L 211 _g/L NA 160 _g/L 220 _g/L
Ozone Dose 28.9 mg/L 24.2 mg/L 15 mg/L 3.9 mg/L 4.3 mg/L
ContactTime 30 min. 28 min. 15 min. 2.2min. 2.4min.
Percent Removals:
TCE >99% >99% >99Z >99% >99%
PCE >99% >99% 95% 75% 79%
CTC 72% 48% 50% 51% 67%
a Trial 1 represents test #128 which was performed on 7/2/87. Trial 2 represents test _129 which was also performed on7/2/87. These tests were selected for comparison because their influent VOC concentrations were similar to those used
for the H202/Ozone tests.
b Trial 1 represents test _313, performed on 11/11/87. Trial 2 represents test _314, performed on 11/12/87.
NA = Not applicable. Optimum operating conditions were determined from Figures 10-12, which are independent of VOCconcentration.
zero to 300 watt-sec/L. Results of these tests are summarized in Table 6 and illustrated in
Figure 13.
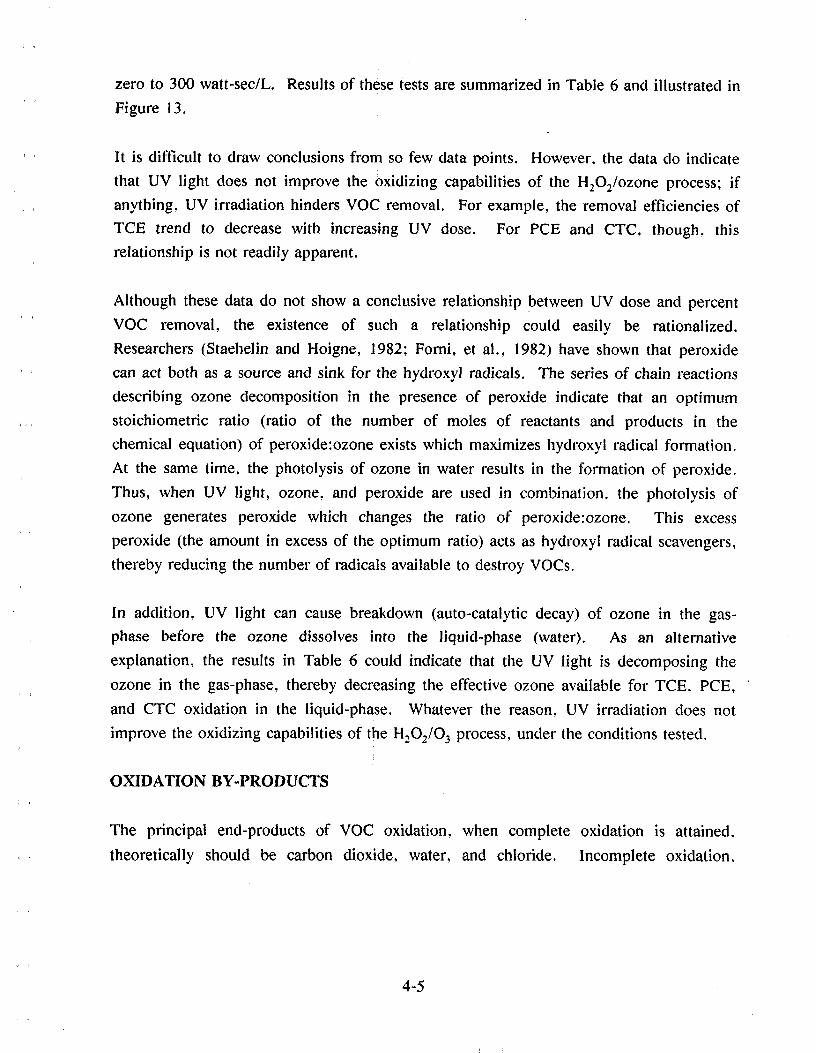
' It is difficult to draw conclusions from so few data points. However, the data do indicate
that UV light does not improve the oxidizing capabilities of the H202/ozone process; if
, anything, UV irradiation hinders VOC removal. For example, the removal efficiencies of
TCE trend to decrease with increasing UV dose. For PCE and CTC, though, this
relationship is not readily apparent.
Although these data do not show a conclusive relationship between UV dose and percent
VOC removal, the existence of such a relationship could easily be rationalized.
Researchers (Staehelin and Hoigne, 1982; Fomi, et al., 1982) have shown that peroxide
can act both as a source and sink for the hydroxyl radicals. The series of chain reactions
describing ozone decomposition in the presence of peroxide indicate that an optimum
, stoichiometric ratio (ratio of the number of moles of reactants and products in the
chemical equation) of peroxide:ozone exists which maximizes hydroxyl radical formation.
At the same time, the photolysis of ozone in water results in the formation of peroxide.
Thus, when UV light, ozone, and peroxide are used in combination, the photolysis of
ozone generates peroxide which changes the ratio of peroxide:ozone. This excess
peroxide (the amount in excess of the optimum ratio) acts as hydroxyl radical scavengers,
thereby reducing the number of radicals available to destroy VOCs.
In addition, UV light can cause breakdown (auto-catalytic decay) of ozone in the gas-
phase before the ozone dissolves into the liquid-phase (water). As an alternative
explanation, the results in Table 6 could indicate that the UV light is decomposing the
ozone in the gas-phase, thereby decreasing the effective ozone available for TCE, PCE.
and CTC oxidation in the liquid-phase. Whatever the reason, UV irradiation does not
improve the oxidizing capabilities of the H:O2/O 3 process, under the conditions tested.
OXIDATION BY-PRODUCTS
The principal end-products of VOC oxidation, when complete oxidation is attained.
_ theoretically should be carbon dioxide, water, and chloride. Incomplete oxidation,
4-5
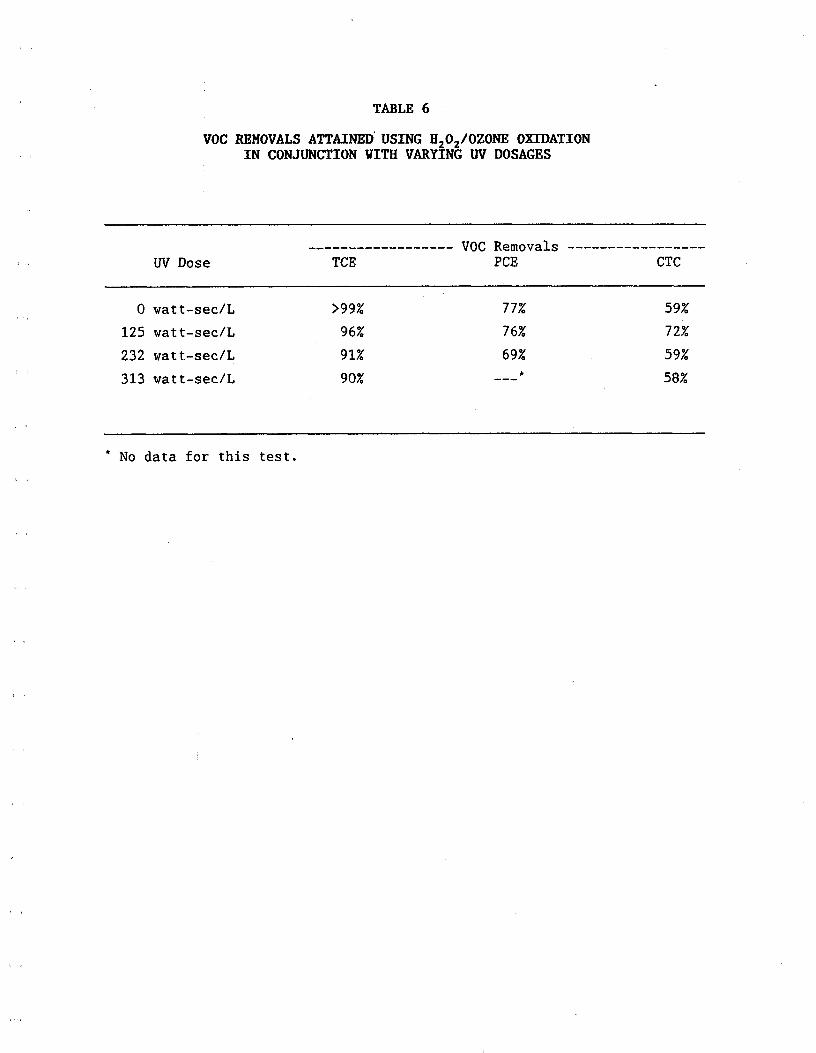
TABLE 6
VOC REMOVALS ATTAINED USING H202/OZONE OXIDATIONIN CONJUNCTION WITH VARYING UV DOSAGES
VOC Removals
UV Dose TCE PCE CTC
0 watt-sec/L >99% 77% 59%
125 watt-sec/L 96% 76% 72%
232 watt-sec/L 91% 69% 59%
' 313 watt-sec/L 90% ---* 58%
* No data for this test.
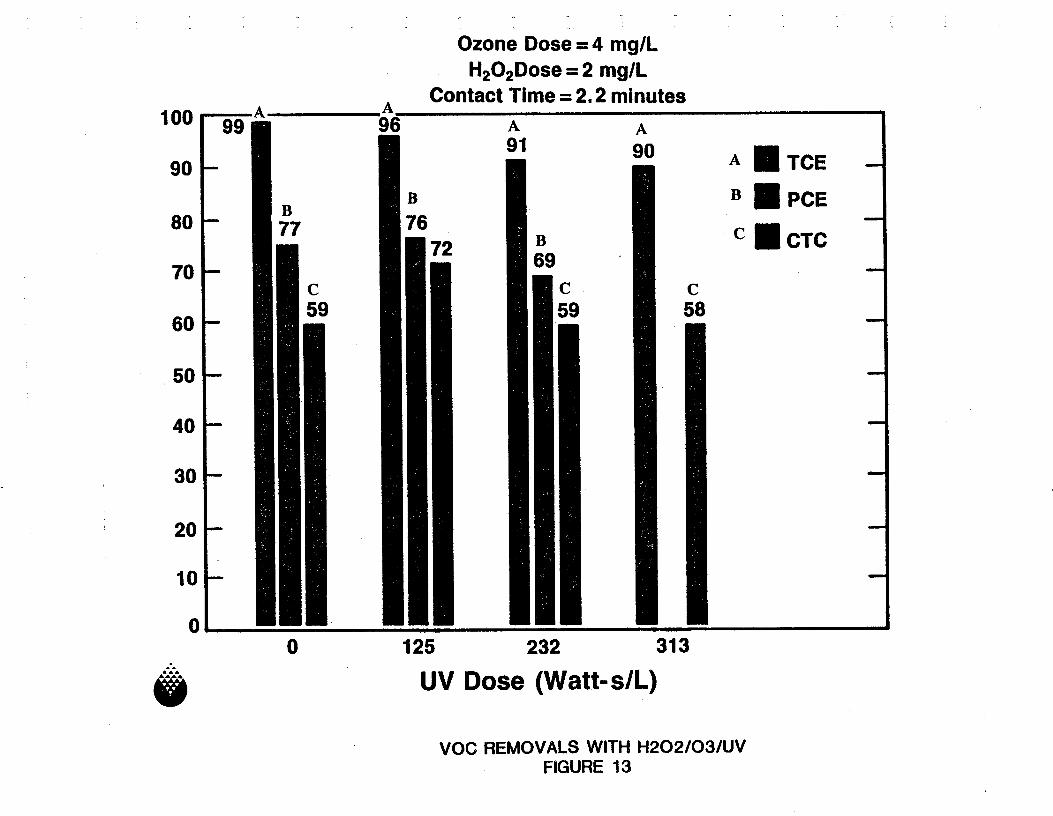
Ozone Dose = 4 mg/LH202Dose= 2 mg/L
Contact Time = 2.2 minutes100" A A ....96 A A
91 9090 A TCE
B B PCEB
8O 77 7672 n ¢ CTC
697O
C C C59 59 58
6O
5O
4O
3O
2O
10
00 125 232 313
A&A
UV Dose (Watt-s/L)
VOC REMOVALS WITH H202/O3/UVFIGURE 13
however, may results in the formation of other organic by-products. Therefore, several
effluent water and off-gas (WMI only) samples were analyzed for "other" organic by-
products which possibly could have been formed as a result of incomplete oxidation of the
VOCs. Most of the potential by-products are volatile organics. Thus, the standard
analytical methodologies for measuring VOCs were employed for by-product analysis.
The list of potential by-products which are amenable to the VOC analytical methodologies
include: tetrachloroethene epoxide; mono-, di-, and tri-chloroacetal isomers; and
phosgene. The potential by-products not amenable to this type of analysis include:
mono-, di-, and tri-chloroacetic acid isomers; chlorinated ethanediols; and
chlorohydroxyacetal isomers.
No oxidation by-products were detected in any of the samples analyzed. The detection
limit for most of these compounds is expected to be between I #g/L and 10 #g/L.
, LONG-TERM PHASE TESTING RESULTS
As discussed earlier, the long-term phase testing was modified to include several studies
lasting between 1-10 days which accomplished the objectives of (1) obtaining reliable
O&M data, and (2) performing as many of the proposed intensive-phase tests as possible.
The following O&M issues were experienced during the pilot studies which could reflect
potential problems that might arise in the full scale treatment facility.
For the U!trox system, the majority of the problems were associated with ozone
_. generation. The most frequent failure was associated with the air drying unit which,
because of the moist air, resulted in a lower production of ozone. One ozone generator
cell had to be replaced and another repaired. Nearing the end of the project, several
bulbs had severely deteriorated, and had a dull purple color as opposed to the brightness
of a new bulb. Instability of the ozone gas flow meters was another difficulty
experienced.
' In the WMI system, there were several breakages of the quartz sheath around the UV
lamp but the cause remained unknown. Early problems with overheating of the oxygen
compressor required its replacement with bottled pure oxygen.
4-6
t .
SUMMARY OF VOC REMOVAL EFFICIENCIES
To summarize the results of this study, the following can be said:
o The performance of the ULTROX UV/ozone system in degrading TCE, PCE?
and CTC was superior to that of the WMI UV/ozone system.
o The H202/ozone AOP demonstrated essentially identical TCE and CTC removals,
and only marginally lower PCE removal, as did the UV/ozone AOP, but used a
substantially lower ozone dose and shorter contact time.
o The combined usage of UV light, ozone, and peroxide, did not improve VOC
removal efficiencies.
o Similar VOC removal efficiencies were obtained when treating contaminated well
water, as when treating water from Windsor Reservoir that had been spiked with
VOCs.
4-7

l
SECTION 5
SECTION 5
REVISED COST ESTIMATES FOR
' FULL-SCALE, LIQUID-PHASE, AOP TREATMENT
Cost estimates for the design, construction, and operation of a full-scale (I) UV/ozone
and (2) H202/ozone treatment facility were prepared using information learned from the
pilot study and are presented in the following paragraphs. Preliminary cost estimates for
UV/ozone treatment were included in the Treatability/Feasibility Report, using design and
operation information supplied by the manufacturer prior to pilot testing. Estimates in
that report were for both the ULTROX and WMI treatment systems. The revised
UV/ozone cost estimates presented in this report are representative of ULTROX's system
only; results from the pilot study indicated WMI's system could not, reliably, provide
satisfactory VOC removal--even for TCE and PCE which are relatively easily oxidized.
Cost estimates for H202/ozone treatment were not included in the Treatability/Feasibility
Report because it is a new process and, at the time, was not known to have been tested at
the pilot level for VOC removal, much less in a full-scale treatment application. Thus,
the figures for H:O2/ozone treatment are "first time" estimates rather than revised
estimates.
General assumptions and design criteria used in determining the cost of UV/ozone
(ULTROX) and H202/ozone treatment are listed in Table 7. These are design criteria and
operating requirements based on results of the pilot study. From the modified long-term
phase testing, the average power consumption for ozone generation, destruction, and gas
recycle were determined to be 18.8 KWH/lb 03 (Table 7). This power requirement was
encorporated in the total annual O&M cost estimate given in Table 8. The revised
estimates for the ULTROX UV/ozone system are feasibility level estimates, meaning that
the accuracy is plus 50% or minus 30% of the actual costs. However, the estimates for
H:O2/Ozone treatment should be assumed less accurate since the process has not yet been
optimized for Pasadena's water and a full-scale facility has never been built.
UV/OZONE
The design criteria used for estimating the cost of UV/ozone (ULTROX) treatment are
5-1
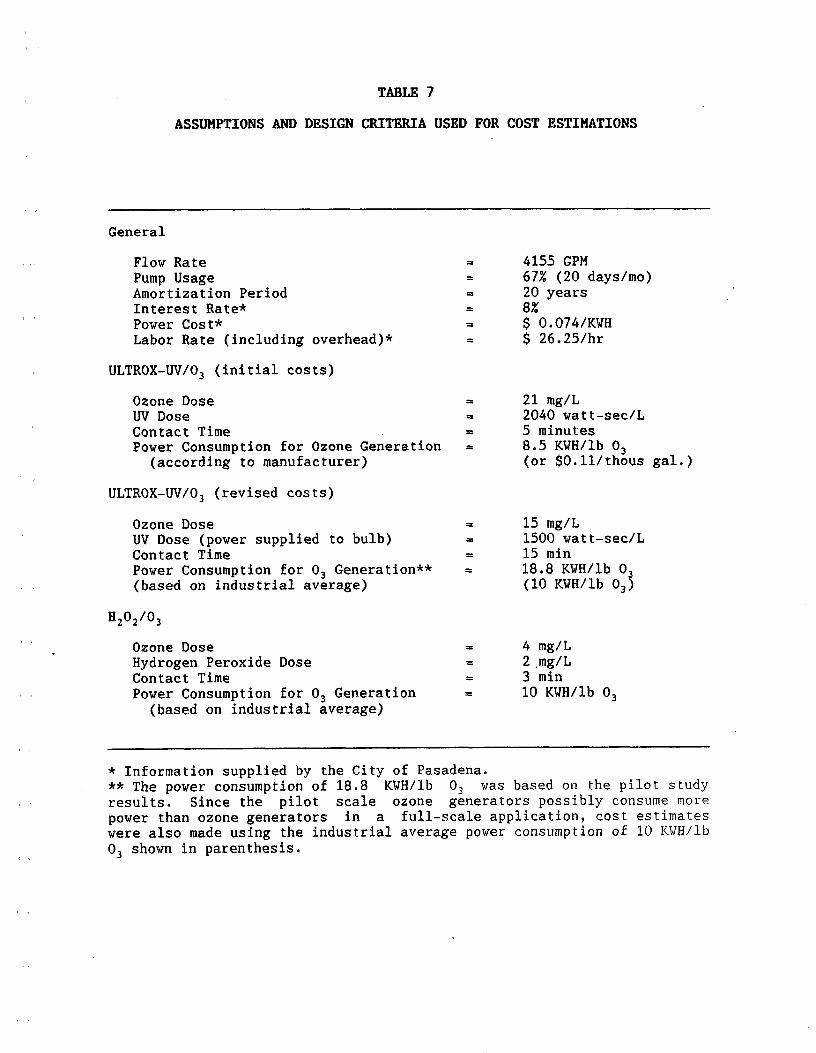
TABLE 7
ASSUHPTIONS AND DESIGN CRITERIA USED FOR COST ESTIHATIONS
General
FlowRate = 4155GPM
Pump Usage = 67% (20 days/mo)AmortizationPeriod = 20yearsInterestRate* = 8%Power Cost* = $ 0.074/KWHLabor Rate (including overhead)* = $ 26.25/hr
ULTROX-UV/O 3 (initial costs)
Ozone Dose = 21 mg/LUVDose = 2040 watt-sec/LContactTime = 5 minutes
Power Consumption for Ozone Generation _ 8.5 KWH/lb 03(according to manufacturer) (or $0.11/thous gal.)
ULTROX-UV/O 3 (revised costs)
Ozone Dose = 15 mg/LUV Dose (power supplied to bulb) = 1500 watt-sec/LContactTime = 15min
Power Consumption for 03 Generation** = 18.8 KWH/lb 03(based on industrial average) (10 KWH/lb 03)
H202/03
Ozone Dose = 4 mg/LHydrogen Peroxide Dose = 2mg/LContactTime = 3 min
Power Consumption for 03 Generation = 10 KWH/lb 03(based on industrial average)
* Information supplied by the City of Pasadena.** The power consumption of 18.8 KWH/lb 03 was based on the pilot studyresults. Since the pilot scale ozone generators possibly consume morepower than ozone generators in a full-scale application, cost estimateswere also made using the industrial average power consumption of 10 KWH/lb
03 shown in parenthesis.
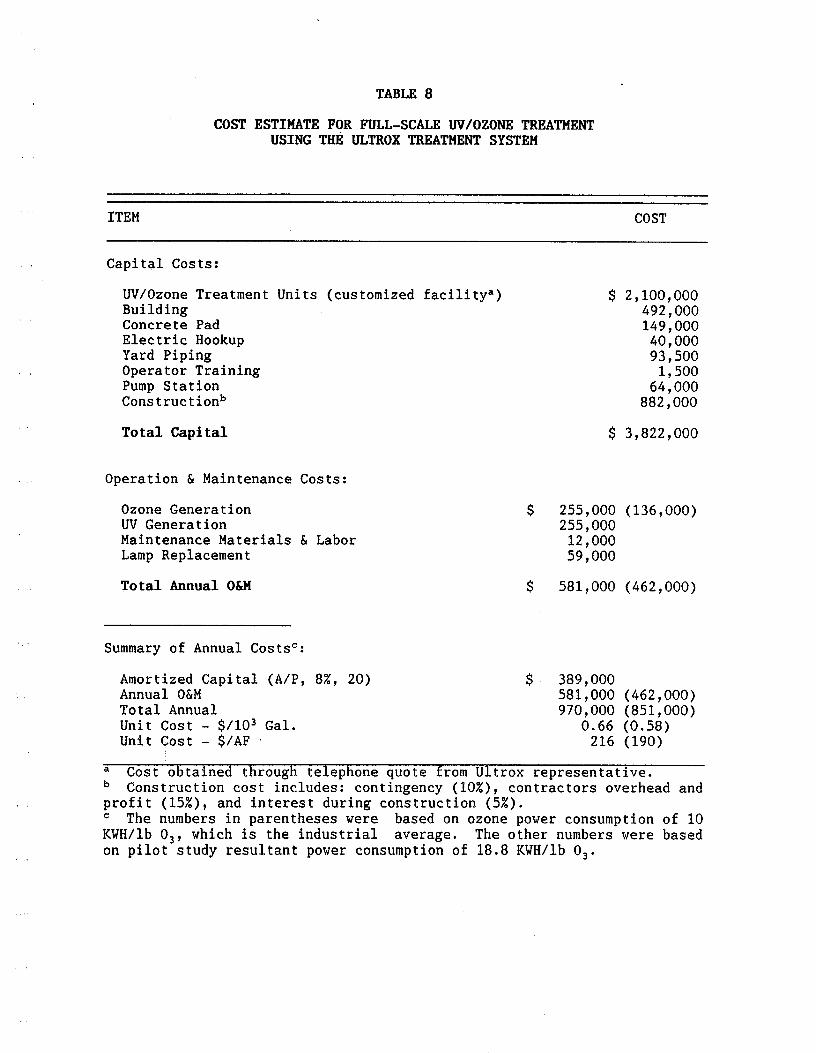
TABLE 8
COST ESTIMATE FOR FULL-SCALE UV/OZONE TREATMENTUSING Tt_ ULTROX TREATMENTSYSTEM
' iTEM COST
, Capital Costs:
UV/Ozone Treatment Units (customized facilitya) $ 2,100,000Building 492,000ConcretePad 149,000Electric Hookup 40,000Yard Piping 93,500Operator Training 1,500PumpStation 64,000Construction b 882,000
Total Capital $ 3,822,000
Operation & Maintenance Costs:
Ozone Generation $ 255,000 (136,000)UV Generation 255,000MaintenanceMaterials& Labor 12,000LampReplacement 59,000
· Total Annual O&M $ 581,000 (462,000)
_ Summary of Annual CostsC:
Amortized Capital (A/P, 8%, 20) $ 389,000AnnualO&M 581,000(462,000)TotalAnnual 970,000(851,000)Unit Cost - $/103 Gal. 0.66 (0.58)Unit Cost - $/AF 216 (190)
a Cost obtained through telephone quote from Ultrox representative.b Construction cost includes: contingency (10%), contractors overhead andprofit (15%), and interest during construction (5%).c The numbers in parentheses were based on ozone power consumption of 10KWH/lb 03, which is the industrial average. The other numbers were basedon pilot study resultant power consumption of 18.8 KWH/lb 03.
listed in Table 7. The required UV dose, ozone dose, and contact time were determined
from the pilot data, as presented in Figures 10, II, and 12, and are sufficient to provide
99% and 95% removals of TCE and PCE, respectively. At these operating conditions,
CTC removal is between 25% and 55%. Results from the pilot work indicate that up to
80% CTC removal can be attained, but the required UV/ozone doses and contact time
would be greater than what is listed in Table 7. Thus, for cost estimation purposes, the
contact time and dosages which provide almost complete removal of TCE and PCE were
selected, even though CTC oxidation is incomplete. Additionally, these design
parameters were assumed independent of initial VOC concentration.
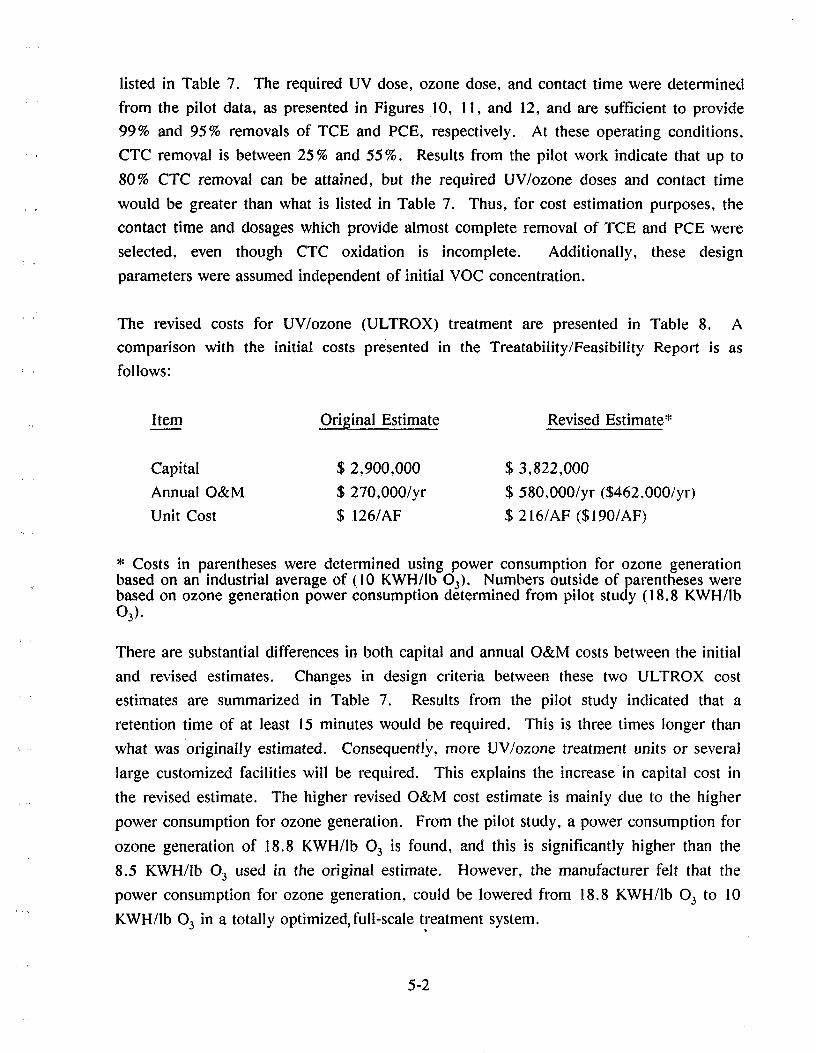
The revised costs for UV/ozone (ULTROX) treatment are presented in Table 8. A
comparison with the initial costs presented in the Treatability/Feasibility Report is asfollows:
Item OriginalEstimate RevisedEstimate*
Capital $ 2,900,000 $ 3,822,000
Annual O&M $ 270,000/yr $ 580,000/yr ($462.000/yr)
Unit Cost $ 126/AF $ 216/AF ($190/AF)
* Costs in parentheses were determined using power consumption for ozone generationbased on an industrial average of (10 KWH/lb 03). Numbers outside of parentheses werebased on ozone generation power consumption determined from pilot study (18.8 KWH/lb03).
There are substantial differences in both capital and annual O&M costs between the initial
and revised estimates. Changes in design criteria between these two ULTROX cost
estimates are summarized in Table 7. Results from the pilot study indicated that a
retention time of at least 15 minutes would be required. This is three times longer than
what was originally estimated. Consequentl3,, more UV/ozone treatment units or several
large customized facilities will be required. This explains the increase in capital cost in
, the revised estimate. The higher revised O&M cost estimate is mainly due to the higher
power consumption for ozone generation. From the pilot study, a power consumption for
ozone generation of 18.8 KWH/lb 03 is found, and this is significantly higher than the
8.5 KWH/lb 03 used in the original estimate. However, the manufacturer felt that the
power consumption for ozone generation, could be lowered from 18.8 KWH/lb 03 to 10
KWH/lb 03 in a totally optimized, full-scale treatment system.
5-2
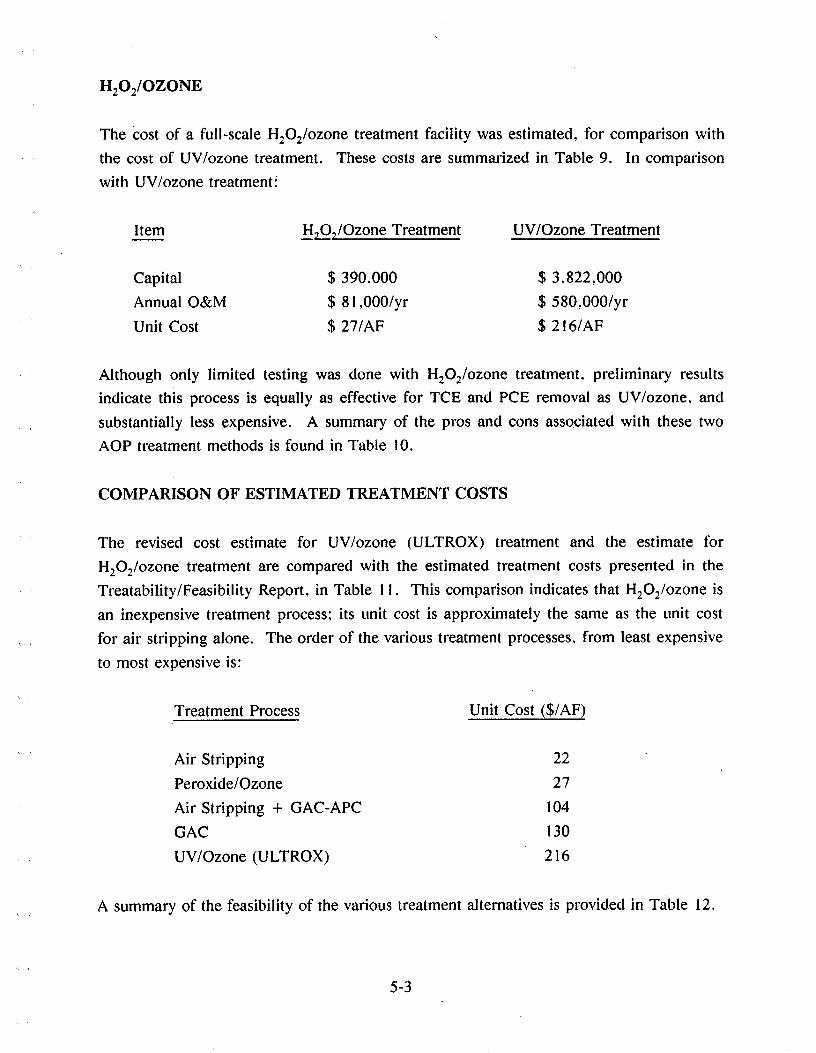
H202/OZONE
The Cost of a full-scale H:O:/ozone treatment facility was estimated, for comparison with
the cost of UV/ozone treatment. These costs are summarized in Table 9, In comparison
with UV/ozone treatment_
Item Hz_O_/Ozone Treatment UV/Ozone Treatment
Capital $ 390,000 $ 3,822,000
Annual O&M $ 81,000/yr $ 580,000/yr
Unit Cost $ 27/AF $ 216/AF
Although only limited testing was done with H:O:/ozone treatment, preliminary results
indicate this process is equally as effective for TCE and PCE removal as UV/ozone, and
substantially less expensive. A summary of the pros and cons associated with these twoAOP treatment methods is found in Table 10.
COMPARISON OF ESTIMATED TREATMENT COSTS
The revised cost estimate for UV/ozone (ULTROX) treatment and the estimate for
H202/ozone treatment are compared with the estimated treatment costs presented in the
Treatability/Feasibility Report, in Table I 1. This comparison indicates that H:O:/ozone is
an inexpensive treatment process; its unit cost is approximately the same as the unit cost
, for air stripping alone. The order of the various treatment processes, from least expensive
to most expensive is:
TreatmentProcess Unit Cost ($/AF)
· AirStripping 22
Peroxide/Ozone 27
AirStripping + GAC-APC 104
GAC 130
UV/Ozone (ULTROX) 216
A summary of the feasibility of the various treatment alternatives is provided in Table 12.
5-3
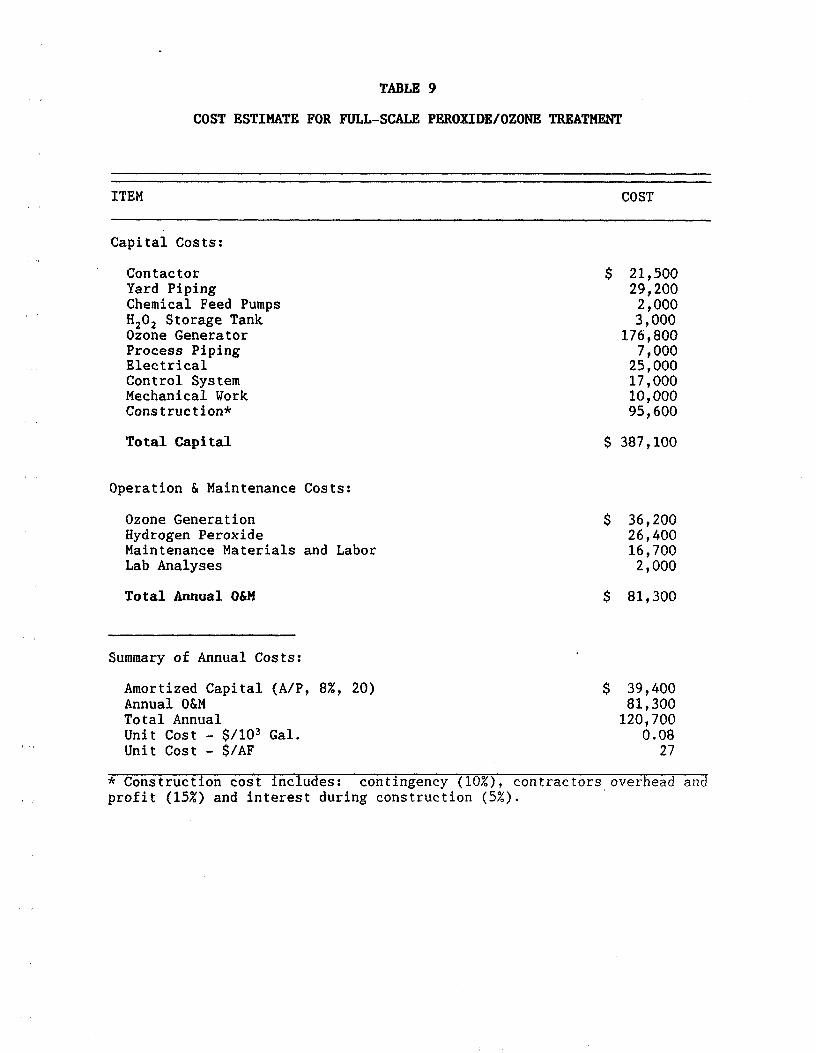
TABLE 9
COST ESTIMATE FOR FULL-SCALE PEROXIDE/OZONE TREATMENT
ITEM COST
Capital Costs:
Contactor $ 21,500YardPiping 29,200ChemicalFeedPumps 2,000
'' H202StorageTank 3,000OzoneGenerator 176,800Process Piping 7,000Electrical 25,000ControlSystem 17,000Mechanical Work 10,000Construction* 95,600
Total Capital $ 387,100
Operation & Maintenance Costs:
OzoneGeneration $ 36,200HydrogenPeroxide 26,400MaintenanceMaterialsand Labor 16,700LabAnalyses 2,000
Total Annual O&M $ 81,300
Summary of Annual Costs:
Amortized Capital (A/P, 8%, 20) $ 39,400AnnualO&M 81,300TotalAnnual 120,700Unit Cost - $/103 Gal. 0.08
' Unit Cost - $/AF 27
* Construction cost includes: contingency (10%), contractors overhead andprofit (15%) and interest during construction (5%).
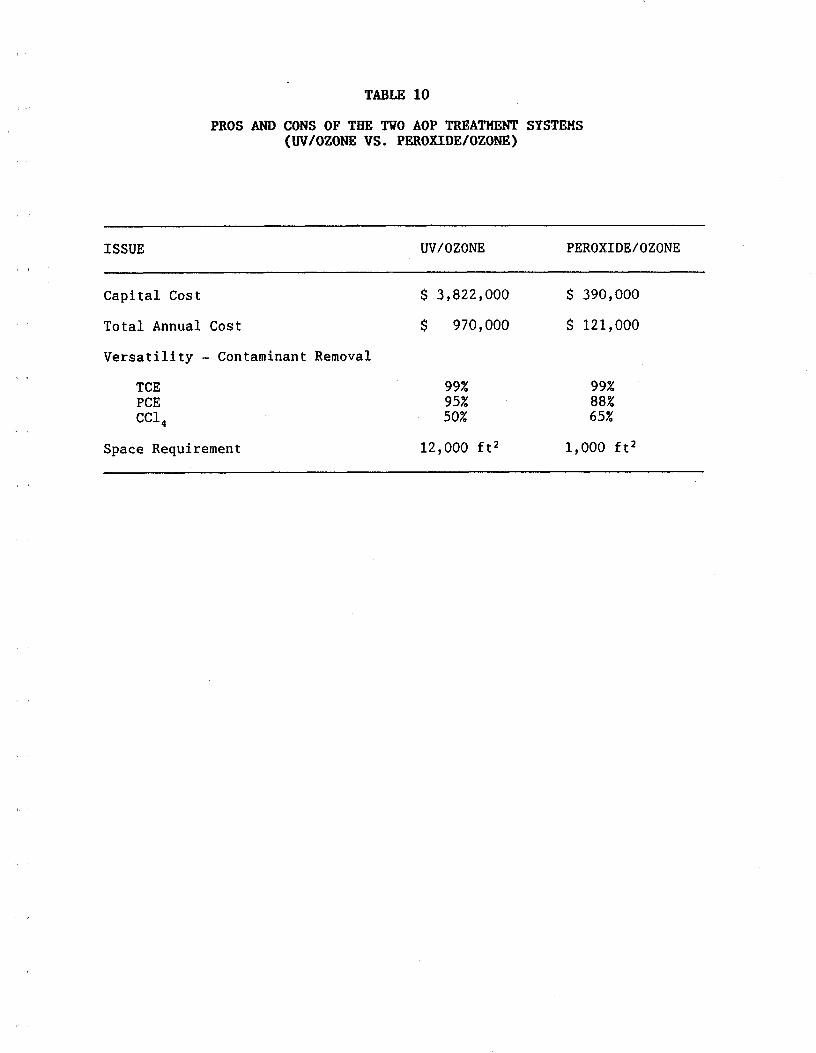
TABLE 10
PROS AND CONS OF TNB TVO AOP TREATMENT SYSTEMS
(UV/OZONE VS. PEROKIDE/OZONE)
ISSUE UV/OZONE PEROXIDE/OZONE
Capital Cost $ 3,822,000 $ 390,000
Total Annual Cost $ 970,000 $ 121,000
Versatility - Contaminant Removal
TCE 99% 99%PCE 95% 88%
CCl 4 50% 65%
Space Requirement 12,000 ft2 1,000 ft2
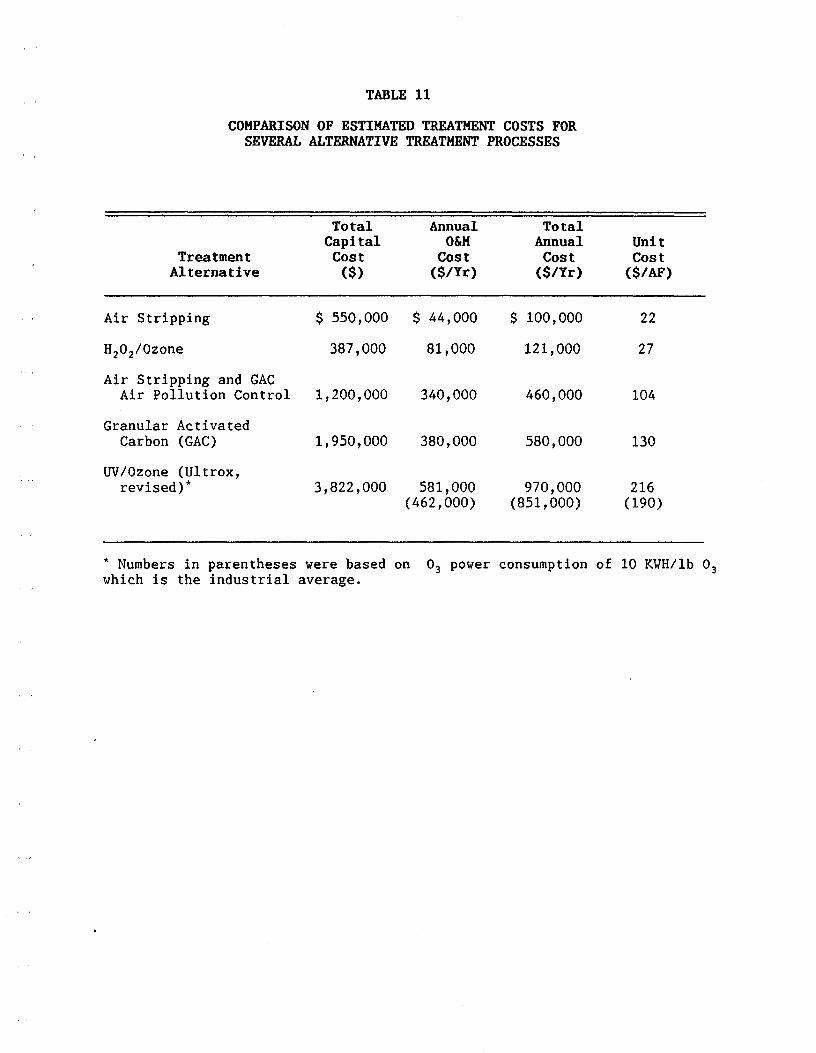
TABLE 11
COMPARISON OF ESTIMATED TREATMENT COSTS FORSEVERAL ALTERNATIVE TREATMENT PROCESSES
Total Annual Total
Capital O&M Annual UnitTreatment Cost Cost Cost Cost
Alternative ($) ($/Yr) ($/Yr) ($/AF)
Air Stripping $ 550,000 $ 44,000 $ 100,000 22
H_O2/0zone 387,000 81,000 121,000 27
Air Stripping and GACAir Pollution Control 1,200,000 340,000 460,000 104
Granular Activated
Carbon (GAC) 1,950,000 380,000 580,000 130
UV/Ozone (Ultrox,
revised)* 3,822,000 581,000 970,000 216(462,000) (851,000) (190)
* Numbers in parentheses were based on 03 power consumption of 10 KWH/lb 03which is the industrial average.
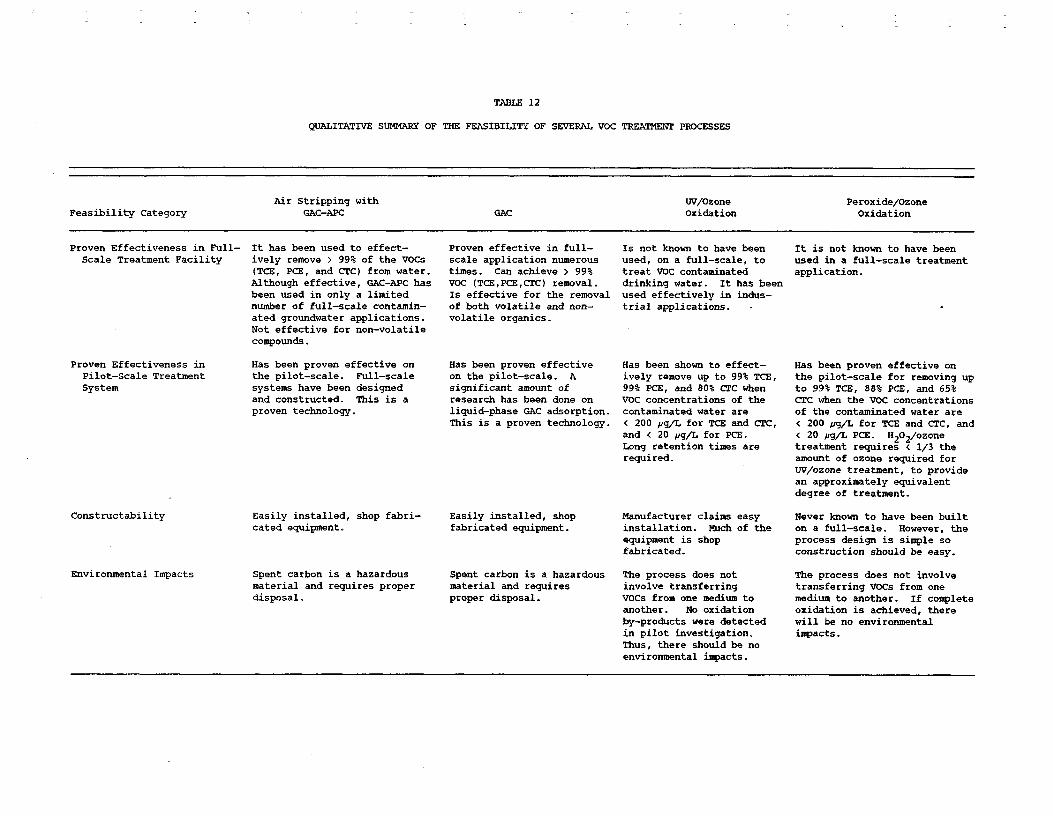
TABLE 12
QUALITATIVE SUMMARY OF THE FEASIBILITY OF SEVERAL VOC TREATMENT PROCESSES
Air Stripping with Ur/Ozone Peroxide/Ozone
Feasibility Category GAC-APC GAC Oxidation Oxidation
Proven Effectiveness in Full- It has been used to effect- Proven effective in full- Is not known to have been It is hot known to have been
Scale Treatment Facility ively remove > 99% of the VOCs scale application numerous used, on a full-scale, to used in a full-scale treatment
(TCE, PCE, and CTC) from water, times. Can achieve > 99% treat VOC contaminated application.
Although effective, GAC-APC has VOC (TCE,PCE,CTC) removal, drinking water. It has been
been used in only a limited Is effective for the removal used effectively in indus-
number of full-scale contamin- of both volatile and non- trial applications.
ated groundwater applications, volatile organics.
Not effective for non-volatile
compounds.
Proven Effectiveness in Has been proven effective on Has been proven effective Has been shown to effect- Has been proven effective on
Pilot-Scale Treatment the pilot-scale. Full-scale on the pilot-scale. A ively remove up to 99% TCE, the pilot-scale for removing up
System systems have been designed significant amount of 99% PCE, and 80% CTCwhen to 99% TCE, 88% PCE, and 65%
and constructed. This is a research has been done on VOC concentrations of the CrC when the VOC concentrations
proven technology, liquid-phase GAC adsorption, contaminated water are of the contaminated water are
This is a proven technology. ( 200 pg/L for TCE and CTC, ( 200 _g/L for TCE and CTC, and
and ( 20 #g/L for PCEo < 20 pg/L PCE. H202/ozoneLong retention times are treatment requires ( 1/3 the
required, amount of ozone required for
UV/ozone treatment, to provide
an approximately equivalent
degree of treatment.
Constructability Easily installed, shop fabri- Easily installed, shop Manufacturer claims easy Never known to have been built
cared equipment, fabricated equipment, installation. Much of the on a full-scale. However, the
equipment is shop process design is simple so
fabricated, construction should be easy.
Environmental Impacts Spent carbon is a hazardous Spent carbon is a hazardous The process does not The process does not involve
material and requires proper material and requires involve transferring transferring VOCs from one
disposal, proper disposal. VOCs from one medium to medium to another. If complete
another. No oxidation oxidation is achieved, there
by-products were detected will be no environmental
in pilot investigation, impacts.
Thus, there should be no
environmental impacts.

SECTION 6
SECTION 6
ALTERNATIVE TREATMENT SCENARIOS
Since the time the Treatability/Feasibility Report was completed, two very new alternative
treatment processes have been developed which may meet the City of Pasadena's
treatment needs more effectively and !ess expensively than was demonstrated by liquid-
phase UV/ozone oxidation. These two processes--liquid-phase H202/ozone and gas-phase
AOP--have been tried at either the bench- or pilot-level and appear to be promising
technologies. Some of the treatment scenarios that will be discussed are a combination of
one of these new AOPs with one or more of the processes identified in the
Treatability/Feasibility report. A description of each treatment scenario, along with
associated advantages and disadvantages, are presented in the following subsections. Cost
, estimates have been prepared for the design, construction, and operation of each of these
alternative treatment scenarios and are presented in the last subsection. Lastly, these costs
are compared with the estimates for (1) air stripping alone, (2) air stripping plus gas-
phase carbon adsorption, (3) liquid-phase carbon adsorption, (4) UV/ozone oxidation
(revised costs for the ULTROX system), and (5) liquid-phase H202/ozone oxidation.
LIQUID-PHASE AOP WITH LIQUID-PHASE GAC
A schematic diagram of this treatment scenario is provided in Figure 14. Under this
scenario, the H202/ozone process is used to first remove 95 % or more of the TCE, 50%-
70% of the CTC, and 70%-90% of the PCE. This partially treated water then passes
through a granular activated carbon (GAC) contactor where the VOCs remaining in the
liquid-phase adsorb onto the carbon and are removed from the water. By removing a
large percentage of the VOCs prior to carbon adsorption, the adsorption capacity and
lifetime of the carbon can be increased substantially.
Excluding economics, which will be discussed later, some of the advantages of thistreatment scenario are:
o Using an AOP to reduce the VOC load passing through the carbon bed may
extend the life of the carbon by 50 or 60 percent, as compared with using only
liquid-phase carbon adsorption (no AOP pretreatment).
6-I
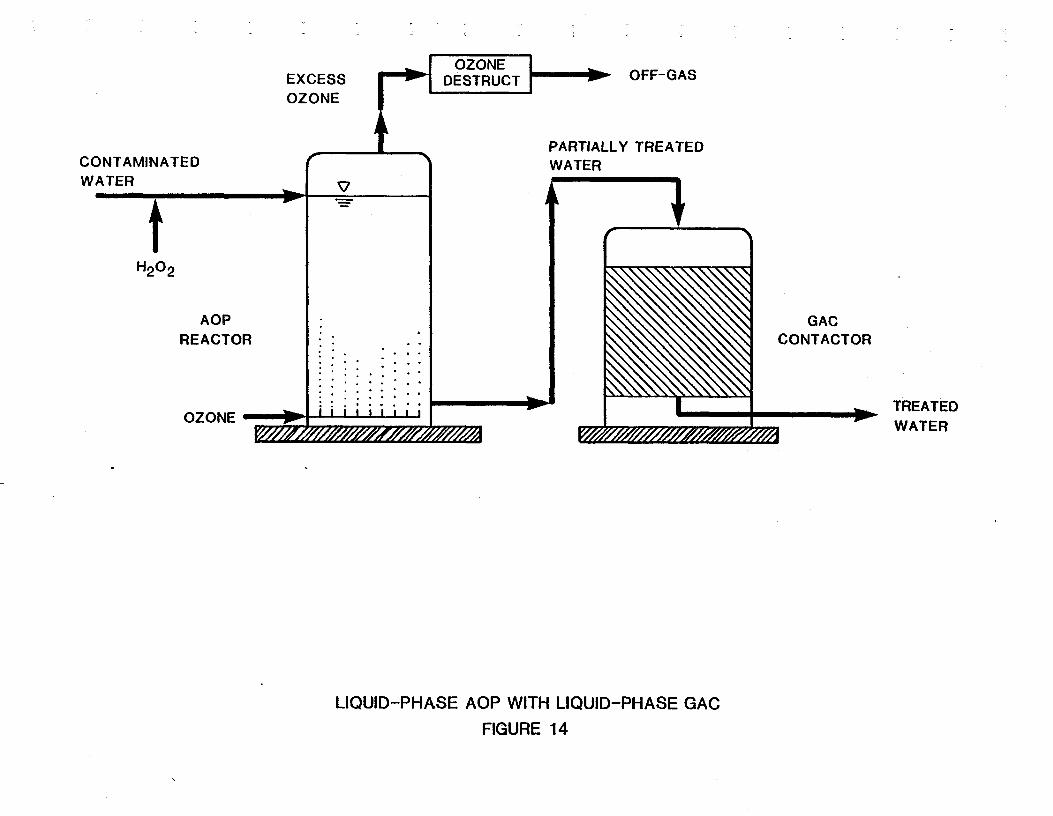
OZONE
EXCESS DESTRUCT IOFF-GAS
!OZONE
PARTIALLY TREATEDCONTAMINATED WATER
WATER
t ?H202
AOP GACREACTOR CONTACTOR
· : : :: · · ' ,.._ TREATEDOZONE ,,.--
WATERV/_ _'///////////////////////__/'/A
LIQUID-PHASE AOP WITH LIQUID-PHASE GACFIGURE 14
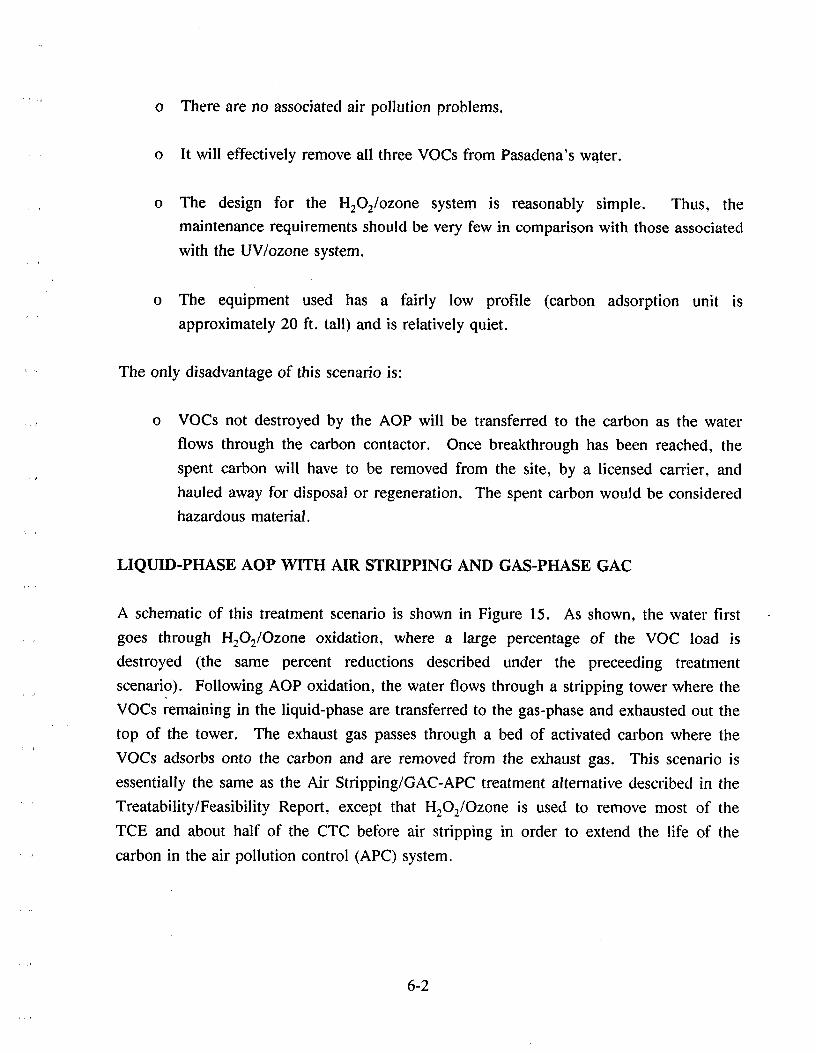
o There are no associated air pollution problems.
o It will effectively remove all three VOCs from Pasadena's water.
o The design for the H:O2/ozone system is reasonably simple. Thus, the
maintenance requirements should be very few in comparison with those associated
with the UV/ozone system.
o The equipment used has a fairly low profile (carbon adsorption unit is
approximately 20 ft. tall) and is relatively quiet.
The only disadvantage of this scenario is:
o VOCs not destroyed by the AOP will be transferred to the carbon as the water
flows through the carbon contactor. Once breakthrough has been reached, the
spent carbon will have to be removed from the site, by a licensed carrier, and
hauled away for disposal or regeneration. The spent carbon would be consideredhazardous material.
LIQUID-PHASE AOP WITH AIR STRIPPING AND GAS-PHASE GAC
A schematic of this treatment scenario is shown in Figure 15. As shown, the water first
goes through H202/Ozone oxidation, where a large percentage of the VOC load is
destroyed (the same percent reductions described under the preceeding treatment
scenario). Following AOP oxidation, the water flows through a stripping tower where the
VOCs remaining in the liquid-phase are transferred to the gas-phase and exhausted out the
top of the tower. The exhaust gas passes through a bed of activated carbon where the
VOCs adsorbs onto the carbon and are removed from the exhaust gas. This scenario is
essentially the same as the Air Stripping/GAC-APC treatment alternative described in the
Treatability/Feasibility Report, except that H202/Ozone is used to remove most of the
TCE and about half of the CTC before air stripping in order to extend the life of the
carbon in the air pollution control (APC) system.
6-2
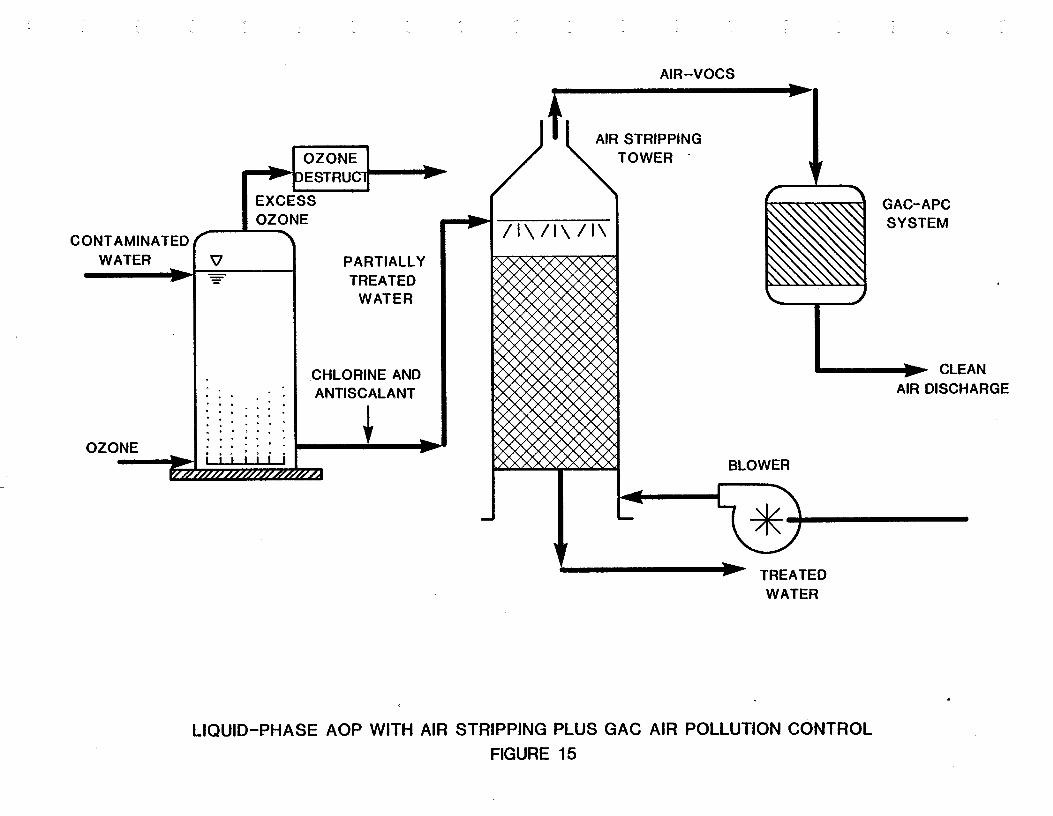
AIR-VOCSIb,.-
lNG·..-- ! OZONE L__
i---_s_.ucT_---
I EXCESS r_ GAC-APC
CONTAMINATED ..._.J,._NE _1 /IX IIX/1\ I SYSTEMWATER _ V PARTIALLY
·'"'- '_- TREATEDWATER _
I __CHLORINE AND ..._ CLEANANTISCALANT AIR DISCHARGE
I· b
· °
OZONE · , ·r BLOWERI"/.,_ ///////r/-//////_ _'/A
" '""- TREATEDWATER
LIQUID-PHASE AOP WITH AIR STRIPPING PLUS GAC AIR POLLUTION CONTROL
FIGURE 15
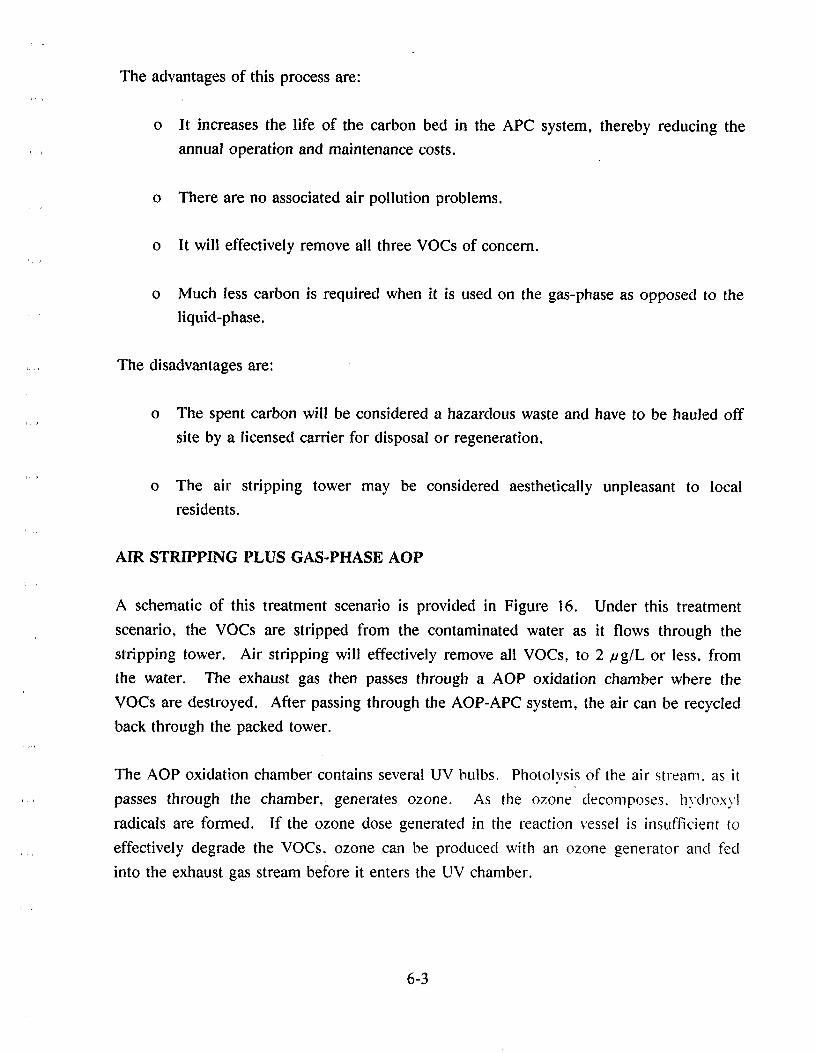
The advantages of this process are:, d
o It increases the life of the carbon bed in the APC system, thereby reducing the
, _ annual operation and maintenance costs.
o There are no associated air pollution problems.
o It will effectively remove all three VOCs of concern.
o Much !ess carbon is required when it is used on the gas-phase as opposed to the
liquid-phase.
, , The disadvantages are:
o The spent carbon will be considered a hazardous waste and have to be hauled offJ
site by a licensed carrier for disposal or regeneration.
t ,
o The air stripping tower may be considered aesthetically unpleasant to localresidents.
AIR STRIPPING PLUS GAS-PHASE AOP
A schematic of this treatment scenario is provided in Figure 16. Under this treatment
scenario, the VOCs are stripped from the contaminated water as it flows through the
stiipping tower. Air stripping will effectively remove all VOCs, to 2 #g/L or less, from
the water. The exhaust gas then passes through a AOP oxidation chamber where the
VOCs are destroyed. After passing through the AOP-APC system, the air can be recycled
back through the packed tower.
The AOP oxidation chamber contains several UV bulbs. Photolysis of the air stream, as it
,, passes through the chamber, generates ozone. As the ozone decomposes, hydroxyl
radicals are formed. If the ozone dose generated in the reaction vessel is insufficient to
, effectively degrade the VOCs. ozone can be produced with an ozone generator and fed
into the exhaust gas stream bef°re it enters the UV chamber.
6-3
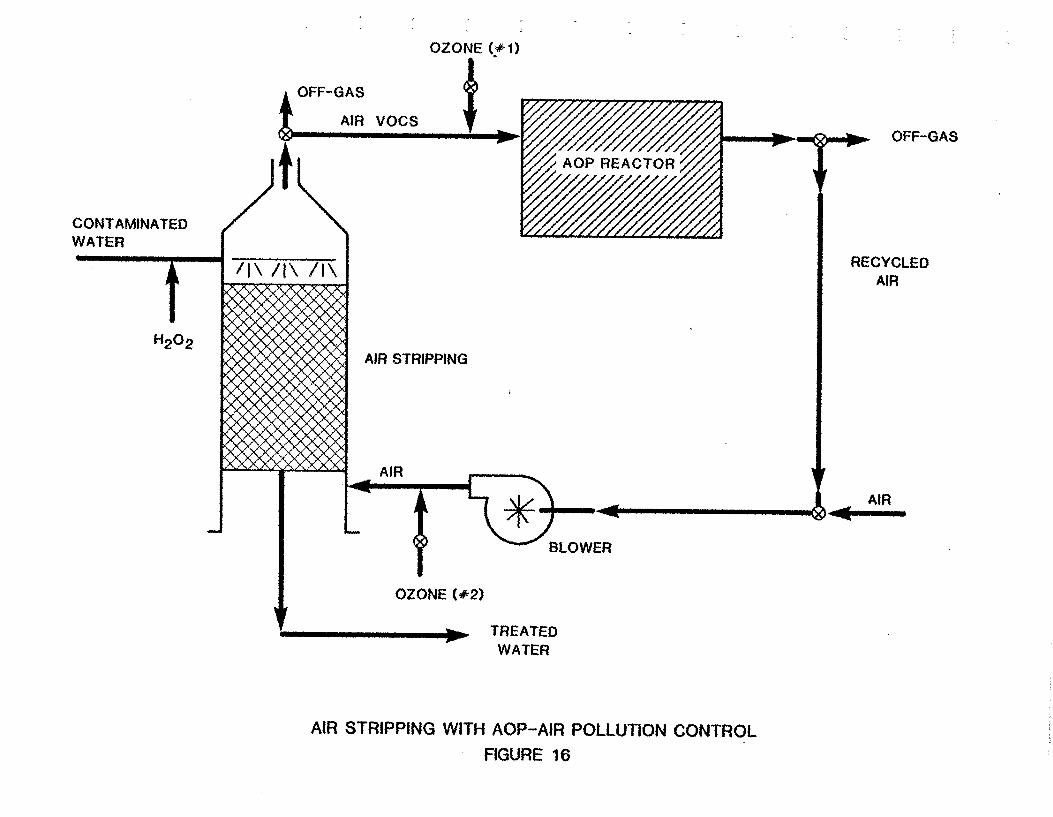
Several advantages of this treatment scenario are:t
o NO OFF-GAS EMISSIONS.
_ Theoretically, after passing through the AOP reaction chamber, the air can berecycled back through the stripping tower so that there are essentially no gasemissions. This concept has not been tested.
o NO HAZARDOUS MATERIAL.
The VOCs will be Oxidized to carbon dioxide, chloride, and water rather thanJ
simply being transferred to another medium such as activated cm'bon. Thisstatement, however, assumes complete oxidation of the VOCs. If the VOCs arenot oxidized in the AOP-APC chamber, they will be recycled (with the recycled
_ gas flow) back through the stripping tower and AOP-APC system.
o THEORETICALLY MORE EFFICIENT THAN LIQUID-PHASE AOP
Air-phase AOP oxidation, theoretically, should destroy the VOCs more efficiently(i.e., require lower UV and ozone closes) than liquid-phase AOP oxidation. Thisis because there are no carbonate/bicarbonate ions present in the gas phase toscavenge the hydroxyl radicals. Results from the pilot study indicate thatapproximately 95% of the hydroxyl radicals produced are consumed bycompounds other than the VOCs. Carbonate/bicarbonate ions are generally themost prevalent hydroxyl radical scavengers.
o OFF-GAS CAN BE ROUTED THROUGH A TEMPORARY GAC-APC RATHERTHAN THE AOP-APC SYSTEM, IF EVER NECESSARY.
If the AOP-APC system ever needs to be temporarily taken out of service, the airemissions fi'om the stripping tower can be routed through a temporary GAC-APCsystem. In this way, the wells can continue to be pumped and the water treated,even if the AOP-APC system is down for repairs.
o PUBLICACCEPTANCE.
Because there are no off-gas emissions and no hazardous materials tO dispose of,the AS+AOP-APC treatment scenario should be acceptable to the public.
The disadvantages associated with this system are:
o THE AOP-APC SYSTEM HAS RECEIVED ONLY LIMITED PILOT-SCALETESTING.
The AOP-APC system is a new, but promising, technology which has receivedon._ limited pilot-scale testing. Results from this testing, however, indicate that_t can be used effectively to destroy TCE and PCE. Because of minimal testing.the effectiveness, system size, optimum UV dose, optimum ozone dose, and costof a full-scale AS+AOP-APC facility is not known. For cost estimationpurposes, assumptions were made about the required UV dose, ozone dose, etc.
6-4
O THE AOP-APC SYSTEM HAS NEVER BEEN TESTED FOR CTC REMOVAL.
The limited pilot-scale testing of the AOP-APC system did not include CTCoxidation. Of the three VOCs of concern (i.e., TCE, PCE, and CTC), only TCEand PCE oxidation have been tried. However, the percent removals seen for bothof these compounds was good (TCE --- 90 % removal, PCE --- 80% removal).
o CAPITAL AND O&M COSTS UNCERTAIN.
Because AOP-APC is a new technology and the system has never been pilottested with the intent of designing and building a full-scale facility, there is a
, great deal of uncertainty associated with an estimated cost of a full-scale AOP-APC system. The costs of designing, building, and operating an air strippingtower are well established. However, a pilot-scale evaluation of the processwould be required in order to obtain the information needed to estimate the costof an AOP-APC system (e.g., UV dose, Ozone dose, contact time, etc.). Thecost estimates for AS+AOP-APC, included in the report, were based on several"best guess" assumptions about operational requirements.
o TALL STRIPPING TOWER IN RESIDENTIAL AREA.
Stripping towers are generally tall and may be asthetically unpleasing to localresidents. However, they can be modified architecturally so that they blend, inwith their surrounding and are less offensive to area residents.
' o PROCESS NOT EFFECTIVE AT REMOVING NON-VOLATILEPOLLUTANTS FROM WATER.
Air stripping will not remove non-volatile pollutants from water. Shouldcontamination by non-volatile toxicants become a problem in the future, analternative treatment process would have to be employed.
o Since the VOCs are destroyed rather than being transferred from one medium toanother, there are no hazardous materials to dispose of and no VOCs emitted tothe atmosphere.
o Air-phase AOP oxidation should be much more effective than liquid-phase AOPbecause there are no carbonate/bicarbonate ions present in the gas phase toscavenge the hydroxyl radicals. Results from the ULTROX/WMI pilot studyindicate that, in the case of Pasadena's water, approximately 95 % of the hydroxylradicals produced are consumed by compounds other than the VOCs.Carbonate/bicarbonate ions are generally the most prevalent hydroxyl radicalscavengers.
The primary disadvantage of this system is 'that it is a new technology and has only been
tested twice--once by JMM and once by a consulting engineering firm Jn the Netherlands-
- at the pilot scale (without an external ozone source). The one AOP-APC pilot test
performed by JMM evaluated the removal of TCE and PCE from the exhaust gas of an air
stripper. The results indicated good removals for all of these compounds (TCE --- 90%:
6-5
PCE ---' 80). However, the system was not tested for CTC removal. The AOP-APC
' ' system was also tested, in conjunction with an air stripper, during a pilot study performed
in the Netherlands (McGregor, et al., 1987). In that study, it was used to treat a
,_ groundwater contaminated with TCE, PCE, and chloroform. Results from this study
indicated total VOC removals of greater than 99%. Again, however, the system was not
tested for CTC removal.
ESTIMATED COST FOR FULL-SCALE TREATMENT
Cost estimates were prepared for design, construction, and operation of each of these
_: alternative treatments. Since the AOP parts of these scenarios are extremely new
technology, the accuracy of the estimates cannot be guaranteed to be within the usual
range for feasibility level estimates-- -30% to +50%. However, they do provide a good
indication of the cost of each scenario relative to the costs of the Ultrox UV/ozone process
evaluated in the Treatability/Feasibility report, and H20:/ozone by itself. The
assumptions and design criteria Used for these estimates are shown in Table 13 and the
cost estimates are compared in Table 14. When reviewing these costs estimates, it should
be stressed that very little is known about the design of an AOP-APC system; thus, for
this process, the design criteria were assumed (based on JMM's experience with the
AOPs) rather than known. The accuracy of the cost estimate for each viable alternative is
given in Table 15.
As-indicated, three of the eight listed treatment alternatives are not viable methods for
removing TCE, PCE, and CTC -- air stripping alone, liquid-phase UV/ozone, and liquid
phase H20:/ozone. The reasons they are not viable are included in Table 14. In regard
to economics, the cost of implementing the various viable treatment scenarios increase in
the following order:
AS+ AOP-APC
AS + GAC-APC
H202/Ozone + AS + GAC-APC
H202/Ozone + GACGAC alone
When reviewing these costs, it should be pointed out and stressed that. for any alternative
processes using activated carbon, the O&M costs may be underestimated. All cost
6-6
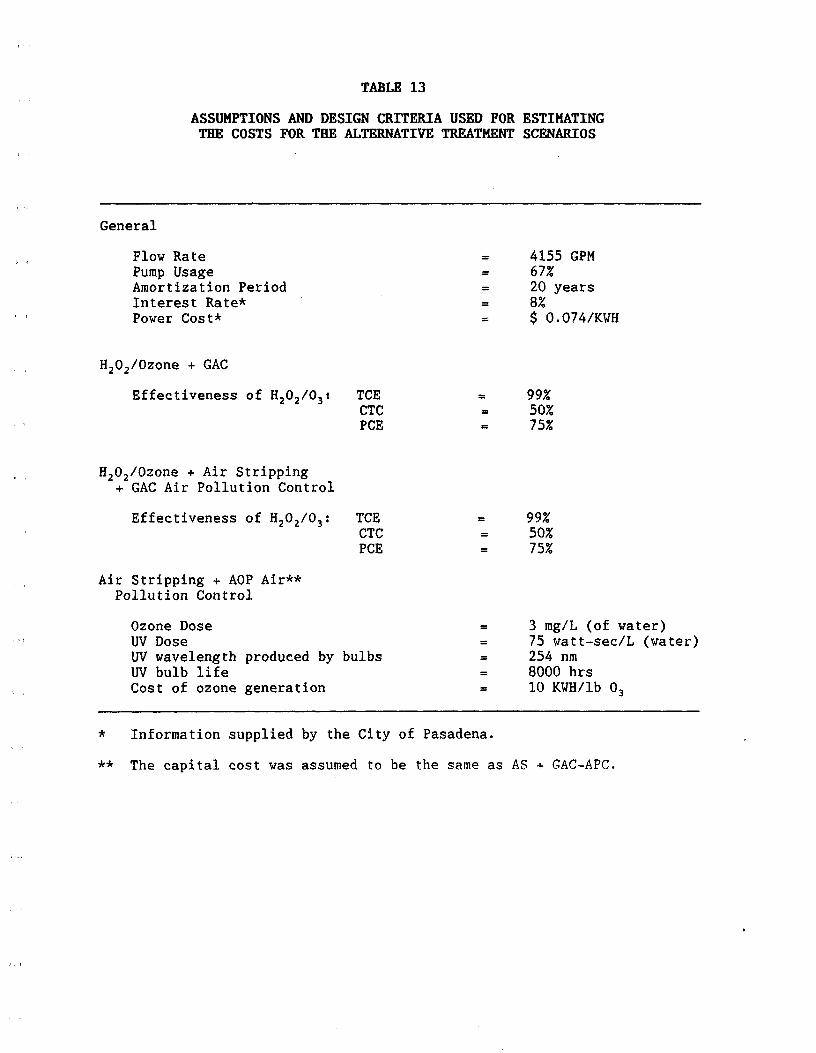
TABLE 13
ASSUMPTIONS AND DESIGN CRITERIA USED FOR ESTIMATINGTHE COSTS FOR THE ALTERNATIVE TREATMENT SCENARIOS
General
FlowRate = 4155GPM
Pump Usage = 67%AmortizationPeriod = 20 yearsInterestRate* = 8%
Power Cost* = $ 0.074/KWH
HaO2/Ozone + GAC
Effectiveness of H202/O3: TCE = 99%CTC = 50%
PCE = 75%
H202/Ozone + Air Stripping+ GAC Air Pollution Control
Effectiveness of H202/03: TCE = 99%CTC = 50%PCE = 75%
Air Stripping + AOP Air**Pollution Control
Ozone Dose = 3 mg/L (of water)UV Dose = 75 watt-sec/L (water)
LTV wavelength produced by bulbs = 254 nmUV bulblife = 8000hfs
Cost of ozone generation = 10 KWH/lb 03
* Information supplied by the City of Pasadena.
** The capital cost was assumed to be the same as AS + GAC-APC.
i
m
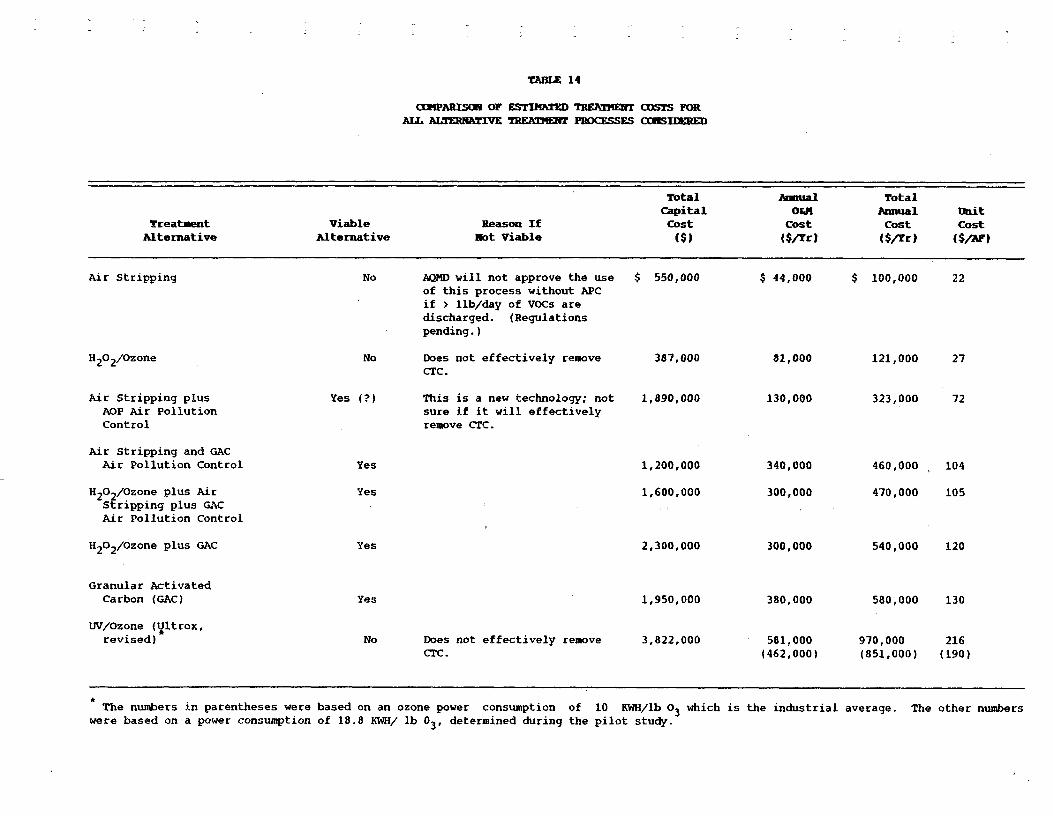
TABLE 14
GOHPARISON OF ESTINATED _ _ F_R
ALL ALTERNATIVE _ _ES CORSIIIERED
Total Amaua! Total
Capital O&H Annual UnitTreatment Viable Reason If Cost Cost Cost Cost
Alternative Alternative Not Viable ($) ($/Tr) ($/Yr) ( $/2_F )
Air Stripping No AQMDwill not approve the use $ 550,000 $ 44,000 $ 100,000 22
of this process without APC
if > lib/day of VOCs aredischarged. (Regulations
pending.)
H202/Ozone No Does not effectively remove 387,000 81,000 121,000 27CTC.
A/r Stripping plus Yes (?) This is a new technology; not 1,890,000 130,000 323,000 72
AOP Air Pollution sure if it will effectivelyControl removecrc.
Air stripping and GAC
Air Pollution Control Yes 1,200,000 340,000 460,000 _ 104
H202/Ozone plus Air Yes 1,600,000 300,000 470,000 105Stripping plus GACAir Pollution Control
H202/Ozone plus GAC Yes 2,300,000 300,000 540,000 120
Granular Activated
Carbon (GAC) Yes 1,950,000 380,000 580,000 130
UV/Ozone (_ltrox,revised) No Does not effectively remove 3,822,000 581,000 970,000 216
CrC. (462,000) (851,000) (190)
The numbers in parentheses were based on an ozone power consumption of 10 KWH/lb O] which is the industrial average. The other numbers
were based on a power consumption of 18.8 KWH/ lb 03, determined during the pilot study.
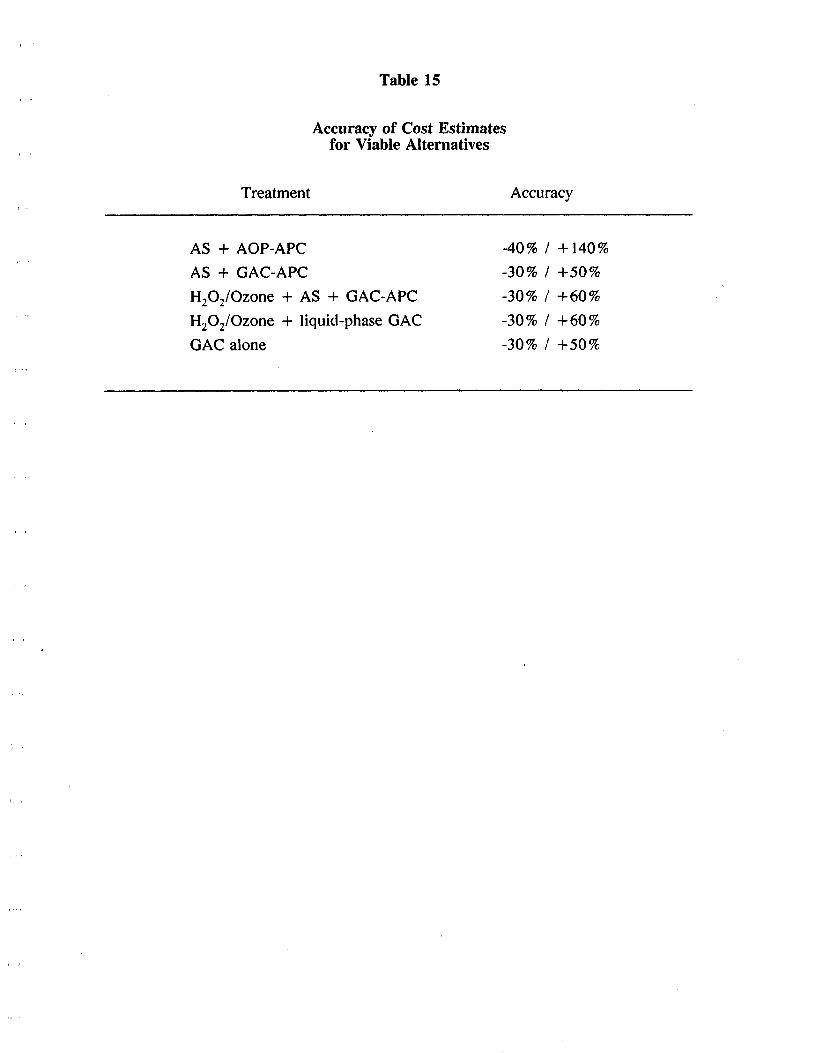
Table 15
Accuracy of Cost Estimatesfor Viable Alternatives
Treatment Accuracy
AS + AOP-APC -40% / +140%
AS + GAC-APC -30% / +50%
HeO:/Ozone + AS + GAC-APC -30% / +60%
_ HeOe/Ozone + liquid-phase GAC -30% / +60%
GAC alone -30% / +50%
estimates (including those in the Treatability/Feasibility report) assumed a'maximum TCE
concentration of 200 #g/L and a maximum CTC concentration of 50 #g/L. This estimate
used for CTC may in fact be too Iow; current CTC concentrations at Well//25 are about
, 20 #g/L. Since the carbon has a lower capacity for CTC than it does for TCE or PCE,
the carbon usage rate is primarily dependent on the CTC concentration. If the CTC
concentrations in the aquifer exceed 50 #g/L, O&M cost for carbon replacement will also
increase proportionally.
6-7

SECTION 7
SECTION 7
cONCLUSIONS
Based on the results of this UV/ozone pilot study, the following conclusions can be made:
o The WMI UV/Ozone system demonstrated the following VOC removals:
TCE = 50% removal
PCE = 50% removal
CTC = 15% removal.
Thus, this treatment system is not capable of providing satisfactory treatment for the
City's VOC contaminated groundwater.
o The ULTROX UV/Ozone system demonstrated the following (maximum) VOCrem oval s:
TCE = 99% removal
PCE = 99% removal
, CTC = 80% removal.
Under the optimum operating conditions for TCE and PCE removal, only 50% -
60% CTC removal is attained. Thus, the ULTROX system can provide effective
treatment for TCE and PCE, but not for CTC.
0 H202/ozone oxidation can provide a degree of treatment comparable to UV/ozone
oxidation, but requires a much lower ozone dose and shorter contact time. Based on
limited testing, H202/ozone does not provide satisfactory removals of CTC.
o Of all the treatment processes considered, the only viable alternatives are:
Air Stripping plus AOP-APC
Air Stripping + GAC-APC
H202/Ozone + Air Stripping + GAC-APC
H202/Ozone + GACGAC
7-1
The first alternative--Air Stripping plus AOP-APC, is known to. be effective in
destroying TCE and PCE, but has never been tested for CTC removal. This
treatment scenario, however, is the only one that would actually destroy the VOCs
rather than simply transferring them to the GAC for subsequent regeneration or
disposal.
o Of the viable treatment alternatives, their estimated costs increase in the followingorder:
Air Stripping plus AOP-APC
Air Stripping + GAC-APC
H202/Ozone + Air Stripping + GAC-APC
H202/Ozone + GACGAC
TREATMENT OPTIONS
As a result of the difficulty experienced in oxidizing CTC when it is in water, UV/Ozone
oxidation is no longer considered a viable alternative for treating the City's contaminated
well water. Peroxide/Ozone oxidation also is not effective at removing CTC from
, drinking water. Thus, the treatment options available to the City are:
1. Proceed with the design and construction of liquid phase GAC treatment which is
· known to be effective in removing TCE, PCE, and CTC from drinking water.
Use of GAC adsorption has the following advantages and disadvantages:
Advantages:
- It has been shown to remove greater than 99 % of TCE, PCE, and CTC.
- If used for liquid phase adsorption, it can also be used to remove manynonvolatile contaminants from the water.
Disadvantages:
- The spent carbon must be transported off site for proper disposal or regeneration.
7-2
- If the VOC concentrations in the contaminated well water increase to higher than
projected levels, the carbon usage rate and associated O&M costs will increase
proportionally. This is of particular concern for CTC since (I) its current
_ concentration is already about half of the concentration used for estimating
treatment costs and (2) GAC has a lower capacity for CTC than it does for TCE, andPCE.
Highestcost of all viable alternatives.
2. Construct a full-scale air stripping tower plus GAC-APC system.
The advantages are as follows:
- This is a proven technology for the removal of VOCs.
- Cost for air stripping plus GAC-APC is lower than cost for liquid phase GAC
Disadvantages include:
The spent carbon will require proper disposal or regeneration.
- Disadvantages associated with air stripping towers, aesthetic appearance andnoise.
- Cost of this system is dependent on the changes in concentrations of VOCs.
Usage rate of GAC and associated O&M costs will increase with increase in VOC
concentrations. Increase in concentration of CTC is of particular concern, since
GAC has a lower capacity for CTC than it does for TCE and PCE.
Air stripping will not be effective for non-volatile compounds.
3. Perform a thorough pilot test evaluation of the air stripping plus AOP-APC
process prior to deciding which of the viable treatment alternatives would provide
the best full-scale treatment. Details of the extended pilot-scale evaluation will
be given later in this section. If the AOP-APC system is proven effective in the
pilot study, the following advantages and disadvantages should be considered:
7-3
Advantages:
The VOCs are (presumably) oxidized to carbon dioxide and water rather than
being transferred to another medium.
- After passing through the AOP reaction chamber, the air can, theoretically, be
recycled back through the stripping tower so that there are essentially no gas
emissions. This concept, however, has not been tried.
- If the cost estimates are correct, it is the least expensive of the viable treatmentalternatives.
Disadvantages:
All the disadvantages associated with the use of an air stripper including its
ineffectivenes for non-volatile compounds.
- The AOP-APC system is a new technology and needs to be piloted before it can
be guaranteed to effectively remove all three VOCs of concern. The system has
been tested for TCE and PCE removal, but never for CTC removal
- There will be a time delay imposed by another pilot study prior to design for
full-scale treatment. This delay could result in spreading of the contaminated
plume to other wells, which could mean further costs to purchase replacement
water or treatment systems.
4. Begin the thorough pilot-scale study of the air stripping plus AOP-APC treatment
system, and simultaneously, design the full-scal e air stripping portion of the
treatment facility. The decision to design for full-scale AOP emissions control,
' or full-scale GAC emissions control, could be made near the end of the extended
pilot study. This will minimize the time delay in construction of a full-scale
treatment system, since the air stripper is a common element to both emissions
control options. Minimizing this time delay would minimize further problems
and costs associated with the spread of the contaminated plume to other wells.
7-4
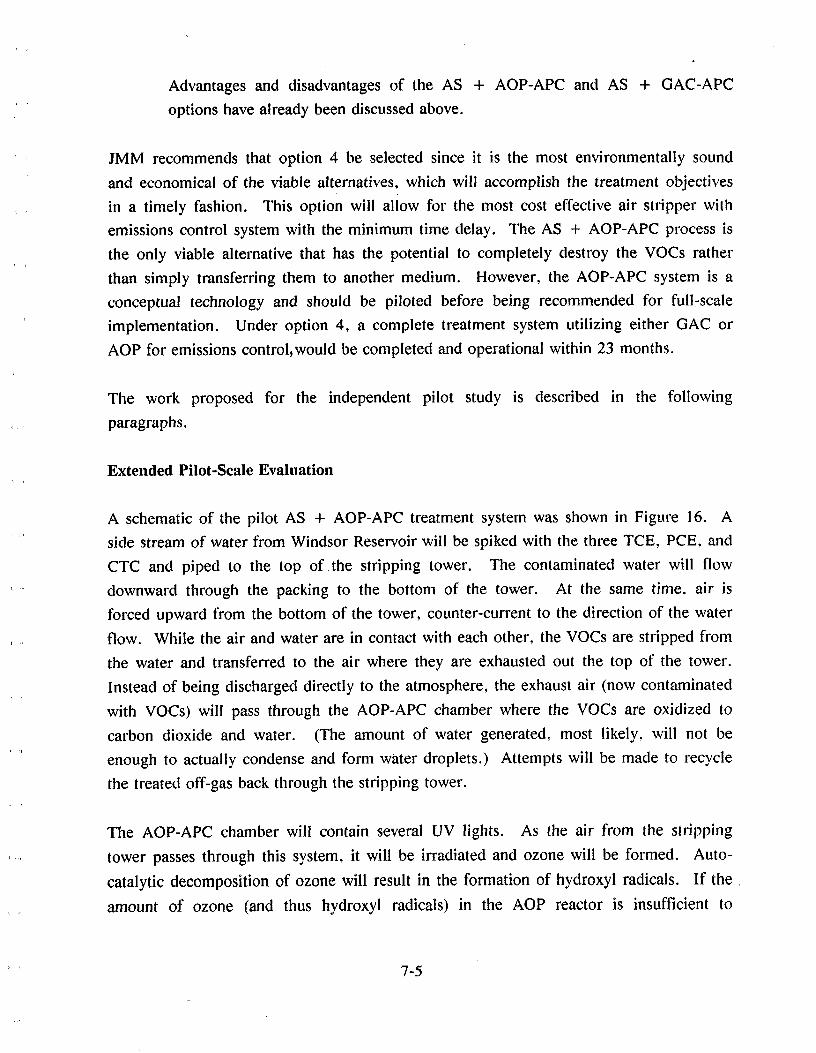
Advantages and disadvantages of the AS + AOP-APC and AS + GAC-APC
options have already been discussed above.
JMM recommends that option 4 be selected since it is the most environmentally sound
and economical of the viable alternatives, which will accomplish the treatment objectives
in a timely fashion. This option will allow for the most cost effective air stripper with
emissions control system with the minimum time delay. The AS + AOP-APC process is
the only viable alternative that has the potential to completely destroy the VOCs rather
than simply transferring them to another medium. However, the AOP-APC system is a
conceptual technology and should be piloted before being recommended for full-scale
implementation. Under option 4, a complete treatment system utilizing either GAC or
AOP for emissions control, would be completed and operational within 23 months.
The work proposed for the independent pilot study is described in the following
paragraphs.
Extended Pilot-Scale Evaluation
A schematic of the pilot AS + AOP-APC treatment system was shown in Figure 16. A
side stream of water from Windsor Reservoir will be spiked with the three TCE, PCE, and
CTC and piped to the top of the stripping tower. The contaminated water will flow
· downward through the packing to the bottom of the tower. At the same time, air is
forced upward from the bottom of the tower, counter-current to the direction of the water
. flow. While the air and water are in contact with each other, the VOCs are stripped from
the water and transferred to the air where they are exhausted out the top of the tower.
Instead of being discharged directly to the atmosphere, the exhaust air (now contaminated
with VOCs) will pass through the AOP-APC chamber where the VOCs are oxidized to
carbon dioxide and water. (The amount of water generated, most likely, will not be
enough to actually condense and form water droplets.) Attempts will be made to recycle
the treated off-gas back through the stripping tower.
The AOP-APC chamber will contain several UV lights. As the air from the stripping
tower passes through this system, it will be irradiated and ozone will be formed. Auto-
catalytic decomposition of ozone will result in the formation of hydroxyl radicals. If the
amount of ozone (and thus hydroxyl radicals) in the AOP reactor is insufficient to
7-5
effectively degrade the CTC, ozone can be generated externally (using an ozone
generator) and fed into the air stream just before it enters the AOP reactor.
Reducing the VOC load entering the AOP-APC system may improve the overall
effectiveness of the treatment process. This can be accomplished by employing AOP
, treatment of the liquid-phase in addition to AOP treatment of the gas-phase. Under this
scenario, peroxide will be spiked into the contaminated water before it enters the stripping
tower and ozone will be fed into the air stream (ozone feed point #2) entering the bottom
of the tower. Thus, liquid-phase H202/ozone oxidation will be taking place in the tower
at the same time the VOCs are being stripped from the water.
The schedule proposed for this pilot work is provided in Figure 17.
7-6
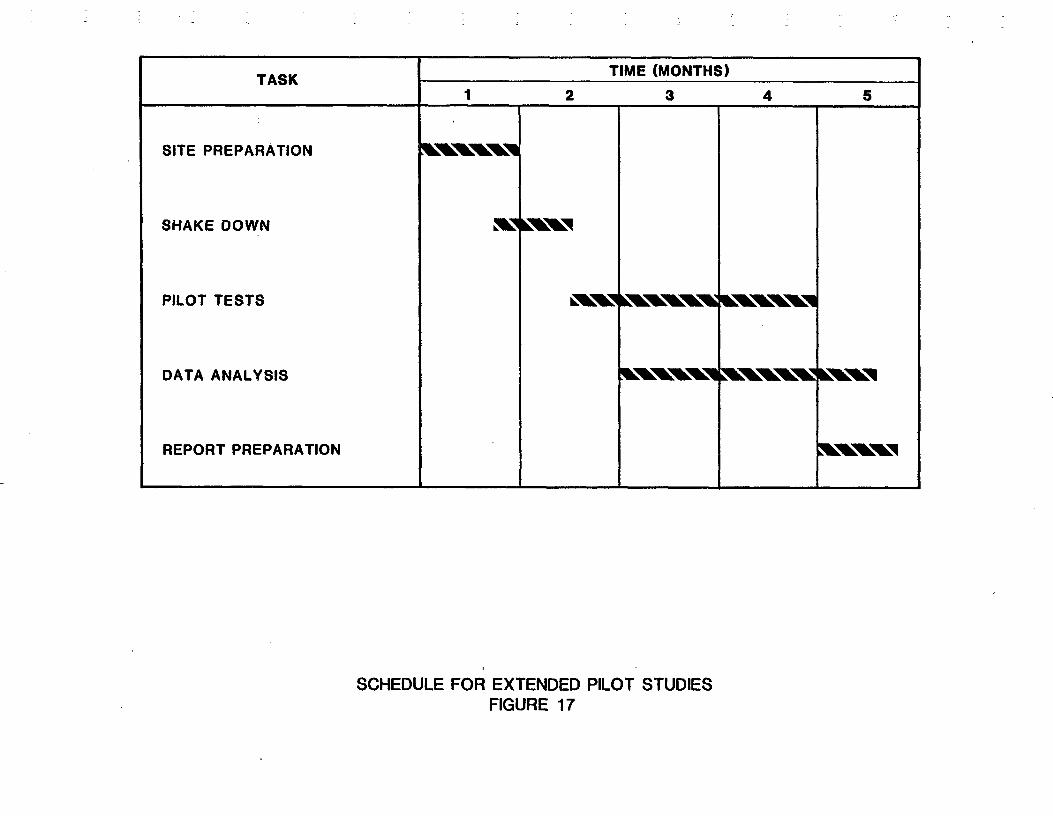
TASK TIME(MONTHS)I 2 3 4 5
[[
SITE PREPARATION _q_._b,,'_b,,'_b,'_'_
SHAKE DOWN _ I&_'_b,,'_
PIL0 T TESTS _k_ ll_'_'_b_b_ k"Rk_"q_'_b_l
DATA A NALYSI S ___II _b_ k_b_lk_l
REPORT PREPARATION _k.'_b,_'_l
u
l
SCHEDULE FOR EXTENDED PILOT STUDIESFIGURE 17
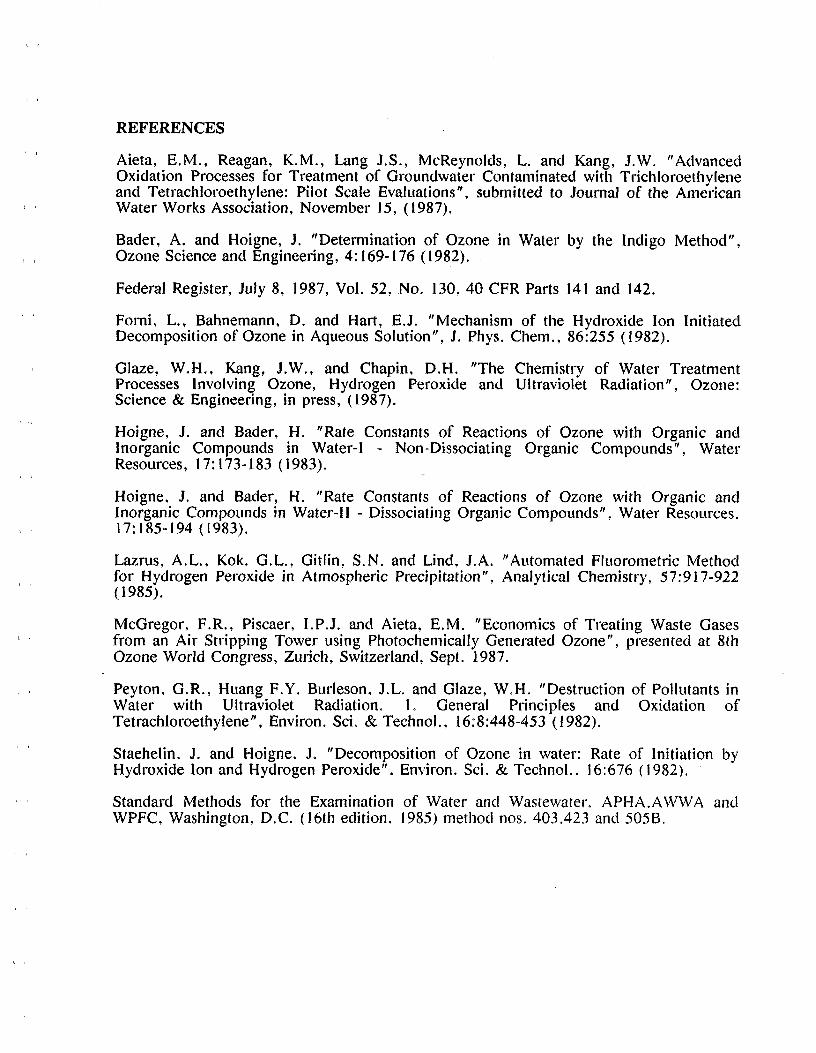
REFERENCES' r
Aieta, E.M., Reagan, K.M., Lang J.S., McReynolds, L. and Kang, J.W. "AdvancedOxidation Processes for Treatment of Groundwater Contaminated with Trichloroethyleneand Tetrachloroethylene: Pilot Scale Evaluations", submitted to Join'hal of the American
_ Water Works Association, November 15, (1987).
Bader, A. and Hoigne, J. "Determination of Ozone in Water by the Indigo Method",, Ozone Science and Engineering, 4:169-176 (1982).
Federal Register, July 8, 1987, Vol. 52, No. 130, 40 CFR Parts 141 and 142.
' Fomi, L., Bahnemann, D. and Hart, E.J. "Mechanism of the Hydroxide Ion InitiatedDecomposition of Ozone in Aqueous Solution", J. Phys. Chem., 86:255 (1982).
Glaze, W.H., Kang, J.W., and Chapin, D.H. "The Chemistry of Water TreatmentProcesses Involving Ozone, Hydrogen Peroxide and Ultraviolet Radiation", Ozone:Science & Engineering, in press, (1987).
Hoigne, J. and Bader, H. "Rate Constants of Reactions of Ozone with Organic andInorganic Compounds in Water-I - Non-Dissociating Organic Compounds", WaterResources, 17:!73-183 (1983).
Hoigne, J. and Bader, H. "Rate Constants of Reactions of Ozone with Organic andInorganic Compounds in Water-Il - Dissociating Organic Compounds", Water Resources,
, 17:185-194(1983).
Lazms, A.L., Kok. G.L., Gitlin, S.N. and Lind, J.A. "Automated Fluorometric Methodfor Hydrogen Peroxide in Atmospheric Precipitation", Analytical Chemistry, 57:917-922(1985).
McGregor, F.R., Piscaer, I.P.J. and Aieta, E.M. "Economics of Treating Waste Gasesfrom an Air Stripping Tower using Photochemically Generated Ozone", presented at 8thOzone World Congress, Zurich, Switzerland, Sept. 1987.
Peyton, G.R., Huang F.Y. Burleson, J.L. and Glaze, W.H. "Destruction of Pollutants inWater with Ultraviolet Radiation. 1. General Principles and Oxidation ofTetrachloroethylene", Environ. Sci. & Techno!., 16:8:448-453 (1982).
Staehelin. J. and Hoigne, J. "Decomposition of Ozone in water: Rate of Initiation byHydroxide Ion and Hydrogen Peroxide", Environ. Sci. & Technol.. 16:676 (1982).
Standard Methods for the Examination of Water and Was_ewater. APHA.AWWA andWPFC, Washington, D.C. (16th edition. 1985) method nos. 403.423 and 505B.
Related Documents