DeBree 1 The Changing Landscape of Sustainable Certifications in the Kenyan Tea Industry: An Exploratory Case Study Author: Schuyler DeBree A.B. in Environmental Science and Policy, Trinity College, Duke University Undergraduate Thesis Nicholas School of the Environment Graduation with Distinction Honors Duke University Durham, North Carolina Published: 2019 Advisors: Dr. Jay Golden Dr. Charlotte Clark

Welcome message from author
This document is posted to help you gain knowledge. Please leave a comment to let me know what you think about it! Share it to your friends and learn new things together.
Transcript

DeBree 1
The Changing Landscape of Sustainable Certifications
in the Kenyan Tea Industry: An Exploratory Case Study
Author: Schuyler DeBree
A.B. in Environmental Science and Policy, Trinity College, Duke University
Undergraduate Thesis
Nicholas School of the Environment Graduation with Distinction Honors
Duke University
Durham, North Carolina
Published:
2019
Advisors:
Dr. Jay Golden
Dr. Charlotte Clark

DeBree 2
Abstract
Agricultural industries increasingly use corporate responsibility mechanisms, such as sustainable
standards and certification schemes, to create sustainable production-consumption systems and
sustainable products. In the case of agricultural products, the study of certifications is especially vital to
ensure that they are truly improving the wellbeing of the economy, society, and environment in areas
where they are applied. Data from 2012 demonstrate that Kenya led the global tea industry in percent of
national tea production certified by one of the four main sustainable certifications in tea (Rainforest
Alliance, Fairtrade, UTZ, and Organic), but there is limited literature on the impact that the
implementation of certifications has had on the Kenyan tea industry. This research will highlight and
discuss previously unevaluated trends within the landscape of sustainable certifications in the current
Kenyan tea industry by combining existing literature, first-hand interview and observation, and data
collection in an exploratory case study. The key trends illuminated by this research, which were
previously undocumented, include, 1) the pervasiveness of Rainforest Alliance 2) the tensions between
farm productivity, insufficient value of tea, and sustainability and 3) the efforts to transcend the capacity
of certification in the short and long term. This study explores these undocumented trends to increase
awareness within tea industry stakeholders and inform future research on sustainable certifications in
Kenya, and elsewhere.

DeBree 3
1. Introduction
Consumption habits, especially in the context of a growing global population and consumer class,
will have major implications on global sustainability (Golden et al., 2010). In agricultural industries,
corporate responsibility mechanisms, such as sustainable standards and certification schemes, have been
increasingly implemented to create sustainable production-consumption systems and sustainable products
(ibid). In this paper, sustainable standards are identified as international standards formed by
organizations such as the International Standardization Organization (ISO) and the Sustainable Agriculture
Network (SAN), which prescribe best practices for sustainability in a given system. Sustainable
certifications are defined as the organizations that audit against sustainable standards to assure and
communicate compliance, such as Rainforest Alliance, Fairtrade, UTZ and Organic. The study of
certifications is vital to ensure that they are truly improving the wellbeing of the economy, society, and
environment in the areas that they are applied (Golden et al., 2010; Oya, Schaefer, Skalidou, McCosker, &
Langer, 2017). The tea industry is one of many agricultural production-consumption systems that has
undertaken a variety of industry-wide sustainability programs, including sustainable certifications. This
research will investigate the present-day landscape of sustainable certifications in the Kenyan tea industry,
to facilitate and inform future research.
Tea (Camelia Sinensis) has historically been the second-most consumed beverage in the world after
water (Hoffman, 2015b; Tea Association of the U.S.A. Inc., n.d.). The tea industry involves a network of
global stakeholders, employing roughly 13 million people, with tea production present in 45 countries
using .07% of global agricultural land (Potts et al., 2014). In an effort to combat the economic,
environmental, and social challenges in the tea industry, implementing sustainable standards and
certification schemes has been a primary focus of many stakeholders (Hoffman, 2015a; Potts et al., 2014;
Van de Wal, n.d.). Sustainable standards have been created by organizations such as the International

DeBree 4
Organization of Standardization (ISO) and the Sustainable Agriculture Network (SAN) (Golden et al.,
2010). Organizations such as the Rainforest Alliance, Fairtrade, UTZ, and Organic, are all sustainable
certifications that audit farms, factories, and facilities against the existing sustainable standards (ibid). If
the tea farms, factories, and/or facilities meet the sustainability standards, then they become ‘certified’ by
the certification scheme(s). Sustainable standards and certifications are therefore intended to enforce
sustainable practices to better the economic, social, and environmental conditions in the communities
where they are implemented, while communicating the commitment to sustainability to the public, and
specifically consumers (ibid).
Kenya has emerged as a leader in the implementation of sustainable certifications in the global tea
industry, with the highest percent of national tea production (72.9% in 2012) certified by one of the four
main certifications: Rainforest Alliance, Fairtrade, UTZ and Organic (Potts et al., 2014). Existing literature
covers the historic and projected sustainability challenges in the global tea industry and in Kenya’s tea
industry, and the intended benefits of sustainable standards and certifications (Forum for the Future, 2013;
Hoffman, 2015a; Kagira, Kimani, & Githii, 2012; The Sustainable Trade Initiative, 2015; Unilever, 2013; Van
de Wal, n.d.; von Bülow & Sorensen, 1993). The process in which Kenya accomplished the rapid
implementation of certified tea production at such a large scale, is also well documented (Cameron, 2017;
Henderson & Nellemann, 2012; L. Chimoita, Dennis Maina, Opiyo Olila, & P.Gweyi Onyango, 2015).
However, quantitative data on the current scale of standard-compliant tea production globally and in
Kenya is not available (the most recent public data is from 2012) and studies that analyze the true impact
of the implemented certifications are limited.
Although there has been some research on the effectiveness of certifications in Kenya, the research
is focused primarily on training programs associated with certifications, such as Farmer Field Schools (FFS),
and not on the comprehensive sustainability outcomes of the certifications themselves (L. Chimoita et al.,
2015; Waarts, Ge, Ton, & Jansen, 2012). The existing research on training programs measures awareness of

DeBree 5
and/ or implementation of Good Agricultural Practices (GAPs) before and after FFS training and Rainforest
Alliance training, but only use tea production and grower livelihood outcomes as metrics (ibid). The few
studies that investigated more holistic sustainability outcomes of the Fairtrade and Rainforest Alliance
certifications found a lack of differentiation between certified and non-certified tea farms in Kenya
(Blowfield & Dolan, 2010; Dolan, 2008; Ochieng, Hughey, & Bigsby, 2013). The perspectives of tea industry
stakeholders lower in the supply chain, such as tea farmers, tea workers, and tea factory owners, are also
underrepresented when analyzing the impacts of certifications. Most importantly, because current
quantitative data on standard-compliant tea production in Kenya is not available, the dramatic increase in
certified tea production, along with the associated consequences, have not been well documented or
evaluated.
This paper will provide an up-to-date overview of the landscape of sustainability certifications in
the Kenyan Tea Industry by combining existing literature, first-hand interview and observation, and
more recent quantitative data in an exploratory case study. First-hand interview and observation
primarily occurred during on-the-ground research in Kenya and the UK in May 2017. The research will
include perspectives from stakeholders largely underrepresented in existing literature such as Kenyan tea
farmers and factory managers and identify areas where more research and investigation are needed. This
work will be a foundation for future research on the effectiveness of certifications in the Kenyan tea
industry through underlining current trends that are insufficiently documented: 1) the pervasiveness of
Rainforest Alliance 2) the tensions between farm productivity, insufficient value of tea, and
sustainability and 3) the efforts to transcend the capacity of certification in the short and long term. This
work has implications for the global tea industry value chain. Hopefully, this research can improve
awareness of important tea industry sustainability trends and increase communication and understanding
between industry stakeholders.

DeBree 6
2. Background
The following background information was collected between August 2016 and May 2017. The
literature review focused on agricultural sustainable standards and certifications, the global tea industry,
the Kenyan tea industry, and existing research on sustainable certifications. General interest literature
research highlighted key sustainability challenges in the tea industry, the intended benefits of
certifications, and the commitments made by members of the tea value chain to certain sustainability
efforts.
2.1 Sustainable Standards and Certifications
International sustainability standards for agriculture are created by organizations such as the
International Organization of Standardization (ISO) and the Sustainable Agriculture Network (SAN)
(Golden et al., 2010). The standard have specific metrics to evaluate the wellbeing of the environment,
society, and economy in growing-regions (Global Trust, n.d.; Golden et al., 2010; SAN/ Rainforest Alliance,
2015). Certification bodies such as the Rainforest Alliance, Fairtrade, UTZ, and Organic, audit growing and
processing facilities against the existing sustainable standards (ibid). If the sustainability standards are
met, then the facilities become ‘certified’ by the certification scheme(s) (ibid).
The specific metrics of sustainability standards, and the focuses and strategies of certification
schemes vary slightly, but usually have the same core goals. Existing research defines and classifies types
of standards and certifications (Ahi & Searcy, 2013; Eckert, Breitschuh, & Sauerbeck, 2000; Formentini &
Taticchi, 2016; Garnett et al., 2013). Sustainable standards and certifications are intended to enforce
sustainable practices to better the economic, social, and environmental conditions in the communities
where they are implemented, while communicating the commitment to sustainability to the public, and

DeBree 7
specifically consumers (Golden et al., 2010). Voluntary standards and certifications can be understood as
market-based solutions to sustainability, and their increasing adoption can be framed in the growing
momentum of “green” or responsible business (Dyllick, Hockerts, & Thomas Dyllick, 2002; A. O’Rourke,
2003; A. R. O’Rourke, 2009; Randjelovic, O’Rourke, & Orsato, 2003).
Numerous studies have been conducted on the impacts of certifications, but the focus of these
studies range from general to specific, and the subject(s) cover a range of geographic, socio-economic, and
industry scales (Cheyns, 2011; Desai & Rudra, 2016; Oya et al., 2017; Pinto, Gardner, McDermott, & Ayub,
2014). The following are some of the common intended benefits of agricultural standards and certifications
(Ethical Consumer, 2014; Hoffman, 2015b; King, Pendlington, Walter, & Smith, n.d.; SAN/ Rainforest
Alliance, 2015):
• Economic: Increase income, increase income and job security, reduce poverty
• Social: Increase gender and ethnic equality, improve community engagement and development,
increase access to education, increase food security
• Environmental: Improve ecosystem health, biodiversity, water quality, and soil quality; decrease
energy and water consumption; decrease carbon footprint; decrease use of agro-chemicals
The intended benefits of certification depend on the certification scheme, and the sustainability
challenges specific to the industry and growing region where it is implemented (Hoffman, 2015b; Mol &
Oosterveer, 2015; Oya et al., 2017; Pinto et al., 2014). Although certifications are proposed as mechanisms
for positive sustainable change, the research conducted on the impacts of certifications have shown
conflicting and uncertain results (Blowfield & Dolan, 2010; Dolan, 2008; Ochieng et al., 2013; Oya et al.,
2017). A systematic review of studies on the impacts of agricultural standards and certifications show that
many studies have high risk of bias, demonstrate insignificant results, or provide conflicting data to other

DeBree 8
studies (Oya et al., 2017). However, some industries with a larger body of research on the impacts of
certifications demonstrate a clearer beneficial impact (ibid).
The coffee industry is one agricultural industry that has received a lot of attention in academic
literature on the impacts of certification (Giovannucci & Ponte, 2005; Haggara, Sotob, Casanovesb, &
Virginiob, 2017; Pierrot, Giovannucci, & Kasterine, 2010; Pinto et al., 2014). For example, on March 26, 2018,
a search of the Agricultural & Environmental Science Database for “sustainability AND tea” produced 390
results, whereas “sustainability AND coffee” produces 672 results. The tea industry on the other hand, is
underrepresented in research, which needs to be reversed to ensure the future of the tea industry is
sustainable, especially in the context of its global and growing influence (Chang, 2015).
2.2 The Global Tea Industry
Tea is the second-most consumed beverage in the world after water (Hoffman, 2015b; Tea
Association of the U.S.A. Inc., n.d.). According to the FAO, tea consumption will continue to increase
(Chang, 2015). Black tea consumption is projected to increase annually at a rate of 3% (ibid). Consumption
projections were not calculated for green tea (ibid). Tea production is also expected to increase, with 2.9%
annual growth for black tea production, and 8.2% annual growth for green tea production (Chang, 2015).
The higher growth rate in green tea production is largely due to the production increases expected in China
(ibid). Based off of projections from 2013 data, global green and black tea production would thereby reach
7.14 million metric tons by 2023 (ibid). The continual growth of the tea industry will exacerbate the existing
sustainability challenges if they are not addressed.
2.2.1 Global Tea Industry Challenges
The tea sector is challenged by various environmental, social, and economic factors. Tea grows in
very specific climates, many of which are located in economically poor, rural regions (Forum for the Future,

DeBree 9
2013; Intergovernmental Group on Tea, 2016; Van de Wal, n.d.). Many tea growing regions are also
susceptible to severe weather and climate change, but have limited resources to mitigate or adapt to the
resulting impacts (ibid). The specific negative impacts of climate change have been projected in some tea
growing nations, such as Sri Lanka (Wijeratne, 1996). Tea production is labor intensive, and when the
commodity price of tea falls, workers harvesting or processing tea are affected by poorer working
conditions, lower wages, and reduced job and income security (Forum for the Future, 2013; Hoffman,
2015a; Kagira et al., 2012; Van de Wal, n.d.).
Other major challenges within the tea industry include gender and ethnic discrimination; lack of
worker healthcare and protective equipment; and poor quality of life (inadequate housing, drinking water,
food, and education) (Potts et al., 2014; Van de Wal, n.d.). Environmental issues associated with tea
production include the loss of natural habitats and biodiversity, emissions from energy use (mainly
electricity and firewood), improper application of chemicals, and water quality impacts due to farming
practices (ibid). Additionally, tea does not contribute to nutritional needs, but uses agricultural inputs.
Therefore, tea production in developing countries can be seen as a process that may negatively compete
with food security by using resources such as water, arable land, and agro-chemicals, and thereby limiting
resources available for producing food that provides sustenance (Garnett et al., 2013).
Many sustainability issues are specific to a given country, region, or individual farm. For instance,
in Kenya there is practically no use of pesticides and herbicides (Azapagic, 2013; Kagira et al., 2012). In
contrast, tea samples analyzed from growing regions in China and India have contained concerning levels
of pesticides and other chemicals (Gurusubramanian, Rahman, Sarmah, Ray, & Bora, 2008; Mamun,
Ahmed, & Paul, 2014). The range of issues, scale of spatial impact, and degree of intensity creates additional
obstacles for addressing sustainability in the tea industry.

DeBree 10
2.2.2 Global Standard-Compliant Tea
The following tables show the key certifications in the tea industry, their attributes and objectives,
and key commitments by tea companies as of 2014:
Table 1: Key Certifications in the Tea Industry as of 2014
Source: The Ethical Consumer (Ethical Consumer, 2014)

DeBree 11
Table 2: Commitments to Certifications from Large Companies as of 2014
Source: The State of Sustainability Initiatives 2014 (Potts et al., 2014)
Other collaborative organizations in the tea industry that drive sustainability include Tea2030 (a branch of
Forum for the Future), and the Ethical Tea Partnership. Both organizations work to bring together
stakeholders to overcome the largest obstacles in the tea industry.
The most recent data on global standard-compliant tea is from 2012, consolidated within the State
of Sustainability Initiatives 2014 report. The report quantifies the scale of production and sales of each
certification up to 2012. By 2012, 577,000 mt of tea, or 12% of global tea production was standard-compliant,
or certified by one of the 4 main certifications in tea (RA, Fairtrade, UTZ, or Organic) (Potts et al., 2014).
Only 174,000 mt of tea, or 30% of all standard-compliant production, was actually sold as standard-
compliant (ibid). The difference between standard-compliant production and sales is important, because
some certifications such as Rainforest Alliance only get paid by tea companies if the tea is sold with the
certification seal on the packaging (Cameron, 2017). Growth in both production and sales of standard-
complaint tea had been dramatic since 2009 (Figure 1). Rainforest Alliance has shown the most significant
growth, especially in sale of standard-compliant tea when compared to the other certifications (Figure 2)
(ibid).

DeBree 12
Figure 1: Growth of Standard-Compliant Tea Production and Sales (2009 – 2012)
Source: The State of Sustainability Initiatives 2014 (Potts et al., 2014)

DeBree 13
Figure 2: Growth of Standard-Compliant Tea Production (2006-2012) and Sales (2008 – 2012) by
Certification
Source: The State of Sustainability Initiatives 2014 (Potts et al., 2014)
2.3 The Kenyan Tea Industry
Tea seedlings from India were first introduced to Kenya in 1903 in the Limuru region by a European
settler, G.W.L Caine (Kagira et al., 2012). Commercial production of tea began in 1924 and was initially
limited to multinational companies and large-scale farms, as early settlers and colonial government wanted

DeBree 14
to “maintain high quality” (ibid). When India gained independence from Britain 1947, the British turned to
Kenya to import increasingly large volumes of black tea (Ochanda, 2012). The total tea production in Kenya
grew dramatically with the demand (ibid). Upon Kenya’s independence from Britain in 1963, land reform
bills allowed local farmers to grow tea, and the Kenya Tea Development Agency (KTDA) was formed to
support the local small-scale farmers (Cameron, 2017). The KTDA was originally government run and
consisted of 20,000 farmers cultivating around 400 hectares of tea (ibid). The KTDA was privatized in 2000,
and has grown to 600,000 smallholder farmers, 67 tea processing facilities, and multiple subsidiary
companies by 2017 (ibid). Smallholder farms under the KTDA, which are 40 hectares or smaller, account
for 60% of Kenya’s tea production (ibid). Privately-owned larger tea estates fall under the Kenya Tea
Growers Association (KTGA) and represent 40% of Kenya’s tea production (ibid).
Figure 3. Organizational Structure of the Tea Industry in Kenya.
Source: Tea Board of Kenya (2004)
In 2014 and 2015 Kenya was the 3rd largest tea producer in the world, behind China and India
(Committee on Commodity Problems, 2016). In 2014, the 448,379 tons of tea produced in Kenya represented
10% of global tea production (ibid). Kenya was also the largest tea exporting country, representing 22% of

DeBree 15
global tea exports (ibid). In 2014, Kenya had the 77th ranked GDP globally at $62,720,000, (Statistics Times,
2014). Out of the total GDP, 29.3% was contributed by the agricultural sector, and 4% by the tea sector
(Committee on Commodity Problems, 2016; Statistics Times, 2014).
2.3.1 Kenyan Tea Industry Challenges
One of the main challenges in the Kenyan Tea Industry is gender inequality (Kagira et al., 2012;
Unilever, 2015; von Bülow & Sorensen, 1993). Evidence of gender inequality and sexual harassment was
illuminated in a report on working conditions from Unilever’s Kericho tea estate (Unilever, 2013). The
consulting company responsible for the report strongly recommended increasing the number of females
in leadership positions (from 3% to 50%) (ibid). A study of smallholder growers in the Kericho District
linked low productivity of tea farms to conflicts between spouses and tense gender relations (von Bülow
& Sorensen, 1993). Women have also historically been marginalized from sharing the income from tea
production (Kagira et al., 2012).
Other key challenges in the smallholder Kenyan tea industry include production related
challenges (old tea bushes, low quality tea, drought and climate change, high costs of farm inputs, poor
employee-employer relationships, lack of training, use of child labor, degradation of natural habitat,
pollution and decline of local water sources, poor safety and health of workers, and lack of farmer
representation), management challenges within the KTDA, local market challenges (lack of overall value
and low domestic consumption), and international market challenges (fluctuation of tea demand and
prices, and requirement of certification to enter international market) (Kagira et al., 2012).
2.3.2 Kenya’s Global Leadership in Certified Tea Production
Unilever has the largest market share of the global tea industry (Henderson & Nellemann, 2012).
For the past 4 years Unilever has been ranked as the number one employer in Kenya by the Top Employer

DeBree 16
Institute, with around 19,000 employees within the country (Edge Magazine, 2016; Unilever, 2016). When
Unilever committed to sourcing more sustainable raw materials in 2006, the company purchased around
60% of tea produced by the KTDA (Cameron, 2017; Hoffman, 2015b). In 2007, Unilever announced that by
2015, they would only buy Rainforest Alliance certified tea (ibid). In order for Unilever to meet this
commitment, and for the KTDA to maintain its largest buyer, both organizations had to collaborate to meet
the Sustainable Agriculture Network (SAN) standards implemented by RA (ibid). Accomplishing this task
was made possible by the unique structure of the KTDA, outside donor organizations, an effective pilot
program with financial incentives and Farmer Field Schools, and the dominant market share of both
Unilever and the KTDA (Cameron, 2017).
When Unilever was initially scaling the RA certification in Kenya, they paid a direct premium for
RA certified tea to encourage adoption. When the pilot program was in place with the KTDA, Unilever
paid a $0.10 USD/ kg tea premium on KTDA tea that was certified by RA tea (ibid). At the time, tea was
typically sold for $2.00/ kg, meaning the premium represented a 5% increase in income (ibid). After 2010
Unilever only paid a premium for tea with the RA seal, which represented about 3% of KTDA production
(ibid).
Largely because of Unilever’s instigation, Kenya became the global leader in producing standard-
compliant tea. As of 2016, the KTDA was 100% RA certified, and most of the 100+ large privately-run
estates, which make up 40% of the country’s production, had adopted the certification scheme (ibid).
Unilever’s commitment to Rainforest Alliance impacted the entire tea industry because many major tea
companies began using certification schemes as third-party insurance of sustainability in order to maintain
a solid reputation and customer base (Potts et al., 2014).
The most recent study on the quantitative scale of implementation of sustainable standards and
certifications within the tea industry is the State of Sustainability Initiatives 2014, which used data from
2011/ 2012. The study showed that by 2012, 272,229 tons of Kenyan tea were standard-compliant, meaning

DeBree 17
that 72.9% of Kenya’s total tea production in 2012 (373,065 tons), was certified by Rainforest Alliance,
Fairtrade, Organic, or UTZ (Potts et al., 2014).
In 2012, Kenya was the 3rd largest producer of tea at 8% of global production, after China (35%) and
India (21%) (ibid). However, Kenya produced 40% of total global certified tea (577,000 tons) (ibid). The
second largest standard-compliant producer was India at 18% of global certified tea (ibid). Compared to
Kenya’s 72.1%, India’s certified production represented 12.2% of total national tea production in 2012 (ibid).
China was the 5th largest producer of certified tea by volume, but the 38,855 tones of certified tea produced
in 2012 only represented .3% of China’s national tea production (ibid).
The other aspect of Kenya’s certified tea production that is intriguing, is the variety of certifications
that are used. In most countries, only one, or maximum two certifications are used in influential volumes
(ibid). In contrast, Kenya’s standard-compliant tea production in 2012 was divided between 3 major
certifications (Rainforest Alliance (40.4%), Fairtrade (23.1%), and UTZ (8.4%)) (ibid). Organic tea also
represented .2% of standard-compliant production (ibid).

DeBree 18
Figure 4: Global Conventional and Standard-Compliant Tea Production by Country and Standard (2012)
Source: The State of Sustainability Initiatives 2014 (Potts et al., 2014).
Kenya was clearly an outlier in certified tea production in 2012. Since then, there has been qualitative
documentation of the continued expansion of the Rainforest Alliance certification in Kenya. According to
Peter Mbadi, the senior manager of agricultural services at the KTDA, “All the tea sold in Mombasa1 is
Rainforest Alliance certified” as of 2017 (Cameron, 2017). Despite the apparent continued increase of
certified tea production and export, there has not been quantitative measurements of certified tea
production, sale, or export since 2012.
1 Mombasa refers to the Mombasa Auction, located in Mombasa Kenya where Kenyan tea is sold for
export

DeBree 19
2.3.3 Existing literature on Certification Effectiveness in Kenya
A study of the economic impacts of certification found the cost of annual audits for a factory,
depending on size and number of associated farmers, is around $3,000 USD (Waarts et al., 2012).
However, realizing a return of investment from certification was uncertain (ibid). A life cycle assessment
of tea produced in Kenya was conducted but did not compare certified and non-certified tea (Azapagic,
2013). The carbon footprint of Kenyan tea from ‘cradle to gate’ was ~3 kg CO2 eq./kg dry tea, and ~12
CO2 eq./kg dry tea from ‘cradle to grave’ (ibid).
Farmer Field Schools (FFS) and similar training programs (such as the Rainforest Alliance
training) have repeatedly been proven to increase knowledge and adoption of Good Agricultural
Practices (GAPs) (L. Chimoita et al., 2015; Waarts, 2017; Waarts et al., 2012). Literature shows that the
quantity and quality of green-leaf per tea bush is increasing, connected to FFS and RA training (ibid). A
study conducted by LEI Wageningen UR investigated the impacts of FFS and RA training between 2010 -
2012 (Waarts et al., 2012). The study showed that 84% of the farmers who participated in the RA training
program felt as though they had benefitted from certification activities, and more than 96% of FFS
participants said that they or their household benefitted from the program (ibid). Both the RA training
and FFS training improved farmer livelihood over a variety of indicators (relationships with family,
access to self-help activates, possibility to send children to school, family welfare, family income, relations
with their tea factory etc.) (ibid). A small majority (52%) of tea farmers with the RA certification in the
training program said they were receiving a higher price for RA certified tea (Waarts et al., 2012).
However, the net income of those farmers was lower than farmers who had attended FFS training but
were not RA certified (ibid). This may be due to the increase in farming inputs required by the RA
certification (ibid).
One study published in 2013 evaluated more holistic sustainability outcomes of the RA
certification in Kenya. The study highlighted some positive impacts of certification (natural resource

DeBree 20
conservation, improved working conditions to a limited extent), but otherwise identified no difference
between certified and non-certified farms in access to health services, employee living conditions, and
other important aspects (Ochieng et al., 2013). Similarly, studies on the use of the Fairtrade certification in
the Kenyan tea industry found that the intended benefits of the certification were not being realized for
many tea producers involved (Blowfield & Dolan, 2010; Dolan, 2008). The authors found that the
Fairtrade certification had questionable impacts on alleviating poverty, and that the goals of the Fairtrade
certification (improved transparency, empowerment, democratic participation, and equal exchange) were
not a reality for many Kenyan tea farmers with the certification (ibid).
3. Methods
This research takes the form of a Case Study, which is defined as “A method of studying
elements of the social through comprehensive description and analysis of a single situation or case”
which usually involves “any number of data gathering methods, for example, surveys, interviews,
observation, quasi-experiments and a range of unobtrusive methods” (O’Leary, 2005). Specifically, this
work is an Exploratory Case Study, because it investigates what trends are present, instead of focusing on
why trends are present (ibid).
Through combining existing literature, web-based data collection, and first-hand interview and
observation, this paper will provide an up-to-date overview of the landscape of sustainable certifications
in the Kenyan Tea Industry. The first phase of research was information gathering, involving the literary
review found in the background section, web-based data collection, and preliminary interviews. The
second phase of research was on-the-ground research in Kenya and England, consisting of conference
notes, casual interviews, standard interviews, and curated observation. The third and final phase of

DeBree 21
research was post-on-the-ground research data collection, where the trends identified in the first two
phases of research were further investigated.
The phases of research are divided because each had a different methodological approach, and a
different amount of preexisting knowledge (described below). The preexisting knowledge differences were
due to the vast amount of information learned in each phase of the case study. During Phase 1, knowledge
of the tea industry as a whole was limited. The questions asked during preliminary interviews and
investigated through literary review and web-based research reflected the need for a foundational
understanding. During Phase 2, conference notes, casual interviews, standard interviews, and curated
observation were interwoven and informed each other throughout the three weeks of on-the-ground-
research. Phase 3 further investigated the key trends that arose in the earlier two stages of research.
Interviewees were selected through a mix of stratified sampling and opportunistic sampling.
Stratified sampling required the division of the tea industry into stakeholders as ‘subgroups’, to ensure that
a range of perspectives throughout the tea supply chain were represented (O’Leary, 2005). Typically,
identified subgroups should be sampled from randomly, but due to the limited time of on-the-ground
research, opportunistic sampling was also utilized. Opportunistic sampling is defined by sampling subjects
who are willing and available in the time-frame of research (ibid). The tea industry stakeholders included
in research are identified by their subgroup (tea grower, tea factory manager, tea company representative,
certification organization representative, or collaborative organization representative) in order to maintain
anonymity, while providing context of the varying perspectives and opinions between stakeholders within
the industry. A description of the stakeholder subgroups can be found in Exhibit B. All interviewees spoke
English, and an IRB was secured to ensure that interviews were conducted ethically. The following chart
identifies the number of data collection points by type of data, and subgroup:

DeBree 22
Table 3: Data Collection by Type and Stakeholder Subgroup
Preliminary
Interview
Conference
Notes*
Casual
Interview
Standard
Interview
Curated
Observation
Total
Tea Farmer Few 2 2 4+ Tea Factory
Manager None 2 3 5
Tea
Company
Rep
5 Multiple 3 1 9+
Certifying
Body Rep 1 Multiple 1 1 3+
Collaborative
Org Rep 1 Multiple 1 1 3+
Total 7 ** 5 7 5 23 *Conference Notes - The stakeholder subgroup was not always apparent during conference proceedings,
so in the results section, the information provided will be identified as either being from the EATTA
Conference, or the Team Up Africa Conference. Occasionally, the stakeholder subgroup will be identified
as well, if it was clear during the conference, and relevant to the data.
**Conference Notes Total - There were no tea factory managers represented at the conferences, but there
were multiple tea company, collaborative organization, and certifying body representatives. A few growers
were represented in conference attendees.
Data collection methods varied by the phase of research and the type of data (explained further
below). All relevant qualitative data was written in a notebook or typed on the computer and later
combined in a cumulative Word document. Manual coding of the qualitative data from all phases of
research was conducted by identifying points of agreement and contention between the data and
illuminating trends. Excel was used to collect quantitative data and conduct additional calculations and
analysis. Visual representations of the data were woven into the qualitative data Word document when
appropriate to exemplify or oppose trends.
3.1 Phase 1: Information Gathering
Phase 1 was intended to build a foundation of knowledge about the sustainable tea industry,
identify gaps in existing knowledge, and determine which gaps would be valuable to conduct research in.

DeBree 23
Phase 1 of research took place between August 2016 and April 2018, and included a literature review, web-
based research, and preliminary interviews.
3.1.1 Literature Review
Literature review began in August of 2016 and continued through May of 2017. The literature
review focused on gathering existing research on agricultural sustainable standards and certifications, the
global tea industry, the Kenyan tea industry, and sustainable certifications specific to the tea industry.
General interest literature research concentrated on key sustainability challenges in the tea industry, the
intended benefits of certifications, and the commitments made by members of the tea value chain to specific
sustainability efforts.
3.1.2 Web-Based Research
Web-based research began in August of 2016 and continued through April of 2018. The web-based
research concentrated on accumulating existing data on the global tea industry, and tea industries in
specific countries. The Food and Agriculture Organization (FAO) and the United Nation’s international
databases were utilized to collect data on the production, consumption, trade flows, pricing, and
environmental impacts of tea. Additional socio-economic data was analyzed including population
demographics, and the general economic status of influential countries in the tea industry. Data was
collected in an aggregate Excel spreadsheet.
3.1.3 Preliminary Interviews
Preliminary interviews were conducted between February 9th, 2017 and March 18th, 2017. The
interviews focused on 1) understanding the past and present landscape of the global tea industry and the
Kenyan tea industry, 2) building a foundation of knowledge about sustainability efforts in the industry, 3)

DeBree 24
identifying gaps in knowledge in the sustainable tea industry, and 4) identifying the gaps that would be
most valuable to conduct research in from the perspective of industry stakeholders. Interviews were
conducted over the phone, via Skype, and via email. Interviews were secured through convenience at first,
and later through a snowball technique, where each interview led to new contacts and potential interviews.
The interviews were semi-structured, with some questions created before-hand but with ample space for
the conversation to follow any direction (Cohen & Crabtree, 2006). Interviews were recorded through
intermittent note-taking on the computer. Later, interview notes were added to the aggregate Word
document and coded manually for trends. A total of 7 preliminary interviews were conducted.
Interviewees included representatives from tea companies, collaborative organizations, and certification
bodies.
3.2 Phase 2: On-the-ground Research
On-the-ground research included conference notes, casual interviews, standard interviews, and
curated observation. Phase 2 of research began in Nairobi on May 8th 2017, and was centered around the
Team Up Africa Conference, hosted by the Ethical Tea Partnership on May 10th, and the East Africa Tea Trading
Association Conference on May 11th and May 12th. Both conferences were located in the Radisson Blu Hotel
in Nairobi, Kenya, and were utilized as a time to gain more knowledge about the current landscape of
Kenya’s tea industry, create additional contacts, conduct observation, and causally interview key
stakeholders. The following week, May 15th – 21st, was spent about an hour outside of Nairobi in the Limuru
tea-growing region. The week was used to conduct interviews and observation concentrated on tea farms
and factories. The final week of on-the-ground research, May 15th – 21st, in London, England, was utilized
to interview key representatives from tea companies, certification bodies, and other collaborative
organizations.

DeBree 25
3.2.1 Conference Notes
Conferences included the Team Up Africa Conference hosted by the Ethical Tea Partnership on
May 10th, and the East Africa Tea Trading Association Conference between May 11th – 12th. Notes were
written by hand in a journal, and later converted into the cumulative Word document and manually coded.
Notes were taken during presentations and panel discussions by a variety of stakeholders in the tea
industry including representatives from tea companies, certification bodies, and collaborative
organizations. Data from conference notes include some of the PowerPoint material that was presented
during the conferences. Notes were also taken on questions asked by conference attendees during panel
discussions and break-out sessions, which included tea farmers, and other stakeholders that did not
identify their positionality. The stakeholder subgroup was not always apparent during conference
proceedings, so in the results section, the information provided will be identified as either being from the
Team Up Africa Conference, or the EATTA Conference. Occasionally, the stakeholder subgroup will be
identified as well, if it was clear during the conference, and relevant to the data.
3.2.2 Casual Interviews
During the conferences (May 10th – 12th) casual interviews were conducted during “tea breaks,”
and the Gala Dinner. Casual interviews were also conducted during the post-conference trip between May
12th – 14th to Kericho and the Maasai Mara during trip meals and drives between locations. Casual
interviewees during the conference included representatives from tea companies, certification bodies, and
collaborative organizations. Casual interviewees during the post-conference trip included representatives
from tea companies, and non-Kenyan tea farmers. Data from casual interviews were either detailed in a
notebook or remembered without note-taking, and later transcribed into a Word document for manual
coding. A total of 5 casual interviews were recorded.

DeBree 26
3.2.3 Standard Interviews
Standard Interviews were conducted between May 16th – 25th. A total of 7 standard interviews were
conducted with tea factory managers, representatives from tea companies, certification bodies, and
collaborative organizations. The interviews were semi-structured, and the interview guides can be found
in Exhibit C (Cohen & Crabtree, 2006). Notes were typed on a laptop or taken by hand and later transcribed
into a Word document for manual coding.
3.2.4 Curated Observation
Curated observation, or expert-led-observation, was conducted on 5 occasions between May 13th -
20th. Each time, the curator was either a tea farmer or a tea factory manager. Observation was conducted of
the tea farm or tea factory that the expert was describing while walking through it. Notes were taken by
hand in a notebook and later converted to a Word document for manual coding. Notes were taken on the
tea growing and processing logistics, perspectives of the tea growers and factory managers, and other
relevant information. The tours of farms and factories lasted between 30 minutes to an hour.
3.3 Phase 3: Post On-the-ground Research
Following on-the-ground research, further data collection was conducted to evaluate the claims
and trends highlighted in the prior two phases of research. Post on-the-ground research data collection
primarily took the form of web-based research and e-mail communications with existing contacts to
confirm or expand upon past interviews or notes. Post on-the-ground research spanned from May 29th –
April 2018, and engaged representatives from tea companies, certification bodies, and collaborative
organizations. Qualitative data was added to the aggregate Word document, and quantitative data was
added to Excel spreadsheets. Excel was used to conduct additional calculations and analysis of the
quantitative data.

DeBree 27
4. Results
The three main trends identified across all phases of research are 1) the pervasiveness of
Rainforest Alliance 2) the tensions between farm productivity, insufficient value of tea, and
sustainability and 3) the efforts to transcend the capacity of certification in the short and long term.
The following results will be organized by trend. Crucial data to exemplify points of contention and
agreement from a variety of research phases and stakeholder subgroups will be used to demonstrate each
trend and sub-trend. The most important data, which are the central points examined in the discussion,
will be in bold font. The phase of research, method of data collection, and stakeholder subgroup
associated with each data point will be identified. An outline of the trends and sub-trends can be found in
Exhibit A and a description of the stakeholder subgroups can be found in Exhibit B.
1) The Pervasiveness of Rainforest Alliance
1.a Evidence • The need to improve certifications was not addressed in either the Team Up Africa Conference or
the East Africa Tea Trading Association (EATTA) Conference by presenters or panelists, until
questions about multiplicity and cost of certification were asked by the crowd. (Phase 2:
Conference Notes, Team Up Africa, EATTA).
• There is no longer a discussion of certifications in Kenya because RA is the baseline. This is not
the case in other countries (Phase 2: Casual Interview, (2) Tea Company Rep, Certification Org Rep,
Collaborative Org Rep).
• RA is ubiquitous in Kenya (Phase 2: Standard Interview, Tea Company Rep).
• RA’s biggest success is the scale and scope of influence on tea exports in Kenya (Phase 2: Standard
Interview, Certification Org Rep).
• The KTDA, at one point, had 10 Fairtrade certified factories. However, now the KTDA only renews
the RA Certification (Phase 1: Preliminary Interview, Collaborative Org Rep).
• In Kenya, the structure for the tea industry is helpful to scale certification and sustainability efforts
quickly because farmers sell consistently to the same factories, which is not always the case in other
tea growing countries or regions (Phase 1: Preliminary Interview, Tea Company Rep).
• (Phase 3: Post On-the-ground Research):
Through e-mail correspondences with RA representatives in November 2017, the most recent data for RA
certified tea volumes globally (as of May 2017) was obtained. The data was used to estimate what
proportion of current Kenyan tea production is RA certified (Table 4). The RA data was sorted for
Kenyan RA certified volumes, and further sorted into KTDA and KTGA RA certified production by
identifying KTDA factories by “Farm name” in the dataset. Any non-KTDA entries were assumed to be
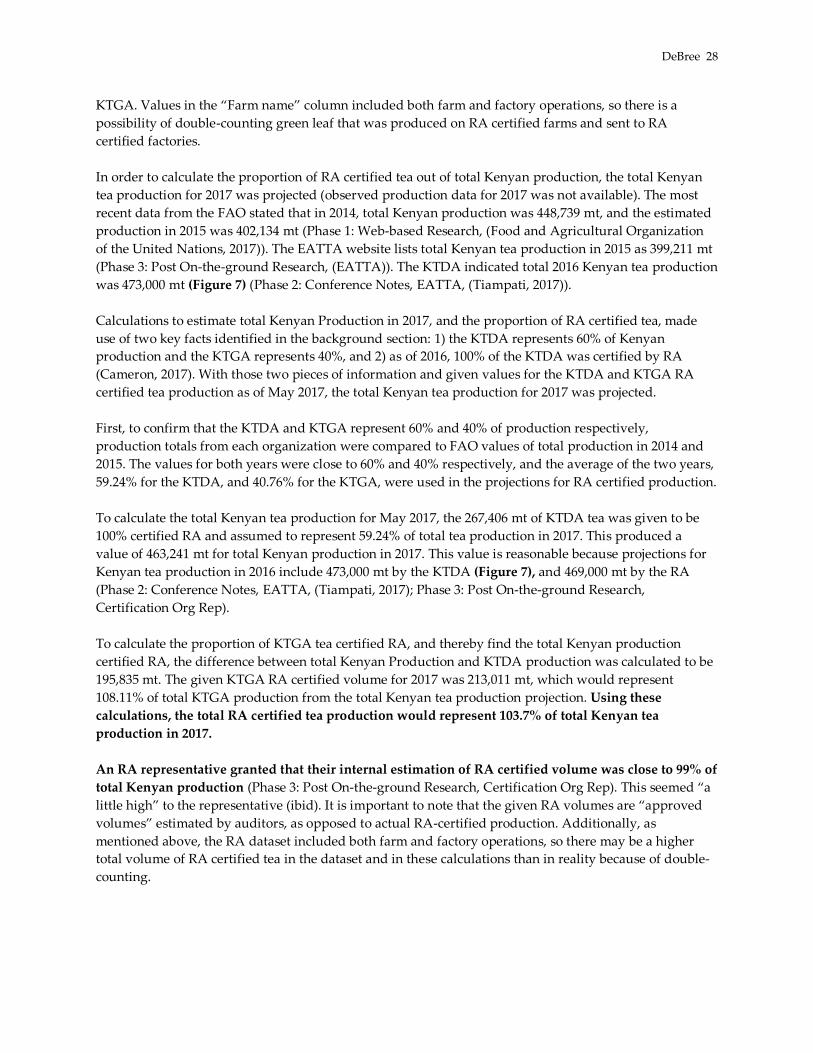
DeBree 28
KTGA. Values in the “Farm name” column included both farm and factory operations, so there is a
possibility of double-counting green leaf that was produced on RA certified farms and sent to RA
certified factories.
In order to calculate the proportion of RA certified tea out of total Kenyan production, the total Kenyan
tea production for 2017 was projected (observed production data for 2017 was not available). The most
recent data from the FAO stated that in 2014, total Kenyan production was 448,739 mt, and the estimated
production in 2015 was 402,134 mt (Phase 1: Web-based Research, (Food and Agricultural Organization
of the United Nations, 2017)). The EATTA website lists total Kenyan tea production in 2015 as 399,211 mt
(Phase 3: Post On-the-ground Research, (EATTA)). The KTDA indicated total 2016 Kenyan tea production
was 473,000 mt (Figure 7) (Phase 2: Conference Notes, EATTA, (Tiampati, 2017)).
Calculations to estimate total Kenyan Production in 2017, and the proportion of RA certified tea, made
use of two key facts identified in the background section: 1) the KTDA represents 60% of Kenyan
production and the KTGA represents 40%, and 2) as of 2016, 100% of the KTDA was certified by RA
(Cameron, 2017). With those two pieces of information and given values for the KTDA and KTGA RA
certified tea production as of May 2017, the total Kenyan tea production for 2017 was projected.
First, to confirm that the KTDA and KTGA represent 60% and 40% of production respectively,
production totals from each organization were compared to FAO values of total production in 2014 and
2015. The values for both years were close to 60% and 40% respectively, and the average of the two years,
59.24% for the KTDA, and 40.76% for the KTGA, were used in the projections for RA certified production.
To calculate the total Kenyan tea production for May 2017, the 267,406 mt of KTDA tea was given to be
100% certified RA and assumed to represent 59.24% of total tea production in 2017. This produced a
value of 463,241 mt for total Kenyan production in 2017. This value is reasonable because projections for
Kenyan tea production in 2016 include 473,000 mt by the KTDA (Figure 7), and 469,000 mt by the RA
(Phase 2: Conference Notes, EATTA, (Tiampati, 2017); Phase 3: Post On-the-ground Research,
Certification Org Rep).
To calculate the proportion of KTGA tea certified RA, and thereby find the total Kenyan production
certified RA, the difference between total Kenyan Production and KTDA production was calculated to be
195,835 mt. The given KTGA RA certified volume for 2017 was 213,011 mt, which would represent
108.11% of total KTGA production from the total Kenyan tea production projection. Using these
calculations, the total RA certified tea production would represent 103.7% of total Kenyan tea
production in 2017.
An RA representative granted that their internal estimation of RA certified volume was close to 99% of
total Kenyan production (Phase 3: Post On-the-ground Research, Certification Org Rep). This seemed “a
little high” to the representative (ibid). It is important to note that the given RA volumes are “approved
volumes” estimated by auditors, as opposed to actual RA-certified production. Additionally, as
mentioned above, the RA dataset included both farm and factory operations, so there may be a higher
total volume of RA certified tea in the dataset and in these calculations than in reality because of double-
counting.

DeBree 29
Table 4: Kenyan Total Tea Production and RA-Certified Tea Production Calculations
Sources: Rainforest Alliance (2017), Food and Agriculture Organization (2017)
Kenyan Tea Production Data from FAO (2014 - 2015)
2014 (mt)
2014 (% of total)
2015 (mt)
2015 (% of total)
Avg % of total (2014-2015)
Smallholder (KTDA) 262,419 58.96% 237,596 59.52% 59.24%
Estate (KTGA) 182,686 41.04% 161,615 40.48% 40.76%
Total 445,105 100% 399,211 100% 100%
Estimated Kenyan Rainforest Alliance Certified Production (May 2017) Key:
May 2017
(mt) % certified
RA % of total
Production Estimated Total
Production Given (FAO)
Smallholder (KTDA) 267,406 100% 59.24% 267,406 Given (RA)
Estate (KTGA) 213,011 108.77% 40.76% 195,835 Calculated
Total 480,417 103.71% 100% 463,241 Assumption
1.b Market Demands Rainforest Alliance • When asked about the motivation behind certification, both tea company and collaborative
organization representatives acknowledged that most Kenyan tea producers adopted certification
because the market demands it (Phase 1: Preliminary Interview, Collaborative Org Rep; Phase 2:
Casual Interview, Tea Company Rep; Standard Interview, Tea Company Rep, (2) Collaborative Org
Rep). • Tea farmers and factory managers in Kenya cited market pressure as the primary reason for
getting RA certified (Phase 2: Standard Interview, (2) Tea Grower, (2) Tea Factory Manager).
• Kenya’s production has largely been driven by consumers in the United Kingdom, who during the
recent past, have tended to be more expectant and demanding of corporate responsibility (Phase 2:
Conference Notes, EATTA, Tea Company Rep; Casual Interview, Tea Company Rep).
• Certification trends always come back to the consumer and market demand (Phase 2: Standard
Interview, Collaborative Org Rep).
• In some key importing countries for Kenya other than Britain, such as Egypt, Afghanistan, Pakistan,
and Sudan, consumers do not care as much about certification (Phase 2: Standard Interview,
Collaborative Org Rep).
1.c Lack of Differentiation/ Lack of Direct Financial Benefit of Certification • One tea company representative reported that they had “never heard anything but positive things
about RA and other certifications.” They had heard many positive environmental stories about
streams that had dried up but were returning to a healthy state. However, the representative also
acknowledged that tea producers’ biggest priority is seeing a profit from the certification, and
insinuated that although environmental benefits are clear, producers may not be seeing direct
financial benefits from certification (Phase 1: Preliminary Interview, Tea Company Rep). • A tea company representative said that RA provides financial differentiation in other countries, such
as Argentina, but not in Kenya. RA differentiation in Argentina is due to the fact that there is a low

DeBree 30
proportion of national tea production certified RA. In comparison, the pervasiveness of RA in Kenya
results in a lack of differentiation, and a lack of higher prices being paid for RA certified tea
(Phase 2: Casual Interview, Tea Company Rep; Standard Interview, Tea Company Rep).
• Many stakeholders, including tea growers and tea factory managers, acknowledge the benefits of
certification. However, many tea farmers and factory managers interviewed said that the costs of
certification are too high, and not shared equally throughout the supply chain. Any profit from the
certification goes directly back to paying for the certification (Phase 2: Casual Interview, (2) Tea
Company Rep; Standard Interview, Tea Grower, Tea Factory Manager).
• RA certification is “good, but not for the money” (Phase 2: Standard Interview, Tea Factory
Manager).
• Although most data suggested a lack of differentiation and direct financial benefit from
certification, there was some data that suggested differentiation. One tea grower discussed how
they are paid a higher price for RA certified tea by one factory but do not receive a higher price for
RA certified tea when selling to anther factory. One tea factory manager interview discussed how
their factory is considered to be the “superior factory in the region,” because it has both an ISO
and RA certification. As a result, the factory does receive higher prices for their certified tea (Phase
2: Standard Interview, Tea Grower, Tea Factory Manager).
• Kenyan factories process both RA and Non-RA tea. Processing both tea leaves is tedious,
considering the leaves must be kept totally separate, or the batch becomes all Non-RA, and
thereby “less valuable.” The processing of both types of leaves takes place on the same day usually,
with a 30 minute to 1-hour gap between processing to fully separate the leaves (Phase 2: Curated
Observation, (3) Tea Factory Manager).
2) The Tensions between Farm Productivity, Insufficient Value of Tea, and
Sustainability
2.a Productivity 2.a.i Evidence • A trend of increasing productivity was mentioned multiple times by a variety of stakeholders
during the Team Up Africa and EATTA Conferences. Increasing productivity was linked to Farmer
Field Schools, and the general increase in knowledge and adoption of Good Agricultural Practices
(GAPs) (Phase 2: Conference Notes, Team Up Africa, EATTA; Casual Interview, Tea Company Rep,
Collaborative Org Rep). • During a presentation by the KTDA at the EATTA conference, the KTDA representative mentioned
that farm productivity was increasing. However, the presentation did not include quantitative data to
demonstrate the trend. Data in the presentation featured growth in number of smallholder tea
farmers (Figure 5), area used for tea farming (Ha) (Figure 6), and total tea production (Figure 7)
(Phase 2: Conference Notes, EATTA, (Tiampati, 2017))

DeBree 31
Figure 5: Increasing Number of Smallholder Tea Growers (1964 – 2016)
Source: Source: An Inspirational Story on Tea – KTDA Holdings LTD Perspective (Tiampati,
2017)
Figure 6: Kenya’s Increasing Area Under Tea (Ha) by Type of Grower
Source: An Inspirational Story on Tea – KTDA Holdings LTD Perspective (Tiampati, 2017)

DeBree 32
Figure 7: Tea Production Trends in Kenya by Type of Grower (2012 – 2016)
Source: An Inspirational Story on Tea – KTDA Holdings LTD Perspective (Tiampati, 2017)
• The trend of increasing production is supported by data from the FAO (Figure 8). Kenyan black tea
production grew from 331,494 tons in 2005 to 448,739 in 2014 (Phase 1: Web-based Research, (Food
and Agricultural Organization of the United Nations, 2017)).
Figure 8. Kenyan Tea Production (2005 – 2014)
Source: Food and Agriculture Organization (2017)

DeBree 33
• One presentation at the Team Up Africa Conference featured data about the difference in yields
between producers across countries but did not demonstrate change in productivity over time
(Figure 9) (Phase 2: Conference Notes, Team Up Africa, (Waarts, 2017)).
Figure 9: Yield Gaps between Tea Farms in Kenya and Other Tea Growing Countries
Source: Towards a sustainable future for smallholder tea farmers and workers (Waarts, 2017)
• (Phase 3: Post On-the-ground Research)
To examine the trend of increasing productivity in tea production, data from the FAO, EATTA, and
KTDA were compared and analyzed. Although values and terminology for the FAO and EATTA varied
slightly, the general trend of yield was the same for both organizations (Table 5). The trend did not
show a clear increase in productivity (Figure 10). The FAO has historic data on tea production, area
harvested (Ha), and Yield. Yield was calculated as (production/ area harvested). The EATTA has historic
data on tea production and “planted hectares” (Ha). Data between 2005 and 2014 was retrieved from both
databases and compared.

DeBree 34
Table 5: FAO and EATTA Data on Kenyan Tea Production, Area Harvested or Planted, and Yield or
“Productivity”
Sources: Food and Agriculture Organization (2017), East African Tea Trading Association (2017)
Figure 10 exhibits the trend of productivity created by the FAO and EATTA data from 2005 – 2014. Data
from the KTDA presentation during the EATTA conference on the tea production and “Area under Tea”
between 2012 – 2016 for smallholders and estate producers was also used to calculate productivity and
included in the figure (Phase 2: Conference Notes, EATTA, (Tiampati, 2017)). The data from the FAO,
EATTA, and KTDA representing total Kenyan tea productivity between 2012 and 2014 match in terms of
productivity trend. The smallholder and estate productivity trend mirrored the total national
productivity values, while the estate values were higher, and smallholder values were lower.
Figure 10: Kenyan Tea ‘Productivity’ (Ha/ mt) Sources: Food and Agriculture Organization (2017), East African Tea Trading Association (2017),
Kenya Tea Development Agency (Phase 2: Conference Notes, (Tiampati, 2017)).

DeBree 35
2.a.ii Risks to Productivity Increases (Old tea bushes, Decreasing farm size, Climate change)
2.a.ii.1 Old Tea Bushes
• After 50 years, the yield of tea bushes starts to decrease. Replanting is suggested earlier than 50 years,
but the cost of replanting is high, and it takes a few years for newly planted bushes to produce tea
leaves that can be sold. If tea growers wait to replace bushes, a downward spiral of decreasing yield
and decreasing income can ensue. The Kenyan Government is working on developing gradual
replanting programs to increase farmer awareness and provide financial help to cover up-front costs
(Phase 2: Conference Notes, Team Up Africa, Collaborative Org Rep; Standard Interview, Tea
Grower, Tea Factory Manager).
2.a.ii.2 Decreasing Farm Size • Decreasing farm size is a risk to productivity because smaller farms have lower yields. Population
growth and subdivision of land are major trends in Kenya that are driving farm sizes to be smaller
and smaller (Figure 11). Studies show that there is a significant difference between maximum,
average, and median farm size, which correlates to significant gaps between maximum, average and
median yields (Figures 9, 12) (Phase 2: Conference Notes, Team Up Africa, (Waarts, 2017)). • Decreasing farm size as a risk to productivity is related to mixed land use and inheritance. For
example, if one farmer passes a tea farm down to four children, each child may want to use the land
originally used for cultivating tea to build their own house, create a garden for vegetables or other
crops, make a pasture to raise livestock etc. In this way, one area that was completely devoted to tea
production is divided into smaller and disconnected tea farms. This trend of the division of land is
largely due to the inheritance culture in Kenya - individuals are unlikely to create community-based
systems and are more likely to separate their assets (Phase 2: Standard Interview, Tea Factory
Manager).
Figure 11: Small and Decreasing Tea Farm Sizes
Source: Towards a sustainable future for smallholder tea farmers and workers (Waarts, 2017)

DeBree 36
Figure 12: Farm Plot Size in Kenya and Other Tea Producing Countries
Source: Towards a sustainable future for smallholder tea farmers and workers (Waarts, 2017)
2.a.ii.3 Climate Change • Climate Change has already been a concern for tea production and productivity in Kenya, as 20-30%
of Kenyan tea crop was lost to drought in 2016 (Phase 2: Conference Notes, Team Up Africa).
• Using models, researchers have shown that the viable land for tea growing is projected to shrink
dramatically due to changes in climate in 25 -50 years (Phase 2: Conference Notes, EATTA).
• Climate mitigation needs to be focused on not just preventing tea quantities from falling, but also tea
quality from falling (Phase 2: Conference Notes, EATTA, Collaborative Org Rep).
• Drought resistant strains of tea bushes are created through selecting for bushes that survive or
maintain high yields throughout drought periods. Using selective breeding of tea bushes, drought
resistant seedlings are created and distributed throughout the KTDA, and KTGA. One tea grower
predicted that eventually, GMOs may be used to produce drought-resistant tea bushes (Phase 2:
Casual Interview, (2) Tea Grower).
• The current Kenyan climate naturally prevents pests and weeds, so there is practically no use of
pesticides or herbicides in the Kenyan tea industry. The high altitude and slightly colder climate
prevent pest. In addition, the horizontal growth of tea bushes creates a canopy of interlocking
branches and shade that deters the growth of weeds (Phase 2: Standard Interview, Tea Grower, Tea
Factory Manager; Curated Observation, Tea Grower, Tea Factory Manager).
2.a.iii Productivity and Sustainability
• Productivity was framed as a sustainability measure by varying stakeholders at the Team Up
Africa and EATTA Conferences (Phase 2: Conference Notes, Team Up Africa, EATTA).

DeBree 37
• Increasing productivity cannot be framed solely as a positive sustainability metric, because if
demand does not increase as well, then increasing yield will drive down the already low price of
tea (Phase 2: Casual Interview, Tea Company Rep, Collaborative Org Rep).
• Farmers in agriculture continue to fall into the trap of believing that in order to make more money
they should produce more, but that is not always the case. It is better to focus on increasing quality
instead of increasing quantity (Phase 2: Standard Interview, Certification Org Rep).
2.b Insufficient Value of Tea 2.b.i Evidence
• The biggest challenge in the tea industry is the lack of value of tea overall (Phase 2: Standard
Interview, Tea Factory Manager, Tea Company Rep, Certification Org Rep, Collaborative Org Rep). • If the tea industry provided a “living wage” for everyone that needed it, the industry would go out of
business. The number of people who want to rely on tea for income and standard of life is greater
than the market demand for tea can support (Phase 2: Conference Notes, EATTA, Collaborative Org
Rep).
2.b.ii Drivers
• Figure 13 provides a visual representation of the production, consumption and trade flows of
Kenyan tea. The graph shows that the Kenyan tea industry is characterized by high production
and export, and low import and domestic consumption. The data included is from the FAO
database (Phase 1: Web-based research, (Food and Agricultural Organization of the United
Nations, 2017)).
Figure 13: Overview of Kenya’s Tea Industry (2005 – 2014) - Production, Consumption, and Trade
Source: Food and Agriculture Organization (2017)

DeBree 38
2.b.ii.1 Shifting International Demand
• Most consumers do not prioritize sustainability. The key factors in their tea buying decision are price
and quality (Phase 1: Preliminary Interview, Tea Company Rep).
• Fluctuations in annual production volumes have mainly been due to drought and political turmoil in
importing countries (Phase 2: Conference Notes, EATTA)
• Standard black tea consumption is dropping in the UK, but premium black tea consumption is rising
(Phase 2: Conference Notes, EATTA, Tea Company Rep).
• The number of beverage options is increasing, and there is a “fight for the mouth.” Humans can only
consume one beverage at a time and will consume a limited number of beverages throughout the day
(Phase 2: Casual Interview, Tea Company Rep).
2.b.ii.2 Lack of Domestic Market
• There is a lack of domestic market in Kenya. Tea processing results in varying “grades” of tea,
which fall on a spectrum of quality and value (Image 1). Kenya’s domestic market typically receives
the low-grade and Non-RA certified tea, while the high-grade RA certified tea is exported (Phase 2:
Curated Observation, (3) Tea Factory Management).
Image 1: Tea Grades from a Kenyan Tea Factory
Source: Schuyler DeBree
2.b.iii Consequences • Tea is sitting in warehouses in Mombasa because the supply is high, and the demand is low. This
creates a dynamic where tea farmers and factories have limited or no control over the prices they
receive for their tea, and the prices tend to be volatile (Phase 2: Conference Notes, EATTA; Casual
Interview, Tea Company Rep, Collaborative Org Rep; Standard Interview, Tea Grower, (2) Tea
Factory Manager) • Farmer Field Schools were linked with increasing tea farmer income between 2009 – 2013. However,
between 2013 – 2015 there was no increases in farmer income. The lack of income increase in the later

DeBree 39
years was attributed to fluctuating market prices (Phase 2: Conference Notes, Team Up Africa,
(Waarts, 2017)).
• Stakeholders at the lower end of the tea value chain showed frustration with the small and volatile
income they receive for their tea, including certified tea. Many stakeholders demonstrated a lack of
trust that the value of tea was being fairly distributed (Phase 2: Standard Interview, Tea Grower, (2)
Tea Factory Manager)
• Eventually people may be forced to stop growing tea and grow other agricultural products (Phase 2:
Standard Interview, Certification Org Rep).
2.b.iv Solutions • There is not enough value addition by certifications that customers are willing to pay for. The tea
industry cannot rely on consumers or companies being willing to pay more – it will not happen –
so other solutions must be found (Phase 2: Conference Notes, Team Up Africa).
2.b.iv.1 De-commoditization/ Luxury teas • De-commoditization of tea may be accomplished through collaborative marketing campaigns and by
growing luxury teas such as purple tea, which was developed in Meru, Kenya (Phase 2: Conference
Notes, Team Up Africa, EATTA, (2) Collaborative Organization Rep). • Coffee is a good example of how de-commoditization can be accomplished (Phase 2: Conference
Notes, Team Up Africa, EATTA).
2.b.iv.2 Futures market
• A futures market should be established at the Mombasa Auction to reduce the risks for tea producers
associated with price volatility. A futures market would allow a fixed price to be set for tea before the
auction (Phase 2: Conference Notes, EATTA, Collaborative Org Rep). • A Futures Market could help to stabilize prices, but it would not solve the original problem (Phase 2:
Standard Interview, Certification Org Rep).
2.b.iv.3 Better Distribution of Value through Supply Chain • The value of tea should be better distributed throughout the value chain. There are too many
stakeholders in the value creation process that have limited value addition but take a
disproportionately large part of the profit margins. More money should go to factories and farmers,
or consumers should pay less. The gap between what the factory and farmers are paid for certified
tea does not accurately reflect the value addition of the middle section of the supply chain (Phase 2:
Standard Interview, Tea Factory Manager).
3) The Efforts to Transcend the Capacity of Certification in the Short and Long
Term
3.a Collaboration – on challenges outside of the scope of certification alone • The Ethical Tea Partnership (ETP) is a collaborative organization that helps farmers that are
uncertified to become RA certified or certified under some other standard. In turn, the ETP’s work
ensures that companies can reach their commitments to sourcing certified tea. Their main goal is to
reduce the workload of tea growers in the certification process by reducing paperwork, financial cost,

DeBree 40
and time. One way that they have tried to accomplish this is through consolidating the auditing
process. RA and UTZ have worked to consolidate their audit process, but Fairtrade still has a
separate audit (Phase 1: Preliminary Interview, Tea Company Rep). • Stakeholders in the tea industry are now looking at the next steps past certification. There are
issues that certifications cannot solve, and some issues are very acute (associated with single
estates or farms). There is a transition to working more with partnerships and programs (Phase 2:
Conference Notes, Team Up Africa, EATTA; Casual Interview, (2) Tea Company Rep, Collaborative
Org Rep).
3.a.i Diversification • One of the biggest remaining sustainability issues in Kenya is malnutrition (lack of balanced
nutritious sustenance) (Phase 1: Preliminary Interview, Tea Company Rep). • It is important for smallholder tea farmers to diversify their farms to ensure a sufficient and balanced
source of food. Tea farmers should grow other agricultural crops and raise livestock (Phase 2:
Conference Notes, EATTA; Casual Interview, Tea Company Rep, Collaborative Org Rep) • RA is advantageous in the context of diversification because the RA certification covers the whole
farm, not just the tea. Therefore, farmers could potentially sell other products as RA certified (Phase
2: Conference Notes, EATTA; Standard Interview, Certification Org Rep)
3.a.ii Increase Market Demand • There is potential to engage customers and increase demand for tea with an industry-wide marketing
campaign involving multiple brands (Phase 2: Conference Notes, EATTA, Collaborative Org Rep)
3.a.iii Develop Domestic Market • In one factory, 95% of the tea processed is sold through the Mombasa Auction, and 5% is sold
domestically. The factory manager suggested that the 16% VAT domestic tax needs to be removed on
tea to improve the domestic market (Phase 2: Standard Interview, Tea Factory Manager; Curated
Observation, Tea Factory Manager).
• Kenyan tea consumers tend to buy Lipton tea from the grocery store, instead of domestic Kenyan
brands because it is perceived as higher quality tea, even though a large amount of Lipton tea is
composed of Kenyan black tea (Phase 2: Standard Interview, Tea Factory Manager).
3.a.iv De-commoditization/ Luxury Teas • Many stakeholders recommended de-commoditizing tea to increase overall value. The coffee
industry was commonly cited as an example for how to accomplish de-commoditization (Phase 2:
Conference Notes, Team Up Africa, EATTA; Casual Interview, Tea Company Rep, Collaborative Org
Rep).
• A new tea variety of “purple tea” is being developed in Kenya. Purple tea has numerous health
benefits and could be sold as a luxury tea (Phase 2: Conference Notes, EATTA, Tea Company Rep,
Collaborative Org Rep)
3.a.v Protecting Tea Pluckers/ Workers
• Tea pluckers and workers are not sufficiently protected by certifications, and additional programs are
needed (Phase 2: Conference Notes, Team Up Africa, EATTA)

DeBree 41
• Only tea farmers are trained by Farmer Field Schools, so there needs to be additional programs to
train, educate, involve, and protect pluckers and workers (Phase 2: Conference Notes, Team Up
Africa, Collaborative Org Rep).
3.a.vi Gender Equality • Gender equality and the empowerment and protection of women are still key issues in the Kenyan
tea industry. There are three levels to improving gender equality and creating safe spaces: Level 1 –
have a gender policy: track the number of female employees, and what kind of jobs/ income they
have. Level 2 – Grievances mechanisms: ways for employees to report sensitive issues with
confidence that the reporter will not be punished unfairly. Level 3 – Look at broader gender norms/
perceptions and reduce patriarchal undertones. (Phase 2: Conference Notes, Team Up Africa,
EATTA, Tea Company Rep, (2) Collaborative Org Rep).
• During an interview, a male factory manager said, “if a woman has the courage to tell me about an
incident [of sexual harassment/ abuse], it is absolutely true” (Phase 2: Standard Interview, Tea
Factory Management).
3.a.vii Connections between Estates and Smallholder Producers
• Connections between estates and smallholder producers can increase the share of knowledge and
decrease the yield gap (Phase 2: Conference Notes, Team Up Africa, (Waarts, 2017); Standard
Interview, Tea Factory Manager).
3.a.viii Continuous Improvement of Certification
• Continuous improvement of certification in other industries is driven by a third-party collaborative
organization, but the tea industry does not have an organization that is pushing for continuous
improvement of sustainability standards. Ethical Tea Partnership and Tea2030 are two collaborative
organizations that may be able to step into this role (Phase 2: Standard Interview, Tea Company Rep).
3.a.ix Long-term Systematic Issues • A focus on long-term systematic problems has not been a focus of companies in the tea industry.
Most companies have invested in short-term projects that increase yields, but Tea2030 is the first
stakeholder to start highlighting long-term systematic issues in the industry, such as climate change
and shifting demand. Tea2030 has started to encourage companies and other stakeholders to act on
long-term projects (Phase 2: Standard Interview, Tea Company Rep, Collaborative Org Rep).
3.b Remaining Improvements/ Value Addition for Certifications 3.b.i Cost/Cost sharing/ Direct Financial Benefit for Producers
• Question from EATTA Conference attendee: “We see the benefits [of certification], but the costs are
not justified” (Phase 2: Conference Notes, EATTA, Tea Grower).
• There needs to be a better way to share the costs of certification, so it is not 100% on the producer
(Phase 1: Preliminary Interview, Collaborative Org Rep; Phase 2: Standard Interview, Tea Grower,
Tea Factory Manager, Tea Company Rep). • There needs to be research done to increase the value transfer to the farmer, as opposed to being
diluted by middle men (Phase 1: Preliminary Interview, Tea Company Rep). • The costs associated with certification for producers are mainly changes to physical structures,
training employees, and management costs (Phase 2: Standard Interview, Tea Factory Manager). • Auditing costs are always increasing (Phase 2: Standard Interview, Certification Org Rep).

DeBree 42
• From the perspective of tea farmers, auditing costs and auditing logistics are the biggest challenge
to staying certified (Phase 2: Standard Interview, (2) Tea Grower). • The KTDA spends about $1 Million USD annually to certify its smallholders (Phase 2: Standard
Interview, Collaborative Org Rep). • A collaborative organization representative suggested that RA does not want to suggest to Unilever
to share the costs of certification with producers, because they are afraid Unilever will back out of the
commitment to RA completely (Phase 2: Standard Interview, Collaborative Org Rep).
• Fairtrade is struggling as a certification because it interferes with markets. Tea farmers do not choose
to get the Fairtrade certification in Kenya because they think no one will buy their tea at an artificially
higher price. Additionally, Fairtrade fails to incentivize increasing quality of tea, only increasing
quantity, because of their use of premiums (Phase 2: Standard Interview, Certification Org Rep,
Collaborative Org Rep).
3.b.ii Multiplicity • In preliminary interviews, lack of standardization was cited as one of the biggest gaps for
improvement in certification schemes. Standardization would have benefits across many
stakeholders in the industry (e.g. tea companies would not have to choose between committing to
certain certifications, consumers would not need to understand multiple certifications to be
consciences consumers, producers would not have to choose between, understand, or pay for
multiple certifications). However, in preliminary interviews, it was also made clear that creating one
sustainable standard for tea is “not in the foreseeable future” (Phase 1: Preliminary Interview, Tea
Company Rep, Collaborative Org Rep). • Question from EATTA Conference attendee: consolidation would make it easier on growers and
bring down cost of production. Is consolidation possible, or a priority? (Phase 2: Conference Notes,
EATTA, Tea Grower).
• Consolidation of standards and certifications was supported by factory managers, because it would
reduce a variety of challenges associated with certification (Phase 2: Standard Interview, (2) Tea
Factory Manager).
• RA and UTZ merged their auditing process, so the audit for both certifications could be done at the
same time. However, farmers and factories still pay for both audits separately (the auditing process is
half the time but still just as expensive) (Phase 1: Preliminary Interview, Collaborative Org Rep). • In response to questions about multiplicity, certification and collaborative organization
representatives highlighted the number of jobs that would be lost if certifications were to be
consolidated (Phase 2: Standard Interview, (2) Certification Org Rep, Collaborative Org Rep).
• (Phase 3: Post On-the-ground Research):
RA and UTZ announced a merger in June 2017: At the time of the merger, 182,000 cocoa, coffee and tea
farmers were certified under both UTZ and RA globally: “The 182,000 cocoa, coffee and tea farmers who
are currently certified under both standards will see savings by avoiding the double administrative load
of implementing two standards, and only need one audit instead of two, meaning they can invest more
efficiently in sustainability” (Phase 3: Post On-the-ground Research, (Rainforest Alliance, 2017)).
3.b.iii Communication • Tea customers have no idea what the Rainforest Alliance certification means (Phase 1: Preliminary
Interview, Tea Company Rep). • There are multiple examples of how the expectations for certified tea farms and factories are different
for consumers, the media, tea companies, and tea workers and growers. The complexities and

DeBree 43
differences in perceived and desired impacts of certification are not communicated throughout the
tea supply chain (Phase 1: Preliminary Interview, Tea Company Rep).
3.b.iv Transparency
• Sainsbury, a major retailor in the UK, recently terminated their agreement to source Fairtrade. One of
the driving forces behind that decision was that the company could not see what the farmers were
doing with the Fairtrade premium, or see what the Fairtrade levy money was going to within the
Fairtrade organization (Phase 2: Standard Interview, Tea Company Rep).
3.b.v Technology • The UTZ certification has developed methods of GIS data collection and analysis that has increased
the value addition of the certification (Phase 2: Casual Interview, Tea Company Rep). • Data capture is one way that certifications could remain relevant (Phase 2: Standard Interview, Tea
Company Rep, Certification Org Rep).
3.b.vi Trust
• There is decreasing trust in business – 72% of people globally say business is failing to take care of the
world and society as a whole (Phase 2: Conference Notes, EATTA, Certification Org Rep).
3.b.vii Measuring Effectiveness of Certifications • Measuring impacts of the certification programs is the “first thing that gets cut” from the budgets
of certification bodies (Phase 2: Standard Interview, Certification Org Rep).
3.b.viii Continual Improvement of Certification • A third-party collaborative organization is needed to push all certifications and companies to
continually improve their sustainability metrics and practices (Phase 2: Standard Interview, Tea
Company Rep). • RA is in the process of developing different levels of certification, which may create premiums
again (Phase 2: Standard Interview, Certification Org Rep).
3.c Long-Term Trends 3.c.i Assurance instead of marketing • Sustainability is not just about pleasing customers, it’s about ensuring that tea is still produced in 10,
20, 50 years (Phase 1: Preliminary Interview, Tea Company Rep). • “People care about the SAN standard, not the green frog” – in other words, consumers care that the
sustainable standard is met, but they do not always care about seeing the RA certification badge on
tea packaging (Phase 2: Casual Interview, Tea Company Rep).
• European consumers expect companies to be responsible. Therefore, UK companies care more about
preventing scandal than actively advertising responsibility. Responsibility is already assumed and
expected, so certifications serve as third-party assurance, but the value addition of green
marketing is less valuable (Phase 2: Casual Interview, Tea Company Rep).
• In Kenya only 10% of RA certified tea is sold with the RA logo (Phase 2: Standard Interview,
Certification Org Rep).
3.c.ii Other models for sustainable tea
3.c.ii.1 Company-specific standards

DeBree 44
• Two separate tea company representatives discussed their respective company-specific standards.
Companies accept tea sourced from a variety of certifications, as long as they align with the
companies’ own standards. This practice allows the company to have more flexibility to source
certified tea from a variety of different certifications as long as they are aligned, but also makes
labeling products as being compliant with a specific certification more difficult. Representatives
also claimed that this practice reduces pressure on tea producers to have multiple or specific
certifications because most are accepted as long as they are aligned with the company standards
(Phase 1: Preliminary Interview, (2) Tea Company Rep). • The organic certification alone is not accepted under one company-specific standard, because it does
not cover the social sustainability metrics included in the company standard (Phase 1: Preliminary
Interview, Tea Company Rep). • Twinnings (Yorkshire) is the benchmark for quality in Europe, and they just dropped their RA
commitment (Phase 2: Casual Interview, (2) Tea Company Rep).
• Company-specific standards will incorporate existing standards. For example, one company-specific
standard program is planning to have their suppliers do an extended survey. If the producer already
has a certification(s), then certain questions will immediately be filled out, which cover the metrics of
the certification. However, additional questions may be asked in the survey that are more relevant
and valuable to the company to assist in data collection (Phase 2: Standard Interview, Tea Company
Rep).
3.c.ii.2 Direct sourcing • Technology can be a tool to move towards transparent and/ or direct sourcing by increasing
knowledge and accessibility for famers, increasing visibility and analytics in supply chain, improving
communication, and influencing the market (Phase 2: Conference Notes, EATTA).
• A tea company started a Facebook page where they had a Malawi tea farmer post directly to
humanize the farmer and increase transparency (Phase 1: Preliminary Interview, Tea Company Rep).
3.c.ii.3 Co-ops
• The Rwandan tea industry is an example of successful nationally-branded tea and co-op system of
farming. The Co-op system improved tea production practices and economics, while also having
social and cultural benefits. Tea farmers pool plots of land, build homes centrally, and pluck/ clean/
and process tea as a community (Phase 2: Conference Notes, EATTA; Casual Interview, Tea
Company Rep).
3.c.ii.4 Foundations • Foundations such as the Gatsby Foundation and the Wood Foundation impact sustainability in lower
ends of the value chain through their “fund and implement” models – providing initial capital to
overcome barriers to entry and working with farmers until their business is self-sustaining (Phase 2:
Conference Notes, EATTA).
3.c.iii Learn from Coffee
• The coffee industry is ahead of the tea industry in sustainability on the smallholder scale, but the
tea industry is ahead of the coffee industry in sustainability on the estate scale (Phase 2: Casual
Interview, Tea Company Rep). • Coffee is a good example of how de-commoditization can be accomplished (Phase 2: Conference
Notes, Team Up Africa, EATTA).

DeBree 45
5. Discussion
The information provided in the background and results section relevant to the three key trends:
1) the pervasiveness of Rainforest Alliance 2) the tensions between farm productivity, insufficient value
of tea, and sustainability and 3) the efforts to transcend certification in the short and long term, will be
further connected and discussed in the following sections.
1) The Pervasiveness of Rainforest Alliance
As demonstrated in the background section, the most recent publically available data for certified
Kenyan tea production is from 2012. In the State of Sustainability Initiatives (2014), Kenya was clearly an
outlier with the highest volume and diversity of standard-compliant production globally, with 72.1%
standard-compliant production, and all 4 of the major certifications represented. At this point in 2012,
Rainforest Alliance (RA) represented 40.9% of total Kenyan tea production, and 56% of certified tea
production in Kenya.
Before beginning Phase 2 (On-the-ground-Research), this research was focused on asking about
the effectiveness of certifications, areas of potential improvement, and how the perception of
certifications differed between stakeholders in the tea industry value chain. However, it became clear
within the first few hours of conference notes, that certifications were no longer the focus of sustainable
development in the Kenyan tea industry. Instead, the focus was on creating programs that surpassed the
capacity of certifications. In the casual and standard interviews that followed, it became clear that RA was
now the baseline for sustainability in Kenya. However, the actual quantitative proportion of Kenya’s tea
that was certified under RA was never discussed in Phase 2 of research. It was not until Phase 3 of
research (Post On-the-ground Research), where current data on the volume of RA certified tea was
obtained (current data being as of May 2017).

DeBree 46
Using the provided data of RA certified volumes in 2017, total Kenyan production in 2017 was
projected. The projections for total Kenyan tea production in 2017 (463,241 mt) seems reasonable, because
it is close to values provided for tea production in 2016 (473,000 mt by the KTDA, and 469,000 mt by the
RA). The projection for total Kenyan tea production in 2017 was then used to estimate the current
proportion of RA certified tea production, which was calculated to be 103.7% of total Kenyan tea
production. These values do not make meaningful sense in the context of the data, because more than
100% of tea production cannot be certified RA. This error may be due to the fact that the values given by
RA are estimates of “approved volumes” of tea calculated by auditors, not observed RA-certified
production. There also could be double counting of RA certified tea, because both certified farms and
factories were included in the RA data. Other potential errors within this projection is that volumes from
farm and factory organizations could have been improperly coded as either KTDA or KTGA. Despite the
apparent lack of precision in the projection, the projection does still demonstrate that close to 100% of
KTGA tea production and total Kenyan tea production is likely RA certified. This was later confirmed by
a Rainforest Alliance repetitive who estimated that RA certified about 99% of current Kenyan tea
production. Even if this estimate “is a little high,” as suggested by the representative, this dramatic
quantitative increase in RA certified tea in Kenya is not sufficiently documented or analyzed.
The research for this thesis had been ongoing for about a year and a half, and it wasn’t until that
moment, that the quantitative scale of the pervasiveness of RA became clear. The difference between
understanding RA as a ‘baseline’ for sustainability and knowing that RA certifies 99% of production is
massive. Whether or not this quantitative value is known throughout the Kenyan tea industry, and
elsewhere, is unknown. There is a possibility that all of the stakeholders interviewed knew the
quantitative scale of RA certification, but it did not occur to them to mention because it has become such
a paradigm. However, there is also a chance that stakeholders in the Kenyan tea industry, and in the

DeBree 47
global tea industry, have no idea just how pervasive the RA certification has become in Kenya in terms of
a quantifiable and tangible number.
The implications for the pervasiveness of RA are that the certification no longer provides
differentiation for the tea sold as RA, and therefore farmers and factories are reporting that a higher price
is not realized for the certified tea. This is particularly frustrating for farmers and factories because they
bare 100% of the costs of certification – which can amount to thousands of dollars a year, depending on
the size of the operation. In addition, due to market demand, it is very difficult for Kenyan tea farmers
and factories to sell their tea unless it is certified by RA. Many stakeholders suggested that it is impossible
to sell Non-RA tea for export within the Kenyan market.
There was only 1 example of a factory manager interviewed that reported realizing a higher price
for certified tea. However, that factory also had an International Standard Organization (ISO) certification
on top of the RA certification which may have been driving differentiation and higher prices. One of the
tea growers who sold their RA certified tea to the factory with the ISO and RA certification said that the
factory paid a higher price for their RA tea. This same grower sold their tea to other factories in the
region, and those factories did not pay a higher price for RA tea. This example, along with other data
from casual and standard interviews, shows that an implication for the pervasiveness of RA is the lack of
differentiation in the Kenyan tea market.
The certainty and exact quantitative economic impacts of the trend of lack of differentiation
cannot be concluded from the data in this research. More research needs to be done to evaluate how the
pervasiveness of RA impacts the prices paid to factories and farmers for RA certified tea. All factories
included in this case study, except for the KTDA factory, processed both RA and Non-RA tea. Data of the
prices received for the RA and Non-RA tea from the same factory should be evaluated and compared. As
RA and Non-RA tea comes from the same factory, it could be assumed that any difference in price paid
for the tea is relevant to the certification. If the Kenyan tea factories and farmers are not receiving a higher

DeBree 48
price for RA certified tea while expected to bare 100% of the cost of certification, then the financial
sustainability of the certification process is questionable. This is especially true in the context that Kenyan
tea producers reported that market demand was the primary driver for getting certified, and they feel
that they must be RA certified to sell their tea. Cost-sharing of certifications, or ways to generate higher
prices for certified tea, need to be developed to help distribute or validate the cost of certification.
It is possible that that RA certification is truly resulting in higher prices paid to factories and
farms, but the higher prices are not perceived because there are no Non-RA tea prices in the export
market to compare with. This is likely true, because in curated observation and standard interviews with
factory managers, they discussed the tedious nature of processing both RA and Non-RA tea. If the
batches become mixed up, all the tea becomes Non-RA, and thereby less valuable. Other data, which
suggests that lower quality Non-RA tea is used in the domestic market, also supports this trend.
Therefore, a more appropriate way to phrase the impact of the pervasiveness of RA, is that it results in a
lack of differentiation (financial and otherwise) in the foreign export market. Meaning, the RA certified
Kenyan tea is truly more valuable than Non-RA Kenyan tea, which can be seen in the comparison
between tea sold for export and tea sold within the domestic market. However, this financial
differentiation is not perceived by growers and factory managers. Additional research on the financial
implications of certification for Kenyan tea farmers and factories must be done (through comparing RA
certified tea, Non-RA tea, additional certifications (ISO), and tea sold in the foreign and domestic
markets) to demonstrate that the RA certification is truly creating value. Results should be communicated
to stakeholders to increase a sense of fairness and transparency in value distribution.
Although farmers and factories recognized the positive environmental and social changes
instigated by certification, receiving a direct financial benefit for certification is still a huge priority. Cost/
cost sharing/ direct financial benefit from certification for producers is a major area of improvement for
certifications, and specifically in Kenya because RA is ubiquitous. The pervasiveness of Rainforest

DeBree 49
Alliance needs to be quantitatively understood throughout the Kenyan tea industry, along with the
potential negative consequences of that pervasiveness. Other areas in which certifications can be
improved will be evaluated further in the third discussion section: moving past certifications in the short
and long term.
2) The Tensions between Farm Productivity, Insufficient Value of Tea, and
Sustainability
Representatives from each of the subgroups included in this case study attribute the
sustainability issues in the tea industry to a core problem: a lack of value for tea. The price paid by a
consumer for tea is relatively low and is not enough to distribute sufficient value throughout the entire
supply chain. Quantifying how the value of certified and non-certified tea is distributed throughout the
supply chain is necessary to improve the transparency and economic sustainability of the tea industry as
a whole.
The consequences of insufficient value are felt in different ways through the supply chain. At the
Mombasa auction, the demand for Kenyan tea is relatively low compared to supply, so tea is sitting in
warehouses waiting to be sold. As a result, Kenyan tea producers have minimal control over the price at
which they sell their tea. Prices tend to be highly volatile, and at times, producers must accept unfairly
low prices. The trends of low prices and limited price control and stability in the export market is
especially problematic because of the large influence that the export market has on the entire Kenyan tea
industry.
Foreign market demand, beginning with British colonization and influence, has a long history of
dictating the trends of the Kenyan tea industry. Both historically, and in modern times, The Kenyan tea
industry is characterized by high production and high export, and low consumption and low import

DeBree 50
(Figure 13). The context of extraordinary export volumes (which make Kenya the largest tea exporter in
the world) is important for understanding the impact of foreign tea markets on Kenyan tea value and
sustainability. The dependence of the Kenyan tea industry on foreign markets, and specifically on the
British market where consumers tend to be more expectant of corporate responsibility, undoubtedly
played a role in the rapid and omnipresent scaling of the RA certification.
Potential strategies to mitigate the insufficient value of tea include: increasing the value of tea,
better-distributing the value of tea between supply chain members, and/or creating mechanisms to reduce
price volatility. Collaborative organization representatives and tea company representatives proposed
increasing the value of tea through ‘de-commoditization,’ similar to what the coffee industry has done. This
could be accomplished through marketing campaigns to frame tea as more of a ‘luxury’ product. Kenyan
tea growers and tea researchers associated with the KTDA recommend producing more ‘specialty teas’
such as a new variety of purple tea that was developed in Meru, Kenya. Another solution for price volatility
and uncertainty suggested by collaborative organizations was a futures market for tea. The solution of
creating a futures market, which may serve to further commoditize tea, may create tension with de-
commoditization efforts.
To combat financial uncertainty, tea growers and tea factory management tend to focus on
increasing green leaf production and yields. Stakeholders at the Team Up Africa and EATTA Conferences
(e.g. collaborative organization, tea company, and certification organization representatives) framed
increasing productivity as a sustainability achievement, and frequently discussed the need to mitigate
potential risks or barriers to increasing productivity. The primary problems in Kenya tied to low and/ or
declining tea farm productivity are old tea bushes, decreasing farm size, and climate change.
The cyclical decline of production and income due to aging tea bushes can be avoided by increasing
tea grower awareness and reducing the up-front costs of replacing old bushes. Decreasing farm size is a
risk to productivity because smaller tea farms tend to have lower productivity (Figures 9, 11, 12). The trend

DeBree 51
of decreasing farm size is tied to Kenya’s increasing population, increasing number of farmers, and
tendency for farmers to separate assets as opposed to utilizing types of community-based farming
arrangements. This issue should be informed by other successful models for sustainable tea farming, such
as the Co-op system developed in Rwanda.
When discussing the risk of climate change to productivity, representatives from collaborative
organizations emphasized that climate change adaption and mitigation must be focused on maintaining
tea quantities and tea quality. Already, drought resistant strains are genetically selected for, and distributed
throughout the Kenyan tea industry. In a casual interview, a tea grower and conference attendee predicted
that genetically modified tea bushes may eventually be used due to intense climate change. However,
certifications currently do not allow for the use of genetically modified organisms. Additionally, no
pesticides or herbicides are used on Kenyan tea farms because the climate naturally prevents pests and
weeds. Therefore, climate change may have implications for the use of chemical inputs in the Kenyan tea
industry, which would impact costs for farmers, chemical pollution, and certification standards for
chemical use. More research should be done to understand how changing climate in Kenya may impact tea
quantity, quality, the use of genetically modified tea bushes, and pesticide and herbicide use.
Despite the risks to productivity, many stakeholders stated that farm productivity was increasing
in Kenya. However, the trend of increasing productivity was never supported by quantitative data. In
Phase 3 (Post On-the-ground Research) a trend of historic productivity was calculated but it did not align
with the claims of increasing productivity. When evaluating data from the KTDA, EATTA, and FAO, the
data values agreed (Table 5), but showed a fluctuating trend of productivity that was neither increasing
nor decreasing (Figure 10). When stakeholders from the KTDA, EATTA, and RA were asked why the
claims of increasing productivity were not reflected in data during post on-the-ground research, no
sufficient answer was provided. More research needs to be done to confirm or refute the claims of
increasing productivity of tea production in Kenya.

DeBree 52
Most importantly, increasing productivity should not be framed as a sustainability metric without
addressing the complexities of market demand and the overall value of tea. Increasing productivity was
frequently framed as a sustainability goal by stakeholders who presented at the Team Up Africa and
EATTA Conferences. This was met by frustration from tea company and collaborative organization
representatives in casual and standard interviews. Stakeholders highlighted that although increasing
productivity is more sustainable in some ways (e.g. reducing inputs), it drives down the price of tea when
demand does not also increase. In Kenya, the supply of tea is already high, and the demand is relatively
low. Trends of increasing tea production are demonstrated in KTDA, EATTA, and FAO data (Table 5), but
demand is decreasing in Britain, and shifting in other locations. Trends of increasing number of tea farmers,
area harvested, and total tea production (Figures 5, 6, 7), mirrored by stagnant, shifting, or decreasing
demand will further deteriorate already low tea prices, along with the limited price stability and control
for producers. If farm productivity also increases significantly, tea price, volatility, and control will likely
continue to decline. It is therefore problematic to frame increasing productivity solely as a sustainability
metric. The complexity of sustainability implications regarding productivity should be better
communicated throughout the tea value chain. Stakeholders including representatives from tea companies,
certification organizations, and collaborative organizations agree that increasing the quality of tea is better
than increasing the quantity of tea in terms of sustainability.
3) The Efforts to Transcend Certification in the Short and Long Term
In the short term, Rainforest Alliance is considered the baseline for sustainability in the Kenyan
tea industry. This is largely due to the scale of RA implementation in Kenya, identified in the first trend:
the pervasiveness of RA. During the conference notes portion of on-the-ground research, the only
stakeholders who discussed certification, were tea growers. On the other hand, representatives from tea

DeBree 53
companies, collaborative organizations, and certification bodies, had moved onto the question of “what’s
next?” Attention was not given to how certifications could improve, but instead on creating programs
that surpass the capacity of certification.
For example, programs championed during the Team Up Africa and EATTA conferences focused
on improving gender equality, improving food security through diversification, and protecting tea
pluckers and tea workers at the bottom of the supply chain. Although yes, these are areas where
collaboration is necessary, there are areas of remaining improvement within the certification schemes.
Efforts in the short-term to transcend certifications may take responsibility away from certifications to
continually improve and evaluate if they can impact areas that initially seem out of their reach.
In the short-term, there are areas where collaborative programs, in addition to certification, are
needed. For example, certifications can ensure that tea farms and factories have a grievance reporting
system for sexual harassment or assault, but it is hard for certifications to measure whether incidents are
actually reported, and if the workplace feels like a safe space for women. Programs to support victims of
sexual harassment and assault, empower women, and shift the patriarchal culture in Kenya are
necessary, and outside of the scope of certification alone. Similarly, certifications cannot force tea farmers
to grow other agricultural products, raise cattle or poultry, or farm other sources of sustenance that can
improve food security. Therefore, collaborative efforts that transcend certification are needed in
diversification efforts. Other areas that likely require collaborative programs include financing the
replacement of old tea bushes, preventing unnecessary shrinkage of tea farms, climate change adaption
and mitigation, forming connections between estate and smallholder producers, and enforcing the
continual improvement of sustainability metrics and practices.
As stakeholders start to look past certifications in the short-term to other solutions for
sustainability challenges, it is important to bring attention back to the areas where certifications can still
be improved. Remaining areas of improvement for certifications in Kenya include cost/ cost sharing/

DeBree 54
direct financial benefit for producers, multiplicity, communication, transparency, technology, trust,
measuring effectiveness, and continual improvement.
The importance of reducing the cost of certification, creating cost-sharing methods, and ensuring
a direct financial benefit for producers was examined within the first and second trends in the discussion.
Certification cost reductions could come from consolidation of standards, and specifically consolidation
of the auditing process. Tea farmers interviewed in this case study identified the costs and logistics of
audits as the primary barrier to initial certification, and to staying certified. RA and UTZ had initially
consolidated their auditing process, and as of June 2017, they announced that their entire organizations
would be consolidated. Cost-sharing strategies need to be developed to distribute the cost of certification
between multiple stakeholders, as opposed to falling completely on producers. As discussed earlier, it is
especially essential if tea producers feel as though they are forced into certification due to market
demand, but do not receive direct financial benefit from the certification. One way to potentially
encourage cost-sharing, is to include valuable data for other stakeholders in the audit processes. For
example, tea companies may be more willing to split the costs of certification if they are receiving
valuable data in the auditing process.
Ensuring a direct financial benefit for producers through certification is a priority for tea growers
and tea factory management, but a complex issue for certification bodies and tea companies. When
Unilever was initially scaling the RA certification in Kenya, they paid a direct premium for RA certified
tea to encourage adoption. However, once the RA certification gained sufficient momentum, Unilever
stopped paying a premium for RA certified tea. RA claims to increase profits for tea producers by
enforcing good agricultural practices, which in turn increase quality of tea, and increases income.
However, as demonstrated in this case study, the increase in income claimed by RA is questionable.
Fairtrade on the other hand is an organization that consistently enforces a premium. In 2012,
Fairtrade had a significant presence in Kenya (representing 23.1% of Kenya’s certified tea production).

DeBree 55
That presence has dwindled largely because stakeholders felt as though the premium interfered too much
with markets, making Fairtrade tea artificially expensive, and too hard to sell. As discussed by a
collaborative organization representative at the EATTA conference, Fairtrade’s intention to pay a living
wage is good, but it is complicated and hard to accomplish in a financially feasible manner. If the tea
industry provided prosperity in a financial sense to everyone who depended on the industry, the
industry would not be financially sustainable.
Multiplicity of certifications is a complex issue that requires more research. Some stakeholders
claimed that the RA, UTZ, Fairtrade, and Organic certifications are similar while others highlighted
insurmountable differences between them. Generally, the goals and metrics of the certifications are
similar, but the language may vary. The certifications do vary in their strategy of enforcing and
implementing sustainable practices. The alignment of goals and metrics presents an opportunity to
consolidate the auditing process – which has been done with UTZ and RA even before the organizations
decided to merge in 2017. It would take substantial effort and compromise to merge the strategies of RA/
UTZ with that of Fairtrade, Organic, and other certifications or standards. Most representatives from tea
companies, collaborative organizations, and certification bodies seemed to think that consolidation of
certifications is unlikely, or very far away.
Another relevant question is whether consolidation of certifications is truly a positive
development in the tea industry. Although consolidating the auditing process would certainly save tea
farmers and factory management costs, time, and resources, it is unclear whether further consolidation of
entire organizations and standards would continue to reduce costs and other inputs. Consolidation may
reduce confusion for tea farmers, and for consumers who are trying to understand the differences
between certification. However, further consolidation may also reduce agency and flexibility. Different
certifications may suit certain industries, geographies, and communities better than others. Consolidation
of certifications would also likely result in loss of jobs within certification organizations. The complexities

DeBree 56
of certification multiplicity, and the potential for consolidation, needs to be researched further. Research
should focus on the degree to which multiplicity increases confusion and costs, and how consolidation of
certifications and standards may decrease confusion and costs, but limit agency and innovation. There
should be additional research on the feasibility of consolidation, and a long-term plan for consolidation
should be formed if it is determined to be feasible and valuable.
Certifications also need to improve their communication, transparency, use of technology, and
creation of trust. Better communication and transparency are needed to align the expectations for
certification outcomes between stakeholders (producers, tea companies, consumers, etc.). Especially in
primary interviews within this research, it was clear that the desired outcomes from certification varied
greatly across the value chain. Technology can help facilitate better communication and transparency and
add new value for certification organizations. Building trust between tea industry stakeholders is also
important, and can be improved through better communication, transparency, and use of technology.
Also, there needs to be a greater focus on measuring the effectiveness of certifications. It is problematic
that measuring effectiveness is one of the first things that is cut from the budget of certification bodies.
Especially for a certification that has reached such a large scale of implementation (an estimated 99% of
Kenyan tea production for RA), there should be data proving its effectiveness and positive impact.
A final area of potential improvement for certifications is developing strategies to enforce
continual improvement of sustainability on tea farms and factories. RA is developing new levels to their
certification, which may serve to promote continuous improvement, and also create differentiation and
direct financial benefits for producers. In other industries, a third-party organization has typically driven
continuous improvement of certifications. Tea2030 and the Ethical Tea Partnership have started to
encourage tea industry stakeholders to consider long-term challenges, so either (or both) organization(s)
may step into the role of driving certification improvement.

DeBree 57
If organizations continue to evaluate ways to improve certifications, advances will increase
sustainability in the short-term and ensure that certifications stay relevant in the long-term. If
certifications do not continue to add value, they may become obsolete. Efforts to transcend certifications
in the long term include third-party assurance, direct sourcing, co-ops, and company-specific standards.
These trends may compliment and work with certifications or replace the need for certification
depending on how the industry develops.
From the perspective of many tea company representatives, third-party assurance is already the
primary role of certifications. The difference between total RA certified tea, and tea sold with RA labeling
is significant. This means that companies value the RA certification for providing assurance of
environmental, economic, and social sustainability in the tea growing process, but do not see as much
value in advertising the tea as RA certified. As consumer and company demand shifts away from valuing
certification as a marketing tool to an assurance tool, certifications must adapt. Direct sourcing will likely
be preferred by consumers and will become increasingly possible as technology advances. Co-op tea
production systems have been successful in other tea growing countries and may be a solution for the
decreasing farm sizes in Kenya, along with other sustainability challenges.
Another major long-term trend is that companies are shifting away from making commitments to
a single certification. Instead, company-specific standards have been developed that usually encompass
many of the same metrics within certifications, along with a few others. These company-specific
standards usually accept a variety of certifications and create flexibility for farmers by not forcing them to
use a specific certification. However, it also makes labeling tea packaging with a specific certification seal
difficult for those companies. This could become problematic for certifications who depend on labeled-tea
for profitability.
As the tea industry continues to focus on improving sustainability, stakeholders can learn from
what the coffee industry has accomplished. The tea industry would benefit from a larger body of research

DeBree 58
on sustainability challenges, sustainability mechanisms, and the effectiveness of sustainability programs
including certifications. The tea industry can also learn from what the coffee industry has achieved in
terms of de-commoditization, and the dramatic improvements to environmental, economic, and social
sustainability within the smallholder coffee sector in varying regions.
Limitations
The primary limitation of this research is the small number of representatives from each
stakeholder subgroup that were interviewed. The limited time allotted for on-the-ground research was a
restrictive factor in obtaining more interviews. Having more interviews from each subgroup may have
highlighted more contention or agreement between trends. One of the gaps in research identified in the
introduction is the lack of representation for the perspectives of members lower in the tea value chain.
Although this research includes data from tea farmers and tea factory managers, data on the lowest
members of the value chain, such as tea pluckers and tea factory workers, is not included. Such data was
difficult to obtain due to time constraints, and the difficulty in contacting and arranging interviews or
other data collection methods with such individuals.
The data used in the background and results section from the FAO is reported from individual
countries and may not be completely reliable. Data collection methods for the EATTA and KTDA are
unknown. It is also important to note that although this research is intended to provide information on
Kenya’s sustainable tea industry to be a model for other tea industries, the structure of Kenya’s industry
is very unique. The organization of smallholder growers into the KTDA was one of the primary reasons
behind the rapid increase in RA implementation and will be hard to replicate for other countries with less
structured smallholder production.

DeBree 59
6. Conclusion
As of 2012, Kenya was an outlier in standard-compliant tea production. There is limited
documentation on the dramatic adoption of the RA certification in the years since, that have solidified
Kenya as even more of an outlier in certified tea. More research on Kenya’s tea industry is necessary,
because fully understanding the impacts of the changing landscape of certifications is vital before framing
Kenya as a model for sustainable tea for other tea industries.
This research highlights trends relating to the certification schemes in the current Kenyan tea
industry that have been previously undocumented or unevaluated in literature. Identifying and evaluating
these trends is especially important in the context of the scale and influence of the Kenyan tea industry,
and the influence of tea as consumer good as a whole. This research will provide a foundation for future
research on the effectiveness of certifications in Kenya, and on sustainability programs generally. This
research, and future research, are essential to ensure that certifications are improving the wellbeing of the
economy, society, and environment in which they are implemented.
Future recommendations by trend are as follows:
1. The pervasiveness of Rainforest Alliance – Future research should compare prices of RA and Non-
RA tea coming from the same Kenyan tea factories to obtain quantitative data on whether a higher
price is being realized for RA certification. Findings should be shared with certified tea producers
to improve transparency and a sense of fairness. Additional research on the implications of the
omnipresence of RA in Kenya is necessary, and the quantitative scale of RA (an estimated 99% of
total Kenyan production) must be better communicated and documented in literature.
2. The tensions between farm productivity, insufficient value of tea, and sustainability – The trend of
farm productivity in Kenya should be quantified and confirmed. Stakeholders in the Kenyan tea
industry must acknowledge that increasing yield is unsustainable if demand does not increase as

DeBree 60
well. Sustainable efforts should focus on increasing tea quality, not just tea quantity. Tea industry
stakeholders should work to increase overall value of tea, better distribute the value of tea, and
capitalize on new market opportunities (mainly the domestic Kenyan market).
3. The efforts to transcend certification in the short and long term -– More research is needed on the
effectiveness of sustainable certifications in the tea industry, to analyze areas for continued
improvement (cost/ cost sharing/ direct financial benefit for producers, multiplicity,
communication, transparency, technology, trust, measuring effectiveness, and continual
improvement). Although sustainability challenges outside of the scope of certification should be
identified and solved through collaboration (value of tea, gender equality, old tea bushes, climate
change adaption and mitigation, connections between estate and smallholder producers, continual
improvement etc.), responsibility cannot be completely removed from certification bodies.
Certifications also need to get creative in terms of adding value to the tea industry, because they
may become obsolete in the long term. Other corporate responsibility mechanisms and sustainable
tea systems, including direct sourcing, co-op systems, and company-specific standards, should be
investigated because third-party certification may not be the long-term solution for tea industry
sustainability.
Acknowledgements: Thank you to everyone who has made this research possible. Primarily, thank you to Dr. Jay Golden, my
advisor and advocate for research-based adventure and development. Thank you to Dr. Charlotte Clark,
Dr. Chantal Reid, and the numerous other Duke staff who helped me with travel and research logistics.
Thank you to my family (especially my parents, brother, and grandparents), my coaches, teammates, and
all the other people in my life who supported me throughout this journey. Most importantly, thank you to
the numerous stakeholders in the tea industry who kindly gave their time and assistance. I hope this
research is valuable to you in some way. I hope it may start to repay the value you gave me through your
willingness to help me learn and grow.

DeBree 61
Appendix
Exhibit A: Outline of Trends
1. The Pervasiveness of Rainforest Alliance
a. Evidence
b. Market Demands Rainforest Alliance
c. Lack of Differentiation/ Lack of Direct Financial Benefit of Certification
2. The Tensions between Farm Productivity, Insufficient Value of Tea, and Sustainability
a. Productivity
i. Evidence
ii. Risks to Productivity Increases
1. Old Tea Bushes
2. Decreasing Farm Size
3. Climate Change
iii. Productivity and Sustainability
b. Insufficient Value of Tea
i. Evidence
ii. Drivers
1. Shifting International Markets
2. Lack of Domestic Market
iii. Consequences
iv. Solutions
1. De-commoditization/ Luxury Teas
2. Futures market
3. Better Distribution of Value through Supply Chain
3. The Efforts to Transcend Certification in the Short and Long term
a. Collaboration – on challenges outside of the scope of certification alone
i. Diversification
ii. Increase Market Demand
iii. Develop Domestic Market
iv. De-commoditization/ Luxury teas
v. Protecting Tea Pluckers/ Workers
vi. Gender Equality
vii. Connections between Estates and Smallholder Producers
viii. Continuous Improvement of Certification
ix. Long-term Systematic Issues
b. Remaining Improvements/ Value Addition for Certifications
i. Cost/Cost sharing/ Direct Financial Benefit for Producers
ii. Multiplicity
iii. Communication
iv. Transparency
v. Technology
vi. Trust
vii. Measuring Effectiveness of Certifications

DeBree 62
viii. Continual Improvement of Certification
c. Long-Term Trends
i. Assurance instead of marketing
ii. Other models for sustainable tea
1. Company-specific Standards
2. Direct Sourcing
3. Co-ops
4. Foundations
iii. Learn from Coffee

DeBree 63
Exhibit B: Description of Stakeholders
Stakeholder Subgroup Abbreviation Description
Tea Farmer -- An individual who owns or is responsible for managing a
tea farm. Someone who is very familiar with the practices
of tea farming and the logistics of the specific tea farm that
they are involved with.
Tea Factory Manager -- An individual who is responsible for managing a tea
factory. Someone who is very familiar with the practices
of tea processing and the logistics of the specific factory
that they are involved with.
Tea Company
Representative
Tea Company
Rep
An individual who works for a company involved in the
tea business, either as a buyer of tea, tea brand, or tea
retailor.
Certification Organization
Representative
Certification
Org Rep
An individual who works for a certification body in the
tea industry (Rainforest Alliance, Fairtrade, UTZ, or
Organic).
Collaborative
Organization
Representative
Collaborative
Org Rep
An individual who works for an organization that is
involved in facilitating collaboration in the tea industry
(Ethical Tea Partnership, Forum for the Future - Tea2030,
The Sustainable Trade Initiative, other research
organizations etc.)
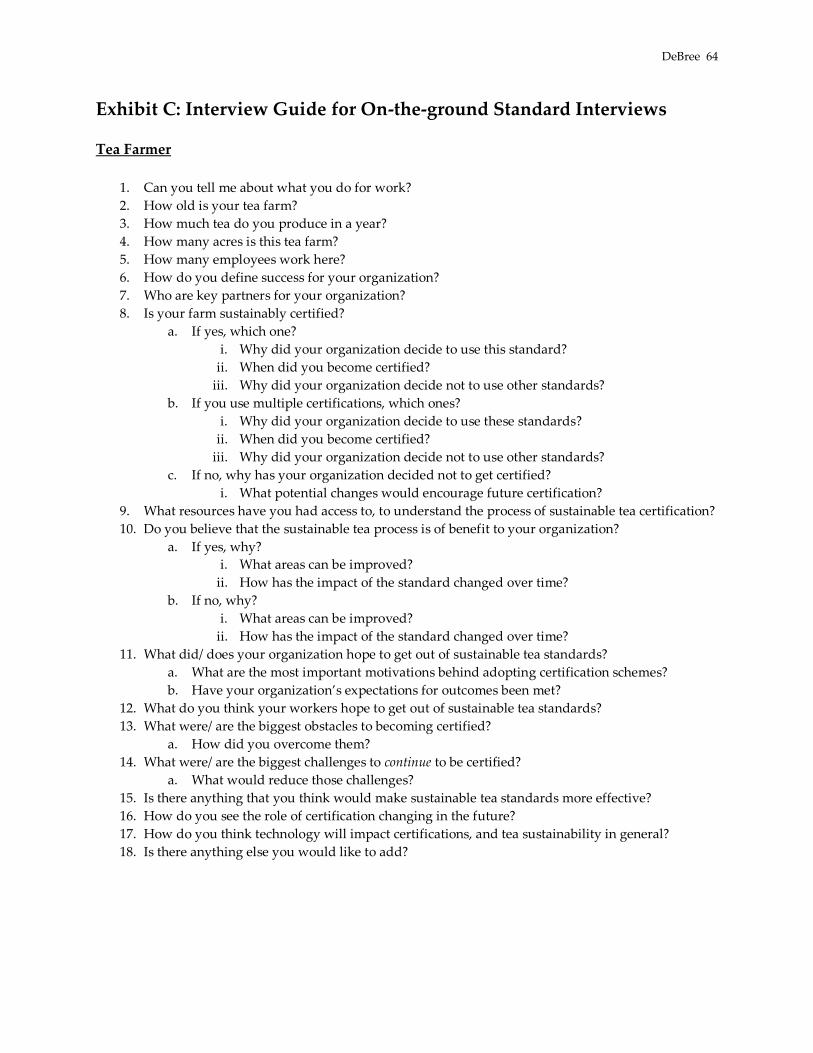
DeBree 64
Exhibit C: Interview Guide for On-the-ground Standard Interviews
Tea Farmer
1. Can you tell me about what you do for work?
2. How old is your tea farm?
3. How much tea do you produce in a year?
4. How many acres is this tea farm?
5. How many employees work here?
6. How do you define success for your organization?
7. Who are key partners for your organization?
8. Is your farm sustainably certified?
a. If yes, which one?
i. Why did your organization decide to use this standard?
ii. When did you become certified?
iii. Why did your organization decide not to use other standards?
b. If you use multiple certifications, which ones?
i. Why did your organization decide to use these standards?
ii. When did you become certified?
iii. Why did your organization decide not to use other standards?
c. If no, why has your organization decided not to get certified?
i. What potential changes would encourage future certification?
9. What resources have you had access to, to understand the process of sustainable tea certification?
10. Do you believe that the sustainable tea process is of benefit to your organization?
a. If yes, why?
i. What areas can be improved?
ii. How has the impact of the standard changed over time?
b. If no, why?
i. What areas can be improved?
ii. How has the impact of the standard changed over time?
11. What did/ does your organization hope to get out of sustainable tea standards?
a. What are the most important motivations behind adopting certification schemes?
b. Have your organization’s expectations for outcomes been met?
12. What do you think your workers hope to get out of sustainable tea standards?
13. What were/ are the biggest obstacles to becoming certified?
a. How did you overcome them?
14. What were/ are the biggest challenges to continue to be certified?
a. What would reduce those challenges?
15. Is there anything that you think would make sustainable tea standards more effective?
16. How do you see the role of certification changing in the future?
17. How do you think technology will impact certifications, and tea sustainability in general?
18. Is there anything else you would like to add?
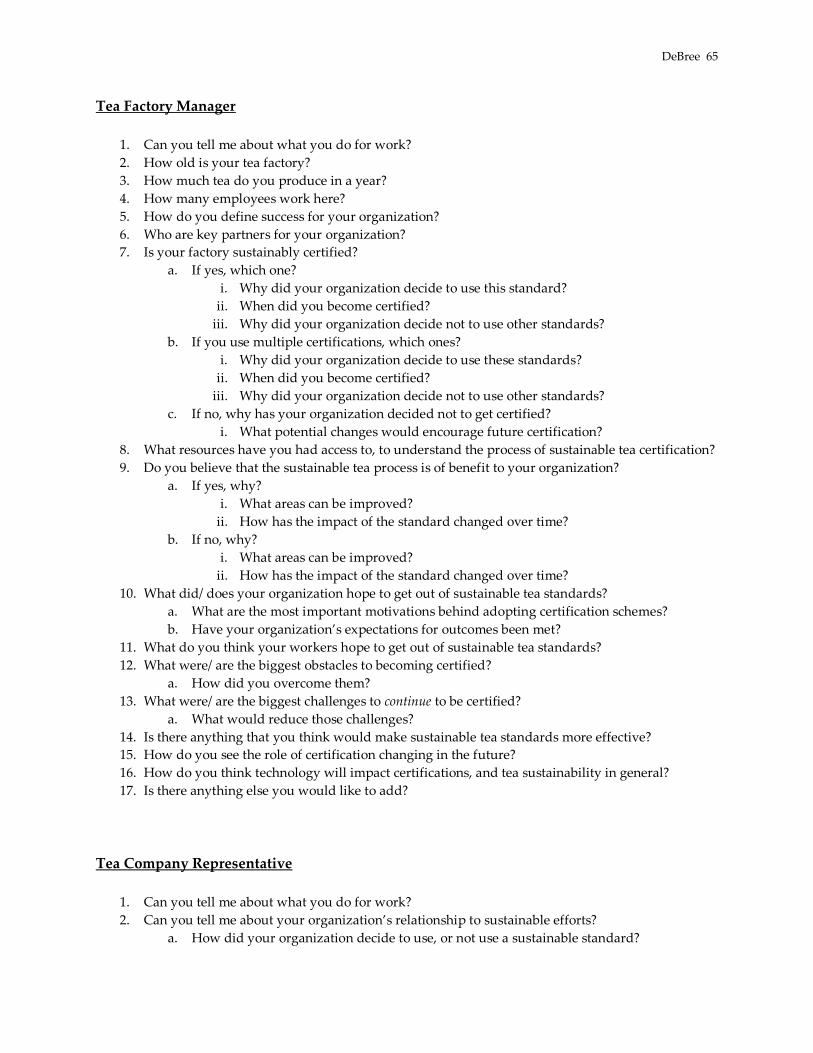
DeBree 65
Tea Factory Manager
1. Can you tell me about what you do for work?
2. How old is your tea factory?
3. How much tea do you produce in a year?
4. How many employees work here?
5. How do you define success for your organization?
6. Who are key partners for your organization?
7. Is your factory sustainably certified?
a. If yes, which one?
i. Why did your organization decide to use this standard?
ii. When did you become certified?
iii. Why did your organization decide not to use other standards?
b. If you use multiple certifications, which ones?
i. Why did your organization decide to use these standards?
ii. When did you become certified?
iii. Why did your organization decide not to use other standards?
c. If no, why has your organization decided not to get certified?
i. What potential changes would encourage future certification?
8. What resources have you had access to, to understand the process of sustainable tea certification?
9. Do you believe that the sustainable tea process is of benefit to your organization?
a. If yes, why?
i. What areas can be improved?
ii. How has the impact of the standard changed over time?
b. If no, why?
i. What areas can be improved?
ii. How has the impact of the standard changed over time?
10. What did/ does your organization hope to get out of sustainable tea standards?
a. What are the most important motivations behind adopting certification schemes?
b. Have your organization’s expectations for outcomes been met?
11. What do you think your workers hope to get out of sustainable tea standards?
12. What were/ are the biggest obstacles to becoming certified?
a. How did you overcome them?
13. What were/ are the biggest challenges to continue to be certified?
a. What would reduce those challenges?
14. Is there anything that you think would make sustainable tea standards more effective?
15. How do you see the role of certification changing in the future?
16. How do you think technology will impact certifications, and tea sustainability in general?
17. Is there anything else you would like to add?
Tea Company Representative
1. Can you tell me about what you do for work?
2. Can you tell me about your organization’s relationship to sustainable efforts?
a. How did your organization decide to use, or not use a sustainable standard?

DeBree 66
i. Would anything have made the process of choosing a standard easier? (ex.
Standardization, transparency)
b. What commitments has your organization made?
c. How has sustainable tea certification impacted your organization?
d. How does your organization plan to use certifications in the future?
3. What resources have you had access to, to understand the process of sustainable tea certification?
a. What resources do you provide to stakeholders through the tea value chain, to improve
understanding of the process of sustainable tea certification? (Growers, consumers,
NGOs etc.)
4. What did/ does your organization hope to get out of sustainable tea standards?
a. What are the most important motivations behind adopting certification schemes?
i. Please rank the top 3 most important improvements for growing regions below,
1 being most important:
1. Economic Conditions
2. Working Conditions
3. Living Conditions
4. Community
5. Environmental Conditions
6. Marketing/ Image
7. Productivity
8. Other – please explain
b. Have your organization’s expectations for outcomes been met?
5. What do you think consumers want to get out of sustainable certifications for tea?
a. What do they prioritize?
b. What methods have you used to determine their expectations?
c. How does your organization communicate the impact of sustainable certification to
customers?
d. What would make communicating sustainable efforts to consumers easier?
6. Is there anything that you think would make sustainable tea standards more effective?
7. How do you see the role of certification changing in the future?
8. How do you think technology will impact certifications, and tea sustainability in general?
9. Is there anything else you would like to add?
Certification Organization Representative
1. Can you tell me about what you do for work?
2. Can you tell me about your organization’s relationship to sustainable efforts?
3. How does your organization define and measure success?
a. How does your organization plan to measure success in the future?
4. What resources do you provide to stakeholders through the tea value chain, to improve
understanding of the process of sustainable tea certification? (Growers, consumers, NGOs etc.)
5. How is your organization planning to improve effectiveness in the future (economic, social,
environmental)?
a. Generally, and in specific regions (Kenya)?
6. What would you say are the most important motivations behind adopting certification schemes?

DeBree 67
a. Please rank the top 3 most important improvements for growing regions below, 1 being
most important:
i. Economic Conditions
ii. Working Conditions
iii. Living Conditions
iv. Community
v. Environmental Conditions
vi. Marketing/ Image
vii. Productivity
viii. Other – please explain
7. How does your organization differentiate itself from other standards?
8. How do you see the role of certification changing in the future?
9. Are there opportunities for standardizing certifications?
a. How can the certification process be easier on growers?
i. What are steps that have been taken in the past?
ii. What steps will be implemented in the future?
b. How can brands/ retailers decide which standard would be best fit for their company?
i. What are steps that have been taken in the past?
ii. What steps will be implemented in the future?
c. How can consumer knowledge and understanding of sustainable tea efforts be
improved?
i. What are steps that have been taken in the past?
ii. What steps will be implemented in the future?
10. How do you think technology will impact certifications, and tea sustainability in general?
11. What do you think tea workers and growers want to get out of sustainable certifications for tea?
a. What outcomes do they prioritize?
b. What methods have you used to determine their expectations?
12. What do you think NGOs/ Government organizations want to get out of sustainable certifications
for tea?
a. What do they prioritize?
b. Are there any other added values they may want?
c. What methods have you used to determine their expectations?
13. What do you think brands/ retailers want to get out of sustainable certifications for tea?
a. What do they prioritize?
b. Are there any other added values they may want?
c. What methods have you used to determine their expectations?
14. What do you think consumers want to get out of sustainable certifications for tea?
a. What do they prioritize?
b. What methods have you used to determine their expectations?
c. How does your organization communicate the impact of sustainable certification to
customers?
d. What would make communicating sustainable efforts to consumers easier?
15. Is there anything else you would like to add?

DeBree 68
Collaborative Organization Representative
1. Can you tell me about what you do for work?
2. How has sustainable tea certification impacted your organization?
a. Does your organization think sustainable tea certifications are valuable?
i. If yes, why?
1. What are some areas of improvement?
2. How has the impact of the standard changed over time?
ii. If no, why?
1. What are some areas of improvement?
2. How has the impact of the standard changed over time?
3. What resources have you had access to, to understand the process of sustainable tea certification?
4. What did/ does your organization hope to get out of sustainable tea standards?
a. What are the most important motivations behind adopting certification schemes?
i. Please rank the top 3 most important improvements for growing regions below,
1 being most important:
1. Economic Conditions
2. Working Conditions
3. Living Conditions
4. Community
5. Environmental Conditions
6. Marketing/ Image
7. Productivity
8. Other – please explain
b. Have your organization’s expectations for outcomes been met?
5. Is there anything that you think would make sustainable tea standards more effective?
6. How do you see the role of certification changing in the future?
7. How do you think technology will impact certifications, and tea sustainability in general?
8. Is there anything else you would like to add?

DeBree 69
Exhibit D: List of Acronyms EATTA – East African Tea Trading Association
FAO – Food and Agriculture Organization
ISO – International Standards Organization
KTDA – Kenya Tea Development Agency
KTGA – Kenya Tea Growers Association
RA – Rainforest Alliance

DeBree 70
Bibliography
Ahi, P., & Searcy, C. (2013). A comparative literature analysis of definitions for green and sustainable
supply chain management. Journal of Cleaner Production, 52, 329–341.
https://doi.org/10.1016/j.jclepro.2013.02.018
Azapagic, A. (2013). Life cycle assessment of tea produced in Kenya. Naivasha; Kenya. Retrieved from
http://www.fao.org/fileadmin/templates/est/Climate_change/kenya/Navaisha_wkp_1/FAO_Uni_Ma
nchester_AZAPAGIC_LCA_of_tea.pdf
Blowfield, M., & Dolan, C. (2010). Fairtrade Facts and Fancies: What Kenyan Fairtrade Tea Tells us About
Business’ Role as Development Agent. Journal of Business Ethics, 93(2), 143–162. Retrieved from
https://doi.org/10.1007/s10551-010-0558-2
Cameron, B. (2017). Brewing a Sustainable Future: Certifying Kenya’s Smallholder Tea Farmers, 2007–2017.
Retrieved from
http://successfulsocieties.princeton.edu/sites/successfulsocieties/files/BC_Kenya_TeaCertification_0.
Chang, K. (2015). World tea production and trade: Current and future development. Rome.
Cheyns, E. (2011). Multi-stakeholder Initiatives for Sustainable Agriculture: Limits of the “Inclusiveness”
Paradigm, 318–354.
Cohen, D., & Crabtree, B. (2006). Semi-Structured Interviews. Qualitative Research Guidelines Project, 2.
Retrieved from https://www.sswm.info/sites/default/files/reference_attachments/COHEN 2006
Semistructured Interview.pdf
Committee on Commodity Problems. (2016). Overview of the Kenyan Tea Industry and Performance
(2014/2015). Naivasha, Kenya.
Desai, R. M., & Rudra, N. (2016). WIDER Working Paper 2016/139 Trade, poverty, and social protection in
developing countries.

DeBree 71
Dolan, C. (2008). In the Mists of Development: Fairtrade in Kenyan Tea Fields. Globalizations, 5(2), 305–
318.
Dyllick, T., Hockerts, K., & Thomas Dyllick, K. H. (2002). Beyond the business case for corporate
sustainability. Business Strategy and the Environment, 11(2), 130–141. https://doi.org/10.1002/bse.323
Eckert, H., Breitschuh, G., & Sauerbeck, D. R. (2000). Criteria and standards for sustainable agriculture.
Journal of Plant Nutrition and Soil Science, 163(4), 337–351. https://doi.org/10.1002/1522-
2624(200008)163:4<337::AID-JPLN337>3.0.CO;2-3
Edge Magazine. (2016). Unilever ranked Top Employer in Kenya. Retrieved February 12, 2017, from
http://www.edgemagazine.co.ke/2016/10/18/unilever-ranked-top-employer-in-kenya/
Ethical Consumer. (2014). Ethical Labels. Retrieved April 4, 2018, from
http://www.ethicalconsumer.org/ethicalreports/tea-industry-report/teacertifications.aspx
Food and Agricultural Organization of the United Nations. (2017). FAOSTAT. Retrieved February 12,
2017, from http://www.fao.org/faostat/en/#data/TP
Formentini, M., & Taticchi, P. (2016). Corporate sustainability approaches and governance mechanisms in
sustainable supply chain management. Journal of Cleaner Production, 112, 1920–1933.
https://doi.org/10.1016/j.jclepro.2014.12.072
Forum for the Future. (2013). The Future of Tea: A Hero Crop for 2030. Retrieved from
file:///Users/schuylerdebree/Downloads/future-tea-report (1).pdf
Garnett, T., Appleby, M. C., Balmford, A., Bateman, I. J., Benton, T. G., Bloomer, P., … Godfray, H. C. J.
(2013). Sustainable Intensification in Agriculture: Premises and Policies. Science, 341(6141).
Giovannucci, D., & Ponte, S. (2005). Standards as a new form of social contract? Sustainability initiatives
in the coffee industry. Food Policy, 30(3), 284–301. https://doi.org/10.1016/j.foodpol.2005.05.007
Global Trust. (n.d.). ISO Management. Retrieved July 24, 2016, from http://www.gtcert.com/iso-
management/

DeBree 72
Golden, J. S., Dooley, K. J., Anderies, J. M., Thompson, B. H., Gereffi, G., & Pratson, L. (2010). Sustainable
Product Indexing: Navigating the Challenge of Ecolabeling. Ecology and Society, 15(3), 8.
Gurusubramanian, G., Rahman, A., Sarmah, M., Ray, S., & Bora, S. (2008). Pesticide usage pattern in tea
ecosystem, their retrospects and alternative measures. Journal of Environmental Biology. Retrieved
from http://jeb.co.in/journal_issues/200811_nov08/paper_01.pdf
Haggara, J., Sotob, G., Casanovesb, F., & Virginiob, E. de M. (2017). Environmental-economic benefits and
trade-offs on sustainably certified coffee farms. Ecoogical Indicators, 79, 330–337.
Henderson, R. M., & Nellemann, F. (2012). Sustainable Tea at Unilever. Harvard Business School, 44, 1–26.
Retrieved from
https://s3.amazonaws.com/academia.edu.documents/37425202/Harved_business_school_paper_on_
Unilever_tea_1.pdf?AWSAccessKeyId=AKIAIWOWYYGZ2Y53UL3A&Expires=1520891332&Signat
ure=%2Fp3JOWGvFXGMoE6e8SKg8Mj0wPA%3D&response-content-disposition=inline%3B
filename
Hoffman, A. (2015a). Tea and Sustainability at Unilever: Turning Over a New Leaf (A).
Hoffman, A. (2015b). Tea and Sustainability at Unilever: Turning Over a New Leaf (B).
Intergovernmental Group on Tea. (2016). Report on the Working Group on Climate Change. Naivasha, Kenya.
Kagira, E. K., Kimani, S. W., & Githii, K. S. (2012). Sustainable Methods of Addressing Challenges Facing
Small Holder Tea Sector in Kenya: A Supply Chain Management Approach. Journal of Management
and Sustainability, 2(2), 75. https://doi.org/10.5539/jms.v2n2p75
King, V., Pendlington, D., Walter, C., & Smith, G. (n.d.). Unilever Sustainable Agriculture Code.
L. Chimoita, E., Dennis Maina, G., Opiyo Olila, D., & P.Gweyi Onyango, J. (2015). The Role of Farmer
Field Schools Approach in Improving Tea Production among Smallholding in Kenya. Universal
Journal of Agricultural Research, 3(1), 4–10. https://doi.org/10.13189/ujar.2015.030102
Mamun, M. S. A., Ahmed, M., & Paul, S. K. (2014). Integrated approaches in tea pest management for

DeBree 73
sustainable tea production. In Proceedings of the Workshop on Tea Production Technology Updated held
on December 14, 2014 organized by Bangladesh Tea Research Institute (pp. 18–32). Retrieved from
https://www.researchgate.net/publication/279456386_Integrated_approaches_in_tea_pest_managem
ent_for_sustainable_tea_production
Mol, A. P. J., & Oosterveer, P. (2015). Certification of markets, markets of certificates: Tracing
sustainability in global agro-food value chains. Sustainability (Switzerland), 7(9), 12258–12278.
https://doi.org/10.3390/su70912258
O’Leary, Z. (2005). Researching Real-World Problems: A Guide to Methods of Inquiry. London: SAGE
Publications.
O’Rourke, A. (2003). The message and methods of ethical investment. Journal of Cleaner Production, 11(6),
683–693. https://doi.org/10.1016/S0959-6526(02)00105-1
O’Rourke, A. R. (2009). The emergence of cleantech. Yale University.
Ochanda, S. O. (2012). A Review of Development of the Tea Industry In Kenya and Possible Areas of
Exploration for Value Addition. African Journal of Horticultural Science, 6. Retrieved from
http://www.hakenya.net/ajhs/index.php/ajhs/article/view/105
Ochieng, B. O., Hughey, K. F. D., & Bigsby, H. (2013). Rainforest Alliance Certification of Kenyan tea
farms: A contribution to sustainability or tokenism? Journal of Cleaner Production, 39, 285–293.
https://doi.org/10.1016/j.jclepro.2012.07.048
Oya, C., Schaefer, F., Skalidou, D., McCosker, C., & Langer, L. (2017). Effects of certification schemes for
agricultural production on socio-economic outcomes in low- and middle-income countries. Campbell
Systematic Reviews, 13(February). https://doi.org/10.4073/csr.2017.3
Pierrot, J., Giovannucci, D., & Kasterine, A. (2010). Trends in the Trade of Certified Coffees. Retrieved from
https://papers.ssrn.com/sol3/papers.cfm?abstract_id=1736842
Pinto, L. F. G., Gardner, T., McDermott, C. L., & Ayub, K. O. L. (2014). Group certification supports an

DeBree 74
increase in the diversity of sustainable agriculture network-rainforest alliance certified coffee
producers in Brazil. Ecological Economics, 107, 59–64. https://doi.org/10.1016/j.ecolecon.2014.08.006
Potts, J., Lynch, M., Wilkings, A., Huppé, G., Cunningham, M., & Voora, V. (2014). The State of
Sustainability Initiatives Review 2014.
Rainforest Alliance. (2017). The Rainforest Alliance and UTZ to Merge, Forming New, Stronger
Organization. Retrieved April 25, 2018, from https://www.rainforest-alliance.org/articles/rainforest-
alliance-utz-merger
Randjelovic, J., O’Rourke, A. R., & Orsato, R. J. (2003). The emergence of green venture capital. Business
Strategy and the Environment, 12(4), 240–253. https://doi.org/10.1002/bse.361
SAN/ Rainforest Alliance. (2015). SAN/Rainforest Alliance Impacts Report 2015. Retrieved from
http://www.rainforest-alliance.org/impact-studies/impacts-report-2015
Statistics Times. (2014). Countries by GDP Sector Composition 2014. Retrieved February 11, 2017, from
http://statisticstimes.com/economy/countries-by-gdp-sector-composition.php
Tea Association of the U.S.A. Inc. (n.d.). Tea Fact Sheet - 2015. Retrieved February 3, 2017, from
http://www.teausa.com/14655/tea-fact-sheet
The Sustainable Trade Initiative. (2015). Understadning Wage Issues in the Tea Indutry.
Tiampati, L. (2017). Inspirational Story on Tea - KTDA Holdings LTD Perspective - 11th - 12th May 2017.
In East Africa Tea Trading Assocation. Nairobi, Kenya: KTDA.
Unilever. (2013). Kericho Tea Estates: Working Conditions. Retrieved from
https://www.unilever.com/Images/kericho-tea-estates-december-2013_tcm244-424953_en.pdf
Unilever. (2015). Unilever Human Rights Report 2015.
Unilever. (2016). Unilever ranked Top Employer in Kenya. Retrieved February 12, 2017, from
https://www.unilever-ewa.com/news/press-releases/2016/unilever-ranked-top-employer-in-
kenya.html

DeBree 75
Van de Wal, S. (n.d.). Sustainability Issues in the Tea Sector: A Comparative Analysis of Six Leading Producing
Countries.
von Bülow, D., & Sorensen, A. (1993). Gender and contract farming: tea outgrower schemes in Kenya.
Review of African Political Economy, 20(56), 38–52. https://doi.org/10.1080/03056249308703984
Waarts, Y. (2017). Towards a sustainable future for smallholder tea farmers and workers. In Team Up
Africa. Nairobi, Kenya: Wageningen University & Research.
Waarts, Y., Ge, L., Ton, G., & Jansen, D. (2012). Sustainable Tea Production in Kenya: Impact assessment of
Rainforest Alliance and Farmer Field School training.
Wijeratne, M. A. (1996). Vulnerability of Sri Lanka Tea Production to Global Climate Change. In Climate
Change Vulnerability and Adaptation in Asia and the Pacific (pp. 87–94). Dordrecht: Springer
Netherlands. https://doi.org/10.1007/978-94-017-1053-4_8
Related Documents