1 Unjust mobilities: The case of rickshaw bans and restrictions in Dhaka A thesis submitted to University College London for the degree of Doctor of Philosophy Md Musleh Uddin Hasan Development Planning Unit Bartlett Faculty of the Built Environment University College London 2013

Welcome message from author
This document is posted to help you gain knowledge. Please leave a comment to let me know what you think about it! Share it to your friends and learn new things together.
Transcript
1
Unjust mobilities: The case of rickshaw bans and
restrictions in Dhaka
A thesis submitted to University College London
for the degree of Doctor of Philosophy
Md Musleh Uddin Hasan
Development Planning Unit
Bartlett Faculty of the Built Environment
University College London
2013
2
Declaration
I, Md Musleh Uddin Hasan, confirm that the work presented in this thesis is my own.
Where information has been derived from other sources, I confirm that this has been
indicated in the thesis.
………………………………….. 1st December, 2013
3
"Mvwn mv†g¨i Mvb,
gvby†li †P†q eo wKQyy bvB, b†n wKQy gnxqvb|"
-we†`ªvnx Kwe KvwR bRiyj Bmjvg (1899-1976)
"I do sing the song of fairness, justice and equity,
Nothing is greater and superior than humanity"
-Rebel poet Kazi Nazrul Islam (1899-1976)
(Translation from Bangla by the author)
4
Dedicated to
Tasmiyah (born in January 2013), her near and dear ones,
Shimul apa (departed in January 2013) and
Khalu abba (departed in December 2013)
5
Abstract
Planning mobilities in contemporary cities, particularly in developing countries, increasingly
focuses on promoting motorised transport (MT) at the expense – side-lined if not banned – of
non-motorised transport (NMT). As NMT serves the needs of a range of users, decisions of
this kind are highly politicised favouring some forms of mobility, and interest, over others;
this raises concerns about justice in access to transport. To planners and decision-makers the
question of just mobilities - a concept developed in this research combining literature mainly
on social justice and mobilities - poses a range of challenges: equitable distribution of
direct/indirect benefits and burdens, fair process of decision making and execution in
introduction or restriction/ban of any given transport mode or infrastructure, justification of
motivations in political terms. Apart from redressing weakness in sustainability studies on
mobility and transport, the proposition provides a broader framework to look into the
distribution of existing and potential human mobilities, process and associated motivations
(politics). The framework is used to explore the impact of a planning intervention – rickshaw
bans/restrictions in Dhaka, Bangladesh - on the users at household level. Around one million
rickshaws – a human pedalled tri-cycle usually carrying two persons – shared more than one-
third of the total of 19.58 million trips in Dhaka in 2009. The volume of passengers
transported (7.6 million person-trips/day in 2009), is equally astonishing; close to double the
highest number of passengers (4.4 million) carried by London Tube in a single day during the
2012 Olympics. Yet in the name of increasing mobility rickshaws are being restricted/banned
in Dhaka roads, particularly since 2002. The study hypothesis is that the withdrawal of
rickshaws from the roads is a manifestation of unjust mobilities in the (transport) planning;
devised by biased studies and plans, and fuelled by vested motivations. While short and
medium distance travellers, women, school going children and their guardians, aged and sick
members of the household and non-work activities are adversely affected by the decision;
long distance activities, work trips and car-users are benefitted. This research also reveals a
cross-sectoral, informal and productive global to local coalition against NMT in an uneven
geography of power relations and multiple interests; which is also contextual and relevant to
cities in developing countries in Asia and elsewhere in the globe. Apart from reviewing a
broad range of theoretical and empirical literature, the research collected information on
individual and household mobility patterns, on the effects of the ban/restriction and on
potential modal options and preferences using a combination of questionnaire surveys, semi-
structured interviews and focus group discussions.
6
Acknowledgements
In the very beginning I wish to express my utmost gratitude to the Almighty, for all the
blessings, including the opportunity to take this dissertation to this final stage.
Next, I remember the wonderful three years spent, in close monitoring, guidance and
encouragement with Professor Julio D. Davila, my direct supervisor. I also acknowledge
Jorge Fiori, my next supervisor and all DPU academics and staffs including Caren Levy,
Colin Marx, Ruth Mcleod, Sivaguru Ganesan. I am also grateful to Commonwealth
Scholarship Commission, my ACU administrators and my DPU friends - Bianca, Pong,
Farnaz, Soo, Tatiana, Marina, Hector, Sigi, Nikhilesh and all others. Of course, I do heartily
acknowledge the people I met in UK during these three years- Alom vai, Lubna apa, Tamjeed
and Waseef from the host family, and other friends and relatives. It was really wonderful to
meet my uncle, aunt, cousins and their families after a long twenty three years. Nazmun, Abed
and their son Rayn, Russell, Ashraf, Sohel vai and their families were amazingly helpful.
Back in home, I must be thankful to my teachers and colleagues in the Department of URP,
BUET, Riaz, Protyoy, Monjur, Muhib, Ruhul vai and all others who helped me in different
ways including that in data and map collection, proof reading etc. I am also extremely
thankful to Labib, Mashrur, Mohiuddin and other research assistants.
Finally, thanks to the Almighty that I have a wonderful family- Tasmiyah, my daughter- born
in this year, her mother, grand-parents, great grand-parents, uncles and aunts. My mother, my
best teacher- who in my school days taught me what I know now as literature review, has
been a constant source of strength; my father, my mentor- who always teaches to remain stick
to values and honesty, has been a constant source of inspiration; Elora has been a constant
guide, sharing and bearing partner. I remember my grandfather-Nana, saying me "cannot you
do something for the homeless and slum people?" I feel, at least, the broader theme of this
research will make him happy. I know Parvez, Fahim, Tanin, Eric, Nawreen, Mangifa, Jeenia
and cousins will have a 'silent' joy, as I am finishing. I am happy that the ever-well-wishing
Baba and Ma will be relieved. I remember my uncles, aunts and cousins who in my childhood
taught me letters, numbers, how to read dial-based table clock, what is school 'examination'.
Hopes and happiness are all around; yet I am getting concerned if my research would be
effectively used for any change in the 'unjust mobility' experience of those who were
interviewed and surveyed during my field study. So, I coin the words from the Prophet (peace
be upon him): "O Lord, give me knowledge that is of use and benefit".
7
Table of contents
Page Abstract 5 Acknowledgements 6 Table of contents 7 List of tables 10 List of figures 11 List of maps 12 List of abbreviations and acronyms 13 List of conversions 14 Chapter 1: Introduction to the research 15 1.1 Introduction 15 1.2 Statement of the problem 15 1.3 Hypothesis and objectives and research questions 21 1.4 Dhaka- the case study city 23 1.4.1 Growth of the city 23 1.4.2 Roads and modes in Dhaka 24 1.4.3 Mess in mobilities and importance of rickshaws in Dhaka 26 1.5 Contribution to knowledge 29 1.6 Scope and limitations of the research 30 1.7 Organisation of chapters 31 1.8 Introducing and operationalising terms used 32 Chapter 2: Methodology and profile of the study area 35 2.1 Introduction 35 2.2 Positioning the research 35 2.2 Justifying the case 37 2.4 Justifying the case study areas 38 2.4.1 Study areas 38 2.4.2 Why three study areas 41 2.5 The fieldwork 43 2.6 Profile of the interviewed households (HH) and respondents 51 2.7 Main time-bound (routined) and main time-flexible (other)
activities of the household members- existing and potential mobilities
60
2.8 Conclusion 64 Chapter 3: Review of literature on justice, politics and mobilities 65 3.1 Introduction 65 3.2 Theories of justice and politics 65 3.2.1 Conceptualising justice- different paradigms 66 3.2.2 Theories of justice and politics - one complementing the other 70 3.2.3 Different notions of justice in practice 75 3.3 Theories of mobility- mobilities 80 3.3.1 Why do people move? 80 3.3.2 Reconciling the old transport planning debate of mobility versus
accessibility 81
3.3.3 Beyond movement- rethinking mobility 83 3.3.4 From mobility to mobilities- a new paradigm 85 3.3.5 Conceptualising mobilities 87 3.3.5.1 Acknowledging urban mobilities 89
8
3.3.6 Conceptualising the politics of mobility 91 3.4 Seeking justice in planning mobilities 93 3.4.1 Planners' dilemma and seeking justice in plan 93 3.4.2 Application of principles of justice in transport planning 96 3.4.3 The politics of mobility in urban land use and transport planning 99 3.5 Conclusion 102 Chapter 4: Towards a just mobilities framework 103 4.1 Introduction 103 4.2 Seeking just mobilities 103 4.2.1 Humanising transport studies - socio-political approach to
transport planning 103
4.2.2 Toward complementing the conceptualisation of sustainability in mobility and transport
106
4.2.3 Complementing other transport and mobility related studies 112 4.3 Towards a just mobilities framework 113 4.4 Conclusion 115 Chapter 5: Distributive effects of rickshaw bans and restrictions on mobilities in Dhaka
117
5.1 Introduction 117 5.2 Presence of rickshaw bans and restrictions during movement for
different activities 117
5.3 General problems in mobilities- linkage with rickshaw bans and restriction
121
5.4 Changes in rickshaw related journey experiences 123 5.4.1 Direct effects on rickshaw journey experiences 123 5.4.2 Indirect effects on rickshaw users 124 5.5 Response strategies of households and respondents to rickshaw
bans and restrictions 125
5.5.1 Forced choice of options for mobilities 125 5.5.2 Changes in activities and pattern of mobilities 126 5.5.3 Mixed perceptions regarding changes in speed and congestion 127 5.6 Perception and choice for rickshaws and other modes 128 5.7 Identifying losers 131 5.8 Statistical validity of the findings 134 5.9 Conclusion 140 Chapter 6: The process of rickshaw bans and restrictions and the politics of (im)mobilities in Dhaka
141
6.1 Introduction 141 6.2 (Biased) Transport policies, studies and plans- bans or
restrictions on rickshaws 141
6.2.1 Note on the rickshaw bans and restrictions in the study areas 149 6.3 The politics of (im)mobilities: A 'glocal' coalition against
rickshaws 150
6.4 Conclusion 161 Chapter 7: Unjust mobilities in Dhaka - Conclusions 162 7.1 Introduction 162 7.1 Unjust mobilities - research objectives revisited 162 7.2.1. Development and application of a just mobilities framework 162 7.2.2 Uncovering the distributional effects of rickshaw
bans/restrictions on the mobilities 163
9
7.2.3 Understanding of the process and the politics of rickshaw bans/restrictions
165
7.3 Unjust mobilities due to rickshaw bans and restrictions 166 7.4. Implications for planning urban transport 169 7.4.1 Implications based on distributional aspects of just mobilities 169 7.4.2 Implications based on processual aspects of' just mobilities 170 7.4.3 Implications based on aspects related to politics of (im)mobilities 171 7.4.4 Policy implications for planning transport in Dhaka 171 7.5 Revisiting the contribution of the research to understanding and
knowledge 173
7.5 Direction for further research 175 References 176 Appendices 200 Appendix A 200 Appendix B: Questionnaire 201 Appendix C 206 Appendix D 215 Appendix E: Focus group discussions (FGDs) 230 Appendix F 244 Appendix G: Photographs 249 Appendix H: Organogram of relevant government bodies 255
10
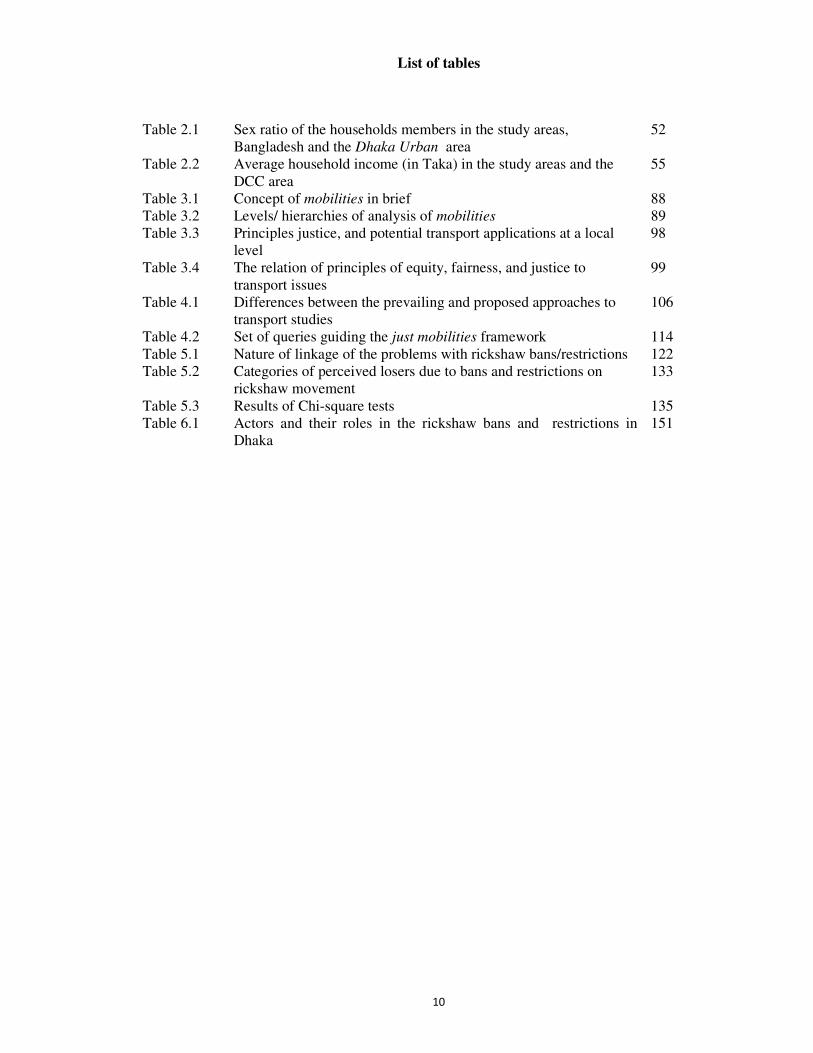
List of tables
Table 2.1 Sex ratio of the households members in the study areas,
Bangladesh and the Dhaka Urban area 52
Table 2.2 Average household income (in Taka) in the study areas and the DCC area
55
Table 3.1 Concept of mobilities in brief 88 Table 3.2 Levels/ hierarchies of analysis of mobilities 89 Table 3.3 Principles justice, and potential transport applications at a local
level 98
Table 3.4 The relation of principles of equity, fairness, and justice to transport issues
99
Table 4.1 Differences between the prevailing and proposed approaches to transport studies
106
Table 4.2 Set of queries guiding the just mobilities framework 114 Table 5.1 Nature of linkage of the problems with rickshaw bans/restrictions 122 Table 5.2 Categories of perceived losers due to bans and restrictions on
rickshaw movement 133
Table 5.3 Results of Chi-square tests 135 Table 6.1 Actors and their roles in the rickshaw bans and restrictions in
Dhaka 151
11
List of figures
Figure 1.1 Modal share of trips for different household (HH) income (inc.)
Groups, 2009 28
Figure 1.2 Modal share in each purpose based trips, 2004 28
Figure 2.1 Work types of the respondents 53 Figure 2.2 Educational qualification of the respondents 54
Figure 2.3 Household distribution (in percent) according to the income level 55 Figure 2.4 Car ownership of the households in the study areas 56 Figure 2.5 Household distribution and car-ownership by income level in the
study areas 57
Figure 2.6 Modal choice by income level in the DHUTS area 58 Figure 2.7 Distribution of length of car-ownership in the study areas 59 Figure 2.8 Distribution of all household members by their main time-bound
(routined) activities (1132 responses) and main time-flexible
(other) activities (936 responses)
61
Figure 2.9 Distribution of household members by their main time-bound
(routined) and main time-flexible (other) activities and sex 63
Figure 3.1 The triangle of conflicting goals for planning, and the three associated conflicts
96
Figure 4.1 Context and scope of a just mobilities framework 116 Figure 5.1 Distribution of household members in three study areas by
activity and presence of rickshaw bans/ restrictions on the way of activities
119
Figure 5.2 Mean rating of different modes for different trips by all respondents
129
Figure 5.3 Share of ratings of importance/usability of rickshaw for short trip by household income level
129
Figure 5.4 Mean of choice ratings of modes by the respondents under different conditions
130
Figure 5.5 Mean of choice ratings (in a scale of 5, 1-lowest, 5-highest) of rickshaw by the respondents in different areas under different conditions
131
Figure 5.6 Means of ratings of the respondents identifying the level of adversity faced by groups of people
132
Figure 6.1 Dynamics of a 'Glocal' coalition against rickshaws in Dhaka 153
12
List of maps
Map 1.1 Gradual growth of Dhaka 24 Map1.2 Area of Dhaka under different administrative jurisdictions 24 Map 2.1 Study areas in the context of DCC area 39 Map 2.2 Study areas in the context of neighbouring areas 39 Map 2.3 Rickshaw banned road, road sections and intersections in the
three study areas 40
Map 2.4a Surveyed households in the Shyamoli 46 Map 2.4b Surveyed households in the Shukrabad 47 Map 2.4c Surveyed households in the Bijoynogar 48 Map 6.1 Proposed rickshaw free roads as per DUTP 147 Map 6.2 Rickshaw free roads in Dhaka in 2010 145
13
List of abbreviations and acronyms
ADB- Asian Development Bank
BBS- Bangladesh Bureau of Statistics
BGB- Border Guards Bangladesh
BRTA- Bangladesh Road Transport Authority
BRTC- Bangladesh Road Transport Corporation
CASE - Clean Air and Sustainable Environment
CBA- Cost Benefit Analysis
CNG- Compressed Natural Gas (CNG) fuelled motorised three-wheeler
DITS- Greater Dhaka Metropolitan Area Integrated Transport Studies; popularly known as
Dhaka Integrated Transport Study
DCC- Dhaka City Corporation
DMDP- Dhaka Metropolitan Development Plan
DMP- Dhaka Metropolitan Police
DUTP- Dhaka Urban Transport Plan
EJ- Environmental Justice
FFT- Fuel Free Transport
FGD- Focus Group Discussion
HH - Household
JICA- Japan International Cooperation Agency
MT- Motorised Transit/Transport
MV- Motorised Vehicle
NMT- Non Motorised Transit/Transport
NMPT- Non motorised Public Transport
NMV- Non motorised Vehicle
RAJUK- Rajdhani Unnayan Kartripakha (Capital Development Authority)
STP- Strategic Transport Plan
Tk- Taka, the currency of Bangladesh
UJ- Urban Justice
WB- World Bank
14
List of conversions
GBP 1 = Tk 115.85*,
US$ 1 = Tk 77.75*.
* As per http://www.xe.com as on the 7th July 2013
1 sq. metre = 10.75 sq. ft
15
Chapter 1
Introduction to the research
1.1 Introduction
This chapter briefly introduces the research that questions the bans/restrictions of the
rickshaws and explores the answer(s) based on the just mobilities framework developed in
this research. Problematising the issue of mobility - due to repeated incidences of rickshaw
bans and restrictions in Dhaka since 2002 - from the perspective of social justice, it
introduces the just mobilities framework for planning urban transport. A short note on the
growth of Dhaka city is provided followed by a description of the roads and modes in the
city and the state of mobility therein. Drawing attention to the importance of rickshaw - a
non-motorised transport (NMT) mode - in Dhaka this chapter sets forth the study:
hypothesis and objectives and research questions. Lastly, delimiting the scope and
limitations of this study and outlining the organisations of chapters in the dissertation, this
chapter finishes with a brief introduction to several repeatedly used operational terms in
the research.
1.2 Statement of the problem
In modern times mobility is a powerful discourse creating its own effects and contexts
(Hannam et al., 2006:1) in multiple disciplines, places, scales and hierarchies. The
multiplicity and transformations in the nature of connections and movement over time and
space have been pivotal in the formulation of a "new mobilities" paradigm (Sheller &
Urry, 2006a), where the singularity of mobility is replaced by the term mobilities to
encompass huge and hurried human and non-human (objects, capital, information)
movement and flows. Along with existing mobilities, Kaufmann et al. (2004) and others
have looked into the problems and possibilities of mobilities from the perspective of
potential movement as well and thus have increased another layer of critical investigation.
Understanding the ways in which mobilities intersect with people, place, pace and mode,
is complex as they are overlapped by aspects and contexts involving policy, politics and
process of distribution of benefits and cost of mobilities over space, society and
16
environment. Cities grew historically as the places of business and people used to flock
them from local and global distances. Ultimately many started residing there to access
better facilities at/with better mobilities. So, cities are practised for the movements of its
citizens, goods, information, ideas and images (Amin & Thrift, 2002; Urry, 2007) and
planned and developed for all possible sorts of mobilities.
Mobilities are also a basic condition in the social order (Kesselring, 2006) with socio-
politico-economic, technological and ecological connections. Technological, social and
cultural developments are rapidly changing the "nature of travel and of communications
conducted at-a-distance" (Hannam et al., 2006:4). The changes are most commonly vivid
and comprehensible to common people in daily experiences in an urban scale than supra-
urban levels- as many people do not have experience of mobilities in those levels. Of
course, the mode of human transportation is a factor in generating and guiding mobilities.
But growth (and decline) of land uses, business (and human interest therein) and
environment are also important. Therefore, urban mobilities both affect and are affected by
factors like the provision of transportation modes and infrastructures; urbanisation, urban
growth and development; varieties in demand, abilities, livelihood pattern, gender and
social roles of the users; motivations of the decision makers and other stakeholders behind
their choices and priorities; and associated effects and externalities: social, economic and
environmental.
Thus planning and provisioning of mobilities is a tension among multiple sectors and
objectives and poses planning challenges in the area that is termed as the "planners’
triangle" (Campbell, 1996). Citizens who will be using the different modes to access their
daily and other destinations may not be equally mobile within the same transportation
system nor do all the modes have the same economic or ecological effects. The question
and contestation regarding (mal)distribution of opportunities like mobility started to
surface more rapidly and severely after the invention of the motor car in the early
twentieth century. Since then striving for motorised mobility1 is manifested in a push for
growth and speed in a period termed as "the age of irresponsibility" (Jackson, 2009:17).
The role of non-motorised transport modes has been denied in developed countries until
1 Over 1 billion cars have been manufactured in the last century (Urry, 2006). At the end of twentieth century 700 million cars were roaming the world in end of the last century (Shove, 1998 quoted in Urry, 2006) with an expected three times increase in car travel between 1990 and 2050 (Hawken, et al., 1999, quoted in Urry, 2006).
17
recently; in developing countries the negligence is still continuing along with the denial of
their right to ply and stay even on the road in many cases.
However concerns are being raised regarding auto-mobility. Studies show several
drawbacks associated with auto-mobility: a finite ecological limit (Jackson, 2009;
Davenport & Davenport, 2006), a failure to appraise and appreciate aesthetics and
architecture along with economic and financial costs and destruction of ecological and
built landscape (Freund & Martin, 1993). Benefits of shifting from car to physically active
transport includes better health and reduced medical cost, reduction in pollution, carbon
emission, accident fatalities, noise, congestion etc (Rabl & de Nazelle, 2012). Also
important is the concern for equality in development. It has been observed that inequality
causes social failure despite material success and a fair society is an essential part of our
well being (Wilkinson & Pickett, 2010). Sen (2001, 1999, 1995), Nussbaum and Glover
(1995) and other scholars have shown that equal and fair access to social, economic and
political activities and opportunities paves the way for people to attain their entitled
capability and reap the fruits of freedom: "certain crucial instrumental freedoms, including
economic opportunities, political freedoms, social facilities, transparency guarantees and
protective security" (Sen, 2001:XII, italic in the original).
Yet, looking for justice in planning mobilities is a challenge. In general the strive for
equity remains low on the policy agenda in many countries as it often requires working
against the interests of national elites, challenging vested interests or dominant ideologies,
or speaking for people who are excluded and ignored systematically by those making
policy (Jones, 2009) in the name of 'rationality' (Flyvberg, 1998). Limited focus on equity
can be attributed to both domestic and international power imbalances requiring a change
in political economy (Jones, 2009) as the car has become central to the organisations of
capitalism and deeply embedded in individual identities (Paterson, 2007). Identification
of stakeholders is also important as "power is everywhere" and "comes from everywhere"
(Foucault 1998:63) in several forms and nature including informality, defined as 'extra-
legality' (Roy, 2009; Roy & AlSayyad, 2004).
Apart from the dimension of power and politics, providing mobilities within an urban
system is a dilemma: where to find a balance among social equity, economic growth and
18
environmental sustainability; how; and why. To the professionals like planners the
question of just mobilities is a practical concern with respect to equitable distribution (of
access to means of and options for mobilities, externalities produced) by fair process (of
introduction or restriction/ban of any transport mode) with logical and ethical motivation
(politics).
The concept of just mobilities, developed and applied in this research, provides a broader
framework to the planners to answer three mobilities related questions: (i) where? i.e.
distributional contexts, (ii) how? i.e. plan, policy and process, and lastly, (iii) why? i.e.
politics and motivation. Theoretically, mobilities relate to where and how, and justice
relates to where, how and why. Moreover, the politics of mobility itself has an urban
(where), processual (how) and motivational (why) basis to exist and work. The framework
is applied to explore the impact of a single planning intervention- rickshaw2
bans/restrictions3, in the urban transport system in Dhaka, Bangladesh.
Dhaka, a megacity, is one of the fastest growing cities in the world and is featured by
almost all possible mobility related problems usually seen in the cities in developing
countries. As motorisation is low and public transport is barely developed, rickshaws have
a vital role in carrying millions of Dhaka citizens; more than one-third of trips are
rickshaw based (JICA, 2010; STP 2005a). In such a context, 1.1 million (Daily Star, 2012)
rickshaws play a vital role in urban mobility in Dhaka (see Appendix G, Photographs).
Rickshaws are like taxis to most of the users, personal vehicles to those who arrange
contact with the rickshaw-drivers, locally called rickshaw-walla, to carry them or their
children to and from school and other regular destinations, para-transits to fill the vacuum
due to no modal integration in local or collector roads to catch public transport, taxis, three
wheelers (popularly known as CNGs4). They also carry 5% of freight in the city (DITS,
1994a:43) and employ half a million poor directly as rickshaw-walla. Moreover,
rickshaws are well suited to the densely built-up Dhaka City Corporation (DCC) area
(Kalabamu, 1987; Majumder, et al., 2009).
2 A non-motorized, fuel free, human pedalled tri-cycle usually carrying two persons 3 Although ban represents a complete ban of rickshaws in the road and restriction means ban of rickshaws in intersection, crossing intersection or partial restriction along a segment of road or in a direction, ban and restriction has been used invariably as ban/restriction in this study. Moreover the plurality of ban and restriction refer to several incidences in several stages or time since 2002 in Dhaka 4 These three wheelers are operated using four stroke engines and use Compressed Natural Gas (CNG) as fuel. So, their popular name is CNG.
19
Yet they are "strongly disliked by many sections of the population, especially middle and
upper classes" (DITS, 1993:6). Decision makers also take advantage of this hostility
towards rickshaws by a section of citizens. "Despite obviously important role for
rickshaws and other non-motorised vehicles in providing transport services to the
community of Dhaka, there are frequent calls for measures to limit the operation of these
vehicles and in the longer term remove them from arterial roads. Finding a socially
acceptable strategy ... has been an impossible goal... Generally rickshaw is viewed with
disfavour by decision-makers ..., who regard it as an inefficient, inhuman and unstable
mode" (DITS, 1994a:43).
In fact, the phasing out policy for rickshaws is not new. Cycle-rickshaws have faced
antagonism in cities stretching from Karachi, Pakistan to Kuala Lumpur, Malaysia (DITS,
1993:6) in different periods of the last century and have been banned in most cities in the
region. As long ago as 1944 a government committee in India recommended that cycle-
rickshaws should be replaced by auto-rickshaws and since the early 1950s there has been
restrictions, in several forms, on issuing rickshaw license in Dhaka (DITS, 1993:6).
American-Whitney, a Consultancy firm, in their study on Dacca5 by-pass in 1968,
assumed that rickshaws would be gone from the roads by the year 1990 (DITS, 1993:6).
In fact, there is a generalised hostility to NMT in favour of ‘modern’ forms of mobility. As
'ways of seeing' is determined by what and how we know (Berger,1972), motorised
transport (MT) is given complete priority over NMTs, often resulting in complete bans of
the latter. In many cases the western concept of auto-mobility, which is now not only
challenged in the west itself but also is being replaced or modified, is transferred to
developing countries either by donors or consultants from developed countries, in a non-
challenging policy environment in the recipient countries where government and
authorities are in many cases obsessed with 'modernisation' like the west. Like Berger's
(1972) views regarding acceptability of particular images and arts, it is observed that the
all problem solving 'image' of cars stimulates consumption (demand) of it and in an
artificial set-up depicting scope for free choices or options, in this case for mobility, the
whole system is used for the 'publicity' and practices against NMT, keeping only the single
option of auto-mobility.
5 The old spelling of Dhaka.
20
NMT is “the neglected Cinderella of transport modes” (Gwilliam, 2003:212) and is
“systematically under-recognized” (World Bank, 2002:xiii). Despite its importance in
people’s everyday transport needs, the future of NMT in Asia has been placed in doubt
(Rahman et al., 2009). NMT detractors depict it as being degrading and slow while
causing congestion and argue for bans, despite the mixed success of bans throughout the
continent (Gallagher, 1992; Hook & Replogle, 1996; Rahman et.al. 2009; Tiwari, 2012).
Bicycles are banned in many Chinese cities (Zacharias, 2012). Rickshaws, as well, are
being banned in an increasing number of Indian cities: Delhi in the 1980s (Ravi, 2012;
Tiwari, 2012) and more recently in Calcutta under a Marxist State government (Sen,
1996). Bans have also been in place in other Asian cities for some time: Jakarta,
Indonesia, since the 1980s (Rahman et.al. 2009); Kuala Lumpur, Malaysia (Hook &
Replogle, 1996); Bangkok, Thailand, since 1962 (Hook & Replogle, 1996); Karachi,
Pakistan since 1969 (Gallagher, 1992); Manila, The Philippines, since the 1950s though
they re-emerged in the 1980s (Replogle, 1991). Bans have also been recorded in other
countries of the Global South including Africa and other Asian countries (World Bank,
2002; Gwilliam, 2003; Pendakur, 2011; Replogle, 1991). The latest additions to this
growing list are Bangladeshi cities: Dhaka (Bari and Efroymson, 2005a & 2005b; Rahman
et al., 2009) and Chittagong.
Dhaka is the last capital city where rickshaws remain a widespread mode of transport.
There were several sporadic attempts to ban rickshaws in different roads. The first planned
intervention occurred in 2002 when DCC initiated, as part of Dhaka Urban Transport
Project (DUTP), the implementation of the “NMT-Free Arterial Network – Phased
Implementation Plan” (STP, 2005b:3-4) for phased withdrawal of rickshaws from 11
major roads in Dhaka City (see Map 6.1 and Appendix G, Photographs) to increase speeds
in major arterial roads (World Bank, 2005). Mirpur road (Gabtoli-Russell Square) and
Panthapath (Russell Square-FDC) were made rickshaw free in December 2002 (New Age,
2005a). However, the movement of people was seriously hampered in absence of adequate
modes, and public protest and civil society outcry has been reported in the media from
time to time. The ban plan had been withheld (but not officially withdrawn) since 2005.
But, since then Dhaka Metropolitan Police (DMP) has been putting restrictions on the
movement of rickshaws in several intersection and road segments, on both or single
carriage ways.
21
The decisions to ban what are seen as antiquated, non-modern vehicles arise out of a
complex set of decisions informed by values and arising from pressures from interest
groups. “Polity involves more than the pressures and counter-pressures on discrete policy
choices” (Stone, 1982:276). Decision-makers and decision-making bodies do not act in a
vacuum but are rather part of a broader social system managing a set of possibilities and
constraints (Zunino, 2006). Such policy decisions in an urban context do not arise from the
domination of a single elite but rather the interaction of many different (public and
private) interests which lead a group to exercise power in urban decision making (Dahl,
1961; Elkin 1987; Stone 1989, 1993; Mollenkopf, 1983).
In such a background, this study argues that bans/restrictions of rickshaws are matters of
investigation as far as social justice is concerned. Since a substantial number of citizens
and trips in Dhaka are rickshaw based, the post bans/restrictions effects on their mobility
is a matter of concern. Plus, questions like why such decisions are taken and by whom -
particularly in a city where motorised mobility is low and public transport is very
inadequate - have been raised. Planners and academics also wonder and are interested to
know how this apparently less logical decision itself has been undertaken and
materialised.
The framework for just mobilities developed here gives a conceptual basis for studying
these questions: distributional effects on mobilities, process of the plan making and
politics behind the decisions.
1.3 Hypothesis, objectives and research questions
Having discussed the background of the research problem, this section puts forward the
hypothesis, objectives and related research questions. The scope of the research is guided
within the frame set by this section.
A. Hypothesis
In Dhaka, transport planning interventions cannot ensure distributional and processual
justice as regards mobilities of its citizens; rather the interventions serve the blue-print for
a car-based, capital intensive transport system. The decision to ban and restrict the most
widely used mode -rickshaws, in several roads is the manifestation of unjust mobilities
22
resulting in an unjust distribution of benefits and burdens; behind this there is a political
motivation, both in the process of decision-making and its execution.
B. Objectives
i. To develop and apply a just mobilities framework of mobility with reference to the
context of planning.
ii. To study the distributional effects of rickshaw bans and restrictions (from the period
2002 to 2012) on the mobilities of the citizens in Dhaka using a just mobilities
framework and identify the losers and gainers.
iii. To study the process of rickshaw bans/restrictions in Dhaka since 2002 and understand
the motivations behind it and thus unearth the politics of (im)mobility, seeing
bans/restrictions as part of a global trend against NMT.
C. Research questions
A set of guiding questions have been identified to express, investigate and achieve the
objectives. They are as follows:
Research Questions for objective i.
- Why and how a just mobilities framework is contextual to the contemporary
literature on justice, mobilities and to the professionals' role in planning?
- How can the framework amalgamate the justice (understood in the context of
distribution, process and politics) and mobilities (understood in the context of
existing and potential mobilities, and access, competence and appropriation of
mobilities)?
Research Questions for objective ii.
- Are the benefits and burdens due to rickshaw bans/restrictions in Dhaka equitably
distributed? What are the responses or coping strategies of different households and
their members for doing different (time-bound and time-flexible) activities?
- Do the users have equal modal options and preferences in the post rickshaw
ban/restriction condition? Do the choice of users for different modes vary in
different modal scenarios - existing and hypothetical?
23
Research Questions for objective iii.
- Why and how does the ideas of bans/restrictions come from and who implement
them? What tools and methodologies are used, and are they neutral or biased?
- Do the externalities of the bans/restrictions have national or global stakeholders
(other than those in local and city levels)? Do they have same interests, and are they
connected?
1.4 Dhaka - the case study city
The case study area is Dhaka City Corporation (DCC)6- the core of the Dhaka megacity7
and contains 55% of the mega-city population in 2001 (BBS, 2008). The core Dhaka city
i.e. Dhaka City Corporation area accommodates around 5.25 million in an area of 160 sq.
km. (i.e. density 33132/ sq. km) in 2001 (BBS, 2008; Hasan, 2010). Dhaka is the primate
city in Bangladesh; next is the port city at Chittagong.
1.4.1 Growth of the city
Dhaka, a fourth century settlement on the Buriganga river, grew to prominence as a
provincial capital in 1610 and a South Asian trading town in the Mughal era. Portuguese,
Dutch, English and French traders arrived in significant numbers in the late 17th century. It
declined at the end of the Mughal rule; particularly during the inception of British colonial
period here in 1765 and with the growth of neighbouring city Kolkata as the Capital of
British Empire. In July 1905, Dhaka was declared the capital of newly formed Assam-
Bengal province and had around 100,000 inhabitants. After the partitioning of British
India in 1947, Dhaka became the capital of East Pakistan in 1947 and faced an influx of
migrants from India. In 1971 Dhaka became the capital of newly independent Bangladesh
followed by a major demographic influx and rapid northward growth to give space and
scope for rise of "a modern city" (Bradley-Birt, 1975:261). "During the period of nearly
100 years from 1867 to 1961, Dhaka’s population increased by more than 0.3 million from
just over 50,000 to below 400,000 (6.25 times in actual figure). However, in the next four
decades (i.e. 1961-2001) the population in the municipal area increased by around 5
million (4,886,590 to be exact) from below 400,000 to more than 5,000,000 (14.26 times
6 In November, 2011, DCC had been divided into DCC (North) and DCC (South). But since the division has little implication in this paper, it is referred to as DCC. 7 The area of Dhaka mega-city is not officially delineated. Usually, and unofficially, the area under the jurisdiction of the Capital Development Authority (RAJUK), is represented as a mega-city. RAJUK area, spreading over 1528 sq. km (DMDP, 1997), is slightly larger than Dhaka SMA area. Population in mega-city area differs based on sources. UN (2012:7) shows Dhaka mega-city was the 9th largest megacity in the world with population 15.4 million in 2011. Sometimes Dhaka Statistical Metropolitan Area (SMA), delineated by Bangladesh Bureau of Statistics and including DCC, 5 other municipalities and several small town centres, is termed as the mega-city area. Dhaka SMA in its area of 1353 sq. km. (Census, 2001) has 9.67 million people (BBS, 2008). There is another representation of Dhaka as Dhaka Metropolitan area (DMA); the 360 sq. km area under the jurisdiction of Dhaka metropolitan police (DMP). Although DCC and DMA area are used interchangeably but these two areas are not the same.
24
in actual figure)" (Hasan, 2010:246). Low and wet lands started to disappear to make way
for new residential, administrational, business and commercial land uses; slums and
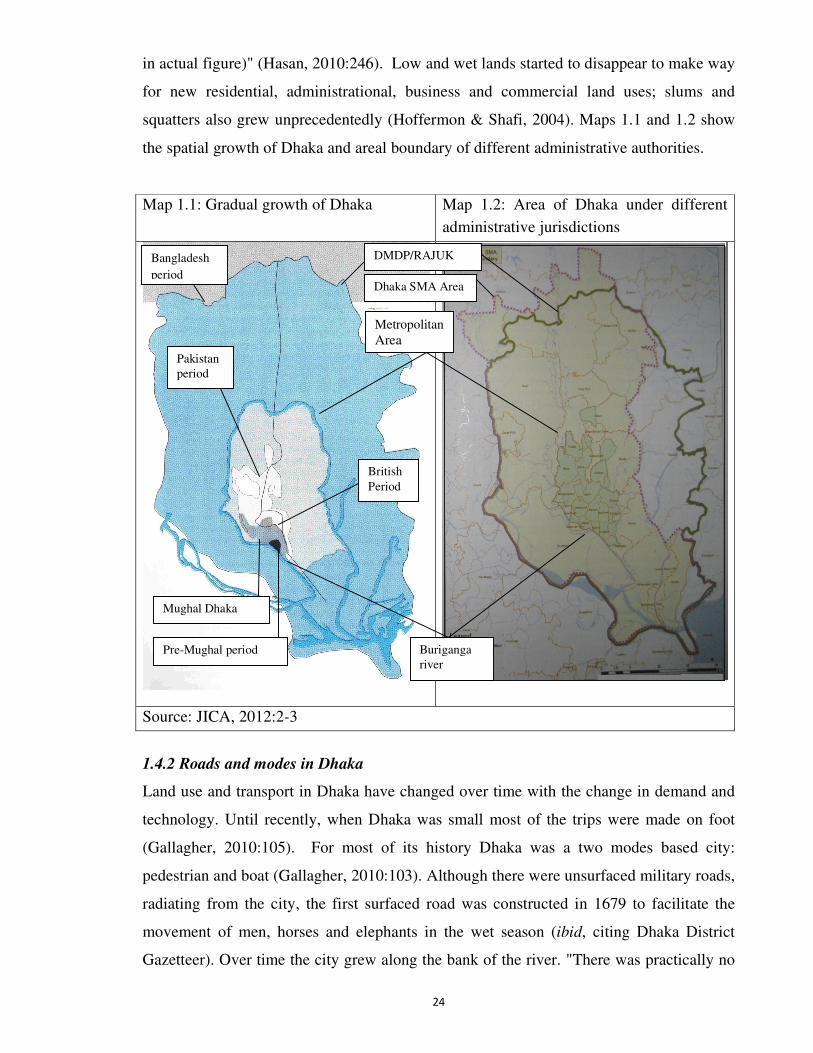
squatters also grew unprecedentedly (Hoffermon & Shafi, 2004). Maps 1.1 and 1.2 show
the spatial growth of Dhaka and areal boundary of different administrative authorities.
Map 1.1: Gradual growth of Dhaka Map 1.2: Area of Dhaka under different
administrative jurisdictions
Source: JICA, 2012:2-3
1.4.2 Roads and modes in Dhaka
Land use and transport in Dhaka have changed over time with the change in demand and
technology. Until recently, when Dhaka was small most of the trips were made on foot
(Gallagher, 2010:105). For most of its history Dhaka was a two modes based city:
pedestrian and boat (Gallagher, 2010:103). Although there were unsurfaced military roads,
radiating from the city, the first surfaced road was constructed in 1679 to facilitate the
movement of men, horses and elephants in the wet season (ibid, citing Dhaka District
Gazetteer). Over time the city grew along the bank of the river. "There was practically no
DMDP/RAJUK
Area
British
Period
Pakistan
period
Pre-Mughal period
Metropolitan Area
Mughal Dhaka
Dhaka SMA Area
Buriganga
river
Bangladesh
period
25
vehicular traffic, which explains the narrow and meandering road network" (ibid:103).
James Taylor, a surgeon, in his book 'A sketch of the topography and statistics of Dacca'
(published in Calcutta in 1840) commented that "Dhaka's roads were extremely narrow
and crooked, and only a few, which were widened by Mr. Walters about ten years ago [i.e.
1830], are wide enough to admit a wheeled conveyance passing through them" (ibid: 104).
By the mid-19th century horse carriage became a widely used mode by the rich. But,
"often driven by mere boys", they were a menace to the pedestrians causing serious
accidents almost in each week (Ahmed, 1986:20). After the First World War cars
appeared first in Dhaka and by 1947 they were 4,400 in number (Gallagher, 2010:104). By
1971 there were 17,000 motor vehicles in Dhaka of which one-third were cars and jeeps,
one-quarter were motor cycles and 80 were private buses (ibid:104). Rickshaws were first
introduced in 1930s and like horse-carriage and motor car they were also imported from
Calcutta; by 1971 they were 20,000 in number (ibid:105). After the independence of
Bangladesh in 1971, both MT and NMT have increased exponentially. In 2012, the total
number of registered MTs was just over 0.7 million including 0.255 million private
vehicles (182,000 cars and rests are jeeps), 0.3 million motor cycles, 40,000 trucks, 10,000
taxis, 20,000 auto-rickshaws/CNG three wheelers and only 20,000 buses and mini buses
(BRTA, 2012). But the number of rickshaws was always high; Dhaka remains the
"rickshaw capital of the world" (Karim, 1992) currently with an unofficial estimated figure
of 1.1 million (Daily Star, 2012).
Today Dhaka is a mega-city and new transport alternatives are being sought and
introduced. In such a context old modes are thought to be outdated or unfit to serve the
needs of the city (Gallagher, 1992, 2010). Rickshaw bans/restrictions are the first and
immediate consequence.
But the current land use and transport infrastructure are not ready to accommodate new
options. Most of the DCC area is built up and highly dense. Only 10% of the total DCC
area is occupied by roads/railways8. Based on a 1998 estimate, Alam and Habib (2003)
8 Citing a Strategic Transport Plan (STP) internal paper, Hoffermon and Shafi (2004:3-2) show that in DCC area land uses like residential, commercial and industrial, administrative and institutional, roads and transport and lastly open space contain 45%, 15%, 20%, 10% and 10% of total land respectively. In another estimate and categorisation, JICA (2010: 3-21) states that land use distribution in DCC is as follows: housing 40.31%, commercial 3.9%, industrial 1.85%, mixed use 3.72%, public facilities 7.10%, road/railways 9.34%, park/play ground/urban green area 1.09%, restricted area/brick field 16.10%, cultivated land/open space/ forest 7.69% and swamp/marsh/char (small river island)/water bodies 8.90%.
26
calculates that lengths of primary, secondary, collector and access roads in DCC area are
199 km, 109 km, 52 km and 2540 km. In fact, over the years the length of primary and
secondary roads has increased negligibly in Dhaka due to little scope for building new
roads without disturbing the existing land uses (Khan & Mitra, 2010). Maps of road
network in Dhaka in 1994 (Appendix A, Map A.1) and in 1998 (Appendix A, Map A.2)
also support the statement. Rahman (2008) shows that from 1995-2005, there was a 5%
addition in road length in Dhaka, while population and traffic increased by 50% and 134%
respectively. It should be mentioned that public buses ply on the primary and most of the
secondary roads. So the area served by public buses is also very limited. Until recently
rickshaws used to ply on most of the roads, except one primary road (airport road). But
recent interventions in the Dhaka roads call for making most of the primary roads off limit
for rickshaws. As the maps in appendix A show that primary roads compartmentalise the
city in several segments, restricting rickshaws, the most widely used mode in Dhaka, in
those roads - without adequate openings for them to continue movement - is most likely
to make rickshaws marooned in some islands or pockets in the city and increase break of
journey of the users.
However, still Gallagher (2010:110) thinks that maybe solutions are in the existing pattern
and condition: " 'urban transport problem' is as old as Dhaka itself. ... Even in the 1830s
roads were insufficient ... Yet those roads in old Dhaka are still operating today with the
same (limited) width and traffic still manages to get through, one way or other. .... Some
of the responses to ... transport problems... have echoes today- for example, the costly
proposals to widen roads... (then it was Islampur Road in Old Dhaka; today it is flyovers
and expressways); a bias towards investing municipal funds in better-off neighbourhoods;
and the general reluctance to raise the taxes to pay for transport improvements".
1.4.3 Mess in mobilities and importance of rickshaws in Dhaka
As far as transportation problems are concerned Dhaka is not an exception amongst Asian
cities and other cities in the developing world; traffic jams, inadequate and uncertain
public transport, no road hierarchy, lack of road safety, excess/unregulated fares (in taxis,
CNGs, para-transits), excessive crowding in public buses, haphazard on-street parking etc
are everyday experiences (Khan & Mitra, 2010). Although roads are jammed with private
cars, along with rickshaws, the luxury of car trips is limited to a few citizens. Every day,
27
in peak hours, people are seen fighting to place their foot in the buses. Of course, women
do not participate in the tussle; are compelled to opt for motorised three wheeler, CNG- at
least at double the fare. Rickshaw-wallas utilise the opportunity by asking for
unreasonable, sometimes 'annoying' (as has been said by an interviewee during the field
survey) fares. Children, going to school and their escorting guardians, mainly mothers live
a nightmare on their way to and from schools. The same is true for aged, diseased persons.
And these problems are exacerbated by rapid growth of population and unregulated land
use development (Khan & Mitra, 2010) .
In such a situation several hundred thousand rickshaws play a vital role in keeping the
citizens mobile. Any visitor to Dhaka is certain to be stunned by the overwhelming
presence and extensive use of rickshaws (Kalabamu, 1987). In fact, there is no accurate
estimate of the number of rickshaws in Dhaka (STP, 2005a:7). DCC stopped providing
licenses to rickshaws in 1979 when the number of licensed rickshaws was 79,5549. But the
number of rickshaws kept growing10. Unofficial estimates place the figure between a
minimum of 0.8 million in 2005 (ibid) and a maximum of 1.1 million, with one million
considered illegal, in 2012 (Daily Star, 2012, quoting DMP Traffic Commissioner). The
volume of passengers transported are equally stunning, with 7.6 million person-trips per
day in 2009 (JICA 2010:3-15), close to double the highest number of passengers carried
(4.4 million) by London Tube in a single day during the 2012 Olympics (Metro, 2012).
This implies a significant growth from the late 1990s when the estimate was between 2.6
and 3.5 million passengers per day (Kalabamu, 1987).
Rickshaw trips are also overwhelming when compared to other modes of transport in
Dhaka. In 2009 out of 19.58 million daily trips in DCC, the modal shares for rickshaws,
car, foot and public bus were 38.7%, 5.2%, 19% and 28.5%, respectively (JICA, 2010;3-
15)11. For a household, trip rate (measured as number of trips/household/day) for
rickshaws (2.9) is more than one-third of the average household trip rate (8.5) (STP,
9 Additional ones were released in 1986 raising the number of licensed rickshaws and vans to 90,000 (Gallagher, 1992 and interview with a DCC official of the Wheel Tax Department in charge of rickshaws, vans etc on the 2nd July, 2012). 10 DasGupta (1981:15) citing Rashid, Police Commissioner, Shankland Cox and Partners' report, Holiday (a now defunct weekly newspaper) report the number of rickshaws as follows: 45,000+ (1978), 81,000 (1979), 50,000 (1979) and 100,000 (1980). He shows an interesting diagram of positive association between growth of population and numbers in rickshaws in Dhaka. After 1990s, DITS, (1994:43) states the number of rickshaws to be 150,000- 200,000. Strategic Transport plan (STP, 2005b:17) estimates the number between 0.4-0.6 million in 2004. 11 Over the decades the share of rickshaw trips remained around one-third of total trips. In 1980, the composition was: foot- 21%, rickshaw-34%, bus-34%, auto rickshaw-4% and car-6% (Midgley, 1994). In 2004 the figures were- rickshaw-34%,, public transport-44%, foot-14% and car (plus auto-rickshaw, motorcycles, etc.)-8% (STP, 2005:2-26).
28
2005b). By contrast the household trip rates for car12 is a mere 0.7 and for bus and on foot
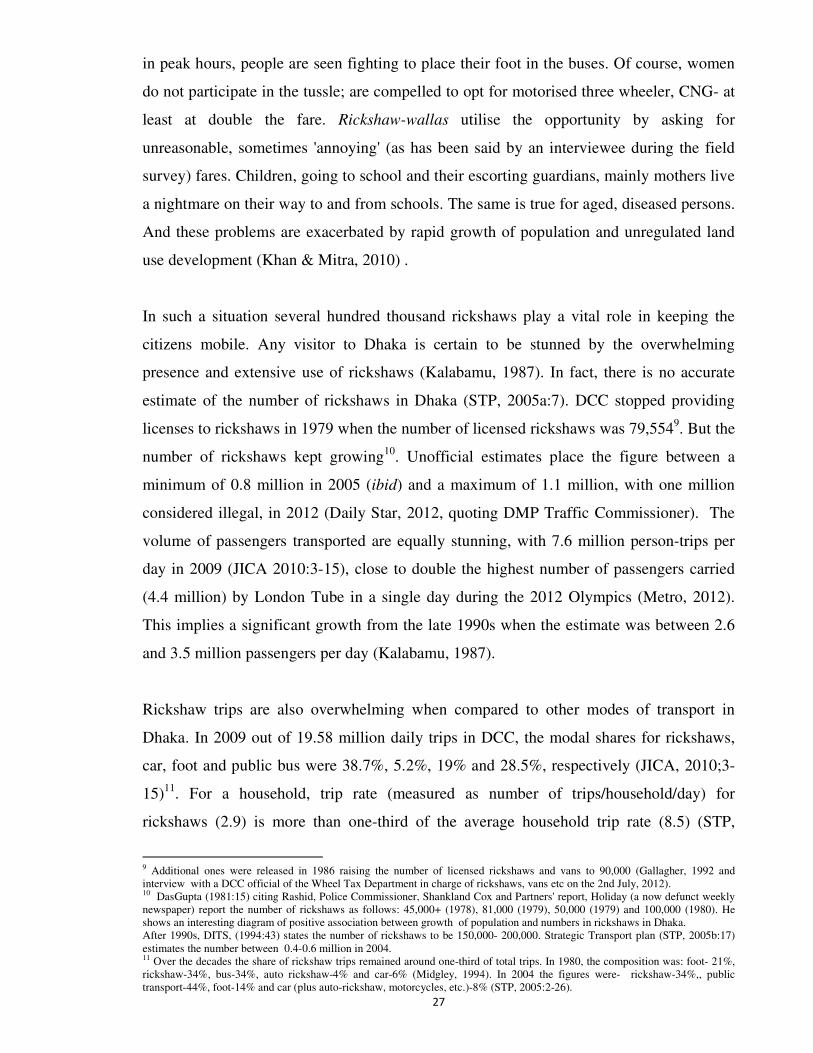
3.7 and 1.2, respectively (STP, 2005b). Although there is a difference in trip length among
low (7.3 km), medium (7.8 km) and high (8.4 km) income households13 (JICA 2010, 12-
7), Figure 1.1 shows that in 2009 rickshaw trips were vital for all household income
groups; rickshaws were the single largest mode used by each group. Similar proportions
were registered for 2004 (STP, 2005a:12).
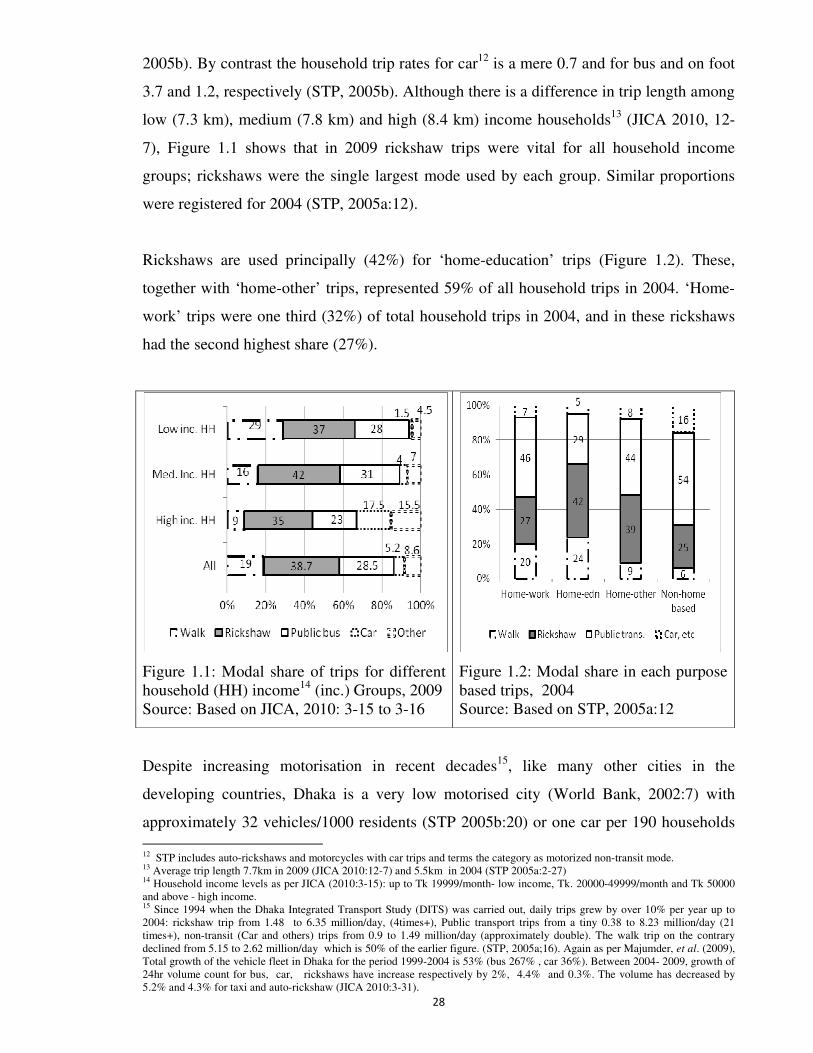
Rickshaws are used principally (42%) for ‘home-education’ trips (Figure 1.2). These,
together with ‘home-other’ trips, represented 59% of all household trips in 2004. ‘Home-
work’ trips were one third (32%) of total household trips in 2004, and in these rickshaws
had the second highest share (27%).
Figure 1.1: Modal share of trips for different household (HH) income14 (inc.) Groups, 2009 Source: Based on JICA, 2010: 3-15 to 3-16
Figure 1.2: Modal share in each purpose based trips, 2004 Source: Based on STP, 2005a:12
Despite increasing motorisation in recent decades15, like many other cities in the
developing countries, Dhaka is a very low motorised city (World Bank, 2002:7) with
approximately 32 vehicles/1000 residents (STP 2005b:20) or one car per 190 households
12 STP includes auto-rickshaws and motorcycles with car trips and terms the category as motorized non-transit mode. 13 Average trip length 7.7km in 2009 (JICA 2010:12-7) and 5.5km in 2004 (STP 2005a:2-27) 14 Household income levels as per JICA (2010:3-15): up to Tk 19999/month- low income, Tk. 20000-49999/month and Tk 50000 and above - high income. 15 Since 1994 when the Dhaka Integrated Transport Study (DITS) was carried out, daily trips grew by over 10% per year up to 2004: rickshaw trip from 1.48 to 6.35 million/day, (4times+), Public transport trips from a tiny 0.38 to 8.23 million/day (21 times+), non-transit (Car and others) trips from 0.9 to 1.49 million/day (approximately double). The walk trip on the contrary declined from 5.15 to 2.62 million/day which is 50% of the earlier figure. (STP, 2005a;16). Again as per Majumder, et al. (2009), Total growth of the vehicle fleet in Dhaka for the period 1999-2004 is 53% (bus 267% , car 36%). Between 2004- 2009, growth of 24hr volume count for bus, car, rickshaws have increase respectively by 2%, 4.4% and 0.3%. The volume has decreased by 5.2% and 4.3% for taxi and auto-rickshaw (JICA 2010:3-31).
29
in Dhaka city (Majumder, et al., 2009). Moreover, the DCC area is very dense, already
built up with organic (unplanned) land use development16. It is argued that the rickshaw is
perfectly suited to be the main mode of transport in this context (Kalabamu (1987:129).
Majumder and his colleagues (2009) observe that rickshaws are more effective in short
distance travel. In fact, the average trip length for rickshaws was 3.81km in 2004 (STP
2005a:2-27) and 3 km in 2009 (JICA, 2010:4-15) - i.e. nearly half the average trip length
(see Footnote 13 for the average trip length). STP (2005b:17) states that "inadequate and
disorganised public bus" has resulted in rickshaws filling the "vacuum created and...
become a popular transport among the middle and lower middle class population".
Although for STP rickshaw users seem to be restricted to a single class, for JICA (2010:3-
31) all "residents are highly dependent on non-motorised transport particularly rickshaw".
1.5 Contribution to knowledge
In short, the contribution of this research includes (i) development of a framework
combining disparate fields of literature from social justice, politics and mobilities; (ii)
drawing attention to the donor influenced, investment driven, motorisation oriented wrong
transport planning in Asian and other developing cities, in general and (iii) in particular,
illustration of unequal outcomes (benefits and burdens) of rickshaw (or NMT in general)
bans in Dhaka, and bringing the associated biased process and 'glocal' (global and local)
politics to light.
Social justice, and equity, is a growing conceptual and practical concern in the field of
development. Disciplines in social science like law, political science, geography, public
policy, development studies are increasingly responding to it; but disciplines like urban
and transport planning and engineering are lagging behind. This research seeks to
contribute to reduce the gap between theory of social justice and practice in planning and
management (of urban transport).
As far as rickshaw is concerned, this research is a pioneering one to bring to light the
unjust distribution of benefits and burdens of ban decisions at the household or user level
16 Zacharias (2005) shows, comparing European and American examples, that rising income does not always result in an increased MT use. Again Kenworthy et al. (1997), Cervero & Kockelman, 1997, Zacharias (2012) suggest urban density, local arrangement or land uses and road infrastructure have an important role in the use of public transport and NMT (cycling, walking). Again, Khisty (2003) observes person-miles traveled increases with city size ( quoting Zahavi) and consequently MT trips increases; the more compact the city is the greater the probability of NMT use. Khisty also shows while limiting distance for walking in developed countries is 0.4km, in developing countries it is 2km and same figures for bicycle is 1.5 km and 9 km respectively.
30
in Dhaka. More importantly, most of the transport literature on rickshaws and all policy
papers and strategies regarding transport in Dhaka, show the importance of rickshaws
mainly, if not only, from the perspective of livelihood of the poor rickshaw-wallas, i.e.
surprisingly and unfortunately not from the context of the rickshaw users in the city. But
the strength of the research is its investigation into the household units. While some
relevant global and local literature on motorised and non-motorised mobility have carried
on-streets surveys, this study did the same at the scale of the household to capture the
individual and collective responses and impact of the planning decision. It is worth
mentioning that in many cases the on-site respondents are neither residents nor directly
affected by the transport planning interventions; but the households in the intervention
areas have direct experience- good or bad - of it.
Finally, this research has vividly exposed the existence of anti-NMT politics in Dhaka
involving business, bureaucratic and others interests of global and local actors realised via
various (formal and informal) processes and forms. It also discloses the failure of 'expert'
prescribed, donor influenced, and recipient (of foreign loans/grant) chosen 'one size fits
all' type of traditional transport solutions. Thus it joins the gradually growing list of
literature urging a rethinking of auto-based approach to urban mobility with the empirical
contribution from the context of a rapidly growing Asian city.
1.6 Scope and limitation of the research
Differentiating mobility and mobilities, the research goes beyond a traditional planning or
engineering definition of mobility (dealing only with distance, time, frequency); borrows
the broader concept of mobilities (that includes existing and potential mobilities in
different destinations for different purposes, process of decision making regarding
mobilities by planning and other agencies, and associated factors and motivations, termed
as politics of mobilities ). Then it has looked into the mobilities of the surveyed
respondents and their households in the context of rickshaw ban/restriction in Dhaka. A
limitation from a methodological perspective arises due to a disproportionate distribution
of female (20%) and male (80%) respondents. So, relevant interpretations have to be
considered keeping in mind this bias17.
17 However the bias was unavoidable during fieldwork in 2012. The household survey was done on randomly selected households. The respondent from the households was whoever came from the household to respond. The survey was mostly done in the weekend when male members used to be at home. And in the context of Bangladesh, it is the adult male member who speaks to a stranger first.
31
It must be admitted that rickshaw bans/restrictions are associated with other issues:
effects on the livelihoods of the rickshaw-wallas and the question for a just transport
solution for Dhaka. These issues are matters of research in their own right. However, since
this study is about mobility and looks at it from the user's side, the livelihoods of the
rickshaw-wallas are not within the purview of it. Similarly, since it investigates the just or
unjust impact of a decision to ban/restrict rickshaws on (urban) mobilities and does not
search for a holistic answer to the question of achieving a just transport system, answering
the question "what could be possible and just alternative to rickshaw based mobilities" is
beyond the scope of the research. Similarly, measuring the degree or level of injustice in
the current scenario of mobilities in Dhaka is beyond the scope. It only explores the
aspects and forces potentially causing unjust mobilities. Finally, it must be mentioned that
this study is not about transport but mobility - of which transport is argued to be a factor
(producing or serving mobility). Therefore, the study is not even about transport planning
solution(s) for Dhaka, nor seeks to answer if in the long-run rickshaws should be there or
not. Rather, the main concern of the thesis is differential effects on the activities (resulting
mobility) of the citizens after the rickshaw bans and restrictions; the way the decisions are
taken; the difference in the explicit (as said) and implicit (as argued in this research)
motivational politics.
1.7 Organisation of chapters
This dissertation consists of seven chapters. Having introduced the research problem, the
case study city - Dhaka and case study in the first chapter, the methodology of the research
and along with its epistemological position are discussed in the second chapter. The
second chapter describes the methodology18 of the research and also provides a profile of
the study area: locations, respondents and households, with respect to the whole Dhaka
city, if and when required and possible. The theoretical basis of mobilities, justice and
politics are reviewed in the next, third chapter. It also discusses the principles of justice in
transport planning, politics of mobility to provide a basis for the development of a just
mobilities framework. The fourth chapter has sought to achieve the first objective. After
drawing on the need and justification for the framework, the just mobilities framework
has been developed; a set of guiding questions has also been identified with regard to
18 Usually methodology comes after the literature review chapter i.e. third chapter in this dissertation. But the first objective of this research i.e. development of a just mobilities framework is very much literature dependent. Therefore, for ease in reference and continuity methodology chapter is put before the literature review chapter.
32
distributive, processual and motivational (politics) components of proposed
conceptualisation of just mobilities. Distributional aspects of mobilities on different socio-
economic and demographic aspects of respondents and households after the
bans/restrictions are presented based on the field work, 2012 in the fifth chapter. Then
comes chapter six. It provides a discussion of the process of the ban/restriction decisions
and an analysis of politics behind it. The final chapter contains a summative discussion on
the nature of mobilities, just or unjust, in Dhaka. It makes a brief revisit to the objectives
and relevant findings of the research and finishes with an indication for further research.
1.8 Introducing and operationalising terms used
A couple of local terms like rickshaw-walla, rickshaw-malik have been repeatedly used in
this research. Since some English equivalents of these terms exist, the use of local terms
requires explanation in the onset of the research.
The term rickshaw originates from a Japanese word Jin-riki-sha which means human
powered vehicle (Gallagher, 1992:25). Rickshaw is a non-motorised vehicle operated by a
person. It usually carries two passengers. There are two types of rickshaws: two-wheeled
and three-wheeled. Two wheeled rickshaws are seen in some parts of Kolkata, India and in
very few tourist spots around the world including Japanese tourist spots. These are drawn
or pulled by a person. In fact, the term Jin-riki-sha was originally applied to hand-pulled
rickshaws which were widely seen in Asian cities in the 1920s and 1930s (ibid:25). And
perhaps, this is the reason for developing the English term 'rickshaw puller' to refer to the
rickshaw-driver/operator.
But in Bangladesh only three-wheeled rickshaws, also called cycle-rickshaws, are seen.
They are also seen in many Indian cities and in some cities in developed countries (mainly
for the tourists). These cycle-rickshaws are pedalled like cycles. So, appropriate English
term to refer to the cycle-rickshaw driver could be rickshaw pedaler. However, instead of
using the term rickshaw pedaler this research has used the locally used Bangla language-
based term rickshaw-walla.
In Dhaka most of the rickshaw-wallas do not have rickshaws of their own. They rent it
from the owners on shift basis-day or evening shift or both. In Dhaka, and also in other
Bangladeshi cities, rickshaw business is garage based. The owner of the garage owns
33
rickshaws, sometimes numbering as high as 100 or even more. Garage owners also
provide non-resident or seasonal rickshaw-wallas with slum like accommodation and two
meals (lunch and dinner). These garage owners are called rickshaw malik in local terms.
This research has used both the terms- rickshaw-malik and garage owners interchangeably.
To avoid confusion over the use of several terms- mobility, mobilities, distribution,
process and politics, in the operational framework of unjust mobilities a brief note is
required in the very beginning; details are discussed in chapter three and chapter four. This
research is about mobility. However, the very conceptualisation of mobility has
experienced a paradigm shift particularly in social sciences and gradually in technical
disciplines like planning, engineering. It is being said that mobility is a complex and
multidimensional phenomena; beyond simple representation of trip, distance and
frequency. Therefore a new key word mobilities is introduced and used in the relevant
literature (Sheller & Urry, 2006a; Kaufmann et al., 2004). This research on urban mobility
also agrees with the new paradigm of mobilities.
Social justice, or injustice, is a fundamental theme of this research. However, just or unjust
mobilities is understood not in a legal term; rather three aspects - distribution of outcomes,
process of decision making or planning and motivations behind the decisions are pivotal in
the framework developed. These three aspects are often briefly termed as distribution,
process and politics in this research.
The activities of the household members are divided into two categories: time-bound
(routined) and time-flexible (other). Examples of time-bound (routined) activities are
going to school, for regular job etc. These activities are done regularly (in most cases at 4/
5 days a week) at specific times. While examples of time-flexible (other) activities are
going for shopping, recreation, visiting relatives etc. i.e. such activities are very common
but not done exactly at the same time of the day or week. (See also footnote 36 for further
clarification and for implications of this categorisation for studies involving social justice
in mobilities).
34
Finally it should be mentioned that Bangladeshi currency Taka (Tk.) has been mentioned
several times in the following chapters. It has been mentioned in current units. One US
Dollar is equivalent to Tk 77.75 and one British pound is equivalent to Tk. 115.8519.
19 As per http://www.xe.com as on 7th July 2013
35
Chapter 2
Methodology and profile of the study area
2.1 Introduction
This chapter illustrates the process and method used to achieve the objectives of the
research. It also outlines the nature of the research and epistemological position of the
author. It should be mentioned that the first objective - to develop a just mobilities
framework - is based on the review of relevant literature on social justice and mobilities.
While the second objective of the research is sought mostly by using the results of a
questionnaire survey, the last objective is sought by using the findings from the semi-
structured interviews and literature. After explaining the fieldwork, a profile of the studied
areas is added which puts light on the locations, respondents and their households and
activities (requiring mobility) done by the respondents and household members. The
profile is supplemented by relevant data and information for the DCC area or greater
Dhaka.
2.2 Positioning the research
Scientific reasoning fundamentally starts with a positivist approach of asking question,
investigation and reaching the 'truth' based on the findings. Mobility studies in the field of
transport planning and engineering are examples: deductive 'logical frame' with an
objective epistemological stance, mechanistic philosophy and 'atomist' or 'realist' social
ontology; applied on a static temporal framework; to make generalisation, prediction or
casual explanation of the variables/data collected by surveys or interviews of samples
(representative of a large population) and analysed by quantitative tools20. On the other
hand, social science studies on mobility are usually done with an interpretivist or
'humanistic' approach: inductive 'logical frame' with a subjective epistemological stance
and teleological/intentional philosophy and 'structural'/constructivist social ontology;
applied on particular theme or motif with a processual/historical time frame; to make an
understanding or social critique of small population (with or without sampling) observed
through participant observation, interactive interviewing, introspection.
Until recently two types of transport studies proceeded almost in parallel, with little
exchange and penetration of each other. However, as no socio-natural knowledge is
20 For details of the difference between the positivist and 'humanistic' approaches see Aunger (1995)
36
ultimate and neutral, there should always remain scope for 'either/or, or black/white'
thinking (Ryan 2006:16). So, challenges to positivism emerge in complex social contexts
while facing the conflicting and or multiple meanings of truth through (absolute) ability
of (and confidence in) science (Williams & May, 1996). In fact, disciplines and
movements in social change like feminism, post structuralism, critical psychology,
anthropology, ethnography, as well as the knowledge of Eastern, Asian and indigenous
societies, "who see all events and phenomena as interconnected", have been critical of
positivist epistemologies (Ryan, 2006:16). The same wave of reorientation is observed in
transport, especially in mobility studies21. Town (1981) observes that sociological
transport research must be distinguished from descriptive social research- while the latter
is limited to the account of social impacts, the former is characterised by the analysis of
travel patterns in given social, political, economic and institutional constraints. In fact,
while descriptive social research in transport accepts the trips as given, sociological
research asks the basic question about why and how trips are made; plus a sociological
approach differs from a social one in the sense that it analyses transport and traffic-related
social data in respect to the relative economic and political assets of social groups and
classes, as well as their conflicting (or merging) interests (Vasconcellos, 2001:33)
Therefore, having started from a positivist thinking, the study has gradually and ultimately
positioned itself within the sphere of 'post-positivism' (Creswell, 2009:6). In fact, the
motivation for this research partially comes from the very experience of the researcher -
while living, studying and working there - regarding the mobility problem in the city of
Dhaka. While, on one hand, the local knowledge has been complementary to explain and
elaborate some dynamics, it could have also generated bias obstructing 'open-minded'
research. As any epistemological approach, whether positivist or relativist, is inevitably
biased by the researcher’s previous background and beliefs (Berg, 2004), a middle ground
between those is sought to conduct the research with care and concern for validity,
reliability and authenticity.
Therefore, a part of my research consists of objective representation of field data with
emphasis on quantitative representativeness (to avoid any numerical bias or anything so
arising from the nativity of the researcher). But the question is 'not about being either
21 For details see section 4.2.1
37
subjective or objective' to answer the research problem, nor the author has inclination to
one over the other. While the quantitative analysis provides an overview, the qualitative
investigation digs into the depth of interpretation of the incidence, experience and
meaning. Plus "adherence to" several "discourse[s]" of justice and mobilities, the concern
with power and politics, the value of narrative or experience of the local stakeholders,
acknowledgement of the "need to be reflexive" (Ryan, 2006:22) in this study has made it
worthy of qualitative research. Again, post-positivist research is not essentially problem
solving, it can be about problem setting – coming up with the right questions which may
themselves lead to empirical research (Ryan, 2006:19). This statement also goes in line
with the research questions and findings of this research.
Thus, as far as method is concerned, this is a mixed method22 research which has been
found to be essential to understand the 'multiplicity and complexity' of the problem. Based
on an extensive literature review a proposition, named just mobilities, has been developed.
To apply a part (distributive justice) of the proposed framework of just mobilities,
sampling (both for studied localities and interviewees) is done followed by a modest
qualitative analysis. This 'logical form' in this research is closer to deductivism due to the
complexity of an extensive theoretical articulation in the literature and just mobilities
framework developed (first objective). Then the predominant 'how' (decision making) and
'why' (motivation or politics) nature of the research to understand the processual justice
part of the theory (incorporated in second and third objectives) leads the research to
undertake a semi-inductive logical form and frame. Thus, as far as a 'temporal framework'
is concerned it mixes both the 'static' (to understand the distributive effect of the rickshaw
bans and restrictions) and 'processual' (to understand the process of and motivation behind
the decisions) ones. Moreover, the ‘how' and 'why’ nature of the research makes it close
to the intrinsic nature of a Case-Study research, whereas the analytical method of selection
of the sample areas, sample for questionnaire survey are good attributes for quantitative
investigation.
2.3 Justifying the case
As has been stated in the first chapter, mobility for the citizens of Dhaka involves a
stressful condition with almost all possible problems found in the developing and rapidly
22 See for details Bryman, 2008, 2006
38
urbanising and motorising cities in developing countries. Whereas rickshaw as a transport
mode is one of the prime movers of citizens, the decision to ban and restrict their
movement is hypothesised to affect the revealed and potential mobilities of the users.
Moreover, in a city where public transport is under-developed and private car ownership is
much low, the decisions are further hypothesised to be taken with a complex motif and
interest. So to study the distributional effects of a planning decision on the mobility of the
citizen plus process and motivations of the decisions, i.e. justice or injustice in one word,
the case of rickshaw bans and restrictions is very appropriate. Besides, during the period
of an increasing focus on NMT, studying rickshaws as non-motorised public transport
(NMPT) in cities like Dhaka and understanding mobility in the city with and without
rickshaws are essential. This also justifies studying rickshaws using the just mobilities
framework developed in the research.
2.4 Justifying the case study areas
2.4.1 Study areas
Initially in 2002 DCC had a plan to ban rickshaw movement in eleven major
roads/corridors in the city (Efroymson & Bari, 2005; see map 6.1). It started the
implementation of the plan by banning rickshaws from Russell Square (located within one
study area - Shukrabad) to Gabtoli section of Mirpur road corridor (see Map 2.1 and Map
2.2). Afterwards DCC banned rickshaws in the whole Mirpur road and partially in several
other corridors (HDRC, 2004; New Age, 2005a). Later on DCC retreated from
implementing the whole plan due to popular uproar and other reasons (Bari
and Efroymson, 2005b). But after DCC, now there is DMP who restricts rickshaw
movement along and in the vicinity of some busy intersections. The research studied both
the old ban and the new restriction areas.
A multistage spatial sampling has been followed to identify study areas. The stages
included identification of (i) rickshaw banned/restricted roads or corridors, (ii) early
banned and recently banned/restricted roads or corridors, (iii) presence/absence of
restriction on rickshaws in the secondary/connecting roads and (iv) similar areas from new
and old ban areas.
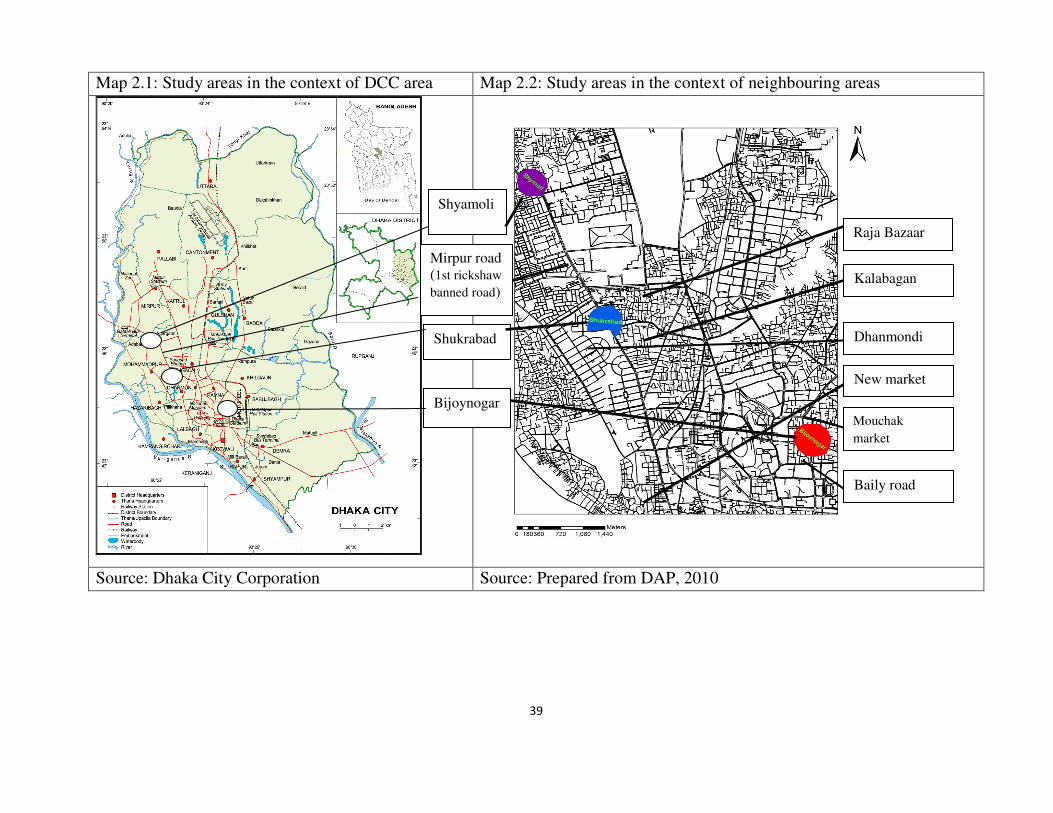
39
Map 2.1: Study areas in the context of DCC area Map 2.2: Study areas in the context of neighbouring areas
Source: Dhaka City Corporation Source: Prepared from DAP, 2010
Shyamoli
Shukrabad
Bijoynogar
Mirpur road (1st rickshaw
banned road)
Baily road
Mouchak
market
New market
Dhanmondi
Kalabagan
Raja Bazaar
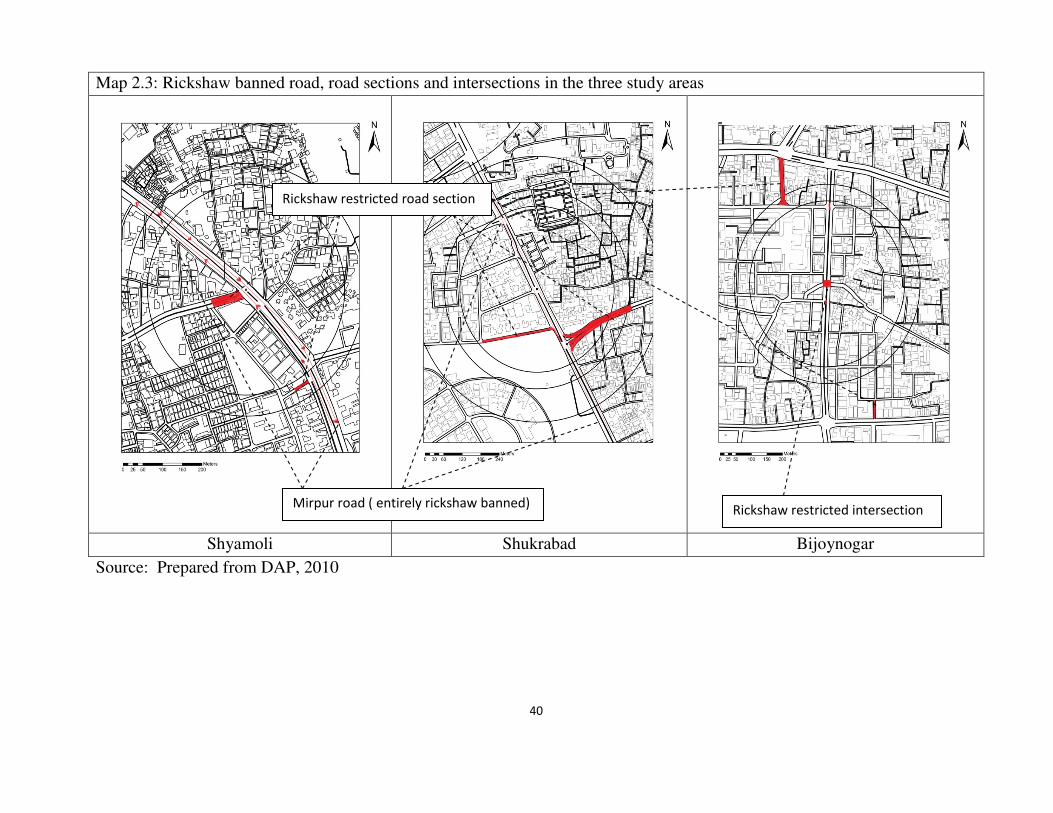
40
Map 2.3: Rickshaw banned road, road sections and intersections in the three study areas
Shyamoli Shukrabad Bijoynogar
Source: Prepared from DAP, 2010
Rickshaw restricted road section
Mirpur road ( entirely rickshaw banned) Rickshaw restricted intersection
41
Three areas - Shyamoli, Shukrabad and Bijoynogar, in DCC area have been selected for
the study (see Map 2.1 and Map 2.2). Out of 90 wards in DCC, Shyamoli is in ward 49,
Shukrabad belongs to ward 28 and ward 29 and Bijoynogar is in ward 36. The first two
areas are along the Mirpur road- the first corridor facing a rickshaw ban since 2002 (see
also Map 2.3). The last one is a recent rickshaw restricted area. Users and locals informed
during field survey that in Bijoynogar restrictions in different intersections started since
early 2011. But restrictions were withdrawn in the next month after public and press
uproar. Later on since the end of 2011 the restrictions were imposed again and so far have
remained permanent in Bijoynogar. Map 2.3 shows that in Shyamoli and Shukrabad
Mirpur road is totally restricted for rickshaws; besides there are a couple of rickshaw-
restricted intersections in all the three study areas.
2.4.2 Why three study areas
The main reason to take three study areas is to understand if there is any variation in the
mobility and or if problems created by the withdrawal of rickshaws are related to the
length of the interventions. Apart from the difference in the duration of bans/ restrictions,
the study areas also differ with respect to nature of bans/restrictions along the road:
Shyamoli and Shukrabad experience ban along the entire major road corridor (Mirpur
road) while Bijoynogar faces restriction on rickshaw movement in the intersections. Apart
from these differences, the areas are similar with respect to -
(i) Road type: All areas are on major roads serving public buses. It should be mentioned
here that in Dhaka public buses ply only on some major roads; not in secondary or tertiary
roads where less road width, strong presence of other type vehicles, indiscriminate onsite
parking of car make the space and scope too little for buses to ply on. All three areas are
served, although too limited to match the demand, by public buses.
(ii) Building type: All types of buildings are present in all three areas. Builidng types
include high and low rise, private and real estate developer built apartments of different
size.
42
(iii) Proximity to major activity centres/CBDs: The first two areas are close to Karwan
bazar - a commercial and retailing hub; New market- a shopping hub; Dhanmondi- a
vibrant hub of educational, commercial, service, residential and recreational/cultural land
uses and activities. Last one, Bijoynogar, is close to Motijheel- a major CBD/commercial
hub; Mouchak-Baily road, Baitul Mokarram area- vibrant shopping attraction;
Segunbagicha-Bailey road area - a hub of mixed land uses like residential, office,
cultural/recreation ones.
(iv) There is no slum in any study area23, although one third of the people in Dhaka live in
slums containing 11% of total land devoted to residential use (CUS, 2006). This is mainly
because the study areas are typical middle class areas24 in the city. Since these areas are
close to CBD, land value is high, land uses are dense and areas are mostly built up. So,
slums are not located exactly within the premise of these study areas.
The other reason for selecting three study areas is to understand if there is any difference
in the mobility pattern of the users in areas where secondary roads have/do not have
restriction on rickshaws. Shukrabad is almost rickshaw restricted area as only one
secondary road is open for rickshaw (see Map 2.3). For other roads passengers have to
leave rickshaws around 250 metre before the intersection. But in the case of Shyamoli
rickshaws can come as close to the intersection with major road. In both cases no rickshaw
can cross the intersection. So they have to take a u-turn with or without passengers in the
reverse direction; if police/ traffic warden do not allow them to stay there, to maintain
traffic order or to restrict a jam of rickshaws which eventually spread in the major road in
some cases. Bijoynogar case is interesting as here one intersection and one secondary road
are restricted for rickshaws (see Map 2.3) .
23 However, slums are found in locations close to these study areas. But during the reconnaissance survey, none of the respondents mention that they are either coming from going to any slum which could be their living or activity area. So exclusion of slum is not suppose to affect the study findings. However, focus group discussion with the rickshaw-wallas reveal that many of them live in the slums- small or big. But they also informed that neither their household members nor most of their neighbours in the slum are rickshaw users - rather they walk. 24 In fact, the study areas are selected on spatial criteria, listed out in the 2nd paragraph of the section 2.4.1; no socio-economic criteria was applied. However, there is a general perception in Dhaka about people living in some areas: Gulshan, Banani, Baridhara, which are planned neighbourhoods, are posh or high income areas; Kalabagan, Moghbazar, Rajarbagh, Elephant road and some other areas including three study areas are middle class areas. The study has only reflected this perception saying that the study areas are middle class areas. It should be mentioned that it has developed no criteria or benchmark for income based classification of citizens in Dhaka. However, later in this chapter car-ownership and other characteristics of the respondents of the households are examined based on the income level defined by JICA (2010), described in Figure 2.5.
43
So it is important to mention that residents in these three study areas cannot use rickshaws
for any activity which is to be done on the other side of the road. However, if they cross
the road on foot, in case of Shyamoli and Bijoynogar they find rickshaws just on the other
side of the road and in case of Shukrabad they have to walk around 250 metre. Since
residents of the area, know the banned/restricted roads/intersections, in case of short
distance trip they walk to the other side and take rickshaws. But non-resident or through
user of the areas face a break of journey. Although residents of the study areas may avoid
break of journey in their localities, but for many others for journeys to other parts of the
city broken journeys are unavoidable; they have to use long distance diverted routes as
rickshaw banned/restricted areas spread almost all parts of the DCC areas.
2.5 The fieldwork
The field work was done in the period between January and July, 2012. While the author
was directly engaged in the data collection, four undergraduate students from the
Department of Urban and Regional Planning (URP), Bangladesh University of
Engineering and Technology (BUET) were recruited to help the author throughout the
period in this regard. Plus required number of part-time assistants were employed to help
the whole team in survey and interview organisations and data input. The team consisted
of both male and female assistants.
In the very beginning the author sat with the four core assistants and briefed them on the
nature and purpose of the research, challenges and ethical issues. When the other
assistants were engaged they also got similar guidelines and had been asked to work only
with any of the four main assistants. The author joined the assistants during data
collection, and made regular inspections to their other activities.
The field work consisted of (A) Reconnaissance survey, (B) Household Survey, (C) Focus
group discussion and (D) Interviews. Each of the questionnaire/checklist of questions for
interview/FGD were tested among the core assistants for their acquaintance with the
questions, difficulties in understanding (if they understood the same what the author
meant). Then the adjusted questionnaire/checklist was tested in the field twice and
necessary adjustments made in questions, words, variables/options. It should be mentioned
44
that for statistical validity 384 sample units25 (128 from each area) were selected (at 5%
confidence interval and 95% confidence level) for household survey as the total
population or number of households were too large. Eventually, 385 households were
surveyed; the number of surveyed households in Shyamoli was 129, i.e. one more from
the required 128.
A. Reconnaissance survey
Initially introductory visits were made in several locations along rickshaw
banned/restricted areas to choose the case study areas. Once the three study areas were
identified, their approximate boundaries were delineated. Plus, the restriction points,
intersections were also visited and several rickshaw users were asked about the origins and
destinations of their trips. It has been found that people (staying in the locality) usually
come to restriction points from less than one-third of a kilometre i.e. residents more than
the distance use the other points for entry to or exit from their residence. Therefore, a
maximum of 350 metre radius from the restriction points are considered for household
survey in each studied location (see maps 2.3 and 2.4 for area covered by 350 metre radius
during survey). It is worth mentioning that there is no slum within 350 metres radius from
any restriction point in any study area nor there was any passenger found either going to
or coming from any nearby slum (see also footnote 23) by rickshaw through the studied
points.
B. Household survey
The survey was done in randomly selected households, one in every 20th households
(housing unit) along the secondary roads in the study areas. An adult person in the
household (male or female) was requested to answer the questions. (In the socio-cultural
context of Bangladesh, most of the time respondents were male) (see also footnote 17).
When the expected house was found having any non-residential use (shop, office etc) or
closed/under lock and key or the respondent refused to take part in the survey the
immediate next household was contacted. Here household means all the persons who live
and eat food cooked in the same oven or stove. The survey was done on weekends or
25 For an unknown population or population size more than 80,000 the statistically valid sample size, at 5% confidence interval and 95% confidence level, is 383 (Source: http://www.surveysystem.com/sscalc.htm, accessed on 16th September, 2013). So, for each study area population size is 127.66 i.e. 128. It means total sample size for three study areas should be 384 (128X3).
45
government holidays or in some cases in the afternoon or evening upon prior
consent/request of a household member.
Maps 2.4a, 2.4b and 2.4c show the location of plots/building of the studied households. It
should be mentioned that household survey has been done along the secondary roads
adjacent to the main/primary road. However, if the land uses along or on roads were found
non-residential - commercial, office, institutional or shipping centres, they were not
considered for the survey. As has been mentioned earlier in subsection A, each study area
is of 350 metres radius which is equivalent to 0.4 square kilometre in extent. The maps
(2.4a, 2.4b and 2.4c) show three rings of 200 metre, 250 metres and 350 metres to show
the locations of households surveyed. Dead end secondary or tertiary roads were not
considered for household survey as rickshaws seldom ply along them; rickshaws were
seen in these roads only when residents or other people come to the houses located along
these dead end roads.
The purpose of the survey was to understand the effects of ban/restriction on the users and
non-users of rickshaws both at household and individual levels. In fact reflection on the
households, not the road user, is one of strengths of this research. It sheds light on the
mobility of the households- both at collective/household level and personal/individual
level. However, the usual transport studies are solely focused on the individual, more
correctly road using individual alone. Mobility studies on Dhaka also mostly surveys the
road users or outdoor respondents and therefore miss the impact of rickshaw
bans/restriction on the households. The World Bank Study by Zohir et al. (2008) on
improving mobility from a gendered perspective is an example.
But it must be mentioned that experiences of the through users of a road or intersection
affected by rickshaw bans/restrictions are important for conceiving the effects at
household level. To include such experiences, the questionnaire has been designed with
questions about the next journey, availability of modes, break of journey and associated
problems, if the respondents do not use rickshaws for the entire journey. The sample
questionnaire is provided in Appendix B.
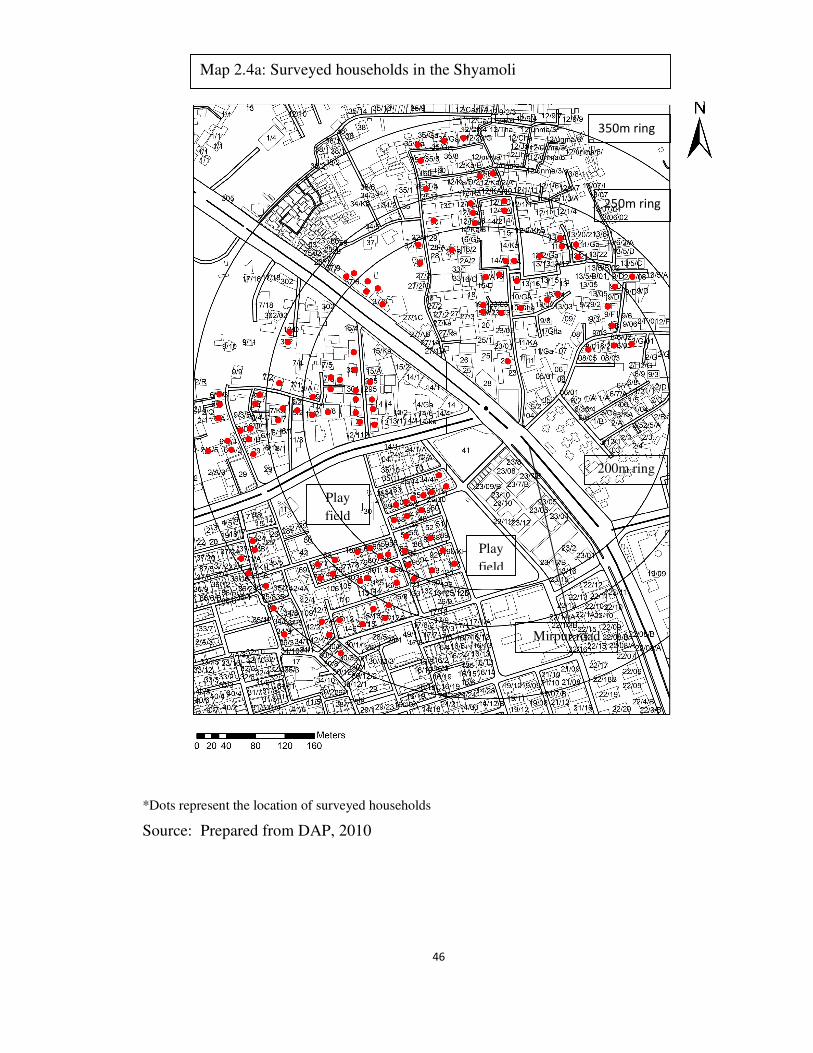
46
*Dots represent the location of surveyed households
Source: Prepared from DAP, 2010
Map 2.4a: Surveyed households in the Shyamoli
Play
field
Play
field
350m ring
250m ring
200m ring
Mirpur road
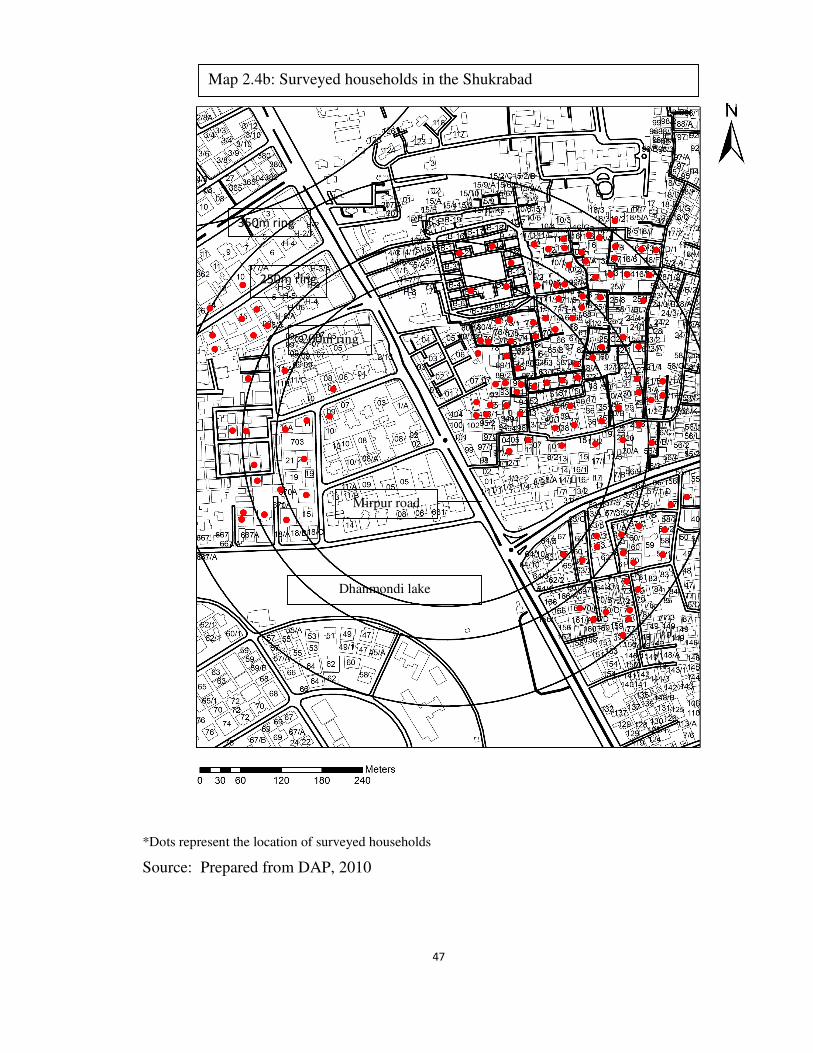
47
*Dots represent the location of surveyed households
Source: Prepared from DAP, 2010
Map 2.4b: Surveyed households in the Shukrabad
200m ring
250m ring
350m ring
Dhanmondi lake
Mirpur road
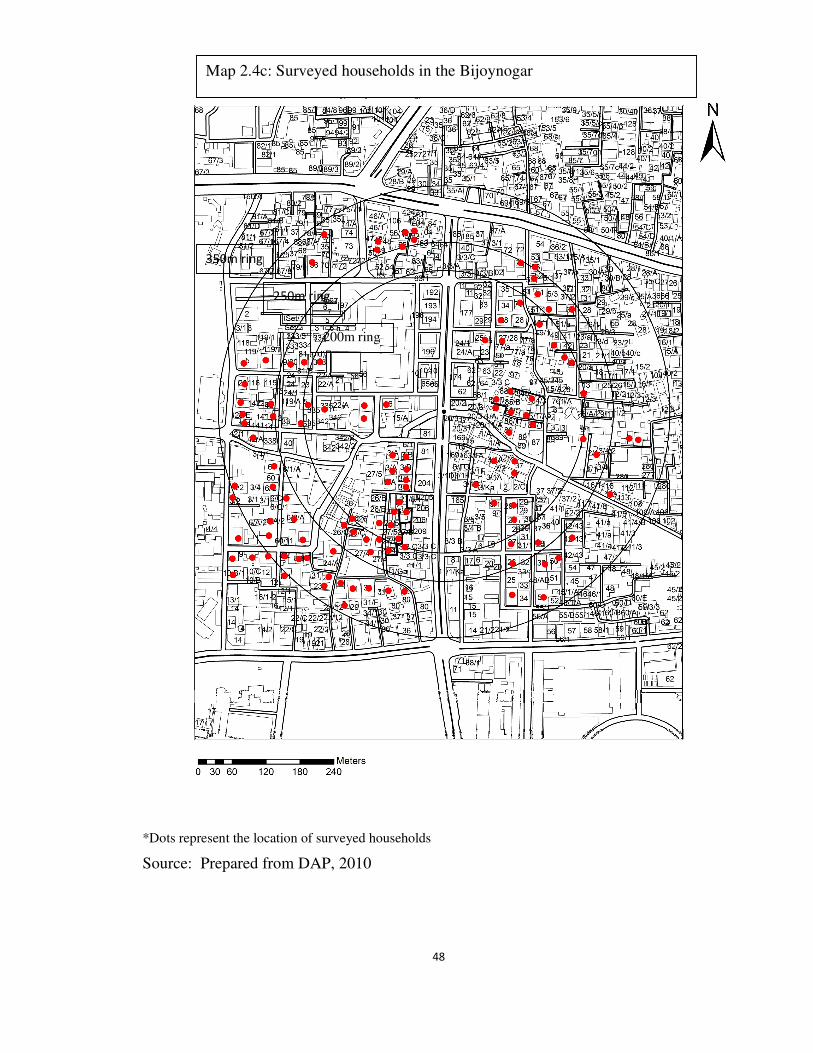
48
*Dots represent the location of surveyed households
Source: Prepared from DAP, 2010
Map 2.4c: Surveyed households in the Bijoynogar
200m ring
250m ring
350m ring
49
C. Focus group discussion (FGD)
FGDs were done for a quick and collective response and understanding of the issue being
researched. FGDs were done for two categories of people-
(i) Guardians escorting their children to and from (primary and secondary) schools. Four
groups of guardians were interviewed in four FGDs. The groups consisted of 8-12
respondents- mainly female guardians. The discussion continued for one hour in the
school premise or on the footpath or local roads where the guardians flocked together. The
FGDs were done before noon- during the transition of two shifts (morning shift finished
and day shift about to start) or during the finishing time (in case of one shift school).
(ii) Rickshaw-wallas in three rickshaw garages i.e. three groups of rickshaw-wallas. The
FGDs took place during the evening when usually the 2nd shift starts and rickshaw-
wallas who rent rickshaws in the 1st shift hand over them in the garage. A group
consisted of 12-15 persons. As all the rickshaw-wallas were male, FGDs were done with
male groups of different age, residence and seasonality (some are seasonal and stay in the
garage and some are permanent rickshaw-wallas who live with their family in near/other
part of the city).
D. Interviews
A series of interviews were done for a better understanding of the problem and also to tri-
angulate the findings from structured questionnaires. In brief the interviews were as
follows.
(i) Open ended interviews of the respondents and household members
These interviews were held during explaining the questionnaire to the respondents of the
household survey. The perception, feelings, experience about rickshaw bans/restrictions,
current/ potential options for them to deal with the (good/bad effect of) the intervention in
their existing and potential movement were discussed.
50
(ii) Open ended interviews of the road users
These were done purposively, both by the author and research assistants. Interviews
include conversation with guardians/mothers escorting children to and from school, co-
passengers in the public bus and co-riders in private cars (here they were either friends,
relatives or colleagues of the author). They were asked about their views on the ban, about
the benefits and problems created and gainers and losers (in their families and in general),
and options available to them to deal with the intervention and their overall views about
rickshaw and motorisation. While in some cases the whole conversation was recorded
with prior permission, the rest and most were kept in writing as brief summary.
(iii) Open ended interviews of the road order maintainers
It was also done purposively with three traffic wardens (who can only direct traffic flows
manually, bars rickshaw movement in ban/restricted roads and sometimes use 'baton
power' to 'discipline' the unruly rickshaw-wallas and to decongest the road intersection by
driving the rickshaw-wallas away along with their rickshaws) and one traffic sergeant
(boss of the traffic wardens with authority to file court case against any breach of
traffic/driving rules)
(iv) Interviews of rickshaw (garage) owners- rickshaw maliks
Two rickshaw garage owners- one near Shyamoli area and other near Bijoynogar area,
talked about their life, business, income, renting condition/procedure of rickshaws,
ban/restriction and internal support/resistance to it, relationship with DCC, Police, their
associations etc.
(v) Semi structured interviews
Semi-structured interviews were done basically to understand the causes and conflicts of
decisions regarding the ban/restriction. Their own experience/story and version of
explanations were recorded (either via voice recorder or written). They were selected
purposively or by snow-balling. The list is as follows:
- Eight experts and academics from planning (three), transport and civil engineering (two),
law (two), architecture (one) disciplines.
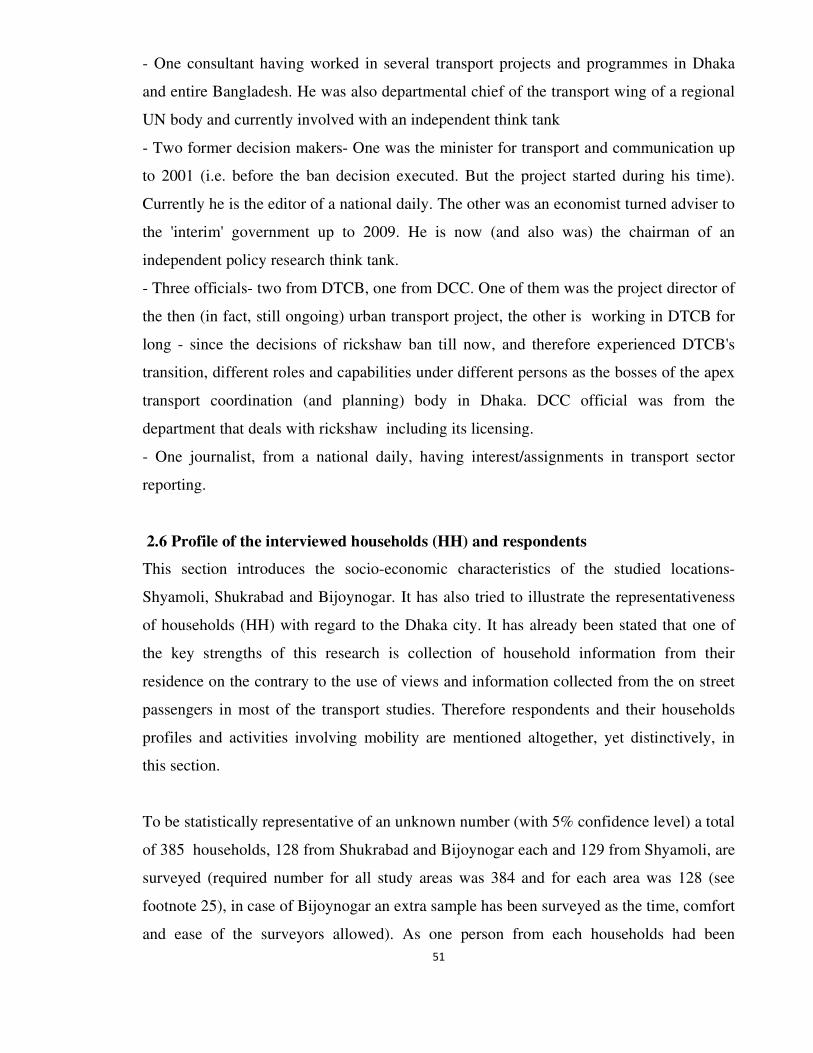
51
- One consultant having worked in several transport projects and programmes in Dhaka
and entire Bangladesh. He was also departmental chief of the transport wing of a regional
UN body and currently involved with an independent think tank
- Two former decision makers- One was the minister for transport and communication up
to 2001 (i.e. before the ban decision executed. But the project started during his time).
Currently he is the editor of a national daily. The other was an economist turned adviser to
the 'interim' government up to 2009. He is now (and also was) the chairman of an
independent policy research think tank.
- Three officials- two from DTCB, one from DCC. One of them was the project director of
the then (in fact, still ongoing) urban transport project, the other is working in DTCB for
long - since the decisions of rickshaw ban till now, and therefore experienced DTCB's
transition, different roles and capabilities under different persons as the bosses of the apex
transport coordination (and planning) body in Dhaka. DCC official was from the
department that deals with rickshaw including its licensing.
- One journalist, from a national daily, having interest/assignments in transport sector
reporting.
2.6 Profile of the interviewed households (HH) and respondents
This section introduces the socio-economic characteristics of the studied locations-
Shyamoli, Shukrabad and Bijoynogar. It has also tried to illustrate the representativeness
of households (HH) with regard to the Dhaka city. It has already been stated that one of
the key strengths of this research is collection of household information from their
residence on the contrary to the use of views and information collected from the on street
passengers in most of the transport studies. Therefore respondents and their households
profiles and activities involving mobility are mentioned altogether, yet distinctively, in
this section.
To be statistically representative of an unknown number (with 5% confidence level) a total
of 385 households, 128 from Shukrabad and Bijoynogar each and 129 from Shyamoli, are
surveyed (required number for all study areas was 384 and for each area was 128 (see
footnote 25), in case of Bijoynogar an extra sample has been surveyed as the time, comfort
and ease of the surveyors allowed). As one person from each households had been
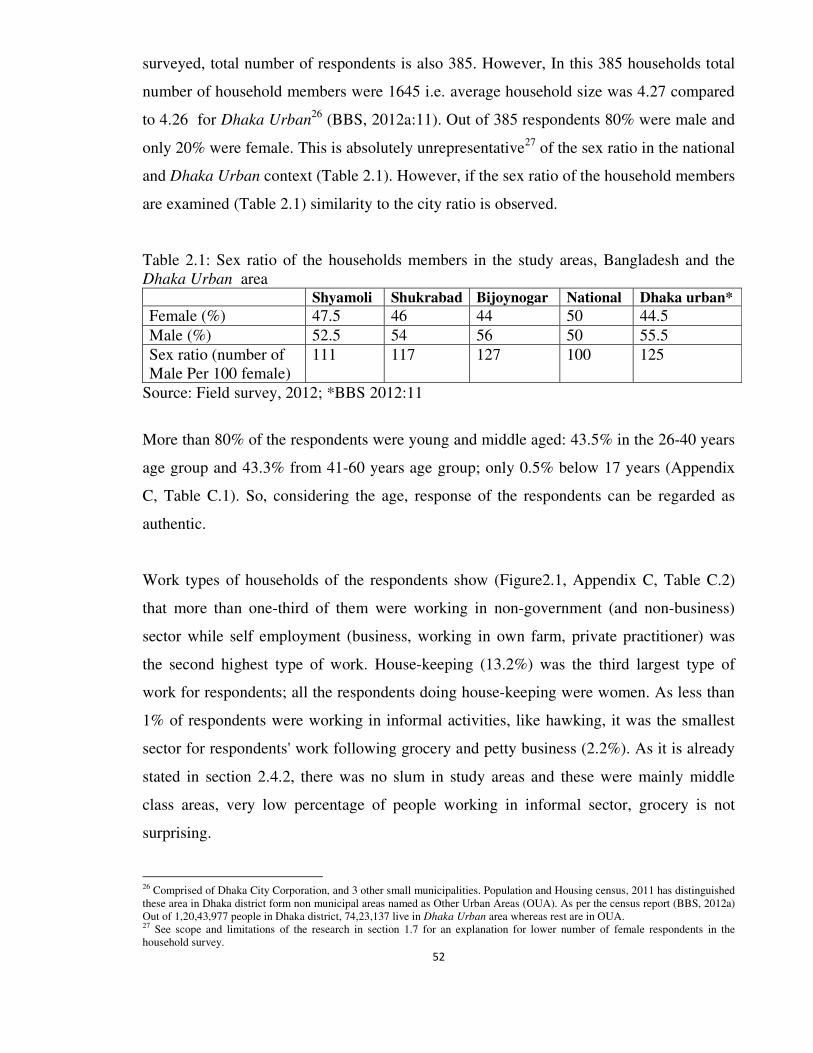
52
surveyed, total number of respondents is also 385. However, In this 385 households total
number of household members were 1645 i.e. average household size was 4.27 compared
to 4.26 for Dhaka Urban26
(BBS, 2012a:11). Out of 385 respondents 80% were male and
only 20% were female. This is absolutely unrepresentative27 of the sex ratio in the national
and Dhaka Urban context (Table 2.1). However, if the sex ratio of the household members
are examined (Table 2.1) similarity to the city ratio is observed.
Table 2.1: Sex ratio of the households members in the study areas, Bangladesh and the Dhaka Urban area Shyamoli Shukrabad Bijoynogar National Dhaka urban*
Female (%) 47.5 46 44 50 44.5
Male (%) 52.5 54 56 50 55.5
Sex ratio (number of Male Per 100 female)
111 117 127 100 125
Source: Field survey, 2012; *BBS 2012:11
More than 80% of the respondents were young and middle aged: 43.5% in the 26-40 years
age group and 43.3% from 41-60 years age group; only 0.5% below 17 years (Appendix
C, Table C.1). So, considering the age, response of the respondents can be regarded as
authentic.
Work types of households of the respondents show (Figure2.1, Appendix C, Table C.2)
that more than one-third of them were working in non-government (and non-business)
sector while self employment (business, working in own farm, private practitioner) was
the second highest type of work. House-keeping (13.2%) was the third largest type of
work for respondents; all the respondents doing house-keeping were women. As less than
1% of respondents were working in informal activities, like hawking, it was the smallest
sector for respondents' work following grocery and petty business (2.2%). As it is already
stated in section 2.4.2, there was no slum in study areas and these were mainly middle
class areas, very low percentage of people working in informal sector, grocery is not
surprising.
26 Comprised of Dhaka City Corporation, and 3 other small municipalities. Population and Housing census, 2011 has distinguished these area in Dhaka district form non municipal areas named as Other Urban Areas (OUA). As per the census report (BBS, 2012a) Out of 1,20,43,977 people in Dhaka district, 74,23,137 live in Dhaka Urban area whereas rest are in OUA. 27 See scope and limitations of the research in section 1.7 for an explanation for lower number of female respondents in the household survey.
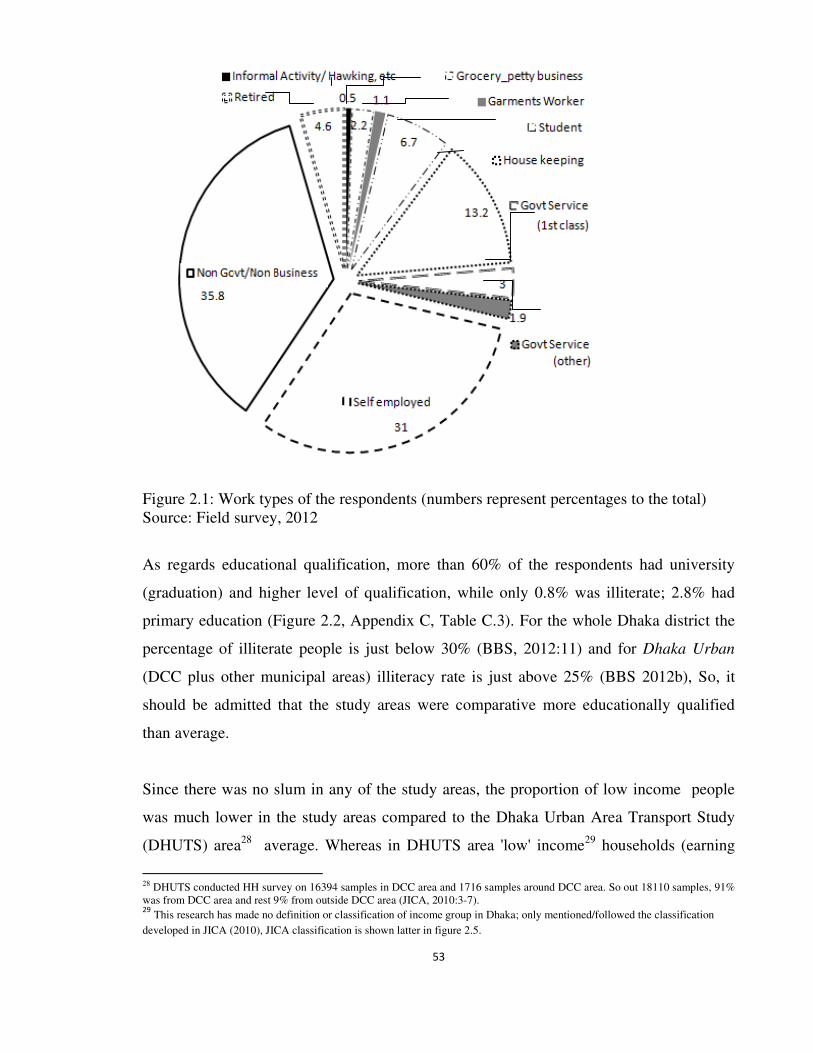
53
Figure 2.1: Work types of the respondents (numbers represent percentages to the total) Source: Field survey, 2012
As regards educational qualification, more than 60% of the respondents had university
(graduation) and higher level of qualification, while only 0.8% was illiterate; 2.8% had
primary education (Figure 2.2, Appendix C, Table C.3). For the whole Dhaka district the
percentage of illiterate people is just below 30% (BBS, 2012:11) and for Dhaka Urban
(DCC plus other municipal areas) illiteracy rate is just above 25% (BBS 2012b), So, it
should be admitted that the study areas were comparative more educationally qualified
than average.
Since there was no slum in any of the study areas, the proportion of low income people
was much lower in the study areas compared to the Dhaka Urban Area Transport Study
(DHUTS) area28 average. Whereas in DHUTS area 'low' income29 households (earning
28 DHUTS conducted HH survey on 16394 samples in DCC area and 1716 samples around DCC area. So out 18110 samples, 91% was from DCC area and rest 9% from outside DCC area (JICA, 2010:3-7). 29
This research has made no definition or classification of income group in Dhaka; only mentioned/followed the classification
developed in JICA (2010), JICA classification is shown latter in figure 2.5.
54
upto Tk. 19999 per month) was the highest (39.8%), in all the study areas this group had
the lowest presence; in fact, much lower than DHUTS average (Figure 2.3, Appendix C,
Table C.4 and C.5). For DHUTS area 'low' and 'middle' (Tk. 20000-49999/month) income
households were almost same. But in Shukrabad 'middle' and 'high' (Tk 50000 and above
per month) income groups were almost same, whereas in Shyamoli 'middle' income group
was approximately double of the 'high' income group; the picture is reverse in Bijoynogar.
So with respect to the DHUTS area the study areas were richer, no doubt. However, if the
comparison could have been made with DCC area30 the difference could have been
milder; the average income in each group for study areas and for DCC area (Table 2.2)
supports the anticipation.
Figure 2.2: Educational qualification of the respondents Source: Field survey, 2012 46.7% of the households in all the study areas lived in the house below the size of 1000 sq
ft; in Shyamoli, Shukrabad and Bijoynogar the figures were 57.4%, 53.9% and 28%
respectively (Appendix C, Table App C.6). In absence of data for the size of all houses in
Dhaka, size of the real estate housing can be mentioned; only 13% of these houses are of
30 Processed data on income group distribution for DCC area is not readily available in JICA, 2010 nor in any other source, to the best of the author's knowledge.
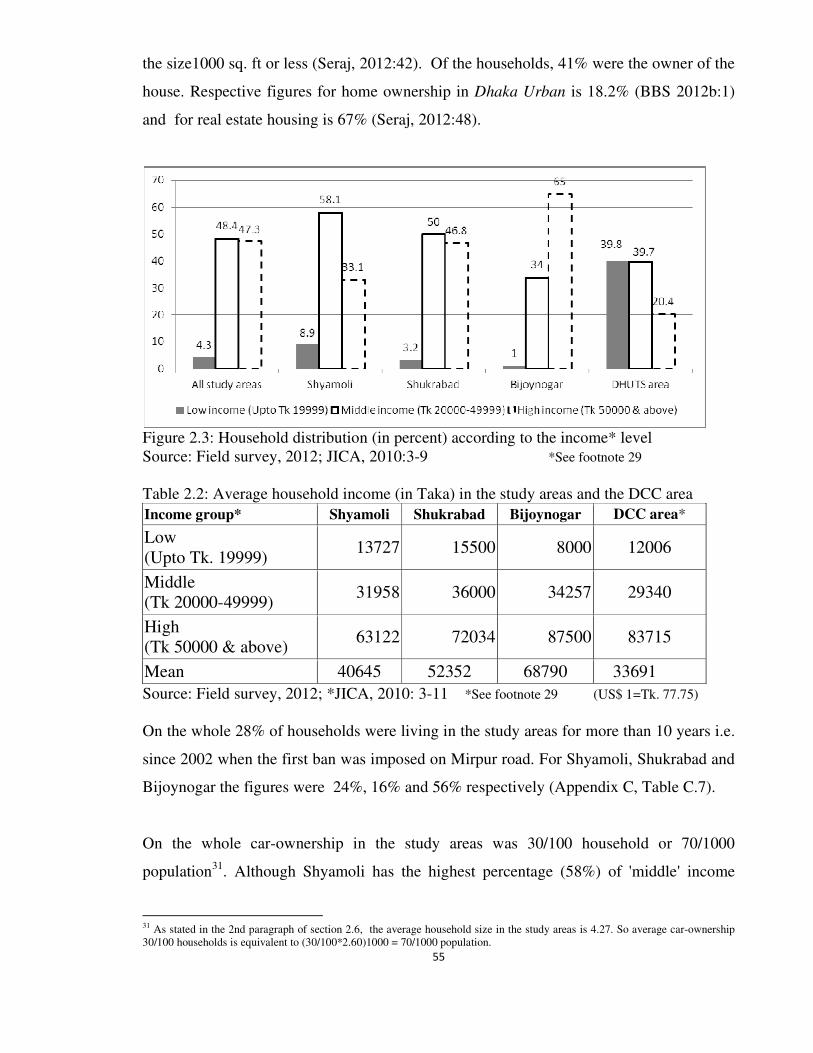
55
the size1000 sq. ft or less (Seraj, 2012:42). Of the households, 41% were the owner of the
house. Respective figures for home ownership in Dhaka Urban is 18.2% (BBS 2012b:1)
and for real estate housing is 67% (Seraj, 2012:48).
Figure 2.3: Household distribution (in percent) according to the income* level Source: Field survey, 2012; JICA, 2010:3-9 *See footnote 29 Table 2.2: Average household income (in Taka) in the study areas and the DCC area
Income group* Shyamoli Shukrabad Bijoynogar DCC area*
Low (Upto Tk. 19999)
13727 15500 8000 12006
Middle (Tk 20000-49999)
31958 36000 34257 29340
High (Tk 50000 & above)
63122 72034 87500 83715
Mean 40645 52352 68790 33691
Source: Field survey, 2012; *JICA, 2010: 3-11 *See footnote 29 (US$ 1=Tk. 77.75) On the whole 28% of households were living in the study areas for more than 10 years i.e.
since 2002 when the first ban was imposed on Mirpur road. For Shyamoli, Shukrabad and
Bijoynogar the figures were 24%, 16% and 56% respectively (Appendix C, Table C.7).
On the whole car-ownership in the study areas was 30/100 household or 70/1000
population31. Although Shyamoli has the highest percentage (58%) of 'middle' income
31 As stated in the 2nd paragraph of section 2.6, the average household size in the study areas is 4.27. So average car-ownership 30/100 households is equivalent to (30/100*2.60)1000 = 70/1000 population.
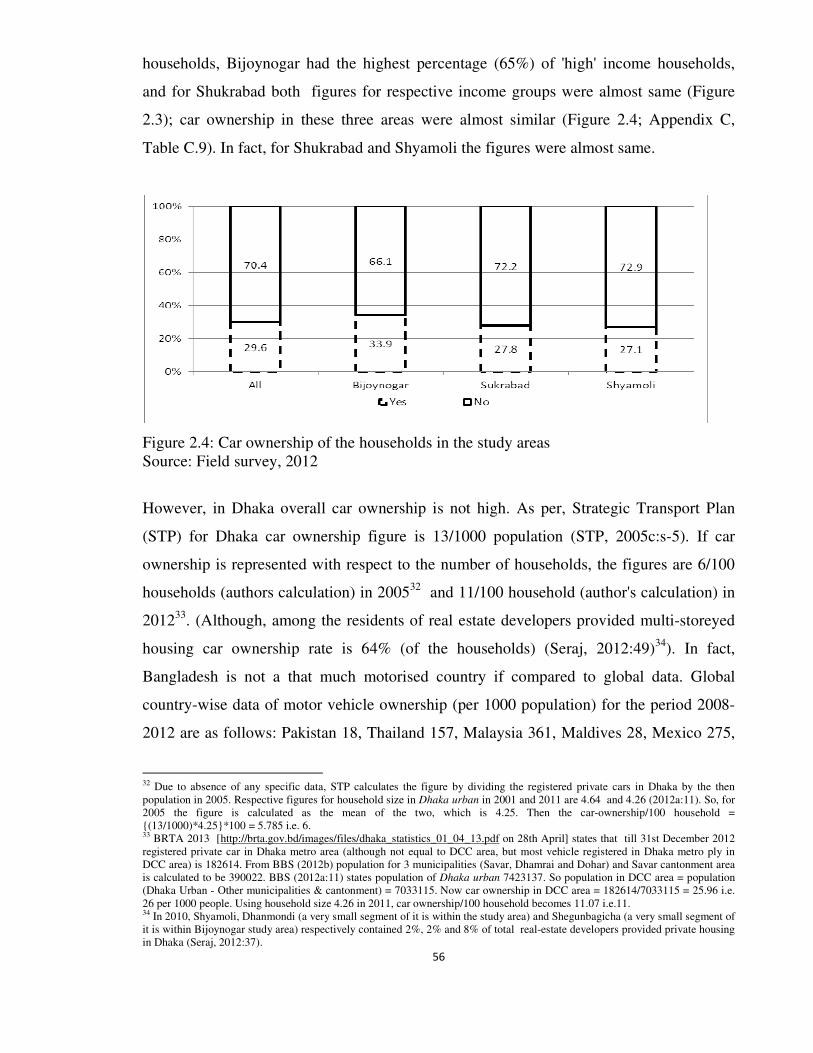
56
households, Bijoynogar had the highest percentage (65%) of 'high' income households,
and for Shukrabad both figures for respective income groups were almost same (Figure
2.3); car ownership in these three areas were almost similar (Figure 2.4; Appendix C,
Table C.9). In fact, for Shukrabad and Shyamoli the figures were almost same.
Figure 2.4: Car ownership of the households in the study areas Source: Field survey, 2012
However, in Dhaka overall car ownership is not high. As per, Strategic Transport Plan
(STP) for Dhaka car ownership figure is 13/1000 population (STP, 2005c:s-5). If car
ownership is represented with respect to the number of households, the figures are 6/100
households (authors calculation) in 200532 and 11/100 household (author's calculation) in
201233. (Although, among the residents of real estate developers provided multi-storeyed
housing car ownership rate is 64% (of the households) (Seraj, 2012:49)34). In fact,
Bangladesh is not a that much motorised country if compared to global data. Global
country-wise data of motor vehicle ownership (per 1000 population) for the period 2008-
2012 are as follows: Pakistan 18, Thailand 157, Malaysia 361, Maldives 28, Mexico 275,
32 Due to absence of any specific data, STP calculates the figure by dividing the registered private cars in Dhaka by the then population in 2005. Respective figures for household size in Dhaka urban in 2001 and 2011 are 4.64 and 4.26 (2012a:11). So, for 2005 the figure is calculated as the mean of the two, which is 4.25. Then the car-ownership/100 household = {(13/1000)*4.25}*100 = 5.785 i.e. 6. 33 BRTA 2013 [http://brta.gov.bd/images/files/dhaka_statistics_01_04_13.pdf on 28th April] states that till 31st December 2012 registered private car in Dhaka metro area (although not equal to DCC area, but most vehicle registered in Dhaka metro ply in DCC area) is 182614. From BBS (2012b) population for 3 municipalities (Savar, Dhamrai and Dohar) and Savar cantonment area is calculated to be 390022. BBS (2012a:11) states population of Dhaka urban 7423137. So population in DCC area = population (Dhaka Urban - Other municipalities & cantonment) = 7033115. Now car ownership in DCC area = 182614/7033115 = 25.96 i.e. 26 per 1000 people. Using household size 4.26 in 2011, car ownership/100 household becomes 11.07 i.e.11. 34 In 2010, Shyamoli, Dhanmondi (a very small segment of it is within the study area) and Shegunbagicha (a very small segment of it is within Bijoynogar study area) respectively contained 2%, 2% and 8% of total real-estate developers provided private housing in Dhaka (Seraj, 2012:37).
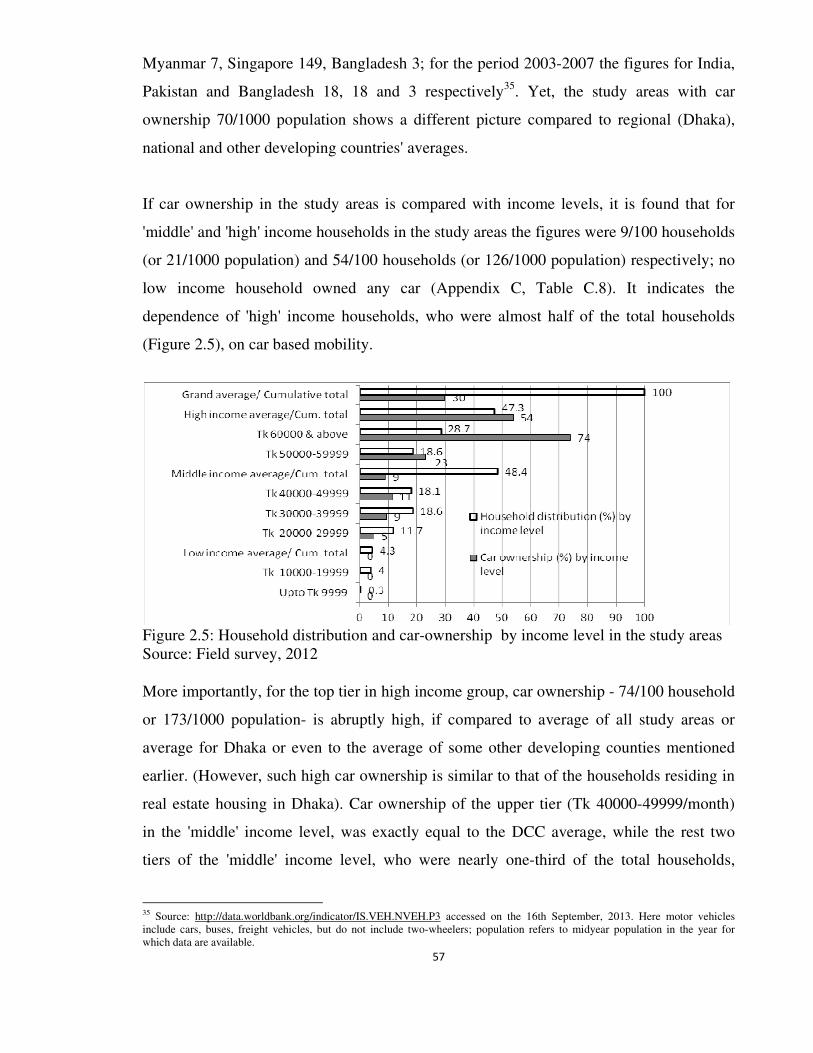
57
Myanmar 7, Singapore 149, Bangladesh 3; for the period 2003-2007 the figures for India,
Pakistan and Bangladesh 18, 18 and 3 respectively35. Yet, the study areas with car
ownership 70/1000 population shows a different picture compared to regional (Dhaka),
national and other developing countries' averages.
If car ownership in the study areas is compared with income levels, it is found that for
'middle' and 'high' income households in the study areas the figures were 9/100 households
(or 21/1000 population) and 54/100 households (or 126/1000 population) respectively; no
low income household owned any car (Appendix C, Table C.8). It indicates the
dependence of 'high' income households, who were almost half of the total households
(Figure 2.5), on car based mobility.
Figure 2.5: Household distribution and car-ownership by income level in the study areas Source: Field survey, 2012 More importantly, for the top tier in high income group, car ownership - 74/100 household
or 173/1000 population- is abruptly high, if compared to average of all study areas or
average for Dhaka or even to the average of some other developing counties mentioned
earlier. (However, such high car ownership is similar to that of the households residing in
real estate housing in Dhaka). Car ownership of the upper tier (Tk 40000-49999/month)
in the 'middle' income level, was exactly equal to the DCC average, while the rest two
tiers of the 'middle' income level, who were nearly one-third of the total households,
35 Source: http://data.worldbank.org/indicator/IS.VEH.NVEH.P3 accessed on the 16th September, 2013. Here motor vehicles include cars, buses, freight vehicles, but do not include two-wheelers; population refers to midyear population in the year for which data are available.
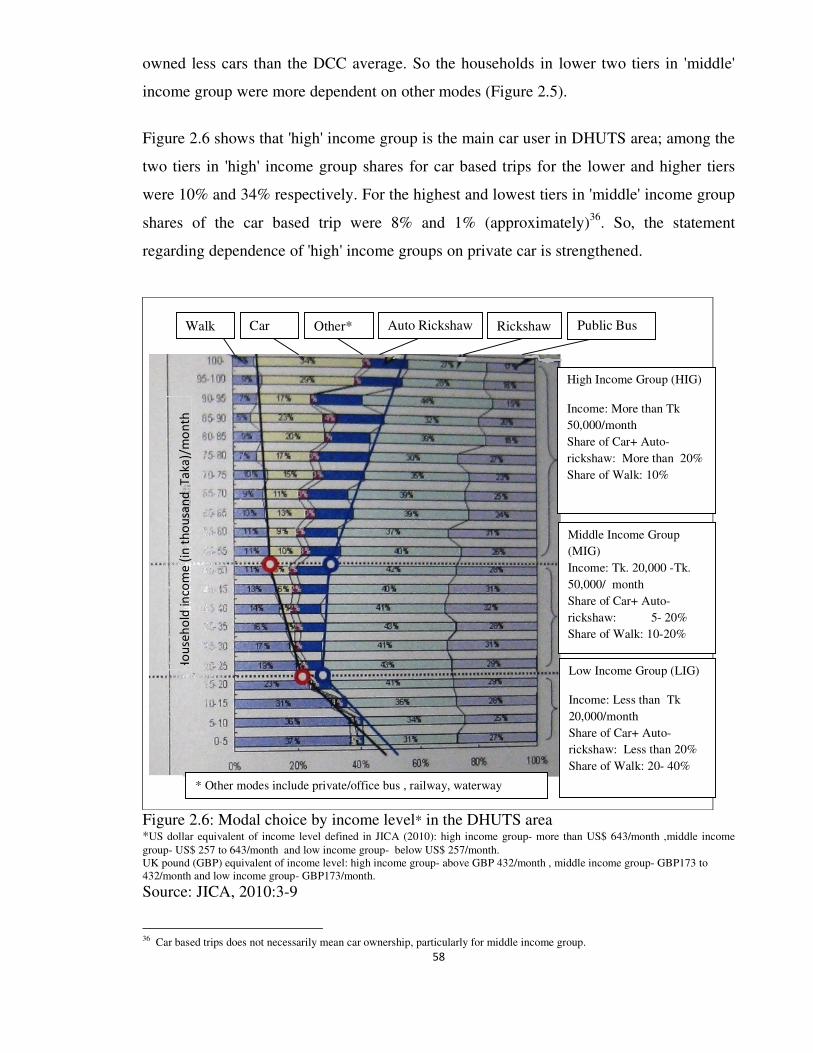
58
owned less cars than the DCC average. So the households in lower two tiers in 'middle'
income group were more dependent on other modes (Figure 2.5).
Figure 2.6 shows that 'high' income group is the main car user in DHUTS area; among the
two tiers in 'high' income group shares for car based trips for the lower and higher tiers
were 10% and 34% respectively. For the highest and lowest tiers in 'middle' income group
shares of the car based trip were 8% and 1% (approximately)36. So, the statement
regarding dependence of 'high' income groups on private car is strengthened.
Figure 2.6: Modal choice by income level* in the DHUTS area *US dollar equivalent of income level defined in JICA (2010): high income group- more than US$ 643/month ,middle income
group- US$ 257 to 643/month and low income group- below US$ 257/month. UK pound (GBP) equivalent of income level: high income group- above GBP 432/month , middle income group- GBP173 to 432/month and low income group- GBP173/month. Source: JICA, 2010:3-9
36 Car based trips does not necessarily mean car ownership, particularly for middle income group.
* Other modes include private/office bus , railway, waterway
Ho
use
ho
ld in
com
e (
in t
ho
usa
nd
Ta
ka)/
mo
nth
High Income Group (HIG)
Income: More than Tk
50,000/month
Share of Car+ Auto-
rickshaw: More than 20%
Share of Walk: 10%
Middle Income Group
(MIG)
Income: Tk. 20,000 -Tk.
50,000/ month
Share of Car+ Auto-
rickshaw: 5- 20%
Share of Walk: 10-20%
Low Income Group (LIG)
Income: Less than Tk
20,000/month
Share of Car+ Auto-
rickshaw: Less than 20%
Share of Walk: 20- 40%
Walk Other* Auto Rickshaw Rickshaw Public Bus Car
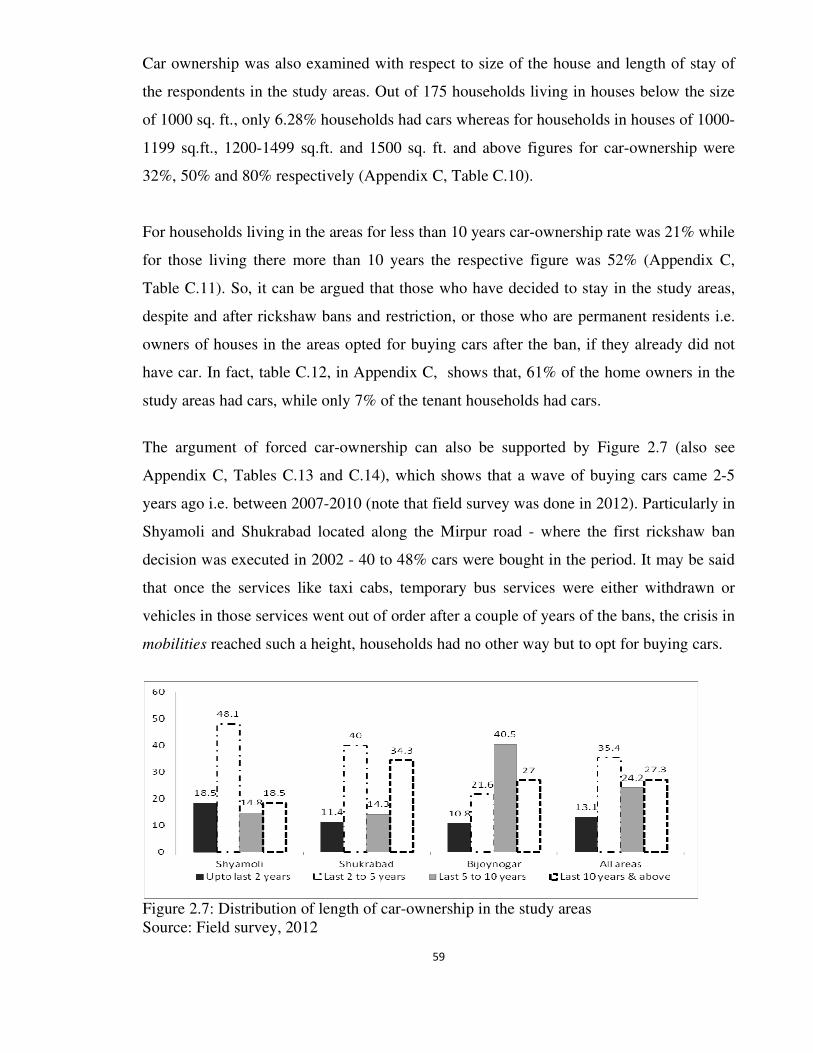
59
Car ownership was also examined with respect to size of the house and length of stay of
the respondents in the study areas. Out of 175 households living in houses below the size
of 1000 sq. ft., only 6.28% households had cars whereas for households in houses of 1000-
1199 sq.ft., 1200-1499 sq.ft. and 1500 sq. ft. and above figures for car-ownership were
32%, 50% and 80% respectively (Appendix C, Table C.10).
For households living in the areas for less than 10 years car-ownership rate was 21% while
for those living there more than 10 years the respective figure was 52% (Appendix C,
Table C.11). So, it can be argued that those who have decided to stay in the study areas,
despite and after rickshaw bans and restriction, or those who are permanent residents i.e.
owners of houses in the areas opted for buying cars after the ban, if they already did not
have car. In fact, table C.12, in Appendix C, shows that, 61% of the home owners in the
study areas had cars, while only 7% of the tenant households had cars.
The argument of forced car-ownership can also be supported by Figure 2.7 (also see
Appendix C, Tables C.13 and C.14), which shows that a wave of buying cars came 2-5
years ago i.e. between 2007-2010 (note that field survey was done in 2012). Particularly in
Shyamoli and Shukrabad located along the Mirpur road - where the first rickshaw ban
decision was executed in 2002 - 40 to 48% cars were bought in the period. It may be said
that once the services like taxi cabs, temporary bus services were either withdrawn or
vehicles in those services went out of order after a couple of years of the bans, the crisis in
mobilities reached such a height, households had no other way but to opt for buying cars.
Figure 2.7: Distribution of length of car-ownership in the study areas Source: Field survey, 2012
60
2.7 Main Time-bound (routined) and main time-flexible (other) activities of the
household members- existing and potential mobilities
Figure 2.8 shows the distribution of all household members according to their main time-
bound (routined) and main time-flexible (other) activities (the two types of activities are
defined in section 1.8. Also see footnote37 below). The figure depicts that majority of the
members reported ‘going for work’ and ‘going to school/study’- about 41% and 37% of
the total respectively- as their main time-bound (routined) activities followed by ‘carrying
children to school’ and ‘going for daily shopping’; these activities shared 87% of the total
activities (Appendix C, Table C.15). Distribution of the members in three study areas
according to their main time-bound (routined) activities also show similar pattern
(Appendix C, Table C.15a).
This is also revealed that ‘visiting family, relatives and friends’ were on the top among the
main time-flexible (other) activities, followed by ‘going for non-daily shopping’ and ‘daily
shopping’ activities. More than 20% of the total members mentioned each of these three
activities as their main time-flexible (other) activities and their cumulative share is 72%
(Appendix C, Table C.16). Top three main time-flexible (other) activities in three study
areas are same, except changes in the chronology (Appendix C, Table C.16a)
Quite naturally among the main time-bound (routined) activities work, education and
accessing community facilities related activities (e.g. daily shopping) are on the top of the
distribution chart and for time-flexible (other) activities social/recreational (e.g. visiting
family, relatives and friends) and accessing community facilities related activities (e.g.
37 Time-bound (routined) activity refers to the activities which are done regularly (in most cases at 4/ 5 days a week) at specific time. Time-flexible (other) activity refers to the very common activities but not done exactly at the same time. For example a mother in the household may go for work, accompany children to school, for kitchen and other shopping etc. Among these activities she may be going for work on the weekdays regularly at a fixed time. She may also be dropping her child to school in every alternate day while going for work and rest of the days the child is accompanied by father. Most of the shopping for the family is done by her, as her husband may be coming from work lately at night; but timing and place for shopping may be flexible. Now, for this mother going to office is the main time-bound (routined) activity, accompanying child to school is the 2nd time-
bound (routined) activity. On the other hand going to kitchen market is the main time-flexible (other) activity, going to non-kitchen shopping is the 2nd time-flexible (other) activity. The classification of activities by households members as time-bound (regular) and time-flexible (other) is argued to be useful for this research. As distinction is made between existing and potential mobilities, activities are also required to be differentiated. This research argues that time-bound (regular) activities falls in the category of existing mobilities, i.e. whatever is the situation these activities are always taking place; little scope to change the mobility pattern- time, frequency, destination. But time-flexible (other) activities are in many cases not mandatorily done; sometimes although required, users may skip it as situation (road condition, weather, availability of modes or accompanying person, etc) does not permit. This study has investigated if such omission of activities has taken place in the study areas due to rickshaw bans/restrictions, and argues that thus if happened, these (time-flexible) activities will fall into the category of potential mobilities. Thus this research seeks to examine which type of mobilities and activities are benefitted and obstructed by the ban/restriction decision.
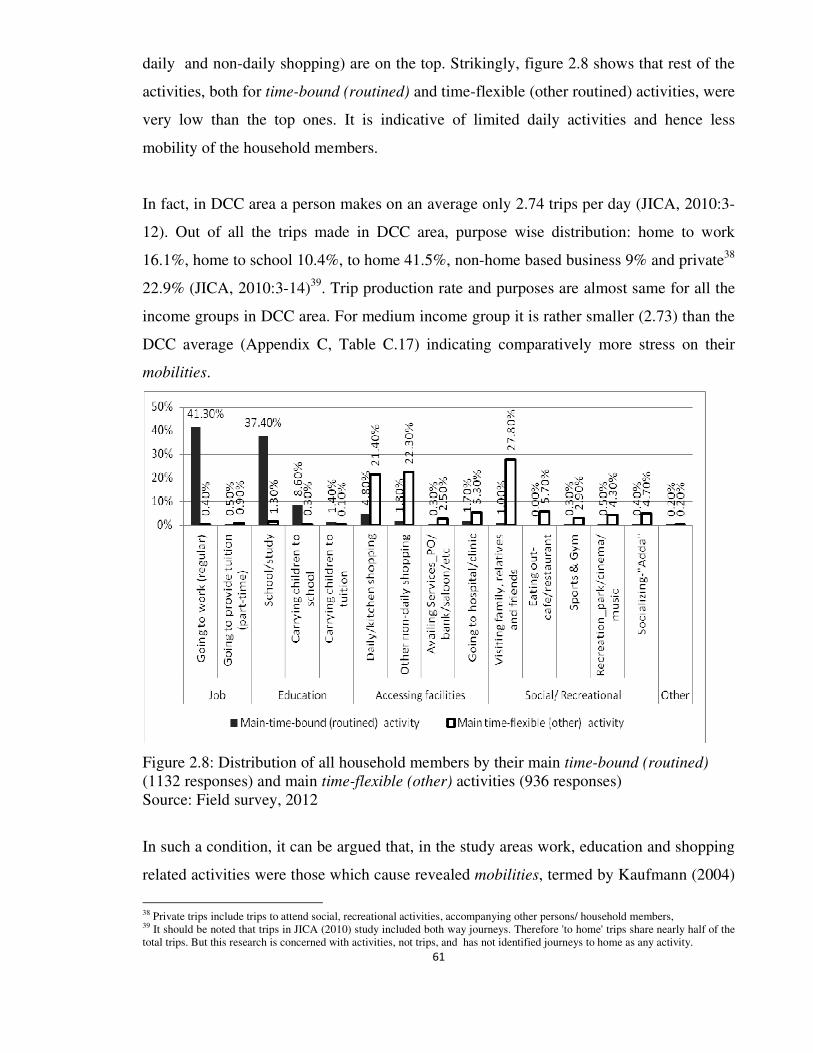
61
daily and non-daily shopping) are on the top. Strikingly, figure 2.8 shows that rest of the
activities, both for time-bound (routined) and time-flexible (other routined) activities, were
very low than the top ones. It is indicative of limited daily activities and hence less
mobility of the household members.
In fact, in DCC area a person makes on an average only 2.74 trips per day (JICA, 2010:3-
12). Out of all the trips made in DCC area, purpose wise distribution: home to work
16.1%, home to school 10.4%, to home 41.5%, non-home based business 9% and private38
22.9% (JICA, 2010:3-14)39. Trip production rate and purposes are almost same for all the
income groups in DCC area. For medium income group it is rather smaller (2.73) than the
DCC average (Appendix C, Table C.17) indicating comparatively more stress on their
mobilities.
Figure 2.8: Distribution of all household members by their main time-bound (routined) (1132 responses) and main time-flexible (other) activities (936 responses) Source: Field survey, 2012
In such a condition, it can be argued that, in the study areas work, education and shopping
related activities were those which cause revealed mobilities, termed by Kaufmann (2004)
38 Private trips include trips to attend social, recreational activities, accompanying other persons/ household members, 39 It should be noted that trips in JICA (2010) study included both way journeys. Therefore 'to home' trips share nearly half of the total trips. But this research is concerned with activities, not trips, and has not identified journeys to home as any activity.
62
as 'existing mobilities'. Whatever the modal option and associated conditions, this type of
mobility will occur. On the other hand, share of activities like accessing community
facilities, doing or attending social/recreation activities were very low compared to
activities mainly causing revealed/existing mobilities. During the focus group discussion
with guardians (mainly mothers) in the school premises and several open-ended interviews
with the households members and road users, it has been found that these less performed
activities can be increased once conditions including modal options become favourable.
So, for many other respondents and their households members these activities were latent
(i.e. did not take place in the then condition) but could happen and cause further mobility
in the area or could make them more mobile. Therefore, following Kaufmann (2004),
these activities (e.g. accessing community facilities, doing or attending social/recreation
activities, currently reported mainly as time-flexible activities), can be termed as 'potential
mobilities'.
Household members are distributed by their main time-bound (routined) and time-flexible
(other) activities and sex in figure 2.9. In case of main time-bound (routined) activities, it
is found that other than 'work', female members were notably active in rest of the
activities. Activities like 'carrying children to (private) tuition' was a 100% female activity;
followed by 'carrying children to school/study', doing 'daily' and 'non-daily shopping',
'visiting family, relatives and friends', 'going to hospital/clinic' (to accompany the sick and
elderly members), going for special/community services (post office, bank etc) which had
more than 50% share by the female members in the households. 'Carrying children to
tuition' became a 100% male job in case of main time-flexible (other) activities i.e. it is
only occasionally done by male members, perhaps, when women in the family could not
do it. Similarly, increase of the male share in most of other time-flexible (other) activities
indicate the same i.e. households activities were in most cases done by female members,
while male members mostly did the routined and work related activities. Zohir et al.
(2008:45) also report that female share in travels for accompanying children to school is
overwhelmingly higher than the male- 29% vs 5.9%; in case of travels for kitchen
shopping, other shopping female share is also higher than male ones40. The difference in
40 Just to mention that this study was done interviewing the road users in outdoor i.e. not based on household survey.
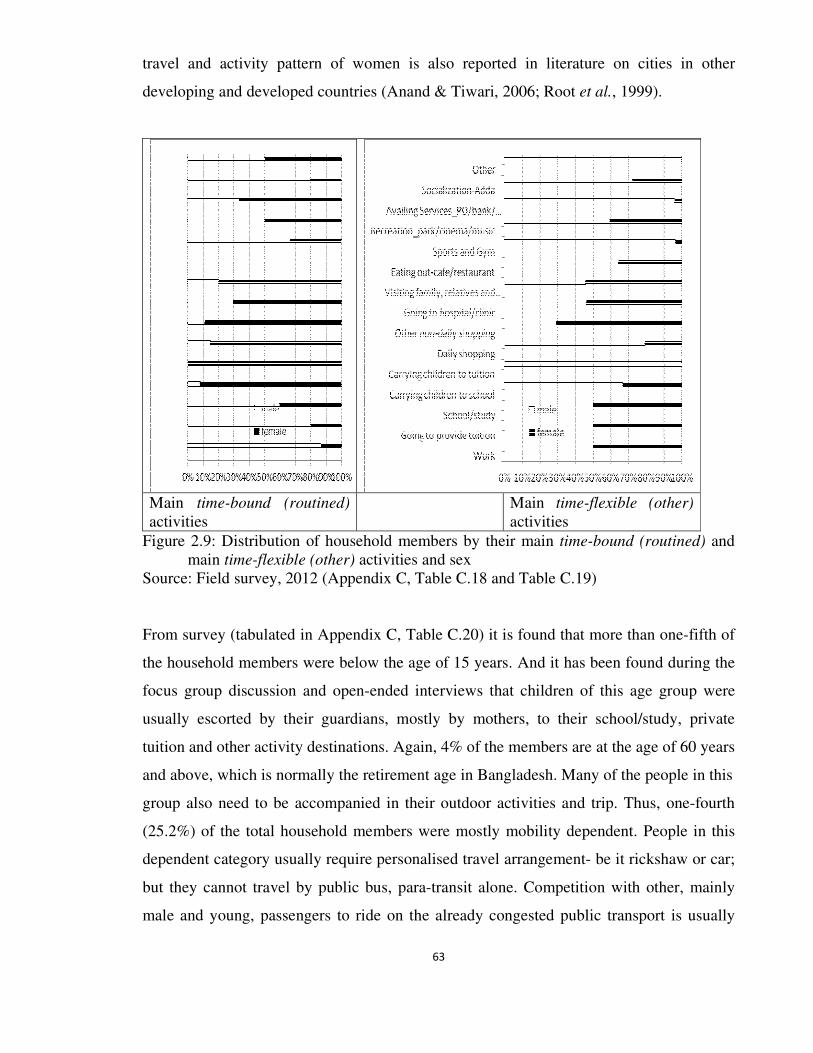
63
travel and activity pattern of women is also reported in literature on cities in other
developing and developed countries (Anand & Tiwari, 2006; Root et al., 1999).
Main time-bound (routined) activities
Main time-flexible (other) activities
Figure 2.9: Distribution of household members by their main time-bound (routined) and main time-flexible (other) activities and sex
Source: Field survey, 2012 (Appendix C, Table C.18 and Table C.19) From survey (tabulated in Appendix C, Table C.20) it is found that more than one-fifth of
the household members were below the age of 15 years. And it has been found during the
focus group discussion and open-ended interviews that children of this age group were
usually escorted by their guardians, mostly by mothers, to their school/study, private
tuition and other activity destinations. Again, 4% of the members are at the age of 60 years
and above, which is normally the retirement age in Bangladesh. Many of the people in this
group also need to be accompanied in their outdoor activities and trip. Thus, one-fourth
(25.2%) of the total household members were mostly mobility dependent. People in this
dependent category usually require personalised travel arrangement- be it rickshaw or car;
but they cannot travel by public bus, para-transit alone. Competition with other, mainly
male and young, passengers to ride on the already congested public transport is usually
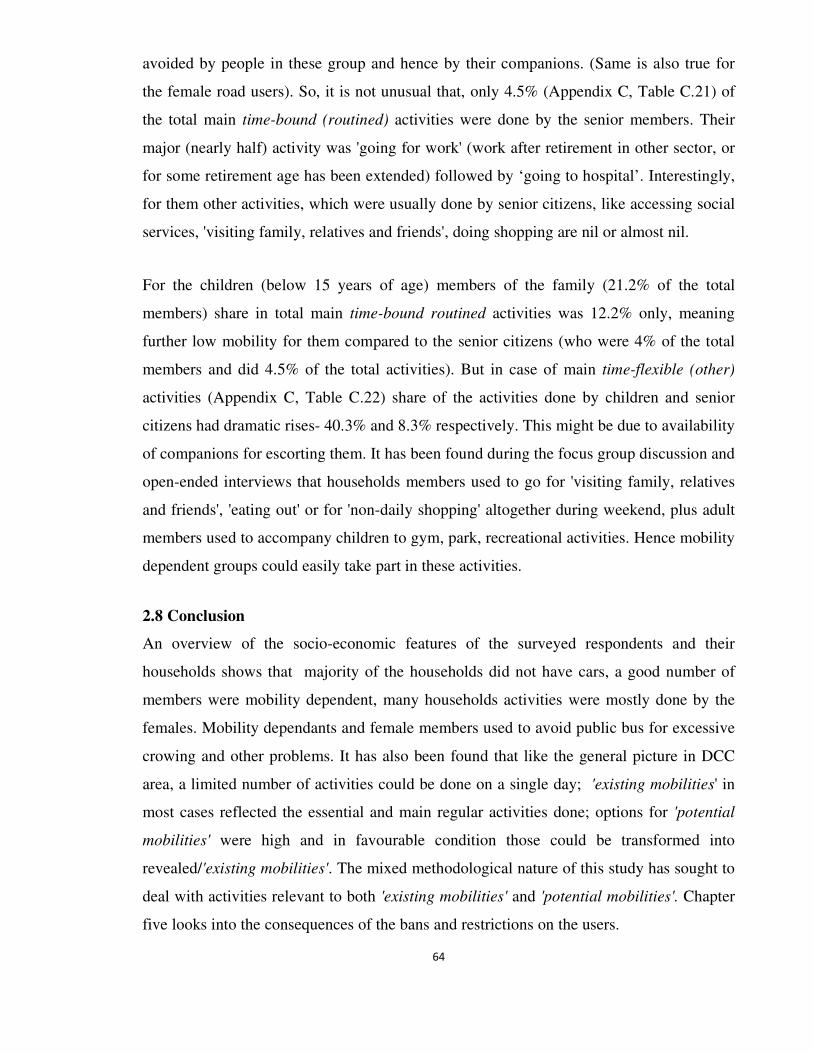
64
avoided by people in these group and hence by their companions. (Same is also true for
the female road users). So, it is not unusual that, only 4.5% (Appendix C, Table C.21) of
the total main time-bound (routined) activities were done by the senior members. Their
major (nearly half) activity was 'going for work' (work after retirement in other sector, or
for some retirement age has been extended) followed by ‘going to hospital’. Interestingly,
for them other activities, which were usually done by senior citizens, like accessing social
services, 'visiting family, relatives and friends', doing shopping are nil or almost nil.
For the children (below 15 years of age) members of the family (21.2% of the total
members) share in total main time-bound routined activities was 12.2% only, meaning
further low mobility for them compared to the senior citizens (who were 4% of the total
members and did 4.5% of the total activities). But in case of main time-flexible (other)
activities (Appendix C, Table C.22) share of the activities done by children and senior
citizens had dramatic rises- 40.3% and 8.3% respectively. This might be due to availability
of companions for escorting them. It has been found during the focus group discussion and
open-ended interviews that households members used to go for 'visiting family, relatives
and friends', 'eating out' or for 'non-daily shopping' altogether during weekend, plus adult
members used to accompany children to gym, park, recreational activities. Hence mobility
dependent groups could easily take part in these activities.
2.8 Conclusion
An overview of the socio-economic features of the surveyed respondents and their
households shows that majority of the households did not have cars, a good number of
members were mobility dependent, many households activities were mostly done by the
females. Mobility dependants and female members used to avoid public bus for excessive
crowing and other problems. It has also been found that like the general picture in DCC
area, a limited number of activities could be done on a single day; 'existing mobilities' in
most cases reflected the essential and main regular activities done; options for 'potential
mobilities' were high and in favourable condition those could be transformed into
revealed/'existing mobilities'. The mixed methodological nature of this study has sought to
deal with activities relevant to both 'existing mobilities' and 'potential mobilities'. Chapter
five looks into the consequences of the bans and restrictions on the users.
65
Chapter 3
Review of literature on justice, politics and mobilities
3.1 Introduction
Two key words of this research on just mobilities are justice and mobility(ies). Plus
inherent in the theories of justice is the question of politics (Young, 1990; Swyngedouw &
Heynen, 2003; Harvey 2003; Harvey, 1996; Harvey & Potter, 2009) which is understood
in the sense of motivation and interest behind the process of decision making and
outcomes. Based on the notion of a 'new mobilities paradigm' this research seeks to
understand mobility as existing and potential movement, along with causes and forces
behind the movement(s) by people and motivation for taking decisions by the decision
makers that produce or cause particular type of movement(s). Thus, while the traditional
notion of mobility deals with limited spatio-temporal aspects (time, frequency, distance)
of the existing movement, a more comprehensive notion of mobility - described here as
mobilities - encompasses a wide range of movements and related aspects. Now the
dilemma for the planners is to decide mobility(ies) for whom (distribution), how (process)
and why (politics). Therefore, apart from reviewing the theories of justice and mobilities,
this chapter also examines the role and conflicts involved in the options and choices
available to the planners. Next to this review is a discussion on the guidelines for
application of principles of justice in transport planning and contexts of politics of
mobilities. However, from the very beginning, it should be mentioned that focus of this
research is mobility, not transport; mobility is seen to have a much bigger role in the
everyday life of citizens as well as in shaping land uses, while transport system allows
movement to take place.
3.2 Theories of justice and politics
Justice is usually "defined and theorised in a narrow legal sense" judging "guilt or
innocence under the law" (Soja, 2010:73). But contemporary planning literature on justice
shows a wide range of key words like social justice, environmental justice, spatial justice,
just city, just planning etc. In fact, “a broader approach" to understand justice opens up
"its attributes and meaning within a given social order and expands beyond the boundaries
of the law to discuss general principles of fairness and democracy” (ibid:74). The
66
following sections elaborate the contemporary debates and development in
conceptualising justice and its subsequent and final amalgamation with process and
politics.
3.2.1 Conceptualising justice - different paradigms
It was Rawls (1971) who first focused on social justice and argued for equal distribution
of the “social goods”: liberty and opportunity, income and wealth and the bases for self
respect. He offered such a broad conceptualisation that, according to Barry (1990:ixx)
"raised the stakes in political philosophy to quite a new level ... with a theory of the human
good, a moral psychology, a theory of the subject matter (the 'basic structure of society')
and the objects (the 'primary goods') of justice, and ... an elaborate structure of argument
in favour of a specific set of principles of justice".
A "very large literature on the concepts of equity, fairness and justice in the disciplines of
philosophy, political theory and law ... has expanded greatly in the last three decades"
(Hay 1995: 501, also see Barry 1990 for details) inspired by Rawls. Drawing on Barry
(1990) and Miller (1976), studies like Hay (1995), Hay and Trinder (1991) and Trinder et
al. (1991) have in fact attempted to distil the following key concepts:
(i) Procedural fairness- proper adherence to and uniform application of rules without
discrimination, arbitrariness, inconsistency etc. It therefore requires the existence of rules
(formal or informal, explicit or implicit) which will be equal for all. There is also an
implication of consistency over time and space while dealing with any/every individual
case. Rawls's theory of justice as fairness is founded on a notion of pure procedural
justice where fair procedures produce outcomes which are by definition fair (Rawls,
1971).
(ii) Fulfilment of legitimate expectations- closely related to but rather wider than
procedural fairness. It argues that people make decisions and perform actions on the basis
of reasonable expectations and that any arbitrarily imposed changes in the conditions or
rules on which those expectations were based would be unjust or unfair (Campbell, 1973
67
quoted in Hay, 1995). There is no necessary element of interpersonal comparison in this
concept.
(iii) Formal equality (also known in economics as horizontal equity) requires that like
benefits (or burdens) be enjoyed (or suffered) by like persons in the same reference group.
It differs from the concept of procedural fairness in that the rules, themselves subject to
criticism, however fairly and consistently applied are nevertheless unjust because they
result in disproportionate benefits or burdens.
(iv) Substantive equality sees equality of final outcomes (net aggregates of burdens and
benefits) i.e. welfare, allocated resources, final income, use, cost etc. It therefore permits
the breach of formal equality and procedural fairness if the net outcome is more equal
(less unequal) than would otherwise have been the case. In a geographic context it would
require that studies of justice look behind spatial distributions to the choice sets,
constraints and information fields from which they arise (Hay, 1995:502). It is the clearest
justification for positive discrimination policies but is also the most difficult formulation
to defend41.
(v, vi and vii) Basic needs, need as demand and wider need - Certain needs are so basic
that failure to meet them is an injustice. However, as things are most often needed as a
means to an end (not as ends in themselves) needs must be justified in terms of the equity
or fairness of the end states (which goes back to substantive equality). Need as demand is
defined as a want backed by a willingness to pay (Culyer, 1980). The final and wider need
implies "a move from necessary minima to a positive conception of needs to be met" and
is also found in "Marx's dictum 'from each according to their capacities, to each according
to their need'" (Trinder et al., 1991:34).
(viii and ix) Liberty rights and Claim rights- the idea of rights may be used in the sense
that justice is upheld where individuals receive their entitlements. Liberty rights speak for
41 The difficulties are threefold, as per Hay (1995:502): (a) inequalities in physical quantities received may be the consequences of the exercise of choice by individuals; (b) equality in physical quantities received may nevertheless result in unequal utilities because different individuals have different utility functions; (c) as Young (1991:18) argues, the emphasis on distributions implicitly assumes a static conception of society, which tends to "ignore, at the same time that it often presupposes, the institutional context that determines material distribution "
68
rights of choice i.e. absence of encroachment on personal freedoms and the correlative
duties of tolerance. Claim rights are the positive affirmation of rights to provide
something (e.g. health care, education, etc.) to the right holder42. "This benefit or interest
notion of rights lies behind the UN Declaration of Human Rights, including the rights to
social security, work, equal pay, fair wages, adequate standard of living and education
alongside civil and political rights" (Trinder et al., 1991:35-6).
(x) Deserts43
- allocation of 'rewards' and 'punishments' based on having or lacking
particular merit, quality or ability or contribution to the common good.
However, Rawlsian theory has a long list of critics. A critical problem arises while
defining the limits of individual responsibility for leading to a proposal for just outcomes
which is "ambition-sensitive but not endowment-sensitive", and for equalising human
capabilities or resources rather than welfare (Smith, 2000a:2-4). In fact, for conservative
thinkers, Rawls is seen as sacrificing too many individual rights and liberties, while as per
radical critics, he has not gone enough, leaving almost untouched the major sources and
causes of inequality (Soja, 2010:75). The debate rumbles into the new millennium, in an
argument for giving priority to improving the well being of those who are badly off and
not substantially responsible for their own condition (Arneson, 2000).
As the 1970s proceeded, serious challenges to liberal egalitarianism emerged (Kymlicka,
1990; Smith, 1994)- most strongly from Marxism, suspicious of social justice under
capitalism but not entirely clear about post-revolution outcomes (Smith, 2002). Miller
(1976) claims that a liberal conception of justice tends to reflect the prevailing social
relations, and argues for a more egalitarian conception of justice than traditional theories
42 Although "rights constitute an important element in a number of accounts, (Rawls (1971) uses liberty rights; Clark (1982) uses property rights), they are not often used as the basic argument because they are demands themselves" (Hay, 1995:502) 43 As per http://www.thefreedictionary.com/deserts (accessed on the 6th July, 2013) The word 'deserts' has different meaning and pronunciation. As for the principles of justice following meaning and pronunciation stated in the website is relevant
"de·sert (d -zûrt ) n. - Something that is deserved or merited, especially a punishment. Often used in the plural: They got their just deserts when the
scheme was finally uncovered. - The state or fact of deserving reward or punishment".
69
propose. Even explicitly socialist or Marxist discussions of justice often fall under a
distributive paradigm. Nell and O’Neill (1980), quoted in Young (1990), assume that the
primary difference between socialist justice and capitalist liberal justice is in their
principles of distribution.
Another challenge to the Rawlsian concept came from communitarianism. Walzer (1983)
argues that meaning of goods subject to distribution could vary with social and cultural
context, requiring different distributional principles. Rawls has also been criticised by
feminists for impersonal rights and rules of traditional (masculinist) perspectives. The
most searching challenge from feminism has been the ethics of care, initially proposed by
Gilligan (1982), which prioritises responsibility to particular persons in need.
During the 1980s, various critiques of social justice began to search for the differences in
terms of disability, ethnicity, gender, past-colonial status, sexual orientation. “Cultural
domination supplants exploitation as the fundamental injustice. And cultural recognition
displaces socio-economic redistribution as the remedy of injustice and goal of political
struggle” (Fraser, 1995:68).
The exposition of the politics of difference by Young (1990) notably argued for the need
to contextualise justice in more concrete geographical, historical and institutional terms.
“[S]ocial justice… requires not the melting of differences, but institutions that promote
reproduction and respect for group differences without oppression” (Young, 1990:47). In
essence, Young was substituting a multisided concept of oppression, and hence injustice,
through five distinct but interacting forms: (i) exploitation (matter of class, Marxist view)
(ii) marginalisation (obstructing participation, access to resources and impacting on
quality of life), (iii) powerlessness (draining away for power, voice, access etc.), (iv)
cultural imperialism (dominance by one group/culture to diminish/evict the other) and (v)
violence (relates to social/institutional practice that tolerate, if not encourage acts putting
certain group/individual in danger). Social justice thus involves “equality among groups
who recognise and affirm one another in their specificity” (Young 1990:248). Such a
perspective resonated with the emerging spirit of multiculturalism and toleration of
“alternative” ways of living.
70
In the process there has been an “erosion of the sense of human sameness or close
similarity”, on which the case for egalitarianism rests (Smith 2002:71). However, later on
a growing movement to revisit some arguments for equality grounded in essential
characteristics of human being which have been subdued by preoccupation of difference
(Smith, 2000b). In fact “the struggle for black civil rights in the United States as well as
that against apartheid in South Africa were more a case of the universalist notion of equal
moral worth encountering particular social construction of difference” (Smith, 1998:36-7).
Thus, some common features continue to characterise theories of social justice: first, a
common concern for distribution of means of human well-being, despite differences in
primary goods, capabilities, opportunities and basic needs); second, a concern for equality,
despite differences in race and gender; third, a concern with the structure of the society
and its institutions, despite differences in aspects of social identity and relations (class,
culture, citizenship) (Smith 2002:71).
3.2.2 Theories of justice and politics - one complementing the other
A contemporary conceptualisation of justice incorporates politics as an integral concern.
On the other hand, politics, itself an independent and old discipline of study, has also
concern for just distribution and process- two pillars of justice. Urban politics, a distinct
branch of politics has particular significance in this review of literature on justice.
Politics is the “art of arranging” (Stone, 1989:xii) or a "capacity to structure the
relationship" governing communities or societies (Stone, 2005:311). Following Cresswell
(2010:21) by politics this research means "social relations that involve the production and
distribution of power". This power based socio-ecological relations, that shapes the
formation of urban environments, constantly shifts between groups of actors and scales;
therefore histo-geographical insights into urban configurations are necessary for the
radical political-ecological urban strategies (Swyngedouw & Heynen, 2003). "A just urban
socio-environmental perspective, therefore, always needs to consider the question of who
gains, who pays and to ask serious questions about the multiple power relations - and the
scalar geometry of these relations - through which deeply unjust socio-environmental
conditions are produced and maintained" (Swyngedouw & Heynen, 2003:898). Moreover
there is a simultaneous “nested” yet sometimes hierarchical power relationship at spatial
71
scales (Jonas 1994:261; Smith 1984, 1993:87-120) within and between social groups
based on gender, class, ethnicity or even ecology (Swyngedouw & Heynen, 2003). Such a
"process based approach" to understand differential access and appropriation of the power
helps to study the scale capabilities of individuals and social groups to actively contribute,
either positively or negatively, to the 'metabolisation' of urban environments and draw
attention to the mechanisms of scale transformation through "social conflict and political
struggle" (Swyngedouw & Heynen, 2003:913).
Structuralist objections to Rawlsian welfarism in geography centred on the claim that the
'distributional perspective' ignores (and thus prevents understanding) the role of the
political-economy in causing territorial injustices (Johnson et al., 1994). Some post-
modernists and feminists have claimed that sources of injustice are rarely locally-specific,
with whole societies, even the globe, subject to structural sources of disadvantage, such as
economic exploitation and racism (Mendus, 1993).
Fainstein's concept of 'just city' (see section 3.2.3) has also been criticised for being less
sensitive to structure of the political economy: "From the start it delimits its scope to
acting within the existing capitalist regime of rights and freedom and is thus constrained to
mitigating the worst outcomes at the margins of an unjust system ... Fainstein's emphasis
on the discursive and inspirational role of the Just City avoids the necessity for outright
conflict and struggle" (Harvey & Potter, 2009:46).
However, Harvey (1993) "has offered a measured response to the postmodernist critique
of universals, such as social justice", drawing heavily upon Young's (1990) five 'faces' (or
sources) of oppression in capitalist societies, by arguing for an "inclusive notion of justice
which draws upon a range of social affiliations and viewpoints, thus avoiding the tendency
of certain modernist approaches to impose a general moral outlook" (Glesson, 1996:230-
1). Moreover, in his recent reflections on Lefebvre’s classic essay- The Right to the City44,
Harvey (2003:939) asserts that “the right to the city is not merely a right of access to what
already exists, but a right to change it after our heart’s desire”; more candid on the role of
politics in justice.
44 See the collection of Henry Lefebvre's works selected, translated and introduced by Kofman & Lebas (1996)
72
Glesson (1996:231-2) argues that a "just geography would explicitly commit itself to
socio-spatial justice" defined as a "fair distribution of the benefits and burdens which arise
from the human transformation of nature ... would, however, only be a starting point as
justice must extend to the nature of distributive processes mechanisms for allocation of
social surplus" to ensure what Young (1990) called the material, psychic and cultural well-
being of people.
Moreover, conceptualisations of spatial justice have also been criticised for not giving
adequate attention to power structures and the consequent politics producing injustice.
Conflation of injustice and distribution signals a liberal spatiality in which space is seen as
a platform upon which social processes and relations unfold and a container for social
practice, rather than as a social structure arising out of existing power relations (Soja,
1980, 1999; Smith, 1984; Harvey 1996). Distributive understandings of justice articulate
and are articulated by an ontology of space in which space itself is figured as prior to
distributive projects (Kobayashi & Ray, 2000), and relationships between environment
and marginalised communities are characterised as fixed spatial configurations and
correlations (Teelucksing, 2002). Such an implicit separation of space from active social
practice serves not only to naturalise certain processes and relations by associating them
with passive spaces, but in so doing imposes depoliticised, banal geographical relations
over existing (and always already political) ones (Stanley, 2009:1000). Critiques of
distributional thinking and their liberal character are now well known, not only in the
environmental justice literature (see in particular Heiman, 1996; Pulido, 1996, 2000;
Warren, 1999; Kobayashi & Ray, 2000; Schlosberg, 2004), but also in scholarship about
justice (see Minow, 2001; Mackinnon, 2001; Young, 1990). Criticising concept of
environmental justice for its focus on distribution and being indifferent to process and
politics, Stanley (2009: 1000) observes: "Many of the problems ... throughout the long
history of internal and external critiques in the discipline [environmental justice],
consistently linked to distributional, liberal explanations of injustice". Whether implicit or
explicit, distributional conceptions of justice as an explanation of injustice and model of
environment–society relations not only prevents consideration of social relations and
processes, but also obscures and normalises existing structural inequalities (Minow 2001;
MacKinnon 2001; Young 1990; Warren 1999; Kobayashi and Ray 2000; Pulido 2000).
73
Feminist political theorists’ familiar argument is that difference should “displace”
distribution as the analytic focus of justice: "denial of difference" is the basis of oppressive
relationships and structures (Young, 1990:10). More specifically, Young situates
production and normalisation of difference at the root of oppression and (in)justice,
suggesting that the universalisation of a dominant group’s experience and culture (as the
norm in relation to which judgments are passed) constructs the differences which mark
some groups as “Other” and therefore subject to differential treatment and exploitation
(Young 1990:59). Differences between people, however, are "always constructed within
existing power relations and oppressive social formations" (Sharma 2006:28). Production
of difference is further a process of "normalising the dominant identities and claims"
against which some experiences and realities are differentiated (Stanley, 2009:1003).
Since the early 1960s, scholars in urban politics have criticised urban decision-makers for
policies that "exacerbated the disadvantages suffered" by poor, females and other weaker
groups (Fainstein, 2010:3). But recently research on cities has taken a "political turn"
where studies "not only look at the causes and patterns of urban inequalities but they also
show a growing interest in explaining how such globalisation-generated inequalities are
politically managed" (Kanai, 2010:1887). A particular concern is to envision how more
egalitarian outcomes may be democratically reached in urban regions that evidence
significant structural transformations in their economic functions and physical shape due
to processes of neoliberal or market-centric globalisation (Purcell, 2007). With an agenda
that has expanded widely over the past three decades, current research efforts engage with
a new politics of spatial justice and social inclusion for cities in a world that the capitalist
system has integrated functionally (Soja, 2000; Purcell, 2002; Sassen, 2002; Robinson,
2006; Irazabal, 2008, 2003a; Gonzalez, 2009).
In fact, studies in urban politics and justice need to account for the various actors
implicated in the process through polymorphic, multidimensional, and complexly
interwoven social agencies and spatial practices. Harvey (1982, 1996), Logan and Molotch
(1987) have shown how the contestation of urban space is (actually and essentially) an
extension of struggles over differing values and ideologies. But it should be remembered
that "just as the economy involves more than buying and selling consumer goods, so the
74
polity involves more than the pressures and counter-pressures on discrete policy choices"
(Stone 1982:276). Decision-makers and decision-making bodies do not act in a vacuum;
rather they are parts of a broader social system managing a set of possibilities and
constraints (Zunino, 2006). Dahl (1961) is first to state that there is no single elite who
dominates, rather many different interests make a group to exercise power in urban
decision making.
In contrast to the pluralist view espoused by Dahl and others, structuralists are primarily
concerned with the economic and functional limits of local government and primarily
consider the power of (local and global) capital in shaping the politics of urban
development (Strom,1996; Sassen, 1991). The process, as Feagin and Smith (1987:5)
observe, can best be understood by analysing cities in terms of their "transnational
linkages ... within the world capitalist economy, its multinational firms and its processes
of economic restructuring". Molotch (1993:31) concludes: "[c]oalition with interests in
growth of a particular place (large property holders, some financial institutions, the local
newspaper) turn government into a vehicle to pursue their material goals". Again Shefter
(1985), Elkin (1987), Stone (1989, 1993), Mollenkopf (1983) have embraced pluralist
understanding of (private and public) interest articulation and coalition building without
completely abandoning structural (economic and institutional) constraints giving way to
the 'regime theory' of urban politics. Urban regime analysis emphasises social
stratification as a source of social and economic coalition building and explores how they
work against open and penetrable arrangements which are relatively stable, cross-sectoral,
informal and productive (Stone, 2005, 2001).
In this connection it is worth reflecting on the contemporary literature on informality. It is
argued that informality has a serious implication for decision making process and
associated politics in an urban context. De Soto (1989, 2000) defines informality45 as
"extra-legal behaviour", in between legality and illegality, of stakeholders whose ends are
legal but means are proscribed by inefficient bureaucracy, exorbitant charges, unjust laws,
45 Lewis (1954, quoted in Soliman, 2004:178) categorised the economy of under-developed countries into two sectors- formal and informal. Hart (1971 quoted in Soliman, 2004:178) talked about formal and informal income opportunities in the economy of developing countries. ILO (1972) popularised the term 'informal' as a particular type of income generating activities in the developing economies.
75
or arbitrary administrative decisions. On one hand, urban informality indulges the
marginal people in the city to live and have livelihood. (In fact, conventional thinking on
informality - which talks about mainly informal settlements - depicts poor as the main
beneficiary). On the other it is informality that helps the powerful or their allies to take
'extra-legal' advantages which, in many cases, cost and cause miseries to the general and
marginal stakeholders. It is argued that "the rich and powerful" take more benefits "than
the poor" using the informal windows and scopes (Bromley, 2004: 277) and the
"techniques of informalization simultaneously enable and stall projects of populism and
developmentalism" (Roy, 2004a:160). So when informality is defined as 'extra-legality',
politics of informality is reshaped. In Roys (2004b:289) words: "The political economy of
urban informality is thus also the politics of representation; the poetics of representation is
thus also the geopolitics of late capitalism".
3.2.3 Different notions of justice in practice
Harvey was one of the first geographers to adopt the Rawlsian analysis, compressing
distributional and procedural justice into “a just distribution justly achieved” (Harvey
1973:116). Rawls’s formal analysis has helped frame an ongoing exploration of spatial
justice among geographers like Reynolds and Shelley (1985), Walzer (1993), Smith
(1994). Walzer’s (1993, in Harvey 1996:350–51) description of "radical particularism" is
close to the notion of procedural justice: “justice is rooted in the distinct understanding of
places, honors, jobs, things of all sorts, that constitute a shared way of life. To override
that understanding is to act unjustly”. Harvey (1973) specifies two conditions for just
distribution of urban infrastructure. While his first condition urges for the distribution of
income to help people overcome special difficulties stemming from the physical and social
environment, the second one calls for distributive mechanisms themselves to be such that
the prospect of the least advantaged territory is as great as possible. Thus, everyone’s
physical integrity should be guaranteed to a minimum level of material well-being,
including those basic needs that must be met in order to remain a normal functional human
being.
Hay (1995:505-6) has identified three notions concerning geographers while
conceptualising justice in a "spatial or territorial context: spatial equality, territorial justice
76
and minimum standards". Spatial (in)equality appears in most studies to combine elements
of equal choice, formal equality and substantive equality based on comparison of
gain/receipt or outcome of anything in different areas. Territorial justice is similarly an
amalgamation of concepts like need, formal equality and substantive equality. Minimum
standards involve specification of certain minimum needs to avoid injustice (and thus
relates directly to the concept of need)46.
Still difficulties arise while applying a distributional and procedural justice concept in a
geographical or spatial context. Spatial, areal or geographical "uniformity may be
observed even where there have been serious breaches" in justice (Hay 1995:503). For
example, a region may have a gross and unjust distribution income at
household/individual level. Yet if the proportions in each income category are identical in
all sub-regions and at all scales there will be no spatial evidence of that inequality (ibid).
This should not, of course, exclude the examination of such injustice from a full
geographical description and analysis of the character of that region; rather it also
necessitates to look into the politics of regional disparity.
In fact, in the course of time clear differences have also emerged between "Rawls’
formulation and Harvey’s trajectory of justice" (Bailey & Grossardt, 2010:66). Power and
class in their geographical specificity are critical preconditions from which justice
emerges ideologically and how it is then operationalised (Harvey, 1996). This dialectical
materialist reasoning leads to a geographical environment that is an active agent in human
socio-economic and cultural systems (Harvey, 1996). Critical cultural geography’s
approach has been to play one off against another, arguing that power controls process and
thus creates unjust distributions through the use of just processes (Smith, 1997).
Although Harvey’s early formulations introduced territorial distribution, spatial structure
and environment into a discourse of social justice it was hitherto devoid of geographical
46 The concept of minimum standard can also be "expanded to incorporate spatial and temporal dimensions as minimum accessibility standard: it must be available within travel distance X and with maximum delay Y (however X and Y may be measured). An advantage of that approach is that it refers to the level of provision available to individuals and is therefore less dependent upon the use of aggregates for arbitrarily defined geographical units. Furthermore, it can be operationalised in a form which allows the establishment of a hierarchy of standards to be used to identify the depth (not just the spatial extent) of unmet need and therefore to establish priorities for intervention" (Hay, 1995:506).
77
content and he soon shifted his focus to the more specific scale of situ and its mechanisms
of distribution based on Marxism (Smith, 2002). However, apart from Harvey (1973) and
Young (1990), as Smith (2002) argues, there has been very little theoretical progress
explicitly directed to the city. But recently justice "seems ... back on the geography
agenda". (Glesson,1996:229). Issues of social justice have increasingly been raised in the
field of development studies, while the notion of environmental justice has also broadened
the scope of normative discourse (Smith, 2000c:Ch8-9).
The American environmental justice movement and related studies have much increased
public awareness of injustice and unsustainable environmental trends at the local level
(Wenz, 1988; Farber, 1998; Sze, 2006). Beginning in the US South in the 1980s, poor,
often rural, African-American communities fought landmark struggles against some of the
world’s largest corporations and unresponsive government agencies (Bullard 1993a, 2000,
2005, 2007; Roberts, 2007; Fujita, 2009). "The movement originally defined itself as
against “environmental racism” and then expanded to include Hispanic, Native American,
and poor white groups facing environmental injustice in local contexts" (Fujita, 2009:378).
Environmental justice also seeks the distribution of the benefits and costs of environmental
resources according to principles of justice. More recently, environmental justice studies
have applied the concept to metropolitan regions (Bullard, 2007) and on a global scale
(Roberts, 2007). In fact, having faced the question if all justice is environmental, Hamlin
(2008:145) answers that "may be not all, but a great" and thus he broadens the concept
from "inequitable distribution of environmental beds: toxic wastes, often from synthetic
organic compounds, ... [to] the environs of communities occupied by poor persons,
minority groups, and groups otherwise marginalised [such as lacking] technologies of
sanitation".
Moreover, a number of environmental justice scholars have recently argued the need to
“widen” and “extend” definitions to improve their conceptual reach (Kurtz 2003;
Debbane´ & Keil, 2004; Schlosberg 2004, 2007; Pellow & Brulle, 2005; Haluza-DeLay
2007; Pellow, 2007; Stanley, 2009:999). They have identified several shortcomings:
"numerous theoretical inadequacies" while conceptualising injustice (Schlosberg,
2004:527); a distinct lack of attention to how environmental inequalities and racisms are
78
actually produced (Pellow, 2000:587); inability to consider the institutional, cultural, or
symbolic causes of injustice (Schlosberg, 2004:518; Mascarenhas, 2007:676; Page,
2007:617); and repeated failure to account for the political and spatial contexts of injustice
(Teelucksingh, 2002, 2007, Debbane´ & Keil, 2004, Hanson, 2007:601).
After the 1990s there seems to be some shift in theorising justice from a social to a spatial
dimension. Dikec (2001, 2007), Swyngedouw (2001, 2005) and others started to link
justice with space- a third dimension after time (history) and society (process). As
Swyngedouw (2005) states: “the question of justice cannot be seen independently from the
‘urban condition', not only seen because most of the world’s population live in cities, but
above all because the city condenses the manifold tensions and contradictions that infuse
modern life”.
Purcell (2008) presents an insightful re-evaluation of Lefebvre’s ideas surveying the
recent literature and cautioning against any reductionist interpretation of the call for a
radical urban metamorphosis. In an insightful turn of phrase, Purcell calls the right to city,
especially in its sense as a right to occupy and inhibit space, an organisational and
mobilising ‘linchpin’, suggesting that it forms an integrative umbrella for coalition
building, a kind of connective tissue or ‘glue’ that can help to unite diverse and
particularised struggles into larger and more powerful movements.
Finally, Soja (2010), in Seeking Spatial Justice, very strongly tries to establish a theory of
spatial justice. In his view, geographies and histories are "socially produced and not
simply given to us by God or nature"; geographies of spatialities can be just as well as
unjust, and they are produced through processes that are simultaneously social and spatial,
subjective and objective, "concretely real and creatively imagined" (Soja, 2010:104).
Thus geographies in which we live can have "both positive and negative effects ... provide
advantage and opportunity, stimulate, emancipate, entertain, enchant, enable ... can also
constrain opportunity, oppress, imprison, subjugates, disempower, close off possibilities”
(ibid:104).
79
As has been stated earlier (in section 3.2. ), Fainstein (2010:3) espouses the idea of a 'just
city' defining it as "a city in which public investment and regulations would produce
equitable outcomes rather than support those already well off". In the western neoliberal
context Fainstein (2010:165) searches answers to the questions: (i) what are the qualities
of a just city? (ii) to what extent have those been realised? (iii) what are the social forces,
politics, planning and policies that shaped the realisation and (iv) what strategies are to be
followed at a sub-national level and what institutional/social movement is required to
improve the social justice record of the cities. Finally she proposes an urban theory of
justice emphasising equity, democracy and diversity.
Thus, combining a normative, scientific and critical theorisation of injustice as a social
product leads directly to the debates about democracy, citizenship, and fundamental
human rights to participate in the politics (of the city-states) as well as its social, cultural,
religious and economic activities (Soja, 2010:74-75). Attempting to draw together the
global justice, environmental justice and human rights movements, the World Charter for
the Right to City, as quoted in Soja (2010:106), begins by recognising that the city “is a
rich and diversified cultural space that belongs to all its inhabitants,” and that everyone
“has a Right to the City free of discrimination based on gender, age, health status, income,
nationality, ethnicity, migratory condition, or political, religious or sexual orientation, and
to preserve cultural memory and identity”.
Contemporary to the concept of 'just city' is the concept of 'urban justice'. Fujita
(2009:377-381) observes that both as "a moral and a political concept" 'urban justice'
"includes the unequal distribution of income and wealth, spatial housing segregation,
uneven allocation of public goods and services, and unfair exercise of political rights,
along lines of class, race, ethnicity, and gender in the context of communities, cities, and
metropolitan regions. Consequently, the concept of a just city and a progressive city has
been around but there is no concept of a just and sustainable city. Bringing sustainable
development into urban justice studies is a growing and urgent trend ... But ultimately, it is
a question of political will whether communities, cities, and metropolitan regions of the
world can commit themselves to sustainable development and to eradicating urban
80
injustice by fundamentally changing the way we produce, consume, and allocate
resources".
3.3 Theories of mobility- mobilities
This section sheds light on the reasons for movement, identifies the limitations of
traditional understanding of mobility as physical movement and explains the new
paradigm of mobility - mobilities. It also seeks to reconcile mobility and accessibility
within the same concept with the help of 'new mobilities' paradigm.
3.3.1 Why do people move?
There are so many reasons for people to move: work, education, food, health, recreation,
social and religious needs etc. Based on Urry (2004:31-32, 2003:163) six different
obligational perspectives can be summarised:
(i) Formal (legal, economic, and familial) obligations- to go to work, public office, visit
professional, attend family events (social, religious).
(ii) Social obligations (less formal but often involve strong normative expectations) of
physical presence and attention to hear, observe, read and sense some 'firsthand' and
emotional work with friends and family for developing extended relations of trust.
(iii) Time obligations -spend moments of 'quality time' with specific person(s) often within
very specific locations, may involve lengthy travel (away from normal patterns of work
and family life) and even a special environment.
(iv) Object obligations- to be co-present to sign contracts or to work on or to see various
objects (related to household and official work) in a specific physical location.
(v) Obligations to place- to sense by oneself a place or a certain kind of place 'directly' -
such as walking within a city, visiting a specific building, making adventure at 'leisure
places'.
(vi) Event obligations-to experience a particular 'live' event programmed to happen at a
specific moment like rallies, concerts, matches, celebrations, film premieres, festivals, etc.
Daily mobilities in an urban setting includes all the obligations, stated above, in a specific
temporal, spatial and social setting. The setting is subject to factors like subjective
81
meaning, control and power which eventually determine modes used and distance
travelled (Hjorthol, 2008:194-5). Moreover, as the obligations stated may be overlapping
and multiple for a single person, Hjorthol simplifies and states that people move and travel
because they:
(i) Want to change place for different reasons,
(ii) Can have access to time, money and modes and
(iii) Have to do so to fulfil different obligations.
3.3.2 Reconciling the old transport planning debate of mobility versus accessibility
A common question and/or confusion, generating from the conservative definition of
mobility in transport planning and engineering studies, is which one should be in focus -
mobility or accessibility? There is no doubt that the benefits accruing from the
development of (and access to) new transport facilities and/or activity centres will depend
crucially on the question of accessibility (Vickerman, 1974; Martens, 2006). Although
used interchangeably, two different forms of accessibility have been distinguished in the
literature: (i) person accessibility- a person having accessibility (or not) to a certain set of
locations and (ii) place accessibility- an activity location being accessible (or inaccessible)
for a certain set of people or from a certain set of other locations (see Pirie 1979; Kwan
1999; Miller, 2007). "Person and location accessibility are thus each other’s mirror image"
(Martens, 2012: 1040). Apart from many other things like physical ability, time,
permission, it is transport, means and options for mobility provided by it, that links person
and place accessibility.
But, if people find themselves in circumstances where their home location relative to
transport services (speeds, distances to stops) and their available mobility tools (car
ownership/access, public transport, season ticket ownership) increase the costs (i.e. the
psychologically weighted sum of travel times, out-of-pocket costs and comfort) relative to
the population average, then they are less likely to engage in travel and society, at large
(Schonfelder & Axhausen, 2003:273).Therefore, persons or households with the same
level at accessibility to locations may differ in other kinds of accessibility depending on
their own condition (socio-economic etc) and transport options, and experience problems
in actually accessing the destinations. All these make them different (the other) with
82
respect to those who can get access to destinations and also may be excluded from the
activities. Naturally, these socio-spatially excluded people are also unable to accomplish
many of the mobilities required for effective social participation (Shove, 2002:1). So, this
is not only a question of the diversion of existing journeys from one destination to another
by changing relative accessibilities, but also of the impact which overall accessibilities to
all destinations can have on the entire mobility pattern, trip generation, distribution, and
mode choice (Vickerman, 1974:675) of a cross section of people.
In this connection it should be mentioned that current developments in transport related
exclusion studies (Church et al., 2000; Clifton, 2003; Froud et al., 2002; Hodgson &
Turner, 2003; Kenyon et al., 2003; Lyons, 2004; Shove, 2002; Ureta, 2008) have also
acknowledged the need for combined understanding of mobility and accessibility
dimensions. Kenyon et al. (2002: 210-11) define transport related social exclusion as the
process which prevents people from “participating in the economic, political and social
life of the community because of reduced accessibility to opportunities, services and social
networks, due in whole or in part to insufficient mobility in a society and environment
built around the assumption of high mobility” (Kenyon et al., 2002:210–211). Lucas
(2012:105) has urged "to reflect on the extent to which a social exclusion approach to the
research of transport disadvantage has been successful in opening up new avenues of
research enquiry and/or identifying new theoretical perspectives and/or methodological
approaches".
In fact "[m]obility’s accessibility function" (Kenyon et al., 2002: 212) requires more
physical mobility and thus enhances social mobility (DETR, 2000:5). Again some people
need both to be able to travel more and to accept the need to travel more if they are to be
socially ‘included’ (ibid). There is evidence that the possibility of choosing jobs in
locations outside the main employment zone, choosing off-peak working hours jobs (part-
time and shift work, requiring low skill and hence low paid, with a predominantly female
workforce) or access to education and training opportunities, leisure activities, hobbies
and pursuits can be constrained by mobility difficulties like lack of accessible, affordable
and available transport (Kenyon et al., 2002:212).
83
Like accessibility, mobility can also be viewed as a social service (Cahill, 1994),
facilitating social interaction and participation, whether at the destination or during the
journey. As mobility has an important social function, lack of mobility can reduce access
to formal and informal social networks, increasing isolation and separation not only from
goods and services but from social activities, family and friends (Kenyon et al.,
2002:212).
So, “what is at stake is not mobility in itself, but mobility in relation to the accessibility to
certain places and people when needed” (Madanipour, 2003:185). Emphasis is required to
be given both to overall accessibility and total mobility in the broader conceptualisation of
mobilities. It will also help reduce, if not remove the confusion (accessibility or mobility?)
while studying inequality and unfairness in distribution of transport services and
associated processes.
3.3.3 Beyond movement- rethinking mobility
Mobility of people are described by the following terms: residential mobility, migration,
travel-tourism and business travel, and lastly day-to-day displacement/commuting
(Schuler et al., 1997, in Kaufmann et al., 2004:748). In fact, discourses on the concept of
mobility have traditionally described it as physical movement (operating in the domains of
geography, urban planning and transport) on one hand and a change in social status on the
other (a sociological construct) (Uteng, 2011:6). However, in an increasingly mobile
world the overwhelming mobilities of the people have added new "dimensions,
dependencies and dynamics" to the understanding of (social and spatial) mobility along
with creating "conceptual confusion" (Kaufmann et al., 2004:745). Kaufmann et al.,
(2004:748) observe that most studies of mobility are deficient in at least two ways- (i)
spatial mobility studies tend to focus on space-time rather than on the interaction between
actors, structures and context, (ii) many spatial and social mobility studies are merely
limited to actual and past fluidity and ignore the potential movement (which might reveal
possibilities and constraints of movement along with wider societal consequences of social
and spatial mobility.
84
However, Mayers (2005, quoted in Uteng, 2011:6) contends that "from the 80’s, this
barrier started to melt away with numerous attempts from both sides to integrate
approaches and to mutually get involved into scientific discourse". In a socio-geographical
context, to explain the production of mobility, Cresswell (2001:20) espouses mobility as a
movement that is socially produced and varies across space and time exerting visible
effects on people, places and things, and the relationships between them. Jones (1987:34)
puts forth three components to express mobility:
- Individual action: observed movement or travel;
- Potential action: journeys that people would like to make, but cannot due to limitations
in the transport system and/or their own temporal, spatial or financial constraints; and
- Freedom of action: which may never manifest in action, but gives the individual options
from which to select and the knowledge that he/she could do something.
Knie (1997, quoted in Uteng, 2011:6) introduces a related understanding of the concept,
and emphasises that mobility is about the construction of possibilities for movement, rather
than actual traffic. Sørensen (1999) notes that mobility refers to the real or symbolic
performance of the provision of physical movement in society. Nijkamp et al. (1990: 22-
24) argue that mobility analysis should be undertaken on a broad scale in the context of
the following four themes:
- Socio-economic: influences of exogenous socioeconomic conditions upon spatial
patterns of interaction;
- Technological: changes in the technological environment affecting spatial behaviour of
individuals or groups;
- Behavioural: motives, constraints and uncertainties facing individuals, households and
groups when taking decisions regarding transport, communication and mobility; and
- Policy analysis: evaluation of actions, usually the application of policy instruments or
measures of decision making agencies regarding transport.
Other than academic literature, efforts (World Bank, 1996; TRB, 2001; OECD, 2002)
have also been made to build a new concept of mobility to redirect any consistent planning
efforts to enhance the overall mobility patterns in urban areas. European research
(TRANSPLUS, 2003; SCATTER, 2008) pioneered the development and application of a
85
new mobility concept to monitor the implemented policies and strategies. The search for a
new mobility concept is now reaching other continents (Gudmundsson, 2001), including
developing countries.
However, mobility, unlike movement, is a contextualised phenomenon (Uteng, 2011:6).
To highlight the historical and cultural basis and diversity of mobility Sørensen (1999)
coins the term ‘mobility regimes’ consisting of the physical shaping of cities and
landscapes, the available transport systems and modes, the relationship between mobility
and economic, social and cultural activities and the meaning attributed to mobility.
Besides, regulatory rules, financing agencies, technologies, land use patterns and aspects
of human behaviour contribute to make them much more complex (Richardson, 2005).
"These reflections from theoretical insights suggest that mobility cannot be analyzed in a
purely instrumental, objectivist mode and that it remains a subjective dimension differing
with the distribution pattern of the constituent resources. ... Mobility, thus, emerges as an
enabling characteristic, a sought after rather than given ‘good/commodity’. The
understanding of mobility has thus crossed the narrow confines of speed and distance...
[rather] has permeated the areas of politics, economics, history, social setup, popular
culture, access, travel behaviour and movement in understanding the creation of identities,
empowerment, conversions into social norms and the circulation of these through time and
space. It brings forth the asymmetries of power and opportunities which might elude a
pure transport focus, and therefore ... builds on the theme of ‘mobility’ of which the
dimension of ‘transport’ is a subset" (Uteng, 2011:6).
3.3.4 From mobility to mobilities - a new paradigm
Mobility is an evocative keyword for the twenty-first century and a powerful discourse
creating its own effects and contexts (Hannam et al., 2006:1). Multiple usage of the term
mobility in diversified ways in disciplines like sociology, tourism, anthropology, transport,
geography, transport-geography, transport planning, spatial/land use/ town planning,
migrations, diaspora and remittance studies have also resulted in several notions about
different types of mobilty: 'time-space compression' (Harvey, 1989), 'death of distance'
(Cairncross, 1997), speeded-up 'liquid modernity' (Bauman, 2000), the growth of an
86
'internet galaxy' (Castells, 2001), and as well as the 'globalisation' of economic, social, and
political life.
Hannam and colleagues (2006:2) observe that globally mobilities are increasingly criss-
crossed by stakeholders like tourists, workers, terrorists, students, migrants, asylum-
seekers, scientists/ scholars, family members, business people, soldiers, guest workers, etc.
producing and intersecting a more "‘networked’ patterning of economic and social life,
even for those who have not moved". Urry (2004:27) identifies five highly inter-dependent
nature of the mobilities that form and reform social life, bearing in mind the massive
inequalities in structured access to each of these: (i) corporeal travel of people for work,
leisure, family life, pleasure, migration, and escape, (ii) physical movement of objects
delivered to producers, consumers, and retailers, (iii) imaginative travel elsewhere through
images of places and peoples on television, (iv) virtual travel often in real time on the
Internet, so transcending geographical and social distance and (v) communicative travel
through person-to-person messages via letters, telephone, fax, and mobile phone.
Therefore, replacing the single notion of mobility, a ‘new mobilities paradigm’ (Sheller &
Urry, 2006a), has been formed within the social sciences; a number of key texts and edited
collections have been launched (Cresswell, 2010:17). The term and concept of 'mobilities'
encompasses both the large-scale movements of people, objects, capital and information
across the world, as well as the more local processes of daily transportation, movement
through public space and the travel of material things within everyday life making it
central to many lives, organisations and governments (Hannam et al., 2006:1). In fact, the
‘new mobilities paradigm’ has exploded a diverse array of works including a new -
broader and diversified - conceptualisation of mobility (Hannam et al., 2006; Kaufmann,
2002; Sheller & Urry, 2006a; Urry, 2007) and those works in sociology of mobility
(Braenholdt & Simonsen,2004; Urry, 2000), geography of mobility (Cresswell, 2006a;
Cresswell & Merriman, 2008), right based mobility (Cresswell, 2006b), gender based
mobility (Uteng & Cresswell, 2008; Silvey, 2004), particular forms and spaces of mobility
ranging from driving and roads (Beckmann, 2001; Merriman, 2007; Urry, 2004) to flying
and airports (Adey, 2004a, 2004b), technologies (Sheller & Urry, 2006b). There is a
"mobility turn" in contemporary flow or movement studies in social science from an
87
integrated, broader and diverse perspectives recognising mobility as 'physical movement
and contain[ing] social meanings' manifested in a politics of mobility (Henderson,
2009:70).
3.3.5 Conceptualising mobilities
From the discussion above, it is evident that a broader conceptualisation of mobility is
required to dissolve the mobility-accessibility debate, encompass human and social
contexts of movements/mobility, revealed and potential travel behaviour/pattern. Several
studies (Flamm & Kaufmann, 2006; Kaufmann et al., 2002 and 2004; Urry 2000;
Kesserling, 2006 ) have discussed a potential 'hybrid' concept (Cattan, 2008:86) -
mobilities - that is not limited to physical displacement, but also integrates the mobility
potential arising from intentions of the individuals, from their strategies and negotiations
in response to external factors and forces.
While explaining the concept of mobilities, Kaufmann et al. (2004:749), Kaufmann (2002:
37) identify three interdependent elements shaping mobility levels and pattern:
- access to mobility providing means, services, infrastructure and degrees of usability,
- competence to recognise and use accessible mobility means, and
- appropriation of a particular choice, including the option of non-action.
While the concept of mobilities incorporates aspects of accessibility on one hand, it goes
further on the other by focusing on the "logic of an actor’s actions, in particular the
reasons behind the choice of tools and localisations, without being concerned with an
action’s maximum utility" i.e. more on actors relationship with space and less on the
possibilities offered by a given territory (Flamm & Kaufmann, 2006:169).
Cresswell (2006a), Hannam et al. (2006) and Sager (2006) also agree and argue that
mobility is closely related to potential and actual movement, where movement must occur
in or refer to some kind of space entangled in networks. No matter what type of space is
imagined, mobility is created by overcoming friction measured as physical distance, costs,
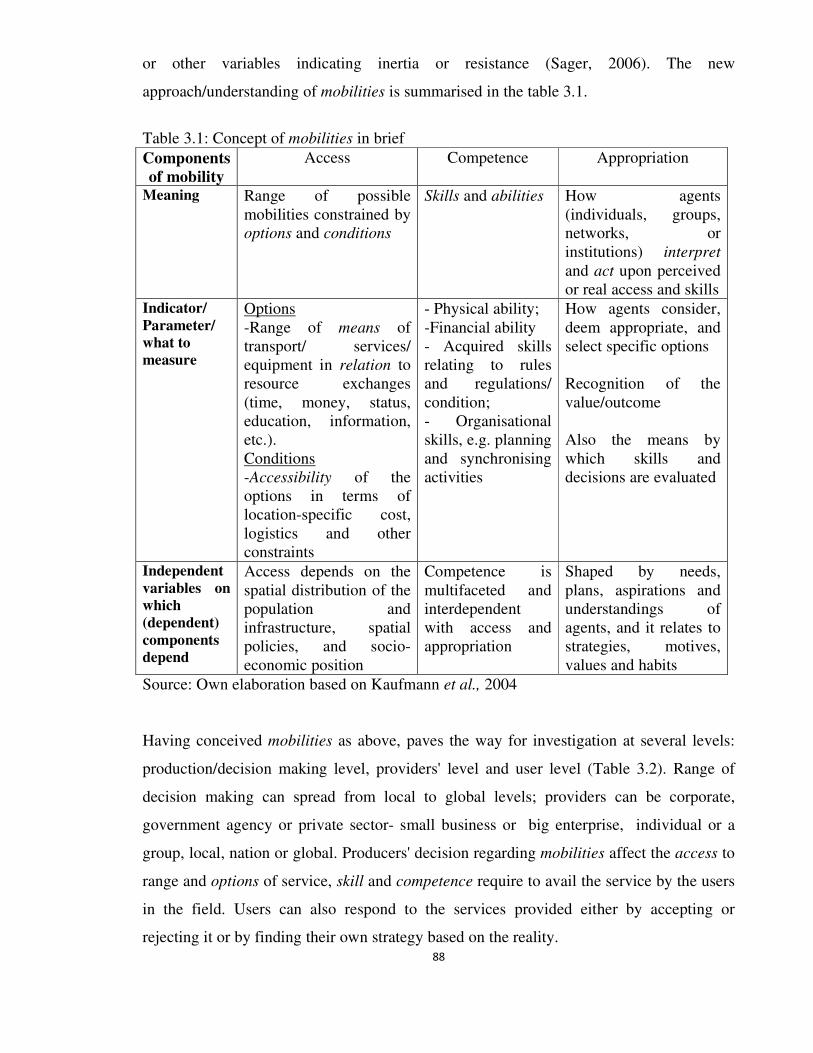
88
or other variables indicating inertia or resistance (Sager, 2006). The new
approach/understanding of mobilities is summarised in the table 3.1.
Table 3.1: Concept of mobilities in brief
Components
of mobility
Access Competence Appropriation
Meaning Range of possible mobilities constrained by options and conditions
Skills and abilities How agents (individuals, groups, networks, or institutions) interpret and act upon perceived or real access and skills
Indicator/
Parameter/
what to
measure
Options -Range of means of transport/ services/ equipment in relation to resource exchanges (time, money, status, education, information, etc.). Conditions -Accessibility of the options in terms of location-specific cost, logistics and other constraints
- Physical ability; -Financial ability - Acquired skills relating to rules and regulations/ condition; - Organisational skills, e.g. planning and synchronising activities
How agents consider, deem appropriate, and select specific options Recognition of the value/outcome Also the means by which skills and decisions are evaluated
Independent
variables on
which
(dependent)
components
depend
Access depends on the spatial distribution of the population and infrastructure, spatial policies, and socio-economic position
Competence is multifaceted and interdependent with access and appropriation
Shaped by needs, plans, aspirations and understandings of agents, and it relates to strategies, motives, values and habits
Source: Own elaboration based on Kaufmann et al., 2004
Having conceived mobilities as above, paves the way for investigation at several levels:
production/decision making level, providers' level and user level (Table 3.2). Range of
decision making can spread from local to global levels; providers can be corporate,
government agency or private sector- small business or big enterprise, individual or a
group, local, nation or global. Producers' decision regarding mobilities affect the access to
range and options of service, skill and competence require to avail the service by the users
in the field. Users can also respond to the services provided either by accepting or
rejecting it or by finding their own strategy based on the reality.
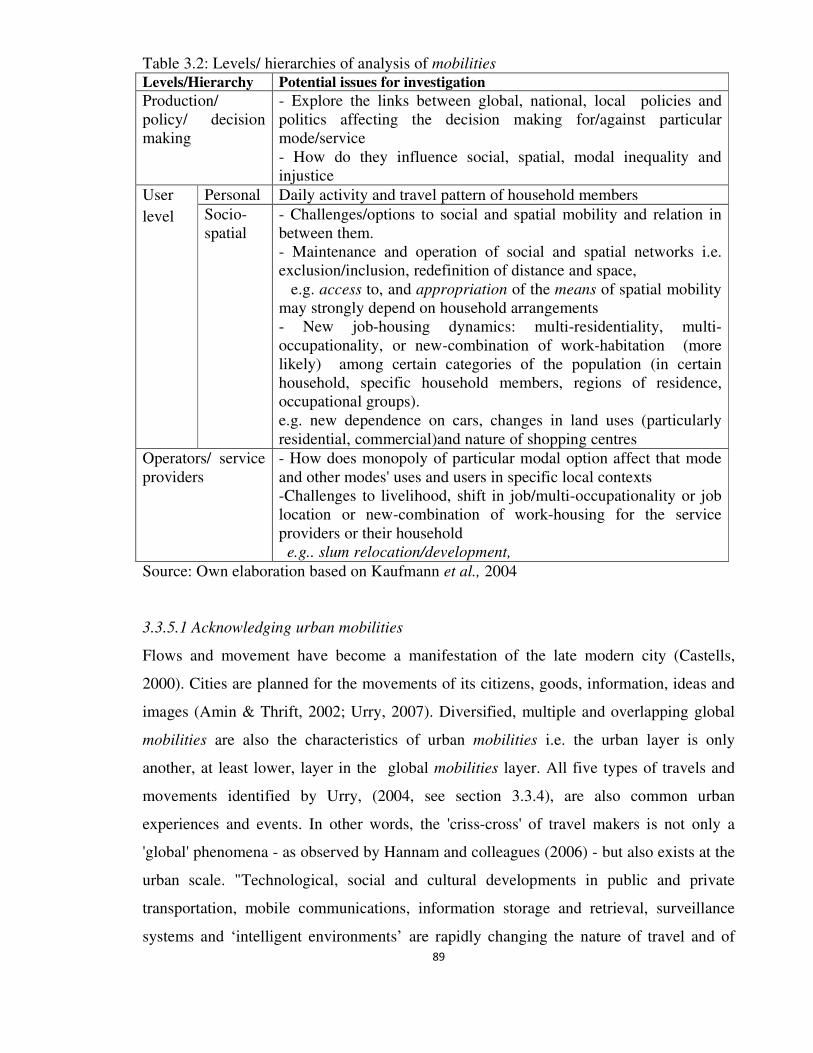
89
Table 3.2: Levels/ hierarchies of analysis of mobilities Levels/Hierarchy Potential issues for investigation
Production/ policy/ decision making
- Explore the links between global, national, local policies and politics affecting the decision making for/against particular mode/service - How do they influence social, spatial, modal inequality and injustice
User
level
Personal Daily activity and travel pattern of household members
Socio- spatial
- Challenges/options to social and spatial mobility and relation in between them. - Maintenance and operation of social and spatial networks i.e. exclusion/inclusion, redefinition of distance and space, e.g. access to, and appropriation of the means of spatial mobility may strongly depend on household arrangements - New job-housing dynamics: multi-residentiality, multi-occupationality, or new-combination of work-habitation (more likely) among certain categories of the population (in certain household, specific household members, regions of residence, occupational groups). e.g. new dependence on cars, changes in land uses (particularly residential, commercial)and nature of shopping centres
Operators/ service providers
- How does monopoly of particular modal option affect that mode and other modes' uses and users in specific local contexts -Challenges to livelihood, shift in job/multi-occupationality or job location or new-combination of work-housing for the service providers or their household e.g.. slum relocation/development,
Source: Own elaboration based on Kaufmann et al., 2004
3.3.5.1 Acknowledging urban mobilities
Flows and movement have become a manifestation of the late modern city (Castells,
2000). Cities are planned for the movements of its citizens, goods, information, ideas and
images (Amin & Thrift, 2002; Urry, 2007). Diversified, multiple and overlapping global
mobilities are also the characteristics of urban mobilities i.e. the urban layer is only
another, at least lower, layer in the global mobilities layer. All five types of travels and
movements identified by Urry, (2004, see section 3.3.4), are also common urban
experiences and events. In other words, the 'criss-cross' of travel makers is not only a
'global' phenomena - as observed by Hannam and colleagues (2006) - but also exists at the
urban scale. "Technological, social and cultural developments in public and private
transportation, mobile communications, information storage and retrieval, surveillance
systems and ‘intelligent environments’ are rapidly changing the nature of travel and of
90
communications conducted at-a-distance" (Hannam et. al. 2006:3). Although the changes
are most vivid and comprehensible to common people in daily experiences in an urban
scale in the developed world, urban people in the rapidly urbanising and motorising
developing world are also gradually experiencing similar changes at a growing rate.
Understanding the ways in which unjust mobilities intersect with people, place, pace and
mode is of course a complex one. Like other mobilities, urban mobilities are the outcomes
of policy, politics and process of distribution of benefits and cost of mobilities over space,
social groups, environment etc. This research is built on the premise that urban mobilities
have different stakeholders: policy/decision maker, user/consumer and provider (agency
and individual/driver). These stakeholders understand and represent mobilities in different
ways: normative versus subjective, existing versus potential. Their priorities are also
different: economic efficiency versus social sustainability, individual benefit versus
collective gain, blind adherence to global trend versus informed consideration of local and
community need, non-motorised (including pedestrian) mobility versus motorised
mobility etc. Rapid changes are taking place in the supply side of the urban transportation
modes, infrastructures and technology. On the other hand in the demand side demand of
the users are also diversifying due to changes in socio-economic and cultural (including
gendered) practices relating mobility. Plus urban/local governments are facing much
political and economic challenges to match national/global requirements and local needs.
So, simple (traditional) notion of mobility seeing urban mobility simply as a matter of
movement in the city is less than sufficient to provide adequate attention to the different
stakeholders of urban mobilities (and their experiences and forms of understanding) and
dismantle their multiple interests.
In this context, the new paradigm of mobilities is sought to be useful. Moreover, adding
the condition of justice to (urban) mobilities will be effective to provide a theoretical and
practical platform for weighing the options, goals, objectives and requirements of different
stakeholders. This research has sought to understand (un)just mobilities with respect to
distributional and processual (in)justice in the urban mobilities of citizens. On one hand, it
seeks to study the dominantly exhibited views and experience of mobilities by decision
makers at the global, national and urban levels, on the other, it digs as deep as to the
91
household scale to identify their multidimensional patterns of mobilities and different
effects of the same intervention in mobilities of citizens categorised with respect to
different socio-economic characteristics.
3.3.6 Conceptualising the politics of mobility
The politics of mobility is one of the most contentious aspects of debates on urban growth
(Hodge, 1990; Hanson, 1995; Dunn, 1998) and transport studies. By politics of mobility
this research means "the ways in which mobilities are both productive of ... social
relations and produced by them" (Cresswell, 2010:21). The social inequality embedded in
the uneven distribution of mobility is a theme emphasised by Urry (2007). Hannam et al.
(2006) depict how particular mobilities induce social inequality by differentiating abilities
to master mobility systems and access to different modes of mobility.
Mobilities are also caught up in power geometries of everyday life (Massey, 1994). There
are new places and technologies that enhance the mobility of some peoples and places
even as they also heighten the immobility of others (Timothy, 2001; Verstraete, 2004;
Wood & Graham, 2006). "Differential mobility empowerments reflect structures and
hierarchies of power and position by race, gender, age and class, ranging from the local to
the global" (Tesfahuney, 1998:501).
Since mobility and power are intertwined, mobility does not only tend to be unequally
distributed, but it also reflects power differences between "people who move and act
faster" and slower (Bauman, 2000:119). To be true, mobility conveys, on the one hand, a
notion of “progress, freedom and modernity” and, on the other, issues of “restricted
movement, vigilance and control” (Cresswell & Uteng, 2008:1). In contemporary cities
mobility is a “highly differentiated activity” (Adey, 2006:83) where “uneven geographies
of oppression” mark people's differential abilities to move (Cresswell, 2006a:742). Since
"one person's speed is another person's slowness" (Cresswell, 2010:21), Albertsen and
Diken, 2001 (quoted in Sager, 2006) notes that whereas access to mobility is a matter of
choice for some, for others it is a question of fate. Some people are constantly forced to
move on and are denied the right to settle down in a suitable place.
92
Henderson (2004) observes that the politics of mobility represents, in one sense, political
struggles over a transport mode (motorised , non-motorised transport, walking) and the
configuration of urban space and, in a broader sense, an extension of ideologies and
normative values about how cities should be configured and by whom. The intense “time-
space compression” of recent decades has left a “disorienting and disruptive impact” on
political economy, balances of (class) power, society and culture (Harvey 1990:284). In
this context, transportation has become central to shaping and reshaping urban geography
and the capitalist mode of production (Harvey, 1982; Hodge, 1990). The turnover of
capital and, therefore, capital accumulation itself, are closely dependent on the cost, speed
and capacity of the transport system (Henderson, 2004:201). Therefore, there is a
distinctive capitalist ideology of mobility (Freund & Martin, 1993, 1996) making speed
and auto-mobility synonymous with economic growth and social progress (Greene &
Wegener, 1997). Under the guise of increased mobility, a covert intention is to serve the
interests of elites in society, business, the transport sector and even international
corporations (Henderson, 2004; Ratanawaraha, n.d.; Pendakur, 2011).
Plus, the politics of mobility should also be studied in relation to democracy (Jensen 2011;
Sheller, 2004, 2008; Cresswell, 2006b) which ultimately leads to "considerations over
rights to mobility" (Jensen, 2011:257), including questions of mobility for whom, at what
cost and conditions (Sheller, 2008).
There are thus multiple ways of understanding and "approaching the unequal distribution
of mobility and subsequent opportunities" for commuting from home to job, education,
shopping, leisure, social gathering (Jensen, 2011:257). In this regard, Cresswell (2010:22-
26) has suggested six facets of mobility to 'differentiate people and things into hierarchies
of mobility' and to examine their engagement in politics- (i) why does a person or thing
move?, (ii) how fast does a person or thing move (slowness or speed by choice)?, (iii) in
what rhythm does a person or thing move (too many one-way trips, journeys at irregular
intervals, or sudden bursts of mobility etc)?, (iv) What route does it take?, (v) how does it
feel? and (vi) when and how does it stop (by choice or force)? Now, in line with the stated
facets, it is necessary to ask "who decided what types of mobility are appropriate, why
93
certain normative visions of mobility are favored over others, and to whom these
mobilities are available" (Henderson, 2004:194).
3.4 Seeking justice in planning mobilities
This section elaborates the importance of justice in the professional role of the planners.
Then the relevant literature is reviewed to identify principles of justice applicable in
transport planning. Finally literature on the politics of mobility is discussed to reflect on
how the politics affects the justice in the planning process.
3.4.1 Planners' dilemma and seeking justice in planning
The question of justice is inherent in and inseparable from a plan. In the words of Soja,
(2010:xvi-ii) “any plan by any public authority, whether for public transit or health policy
or for location of schools and fire stations, should be subjected to a ‘justice test’ to
determine whether the distributional pattern proposed was fair and equitable for all areas
and communities affected, with fairness based on the different needs of the rich and the
poor as well as majority and minority populations. Similar legal tests could be applied to
tax policies, electoral districting, hospital closures, school building programs, the health
effects of air and water pollution, the siting of toxic facilities, practically every planning
and policy decision influencing urban life”.
It should be noted that in many cities in developing countries, economic growth has not
necessarily been poor-friendly; rather it has further widened the rich-poor divide (BOND,
2006). Therefore, "along with economic and environmental sustainability, achieving social
sustainability is equally important in the case of developing countries" (Dave, 2009:190).
“Especially in an urban context, disadvantaged individuals and groups frequently
experience social exclusion centrally because they do not have access in the same way as
other groups within urban space … [T]he lack of accessibility can be identified and
studied in the presence of mechanisms developed specifically to control the access of
people to certain places and areas. Among them the land and property market appears as a
key actor” (Ureta, 2008:272). This would then, as Harvey (2006) suggested, create uneven
geographical and social development by having different perceptions of gains and losses
among society.
94
But, there is no universal formula for planners to plan, develop and manage cities; rather it
requires a detailed understanding of local issues, regional strategies and urban history
(Marcotullio, 2004; Sorensen et al., 2004). Moreover, since the end of the last century
urban transport, land use and infrastructure planning and management programmes in the
global south and Asia have focused on public participation, more active role of local
government and sustainability (Neumann, 1999; Barret & Usui, 2002). But it is "hard to
escape the conclusion" that cities are not meeting sustainability goals, nor the verbatim
application of sustainability agenda in all cities in developed and developing countries will
be effective (Sorensen et al., 2004:4). Plus, most authors discussing planning procedures
and sustainability do not clarify what they consider to be the substantive content of
sustainable spatial planning (Næss, 2001:503).
Berke and Conroy (2000:30) state that the explicit inclusion of the sustainability concept
has no effect on how well plans actually promote sustainability principles. Their statement
supports the frequent criticism that despite generating widespread appeal the sustainable
development concept is superficial, lacks political commitment, and cannot serve as an
influential basis for policy development.
Moreover, Berke and Conroy (2000) raise questions regarding the credibility of the roles
played by planners. In fact, planners have a mixed image. On one hand they are seen as
defenders of the poor, socio-economic equity (Harvey, 1985), proponents of holistic and
harmonised growth (Marcuse, 1976), enthusiasts to value natural environment (Campbell,
1996). But planners' involvement in downtown redevelopment, planning of free way and
other investment intensive infrastructure and land uses at the cost of natural destruction
(Campbell 1996), belie their 'self-image' (Harvey, 1985). So, Berke and Conroy (2000)
urge planners to play a critical role in promoting the dialogue between sustainability and
public policy solutions to promote community sustainability. In reality planners have to
serve the narrower interests of their clients, including authorities and bureaucrats
(Marcuse, 1976), yet they have to make efforts to work outside those limitations
(Hoffman, 1989).
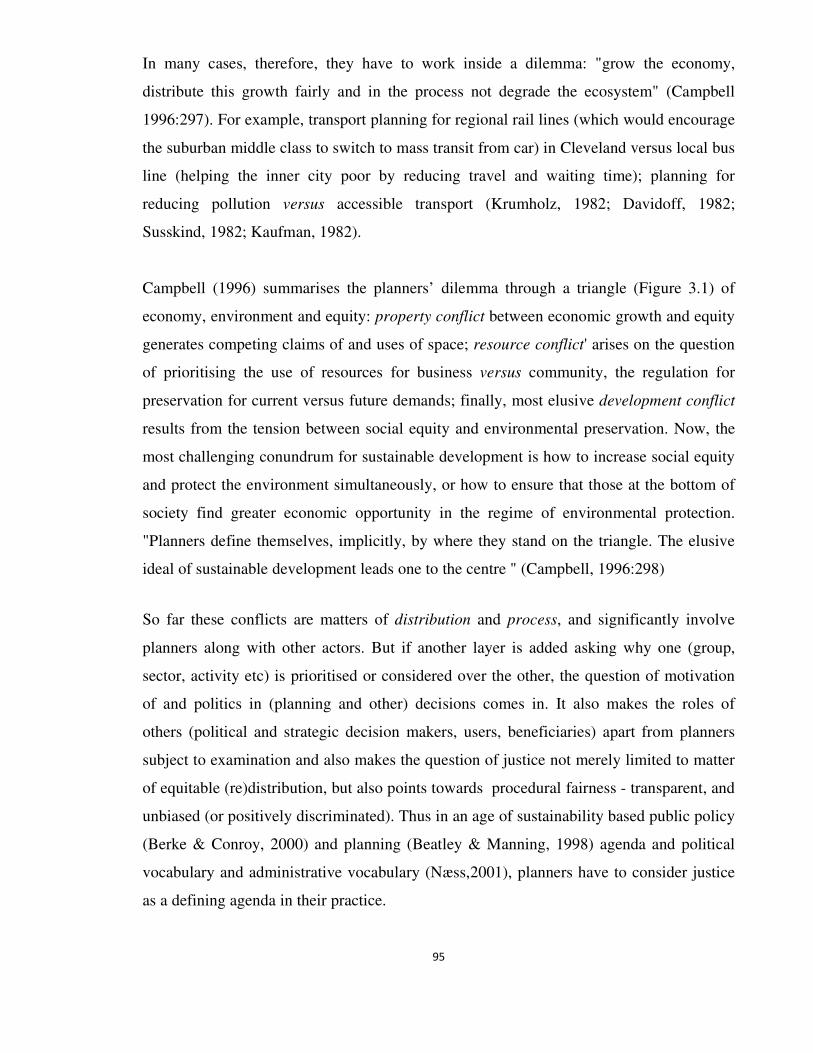
95
In many cases, therefore, they have to work inside a dilemma: "grow the economy,
distribute this growth fairly and in the process not degrade the ecosystem" (Campbell
1996:297). For example, transport planning for regional rail lines (which would encourage
the suburban middle class to switch to mass transit from car) in Cleveland versus local bus
line (helping the inner city poor by reducing travel and waiting time); planning for
reducing pollution versus accessible transport (Krumholz, 1982; Davidoff, 1982;
Susskind, 1982; Kaufman, 1982).
Campbell (1996) summarises the planners’ dilemma through a triangle (Figure 3.1) of
economy, environment and equity: property conflict between economic growth and equity
generates competing claims of and uses of space; resource conflict' arises on the question
of prioritising the use of resources for business versus community, the regulation for
preservation for current versus future demands; finally, most elusive development conflict
results from the tension between social equity and environmental preservation. Now, the
most challenging conundrum for sustainable development is how to increase social equity
and protect the environment simultaneously, or how to ensure that those at the bottom of
society find greater economic opportunity in the regime of environmental protection.
"Planners define themselves, implicitly, by where they stand on the triangle. The elusive
ideal of sustainable development leads one to the centre " (Campbell, 1996:298)
So far these conflicts are matters of distribution and process, and significantly involve
planners along with other actors. But if another layer is added asking why one (group,
sector, activity etc) is prioritised or considered over the other, the question of motivation
of and politics in (planning and other) decisions comes in. It also makes the roles of
others (political and strategic decision makers, users, beneficiaries) apart from planners
subject to examination and also makes the question of justice not merely limited to matter
of equitable (re)distribution, but also points towards procedural fairness - transparent, and
unbiased (or positively discriminated). Thus in an age of sustainability based public policy
(Berke & Conroy, 2000) and planning (Beatley & Manning, 1998) agenda and political
vocabulary and administrative vocabulary (Næss,2001), planners have to consider justice
as a defining agenda in their practice.
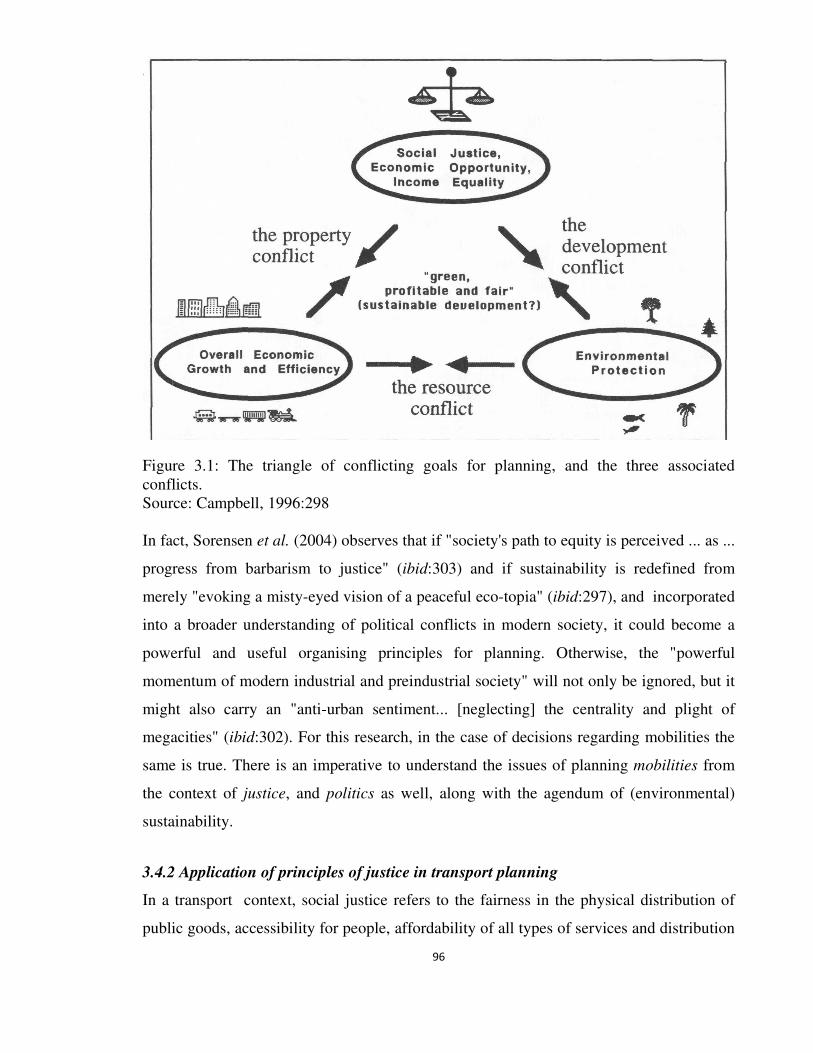
96
Figure 3.1: The triangle of conflicting goals for planning, and the three associated conflicts. Source: Campbell, 1996:298 In fact, Sorensen et al. (2004) observes that if "society's path to equity is perceived ... as ...
progress from barbarism to justice" (ibid:303) and if sustainability is redefined from
merely "evoking a misty-eyed vision of a peaceful eco-topia" (ibid:297), and incorporated
into a broader understanding of political conflicts in modern society, it could become a
powerful and useful organising principles for planning. Otherwise, the "powerful
momentum of modern industrial and preindustrial society" will not only be ignored, but it
might also carry an "anti-urban sentiment... [neglecting] the centrality and plight of
megacities" (ibid:302). For this research, in the case of decisions regarding mobilities the
same is true. There is an imperative to understand the issues of planning mobilities from
the context of justice, and politics as well, along with the agendum of (environmental)
sustainability.
3.4.2 Application of principles of justice in transport planning
In a transport context, social justice refers to the fairness in the physical distribution of
public goods, accessibility for people, affordability of all types of services and distribution
97
of other gains (such as increases in land and property prices) (Beyazit, 2011). Transport
infrastructure investments and consequent land use development are “likely to cause some
groups to be better off, but also some to be worse off, where the incidence of gains and
losses over different interest groups will generally vary over space” (Verhoef, et. al.
1997:31). Harvey (1973) in Social Justice and the City, one of the early contributions in
this regard, mentioned differential effects of transport facilities in reaching other services
and more importantly the job market i.e. land uses. But he did not go further than
discussing their distributive effects in terms of income. By the mid-1990s, a growing
interest in the relationship between social justice and transport reappeared; studies
included issues as gender, ethnicity, age, class and disability (Banister, 1994; Church et.
al., 2000; Sánchez et. al., 2003; Rajé et. al., 2004), and indicators such as income (Cervero
& Landis, 1997; Leck et al., 2008), inaccessibility/travel poverty (Lucas et al., 2001;
Lucas, 2005), social participation (Putnam, 2000), distributional effect of transport
development/infrastructure (Forkenbrock et al., 1999; Bureau & Glachant, 2011; Lucas et
al. 2009). Trinder et al. (1991) and Hay and Trinder (1991) have summarised the
application of justice principles to transport at a local level (Table 3.3).
Trinder et al. (1991:35-36) further identified four broad areas of transport issues which
may generate discussion as long as social justice is concerned: (i) how decisions are made
(process issues), (ii) who gets what (provision issues), (iii) who pays for transport (burden
of costs issues), and (iv) who suffers from the use of transport (externalities issues). They
also seek to understand these four areas with respect to the ten key principles (as presented
in Table 3.3) of justice in table 3.4. In terms of process, procedural fairness and liberty
rights have been identified to be most important criteria. In contrast, in terms of provision,
a wide range of justice principles including expectations, formal equality and substantive
equality, need as demand, basic need, and wider need and claim rights are used as criteria.
Formal equality and substantive equality might be used to argue for burden of costs for
matters relating to externalities. The principle of liberty rights might also be used to press
the case for compensation for individuals affected by development.
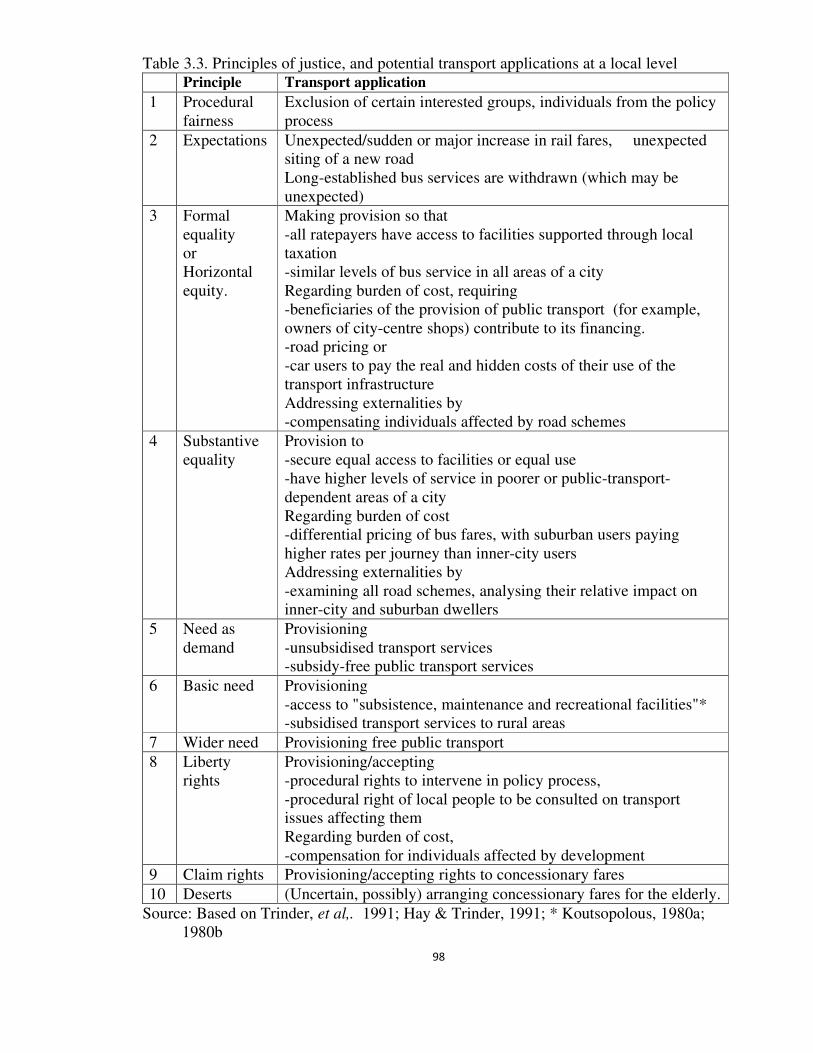
98
Table 3.3. Principles of justice, and potential transport applications at a local level
Principle Transport application
1 Procedural fairness
Exclusion of certain interested groups, individuals from the policy process
2 Expectations Unexpected/sudden or major increase in rail fares, unexpected siting of a new road Long-established bus services are withdrawn (which may be unexpected)
3 Formal equality or Horizontal equity.
Making provision so that -all ratepayers have access to facilities supported through local taxation -similar levels of bus service in all areas of a city Regarding burden of cost, requiring -beneficiaries of the provision of public transport (for example, owners of city-centre shops) contribute to its financing. -road pricing or -car users to pay the real and hidden costs of their use of the transport infrastructure Addressing externalities by -compensating individuals affected by road schemes
4 Substantive equality
Provision to -secure equal access to facilities or equal use -have higher levels of service in poorer or public-transport-dependent areas of a city Regarding burden of cost -differential pricing of bus fares, with suburban users paying higher rates per journey than inner-city users Addressing externalities by -examining all road schemes, analysing their relative impact on inner-city and suburban dwellers
5 Need as demand
Provisioning -unsubsidised transport services -subsidy-free public transport services
6 Basic need Provisioning -access to "subsistence, maintenance and recreational facilities"* -subsidised transport services to rural areas
7 Wider need Provisioning free public transport
8 Liberty rights
Provisioning/accepting -procedural rights to intervene in policy process, -procedural right of local people to be consulted on transport issues affecting them Regarding burden of cost, -compensation for individuals affected by development
9 Claim rights Provisioning/accepting rights to concessionary fares
10 Deserts (Uncertain, possibly) arranging concessionary fares for the elderly.
Source: Based on Trinder, et al,. 1991; Hay & Trinder, 1991; * Koutsopolous, 1980a; 1980b
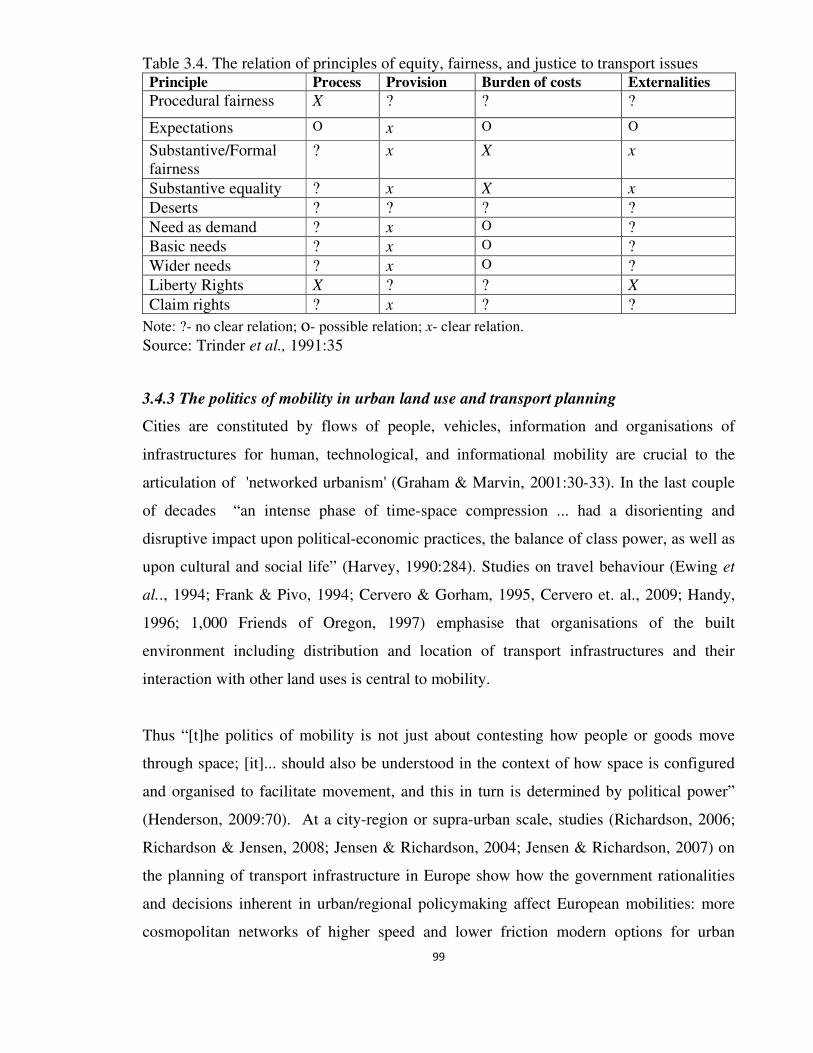
99
Table 3.4. The relation of principles of equity, fairness, and justice to transport issues Principle Process Provision Burden of costs Externalities
Procedural fairness X ? ? ?
Expectations O x O O
Substantive/Formal fairness
? x X x
Substantive equality ? x X x
Deserts ? ? ? ?
Need as demand ? x O ? Basic needs ? x O ?
Wider needs ? x O ?
Liberty Rights X ? ? X
Claim rights ? x ? ?
Note: ?- no clear relation; o- possible relation; x- clear relation.
Source: Trinder et al., 1991:35
3.4.3 The politics of mobility in urban land use and transport planning
Cities are constituted by flows of people, vehicles, information and organisations of
infrastructures for human, technological, and informational mobility are crucial to the
articulation of 'networked urbanism' (Graham & Marvin, 2001:30-33). In the last couple
of decades “an intense phase of time-space compression ... had a disorienting and
disruptive impact upon political-economic practices, the balance of class power, as well as
upon cultural and social life” (Harvey, 1990:284). Studies on travel behaviour (Ewing et
al.., 1994; Frank & Pivo, 1994; Cervero & Gorham, 1995, Cervero et. al., 2009; Handy,
1996; 1,000 Friends of Oregon, 1997) emphasise that organisations of the built
environment including distribution and location of transport infrastructures and their
interaction with other land uses is central to mobility.
Thus “[t]he politics of mobility is not just about contesting how people or goods move
through space; [it]... should also be understood in the context of how space is configured
and organised to facilitate movement, and this in turn is determined by political power”
(Henderson, 2009:70). At a city-region or supra-urban scale, studies (Richardson, 2006;
Richardson & Jensen, 2008; Jensen & Richardson, 2004; Jensen & Richardson, 2007) on
the planning of transport infrastructure in Europe show how the government rationalities
and decisions inherent in urban/regional policymaking affect European mobilities: more
cosmopolitan networks of higher speed and lower friction modern options for urban
100
citizens; denial of the less affordable citizens from access to high speed trains, airport etc.
which essentially require higher affordability.
On the other hand at city scale, while putting light on the impact of sidewalks, crosswalks
and compact, mixed-urban land uses on ‘walking as a form of mobility’ Henderson
(2004:195) shows that “if the street is a six-lane, high-speed traffic road with no safe
crosswalk, pedestrian mobility is significantly impeded… [I]t reveals that some forms of
mobility are incongruent... [and] car-based mobility is theoretically privileged”. However,
the ability to have good mobility by car requires not just wide, fast roads, but also plentiful
and convenient parking, and low-density, dispersed development so that car-based
mobility is not obstructed or congested (Gordon & Richardson, 1997a, 1997b). Such ideas
and covert politics of mobility "are not innocent but crucially linked to particular
categorisation of people (subjectivities)” (Jensen, 2011:261-2): car owner or not,
pedestrian or motorist. Rose (1999), Huxley (2002), Jensen (2006) have also shown how
the urban subjects are historically produced to behave in certain form (that is taken for
granted) as they move around urban space.
Again, matter is not only “How space is configured …or [which] mode [is] used to
overcome spatial distance … [but] also… the degree of spatial and temporal distance
across space” (Henderson, 2004:195). With the example of a person driving five miles in
five minutes to buy groceries and another walking a few blocks for the same within five
minutes, Henderson (2004) shows how different kinds of mobility with radically different
distances and modes of transport, with differing infrastructure requirements and spatial
configurations connect places in space and time in very discrete ways. He also insists that
answer to the question ‘which person in the above example has the better mobility’
depends on “factors beyond simple transportation studies and extends into normative
values and ideologies, or a systematic set of fundamental beliefs and principles that assert
what mobility should be and for whom” (Henderson, 2004:195). The resulting spatial
organisations and mobility regime, called “autospace” (Freund & Martin, 1993),
incongruent with widespread transit, pedestrian and bicycling spaces has more than a
physical impact on cities - an ideological impact effectively naturalised the car and creates
101
an ambivalence toward problems of cars among much of the middle class (Sheller & Urry,
2000).
Cresswell (2008), furthermore, identifies the politics of mobility in access to movement
during the crisis period. Using the case study of Hurricane Katrina, he examines the
response of the city authorities in New Orleans; demonstrates how the politics of mobility,
i.e. deciding whom to move and when, how and where, had severe, at times fatal, costs for
the under-privileged population of New Orleans, while the wealthier citizens were able to
escape the disaster (Cresswell, 2008).
Thus, mobility is an ingredient in the basic social and political logic with an active part in
the constitution of the city (Kesselring, 2001:183–184, in Jensen, 2011:262). Here comes
the question of government intervention; what can meaningfully be seen as (policy)
problems, as causes and effects (Jensen, 2011:258) and solution as well which are
"inextricably entangled with governmental practices" (Huxley, 2007:189). Again the
politics also exploit the sufferings of the people to justify their plans, decisions and further
investments. A particular form of knowledge and techniques is enmeshed with the daily
practices, perception, imaginaries and experience of the mobile or immobile urban
citizens (Jensen, 2011:257-9) to legitimise costly transport infrastructure (Jensen, 2006).
Moreover, “while the problem is usually described in terms of land-use planning, solutions
are rarely within the powers of local authority land-use planners to effect. Many planning
decisions are taken out of their hands by the private sector and other more powerful public
sector agencies ... [and] do not include transport and accessibility as essential criteria in
their location assessments. As such, planners are regularly forced to bow to the pressures
of other more compelling considerations, such as private profit, job creation and value for
money” (Lucas, 2005:802).
So, mobility contains embedded social relations just as Lefebvre (1991) theorised that the
character and nature of produced space reflects the dominant modes of production and
social relations within a given society. Accordingly, this is very valid to ask “who
decide[s] what types of mobility are appropriate, why certain normative visions of
mobility are favoured over others, and to whom these mobilities are available”
102
(Henderson, 2004:195). Harvey (1982, 1996), Logan and Molotch (1987) have analyzed
how the contest for urban space is an extension of struggles over differing values and
ideologies; their findings can also be extended to the politics of mobility. Since
transportation is a major component of this production of space (Harvey, 1982) and central
to any understanding of the political economy of capitalism because it provides the
conditions for capital accumulation and provides for the social reproduction of labour
(Holdge, 1990). Transportation minimises the spatial impedance to the mobility of
capital, people and products allowing for smoother spatial integration and facilitating the
“annihilation of space by time” (Harvey, 1983:219). While writing on Atlanta, USA
Henderson (2004:202-3) asserts that the obsession with the automobile in the name of
‘progress’ was rooted in the underlying logic of capitalism and its relationship to “hard
mobility” defined as a form of movement centred on high-speed, high occupancy, energy
and land intensive mobile and fixed infrastructure that decreases circulation times of
capital; only at the cost of removal of “soft” mobilities - pedestrian and transit spaces.
3.5 Conclusion
Reviewing literature extensively this chapter has built platform for a just mobilities
framework developed in the next chapter. A large volume of literature that seeks to
address the issue of justice and/or social justice for the last five decades has been
reviewed. It has been found that issue of politics is drawing an increasing attention along
with conventional discussion on distribution and process in the scholarship of justice.
Similarly literature on mobility has expanded discussion from existing mobility to
incorporate potential mobility with respect to access, competence and appropriation.
Contemporary mobility literature also acknowledges the context of the underlying process
and politics resulting in differential distribution of access to mobility by various people, in
different time and place for numerous reasons and motivations. The multiplicity and
complexity of mobility is sought to be caught as a new paradigm called mobilities in
recent literature on transport, urban planning, sociology, etc. This chapter has also shed
light on how the academic knowledge on mobility and justice is in a position to initiate
mutually beneficial dialogue under a framework called just mobilities.
103
Chapter 4
Towards a just mobilities framework
4.1 Introduction
Having discussed the theories of justice and mobilities in the previous chapter, a
framework for just mobilities is developed here. At first a brief discussion sheds light on
the need for seeking just mobilities. It is argued that development of the framework is in
line with the chronological changes in mobility and transport studies. Then a framework is
developed which is based on the principles of justice and aspects of mobilities as discussed
in the previous (third) chapter.
4.2 Seeking just mobilities
This section seeks to demonstrate and justify the requirement of the concept of just
mobilities' to complement the ongoing reorientation in transport and sociological studies,
fill the shortcomings in studies/policies on sustainable transport/mobility, transport related
exclusion, and the politics of mobility .
4.2.1 Humanising transport studies - socio-political approach to transport planning
Transport is usually seen as a technical area dealt by engineering, construction and
management; sociology often sees it as only a tool not an end itself, with little effect on
shaping people's values (Town, 1981). Vasconcellous (2001:36) further finds "engineers
resistance" to social and political approaches in the technical, "neutral" and "corporate"
sectors of transport. However, a new (socio-political) approach is proposed- resulting in
the emergence of a new area of sociological research (Healey, 1977; Yago, 1983; De
Boer, 1986) - not just to "complement the traditional one but replace it, without
minimising the importance of competent technical treatment in specific phases of
analytical process" (Vasconcellos, 2001:33).
Healey (1977), quoted in Vasconcellos (2001), distinguishes between 'sociology of
transport' and 'sociology in transport' to differentiate the quantitative analysis of transport
related social issues from a more profound analysis of causes and effects on both users
104
and non-users. Based on Healey (1977) and Rimmer (1978), Vasconcellos (2001:34)
identified several phases: (i) description and prediction, (ii) rejection and (iii) redirection.
The first phase, contemporary to the prime time of neoclassical market economics, was
characterised by the role of highway engineers devoted to accommodate automobiles in
the growing cities using four-step forecasting models; planners' had a limited role to
satisfy the revealed community aspirations; no practical need to use the social and political
approaches. In the second (rejection) phase the most important assumption - supposed
neutrality and technicality of methodology - was challenged followed by a lack of
confidence in market supply and demand; sociology and political science entered for the
first time in the field of transport; cost-benefit analysis (CBA) included social and
environmental impacts; political participation in the decision-making process was
formalised. "However transport planning continued to be consensus-seeking, broadly
market based and with a narrow, aggregate and one-way view of [CBA] that neglected
contributions by and interference from the users" (Vasconcellos, 2001:34). These are
sufficient reasons for identifying a 'trivialisations of sociology', with its adoption for
transport planning being only a 'survival tool' (Healey, 1977 quoted in Vasconcellos,
2001). The final phase, redirection, is characterised by a rethinking of transport planning;
sociology, for the first time, is used in analysing social structure and social change; focus
shifted on the analysis of the decision-making process, rather than the decisions
themselves; divergence and conflicts in needs, interests and values, inside and between
groups and classes had been acknowledged and accepted; distributive and equity effects of
policies along with economic efficiency are investigated. Thus the long-held separation
between engineering and sociology was no longer defensible, and planning became
politically mature (Healey, 1977, quoted in Vasconcellos, 2001).
De Boer (1986) makes further chronological detailing of transport sociology. While during
the 1930s (in the US) and 1950s (in Europe) the major concern was traffic and road safety,
later in the 1960s, the major problem appeared to be traffic congestion. In the 1970s
further reassessment at micro and macro levels was done. Firstly, at micro level transport
planners became aware of the disconnection between manifest demand (identified by
origin-destination surveys) and actual needs of travel, and the time and social limits of
individual trips. Many studies showed that actual need could have changed from manifest
105
demand if prevailing had condition changed. Again demand for travel is not unlimited as
individuals are constrained by both personal and family limits, along with environmental
and transport constraints. Finally, all the models were challenged on the basis of their
supposed ability to represent actual behaviour and forecast the future (Kanafani, 1983;
Atkins, 1986; Dimitrou, 1990).
At the macro level politicisation of the transport issue questioned the impact of
automobile, nature and scope of public transport policies. Initially, Buchanan (1963) and
subsequent studies, quoted in Vasconcellos (2001:35), conservatively conceived the
conflict as an accessibility versus environment issue and proposed only the
reorganisations of space i.e. proposed no structural change. Then a more political and
sociological wave systematically questioned the privileges enjoyed by the automobile use
and users i.e. ultimately questioned capitalist society. Lastly, a new critical approach
emerged with an increasing concern for equity issues in transport, and the reassessment of
the prevailing development of auto oriented cities at first in developed and then in
developing countries.
In fact, Vasconcellos (2001:37-8) proposes a new window of sociological study-
'sociology of circulation', assuming three central issues for transport and traffic policies:
distribution of access in space; use of the city by different social classes and groups; and
conditions of equity, safety, comfort, efficiency, environment and cost. "Sociological
approach would therefore allow for the analysis of why space is divided in the prevailing
way, why some people may have access to certain transport modes, and how externalities
are generated and experienced by [users]... what would happen to demand and modal split
if different conditions prevailed" (Vasconcellos, 2001:39). Putting the example of urban
transport quality and traffic accidents, he summarises the differences between the
prevailing and proposed approach to transport studies (Table 4.1).
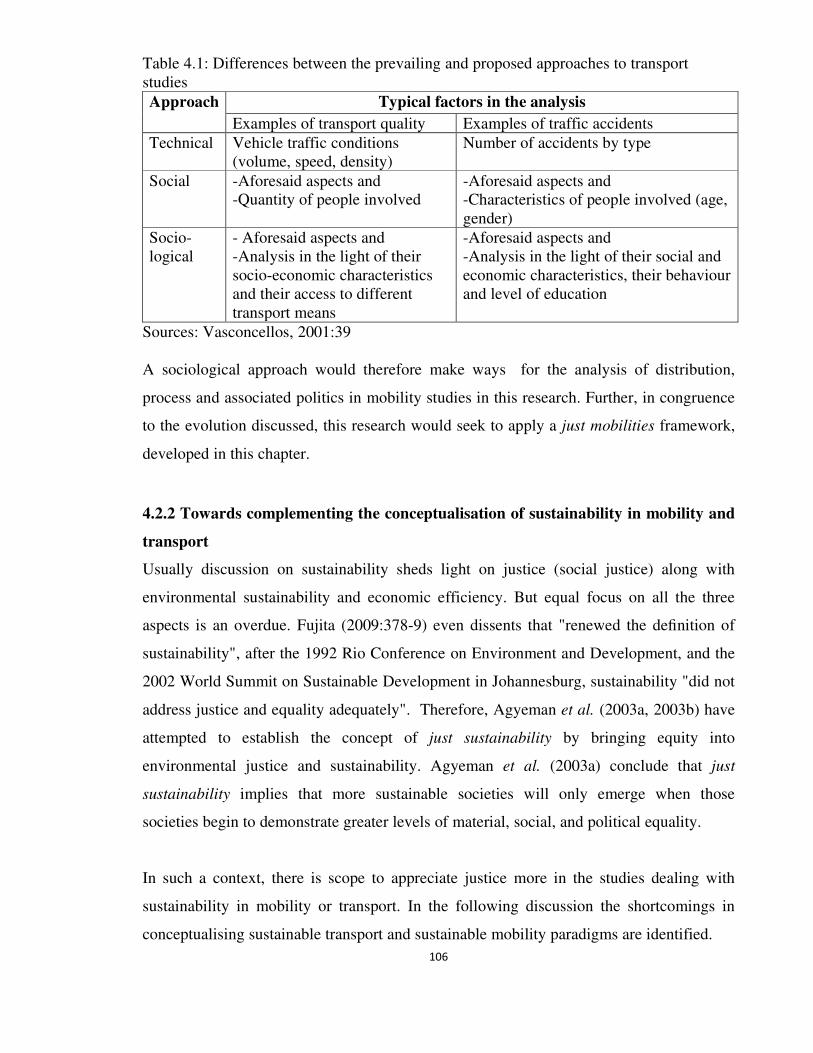
106
Table 4.1: Differences between the prevailing and proposed approaches to transport studies
Approach Typical factors in the analysis
Examples of transport quality Examples of traffic accidents
Technical Vehicle traffic conditions (volume, speed, density)
Number of accidents by type
Social -Aforesaid aspects and -Quantity of people involved
-Aforesaid aspects and -Characteristics of people involved (age, gender)
Socio-logical
- Aforesaid aspects and -Analysis in the light of their socio-economic characteristics and their access to different transport means
-Aforesaid aspects and -Analysis in the light of their social and economic characteristics, their behaviour and level of education
Sources: Vasconcellos, 2001:39 A sociological approach would therefore make ways for the analysis of distribution,
process and associated politics in mobility studies in this research. Further, in congruence
to the evolution discussed, this research would seek to apply a just mobilities framework,
developed in this chapter.
4.2.2 Towards complementing the conceptualisation of sustainability in mobility and
transport
Usually discussion on sustainability sheds light on justice (social justice) along with
environmental sustainability and economic efficiency. But equal focus on all the three
aspects is an overdue. Fujita (2009:378-9) even dissents that "renewed the definition of
sustainability", after the 1992 Rio Conference on Environment and Development, and the
2002 World Summit on Sustainable Development in Johannesburg, sustainability "did not
address justice and equality adequately". Therefore, Agyeman et al. (2003a, 2003b) have
attempted to establish the concept of just sustainability by bringing equity into
environmental justice and sustainability. Agyeman et al. (2003a) conclude that just
sustainability implies that more sustainable societies will only emerge when those
societies begin to demonstrate greater levels of material, social, and political equality.
In such a context, there is scope to appreciate justice more in the studies dealing with
sustainability in mobility or transport. In the following discussion the shortcomings in
conceptualising sustainable transport and sustainable mobility paradigms are identified.
107
A. Complete aspects of justice remain unaddressed
There is a large volume of literature on sustainable transport and land use (EFTE 1994;
Banister 1997, 2000, 2005; Banister et al. 1997; Possum 1998) including land-use and
transport interaction (Cervero 2003, 2002, 2001; Cervero & Murakami, 2010; Cervero &
Radisch, 1996; Cervero & Kockleman, 1997; Frank, 2000)47 sustainable mobility
(Banister & Streen 1999; Banister 2005, 2008), green/sustainable transport policy and
strategy or review of projects (EFTE, 1994; Janic, 2006; Banister, 2005, CEC, 1999,
Litman 2003, OECD 2001). A review of definitions48 shows that sustainable transport
system prioritises economic and environmental sustainability; commits to social
sustainability only with respect to socio-economic welfare without depleting natural
resources, destroying the environment and harming human health (Janic, 2006: 84).
Martens (2012) has listed several transport literature talking about distributive justice i.e.
other aspects of justice, namely process and politics (see section 3.2.1) are left
unaddressed. Moreover, Martens (2012) questions the contribution further observing that
the literature has focused on precisely the composite parts such as road and gasoline taxes
(Altshuler, 1979); transit investments and subsidies (Cervero 1981; Hodge 1988; Garrett
and Taylor 1999); infrastructure investments (Lucy 1988; Brocker et al. 2010); road user
charges (Smeed 1964; Richardson 1974; Ecola and Light 2009); and transit service
(Murray and Davis 2001; Rucker 1984; Wu and Hine 2003) and distribution of transport-
related burdens (e.g., Feitelson 2002; Forkenbrock and Schweitzer 1999; Schweitzer and
Valenzuela 2004).
Announcement of 'the sustainable mobility paradigm' (Banister, 2008) is a major step
forward. It equally focuses on sustainable mobility and urban sustainability in transport:
47 see Ewing and Cervero (2010, 2001) for reviews of studies on transport and land use 48Some definitions are as follows: Sustainable transportation is that, which does not endanger public health or ecosystems and that meets needs for access consistent with (a) use of renewable resources that are below their rates of regeneration, and (b) use of non-renewable resources below the rates of development of renewable substitutes. (Wiederkehr, 2004:14) A sustainable transport system i) allows basic access and development needs of individuals, companies and society to be met safely in a manner consistent with human and ecosystem health and promotes equity between successive generations; ii) is affordable, operates fairly and efficiently, offers a choice of transport mode and supports a competitive economy as well as balanced regional development; and iii) limits emissions and waste within the planet’s ability to absorb them, uses renewable resources at or below their rates of generation, and uses non-renewable resources at or below the rates of development of renewable substitutes while minimising the impacts of the use of land and generation of noise. (CEC, 1999) A sustainable transport system is one in which fuel consumption, vehicle emissions, safety, congestion, and social and economic access are of such levels that they can be sustained into the indefinite future without causing great or irreparable harm to future generation of people throughout the world. (Richardson, 1999:27)
108
"Sustainable mobility provides an alternative paradigm within which to investigate the
complexity of cities, and to strengthen the links between land use and transport" (Banister,
2008:73). However, compared to the way travel, land use issues are investigated, the
social dimension is less addressed49. Quoting and complying with Marshall (2001),
Banister (2008:75) calls for modal shift to NMT; management based, social dimension
and people and NMT focused transport planning. These propositions are very much in line
with this research. But, propositions to initiate the process are more technology and
behaviour focused, with less, if any, reference to politics: "The sustainable mobility
paradigm is moving towards an objective-based planning system that is trying to
implement a range of policy interventions, but with an important additional element,
namely the support of all stakeholders. Underlying this discussion is the need to
understand behaviour, and to explore the means by which cooperation and support can be
obtained, so that real change can take place. The notion of personal utility must be placed
in the wider context of social welfare" (Banister (2008:79).
However, "given the current conditions of our cities, where a significant part of the
population can spend hours only to reach the daily destinations, it is very difficult to
separate the two goals [quality of life and sustainable mobility]. The consequence of this is
a growing public support to the concept of sustainable mobility or at least to measures that
lead to the concept" (Miranda & da Silva, 2012:142). So, sustainable mobility has been in
focus for a long list of literature and practical projects. Miranda and da Silva (2012) have
developed an index for urban sustainable mobility ('I_SUM') and applied it in Curitiba,
Brazil. Despite having a theme namely 'social inclusion' and relevant indicator 'vertical
equity', the 'I_SUM' is yet to appreciate other principles of justice (process and politics),
stated in section 3.2.1. On the other hand, although literature has started to acknowledge
the aspects of justice, projects on sustainable mobility is lagging behind50.
49 Banister (2000:115-116) summarised the following issues to be burning from transport perspective for its conformity to sustainable urban development - congestion, increased air pollution, traffic noise, road safety, degradation of urban landscape, space occupation (particularly by auto-oriented infrastructure/facilities), use of fossil fuel (and global warming), dispersed land use development, development pressure in car-accessible locations, globalisation and new pattern (and intensity of) freight transport. Among the targets to achieve sustainability, identified by Banister (2000), include reducing need for travel, compact development, reduce dependence of car and shift to public transport and bike etc. requiring environmentally sensitive local and national/global political intervention. 50 Janic (2006) reviewed out of 170 EU project for sustainable mobility under four themes . His findings in each theme is as follows: (i) Integrated policy aspects of sustainable mobility (discussing issues relating to Understanding the market Visioning the future, Tools and method, Transport management, Pricing and financing, Mobility management, New technologies and transport concepts)-72 projects, (ii) Economic aspects of sustainable mobility (Land-use and macroeconomic effects, Regional linking,
109
Therefore, it can be argued that consideration for a processual component of mobility
planning and the question of uneven distribution of power and politics while
implementing that plan are yet to be done. (To be true, under the contemporary
sustainability theme these aspects are not essentially required to be addressed). In fact, the
crux of the problem is that neither the mainstream environmental movement nor the
disciplines and literature following it has sufficiently addressed the fact that social
inequality and imbalances in social power are at the heart of environmental degradation,
resource depletion, pollution, and even overpopulation (Futita, 2009). But, the
environmental crisis can simply not be solved without social justice (Bullard, 1993b:23).
Just as environment is not "colour-blind" (Ageyman & Evans, 1999:3) nor transport and
mobilities are power-blind. So, appreciating entire aspects of justice in the just mobilities
framework developed latter in this chapter, is sought to contribute toward fulfilment of the
felt need in the 'sustainable mobility paradigm' and other transport studies.
B. Mobility is understood partially if not misunderstood
Challenging the notion transport is a derived demand, 'Sustainable mobility paradigm',
considers travel as a "valued activity" (Banister, 2008:74) . This research also supports the
argument. However, Banister and other proponents of sustainable mobility also argue for
reduced need for travel, which reflects that they are only meaning car based mobility (in
cities in the developed countries). Plus Banister's (2008:75) interest in accessibility, rather
than mobility (ibid:75), also suggests that a narrow meaning of mobility has been used.
But this research, drawing on Kaufman et al. (2002, 2004) and others, has defined
mobility with respect to existing and potential mobility in conjunction with access (to
options and range of mobility i.e. incorporating accessibility), competence and
appropriation of mobility.
Completion of the Single Market, EU competitiveness, employment and innovations, External trade Pricing, financing and external costs)-42 projects, (iii) Social aspects of sustainable mobility (Physical accessibility, Pricing acceptance and equity, Support for public, transport European cohesion, Working conditions) -33 projects and (iv) Environmental aspects of sustainable mobility (Understanding environmental impacts, Mitigating the environmental impacts of transport, Development of environmentally friendly forms of transport)-20 projects. So it is evident that under theme of sustainable mobility there comes almost all aspect of sustainability although projects relating economic, financial, technological aspects dominate, at least in terms of number.
110
Studies on sustainable transport, like Kennedy et al. (2005), also emphasise much on land
use and accessibility51; neither mobility nor justice has received similar attention. On the
other hand, studies on 'just accessibility', like Lucas (2005), urge for equity and justice in
transport planning; but their key focus is also accessibility not mobility52. These studies
overlook the social function of mobility (as argued by Kenyon et al. 2002:212). and
potential mobility (Kaufman et al. 2002, 2004 and others) and hence conceived mobility
only partially.
Similarly, the idea of 'Street for all' (users and functions)53 to bring about a sustainable,
equitable, accessible and socially just transport and land use planning system" Khayesi et
al. (2010:107) comes close to both distributive and processual (and political) components
of justice (argued in this research) but are silent regarding potential mobilities.
C. Bias towards developed country urbanisations, less viability in the developing world
A careful review of the literature on sustainability on transport reveals bias towards
urbanisations (and associated development) in developed countries. Whereas cities in
developing countries are already compact featuring lower average trip length, low car
ownership, high proportion of NMT (including pedestrian) use, higher incidence of
poverty (featuring less mobility of the poor and those not owning cars compared to rest in
the same city and society), etc. call for reduced trip and length, modal shift seem to be
alien. Important to note, while arguing for reduced mobility, Banister (2008:75) "in its
pure form ... means that a trip is no longer made, as it has either been replaced by a non-
travel activity or it has been substituted through technology, for example Internet
shopping". Thus the proposition of sustainable urban mobility loses its appeal as a policy
agenda in developing countries; particularly in a period when "urban mobility is
51 Kennedy et al. (2005) argued that sustainable transportation requires suitable establishment of four pillars: effective governance of land use and transportation; fair, efficient, stable funding; strategic infrastructure investments; and attention to neighbourhood design. But to them mobility is different from accessibility and it does not take into account social function of mobility. 52 “The key aims for accessibility planning are to ensure that local decision-makers have improved information on the areas where accessibility is poorest and the barriers to accessibility from the perspective of the people who are living there. It is also designed to create a more transparent, integrated and equitable process for transport and land-use decisions. Transport planners are being encouraged to ‘think out of the box’ and work more collaboratively with their partner agencies, so that a wider range of solutions to accessibility problems can be identified and greater value for money achieved through their combined and synchronised efforts”. 53 Khayesi et al. (2010) referred to success of BRT in Bogota and Curitiba, development of the long network of cycling and pedestrian paths in Bogota and non-motorized transport intervention in Nairobi, Kenya as success stories. They also underscore the need for pro “streets for all” institutions and individuals to be radically innovative at political, planning, research and participation fronts, drawing on competence, resources, (ibid:122).
111
increasingly becoming one of the planning and development issues" (Sietchiping,
2012:183)
Writing on Mauritius, Enoch (2003:297) clearly states: "while Mauritius is clearly a
developing country, the future policy options currently being considered by the
Government are perhaps better suited to a western developed nation than to a less capital
intensive country". Whitelegg (1997:12) elaborates more dramatically: "The developing
world meets many of the criteria for sustainable transport and sustainable development.
Most transport is still accomplished by human and animal power, car ownership levels are
low, fossil fuel dependence is low, and in large cities population densities are such that
accessibility indices register values that would make many cities in North America and
Europe very jealous. Most people in most cities in developing countries live very close to
most things they need to do and produce very small amounts of greenhouse gases".
Although many studies on developing country report on the "exclusionary planning
process not consulting the people" (Ahmed et al, 2008:126)54 and bias in decision
making55 resulting mobility problems, to the best of this author's knowledge, there is very
little literature conceptualising sustainable transport and mobility in a developing country
context. These literature again adds little to the sustainability concept already as biased
towards the developed world56. Sustainable transport development potential in developing
54 With most of India’s urban poor cannot afford any private motorized transport at all, and many cannot even afford the low fares on public transport (Mohan, 2001; Whitelegg & Williams, 2000; Badami et al., 2004), Pucher et al. (2005:186) also adds the Indian middle class a victim of poor transport in cities. However, Pucher et al. (2005:193) doubts that "the already extreme inequity in mobility and accessibility in Indian society will probably get even worse. Not only will the poor benefit least from increasing motorisations, but they will bear a disproportionate share of the social and environmental costs of that motorisations". Overlooking the most sustainable and affordable modes (walking and biking) in urban transportation priorities is said to have serious (in)equity impacts in urban Beijing and Karachi. (Ahmed et al., 2008:136). 55 Researchers are also aware of bias in government policies and of decision-makers."Politicians often lack knowledge regarding the dynamics of urban transport. They lack social commitment to act in the interest of the less privileged, and they lack political will to confront the privileged urban elite" Lim (1997:7). Pucher et al (2005),Vasconcellos (2001), Tiwari, (2001) Low and Banerjee-Guha, (2003), Badami et al. (2004) echo the same in case of Indian cities: while the poor are one fourth of India's population and suffer the most from severe and worsening transport problems in cities, government policies generally focus on serving the needs of an elite minority. For example, a disproportionate share of government funds is spent facilitating the ownership and use of private cars, while the needs of mostly low income pedestrians and cyclists are ignored, and public transport does not get adequate and prioritised funding. 56 To Sarkar and Tagore (2011:1350) sustainable transport in Indian cities context refers to any means of transport with low impact on the environment, and includes walking and cycling, transit-oriented development, green vehicles, car sharing and building or protecting urban transport systems that are fuel-efficient, space-saving and promote healthy lifestyles. Singh (2005) underscores the importance of encouraging the “green” modes, such as bicycles, cycle rickshaws, and pedestrians, in an urban transport strategy, but not clear about the outline or framework of a sustainable transport. While writing on Pakistani cities, Imran & Low (2003: 34-35) developed sustainable transport guiding principles comprised of aspects like economic viability, accessibility for all, ecological sustainability, social equity, health and safety, integrated planning, land and resource use, education and public participation, consensus building through networking, individual and community responsibility.
112
countries is suffering an irreversible decline due to "depredations of increased vehicle
manufacturing capacity, vehicle ownership and use and pollution"- Calcutta is an obvious
example (Whitelegg, 1997:13).
On the other hand, Lim (1997:7) observes: "Lack of mobility should be considered as a
handicap in a similar way as deprivation in other forms of social amenities and services. ...
Even with car-owning households, many members of the family are still immobile i.e. the
young, the aged, and those with ill-health as well as the adult non-drivers. In developing
countries, the increased use of private cars can only provide added mobility to the urban
rich at the expense of the already less mobile urban poor".
Agreeing with the typical aspects of sustainable transport, Bae and Suthiranart (2003:37-
38), add "another view of sustainable transportation, particularly relevant in Bangkok, to
maintain and promote the capacity for people to move around the core city at tolerable
speeds ... Sustainable transportation in this context implies attention to both equity (more
accessibility for the poor) and efficiency (ensuring that deficiencies in the transportation
system do not undermine urban productivity). It also avoids a focus on one or two modes
by implying a more holistic, multi-modal strategy". Interestingly, unlike any discussion on
sustainability, this view has little reference to environment.
4.2.3 Complementing other transport and mobility related studies
Studies of transport related social exclusion (see section 3.3.2) deal a lot on the
distributive and processual components of justice. Social exclusion centres upon the
processes of unequal access to participation in society (Duffy, 1998) or is said to have a
focus upon resource and power relationships between individuals, groups and the state
(Dibben, 2001; Judge, 1995; Room, 1995). However, the concept of and literature on
transport related exclusion is yet to explicitly acknowledge the broader concept of
mobility and elaborately consider the politics of mobility. The same is true for the
Verma, et. al., (2011) have identified three components of sustainable transport: energy management (reducing dependence on fossil fuel), Capacity management (encouraging public transport, cycling and walking) and environmental management (minimising environmental impacts). They observed that sustainable transport is also important for developing countries from the perspective of climate change, i.e. to improve carbon footprint/ ecological footprint (EF) of transportation; but expressed mobility in terms of speed, travel times, delays, etc. along the important corridors of the city.
113
literature on transport disadvantaged (Yigitcanlar et al., 2010; Ureta, 2008; Litman 2003;
Murray & Davis, 2001; Hunt, et al. 2005).
Moreover, a long list of studies on politics of mobility has already been mentioned
previously (see sections 3.3.6 and 3.4.3). But they make scant reference to the broader
aspects of mobility.
4.3 Towards a just mobilities framework
A just mobilities framework considers equity (horizontal and substantial), fairness
(procedural) and justice on needs, expectations and rights different stakeholders of
mobilities namely producer (decision/policy maker), service provider (collective or
individual, institution/agency or self-employed driver/mover) and consumer (user) of
options and facilities of mobilities. It considers the process of knowledge making and of
producing/delivering mobilities options and facilities by different agencies, authorities. It
inspects socio-spatial distribution of needs (basic needs, demand and wider needs), rights
(liberty and claim rights) of and deserts (reward and punishment according to merit) to
mobilities of different groups (opting to move or not) represented by income/livelihood,
housing, car ownership, access or distance to power or decision makers of different kinds
other factors. It identifies the nature of effects and externalities of mobilities on different
groups and stakeholders (table 4.2). All the processes, activities, effects and externalities
are expected to be discussed in different hierarchies- global, national and local (figure
4.1). Lastly, the contexts and blueprint of politics (for personal, professional,
organisational or collective profit and/or gains in mobility, business, bureaucracy,
technocracy, governance etc.) in the distribution and process (of making and) of mobilities
are also disclosed in the framework developed.
In the previous chapter different principles of justice (section 3.2.1) and their application
in planning transport and mobilities (section 3.4.2), and aspects of a broader concept of
mobility, namely mobilities, were discussed. Based on those discussions a set of guiding
questions to organise a just mobilities framework has been presented in the 2nd column of
table 4.2. It should be mentioned that each question refers to more than one aspect of
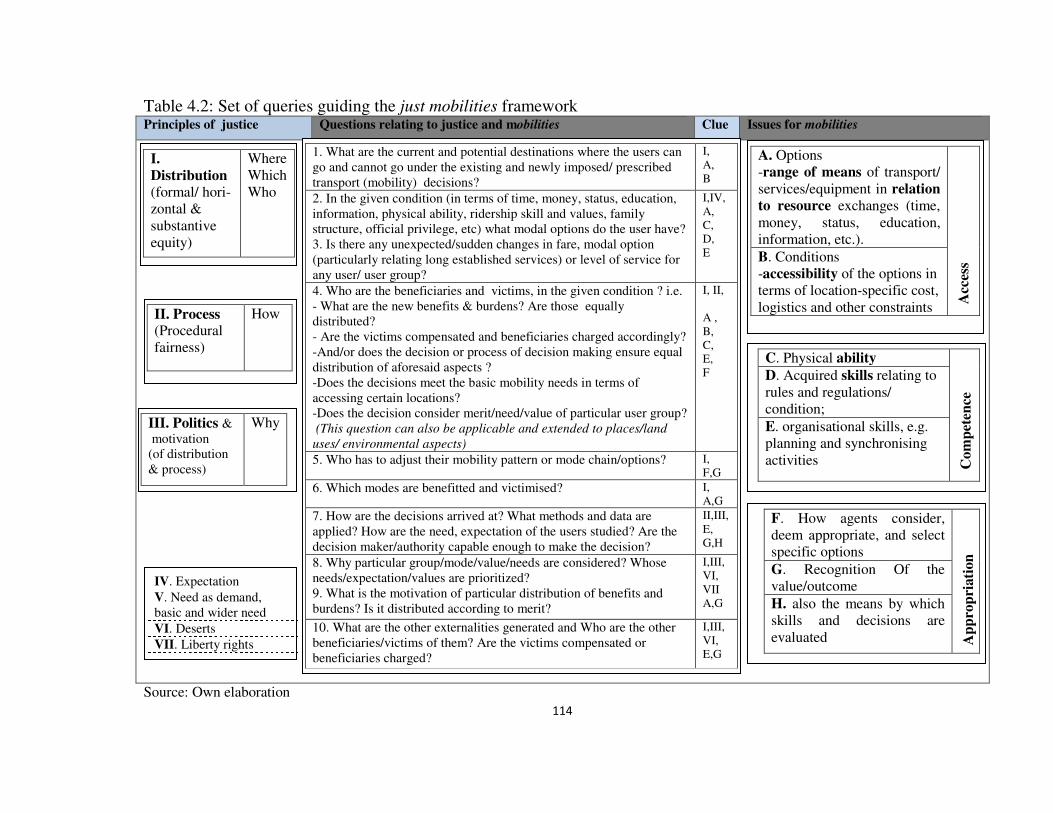
114
Table 4.2: Set of queries guiding the just mobilities framework Principles of justice Questions relating to justice and mobilities Clue Issues for mobilities
Source: Own elaboration
I.
Distribution
(formal/ hori-zontal & substantive equity)
Where Which Who
II. Process (Procedural fairness)
How
III. Politics & motivation (of distribution & process)
Why
A. Options -range of means of transport/ services/equipment in relation
to resource exchanges (time, money, status, education, information, etc.).
Acc
ess
B. Conditions -accessibility of the options in terms of location-specific cost, logistics and other constraints
C. Physical ability
Com
pet
ence
D. Acquired skills relating to rules and regulations/ condition;
E. organisational skills, e.g. planning and synchronising activities
F. How agents consider, deem appropriate, and select specific options
Ap
pro
pri
ati
on
G. Recognition Of the value/outcome
H. also the means by which skills and decisions are evaluated
1. What are the current and potential destinations where the users can go and cannot go under the existing and newly imposed/ prescribed transport (mobility) decisions?
I, A, B
2. In the given condition (in terms of time, money, status, education, information, physical ability, ridership skill and values, family structure, official privilege, etc) what modal options do the user have? 3. Is there any unexpected/sudden changes in fare, modal option (particularly relating long established services) or level of service for any user/ user group?
I,IV, A, C, D, E
4. Who are the beneficiaries and victims, in the given condition ? i.e. - What are the new benefits & burdens? Are those equally distributed? - Are the victims compensated and beneficiaries charged accordingly? -And/or does the decision or process of decision making ensure equal distribution of aforesaid aspects ? -Does the decisions meet the basic mobility needs in terms of accessing certain locations? -Does the decision consider merit/need/value of particular user group? (This question can also be applicable and extended to places/land
uses/ environmental aspects)
I, II, A , B, C, E, F
5. Who has to adjust their mobility pattern or mode chain/options? I, F,G
6. Which modes are benefitted and victimised? I, A,G
7. How are the decisions arrived at? What methods and data are applied? How are the need, expectation of the users studied? Are the decision maker/authority capable enough to make the decision?
II,III, E, G,H
8. Why particular group/mode/value/needs are considered? Whose needs/expectation/values are prioritized? 9. What is the motivation of particular distribution of benefits and burdens? Is it distributed according to merit?
I,III, VI, VII A,G
10. What are the other externalities generated and Who are the other beneficiaries/victims of them? Are the victims compensated or beneficiaries charged?
I,III, VI, E,G
IV. Expectation
V. Need as demand, basic and wider need
VI. Deserts
VII. Liberty rights
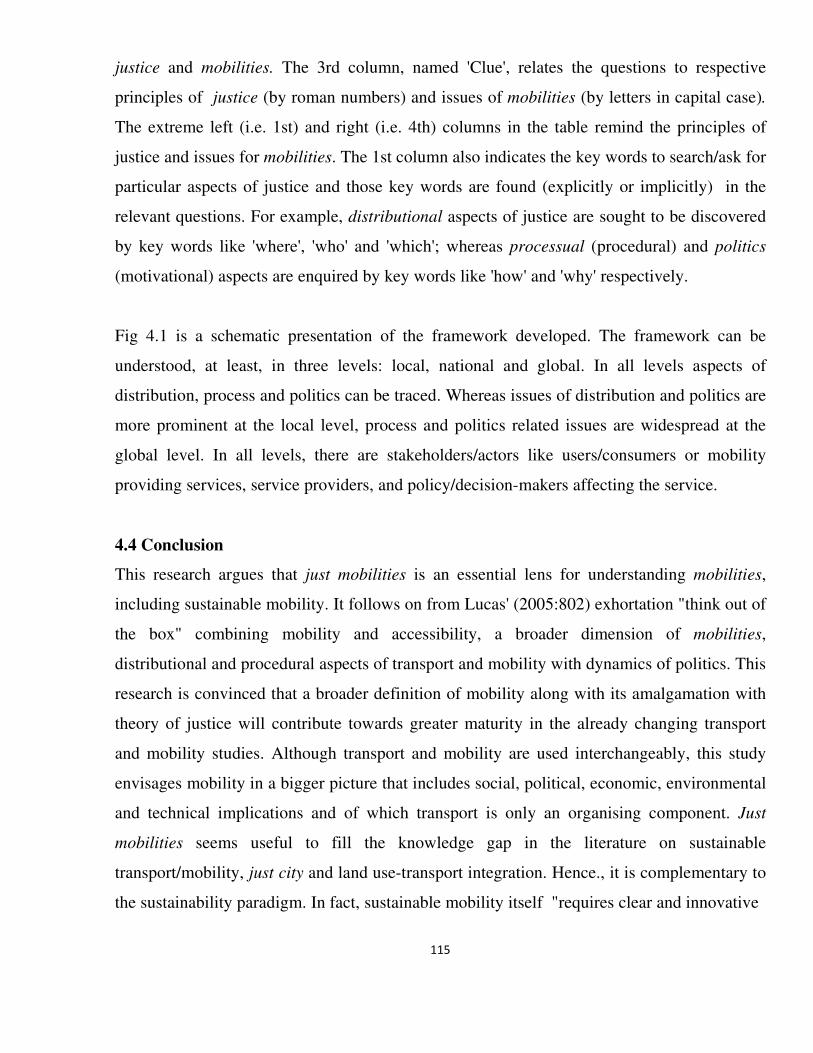
115
justice and mobilities. The 3rd column, named 'Clue', relates the questions to respective
principles of justice (by roman numbers) and issues of mobilities (by letters in capital case).
The extreme left (i.e. 1st) and right (i.e. 4th) columns in the table remind the principles of
justice and issues for mobilities. The 1st column also indicates the key words to search/ask for
particular aspects of justice and those key words are found (explicitly or implicitly) in the
relevant questions. For example, distributional aspects of justice are sought to be discovered
by key words like 'where', 'who' and 'which'; whereas processual (procedural) and politics
(motivational) aspects are enquired by key words like 'how' and 'why' respectively.
Fig 4.1 is a schematic presentation of the framework developed. The framework can be
understood, at least, in three levels: local, national and global. In all levels aspects of
distribution, process and politics can be traced. Whereas issues of distribution and politics are
more prominent at the local level, process and politics related issues are widespread at the
global level. In all levels, there are stakeholders/actors like users/consumers or mobility
providing services, service providers, and policy/decision-makers affecting the service.
4.4 Conclusion
This research argues that just mobilities is an essential lens for understanding mobilities,
including sustainable mobility. It follows on from Lucas' (2005:802) exhortation "think out of
the box" combining mobility and accessibility, a broader dimension of mobilities,
distributional and procedural aspects of transport and mobility with dynamics of politics. This
research is convinced that a broader definition of mobility along with its amalgamation with
theory of justice will contribute towards greater maturity in the already changing transport
and mobility studies. Although transport and mobility are used interchangeably, this study
envisages mobility in a bigger picture that includes social, political, economic, environmental
and technical implications and of which transport is only an organising component. Just
mobilities seems useful to fill the knowledge gap in the literature on sustainable
transport/mobility, just city and land use-transport integration. Hence., it is complementary to
the sustainability paradigm. In fact, sustainable mobility itself "requires clear and innovative
116
Source: Own elaboration
thinking about city futures in terms of the reality (what is already there), desirability (what we
would like to see), and the role that transport can (and should) play in achieving sustainable
cities" (Banister, 2008:73).
Fig.4.1: Context and scope of a just mobilities framework
Socio-Spatial and modal Distribution (based on needs, right and desert for different groups represented by income, livelihood, car ownership, housing, access to power and decision makers etc.
Glo
bal
N
atio
nal
Lo
cal
Negative
Mixed/?/!
Positive
Use
r/C
on
sum
er
Ser
vic
e p
rov
ider
/mo
ver
Pro
du
cer/
Dec
isio
n/p
oli
cy m
aker
Sta
keh
old
ers/
Act
ors
in
vo
lved
Hie
rarc
h
y
Distribution of Nature of
effects and externalities
117
Chapter 5
Distributive effects of rickshaw bans and restrictions on mobilities in Dhaka
5.1 Introduction
This chapter starts with the hypothesis that rickshaw bans or partial restrictions in transport
corridors in Dhaka have changed the conditions and options for road use and thus have
affected different aspects of mobility. As discussed in chapter three, this research conceives
mobility as mobilities defined in terms of existing and potential mobility of the citizens with
respect to their access (to the range of options and conditions), competence (skills and
abilities- physical, financial, social and others, to recognise 'manifest demand' and actual
needs' of movement, and use modes) and appropriation (of existing and potential movement,
particular choices- forced or not). This assumption is examined and reported in this chapter
based on the field level data collected from three study areas in Dhaka, namely Shyamoli,
Shukrabad and Bijoynogar, through a questionnaire survey, open ended interviews and focus
group discussion (FGD). At first the condition of rickshaw bans/restrictions, in terms of
experience of the respondents and other household members, is explored and afterwards the
effects and responses are described.
5.2 Presence of rickshaw bans and restrictions during movement for different activities
This study has categorised the activities by the household members into two categories: time-
bound (routined) and time-flexible (other). In brief, time-bound (routined) activities are
defined as those activities which are done regularly (4/5 days a week) at the same time (e.g.
going for work, school etc.), while time-flexible (other) activities are those activities which
are also done often but not exactly at the same time (e.g. going for shopping or medical
services, visiting relatives etc.) (see section 1.8 and section 2.7 for further details). During
survey around 90% of the household members reported that there are rickshaw banned
corridors or restricted intersections on their way to time-bound (routined) activities
(Appendix D, Table D.1); the figure was 83% for time-flexible (other) activities done by the
household members. A similar pattern is observed in three different study areas with new ban
118
area Bijoynogar having the highest restricted activities – almost 93% for time-bound
(routined) and 88% for time-flexible (other) activities (Appendix D, Table D.2).
Figure 5.1 shows experience of all household members (in all three study areas) of rickshaw
bans/restrictions i.e. presence of bans/restriction on their way to perform their main time-
bound (routined) and main time-flexible (other) activities. It shows that only in case of one
time-bound (routined) activity, namely 'other', households members face no rickshaw ban or
restriction. But this category of time-bound (routined) activity was only 0.2% of all main
time-bound (routined) activities. In case of main time-flexible (other) activities, two types of
activities, namely 'carrying children to tuition' and 'availing services - post office/bank/barber
etc', faced no rickshaw bans/restrictions. But each of these two activities shared only around
1% of all main time-flexible (other) activities57. On the whole, as table 5.1 shows, main time-
bound (routined) activities faced 50%-100% bans/restrictions and main time-flexible (other)
activities face 30%-100% bans/restrictions. Important to note, among the main time-bound
(routined) activities going to 'work', 'school/study', 'carrying children to school', 'daily/kitchen
shopping' faced nearly 80% or more bans/restrictions while riding on rickshaws; in the total
responses of experiences of bans/restrictions on the way to time-bound (routined) activities
respective share of the four activities were 41.60%, 37.4%, 8.4% and 4.9% i.e. 92.3% of the
total responses relating to bans/restriction on the way to main time-bound (routined) activities
(Appendix D, Table D.3). On the other hand, while performing top three main time-flexible
(other) activities, namely 'daily/kitchen shopping', 'non-daily shopping' and 'visiting family,
relatives and friends', cumulatively faced 60% of the bans/restrictions in time-flexible (other)
activities. Thus 87% of all main time-bound (routined) activities (constituting three top
activities- going to 'work', 'school/study', 'carrying children to school') (see section 2.7 for
distribution of main activities time-bound (routined) and time-flexible (other) activities) faced
80% of all reported bans/restrictions in time-bound (routined) activities and 72% of all main
57 Confusion may arise finding same activities on both sides (time-bound and time-flexible) of the figure5.1. In fact, during field survey same list of activities, prepared after reconnaissance survey, was given to the respondents. They choose their time-bound (regular) and
time-flexible (other) activities from the list. Therefore, in case of one household member one activity, say 'carrying children to tuition' was time-bound (regular) activity, but for another household member, who might escort children in an emergency, it was a time-
flexible (other) activity. See Appendix B, tables B.15 and B.16 for the household members' distribution based on time-bound (routined) and time-flexible (other) activities
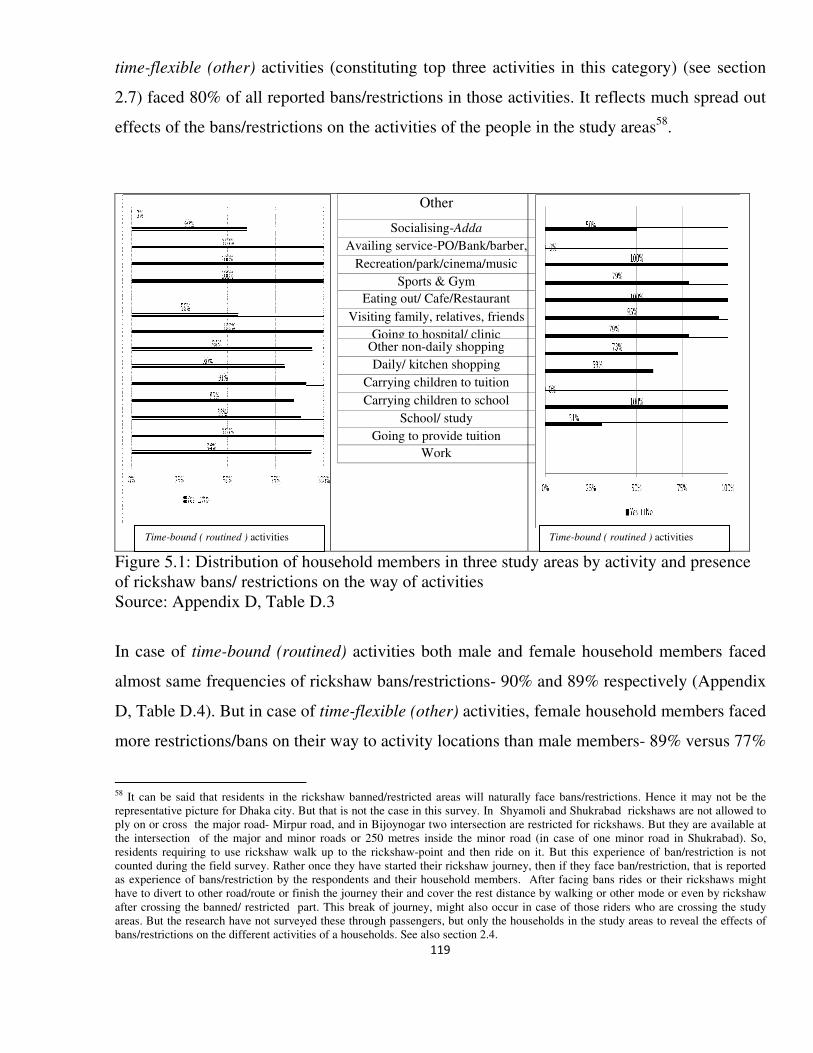
119
time-flexible (other) activities (constituting top three activities in this category) (see section
2.7) faced 80% of all reported bans/restrictions in those activities. It reflects much spread out
effects of the bans/restrictions on the activities of the people in the study areas58.
Other
Socialising-Adda
Availing service-PO/Bank/barber, etc Recreation/park/cinema/music i Sports & Gym
Eating out/ Cafe/Restaurant
Visiting family, relatives, friends s Going to hospital/ clinic
Other non-daily shopping
Daily/ kitchen shopping
Carrying children to tuition
Carrying children to school
School/ study
Going to provide tuition
Work
Figure 5.1: Distribution of household members in three study areas by activity and presence of rickshaw bans/ restrictions on the way of activities Source: Appendix D, Table D.3
In case of time-bound (routined) activities both male and female household members faced
almost same frequencies of rickshaw bans/restrictions- 90% and 89% respectively (Appendix
D, Table D.4). But in case of time-flexible (other) activities, female household members faced
more restrictions/bans on their way to activity locations than male members- 89% versus 77%
58 It can be said that residents in the rickshaw banned/restricted areas will naturally face bans/restrictions. Hence it may not be the representative picture for Dhaka city. But that is not the case in this survey. In Shyamoli and Shukrabad rickshaws are not allowed to ply on or cross the major road- Mirpur road, and in Bijoynogar two intersection are restricted for rickshaws. But they are available at the intersection of the major and minor roads or 250 metres inside the minor road (in case of one minor road in Shukrabad). So, residents requiring to use rickshaw walk up to the rickshaw-point and then ride on it. But this experience of ban/restriction is not counted during the field survey. Rather once they have started their rickshaw journey, then if they face ban/restriction, that is reported as experience of bans/restriction by the respondents and their household members. After facing bans rides or their rickshaws might have to divert to other road/route or finish the journey their and cover the rest distance by walking or other mode or even by rickshaw after crossing the banned/ restricted part. This break of journey, might also occur in case of those riders who are crossing the study areas. But the research have not surveyed these through passengers, but only the households in the study areas to reveal the effects of bans/restrictions on the different activities of a households. See also section 2.4.
Time-bound ( routined ) activities Time-bound ( routined ) activities
120
(Appendix D, Table D.4). It means that for the females bans/restriction related problems,
discussed later in section 5.3, were round the clock and more stressful experiences. Moreover,
activities mostly done by female household members such as 'carrying children to school',
'doing daily and non-daily shopping', 'visiting family, relatives, friends' (See figure 2.9) faced
ban/restriction in more than 50% cases (Figure 5.1). During the focus group discussions
(FGDs) with guardians in the school premises it had been reveled that in the socio-economic
context of Dhaka women from the non-car owning households were more comfortable with
rickshaws than other public transport modes as they usually did not ensure the privacy and
comfort they look for. For the same reason, it can be argued that for the female respondents
and female household members rickshaw was a more favoured choice and hence female
respondents faced and consequently reported more rickshaw bans/restrictions during their
activities. Other studies also support these findings59. However, after the initial bans and
restrictions several new buses were introduced which helped a section of citizens, mainly
males to change their modal choice from rickshaw to bus, said the development activist,
interviewed during the field work. But they were inadequate compared to the required
number. So, women usually avoided the bus service for short and medium distance trips and
time-flexible (other) or any emergency activities; they either took rickshaws or CNGs, said
the female guardians in Focus Group discussions.
81% of the children (below 15 years of age), i.e. household members in the mobility
dependent group, faced rickshaw bans/restrictions on the way to time-bound (regular)
activities (Appendix D, Table D.5). 85% of the total people over 60 years, who were also
mobility dependent in most cases, faced the bans/restrictions on rickshaw movement on their
59 DITS (1993) found that reasons for using rickshaws were mainly convenience, door-to-door service, absence of alternatives, cultural factors and privacy/segregation. It also reported that in 1993 women used rickshaws for 70% of all trips, bus for only 7% of all trips; for men and children the figures were 62% and 15% respectively (ibid:6). Zohir (2003) also found the same reasons, plus flexibility in using and availing rickshaws. Women did not travel in crowded bus because of lack of privacy, unfriendly behaviour/service by the bus driver/helper, difficulty in riding a running bus etc., the study added. Zohir et al. (2008:39), referring to other studies, report that from 1993-97 use of rickshaws has increased to 35.3% (of all trips) from 21% for women, while for men the increase was comparatively low- from 15% to 24% . Again, from 1997 to 2008, the use of rickshaw had more for men than women; from 35.3% to 30% for women and from 24% to 15% for men. In Mirpur road corridor overall use of rickshaws declined from 36.5% to 23.3%. But alternative transport modes were not gender-sensitive; so routes on which housewives travelled to escort their school going children, rickshaws still remained dominant mode for 41% of housewives.
121
ways to time-bound (regular) activities. In case of time-flexible (other) activities for the two
groups respective figures were 81% and 90% (Appendix D, Table D.5)
5.3 General problems in mobilities- linkage with rickshaw bans and restriction
During the survey respondents identified different problems (shown in Appendix D, Figure
D.1) associated with their journey towards various activities - both time-bound and time
flexible. Tussles to get on the mode, poor road condition, break of journey, long waiting times
and problems in negotiating travel fares were reported as the five major problems. Although
the problems were identified in general with regard to the transport and mobility experience
in Dhaka, rickshaw bans/restrictions could also be their direct or indirect causes. Since
rickshaws were withdrawn or diverted, a shortage for modes was created in the road in
absence of adequate number of substitute modes and routes. After the first initial ban in 2002,
new buses rolled in and new bus routes were introduced along with taxi cab service. As these
measures failed to meet the demand, tussle with co-passengers was a "real horror", said one
participant in a focus group discussion (FGD). Again, soon many taxi-cabs and buses,
introduced in 2002, were out of order or were taken off from the road, informed one DTCB
official during interview. The problem aggravated as the drivers of taxi cabs and three
wheelers or rickshaw-wallas started seeking "unreasonable, sometimes astonishing, fare
while metered taxi or CNG drivers refused to go as per metres [to calculate fare by distance
and waiting time]", exclaimed several participants in FGDs. The problems became more
serious if someone had to carry luggage and/or to accompany an elderly or children
somewhere. If any destination could be reached by rickshaw using another road, which would
be a local road and hence in most cases was "ill maintained", jerking made the journey really
a difficult and uncomfortable experience; in many cases rickshaw journeys were not
continuous, i.e. door to door; the break of journey was a must, recalled several FGD
participants.
Based on the insight gained during field work, interviews and FGDs (Appendix E, FGDs), the
linkage of mobility and transport related problems (identified by the respondents of the
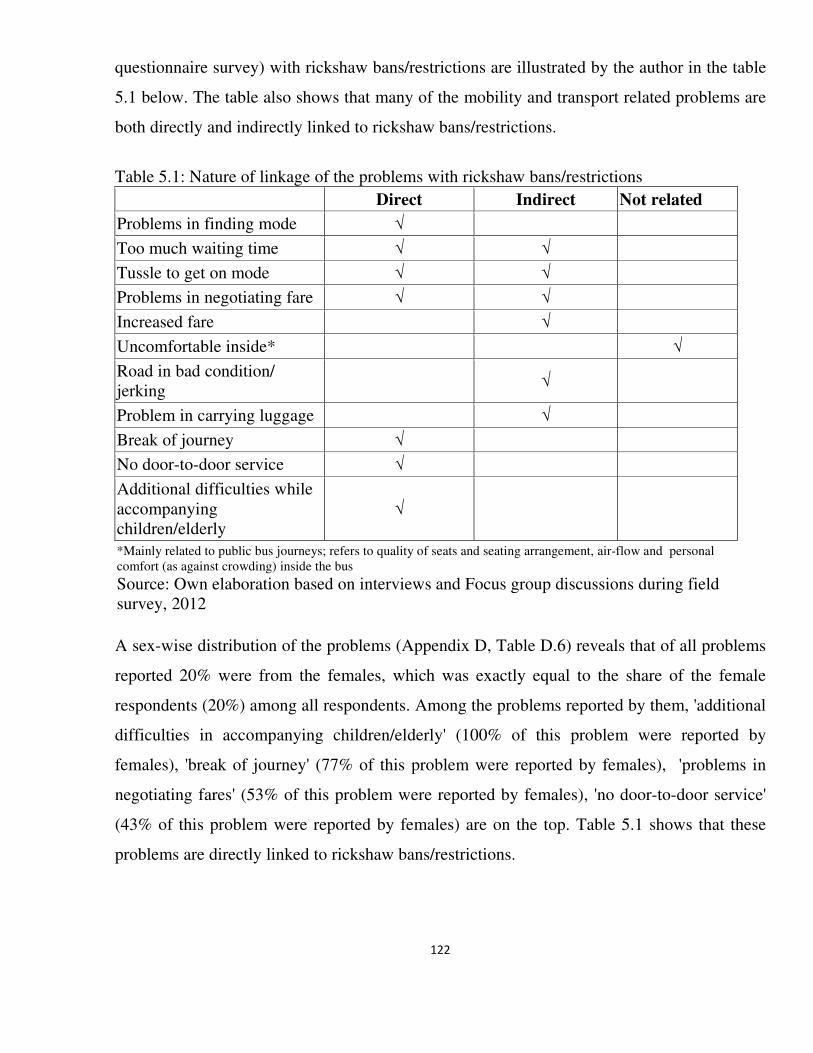
122
questionnaire survey) with rickshaw bans/restrictions are illustrated by the author in the table
5.1 below. The table also shows that many of the mobility and transport related problems are
both directly and indirectly linked to rickshaw bans/restrictions.
Table 5.1: Nature of linkage of the problems with rickshaw bans/restrictions
Direct Indirect Not related
Problems in finding mode √
Too much waiting time √ √
Tussle to get on mode √ √
Problems in negotiating fare √ √
Increased fare √
Uncomfortable inside* √
Road in bad condition/ jerking
√
Problem in carrying luggage √
Break of journey √
No door-to-door service √
Additional difficulties while accompanying children/elderly
√
*Mainly related to public bus journeys; refers to quality of seats and seating arrangement, air-flow and personal comfort (as against crowding) inside the bus
Source: Own elaboration based on interviews and Focus group discussions during field survey, 2012
A sex-wise distribution of the problems (Appendix D, Table D.6) reveals that of all problems
reported 20% were from the females, which was exactly equal to the share of the female
respondents (20%) among all respondents. Among the problems reported by them, 'additional
difficulties in accompanying children/elderly' (100% of this problem were reported by
females), 'break of journey' (77% of this problem were reported by females), 'problems in
negotiating fares' (53% of this problem were reported by females), 'no door-to-door service'
(43% of this problem were reported by females) are on the top. Table 5.1 shows that these
problems are directly linked to rickshaw bans/restrictions.
123
This research has found (Appendix D, Table D.7) that car-owners reported problems mainly
with respect to road condition. So, it is indicative that personalised car users60 were facing
different problems compared to non-owners. However, it does not mean that they were not at
all adversely affected; non-car-using members of a car-owning household faced similar
problems like 'problems in finding modes', 'too much waiting time', 'problems in negotiating
fare', 'no door-to-door service' etc. (Appendix E, FGDs).
When the problems are distributed according to main time-bound (routined) activities
(Appendix D, Table C.8), most (82%) of the respondents reported problems during ‘going for
work', which also shared highest (41.30%) of all main time-bound (regular) activities (Figure
2.8). In fact, Appendix D (Table D.8) and Appendix E (FGDs) show that activities like going
to 'work' and going to 'school/study' faced each type of problems reported by respondents.
Again, problems like 'too much waiting time', 'problems in negotiating fare', 'break of
journey', 'no door-door service', which were directly linked to rickshaw bans/restrictions,
affect all or most of the activities.
5.4 Changes in rickshaw related journey experiences
Since the movement of rickshaws were banned/restricted, two types of changes occurred in
rickshaw related journey experiences - one was the direct effect on the experiences of
rickshaw journeys, the other was the secondary effect on the user of rickshaws.
5.4.1 Direct effects on the rickshaw journey experiences
Despite bans/restrictions, many households and their members had to use rickshaws for
different activities. The respondents identified such changes in their journey experiences as
follows: three-quarters of the respondents reported that on their way to different activities, for
which previously rickshaws could be used uninterruptedly, breaks of journey increased; 71%
stated increases in the financial cost of mobility; more than half experienced increase in daily
60 Personalised car users refer to the private car owners or those officials who are provided with private cars to be used by them and household members.
124
travel distance for different activities (as in most cases short and better conditioned roads are
off limit for this mode) (Appendix D, Table D.9).
An area-wise picture of the incidence in the breaks of journey shows that this was highest in
Shyamoli (81%), least in Bijoynogar (68%) (Appendix D, Table D.10). Bijoynogar was
comparatively better served by public buses and also had highest car ownership among the
study areas. So use of rickshaws was lower here among the three study areas. Again 'contact
arrangement'61 for rickshaws was also highest here (Appendix D, Table D.10). The incidence
of break of journey for residents here was low, but not for those through passengers who used
to cross the area by rickshaw. Shyamoli was less served by public bus compared to
Shukrabad and Bijoynogar, and had lowest car-ownership. So, the short and medium length
journeys were much affected due to bans/restrictions here in general in Shyamoli.
5.4.2 Indirect effects on rickshaw users
The problematic journey experiences resulting from bans/restrictions on rickshaws caused
some other secondary effects. This affected children's school attendance, a time-bound
(routined) activity; 62% of the respondents said that overcrowding and discomfort in public
buses increased as a consequence of inadequacy and inefficiency of public transport; 37% of
respondents thought that school-goers in their households became more reluctant to go to
school due to difficulties they, along with their guardians, faced in the morning while going
to schools (Appendix D, Table D.9). Similarly, as specialised transportation service for
medical emergencies was really inadequate in Dhaka; people themselves had no option but to
carry ill/diseased persons to hospitals/clinics - for the non-car-owners rickshaws were always
a common and readily available mode. But, 55% of respondents noted that even carrying
ill/diseased members to hospitals/clinics became more difficult (Appendix D, Table D.9) after
bans/restriction.
61 As finding a rickshaw becomes difficult for a particular activity, mostly during morning or evening hours, some households have made a monthly contact agreement with a rickshaw-walla, CNG driver or school van drivers to carry a households member, in most cases school going children or office going female member, to the destination via rickshaw allowed roads. It saves the time, effort and hassle to find a mode during the particular activity. Moreover, the contacted driver or rickshaw-walla takes more care of the passenger in a poor road condition, accepts changes in schedule and also provides extra service to other members of the household at reasonable fare.
125
5.5 Response strategies of households and respondents to rickshaw bans and restrictions
As rickshaw bans/restrictions changed access (options for mode, and conditions of mobilities)
respondents and their households developed their own strategies i.e. appropriation, based on
their competence -skill, affordability, health condition and other related aspects. The
following discussion is based on the questionnaire survey, FGD and interviews.
5.5.1. Forced choice of options for mobilities
The bans/restrictions changed the modal use of household members and respondents; some
reported that they were even forced to change their modes. 12% of the respondents reported
that their households had been forced to buy a private car; 52% of the respondents
experienced forced bus ridership; 66% of the respondents experienced forced walking
(Appendix D, Table D.11). Households who could not afford a car - either for financial
difficulty or for other reasons like lack of parking space, having no house of their own (i.e.
currently a tenant), but facing enormous difficulties in finding a suitable mode at reasonable
fares to reach their destinations, opted for 'contact arrangement' (see footnote 61) with
rickshaw-walla, drivers of CNG, school van etc. Respondents reported that 18% of the
households made 'contact arrangement' for rickshaws, 14% for CNGs and 13% for school
vans (Appendix D, Table D.11).
If forced car ownership is investigated area-wise (Appendix D, Table D.12), two old ban
areas show opposite features; Shyamoli which had a comparatively higher share of low and
medium income households than Shukrabad (in fact, than Bijoynogar as well) (Appendix B,
Table B.4) revealed low level of forced car-ownership; Shukrabad, which has nearly 50%
more high income households than Shyamoli (Appendix B, Table B.4), had the highest
response in this regard. Different share of forced car ownership in two low car-owning areas-
Shukrabad and Shyamoli, could be explained by the difference in affordability. For
households in Bijoynogar, which already had higher car-ownership than the other two areas
(Figure 2.5), forced car ownership was in between the other two study areas.
126
In case of forced 'contact arrangement' for rickshaws, interestingly, households in high
income areas showed higher response and vice versa (Appendix D, Table D.12). It can be
explained by three reasons: (i) forced rickshaw arrangement was a short term response; in the
longer term affected people used to buy cars or change routes or nature of activities (see
section 5.5.2) or any other option would have developed. Among the study areas Bijoynogar
was the latest ban area; residents in Shyamoli were experiencing rickshaw ban earlier than
Shukrabad. So it was found that residents in Shukrabad and Shyamoli adjusted with
bans/restrictions through other responses; but those in Bijoynogar had to opt for 'contact
arrangement' for rickshaws (ii) Another important issue is the availability of rickshaws in
different local roads. As the bans/restrictions (in and around the study areas) turned several
parts of Bijoynogar and Shukrabad into rickshaw free islands, residents in those areas had to
opt for 'contact arrangement' for rickshaws particularly for children (to carry them to schools)
and for women office goers, (iii) However if there were other options like school vans for
school children, forced 'contact arrangements' for rickshaws decreased. It happened in the
case of Shyamoli, where in the absence of rickshaws, many (21% - highest among the study
areas) households had been forced to contact privately run school vans; however as
Bijoynogar was a very recent ban area, here the school van service was less developed and
hence least households (7%) could arrange it (Appendix D, Table D.12) and consequently the
share of forced contact-rickshaw arrangement was highest.
5.5.2 Changes in activities and pattern of mobilities
When respondents were asked if the withdrawal of rickshaws had prevented them from using
this mode for a particular purpose62, 17% answered affirmatively (Appendix D, Table D.11).
However, it was found that the households and members who could not afford to make
changes in their mode or journey/route, changed - either avoid or changed the frequency and
timing - less essential and non-routined activities (which could be termed as potential ones).
16% of respondents reported that the decision prevented them or their family members from
62 For example, someone may usually prefer using only rickshaws to go to or come from the kitchen market or shopping centre or to visit relatives nearby. The activity can also be performed using CNG three wheelers which are far less available than rickshaws in Dhaka and costlier. But as rickshaws are unavailable now they are forced to opt for other modes and use of rickshaw for the purpose is completely prevented.'
127
visiting friends and relatives; 17% of the respondents or their fellow members had been
prevented from participating into classes, educational programmes or training events
requiring regular attendance (Appendix D, Table D.11). Many (37%) of the respondents
reported that as they had to spend more time to find a mode or get into public transport,
particularly while going for work, their effective working hours reduced63 (Appendix D,
Table D.11). Again, a similar number of respondents (33%) expressed frustration as more
time was spent on the road, their non-working hours reduced affecting activities associated
with family, friends and relatives (Appendix D, Table D.11). Finally, the perception
regarding independent mobilities of him/herself and members of the households showed that
57.5% of respondents thought that they or their household members' independence at
movement was affected due to the withdrawal of rickshaws (Appendix D, Table D.11).
5.5.3. Mixed perceptions regarding changes in speed and congestion
As regards the definition of mobilities by Kaufman et al. (2002, 2004) and other scholars,
appropriation of mobilities also means interpretation and understanding on the mobility
situation along with responses to the prevailing mobility conditions. The survey has revealed
that many respondents do not agree with the announced potential advantages of the rickshaw
bans/restrictions, such as increased speed of bus and other motorised modes, reduction in
traffic jam etc.
In fact, one of the most stated reasons in contemporary transport planning and engineering
intervention in cities is increased speed, also expressed in the guise of the term 'increased
mobility'. No exception also was there while making rickshaws off limit in many roads;
increased speed and reducing congestion were two main objectives of the project(s). But road
users found it hard to reach such conclusion. 61% of respondents said that the decision had
increased congestion in the rickshaw permitted roads, as rickshaws from banned roads were
also diverted there (Appendix D, Table D.13). Regarding congestion in major roads - many of
63 It has been revealed during open-ended discussion during household survey that as people doing work/job are always in uncertainty regarding availing a suitable mode(s) that will give them a comfortable journey after the busy office hours, some of them leave offices earlier than they should. Plus, many times they come lately in the office due to unavailability of transport, demanding of 'unreasonable' fare by drivers or rickshaw-wallas when a mode if found; crowd in the public transport. Thus effecting working/office time is reduced and even the authority has to remain 'indulging' as it also know the reality.
128
which were rickshaw free then - slightly more than half (50.3%) of respondents reported no
major change (Appendix D, Table D.13). Similarly although the majority (52.5%) of
respondents stated that speed of the motorised traffic increased, nearly half (46.4%) reported
no change (Appendix D, Table D.13). These finding were similar to those in other studies,
like DSM Consultants (2006), HDRC (2004), carried out to evaluate execution of the NMT
withdrawal plan in Dhaka.
5.6 Perception and choice for rickshaws and other modes
This section reports on the perception of respondents on the importance or usability of
rickshaws and other widely used modes in Dhaka for short (less than 2 km), medium (2-5
km) and long (5km and above) trips. It also discloses the respondents' choice of different
modes in four different real or hypothetical conditions/situations: (i) current (when rickshaw
is/was banned/restricted in several roads/intersections), (ii) rickshaw allowed in whole Dhaka,
(iii) 1st condition i.e. current plus good public transport and (iv) lastly, 2nd condition plus
good public transportation.
Figure 5.2 depicts the mean rating of different modes for various trips by the respondents.
When respondents were asked to rate (in a scale of 5, 1 for minimum and 5 for maximum) the
importance or usability of different modes for three different types of trips (in terms of
distance) the mean rating of rickshaws were highest for short trips (below 2 km). In the case
of medium length trips (2-5 km) although the mean rating for rickshaw was third highest
(3.56) it was not far from the highest mean rating (3.77) for car and almost the same for the
second highest mean rating (3.58) for CNG three wheelers. For long distance trips (above 5
km), rickshaws were rated quite low, which was natural; public bus received highest rating
followed by car. JICA (2010:3-15, 3-17 ) mentions that more than 50% of rickshaw trips are
for a distance covering 1-3 km and average trip distance by rickshaws is 1.8 km. In such a
condition bans or restrictions on rickshaws did not satisfy the choice of a large number of
respondents who used it mainly for medium and short trips.
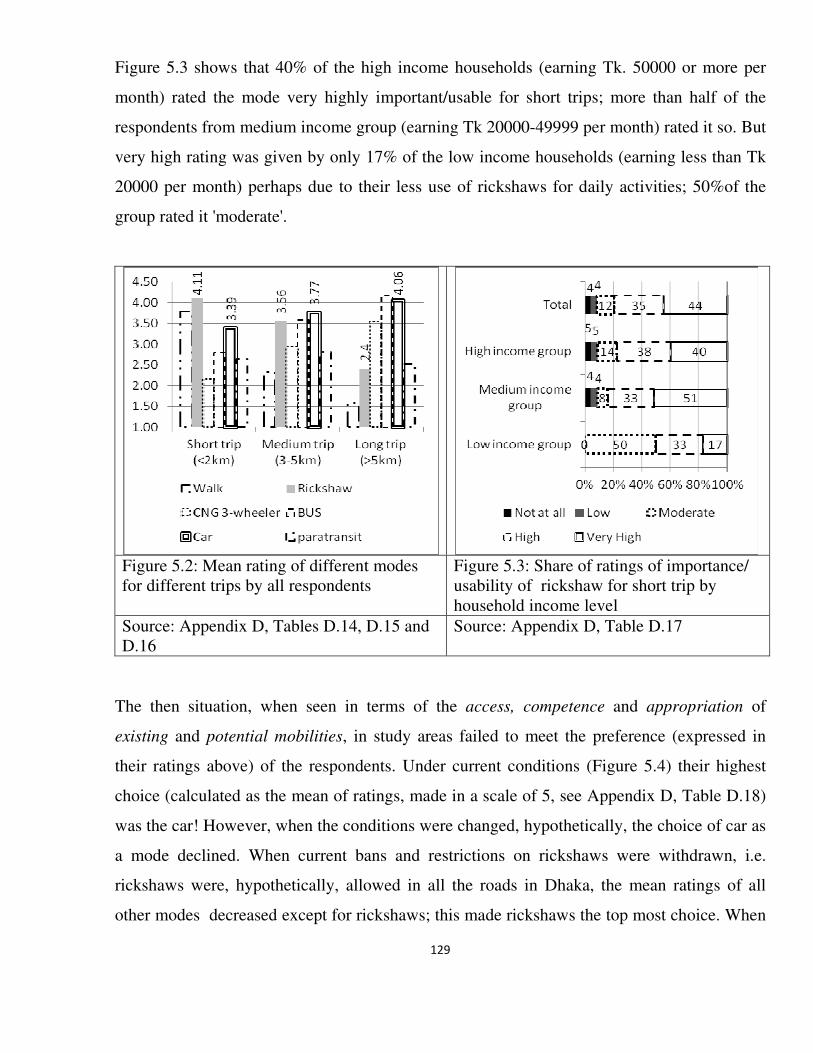
129
Figure 5.3 shows that 40% of the high income households (earning Tk. 50000 or more per
month) rated the mode very highly important/usable for short trips; more than half of the
respondents from medium income group (earning Tk 20000-49999 per month) rated it so. But
very high rating was given by only 17% of the low income households (earning less than Tk
20000 per month) perhaps due to their less use of rickshaws for daily activities; 50%of the
group rated it 'moderate'.
Figure 5.2: Mean rating of different modes for different trips by all respondents
Figure 5.3: Share of ratings of importance/ usability of rickshaw for short trip by household income level
Source: Appendix D, Tables D.14, D.15 and D.16
Source: Appendix D, Table D.17
The then situation, when seen in terms of the access, competence and appropriation of
existing and potential mobilities, in study areas failed to meet the preference (expressed in
their ratings above) of the respondents. Under current conditions (Figure 5.4) their highest
choice (calculated as the mean of ratings, made in a scale of 5, see Appendix D, Table D.18)
was the car! However, when the conditions were changed, hypothetically, the choice of car as
a mode declined. When current bans and restrictions on rickshaws were withdrawn, i.e.
rickshaws were, hypothetically, allowed in all the roads in Dhaka, the mean ratings of all
other modes decreased except for rickshaws; this made rickshaws the top most choice. When
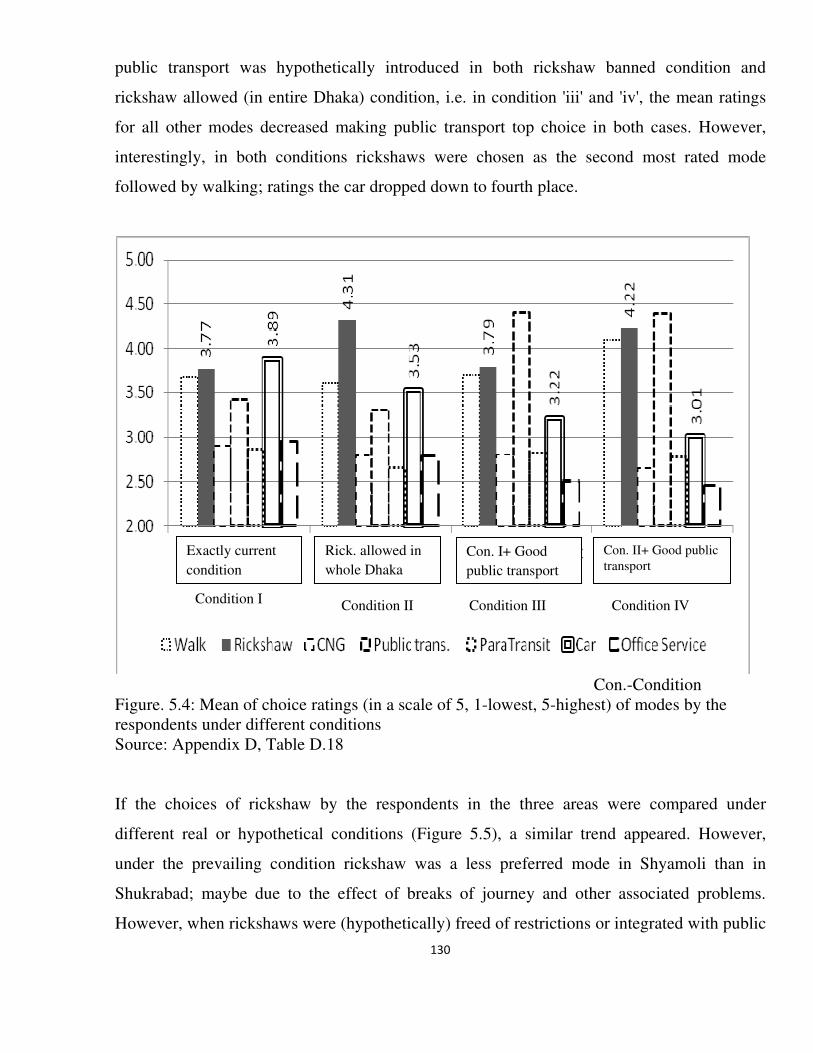
130
public transport was hypothetically introduced in both rickshaw banned condition and
rickshaw allowed (in entire Dhaka) condition, i.e. in condition 'iii' and 'iv', the mean ratings
for all other modes decreased making public transport top choice in both cases. However,
interestingly, in both conditions rickshaws were chosen as the second most rated mode
followed by walking; ratings the car dropped down to fourth place.
Con.-Condition Figure. 5.4: Mean of choice ratings (in a scale of 5, 1-lowest, 5-highest) of modes by the respondents under different conditions Source: Appendix D, Table D.18
If the choices of rickshaw by the respondents in the three areas were compared under
different real or hypothetical conditions (Figure 5.5), a similar trend appeared. However,
under the prevailing condition rickshaw was a less preferred mode in Shyamoli than in
Shukrabad; maybe due to the effect of breaks of journey and other associated problems.
However, when rickshaws were (hypothetically) freed of restrictions or integrated with public
Condition I
Condition II Condition III Condition IV
Con. I+ Good
public transport
Con. II+ Good public
transport Rick. allowed in
whole Dhaka
Exactly current
condition
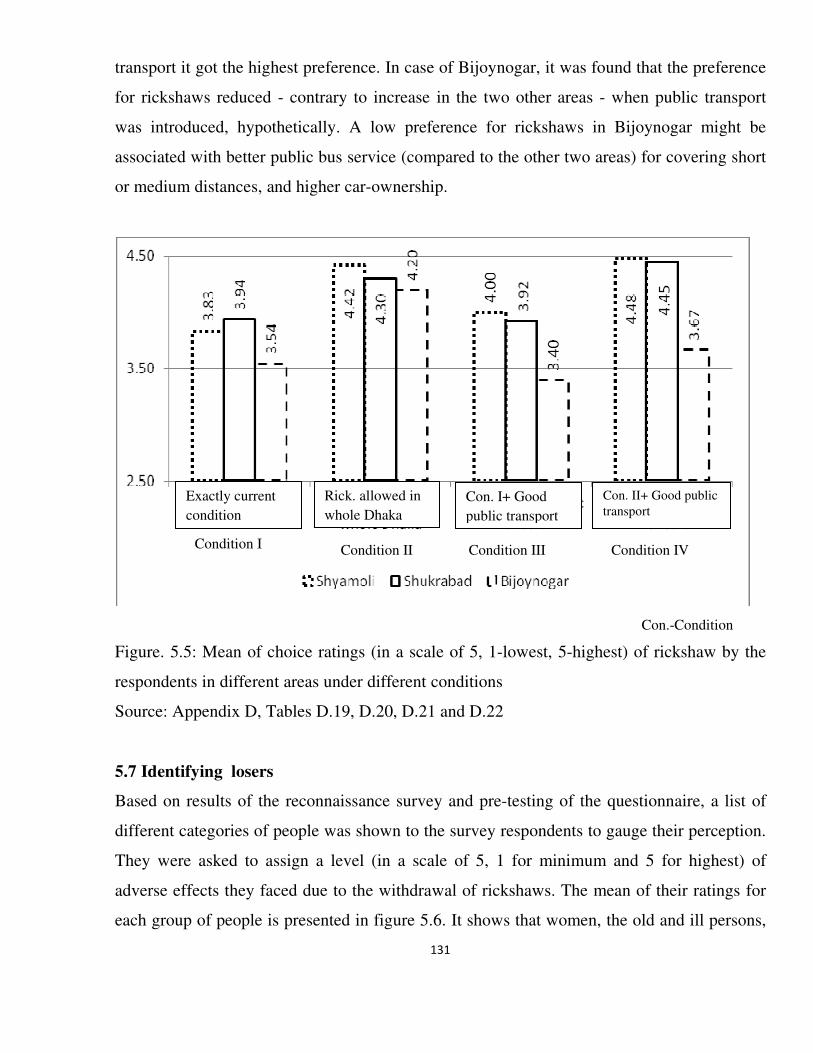
131
transport it got the highest preference. In case of Bijoynogar, it was found that the preference
for rickshaws reduced - contrary to increase in the two other areas - when public transport
was introduced, hypothetically. A low preference for rickshaws in Bijoynogar might be
associated with better public bus service (compared to the other two areas) for covering short
or medium distances, and higher car-ownership.
Con.-Condition
Figure. 5.5: Mean of choice ratings (in a scale of 5, 1-lowest, 5-highest) of rickshaw by the
respondents in different areas under different conditions
Source: Appendix D, Tables D.19, D.20, D.21 and D.22
5.7 Identifying losers
Based on results of the reconnaissance survey and pre-testing of the questionnaire, a list of
different categories of people was shown to the survey respondents to gauge their perception.
They were asked to assign a level (in a scale of 5, 1 for minimum and 5 for highest) of
adverse effects they faced due to the withdrawal of rickshaws. The mean of their ratings for
each group of people is presented in figure 5.6. It shows that women, the old and ill persons,
Condition I
Condition II Condition III Condition IV
Con. I+ Good
public transport
Con. II+ Good public
transport Rick. allowed in
whole Dhaka
Exactly current
condition
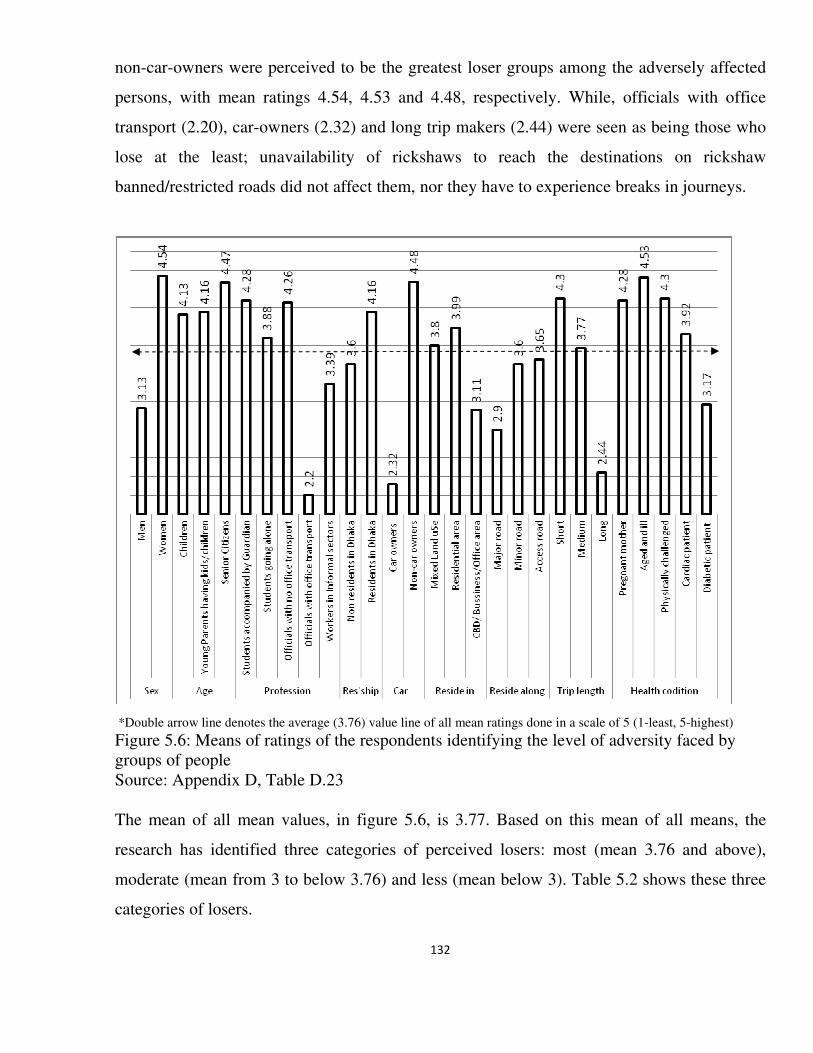
132
non-car-owners were perceived to be the greatest loser groups among the adversely affected
persons, with mean ratings 4.54, 4.53 and 4.48, respectively. While, officials with office
transport (2.20), car-owners (2.32) and long trip makers (2.44) were seen as being those who
lose at the least; unavailability of rickshaws to reach the destinations on rickshaw
banned/restricted roads did not affect them, nor they have to experience breaks in journeys.
*Double arrow line denotes the average (3.76) value line of all mean ratings done in a scale of 5 (1-least, 5-highest)
Figure 5.6: Means of ratings of the respondents identifying the level of adversity faced by groups of people Source: Appendix D, Table D.23 The mean of all mean values, in figure 5.6, is 3.77. Based on this mean of all means, the
research has identified three categories of perceived losers: most (mean 3.76 and above),
moderate (mean from 3 to below 3.76) and less (mean below 3). Table 5.2 shows these three
categories of losers.
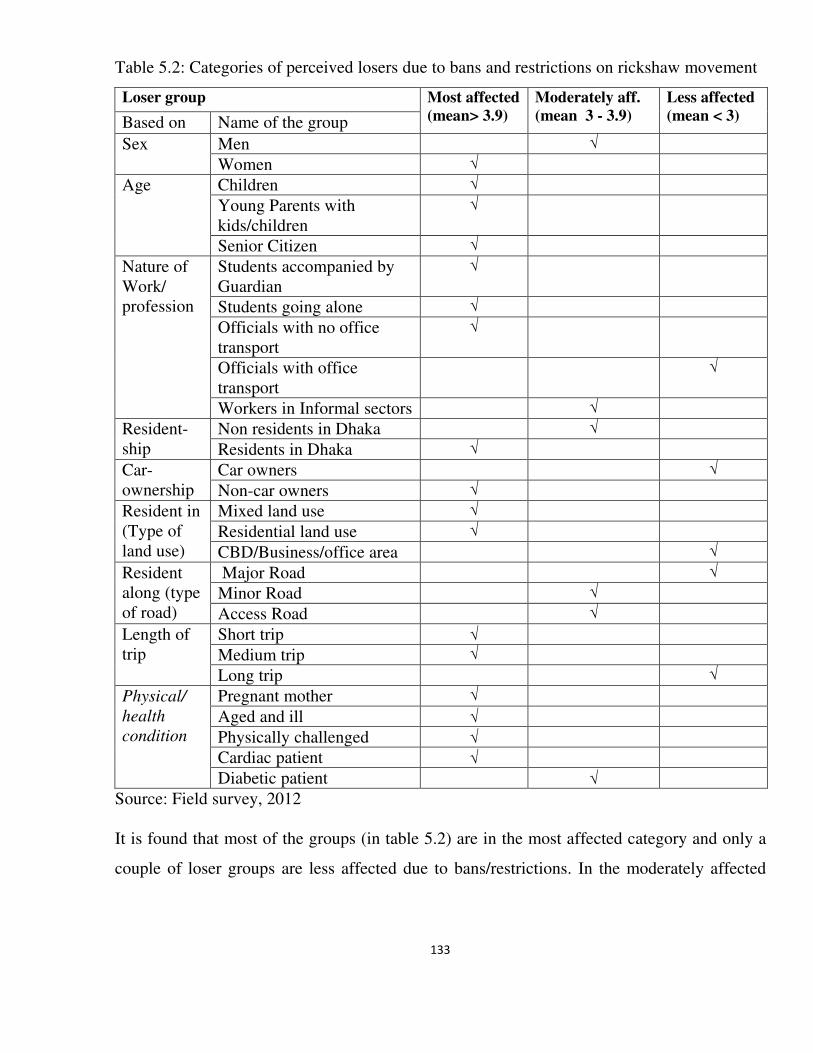
133
Table 5.2: Categories of perceived losers due to bans and restrictions on rickshaw movement
Loser group Most affected
(mean> 3.9)
Moderately aff.
(mean 3 - 3.9)
Less affected
(mean < 3) Based on Name of the group
Sex Men √
Women √
Age Children √
Young Parents with kids/children
√
Senior Citizen √
Nature of Work/ profession
Students accompanied by Guardian
√
Students going alone √
Officials with no office transport
√
Officials with office transport
√
Workers in Informal sectors √
Resident-ship
Non residents in Dhaka √
Residents in Dhaka √
Car-ownership
Car owners √
Non-car owners √
Resident in (Type of land use)
Mixed land use √
Residential land use √
CBD/Business/office area √
Resident along (type of road)
Major Road √
Minor Road √
Access Road √
Length of trip
Short trip √
Medium trip √
Long trip √
Physical/
health
condition
Pregnant mother √
Aged and ill √
Physically challenged √
Cardiac patient √
Diabetic patient √
Source: Field survey, 2012 It is found that most of the groups (in table 5.2) are in the most affected category and only a
couple of loser groups are less affected due to bans/restrictions. In the moderately affected
134
category there were informal sector workers and non-residents in Dhaka64. The informal
workers like hawkers, vendors in many cases use to carry the goods they hawk or vend by
mode like rickshaw. So in the perception of the respondents the bans and restriction affect
them moderately. On the hand, non-residents of Dhaka use to face severe problems while
making short and medium trips. Being strangers in Dhaka they do not know their destinations
well and also do not know public transport links, if any, to the places they want to go. So their
first and best choice is rickshaw; CNG is costly for any user- resident of non-resident. But the
problem of the non-residents due to rickshaw bans/restrictions is transitory, whereas for
residents in Dhaka problems in mobilities are everyday experiences. This may explain why
the respondents, who were residents in Dhaka, perceived themselves as more adversely
affected than the non-residents.
5.8 Statistical validity of the findings
This section provides a brief note on the statistical validity of the findings from household
survey which are already stated in this chapter. The results of Chi-square tests are
summarised along with interpretations in table 5.3. It should be mentioned that in the Chi-
square test if probability (P) value is less than 0.05, the null hypothesis, which usually
hypothesise of no difference between the variables concerned, is rejected.
64 As it has already been stated that during reconnaissance survey no rickshaw was found going to or coming from slums, neighbouring the study areas, Studies like Zohir (2008), Zohir, et al. (2008) indicate that poor people including those working in readymade garment factories in Dhaka mostly walk to reach their destinations for different activities
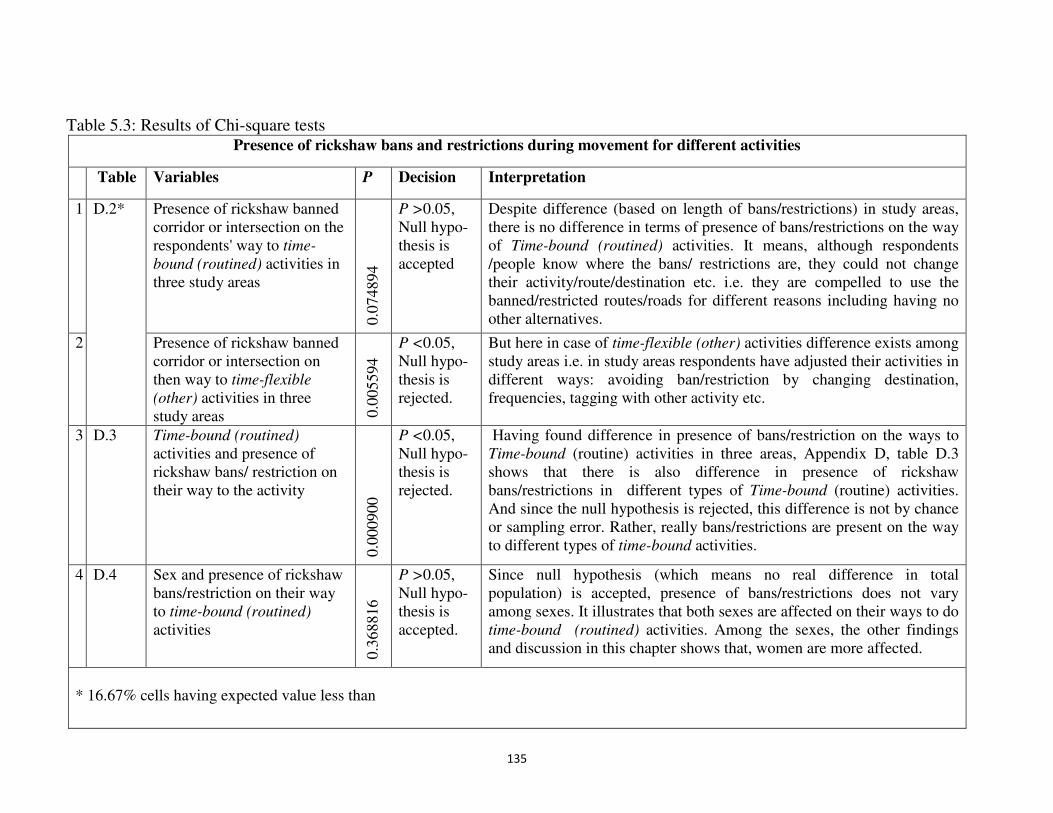
135
Table 5.3: Results of Chi-square tests Presence of rickshaw bans and restrictions during movement for different activities
Table Variables P Decision Interpretation
1 D.2* Presence of rickshaw banned corridor or intersection on the respondents' way to time-
bound (routined) activities in three study areas
0.0
74894
P >0.05, Null hypo-thesis is accepted
Despite difference (based on length of bans/restrictions) in study areas, there is no difference in terms of presence of bans/restrictions on the way of Time-bound (routined) activities. It means, although respondents /people know where the bans/ restrictions are, they could not change their activity/route/destination etc. i.e. they are compelled to use the banned/restricted routes/roads for different reasons including having no other alternatives.
2 Presence of rickshaw banned corridor or intersection on then way to time-flexible
(other) activities in three study areas 0
.005594
P <0.05, Null hypo-thesis is rejected.
But here in case of time-flexible (other) activities difference exists among study areas i.e. in study areas respondents have adjusted their activities in different ways: avoiding ban/restriction by changing destination, frequencies, tagging with other activity etc.
3 D.3 Time-bound (routined) activities and presence of rickshaw bans/ restriction on their way to the activity
0.0
00900
P <0.05, Null hypo-thesis is rejected.
Having found difference in presence of bans/restriction on the ways to Time-bound (routine) activities in three areas, Appendix D, table D.3 shows that there is also difference in presence of rickshaw bans/restrictions in different types of Time-bound (routine) activities. And since the null hypothesis is rejected, this difference is not by chance or sampling error. Rather, really bans/restrictions are present on the way to different types of time-bound activities.
4 D.4 Sex and presence of rickshaw bans/restriction on their way to time-bound (routined) activities
0.3
68816
P >0.05, Null hypo-thesis is accepted.
Since null hypothesis (which means no real difference in total population) is accepted, presence of bans/restrictions does not vary among sexes. It illustrates that both sexes are affected on their ways to do time-bound (routined) activities. Among the sexes, the other findings and discussion in this chapter shows that, women are more affected.
* 16.67% cells having expected value less than
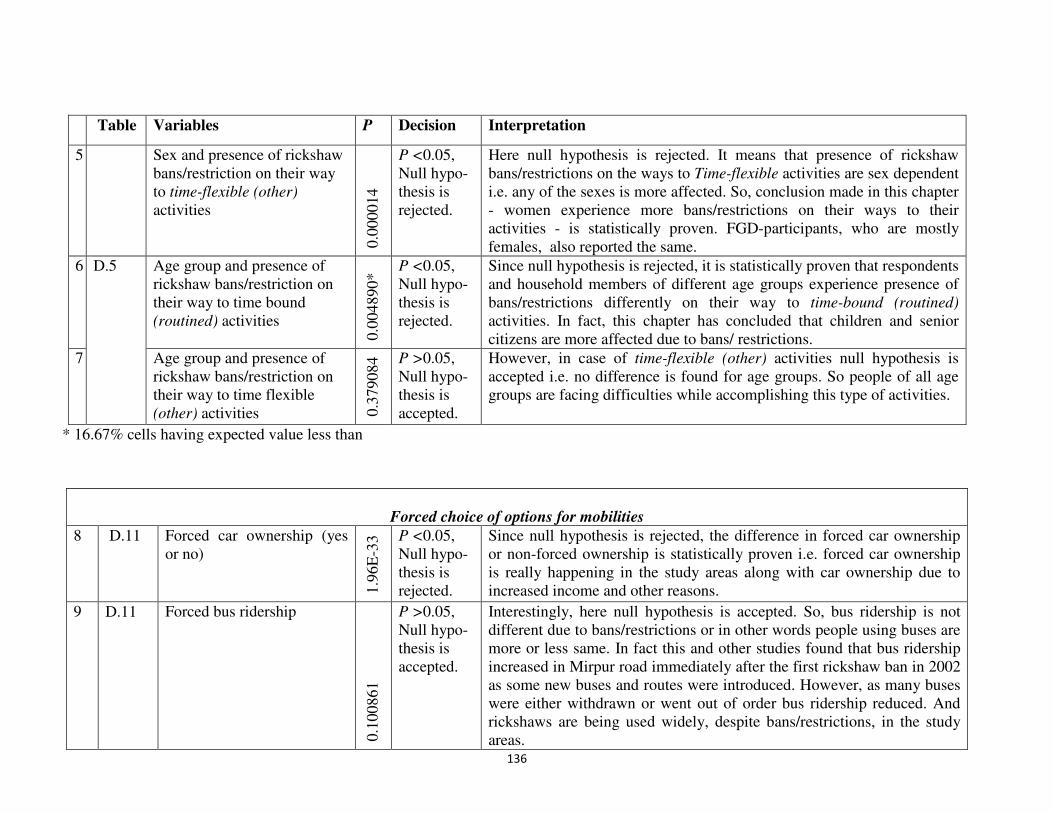
136
Table Variables P Decision Interpretation
5 Sex and presence of rickshaw bans/restriction on their way to time-flexible (other) activities
0.0
00014
P <0.05, Null hypo-thesis is rejected.
Here null hypothesis is rejected. It means that presence of rickshaw bans/restrictions on the ways to Time-flexible activities are sex dependent i.e. any of the sexes is more affected. So, conclusion made in this chapter - women experience more bans/restrictions on their ways to their activities - is statistically proven. FGD-participants, who are mostly females, also reported the same.
6 D.5 Age group and presence of rickshaw bans/restriction on their way to time bound (routined) activities
0.0
04890* P <0.05,
Null hypo-thesis is rejected.
Since null hypothesis is rejected, it is statistically proven that respondents and household members of different age groups experience presence of bans/restrictions differently on their way to time-bound (routined) activities. In fact, this chapter has concluded that children and senior citizens are more affected due to bans/ restrictions.
7 Age group and presence of rickshaw bans/restriction on their way to time flexible (other) activities 0
.379084 P >0.05,
Null hypo-thesis is accepted.
However, in case of time-flexible (other) activities null hypothesis is accepted i.e. no difference is found for age groups. So people of all age groups are facing difficulties while accomplishing this type of activities.
* 16.67% cells having expected value less than
Forced choice of options for mobilities
8 D.11
Forced car ownership (yes or no)
1.9
6E
-33
P <0.05, Null hypo-thesis is rejected.
Since null hypothesis is rejected, the difference in forced car ownership or non-forced ownership is statistically proven i.e. forced car ownership is really happening in the study areas along with car ownership due to increased income and other reasons.
9 D.11 Forced bus ridership
0.1
00861
P >0.05, Null hypo-thesis is accepted.
Interestingly, here null hypothesis is accepted. So, bus ridership is not different due to bans/restrictions or in other words people using buses are more or less same. In fact this and other studies found that bus ridership increased in Mirpur road immediately after the first rickshaw ban in 2002 as some new buses and routes were introduced. However, as many buses were either withdrawn or went out of order bus ridership reduced. And rickshaws are being used widely, despite bans/restrictions, in the study areas.
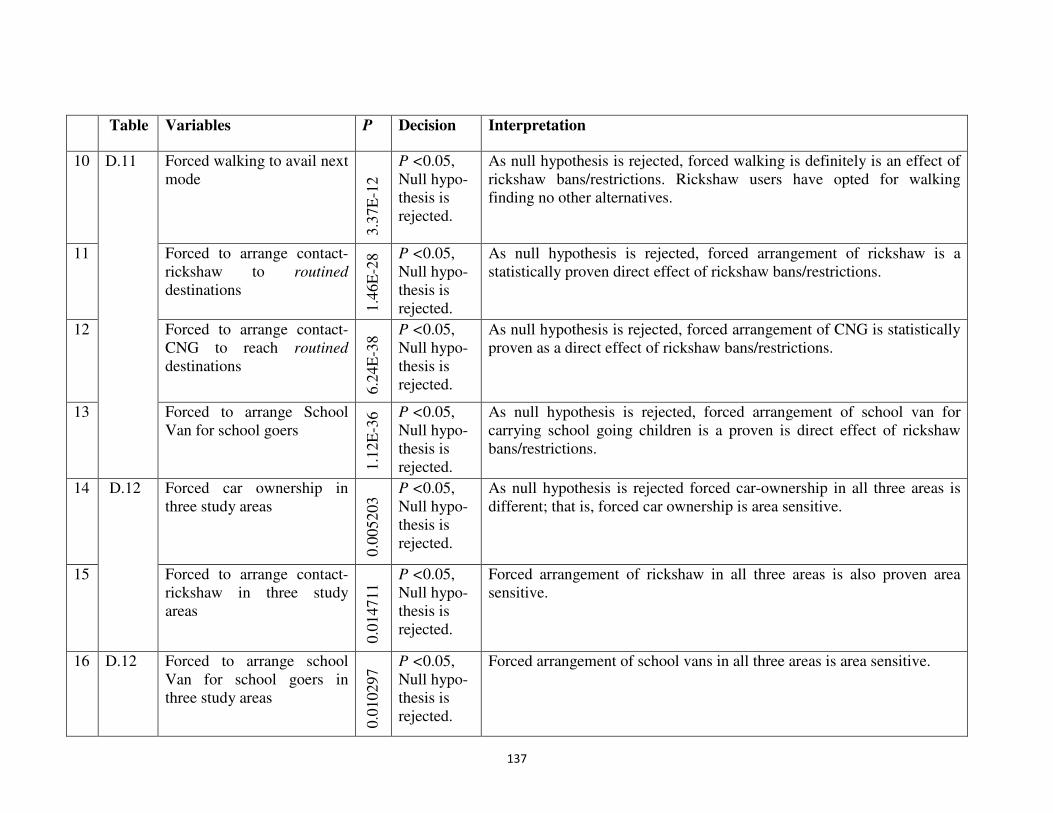
137
Table Variables P Decision Interpretation
10 D.11 Forced walking to avail next mode
3.3
7E
-12
P <0.05, Null hypo-thesis is rejected.
As null hypothesis is rejected, forced walking is definitely is an effect of rickshaw bans/restrictions. Rickshaw users have opted for walking finding no other alternatives.
11 Forced to arrange contact-rickshaw to routined destinations
1.4
6E
-28
P <0.05, Null hypo-thesis is rejected.
As null hypothesis is rejected, forced arrangement of rickshaw is a statistically proven direct effect of rickshaw bans/restrictions.
12 Forced to arrange contact-CNG to reach routined destinations
6.2
4E
-38
P <0.05, Null hypo-thesis is rejected.
As null hypothesis is rejected, forced arrangement of CNG is statistically proven as a direct effect of rickshaw bans/restrictions.
13 Forced to arrange School Van for school goers
1.1
2E
-36
P <0.05, Null hypo-thesis is rejected.
As null hypothesis is rejected, forced arrangement of school van for carrying school going children is a proven is direct effect of rickshaw bans/restrictions.
14 D.12
Forced car ownership in three study areas
0.0
05203 P <0.05,
Null hypo-thesis is rejected.
As null hypothesis is rejected forced car-ownership in all three areas is different; that is, forced car ownership is area sensitive.
15 Forced to arrange contact-rickshaw in three study areas
0.0
14711
P <0.05, Null hypo-thesis is rejected.
Forced arrangement of rickshaw in all three areas is also proven area sensitive.
16 D.12
Forced to arrange school Van for school goers in three study areas
0.0
10297
P <0.05, Null hypo-thesis is rejected.
Forced arrangement of school vans in all three areas is area sensitive.
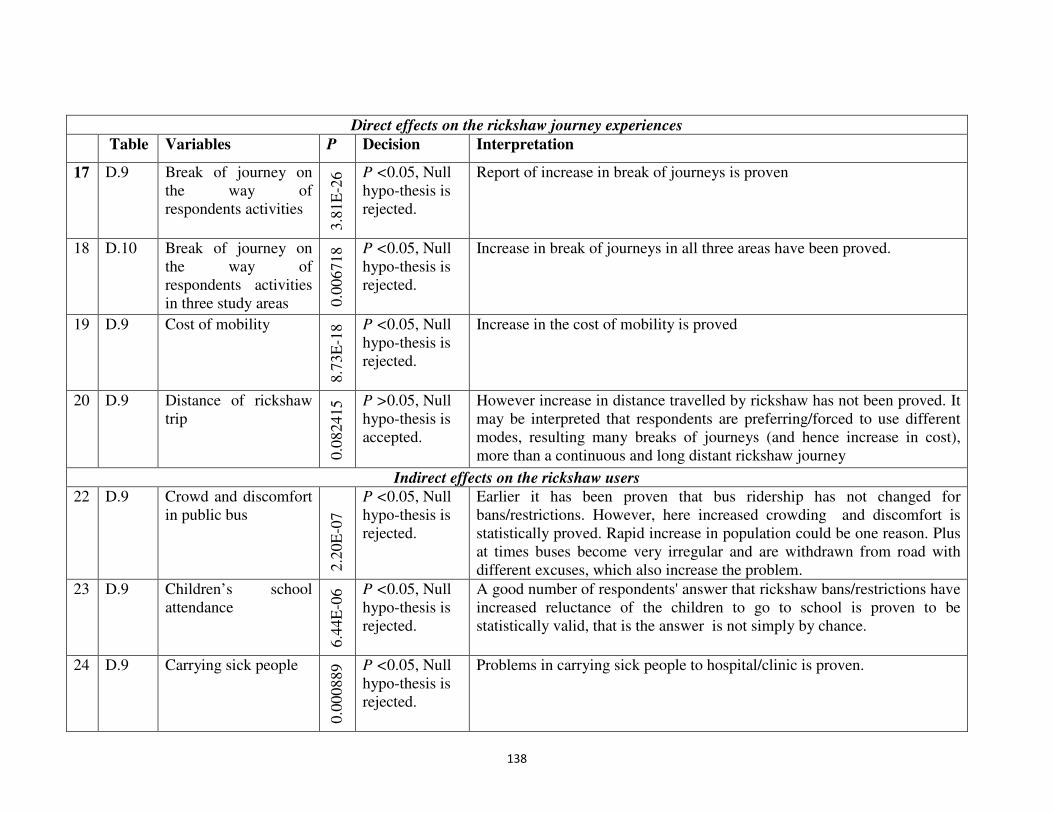
138
Direct effects on the rickshaw journey experiences
Table Variables P Decision Interpretation
17 D.9 Break of journey on the way of respondents activities
3.8
1E
-26
P <0.05, Null hypo-thesis is rejected.
Report of increase in break of journeys is proven
18 D.10 Break of journey on the way of respondents activities in three study areas 0
.006718
P <0.05, Null hypo-thesis is rejected.
Increase in break of journeys in all three areas have been proved.
19 D.9 Cost of mobility 8.7
3E
-18
P <0.05, Null hypo-thesis is rejected.
Increase in the cost of mobility is proved
20 D.9 Distance of rickshaw trip
0.0
82415 P >0.05, Null
hypo-thesis is accepted.
However increase in distance travelled by rickshaw has not been proved. It may be interpreted that respondents are preferring/forced to use different modes, resulting many breaks of journeys (and hence increase in cost), more than a continuous and long distant rickshaw journey
Indirect effects on the rickshaw users 22 D.9 Crowd and discomfort
in public bus
2.2
0E
-07
P <0.05, Null hypo-thesis is rejected.
Earlier it has been proven that bus ridership has not changed for bans/restrictions. However, here increased crowding and discomfort is statistically proved. Rapid increase in population could be one reason. Plus at times buses become very irregular and are withdrawn from road with different excuses, which also increase the problem.
23 D.9 Children’s school attendance
6.4
4E
-06
P <0.05, Null hypo-thesis is rejected.
A good number of respondents' answer that rickshaw bans/restrictions have increased reluctance of the children to go to school is proven to be statistically valid, that is the answer is not simply by chance.
24 D.9 Carrying sick people
0.0
00889
P <0.05, Null hypo-thesis is rejected.
Problems in carrying sick people to hospital/clinic is proven.
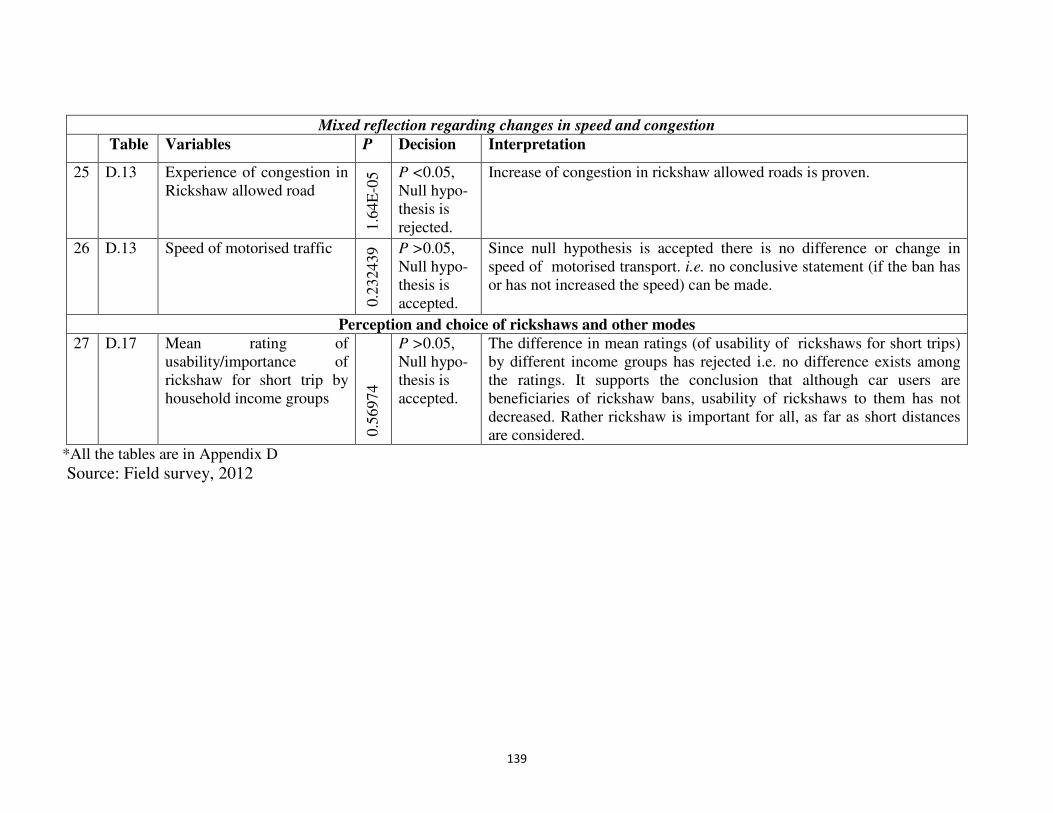
139
Mixed reflection regarding changes in speed and congestion
Table Variables P Decision Interpretation
25 D.13 Experience of congestion in Rickshaw allowed road
1.6
4E
-05
P <0.05, Null hypo-thesis is rejected.
Increase of congestion in rickshaw allowed roads is proven.
26 D.13 Speed of motorised traffic
0.2
32439
P >0.05, Null hypo-thesis is accepted.
Since null hypothesis is accepted there is no difference or change in speed of motorised transport. i.e. no conclusive statement (if the ban has or has not increased the speed) can be made.
Perception and choice of rickshaws and other modes
27 D.17 Mean rating of usability/importance of rickshaw for short trip by household income groups
0.5
6974
P >0.05, Null hypo-thesis is accepted.
The difference in mean ratings (of usability of rickshaws for short trips) by different income groups has rejected i.e. no difference exists among the ratings. It supports the conclusion that although car users are beneficiaries of rickshaw bans, usability of rickshaws to them has not decreased. Rather rickshaw is important for all, as far as short distances are considered.
*All the tables are in Appendix D
Source: Field survey, 2012
140
5.9 Conclusion
This chapter has illustrated that adverse effects of rickshaw bans and restrictions
permeated all strata of the communities in the study areas, as far as mobilities were
concerned; there were differential impacts (real or perceived) depending on sex, age,
health condition, housing location, trip and nature of work/profession. However, women
were found to be those who lose more as almost all the activities they used do, which were
mainly short and medium length trips, were highly affected by the decision to reduce
circulation of rickshaws. By contrast, personalised car users-car, car owners and officials
provided with cars by the offices, were least affected by the bans. Rather this facilitated
their long distant trips. However, since non-driving members in car-owning households
had to use rickshaws, for different activities, they also suffered from the restrictions on
rickshaws.
Area-wise response following the rickshaw bans and restrictions showed that areas with
greater incidence of car-ownership and comparatively better public bus service suffered
less frequent breaks of journey and other problems. However, preferences for rickshaws
remain untamed in different real and hypothetical situations. As soon as rickshaws were
hypothetically freed from restricted movement, respondents jumped for it. However better
integration with public transport could reduce the modal shift to an extent, but modal
choice for rickshaws will/would continue, as evident in the response of the respondents.
141
Chapter 6
The process of rickshaw bans and restrictions and the politics of (im)mobilities in
Dhaka
6.1 Introduction
As has already been discussed, by process this research means the decision-making
process including background studies, policies, implementation tools and strategies;
politics means arrangements to generate and guide the process to result in outcomes
serving subjective interests and motivation(s)- usually concealed in the vision of the plans
and decisions, implicit in the process and explicit in the outcomes. Based on the literature
and semi structured interviews with the experts, academics, citizen activists, concerned
officials, decision makers/politicians, rickshaw (garage) owners and rickshaw-wallas, this
chapter discusses the process of rickshaw bans and restriction in Dhaka in general and in
the study areas in particular, and the associated politics of (im)mobilities. At first it
examines the set of measures seeking the complete ban and restriction on the movement of
rickshaws. Then the key features of the politics of rickshaw bans and restrictions,
discussed under the notion of politics of (im)mobility is outlined; this reveals a complex
range of interests among global-local ('glocal') actors and a socio-politico-decisional
structure of a coalition against NMT, supported by a normative vision for a car-oriented
planning.
6.2 (Biased) Transport policies, studies and plans - bans or restrictions on rickshaws
Attempts to ban rickshaws in Dhaka are not new. A veteran academic and President of a
professional body65 remembered of attempts in the 1960s (contemporary to the period of
rickshaw ban in Karachi, Pakistan) in the then East Pakistan (now Bangladesh) to
withdraw rickshaws from important Dhaka roads.
The first ban in the Dhaka City Corporation (DCC) area was imposed by Dhaka
Metropolitan Police (DMP) in two roads in Motijheel (the central business district) in June
1981 and lifted on the following September due to strong protests by a 'union'66 of
65 Interviewed during fieldwork 66 Advised and helped (to get organisational license) by a small left-wing party. Later a federation of rickshaw-wallas unions across the country was formed and collapsed in 1982 - when Martial law was declared after military Coup - mainly because of the top-down nature of the federation which had little to do with different nature of problems in different parts of the country. Later on
142
rickshaw-wallas (Gallagher, 1992:569-571). The first successful closure was on Airport
Road in December 198667 with an official logic of its being a 'VIP road' (though not due to
congestion); in reality the President68 wanted the route to and from the airport to be free-
flowing (Gallagher, 1992:578-81). For the next two weeks there were protests and
strikes69. Then suddenly DCC announced the issuance of licenses for rickshaw and
rickshaw-vans and "nearly 90,000 were issued"70; the strike was called off, and the idea of
a 'VIP road' was quietly shelved. In April 1987, the government again announced a plan to
completely ban rickshaws in the city on “safety grounds” but this never materialised
(Rahman, et al., 2009). In fact, safety issue is another popular anti-rickshaw logic:
rickshaw is very light to withstand the thrust of other motor vehicles, being its passenger
is unsafe as there is nothing like 'seat belts', etc. But in 2011, out 400 accidents in Dhaka
Metropolitan (DMP) area 97 accidents involved rickshaws and all of them involved injury
or fatal casualty to the rickshaw passengers mostly due to the violation of traffic rules
(e.g,. speed limit, lane guidelines) by the drivers of the motor vehicles and in some cases
for the sudden lane change or right turn by the rickshaw i.e. rickshaw-wallas (ARI, 2012).
So, safety is more concerned with application and obedience to traffic rules, not with
rickshaw, as a mode.
In 1992, UNDP supported the Planning Commission of Bangladesh Government for the
preparation of a comprehensive Dhaka Integrated Transport Study (DITS) including a
transport database, action plans and local capacity building (DITS, 1994b:1). The very
first page of the DITS report is noticeable: "many observers have commented on the need
of various forms of transport infrastructure development from fly-overs to high capacity
commuter rail systems... [A] shortage of development funds has held back the
implementation of such capital intensive proposals". This is the time when the
Bangladeshi economy was liberalised, large scale privatisations started (Monem, 2001)
and World Bank was increasingly providing 'urban sector loans' to a multitude of sub-
projects, making monitoring difficult (Hook & Replogle, 1996:83).
a section of union joined 'kings party' and another merged with 'Malik Sangram Parishad'' (organisations of owners) (Gallagher, 1992:567-77) 68 A military dictator 69 One failed for pro-government side's unwillingness 70 Meanwhile, several organisations of rickshaw-wallas and maliks (owners) issued 'number plates' of their own (which in total rose to 8,000) to give rickshaw-wallas 'a degree of protection' and put pressure on the authority.
143
On the one hand, DITS was the first technical attempt to give attention to NMT (by
proposing segregation from MT, licensing all rickshaws, introducing insurance for
rickshaw-wallas etc.) and, on the other, it also proposed banning them to keep the primary
roads congestion free71 and "open only for motorised modes" (DITS, 1994a:119-131; see
also Appendix F, Table F.1). The syllabus of the DITS fellowship programmes for
Bangladeshi officials in Australia and Thailand (DITS, 1994b:K-1-K-3) made no reference
to NMT or rickshaws but to transport modelling; plus several cities visited as part of study
tours (ibid:L-1) were those which had 'systematically' destroyed NMT.
Then came the World Bank funded (contributing US$177.0 million) (World Bank,
2005:13) Dhaka Urban Transport Project (DUTP) Phase-II (total project cost US$234.2
million, rest US$57.2 million given by the Government of Bangladesh) in 1999 based on
DITS and DUTP-Phase-I (initiated in 1996) and an aide-memoire of a pre-appraisal
Mission of World Bank in 1998 (GoB, 1999:i). The philosophy of DUTP is quite clear in
its project proforma: the "[d]evelopment of the economy of Bangladesh will depend on it
attracting a share of global investment. Dhaka, as the nation's gateway for such
investment, must be provided with a reliable, secure and comfortable transport system if it
is to compete successfully with other major cities" (GoB, 1999:32). One of the expected
benefits is the increase in average speed of motorised vehicles from 15km/hr to 30km/hr
by the end of the project (ibid:72). DUTP involved DCC, DMP, DTCB (Dhaka Transport
Coordination Board), RAJUK (Capital Development Authority) and consisted of
construction works (for new road, grade-separator or fly-over and footpath, road
channelisation, installation of automated signaling, bus lane etc.-76% of total cost),
equipment purchase (5% of the cost and mostly for DMP72), NMT protection measures
(NMT and MT separation in major roads, separate NMT lane construction, NMT network
development in whole Dhaka, NMT underpass development and declaration of a couple of
areas as NMT zones etc.) (World Bank, 2005; JICA, 2010). Interestingly, the very first
71 Taylor (2004:299) states that as part of a 'politics of congestion mitigation' at first public officials, exaggerate the consequences of metropolitan traffic and then "cynically use congestion as a rationale for funding high-profile, politically-popular projects". 72 Note that police, an important organ of state machinery, is being funded and equipped by a project in other sector under other ministry. So, there should be less, or no, reason for DMP, which is ill equipped to handle the duties and responsibilities they are entrusted with, to show lack of interest in such project.
144
meeting of the Public Consultative Meeting of DUTP-Phase-1 proposed to ban rickshaws
in 200 km of main roads and in the long run to phase out them (UN-ESCAP, 1997:7-1).
Although many of the infrastructure components of the DUTP were implemented, the
expected number of new bus or bus routes did not come into roads (plus several new
buses/routes were withdrawn after a couple of years). Plus, a citizen activist73 informs that
NMT lane and other compensatory measures for rickshaw movement were never carefully
implemented or maintained while the automated signals installed lacked synchronisation
for rickshaws and cycles (Bari & Efroymson, 2005a:18-19). No NMT zone network was
implemented either.
In 2002, DCC initiated - as part of DUTP - the implementation of the “NMT-Free Arterial
Network – Phased Implementation Plan” (STP, 2005b:3-4) for a phased withdrawal of
rickshaws from major roads in Dhaka City (see Map 6.1) to increase speeds in major
arterial roads (World Bank, 2005). Mirpur Road (Gabtoli-Russell Square) and Panthapath
(Russell Square-FDC) were made rickshaw free in December 2002 for demonstration on a
pilot basis as part of the plan to make 120 km roads rickshaw free in Dhaka (HDRC, 2004;
New Age, 2005a).
Initially some segments of the corridors had separate rickshaw lanes. A rickshaw-walla
shares his experience74: "as the rickshaws are innumerable, there were always queues in
the lane which spread and stretched up to the intersections and clogged them. Besides
many rickshaw-wallas used to defy the lane-rule and move on the lane for motor vehicles.
At times my passengers also insisted me to do so. Although traffic police got very rude
with us at times, but let loose when they got tired in an unreasonable war. Ultimately NMT
lanes in many roads were abolished followed by a full ban of the rickshaws in those
segments". Based on a comparison between 2000 and 2005, no immediate increase in car
mobility is evident (DSM Consultants, 2006); HDRC (2004:v) has found nine minutes
saving per passenger per day in the Mirpur road demonstration corridor - the first rickshaw
banned road. Rather MTs and pedestrians started to face new problems due to diverted
73 Interviewed during fieldwork 74 Said in a focus group discussion (FGD) with rickshaw-wallas
145
rickshaws in local and other roads they (MTs and pedestrians) used to use (Majumder, et
al., 2009). But public misery in terms of transport and livelihoods75 (particularly for
rickshaw-wallas) increased enormously (HDRC, 2004; Efroymson & Bari, 2005).
Ultimately, in the face of popular dissent and civil activists' protests (see Efroymson and
Bari, 2005 for an account) the World Bank withdrew its support for any sort of NMT ban
in 2005 and also demanded measures for including NMT and users' protection measures
(New Age, 2005a and 2005b; World Bank, 2005; Hummel, 2008; Efroymson & Bari,
2005:35). The DCC and the government remained undecided, fearing "a negative impact
in the national election of 2006" (Daily Star, 2004).
On the eve of the 2002 ban, several associations of rickshaw-walla and malik (owner)
started selling 'license plates'76 (see Appendix G, Photographs for a couple of license
plates issued by different associations). An association close to the then party in
government eventually reached a tri-partite 'verbal' agreement with DCC and DMP to
issue new rickshaw licenses. In the name of this agreement, they sold as many as 43,000
'license plates' which led to the filing of several court cases against the association/its
leaders (who sold 43,000 licence plates) by DCC in the following years when another
political party came into power. But things ultimately ran nowhere. These 'license plates'
are still in evidence today (See Appendix G; last three photographs of the different
'license/number plates' issued by three different rickshaw owners associations). In fact,
Nayadiganta (2012) reports that 'license/number plate' business still exists and around one
million new 'plates' (each costing Bangladeshi Tk 500 for two months) have been issued in
the last four years by as many as 28 associations involving Bangladeshi Tk 400 million.
As per the report, the money went to the corrupt officials/staffs of DCC and DMP. DCC
employees identify rickshaws with expired or no 'plates' and police seize and dump those
unless freed by the owner at the cost of Bangladeshi Tk 4-5 thousand. Again focus group
discussions (FGD) with the rickshaw-wallas during fieldwork (See Appendix E, FGDs)
reveals that there are also thieves - appointed by some associations - to steal rickshaws
which are released only after providing ransom. However, rickshaws having 'licence
plates' of different associations, are usually not stolen by the thieves who are also
75 However, examination of the impact on livelihood and income is out of the scope of the study. 76 Informed the DCC official interviewed
146
appointed by those associations. Thus rickshaw-maliks or rickshaw-wallas are compelled
to buy a 'license plate' form those associations to avoid their rickshaws being stolen.
During fieldwork some rickshaws were found to have such 'license plates' issued by
several associations, although they had an original DCC license. Thus the vicious circle of
money collections and distribution continues with informal assurance of 'hassle free'
movement rickshaws on roads (rickshaw banned or not). Etzold (2012), quoted in
Hackenbroch (2013:51), also found a similar cycle in the "regular" state-led evictions of
street vendors in Dhaka which carried out to "serve as a reminder to the ordinary to
continue their regular payments to the powerful and thus as a means to re-confirm existing
power relations".
Although the rickshaw ban plan (as seen in map 6.1) of DUTP has never been abandoned
nor fully executed, it has been learnt during fieldwork that in recent years another practice
of unorganised/unplanned restriction on rickshaws in particular intersections or segments
is in full swing. It is being done by the traffic department of DMP in the name of easing
congestion in the road and ensuring a smooth flow of vehicles. Once the NMT phasing out
started as per DUTP in December 2004 (December 2002 phase out was a pilot phase of
this project), DMP started this practice of adding new roads in the restriction list and
implemented it during public holidays77. Many roads, which are not in the original plan,
i.e. DUTP, are rickshaw free now. Maps 6.1 and 6.2 show the difference up to 2012.
Latest report in the Daily Star (2012) says that as many as 22 roads (longer sections) and
eight link roads (quite short sections and junctions) are now off-limit to rickshaws.
Meanwhile the National Land Transport Policy (NLTP) of 2004 argued for the
continuation of a 'progressive ban' of rickshaws on major roads, aiming to reduce rickshaw
trips by half in Dhaka over the following ten years. Most interestingly it envisaged an
increase in the share of car trips up to 30% of all mechanised trips of 2022 (GoB, 2004:32-
42) compared to only 15% in 2004 (STP, 2005b) and 9.94% in 2009 (JICA, 2010).
77 Such an example is reported in Bari & Efroymson (2005b:32) where a road adjacent to Mirpur road was also made off limit for rickshaw without any declaration and plan.
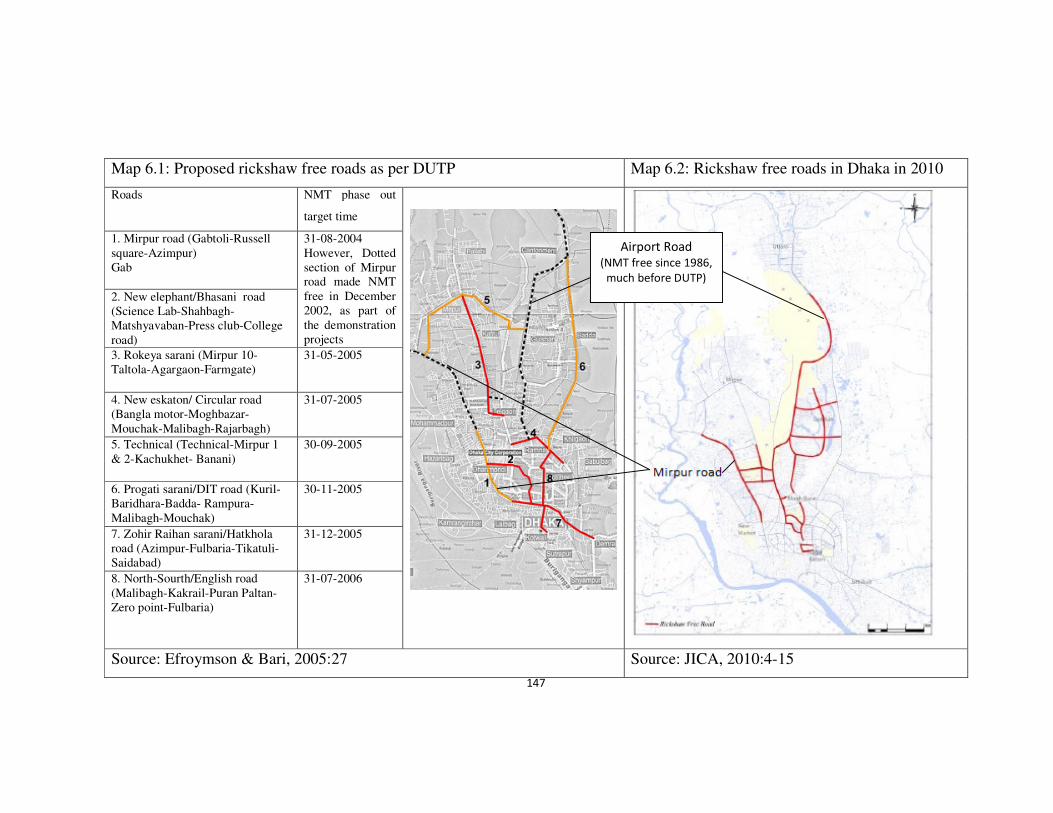
147
Map 6.1: Proposed rickshaw free roads as per DUTP Map 6.2: Rickshaw free roads in Dhaka in 2010
Roads NMT phase out
target time
1. Mirpur road (Gabtoli-Russell square-Azimpur) Gab
31-08-2004 However, Dotted section of Mirpur road made NMT free in December 2002, as part of the demonstration projects
2. New elephant/Bhasani road (Science Lab-Shahbagh-Matshyavaban-Press club-College road)
3. Rokeya sarani (Mirpur 10- Taltola-Agargaon-Farmgate)
31-05-2005
4. New eskaton/ Circular road (Bangla motor-Moghbazar-Mouchak-Malibagh-Rajarbagh)
31-07-2005
5. Technical (Technical-Mirpur 1 & 2-Kachukhet- Banani)
30-09-2005
6. Progati sarani/DIT road (Kuril-Baridhara-Badda- Rampura-Malibagh-Mouchak)
30-11-2005
7. Zohir Raihan sarani/Hatkhola road (Azimpur-Fulbaria-Tikatuli-Saidabad)
31-12-2005
8. North-Sourth/English road (Malibagh-Kakrail-Puran Paltan-Zero point-Fulbaria)
31-07-2006
Source: Efroymson & Bari, 2005:27 Source: JICA, 2010:4-15
Airport Road
(NMT free since 1986,
much before DUTP)
148
After DUTP, the World Bank-funded Strategic Transport Plan (STP) 2004-2024 was
prepared by DTCB in 2004 with the major objective to establish a sound policy
framework for sustainability of current and future investments in the transport sector
(JICA, 2010:10-6). One of the main activities done was the development of a computer
simulation model to guide and evaluate planning strategies. Such simulation models do
not take into account rickshaws, walking or short trips in many cases for methodological
inability to incorporate them or deliberate exclusion of them to make the model calibration
less time and effort consuming (Bari & Efroymson, 2005b; Rodriguez & Joo, 2004; Ewing
& Cervero, 2001; Wigan, 1995) and are more concerned to show that car-oriented
development is cost-effective (Martens, 2006). Therefore, such models are no longer
considered for multimodal transport appraisal (White, et al., 2001). The estimated cost of
the programmes/projects proposed in STP is US$ 5,519 million (excluding land and
property acquisition costs) (JICA, 2011:10-8), with the allocation of funds as follows:
63% metro (serving 8% of all trips), 30% car-friendly projects (including expressways),
6.27% Bus Rapid Transit (BRT), 0.41% bus, 0.24%-pedestrian and 0.24%-rickshaws (Bari
& Efroymson, 2008:6).
As the government 'expects' donor assistance in projects arising from STP, the Japanese
aid agency JICA has come up to support DTCB in preparation of the Dhaka Urban Area
Transport Study (DHUTS) with the aim of formulating an urban transport network
development plan and projects (JICA, 2010:E-1-E-2). DHUTS claims to "open a new era
of innovative transport system in Dhaka ... based on lessons learnt from many cities78 in
Asian countries...[with] Mass Rapid Transit (MRT) system as a backbone of transport
system' (ibid:E-6-E-7). Simultaneously, the World Bank funded the Clean Air and
Sustainable Environment (CASE) project launched in 2009 involving DTCB and DCC
(JICA, 2010:10-12) for traffic safety, separation of MT and NMT and design of BRT
(under its transport component). But a transport expert comments that "the BRT, MRT
routes and fly-overs, proposed and under construction, conflict with each other and the
first one implemented will seize the feasibility and engineering possibility for the rest
forever"79. And a relevant project official80 disclosed during an interview that "we have
78 However, like many other academic literature, the post-DUTP appraisal (DSM Consultants, 2006), Bari and Efroymson (2006) contradict. So what Efroymson and Bari (2005:9) observe regarding STP, is also true for DHUTS- "It would appear that STP team members have not learned from the failure of similar policies in many developing cities of Asia, notable among them Dhaka (under DUTP), Jakarta, and Bangkok". 79 Interviewed during fieldwork 80 Interviewed during fieldwork
149
completed the study and design for the NMT lane in one road and are about to call for
tender for implementation. But to our utter surprise DMP has recently banned rickshaw in
that road". Baumgart and Kreibich (2011: 18) rightly observe: "Urban planning in the
Metropolitan Area of Dhaka city is confronted with continuous violation of the legal
planning documents"
6.2.1 Note on the rickshaw bans and restrictions in the study areas
Maps 6.1 and 6.2 show the proposed rickshaw banned corridors in DUTP and current
(2010) state to rickshaw banned streetscape respectively. As has already been said (section
3.4.1) Shyamoli and Shukrabad are on the Mirpur road which was made rickshaw free in
2002. Bijoynogar is on corridor number 8 (map 6.1) and was stated to be made NMT free
in 2006 as per original plan. But it has been partially made rickshaw free in the vicinity of
Bijoynogar recently. Users and locals have informed, during field survey, that here
restriction started since the early 2011. But the restriction was withdrawn after public and
press uproar, as respondents of the household survey and reconnaissance surveys revealed
during fieldwork. However, since the end of the 2011 the restriction reappeared and
became permanent. However, no official announcement was there neither from DMP nor
DCC. In fact DMP expressed its inability to provide any recent map of the rickshaw
restricted roads when contacted, shared another transport researcher81.
As discussed in the third chapter, any form of participation or consultation with the
stakeholders ought to reflect their need or expectation to ensure justice. The respondents in
the three study areas were asked if they were consulted before making and executing the
decision of bans/restrictions. Almost all of the respondents (96.9%) answered negatively
(Appendix F, Table F.2). The majority of the respondents (68.4%) claim that the decision
is contrary to their mobility needs (Appendix F, Table F.3). 80% of the respondents from
non-car-owning households said that the decision was contradictory to their and their
households members mobility needs; even 40% of the respondents from car-owning
households reported that the decision was contrary to their and their households members
mobility needs (Appendix F, Table F.4). It shows not only the regular rickshaw users, who
are usually non-car owners, are affected bt the rickshaw bans/restrictions, non-driving
members are also in difficulties to conduct their daily mobilities. 76% of the respondents
term the ban unexpected either to them or their household members (Appendix F, Table
81 Interviewed during fieldwork.
150
F.5). Important to note, even among the respondents from car owning households 61%
term it unexpected either to them or their households (Appendix F, Table F.6)82. It is also
important to mention that from car-owning households about 60% of the respondents
stated that the decision was not contrary to their needs and for 39% from it was neither
unexpected nor expected. It strengthens the findings in the previous chapter (section 5.7)
that non-car owners are one of the most affected losers of the decision, or in other words
car owners and personalised car users (private and office provided car users) are those
who are benefitted the most. So whereas, on an average 66% of all respondents do not
agree with the idea of a complete ban of rickshaws and more than 70% from low and
medium income group are on this side, there is a sharp decrease of the share to 58% for
high income respondents who do not support the idea at all (Appendix F, Table F.7). And
not surprisingly almost 60% of the car owners support the idea of a ban (Appendix F,
Table F.8).
6.3 The politics of (im)mobilities: A 'glocal' coalition against rickshaws
This research argues that car-oriented investment interests have brought under the same
umbrella a range of global and local actors coalesced in an alliance against rickshaws, its
users and drivers, facilitated by a politics of informal arrangements (in the form of
illegality, extra-legality, corruption/rewards, collusive coalition-building, 'machine
politics', biased knowledge production/application in the context of an urban elite-middle
class mindset). It also argues that an alliance of autocrats and technocrats in the context of
weak democracy is a breeding ground for such informal politics and decision making.
Here planning decisions are taken less or non transparently with particular motivation of
taking advantage of 'extra-legal' options available and known to the vested interest groups.
In this case, the actors in the alliance include both institutions and individuals – donors,
government (executives and businessmen turned politicians), patron-client based
democratic/autocratic political machinery, project identifying and formulating bureaucrats
(government/donors), consultants/experts and businessmen (national/international),
government agencies-(implementing and operating)- DCC/DMP/DTCB/RAJUK, as well
as a section of the urban elite and the middle class who have access to transport decision
makers.
82 Sections 3.2.1 and 3.4.2 show that a just process should also take the expectation of the stakeholders into consideration. But here in the case of rickshaw ban/restriction it has been found absent like consultation with and participation of people/end users in the decision making process
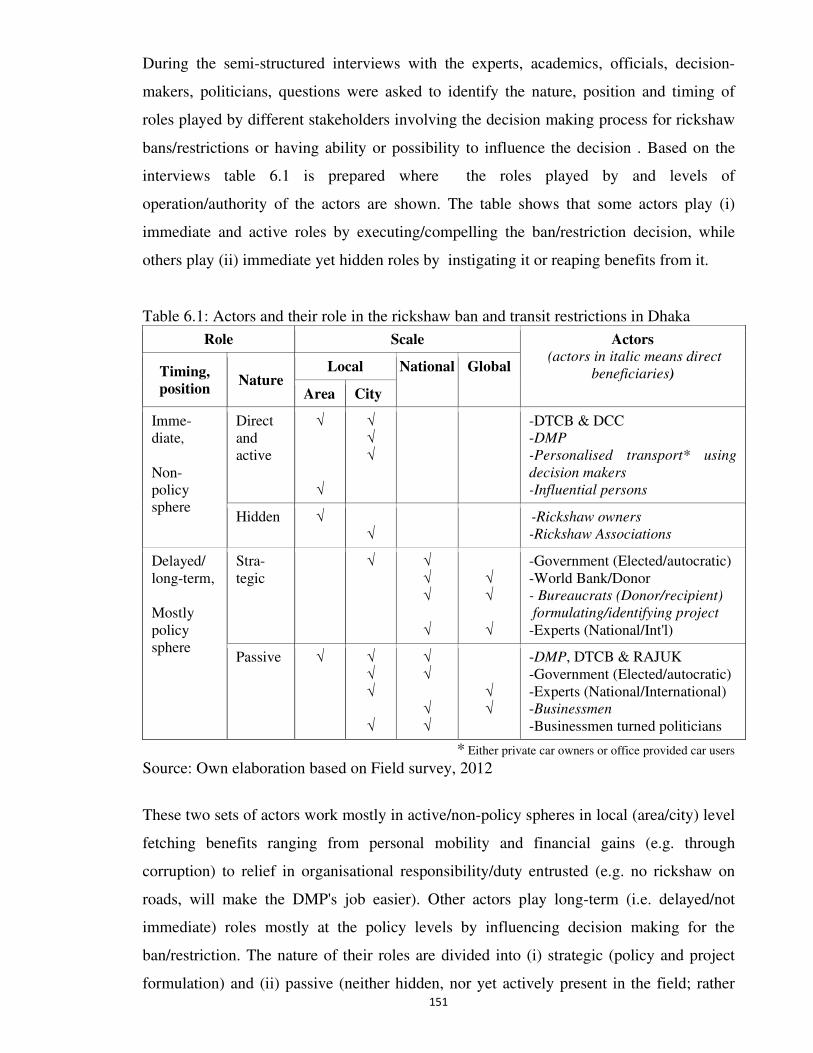
151
During the semi-structured interviews with the experts, academics, officials, decision-
makers, politicians, questions were asked to identify the nature, position and timing of
roles played by different stakeholders involving the decision making process for rickshaw
bans/restrictions or having ability or possibility to influence the decision . Based on the
interviews table 6.1 is prepared where the roles played by and levels of
operation/authority of the actors are shown. The table shows that some actors play (i)
immediate and active roles by executing/compelling the ban/restriction decision, while
others play (ii) immediate yet hidden roles by instigating it or reaping benefits from it.
Table 6.1: Actors and their role in the rickshaw ban and transit restrictions in Dhaka
Role Scale Actors
(actors in italic means direct
beneficiaries) Timing,
position Nature
Local National Global
Area City
Imme-diate, Non-policy sphere
Direct and active
√ √
√ √ √
-DTCB & DCC -DMP
-Personalised transport* using
decision makers
-Influential persons
Hidden √ √
-Rickshaw owners
-Rickshaw Associations
Delayed/ long-term, Mostly policy sphere
Stra-tegic
√ √ √ √ √
√ √ √
-Government (Elected/autocratic) -World Bank/Donor - Bureaucrats (Donor/recipient)
formulating/identifying project
-Experts (National/Int'l)
Passive √ √ √ √ √
√ √ √ √
√ √
-DMP, DTCB & RAJUK -Government (Elected/autocratic) -Experts (National/International) -Businessmen -Businessmen turned politicians
* Either private car owners or office provided car users Source: Own elaboration based on Field survey, 2012
These two sets of actors work mostly in active/non-policy spheres in local (area/city) level
fetching benefits ranging from personal mobility and financial gains (e.g. through
corruption) to relief in organisational responsibility/duty entrusted (e.g. no rickshaw on
roads, will make the DMP's job easier). Other actors play long-term (i.e. delayed/not
immediate) roles mostly at the policy levels by influencing decision making for the
ban/restriction. The nature of their roles are divided into (i) strategic (policy and project
formulation) and (ii) passive (neither hidden, nor yet actively present in the field; rather
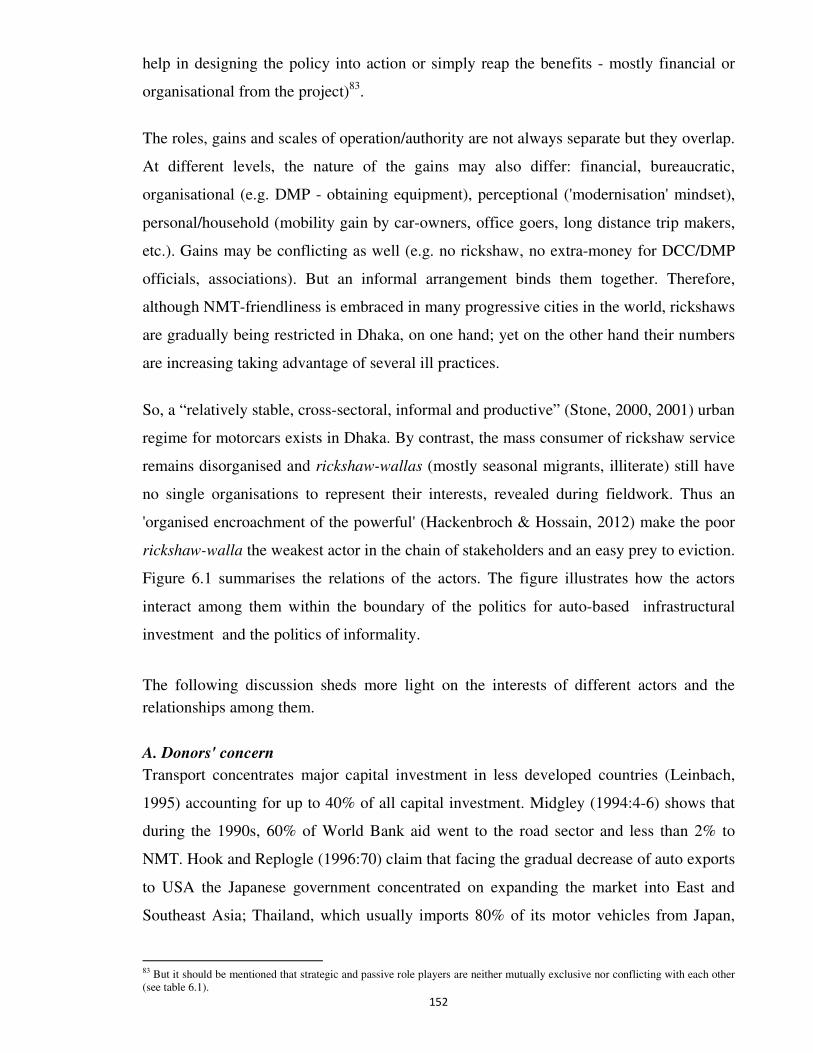
152
help in designing the policy into action or simply reap the benefits - mostly financial or
organisational from the project)83.
The roles, gains and scales of operation/authority are not always separate but they overlap.
At different levels, the nature of the gains may also differ: financial, bureaucratic,
organisational (e.g. DMP - obtaining equipment), perceptional ('modernisation' mindset),
personal/household (mobility gain by car-owners, office goers, long distance trip makers,
etc.). Gains may be conflicting as well (e.g. no rickshaw, no extra-money for DCC/DMP
officials, associations). But an informal arrangement binds them together. Therefore,
although NMT-friendliness is embraced in many progressive cities in the world, rickshaws
are gradually being restricted in Dhaka, on one hand; yet on the other hand their numbers
are increasing taking advantage of several ill practices.
So, a “relatively stable, cross-sectoral, informal and productive” (Stone, 2000, 2001) urban
regime for motorcars exists in Dhaka. By contrast, the mass consumer of rickshaw service
remains disorganised and rickshaw-wallas (mostly seasonal migrants, illiterate) still have
no single organisations to represent their interests, revealed during fieldwork. Thus an
'organised encroachment of the powerful' (Hackenbroch & Hossain, 2012) make the poor
rickshaw-walla the weakest actor in the chain of stakeholders and an easy prey to eviction.
Figure 6.1 summarises the relations of the actors. The figure illustrates how the actors
interact among them within the boundary of the politics for auto-based infrastructural
investment and the politics of informality.
The following discussion sheds more light on the interests of different actors and the
relationships among them.
A. Donors' concern
Transport concentrates major capital investment in less developed countries (Leinbach,
1995) accounting for up to 40% of all capital investment. Midgley (1994:4-6) shows that
during the 1990s, 60% of World Bank aid went to the road sector and less than 2% to
NMT. Hook and Replogle (1996:70) claim that facing the gradual decrease of auto exports
to USA the Japanese government concentrated on expanding the market into East and
Southeast Asia; Thailand, which usually imports 80% of its motor vehicles from Japan,
83 But it should be mentioned that strategic and passive role players are neither mutually exclusive nor conflicting with each other (see table 6.1).
153
received Japanese investment of US$135 million and US$283.5 million in 1963-1986 and
1987-91, respectively, followed by a pledge of $500 million for the next five years after
1996. Whitelegg and Williams (2000:8) observe that although the World Bank has been
promoting sustainable forms of transport on one hand, governments in the developing
world, on the other, are still being encouraged to pursue transport policies linked to
outdated notions of modernisation and car dependency. A similar observation comes from
a member of the Advisory Committee of STP84: "after attending several meetings, I was
convinced that the ultimate purpose was to establish the need for investment intensive
interventions like MRT and expressways under the coating of a scientific study. And it is
not surprising that Japan, which is the primary source of imported (reconditioned) autos
for Bangladesh, has recently expressed its interest to fund those projects".
Dot line represents the link with different politics. Solid line represents the link among the actors
Figure 6.1: The dynamics of a 'glocal' coalition against rickshaws in Dhaka
Source: Own elaboration
84 Interviewed during fieldwork
The politics for auto-based infrastructural investment and development
Experts
Rick. owner/
asso'tion leader
Elite/
middle
class
Personalized vehicle user
Imple- menting/ field level
Govt.
agency
Businessmen
Businessman-turned
Politician
Project planning
Bureaucrats
Govern-ment
Donor
The politics of informality (extra-legal/illegal practices, collusive coalition-building, 'machine politics' biased knowledge production/application)
Machine pol
Autocracy
Autocracy
Local
Global
National
Project planning
Bureaucrats Businessmen
Experts
Machine politics . Autocracy
.
154
B. Government's gain
As automobile is a 'status symbol' (Hummel, 2008) and NMT is seen as 'primitive and
outmoded' (Hook & Replogle 1996:82) and an 'insult to decision-makers' (Whitelegg &
Williams, 2000:17), banning NMT reaps a political gain. A former Minister and now
editor of a national daily offers clues of another special interest of the Bangladesh
Government85: "There is a trio of Prime minister, Foreign Minister and Finance Minister
who usually do not or cannot say no to any option for getting foreign grant, loan
especially when it is large and at low cost. Therefore often agencies are interested to
formulate projects which will bring in dollars, but not quality or well-being to the people.
It also creates a sort of competition among the government agencies to show competence
in bringing in foreign funded projects". Thus intermediaries and officials even create
unnecessary demand for aid (Sobhan, 2007). Efroymson and Bari (2005:4) allege that
"STP is mainly designed to satisfy the needs of the project hungry bureaucrats".
C. Nexus between donors and recipient bureaucracy
Sometimes the interests of donors and government bureaucracy merge while formulating
projects. "The donor bureaucracy may have set a target for Bangladesh for the year and
can only hit this target if 3 or 4 [big] projects ... are cleared for placement before the Board
for approval ... If any project is not finalised ... the aid target would crash and would
reflect poorly on the official[s' performance] ... This therefore creates a collusive interest
between donor and recipient bureaucracy to inflate the size of one project rather than to
seek out more small projects." (Sobhan, 2007:127).
D. 'Machine politics', autocracy and weak government
Rahman et al. (2009) express concern that by banning rickshaws in Dhaka, the
government is doing the same mistake of banning becak by Indonesian General Suharto.
In fact, NMT bans are a common feature to several autocratic governments: General
Ayub Khan- Karachi, General Ershad- first road ban for rickshaw in Dhaka, Field Marshal
Sarit- Bangkok. One exception is the Manila, Philippines where the NMT ban occurred
under a democratic government, immediately before Ferdinand Marcos, an autocrat came
into power.
85 Interviewed during fieldwork
155
Like many other similar countries, in Bangladesh, the military government left an
enduring legacy of a 'technocratic political style' (Silva, 1995:200) partially replacing
traditional bureaucracy with ‘flexible’/short-term public workers, professionals as
advisors, consultants which usually focuses on, as per Zunino (2006:1835), "political
demobilisation and elite politics as the means to consolidate democracy”. The low
capacity of technical bodies (like DTCB) can also be explained by a 'part-time'
technocracy. DTCB is usually run by bureaucrats deputed from central government
administration not by full-time technical professionals (which is also a part of
"bureaucratic politics"86). This results in a lack of effective leadership, and long term
planning, monitoring and evaluation become dependent on external consultants. Baumgart
(2010:53) also identifies an inappropriate institutional setup along with a dysfunctional
statutory system and serious resource constraints as the causes of "inefficient urban
management" in Dhaka.
Moreover, in Bangladesh "[c]lientele politics and networks between members of the
current ruling party, either the Awami league (AL) or the Bangladesh Nationalist Party
(BNP), are embedded in an extensive sphere of negotiations with unbalanced power
relations" (Baumgart & Kreibich, 2011: 18-19). The structure of patron-client politics,
known as 'machine-politics', has several extensive and pervasive forms: (i) horizontally
the political party (particularly one in power) creates loyalists among the key actors in the
state, para-state and other organisations through 'extra-organisational rewards and (ii)
vertically the party spreads downwards to the loyal follower protecting them from
harm/distress or providing benefits (jobs, license) (Islam, 2002:62-63). Indulgence to the
corruption by the DMP/DCC people or overlooking the selling of 'license plate' by the
rickshaw association leaders inclined to the ruling party attests the claim.
Patron-clientelism also makes leaders non-responsive or less pro-poor/people. Bari
and Efroymson (2005b:22) shows how the victorious candidates betrayed his own pledge
for freeing banned roads to rickshaws after his victory in parliament election. Again,
during fieldwork it was revealed that the organisations of rickshaw-walla, malik usually
had no/little allegiance to the party in power from 2001-2006, when the ban decision was
implemented. Similar is the case in Delhi, where "the democratic electoral process forces
86 From the interview of a DTCB official
156
politicians to listen to the lower middle class and the poor majority at election time.
However, after the elections, and during policy making, politicians are dominated by
upper-middle-class technocrats and experts with different concerns" (Thynell et al.,
2010:428)
Moreover, in a weaker democracy government does not 'quarrel' or negotiate with
military, paramilitary or other organised forces. An official (See footnote 82) involved in
the 2002 rickshaw ban process remembers: "Buses plying on the NMT free road, as per
negotiation, were withdrawn by the owners and their association and government could
take no measure. Plus we repeatedly tried to find an opening though BDR87
headquarters.
But all in vain! BDR was not interested and government even ignored the whole NMT
plan!".
Besides, a centre-dependent local government, which fails to take local initiative for
NMT, may also be another vested face of 'machine-politics' (World Bank, 2002:127).
E. Inland Business-Bureaucratic interest
The interests of government officials and businessmen come together on expensive
infrastructure mega-projects, like metro rail or highways, making them politically easier to
implement than even simple pavement improvements (Hook 2003:31). Hook and Replogle
(1996:82) argued that the becak industry, which was controlled by very small
entrepreneurs, was "not profitable to any of the President's relatives". Moreover, after the
ban, the Jakarta City Council introduced motorised tuk-tuk (manufactured by the
president's family firm) indicating 'presidential approval' to becak ban!
Similarly, in Dhaka the rickshaw business is confined to 'non-elites'. Gallagher (1992) and
DasGupta (1981) classified people in the rickshaw business into: rickshaw-wallas (owning
1-2 rickshaws), mechanics (owning 3-7 rickshaws), garage owner-malik (owning 17+
rickshaws), investors (from local business, public/private service, having as many as 60
rickshaws). Interviews and focus group discussions (FGDs) with rickshaw-malik and
rickshaw-wallas(Appendix E, FGDs) for this research suggest similar findings and
categories, except that the number of rickshaws under maliks and investors is higher now;
87 Para-military force mostly administered by army high-ups
157
the average range is 50-100. Besides, contemporary to rickshaw ban there was a ban on
two-stroke auto-rickshaws resulting in the introduction of four-stroke auto-rickshaws
whose license was exclusively given to the ruling party high-ups including associates of
several ministers, a citizen activist (See foot note 73) informs.
F. Inland Business-Politics nexus
Pucher et al. (2005:196) identify the political influence of the automobile and highway
lobbies as a formidable obstacle to improved transport policies in India. In Bangladesh a
programme to privatise state assets was introduced in 1991 to reward and promote the
interest of key entrepreneurs groups supporting successive Bangladesh regimes. Since the
third parliamentary election in 1986 onwards the number of businessmen turned
politicians increased to reach over 50% in Parliament (Monem, 2001).
"The ruling class and bureaucrats [are] therefore quick to ...[approve]... misguided policy
directives without a scientific or logical basis" (Efroymson & Bari, 2005:4) and thus
disregard the needs of the rickshaw industry. Despite liberalisation in Bangladesh, import
duties on bicycles (170%) and its parts (also used for rickshaws) are higher than for
motorcycles and reconditioned cars (Replogle, 1991:12). The statement, made two
decades ago, is even true today.
G. United elites and middle class
"There is almost certainly a lack of interest by engineers... who favor ... more technically
rewarding road and bridge design. Police often focus on the difficulties of enforcing NMT
routes and the lack of respect of cyclists for traffic regulations. Similarly, the richer and
more politically influential classes are likely to be car users and to have a vested interest in
reducing the nuisance offered by slow-moving and congesting NMT" (World Bank,
2002b:127). Thus actors with a 'discriminatory mindset' (Efroymson & Bari, 2005:4) make
an informal coalition in favour of the urban elite and middle class (Vasconcellos, 2001;
Tiwari, 2001; Low & Banerjee-Guha, 2003) putting an "invisible hand" (Kreibich (2010)
to ensure rickshaw ban decisions in Dhaka and elsewhere in Bangladesh. The same elite-
middle class mindset appears when DTCB boss sweepingly terms all beneficiaries of the
rickshaw trade as 'the criminal elements' with a call to 'target them' (Daily Star, 2003). The
most recent example of elite discrimination against rickshaws and rickshaw-wallas is
158
found in Baridhara, Dhaka, a high class mixed land use area housing the diplomatic zone.
The home owners and residents society of Baridhara have put restriction on the lungi
(local male wear of the Bangladeshi people) clad rickshaw-wallas from entering the area
(See Appendix D, News). In fact, this is a 'new politics' (Harris, 2006) by the middle class
for "accessing urban services involving civil society, residents' association" (Hossain,
2013:79).
This explains, despite studies arguing for a separation of NMT and MT and for no
numerical control of rickshaws (STP 2005b:17), why they are being banned. A retired
professor88 recalls, "I have never seen in my professional life any individualised transport
using decision-maker talking in favour of rickshaws". A journalist89 boastfully describes
how he compelled the Police Commissioner to ban rickshaws in the area he lived. Anjaria
(2006) also reported similar application of state authority by Mumbai officials keeping
street hawkers in a 'state of flux' by not mainstreaming them as stipulated in the legal and
planning frameworks.
H. The politics of informality
Exploitation based on imbalanced power relations and structures (Banks, 2008; de Smedt,
2009) exist both in policy levels (discussed in the previous sub-section H of section 6.3)
and in practice. Policemen or officials bend some rules in exchange for 'protection fees'.
Often "operators have to rely on local mafia, or they themselves may be [so]"
(Ratanawaraha, n.d.). The 'license/number plate' business with illegal rickshaws described
earlier is a case to refer in this point as well.
Sometimes insiders instigate DMP/DCC for the ban. A veteran rickshaw garage owner - in
the rickshaw business for the last 45 years - informed that one large rickshaw garage
owner from Moghbazar, who was said to own 1,200 rickshaws, supported restrictions in
his area to keep rickshaws from other parts of the city coming into his area; thus he
wanted to have a monopoly in his business in Moghbazar area.
88 Interviewed during fieldwork 89 Interviewed during fieldwork
159
Usually DMP used to announce their plan earlier and they used to execute the ban on the
first working day after any long public holiday such as the Eid vacation90. Now there is no
announcement. "One day I found one of the intersections in my daily travel route closed
for rickshaws in the evening, which was open in the same day morning" exclaimed a field
survey respondent. Experts and citizen activist, interviewed, think that perhaps it is a
strategy by DMP to keep the restriction officially unnoticeable and flexible. There is also
subjective flexibility for certain users (students with ID card, guardians with school going
children etc.) which has been found to be contemporary to a court case filed by a female
advocate (Writ, 2011) on the ground of problems faced by her and her school-going child's
mobility in absence of any other alternative mode. While giving their ruling, the High
Court ordered DMP to provide a list of all such restricted intersections and to make
footpaths free for pedestrian movement (Rule, 2012). An amicus curie91 for these writs
observed that the court understood the importance of rickshaws and their efficiency for the
local context in Dhaka, but feared had they given any rule right now to lift the ban, the
whole city would be flooded with rickshaws- mostly unlicensed - overnight. So the rule of
the court may be considered as another example of "state facilitated informal practice"
(Hossain, 2013:55).
I. Coalition and the blame game: shifting responsibility
Regime analysis accepts the presence of 'minor yet important' disagreement among
coalition partners (see Handerson, 2004 and studies by Stone). Similarly, there are
disagreements in the 'glocal' coalition against rickshaws. DCC limits its role to licensing
and handling legal rickshaws and asks DMP to act against illegal ones. DMP says they are
actually entitled to work only for motorised transport (as per the Motor Vehicles Act of
1962) and considers that the rickshaw issue is ultimately a land-use and transport planning
failure for which it (DMP) blames RAJUK. Again, observation during field survey reveals
a mixed tendency by the public to blame rickshaws and rickshaw-wallas for urban ills as
well as highlighting its use in their daily mobilities. A professor and consultant to several
transport projects (see footnote 79) sums this up: "In Dhaka we do not have any hierarchy
in urban roads and associated land-use controls. So rickshaw-wallas, for most of whom
this is the first job in Dhaka, suddenly and directly drift into a major thoroughfare from a
local/neighbourhood road. This makes road users, other than the passengers and
90 Interview of rickshaw-wallas and experts 91 Interviewed during fieldwork
160
rickshaw-wallas of the particular rickshaws, disturbed and annoyed. Often, they become
easy targets to air the wrath of traffic police who ultimately find rickshaws at hand to
ventilate their wrath in the road where almost no one follows traffic rules".
Besides, blame game exists between government and donors. The implementation
completion report on DUTP (World Bank, 2005:19) blamed the design of the project for
not providing a safety net for people affected and the government for delayed decisions on
a mitigation package, and termed the impact assessment study as “not of high quality”.
But, it was the World Bank who "originally supported this plan" (Hummel, 2008) and
"expressed dissatisfaction at the limited progress of the rickshaw-ban programme along
with other plans" just before the mass/2nd phase ban was supposed to start (Daily Star,
2004). So, donors should also bear responsibility for the public misery and failure of the
rickshaw ban project.
J. 'Day-to-day planning' and the 'tyranny of small decisions' Nilsson (2007) introduced the term “day-to-day planning” referring to the tendency to
formulate plans for future establishments as the need and case arise, rather than following
a coordinated strategy. "The actual planning process therefore often begins after the
important political decisions regarding the practical configuration of the project have been
made, with the result that day-to-day planning comes to bear a strong resemblance to
incrementalism ... tends to create a disconnect between individual planning projects and
long-term plans, then decision-making and planning practice can forge ahead, unaffected
by lofty environmental rhetoric." (Hrelja, 2011:513). However, such 'tyranny of small
decisions' (Odum, 1982) is seldom problematised although the decisions are not objective,
neutral and interest free (Hrelja, 2011). In fact, according to Nilsson (2007), growth-
related planning issues are often handled in 'day-to-day planning', since it can deal with
them quickly as they arise, creating a flexibility and freedom of action for planners that
allows them to accommodate the wishes of other actors, such as members of the business
community.
The management of rickshaws in Dhaka including bans and restrictions is the best
example of 'day-to-day planning' and 'tyranny of small decisions'; where DCC plans to
withdraw them from several roads, Bangladesh Road Transport Corporation (BRTC) -
161
operating government public buses, and Bangladesh Road Transport Authority (BRTA) -
fixing bus routes (in association with other agencies and stakeholders), do not ensure
adequate number of public buses and bus routes to provide alternatives. DTCB, which led
the NMT withdrawal operation from 2002-2005, now makes NMT lanes in roads once it
has got fund for the Clean Air and Sustainable Environment (CASE) project. But
meanwhile, DMP has banned rickshaws in those roads (where DTCB has made rickshaw
lanes), to ease the flow of (motor) traffic. As DMP sees rickshaws as the trouble makers, it
is its own departmental decision to control rickshaw for the sake of MTs under the aegis of
the Motor vehicle Act, 1962.
However, 'muddling' (Lindblom, 1979) through these actions ultimately results 'circularity'
or 'controlled volitions' (Lindblom, 1977) i.e. people are persuaded to demand only what
goes in favour of beneficiaries of auto-mobility. The worst consequence of such actions
ultimately makes alternative options for urban mobilities limited, if not seized.
6.4 Conclusion
This chapter has discussed the dynamics of ban/restriction of rickshaws in Dhaka seeing it
as part of a global trend against NMTs in urban areas. The politics of (im)mobility works
through a coalition of global and local actors grouped together informally with varied
interests - small-big, administrative-business, political-personal, bureaucratic-technocratic,
etc. The potential to extract some benefits, despite occasional differences, make them
work together- knowingly or unknowingly. However, the ban is part of a blue-print for a
car-based transport system and land-use development, as well as to help secure a place for
national and international capital in creating costly transport infrastructure.
162
Chapter 7
Unjust mobilities in Dhaka - conclusions
7.1 Introduction
This chapter sums up the whole dissertation with respect to the objectives of the research
and advances the research conclusions on the nature of mobilities in Dhaka. Taking cues
from the findings of the field work in the three study areas it explores whether the urban
mobilities in Dhaka is just or not and how. It also sheds light on the planning and policy
implications of the findings of the research. Finally, it concludes with suggestions for
further research with respect to just mobilities, particularly for planning NMT based
mobilities in cities of developing countries.
This chapter summarises the dissertation towards research conclusions (on mobilities in
Dhaka). With reference to the empirical findings presented in the earlier chapters it
outlines the facts on distribution, process and politics- that condition justice - in urban
mobilities in Dhaka. It continues presenting the contribution of this research for planning
and policy considerations. This chapter then closes indicating scopes for further research
on mobilities, particularly on planning NMT based mobilities in cities of the developing
countries.
7.2 Unjust mobilities - research objectives revisited
This section reminds the objectives of the research and briefly discusses the relevant
outcomes. As part of the first objective a just mobilities framework has been developed
which has been applied latter in the research to understand the distributional effects of
rickshaw bans and restrictions in Dhaka - second objective, and to understand the process
and politics associated with the interventions - third objective.
7.2.1. Development and application of a just mobilities framework
In the backdrop of multidisciplinary interests and dialogues regarding (social) justice, it
has been understood that any framework involving it should encompass, at least, three
aspects: distributional (outcomes), processual (studies, methods, decision making process)
and political (motivational basis for particular decisions made). This research also seeks to
reconcile the old debate of mobility versus accessibility and to address the weakness of
sustainability approaches in transport and mobility. It is convinced that mobility is a
163
product of a complex process intrinsically guided by subjective interests of decision
makers or potential beneficiaries - direct or indirect. In fact, a broader definition of
mobility points out that destination, distance, frequency, time and speed of revealed
mobility, and the possibility of potential mobility (to become a reality) depend on
underlying processes and the motivations behind the processes. The process and politics
involved in the planning of mobility and consequent distribution of outcomes are so
varied, multidimensional, complex and involve so many stakeholders that mobility is best
understood as mobilities, following the 'new mobilities paradigm'. Consequently, the
research also conceives urban mobility as urban mobilities given the multiplicity of
citizens on the move, diversity of decision-makers and recipients of the externalities of the
mobilities.
This understanding of justice and mobilities leads to a just mobilities framework. The
framework that involves distribution, process and politics associated with access,
competence and appropriation of mobilities. Thus it paves way for further dialogue
between technical and sociological studies of mobilities and transport and accordingly
contributes to the discussion of social sustainability, which is less appreciated compared to
environmental sustainability and economic efficiency in the sustainability literature. While
doing so, it also advances the concept of sustainable mobility and transport towards further
perfection by redressing the developed country bias in its contemporary conceptualisation.
The three dimensional framework of just mobilities also seeks to identify and understand
global to local ('glocal') forces and stakeholders forcing and formulating the process of
planning mobilities at national and local (urban) levels and distribution of mobilities (an
outcomes of the process) at local (urban, community, neighbourhood, household or even
individual) levels.
7.2.2 Uncovering the distributional effects of rickshaw bans/restrictions on the
mobilities
The research has sought to assess the distributional effects of rickshaw bans and
restrictions in Dhaka. Based on stratified spatial sampling three study areas along the
major roads of Dhaka were selected: Shyamoli, Shukrabad and Bijoynogar. First two areas
were along the Mirpur road, where rickshaws were banned first, in 2002, as per Dhaka
Urban Transport Plan (DUTP) and the last area was a recent rickshaw-restricted area
where rickshaws were banned from crossing particular intersections. In all three areas
164
there are one or two rickshaw banned minor road sections as well. All these areas are
mainly middle class areas in Dhaka with 30% of households owning private cars; there is
no slum in the surveyed portion of the study area. Mixed land uses have developed in the
three areas with mostly commercial and institutional uses along the major roads. The
assessment of distributional effects of rickshaw ban/restriction is based on the
questionnaire survey of households in the randomly selected residential units in the study
areas. Apart from questionnaire survey, focus group discussions (FGDs), open-ended and
semi-structure interviews were also conducted.
The study found that, women, senior citizens, school goers, young parents having children
are among the most affected losers due to the rickshaw ban/restriction decision. Some
activities like 'carrying children to school', 'to tuition', doing 'shopping', 'visiting family,
friends' and 'escorting ill/aged members to hospital' are mainly done by female members
of the households. These activities, in many cases, require short trips (less than 2 km in
length) to be made by rickshaws and are hence seriously affected by bans and restrictions.
However, rickshaw banned/restricted roads/intersections also impact on the household
members' 'work' trips which represent 41% of all time-bound (regular) activities, defined
as activities which are done regularly (four/five days a week) at the same time of the day.
But, in many cases work trips are comparatively longer for which rickshaws are less
suitable and other modal options are more easily available. Plus car-owning households, or
officials using official cars mainly use cars for this purpose. So, they feel less effects of
the bans with respect to the effects felt by other activity makers. With respect to age, one
fourth of members in the households are children and senior citizens and are hence
mobility dependent in the context of Dhaka. Their activities and associated mobilities are
adversely affected due to bans and restrictions on rickshaws. In such a context of
mobilities in Dhaka, 12% of the surveyed households are forced to buy cars in this
condition of mobilities while some have made contact arrangements with drivers of CNG,
and school vans and with rickshaw-wallas to avoid hassle while doing some essential
time-bound (regular) activities like going to school or office. (Thus withdrawal of
restrictions on rickshaws have been proved to be one of the causes of increased
motorisation in Dhaka.) But other members who do not have access to a car or for whom
'contact arrangements' are not made cannot avoid the problems created due to the
intervention on movement of rickshaws.
165
However, despite different efforts to withdraw NMT, the popularity of rickshaws in Dhaka
is indisputable. Respondents' preference for rickshaws for short trips (below 2 km) is
highest among all modes; for medium trips (between 2 to 5 km) car is most preferred
followed by rickshaws. However, when respondents are asked to rate their preference for
different modes on the whole (irrespective of activities and distance travelled) rickshaws
get second highest preference under current condition and the highest preference in the
hypothetical situation of bans being lifted.
7.2.3 Understanding the process and the politics of rickshaw bans/restrictions
Attempt to remove rickshaws from major roads of Dhaka is not a new phenomenon. What
is new is how dominant knowledge on transportation studies that promotes anti-NMT
modes and ideas are applied in the justification of the attempts. Important here is to
understand how, behind the scientific discourse, the justification is negotiated in a power
game participated by the Planning Commission of Bangladesh, Dhaka Transport
Coordination Board (DTCB), Dhaka City Corporation (DCC), Dhaka Metropolitan Police
(DMP), RAJUK (Capital Development Authority) and the consultants' team(s) dominated
by foreign experts, and overseas (financial/donor) institutions.
Despite several incidences of bans on rickshaws and related authoritative decisions,
operation of rickshaws could not be stopped completely from major (and some other
minor) roads. In fact, decisions to ban or restrict rickshaws resulted from an ‘expert’ based
'one size fit all' solution that is biased towards 'elite', car users in the community and till
date continues to overlook the importance of public participation in planning and decision
making in the city. Therefore there were protests from civil society, users and rickshaw-
wallas. In fact, in many cases protests resulted in a sort of popular 'insurgence' and
reluctance to follow the ban decisions. Yet plan making bodies, government, donors,
entrepreneurs, field level officials and others concerned are not reluctant to take or invest
in similar efforts.
The research has shown that multiple actors with diverse and shared interests have formed
a 'glocal' (global plus local) alliance against rickshaws, its users and drivers. On one side
of the alliance is the politics of auto-based infrastructural investments and development
planning that, for their large and capital intensive nature and thus scale benefits, are
166
attractive to the government, government bureaucracy, professional experts and the
financing organisations. On the other hand, donors are more interested to invest in larger
projects than in a number of smaller ones. Large project means investment under less
administrative costs for financial institutions, business opportunity for foreign companies.
Such projects also indicate government success and thus political benefits for the ruling
political party, create opportunities to sell expertise for professionals, and earning
opportunities in the administrative process for the government bureaucrats. The modernist
nature of these large projects banning rickshaws also gets supports from urban elites and
middle-class groups who treat rickshaws as a symbol of backwardness and
underdevelopment.
On the other side of the alliance there is the politics of informality in the form of illegality,
extra-legality, corruption/rewards, collusive coalition-building, patron-client based
'machine politics', biased knowledge production/application by consultants/experts and
implementing agencies, the 'day-to-day' nature of planning. The research argues that an
alliance of autocrats and technocrats in the context of weak democracy is a breeding
ground for informal politics.
7.3 Unjust mobilities due to rickshaw bans and restrictions
The just mobilities framework developed in this research does not limit mobilities in the
existence or absence of a fair and equitable distribution (horizontally and vertically) of
mobility outcomes - burdens and advantages. Rather, just mobilities is considered here as
a fair and merit based distribution of opportunities and options for mobilities and
conceives them (opportunities and options for mobilities) as products of a fair process
involving fair politics. (It is aware that only procedural fairness does not create just
distribution unless motifs are responsive to needs, rights and merits). So, anything
otherwise in distribution, process and politics would be indicative of unjust mobilities.
From this point of view, this section shows how the ten key concepts of justice- procedural
fairness, fulfilment of legitimate expectations, formal equality, substantive equality, basic
rights, need as demand and wider need, liberty rights and claim rights, and finally deserts
(Hay & Trinder, 1991; Trinder et al., 1991) are overlooked in planning mobilities in
Dhaka resulting into different types of injustice. It is found that at least four faces of
injustice, among the five - exploitation, marginalisation, powerlessness, cultural
167
imperialism and violence, identified by Young (1990) exist in post-rickshaw-
ban/restriction Dhaka.
The research has focused on the residential areas. As regards distribution of mobility
outcomes after bans/restrictions, it has been found that the decisions affected everyone
regardless of their socio-economic conditions, however unequally, raising a concern from
the perspective of 'formal/horizontal equity'. Moreover, in the context of special mobility
needs and problems of particular groups of people, positive discrimination could be done
to ensure 'substantive equity'; but what was done was reverse. Women’s activities are
severely disturbed and they are the most affected group of the rickshaw ban. Whereas
mobility dependent people (children and senior citizens) should also be the concern of
any transport planning intervention, the decisions of bans and restrictions seem to be
concerned mainly with time-bound (regular) activities, like 'going to work', by working
and adult people. Long distant motorised trips are the exclusive policy concerns;
methodology, models and their application are also biased. These decisions are based on a
discourse that links non-motorised transport (NMT) with the ‘troubles’ and ‘congestion’
and motorised transport (MT) as faster and symbol of development.
Promotion of MTs on the road however has been creating a serious disturbance/hindrance
to the short distance trips on which the daily life depends, like 'going to school/study',
'carrying children to school/tuition', 'kitchen and other daily shopping', 'accessing
community facilities, visiting family, relatives and friends'. On the other hand car and
motor vehicle based long distance trips have benefitted. Since women and mobility
dependent people use rickshaws extensively, in the absence of adequate and effective
public transport that cares for them, they are most unfairly burdened. It can also be said
that the decisions are taken keeping in mind the existing mobilities alone. But potential or
suppressed activities requiring movement have not been considered, let alone encouraged.
This ultimately benefits those who have personalised vehicles (private or official cars), or
can afford to meet the demand for the high, which is in most cases 'unreasonable', fare by
opportunist rickshaw-wallas and drivers of taxis, CNG three wheelers. Such biased
distribution of benefits and burdens is in no way compatible to principles of justice like
'deserts' and 'needs' (Hay & Trinder, 1991 and Trinder et al., 1991).
168
The process of rickshaw bans and restrictions hardly pass the filter of 'processual justice'
(Rawls, 1971) or 'procedural fairness' (Hay & Trinder, 1991 and Trinder et al., 1991). It
has been stated in chapter six (section 6.2) that since 2002 the withdrawal of rickshaws are
done under the aegis of different scientific studies, strategies and plans by Dhaka City
Corporation (DCC) and Dhaka Transport Coordination Board (DTCB). The very objective
of these background works are questioned as their motif was to enhance motorised
mobility and ensuring 'congestion free' roads. Better management and integration (with
other modes) of rickshaw, which is by far the largest mode of transport both in terms of
number and people carried, were not even in the policy and planning agenda. Moreover,
the way conclusions are drawn based on biased modelling tools and cost-benefit analysis
are increasingly being questioned for their inability to do justice to pedestrian and non-
motorised traffic including rickshaws. With regards to the authority of decision making, it
is seen that decisions and plans do come from different agencies and until recently there
was no authority in Dhaka to look into transport planning. Interestingly, when the question
for implementation is addressed, Dhaka Metropolitan Police (DMP) becomes the main
role player making planning a policing activity. Even, the newly formed transport
authority- DTCB, is by-passed by the police department which often bans and restricts
rickshaws at their will (as and when found necessary according to their own judgement).
Therefore, now many new roads or road sections or intersections, outside the 2002 plan,
are rickshaw free, while several major roads, as per the plan, are not. Thus not only the
'liberty right' of free movement is ignored, 'claim right' of the people from the government
to ensure just mobility has been denied. Moreover, participation of different categories
(based on sex, age, activity type etc.) of rickshaw users is never ensured in such plans and
decision making processes. So, the 'needs' and 'expectations' of the rickshaw users and
their households are not addressed. Rather a top-down approach is followed.
Finally, the politics in this sort of planning decision in one way resembles a face of
injustice - 'cultural imperialism' (Young, 1990), by trying to evict so called 'slow, eye-
soring, old-fashioned' rickshaws, the most popular transport mode in many Dhaka roads.
On the other hand the politics also disregards the need, sometimes as if even the existence,
of rickshaws, its users and other stakeholders reminding what Young (1990) calls
'exploitation' of one class by the other. As it has already been stated that the rickshaws are
banned not only for the sake of banning them, rather this is a part of a blue print to make a
169
car-based urban transport system and thus to ensure a motor friendly investment climate.
Role players - from local, national and global arena - do not necessarily have the same
interest, but the outcome i.e. rickshaw free roads, give a common platform to realise their
own interests. Weak democracy, corruption, lack of transparency make the platform
stronger. The elite and middle class mindset against rickshaws and 'love affair' with 'West-
like modernisation' keep the idea and effort fresh and vibrant. The whole process and
outcomes of rickshaw bans/restrictions results in 'marginalisation' (Young, 1990) of the
'powerless' (ibid) rickshaw users and other stakeholders. Thus at least four of five faces of
injustice, as espoused by Young (1990)- 'exploitation', 'marginalisation', 'powerlessness',
'cultural imperialism' and 'violence'- exist in Dhaka as far as rickshaw ban/restriction is
concerned.
7.4 Implications for planning urban transport
Hickman, et al. (2011) urge for a 'change in course of urban transport planning' in rapidly
urbanising Asian cities by developing mass transit systems, encouraging NMTs, better
land use transport coordination instead of construction and supply based transport
solutions. In the backdrop of unjust mobilities in Dhaka, as reported in the previous
section, this section suggests what could be done, as far as planning is concerned. A few
relevant policy suggestions based on the findings of the research are put forward.
7.4.1 Implications based on distributional aspects of just mobilities
The repeated incidences of bans and restrictions of rickshaws show that transport planning
decisions in Dhaka are taken keeping in mind the following things: long distance trips -
mainly work activities/trips, activities involving existing mobilities, mainly male, young
and active population as the mode and road users and finally motorised mobility as a
fundamental and inherent objective. In fact, this not only the case for Dhaka, but true for
many other cities. It is now widely acknowledged that transport policies are gender biased
(Anand & Tiwari, 2006), and there is an urgent need to recognise mobility needs based on
particular transportation users (like women, children, girls and boys, senior citizens) by
traffic planners and policy-makers along with the traditional men and youth centred design
of mobility (Zauke & Spitzner, 1997). Recent transport planning literature, which has
emerged in several developed countries and which is informed by gender methods,
highlights the gap between the specific needs of women and transport planning (World
Bank, 1999). But models are also still unable to understand women's special mobility
170
needs/factors like security (Root et al, 2000). Therefore, from a just and fair distributional
perspective of just mobilities framework, at least the mindset guiding the planning
process must be changed in the very beginning and hence the process should be
intervened accordingly.
Even if, NMTs should be essentially withdrawn from or segregated in some roads,
alternative modal options for the NMT users and alternative routes for the diverted NMTs
must be planned, effectively implemented and monitored. Plus the vacuum created must
be filled by public transport, not cars. i.e. NMT withdrawal should not be a subsidy for
private cars. (Unfortunately, it has happened in Dhaka). Since short distance trips and
activities are among the most affected due to the ban/restriction, and rickshaws are most
suitable for these trips in the dense, unplanned land use development in Dhaka, integrating
NMT/rickshaws is a must with the mass/public transport.
Besides, there must be options/infusions for positive discrimination to facilitate the
mobilities of the women and mobility dependant population- children, diseased and elderly
persons. Similarly, if and when possible beneficiaries (user) and recipients of externalities
(other stakeholders or land uses) can be fairly charged to ensure just distribution of
burdens and benefits.
7.4.2 Implications based on processual aspects of just mobilities
There is an urgent need to rethink regarding the current process of urban transport
planning. The whole process of discrimination and indulging bias or particular interest
should be reviewed, if not (radically) discarded. The first thing to be stressed is the need
for development and application of the tools and methodologies to reflect the importance
and extensive use of rickshaws in particular, NMT (including pedestrian) in general.
Modeling used to forecast transport scenarios and to make modal alternatives must be
NMT and gender sensitive. People involved in planning and decision making must also be
trained and educated to avoid any prejudice against NMT and do fair judgement towards
rickshaws. Besides, effective public participation and informed stakeholder analysis must
be done while formulating transport plans to filter any vested motif in the decision and
plan and to judge the needs and expectations, two principles of justice, of users and other
stakeholders.
171
7.4.3 Implications based on aspects related to politics of (im)mobilities
All the suggestions made above regarding process of planning and decision making are
relevant in this section as well. Plus governance of mobility related decisions can be
suggested (Akhter & Grane, 2012); careful balance is required among social equity,
economic efficiency and environmental sustainability. Besides, project identification
should be independent - neither donor driven nor investment/business driven, and careful
to avoid conflict of interests. Options should be there to listen to and consider the marginal
and user voices in identifying their requirement. Project planning and implementation
should be evaluated and monitored. A more transparent form of governance, a stronger
and more imaginative local government (Dávila, 2009), a more highly qualified
bureaucracy and a better informed public could conceivably turn the pro-growth
investment into a pro-people movement and ensure competition in urban transport market
while preventing what Replogle (1991:13) termed “monopoly and oligopoly of particular
modes and service providers”.
Finally, the government, concerned authorities, experts and consultants must be aware of
the weakness and failure of the supply oriented 'predict and provide' type solution to
problems in mobilities. Rather transport demand management, utilisation of existing
resources including rickshaw - a green and local mode, and rickshaw based mobility as a
culture must be prioritised in planning urban transport. In fact, "[i]t is becoming
increasingly important to think about longer term possibilities and directions that are trend
breaking and can help anticipate the unexpected" (Banister & Hickman, 2012:1).
7.4.4 Policy implications for planning transport in Dhaka
The case study has clearly shown that transport planning process in Dhaka is
discriminatory, biased, lacks adequate mechanism to check infiltration of business only
motifs or 'elite' interest, to hear the marginal and user voices. It is not responsive to the
need of women, children, aged and ill persons, short or medium distance trip makers and
non-car owning households (see figure 5.6) nor even to school-goers or participants into
training/educational programmes (see section 5.5.2). So, it is an imperative for transport
policies and programmes that their focus should be readjusted, if not changed. Again, anti-
NMT policies are also causing forced car ownership- 12% in the study areas (see section
5.5.1). But NMT based and user-responsive transport policy making is not an independent
172
and separate agendum. Increased motorisation, particularly increased car ownership is also
a matter of concern as far as environmental sustainability, fossil fuel supply, foreign
currency reserves92 etc are considered. So, rickshaw friendliness in urban transport polices
for Dhaka can also be contextualised with the greater sustainability concerns.
Moreover, currently in Dhaka neither the transport planning, management and
implementation activities nor the involved authorities are organised and integrated. Too
many agencies and authorities are currently involved: Planning commission, DCC, DTCB,
DMP, BRTA, BRTC, LGED, RAJUK, DoE, BGB, even Bangladesh Army and so on.
Organograms and relevant horizontal and vertical linkages of some of these the agencies
(see Appendix H, Organogram) show that they are liable to different ministries with little
scope or need for lateral or horizontal talks regarding issues of mutual concern. Therefore
sometimes they even work completely against others' plans or decisions (see foot note 80
and relevant discussion). Apart from improvement of capacity (in terms of ability for both
planning/engineering and sociological analysis) of the technical and other bodies and
efficient leadership (by right persons, not merely a bureaucrat) of these bodies, effective
mechanism for integration of their policies and coordination of their activities should be
ensured.
Apart from urging for an increased importance of rickshaws, or NMT in general, in urban
transport policies, the case study has also reiterated the need for home grown, context
specific transport policies for Dhaka. It has shown that rickshaw is the prime mover of the
citizens, car ownership is extremely low compared to other countries, land use
development is unplanned and many people living in abject hardship to spend at all for
mobility. So, 'fit-to-all' policies and suggestions transported by donors like the World
Bank, JICA etc. should not be accepted only because it involves injection of a large
amount of foreign currency in the economy (see foot note 85). Rather conventional 'expert'
led 'technical' and 'financial' viability studies must include measures to reflect the (general
and special) needs, affordability of the users and other stakeholders. The cost-benefit
analysis must include the cost of demise of NMT and rise of MT. The pros and cons
including political or business motivation should be examined and widely discussed with
relevant stakeholders and multiple professionals (not only engineers) to identify the
92 Bangladesh is 100% import dependent for petrol, diesel and octane.
173
unseen and unraised issues by single professionals/stakeholders and to address the inertia
developed in the traditional mobility solutions prescribed by biased donors or 'prejudiced'
'experts'. In brief and general it can be said the planning, including transport planning, in
Dhaka needs a fundamental, if nor radical, transformation; objective and target (groups) of
the project/intervention, project planning and management, implementing and investment
authority and capacity, methodology and tools for background studies, through appraisal
of benefits and burdens - social, economic, environmental etc should be matters of
concern.
7.5 Revisiting the contribution of the research to understanding and knowledge
The research would be of use directly to the disciplines like urban planning, transport
planning social science, law, urban politics, geography, public policy and sustainability
studies and indirectly to transport engineering, gender studies, political science, transport
project management. As far as replicability is concerned, it should be useful in the context
of cities where NMT is a significant part of modal fleet- Asian and other developed
country cities; or where NMT is sought to be encouraged, cities in the global north.
The new mobilities paradigm has enormously broadened the scope of mobilities research
resulting in a 'mobilities turn' in social science, particularly in sociology. However, the
initiative to translate the concept to other disciplines with applicable indicators is overdue.
When the question of assessing the worthiness of an intervention having implications on
mobility arises, this research sought to make a contribution from an applied socio-spatial
discipline like planning, geography, public policy. This research draws on disciplines like
sociology and planning by converting the sociological concept of mobilities into a
potential concern for planning urban mobility. Again, by amalgamating concepts of justice
with mobilities, the scope for interaction among sociology, political science, law, public
policy, gender studies is created.
“[U]rban geography (of the past three decades) must rank as one of the few social science
disciplines that has failed to investigate actively the relevance of liberal theories of social
justice as a guide to urban policy and planning practice … [There] has been total lack of
interest in developing accounts of social justice grounded in empirical understandings
thereof … [I]f geographers and urban planners [are] engaged in the development of an
empirically based understanding of social justice, very different social justice frameworks
174
would be suggested as guidelines to planning practice, since what ‘ordinary urban
citizens’, particularly in terms of the case study reviewed …, deem to be socially just,
challenges the post-structuralist/structuralist debates in geographical social justice
discourse” (Visser, 2001:1675). Fredericks (2011) also expresses similar concern
regarding absence of any direct or indirect policies for environmental justice accompanied
by sufficient indexes, methods of monitoring. So, it is expected that the development and
application of just mobilities framework would be useful to contribute with empirical
evidence towards better understanding of social justice in the specific context of urban
transport and land use (planning and management).
Moreover, apart from a return of a social justice wave in the geography and urban studies
literature (Harvey 1996, Smith 1994a), reservations against banning the non-motorised
transport (NMT) and fuel free transport (FFT) in developing countries and a concern for
‘walkable and livable’ communities, particularly in developed countries, are growing.
Therefore, it is worth examining mobility due to withdrawal of NMT from Dhaka roads
from an angle of social justice.
Furthermore, “[g]lobal cities research has taken a political turn. Researchers not only look
at the causes and patterns of urban inequalities but they also show a growing interest in
explaining how … inequalities are politically managed” (Kanai, 2010:1887). But the
subtle relationship between transport and social exclusion (Barry, 1998; Pacione, 1995)
could not be fully appreciated (Church et. al., 1999) and measured (Hine and Mitchell,
2001). These efforts could not go further than stating the unjust outcomes of transport
project and policy implementations as facts and have not proposed a robust,
comprehensive analysis and assessment tool for the projects (Beyazit, 2011). This is partly
due to the dominance of the current evaluation and appraisal methods such as Cost–
Benefit Analysis (CBA) which in turn forces transport investments to move away from a
socially just picture (Beyazit, 2011). This study seeks to make a contribution towards the
development of the link between justice and mobility with reference to the associated
politics behind them.
Finally, a general yet very strong message of this research is that transport policies and
interventions should be context specific; there is no universal formula to solve urban
transport problems. Like many other studies in the fields of development, the case study of
this research has shown the impact of choosing a 'wrong' transport policy with an
175
intention- implicit or explicit, of' 'modernisation'. It draws our attention to the fact that
Western solutions to transport planning – that now seem very outdated in a growing
number of progressive Western cities including Amsterdam, Copenhagen etc.; refused or
bi-passed in the visionary developing cities like Curitiba, Bogota etc – should not be
implemented blindly in Asian cities such as Dhaka and in other rapidly growing
developing cities. Neither the donor agencies nor the governments of the host countries
should get involved into investment hungry and construction friendly projects only
'because money is there' or could be there.
7.6 Direction for further research
Further research is needed to examine the responses of communities and citizens to such
top-down intervention, gauge the socio-economic and environmental losses arising from
rickshaw ban/restriction as well as its impact on land-use and housing. The impact of
rickshaw bans and restrictions on particular activities like 'going to school', 'going for
shopping' and so on can be investigated further. Based on the just mobilities framework
developed in this research, measuring and quantifying the level of injustice is an
immediate next task; the framework may also require further adjustment and refinement in
this regard. How to segregate motorised and non-motorised transport in major roads, how
to locate rickshaw stands in those roads so that public transport and rickshaws can
complement each other should be potential research agenda. As mentioned earlier
development of an inclusive, NMT and gender sensitive methodologies, tools and
modelling techniques needs more contributive research. This is unfortunate that
Bangladesh, being a country of NMT and in the context of growing positive concerns for
such green modes, does not have a NMT law nor an NMT policy. Therefore research on
the adoption of a NMT policy and a more progressive and integrated transport policy that
recognises the role of rickshaws in the transport system and mobility condition in Dhaka
can be essential contributions. In general it can be said that as there is a growing concern
over the use of the Western solutions to transport planning, in Asian cities such as Dhaka,
there needs to be a much stronger appreciation of context, and researches should seek to
develop transport strategies in relation to this.
................
176
References
1,000 Friends of Oregon (1997) Making the Connections: A Summary of the LUTRAQ
Project, Portland, OR: Author
Adey, P. (2006) If mobility is everything then it is nothing: Towards a relational politics
of (im)mobilities, Mobilities 1(1), 75–94
Adey P. (2004a) Secured and sorted mobilities: examples from the airport, Surveillance
and Society, 1, 500- 519
Adey P. (2004b) Surveillance at the airport: surveilling mobility/mobilising surveillance,
Environment and Planning A, 36, 1365 – 1380
Ahmed, Qureshi I. and Shi Ye, Huapu Lu (2008) Urban transportation and equity: A case
study of Beijing and Karachi, Transportation Research Part A, 42, 125–139
Ahmed, Sharif U. (1986) Dacca: A study in urban history and development, London
Studies on South Asia, No 4, London: Curzon Press
Agyeman, J., Bullard, R. D. and Evans, B. (eds) (2003a) Just Sustainabilities:
Development in an Unequal World, Cambridge, MA: MIT Press
Agyeman, J., Bullard, R.D. and Evans, B. (eds) (2003b) Introduction: joined-up thinking:
bringing together sustainability, environmental justice and equity, in Just
Sustainabilities: Development in an Unequal World, Cambridge, MA: MIT Press,
1-16
Ageyman, J. and Evans, B. (1999) Sustainability, equity and environmental justice, Local
Environment: The International Journal of Justice and Sustainability, 4(1), 3-4
Akhter, Mahboob E. and Graner, E. (2012) Governing transport in Dhaka city:
Stakeholders and institutional arrangements, State of Cities: Urban Governance in
Dhaka, Institute of Governance Studies, BRAC University, Dhaka, 65-86
Alam, M. J. B. and Habib, K. M. N. (2003) Effects of alternative transport options on
congestion and air pollution Dhaka city, Journal of Civil Engineering CE, 31(2),
165-175
Altshuler, A. (1979) The Urban Transportation System, Cambridge, MA: MIT Press
Arneson, R. J. (2000) Luck egalitarianism and prioritization, Ethics, 110, 339-49
Anand, A. and Tiwari, G. (2006) A gendered perspective of the shelter-transport-
livelihood link: The case of poor women in Delhi, Transport Reviews, 26(1), 63–80
Anjaria, J. S. (2006) Street hawkers and public space in Mumbai, Economic and Political
Weekly, May 27, 2140-2146.
ARI (2012) ARI Database, 2012, Accident Research Institute (ARI), Bangladesh
University of Engineering and Technology (BUET), Dhaka
Atkins, S. T. (1986) Transportation planning models- what the papers say, Traffic
engineering and control, September 1986, 460-77
Aunger, R. (1995) On ethnography: Storytelling or science?, Current Anthropology, 36(1),
97-130
Badami, M., Tiwari, G. and Mohan, D. (2004) Access and mobility for the urban poor in
India: bridging the gap between policy and needs, Paper presented at the Forum on
Urban Infrastructure and Public Service Delivery for the Urban Poor, July 24-25,
2004, National Institute of Urban Affairs, Delhi, India.
177
Banks, N. (2008) A tale of two wards: political participation and the urban poor in Dhaka
City, Environment and Urbanization, 20(2), 361–376.
Banister, D. (2008) The sustainable mobility paradigm, Transport Policy, 15, 73–80
Banister, D. (2005) Unsustainable Transport: City Transport in the New Century,
London: Routledge
Banister, D. (2000) Sustainable urban development and transport - a Eurovision for 2020,
Transport Reviews, 20(1), 113-130
Banister, D. (1997) Reducing the need to travel, Environment and Planning B, 24, 437-
449.
Banister, D. (1994) Equity and acceptability questions, Internalizing the Social Costs of
Transport, 153–175, Paris: OECD/ECMT
Banister, D. and Hickman, R. (2012) Transport futures: Thinking the unthinkable,.
Transport Policy, in http://dx.do i.org/10.1016/j.tranpol.2012.07.005, accessed on
7th July 2013
Banister, D. and Steen, P. (1999) Policy scenario building for sustainable mobility, Paper
presented at the ESF/NSF Trans Atlantic Research conference on Social Change
and sustainable Transport (SCAST), University of California at Berkeley, CA
Bailey, K. and Grossardt, T. (2010) Toward structured public involvement: Justice,
geography and collaborative geospatial/geo-visual decision support systems,
Annals of the Association of American Geographers, 100(1), 57-86
Bari, M. M. and Efroymson, D. (2008) Colonial bureaucracy and sustainable transport
developments in Bangladesh, WBB Trust, Dhaka
Bari, M. M. and Efroymson, D. (2006) Dhaka Strategic Transport Plan (STP)-A critical
review, May 2006, WBB Trust, Dhaka
Bari, M. M. and Efroymson, D. (2005a) Efficient Use of Road Space and Maximisation of
Door-to-Door Mobility: Suggestions for Improvements in Dhaka, June 2005, WBB
Trust, Dhaka
Bari, M. M. and Efroymson, D. (2005b) Rickshaw Bans in Dhaka City: An Overview of
the Arguments For and Against, Roads for People, Dhaka
Barret, B. and Usui, M. (2002) Local agenda 21 in Japan: transforming local
environmental governance, Local Environment, 7(1), 49-67
Barry, B. (1990) Political argument (2nd ed), London: Harvester
Barter, P. A. (2000) Transport dilemmas in dense urban areas: Examples from Easter Asia,
in Jenks, M. and Burgess, R. (eds) Compact Cities: Sustainable Urban Form for
Developing Countries, , London: E. & F. N. Spon, 271-284
Bauman, Z. (2000) Liquid Modernity, Cambridge: Polity Press
Baumgart, S. (2011) The mega-city Dhaka: confronting mega-challenges, 400 years of
Dhaka and beyond, Volume III: Urbanization and Urban Development, Asiatic
Society of Bangladesh: Dhaka, 53-64
Baumgart, S. and Kreibich, V. (2011) Informal urbanization - Historical and geographical
perspectives, DISP-The planning Review, 187(4), 12-23
Baerenholdt J. O. and Simonsen K. (2004) Space Odysseys: Spatiality and Social
Relations in the 21st Century, Aldershot: Ashgate
178
BBS (2012a) Main Census Results at National, Division and Zila Levels, Community
Report: Zila Dhaka, Bangladesh population and housing census, 2011, Bangladesh
Bureau of Statistics (BBS), Dhaka in
http://bbs.gov.bd/WebTestApplication/userfiles/Image/Census2011/Dhaka/Dhaka/
Dhaka%20at%20a%20glance%20General.pdf, accessed on the 23rd April, 2013
BBS (2012b) Table C-06 : Distribution of Population aged 7 years and above by Literacy,
Sex, Residence and Community, Community Report: Zila Dhaka, Bangladesh
population and housing census, 2011, Bangladesh Bureau of Statistics (BBS),
Dhaka in
http://bbs.gov.bd/WebTestApplication/userfiles/Image/Census2011/Dhaka/Dhaka/
Dhaka_C06.pdf, accessed on the 23rd April, 2013
BBS (2008) Statistical Pocket Book, Bangladesh 2008, Bangladesh Bureau of Statistics
(BBS), Dhaka
BBS (1997) Bangladesh Population Census 1991, Volume 3- Urban Area Report,
Bangladesh Bureau of Statistics (BBS), Dhaka
Beatley, T. and Manning, K. (1998) The Ecology of Place: Planning for environment,
Economy and Community, Washington, DC: Island Press
Beckmann J. (2001) Automobility - a social problem and theoretical concept, Environment
and Planning D: Society and Space, 19, 593- 607
Berger, J. (1972) Ways of Seeing, London: Penguin Books
Berke, Philip R. and Conroy, Maria Manta (2000) Are we planning for sustainable
development?, Journal of the American Planning Association, 66(1), 21-33
Berg, B. L. (2004) Qualitative Research Methods, London: Pearson/Allyn and Bacon
Beyazit, E. (2011) Evaluating social justice in transport: Lessons to be learned from the
capability approach, Transport Reviews, 31(1), 117–134
BOND (2006) Asia 2015: Promoting growth, ending poverty, in Proceedings of the
conference Asia 2015: Promoting Growth, Ending Poverty, 2006, British Overseas
NGOs for Development (BOND), London, 1–15.
Bradley-Birt, F. B. (1975) Romance of an Eastern Capital, Delhi: Metropolitan Book
Bröcker, J., Korzhenevych, A. and Schürmann, C. (2010) Assessing spatial equity and
efficiency impacts of transport infrastructure projects, Transportation Research
Part B 44, 795–811
BRTA (2013) Dhaka Metro statistics, Bangladesh Road Transport Authority (BRTA),
Dhaka, in http://brta.gov.bd/images/files/dhaka_statistics_01_04_13.pdf, accessed
on the 28th April, 2013
BRTA (2012) Number of year-wise registered motor vehicles in Dhaka (upto June 2012),
in the website of Bangladesh Road Transport Authority (BRTA)
<http://www.brta.gov.bd/images/files/motor_v_dhaka_05-08-12.pdf>, accessed on
the 28th Dec, 2012
Bromley, R. (2004) Power, property and povety: Why De Soto's "Mystery of Capital"
cannot be solved, in Roy, A. and AlSayyad, N. (eds) Urban Informality-
Transnational perspectives from the Middle East, Latin America and South Asia,
Lanhum, USA: Lexington Books, 271-288
179
Bryman, A. (2008) Social Research Methods (3rd ed), Oxford: Oxford University Press,
602-626
Bryman, A. (ed) (2006) Mixed Methods, London, Thousand Oaks, New Delhi: Sage
Buchanan, C. (1963) Traffic in Towns, Her Majesty Stationary Office (HMSO), London
Bullard, R. D. (ed) (2007) Growing Smarter: Achieving Liveable Communities,
Environmental Justice, and Regional Equity, Cambridge, MA: MIT Press
Bullard, R. D. (ed) (2005) Quest for Environmental Justice: Human Rights and the
Politics of Pollution, San Francisco: Sierra Club Books
Bullard, R. D. (ed) (2000) Dumping in Dixie: Race, Class and Environmental Quality,
Boulder, CO: Westview Press
Bullard, R. D. (ed) (1993a) Confronting Environmental Racism: Voices from Grassroots,
Boston: South End Press
Bullard, R. D. (1993b) Anatomy of environmental racism and the environmental justice
movement, in Bullard, R. D. (ed.) Confronting Environmental Racism: Voices from
the Grassroots, Boston, MA: South End Press
Bureau, B. and Glachant, M. (2011) Distributional effects of public transport policies in
the Paris Region, Transport Policy, 18, 745–754
Cahill, M. (1994) The New Social Policy, Oxford: Blackwell
Campbell, S. (1996) Green cities, growing cities, just cities?: Urban planning and the
contradictions of sustainable development, Journal of the American Planning
Association, 62(3), 296-312
Cairncross, F. (1997) The Death of Distance, London: Orion
Castells, M. (2001) The Internet Galaxy, Oxford: Oxford University Press
Cass, N., Shove, E. and Urry, J. (2005) Social exclusion, mobility and access, Sociological
Review, 53(3), 539-555
CEC (1999) Integrating the Environmental Dimension: A Strategy for the Transport
Sector, A Status Report, Commission of the European Communities, Brussels
Cervero, R. (2003) Growing smart by linking transportation and land use: Perspectives
from California, Built Environment, 29 (1), 66-78
Cervero, R. (2002) Built environments and mode choice: Toward a normative framework.
Transportation Research D, 7(4), 265-284
Cervero, R. (2001) Transport and land use, Australian Planner, 38(1), 29-37.
Cervero, R. (1981) Efficiency and equity impacts of current transit fare policies, Transport
Research Records, Transport Research Board, 799, 7-15
Cervero, R. and Gorham, R. (1995) Commuting in transit versus automobile
neighborhoods, Journal of the American Planning Association, 61, 210–225
Cervero, R. and Kockleman, K. (1997) Travel demand and the 3Ds: density, diversity, and
design, Transportation Research D: Transport and Environment, 2(3), 199-219
Cervero, R. and Landis, J. (1997) Twenty years of the bay area rapid transit system: Land
use and development impacts, Transport Research, 31(4), 309–333
Cervero, R. and Murakami, J. (2010) Effects of built environments on vehicle miles
traveled: Evidence from 370 U.S. metropolitan areas, Environment and Planning A,
42(2), 400-418
180
Cervero, R. and Radisch, Carolyn (1996) Travel choices in pedestrian versus automobile
oriented neighborhoods, Transport Policy, 3(3), 127-141
Cervero, R., Sarmiento, Olga L., Jacoby, Enrique, G., Luis, F. and Neiman, A. (2009)
Influences of built environments on walking and cycling: Lessons from Bogotá',
International Journal of Sustainable Transportation 3(4), 203-226
Charlstein, T., Parkes, D. and Thirft, N. (1978) Human activity and time geography, UK:
Edward Arnold
Church, A., Frost, M. and Sullivan, K. (2000) Transport and social exclusion in London,
Transport Policy, 7(3), 195–205
Church, A and Frost, M (1999) Transport and Social Exclusion in London: Exploring
Current and Potential Indicators, Report for London Transport Planning
Clark, G. L. (1982) Rights, property and community, Economic Geography, 58, 120-38
Clifton, K. (2003) Examining travel choices of low-income populations: issues, methods
and new approaches, Moving through Nets: The Physical and Social Dimensions of
Travel, Proceedings of the 10th International Conference on Travel Behaviour
Research, 10-15 August, 2003, Laurence
Creswell, John W. (2009) Research Design: Qualitative, Quantitative and Mixed Methods
Approaches (3rd ed), Los Angeles, London, New Delhi, Singapore: Sage
Cresswell, T. (2010) Towards a politics of mobility, Environment and Planning D: Society
and Space, 28, 17- 31
Cresswell, T. (2008) Understanding mobility holistically: The case of hurricane Katrina, in
Bergmann, S. and Sager, T. (eds) The Ethics of Mobilities: Rethinking Place,
Exclusion, Freedom and Environment, 25–38, Aldershot: Ashgate
Cresswell, T. (2006a) On the Move: Mobility in the Modern Western World, New York:
Routledge
Cresswell, T. (2006b) The right to mobility: The production of mobility in the courtroom,
Antipode, 38(4), 735–754
Cresswell, T. (2001) The production of mobilities, New Formations, 43 (Spring), 3-25
Cresswell, T., Merriman P (eds) (2008) Geographies of Mobility: Practices, Spaces,
Subjects, UK: Ashgate
Cresswell, T. and Uteng, Tanu P. (2008) Gendered mobilities: Towards holistic
understanding, in Uteng, Tanu p. and Cresswell, T. (eds) Gendered Mobilities, 1-
25, Aldershot: Ashgate
Culyer, A. J. (1980) The Political Economy of Social Policy, Oxford: Martin Robertson
CUS (Centre for Urban Studies), National Institute of Population Research and Training
(NIPORT) and MEASURE Evaluation (2006) Slums of Urban Bangladesh:
Mapping and Census, 2005, Dhaka, Bangladesh and Chapel Hill, USA
Dahl, A. (1961) Who Governs? Democracy and Power in an American City, New Haven,
CT: Yale University Press
DAP (2010) GIS database of Detailed Area Plan (DAP) for Dhaka, collected by personal
communication during field work, 2011
Dávila, J. D. (2009) Being a Mayor: four views from Colombia, Environment and
Urbanization, 20(1), 37-57
181
Daily Star (2012) Rickshaws clog city, The Daily Star, 29th March, 2012, Dhaka
Daily Star (2004) Dilemma delays plan for fresh ban on rickshaws, The Daily star, 2nd
August, 2002, Dhaka
Daily Star (2003) Real beneficiaries of rickshaw trade are criminal elements, DTCB
director alleges, The Daily Star, 8th September, 2003, Dhaka
DasGupta, T. K. (1981) The Role of the Rickshaw in the Economy of Dhaka, Unpublished
Masters thesis, in Department of Urban and Regional Planning (URP), Bangladesh
university of Engineering and Technology (BUET), Dhaka
Dave, S. (2009) Neighbourhood Density and Social Sustainability in Cities of Developing
Countries, Sustainable Development, 19, 189–205
Davenport, J. and Davenport, Julia L. (eds) (2006) The Ecology of Transportation:
Managing Mobility for the Environment, Dordrecht, The Netherlands: Springer
Davidoff, P. (1982) Comment, Journal of the American Planning Association, 48(2), 179-
180
Debbane´, A. M. and Keil, R. (2004) Multiple distinctions: environmental justice and
urban water in Canada and South Africa, Space and Polity, 8(2), 209–225.
De Boer, E. (ed) (1986) Transport Sociology: Social Aspects of Transport Planning,
Pergamon Press
De Soto, H. (2000) The Mystery of Capital, New York: Basic Books
De Soto, H. (1989) The Other Path: The Invisible Revolution in the Third World, New
York: Harper and Row
De Smedt, J. (2009) No Rail, no peace! Big man politics and election violence at the
Kibera grassroots, African Affairs, 108(433), 581–598
DETR (2000) Summary, Social Exclusion and the Provision and Availability of Public
Transport, Department of the Environment, Transport and the Regions (DETR),
London
Dibben, P. (2001) Transport and social exclusion in rural areas, in Proceedings of UTSG
33rd Annual Conference, 3-5 January 2001, St Anne’s College, Oxford
Dikec, M. (2001) Justice and spatial imagination, Environment and Planning A, 33, 1785-
1805
Dimitrou, H. (1990) Transport problems of the third world, in Banjo, G. A. and Dimitrou,
H. T. (eds) Transport Planning for Third World Cities, London: Routledge, 50-83
DITS (1994a) Final Report: Vol 1-Database and Immediate action plan, Greater Dhaka
Metropolitan Area Integrated Transport Study prepared by PPK Consultants Pty
Ltd, Australia, Delcan International Cooperation, Canada and Development Design
Consultants, Bangladesh, November 1994, Submitted to Planning Commission,
Government of Bangladesh and UNDP
DITS (1994b) Final Report: Vol 2-Strategic decisions, Greater Dhaka Metropolitan Area
Integrated Transport Study, prepared by PPK Consultants Pty Ltd, Australia,
Delcan International Cooperation, Canada and Development Design Consultants,
Bangladesh, November 1994, Submitted to Planning Commission, Government of
Bangladesh and UNDP
182
DITS (1993) Mobility of women, Working paper no 30, for Greater Dhaka Metropolitan
area integrated transport studies, prepared by PPK Consultants Ltd, Australia in
association with Delcan International Corporation, Canada and Development
Design Consultants, Bangladesh Submitted to Planning Commission, Government
of Bangladesh and UNDP
DITS (1993a) Policies for the Rickshaws, Working paper no. 6, prepared for Greater
Dhaka Metropolitan Area Integrated Transport Studies (DITS), by PPK Consultants
Pvt Ltd, Australia, Delcan International Cooperation, Canada and Development
Design Consultants, Bangladesh, April, 1993
DMDP (1997) Dhaka Metropolitan Development Plan (1995 - 2015) Volume-I: Dhaka
Structure Plan, Rajdhani Unnayan Kartripakkha (RAJUK), Dhaka
DSM (Design, Supervision and Monitoring) Consultants (2006) Impact Assessment of
DUTP "After Project”, Final Report Submitted to Dhaka Transport Co-ordination
Board (DTCB), Ministry of Communications, Government of the People's Republic
of Bangladesh, by the DSM Consultants comprised of DHV Consultants BV, the
Netherlands, Japan Overseas Co., Ltd., (JOC), Japan, Finnroad Oy, Finland,
Operation Research Group (ORG), India, SARM Associates Ltd., Bangladesh,
Desh Upodesh Ltd., (DUL), Bangladesh and Dev Consultants Ltd., Bangladesh,
February, 2006
Dunn, J. (1998) Driving Forces: The Automobile, its Enemies, and the Politics of Mobility,
Brookings Institute, Washington, DC
DUTP (1998) Dhaka urban transport plan-Phase I, Final report, prepared by DDC Ltd
and Mott MacDonald Ltd
Ecola, L. and Light, T. (2009) Equity and Congestion Pricing: A Review of the Evidence,
Rand Corporation, Santa Monica
Efroymson, D. and Bari, M.M (2005) Improving Dhaka’s Traffic Situation, Lessons from
Mirpur Road, WBB Trust, Dhaka
EFTE (1994) Green Urban Transport: A Survey, Preliminary report 94/2, January,
European Federation For Transport And The Environment (EFTE), Brussels
Elkin, S. I. (1987) City and Regime in the American Republic, University of Chicago
press, Chicago
Enoch, Marcus P. (2003) Transport practice and policy in Mauritius, Journal of Transport
Geography, 11, 297–306
Ewing, R. and Cervero, R. (2010) Travel and the built environment: A Meta-Analysis,
Journal of the American Planning Association, 76 (3), 265-295
Ewing, R. and Cervero, R. (2001) Travel and the built environment, Transportation
Research Record, 1780, 87–114.
Ewing, R., Haliyur, P. and Page, W. (1994) Getting around a traditional city, a suburban
planned unit development, EFTE and everything in between. Transportation
Research Record, 1466, 53–62
Fainstein, Susan S. (2010) The Just City, New York: Cornell University Press
Farber, D. (1998) The Struggle for Ecological Democracy: Environmental Justice
Movement in the United States, New York: Guilford Press
183
Feagin, J. R. and Smith, M. P. (1987) Cities and the new international division of labor: an
overview, in Smith, M. P. and Feagin, J. R. (eds) The Capitalist City, 3-34, Oxford,
UK and Cambridge, MA: Basil Blackwell
Feitelson, E. (2002) Introducing environmental equity dimensions into the sustainable
transport discourse: issues and pitfalls, Transportation Research D, 7, 99–118
Flyvbjerg, Bent (1998) Rationality and power: democracy in practice, Chicago: The
University of Chicago Press
Foucault, M. (1998) The history of Sexuality: The Will to Knowledge, London:
Penguin
Foucault, M. (1991) Discipline and Punish: The Birth of a Prison, London: Penguin
Forkenbrock, David J. and Schweitzer, Lisa A. (1999) Environmental Justice in
Transportation Planning, Journal of the American Planning Association, 65(1), 96 -
112
Frank, L. D. (2000) Land use and transportation interaction: Implications on public health
and quality of life, Journal of Planning Education and Research, 20(1), 6-22
Frank, L. and Pivo, G. (1994) The impacts of mixed use and density on the utilization of
three models of travel: The single occupant vehicle, transit and walking,
Transportation Research Record, 1466, 44-52
Fraser, N. (1995) From redistribution to recognition? Dilemma of justice in a
‘Postsocialist’ age, New Left Review, 212, 68-93
Freund, P. and Martin, G. (1996) The commodity that is eating the world: The
automobile, the environment, and capitalism, Capitalism, Nature, and Socialism, 4,
3-29
Freund, P. and Martin, G. (1993) The Ecology of the Automobile, Montréal, New York:
Black Rose Books
Froud, J., Johal, S., Leaver, A. and Williams, K. (2002) Not enough money: The resources
and choices of the motoring poor, Competition and Change, 6(1), 95-111
Fujita, K. (2009) Urban justice and sustainability, Local Environment: The International
Journal of Justice and Sustainability, 14(5), 377-385
Gallagher, R. (2010) Evolution of transport in Dhaka Since 1947, in Hafiz, R. and
Rabbani, A. K. M. G. (eds) 400 years of Capital Dhaka and Beyond, Vol. III
Urbanization and Urban Development, Asiatic Society of Bangladesh, Dhaka, 103-
112
Gallagher, R. (1992) The Rickshaws of Bangladesh, Dhaka: University Press Limited
Garrett, M., Taylor, B. (1999) Reconsidering social equity in public transit, Berkeley
Planning Journal, 13, 6–27
Geddes, P. (1917) Report on Town Planning, Dacca, Bengal Secretariat Book Report,
Calcutta, India
Gilligan, C. (1982) In a Different Voice: Psychological Theory and Women’s
Development, Cambridge, MA: Harvard University Press
Gleeson, B. (1996) Justifying justice, Area, 28(2), 229-234
GoB (2004) The National Land Transport Policy-2004, Ministry of Communication,
Government of Bangladesh (GoB), Dhaka, Bangladesh.
184
GoB (1999) Project Proforma-PP (GDTPCB's Component), Dhaka Urban Transport
Project, Greater Dhaka Transport Planning and Co-ordination Board (GDTPCB),
Government of Bangladesh (GoB), Dhaka
Gonzalez, S. (2009) (Dis)connecting Milan(ese): deterritorialised urbanism and
disempowering politics in globalising cities, Environment and Planning A, 41, 31-
47
Gordon, P. and Richardson, H. (1997a) Why Sprawl is Good, Cascade Policy Institute,
Oregon, USA
Gordon, P. and Richardson, H. (1997b) Are compact cities a desirable planning goal?
Journal of the American Planning Association, 63, 95–106
Garb, Y. and Levine, J. (2002) Congestion pricing’s conditional promise: Promotion of
accessibility or mobility? Transport Policy, 9, 179–188
Graham, S. and Marvin, S., (2001) Splintering Urbanism: Network Infrastructures,
Technological Mobilities and the Urban Condition, London: Routledge
Greene, D. and Wegener, M. (1997) Sustainable transport, Journal of Transport
Geography, 5, 177–190.
Gudmundsson, H. (2001) Indicators and Performance Measures for Transportation,
Environment and Sustainability in North America, Report from a German Marshall
Fund Fellowship 2000 individual Study Tour, October 2000, National
Environmental Research Institute (NERI), Denmark, 87 pages, Research Notes
from NERI Number 148. in
http://www2.dmu.dk/1_viden/2_Publikationer/3_arbrapporter/rapporter/AR148.pdf
accessed on 2nd February 2013
Gwilliam, K. (2003) Urban transport in developing countries, Transport Reviews, 23(2),
197-216
Hack, G. (2000) Infrastructure and regional form, Simmonds, R. and Hack, G. (eds)
Global City Regions: Their Emerging Forms, London: Spon Press, 183-192
Hackenbroch, K. (2013) The Spatiality of Livelihoods - Negotiations of Access to Public
Space in Dhaka, Bangladesh, Stuttgart: Franz Steiner Verlag
Hackenbroch, K. and Hossain, S. (2012) “The organised encroachment of the powerful”—
Everyday practices of public space and water supply in Dhaka, Bangladesh,
Planning Theory and Practice, 1–24
Haluza-DeLay, R. (2007) Special issue: Environmental justice in Canada, Local
Environment, 12(6), 557–674
Hamlin, C. (2008) Is all justice environmental?, Environmental Justice, 1(3), 145-148
Handy, S. (1996) Understanding the link between urban form and non-work travel
behavior, Journal of Planning Education and Research, 15, 183-198
Hannam, K., Sheller, M. and Urry, J. (2006) Editorial: Mobilities, immobilities and
moorings, Mobilities, 1(1), 1-22
Harris, J. (2006) Power Matters: Essay on Institutions, Politics, and Society in India, New
Delhi: Oxford University Press
Harvey, D. (2006) The Limits to Capital, London-New York: Verso
185
Harvey, D. (2003) The right to the city, International Journal of Urban and Regional
Research, 27, 939-941
Harvey, D. (1997) The new urbanism and the communitarian trap, Harvard Design
Magazine, Winter/Spring, 68–69
Harvey, D. (1996) Justice, Nature, and the Geography of Difference, Malden, MA:
Blackwell
Harvey, D. (1989) The Condition of Postmodernity, Oxford: Basil Blackwell
Harvey, D. (1985) The Urbanization of Capital, Baltimore: John Hopkins University Press
Harvey, D. (1982) The Limits to Capital, Oxford, UK: Blackwell
Harvey, D. (1973) Social Justice and the City, Baltimore: Johns Hopkins University Press
Harvey, D. and Potter, Cuz (2009) The right to the Just City, in Marcuse, P., Connolly, J.,
Novy, J., Olivo, I., Potter, C. and Steil, J. (eds) Searching for the Just City: Debates
in Urban Theory and Practice, 40-51, London: Routledge
Hasan, M. M. U. (2010) Population Distribution in Dhaka in the Post-independence
Period- An Analysis at Ward Level, in Hafiz, R. and Rabbani, A. K. M. G. (eds) in
400 years of Capital Dhaka and Beyond, Vol. III Urbanization and Urban
Development, Asiatic Society of Bangladesh, Dhaka, 245-262
Haughton, G. and Hunter, C. (1994) Sustainable Cities, London: Jessica Kingsley
Publishers
Hay, Alan M. (1995) Concepts of Equity, Fairness and justice in geographical studies,
Transactions of the Institute of British Geographers, New Series, 20 (4), 500-508
Hay, A and Trinder, E. (1991) Concepts of equity, fairness, and justice expressed by local
transport policy-makers, Environment and Planning C: Government and Policy, 9,
453-465
HDRC (Human Development Research Centre) (2004) After Study on the Impact of
Mirpur Demonstration Corridor Project (Gabtoli - Russel Square), prepared for
Dhaka Transport Coordination Board (DTCB), August 2004
Heiman, M. (1996) Race, waste, and class: New perspectives in environmental justice,
Antipode, 28(2), 111–121
Henderson, J. (2009) The spaces of parking: Mapping the politics of mobility in San
Francisco, Antipode, 41(1), 70–91
Henderson, J. (2004) The politics of mobility and business elites in Atlanta, Georgia,
Urban Geography, 25(3), 193–216
Hanson, S. (1995) Getting there: Urban transportation in context, in Hanson, S. (ed) The
Geography of Urban Transportation, New York, NY: Guilford
Hodge, D. C. (1990) Geography and the political economy of urban transportation, Urban
Geography, 11, 87–100.
Hodge, D. C. (1988) Fiscal equity in urban mass transit systems: a geographical analysis,
Annals of Association of. American Geographers, 78, 288–306
Hook, W. (2003) Sustainable transport - A source book for policy-makers in developing
countries: Module 3 - Preserving and expanding the role of non-motorised
transport, GTZ-Transport and Mobility Group, GTZ, Germany
186
Hossain, S. (2013) Contested Water Supply: Claim Making and the Politics of Regulation
in Dhaka, Bangladesh, Stuttgart: Franz Steiner Verlag
Hickman, R., Fremer, P., Breithapt, M. and Saxena, S. (2011) Changing Course in Urban
Transport: An Illustrated Guide, prepared for ADB and GIZ, in
www.adb.org/documents/books/changing-course-urban-transport/default.asp
accessed on 7th June, 2013
Hine, J. P. and Mitchell, Fiona. (2001) The Role of Transport on Social Exclusion in
Urban Scotland, Scottish Executive Central Research Unit, Edinburgh
Hjorthol, R. (2008) Daily mobility of men and women - A barometer of gender equality?
in Uteng, Tanu p. and Cresswell, T. (eds) Gendered mobilities, 193-210,
Aldershot,UK, Burlington,USA: Ashgate
Hodgson, F. C. and Turner, J. (2003) Participation not consumption: the need for new
participatory practices to address transport and social exclusion, Transport Policy,
10: 265–272
Hoffermon, R. and Shafi, S. (2004) Existing Land use and future scenarios, Working
Paper 2, Strategic Transport Plan for Dhaka, submitted by The Louis Berger Group,
inc and Bangladesh Consultants Limited to Dhaka Transport Coordination Board
(DTCB), Ministry of Communication, Government of Bangladesh
Hook, W. and Replogle, M. (1996) Motorization and non-motorized transport in Asia-
Transport system evolution in China, Japan and Indonesia, Land use Policy, 13(1),
69-84
Hrelja, R. (2011) The tyranny of small decisions- Unsustainable cities and local day-to-
day transport planning, Planning Theory Practice, 12(4), 511-524
Hummel, K. (2008) The rickshaw as an endangered species, The Bengal Gaze,
http://www.popmatters.com/pm/archive/contributor/122/, accessed on 30th
September, 2012
Hunt, J., Kriger, D. and Miller, E. (2005) Current operational urban landuse– transport
modelling frameworks: a review, Transport Review,, 25(3), 329-376
Huxley, M. (2007) Geographies of governmentality, in Crampton, J. W. and Elden, S.
(eds) Space, Knowledge and Power. Foucault and Geography, 185–204,
Aldershot:Ashgate
Huxley, M. (2006) Spatial rationalities: Order, environment, evolution and government,
Social and Cultural Geography, 7(5), 771–787
Huxley, M. (2002) Governmentality, gender, planning: A Foucauldian perspective, in
Allmendinger, P. and Tewdwr-Jones, M. (eds) Planning Futures. New Directions
for Planning Theory,136–153, Abingdon: Routledge
ILO (1972) Employment, Income and Equality: A Strategy for Increasing Productive
Employment in Kenya, International Labour Organisation (ILO), Geneva,
Switzerland: ILO Press
Imran, M., and Low, N. (2003) Time to Change the Old Paradigm: Promoting Sustainable
Urban Transport in Lahore, Pakistan, World Transport Policy and Practice, 9(2),
32–39
187
Iraza¨bal, C. (2008) Ordinary Places, Extraordinary Events: Citizenship, Democracy, and
Public Space in Latin America, London: Routledge
Islam, S. A. (2002) Political parties and future of democracy, in Chowdhury, A. M. and
Alam, F. (eds) Bangladesh on the threshold of twenty first century, Asiatic Society
of Bangladesh, Dhaka, 61-70
Jackson, T. (2009) Prosperity Without Growth: Economics for a Finite Planet, UK and
USA: Earthscan
Janic, M. (2006) Sustainable Transport in the European Union: A Review of the Past
Research and Future Ideas, Transport Reviews, 26(1), 81-104
Jensen, A. (2011) Mobility, space and power: On the multiplicities of seeing mobility,
Mobilities, 6(2), 255-271
Jensen, A. (2007) New region, new story: Imagining mobile subjects in transnational
space, Space and Polity, 11(2), 137–150.
Jensen, A. (2006) Governing with Rationalities of Mobility- A Study of Institution Building
and Governmentality in European Transport Policy, Doctoral dissertation,
Roskilde University, Denmark
Jensen, Ole B. and Richardson, T. (2004) Making European Space, London: Routledge
Jensen, A. and Richardson, T. (2007) New region, new story: Imagining mobile subjects
in transnational space, Space and Polity, 11(2), 137–150
JICA (2010) Dhaka Urban Transport Network Development Study (DHUTS)- Final
Report, Submitted to Dhaka Transport Coordination Board (DTCB), Ministry of
Communication, Government of Bangladesh
Johnston, R. J., Gregory D and Smith D M (eds) (1994) The Dictionary of Human
Geography (3rd ed), Oxford: Blackwell
Jonas, A. (1994) Editorial, Environment and Planning D: Society and Space 12:257– 264
Jones, H. (2009) Equity in Development: Why it is Important and How to Achieve it, ODI
Working Papers 311, November 2009 in http://www.odi.org.uk/publications/3480-
equity-development-working-paper, accessed on the 7th September 2013
Jones, P.M. (1987) Mobility and the individual in western industrial society, in P. Nijkamp
and S. Reichman (eds) Transportation Planning in a Changing World, 29-47,
Aldershot: Gower
Judge, A. (1995) Social exclusion: a metaphoric trap? Moving beyond false dialogue, in
Proceedings of The European Continental Forum on Citizenship and Ways Out of
Social Apartheid, Paris, 16–17 February 1995
Kalabamu, F. T. (1987) Rickshaws and the Traffic Problems of Dhaka, Habitat
International, 11(2), 123-131
Kanafani, A. (1983) Transport Demand Analysis, New York, London: McGraw Hill
Kanai, J. M. (2010) The politics of inequality in globalizing cities: how the middle classes
matter in the governing of Buenos Aires, Environment and Planning A, 42, 1887-
1901
Kaufmann, V. (2002) Re-thinking Mobility: Contemporary Sociology, Aldershot: Ashgate,
Kaufman, Jerome L. (1982) Comment, Journal of the American Planning Association,
48(2), 175-178
188
Kaufmann, V., Bergman, M. M. and Joye, D. (2004) Motility: Mobility as capital,
International Journal of Urban and Regional Research, 28(4):745-756
Kennedy, C., Miller, E., Shalaby, A., Maclean, H. and Coleman, J. (2005) The four pillars
of sustainable urban transportation, Transport Reviews, 25(4), 393-414
Kenyon, S., Rafferty, J. and Lyons, G. (2003) Social Exclusion and transport in the UK: a
role for the virtual accessibility in the alleviation of mobility-related exclusion?,
Journal of Social Policy, 32(3), 317-338
Kenyon, S., Lyon, G. and Rafferty, J. (2002) Transport and social exclusion: Investigating
the possibility of promoting inclusion through virtual mobility, Journal of
Transport Geography, 10, 207-19
Kesselring, S. (2006) Pioneering mobilities: New patterns of movement and motility in a
mobile world, Environment and Planning A. (Special Issue on Mobilities and
Materialities), 38(2), 269-279
Khan, Asif uz Z. and Mitra, Suman K. (2010) Transportation infrastructures of Dhaka
city: Status and challenges, in Hafiz, R. and Rabbani, A. K. M. G. (eds) in 400
years of Capital Dhaka and beyond, Vol. III Urbanization and Urban Development,
Asiatic Society of Bangladesh, Dhaka, 233-244
Khayesi, M., Monheim, H. and Nebe, Johannes M. (2010) Negotiating “Streets for All” in
urban transport planning: The case for pedestrians, cyclists and street vendors in
Nairobi, Kenya, Antipode, 42(1), 103-126
Kobayashi, A. and Ray, B. (2000) Civil risk and landscapes of marginality in Canada: A
pluralist approach to social justice, The Canadian Geographer, 44(4), 401-417.
Kofman, E. and Lebas, E. (eds) (1999) The right to the city, in Writings on cities: Henry
Lefebvre, Oxford: Blackwell, 147-159
Koutsopoulos, K. C. (1980a) Concepts of transportation need revisited, Transportation
Research Record, 761, 66-69
Koutsopoulos, K. C. (1980b) Determining transport needs, Traffic Quarterly, 34 , 397-412
Kreibich, V. (2010) The invisible hand- Informal urbanisation in Tanzania,
Geographische Rundschau, international edition, 6(2), 38-43
Krumholz, N. (1982) A retrospective view of equity planning Cleveland 1969–1979,
Journal of the American Planning Association, 48(2), 163-174
Kwan, M. P. (1998) Space-time and integral measures of individual accessibility: A
comparative analysis using a point-based framework, Geographical Analysis, 30,
191-216
Kurtz, H. (2003) Scale frames and counter-scale frames: constructing the problem of
environmental injustice, Political Geography, 22, 887-916.
Kymlicka, W. (1990) Contemporary Political Philosophy: An Introduction. Oxford:
Clarendon Press
Le Grand, J. (1991) Equity and choice, London: HarperCollins
Lefebvre, H. (1991) The Production of Space, Donald Nicholson-Smith (trans.), Oxford:
Basil Blackwell
Logan, J. R. and Molotch, H., (1987) Urban Fortunes: The Political Economy of Place,
Berkeley, CA: University of California Press
189
Leck, E., Bekhor, S. and Gat, D. (2008) Equity impacts of transportation improvements on
core and peripheral cities, Journal of Transport and Land Use, 2(1), 153–182
Leinbach, Thomas R. (1995) Transport and third world development: review, issues, and
prescription, Transportation Research-A, 29A(5), 337-344.
Lim, W. (1997) Critical issues for Asian cities, City, 2(7), 86-94
Lindblom, Charles E. (1979) Still muddling, not yet through, Public Administration
Review, 39(6), 517–526
Lindblom, Charles E. (1977) Politics and Markets: The World's Political-Economic
Systems, New York: Basic Books
Litman, T. (2003a) Sustainable Transportation and TDM: Planning that Balances
Economics, Social and Ecological Objectives, Victoria Transport Policy Institute,
Victoria in http://vtpi.org/tdm/tdm67.htm, accessed on 19th April, 2013
Low, N. and Banerjee-Guha, S. (2003) The global tyranny of roads: observations from
Mumbai and Melbourne, World Transport Policy and Practice, 9(2), 5–17.
Lucas, K. (2012) Transport and social exclusion: Where are we now?, Transport Policy,
20, 105–113
Lucas, K. (2005) Providing transport for social inclusion within a framework for
environmental justice in the UK, Transportation Research A, 40, 801–809
Lucas, K., Tyler, S. and Christodoulou, G. (2009) Assessing the ‘value’ of new transport
initiatives in deprived neighbourhoods in the UK, Transport Policy, 16, 115–122
Lucas, K., Grosvenor, T. and Simpson, R. (2001) Transport, the Environment and Social
Exclusion, York: York Publishing Services
Lucy, W. H. (1988) Equity planning for infrastructure: applications, in Stein, J. M. (ed)
Public Infrastructure Planning and Management, 227–240, Newbury Park: Sage
Lyons, G. (2004) Transport and society, Transport Review, 24(4), 485–509
Madanipour, A. (2003) Social exclusion and space, in Le Gates, R. and Stout, F. (eds),
The City Reader, London: Routledge.
Majumder, J., Haque, M. S. and Alam, M. J. B. (2009) Transport crisis in Dhaka city, in
Alam, M. J. B. (ed) Transport Problems in Dhaka City: Issues, Concerns and
Policy Options, Department of Civil Engineering, BUET, Dhaka
Marcotullio, Peter J. (2004) Why the Asian urban experience should make us think
differently about planning approaches, in Sorensen, A., Marcotullio, Peter J. and
Grant, J. (eds) Towards Sustainable cities-East Asian, North American and
European Perspectives on managing Urban Regions, 38-58, Aldershot: Ashgate
Martens, K. (2012) Justice in transport as justice in accessibility: applying Walzer’s
‘Spheres of Justice’ to the transport sector, Transportation, 39, 1035–1053
Martens, K. (2006) Basing transport planning on principles of social justice, Berkeley
Planning Journal, 19, 1-17
MacKinnon, C. A. (2001) The liberal state, in Dyzenhaus, D. and Ripstein, A. (eds) Law
and morality: readings in legal philosophy (2nd ed.), Toronto: University of
Toronto Press, 218–231, reprinted from MacKinnon, C. A. (1989) Towards a
feminist theory of state, Ch. 8, Massachusetts: Harvard University Press
190
Mascarenhas, M. (2007) Where the waters divide: First Nations, tainted water and
environmental justice in Canada, Local Environment, 12(6), 565–577.
Massey, D. (1994) Power-geometry and a progressive sense of place, in Robertson, G.,
Mash, M., Tickner, L., Bird, J., Curtis, B. and Putnam, T. (eds) Travellers’ Tales:
Narratives of Home and Displacement, London: Routledge
McLaren, D. (2003) Environmental space, equity and the ecological debt, in Agyeman, J.,
Bullard, R.D. and Evans, B. (eds) Just Sustainabilities: Development in an Unequal
World, Cambridge, MA: MIT Press, 19–37.
Mendus S. (1993) Different voices, still lives: problems in the ethics of care, Journal of
Applied Philosophy, 10, 17-27
Midgley, P. (1994) Urban Transport in Asia: An Operational Agenda for the 1990s,
Technical paper no. 224, Asia Technical Department Series, The World Bank,
Washington
Miller, H. J. (2007) Place-based versus people-based geographic information science,
Geography Compass, 1, 503–535
Minow, M. L. (2001) Forward [to the Supreme Court 1986 Term]: Justice engendered, in
Dyzenhaus, D. and Ripstein, A. (eds) Law and morality; readings in legal
philosophy (2nd ed), Toronto: University of Toronto Press, 231-242, reprinted from
Minow, Martha L. (1987) Foreword: The Supreme Court, 1986 Term - Justice
Engendered, Harvard Law Review, 110
Miranda, H.F. and da Silva, A.N. R. (2012) Benchmarking sustainable urban mobility:
The case of Curitiba, Brazil, Transport Policy, 21, 141–151
Mohan, D. (2001) Planning for public transport: integrating safety, environment and
economic issues, Paper presented at Workshop on Transport, Land Use and the
Environment, Pune, India, Dec. 3–4, 2001.
Monem, M. (2001) Politics business nexus and privatization of public enterprises in
Bangladesh, Journal of Asiatic Society of Bangladesh, 46(1), 137-161
Mollenkopf, J. H. (1983) The Contested City, Princeton, NJ: Princeton University press
Molotch, H. (1993) The political analysis of growth machines, Journal of Urban Affairs,
15(1), 29-53
Miller, D. (1976) Social Justice, Oxford: Clarendon Press
Murdock, G. (1986) Poor connections: income, inequality and the information society, in
Golding, P. (ed), Excluding the Poor, Child Poverty Action Group, London
Murray, A. and Davis, R. (2001) Equity in regional service provision, Journal of Regional
Science, 41(4), 557-600
Næss, P. (2001) Urban planning and sustainable development, European Planning
Studies, 9(4), 503-524
Nayadiganta (2012) Earning several millions buy illegal number plates (In Bangla- Vua
number plate diye koti taka uparjon), The Daily Nayadoganta, 20th September,
2012, Dhaka
New Age (2005a) No aid if rickshaw pullers are not protected, The Daily New Age, 9th
February, 2005, Dhaka
191
New Age (2005b) WB sets deadline to lessen rickshaw puller's woes, The Daily New Age,
11th February, 2005, Dhaka
Newman, E. (1999) Sustainable urban societies: a technological or a political goal?, in
Inoguchi, T., Newman, E and Paoletto, G. (eds) New Approaches for Eco-societies,
Tokyo, New York: United Nations University Press, 71-101
Nijkamp P., Reichman S. and Wegener M. (Eds) (1990) Euromobile: Transport,
Communications and Mobility in Europe. A Cross-national Overview, Aldershot:
Averbury
Nilsson, K. (2007) Managing complex spatial planning processes, Planning Theory and
Practice, 8, 431–447
Nussbaum, M. C. and Glover, J. (eds) (1995) Women, Culture and Development, Oxford:
Clarendon Press
Odum, W. (1982) Environmental degradation and the tyranny of small decisions, Bio
Science, 32, 728–729.
Osborne, T. and Rose, N. (2004) Spatial phenomenotechnics: making space with Charles
Booth and Patrick Geddes, Environment and Planning D: Society and Space, 22(2),
209–228
OECD (2002) Governance for Sustainable Development: Five OECD Case Studies,
Organization for Economic Co-operation and Development(OECD), Washington
DC
OECD (2001) Policy Instruments for Achieving Project Environmentally Sustainable
Transport, Organization for Economic Co-operation and Development, Paris
Paterson, M. (2007) Automobile Politics: Ecology and Cultural Political Economy,
Cambridge, New York: Cambridge University Press
Pellow, D. (2007) Resisting Global Toxics, Transnational Movements for Environmental
Justice, Cambridge, MA: MIT Press
Pellow, D. and Brulle, R. (eds) (2005) Power, Justice and The Environment: A Critical
Appraisal of the Environmental Justice Movement, Cambridge, MA: MIT Press
Pendakur, V. S. (2011) Non-motorized urban transport as neglected modes in Dimitriou,
Harry T. and Gakenheimer, Ralph (eds) Urban Transport in the Developing World-
A Handbook of Policy and Practice, 203-31, Cheltenham, UK: Edward Elgar
Pirie, G. H. (1979) Measuring accessibility: a review and proposal, Environment and
Planning A, 11, 299–312
POSSUM (1998) Final Report on Policy Scenarios for Sustainable Mobility, December,
CEC, Brussels
Pucher, J., Korattyswaropama, N., Mittal, N. and Ittyerah, N. (2005) Urban transport crisis
in India, Transport Policy, 12, 185–198
Pulido, L. (2000) Rethinking environmental racism: white privilege and urban
development in Southern California, Annals of the Association of American
Geographers, 90(1), 12–40.
Pulido, L., (1996) A critical review of the methodology of environmental racism research,
Antipode, 28(2), 142–159.
192
Purcell, M. (2008). Recapturing Democracy: Neoliberalization and the Struggle for
Alternative Urban Future, New York: Routledge
Purcell M. (2007) City-regions, neoliberal globalization and democracy: a research
agenda, International Journal of Urban and Regional Research, 31, 197-206
Putnam, R. D. (2000) Bowling Alone: The Collapse and Revival of American Community,
New York: Simon and Schuster
Rabl, A. and de Nazelle, A. (2012) Benefits of shift from car to active transport,
Transport Policy, 19, 121–131
Rahman, M. S. (2008) Future mass rapid transit in Dhaka city: Options, issues and
realities, Jahanginagar Planning Review, 6, 69-81
Rahman, Mamun M., D'Este, G. and Bunker, Jonathan M. (2009) Is there a future for non-
motorized public transport in Asia?, in Proceedings of the 8th International
Conference of the Eastern Asia Society for Transportation Studies (EASTS) , 16 -
19 November 2009, Surabaya, Indonesia
Rajé, F., Grieco, M., Hine, J. and Preston, J. (2004) Transport, Demand Management and
Social Inclusion: The Need for Ethnic Perspectives, Aldershot: Ashgate
Ratanawaraha, A. (n.d.) Informal mobility is here to stay, Trendnovation Southeast, Issue
14, Newsletter is published by Noviscape Consulting Group (NCG), in
http://trendsoutheast.org/2011/all-issues/issue-14/informal-mobility-is-here-to-stay,
accessed on 22nd Sep 2012
Rawls, J. (1971). A Theory of Justice, Cambridge, MA: Harvard University Press
Replogle, M. (1991) Non-motorized vehicles in Asia: Lessons for sustainable transport
planning and policy, World Bank Technical Report 162, Environmental Defence
Fund, Washington DC, USA
Reynolds, D. and Shelley, F. (1985) Procedural justice and local democracy, Political
Geography, 4, 267–88.
Richardson, H. (1993) Problems of metropolitan management in Asia, in Cheema, Shabbir
G. (ed), Urban Management: Policies and Innovations in Developing Countries,
51–75, Westport: Greenwood Praeger Press
Richardson, H. W. (1974) A note on the distributional effects of road pricing, Journal of
Transport Economics and Policy, 8, 82–85
Richardson, T. (2006) The thin simplification of European space: dangerous calculations?,
Journal of Comparative European Politics, 4(3–4), 203–217
Richardson, B. C. (2005) Sustainable transport: analysis frameworks, Journal of Transport
Geography, 13, 29–39.
Richardson, B. C. (1999) Towards a policy on a sustainable transportation system,
Transportation Research Record, 1670, 27–34
Richardson, T. and Jensen, O. B. (2008) How mobility systems produce inequality:
Making mobile subject types on the Bangkok sky train, Built Environment, 34(2),
218–231
Rimmer, J. (1978) Redirections in transport geography, Papers in Human Geography,
2(1), 76-100
193
Roberts, J. T. (2007) Globalizing environmental justice, in Sandler, R. and Pezzullo, P.C.
(eds) Environmental justice and environmentalism, Cambridge, MA: MIT Press,
285–307
Robinson, J. (2006) Ordinary Cities: Between Modernity and Development, London:
Routledge
Rodrıguez, D. A. and Joo J. (2004) The relationship between non-motorized mode choice
and the local physical environment, Transportation Research Part-D, 9, 151-173
Room, G. (1995) Poverty in Europe: competing paradigms of analysis, Policy and
Politics, 23 (2), 103-113
Root, A., Schintler, L. and Button, K. (2000) Women, travel and the idea of 'sustainable
transport', Transport Reviews, 20(3), 369-383
Rose, N. (1999) Powers of Freedom- Reframing Political Thought, Cambridge:
Cambridge University Press
Roy, A. (2009) Why India cannot plan its cities: Informality, insurgence and the idiom of
urbanizatiom, Planning theory, 8(1):76-87
Roy, A. (2004a) The gentleman's city: Urban informality in the Calcutta of the new
communism, in Roy, A. and AlSayyad, N. (eds) Urban Informality- Transnational
perspectives from the Middle East, Latin America and South Asia, Lanhum, USA:
Lexington Books, 289-318
Roy, A. (2004b) Transnational trespassing: The geopolitics of urban informality, in Roy,
A. and AlSayyad, N. (eds) Urban Informality- Transnational perspectives from the
Middle East, Latin America and South Asia, Lanhum, USA: Lexington Books, 289-
318
Roy, A. and AlSayyad, N. (2004) Urban Informality: Transnational Perspectives from the
Middle East, Latin America, and South Asia, Lanham, USA: Lexington Books
Rucker, G. (1984) Public transportation: another gap in rural America, Transport.
Quarterly, 38, 419–432
Rule (2012) Rule dated 5th March 2012, Writ Petition no 7132 of 2011 and Writ Petition
8619 of 2011 in the Supreme Court of Bangladesh, High Court Division, Dhaka
(pending full hearing/judgment)
Ryan, Anne B. (2006) Post-positivist approaches to research, in Antonesa, M., Fallon, H.,
Ryan, Anne B., Ryan, A. and Walsh, T. with L. Borys (eds) Researching and
writing your thesis: A guide for postgraduate students, Maynooth: MACE, 12-28.
Also in :http://eprints.nuim.ie/archive/00000874/ accessed on 9th September 2012
Sager, T. (2006) Freedom as mobility: Implications of the distinction between actual and
potential travelling, Mobilities, 1(3), 465-488
Sassen, S. (2002) The repositioning of citizenship: Emergent subjects and spaces for
politics, Berkeley Journal of Sociology, 46, 4-25
Sassen, S. (1991) The global city, New York, London, Tokyo, Princeton, NJ: Princeton
University Press
Sarkar, P. K. and Tagore, Pratiti (2011) An approach to the development of sustainable
urban transport system in Kolkata, Current Science, 100(9), 1349-1361
194
SCATTER (2008) Sprawling cities and transport: from evaluation to recommendations,
in /http://www.casa.ucl.ac.uk/scatter, accessed on 1st February, 2013
Schlosberg, D. (2007) Defining Environmental Justice: Theories, Movements, Nature,
UK: Oxford University Press.
Schlosberg, D. (2004) Reconceiving environmental justice: Global movements and
political theories, Environmental Politics, 13(3), 517-540
Schonfleder, S. and Axhausen, Kay W. (2003) Activity Spaces: Measures of social
exclusion?, Transport Policy, 10, 273-286
Schweitzer, L., Valenzuela, A. (2004) Environmental injustice and transportation: The
claims and the evidence, Journal of Planning Literature, 18, 383-398
Sietchiping, R., Permezel,M. J. and Ngomsi, C. (2012) Viewpoint: Transport and mobility
in sub-Saharan African cities: An overview of practices, lessons and options for
improvements, Cities, 29, 183–189
Seraj, T. M. (2012) Private Sector Housing, Dhaka: Pearl Publications
Sen, A. (2001) Development as freedom, (1st paperback ed), UK, USA: Oxford
University Press
Sen, A. (1999) Commodities and Capabilities, New Delhi: Oxford University Press
Sen, A. (1995) Inequality Re-examined, (1st paperback ed), USA: Harvard University
Press
Shefter, M. (1985) Political Crisis, Fiscal Crisis: The Collapse and Revival of New York
City, New York: Basic Books
Sharma, N. (2006) Home Economics: Nationalism and The Making Of Migrant Workers
in Canada, Toronto: University of Toronto Press
Sheller, M. (2004) Mobile Publics: Beyond the Network Perspective, Environment and
Planning-D: Society and Space, 22(1), 39–52.
Sheller, M. (2008) Mobility, freedom and public spaces, in Bergmann, S. and Sager, T.
(eds) The Ethics of Mobilities: Rethinking Place, Exclusion, Freedom and
Environment, 25–38, Aldershot: Ashgate
Sheller, M. and Urry, J. (2006a) The new mobilities paradigm, Environment and Planning
A, 38(2) 207- 226
Sheller M. and Urry J, (2006b) Mobile Technologies of the City, New York: Routledge
Shove, E. (2002) Rushing around: coordination, mobility and inequality, ESRC Mobile
Network Meeting, DfT, London, October, 2002
Silva, E. (1995) Intellectuals, technocrats, and politics in Chile: from global projects to the
‘management of things’, in Galjart B. and Silva, P. (eds) Designers and
Development: Intellectuals in the Third World, 190–212, Leiden: Leiden University
Press,
Silvey, R (2004) Power, difference and mobility: feminist advances in migration studies,
Progress in Human Geography, 28(4), 1-17
Singh, Sanjay K. (2005) Review of urban transportation in India, Journal of Public
Transportation, 8(1), 79-97
Smeed, R. J. (1964) Road Pricing: The Economic and Technical Possibilities, Her
Majesty's Stationery Office (HMSO), London
195
Smith, David M. (2002) Social justice and the South African city, in Eade, J. and Mele, C.
(eds) Understanding the City: Contemporary and Future Perspectives, Oxford:
Blackwell, 66-81
Smith, David M. (2000a) Moral progress in human geography: Transcending the place of
good fortune, Progress in Human Geography, 24, 1-18
Smith, David M. (2000b) Social justice revisited, Environment and Planning A, 32, 1149-
62
Smith, David M. (2000c) Moral Geographies: Ethics in a World of Difference, Edinburgh:
Edinburgh University Press
Smith, David M. (1998) How far should we care? On the spatial scope of beneficence,
Progress in Human Geography, 22, 15-38
Smith, D. (1997) Back to the good life: Towards an enlarged conception of social justice,
Environment and Planning D: Society and Space 15 (1), 19–35
Smith, David M (1994) Geography and Social Justice, Oxford: Blackwell
Smith, N. (1984) Uneven Development- Nature, Capital and The Production of Space,
Malden, MA: Blackwell
Smith, N. (1993) Homeless/global: Scaling places, in J Bird, J., Curtis, B., Putnam, T.,
Robertson, G. and Tickner, L. (eds) Mapping the Futures: Local Cultures, Global
Change, London: Routledge
Sobhan, R. (2007) Collected Works of Rehman Sobhan -Challenging injustice-The
Odyssey of a Bangladeshi Economist, Volume 1, Centre for Policy Dialogue,
Dhaka
Soja, Edward W. (2010) Seeking Spatial Justice, London: University of Minnesota Press
Soja, E. W. (2000) Postmetropolis: Critical Studies of Cities and regions, Malden, MA:
Blackwell
Soja, E. (1999) Thirdspace: expanding the scope of the geographical imagination, in
Massey, D., Allen, J. and Sarre, P. (eds) Human Geography Today, Cambridge,
MA: Polity Press in Association with Blackwell, 260–278
Soja, E. (1980) The socio-spatial dialectic, Annals of the Association of American
Geographers, 70(2), 207–225.
Soliman, Ahmed M. (2004) Titling as Sphinxes: Locating urban informality in Egyptian
cities, in Roy, A. and AlSayyad, N. (eds) Urban Informality- Transnational
perspectives from the Middle East, Latin America and South Asia, Lanhum, USA:
Lexington Books, 171-208
Sorensen, A., Marcotullio, Peter J. and Grant, J. (2004) Towards sustainable cities, in
Sorensen, A., Marcotullio, Peter J. and Grant, J. (eds) Towards Sustainable Cities-
East Asian, North American and European Perspectives on Managing Urban
Regions, England: Ashgate Publishing, 3-23
Sørensen K. H. (1999) Rush-hour Blues or the Whistle of Freedom? Understanding
Modern Mobility, STS-working paper 3(99), Department of interdisciplinary
studies of culture, Centre for technology and society, Trondheim
Stanley, A. (2009) Just space or spatial justice? Difference, discourse, and environmental
justice, Local Environment, 14(10), 999-1014
196
Stone, C. N. (2005) Looking back to look forward: Reflections on urban regime analysis,
Urban Affairs Review, 40(3), 309-341
Stone, C. N. (2001) The Atlanta experience re-examined: The link between agenda and
regime change, Urban Affairs Review, 25(1), 20-34
Stone, C. N. (1993) Urban regimes: A political economy approach, Journal of Urban
Affairs, 15(1), 1-28
Stone, C. N. (1989) Regime politics: Governing Atlanta 1946-1988, Lawrence: University
Press of Kansas
Stone, C. N. (1982) Social stratification, nondecision-making, and the study of community
power, American Politics Quarterly, 10(3), 275–302.
STP (2005a) Survey Result, Working Paper 7, Strategic Transport Plan for Dhaka prepared
by Louis Berger Group and Bangladesh Consultant (Ltd), prepared for Dhaka
Transport Co-ordination Board (DTCB), Ministry of Communication, Government
of Bangladesh
STP (2005b) The Urban Transport Policy - Final Report, Strategic Transport Plan for
Dhaka, prepared by Louis Berger Group and Bangladesh Consultant (Ltd),
prepared for Dhaka Transport Co-ordination Board (DTCB), Ministry of
Communication, Government of Bangladesh, September 2005
STP (2005c) Executive Summary, Strategic Transport Plan for Dhaka, The Louis Berger
Group and Bangladesh Consultants (Ltd), Dhaka
Strom , E. (1996) In search of the growth coalition: American urban theories and the
redevelopment of Berlin, Urban Affairs Review, 31, 455-481
Susskind, L. (1982) Comment, Journal of the American Planning Association, 48(2), 181-
183
Swynegedouw, E. (2005) Introduction to David Harvey, in Scholar R. (ed.) Divided Cities,
Oxford: Oxford University Press , 79-82.
Swynegedouw, E. (2001) Neither global nor local: ‘Glocalization' and the politics of scale,
in Jessop B. (ed) Regulation Theory and the Crisis of Capitalism, Cheltenham,
Glos/Northampton, MA: Edward. Elgar, 196-225, Reprinted from: Cox K. (ed)
(1997) Spaces of Globalization: Reasserting the Power of the Local, New
York/London: Guilford/Longman, 137-66
Swyngedouw , E. and Heynen, Nikolas C (2003) Urban political ecology, justice and the
politics of scale, Antipode, 35(5), 898-918
Sze, J. (2006) New York: The Racial Politics of Urban Health and Environmental Justice,
Cambridge, MA: MIT Press.
Taylor, Brian D. (2004) The politics of congestion mitigation, Transport Policy, 11, 299-
302
Teelucksingh, C. (2007) Environmental racialization: linking racialization to the
environment in Canada, Local Environment, 12(6), 645–661.
Tesfahuney, M. (1998) Mobility, racism and geopolitics, Political Geography, 17(5), 499-
515
Thynell, M., Mohan, D. and Tiwari, G. (2010) Sustainable transport and the
modernisation of urban transport in Delhi and Stockholm, Cities, 27, 421-429
197
Tiwari, G. (2012) Role of cycle rickshaw in urban transport: Today and tomorrow paper
presented in the Workshop on Rickshaws held at the Indian Institute of Technology,
Delhi, 11-12 July 2012
Tiwari, G. (2001) Pedestrian infrastructure in the city transport system: Delhi case study,
World Transport Policy and Practice, 7(4), 13–18
Tiwari, G., Mohan, D. (1999) Sustainable transport systems: linkages between
environmental issues, public transport, non-motorized transport, and safety,
Economic and Political Weekly, 34(25), 1589–1596.
Timothy, D. J. (2001) Tourism and Political Boundaries, London: Routledge
Town, S. (1981) The sociologists perspective on transport, in Banister, D. and Hall, P.
(eds) Transportation and Public Policy Planning, London: Mansel, 30-33
TRANSPLUS (2003) Achieving Sustainable Transport and Land Use with Integrated
Policies, in
http://www.transportresearch.info/Upload/Documents/200607/20060727_161314_
91463_TRANSPLUS_Final_Report.pdf, accessed on the 1st February, 2013
TRB (2001) Transportation, energy and environmental policy: managing transitions, in
Transportation Research Board (TRB),VIII Biennial Asilomar Conference,
available in: http://onlinepubs.trb.org/onlinepubs/conf/asilomar.pdf, accessed on 1st
February, 2013
Trinder, E., Hay, A, Dignan, J. , Else, P. and Skorupski, J. (1991) Concept of equity,
fairness and justice in British transport legislation, 1960-88, Environment and
Planning C: Government and Policy, 9, 31-50
UN ESCAP (1997) Background Papers of Non-Motorised Transport in Dhaka (Draft),
Integration of non-motorised transport in the urban transport system of Dhaka,
Bangladesh
Ureta, S. (2008) To move or not to move? Social exclusion, accessibility and daily
mobility among the low-income population in Santiago, Chile, Mobilities, 3(2),
269–289
Urry, John (2007) Mobilities, Cambridge: Polity Press
Urry, John (2006) Inhabiting the car, Sociological Review, 54 (Special issue S 1), 17-31
Urry, J. (2004a) The system of automobility, Theory, Culture and Society, 21(4/5):25- 39
Urry, J. (2004b) Connections, Environment and Planning D: Society and Space, 22, 27-37
Urry, J. (2003) Social networks, travel and talk, British Journal of Sociology, 54(2), 155-
75
Urry, J. (2000) Sociology beyond Societies, Mobilities for the Twenty-first Century, New
York: Routledge
Uteng, Tanu P. (2011) Gender and Mobility in the Developing World, background paper
of World Development Report 2012- Gender equality and development, World
Bank
Vasconcellos, E. (2001) Urban Transport, Environment and Equity: The Case for
Developing Countries, London: Earthscan Press
Verma, A., Sreenivasulu, S. and Dash, N. (2011) Achieving sustainable transportation
system for Indian cities – problems and issues, Current Science, 100(9), 1328-1339
198
Verstraete, G. (2004) Technological frontiers and the politics of mobility in the European
Union, in Ahmed, S. Castañeda, C., Fortier, A. M. and M. Sheller (eds),
Uprootings/Regroundings: Questions of Home and Migration, London: Berg, 225-
50
Verhoef, E. T., Nijkamp, P., Rietveld, P. and Lakshmanan, T. R. (1997) Benefits and
Costs of Transport: Classification, Methodologies and Policies, Discussion paper
97084, Institute of Tinbergen, Rotterdam
Vickerman, R. W. (1974) Accessibility, attraction and potential: A review of some
concepts and their use in determining mobility, Environment and Planning A, 6,
675-691
Vigar, G. (1999) Transport for people: accessibility, mobility and equity in transport
planning, in Greed, C.H. (ed.) Social Town Planning, 90–101, London: Routledge
Walzer, Michael (1983) Spheres of justice: A Defence of Pluralism and Equity, Oxford,
UK: Blackwell
Warren, K. (1999) Environmental justice: some ecofeminist worries about a distributive
model, Environmental Ethics, 21(1), 151–161.
Wenz, P. (1988) Environmental Justice, Albany: SUNY Press
White, C., Gordon, A., and Gray, P. (2001) Economic Appraisal of Multi-modal Transport
Investments: The Development of TUBA, A report prepared for the Department of
Transport, Local Government and the Regions, UK
Whitelegg, J. (1997) Sustainable transport solutions for Calcutta, World Transport Policy
and Practice, 3(3), 12-14
Whitelegg, J. and Williams, N. (2000) Non-motorized transport and sustainable
development: evidence from Calcutta, Local Environment, 5(1), 7–18.
Wiederkehr, P., Gilbert, R., Crist, P. and Caïd, N. (2004) Environmentally Sustainable
Transport (EST): Concept, Goal, and Strategy – The OECD’s EST Project, EJTIR,
4(1)11-25, in
http://www.richardgilbert.ca/Files/2004/EST,%20Concept,%20Goal,%20and%20St
rategy.pdf, accessed on the 15th April, 2013
Wigan, M. (1995) Treatment of walking as a mode of transportation, Transportation
Research Record, 1487, 7–13
Wilkinson, R. and Pickett, K. (2010) The Spirit Level: Why Equality is Better for
Everyone, London: Penguin Books
Williams, M. and T. May (1996) An Introduction to Philosophy of Social Research,
London: UCL Press
Wood, D. and Graham, S. (2006) Permeable boundaries in the software-sorted society:
surveillance and the differentiation of mobility, in Sheller, M. and Urry, J. (eds)
Mobile Technologies of the City, London: Routledge
World Bank (2005) Implementation Completion Report (IDA 31630) On A Credit in the
amount of US$177 Million To the People's Republic of Bangladesh For Dhaka
Urban Transport Project, Report no-34544-BD
World Bank. (2002) Cities on the Move: A World Bank Urban Transport Strategy Review,
World Bank, Washington DC
199
World Bank (1999) Gender and transport: a rationale for action, PREM Notes, no. 14,
World Bank, 1-2
World Bank, (1996) Sustainable Transport: Priorities for Policy Reform, World Bank
Writ (2011) Writ Petition no 7132 of 2011 in the Supreme Court of Bangladesh, High
Court Division, Dhaka (pending full hearing/judgment)
Wu, B.M., Hine, J.P. (2003) A PTAL approach to measuring changes in bus service
accessibility, Transport Policy, 10, 307–320
Yigitcanlar T., Rashid, K. and Dur, F. (2010) Sustainable Urban and Transport
Development for Transportation Disadvantaged: A Review, The Open
Transportation Journal, (4), 1-8
Yago, G (1983) The sociology of transportation, American Sociological Review, 9, 71-90
Young, Iris M. (1990) Justice and the Politics of Difference, NJ: Princeton University
Press
Zohir, S. C. (2008) Gender issues in Dhaka transport: a review, chapter in Proceedings of
International Conference on Best Practices to Relieve Congestion on Mixed-Traffic
Urban Streets in Developing Countries, September 12-14, 2008, IIT Madras,
Chennai, India, Allied Publishers (Pvt) Ltd
Zohir, S. C. (2003) Integrating gender into World Bank financed transport programs:
case study of Bangladesh- Dhaka Urban Transport Project, report prepared for ICT
Net, Japan
Zohir, S. C., Majumder, P.P., Alam, K. and Shah, W. H. (2008) Gender Analysis for
Improving Mobility in Dhaka City, Bangladesh Institute of Development Studies
(BIDS), Dhaka, report prepared for Worlds Bank, Dhaka office
Zauke, G., and Spitzner, M. (1997) Freedom of movement for women: Feminist
approaches to traffic reduction and a more ecological transport science, World
Transport Policy and Practice, 3(2) 17-23.
Zunino, Hugo M. (2006) Power relations in urban decision-making: Neo-liberalism,
'techno-politicians' and authoritarian redevelopment in Santiago, Chile, Urban
Studies, 43(10), 1825–1846
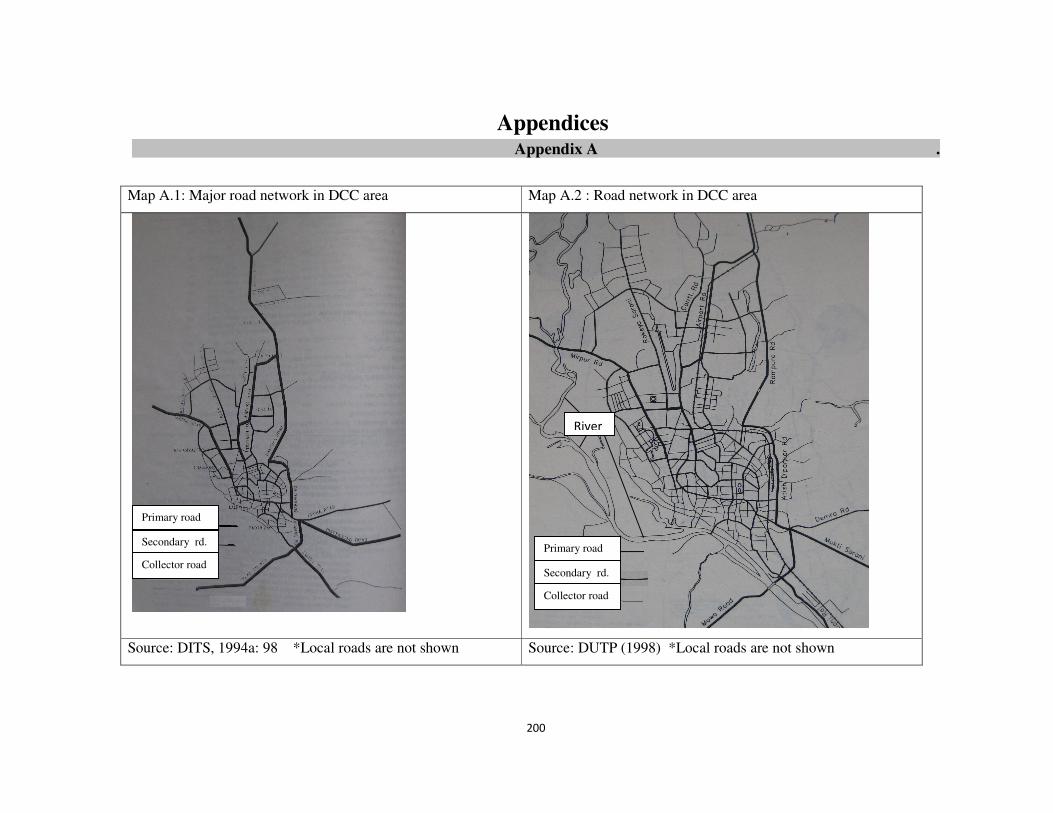
200
Appendices Appendix A .
Map A.1: Major road network in DCC area Map A.2 : Road network in DCC area
Source: DITS, 1994a: 98 *Local roads are not shown Source: DUTP (1998) *Local roads are not shown
Primary road
Secondary rd.
Collector road
Primary road
Secondary rd.
Collector road
River
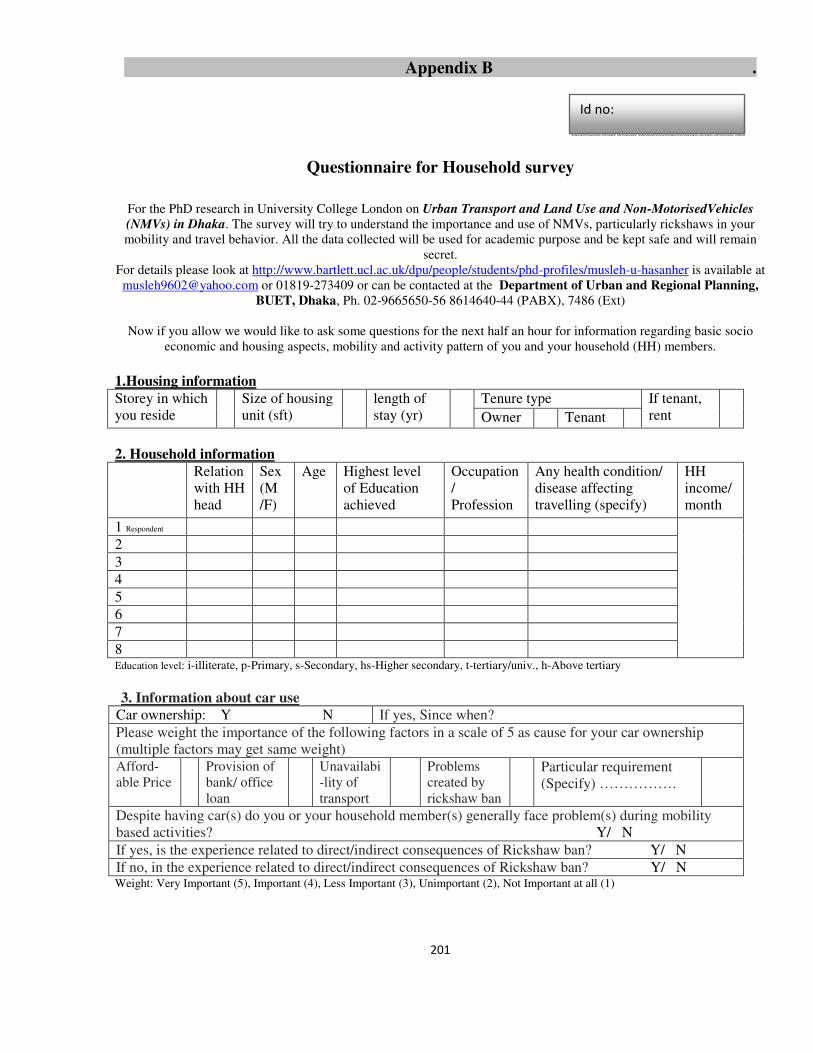
201
Appendix B .
Questionnaire for Household survey
For the PhD research in University College London on Urban Transport and Land Use and Non-MotorisedVehicles
(NMVs) in Dhaka. The survey will try to understand the importance and use of NMVs, particularly rickshaws in your mobility and travel behavior. All the data collected will be used for academic purpose and be kept safe and will remain
secret. For details please look at http://www.bartlett.ucl.ac.uk/dpu/people/students/phd-profiles/musleh-u-hasanher is available at [email protected] or 01819-273409 or can be contacted at the Department of Urban and Regional Planning,
BUET, Dhaka, Ph. 02-9665650-56 8614640-44 (PABX), 7486 (Ext)
Now if you allow we would like to ask some questions for the next half an hour for information regarding basic socio economic and housing aspects, mobility and activity pattern of you and your household (HH) members.
1.Housing information
Storey in which you reside
Size of housing unit (sft)
length of stay (yr)
Tenure type If tenant, rent
Owner Tenant
2. Household information
Relation with HH head
Sex (M /F)
Age Highest level of Education achieved
Occupation/ Profession
Any health condition/ disease affecting travelling (specify)
HH income/ month
1 Respondent
2
3
4
5
6
7
8 Education level: i-illiterate, p-Primary, s-Secondary, hs-Higher secondary, t-tertiary/univ., h-Above tertiary
3. Information about car use
Car ownership: Y N If yes, Since when?
Please weight the importance of the following factors in a scale of 5 as cause for your car ownership (multiple factors may get same weight) Afford-able Price
Provision of bank/ office loan
Unavailabi-lity of transport
Problems created by rickshaw ban
Particular requirement (Specify) …………….
Despite having car(s) do you or your household member(s) generally face problem(s) during mobility based activities? Y/ N
If yes, is the experience related to direct/indirect consequences of Rickshaw ban? Y/ N
If no, in the experience related to direct/indirect consequences of Rickshaw ban? Y/ N Weight: Very Important (5), Important (4), Less Important (3), Unimportant (2), Not Important at all (1)
Id no:
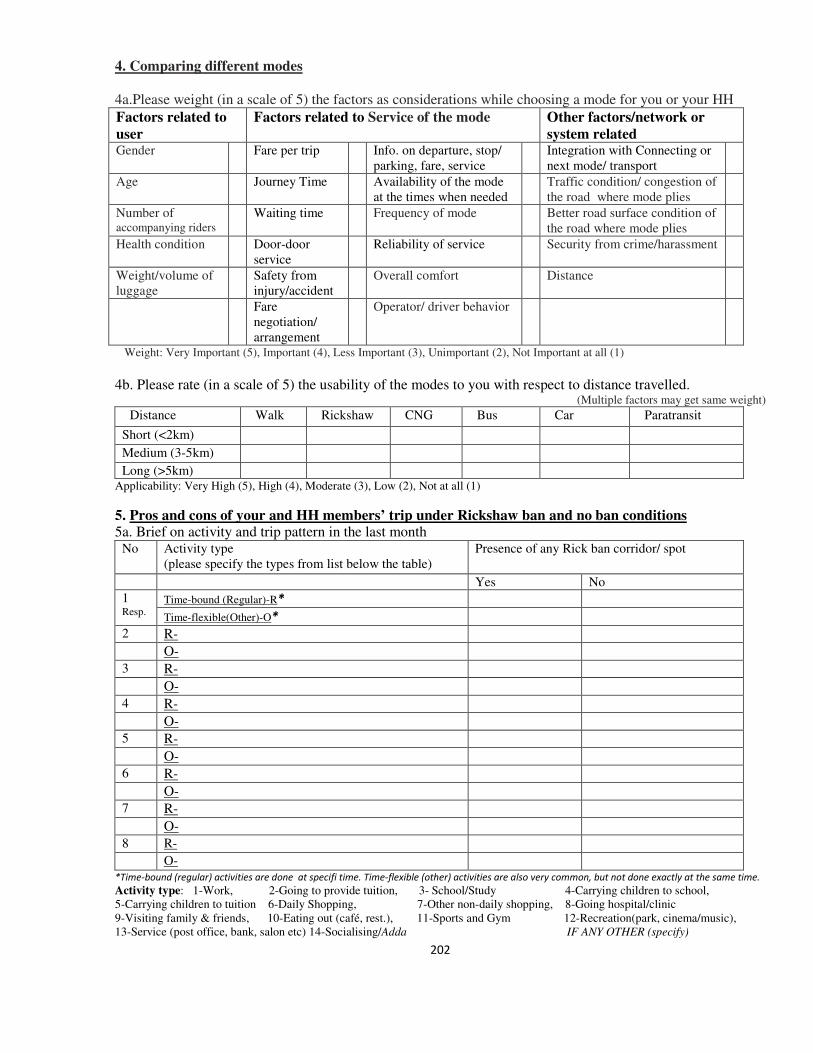
202
4. Comparing different modes 4a.Please weight (in a scale of 5) the factors as considerations while choosing a mode for you or your HH
Factors related to
user
Factors related to Service of the mode Other factors/network or
system related Gender Fare per trip Info. on departure, stop/
parking, fare, service Integration with Connecting or
next mode/ transport
Age Journey Time Availability of the mode at the times when needed
Traffic condition/ congestion of the road where mode plies
Number of accompanying riders
Waiting time Frequency of mode Better road surface condition of the road where mode plies
Health condition Door-door service
Reliability of service Security from crime/harassment
Weight/volume of luggage
Safety from injury/accident
Overall comfort Distance
Fare negotiation/ arrangement
Operator/ driver behavior
Weight: Very Important (5), Important (4), Less Important (3), Unimportant (2), Not Important at all (1)
4b. Please rate (in a scale of 5) the usability of the modes to you with respect to distance travelled.
(Multiple factors may get same weight) Distance Walk Rickshaw CNG Bus Car Paratransit
Short (<2km)
Medium (3-5km)
Long (>5km) Applicability: Very High (5), High (4), Moderate (3), Low (2), Not at all (1)
5. Pros and cons of your and HH members’ trip under Rickshaw ban and no ban conditions 5a. Brief on activity and trip pattern in the last month
No Activity type (please specify the types from list below the table)
Presence of any Rick ban corridor/ spot
Yes No
1 Resp.
Time-bound (Regular)-R*
Time-flexible(Other)-O* 2 R- O- 3 R- O- 4 R- O- 5 R- O- 6 R- O- 7 R- O- 8 R- O-
*Time-bound (regular) activities are done at specifi time. Time-flexible (other) activities are also very common, but not done exactly at the same time.
Activity type: 1-Work, 2-Going to provide tuition, 3- School/Study 4-Carrying children to school, 5-Carrying children to tuition 6-Daily Shopping, 7-Other non-daily shopping, 8-Going hospital/clinic 9-Visiting family & friends, 10-Eating out (café, rest.), 11-Sports and Gym 12-Recreation(park, cinema/music), 13-Service (post office, bank, salon etc) 14-Socialising/Adda IF ANY OTHER (specify)
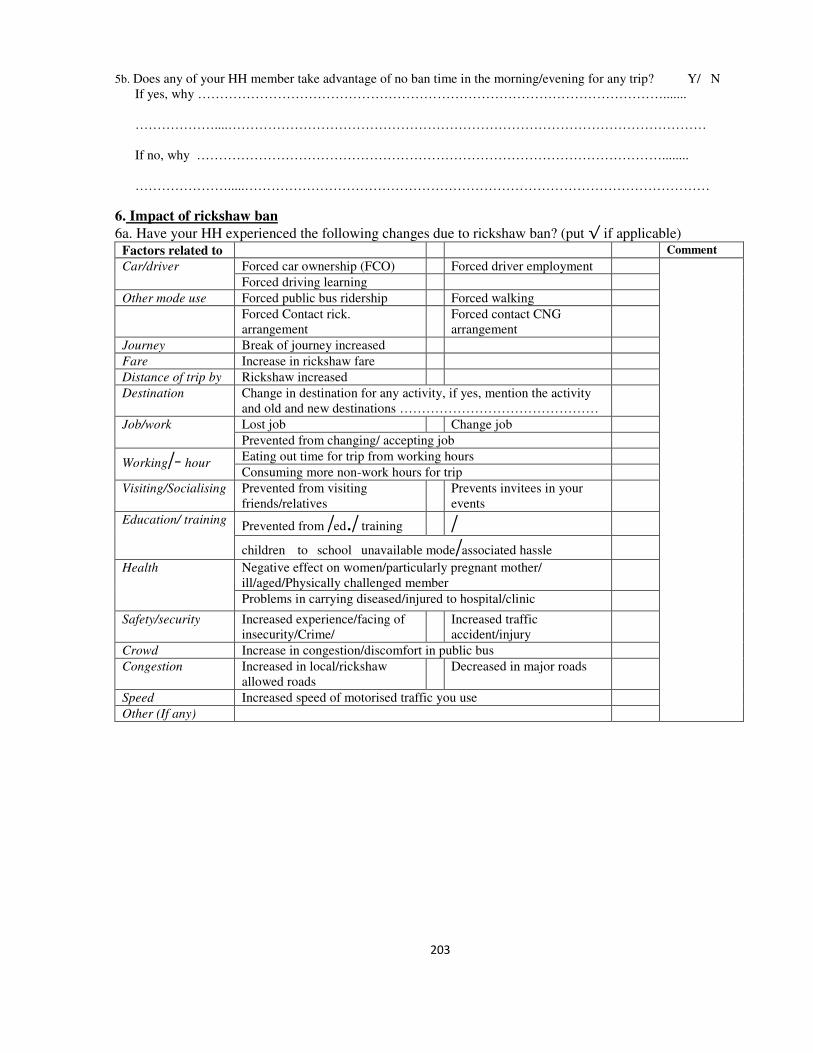
203
5b. Does any of your HH member take advantage of no ban time in the morning/evening for any trip? Y/ N If yes, why ……………………………………………………………………………………………....... ………………....……………………………………………………………………………………………… If no, why ……………………………………………………………………………………………........ ………………….....……………………………………………………………………………………………
6. Impact of rickshaw ban
6a. Have your HH experienced the following changes due to rickshaw ban? (put √ if applicable) Factors related to Comment
Car/driver Forced car ownership (FCO) Forced driver employment
Forced driving learning
Other mode use Forced public bus ridership Forced walking
Forced Contact rick. arrangement
Forced contact CNG arrangement
Journey Break of journey increased
Fare Increase in rickshaw fare
Distance of trip by Rickshaw increased
Destination Change in destination for any activity, if yes, mention the activity and old and new destinations ………………………………………
Job/work Lost job Change job
Prevented from changing/ accepting job
Working/ - hour Eating out time for trip from working hours
Consuming more non-work hours for trip
Visiting/Socialising Prevented from visiting friends/relatives
Prevents invitees in your events
Education/ training Prevented from /ed./ training
/
children to school unavailable mode/associated hassle
Health Negative effect on women/particularly pregnant mother/ ill/aged/Physically challenged member
Problems in carrying diseased/injured to hospital/clinic
Safety/security Increased experience/facing of insecurity/Crime/
Increased traffic accident/injury
Crowd Increase in congestion/discomfort in public bus
Congestion Increased in local/rickshaw allowed roads
Decreased in major roads
Speed Increased speed of motorised traffic you use
Other (If any)
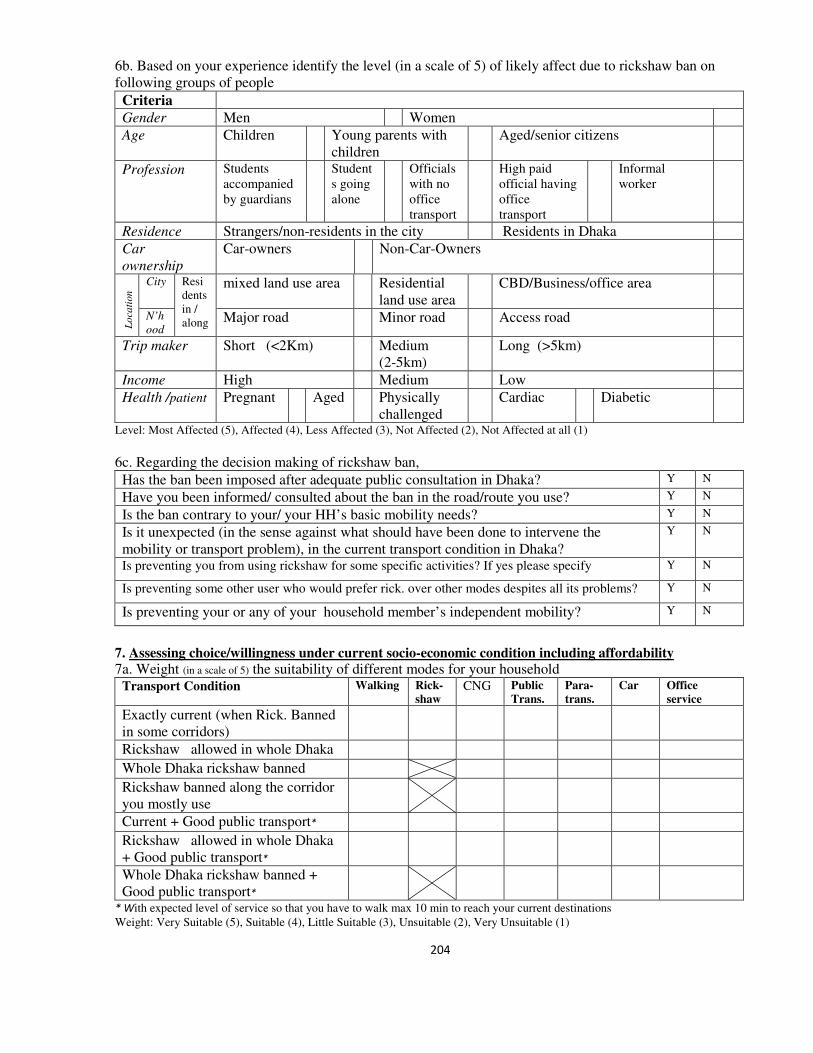
204
6b. Based on your experience identify the level (in a scale of 5) of likely affect due to rickshaw ban on following groups of people
Criteria
Gender Men Women
Age Children Young parents with children
Aged/senior citizens
Profession Students accompanied by guardians
Students going alone
Officials with no office transport
High paid official having office transport
Informal worker
Residence Strangers/non-residents in the city Residents in Dhaka
Car
ownership
Car-owners Non-Car-Owners
Lo
cati
on City Resi
dents in / along
mixed land use area Residential land use area
CBD/Business/office area
N’h
ood Major road Minor road Access road
Trip maker Short (<2Km) Medium (2-5km)
Long (>5km)
Income High Medium Low
Health /patient Pregnant Aged Physically challenged
Cardiac Diabetic
Level: Most Affected (5), Affected (4), Less Affected (3), Not Affected (2), Not Affected at all (1)
6c. Regarding the decision making of rickshaw ban,
Has the ban been imposed after adequate public consultation in Dhaka? Y N
Have you been informed/ consulted about the ban in the road/route you use? Y N
Is the ban contrary to your/ your HH’s basic mobility needs? Y N
Is it unexpected (in the sense against what should have been done to intervene the mobility or transport problem), in the current transport condition in Dhaka?
Y N
Is preventing you from using rickshaw for some specific activities? If yes please specify Y N
Is preventing some other user who would prefer rick. over other modes despites all its problems? Y N
Is preventing your or any of your household member’s independent mobility? Y N
7. Assessing choice/willingness under current socio-economic condition including affordability 7a. Weight (in a scale of 5) the suitability of different modes for your household
Transport Condition Walking Rick-
shaw CNG Public
Trans.
Para-
trans.
Car Office
service
Exactly current (when Rick. Banned in some corridors)
Rickshaw allowed in whole Dhaka Whole Dhaka rickshaw banned Rickshaw banned along the corridor you mostly use
Current + Good public transport* Rickshaw allowed in whole Dhaka + Good public transport*
Whole Dhaka rickshaw banned + Good public transport*
* With expected level of service so that you have to walk max 10 min to reach your current destinations
Weight: Very Suitable (5), Suitable (4), Little Suitable (3), Unsuitable (2), Very Unsuitable (1)
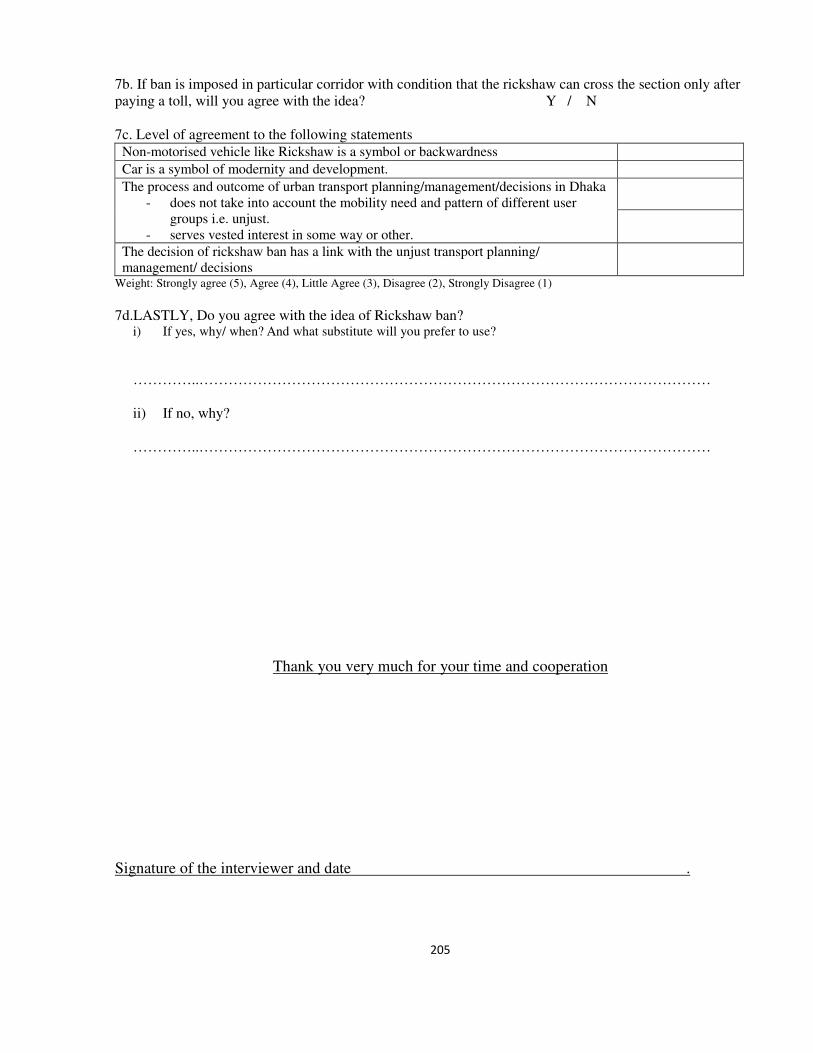
205
7b. If ban is imposed in particular corridor with condition that the rickshaw can cross the section only after paying a toll, will you agree with the idea? Y / N 7c. Level of agreement to the following statements
Non-motorised vehicle like Rickshaw is a symbol or backwardness Car is a symbol of modernity and development. The process and outcome of urban transport planning/management/decisions in Dhaka
- does not take into account the mobility need and pattern of different user groups i.e. unjust.
- serves vested interest in some way or other.
The decision of rickshaw ban has a link with the unjust transport planning/ management/ decisions
Weight: Strongly agree (5), Agree (4), Little Agree (3), Disagree (2), Strongly Disagree (1) 7d.LASTLY, Do you agree with the idea of Rickshaw ban?
i) If yes, why/ when? And what substitute will you prefer to use?
…………..……………………………………………………………………………………………
ii) If no, why? …………..……………………………………………………………………………………………
Thank you very much for your time and cooperation
Signature of the interviewer and date .
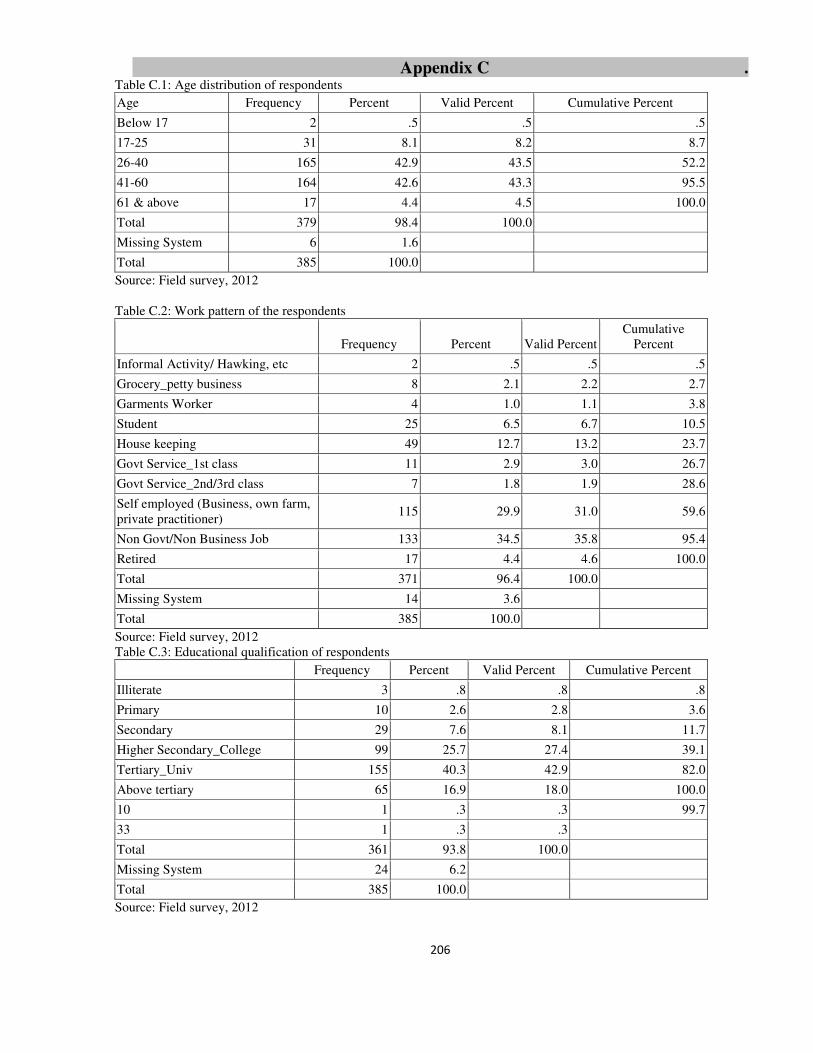
206
Appendix C . Table C.1: Age distribution of respondents
Age Frequency Percent Valid Percent Cumulative Percent
Below 17 2 .5 .5 .5
17-25 31 8.1 8.2 8.7
26-40 165 42.9 43.5 52.2
41-60 164 42.6 43.3 95.5
61 & above 17 4.4 4.5 100.0
Total 379 98.4 100.0
Missing System 6 1.6
Total 385 100.0
Source: Field survey, 2012 Table C.2: Work pattern of the respondents
Frequency Percent Valid Percent
Cumulative Percent
Informal Activity/ Hawking, etc 2 .5 .5 .5
Grocery_petty business 8 2.1 2.2 2.7
Garments Worker 4 1.0 1.1 3.8
Student 25 6.5 6.7 10.5
House keeping 49 12.7 13.2 23.7
Govt Service_1st class 11 2.9 3.0 26.7
Govt Service_2nd/3rd class 7 1.8 1.9 28.6
Self employed (Business, own farm, private practitioner)
115 29.9 31.0 59.6
Non Govt/Non Business Job 133 34.5 35.8 95.4
Retired 17 4.4 4.6 100.0
Total 371 96.4 100.0
Missing System 14 3.6
Total 385 100.0
Source: Field survey, 2012 Table C.3: Educational qualification of respondents
Frequency Percent Valid Percent Cumulative Percent
Illiterate 3 .8 .8 .8
Primary 10 2.6 2.8 3.6
Secondary 29 7.6 8.1 11.7
Higher Secondary_College 99 25.7 27.4 39.1
Tertiary_Univ 155 40.3 42.9 82.0
Above tertiary 65 16.9 18.0 100.0
10 1 .3 .3 99.7
33 1 .3 .3
Total 361 93.8 100.0
Missing System 24 6.2
Total 385 100.0
Source: Field survey, 2012
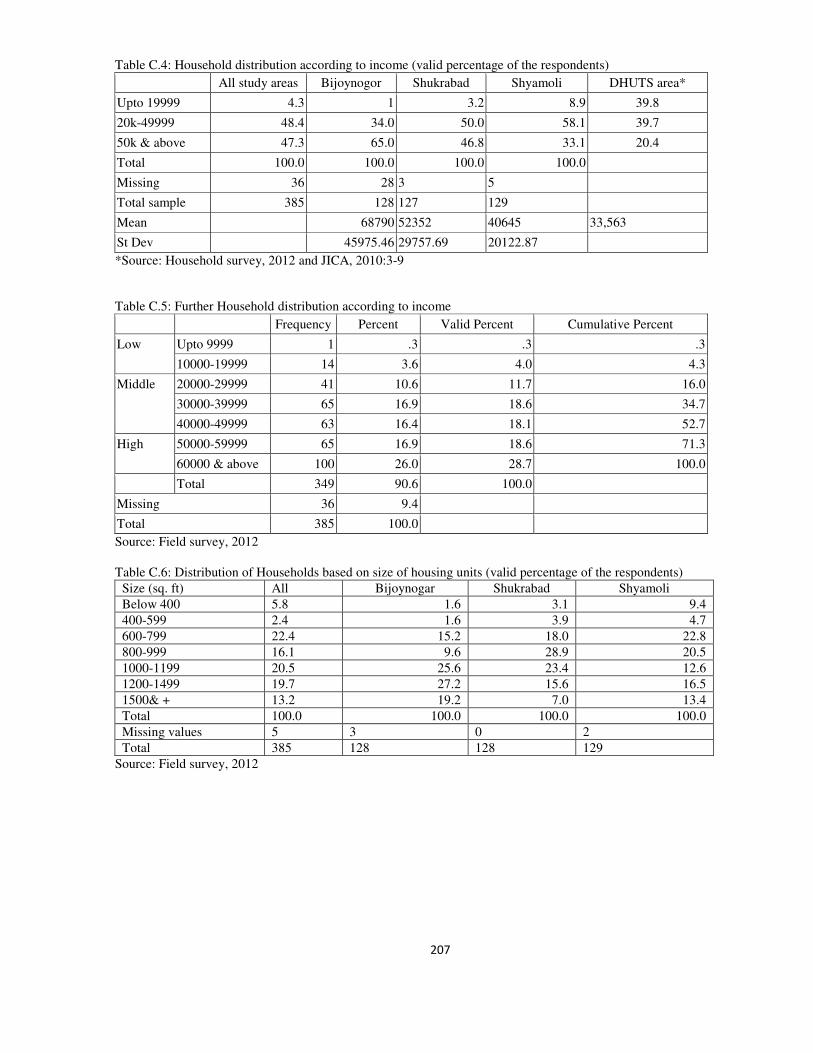
207
Table C.4: Household distribution according to income (valid percentage of the respondents)
All study areas Bijoynogor Shukrabad Shyamoli DHUTS area*
Upto 19999 4.3 1 3.2 8.9 39.8
20k-49999 48.4 34.0 50.0 58.1 39.7
50k & above 47.3 65.0 46.8 33.1 20.4
Total 100.0 100.0 100.0 100.0
Missing 36 28 3 5
Total sample 385 128 127 129
Mean 68790 52352 40645 33,563
St Dev 45975.46 29757.69 20122.87
*Source: Household survey, 2012 and JICA, 2010:3-9 Table C.5: Further Household distribution according to income
Frequency Percent Valid Percent Cumulative Percent
Low Upto 9999 1 .3 .3 .3
10000-19999 14 3.6 4.0 4.3
Middle 20000-29999 41 10.6 11.7 16.0
30000-39999 65 16.9 18.6 34.7
40000-49999 63 16.4 18.1 52.7
High 50000-59999 65 16.9 18.6 71.3
60000 & above 100 26.0 28.7 100.0
Total 349 90.6 100.0
Missing 36 9.4
Total 385 100.0
Source: Field survey, 2012 Table C.6: Distribution of Households based on size of housing units (valid percentage of the respondents)
Size (sq. ft) All Bijoynogar Shukrabad Shyamoli
Below 400 5.8 1.6 3.1 9.4
400-599 2.4 1.6 3.9 4.7
600-799 22.4 15.2 18.0 22.8
800-999 16.1 9.6 28.9 20.5
1000-1199 20.5 25.6 23.4 12.6
1200-1499 19.7 27.2 15.6 16.5
1500& + 13.2 19.2 7.0 13.4
Total 100.0 100.0 100.0 100.0
Missing values 5 3 0 2
Total 385 128 128 129
Source: Field survey, 2012
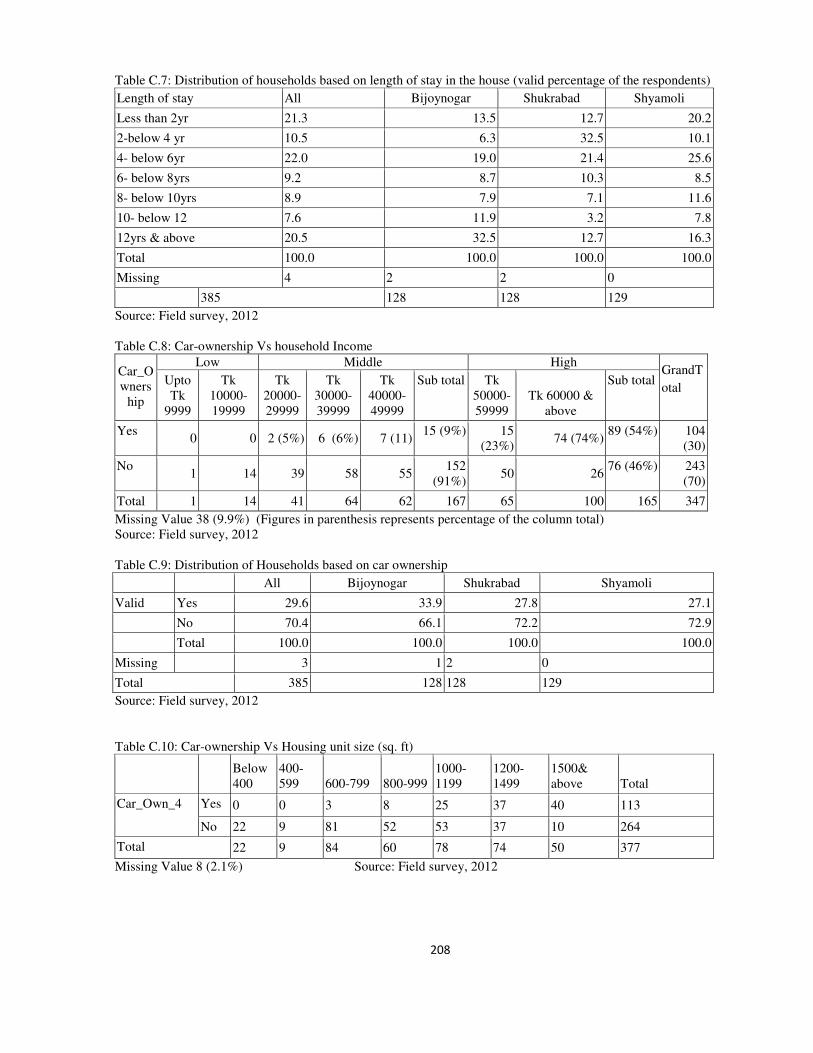
208
Table C.7: Distribution of households based on length of stay in the house (valid percentage of the respondents)
Length of stay All Bijoynogar Shukrabad Shyamoli
Less than 2yr 21.3 13.5 12.7 20.2
2-below 4 yr 10.5 6.3 32.5 10.1
4- below 6yr 22.0 19.0 21.4 25.6
6- below 8yrs 9.2 8.7 10.3 8.5
8- below 10yrs 8.9 7.9 7.1 11.6
10- below 12 7.6 11.9 3.2 7.8
12yrs & above 20.5 32.5 12.7 16.3
Total 100.0 100.0 100.0 100.0
Missing 4 2 2 0
385 128 128 129
Source: Field survey, 2012 Table C.8: Car-ownership Vs household Income
Car_Owners
hip
Low Middle High GrandT
otal Upto Tk
9999
Tk 10000-19999
Tk 20000-29999
Tk 30000-39999
Tk 40000-49999
Sub total Tk 50000-59999
Tk 60000 & above
Sub total
Yes 0 0 2 (5%) 6 (6%) 7 (11)
15 (9%) 15 (23%)
74 (74%) 89 (54%) 104
(30)
No 1 14 39 58 55
152 (91%)
50 26 76 (46%) 243
(70)
Total 1 14 41 64 62 167 65 100 165 347
Missing Value 38 (9.9%) (Figures in parenthesis represents percentage of the column total) Source: Field survey, 2012 Table C.9: Distribution of Households based on car ownership
All Bijoynogar Shukrabad Shyamoli
Valid Yes 29.6 33.9 27.8 27.1
No 70.4 66.1 72.2 72.9
Total 100.0 100.0 100.0 100.0
Missing 3 1 2 0
Total 385 128 128 129
Source: Field survey, 2012 Table C.10: Car-ownership Vs Housing unit size (sq. ft)
Below 400
400-599 600-799 800-999
1000-1199
1200-1499
1500& above Total
Car_Own_4 Yes 0 0 3 8 25 37 40 113
No 22 9 81 52 53 37 10 264
Total 22 9 84 60 78 74 50 377
Missing Value 8 (2.1%) Source: Field survey, 2012
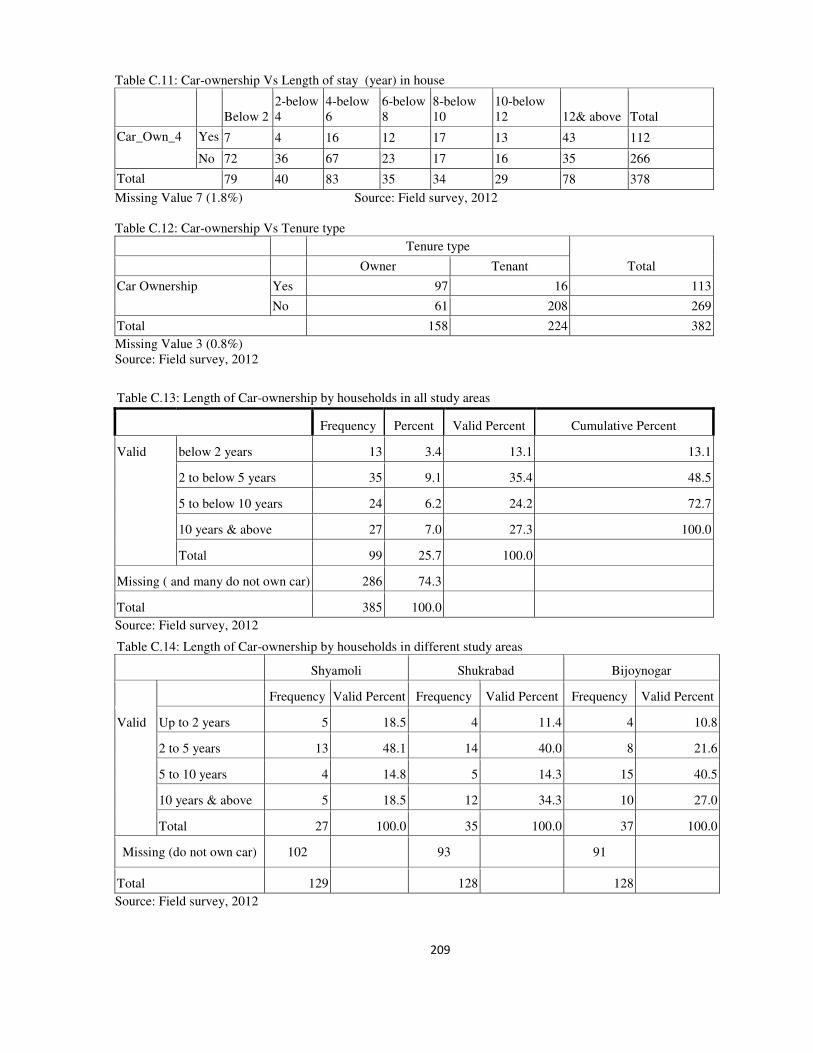
209
Table C.11: Car-ownership Vs Length of stay (year) in house
Below 2 2-below 4
4-below 6
6-below 8
8-below 10
10-below 12 12& above Total
Car_Own_4 Yes 7 4 16 12 17 13 43 112
No 72 36 67 23 17 16 35 266
Total 79 40 83 35 34 29 78 378
Missing Value 7 (1.8%) Source: Field survey, 2012 Table C.12: Car-ownership Vs Tenure type
Tenure type
Total Owner Tenant
Car Ownership Yes 97 16 113
No 61 208 269
Total 158 224 382
Missing Value 3 (0.8%) Source: Field survey, 2012
Table C.13: Length of Car-ownership by households in all study areas
Frequency Percent Valid Percent Cumulative Percent
Valid below 2 years 13 3.4 13.1 13.1
2 to below 5 years 35 9.1 35.4 48.5
5 to below 10 years 24 6.2 24.2 72.7
10 years & above 27 7.0 27.3 100.0
Total 99 25.7 100.0
Missing ( and many do not own car) 286 74.3
Total 385 100.0
Source: Field survey, 2012
Table C.14: Length of Car-ownership by households in different study areas
Shyamoli Shukrabad Bijoynogar
Frequency Valid Percent Frequency Valid Percent Frequency Valid Percent
Valid Up to 2 years 5 18.5 4 11.4 4 10.8
2 to 5 years 13 48.1 14 40.0 8 21.6
5 to 10 years 4 14.8 5 14.3 15 40.5
10 years & above 5 18.5 12 34.3 10 27.0
Total 27 100.0 35 100.0 37 100.0
Missing (do not own car) 102 93 91
Total 129 128 128
Source: Field survey, 2012
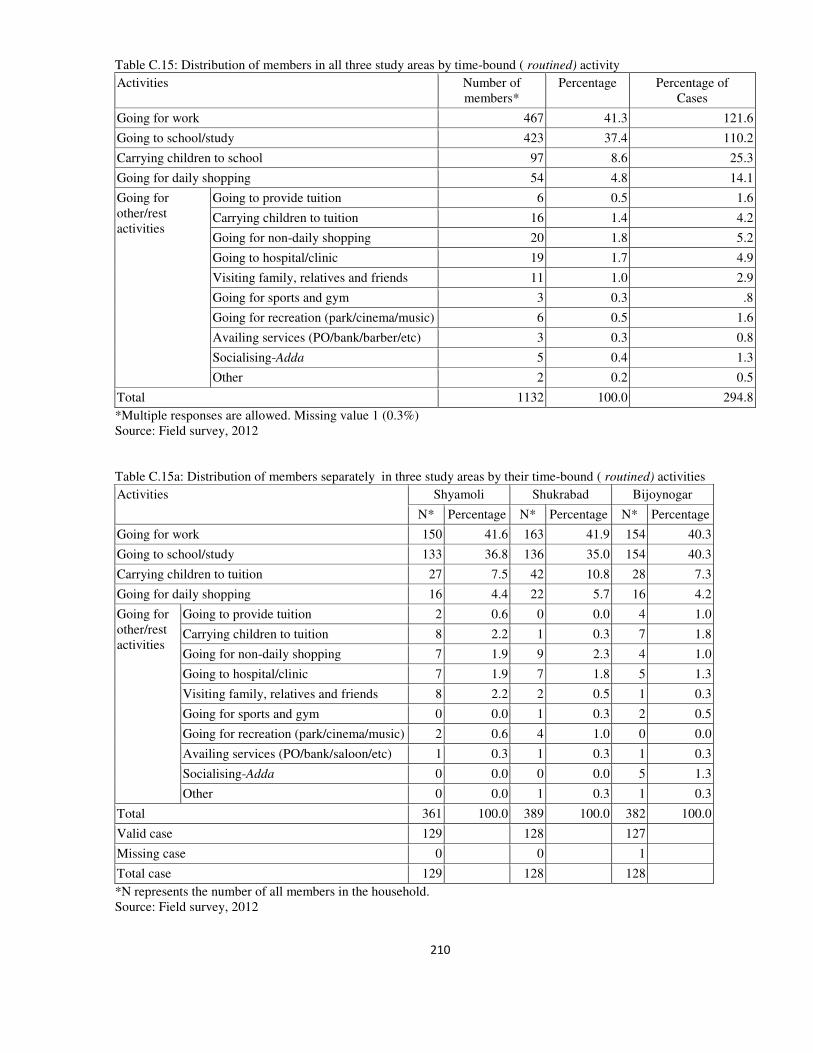
210
Table C.15: Distribution of members in all three study areas by time-bound ( routined) activity
Activities Number of members*
Percentage Percentage of Cases
Going for work 467 41.3 121.6
Going to school/study 423 37.4 110.2
Carrying children to school 97 8.6 25.3
Going for daily shopping 54 4.8 14.1
Going for other/rest activities
Going to provide tuition 6 0.5 1.6
Carrying children to tuition 16 1.4 4.2
Going for non-daily shopping 20 1.8 5.2
Going to hospital/clinic 19 1.7 4.9
Visiting family, relatives and friends 11 1.0 2.9
Going for sports and gym 3 0.3 .8
Going for recreation (park/cinema/music) 6 0.5 1.6
Availing services (PO/bank/barber/etc) 3 0.3 0.8
Socialising-Adda 5 0.4 1.3
Other 2 0.2 0.5
Total 1132 100.0 294.8
*Multiple responses are allowed. Missing value 1 (0.3%) Source: Field survey, 2012 Table C.15a: Distribution of members separately in three study areas by their time-bound ( routined) activities
Activities Shyamoli Shukrabad Bijoynogar
N* Percentage N* Percentage N* Percentage
Going for work 150 41.6 163 41.9 154 40.3
Going to school/study 133 36.8 136 35.0 154 40.3
Carrying children to tuition 27 7.5 42 10.8 28 7.3
Going for daily shopping 16 4.4 22 5.7 16 4.2
Going for other/rest activities
Going to provide tuition 2 0.6 0 0.0 4 1.0
Carrying children to tuition 8 2.2 1 0.3 7 1.8
Going for non-daily shopping 7 1.9 9 2.3 4 1.0
Going to hospital/clinic 7 1.9 7 1.8 5 1.3
Visiting family, relatives and friends 8 2.2 2 0.5 1 0.3
Going for sports and gym 0 0.0 1 0.3 2 0.5
Going for recreation (park/cinema/music) 2 0.6 4 1.0 0 0.0
Availing services (PO/bank/saloon/etc) 1 0.3 1 0.3 1 0.3
Socialising-Adda 0 0.0 0 0.0 5 1.3
Other 0 0.0 1 0.3 1 0.3
Total 361 100.0 389 100.0 382 100.0
Valid case 129 128 127
Missing case 0 0 1
Total case 129 128 128
*N represents the number of all members in the household. Source: Field survey, 2012
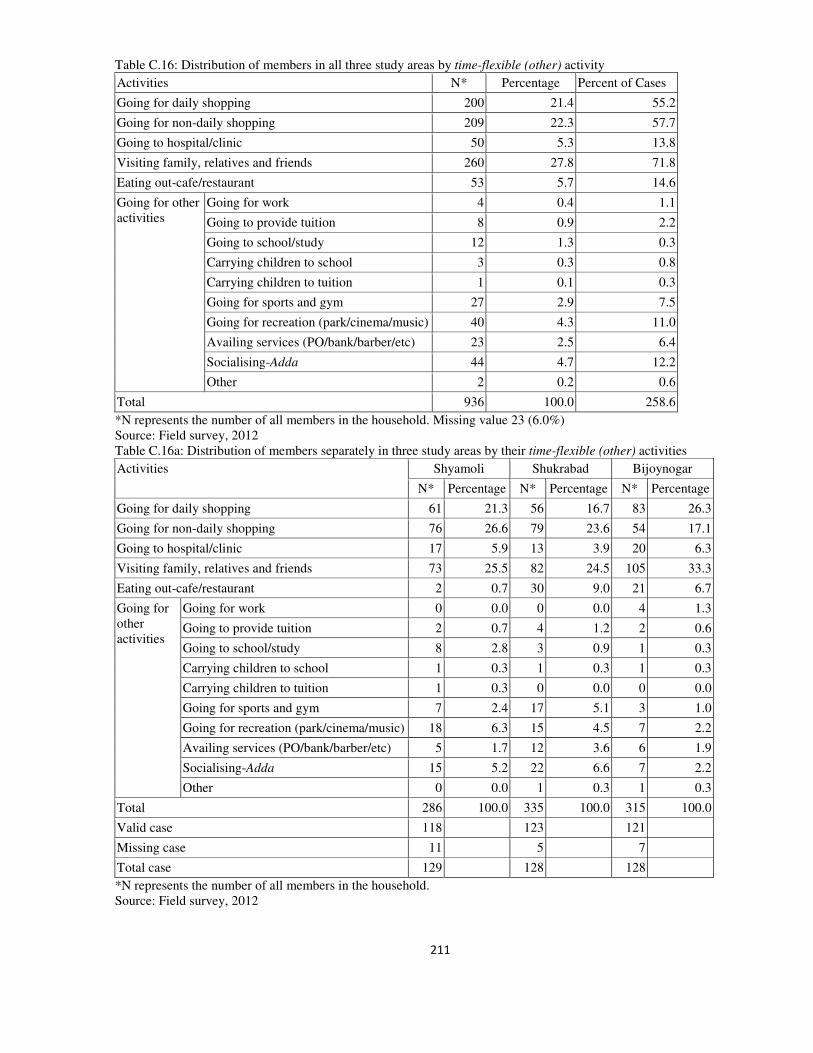
211
Table C.16: Distribution of members in all three study areas by time-flexible (other) activity
Activities N* Percentage Percent of Cases
Going for daily shopping 200 21.4 55.2
Going for non-daily shopping 209 22.3 57.7
Going to hospital/clinic 50 5.3 13.8
Visiting family, relatives and friends 260 27.8 71.8
Eating out-cafe/restaurant 53 5.7 14.6
Going for other activities
Going for work 4 0.4 1.1
Going to provide tuition 8 0.9 2.2
Going to school/study 12 1.3 0.3
Carrying children to school 3 0.3 0.8
Carrying children to tuition 1 0.1 0.3
Going for sports and gym 27 2.9 7.5
Going for recreation (park/cinema/music) 40 4.3 11.0
Availing services (PO/bank/barber/etc) 23 2.5 6.4
Socialising-Adda 44 4.7 12.2
Other 2 0.2 0.6
Total 936 100.0 258.6
*N represents the number of all members in the household. Missing value 23 (6.0%) Source: Field survey, 2012 Table C.16a: Distribution of members separately in three study areas by their time-flexible (other) activities
Activities Shyamoli Shukrabad Bijoynogar
N* Percentage N* Percentage N* Percentage
Going for daily shopping 61 21.3 56 16.7 83 26.3
Going for non-daily shopping 76 26.6 79 23.6 54 17.1
Going to hospital/clinic 17 5.9 13 3.9 20 6.3
Visiting family, relatives and friends 73 25.5 82 24.5 105 33.3
Eating out-cafe/restaurant 2 0.7 30 9.0 21 6.7
Going for other activities
Going for work 0 0.0 0 0.0 4 1.3
Going to provide tuition 2 0.7 4 1.2 2 0.6
Going to school/study 8 2.8 3 0.9 1 0.3
Carrying children to school 1 0.3 1 0.3 1 0.3
Carrying children to tuition 1 0.3 0 0.0 0 0.0
Going for sports and gym 7 2.4 17 5.1 3 1.0
Going for recreation (park/cinema/music) 18 6.3 15 4.5 7 2.2
Availing services (PO/bank/barber/etc) 5 1.7 12 3.6 6 1.9
Socialising-Adda 15 5.2 22 6.6 7 2.2
Other 0 0.0 1 0.3 1 0.3
Total 286 100.0 335 100.0 315 100.0
Valid case 118 123 121
Missing case 11 5 7
Total case 129 128 128
*N represents the number of all members in the household. Source: Field survey, 2012
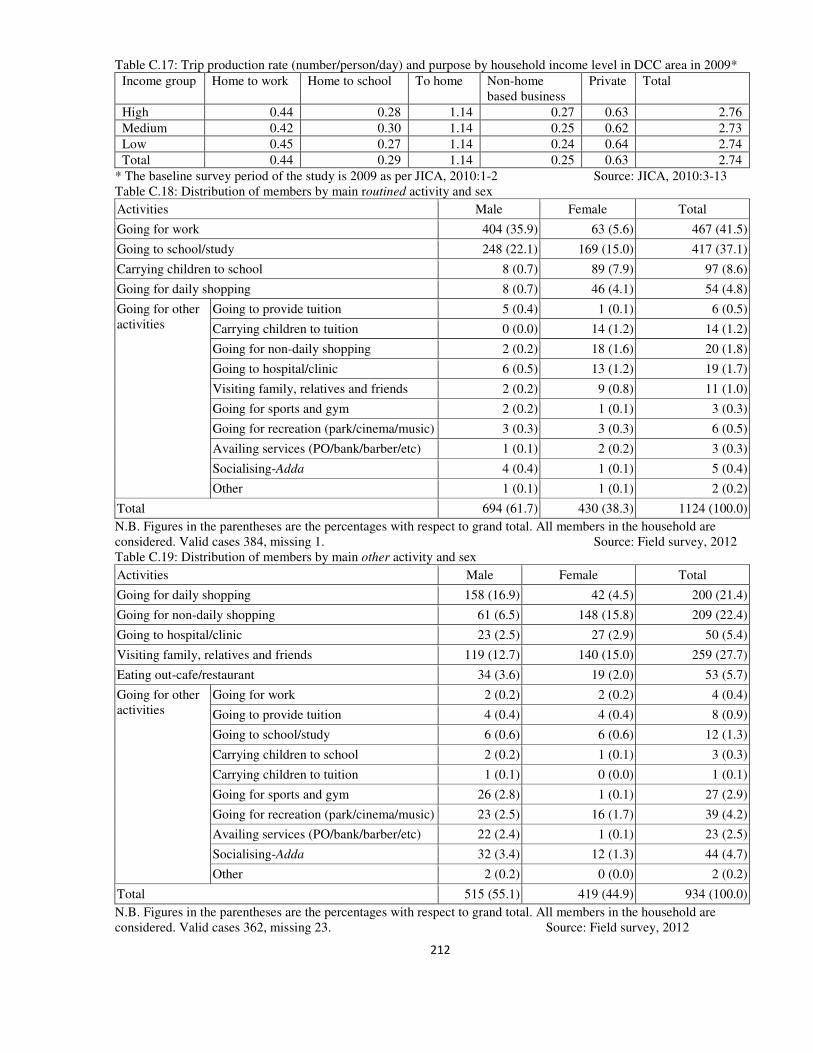
212
Table C.17: Trip production rate (number/person/day) and purpose by household income level in DCC area in 2009*
Income group Home to work Home to school To home Non-home based business
Private Total
High 0.44 0.28 1.14 0.27 0.63 2.76
Medium 0.42 0.30 1.14 0.25 0.62 2.73
Low 0.45 0.27 1.14 0.24 0.64 2.74
Total 0.44 0.29 1.14 0.25 0.63 2.74
* The baseline survey period of the study is 2009 as per JICA, 2010:1-2 Source: JICA, 2010:3-13 Table C.18: Distribution of members by main routined activity and sex
Activities Male Female Total
Going for work 404 (35.9) 63 (5.6) 467 (41.5)
Going to school/study 248 (22.1) 169 (15.0) 417 (37.1)
Carrying children to school 8 (0.7) 89 (7.9) 97 (8.6)
Going for daily shopping 8 (0.7) 46 (4.1) 54 (4.8)
Going for other activities
Going to provide tuition 5 (0.4) 1 (0.1) 6 (0.5)
Carrying children to tuition 0 (0.0) 14 (1.2) 14 (1.2)
Going for non-daily shopping 2 (0.2) 18 (1.6) 20 (1.8)
Going to hospital/clinic 6 (0.5) 13 (1.2) 19 (1.7)
Visiting family, relatives and friends 2 (0.2) 9 (0.8) 11 (1.0)
Going for sports and gym 2 (0.2) 1 (0.1) 3 (0.3)
Going for recreation (park/cinema/music) 3 (0.3) 3 (0.3) 6 (0.5)
Availing services (PO/bank/barber/etc) 1 (0.1) 2 (0.2) 3 (0.3)
Socialising-Adda 4 (0.4) 1 (0.1) 5 (0.4)
Other 1 (0.1) 1 (0.1) 2 (0.2)
Total 694 (61.7) 430 (38.3) 1124 (100.0)
N.B. Figures in the parentheses are the percentages with respect to grand total. All members in the household are considered. Valid cases 384, missing 1. Source: Field survey, 2012 Table C.19: Distribution of members by main other activity and sex
Activities Male Female Total
Going for daily shopping 158 (16.9) 42 (4.5) 200 (21.4)
Going for non-daily shopping 61 (6.5) 148 (15.8) 209 (22.4)
Going to hospital/clinic 23 (2.5) 27 (2.9) 50 (5.4)
Visiting family, relatives and friends 119 (12.7) 140 (15.0) 259 (27.7)
Eating out-cafe/restaurant 34 (3.6) 19 (2.0) 53 (5.7)
Going for other activities
Going for work 2 (0.2) 2 (0.2) 4 (0.4)
Going to provide tuition 4 (0.4) 4 (0.4) 8 (0.9)
Going to school/study 6 (0.6) 6 (0.6) 12 (1.3)
Carrying children to school 2 (0.2) 1 (0.1) 3 (0.3)
Carrying children to tuition 1 (0.1) 0 (0.0) 1 (0.1)
Going for sports and gym 26 (2.8) 1 (0.1) 27 (2.9)
Going for recreation (park/cinema/music) 23 (2.5) 16 (1.7) 39 (4.2)
Availing services (PO/bank/barber/etc) 22 (2.4) 1 (0.1) 23 (2.5)
Socialising-Adda 32 (3.4) 12 (1.3) 44 (4.7)
Other 2 (0.2) 0 (0.0) 2 (0.2)
Total 515 (55.1) 419 (44.9) 934 (100.0)
N.B. Figures in the parentheses are the percentages with respect to grand total. All members in the household are considered. Valid cases 362, missing 23. Source: Field survey, 2012
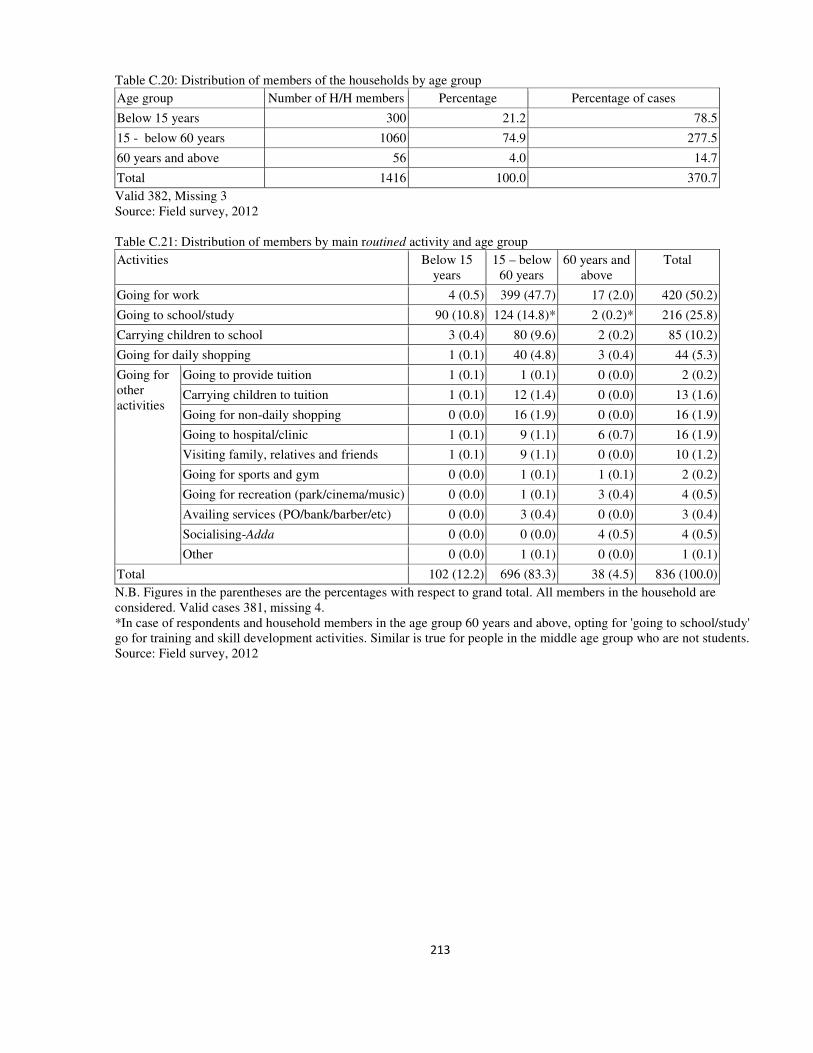
213
Table C.20: Distribution of members of the households by age group
Age group Number of H/H members Percentage Percentage of cases
Below 15 years 300 21.2 78.5
15 - below 60 years 1060 74.9 277.5
60 years and above 56 4.0 14.7
Total 1416 100.0 370.7
Valid 382, Missing 3 Source: Field survey, 2012 Table C.21: Distribution of members by main routined activity and age group
Activities Below 15 years
15 – below 60 years
60 years and above
Total
Going for work 4 (0.5) 399 (47.7) 17 (2.0) 420 (50.2)
Going to school/study 90 (10.8) 124 (14.8)* 2 (0.2)* 216 (25.8)
Carrying children to school 3 (0.4) 80 (9.6) 2 (0.2) 85 (10.2)
Going for daily shopping 1 (0.1) 40 (4.8) 3 (0.4) 44 (5.3)
Going for other activities
Going to provide tuition 1 (0.1) 1 (0.1) 0 (0.0) 2 (0.2)
Carrying children to tuition 1 (0.1) 12 (1.4) 0 (0.0) 13 (1.6)
Going for non-daily shopping 0 (0.0) 16 (1.9) 0 (0.0) 16 (1.9)
Going to hospital/clinic 1 (0.1) 9 (1.1) 6 (0.7) 16 (1.9)
Visiting family, relatives and friends 1 (0.1) 9 (1.1) 0 (0.0) 10 (1.2)
Going for sports and gym 0 (0.0) 1 (0.1) 1 (0.1) 2 (0.2)
Going for recreation (park/cinema/music) 0 (0.0) 1 (0.1) 3 (0.4) 4 (0.5)
Availing services (PO/bank/barber/etc) 0 (0.0) 3 (0.4) 0 (0.0) 3 (0.4)
Socialising-Adda 0 (0.0) 0 (0.0) 4 (0.5) 4 (0.5)
Other 0 (0.0) 1 (0.1) 0 (0.0) 1 (0.1)
Total 102 (12.2) 696 (83.3) 38 (4.5) 836 (100.0)
N.B. Figures in the parentheses are the percentages with respect to grand total. All members in the household are considered. Valid cases 381, missing 4. *In case of respondents and household members in the age group 60 years and above, opting for 'going to school/study' go for training and skill development activities. Similar is true for people in the middle age group who are not students. Source: Field survey, 2012
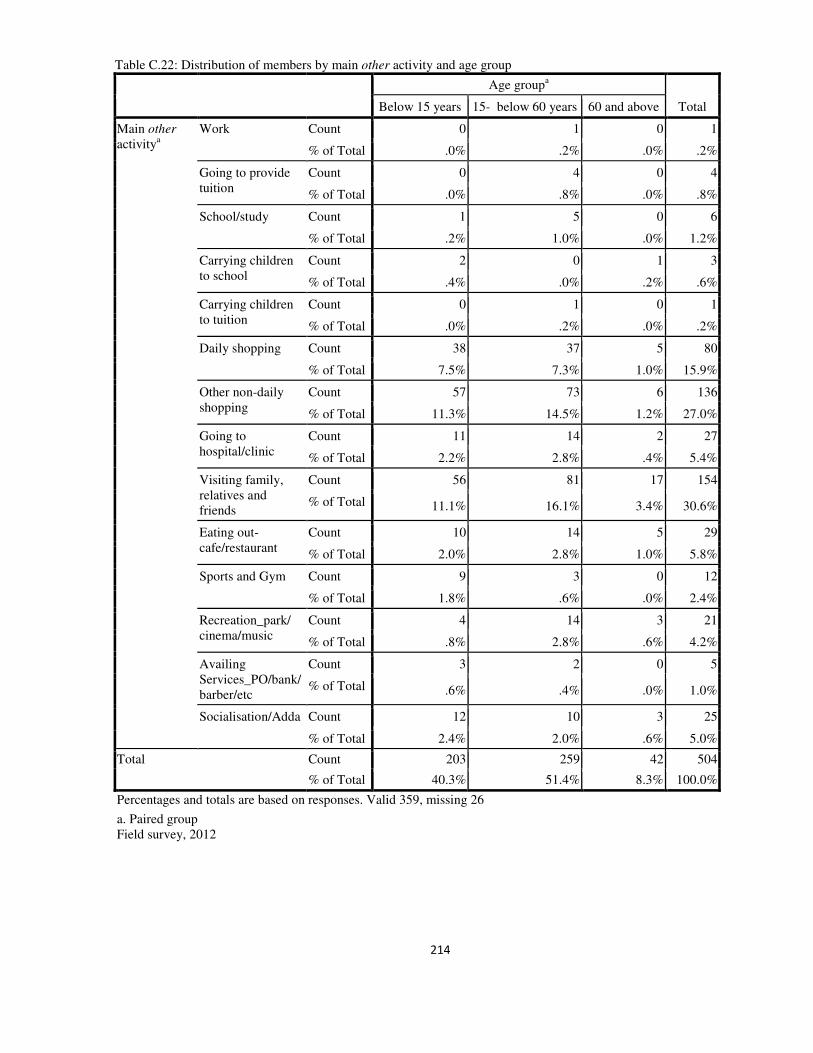
214
Table C.22: Distribution of members by main other activity and age group
Age groupa
Total Below 15 years 15- below 60 years 60 and above
Main other activitya
Work Count 0 1 0 1
% of Total .0% .2% .0% .2%
Going to provide tuition
Count 0 4 0 4
% of Total .0% .8% .0% .8%
School/study Count 1 5 0 6
% of Total .2% 1.0% .0% 1.2%
Carrying children to school
Count 2 0 1 3
% of Total .4% .0% .2% .6%
Carrying children to tuition
Count 0 1 0 1
% of Total .0% .2% .0% .2%
Daily shopping Count 38 37 5 80
% of Total 7.5% 7.3% 1.0% 15.9%
Other non-daily shopping
Count 57 73 6 136
% of Total 11.3% 14.5% 1.2% 27.0%
Going to hospital/clinic
Count 11 14 2 27
% of Total 2.2% 2.8% .4% 5.4%
Visiting family, relatives and friends
Count 56 81 17 154
% of Total 11.1% 16.1% 3.4% 30.6%
Eating out-cafe/restaurant
Count 10 14 5 29
% of Total 2.0% 2.8% 1.0% 5.8%
Sports and Gym Count 9 3 0 12
% of Total 1.8% .6% .0% 2.4%
Recreation_park/ cinema/music
Count 4 14 3 21
% of Total .8% 2.8% .6% 4.2%
Availing Services_PO/bank/barber/etc
Count 3 2 0 5
% of Total .6% .4% .0% 1.0%
Socialisation/Adda Count 12 10 3 25
% of Total 2.4% 2.0% .6% 5.0%
Total Count 203 259 42 504
% of Total 40.3% 51.4% 8.3% 100.0%
Percentages and totals are based on responses. Valid 359, missing 26
a. Paired group Field survey, 2012
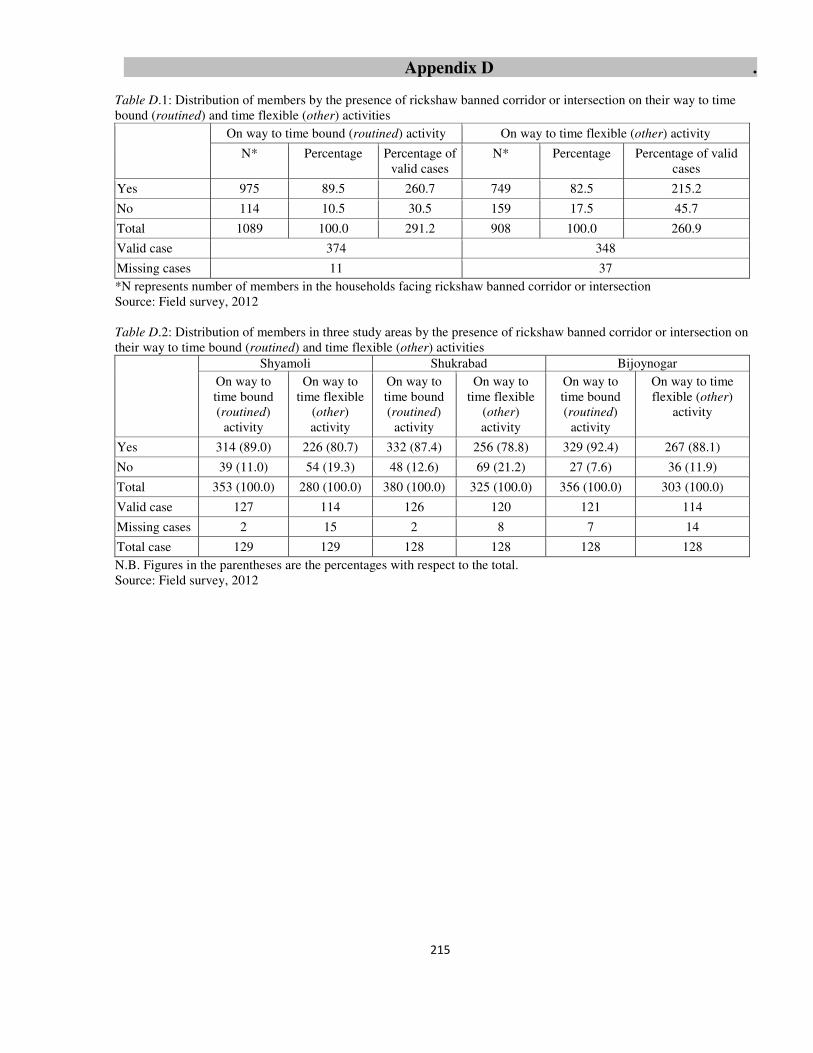
215
Appendix D . Table D.1: Distribution of members by the presence of rickshaw banned corridor or intersection on their way to time bound (routined) and time flexible (other) activities
On way to time bound (routined) activity On way to time flexible (other) activity
N* Percentage Percentage of valid cases
N* Percentage Percentage of valid cases
Yes 975 89.5 260.7 749 82.5 215.2
No 114 10.5 30.5 159 17.5 45.7
Total 1089 100.0 291.2 908 100.0 260.9
Valid case 374 348
Missing cases 11 37
*N represents number of members in the households facing rickshaw banned corridor or intersection Source: Field survey, 2012 Table D.2: Distribution of members in three study areas by the presence of rickshaw banned corridor or intersection on their way to time bound (routined) and time flexible (other) activities
Shyamoli Shukrabad Bijoynogar
On way to time bound (routined)
activity
On way to time flexible
(other) activity
On way to time bound (routined)
activity
On way to time flexible
(other) activity
On way to time bound (routined)
activity
On way to time flexible (other)
activity
Yes 314 (89.0) 226 (80.7) 332 (87.4) 256 (78.8) 329 (92.4) 267 (88.1)
No 39 (11.0) 54 (19.3) 48 (12.6) 69 (21.2) 27 (7.6) 36 (11.9)
Total 353 (100.0) 280 (100.0) 380 (100.0) 325 (100.0) 356 (100.0) 303 (100.0)
Valid case 127 114 126 120 121 114
Missing cases 2 15 2 8 7 14
Total case 129 129 128 128 128 128
N.B. Figures in the parentheses are the percentages with respect to the total. Source: Field survey, 2012
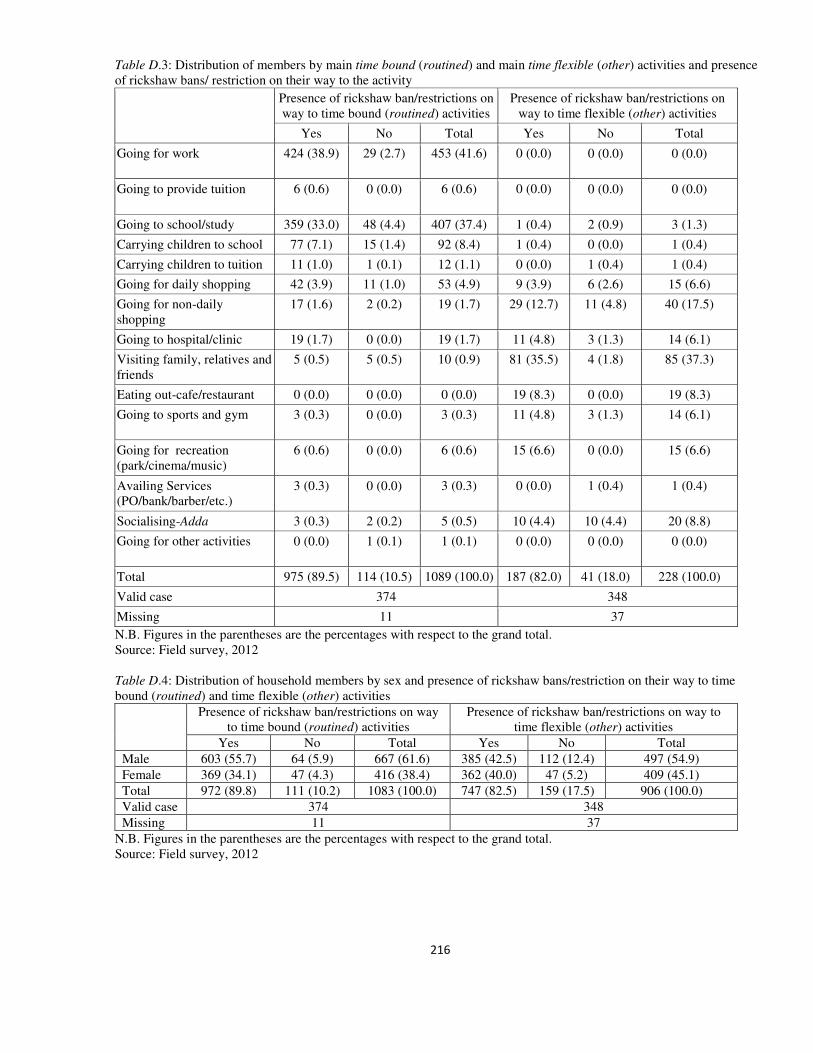
216
Table D.3: Distribution of members by main time bound (routined) and main time flexible (other) activities and presence of rickshaw bans/ restriction on their way to the activity
Presence of rickshaw ban/restrictions on way to time bound (routined) activities
Presence of rickshaw ban/restrictions on way to time flexible (other) activities
Yes No Total Yes No Total
Going for work 424 (38.9) 29 (2.7) 453 (41.6) 0 (0.0) 0 (0.0) 0 (0.0)
Going to provide tuition 6 (0.6) 0 (0.0) 6 (0.6) 0 (0.0) 0 (0.0) 0 (0.0)
Going to school/study 359 (33.0) 48 (4.4) 407 (37.4) 1 (0.4) 2 (0.9) 3 (1.3)
Carrying children to school 77 (7.1) 15 (1.4) 92 (8.4) 1 (0.4) 0 (0.0) 1 (0.4)
Carrying children to tuition 11 (1.0) 1 (0.1) 12 (1.1) 0 (0.0) 1 (0.4) 1 (0.4)
Going for daily shopping 42 (3.9) 11 (1.0) 53 (4.9) 9 (3.9) 6 (2.6) 15 (6.6)
Going for non-daily shopping
17 (1.6) 2 (0.2) 19 (1.7) 29 (12.7) 11 (4.8) 40 (17.5)
Going to hospital/clinic 19 (1.7) 0 (0.0) 19 (1.7) 11 (4.8) 3 (1.3) 14 (6.1)
Visiting family, relatives and friends
5 (0.5) 5 (0.5) 10 (0.9) 81 (35.5) 4 (1.8) 85 (37.3)
Eating out-cafe/restaurant 0 (0.0) 0 (0.0) 0 (0.0) 19 (8.3) 0 (0.0) 19 (8.3)
Going to sports and gym 3 (0.3) 0 (0.0) 3 (0.3) 11 (4.8) 3 (1.3) 14 (6.1)
Going for recreation (park/cinema/music)
6 (0.6) 0 (0.0) 6 (0.6) 15 (6.6) 0 (0.0) 15 (6.6)
Availing Services (PO/bank/barber/etc.)
3 (0.3) 0 (0.0) 3 (0.3) 0 (0.0) 1 (0.4) 1 (0.4)
Socialising-Adda 3 (0.3) 2 (0.2) 5 (0.5) 10 (4.4) 10 (4.4) 20 (8.8)
Going for other activities 0 (0.0) 1 (0.1) 1 (0.1) 0 (0.0) 0 (0.0) 0 (0.0)
Total 975 (89.5) 114 (10.5) 1089 (100.0) 187 (82.0) 41 (18.0) 228 (100.0)
Valid case 374 348
Missing 11 37
N.B. Figures in the parentheses are the percentages with respect to the grand total. Source: Field survey, 2012 Table D.4: Distribution of household members by sex and presence of rickshaw bans/restriction on their way to time bound (routined) and time flexible (other) activities
Presence of rickshaw ban/restrictions on way to time bound (routined) activities
Presence of rickshaw ban/restrictions on way to time flexible (other) activities
Yes No Total Yes No Total
Male 603 (55.7) 64 (5.9) 667 (61.6) 385 (42.5) 112 (12.4) 497 (54.9)
Female 369 (34.1) 47 (4.3) 416 (38.4) 362 (40.0) 47 (5.2) 409 (45.1)
Total 972 (89.8) 111 (10.2) 1083 (100.0) 747 (82.5) 159 (17.5) 906 (100.0)
Valid case 374 348
Missing 11 37
N.B. Figures in the parentheses are the percentages with respect to the grand total. Source: Field survey, 2012
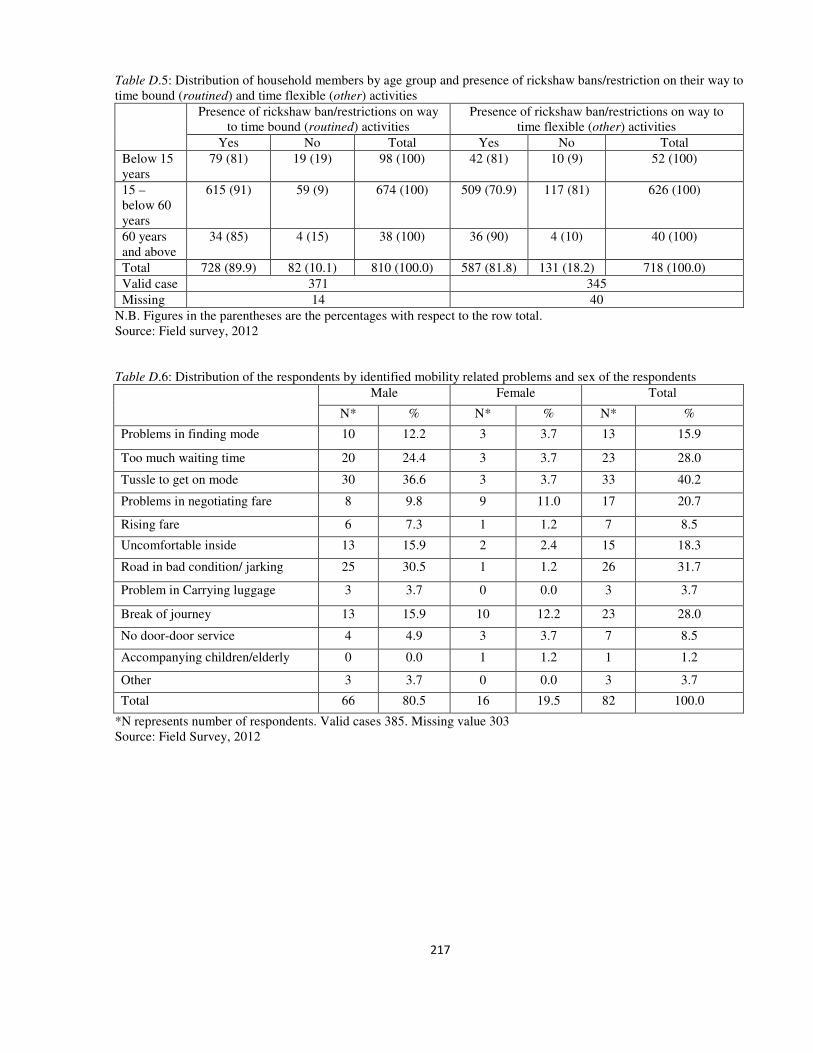
217
Table D.5: Distribution of household members by age group and presence of rickshaw bans/restriction on their way to time bound (routined) and time flexible (other) activities
Presence of rickshaw ban/restrictions on way to time bound (routined) activities
Presence of rickshaw ban/restrictions on way to time flexible (other) activities
Yes No Total Yes No Total
Below 15 years
79 (81) 19 (19) 98 (100) 42 (81) 10 (9) 52 (100)
15 – below 60 years
615 (91) 59 (9) 674 (100) 509 (70.9) 117 (81) 626 (100)
60 years and above
34 (85) 4 (15) 38 (100) 36 (90) 4 (10) 40 (100)
Total 728 (89.9) 82 (10.1) 810 (100.0) 587 (81.8) 131 (18.2) 718 (100.0)
Valid case 371 345
Missing 14 40
N.B. Figures in the parentheses are the percentages with respect to the row total. Source: Field survey, 2012 Table D.6: Distribution of the respondents by identified mobility related problems and sex of the respondents
Male Female Total
N* % N* % N* %
Problems in finding mode 10 12.2 3 3.7 13 15.9
Too much waiting time 20 24.4 3 3.7 23 28.0
Tussle to get on mode 30 36.6 3 3.7 33 40.2
Problems in negotiating fare 8 9.8 9 11.0 17 20.7
Rising fare 6 7.3 1 1.2 7 8.5
Uncomfortable inside 13 15.9 2 2.4 15 18.3
Road in bad condition/ jarking 25 30.5 1 1.2 26 31.7
Problem in Carrying luggage 3 3.7 0 0.0 3 3.7
Break of journey 13 15.9 10 12.2 23 28.0
No door-door service 4 4.9 3 3.7 7 8.5
Accompanying children/elderly 0 0.0 1 1.2 1 1.2
Other 3 3.7 0 0.0 3 3.7
Total 66 80.5 16 19.5 82 100.0
*N represents number of respondents. Valid cases 385. Missing value 303 Source: Field Survey, 2012
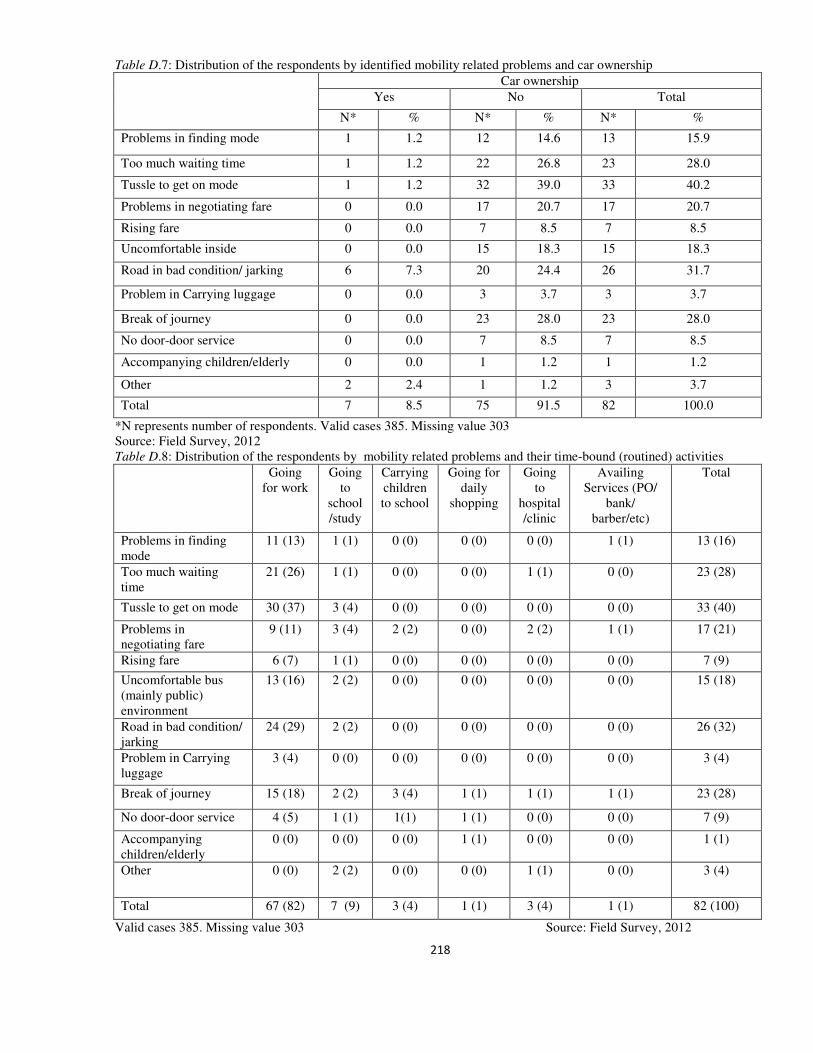
218
Table D.7: Distribution of the respondents by identified mobility related problems and car ownership
Car ownership
Yes No Total
N* % N* % N* %
Problems in finding mode 1 1.2 12 14.6 13 15.9
Too much waiting time 1 1.2 22 26.8 23 28.0
Tussle to get on mode 1 1.2 32 39.0 33 40.2
Problems in negotiating fare 0 0.0 17 20.7 17 20.7
Rising fare 0 0.0 7 8.5 7 8.5
Uncomfortable inside 0 0.0 15 18.3 15 18.3
Road in bad condition/ jarking 6 7.3 20 24.4 26 31.7
Problem in Carrying luggage 0 0.0 3 3.7 3 3.7
Break of journey 0 0.0 23 28.0 23 28.0
No door-door service 0 0.0 7 8.5 7 8.5
Accompanying children/elderly 0 0.0 1 1.2 1 1.2
Other 2 2.4 1 1.2 3 3.7
Total 7 8.5 75 91.5 82 100.0
*N represents number of respondents. Valid cases 385. Missing value 303 Source: Field Survey, 2012 Table D.8: Distribution of the respondents by mobility related problems and their time-bound (routined) activities
Going for work
Going to
school /study
Carrying children to school
Going for daily
shopping
Going to
hospital/clinic
Availing Services (PO/
bank/ barber/etc)
Total
Problems in finding mode
11 (13) 1 (1) 0 (0) 0 (0) 0 (0) 1 (1) 13 (16)
Too much waiting time
21 (26) 1 (1) 0 (0) 0 (0) 1 (1) 0 (0) 23 (28)
Tussle to get on mode 30 (37) 3 (4) 0 (0) 0 (0) 0 (0) 0 (0) 33 (40)
Problems in negotiating fare
9 (11) 3 (4) 2 (2) 0 (0) 2 (2) 1 (1) 17 (21)
Rising fare 6 (7) 1 (1) 0 (0) 0 (0) 0 (0) 0 (0) 7 (9)
Uncomfortable bus (mainly public) environment
13 (16) 2 (2) 0 (0) 0 (0) 0 (0) 0 (0) 15 (18)
Road in bad condition/ jarking
24 (29) 2 (2) 0 (0) 0 (0) 0 (0) 0 (0) 26 (32)
Problem in Carrying luggage
3 (4) 0 (0) 0 (0) 0 (0) 0 (0) 0 (0) 3 (4)
Break of journey 15 (18) 2 (2) 3 (4) 1 (1) 1 (1) 1 (1) 23 (28)
No door-door service 4 (5) 1 (1) 1(1) 1 (1) 0 (0) 0 (0) 7 (9)
Accompanying children/elderly
0 (0) 0 (0) 0 (0) 1 (1) 0 (0) 0 (0) 1 (1)
Other 0 (0) 2 (2) 0 (0) 0 (0) 1 (1) 0 (0) 3 (4)
Total 67 (82) 7 (9) 3 (4) 1 (1) 3 (4) 1 (1) 82 (100)
Valid cases 385. Missing value 303 Source: Field Survey, 2012
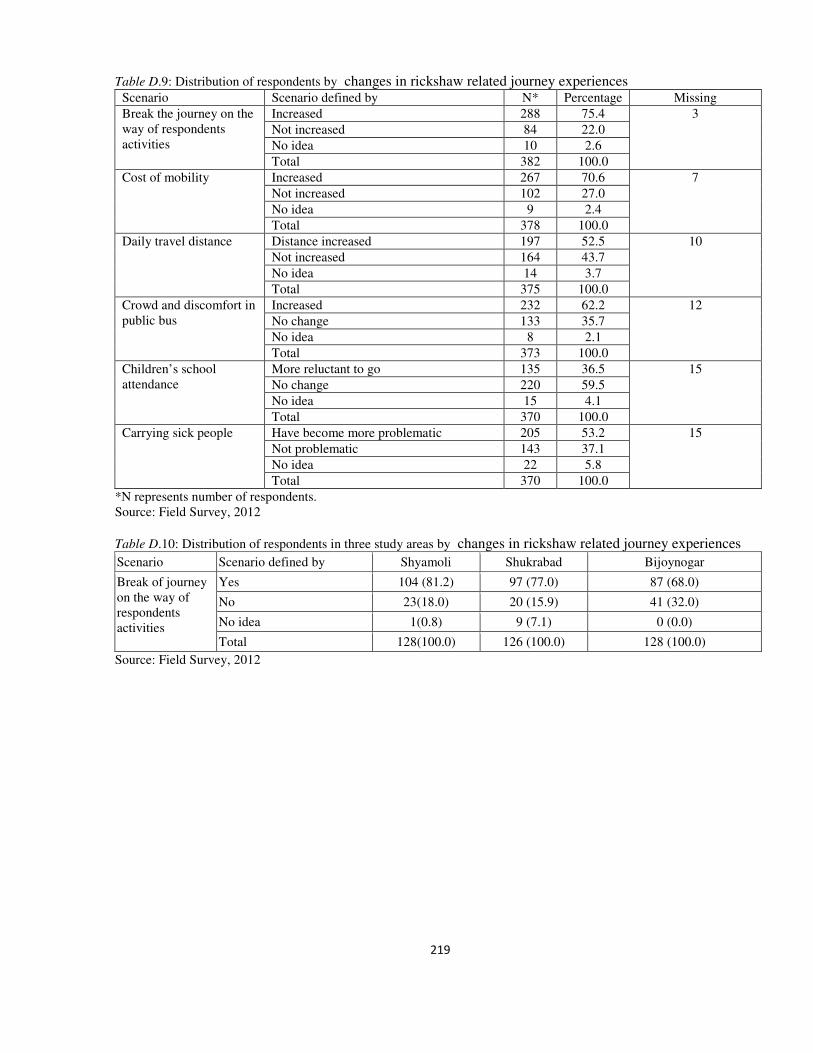
219
Table D.9: Distribution of respondents by changes in rickshaw related journey experiences Scenario Scenario defined by N* Percentage Missing
Break the journey on the way of respondents activities
Increased 288 75.4 3
Not increased 84 22.0
No idea 10 2.6
Total 382 100.0
Cost of mobility Increased 267 70.6 7
Not increased 102 27.0
No idea 9 2.4
Total 378 100.0
Daily travel distance Distance increased 197 52.5 10
Not increased 164 43.7
No idea 14 3.7
Total 375 100.0
Crowd and discomfort in public bus
Increased 232 62.2 12
No change 133 35.7
No idea 8 2.1
Total 373 100.0
Children’s school attendance
More reluctant to go 135 36.5 15
No change 220 59.5
No idea 15 4.1
Total 370 100.0
Carrying sick people Have become more problematic 205 53.2 15
Not problematic 143 37.1
No idea 22 5.8
Total 370 100.0
*N represents number of respondents. Source: Field Survey, 2012
Table D.10: Distribution of respondents in three study areas by changes in rickshaw related journey experiences
Scenario Scenario defined by Shyamoli Shukrabad Bijoynogar
Break of journey on the way of respondents activities
Yes 104 (81.2) 97 (77.0) 87 (68.0)
No 23(18.0) 20 (15.9) 41 (32.0)
No idea 1(0.8) 9 (7.1) 0 (0.0)
Total 128(100.0) 126 (100.0) 128 (100.0)
Source: Field Survey, 2012
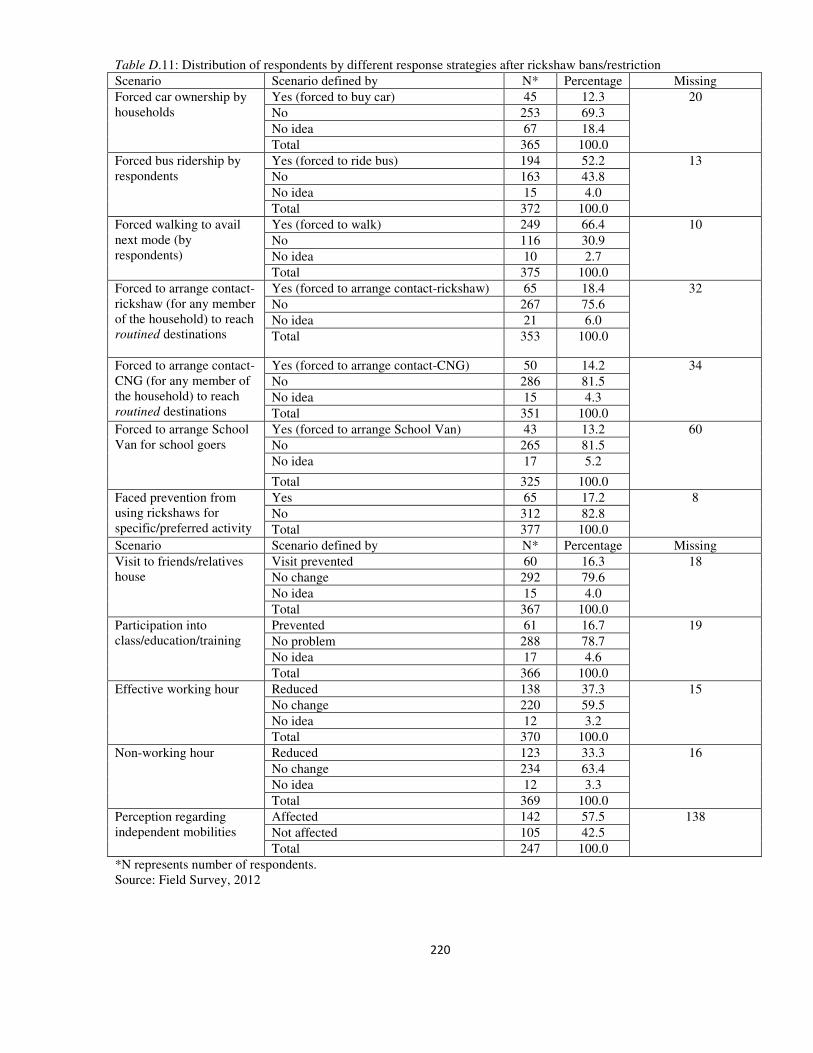
220
Table D.11: Distribution of respondents by different response strategies after rickshaw bans/restriction
Scenario Scenario defined by N* Percentage Missing
Forced car ownership by households
Yes (forced to buy car) 45 12.3 20
No 253 69.3
No idea 67 18.4
Total 365 100.0
Forced bus ridership by respondents
Yes (forced to ride bus) 194 52.2 13
No 163 43.8
No idea 15 4.0
Total 372 100.0
Forced walking to avail next mode (by respondents)
Yes (forced to walk) 249 66.4 10
No 116 30.9
No idea 10 2.7
Total 375 100.0
Forced to arrange contact-rickshaw (for any member of the household) to reach routined destinations
Yes (forced to arrange contact-rickshaw) 65 18.4 32
No 267 75.6
No idea 21 6.0
Total 353 100.0
Forced to arrange contact-CNG (for any member of the household) to reach routined destinations
Yes (forced to arrange contact-CNG) 50 14.2 34
No 286 81.5
No idea 15 4.3
Total 351 100.0
Forced to arrange School Van for school goers
Yes (forced to arrange School Van) 43 13.2 60
No 265 81.5
No idea 17 5.2
Total 325 100.0
Faced prevention from using rickshaws for specific/preferred activity
Yes 65 17.2 8
No 312 82.8
Total 377 100.0
Scenario Scenario defined by N* Percentage Missing
Visit to friends/relatives house
Visit prevented 60 16.3 18
No change 292 79.6
No idea 15 4.0
Total 367 100.0
Participation into class/education/training
Prevented 61 16.7 19
No problem 288 78.7
No idea 17 4.6
Total 366 100.0
Effective working hour Reduced 138 37.3 15
No change 220 59.5
No idea 12 3.2
Total 370 100.0
Non-working hour Reduced 123 33.3 16
No change 234 63.4
No idea 12 3.3
Total 369 100.0
Perception regarding independent mobilities
Affected 142 57.5 138
Not affected 105 42.5
Total 247 100.0
*N represents number of respondents. Source: Field Survey, 2012
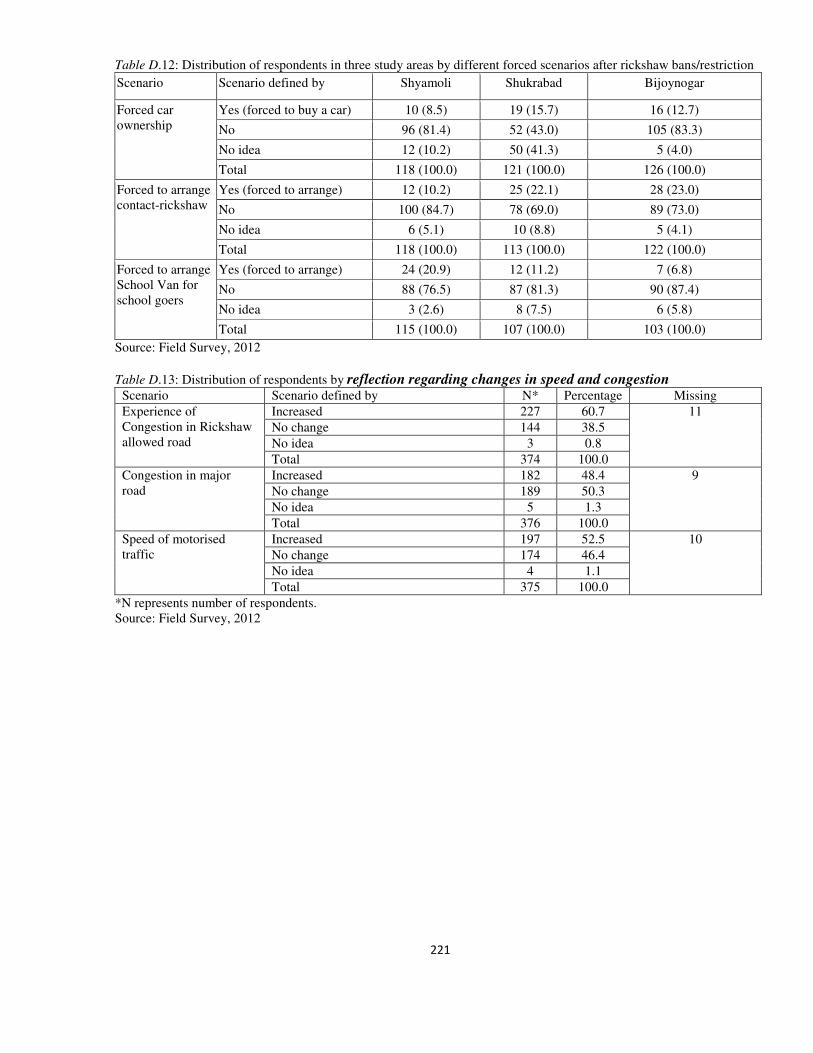
221
Table D.12: Distribution of respondents in three study areas by different forced scenarios after rickshaw bans/restriction
Scenario Scenario defined by Shyamoli Shukrabad Bijoynogar
Forced car ownership
Yes (forced to buy a car) 10 (8.5) 19 (15.7) 16 (12.7)
No 96 (81.4) 52 (43.0) 105 (83.3)
No idea 12 (10.2) 50 (41.3) 5 (4.0)
Total 118 (100.0) 121 (100.0) 126 (100.0)
Forced to arrange contact-rickshaw
Yes (forced to arrange) 12 (10.2) 25 (22.1) 28 (23.0)
No 100 (84.7) 78 (69.0) 89 (73.0)
No idea 6 (5.1) 10 (8.8) 5 (4.1)
Total 118 (100.0) 113 (100.0) 122 (100.0)
Forced to arrange School Van for school goers
Yes (forced to arrange) 24 (20.9) 12 (11.2) 7 (6.8)
No 88 (76.5) 87 (81.3) 90 (87.4)
No idea 3 (2.6) 8 (7.5) 6 (5.8)
Total 115 (100.0) 107 (100.0) 103 (100.0)
Source: Field Survey, 2012
Table D.13: Distribution of respondents by reflection regarding changes in speed and congestion Scenario Scenario defined by N* Percentage Missing
Experience of Congestion in Rickshaw allowed road
Increased 227 60.7 11
No change 144 38.5
No idea 3 0.8
Total 374 100.0
Congestion in major road
Increased 182 48.4 9
No change 189 50.3
No idea 5 1.3
Total 376 100.0
Speed of motorised traffic
Increased 197 52.5 10
No change 174 46.4
No idea 4 1.1
Total 375 100.0
*N represents number of respondents. Source: Field Survey, 2012
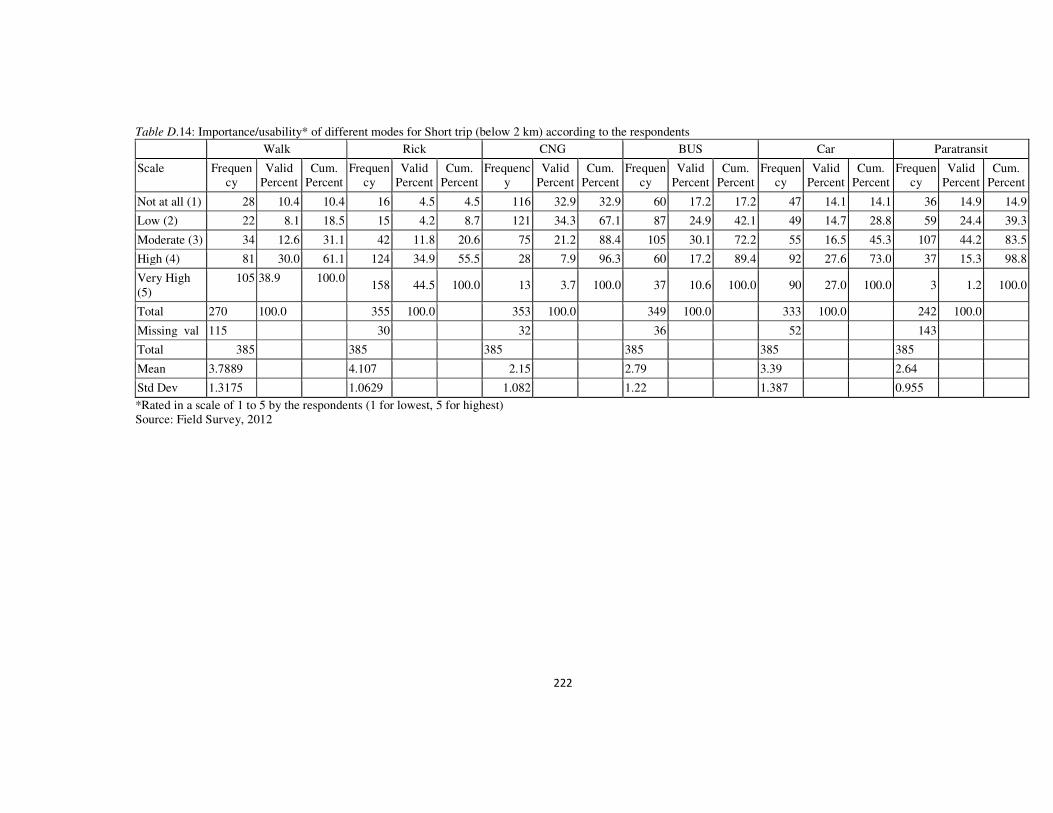
222
Table D.14: Importance/usability* of different modes for Short trip (below 2 km) according to the respondents
Walk Rick CNG BUS Car Paratransit
Scale Frequency
Valid Percent
Cum. Percent
Frequency
Valid Percent
Cum. Percent
Frequency
Valid Percent
Cum. Percent
Frequency
Valid Percent
Cum. Percent
Frequency
Valid Percent
Cum. Percent
Frequency
Valid Percent
Cum. Percent
Not at all (1) 28 10.4 10.4 16 4.5 4.5 116 32.9 32.9 60 17.2 17.2 47 14.1 14.1 36 14.9 14.9
Low (2) 22 8.1 18.5 15 4.2 8.7 121 34.3 67.1 87 24.9 42.1 49 14.7 28.8 59 24.4 39.3
Moderate (3) 34 12.6 31.1 42 11.8 20.6 75 21.2 88.4 105 30.1 72.2 55 16.5 45.3 107 44.2 83.5
High (4) 81 30.0 61.1 124 34.9 55.5 28 7.9 96.3 60 17.2 89.4 92 27.6 73.0 37 15.3 98.8
Very High (5)
105 38.9 100.0 158 44.5 100.0 13 3.7 100.0 37 10.6 100.0 90 27.0 100.0 3 1.2 100.0
Total 270 100.0 355 100.0 353 100.0 349 100.0 333 100.0 242 100.0
Missing val 115 30 32 36 52 143
Total 385 385 385 385 385 385
Mean 3.7889 4.107 2.15 2.79 3.39 2.64
Std Dev 1.3175 1.0629 1.082 1.22 1.387 0.955
*Rated in a scale of 1 to 5 by the respondents (1 for lowest, 5 for highest) Source: Field Survey, 2012
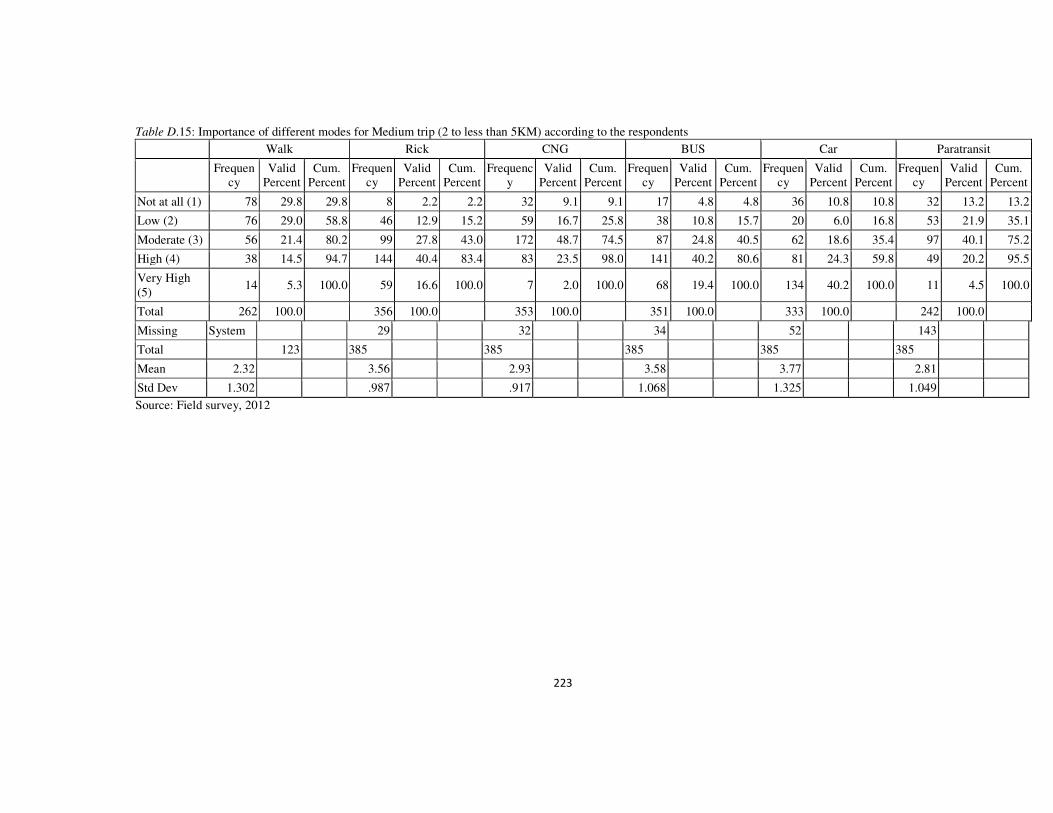
223
Table D.15: Importance of different modes for Medium trip (2 to less than 5KM) according to the respondents
Walk Rick CNG BUS Car Paratransit
Frequency
Valid Percent
Cum. Percent
Frequency
Valid Percent
Cum. Percent
Frequency
Valid Percent
Cum. Percent
Frequency
Valid Percent
Cum. Percent
Frequency
Valid Percent
Cum. Percent
Frequency
Valid Percent
Cum. Percent
Not at all (1) 78 29.8 29.8 8 2.2 2.2 32 9.1 9.1 17 4.8 4.8 36 10.8 10.8 32 13.2 13.2
Low (2) 76 29.0 58.8 46 12.9 15.2 59 16.7 25.8 38 10.8 15.7 20 6.0 16.8 53 21.9 35.1
Moderate (3) 56 21.4 80.2 99 27.8 43.0 172 48.7 74.5 87 24.8 40.5 62 18.6 35.4 97 40.1 75.2
High (4) 38 14.5 94.7 144 40.4 83.4 83 23.5 98.0 141 40.2 80.6 81 24.3 59.8 49 20.2 95.5
Very High (5)
14 5.3 100.0 59 16.6 100.0 7 2.0 100.0 68 19.4 100.0 134 40.2 100.0 11 4.5 100.0
Total 262 100.0 356 100.0 353 100.0 351 100.0 333 100.0 242 100.0
Missing System 29 32 34 52 143
Total 123 385 385 385 385 385
Mean 2.32 3.56 2.93 3.58 3.77 2.81
Std Dev 1.302 .987 .917 1.068 1.325 1.049
Source: Field survey, 2012
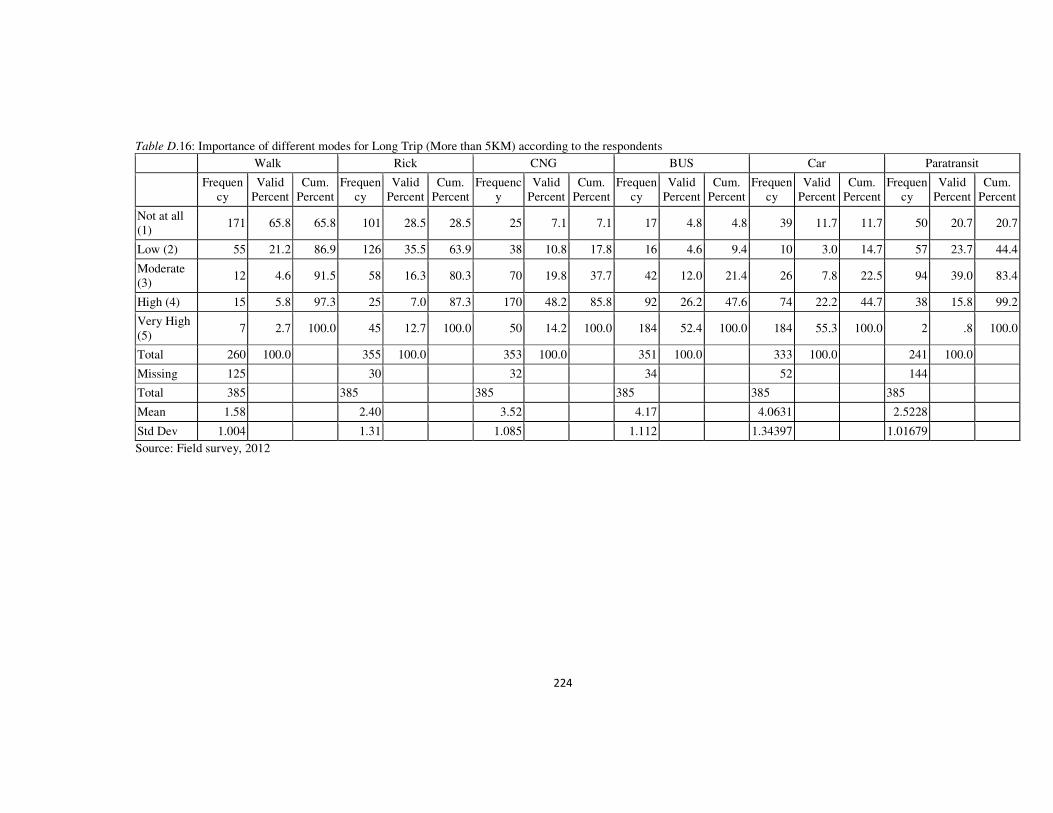
224
Table D.16: Importance of different modes for Long Trip (More than 5KM) according to the respondents
Walk Rick CNG BUS Car Paratransit
Frequency
Valid Percent
Cum. Percent
Frequency
Valid Percent
Cum. Percent
Frequency
Valid Percent
Cum. Percent
Frequency
Valid Percent
Cum. Percent
Frequency
Valid Percent
Cum. Percent
Frequency
Valid Percent
Cum. Percent
Not at all (1)
171 65.8 65.8 101 28.5 28.5 25 7.1 7.1 17 4.8 4.8 39 11.7 11.7 50 20.7 20.7
Low (2) 55 21.2 86.9 126 35.5 63.9 38 10.8 17.8 16 4.6 9.4 10 3.0 14.7 57 23.7 44.4
Moderate (3)
12 4.6 91.5 58 16.3 80.3 70 19.8 37.7 42 12.0 21.4 26 7.8 22.5 94 39.0 83.4
High (4) 15 5.8 97.3 25 7.0 87.3 170 48.2 85.8 92 26.2 47.6 74 22.2 44.7 38 15.8 99.2
Very High (5)
7 2.7 100.0 45 12.7 100.0 50 14.2 100.0 184 52.4 100.0 184 55.3 100.0 2 .8 100.0
Total 260 100.0 355 100.0 353 100.0 351 100.0 333 100.0 241 100.0
Missing 125 30 32 34 52 144
Total 385 385 385 385 385 385
Mean 1.58 2.40 3.52 4.17 4.0631 2.5228
Std Dev 1.004 1.31 1.085 1.112 1.34397 1.01679
Source: Field survey, 2012
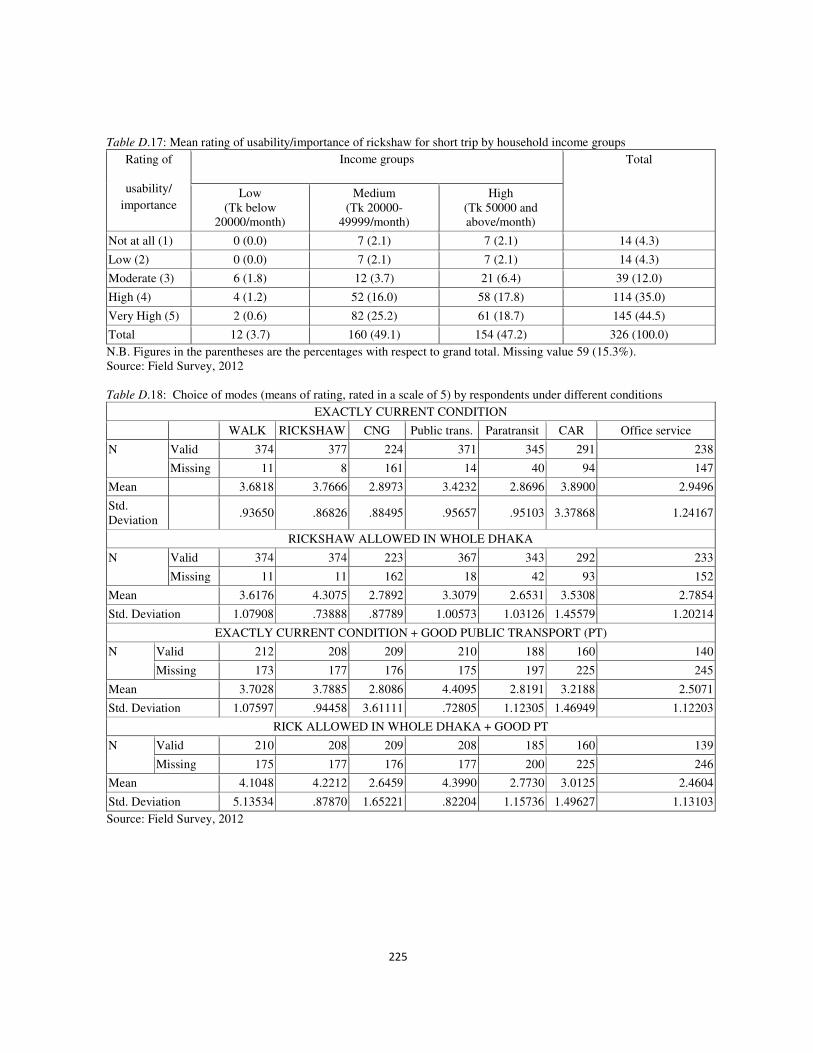
225
Table D.17: Mean rating of usability/importance of rickshaw for short trip by household income groups
Rating of
usability/
importance
Income groups Total
Low (Tk below
20000/month)
Medium (Tk 20000-
49999/month)
High (Tk 50000 and above/month)
Not at all (1) 0 (0.0) 7 (2.1) 7 (2.1) 14 (4.3)
Low (2) 0 (0.0) 7 (2.1) 7 (2.1) 14 (4.3)
Moderate (3) 6 (1.8) 12 (3.7) 21 (6.4) 39 (12.0)
High (4) 4 (1.2) 52 (16.0) 58 (17.8) 114 (35.0)
Very High (5) 2 (0.6) 82 (25.2) 61 (18.7) 145 (44.5)
Total 12 (3.7) 160 (49.1) 154 (47.2) 326 (100.0)
N.B. Figures in the parentheses are the percentages with respect to grand total. Missing value 59 (15.3%). Source: Field Survey, 2012 Table D.18: Choice of modes (means of rating, rated in a scale of 5) by respondents under different conditions
EXACTLY CURRENT CONDITION
WALK RICKSHAW CNG Public trans. Paratransit CAR Office service
N Valid 374 377 224 371 345 291 238
Missing 11 8 161 14 40 94 147
Mean 3.6818 3.7666 2.8973 3.4232 2.8696 3.8900 2.9496
Std. Deviation
.93650 .86826 .88495 .95657 .95103 3.37868 1.24167
RICKSHAW ALLOWED IN WHOLE DHAKA
N Valid 374 374 223 367 343 292 233
Missing 11 11 162 18 42 93 152
Mean 3.6176 4.3075 2.7892 3.3079 2.6531 3.5308 2.7854
Std. Deviation 1.07908 .73888 .87789 1.00573 1.03126 1.45579 1.20214
EXACTLY CURRENT CONDITION + GOOD PUBLIC TRANSPORT (PT)
N Valid 212 208 209 210 188 160 140
Missing 173 177 176 175 197 225 245
Mean 3.7028 3.7885 2.8086 4.4095 2.8191 3.2188 2.5071
Std. Deviation 1.07597 .94458 3.61111 .72805 1.12305 1.46949 1.12203
RICK ALLOWED IN WHOLE DHAKA + GOOD PT
N Valid 210 208 209 208 185 160 139
Missing 175 177 176 177 200 225 246
Mean 4.1048 4.2212 2.6459 4.3990 2.7730 3.0125 2.4604
Std. Deviation 5.13534 .87870 1.65221 .82204 1.15736 1.49627 1.13103
Source: Field Survey, 2012
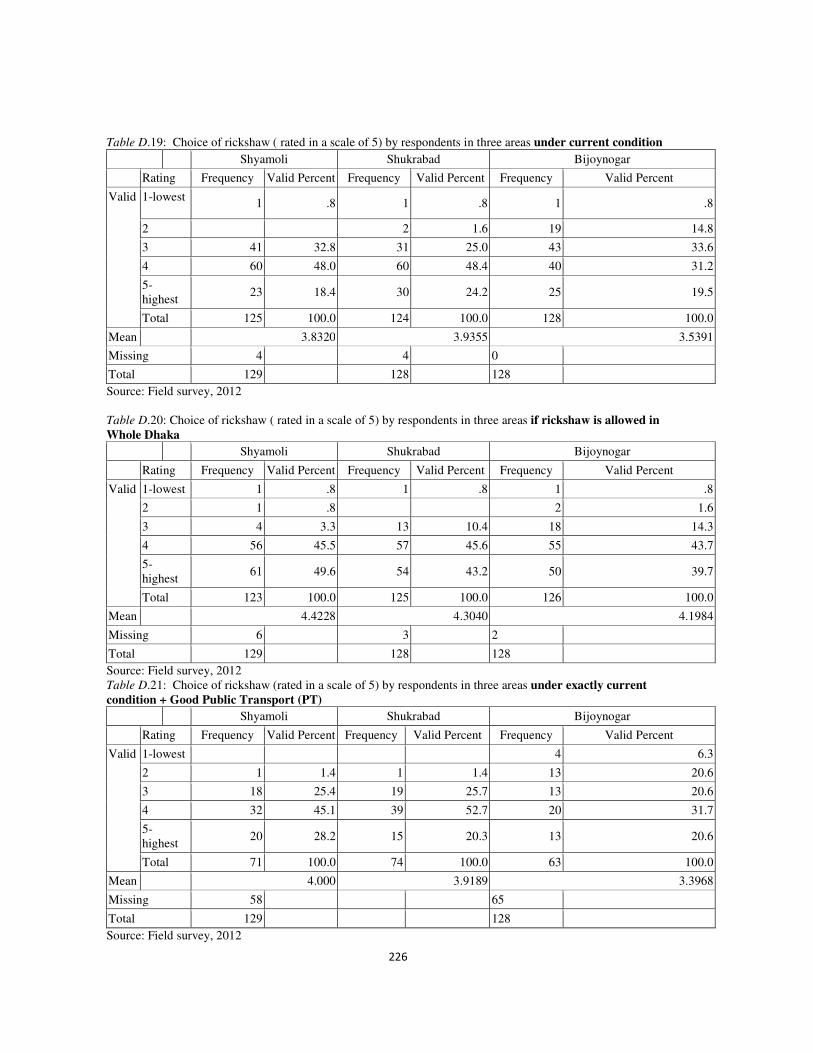
226
Table D.19: Choice of rickshaw ( rated in a scale of 5) by respondents in three areas under current condition
Shyamoli Shukrabad Bijoynogar
Rating Frequency Valid Percent Frequency Valid Percent Frequency Valid Percent
Valid 1-lowest 1 .8 1 .8 1 .8
2 2 1.6 19 14.8
3 41 32.8 31 25.0 43 33.6
4 60 48.0 60 48.4 40 31.2
5- highest
23 18.4 30 24.2 25 19.5
Total 125 100.0 124 100.0 128 100.0
Mean 3.8320 3.9355 3.5391
Missing 4 4 0
Total 129 128 128
Source: Field survey, 2012 Table D.20: Choice of rickshaw ( rated in a scale of 5) by respondents in three areas if rickshaw is allowed in
Whole Dhaka
Shyamoli Shukrabad Bijoynogar
Rating Frequency Valid Percent Frequency Valid Percent Frequency Valid Percent
Valid 1-lowest 1 .8 1 .8 1 .8
2 1 .8 2 1.6
3 4 3.3 13 10.4 18 14.3
4 56 45.5 57 45.6 55 43.7
5- highest
61 49.6 54 43.2 50 39.7
Total 123 100.0 125 100.0 126 100.0
Mean 4.4228 4.3040 4.1984
Missing 6 3 2
Total 129 128 128
Source: Field survey, 2012 Table D.21: Choice of rickshaw (rated in a scale of 5) by respondents in three areas under exactly current
condition + Good Public Transport (PT)
Shyamoli Shukrabad Bijoynogar
Rating Frequency Valid Percent Frequency Valid Percent Frequency Valid Percent
Valid 1-lowest 4 6.3
2 1 1.4 1 1.4 13 20.6
3 18 25.4 19 25.7 13 20.6
4 32 45.1 39 52.7 20 31.7
5- highest
20 28.2 15 20.3 13 20.6
Total 71 100.0 74 100.0 63 100.0
Mean 4.000 3.9189 3.3968
Missing 58 65
Total 129 128
Source: Field survey, 2012
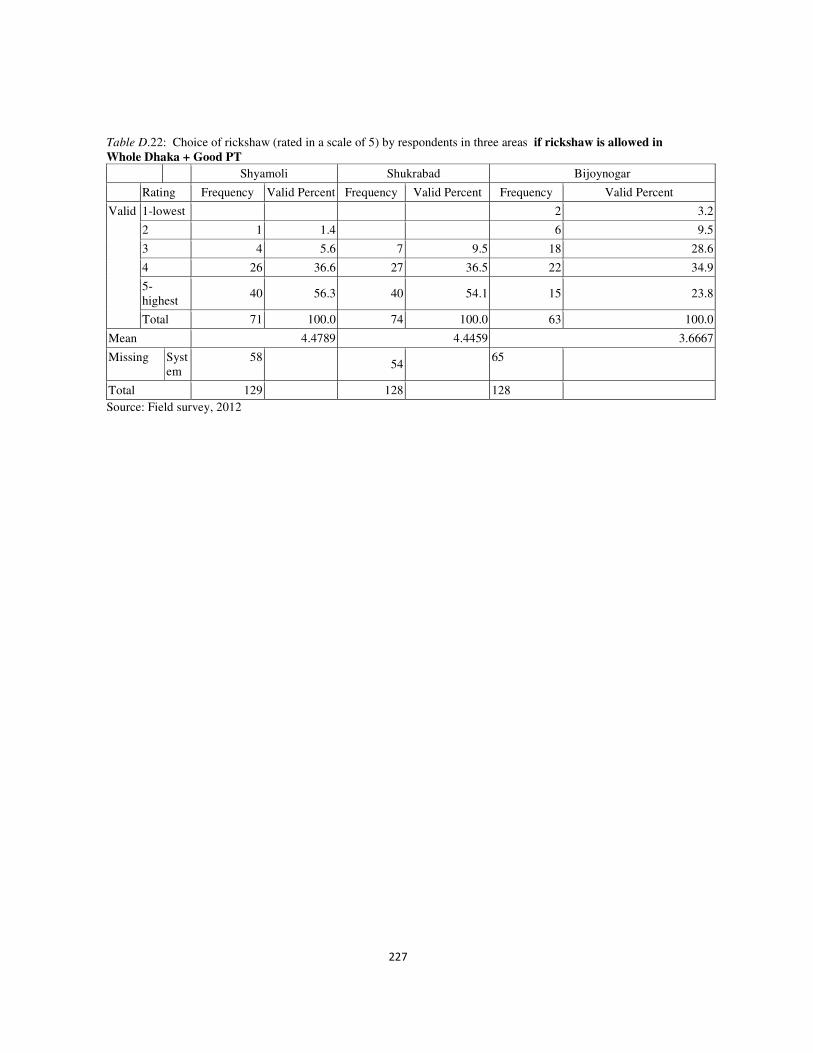
227
Table D.22: Choice of rickshaw (rated in a scale of 5) by respondents in three areas if rickshaw is allowed in
Whole Dhaka + Good PT
Shyamoli Shukrabad Bijoynogar
Rating Frequency Valid Percent Frequency Valid Percent Frequency Valid Percent
Valid 1-lowest 2 3.2
2 1 1.4 6 9.5
3 4 5.6 7 9.5 18 28.6
4 26 36.6 27 36.5 22 34.9
5- highest
40 56.3 40 54.1 15 23.8
Total 71 100.0 74 100.0 63 100.0
Mean 4.4789 4.4459 3.6667
Missing System
58 54
65
Total 129 128 128
Source: Field survey, 2012
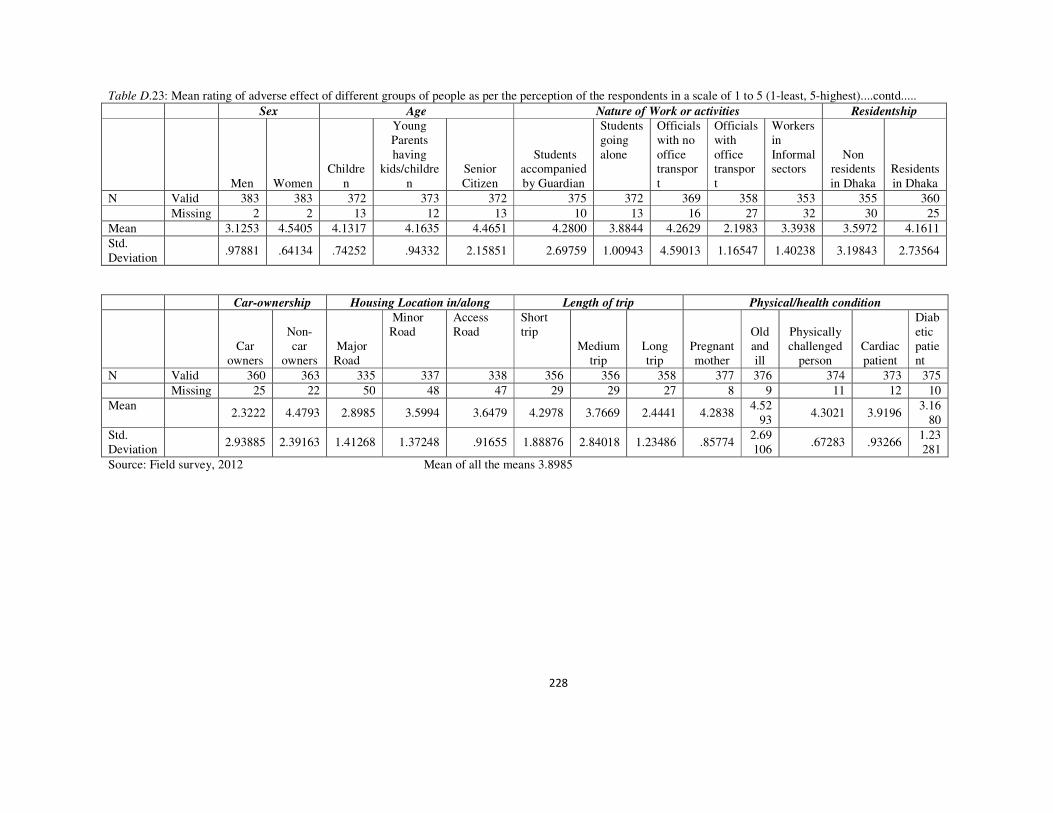
228
Table D.23: Mean rating of adverse effect of different groups of people as per the perception of the respondents in a scale of 1 to 5 (1-least, 5-highest)....contd.....
Sex Age Nature of Work or activities Residentship
Men Women
Childre
n
Young Parents having
kids/children
Senior Citizen
Students accompanied by Guardian
Students going alone
Officials with no office transport
Officials with office transport
Workers in Informal sectors
Non residents in Dhaka
Residents in Dhaka
N Valid 383 383 372 373 372 375 372 369 358 353 355 360
Missing 2 2 13 12 13 10 13 16 27 32 30 25
Mean 3.1253 4.5405 4.1317 4.1635 4.4651 4.2800 3.8844 4.2629 2.1983 3.3938 3.5972 4.1611
Std. Deviation
.97881 .64134 .74252 .94332 2.15851 2.69759 1.00943 4.59013 1.16547 1.40238 3.19843 2.73564
Car-ownership Housing Location in/along Length of trip Physical/health condition
Car owners
Non-car
owners Major Road
Minor Road
Access Road
Short trip
Medium trip
Long trip
Pregnant mother
Old and ill
Physically challenged
person Cardiac patient
Diabetic patient
N Valid 360 363 335 337 338 356 356 358 377 376 374 373 375
Missing 25 22 50 48 47 29 29 27 8 9 11 12 10
Mean 2.3222 4.4793 2.8985 3.5994 3.6479 4.2978 3.7669 2.4441 4.2838
4.5293
4.3021 3.9196 3.16
80
Std. Deviation
2.93885 2.39163 1.41268 1.37248 .91655 1.88876 2.84018 1.23486 .85774
2.69106
.67283 .93266 1.23281
Source: Field survey, 2012 Mean of all the means 3.8985
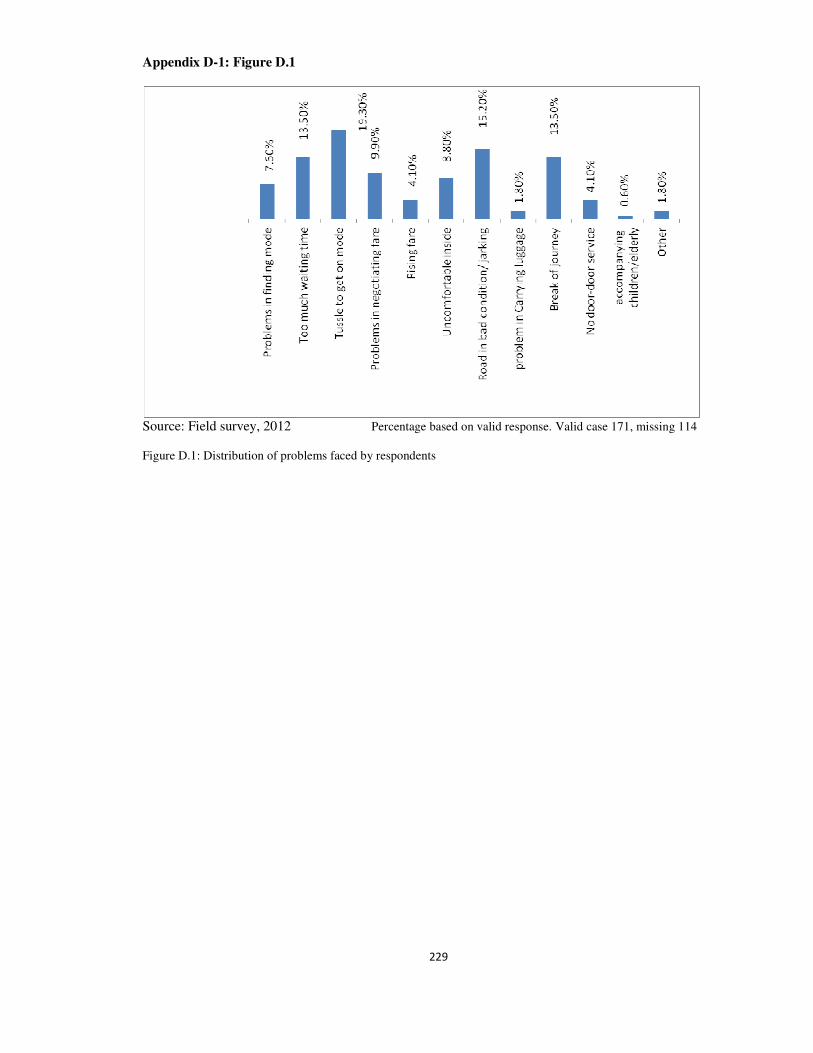
229
Appendix D-1: Figure D.1
Source: Field survey, 2012 Percentage based on valid response. Valid case 171, missing 114 Figure D.1: Distribution of problems faced by respondents
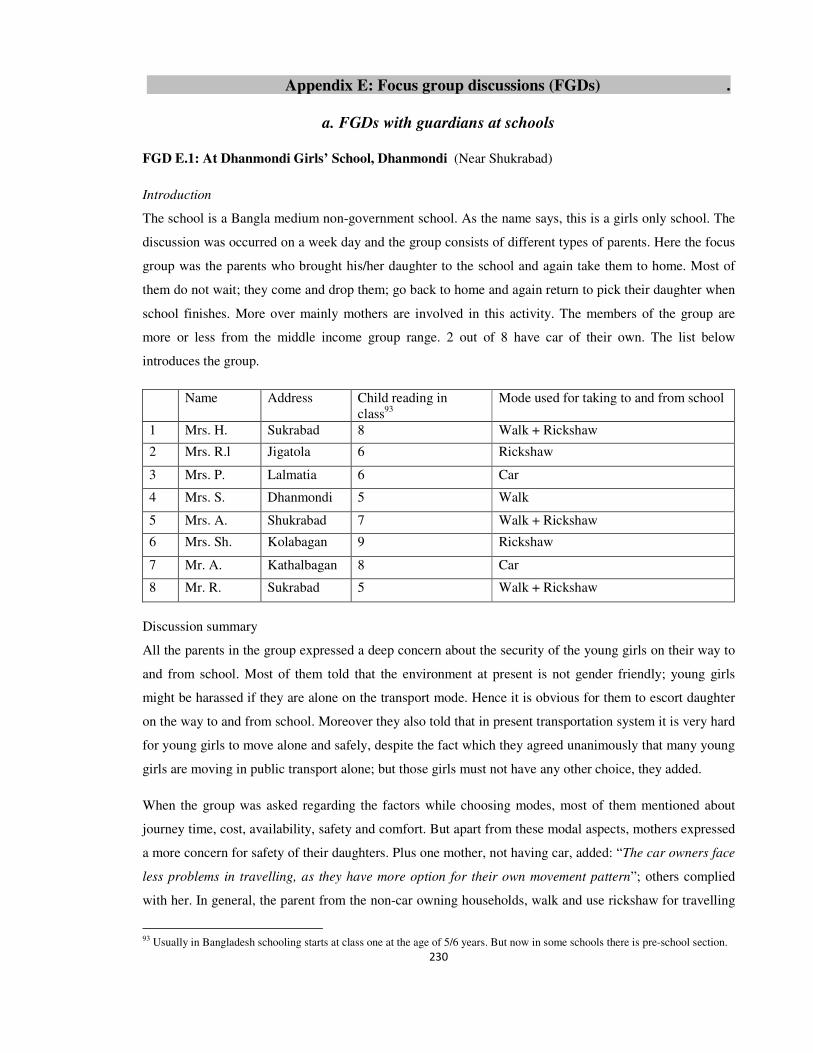
230
Appendix E: Focus group discussions (FGDs) .
a. FGDs with guardians at schools
FGD E.1: At Dhanmondi Girls’ School, Dhanmondi (Near Shukrabad)
Introduction
The school is a Bangla medium non-government school. As the name says, this is a girls only school. The
discussion was occurred on a week day and the group consists of different types of parents. Here the focus
group was the parents who brought his/her daughter to the school and again take them to home. Most of
them do not wait; they come and drop them; go back to home and again return to pick their daughter when
school finishes. More over mainly mothers are involved in this activity. The members of the group are
more or less from the middle income group range. 2 out of 8 have car of their own. The list below
introduces the group.
Name Address Child reading in class93
Mode used for taking to and from school
1 Mrs. H. Sukrabad 8 Walk + Rickshaw
2 Mrs. R.l Jigatola 6 Rickshaw
3 Mrs. P. Lalmatia 6 Car
4 Mrs. S. Dhanmondi 5 Walk
5 Mrs. A. Shukrabad 7 Walk + Rickshaw
6 Mrs. Sh. Kolabagan 9 Rickshaw
7 Mr. A. Kathalbagan 8 Car
8 Mr. R. Sukrabad 5 Walk + Rickshaw
Discussion summary
All the parents in the group expressed a deep concern about the security of the young girls on their way to
and from school. Most of them told that the environment at present is not gender friendly; young girls
might be harassed if they are alone on the transport mode. Hence it is obvious for them to escort daughter
on the way to and from school. Moreover they also told that in present transportation system it is very hard
for young girls to move alone and safely, despite the fact which they agreed unanimously that many young
girls are moving in public transport alone; but those girls must not have any other choice, they added.
When the group was asked regarding the factors while choosing modes, most of them mentioned about
journey time, cost, availability, safety and comfort. But apart from these modal aspects, mothers expressed
a more concern for safety of their daughters. Plus one mother, not having car, added: “The car owners face
less problems in travelling, as they have more option for their own movement pattern”; others complied
with her. In general, the parent from the non-car owning households, walk and use rickshaw for travelling
93 Usually in Bangladesh schooling starts at class one at the age of 5/6 years. But now in some schools there is pre-school section.
231
shorter distance while for longer distance they usually use bus and in few cases, CNG. To accompany
children to and from school main modes are walk plus rickshaw. But they informed that finding a rickshaw
in the morning becomes difficult and during returning as the demand for rickshaws goes very high around
the school premises, ricksahw-wallas demand excessive fare showing different reason including extra long
distance to be covered for avoing rickshaw banned/restricted roads/intersectipons. Car owners are more
dependent on car, despite facing different problems like inadequacy of parking, theft of car parts (like
mirror), dependace on driver. But other members of the car-owning households face difficulties. One car
owner even expressed that they do not have more than one car so that all the members of the family could
use them. Mrs. Puja Karmaokar coming form Lalmatia informed: “while my girl and I use the car to come
to school, her father have to wait at home for going to office by car. But at noon he has to leave the car to
pick us from the school . So her father has to come from office by bus and I have to come to school (for
pick up) by rickshaw; a daily nightmare for both of us”
Guardians accompany their children every school day, and also during the weekend, if extra
class/examination is declared to cover the postponed class/examination for strike or any disrupting event,
mainly political. Mothers are mainly the person who accompany child and usually some of them wait until
the classes are over. Fathers, who accompany their children drop them to school on their way to work.
Then either thyy or mother of the children pick them after school hours. During weekend, mainly parents
look after these matters of dropping and picking up; mothers are spared.
In this group there are three members coming from sukrabad. It is noticeable that on their way to school
they have to face the rickshaw ban two times: one obviously at Shukrabad as Mirpur road is off-limit for
ricksahws, the other one is near the school. There is another way to avoid the banned section near the
school, but that requires more money, time and distance to be covered. So they cross the Mirpur road and
ride on the rickshaw. They added that, crossing the road involves risk of accidents as there is not enough
foot over-bridge. If they have to use a foot over-bridge they have to walk a considerable distance. Mrs.
Arifa Zannat commented: “While the time of hurry my daughter and I have to cross the road directly with
enormous risk of encountering fast moving vehicles, but we cannot waste time [!]. We do not have a
rickshaw at our desired place; we have to go to Dhanmondi side.”
But negotiating a rickshaw ride at reasonable fare is another difficult task ahed after crossing the road.
From Shukrabad to Dhanmondi Girls’ School they have to pay around Tk 25-30 for each trip, whereas
reasonable fare, according to them should be Tk 15. Moreover, guardians work at home has also increased
after rickshaw ban; they have to prepare their daughter and themselves earlier than the time when rickshaw
was allowed. In such condition, Mrs. Habiba Islam, coming from Shukrabad told; “Although my family is
not solvent enough, we are thinking of buying a car, after watching the advantages of car-use. Moreover I
feel like being deprived while using the road as the car owner can pass any section very easily, no body
obstruct them as even they are given priority than the pedestrian; in this situation by compromising with
some other household expenditure my husband and me have decided to buy a car as early as possible”.
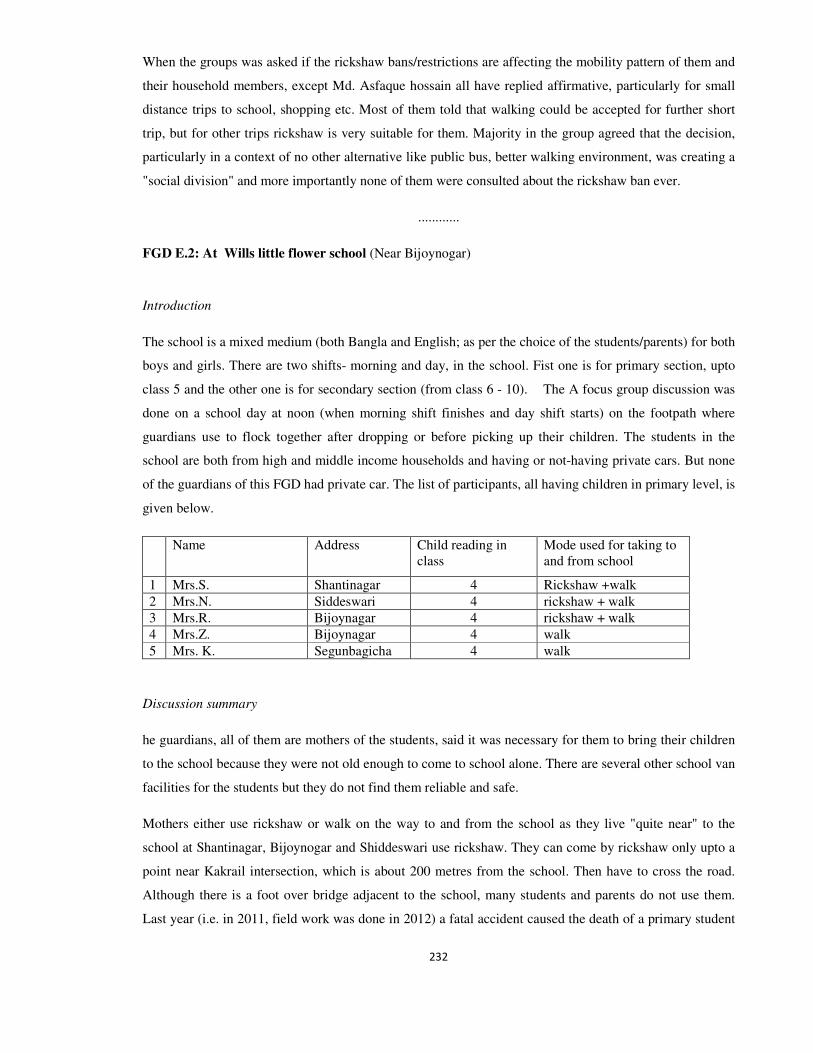
232
When the groups was asked if the rickshaw bans/restrictions are affecting the mobility pattern of them and
their household members, except Md. Asfaque hossain all have replied affirmative, particularly for small
distance trips to school, shopping etc. Most of them told that walking could be accepted for further short
trip, but for other trips rickshaw is very suitable for them. Majority in the group agreed that the decision,
particularly in a context of no other alternative like public bus, better walking environment, was creating a
"social division" and more importantly none of them were consulted about the rickshaw ban ever.
............
FGD E.2: At Wills little flower school (Near Bijoynogar)
Introduction
The school is a mixed medium (both Bangla and English; as per the choice of the students/parents) for both
boys and girls. There are two shifts- morning and day, in the school. Fist one is for primary section, upto
class 5 and the other one is for secondary section (from class 6 - 10). The A focus group discussion was
done on a school day at noon (when morning shift finishes and day shift starts) on the footpath where
guardians use to flock together after dropping or before picking up their children. The students in the
school are both from high and middle income households and having or not-having private cars. But none
of the guardians of this FGD had private car. The list of participants, all having children in primary level, is
given below.
Name Address Child reading in class
Mode used for taking to and from school
1 Mrs.S. Shantinagar 4 Rickshaw +walk
2 Mrs.N. Siddeswari 4 rickshaw + walk
3 Mrs.R. Bijoynagar 4 rickshaw + walk
4 Mrs.Z. Bijoynagar 4 walk
5 Mrs. K. Segunbagicha 4 walk
Discussion summary
he guardians, all of them are mothers of the students, said it was necessary for them to bring their children
to the school because they were not old enough to come to school alone. There are several other school van
facilities for the students but they do not find them reliable and safe.
Mothers either use rickshaw or walk on the way to and from the school as they live "quite near" to the
school at Shantinagar, Bijoynogar and Shiddeswari use rickshaw. They can come by rickshaw only upto a
point near Kakrail intersection, which is about 200 metres from the school. Then have to cross the road.
Although there is a foot over bridge adjacent to the school, many students and parents do not use them.
Last year (i.e. in 2011, field work was done in 2012) a fatal accident caused the death of a primary student
233
and her mother as a bus ran over them. They informed that many other guardians, particularly father, who
come from Bijoynogar and Shegunbagicha with their children do not use rickshaw at all for the break of
journey and "excessive" demand for fare by the rickshaw-walla and prefer of forced to walk. But Mrs.
Sangida says “My child always opposes to walk in hot weather days, particularly during returning to
home.” A large number of mothers of primary students in this school, as has been found during the FGD
and been reported by the participants, do not at all go back home after dropping their children in the early
morning. They return at noon with their children. A participant, who also do so, expressed utter
helplessness: "What can I do? Otherwise I have to make four trips. I cannot find rickshaw for each trip,
nor it will reasonable at the current financial condition of family. My husband leaves home for office one
hour after we leave. The house remains under lock and key for 3/4 hours which increase the risk of being
theft. Plus after returning home, when I am damn tired, I have to prepare the lunch and do all the pending
household activities".
Restrictions/bans on rickshaws have a great impact on other activities done by mothers and mobility of
other household members.. They said that sometimes they have to sacrifice going to the places where they
must have to use "costly" CNG,a s rickshaw is not allowed somewhere in between. Some other yet
continue the actrivitry, only at the cost of more break of journeys. Mrs. Razia said: “before going to
Mouchak [a prominet shopping area] I used rickshaw directly from my home but now I can go by rickshaw
upto Kakrail, then get down, cross the road and take another rickshaw from kakrail. Sometimes finding a
rickshaw even at higher fare becomes very much difficult”. Mrs. Nilufar said that earlier she went to new
market [another very promonent shopping zone, around 5-6 km from her home] by rickshaw easily; now
she has stopped going there and when necessary she only goes on holidays when rickshaw ban situation is
more relaxed.
According to them, although all are suffering from this rickhaw ban - more or less, women especially who
take their children to school, aged, physically challenged people are the most adversely affected. Mrs.
Nilufar appealed that at least these people should be spared in the banned/restricted areas. Mrs Sangida and
Mrs. Razia do not prefer bus, rather use CNG, if compelled to so, although bus is even less costly than
rickshaw. But, other said that if required they will use bus. But all of them are unanimous that the
condition inside the bus and arangements for getting in and out from the bus are neither suitable nor safe
for the women and children.
...............
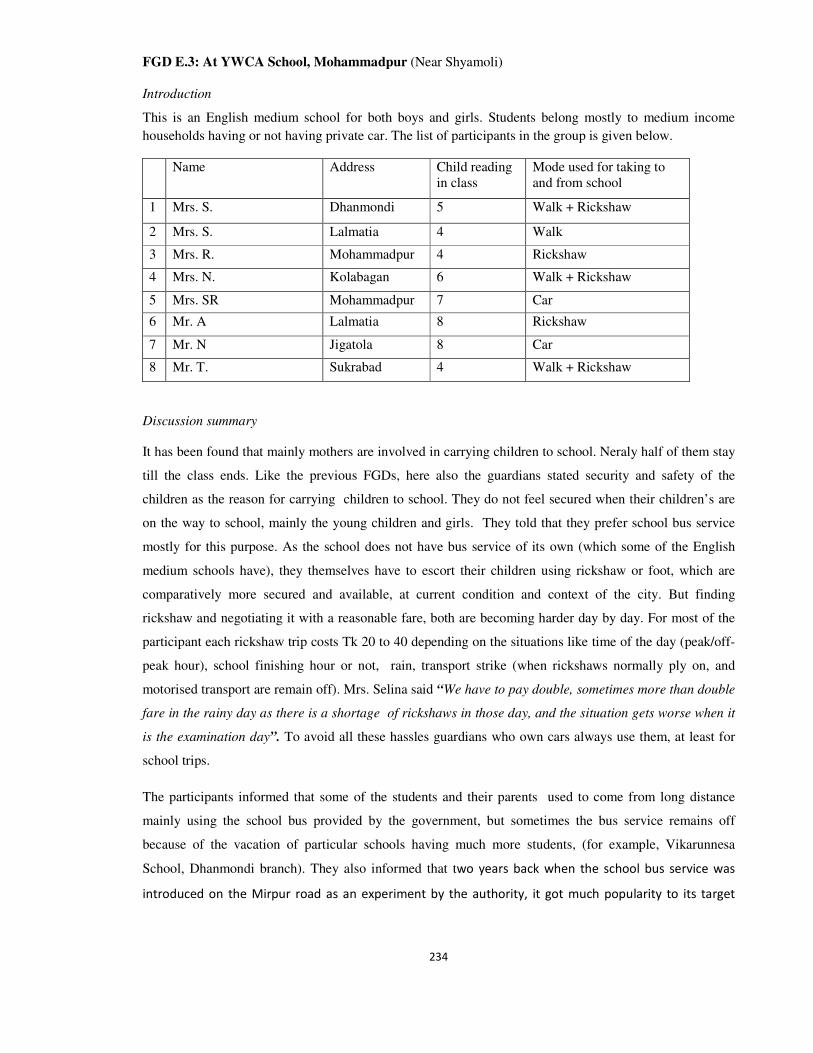
234
FGD E.3: At YWCA School, Mohammadpur (Near Shyamoli) Introduction
This is an English medium school for both boys and girls. Students belong mostly to medium income
households having or not having private car. The list of participants in the group is given below.
Name Address Child reading in class
Mode used for taking to and from school
1 Mrs. S. Dhanmondi 5 Walk + Rickshaw
2 Mrs. S. Lalmatia 4 Walk
3 Mrs. R. Mohammadpur 4 Rickshaw
4 Mrs. N. Kolabagan 6 Walk + Rickshaw
5 Mrs. SR Mohammadpur 7 Car
6 Mr. A Lalmatia 8 Rickshaw
7 Mr. N Jigatola 8 Car
8 Mr. T. Sukrabad 4 Walk + Rickshaw
Discussion summary
It has been found that mainly mothers are involved in carrying children to school. Neraly half of them stay
till the class ends. Like the previous FGDs, here also the guardians stated security and safety of the
children as the reason for carrying children to school. They do not feel secured when their children’s are
on the way to school, mainly the young children and girls. They told that they prefer school bus service
mostly for this purpose. As the school does not have bus service of its own (which some of the English
medium schools have), they themselves have to escort their children using rickshaw or foot, which are
comparatively more secured and available, at current condition and context of the city. But finding
rickshaw and negotiating it with a reasonable fare, both are becoming harder day by day. For most of the
participant each rickshaw trip costs Tk 20 to 40 depending on the situations like time of the day (peak/off-
peak hour), school finishing hour or not, rain, transport strike (when rickshaws normally ply on, and
motorised transport are remain off). Mrs. Selina said “We have to pay double, sometimes more than double
fare in the rainy day as there is a shortage of rickshaws in those day, and the situation gets worse when it
is the examination day”. To avoid all these hassles guardians who own cars always use them, at least for
school trips.
The participants informed that some of the students and their parents used to come from long distance
mainly using the school bus provided by the government, but sometimes the bus service remains off
because of the vacation of particular schools having much more students, (for example, Vikarunnesa
School, Dhanmondi branch). They also informed that two years back when the school bus service was
introduced on the Mirpur road as an experiment by the authority, it got much popularity to its target
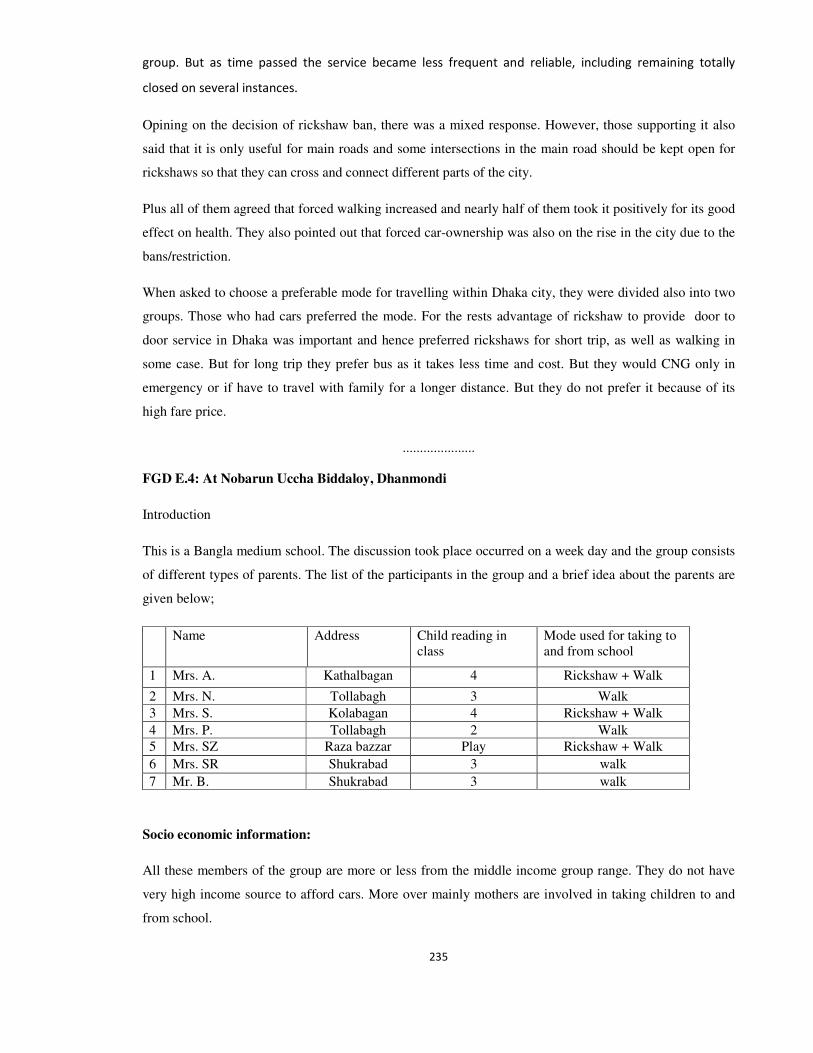
235
group. But as time passed the service became less frequent and reliable, including remaining totally
closed on several instances.
Opining on the decision of rickshaw ban, there was a mixed response. However, those supporting it also
said that it is only useful for main roads and some intersections in the main road should be kept open for
rickshaws so that they can cross and connect different parts of the city.
Plus all of them agreed that forced walking increased and nearly half of them took it positively for its good
effect on health. They also pointed out that forced car-ownership was also on the rise in the city due to the
bans/restriction.
When asked to choose a preferable mode for travelling within Dhaka city, they were divided also into two
groups. Those who had cars preferred the mode. For the rests advantage of rickshaw to provide door to
door service in Dhaka was important and hence preferred rickshaws for short trip, as well as walking in
some case. But for long trip they prefer bus as it takes less time and cost. But they would CNG only in
emergency or if have to travel with family for a longer distance. But they do not prefer it because of its
high fare price.
.....................
FGD E.4: At Nobarun Uccha Biddaloy, Dhanmondi
Introduction
This is a Bangla medium school. The discussion took place occurred on a week day and the group consists
of different types of parents. The list of the participants in the group and a brief idea about the parents are
given below;
Name Address Child reading in class
Mode used for taking to and from school
1 Mrs. A. Kathalbagan 4 Rickshaw + Walk
2 Mrs. N. Tollabagh 3 Walk
3 Mrs. S. Kolabagan 4 Rickshaw + Walk
4 Mrs. P. Tollabagh 2 Walk 5 Mrs. SZ Raza bazzar Play Rickshaw + Walk
6 Mrs. SR Shukrabad 3 walk
7 Mr. B. Shukrabad 3 walk
Socio economic information:
All these members of the group are more or less from the middle income group range. They do not have
very high income source to afford cars. More over mainly mothers are involved in taking children to and
from school.
236
Discussion summary
According to the parents the city is "not suitable for the children to move alone". Moreover since there is
no school bus service, or van service (usually provided as a local/private initiative) they have to escort their
children. Like other guardians in other schools, escorting is mainly mothers' activity. Those residing
nearby, usually walk to and from school for a maximum of 20 minutes. But Mothers coming from
Kanthalbaghan, Kalabagan and Raza Bazaar have to come by rickshaw despite presence of rickshaw
banned/restricted roads/intersections on their way. Mrs. Sabrina coming from Kalabagan said: “Carrying
little boys and girls to school has become tough now-a-days due to rickshaw ban on Dhanmondi main
road, plus there is no van service. But the children are unable to carry heavy school bags alone. Overall,
we are facing enormous extra pressure to ensure our children reach school and return home safely and
comfortably”. Mrs. Shila, from Raza Bazaar, informed that she faces the ban two times at Shukrabad and
Dhanmondi. She also said: “My girl is very little to be carried by others; except her father and I. I have to
pass whole time in the school premise like her. This is seriously hindering household activities. We have
employed a maid servant for cooking and washing, but who will do other activities including visiting
relatives, attending social activities. We do not have any social life, as if all the hours are spent outdoor or
on the road”.
Besides, their own problems, most of the participants expressed strong sympathy for the aged persons and
the children. One of them said: “all [section of ] the people of the city have not been considered while
taking the decision of rickshaw ban”.
However, Mr. Bashar, from Shukrabad observed that rickshaw bans/restrictions had also some positive
impacts. He mentioned that the speed of vehicles have been increased "in the main road of Dhanmondi"
and many of the people are now willing to walk rather than using rickshaw for the short trip. He continued:
“When rickshaw was allowed I usually went to Shanker by rickshaw; but now as I have to face break of
journey, so I go on foot. It requires more time but it is a good habit.”
Regarding preference for modes at present situation, most of them argued for rickshaw and Bus; none of
them can afford car. They also told about walking but regreted that the the city is in no way pedestrian
friendly. Hence they are bound to use rickshaw. For long distance they favoured bus. CNG would be used
when all in the family are going out altogether.
At the end regarding the idea of rickshaw ban, a strong opposition was expressed by mothers. But Mr.
Bashar had a different view: “Ok, rickshaw ban can be acceptable in major roads but there must be some
other options for short trip makers and the pedestrian network should made user friendly. Then rickshaw
ban will be accepted by all.”
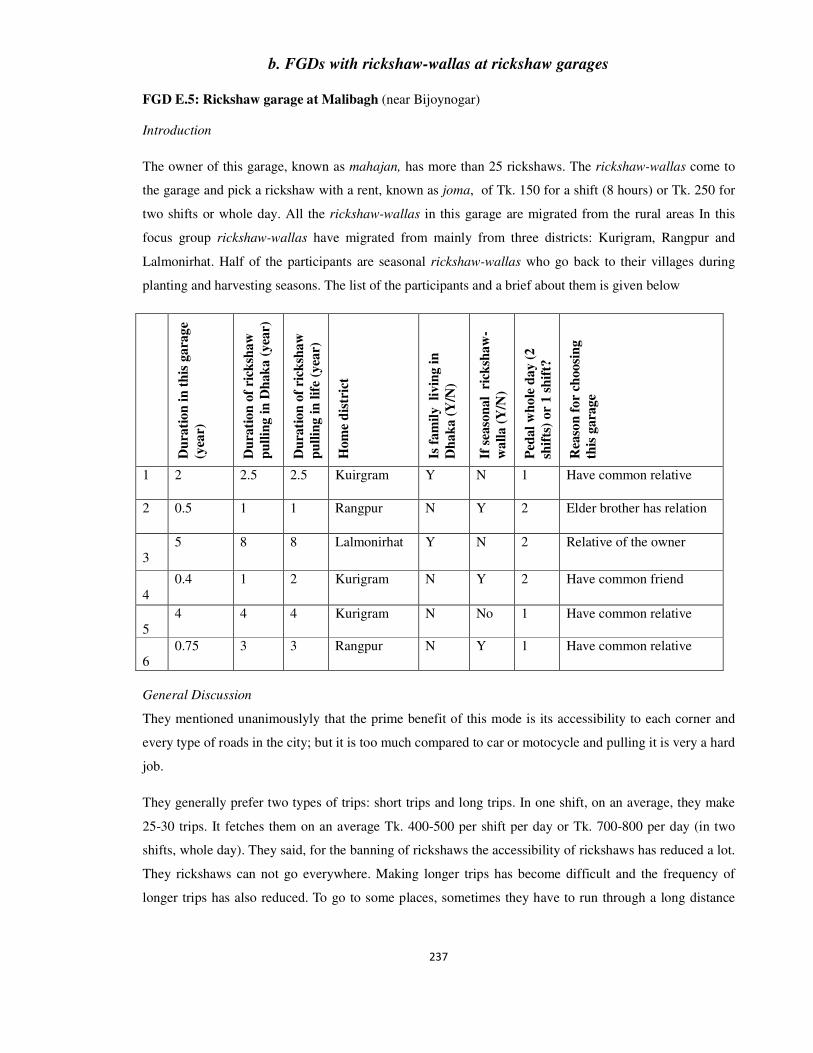
237
b. FGDs with rickshaw-wallas at rickshaw garages
FGD E.5: Rickshaw garage at Malibagh (near Bijoynogar)
Introduction
The owner of this garage, known as mahajan, has more than 25 rickshaws. The rickshaw-wallas come to
the garage and pick a rickshaw with a rent, known as joma, of Tk. 150 for a shift (8 hours) or Tk. 250 for
two shifts or whole day. All the rickshaw-wallas in this garage are migrated from the rural areas In this
focus group rickshaw-wallas have migrated from mainly from three districts: Kurigram, Rangpur and
Lalmonirhat. Half of the participants are seasonal rickshaw-wallas who go back to their villages during
planting and harvesting seasons. The list of the participants and a brief about them is given below
Du
rati
on
in
th
is g
ara
ge
(yea
r)
Du
rati
on
of
rick
shaw
pu
llin
g i
n D
hak
a (
yea
r)
Du
rati
on
of
rick
shaw
pu
llin
g i
n l
ife
(yea
r)
Hom
e d
istr
ict
Is f
am
ily li
vin
g i
n
Dh
ak
a (
Y/N
)
If s
easo
nal
ric
ksh
aw
-
wa
lla (
Y/N
)
Ped
al
wh
ole
da
y (
2
shif
ts)
or
1 s
hif
t?
Rea
son
fo
r ch
oosi
ng
this
gara
ge
1 2 2.5 2.5 Kuirgram Y N 1 Have common relative
2 0.5 1 1 Rangpur N Y 2 Elder brother has relation
3
5 8 8 Lalmonirhat Y N 2 Relative of the owner
4
0.4 1 2 Kurigram N Y 2 Have common friend
5
4 4 4 Kurigram N No 1 Have common relative
6
0.75 3 3 Rangpur N Y 1 Have common relative
General Discussion
They mentioned unanimouslyly that the prime benefit of this mode is its accessibility to each corner and
every type of roads in the city; but it is too much compared to car or motocycle and pulling it is very a hard
job.
They generally prefer two types of trips: short trips and long trips. In one shift, on an average, they make
25-30 trips. It fetches them on an average Tk. 400-500 per shift per day or Tk. 700-800 per day (in two
shifts, whole day). They said, for the banning of rickshaws the accessibility of rickshaws has reduced a lot.
They rickshaws can not go everywhere. Making longer trips has become difficult and the frequency of
longer trips has also reduced. To go to some places, sometimes they have to run through a long distance
238
unnecessarily only for the banned corridor on the route. Some rickshaw-wallas have admitted that to make
longer trips they demand much high fare now.
In different parts of the day they have different passenger groups - in the morning the school goers, while
in the evening the office returnees are prominent. For the banning all trip makers are more or less affected.
A member of this discussion group, Mr. A. J. said, “When a passenger wants to go Segunbagicha from
Malibagh sometimes it become problematic because of the banned corridor. Though they get on a
rickshaw but they must have to get down from the rickshaw at kakrail. In that case, we have to negotiate
with hime/her for the full rent to Segunbagicha, because I might not find another passenger to come back.
But, bearing full fare for a half ride is of course problematic for passenger”. Another rickshaw-puller Mr.
S. added, “But sometimes it is considered for the students. If the passenger is a student of school, college
or university and shows his/her ID card then the rickshaw can pass through the banned corridor.”
Now when the group was asked about their mental and physical condition and the relationship with their
household members, we observed a mixed responses. Some rickshaw-wallas, mainly the young and
unmarried ones pull rickshaws for one shift mainly as they don’t need to pull rickshaw for two shifts. On
the other hand, the older ones pulls rickshaw for two shifts as they often have a large family to feed.
However, some one rickshaw-walla gave priority to stay with and pass time with the family over pulling
for the second shift. But all rickshaw-wallas have agreed in one point that pulling rickshaw for two shifts is
very hard job.
All of them have to go to villages as their families or relatives or 'roots' are there. Some go frequently-
once a month, others go after every three months interval. However, these frequencies are never fixed and
regular. But seasonal rickshaw-wallas would must go home in the planting and harvesting seasons. They
themselves normally carry the money for the family, but in some special cases they send the money
through some reliable person.
They are unanimous that banning rickshaw has not reduced traffic congestion but has added problems to
daily mobility of the passengers; even after the bans the number of rickshaw and garage has increased
indicating that income from owning a garage has increased; lastly, due to its demand rickshaw cannot be
completely withdrawn from the city.
........................
FGD E.6: Rickshaw garage at Mohammadpur (near Adabor, in between Shukrabad and Shyamoli )
Introduction
This focus group is composed of rickshaw pullers coming different parts of the country. Previous they
were either unemployed or engaged in agriculture. The rent for rickshaws, i.e. joma, per shift varies from
70-100 in this garage. Their brief introduction is as follows:
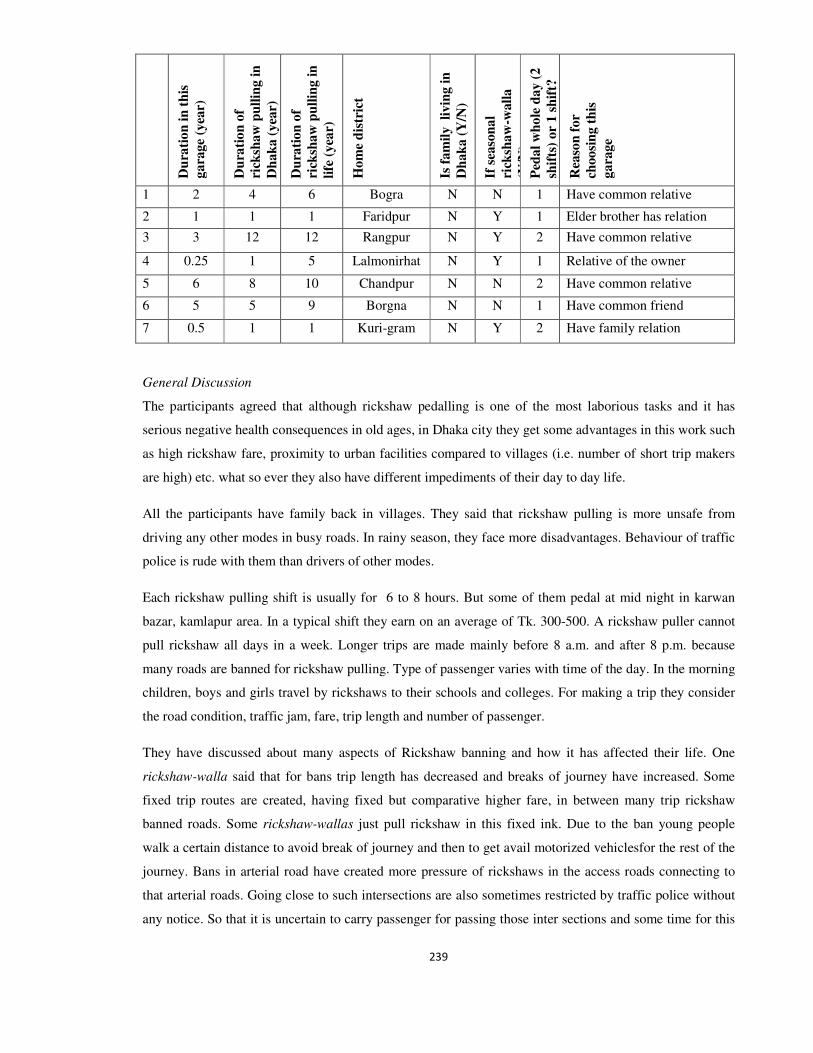
239
Du
rati
on
in
th
is
gara
ge
(yea
r)
Du
rati
on
of
rick
shaw
pu
llin
g i
n
Dh
ak
a (
yea
r)
Du
rati
on
of
rick
shaw
pu
llin
g i
n
life
(yea
r)
Ho
me
dis
tric
t
Is f
am
ily
livin
g i
n
Dh
ak
a (
Y/N
)
If s
easo
na
l
rick
shaw
-wall
a
(Y/N
) P
edal
wh
ole
day (
2
shif
ts)
or
1 s
hif
t?
Rea
son
for
choo
sin
g t
his
gara
ge
1 2 4 6 Bogra N N 1 Have common relative
2 1 1 1 Faridpur N Y 1 Elder brother has relation
3 3 12 12 Rangpur N Y 2 Have common relative
4 0.25 1 5 Lalmonirhat N Y 1 Relative of the owner
5 6 8 10 Chandpur N N 2 Have common relative
6 5 5 9 Borgna N N 1 Have common friend
7 0.5 1 1 Kuri-gram N Y 2 Have family relation
General Discussion
The participants agreed that although rickshaw pedalling is one of the most laborious tasks and it has
serious negative health consequences in old ages, in Dhaka city they get some advantages in this work such
as high rickshaw fare, proximity to urban facilities compared to villages (i.e. number of short trip makers
are high) etc. what so ever they also have different impediments of their day to day life.
All the participants have family back in villages. They said that rickshaw pulling is more unsafe from
driving any other modes in busy roads. In rainy season, they face more disadvantages. Behaviour of traffic
police is rude with them than drivers of other modes.
Each rickshaw pulling shift is usually for 6 to 8 hours. But some of them pedal at mid night in karwan
bazar, kamlapur area. In a typical shift they earn on an average of Tk. 300-500. A rickshaw puller cannot
pull rickshaw all days in a week. Longer trips are made mainly before 8 a.m. and after 8 p.m. because
many roads are banned for rickshaw pulling. Type of passenger varies with time of the day. In the morning
children, boys and girls travel by rickshaws to their schools and colleges. For making a trip they consider
the road condition, traffic jam, fare, trip length and number of passenger.
They have discussed about many aspects of Rickshaw banning and how it has affected their life. One
rickshaw-walla said that for bans trip length has decreased and breaks of journey have increased. Some
fixed trip routes are created, having fixed but comparative higher fare, in between many trip rickshaw
banned roads. Some rickshaw-wallas just pull rickshaw in this fixed ink. Due to the ban young people
walk a certain distance to avoid break of journey and then to get avail motorized vehiclesfor the rest of the
journey. Bans in arterial road have created more pressure of rickshaws in the access roads connecting to
that arterial roads. Going close to such intersections are also sometimes restricted by traffic police without
any notice. So that it is uncertain to carry passenger for passing those inter sections and some time for this
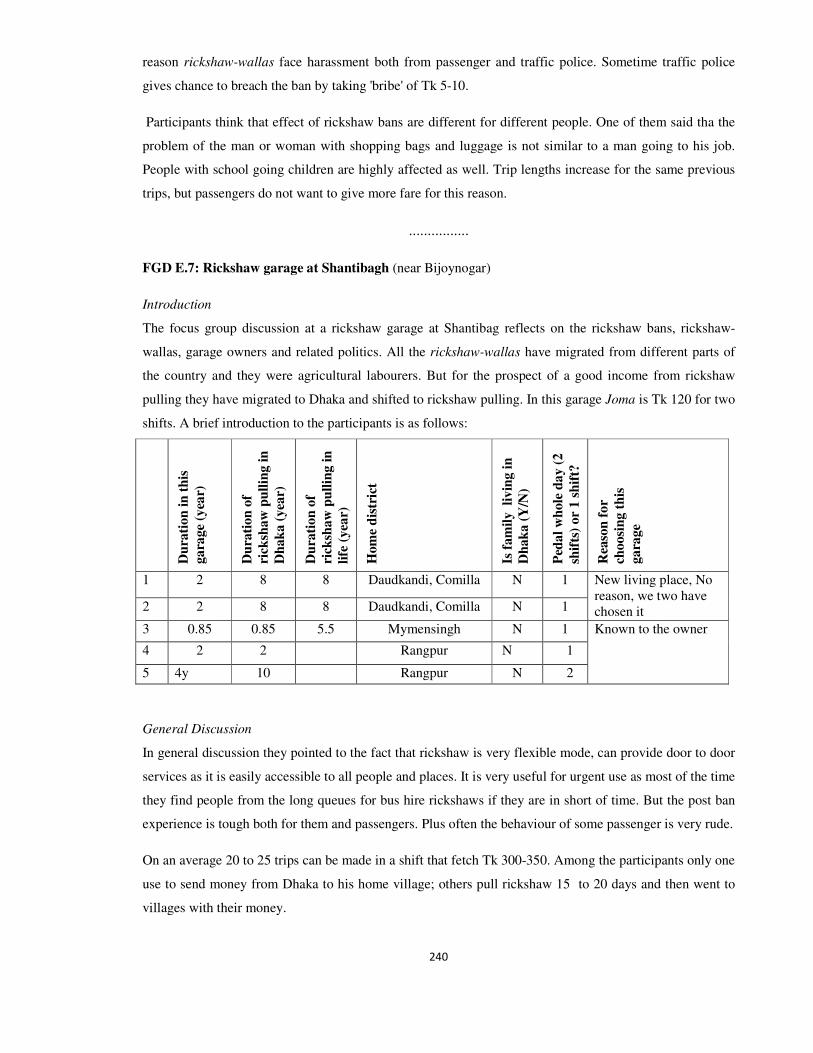
240
reason rickshaw-wallas face harassment both from passenger and traffic police. Sometime traffic police
gives chance to breach the ban by taking 'bribe' of Tk 5-10.
Participants think that effect of rickshaw bans are different for different people. One of them said tha the
problem of the man or woman with shopping bags and luggage is not similar to a man going to his job.
People with school going children are highly affected as well. Trip lengths increase for the same previous
trips, but passengers do not want to give more fare for this reason.
................
FGD E.7: Rickshaw garage at Shantibagh (near Bijoynogar)
Introduction
The focus group discussion at a rickshaw garage at Shantibag reflects on the rickshaw bans, rickshaw-
wallas, garage owners and related politics. All the rickshaw-wallas have migrated from different parts of
the country and they were agricultural labourers. But for the prospect of a good income from rickshaw
pulling they have migrated to Dhaka and shifted to rickshaw pulling. In this garage Joma is Tk 120 for two
shifts. A brief introduction to the participants is as follows:
Du
rati
on
in
th
is
ga
rage
(yea
r)
Du
rati
on
of
rick
shaw
pu
llin
g i
n
Dh
ak
a (
yea
r)
Du
rati
on
of
rick
shaw
pu
llin
g i
n
life
(yea
r)
Hom
e d
istr
ict
Is f
am
ily li
vin
g i
n
Dh
ak
a (
Y/N
)
Ped
al
wh
ole
da
y (
2
shif
ts)
or
1 s
hif
t?
Rea
son
fo
r
choosi
ng t
his
ga
rage
1 2 8 8 Daudkandi, Comilla N 1 New living place, No reason, we two have chosen it 2 2 8 8 Daudkandi, Comilla N 1
3 0.85 0.85 5.5 Mymensingh N 1 Known to the owner
4 2 2 Rangpur N 1
5 4y 10 Rangpur N 2
General Discussion
In general discussion they pointed to the fact that rickshaw is very flexible mode, can provide door to door
services as it is easily accessible to all people and places. It is very useful for urgent use as most of the time
they find people from the long queues for bus hire rickshaws if they are in short of time. But the post ban
experience is tough both for them and passengers. Plus often the behaviour of some passenger is very rude.
On an average 20 to 25 trips can be made in a shift that fetch Tk 300-350. Among the participants only one
use to send money from Dhaka to his home village; others pull rickshaw 15 to 20 days and then went to
villages with their money.
241
In general they try to take all types of passengers. But after the rickshaw ban they prefer to take long trips
as they can charge comparatively more charge compared to pre-ban condition. They are less interested in
very short trips; although fare is higher compared to distance, but it requires much negotiation with the
passengers and in many cases passengers also prefer walking for short distances than hiring a rickshaw at
higher fare. They also avoid going to those places where passengers are not available easily for a return
trip. They also prefer not to go to the location where there is only one road opened for rickshaws, others
are blocked, channelling all rickshaws in a single road and thus reducing probability to get passengers (as
supply of rickshaws increases). Also after they prefer not take those routes trips on which ban imposed.
Bans have reduced their trip frequency. Plus no prior information about ban or restrictions often compels
them to bargain with the traffic police or to pedal much extra miles then anticipated. In their opinion their
income has reduced due of bans. But sometimes they make trips breaching the ban or using alternate long
route which fetch them usually two times of the original fare. But bans do not affect their households'
mobility as they do not live in Dhaka city.
They opined that the school going children and their parents are the worst victims; also people with heavy
or more than luggage. One of them said “it is very sad to see the guardians when they bargain with traffic
police or have to quit the rickshaw in the banned point and walk with the school going little children. I
have to take less money for the trips as they cannot provide them service to the school gates". All of them
think that without rickshaw the mobility in Dhaka will be seriously hampered. One of them said that
rickshaw banning situation does not reduce traffic jam rather they have seen that traffic jam is increasing
day by day.
The rickshaw garage owner's perspective
When found during the FGD the owners of the garage was very shortly interviewed. He said that he was
little engaged in the local politics. He shared his experience that there was huge politics in the business
and it is becoming complex day because of some organizations. He observed that rickshaws were still
increasing after the ban.
.........................
FGD E.8: Rickshaw garage at Adabor ring road (near Shyamoli)
Introduction
This focus group composed of rickshaw pullers who came to Dhaka from different rural areas of the
country. They have shifted from various professions; but among the professions most of them shifted from
agriculture. Still 57.14% of them (in the group) has seasonal change of occupation; they used to go to the
villages during planting and harvesting seasons. One thing is notable; all of them left their families in
villages, had to maintain multi-spatial households. In this garage joma for one shift is Tk. 50-60 and for
two shifts Tk 120. Their brief introduction is as follows:
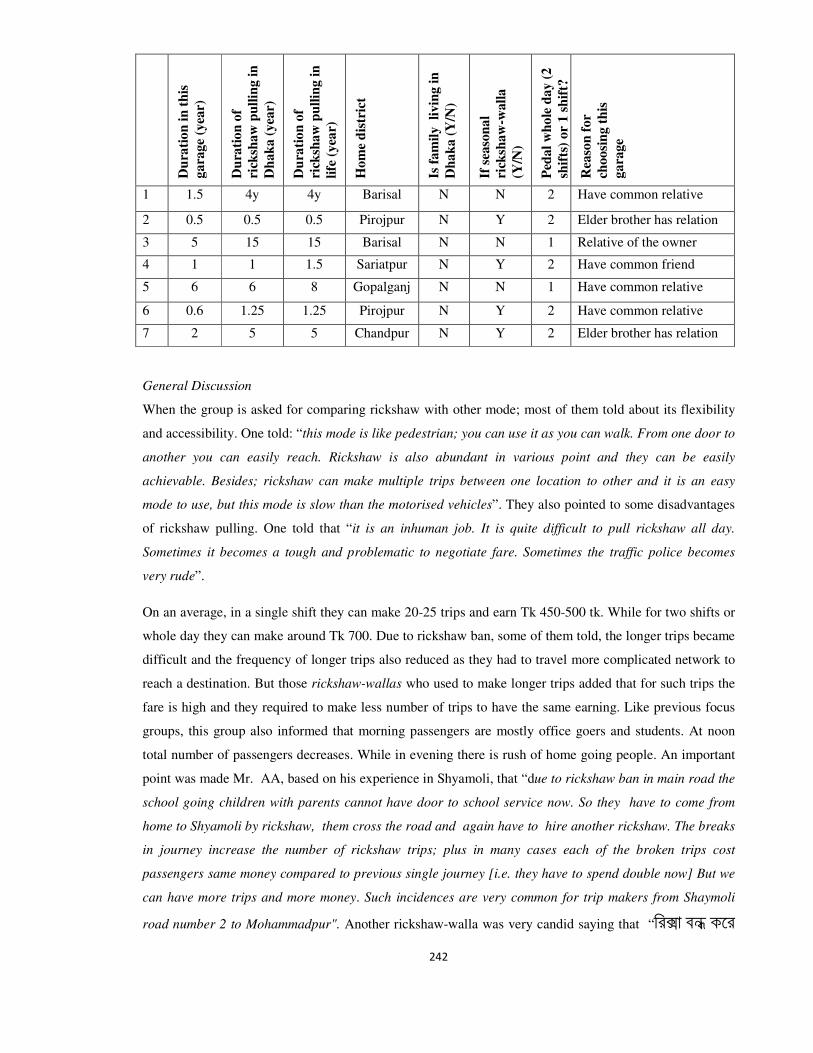
242
Du
rati
on
in
th
is
gara
ge
(yea
r)
Du
rati
on
of
rick
shaw
pu
llin
g i
n
Dh
ak
a (
yea
r)
Du
rati
on
of
rick
shaw
pu
llin
g i
n
life
(yea
r)
Ho
me
dis
tric
t
Is f
am
ily
livin
g i
n
Dh
ak
a (
Y/N
)
If s
easo
na
l
rick
shaw
-wall
a
(Y/N
)
Ped
al
wh
ole
day (
2
shif
ts)
or
1 s
hif
t?
Rea
son
for
choo
sin
g t
his
gara
ge
1 1.5 4y 4y Barisal N N 2 Have common relative
2 0.5 0.5 0.5 Pirojpur N Y 2 Elder brother has relation
3 5 15 15 Barisal N N 1 Relative of the owner
4 1 1 1.5 Sariatpur N Y 2 Have common friend
5 6 6 8 Gopalganj N N 1 Have common relative
6 0.6 1.25 1.25 Pirojpur N Y 2 Have common relative
7 2 5 5 Chandpur N Y 2 Elder brother has relation
General Discussion
When the group is asked for comparing rickshaw with other mode; most of them told about its flexibility
and accessibility. One told: “this mode is like pedestrian; you can use it as you can walk. From one door to
another you can easily reach. Rickshaw is also abundant in various point and they can be easily
achievable. Besides; rickshaw can make multiple trips between one location to other and it is an easy
mode to use, but this mode is slow than the motorised vehicles”. They also pointed to some disadvantages
of rickshaw pulling. One told that “it is an inhuman job. It is quite difficult to pull rickshaw all day.
Sometimes it becomes a tough and problematic to negotiate fare. Sometimes the traffic police becomes
very rude”.
On an average, in a single shift they can make 20-25 trips and earn Tk 450-500 tk. While for two shifts or
whole day they can make around Tk 700. Due to rickshaw ban, some of them told, the longer trips became
difficult and the frequency of longer trips also reduced as they had to travel more complicated network to
reach a destination. But those rickshaw-wallas who used to make longer trips added that for such trips the
fare is high and they required to make less number of trips to have the same earning. Like previous focus
groups, this group also informed that morning passengers are mostly office goers and students. At noon
total number of passengers decreases. While in evening there is rush of home going people. An important
point was made Mr. AA, based on his experience in Shyamoli, that “due to rickshaw ban in main road the
school going children with parents cannot have door to school service now. So they have to come from
home to Shyamoli by rickshaw, them cross the road and again have to hire another rickshaw. The breaks
in journey increase the number of rickshaw trips; plus in many cases each of the broken trips cost
passengers same money compared to previous single journey [i.e. they have to spend double now] But we
can have more trips and more money. Such incidences are very common for trip makers from Shaymoli
road number 2 to Mohammadpur". Another rickshaw-walla was very candid saying that “���� � � �
243
��� ��� � � ��, � �� ��� �� �? �� �� ��� ��� �� ���� ���� �� � �� ����� � �����
�� �” (in Bangla), translation: "Banning rickshaw has not reduced traffic congestion but adding
problems to daily mobility and some addition to our income". Both the number of rickshaw and garage
increased.
While discussing the problems due to bans, some of them pointed out that often they have to defy
bans/restrictions as passengers insist either. So they had to look for ways to escape the "angry" traffic
police. Mr E, a rickshaw puller, said that “Sometimes we can only cross the road after giving small amount
of money to the traffic police”. Besides, sudden change in ban/restriction by traffic police is another
problem to them. If they find a new ban/restriction, they have to taket another route. But passengers are
usually reluctant to give extra fare for the detouring.
When the group was asked about visiting their families and sending money to them, they expressed their
sadness for living away from them. Some of them visit families frequently, and of course during planting
and harvesting seasons. But for around 40% of the participants pedalling rickshaw in Dhaka is a permanent
work; they visit their families in every three months. But around 60% of them send money weekly and rest
take their earnings home when they go to villages.
.......................
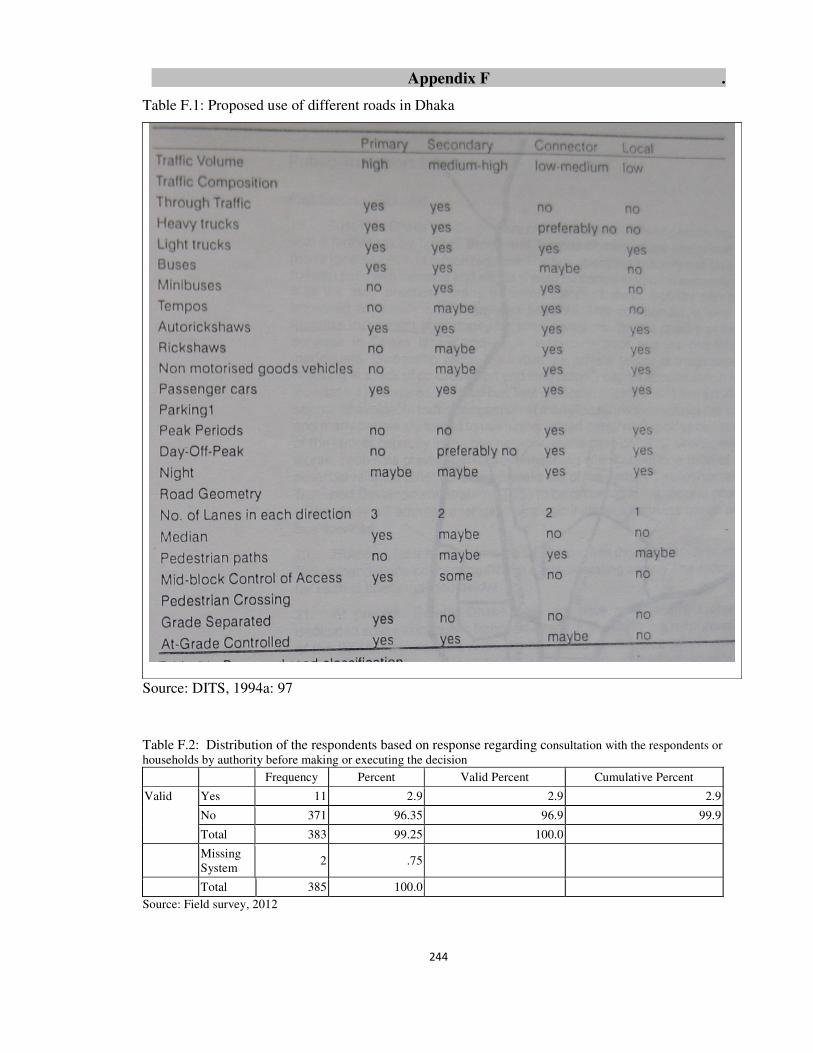
244
Appendix F .
Table F.1: Proposed use of different roads in Dhaka
Source: DITS, 1994a: 97
Table F.2: Distribution of the respondents based on response regarding consultation with the respondents or households by authority before making or executing the decision
Frequency Percent Valid Percent Cumulative Percent
Valid Yes 11 2.9 2.9 2.9
No 371 96.35 96.9 99.9
Total 383 99.25 100.0
Missing System
2 .75
Total 385 100.0
Source: Field survey, 2012
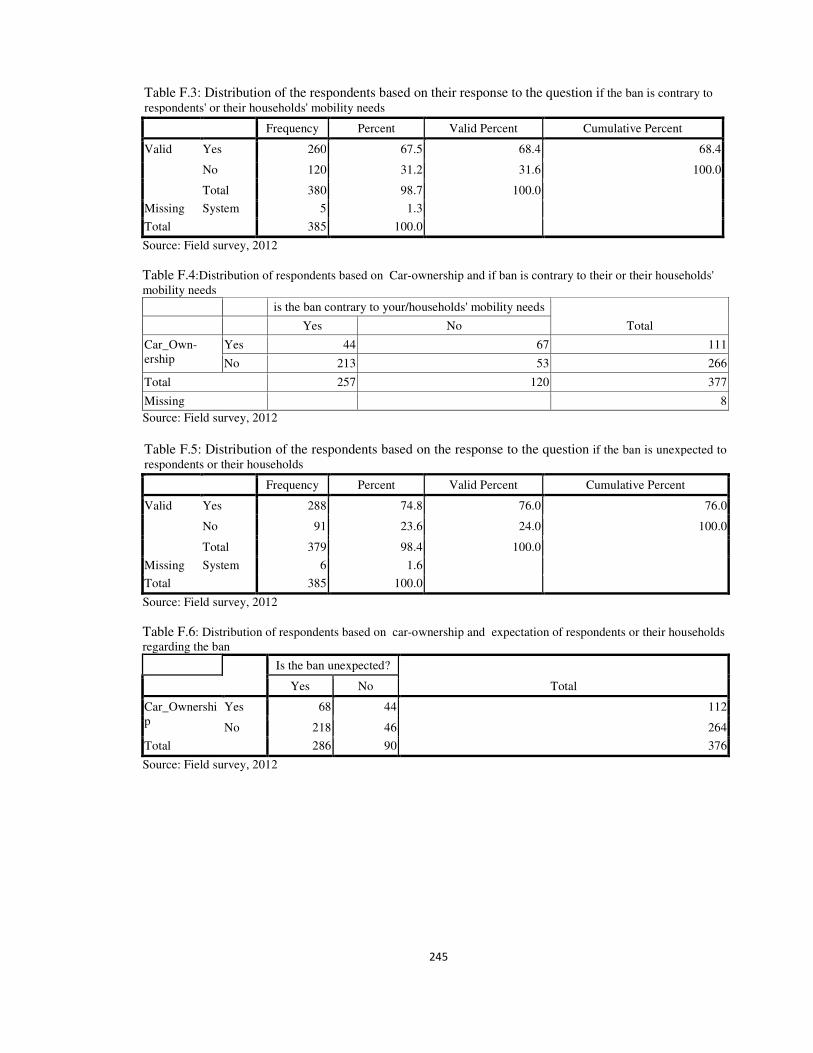
245
Table F.3: Distribution of the respondents based on their response to the question if the ban is contrary to
respondents' or their households' mobility needs
Frequency Percent Valid Percent Cumulative Percent
Valid Yes 260 67.5 68.4 68.4
No 120 31.2 31.6 100.0
Total 380 98.7 100.0
Missing System 5 1.3
Total 385 100.0
Source: Field survey, 2012
Table F.4:Distribution of respondents based on Car-ownership and if ban is contrary to their or their households' mobility needs
is the ban contrary to your/households' mobility needs
Total Yes No
Car_Own-ership
Yes 44 67 111
No 213 53 266
Total 257 120 377
Missing 8
Source: Field survey, 2012
Table F.5: Distribution of the respondents based on the response to the question if the ban is unexpected to respondents or their households
Frequency Percent Valid Percent Cumulative Percent
Valid Yes 288 74.8 76.0 76.0
No 91 23.6 24.0 100.0
Total 379 98.4 100.0
Missing System 6 1.6
Total 385 100.0
Source: Field survey, 2012
Table F.6: Distribution of respondents based on car-ownership and expectation of respondents or their households regarding the ban
Is the ban unexpected?
Total Yes No
Car_Ownership
Yes 68 44 112
No 218 46 264
Total 286 90 376
Source: Field survey, 2012
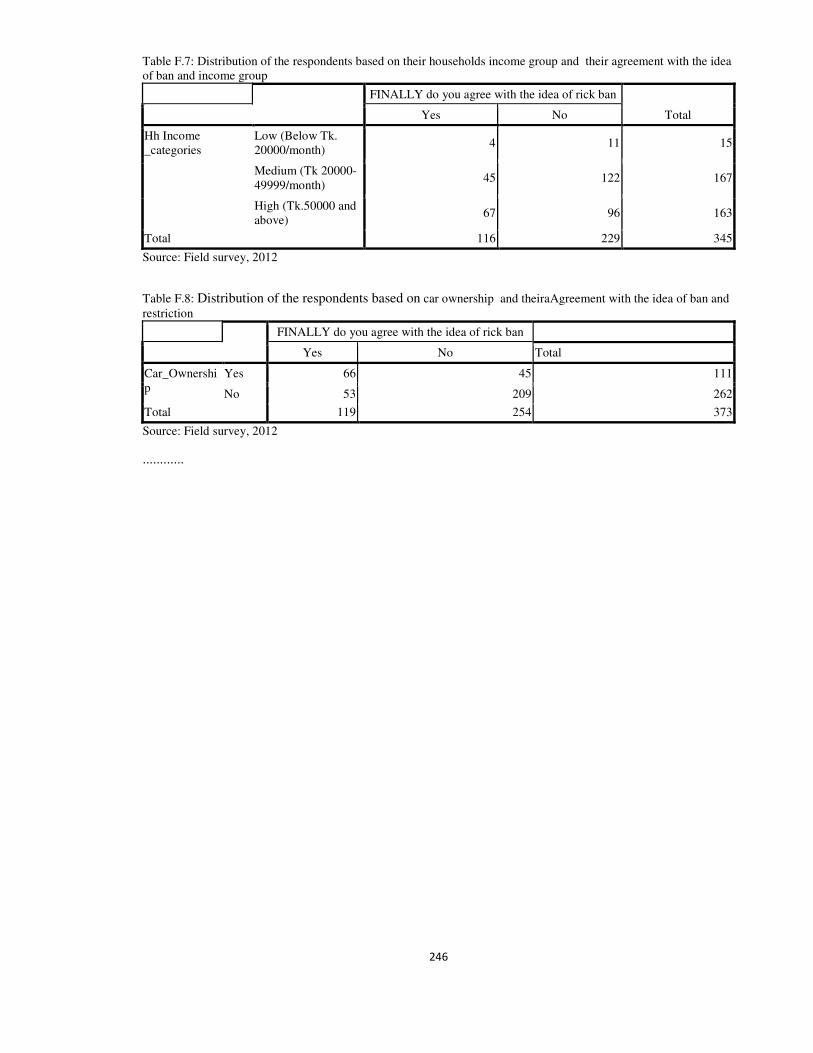
246
Table F.7: Distribution of the respondents based on their households income group and their agreement with the idea of ban and income group
FINALLY do you agree with the idea of rick ban
Total Yes No
Hh Income _categories
Low (Below Tk. 20000/month)
4 11 15
Medium (Tk 20000-49999/month)
45 122 167
High (Tk.50000 and above)
67 96 163
Total 116 229 345
Source: Field survey, 2012
Table F.8: Distribution of the respondents based on car ownership and theiraAgreement with the idea of ban and
restriction
FINALLY do you agree with the idea of rick ban
Yes No Total
Car_Ownership
Yes 66 45 111
No 53 209 262
Total 119 254 373
Source: Field survey, 2012
............
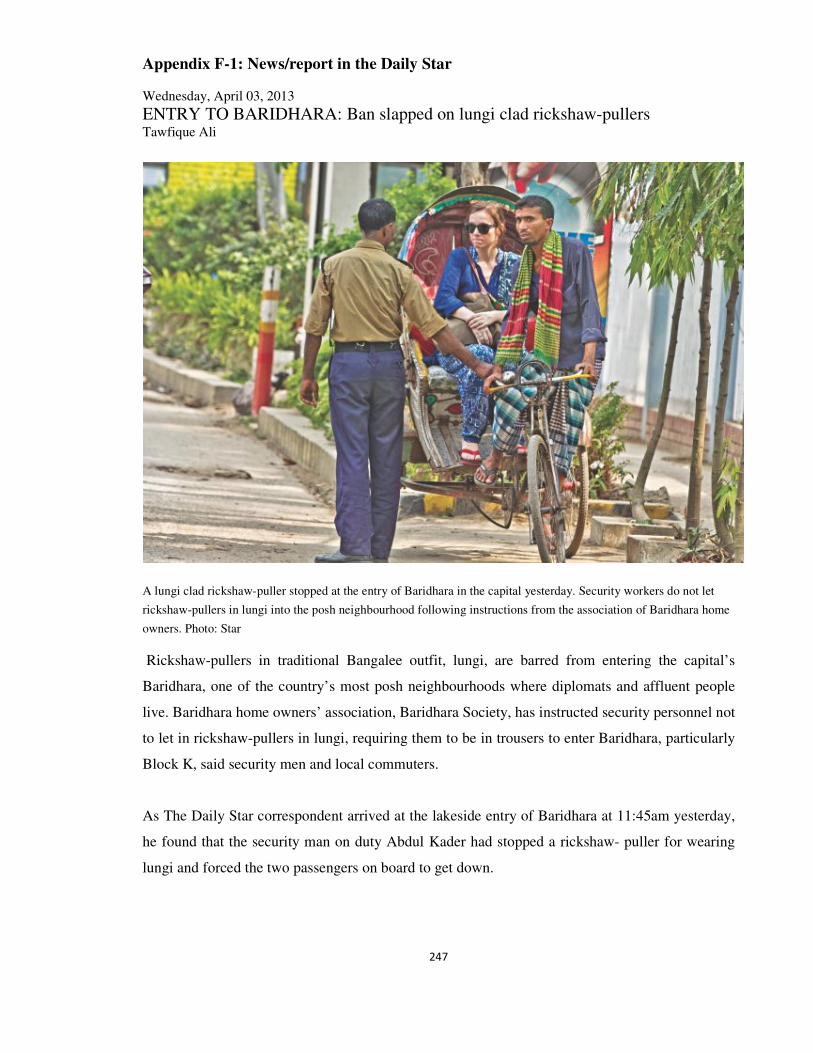
247
Appendix F-1: News/report in the Daily Star
Wednesday, April 03, 2013
ENTRY TO BARIDHARA: Ban slapped on lungi clad rickshaw-pullers Tawfique Ali
A lungi clad rickshaw-puller stopped at the entry of Baridhara in the capital yesterday. Security workers do not let
rickshaw-pullers in lungi into the posh neighbourhood following instructions from the association of Baridhara home
owners. Photo: Star
Rickshaw-pullers in traditional Bangalee outfit, lungi, are barred from entering the capital’s
Baridhara, one of the country’s most posh neighbourhoods where diplomats and affluent people
live. Baridhara home owners’ association, Baridhara Society, has instructed security personnel not
to let in rickshaw-pullers in lungi, requiring them to be in trousers to enter Baridhara, particularly
Block K, said security men and local commuters.
As The Daily Star correspondent arrived at the lakeside entry of Baridhara at 11:45am yesterday,
he found that the security man on duty Abdul Kader had stopped a rickshaw- puller for wearing
lungi and forced the two passengers on board to get down.
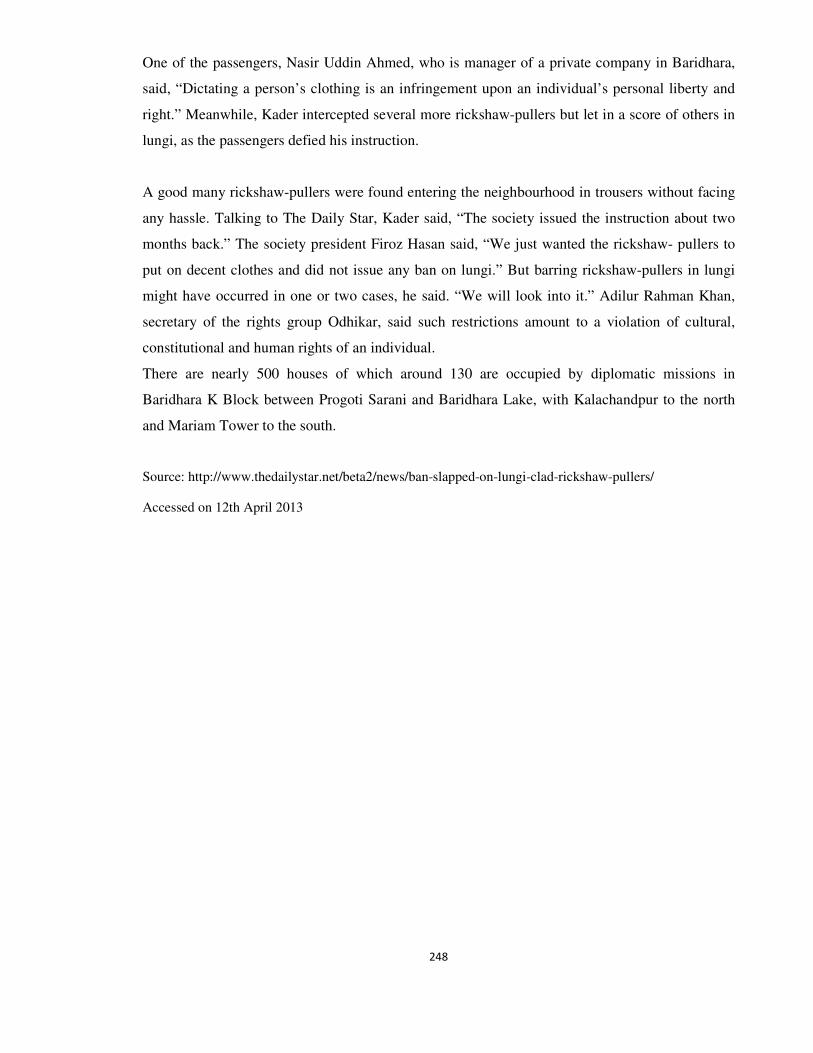
248
One of the passengers, Nasir Uddin Ahmed, who is manager of a private company in Baridhara,
said, “Dictating a person’s clothing is an infringement upon an individual’s personal liberty and
right.” Meanwhile, Kader intercepted several more rickshaw-pullers but let in a score of others in
lungi, as the passengers defied his instruction.
A good many rickshaw-pullers were found entering the neighbourhood in trousers without facing
any hassle. Talking to The Daily Star, Kader said, “The society issued the instruction about two
months back.” The society president Firoz Hasan said, “We just wanted the rickshaw- pullers to
put on decent clothes and did not issue any ban on lungi.” But barring rickshaw-pullers in lungi
might have occurred in one or two cases, he said. “We will look into it.” Adilur Rahman Khan,
secretary of the rights group Odhikar, said such restrictions amount to a violation of cultural,
constitutional and human rights of an individual.
There are nearly 500 houses of which around 130 are occupied by diplomatic missions in
Baridhara K Block between Progoti Sarani and Baridhara Lake, with Kalachandpur to the north
and Mariam Tower to the south.
Source: http://www.thedailystar.net/beta2/news/ban-slapped-on-lungi-clad-rickshaw-pullers/
Accessed on 12th April 2013
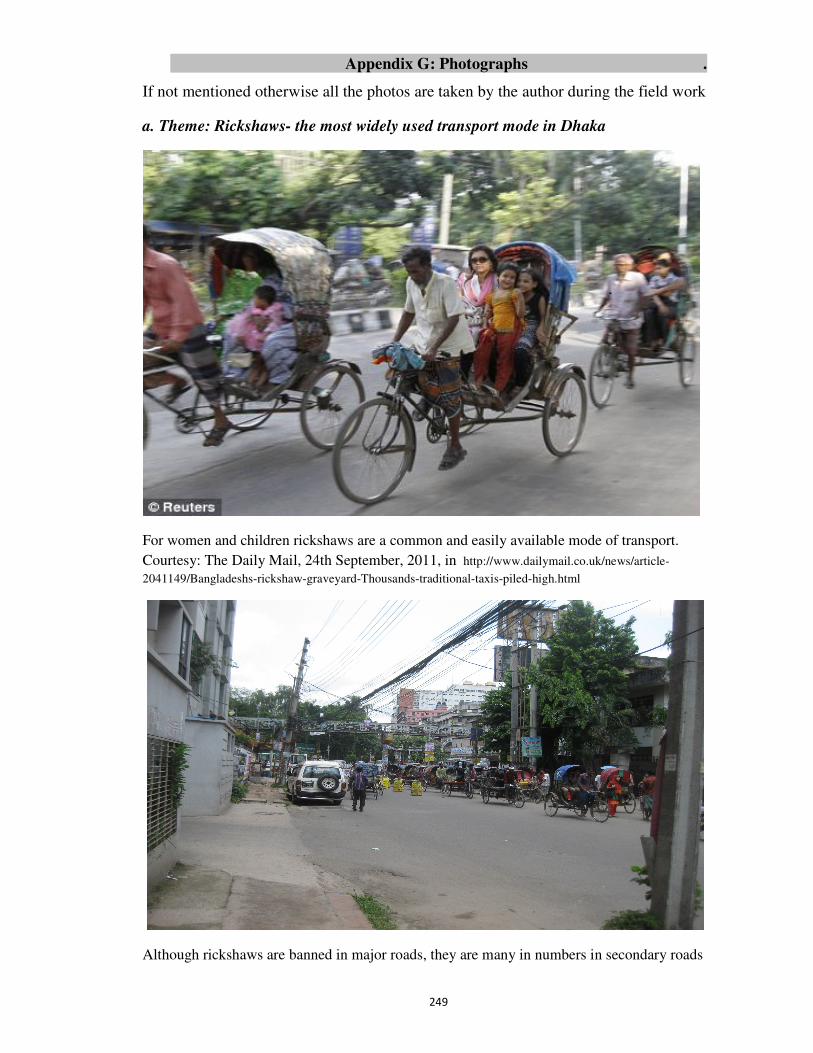
249
Appendix G: Photographs .
If not mentioned otherwise all the photos are taken by the author during the field work
a. Theme: Rickshaws- the most widely used transport mode in Dhaka
For women and children rickshaws are a common and easily available mode of transport.
Courtesy: The Daily Mail, 24th September, 2011, in http://www.dailymail.co.uk/news/article-
2041149/Bangladeshs-rickshaw-graveyard-Thousands-traditional-taxis-piled-high.html
Although rickshaws are banned in major roads, they are many in numbers in secondary roads
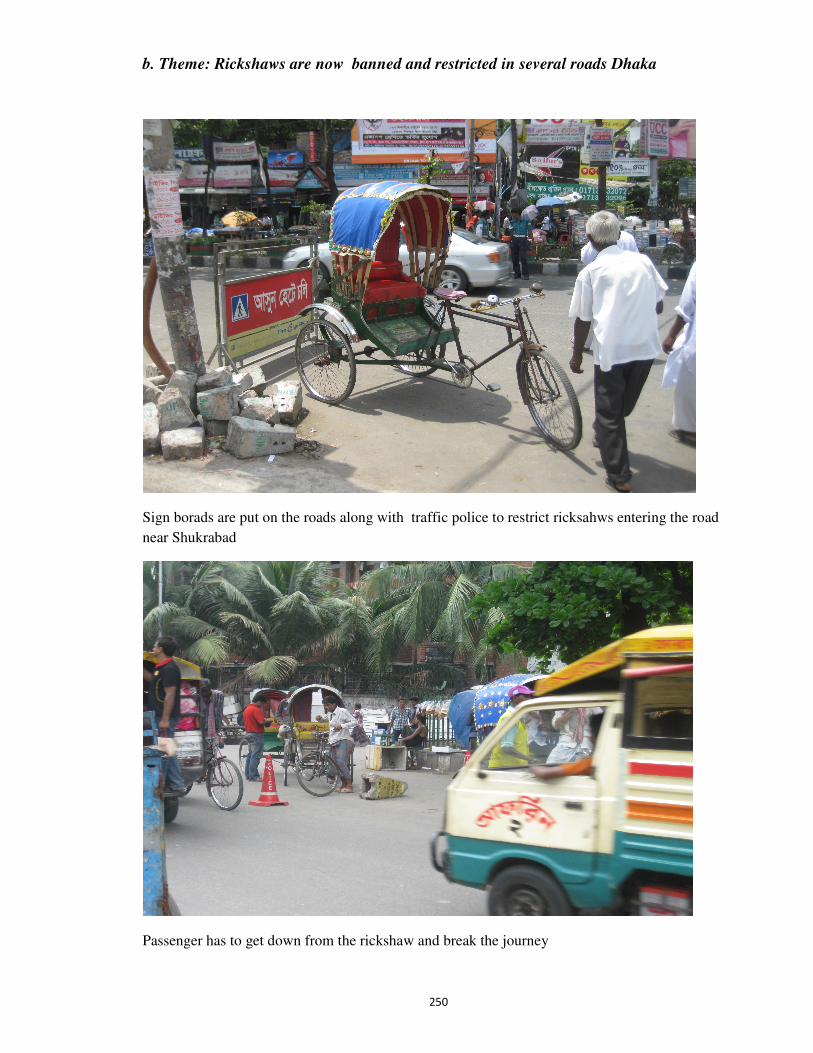
250
b. Theme: Rickshaws are now banned and restricted in several roads Dhaka
Sign borads are put on the roads along with traffic police to restrict ricksahws entering the road
near Shukrabad
Passenger has to get down from the rickshaw and break the journey
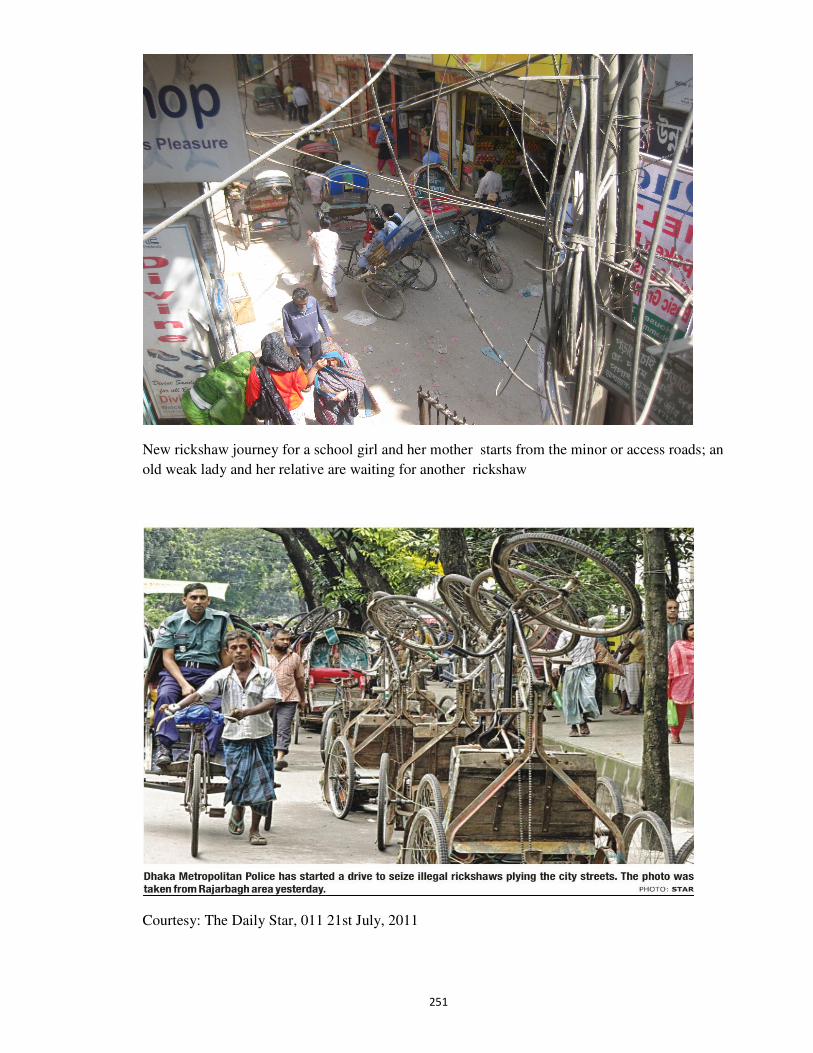
251
New rickshaw journey for a school girl and her mother starts from the minor or access roads; an
old weak lady and her relative are waiting for another rickshaw
Courtesy: The Daily Star, 011 21st July, 2011
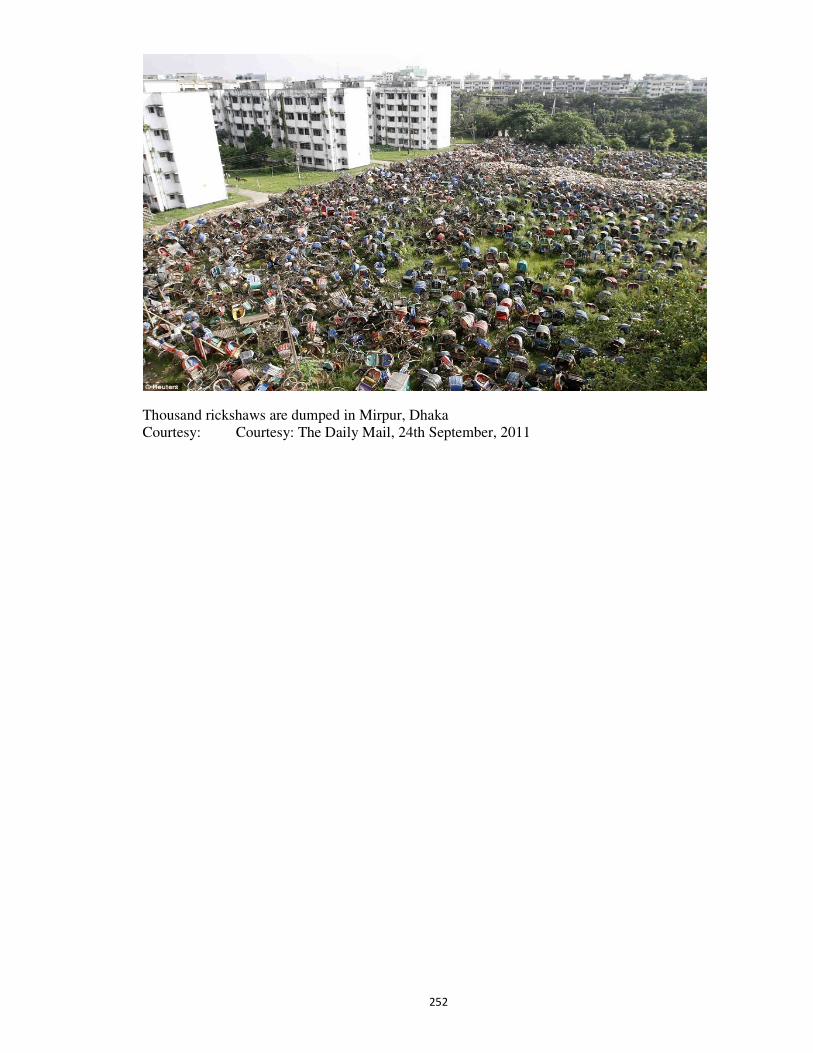
252
Thousand rickshaws are dumped in Mirpur, Dhaka Courtesy: Courtesy: The Daily Mail, 24th September, 2011
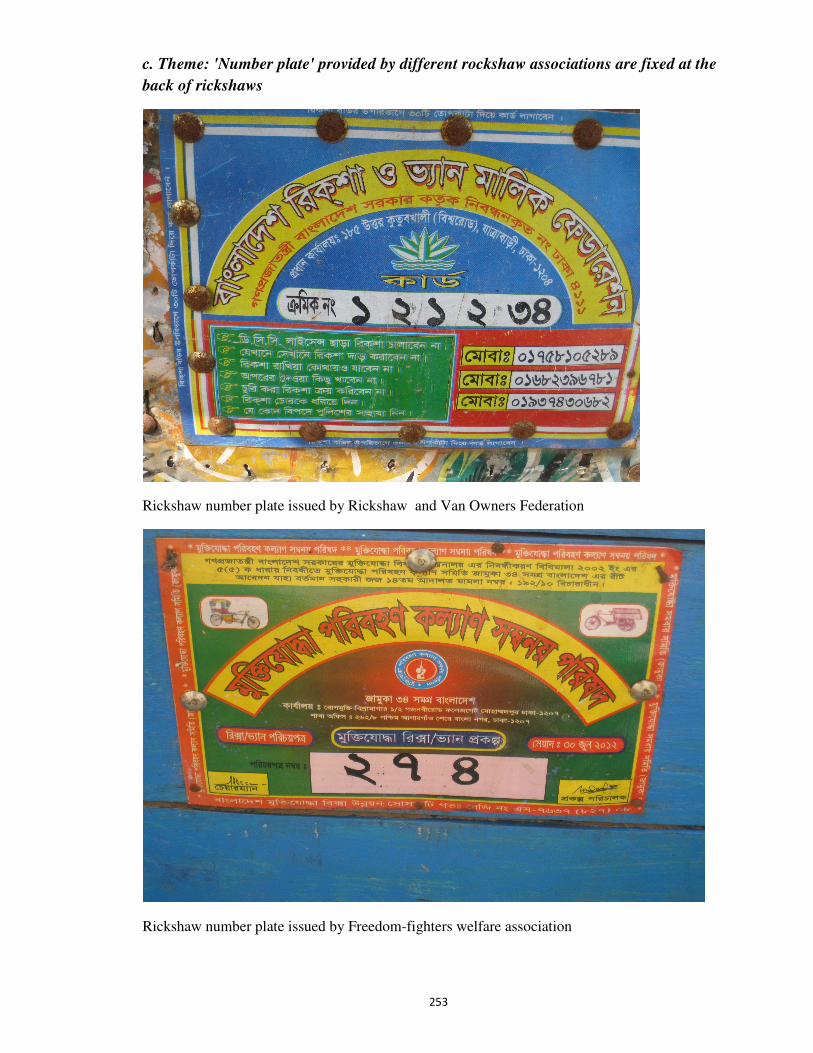
253
c. Theme: 'Number plate' provided by different rockshaw associations are fixed at the
back of rickshaws
Rickshaw number plate issued by Rickshaw and Van Owners Federation
Rickshaw number plate issued by Freedom-fighters welfare association
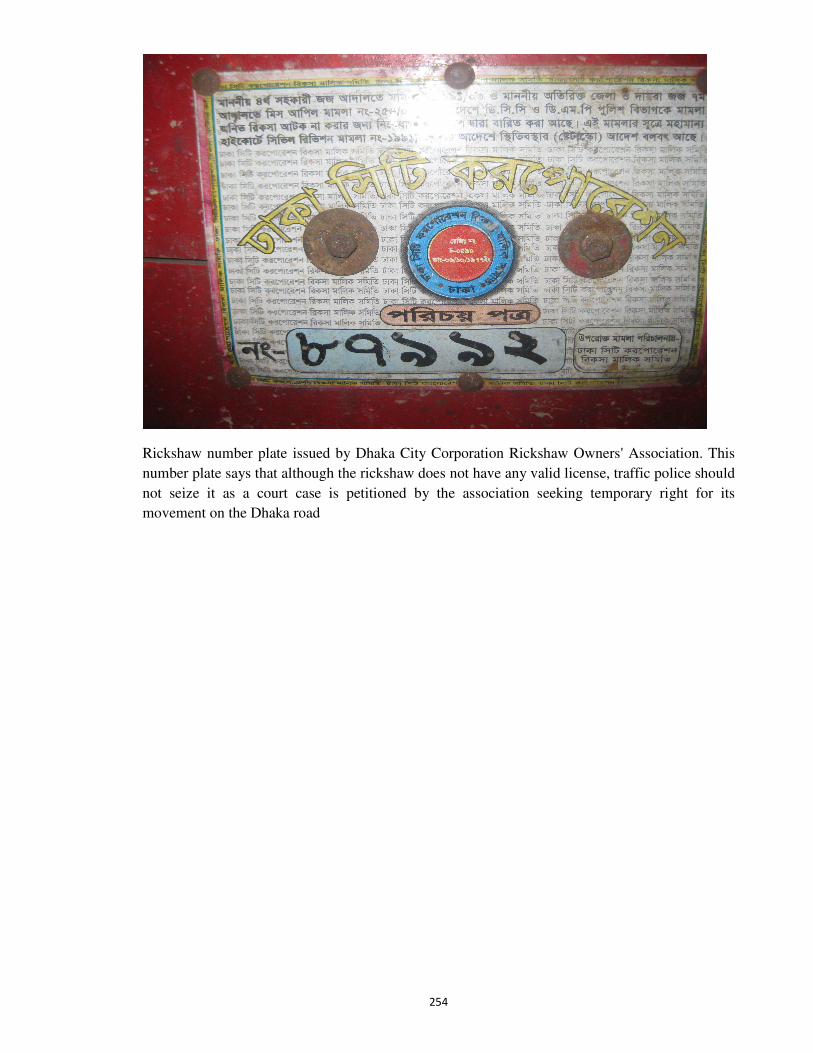
254
Rickshaw number plate issued by Dhaka City Corporation Rickshaw Owners' Association. This
number plate says that although the rickshaw does not have any valid license, traffic police should
not seize it as a court case is petitioned by the association seeking temporary right for its
movement on the Dhaka road
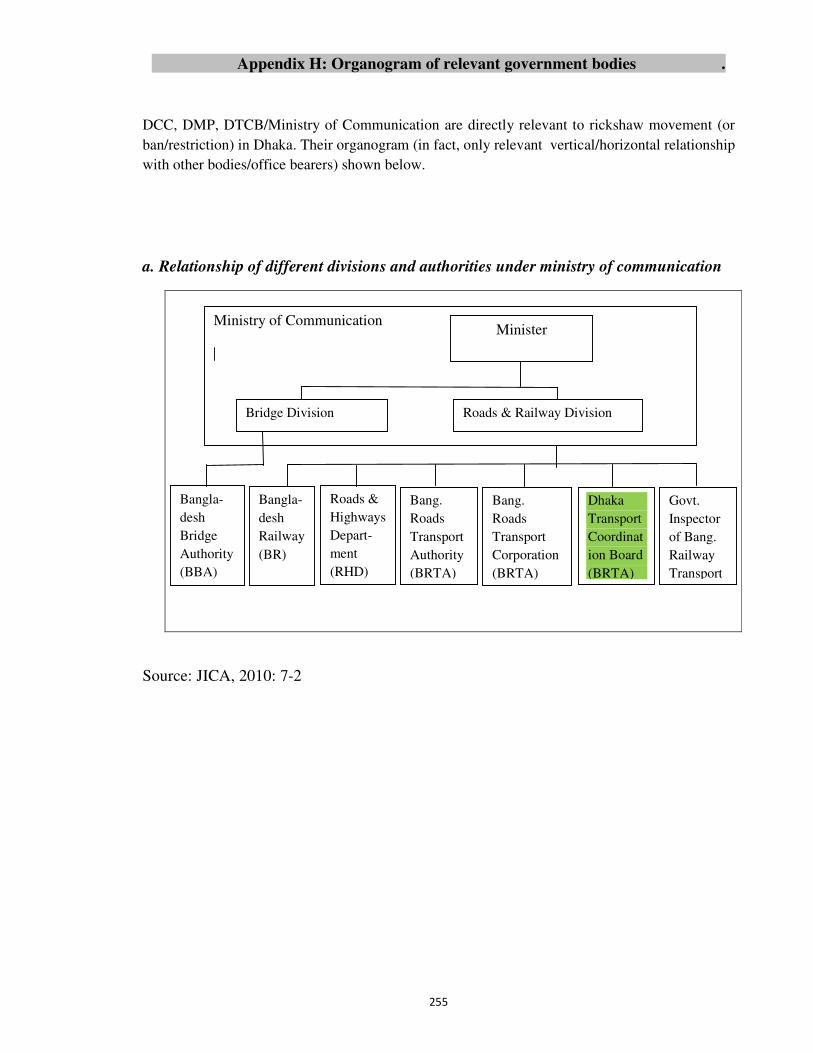
255
Appendix H: Organogram of relevant government bodies .
DCC, DMP, DTCB/Ministry of Communication are directly relevant to rickshaw movement (or
ban/restriction) in Dhaka. Their organogram (in fact, only relevant vertical/horizontal relationship
with other bodies/office bearers) shown below.
a. Relationship of different divisions and authorities under ministry of communication
Source: JICA, 2010: 7-2
Bangla-
desh
Bridge
Authority
(BBA)
Bangla-
desh
Railway
(BR)
Roads &
Highways
Depart-
ment
(RHD)
Bang.
Roads
Transport
Authority
(BRTA)
Bang.
Roads
Transport
Corporation
(BRTA)
Dhaka
Transport
Coordinat
ion Board
(BRTA)
Govt.
Inspector
of Bang.
Railway
Transport
Ministry of Communication
Minister
Bridge Division
Roads & Railway Division
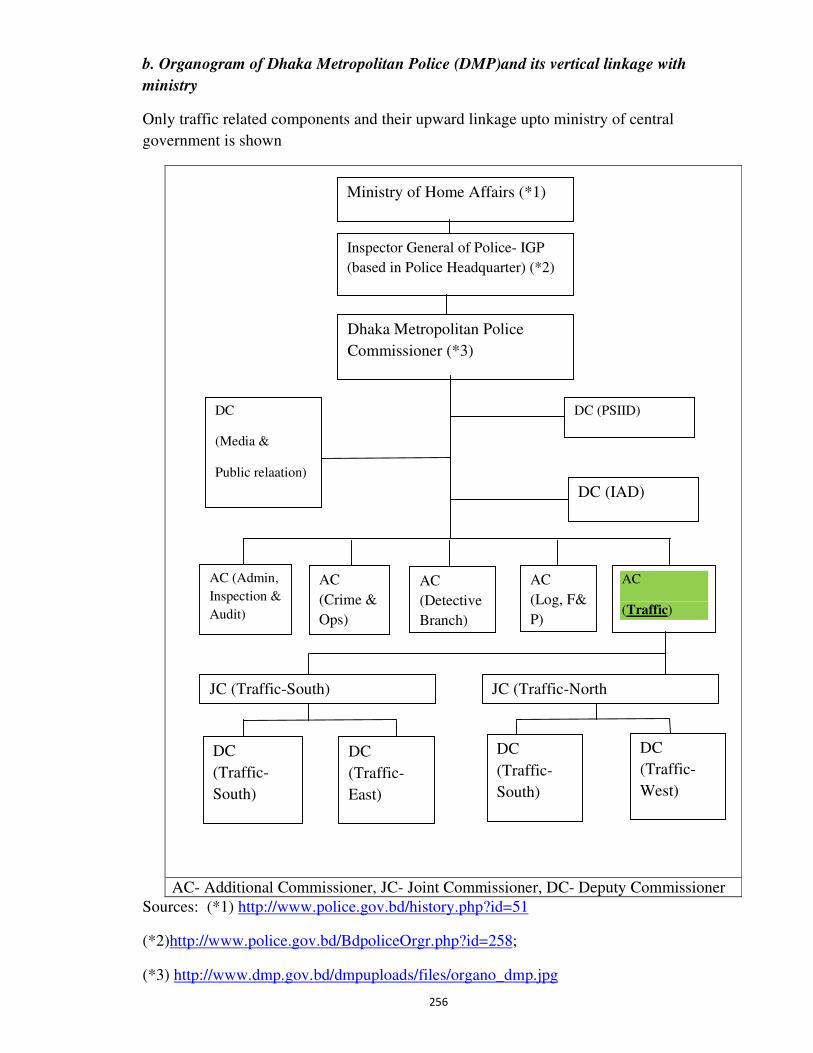
256
b. Organogram of Dhaka Metropolitan Police (DMP)and its vertical linkage with
ministry
Only traffic related components and their upward linkage upto ministry of central
government is shown
AC- Additional Commissioner, JC- Joint Commissioner, DC- Deputy Commissioner
Sources: (*1) http://www.police.gov.bd/history.php?id=51
(*2)http://www.police.gov.bd/BdpoliceOrgr.php?id=258;
(*3) http://www.dmp.gov.bd/dmpuploads/files/organo_dmp.jpg
DC
(Traffic-
East)
DC
(Traffic-
South)
DC
(Traffic-
South)
DC
(Traffic-
West)
JC (Traffic-North JC (Traffic-South)
AC (Admin,
Inspection &
Audit)
AC
(Crime &
Ops)
AC
(Detective
Branch)
AC
(Log, F&
P)
AC
(Traffic)
DC (PSIID) DC
(Media &
Public relaation)
DC (IAD)
Dhaka Metropolitan Police
Commissioner (*3)
Inspector General of Police- IGP
(based in Police Headquarter) (*2)
Ministry of Home Affairs (*1)
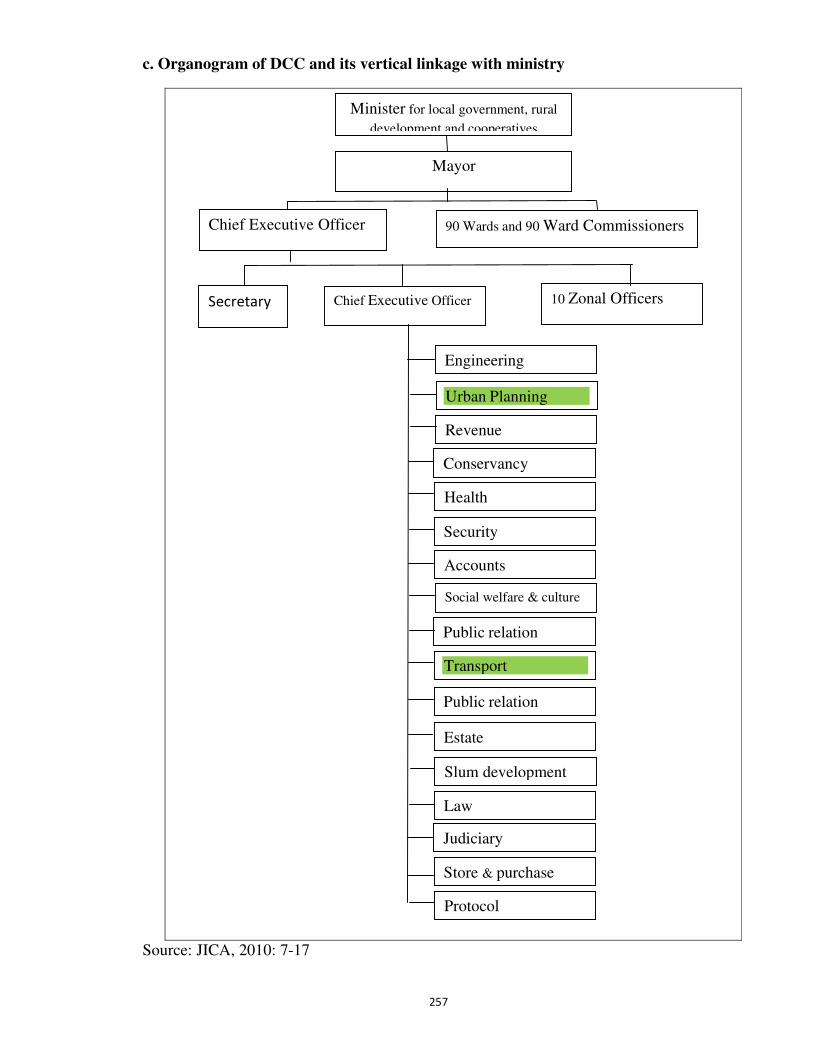
257
c. Organogram of DCC and its vertical linkage with ministry
Source: JICA, 2010: 7-17
Mayor
Minister for local government, rural
development and cooperatives
Chief Executive Officer 90 Wards and 90 Ward Commissioners
Secretary Chief Executive Officer 10 Zonal Officers
Engineering
Urban Planning
Law
Judiciary
Protocol
Store & purchase
Revenue
Conservancy
Health
Security
Public relation
Accounts
Social welfare & culture
Transport
Public relation
Slum development
Estate
Related Documents

![Untitled-2 [panoramacambalkon.com] · ANOR Bans Tente . ANOR Bans Tente . ANOR Bans Tente](https://static.cupdf.com/doc/110x72/5aece14e7f8b9ae5318f7946/untitled-2-bans-tente-anor-bans-tente-anor-bans-tente.jpg)