The Canadian Equalization Program: Main Elements, Achievements and Challenges Jean-Thomas Bernard Visiting Professor Department of Economics University of Ottawa December 2012

Welcome message from author
This document is posted to help you gain knowledge. Please leave a comment to let me know what you think about it! Share it to your friends and learn new things together.
Transcript

The Canadian Equalization Program: Main Elements, Achievements and Challenges
Jean-Thomas BernardVisiting ProfessorDepartment of EconomicsUniversity of Ottawa
December 2012

Summary 3
Introduction 4
Equalization 101 5
Equalization in Numbers 8
Problems of Implementation 13
A Useful Change 15
Conclusion 16
CONTENT

3
SUMMARY
The Canadian equalization program is intended to enable provincial governments to offer services of comparable quality while collecting revenues from their citizens that require approximately the same level of effort. In reality, it is the fiscal capacity (the capacity of the provinces to obtain revenues from certain sources) that is partially equalized; the provinces keep complete freedom regarding expenses. Fiscal capacity is evaluated by applying the Representative Tax System, which is supposed to reflect the fiscal practices commonly adopted by the provinces. The federal government finances the equalization transfers out of the taxes it collects; consequently all Canadian citizens participate in it, even those from the receiving provinces. The natural resources sector is at the origin of most of the difficulties encountered since the establishment of this program in 1957. The differences in the endowments of the provinces and the instability of natural resource prices are the main causes. The Canadian economy is in a phase in which the role of natural resources has increased; this will be a source of tension in the application of the equalization program, both between the federal government and the provinces and between the provinces themselves. The creation of sovereign natural resource funds by the provinces would be a mechanism to reduce the impact of raw material price instability while respecting the power of the provinces over natural resources on their territories.
Thanks to Md. Jakir Hussain and Natasha Plourde for their assistance and Martin Coiteux for his comments. I remain sole responsible for the information and opinions presented in this text.

4
INTRODUCTION
Even though Canada’s equalization program has formally existed for 55 years and is written into the Constitution Act of 1982, it remains mainly the concern of federal and provincial Finance officials and a few academic experts. For the general public, it is an obscure aspect of federal-provincial relations and does not seem to have much to do in the lives of ordinary people because it is about transfers from the federal government to some provincial governments. The fact remains, however, that all Canadian citizens are affected by it through the quantity and quality of the services they receive from their provincial governments and in terms of the taxes they pay to the two levels of government.
The first objective of this paper on equalization is to provide an introduction to the Canadian equalization program: goals, implementation and results. The second objective is to analyze the main difficulties that have emerged since the introduction of the program. Particular attention is paid to the role of the natural resource sector since the provinces own the resources and control their development. In fact, the large differences of revenues obtained by the provinces as owners of most of the natural resources on their territories and the instability of resource prices have been and remain at the origin of the greatest difficulties encountered in the implementation of the Canadian equalization program.
This paper first presents a description of the main elements of the Canadian equalization program. Second, it looks at what the numbers tell us regarding the following questions: which provinces benefit from this program? Who pays for these transfers? Is the policy objective reached? Third, it analyzes the main problems encountered during the implementation of this program, taking into account the specific redistribution formula used to accomplish the program’s objectives. Fourth, it presents a proposal to better take into account the impacts of the variability in raw material prices, while respecting the provinces in their role as owners of the natural resources on their respective territories. In conclusion, the potential evolution of this program is considered in the context of the accelerating shift of Canadian economic activity from east to west over the past decade under the impetus of natural resources.

5
The Great Depression of 1929 brought such a fall in the revenues collected by the provinces that some of them had difficulty meeting their obligations under the Canadian constitution in the areas of health, education and infrastructure, to the point where they were effectively bankrupt.1 This was particularly the case for the three Prairie Provinces. The Rowell-Sirois Royal Commission was created by the federal government to analyze this subject. Its report, published in 1940, recommended that the federal government pay grants directly to the provinces to relieve their fiscal shortfalls. Because of the Second World War, the formal equalization program did not appear until 1957; the main elements are described in the following paragraphs.
The goal of this program is written explicitly in Subsection 36(2) of the Constitution Act of1982: “Parliament and the government of Canada are committed to the principle of making equalization payments to ensure that provincial governments have sufficient revenues to provide reasonably comparable levels of public services at reasonably comparable levels of taxation.”
The goal of the program is simple and clear: every Canadian citizen should have access to comparable public services while bearing roughly the same tax burden and now it is the constitutional responsibility of the federal government to provide grants to the provinces to reach this goal. However, the provinces remain responsible for determining what services they offer to their citizens in the matters under their jurisdiction according to the Canadian Constitution. So there is no examination of the needs of the provinces by the federal government. The basic idea is that the provinces determine the services to be provided to their citizens and collect taxes to this end. However, all of them do not have the same capacity to generate revenues. A poor province would have to impose a much greater burden on its citizens in order to offer services of quality comparable to a wealthier province. A key concept of the Canadian equalization system is fiscal capacity: the ability of a province to collect revenues from a given source. It is the fiscal capacity of the province that the federal government seeks to equalize by providing grants to the poorer provinces. The fiscal capacity of a province for a given source of revenue is evaluated not on the basis of the actual revenue collected by this province, but rather by how much the province would collect if it applied the Representative Tax System (RTS); the RTS is supposed to be a reflection of the current fiscal practices of the ten provinces without in any way reproducing the particularities of each of them.
1EQUALIZATION 101
1. This section is drawn largely from the Expert Panel on Equalization and Territorial Formula Financing (2006).

6
where REj R = right to equalization of a province j, for the tax base R, POPj = population of province j, ATRR = average tax rate applied to the tax base R according to the RTS, FCj R = tax base R of a province j, STANR = average per capita tax base R at the national level.
According to the formula (1) above, the determination of the right to equalization of the province for the tax base R depends on the comparison between the per capita fiscal capacity of this province for the source in questionand the national standard, which is the average capacity per capita (STANR) at the national level. This difference is multiplied by the tax rate for this tax base according to the RTS, (ATRR) and the population of the province (POPj ) to take into account its demographic weight. Therefore if the province is relatively poor for a tax base according to the RTS, it has the right to receive compensation (+); otherwise it is in a surplus situation (-).
Here is an example of the application of the above formula. Québec produces no oil, therefore its fiscal capacity for this source is zero (FCj R = 0). On the other hand, there is a per capita production of about 33 barrels for Canada as a whole (STANR), concentrated mostly in Western Canada, particularly Alberta. Québec therefore has a deficit for this tax base while Alberta has a surplus; ATRR represents the average amount per barrel collected by the petroleum-producing provinces. Québec would therefore have a positive right (+) for this source while Alberta would have a negative (-) one.
Formula (1) is applied to a set of tax bases and then the positive (+) and negative (-) rights are added up for the tax bases. If the sum is positive for a province, this province has a right to an equalization grant from the federal government. However, if the sum is negative, the province receives nothing. The federal government pays the amounts to the receiving provinces without any condition; the receiving provinces do not have to account for how they spend this money. The federal government finances the transfers out of the taxes it collects. Consequently it is the Canadian taxpayers as a whole who pay for the cost of the equalization program, including the taxpayers of receiving provinces.
The number of tax bases has evolved significantly since the introduction of the equalization program in 1957. At that time, it had only three tax bases: personal income tax, corporate income tax and inheritance tax. In 1962, another tax base was added: 50% of natural resource revenues. From review to review, the number of tax bases has been expanded to 33, 14 of them associated with oil and gas resources. The intended goal of this expansion was to achieve equity between the provinces by including the most significant sources of revenues used by the provinces2. Following a recommendation by the Expert Panel on Equalization and Territorial Formula Financing (2006), the 33 tax bases previously considered are now grouped into five large tax bases: personal income tax, corporate income tax, sales tax, property taxes and natural resource revenues (50%). The rate of inclusion of natural resource revenues has varied over time from 0% (exclusion), to 50%, 100%, 33.3%, 50%, 100%, 70% and 50%. This variation shows the lack of consensus regarding the rate of inclusion of natural resource revenues.
2. The addition of tax bases for petroleum and gas resources results from the need to take into account other characteristics of these resources than their simple volume. There are other dimensions to consider than the number of barrels or cubic meters. These resources vary in terms of quality and cost of exploitation: for example, tar sands oil does not have the same value or cost as conventional petroleum. An aggregation at a too-high level would raise problems of fairness, especially between producing provinces, and there could also be impacts for the receiving provinces.
REj R = POPj * ATRR {STAN R } (1)FCj R
POPj
The right of a province to receive an equalization grant for a given source of revenue or tax base is determined by applying the following formula:
( )FCj R
POPj
7
The identification of the national standard (STANR) in formula (1) has also raised some controversies. Note that the standard is the comparison point used to determine whether a province has a surplus or a deficiency in its tax base for a given source of revenue. Two concepts are in conflict regarding how to measure the national standard: the first concept is to bring the poorest provinces up to the level of the richest. Thus, in 1957, the national standard was based on the average of the two richest provinces. Subsequently, a concept less favourable to redistribution was adopted and the national standard was based on the average of the ten provinces. To reduce the influence of the extreme cases of poverty or wealth, the standard of five provinces (British Columbia, Saskatchewan, Manitoba, Ontario and Québec) was used from 1982 to 2004. In 2007, the Canadian government re-introduced the standard of ten provinces following the recommendation of the Expert Panel. The use of this standard is intended to bring the poorest provinces to the average level for all of Canada and not to that of the richest provinces.
Besides equalization payments, the federal government makes other transfer payments to the provinces such as those in health, post-secondary education, and social services. These programs have two major differences compared to equalization: first, they are per capita transfers, without regard to the wealth level of the provinces; and second, they are conditional, as the federal government imposes certain standards that the provinces must respect, even though the matter is under provincial jurisdiction. For example, the health transfers are conditional on health services being universal, free, and accessible between provinces. Even though these per capita transfers do not specifically aim to achieve redistribution of revenues from one province to another, they nevertheless include an element of redistribution: in financing these transfers, the federal government collects relatively more revenues from richer provinces compared to those less well endowed; hence some redistribution follows.
In summary, the federal government makes transfer payments to some provinces which are intended to make the fiscal capacities (the base on which the provinces are able to collect taxes) more equal from province to province. These transfers enable provincial governments to provide public services that are reasonably comparable across Canada. The provinces remain free, however, to determine the level and quality of the services they offer. To measure fiscal capacity, the federal government applies the RTS, a representation of the practices applied by the provinces. The equalization payments made to the beneficiary provinces are paid out of the tax revenues collected by the federal government; that is, the taxes paid by all Canadians. There is no specific tax to support the equalization program.
To conclude this section, note that most countries with a federal government have adopted some type of equalization system between provinces or member States. This is the case for Germany, Switzerland and Australia, but not for the United States.

8
To understand the outcomes of the application of the Canadian equalization program, it is helpful to keep in mind the overall distribution of economic activity between the provinces and its evolution over the years. To this end, the provinces can be divided into three groups: the rich province (Alberta), the intermediate provinces (British Columbia, Saskatchewan, Ontario and Newfoundland and Labrador), and the poor provinces (Manitoba, Québec, New Brunswick, Nova Scotia and Prince Edward Island). Although Alberta received equalization payments during the first years of the program, when natural resources were not included, it has not benefited from this program since then. Its economic development has been driven by hydrocarbon production, whose returns have been enhanced by the oil crises of 1973 and 1979, the 1988 Canada-US free trade agreement, and the more recent price rise which began in 2000. Since per capita revenue is high in Alberta, the other sources of revenue accessible to the government of this province are also well endowed.
The intermediate provinces have this status because their situation is changing: they receive payments during some years but draw nothing in other years. British Columbia is rich in natural resources: forest products, natural gas, mines and hydroelectricity, but it is relatively poor in other revenue sources. Its status depends therefore on the price of raw materials. This is also the case for Saskatchewan, whose status also depends on the price of farm products. Until 2009, Ontario had never received equalization payments. This province has few natural resources, but its other sources of revenue have been well nourished by the manufacturing and financial services sectors. In the implementation of the equalization program, there was an Ontario clause: an implicit clause that, as the most populous and among the richest provinces, it should normally not have access to equalization, and that the program should even be adapted to make this so. The decline of the Ontario manufacturing sector, which was accelerated by the 2008 recession, and the economic strength of the Western provinces, based on the development of natural resources, have finally brought Ontario to receive equalization payments since the 2009-2010 budget year. The case of Newfoundland and Labrador is similar to that of Ontario, except in the opposite direction. This province was relatively poor and had received equalization payments since the beginning of the program. The discovery of oil off the East Coast and the oil revenue sharing agreement with the federal government3 has removed it from the equalization beneficiaries since the 2008-2009 budget year.
The provinces considered as poor have relatively few natural resources, and their other sources of revenue are below the national average because income per capita is lower. They have received benefits from the federal equalization program year after year.
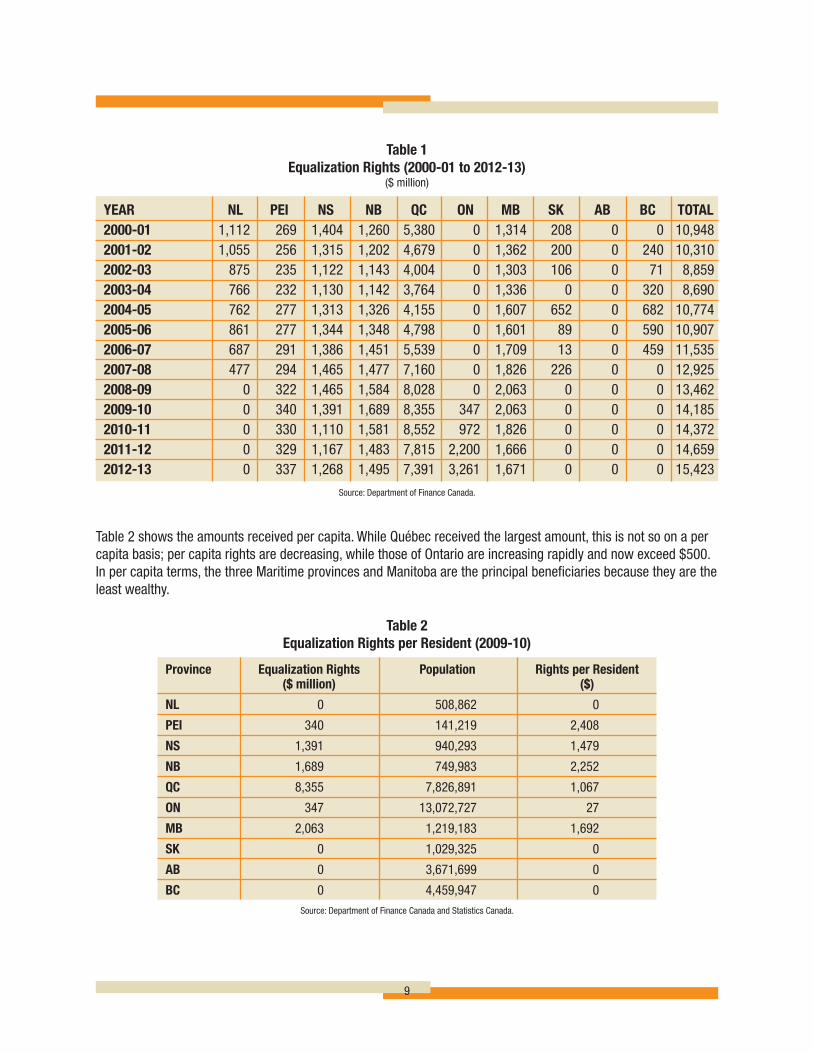
Now that we have been introduced to the status of each province for the purpose of equalization, let’s look at this program by the numbers. Table 1 presents equalization rights by province from 2000-2001 to 2012-2013. It shows Alberta as the only province that has not received any amount during this period, while Prince Edward Island, Nova Scotia, New Brunswick and Québec have been beneficiaries every year. On average Québec has received about 50% of the federal equalization payments. The status of Saskatchewan and British Columbia have been intermittent due to raw material price volatility. Since 2010, the amounts received by Québec have declined, while Ontario’s have increased. The disappearance of the difference in the unemployment rates between the latter two provinces helps to explain this convergence of the two most populous provinces.
3. Oil and gas revenues currently constitute more than 30% of the budget of Newfoundland and Labrador.
2EQUALIZATION IN NUMBERS
9
Table 2 shows the amounts received per capita. While Québec received the largest amount, this is not so on a per capita basis; per capita rights are decreasing, while those of Ontario are increasing rapidly and now exceed $500. In per capita terms, the three Maritime provinces and Manitoba are the principal beneficiaries because they are the least wealthy.
Table 1Equalization Rights (2000-01 to 2012-13)
($ million)
YEAR NL PEI NS NB QC ON MB SK AB BC TOTAL 2000-01 1,112 269 1,404 1,260 5,380 0 1,314 208 0 0 10,948 2001-02 1,055 256 1,315 1,202 4,679 0 1,362 200 0 240 10,310 2002-03 875 235 1,122 1,143 4,004 0 1,303 106 0 71 8,859 2003-04 766 232 1,130 1,142 3,764 0 1,336 0 0 320 8,690 2004-05 762 277 1,313 1,326 4,155 0 1,607 652 0 682 10,774 2005-06 861 277 1,344 1,348 4,798 0 1,601 89 0 590 10,907 2006-07 687 291 1,386 1,451 5,539 0 1,709 13 0 459 11,535 2007-08 477 294 1,465 1,477 7,160 0 1,826 226 0 0 12,925 2008-09 0 322 1,465 1,584 8,028 0 2,063 0 0 0 13,462 2009-10 0 340 1,391 1,689 8,355 347 2,063 0 0 0 14,185 2010-11 0 330 1,110 1,581 8,552 972 1,826 0 0 0 14,372 2011-12 0 329 1,167 1,483 7,815 2,200 1,666 0 0 0 14,659 2012-13 0 337 1,268 1,495 7,391 3,261 1,671 0 0 0 15,423
Source: Department of Finance Canada.
Province Equalization Rights Population Rights per Resident ($ million) ($)
NL 0 508,862 0
PEI 340 141,219 2,408
NS 1,391 940,293 1,479
NB 1,689 749,983 2,252
QC 8,355 7,826,891 1,067
ON 347 13,072,727 27
MB 2,063 1,219,183 1,692
SK 0 1,029,325 0
AB 0 3,671,699 0
BC 0 4,459,947 0
Table 2Equalization Rights per Resident (2009-10)
Source: Department of Finance Canada and Statistics Canada.

10
The federal government finances the equalization transfers out of the taxes collected from all Canadian taxpayers. Table 3 shows the amounts it collects in each province. Ontario’s weight is evident. For each dollar received as equalization by Ontario, this province finances 39.5¢, for a net gain of 60.5¢. For Québec, the net gain is 81.6¢. As for Alberta, it finances 16.7¢ per dollar paid to receiving provinces without drawing any direct benefits itself.
Table 4 shows the per capita amounts collected by the federal government in each province. Alberta occupies the top position with $9,802, while New Brunswick is in the last place with $4,924. Québec contributes $5,069, a bit more than New Brunswick, while the national average is $6,404.
Province Revenues Percentage ($ million)
Canada 216,019 100.0
NL 3,811 1.8
PEI 739 0.3
NS 5,034 2.3
NB 3,693 1.7
QC 39,677 18.4
ON 85,239 39.5
MB 6,453 3.0
SK 7,074 3.3
AB 35,990 16.7
BC 27,221 12.6
Table 3Percentage of Federal Revenues Collected in Each Province (2009)
Source: Statistics Canada, Federal Government Revenue and Expenditures, Table 7, Publication # 13-018-X.
Source: Statistics Canada, Federal Government Revenue and Expenditures, Table 7, Publication # 13-018-X and CANSIM Table # 051-0001.
Province Revenues Population Per Resident ($ million) ($)
Canada 216,019 33,729,690 6,404
NL 3,811 508,862 7,489
PEI 739 141,219 5,233
NS 5,034 940,293 5,354
NB 3,693 749,983 4,924
QC 39,677 7,826,891 5,069
ON 85,239 13,072,727 6,520
MB 6,453 1,219,183 5,293
SK 7,074 1,029,325 6,872
AB 35,990 3,671,699 9,802
BC 27,221 4,459,947 6,103
Table 4Revenues Collected per Resident in Each Province by the Federal Government (2009)

11
Tables 5 and 6 show the relative importance of the equalization program compared to the federal budget and to the overall Canadian economy. Since budget year 2004-2005, the share of equalization transfers constitutes more than 5% of the expenses of the federal government, and is trending upward. The program represents less than 1.0% of Canada’s GDP, but the trend is slightly upward.
Table 7 presents the relative importance of equalization transfers compared to all revenues collected by each province. For Québec, this is 8 cents per dollar spent, while for Prince Edward Island it is more than 20 cents per dollar spent.
Year Federal Expenditures Equalization Rights Percentage ($ million) ($ million)
2003-04 177,124 8,690 4.91
2004-05 210,480 10,774 5.12
2005-06 208,985 10,907 5.22
2006-07 222,214 11,535 5.19
2007-08 232,823 12,925 5.55
2008-09 238,847 13,462 5.64
2009-10 274,198 14,185 5.17
Table 5Equalization Rights as a Percentage of Federal Expenditures (2003-04 to 2009-10)
Source: Department of Finance Canada and Annual Financial Report of the Government of Canada.
Year Equalization Rights GDP Percentage ($ million) ($ million)
2003-04 8,690 1,224,300 0.71
2004-05 10,774 1,310,896 0.82
2005-06 10,907 1,399,423 0.78
2006-07 11,535 1,465,861 0.79
2007-08 12,925 1,550,415 0.83
2008-09 13,462 1,587,709 0.85
2009-10 14,185 1,549,783 0.92
Table 6Equalization Rights as a Percentage of Gross Domestic Product (2003-04 to 2009-10)
Source: Department of Finance Canada and Statistics Canada, CANSIM Table # 380-0001.

12
Table 8 reports per capita expenses of the provincial governments and the amounts financed by equalization transfers. These transfers reduce the differences between the provinces, since these differences are smaller in the first column than the last. However, the differences are not completely eliminated. In fact, the provinces have complete freedom regarding the level of their expenses, and this represents a source of difference. Thus, for the 2008-2009 budget Québec spent more per capita ($12,700) than Ontario ($10,485), a difference of $2,215. Québec financed $11,674 from revenues other than equalization and Ontario, $10,485, for a difference of $1,189 between the two provinces; the rest of the difference in expenses was covered by equalization ($1,026). Québec has one of the highest per capita expenses even though other provinces are wealthier and do not receive equalization grants.
Province Revenues Equalization Rights Percentage ($ million) ($ million)
NL 8,374 0 0.0
PEI 1,576 322 20.4
NS 11,074 1,465 13.2
NB 8,978 1,584 17.6
QC 101,392 8,028 7.9
ON 141,577 0 0.0
MB 14,715 2,063 14.0
SK 17,032 0 0.0
AB 51,388 0 0.0
BC 48,949 0 0.0
Table 7Equalization Rights as a Percentage of Revenues of Provincial and Local Administrations (2008-2009)
Source: Department of Finance Canada and Statistics Canada, CANSIM Table # 385-0001.
Province Total Expenditures* Equalization Rights Expenditures Without Equalization Rights
NL 12,909 0 12,909
PEI 10,969 2,280 8,689
NS 10,908 1,558 9,350
NB 11,238 2,112 9,126
QC 12,700 1,026 11,674
ON 10,485 0 10,485
MB 11,102 1,692 9,410
SK 13,125 0 13,125
AB 13,224 0 13,224
BC 10,979 0 10,979
Table 8Provincial Expenditures and Equalization Rights per Resident (2008-09)
* Expenditures do not include interest expenses.Source: Department of Finance Canada and Statistics Canada, CANSIM Table # 385-0001.

13
The Canadian equalization program reduces the differences in fiscal capacity between the provinces to enable them to offer their citizens approximately the same level of services in an overall perspective of equity in the tax burden borne by citizens. The previous section showed that this goal can be considered to be achieved, while provincial governments still have complete freedom regarding the level of their expenses. However, the implementation of the program raises issues that often require decision-makers to choose between goals that seem to be equally important. Often there is a fundamental choice to be made between equity and efficiency; the pursuit of equity through a more egalitarian redistribution has negative effects on efficiency, so that the pieces of pie are more equal but the pie itself is smaller due to redistribution. We will consider four aspects that have regularly caused problems in the implementation of the equalization program.
I) StabilityThe receiving provinces wish to receive transfers that are stable over time, since the needs of their populations are more or less stable. One method used to increase the stability of the transfers is to base the computations on moving averages applied to statistical data that were generated two or three years ago to ensure their availability. This practice can cause problems of equity if the situation of a province changes rapidly, as it does in the case of provinces whose economies depend on natural resource prices. Also the tax revenues of the two levels of government follow the economic cycles; hence stable payments by the federal government make federal budget balancing more difficult, to the benefit of receiving provinces. The federal government currently avoids this problem by letting the total amount dedicated to the equalization program increase with the Gross Domestic Product4. The problem thus lands back on the receiving provinces. There is no solution to this problem that is satisfactory to both levels of government. The gain of one is at the cost of the other.
It should be noted that the variability of federal government tax revenues is smaller than the variability of the tax revenues of most provincial governments, since the Canadian economy has the benefit of greater diversification than that of any province. A recent example of this phenomenon is the economic growth of the Western provinces, driven by the prices of raw materials, and the relative decline of Ontario’s economy as the manufacturing sector is slowed by the rise in the dollar’s value – a rise caused by the increasing raw material prices. The federal government’s capacity to pay is therefore more stable than that of the provinces and equalization is a policy by which this relative stability is passed on to the receiving provinces.
II) PredictabilityThe governments establish their budgets over a three- to five-year horizon. The provinces want to know the amounts they will receive as equalization rights and the federal government also wishes to know its commitments. For the three fiscal years from 2004-2005 to 2006-2007 the federal government`s solution was to let this envelope increase by a fixed rate of 3.5% per year. This determinist solution aggravated the budgetary difficulties of the federal government during the recession and may create problems of equity among the provinces due to the changes in their needs over time that do not vary at the same pace. There is no definite entitlement to receive equalization grants. A province could be entitled to receive money under one scheme and nothing under a different scheme. An additional factor is that a change of government at the federal level may also bring changes to the orientation of the equalization program.
3PROBLEMS OF IMPLEMENTATION
4. The formula thus serves to determine the shares allocated to the receiving provinces.
14
III) Incentives for Receiving Provinces One desirable feature of an equalization program is to interfere as little as possible with respect to the behaviour of the receiving provinces. Getting an equalization grant should not lead a province to modify its behaviour, particularly regarding the collection of revenues. Unfortunately the Canadian equalization program opens the door to strategic behaviours because the receiving provinces have the possibility of influencing their fiscal capacity and hence the amounts that they get under this program. Smart (2007) analyzed provincial fiscal policies in effect from 1972 to 2002, and showed that the average tax rates were higher in the provinces receiving equalization payments than in the other provinces; also that the receiving provinces raised these rates at the moment of receiving equalization payments. In doing so, they caused a flight of economic activity to other provinces, but they were compensated for this loss by larger equalization grants.
There are also specific examples of strategic behaviour adopted by a receiving province where the cost of one of its decisions is partially compensated by increased equalization transfers. Newfoundland and Labrador, when it was receiving equalization payments, adopted an uncompromising policy for many years toward the development of the nickel deposit at Voisey’s Bay in Labrador. The province required the transformation of the ore on the island, while the company preferred to ship the unprocessed ore to its existing plants in Sudbury, Ontario. In taking this stance, the province deprived itself of mine royalties. The shortfall was partially compensated, however, by equalization payments that reflected the reduced fiscal capacity.
For several years, Québec did not levy royalties on Hydro-Québec’s hydroelectric production, as other provinces do which have hydroelectric resources. One explanation for this is equalization. By not levying royalties on hydroelectric production, Québec, which has major hydroelectric resources, reduced the national average tax rate (ATR) for this source, which reduced its loss for this tax base.5
It is difficult to conceive of an equalization program that would not affect the behaviour of the receiving provinces, since money does not fall from trees and decision makers inevitably respond to incentives.
IV) Inclusion or Exclusion of Natural Resource RevenuesAs indicated in Section 1, the inclusion rate of natural resource revenues collected by the provinces has varied from 0% to 100%. Two schools of thought present opposing views on this subject. On one side, some argue that natural resources belong to the provinces and that they alone should benefit from these resources on behalf of their citizens. Others, however, argue that the natural resource revenues are like any other revenues that serve to finance services to citizens; therefore there is no reason to treat them differently. The degree of inclusion of natural resources in equalization has varied with the weight given to these two different schools of thought. It remains true that the degree of inclusion influences the provinces in developing their resources. Once again there is a trade-off between equity and efficiency.
5. In 2006, the government of Québec introduced a royalty on Hydro-Québec’s hydroelectric production that brought in about $600 million per year, which it invested in the Generations Fund. Bernard and Ben Mabrouk (2010) estimated that under the equalization program in effect in 2007, Québec was losing 38¢ in equalization payments for every dollar collected by royalties on hydroelectricity production.
15
As underlined in the previous section, the natural resource sectors have been sources of difficulty in the implementation of the Canadian equalization program. These difficulties have arisen in large part because of the variability of raw material prices and the impacts this has on the levels of activity in these sectors and on the revenues that flow to the provinces as owners of these resources. Currently, all the revenues that flow to the provinces from natural resources are included in the equalization formula: auctions, royalties, profit-sharing agreements and dividends from State-owned enterprises. There is a need to transform these unstable revenues into more stable revenues for purposes of equalization. One way to reach this goal would be to subtract from equalization rights the natural resource revenues collected by the province but put into a sovereign fund, and only to include amounts that are withdrawn from the fund (without concern for the use being made of these amounts by the province). This would introduce a distinction between the exploitation of resources and the use of the revenues that these resources generate for the provinces as their owners. An additional stabilizing influence would be the revenues earned by the sovereign funds, whose return would be relatively more stable than raw material prices, due to the diversification of the investments.
The introduction of such a modification requires the collaboration of the federal government and the provincial governments. The provinces would have to create the sovereign funds, which would have to be recognized by the federal government for equalization purposes. There are already two such funds in Canada: the Alberta Heritage Fund, which receives hydrocarbon revenues on a discretionary basis, and the Generations Fund of Québec, which receives mainly hydroelectric royalties. These two funds, which are not taken into consideration in the current equalization program, are rather small compared to the total revenues that these two provinces draw as the owners of resources. In 2011, Hydro-Québec paid out $598 million in royalties on hydroelectricity and $1,958 million in dividends. Only the first amount is deposited in the Generations Fund. As for the Alberta Heritage Fund, its current value is $15.2 billion, the same value it had 25 years ago; no net growth has occurred even if the province has received huge amount of natural resource revenues over that period.
4A USEFUL CHANGE

16
The Canadian equalization program is intended to enable provincial governments to offer reasonably comparable levels of services while collecting revenues from their citizens that require reasonably comparable tax burdens. In fact, it is the fiscal capacity, that is, the ability of the provinces to collect revenues from certain sources, which is being partially equalized; the provinces have complete freedom regarding their expenditures. Fiscal capacity is evaluated using the RTS, the fiscal regime which is supposed to reflect the practices commonly adopted by the provinces. The federal government finances the equalization transfers from the taxes which are collected from all Canadians, including those from the receiving provinces. This equalization program reduces the differences in fiscal capacity between the provinces, but does not eliminate them. Most of the difficulties encountered in the implementation of the program since it began in 1957 are related to natural resource revenues. With a few exceptions, the provinces are the owners of the natural resources on their territories, and draw revenues from them that are used to finance the services available to their citizens. The different natural resources endowments among the provinces accentuate the need for redistribution on the part of the federal government, and the variability of natural resources prices sometimes creates budget planning problems both for the federal government that makes the payments and for the receiving provinces. The major change over the past five years has been the addition of Ontario as a receiving province. The relative decline of Ontario was caused by the weakening of its manufacturing sector, accelerated by the 2008 economic crisis and by the shift of economic activity from central Canada to the West under the impetus of natural resource development. Previously, Ontario was a stabilizing factor for the Canadian equalization program because of the size of its economy and the lesser role that natural resources play in this province’s economy. Now, the Canadian economic leaders are the Western provinces whose economies depend on natural resources. These provinces are richer, but their revenues are more variable. It follows that there is greater variability in equalization transfers, while the needs of the receiving provinces are constantly increasing. Furthermore, Ottawa’s revenues are also subject to the variability of resource prices. This new era of increased dependence on natural resources will be a source of tension between the federal government and the receiving provinces; also between the have provinces and the have not provinces. As owners of the natural resources on their territories, the provinces that draw revenues from them are not disposed to share their rents with the other members of the federation which are less well off. The creation of sovereign funds by the provinces and their recognition by the federal government would help reduce the impacts of the variability of raw material prices and of the revenues that the provinces draw from them.
The equalization program will continue because it is entrenched in the Canadian Constitution; however, it is possible that downward adjustments will be made to the amounts granted in the present program due to the growing influence of natural resources in the Canadian economy.
CONCLUSION

17
References
Bernard, J.-T. and Mabrouk, S. B. (2010). Péréquation et comportement stratégique des provinces bénéficiaires : un contre-exemple intriguant. Canadian Public Policy, Analyse de Politiques, 36 (2), 215-225.
Expert Panel on Equalization and Territorial Formula Financing (2006). Achieving a National Purpose: Putting Equalization Back on Track. Ottawa: Department of Finance Canada, 155 pages.
Smart, M. (2007). Raising Taxes through Equalization. Canadian Journal of Economics, Revue Canadienne d’économique, 40 (4), 1188-1212.
Related Documents