The Bangchak Petroleum PLC Analyst Meeting – 1Q2016 May 18, 2016

Welcome message from author
This document is posted to help you gain knowledge. Please leave a comment to let me know what you think about it! Share it to your friends and learn new things together.
Transcript

The Bangchak Petroleum PLCAnalyst Meeting – 1Q2016
May 18, 2016
AGENDA
2
Performance Summary1
Oil Market Outlook2
Financial Performance Update3
Going Forward in 20164
AGENDA
3
Performance Summary1
Oil Market Outlook2
Financial Performance Update3
Going Forward in 20164
1,829
1,193
2,517
1,324
Target
Accounting
Operating
EBITDA Inventory Loss
Group Performance - Quarterly Result Summary
4
Unit: THB Million
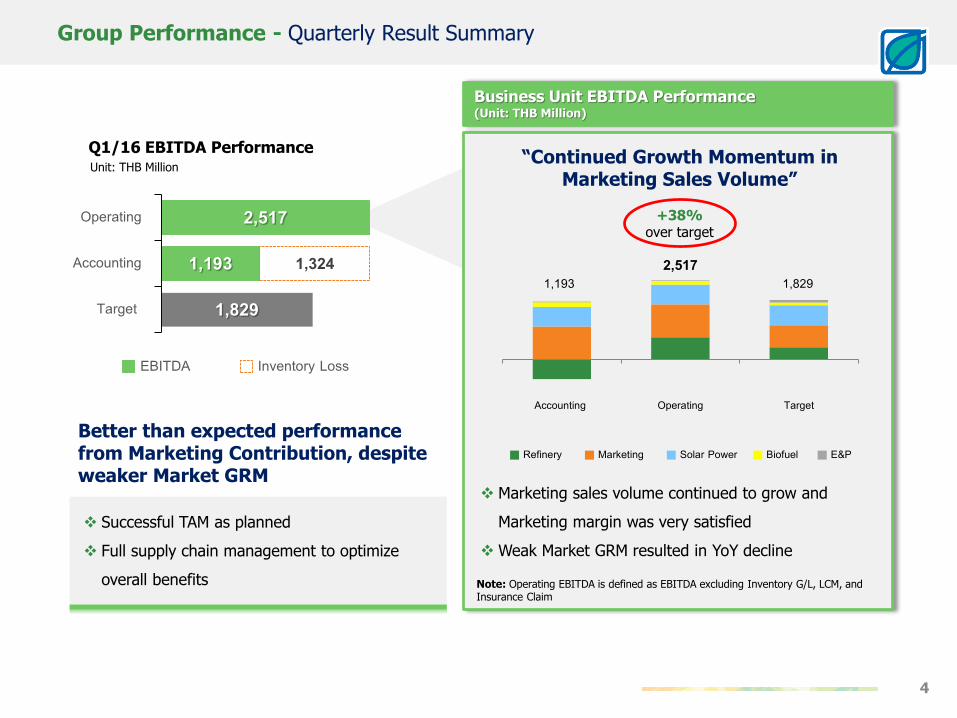
Q1/16 EBITDA Performance
Note: Operating EBITDA is defined as EBITDA excluding Inventory G/L, LCM, and Insurance Claim
Successful TAM as planned
Full supply chain management to optimize
overall benefits
Better than expected performancefrom Marketing Contribution, despite weaker Market GRM
Business Unit EBITDA Performance (Unit: THB Million)
Marketing sales volume continued to grow and
Marketing margin was very satisfied
Weak Market GRM resulted in YoY decline
“Continued Growth Momentum in Marketing Sales Volume”
Accounting Operating Target
Refinery Marketing Solar Power Biofuel E&P
1,1932,517
1,829
+38%over target
BCP Portfolios
5
Refinery Marketing Green Power Plant Biofuel E&P

Refinery Performance – Smooth Operation after Turnaround Maintenance
6
109 114
64
Q1/15 Q4/15 Q1/16
Unit: KBD
Refinery Crude Run
TAM
Note: TAM = Annual Turnaround Maintenance
TAM Period: 45 Days
(February 8 – March 23)
Crude run after TAM = 110 KBD
Product Yield
16% 15% 18%1% 1%
50% 53% 49%
11% 9% 10%20% 19% 19%3% 2% 2%
Q1/15 Q4/15 Q1/16
LPGGasoline
Jet
Diesel
Fuel Oil
UCO
TAM
52 43 33
56 71
31
Q1/15 Q4/15 Q1/16
Domestic
109
Unit: KBD
Crude sourcing
Import
114
64
TAM
Plan level110 KBD
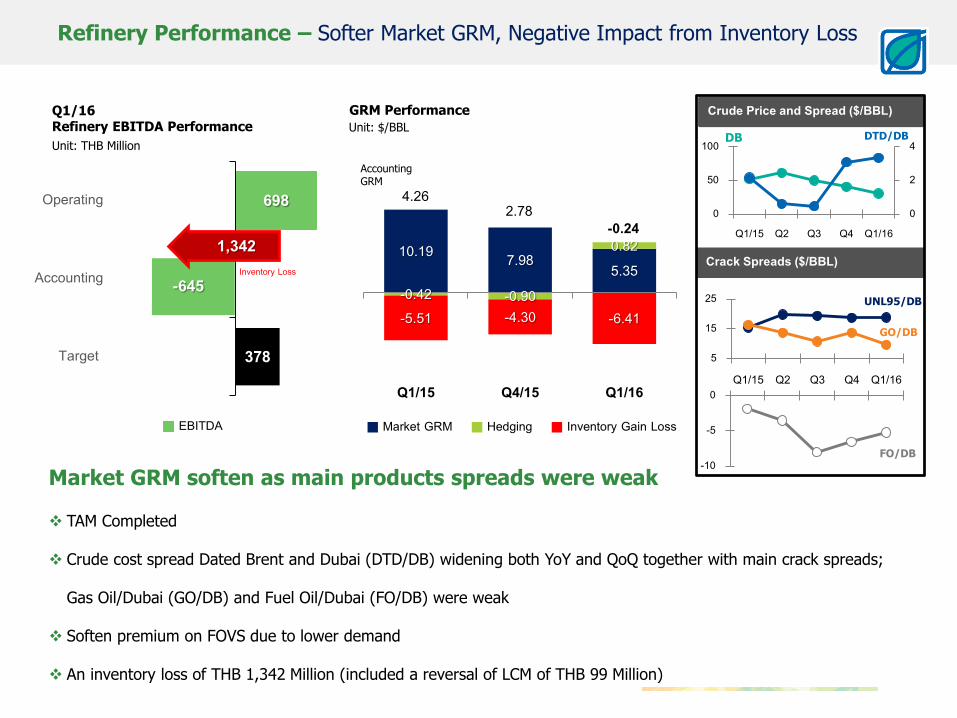
10.19 7.98 5.35-0.42 -0.90
0.82
-5.51 -4.30 -6.41
Q1/15 Q4/15 Q1/16
Market GRM Hedging Inventory Gain Loss
Refinery Performance – Softer Market GRM, Negative Impact from Inventory Loss
Market GRM soften as main products spreads were weak
TAM Completed
Crude cost spread Dated Brent and Dubai (DTD/DB) widening both YoY and QoQ together with main crack spreads;
Gas Oil/Dubai (GO/DB) and Fuel Oil/Dubai (FO/DB) were weak
Soften premium on FOVS due to lower demand
An inventory loss of THB 1,342 Million (included a reversal of LCM of THB 99 Million)
Unit: $/BBL
GRM Performance
0
2
4
0
50
100
Q1/15 Q2 Q3 Q4 Q1/16
Crude Price and Spread ($/BBL)
5
15
25
Q1/15 Q2 Q3 Q4 Q1/16
GO/DB
UNL95/DB
-10
-5
0
FO/DB
Crack Spreads ($/BBL)
DB DTD/DB
AccountingGRM
4.262.78
-0.24
378
698
Target
Accounting
Operating
EBITDA
Inventory Loss
Unit: THB Million
Q1/16 Refinery EBITDA Performance
-645
1,342

0.75 0.90 0.93
Marketing Performance – Marketing Sales Volume Continued to Grow
705
1,041
1,051
10
Target
Accounting
Operating
EBITDA Inventory Loss
Unit: THB Million
Q1/16 Marketing EBITDA Performance
0.95 1.17 1.09
0.480.48 0.68
Q1/15 Q4/15 Q1/16
Unit: THB/Litre
Net MKM Margin
Retail Margin dropped slightly from rising oil price during quarter
Industrial Margin increased as supply tighten from emergency shutdown of other refineries
TotalMKM
Industrial MarketRetail Market
+9% YoY
+13% YoY
+3% YoY
Unit: Million Litre
Marketing Sales Volume
1,4651,3901,344
Industrial MarketRetail Market
Sales Volume Growth Despite TAMLow Oil Prices Driven Demand
Demand improved from retail price drop
The stock of oil products were accumulated before TAM period to maintain overall Marketing sales volume
Full supply chain management to optimize overall benefits
782 851 887
562 538 578
Q1/15 Q4/15 Q1/16
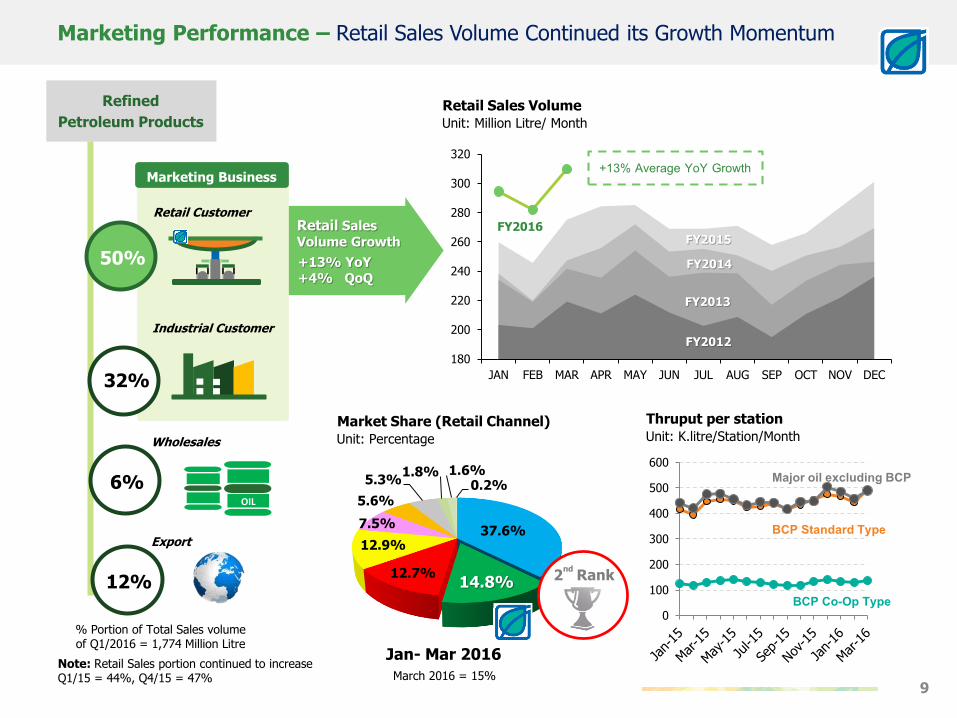
Marketing Performance – Retail Sales Volume Continued its Growth Momentum
9
180
200
220
240
260
280
300
320
JAN FEB MAR APR MAY JUN JUL AUG SEP OCT NOV DEC
FY2012
FY2013
FY2014
FY2015
Unit: Million Litre/ Month
Retail Sales Volume
0
100
200
300
400
500
600
Major oil excluding BCP
BCP Standard Type
BCP Co-Op Type
Unit: K.litre/Station/Month
Thruput per station
FY2016
+13% Average YoY Growth
Retail Sales
Volume Growth
+13% YoY+4% QoQ
Refined
Petroleum Products
Export
OIL
Wholesales
Marketing Business
Industrial Customer
Retail Customer
6%
12%
% Portion of Total Sales volume of Q1/2016 = 1,774 Million Litre
32%
50%
Note: Retail Sales portion continued to increase Q1/15 = 44%, Q4/15 = 47%
Unit: Percentage
Market Share (Retail Channel)
37.6%
14.8%12.7%
12.9%
7.5%
5.6%
5.3%1.8% 1.6%
0.2%
2nd
Rank
Jan- Mar 2016
March 2016 = 15%

Marketing Network and Non-Oil Increase Thruput per S/S by Network Expansion and Non-Oil Business Extension
10
Unit: THB Million
Q1/16 Non-Oil Revenue Performance
Non Oil Business
expansion is aimed for widening BCP customer segments for growth
Coffee Store
21 Stores
Fresh Cooking Food
3 Stores
Oil Businessexpansion of service station
+10NEWService Stations
1,074 Service Stations
As of Mar 2016
Growth in both Oil & Non-Oil
New service station in strategic location (High volume area)
Consistently improves quality and appearance of existing
service stations and closes down some stations with less
than target sales volume
Introducing “New Non-Oil” businesses to enhance
Marketing Business growth
Convenience store
365 Stores
164 Stores
43 52 52
Q1/15 Q4/15 Q1/16
+20% YoY-1% QoQ

R&M EarningsMarketing Business Captures a Demand Surge During Low Oil Price Environment
11
Substantial return from Marketing Business contribution helps overall R&M earnings
Refinery Business earning was volatile due to market conditions and Turnaround maintenance (TAM) while Marketing Business triumphant during lower oil prices environment
Marketing sales volume increased 9% YoY and 5% QoQ
Refinery-645
Marketing1,041
Renewable774
E&P22
EBITDA
1,193THB Million
Q1/2016(Actual)
Accounting 798130
-645
740
549 1,041
Q1/2015 Q4/2015 Q1/2016
Unit: THB Million
Refinery and Marketing EBITDA
BCP Portfolios
12
Refinery Marketing Green Power Plant Biofuel E&P
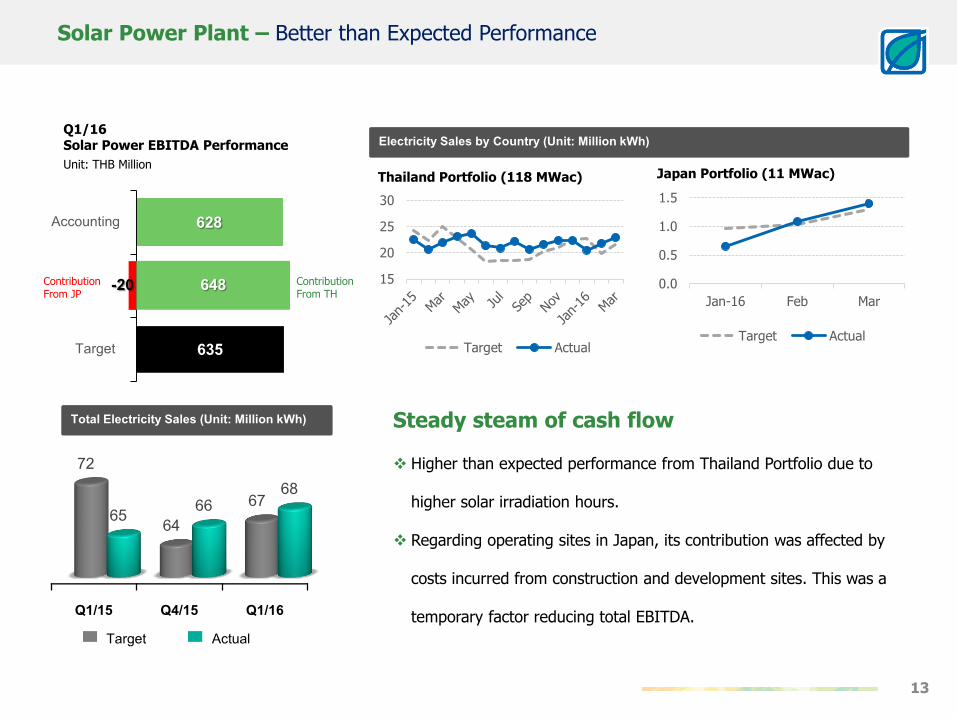
Solar Power Plant – Better than Expected Performance
13
ActualTargetQ1/15 Q4/15 Q1/16
72
6467
65 6668
Total Electricity Sales (Unit: Million kWh)
15
20
25
30
Target Actual
Thailand Portfolio (118 MWac)
Electricity Sales by Country (Unit: Million kWh)
0.0
0.5
1.0
1.5
Jan-16 Feb Mar
Target Actual
Japan Portfolio (11 MWac)
635
628
Target
Accounting
Unit: THB Million
Q1/16 Solar Power EBITDA Performance
Steady steam of cash flow
Higher than expected performance from Thailand Portfolio due to
higher solar irradiation hours.
Regarding operating sites in Japan, its contribution was affected by
costs incurred from construction and development sites. This was a
temporary factor reducing total EBITDA.
648-20Contribution From JP
Contribution From TH

BCPG Progress Update
14
30th June 2015: Establishment of BCPG
Establishment
Completed in December 2015
Restructuring
First filing : 29th March 2016Expected to IPO in 2H2016
IPO
Progress
BCPGGreen Power Plant Investment Stories
Data as of April 2016
BCPG
BCP Subsidiaries
Geothermal
Wind
Biomass & Biogas
Existing Portfolio
118 MWFully Operated
BCPG Japan Portfolio
164 MWFully Operated 11 MW
Solar Power Plant
Strategic Position of BCPG
Develop, Own & Operate
Green Power Plant
Looking for favorable return together
with social & environmental friendly
Broaden opportunities scope outside
Thailand
500 MWIn FY2020

Biofuel – Demand Increased as Diesel Price was Cheap
15
Unit: THB Million
Q1/16 Biofuel EBITDA Performance
89
146
118
Target
Accounting
Operating
EBITDA Inventory Gain
Q1/15 Q4/15 Q1/16
355 367 385405
620705
Daily Production Sales Volume
Building volume for new plant (BBF Plant#2)
Strong demand for B100
Improvement in Biodiesel plant’s efficiency enabled it to raise its average daily production rate
Current BBF sales volume was ≈90% of its expected new capacity
(Existing 360 K. Litre/day + Plant#2 450 K. Litre/day = 810 K. litre/day)
Daily Production and Sales Volume (Unit: K. Litre per day)
Note: EBITDA including a share of profit from Ubon Bio Ethanol (UBE) of Baht 12 million
Biodiesel Plant (BBF)
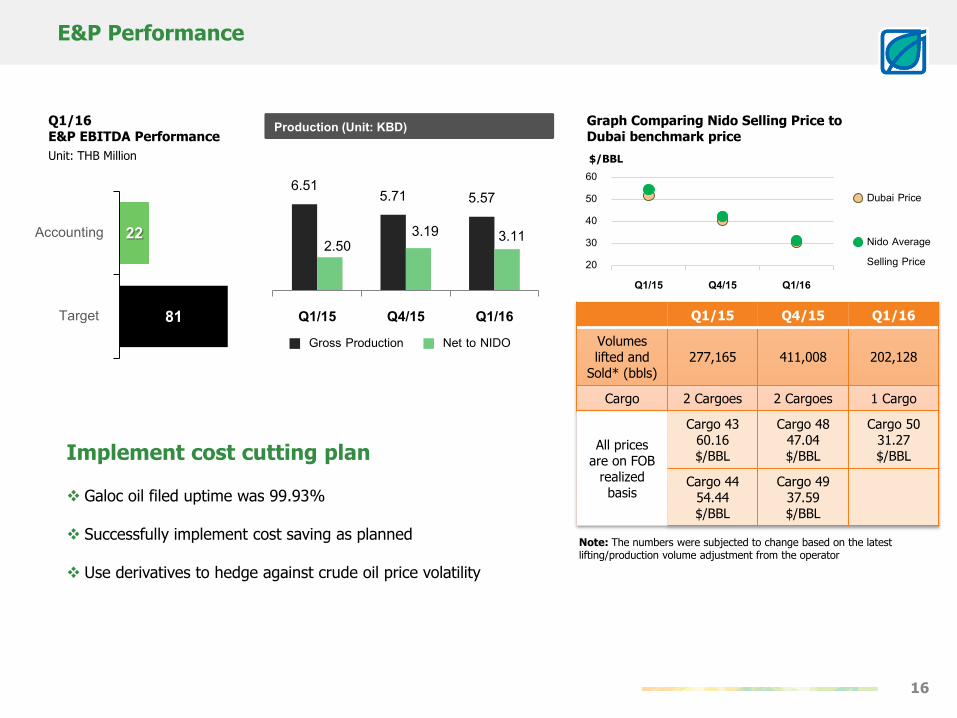
E&P Performance
16
Unit: THB Million
Q1/16 E&P EBITDA Performance
81
22
Target
Accounting
Production (Unit: KBD)
6.51 5.71 5.57
2.503.19 3.11
Q1/15 Q4/15 Q1/16 Gross Production Net to NIDO
Q1/15 Q4/15 Q1/16
Volumes lifted and
Sold* (bbls)277,165 411,008 202,128
Cargo 2 Cargoes 2 Cargoes 1 Cargo
All prices are on FOB
realized basis
Cargo 4360.16 $/BBL
Cargo 4847.04 $/BBL
Cargo 5031.27 $/BBL
Cargo 4454.44 $/BBL
Cargo 4937.59 $/BBL
Note: The numbers were subjected to change based on the latest lifting/production volume adjustment from the operator
Implement cost cutting plan
Galoc oil filed uptime was 99.93%
Successfully implement cost saving as planned
Use derivatives to hedge against crude oil price volatility
Graph Comparing Nido Selling Price to Dubai benchmark price
2030405060
Q1/15 Q4/15 Q1/16
Dubai Price
Nido AverageSelling Price
$/BBL
2015 ActualQ1/2016
Target2016
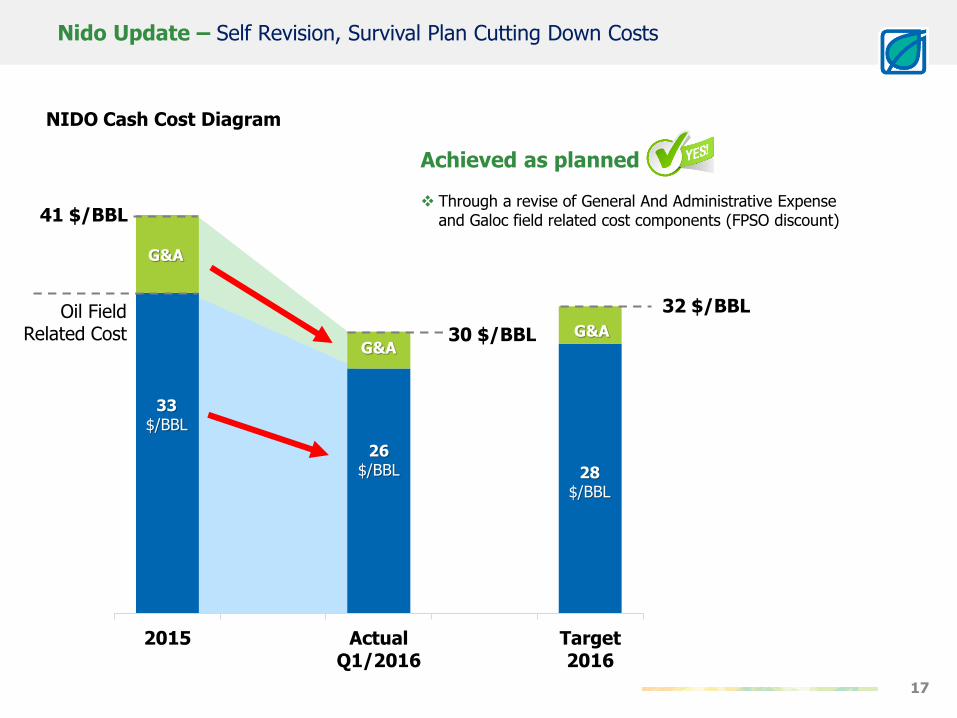
Nido Update – Self Revision, Survival Plan Cutting Down Costs
17
NIDO Cash Cost Diagram
Achieved as planned
Through a revise of General And Administrative Expense and Galoc field related cost components (FPSO discount) 41 $/BBL
Oil FieldRelated Cost
33 $/BBL
G&A
32 $/BBL
26 $/BBL 28
$/BBL
30 $/BBLG&A
G&A

AGENDA
18
Performance Summary1
Oil Market Outlook2
Financial Performance Update3
Going Forward in 20164

19
Supply Rebalancing is Well Under Way
681.2
554.4
436.3
2014A 2015E 2016E
Up
stre
am C
apex
($
Bill
ion
)
Others Middle East
United States Global Capex
-126.8(-18.6% y/y)
-118.1(-21.3% y/y)
Upstream CAPEXOPEC11+Russia: in talk on freeze production.
[MBD] 2015 2016 2017 2018
OPEC 11 + Russia freeze 39.8 40.0 40.0 40.0
Iran 2.9 3.3 3.6 3.8
Libya 0.4 0.4 0.5 0.6
US Shale Oil 4.2 3.8 3.8 4.2
Other Non-OPEC &OPEC NGLs
49.1 48.1 47.9 47.9
Total Supply 96.4 95.6 95.8 95.8
Total Demand 94.7 95.9 96.9 97.9
Over / (Under) Supply 1.7 (0.3) (1.1) (2.1)
back on line
Declining as economic driven
Declining as lack of CAPEX
Supply/Demand balance early
next year
Source: IEA, Energy Aspects, FGE, PIRA and BCP analysis
U.S. Tight Oil Production Scenarios Crude production growth by grade
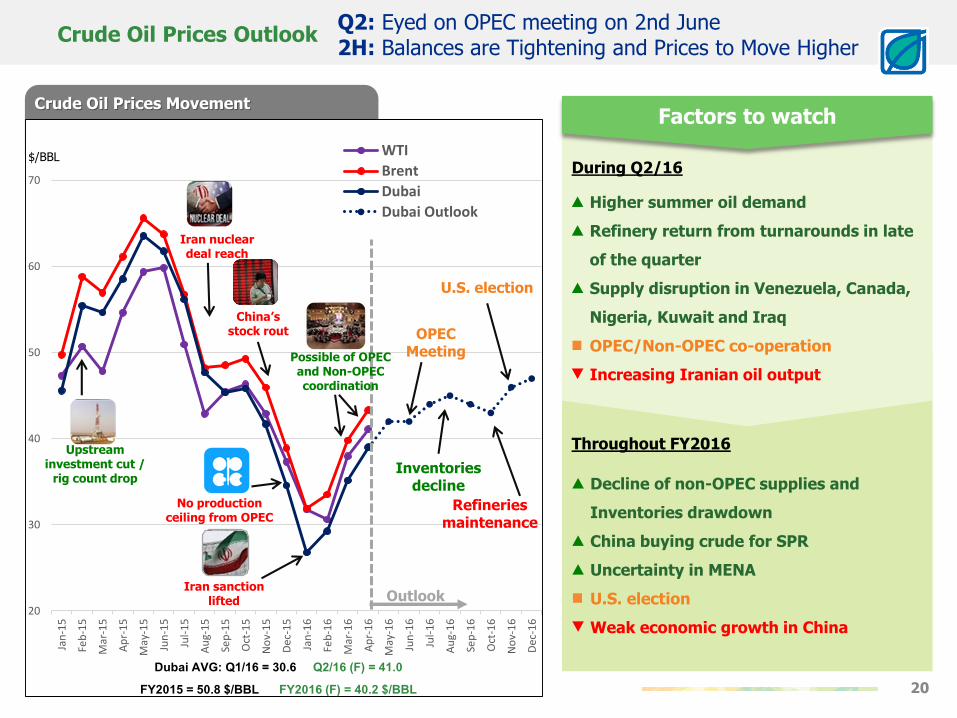
Crude Oil Prices Movement
20
30
40
50
60
70
Jan
-15
Feb
-15
Mar
-15
Ap
r-1
5
May
-15
Jun
-15
Jul-
15
Au
g-1
5
Sep
-15
Oct
-15
No
v-1
5
Dec
-15
Jan
-16
Feb
-16
Mar
-16
Ap
r-1
6
May
-16
Jun
-16
Jul-
16
Au
g-1
6
Sep
-16
Oct
-16
No
v-1
6
Dec
-16
WTI
Brent
Dubai
Dubai Outlook
Crude Oil Prices Outlook
20
Q2: Eyed on OPEC meeting on 2nd June2H: Balances are Tightening and Prices to Move Higher
OPEC Meeting
Iran nuclear deal reach
China’s stock rout
Upstream investment cut /
rig count drop
No production ceiling from OPEC
Inventories decline
Refineries maintenance
OutlookIran sanction
lifted
U.S. election
Dubai AVG: Q1/16 = 30.6 Q2/16 (F) = 41.0 FY2015 = 50.8 $/BBL FY2016 (F) = 40.2 $/BBL
$/BBL
Possible of OPEC and Non-OPEC coordination
During Q2/16
Factors to watch
Higher summer oil demand
Refinery return from turnarounds in late
of the quarter
Supply disruption in Venezuela, Canada,
Nigeria, Kuwait and Iraq
OPEC/Non-OPEC co-operation
Increasing Iranian oil output
Decline of non-OPEC supplies and
Inventories drawdown
China buying crude for SPR
Uncertainty in MENA
U.S. election
Weak economic growth in China
Throughout FY2016
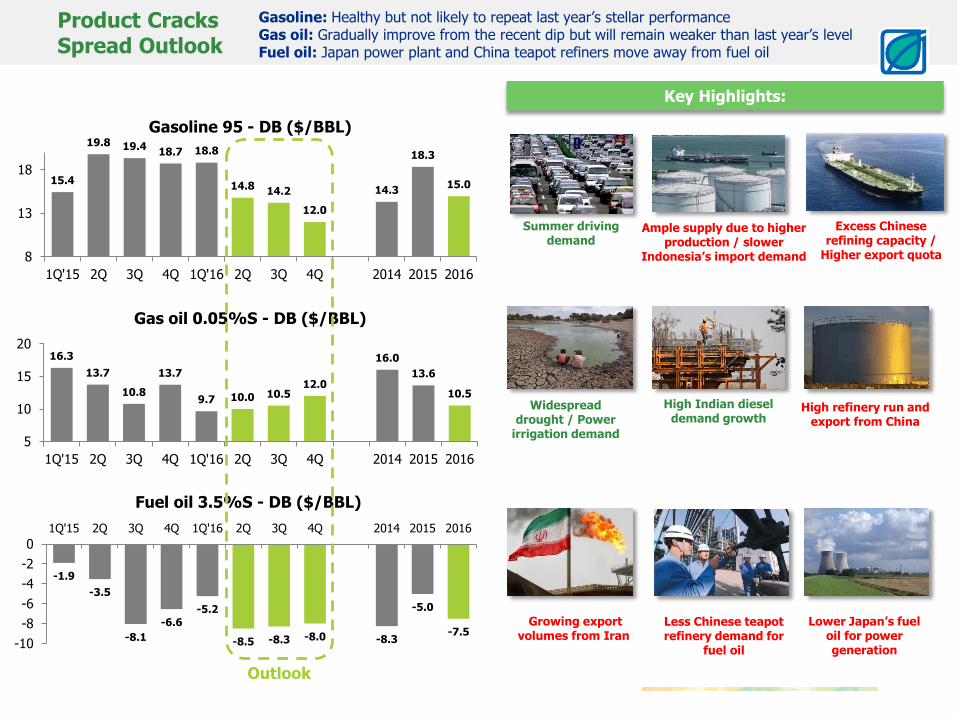
Product Cracks Spread Outlook
Gasoline: Healthy but not likely to repeat last year’s stellar performanceGas oil: Gradually improve from the recent dip but will remain weaker than last year’s levelFuel oil: Japan power plant and China teapot refiners move away from fuel oil
15.4
19.8 19.418.7 18.8
14.814.2
12.0
14.3
18.3
15.0
8
13
18
1Q'15 2Q 3Q 4Q 1Q'16 2Q 3Q 4Q 2014 2015 2016
Gasoline 95 - DB ($/BBL)
16.3
13.7
10.8
13.7
9.7 10.0 10.512.0
16.0
13.6
10.5
5
10
15
20
1Q'15 2Q 3Q 4Q 1Q'16 2Q 3Q 4Q 2014 2015 2016
Gas oil 0.05%S - DB ($/BBL)
-1.9
-3.5
-8.1
-6.6
-5.2
-8.5 -8.3 -8.0 -8.3
-5.0
-7.5-10
-8
-6
-4
-2
0
1Q'15 2Q 3Q 4Q 1Q'16 2Q 3Q 4Q 2014 2015 2016
Fuel oil 3.5%S - DB ($/BBL)
Outlook
Ample supply due to higher production / slower
Indonesia’s import demand
Key Highlights:
Excess Chinese refining capacity /
Higher export quota
Summer driving demand
Widespread drought / Power
irrigation demand
High Indian diesel demand growth
High refinery run and export from China
Growing export volumes from Iran
Less Chinese teapot refinery demand for
fuel oil
Lower Japan’s fuel oil for power generation

AGENDA
22
Performance Summary1
Oil Market Outlook2
Financial Performance Update3
Going Forward in 20164

Q1/16 Remarks
Quarterly Remark – From Financial Aspects
23
• Acquired Solar Power Business in Japan
BCPG Purchase the entire solar power plant business of SunEdison in Japan within the budget of JPY 9,626 million (equivalent
to THB 2,915 million) with total capacity of 198 Megawatts portfolio
Payment was divided into 2 parts:
1. Upfront Payment of no more than JPY 4,256 million (equivalent to THB 1,275 million) determined from the valuation of the
projects with aggregate capacity of 63 Megawatts; the O&M, and development Platforms
2. Deferred Payment based on the Condition Precedents for each project
• BCPG increased registered share capital from THB 3,700 Million to THB 10,000 million
BCP paid up additional THB 3,300 million, the rest THB 3,000 million will be sold through IPO
• Invested in Huang Ming Japan
Subsidiary of BCPG acquire 100% of total outstanding shares of Huang Ming in order to expand its investment in solar power
plant project in Japan
• Established Bangchak Retail
BCP own 100% with initial registered capital of THB 300 million for the purposes of operating food centre and distribution of
consumer products
• Divested an investment in ASEAN Potash Chaiyaphum Plc. (APMC)
• Finished Nido Debt Restructure
The restructuring of credit facility of USD 120 million between BCP and Nido was done during the quarter

Statement of Income
Key Financial Performance - Consolidated
24
Unit: THB Million Q1/15 Q4/15 Q1/16
Revenue 39,445 35,136 30,276
Cost of goods sold (37,082) (33,097) (29,327)
Gross Profit 2,363 2,039 949
Investment income and other income 104 99 126
Selling and administrative expenses (1,057) (1,672) (1,212)
Gain (loss) from oil hedging contract (136) (312) 163
Gain (loss) from FX forward contracts (5) 24 56
Gain on foreign exchange 266 92 84
Reversal of Allowance for loss from impairment of assets 11 (70) 2
Share of profit of associate 12 4 13
EBIT 1,558 203 180
Finance costs (411) (412) (373)
Income tax (expense) credit (91) 17 167
Profit for the period 1,056 (191) (25)
Owners of the Company 1,037 (112) 47
Non-controlling interests 19 (79) (72)
Earnings per share (Baht per Share) 0.75 (0.09) 0.03
REMARK
Revenue
• Fallen oil price lead to revenue decrease
• Lower Refinery crude run from TAM
• Slightly lower total sales volume +1% YoY -3% QoQ
• Marketing sales volume grew +9% YoY +5% QoQ
Gross Margin
• Soften Market GRM
• Consolidated Inventory loss ≈ THB 1,324 Million
Income tax creditDeferred tax expense recorded, resulted from the taxable loss
Selling and administrative expense
Due to the increased expense in BCPG Japan

BCP Group Performance - Consolidated
25
1Q2016 BCP BGN BBF BCPG BCR BCPE BCPI NIDO Total
% of Share holding 100% 70% 100% 100% 100% 100% 81.41%
Revenue 28,520 6,657 1,867 783 - - - 233
Net Profit (357) 22 116 390 (15) (0) 15 (174) (3)
UBE - Share of profit of investments in associates 13
NIDO - Adjust loss from impairment of assets (401)
Eliminations 366
Net Profit for the period (25)
Profit (loss) attributable to:
Owner of the company 47
Non-controlling interests (72)
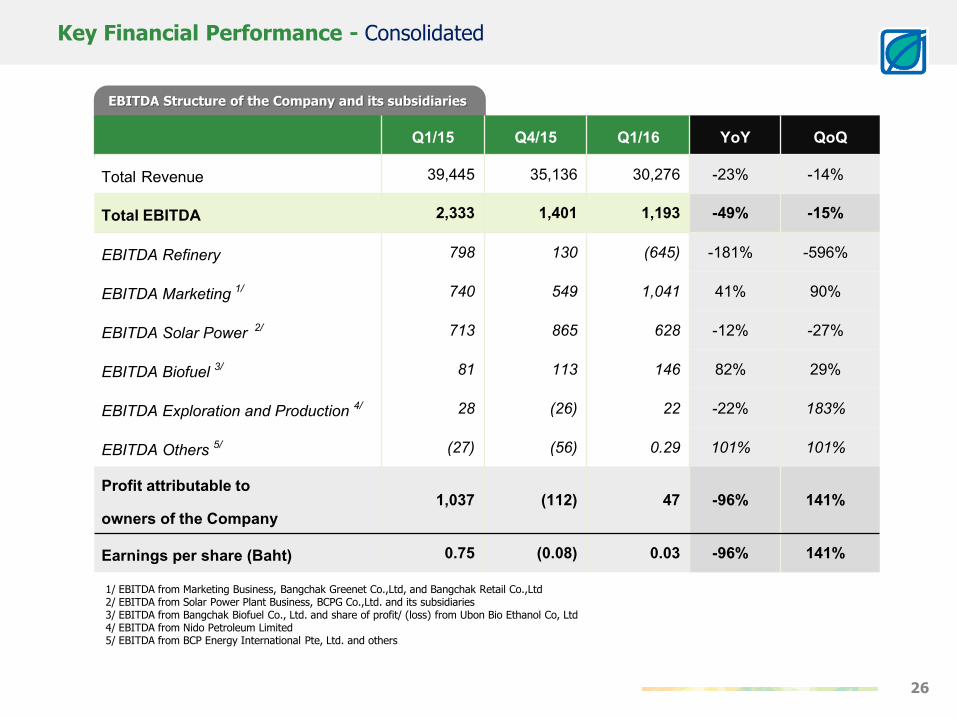
EBITDA Structure of the Company and its subsidiaries
Key Financial Performance - Consolidated
26
Q1/15 Q4/15 Q1/16 YoY QoQ
Total Revenue 39,445 35,136 30,276 -23% -14%
Total EBITDA 2,333 1,401 1,193 -49% -15%
EBITDA Refinery 798 130 (645) -181% -596%
EBITDA Marketing 1/ 740 549 1,041 41% 90%
EBITDA Solar Power 2/ 713 865 628 -12% -27%
EBITDA Biofuel 3/ 81 113 146 82% 29%
EBITDA Exploration and Production 4/ 28 (26) 22 -22% 183%
EBITDA Others 5/ (27) (56) 0.29 101% 101%
Profit attributable to owners of the Company
1,037 (112) 47 -96% 141%
Earnings per share (Baht) 0.75 (0.08) 0.03 -96% 141%
1/ EBITDA from Marketing Business, Bangchak Greenet Co.,Ltd, and Bangchak Retail Co.,Ltd2/ EBITDA from Solar Power Plant Business, BCPG Co.,Ltd. and its subsidiaries3/ EBITDA from Bangchak Biofuel Co., Ltd. and share of profit/ (loss) from Ubon Bio Ethanol Co, Ltd4/ EBITDA from Nido Petroleum Limited 5/ EBITDA from BCP Energy International Pte, Ltd. and others

Key Financial Position - Consolidated
27
Assets:
• Cash & Equivalents increased by THB 5,501 million mainly from a reclassification of THB 4,500 Million current investment to cash, due to its maturity
• Inventory decreased by THB 3,629 million mainly from
• Lower unit price of crude oil and finished products
• Volume of inventory decreased from 6.4 to 5.5 million barrels
• PP&E increased by THB 2,223 million from refinery machinery and equipment, biodiesel plant, and acquisition of solar power business in Japan
• Other Non Current assets increased mainly from goodwill of solar power business in Japan
Liabilities & Equity:
• Current Liabilities increased mainly from
• Account Payable increased THB 738 million from higher product prices while crude oil purchase decreased as the refinery was in turnaround maintenance
• Long-term debt decreased by THB 638 million
• Company’s long-term loans pre-payment
• Subsidiary‘s long-term loans increased from BBF and BCPG (the acquisition of solar power business in Japan)
40,044 42,26735,983 35,985
8,0999,553
13,945 10,316
2,838 3,333
11,983 6,446
33,658 33,021
7,872 13,373 9,462 9,616Cash and Equivalents
Current Assets
Inventory
PP&E
Non Current Assets
81,942 81,956 81,942 81,956
Assets Liabilities & EquityUnit: THB Million
31 Dec 15 31 Mar 16 31 Dec 15 31 Mar 16
Current Liabilities
Long Term Debt
Total Equity
Non Current Liabilities
(Including current portion of L/T debt)

6,037 2,812
585
3,102
4,499
364
Cash From Operation(CFO)
Funding
Others
11,486
Sources of Cash Used of Cash
Debt Service
5,915
Asset PurchaseAcquisition
Cash Received from maturity of short-term investment
Cash Flow - Consolidated
28
PP&E Refinery & Biodiesel plant Intangible assets and Others
THB 1,377 million THB 171 million
Acquisition of solar power business (SunEdison Japan)
• Solar Power plant: THB 963 million
• Construction works (BCPG): THB 397 million
Asset Purchase / Acquisition
Q1/2016 Sources and Uses of CashUnit: THB Million
Beginning Cash 7,872
Change in Cash 5,571
FX adjustment (70)
Ending Cash 13,373
CFO was sufficed for debtsStill have cash on hands for investment
Cash flow from operation (CFO) was enough to service debt, and enough for acquisition
0.55 0.50 0.54 0.59 0.55
Q1/15 Q2 Q3 Q4 Q1/16
Net IBD/E Ratio (Times)
8,33825%
7,03621%1,662
5%
15,98549%
Baht LoanBaht Bond
USD Loan
33,021 THB Million
(as of March 31, 2016)
Long-Term Debt Portion
JPY Loan
AGENDA
29
Performance Summary1
Oil Market Outlook2
Financial Performance Update3
Going Forward in 20164
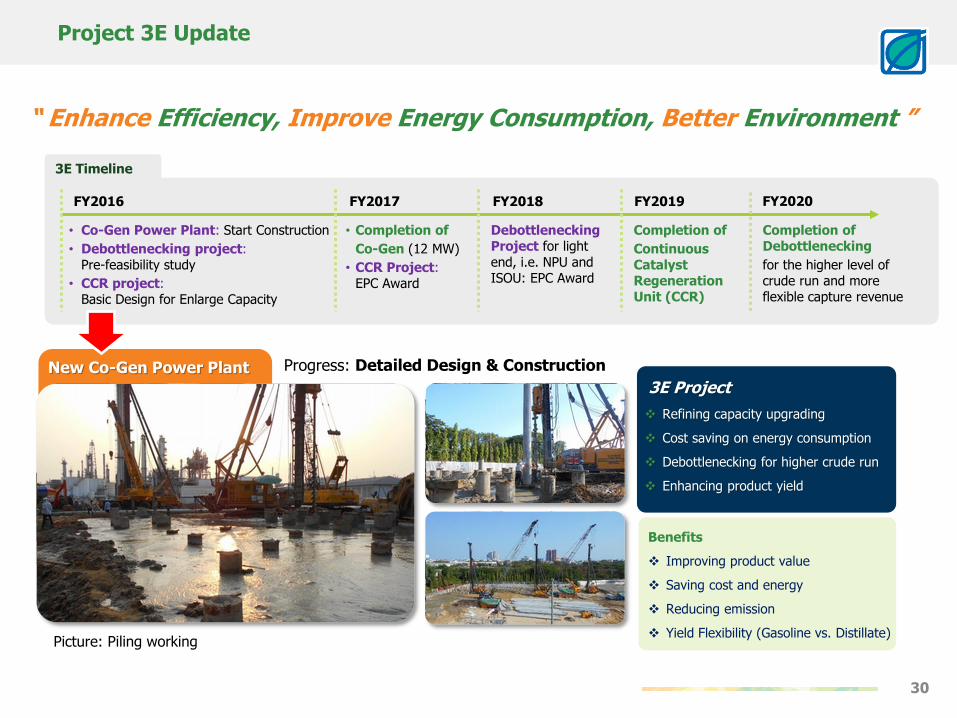
Project 3E Update
30
New Co-Gen Power Plant Progress: Detailed Design & Construction
Picture: Piling working
Benefits
Improving product value
Saving cost and energy
Reducing emission
Yield Flexibility (Gasoline vs. Distillate)
Refining capacity upgrading
Cost saving on energy consumption
Debottlenecking for higher crude run
Enhancing product yield
3E Project
3E Timeline
FY2016 FY2018
• Completion of
Co-Gen (12 MW)
• CCR Project:EPC Award
Completion of
Continuous Catalyst Regeneration Unit (CCR)
FY2019FY2017
• Co-Gen Power Plant: Start Construction
• Debottlenecking project: Pre-feasibility study
• CCR project: Basic Design for Enlarge Capacity
“ Enhance Efficiency, Improve Energy Consumption, Better Environment ”
DebottleneckingProject for light end, i.e. NPU and ISOU: EPC Award
Completion of Debottlenecking
for the higher level of crude run and more flexible capture revenue
FY2020

Marketing Business Strategies
31
TURN PRO Program
“ NationwideCoverage ”
“ ProfessionalCo-Op”
“ Excellence Service & Management System ”
Improve Efficiency
Open new service stations in main road, high visible area, and fully equipped with Non-Oil business
CO-OP competency improvement to enhance competitiveness and equip Non-oil to those CO-OP with potentials
Enhance service system, site management system, and franchising

Bangchak Service Station : Customer Destination
32
Actual Q1/2016
+10NEWService Stations Most
Admired Service Station
+60NEWStations Targetin FY2016
Actual Q1/2016: Number of service station = 1,074 stationsNew service station = +10
New Subsidiary - Bangchak Retail Company Limited (BCR)
33
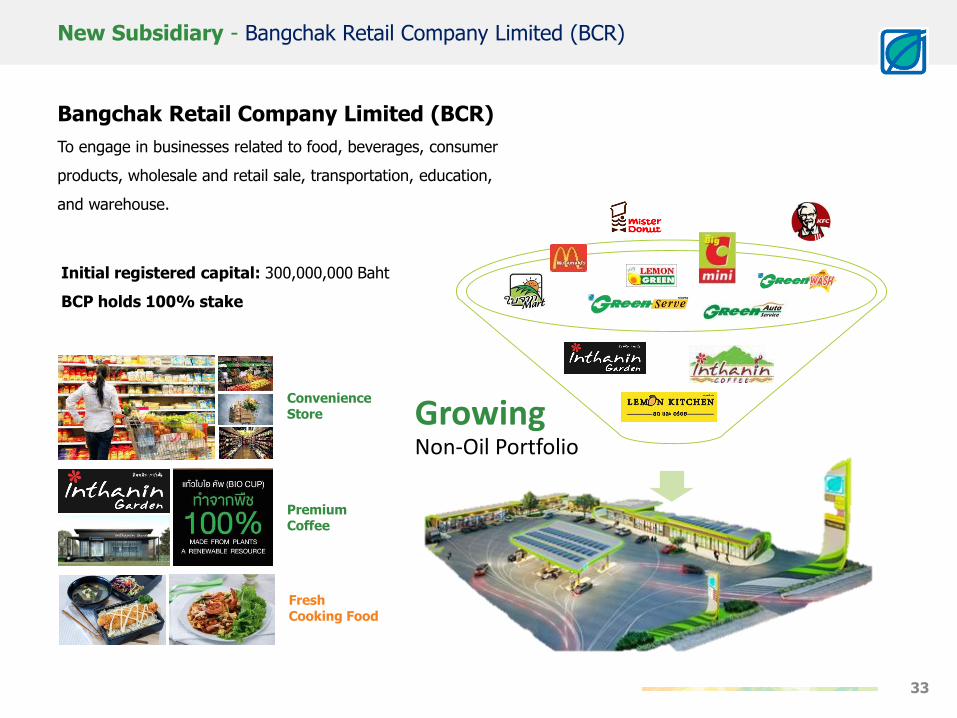
Bangchak Retail Company Limited (BCR)
To engage in businesses related to food, beverages, consumer
products, wholesale and retail sale, transportation, education,
and warehouse.
Initial registered capital: 300,000,000 Baht
BCP holds 100% stake
Fresh Cooking Food
Premium Coffee
Convenience Store Growing
Non-Oil Portfolio
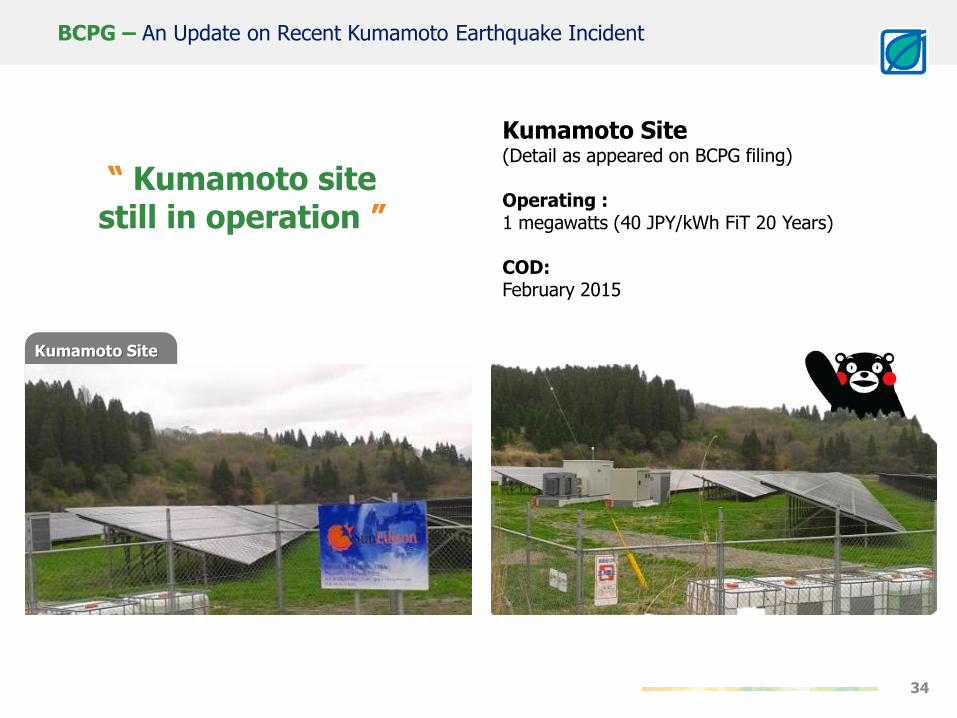
Kumamoto Site
BCPG – An Update on Recent Kumamoto Earthquake Incident
34
Kumamoto Site (Detail as appeared on BCPG filing)
Operating : 1 megawatts (40 JPY/kWh FiT 20 Years)
COD:February 2015
“ Kumamoto site still in operation ”

BCPG Japan Portfolio Update - Advance Development
35
Nikaho Project 13 MW installed / 9 MW PPA
Nagi Project 14 MW installed / 10.5 MW PPA
Project Progress : Engineering & Procurement processSchedule COD : Q1/17
Project Progress : 73%Schedule COD : Q3/16
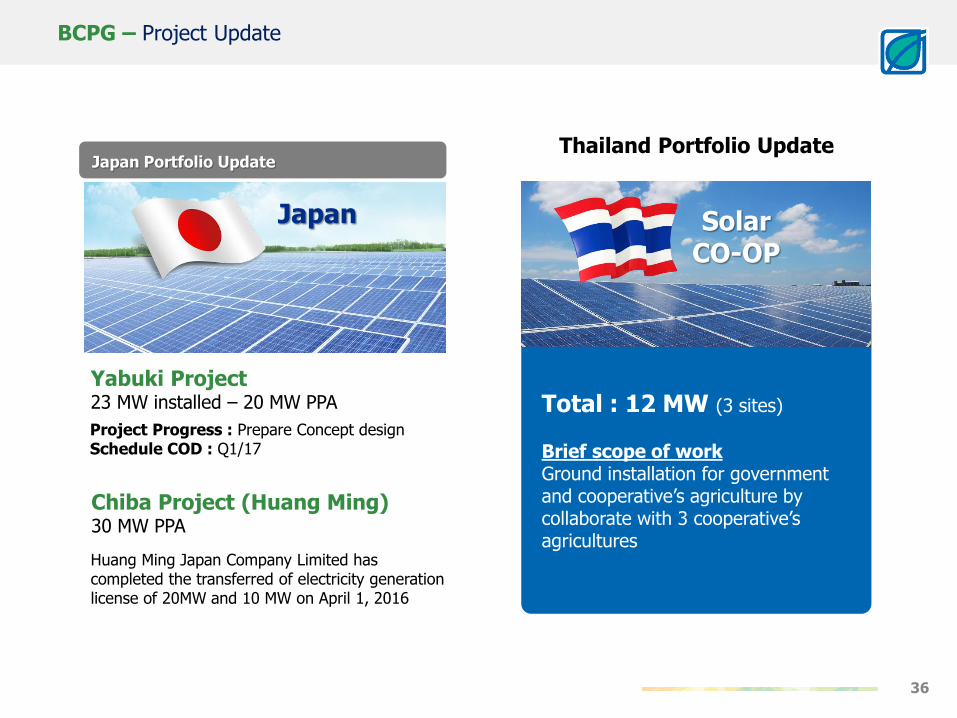
BCPG – Project Update
36
Thailand Portfolio Update
Total : 12 MW (3 sites)
Brief scope of workGround installation for government and cooperative’s agriculture by collaborate with 3 cooperative’s agricultures
Solar CO-OP
Huang Ming Japan Company Limited has completed the transferred of electricity generation license of 20MW and 10 MW on April 1, 2016
Chiba Project (Huang Ming) 30 MW PPA
Yabuki Project 23 MW installed – 20 MW PPA
Project Progress : Prepare Concept designSchedule COD : Q1/17
Japan Portfolio Update
Japan

Biodiesel Plant#2 – Project Update
37
NEW Capacity
Plant#2 additional 450,000 litre/day
New Total Capacity 810,000 Litre/day
COD: 3Q2016
Investment Cost: ≈1,800 THB Million
Mainly supplied to BCP
BBF Sales Volume
BBF sales volume ≈ 700,000 Litre/day
BCP captive use ≈ 545,000 Litre/day
Note: Jan-Mar 2016
Project Progress 95% as of Apr 16
“ An investment for greater certainty of Biodiesel supply
and supporting demand growth ”

• Western Lithium USA Corporation changed its name to “Lithium Americas Corp. (LAC)”
• New Subsidiary / Joint venture
– BCP Trading Pte. Ltd. (BCPT) in Singapore with initial registered capital of 1,000,000 USD to trade
commodities which include crude oil, petroleum products, petrochemicals and other related chemicals and to
conduct other businesses that would benefit the company including but not limited to hedging, chartering,
storage and distribution. BCP holds 100% stake
– Bangchak Bioethanol (Chachoengsao) Company Limited a joint venture investment with Sima Inter
Product Company Limited (SIMA) with initial registered capital of 1,000,000 Baht. The registered capital will be
increased to 500,000,000 Baht for the transfer of assets, rights and permits. BCP holds 85% stake
Other Remarks
38
APPENDIXProfit and Loss (Consolidated)
Profit and Loss (Company)
Financial Performance:
• Refinery BU (Company)
• Marketing BU (Company)
• Solar Business
• Biodiesel Business (BBF)
Financial Ratio (Consolidated)

Profit and Loss (Consolidated)
40
Unit: THB Million Q1/15 Q4/15 Q1/16 YoY QoQ
Sales Revenue 39,445 35,136 30,276 -23% -14%
Cost of Goods Sold (37,082) (33,097) (29,327) -21% -11%
EBITDA 2,333 1,401 1,193 -49% -15%
Depreciation and Amortization (1,052) (1,219) (1,099) 4% -10%
Gain (loss) on foreign exchange 266 92 84 -68% -8%
Net reversal of allowance for loss from impairment of assets
11 (70) 2 -85% -102%
Financial Cost (411) (412) (373) -9% -9%
Pre-tax Profit 1,147 (208) (193) -117% -7%
Income Tax Expense (91) 17 167 -285% 871%
Profit for the year 1,056 (191) (25) -102% -87%
Owners of the Company 1,037 (112) 47 -96% -141%
Non-controlling interests 19 (79) (72) -477% -8%
EPS (Baht/Share) 0.75 (0.09) 0.03
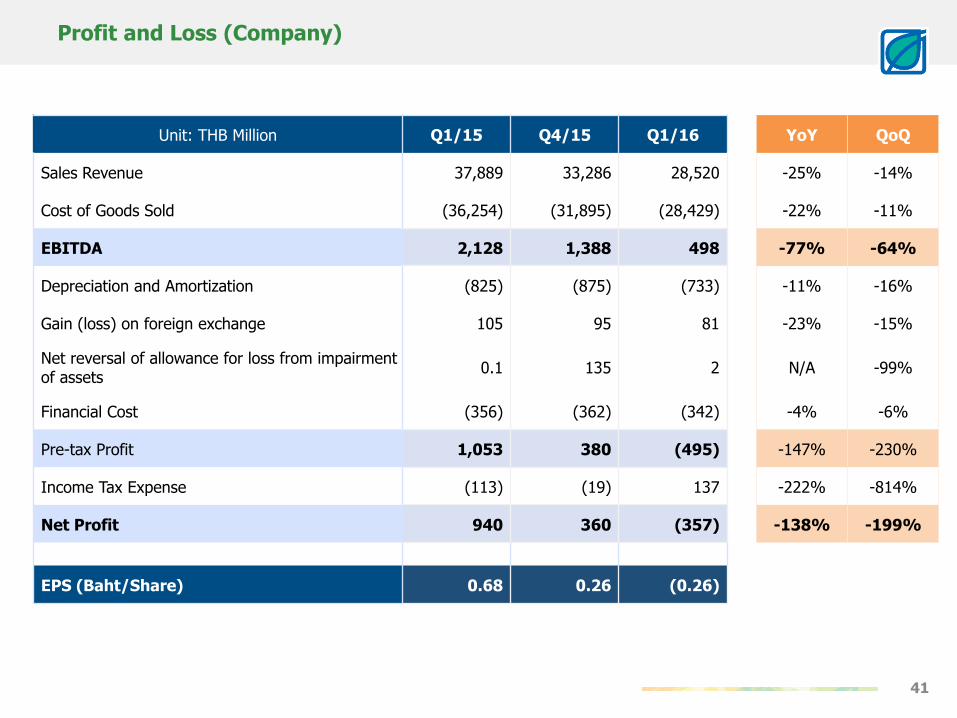
Profit and Loss (Company)
41
Unit: THB Million Q1/15 Q4/15 Q1/16 YoY QoQ
Sales Revenue 37,889 33,286 28,520 -25% -14%
Cost of Goods Sold (36,254) (31,895) (28,429) -22% -11%
EBITDA 2,128 1,388 498 -77% -64%
Depreciation and Amortization (825) (875) (733) -11% -16%
Gain (loss) on foreign exchange 105 95 81 -23% -15%
Net reversal of allowance for loss from impairment of assets
0.1 135 2 N/A -99%
Financial Cost (356) (362) (342) -4% -6%
Pre-tax Profit 1,053 380 (495) -147% -230%
Income Tax Expense (113) (19) 137 -222% -814%
Net Profit 940 360 (357) -138% -199%
EPS (Baht/Share) 0.68 0.26 (0.26)

Financial Performance: Refinery BU (Company)
42
Q1/15 Q4/15 Q1/16
THB Million $/BBL THB Million $/BBL THB Million $/BBL
Market GRM 3,267 10.19 3,023 7.98 1,120 5.35
Oil Hedging (136) (0.42) (339) (0.90) 172 0.82
Inventory Gain/Loss (1,766) (5.51) (1,631) (4.30) (1,342) (6.41)
Total GRM 1,365 4.26 1,053 2.78 (51) (0.24)
Other Income 36 0.11 42 0.11 38 0.18
FX Forward Contract 5 0.02 25 0.06 56 0.27
Operating Expenses (606) (1.89) (989) (2.61) (688) (3.29)
EBITDA 798 2.49 130 0.34 (645) (3.08)
Key factor:
Crude Run (KBD) 108.63 114.37 64.18
Exchange Rate (THB/USD) 32.80 36.00 35.83
Avg. Dubai Price (USD/BBL) 51.76 40.68 30.59

Financial Performance: Marketing BU (Company)
43
Q1/15 Q4/15 Q1/16
THB Million Baht/L THB Million Baht/L THB Million Baht/L
Net Retail Margin 739 0.95 998 1.17 965 1.09
Net Industrial Margin 272 0.48 257 0.48 395 0.68
Net Marketing Margin 1,011 0.75 1,255 0.90 1,360 0.93
Other Income 269 0.20 254 0.18 264 0.18
Operating Expenses (547) (0.41) (927) (0.67) (598) (0.41)
EBITDA 734 0.55 581 0.42 1,026 0.70
Sales Volume KBD ML/Mo KBD ML/Mo KBD ML/Mo
- Retail 54.63 261 58.20 284 61.29 296
- Industrial 39.28 187 36.82 179 39.96 193
Total Sales Volume 93.90 448 95.02 463 101.25 488

Financial Performance: Solar Power Business
44
Unit: THB Million Q1/15 Q4/15 Q1/16 YoY% QoQ%
Revenue 752 752 783 4% 4%
Gross Profit 593 563 600 1% 7%
Other Income/(Other Expense) 6 187 3 -37% -98%
Operating Expense (5) (23) (113) 2289% 402%
EBITDA 713 865 628 -12% -27%
Electricity Sales (MM kWh) 65.17 66.40 68.48 5% 3%

Financial Performance: Biodiesel Business (BBF)
45
Unit: THB Million Q1/15 Q4/15 Q1/16 YoY% QoQ%
Revenue 1,235 1,423 1,867 51% 31%
Gross Profit 73 109 132 82% 21%
Other Income/(Other Expense) 1 1 0.2 -76% -76%
Operating Expense (9) (15) (13) 40% -12%
EBITDA 69 109 134 95% 22%
Average Production Rate (K. Litre/Day)
355 367 385 8% 5%

Financial Ratio (Consolidated)
46
Q1/15 Q4/15 Q1/16
Profitability Ratios (%)
EBITDA Margin 5.91% 3.99% 3.94%
Profit Margin 2.68% -0.54% -0.08%
Return on Assets (ROA) 0.53% 12.07% 9.07%
Return on Equity (ROE) 1/ 1.39% 8.04% 6.11%
31 Mar 15 31 Dec 15 31 Mar 16
Liquidity Ratios (times)
Current Ratio 2.88 3.22 2.84
Quick Ratio 1.86 1.89 1.87
Financial Policy Ratios (times)
Interest bearing debt to Equity 0.97 0.94 0.92
Net Interest bearing debt to Equity 0.55 0.59 0.55
Q1/15 Q4/15 Q1/16
DSCR 1.59 3.73 2.03
1/ Profit and Total equity attributable to owners of the Company
Note: ROE, ROA are annualized figures.

Disclaimer : The information contained herein is being furnished on a confidential basis for discussion purposes only and only for the use of the
recipient, and may be subject to completion or amendment through the delivery of additional documentation. Except as otherwise provided herein, this
document does not constitute an offer to sell or purchase any security or engage in any transaction. The information contained herein has been
obtained from sources that The Bangchak Petroleum Public Company Limited (“BCP”) considers to be reliable; however, BCP makes no representation
as to, and accepts no responsibility or liability for, the accuracy or completeness of the information contained herein. Any projections, valuations and
statistical analyses contained herein have been provided to assist the recipient in the evaluation of the matters described herein; such projections,
valuations and analyses may be based on subjective assessments and assumptions and may utilize one among alternative methodologies that produce
differing results; accordingly, such projections, valuations and statistical analyses are not to be viewed as facts and should not be relied upon as an
accurate representation of future events. The recipient should make an independent evaluation and judgment with respect to the matters contained
herein.
Thank [email protected]. +662 335 4390, 335 4583
www.bangchak.co.th
click Investor Relations
Related Documents