Citation: Van Steenkiste, G.; Delhaas, T.; Hermans, B.; Vera, L.; Decloedt, A.; van Loon, G. An Exploratory Study on Vectorcardiographic Identification of the Site of Origin of Focally Induced Premature Depolarizations in Horses, Part I: The Atria. Animals 2022, 12, 549. https://doi.org/ 10.3390/ani12050549 Academic Editor: Enrica Zucca Received: 6 January 2022 Accepted: 9 February 2022 Published: 23 February 2022 Publisher’s Note: MDPI stays neutral with regard to jurisdictional claims in published maps and institutional affil- iations. Copyright: © 2022 by the authors. Licensee MDPI, Basel, Switzerland. This article is an open access article distributed under the terms and conditions of the Creative Commons Attribution (CC BY) license (https:// creativecommons.org/licenses/by/ 4.0/). animals Article An Exploratory Study on Vectorcardiographic Identification of the Site of Origin of Focally Induced Premature Depolarizations in Horses, Part I: The Atria Glenn Van Steenkiste 1, * , Tammo Delhaas 2 , Ben Hermans 2 , Lisse Vera 1 , Annelies Decloedt 1 and Gunther van Loon 1 1 Equine Cardioteam, Department of Internal Medicine, Reproduction and Population Medicine, Faculty of Veterinary Medicine, Ghent University, 9820 Merelbeke, Belgium; [email protected] (L.V.); [email protected] (A.D.); [email protected] (G.v.L.) 2 Department of Biomedical Engineering, CARIM School for Cardiovascular Diseases, Maastricht University, 6200 MD Maastricht, The Netherlands; [email protected] (T.D.); [email protected] (B.H.) * Correspondence: [email protected] Simple Summary: Arrhythmias are common in horses, but in order to offer adequate treatment, the anatomical location from where the arrhythmia originates must first be known. The objective of this study was to differentiate between the various anatomical origins of atrial premature depolarizations and to further differentiate these from normal sinus rhythm based upon the vectorcardiography char- acteristics of seven horses without cardiovascular disease. With vectorcardiography, the magnitude and direction of the cardiac electrical forces were derived from an electrocardiographic recording and were plotted in three dimensions. The three directions were represented by the right–left axis, head–tail axis, and dorsoventral axis. Under general anaesthesia, atrial premature depolarizations were induced by pacing inside the heart, guided by a 3D mapping system that allowed us to see the 3D position of the pacing catheter inside the heart in real-time. An adapted statistical test optimized for spherical data was used to demonstrate that the maximal directions of the first and second half of the P wave showed significant differences between the paced locations and between the paced complexes and sinus rhythm. The current study provides a practical approach to identifying the approximate site of origin of an atrial arrhythmia using a custom 12-lead ECG. Abstract: In human cardiology, the anatomical origin of atrial premature depolarizations (APDs) is derived from P wave characteristics on a 12-lead electrocardiogram (ECG) and from vectorcar- diography (VCG). The objective of this study is to differentiate between anatomical locations of APDs and to differentiate APDs from sinus rhythm (SR) based upon VCG characteristics in seven horses without cardiovascular disease. A 12-lead ECG was recorded under general anaesthesia while endomyocardial atrial pacing was performed (800–1000 ms cycle length) at the left atrial free wall and septum, right atrial free wall, intervenous tubercle, as well as at the junction with the cranial and caudal vena cava. Catheter positioning was guided by 3D electro-anatomical mapping and transthoracic ultrasound. The VCG was calculated from the 12-lead ECG using custom-made algorithms and was used to determine the mean electrical axis of the first and second half of the P wave. An ANOVA for spherical data was used to test if the maximal directions between each paced location and the maximal directions between every paced location and SR were significantly (p < 0.05) different. Atrial pacing data were not available from the LA septum in three horses, the intervenous tubercle in two horses, and from the LA free wall in one horse. The directions of the maximal electrical axes showed significant differences between all paced locations and between the paced locations and SR. The current results suggest that VCG is useful for identifying the anatomical origin of an atrial ectopy. Keywords: focal; atrial tachycardia; P wave; electrophysiology; electrocardiography Animals 2022, 12, 549. https://doi.org/10.3390/ani12050549 https://www.mdpi.com/journal/animals

Welcome message from author
This document is posted to help you gain knowledge. Please leave a comment to let me know what you think about it! Share it to your friends and learn new things together.
Transcript
�����������������
Citation: Van Steenkiste, G.; Delhaas,
T.; Hermans, B.; Vera, L.; Decloedt, A.;
van Loon, G. An Exploratory Study
on Vectorcardiographic Identification
of the Site of Origin of Focally
Induced Premature Depolarizations
in Horses, Part I: The Atria. Animals
2022, 12, 549. https://doi.org/
10.3390/ani12050549
Academic Editor: Enrica Zucca
Received: 6 January 2022
Accepted: 9 February 2022
Published: 23 February 2022
Publisher’s Note: MDPI stays neutral
with regard to jurisdictional claims in
published maps and institutional affil-
iations.
Copyright: © 2022 by the authors.
Licensee MDPI, Basel, Switzerland.
This article is an open access article
distributed under the terms and
conditions of the Creative Commons
Attribution (CC BY) license (https://
creativecommons.org/licenses/by/
4.0/).
animals
Article
An Exploratory Study on Vectorcardiographic Identification ofthe Site of Origin of Focally Induced Premature Depolarizationsin Horses, Part I: The AtriaGlenn Van Steenkiste 1,* , Tammo Delhaas 2 , Ben Hermans 2 , Lisse Vera 1, Annelies Decloedt 1
and Gunther van Loon 1
1 Equine Cardioteam, Department of Internal Medicine, Reproduction and Population Medicine, Faculty ofVeterinary Medicine, Ghent University, 9820 Merelbeke, Belgium; [email protected] (L.V.);[email protected] (A.D.); [email protected] (G.v.L.)
2 Department of Biomedical Engineering, CARIM School for Cardiovascular Diseases, Maastricht University,6200 MD Maastricht, The Netherlands; [email protected] (T.D.);[email protected] (B.H.)
* Correspondence: [email protected]
Simple Summary: Arrhythmias are common in horses, but in order to offer adequate treatment, theanatomical location from where the arrhythmia originates must first be known. The objective of thisstudy was to differentiate between the various anatomical origins of atrial premature depolarizationsand to further differentiate these from normal sinus rhythm based upon the vectorcardiography char-acteristics of seven horses without cardiovascular disease. With vectorcardiography, the magnitudeand direction of the cardiac electrical forces were derived from an electrocardiographic recordingand were plotted in three dimensions. The three directions were represented by the right–left axis,head–tail axis, and dorsoventral axis. Under general anaesthesia, atrial premature depolarizationswere induced by pacing inside the heart, guided by a 3D mapping system that allowed us to see the3D position of the pacing catheter inside the heart in real-time. An adapted statistical test optimizedfor spherical data was used to demonstrate that the maximal directions of the first and second halfof the P wave showed significant differences between the paced locations and between the pacedcomplexes and sinus rhythm. The current study provides a practical approach to identifying theapproximate site of origin of an atrial arrhythmia using a custom 12-lead ECG.
Abstract: In human cardiology, the anatomical origin of atrial premature depolarizations (APDs)is derived from P wave characteristics on a 12-lead electrocardiogram (ECG) and from vectorcar-diography (VCG). The objective of this study is to differentiate between anatomical locations ofAPDs and to differentiate APDs from sinus rhythm (SR) based upon VCG characteristics in sevenhorses without cardiovascular disease. A 12-lead ECG was recorded under general anaesthesiawhile endomyocardial atrial pacing was performed (800–1000 ms cycle length) at the left atrial freewall and septum, right atrial free wall, intervenous tubercle, as well as at the junction with thecranial and caudal vena cava. Catheter positioning was guided by 3D electro-anatomical mappingand transthoracic ultrasound. The VCG was calculated from the 12-lead ECG using custom-madealgorithms and was used to determine the mean electrical axis of the first and second half of theP wave. An ANOVA for spherical data was used to test if the maximal directions between eachpaced location and the maximal directions between every paced location and SR were significantly(p < 0.05) different. Atrial pacing data were not available from the LA septum in three horses, theintervenous tubercle in two horses, and from the LA free wall in one horse. The directions of themaximal electrical axes showed significant differences between all paced locations and between thepaced locations and SR. The current results suggest that VCG is useful for identifying the anatomicalorigin of an atrial ectopy.
Keywords: focal; atrial tachycardia; P wave; electrophysiology; electrocardiography
Animals 2022, 12, 549. https://doi.org/10.3390/ani12050549 https://www.mdpi.com/journal/animals
Animals 2022, 12, 549 2 of 12
1. Introduction
Atrial tachycardia (AT) in horses can be treated by a recently developed novel tech-nique, i.e., ablation in which the focus of the atrial tachycardia is cauterized [1,2]. Toshorten anaesthesia time and simplify the procedure of this advanced technique, accuratepre-procedural prediction of the anatomical origin of the atrial tachycardia by analysingthe surface electrocardiogram (ECG) is advisable. In human medicine, specific 12-lead ECGcharacteristics have been described to differentiate between sinus rhythm (SR) and AT, aswell as to identify the origin of atrial premature depolarizations (APDs) and AT [3,4]. Sinceprevious studies in horses revealed contradictory results concerning the diagnostic valueof the 12-lead ECG for the localization of premature depolarizations [5–8], the 12-lead ECGhas been considered unreliable in horses. However, this unreliability might be related to theshortcomings of the applied lead systems. Indeed, guidelines for the electrode placementof a 12-lead ECG in horses were based on human electrode placement [9]. By placingthe limb electrodes on the extremities of the horse, not only is Wilson’s central terminal(WCT) placed outside the heart, but Einthoven’s triangle is also almost perpendicular tothe electrical axis of the equine heart, as well as ventral to the heart. This gave rise tounreliable results because of the wide individual variations of the recorded ECG tracebetween horses [10,11]. Moreover, the ECG was extremely sensitive to forelimb movement.Different orthogonal lead systems were proposed to overcome this issue, and althoughthese were more reliable, they were never widely used except in experimental setups, asthey required purpose-built ECG recording devices [8,11–13]. Recently, an adapted 12-leadECG configuration was proposed [14], which can be applied using human ECG recordingdevices. This new electrode configuration addresses some of the original shortcomings byplacing Einthoven’s triangle in a plane close to the mean electrical axis of the heart andthe precordial electrodes in a plane perpendicular to the electrical axis of the heart [14].Moreover, the configuration also allows the construction of vectorcardiograms (VCGs), inwhich cardiac electrical forces at a given point in time are summed into a single vectorwhich has a direction and a magnitude. The past decades have shown a revival of vectorcar-diography in human medicine owing to the possibility of mathematically synthesizing thethree orthogonal leads of the VCG from the 12-lead ECG, avoiding the need for specializedrecording equipment [15]. Whereas a 12-lead ECG is usually interpreted by a humanphysician from their knowledge of the different ECG complexes, a VCG can give a visual3D representation of the electrical activity in the heart without the need for memorizingall the different ECG configurations. Since a VCG is able to be calculated from a 12-leadECG, but the inverse transformation does not result in a perfect 12-lead ECG [16], the VCGcontains slightly less information compared to the 12-lead ECG from a purely theoreticalpoint of view. Nevertheless, the VCG also contains additional kinds of information thatremain unexplored in the 12-lead ECG. Examples of these are the true P wave axes in threedimensions and the vector loop inscription direction [15,17,18].
The objective of this study was to determine if VCG-derived P wave characteristicscould be used: 1. to differentiate between SR and pacing-induced APDs; 2. to identify theanatomical origin of the pacing-induced APD.
2. Materials and Methods2.1. Study Set-Up
A cross-sectional analytic study design was used. This research was approved by theethical committee of the Faculty of Veterinary Medicine, Ghent University (EC2016/35),and animal care was provided according to their guidelines. Seven warmbloods agedapproximately 12.5 years (5–20 years, median range), 163 cm (158–179 cm) at the withers,and 548 kg (420–706 kg) were used. Four of the horses were owned by the Faculty ofVeterinary Medicine, whereas three horses were donated by their owners for the purposeof scientific research followed by euthanasia because of pre-existing orthopaedic problems.Horses were included in the study if their auscultation, biochemistry (electrolytes andcardiac troponin I), echocardiography, and ECG results were normal. Data from the
Animals 2022, 12, 549 3 of 12
currently described study were obtained at the same time as those from a previouslydescribed study [19].
2.2. Electrophysiological Study
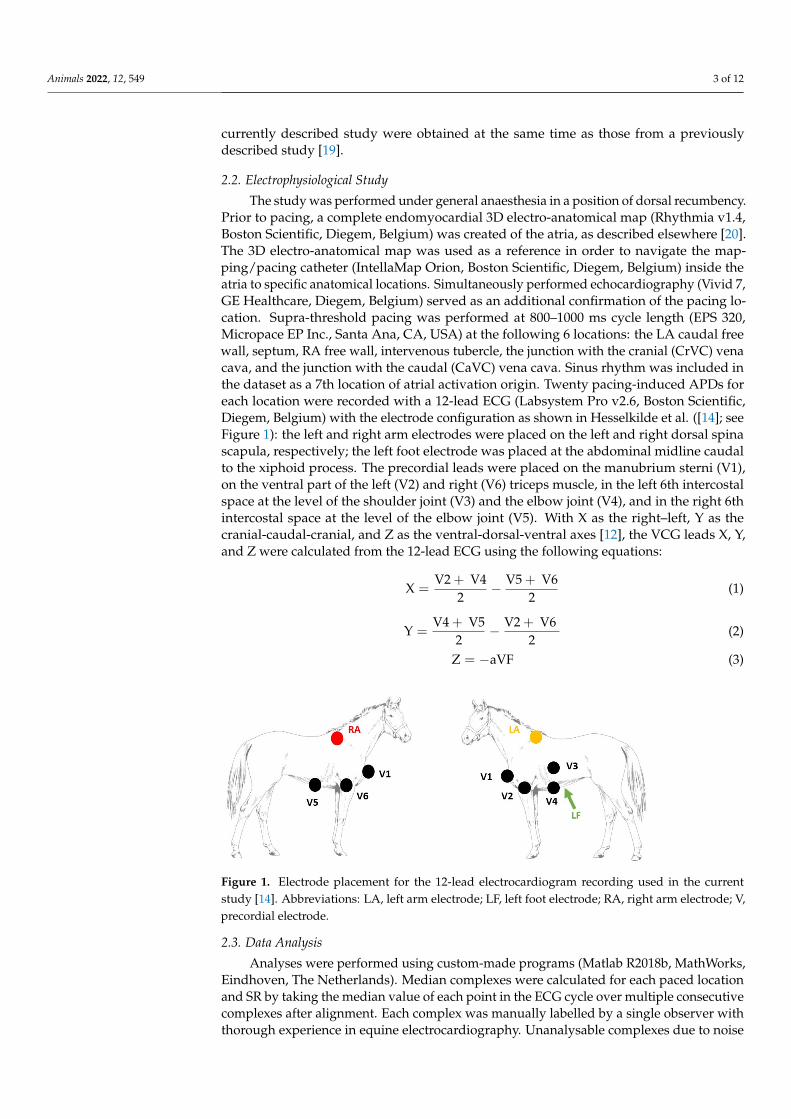
The study was performed under general anaesthesia in a position of dorsal recumbency.Prior to pacing, a complete endomyocardial 3D electro-anatomical map (Rhythmia v1.4,Boston Scientific, Diegem, Belgium) was created of the atria, as described elsewhere [20].The 3D electro-anatomical map was used as a reference in order to navigate the map-ping/pacing catheter (IntellaMap Orion, Boston Scientific, Diegem, Belgium) inside theatria to specific anatomical locations. Simultaneously performed echocardiography (Vivid 7,GE Healthcare, Diegem, Belgium) served as an additional confirmation of the pacing lo-cation. Supra-threshold pacing was performed at 800–1000 ms cycle length (EPS 320,Micropace EP Inc., Santa Ana, CA, USA) at the following 6 locations: the LA caudal freewall, septum, RA free wall, intervenous tubercle, the junction with the cranial (CrVC) venacava, and the junction with the caudal (CaVC) vena cava. Sinus rhythm was included inthe dataset as a 7th location of atrial activation origin. Twenty pacing-induced APDs foreach location were recorded with a 12-lead ECG (Labsystem Pro v2.6, Boston Scientific,Diegem, Belgium) with the electrode configuration as shown in Hesselkilde et al. ([14]; seeFigure 1): the left and right arm electrodes were placed on the left and right dorsal spinascapula, respectively; the left foot electrode was placed at the abdominal midline caudalto the xiphoid process. The precordial leads were placed on the manubrium sterni (V1),on the ventral part of the left (V2) and right (V6) triceps muscle, in the left 6th intercostalspace at the level of the shoulder joint (V3) and the elbow joint (V4), and in the right 6thintercostal space at the level of the elbow joint (V5). With X as the right–left, Y as thecranial-caudal-cranial, and Z as the ventral-dorsal-ventral axes [12], the VCG leads X, Y,and Z were calculated from the 12-lead ECG using the following equations:
X =V2 + V4
2− V5 + V6
2(1)
Y =V4 + V5
2− V2 + V6
2(2)
Z = −aVF (3)
Animals 2022, 12, x FOR PEER REVIEW 3 of 13
approximately 12.5 years (5–20 years, median range), 163 cm (158–179 cm) at the withers, and 548 kg (420–706 kg) were used. Four of the horses were owned by the Faculty of Veterinary Medicine, whereas three horses were donated by their owners for the purpose of scientific research followed by euthanasia because of pre-existing orthopaedic problems. Horses were included in the study if their auscultation, biochemistry (electrolytes and cardiac troponin I), echocardiography, and ECG results were normal. Data from the currently described study were obtained at the same time as those from a previously described study [19].
2.2. Electrophysiological Study The study was performed under general anaesthesia in a position of dorsal
recumbency. Prior to pacing, a complete endomyocardial 3D electro-anatomical map (Rhythmia v1.4, Boston Scientific, Diegem, Belgium) was created of the atria, as described elsewhere [20]. The 3D electro-anatomical map was used as a reference in order to navigate the mapping/pacing catheter (IntellaMap Orion, Boston Scientific, Diegem, Belgium) inside the atria to specific anatomical locations. Simultaneously performed echocardiography (Vivid 7, GE Healthcare, Diegem, Belgium) served as an additional confirmation of the pacing location. Supra-threshold pacing was performed at 800–1000 ms cycle length (EPS 320, Micropace EP Inc., Santa Ana, CA, USA) at the following 6 locations: the LA caudal free wall, septum, RA free wall, intervenous tubercle, the junction with the cranial (CrVC) vena cava, and the junction with the caudal (CaVC) vena cava. Sinus rhythm was included in the dataset as a 7th location of atrial activation origin. Twenty pacing-induced APDs for each location were recorded with a 12-lead ECG (Labsystem Pro v2.6, Boston Scientific, Diegem, Belgium) with the electrode configuration as shown in Hesselkilde et al. ([14]; see Figure 1): the left and right arm electrodes were placed on the left and right dorsal spina scapula, respectively; the left foot electrode was placed at the abdominal midline caudal to the xiphoid process. The precordial leads were placed on the manubrium sterni (V1), on the ventral part of the left (V2) and right (V6) triceps muscle, in the left 6th intercostal space at the level of the shoulder joint (V3) and the elbow joint (V4), and in the right 6th intercostal space at the level of the elbow joint (V5). With X as the right–left, Y as the cranial-caudal-cranial, and Z as the ventral-dorsal-ventral axes [12], the VCG leads X, Y, and Z were calculated from the 12-lead ECG using the following equations: X = V2 + V42 − V5 + V62 (1)
Y = V4 + V52 − V2 + V6 2 (2)Z = −aVF (3)
Figure 1. Electrode placement for the 12-lead electrocardiogram recording used in the current study [14]. Abbreviations: LA, left arm electrode; LF, left foot electrode; RA, right arm electrode; V, precordial electrode.
Figure 1. Electrode placement for the 12-lead electrocardiogram recording used in the currentstudy [14]. Abbreviations: LA, left arm electrode; LF, left foot electrode; RA, right arm electrode; V,precordial electrode.
2.3. Data Analysis
Analyses were performed using custom-made programs (Matlab R2018b, MathWorks,Eindhoven, The Netherlands). Median complexes were calculated for each paced locationand SR by taking the median value of each point in the ECG cycle over multiple consecutivecomplexes after alignment. Each complex was manually labelled by a single observer withthorough experience in equine electrocardiography. Unanalysable complexes due to noise
Animals 2022, 12, 549 4 of 12
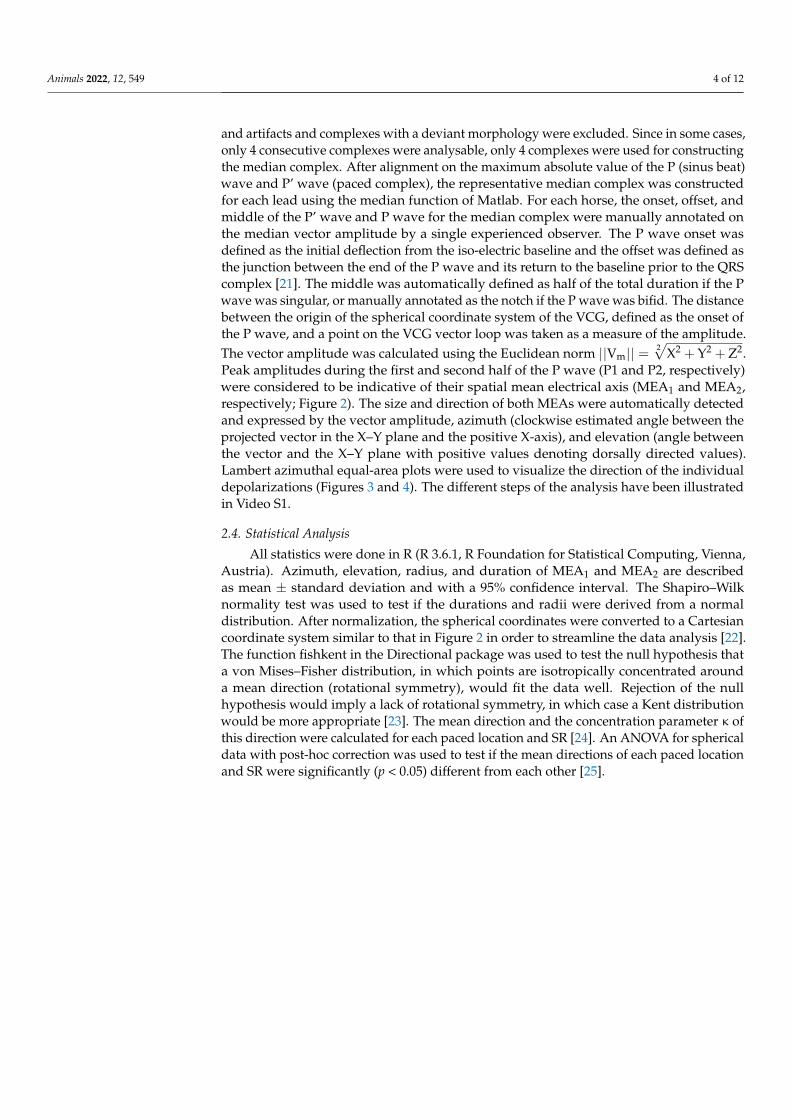
and artifacts and complexes with a deviant morphology were excluded. Since in some cases,only 4 consecutive complexes were analysable, only 4 complexes were used for constructingthe median complex. After alignment on the maximum absolute value of the P (sinus beat)wave and P’ wave (paced complex), the representative median complex was constructedfor each lead using the median function of Matlab. For each horse, the onset, offset, andmiddle of the P’ wave and P wave for the median complex were manually annotated onthe median vector amplitude by a single experienced observer. The P wave onset wasdefined as the initial deflection from the iso-electric baseline and the offset was defined asthe junction between the end of the P wave and its return to the baseline prior to the QRScomplex [21]. The middle was automatically defined as half of the total duration if the Pwave was singular, or manually annotated as the notch if the P wave was bifid. The distancebetween the origin of the spherical coordinate system of the VCG, defined as the onset ofthe P wave, and a point on the VCG vector loop was taken as a measure of the amplitude.The vector amplitude was calculated using the Euclidean norm ||Vm|| =
2√
X2 + Y2 + Z2.Peak amplitudes during the first and second half of the P wave (P1 and P2, respectively)were considered to be indicative of their spatial mean electrical axis (MEA1 and MEA2,respectively; Figure 2). The size and direction of both MEAs were automatically detectedand expressed by the vector amplitude, azimuth (clockwise estimated angle between theprojected vector in the X–Y plane and the positive X-axis), and elevation (angle betweenthe vector and the X–Y plane with positive values denoting dorsally directed values).Lambert azimuthal equal-area plots were used to visualize the direction of the individualdepolarizations (Figures 3 and 4). The different steps of the analysis have been illustratedin Video S1.
2.4. Statistical Analysis
All statistics were done in R (R 3.6.1, R Foundation for Statistical Computing, Vienna,Austria). Azimuth, elevation, radius, and duration of MEA1 and MEA2 are describedas mean ± standard deviation and with a 95% confidence interval. The Shapiro–Wilknormality test was used to test if the durations and radii were derived from a normaldistribution. After normalization, the spherical coordinates were converted to a Cartesiancoordinate system similar to that in Figure 2 in order to streamline the data analysis [22].The function fishkent in the Directional package was used to test the null hypothesis thata von Mises–Fisher distribution, in which points are isotropically concentrated arounda mean direction (rotational symmetry), would fit the data well. Rejection of the nullhypothesis would imply a lack of rotational symmetry, in which case a Kent distributionwould be more appropriate [23]. The mean direction and the concentration parameter κ ofthis direction were calculated for each paced location and SR [24]. An ANOVA for sphericaldata with post-hoc correction was used to test if the mean directions of each paced locationand SR were significantly (p < 0.05) different from each other [25].
Animals 2022, 12, 549 5 of 12Animals 2022, 12, x FOR PEER REVIEW 5 of 13
Figure 2. Example measurements of P wave characteristics of a median sinus rhythm or paced beat. The first (P1) and second (P2) part of the P (sinus rhythm) or P’ (paced complex) wave were selected on the 12-lead ECG. After selecting the timeframe, the VCG axes were calculated from the 12-lead ECG with X representing the right–left, Y the cranial–caudal, and Z the ventral–dorsal axes. After the calculation of the VCG, the spherical coordinates were calculated from the VCG; for P1 and P2, the coordinate with the largest radius is the mean electrical axis (MEA). The MEA is shown by the red (P1) or blue (P2) arrow on the sphere. The azimuth (α) and elevation (ε) of MEA2 are indicated on the sphere. Below the sphere, 3 polar plots are given with the transverse, sagittal, and dorsal projections of the VCG. The MEA of P2 is indicated on the polar plots by the blue arrow with the measurements for the azimuth and elevation. Note on the 2D polar plots that the elevation measured from the transverse plane has a different angle than the measurement from the sagittal plane. This is because the maximum radius of the VCG is view-dependent if projected into a 2D plane. It is also why the azimuth, elevation, and maximal radii for the statistics were measured in 3D space.
Figure 2. Example measurements of P wave characteristics of a median sinus rhythm or paced beat.The first (P1) and second (P2) part of the P (sinus rhythm) or P’ (paced complex) wave were selectedon the 12-lead ECG. After selecting the timeframe, the VCG axes were calculated from the 12-leadECG with X representing the right–left, Y the cranial–caudal, and Z the ventral–dorsal axes. Afterthe calculation of the VCG, the spherical coordinates were calculated from the VCG; for P1 and P2,the coordinate with the largest radius is the mean electrical axis (MEA). The MEA is shown by thered (P1) or blue (P2) arrow on the sphere. The azimuth (α) and elevation (ε) of MEA2 are indicatedon the sphere. Below the sphere, 3 polar plots are given with the transverse, sagittal, and dorsalprojections of the VCG. The MEA of P2 is indicated on the polar plots by the blue arrow with themeasurements for the azimuth and elevation. Note on the 2D polar plots that the elevation measuredfrom the transverse plane has a different angle than the measurement from the sagittal plane. This isbecause the maximum radius of the VCG is view-dependent if projected into a 2D plane. It is alsowhy the azimuth, elevation, and maximal radii for the statistics were measured in 3D space.
Animals 2022, 12, 549 6 of 12Animals 2022, 12, x FOR PEER REVIEW 6 of 13
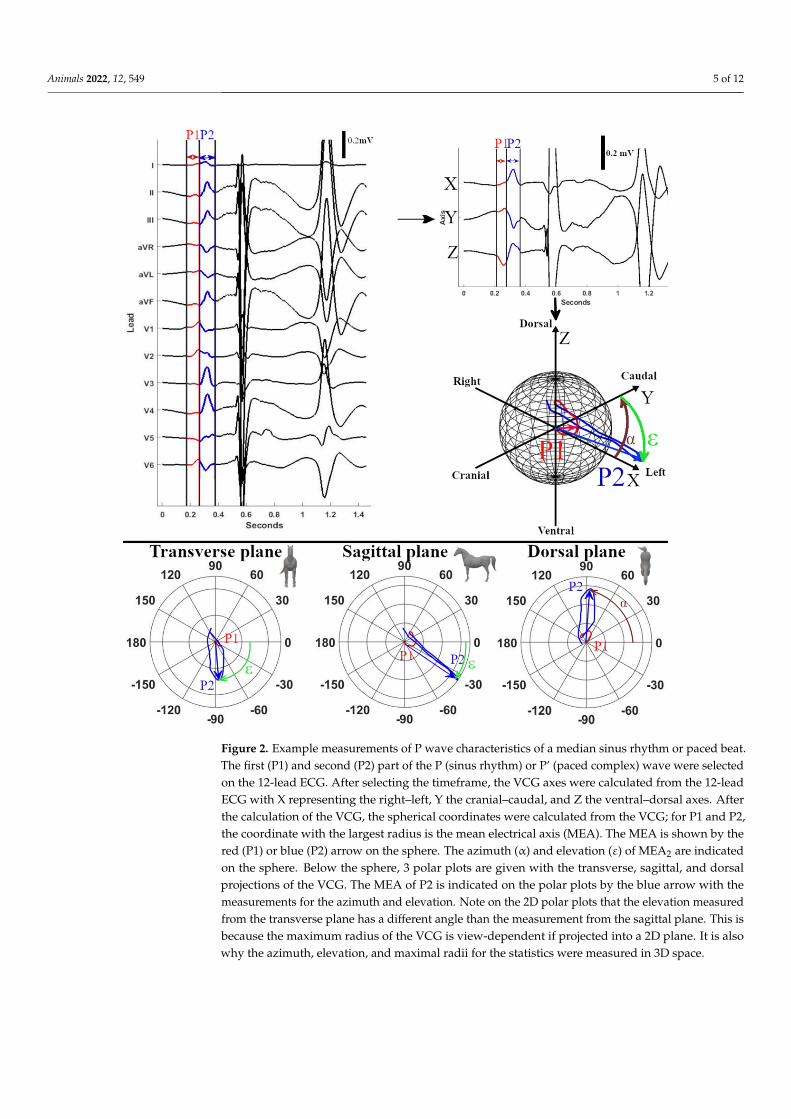
Figure 3. Spatial directions of the mean electrical axis (MEA) of the first half of the P wave for individual induced APDs visualized with a Lambert azimuthal equal-area plot. Dots inside the green circle represent a dorsal MEA, while dots outside represent a ventral MEA. Left is 0° and caudal is 90°. Different P wave origins are indicated by different colours. Abbreviations: LA, left atrium; RA, right atrium; VC, vena cava.
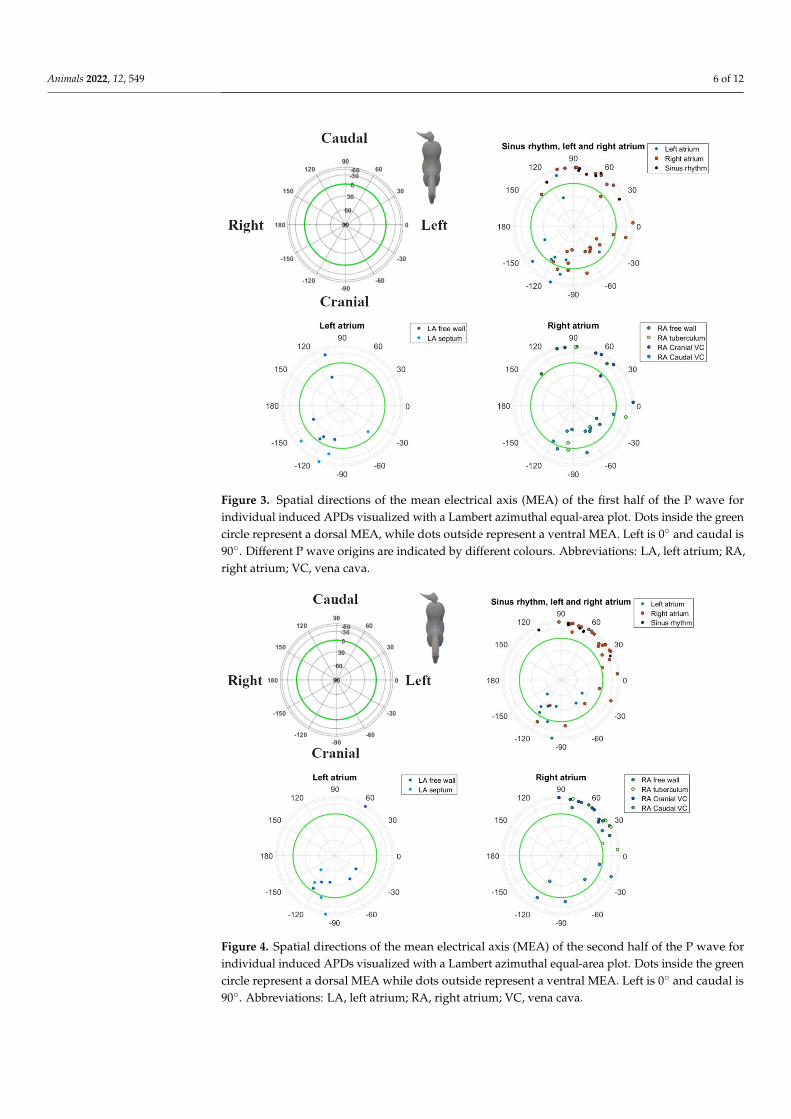
Figure 4. Spatial directions of the mean electrical axis (MEA) of the second half of the P wave for individual induced APDs visualized with a Lambert azimuthal equal-area plot. Dots inside the green circle represent a dorsal MEA while dots outside represent a ventral MEA. Left is 0° and caudal is 90°. Abbreviations: LA, left atrium; RA, right atrium; VC, vena cava.
Figure 3. Spatial directions of the mean electrical axis (MEA) of the first half of the P wave forindividual induced APDs visualized with a Lambert azimuthal equal-area plot. Dots inside the greencircle represent a dorsal MEA, while dots outside represent a ventral MEA. Left is 0◦ and caudal is90◦. Different P wave origins are indicated by different colours. Abbreviations: LA, left atrium; RA,right atrium; VC, vena cava.
Animals 2022, 12, x FOR PEER REVIEW 6 of 13
Figure 3. Spatial directions of the mean electrical axis (MEA) of the first half of the P wave for individual induced APDs visualized with a Lambert azimuthal equal-area plot. Dots inside the green circle represent a dorsal MEA, while dots outside represent a ventral MEA. Left is 0° and caudal is 90°. Different P wave origins are indicated by different colours. Abbreviations: LA, left atrium; RA, right atrium; VC, vena cava.
Figure 4. Spatial directions of the mean electrical axis (MEA) of the second half of the P wave for individual induced APDs visualized with a Lambert azimuthal equal-area plot. Dots inside the green circle represent a dorsal MEA while dots outside represent a ventral MEA. Left is 0° and caudal is 90°. Abbreviations: LA, left atrium; RA, right atrium; VC, vena cava.
Figure 4. Spatial directions of the mean electrical axis (MEA) of the second half of the P wave forindividual induced APDs visualized with a Lambert azimuthal equal-area plot. Dots inside the greencircle represent a dorsal MEA while dots outside represent a ventral MEA. Left is 0◦ and caudal is90◦. Abbreviations: LA, left atrium; RA, right atrium; VC, vena cava.

Animals 2022, 12, 549 7 of 12
3. Results
The ECG data quality was insufficient for analysis while pacing from the LA septumin three horses, the RA intervenous tubercle in two horses, and from the LA free wall inone horse. In these cases, due to the adjacent T wave or pacing spike, the P wave waspartially hidden. In all other locations and during sinus rhythm, good quality ECGs couldbe recorded. One horse had two rate-dependent sinus node exit areas, one at the medialcrista terminalis and another one at the right atrial free wall [19]. In this horse, the dominantP wave morphology correlating to the medial crista terminalis was selected for furtheranalysis. Descriptive statistics for the P waves of the various atrial pace locations and theSR are given in Table 1. The durations and radii were all derived from a normal distribution.Distributions of the directions of MEA1 and MEA2 for the SR and each pace location showedrotational symmetry (p ≥ 0.05). Hence, a von Mises–Fisher distribution was assumed.The ANOVA showed that the directions of MEA1 (p < 0.001) and MEA2 (p < 0.001) weresignificantly different between all the paced locations as well as between the paced locationsand the SR. Post-hoc results from the ANOVA for individual combinations are shown inTable 2. The mean direction and the concentration parameter κ of MEA1 and MEA2 foreach location are shown in Figure 5. Only these mean directions are described below. Forthe individual variations of MEA1 and MEA2, the reader is referred to Figures 3 and 4, inwhich the individual MEA1 and MEA2 are shown in the Lambert azimuthal equal-area plot.
In horses in SR, the average directions of both MEA1 and MEA2 were directed leftcaudoventrally. Pacing at the LA free wall induced a right MEA1 and a left cranial MEA2.Induced APDs from the LA septum had a right cranial MEA1 and MEA2.
For APDs originating from the RA to the CrVC junction, both MEA1 and MEA2 weredirected left caudoventrally, whereas pacing from the RA to CaVC junction induced a leftcranially directed MEA1 and MEA2. Four induced APDs from the RA free wall had a leftcranial MEA1, and three had a caudal MEA1. All APDs from the RA free wall had a leftcaudoventral MEA2. Pacing at the intervenous tubercle showed a left cranial MEA1 andright caudoventral MEA2.
Table 1. Descriptive statistics of the electrical axis distributions for the different induced atrialpremature depolarizations. The mean electrical axis is measured as the maximum radius during thefirst (P1) or second (P2) half of the P wave.
PacingLocation n Mean Electrical Axis P1 Mean Electrical Axis P2
Azimuth(◦)
Elevation(◦)
Radius(mV)
Duration(ms) κ
Azimuth(◦)
Elevation(◦)
Radius(mV)
Duration(ms) κ
Sinus rhythm 7 69 ± 48 −44 ± 14 0.10 ± 0.05 70 ± 20 12 72 ± 25 −47 ± 6 0.18 ± 0.05 80 ± 20 21.2Left atrium
Free wall 6 −156 ± 66 11 ± 21 0.14 ± 0.07 100 ± 30 1.9 −77 ± 62 18 ± 36 0.18 ± 0.09 90 ± 20 2.3Septum 4 −102 ± 34 −31 ± 37 0.11 ± 0.07 50 ± 10 3.1 −117 ± 14 1 ± 50 0.20 ± 0.08 80 ± 10 3.0
Right atriumCaudal venacava junction 7 −78 ± 35 12 ± 21 0.13 ± 0.08 100 ± 30 4.3 −53 ± 54 −4 ± 24 0.13 ± 0.06 80 ± 10 2.3
Cranial venacava junction 7 61 ± 32 −51 ± 23 0.09 ± 0.05 90 ± 30 8.4 63 ± 18 −51 ± 14 0.24 ± 0.09 90 ± 10 22.6
Free wall 7 −16 ± 78 11 ± 37 0.13 ± 0.08 90 ± 40 1.2 47 ± 18 −47 ± 13 0.21 ± 0.08 90 ± 20 20.1Intervenous
tubercle 5 −55 ± 69 −9 ± 35 0.15 ± 0.14 80 ± 40 1.9 72 ± 25 −50 ± 23 0.18 ± 0.09 80 ± 30 9.6
κ, concentration parameter; n, number of horses.
Animals 2022, 12, 549 8 of 12
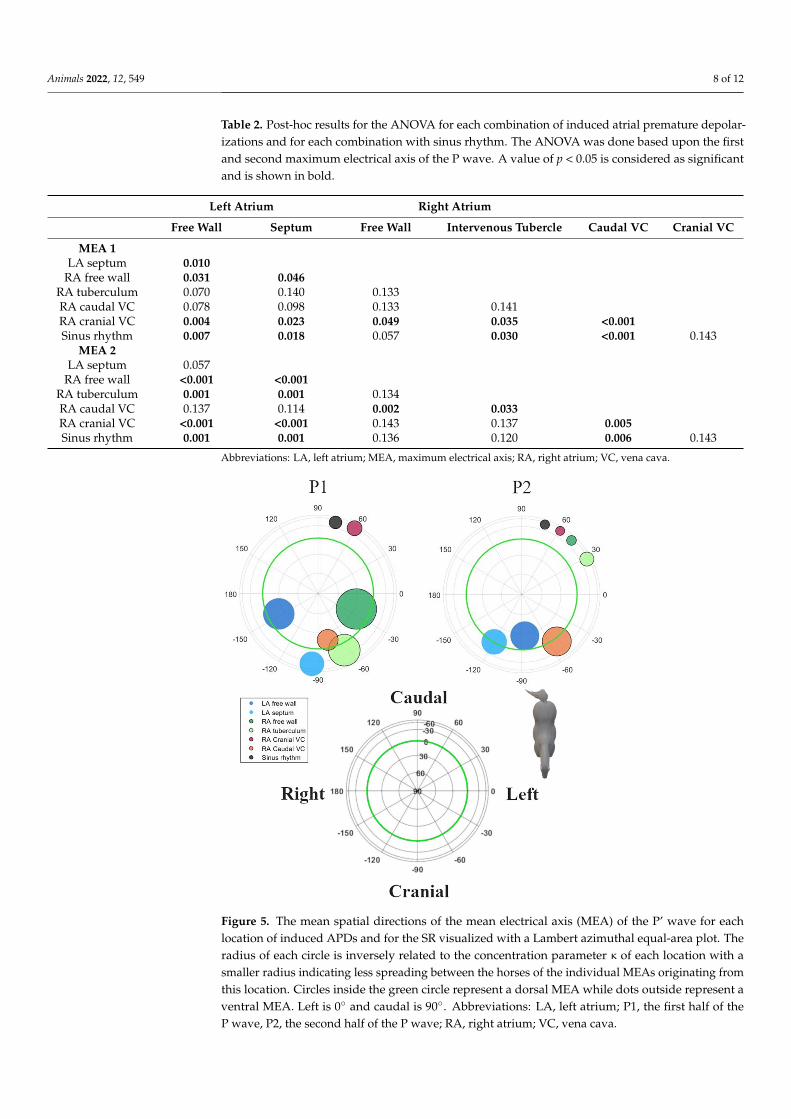
Table 2. Post-hoc results for the ANOVA for each combination of induced atrial premature depolar-izations and for each combination with sinus rhythm. The ANOVA was done based upon the firstand second maximum electrical axis of the P wave. A value of p < 0.05 is considered as significantand is shown in bold.
Left Atrium Right Atrium
Free Wall Septum Free Wall Intervenous Tubercle Caudal VC Cranial VC
MEA 1LA septum 0.010
RA free wall 0.031 0.046RA tuberculum 0.070 0.140 0.133RA caudal VC 0.078 0.098 0.133 0.141RA cranial VC 0.004 0.023 0.049 0.035 <0.001Sinus rhythm 0.007 0.018 0.057 0.030 <0.001 0.143
MEA 2LA septum 0.057
RA free wall <0.001 <0.001RA tuberculum 0.001 0.001 0.134RA caudal VC 0.137 0.114 0.002 0.033RA cranial VC <0.001 <0.001 0.143 0.137 0.005Sinus rhythm 0.001 0.001 0.136 0.120 0.006 0.143
Abbreviations: LA, left atrium; MEA, maximum electrical axis; RA, right atrium; VC, vena cava.
Animals 2022, 12, x FOR PEER REVIEW 8 of 13
Table 2. Post-hoc results for the ANOVA for each combination of induced atrial premature depolarizations and for each combination with sinus rhythm. The ANOVA was done based upon the first and second maximum electrical axis of the P wave. A value of p < 0.05 is considered as significant and is shown in bold.
Left Atrium Right Atrium
Free Wall Septum Free Wall Intervenous Tubercle Caudal VC Cranial VC
MEA 1 LA septum 0.010
RA free wall 0.031 0.046 RA tuberculum 0.070 0.140 0.133 RA caudal VC 0.078 0.098 0.133 0.141 RA cranial VC 0.004 0.023 0.049 0.035 <0.001 Sinus rhythm 0.007 0.018 0.057 0.030 <0.001 0.143
MEA 2
LA septum 0.057 RA free wall <0.001 <0.001
RA tuberculum 0.001 0.001 0.134 RA caudal VC 0.137 0.114 0.002 0.033 RA cranial VC <0.001 <0.001 0.143 0.137 0.005 Sinus rhythm 0.001 0.001 0.136 0.120 0.006 0.143
Abbreviations: LA, left atrium; MEA, maximum electrical axis; RA, right atrium; VC, vena cava.
Figure 5. The mean spatial directions of the mean electrical axis (MEA) of the P’ wave for each location of induced APDs and for the SR visualized with a Lambert azimuthal equal-area plot. The
Figure 5. The mean spatial directions of the mean electrical axis (MEA) of the P’ wave for eachlocation of induced APDs and for the SR visualized with a Lambert azimuthal equal-area plot. Theradius of each circle is inversely related to the concentration parameter κ of each location with asmaller radius indicating less spreading between the horses of the individual MEAs originating fromthis location. Circles inside the green circle represent a dorsal MEA while dots outside represent aventral MEA. Left is 0◦ and caudal is 90◦. Abbreviations: LA, left atrium; P1, the first half of theP wave, P2, the second half of the P wave; RA, right atrium; VC, vena cava.
Animals 2022, 12, 549 9 of 12
4. Discussion
The current study describes the P wave characteristics during SR and pacing-inducedAPDs at different anatomical locations in an experimental study set-up. Based upon VCGcharacteristics, significant differentiation between sinus rhythm and APDs in general aswell as between APDs from different anatomical locations was found.
Since the applied, recently described electrode placement [14] has the limb leadsembracing the thorax, the Einthoven triangle is almost in line with the mean electricalaxis of the equine heart, and the Wilson central terminal (WCT) is close to the heart. Incombination with the unipolar precordial leads placed in a plane perpendicular to the meanelectrical axis, more reliable information about atrial and ventricular electrophysiologycould be obtained, as compared to older electrode placement configurations [9,14], whichwere based upon human electrode placement with limb leads on the limbs of the horse.These historical electrode placement configurations in horses with limb leads on the limbsrecorded potentials in a plane perpendicular to the mean electrical axis, had the WCTfar outside the heart and, hence, due to the wide individual variations in the recordedECG traces between horses, gave rise to unreliable results. Moreover, the ECG was alsoextremely sensitive to forelimb position or movement [10,11].
Our electrode placement also allowed us to calculate electrical forces in three orthog-onal, anatomically well-defined directions. These left–right, cranial–caudal, and ventral–dorsal leads were used to reconstruct the VCG. Based on this VCG, we were able to derivethe following information. During SR at rest, P1 was generated by the depolarization of theRA in a caudoventral direction; P2 was produced by the depolarization of the LA, again ina caudoventral direction, as described previously [26]. The SR VCG is similar to the APDsoriginating from the junction between RA and CrVC, making it difficult to distinguishbetween both, which is also the case in humans [27]. One horse had a MEA1 in SR that wasdirected left craniodorsally. This particular horse had two sinus node exit areas, one at themedial crista terminalis and another at the right atrial free wall [19]. The P wave of thesinus rhythm originating from the RA free wall had a MEA1 which was close to a clusterof APDs originating from the RA free wall. Likewise, in humans and dogs, the exit areaof the sinus node can vary, both within and between individuals [28–30]. In humans, thesinus node region has been described to be as large as 7.5 × 1.5 cm, and some preferentialpathways of sinus node exits have been associated with atrial remodelling [31]. Table 2and Figures 3 and 5 show that the clusters of P1 represent the anatomical origin within theatria of the induced APD, which also allows for differentiation between the anatomicalorigins within the atria of the APD. Note that the cluster sizes of P1 and P2 for the LAfree wall are very similar (Figure 5; Table 2) while there appears to be a greater differencebetween the P1 and P2 cluster sizes in Figures 3 and 4. Despite offering accurate arearepresentation in all regions of the sphere, the Lambert azimuthal equal-area projectiondoes not accurately represent the angles. This leads to a distortion at the edges of the 2Drepresentation of the sphere. The results from P2 show clustering representing the intera-trial origin of the APD. This matches previous findings in horses [19,32]. Indeed, during P1,the depolarization wave spread within the atrium of origin, causing MEA1, while duringP2, the depolarization spread to the adjacent atrium, causing MEA2. Since P1 resulted fromthe depolarization of the paced atrium, it is more sensitive to slight changes in catheterposition during pacing than P2, which represents the depolarization from right-to-left orvice versa using well-defined pathways. This could explain the large variation in resultsfor the LA free wall MEA1, as manoeuvring the catheter to a specific location was moredifficult. Figures 3–5 show that the current results allow us to differentiate between aleft or right atrial ectopic rhythm, but the prediction of where the origin lies within anatrium might be limited to larger areas. The induced APDs of the RA free wall had a leftcraniodorsal MEA1 in four out of seven horses, whereas in the remaining three horses,these RA free wall-induced APDs had a caudoventral MEA1. This could be explainedby slight differences in the free wall pacing site. The presence of the left cranial MEA2of APDs originating from the junction with the CaVC is in contradiction with a previous
Animals 2022, 12, 549 10 of 12
study [32] in which APDs induced at the ostium of the coronary sinus also had a craniallydirected MEA1 but were followed by a caudally directed MEA2. In our results, MEA2 forthe RA to the CaVC junction was in a left cranial direction in most cases, which implies thatthe LA is also depolarized from caudal to cranial. This makes it difficult to differentiatebetween the RA to CaVC junction and the LA. Similar to in humans, in which an anteriorbreakthrough site from the right to the left atrium through the oval fossa or coronary sinushas been describedKlik of tik om tekst in te voeren., we found evidence for this samebreakthrough site in horses [19,33,34]. Another possible explanation for the left cranialorientation of MEA2 while pacing near the CaVC might be that pacing at this site resultedin the transmural electrical stimulation of the adjacent left atrial myocardium. The unex-pected caudally directed MEA2 in two horses while pacing at the LA could be caused by aleft-to-right atrial breakthrough site at the Bachmann bundle, while the cranially directedMEA2s could have a caudal left-to-right atrial breakthrough site. In human medicine,left-to-right breakthroughs have been described at the level of the oval fossa, coronarysinus, and the intervenous tubercle at the insertion point of the Bachmann bundle [35].Whatever the underlying mechanisms of the breakthrough from RA to LA or from LA toRA in horses, they can be elucidated by the electro-anatomical mapping of the atria whilepacing at the RA or LA.
Human 12-lead ECG characteristics [36–39] cannot be applied in horses because ofthe different anatomical positioning and electrophysiology of the equine heart. No directcomparison of the current data with the previously described P wave characteristics forhorses was able to be made because of a different electrode configuration and the differentanatomical locations for the origins of the APDs [10,32].
Limitations
Only a small number of animals was used in the current study, but the power of thetest was sufficient to show that the VCG derived from a 12-lead ECG has an added value forequine electrocardiography and can be used to identify the anatomical origin of atrial ectopy.Though only four complexes could be used to construct the median complex, instead ofthe planned twenty complexes, we observed no visual differences between the mediancomplexes constructed from either four or twenty complexes in the cases with twentycomplexes available. The current study was done in healthy horses and in an experimentaldesign with induced APDs. However, similar pacing studies in humans have been usefulin defining the diagnostic criteria applicable to clinical patients [37]. Nevertheless, morestudies should be done in a larger group of horses, preferably standing, in order to accountfor more possible anatomical variations between animals. Some structural abnormalities,e.g. small areas of fibrosis, could have been missed with the current inclusion criteria,with a possible impact on the resulting vectors. Some anatomical locations, such as the LAseptum and the RA intervenous tubercle, were only available from a limited number ofhorses because the recordings taken of the other horses had poor ECG quality. This mighthave impacted the statistical power of our test for these locations.
Although improved, the current electrode configuration might still not be the mostoptimal, because the WCT is still dorsal to the heart instead of in the centre of the heart.However, because of the current method of calculation of the VCG from the 12-lead ECG,the effect of WCT is completely omitted from all axes, since X, Y, and Z are bipolar. Mostof the precordial electrodes were placed in a plane near the apex of the ventricles, whilein human and small animal medicine, the electrodes are placed as close as possible to themiddle of the heart in order to obtain better sensitivity and specificity in detecting a changein the conduction pattern.
5. Conclusions
The current results suggest that the VCG derived from a 12-lead ECG is useful inidentifying the anatomical origins of an atrial ectopy. This VCG has the potential to be usefulin the construction of a clinically applicable algorithm for the purpose of differentiating
Animals 2022, 12, 549 11 of 12
between the varying anatomical origins of APDs. Further research should be done not onlyin a larger group of horses with experimentally induced arrhythmias, but also in clinicalequine patients, in which the underlying causes and locations of APDs or AT are identifiedusing endocardial mapping. Alternative electrode positions should also be investigated.
Supplementary Materials: The following are available online at https://www.mdpi.com/article/10.3390/ani12050549/s1, Video S1: Video illustrating the data analysis workflow. The video includesthe annotation of the electrocardiogram (ECG), vectorcardiogram (VCG) calculation, unit sphere pro-jection of the mean electrical axis, and transformation to a Lambert Azimuthal equal-area projection.Abbreviations: LA; left atrium; RA, right atrium; SR, sinus rhythm.
Author Contributions: Conceptualization, G.V.S., L.V., A.D. and G.v.L.; data curation, G.V.S., T.D.and B.H.; formal analysis, G.V.S., T.D. and B.H.; funding acquisition, G.v.L.; investigation, T.D.,L.V., A.D. and G.v.L.; methodology, G.V.S., T.D., L.V., A.D. and G.v.L.; project administration, G.v.L.;software, G.V.S., T.D. and B.H.; supervision, T.D. and G.v.L.; writing—original draft preparation,G.V.S.; writing—review and editing, G.V.S., T.D., B.H., L.V., A.D. and G.v.L. All authors have readand agreed to the published version of the manuscript.
Funding: L.V. (1134917N) and G.V.S. (1S56217N) are Ph.D. fellows funded by the Research FoundationFlanders (FWO-Vlaanderen).
Institutional Review Board Statement: The animal study protocol was approved by the InstitutionalEthics Committee of Ghent Uni-versity (EC2016/35, accepted 1 June 2016).
Informed Consent Statement: All owners signed an informed consent.
Data Availability Statement: The data is available from the authors upon reasonable request.
Conflicts of Interest: The authors declare no conflict of interest.
References1. Van Steenkiste, G.; Duytschaever, M.; De Clercq, D.; Tavernier, R.; Michielsen, A.; Decloedt, A.; Schauvliege, S.; van Loon, G.
First successful radiofrequency ablation of atrial tachycardia in a horse guided by a high density 3D electro-anatomical mappingsystem (Rhythmia). J. Vet. Intern. Med. 2019, 33, 1547. [CrossRef]
2. Van Loon, G.; Van Steenkiste, G.; Vera, L.; Decloedt, A. Catheter-based electrical interventions to study, diagnose and treatArrhythmias in horses: From refractory period to electro-anatomical mapping. Vet. J. 2020, 263, 105519. [CrossRef] [PubMed]
3. Lee, J.; Fynn, S. P wave morphology in guiding the ablation strategy of focal atrial tachycardias and atrial flutter. Curr. Cardiol. Rev.2014, 11, 103–110. [CrossRef] [PubMed]
4. Santilli, R.A.; Perego, M.; Crosara, S.; Gardini, F.; Bellino, C.; Moretti, P.; Spadacini, G. Utility of 12-lead electrocardiogram fordifferentiating paroxysmal supraventricular tachycardias in dogs. J. Vet. Intern. Med. 2008, 22, 915–923. [CrossRef]
5. Muylle, E.; Oyaert, W. Equine electrocardiography. The genesis of the different configurations of the “QRS” complex. ZentralblattVeterinärmedizin Reihe A 1977, 24, 762–771. [CrossRef]
6. Holmes, J.R.; Alps, B.J. Studies into equine electrocardiography and vectorcardiography IV. Vector distributions in somearrhythmias. Can. J. Comp. Med. Vet. Sci. 1967, 31, 150–155.
7. Pfister, R.; Seifert-Alioth, C.; Beglinger, R. Die Bestimmung des Ursprungsortes Ventrikulärer Extrasystolen beim Pferd. SchweizerArchiv Tierheilkunde Fachzeitschrift Tierärztinnen Tierärzte 1984, 126, 165–172. [CrossRef]
8. Hamlin, R.L.; Smetzer, D.L.; Smith, C.R. Analysis of QRS complex recorded through a semiorthogonal lead system in the horse.Am. J. Physiol. 1964, 207, 325–333. [CrossRef]
9. Van Zijl, W.J.J. The electrocardiogram of the normal horse using the techniques of Einthoven and Wilson. Tijdschrift Diergeneeskunde1951, 76, 85–96.
10. Muylle, E.; Oyaert, W. Atrial activation pathways and the P wave in the horse. Zentralblatt Veterinärmedizin Reihe A 1975, 22, 474–484.[CrossRef]
11. Holmes, J.R.; Darke, P.G.G.G. Studies on the development of a new lead system for equine electrocardiography. Equine Vet. J.1970, 2, 12–21. [CrossRef]
12. Holmes, J.R.; Else, R.W. Further studies on a new lead for equine electrocardiography. Equine Vet. J. 1972, 4, 81–87. [CrossRef][PubMed]
13. Muylle, E.; Oyaert, W. Clinical evaluation of cardiac vectors in the horse. Equine Vet. J. 1971, 3, 129–136. [CrossRef]14. Hesselkilde, E.M.; Isaksen, J.L.; Petersen, B.V.; Carstensen, H.; Jespersen, T.; Pehrson, S.; Kanters, J.K.; Buhl, R. A novel approach
for obtaining 12-lead electrocardiograms in horses. J. Vet. Intern. Med. 2021, 35, 521–531. [CrossRef]15. Man, S.; Maan, A.C.; Schalij, M.J.; Swenne, C.A. Vectorcardiographic diagnostic & prognostic information derived from the
12-lead electrocardiogram: Historical review and clinical perspective. J. Electrocardiol. 2015, 48, 463–475. [CrossRef]

Animals 2022, 12, 549 12 of 12
16. Augustyniak, P. On the equivalence of the 12-lead ECG and the VCG representations of the cardiac electrical activity. InProceedings of the 10th International Conference on System-Modelling-Control, Zakopane, Poland, 21–25 May 2001; pp. 21–25.
17. Sano, T.; Hellerstein, H.K.; Vayda, E. P vector loop in health and disease as studied by the technique of electrical dissection of thevectorcardiogram (differential vectorcardiography). Am. Heart J. 1957, 53, 854–879. [CrossRef]
18. Rangel, M.O.; O’Neal, W.T.; Soliman, E.Z. Usefulness of the electrocardiographic P-wave axis as a predictor of atrial fibrillation.Am. J. Cardiol. 2016, 117, 100–104. [CrossRef]
19. Van Steenkiste, G.; Vera, L.; Decloedt, A.; Schauvliege, S.; Boussy, T.; van Loon, G. Endocardial electro-anatomic mapping in healthyhorses: Normal sinus impulse propagation in the left and right atrium and the ventricles. Vet. J. 2020, 258, 105452. [CrossRef]
20. Van Steenkiste, G.; De Clercq, D.; Boussy, T.; Vera, L.; Schauvliege, S.; Decloedt, A.; van Loon, G. Three dimensional ultra-high-density electro-anatomical cardiac mapping in horses: Methodology. Equine Vet. J. 2020, 52, 765–772. [CrossRef]
21. Magnani, J.W.; Mazzini, M.J.; Sullivan, L.M.; Williamson, M.; Ellinor, P.T.; Benjamin, E.J. P-wave indices, distribution and qualitycontrol assessment (from the Framingham Heart Study). Ann. Noninvasive Electrocardiol. 2010, 15, 77–84. [CrossRef]
22. Cremers, J.; Klugkist, I. One direction? A tutorial for circular data analysis using R with examples in cognitive psychology. Front.Psychol. 2018, 9, 1–13. [CrossRef] [PubMed]
23. Paine, P.J.; Preston, S.P.; Tsagris, M.; Wood, A.T.A. An elliptically symmetric angular gaussian distribution. Stat. Comput. 2018,28, 689–697. [CrossRef]
24. Sra, S. A short note on parameter approximation for von Mises-Fisher distributions: And a fast implementation of I s(x). Comput.Stat. 2012, 27, 177–190. [CrossRef]
25. Mardia, K.V.; Jupp, P.E. Statistics of Directional Data, 2nd ed.; John Wiley & Sons, Ltd.: Hoboken, NJ, USA, 1972; ISBN 0471953334.26. Hamlin, R.L.; Himes, J.A.; Guttridge, H.; Kirkham, W. P wave in the electrocardiogram of the horse. Am. J. Vet. Res. 1970, 31, 1027–1031.
[PubMed]27. Platonov, P.G. P-wave morphology: Underlying mechanisms and clinical implications. Ann. Noninvasive Electrocardiol. 2012, 17, 161–169.
[CrossRef] [PubMed]28. Boineau, J.P.; Canavan, T.E.; Schuessler, R.B.; Can, M.E.; Corr, P.B.; Cox, J.L. Demonstration of a widely distributed atrial
pacemaker complex in the human heart. Circulation 1988, 77, 1221–1237. [CrossRef] [PubMed]29. Stiles, M.K.; Brooks, A.G.; Roberts-Thomson, K.C.; Kuklik, P.; John, B.; Young, G.D.; Kalman, J.M.; Sanders, P. High-density
mapping of the sinus node in humans: Role of preferential pathways and the effect of remodeling. J. Cardiovasc. Electrophysiol.2010, 21, 532–539. [CrossRef]
30. Fedorov, V.V.; Schuessler, R.B.; Hemphill, M.; Ambrosi, C.M.; Chang, R.; Voloshina, A.S.; Brown, K.; Hucker, W.J.; Efimov, I.R.Structural and functional evidence for discrete exit pathways that connect the canine sinoatrial node and atria. Circ. Res. 2009,104, 915–923. [CrossRef]
31. Konings, K.T.; Kirchhof, C.J.; Smeets, J.R.; Wellens, H.J.; Penn, O.C.; Allessie, M.A. High-density mapping of electrically inducedatrial fibrillation in humans. Circulation 1994, 89, 1665–1680. [CrossRef]
32. Hamlin, R.L.; Smetzer, D.L.; Senta, T.; Smith, C.R. Atrial activation paths and P waves in horses. Am. J. Physiol. 1970, 219, 306–313.[CrossRef]
33. De Ponti, R.; Ho, S.Y.; Salerno-Uriarte, J.A.; Tritto, M.; Spadacini, G. Electroanatomic analysis of sinus impulse propagation innormal human atria. J. Cardiovasc. Electrophysiol. 2002, 13, 1–10. [CrossRef]
34. Holmqvist, F.; Husser, D.; Tapanainen, J.M.; Carlson, J.; Jurkko, R.; Xia, Y.; Havmöller, R.; Kongstad, O.; Toivonen, L.; Olsson,S.B.; et al. Interatrial conduction can be accurately determined using standard 12-lead electrocardiography: Validation of P-wavemorphology using electroanatomic mapping in man. Heart Rhythm 2008, 5, 413–418. [CrossRef] [PubMed]
35. Dong, J.; Zrenner, B.; Schreieck, J.; Deisenhofer, I.; Karch, M.; Schneider, M.; Von Bary, C.; Weyerbrock, S.; Yin, Y.; Schmitt, C.Catheter ablation of left atrial focal tachycardia guided by electroanatomic mapping and new insights into interatrial electricalconduction. Heart Rhythm 2005, 2, 578–591. [CrossRef] [PubMed]
36. Qian, Z.Y.; Hou, X.F.; Xu, D.J.; Yang, B.; Chen, M.L.; Chen, C.; Zhang, F.X.; Shan, Q.J.; Cao, K.J.; Zou, J.G. An algorithm to predictthe site of origin of focal atrial tachycardia. Pacing Clin. Electrophysiol. 2011, 34, 414–421. [CrossRef]
37. Tang, C.W.; Scheinman, M.M.; Van Hare, G.F.; Epstein, L.M.; Fitzpatrick, A.P.; Lee, R.J.; Lesh, M.D. Use of P wave configurationduring atrial tachycardia to predict site of origin. J. Am. Coll. Cardiol. 1995, 26, 1315–1324. [CrossRef]
38. Tada, H.; Nogami, A.; Naito, S.; Suguta, M.; Nakatsugawa, M.; Horie, Y.; Tomita, T.; Hoshizaki, H.; Oshima, S.; Taniguchi, K.Simple electrocardiographic criteria for identifying the site of origin of focal right atrial tachycardia. Pacing Clin. Electrophysiol.1998, 21, 2431–2439. [CrossRef]
39. Kistler, P.M.; Roberts-Thomson, K.C.; Haqqani, H.M.; Fynn, S.P.; Singarayar, S.; Vohra, J.K.; Morton, J.B.; Sparks, P.B.; Kalman, J.M.P-wave morphology in focal atrial tachycardia. J. Am. Coll. Cardiol. 2006, 48, 1010–1017. [CrossRef]
Related Documents