Welcome message from author
This document is posted to help you gain knowledge. Please leave a comment to let me know what you think about it! Share it to your friends and learn new things together.
Transcript


Een op intrinsieke kinetiek gebaseerde methodologievoor de multischaalmodellering van chemische reacties
An Intrinsic Kinetics Based Methodologyfor Multi-Scale Modeling of Chemical Reactions
Kenneth Toch
Promotoren: prof. dr. ir. J. W. Thybaut, prof. dr. ir. G. B. MarinProefschrift ingediend tot het behalen van de graad van Doctor in de Ingenieurswetenschappen: Chemische Technologie
Vakgroep Chemische Proceskunde en Technische ChemieVoorzitter: prof. dr. ir. G. B. MarinFaculteit Ingenieurswetenschappen en ArchitectuurAcademiejaar 2014 - 2015

ISBN 978-90-8578-751-8NUR 913, 952Wettelijk depot: D/2014/10.500/97

Promotoren:
Prof. Dr. Ir. Joris Thybaut Universiteit Gent
Prof. Dr. Ir. Guy B. Marin Universiteit Gent
Examencommissie:
Prof. Dr. Ir. Patrick De Baets, voorzitter Universiteit Gent
Dr. Ir. Vladimir Galvita*, secretaris Universiteit Gent
Dr. Ir. Michael Caracotsios* (Northwestern University
& Honeywell UOP)
Prof. Dr. Ir. Stijn van Hulle* Universiteit Gent
Prof. Dr. Ir. Guy B. Marin, promotor Universiteit Gent
Prof. Dr. Ir. Agustin Martinez CSIC-ITQ
Prof. Dr. Ir. Mark Saeys Universiteit Gent
Prof. Dr. Ir. Joris Thybaut*, promotor Universiteit Gent
* lees commissie
Universiteit Gent
Faculteit Ingenieurswetenschappen en Architectuur
Vakgroep Chemische Proceskunde en Technische Chemie
Laboratorium voor Chemische Techniek
Technologiepark 914
B-9052 Gent
België
Tel.: +32 (0)9 331 17 57
Fax: +32 (0)9 331 17 59
http://www.lct.ugent.be
This work was supported by the Research Board of Ghent University (BOF) , Shell and the 'Long Term
Structural Methusalem Funding by the Flemish Government'
This work reports work undertaken in the context of the project “OCMOL, Oxidative Coupling of
Methane followed by Oligomerization to Liquids”. OCMOL is a Large Scale Collaborative Project
supported by the European Commission in the 7th Framework Programme (GA n°228953). For
further information about OCMOL see: http://www.ocmol.eu or http://www.ocmol.com.


i
Acknowledgments
This has been an interesting period. Since five years I waited for this moment. Not that I
wanted it to stop, but rather because it would be an accomplishment. Which
accomplishment? A kinetic model? Some optimized catalyst? Regression analysis? Exciting
statistics? I do not think so. Maybe it is being able to develop yourself. Getting to know
yourself. Nobody said it was going to be easy. Everybody has his/her heights and lows, both
scientifically as emotionally (during his PhD). Coping with these extrema and evolving into a
better person, both scientifically as emotionally, is as important as publishing your latest
findings in an international journal. And now, finally, I am here, writing these
acknowledgments, being content with what I have accomplished.
There is a large number of people I’d like to acknowledge for their guidance and support
throughout the last five years of my PhD research. First of all, I’d like to acknowledge prof.
Guy B. Marin for allowing me to reach out higher than I could ever imagine. A warm thanks
goes to prof. Joris W. Thybaut who believed in me to reach out higher than I could ever
imagine. I thank both of you letting me participate in a large scale project. OCMOL has
shown me around in some of Europe’s nicest meeting rooms every six months. Most of all, it
allowed me to interact with other people having different backgrounds but having the same
goal. You also helped me improving my writing skills, although maybe at a slower rate than
we would have liked. Next to this, I’d like to acknowledge Joris again for the professional
relationship we have built up. Hopefully we can keep on exploiting it in the future!
I’d like to acknowledge the European Commission for supporting the Large Scale
Collaborative Project “OCMOL, Oxidative Coupling of Methane followed by Oligomerization
to Liquids”, GA n°228953 for the work undertaken on ethene oligomerization. I’d like to
acknowledge Shell for their support during the work performed on xylene isomerization.
The Research Board of Ghent University is acknowledged for their funding of my first PhD

ii
year. Finally, I’d also like to acknowledge the 'Long Term Structural Methusalem Funding by
the Flemish Government'
Besides the thesis promoters and financial supporters, a lot of LCT people have contributed
directly or indirectly to my accomplishment. Prof. Reyniers, looking back, I should have
visited you more to discuss reaction mechanisms on ethene oligomerization. Nevertheless,
thank you for the valuable input you’ve given me. Vladimir, Hilde and Evgeniy, thank you for
guiding me in what I may call ‘my neophyte’: catalyst characterization.
I had the honor to go on this quest with several companions and end with friends. Bart, you
started your PhD when I started my master thesis, so we know each other for the longest
time. Thanks for all the scientific discussion and entertainment! Only a pity I did not beat
you to the line! Kristof, thank you for being the devil’s advocate and your unconditional
enthusiasm. Jeroen, although we disagree on music, I think we can agree on our humor.
Jonas, you always make me feel dumb, so thank you! Jolien, I hope you find the right
acronyms and the way to your goal! Evelien, thank you for your cooperation during some
side project, companionship to San-Francisco and the yummy snacks during the coffee
breaks! Chetan and Luis, thanks for not laughing at me while doing the challenger course.
Vaios, thank you for your companionship during all the OCMOL meetings and for teaching
me your credo: ‘relaaaax’. Although Aaron and Kae have already left the building (together),
I’d like to thank them for the great times we’ve spent together during the first years of my
career at the LCT. I hope for everybody of the CaRE group and LCT that these kind of
friendships might grow during your PhD and further career.
I’d like to thank the technical support during the last five years. Despite their workload,
these guys always found the time to help me when I was in technical difficulties. Therefore:
Thank you Bert, Brecht, Erwin, Georges, Hans, Jaimy, Marcel, Michaël and Tom.
Petra, Sarah, Kim and Kevin: thank you for helping me or at least pointing me in the right
direction when I had some administrative difficulties.

iii
Also, a number of squires joined me in my quest for a PhD. Wouter, Brecht, Julie and Jolien
aided me either data acquisition, model construction or model discrimination.
Lastly, I’d like to thank the people who should be somewhere at the top of this list: my
family. My parents showed me the possibilities in life. They gave me choices and I can only
hope I make them proud. I was lucky enough to found an own family. Nele, I love you, thank
you for walking this path with me. Your support was, is and will be an invaluable asset in our
life. Our love resulted into two lovely boys (maybe more in the future, who knows?), let’s
hope we can give them the same chances as our parents gave us.
Kenneth
Fall 2014
Only now I've come to this moment in my life
Fixing pieces to a puzzle with no defects


v
Table of Contents
Acknowledgments i
Table of contents v
List of figures xiii
List of tables xxix
List of symbols xxxiii
Glossary of terms xLi
Summary xLvii
Samenvatting Lix
Chapter 1 Introduction 1
1.1 Multi-scale modeling 1
1.2 Single-Event MicroKinetic modeling 3
1.3 Model Based Catalyst Design 4
1.4 Introduction to the chemical reactions used for Model Based Catalyst Design and
multi-scale modeling 5
1.4.1 n-Hexane hydrocracking: a case study 5
1.4.2 Ethene oligomerization: searching for sustainable fuels and chemicals 6
1.4.3 Xylene isomerization: meeting the world demand for polymer production 9
1.5 Scope of the thesis 10
1.6 References 11
Chapter 2 Procedures 15
2.1 Experimental 16
2.1.1 Catalysts 16
2.1.1.1 Pt/H-ZSM-5 for n-hexane hydroisomerization 16
2.1.1.2 Ni-SiO2-Al2O3 for ethene oligomerization 16
2.1.1.3 Ni-Beta for ethene oligomerization 19
2.1.1.4 Pt/H-ZSM-5 for xylene isomerization 20
vi
2.1.2 Reactor set-ups 20
2.1.2.1 Reactor set-up for n-hexane hydroisomerization 20
2.1.2.2 Reactor set-up for ethene oligomerization 21
2.1.2.3 Reactor set-up for experimental validation of the industrial reactor model
for ethene oligomerization 22
2.1.2.4 Reactor set-up for xylene isomerization 22
2.1.3 Determination of outlet composition, flow rates, conversions, selectivities and
yields 23
2.1.3.1 Outlet composition 23
2.1.3.2 Measured set-up flow rates 25
2.1.3.3 Mass and element balances 26
2.1.3.4 Outlet flow rates 26
2.1.3.5 Conversion, selectivities and yields 27
2.2 Modeling 28
2.2.1 A systematic methodology for kinetic modeling 28
2.2.1.1 Data analysis and model construction 29
2.2.1.2 Regression 30
2.2.1.3 Physical and statistical assessment 30
2.2.2 Reactor models 31
2.2.2.1 Continuous stirred tank reactor 31
2.2.2.2 Plug flow reactor 31
2.2.3 Parameter estimation 32
2.2.3.1 Isothermal vs. non-isothermal regression 32
2.2.3.2 Reparameterization of the Arrhenius and Van’t Hoff equation 34
2.2.4 Statistical and physical assessment of the model and parameter estimates 34
2.2.5 Residual analysis 37
2.2.5.1 Parity diagram 37
2.2.5.2 Performance figure 38

vii
2.2.5.3 Residual figure 39
2.2.5.4 Normal probability figure 40
2.2.6 Single-Event MicroKinetic (SEMK) methodology 41
2.3 References 42
Chapter 3 Kinetic Modeling of n-Hexane Hydroisomerization on a Bifunctional zeolite 45
3.1 Procedures 46
3.1.1 Experimental conditions 46
3.1.2 Reactor model 47
3.1.3 Parameter estimation 47
3.2 n-Hexane Hydroisomerization: experimental observations 48
3.3 n-Hexane Hydroisomerization: kinetic model development 50
3.3.1 Reaction network and catalytic cycle 50
3.3.2 Rate-equation derivation 55
3.4 n-Hexane Hydroisomerization: modeling 58
3.4.1 Isothermal regression 58
3.4.2 Non-isothermal regression 60
3.4.3 Model performance 63
3.5 Conclusions 66
3.6 References 67
Chapter 4 Single-Event Modeling of Ethene Oligomerization on Ni-SiO2-Al2O3 69
4.1 Procedures 69
4.1.1 Experimental conditions 69
4.1.2 Definition of responses 70
4.2 Experimental investigation 70
4.3 SEMK model construction 74
4.3.1 Proposed mechanism for ethene oligomerization 74
4.3.1.1 Degenerate polymerization 75
4.3.1.2 Concerted coupling 76
4.3.1.3 SEMK reaction mechanism 77
4.3.2 Rate equations 78

viii
4.3.3 Reaction network generation 81
4.3.4 Determination of the number of single events 81
4.4 Model regression and assessment 83
4.4.1 Identification, classification and determination of the model parameters 83
4.4.1.1 Physisorption 83
4.4.1.2 Nickel ion catalyzed oligomerization 84
4.4.1.3 Double bond isomerization 84
4.4.1.4 Estimation of the reaction enthalpies and activation energies 85
4.4.2 Revised model: fast and irreversible nickel ion activation 86
4.4.3 Model parameter assessment 87
4.4.4 Kinetic model performance 89
4.4.5 Physisorbed and chemisorbed species concentrations 91
4.5 Conclusions 94
4.6 References 95
Chapter 5 Exploiting Bifunctional Heterogeneous Catalysts in Ethene Oligomerization:
Guidelines for Rational Catalyst Design 97
5.1 Procedures 98
5.1.1 Experimental conditions 98
5.1.2 Definition of responses 98
5.2 Ethene oligomerization on bifunctional catalysts: experimental investigation 99
5.3 Extension of the SEMK model for ethene oligomerization to bifunctional catalysts
103
5.3.1 Reaction network for ethene oligomerization on Ni-Beta zeolite 103
5.3.2 Physisorption in the zeolite pores 105
5.3.3 Metal-ion catalyzed elementary steps 107
5.3.4 Acid catalyzed elementary steps 107
5.3.5 Net rate of formation 108
5.4 Ethene oligomerization on bifunctional catalysts: assessment of acid activity 109
5.4.1 Determination of the model parameters 109
5.4.1.1 Pre-exponential factors 110
ix
5.4.1.2 Activation energies and standard reaction enthalpies 110
5.4.1.3 Thermodynamic consistency for alkylation and cracking 111
5.4.1.4 Summary 112
5.4.2 Estimation of the model parameters 114
5.4.3 Kinetic model performance 117
5.5 Catalyst design guidelines for chemicals and fuel production from ethene
oligomerization 119
5.5.1 Metal-ion versus acid catalyzed oligomerization: reaction path analysis 120
5.5.2 Strength and concentration of the acid sites 126
5.5.3 Ethene standard coordination enthalpy and nickel content 128
5.5.4 Physisorption parameters 129
5.6 Conclusions 131
5.7 References 132
Chapter 6 Scale Up Chemicals and Fuel Production by Ethene Oligomerization: Industrial
Reactor Design 135
6.1 Experimental setup for reactor model validation 135
6.2 Multi-scale ethene oligomerization industrial reactor model 136
6.2.1 Reactor scale 138
6.2.1.1 Mass balance 139
6.2.1.2 Energy balance 139
6.2.1.3 Momentum balance 141
6.2.2 Catalyst pellet scale – liquid formation 142
6.2.3 Crystallite scale 144
6.2.3.1 Mass transfer limitations 144
6.2.3.2 Energy transfer limitations 147
6.2.4 Nanoscale – intrinsic kinetics description 147
6.2.5 Experimental validation of the reactor model 147
6.3 Design of an industrial oligomerization reactor 151
6.3.1 Effect of heating regime 152
x
6.3.2 Effect of the reactor geometry on the temperature profile and pressure drop
155
6.3.3 Effect of liquid formation on the conversion of ethene 156
6.3.4 Effect of the shape factor on the coverage profile of ethene in a catalyst
particle 162
6.3.5 Final industrial reactor design 162
6.4 Conclusions 164
6.5 References 165
Chapter 7 Catalyst Design for Ethylbenzene Dealkylation and Xylene Isomerization 167
7.1 Procedures 167
7.1.1 Experimental conditions 167
7.1.2 Reactor model 168
7.1.3 Definition of responses 168
7.2 Xylene isomerization on Pt/H-ZSM-5: proposed reaction network and observed
behavior 169
7.2.1 Elementary steps and reaction network of xylene isomerization on Pt/H-ZSM-5
170
7.2.1.1 Alkyl shift 170
7.2.1.2 Dealkylation 171
7.2.1.3 Transalkylation 171
7.2.1.4 Hydrogenation 172
7.2.1.5 Overall reaction network 172
7.2.2 Observed behavior of xylene isomerization on Pt/H-ZSM-5 174
7.3 The Single-Event MicroKinetic model for xylene isomerization on Pt/H-ZSM-5 175
7.3.1 Acid-catalyzed reaction rates 176
7.3.2 Hydrogenation rate 177
7.3.3 Net rates of formation 178
7.4 Xylene isomerization on Pt/H-ZSM-5: kinetic modeling 178
7.4.1 Determination of the model parameters 178
7.4.1.1 Calculation of the pre-exponential factors 179
xi
7.4.1.2 Calculation of the physisorption parameters 180
7.4.1.3 Estimation of the activation energies and protonation enthalpy 181
7.4.2 Kinetic model performance 183
7.5 Discussion 185
7.6 Identification of an optimal catalyst for xylene isomerization 187
7.7 Conclusions 191
7.8 References 191
Chapter 8 Conclusions and Future Work 193
Appendix A: Properties of Pure Components and Mixtures 197
A.1 Pure component properties 197
A.1.1 Heat capacity for gasses 198
A.1.2 Heat capacity for liquids 198
A.1.3 Vapor pressure 199
A.2 Mixing rules for (critical) properties 199
A.2.1 Critical temperature 199
A.2.2 Critical volume of gas mixtures 200
A.2.3 Critical compressibility factor of gas mixtures 200
A.2.4 Critical pressure of gas mixtures 201
A.2.5 Molecular mass of mixtures 201
A.2.6 Acentric factor of mixtures 201
A.3 Volumetric flow rates 201
A.4 Molar volume 202
A.4.1 Molar volume of liquid components 202
A.4.2 Molar volume of liquid mixtures 202
A.5 Heat capacity of mixtures 203
A.5.1 Heat capacity of gas or liquid mixtures 203
A.5.2 Heat capacity of gas-liquid mixtures 203
A.6 Thermal conductivity 203
A.6.1 Thermal conductivity of gas components 203
A.6.2 Thermal conductivity of gas mixtures 205
A.6.3 Thermal conductivity of liquid components 205
xii
A.6.4 Thermal conductivity of liquid mixtures 205
A.6.5 Thermal conductivity of gas-liquid mixtures 205
A.7 Viscosity 206
A.7.1 Viscosity of gas components 206
A.7.2 Viscosity of gas mixtures 207
A.7.3 Viscosity of liquid components 208
A.7.4 Viscosity of liquid mixtures 209
A.7.5 Viscosity of gas-liquid mixtures 210
A.8 Surface tension 210
A.8.1 Surface tension of liquid components 210
A.8.2 Surface tension of liquid mixtures 210
A.9 References 210

xiii
List of figures
Figure 1-1: Multi-scale approach of reaction engineering as envisioned by the Laboratory
of Chemical Technology, Ghent University [4].
Figure 1-2: Model based catalyst design [17]
Figure 1-3: literature survey (Web of Knowledge) using the key words: Topic=((ethene )
AND (oligomerization OR oligomerisation OR dimerization OR dimerisation))
AND (heterogenous OR heterogeneous OR silica OR alumina) as accessed on
September 1st , 2014; full line: cumulative number of articles as function of
year; dotted line: number of articles published.
Figure 2-1: FTIR spectra of CO adsorbed on the amorphous Ni-SiO2-Al2O3 at 293 K
during CO adsorption (a) and after CO adsorption (b-c). Sample (b) has been
pretreated for 8 hours at 773 K under flowing He. Sample (c) has been
pretreated for 8 hours at 773 K under flowing H2.
Figure 2-2: Recorder TCD signal of H2-TPR of the amorphous Ni-SiO2-Al2O3 under
5%H2/Ar at a temperature increase of 10 K min-1
.
Figure 2-3: Proposed procedure for kinetic modeling
Figure 2-4: Arrhenius plot for the unreparameterized Arrhenius relation (left) and the
reparametrized Arrhenius relation (right).
Figure 2-5: Parity diagrams for 4 theoretical cases: (a) adequate model with a normal
distributed error with expected value equal to zero, (b) inadequate model
with a normal distributed error with expected value equal to zero, (c)
adequate model with a two-tailed t-distributed error and (d) adequate model
with a normal distributed error with expected value equal to three
Figure 2-6: Residual figures for 4 theoretical cases: (a) adequate model with a normal
distributed error with expected value equal to zero, (b) inadequate model
with a normal distributed error with expected value equal to zero, (c)
adequate model with a two-tailed t-distributed error and (d) adequate model
with a normal distributed error with expected value equal to three.
xiv
Figure 2-7: Normal probability figures for 4 theoretical cases: (a) adequate model with a
normal distributed error with expected value equal to zero, (b) inadequate
model with a normal distributed error with expected value equal to zero, (c)
adequate model with a two-tailed t-distributed error and (d) adequate model
with a normal distributed error with expected value equal to three
Figure 3-1: Schematic overview of (ideal) hydroisomerization of n-hexane over a
bifunctional zeolite
Figure 3-2: n-Hexane conversion on Pt/H-ZSM-5 catalyst as a function of the
temperature at different hydrogen to n-hexane molar inlet ratio and total
pressures. Symbols correspond to experimental observations, lines
correspond to model simulations, i.e., Eqs. 3-1 to 3-3, in which the net rates
of formation are given by Eqs. 3-4 to 3-6 using the parameters from Table 3-
4. , full line: F0
H2 / F0
C6 = 50 mol mol-1
, ptot = 1.0 MPa; , dashed line: F0
H2 /
F0
C6 = 100 mol mol-1
, ptot = 1.0 MPa; , dotted line: F0
H2 / F0
C6 = 50 mol mol-1
,
ptot = 2.0 MPa.
Figure 3-3: n-Hexane hydroisomerization product selectivity on Pt/H-ZSM-5 catalyst as a
function of the conversion. Symbols correspond to experimental
observations, lines correspond to model simulations, i.e., Eqs. 3-1 to 3-3, in
which the net rates of formation are given by Eqs. 3-4 to 3-6 using the
parameters from Table 3-4. , full line: 2MP; , dashed line: 3MP; ,
dotted line: propane.
Figure 3-4: Molar ratio of 2MP to 3MP as function of n-C6 conversion on Pt/H-ZSM-5
catalyst. The dotted line represents the calculated thermodynamic
equilibrium. The higher conversions were obtained mainly due to higher
reaction temperatures and, hence, the shift of the thermodynamic
equilibrium.
Figure 3-5: Simplified reaction scheme of n-hexane hydroisomerization on a bifunctional
catalyst
Figure 3-6: Alternative, simplified reaction scheme of n-hexane hydroisomerization on a
bifunctional catalyst
xv
Figure 3-7: Normal probability figure for the molar outlet flow rate of 3MP determined
by solving the set of Eqs. 3-1 to 3-3, in which the net rates of formation are
based upon the alternative reaction scheme given in Figure 3-6.
Figure 3-8: Physisorption equilibrium of n-hexane, 2MP and 3MP in the zeolite pores
Figure 3-9: (de-)Hydrogenation equilibrium between a physisorbed n-hexane, 2MP and
3MP molecule and one of their corresponding alkene
Figure 3-10: (de-)Protonation equilibrium between n-hexylene, 2-methyl-pentylene and 3-
methyl-pentylene and (one of) their corresponding carbenium ions
Figure 3-11: pcp-branching of a hexyl to 2- and 3-methyl-pentyl
Figure 3-12: Cracking via β-scission of a 2-methyl-pentyl to propylene and propyl
Figure 3-13: Arrhenius plot, ln(kcomp) and ln(Kphys
) as function of the reciprocal of
temperature for which kcomp and Kphys
are obtained from Table 3-2.
Figure 3-14: Parity diagram for the molar outlet flow rate of 2MP (), 3MP () and
propane () determined by solving the set of Eqs. 3-1 to 3-3, in which the
net rates of formation are given by Eqs. 3-4 to 3-6 using the parameters from
Table 3-4.
Figure 3-15: Residual figures for the molar outlet flow rate of 2MP (top), 3MP (middle)
and propane (bottom) as function of pressure (left) and temperature (right)
determined by solving the set of Eqs. 3-1 to 3-3, in which the net rates of
formation are given by Eqs. 3-4 to 3-6 using the parameters from Table 3-4.
Figure 3-16: Normal probability figure for the molar outlet flow rate of 2MP determined
by solving the set of Eqs. 3-1 to 3-3, in which the net rates of formation are
given by Eqs. 3-4 to 3-6 using the parameters from Table 3-4.
Figure 3-17: Normal probability figure for the molar outlet flow rate of 3MP determined
by solving the set of Eqs. 3-1 to 3-3, in which the net rates of formation are
given by Eqs. 3-4 to 3-6 using the parameters from Table 3-4.
Figure 3-18: Normal probability figure for the molar outlet flow rate of propane
determined by solving the set of Eqs. 3-1 to 3-3, in which the net rates of
formation are given by Eqs. 3-4 to 3-6 using the parameters from Table 3-4.
Figure 4-1: Ethene oligomerization product yields on 1.8wt% Ni-SiO2-Al2O3 as function of
ethene conversion. Symbols correspond to experimental data, lines
correspond to model simulations, i.e., by integration of Eq. 2-21, with the
xvi
corresponding net rates of formation as given by Eq. 4-27 and the parameter
values as reported in Table 4-4; , full line: butene; , dashed line: hexene.
Figure 4-2: Experimental product distribution: molar fraction as function of carbon
number. The full line shows the linear trend of the logarithm of the molar
fraction of the components as function of their carbon number.
Figure 4-3: Ethene conversion on 1.8wt% Ni-SiO2-Al2O3 as function of space-time at
different temperatures, at 3.5MPa total pressure and an ethene inlet partial
pressure equal to 0.35 MPa. Symbols correspond to experimental data, lines
correspond to model simulations, i.e., by integration of Eq. 2-21, with the
corresponding net rates of formation as given by Eq. 4-27 and the parameter
values as reported in Table 4-4; , full line: 443 K; , dash-dotted line: 473
K; , dashed line: 493 K.
Figure 4-4: Ethene conversion on 1.8wt% Ni-SiO2-Al2O3 as function of space-time at
different inlet ethene partial pressures, at 3.5 MPa total pressure and at
473K. Symbols correspond to experimental data, lines correspond to model
simulations, i.e., by integration of Eq. 2-21, with the corresponding net rates
of formation as given by Eq. 4-27 and the parameter values as reported in
Table 4-4; , full line: 0.15 MPa; , dash-dotted line: 0.25 MPa; , dashed
line: 0.35 MPa.
Figure 4-5: Ethene oligomerization rate on 1.8wt% Ni-SiO2-Al2O3 as function of ethene
inlet partial pressure at different space-times and temperatures. Symbols
correspond to experimental data, lines are determined by linear regression
for each set of experimental conditions indicating the first order dependency
on the reaction rate of the ethene inlet partial pressure; : 4.8 kgcat s molC2-1
and 473 K; : 7.2 kgcat s molC2-1
and 473 K; : 4.8 kgcat s molC2-1
and 503 K;
: 7.2 kgcat s molC2-1
and 503 K.
Figure 4-6: Proposed mechanism for ethene oligomerization on a heterogeneous nickel-
based catalyst based on degenerated polymerization, (*
) the multi-
elementary step isomerization is depicted as a elementary step for not to
overload the figure.
Figure 4-7: Proposed mechanism for ethene oligomerization on a heterogeneous nickel
catalyst based on concerted coupling

xvii
Figure 4-8: Theoretical ASF distributions given by Eq. 4-28 for different chain growth
probabilities α. Full lines: αref, dashed lines: 1.15 αref, dotted lines: 1.30 αref.
Left: αref = 0.1, middle: αref = 0.3, right: αref = 0.5.
Figure 4-9: Residual diagrams for the molar outlet flow rate of butene as function of
temperature (a), inlet partial pressure of ethene (b), space-time (c) and molar
flow rate of butene (d). Residuals are determined by integration of Eq. 2-21,
with the corresponding net rates of formation, Eq. 4-27 and the parameter
values reported in Table 4-4.
Figure 4-10: Residual diagrams for the molar outlet flow rate of ethene (a), hexene (b),
octene (c) and 1-butene (d) as function of inlet partial pressure of ethene.
Residual are determined by integration of Eq. 2-21, with the corresponding
net rates of formation, Eq. 4-27 and the parameter values reported in Table
4-4.
Figure 4-11: Catalyst occupancy by physisorbed species and the corresponding
physisorbed fractions as a function of space-time at 473 K and an inlet ethene
partial pressure equal to 0.35 MPa, calculated by integration of Eq. 2-21, with
the corresponding net rates of formation, Eq. 4-27 and the parameter values
reported in Table 4-4. Full line: catalyst occupancy by physisorbed species,
dotted line: physisorbed fraction of ethene, short-dashed line: physisorbed
fraction of butene, long-dashed line: physisorbed fraction of hexene, dashed
dotted line: physisorbed fraction of octene.
Figure 4-12: Catalyst occupancy by physisorbed species and the corresponding
physisorbed fractions as a function of temperature at an inlet ethene partial
pressure equal to 0.35 MPa at 13.4% conversion, calculated by integration of
Eq. 2-21, with the corresponding net rates of formation, Eq. 4-27 and the
parameter values reported in Table 4-4. Full line: catalyst occupancy by
physisorbed species, dotted line: physisorbed fraction of ethene, short-
dashed line: physisorbed fraction of butene, long-dashed line: physisorbed
fraction of hexene, dashed dotted line: physisorbed fraction of octene.
Figure 4-13: Catalyst occupancy by physisorbed species and the corresponding
physisorbed fractions as a function of the inlet ethene partial pressure at 473
K, at 13.4% conversion, calculated by integration of Eq. 2-21, with the

xviii
corresponding net rates of formation, Eq. 4-27 and the parameter values
reported in Table 4-4. Full line: catalyst occupancy by physisorbed species,
dotted line: physisorbed fraction of ethene, short-dashed line: physisorbed
fraction of butene, long-dashed line: physisorbed fraction of hexene, dashed
dotted line: physisorbed fraction of octene.
Figure 5-1: Ethene conversion and butene and hexene selectivity on 4.9wt% Ni-Beta as
function of time-on-stream at 523 K, 10.2 kgcat s mol-1
, 2.5 MPa total pressure
and an ethene inlet partial pressure equal to 0.25 MPa. Symbols correspond
to experimental observations, lines are the exponential trend lines to
determine the ethene conversion and product selectivities at zero hour time-
on-stream. , full line: conversion, left axis; , dashed line: butene
selectivity, right axis; , dotted line: hexene selectivity, right axis.
Figure 5-2: Ethene conversion and butene and hexene selectivity on 4.9wt% Ni-Beta as
function of space-time at 523 K, 3.0MPa total pressure and an ethene inlet
partial pressure equal to 0.35 MPa. Symbols correspond to experimental
observations, lines correspond to model simulations, i.e., integration of Eq. 2-
21, with the corresponding net rates of formation as given by Eq. 5-15 and
the parameter values as reported in Tables 5-5 and 5-6; , full line:
conversion, left axis; , dashed line: butene selectivity, right axis; , dotted
line: hexene selectivity, right axis.
Figure 5-3: Propene and pentene selectivity on 4.9wt% Ni-Beta as function of space-time
at 523 K, 3.0 MPa total pressure and an ethene inlet partial pressure equal to
0.35 MPa. Symbols correspond to experimental observations, lines
correspond to model simulations, i.e., integration of Eq. 2-21, with the
corresponding net rates of formation as given by Eq. 5-15 and the parameter
values as reported in Tables 5-5 and 5-6 , full line: propene; , dashed line:
pentene. M
Figure 5-4: Ethene conversion and propene and pentene selectivity on 4.9wt% Ni-Beta as
function of temperature at 10.5 kgcat s mol-1
, 3.0 MPa total pressure and an
ethene inlet partial pressure equal to 0.35 MPa. Symbols correspond to
experimental observations, lines correspond to model simulations, i.e.,
integration of Eq. 2-21, with the corresponding net rates of formation as
xix
given by Eq. 5-15 and the parameter values as reported in Tables 5-5 and 5-6;
, full line: conversion, left axis; , dashed line: propene selectivity, right
axis; , dotted line: pentene selectivity, right axis.
Figure 5-5: Schematic representation of the ethene oligomerization reaction network
involving Ni-ion oligomerization and acid catalyzed alkylation, isomerization
and cracking.
Figure 5-6: Energy diagram for alkylation and β-scission
Figure 5-7: Simulated ethene oligomerization rates as function of space-time at 473 K
and an inlet ethene partial pressure of 0.34 MPa. Full line: Ni-Beta zeolite, as
determined by the model given by integration of Eq. 2-21 in which the net
rates of formation is given by Eq. 5-15 with the parameter values given in
Tables 5-5 and 5-6. Dashed line: Ni-SiO2-Al2O3 as determined by the model
given by integration of Eq. 2-21 in which the net rates of formation is given by
Eq. 4-27 with the parameter values given in Table 4-4.
Figure 5-8: Parity diagrams for the molar outlet flow rate of ethene (a), propene (b),
butene (c), pentene (d) and hexene (e) as determined by integration of Eq. 2-
21, with the corresponding net rates of formation, Eq. 5-15 and the
parameter values reported in Tables 5-5 and 5-6.
Figure 5-9: Residual figures for the molar outlet flow rate of propene (a) and butene (b)
as function of temperature as determined by integration of Eq. 2-21, with the
corresponding net rates of formation, Eq. 5-15 and the parameter values
reported in Tables 5-5 and 5-6.
Figure 5-10: Normal probability figures for the molar outlet flow rate of propene (a) and
butene (b) as determined by integration of Eq. 2-21, with the corresponding
net rates of formation, Eq. 5-15 and the parameter values reported in Tables
5-5 and 5-6.
Figure 5-11: Ethene conversion and selectivity towards linear 1-alkenes (full line), gasoline
(dotted line) and propene (dashed line) on Ni-Beta as function of space-time
at 503 K and an ethene inlet partial pressure of 1.0 MPa as obtained by
integration of Eq. 2-21, with the corresponding net rates of formation, Eq. 5-
15 and the parameter values reported in Tables 5-5 and 5-6.
xx
Figure 5-12: Selectivity towards linear 1-alkenes (full line), gasoline (dotted line) and
propene (dashed line) as function of conversion on Ni-Beta at 503 K and an
ethene inlet partial pressure of 1.0 MPa as obtained by integration of Eq. 2-
21, with the corresponding net rates of formation, Eq. 5-15 and the
parameter values reported in Tables 5-5 and 5-6.
Figure 5-13: Reaction path analysis for ethene oligomerization on Ni-Beta at 503 K, an
ethene inlet partial pressure of 1.0 MPa and a conversion of 1% (a), 50% (b),
70% (c) and 99% (d), see also Figures 5-11 and 5-12. The model simulations
were obtained by integration of Eq. 2-21, with the corresponding net rates of
formation, Eq. 5-15 and the parameter values reported in Tables 5-5 and 5-6.
The alkenes are lumped per carbon number. The height of the horizontal line
in these circle is proportional to the mass fraction of the corresponding
alkene lump. If no line is visible it indicates that the corresponding mass
fraction is very small, i.e., less than 1%. However, these lump may still
significantly contribute to the product formation. Additionally, alkene lumps
in watermark indicate that its mass fraction is less than 0.1%. The vertical
gray-scale code is used to differentiate between the different structural
isomers, i.e., white: linear alkenes, light grey: monobranched alkenes and
dark grey: dibranched alkenes. The surface area taken by these colors is
proportional to the mass fraction of each structural isomer in the alkene
lump. The color of the arrows indicate the reaction family: blue = metal-ion
oligomerization, red = acid alkylation, green = β-scission. pcp-branching and
alkyl shift are not explicitly shown as they only change the isomer distribution
within an alkene lump. The size of the arrow is linearly proportional to the
rate of the corresponding step. The numbers at the arrow head indicate the
fraction of the lump which is produced via the corresponding step while
numbers next to the arrow shaft indicate the fraction of the lump which is
consumed via this step.
Figure 5-14: Selectivity towards linear 1-alkenes (full line), gasoline (dotted line) and
propene (dashed line) as function of temperature at an ethene inlet partial
pressure of 1.0 MPa and a conversion of 50% as obtained by integration of

xxi
Eq. 2-21, with the corresponding net rates of formation as given by Eq. 5-15
and the parameter values as reported in Tables 5-5 and 5-6.
Figure 5-15: Reaction path analysis for ethene oligomerization on Ni-Beta at 50% ethene
conversion, an ethene inlet partial pressure of 1.0 MPa of and 443 K (a), 483
K (b), 523 K (c) and 573 K (d), corresponding with (a), (b), (c) and (d) in Figure
5-14. The model simulations were obtained by integration of Eq. 2-21, with
the corresponding net rates of formation, Eq. 5-15 and the parameter values
reported in Tables 5-5 and 5-6. The alkenes are lumped per carbon number.
The height of the horizontal line in these circle is proportional to the mass
fraction of the corresponding alkene lump. If no line is visible it indicates that
the corresponding mass fraction is very small, i.e., less than 1%. However,
these lump may still significantly contribute to the product formation.
Additionally, alkene lumps in watermark indicate that its mass fraction is less
than 0.1%. The vertical gray-scale code is used to differentiate between the
different structural isomers, i.e., white: linear alkenes, light grey:
monobranched alkenes and dark grey: dibranched alkenes. The surface area
taken by these colors is proportional to the mass fraction of each structural
isomer in the alkene lump. The color of the arrows indicate the reaction
family: blue = metal-ion oligomerization, red = acid alkylation, green = β-
scission. pcp-branching and alkyl shift are not explicitly shown as they only
change the isomer distribution within an alkene lump. The size of the arrow is
linearly proportional to the rate of the corresponding step. The numbers at
the arrow head indicate the fraction of the lump which is produced via the
corresponding step while numbers next to the arrow shaft indicate the
fraction of the lump which is consumed via this step.
Figure 5-16: Selectivity towards linear 1-alkenes (full line), gasoline (dotted line) and
propene (dashed line) on Ni-Beta as function of alkene standard protonation
enthalpy (s) at 50% ethene conversion, 503 K and an ethene inlet partial
pressure of 1.0 MPa as obtained by integration of Eq. 2-21, with the
corresponding net rates of formation as given by Eq. 5-15 and the parameter
values as reported in Tables 5-5 and 5-6. The alkene standard protonation

xxii
enthalpy for the formation of tertiary carbenium ions is determined to be 30
kJ mol-1
more negative than that of secondary carbenium ion formation.
Figure 5-17: Reaction path analysis for ethene oligomerization on Ni-Beta at 50% ethene
conversion, 503 K, an ethene inlet partial pressure of 1.0 MPa of and an
alkene standard protonation enthalpy (s) equal to -80 kJ mol-1
. The alkene
standard protonation enthalpy for the formation of tertiary carbenium ions is
determined to be 30 kJ mol-1
less. The model simulations were obtained by
integration of Eq. 2-21, with the corresponding net rates of formation, Eq. 5-
15 and the parameter values reported in Tables 5-5 and 5-6. The alkenes are
lumped per carbon number. The height of the horizontal line in these circle is
proportional to the mass fraction of the corresponding alkene lump. If no line
is visible it indicates that the corresponding mass fraction is very small, i.e.,
less than 1%. However, these lump may still significantly contribute to the
product formation. Additionally, alkene lumps in watermark indicate that its
mass fraction is less than 0.1%. The vertical gray-scale code is used to
differentiate between the different structural isomers, i.e., white: linear
alkenes, light grey: monobranched alkenes and dark grey: dibranched
alkenes. The surface area taken by these colors is proportional to the mass
fraction of each structural isomer in the alkene lump. The color of the arrows
indicate the reaction family: blue = metal-ion oligomerization, red = acid
alkylation, green = β-scission. pcp-branching and alkyl shift are not explicitly
shown as they only change the isomer distribution within an alkene lump.
The size of the arrow is linearly proportional to the rate of the corresponding
step. The numbers at the arrow head indicate the fraction of the lump which
is produced via the corresponding step while numbers next to the arrow
shaft indicate the fraction of the lump which is consumed via this step.
Figure 5-18: Selectivity towards linear 1-alkenes (full line), gasoline (dotted line) and
propene (dashed line) on Ni-Beta as function of acid site concentration (s) at
50% ethene conversion, 503 K and an ethene inlet partial pressure of 1.0 MPa
as obtained by integration of Eq. 2-21, with the corresponding net rates of
formation as given by Eq. 5-15 and the parameter values as reported in
Tables 5-5 and 5-6.
xxiii
Figure 5-19: Selectivity towards linear 1-alkenes (full line), gasoline (dotted line) and
propene (dashed line) on Ni-Beta as function of ethene standard
coordination enthalpy at a nickel-ion site at 50% ethene conversion, 503 K
and an ethene inlet partial pressure of 1.0 MPa as obtained by integration of
Eq. 2-21, with the corresponding net rates of formation as given by Eq. 5-15
and the parameter values as reported in Tables 5-5 and 5-6.
Figure 5-20: Selectivity towards linear 1-alkenes (full line), gasoline (dotted line) and
propene (dashed line) on Ni-Beta as function of nickel content at 50% ethene
conversion, 503 K and an ethene inlet partial pressure of 1.0 MPa as obtained
by integration of Eq. 2-21, with the corresponding net rates of formation as
given by Eq. 5-15 and the parameter values as reported in Tables 5-5 and 5-6.
Figure 5-21: Selectivity towards linear 1-alkenes (full line), gasoline (dotted line) and
propene (dashed line) on Ni-USY as function of temperature at an ethene
inlet partial pressure of 1.0 MPa and a conversion of 50% as obtained by
integration of Eq. 2-21, with the corresponding net rates of formation as
given by Eq. 5-15 and the parameter values as reported in Tables 5-5 and 5-6.
Figure 5-22: Selectivity towards linear 1-alkenes (full line), gasoline (dotted line) and
propene (dashed line) as function of conversion on Ni-USY at 503 K and an
ethene inlet partial pressure of 1.0 MPa as obtained by integration of Eq. 2-
21, with the corresponding net rates of formation as given by Eq. 5-15 and
the parameter values as reported in Tables 5-5 and 5-6.
Figure 6-1: Graphical representation of the industrial reactor model for the
heterogeneous, bifunctional catalyst ethene oligomerization.
Figure 6-2: Mathematical representation of the industrial reactor model for the
heterogeneous, bifunctional catalyst ethene oligomerization.
Figure 6-3: Fractional coverage of ethene in a catalyst particle as function of the number
of mesh points, used for descretizing the partial differential equations
describing these profiles, at the reactor inlet (no conversion): full line: 3 mesh
points, small dashed line: 5 mesh points, dotted line: 10 mesh points. The
inlet temperature is equal to 503 K, the inlet partial pressure and molar flow
rate of ethene is equal resp. 1.0 MPa and. The diffusion coefficient for ethene
is taken equal to 10-16
m2 s
-1 for illustration purposes.
xxiv
Figure 6-4: Time needed to determine the initial concentration profile as function of the
number of mesh points, used for descretizing the partial differential
equations describing these profiles, at the reactor inlet (no conversion). The
inlet temperature is equal to 503 K, the inlet partial pressure and molar flow
rate of ethene is equal resp. 1.0 MPa and 37.2 mol s-1
. The catalyst used is Ni-
Beta. The diffusion coefficient for ethene is taken equal to 10-16
m2 s
-1 for
illustration purposes.
Figure 6-5: Ethene conversion as function of space-time on Ni-SiO2-Al2O3 at 493 K, 3.5
MPa total pressure and 2.6 MPa inlet ethene pressure; black line: simulation
results as obtained using the simulation model for an industrial
oligomerization reactor, see equations 6-3, 6-6 and 6-14.
Figure 6-6: Ethene conversion on Ni-SiO2-Al2O3 as function of temperature at 48.0 kgcat s
molC2-1
, 3.5 MPa total pressure and 2.6 MPa inlet ethene pressure; black line:
simulation results as obtained using the simulation model for an industrial
oligomerization reactor, see equations 6-3, 6-6 and 6-14.
Figure 6-7: Ethene conversion on Ni-SiO2-Al2O3 as function of ethene inlet molar fraction
at 48.0 kgcat s molC2-1
, 493 K and 3.5 MPa total pressure; black line: simulation
results as obtained using the simulation model for an industrial
oligomerization reactor, see equations 6-3, 6-6 and 6-14.
Figure 6-8: Ethene conversion on Ni-SiO2-Al2O3 as function of total pressure at 22.4 kgcat
s molC2-1
, 493 K and 2.6 MPa inlet ethene pressure; black line: simulation
results as obtained using the simulation model for an industrial
oligomerization reactor, see equations 6-3, 6-6 and 6-14.
Figure 6-9: Temperature increase during operation of the pilot plant reactor using the Ni-
SiO2-Al2O3 as function of the dimensionless reactor length as obtained using
the simulation model for an industrial oligomerization reactor, see equations
6-3, 6-6 and 6-14, at 3.5 MPa total pressure and 2.6 MPa inlet ethene
pressure for different reactor wall temperatures: full line: 443 K, dotted line:
453 K, dashed line: 473 K, dashed-dotted line: 493 K. The inlet temperature
was taken equal to the reactor wall temperature.
Figure 6-10: Ethene conversion (left axis) and reactor temperature (right) as function of
the Ni-Beta catalyst mass, i.e., axial reactor coordinate as obtained using the

xxv
simulation model for an industrial oligomerization reactor, see equations 6-3,
6-6 and 6-14, at 503 K inlet temperature, 1.0 MPa inlet ethene pressure and
an inlet ethene molar flow rate equal to 37.2 mol s-1
, full line: isothermal
case, dashed lines: adiabatic case.
Figure 6-11: Reactor temperature (left axis) and product yield (right) as function of the Ni-
Beta catalyst mass, i.e., axial reactor coordinate as obtained using the
simulation model for an adiabatic industrial oligomerization reactor, see
equations 6-3, 6-6 and 6-14, at 503 K inlet temperature, 1.0 MPa inlet ethene
pressure and an inlet ethene molar flow rate equal to 37.2 mol s-1
, full line,
left axis: reactor temperature; full line, right axis: 1-alkene yield; dashed line:
propene yield; dotted line: dotted line: gasoline yield.
Figure 6-12: Reactor temperature as function of axial reactor coordinate as obtained using
the simulation model for an adiabatic industrial oligomerization reactor, see
equations 6-3, 6-6 and 6-14, at 503 K inlet temperature, 1.0 MPa inlet ethene
pressure and an inlet ethene molar flow rate equal to 37.2 mol s-1
, full line:
Ni-Beta, dashed lines: Ni-SiO2-Al2O3.
Figure 6-13: Reactor temperature (left axis) and heat produced (right axis) as function of
the Ni-Beta catalyst mass, i.e., axial reactor coordinate as obtained using the
simulation model for a heat exchanging industrial oligomerization reactor,
see equations 6-3, 6-6 and 6-14, at 503 K inlet temperature, a constant
cooling medium temperature of 503 K, 1.0 MPa inlet ethene pressure and an
inlet ethene molar flow rate equal to 37.2 mol s-1
, full line: reactor
temperature, dashed line: produced heat.
Figure 6-14: Reactor temperature as function of the Ni-Beta catalyst mass, i.e., axial
reactor coordinate as obtained using the simulation model for a heat
exchanging industrial oligomerization reactor with varying length to diameter
ratio (Lr/dr), see equations 6-3, 6-6 and 6-14, at 503 K inlet temperature, 1.0
MPa inlet ethene pressure and an inlet ethene molar flow rate equal to 37.2
mol s-1
, full line: Lr/dr = 15, dashed line: Lr/dr = 10, dotted line: Lr/dr = 8,
dashed-dotted line: Lr/dr = 5.
Figure 6-15: Pressure drop as function of the catalyst pellet to reactor diameter ratio as
obtained using the simulation model for an isothermal industrial
xxvi
oligomerization reactor using the Ni-Beta catalyst, see equations 6-3, 6-6 and
6-14, at 503 K inlet temperature, 1.0 MPa inlet ethene pressure and an inlet
ethene molar flow rate equal to 37.2 mol s-1
.
Figure 6-16: Ethene conversion as function of the catalyst mass, i.e., axial reactor
coordinate as obtained using the simulation model for an isothermal
industrial oligomerization reactor see equations 6-3, 6-6 and 6-14, for a Ni-
Beta catalyst containing only Ni-ion sites (type I and III) at 393 K inlet
temperature, 10.0 MPa inlet ethene pressure and an inlet ethene molar flow
rate equal to 37.2 mol s-1
. Full line: ignoring liquid formation, dashed line:
Amacro = 100 Amicro (type I), dotted line: Amicro = 100 Amacro (type III)
Figure 6-17: Ethene conversion (left) and wetting efficiency and phase molar gas fraction
(right) as function of the catalyst mass, i.e., axial reactor coordinate as
obtained using the simulation model for an isothermal industrial
oligomerization reactor see equations 6-3, 6-6 and 6-14, for a Ni-Beta catalyst
containing only Ni-ion sites having a macroporous surface area which highly
exceeds the microprours surface area, i.e., Amacro = 100 Amicro (type I), at 393 K
inlet temperature, 10.0 MPa inlet ethene pressure and an inlet ethene molar
flow rate equal to 37.2 mol s-1
. Full line: ethene conversion, dashed line:
molar gas phase fraction, dotted line: wetting efficiency
Figure 6-18: Ethene conversion (left) and wetting efficiency and phase molar gas fraction
(right) as function of the catalyst mass, i.e., axial reactor coordinate as
obtained using the simulation model for an isothermal industrial
oligomerization reactor see equations 6-3, 6-6 and 6-14, for a Ni-Beta catalyst
containing only Ni-ion sites having a microporous surface area which highly
exceeds the macroprours surface area, i.e., Amicro = 100 Amacro (type III), at 393
K inlet temperature, 10.0 MPa inlet ethene pressure and an inlet ethene
molar flow rate equal to 37.2 mol s-1
. Full line: ethene conversion, dashed
line: molar gas phase fraction, dotted line: wetting efficiency
Figure 6-19: Ethene conversion as function of the catalyst mass, i.e., axial reactor
coordinate as obtained using the simulation model for an isothermal
industrial oligomerization reactor see equations 6-3, 6-6 and 6-14, for a Ni-
Beta catalyst containing acid and Ni-ion sites (type II and IV) at 393 K inlet

xxvii
temperature, 10.0 MPa inlet ethene pressure and an inlet ethene molar flow
rate equal to 37.2 mol s-1
. Full line: ignoring liquid formation, dashed line:
Amacro = 100 Amicro (type II), dotted line: Amicro = 100 Amacro (type IV)
Figure 6-20: 1-alkene selectivity as function of ethene conversion using the simulation
model for an isothermal industrial oligomerization reactor see equations 6-3,
6-6 and 6-14, for a Ni-Beta catalyst containing acid and Ni-ion sites (type II
and IV) at 393 K inlet temperature, 10.0 MPa inlet ethene pressure and an
inlet ethene molar flow rate equal to 37.2 mol s-1
. Full line: ignoring liquid
formation, dashed line: Amacro = 100 Amicro (type II), dotted line: Amicro = 100
Amacro (type IV)
Figure 6-21: Propene selectivity as function of ethene conversion using the simulation
model for an isothermal industrial oligomerization reactor see equations 6-3,
6-6 and 6-14, for a Ni-Beta catalyst containing acid and Ni-ion sites (type II
and IV) at 393 K inlet temperature, 10.0 MPa inlet ethene pressure and an
inlet ethene molar flow rate equal to 37.2 mol s-1
. Full line: ignoring liquid
formation, dashed line: Amacro = 100 Amicro (type II), dotted line: Amicro = 100
Amacro (type IV)
Figure 6-22: Fractional coverage of ethene in a Ni-Beta catalyst particle as function of the
shape factor s, at the reactor inlet (no conversion): full line: slab (s=0), dotted
line: cylinder (s=1), dashed line: sphere (s=2). The inlet temperature is equal
to 503 K, the inlet partial pressure and molar flow rate of ethene is equal
resp. 1.0 MPa and. The diffusion coefficient for ethene is taken equal to 10-16
m2 s
-1 for illustration purposes.
Figure 6-23: Ethene conversion (left axis) and reactor temperature (right) as function of
the Ni-Beta catalyst mass, i.e., axial reactor coordinate as obtained using the
simulation model for an adiabatic industrial oligomerization reactor, see
equations 6-3, 6-6 and 6-14, at 573 K inlet temperature, 3.5 MPa inlet ethene
pressure and an inlet ethene molar flow rate equal to 37.2 mol s-1
Figure 6-24: Product yield as function of the Ni-Beta catalyst mass, i.e., axial reactor
coordinate as obtained using the simulation model for an adiabatic industrial
oligomerization reactor, see equations 6-3, 6-6 and 6-14, at 573 K inlet
temperature, 3.5 MPa inlet ethene pressure and an inlet ethene molar flow
xxviii
rate equal to 37.2 mol s-1
; full line: 1- alkenes, dashed line: propene, dotted
line: gasoline.
Figure 7-1: Schematic representation of alkyl shift of a dialkyl substituted aromatic
component
Figure 7-2: Schematic overview of dealkylation of an alkyl substituted aromatic
component
Figure 7-3: Schematic overview of transalkylation between two metaxylene molecules
Figure 7-4: Schematic overview of the total hydrogenation of a dialkyl substituted
aromatic component
Figure 7-5: Schematic representation of the reaction network for xylene isomerization on
a bifunctional catalyst. A gas phase aromatic component can physisorb on the
catalyst surface followed by a possible interaction with either acid or metal
sites. Depending on the nature of the active site, acid catalyzed isomerization
or scission or metal catalyzed hydrogenation occurs. Products formed leave
the active sites and desorb from the catalyst surface.
Figure 7-6: Parity diagrams for the responses of the kinetic model for xylene
isomerization on a bifunctional Pt/H-ZSM-5 catalyst: conversion of
ethylbenzene (a), benzene selectivity (b), conversion of xylene (c), mass
fraction of toluene (d), mass fraction of C9+-components (e) and approach to
equilibrium (ate) of paraxylene (f). The parity diagrams are obtained using
equations 1 to 4 with the molar outlet flow rates determined by the kinetic
model consisting of the reactor model, see Eq. 2-21, the reaction rate
equations, see Eqs. 7-12 to 7-14, and the net rates of formation, see Eqs. 7-15
to 7-17. See Table 7-6 for the estimated parameter values and their 95%
confidence interval.
Figure 7-7: Simulated approach to equilibrium for paraxylene (a), benzene yield (b),
xylene conversion (c) and profit function Ψ=ab/c (d) as function of
protonation enthalpy at the reaction conditions as defined in Table 7-9. Full
line: at 673 K and 1.0 MPa; dotted line: at 653 K and 1 MPa; dashed line: 633
K and 1.0 MPa.
xxix
List of tables
Table 2-1: Properties of the Pt/H-ZSM-5 catalyst used for n-hexane hydroisomerization
Table 2-2: Properties of the Ni-SiO2-Al2O3 catalyst used for ethene oligomerization
Table 2-3: Properties of the Ni-Beta catalyst used for ethene oligomerization
Table 2-4: Properties of the Pt/H-ZSM-5 catalyst used for xylene isomerization
Table 3-1: Range of experimental conditions for n-hexane hydroisomerization on
Pt/H-ZSM-5
Table 3-2: Parameter estimates and corresponding 95% confidence interval as function
of temperature determined by isothermal regression to the experimental
data of the kinetic model given by the set of Eqs. 3-1 to 3-3, in which the net
rates of formation are given by Eqs. 3-4 to 3-6. Not statistically significant
parameters are indicated in italics.
Table 3-3: Determined values of the pre-exponential factor, kinetic/equilibrium
coefficient at average temperature, i.e., 531.48 K, and activation energy and
reaction enthalpy by the isothermal regression and the Arrhenius plot, see
Figure 3-12.
Table 3-4: Parameter estimates, corresponding approximate 95% individual confidence
interval and t values of the kinetic/equilibrium coefficients at average
temperature and activation energies and reaction enthalpy determined by
non-isothermal regression to the experimental data of the kinetic model
given by the set of Eqs. 3-1 to 3-3, in which the net rates of formation are
given by Eqs. 3-4 to 3-6.
Table 3-5: Binary correlation coefficient matrix as determined by non-isothermal
regression to the experimental data of the kinetic model given by the set of
Eqs. 3-1 to 3-3, in which the net rates of formation are given by Eqs. 3-4
to 3-6.
Table 4-1: Ranges of experimental conditions for ethene oligomerization on Ni-SiO2-
Al2O3
xxx
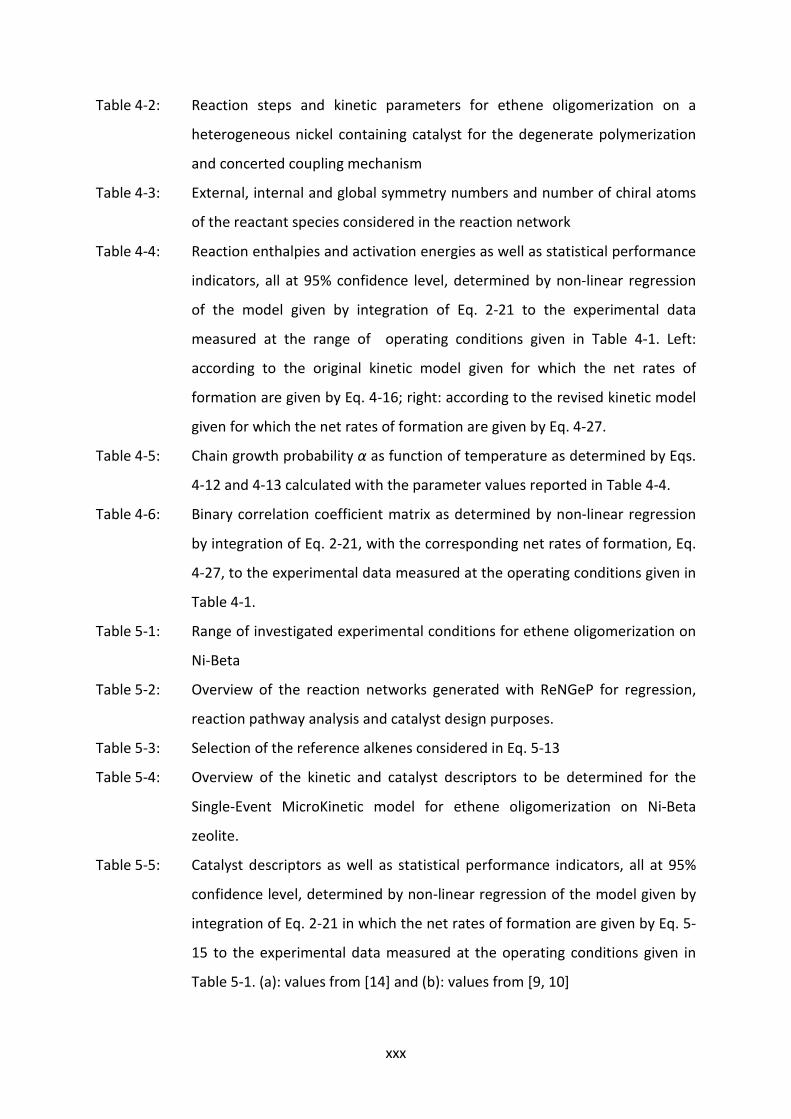
Table 4-2: Reaction steps and kinetic parameters for ethene oligomerization on a
heterogeneous nickel containing catalyst for the degenerate polymerization
and concerted coupling mechanism
Table 4-3: External, internal and global symmetry numbers and number of chiral atoms
of the reactant species considered in the reaction network
Table 4-4: Reaction enthalpies and activation energies as well as statistical performance
indicators, all at 95% confidence level, determined by non-linear regression
of the model given by integration of Eq. 2-21 to the experimental data
measured at the range of operating conditions given in Table 4-1. Left:
according to the original kinetic model given for which the net rates of
formation are given by Eq. 4-16; right: according to the revised kinetic model
given for which the net rates of formation are given by Eq. 4-27.
Table 4-5: Chain growth probability α as function of temperature as determined by Eqs.
4-12 and 4-13 calculated with the parameter values reported in Table 4-4.
Table 4-6: Binary correlation coefficient matrix as determined by non-linear regression
by integration of Eq. 2-21, with the corresponding net rates of formation, Eq.
4-27, to the experimental data measured at the operating conditions given in
Table 4-1.
Table 5-1: Range of investigated experimental conditions for ethene oligomerization on
Ni-Beta
Table 5-2: Overview of the reaction networks generated with ReNGeP for regression,
reaction pathway analysis and catalyst design purposes.
Table 5-3: Selection of the reference alkenes considered in Eq. 5-13
Table 5-4: Overview of the kinetic and catalyst descriptors to be determined for the
Single-Event MicroKinetic model for ethene oligomerization on Ni-Beta
zeolite.
Table 5-5: Catalyst descriptors as well as statistical performance indicators, all at 95%
confidence level, determined by non-linear regression of the model given by
integration of Eq. 2-21 in which the net rates of formation are given by Eq. 5-
15 to the experimental data measured at the operating conditions given in
Table 5-1. (a): values from [14] and (b): values from [9, 10]
xxxi
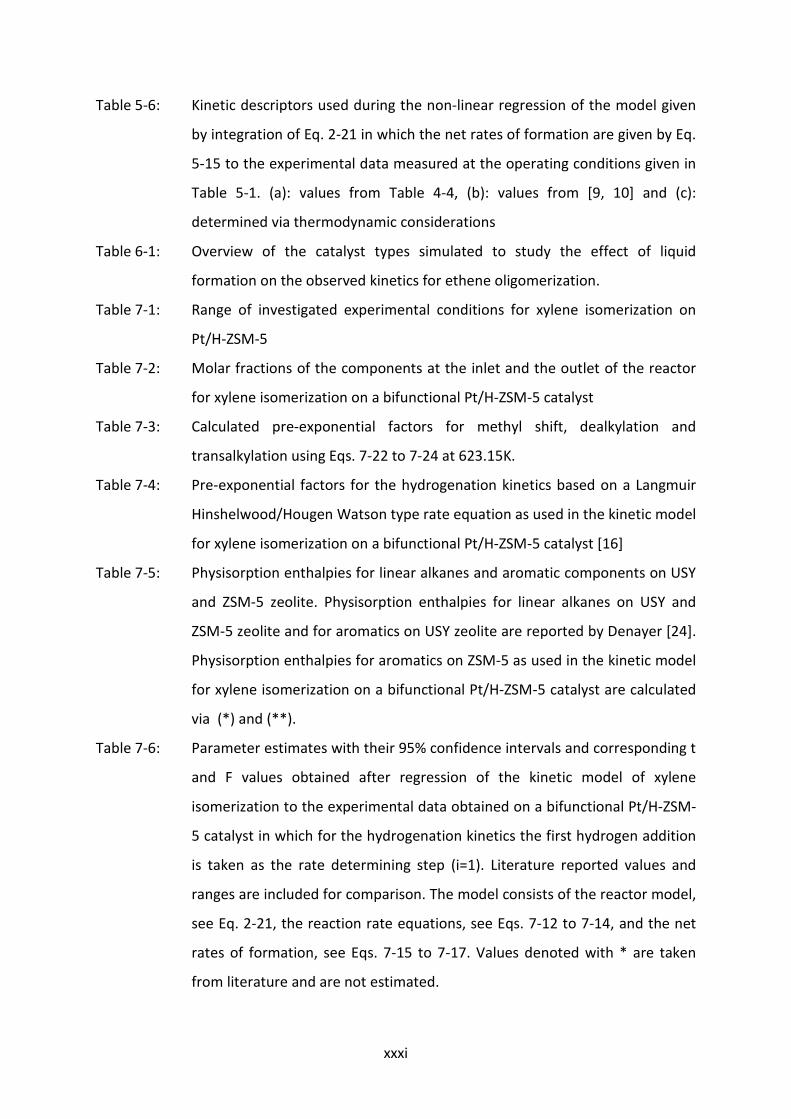
Table 5-6: Kinetic descriptors used during the non-linear regression of the model given
by integration of Eq. 2-21 in which the net rates of formation are given by Eq.
5-15 to the experimental data measured at the operating conditions given in
Table 5-1. (a): values from Table 4-4, (b): values from [9, 10] and (c):
determined via thermodynamic considerations
Table 6-1: Overview of the catalyst types simulated to study the effect of liquid
formation on the observed kinetics for ethene oligomerization.
Table 7-1: Range of investigated experimental conditions for xylene isomerization on
Pt/H-ZSM-5
Table 7-2: Molar fractions of the components at the inlet and the outlet of the reactor
for xylene isomerization on a bifunctional Pt/H-ZSM-5 catalyst
Table 7-3: Calculated pre-exponential factors for methyl shift, dealkylation and
transalkylation using Eqs. 7-22 to 7-24 at 623.15K.
Table 7-4: Pre-exponential factors for the hydrogenation kinetics based on a Langmuir
Hinshelwood/Hougen Watson type rate equation as used in the kinetic model
for xylene isomerization on a bifunctional Pt/H-ZSM-5 catalyst [16]
Table 7-5: Physisorption enthalpies for linear alkanes and aromatic components on USY
and ZSM-5 zeolite. Physisorption enthalpies for linear alkanes on USY and
ZSM-5 zeolite and for aromatics on USY zeolite are reported by Denayer [24].
Physisorption enthalpies for aromatics on ZSM-5 as used in the kinetic model
for xylene isomerization on a bifunctional Pt/H-ZSM-5 catalyst are calculated
via (*) and (**).
Table 7-6: Parameter estimates with their 95% confidence intervals and corresponding t
and F values obtained after regression of the kinetic model of xylene
isomerization to the experimental data obtained on a bifunctional Pt/H-ZSM-
5 catalyst in which for the hydrogenation kinetics the first hydrogen addition
is taken as the rate determining step (i=1). Literature reported values and
ranges are included for comparison. The model consists of the reactor model,
see Eq. 2-21, the reaction rate equations, see Eqs. 7-12 to 7-14, and the net
rates of formation, see Eqs. 7-15 to 7-17. Values denoted with * are taken
from literature and are not estimated.

xxxii
Table 7-7: Correlation coefficient matrix from the regression of the experimental data to
the proposed kinetic model for xylene isomerization on a bifunctional Pt/H-
ZSM-5 catalyst. The model consists of the reactor model, see Eq. 2-21, the
reaction rate equations, see Eqs. 7-12 to 7-14, and the net rates of formation,
see Eqs. 7-15 to 7-17. The protonation enthalpy not included as estimated
parameter.
Table 7-8: Relative pre-exponential factors as determined in the kinetic model for
xylene isomerization on a bifunctional Pt/H-ZSM-5 catalyst, linked to the
changes in entropy during the formation of the transition state
Table 7-9: Reaction conditions used in the investigation of the effect of the protonation
enthalpy and the total acid site concentration on the simulated catalyst
performance. The model consists of the reactor model, see Eq. 2-21, the
reaction rate equations, see Eqs. 7-12 to 7-14, and the net rates of formation,
see Eqs. 7-15 to 7-17. All parameter estimates, except the value for the
protonation enthalpy, from Table 7-6 are used as input for the simulations.
Table 9-1: Critical and other properties of the linear 1-alkenes used as reference
components, * determined by extrapolation
Table 9-2: Coefficients for the determination of the heat capacity of the reference
components, see Eq. 9-1.
Table 9-3: Coefficients for the determination of the vapor pressure of the reference
components, see Eqs. 9-3 and 9-4, * determined by extrapolation
Table 9-4: Coefficients used in the determination of the molar volume of a pure liquid
components, see Eqs. 9-25 to 9-27.
Table 9-5: Coefficients used to determine Bi to calculate the thermal conductivity of a
gas component, see Eq. 9-43.
Table 9-6: Coefficient used for the determination of the thermal conductivity of a liquid
olefin, see Eq.9-44.
Table 9-7: Coefficients used to determine Ei to calculate the viscosity of a gas
component, see Eq. 9-57.

xxxiii
List of symbols
Roman symbols
ta (e.g. Ca ) number of t atoms (e.g. carbon number) [-]
A peak surface area [-]
A pre-exponential factor [variable]
A surface area / cross-sectional area [m2]
ATE approach to equilibrium [-]
b model parameter vector
+HC acid site concentration [mol gcat
-1]
iC concentration of component i [mol gcat-1
]
pC heat capacity [J K-1
]
CF calibration factor [variable]
d diameter [m]
.. fd degrees of freedom [-]
e error [variable]
te element t
( )iE expected value of i [variable]
aE activation energy [J mol-1
]
f friction factor [-]
F molar flow rate [mol s-1
]
aF F-value resulting from the adequacy test [-]
sF F-value resulting from the significance test [-]
g gravitational acceleration [m3 kg
-1 s
-2]
Ga Galileo number [-]
h Planck’s constant [J s]
H Henry coefficient [mol g-1
Pa-1
]
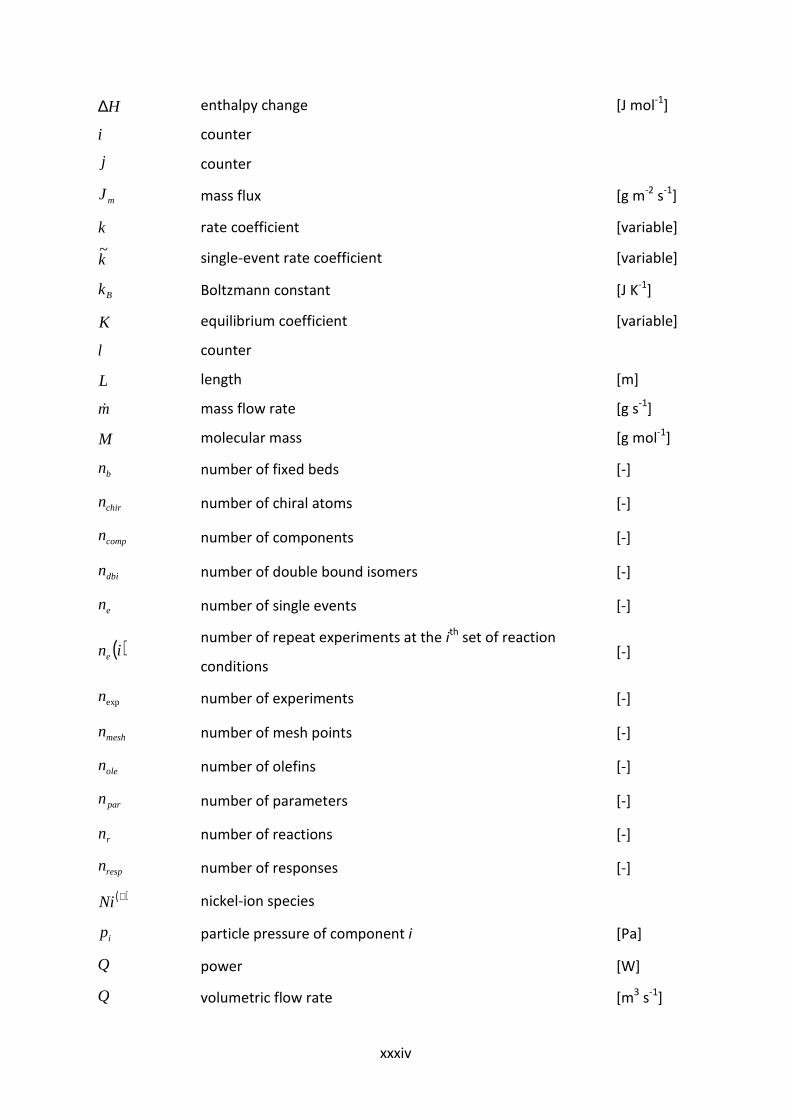
xxxiv
H∆ enthalpy change [J mol-1
]
i counter
j counter
mJ mass flux [g m-2
s-1
]
k rate coefficient [variable]
k~
single-event rate coefficient [variable]
Bk Boltzmann constant [J K-1
]
K equilibrium coefficient [variable]
l counter
L length [m]
m& mass flow rate [g s-1
]
M molecular mass [g mol-1
]
bn number of fixed beds [-]
chirn number of chiral atoms [-]
compn number of components [-]
dbin number of double bound isomers [-]
en number of single events [-]
( )ine number of repeat experiments at the i
th set of reaction
conditions [-]
expn number of experiments [-]
meshn number of mesh points [-]
olen number of olefins [-]
parn number of parameters [-]
rn number of reactions [-]
respn number of responses [-]
( )+Ni nickel-ion species
ip particle pressure of component i [Pa]
Q power [W]
Q volumetric flow rate [m3 s
-1]
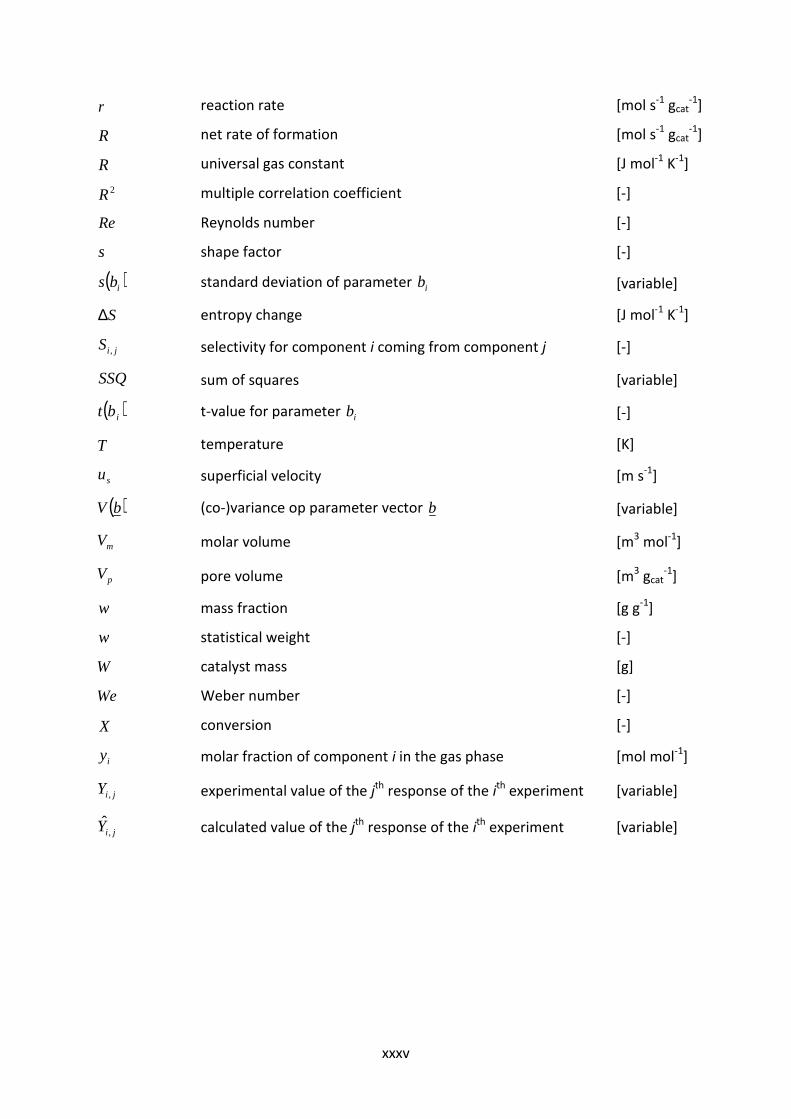
xxxv
r reaction rate [mol s-1
gcat-1
]
R net rate of formation [mol s-1
gcat-1
]
R universal gas constant [J mol-1
K-1
]
2R multiple correlation coefficient [-]
Re Reynolds number [-]
s shape factor [-]
( )ibs standard deviation of parameter ib [variable]
S∆ entropy change [J mol-1
K-1
]
jiS , selectivity for component i coming from component j [-]
SSQ sum of squares [variable]
( )ibt t-value for parameter ib [-]
T temperature [K]
su superficial velocity [m s-1
]
( )bV (co-)variance op parameter vector b [variable]
mV molar volume [m3 mol
-1]
pV pore volume [m3 gcat
-1]
w mass fraction [g g-1
]
w statistical weight [-]
W catalyst mass [g]
We Weber number [-]
X conversion [-]
iy molar fraction of component i in the gas phase [mol mol-1
]
jiY , experimental value of the jth
response of the ith
experiment [variable]
jiY ,ˆ calculated value of the j
th response of the i
th experiment [variable]

xxxvi
Greek symbols
α chain growth probability [-]
α heat transfer coefficient [W m-2
K-1
]
ijα
stoichiometric coefficient with respect to component i for
reaction j [-]
β real parameter vector
γ combined chain growth probability [-]
ε bed porosity [-]
η catalyst effectiveness [-]
wη wetting efficiency [-]
θ fractional occupancy [-]
λ thermal conductivity [W m-1
K-1
]
µ dynamic viscosity [Pa s]
ρ mass density [g m-3
]
ji,ρ binary correlation coefficient between parameter i and j [-]
σ standard deviation [variable]
σ surface tension [N m-1
]
σ symmetry numbers [-]
2iiσ covariance of response i [variable]
ϕ molar gas fraction [mol mol-1
]
eϕ element balance [-]
mϕ mass balance [-]
ξ dimensionless distance [-]
xxxvii
Subscripts
MP2 2-methyl-pentane
MP3 3-methyl-pentane
aro aromatic
A aromatic
b catalyst bed
B benzene
c catalyst crystallite
car carbenium ion
comp composite
exp experimental
ext external
f fluidum
f formation
gl global
int internal
is internal standard
LOF lack of fit
m mean
m metal
MX meta-xylene
naft naphthalene
o non-micro porous
ole olefin
OX orthoxylene
p catalyst pellet
p micro porous
PE pure-error
PX paraxylene
r reaction
xxxviii
r reactor
r reduced
ref reference
REG regression
RES residual
sim simulated
tot total
TOL toluene
XYL xylene
xxxix
Superscripts
+ carbenium ion
≠ transition state
0 inlet
0 standard
p2 two-phase
a activation
as alkyl shift
bs beta-scission
c coordination
chem chemisorption
da dealkylation
deh dehydrogenation
eq equilibrium
f forward
g gas
hyd hydrogenation
ins insertion
iso isomerization
l liquid
ms methyl shift
pcp protonated-cyclo-propyl branching
phys physisorption
pr protonation
r reactant
r reverse
s surface
sat saturation
ta transalkylation
ter termination

xl
trans translational
wall wall
xli
Glossary of terms
Activation energy For an elementary step, the difference in internal energy between
transition state and reactants. A measure for the temperature
dependence of the rate coefficient.
Active sites Groups at the surface of a solid or enzyme, responsible for their
catalytic activity.
Adsorption The preferential concentration of a species at the interface between
two phases. Adherence of the atoms, ions or molecules of a gas or
liquid to the surface of another substance.
Arrhenius relation Expresses the dependence of a rate coefficient k corresponding with
a chemical reaction on the temperature T and activation energy, Ea:
k=A exp(Ea/RT) with R is the universal gas constant, T the temperate
and A the pre-exponential factor.
Catalyst A source of active centers regenerated at the end of a closed
reaction sequence..
Chemisorption Also known as chemical adsorption. Adsorption in which the forces
involved are valence forces of the same kind as those operating in
the formation of chemical compounds. Chemisorption strongly
depends on the surface and the sorptive, and only one layer of
chemisorbed molecules is formed. Its energy of adsorption is the
same order of magnitude as in chemical reactions, and the
adsorption may be activated.
Conversion Measure for the amount of a reactant that has been transformed
into products as a result of a chemical reaction.
Deactivation The decrease in conversion in a catalytic reaction with time of run
under constant reaction conditions.
xlii
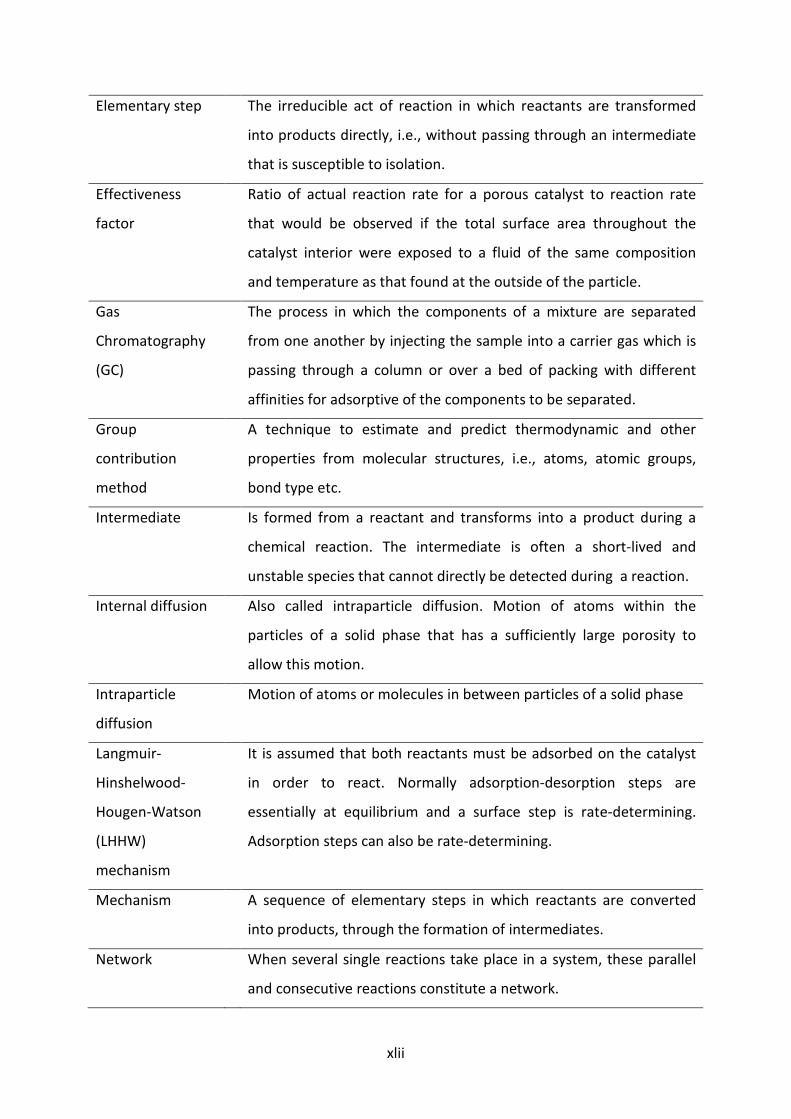
Elementary step The irreducible act of reaction in which reactants are transformed
into products directly, i.e., without passing through an intermediate
that is susceptible to isolation.
Effectiveness
factor
Ratio of actual reaction rate for a porous catalyst to reaction rate
that would be observed if the total surface area throughout the
catalyst interior were exposed to a fluid of the same composition
and temperature as that found at the outside of the particle.
Gas
Chromatography
(GC)
The process in which the components of a mixture are separated
from one another by injecting the sample into a carrier gas which is
passing through a column or over a bed of packing with different
affinities for adsorptive of the components to be separated.
Group
contribution
method
A technique to estimate and predict thermodynamic and other
properties from molecular structures, i.e., atoms, atomic groups,
bond type etc.
Intermediate Is formed from a reactant and transforms into a product during a
chemical reaction. The intermediate is often a short-lived and
unstable species that cannot directly be detected during a reaction.
Internal diffusion Also called intraparticle diffusion. Motion of atoms within the
particles of a solid phase that has a sufficiently large porosity to
allow this motion.
Intraparticle
diffusion
Motion of atoms or molecules in between particles of a solid phase
Langmuir-
Hinshelwood-
Hougen-Watson
(LHHW)
mechanism
It is assumed that both reactants must be adsorbed on the catalyst
in order to react. Normally adsorption-desorption steps are
essentially at equilibrium and a surface step is rate-determining.
Adsorption steps can also be rate-determining.
Mechanism A sequence of elementary steps in which reactants are converted
into products, through the formation of intermediates.
Network When several single reactions take place in a system, these parallel
and consecutive reactions constitute a network.
xliii
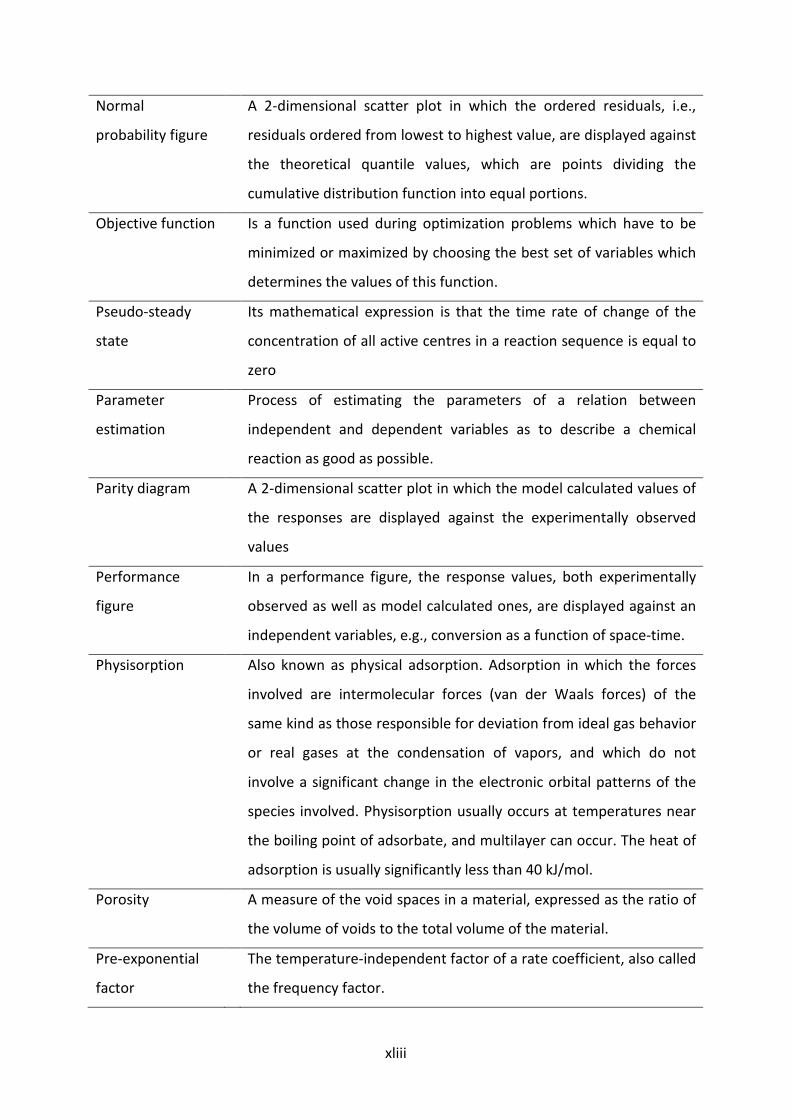
Normal
probability figure
A 2-dimensional scatter plot in which the ordered residuals, i.e.,
residuals ordered from lowest to highest value, are displayed against
the theoretical quantile values, which are points dividing the
cumulative distribution function into equal portions.
Objective function Is a function used during optimization problems which have to be
minimized or maximized by choosing the best set of variables which
determines the values of this function.
Pseudo-steady
state
Its mathematical expression is that the time rate of change of the
concentration of all active centres in a reaction sequence is equal to
zero
Parameter
estimation
Process of estimating the parameters of a relation between
independent and dependent variables as to describe a chemical
reaction as good as possible.
Parity diagram A 2-dimensional scatter plot in which the model calculated values of
the responses are displayed against the experimentally observed
values
Performance
figure
In a performance figure, the response values, both experimentally
observed as well as model calculated ones, are displayed against an
independent variables, e.g., conversion as a function of space-time.
Physisorption Also known as physical adsorption. Adsorption in which the forces
involved are intermolecular forces (van der Waals forces) of the
same kind as those responsible for deviation from ideal gas behavior
or real gases at the condensation of vapors, and which do not
involve a significant change in the electronic orbital patterns of the
species involved. Physisorption usually occurs at temperatures near
the boiling point of adsorbate, and multilayer can occur. The heat of
adsorption is usually significantly less than 40 kJ/mol.
Porosity A measure of the void spaces in a material, expressed as the ratio of
the volume of voids to the total volume of the material.
Pre-exponential
factor
The temperature-independent factor of a rate coefficient, also called
the frequency factor.

xliv
Reaction family Classification of elementary reaction steps on the basis of same
features
Reaction rate The number of moles of a component created by a chemical reaction
per unit of time, volume or catalyst weight.
Rate-determining
step
If, in a reaction sequence, consisting of n steps, (n-1) steps are
reversible and if the rate of each of these (n-1) steps potentially
larger in either direction than the rate of the nth step, the latter is
said to be rate-determining. The rate-determining step need not be
reversible.
Residual plot A 2-dimensional scatter plot in which the residuals, i.e., the
differences between the model simulated values and the observed
values, are put against the independent (or dependent) variable
values.
Single Event
MicroKinetics
Single Event MicroKinetics: A kinetic modeling concept in which
elementary steps are grouped into reaction families mainly based on
enthalpic/energetic considerations. By accounting for the symmetry
effects of reactant and transition state a unique, single-event rate
coefficient suffices per reaction family. As a result, the number of
adjustable parameters is greatly reduced. (abbrev.: SEMK)
Steady state A system in steady-state has certain properties that are time-
independent.
Surface coverage Ratio of the amount of adsorbed substance to the monolayer
capacity (also, sometimes defined for metals as the ratio of the
number of adsorbed atoms or groups to the number of metal
surface atoms).
Support Also called carrier. Material, usually of high surface area, on which
the active catalytic material, present as the minor component, is
dispersed. The support may be catalytically inert, but it may
contribute to the overall catalytic activity.
Surface coverage Ratio of the amount of adsorbed substance to the monolayer
capacity

xlv
Steady state A system in steady-state has certain properties that are time-
independent.
Transition state Also called activated complex.. The configuration of highest potential
energy along the path of lowest energy between reactants and
products.
Transition state
theory
Theory to calculate the rate of an elementary reaction from a
knowledge of the properties of the reacting components and their
concentrations. Differs from collision theory in that it takes into
account the internal structure of reactant components.


xlvii
Summary
Kinetic modeling provides chemical engineers with a useful tool for process control, reaction
mechanism elucidation, catalyst design and industrial reactor optimization. The
development of a systematic methodology for the construction of such models will be a
valuable asset. It will increase the fundamental understanding of the underlying chemistry
and promotes communication between researchers with an industrial and academic
background. In this work, such a systematic methodology was developed.
Figure 1: Proposed procedure for kinetic modeling
The methodology is presented in Figure 1. Although most of the concepts used are already
know for several decades, the actual integration into a single methodology is rather unique.
It starts from intrinsic kinetic data obtained from a well-designed experimental campaign.
These data are supposed not to reflect any other phenomena than the reaction kinetics, i.e.,
so-called intrinsic kinetics are concerned. Additional phenomena, such as transport
limitations, phase effects, may occur when extrapolating the intrinsic kinetics towards more
realistic, industrial conditions and are typically accounted for a posteriori in the model
construction via suitable correlations [1]. From the intrinsic kinetics experimental data
literature survey
initial parameter
value determination
(sequential)
experimental
design
model refinement
data analysis
physical and
statistical
assessment
adequate
kinetic model
new conceptnew reaction
reactionmechanism and correspondingkinetic model
experimentaldataset
parameter estimates
regression
xlviii
complemented with a literature survey, possible reaction mechanism(s) and the
corresponding (micro)kinetic model(s) can be constructed. These models contain a variety
of unknown parameters. While some of these can potentially be determined from
independent characterization measurements, other parameters such as pre-exponential
factors and activation energies typically have to be assessed via regression of the kinetic
model to the experimental data, see Figure 1. Subsequently, the resulting parameter
estimates are evaluated for their physical meaning and statistical significance. Upon a
positive evaluation of the parameter estimates and when the kinetic model is both globally
significant and capable of describing the experimental data adequately, the procedure is
considered to have converged. If not, the model should be refined, which can be achieved
via a mere reformulation of the model or, alternatively, may comprise an additional set of
experimental measurements, eventually planned via a sequential experimental design, see
Figure 1.
With the gradual increase of computational resources over the last decades, kinetic models
have gradually become more complex, i.e., ranging from power-law over Langmuir-
Hinshelwood/Hougen-Watson to microkinetic models. Also industrially, where rather simple
models suffice for process control around a stable operating point, the advantages of such
detailed microkinetic models are recognized, e.g., with respect to rational catalyst design
and industrial reactor optimization. In order to reduce the number of parameters in
microkinetic models, the Single-Event MicroKinetic (SEMK) methodology can be employed
[2]. The fundamental character of this methodology makes that the model parameters have
a precise physical meaning and, hence, that a distinction can be made between so-called
catalyst and kinetic descriptors. Catalyst descriptors are model parameters which are
directly related to catalyst properties, e.g., acid strength of the active site, pore volume…
Kinetic descriptors are parameters which are directly related to the reaction families and are
independent of the catalyst used, e.g., activation energies [3].
As part of the present work, the intrinsic kinetics based methodology implemented in a
multi-scale modeling suite was applied successfully to three different, industrially relevant
chemical reactions, i.e., n-hexane hydroisomerization, ethene oligomerization and xylene
isomerization.

xlix
n-Hexane hydroisomerization
n-Hexane hydroisomerization on Pt/H-ZSM-5 proved to be an excellent case study owing to
the limited number of components and reaction steps involved. A good trade-off was found
between the physical meaning and statistical significance of the model as a whole and the
individual parameter estimates through the use of Langmuir-Hinshelwood/Hougen-Watson
(LHHW) type rate equations. Limited deviations between the experimental and simulated
outlet molar flow rates could be attributed to internal mass transport effects. It lead to the
model formally not being adequate, however, for the illustrative purposes of the case study,
it would be beyond the scope to actually account for these transport effects in detail. This
has been the subject of a separate investigation [4].
Ethene oligomerization
Next, the methodology has been applied to ethene oligomerization on different
heterogeneous, bifunctional catalysts. This reaction has been investigated within the
framework of the EU FP7 IP OCMOL, i.e., Oxidative Coupling of Methane followed by
Oligomerization to Liquids, which aims at economically exploiting stranded natural gas
reserves [5]. Ethene oligomerization is already performed industrially using homogeneous
Ni catalysts [6]. Besides the use of ecologically unfriendly solvents, the product distribution
cannot be tuned easily with this family of catalysts [7]. The use of heterogeneous catalysts
opens up opportunities in this respect and was explored in this work. These heterogeneous
catalysts contain a nickel-ion and acid sites. The acid sites are provided by the support, e.g.,
amorphous SiO2-Al2O3 and Beta zeolite. Ethene is not easily protonated under the relative
mild reaction conditions applied as relative unstable primary carbenium ions are necessarily
involved. Instead, ethene dimerizes on the nickel-ion sites after which the resulting butenes
protonate and undergo acid catalyzed alkylation, isomerization and cracking, as illustrated in
Figure 2.
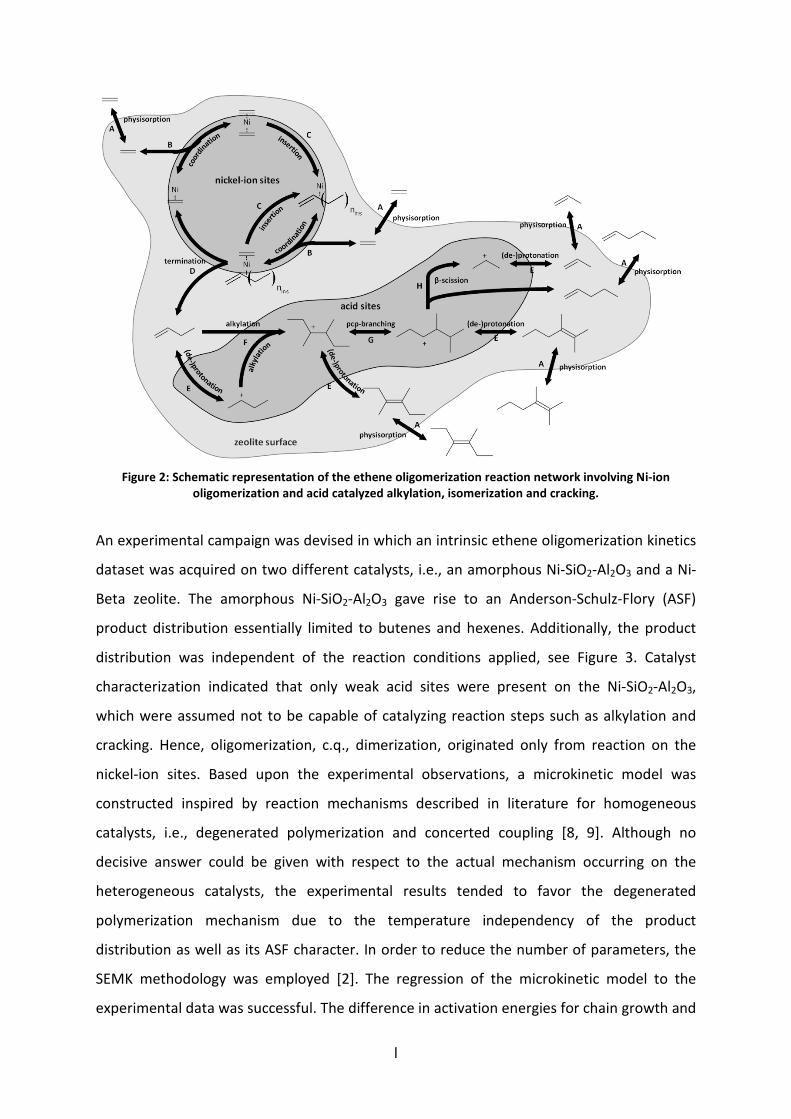
l
Figure 2: Schematic representation of the ethene oligomerization reaction network involving Ni-ion
oligomerization and acid catalyzed alkylation, isomerization and cracking.
An experimental campaign was devised in which an intrinsic ethene oligomerization kinetics
dataset was acquired on two different catalysts, i.e., an amorphous Ni-SiO2-Al2O3 and a Ni-
Beta zeolite. The amorphous Ni-SiO2-Al2O3 gave rise to an Anderson-Schulz-Flory (ASF)
product distribution essentially limited to butenes and hexenes. Additionally, the product
distribution was independent of the reaction conditions applied, see Figure 3. Catalyst
characterization indicated that only weak acid sites were present on the Ni-SiO2-Al2O3,
which were assumed not to be capable of catalyzing reaction steps such as alkylation and
cracking. Hence, oligomerization, c.q., dimerization, originated only from reaction on the
nickel-ion sites. Based upon the experimental observations, a microkinetic model was
constructed inspired by reaction mechanisms described in literature for homogeneous
catalysts, i.e., degenerated polymerization and concerted coupling [8, 9]. Although no
decisive answer could be given with respect to the actual mechanism occurring on the
heterogeneous catalysts, the experimental results tended to favor the degenerated
polymerization mechanism due to the temperature independency of the product
distribution as well as its ASF character. In order to reduce the number of parameters, the
SEMK methodology was employed [2]. The regression of the microkinetic model to the
experimental data was successful. The difference in activation energies for chain growth and

li
termination was about 10 kJ mol-1
and the pre-exponential factors for both steps are equal
which led to a low chain growth probability of 0.1 and the simulated product distributions
being practically constant in the investigated temperature range. The model could
adequately predict the experimental observations, see Figures 3 and 4.
Figure 3: Ethene oligomerization product yields on 1.8wt% Ni-SiO2-Al2O3 as function of ethene conversion.
Symbols correspond to experimental data, lines correspond to model simulations, i.e., by integration of Eq.
2-21, with the corresponding net rates of formation as given by Eq. 4-27 and the parameter values as
reported in Table 4-4; , full line: butene; , dashed line: hexene.
Figure 4: Ethene conversion on 1.8wt% Ni-SiO2-Al2O3 as function of space-time at different inlet ethene
partial pressures, at 3.5 MPa total pressure and at 473 K. Symbols correspond to experimental data, lines
correspond to model simulations, i.e., by integration of Eq. 2-21, with the corresponding net rates of
formation as given by Eq. 4-27 and the parameter values as reported in Table 4-4; , full line: 0.15 MPa; ,
dash-dotted line: 0.25 MPa; , dashed line: 0.35 MPa.
0
2
4
6
8
10
12
14
16
0 5 10 15 20
Yie
ld [
%]
Conversion [%]
0
5
10
15
20
0 5 10 15
Co
nv
ers
ion
[%
]
Space-time [kgcat s molC2-1]

lii
The data acquired on the Ni-Beta zeolite indicated acid site activity by the production of odd
carbon numbered alkenes. The SEMK model was extended with acid catalyzed steps such as
(de-)protonation, alkylation, isomerization and cracking, which resulted in more than 20
unknown parameters. However, most of these parameters were kinetic descriptors and
could be retrieved from literature or calculated from thermodynamic considerations. Only 2
catalyst descriptors needed to be estimated which resulted in a physically meaningful and
statistically significant model and parameters. Based upon this model, a reaction path
analysis was performed, vide Figure 5. At low conversion, ethene dimerization on the
nickel-ion sites is the dominant pathway, see Figure 5(left). With increasing conversion, the
butenes produced are protonated and mainly undergo alkylation towards octene. Octene
instantaneously isomerizes and cracks, resulting in a considerable C3-C5 fraction, Figure
5(right).
Figure 5: Reaction path analysis for ethene oligomerization on Ni-Beta at 503 K, an ethene inlet partial
pressure of 1.0 MPa and a conversion of 50% (left) and 99% (right). The model simulations were obtained by
integration of Eq. 2-21, with the corresponding net rates of formation, Eq. 5-14 and the parameter values
reported in Tables 5-5 and 5-6. The alkenes are lumped per carbon number. The height of the horizontal line
in these circle is proportional to the mass fraction of the corresponding alkene lump. If no line is visible it
indicates that the corresponding mass fraction is very small, i.e., less than 1%. However, these lump may still
significantly contribute to the product formation. Additionally, alkene lumps in watermark indicate that its
mass fraction is less than 0.1%. The vertical gray-scale code is used to differentiate between the different
structural isomers, i.e., white: linear alkenes, light grey: monobranched alkenes and dark grey: dibranched
alkenes. The surface area taken by these colors is proportional to the mass fraction of each structural isomer
in the alkene lump. The color of the arrows indicate the reaction family: blue = metal-ion oligomerization,
red = acid alkylation, green = β-scission. pcp-branching and alkyl shift are not explicitly shown as they only
change the isomer distribution within an alkene lump. The size of the arrow is linearly proportional to the
rate of the corresponding step. The numbers at the arrow head indicate the fraction of the lump which is
produced via the corresponding step while numbers next to the arrow shaft indicate the fraction of the
lump which is consumed via this step.
C3
C2
100
35
35 100
100
97
3
2
98
30
16
50 50
C6
C4
C5C8
84
C7
C3
C2
70
35
35 100
96
86
2
2
98
30
20
50 50
C6
C4
C5
70
C7
10
12
100
10050
50
5050
2
2
2
28
C8
12 88
100
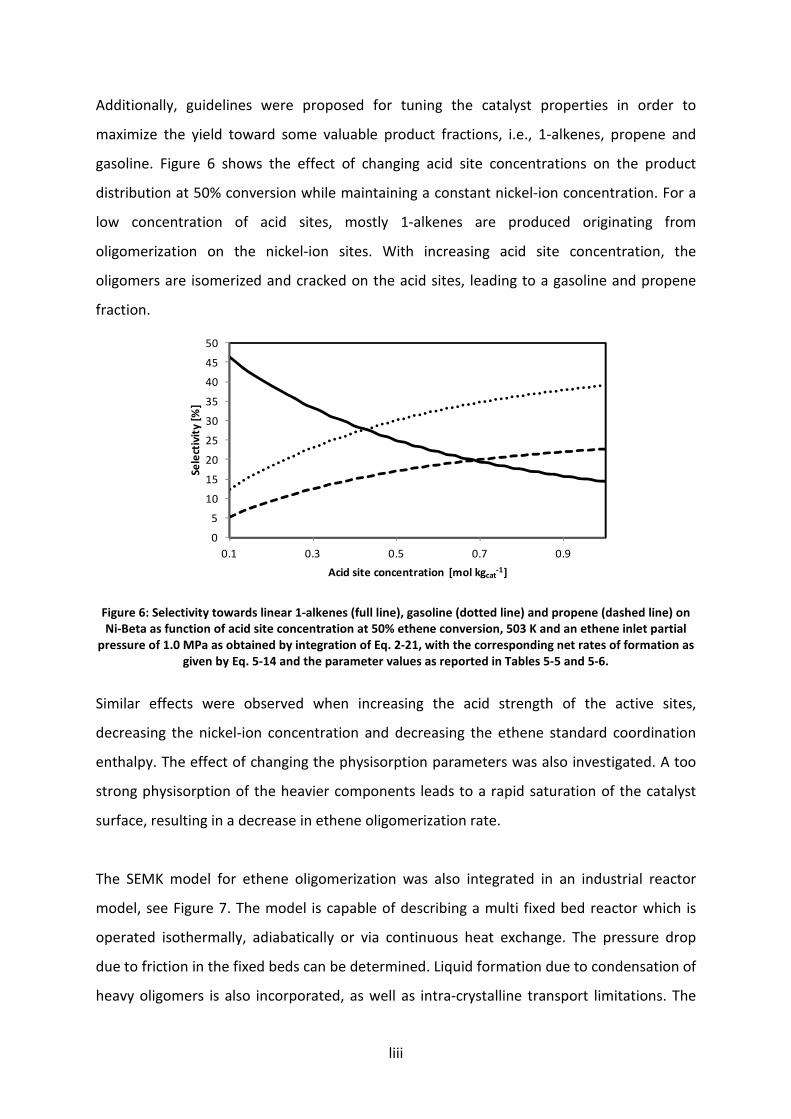
liii
Additionally, guidelines were proposed for tuning the catalyst properties in order to
maximize the yield toward some valuable product fractions, i.e., 1-alkenes, propene and
gasoline. Figure 6 shows the effect of changing acid site concentrations on the product
distribution at 50% conversion while maintaining a constant nickel-ion concentration. For a
low concentration of acid sites, mostly 1-alkenes are produced originating from
oligomerization on the nickel-ion sites. With increasing acid site concentration, the
oligomers are isomerized and cracked on the acid sites, leading to a gasoline and propene
fraction.
Figure 6: Selectivity towards linear 1-alkenes (full line), gasoline (dotted line) and propene (dashed line) on
Ni-Beta as function of acid site concentration at 50% ethene conversion, 503 K and an ethene inlet partial
pressure of 1.0 MPa as obtained by integration of Eq. 2-21, with the corresponding net rates of formation as
given by Eq. 5-14 and the parameter values as reported in Tables 5-5 and 5-6.
Similar effects were observed when increasing the acid strength of the active sites,
decreasing the nickel-ion concentration and decreasing the ethene standard coordination
enthalpy. The effect of changing the physisorption parameters was also investigated. A too
strong physisorption of the heavier components leads to a rapid saturation of the catalyst
surface, resulting in a decrease in ethene oligomerization rate.
The SEMK model for ethene oligomerization was also integrated in an industrial reactor
model, see Figure 7. The model is capable of describing a multi fixed bed reactor which is
operated isothermally, adiabatically or via continuous heat exchange. The pressure drop
due to friction in the fixed beds can be determined. Liquid formation due to condensation of
heavy oligomers is also incorporated, as well as intra-crystalline transport limitations. The
0
5
10
15
20
25
30
35
40
45
50
0.1 0.3 0.5 0.7 0.9
Se
lect
ivit
y [
%]
Acid site concentration [mol kgcat-1]
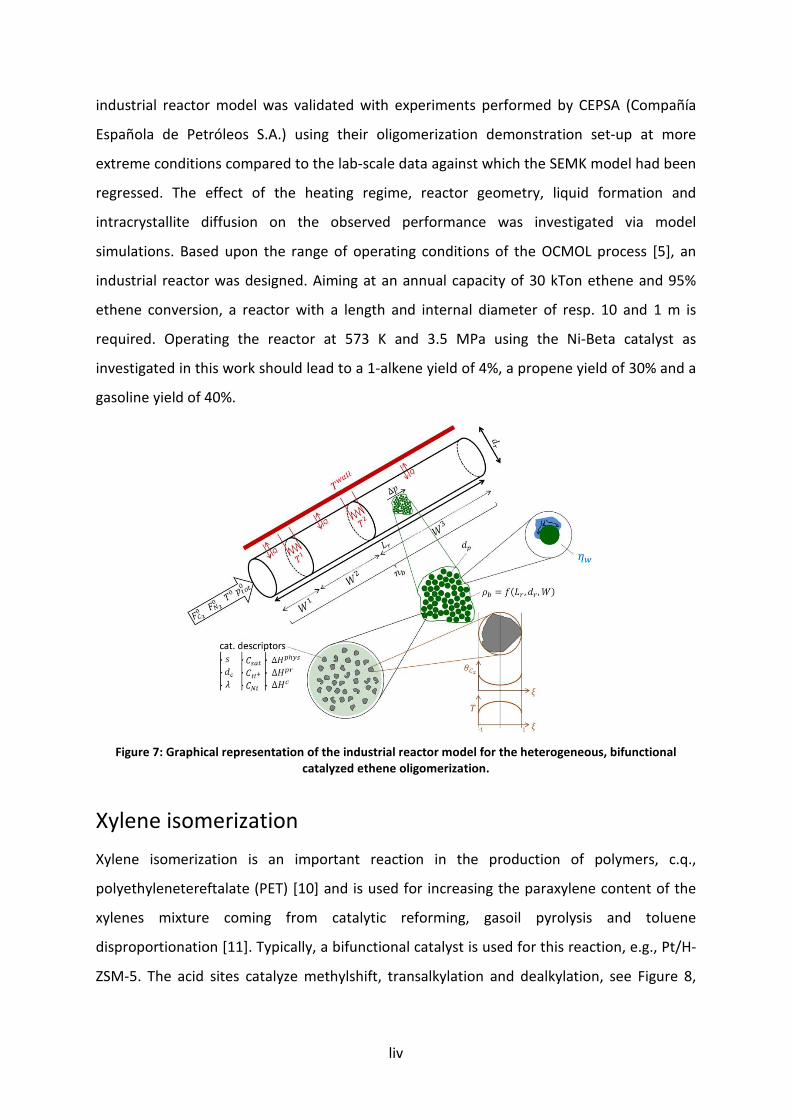
liv
industrial reactor model was validated with experiments performed by CEPSA (Compañía
Española de Petróleos S.A.) using their oligomerization demonstration set-up at more
extreme conditions compared to the lab-scale data against which the SEMK model had been
regressed. The effect of the heating regime, reactor geometry, liquid formation and
intracrystallite diffusion on the observed performance was investigated via model
simulations. Based upon the range of operating conditions of the OCMOL process [5], an
industrial reactor was designed. Aiming at an annual capacity of 30 kTon ethene and 95%
ethene conversion, a reactor with a length and internal diameter of resp. 10 and 1 m is
required. Operating the reactor at 573 K and 3.5 MPa using the Ni-Beta catalyst as
investigated in this work should lead to a 1-alkene yield of 4%, a propene yield of 30% and a
gasoline yield of 40%.
Figure 7: Graphical representation of the industrial reactor model for the heterogeneous, bifunctional
catalyzed ethene oligomerization.
Xylene isomerization
Xylene isomerization is an important reaction in the production of polymers, c.q.,
polyethylenetereftalate (PET) [10] and is used for increasing the paraxylene content of the
xylenes mixture coming from catalytic reforming, gasoil pyrolysis and toluene
disproportionation [11]. Typically, a bifunctional catalyst is used for this reaction, e.g., Pt/H-
ZSM-5. The acid sites catalyze methylshift, transalkylation and dealkylation, see Figure 8,

lv
while the noble metal decreases coke formation but also hydrogenates a small fraction of
the aromatic feed components, see Figure 8.
CH3
CH3
CH3
CH3
CH3
CH3
CH3
CH3
CH3
CH3
CH3
CH3
+
CH3
CH3
+
CH3
CH3
+
CH3
CH3
CH3CH3
CH3
C2H6
CH3+
CH3
CH3 CH3
+
CH3
CH3
CH3
Physisorption
Physisorption
(de-)Protonation
Physisorption Physisorption
(de-)ProtonationMethylshift
Dealkylation
(de-
)Hyd
rog
enat
ion
Metal sites Acid sites
Zeolite
CH3
CH3CH3
(de-)Protonation
Chemisorption
Chemisorption
CH3
Transalkylation
R
R
R
R
CH4
Figure 8: Schematic representation of the reaction network for xylene isomerization on a bifunctional
catalyst. A gas phase aromatic component can physisorb on the catalyst surface followed by a possible
interaction with either acid or metal sites. Depending on the nature of the active site, acid catalyzed
isomerization or scission or metal catalyzed hydrogenation occurs. Products formed leave the active sites
and desorb from the catalyst surface.
In order to elucidate and quantify the main reaction pathways, a SEMK model was
constructed. A limited, but well-designed experimental dataset on an industrially developed
Pt/H-ZSM-5 was provided by Shell for model evaluation through regression. The model
could adequately describe the experimental data and was subsequently used to identify the
constraints for an optimal Pt/H-ZSM-5 catalyst, as illustrated in Figure 9. It maps the value of
a ‘profit’ function ψ, defined by valuable product yields and losses, as a function of the
standard protonation enthalpy, which is a measure of the average acid strength of the
active sites [12]. On a catalyst containing only weak acid sites, corresponding to a standard
protonation enthalpy less negative than -60 kJ mol-1
, few activity is observed corresponding
to a low ‘profit’. With increasing acid strength of the active sites, corresponding to standard
protonation enthalpies between -60 and -80 kJ mol-1
, the profit function increases because
the para-xylene and benzene yield increases. With even stronger acid sites, corresponding
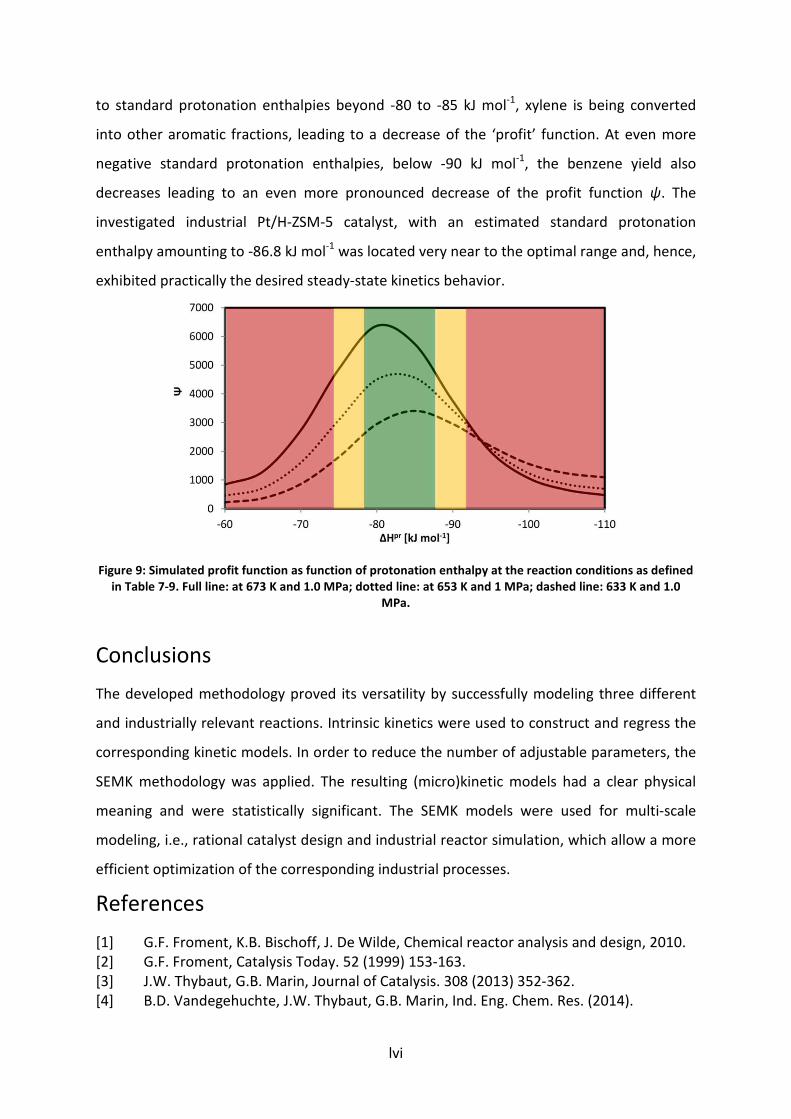
lvi
to standard protonation enthalpies beyond -80 to -85 kJ mol-1
, xylene is being converted
into other aromatic fractions, leading to a decrease of the ‘profit’ function. At even more
negative standard protonation enthalpies, below -90 kJ mol-1
, the benzene yield also
decreases leading to an even more pronounced decrease of the profit function ψ. The
investigated industrial Pt/H-ZSM-5 catalyst, with an estimated standard protonation
enthalpy amounting to -86.8 kJ mol-1
was located very near to the optimal range and, hence,
exhibited practically the desired steady-state kinetics behavior.
Figure 9: Simulated profit function as function of protonation enthalpy at the reaction conditions as defined
in Table 7-9. Full line: at 673 K and 1.0 MPa; dotted line: at 653 K and 1 MPa; dashed line: 633 K and 1.0
MPa.
Conclusions
The developed methodology proved its versatility by successfully modeling three different
and industrially relevant reactions. Intrinsic kinetics were used to construct and regress the
corresponding kinetic models. In order to reduce the number of adjustable parameters, the
SEMK methodology was applied. The resulting (micro)kinetic models had a clear physical
meaning and were statistically significant. The SEMK models were used for multi-scale
modeling, i.e., rational catalyst design and industrial reactor simulation, which allow a more
efficient optimization of the corresponding industrial processes.
References
[1] G.F. Froment, K.B. Bischoff, J. De Wilde, Chemical reactor analysis and design, 2010.
[2] G.F. Froment, Catalysis Today. 52 (1999) 153-163.
[3] J.W. Thybaut, G.B. Marin, Journal of Catalysis. 308 (2013) 352-362.
[4] B.D. Vandegehuchte, J.W. Thybaut, G.B. Marin, Ind. Eng. Chem. Res. (2014).
lvii
[5] http://www.ocmol.eu/, 2014.
[6] Ullmann's Encyclopedia of Industrial Chemistry (2014).
[7] P.T. Anastas, M.M. Kirchhoff, T.C. Williamson, Applied Catalysis a-General. 221
(2001) 3-13.
[8] C. Lepetit, J.Y. Carriat, C. Bennett, Applied Catalysis a-General. 123 (1995) 289-300.
[9] S.M. Pillai, M. Ravindranathan, S. Sivaram, Chemical Reviews. 86 (1986) 353-399.
[10] Ullmann’s Encyclopedia of Industrial Chemistry, 6th ed.
[11] Kirk-Othmer Encyclopediae of Chemical Technology, 4th ed.
[12] J.W. Thybaut, G.B. Marin, G.V. Baron, P.A. Jacobs, J.A. Martens, Journal of Catalysis.
202 (2001) 324-339.

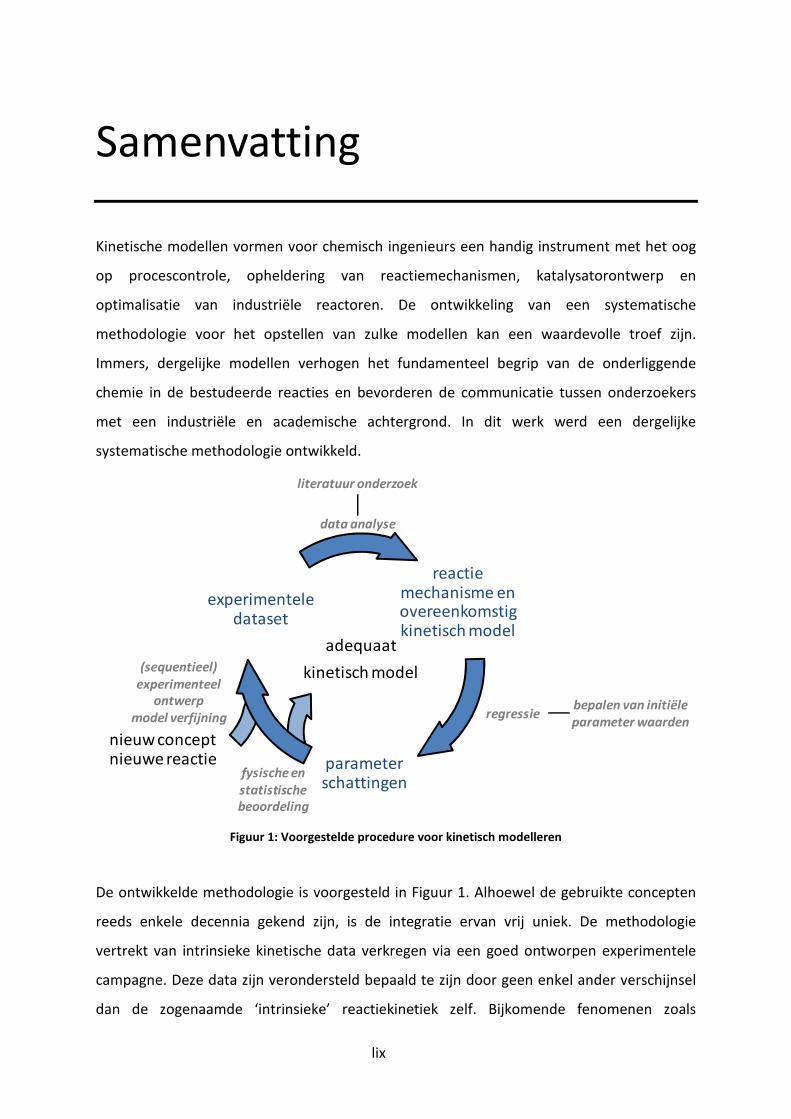
lix
Samenvatting
Kinetische modellen vormen voor chemisch ingenieurs een handig instrument met het oog
op procescontrole, opheldering van reactiemechanismen, katalysatorontwerp en
optimalisatie van industriële reactoren. De ontwikkeling van een systematische
methodologie voor het opstellen van zulke modellen kan een waardevolle troef zijn.
Immers, dergelijke modellen verhogen het fundamenteel begrip van de onderliggende
chemie in de bestudeerde reacties en bevorderen de communicatie tussen onderzoekers
met een industriële en academische achtergrond. In dit werk werd een dergelijke
systematische methodologie ontwikkeld.
Figuur 1: Voorgestelde procedure voor kinetisch modelleren
De ontwikkelde methodologie is voorgesteld in Figuur 1. Alhoewel de gebruikte concepten
reeds enkele decennia gekend zijn, is de integratie ervan vrij uniek. De methodologie
vertrekt van intrinsieke kinetische data verkregen via een goed ontworpen experimentele
campagne. Deze data zijn verondersteld bepaald te zijn door geen enkel ander verschijnsel
dan de zogenaamde ‘intrinsieke’ reactiekinetiek zelf. Bijkomende fenomenen zoals
literatuur onderzoek
bepalen van initiële
parameter waarden
(sequentieel)
experimenteel
ontwerp
model verfijning
data analyse
fysische en
statistische
beoordeling
adequaat
kinetisch model
nieuw conceptnieuwe reactie
reactie mechanisme en overeenkomstig kinetisch model
experimentele dataset
parameter schattingen
regressie

lx
transportoverdracht en fase-effecten kunnen potentieel snelheidslimiterend worden bij
extrapolatie naar realistische, industriële condities en worden bij voorkeur a posteriori in
rekening gebracht via de gepaste correlaties [1]. De intrinsieke kinetische experimentele
data, aangevuld met een literatuuronderzoek, leiden typisch tot één of, bij gebrek aan
eensgezindheid, tot meerdere mogelijke reactiemechanismen waarvoor overeenkomstige
kinetische modellen kunnen worden opgesteld. Deze kinetische modellen bevatten
verschillende onbekende parameters. Een aantal van deze parameters worden typisch
bepaald aan de hand van onafhankelijke karakteriseringexperimenten. Voor andere
parameters, zoals b.v. de pre-exponentiële factoren, is het mogelijk om, gebaseerd op
principiële overwegingen, een grootteorde vast te leggen, terwijl de waarden voor een
laatste stel van parameters zoals de activeringsenergieën, worden bepaald met behulp van
regressie, zie Figuur 1. Vervolgens worden de verkregen parameters beoordeeld naar hun
fysische betekenis en statistische significantie. Na een positieve beoordeling van de
individuele parameterschattingen en het globale model, wordt de procedure beschouwd als
afgelopen, zeker als het model tevens als adequaat geëvalueerd wordt. In het ander geval
moet het kinetische model worden verfijnd. Dit kan aan de hand van een herformulering
van het model of via het uitvoeren van een aantal bijkomende experimenten, eventueel via
sequentieel experimenteel ontwerp, zie Figuur 1.
Gedurende de laatste decennia zijn de computationele middelen gestaag toegenomen
waardoor de kinetische modellen complexer werden. Een duidelijke evolutie van machtswet
over Langmuir-Hinshelwood/Hougen-Watson tot microkinetische modellen heeft zich in de
loop der jaren voltrokken. Industrieel gezien volstaan eenvoudige modellen voor
procescontrole rond een welbepaald, stabiel werkingspunt. Echter, de voordelen van
gedetailleerde, microkinetische modellen worden steeds meer duidelijk voor de industrie,
met name rationeel katalysatorontwerp en optimalisatie van industriële reactoren. Om het
aantal parameters in microkinetische modellen in de hand te houden wordt typisch gebruik
gemaakt van de Single-Event MicroKinetic (SEMK) methodologie [2]. Het fundamenteel
karakter van deze methodologie zorgt ervoor dat de modelparameters een duidelijke
fysische betekenis hebben en dat een onderscheid wordt gemaakt tussen zogenaamde
kinetische en katalysatordescriptoren. Katalysatordescriptoren zijn modelparameters die in
direct verband staan met katalysatoreigenschappen zoals de zuursterkte, porievolume, etc.
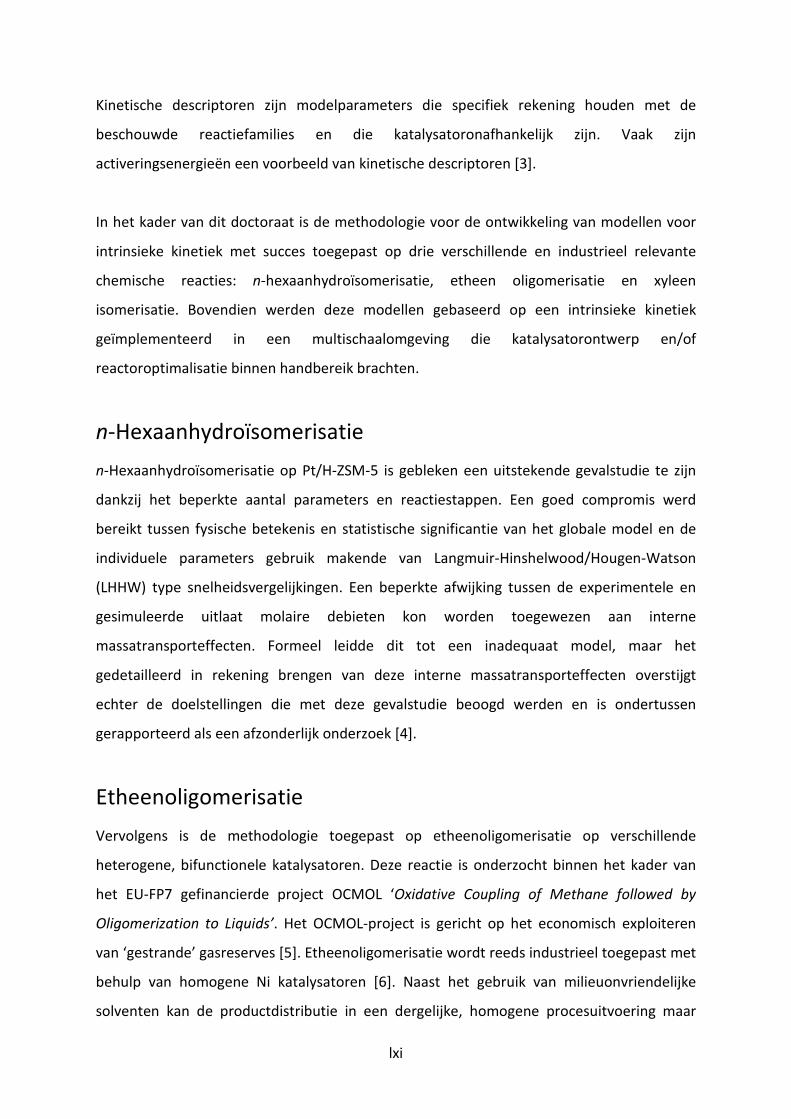
lxi
Kinetische descriptoren zijn modelparameters die specifiek rekening houden met de
beschouwde reactiefamilies en die katalysatoronafhankelijk zijn. Vaak zijn
activeringsenergieën een voorbeeld van kinetische descriptoren [3].
In het kader van dit doctoraat is de methodologie voor de ontwikkeling van modellen voor
intrinsieke kinetiek met succes toegepast op drie verschillende en industrieel relevante
chemische reacties: n-hexaanhydroïsomerisatie, etheen oligomerisatie en xyleen
isomerisatie. Bovendien werden deze modellen gebaseerd op een intrinsieke kinetiek
geïmplementeerd in een multischaalomgeving die katalysatorontwerp en/of
reactoroptimalisatie binnen handbereik brachten.
n-Hexaanhydroïsomerisatie
n-Hexaanhydroïsomerisatie op Pt/H-ZSM-5 is gebleken een uitstekende gevalstudie te zijn
dankzij het beperkte aantal parameters en reactiestappen. Een goed compromis werd
bereikt tussen fysische betekenis en statistische significantie van het globale model en de
individuele parameters gebruik makende van Langmuir-Hinshelwood/Hougen-Watson
(LHHW) type snelheidsvergelijkingen. Een beperkte afwijking tussen de experimentele en
gesimuleerde uitlaat molaire debieten kon worden toegewezen aan interne
massatransporteffecten. Formeel leidde dit tot een inadequaat model, maar het
gedetailleerd in rekening brengen van deze interne massatransporteffecten overstijgt
echter de doelstellingen die met deze gevalstudie beoogd werden en is ondertussen
gerapporteerd als een afzonderlijk onderzoek [4].
Etheenoligomerisatie
Vervolgens is de methodologie toegepast op etheenoligomerisatie op verschillende
heterogene, bifunctionele katalysatoren. Deze reactie is onderzocht binnen het kader van
het EU-FP7 gefinancierde project OCMOL ‘Oxidative Coupling of Methane followed by
Oligomerization to Liquids’. Het OCMOL-project is gericht op het economisch exploiteren
van ‘gestrande’ gasreserves [5]. Etheenoligomerisatie wordt reeds industrieel toegepast met
behulp van homogene Ni katalysatoren [6]. Naast het gebruik van milieuonvriendelijke
solventen kan de productdistributie in een dergelijke, homogene procesuitvoering maar
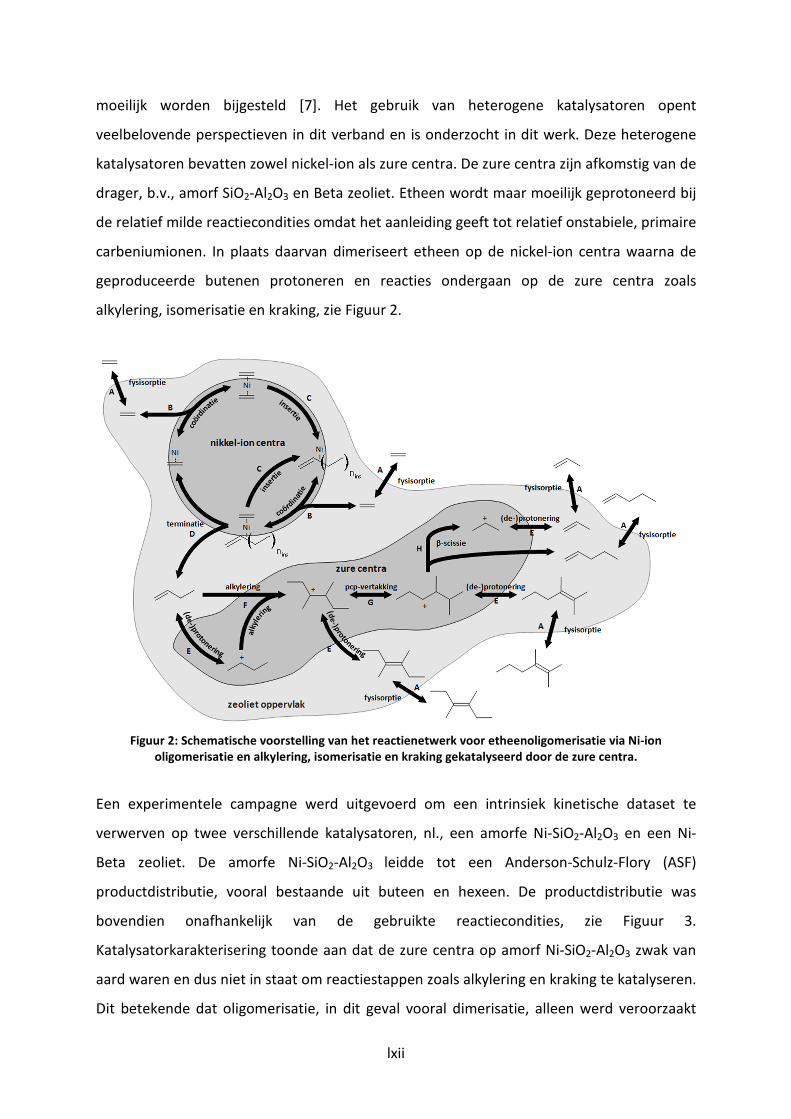
lxii
moeilijk worden bijgesteld [7]. Het gebruik van heterogene katalysatoren opent
veelbelovende perspectieven in dit verband en is onderzocht in dit werk. Deze heterogene
katalysatoren bevatten zowel nickel-ion als zure centra. De zure centra zijn afkomstig van de
drager, b.v., amorf SiO2-Al2O3 en Beta zeoliet. Etheen wordt maar moeilijk geprotoneerd bij
de relatief milde reactiecondities omdat het aanleiding geeft tot relatief onstabiele, primaire
carbeniumionen. In plaats daarvan dimeriseert etheen op de nickel-ion centra waarna de
geproduceerde butenen protoneren en reacties ondergaan op de zure centra zoals
alkylering, isomerisatie en kraking, zie Figuur 2.
Figuur 2: Schematische voorstelling van het reactienetwerk voor etheenoligomerisatie via Ni-ion
oligomerisatie en alkylering, isomerisatie en kraking gekatalyseerd door de zure centra.
Een experimentele campagne werd uitgevoerd om een intrinsiek kinetische dataset te
verwerven op twee verschillende katalysatoren, nl., een amorfe Ni-SiO2-Al2O3 en een Ni-
Beta zeoliet. De amorfe Ni-SiO2-Al2O3 leidde tot een Anderson-Schulz-Flory (ASF)
productdistributie, vooral bestaande uit buteen en hexeen. De productdistributie was
bovendien onafhankelijk van de gebruikte reactiecondities, zie Figuur 3.
Katalysatorkarakterisering toonde aan dat de zure centra op amorf Ni-SiO2-Al2O3 zwak van
aard waren en dus niet in staat om reactiestappen zoals alkylering en kraking te katalyseren.
Dit betekende dat oligomerisatie, in dit geval vooral dimerisatie, alleen werd veroorzaakt

lxiii
door de nickel-ion centra. Gebaseerd op de experimentele waarnemingen werd een
microkinetisch model opgesteld, geïnspireerd op reactiemechanismen voor homogene
katalyse zoals beschreven in de literatuur, nl., degeneratieve polymerisatie en
gecoördineerde koppeling [8, 9]. Er kon geen uitsluitsel worden gegeven over welk
mechanisme effectief doorging op de heterogene katalysatoren. Echter, de
temperatuursonafhankelijkheid van de productdistributie en het ASF karakter ervan
zorgden voor een voorkeur voor het degeneratievepolymerisatiemechanisme. Om het
aantal parameters te beperken werd de SEMK methodologie toegepast. De regressie van
het kinetisch model aan de experimentele data kende een positieve uitkomst. Het verschil in
activeringsenergieën voor ketengroei en terminatie was beperkt tot 10 kJ mol-1
en de pre-
exponentiële factoren voor beide stappen waren identiek. Dit leidde tot een lage
ketengroeiprobabiliteit en gesimuleerde productdistributies die onafhankelijk waren in het
beschouwde temperatuursgebied. Het model was in staat om de experimentele
waarnemingen adequaat te voorspellen, zie Figuren 3 en 4.
Figuur 3: Productopbrengsten van etheenoligomerisatie op 1.8m% Ni-SiO2-Al2O3 als functie van de
etheenconversie. Symbolen stemmen overeen met experimentele data, lijnen met modelsimulaties, nl., via
integratie van vgl. 2-21 waarin de netto-vormingssnelheden gegeven zijn door vgl. 4-27 met de
parameterwaarden zoals in Tabel 4-4; , volle lijn: buteen; , onderbroken lijn: hexeen.
0
2
4
6
8
10
12
14
16
0 5 10 15 20
Op
bre
ng
st [
%]
Conversie [%]
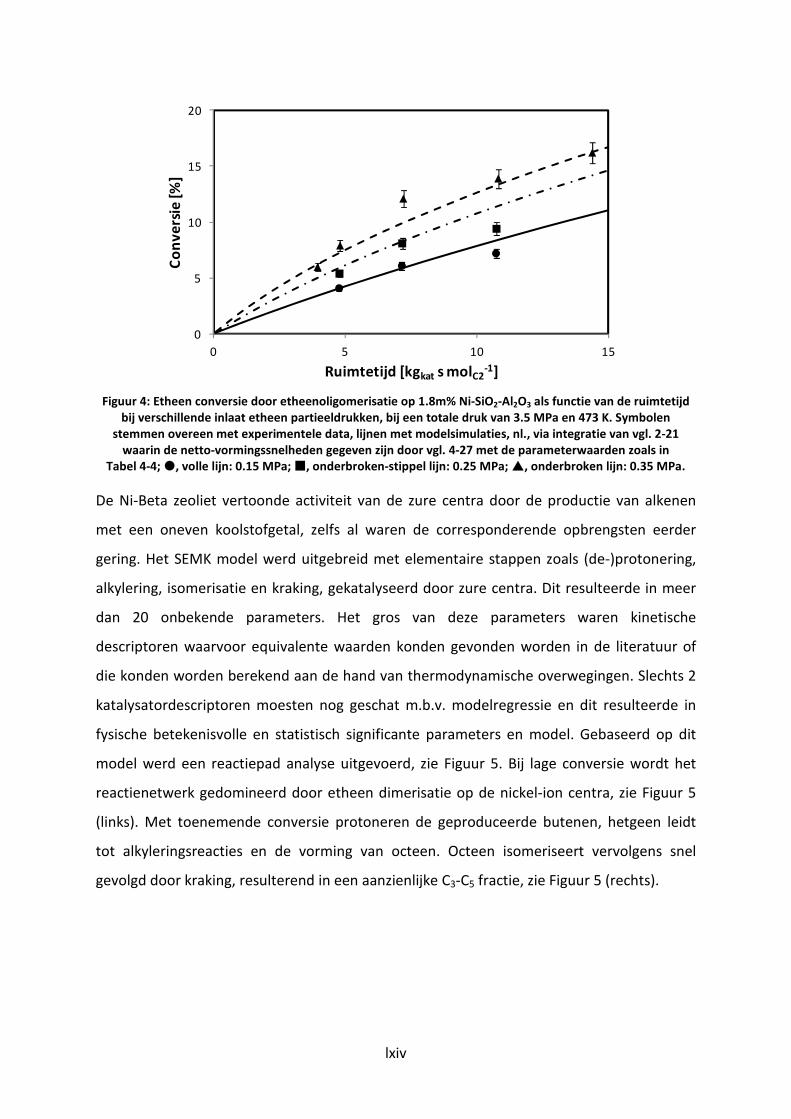
lxiv
Figuur 4: Etheen conversie door etheenoligomerisatie op 1.8m% Ni-SiO2-Al2O3 als functie van de ruimtetijd
bij verschillende inlaat etheen partieeldrukken, bij een totale druk van 3.5 MPa en 473 K. Symbolen
stemmen overeen met experimentele data, lijnen met modelsimulaties, nl., via integratie van vgl. 2-21
waarin de netto-vormingssnelheden gegeven zijn door vgl. 4-27 met de parameterwaarden zoals in
Tabel 4-4; , volle lijn: 0.15 MPa; , onderbroken-stippel lijn: 0.25 MPa; , onderbroken lijn: 0.35 MPa.
De Ni-Beta zeoliet vertoonde activiteit van de zure centra door de productie van alkenen
met een oneven koolstofgetal, zelfs al waren de corresponderende opbrengsten eerder
gering. Het SEMK model werd uitgebreid met elementaire stappen zoals (de-)protonering,
alkylering, isomerisatie en kraking, gekatalyseerd door zure centra. Dit resulteerde in meer
dan 20 onbekende parameters. Het gros van deze parameters waren kinetische
descriptoren waarvoor equivalente waarden konden gevonden worden in de literatuur of
die konden worden berekend aan de hand van thermodynamische overwegingen. Slechts 2
katalysatordescriptoren moesten nog geschat m.b.v. modelregressie en dit resulteerde in
fysische betekenisvolle en statistisch significante parameters en model. Gebaseerd op dit
model werd een reactiepad analyse uitgevoerd, zie Figuur 5. Bij lage conversie wordt het
reactienetwerk gedomineerd door etheen dimerisatie op de nickel-ion centra, zie Figuur 5
(links). Met toenemende conversie protoneren de geproduceerde butenen, hetgeen leidt
tot alkyleringsreacties en de vorming van octeen. Octeen isomeriseert vervolgens snel
gevolgd door kraking, resulterend in een aanzienlijke C3-C5 fractie, zie Figuur 5 (rechts).
0
5
10
15
20
0 5 10 15
Co
nv
ers
ie [
%]
Ruimtetijd [kgkat s molC2-1]
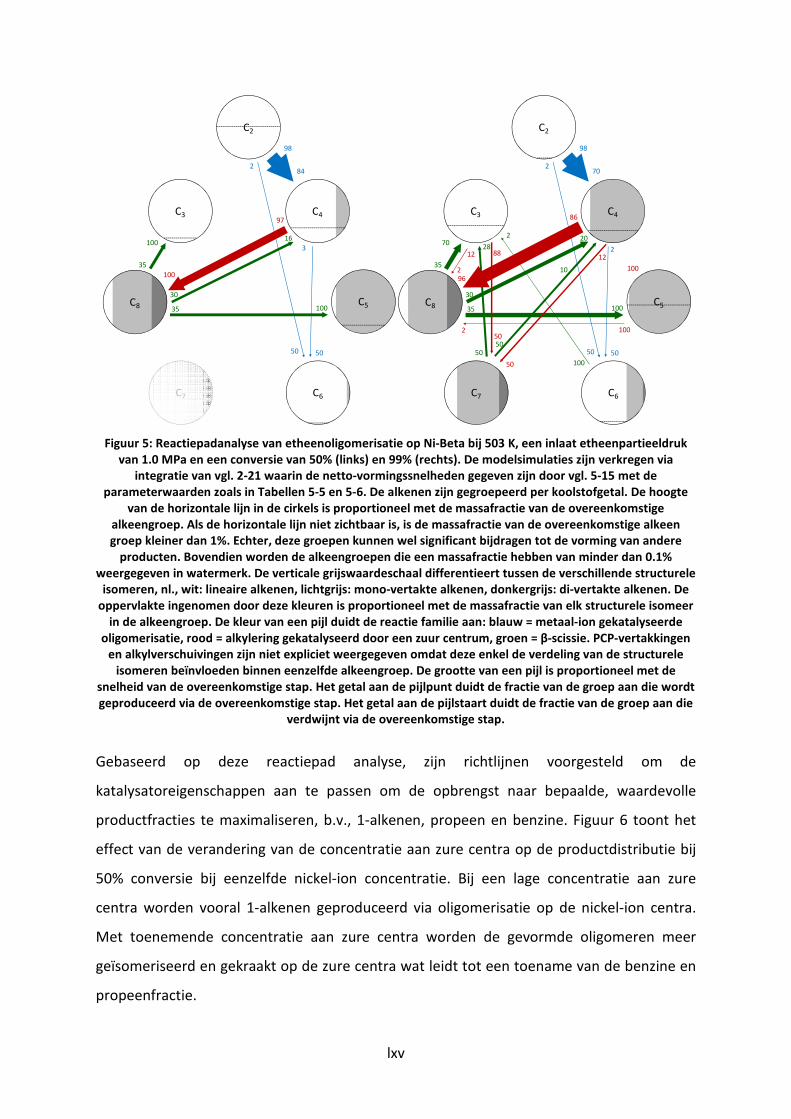
lxv
Figuur 5: Reactiepadanalyse van etheenoligomerisatie op Ni-Beta bij 503 K, een inlaat etheenpartieeldruk
van 1.0 MPa en een conversie van 50% (links) en 99% (rechts). De modelsimulaties zijn verkregen via
integratie van vgl. 2-21 waarin de netto-vormingssnelheden gegeven zijn door vgl. 5-15 met de
parameterwaarden zoals in Tabellen 5-5 en 5-6. De alkenen zijn gegroepeerd per koolstofgetal. De hoogte
van de horizontale lijn in de cirkels is proportioneel met de massafractie van de overeenkomstige
alkeengroep. Als de horizontale lijn niet zichtbaar is, is de massafractie van de overeenkomstige alkeen
groep kleiner dan 1%. Echter, deze groepen kunnen wel significant bijdragen tot de vorming van andere
producten. Bovendien worden de alkeengroepen die een massafractie hebben van minder dan 0.1%
weergegeven in watermerk. De verticale grijswaardeschaal differentieert tussen de verschillende structurele
isomeren, nl., wit: lineaire alkenen, lichtgrijs: mono-vertakte alkenen, donkergrijs: di-vertakte alkenen. De
oppervlakte ingenomen door deze kleuren is proportioneel met de massafractie van elk structurele isomeer
in de alkeengroep. De kleur van een pijl duidt de reactie familie aan: blauw = metaal-ion gekatalyseerde
oligomerisatie, rood = alkylering gekatalyseerd door een zuur centrum, groen = β-scissie. PCP-vertakkingen
en alkylverschuivingen zijn niet expliciet weergegeven omdat deze enkel de verdeling van de structurele
isomeren beïnvloeden binnen eenzelfde alkeengroep. De grootte van een pijl is proportioneel met de
snelheid van de overeenkomstige stap. Het getal aan de pijlpunt duidt de fractie van de groep aan die wordt
geproduceerd via de overeenkomstige stap. Het getal aan de pijlstaart duidt de fractie van de groep aan die
verdwijnt via de overeenkomstige stap.
Gebaseerd op deze reactiepad analyse, zijn richtlijnen voorgesteld om de
katalysatoreigenschappen aan te passen om de opbrengst naar bepaalde, waardevolle
productfracties te maximaliseren, b.v., 1-alkenen, propeen en benzine. Figuur 6 toont het
effect van de verandering van de concentratie aan zure centra op de productdistributie bij
50% conversie bij eenzelfde nickel-ion concentratie. Bij een lage concentratie aan zure
centra worden vooral 1-alkenen geproduceerd via oligomerisatie op de nickel-ion centra.
Met toenemende concentratie aan zure centra worden de gevormde oligomeren meer
geïsomeriseerd en gekraakt op de zure centra wat leidt tot een toename van de benzine en
propeenfractie.
C3
C2
100
35
35 100
100
97
3
2
98
30
16
50 50
C6
C4
C5C8
84
C7
C3
C2
70
35
35 100
96
86
2
2
98
30
20
50 50
C6
C4
C5
70
C7
10
12
100
10050
50
5050
2
2
2
28
C8
12 88
100

lxvi
Figuur 6: Selectiviteit naar 1-alkenen (volle lijn), benzine (stippellijn) en propeen (gestreepte lijn) op Ni-Beta
als functie van de concentratie aan zure centra bij 50% etheenconversie, 503 K en een inlaat
etheenpartieeldruk van 1.0 MPa. De resultaten zijn verkregen door integratie van vgl. 2-21 waarin de netto-
vormingssnelheden gegeven zijn door vgl. 5-15 met de parameter waarden zoals in Tabellen 5-5 en 5-6.
Gelijkaardige effecten werden waargenomen bij stijgende zuursterkte, dalende concentratie
aan nickel-ion centra en dalende etheen standaard coördinatie enthalpie. Het effect van een
verandering in fysisorptieparameters werd ook onderzocht. Een te sterke fysisorptie van de
zwaardere componenten leidt tot een snelle saturatie van het katalysatoroppervlak en een
daling van de etheenoligomerisatiesnelheid.
Het SEMK-model voor etheenoligomerisatie is tevens geïntegreerd in een multi-schaalmodel
voor een industriële reactor, zie Figuur 7. Dit model is in staat om een multi-vastbedreactor
te beschrijven die zowel isotherm, adiabatisch en via warmte-uitwisseling kan worden
bedreven. De drukval als gevolg van wrijving met het vast bed kan worden bepaald.
Vloeistofvorming door condensatie van zware oligomeren is eveneens opgenomen, net als
intrakristallijne transportlimitaties. Het industriëlereactormodel is gevalideerd a.h.v. een
stel experimenten uitgevoerd door CEPSA (Compañía Española de Petróleos S.A.)
gebruikmakende van hun oligomerisatie demonstratie-eenheid. Deze testen werden
uitgevoerd bij meer extreme reactiecondities dan toegepast bij de acquisitie van de
laboschaaldata gebruikt voor het opstellen van het intrinsiek kinetische model. Het effect
van het verwarmingsregime, de reactorgeometrie, vloeistofvorming en intrakristallijne
diffusie op de waargenomen performantie is onderzocht a.h.v. modelsimulaties. Een
industriële reactor is ontworpen gebaseerd op het bereik van reactiecondities voor het
0
5
10
15
20
25
30
35
40
45
50
0.1 0.3 0.5 0.7 0.9
Se
lect
ivit
eit
[%
]
Concentratie zure centra [mol kgkat-1]

lxvii
OCMOL proces [5]. Een jaarlijkse capaciteit van 30 kTon etheen en een conversie van 95%
werden voorgesteld als ontwerpparameters. Dit leidde tot een reactor van ca. 10 m lang en
1 m in diameter. Indien de reactor adiabatisch wordt bedreven met inlaattemperatuur en
etheendruk van respectievelijk 573 K en 3.5 MPa met de Ni-Beta zeoliet, wordt een 1-alkeen
opbrengst verkregen van 4%. Voor propeen en benzine bedraagt dit resp. 30% en 40%.
Figuur 7: Grafische voorstelling van het industriëlereactormodel voor de heterogeen, bifunctioneel
gekatalyseerde etheen oligomerisatie.
Xyleenisomerisatie
Xyleenisomerisatie is een belangrijke reactie voor de productie van monomeren die gebruikt
worden voor een belangrijk polymeer, nl., polyethyleentereftalaat (PET) [10].
Xyleenisomerisatie en wordt ingezet om de paraxyleenhoeveelheid te verhogen in xyleen
mengsels komende van katalytisch reformen, pyrolyse van gasolie en tolueen
disproportionering [11]. Typisch wordt een bifunctionele katalysator gebruikt voor deze
reactie, b.v., Pt/H-ZSM-5. De zure centra katalyseren methylverschuivingen,
transalkylerings- en dealkyleringsreacties, zie Figuur 8. Het edelmetaal, in dit geval Pt,
vermindert de cokesvorming maar leidt tevens tot de hydrogenering van een kleine fractie
aan aromaten, zie Figuur 8.

lxviii
CH3
CH3
CH3
CH3
CH3
CH3
CH3
CH3
CH3
CH3
CH3
CH3
+
CH3
CH3
+
CH3
CH3
+
CH3
CH3
CH3CH3
CH3
C2H6
CH3+
CH3
CH3 CH3
+
CH3
CH3
CH3
Fysisorptie
Fysisorptie
(de-)Protonering
Fysisorptie Fysisorptie
(de-)ProtoneringMethylshift
Dealkylering
(de-
)Hyd
rog
ener
ing
Metaal centra Zure centra
Zeoliet
CH3
CH3CH3
(de-)Protonering
Chemisorptie
Chemisorptie
CH3
Transalkylering
R
R
R
R
CH4
Figuur 8: Schematische voorstelling van het reactienetwerk voor xyleenisomerisatie op een bifunctionele
katalysator. Een gasfasecomponent kan fysisorberen op het katalysatoroppervlak, gevolgd door een
mogelijke interactie met ofwel de zure als metallische centra. Afhankelijk van het type actief centrum,
ondergaat de component isomerisatie of scissie op de zure centra of hydrogenering op de metallische
centra. De gevormde producten verlaten de actieve centra en desorberen van het katalysatoroppervlak.
Om de voornaamste reactiepaden te bepalen, is een SEMK model opgesteld. Een beperkte,
maar goed ontworpen experimentele dataset op een industriële Pt/H-ZSM-5 was door Shell
aangereikt en werd gebruikt voor modelevaluatie en -regressie. Het resulterende model kon
de experimentele data adequaat beschrijven en werd vervolgens gebruikt om optimale
Pt/H-ZSM-5 eigenschappen te bepalen, zie Figuur 9. Figuur 9 toont de waarde van een
‘opbrengst’functie ψ als functie van de standaard protoneringsenthalpie. Deze standaard
protoneringsenthalpie is een maat voor de gemiddelde zuursterkte van de actieve centra
[12]. De ‘opbrengst’functie is gedefinieerd a.h.v. opbrengst en verlies van waardevolle
producten. Op een katalysator met zwak zure centra, overeenkomstig met een standaard
protoneringsenthalpie lager dan -60 kJ mol-1
, wordt er slechts weinig activiteit
waargenomen, wat overeenkomt met een lage ‘opbrengst’. Met toenemende zuursterkte
van de actieve centra, d.i. tussen -60 en -80 kJ mol-1
, neemt de ‘opbrengst’functie toe door
een toenemende opbrengst aan paraxyleen en benzeen. Met nog sterkere zure centra, nl.,
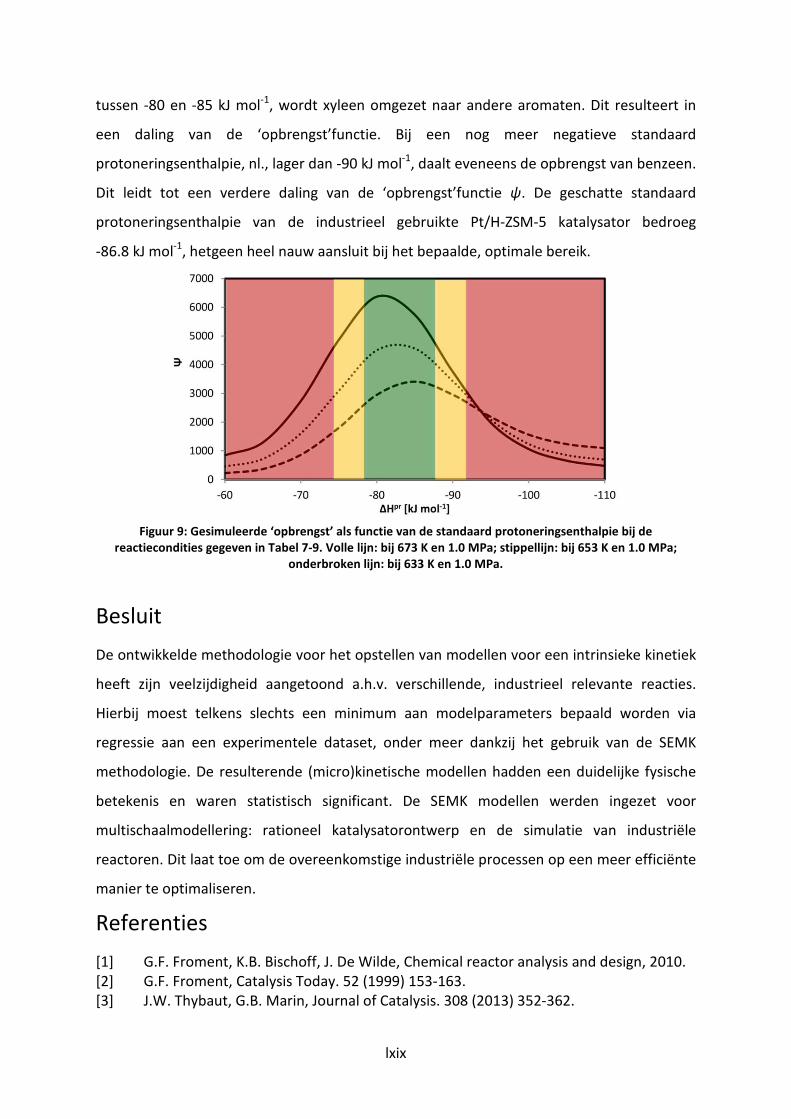
lxix
tussen -80 en -85 kJ mol-1
, wordt xyleen omgezet naar andere aromaten. Dit resulteert in
een daling van de ‘opbrengst’functie. Bij een nog meer negatieve standaard
protoneringsenthalpie, nl., lager dan -90 kJ mol-1
, daalt eveneens de opbrengst van benzeen.
Dit leidt tot een verdere daling van de ‘opbrengst’functie ψ. De geschatte standaard
protoneringsenthalpie van de industrieel gebruikte Pt/H-ZSM-5 katalysator bedroeg
-86.8 kJ mol-1
, hetgeen heel nauw aansluit bij het bepaalde, optimale bereik.
Figuur 9: Gesimuleerde ‘opbrengst’ als functie van de standaard protoneringsenthalpie bij de
reactiecondities gegeven in Tabel 7-9. Volle lijn: bij 673 K en 1.0 MPa; stippellijn: bij 653 K en 1.0 MPa;
onderbroken lijn: bij 633 K en 1.0 MPa.
Besluit
De ontwikkelde methodologie voor het opstellen van modellen voor een intrinsieke kinetiek
heeft zijn veelzijdigheid aangetoond a.h.v. verschillende, industrieel relevante reacties.
Hierbij moest telkens slechts een minimum aan modelparameters bepaald worden via
regressie aan een experimentele dataset, onder meer dankzij het gebruik van de SEMK
methodologie. De resulterende (micro)kinetische modellen hadden een duidelijke fysische
betekenis en waren statistisch significant. De SEMK modellen werden ingezet voor
multischaalmodellering: rationeel katalysatorontwerp en de simulatie van industriële
reactoren. Dit laat toe om de overeenkomstige industriële processen op een meer efficiënte
manier te optimaliseren.
Referenties
[1] G.F. Froment, K.B. Bischoff, J. De Wilde, Chemical reactor analysis and design, 2010.
[2] G.F. Froment, Catalysis Today. 52 (1999) 153-163.
[3] J.W. Thybaut, G.B. Marin, Journal of Catalysis. 308 (2013) 352-362.

lxx
[4] B.D. Vandegehuchte, J.W. Thybaut, G.B. Marin, Ind. Eng. Chem. Res. (2014).
[5] http://www.ocmol.eu/, 2014.
[6] Ullmann's Encyclopedia of Industrial Chemistry (2014).
[7] P.T. Anastas, M.M. Kirchhoff, T.C. Williamson, Applied Catalysis a-General. 221
(2001) 3-13.
[8] C. Lepetit, J.Y. Carriat, C. Bennett, Applied Catalysis a-General. 123 (1995) 289-300.
[9] S.M. Pillai, M. Ravindranathan, S. Sivaram, Chemical Reviews. 86 (1986) 353-399.
[10] Ullmann’s Encyclopedia of Industrial Chemistry, 6th ed.
[11] Kirk-Othmer Encyclopediae of Chemical Technology, 4th ed.
[12] J.W. Thybaut, G.B. Marin, G.V. Baron, P.A. Jacobs, J.A. Martens, Journal of Catalysis.
202 (2001) 324-339.

1
Chapter 1
Introduction
Among other aspects, chemical reaction and reactor engineering focuses on the
development of comprehensive models, accounting for net production rates based on
intrinsic chemical kinetics as well as for transport phenomena at the catalyst pellet and the
reactor scale [1, 2]. Reactor integration into an overall plant and the corresponding
optimization heavily rely on adequate reactor and kinetic models which should, hence, be
an essential element in the toolbox mastered by chemical engineers. It offers strategic
advantages for engineers to adopt a systematic methodology when constructing such a
model. This leads to an increased understanding of the occurring phenomena and facilitates
academic and industrial communication between researchers in a similar field. Such a
systematic methodology is proposed in this work, which is aimed at acquiring adequate
kinetic models with a sound physical meaning and a justifiable statistical significance
starting from intrinsic kinetic data.
1.1 Multi-scale modeling
At the Laboratory of Chemical Technology at Ghent University, chemical engineering is
approached in a multi-scale ideology as depicted in Figure 1-1. As can be seen in Figure 1-1,
kinetics are situated centrally between the fundamental phenomena occurring at the
catalyst scale and the applied phenomena at the reactor scale. In order to elucidate the
underlying reaction mechanisms and design corresponding industrial reactors, an adequate
mathematical representation of the occurring chemical kinetics is necessary. Several types
of kinetic models can be considered, i.e., power laws, Langmuir-Hinshelwood/Hougen-
Watson (LHHW), Eley-Rideal, Mars-van Krevelen, lumped models and detailed mechanistic
models… [3]. The order in which they are presented corresponds with increasing level of
detail and complexity in the model as well as of CPU time needed when performing the
model simulations. While for industrial process simulations, ‘easy-to-use’ models such as
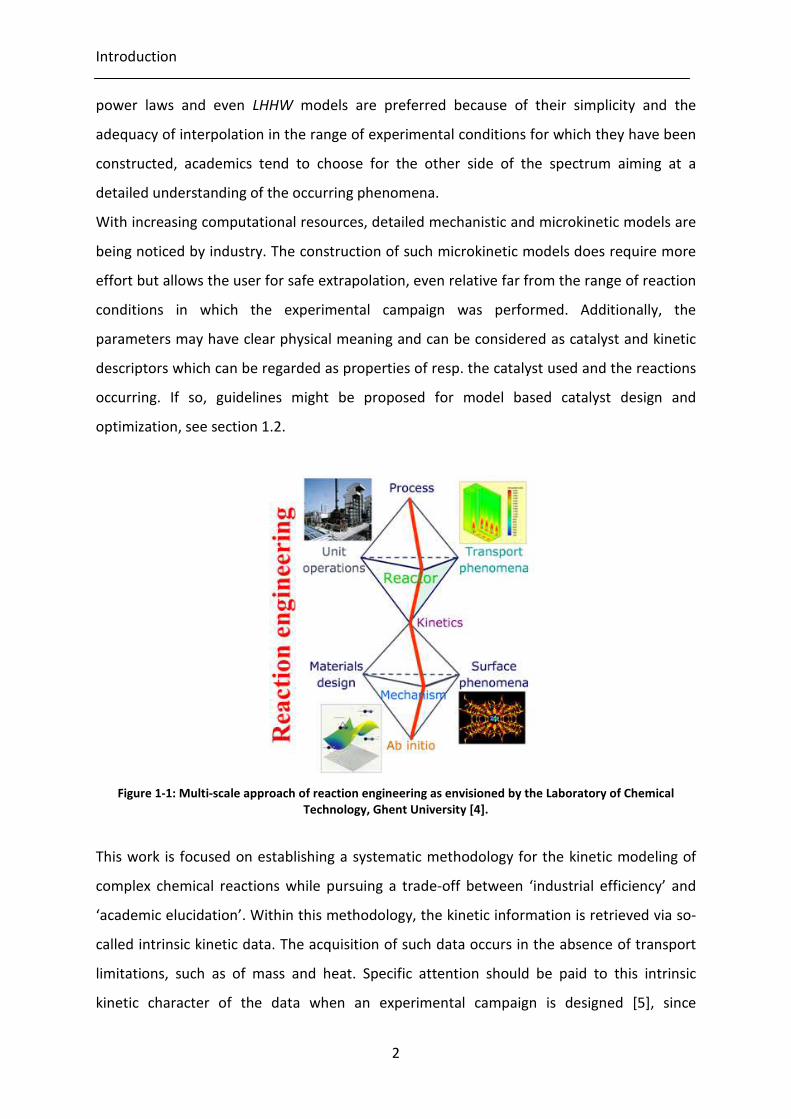
Introduction
2
power laws and even LHHW models are preferred because of their simplicity and the
adequacy of interpolation in the range of experimental conditions for which they have been
constructed, academics tend to choose for the other side of the spectrum aiming at a
detailed understanding of the occurring phenomena.
With increasing computational resources, detailed mechanistic and microkinetic models are
being noticed by industry. The construction of such microkinetic models does require more
effort but allows the user for safe extrapolation, even relative far from the range of reaction
conditions in which the experimental campaign was performed. Additionally, the
parameters may have clear physical meaning and can be considered as catalyst and kinetic
descriptors which can be regarded as properties of resp. the catalyst used and the reactions
occurring. If so, guidelines might be proposed for model based catalyst design and
optimization, see section 1.2.
Figure 1-1: Multi-scale approach of reaction engineering as envisioned by the Laboratory of Chemical
Technology, Ghent University [4].
This work is focused on establishing a systematic methodology for the kinetic modeling of
complex chemical reactions while pursuing a trade-off between ‘industrial efficiency’ and
‘academic elucidation’. Within this methodology, the kinetic information is retrieved via so-
called intrinsic kinetic data. The acquisition of such data occurs in the absence of transport
limitations, such as of mass and heat. Specific attention should be paid to this intrinsic
kinetic character of the data when an experimental campaign is designed [5], since
Chapter 1
3
transport limitations may conceal and bias the experimental observations. The modeling of
transport limited data relies on more complex expressions and, more importantly, requires
additional model parameters which enhance the degrees of freedom of the model and,
hence, potentially jeopardize the sound statistical and physical meaning of the final
parameter estimates. For industrial reactor modeling purposes, the required transport
phenomena are typically accounted for via the proper correlations [1].
In order to obtain a kinetic model with both a sound statistical and physical interpretation,
simple power law and even LHHW kinetics tend to be insufficient. Microkinetic models,
which meet these requirements, often contain a gargantuan amount of components,
intermediates and elementary steps, which allows for rational catalyst design. However, this
requires more computational effort to determine the unknown kinetic and catalyst
descriptors. In this work, in order to decrease the computational effort needed to solve
these microkinetic models, the Single-Event MicroKinetic (SEMK) methodology has been
applied, see section 1.2. As will be clear from this work, such a microkinetic approach could
yield adequate kinetic models with a clear physiochemical meaning, allowing for
optimization at smaller and larger scale, i.e., resp. catalyst and reactor scale. The systematic
methodology developed in this work and the following multi scale modeling and
optimization will be illustrated with several industrially relevant reactions used for the
production of chemicals and fuels employing bifunctional catalysts such as n-hexane
hydrocracking, see section 1.4.1 and chapter 3, ethene oligomerization, see section 1.4.2
and chapters 4, 5 and 6, and xylene isomerization, see section 1.4.3 and chapter 7.
1.2 Single-Event MicroKinetic modeling
The SEMK methodology is ideally suited for the detailed kinetic modelling of reactions in
complex mixtures [6]. Rather than lumping species into pseudo components, reaction
families are defined to reduce the number of model parameters. Per reaction family a
unique rate coefficient denoted as “single-event” rate coefficient, is defined. To calculate
the actual rate coefficient of an elementary step, the single-event rate coefficient is
multiplied with the number of single events. The latter accounts for the number of
indistinguishable manners in which an elementary step can occur and depends on the
structural differences between the reactants and the transitition state. This methodology is
Introduction
4
already applied successfully to acid, metal and bifunctional catalyzed reactions, i.e.,
hydroconversion [7, 8], alkylation [9], catalytic cracking [10], catalytic reforming [11],
methanol to olefins [12, 13], Fischer-Tropsch synthesis [14], hydrogenation of aromatics [15]
and xylene isomerization [16]. Within such SEMK models, a distinction is made between
kinetic and catalyst descriptors, the former are reaction specific and catalyst independent,
e.g., activation energies and pre-exponential factors while the latter take into account the
effect of the catalyst properties, e.g., acid site strength through the protonation enthalpy,
while the former are reaction specific and catalyst independent, e.g., activation energies
and pre-exponential factors. When both types of model parameters have been quantified,
an optimal catalyst can be designed by the optimization of a cost function, e.g., defined by
the product yield, within a specified range of operating conditions, as a function of the
catalyst descriptors [16, 17], hence, bringing model based catalyst design within reach, see
section 1.2.
1.3 Model Based Catalyst Design
A schematic overview of model based catalyst design is given in Figure 1-2. Traditionally, an
optimal catalyst is being identified via a number of iterations between the synthesis of
consecutive generations in a catalyst library and the analysis of the performance testing
results in the corresponding activity library, see the forward and reverse arrow of step 2 in
Figure 1-2. Model based catalyst design quantifies the information contained in the activity
library through the kinetic and catalyst descriptors in the adequate microkinetic models that
are constructed. By ‘in-silico’ determination of optimal catalyst descriptor values, see
section 1.2 and step 4 in Figure 1-2, guidelines are proposed for synthesizing a new
generation catalyst library. As such, model based catalyst design allows a more rational
approach in catalyst design and optimization.

Chapter 1
5
Figure 1-2: Model based catalyst design [17]
1.4 Introduction to the chemical reactions used for Model
Based Catalyst Design and multi-scale modeling
In total, three relevant industrial chemical reactions have been modeled by applying the
methodology described in previous sections, i.e., n-hexane hydroisomerization, ethene
oligomerization and xylene isomerization. n-Hexane hydroisomerization is considered as a
case study in which the methodology is illustrated. For ethene oligomerization, a
microkinetic model is constructed based upon intrinsic kinetic data. This microkinetic model
is used for multi-scale modeling, i.e., model based catalyst design and industrial reactor
optimization. A microkinetic model has been constructed for xylene isomerization based
upon a limited, but well-designed experimental data set obtained from Shell. The resulting
knowledge is used to provide guidelines for the optimization of the industrially used xylene
isomerization catalyst.
1.4.1 n-Hexane hydrocracking: a case study
n-Hexane hydroisomerization over a bifunctional zeolite is used in this work as a case study
to illustrate the systematic methodology developed for kinetic modeling as developed in
this work. This model reaction only entails a limited reaction network for which the
catalyst library activity library
optimizeddescriptors
newconcept
industrialapplication
performance testing
design
synthesis
kinetic and catalystdescriptors
modelling
1
2
3
4
Introduction
6
mechanism is well-established [18-24]. While the acid function provided by the H-ZSM-5
zeolite framework provokes the skeletal rearrangement and cracking, the metal function
enables operating at moderate temperatures in the range between 200°C to 300°C while
avoiding deactivation by coking. In order to acquire the most details as possible about the
acid catalyzed reaction mechanism, the experimental investigation was performed at gas
phase conditions under which ideal hydrocracking occurs [20, 22, 23, 25-29]. When
performing experiments within such a range of operating conditions, the acid catalyzed
reactions are rate determining, leading to specific kinetic behavior, e.g., exhibiting a
maximum isomer yield.
The goal of modeling the hydroisomerization of n-hexane over a bifunctional catalyst is
twofold:
1. illustrate the systematic methodology proposed for kinetic modeling.
2. develop a kinetic model exhibiting an adequate balance between statistical
significance and physical meaning.
This case study is an ideal exercise for engineering students and young professionals new to
the field of chemical reaction engineering and has been successfully used during several
modeling courses at Ghent University and international workshops.
1.4.2 Ethene oligomerization: searching for sustainable fuels
and chemicals
The pursuit of so-called ‘sustainable’ fuels and chemicals has never assumed such a global
character as today. With increasing environmental concern and corresponding legislation as
well as crude oil depletion, new feedstocks and processes are screened for their economic
potential while accounting for their environmental impact. Shale gas and oil, tar sands and
stranded gas are exploited to aid in the transition to non-conventional hydrocarbon sources.
Of these hydrocarbon sources, stranded gas is the most promising for the transition to
sustainable processes.
Natural gas reservoirs are considered to be stranded when their commercial exploitation is
impossible. For such, typically small, reservoirs several projects are investigating the
application of gas-to-liquid technologies, e.g., Next-GTL [30], CARENA [31], DEMCAMER [32]
and OCMOL [33]. The present work has been performed within the framework of OCMOL
Chapter 1
7
which is the acronym for ‘Oxidative Coupling of Methane followed by the Oligomerization to
Liquids’ [33]. It is aimed at to use heterogeneous catalysts in order to improve the process’
sustainability by nullifying the need for environmental unfriendly solvents and decreasing
the energy requirements for solvent recuperation [34].
In the first step of this integrated process, methane originating from stranded gas or biogas
is oxidatively coupled to form ethene. In a subsequent step, the latter is oligomerized and
transformed into liquid fuels, e.g., gasoline, or chemicals such as linear 1-alkenes and
propene. The latter could be an important asset when shale gas is used as feed to the
OCMOL process. Shale gas processing leads to a product slate primarily composed of ethene
rather than propene which, hence, indirectly affects the production of polypropylene and
other propene derivates [35].
Ethene is not susceptible to acid catalysis under the mild reaction conditions, i.e., at
temperatures 523 K, used in this work, because it necessarily requires the involvement of
primary carbenium ions. However, in the presence of nickel-ions, ethene is readily
dimerized to butene which, in turn, can undergo further acid catalyzed steps via secondary
carbenium ions .
Ethene oligomerization is a well-established reaction which, in a homogeneously catalyzed
process configuration, has already been implemented at the industrial scale [36]. Commonly
used catalysts such as trialkylammonium and nickel complexes, typically lead to linear 1-
alkenes [37]. While 1-alkenes are high-value products, these processes offer little flexibility
in tuning the product distribution to respond to potential fluctuations in market demands
for fuels and chemicals. Additionally, the use of homogeneous catalysts is inherently
coupled to the use of environmentally unfriendly solvents and an extensive energy
consumption for their recuperation [34]. The use of heterogeneous catalysts may help to
overcome these disadvantages. Nowadays it is attempted to immobilize active sites for
ethene oligomerization on a heterogeneous support, hence, avoiding further catalyst
separation. Active metals such as nickel [38, 39] or chromium [40, 41] are then deposited on
acidic supports such as zeolites or silica-alumina. The acid sites of these supports catalyze
the further reactions of the dimers, i.e., butenes, produced at the metal sites and guarantee
the desired product flexibility. The use of specific zeolite framework structures such as ZSM-
5 or ZSM-22 enables a further tuning of the product yields [7, 42].
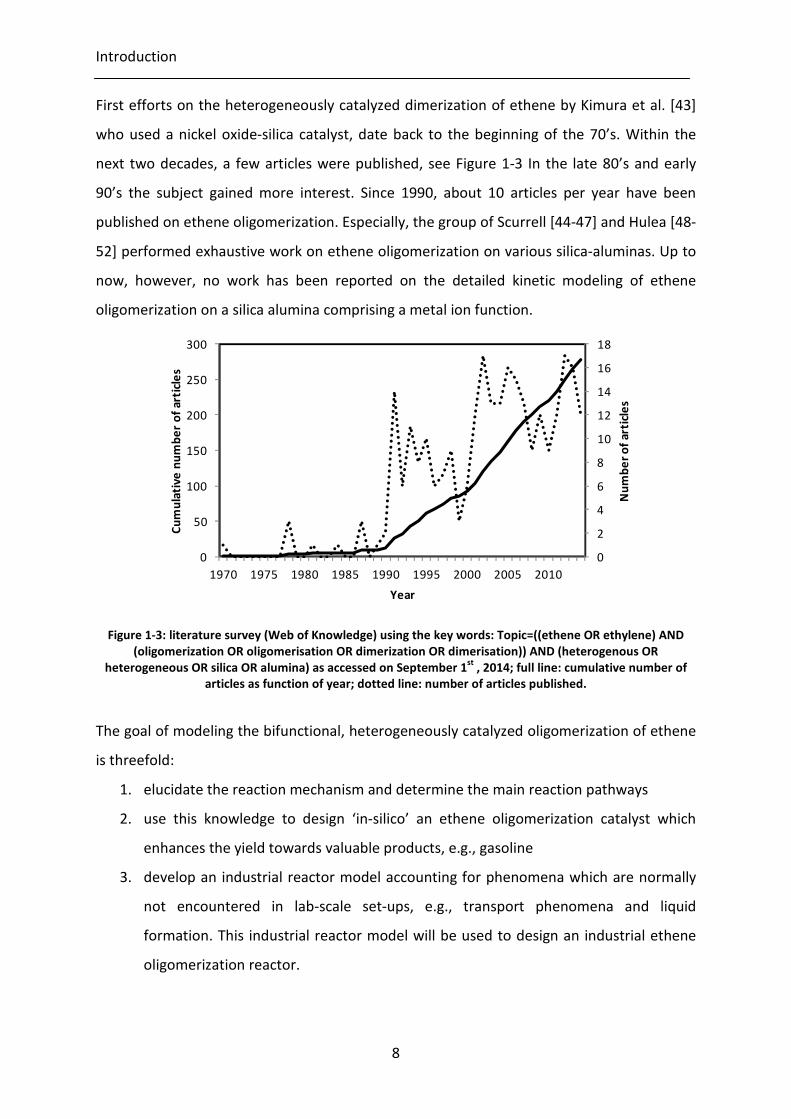
Introduction
8
First efforts on the heterogeneously catalyzed dimerization of ethene by Kimura et al. [43]
who used a nickel oxide-silica catalyst, date back to the beginning of the 70’s. Within the
next two decades, a few articles were published, see Figure 1-3 In the late 80’s and early
90’s the subject gained more interest. Since 1990, about 10 articles per year have been
published on ethene oligomerization. Especially, the group of Scurrell [44-47] and Hulea [48-
52] performed exhaustive work on ethene oligomerization on various silica-aluminas. Up to
now, however, no work has been reported on the detailed kinetic modeling of ethene
oligomerization on a silica alumina comprising a metal ion function.
Figure 1-3: literature survey (Web of Knowledge) using the key words: Topic=((ethene OR ethylene) AND
(oligomerization OR oligomerisation OR dimerization OR dimerisation)) AND (heterogenous OR
heterogeneous OR silica OR alumina) as accessed on September 1st
, 2014; full line: cumulative number of
articles as function of year; dotted line: number of articles published.
The goal of modeling the bifunctional, heterogeneously catalyzed oligomerization of ethene
is threefold:
1. elucidate the reaction mechanism and determine the main reaction pathways
2. use this knowledge to design ‘in-silico’ an ethene oligomerization catalyst which
enhances the yield towards valuable products, e.g., gasoline
3. develop an industrial reactor model accounting for phenomena which are normally
not encountered in lab-scale set-ups, e.g., transport phenomena and liquid
formation. This industrial reactor model will be used to design an industrial ethene
oligomerization reactor.
0
2
4
6
8
10
12
14
16
18
0
50
100
150
200
250
300
1970 1975 1980 1985 1990 1995 2000 2005 2010
Nu
mb
er
of
art
icle
s
Cu
mu
lati
ve
nu
mb
er
of
art
icle
s
Year

Chapter 1
9
1.4.3 Xylene isomerization: meeting the world demand for
polymer production
During the last decades, thermoplastic polymers have become very important. They have
proven their flexibility, durability and broad application area. One of the most common
thermoplastic polymers is PET – polyethylenetereftalate. The main uses for this polymer are
in synthetic fibers, beverage bottles, food and other containers, films and foils [53]. The key
building blocks of this polymer are ethylene and tereftalic acid. The latter is formed by
partial oxidation of paraxylene, which, as a raw material, is generally co-produced with
other xylene isomers, i.e., metaxylene and orthoxylene. Ethylbenzene is usually present as
well in such xylene mixtures. All these components exhibit very similar boiling points.
Conventional xylene mixtures produced by catalytic reforming, gasoil pyrolysis, toluene
disproportionation or from charcoal, contain an excess of metaxylene and a deficit of
paraxylene in comparison with the global market demand. Metaxylene, which is
economically and industrially less interesting, typically makes up about two thirds of such
mixtures, while at least 70% is required as paraxylene [54]. Additionally, a large amount of
the orthoxylene is needed for the production of plasticizers trough phthalic anhydride [53].
Isomerization processes in which the less valuable products are transformed into the
desired isomers, play a pivotal role in matching the market demand while preventing xylene
losses.
Xylene isomerization is an acid-catalyzed process which makes use of either amorphous
silica-aluminates, zeolites or metal oxides. Nowadays, mostly zeolite based isomerization
processes are commercialized because of the broad range in which the catalyst properties
can be tuned, i.e., shape selectivity, acid site density, surface area,… [53, 54]. The use of a
metallic function such as platinum provides a bifunctional character to the zeolite which
suppresses deactivation in the presence of hydrogen.
First efforts related to kinetic modelling of xylene isomerization on H-ZSM-5 were reported
in 1995 by Liang et al. [55] who proposed a kinetic model for toluene disproportionation on
ZSM-5, including diffusion phenomena. In 1996 Morin et al. [56] constructed a kinetic model
for xylene isomerization on HY zeolites. Iliyas and Al-Khattaf [57-61] performed kinetic
measurements and correspondingly constructed a kinetic model for xylene isomerization on
both USY and H-ZSM-5 zeolites. Gonzalez et al. [62] constructed a quadratic model for the
Introduction
10
isomerization of xylenes over a Pt/mordenite catalyst. More recently, some authors
published on the use of a membrane reactor [63-67] or a moving bed reactor [68] for the
isomerization of xylene. Despite the major industrial interest and relevance of the subject,
no entirely fundamental kinetic modeling methodology, such as the Single-Event
MicroKinetics (SEMK), has been applied to xylene isomerization yet.
The goal of modeling the isomerization of xylene is threefold:
1. SEMK model construction based upon a limited, but well-designed experimental
data set obtained from Shell.
2. reaction mechanism elucidation and reaction pathway analysis
3. use this knowledge to provide guidelines for the optimization of the industrially used
xylene isomerization catalyst
1.5 Scope of the thesis
In this work, the multi-scale modeling approach of the Laboratory of Chemical Technology is
approached starting from a systematic methodology. This systematic methodology is based
on intrinsic kinetics which are used to determine the catalyst and kinetic descriptors by
regression. This should result in an adequate microkinetic model which has a sound physical
meaning and a justifiable statistical significance. Using these microkinetic models, new
catalyst can be tailored ‘in-silico’. Similarly, industrial reactors can be designed and
optimized by including phenomena which are occurring and influencing the kinetics at larger
scales. This multi-scale modeling approach has been illustrated by and applied to three
industrial relevant chemical reactions, i.e., n-hexane hydroisomerization, ethene
oligomerization and xylene isomerization.
The scope of the thesis can be summarized in the following bullet points:
a. To develop a systematic methodology for (kinetic) modelling (chapter 2, section )
b. Apply the developed methodology for modeling industrially relevant reactions:
i. n-hexane hydroisomerization (chapter 3)
ii. ethene oligomerization (chapter 4, 5 and 6)
iii. xylene isomerization (chapter 7)
Chapter 1
11
c. Illustrate the benefits of (Single-Event) MicroKinetic modeling towards multi scale
modeling:
i. Catalyst design (chapter 5 and 7)
ii. Industrial reactor design (chapter 6)
1.6 References
[1] G.F. Froment, K.B. Bischoff, J. De Wilde, Chemical reactor analysis and design, 2010.
[2] G.B. Marin, G.S. Yablonsky, Kinetics of Chemical Reactions: Decoding Complexity,
2011.
[3] A.N.R. Bos, L. Lefferts, G.B. Marin, M.H.G.M. Steijns, Applied Catalysis a-General. 160
(1997) 185-190.
[4] http://www.lct.ugent.be/, 2014.
[5] R.J. Berger, E.H. Stitt, G.B. Marin, F. Kapteijn, J.A. Moulijn, Cattech. 5 (2001) 30-60.
[6] G.F. Froment, Catalysis Today. 52 (1999) 153-163.
[7] C.S.L. Narasimhan, J.W. Thybaut, G.B. Marin, P.A. Jacobs, J.A. Martens, J.F. Denayer,
G.V. Baron, Journal of Catalysis. 220 (2003) 399-413.
[8] J.W. Thybaut, I.R. Choudhury, J.F. Denayer, G.V. Baron, P.A. Jacobs, J.A. Martens,
G.B. Marin, Topics in Catalysis. 52 (2009) 1251-1260.
[9] J.M. Martinis, G.F. Froment, Industrial & Engineering Chemistry Research. 45 (2006)
954-967.
[10] R. Quintana-Solorzano, J.W. Thybaut, P. Galtier, G.B. Marin, Catalysis Today. 150
(2010) 319-331.
[11] R. Sotelo-Boyas, G.F. Froment, Industrial & Engineering Chemistry Research. 48
(2009) 1107-1119.
[12] T.Y. Park, G.F. Froment, Industrial & Engineering Chemistry Research. 40 (2001)
4187-4196.
[13] T.Y. Park, G.F. Froment, Industrial & Engineering Chemistry Research. 40 (2001)
4172-4186.
[14] G. Lozano-Blanco, J.W. Thybaut, K. Surla, P. Galtier, G.B. Marin, Industrial &
Engineering Chemistry Research. 47 (2008) 5879-5891.
[15] T. Bera, J.W. Thybaut, G.B. Marin, Industrial & Engineering Chemistry Research. 50
(2011) 12933-12945.
[16] K. Toch, J.W. Thybaut, B.D. Vandegehuchte, C.S.L. Narasimhan, L. Domokos, G.B.
Marin, Applied Catalysis a-General. 425-426 (2012) 130-144.
[17] J.W. Thybaut, G.B. Marin, Journal of Catalysis. 308 (2013) 352-362.
[18] J.F. Allain, P. Magnoux, P. Schulz, M. Guisnet, Applied Catalysis a-General. 152 (1997)
221-235.
[19] M.A. Baltanas, G.F. Froment, Computers & Chemical Engineering. 9 (1985) 71-81.
[20] M.A. Baltanas, H. Vansina, G.F. Froment, Industrial & Engineering Chemistry Product
Research and Development. 22 (1983) 531-539.
[21] G.G. Martens, J.W. Thybaut, G.B. Marin, Industrial & Engineering Chemistry
Research. 40 (2001) 1832-1844.
[22] M. Steijns, G. Froment, P. Jacobs, J. Uytterhoeven, J. Weitkamp, Industrial &
Engineering Chemistry Product Research and Development. 20 (1981) 654-660.

Introduction
12
[23] M. Steijns, G.F. Froment, Industrial & Engineering Chemistry Product Research and
Development. 20 (1981) 660-668.
[24] A. vandeRunstraat, J. vanGrondelle, R.A. vanSanten, Industrial & Engineering
Chemistry Research. 36 (1997) 3116-3125.
[25] C.S. Raghuveer, J.W. Thybaut, R. De Bruycker, K. Metaxas, T. Bera, G.B. Marin, Fuel.
125 206-218.
[26] J.W. Thybaut, C.S.L. Narasimhan, J.F. Denayer, G.V. Baron, P.A. Jacobs, J.A. Martens,
G.B. Marin, Industrial & Engineering Chemistry Research. 44 (2005) 5159-5169.
[27] J.W. Thybaut, C.S.L. Narasimhan, G.B. Marin, Catalysis Today. 111 (2006) 94-102.
[28] H. Vansina, M.A. Baltanas, G.F. Froment, Industrial & Engineering Chemistry Product
Research and Development. 22 (1983) 526-531.
[29] J. Weitkamp, Erdol & Kohle Erdgas Petrochemie. 31 (1978) 13-22.
[30] http://cordis.europa.eu/project/rcn/93080_en.html, 2014.
[31] http://www.carenafp7.eu/, 2014.
[32] http://www.demcamer.org/, 2014.
[33] http://www.ocmol.eu/, 2014.
[34] P.T. Anastas, M.M. Kirchhoff, T.C. Williamson, Applied Catalysis a-General. 221
(2001) 3-13.
[35] T.K. Swift, M.G. Moore, Chemical Engineering Progress. 109 (2013) 24-28.
[36] Ullmann's Encyclopedia of Industrial Chemistry (2014).
[37] J.J. Spivey, D.E. Resasco, A.G. Dixon, M. Boudart, Catalysis, 1999.
[38] R. Abeywickrema, M.A. Bennett, K.J. Cavell, M. Kony, A.F. Masters, A.G. Webb,
Journal of the Chemical Society-Dalton Transactions (1993) 59-68.
[39] L.X. Pei, X.M. Liu, H.Y. Gao, Q. Wu, Applied Organometallic Chemistry. 23 (2009) 455-
459.
[40] N. Peulecke, B.H. Muller, S. Peitz, B.R. Aluri, U. Rosenthal, A. Wohl, W. Muller, M.H.
Al-Hazmi, F.M. Mosa, Chemcatchem. 2 (2010) 1079-1081.
[41] P.Y. Qiu, R.H. Cheng, Z. Liu, B.P. Liu, B. Tumanskii, M.S. Eisen, Journal of
Organometallic Chemistry. 699 (2012) 48-55.
[42] C.S.L. Narasimhan, J.W. Thybaut, J.A. Martens, P.A. Jacobs, J.F. Denayer, G.B. Marin,
Journal of Physical Chemistry B. 110 (2006) 6750-6758.
[43] K. Kimura, H. Ai, A. Ozaki, Journal of Catalysis. 18 (1970) 271-&.
[44] J. Heveling, C.P. Nicolaides, M.S. Scurrell, Abstracts of Papers of the American
Chemical Society. 202 (1991) 8-Petr.
[45] J. Heveling, C.P. Nicolaides, M.S. Scurrell, Journal of the Chemical Society-Chemical
Communications (1991) 126-127.
[46] J. Heveling, C.P. Nicolaides, M.S. Scurrell, Applied Catalysis a-General. 173 (1998) 1-9.
[47] J. Heveling, C.P. Nicolaides, M.S. Scurrell, Catalysis Letters. 95 (2004) 87-91.
[48] V. Hulea, F. Fajula, Journal of Catalysis. 225 (2004) 213-222.
[49] M. Lallemand, A. Finiels, F. Fajula, V. Hulea, Applied Catalysis a-General. 301 (2006)
196-201.
[50] M. Lallemand, A. Finiels, F. Fajula, V. Hulea, Journal of Physical Chemistry C. 113
(2009) 20360-20364.
[51] M. Lallemand, A. Finiels, F. Fajula, V. Hulea, Chemical Engineering Journal. 172 (2011)
1078-1082.
[52] M. Lallemand, O.A. Rusu, E. Dumitriu, A. Finiels, F. Fajula, V. Hulea, Applied Catalysis
a-General. 338 (2008) 37-43.
Chapter 1
13
[53] Ullmann’s Encyclopedia of Industrial Chemistry, 6th ed.
[54] Kirk-Othmer Encyclopediae of Chemical Technology, 4th ed.
[55] W.G. Liang, S.Y. Chen, S.Y. Peng, Chemical Engineering Science. 50 (1995) 2391-2396.
[56] S. Morin, N.S. Gnep, M. Guisnet, Journal of Catalysis. 159 (1996) 296-304.
[57] S. Al-Khattaf, A. Iliyas, A. Al-Amer, T. Inui, Journal of Molecular Catalysis a-Chemical.
225 (2005) 117-124.
[58] S. Al-Khattaf, N.M. Tukur, A. Al-Amer, Industrial & Engineering Chemistry Research.
44 (2005) 7957-7968.
[59] A. Iliyas, S. Al-Khattaf, Applied Catalysis a-General. 269 (2004) 225-236.
[60] A. Iliyas, S. Al-Khattaf, Industrial & Engineering Chemistry Research. 43 (2004) 1349-
1358.
[61] A. Iliyas, S. Al-Khattaf, Chemical Engineering Journal. 107 (2005) 127-132.
[62] H. Gonzalez, A. Rodriguez, L. Cedeno, J. Ramirez, J. Aracil, Industrial & Engineering
Chemistry Research. 35 (1996) 3964-3972.
[63] A.L. Deshayes, E.E. Miro, G.I. Horowitz, Chemical Engineering Journal. 122 (2006)
149-157.
[64] A.M. Tarditi, G.I. Horowitz, E.A. Lombardo, Catalysis Letters. 123 (2008) 7-15.
[65] A.M. Tarditi, S. Irusta, E.A. Lombardo, Chemical Engineering Journal. 122 (2006) 167-
174.
[66] Y.F. Yeong, A.Z. Abdullah, A.L. Ahmad, S. Bhatia, Chemical Engineering Journal. 157
(2010) 579-589.
[67] C. Zhang, Z. Hong, X.H. Gu, Z.X. Zhong, W.Q. Jin, N.P. Xu, Industrial & Engineering
Chemistry Research. 48 (2009) 4293-4299.
[68] M. Minceva, P.S. Gomes, V. Meshko, A.E. Rodrigues, Chemical Engineering Journal.
140 (2008) 305-323.


15
Chapter 2
Procedures
This chapter gives an overview of all experimental and modeling procedures applied in this
work. In total, four different experimental set-ups were used for the acquisition of kinetic
data. Two experimental set-ups were located at two different industrial partners. One was
used to experimentally validate the industrial reactor model for ethene oligomerization, see
Chapter 6, while the other was used to acquire the intrinsic kinetic dataset for xylene
isomerization on Pt/H-ZSM-5, see Chapter 7. The two other experimental set-ups were
situated at the Laboratory of Chemical Technology at Ghent University, i.e., a CSTR type
Berty reactor set-up and a HTK-1 plug flow reactor set-up. The Berty set-up was used for the
n-hexane hydroisomerization experiments on a Pt/H-ZSM-5 catalyst different from the one
used in the xylene isomerization experiments. The High-Throughput Kinetic Set-up, HTK-1,
was used for the acquisition of intrinsic ethene oligomerization data on an amorphous Ni-
SiO2-Al2O3 and a Ni-Beta catalyst. A discussion on these catalysts and experimental set-ups is
given in resp. sections 2.1.1 and 2.1.2. The results from such typical experimental campaign
are raw data which have to be reconciliated before they can be used for (micro)kinetic
modeling purposes. The procedure of transforming this raw data into useable numbers is
described in section 2.1.3.
A systematic methodology to adequately model the observed kinetics was proposed, see
section 2.2.1, and was applied throughout this thesis. Mathematical models are at hand for
any of the considered reactors, see section 2.2.2, and are used in the determination of
unknown parameters via model regression to experimental data, see section 2.2.3. The
regression results were evaluated based on their physical meaning and statistical
significance as described in sections 2.2.4 and 2.2.5. Single-Event MicroKinetics are used
throughout this work to describe complex chemical reactions. A short overview is given in
section 2.2.6. Lastly, if the kinetic model was able to adequately describe the experimental
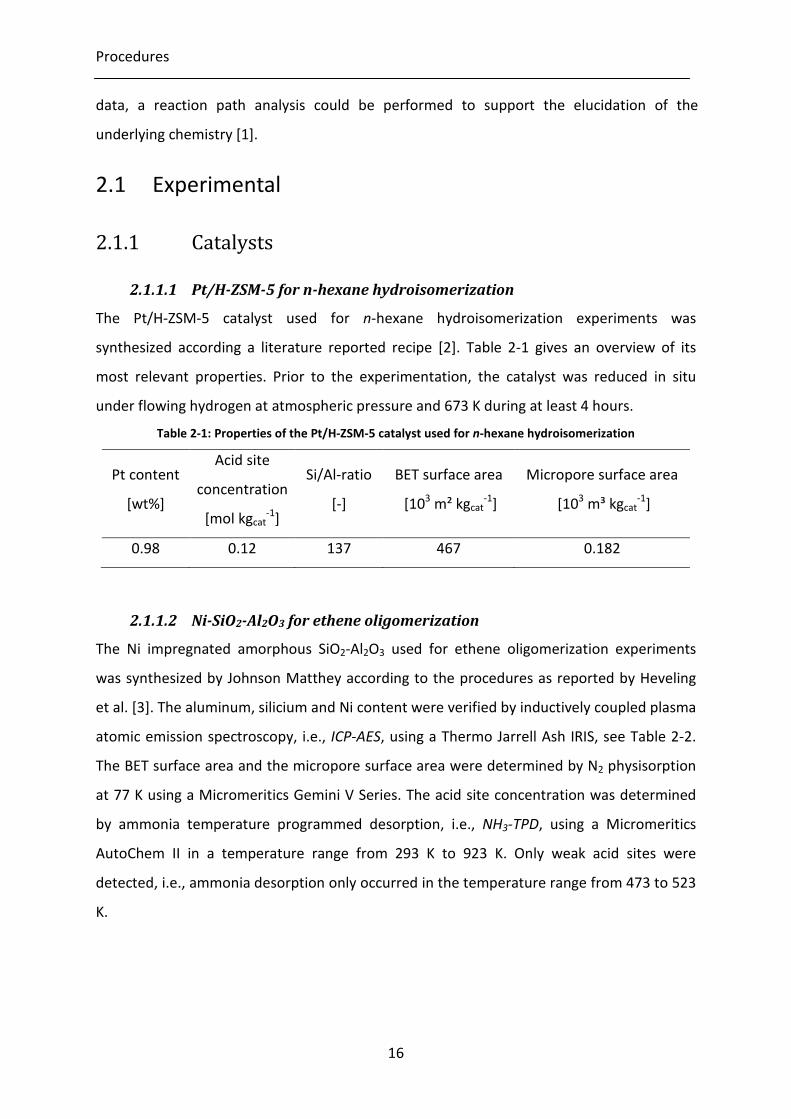
Procedures
16
data, a reaction path analysis could be performed to support the elucidation of the
underlying chemistry [1].
2.1 Experimental
2.1.1 Catalysts
2.1.1.1 Pt/H-ZSM-5 for n-hexane hydroisomerization
The Pt/H-ZSM-5 catalyst used for n-hexane hydroisomerization experiments was
synthesized according a literature reported recipe [2]. Table 2-1 gives an overview of its
most relevant properties. Prior to the experimentation, the catalyst was reduced in situ
under flowing hydrogen at atmospheric pressure and 673 K during at least 4 hours.
Table 2-1: Properties of the Pt/H-ZSM-5 catalyst used for n-hexane hydroisomerization
Pt content
[wt%]
Acid site
concentration
[mol kgcat-1
]
Si/Al-ratio
[-]
BET surface area
[103 m² kgcat
-1]
Micropore surface area
[103 m³ kgcat
-1]
0.98 0.12 137 467 0.182
2.1.1.2 Ni-SiO2-Al2O3 for ethene oligomerization
The Ni impregnated amorphous SiO2-Al2O3 used for ethene oligomerization experiments
was synthesized by Johnson Matthey according to the procedures as reported by Heveling
et al. [3]. The aluminum, silicium and Ni content were verified by inductively coupled plasma
atomic emission spectroscopy, i.e., ICP-AES, using a Thermo Jarrell Ash IRIS, see Table 2-2.
The BET surface area and the micropore surface area were determined by N2 physisorption
at 77 K using a Micromeritics Gemini V Series. The acid site concentration was determined
by ammonia temperature programmed desorption, i.e., NH3-TPD, using a Micromeritics
AutoChem II in a temperature range from 293 K to 923 K. Only weak acid sites were
detected, i.e., ammonia desorption only occurred in the temperature range from 473 to 523
K.
Chapter 2
17
Table 2-2: Properties of the Ni-SiO2-Al2O3 catalyst used for ethene oligomerization
Ni content
[wt%]
Acid site
concentration
(weak)
[mol kgcat-1
]
Si/Al ratio
[-]
BET surface area
[103
m2 kgcat
-1]
Micropore surface area
[103 m
2 kgcat
-1]
1.8 0.80 0.21 199 17.8
Efforts to elucidate the nature of the active site for ethene oligomerization were made. Ni0,
isolated Ni+ or Ni
2+ species and into lesser extent NiO, are known to be catalytically active
for ethene oligomerization [4]. XPS measurements of the Ni-SiO2-Al2O3 catalyst showed the
presence of Ni2+
species, i.e., either isolated Ni2+
or NiO. Diffuse reflectance infrared fourier
transform (DRIFT) spectroscopy of adsorbed CO was performed on the Ni-SiO2-Al2O suing a
Bruker Tensor 27 with a Specac environmental cell. Two different pretreatments were given
to the catalyst, i.e., 8 hours at 773 K under flowing He and 8 hours at 773 K under flowing
H2. A similar pretreatment, except for the temperature, i.e., 573 K instead of 773 K, was also
applied but yielded the same results. Figure 2-1a shows a typical IR spectrum recorded while
CO was adsorbed at 293 K. The two peaks at 2180 and 2120 cm-1
can be assigned to gas
phase CO [5]. The peaks between 2060 and 2000 cm-1
cannot be attributed to gas phase CO,
but could possible indicate the presence of Ni0-CO or a binuclear bridging Ni
+ complex, i.e.,
Ni+-(CO)2 [4, 6]. When the CO gas flow was changed for He, both catalyst samples showed a
similar IR spectrum, see Figure 2-1b and Figure 2-1c. It must be noted that these peaks
disappeared slowly over time, indicating a slow desorption of CO from the nickel sites. The
peaks at 2180 cm-1
and 2120 cm-1
indicate the presence of resp. Ni2+
-(CO) and Ni+-(CO)
species.
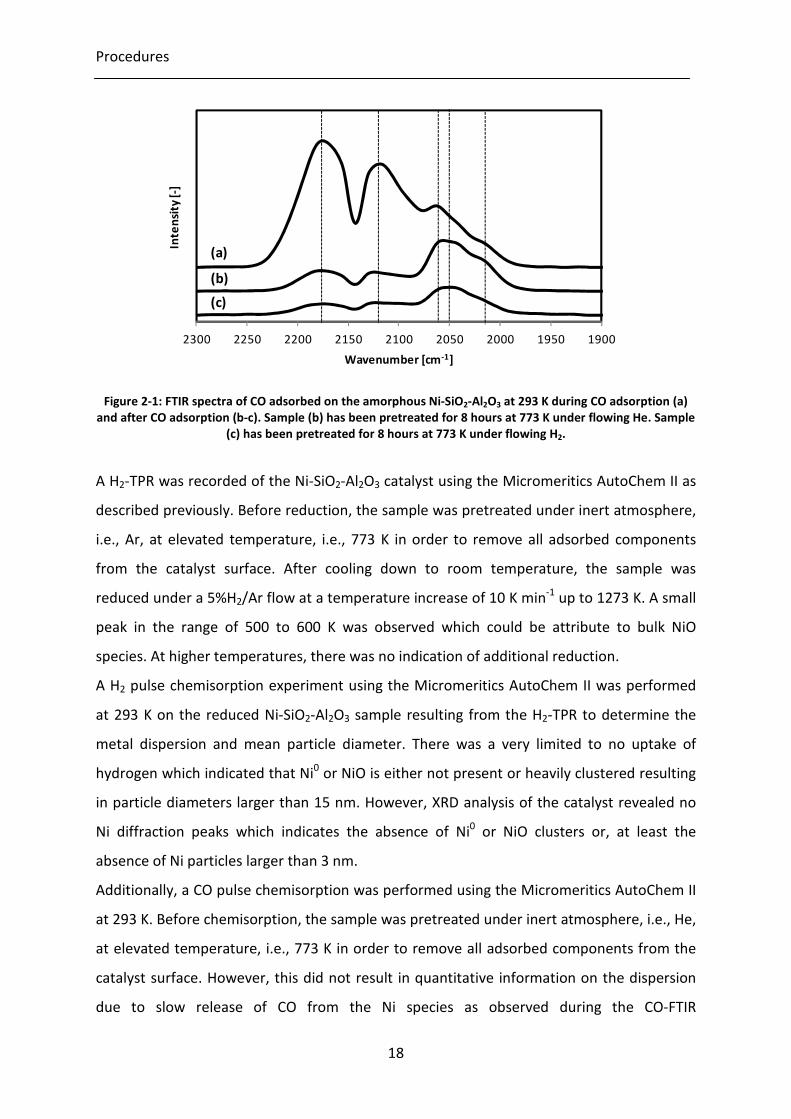
Procedures
18
Figure 2-1: FTIR spectra of CO adsorbed on the amorphous Ni-SiO2-Al2O3 at 293 K during CO adsorption (a)
and after CO adsorption (b-c). Sample (b) has been pretreated for 8 hours at 773 K under flowing He. Sample
(c) has been pretreated for 8 hours at 773 K under flowing H2.
A H2-TPR was recorded of the Ni-SiO2-Al2O3 catalyst using the Micromeritics AutoChem II as
described previously. Before reduction, the sample was pretreated under inert atmosphere,
i.e., Ar, at elevated temperature, i.e., 773 K in order to remove all adsorbed components
from the catalyst surface. After cooling down to room temperature, the sample was
reduced under a 5%H2/Ar flow at a temperature increase of 10 K min-1
up to 1273 K. A small
peak in the range of 500 to 600 K was observed which could be attribute to bulk NiO
species. At higher temperatures, there was no indication of additional reduction.
A H2 pulse chemisorption experiment using the Micromeritics AutoChem II was performed
at 293 K on the reduced Ni-SiO2-Al2O3 sample resulting from the H2-TPR to determine the
metal dispersion and mean particle diameter. There was a very limited to no uptake of
hydrogen which indicated that Ni0 or NiO is either not present or heavily clustered resulting
in particle diameters larger than 15 nm. However, XRD analysis of the catalyst revealed no
Ni diffraction peaks which indicates the absence of Ni0 or NiO clusters or, at least the
absence of Ni particles larger than 3 nm.
Additionally, a CO pulse chemisorption was performed using the Micromeritics AutoChem II
at 293 K. Before chemisorption, the sample was pretreated under inert atmosphere, i.e., He,
at elevated temperature, i.e., 773 K in order to remove all adsorbed components from the
catalyst surface. However, this did not result in quantitative information on the dispersion
due to slow release of CO from the Ni species as observed during the CO-FTIR
190019502000205021002150220022502300
Inte
nsi
ty [
-]
Wavenumber [cm-1]
(a)
(b)
(c)
Chapter 2
19
measurements. After several CO pulses until the corresponding peak surface areas did not
change anymore, it was assumed that the Ni species were saturated with CO. On this
sample, a TPD was performed. The volume of CO gas released was used to determine the
dispersion. Depending on the configuration assumed, i.e., linear or a binuclear bridging Ni
complex, the dispersion was equal to resp. 140% and 70%.
Concluding, the H2 pulse chemisorption experiment showed that the amount of Ni0 or NiO is
negligible, even after reduction of the catalyst at high temperature. This could be attributed
to individual Ni species which are in an exchange position and are difficult reduced. This
would explain the high dispersion as determined by CO pulse chemisorption and the XRD
analysis. The nature of these Ni species could not be specified via DRIFT of CO adsorption on
the catalyst, i.e., Ni2+
or Ni+, but XPS measurement indicated the presence of mainly Ni
2+
species. On top of that, the pretreatment of the catalyst at elevated temperature under
inert flow can also lead to the reduction of Ni2+
to Ni+ via a dehydration mechanism [4], so
the determination of the actual active site is not a sinecure.
2.1.1.3 Ni-Beta for ethene oligomerization
The Ni-Beta zeolite used for ethene oligomerization experiments was synthesized at CSIC-
ITQ [7]. An elemental analysis was performed by ICP-AES to determine the nickel content,
i.e., 4.9 wt%, and Si/Al-ratio, i.e., 12.5. An XRD analysis of the catalyst showed the presence
of NiO particles. Via N2 adsorption experiments at 77K, the BET surface area and micropore
volume were determined to amount to resp. 458 m2 g
-1 and 0.135 cm
3 g
-1. The acid site
concentration equals 6.3 10-4
mol g-1
as measured by NH3-TPD. The nature of the active sites
on this catalyst has already been elucidated in literature [7]. An overview of the Ni-Beta
zeolite properties is given in Table 2-3. A more detailed discussion on the Ni-Beta catalyst
can be found in [7].
Table 2-3: Properties of the Ni-Beta catalyst used for ethene oligomerization
Ni content
[wt%]
Acid site
concentration
[mol kgcat-1
]
Si/Al ratio
[-]
BET surface area
[103
m2 kgcat
-1]
Micropore volume
[103 m
3 kgcat
-1]
4.9 0.63 12.5 458 135

Procedures
20
2.1.1.4 Pt/H-ZSM-5 for xylene isomerization
The Pt/H-ZSM-5 catalyst used for xylene isomerization experiments was prepared by an
industrial partner using a ZSM-5 with a silica to alumina ratio of 80 available from Zeolyst.
The zeolite was mixed with a silica binder and extruded into a cylinder form with a diameter
of 1.6 mm. After calcination the extrudates were pore volume impregnated to achieve a Pt
loading of 200 ppmw. The catalyst obtained was characterized by 27
Al MAS NMR and IR
spectroscopy, i.e., analyzing both the OH region and H/D exchange spectra. The results
validated the theoretically expected acid site concentration in the catalyst, i.e. 0.35 mol kg-1
[8]. Laser ablation inductively couple plasma mass spectrometry (LA-ICP-MS) measurements
having a spatial resolution of 30 μm indicated only minor variations in the Pt loading from
the edge to the centre of the cross section of the extrudates.
Table 2-4: Properties of the Pt/H-ZSM-5 catalyst used for xylene isomerization
Pt content
[ppmw]
Acid site
concentration
[mol kgcat-1
]
Si/Al ratio
[-]
200 0.35 80
2.1.2 Reactor set-ups
2.1.2.1 Reactor set-up for n-hexane hydroisomerization
The n-hexane hydroisomerization experiments were performed in a Berty reactor set-up at
the LCT at Ghent University. It is a gas-phase continuous stirred tank reactor (CSTR). Prior to
entering the reactor, n-hexane and hydrogen are mixed in an evaporator/pre-heater to
ensure that the reactor feed is completely gaseous. The n-hexane feed flow rate is verified
by monitoring the mass of the feed reservoir. Methane is added to the reactor effluent as an
internal standard for analytical and mass and carbon balance verification purposes. After
reaching steady state operation after ca. 1 hour, a sample is taken via a 6-way valve and is
injected on a HP Series II 5890 instrument with a 50 m (id = 0.25 mm) RSL-150 column with a
0.25 μm poly(dimethylsiloxane) film for GC analysis. More details on the Berty reactor and
set-up can be found in literature [9-11].

Chapter 2
21
2.1.2.2 Reactor set-up for ethene oligomerization
The oligomerization experiments were performed in the HTK-1 set-up available at the LCT at
Ghent University. It comprises 8 plug flow reactors, each with an internal diameter of 0.011
m and a total length of 0.811 m [12]. Each reactor pair is placed in a heating jacket, capable
of reaching 923 K, and the temperature is controlled at three points throughout each
individual reactor using either a multipoint thermocouple at the outer side of the reactor
wall or in the centre of the reactor, i.e., the catalyst bed. The pressure is regulated via a
back-pressure regulator, operating up to 20 MPa. Prior to loading it into the reactor, the
catalyst powder was pressed into flakes and crushed again into pellets with a diameter of
300 μm to 560 μm to avoid mass transport limitations at the pellet scale [13]. For each run,
0.5 to 1.0 g of the catalyst was physically mixed with inert material of a similar diameter. To
avoid heat transport limitations in the case of ethene oligomerization, it was determined
that the bed should only contain about 10wt% of active material [13]. Non-porous sintered
α-Al2O3 was used as inert material and was also placed in front of the catalyst bed to assure
a homogeneous inlet flow pattern and to enhance the preheating of the reactor inlet flow.
The relatively high thermal conductivity of the α-Al2O3 , i.e., ±30 W m-1
K-1
, also ensured a
smooth and sufficient heat removal from the catalyst bed.
After catalyst loading, the catalyst was pre-treated in situ under a nitrogen flow with a
space-time of 4 kgcat s molN2-1
, at atmospheric pressure and 573 K for several hours. After
this period, the reactor was cooled down to the required reaction temperature under the
same nitrogen flow rate as during the pre-treatment and at atmospheric pressure.
During reaction, care was taken to work at gas phase conditions, even in the analysis section
operating at atmospheric pressure and heat traced up to 313 K. The inlet feed contained 10
to 20 mol% of ethene, diluted with nitrogen. Methane was also sent in small quantities as
internal standard. Each of the feed flow rates is individually controlled using thermal mass
flow controllers.
The effluent analysis occurred on-line using an Agilent 3000 micro-GC. This gas
chromatograph contains 4 parallel columns each being connected to a thermal conductivity
detector (TCD). Two of these channels sufficed to completely analyze the reactor effluent.
On the first column, i.e., a PLOT U (8 m x 0.32 mm), methane, ethene and nitrogen were
quantitatively determined. On the second column, i.e., an OV-1 (10 m x 0.15 mm x 2.0 μm),
ethene and the oligomerization products were quantitatively determined. It was possible to
Procedures
22
separate all butene isomers, i.e., 1-butene and 2-cis and 2-trans butene. The higher alkenes
formed were detected as a lump per carbon number since the internal isomers could not be
separated on the columns used. Ethene was used as a reference component between both
columns [14].
2.1.2.3 Reactor set-up for experimental validation of the industrial reactor
model for ethene oligomerization
The experimental data used to validate the industrial reactor simulation model were
oligomerization demonstration unit constructed at CEPSA. The unit consists of one fixed bed
reactor which can be heated by an electrical furnace. The reactor is capable of operating at
temperatures up to 823 K and pressures up to 5.0 MPa. Three gasses can be independently
fed to the reactor inlet after preheating. The reactor temperature could be kept within 2 K
of the temperature set-point. The product stream is cooled down and sent to a knock-out
drum at atmospheric pressure which separates the reactor effluent into a gaseous and
liquid fraction. The liquid flow rate is monitored by a weighing scale while the gas flow rate
is measured by a wet gas meter. The gas flow is analyzed online using a Varian 3800 gas
chromatograph while the liquid phase is analyzed off-line.
2.1.2.4 Reactor set-up for xylene isomerization
The xylene isomerization experiments were performed using in a gas phase reactor set-up
with a down flow reactor on a gram scale available at Shell. The catalyst was mixed with
inert material and loaded in the isothermal section of the reactor. After catalyst reduction at
atmospheric conditions, the reactor was pressurized and an industrial feedstock
corresponding to a paraxylene extracted recycle feed to a BTX unit was introduced while
ensuring proper vaporization of the feedstock upstream of the reactor.
The products were analyzed on-line, while maintaining vapor phase conditions, and were
also collected, at a lower temperature, in the depressurized section of the unit in a gas-
liquid separator/condenser for off-line analysis and further product identification and
evaluation. During analysis a proper separation between hydrocarbons up to C12 was
achieved, i.e., with grouping of paraffins, isoparaffins, olefins and aromatic molecules per
carbon number, including the quantitative separation of the xylene isomers using a
combination of suitable columns and FID/TCD detectors.
Chapter 2
23
2.1.3 Determination of outlet composition, flow rates,
conversions, selectivities and yields
For every experimental campaign performed within this work, the outlet flow consisted only
of a gas phase and was analysed via gas chromatography. The raw data obtained from a gas
chromatography, i.e., the peak surface areas were translated into the corresponding outlet
flow rates, see section 2.1.3.1. Error analysis [15] has shown that the recommended
procedure to calculate conversion, selectivities and product yields, is as follows:
1. Measured set-up outlet flow rates
2. Verification of mass balance(s)
3. Application of normalization method to calculate conversions and selectivities
First, the outlet flow rates are measured directly or indirectly, see section 2.1.3.2. From
these measured set-up flow rates, the mass and elemental balances are verified, see section
2.1.3.3. If the mass and elemental balances are closed within 5%, the outlet flow rates are
determined via the normalization method, see section 2.1.3.4. Normalizing the outlet flow
rates leads to closed mass and element balances. Indirectly, it is assumed that the error on
the balances are proportionally distributed over all flow rates. However, the error on the
balances could be situated in the flow rate of a limited number of different components.
Therefore, it should be verified that the balances are closed within 5% in order to minimize
these effects on the further calculations. Finally, these ‘normalized’ outlet flow rates are
used to calculated conversion, selectivities and product yields, see section 2.1.3.5.
2.1.3.1 Outlet composition
As mentioned in previous paragraph, the set-up outlet composition obtained during the
experimental campaigns always comprised either a gas phase or both gas and liquid phase
and was determined using gas chromatography. Due to the component specific nature of
the detectors used, i.e., FID and TCD, calibration factors are used to relate the measured
peak surface areas A with the flow composition. In this work, the calibration factors were
based upon work done by Dietz [16]. A calibration factor, CF , gives th relationship between
a molar quantity and the measured peak area and is defined as their ratio. Depending on
the experimental campaign, only one or several detectors were used. The next two
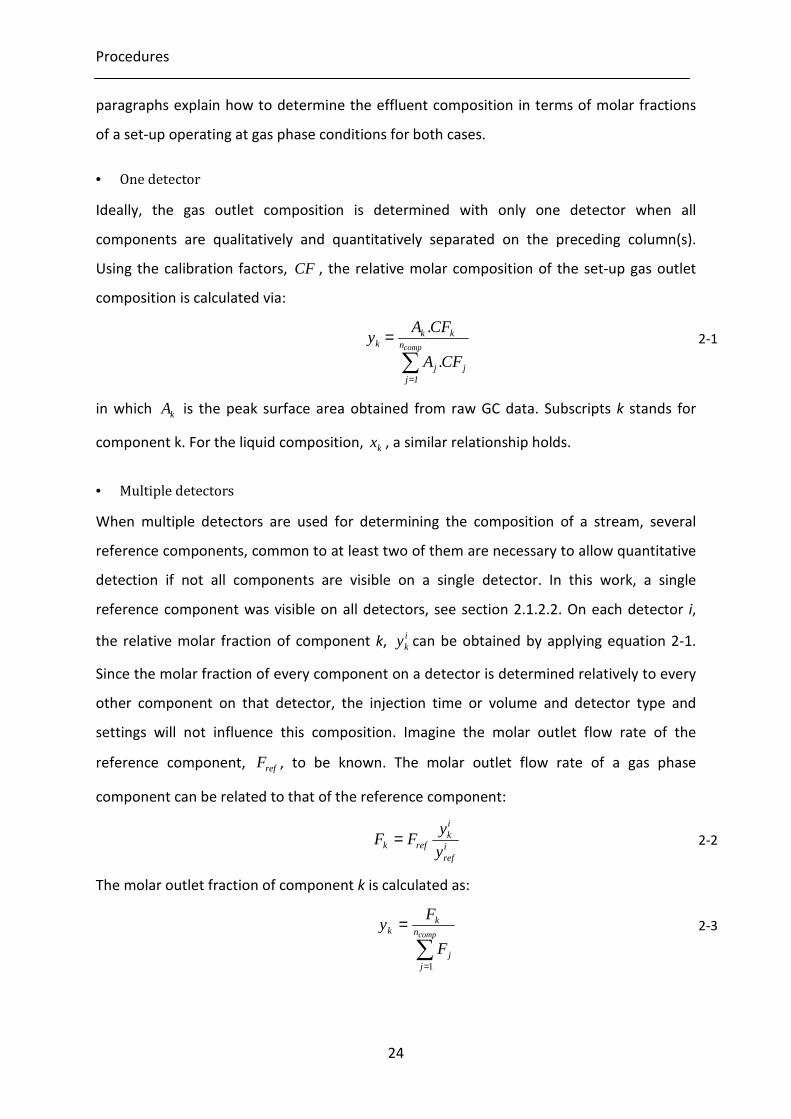
Procedures
24
paragraphs explain how to determine the effluent composition in terms of molar fractions
of a set-up operating at gas phase conditions for both cases.
• One detector
Ideally, the gas outlet composition is determined with only one detector when all
components are qualitatively and quantitatively separated on the preceding column(s).
Using the calibration factors, CF , the relative molar composition of the set-up gas outlet
composition is calculated via:
∑
=
=compn
1jjj
kkk
CF.A
CF.Ay
2-1
in which kA is the peak surface area obtained from raw GC data. Subscripts k stands for
component k. For the liquid composition, kx , a similar relationship holds.
• Multiple detectors
When multiple detectors are used for determining the composition of a stream, several
reference components, common to at least two of them are necessary to allow quantitative
detection if not all components are visible on a single detector. In this work, a single
reference component was visible on all detectors, see section 2.1.2.2. On each detector i,
the relative molar fraction of component k, iky can be obtained by applying equation 2-1.
Since the molar fraction of every component on a detector is determined relatively to every
other component on that detector, the injection time or volume and detector type and
settings will not influence this composition. Imagine the molar outlet flow rate of the
reference component, refF , to be known. The molar outlet flow rate of a gas phase
component can be related to that of the reference component:
iref
ik
refk y
yFF =
2-2
The molar outlet fraction of component k is calculated as:
∑
=
=compn
jj
kk
F
Fy
1
2-3
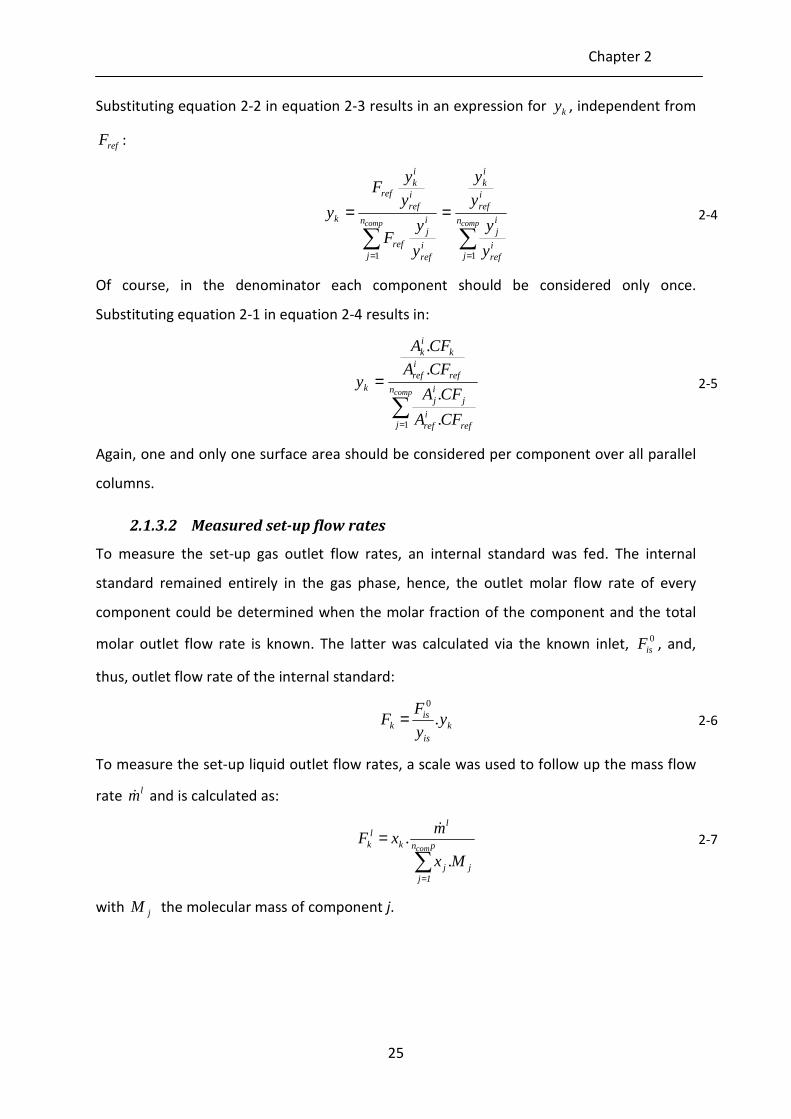
Chapter 2
25
Substituting equation 2-2 in equation 2-3 results in an expression for ky , independent from
refF :
∑∑
==
==compcomp n
jiref
ij
iref
ik
n
jiref
ij
ref
iref
ik
ref
k
y
y
y
y
y
yF
y
yF
y
11
2-4
Of course, in the denominator each component should be considered only once.
Substituting equation 2-1 in equation 2-4 results in:
∑
=
=compn
j refiref
jij
refiref
kik
k
CFA
CFA
CFA
CFA
y
1 .
.
.
.
2-5
Again, one and only one surface area should be considered per component over all parallel
columns.
2.1.3.2 Measured set-up flow rates
To measure the set-up gas outlet flow rates, an internal standard was fed. The internal
standard remained entirely in the gas phase, hence, the outlet molar flow rate of every
component could be determined when the molar fraction of the component and the total
molar outlet flow rate is known. The latter was calculated via the known inlet, 0
isF , and,
thus, outlet flow rate of the internal standard:
kis
isk y
y
FF .
0
=
2-6
To measure the set-up liquid outlet flow rates, a scale was used to follow up the mass flow
rate lm& and is calculated as:
∑=
=pn
1jjj
l
kl
k com
M.x
m.xF
&
2-7
with jM the molecular mass of component j.
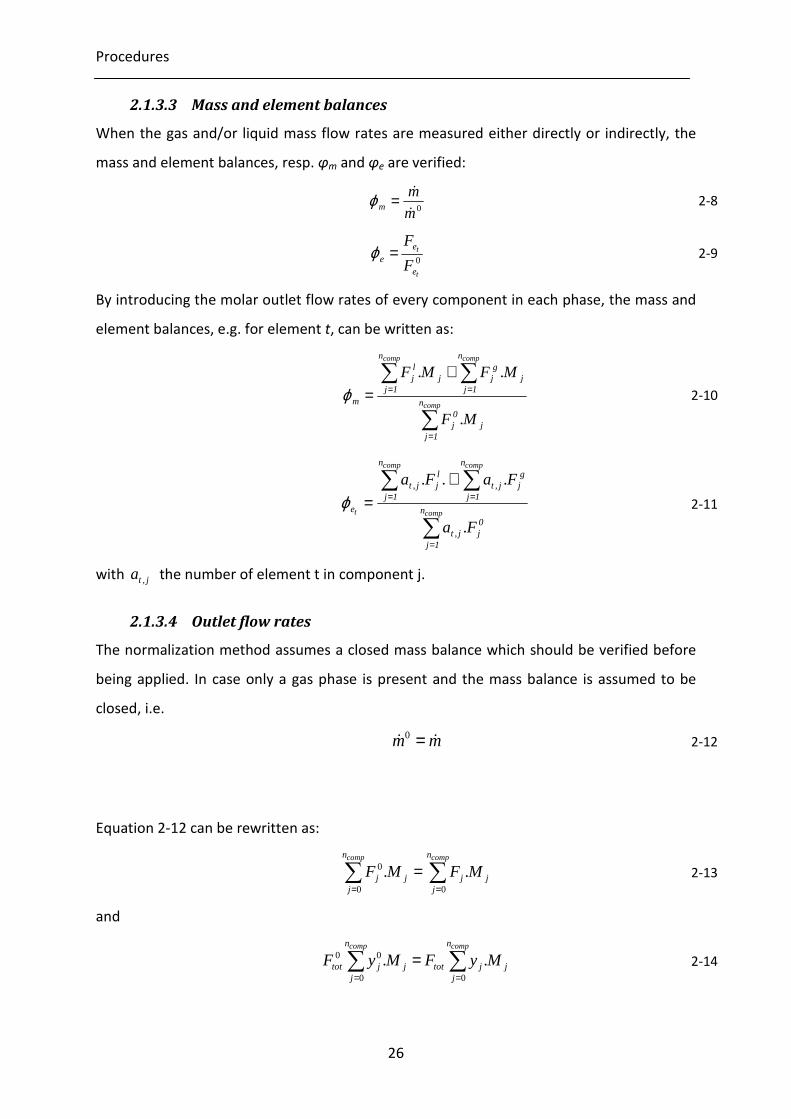
Procedures
26
2.1.3.3 Mass and element balances
When the gas and/or liquid mass flow rates are measured either directly or indirectly, the
mass and element balances, resp. φm and φe are verified:
0m
mm
&
&
=ϕ
2-8
0
t
t
e
ee F
F=ϕ
2-9
By introducing the molar outlet flow rates of every component in each phase, the mass and
element balances, e.g. for element t, can be written as:
∑
∑∑
=
==
+=
comp
compcomp
n
1jj
0j
n
1jj
gj
n
1jj
lj
m
M.F
M.FM.F
ϕ
2-10
∑
∑ ∑
=
= =+
=comp
comp comp
t n
1j
0jj,t
n
1j
n
1j
gjj,t
ljj,t
e
F.a
F.a.F.a
ϕ
2-11
with j,ta the number of element t in component j.
2.1.3.4 Outlet flow rates
The normalization method assumes a closed mass balance which should be verified before
being applied. In case only a gas phase is present and the mass balance is assumed to be
closed, i.e.
mm && =0 2-12
Equation 2-12 can be rewritten as:
∑∑==
=compcomp n
jjj
n
jjj MFMF
00
0 .. 2-13
and
∑∑==
=compcomp n
jjjtot
n
jjjtot MyFMyF
00
00 .. 2-14

Chapter 2
27
Solving this equation to totF gives:
j
n
jj
j
n
jj
totkk
My
My
FyFcomp
comp
.
.
..
1
1
0
0
∑
∑
=
== 2-15
If both a gas and liquid phase were present at the set-up outlet, a set of two equations
should be solved simultaneously, e.g., the mass and an element balance:
j
n
1jj
gj
n
1jj
lj
n
1j
0j
0,gj
n
1j
0j
0,l
gl0
M.y.FM.x.FM.y.FM.x.F
mmmcompcompcompcomp
∑∑∑∑====
+=+
+= &&&
2-16
and
j,k
n
1jj
gn
1jj,kj
ln
1jj,k
0j
0,gn
1jj,k
0j
0,l
ge
le
0e
a.y.Fa.x.Fa.y.Fa.x.F
FFF
compcompcompcomp
kkk
∑∑∑∑====
+=+
+=
2-17
2.1.3.5 Conversion, selectivities and yields
The conversion of feed component k, kX , is defined on a molar basis:
0
0
k
kkk F
FFX
−=
2-18
The selectivity towards component k is defined on an elemental basis such as carbon,
oxygen, hydrogen or even nitrogen, see Chen Qi [15]. The selectivity for component k
originating from component v based on the element et is defined as:
( )( )vvvt
kkktvk FFa
FFaS
−−
=0
,
0,
, .
.
2-19
with 0
kF the molar inlet flow rate of component k, Fv the molar outlet flow rate of feed
component v and at,k the number of t atoms in component k. Physically, this definition of
selectivity can be translated as the fraction of element et being transferred to product k
from v at a certain conversion of v. The product yields are determined on mass basis by
multiplication of the conversion and the aforementioned product selectivities.
Procedures
28
2.2 Modeling
2.2.1 A systematic methodology for kinetic modeling
The kinetic modeling of chemical reactions requires the combination of different fields of
expertise, e.g., optimization theory [17], parameter estimation [18] and chemical reactor
and reaction engineering [19, 20]. Several authors, e.g., Box et al., Froment et al., Buzzi-
Ferraris et al., Stewart et al. … have reported general techniques and methodologies for this
purpose. For example, several methods for multiresponse parameter estimation by applying
Bayesian theory [21-23] or least squares are reported [24]. The reformulation and analysis
of kinetic models, including the handling of outliers, model discrimination and experimental
design is also extensively discussed [25-27]. With the increased use of computers in the
course of previous decades, a number of regression software packages were specifically
developed for chemical kinetics modeling [28-30]. While all literature cited excels in
describing these techniques, no work seems to be available which combines these
techniques in an applied manner, i.e., from data processing to an adequate kinetic model.
In this section, a systematic methodology for chemical kinetics modeling is proposed. It aims
at maximizing the amount of information that can be retrieved while minimizing the effort.
The model that is most closely corresponding to the physical reality is likely to be much
more complex than the statistically most relevant one. It is important to acquire a good
balance between what is physically meaningful and statistically required. The parameters
obtained by regression should have a clear physical meaning with confidence intervals of an
acceptable size, i.e., at least inferior to the parameter value itself [31]. Also, the model
adequacy should be verified to evaluate the extent to which the model exhibits systematic
deviations from the experimental observations.
The methodology comprises three main steps after having acquired the experimental data:
data analysis, regression and a physical and statistical assessment, see Figure 2-2. Model
discrimination and sequential experimental design are potential add-ons that are
incorporated in the figure but not further addressed in the present work.

Chapter 2
29
Figure 2-2: Proposed procedure for kinetic modeling
2.2.1.1 Data analysis and model construction
Prior to setting up a kinetic model, experimental data are needed which contain the
necessary information to construct a kinetic model and to determine the corresponding
kinetic parameters, see Figure 2-2.
One option to extract the valuable information from the experimental data is to plot the
dependent variables, e.g., molar outlet flow rates, conversions, selectivities, as function of
the independent variables such as reaction temperature, inlet partial pressures, space-
time… The observed trend as function of the independent variables can then be used to
evaluate apparently required functional relationships and corresponding potential reaction
mechanisms [25].
A more specific option for information extraction is to apply the method of initial rates [19].
Several kinetic models may be proposed depending on which of the elementary steps is
considered to be rate determining, e.g., adsorption, desorption or surface reaction. Within
the method of initial rates, differential experimental data, i.e., data obtained at conversion
and space-time close to zero, are plotted against the independent variables, more
particularly the reactant partial pressure or the total pressure. The trend obtained is
compared to that exhibited by the different models which can lead to an initial model
discrimination. Other methods are also reported in literature which are based on the use of
literature survey
initial parameter
value determination
(sequential)
experimental
design
model refinement
data analysis
physical and
statistical
assessment
adequate
kinetic model
new conceptnew reaction
reactionmechanism and correspondingkinetic model
experimentaldataset
parameter estimates
regression

Procedures
30
so-called intrinsic parameters, i.e., obtained when rewriting the rate expressions in terms of
fractional coverages [32].
As indicated by Figure 2-2, from the knowledge gained by data analysis and literature, a
reaction network and mechanism can be constructed and the corresponding rate-equations
are derived .
2.2.1.2 Regression
After the data analysis and model construction, the model(s) can be regressed to the
experimental data. However, due to the typical non-linear character of kinetic models, it is
important to have good initial guesses for the parameter estimates. If the initial guesses for
the parameter estimates are too remote from the true values, the optimization routine
might end up in a local extremum. Good initial parameter values can be obtained by
linearization of the model, e.g., through an isothermal regression, see section 2.2.3.1, or
from a literature survey or ab-initio calculations [33].
During regression, typically a residual sum of squares is minimized or a probability density
function is maximized. The objective function should be carefully defined in accordance with
the problem formulation and may require the introduction of weights [26]. In order to
identify the optimum of the objective function, various optimization routines are available
in literature such as the Rosenbrock [34] and Levenberg-Marquardt algorithm [35].
2.2.1.3 Physical and statistical assessment
Having performed the regression, the model performance and corresponding parameters,
should be evaluated, see Figure 2-2. These tests are two-fold, i.e., assessing the physical
meaning and verifying statistical significance.
For the model, the physical meaning and statistical significance can be assessed by analyzing
the residuals, as described in section 2.2.5. The parity diagram and residual and normal
probability figure are mostly used to determine the statistical significance while the
performance figure is used to assess the physical meaning of the model. Additionally,
statistical tests can be performed for model significance and adequacy, see section 2.2.4.
For the kinetic parameters, also both the physical meaning and statistical significance should
be investigated. The first can be done by verifying if the values obtained are in line with
what can be expected on physical grounds, e.g., the reaction order estimated is sensible, the
activation energy obtained has a positive value… The latter is assessed by the actual value of

Chapter 2
31
the parameter estimate in combination with the corresponding confidence interval, which
should not include zero. If so, this parameter is deemed to be statistically insignificant and
could be excluded from the kinetic model. It must be kept in mind, however, that a
statistically insignificant parameter does not necessarily corresponds to a step that does not
contribute to the model. Such a parameter may correspond to a step which is so fast that
the actual rate is irrelevant, as long as it is sufficiently high compared to the other
elementary steps in the reaction mechanism.
All these assessments can be used to determine any shortcomings in the model, which may
be, but not limited to, missing reaction steps or whether the set of parameter values
obtained is only a local optimum. Therefore, the kinetic model can be reformulated based
on the assessment or additional experiments can be performed, preferentially via sequential
experimental design, see Figure 2-2. If both the physical and statistical significance are
fulfilled and, hence, no additions or corrections to the model are necessary, the procedure is
considered to be converged and the modeling as finalized.
2.2.2 Reactor models
2.2.2.1 Continuous stirred tank reactor
For a steady-state ideal continuous stirred tank reactor, the outlet molar flow rates are
described by a set of algebraic equations:
compiii niWRFF ...10 =+=
2-20
with W the catalyst mass and iR the net rate of formation of component i. This set of
differential equations is solved by DDASPK [36].
2.2.2.2 Plug flow reactor
For a steady-state ideal plug flow reactor, the molar flow rates in a point of the reactor are
described by a set of differential equations:
compi
i niRdW
dF...1== 2-21
This set of differential equations is solved by DDASPK [36] with the following initial
conditions:
00 ii FFW =→= 2-22
Procedures
32
Inert components, e.g., nitrogen, are not explicitly accounted for in this set of differential
equations since the net rate of formation of these components equals zero.
2.2.3 Parameter estimation
The model parameter vector b was estimated by the minimization of the weighted sum of
squared residuals, SSQ:
( ) MinYYwSSQ bn
i
n
jjijij
resp
→−=∑∑= =
exp
1 1
2
,,ˆ 2-23
in which expn and respn are resp. the number of experiments and responses, jw the
statistical weight attributed to response j, and jiY,ˆ and jiY, resp. the corresponding model
calculated and experimental response value. The statistical weights were determined from
the inverse of the covariance matrix of the experimental errors:
( )1
parrespexp
1
2
,,
2 .
ˆ1
exp−
=
−
−==∑
nnn
YYw
n
ijiji
jjj σ
2-24
By adjusting the value for the parameter vector b , while minimizing the SSQ, b will
converge to the true parameter vector β . The SSQ minimization was performed by use of
a Rosenbrock [34] followed by a Levenberg-Marquardt algorithm [35]. The former is more
robust against divergence and is used for bringing the parameter values in the
neighborhood of the optimal parameters while the latter is applied for reaching the true
minimum of the SSQ.
2.2.3.1 Isothermal vs. non-isothermal regression
When performing a regression, the goal is to determine the set of optimal parameters
corresponding to the global minimum of the objective function. In many cases, the objective
function also contains several local extrema. It is possible that, by choosing a certain set of
initial parameter values, the final set of parameters obtained from regression is situated in a
local minimum. Sometimes, this will not be evident from the model performance since it
may seem to be adequate. This is more likely the case in highly non-linear models, e.g.,
Chapter 2
33
when using the Arrhenius or van ‘t Hoff relation for describing the temperature dependence
of a rate or equilibrium coefficient.
If sufficient isothermal kinetic data, i.e., a subset of kinetic data in which the temperature is
constant, are available, a regression per temperature to these subset(s) of experimental
data can be performed. This is also denoted as isothermal regression. This has several
advantages. Firstly, per rate coefficient only one parameter needs to be estimated rather
than two, i.e., the rate coefficient itself, rather than the pre-exponential factor and the
reaction enthalpy or activation energy. Secondly, the regression of an isothermal model
which can be linearized, results in a linear regression for which a priori no initial estimates
are required. By performing the isothermal regression, a value for each rate and/or
equilibrium coefficient is obtained at every temperature. The coefficients obtained at every
temperature can then be used to construct so-called Arrhenius and van ‘t Hoff plots, see
resp. equation 2-25 and 2-26.
( ) ( )TR
EAk
RT
EAk aa 1
lnlnexp ln −=→
−=
2-25
( ) ( )TR
HAK
RT
HAK
1lnlnexp ln ∆+=→
∆=
2-26
Linear regression of these isothermally determined parameter estimates yields a value for
the slope and intercept which are a measure for resp. the activation energy or reaction
enthalpy and pre-exponential factor, see equation 2-27.
MinRT
EAk a
parEA
n
i
ai →
−−∑=
,
2
1
exp
2-27
These values typically serve as initial parameter values in the non-isothermal regression in
which all data are simultaneously assessed and where the Arrhenius and van ‘t Hoff
relationships are directly implemented. This last regression is typically considered to be the
actual one since the parameters are estimated based on the minimization of the residual
sum of squares of the directly observed values, see equation 2-28.
( ) MinFF aEAn
iii →−∑
=
,
2
1
exp
ˆ
2-28
This is the only regression which is supposed to allow determining the global extremum of
the objective function, however, the above described procedure starting with isothermal
regressions provides the most suitable initial guesses for this non-isothermal regression.

Procedures
34
2.2.3.2 Reparameterization of the Arrhenius and Van’t Hoff equation
In the Arrhenius and van ‘t Hoff relation, a pronounced correlation is typically found
between the pre-exponential factor and activation energy or reaction enthalpy. To
overcome the corresponding regression issues, reparametrized versions of these relations
are used in which the rate or equilibrium coefficient at the mean temperature is used, see
resp. equation 2-29 and 2-30 [37]. The concept of reparameterization is also illustrated in
Figure 2-4. The ‘classical’, unreparameterized and reparametrized Arrhenius relation is used
in resp. the left and right Arrhenius plot in Figure 2-4 to determine the kinetic parameters.
In case of the unreparameterized Arrhenius relation it is clear that the activation energy,
i.e., the slope of the line, will compensate for the pre-exponential factor value, i.e., the
intersection with the y-axis (at x = 0). In contrast to this, with the reparametrized Arrhenius
relation, a change of the rate coefficient at mean temperature cannot be compensated by
any change in activation energy.
−−⋅=
m
aTm TTR
Ekk
11exp
2-29
−∆⋅=
mTm TTR
HKK
11exp
2-30
Figure 2-3: Arrhenius plot for the unreparameterized Arrhenius relation (left) and the reparametrized
Arrhenius relation (right).
2.2.4 Statistical and physical assessment of the model and
parameter estimates
The model significance is typically verified by testing the null hypothesis that all parameters
would simultaneously be equal to zero, via an F test [24, 30]. In this F test, the ratio of the
log
k
T-1 [K-1]
Ea1
Ea2
Ea3
A1
A2
A3
log
k
T-1 [K-1]
k1Tm
Tm-1 [K-1]
Ea1
k2Tm
k3Tm
Chapter 2
35
mean regression sum of squares and the mean residual sum of squares is taken, see
equation 2-28.
( )parrespexp
n
1i
n
1j
2
j,ij,i
par
n
1i
n
1j
2j,i
RES
RES
REG
REG
s
nnn
YY
n
Y
.f.d
SSQ.f.d
SSQ
Fresp exp
resp exp
−
−==
∑∑
∑∑
= =
= =
2-31
If the calculated value exceeds the tabulated F value at a selected confidence level, e.g.,
95%, with the corresponding degrees of freedom, the null hypothesis is rejected and the
model is deemed to be significant. In practice, the above mentioned null hypothesis is easily
rejected, and, hence, for having a reliable assessment of the model significance, the
calculated F values should at the very least be of the order of magnitude of 100.
The model’s adequacy is assessed by evaluating if the deviation between the experimental
observations and model prediction can be attributed solely to experimental errors and not
to a lack-of-fit of the model. If a lack-of-fit is present, systematic deviations between the
model calculated and observed values occur. The model’s adequacy is determined by
partitioning the residuals’ sum of squares, i.e., the difference between model calculated and
observed values, into a pure-error sum of squares, SSQPE, as determined by repeat
experiments, and a lack-of-fit sum of squares, SSQLOF [37]:
PELOFRES SSQSSQSSQ +=
2-32
The pure-error sum of squares is determined by repeat experiments as follows:
( )21 1
)(
1
)()(,∑∑∑
= = =
−=k
i
n
j
in
l
i
jiljPE
resp e
yySSQ
2-33
with k the number of different sets of repeat experiments, )(ine the number of repeat
experiments at the ith
set of repeat experiments, )(,iljy the i
th experimental observation
corresponding to the ith
set of repeat experiments and the jth
response and )(i
jy the average
value of the ith
set of repeat experiments and the jth
response. The corresponding degrees
of freedom are given by:
( )∑=
−=k
ierespPE innfd
1
1)(..
2-34

Procedures
36
The ratio of the lack-of-fit and pure-error sum of squares follows an F distribution with the
corresponding degrees of freedom under the hypothesis that the model is adequate, see
equation 2-35.
PE
PE
LOF
LOF
a
fd
SSQfd
SSQ
F
..
..=
2-35
If the calculated F value exceeds the corresponding tabulated F value, the model is not
adequate. In contrast to the test for the global significance of the model, the model
adequacy test is very difficult to be fulfilled, particularly for models that are non linear in the
parameters.
The significance of every individual parameter is tested by means of a t test. In most cases,
the value against which a parameter estimate is tested is zero. It is, hence, tested, if the
confidence interval comprises the zero value or not. The t value is calculated by the ratio of
the parameter value and its standard deviation ( )ibs :
( ) ( )i
ii bs
bbt =
2-36
If the calculated value exceeds the tabulated value at a selected confidence level, e.g., 95%,
with nexp.nresp – npar degrees of freedom, the parameter is considered to be significantly
different from zero. In practice, good t values are in the order of 10 to 100.
The binary correlation coefficient between two parameters i and j is calculated via the
(co-)variances of these parameters, ( )bV , see equation 2-37. Two parameters i and j are
strongly correlated if 95.0, ≥jiρ .
( )( ) ( ) jjii
jiji
bVbV
bV
,,
,, =ρ
2-37
Besides a statistical assessment of the model and the parameter estimates, the physical
significance of both should be evaluated. The physical meaning of the model is reflected in
the qualitative prediction of the effect of changing reaction conditions. Additionally, the
model should not result in physically unrealistic predictions. The physical meaning of the
individual parameter estimates can be determined by validating if the order of magnitude of
the parameter value and its sign are acceptable. If needed, literature reported values can
assist in this.
Chapter 2
37
2.2.5 Residual analysis
Model performance can be assessed using statistical tests such as the F test for the model
adequacy if an estimate of the error variance is available from repetition experiments.
Another method is to perform a residual analysis in which it is verified to what extent the
residuals adopt the assumed behavior for the experimental error, i.e., a zero mean and
constant variance. A residual is the numerical difference between the simulated and the
experimental values. Residual analysis is a general term in which, among others, the
following tools can be included: parity diagrams, performance figures, residual figures and
normal probability figures. All these tools are illustrated in what follows making use of a
theoretical example, according to the very simple model y= x. Of course in the ‘measured’
variable y an experimental error e is included. 4 models are proposed to simulate the
response y as a function of the independent variable x and the error e:
(a) exy += 1000K=x ( )5,0 =∝ σNe
(b) exaxy ++= 2 1000K=x ( )5,0 =∝ σNe 07.0=a
(c) exy += 1000K=x ( )5te∝
(d) exy += 1000K=x ( )5,3 =∝ σNe
The reference model is represented by model (a), i.e., the adequate model predicting y, in
which the error, e, is normally distributed with expected value 0 and a constant variance σ.
(b) is an inadequate model due to a redundant quadratic term. (c) represents a model
without a systematic deviation in which the error is not normally distributed, but according
to a two-tailed t-distribution with the number of degrees of freedom equal to 5. Finally, (d)
is an inadequate model with a normally distributed error with a systematic deviation
amounting to 3.
2.2.5.1 Parity diagram
A parity diagram is a 2-dimensional scatter plot in which the model calculated values of the
responses are displayed against the experimentally observed values. Investigating the
distribution of the scatter points around the first bisector allows determining the model’s
adequacy and the error distribution. If the model is adequate and the assumptions made
with respect to the experimental error are valid, meaning that the errors are distributed
normally with an expected value of zero and a constant standard deviation, the model
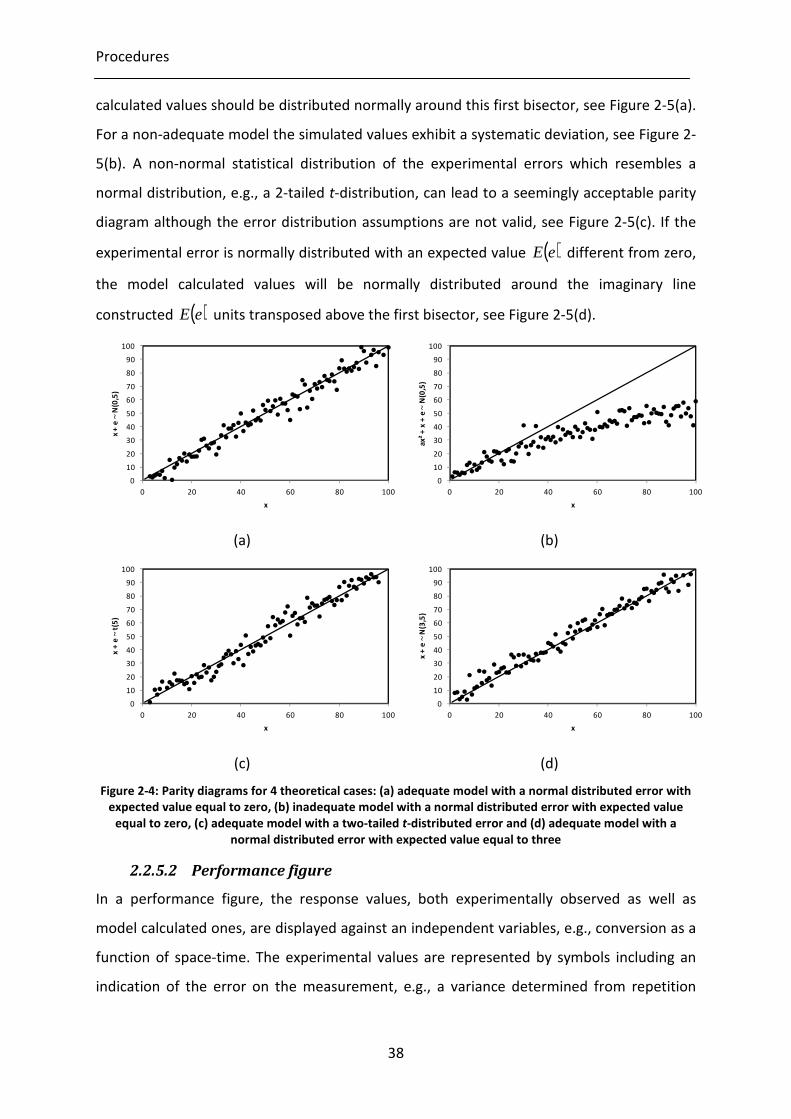
Procedures
38
calculated values should be distributed normally around this first bisector, see Figure 2-5(a).
For a non-adequate model the simulated values exhibit a systematic deviation, see Figure 2-
5(b). A non-normal statistical distribution of the experimental errors which resembles a
normal distribution, e.g., a 2-tailed t-distribution, can lead to a seemingly acceptable parity
diagram although the error distribution assumptions are not valid, see Figure 2-5(c). If the
experimental error is normally distributed with an expected value ( )eE different from zero,
the model calculated values will be normally distributed around the imaginary line
constructed ( )eE units transposed above the first bisector, see Figure 2-5(d).
(a) (b)
(c) (d)
Figure 2-4: Parity diagrams for 4 theoretical cases: (a) adequate model with a normal distributed error with
expected value equal to zero, (b) inadequate model with a normal distributed error with expected value
equal to zero, (c) adequate model with a two-tailed t-distributed error and (d) adequate model with a
normal distributed error with expected value equal to three
2.2.5.2 Performance figure
In a performance figure, the response values, both experimentally observed as well as
model calculated ones, are displayed against an independent variables, e.g., conversion as a
function of space-time. The experimental values are represented by symbols including an
indication of the error on the measurement, e.g., a variance determined from repetition
0
10
20
30
40
50
60
70
80
90
100
0 20 40 60 80 100
x +
e ~
N(0
,5)
x
0
10
20
30
40
50
60
70
80
90
100
0 20 40 60 80 100
ax
² +
x +
e ~
N(0
,5)
x
0
10
20
30
40
50
60
70
80
90
100
0 20 40 60 80 100
x +
e ~
t(5
)
x
0
10
20
30
40
50
60
70
80
90
100
0 20 40 60 80 100
x +
e ~
N(3
,5)
x
Chapter 2
39
experiments, while the model calculated values are plotted as a continuous function. Such a
performance figure typically provides more detailed information on the agreement between
model simulations and experimental data compared to a parity diagram. From a
performance figure, the effect of the reaction conditions on the simulated values and the
corresponding residuals can be thoroughly analyzed while a parity diagram integrates all this
information in a single figure.
2.2.5.3 Residual figure
A residual figure is a 2-dimensional scatter plot in which the residuals, i.e., the differences
between the model simulated values and the observed values, are put against the
independent (or dependent) variable values. It contains mainly information on the
occurrence of systematic deviations, i.e., the model adequacy. Information on the error
distribution can also be obtained from these figures. If the experimental error is normally
distributed, the residuals should be distributed normally over the x-axis in these residual
figures, see Figure 2-6(a). If the model is adequate, systematic deviations from this normal
distribution as function of the independent variable values are absent. If present, they can
provide strategic information on the origin of the model inadequacy. For example, a
systematic increase of the residual of a product outlet flow rate as function of the reaction
temperature can indicate that an activation energy determining the production rate of this
product is too high. Other model inadequacies, e.g., redundant terms in the model
equation, can also be indicated by these plots, see Figure 2-6(b). Deviations from the
standard normal distribution are also sometimes detectable, see Figure 2-6(d).

Procedures
40
(a) (b)
(c) (d)
Figure 2-5: Residual figures for 4 theoretical cases: (a) adequate model with a normal distributed error with
expected value equal to zero, (b) inadequate model with a normal distributed error with expected value
equal to zero, (c) adequate model with a two-tailed t-distributed error and (d) adequate model with a
normal distributed error with expected value equal to three.
2.2.5.4 Normal probability figure
A normal probability figure is a 2-dimensional scatter plot in which the ordered residuals,
i.e., residuals ordered from lowest to highest value, are displayed against the theoretical
quantile values, which are points dividing the cumulative distribution function into equal
portions. It provides the most objective information on the error distribution. If linear
regression of these points leads to an adequate result, e.g., R² > 0.97 [38], the error is
considered to be normally distributed with an expected value equal to zero, see Figure 2-
7(a). A non-adequate model, i.e., a model containing systematic deviations, can still lead to
near acceptable linear regression results of the normal probability figure based upon the R2
value, see Figure 2-7(b). However; visually these shortcoming are more easy noticeable.
Non-normal error distributions are fairly easily detected by the construction of a normal
probability figure. If the error is distributed according to a two-tailed t distribution,
pronounced deviations as a result of these tails will be present in the normal probability
figure due to the nature of this distribution, as is clearly indicated in Figure 2-7(c). Another
-20
-15
-10
-5
0
5
10
15
20
0 20 40 60 80 100e ~
N(0
,5)
x-70
-60
-50
-40
-30
-20
-10
0
10
20
0 20 40 60 80 100
e ~
N(0
,5)
x
-15
-10
-5
0
5
10
15
0 20 40 60 80 100e ~
t(5
)
x-15
-10
-5
0
5
10
15
0 20 40 60 80 100e ~
N(3
,5)
x

Chapter 2
41
example is given in Figure 2-7(d) where the expected value of the error is different from
zero. A model leading to a normal probability plot from which it is concluded that the
residuals are normally distributed will typically also be evaluated as an adequate model. It
should be noted, however, that such a correspondence between the interpretation of a
normal probability plot and the model adequacy test cannot be mathematically
demonstrated, but that it can be expected to hold for all practical purposes.
(a) (b)
(c) (d)
Figure 2-6: Normal probability figures for 4 theoretical cases: (a) adequate model with a normal distributed
error with expected value equal to zero, (b) inadequate model with a normal distributed error with
expected value equal to zero, (c) adequate model with a two-tailed t-distributed error and (d) adequate
model with a normal distributed error with expected value equal to three
2.2.6 Single-Event MicroKinetic (SEMK) methodology
In the Single-Event MicroKinetic methodology, a unique single-event rate coefficient k~
is
assigned to each elementary reaction family. The single-event rate coefficient is assumed to
only depend on the reaction family of the elementary step, e.g., 1,2-alkyl shift, alkylation…
and the types of carbenium ions involved. This is obtained by explicitly accounting for the
symmetry of the transition state and of the reactants:
knk e
~⋅=
3-38
R² = 0.9845-15
-10
-5
0
5
10
15
-3 -2 -1 0 1 2 3
Ra
nk
ed
Re
sid
ua
ls
Theoretical Quantiles
R² = 0.9456
-70
-60
-50
-40
-30
-20
-10
0
10
20
30
-3 -2 -1 0 1 2 3R
an
ke
d R
esi
du
als
Theoretical Quantiles
R² = 0.8294-50
-40
-30
-20
-10
0
10
20
30
40
-3 -2 -1 0 1 2 3
Ra
nk
ed
Re
sid
ua
ls
Theoretical Quantiles
R² = 0.9566
-20
-15
-10
-5
0
5
10
15
20
-3 -2 -1 0 1 2 3
Ra
nk
ed
Re
sid
ua
ls
Theoretical Quantiles
Procedures
42
with, ne, the number of single events defined as the ratio of the global symmetry number
glσ of the reactant to that of the transition state:
≠=gl
rgl
enσσ
3-39
The global symmetry number glσ is calculated as follows:
chirn
extintgl 2
σσσ =
3-40
with intσ and extσ being, respectively, the internal and external symmetry number and chirn
the number of chiral atoms. Using this single event concept, the number of rate coefficients
required to describe the chemical kinetics in complex mixtures is reduced drastically. This is
described more extensively in previous work [39-43].
The fundamental character of the model makes that the model parameters have a precise
physical meaning and, hence, that a distinction can be made between so-called catalyst and
kinetic descriptors. Catalyst descriptors are model parameters which are directly related to
catalyst properties, e.g., acid site strength, pore volume… Where possible, catalyst
characterization techniques such as NH3-TPD, BET measurements… can be used to
determine the catalyst descriptors independently from the reaction kinetics and, hence, the
kinetic descriptors. The latter are parameters which are directly related to the reaction
families and are independent of the catalyst used, e.g., activation energies [42].
2.3 References
[1] P. Kumar, J.W. Thybaut, S. Teketel, S. Svelle, P. Beato, U. Olsbye, G.B. Marin,
Catalysis Today. 215 (2013) 224-232.
[2] H. Robson, Verified Synthesis of Zeolitic Materials, Elsevier, 2001.
[3] J. Heveling, C.P. Nicolaides, M.S. Scurrell, Applied Catalysis a-General. 173 (1998) 1-9.
[4] A. Finiels, F. Fajula, V. Hulea, Catalysis Science & Technology. 4 (2014) 2412-2426.
[5] NIST Standard Reference Database Number 69.
[6] A. Sarkar, D. Seth, M. Jiang, F.T.T. Ng, G.L. Rempel, Topics in Catalysis. 57 (2014) 730-
740.
[7] A. Martinez, M.A. Arribas, P. Concepcion, S. Moussa, Applied Catalysis a-General. 467
(2013) 509-518.
[8] R. Van Borm, A. Aerts, M.F. Reyniers, J.A. Martens, G.B. Marin, Industrial &
Engineering Chemistry Research. 49 (2010) 6815-6823.
[9] J.M. Berty, Chemical Engineering Progress. 70 (1974) 78-85.
[10] M. Steijns, G. Froment, P. Jacobs, J. Uytterhoeven, J. Weitkamp, Industrial &
Engineering Chemistry Product Research and Development. 20 (1981) 654-660.

Chapter 2
43
[11] M. Steijns, G.F. Froment, Industrial & Engineering Chemistry Product Research and
Development. 20 (1981) 660-668.
[12] N. Navidi, J.W. Thybaut, G.B. Marin, Applied Catalysis a-General. 469 (2014) 357-366.
[13] R.J. Berger, E.H. Stitt, G.B. Marin, F. Kapteijn, J.A. Moulijn, Cattech. 5 (2001) 30-60.
[14] K.M. Van Geem, S.P. Pyl, M.F. Reyniers, J. Vercammen, J. Beens, G.B. Marin, Journal
of Chromatography A. 1217 (2010) 6623-6633.
[15] Q. Chen, Internal report Eindhoven University of Technology - Final Version (1992).
[16] W.A. Dietz, Journal of Gas Chromatography. 5 (1967) 68-&.
[17] T.F. Edgar, D.M. Himmelblau, L. Lasdon, Optimization of Chemical Processes,
McGraw-Hill Higher Education, 2001.
[18] Y. Bard, Nonlinear Parameter Estimation, Academic Press, 1974.
[19] G.F. Froment, K.B. Bischoff, J. De Wilde, Chemical reactor analysis and design, 2010.
[20] G.B. Marin, G.S. Yablonsky, Kinetics of Chemical Reactions: Decoding Complexity,
2011.
[21] G.E.P. Box, N.R. Draper, Biometrika. 52 (1965) 355.
[22] M.J. Box, N.R. Draper, Annals of Mathematical Statistics. 41 (1970) 1391.
[23] M.J. Box, N.R. Draper, W.G. Hunter, Technometrics. 12 (1970) 613.
[24] G.F. Froment, L.H. Hosten, in: J. Anderson, M. Boudart (Eds.), Catalysis Science and
Technology, 1981.
[25] G. Buzzi-Ferraris, Catalysis Today. 52 (1999) 125-132.
[26] G. Buzzi-Ferraris, F. Manenti, Chemical Engineering Science. 64 (2009) 1061-1074.
[27] G. Buzzi-Ferraris, F. Manenti, Computers & Chemical Engineering. 34 (2010) 1904-
1906.
[28] BzzMath: Numerical libraries in C++, http://www.chem.polimi.it/homes/gbuzzi.
[29] G. Buzzi-Ferraris, F. Manenti, 22 European Symposium on Computer Aided Process
Engineering. 30 (2012) 1312-1316.
[30] W.E. Stewart, M. Caracotsios, Computer-Aided Modeling of Reactive Systems, John
Wiley & Sons, Inc., 2008.
[31] M. Boudart, Industrie Chimique Belge-Belgische Chemische Industrie. 31 (1966) 74.
[32] J.R. Kittrell, R. Mezaki, Aiche Journal. 13 (1967) 389.
[33] A. vandeRunstraat, J. vanGrondelle, R.A. vanSanten, Industrial & Engineering
Chemistry Research. 36 (1997) 3116-3125.
[34] H.H. Rosenbrock, Computer Journal. 3 (1960) 175-184.
[35] D.W. Marquardt, Journal of the Society for Industrial and Applied Mathematics. 11
(1963) 431-441.
[36] Netlib, http://www.netlib.org, (2012).
[37] J.R. Kittrell, Advances of Chemical Engineering. 8 (1970).
[38] Athena Visual Studio, Web page http://www.athenavisual.com/.
[39] G.G. Martens, G.B. Marin, J.A. Martens, P.A. Jacobs, G.V. Baroni, Journal of Catalysis.
195 (2000) 253-267.
[40] G.D. Svoboda, E. Vynckier, B. Debrabandere, G.F. Froment, Industrial & Engineering
Chemistry Research. 34 (1995) 3793-3800.
[41] J.W. Thybaut, G.B. Marin, Chemical Engineering & Technology. 26 (2003) 509-514.
[42] J.W. Thybaut, G.B. Marin, Journal of Catalysis. 308 (2013) 352-362.
[43] J.W. Thybaut, G.B. Marin, G.V. Baron, P.A. Jacobs, J.A. Martens, Journal of Catalysis.
202 (2001) 324-339.


45
Chapter 3
Kinetic Modeling of n-Hexane
Hydroisomerization on a
Bifunctional zeolite
In this chapter, the systematic methodology developed in chapter 2 is demonstrated by
applying it to a model reaction involving a limited reaction network and an established
reaction mechanism, i.e., n-hexane hydroisomerization over a bifunctional zeolite such as
platinum impregnated H-ZSM-5 [1-7]. While the acid function provided by the H-ZSM-5
zeolite framework provokes skeletal rearrangement and cracking, the metal function
enables operating at relatively low temperatures and avoiding deactivation by coking. In
order to acquire the most details as possible about the acid catalyzed reaction mechanism,
the experimental investigation was performed at gas phase conditions under which ideal
hydrocracking occurs [3, 5, 6, 8-12]. When performing experiments within such a range of
operating conditions, the acid catalyzed reactions are rate determining, leading to specific
kinetic behavior, e.g., exhibiting a maximum in the isomer yield. The hydroisomerization
reaction mechanism has already been discussed extensively in the literature [9, 13]. A short
recapitulation is given in Figure 3-1. In a first step, gas phase alkanes are physically adsorbed
within the catalyst pores where they are subsequently dehydrogenated at the metal, i.e.,
platinum, sites. The produced alkenes desorb from the metal sites and diffuse towards the
acid sites where they are protonated to form reactive carbenium ions. These carbenium ions
undergo isomerization and cracking reactions. The product carbenium ions are converted
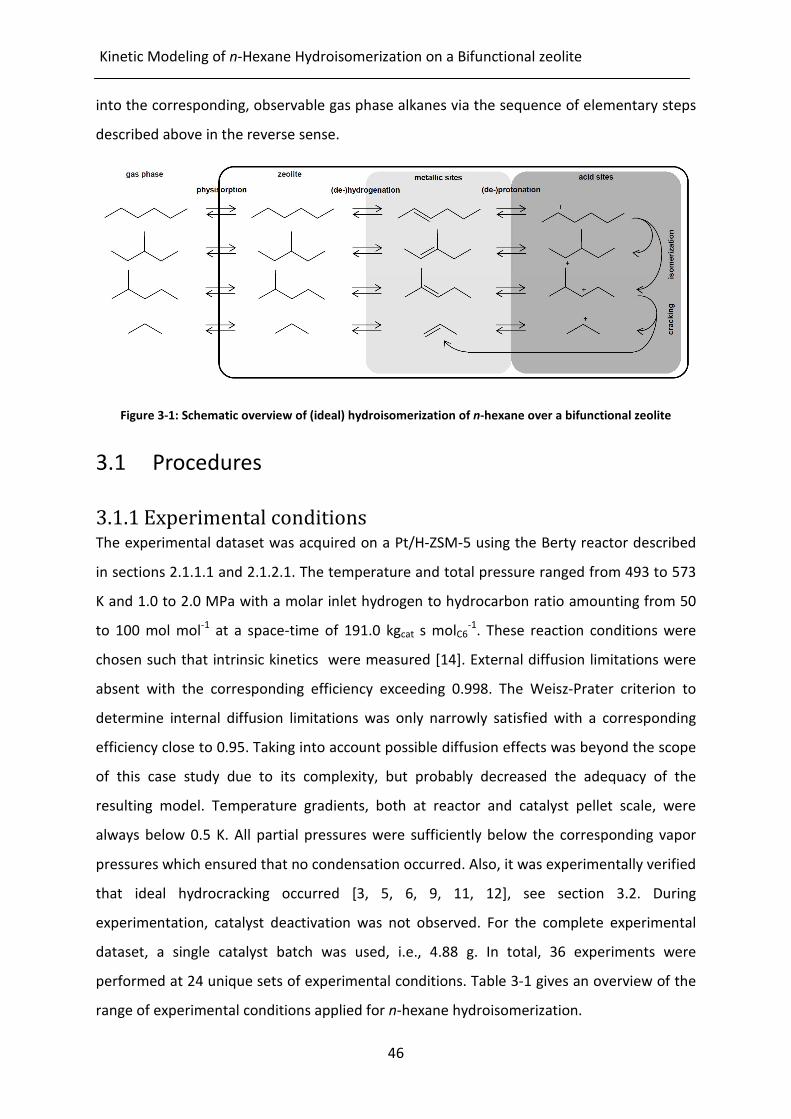
Kinetic Modeling of n-Hexane Hydroisomerization on a Bifunctional zeolite
46
into the corresponding, observable gas phase alkanes via the sequence of elementary steps
described above in the reverse sense.
Figure 3-1: Schematic overview of (ideal) hydroisomerization of n-hexane over a bifunctional zeolite
3.1 Procedures
3.1.1 Experimental conditions The experimental dataset was acquired on a Pt/H-ZSM-5 using the Berty reactor described
in sections 2.1.1.1 and 2.1.2.1. The temperature and total pressure ranged from 493 to 573
K and 1.0 to 2.0 MPa with a molar inlet hydrogen to hydrocarbon ratio amounting from 50
to 100 mol mol-1
at a space-time of 191.0 kgcat s molC6-1
. These reaction conditions were
chosen such that intrinsic kinetics were measured [14]. External diffusion limitations were
absent with the corresponding efficiency exceeding 0.998. The Weisz-Prater criterion to
determine internal diffusion limitations was only narrowly satisfied with a corresponding
efficiency close to 0.95. Taking into account possible diffusion effects was beyond the scope
of this case study due to its complexity, but probably decreased the adequacy of the
resulting model. Temperature gradients, both at reactor and catalyst pellet scale, were
always below 0.5 K. All partial pressures were sufficiently below the corresponding vapor
pressures which ensured that no condensation occurred. Also, it was experimentally verified
that ideal hydrocracking occurred [3, 5, 6, 9, 11, 12], see section 3.2. During
experimentation, catalyst deactivation was not observed. For the complete experimental
dataset, a single catalyst batch was used, i.e., 4.88 g. In total, 36 experiments were
performed at 24 unique sets of experimental conditions. Table 3-1 gives an overview of the
range of experimental conditions applied for n-hexane hydroisomerization.

Chapter 3
47
Table 3-1: Range of experimental conditions for n-hexane hydroisomerization on Pt/H-ZSM-5
Temperature
[K]
Total pressure
[MPa]
Hydrogen to hydrocarbon
feed ratio
[mol mol-1
]
Space time
[kgcat s molC2-
1]
493 – 573 1.00 – 2.00 50 – 100 191.0
3.1.2 Reactor model For modeling purposes, the reactor is considered as an ideal CSTR as described in section 2.2.2.1.
The CSTR is described by a set of algebraic equations for the components in the reaction mixture:
30 C and 3MP 2MP,i =+= WRFF iii
3-1
with W the catalyst mass and iR the net rate of formation of component i, see equations 3-4 to 3-6
in section 3.3.1. In order to eliminate any linear dependence in the set of reactor balance equations,
the carbon and hydrogen balances were used to calculate the hydrogen and n-hexane molar flow
rate, see resp. equation 3-2 and 3-3.
2
332
066
CMPMPnCnC
FFFFF −−−=
3-2
2
30
22
CHH
FFF −=
3-3
3.1.3 Parameter estimation The regression was performed with a commercially available software package, i.e., Athena
Visual Studio [15, 16]. In this software package, Bayesian estimation is conventionally used
for multiresponse regression purposes [17]. Differences amounting to at least one order of
magnitude occur between the responses. Via Bayesian estimation, it is statistically assured
that every response, and even each measurement within a response, is equally accounted
for. The assumptions made within this package lead to an optimization criterion which is
equivalent to generalized least squares, GLS. Using a CSTR typically leads to the direct
determination of the reaction rates and, hence, these could be used as responses in the
objective function. However, using the molar outlet flow rates calculated from a CSTR mass
balance eliminates the double use of the measurements, i.e., as experimental observations
(reaction rate) and as independent variables (reactor concentrations or partial pressures). In
total, 3 responses are considered, i.e., the molar outlet flow rate of the products: 2-methyl
pentane (2MP), 3-methyl pentane (3MP), and propane (C3). The molar outlet flow rate of

Kinetic Modeling of n-Hexane Hydroisomerization on a Bifunctional zeolite
48
the reactants, i.e., n-hexane and hydrogen were not taken into account into the regression.
These flow rates were determined from the product outlet flow rates using resp. a carbon
and hydrogen balance. This was justified because the experimental data is normalized
before being used for further analysis and regression, see section 2.1.3.
3.2 n-Hexane Hydroisomerization: experimental
observations
In the entire range of operating conditions, so-called ideal hydrocracking behavior was
observed [3, 5, 6, 8-12]. With increasing temperature, i.e., from 493 to 573 K, the n-hexane
conversion increased with the temperature, from ca. 20% to ca. 80%, see Figure 3-2. A
higher inlet hydrogen to n-hexane molar ratio and/or total pressure resulted in a decrease
of the conversion, see Figure 3-2. If the hydrogenation reaction is in quasi-equilibrium and
the inlet hydrogen to n-hexane molar ratio and/or total pressure increases, this equilibrium
is shifted towards the alkanes and, hence, less n-hexane is converted [9].
Figure 3-2: n-Hexane hydroisomerization conversion on Pt/H-ZSM-5 catalyst as a function of the
temperature at different hydrogen to n-hexane molar inlet ratio and total pressures. Symbols correspond to
experimental observations, lines correspond to model simulations, i.e., Eqs. 3-1 to 3-3, in which the net
rates of formation are given by Eqs. 3-4 to 3-6 using the parameters from Table 3-4. , full line: F0
H2 / F0
C6 =
50 mol mol-1
, ptot = 1.0 MPa; , dashed line: F0
H2 / F0
C6 = 100 mol mol-1
, ptot = 1.0 MPa; , dotted line: F0
H2 /
F0
C6 = 50 mol mol-1
, ptot = 2.0 MPa.
In Figure 3-3, the product selectivity as function of the n-hexane conversion is given. At low
conversions, almost exclusively isomerization via protonated cyclopropyl (pcp) branching
occurs to 2MP and 3MP. In general, the ratio of 2MP and 3MP is close to 2 at n-hexane
10
20
30
40
50
60
70
80
480 500 520 540 560 580
Co
nv
ers
ion
[%
]
Temperature [K]

Chapter 3
49
conversions below 50% after which it decreases to the thermodynamic equilibrium, i.e.,
around 1.5, see Figure 3-4. The higher molar ratio of 2MP to 3MP than expected from
kinetic considerations can be attributed to the occurrence of intracrystalline diffusion
effects [18], the latter also being confirmed by the absence of di-branched components. The
critical diameter of 2MP amounts to 0.54 nm [19] and is slightly smaller than that of 3MP,
i.e., 0.56 nm [18]. This difference in critical diameter and spatial structure can indeed lead to
a difference in diffusivity in the medium sized pores of the ZSM-5 zeolite investigated in this
work [18].
Figure 3-3: n-Hexane hydroisomerization product selectivity on Pt/H-ZSM-5 catalyst as a function of the
conversion. Symbols correspond to experimental observations, lines correspond to model simulations, i.e.,
Eqs. 3-1 to 3-3, in which the net rates of formation are given by Eqs. 3-4 to 3-6 using the parameters from
Table 3-4. , full line: 2MP; , dashed line: 3MP; , dotted line: propane.
0
10
20
30
40
50
60
70
0 20 40 60 80 100
Se
lect
ivit
y [
%]
Conversion [%]
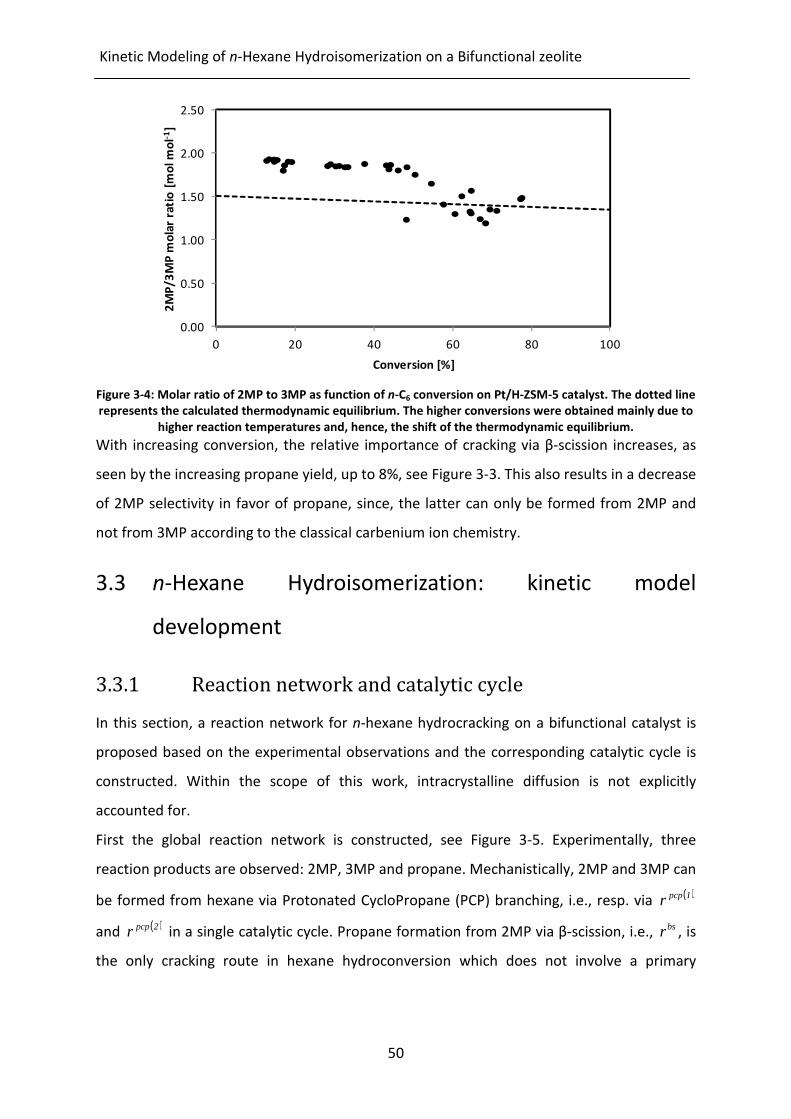
Kinetic Modeling of n-Hexane Hydroisomerization on a Bifunctional zeolite
50
Figure 3-4: Molar ratio of 2MP to 3MP as function of n-C6 conversion on Pt/H-ZSM-5 catalyst. The dotted line
represents the calculated thermodynamic equilibrium. The higher conversions were obtained mainly due to
higher reaction temperatures and, hence, the shift of the thermodynamic equilibrium.
With increasing conversion, the relative importance of cracking via β-scission increases, as
seen by the increasing propane yield, up to 8%, see Figure 3-3. This also results in a decrease
of 2MP selectivity in favor of propane, since, the latter can only be formed from 2MP and
not from 3MP according to the classical carbenium ion chemistry.
3.3 n-Hexane Hydroisomerization: kinetic model
development
3.3.1 Reaction network and catalytic cycle
In this section, a reaction network for n-hexane hydrocracking on a bifunctional catalyst is
proposed based on the experimental observations and the corresponding catalytic cycle is
constructed. Within the scope of this work, intracrystalline diffusion is not explicitly
accounted for.
First the global reaction network is constructed, see Figure 3-5. Experimentally, three
reaction products are observed: 2MP, 3MP and propane. Mechanistically, 2MP and 3MP can
be formed from hexane via Protonated CycloPropane (PCP) branching, i.e., resp. via ( )1pcpr
and ( )2pcpr in a single catalytic cycle. Propane formation from 2MP via β-scission, i.e., bsr , is
the only cracking route in hexane hydroconversion which does not involve a primary
0.00
0.50
1.00
1.50
2.00
2.50
0 20 40 60 80 100
2M
P/
3M
P m
ola
r ra
tio
[m
ol
mo
l-1]
Conversion [%]

Chapter 3
51
carbenium ion and, hence, the only one which occurs to an appreciable extent under the
reaction conditions applied.
Figure 3-5: Simplified reaction scheme of n-hexane hydroisomerization on a bifunctional catalyst
As an alternative, the following reaction scheme could also proposed for the
hydroisomerization of n-hexane on Pt/H-ZSM-5, see Figure 3-6. For this reaction scheme it is
assumed that the reaction rate of PCP branching of n-hexane towards 2MP and 3MP is
equal, i.e., pcpr . This is justified by the same transition state through which the formation of
2MP and 3MP by pcp-branching is occurring. To account for the difference between the
conversion to 2MP and 3MP, an additional isomerization step from 3MP to 2MP via an
alkylshift is assumed, i.e., asr . However, after regression, statistical tests showed that using
this alternative reaction scheme led to a globally less significant and less adequate model. In
addition, with the normal probability figures, it was determined that the residuals were not
normally distributed, see Figure 3-7. An extended discussion of these results is beyond the
scope of this work. The use of one of the C6 isomers as a (co-)feed during experiments could
also lead to a better understanding of the underlying chemistry and, hence, the
corresponding reaction network.
Figure 3-6: Alternative reaction scheme of n-hexane hydroisomerization on a bifunctional catalyst
( )1pcpr2
2H−
( )2pcpr
bsr
2 2H−
pcpr
pcpr
bsr
asr

Kinetic Modeling of n-Hexane Hydroisomerization on a Bifunctional zeolite
52
Figure 3-7: Normal probability figure for the molar outlet flow rate of 3MP determined by solving the set of
Eqs. 3-1 to 3-3, in which the net rates of formation are based upon the alternative reaction scheme given in
Figure 3-6.
The net rate of formation of all the components, i.e., n-hexane, 2MP, 3MP, propane and
hydrogen is obtained from the rate of the individual reactions by accounting for the
stoichiometry in the global reaction network, see Figure 3-5:
( ) ( )2pcp1pcp
nC rrR6
−−=
3-4
( ) bs1pcp
MP2 rrR −=
3-5
2pcp
MP3 rR =
3-6
bs
C r2R3
=
3-7
bs
H rR2
−=
3-8
Experimentally, the n-hexane conversion decreased with increasing total pressure and inlet
hydrogen to n-hexane molar ratio, see section 3.2. As mentioned before, this is indicative of
the occurrence of ideal hydrocracking, such that the following hypotheses can be made
with respect to the catalytic cycle comprised by each of the steps in the global reaction
network:
Hypothesis 1: The reactions on the acid sites, e.g., PCP branching and cracking, are rate
determining within a catalytic cycle while all the other steps, i.e., sorption, (de-
)hydrogenation and (de-)protonation are in quasi-equilibrium [3, 5, 6, 9, 11, 12].
R² = 0.8921
-1.50
-1.00
-0.50
0.00
0.50
1.00
1.50
-3 -2 -1 0 1 2 3
Ord
ere
d R
esi
du
als
F3
Me
C5
[10
-6m
ol s
-1]
Theoretical quantiles

Chapter 3
53
The difference in physisorption between the C6 alkanes is expected to be negligible due to
their structural resemblance. Additionally, the amount of propane adsorbed is negligible
compared to that of C6 alkanes due to its lower carbon number [20].
Hypothesis 2: All C6 hydrocarbons are considered to interact in an identical manner with an
adsorption site, i.e., the physisorption enthalpy and entropy are identical.
Hypothesis 3: The cracking product, propane, is instantaneously released to the gas phase,
i.e., it does not physisorb in the zeolite pores.
In a first step, gas phase C6 alkanes physisorb with the zeolite framework at a physisorption
site [ ]. This physical adsorption is quantified via an equilibrium coefficient physK (hypothesis
1-3), see
Figure 3-8:
+Kphys
+Kphys
+Kphys
Figure 3-8: Physisorption equilibrium of n-hexane, 2MP and 3MP in the zeolite pores
Secondly, the alkanes diffuse to and chemisorb onto a metallic site, i.e., Pt. On this site, the
alkanes are dehydrogenated yielding a corresponding alkene and hydrogen which is
accounted for via the equilibrium coefficient dehK (hypothesis 1), see Figure 3-9. Implicitly, it
is assumed that the alkenes can desorb from the zeolite pores to the gas phase in a similar
way as the alkanes. However, the amount of physisorbed as well as gas phase alkenes is
negligibly small compared to the alkanes due to the quasi-equilibrium of the hydrogenation
under a hydrogen excess. As a result these alkenes are not explicitly accounted for in any of
the mass or site balances.
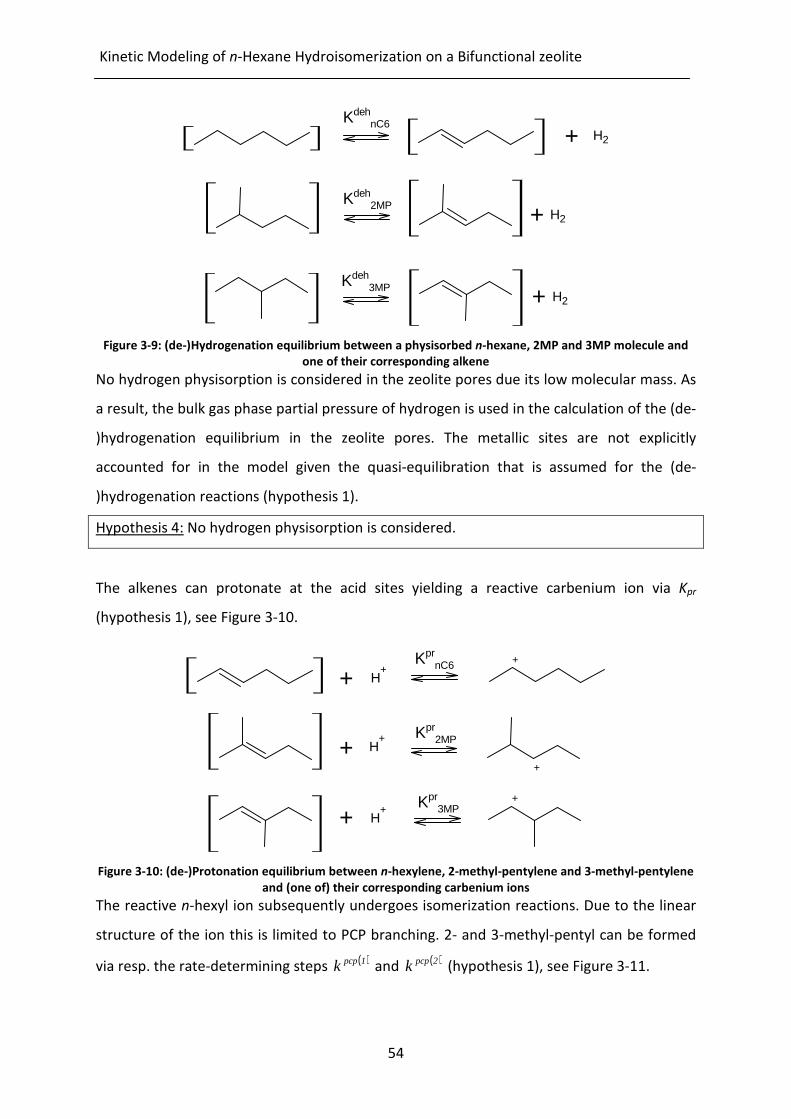
Kinetic Modeling of n-Hexane Hydroisomerization on a Bifunctional zeolite
54
H2+Kdeh
nC6
+ H2
Kdeh2MP
+ H2
Kdeh3MP
Figure 3-9: (de-)Hydrogenation equilibrium between a physisorbed n-hexane, 2MP and 3MP molecule and
one of their corresponding alkene
No hydrogen physisorption is considered in the zeolite pores due its low molecular mass. As
a result, the bulk gas phase partial pressure of hydrogen is used in the calculation of the (de-
)hydrogenation equilibrium in the zeolite pores. The metallic sites are not explicitly
accounted for in the model given the quasi-equilibration that is assumed for the (de-
)hydrogenation reactions (hypothesis 1).
Hypothesis 4: No hydrogen physisorption is considered.
The alkenes can protonate at the acid sites yielding a reactive carbenium ion via Kpr
(hypothesis 1), see Figure 3-10.
+ H+
+KprnC6
+
Kpr2MP
+
+ H+
+ H+ Kpr
3MP
Figure 3-10: (de-)Protonation equilibrium between n-hexylene, 2-methyl-pentylene and 3-methyl-pentylene
and (one of) their corresponding carbenium ions
The reactive n-hexyl ion subsequently undergoes isomerization reactions. Due to the linear
structure of the ion this is limited to PCP branching. 2- and 3-methyl-pentyl can be formed
via resp. the rate-determining steps ( )1pcpk and ( )2pcpk (hypothesis 1), see Figure 3-11.
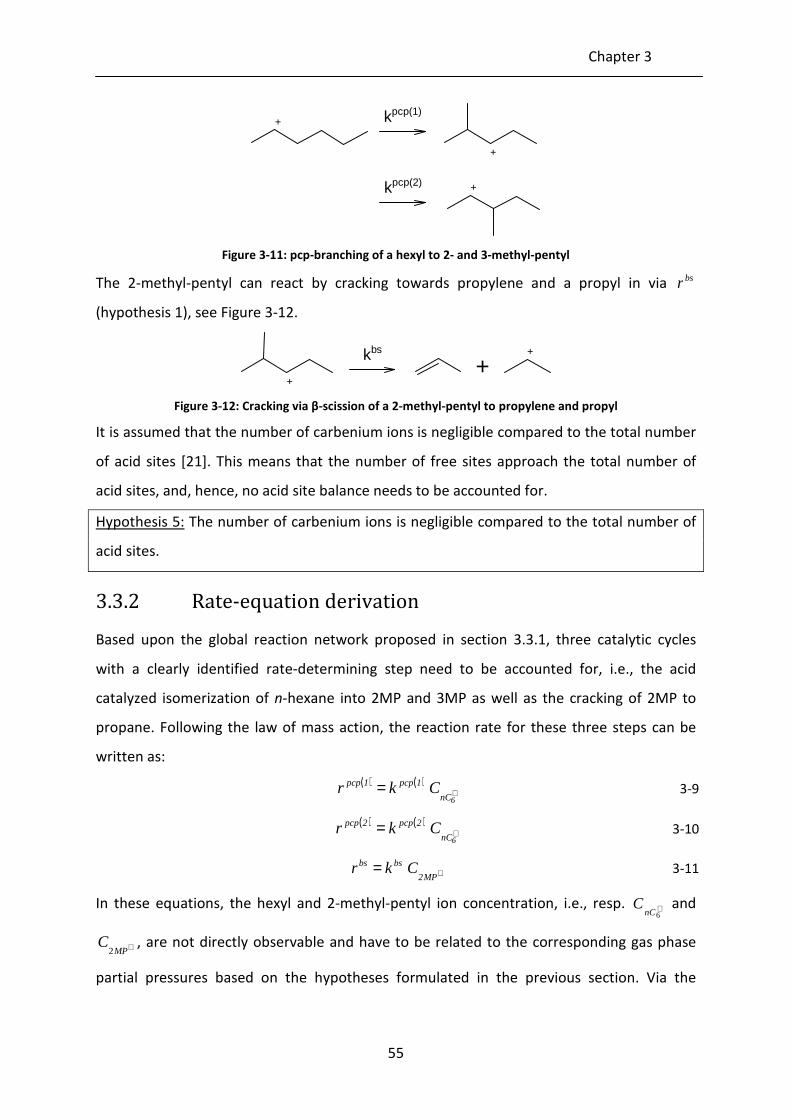
Chapter 3
55
+
+ kpcp(1)
+kpcp(2)
Figure 3-11: pcp-branching of a hexyl to 2- and 3-methyl-pentyl
The 2-methyl-pentyl can react by cracking towards propylene and a propyl in via bsr
(hypothesis 1), see Figure 3-12.
+
++
kbs
Figure 3-12: Cracking via β-scission of a 2-methyl-pentyl to propylene and propyl
It is assumed that the number of carbenium ions is negligible compared to the total number
of acid sites [21]. This means that the number of free sites approach the total number of
acid sites, and, hence, no acid site balance needs to be accounted for.
Hypothesis 5: The number of carbenium ions is negligible compared to the total number of
acid sites.
3.3.2 Rate-equation derivation
Based upon the global reaction network proposed in section 3.3.1, three catalytic cycles
with a clearly identified rate-determining step need to be accounted for, i.e., the acid
catalyzed isomerization of n-hexane into 2MP and 3MP as well as the cracking of 2MP to
propane. Following the law of mass action, the reaction rate for these three steps can be
written as:
( ) ( )+=6nC
1pcp1pcp Ckr
3-9
( ) ( )+=6nC
2pcp2pcp Ckr
3-10
+=
MP2
bsbs Ckr
3-11
In these equations, the hexyl and 2-methyl-pentyl ion concentration, i.e., resp. +6nC
C and
+MPC
2, are not directly observable and have to be related to the corresponding gas phase
partial pressures based on the hypotheses formulated in the previous section. Via the

Kinetic Modeling of n-Hexane Hydroisomerization on a Bifunctional zeolite
56
protonation equilibrium, the carbenium ion concentration can be expressed in terms of the
physisorbed alkene concentration:
+
+
=
=H
physnC
nCprnC CC
CK
6
6
6
3-12
Under hypothesis 5, the concentration of free acid sites, freeHC
,+ , approaches the total acid
site concentration, +HC , under all reaction conditions. The alkene concentration is
calculated via the hydrogenation equilibrium:
phys
nC
Hphys
nCdehnC
6
26
6 C
pCK ==
3-13
The concentration of the physisorbed alkanes, e.g., physnCC
6 is calculated via the physisorption
equilibria:
physfreenC
physnCphys
Cp
CK
6
6=
3-14
Lastly, the concentration of free physisorption sites, i.e., physfreeC , is determined via a
physisorption site balance (hypotheses 1-4):
physMP
physMP
physnC
physfree
phystot CCCCC 326
+++=
3-15
By substituting the physisorbed alkanes concentration in equation 3-15 with the
corresponding equilibria, the concentration of free physisorption sites is given by the
following Langmuir isotherm:
( )MPMPnCphys
phystotphys
free pppK
CC
3261 +++=
3-16
Combining equation 3-9 to equation 3-16 leads to the following expressions for the rate
determining steps in terms of observable partial pressures and adjustable model
parameters only:
( )
( )
( )MP3MP2nCphys
H
nCphystotH
1pcpprnC
dehnC
phys
1pcp
pppK1
p
pCCkKKK
r6
2
6
66
+++=
+
3-17
( )
( )
( )MP3MP2nCphys
H
nCphystotH
2pcpprnC
dehnC
phys
2pcp
pppK1
p
pCCkKKK
r6
2
6
66
+++=
+
3-18

Chapter 3
57
( )MP3MP2nC
phys
H
MP2phystotH
bsprMP2
dehMP2
phys
bs
pppK1
p
pCCkKKK
r6
2
+++=
+
3-19
A product of several parameters occurs in the numerator of these rate expressions. In order
to avoid a pronounced correlation between these parameters, they are lumped into a
single, composite rate coefficient:
( ) ( )1pcp
compphys
totH
1pcpprnC
dehnC
phys kCCkKKK66
=+
3-20
( ) ( )2pcp
compphys
totH
2pcpprnC
dehnC
phys kCCkKKK66
=+
3-21
bscomp
phystotH
bsprMP2
dehMP2
phys kCCkKKK =+
3-22
Of course, it may be possible to assess the catalyst descriptors such as +HC and phys
totC via
separate, dedicated measurements. It is, however, beyond the scope of the present work
aiming at a systematic methodology to further elaborate on this, and, hence, these
descriptors are incorporated into the lumped rate coefficients. The final rate expressions
used in the modeling of the n-hexane hydroconversion kinetics in terms of adjustable
parameters, i.e., ( )1pcpcompk , ( )2pcp
compk , bscompk and physK , hence, become:
( )
( )
( )MP3MP2nCphys
H
nC1pcpcomp
1pcp
pppK1
p
pk
r6
2
6
+++=
3-23
( )
( )
( )MP3MP2nCphys
H
nC2pcpcomp
2pcp
pppK1
p
pk
r6
2
6
+++=
3-24
( )MP3MP2nC
phys
H
MP2bscomp
bs
pppK1
p
pk
r6
2
+++=
3-25
From these reaction rates, the net rate of formation of all the components, i.e., n-hexane,
2MP, 3MP, propane and hydrogen can be determined using equation 3-4 to 3-8.

Kinetic Modeling of n-Hexane Hydroisomerization on a Bifunctional zeolite
58
3.4 n-Hexane Hydroisomerization: modeling
3.4.1 Isothermal regression
An isothermal regression at each of the investigated temperatures has been performed and
yielded the estimates for the 4 rate coefficients, i.e., ( )1pcpcompk , ( )2pcp
compk , bscompk
and physK and the
corresponding individual 95% confidence intervals as reported in Table 3-2.
Table 3-2: Parameter estimates and corresponding 95% confidence interval as function of temperature
determined by isothermal regression to the experimental data of the kinetic model given by the set of Eqs.
3-1 to 3-3, in which the net rates of formation are given by Eqs. 3-4 to 3-6. Not statistically significant
parameters are indicated in italics.
Temperature [K] 493 513 533 553 573
( )1pcpcompk [10
-6 mol s
-1 kgcat
-
1]
72.9 ± 11.8 150.6 ± 40.8 215.8 ± 51.3 281.1 ± 48.7 566.9 ± 158.9
( )2pcpcompk [10
-6 mol s
-1
kgcat-1
] 37.9 ± 6.4 80.2 ± 22.8 113.1 ± 28.2 189.2 ± 33.5 358.5 ± 101.9
bscompk [10
-6 mol s
-1 kgcat
-
1]
8.9 ± 8.9 8.4 ± 12.9 17.9 ± 9.0 23.6 ± 6.3 52.1 ± 16.0
physK [10-5
Pa-1
] 4.0 ± 1.3 2.8 ± 2.0 1.2 ± 1.4 -0.2 ± 0.7 1.1 ± 1.6
Fs 676.8 (4.3) 264.3 (4.6) 327.3 (4.5) 506.9 (4.5) 283.1 (4.5)
number of data points 9 6 7 7 7
The PCP branching rate coefficients increase with the temperature while the ratio of both
rate coefficients, i.e.,
( )
( )2pcpcomp
1pcpcomp
k
k, decreases from ca. 2.0 to 1.5 with increasing temperature
from 493 to 573 K. This indicates that the composite activation energy of ( )1pcpcompk is smaller
than that of ( )2pcpcompk . Both catalytic cycles include the same elementary steps in which a
secondary carbenium ion undergoes PCP branching leading to another secondary carbenium
ion and, hence, it could be expected that the activation energies are identical.
Intracrystalline diffusion phenomena are considered to be at the origin of this deviation, as
explained in section 3.2. With increasing conversion, especially at higher temperatures, 2MP
and 3MP are produced in amounts corresponding to thermodynamic equilibrium. Hence,

Chapter 3
59
the rate coefficient of PCP branching towards 3MP has to increase faster with the
temperature than that leading to 2MP, resulting in a higher activation energy of the former.
The limited cracking at lower temperatures leads to a difficult determination of the
corresponding rate coefficient. As a result, its value is sometimes not significantly estimated,
i.e., the confidence interval includes zero as a possible parameter value. However, with
increasing temperature, cracking becomes more important and, hence, the corresponding
rate coefficient, bscompk , increases and can be estimated significantly from 533 K onwards.
The opposite holds true for the physisorption equilibrium coefficient physK . Physisorption is
an exothermic step and, hence, it is most pronounced at lower temperatures. As a result,
also the corresponding physisorption coefficient is statistically most significantly determined
in the lower temperature range which is evident from the higher t values (not shown) and
the corresponding relatively more narrow confidence intervals. At higher temperatures, the
physisorption equilibrium coefficient adopts such a small value that in the adsorption term
in equation 3-23 to 3-25, ( )556 MeC3MeC2nC
phys pppK ++ becomes negligible compared to 1
and it becomes impossible to estimate the physisorption coefficient significantly.
Plotting the logarithm of the estimates for the composite rate coefficients against the
reciprocal of temperature results in an Arrhenius plot, see Figure 3-13. For the Arrhenius
plot, also the statistically non-significant estimates have been included as long as their value
was physically meaningful. The slope of the trend lines, corresponding to R
Ea or R
H phys∆−,
and the intercept with the y-axis, corresponding to ( )Aln allow determining the initial
guesses for the non-isothermal regression as reported in Table 3-3.
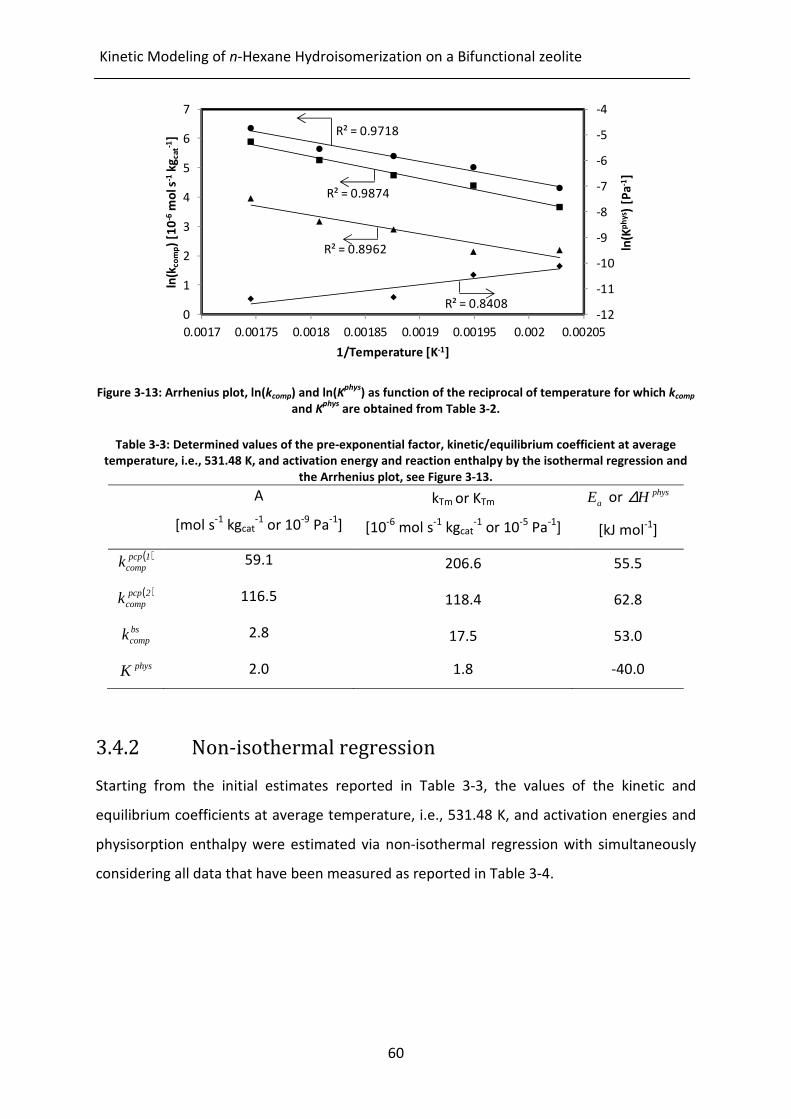
Kinetic Modeling of n-Hexane Hydroisomerization on a Bifunctional zeolite
60
Figure 3-13: Arrhenius plot, ln(kcomp) and ln(Kphys
) as function of the reciprocal of temperature for which kcomp
and Kphys
are obtained from Table 3-2.
Table 3-3: Determined values of the pre-exponential factor, kinetic/equilibrium coefficient at average
temperature, i.e., 531.48 K, and activation energy and reaction enthalpy by the isothermal regression and
the Arrhenius plot, see Figure 3-13.
A
[mol s-1
kgcat-1
or 10-9
Pa-1
]
kTm or KTm
[10-6
mol s-1
kgcat-1
or 10-5
Pa-1
]
aE or physH∆
[kJ mol-1
]
( )1pcpcompk 59.1 206.6 55.5
( )2pcpcompk 116.5 118.4 62.8
bscompk 2.8 17.5 53.0
physK 2.0 1.8 -40.0
3.4.2 Non-isothermal regression
Starting from the initial estimates reported in Table 3-3, the values of the kinetic and
equilibrium coefficients at average temperature, i.e., 531.48 K, and activation energies and
physisorption enthalpy were estimated via non-isothermal regression with simultaneously
considering all data that have been measured as reported in Table 3-4.
R² = 0.9718
R² = 0.9874
R² = 0.8962
R² = 0.8408-12
-11
-10
-9
-8
-7
-6
-5
-4
0
1
2
3
4
5
6
7
0.0017 0.00175 0.0018 0.00185 0.0019 0.00195 0.002 0.00205
ln(K
ph
ys )
[P
a-1
]
ln(k
co
mp)
[10
-6m
ol s
-1k
gc
at-1
]
1/Temperature [K-1]

Chapter 3
61
Table 3-4: Parameter estimates, corresponding approximate 95% individual confidence interval and t values
of the kinetic/equilibrium coefficients at average temperature and activation energies and reaction enthalpy
determined by non-isothermal regression to the experimental data of the kinetic model given by the set of
Eqs. 3-1 to 3-3, in which the net rates of formation are given by Eqs. 3-4 to 3-6.
comp,Tm
k or TmK
[10-6
mol s-1
kgcat-1
or 10-5
Pa-1
]
|t value|
tabulated value:
2.0
comp,aE or physH∆
[kJ mol-1
]
|t value|
tabulated value:
2.0
( )1pcpcompk 200.0 ± 22.8 18.5 53.5 ± 7.1 15.9
( )2pcpcompk 114.5 ± 13.7 17.6 61.4 ± 7.8 16.6
bscompk 14.6 ± 2.4 12.7 68.0 ± 9.7 14.8
physK 1.0 ± 0.6 3.3 -88.6 ± 28.0 6.8
The model has a higher F value for the global significance of the regression than the
corresponding tabulated F value, i.e., 2365 compared to 3.9. All parameters are estimated
significantly, as reflected by their confidence interval and corresponding t value exceeding
the tabulated t value. The coefficients concerning cracking, bscompk , and physisorption, physK ,
have the widest confidence intervals. As discussed in section 3.4.1, the information
contained in the data corresponding to these parameters is constrained to the higher
respectively lower temperature range. Literature values for the activation energies of PCP
branching and cracking are difficult to find due to their composite nature. However, the
physisorption enthalpy estimate, i.e., 88 kJ mol-1
, corresponds rather well to physisorption
studies of n-hexane on ZSM-5, i.e., 70-80 kJ mol-1
[7, 22, 23]. A different activation energy
for PCP branching to 2MP and 3MP was obtained, i.e., resp. 53 and 61 kJ mol-1
. This
composed activation energy comprises the physisorption enthalpy, the dehydrogenation
enthalpy, the protonation enthalpy and the activation energy of the elementary step. The
physisorption enthalpy is estimated to be ca. -90 kJ mol-1
, the dehydrogenation enthalpy is
determined by thermodynamic calculations to be ca. 100 kJ mol-1
and protonation
enthalpies are reported to be within the range of ca. -70 to -90 kJ mol-1
[7, 13].The
activation energy for PCP branching (s,s) is reported to be equal to ca. 110-130 kJ mol-1
[7,
13]. From the parameter estimates, the activation energy for PCP branching (s,s) amounts to
120-140 kJ mol-1
which corresponds rather well to the literature values. The occurrence of
diffusion effects is not pronounced since this would lead to an observed activation energy
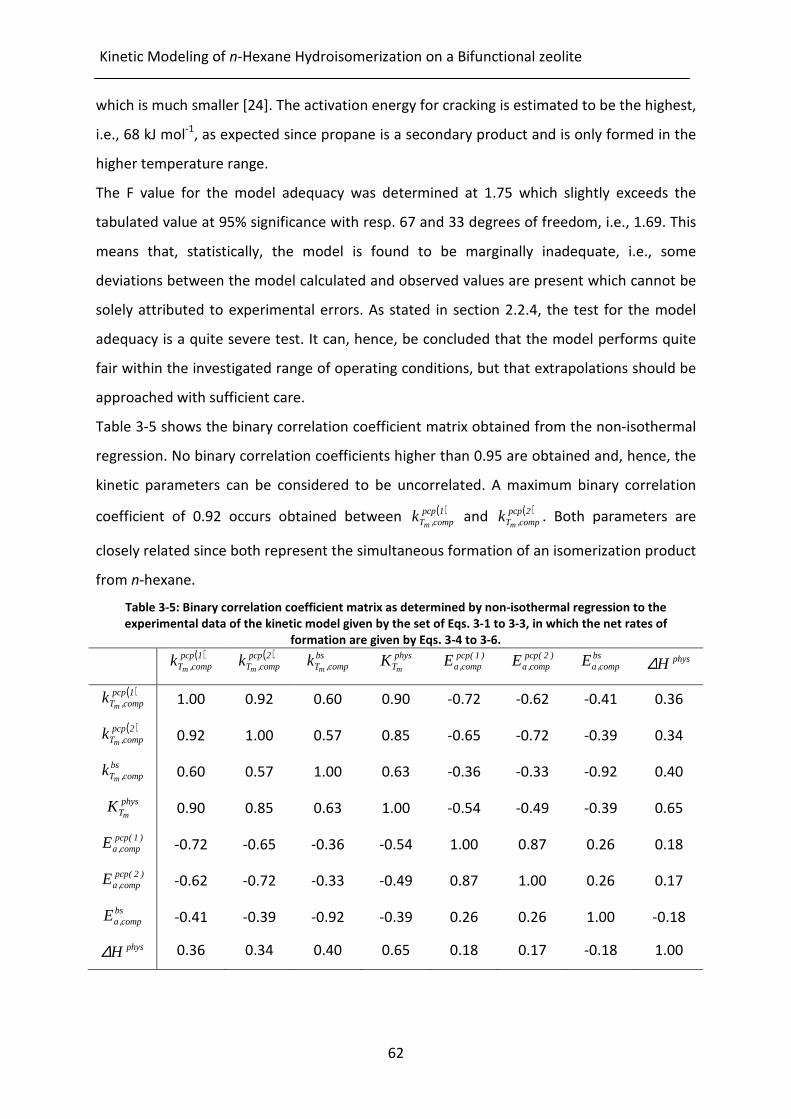
Kinetic Modeling of n-Hexane Hydroisomerization on a Bifunctional zeolite
62
which is much smaller [24]. The activation energy for cracking is estimated to be the highest,
i.e., 68 kJ mol-1
, as expected since propane is a secondary product and is only formed in the
higher temperature range.
The F value for the model adequacy was determined at 1.75 which slightly exceeds the
tabulated value at 95% significance with resp. 67 and 33 degrees of freedom, i.e., 1.69. This
means that, statistically, the model is found to be marginally inadequate, i.e., some
deviations between the model calculated and observed values are present which cannot be
solely attributed to experimental errors. As stated in section 2.2.4, the test for the model
adequacy is a quite severe test. It can, hence, be concluded that the model performs quite
fair within the investigated range of operating conditions, but that extrapolations should be
approached with sufficient care.
Table 3-5 shows the binary correlation coefficient matrix obtained from the non-isothermal
regression. No binary correlation coefficients higher than 0.95 are obtained and, hence, the
kinetic parameters can be considered to be uncorrelated. A maximum binary correlation
coefficient of 0.92 occurs obtained between ( )1pcpcomp,Tm
k
and ( )2pcp
comp,Tmk . Both parameters are
closely related since both represent the simultaneous formation of an isomerization product
from n-hexane.
Table 3-5: Binary correlation coefficient matrix as determined by non-isothermal regression to the
experimental data of the kinetic model given by the set of Eqs. 3-1 to 3-3, in which the net rates of
formation are given by Eqs. 3-4 to 3-6.
( )1pcp
comp,Tmk
( )2pcpcomp,Tm
k bscomp,Tm
k physTm
K )1(pcpcomp,aE )2(pcp
comp,aE bscomp,aE physH∆
( )1pcpcomp,Tm
k 1.00 0.92 0.60 0.90 -0.72 -0.62 -0.41 0.36
( )2pcpcomp,Tm
k 0.92 1.00 0.57 0.85 -0.65 -0.72 -0.39 0.34
bscomp,Tm
k 0.60 0.57 1.00 0.63 -0.36 -0.33 -0.92 0.40
physTm
K 0.90 0.85 0.63 1.00 -0.54 -0.49 -0.39 0.65
)1(pcpcomp,aE -0.72 -0.65 -0.36 -0.54 1.00 0.87 0.26 0.18
)2(pcpcomp,aE -0.62 -0.72 -0.33 -0.49 0.87 1.00 0.26 0.17
bscomp,aE -0.41 -0.39 -0.92 -0.39 0.26 0.26 1.00 -0.18
physH∆ 0.36 0.34 0.40 0.65 0.18 0.17 -0.18 1.00

Chapter 3
63
3.4.3 Model performance
An initial visual assessment of the model’s performance can be made from Figure 3-2 and
Figure 3-3. It is clear that the model is able to simulate the observed trends very well. In
Figure 3-14, the parity diagram of the three responses, i.e., the three reaction products:
2MP, 3MP and propane, are shown. For all three components, the simulated points are
distributed uniformly around the first bisector of the parity diagram, indicating that no
pronounced systematic deviations occur between model simulations and experimental data.
For the propane response, however, at low outlet flow rates, which are corresponding to
the experiments at lowest temperatures, the largest relative deviations are obtained which
is agreement with the wider confidence intervals of estimates for the cracking rate
coefficients at these temperatures, as discussed in section 3.4.1.
Figure 3-14: Parity diagram for the molar outlet flow rate of 2MP (), 3MP () and propane ()
determined by solving the set of Eqs. 3-1 to 3-3, in which the net rates of formation are given by Eqs. 3-4 to
3-6 using the parameters from Table 3-4.
The behavior of the responses’ residuals which are expected to approach the true
experimental error does also not exhibit any particular trend with the operating conditions,
i.e., temperature and pressure, as shown by the residual figures, see Figure 3-15. For all
responses and operating conditions, the residuals are normally distributed around the x-axis
indicating no lack of fit by the model and the normal distribution of the experimental error
with expected value equal to zero. However, based on the experimental error determined
0.00
2.00
4.00
6.00
8.00
10.00
12.00
0.00 2.00 4.00 6.00 8.00 10.00 12.00
Fsi
m[1
0-6
mo
l s-1
]
Fexp [10-6 mol s-1]
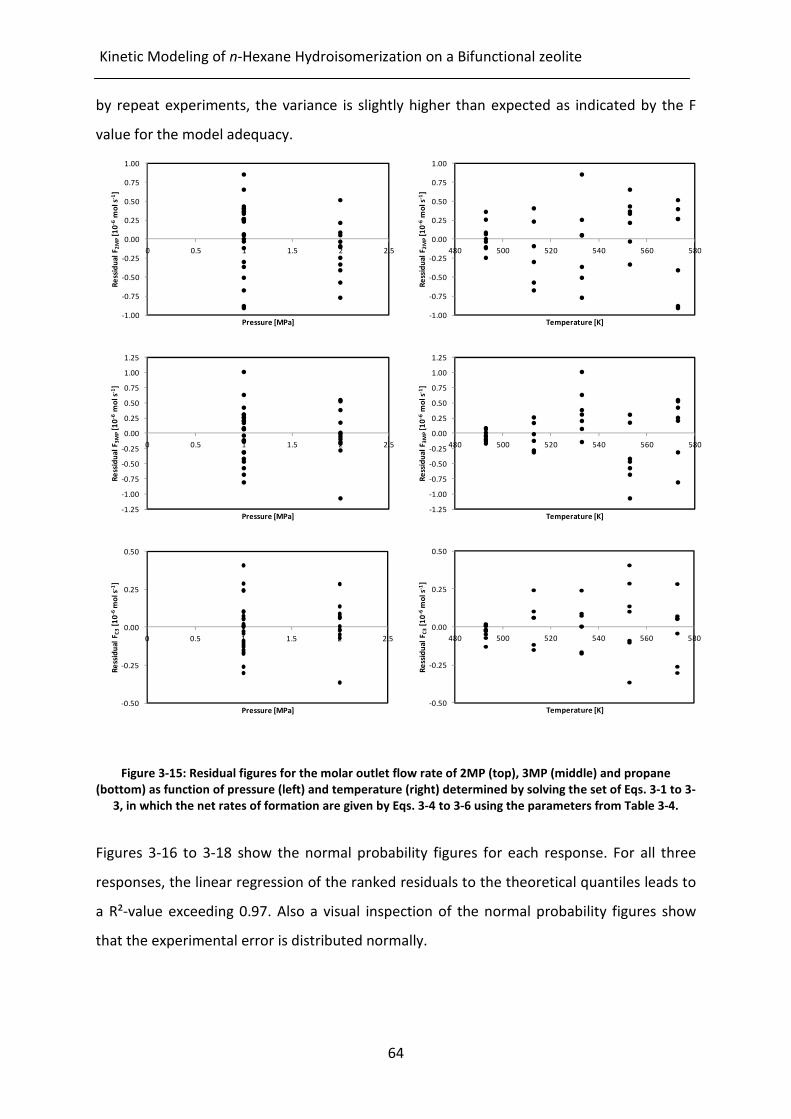
Kinetic Modeling of n-Hexane Hydroisomerization on a Bifunctional zeolite
64
by repeat experiments, the variance is slightly higher than expected as indicated by the F
value for the model adequacy.
Figure 3-15: Residual figures for the molar outlet flow rate of 2MP (top), 3MP (middle) and propane
(bottom) as function of pressure (left) and temperature (right) determined by solving the set of Eqs. 3-1 to 3-
3, in which the net rates of formation are given by Eqs. 3-4 to 3-6 using the parameters from Table 3-4.
Figures 3-16 to 3-18 show the normal probability figures for each response. For all three
responses, the linear regression of the ranked residuals to the theoretical quantiles leads to
a R²-value exceeding 0.97. Also a visual inspection of the normal probability figures show
that the experimental error is distributed normally.
-1.00
-0.75
-0.50
-0.25
0.00
0.25
0.50
0.75
1.00
0 0.5 1 1.5 2 2.5
Re
ssid
ua
l F
2M
P[1
0-6
mo
l s-1
]
Pressure [MPa]-1.00
-0.75
-0.50
-0.25
0.00
0.25
0.50
0.75
1.00
480 500 520 540 560 580
Re
ssid
ua
l F
2M
P[1
0-6
mo
l s-1
]
Temperature [K]
-1.25
-1.00
-0.75
-0.50
-0.25
0.00
0.25
0.50
0.75
1.00
1.25
0 0.5 1 1.5 2 2.5
Re
ssid
ua
l F
3M
P[1
0-6
mo
l s-1
]
Pressure [MPa]-1.25
-1.00
-0.75
-0.50
-0.25
0.00
0.25
0.50
0.75
1.00
1.25
480 500 520 540 560 580
Re
ssid
ua
l F
3M
P[1
0-6
mo
l s-1
]
Temperature [K]
-0.50
-0.25
0.00
0.25
0.50
0 0.5 1 1.5 2 2.5
Re
ssid
ua
l F
C3
[10
-6m
ol
s-1]
Pressure [MPa]-0.50
-0.25
0.00
0.25
0.50
480 500 520 540 560 580
Re
ssid
ua
l F
C3
[10
-6m
ol
s-1]
Temperature [K]

Chapter 3
65
Figure 3-16: Normal probability figure for the molar outlet flow rate of 2MP determined by solving the set of
Eqs. 3-1 to 3-3, in which the net rates of formation are given by Eqs. 3-4 to 3-6 using the parameters from
Table 3-4.
Figure 3-17: Normal probability figure for the molar outlet flow rate of 3MP determined by solving the set of
Eqs. 3-1 to 3-3, in which the net rates of formation are given by Eqs. 3-4 to 3-6 using the parameters from
Table 3-4.
R² = 0.972
-1.50
-1.00
-0.50
0.00
0.50
1.00
1.50
-3 -2 -1 0 1 2 3
Ra
nk
ed
Re
sid
ua
ls F
2M
P[1
0-6
mo
l s-1
]
Theoretical quantiles
R² = 0.984
-1.50
-1.00
-0.50
0.00
0.50
1.00
1.50
-3 -2 -1 0 1 2 3
Ra
nk
ed
Re
sid
ua
ls F
3M
P[1
0-6
mo
l s-1
]
Theoretical quantiles

Kinetic Modeling of n-Hexane Hydroisomerization on a Bifunctional zeolite
66
Figure 3-18: Normal probability figure for the molar outlet flow rate of propane determined by solving the
set of Eqs. 3-1 to 3-3, in which the net rates of formation are given by Eqs. 3-4 to 3-6 using the parameters
from Table 3-4.
3.5 Conclusions
The developed methodology for kinetic modeling was successfully applied to n-hexane
hydroisomerization over a bifunctional catalyst, i.e., Pt/H-ZSM-5. The kinetic model
obtained was able to describe the experimental data very satisfactory. However, the
variance of the residuals could not only be attributed to experimental error as repeat
experiments and the test for model adequacy have revealed. All parameter estimates
obtained could be traced back in terms of the phenomena that were actually occurring. The
values of the composite activation energies for PCP branching and β-scission were
determined to be statistically significant. The composite activation energy for β-scission was
higher than those of PCP branching, hence, the production of cracked products, i.e.,
propane, is regarded as a secondary reaction which is only becoming important at higher
temperatures, as experimentally observed. The composite activation energy for PCP
branching towards 3MP exceeds that of the reaction leading to 2MP, which resulted from
the experimental observation that the 2MP to 3MP molar ratio decreases with increasing
temperature. This could be due to intracrystalline diffusion effects in the medium pore sized
MFI support. This support is selective to the formation of 2MP at lower conversions. The
physisorption enthalpy for the C6 components corresponds well with reported values from
literature.
R² = 0.979-0.50
-0.25
0.00
0.25
0.50
-3 -2 -1 0 1 2 3
Ra
nk
ed
Re
sid
ua
ls F
C3
[10
-6m
ol
s-1]
Theoretical quantiles

Chapter 3
67
3.6 References
[1] J.F. Allain, P. Magnoux, P. Schulz, M. Guisnet, Applied Catalysis a-General. 152 (1997)
221-235.
[2] M.A. Baltanas, G.F. Froment, Computers & Chemical Engineering. 9 (1985) 71-81.
[3] M.A. Baltanas, H. Vansina, G.F. Froment, Industrial & Engineering Chemistry Product
Research and Development. 22 (1983) 531-539.
[4] G.G. Martens, J.W. Thybaut, G.B. Marin, Industrial & Engineering Chemistry
Research. 40 (2001) 1832-1844.
[5] M. Steijns, G. Froment, P. Jacobs, J. Uytterhoeven, J. Weitkamp, Industrial &
Engineering Chemistry Product Research and Development. 20 (1981) 654-660.
[6] M. Steijns, G.F. Froment, Industrial & Engineering Chemistry Product Research and
Development. 20 (1981) 660-668.
[7] A. vandeRunstraat, J. vanGrondelle, R.A. vanSanten, Industrial & Engineering
Chemistry Research. 36 (1997) 3116-3125.
[8] C.S. Raghuveer, J.W. Thybaut, R. De Bruycker, K. Metaxas, T. Bera, G.B. Marin, Fuel.
125 206-218.
[9] J.W. Thybaut, C.S.L. Narasimhan, J.F. Denayer, G.V. Baron, P.A. Jacobs, J.A. Martens,
G.B. Marin, Industrial & Engineering Chemistry Research. 44 (2005) 5159-5169.
[10] J.W. Thybaut, C.S.L. Narasimhan, G.B. Marin, Catalysis Today. 111 (2006) 94-102.
[11] H. Vansina, M.A. Baltanas, G.F. Froment, Industrial & Engineering Chemistry Product
Research and Development. 22 (1983) 526-531.
[12] J. Weitkamp, Erdol & Kohle Erdgas Petrochemie. 31 (1978) 13-22.
[13] B.D. Vandegehuchte, J.W. Thybaut, A. Martinez, M.A. Arribas, G.B. Marin, Applied
Catalysis A: General. 441-442 (2012) 10-20.
[14] EUROKIN_fixed-bed_html, EUROKIN spreadsheet on requirements for measurement
of intrinsic kinetics in the gas-solid fixed-bed reactor, 2012.
[15] Athena Visual Studio, Web page http://www.athenavisual.com/.
[16] W.E. Stewart, M. Caracotsios, Computer-Aided Modeling of Reactive Systems, John
Wiley & Sons, Inc., 2008.
[17] Y. Bard, Nonlinear Parameter Estimation, Academic Press, 1974.
[18] V.R. Choudhary, D.B. Akolekar, Journal of Catalysis. 117 (1989) 542-548.
[19] A.F.P. Ferreira, M.C. Mittelmeijer-Hazeleger, J.V.D. Bergh, S. Aguado, J.C. Jansen, G.
Rothenberg, A.E. Rodrigues, F. Kapteijn, Microporous and Mesoporous Materials. 170
(2013) 26-35.
[20] J.F.M. Denayer, G.V. Baron, Adsorption-Journal of the International Adsorption
Society. 3 (1997) 251-265.
[21] J.W. Thybaut, G.B. Marin, G.V. Baron, P.A. Jacobs, J.A. Martens, Journal of Catalysis.
202 (2001) 324-339.
[22] W. Makowski, D. Majda, Applied Surface Science. 252 (2005) 707-715.
[23] S. Savitz, A.L. Myers, R.J. Gorte, D. White, Journal of the American Chemical Society.
120 (1998) 5701-5703.
[24] G.F. Froment, K.B. Bischoff, J. De Wilde, Chemical reactor analysis and design, 2010.


69
Chapter 4
Single-Event Modeling of
Ethene Oligomerization on
Ni-SiO2-Al2O3
In this chapter, ethene oligomerization on an amorphous nickel silica-alumina catalyst was
investigated experimentally as well as by SEMK modeling. Due to the catalyst’s amorphous
structure, no specific pore geometry or framework related effects needed to be considered.
In addition, the catalyst used had only rather weak acid sites and, hence, the observed
ethene oligomerization, c.q., dimerization, originated exclusively from the nickel ion sites.
This allowed to specifically determine the metal ion kinetics. The high selectivity towards
butenes of these nickel ion sites will be exploited in chapter 5 by adding a stronger acidic
function within a tailored pore structure aiming at selectively converting the butenes
toward heavier and highly branched alkenes.
4.1 Procedures
4.1.1 Experimental conditions
The experimental dataset was obtained on a Ni-SiO2-Al2O3 catalyst using the HTK-1 set-up as
described in resp. section 2.1.1.2 and 2.1.2.2. Initially, when sending ethene to a fresh
catalyst bed, the temperature in the catalyst bed increased for ca. 10 K over 2 to 3 minutes,
after which the temperature again decreased to the set point, see also section 4.4.2. After a
period of ca. 1 hour, steady state was obtained and the effluent was analysed. No
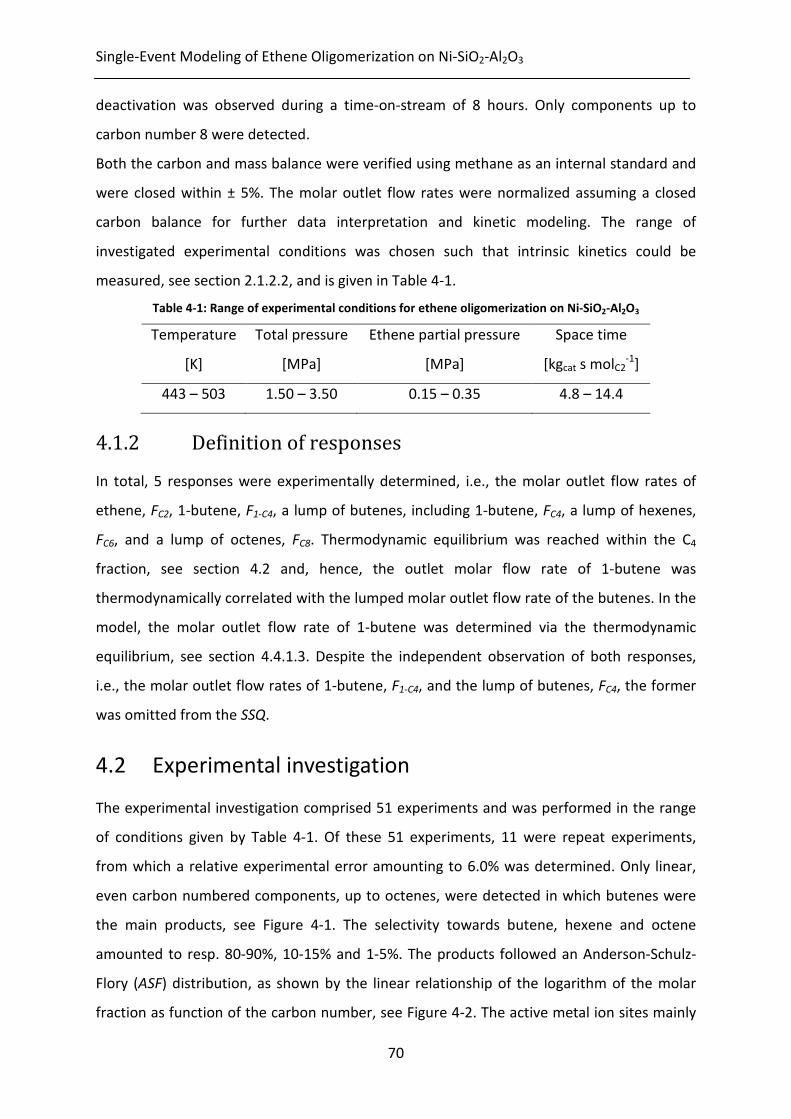
Single-Event Modeling of Ethene Oligomerization on Ni-SiO2-Al2O3
70
deactivation was observed during a time-on-stream of 8 hours. Only components up to
carbon number 8 were detected.
Both the carbon and mass balance were verified using methane as an internal standard and
were closed within ± 5%. The molar outlet flow rates were normalized assuming a closed
carbon balance for further data interpretation and kinetic modeling. The range of
investigated experimental conditions was chosen such that intrinsic kinetics could be
measured, see section 2.1.2.2, and is given in Table 4-1.
Table 4-1: Range of experimental conditions for ethene oligomerization on Ni-SiO2-Al2O3
Temperature
[K]
Total pressure
[MPa]
Ethene partial pressure
[MPa]
Space time
[kgcat s molC2-1
]
443 – 503 1.50 – 3.50 0.15 – 0.35 4.8 – 14.4
4.1.2 Definition of responses
In total, 5 responses were experimentally determined, i.e., the molar outlet flow rates of
ethene, FC2, 1-butene, F1-C4, a lump of butenes, including 1-butene, FC4, a lump of hexenes,
FC6, and a lump of octenes, FC8. Thermodynamic equilibrium was reached within the C4
fraction, see section 4.2 and, hence, the outlet molar flow rate of 1-butene was
thermodynamically correlated with the lumped molar outlet flow rate of the butenes. In the
model, the molar outlet flow rate of 1-butene was determined via the thermodynamic
equilibrium, see section 4.4.1.3. Despite the independent observation of both responses,
i.e., the molar outlet flow rates of 1-butene, F1-C4, and the lump of butenes, FC4, the former
was omitted from the SSQ.
4.2 Experimental investigation
The experimental investigation comprised 51 experiments and was performed in the range
of conditions given by Table 4-1. Of these 51 experiments, 11 were repeat experiments,
from which a relative experimental error amounting to 6.0% was determined. Only linear,
even carbon numbered components, up to octenes, were detected in which butenes were
the main products, see Figure 4-1. The selectivity towards butene, hexene and octene
amounted to resp. 80-90%, 10-15% and 1-5%. The products followed an Anderson-Schulz-
Flory (ASF) distribution, as shown by the linear relationship of the logarithm of the molar
fraction as function of the carbon number, see Figure 4-2. The active metal ion sites mainly

Chapter 4
71
dimerized ethene to butene while only a limited amount of butene further reacted towards
hexene and octene. The butene and hexene product yields exhibited a linear trend with the
ethene conversion, independent of the operating conditions used, see Figure 4-1. This
showed that the ratio of chain growth to termination, similar to polymerization kinetics, see
section 4.3.1, was constant for all reaction conditions applied. Such a trend, together with
the absence of odd-carbon numbered product alkenes, which would have been the result
from acid catalyzed cracking reactions, and the results from the NH3-TPD measurements,
indicated that the only active sites on the catalyst were the metal ion sites. The metal ion
sites acted primarily as dimerization sites and to a limited extent also as trimerization sites.
If acid catalyzed reactions, i.e., acid catalyzed oligomerization in particular, would have
occurred, the butene yield would have increased less than proportional with the conversion
due to additional consumption of butenes by dimerization to octene on the acid sites. This
would have resulted in a deviation from the ASF product distribution [1]. In addition, odd-
carbon numbered products would have been produced.
Figure 4-1: Ethene oligomerization product yields on 1.8wt% Ni-SiO2-Al2O3 as function of ethene conversion.
Symbols correspond to experimental data, lines correspond to model simulations, i.e., by integration of Eq.
2-21, with the corresponding net rates of formation as given by Eq. 4-27 and the parameter values as
reported in Table 4-4; , full line: butene; , dashed line: hexene.
0
2
4
6
8
10
12
14
16
0 5 10 15 20
Yie
ld [
%]
Conversion [%]

Single-Event Modeling of Ethene Oligomerization on Ni-SiO2-Al2O3
72
Figure 4-2: Experimental product distribution: molar fraction as function of carbon number. The full line
shows the linear trend of the logarithm of the molar fraction of the components as function of their carbon
number.
In the whole range of reaction conditions tested, double bond isomerization was observed
within the butene fraction and was found to establish thermodynamic equilibrium within
this fraction. In general, 30 to 40% of the butenes were found as 1-butene depending on the
reaction temperature. This thermodynamic equilibrium of the butene isomers was also
experimentally observed by Espinoza et al. on a similar catalyst and at similar reaction
conditions [2]. As can be seen from Figures 4-3 and 4-4, the effects of increasing space time,
temperature and ethene partial pressure were as expected: they resulted in an increase of
the ethene conversion.
0.00
0.01
0.10
1.00
2 4 6 8 10
Mo
lar
fra
ctio
n [
-]
Carbon number [-]
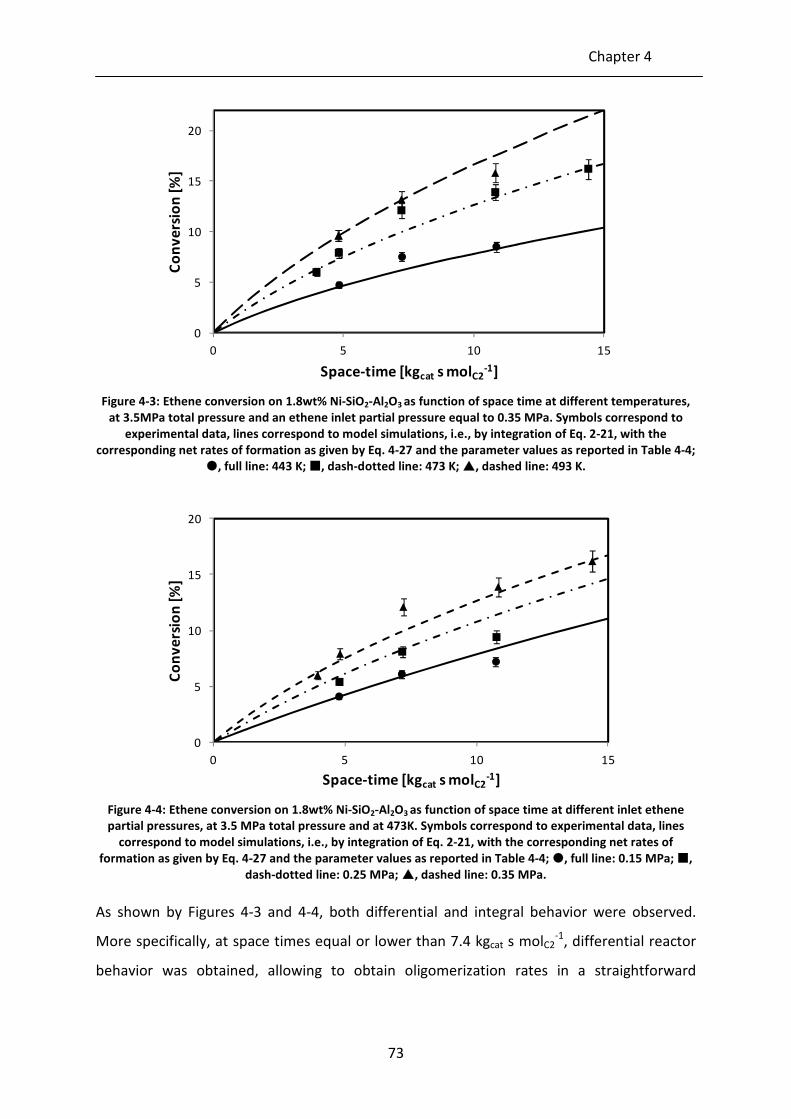
Chapter 4
73
Figure 4-3: Ethene conversion on 1.8wt% Ni-SiO2-Al2O3 as function of space time at different temperatures,
at 3.5MPa total pressure and an ethene inlet partial pressure equal to 0.35 MPa. Symbols correspond to
experimental data, lines correspond to model simulations, i.e., by integration of Eq. 2-21, with the
corresponding net rates of formation as given by Eq. 4-27 and the parameter values as reported in Table 4-4;
, full line: 443 K; , dash-dotted line: 473 K; , dashed line: 493 K.
Figure 4-4: Ethene conversion on 1.8wt% Ni-SiO2-Al2O3 as function of space time at different inlet ethene
partial pressures, at 3.5 MPa total pressure and at 473K. Symbols correspond to experimental data, lines
correspond to model simulations, i.e., by integration of Eq. 2-21, with the corresponding net rates of
formation as given by Eq. 4-27 and the parameter values as reported in Table 4-4; , full line: 0.15 MPa; ,
dash-dotted line: 0.25 MPa; , dashed line: 0.35 MPa.
As shown by Figures 4-3 and 4-4, both differential and integral behavior were observed.
More specifically, at space times equal or lower than 7.4 kgcat s molC2-1
, differential reactor
behavior was obtained, allowing to obtain oligomerization rates in a straightforward
0
5
10
15
20
0 5 10 15
Co
nv
ers
ion
[%
]
Space-time [kgcat s molC2-1]
0
5
10
15
20
0 5 10 15
Co
nv
ers
ion
[%
]
Space-time [kgcat s molC2-1]

Single-Event Modeling of Ethene Oligomerization on Ni-SiO2-Al2O3
74
manner. In this space time range, a linear relationship between the oligomerization rate and
ethene inlet partial pressure was found, see Figures 4-5.
Figure 4-5: Ethene oligomerization rate on 1.8wt% Ni-SiO2-Al2O3 as function of ethene inlet partial pressure
at different space times and temperatures. Symbols correspond to experimental data, lines are determined
by linear regression for each set of experimental conditions indicating the first order dependency on the
reaction rate of the ethene inlet partial pressure; : 4.8 kgcat s molC2-1
and 473 K; : 7.2 kgcat s molC2-1
and
473 K; : 4.8 kgcat s molC2-1
and 503 K; : 7.2 kgcat s molC2-1
and 503 K.
A similar observation was made on an amorphous nickel oxide silica-alumina by Kiessling
and Froment [3]. Therefore, they proposed the use of an Eley-Rideal mechanism to describe
the oligomerization of ethene on amorphous nickel oxide silica-alumina [3].
4.3 SEMK model construction
4.3.1 Proposed mechanism for ethene oligomerization
Two mechanisms have already been proposed for alkene oligomerization on nickel
complexes, i.e., degenerate polymerization and concerted coupling [4, 5]. Yet another
mechanism, i.e., reductive isomerization only occurs in the presence of hydrogen [5].
It is reported that, for both mechanisms, alkene desorption occurs through β-hydride
elimination which, hence, regenerates the active site [4], i.e., Ni-H. However, based on DFT
calculations, Fan et al. [6] concluded that Ni-H regeneration through β-hydride elimination is
energetically very demanding. These authors showed that regeneration would rather occur
through β-hydride transfer to form a nickel-ethene species, which is then denoted as the
actual catalytic site and which is agreement with the work by Speier et al. [7].
0.006
0.010
0.014
0.018
0.022
0.026
0.030
0.10 0.15 0.20 0.25 0.30 0.35 0.40
Eth
en
e o
lig
om
eri
zati
on
rat
e
[mo
l C2
s-1k
gcat-1
]
Inlet ethene partial pressure [MPa]
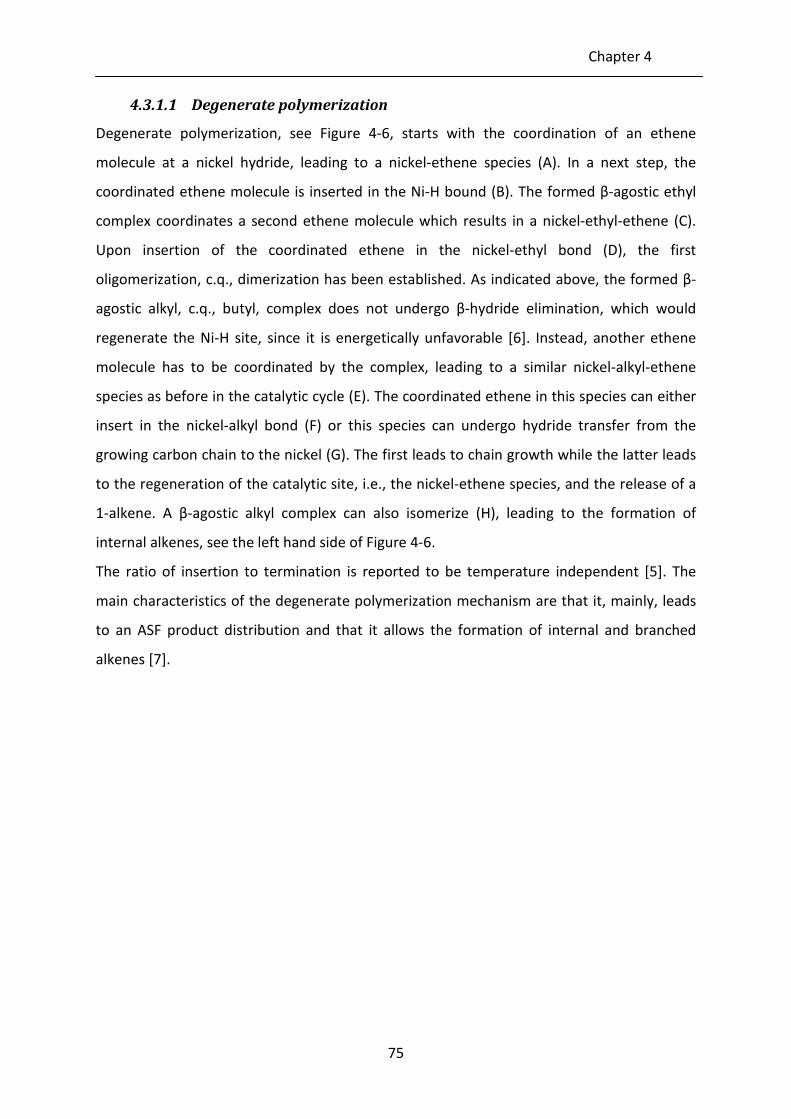
Chapter 4
75
4.3.1.1 Degenerate polymerization
Degenerate polymerization, see Figure 4-6, starts with the coordination of an ethene
molecule at a nickel hydride, leading to a nickel-ethene species (A). In a next step, the
coordinated ethene molecule is inserted in the Ni-H bound (B). The formed β-agostic ethyl
complex coordinates a second ethene molecule which results in a nickel-ethyl-ethene (C).
Upon insertion of the coordinated ethene in the nickel-ethyl bond (D), the first
oligomerization, c.q., dimerization has been established. As indicated above, the formed β-
agostic alkyl, c.q., butyl, complex does not undergo β-hydride elimination, which would
regenerate the Ni-H site, since it is energetically unfavorable [6]. Instead, another ethene
molecule has to be coordinated by the complex, leading to a similar nickel-alkyl-ethene
species as before in the catalytic cycle (E). The coordinated ethene in this species can either
insert in the nickel-alkyl bond (F) or this species can undergo hydride transfer from the
growing carbon chain to the nickel (G). The first leads to chain growth while the latter leads
to the regeneration of the catalytic site, i.e., the nickel-ethene species, and the release of a
1-alkene. A β-agostic alkyl complex can also isomerize (H), leading to the formation of
internal alkenes, see the left hand side of Figure 4-6.
The ratio of insertion to termination is reported to be temperature independent [5]. The
main characteristics of the degenerate polymerization mechanism are that it, mainly, leads
to an ASF product distribution and that it allows the formation of internal and branched
alkenes [7].
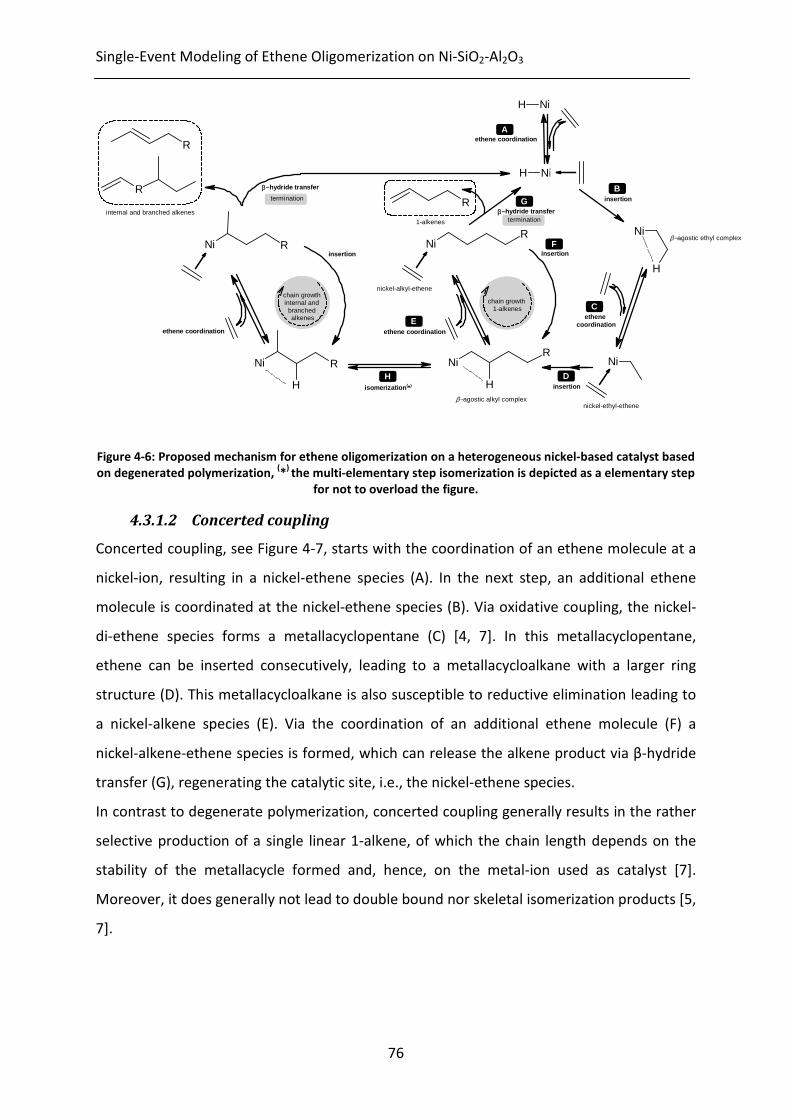
Single-Event Modeling of Ethene Oligomerization on Ni-SiO2-Al2O3
76
ethene coordination
insertion
β−hydride transfer
NiH H
Ni
NiH
H
NiH
H
R
R
Ni HH
ethene coordination
NiHR β−agostic ethyl complex
insertion
ethene coordination
chain growth 1-alkenes
termination
NiH R
H isomerization(*)
ethene coordination
NiH R
β−hydride transfer
termination
R
chain growth internal and
branched alkenes
insertioninsertion
H
A
B
C
D
E
F
G
β−agostic alkyl complexnickel-ethyl-ethene
nickel-alkyl-ethene
R
1-alkenes
internal and branched alkenes
Figure 4-6: Proposed mechanism for ethene oligomerization on a heterogeneous nickel-based catalyst based
on degenerated polymerization, (*
) the multi-elementary step isomerization is depicted as a elementary step
for not to overload the figure.
4.3.1.2 Concerted coupling
Concerted coupling, see Figure 4-7, starts with the coordination of an ethene molecule at a
nickel-ion, resulting in a nickel-ethene species (A). In the next step, an additional ethene
molecule is coordinated at the nickel-ethene species (B). Via oxidative coupling, the nickel-
di-ethene species forms a metallacyclopentane (C) [4, 7]. In this metallacyclopentane,
ethene can be inserted consecutively, leading to a metallacycloalkane with a larger ring
structure (D). This metallacycloalkane is also susceptible to reductive elimination leading to
a nickel-alkene species (E). Via the coordination of an additional ethene molecule (F) a
nickel-alkene-ethene species is formed, which can release the alkene product via β-hydride
transfer (G), regenerating the catalytic site, i.e., the nickel-ethene species.
In contrast to degenerate polymerization, concerted coupling generally results in the rather
selective production of a single linear 1-alkene, of which the chain length depends on the
stability of the metallacycle formed and, hence, on the metal-ion used as catalyst [7].
Moreover, it does generally not lead to double bound nor skeletal isomerization products [5,
7].
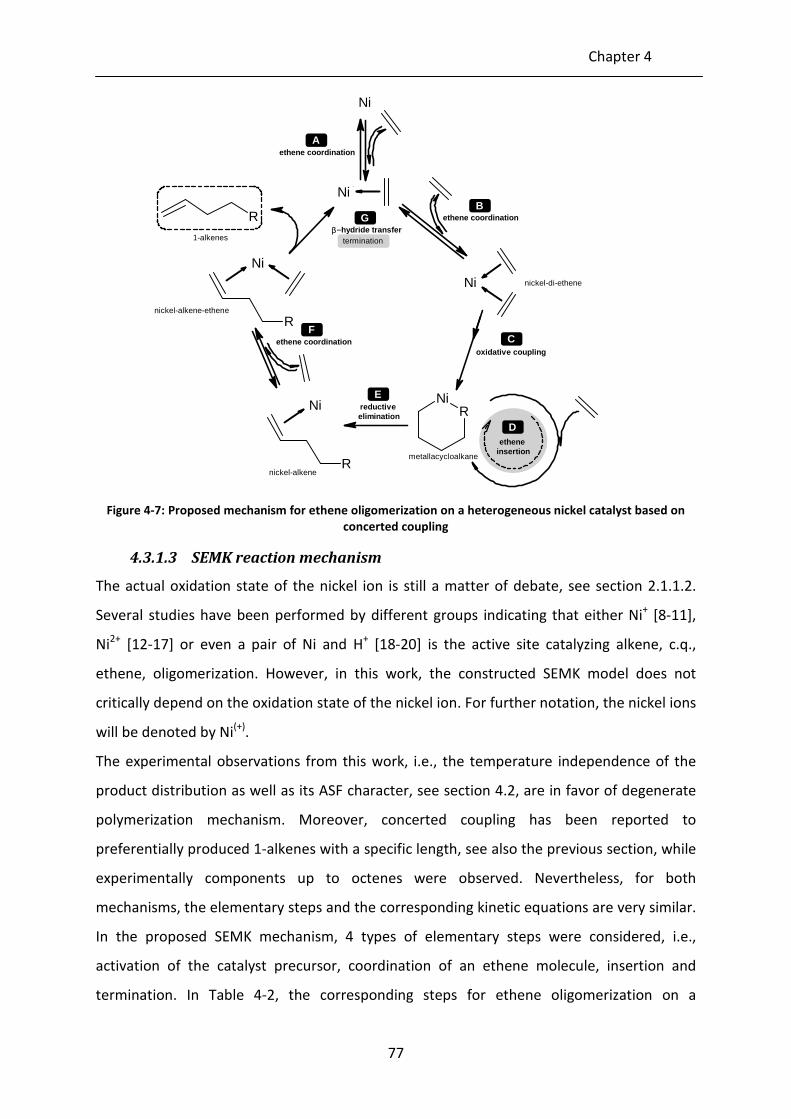
Chapter 4
77
ethene coordination
metallacycloalkane
Ni
Ni+
H
Ni
R
Ni
ethene coordination
oxidative coupling
reductive elimination
β−hydride transfer
ethene coordination
R
termination
ethene insertion
A
B
C
E
F
G
RNi
D
R
Ninickel-di-ethene
nickel-alkene
nickel-alkene-ethene
1-alkenes
Figure 4-7: Proposed mechanism for ethene oligomerization on a heterogeneous nickel catalyst based on
concerted coupling
4.3.1.3 SEMK reaction mechanism
The actual oxidation state of the nickel ion is still a matter of debate, see section 2.1.1.2.
Several studies have been performed by different groups indicating that either Ni+ [8-11],
Ni2+
[12-17] or even a pair of Ni and H+ [18-20] is the active site catalyzing alkene, c.q.,
ethene, oligomerization. However, in this work, the constructed SEMK model does not
critically depend on the oxidation state of the nickel ion. For further notation, the nickel ions
will be denoted by Ni(+)
.
The experimental observations from this work, i.e., the temperature independence of the
product distribution as well as its ASF character, see section 4.2, are in favor of degenerate
polymerization mechanism. Moreover, concerted coupling has been reported to
preferentially produced 1-alkenes with a specific length, see also the previous section, while
experimentally components up to octenes were observed. Nevertheless, for both
mechanisms, the elementary steps and the corresponding kinetic equations are very similar.
In the proposed SEMK mechanism, 4 types of elementary steps were considered, i.e.,
activation of the catalyst precursor, coordination of an ethene molecule, insertion and
termination. In Table 4-2, the corresponding steps for ethene oligomerization on a

Single-Event Modeling of Ethene Oligomerization on Ni-SiO2-Al2O3
78
heterogeneous nickel containing catalyst are listed as they occur in degenerate
polymerization and coupling mechanism. Before any chemical interactions take place,
physical adsorption of the alkenes at the catalyst surface, denoted as physisorption, occurs
[3].
Table 4-2: Reaction steps and kinetic parameters for ethene oligomerization on a heterogeneous nickel
containing catalyst for the degenerate polymerization and concerted coupling mechanism
SEMK
reaction family
kinetic
parameter
degenerate
polymerization
concerted
coupling
activation of the
catalyst precursor
aK
coordination and insertion of
an ethene molecule leading to
a β-agostic ethyl complex
coordination of an ethene
molecule leading a
nickel-alkene species
coordination of an
ethene molecule
cK leading to a nickel-alkyl-ethene
species
leading to a nickel-alkene-
ethene species
insertion insk insertion of the nickel-alkyl-
ethene species
oxidative coupling, followed
by reductive elimination.
termination terk β-hydride transfer
In short, nickel-alkyl/alkene-ethene species are subject to two competitive reactions, i.e.,
insertion and termination. The formation of internal alkenes can be attributed to either the
occurrence of the degenerate polymerization mechanism or to the presence of (weakly) acid
sites on which alkenes can subsequently undergo double bound isomerization via
consecutive protonation/deprotonation reactions. The thermodynamic equilibrium within
the internal alkenes was accounted for in the kinetic model by redistributing the net rate of
formation of the alkenes according to the thermodynamic equilibrium at the reaction
conditions considered, see section 4.4.1.3.
4.3.2 Rate equations
In the following, the rate equations for ethene oligomerization are derived in accordance
with the mechanistic details as outlined in section 4.3.1. First, the pseudo steady state was
assumed for all nickel ion species, i.e., their net rate of formation was set equal to zero:
( )( ) ( )( )( ) 1...10
222+=== ++ niRR
ii CCNiCNi 4-1
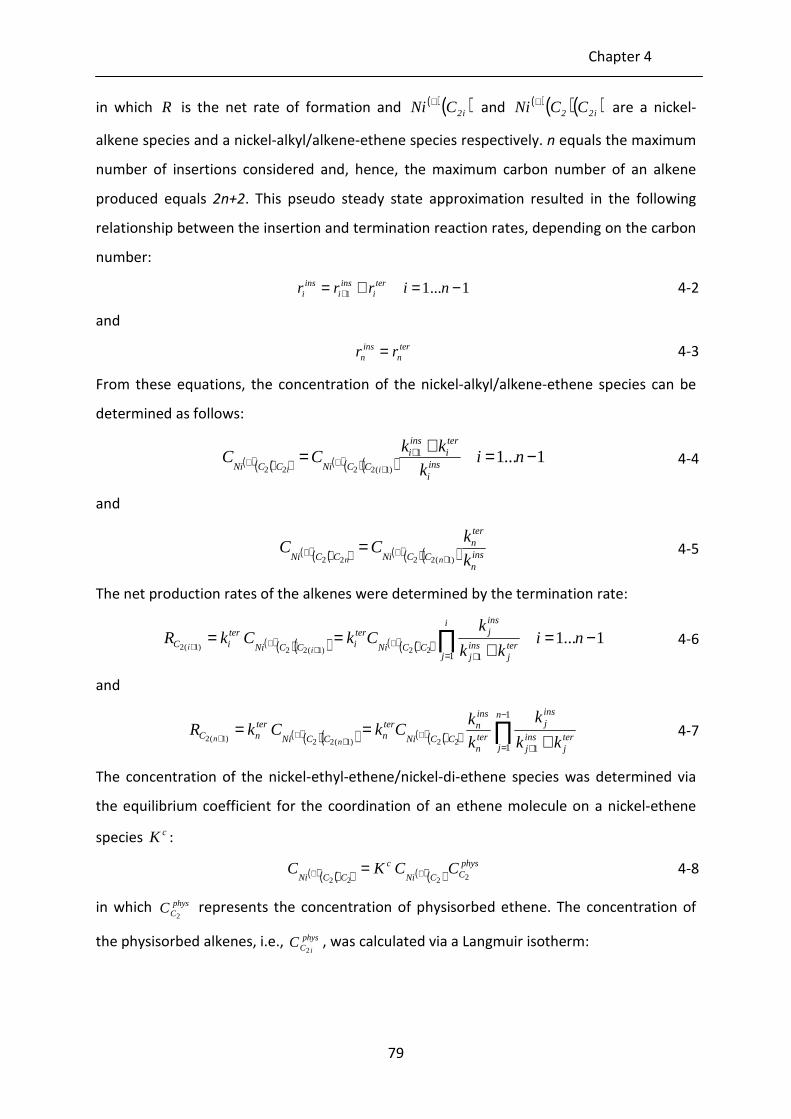
Chapter 4
79
in which R is the net rate of formation and ( )( )i2CNi +
and ( )( )( )i22 CCNi +
are a nickel-
alkene species and a nickel-alkyl/alkene-ethene species respectively. n equals the maximum
number of insertions considered and, hence, the maximum carbon number of an alkene
produced equals 2n+2. This pseudo steady state approximation resulted in the following
relationship between the insertion and termination reaction rates, depending on the carbon
number:
1...11 −=+= + nirrr ter
iins
iins
i 4-2
and
ter
nins
n rr = 4-3
From these equations, the concentration of the nickel-alkyl/alkene-ethene species can be
determined as follows:
( )( )( ) ( )( )( ) 1...11
)1(2222−=+= +
+++ ni
k
kkCC
insi
teri
insi
CCNiCCNi ii 4-4
and
( )( )( ) ( )( )( ) insn
tern
CCNiCCNi k
kCC
nn )1(2222 +++ = 4-5
The net production rates of the alkenes were determined by the termination rate:
( )( )( ) ( )( )( ) 1...11 1
22)1(22)1(2−=
+== ∏
= ++
+++
nikk
kCkCkR
i
jterj
insj
insj
CCNi
teriCCNi
teriC
ii 4-6
and
( )( )( ) ( )( )( ) ∏−
= + +== +
+++
1
1 122)1(22)1(2
n
jterj
insj
insj
tern
insn
CCNi
ternCCNi
ternC kk
k
k
kCkCkR
nn 4-7
The concentration of the nickel-ethyl-ethene/nickel-di-ethene species was determined via
the equilibrium coefficient for the coordination of an ethene molecule on a nickel-ethene
species cK :
( )( )( ) ( )( )
physCCNi
c
CCNiCCKC
2222++ = 4-8
in which physCC
2 represents the concentration of physisorbed ethene. The concentration of
the physisorbed alkenes, i.e., physC i
C2
, was calculated via a Langmuir isotherm:
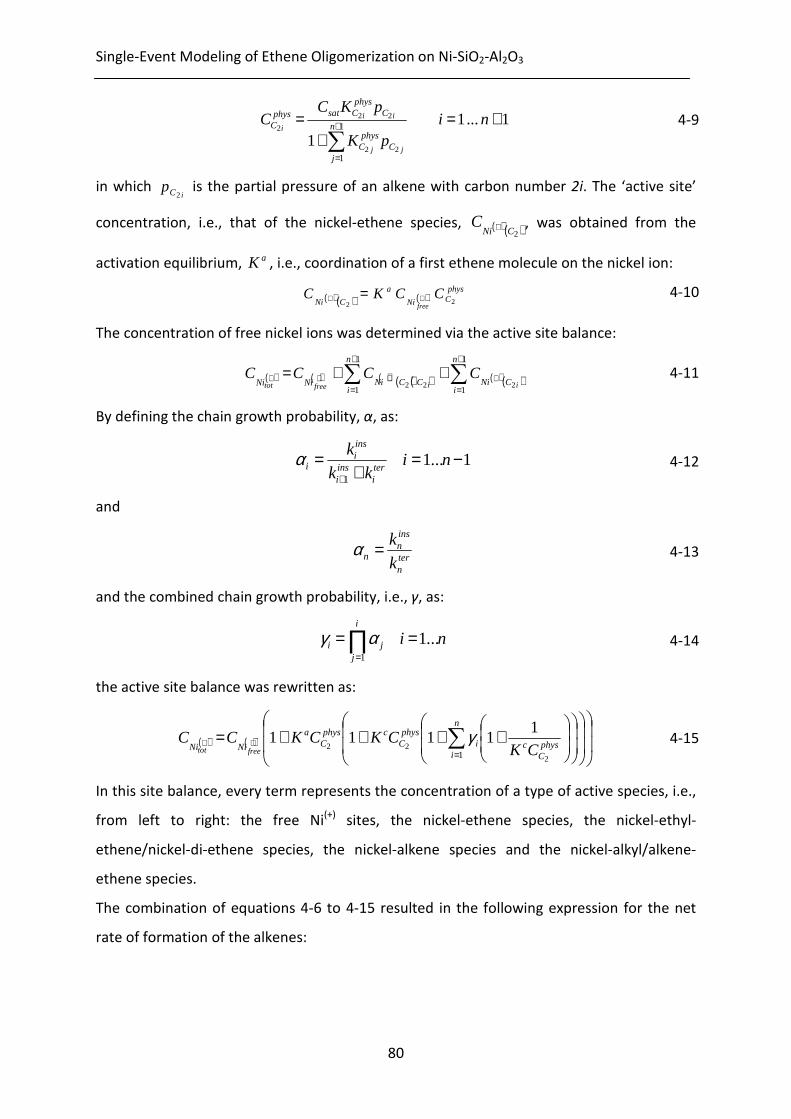
Single-Event Modeling of Ethene Oligomerization on Ni-SiO2-Al2O3
80
11
11
122
22
2+=
+=
∑+
=
n...ipK
pKCC n
jC
physC
Cphys
CsatphysC
jj
ii
i 4-9
in which iCp
2 is the partial pressure of an alkene with carbon number 2i. The ‘active site’
concentration, i.e., that of the nickel-ethene species, ( )( )2CNiC + , was obtained from the
activation equilibrium, aK , i.e., coordination of a first ethene molecule on the nickel ion:
( )( ) ( )
physCNi
a
CNiCCKC
free22
++ = 4-10
The concentration of free nickel ions was determined via the active site balance:
( ) ( ) ( )( )( ) ( )( )∑∑
+
=
+
=++++ ++=
1
1
1
1222
n
iCNi
n
iCCNiNiNi iifreetot
CCCC 4-11
By defining the chain growth probability, α, as:
1...11
−=+
=+
nikk
kteri
insi
insi
iα 4-12
and
tern
insn
n k
k=α 4-13
and the combined chain growth probability, i.e., γ, as:
nii
jji ...1
1
==∏=
αγ 4-14
the active site balance was rewritten as:
( ) ( )
++++= ∑
=++ phys
Cc
n
ii
physC
cphysC
a
NiNi CKCKCKCC
freetot2
22
11111
1
γ 4-15
In this site balance, every term represents the concentration of a type of active species, i.e.,
from left to right: the free Ni(+)
sites, the nickel-ethene species, the nickel-ethyl-
ethene/nickel-di-ethene species, the nickel-alkene species and the nickel-alkyl/alkene-
ethene species.
The combination of equations 4-6 to 4-15 resulted in the following expression for the net
rate of formation of the alkenes:

Chapter 4
81
( ) ( )ni
CKCKCK
CCKKkR
physC
c
n
jj
physC
cphysC
a
iphys
CNi
acteri
Ctot
i...1
11111
2
22
2
)1(2
1
2
=
++++
=
∑=
+
+
γ
γ 4-16
4.3.3 Reaction network generation
For the model, a detailed reaction network, comprising all components and elementary
reactions, was required. Since the manual determination of such elementary reaction
networks may represent a gargantuan effort, especially when, in a later stage, acid catalyzed
steps will be accounted for, an in-house reaction network generation program, ReNGeP [21]
was used. In the framework of the present work, the latter was extended with the
elementary reaction families of metal ion catalyzed oligomerization, i.e., insertion and
termination by β-hydride transfer. In ReNGeP, elementary reactions are described by simple
operations on matrices, that represent the reactants. In addition, the matrices are
converted to vectors for subsequent use in the kinetic model [22]. Because in the present
work only metal ion oligomerization, double bond isomerization and a maximum carbon
number equal to 8 were considered, the reaction network was rather limited, i.e., a total of
16 species and 31 corresponding elementary steps.
4.3.4 Determination of the number of single events
In order to apply the Single-Event MicroKinetic (SEMK) methodology, the number of single
events should be determined for the metal-ion catalyzed ethene oligomerization, see
section 2.3. Ethene does not have any chiral atoms and, hence, chirn equals 0. Because of
the presence of π-electrons, no internal symmetry axis is present with respect to this double
bond in alkenes heavier than ethene. In the gas phase, ethene has three external symmetry
axes, i.e., one along each of the three Cartesian axes. When physisorbed, its rotational
freedom is limited such that only a single symmetry axis remains.
The nickel-alkene species, i.e., ( )( )2CNi + ,
( )( )4CNi +,
( )( )6CNi + and
( )( )8CNi +, all have one
chiral atom, i.e., the carbon atom bound to the nickel ion, and no external symmetry axis.
For ( )( )4CNi +
, ( )( )6CNi +
and ( )( )8CNi +
, there exists one terminal CH3-group which leads to
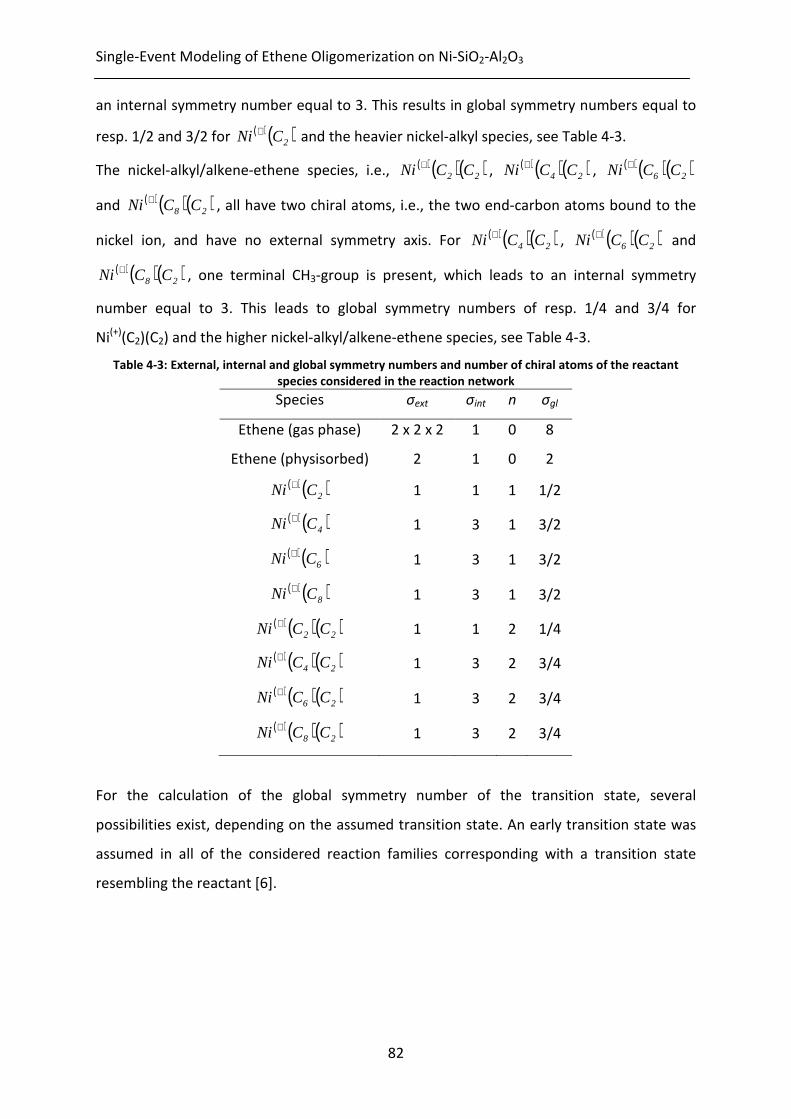
Single-Event Modeling of Ethene Oligomerization on Ni-SiO2-Al2O3
82
an internal symmetry number equal to 3. This results in global symmetry numbers equal to
resp. 1/2 and 3/2 for ( )( )2CNi + and the heavier nickel-alkyl species, see Table 4-3.
The nickel-alkyl/alkene-ethene species, i.e., ( )( )( )22 CCNi + , ( )( )( )24 CCNi +
, ( )( )( )26 CCNi +
and ( )( )( )28 CCNi +
, all have two chiral atoms, i.e., the two end-carbon atoms bound to the
nickel ion, and have no external symmetry axis. For ( )( )( )24 CCNi +
, ( )( )( )26 CCNi +
and
( )( )( )28 CCNi +, one terminal CH3-group is present, which leads to an internal symmetry
number equal to 3. This leads to global symmetry numbers of resp. 1/4 and 3/4 for
Ni(+)
(C2)(C2) and the higher nickel-alkyl/alkene-ethene species, see Table 4-3.
Table 4-3: External, internal and global symmetry numbers and number of chiral atoms of the reactant
species considered in the reaction network
Species σext σint n σgl
Ethene (gas phase) 2 x 2 x 2 1 0 8
Ethene (physisorbed) 2 1 0 2
( )( )2CNi + 1 1 1 1/2
( )( )4CNi + 1 3 1 3/2
( )( )6CNi + 1 3 1 3/2
( )( )8CNi + 1 3 1 3/2
( )( )( )22 CCNi + 1 1 2 1/4
( )( )( )24 CCNi + 1 3 2 3/4
( )( )( )26 CCNi + 1 3 2 3/4
( )( )( )28 CCNi + 1 3 2 3/4
For the calculation of the global symmetry number of the transition state, several
possibilities exist, depending on the assumed transition state. An early transition state was
assumed in all of the considered reaction families corresponding with a transition state
resembling the reactant [6].
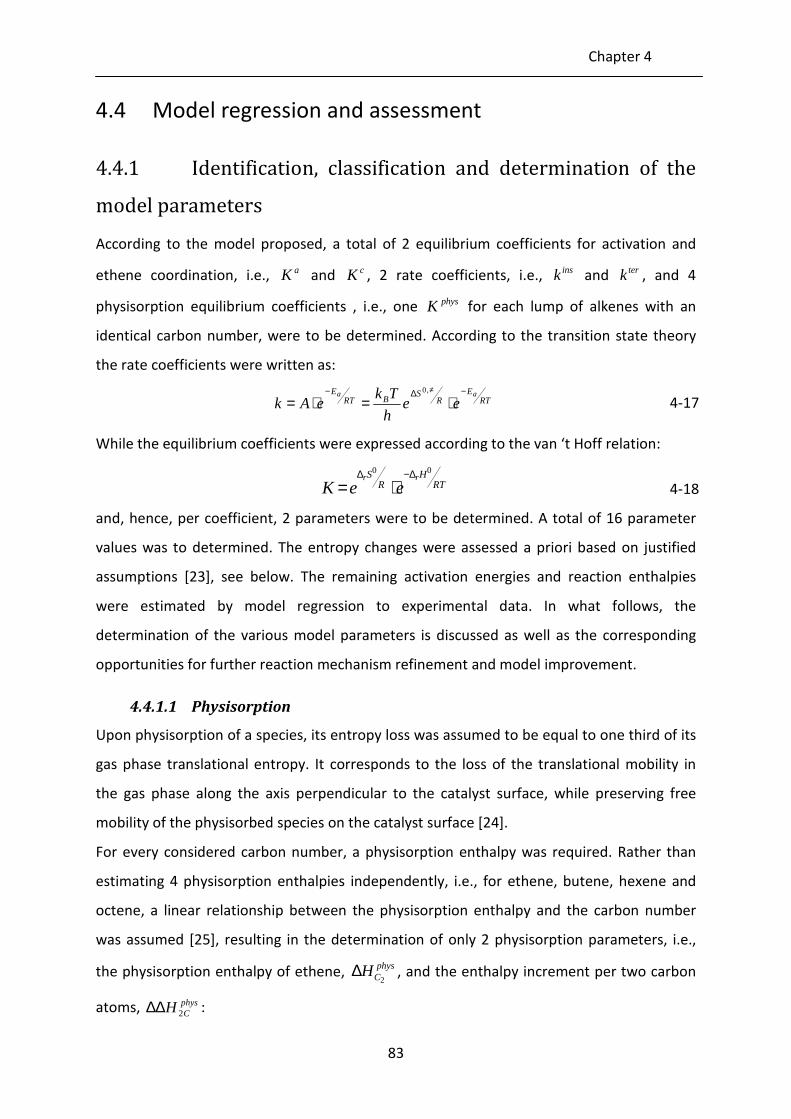
Chapter 4
83
4.4 Model regression and assessment
4.4.1 Identification, classification and determination of the
model parameters
According to the model proposed, a total of 2 equilibrium coefficients for activation and
ethene coordination, i.e., aK and cK , 2 rate coefficients, i.e., insk and
terk , and 4
physisorption equilibrium coefficients , i.e., one physK for each lump of alkenes with an
identical carbon number, were to be determined. According to the transition state theory
the rate coefficients were written as:
RTE
RS
BRTE aa
eeh
TkeAk
−∆−⋅=⋅=
≠,0
4-17
While the equilibrium coefficients were expressed according to the van ‘t Hoff relation:
RT
HR
S rr
eeK00 ∆−∆
⋅= 4-18
and, hence, per coefficient, 2 parameters were to be determined. A total of 16 parameter
values was to determined. The entropy changes were assessed a priori based on justified
assumptions [23], see below. The remaining activation energies and reaction enthalpies
were estimated by model regression to experimental data. In what follows, the
determination of the various model parameters is discussed as well as the corresponding
opportunities for further reaction mechanism refinement and model improvement.
4.4.1.1 Physisorption
Upon physisorption of a species, its entropy loss was assumed to be equal to one third of its
gas phase translational entropy. It corresponds to the loss of the translational mobility in
the gas phase along the axis perpendicular to the catalyst surface, while preserving free
mobility of the physisorbed species on the catalyst surface [24].
For every considered carbon number, a physisorption enthalpy was required. Rather than
estimating 4 physisorption enthalpies independently, i.e., for ethene, butene, hexene and
octene, a linear relationship between the physisorption enthalpy and the carbon number
was assumed [25], resulting in the determination of only 2 physisorption parameters, i.e.,
the physisorption enthalpy of ethene, phys
CH2
∆ , and the enthalpy increment per two carbon
atoms, physCH 2∆∆ :
Single-Event Modeling of Ethene Oligomerization on Ni-SiO2-Al2O3
84
( )4...1
22
2
)1(
3 ==∆∆⋅−+∆−−
ieeK RT
HiH
RS
physC
physC
physCtrans
i 4-19
4.4.1.2 Nickel ion catalyzed oligomerization
The first two steps in the nickel ion catalyzed oligomerization following physisorption are
nickel ion activation and ethene coordination at a nickel-alkene species. These two steps are
structurally related since they both involve the binding of an ethene molecule on a nickel
ion. Hence, an identical entropy loss was assumed. Because a coordinated species was
assumed to have lost an amount of entropy corresponding to the loss of all translational
degrees of freedom, the change in entropy upon coordination of a physisorbed species
amounted to two thirds of the translational entropy of that component in the gas phase.
The reaction enthalpies of the activation by coordination of ethene and the second
coordination of ethene at the nickel-alkene species, however, were assumed not to be
identical. The presence of a first ethene ligand after activation was allowed to affect the
coordination enthalpy of the second ethene molecule. Hence, for both activation and
coordination of a second ethene molecule, one parameter was to be determined, i.e., aH∆
and cH∆ :
RT
HR3
S2aatrans
eeK∆−−
⋅= 4-20
RT
HR3
S2cctrans
eeK∆−−
⋅= 4-21
For insertion and termination, an early transition state was assumed, as already discussed in
section 4.3.4. Consequently, the entropy change corresponding to transition state formation
was set to zero. Per reaction family, one parameter was to be estimated, i.e., the
corresponding activation energies insaE and ter
aE . The kinetic coefficients, based on the
transition state theory, were as follows:
RTE
Binsinsa
eh
Tkk
−= 4-22
RTE
Btertera
eh
Tkk
−= 4-23
4.4.1.3 Double bond isomerization
Double bond isomerization was experimentally observed to reach thermodynamic
equilibrium during each experiment, see section 4.2. Based on the experimental
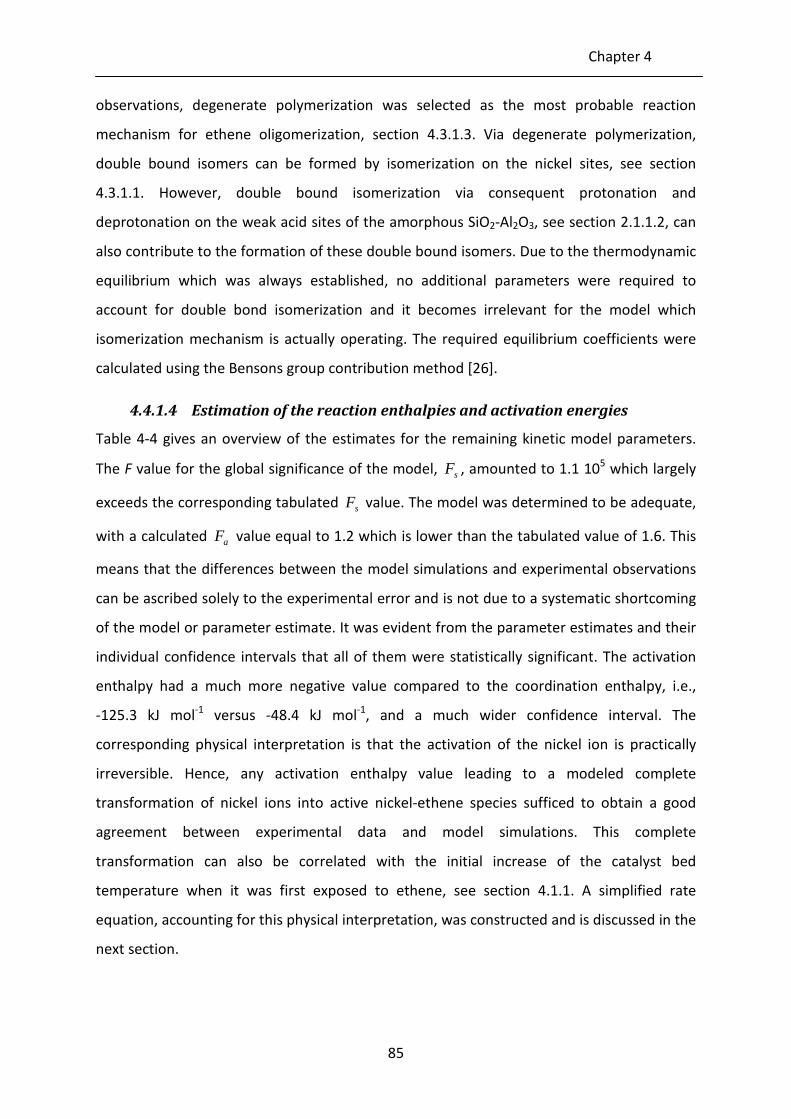
Chapter 4
85
observations, degenerate polymerization was selected as the most probable reaction
mechanism for ethene oligomerization, section 4.3.1.3. Via degenerate polymerization,
double bound isomers can be formed by isomerization on the nickel sites, see section
4.3.1.1. However, double bound isomerization via consequent protonation and
deprotonation on the weak acid sites of the amorphous SiO2-Al2O3, see section 2.1.1.2, can
also contribute to the formation of these double bound isomers. Due to the thermodynamic
equilibrium which was always established, no additional parameters were required to
account for double bond isomerization and it becomes irrelevant for the model which
isomerization mechanism is actually operating. The required equilibrium coefficients were
calculated using the Bensons group contribution method [26].
4.4.1.4 Estimation of the reaction enthalpies and activation energies
Table 4-4 gives an overview of the estimates for the remaining kinetic model parameters.
The F value for the global significance of the model, sF , amounted to 1.1 105 which largely
exceeds the corresponding tabulated sF value. The model was determined to be adequate,
with a calculated aF value equal to 1.2 which is lower than the tabulated value of 1.6. This
means that the differences between the model simulations and experimental observations
can be ascribed solely to the experimental error and is not due to a systematic shortcoming
of the model or parameter estimate. It was evident from the parameter estimates and their
individual confidence intervals that all of them were statistically significant. The activation
enthalpy had a much more negative value compared to the coordination enthalpy, i.e.,
-125.3 kJ mol-1
versus -48.4 kJ mol-1
, and a much wider confidence interval. The
corresponding physical interpretation is that the activation of the nickel ion is practically
irreversible. Hence, any activation enthalpy value leading to a modeled complete
transformation of nickel ions into active nickel-ethene species sufficed to obtain a good
agreement between experimental data and model simulations. This complete
transformation can also be correlated with the initial increase of the catalyst bed
temperature when it was first exposed to ethene, see section 4.1.1. A simplified rate
equation, accounting for this physical interpretation, was constructed and is discussed in the
next section.
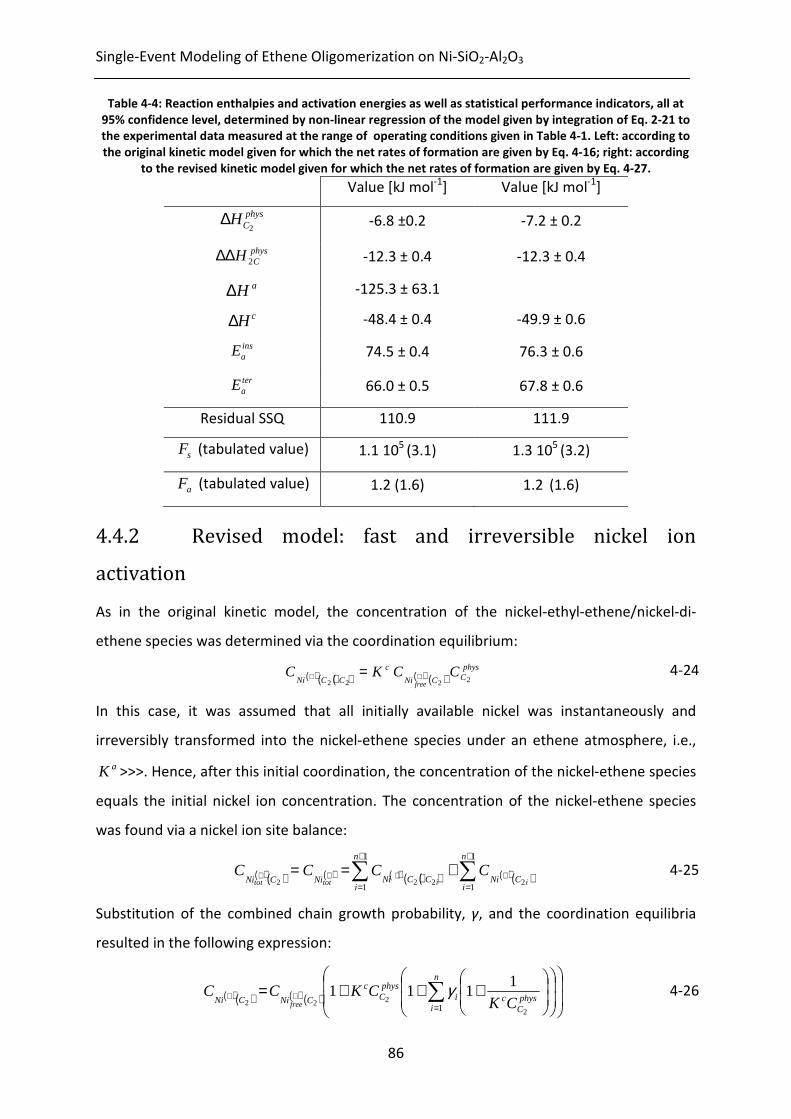
Single-Event Modeling of Ethene Oligomerization on Ni-SiO2-Al2O3
86
Table 4-4: Reaction enthalpies and activation energies as well as statistical performance indicators, all at
95% confidence level, determined by non-linear regression of the model given by integration of Eq. 2-21 to
the experimental data measured at the range of operating conditions given in Table 4-1. Left: according to
the original kinetic model given for which the net rates of formation are given by Eq. 4-16; right: according
to the revised kinetic model given for which the net rates of formation are given by Eq. 4-27.
Value [kJ mol-1
] Value [kJ mol-1
]
physCH
2∆ -6.8 ±0.2 -7.2 ± 0.2
physCH 2∆∆ -12.3 ± 0.4 -12.3 ± 0.4
aH∆ -125.3 ± 63.1
cH∆ -48.4 ± 0.4 -49.9 ± 0.6
insaE 74.5 ± 0.4 76.3 ± 0.6
teraE 66.0 ± 0.5 67.8 ± 0.6
Residual SSQ 110.9 111.9
sF (tabulated value) 1.1 105
(3.1) 1.3 105
(3.2)
aF (tabulated value) 1.2 (1.6) 1.2 (1.6)
4.4.2 Revised model: fast and irreversible nickel ion
activation
As in the original kinetic model, the concentration of the nickel-ethyl-ethene/nickel-di-
ethene species was determined via the coordination equilibrium:
( )( )( ) ( ) ( )
physCCNi
c
CCNiCCKC
free2222
++ =
4-24
In this case, it was assumed that all initially available nickel was instantaneously and
irreversibly transformed into the nickel-ethene species under an ethene atmosphere, i.e.,
aK >>>. Hence, after this initial coordination, the concentration of the nickel-ethene species
equals the initial nickel ion concentration. The concentration of the nickel-ethene species
was found via a nickel ion site balance:
( )( ) ( ) ( )( )( ) ( )( )∑∑
+
=
+
=++++ +==
1
1
1
12222
n
iCNi
n
iCCNiNiCNi iitottot
CCCC 4-25
Substitution of the combined chain growth probability, γ, and the coordination equilibria
resulted in the following expression:
( )( ) ( ) ( )
+++= ∑
=++ phys
Cc
n
ii
physC
c
CNiCNi CKCKCC
free2
222
1111
1
γ 4-26

Chapter 4
87
The combination of equations 4-6, 4-8 and 4-27 to 4-29 resulted in the net rate of formation
of the alkenes for the simplified kinetic model:
( )ni
CKCK
CCKkR
physC
c
n
ii
physC
c
iphys
CNi
cteri
Ctot
i...1
1111
2
2
2
)1(2
1
=
+++
=
∑=
+
+
γ
γ 4-27
In Table 4-4 an overview is also given of the parameter estimates for the revised kinetic
model. The model had a 20% higher sF value for the global significance than the original
model. This increase stemmed from the reduction in number of parameters without
pronounced effect on the residual sum of squares, see Table 4-4. As for the original model,
the revised kinetic model was tested to be adequate with the calculated aF value equal to
1.2. Similar parameter estimates and corresponding confidence intervals were obtained for
the revised model compared to the original model, see Table 4-4.
4.4.3 Model parameter assessment
The activation energy for insertion and termination differed by about 10 kJ mol-1
. In
combination with an identical pre-exponential factor for both reactions, see section 4.4.1.2,
this led to low chain growth probabilities around 0.1, see Table 4-5. The difference in
activation energies between insertion and termination was sufficiently small for the chain
growth probabilities to be practically constant in the investigated temperature range.
Table 4-5: Chain growth probability α as function of temperature as determined by Eqs. 4-12 and 4-13
calculated with the parameter values reported in Table 4-4.
Temperature
[K] 443 453 463 473 483 493 503
α [-] 0.090 0.095 0.099 0.103 0.107 0.112 0.116
The more termination is dominating insertion, corresponding with low chain growth
probabilities, the less product selectivities depend on the reaction conditions. At these low
chain growth probabilities, a relative change of 30%, i.e., the change of the chain growth
probability in this work in the investigated temperature range, will not result in a noticeable
change in the product distribution. This is illustrated with the following three theoretical
Anderson Schulz Flory distributions, see equation 4-28 for which the product distribution is
given by:
Single-Event Modeling of Ethene Oligomerization on Ni-SiO2-Al2O3
88
( ) 121 −−= ii iw αα 4-28
in which wi is the mass fraction of a component with carbon number i. From the theoretical
ASF distributions it was clear that, indeed, for sufficiently small chain growth probabilities,
e.g., α = 0.1, a relative deviation of 30% would not lead to a significant change in product
distribution. The higher the chain growth probability, the more visible changes in the
product distribution becomes, see Figure 4-8.
Figure 4-8: Theoretical ASF distributions given by Eq. 4-31 for different chain growth probabilities α. Full
lines: αref, dashed lines: 1.15 αref, dotted lines: 1.30 αref. Left: αref = 0.1, middle: αref = 0.3, right: αref = 0.5.
The above discussed behavior explains the apparent independence of the product
selectivity from the reaction conditions, especially of the reaction temperature, as
experimentally observed, see Figure 4-1.
With the obtained parameters estimates, the denominator of equation 4-27 amounted to
1.10 to 1.13 in the range of investigated reaction conditions. Additionally, the change in
concentration of physisorbed components, as a function of the ethene inlet partial pressure
was practically linear, see section 4.4.4. This was due to the relatively low surface coverage
with physisorbed components and the small interval in which the inlet partial pressure of
ethene was varied. Exhibiting such a behavior, the kinetic model was in agreement with the
reported first order dependency of the reaction rate as function of ethene partial pressure
by Kiessling and Froment [3].
The binary correlation coefficients between the parameter estimates were very similar for
both the original and revised kinetic model. In Table 4-6, the binary correlation coefficients
for the revised kinetic model are given. Overall, correlation coefficients below 0.95 were
obtained, indicating that the corresponding parameters were not significantly correlated.
Nevertheless, some of the correlation coefficients exhibited logic trends. The activation
energies of insertion and termination were correlated positively, i.e., a correlation
coefficient amounting to 0.94, meaning that an increase of one of the activation energies
led to an increase of the activation energy of the other reaction. The positive correlation has
0.00
0.20
0.40
0.60
0.80
1.00
0 2 4 6 8 10
Mo
lar
fra
ctio
n [
-]
Carbon number [-]
0.00
0.20
0.40
0.60
0.80
1.00
0 2 4 6 8 10
Mo
lar
fra
ctio
n [
-]
Carbon number [-]
0.00
0.20
0.40
0.60
0.80
1.00
0 2 4 6 8 10
Mo
lar
fra
ctio
n [
-]
Carbon number [-]
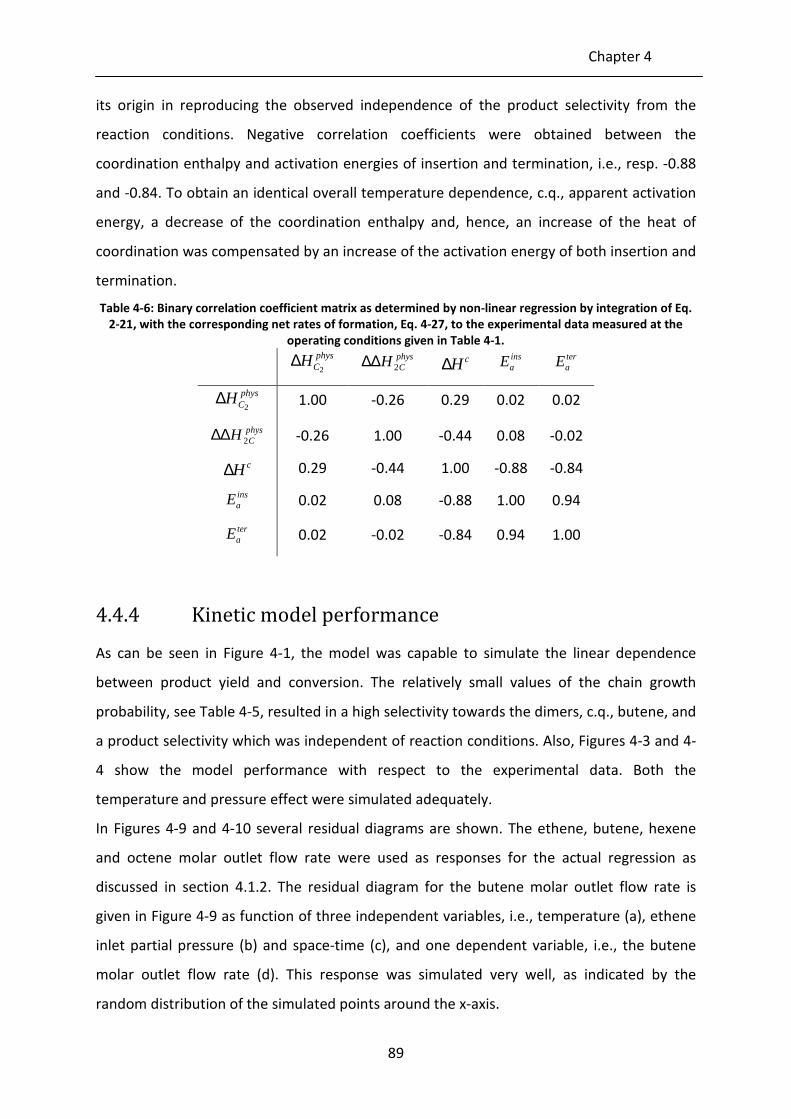
Chapter 4
89
its origin in reproducing the observed independence of the product selectivity from the
reaction conditions. Negative correlation coefficients were obtained between the
coordination enthalpy and activation energies of insertion and termination, i.e., resp. -0.88
and -0.84. To obtain an identical overall temperature dependence, c.q., apparent activation
energy, a decrease of the coordination enthalpy and, hence, an increase of the heat of
coordination was compensated by an increase of the activation energy of both insertion and
termination.
Table 4-6: Binary correlation coefficient matrix as determined by non-linear regression by integration of Eq.
2-21, with the corresponding net rates of formation, Eq. 4-27, to the experimental data measured at the
operating conditions given in Table 4-1.
phys
CH2
∆ physCH 2∆∆ cH∆
insaE ter
aE
physCH
2∆ 1.00 -0.26 0.29 0.02 0.02
physCH 2∆∆ -0.26 1.00 -0.44 0.08 -0.02
cH∆ 0.29 -0.44 1.00 -0.88 -0.84
insaE 0.02 0.08 -0.88 1.00 0.94
teraE 0.02 -0.02 -0.84 0.94 1.00
4.4.4 Kinetic model performance
As can be seen in Figure 4-1, the model was capable to simulate the linear dependence
between product yield and conversion. The relatively small values of the chain growth
probability, see Table 4-5, resulted in a high selectivity towards the dimers, c.q., butene, and
a product selectivity which was independent of reaction conditions. Also, Figures 4-3 and 4-
4 show the model performance with respect to the experimental data. Both the
temperature and pressure effect were simulated adequately.
In Figures 4-9 and 4-10 several residual diagrams are shown. The ethene, butene, hexene
and octene molar outlet flow rate were used as responses for the actual regression as
discussed in section 4.1.2. The residual diagram for the butene molar outlet flow rate is
given in Figure 4-9 as function of three independent variables, i.e., temperature (a), ethene
inlet partial pressure (b) and space-time (c), and one dependent variable, i.e., the butene
molar outlet flow rate (d). This response was simulated very well, as indicated by the
random distribution of the simulated points around the x-axis.

Single-Event Modeling of Ethene Oligomerization on Ni-SiO2-Al2O3
90
a b
c d
Figure 4-9: Residual diagrams for the molar outlet flow rate of butene as function of temperature (a), inlet
partial pressure of ethene (b), space-time (c) and molar flow rate of butene (d). Residuals are determined by
integration of Eq. 2-21, with the corresponding net rates of formation, Eq. 4-27 and the parameter values
reported in Table 4-4.
The residual diagrams as function of ethene inlet partial pressure for the other modeled
responses are given in Figure 4-10, i.e., ethene (a), hexene (b) and octene (c). These
responses were simulated very well without any systematic deviation. Additionally, no
deviation could be observed in any of the residual diagrams, which indicated the model’s
adequacy. The 1-butene molar outlet flow rate, which was not used during regression and
only calculated via the thermodynamic equilibrium within the C4 internal alkenes, was also
well simulated and the corresponding residuals were independent of the operating
conditions, see Figure 4-10d.
-1.5
-1
-0.5
0
0.5
1
1.5
440 450 460 470 480 490 500 510
Re
sid
ua
l FC
4[1
0-6
mo
l s-1
]
Temperature [K] -1.5
-1
-0.5
0
0.5
1
1.5
0.1 0.15 0.2 0.25 0.3 0.35 0.4
Re
sid
ua
l F C
4[1
0-6
mo
l s-1
]
Inlet ethene partial pressure [MPa]
-1.5
-1
-0.5
0
0.5
1
1.5
0 2 4 6 8 10 12 14 16
Re
sid
ua
l FC
4[1
0-6
mo
l s-1
]
Space-time [kgcat s molC2-1]
-1.5
-1
-0.5
0
0.5
1
1.5
0 1 2 3 4 5 6 7 8
Re
sid
ua
l F
C4
[10
-6m
ol s
-1]
Outlet flow rate of butene [10-6 mol s-1]
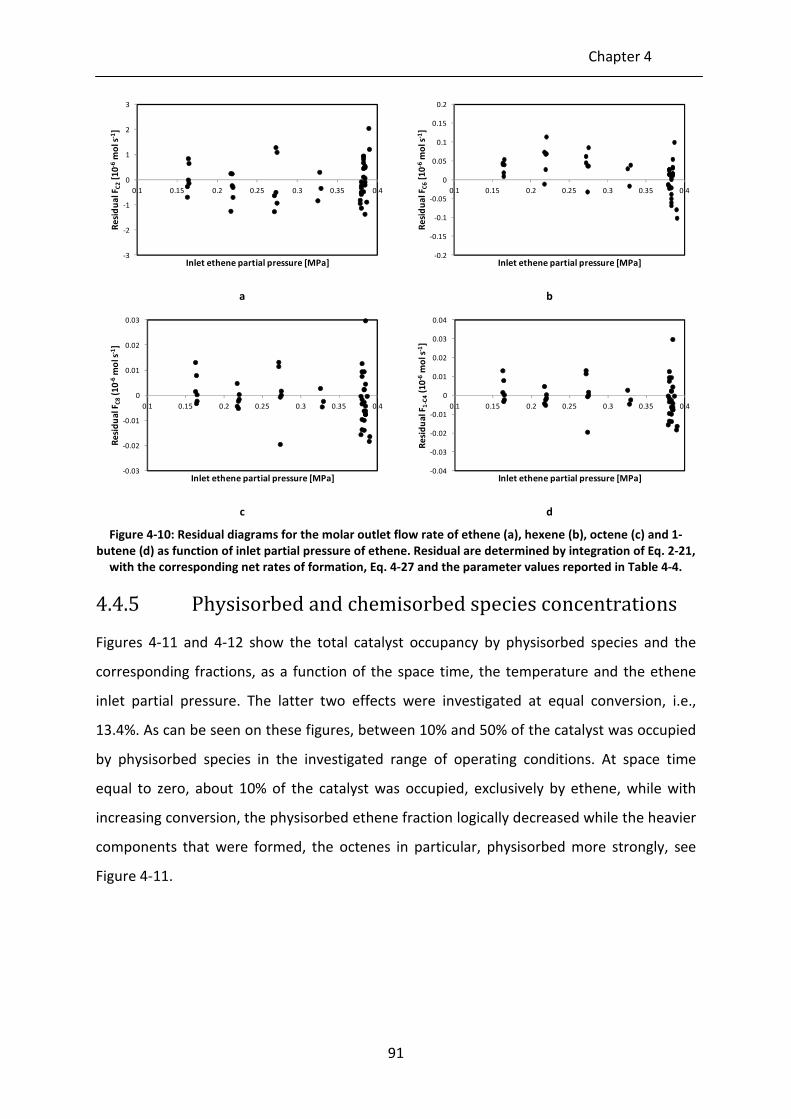
Chapter 4
91
a b
c d
Figure 4-10: Residual diagrams for the molar outlet flow rate of ethene (a), hexene (b), octene (c) and 1-
butene (d) as function of inlet partial pressure of ethene. Residual are determined by integration of Eq. 2-21,
with the corresponding net rates of formation, Eq. 4-27 and the parameter values reported in Table 4-4.
4.4.5 Physisorbed and chemisorbed species concentrations
Figures 4-11 and 4-12 show the total catalyst occupancy by physisorbed species and the
corresponding fractions, as a function of the space time, the temperature and the ethene
inlet partial pressure. The latter two effects were investigated at equal conversion, i.e.,
13.4%. As can be seen on these figures, between 10% and 50% of the catalyst was occupied
by physisorbed species in the investigated range of operating conditions. At space time
equal to zero, about 10% of the catalyst was occupied, exclusively by ethene, while with
increasing conversion, the physisorbed ethene fraction logically decreased while the heavier
components that were formed, the octenes in particular, physisorbed more strongly, see
Figure 4-11.
-3
-2
-1
0
1
2
3
0.1 0.15 0.2 0.25 0.3 0.35 0.4
Re
sid
ua
l F C
2[1
0-6
mo
l s-1
]
Inlet ethene partial pressure [MPa]-0.2
-0.15
-0.1
-0.05
0
0.05
0.1
0.15
0.2
0.1 0.15 0.2 0.25 0.3 0.35 0.4
Re
sid
ua
l F C
6[1
0-6
mo
l s-1
]
Inlet ethene partial pressure [MPa]
-0.03
-0.02
-0.01
0
0.01
0.02
0.03
0.1 0.15 0.2 0.25 0.3 0.35 0.4
Re
sid
ua
l F
C8
(10
-6m
ol s
-1]
Inlet ethene partial pressure [MPa]-0.04
-0.03
-0.02
-0.01
0
0.01
0.02
0.03
0.04
0.1 0.15 0.2 0.25 0.3 0.35 0.4
Re
sid
ua
l F
1-C
4(1
0-6
mo
l s-1
]
Inlet ethene partial pressure [MPa]

Single-Event Modeling of Ethene Oligomerization on Ni-SiO2-Al2O3
92
Figure 4-11: Catalyst occupancy by physisorbed species and the corresponding physisorbed fractions as a
function of space-time at 473 K and an inlet ethene partial pressure equal to 0.35 MPa, calculated by
integration of Eq. 2-21, with the corresponding net rates of formation, Eq. 4-27 and the parameter values
reported in Table 4-4. Full line: catalyst occupancy by physisorbed species, dotted line: physisorbed fraction
of ethene, short-dashed line: physisorbed fraction of butene, long-dashed line: physisorbed fraction of
hexene, dashed dotted line: physisorbed fraction of octene.
With increasing temperature, physisorption became less pronounced, see Figures 4-12.
Since physisorption is an exothermic process and was assumed to be in equilibrium, a
temperature increase led to a shift in the physisorption equilibrium towards the gas phase
molecules. Due to the low physisorption enthalpy of light components in comparison with
heavier components, the physisorption equilibrium of the former were influenced less by a
temperature increase compared to the latter. At equal conversion levels, this led to an
increase of the physisorbed fraction of the most weakly physisorbed component, i.e.,
ethene, and a decrease of the physisorbed fraction of the stronger physisorbed
components as function of the temperature.
0.0
0.2
0.4
0.6
0.8
1.0
0.0
0.1
0.2
0.3
0.4
0.5
0.0 5.0 10.0 15.0 20.0
Ph
ysi
sorb
ed
fra
ctio
ns
[-]
Ca
taly
st o
ccu
pa
ncy
by
ph
ysi
sorb
ed
spe
cie
s[-
]
Space-time [kgcat s mol-1]

Chapter 4
93
Figure 4-12: Catalyst occupancy by physisorbed species and the corresponding physisorbed fractions as a
function of temperature at an inlet ethene partial pressure equal to 0.35 MPa at 13.4% conversion,
calculated by integration of Eq. 2-21, with the corresponding net rates of formation, Eq. 4-27 and the
parameter values reported in Table 4-4. Full line: catalyst occupancy by physisorbed species, dotted line:
physisorbed fraction of ethene, short-dashed line: physisorbed fraction of butene, long-dashed line:
physisorbed fraction of hexene, dashed dotted line: physisorbed fraction of octene.
Increasing the ethene inlet partial pressure, while maintaining an equal level of conversion,
increased the catalyst occupancy by physisorbed species linearly. This was in accordance
with the first order dependency of the reaction rate to the ethene partial pressure. The
physisorbed fractions did not change appreciably since the relative change in partial
pressure was equal for every component.
0.0
0.1
0.2
0.3
0.4
0.5
0.20
0.25
0.30
0.35
0.40
443 453 463 473 483 493 503
Ph
ysi
sorb
ed
fra
ctio
ns
[-]
Ca
taly
st o
ccu
pa
ncy
by
ph
ysi
sorb
ed
spe
cie
s[-
]
Temperature [K]
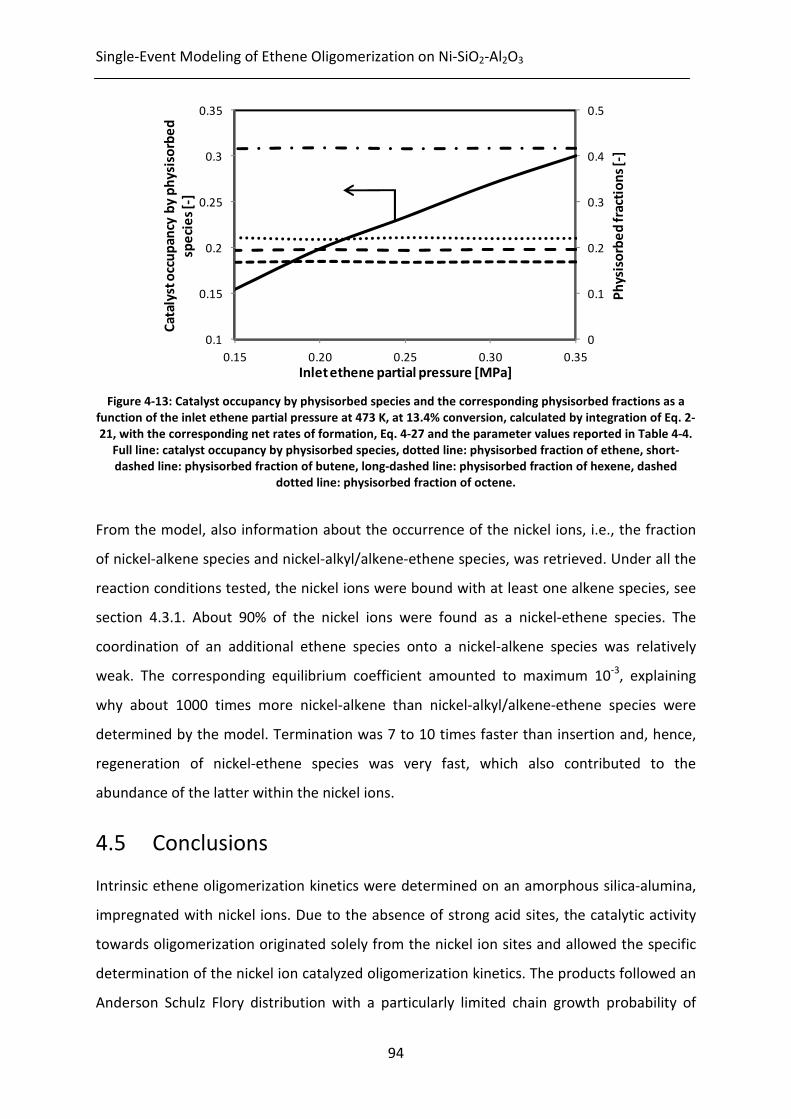
Single-Event Modeling of Ethene Oligomerization on Ni-SiO2-Al2O3
94
Figure 4-13: Catalyst occupancy by physisorbed species and the corresponding physisorbed fractions as a
function of the inlet ethene partial pressure at 473 K, at 13.4% conversion, calculated by integration of Eq. 2-
21, with the corresponding net rates of formation, Eq. 4-27 and the parameter values reported in Table 4-4.
Full line: catalyst occupancy by physisorbed species, dotted line: physisorbed fraction of ethene, short-
dashed line: physisorbed fraction of butene, long-dashed line: physisorbed fraction of hexene, dashed
dotted line: physisorbed fraction of octene.
From the model, also information about the occurrence of the nickel ions, i.e., the fraction
of nickel-alkene species and nickel-alkyl/alkene-ethene species, was retrieved. Under all the
reaction conditions tested, the nickel ions were bound with at least one alkene species, see
section 4.3.1. About 90% of the nickel ions were found as a nickel-ethene species. The
coordination of an additional ethene species onto a nickel-alkene species was relatively
weak. The corresponding equilibrium coefficient amounted to maximum 10-3
, explaining
why about 1000 times more nickel-alkene than nickel-alkyl/alkene-ethene species were
determined by the model. Termination was 7 to 10 times faster than insertion and, hence,
regeneration of nickel-ethene species was very fast, which also contributed to the
abundance of the latter within the nickel ions.
4.5 Conclusions
Intrinsic ethene oligomerization kinetics were determined on an amorphous silica-alumina,
impregnated with nickel ions. Due to the absence of strong acid sites, the catalytic activity
towards oligomerization originated solely from the nickel ion sites and allowed the specific
determination of the nickel ion catalyzed oligomerization kinetics. The products followed an
Anderson Schulz Flory distribution with a particularly limited chain growth probability of
0
0.1
0.2
0.3
0.4
0.5
0.1
0.15
0.2
0.25
0.3
0.35
0.15 0.20 0.25 0.30 0.35
Ph
ysi
sorb
ed
fra
ctio
ns
[-]
Ca
taly
st o
ccu
pa
ncy
by
ph
ysi
sorb
ed
spe
cie
s [-
]
Inlet ethene partial pressure [MPa]
Chapter 4
95
about 0.1. As a result, the nickel ion sites mainly dimerized ethene to butene. The product
selectivities were independent of the operating conditions as can be expected from an
insertion-termination mechanism exhibiting low chain growth probabilities. The reaction
rate increased linearly with increasing ethene partial pressure.
A Single-Event MicroKinetic model for ethene oligomerization was constructed. On a fresh
catalyst, ethene coordinated fast and irreversibly on the nickel ion sites, forming the active
nickel-ethyl species, after which the insertion-termination mechanism started. Degenerate
polymerization was determined to be the most likely reaction mechanism, but the
occurrence of a concerted coupling mechanism could not be totally excluded. The kinetic
parameters were all estimated with narrow confidence intervals and a precise physical
meaning. The model itself was statistically tested to be significant and adequate and was
able to describe all experimental data without any systematic deviations.
The catalyst occupancy by physisorbed species ranged from 10% to 50%, mainly comprising
ethene and octene. There was a linear increase of the concentration of physisorbed
components as function of the ethene partial pressure. About 90% of the nickel ions were
found to be a nickel-ethene species, due to the rather weak coordination of an additional
ethene species and the high rate of termination compared to insertion.
4.6 References
[1] J. Patzlaff, Y. Liu, C. Graffmann, J. Gaube, Applied Catalysis a-General. 186 (1999)
109-119.
[2] R.L. Espinoza, C.J. Korf, C.P. Nicolaides, R. Snel, Applied Catalysis. 29 (1987) 175-184.
[3] D. Kiessling, G.F. Froment, Applied Catalysis. 71 (1991) 123-138.
[4] C. Lepetit, J.Y. Carriat, C. Bennett, Applied Catalysis a-General. 123 (1995) 289-300.
[5] S.M. Pillai, M. Ravindranathan, S. Sivaram, Chemical Reviews. 86 (1986) 353-399.
[6] L. Fan, A. Krzywicki, A. Somogyvari, T. Ziegler, Inorganic Chemistry. 35 (1996) 4003-
4006.
[7] F. Speiser, P. Braunstein, W. Saussine, Accounts of Chemical Research. 38 (2005)
784-793.
[8] F.X. Cai, C. Lepetit, M. Kermarec, D. Olivier, Journal of Molecular Catalysis. 43 (1987)
93-116.
[9] T.X. Cai, Catalysis Today. 51 (1999) 153-160.
[10] A.A. Davydov, M. Kantcheva, M.L. Chepotko, Catalysis Letters. 83 (2002) 97-108.
[11] I.V. Elev, B.N. Shelimov, V.B. Kazanskii, Kinetics and Catalysis. 25 (1984) 955-958.
[12] L. Bonneviot, D. Olivier, M. Che, Journal of Molecular Catalysis. 21 (1983) 415-430.
[13] A.K. Ghosh, L. Kevan, Journal of Physical Chemistry. 94 (1990) 3117-3121.
[14] J. Heveling, C.P. Nicolaides, M.S. Scurrell, Applied Catalysis a-General. 173 (1998) 1-9.
Single-Event Modeling of Ethene Oligomerization on Ni-SiO2-Al2O3
96
[15] M. Lallemand, A. Finiels, F. Fajula, V. Hulea, Applied Catalysis a-General. 301 (2006)
196-201.
[16] A. Martinez, M.A. Arribas, P. Concepcion, S. Moussa, Applied Catalysis a-General. 467
(2013) 509-518.
[17] A.N. Mlinar, G.B. Baur, G.G. Bong, A. Getsoian, A.T. Bell, Journal of Catalysis. 296
(2012) 156-164.
[18] V. Hulea, F. Fajula, Journal of Catalysis. 225 (2004) 213-222.
[19] F.T.T. Ng, D.C. Creaser, Applied Catalysis a-General. 119 (1994) 327-339.
[20] R. Spinicci, A. Tofanari, Materials Chemistry and Physics. 25 (1990) 375-383.
[21] G.G. Martens, J.W. Thybaut, G.B. Marin, Industrial & Engineering Chemistry
Research. 40 (2001) 1832-1844.
[22] J.W. Thybaut, G.B. Marin, Journal of Catalysis. 308 (2013) 352-362.
[23] J.A. Dumesic, D.F. Rudd, L.M. Aparicio, J.E. Rekoske, A.A. Trevino, The Microkinetics
of Heterogeneous Catalysis American Chemical Society, Washington, DC, 1993.
[24] G.G. Martens, G.B. Marin, J.A. Martens, P.A. Jacobs, G.V. Baroni, Journal of Catalysis.
195 (2000) 253-267.
[25] J.F.M. Denayer, G.V. Baron, Adsorption-Journal of the International Adsorption
Society. 3 (1997) 251-265.
[26] S.W. Benson, J.H. Buss, Journal of Chemical Physics. 29 (1958) 546-572.
97
Chapter 5
Exploiting Bifunctional
Heterogeneous Catalysts in
Ethene Oligomerization:
Guidelines for Rational
Catalyst Design
In this work, ethene oligomerization is investigated on a bifunctional, heterogeneous
catalyst, i.e., Ni-Beta zeolite. The experimental results indicate the presence of acid
catalyzed reactions such as isomerization, oligomerization and cracking as evident from the
formation of odd carbon numbered alkenes, e.g., propene and pentene. For modeling
purposes, the SEMK model for metal-ion catalyzed ethene oligomerization, see chapter 4, is
extended to account for these acid catalyzed elementary steps. Based on the SEMK model, a
reaction path analysis is performed from which guidelines were derived for rational catalyst
design aiming at the production of propene, linear 1-alkenes and gasoline.
Exploiting Bifunctional Heterogeneous Catalysts in Ethene Oligomerization: Guidelines for
Rational Catalyst Design
98
5.1 Procedures
5.1.1 Experimental conditions
The experimental dataset was obtained on a Ni-Beta zeolite using the HTK-1 set-up as
described in sections 2.1.1.3 and 2.1.2.2. Catalyst deactivation was observed from the
exponential decrease in observed ethene conversion with time-on-stream. Therefore, the
outlet molar composition was measured during 8 hours and an extrapolation was
performed to zero time-on-stream to approximate the activity of a fresh catalyst. In
between every run, the reactor was emptied and carefully cleaned.
Methane was not detected in the product stream and was fed as an internal standard to
verify the carbon and mass balance which was always closed within ± 5%. The separation of
the C5+ double bound isomer alkenes was not possible with the present analysis equipment.
Therefore, the product outlet molar flow rates were lumped per carbon number. A clear
distinction between different carbon numbered alkenes could be made up to octene.
Additionally, only components up to octene were detected significantly. In total, 14
experiments including one repeat experiment, were performed. The range of investigated
experimental conditions was chosen as such intrinsic kinetics were obtained, see section
2.1.2.2, and is given in Table 5-1.
Table 5-1: Range of investigated experimental conditions for ethene oligomerization on Ni-Beta
Temperature
[K]
Total pressure
[MPa]
Ethene partial pressure
[MPa]
Space-time
[kgcat s molC2-1
]
443 – 543 1.5 – 3.5 0.17 – 0.40 4.2 – 12.7
5.1.2 Definition of responses
In total, 7 responses were used, i.e., the lumped outlet molar flow rates per carbon number,
ranging from ethene to octene.
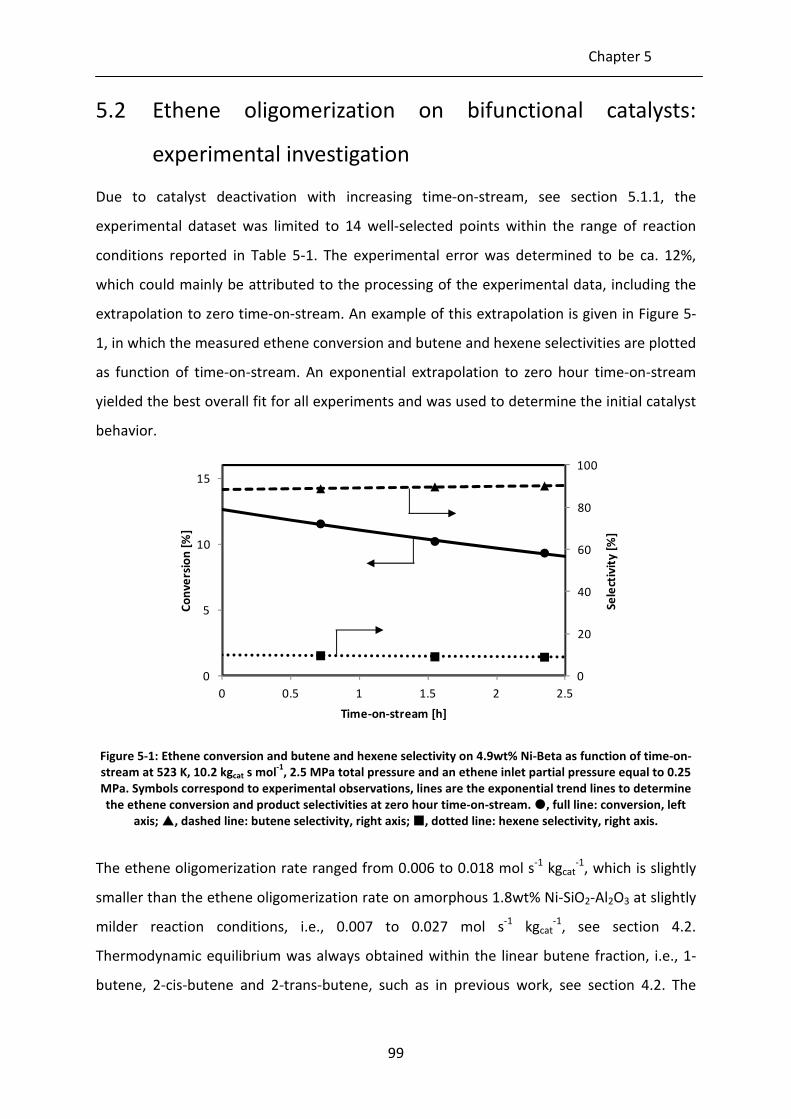
Chapter 5
99
5.2 Ethene oligomerization on bifunctional catalysts:
experimental investigation
Due to catalyst deactivation with increasing time-on-stream, see section 5.1.1, the
experimental dataset was limited to 14 well-selected points within the range of reaction
conditions reported in Table 5-1. The experimental error was determined to be ca. 12%,
which could mainly be attributed to the processing of the experimental data, including the
extrapolation to zero time-on-stream. An example of this extrapolation is given in Figure 5-
1, in which the measured ethene conversion and butene and hexene selectivities are plotted
as function of time-on-stream. An exponential extrapolation to zero hour time-on-stream
yielded the best overall fit for all experiments and was used to determine the initial catalyst
behavior.
Figure 5-1: Ethene conversion and butene and hexene selectivity on 4.9wt% Ni-Beta as function of time-on-
stream at 523 K, 10.2 kgcat s mol-1
, 2.5 MPa total pressure and an ethene inlet partial pressure equal to 0.25
MPa. Symbols correspond to experimental observations, lines are the exponential trend lines to determine
the ethene conversion and product selectivities at zero hour time-on-stream. , full line: conversion, left
axis; , dashed line: butene selectivity, right axis; , dotted line: hexene selectivity, right axis.
The ethene oligomerization rate ranged from 0.006 to 0.018 mol s-1
kgcat-1
, which is slightly
smaller than the ethene oligomerization rate on amorphous 1.8wt% Ni-SiO2-Al2O3 at slightly
milder reaction conditions, i.e., 0.007 to 0.027 mol s-1
kgcat-1
, see section 4.2.
Thermodynamic equilibrium was always obtained within the linear butene fraction, i.e., 1-
butene, 2-cis-butene and 2-trans-butene, such as in previous work, see section 4.2. The
0
20
40
60
80
100
0
5
10
15
0 0.5 1 1.5 2 2.5
Se
lect
ivit
y [
%]
Co
nv
ers
ion
[%
]
Time-on-stream [h]

Exploiting Bifunctional Heterogeneous Catalysts in Ethene Oligomerization: Guidelines for
Rational Catalyst Design
100
product distribution consisted mainly of butene and hexene, i.e., resp. 80-90% and 5-10%,
while small amounts of odd carbon numbered alkenes were produced. Propene and
pentene contributed for resp. ca. 0.1-1.0% and 0.2-2.5% to the product distribution.
Heptene was only detected in trace amounts while octene was formed to a similar extent as
propene. The even carbon numbered alkenes can reasonably be mainly related to
oligomerization on the nickel-ion sites, while the acid sites are responsible for the
production of the odd carbon numbered alkenes [1].
The space-time effect on the ethene conversion and product selectivities is shown in Figures
5-2 and 5-3. With increasing space-time and conversion, the butene selectivity decreases
while the hexene selectivity remains more or less constant and other product selectivities
increase. The butene formation from ethene is, hence, considered as the first step in the
reaction mechanism and, correspondingly, butene can be regarded as a primary product. All
other components are formed from butene via further oligomerization on the nickel-ion
sites or oligomerization, isomerization and cracking on the acid sites and are secondary
products.
Figure 5-2: Ethene conversion and butene and hexene selectivity on 4.9wt% Ni-Beta as function of space-
time at 523 K, 3.0MPa total pressure and an ethene inlet partial pressure equal to 0.35 MPa. Symbols
correspond to experimental observations, lines correspond to model simulations, i.e., integration of Eq. 2-
21, with the corresponding net rates of formation as given by Eq. 5-15 and the parameter values as reported
in Tables 5-5 and 5-6; , full line: conversion, left axis; , dashed line: butene selectivity, right axis; ,
dotted line: hexene selectivity, right axis.
0
20
40
60
80
100
0
5
10
15
20
5 7 9 11 13
Se
lect
ivit
y [
%]
Co
nv
ers
ion
[%
]
Space-time [kgcat s mol-1]
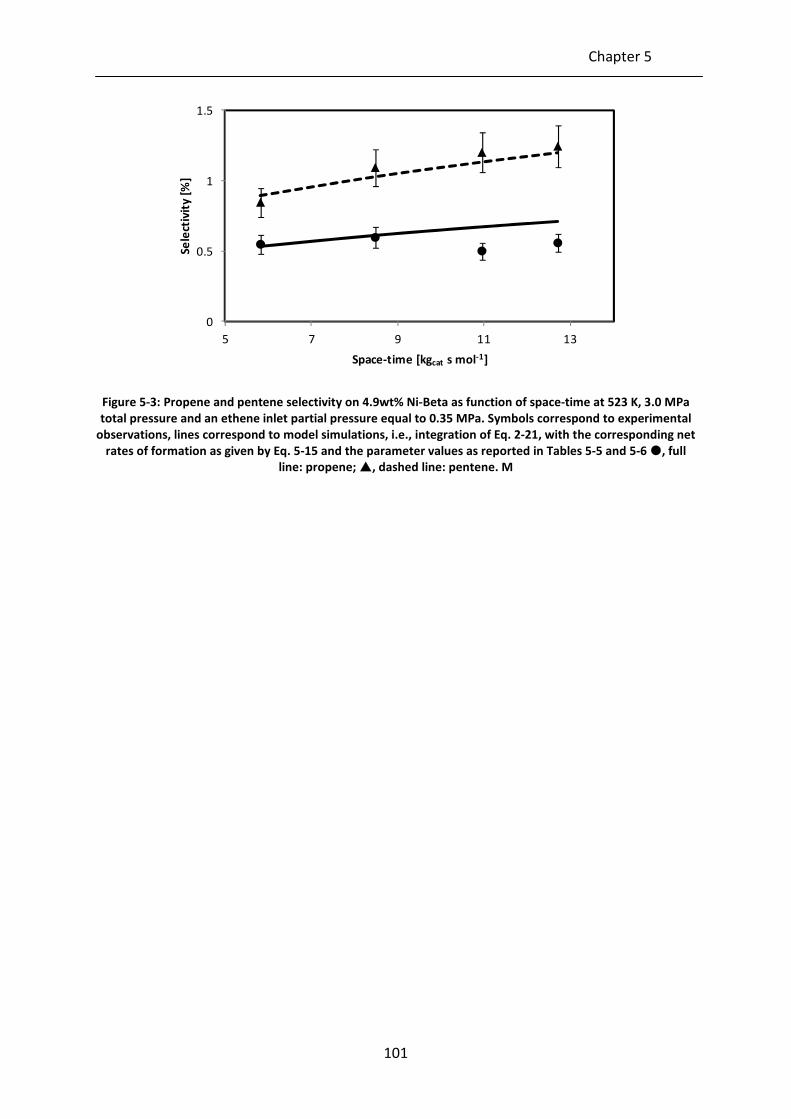
Chapter 5
101
Figure 5-3: Propene and pentene selectivity on 4.9wt% Ni-Beta as function of space-time at 523 K, 3.0 MPa
total pressure and an ethene inlet partial pressure equal to 0.35 MPa. Symbols correspond to experimental
observations, lines correspond to model simulations, i.e., integration of Eq. 2-21, with the corresponding net
rates of formation as given by Eq. 5-15 and the parameter values as reported in Tables 5-5 and 5-6 , full
line: propene; , dashed line: pentene. M
0
0.5
1
1.5
5 7 9 11 13
Se
lect
ivit
y [
%]
Space-time [kgcat s mol-1]
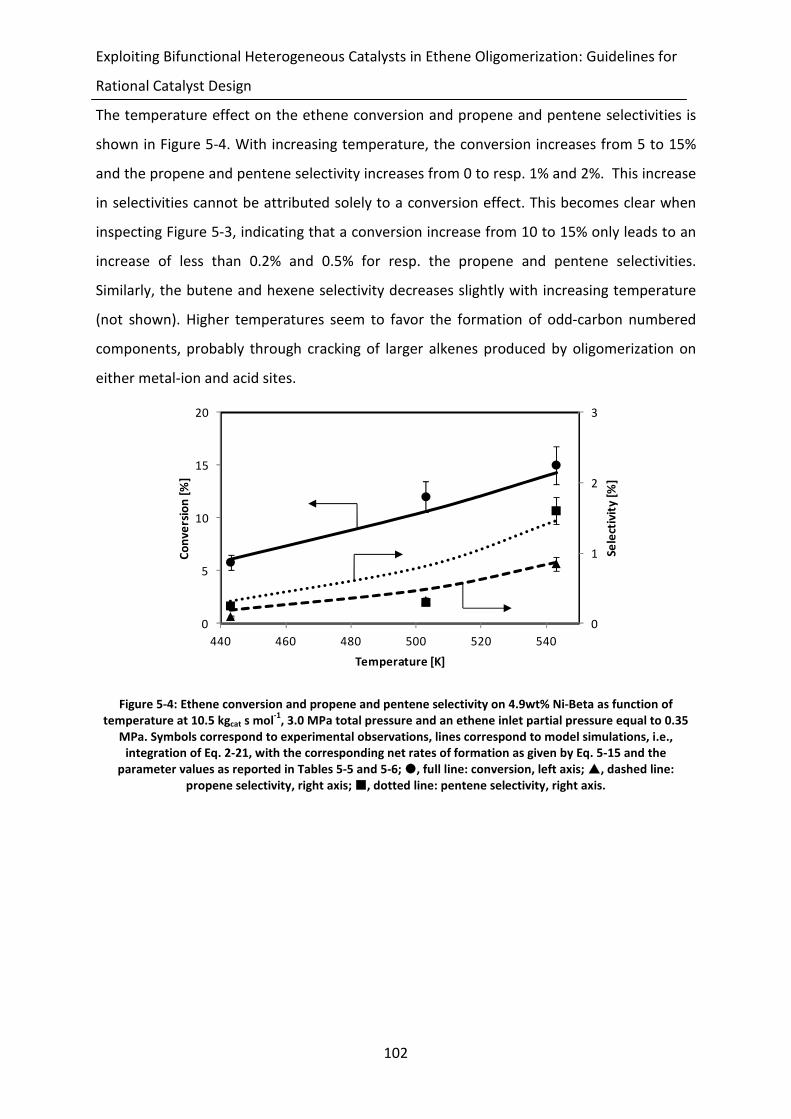
Exploiting Bifunctional Heterogeneous Catalysts in Ethene Oligomerization: Guidelines for
Rational Catalyst Design
102
The temperature effect on the ethene conversion and propene and pentene selectivities is
shown in Figure 5-4. With increasing temperature, the conversion increases from 5 to 15%
and the propene and pentene selectivity increases from 0 to resp. 1% and 2%. This increase
in selectivities cannot be attributed solely to a conversion effect. This becomes clear when
inspecting Figure 5-3, indicating that a conversion increase from 10 to 15% only leads to an
increase of less than 0.2% and 0.5% for resp. the propene and pentene selectivities.
Similarly, the butene and hexene selectivity decreases slightly with increasing temperature
(not shown). Higher temperatures seem to favor the formation of odd-carbon numbered
components, probably through cracking of larger alkenes produced by oligomerization on
either metal-ion and acid sites.
Figure 5-4: Ethene conversion and propene and pentene selectivity on 4.9wt% Ni-Beta as function of
temperature at 10.5 kgcat s mol-1
, 3.0 MPa total pressure and an ethene inlet partial pressure equal to 0.35
MPa. Symbols correspond to experimental observations, lines correspond to model simulations, i.e.,
integration of Eq. 2-21, with the corresponding net rates of formation as given by Eq. 5-15 and the
parameter values as reported in Tables 5-5 and 5-6; , full line: conversion, left axis; , dashed line:
propene selectivity, right axis; , dotted line: pentene selectivity, right axis.
0
1
2
3
0
5
10
15
20
440 460 480 500 520 540
Se
lect
ivit
y [
%]
Co
nv
ers
ion
[%
]
Temperature [K]

Chapter 5
103
5.3 Extension of the SEMK model for ethene
oligomerization to bifunctional catalysts
5.3.1 Reaction network for ethene oligomerization on Ni-
Beta zeolite
A reaction network for ethene oligomerization on Ni-Beta zeolite is based upon the reaction
mechanism for metal-ion oligomerization proposed in section 4.3, and classical carbenium
ion chemistry, see Figure 5-5.
In a first step, ethene is physisorbed from the gas bulk phase in the zeolite pores (A). Ethene
protonates difficult at the acid sites under the relative mild conditions applied due to the
unstable primary carbenium ion formed. Compared to secondary and tertiary carbenium
ions, the concentration of primary carbenium ions would be negligible. A physisorbed
ethene molecule rather coordinates at a nickel-ethene species. This nickel-ethene species
acts as the active site for metal-ion oligomerization, see section 4.3.1. On the nickel-ethene
species, a second ethene molecule is coordinated, leading to a nickel-di-ethene species (B).
Insertion of one of the ethene groups into the bond between the nickel atom and the other
ethene group leads to a nickel-butene species (C). Subsequently, another ethene molecule
coordinates at this nickel-butene species (B), which can either lead to an increased number
of insertions nins (C), i.e., chain growth to form hexene, octene… , or to releasing butene
within the zeolite pores and recycling the active nickel-ethene species (D).
Butene can protonate on an acid site (E) and alkylate to form an octyl carbenium ion (F).
This octyl carbenium ion can deprotonate (E) and desorb towards the bulk phase (A),
however, it can also undergo other acid catalyzed reactions at the reaction conditions
applied in this work such as isomerization via alkyl shift or pcp-branching (G) and cracking
via β-scission towards smaller molecules such as propene and pentene (H). The rate
equations for these elementary steps are derived in the following sections.

Exploiting Bifunctional Heterogeneous Catalysts in Ethene Oligomerization: Guidelines for
Rational Catalyst Design
104
Figure 5-5: Schematic representation of the ethene oligomerization reaction network involving Ni-ion
oligomerization and acid catalyzed alkylation, isomerization and cracking.
Such a detailed, elementary step based reaction network forms the basis of the kinetic
model. The construction of such a complete network requires a gargantuan effort and,
hence, has been done practically using an in-house computer software tool, i.e., ReNGeP
[5]. In total, two separate reaction networks were generated of which one contains
components limited to a carbon number of 8. This network was used for the regression of
kinetic model to the experimental data, see section 5.4.2. The use of the small reaction
network is valid since experimentally, only components up to octene were significantly
detected. It also decreases the CPU time drastically.
For the reaction path analysis and consecutive catalyst optimization, see section 5.5, a
reaction network with components up to C12 alkenes was used instead. The contribution of
higher alkenes cannot be totally neglected at the higher conversion range investigated for
the reaction path analysis and catalyst optimization. It was validated that with the
parameters determined via regression, the deviation of the simulation results between the
C8 and C12 network was less than 5%. In both reaction networks, the following elementary
steps were considered: metal-ion oligomerization, protonation, deprotonation, pcp-

Chapter 5
105
branching, 1,2 alkyl shift, alkylation and β-scission. To limit the number of components, the
degree of branching was limited to 2. An overview of the size of both reaction networks is
given in Table 5-2.
Table 5-2: Overview of the reaction networks generated with ReNGeP for regression, reaction pathway
analysis and catalyst design purposes.
purpose of the reaction
network
regression
(max. C8)
reaction path analysis and
catalyst design (max. C12)
number of alkenes 116 1220
number of carbenium ions 88 972
number of elementary steps
metal-ion oligomerization 3 5
protonation 165 1985
deprotonation 165 1985
pcp-branching 158 1096
1,2 alkyl shift 58 668
alkylation 23 330
β-scission 23 330
5.3.2 Physisorption in the zeolite pores
Prior to undergoing chain growth and skeletal rearrangement reactions, the alkenes
physisorb in the zeolite pores. The physisorbed alkene concentrations, physiC , depends on
the saturation concentration satC and the fractional occupancy of alkene i iθ :
olei
satphysi n...iCC 1== θ 5-1
The fractional occupancy of alkene i on the zeolite surface is determined using a Langmuir
isotherm:
olen
jj
physj
iphys
ii n...i
pK
pKole
1
11
=+
=
∑=
θ 5-2
in which ip is the partial pressure of alkene i. The saturation concentration, satC , is given
by:
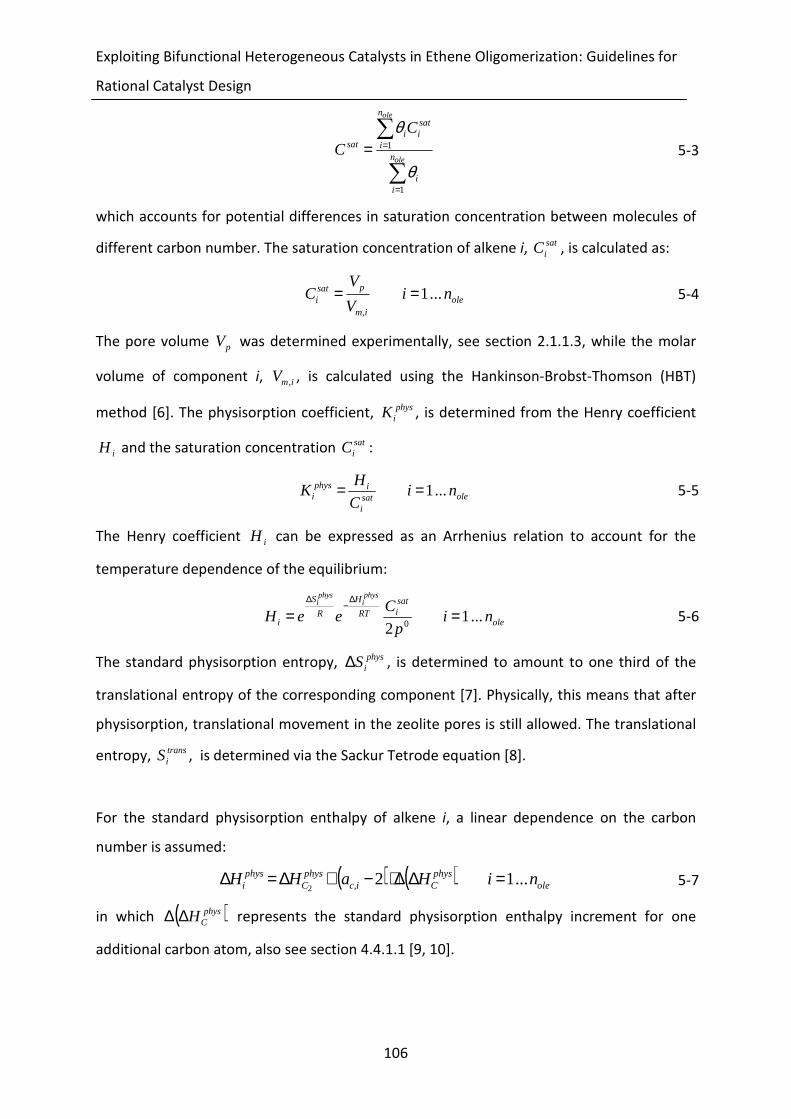
Exploiting Bifunctional Heterogeneous Catalysts in Ethene Oligomerization: Guidelines for
Rational Catalyst Design
106
∑
∑
=
==ole
ole
n
ii
n
i
satii
sat
CC
1
1
θ
θ 5-3
which accounts for potential differences in saturation concentration between molecules of
different carbon number. The saturation concentration of alkene i, satiC , is calculated as:
ole
im
psati n...i
V
VC 1
,
== 5-4
The pore volume pV was determined experimentally, see section 2.1.1.3, while the molar
volume of component i, imV , , is calculated using the Hankinson-Brobst-Thomson (HBT)
method [6]. The physisorption coefficient, physiK , is determined from the Henry coefficient
iH and the saturation concentration sat
iC :
olesat
i
iphysi n...i
C
HK 1== 5-5
The Henry coefficient iH can be expressed as an Arrhenius relation to account for the
temperature dependence of the equilibrium:
ole
satiRT
H
R
S
i n...ip
CeeH
physi
physi
12 0
==∆
−∆
5-6
The standard physisorption entropy, physiS∆ , is determined to amount to one third of the
translational entropy of the corresponding component [7]. Physically, this means that after
physisorption, translational movement in the zeolite pores is still allowed. The translational
entropy, transiS , is determined via the Sackur Tetrode equation [8].
For the standard physisorption enthalpy of alkene i, a linear dependence on the carbon
number is assumed:
( ) ( ) ole
physCic
physC
physi n...iHaHH 12,2
=∆∆⋅−+∆=∆ 5-7
in which ( )physCH∆∆
represents the standard physisorption enthalpy increment for one
additional carbon atom, also see section 4.4.1.1 [9, 10].
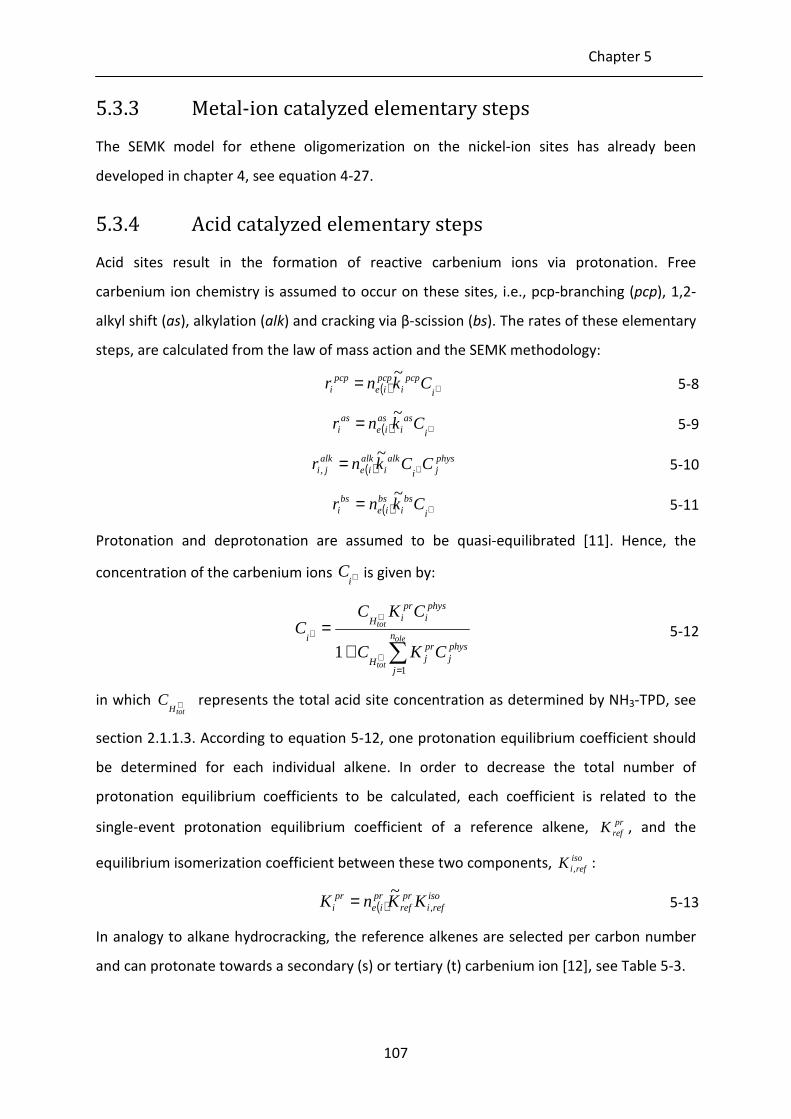
Chapter 5
107
5.3.3 Metal-ion catalyzed elementary steps
The SEMK model for ethene oligomerization on the nickel-ion sites has already been
developed in chapter 4, see equation 4-27.
5.3.4 Acid catalyzed elementary steps
Acid sites result in the formation of reactive carbenium ions via protonation. Free
carbenium ion chemistry is assumed to occur on these sites, i.e., pcp-branching (pcp), 1,2-
alkyl shift (as), alkylation (alk) and cracking via β-scission (bs). The rates of these elementary
steps, are calculated from the law of mass action and the SEMK methodology:
( ) +=
i
pcpi
pcpie
pcpi Cknr
~ 5-8
( ) +=
i
asi
asie
asi Cknr
~ 5-9
( )
physji
alki
alkie
alkji CCknr += ~
, 5-10
( ) +=
i
bsi
bsie
bsi Cknr
~ 5-11
Protonation and deprotonation are assumed to be quasi-equilibrated [11]. Hence, the
concentration of the carbenium ions +iC is given by:
∑=
+
+
+
+=
ole
tot
tot
n
j
physj
prjH
physi
priH
i
CKC
CKCC
1
1 5-12
in which +totH
C represents the total acid site concentration as determined by NH3-TPD, see
section 2.1.1.3. According to equation 5-12, one protonation equilibrium coefficient should
be determined for each individual alkene. In order to decrease the total number of
protonation equilibrium coefficients to be calculated, each coefficient is related to the
single-event protonation equilibrium coefficient of a reference alkene, prrefK , and the
equilibrium isomerization coefficient between these two components, isorefiK , :
( )
isorefi
prref
prie
pri KKnK ,
~= 5-13
In analogy to alkane hydrocracking, the reference alkenes are selected per carbon number
and can protonate towards a secondary (s) or tertiary (t) carbenium ion [12], see Table 5-3.

Exploiting Bifunctional Heterogeneous Catalysts in Ethene Oligomerization: Guidelines for
Rational Catalyst Design
108
Table 5-3: Selection of the reference alkenes considered in Eq. 5-13
carbon
number reference alkene remarks
2 none under the conditions applied, the protonation of
ethene is very difficult
3 propene
4 1-butene (s) and isobutene
(t)
for C4, no component exists which lead to both a
secondary and tertiary carbenium ion
≥5
2-methyl-2-alkene
As a result, the carbenium ion concentrations are calculated as follows:
( )
( )∑=
+
+
+
+=
ole
tot
tot
n
j
physj
isorefj
prref
prjeH
physi
isorefi
prref
prieH
i
CKKnC
CKKnCC
1,
,
~1
~
5-14
5.3.5 Net rate of formation
The net rate of formation of an alkene, iR , is determined as the sum of reaction rates jir , in
which alkene i or a corresponding carbenium ion is involved, times the stoichiometric
coefficient with respect to alkene i or its corresponding reactive intermediate, i.e., jiα , see
equation 5-15.
∑=
=rn
j
ji
jii rR
1
α 5-15
Herein, nr stands for the total number of elementary reaction steps in the reaction network.
As commented in section 5.2, thermodynamic equilibrium between the C4 double isomers
was observed. Hence, also for all alkenes of a higher carbon number, the double bound
isomers were assumed to be in thermodynamic equilibrium. A summation over the net rates
of formation of all components within an alkene lump, containing the double bound
isomers, results in the corresponding net rate of formation of that lump, i.e., dbiiR :
Ri
Chapter 5
109
∑=
=dbin
jj
dbii RR
1
5-16
with nbdi
the number of double bound isomers in that lump. The thermodynamic equilibrium
between the double bound isomers is determined by the thermodynamic equilibrium
coefficient jK . To determine this thermodynamic equilibrium coefficient, one reference
alkene was chosen per lump, c.q., the 1-alkene. The thermodynamic equilibrium coefficient
is calculated via by Bensons’ group contribution method [13]. The net rate of formation of
an alkene belonging to a lump is calculated from dbiiR
by redistributing dbi
iR over all alkenes
in that lump according the thermodynamic equilibrium coefficients jK :
dbijn
jj
ii R
K
KR
dbi
∑=
=
1
5-17
5.4 Ethene oligomerization on bifunctional catalysts:
assessment of acid activity
5.4.1 Determination of the model parameters
In the kinetic model derived in section 5.3, a number of rate and equilibrium coefficients are
present for which a value needs to be determined. The temperature dependency of these
coefficients can be adequately captured by means of an Arrhenius and van ‘t Hoff
expression:
RTE
RS
BRTE aa
eeh
TkAek
−∆−⋅==
≠0
5-18
RT
HR
S rr
eeK00 ∆−∆
⋅= 5-19
with Bk and h resp. Boltzmann and Planck’s constant, 0≠∆S the standard entropy change
during transition state formation, 0Sr∆
the standard reaction entropy, aE the activation
energy and 0Hr∆ the standard reaction enthalpy. Hence, for every rate or equilibrium
coefficient, two parameters are to be determined, i.e., a pre-exponential factor defined by
an entropy change and a standard reaction enthalpy or activation energy.

Exploiting Bifunctional Heterogeneous Catalysts in Ethene Oligomerization: Guidelines for
Rational Catalyst Design
110
5.4.1.1 Pre-exponential factors
For the insertion and termination step during metal-ion oligomerization, an early transition
state is assumed and, hence, the entropy change during transition state formation equals
zero, as discussed in section 4.4.1.2. As a result, the corresponding pre-exponential factor
can be obtained as:
h
TkA Bterins
i =/ 5-20
A gas phase component which is coordinated at a nickel-alkene species site, has lost all of its
degrees of translational freedom. One third of the translational entropy was assumed to be
already lost during physisorption, see section 5.3.2, and, hence, two third of the
translational entropy can be attributed to the coordination step, see section 4.4.1.2.
Similarly, the entropy change during transition state formation in alkene protonation
amounts to two third of the translational entropy.
For the acid catalyzed isomerization reactions, i.e., pcp-branching and 1,2 alkyl shift, also no
entropy changes are assumed for during transition state formation:
h
TkA Baspcp
i =/ 5-21
During β-scission, a bond is elongated and eventually broken which corresponds to a gain of
one degree of translation freedom. The corresponding pre-exponential factor is calculated
as follows:
R
SBbs
i
transi
eh
TkA
∆
= 5-22
For alkylation, the entropy change during transition state formation can be related to that
for β-scission considering thermodynamic consistency, see section 5.4.1.3.
5.4.1.2 Activation energies and standard reaction enthalpies
For the insertion and termination steps occurring as part of metal-ion oligomerization on an
amorphous Ni-SiO2-Al2O3, values for the activation energies were already in chapter 4, see
Table 4-4. Additionally, for the acid catalyzed reactions, activation energies for pcp-
branching, 1,2 alkyl shift and β-scission were estimated by Vandegehuchte et al. [14] using
experimental n-hexadecane hydrocracking data obtained on a Pt/H-Beta zeolite. The

Chapter 5
111
activation energy for alkylation is determined from thermodynamic constraints, see section
5.4.1.3. All these kinetic descriptors remain fixed during the model regression.
The ethene standard physisorption enthalpy in the Ni-Beta zeolite pores, phys
CH2
∆ , and the
standard physisorption enthalpy increment per carbon atom, ( )physCH∆∆ were retrieved
from work on alkane physisorption by Denayer et al. [9, 10], i.e., resp. -22.6 and -10.0 kJ
mol-1
. The minor difference in molecular mass and structure of the alkenes in this work and
of the alkanes in the work of Denayer et al., is assumed to be negligible. From the work of
Vandegehuchte et al. [14], the alkene standard protonation enthalpy for secondary (s)
carbenium ion formation, i.e., prsH∆ , was determined to be 30 kJ mol
-1 higher than the
alkene standard protonation enthalpy for tertiary (t) carbenium ion formation prtH∆ . This
relationship was also implemented in the kinetic model.
In total, only 2 catalyst descriptors are estimated, i.e., the ethene standard coordination
enthalpy at a nickel-alkene species, cH∆ , and the alkene standard protonation enthalpy for
secondary (s) carbenium ion formation, i.e., prsH∆ .
5.4.1.3 Thermodynamic consistency for alkylation and cracking
For each reversible reaction, the thermodynamic consistency between the forward (f) and
reverse (r) reaction rate coefficient enables to relate the corresponding activation energies
to each other via the standard reaction enthalpy 0Hr∆ :
rar
fa EHE =∆+ 0 5-23
A similar relationship holds for the standard activation entropy:
rr
f SSS ∆=∆+∆ 0 5-24
As a result, the number of adjustable parameters can be significantly reduced, i.e., one
activation energy per reaction pair provided that the reaction enthalpy and entropy can be
calculated independently. Applied to alkylation and β-scission, this relationship becomes:
bsa
alkalka EHE =∆+ ,0 5-25
A schematic overview of the thermodynamic consistency accounted for between alkylation
and β-scission is given in Figure 5-6.
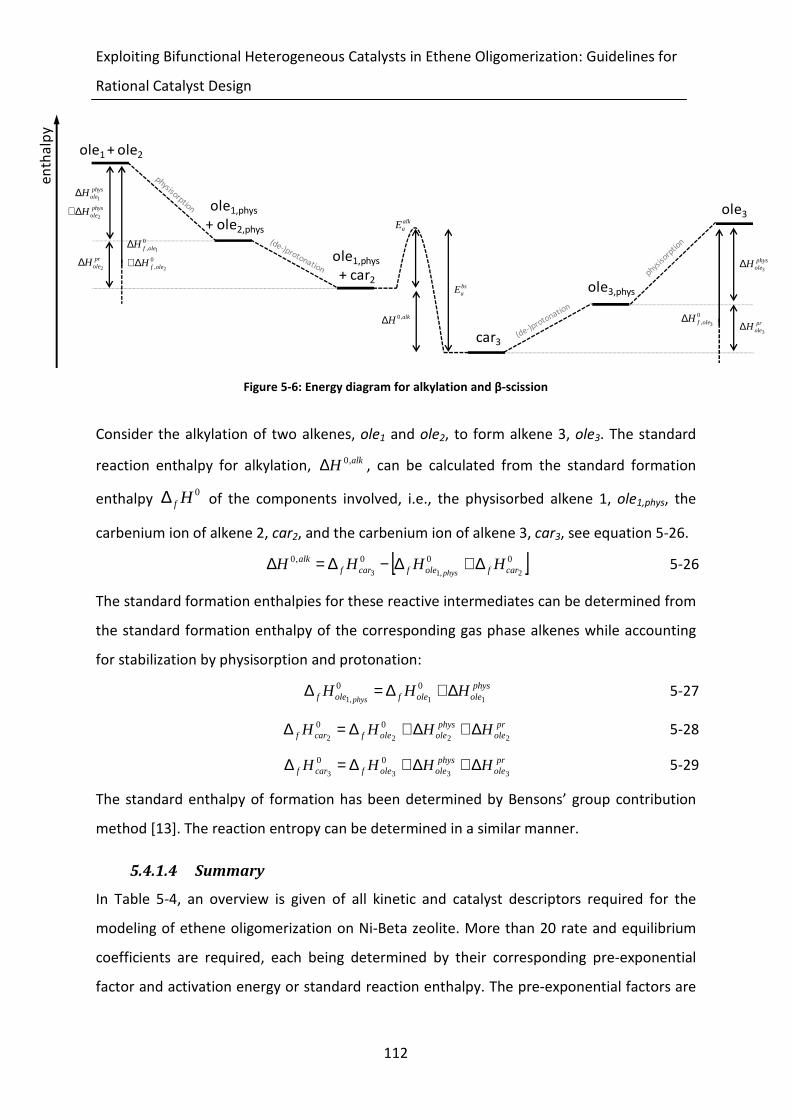
Exploiting Bifunctional Heterogeneous Catalysts in Ethene Oligomerization: Guidelines for
Rational Catalyst Design
112
Figure 5-6: Energy diagram for alkylation and β-scission
Consider the alkylation of two alkenes, ole1 and ole2, to form alkene 3, ole3. The standard
reaction enthalpy for alkylation, alkH ,0∆ , can be calculated from the standard formation
enthalpy 0Hf∆ of the components involved, i.e., the physisorbed alkene 1, ole1,phys, the
carbenium ion of alkene 2, car2, and the carbenium ion of alkene 3, car3, see equation 5-26.
[ ]000,0
2,13 carfolefcarfalk HHHH
phys∆+∆−∆=∆ 5-26
The standard formation enthalpies for these reactive intermediates can be determined from
the standard formation enthalpy of the corresponding gas phase alkenes while accounting
for stabilization by physisorption and protonation:
physoleolefolef HHH
phys 11,1
00 ∆+∆=∆ 5-27
prole
physoleolefcarf HHHH
2222
00 ∆+∆+∆=∆ 5-28
prole
physoleolefcarf HHHH
3333
00 ∆+∆+∆=∆ 5-29
The standard enthalpy of formation has been determined by Bensons’ group contribution
method [13]. The reaction entropy can be determined in a similar manner.
5.4.1.4 Summary
In Table 5-4, an overview is given of all kinetic and catalyst descriptors required for the
modeling of ethene oligomerization on Ni-Beta zeolite. More than 20 rate and equilibrium
coefficients are required, each being determined by their corresponding pre-exponential
factor and activation energy or standard reaction enthalpy. The pre-exponential factors are
ole1 + ole2
ole1,phys
+ ole2,phys
ole1,phys
+ car2
car3
ole3,phys
ole3
en
tha
lpy
physole
physole
H
H
2
1
∆+
∆
0,
0,
2
1
olef
olef
H
H
∆+
∆pr
oleH2
∆
alkH ,0∆
alkaE
bsaE
physoleH
3∆
proleH
3∆
0, 3olefH∆

Chapter 5
113
quantified based on judicious assumptions regarding the entropy change during transition
state formation. Due to the fundamental character of the model, a large number of kinetic
and catalyst descriptors could be retrieved from literature. The introduction of
thermodynamic consistency between alkylation and cracking through β-scission leads to the
direct determination of the standard alkylation enthalpy and entropy. The only parameters
to be determined are related to the catalyst descriptors. In total, there are only 2 catalyst
descriptors to be estimated, i.e., the standard ethene coordination enthalpy at a nickel-
ethene species, cH∆ , and the alkene standard protonation enthalpy for forming a
secondary (s) carbenium ion, prsH∆ . The alkene standard protonation enthalpy for forming
a tertiary (t) carbenium ion, prtH∆ , is determined via a linear relationship with the alkene
standard protonation enthalpy for forming a secondary (s) carbenium ion, see section
5.4.1.2.
Table 5-4: Overview of the kinetic and catalyst descriptors to be determined for the Single-Event
MicroKinetic model for ethene oligomerization on Ni-Beta zeolite.
kinetic
descriptors pre-exponential factor activation energy
insk~
determined using TST see Table 4-4
terk~
determined using TST see Table 4-4
[ ][ ][ ][ ]ttsttsss
k pcp
,,,,
~ determined using TST values from Vandegehuchte et al. [14]
[ ][ ][ ][ ]ttsttsss
k as
,,,,
~ determined using TST values from Vandegehuchte et al. [14]
[ ][ ][ ][ ]ttsttsss
k alk
,,,,
~
calculated from bsA using
thermodynamic considerations
calculated from bsaE using
thermodynamic considerations
[ ][ ][ ][ ]ttsttsss
k bs
,,,,
~ determined using TST values from Vandegehuchte et al. [14]
catalyst
descriptor pre-exponential factor standard reaction enthalpy
cK~
determined using TST to be estimated:
cH∆

Exploiting Bifunctional Heterogeneous Catalysts in Ethene Oligomerization: Guidelines for
Rational Catalyst Design
114
[ ][ ]ts
K pr~ determined using TST
to be estimated:
prsH∆ ( pr
tH∆ is determined via a
linear relationship with prsH∆ [14])
physK determined using TST values from Denayer et al. [9, 10]
5.4.2 Estimation of the model parameters
The model parameters values are reported in Tables 5-5 and 5-6, of which 21 were
determined from literature or thermodynamic consistency and 2 were estimated. Both
standard reaction enthalpies were deemed to be significant as indicated by their respective
confidence interval. The model was found to be globally significant with a calculated sF
value higher than 2700 which exceeds the tabulated sF value of 4.0 more than two order of
magnitude. Additionally, the model was determined to be adequate as indicated by the
corresponding aF value equal to 2.4 which is lower than the tabulated aF value of 4.4. This
implies that deviations of the model with respect to the experimental observations can be
attributed to experimental errors only and are not due to any systematic shortcomings of
the model itself. The binary correlation coefficient between cH∆ and pr
sH∆ amounts to
only 0.03, which means that there is no correlation between these two parameters.
Table 5-5: Catalyst descriptors as well as statistical performance indicators, all at 95% confidence level,
determined by non-linear regression of the model given by integration of Eq. 2-21 in which the net rates of
formation are given by Eq. 5-15 to the experimental data measured at the operating conditions given in
Table 5-1. (a): values from [14] and (b): values from [9, 10]
Type Catalyst
descriptor Value (kJ mol
-1)
nickel-ion sites cH∆ -80.3 ± 0.2
acid sites
prsH∆ -40.1 ± 0.3
prtH∆ pr
sH∆ - 30.0 (a)
zeolite
support
physCH
2∆ -22.6
(b)
( )physCH∆∆ -10.0
(b)
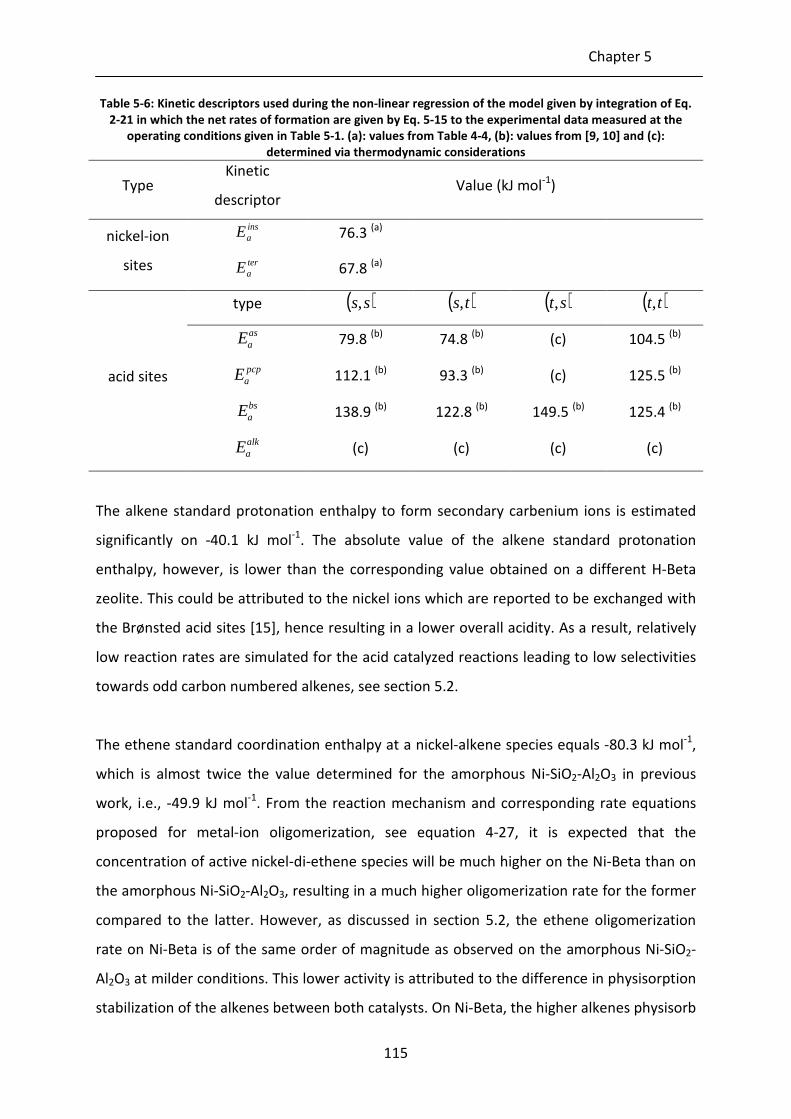
Chapter 5
115
Table 5-6: Kinetic descriptors used during the non-linear regression of the model given by integration of Eq.
2-21 in which the net rates of formation are given by Eq. 5-15 to the experimental data measured at the
operating conditions given in Table 5-1. (a): values from Table 4-4, (b): values from [9, 10] and (c):
determined via thermodynamic considerations
Type Kinetic
descriptor Value (kJ mol
-1)
nickel-ion
sites
insaE 76.3
(a)
teraE 67.8
(a)
acid sites
type ( )ss, ( )ts, ( )st, ( )tt,
asaE 79.8
(b) 74.8
(b) (c) 104.5
(b)
pcpaE 112.1
(b) 93.3
(b) (c) 125.5
(b)
bsaE 138.9
(b) 122.8
(b) 149.5
(b) 125.4
(b)
alkaE (c) (c) (c) (c)
The alkene standard protonation enthalpy to form secondary carbenium ions is estimated
significantly on -40.1 kJ mol-1
. The absolute value of the alkene standard protonation
enthalpy, however, is lower than the corresponding value obtained on a different H-Beta
zeolite. This could be attributed to the nickel ions which are reported to be exchanged with
the Brønsted acid sites [15], hence resulting in a lower overall acidity. As a result, relatively
low reaction rates are simulated for the acid catalyzed reactions leading to low selectivities
towards odd carbon numbered alkenes, see section 5.2.
The ethene standard coordination enthalpy at a nickel-alkene species equals -80.3 kJ mol-1
,
which is almost twice the value determined for the amorphous Ni-SiO2-Al2O3 in previous
work, i.e., -49.9 kJ mol-1
. From the reaction mechanism and corresponding rate equations
proposed for metal-ion oligomerization, see equation 4-27, it is expected that the
concentration of active nickel-di-ethene species will be much higher on the Ni-Beta than on
the amorphous Ni-SiO2-Al2O3, resulting in a much higher oligomerization rate for the former
compared to the latter. However, as discussed in section 5.2, the ethene oligomerization
rate on Ni-Beta is of the same order of magnitude as observed on the amorphous Ni-SiO2-
Al2O3 at milder conditions. This lower activity is attributed to the difference in physisorption
stabilization of the alkenes between both catalysts. On Ni-Beta, the higher alkenes physisorb
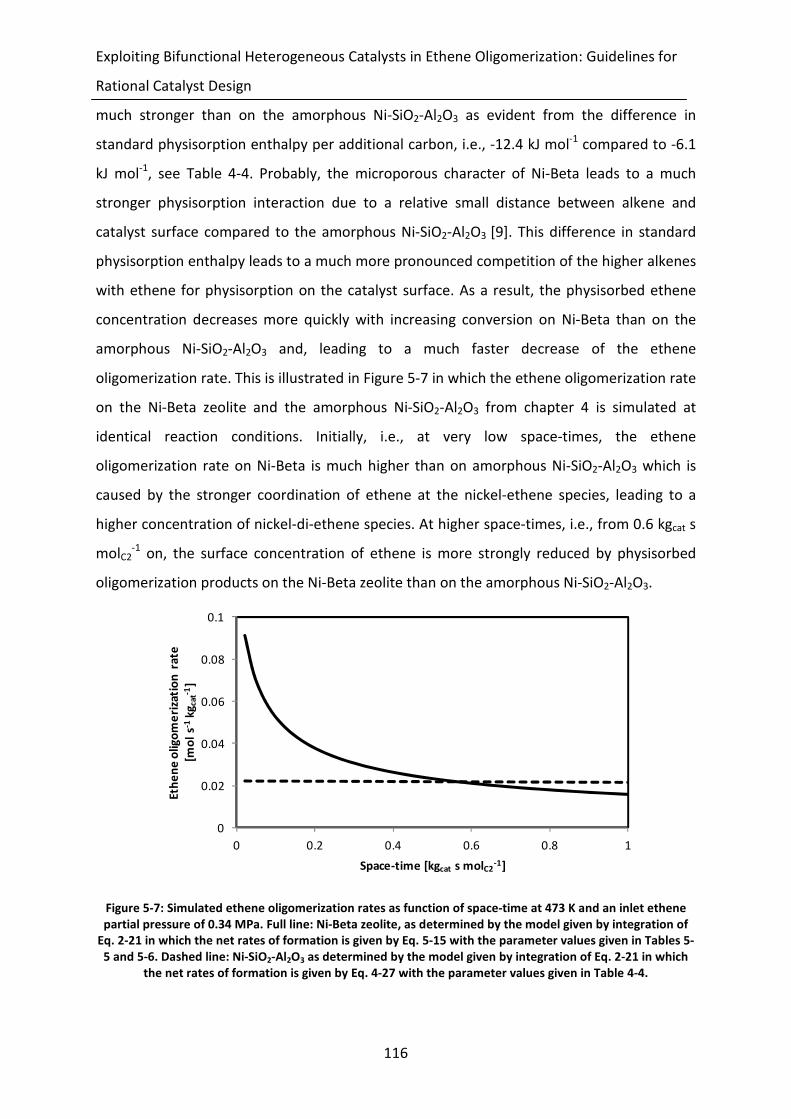
Exploiting Bifunctional Heterogeneous Catalysts in Ethene Oligomerization: Guidelines for
Rational Catalyst Design
116
much stronger than on the amorphous Ni-SiO2-Al2O3 as evident from the difference in
standard physisorption enthalpy per additional carbon, i.e., -12.4 kJ mol-1
compared to -6.1
kJ mol-1
, see Table 4-4. Probably, the microporous character of Ni-Beta leads to a much
stronger physisorption interaction due to a relative small distance between alkene and
catalyst surface compared to the amorphous Ni-SiO2-Al2O3 [9]. This difference in standard
physisorption enthalpy leads to a much more pronounced competition of the higher alkenes
with ethene for physisorption on the catalyst surface. As a result, the physisorbed ethene
concentration decreases more quickly with increasing conversion on Ni-Beta than on the
amorphous Ni-SiO2-Al2O3 and, leading to a much faster decrease of the ethene
oligomerization rate. This is illustrated in Figure 5-7 in which the ethene oligomerization rate
on the Ni-Beta zeolite and the amorphous Ni-SiO2-Al2O3 from chapter 4 is simulated at
identical reaction conditions. Initially, i.e., at very low space-times, the ethene
oligomerization rate on Ni-Beta is much higher than on amorphous Ni-SiO2-Al2O3 which is
caused by the stronger coordination of ethene at the nickel-ethene species, leading to a
higher concentration of nickel-di-ethene species. At higher space-times, i.e., from 0.6 kgcat s
molC2-1
on, the surface concentration of ethene is more strongly reduced by physisorbed
oligomerization products on the Ni-Beta zeolite than on the amorphous Ni-SiO2-Al2O3.
Figure 5-7: Simulated ethene oligomerization rates as function of space-time at 473 K and an inlet ethene
partial pressure of 0.34 MPa. Full line: Ni-Beta zeolite, as determined by the model given by integration of
Eq. 2-21 in which the net rates of formation is given by Eq. 5-15 with the parameter values given in Tables 5-
5 and 5-6. Dashed line: Ni-SiO2-Al2O3 as determined by the model given by integration of Eq. 2-21 in which
the net rates of formation is given by Eq. 4-27 with the parameter values given in Table 4-4.
0
0.02
0.04
0.06
0.08
0.1
0 0.2 0.4 0.6 0.8 1
Eth
en
e o
lig
om
eri
zati
on
ra
te
[mo
l s-1
kg
cat-1
]
Space-time [kgcat s molC2-1]
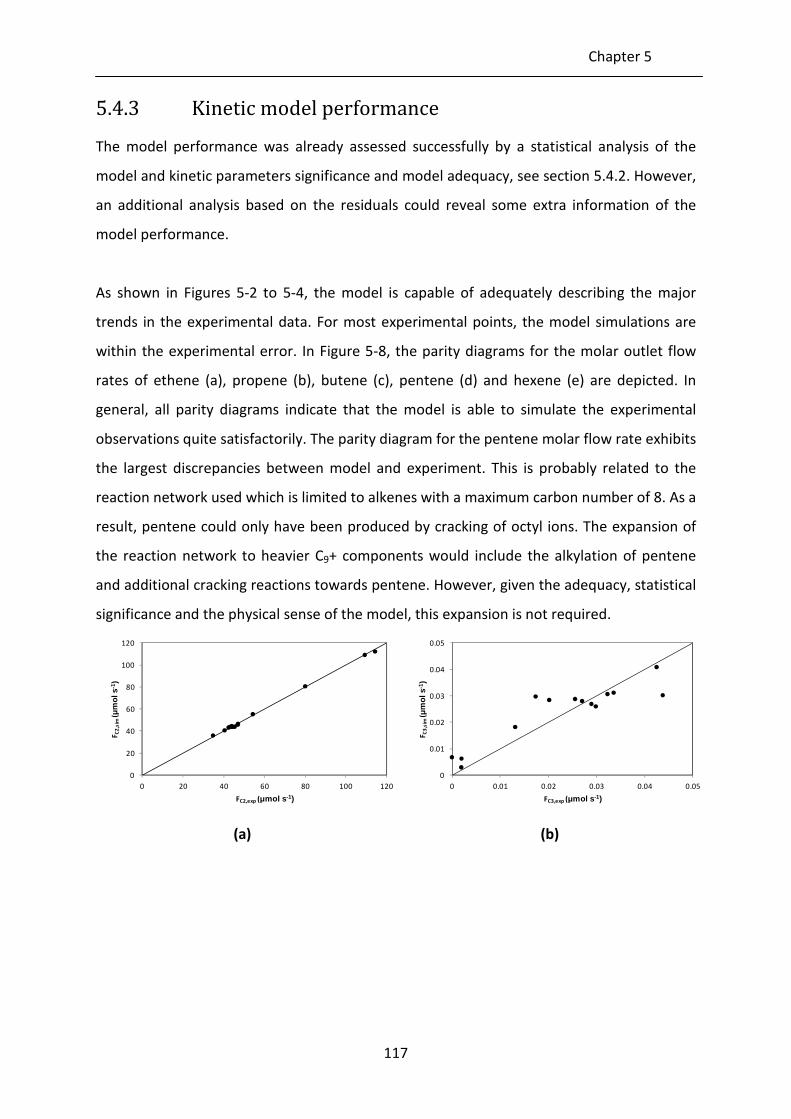
Chapter 5
117
5.4.3 Kinetic model performance
The model performance was already assessed successfully by a statistical analysis of the
model and kinetic parameters significance and model adequacy, see section 5.4.2. However,
an additional analysis based on the residuals could reveal some extra information of the
model performance.
As shown in Figures 5-2 to 5-4, the model is capable of adequately describing the major
trends in the experimental data. For most experimental points, the model simulations are
within the experimental error. In Figure 5-8, the parity diagrams for the molar outlet flow
rates of ethene (a), propene (b), butene (c), pentene (d) and hexene (e) are depicted. In
general, all parity diagrams indicate that the model is able to simulate the experimental
observations quite satisfactorily. The parity diagram for the pentene molar flow rate exhibits
the largest discrepancies between model and experiment. This is probably related to the
reaction network used which is limited to alkenes with a maximum carbon number of 8. As a
result, pentene could only have been produced by cracking of octyl ions. The expansion of
the reaction network to heavier C9+ components would include the alkylation of pentene
and additional cracking reactions towards pentene. However, given the adequacy, statistical
significance and the physical sense of the model, this expansion is not required.
(a) (b)
0
20
40
60
80
100
120
0 20 40 60 80 100 120
FC
2,s
im(µ
mo
l s-1
)
FC2,exp (µmol s-1)
0
0.01
0.02
0.03
0.04
0.05
0 0.01 0.02 0.03 0.04 0.05
FC
3,s
im(µ
mo
l s-1
)
FC3,exp (µmol s-1)
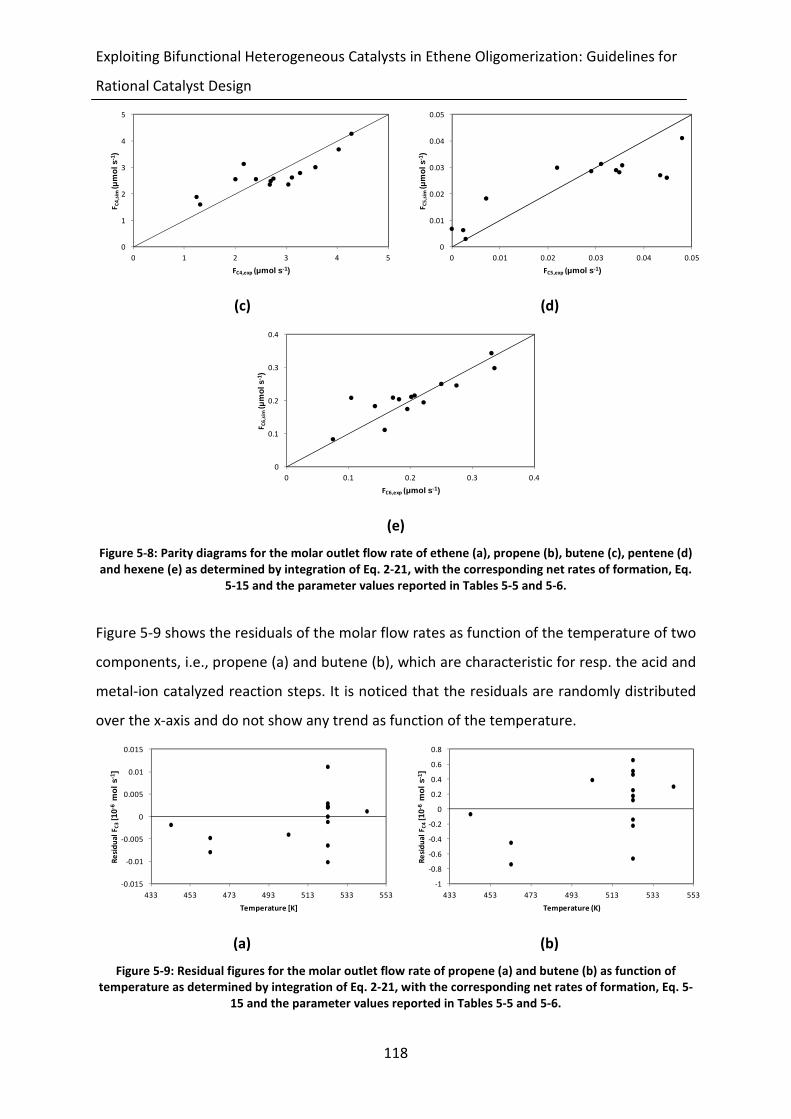
Exploiting Bifunctional Heterogeneous Catalysts in Ethene Oligomerization: Guidelines for
Rational Catalyst Design
118
(c) (d)
(e)
Figure 5-8: Parity diagrams for the molar outlet flow rate of ethene (a), propene (b), butene (c), pentene (d)
and hexene (e) as determined by integration of Eq. 2-21, with the corresponding net rates of formation, Eq.
5-15 and the parameter values reported in Tables 5-5 and 5-6.
Figure 5-9 shows the residuals of the molar flow rates as function of the temperature of two
components, i.e., propene (a) and butene (b), which are characteristic for resp. the acid and
metal-ion catalyzed reaction steps. It is noticed that the residuals are randomly distributed
over the x-axis and do not show any trend as function of the temperature.
(a) (b)
Figure 5-9: Residual figures for the molar outlet flow rate of propene (a) and butene (b) as function of
temperature as determined by integration of Eq. 2-21, with the corresponding net rates of formation, Eq. 5-
15 and the parameter values reported in Tables 5-5 and 5-6.
0
1
2
3
4
5
0 1 2 3 4 5
FC
4,s
im(µ
mo
l s-1
)
FC4,exp (µmol s-1)
0
0.01
0.02
0.03
0.04
0.05
0 0.01 0.02 0.03 0.04 0.05
FC
5,s
im(µ
mo
l s-1
)
FC5,exp (µmol s-1)
0
0.1
0.2
0.3
0.4
0 0.1 0.2 0.3 0.4
FC
6,s
im(µ
mo
l s-1
)
FC6,exp (µmol s-1)
-0.015
-0.01
-0.005
0
0.005
0.01
0.015
433 453 473 493 513 533 553
Re
sid
ua
l F
C3
[10-
6m
ol
s-1 ]
Temperature [K]
-1
-0.8
-0.6
-0.4
-0.2
0
0.2
0.4
0.6
0.8
433 453 473 493 513 533 553
Re
sid
ua
l F
C4
[10-
6m
ol
s-1 ]
Temperature (K)
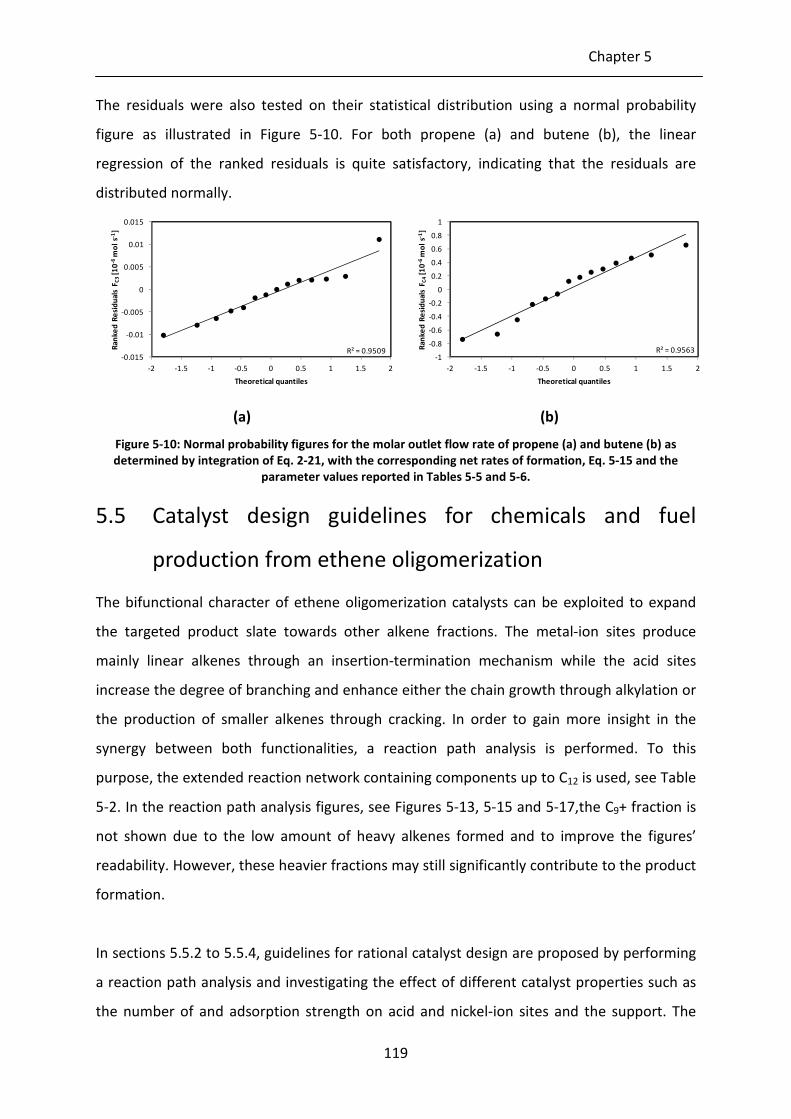
Chapter 5
119
The residuals were also tested on their statistical distribution using a normal probability
figure as illustrated in Figure 5-10. For both propene (a) and butene (b), the linear
regression of the ranked residuals is quite satisfactory, indicating that the residuals are
distributed normally.
(a) (b)
Figure 5-10: Normal probability figures for the molar outlet flow rate of propene (a) and butene (b) as
determined by integration of Eq. 2-21, with the corresponding net rates of formation, Eq. 5-15 and the
parameter values reported in Tables 5-5 and 5-6.
5.5 Catalyst design guidelines for chemicals and fuel
production from ethene oligomerization
The bifunctional character of ethene oligomerization catalysts can be exploited to expand
the targeted product slate towards other alkene fractions. The metal-ion sites produce
mainly linear alkenes through an insertion-termination mechanism while the acid sites
increase the degree of branching and enhance either the chain growth through alkylation or
the production of smaller alkenes through cracking. In order to gain more insight in the
synergy between both functionalities, a reaction path analysis is performed. To this
purpose, the extended reaction network containing components up to C12 is used, see Table
5-2. In the reaction path analysis figures, see Figures 5-13, 5-15 and 5-17,the C9+ fraction is
not shown due to the low amount of heavy alkenes formed and to improve the figures’
readability. However, these heavier fractions may still significantly contribute to the product
formation.
In sections 5.5.2 to 5.5.4, guidelines for rational catalyst design are proposed by performing
a reaction path analysis and investigating the effect of different catalyst properties such as
the number of and adsorption strength on acid and nickel-ion sites and the support. The
R² = 0.9509-0.015
-0.01
-0.005
0
0.005
0.01
0.015
-2 -1.5 -1 -0.5 0 0.5 1 1.5 2
Ra
nk
ed
Re
sid
ua
ls F
C3
[10
-6m
ol
s-1]
Theoretical quantiles
R² = 0.9563-1
-0.8
-0.6
-0.4
-0.2
0
0.2
0.4
0.6
0.8
1
-2 -1.5 -1 -0.5 0 0.5 1 1.5 2
Ra
nk
ed
Re
sid
ua
ls F
C4
[10
-6m
ol
s-1]
Theoretical quantiles
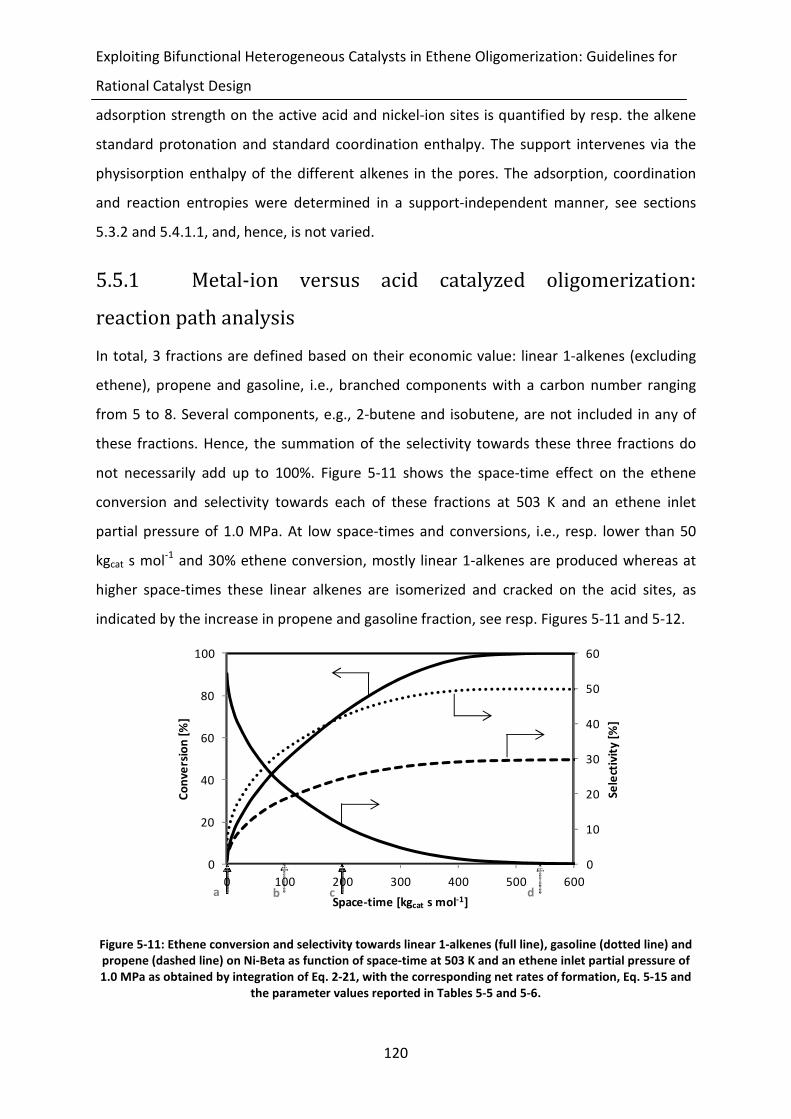
Exploiting Bifunctional Heterogeneous Catalysts in Ethene Oligomerization: Guidelines for
Rational Catalyst Design
120
adsorption strength on the active acid and nickel-ion sites is quantified by resp. the alkene
standard protonation and standard coordination enthalpy. The support intervenes via the
physisorption enthalpy of the different alkenes in the pores. The adsorption, coordination
and reaction entropies were determined in a support-independent manner, see sections
5.3.2 and 5.4.1.1, and, hence, is not varied.
5.5.1 Metal-ion versus acid catalyzed oligomerization:
reaction path analysis
In total, 3 fractions are defined based on their economic value: linear 1-alkenes (excluding
ethene), propene and gasoline, i.e., branched components with a carbon number ranging
from 5 to 8. Several components, e.g., 2-butene and isobutene, are not included in any of
these fractions. Hence, the summation of the selectivity towards these three fractions do
not necessarily add up to 100%. Figure 5-11 shows the space-time effect on the ethene
conversion and selectivity towards each of these fractions at 503 K and an ethene inlet
partial pressure of 1.0 MPa. At low space-times and conversions, i.e., resp. lower than 50
kgcat s mol-1
and 30% ethene conversion, mostly linear 1-alkenes are produced whereas at
higher space-times these linear alkenes are isomerized and cracked on the acid sites, as
indicated by the increase in propene and gasoline fraction, see resp. Figures 5-11 and 5-12.
Figure 5-11: Ethene conversion and selectivity towards linear 1-alkenes (full line), gasoline (dotted line) and
propene (dashed line) on Ni-Beta as function of space-time at 503 K and an ethene inlet partial pressure of
1.0 MPa as obtained by integration of Eq. 2-21, with the corresponding net rates of formation, Eq. 5-15 and
the parameter values reported in Tables 5-5 and 5-6.
0
10
20
30
40
50
60
0
20
40
60
80
100
0 100 200 300 400 500 600
Se
lect
ivit
y [
%]
Co
nv
ers
ion
[%
]
Space-time [kgcat s mol-1]a b c d
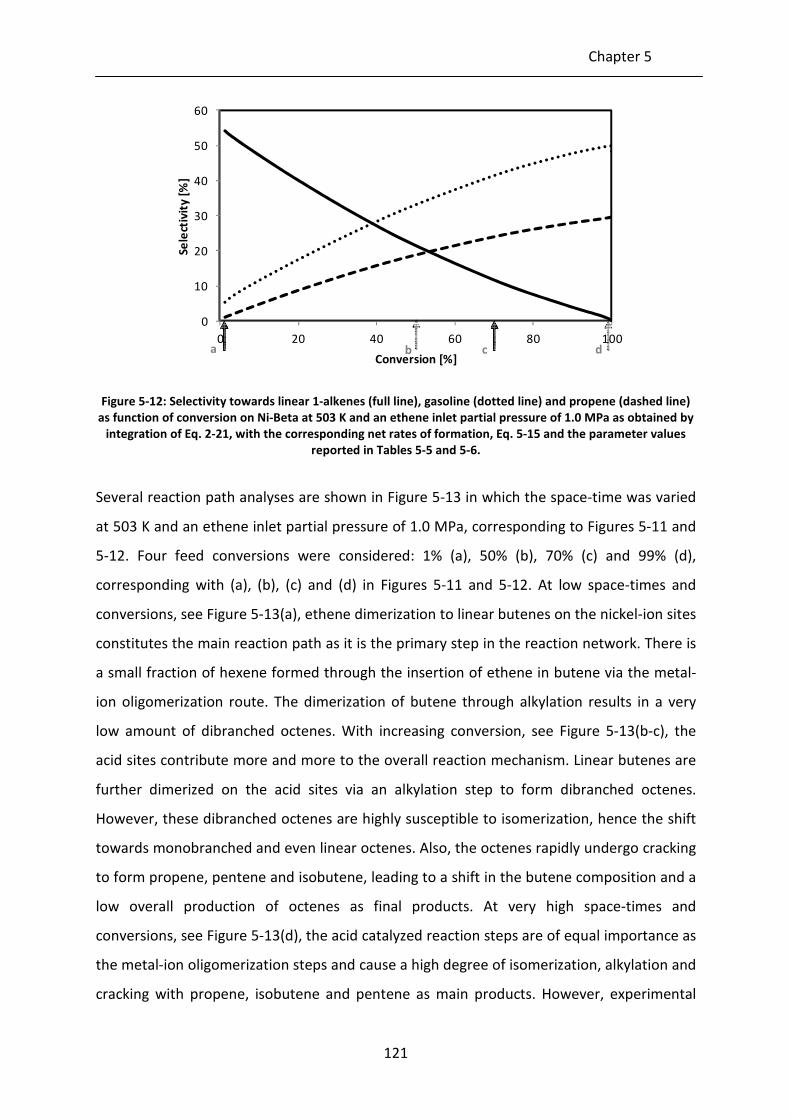
Chapter 5
121
Figure 5-12: Selectivity towards linear 1-alkenes (full line), gasoline (dotted line) and propene (dashed line)
as function of conversion on Ni-Beta at 503 K and an ethene inlet partial pressure of 1.0 MPa as obtained by
integration of Eq. 2-21, with the corresponding net rates of formation, Eq. 5-15 and the parameter values
reported in Tables 5-5 and 5-6.
Several reaction path analyses are shown in Figure 5-13 in which the space-time was varied
at 503 K and an ethene inlet partial pressure of 1.0 MPa, corresponding to Figures 5-11 and
5-12. Four feed conversions were considered: 1% (a), 50% (b), 70% (c) and 99% (d),
corresponding with (a), (b), (c) and (d) in Figures 5-11 and 5-12. At low space-times and
conversions, see Figure 5-13(a), ethene dimerization to linear butenes on the nickel-ion sites
constitutes the main reaction path as it is the primary step in the reaction network. There is
a small fraction of hexene formed through the insertion of ethene in butene via the metal-
ion oligomerization route. The dimerization of butene through alkylation results in a very
low amount of dibranched octenes. With increasing conversion, see Figure 5-13(b-c), the
acid sites contribute more and more to the overall reaction mechanism. Linear butenes are
further dimerized on the acid sites via an alkylation step to form dibranched octenes.
However, these dibranched octenes are highly susceptible to isomerization, hence the shift
towards monobranched and even linear octenes. Also, the octenes rapidly undergo cracking
to form propene, pentene and isobutene, leading to a shift in the butene composition and a
low overall production of octenes as final products. At very high space-times and
conversions, see Figure 5-13(d), the acid catalyzed reaction steps are of equal importance as
the metal-ion oligomerization steps and cause a high degree of isomerization, alkylation and
cracking with propene, isobutene and pentene as main products. However, experimental
0
10
20
30
40
50
60
0 20 40 60 80 100
Se
lect
ivit
y [
%]
Conversion [%]a b c d
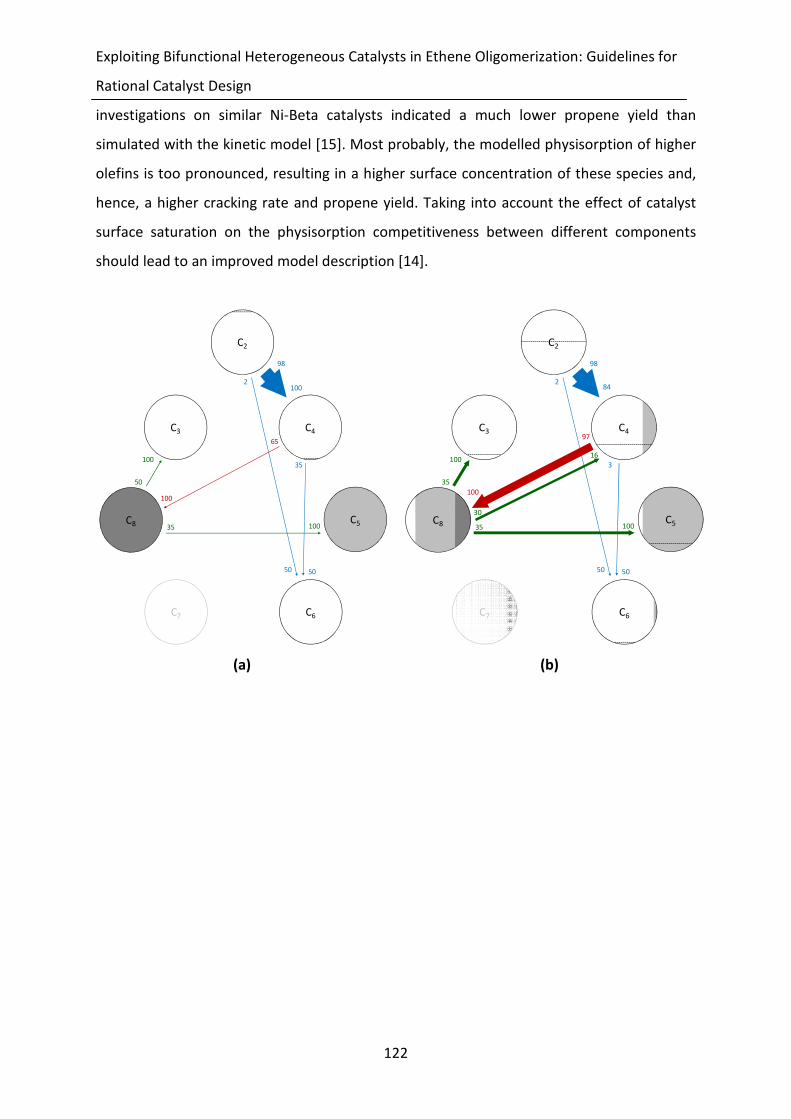
Exploiting Bifunctional Heterogeneous Catalysts in Ethene Oligomerization: Guidelines for
Rational Catalyst Design
122
investigations on similar Ni-Beta catalysts indicated a much lower propene yield than
simulated with the kinetic model [15]. Most probably, the modelled physisorption of higher
olefins is too pronounced, resulting in a higher surface concentration of these species and,
hence, a higher cracking rate and propene yield. Taking into account the effect of catalyst
surface saturation on the physisorption competitiveness between different components
should lead to an improved model description [14].
(a) (b)
C3 C4
C7 C6
C5C8
C2
100
50
100
65
35
2
98
50 50
35 100
100
C3
C2
100
35
35 100
100
97
3
2
98
30
16
50 50
C6
C4
C5C8
84
C7
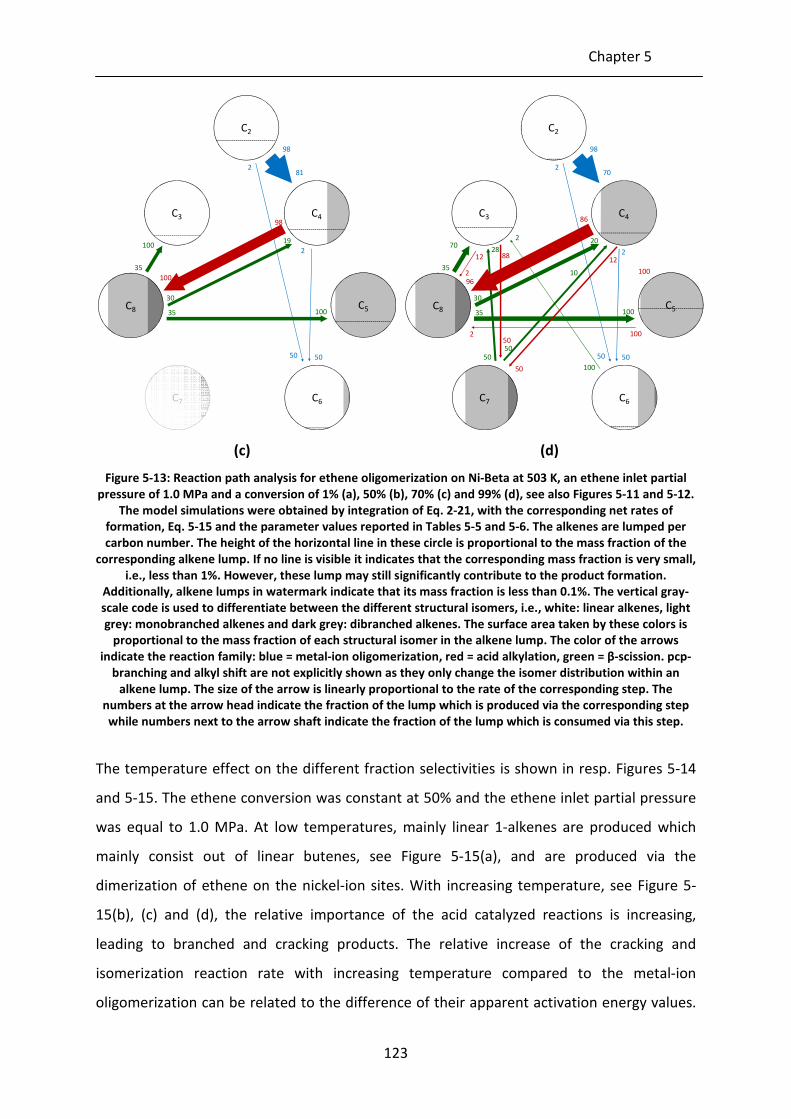
Chapter 5
123
(c) (d)
Figure 5-13: Reaction path analysis for ethene oligomerization on Ni-Beta at 503 K, an ethene inlet partial
pressure of 1.0 MPa and a conversion of 1% (a), 50% (b), 70% (c) and 99% (d), see also Figures 5-11 and 5-12.
The model simulations were obtained by integration of Eq. 2-21, with the corresponding net rates of
formation, Eq. 5-15 and the parameter values reported in Tables 5-5 and 5-6. The alkenes are lumped per
carbon number. The height of the horizontal line in these circle is proportional to the mass fraction of the
corresponding alkene lump. If no line is visible it indicates that the corresponding mass fraction is very small,
i.e., less than 1%. However, these lump may still significantly contribute to the product formation.
Additionally, alkene lumps in watermark indicate that its mass fraction is less than 0.1%. The vertical gray-
scale code is used to differentiate between the different structural isomers, i.e., white: linear alkenes, light
grey: monobranched alkenes and dark grey: dibranched alkenes. The surface area taken by these colors is
proportional to the mass fraction of each structural isomer in the alkene lump. The color of the arrows
indicate the reaction family: blue = metal-ion oligomerization, red = acid alkylation, green = β-scission. pcp-
branching and alkyl shift are not explicitly shown as they only change the isomer distribution within an
alkene lump. The size of the arrow is linearly proportional to the rate of the corresponding step. The
numbers at the arrow head indicate the fraction of the lump which is produced via the corresponding step
while numbers next to the arrow shaft indicate the fraction of the lump which is consumed via this step.
The temperature effect on the different fraction selectivities is shown in resp. Figures 5-14
and 5-15. The ethene conversion was constant at 50% and the ethene inlet partial pressure
was equal to 1.0 MPa. At low temperatures, mainly linear 1-alkenes are produced which
mainly consist out of linear butenes, see Figure 5-15(a), and are produced via the
dimerization of ethene on the nickel-ion sites. With increasing temperature, see Figure 5-
15(b), (c) and (d), the relative importance of the acid catalyzed reactions is increasing,
leading to branched and cracking products. The relative increase of the cracking and
isomerization reaction rate with increasing temperature compared to the metal-ion
oligomerization can be related to the difference of their apparent activation energy values.
C3
C2
100
35
35 100
100
98
2
2
98
30
19
50 50
C6
C4
C5
81
C7
C8
C3
C2
70
35
35 100
96
86
2
2
98
30
20
50 50
C6
C4
C5
70
C7
10
12
100
10050
50
5050
2
2
2
28
C8
12 88
100

Exploiting Bifunctional Heterogeneous Catalysts in Ethene Oligomerization: Guidelines for
Rational Catalyst Design
124
For metal-ion oligomerization, assuming ethene dimerization, the apparent activation
energy is determined as:
tera
cphysC
tera EHHE +∆+∆=
2 5-30
and is equal to ca. -35 kJ mol-1
, see Table 5-6. For cracking an octene molecule the apparent
activation energy is determined as:
( ) bsa
prts
physC
physC
bsa EHHHE +∆+∆∆+∆= /6
2 5-31
and varies between -30 to 30 kJ mol-1
, see Table 5-6, which is higher than the apparent
activation energy for metal-ion oligomerization. Similarly, the apparent activation energy for
alkylation of linear butenes amounts to ca. -20 kJ mol-1
, see Table 5-6. which is slightly
higher than the apparent activation for metal-ion oligomerization. As a result, these acid
catalyzed reactions will dominate metal-ion oligomerization in the higher temperature
range, resulting in a product spectrum containing odd-carbon numbered, branched alkenes,
see Figure 5-15(d).
Figure 5-14: Selectivity towards linear 1-alkenes (full line), gasoline (dotted line) and propene (dashed line)
as function of temperature at an ethene inlet partial pressure of 1.0 MPa and a conversion of 50% as
obtained by integration of Eq. 2-21, with the corresponding net rates of formation as given by Eq. 5-15 and
the parameter values as reported in Tables 5-5 and 5-6.
0
10
20
30
40
50
60
443 463 483 503 523 543 563
Se
lect
ivit
y [
%]
Temperature [K]a b c d
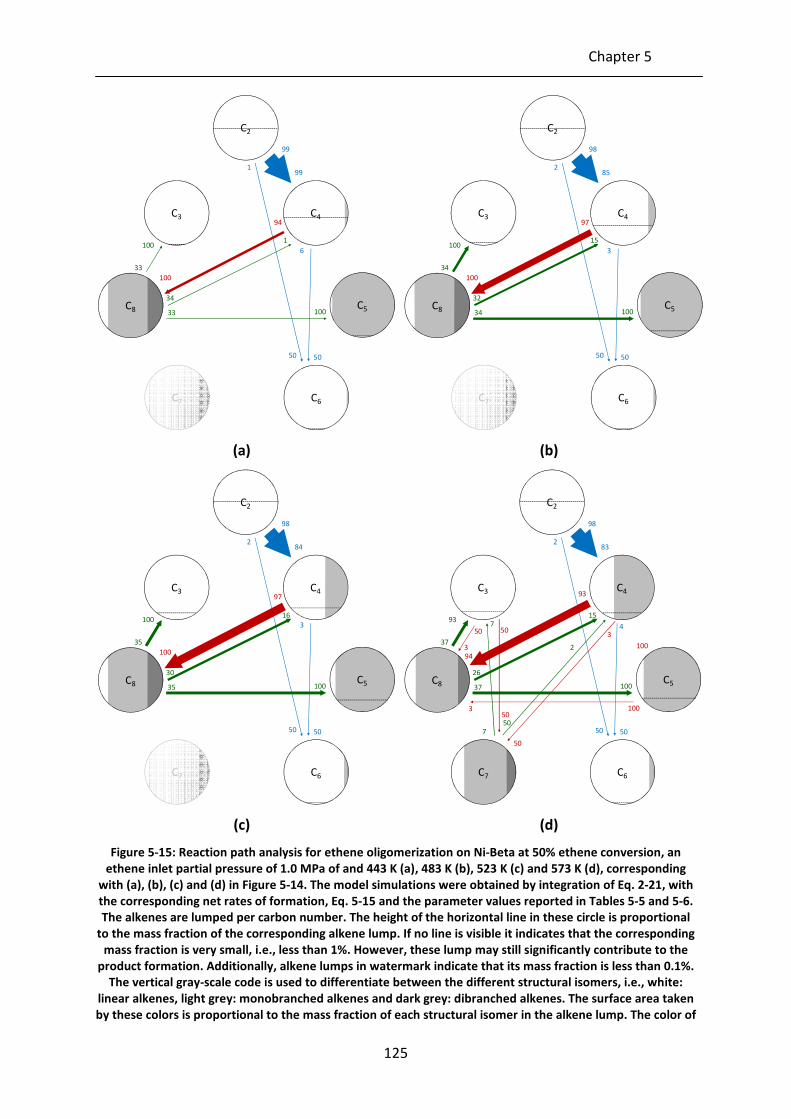
Chapter 5
125
(a) (b)
(c) (d)
Figure 5-15: Reaction path analysis for ethene oligomerization on Ni-Beta at 50% ethene conversion, an
ethene inlet partial pressure of 1.0 MPa of and 443 K (a), 483 K (b), 523 K (c) and 573 K (d), corresponding
with (a), (b), (c) and (d) in Figure 5-14. The model simulations were obtained by integration of Eq. 2-21, with
the corresponding net rates of formation, Eq. 5-15 and the parameter values reported in Tables 5-5 and 5-6.
The alkenes are lumped per carbon number. The height of the horizontal line in these circle is proportional
to the mass fraction of the corresponding alkene lump. If no line is visible it indicates that the corresponding
mass fraction is very small, i.e., less than 1%. However, these lump may still significantly contribute to the
product formation. Additionally, alkene lumps in watermark indicate that its mass fraction is less than 0.1%.
The vertical gray-scale code is used to differentiate between the different structural isomers, i.e., white:
linear alkenes, light grey: monobranched alkenes and dark grey: dibranched alkenes. The surface area taken
by these colors is proportional to the mass fraction of each structural isomer in the alkene lump. The color of
C3
C2
C6
C4
C5C8
100
33
33 100
100
6
1
99
34
1
50 50
99
94
C7
C3
C2
C6
C4
C5C8
100
34
34 100
100
3
2
98
32
15
50 50
85
97
C7
C3
C2
100
35
35 100
100
97
3
2
98
30
16
50 50
C6
C4
C5C8
84
C7
C3
C2
C6
C4
C5C8
C7
50
100
2
98
50 50
83
2
3
100
50
100
93
373
50
26
750
50
7
3
94
37
4
15
93
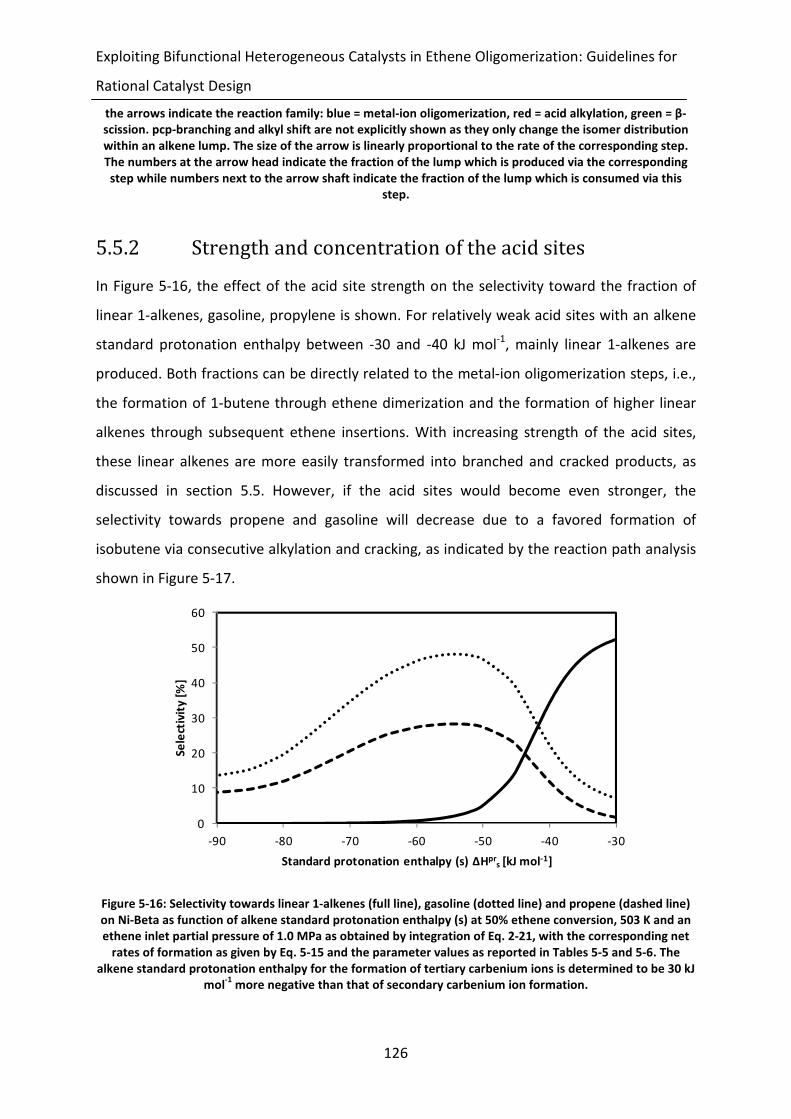
Exploiting Bifunctional Heterogeneous Catalysts in Ethene Oligomerization: Guidelines for
Rational Catalyst Design
126
the arrows indicate the reaction family: blue = metal-ion oligomerization, red = acid alkylation, green = β-
scission. pcp-branching and alkyl shift are not explicitly shown as they only change the isomer distribution
within an alkene lump. The size of the arrow is linearly proportional to the rate of the corresponding step.
The numbers at the arrow head indicate the fraction of the lump which is produced via the corresponding
step while numbers next to the arrow shaft indicate the fraction of the lump which is consumed via this
step.
5.5.2 Strength and concentration of the acid sites
In Figure 5-16, the effect of the acid site strength on the selectivity toward the fraction of
linear 1-alkenes, gasoline, propylene is shown. For relatively weak acid sites with an alkene
standard protonation enthalpy between -30 and -40 kJ mol-1
, mainly linear 1-alkenes are
produced. Both fractions can be directly related to the metal-ion oligomerization steps, i.e.,
the formation of 1-butene through ethene dimerization and the formation of higher linear
alkenes through subsequent ethene insertions. With increasing strength of the acid sites,
these linear alkenes are more easily transformed into branched and cracked products, as
discussed in section 5.5. However, if the acid sites would become even stronger, the
selectivity towards propene and gasoline will decrease due to a favored formation of
isobutene via consecutive alkylation and cracking, as indicated by the reaction path analysis
shown in Figure 5-17.
Figure 5-16: Selectivity towards linear 1-alkenes (full line), gasoline (dotted line) and propene (dashed line)
on Ni-Beta as function of alkene standard protonation enthalpy (s) at 50% ethene conversion, 503 K and an
ethene inlet partial pressure of 1.0 MPa as obtained by integration of Eq. 2-21, with the corresponding net
rates of formation as given by Eq. 5-15 and the parameter values as reported in Tables 5-5 and 5-6. The
alkene standard protonation enthalpy for the formation of tertiary carbenium ions is determined to be 30 kJ
mol-1
more negative than that of secondary carbenium ion formation.
0
10
20
30
40
50
60
-90 -80 -70 -60 -50 -40 -30
Se
lect
ivit
y [
%]
Standard protonation enthalpy (s) ΔHprs [kJ mol-1]
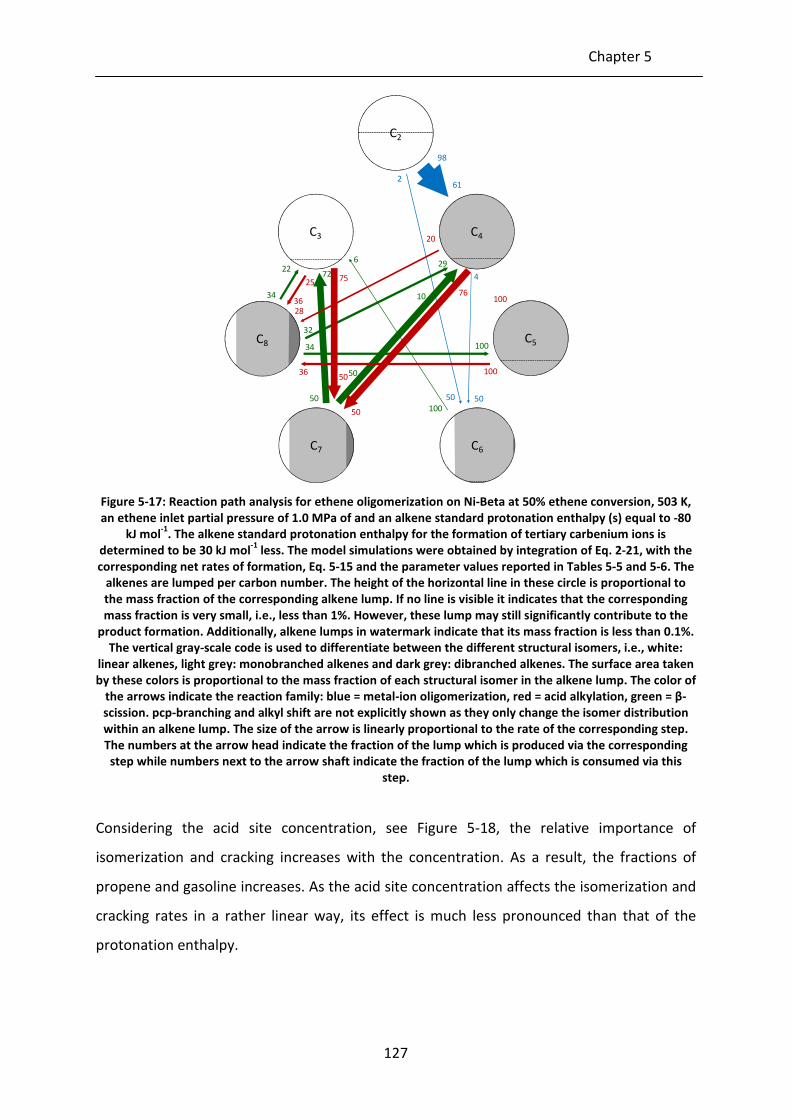
Chapter 5
127
Figure 5-17: Reaction path analysis for ethene oligomerization on Ni-Beta at 50% ethene conversion, 503 K,
an ethene inlet partial pressure of 1.0 MPa of and an alkene standard protonation enthalpy (s) equal to -80
kJ mol-1
. The alkene standard protonation enthalpy for the formation of tertiary carbenium ions is
determined to be 30 kJ mol-1
less. The model simulations were obtained by integration of Eq. 2-21, with the
corresponding net rates of formation, Eq. 5-15 and the parameter values reported in Tables 5-5 and 5-6. The
alkenes are lumped per carbon number. The height of the horizontal line in these circle is proportional to
the mass fraction of the corresponding alkene lump. If no line is visible it indicates that the corresponding
mass fraction is very small, i.e., less than 1%. However, these lump may still significantly contribute to the
product formation. Additionally, alkene lumps in watermark indicate that its mass fraction is less than 0.1%.
The vertical gray-scale code is used to differentiate between the different structural isomers, i.e., white:
linear alkenes, light grey: monobranched alkenes and dark grey: dibranched alkenes. The surface area taken
by these colors is proportional to the mass fraction of each structural isomer in the alkene lump. The color of
the arrows indicate the reaction family: blue = metal-ion oligomerization, red = acid alkylation, green = β-
scission. pcp-branching and alkyl shift are not explicitly shown as they only change the isomer distribution
within an alkene lump. The size of the arrow is linearly proportional to the rate of the corresponding step.
The numbers at the arrow head indicate the fraction of the lump which is produced via the corresponding
step while numbers next to the arrow shaft indicate the fraction of the lump which is consumed via this
step.
Considering the acid site concentration, see Figure 5-18, the relative importance of
isomerization and cracking increases with the concentration. As a result, the fractions of
propene and gasoline increases. As the acid site concentration affects the isomerization and
cracking rates in a rather linear way, its effect is much less pronounced than that of the
protonation enthalpy.
C3
C2
C6
C4
C5C8
C7
50
100
2
98
50 50
61
10 76100
50 100
22
3436
25
32
75
50
50
36
28
34
4
29
20
72
6
100

Exploiting Bifunctional Heterogeneous Catalysts in Ethene Oligomerization: Guidelines for
Rational Catalyst Design
128
Figure 5-18: Selectivity towards linear 1-alkenes (full line), gasoline (dotted line) and propene (dashed line)
on Ni-Beta as function of acid site concentration (s) at 50% ethene conversion, 503 K and an ethene inlet
partial pressure of 1.0 MPa as obtained by integration of Eq. 2-21, with the corresponding net rates of
formation as given by Eq. 5-15 and the parameter values as reported in Tables 5-5 and 5-6.
5.5.3 Ethene standard coordination enthalpy and nickel
content
The effect of the ethene standard coordination enthalpy and nickel content is opposite to
the effect of resp. acid site strength and concentration. Increasing the standard
coordination enthalpy of ethene at a nickel-ion site, see Figure 5-19, or the nickel content,
see Figure 5-20, results in an increased contribution of the metal-ion oligomerization steps
mainly resulting in 1-butene. With decreasing standard coordination enthalpy and/or nickel
content, acid catalysis becomes more important, leading to an increase in propene and
gasoline selectivity.
0
5
10
15
20
25
30
35
40
45
50
0.1 0.3 0.5 0.7 0.9
Se
lect
ivit
y [
%]
Acid site concentration [mol kgcat-1]
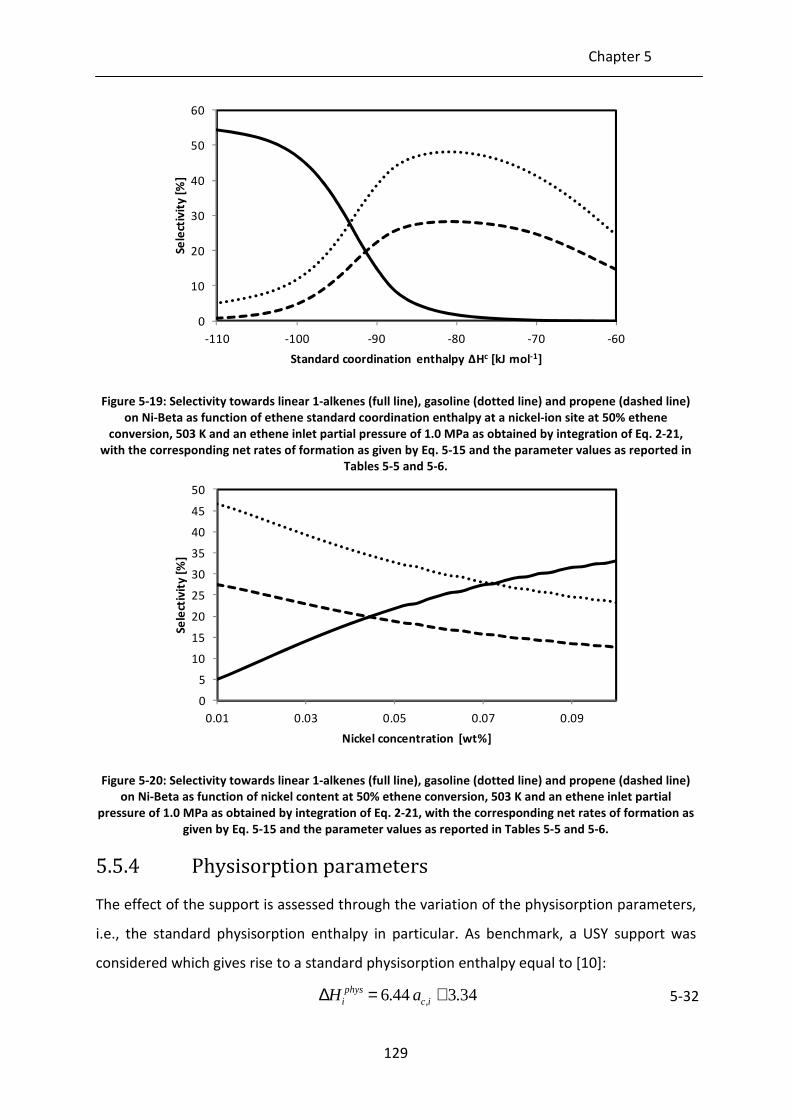
Chapter 5
129
Figure 5-19: Selectivity towards linear 1-alkenes (full line), gasoline (dotted line) and propene (dashed line)
on Ni-Beta as function of ethene standard coordination enthalpy at a nickel-ion site at 50% ethene
conversion, 503 K and an ethene inlet partial pressure of 1.0 MPa as obtained by integration of Eq. 2-21,
with the corresponding net rates of formation as given by Eq. 5-15 and the parameter values as reported in
Tables 5-5 and 5-6.
Figure 5-20: Selectivity towards linear 1-alkenes (full line), gasoline (dotted line) and propene (dashed line)
on Ni-Beta as function of nickel content at 50% ethene conversion, 503 K and an ethene inlet partial
pressure of 1.0 MPa as obtained by integration of Eq. 2-21, with the corresponding net rates of formation as
given by Eq. 5-15 and the parameter values as reported in Tables 5-5 and 5-6.
5.5.4 Physisorption parameters
The effect of the support is assessed through the variation of the physisorption parameters,
i.e., the standard physisorption enthalpy in particular. As benchmark, a USY support was
considered which gives rise to a standard physisorption enthalpy equal to [10]:
34.344.6 , +=∆ icphys
i aH 5-32
0
10
20
30
40
50
60
-110 -100 -90 -80 -70 -60
Se
lect
ivit
y [
%]
Standard coordination enthalpy ΔHc [kJ mol-1]
0
5
10
15
20
25
30
35
40
45
50
0.01 0.03 0.05 0.07 0.09
Se
lect
ivit
y [
%]
Nickel concentration [wt%]
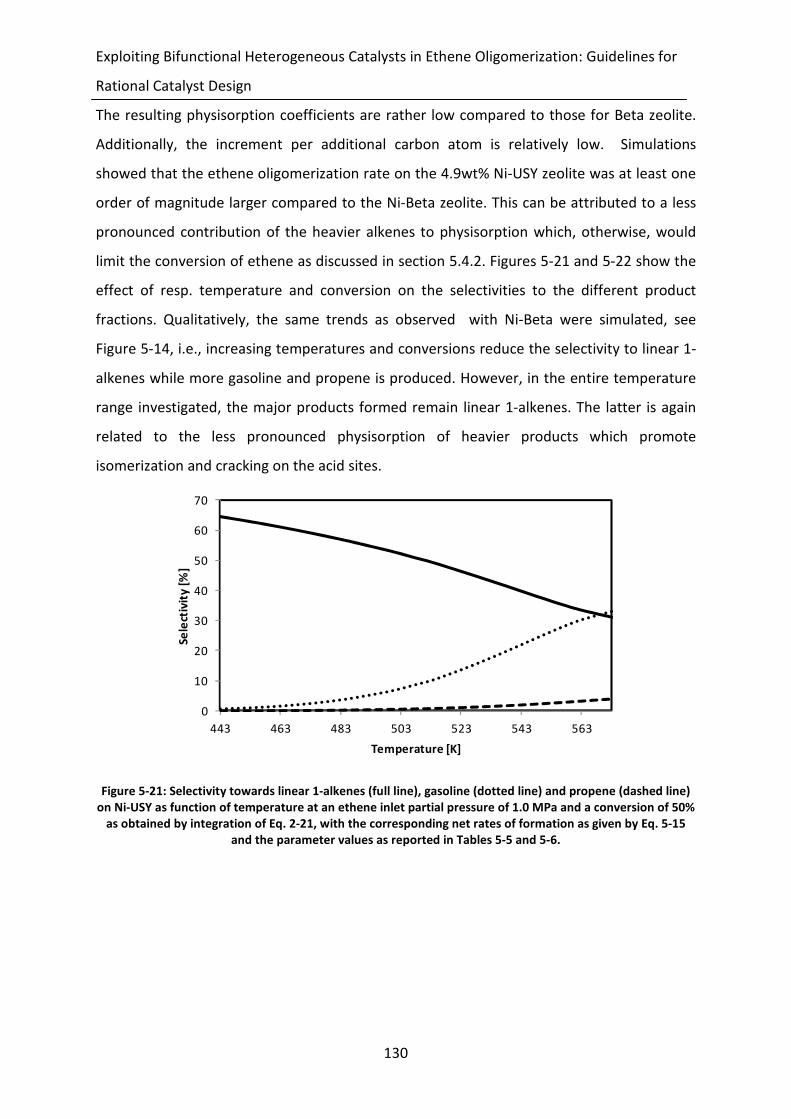
Exploiting Bifunctional Heterogeneous Catalysts in Ethene Oligomerization: Guidelines for
Rational Catalyst Design
130
The resulting physisorption coefficients are rather low compared to those for Beta zeolite.
Additionally, the increment per additional carbon atom is relatively low. Simulations
showed that the ethene oligomerization rate on the 4.9wt% Ni-USY zeolite was at least one
order of magnitude larger compared to the Ni-Beta zeolite. This can be attributed to a less
pronounced contribution of the heavier alkenes to physisorption which, otherwise, would
limit the conversion of ethene as discussed in section 5.4.2. Figures 5-21 and 5-22 show the
effect of resp. temperature and conversion on the selectivities to the different product
fractions. Qualitatively, the same trends as observed with Ni-Beta were simulated, see
Figure 5-14, i.e., increasing temperatures and conversions reduce the selectivity to linear 1-
alkenes while more gasoline and propene is produced. However, in the entire temperature
range investigated, the major products formed remain linear 1-alkenes. The latter is again
related to the less pronounced physisorption of heavier products which promote
isomerization and cracking on the acid sites.
Figure 5-21: Selectivity towards linear 1-alkenes (full line), gasoline (dotted line) and propene (dashed line)
on Ni-USY as function of temperature at an ethene inlet partial pressure of 1.0 MPa and a conversion of 50%
as obtained by integration of Eq. 2-21, with the corresponding net rates of formation as given by Eq. 5-15
and the parameter values as reported in Tables 5-5 and 5-6.
0
10
20
30
40
50
60
70
443 463 483 503 523 543 563
Se
lect
ivit
y [
%]
Temperature [K]
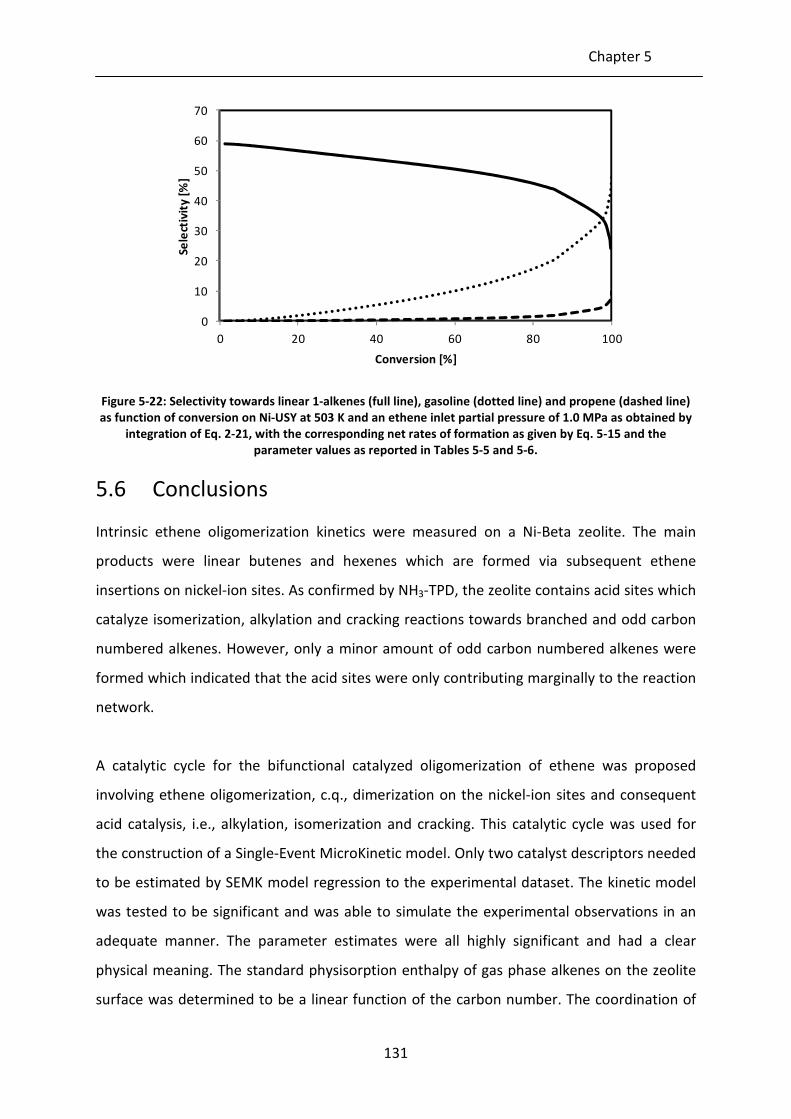
Chapter 5
131
Figure 5-22: Selectivity towards linear 1-alkenes (full line), gasoline (dotted line) and propene (dashed line)
as function of conversion on Ni-USY at 503 K and an ethene inlet partial pressure of 1.0 MPa as obtained by
integration of Eq. 2-21, with the corresponding net rates of formation as given by Eq. 5-15 and the
parameter values as reported in Tables 5-5 and 5-6.
5.6 Conclusions
Intrinsic ethene oligomerization kinetics were measured on a Ni-Beta zeolite. The main
products were linear butenes and hexenes which are formed via subsequent ethene
insertions on nickel-ion sites. As confirmed by NH3-TPD, the zeolite contains acid sites which
catalyze isomerization, alkylation and cracking reactions towards branched and odd carbon
numbered alkenes. However, only a minor amount of odd carbon numbered alkenes were
formed which indicated that the acid sites were only contributing marginally to the reaction
network.
A catalytic cycle for the bifunctional catalyzed oligomerization of ethene was proposed
involving ethene oligomerization, c.q., dimerization on the nickel-ion sites and consequent
acid catalysis, i.e., alkylation, isomerization and cracking. This catalytic cycle was used for
the construction of a Single-Event MicroKinetic model. Only two catalyst descriptors needed
to be estimated by SEMK model regression to the experimental dataset. The kinetic model
was tested to be significant and was able to simulate the experimental observations in an
adequate manner. The parameter estimates were all highly significant and had a clear
physical meaning. The standard physisorption enthalpy of gas phase alkenes on the zeolite
surface was determined to be a linear function of the carbon number. The coordination of
0
10
20
30
40
50
60
70
0 20 40 60 80 100
Se
lect
ivit
y [
%]
Conversion [%]

Exploiting Bifunctional Heterogeneous Catalysts in Ethene Oligomerization: Guidelines for
Rational Catalyst Design
132
ethene at a nickel-alkene species was considerably more strong than the protonation of the
C3+ alkenes.
A reaction path analysis of ethene oligomerization on the Ni-Beta was performed using the
kinetic model. Linear 1-alkenes are produced at low conversion and low temperature when
the reaction mechanism is dominated by the metal-ion oligomerization route. Increasing the
conversion and temperature leads to an increase in acid catalyzed reaction rates, leading to
mainly gasoline and propene products. By adjusting the catalyst descriptor values,
guidelines for catalyst design were uncovered. Mainly the ratios of the nickel-ion and acid
site concentration and strength determine the product distribution. A catalyst with a high
concentration of and strong nickel-ion sites gives primarily rise to the formation of linear 1-
alkenes. With increasing acid site strength and concentration or decreasing nickel-ion site
strength and concentration, the propene and gasoline fractions become larger. Eventually, a
highly acidic catalyst would give rise to nearly exclusively isobutene through extended
alkylation and subsequent cracking. The effect of the physisorption parameters was also
investigated. A zeolite on which there is strong physisorption competition of the heavy to
the lighter alkenes, will result in a less active catalyst due to the pronounced reduction in
surface occupancy of ethene. However, this also increases the isomerization and cracking
rate, and, hence, the selectivity towards propene and a gasoline fraction. A catalyst for
which the competitive physisorption is less pronounced, will be more active and more
selective to metal-ion oligomerization towards linear 1-alkenes.
5.7 References
[1] J. Heveling, C.P. Nicolaides, M.S. Scurrell, Catalysis Letters. 95 (2004) 87-91.
[2] M.A. Baltanas, K.K. Vanraemdonck, G.F. Froment, S.R. Mohedas, Industrial &
Engineering Chemistry Research. 28 (1989) 899-910.
[3] G.D. Svoboda, E. Vynckier, B. Debrabandere, G.F. Froment, Industrial & Engineering
Chemistry Research. 34 (1995) 3793-3800.
[4] J.W. Thybaut, G.B. Marin, Journal of Catalysis. 308 (2013) 352-362.
[5] G.G. Martens, J.W. Thybaut, G.B. Marin, Industrial & Engineering Chemistry
Research. 40 (2001) 1832-2144.
[6] B.E. Poling, J.M. Prausnitz, J.P. O'Connell, The Properties of Gases and Liquids,
McGraw-Hill Professional, 2000.

Chapter 5
133
[7] G.G. Martens, G.B. Marin, J.A. Martens, P.A. Jacobs, G.V. Baroni, Journal of Catalysis.
195 (2000) 253-267.
[8] W.J. Moore, Physical Chemistry, Prentice-Hall, Englewood Cliffs, 1962.
[9] J.F. Denayer, G.V. Baron, J.A. Martens, P.A. Jacobs, Journal of Physical Chemistry B.
102 (1998) 3077-3081.
[10] J.F.M. Denayer, G.V. Baron, Adsorption-Journal of the International Adsorption
Society. 3 (1997) 251-265.
[11] J.M. Martinis, G.F. Froment, Industrial & Engineering Chemistry Research. 45 (2006)
954-967.
[12] E. Vynckier, G.F. Froment, in: G. Astarita, S.I. Sandler (Eds.), Kinetic and
Thermodynamic Lumping of Multicomponent Mixtures, Elsevier, 1991, p. 131.
[13] S.W. Benson, J.H. Buss, Journal of Chemical Physics. 29 (1958) 546-572.
[14] B.D. Vandegehuchte, J.W. Thybaut, A. Martinez, M.A. Arribas, G.B. Marin, Applied
Catalysis a-General. 441 (2012) 10-20.
[15] A. Martinez, M.A. Arribas, P. Concepcion, S. Moussa, Applied Catalysis a-General. 467
(2013) 509-518.


135
Chapter 6
Scale Up Chemicals and Fuel
Production by Ethene
Oligomerization:
Industrial Reactor Design
In the present Chapter, an industrial reactor is designed for ethene oligomerization
employing bifunctional, heterogeneous catalysts which comprise nickel-ions on an acid
support such as amorphous silica-alumina or zeolites, i.e., MCM-41 and Beta. In contrast to
ideal laboratory reactors, non-ideal hydrodynamics at the reactor scale and transport
phenomena at the catalyst crystallite scale are much more likely to impact on the overall
behavior and, hence, have to be accounted for. A simulation code is developed including the
microkinetic model for ethene oligomerization developed in Chapters 4 and 5. Additionally,
transport limitations and the formation of liquids due to condensation of heavy alkenes and
their effects on the observed kinetics are included.
6.1 Experimental setup for reactor model validation
The experimental data used to validate the simulation model were acquired on an
oligomerization demonstration unit constructed at an industrial partner as described in
section 2.1.2.3. The reaction conditions applied for these experiments were much more
severe compared to those applied for the acquisition of the intrinsic kinetic data. The
Scale Up the Production of Chemicals and Fuel by Ethene Oligomerization:
Industrial Reactor Design
136
catalyst used during this experimental campaign was the amorphous Ni-SiO2-Al2O3 catalyst
as described in section 2.1.1.2. The catalyst powder was pelletized, crushed and sieved to
obtain a particle size of 1.0 to 2.0 10-3
m. For each run, 20 g of catalyst, diluted with SiC as
an inert, was loaded in the reactor. Prior to experimentation, the catalyst was pretreated for
16 hours in-situ under a nitrogen flow at atmospheric pressure at 673 K .
6.2 Multi-scale ethene oligomerization industrial reactor
model
A graphical representation of the reactor model and the phenomena that are accounted for
is given in Figure 6-1. The reactor model describes a tubular reactor with a specified length
and diameter, i.e., resp. rL and rd . The inlet conditions are specified by the inlet molar flow
rates of ethene 0
2CF and nitrogen 0
2NF , inlet temperature 0T and inlet total pressure
0totp .
Several fixed beds, i.e., with catalyst masses 1W , 2W and 3W and bn the number of beds
can be contained in the reactor with interbed heat exchange depicted by the temperatures
1T and 2T . It is possible to operate the reactor in an isothermal, adiabatic or heat exchange
mode. In the heat exchange mode, the heat input Q is defined by a reactor wall
temperature, i.e., wallT . The pressure drop along the axial reactor coordinate, p∆ , can also
be calculated. It is possible to determine, if any, liquids formation at the reaction conditions
applied. If so, a so-called catalyst wetting efficiency, wη , is calculated and resulting in a
reduced catalyst surface area which is in contact with a gas phase. The reactor model is
capable to account for intraparticle mass and heat transfer limitations inside a crystallite
with diameter cL in the direction of the diffusion path. This is represented in Figure 6-1 by
the ethene coverage profile, i.e., 2Cθ , and temperature profile as function of the
dimensionless crystallite diameter, i.e., cξ . Also, the observed kinetics are highly depending
on the catalyst properties, c.q., descriptors, such as the crystallite shape factor, s , crystallite
diameter, cd , thermal conductivity, pλ , saturation concentration, satC , concentration of
acid and nickel-ion sites, +HC and NiC , and standard enthalpies of physisorption,

Chapter 6
137
protonation and coordination, physH∆ ,
prH∆ and cH∆ . The reactor model does not
account for external mass and heat transfer nor radial gradients at reactor scale.
Additionally, three parameters can be changed which aid in solving the set of partial
differential equations, PDEs, of which the number of mesh points meshn is the most
important in defining the number of points used to discretize the PDE’s to a set of ODE’s.
A number of output files, depending on the details required, is generated during the reactor
simulation. All these output files report on various variables as a function of the reactor axial
coordinate. Depending on the level of detail required for the simulation, this can include
conversion, reactor temperature, pressure, product selectivities, wetting efficiency, liquid
fraction and concentration and temperature profiles in a crystallite.
Figure 6-1: Graphical representation of the industrial reactor model for the heterogeneous, bifunctional
catalyst ethene oligomerization.
Another graphical, more mathematical orientated, representation of the phenomena that
can be accounted for by the reactor model is given in Figure 6-2. Four scales are considered:
the reactor scale, the catalyst pellet scale, the catalyst particle scale and the nano scale. At
the reactor scale which is comprises the mass, energy and impulse balance, see section
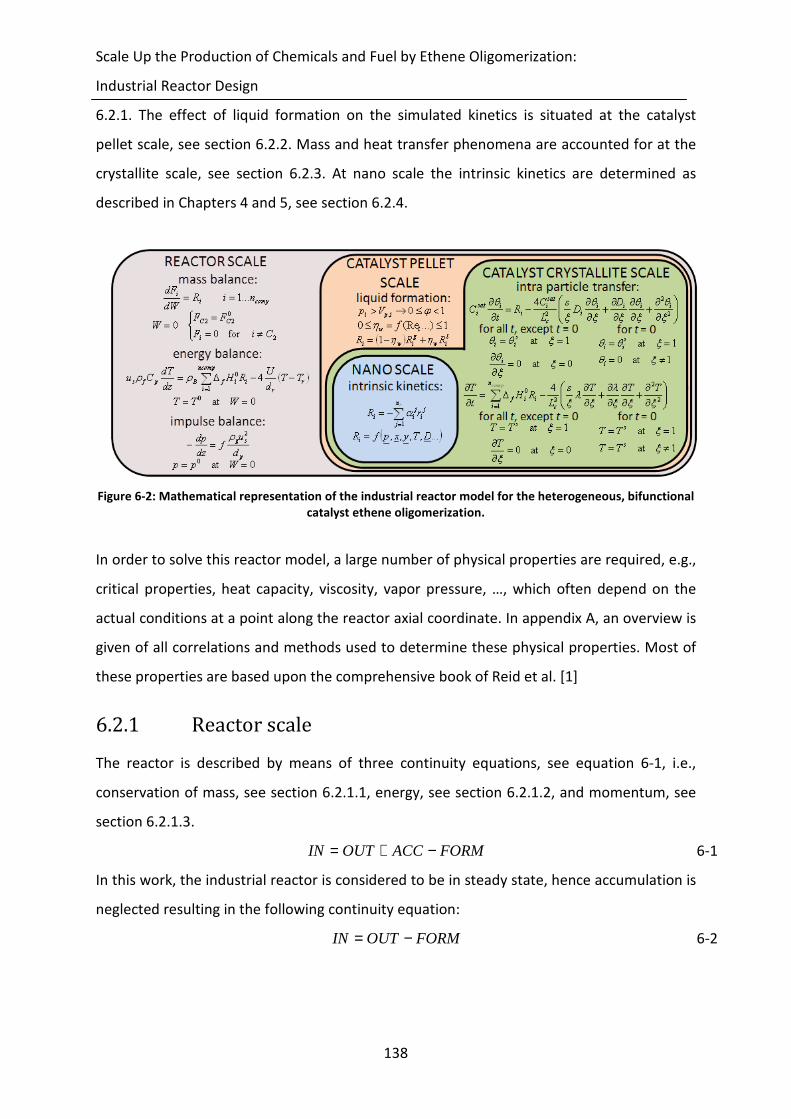
Scale Up the Production of Chemicals and Fuel by Ethene Oligomerization:
Industrial Reactor Design
138
6.2.1. The effect of liquid formation on the simulated kinetics is situated at the catalyst
pellet scale, see section 6.2.2. Mass and heat transfer phenomena are accounted for at the
crystallite scale, see section 6.2.3. At nano scale the intrinsic kinetics are determined as
described in Chapters 4 and 5, see section 6.2.4.
Figure 6-2: Mathematical representation of the industrial reactor model for the heterogeneous, bifunctional
catalyst ethene oligomerization.
In order to solve this reactor model, a large number of physical properties are required, e.g.,
critical properties, heat capacity, viscosity, vapor pressure, …, which often depend on the
actual conditions at a point along the reactor axial coordinate. In appendix A, an overview is
given of all correlations and methods used to determine these physical properties. Most of
these properties are based upon the comprehensive book of Reid et al. [1]
6.2.1 Reactor scale
The reactor is described by means of three continuity equations, see equation 6-1, i.e.,
conservation of mass, see section 6.2.1.1, energy, see section 6.2.1.2, and momentum, see
section 6.2.1.3.
FORMACCOUTIN −+= 6-1
In this work, the industrial reactor is considered to be in steady state, hence accumulation is
neglected resulting in the following continuity equation:
FORMOUTIN −= 6-2

Chapter 6
139
6.2.1.1 Mass balance
For the reactor mass balance, see equation 6-2, the IN and OUT term correspond with
the variation in the molar flow rate of every component over an infinitesimal amount of
catalyst, i.e., ( ) iii FdFF −+ and the formation term FORM is represented by the net rate
of formation iR in the infinitesimal amount of catalyst:
oleii n...1idWRdF == 6-3
in which iF is the molar flow rate of component i, W is the catalyst mass, iR is the net rate
of formation of component i and olen is the number of alkenes considered in the reaction
network.
The initial conditions for this set of differential equations are given by:
≠==
=2
022
for00
CiF
FFW
i
CC 6-4
The infinitesimal catalyst mass dW can be rewritten in terms of axial distance along the
reactor, i.e., z , via:
dzAdW br ρ= 6-5
in which rA is the cross-sectional area of the reactor tube and bρ is the bed density of the
reactor.
6.2.1.2 Energy balance
For the energy balance over the reactor, see equation 6-2, heat can enter ( IN ) and leave
(OUT ) the in two manners: either with components flow, i.e., ( )[ ]TdTTCu f,pfs −+ρ , or
via heat transfer with the reactor wall in an infinitesimal volume of the reactor, i.e.,
( )dzTTd
U4 r
r
− . Heat can also be produced or consumed
( FORM ) by the chemical reactions in an infinitesimal volume of the reactor, i.e.,
dzRHolen
1ii
0ifB∑
=
∆ρ :
( )dzTTd
U4dzRHdTCu r
r
n
1ii
0ifBf,pfs
ole
−−= ∑=
∆ρρ 6-6
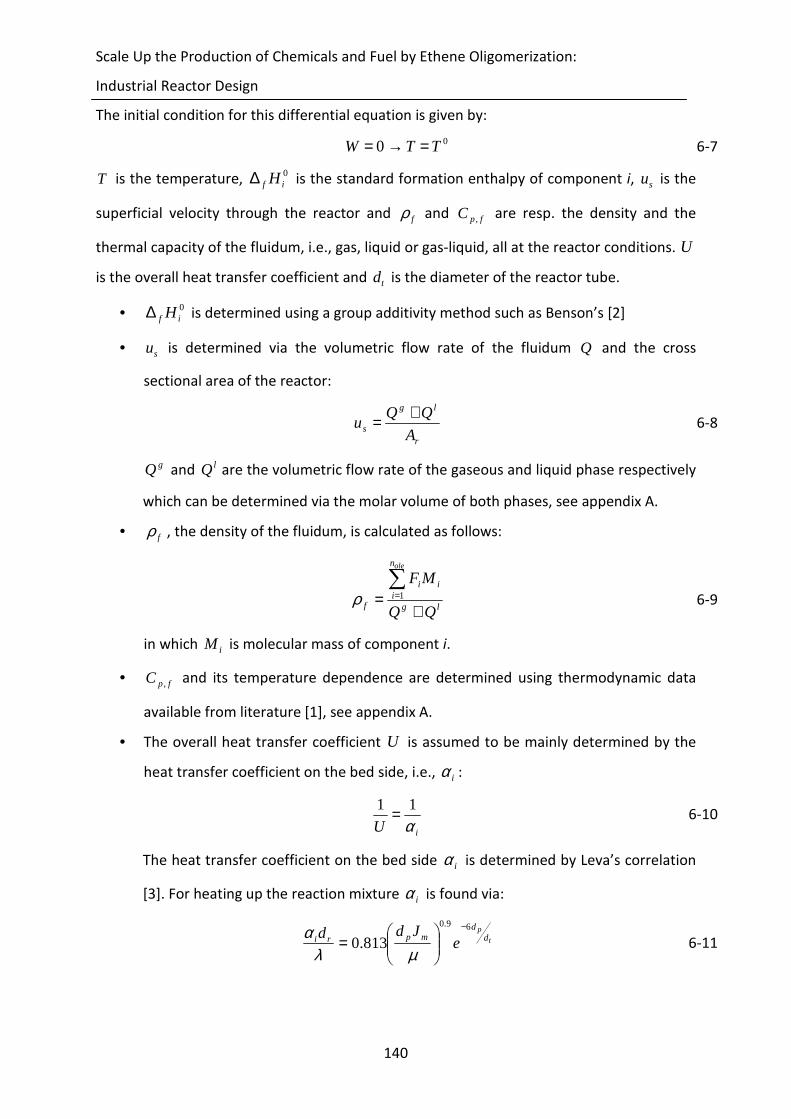
Scale Up the Production of Chemicals and Fuel by Ethene Oligomerization:
Industrial Reactor Design
140
The initial condition for this differential equation is given by:
00 TTW =→= 6-7
T is the temperature, 0if H∆ is the standard formation enthalpy of component i, su is the
superficial velocity through the reactor and fρ and fpC , are resp. the density and the
thermal capacity of the fluidum, i.e., gas, liquid or gas-liquid, all at the reactor conditions. U
is the overall heat transfer coefficient and td is the diameter of the reactor tube.
• 0if H∆ is determined using a group additivity method such as Benson’s [2]
• su is determined via the volumetric flow rate of the fluidum Q and the cross
sectional area of the reactor:
r
lg
s A
QQu
+= 6-8
gQ and lQ are the volumetric flow rate of the gaseous and liquid phase respectively
which can be determined via the molar volume of both phases, see appendix A.
• fρ , the density of the fluidum, is calculated as follows:
lg
n
iii
f QQ
MFole
+=∑
=1ρ 6-9
in which iM is molecular mass of component i.
• fpC , and its temperature dependence are determined using thermodynamic data
available from literature [1], see appendix A.
• The overall heat transfer coefficient U is assumed to be mainly determined by the
heat transfer coefficient on the bed side, i.e., iα :
iU α
11 = 6-10
The heat transfer coefficient on the bed side iα is determined by Leva’s correlation
[3]. For heating up the reaction mixture iα is found via:
t
pd
dmpri e
Jdd 69.0
813.0−
=
µλα
6-11
Chapter 6
141
For cooling down the reaction mixture iα is found via:
t
pd
dmpri e
Jdd 6.47.0
50.3−
=
µλα
6-12
λ is the thermal conductivity of the fluidum flowing through the reactor and is
determined as described in appendix A. rd and pd are the diameter of resp. the
reactor and a catalyst pellet. mJ is the superficial mass flow rate and µ is the
dynamic viscosity, see appendix A.
6.2.1.3 Momentum balance
For the momentum balance over the reactor, see equation 6-2, the momentum over the
reactor, i.e., IN and OUT, is given by the pressure profile dz
dp− . Momentum can be lost
(-FORM) throughout the reactor because of friction with the packed bed and is represented
by p
sf
d
uf
2ρ:
p
sf
d
uf
dz
dp2ρ
=− 6-13
p is the total pressure in the reactor, fρ is the density of the fluidum, su is the superficial
velocity of the fluidum, pd is the catalyst pellet diameter and f is the friction factor.
• The friction factor f is determined by a correlation of Hicks [4]:
( ) 2.0
3
2.1
Re1
8.6 −−=B
Bfεε
6-14
The bed porosity Bε can be found via a correlation of Haughey and Beveridge
[5]:
−
++=2
2
2
1073.038.0
p
t
p
t
B
d
d
d
d
ε 6-15
while the Reynolds number of a fluid in a packed bed is given by:
( )B
pmdJ
εµ −=
1Re 6-16

Scale Up the Production of Chemicals and Fuel by Ethene Oligomerization:
Industrial Reactor Design
142
• For two phase flow through a fixed bed, the friction factor can be determined
by [6]:
+=κκ3.17
3.311
5.1f 6-17
κ is a dimensionless parameter given by:
( ) 25.0Re ll
g
l
lm
gm We
J
J
ρρκ = 6-18
in which gmJ is the gas superficial mass flow rate and lRe and lWe are the
Reynolds and Weber number of the liquid phase given by resp.:
l
plm
L
dJ
µ=Re 6-19
( )
ll
plm
L
dJWe
σρ
2
= 6-20
lσ is the surface tension of the liquid fluidum, see appendix A.
6.2.2 Catalyst pellet scale – liquid formation
Throughout the catalyst bed, heavy components can be formed via oligomerization which
can condense to form liquids. These liquids can partially or fully wet the surface of a catalyst
pellet, which results in a shift in surface concentrations to heavier components. As a result,
the simulated kinetics can be altered significantly.
To account for potential phase transition from gas to liquid phase, a parameter ϕ is
introduced, which equals the molar ratio of the gas flow rate to the total flow rate:
tot
g
F
F=ϕ 6-21
In practice for ethene oligomerization, ϕ equals 1 at the reactor inlet, and can, potentially,
decrease along the axial reactor coordinate. The vapor liquid equilibrium is determined in a
similar manner as described by the Grayson Streed model [7]. However, using this method
at every point along the reactor axial coordinate would require a considerable amount of
CPU time. Hence, before this method is actually invoked, the partial pressure of every
component is compared with its vapor pressure. The Grayson Streed method is only
effectively launched if the partial pressure of a component reaches 90% of its vapor
pressure.
Chapter 6
143
It can be expected that condensation in the micropores will occur even under conditions at
which condensation will occur in larger pores and can be attributed to capillary effects. In
this work, a difference is made between the microporous (subscript p) and macroporous
(subscript o) surface area. The latter is referring to both macro and mesoporous surface
area as the outer surface area. In order to account for the difference between the
microporous and macroporous surface area, a weighted average is taken of the net rate of
formation under the reaction conditions in the micropores and non-micropores, resp. piR ,
and oiR , :
op
oiopipi AA
RARAR
++
= ,, 6-22
The net rate of formation for every component in any point along the axial reactor
coordinate can be written as function of the wetting efficiency, i.e., wη , which is the ratio of
the wetted catalyst surface area and the total catalyst surface area:
( ) pwl
pipwg
pipi RRR ,,,,, 1 ηη +−= 6-23
( ) owloiow
goioi RRR ,,,,, 1 ηη +−= 6-24
in which giR and l
iR are the net rate of formation of component i resulting from the
composition of resp. the gas and liquid phase.
Methods are described in literature in order to determine the wetting efficiency of
micropores due to capillary condensation [8]. However, modeling these effects is typically
quite CPU intensive. Therefore, it is assumed that the micropores are filled up
instantaneously when any liquids are formed. This is translated mathematically into:
1, =pwη 6-25
l
pipi RR ,, = 6-26
The wetting efficiency for the macroporous area ow,η is described by a correlation proposed
by Aldahhan et al. for trickle bed reactors at high pressure [9]:

Scale Up the Production of Chemicals and Fuel by Ethene Oligomerization:
Industrial Reactor Design
144
9
1
3
1
,
1Re104.1
∆+=
l
l
ow Ga
gz
P
ρη 6-27
z
P∆ is the pressure gradient through the bed, g is the gravitational constant and lGa is the
dimensionless liquid Galileo number determined by:
( )
2
3
33
1
−=
l
l
B
Bpl dgGa
µρ
εε
6-28
The correlation proposed by Aldahhan is only applicable for trickle bed regime and, hence,
at very low and high values of ϕ , a substantial deviation can be expected. Therefore, at the
regimes with nearly only pure gas or liquid, the following linear correlation between ow,η
and ϕ is proposed:
ϕη −= 1,ow 6-29
6.2.3 Crystallite scale
6.2.3.1 Mass transfer limitations
To incorporate intraparticle diffusion limitations, for every component i, a one-dimensional
transient mass balance over an infinitesimal volume of the crystallite is considered, see
equation 6-30. It was preferred to solve this transient mass balance rather than a steady
state mass balance because, in the case of second order differential equations, solving the
latter balances is not guaranteed to lead to a solution.
∂∂+
∂∂
∂∂+
∂∂−=
∂∂
2
2
2
4
ξθ
ξθ
ξξθ
ξθ iiii
ic
sati
iisat
i
DD
s
L
CR
tC 6-30
satiC is the saturation concentration of component i, cL is the crystallite diameter in the
direction of the diffusion path, ξ is the dimensionless length of the crystallite, i.e.,
c
c
c
c
L
d
L
r == 2ξ , s is the crystallite shape factor, i.e., 0, 1 or 2 for resp. a slab, cylinder or
sphere, D is the intraparticle diffusion coefficient and θ is the fractional occupancy of the
catalyst surface by the component considered. R , the net rate of formation, is affected by
the shape of the crystallite assumed and is determined as follows:
Chapter 6
145
( ) ( )( )∑=
++++=meshn
j
sjcjc
sjcjc
meshi rrRrrR
n
sR
11,1,,,2
1 6-31
For this set of partial differential equations, the following boundary and initial conditions
were considered:
for all t, except t=0
0at0
1at
==∂∂
==
ξξθ
ξθθ
i
sii
for t=0
1at0
1at
≠===
ξθξθθ
i
sii
siθ is the fractional occupancy by component i of the catalyst surface at the outer surface of
the crystallite.
These sets of partial differential equations are solved by a finite difference method. The
partial differential equation is discretized over the dimensional length of the crystallite ξ
over a user-defined number of mesh points, meshn . Every partial differential equation is
rewritten as a set of meshn ordinary differential equations. These equations are solved until
steady state which is defined as the maximum relative deviation allowed of the
concentration profile between two time integration steps in the reactor model, e.g., 0.1%.
In Figures 6-3 and 6-4, the effect of the number of mesh points on the coverage profile of
ethene in a crystallite, catalyst effectiveness η and CPU time needed to determine the
initial concentration profile is shown. Increasing the number of mesh points, leads to a
better and smoother description of the coverage profile, see Figure 6-3. However, by
increasing the number of mesh points with one, a total of ncomp ordinary differential
equations are added to the set of equations to be solved. This leads to an exponential
increase of CPU time needed to determine the coverage profile of every component in the
catalyst particle, see Figure 6-4. Additionally, the catalyst effectiveness as function of the
number of mesh points was nearly constant already when using 10-15 mesh points.
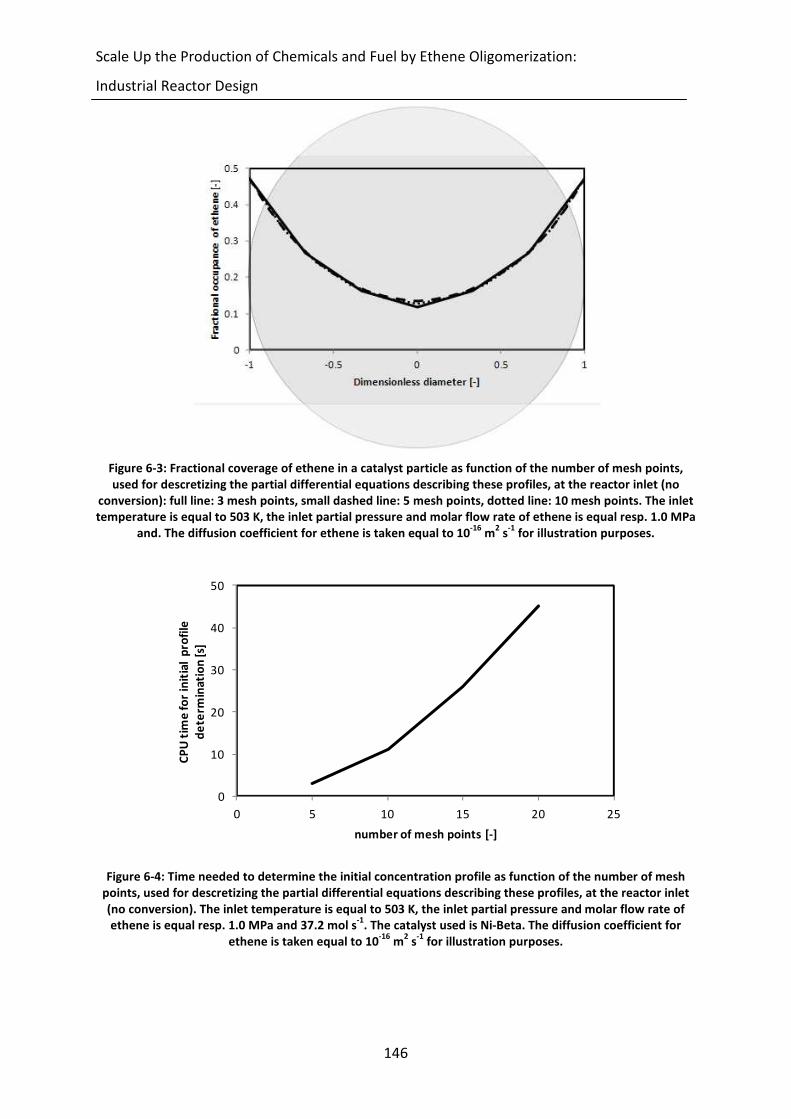
Scale Up the Production of Chemicals and Fuel by Ethene Oligomerization:
Industrial Reactor Design
146
Figure 6-3: Fractional coverage of ethene in a catalyst particle as function of the number of mesh points,
used for descretizing the partial differential equations describing these profiles, at the reactor inlet (no
conversion): full line: 3 mesh points, small dashed line: 5 mesh points, dotted line: 10 mesh points. The inlet
temperature is equal to 503 K, the inlet partial pressure and molar flow rate of ethene is equal resp. 1.0 MPa
and. The diffusion coefficient for ethene is taken equal to 10-16
m2 s
-1 for illustration purposes.
Figure 6-4: Time needed to determine the initial concentration profile as function of the number of mesh
points, used for descretizing the partial differential equations describing these profiles, at the reactor inlet
(no conversion). The inlet temperature is equal to 503 K, the inlet partial pressure and molar flow rate of
ethene is equal resp. 1.0 MPa and 37.2 mol s-1
. The catalyst used is Ni-Beta. The diffusion coefficient for
ethene is taken equal to 10-16
m2 s
-1 for illustration purposes.
0
10
20
30
40
50
0 5 10 15 20 25
CP
U t
ime
fo
r in
itia
l p
rofi
le
de
term
ina
tio
n [
s]
number of mesh points [-]

Chapter 6
147
6.2.3.2 Energy transfer limitations
In order to account for temperature gradients in a catalyst particle, an analogous balance as
equation 6-30 is considered for intraparticle heat transfer limitations:
∂∂+
∂∂
∂∂+
∂∂−∆=
∂∂
∑=
2
2
21
0 4
ξξξλ
ξλ
ξTTTs
LRH
t
T
ci
n
iif
ole
6-32
with the following boundary and initial conditions:
for all t, except t=0
0at0
1at
==∂∂
==
ξξ
ξT
TT s
for t=0
1...0at == ξsTT
6.2.4 Nanoscale – intrinsic kinetics description
At the nanoscale, i.e., at the scale of the active sites, the kinetics are described by the
intrinsic kinetic models developed in Chapters 4 and 5. For every component, the net rate of
formation is calculated as a function of the local reaction conditions, i.e., surface coverage,
temperature…
6.2.5 Experimental validation of the reactor model
A limited number of well chosen experiments were performed by an industrial OCMOL
partner on the experimental set-up described in section 6.1. The experimental results are
compared to the model predictions for validation purposes.
The space-time effect on the ethene conversion is shown in Figure 6-5. There is a good
agreement between the experimental observations and the simulation results. The absence
of repetition experiments makes it difficult to find a solid explanation for this effect,
however, given the trend in conversion versus space time, this experimental point seems to
be situated at a lower value than would be expected.
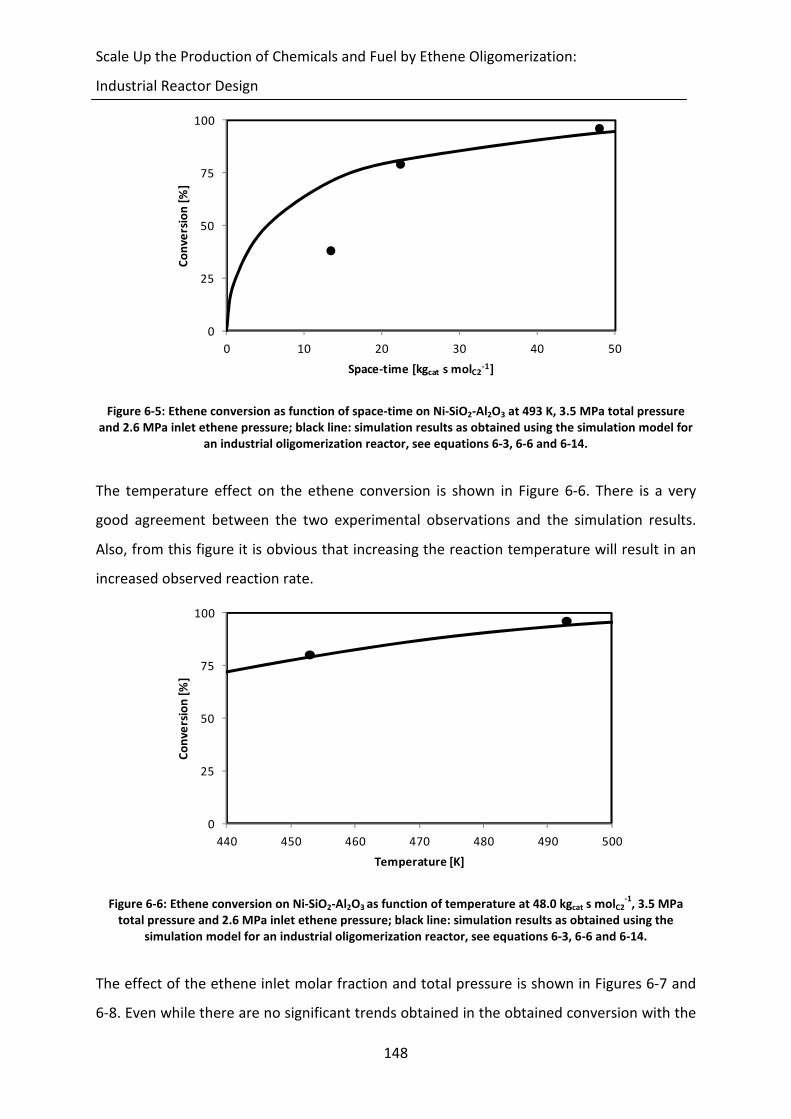
Scale Up the Production of Chemicals and Fuel by Ethene Oligomerization:
Industrial Reactor Design
148
Figure 6-5: Ethene conversion as function of space-time on Ni-SiO2-Al2O3 at 493 K, 3.5 MPa total pressure
and 2.6 MPa inlet ethene pressure; black line: simulation results as obtained using the simulation model for
an industrial oligomerization reactor, see equations 6-3, 6-6 and 6-14.
The temperature effect on the ethene conversion is shown in Figure 6-6. There is a very
good agreement between the two experimental observations and the simulation results.
Also, from this figure it is obvious that increasing the reaction temperature will result in an
increased observed reaction rate.
Figure 6-6: Ethene conversion on Ni-SiO2-Al2O3 as function of temperature at 48.0 kgcat s molC2-1
, 3.5 MPa
total pressure and 2.6 MPa inlet ethene pressure; black line: simulation results as obtained using the
simulation model for an industrial oligomerization reactor, see equations 6-3, 6-6 and 6-14.
The effect of the ethene inlet molar fraction and total pressure is shown in Figures 6-7 and
6-8. Even while there are no significant trends obtained in the obtained conversion with the
0
25
50
75
100
0 10 20 30 40 50
Co
nv
ers
ion
[%
]
Space-time [kgcat s molC2-1]
0
25
50
75
100
440 450 460 470 480 490 500
Co
nv
ers
ion
[%
]
Temperature [K]
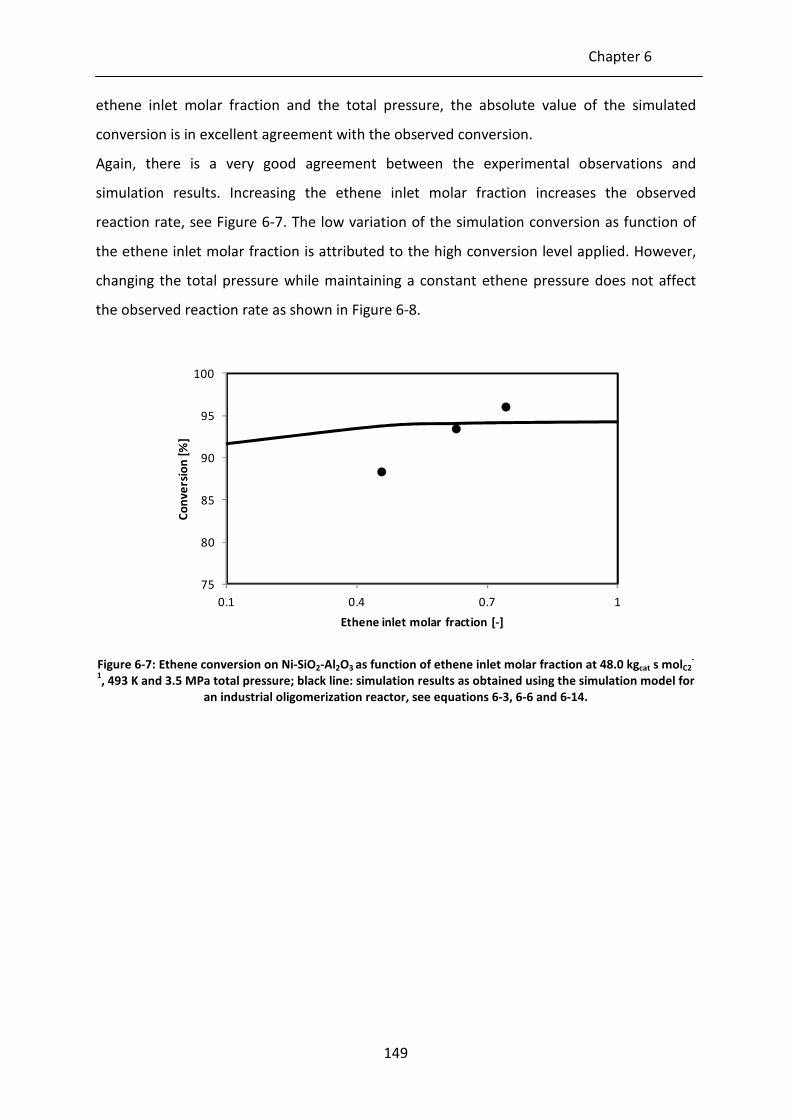
Chapter 6
149
ethene inlet molar fraction and the total pressure, the absolute value of the simulated
conversion is in excellent agreement with the observed conversion.
Again, there is a very good agreement between the experimental observations and
simulation results. Increasing the ethene inlet molar fraction increases the observed
reaction rate, see Figure 6-7. The low variation of the simulation conversion as function of
the ethene inlet molar fraction is attributed to the high conversion level applied. However,
changing the total pressure while maintaining a constant ethene pressure does not affect
the observed reaction rate as shown in Figure 6-8.
Figure 6-7: Ethene conversion on Ni-SiO2-Al2O3 as function of ethene inlet molar fraction at 48.0 kgcat s molC2-
1, 493 K and 3.5 MPa total pressure; black line: simulation results as obtained using the simulation model for
an industrial oligomerization reactor, see equations 6-3, 6-6 and 6-14.
75
80
85
90
95
100
0.1 0.4 0.7 1
Co
nv
ers
ion
[%
]
Ethene inlet molar fraction [-]

Scale Up the Production of Chemicals and Fuel by Ethene Oligomerization:
Industrial Reactor Design
150
Figure 6-8: Ethene conversion on Ni-SiO2-Al2O3 as function of total pressure at 22.4 kgcat s molC2-1
, 493 K and
2.6 MPa inlet ethene pressure; black line: simulation results as obtained using the simulation model for an
industrial oligomerization reactor, see equations 6-3, 6-6 and 6-14.
The isothermicity of the reactor in the pilot plant was also verified. As for the previous
simulations, the reactor dimensions and inert used to dilute the catalyst bed was taken into
account. From simulations, the temperature increase due to the exothermal oligomerization
reaction, varied between ca. 3 to 6K, depending on the inlet and reactor wall temperature.
Increasing the inlet and reactor wall temperature results in a larger temperature increase in
the catalyst bed. However, this ‘hot spot’ is situated near the inlet and is small, i.e., less than
10% of the reactor length. After this ‘hot spot’, the temperature is within 2K of the reactor
wall as experimentally determined, see section 6.1.
50
60
70
80
90
100
3 3.5 4 4.5 5
Co
nv
ers
ion
[%
]
Total pressure [MPa]
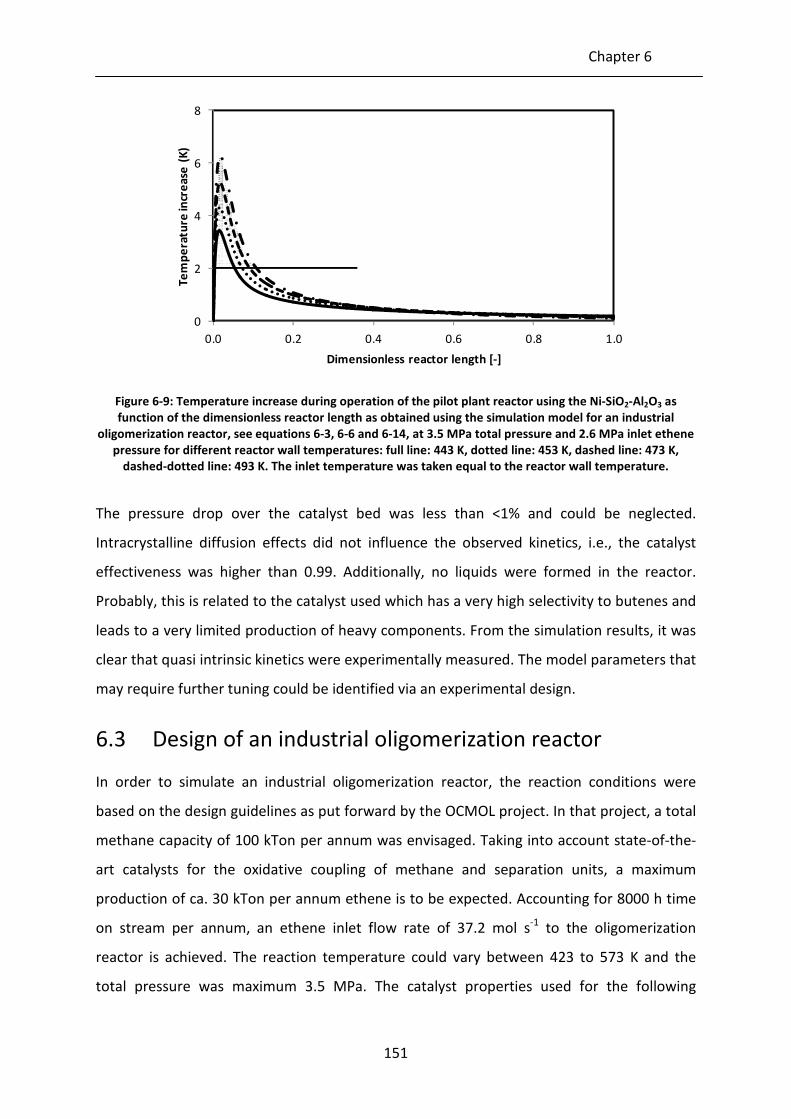
Chapter 6
151
Figure 6-9: Temperature increase during operation of the pilot plant reactor using the Ni-SiO2-Al2O3 as
function of the dimensionless reactor length as obtained using the simulation model for an industrial
oligomerization reactor, see equations 6-3, 6-6 and 6-14, at 3.5 MPa total pressure and 2.6 MPa inlet ethene
pressure for different reactor wall temperatures: full line: 443 K, dotted line: 453 K, dashed line: 473 K,
dashed-dotted line: 493 K. The inlet temperature was taken equal to the reactor wall temperature.
The pressure drop over the catalyst bed was less than <1% and could be neglected.
Intracrystalline diffusion effects did not influence the observed kinetics, i.e., the catalyst
effectiveness was higher than 0.99. Additionally, no liquids were formed in the reactor.
Probably, this is related to the catalyst used which has a very high selectivity to butenes and
leads to a very limited production of heavy components. From the simulation results, it was
clear that quasi intrinsic kinetics were experimentally measured. The model parameters that
may require further tuning could be identified via an experimental design.
6.3 Design of an industrial oligomerization reactor
In order to simulate an industrial oligomerization reactor, the reaction conditions were
based on the design guidelines as put forward by the OCMOL project. In that project, a total
methane capacity of 100 kTon per annum was envisaged. Taking into account state-of-the-
art catalysts for the oxidative coupling of methane and separation units, a maximum
production of ca. 30 kTon per annum ethene is to be expected. Accounting for 8000 h time
on stream per annum, an ethene inlet flow rate of 37.2 mol s-1
to the oligomerization
reactor is achieved. The reaction temperature could vary between 423 to 573 K and the
total pressure was maximum 3.5 MPa. The catalyst properties used for the following
0
2
4
6
8
0.0 0.2 0.4 0.6 0.8 1.0
Te
mp
era
ture
incr
ea
se (
K)
Dimensionless reactor length [-]

Scale Up the Production of Chemicals and Fuel by Ethene Oligomerization:
Industrial Reactor Design
152
simulations are those of the Ni-Beta catalyst as described in section 2.1.1.3. The effect of
different heating regimes, reactor geometry, liquid formation and mass transport limitations
are discussed in the following sections. A final design for an industrial ethene
oligomerization reactor is given ins section 6.3.5.
6.3.1 Effect of heating regime
The effect of operating the industrial ethene oligomerization reactor in an adiabatic
compared to an isothermal mode is shown in Figure 6-10. Due to the exothermicity of the
oligomerization reactor, the temperature increases with ca. 20 K up to 5 toncat. Also no
significant temperature differences in the catalyst pellets are simulated. Hereafter, the
temperature decreases steadily. Since heat exchange is not allowed in an adiabatic
operation, this temperature decrease can only be attributed to endothermic reactions.
From a catalyst mass of 5 ton, energetically, endothermic cracking is contributing more than
exothermic oligomerization, resulting in the temperature decrease. This is also illustrated in
Figure 6-11 which shows the temperature profile and yield of 1-alkenes, propene and
gasoline throughout the catalyst bed. While 1-alkenes are clearly the primary products and
are formed through exothermic oligomerization, propene and gasoline are secondary
products which are formed through endothermic cracking of the oligomers, see Chapter 5.
At the maximum 1-alkenes yield, the oligomerization and cracking rates are identical.
Because of the similar global heat effects by both reactions, the endothermicity of the
cracking is compensated by the exothermicity of the oligomerization at the same point,
explaining why the maximum 1-alkene yield coincides with that obtained for the
temperature. After this maximum, cracking of oligomers to propene and gasoline will
dominate the reaction pathways leading to a temperature decrease. Because the
temperature throughout the reactor exceeds the inlet temperature, an adiabatic operation
will require less catalyst to obtain a similar conversion level in an isothermal operation, see
Figure 6-10. The temperature increase, however, is not sufficiently high to justify the use of
a multi fixed bed reactor. The absence of acid functionality on the ethene oligomerization
catalyst, e.g., the Ni-SiO2-Al2O3 catalyst used in Chapter 4, results in a larger adiabatic
temperature increase, see Figure 6-12. Since acid sites are required to catalyze the cracking
of oligomers, no major endothermic reactions can occur.

Chapter 6
153
Figure 6-10: Ethene conversion (left axis) and reactor temperature (right) as function of the Ni-Beta catalyst
mass, i.e., axial reactor coordinate as obtained using the simulation model for an industrial oligomerization
reactor, see equations 6-3, 6-6 and 6-14, at 503 K inlet temperature, 1.0 MPa inlet ethene pressure and an
inlet ethene molar flow rate equal to 37.2 mol s-1
, full line: isothermal case, dashed lines: adiabatic case.
Figure 6-11: Reactor temperature (left axis) and product yield (right) as function of the Ni-Beta catalyst
mass, i.e., axial reactor coordinate as obtained using the simulation model for an adiabatic industrial
oligomerization reactor, see equations 6-3, 6-6 and 6-14, at 503 K inlet temperature, 1.0 MPa inlet ethene
pressure and an inlet ethene molar flow rate equal to 37.2 mol s-1
, full line, left axis: reactor temperature;
full line, right axis: 1-alkene yield; dashed line: propene yield; dotted line: dotted line: gasoline yield.
500
510
520
530
0
20
40
60
80
100
0 5 10 15 20
Te
mp
era
ture
[K
]
Co
nv
ers
ion
[%
]
Catalyst mass [103 kgcat]
0
10
20
30
40
50
500
510
520
530
0 5 10 15 20
Yie
ld [
%]
Te
mp
era
ture
[K
]
Catalyst mass [103 kgcat]
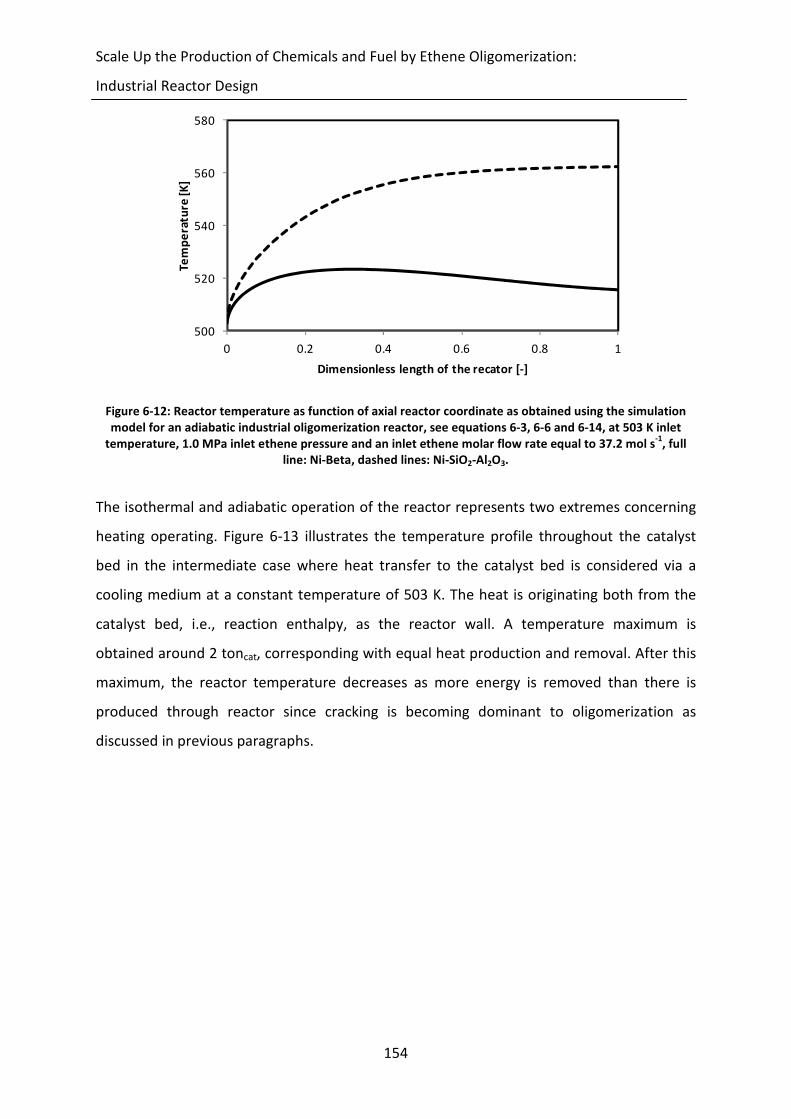
Scale Up the Production of Chemicals and Fuel by Ethene Oligomerization:
Industrial Reactor Design
154
Figure 6-12: Reactor temperature as function of axial reactor coordinate as obtained using the simulation
model for an adiabatic industrial oligomerization reactor, see equations 6-3, 6-6 and 6-14, at 503 K inlet
temperature, 1.0 MPa inlet ethene pressure and an inlet ethene molar flow rate equal to 37.2 mol s-1
, full
line: Ni-Beta, dashed lines: Ni-SiO2-Al2O3.
The isothermal and adiabatic operation of the reactor represents two extremes concerning
heating operating. Figure 6-13 illustrates the temperature profile throughout the catalyst
bed in the intermediate case where heat transfer to the catalyst bed is considered via a
cooling medium at a constant temperature of 503 K. The heat is originating both from the
catalyst bed, i.e., reaction enthalpy, as the reactor wall. A temperature maximum is
obtained around 2 toncat, corresponding with equal heat production and removal. After this
maximum, the reactor temperature decreases as more energy is removed than there is
produced through reactor since cracking is becoming dominant to oligomerization as
discussed in previous paragraphs.
500
520
540
560
580
0 0.2 0.4 0.6 0.8 1
Te
mp
era
ture
[K
]
Dimensionless length of the recator [-]

Chapter 6
155
Figure 6-13: Reactor temperature (left axis) and heat produced (right axis) as function of the Ni-Beta catalyst
mass, i.e., axial reactor coordinate as obtained using the simulation model for a heat exchanging industrial
oligomerization reactor, see equations 6-3, 6-6 and 6-14, at 503 K inlet temperature, a constant cooling
medium temperature of 503 K, 1.0 MPa inlet ethene pressure and an inlet ethene molar flow rate equal to
37.2 mol s-1
, full line: reactor temperature, dashed line: produced heat.
6.3.2 Effect of the reactor geometry on the temperature
profile and pressure drop
Changing the reactor geometry of a tubular fixed bed reactor, i.e., the length to diameter
ratio, mainly affects the heat transfer from the catalyst bed. In order to avoid too
pronounced hot spots in the reactor, the length to diameter should be chosen sufficiently
high, see Figure 6-14. However, this causes the pressure drop to increase as a function of
the ratio between the catalyst pellet diameter and that of the reactor tube. However, under
the reaction conditions investigated, the pressure drop is negligible when the reactor and
pellet diameter differ less than 2 orders of magnitude, see Figure 6-15.
-4
-2
0
2
4
6
8
10
500
510
520
530
0 5 10 15 20
He
at
pro
du
ced
[J
kg
cat-1
s-1]
Te
mp
era
ture
[K
]
Catalyst mass [103 kgcat]

Scale Up the Production of Chemicals and Fuel by Ethene Oligomerization:
Industrial Reactor Design
156
Figure 6-14: Reactor temperature as function of the Ni-Beta catalyst mass, i.e., axial reactor coordinate as
obtained using the simulation model for a heat exchanging industrial oligomerization reactor with varying
length to diameter ratio (Lr/dr), see equations 6-3, 6-6 and 6-14, at 503 K inlet temperature, 1.0 MPa inlet
ethene pressure and an inlet ethene molar flow rate equal to 37.2 mol s-1
, full line: Lr/dr = 15, dashed line:
Lr/dr = 10, dotted line: Lr/dr = 8, dashed-dotted line: Lr/dr = 5.
Figure 6-15: Pressure drop as function of the catalyst pellet to reactor diameter ratio as obtained using the
simulation model for an isothermal industrial oligomerization reactor using the Ni-Beta catalyst, see
equations 6-3, 6-6 and 6-14, at 503 K inlet temperature, 1.0 MPa inlet ethene pressure and an inlet ethene
molar flow rate equal to 37.2 mol s-1
.
6.3.3 Effect of liquid formation on the conversion of ethene
At sufficiently low temperatures, high pressures or high ethene conversions, condensation
of heavy alkenes formed by oligomerization is most likely, potentially causing a change in
the observed reaction kinetics. These possible effects are illustrated in this paragraph. Four
500
505
510
515
520
0 5 10 15 20
Te
mp
era
ture
[K
]
Catalyst mass [103 kgcat]
0
10
20
30
40
50
0 2 4
Pre
ssu
re d
rop
[%
]
Pellet diamater to reactor diameter ratio: log(dp dr-1) [-]
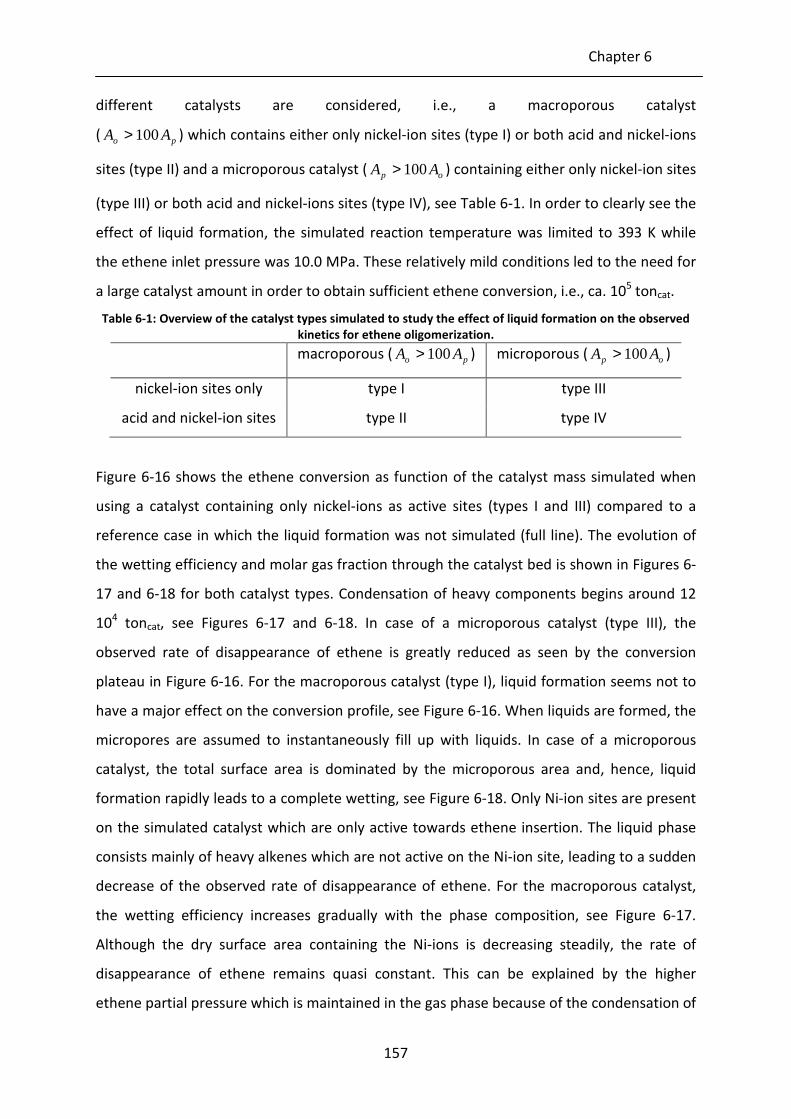
Chapter 6
157
different catalysts are considered, i.e., a macroporous catalyst
( po AA 100> ) which contains either only nickel-ion sites (type I) or both acid and nickel-ions
sites (type II) and a microporous catalyst ( op AA 100> ) containing either only nickel-ion sites
(type III) or both acid and nickel-ions sites (type IV), see Table 6-1. In order to clearly see the
effect of liquid formation, the simulated reaction temperature was limited to 393 K while
the ethene inlet pressure was 10.0 MPa. These relatively mild conditions led to the need for
a large catalyst amount in order to obtain sufficient ethene conversion, i.e., ca. 105 toncat.
Table 6-1: Overview of the catalyst types simulated to study the effect of liquid formation on the observed
kinetics for ethene oligomerization.
macroporous ( po AA 100> ) microporous ( op AA 100> )
nickel-ion sites only type I type III
acid and nickel-ion sites type II type IV
Figure 6-16 shows the ethene conversion as function of the catalyst mass simulated when
using a catalyst containing only nickel-ions as active sites (types I and III) compared to a
reference case in which the liquid formation was not simulated (full line). The evolution of
the wetting efficiency and molar gas fraction through the catalyst bed is shown in Figures 6-
17 and 6-18 for both catalyst types. Condensation of heavy components begins around 12
104 toncat, see Figures 6-17 and 6-18. In case of a microporous catalyst (type III), the
observed rate of disappearance of ethene is greatly reduced as seen by the conversion
plateau in Figure 6-16. For the macroporous catalyst (type I), liquid formation seems not to
have a major effect on the conversion profile, see Figure 6-16. When liquids are formed, the
micropores are assumed to instantaneously fill up with liquids. In case of a microporous
catalyst, the total surface area is dominated by the microporous area and, hence, liquid
formation rapidly leads to a complete wetting, see Figure 6-18. Only Ni-ion sites are present
on the simulated catalyst which are only active towards ethene insertion. The liquid phase
consists mainly of heavy alkenes which are not active on the Ni-ion site, leading to a sudden
decrease of the observed rate of disappearance of ethene. For the macroporous catalyst,
the wetting efficiency increases gradually with the phase composition, see Figure 6-17.
Although the dry surface area containing the Ni-ions is decreasing steadily, the rate of
disappearance of ethene remains quasi constant. This can be explained by the higher
ethene partial pressure which is maintained in the gas phase because of the condensation of
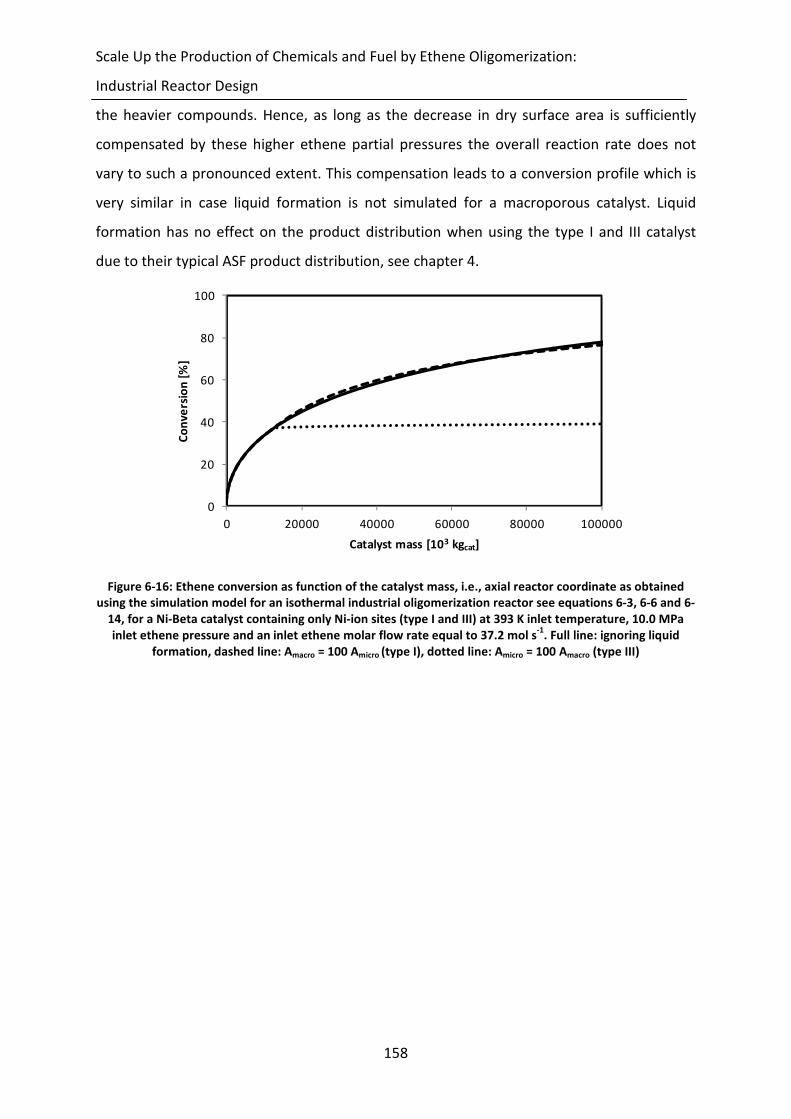
Scale Up the Production of Chemicals and Fuel by Ethene Oligomerization:
Industrial Reactor Design
158
the heavier compounds. Hence, as long as the decrease in dry surface area is sufficiently
compensated by these higher ethene partial pressures the overall reaction rate does not
vary to such a pronounced extent. This compensation leads to a conversion profile which is
very similar in case liquid formation is not simulated for a macroporous catalyst. Liquid
formation has no effect on the product distribution when using the type I and III catalyst
due to their typical ASF product distribution, see chapter 4.
Figure 6-16: Ethene conversion as function of the catalyst mass, i.e., axial reactor coordinate as obtained
using the simulation model for an isothermal industrial oligomerization reactor see equations 6-3, 6-6 and 6-
14, for a Ni-Beta catalyst containing only Ni-ion sites (type I and III) at 393 K inlet temperature, 10.0 MPa
inlet ethene pressure and an inlet ethene molar flow rate equal to 37.2 mol s-1
. Full line: ignoring liquid
formation, dashed line: Amacro = 100 Amicro (type I), dotted line: Amicro = 100 Amacro (type III)
0
20
40
60
80
100
0 20000 40000 60000 80000 100000
Co
nv
ers
ion
[%
]
Catalyst mass [103 kgcat]
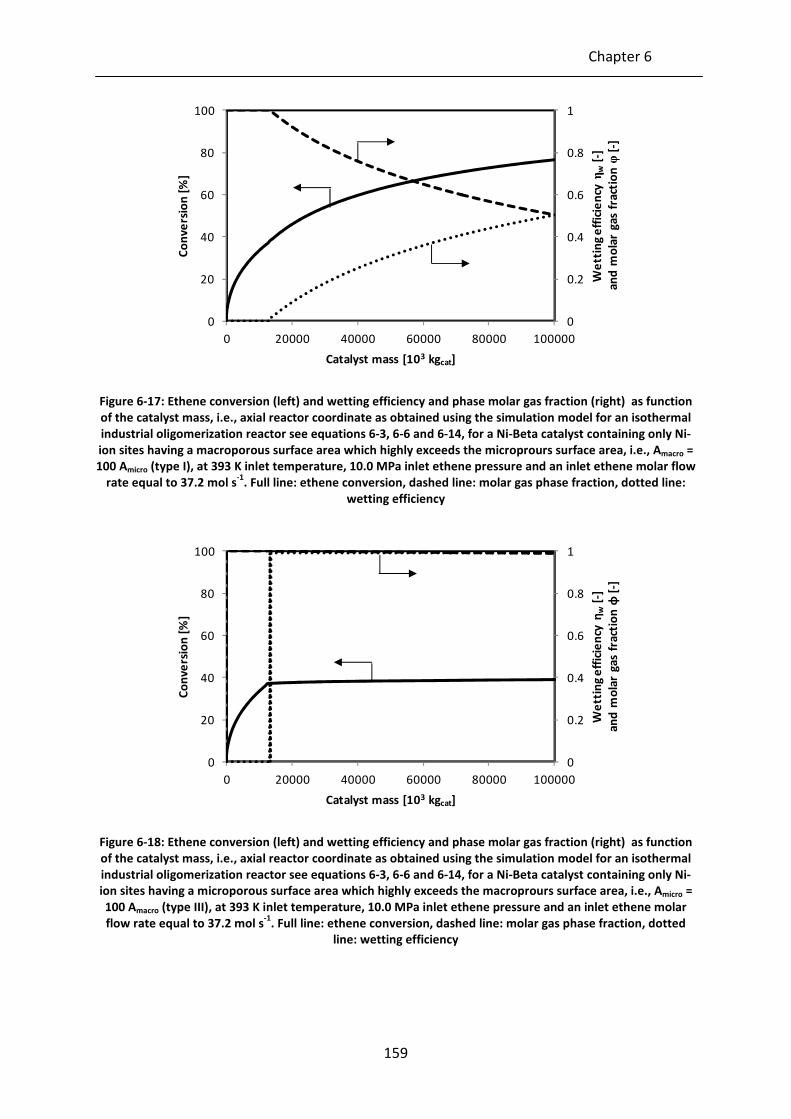
Chapter 6
159
Figure 6-17: Ethene conversion (left) and wetting efficiency and phase molar gas fraction (right) as function
of the catalyst mass, i.e., axial reactor coordinate as obtained using the simulation model for an isothermal
industrial oligomerization reactor see equations 6-3, 6-6 and 6-14, for a Ni-Beta catalyst containing only Ni-
ion sites having a macroporous surface area which highly exceeds the microprours surface area, i.e., Amacro =
100 Amicro (type I), at 393 K inlet temperature, 10.0 MPa inlet ethene pressure and an inlet ethene molar flow
rate equal to 37.2 mol s-1
. Full line: ethene conversion, dashed line: molar gas phase fraction, dotted line:
wetting efficiency
Figure 6-18: Ethene conversion (left) and wetting efficiency and phase molar gas fraction (right) as function
of the catalyst mass, i.e., axial reactor coordinate as obtained using the simulation model for an isothermal
industrial oligomerization reactor see equations 6-3, 6-6 and 6-14, for a Ni-Beta catalyst containing only Ni-
ion sites having a microporous surface area which highly exceeds the macroprours surface area, i.e., Amicro =
100 Amacro (type III), at 393 K inlet temperature, 10.0 MPa inlet ethene pressure and an inlet ethene molar
flow rate equal to 37.2 mol s-1
. Full line: ethene conversion, dashed line: molar gas phase fraction, dotted
line: wetting efficiency
0
0.2
0.4
0.6
0.8
1
0
20
40
60
80
100
0 20000 40000 60000 80000 100000
We
ttin
g e
ffic
ien
cy η
w[-
]
an
d m
ola
r g
as
fra
ctio
n φ
[-]
Co
nv
ers
ion
[%
]
Catalyst mass [103 kgcat]
0
0.2
0.4
0.6
0.8
1
0
20
40
60
80
100
0 20000 40000 60000 80000 100000
We
ttin
g e
ffic
ien
cy η
w[-
]
an
d m
ola
r g
as
fra
ctio
n φ
[-]
Co
nv
ers
ion
[%
]
Catalyst mass [103 kgcat]
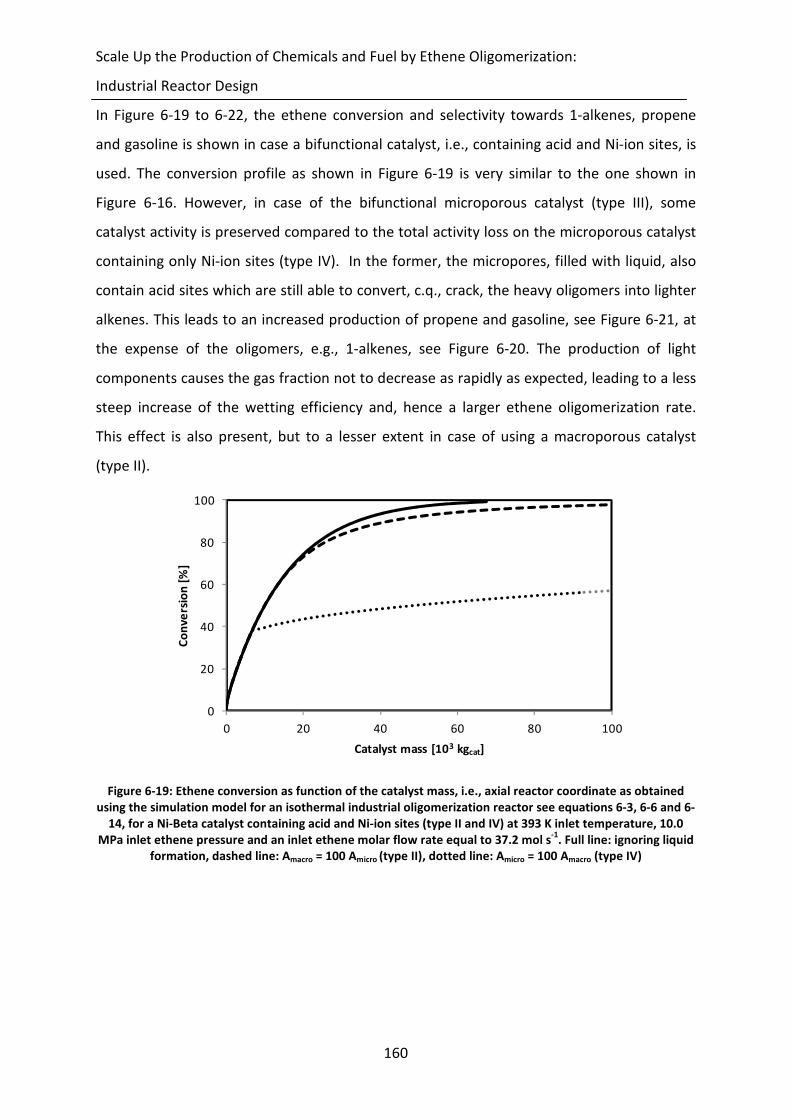
Scale Up the Production of Chemicals and Fuel by Ethene Oligomerization:
Industrial Reactor Design
160
In Figure 6-19 to 6-22, the ethene conversion and selectivity towards 1-alkenes, propene
and gasoline is shown in case a bifunctional catalyst, i.e., containing acid and Ni-ion sites, is
used. The conversion profile as shown in Figure 6-19 is very similar to the one shown in
Figure 6-16. However, in case of the bifunctional microporous catalyst (type III), some
catalyst activity is preserved compared to the total activity loss on the microporous catalyst
containing only Ni-ion sites (type IV). In the former, the micropores, filled with liquid, also
contain acid sites which are still able to convert, c.q., crack, the heavy oligomers into lighter
alkenes. This leads to an increased production of propene and gasoline, see Figure 6-21, at
the expense of the oligomers, e.g., 1-alkenes, see Figure 6-20. The production of light
components causes the gas fraction not to decrease as rapidly as expected, leading to a less
steep increase of the wetting efficiency and, hence a larger ethene oligomerization rate.
This effect is also present, but to a lesser extent in case of using a macroporous catalyst
(type II).
Figure 6-19: Ethene conversion as function of the catalyst mass, i.e., axial reactor coordinate as obtained
using the simulation model for an isothermal industrial oligomerization reactor see equations 6-3, 6-6 and 6-
14, for a Ni-Beta catalyst containing acid and Ni-ion sites (type II and IV) at 393 K inlet temperature, 10.0
MPa inlet ethene pressure and an inlet ethene molar flow rate equal to 37.2 mol s-1
. Full line: ignoring liquid
formation, dashed line: Amacro = 100 Amicro (type II), dotted line: Amicro = 100 Amacro (type IV)
0
20
40
60
80
100
0 20 40 60 80 100
Co
nv
ers
ion
[%
]
Catalyst mass [103 kgcat]

Chapter 6
161
Figure 6-20: 1-alkene selectivity as function of ethene conversion using the simulation model for an
isothermal industrial oligomerization reactor see equations 6-3, 6-6 and 6-14, for a Ni-Beta catalyst
containing acid and Ni-ion sites (type II and IV) at 393 K inlet temperature, 10.0 MPa inlet ethene pressure
and an inlet ethene molar flow rate equal to 37.2 mol s-1
. Full line: ignoring liquid formation, dashed line:
Amacro = 100 Amicro (type II), dotted line: Amicro = 100 Amacro (type IV)
Figure 6-21: Propene selectivity as function of ethene conversion using the simulation model for an
isothermal industrial oligomerization reactor see equations 6-3, 6-6 and 6-14, for a Ni-Beta catalyst
containing acid and Ni-ion sites (type II and IV) at 393 K inlet temperature, 10.0 MPa inlet ethene pressure
and an inlet ethene molar flow rate equal to 37.2 mol s-1
. Full line: ignoring liquid formation, dashed line:
Amacro = 100 Amicro (type II), dotted line: Amicro = 100 Amacro (type IV)
50
60
70
80
0 20 40 60 80 100
Se
lect
ivit
y [
%]
Conversion [%]
0
2
4
6
8
0 20 40 60 80 100
Se
lect
ivit
y [
%]
Conversion [%]
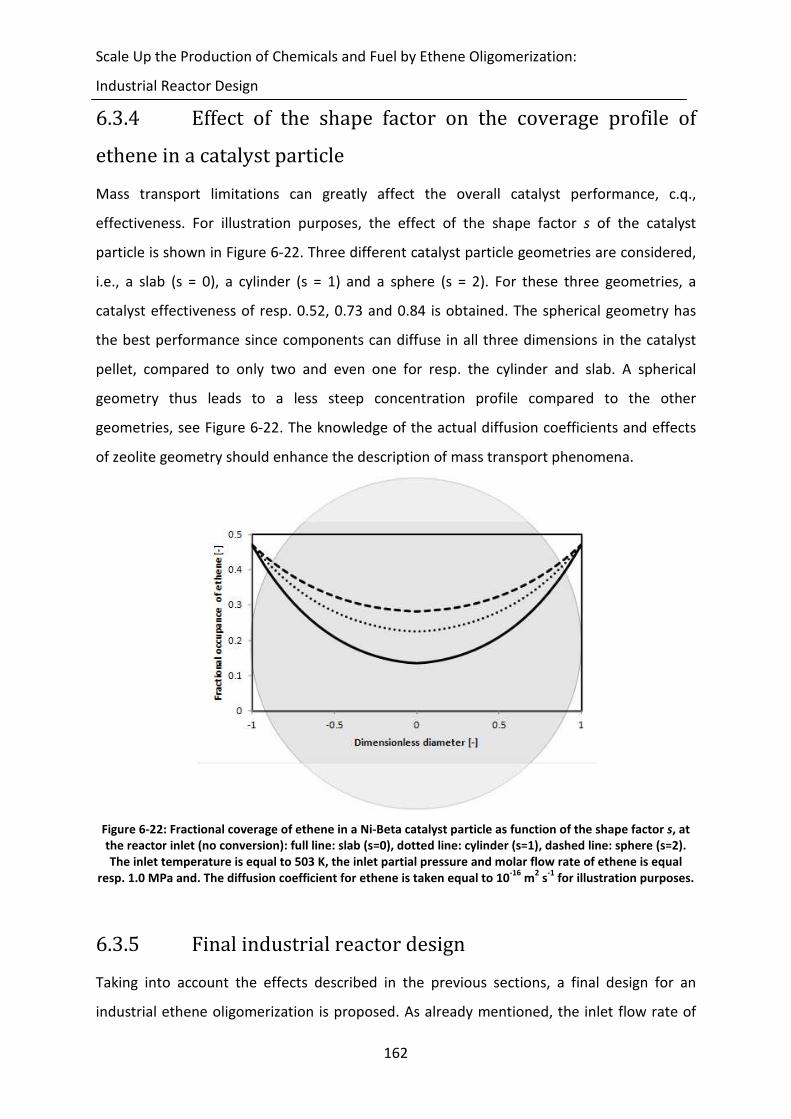
Scale Up the Production of Chemicals and Fuel by Ethene Oligomerization:
Industrial Reactor Design
162
6.3.4 Effect of the shape factor on the coverage profile of
ethene in a catalyst particle
Mass transport limitations can greatly affect the overall catalyst performance, c.q.,
effectiveness. For illustration purposes, the effect of the shape factor s of the catalyst
particle is shown in Figure 6-22. Three different catalyst particle geometries are considered,
i.e., a slab (s = 0), a cylinder (s = 1) and a sphere (s = 2). For these three geometries, a
catalyst effectiveness of resp. 0.52, 0.73 and 0.84 is obtained. The spherical geometry has
the best performance since components can diffuse in all three dimensions in the catalyst
pellet, compared to only two and even one for resp. the cylinder and slab. A spherical
geometry thus leads to a less steep concentration profile compared to the other
geometries, see Figure 6-22. The knowledge of the actual diffusion coefficients and effects
of zeolite geometry should enhance the description of mass transport phenomena.
Figure 6-22: Fractional coverage of ethene in a Ni-Beta catalyst particle as function of the shape factor s, at
the reactor inlet (no conversion): full line: slab (s=0), dotted line: cylinder (s=1), dashed line: sphere (s=2).
The inlet temperature is equal to 503 K, the inlet partial pressure and molar flow rate of ethene is equal
resp. 1.0 MPa and. The diffusion coefficient for ethene is taken equal to 10-16
m2 s
-1 for illustration purposes.
6.3.5 Final industrial reactor design
Taking into account the effects described in the previous sections, a final design for an
industrial ethene oligomerization is proposed. As already mentioned, the inlet flow rate of

Chapter 6
163
ethene amounts to 30 kTon per annum, which equals 37.2 mol s-1
. The temperature and
ethene inlet partial pressure were taken as high as possible within the operating window of
the OMCOL project, i.e., resp. 573 K and 3.5 MPa. No diluent is sent with the reactants into
the reactor. An ethene conversion of 95% was aimed at. Figure 6-23 shows the conversion
and temperature profile for a single fixed bed adiabatic reactor since the temperature
increase is limited to 20 K. The desired ethene conversion is reached at a catalyst mass of
8.2 ton. The catalyst density amounts to ca. 1200 kg m-3
and the bed porosity equals ca. 0.3.
If a reactor length to diameter ratio of ca. 10 is assumed, this corresponds to a reactor
length of 10.5 m, a reactor diameter of 1.0 m and a total reactor volume of 8.9 m3. The yield
towards 1-alkenes, propene and gasoline is shown in Figure 6-24. At 95% ethene conversion,
the yield towards 1-alkenes, propene and gasoline is limited to resp. 4%, 30% and 40% . The
remaining 26% is constituted of other fractions, such as iso-butene. Preliminary simulations
showed that recycling of any of the components and fractions did not result in a remarkable
product yield increase. Under the reaction conditions applied, no liquids were formed and
the pressure drop (dp = 1-2 m-2
) and intracrystalline transport limitations were negligible,
i.e., <1%. If liquids would be formed, the yield towards 1-alkenes and gasoline can be
increased slightly, i.e., resp. to 5% and 46%, at a cost of propene production. However, this
comes at the cost of having to apply much higher space-times, and hence use more catalyst
to obtain a similar conversion level.
Figure 6-23: Ethene conversion (left axis) and reactor temperature (right) as function of the Ni-Beta catalyst
mass, i.e., axial reactor coordinate as obtained using the simulation model for an adiabatic industrial
oligomerization reactor, see equations 6-3, 6-6 and 6-14, at 573 K inlet temperature, 3.5 MPa inlet ethene
pressure and an inlet ethene molar flow rate equal to 37.2 mol s-1
570
575
580
585
590
0
20
40
60
80
100
0 2 4 6 8 10
Te
mp
era
ture
[K
]
Co
nv
ers
ion
[%
]
Catalyst mass [103 kgcat]

Scale Up the Production of Chemicals and Fuel by Ethene Oligomerization:
Industrial Reactor Design
164
Figure 6-24: Product yield as function of the Ni-Beta catalyst mass, i.e., axial reactor coordinate as obtained
using the simulation model for an adiabatic industrial oligomerization reactor, see equations 6-3, 6-6 and 6-
14, at 573 K inlet temperature, 3.5 MPa inlet ethene pressure and an inlet ethene molar flow rate equal to
37.2 mol s-1
; full line: 1- alkenes, dashed line: propene, dotted line: gasoline.
6.4 Conclusions
A model for simulating an industrial ethene oligomerization reactor was constructed. A
microkinetics based scheme rather than a global kinetics one was implemented at the core
of this model to gain more insight in the effect of varying reactor operation conditions and
geometry on the observed kinetics. The reactor model is capable of simulating different
reactor configurations, i.e., single versus multi fixed bed with interbed cooling and or
heating, including reactor geometry, i.e., length and diameter. Also the effect of different
heating regimes is accounted for: isothermal, adiabatic or heating exchanging. Intraparticle
mass and heat transfer effects can be added to the simulation at the cost of CPU time. If
expected, pressure drop effects and the influence of liquid formation can be included in the
calculations. Also the catalyst properties can be adjusted, i.e., both physical, e.g., diameter
and shape factor, concentration of active sites, etc., and chemical, e.g., physisorption
enthalpy, etc.
Using a catalyst containing only Ni-ion sites as active sites, leads to an ASF product
distribution but also to a high temperature increase when operating the reactor
adiabatically. A bifunctional catalyst leads to a less pronounced temperature increase due to
the occurrence of endothermic cracking reactions. Also the product distribution is distinctly
different on a bifunctional catalyst compared to a monofunctional one with the formation of
0
10
20
30
40
50
0 2 4 6 8 10
Yie
ld [
%]
Catalyst mass [103 kgcat]
Chapter 6
165
highly branched and odd-carbon numbered products. The reactor geometry, i.e., length to
diameter ratio, should be chosen wisely in order to minimize hot-spots if needed when
operating in heat-exchanging mode and to avoid too large pressure drops. The formation of
liquids can greatly enhance product yields in case a microporous, bifunctional catalyst is
used. The liquids in the micropores are relatively easy transformed into propene and a
gasoline fraction since this liquid fraction is enriched in heavy alkenes. The ethene
conversion increases more moderately at such conditions, however. A final design for an
industrial ethene oligomerization reactor was proposed based upon the requirements and
operating window of the OCMOL project.
6.5 References
[1] R.C. Reid, J.M. Prausnitz, B.E. Poling, The Properties of Gases and Liquids (4th ed.),
1988.
[2] S.W. Benson, J.H. Buss, Journal of Chemical Physics. 29 (1958) 546-572.
[3] M. Leva, Chem. Eng. 56 (1949) 115-124.
[4] R.E. Hicks, Industrial & Engineering Chemistry Fundamentals. 9 (1970) 500-&.
[5] D.P. Haughey, Beveridg.Gs, Canadian Journal of Chemical Engineering. 47 (1969)
130-&.
[6] F. Larachi, A. Laurent, N. Midoux, G. Wild, Chemical Engineering Science. 46 (1991)
1233-1246.
[7] R. Torres, J.C. de Hemptinne, I. Machin, Oil & Gas Science and Technology. 68 (2013)
217-233.
[8] J. Wood, L.F. Gladden, F.J. Keil, Chemical Engineering Science. 57 (2002) 3047-3059.
[9] M.H. Aldahhan, M.P. Dudukovic, Chemical Engineering Science. 50 (1995) 2377-
2389.


167
Chapter 7
Catalyst Design for
Ethylbenzene Dealkylation and
Xylene Isomerization
In this chapter, a fundamental kinetic model of the single-event type (SEMK) is constructed
for ethylbenzene dealkylation and xylene isomerization on a bifunctional catalyst, Pt/HZSM-
5. It accounts for the acid-catalyzed reactions involved, i.e., (de-)protonation, intra- and
intermolecular isomerization, resp. 1,2 methyl-shift and transalkylation, and
hydrodealkylation, i.e., β-scission, as well as for the metal catalyzed hydrogenation
reactions.
7.1 Procedures
7.1.1 Experimental conditions
The experimental dataset was obtained on a Pt/H-ZSM-5 zeolite as described in section
2.1.1.4 by Shell in a fixed bed reactor, see section 2.1.2.3. With the Si/Al ratio of the catalyst
equal to 15, the concentration of the acid sites is calculated as 1.7 mol kg-1
[1]. The catalyst
contained a minimal quantity of Pt to avoid deactivation by coking. However, these metallic
sites also result in some, undesired, hydrogenation of the aromatic feed. The range of
reaction conditions tested is give in Table 7-1. The temperature and pressure were varied
between 623 and 673 K and 0.4 and 1.2 MPa. The feed flow contained metaxylene,
orthoxylene, ethylbenzene and hydrogen, but no paraxylene. The ethylbenzene-
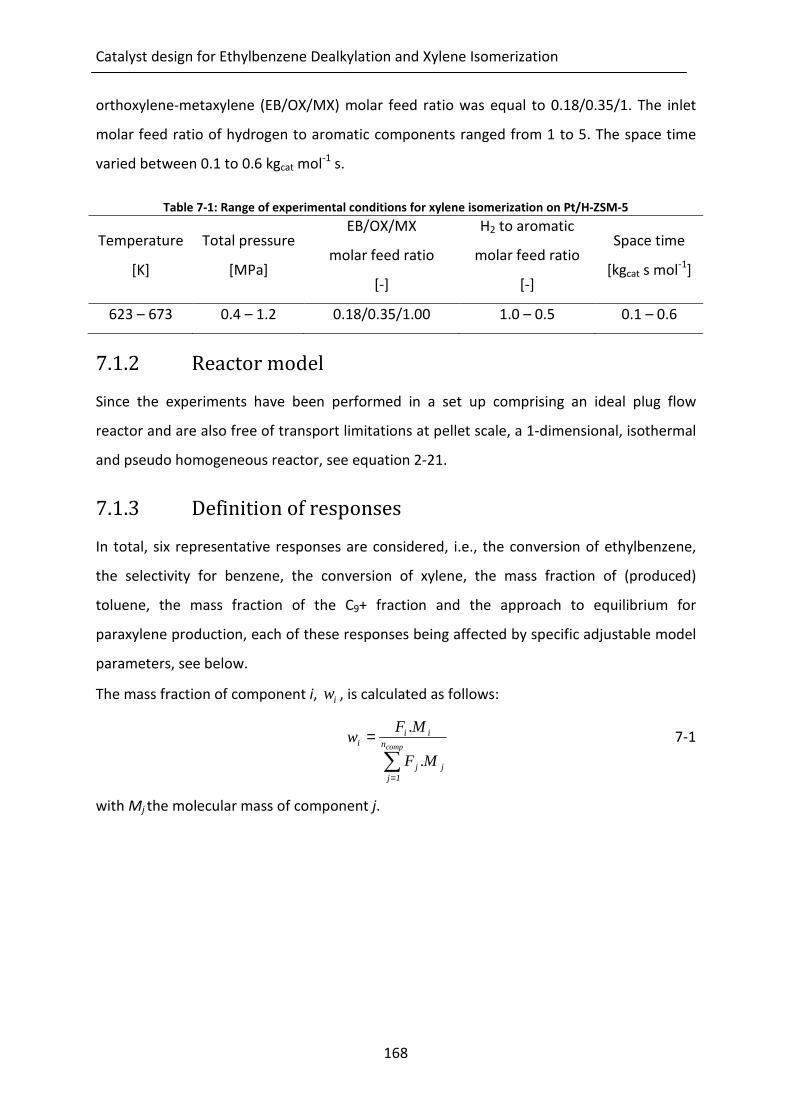
Catalyst design for Ethylbenzene Dealkylation and Xylene Isomerization
168
orthoxylene-metaxylene (EB/OX/MX) molar feed ratio was equal to 0.18/0.35/1. The inlet
molar feed ratio of hydrogen to aromatic components ranged from 1 to 5. The space time
varied between 0.1 to 0.6 kgcat mol-1
s.
Table 7-1: Range of experimental conditions for xylene isomerization on Pt/H-ZSM-5
Temperature
[K]
Total pressure
[MPa]
EB/OX/MX
molar feed ratio
[-]
H2 to aromatic
molar feed ratio
[-]
Space time
[kgcat s mol-1
]
623 – 673 0.4 – 1.2 0.18/0.35/1.00 1.0 – 0.5 0.1 – 0.6
7.1.2 Reactor model
Since the experiments have been performed in a set up comprising an ideal plug flow
reactor and are also free of transport limitations at pellet scale, a 1-dimensional, isothermal
and pseudo homogeneous reactor, see equation 2-21.
7.1.3 Definition of responses
In total, six representative responses are considered, i.e., the conversion of ethylbenzene,
the selectivity for benzene, the conversion of xylene, the mass fraction of (produced)
toluene, the mass fraction of the C9+ fraction and the approach to equilibrium for
paraxylene production, each of these responses being affected by specific adjustable model
parameters, see below.
The mass fraction of component i, iw , is calculated as follows:
∑=
=compn
1jjj
iii
M.F
M.Fw
7-1
with Mj the molecular mass of component j.

Chapter 7
169
The approach to equilibrium, ATE , of component i in lump B is defined as the
approximation of the experimental molar outlet fraction of component i in lump B to the
equilibrium molar outlet fraction of i in lump B. In this context, a lump is defined as a group
of isomers.
∑∑
∑
∑
=
=
=
= ==B,comp
B,comp
B,comp
Bcomp,
n
1jj
in
1ji,j
n
1j
eqj
eqi
n
1jj
i
B,i
F
FK
F
F
F
F
ATE
7-2
with i,jK the equilibrium coefficient between component j and i. In practice this ATE is
calculated for paraxylene within the xylene mixture, i.e., excluding ethylbenzene.
7.2 Xylene isomerization on Pt/H-ZSM-5: proposed reaction
network and observed behavior
ZSM-5 zeolites with significantly different properties and resulting catalytic behavior have
been reported for a variety of chemical conversions. Among others, ZSM-5 is applied in
processes such as methanol conversion to olefins, hydrocracking, xylene isomerization,
amination, catalytic cracking… [2]. Depending on the feed to be converted, ZSM-5 type
zeolites may exhibit pronounced shape selective properties due to their microporous
structure consisting of 10-member sinusoidal rings with dimensions 5.1 by 5.5 nm and 5.3
by 5.6 nm [3]. Particularly for ethylbenzene dealkylation and xylene isomerization, high
selectivities towards paraxylene have been reported for some ZSM-5 samples [4-8]. On
other ZSM-5 samples near thermodynamic equilibrium for the xylene mixture was found to
be established, making shape selectivity irrelevant in those cases [9]. The ZSM-5 zeolite
investigated in the current work did not exhibit any evidence for shape selectivity towards
paraxylene at the investigated operating conditions, i.e., the xylene outlet mixture almost
approached thermodynamic equilibrium with an ATE of approximately 99%. As a result, no
shape selectivity effects are accounted for in the model.
Due to the bifunctional character of the catalyst, both acid and metal catalyzed reactions
have to be considered in the reaction network. However, the acid catalyzed reactions
determine the effluent composition to a large extent. The following acid catalyzed
Catalyst design for Ethylbenzene Dealkylation and Xylene Isomerization
170
elementary reactions have been considered in a mixture consisting of xylene isomers and
ethylbenzene: alkyl shift, transalkylation and dealkylation. The paring reaction has been
proposed by Al-Khattaf as possible reaction pathway towards benzene and light alkenes,
mainly propene [10]. However, in this work, ethane was the abundant light hydrocarbon
originating from ethylbenzene dealkylation and C10+ components were only formed to a
minor extent [11]. Therefore, the paring reaction was not included in the reaction network.
The most likely mechanism for ethylbenzene isomerization into xylenes consecutively
requires aromatic hydrogenation, acid catalyzed isomerization and cycloalkane
dehydrogenation [12]. Because aromatic hydrogenation was experimentally found to be of
minor importance at the investigated conditions, ethylbenzene isomerization into xylenes
was not considered. The molar outlet fraction of cycloalkanes is also low in comparison with
the amount formed at thermodynamic equilibrium, i.e., 5-10%. In the paragraphs 7.2.1.1 to
7.2.1.4, the mechanisms of the reaction families considered in the network are discussed in
some more detail. Paragraph 7.2.1.5 discusses the overall reaction network considered,
including some constraints imposed on the considered components. In paragraph 7.2.2, the
experimental observations are discussed.
7.2.1 Elementary steps and reaction network of xylene
isomerization on Pt/H-ZSM-5
7.2.1.1 Alkyl shift
In principle both methyl and ethyl shifts may occur within the elementary reaction family of
the alkyl shifts. Both 1,2 and 1,3 alkyl shifts have been reported on H-ZSM-5 zeolites [13].
The experiments performed as part of the current work were at conditions where the
thermodynamic equilibrium was approached for the xylene mixture. From the elementary
reaction families considered in the overall network, alkyl shifts are the fastest and, hence, it
is practically impossible to discriminate between 1,2 and 1,3 alkyl shifts. Because a 1,3 alkyl
shift is equivalent with two consecutive 1,2 alkyl shifts it is sufficient to include the 1,2 alkyl
shifts only. A schematic representation of an alkyl shift of a dialkyl substituted aromatic
component is given in Figure 7-1.

Chapter 7
171
R1
R2
+
R1
R2
+
Figure 7-1: Schematic representation of alkyl shift of a dialkyl substituted aromatic component
7.2.1.2 Dealkylation
The dealkylation of ethylbenzene and xylenes can proceed either through an acid catalyzed
mechanism or a metal catalyzed mechanism, i.e., hydrogenolysis. With the catalyst used and
at the operating conditions considered, hydrogenolysis can be neglected [14]. Dealkylation
of xylenes through acid catalysis can be neglected too. The extremely low stability of the
product methyl ion results in huge activation energies for this elementary reaction family
such that its contribution to the overall conversion is negligible. With respect to de-
ethylation, which also involves a rather unstable primary carbenium ion, but less unstable
than the methyl ion produced by de-methylation, it has been reported that the product
alkene, i.e., ethylene, can be instantaneously hydrogenated to ethane in the presence of
platinum and hydrogen [14]. A schematic overview of dealkylation of an alkyl substituted
aromatic component is given in Figure 7-2.
R
+ R++
Figure 7-2: Schematic overview of dealkylation of an alkyl substituted aromatic component
7.2.1.3 Transalkylation
Within the transalkylation reaction family, i.e., intermolecular isomerization, a distinction is
made between transmethylation and transethylation. Transmethylation is reported to occur
at temperatures exceeding 573 K. Several mechanisms for transmethylation are described in
the literature, the one proposed by Guisnet et al. [15] being the most accepted. In this
bimolecular mechanism, an aromatic component interchanges a methyl group with an
aromatic carbenium ion. Globally, the aromatic carbenium ion loses its charge and a methyl
group which both migrate to the aromatic component. The formation of the benzylic
carbocation intermediate is selected as the rate-determining step, which provided the most
globally significant kinetic model. A schematic overview of transalkylation between two
metaxylene molecules is given in Figure 7-3.

Catalyst design for Ethylbenzene Dealkylation and Xylene Isomerization
172
CH3
CH3
+
CH3
CH3
CH3
CH3
CH3
CH3
CH3
CH3
CH3
++ ++
Figure 7-3: Schematic overview of transalkylation between two metaxylene molecules
Because of steric hindrance of the transition state in the medium sized pores of the catalyst,
it can reasonably be assumed that transethylation can only occur via a dealkylation-
realkylation route. Due to the rapid hydrogenation of the ethylene molecules formed [14],
the reethylation step is very unlikely and, hence, trans-ethylation is neglected in the
reaction mechanism. This is justified by the absence of diethyl benzene components in the
reactor effluent.
7.2.1.4 Hydrogenation
Hydrogenation of aromatic components only accounts for less than 1% of the conversion of
the feed mixture. Hence, because the hydrogenation of aromatics is clearly not the major
reaction family in the isomerization of xylene, this reaction is described using a
conventional, literature reported Langmuir Hinshelwood/Hougen Watson type mechanism
[16], see paragraph 7.3.2, rather than using the single-event methodology [17]. A schematic
overview of the total hydrogenation of a dialkyl substituted aromatic component is given in
Figure 7-4.
R1
R2
3H2
R1
R2
+
Figure 7-4: Schematic overview of the total hydrogenation of a dialkyl substituted aromatic component
7.2.1.5 Overall reaction network
The reaction network is generated automatically by means of an in-house computer
algorithm [18-20]. In this algorithm, the molecules are represented using matrices and
arrays. Elementary reactions are represented by performing simple operations on the
reactant matrices. The arrays form a simplified representation of the molecules used for
storage of the automatically generated reaction network.
Chapter 7
173
The reaction network is the result of a compromise between accounting for sufficient detail
and limiting the extent of the network to what is relevant for the description of the
observed data. Considering the discussions in the previous paragraphs, the following
assumptions are made:
a. alkyl shift (intramolecular isomerization, ms): only 1,2 methyl shifts are
included and 1,3 methyl shift and ethyl shifts are neglected due to the
experimental approximation of thermodynamic equilibrium between the
xylene isomers. 1,2 ethyl shifts are not included, see f,
b. dealkylation (β-scission, da): demethylation is neglected due to the very high
instability of the methylcarbocations formed. Only de-ethylation is
considered, with the ethylene formed instantaneously being hydrogenated
into ethane,
c. transalkylation (intermolecular isomerization, ta): transethylation is not
accounted for due to steric hindrance of the transition state in the pores of
H-ZSM-5. Only transmethylation is considered,
d. hdyrogenation (hyd): complete hydrogenation of the aromatic components is
taken into account, i.e., no cycloalkenes are considered.
Some further assumptions are made in order to keep the size of the reaction network
between reasonable limits and in accordance with the experimental observations:
e. the aromatic components can have a maximum of three substituent groups,
leading to a maximum carbon number equal to 10, e.g., 2-ethyl-metaxylene,
f. only one ethyl substituent per component is allowed. As a result, all
necessary alkyl shift isomerization reactions can be captured via 1,2 methyl
shifts,
g. endocyclic β-scissions are not implemented due to the high stability of the
aromatic rings. Moreover, with respect to acyclic components in the reactor
effluent, only the C2 fraction which can be formed by exo-cyclic β-scission
from ethylbenzene was considered,
h. protonation and deprotonation of aromatic components are assumed to be
in quasi-equilibrium,
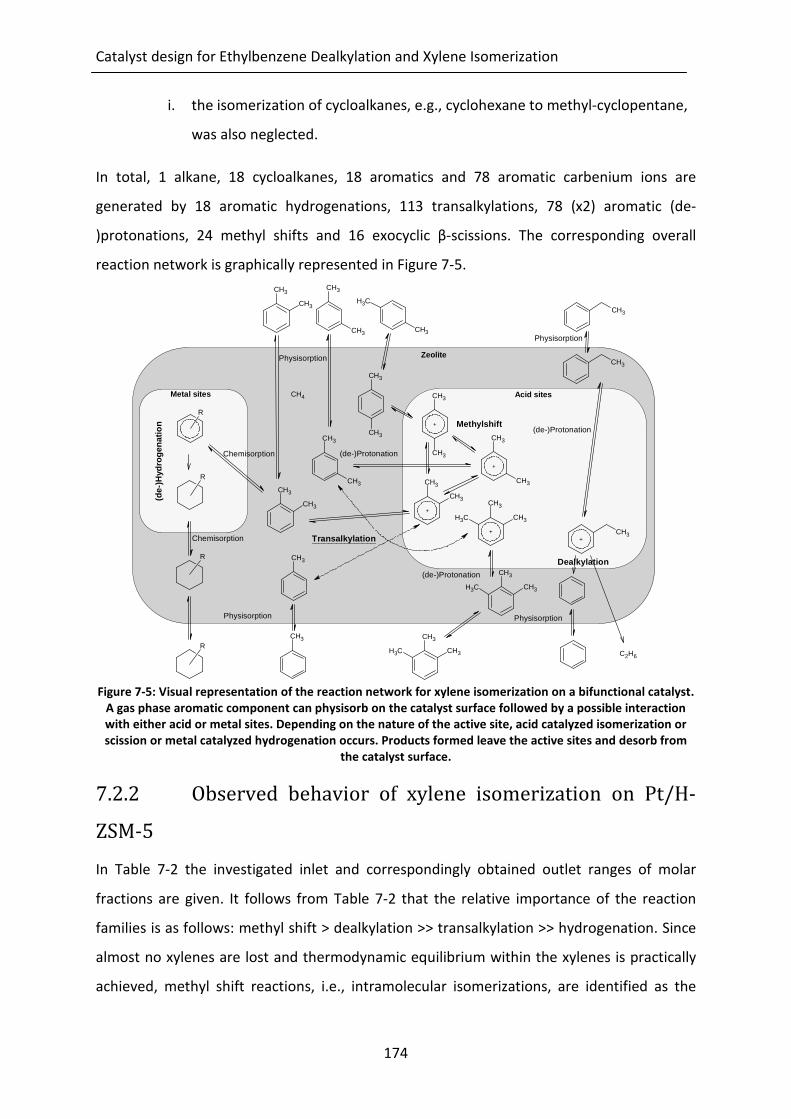
Catalyst design for Ethylbenzene Dealkylation and Xylene Isomerization
174
i. the isomerization of cycloalkanes, e.g., cyclohexane to methyl-cyclopentane,
was also neglected.
In total, 1 alkane, 18 cycloalkanes, 18 aromatics and 78 aromatic carbenium ions are
generated by 18 aromatic hydrogenations, 113 transalkylations, 78 (x2) aromatic (de-
)protonations, 24 methyl shifts and 16 exocyclic β-scissions. The corresponding overall
reaction network is graphically represented in Figure 7-5.
CH3
CH3
CH3
CH3
CH3
CH3
CH3
CH3
CH3
CH3
CH3
CH3
+
CH3
CH3
+
CH3
CH3
+
CH3
CH3
CH3CH3
CH3
C2H6
CH3+
CH3
CH3 CH3
+
CH3
CH3
CH3
Physisorption
Physisorption
(de-)Protonation
Physisorption Physisorption
(de-)ProtonationMethylshift
Dealkylation
(de-
)Hyd
rog
enat
ion
Metal sites Acid sites
Zeolite
CH3
CH3CH3
(de-)Protonation
Chemisorption
Chemisorption
CH3
Transalkylation
R
R
R
R
CH4
Figure 7-5: Visual representation of the reaction network for xylene isomerization on a bifunctional catalyst.
A gas phase aromatic component can physisorb on the catalyst surface followed by a possible interaction
with either acid or metal sites. Depending on the nature of the active site, acid catalyzed isomerization or
scission or metal catalyzed hydrogenation occurs. Products formed leave the active sites and desorb from
the catalyst surface.
7.2.2 Observed behavior of xylene isomerization on Pt/H-
ZSM-5
In Table 7-2 the investigated inlet and correspondingly obtained outlet ranges of molar
fractions are given. It follows from Table 7-2 that the relative importance of the reaction
families is as follows: methyl shift > dealkylation >> transalkylation >> hydrogenation. Since
almost no xylenes are lost and thermodynamic equilibrium within the xylenes is practically
achieved, methyl shift reactions, i.e., intramolecular isomerizations, are identified as the

Chapter 7
175
main reaction that is occurring. Ethylbenzene conversions range from 30 % up to near 100
%. As a result, also dealkylation is a very important reaction family, however, somewhat less
important compared to methyl shifts given the lower ethylbenzene fraction in the feed than
the xylenes fraction. Transalkylation, i.e., intermolecular isomerization and responsible for
the xylene losses, only proceeds to a little extent, as evidenced by the low quantities formed
of toluene and heavy components. From the reactions discussed above, hydrogenation is
occurring to the lowest extent as this can be clearly seen by the very low molar outlet
fractions of hydrogenated products, i.e., cycloalkanes. This hydrogenation activity is the
result of a compromise between avoiding coke formation by hydrogenation of coke
precursors and limiting aromatics, c.q., benzene, losses to cycloalkanes.
Table 7-2: Molar fractions of the components at the inlet and the outlet of the reactor for xylene
isomerization on a bifunctional Pt/H-ZSM-5 catalyst
0y [%]
outletminy [%]
outletmaxy [%]
C6H6 0.0 4.1 10.0
C7H8 0.0 0.3 3.7
EB 12.0 0.8 7.6
XYL (PX) 88.0 (0.0) 81.2 (18.4) 87.0 (19.7)
C9+ (aro) 0.0 0.8 3.2
cyclohexane 0.0 0.2 1.1
7.3 The Single-Event MicroKinetic model for xylene
isomerization on Pt/H-ZSM-5
Using the single-event concept, the number of rate coefficients required to describe the
chemical kinetics in complex mixtures is reduced drastically, see section 2.4. In the case of
aromatic components, the positive charge transferred by the active site towards the
hydrocarbon reactant is assumed to be delocalized over the aromatic ring structure and,
hence, no distinction is made between secondary and tertiary aromatic carbenium ions.
Given the elementary reaction families considered as discussed in Section 7.2, these
assumptions result in a total number of four single-event rate coefficients, i.e., one
equilibrium coefficient for (de)protonation, rpK~
, and three rate coefficients for methyl
shifts, smk~
, transalkylation, tak~
, and dealkylation, adk~
. For the hydrogenation kinetics, a
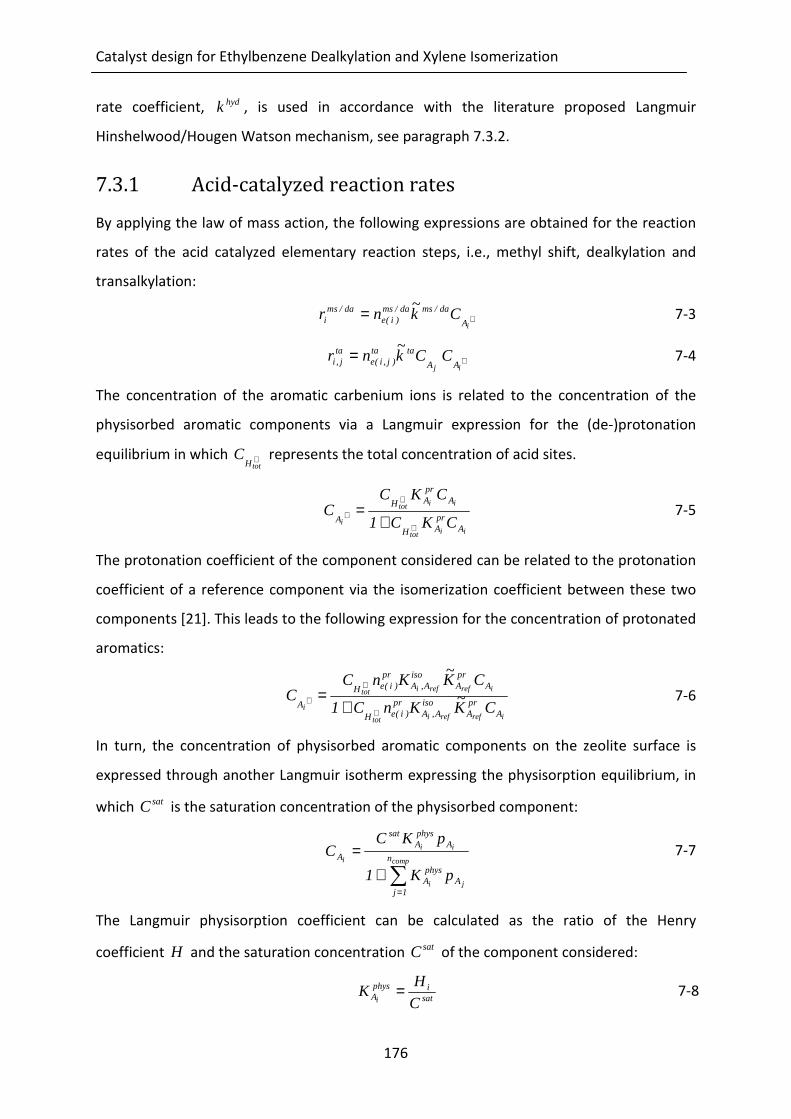
Catalyst design for Ethylbenzene Dealkylation and Xylene Isomerization
176
rate coefficient, hydk , is used in accordance with the literature proposed Langmuir
Hinshelwood/Hougen Watson mechanism, see paragraph 7.3.2.
7.3.1 Acid-catalyzed reaction rates
By applying the law of mass action, the following expressions are obtained for the reaction
rates of the acid catalyzed elementary reaction steps, i.e., methyl shift, dealkylation and
transalkylation:
+=iA
da/msda/ms)i(e
da/smi Ck
~nr
7-3
+=ij AA
tata)j,i(e
taj,i CCk
~nr
7-4
The concentration of the aromatic carbenium ions is related to the concentration of the
physisorbed aromatic components via a Langmuir expression for the (de-)protonation
equilibrium in which +totH
C represents the total concentration of acid sites.
iitot
iitot
iA
prAH
AprAH
A CKC1
CKCC
+
+
+ +=
7-5
The protonation coefficient of the component considered can be related to the protonation
coefficient of a reference component via the isomerization coefficient between these two
components [21]. This leads to the following expression for the concentration of protonated
aromatics:
irefrefitot
irefrefitot
iA
prA
isoA,A
pr)i(eH
AprA
isoA,A
pr)i(eH
A CK~
KnC1
CK~
KnCC
+
+
+ +=
7-6
In turn, the concentration of physisorbed aromatic components on the zeolite surface is
expressed through another Langmuir isotherm expressing the physisorption equilibrium, in
which satC is the saturation concentration of the physisorbed component:
∑=
+=
comp
ji
ii
i n
1jA
physA
AphysA
sat
A
pK1
pKCC
7-7
The Langmuir physisorption coefficient can be calculated as the ratio of the Henry
coefficient H and the saturation concentration satC of the component considered:
sat
iphysA C
HK
i= 7-8
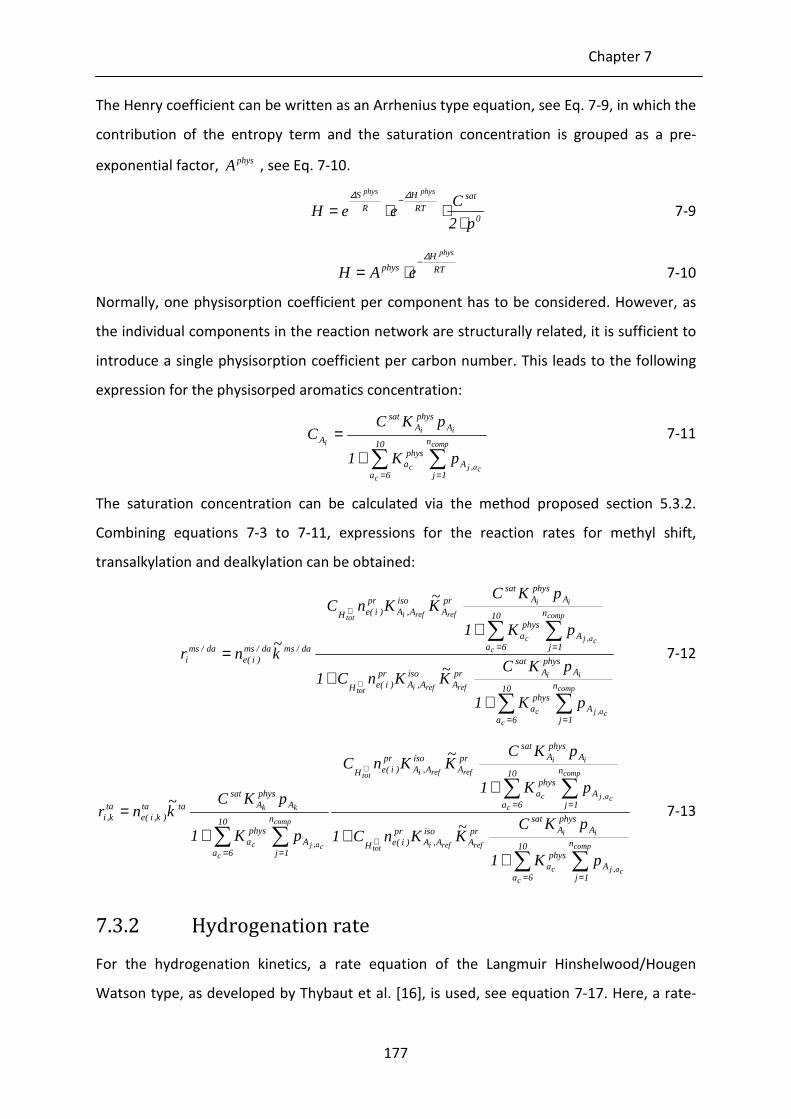
Chapter 7
177
The Henry coefficient can be written as an Arrhenius type equation, see Eq. 7-9, in which the
contribution of the entropy term and the saturation concentration is grouped as a pre-
exponential factor, physA , see Eq. 7-10.
0
satRT
H
R
S
p2
CeeH
physphys
⋅⋅⋅=
− ∆∆
7-9
RT
Hphys
phys
eAH∆−
⋅=
7-10
Normally, one physisorption coefficient per component has to be considered. However, as
the individual components in the reaction network are structurally related, it is sufficient to
introduce a single physisorption coefficient per carbon number. This leads to the following
expression for the physisorped aromatics concentration:
∑∑==
+=
comp
ca,j
c
c
ii
i n
1jA
10
6a
physa
AphysA
sat
A
pK1
pKCC
7-11
The saturation concentration can be calculated via the method proposed section 5.3.2.
Combining equations 7-3 to 7-11, expressions for the reaction rates for methyl shift,
transalkylation and dealkylation can be obtained:
∑∑
∑∑
==
==
++
+=
+
+
comp
ca,j
c
c
ii
refrefitot
comp
ca,j
c
c
ii
refrefitot
n
1jA
10
6a
physa
AphysA
satprA
isoA,A
pr)i(eH
n
1jA
10
6a
physa
AphysA
satprA
isoA,A
pr)i(eH
da/smda/sm)i(e
da/smi
pK1
pKCK~
KnC1
pK1
pKCK~
KnC
k~
nr
7-12
∑∑
∑∑
∑∑
==
==
== ++
+
+=
+
+
comp
ca,j
c
c
ii
refrefitot
comp
ca,j
c
c
ii
refrefitot
comp
ca,j
c
c
kk
n
1jA
10
6a
physa
AphysA
satprA
isoA,A
pr)i(eH
n
1jA
10
6a
physa
AphysA
satprA
isoA,A
pr)i(eH
n
1jA
10
6a
physa
AphysA
sat
tata)k,i(e
tak,i
pK1
pKCK~
KnC1
pK1
pKCK~
KnC
pK1
pKCk~
nr
7-13
7.3.2 Hydrogenation rate
For the hydrogenation kinetics, a rate equation of the Langmuir Hinshelwood/Hougen
Watson type, as developed by Thybaut et al. [16], is used, see equation 7-17. Here, a rate-
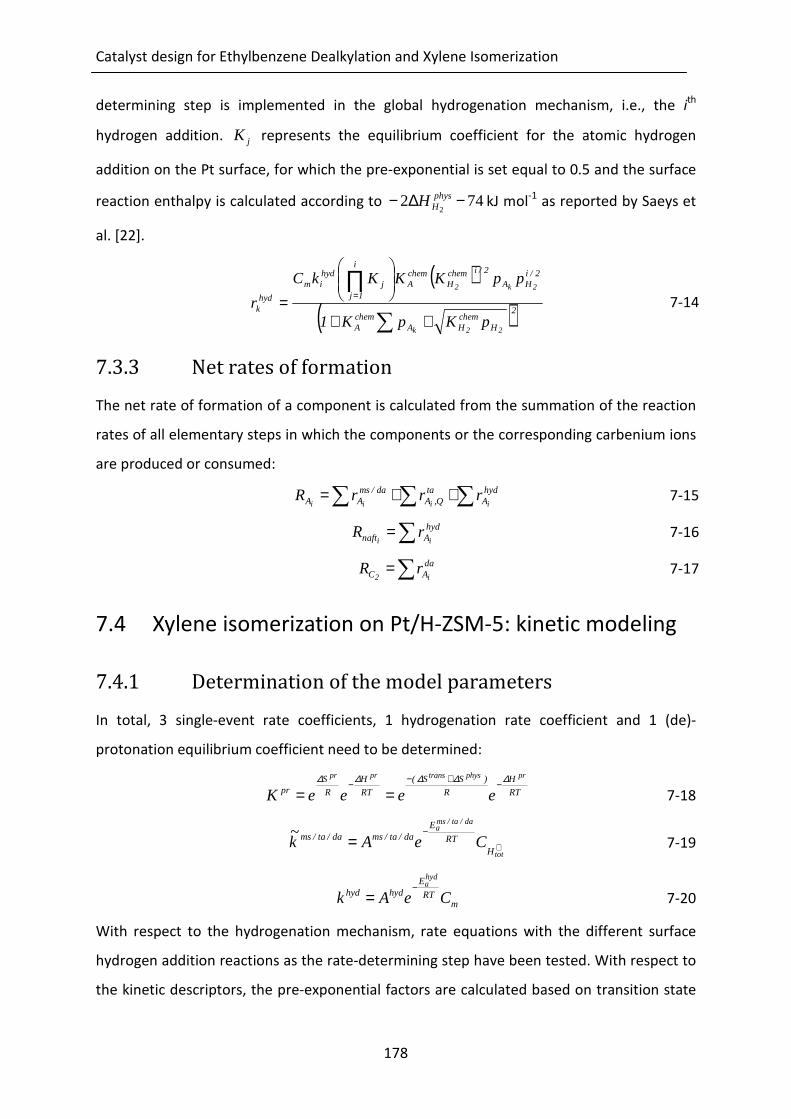
Catalyst design for Ethylbenzene Dealkylation and Xylene Isomerization
178
determining step is implemented in the global hydrogenation mechanism, i.e., the ith
hydrogen addition. jK represents the equilibrium coefficient for the atomic hydrogen
addition on the Pt surface, for which the pre-exponential is set equal to 0.5 and the surface
reaction enthalpy is calculated according to 7422
−∆− physHH kJ mol
-1 as reported by Saeys et
al. [22].
( )
( )2HchemHA
chemA
2/iHA
2/ichemH
chemA
i
1jj
hydim
hydk
22k
2k2
pKpK1
ppKKKkC
r
∑
∏
++
= = 7-14
7.3.3 Net rates of formation
The net rate of formation of a component is calculated from the summation of the reaction
rates of all elementary steps in which the components or the corresponding carbenium ions
are produced or consumed:
∑∑∑ ++= hydA
taQ,A
ad/smAA iiii
rrrR 7-15
∑= hyd
Anaft iirR 7-16
∑= da
AC i2rR 7-17
7.4 Xylene isomerization on Pt/H-ZSM-5: kinetic modeling
7.4.1 Determination of the model parameters
In total, 3 single-event rate coefficients, 1 hydrogenation rate coefficient and 1 (de)-
protonation equilibrium coefficient need to be determined:
RT
H
R
)SS(
RT
H
R
Spr
prphystransprpr
eeeeK∆∆∆∆∆ −+−−
==
7-18
+
−=
tot
da/ta/msa
HRT
Eda/ta/msda/ta/ms CeAk
~
7-19
mRT
Ehydhyd CeAk
hyda−
=
7-20
With respect to the hydrogenation mechanism, rate equations with the different surface
hydrogen addition reactions as the rate-determining step have been tested. With respect to
the kinetic descriptors, the pre-exponential factors are calculated based on transition state

Chapter 7
179
theory and making judicious assumptions on the differences in mobility of the species
involved as reactant and transition state, see paragraph 7.4.1.1. The activation energies of
the elementary reaction families are estimated from regression, see paragraph 7.4.1.3. As
for the catalyst descriptors, the parameters used for the physisorption equilibrium are
determined based on reported values, see paragraph 7.4.1.2, and the protonation enthalpy
is estimated from regression, see paragraph 7.4.1.3.
7.4.1.1 Calculation of the pre-exponential factors
The pre-exponential factors are calculated from transition state theory [23]:
R
SB eh
TkA
≠−
=∆
7-21
with Bk the Boltzmann constant and h the Planck constant. By assessing the entropy
difference between the reacting species and that in the transition state, a priori values can
be obtained for the pre-exponential factors.
For methyl shift reactions, only the internal migration of a methyl group occurs which can
reasonably be assumed not to affect the entropy. Hence, no global change in the number of
degrees of freedom or entropy needs to be accounted for:
h
TkA Bms =
7-22
During dealkylation, the elongation of the bond which is breaking can be regarded as a gain
in entropy corresponding to one translational degree of freedom, which is in agreement
with assumptions made in previous work for acyclic β-scissions [23].
R3
SBda
trans
eh
TkA
∆
=
7-23
For transalkylation, a physisorbed aromatic component is coupled with an aromatic
carbenium ion. During the formation of the transition state, the physisorbed molecule loses
all remaining degrees of freedom, which corresponds to the protonation entropy prS∆ and
can be calculated as ( )phystrans SS ∆∆ −− while one translational degree of freedom is gained
by the elongation of the new bond between the two molecules:
3
S
R
)SS(Bta
transphystrans
eh
TkA
∆∆∆ ++−=
7-24
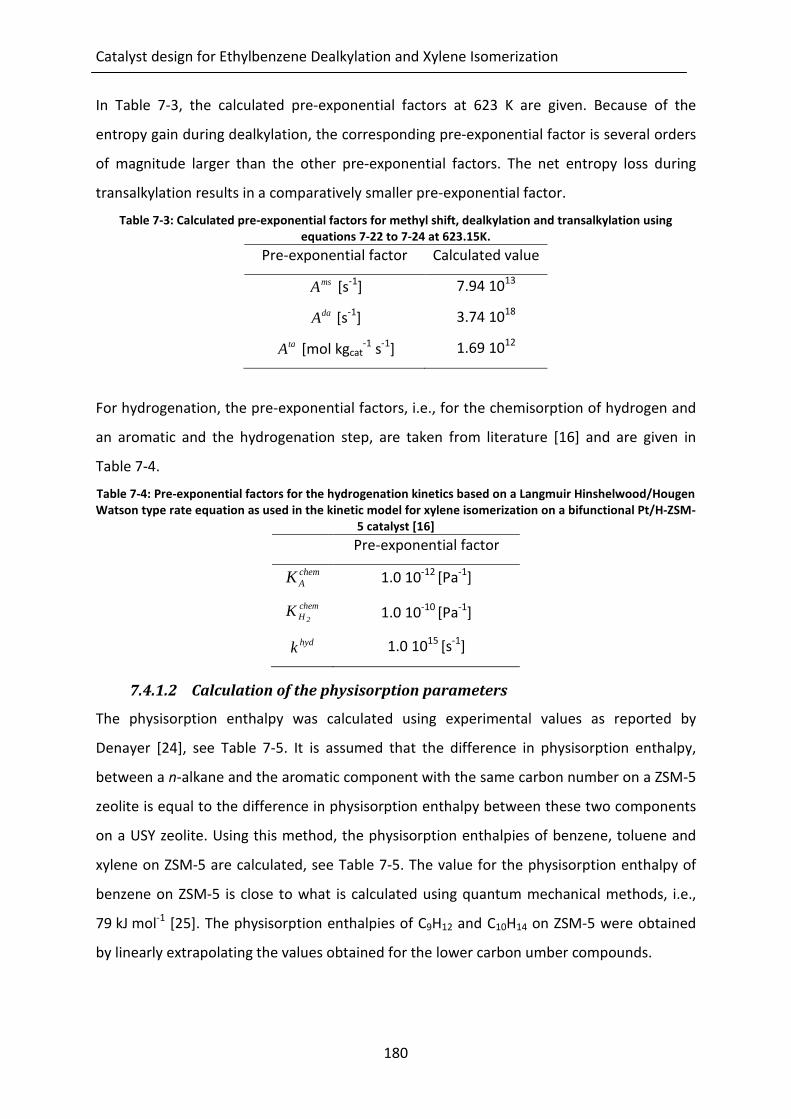
Catalyst design for Ethylbenzene Dealkylation and Xylene Isomerization
180
In Table 7-3, the calculated pre-exponential factors at 623 K are given. Because of the
entropy gain during dealkylation, the corresponding pre-exponential factor is several orders
of magnitude larger than the other pre-exponential factors. The net entropy loss during
transalkylation results in a comparatively smaller pre-exponential factor.
Table 7-3: Calculated pre-exponential factors for methyl shift, dealkylation and transalkylation using
equations 7-22 to 7-24 at 623.15K.
Pre-exponential factor Calculated value
msA [s-1
] 7.94 1013
daA [s-1
] 3.74 1018
taA [mol kgcat-1
s-1
] 1.69 1012
For hydrogenation, the pre-exponential factors, i.e., for the chemisorption of hydrogen and
an aromatic and the hydrogenation step, are taken from literature [16] and are given in
Table 7-4.
Table 7-4: Pre-exponential factors for the hydrogenation kinetics based on a Langmuir Hinshelwood/Hougen
Watson type rate equation as used in the kinetic model for xylene isomerization on a bifunctional Pt/H-ZSM-
5 catalyst [16]
Pre-exponential factor
chemAK 1.0 10
-12 [Pa
-1]
chemH 2
K 1.0 10-10
[Pa-1
]
hydk 1.0 1015
[s-1
]
7.4.1.2 Calculation of the physisorption parameters
The physisorption enthalpy was calculated using experimental values as reported by
Denayer [24], see Table 7-5. It is assumed that the difference in physisorption enthalpy,
between a n-alkane and the aromatic component with the same carbon number on a ZSM-5
zeolite is equal to the difference in physisorption enthalpy between these two components
on a USY zeolite. Using this method, the physisorption enthalpies of benzene, toluene and
xylene on ZSM-5 are calculated, see Table 7-5. The value for the physisorption enthalpy of
benzene on ZSM-5 is close to what is calculated using quantum mechanical methods, i.e.,
79 kJ mol-1
[25]. The physisorption enthalpies of C9H12 and C10H14 on ZSM-5 were obtained
by linearly extrapolating the values obtained for the lower carbon umber compounds.

Chapter 7
181
Table 7-5: Physisorption enthalpies for linear alkanes and aromatic components on USY and ZSM-5 zeolite.
Physisorption enthalpies for linear alkanes on USY and ZSM-5 zeolite and for aromatics on USY zeolite are
reported by Denayer [24]. Physisorption enthalpies for aromatics on ZSM-5 as used in the kinetic model for
xylene isomerization on a bifunctional Pt/H-ZSM-5 catalyst are calculated via (*) and (**).
physH∆ [kJ mol-1
] physH∆ [kJ mol-1
]
USY [24] ZSM-5 [24] USY [24] ZSM-5 (used in the model)
n-C6 43.3 68.8 C6H6 50.2 75.7(*
)
n-C7 50.3 79.6 C7H8 58.4 87.7(*
)
n-C8 56.5 90.7 C8H10 63.6 97.8(*
)
C9H12 - 109.2(**
)
C10H14 - 120.2(**
)
* Calculated via:
−−
−+−−
=−
phys
5ZSM,7
CnHphys
USYTOL,H
phys
5ZSM,7
CnH
phys
5ZSMTOL,H ∆∆∆∆
** Calculated via linear extrapolation
The pre-exponential factor for physisorption, physA , is calculated from the physisorption
entropy, see equations 7-9 and 7-10. The latter is determined assuming that one degree of
freedom is lost during physisorption, see section 4.4.1.1. The calculated pre-exponential
factors are slightly lower than those reported by Denayer on a Y zeolite [24], resulting from
a more negative physisorption entropy, i.e., more stabilization, in a medium pore zeolite,
e.g., ZSM-5, than in a large pore zeolite, e.g., Y.
7.4.1.3 Estimation of the activation energies and protonation enthalpy
In total, 5 parameters are to be estimated by regression, i.e., the protonation enthalpy
( prH∆ ) for the aromatic carbenium ion formation, the activation energies for methyl shift
(msaE ), dealkylation (
daaE ), transalkylation (
taaE ) and the activation energy for
hydrogenation (hydaE ). Initial guesses for these model parameters have been obtained from
the literature [22, 26-28] and lead to a reasonable agreement between experimentally
observed and model calculated responses. The chemisorption enthalpies for aromatics and
hydrogen on the metallic sites are taken from literature [16] and are not adjusted during the
data regression.
The estimated parameter values, along with the corresponding t values are reported in
Table 7-6.

Catalyst design for Ethylbenzene Dealkylation and Xylene Isomerization
182
Table 7-6: Parameter estimates with their 95% confidence intervals and corresponding t and F values
obtained after regression of the kinetic model of xylene isomerization to the experimental data obtained on
a bifunctional Pt/H-ZSM-5 catalyst in which for the hydrogenation kinetics the first hydrogen addition is
taken as the rate determining step (i=1). Literature reported values and ranges are included for comparison.
The model consists of the reactor model (equation 2-21), the reaction rate equations (equations 7-12 to 7-
14) and the net rates of formation (equations 7-15 to 7-17). Values denoted with * are taken from literature
and are not estimated.
Estimated value (i=1)[kJ mol-1
] t value Reported value [kJ mol-1
]
prH∆ -86.8 ± 3.3 26.1 -60 to -100 [28]
msaE 138.4 ± 3.2 43.4 132 [26]
daaE 198.4 ± 3.1 63.6 -
taaE 129.1 ± 3.2 40.4 112 to 121, 139 [27]
hydaE 72.6 ± 0.6 115.9 75 [22]
chemAH∆ * - 70 [16]
chemH 2
H∆ * - 42 [16]
sF value 2.97 104 Tabulated sF value 3.20
Tabulated t value 1.976
The sF value for the global significance of the regression is much higher than the tabulated
value, implying that the regression is globally significant. In addition, each of the individual
parameters is estimated significantly as evidenced by their t values, see Table 7-6. A rather
strong correlation is obtained between the activation energies of all acid catalyzed
reactions, most probably via the standard protonation enthalpy. The highest absolute
correlation, amounting to 0.999 is obtained between the protonation enthalpy and the
dealkylation activation energy. Such a value can be understood from the catalytic cycle in
which ethylbenzene undergoes dealkylation into benzene and ethane. At the investigated
operating conditions, this is a practically irreversible reaction in which a surface
intermediate formed by protonation ( prH∆ ) reacts through dealkylation (daaE ). If the
simulated surface concentration becomes higher because of a more negative protonation
enthalpy, the dealkylation activation energy will compensate for this by becoming higher.
Moreover, the activation energy for dealkylation is the only adjustable parameter that is
exclusively related to the ethylbenzene conversion response. The high correlation
coefficients between the protonation enthalpy and the activation energies for methyl shift
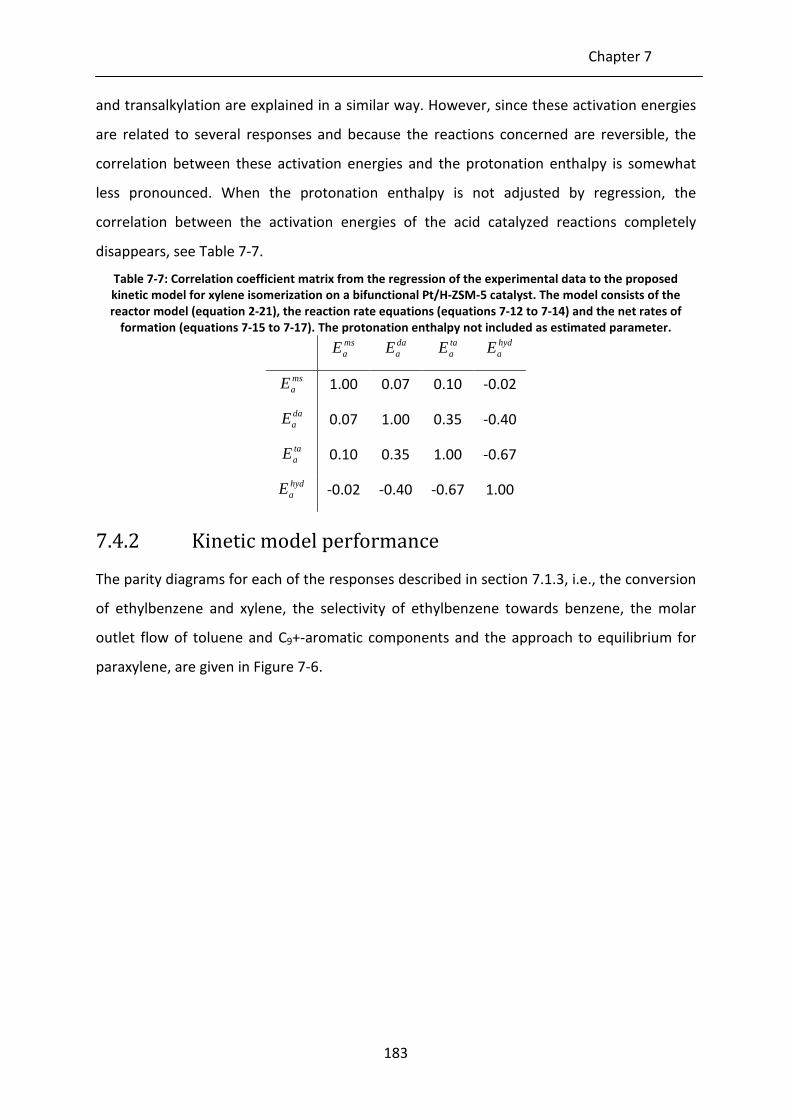
Chapter 7
183
and transalkylation are explained in a similar way. However, since these activation energies
are related to several responses and because the reactions concerned are reversible, the
correlation between these activation energies and the protonation enthalpy is somewhat
less pronounced. When the protonation enthalpy is not adjusted by regression, the
correlation between the activation energies of the acid catalyzed reactions completely
disappears, see Table 7-7.
Table 7-7: Correlation coefficient matrix from the regression of the experimental data to the proposed
kinetic model for xylene isomerization on a bifunctional Pt/H-ZSM-5 catalyst. The model consists of the
reactor model (equation 2-21), the reaction rate equations (equations 7-12 to 7-14) and the net rates of
formation (equations 7-15 to 7-17). The protonation enthalpy not included as estimated parameter.
msaE
daaE
taaE
hydaE
msaE 1.00 0.07 0.10 -0.02
daaE 0.07 1.00 0.35 -0.40
taaE 0.10 0.35 1.00 -0.67
hydaE -0.02 -0.40 -0.67 1.00
7.4.2 Kinetic model performance
The parity diagrams for each of the responses described in section 7.1.3, i.e., the conversion
of ethylbenzene and xylene, the selectivity of ethylbenzene towards benzene, the molar
outlet flow of toluene and C9+-aromatic components and the approach to equilibrium for
paraxylene, are given in Figure 7-6.

Catalyst design for Ethylbenzene Dealkylation and Xylene Isomerization
184
(a) (b)
(c) (d)
(e) (f)
Figure 7-6: Parity diagrams for the responses of the kinetic model for xylene isomerization on a bifunctional
Pt/H-ZSM-5 catalyst: conversion of ethylbenzene (a), benzene selectivity (b), conversion of xylene (c), mass
fraction of toluene (d), mass fraction of C9+-components (e) and approach to equilibrium (ate) of paraxylene
(f). The parity diagrams are obtained using equations 1 to 4 with the molar outlet flow rates determined by
the kinetic model consisting of the reactor model (equation 2-21), the reaction rate equations (equations 7-
15 to 7-17) and the net rates of formation (equations 7-18 to 7-20). See Table 7-6 for the estimated
parameter values and their 95% confidence interval.
30
40
50
60
70
80
90
100
30 40 50 60 70 80 90 100
XEB
-SIM
[%]
XEB-EXP [%]
86
88
90
92
94
96
98
100
86 88 90 92 94 96 98 100
SB
-SIM
[%]
SB-EXP [%]
0
1
2
3
4
5
6
7
8
0 1 2 3 4 5 6 7 8
XX
YL-
SIM
[%]
XXYL-EXP [%]
0
1
2
3
4
0 1 2 3 4
wT
OL
-SIM
[%]
wTOL-EXP [%]
0
1
2
3
4
0 1 2 3 4
wC
9+
-SIM
[%
]
wC9+-EXP [%]
97
97.5
98
98.5
99
99.5
100
97 97.5 98 98.5 99 99.5 100
AT
E PX
-SIM
[%
]
ATEPX-EXP [%]
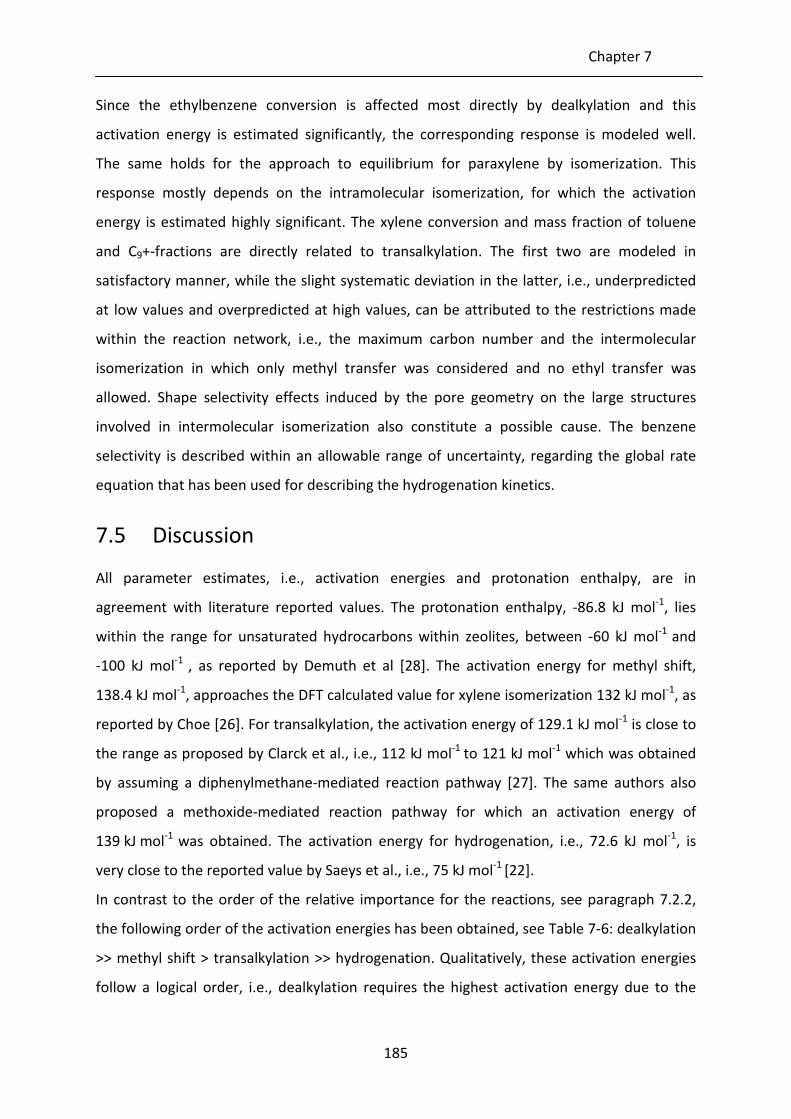
Chapter 7
185
Since the ethylbenzene conversion is affected most directly by dealkylation and this
activation energy is estimated significantly, the corresponding response is modeled well.
The same holds for the approach to equilibrium for paraxylene by isomerization. This
response mostly depends on the intramolecular isomerization, for which the activation
energy is estimated highly significant. The xylene conversion and mass fraction of toluene
and C9+-fractions are directly related to transalkylation. The first two are modeled in
satisfactory manner, while the slight systematic deviation in the latter, i.e., underpredicted
at low values and overpredicted at high values, can be attributed to the restrictions made
within the reaction network, i.e., the maximum carbon number and the intermolecular
isomerization in which only methyl transfer was considered and no ethyl transfer was
allowed. Shape selectivity effects induced by the pore geometry on the large structures
involved in intermolecular isomerization also constitute a possible cause. The benzene
selectivity is described within an allowable range of uncertainty, regarding the global rate
equation that has been used for describing the hydrogenation kinetics.
7.5 Discussion
All parameter estimates, i.e., activation energies and protonation enthalpy, are in
agreement with literature reported values. The protonation enthalpy, -86.8 kJ mol-1
, lies
within the range for unsaturated hydrocarbons within zeolites, between -60 kJ mol-1
and
-100 kJ mol-1
, as reported by Demuth et al [28]. The activation energy for methyl shift,
138.4 kJ mol-1
, approaches the DFT calculated value for xylene isomerization 132 kJ mol-1
, as
reported by Choe [26]. For transalkylation, the activation energy of 129.1 kJ mol-1
is close to
the range as proposed by Clarck et al., i.e., 112 kJ mol-1
to 121 kJ mol-1
which was obtained
by assuming a diphenylmethane-mediated reaction pathway [27]. The same authors also
proposed a methoxide-mediated reaction pathway for which an activation energy of
139 kJ mol-1
was obtained. The activation energy for hydrogenation, i.e., 72.6 kJ mol-1
, is
very close to the reported value by Saeys et al., i.e., 75 kJ mol-1
[22].
In contrast to the order of the relative importance for the reactions, see paragraph 7.2.2,
the following order of the activation energies has been obtained, see Table 7-6: dealkylation
>> methyl shift > transalkylation >> hydrogenation. Qualitatively, these activation energies
follow a logical order, i.e., dealkylation requires the highest activation energy due to the

Catalyst design for Ethylbenzene Dealkylation and Xylene Isomerization
186
bond cleavage between the side chain and the aromatic ring and the formation of a rather
unstable ethylcarbenium ion, with an activation energy amounting to 198.4 kJ mol-1
. The
activation energy for transalkylation is slightly lower than the activation energy for methyl
shift.
The difference in ranking of the reactions according to the relative importance or to the
activation energies is explained by major differences in the pre-exponential factors, see
Table 7-8. The activation energy of dealkylation largely exceeds that of methyl shift.
However, the entropy gain in the case of dealkylation compared to the identical entropy of
the transition state and the reactant in the case of a methyl shift leads to a significantly
higher pre-exponential factor for dealkylation than for methyl shift, finally resulting in
comparable reaction rates at the investigated operating conditions. Similarly, the difference
in importance between methyl shift and transalkylation is explained. During the formation
of the transition state of transalkylation, entropy is lost, resulting in a pre-exponential factor
which is about 105 times lower than the pre-exponential factor of methyl shift. The low
reaction rate for hydrogenation can be explained by the minor amount of metal sites
compared to the total concentration of acid sites. The ethylene formed by ethylbenzene
dealkylation is also strongly competing with the aromatics for the metal sites on the Pt
surface. Moreover, the investigated temperature range in this work is far beyond that in
which a maximum hydrogenation rate can be expected [16].
Table 7-8: Relative pre-exponential factors as determined in the kinetic model for xylene isomerization on a
bifunctional Pt/H-ZSM-5 catalyst, linked to the changes in entropy during the formation of the transition
state
S∆ A
DA > 0 105 Aref
MS 0 Aref
TA < 0 10-5
Aref
HYD - 10-6
Aref
The best regression results have been obtained assuming the first hydrogen addition to be
rate determining, with an sF value over 104. This result is clearly different from the results
obtained by Thybaut et al. [16] who have found the 3rd
or the 4th
surface hydrogen addition
step to be rate determining. This apparent contradiction may be explained, however, by
differences in catalytic material and, mainly, in operating conditions used. The hydrogen to
hydrocarbon inlet molar ratio is rather low, i.e., 1 to 4, compared to 5 to 10 in [16]. More
Chapter 7
187
importantly, the temperature is much higher, i.e., 623 to 673 K in this work compared to
423 to 498 K previously in [16]. This temperature effect will result in lower surface
concentrations of the reactive intermediates and can result in a forward shift of the rate-
determining step in the hydrogenation reaction mechanism as evidenced by the evolution
of the hydrogen partial reaction order with the temperature [16]. Also, the competition
between ethylene and aromatics for hydrogenation on the metal sites could be contributing
to this observation.
7.6 Identification of an optimal catalyst for xylene
isomerization
Having determined the kinetic and the catalyst descriptor values with the SEMK model for
xylene isomerization, the latter descriptors can be the subject of a performance
optimization while the kinetic descriptors are inherent to the elementary reaction families
considered and, hence, invariable. By investigating the effect of the catalyst descriptors on
the simulated performance, an optimized catalyst can be identified. The protonation
enthalpy is taken as the most relevant catalyst descriptor to vary. It corresponds with the
acid strength of the active sites. Whereas, for the present case, not assuming any shape
selectivity effects, the physisorption properties can reasonably be assumed not to vary
much with the Si/Al ratio of the zeolite considered [29], the acid strength of the active sites,
quantified by the standard protonation enthalpy, will evolve with this Si/Al ratio as will the
total acid site concentration. Because a change in the acid site concentration can be
compensated by a change in the space time, it is the effect of the protonation enthalpy that
has been investigated in a wide range from -60 kJ mol-1
to -110 kJ mol-1
, which includes the
value obtained by regression, i.e., -86.8 kJ mol-1
, see Table 7-6. The reaction conditions used
in the simulation are given in Table 7-9.

Catalyst design for Ethylbenzene Dealkylation and Xylene Isomerization
188
Table 7-9: Reaction conditions used in the investigation of the effect of the protonation enthalpy and the
total acid site concentration on the simulated catalyst performance. The model consists of the reactor
model (equation 2-21), the reaction rate equations (equations 7-15 to 7-17) and the net rates of formation
(equations 7-18 to 7-20). All parameter estimates, except the value for the protonation enthalpy, from Table
7-6 are used as input for the simulations.
0MXF [mol s
-1] 4.73 10
-3
0OXF [mol s
-1] 1.67 10
-3
0EBF [mol s
-1] 0.87 10
-3
T [K] 633–673
p [MPa] 1.00
0HC 108
/ FW [kgcat mol-1
s] 0.14
The three most relevant responses have been considered, i.e., the approach to equilibrium
for paraxylene, the benzene yield and the xylene conversion. It is clear that the first two
responses are to be maximized while the last is to be minimized. Hence, a profit function Ψ
is defined, as the product of the benzene yield and the approach to equilibrium for
paraxylene divided by the xylene conversion. The evolution of the three response values as
well as of the profit function with the protonation enthalpy is given in Figure 7-7 at three
different temperatures. For the approach to equilibrium for paraxylene, see Figure 7-7a, a
threshold standard protonation enthalpy of about -70 kJ mol-1
, is needed to initiate the
xylene isomerization and between -80 to -85 kJ mol-1
is required to reach the equilibrium.
With increasing temperature, isomerization will occur at the same rate with slightly less
negative standard protonation enthalpies to reach the same approach to equilibrium for
paraxylene.
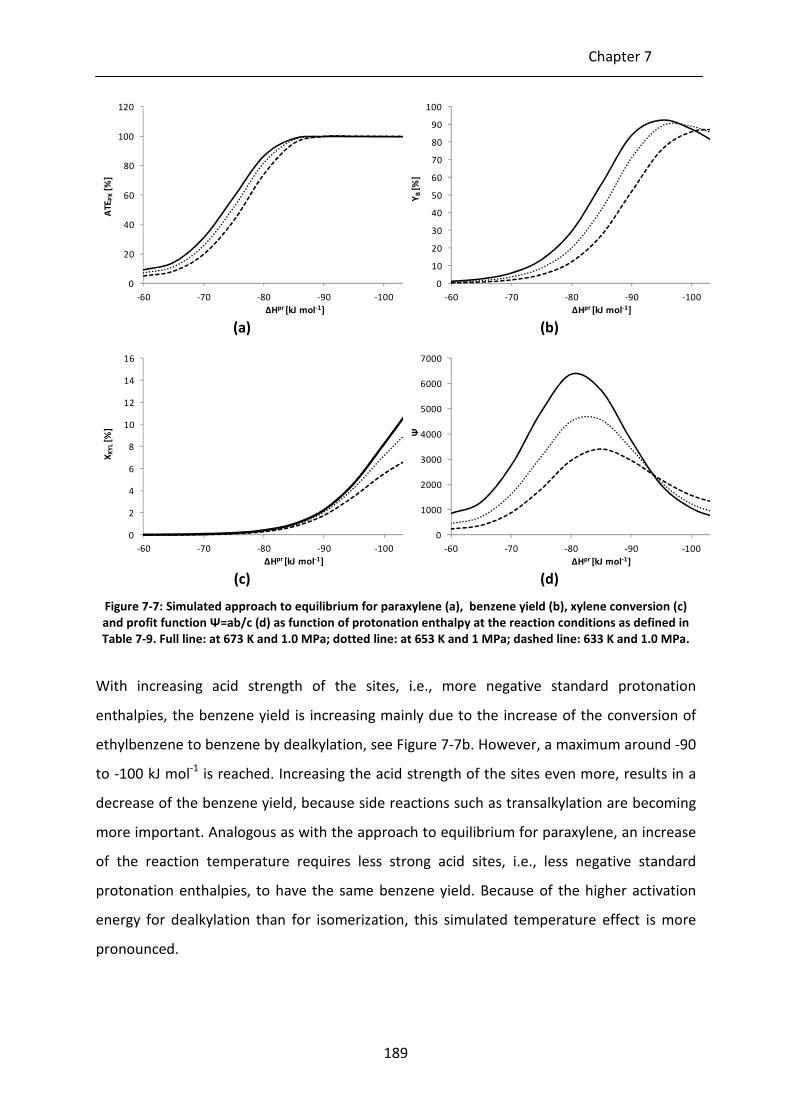
Chapter 7
189
(a) (b)
(c) (d)
Figure 7-7: Simulated approach to equilibrium for paraxylene (a), benzene yield (b), xylene conversion (c)
and profit function Ψ=ab/c (d) as function of protonation enthalpy at the reaction conditions as defined in
Table 7-9. Full line: at 673 K and 1.0 MPa; dotted line: at 653 K and 1 MPa; dashed line: 633 K and 1.0 MPa.
With increasing acid strength of the sites, i.e., more negative standard protonation
enthalpies, the benzene yield is increasing mainly due to the increase of the conversion of
ethylbenzene to benzene by dealkylation, see Figure 7-7b. However, a maximum around -90
to -100 kJ mol-1
is reached. Increasing the acid strength of the sites even more, results in a
decrease of the benzene yield, because side reactions such as transalkylation are becoming
more important. Analogous as with the approach to equilibrium for paraxylene, an increase
of the reaction temperature requires less strong acid sites, i.e., less negative standard
protonation enthalpies, to have the same benzene yield. Because of the higher activation
energy for dealkylation than for isomerization, this simulated temperature effect is more
pronounced.
0
20
40
60
80
100
120
-100-90-80-70-60
AT
EP
X[%
]
ΔHpr [kJ mol-1]
0
10
20
30
40
50
60
70
80
90
100
-100-90-80-70-60
YB
[%]
ΔHpr [kJ mol-1]
0
2
4
6
8
10
12
14
16
-100-90-80-70-60
XX
YL
[%]
ΔHpr [kJ mol-1]
0
1000
2000
3000
4000
5000
6000
7000
-100-90-80-70-60
Ψ
ΔHpr [kJ mol-1]
Catalyst design for Ethylbenzene Dealkylation and Xylene Isomerization
190
For the conversion of xylenes, due to transalkylation reactions, a threshold standard
protonation enthalpy between -90 to -100 kJ mol-1
is required to initiate xylene, i.e., in the
same range of standard protonation enthalpies for which a maximum is obtained in the
benzene yield, see Figure 7-7c. Again, increasing the temperature results in the same level
of conversion of xylene with weaker acid sites.
All these observations are combined in the profit function Ψ, which is visualized in Figure 7-
7d. On a catalyst with only weak acid sites, corresponding to a protonation enthalpy less
negative than -60 kJ mol-1
, few activity is observed corresponding to a low profit. With
increasing acid strength of the active sites, corresponding to standard protonation
enthalpies between -60 and -80 kJ mol-1
, the profit function increases because both the
approach to equilibrium and the benzene yield increase, while the xylene conversion
remains practically negligible. At the investigated operating conditions, with even stronger
acid sites, corresponding to standard protonation enthalpies beyond -80 to -85 kJ mol-1
,
xylene conversion becomes non-negligible, leading to a decrease of the profit function. At
even more negative standard protonation enthalpies, below -90 kJ mol-1
, also the benzene
yield decreases, leading to an even more pronounced decrease of the profit function Ψ. The
maximum in the profit function significantly increases with the reaction temperature. It is a
consequence of the significantly higher activation energy for dealkylation, compared to
transalkylation. The activation energy of the latter reaction is comparable to that of the
isomerization and, hence, no important temperature effect on isomerization versus
transalkylation is simulated. The use of higher temperatures, i.e., 673 K, combined with a
catalysts having acid sites of moderate strength, i.e., standard protonation enthalpies
between -80 and -85 kJ mol-1
are identified as leading to the optimal xylene isomerization
and ethylbenzene dealkylation behavior. The present catalyst, with an estimated standard
protonation enthalpy amounting to -86.8 kJ mol-1
, see Table 7-6, is very close to this optimal
range.
In the present example, the set of variable catalyst descriptors does not include shape
selectivity descriptors, which severely restricts the ability to tune the catalyst. The use of
shape selective catalyst, e.g., ZSM-22 or other ZSM-5 samples, would give a much greater
flexibility to increase the selectivity towards the valuable products [30], but goes beyond the
scope of the present thesis.
Chapter 7
191
7.7 Conclusions
A fundamental Single-Event MicroKinetic (SEMK) model has been constructed for industrial
“ethylbenzene dealkylation / xylene isomerization” on a Pt/H-ZSM-5 catalyst. The model is
able to adequately reproduce the experimental observations in terms of ethylbenzene
conversion, xylenes conversion, benzene selectivity, toluene and C9+ mass fraction,
approach to equilibrium. All model parameters are statistically and physically significant,
i.e., the obtained estimates are in line with literature reported values.
The overall product distribution is mainly governed by methyl shift and dealkylation
reactions while xylene losses via transalkylation and hydrogenation are minimal. The
relative importance of the various reaction families is confirmed by the obtained activation
energies and pre-exponential factors. The high activation energy for dealkylation is
compensated by a high pre-exponential factor, leading to a rate coefficient which is
comparable to that of methyl shift at the considered operating conditions. Transalkylation,
on the other hand, has a much lower pre-exponential factor than the methyl shift due to the
net entropy loss during transition state formation resulting in a lower rate coefficient. The
lesser extent of the hydrogenation reactions is attributed to the limited number of Pt metal
sites as well as to the high temperature and correspondingly low surface concentration of
the reactive intermediates. Also the competition between ethylene and the aromatics for
the Pt metal sites may contribute to this phenomenon.
The application of the SEMK methodology towards xylene isomerization and ethylbenzene
dealkylation illustrates its versatility in the assessment of complex reaction kinetics in
general and that of acid catalyzed reactions in particular. A limited effort on the extension of
the methodology suffices for the development of an adequate model that can be used in
the simulation of industrial reactors and/or the design of new and improved catalysts was
shown. Catalysts with acid sites of moderate strength and used at higher temperatures
optimize the isomerization and dealkylation behavior versus transalkylation.
7.8 References
[1] K.Y. Wang, X.S. Wang, G. Li, Catalysis Communications. 8 (2007) 324-328.
[2] Zeolites and Ordered Mesoporous Materials: Progress and Prospects, Elsevier, 2005.
[3] Database of Zeolite Structures, http://www.iza-structure.org/databases/, 2009.
[4] F. Bauer, E. Bilz, A. Freyer, Applied Catalysis a-General. 289 (2005) 2-9.

Catalyst design for Ethylbenzene Dealkylation and Xylene Isomerization
192
[5] N.Y. Chen, Industrial & Engineering Chemistry Research. 40 (2001) 4157-4161.
[6] A. Iliyas, S. Al-Khattaf, Chemical Engineering Journal. 107 (2005) 127-132.
[7] J.H. Kim, T. Kunieda, M. Niwa, Journal of Catalysis. 173 (1998) 433-439.
[8] S. Morin, P. Ayrault, S. ElMouahid, N.S. Gnep, M. Guisnet, Applied Catalysis a-
General. 159 (1997) 317-331.
[9] T.C. Tsai, I. Wang, C.K. Huang, S.D. Liu, Applied Catalysis a-General. 321 (2007) 125-
134.
[10] S. Al-Khattaf, A. Iliyas, A. Al-Amer, T. Inui, Journal of Molecular Catalysis a-Chemical.
225 (2005) 117-124.
[11] R.F. Sullivan, R.P. Sieg, G.E. Langlois, C.J. Egan, Journal of the American Chemical
Society. 83 (1961) 1156-&.
[12] Y.S. Hsu, T.Y. Lee, H.C. Hu, Industrial & Engineering Chemistry Research. 27 (1988)
942-947.
[13] S. Al-Khattaf, N.M. Tukur, A. Al-Amer, Industrial & Engineering Chemistry Research.
44 (2005) 7957-7968.
[14] J.M. Silva, M.F. Ribeiro, F.R. Ribeiro, E. Benazzi, M. Guisnet, Applied Catalysis a-
General. 125 (1995) 1-14.
[15] M. Guisnet, N.S. Gnep, S. Morin, Microporous and Mesoporous Materials. 35-6
(2000) 47-59.
[16] J.W. Thybaut, M. Saeys, G.B. Marin, Chemical Engineering Journal. 90 (2002) 117-
129.
[17] T. Bera, J.W. Thybaut, G.B. Marin, Industrial & Engineering Chemistry Research, In
Press, doi: 10.1021/ie200541q.
[18] G.F. Froment, Catalysis Today. 52 (1999) 153-163.
[19] G.G. Martens, J.W. Thybaut, G.B. Marin, Industrial & Engineering Chemistry
Research. 40 (2001) 1832-2144.
[20] G. Lozano-Blanco, J.W. Thybaut, K. Surla, P. Galtier, G.B. Marin, Oil & Gas Science and
Technology-Revue de l'Institut Francais du Petrole. 61 (2006) 489-496.
[21] E. Vynckier, G.F. Froment, in: G. Astarita, S.I. Sandler (Eds.), Kinetic and
Thermodynamic Lumping of Multicomponent Mixtures, Elsevier, 1991, p. 131.
[22] M. Saeys, M.F. Reyniers, J.W. Thybaut, M. Neurock, G.B. Marin, Journal of Catalysis.
236 (2005) 129-138.
[23] G.G. Martens, G.B. Marin, J.A. Martens, P.A. Jacobs, G.V. Baroni, Journal of Catalysis.
195 (2000) 253-267.
[24] J.F. Denayer, W. Souverijns, P.A. Jacobs, J.A. Martens, G.V. Baron, Journal of Physical
Chemistry B. 102 (1998) 4588-4597.
[25] R. Rungsirisakun, B. Jansang, P. Pantu, J. Limtrakul, Journal of Molecular Structure.
733 (2005) 239-246.
[26] J.C. Choe, Chemical Physics Letters. 435 (2007) 39-44.
[27] L.A. Clark, M. Sierka, J. Sauer, Journal of the American Chemical Society. 126 (2004)
936-947.
[28] T. Demuth, P. Raybaud, S. Lacombe, H. Toulhoat, Journal of Catalysis. 222 (2004)
323-337.
[29] J.F. Denayer, G.V. Baron, P.A. Jacobs, J.A. Martens, Physical Chemistry Chemical
Physics. 2 (2000) 1007-1014.
[30] I.R. Choudhury, J.W. Thybaut, P. Balasubramanian, J.F.M. Denayer, J.A. Martens, G.B.
Marin, Chemical Engineering Science. 65 (2010) 174-178.
193
Chapter 8
Conclusions and Future Work
An intrinsic kinetics based methodology for multi-scale modeling of chemical reactions has
been developed, applied and validated. Intrinsic kinetics are used to construct (micro)kinetic
models with a sound physical meaning and clear statistical significance. Microkinetic models
tend to account for a large number of components, intermediates and elementary steps.
This opens up opportunities for model based catalyst design and multi-scale modeling but
requires an increased computational effort. The Single-Event MicroKinetic methodology is at
hand to keep the number of adjustable parameters and the computational effort for
regression within tractable limits.
As a proof of concept, the methodology was first developed for n-hexane
hydroisomerization kinetics on Pt/H-ZSM-5. Because of the limited number of components
and elementary steps and the correspondingly rather simple rate equations, it can be used
as a case study in a tutorial for newcomers in the field of reaction engineering. The trade-off
between physical meaning and statistical significance resulted in LHHW-type rate equations
that could practically adequately simulate the experimental data. Limited deviations due to
mass transport effects, which were not sufficiently relevant to account for in this example
case, were at the origin of the ultimate non-adequacy of the model.
The methodology was subsequently applied to intrinsic ethene oligomerization kinetics.
Experimental datasets were acquired on two different Ni-ion containing heterogeneous
catalysts, i.e., Ni-SiO2-Al2O3 and Ni-Beta. Based on the experimental observations, analogies
from homogeneous oligomerization catalysis and free carbenium ion chemistry, a SEMK
model was proposed. The SEMK model was regressed to the experimental data to
determine the unknown parameters. Only a limited number of parameters were allowed to
vary, i.e., the unknown kinetic descriptors for the metal-ion oligomerization steps, and the
catalyst descriptors. All other descriptor values such as the activation energies for the acid

Conclusions and Future Work
194
catalyzed steps were taken from literature. Through model discrimination, the nickel-ethyl
species was determined to be most probably the actual active species for ethene
oligomerization. All parameter estimates were statistically significant and had a sound
physical meaning. Relatively low chain growth probabilities were determined corresponding
to the very selective dimerization of ethene on the nickel-ion sites. Oligomer products do
not undergo further chain growth on the nickel-ions. A too strong adsorption of the heavier
oligomers result in a decrease in oligomerization rate which is ascribed to a decreasing
ethene surface concentration. The resulting model was capable of adequately describing the
experimental data obtained on both catalysts. Based on this SEMK model, a reaction path
analysis was performed in order to elucidate the main reaction pathways. Although acid
sites were present on the catalysts studied, they contributed only marginally to the product
spectrum through isomerization and cracking. The reaction path analysis eventually lead to
several guidelines for catalyst design, tailored to the production of 1-alkenes, propene and
gasoline. The product spectrum is mainly determined by the ratio of the concentration and
strength of the acid and nickel-ion sites. The SEMK model was also used in the construction
of an industrial reactor model. This industrial reactor model included phenomena which are
absent at well-performed lab-scale experiments, e.g., transport phenomena, pressure drop,
condensation… Using this reactor model, an industrial reactor was designed which can
operate within the limits of the OCMOL project.
Xylene isomerization on Pt/H-ZSM-5 was the third bifunctionally catalyzed reaction that was
investigated in this work. A limited, but well-designed experimental dataset from Shell was
used to regress the SEMK model which was extended with reaction families such as
transalkylation and dealkylation to account for the occurring chemistry. Again, all catalyst
and kinetic descriptors were estimated significantly and had a sound physical meaning. Via a
profit function accounting for the paraxylene and benzene yield and xylene losses, it could
be demonstrated that the investigated catalyst exhibited practically the desired steady-state
kinetics behavior.
A PhD maybe is the end of a specific research project but seldom constitutes the
culmination of an entire research programme. It rather generates new opportunities and
perspectives for future work.
Chapter 8
195
Efforts should be made to extend or at least verify if the systematic methodology for kinetic
modeling to other engineering domains. The author is convinced that the concepts and
methodology described in this work are employable in other domains than reaction
engineering. The case study on n-hexane hydroisomerization developed for illustrating the
systematic methodology for kinetic modeling should be distributed as much as possible, i.e.,
through publication(s), master student courses and tailored specialty courses. The case
study illustrates some very particular and difficult concepts using a well described, well
known reaction.
The work on ethene oligomerization could be extended by performing some experiments in
which one of the main products, e.g., butene, is used as (co-)feed. Not only will this lead to a
better understanding of the underlying reaction network but also to an improved estimation
of some of the kinetic parameters. Additionally, the effect of pore geometries could be
investigated. The particular structure of some zeolites, e.g., ZSM-5 and ZSM-22 zeolite,
potentially influences the resulting catalyst performance as it proved to do so with other
chemical reactions, e.g., hydrocracking. This could also be applied to the work on xylene
isomerization, in which the influence of shape-selectivity effects originating from the ZSM-5
framework was not explicitly accounted for. The methodology for investigating the effect of
pore geometry has already been developed and successfully applied in the LCT and
described in literature. However, its application on ethene oligomerization and xylene
isomerization would require an amount of time corresponding to one PhD project.


197
Appendix A: Properties of Pure
Components and Mixtures
In this appendix, an overview is given of all the methods to calculate the properties of pure
components and mixtures as needed in the reactor model described in Chapter 6. In the
reactor model, reference components are chosen to limit the number of physical properties
to be determined. One reference component per carbon number is selected, i.e., the linear
1-alkene.
A.1 Pure component properties
Table A-1 gives the pure reference components critical properties, i.e., critical temperature
cT , pressure cp , volume cV and compressibility factor cZ , other properties, i.e., boiling
point bT , acentric factor ω , molar volume parameter for the HBT correlation *V , molecular
mass wM and dipole moment D for the reference components. Additionally, the critical
properties of nitrogen can also be found in the table.
Table A-1: Critical and other properties of the linear 1-alkenes used as reference components, * determined
by extrapolation
cT
[K]
bT
[K]
cp
[bar]
cV
[cm3 mol
-1]
cZ
[-]
ω
[-]
*V
[l mol-1
]
wM
[g mol-1
]
D
[debye]
C2 282 169 50.4 130 0.280 0.088 0.131 28 0.0
C3 365 225 46.0 181 0.274 0.145 0.183 42 0.4
C4 420 267 40.2 240 0.277 0.192 0.237 56 0.3
C5 470 303 35.3 300 0.310 0.282 0.295 70 0.4
C6 504 337 31.7 350 0.260 0.285 0.351 84 0.4
C7 537 374 28.3 440 0.280 0.394 0.411 98 0.3
C8 567 394 27.7 464 0.260 0.388 0.471 112 0.3

Appendix: Properties of Pure Components an Mixtures
198
C9 592 420 23.4 580 0.280 0.433 0.533 126 0.3*
C10 615 444 22.0 650 0.280 0.498 0.601 140 0.3*
C11 637 466 19.9 735* 0.280* 0.530 0.668 154 0.3*
C12 657 487 18.5 825* 0.280* 0.564 0.734 168 0.3*
N2 126 77 33.9 90 0.290 0.039 - 28 0.0
A.1.1 Heat capacity for gasses Table A-2 gives the coefficients used to determine the heat capacity of gaseous reference
components at a certain temperature T via:
32 DTCTBTAC p +++= A-1
Table A-2: Coefficients for the determination of the heat capacity of the reference components, see Eq. A-1.
Cp [J mol-1
K-1
]
A B C D
C2 3.806 1.566 10-1
-8.348 10-5
1.755 10-8
C3 3.710 2.345 10-1
-1.160 10-4
2.205 10-8
C4 -2.994 3.532 10-1
-1.990 10-4
4.463 10-8
C5 -1.340 10-1
4.329 10-1
-2.317 10-4
4.681 10-8
C6 -1.749 5.309 10-1
-2.903 10-4
6.054 10-8
C7 -3.303 6.297 10-1
-3.512 10-4
7.607 10-8
C8 -4.099 7.239 10-1
-4.036 10-4
8.675 10-8
C9 -3.718 8.122 10-1
-4.509 10-4
9.705 10-8
C10 -4.664 9.077 10-1
-5.058 10-4
1.095 10-7
C11 -5.585 1.003 -5.602 10-4
1.216 10-7
C12 -6.544 1.098 -6.155 10-4
1.341 10-7
N2 3.150 101 -1.357 10
-2 2.680 10
-5 -1.168 10
-8
A.1.2 Heat capacity for liquids For liquids, the heat capacity of a liquid at 293 K can be determined using the Chueh-
Swanson group contribution method [1]. The temperature dependency of the heat capacity
for the liquid component is given by:

Appendix A
199
( )
−+
−++
−++=
irir
iri
irip
lip TT
T
TRCC
,,
31
,
,
0,, 1
742.112.2511.1725.0
1
45.045.1 ω A-2
A.1.3 Vapor pressure Table A-3 gives the coefficients and number of equation used for the determination of the
vapor pressure of the reference components.
−+
−+
−+
−=
0.6
,
0.3
,
5.1
,,
,,, 1111exp
icicicic
icicip T
TD
T
TC
T
TB
T
TA
T
TpV A-3
+−=
CT
BAV ip exp, A-4
Table A-3: Coefficients for the determination of the vapor pressure of the reference components,
see Eqs. A-3 and A-4, * determined by extrapolation
Vp [bar]
A B C D eq.
C2 -6.32055 1.16819 -1.55935 -1.83552 32
C3 -6.64231 1.21857 1.81005 -2.48212 32
C4 -6.88204 1.27051 -2.26284 -2.61632 32
C5 -7.04875 1.17813 2.45105 2.21727 32
C6 -7.76467 2.29843 -4.44302 0.89947 32
C7 -8.26875 3.02688 6.18709 4.33049 32
C8 9.2352 3134.97 -58.00 - 33
C9 -8.30824 2.03357 5.42753 0.95331 32
C10 9.05778 3.06154 7.07236 4.20695 32
C11 9.05778* 3.06154* 7.07236* 4.20695* 32
C12 9.05778* 3.06154* 7.07236* 4.20695* 32
A.2 Mixing rules for (critical) properties
A.2.1 Critical temperature
To determine the critical temperature of a liquid mixture, i.e., l
cmT , the Chueh-Prausnitz
rules are recommended [1]:
∑ ∑= =
=comp comp
m
n
i
n
jijcji
lc TT
1 1,φφ A-5
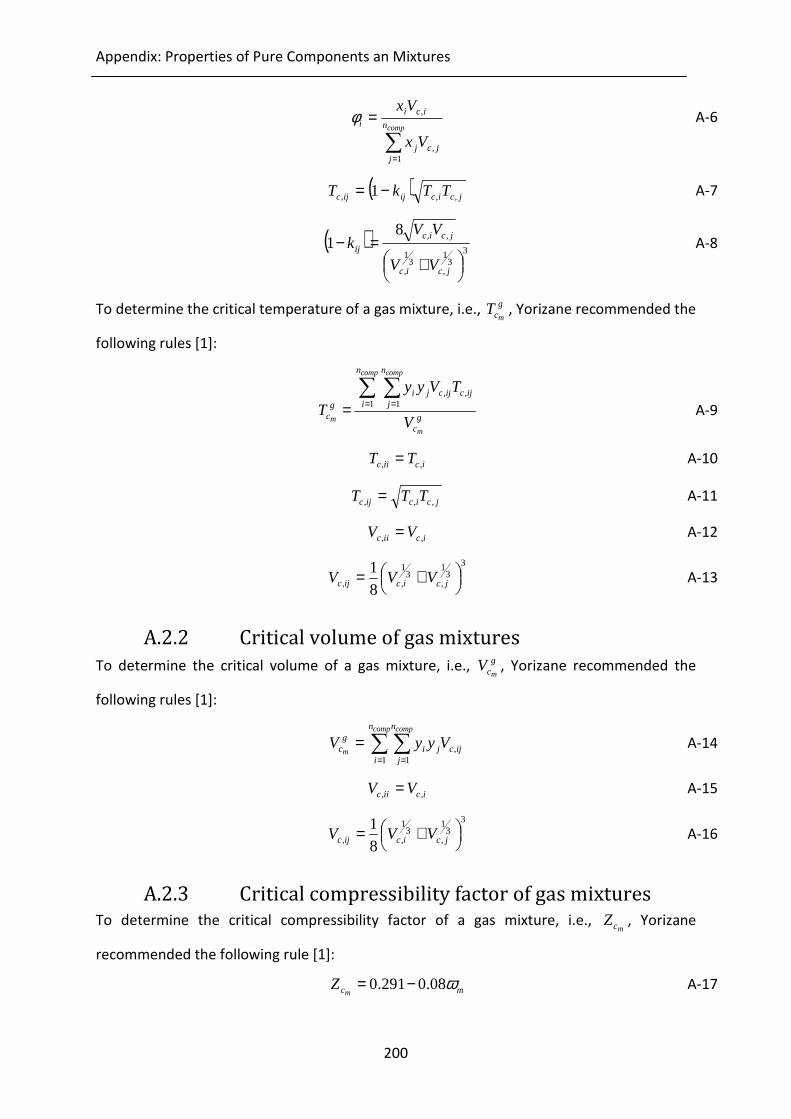
Appendix: Properties of Pure Components an Mixtures
200
∑=
=compn
jjcj
icii
Vx
Vx
1,
,φ A-6
( ) jcicijijc TTkT ,,, 1−= A-7
( )3
31
,3
1
,
,,81
+
=−jcic
jcic
ij
VV
VVk A-8
To determine the critical temperature of a gas mixture, i.e., g
cmT , Yorizane recommended the
following rules [1]:
g
c
n
i
n
jijcijcji
gc
m
comp comp
m V
TVyy
T∑ ∑
= == 1 1,,
A-9
iciic TT ,, = A-10
jcicijc TTT ,,, = A-11
iciic VV ,, = A-12
3
31
,3
1
,, 8
1
+= jcicijc VVV A-13
A.2.2 Critical volume of gas mixtures
To determine the critical volume of a gas mixture, i.e., g
cmV , Yorizane recommended the
following rules [1]:
∑ ∑= =
=comp comp
m
n
i
n
jijcji
gc VyyV
1 1, A-14
iciic VV ,, = A-15
3
31
,3
1
,, 8
1
+= jcicijc VVV A-16
A.2.3 Critical compressibility factor of gas mixtures
To determine the critical compressibility factor of a gas mixture, i.e., mcZ , Yorizane
recommended the following rule [1]:
mcmZ ω08.0291.0 −= A-17

Appendix A
201
A.2.4 Critical pressure of gas mixtures
To determine the critical pressure of a gas mixture, i.e., mcp , Yorizane recommended the
following rule [1]:
m
mm
mc
ccc V
RTZp = A-18
A.2.5 Molecular mass of mixtures
To determine the critical molecular mass of a gas or liquid mixture, i.e., mM , Yorizane
recommended resp. the following rules [1]:
∑=
=compn
iii
gm MyM
1
A-19
∑=
=compn
iii
lm MxM
1
A-20
A.2.6 Acentric factor of mixtures
To determine the acentric factor of a gas or liquid mixture, i.e., mω , Yorizane recommended
resp. the following rules [1]:
∑=
=compn
iii
gm y
1
ωω A-21
∑=
=compn
iii
lm x
1
ωω A-22
A.3 Volumetric flow rates gQ is the volumetric gas flow rate and is determined by assuming an ideal gas:
p
FRTQ
compn
i
gi
g∑
== 1 A-23
with R the universal gas constant and p the total pressure at a certain point in the reactor.
lQ is the volumetric liquid flow rate and is determined via its molar volume l
mV , see
paragraph A-4:
∑=
=compn
i
li
lml FVQ
1
A-24
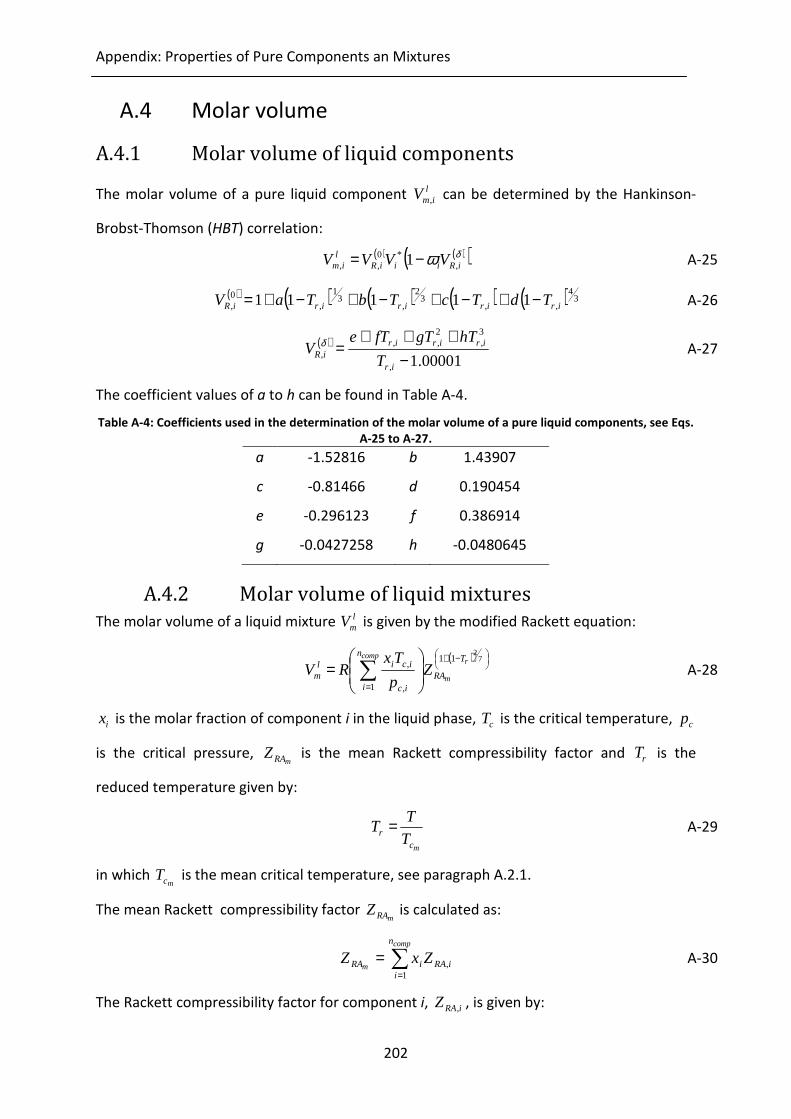
Appendix: Properties of Pure Components an Mixtures
202
A.4 Molar volume
A.4.1 Molar volume of liquid components
The molar volume of a pure liquid component l
imV , can be determined by the Hankinson-
Brobst-Thomson (HBT) correlation:
( ) ( )( )δω iRiiiR
lim VVVV ,
*0,, 1−= A-25
( ) ( ) ( ) ( ) ( ) 3
4
,,3
2
,3
1
,0, 11111 iririririR TdTcTbTaV −+−+−+−+= A-26
( )
00001.1,
3,
2,,
, −+++
=ir
iriririR T
hTgTfTeV δ
A-27
The coefficient values of a to h can be found in Table A-4.
Table A-4: Coefficients used in the determination of the molar volume of a pure liquid components, see Eqs.
A-25 to A-27.
a -1.52816 b 1.43907
c -0.81466 d 0.190454
e -0.296123 f 0.386914
g -0.0427258 h -0.0480645
A.4.2 Molar volume of liquid mixtures
The molar volume of a liquid mixture l
mV is given by the modified Rackett equation:
( )
−+
=
= ∑
72
11
1 ,
, r
m
comp T
RA
n
i ic
icilm Z
p
TxRV A-28
ix is the molar fraction of component i in the liquid phase, cT is the critical temperature, cp
is the critical pressure, mRAZ is the mean Rackett compressibility factor and rT is the
reduced temperature given by:
mcr T
TT = A-29
in which mcT is the mean critical temperature, see paragraph A.2.1.
The mean Rackett compressibility factor mRAZ is calculated as:
∑=
=comp
m
n
iiRAiRA ZxZ
1, A-30
The Rackett compressibility factor for component i, iRAZ , , is given by:
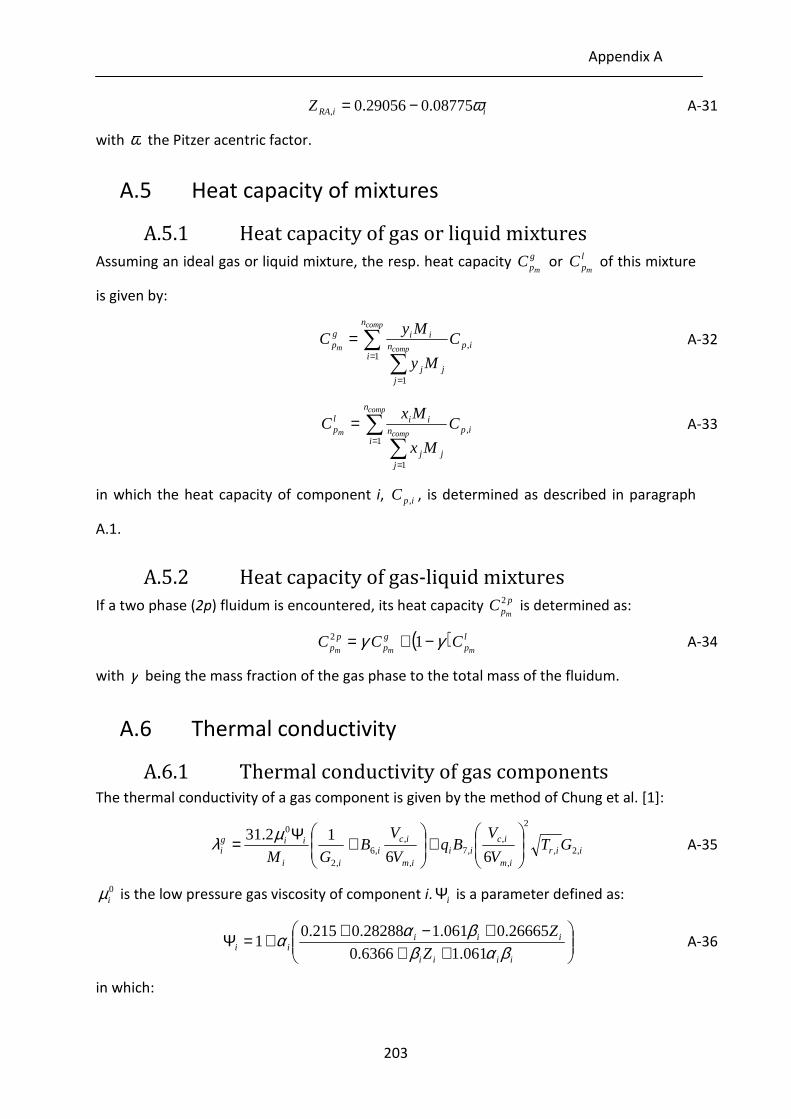
Appendix A
203
iiRAZ ω08775.029056.0, −= A-31
with ω the Pitzer acentric factor.
A.5 Heat capacity of mixtures
A.5.1 Heat capacity of gas or liquid mixtures
Assuming an ideal gas or liquid mixture, the resp. heat capacity gpm
C or lpm
C of this mixture
is given by:
∑∑
=
=
=comp
compm
n
iipn
jjj
iigp C
My
MyC
1,
1
A-32
∑∑
=
=
=comp
compm
n
iipn
jjj
iilp C
Mx
MxC
1,
1
A-33
in which the heat capacity of component i, ipC , , is determined as described in paragraph
A.1.
A.5.2 Heat capacity of gas-liquid mixtures
If a two phase (2p) fluidum is encountered, its heat capacity p
pmC 2
is determined as:
( ) lp
gp
pp mmm
CCC γγ −+= 12 A-34
with γ being the mass fraction of the gas phase to the total mass of the fluidum.
A.6 Thermal conductivity
A.6.1 Thermal conductivity of gas components The thermal conductivity of a gas component is given by the method of Chung et al. [1]:
iirim
icii
im
ici
ii
iigi GT
V
VBq
V
VB
GM ,2,
2
,
,,7
,
,,6
,2
0
66
12.31
+
+Ψ= µλ A-35
0iµ is the low pressure gas viscosity of component i. iΨ is a parameter defined as:
+++−++=Ψ
iiii
iiiii Z
Z
βαββαα061.16366.0
26665.0061.128288.0215.01 A-36
in which:
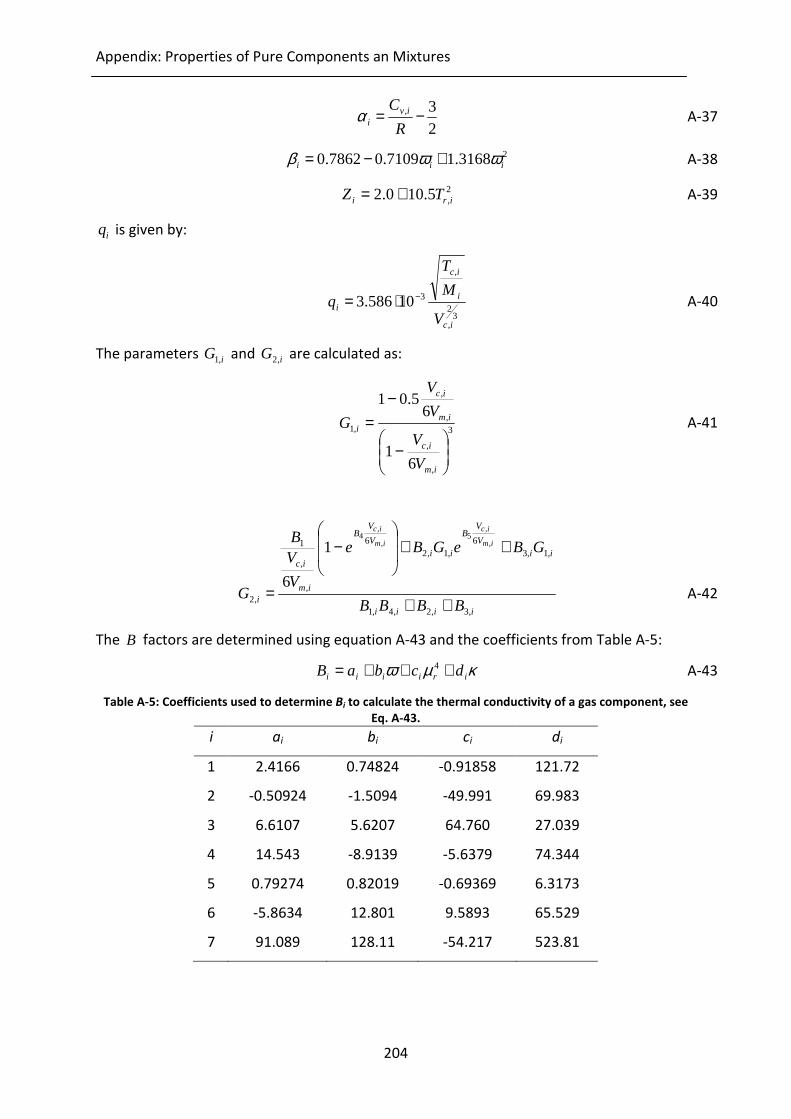
Appendix: Properties of Pure Components an Mixtures
204
2
3, −=R
C iviα A-37
23168.17109.07862.0 iii ωωβ +−= A-38
2,5.100.2 iri TZ += A-39
iq is given by:
3
2
,
,
310586.3ic
i
ic
i
V
M
T
q −⋅= A-40
The parameters iG ,1 and iG ,2 are calculated as:
3
,
,
,
,
,1
61
65.01
−
−=
im
ic
im
ic
i
V
V
V
V
G A-41
iiii
iiV
VB
iiV
VB
im
ic
i BBBB
GBeGBe
V
VB
G
im
ic
im
ic
,3,2,4,1
,1,36
,1,26
,
,
1
,2
,
,5
,
,4
1
6
++
++
−
= A-42
The B factors are determined using equation A-43 and the coefficients from Table A-5:
κµω iriiii dcbaB +++= 4 A-43
Table A-5: Coefficients used to determine Bi to calculate the thermal conductivity of a gas component, see
Eq. A-43.
i ai bi ci di
1 2.4166 0.74824 -0.91858 121.72
2 -0.50924 -1.5094 -49.991 69.983
3 6.6107 5.6207 64.760 27.039
4 14.543 -8.9139 -5.6379 74.344
5 0.79274 0.82019 -0.69369 6.3173
6 -5.8634 12.801 9.5893 65.529
7 91.089 128.11 -54.217 523.81
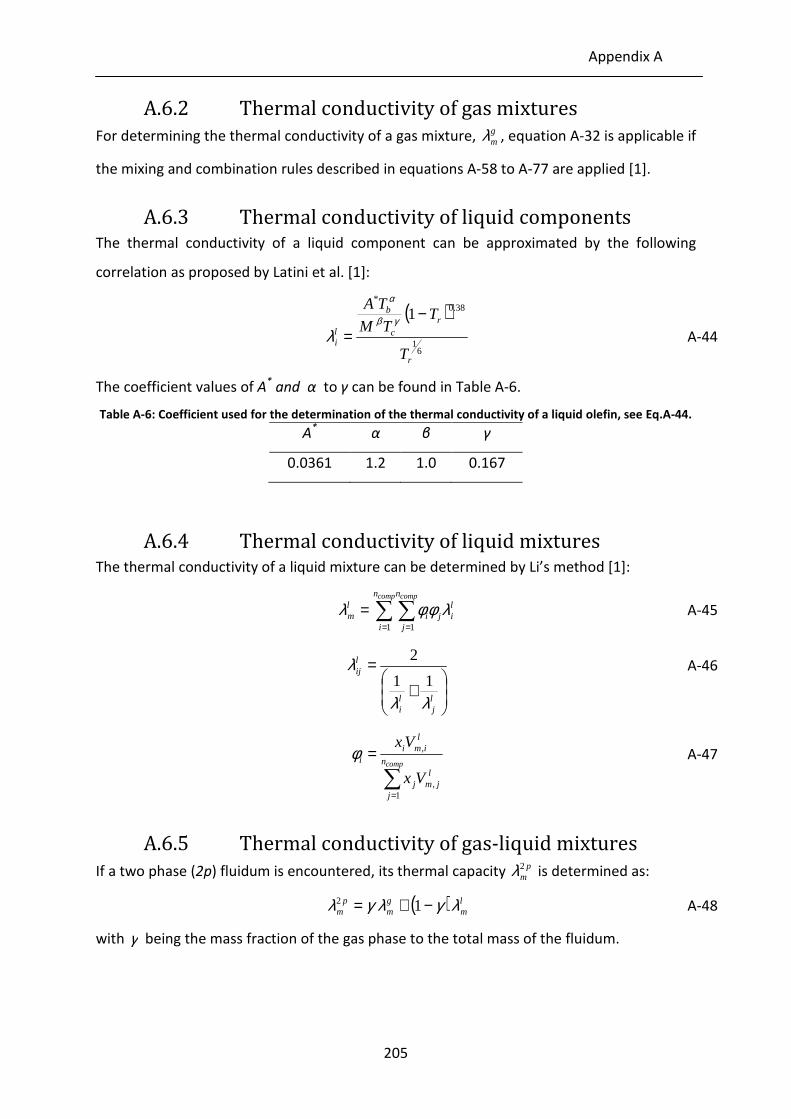
Appendix A
205
A.6.2 Thermal conductivity of gas mixtures
For determining the thermal conductivity of a gas mixture, gmλ , equation A-32 is applicable if
the mixing and combination rules described in equations A-58 to A-77 are applied [1].
A.6.3 Thermal conductivity of liquid components The thermal conductivity of a liquid component can be approximated by the following
correlation as proposed by Latini et al. [1]:
( )
61
38.0*
1
r
rc
b
li
T
TTM
TA −=
γβ
α
λ A-44
The coefficient values of A* and α to γ can be found in Table A-6.
Table A-6: Coefficient used for the determination of the thermal conductivity of a liquid olefin, see Eq.A-44.
A* α β γ
0.0361 1.2 1.0 0.167
A.6.4 Thermal conductivity of liquid mixtures The thermal conductivity of a liquid mixture can be determined by Li’s method [1]:
∑ ∑= =
=comp compn
i
n
j
liji
lm
1 1
λφφλ A-45
+
=
lj
li
lij
λλ
λ11
2 A-46
∑=
=compn
j
ljmj
limi
i
Vx
Vx
1,
,φ A-47
A.6.5 Thermal conductivity of gas-liquid mixtures
If a two phase (2p) fluidum is encountered, its thermal capacity p
m2λ is determined as:
( ) lm
gm
pm λγλγλ −+= 12
A-48
with γ being the mass fraction of the gas phase to the total mass of the fluidum.
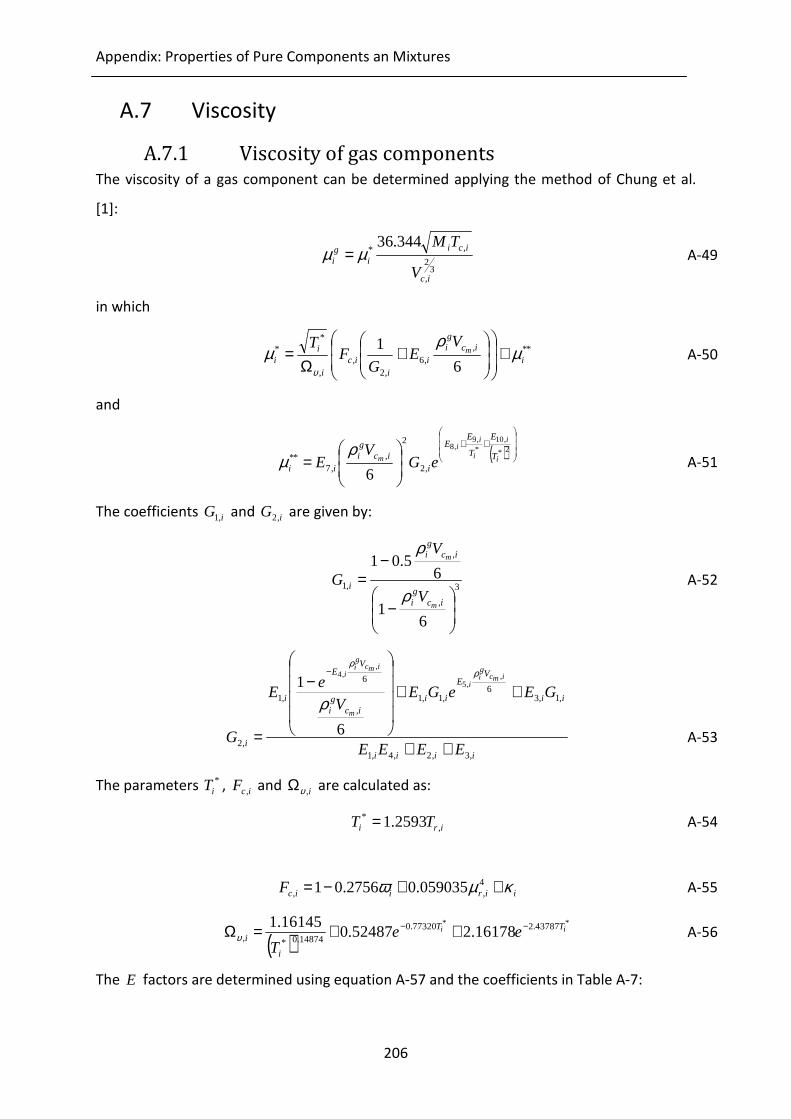
Appendix: Properties of Pure Components an Mixtures
206
A.7 Viscosity
A.7.1 Viscosity of gas components The viscosity of a gas component can be determined applying the method of Chung et al.
[1]:
3
2
,
,*344.36
ic
ici
igi
V
TMµµ = A-49
in which
**,
,6,2
,,
**
6
1i
icgi
ii
ici
ii
mV
EG
FT
µρ
µυ
+
+
Ω= A-50
and
( )
++
=
2*
,10*,9
,8
,2
2
,,7
**
6i
i
i
ii
m T
E
T
EE
iic
gi
ii eGV
Eρ
µ A-51
The coefficients iG ,1 and iG ,2 are given by:
3
,
,
,1
61
65.01
−
−=
icgi
icgi
i
m
m
V
V
Gρ
ρ
A-52
iiii
ii
VE
iiic
gi
VE
i
i EEEE
GEeGEV
eE
G
imcgi
i
m
imcgi
i
,3,2,4,1
,1,36
,1,1,
6
,1
,2
,,5
,,4
6
1
++
++
−
=
− ρρ
ρ
A-53
The parameters *
iT , icF , and i,υΩ are calculated as:
iri TT ,* 2593.1= A-54
iiriicF κµω ++−= 4,, 059035.02756.01 A-55
( )** 43787.277320.0
14874.0*, 16178.252487.016145.1
ii TT
i
i eeT
−− ++=Ωυ A-56
The E factors are determined using equation A-57 and the coefficients in Table A-7:
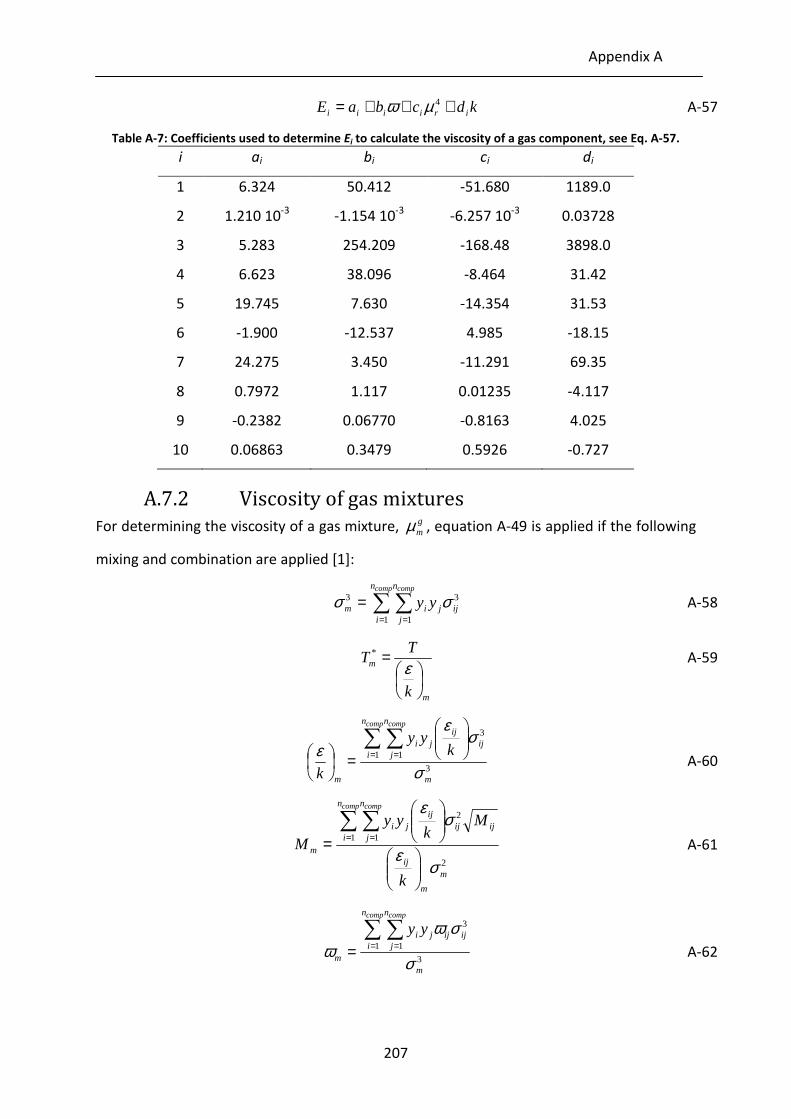
Appendix A
207
kdcbaE iriiii +++= 4µω A-57
Table A-7: Coefficients used to determine Ei to calculate the viscosity of a gas component, see Eq. A-57.
i ai bi ci di
1 6.324 50.412 -51.680 1189.0
2 1.210 10-3
-1.154 10-3
-6.257 10-3
0.03728
3 5.283 254.209 -168.48 3898.0
4 6.623 38.096 -8.464 31.42
5 19.745 7.630 -14.354 31.53
6 -1.900 -12.537 4.985 -18.15
7 24.275 3.450 -11.291 69.35
8 0.7972 1.117 0.01235 -4.117
9 -0.2382 0.06770 -0.8163 4.025
10 0.06863 0.3479 0.5926 -0.727
A.7.2 Viscosity of gas mixtures
For determining the viscosity of a gas mixture, gmµ , equation A-49 is applied if the following
mixing and combination are applied [1]:
∑ ∑= =
=comp compn
i
n
jijjim yy
1 1
33 σσ A-58
m
m
k
TT
=
ε*
A-59
3
1 1
3
m
n
i
n
jij
ijji
m
comp comp
kyy
k σ
σε
ε ∑ ∑= =
=
A-60
2
1 1
2
m
m
ij
n
i
n
jijij
ijji
m
k
Mk
yy
M
comp comp
σε
σε
=∑ ∑
= = A-61
3
1 1
3
m
n
i
n
jijijji
m
comp comp
yy
σ
σωω
∑ ∑= == A-62
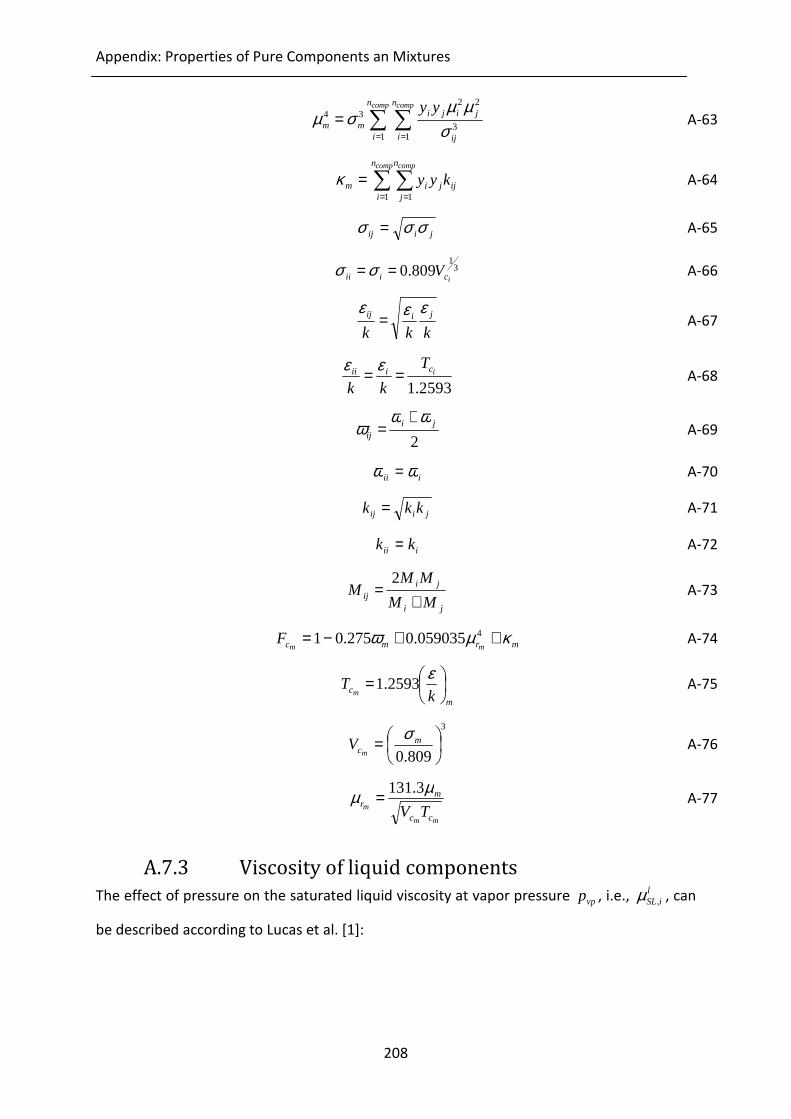
Appendix: Properties of Pure Components an Mixtures
208
∑ ∑= =
=comp compn
i
n
i ij
jijimm
yy
1 13
2234
σµµ
σµ A-63
∑ ∑= =
=comp compn
i
n
jijjim kyy
1 1
κ A-64
jiij σσσ = A-65
31
809.0iciii V== σσ A-66
kkk
jiij εεε= A-67
2593.1
iciiiT
kk== εε
A-68
2
jiij
ωωω
+= A-69
iii ωω = A-70
jiij kkk = A-71
iii kk = A-72
ji
jiij MM
MMM
+=
2 A-73
mrmc mmF κµω ++−= 4059035.0275.01 A-74
m
c kT
m
= ε2593.1 A-75
3
809.0
= mcm
Vσ
A-76
mm
m
cc
mr
TV
µµ 3.131= A-77
A.7.3 Viscosity of liquid components
The effect of pressure on the saturated liquid viscosity at vapor pressure vpp , i.e., l
iSL,µ , can
be described according to Lucas et al. [1]:

Appendix A
209
irii
A
iri
liSL
li PC
PD
i
,
,
, 1
118.2
∆+
∆
=ω
µµ A-78
0513.10523.1
10674.49991.0
03877.0,
4
−⋅−= −
−
iri T
A A-79
( ) 2086.00039.1
3257.02906.0573.2
,
−−
=irT
D A-80
7,
6,
5,
4,
3,
2,,
6719.158127.591209.968291.84
1706.444040.131616.207921.0
iriririr
iririri
TTTT
TTTC
+−+−
+−+−= A-81
ic
ivpir P
PPP
,
,,
−=∆ A-82
The effect of temperature on the viscosity of a liquid component liµ is described as [1]:
( ) ( )233
2661.0
,
2661.0 KliK
li
TT −+= −− µµ A-83
with l
iK ,µ being the viscosity of liquid component i at a temperature of TK Kelvin.
A.7.4 Viscosity of liquid mixtures The viscosity of a liquid mixture can be determined using the method of Grunberg and
Nissan [1]:
+= ∑ ∑∑
= ==
comp compcomp n
i
n
jijji
n
i
lii
lm Gxxx
1 11
lnexp µµ A-84
ijG is an interaction parameter and is function of components i and j and the temperature.
A value for ijG at 298 K can be obtained via a group contribution method proposed by Isdale
et al. [1].
WG jiij +Σ∆−Σ∆= A-85
0=iiG A-86
In which iΣ∆ are the group contribution W is given by:
( ) ( )ji
ji
ji NNNN
NNW −−
+−
= 1188.03161.0 2
A-87
in which iN is the number of carbon atoms in component i.
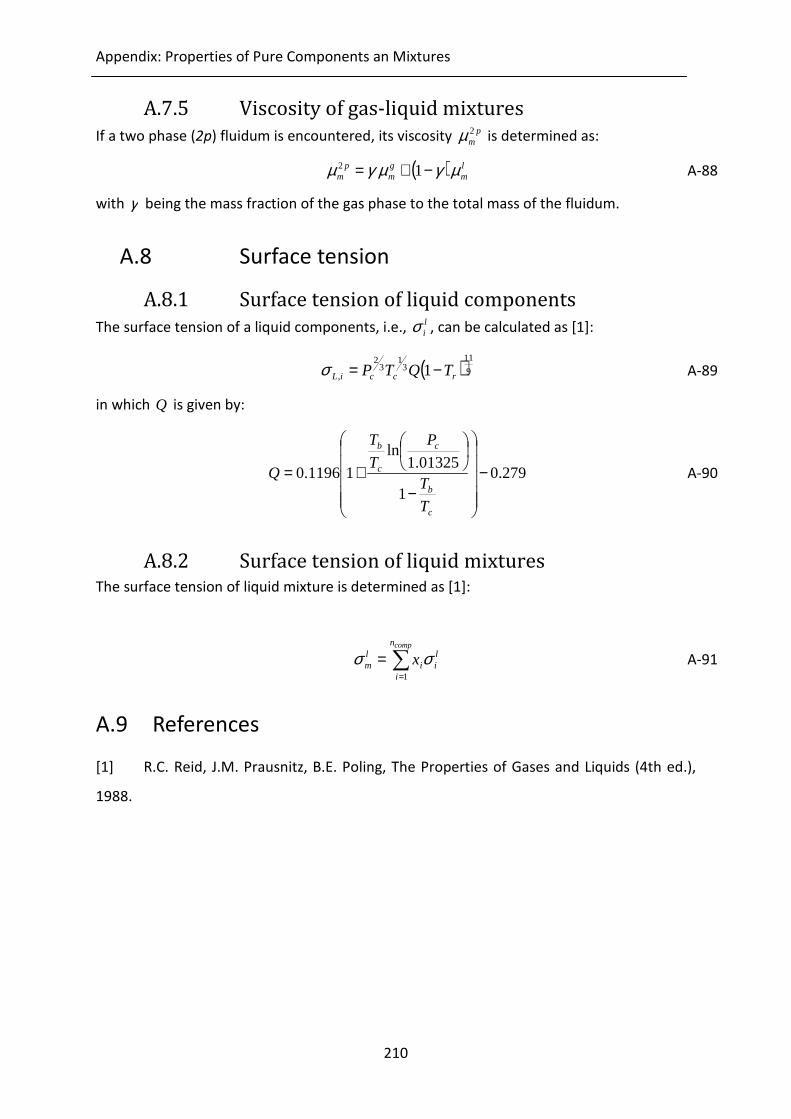
Appendix: Properties of Pure Components an Mixtures
210
A.7.5 Viscosity of gas-liquid mixtures
If a two phase (2p) fluidum is encountered, its viscosity p
m2µ is determined as:
( ) lm
gm
pm µγµγµ −+= 12
A-88
with γ being the mass fraction of the gas phase to the total mass of the fluidum.
A.8 Surface tension
A.8.1 Surface tension of liquid components
The surface tension of a liquid components, i.e., liσ , can be calculated as [1]:
( ) 9
113
13
2
, 1 rcciL TQTP −=σ A-89
in which Q is given by:
279.01
01325.1ln
11196.0 −
−
+=
c
b
c
c
b
T
T
P
T
T
Q A-90
A.8.2 Surface tension of liquid mixtures The surface tension of liquid mixture is determined as [1]:
∑=
=compn
i
lii
lm x
1
σσ A-91
A.9 References
[1] R.C. Reid, J.M. Prausnitz, B.E. Poling, The Properties of Gases and Liquids (4th ed.),
1988.


Related Documents