The assessment of user-perceived web quality: Application of a satisfaction benchmarking approach Evangelos Grigoroudis a, * , Charalambos Litos a , Vassilis A. Moustakis a,b , Yannis Politis a , Loukas Tsironis a a Technical University of Crete, Department of Production Engineering and Management, University Campus, 73100 Chania, Greece b Institute of Computer Science, Foundation for Research and Technology-Hellas (FORTH), Science and Technology Park of Crete, 71110 Heraklion, Greece Available online 3 November 2006 Abstract The assessment of website quality is considered as a problem of measuring user satisfaction, in order to analyse user perceptions and preferences. The presented pilot user satisfaction survey concerns the major cellular phone service provid- ers in Greece. The analysis is based on a multicriteria preference disaggregation approach for satisfaction benchmarking analysis and consists of the following parts: (1) the user satisfaction analysis, which concerns the identification of customer preferences and includes the estimation of the relative importance and the demanding level of the different user satisfaction dimensions, and (2) the satisfaction benchmarking analysis, which is mainly focused on the performance evaluation of the competitive organisations against the satisfaction criteria, as well as the identification of the competitive advantages of each company. The results presented in this paper demonstrate how business organisations may locate their position against competition, pinpoint their weak points and determine which website characteristics will improve their global performance. Ó 2006 Elsevier B.V. All rights reserved. Keywords: Multiple criteria analysis; Website quality; Customer satisfaction; Benchmarking analysis 1. Introduction With the proliferation of websites and the com- mercial Internet invested in them, assessment of website quality has evolved as an important activity. Business organisations throughout the world invest time and money in order to develop and maintain user-perceived quality websites. These websites should provide an effective communication and information channel between companies and their customers. In some cases, they are part of the total product offered, usually providing useful web ser- vices for customers. Evidently, a website should clearly reflect the quality efforts undertaken by a business organisa- tion, given that it is an important part of the connection with the set of customers. Therefore, companies wish to offer quality interfaces to their customers (Dale, 1999). Another important reason for companies to provide high quality websites is 0377-2217/$ - see front matter Ó 2006 Elsevier B.V. All rights reserved. doi:10.1016/j.ejor.2006.09.017 * Corresponding author. Tel.: +30 28210 37346; fax: +30 28210 69410. E-mail address: [email protected] (E. Grigoroudis). Available online at www.sciencedirect.com European Journal of Operational Research 187 (2008) 1346–1357 www.elsevier.com/locate/ejor

Welcome message from author
This document is posted to help you gain knowledge. Please leave a comment to let me know what you think about it! Share it to your friends and learn new things together.
Transcript
Available online at www.sciencedirect.com
European Journal of Operational Research 187 (2008) 1346–1357
www.elsevier.com/locate/ejor
The assessment of user-perceived web quality: Applicationof a satisfaction benchmarking approach
Evangelos Grigoroudis a,*, Charalambos Litos a, Vassilis A. Moustakis a,b,Yannis Politis a, Loukas Tsironis a
a Technical University of Crete, Department of Production Engineering and Management, University Campus, 73100 Chania, Greeceb Institute of Computer Science, Foundation for Research and Technology-Hellas (FORTH), Science and Technology Park of Crete,
71110 Heraklion, Greece
Available online 3 November 2006
Abstract
The assessment of website quality is considered as a problem of measuring user satisfaction, in order to analyse userperceptions and preferences. The presented pilot user satisfaction survey concerns the major cellular phone service provid-ers in Greece. The analysis is based on a multicriteria preference disaggregation approach for satisfaction benchmarkinganalysis and consists of the following parts: (1) the user satisfaction analysis, which concerns the identification of customerpreferences and includes the estimation of the relative importance and the demanding level of the different user satisfactiondimensions, and (2) the satisfaction benchmarking analysis, which is mainly focused on the performance evaluation of thecompetitive organisations against the satisfaction criteria, as well as the identification of the competitive advantages ofeach company. The results presented in this paper demonstrate how business organisations may locate their positionagainst competition, pinpoint their weak points and determine which website characteristics will improve their globalperformance.� 2006 Elsevier B.V. All rights reserved.
Keywords: Multiple criteria analysis; Website quality; Customer satisfaction; Benchmarking analysis
1. Introduction
With the proliferation of websites and the com-mercial Internet invested in them, assessment ofwebsite quality has evolved as an important activity.Business organisations throughout the world investtime and money in order to develop and maintainuser-perceived quality websites. These websites
0377-2217/$ - see front matter � 2006 Elsevier B.V. All rights reserved
doi:10.1016/j.ejor.2006.09.017
* Corresponding author. Tel.: +30 28210 37346; fax: +30 2821069410.
E-mail address: [email protected] (E. Grigoroudis).
should provide an effective communication andinformation channel between companies and theircustomers. In some cases, they are part of the totalproduct offered, usually providing useful web ser-vices for customers.
Evidently, a website should clearly reflect thequality efforts undertaken by a business organisa-tion, given that it is an important part of theconnection with the set of customers. Therefore,companies wish to offer quality interfaces to theircustomers (Dale, 1999). Another important reasonfor companies to provide high quality websites is
.
E. Grigoroudis et al. / European Journal of Operational Research 187 (2008) 1346–1357 1347
the lack of human contact offered, given that inter-action is accomplished purely through technology.Although companies may try to emulate humanbehaviour with technology, the interaction isdifferent because some of its important aspects, likecourtesy, friendliness, helpfulness, care, commit-ment, flexibility, and cleanliness, cannot be replacedwith technology (Cox and Dale, 1999). The absenceof these aspects has to be replaced by better perfor-mance or excellence on specific web factors(Zeithaml, 2002; Palmer, 2002; Iwaarden et al.,2004).
Modern websites present a significant variety offeatures, complexity of structure and pluralityof offered services. As in the case of all informa-tion systems, evaluation is an aspect of theirdevelopment and operation that can contribute tomaximising the exploitation of invested resources(Adelman, 1991). Additionally, website assessmentcan also significantly contribute to their develop-ment that serve user needs and meet the user expec-tations to the maximum possible extend.
A main objective of the presented survey is tostudy the issues introduced, by adopting a qualityoriented approach in website quality assessment.Such an approach considers the website as the‘‘product’’ and the user as the ‘‘customer’’ of theInternet services offered. It focuses on the analysisand assessment of the set of website’s features thataffect the overall user satisfaction (Zhang and vonDran, 2001). These factors influence overall userexperience, and thus, exploring the degree of web-site quality and the expectations anticipated by theusers is the crucial key for further development. Lit-erature on website quality assessment includes theperspectives of a broad range of experts in humanfactors, cognitive psychology and web development,and researches addressing issues associated with thedesign and usability of web products. Traditionalhuman factors offer insights in achieving usableweb-based interfaces. Literature review offershuman factors methodology for designing web pagesand psychology research that can potentially beapplied to web design (Vora, 1998).
The research presented in this paper concerns theanalysis of user-perceived web quality through apilot customer satisfaction survey for the majorcellular phone service providers in Greece. The anal-ysis is based on an ordinal regression approach forsatisfaction benchmarking analysis. The imple-mented MUSA+ method is used in order to assessuser satisfaction and preferences for a set of compet-
itive business organisations. The main objective ofthe method is the aggregation of the preferences ofcompetitive organisations’ customers into a collec-tive value function.
The paper is organised into five sections. Section2 gives briefly the problem of web quality assess-ment and presents an overview of the satisfactioncriteria proposed for website users. The basic princi-ples of the implemented multicriteria preference dis-aggregation approach, as well as the discussion onthe results provided are presented in Section 3, whilethe main results from the user satisfaction bench-marking analysis are described in Section 4. Finally,Section 5 summarises some concluding remarks andgives potential future extensions for the imple-mented methodology.
2. Satisfaction criteria for website users
Several research efforts, in the context of websitequality assessment, are focused on the multi-dimensional nature of the problem (Grose et al.,1998; Vora, 1998; Ivory et al., 2001; Ranganathanand Ganapathy, 2002; Moustakis et al., 2004). Inseveral cases, website quality is related to the levelof user expectations fulfilment (Parasuraman et al.,1985; Gattorna and Walters, 1996; The Interna-tional Academy of Digital Arts and Sciences,2003). Also, the quality standards 14598-3 (ISO,1998a) and 9126-1 (ISO, 1998b) include methodol-ogies for assessing general characteristics for soft-ware usage. These ISO standards capture externalfeatures, but fail to account the internal character-istics arising during the development process(Losavio, 2002).
Furthermore, the SERVQUAL model (Parasur-aman et al., 1985, 1988, 1991) has also been usedfor the website quality assessment. In this context,Iwaarden et al. (2004) present a survey amongst stu-dents at Northeastern and Erasmus Universities inorder to identify the most important quality aspectsin the design and use of websites. The SERVQUALmodel proposes a universal set of quality dimen-sions (tangibles, reliability, responsiveness, assur-ance and empathy), although there is somecriticism for the results of this scale (Lam andWoo, 1997).
In order to achieve high quality websites, design-ers have to firstly understand the different qualitydimensions that affect user expectations, and thenrelate these quality characteristics to specific designfeatures (Zhang and von Dran, 2001).
1348 E. Grigoroudis et al. / European Journal of Operational Research 187 (2008) 1346–1357
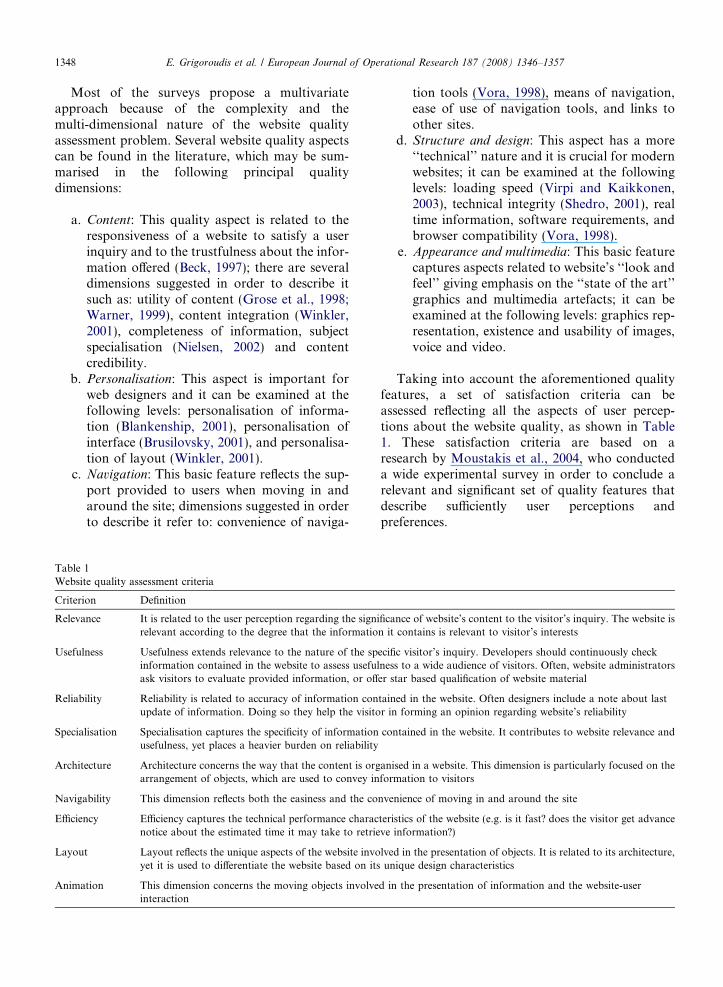
Most of the surveys propose a multivariateapproach because of the complexity and themulti-dimensional nature of the website qualityassessment problem. Several website quality aspectscan be found in the literature, which may be sum-marised in the following principal qualitydimensions:
a. Content: This quality aspect is related to theresponsiveness of a website to satisfy a userinquiry and to the trustfulness about the infor-mation offered (Beck, 1997); there are severaldimensions suggested in order to describe itsuch as: utility of content (Grose et al., 1998;Warner, 1999), content integration (Winkler,2001), completeness of information, subjectspecialisation (Nielsen, 2002) and contentcredibility.
b. Personalisation: This aspect is important forweb designers and it can be examined at thefollowing levels: personalisation of informa-tion (Blankenship, 2001), personalisation ofinterface (Brusilovsky, 2001), and personalisa-tion of layout (Winkler, 2001).
c. Navigation: This basic feature reflects the sup-port provided to users when moving in andaround the site; dimensions suggested in orderto describe it refer to: convenience of naviga-
Table 1Website quality assessment criteria
Criterion Definition
Relevance It is related to the user perception regarding the signrelevant according to the degree that the informatio
Usefulness Usefulness extends relevance to the nature of the spinformation contained in the website to assess usefuask visitors to evaluate provided information, or off
Reliability Reliability is related to accuracy of information conupdate of information. Doing so they help the visito
Specialisation Specialisation captures the specificity of informationusefulness, yet places a heavier burden on reliability
Architecture Architecture concerns the way that the content is orgarrangement of objects, which are used to convey in
Navigability This dimension reflects both the easiness and the co
Efficiency Efficiency captures the technical performance characnotice about the estimated time it may take to retrie
Layout Layout reflects the unique aspects of the website invoyet it is used to differentiate the website based on its
Animation This dimension concerns the moving objects involveinteraction
tion tools (Vora, 1998), means of navigation,ease of use of navigation tools, and links toother sites.
d. Structure and design: This aspect has a more‘‘technical’’ nature and it is crucial for modernwebsites; it can be examined at the followinglevels: loading speed (Virpi and Kaikkonen,2003), technical integrity (Shedro, 2001), realtime information, software requirements, andbrowser compatibility (Vora, 1998).
e. Appearance and multimedia: This basic featurecaptures aspects related to website’s ‘‘look andfeel’’ giving emphasis on the ‘‘state of the art’’graphics and multimedia artefacts; it can beexamined at the following levels: graphics rep-resentation, existence and usability of images,voice and video.
Taking into account the aforementioned qualityfeatures, a set of satisfaction criteria can beassessed reflecting all the aspects of user percep-tions about the website quality, as shown in Table1. These satisfaction criteria are based on aresearch by Moustakis et al., 2004, who conducteda wide experimental survey in order to conclude arelevant and significant set of quality features thatdescribe sufficiently user perceptions andpreferences.
ificance of website’s content to the visitor’s inquiry. The website isn it contains is relevant to visitor’s interests
ecific visitor’s inquiry. Developers should continuously checklness to a wide audience of visitors. Often, website administratorser star based qualification of website material
tained in the website. Often designers include a note about lastr in forming an opinion regarding website’s reliability
contained in the website. It contributes to website relevance and
anised in a website. This dimension is particularly focused on theformation to visitors
nvenience of moving in and around the site
teristics of the website (e.g. is it fast? does the visitor get advanceve information?)
lved in the presentation of objects. It is related to its architecture,unique design characteristics
d in the presentation of information and the website-user

E. Grigoroudis et al. / European Journal of Operational Research 187 (2008) 1346–1357 1349
3. Methodology
3.1. Model development
Customer satisfaction surveys often include col-lection of global and partial satisfaction judgements(for a set of service criteria/attributes/characteris-tics). Benchmarking analysis requires this qualita-tive data set to be expanded in order to includesatisfaction judgement for a set of competitive busi-ness organisations. Thus, satisfaction benchmarkinganalysis is usually a problem of exploring this ordi-nal data set, and evaluating collective measures ofsatisfaction performance.
The MUSA+ method, applied in this research, isan extension of the original MUSA (MUlticriteriaSatisfaction Analysis) method proposed by Grigo-roudis and Siskos (2002) for the case of customerbenchmarking analysis.
The original MUSA method is a multicriteriapreference disaggregation approach, which providesquantitative measures of customer satisfaction con-sidering the qualitative form of customers’ judge-ments. The main objective of the MUSA methodis the aggregation of individual judgements into acollective value function, assuming that client’sglobal satisfaction depends on a set of n criteriaor variables representing service characteristicdimensions.
The method infers an additive collective valuefunction Y* and a set of partial satisfaction func-tions X �i , given customer’s global satisfaction Y
and partial satisfaction Xi according to the ith crite-rion (ordinal scaling). The main objective of themethod is to achieve the maximum consistencybetween the value function Y* and the customers’judgements Y. Based on the modelling of preferencedisaggregation approach, the ordinal regressionequation becomes as follows:
eY � ¼Pni¼1
biX �i � rþ þ r�;
Pni¼1
bi ¼ 1;
8>><>>: ð1Þ
where eY � is the estimation of the global value func-tion Y*, bi is the weight of the ith criterion, n is thenumber of criteria, and r+ and r� are the overesti-mation and the underestimation errors, respectively.It should be noted that the method follows the prin-ciples of ordinal regression analysis under con-straints using linear programming techniques
(Jacquet-Lagreze and Siskos, 1982; Siskos and Yan-nacopoulos, 1985; Siskos, 1985).
The global and partial satisfaction Y* and X �i aremonotone functions normalised in the interval[0,100]. Thus, in order to reduce the size of themathematical program, removing the monotonicityconstraints for Y* and X �i , the following transforma-tion equations are used:
zm ¼ y�mþ1 � y�m for m ¼ 1; 2; . . . ; a� 1;
wik ¼ bix�kþ1i � bix�ki for k ¼ 1; 2; . . . ; ai � 1
and i ¼ 1; 2; . . . ; n;
8><>:
ð2Þ
where y*m is the value of the ym satisfaction level, x�ki
is the value of the xki satisfaction level, and a and ai
are the number of global and partial satisfactionlevels.
In the case of MUSA+, a sample of customershas evaluated all the satisfaction criteria for a setof competitive companies, and the basic estimationmodel can be written as follows:
min½ � F ¼PMj¼1
PTt¼1
rþtj þ r�tj
subject to
Pni¼1
Pqtji�1
k¼1
wik �Pqtj�1
m¼1
zm � rþtj þ r�tj ¼ 0
for j¼ 1;2; . . . ;M and t ¼ 1;2; . . . ;T ;Pa�1
m¼1
zm ¼ 100;
Pni¼1
Pai�1
k¼1
wik ¼ 100;
zm;wik;rþtj ;r�tj P 0 8m; i; j; k; t;
8>>>>>>>>>>>>>>>>>>>><>>>>>>>>>>>>>>>>>>>>:
ð3Þ
where qtj and qtji are the global and partial satisfac-tion judgements of the jth customer for the tth com-pany with yqtj 2 Y ¼ fy1; y2; . . . ; yqtj ; . . . ; yag andx
qtjii 2 X i ¼ fx1
i ; x2i ; . . . ; x
qtjii ; . . . ; xai
i g, M is the numberof customers, and T is the number of competitivecompanies.
Alternative objective functions of LP (3) mayalso be considered, taken into account additionalinformation on the sample of customers or the setof competitive companies. For example, if a differ-ent number of customers have evaluated the set ofcompanies, the error variables may be weightedaccording to the market share of each company:
1350 E. Grigoroudis et al. / European Journal of Operational Research 187 (2008) 1346–1357
F ¼XT
t¼1
Ct
Mt
XM
j¼1
ðrþtj þ r�tj Þ; ð4Þ
where Ct are the sales of the tth company and Mt isthe number of customer evaluating the tth company.
Similarly to the original MUSA method, theapplied model includes also a post optimality anal-ysis stage in order to overcome the problem ofmodel stability. Thus, the final solution of the prob-lem is calculated by exploring multiple or near opti-mal solutions of LP (3) (Grigoroudis and Siskos,2002).
Grigoroudis and Siskos (2004) present an appli-cation of a draft version of MUSA+ method tothe transportation-telecommunications sector. Alsoan analytical presentation of the original MUSAmethod is given by Siskos et al. (1998) and Grigo-roudis and Siskos (2002), while several applicationsof the ordinal regression approach to the customersatisfaction evaluation problem can be found inthe literature (Siskos et al., 1998; Mihelis et al.,2001; Siskos et al., 2001; Siskos and Grigoroudis,2002; Grigoroudis et al., 2002; Politis and Siskos,2004).
3.2. Basic results
The main results of the method are based on theevaluation of criteria weights and the set of addi-tive/marginal value functions (see Grigoroudis andSiskos, 2002):
• The value functions Y*, X �i show the real value(0–100) that customers give for each level of theglobal/marginal ordinal satisfaction scale; theform of these curves indicates the demandinglevel of the customers.
• The estimated weights show the relative impor-tance within a set of criteria; the calculation ofweights, using the main model variables, is basedon expression (2).
Similarly to the original MUSA method, addi-tional results based on global and partial explana-tory analysis may also be obtained. These resultsinclude the average satisfaction indices, the averagedemanding and improvement indices.
The average global and partial satisfaction indi-ces, St and Sti, respectively, for each companyincluded in the survey may be considered as the
basic evaluation performance measures, and theyare assessed through the following equations:
St ¼ 1100
Pam¼1
pmt y�m for t ¼ 1; 2; . . . T ;
Sti ¼ 1100
Pai
k¼1
pktix�ki for i ¼ 1; 2; . . . ; n
and t ¼ 1; 2; . . . T ;
8>>>>><>>>>>:
ð5Þ
where pmt and pk
ti are the frequencies of customersbelonging to the ym and xk
i satisfaction levels, respec-tively, for the tth company. It can be easily observedthat the average satisfaction indices are basically themean value of the global and marginal value functions.
Also, these indices can be included in the basicLP formula (3) assuming that the average globalsatisfaction index is the weighted sum of the partialsatisfaction indices. These additional constraints toLP (3), using formulae (2) and (5), have the follow-ing form:
St ¼Xn
i¼1
biSti ()Xn
i¼1
Xai
k¼2
pkti
Xk�1
d¼1
wid �Xa
m¼2
pmt
�Xm�1
d¼1
zd ¼ 0 for t ¼ 1; 2; . . . ; T : ð6Þ
The shape of global and partial satisfaction func-tions indicates customers’ demanding level. Theseindices are normalised in the interval [�1,1] andrepresent the average deviation of the estimated va-lue functions from a ‘‘normal’’ (linear) curve. Theaverage demanding indices can be used for customerbehaviour analysis, but they can also indicate theextent of company’s improvement efforts: the higherthe value of the demanding index, the more the sat-isfaction level should be improved in order to fulfilcustomers’ expectations.
3.3. Diagrams and mapping
Combining the results presented in the previoussections, a series of perceptual maps can be devel-oped helping to benchmark the set of competitivecompanies and define possible improvementactions, according to customer satisfaction.
The action diagrams, as shown in Fig. 1, combinecriteria weights and average satisfaction indices.They indicate the strong and the weak points of cus-tomer satisfaction, and may define the requiredimprovement efforts. Each of these maps is dividedinto quadrants, according to performance (high/low) and importance (high/low):

Transfer resources(high performance/low importance)
Status quo(low performance/low importance)
Leverage opportunity(high performance/high importance)
Action opportunity(low performance/high importance)
Low High
Low
Hig
h
PER
FOR
MA
NC
E
IMPORTANCE
Fig. 1. Action diagram.
“Struggle” quadrant(high performance/worst than
competition)
Competitive disadvantages(low performance/worst than
competition)
Competitive advantages(high performance/better than
competition)
“Waiting” quadrant(low performance/better than
competition)
Low High
Low
Hig
h
PE
RF
OR
MA
NC
E
COMPARATIVE PERFORMANCE
Fig. 2. Comparative performance diagram.
E. Grigoroudis et al. / European Journal of Operational Research 187 (2008) 1346–1357 1351
a. The strong points of the company are located inthe leverage opportunity quadrant; usually thesesatisfaction criteria can be used as an advantageagainst competition.
b. On the other hand, the weak points are located inthe action opportunity quadrant; this area indi-cates critical satisfaction dimensions that shouldbe improved.
c. The transfer resources quadrant refers to satisfac-tion criteria for which company’s resources maybe better used elsewhere.
d. Usually, no action is required for criteria locatedin the status quo quadrant; however, the companyshould monitor potential changes in customerbehaviour, given the low performance on thesecharacteristics.
The action diagrams may help to gap analysis(Hill, 1996; Woodruff and Gardial, 1996; Vavra,1997) and they are similar to SWOT analysis.
The satisfaction benchmarking analysis is basedon the comparative performance diagrams. Thesediagrams present the average satisfaction indicesof a particular company in relation to the perfor-mance of the other competitive companies. Theyare divided into four quadrants and can be usedas a benchmarking tool in order to assess the perfor-mance of the different characteristics of the com-pany against the competitors (Fig. 2):
a. Competitive advantages: this area indicates thecompetitive advantages of the company.
b. Struggle quadrant: it refers to criteria for whicheven though the company has high performance,it is still lower than the performance of the com-
petitors as there is a high competition. These cri-teria are probably worth to improve, only if theyare important to customers.
c. Competitive disadvantages: this area indicates thecompetitive disadvantages of the company.
d. Waiting quadrant: it shows the criteria for whichthe company has low performance but they arestill better than the competitors. These criterianeed special monitoring as potential changes inthe future may convert them to critical pointsor competitive advantages.
There are alternative comparative performancemeasures that can be used in these diagrams. Theperformance of satisfaction criterion for a particularcompany can be compared with:
• the average of the sector (mean value of the sat-isfaction indices for the total set of competitivecompanies),
• the best company in the market (i.e. the companywith the highest average global satisfactionindex), or
• the best-in-class company (i.e. the company withthe highest satisfaction index in this particularcriterion).
It should be noted that usually a relative form ofthe aforementioned diagrams is used, in order toovercome the problem of assessing the cut-off levelsfor horizontal and vertical axes. In these relativediagrams use the centroid of all points as the cut-off level for the axes (Grigoroudis and Siskos,2002). Furthermore, these relative diagrams are veryuseful, if points are concentrated in a small area
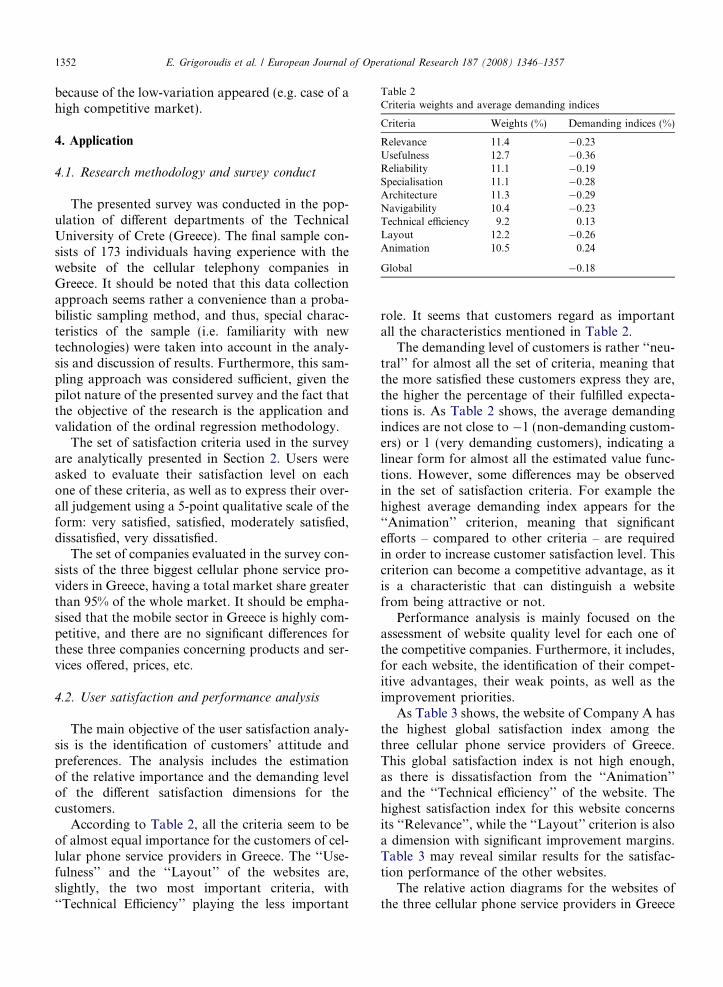
Table 2Criteria weights and average demanding indices
Criteria Weights (%) Demanding indices (%)
Relevance 11.4 �0.23Usefulness 12.7 �0.36Reliability 11.1 �0.19Specialisation 11.1 �0.28Architecture 11.3 �0.29Navigability 10.4 �0.23Technical efficiency 9.2 0.13Layout 12.2 �0.26Animation 10.5 0.24
Global �0.18
1352 E. Grigoroudis et al. / European Journal of Operational Research 187 (2008) 1346–1357
because of the low-variation appeared (e.g. case of ahigh competitive market).
4. Application
4.1. Research methodology and survey conduct
The presented survey was conducted in the pop-ulation of different departments of the TechnicalUniversity of Crete (Greece). The final sample con-sists of 173 individuals having experience with thewebsite of the cellular telephony companies inGreece. It should be noted that this data collectionapproach seems rather a convenience than a proba-bilistic sampling method, and thus, special charac-teristics of the sample (i.e. familiarity with newtechnologies) were taken into account in the analy-sis and discussion of results. Furthermore, this sam-pling approach was considered sufficient, given thepilot nature of the presented survey and the fact thatthe objective of the research is the application andvalidation of the ordinal regression methodology.
The set of satisfaction criteria used in the surveyare analytically presented in Section 2. Users wereasked to evaluate their satisfaction level on eachone of these criteria, as well as to express their over-all judgement using a 5-point qualitative scale of theform: very satisfied, satisfied, moderately satisfied,dissatisfied, very dissatisfied.
The set of companies evaluated in the survey con-sists of the three biggest cellular phone service pro-viders in Greece, having a total market share greaterthan 95% of the whole market. It should be empha-sised that the mobile sector in Greece is highly com-petitive, and there are no significant differences forthese three companies concerning products and ser-vices offered, prices, etc.
4.2. User satisfaction and performance analysis
The main objective of the user satisfaction analy-sis is the identification of customers’ attitude andpreferences. The analysis includes the estimationof the relative importance and the demanding levelof the different satisfaction dimensions for thecustomers.
According to Table 2, all the criteria seem to beof almost equal importance for the customers of cel-lular phone service providers in Greece. The ‘‘Use-fulness’’ and the ‘‘Layout’’ of the websites are,slightly, the two most important criteria, with‘‘Technical Efficiency’’ playing the less important
role. It seems that customers regard as importantall the characteristics mentioned in Table 2.
The demanding level of customers is rather ‘‘neu-tral’’ for almost all the set of criteria, meaning thatthe more satisfied these customers express they are,the higher the percentage of their fulfilled expecta-tions is. As Table 2 shows, the average demandingindices are not close to �1 (non-demanding custom-ers) or 1 (very demanding customers), indicating alinear form for almost all the estimated value func-tions. However, some differences may be observedin the set of satisfaction criteria. For example thehighest average demanding index appears for the‘‘Animation’’ criterion, meaning that significantefforts – compared to other criteria – are requiredin order to increase customer satisfaction level. Thiscriterion can become a competitive advantage, as itis a characteristic that can distinguish a websitefrom being attractive or not.
Performance analysis is mainly focused on theassessment of website quality level for each one ofthe competitive companies. Furthermore, it includes,for each website, the identification of their compet-itive advantages, their weak points, as well as theimprovement priorities.
As Table 3 shows, the website of Company A hasthe highest global satisfaction index among thethree cellular phone service providers of Greece.This global satisfaction index is not high enough,as there is dissatisfaction from the ‘‘Animation’’and the ‘‘Technical efficiency’’ of the website. Thehighest satisfaction index for this website concernsits ‘‘Relevance’’, while the ‘‘Layout’’ criterion is alsoa dimension with significant improvement margins.Table 3 may reveal similar results for the satisfac-tion performance of the other websites.
The relative action diagrams for the websites ofthe three cellular phone service providers in Greece
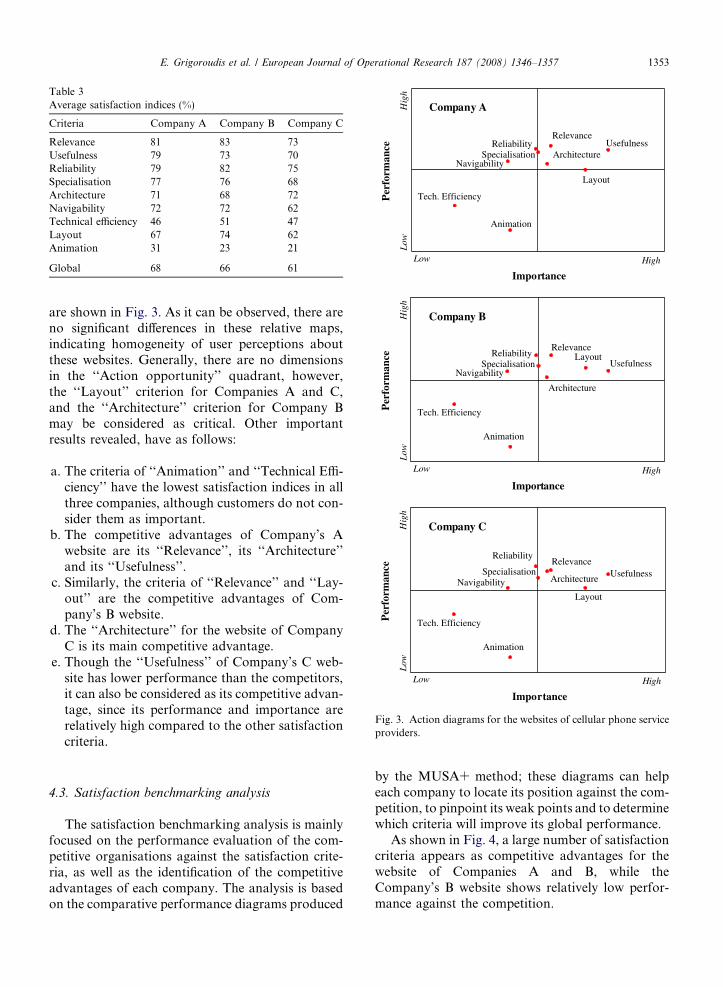
Table 3Average satisfaction indices (%)
Criteria Company A Company B Company C
Relevance 81 83 73Usefulness 79 73 70Reliability 79 82 75Specialisation 77 76 68Architecture 71 68 72Navigability 72 72 62Technical efficiency 46 51 47Layout 67 74 62Animation 31 23 21
Global 68 66 61Importance
Per
form
ance
HighLow
Hig
hL
ow
RelevanceUsefulnessReliability
Specialisation ArchitectureNavigability
Tech. Efficiency
Layout
Animation
Company A
Importance
Per
form
ance
HighLow
Hig
hL
ow
RelevanceReliability
Specialisation
Architecture
Navigability
Tech. Efficiency
Layout
Animation
Company B
Usefulness
Importance
Per
form
ance
HighLow
Hig
hL
ow
RelevanceReliability
SpecialisationArchitectureNavigability
Tech. Efficiency
Layout
Animation
Company C
Usefulness
Fig. 3. Action diagrams for the websites of cellular phone serviceproviders.
E. Grigoroudis et al. / European Journal of Operational Research 187 (2008) 1346–1357 1353
are shown in Fig. 3. As it can be observed, there areno significant differences in these relative maps,indicating homogeneity of user perceptions aboutthese websites. Generally, there are no dimensionsin the ‘‘Action opportunity’’ quadrant, however,the ‘‘Layout’’ criterion for Companies A and C,and the ‘‘Architecture’’ criterion for Company Bmay be considered as critical. Other importantresults revealed, have as follows:
a. The criteria of ‘‘Animation’’ and ‘‘Technical Effi-ciency’’ have the lowest satisfaction indices in allthree companies, although customers do not con-sider them as important.
b. The competitive advantages of Company’s Awebsite are its ‘‘Relevance’’, its ‘‘Architecture’’and its ‘‘Usefulness’’.
c. Similarly, the criteria of ‘‘Relevance’’ and ‘‘Lay-out’’ are the competitive advantages of Com-pany’s B website.
d. The ‘‘Architecture’’ for the website of CompanyC is its main competitive advantage.
e. Though the ‘‘Usefulness’’ of Company’s C web-site has lower performance than the competitors,it can also be considered as its competitive advan-tage, since its performance and importance arerelatively high compared to the other satisfactioncriteria.
4.3. Satisfaction benchmarking analysis
The satisfaction benchmarking analysis is mainlyfocused on the performance evaluation of the com-petitive organisations against the satisfaction crite-ria, as well as the identification of the competitiveadvantages of each company. The analysis is basedon the comparative performance diagrams produced
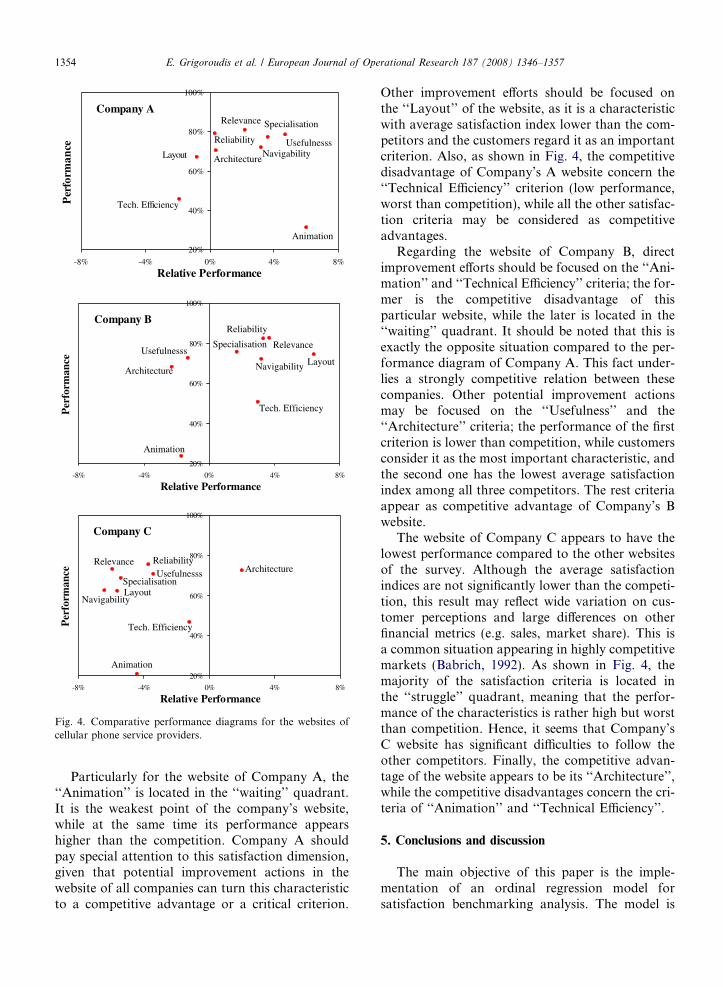
by the MUSA+ method; these diagrams can helpeach company to locate its position against the com-petition, to pinpoint its weak points and to determinewhich criteria will improve its global performance.
As shown in Fig. 4, a large number of satisfactioncriteria appears as competitive advantages for thewebsite of Companies A and B, while theCompany’s B website shows relatively low perfor-mance against the competition.
20%
40%
60%
80%
100%
-8% -4% 0% 4% 8%
Relative Performance
Per
form
ance
Relevance
UsefulnesssReliability
Specialisation
ArchitectureNavigability
Tech. Efficiency
Layout
Animation
Company A
20%
40%
60%
80%
100%
-8% -4% 0% 4% 8%
Relative Performance
Per
form
ance
RelevanceUsefulnesss
Reliability
Specialisation
Architecture Navigability
Tech. Efficiency
Layout
Animation
Company B
20%
40%
60%
80%
100%
-8% -4% 0% 4% 8%
Relative Performance
Per
form
ance
RelevanceUsefulnesss
Reliability
SpecialisationArchitecture
Navigability
Tech. Efficiency
Layout
Animation
Company C
Fig. 4. Comparative performance diagrams for the websites ofcellular phone service providers.
1354 E. Grigoroudis et al. / European Journal of Operational Research 187 (2008) 1346–1357
Particularly for the website of Company A, the‘‘Animation’’ is located in the ‘‘waiting’’ quadrant.It is the weakest point of the company’s website,while at the same time its performance appearshigher than the competition. Company A shouldpay special attention to this satisfaction dimension,given that potential improvement actions in thewebsite of all companies can turn this characteristicto a competitive advantage or a critical criterion.
Other improvement efforts should be focused onthe ‘‘Layout’’ of the website, as it is a characteristicwith average satisfaction index lower than the com-petitors and the customers regard it as an importantcriterion. Also, as shown in Fig. 4, the competitivedisadvantage of Company’s A website concern the‘‘Technical Efficiency’’ criterion (low performance,worst than competition), while all the other satisfac-tion criteria may be considered as competitiveadvantages.
Regarding the website of Company B, directimprovement efforts should be focused on the ‘‘Ani-mation’’ and ‘‘Technical Efficiency’’ criteria; the for-mer is the competitive disadvantage of thisparticular website, while the later is located in the‘‘waiting’’ quadrant. It should be noted that this isexactly the opposite situation compared to the per-formance diagram of Company A. This fact under-lies a strongly competitive relation between thesecompanies. Other potential improvement actionsmay be focused on the ‘‘Usefulness’’ and the‘‘Architecture’’ criteria; the performance of the firstcriterion is lower than competition, while customersconsider it as the most important characteristic, andthe second one has the lowest average satisfactionindex among all three competitors. The rest criteriaappear as competitive advantage of Company’s Bwebsite.
The website of Company C appears to have thelowest performance compared to the other websitesof the survey. Although the average satisfactionindices are not significantly lower than the competi-tion, this result may reflect wide variation on cus-tomer perceptions and large differences on otherfinancial metrics (e.g. sales, market share). This isa common situation appearing in highly competitivemarkets (Babrich, 1992). As shown in Fig. 4, themajority of the satisfaction criteria is located inthe ‘‘struggle’’ quadrant, meaning that the perfor-mance of the characteristics is rather high but worstthan competition. Hence, it seems that Company’sC website has significant difficulties to follow theother competitors. Finally, the competitive advan-tage of the website appears to be its ‘‘Architecture’’,while the competitive disadvantages concern the cri-teria of ‘‘Animation’’ and ‘‘Technical Efficiency’’.
5. Conclusions and discussion
The main objective of this paper is the imple-mentation of an ordinal regression model forsatisfaction benchmarking analysis. The model is

Table 4Summary of results
Company A Company B Company C
Competitiveadvantages
Relevance Relevance Architecture
Architecture LayoutUsefulness Reliability
Competitivedisadvantages
Technicalefficiency
Animation Animation
Technicalefficiency
Weak points Layout Technicalefficiency
Animation
Animation Animation LayoutTechnicalefficiency
Architecture Technicalefficiency
Improvementpriorities
Technicalefficiency
Animation Animation
Animation Technicalefficiency
Technicalefficiency
E. Grigoroudis et al. / European Journal of Operational Research 187 (2008) 1346–1357 1355
an extension of the MUSA method, a multicriteriapreference disaggregation approach. The applica-tion presented refers to the evaluation of web-site quality for three cellular phone service provid-ers in Greece, and the most important resultsinclude:
• the determination of the strong and weak pointsof the three websites,
• the performance evaluation of the sites (globallyand per criteria),
• the identification of the websites’ competitiveadvantages and disadvantages, and
• the improvement priorities for each website.
The main advantage of the applied method isthat it fully considers the qualitative form of cus-tomer judgements and preferences, as expressed ina customer satisfaction survey. Furthermore,MUSA+ is able to assess an integrated benchmark-ing system, given the wide range of results provided(e.g. value functions, criteria weights, average satis-faction indices, average demanding indices, action,improvement, and comparative performance dia-grams, etc). Thus, discussion is focused not onlyon the descriptive analysis of customer satisfactiondata, but it is able to give emphasis on the analysisof customer preferences and expectations.
The analysis presented in Section 4 indicates theimprovement efforts that the cellular phone provid-ers may consider for the development of their web-sites. Table 4 summarises the concluding remarks
for the three websites examined. In general, theimprovement actions for each website should befocused on the following points:
a. The criteria of ‘‘Technical Efficiency’’ and ‘‘Ani-mation’’ appear to be the most importantimprovement actions for all the websites,although priorities may vary. This fact is justifiedby the relatively low average satisfaction indicesestimated for these particular characteristics.
b. Moreover, improvement efforts by Company Acan turn ‘‘Animation’’ to one of its competitiveadvantages, while the same occurs for the ‘‘Tech-nical Efficiency’’ of Company’s B website. In gen-eral, these two companies appear to have a highlevel of competitive intension.
c. Although several characteristics of Company’s Cwebsite appear to be at disadvantage, theimprovement efforts should focus on ‘‘Anima-tion’’ and ‘‘Technical Efficiency’’, taken intoaccount the competition.
Customer satisfaction benchmarking analysis is auseful tool for modern business organisations inorder to locate their position against competition.This gives the ability to identify the most criticalimprovement actions and adopt the best practicesof the industry.
Future research efforts and extensions of thepresented approach include mainly the implemen-tation of the MUSA+ method to additional cus-tomer satisfaction surveys in other businesssectors with different characteristics. Also, addi-tional approaches may be combined for the valida-tion of obtained results (e.g. advanced statisticaltools) and the enhancement of the method (e.g.Kano’s model).
References
Adelman, L., 1991. Experiments, quasi-experiments, and casestudies: A review of empirical methods for evaluating decisionsupport systems. IEEE Transactions on Systems, Man andCypernetics 21 (2), 293–301.
Babrich, P., 1992. Customer satisfaction: How good is goodenough. Quality Progress 25 (12), 65–68.
Beck S., 1997. Evaluation criteria: The good, the bad and theugly: Or, why it’s a good idea to evaluate web sources.<http://lib.nmsu.edu/instruction/evalcrit.html> (accessed31.08.03).
Blankenship, E. 2001. Portal design vs. web design. Availablefrom: <http://www.sapdesignguild.org/editions/edition3/gra-phic. asp>.

1356 E. Grigoroudis et al. / European Journal of Operational Research 187 (2008) 1346–1357
Brusilovsky, P., 2001. Adaptive hypermedia. User Modelling andUser Adaptive Interaction 11 (1/2), 87–110.
Cox, J., Dale, B., 1999. Service quality and e-commerce: Anexploratory analysis. Managing Service Quality 11 (2), 121–131.
Dale, B.G., 1999. Managing Quality, third ed. Blackwell Scien-tific Publications, Oxford.
Gattorna, L., Walters, W., 1996. Managing the Supply Chain: AStrategic Perspective. Macmillan Business, Basingstoke.
Grigoroudis, E., Siskos, Y., 2002. Preference disaggregation formeasuring and analysing customer satisfaction: The MUSAmethod. European Journal of Operational Research 143 (1),148–170.
Grigoroudis, E., Siskos, Y., 2004. A survey of customer satisfac-tion barometers: Results from the transportation-communi-cations sector. European Journal of Operational Research152 (2), 334–353.
Grigoroudis, E., Politis, Y., Siskos, Y., 2002. Satisfactionbenchmarking and customer classification: An applicationto the branches of a banking organization. InternationalTransactions in Operational Research 9 (5), 599–618.
Grose, E., Forsythe, C., Ratner, J., 1998. Using web andtraditional style guides to design web interfaces. In: Grose,C., Forsythe, C., Ratner, J. (Eds.), Human Factors and WebDevelopment. Lawrence Erlbaum Associates, New Jersey, pp.121–131.
Hill, N., 1996. Handbook of Customer Satisfaction Measure-ment. Gower Publishing, Hampshire.
ISO, 1998a. ISO/IEC 14598-3: Information technology – Soft-ware product evaluation – Part 3: Process for developers.Available from: <http://www.iso.org/iso/en/CatalogueDetail-Page.CatalogueDetail?CSNUMBER=24904&COMMID=&scopelist>.
ISO, 1998b. ISO/IEC 9126-1: Information technology – Softwarequality characteristics and metrics – Part 1: Quality charac-teristics and subcharacteristics.
Ivory, M., Sinha, R., Hearst, M., 2001. Empirically validated webpage design metrics. In: Proceedings of the ACM SIGCHI’01Conference ‘‘Human Factors in Computing Systems’’. Avail-able from: <http://webtango.berkeley.edu/papers/chi2001/index.html>.
Iwaarden, J., van, T., van der Wiele, L., Ball, Millen, R., 2004.Perceptions about the quality of web sites: A survey amongststudents at Northeastern University and Erasmus University.Information and Management 41 (8), 947–959.
Jacquet-Lagreze, E., Siskos, J., 1982. Assessing a set of additiveutility functions for multicriteria decision-making: The UTAmethod. European Journal of Operational Research 10 (2),151–164.
Lam, S.S., Woo, K.S., 1997. Measuring service quality: A test-retest reliability investigation of SERVQUAL. Journal of theMarket Research Society 39, 381–396.
Losavio, F., 2002. Quality models to design software architec-ture. Journal of Object Technology 1 (4), 165–178.
Mihelis, G., Grigoroudis, E., Siskos, Y., Politis, Y., Malandrakis,Y., 2001. Customer satisfaction measurement in the privatebank sector. European Journal of Operational Research 130(2), 347–360.
Moustakis, V., Litos, C., Dalivigas, A., Tsironis, L., 2004.Website assessment criteria. In: Proceedings of InternationalConference on Information Quality, Boston: MIT, November5–7, pp. 59–73.
Nielsen, J., 2002. Designing web usability: The practice ofsimplicity. New Riders Publishing, Indianapolis, USA.
Palmer, J.W., 2002. Web site usability, design, and performancemetrics. Information Systems Research 13 (2), 151–167.
Parasuraman, A., Zeithaml, V.A., Berry, L.L., 1985. A concep-tual model of service quality and its implications for futureresearch. Journal of Marketing 49, 41–50.
Parasuraman, A., Zeithaml, V.A., Berry, L.L., 1988. SERV-QUAL: A multiple item scale for measuring consumerperceptions of service quality. Journal of Retailing 64 (1),14–40.
Parasuraman, A., Zeithaml, V.A., Berry, L.L., 1991. Refinementand reassessment of the SERVQUAL scale. Journal ofRetailing 67 (4), 420–450.
Politis, Y., Siskos, Y., 2004. Multicriteria methodology for theevaluation of a Greek engineering department. EuropeanJournal of Operational Research 156 (1), 223–240.
Ranganathan, C., Ganapathy, S., 2002. Key dimensions ofbusiness-to-consumer web sites. Information and Manage-ment 39 (6), 457–465.
Shedro, N., 2001. Experience design 1. New Riders Publishing,Indianapolis.
Siskos, J., 1985. Analyse de regression et programmation lineaire.Revue de Statistique Appliquee 23 (2), 41–55.
Siskos, Y., Grigoroudis, E., 2002. Measuring customer satisfac-tion for various services using multicriteria analysis. In:Bouyssou, D., Jacquet-Lagreze, E., Perny, P., Sllowinski, R.,Vanderpooten, D., Vincke, P. (Eds.), Aiding Decisions withMultiple Criteria: Essays in Honor of Bernard Roy. KluwerAcademic Publishers, Dordrecht, pp. 457–482.
Siskos, J., Yannacopoulos, D., 1985. UTASTAR: An ordinalregression method for building additive value functions.Investigacao Operacional 5 (1), 39–53.
Siskos, Y., Grigoroudis, E., Zopounidis, C., Saurais, O., 1998.Measuring customer satisfaction using a collective preferencedisaggregation model. Journal of Global Optimization 12 (2),175–195.
Siskos, Y., Grigoroudis, E., Politis, Y., Malandrakis, Y., 2001.Customer satisfaction evaluation: Some real experiences. In:Colorni, A., Paruccini, M., Roy, B. (Eds.), A-MCD-A:Multiple Criteria Decision Aiding. European Commission,Joint Research Center, EUR 19808 EN, pp. 297–314.
The International Academy of Digital Arts and Sciences, 2003.The webby awards 2003 judging criteria. <http://www.web-byawards.com/judging/criteria.html> (accessed December2003).
Vavra, T.G., 1997. Improving your Measurement of CustomerSatisfaction: A Guide to Creating, Conducting, Analyzing,and Reporting Customer Satisfaction Measurement Pro-grams. ASQC Quality Press, Milwaukee.
Virpi, R., Kaikkonen, A., 2003. Acceptable download times inthe mobile internet. In: Proceedings of the 10th InternationalConference on Human-Computer Interaction, 4, LawrenceErlbaum Associates, New Jersey, pp. 1467–1472.
Vora P., 1998. Human factors methodology for designing websites, in: E. Grose, C. Forsythe, J. Ratner (Eds.). HumanFactors and Web Development, Lawrence Erlbaum Associ-ates, New Jersey, pp. 189–198.
Warner S., 1999. Internet portals, what are they and how to builda niche internet portal to enhance the delivery of informationservices. In: Proceedings of the 8th Asian-Pacific SHLLConference.

E. Grigoroudis et al. / European Journal of Operational Research 187 (2008) 1346–1357 1357
Winkler, R., 2001. Portals-The all-in-one web supersites: Fea-tures, functions, definition, taxonomy. Available from:<http://www.sapdesignguild.org/editions/edition3/overview_edition3.asp>.
Woodruff, R.B., Gardial, S.F., 1996. Know your Customer: NewApproaches to Understanding Customer Value and Satisfac-tion. Blackwell Publishers, Oxford.
Zeithaml, V., 2002. Guru’s view: Service excellence in electronicchannels, special on service excellence. Managing ServiceQuality 12 (3), 135–138.
Zhang, P., von Dran, G., 2001. User expectations and rankings ofquality factors in different website domains. InternationalJournal of Electronic Commerce 6 (2), 9–33.
Related Documents