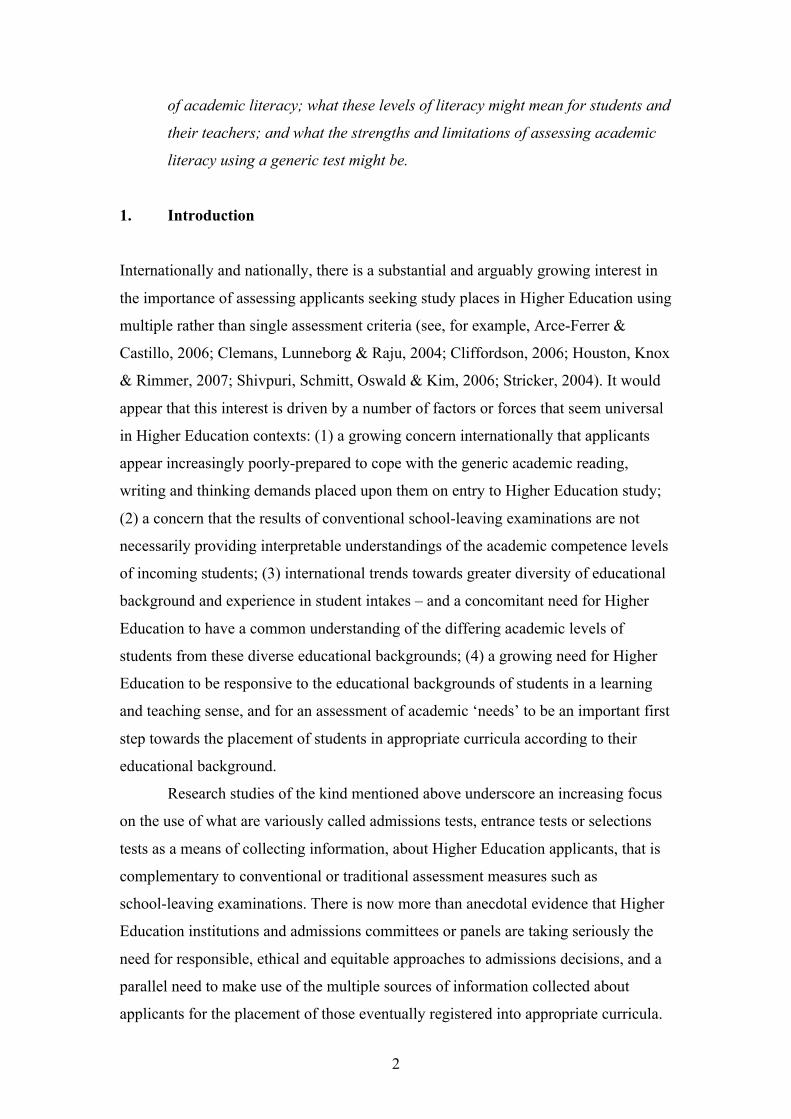
1 The assessment of entry-level students’ academic literacy: does it matter? Alan Cliff and Kutlwano Ramaboa University of Cape Town Carol Pearce Cape Peninsula University of Technology The assessment of entry-level students’ academic literacy: does it matter? In Higher Education both nationally and internationally, the need to assess incoming students’ readiness to cope with the typical reading and writing demands they will face in the language-of-instruction of their desired place of study is (almost) common cause. This readiness to cope with reading and writing demands in a generic sense is at the heart of what is meant by notions of academic literacy. ‘Academic literacy’ suggests, at least, that entry-level students possess some basic understanding of – or capacity to acquire an understanding of – what it means to read for meaning and argument; to pay attention to the structure and organisation of text; to be active and critical readers; and to formulate written responses to academic tasks that are characterised by logical organisation, coherence and precision of expression. This paper attempts to address two crucial questions in the assessment of students’ academic literacy: (1) Does such an assessment matter, i.e. does understanding students’ academic literacy levels have consequence for teaching and learning, and for the academic performance of students, in Higher Education? (2) Do generic levels of academic literacy in the sense described above relate to academic performance in discipline-specific contexts? Attempts to address these two questions draw on comparative data based on an assessment of students’ academic literacy and subsequent academic performance across two disciplines at the University of Cape Town and the Cape Peninsula University of Technology. Quantitative analyses illustrate relationships between students’ academic literacy levels and the impacts these have on academic performance. Conclusions to the paper attempt a critical assessment of what the analyses tell us about students’ levels

Welcome message from author
This document is posted to help you gain knowledge. Please leave a comment to let me know what you think about it! Share it to your friends and learn new things together.
Transcript
1
The assessment of entry-level students’ academic literacy: does it matter?
Alan Cliff and Kutlwano Ramaboa University of Cape Town Carol Pearce Cape Peninsula University of Technology
The assessment of entry-level students’ academic literacy: does it matter?
In Higher Education both nationally and internationally, the need to assess
incoming students’ readiness to cope with the typical reading and writing
demands they will face in the language-of-instruction of their desired place of
study is (almost) common cause. This readiness to cope with reading and
writing demands in a generic sense is at the heart of what is meant by notions
of academic literacy. ‘Academic literacy’ suggests, at least, that entry-level
students possess some basic understanding of – or capacity to acquire an
understanding of – what it means to read for meaning and argument; to pay
attention to the structure and organisation of text; to be active and critical
readers; and to formulate written responses to academic tasks that are
characterised by logical organisation, coherence and precision of expression.
This paper attempts to address two crucial questions in the assessment of
students’ academic literacy: (1) Does such an assessment matter, i.e. does
understanding students’ academic literacy levels have consequence for
teaching and learning, and for the academic performance of students, in
Higher Education? (2) Do generic levels of academic literacy in the sense
described above relate to academic performance in discipline-specific
contexts? Attempts to address these two questions draw on comparative data
based on an assessment of students’ academic literacy and subsequent
academic performance across two disciplines at the University of Cape Town
and the Cape Peninsula University of Technology. Quantitative analyses
illustrate relationships between students’ academic literacy levels and the
impacts these have on academic performance. Conclusions to the paper
attempt a critical assessment of what the analyses tell us about students’ levels
2
of academic literacy; what these levels of literacy might mean for students and
their teachers; and what the strengths and limitations of assessing academic
literacy using a generic test might be.
1. Introduction
Internationally and nationally, there is a substantial and arguably growing interest in
the importance of assessing applicants seeking study places in Higher Education using
multiple rather than single assessment criteria (see, for example, Arce-Ferrer &
Castillo, 2006; Clemans, Lunneborg & Raju, 2004; Cliffordson, 2006; Houston, Knox
& Rimmer, 2007; Shivpuri, Schmitt, Oswald & Kim, 2006; Stricker, 2004). It would
appear that this interest is driven by a number of factors or forces that seem universal
in Higher Education contexts: (1) a growing concern internationally that applicants
appear increasingly poorly-prepared to cope with the generic academic reading,
writing and thinking demands placed upon them on entry to Higher Education study;
(2) a concern that the results of conventional school-leaving examinations are not
necessarily providing interpretable understandings of the academic competence levels
of incoming students; (3) international trends towards greater diversity of educational
background and experience in student intakes – and a concomitant need for Higher
Education to have a common understanding of the differing academic levels of
students from these diverse educational backgrounds; (4) a growing need for Higher
Education to be responsive to the educational backgrounds of students in a learning
and teaching sense, and for an assessment of academic ‘needs’ to be an important first
step towards the placement of students in appropriate curricula according to their
educational background.
Research studies of the kind mentioned above underscore an increasing focus
on the use of what are variously called admissions tests, entrance tests or selections
tests as a means of collecting information, about Higher Education applicants, that is
complementary to conventional or traditional assessment measures such as
school-leaving examinations. There is now more than anecdotal evidence that Higher
Education institutions and admissions committees or panels are taking seriously the
need for responsible, ethical and equitable approaches to admissions decisions, and a
parallel need to make use of the multiple sources of information collected about
applicants for the placement of those eventually registered into appropriate curricula.
3
Furthermore, there is a clear need to assess the outcomes of the use of multiple
selections criteria on the academic progression of students thus selected.
The use of admissions tests such as the Scholastic Aptitude Test (SAT) (ETS,
2007) or the Graduate Management Admission Test (GMAT) (GMAC, 2007), or
assessments of language proficiency such as the International English Language
Testing System (IELTS) (British Council, 2007) or the Test of English as a Foreign
Language (TOEFL) (ETS, 2007), have become common cause in assessing
applicants’ readiness for Higher Education. These tests are implemented principally
because it is believed that they will yield information about applicants’ abilities to
cope with the typical reading, writing and thinking demands they will likely face in
Higher Education or that they will indicate the extent to which applicants will be able
to cope with the language demands placed upon them in a particular
medium-of-instruction.
One form of complementary assessment that has become commonly used in
the South African Higher Education landscape, to assess students’ readiness to cope
with typical language and learning demands, is an assessment of academic literacy.
The Placement Test in English for Educational Purposes (PTEEP) (AARP, 2007), for
example, is a test that is used at the pre-admissions stage to assess applicants’
responsiveness to progressively more demanding reading and writing tasks. Based on
the levels of responsiveness applicants demonstrate in this assessment – when
compared with other applicants from similar educational backgrounds – these
applicants are regarded as ‘recommendable’ or ‘not recommendable’ for particular
forms of Higher Education provision (for example, conventional / mainstream or
foundational provision). Scores on the PTEEP are used as complementary measures to
other standard or alternate assessments of applicants’ readiness for Higher Education.
Another example of an academic literacy assessment that is used in South Africa is
the Standardised Assessment Test for Access and Placement (SATAP) (SATAP,
2007). This assessment has historically been used after applicants have been selected
for Higher Education studies, as a means of assessing the extent to which these
students might require assistance with coping with the academic literacy demands
they are likely to face. A third and final example of an academic literacy test is the
Test of Academic Literacy Levels (TALL) (UAL, 2007), used post-selection by a
number of Higher Education institutions to place students scoring below a certain
4
score in courses that teach generic academic literacy in one or two media-of-
instruction (Weideman, 2003; Van der Slik & Weideman, 2005).
Before proceeding any further with the arguments in this paper, it seems necessary
to explain what is meant by ‘academic literacy’ in this context. Academic literacy in
the sense delineated in this paper (cf. Bachman & Palmer, 1996; Yeld, 2001; Cliff &
Yeld, 2006; Weideman, 2006) means the extent to which students are able to:
• make meaning from texts that they are likely to encounter in their studies;
• understand words and discourse signals in their contexts;
• identify and track academic argument;
• understand and evaluate the evidential basis of argument;
• extrapolate and draw inferences and conclusions from what is stated or given;
• identify main from supporting ideas in the overall organisation of a text;
• understand information presented visually (e.g. graphs, tables, flow-charts);
• understand basic numerical concepts and information used in text, including
basi!c numerical manipulations
In essence then, academic literacy is necessarily a form of verbal reasoning that is
crucially language-dependent. It follows that an assessment of academic literacy
becomes an assessment of a student’s verbal reasoning capacity in a particular
language and this, in turn, implies that academic literacy is associated with Higher
Education medium-of-instruction. The assessment of academic literacy is, therefore,
not an assessment of language per se, but an assessment of the use of language as a
vehicle for making meaning, making argument and understanding underlying point.
The notion of academic literacy is conceived of from a different but related angle
in student learning research. There, it is taken to refer to students’ abilities to process
information they read in a ‘deep’ sense, i.e. to understand the underlying point,
structure or argument of what is read (Marton & Säljö, 1976a & b) rather than to view
what is read as consisting of isolated or discrete ‘bits’ of information. Theoretical
frameworks drawn from research into how students learn in Higher Education have
drawn a distinction between what are referred to as the ‘deep’ and ‘surface’ approach
to learning (cf. Marton & Säljö, 1984). The former depicts learning – and, by
extension, academic literacy – as a process of seeing how knowledge contributes to
understanding, how understanding contributes towards ‘seeing’ the world differently,
and how ‘seeing’ differently leads to the development of one’s own point of view that
5
is based on new understandings and insights. ‘Surface’ learning, on the other hand, is
described as viewing knowledge as having a discrete, factual character, disconnected
and disembodied from other knowledge and to be reproduced in an untransformed
form, usually to fulfil narrow assessment requirements. It follows – from earlier
discussion of the meaning of academic literacy – that ‘deep’ approaches to learning
appear close to the reading, writing and thinking approaches described earlier, when
the notion of academic literacy was explicated.
Later formulations drawn from student learning research in Higher Education
argued that ‘deep’ and ‘surface’ approaches to learning are influenced by the context
in which students learn and by students’ perceptions of that context; by how students
conceive of what learning is; and by students’ underlying forms of motivation for
learning. These, in turn, influence how students approach typical reading, writing and
thinking tasks in Higher Education. The terms ‘meaning’ and ‘reproducing’
orchestration (Meyer, 1991) were formulated to describe qualitative distinctions in the
ways in which individual students ‘orchestrated’ their learning in accordance with
their conceptions of learning, their perceptions of their learning contexts and their
complex or less complex understandings of the purposes of Higher Education study.
Whether one approaches notions of academic literacy as being about coping with
typical academic reading and writing demands or whether one views academic
literacy as being related to ‘deep’ approaches or ‘meaning’ orchestrations towards
learning, the commonality in the two approaches appears to lie in language. Students
approach language to read texts in Higher Education; they use language to express
their understandings of these texts or to produce viewpoints of their own; and they are
exposed to or use language to engage with their own understandings of what learning
is. Assessments of academic literacy, then, are assessments of responses to and
production of language, albeit language in a specialised, applied form: the language of
reasoning, argument, exposition, explanation.
As was argued earlier, a common assumption about assessing students’ levels of
academic literacy – whether prior to or on entry to Higher Education – is that
important understandings about how these students will cope will be gained from this
assessment process. A second assumption appears to be that assessments of generic
forms of academic literacy are useful for understanding how students will cope in
discipline-specific contexts. A third – perhaps less common – assumption is that
assessments of academic literacy will lead to specific learning and teaching
6
interventions to support those students who are deemed not yet ready to cope with the
generic academic literacy demands placed upon them in Higher Education.
This takes us back to the title of this paper: does the assessment of students’
academic literacy matter, i.e. in this context, (1) are results on tests of academic
literacy associated with subsequent academic performance of students across a range
of disciplines and, if so, how; and (2) do results on tests of academic literacy provide
useful information in suggesting teaching and learning interventions necessary to
improve students’ levels of academic literacy, and with what consequence for student
achievement? There is ready intuitive and intellectual understanding amongst Higher
Education academics that the characteristics of academic literacy as defined earlier in
this paper are important if students are going to become academically literate in the
generic sense, but there is arguably less agreement about how important this generic
academic literacy is in discipline-specific contexts.
The studies described and analysed later in this paper represent an attempt to
respond to questions raised in the previous paragraph by being focused on (1) the
predictive validity of a generic test of academic literacy; and (2) the consequences for
teaching and learning of data collected from this generic test. The studies are based on
the use of the PTEEP (referred to earlier), and it is to an explication of the construct
and psychometric properties of the PTEEP that this paper now turns.
2. An academic literacy test: the Placement Test in English for Educational
Purposes (PTEEP)
The construct or ‘blueprint’ for the PTEEP is fully explicated in Yeld (2001) and a
detailed explanation is not attempted here. The principal features of the approach to
the development of the PTEEP are that it is: (1) a generic test, designed to provide
complementary information to traditional achievement tests (such as the
school-leaving examination); (2) developed by national interdisciplinary teams of
expertise, to increase both its face and content validity; (3) relatively
curriculum-independent, so as to downplay the role of prior exposure to knowledge;
(4) designed to assess language as a vehicle for academic study and reasoning rather
than language per se; (5) developed according to a theme and a set of specifications,
so as to ensure that engagement for the writers can be ‘scaffolded’, made
7
progressively more complex, and be authentic to a Higher Education context (adapted
from Cliff, Hanslo, Ramaboa & Visser, 2005).
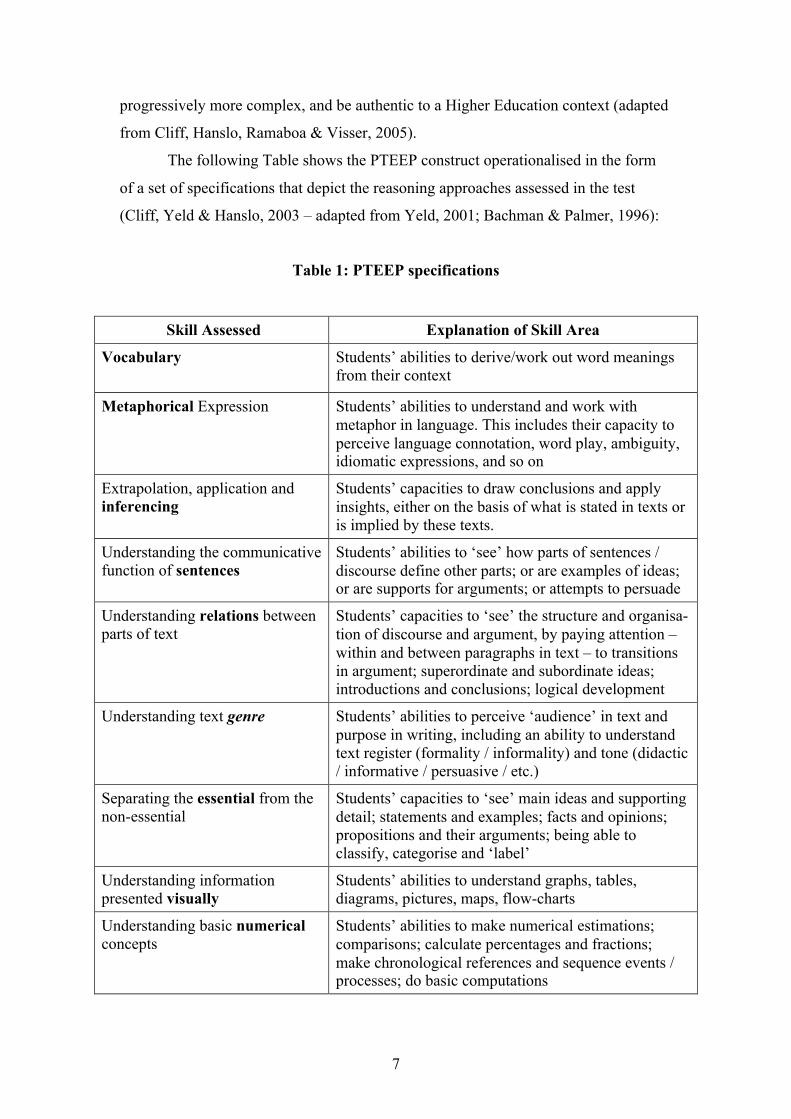
The following Table shows the PTEEP construct operationalised in the form
of a set of specifications that depict the reasoning approaches assessed in the test
(Cliff, Yeld & Hanslo, 2003 – adapted from Yeld, 2001; Bachman & Palmer, 1996):
Table 1: PTEEP specifications
Skill Assessed Explanation of Skill Area
Vocabulary
Students’ abilities to derive/work out word meanings from their context
Metaphorical Expression Students’ abilities to understand and work with metaphor in language. This includes their capacity to perceive language connotation, word play, ambiguity, idiomatic expressions, and so on
Extrapolation, application and inferencing
Students’ capacities to draw conclusions and apply insights, either on the basis of what is stated in texts or is implied by these texts.
Understanding the communicative function of sentences
Students’ abilities to ‘see’ how parts of sentences / discourse define other parts; or are examples of ideas; or are supports for arguments; or attempts to persuade
Understanding relations between parts of text
Students’ capacities to ‘see’ the structure and organisa-tion of discourse and argument, by paying attention – within and between paragraphs in text – to transitions in argument; superordinate and subordinate ideas; introductions and conclusions; logical development
Understanding text genre Students’ abilities to perceive ‘audience’ in text and purpose in writing, including an ability to understand text register (formality / informality) and tone (didactic / informative / persuasive / etc.)
Separating the essential from the non-essential
Students’ capacities to ‘see’ main ideas and supporting detail; statements and examples; facts and opinions; propositions and their arguments; being able to classify, categorise and ‘label’
Understanding information presented visually
Students’ abilities to understand graphs, tables, diagrams, pictures, maps, flow-charts
Understanding basic numerical concepts
Students’ abilities to make numerical estimations; comparisons; calculate percentages and fractions; make chronological references and sequence events / processes; do basic computations
8
As can be seen from the above Table, the construct of the PTEEP is
conceptually constituted of nine sub-constructs that cover reasoning and meaning-
making at a word, sentence, paragraph and argument level. An important feature of
the PTEEP is its additional focus on visual and numerical literacy: these
sub-constructs are included in the PTEEP because they contain special forms of
language that are central components of most, if not all, academic programmes of
instruction.
The 2007 PTEEP has an overall Cronbach alpha reliability of 0.89 (typically,
overall reliabilities for the test are between 0.85 and 0.92) – if the edit-type question is
removed from the analysis, the alpha rises to 0.92. The Cronbach alpha is based on a
sample of n = 2456 writers.
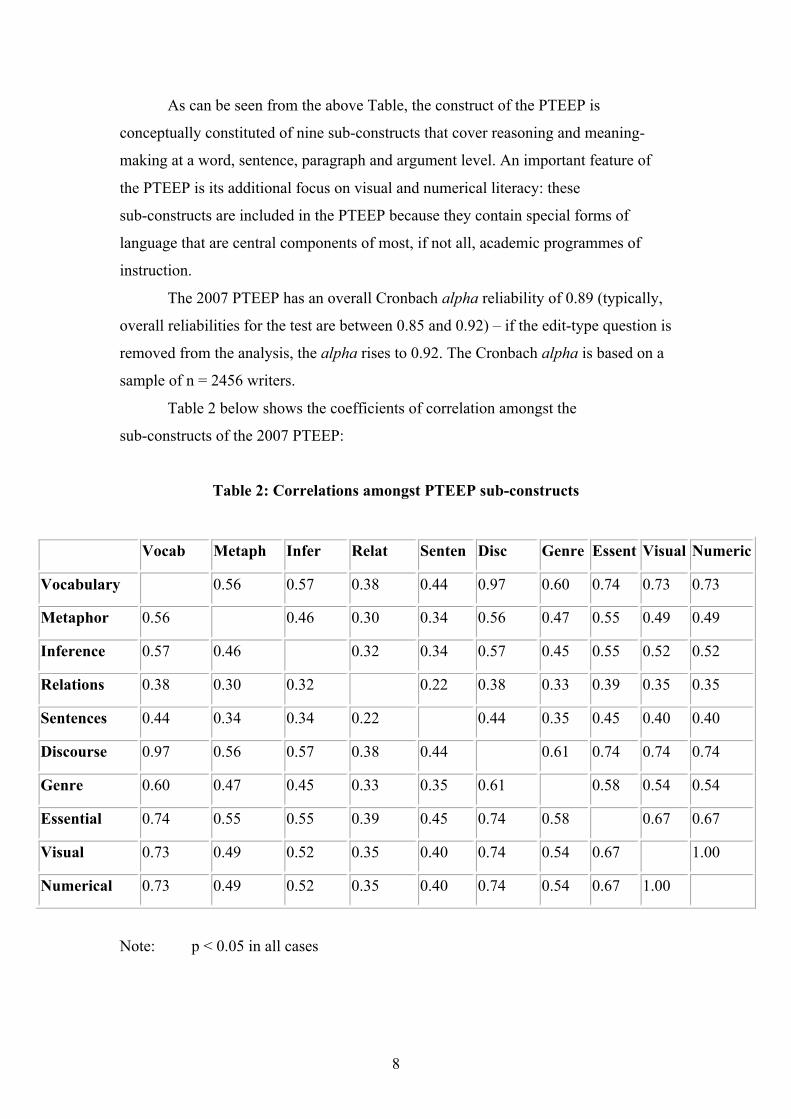
Table 2 below shows the coefficients of correlation amongst the
sub-constructs of the 2007 PTEEP:
Table 2: Correlations amongst PTEEP sub-constructs
Vocab Metaph Infer Relat Senten Disc Genre Essent Visual Numeric
Vocabulary 0.56 0.57 0.38 0.44 0.97 0.60 0.74 0.73 0.73
Metaphor 0.56 0.46 0.30 0.34 0.56 0.47 0.55 0.49 0.49
Inference 0.57 0.46 0.32 0.34 0.57 0.45 0.55 0.52 0.52
Relations 0.38 0.30 0.32 0.22 0.38 0.33 0.39 0.35 0.35
Sentences 0.44 0.34 0.34 0.22 0.44 0.35 0.45 0.40 0.40
Discourse 0.97 0.56 0.57 0.38 0.44 0.61 0.74 0.74 0.74
Genre 0.60 0.47 0.45 0.33 0.35 0.61 0.58 0.54 0.54
Essential 0.74 0.55 0.55 0.39 0.45 0.74 0.58 0.67 0.67
Visual 0.73 0.49 0.52 0.35 0.40 0.74 0.54 0.67 1.00
Numerical 0.73 0.49 0.52 0.35 0.40 0.74 0.54 0.67 1.00
Note: p < 0.05 in all cases
9
The sub-constructs are defined in Table 1. In Table 2, however, the
‘relations’ sub-construct has been separated into two: ‘relations’ and
‘discourse’.
The mostly moderate correlations between the PTEEP sub-constructs suggests
there to be some empirical support for the conceptual sub-constructs as defined in
Table 1. The sub-constructs for the most part seem to be assessing aspects of
academic literacy that are at least partly discrete from one another, which seems
justification for the separation of the construct into its sub-constructs. Given the large
sample size from which these data were drawn (n = 2456) and the diversity of the
writer pool in terms of demographic factors (such as school and linguistic
background), correlations in Table 2 are arguably between the sub-constructs of the
test rather than related to the homogeneity of the writer pool.
Two exceptions are apparent from Table 2: (1) the correlation of 0.97 between
the ‘vocabulary’ and ‘discourse’ sub-constructs suggests that writer performance in
one is strongly associated with writer performance in the other. This seems
theoretically surprising, but can be explained by the fact that the questions assessing
discourse indicators in the 2007 PTEEP in many cases asked writers to assess the
meanings of words from academic word lists, for example, ‘however’; ‘nevertheless’;
‘because’; and so on. The correlation of 1.00 between the ‘visual’ and the ‘numerical’
sub-construct is not surprising, since writer performance on these two constructs was
assessed by the same set of questions.
Typically, the PTEEP consists of between 65 and 70 items / questions, divided
into the following question-types: multiple-choice questions; short-response
questions; a flow-chart / concept map question; an edit-type question; and a one-page
expository essay question. There are at least three texts for reading in the PTEEP, all
of which are related to the theme for that particular test.
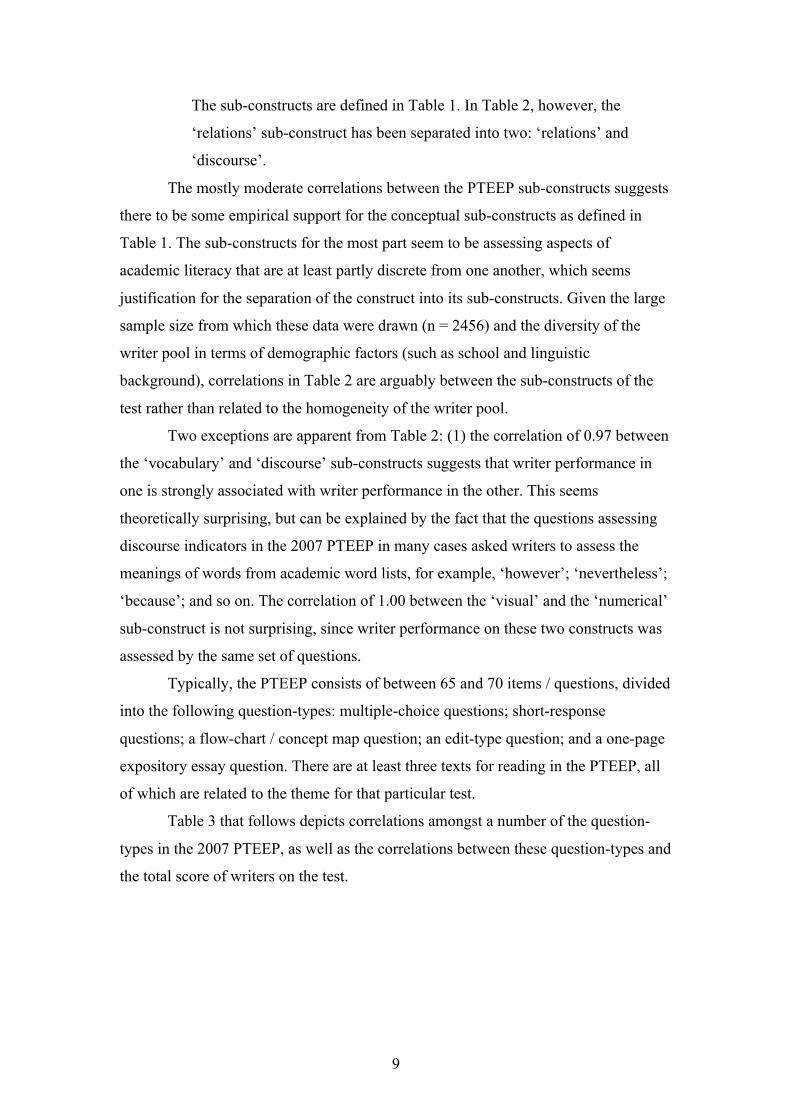
Table 3 that follows depicts correlations amongst a number of the question-
types in the 2007 PTEEP, as well as the correlations between these question-types and
the total score of writers on the test.
10
Table 3: Correlations amongst question-types on the PTEEP
Total Short
pieces
Edit
Question Essay
Multi-
choice
Total 0.95 0.88 0.84 0.92
Short pieces 0.95 0.93 0.69 0.83
Edit Question 0.88 0.93 0.64 0.77
Essay 0.84 0.69 0.64 0.66
Multi-choice 0.92 0.83 0.77 0.66
Note: p < 0.05 in all cases.
The high correlations between various question types and the total score of
writers on the test suggest that assessment using any one question type will suffice for
determining the overall performance of writers. In particular, the multiple-choice
questions on their own, or the short response pieces on their own, are very strongly
correlated with the total score. The correlation of the short pieces to the total score is
somewhat surprising, given that these pieces are assessed by different markers, but it
is also encouraging evidence of standardisation amongst these markers for this
question-type. The more moderate correlations amongst different question-types on
the test suggest that, although any one question-type might be useful for predicting
overall writer performance on the test, each of the question-types does yield
somewhat discrete information about writer performance – or that marker
standardisation, whilst reasonable, has not yet reached completely desirable levels.
In summarising this section of the paper – and to return to the topic of whether
an assessment of academic literacy as measured by the PTEEP matters – it would
seem that there is justification for the division of the PTEEP construct into its sub-
constructs, but it would also seem that there is some degree of overlap amongst the
sub-constructs. This is not surprising, given that academic literacy would seem to be a
complex construct the sub-constructs of which cannot wholly be separated into
constituent parts.
11
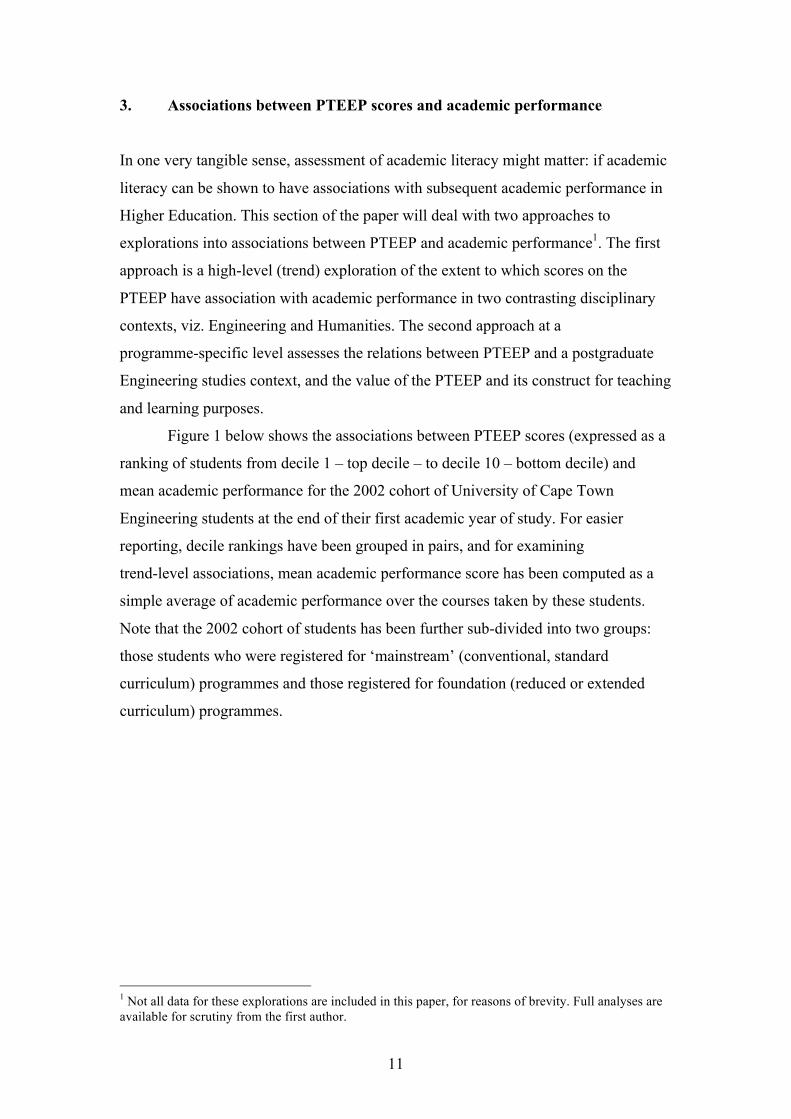
3. Associations between PTEEP scores and academic performance
In one very tangible sense, assessment of academic literacy might matter: if academic
literacy can be shown to have associations with subsequent academic performance in
Higher Education. This section of the paper will deal with two approaches to
explorations into associations between PTEEP and academic performance1. The first
approach is a high-level (trend) exploration of the extent to which scores on the
PTEEP have association with academic performance in two contrasting disciplinary
contexts, viz. Engineering and Humanities. The second approach at a
programme-specific level assesses the relations between PTEEP and a postgraduate
Engineering studies context, and the value of the PTEEP and its construct for teaching
and learning purposes.
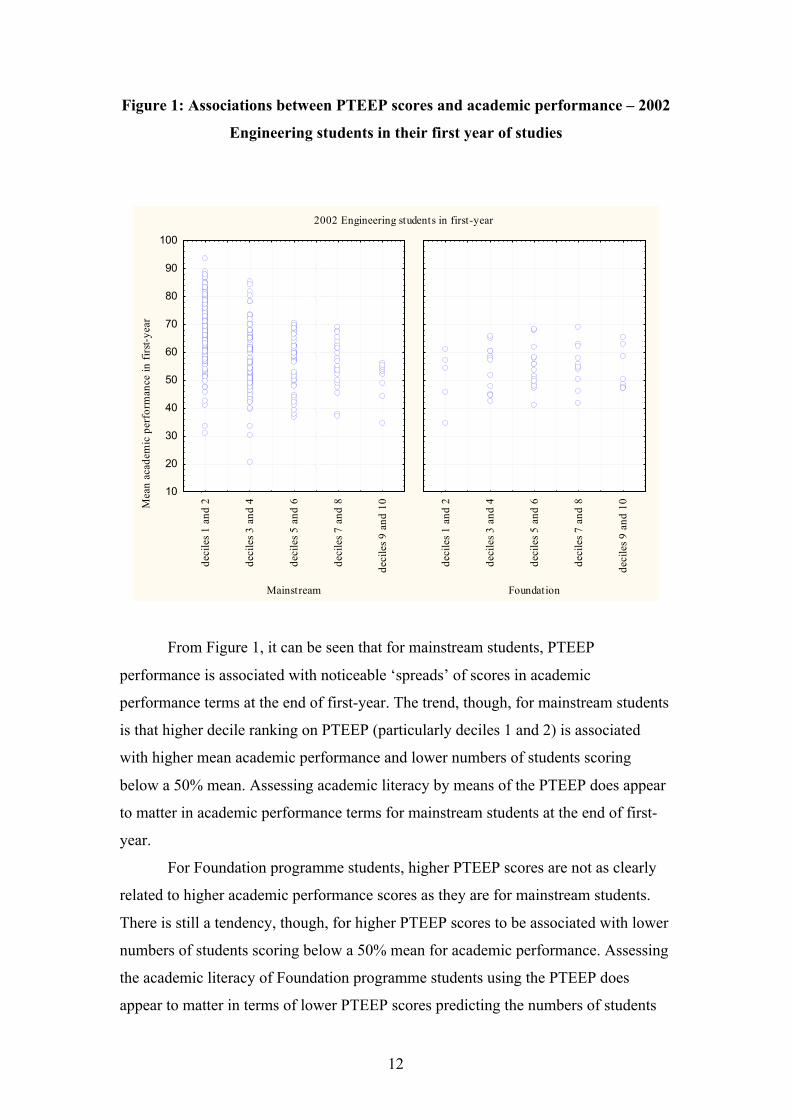
Figure 1 below shows the associations between PTEEP scores (expressed as a
ranking of students from decile 1 – top decile – to decile 10 – bottom decile) and
mean academic performance for the 2002 cohort of University of Cape Town
Engineering students at the end of their first academic year of study. For easier
reporting, decile rankings have been grouped in pairs, and for examining
trend-level associations, mean academic performance score has been computed as a
simple average of academic performance over the courses taken by these students.
Note that the 2002 cohort of students has been further sub-divided into two groups:
those students who were registered for ‘mainstream’ (conventional, standard
curriculum) programmes and those registered for foundation (reduced or extended
curriculum) programmes.
1 Not all data for these explorations are included in this paper, for reasons of brevity. Full analyses are available for scrutiny from the first author.
12
Figure 1: Associations between PTEEP scores and academic performance – 2002
Engineering students in their first year of studies
2002 Engineering students in first-year
Mea
n ac
adem
ic p
erfo
rman
ce in
firs
t-yea
r
Mainstream
deci
les 1
and
2
deci
les 3
and
4
deci
les 5
and
6
deci
les 7
and
8
deci
les 9
and
10
10
20
30
40
50
60
70
80
90
100
Foundation
deci
les 1
and
2
deci
les 3
and
4
deci
les 5
and
6
deci
les 7
and
8
deci
les 9
and
10
From Figure 1, it can be seen that for mainstream students, PTEEP
performance is associated with noticeable ‘spreads’ of scores in academic
performance terms at the end of first-year. The trend, though, for mainstream students
is that higher decile ranking on PTEEP (particularly deciles 1 and 2) is associated
with higher mean academic performance and lower numbers of students scoring
below a 50% mean. Assessing academic literacy by means of the PTEEP does appear
to matter in academic performance terms for mainstream students at the end of first-
year.
For Foundation programme students, higher PTEEP scores are not as clearly
related to higher academic performance scores as they are for mainstream students.
There is still a tendency, though, for higher PTEEP scores to be associated with lower
numbers of students scoring below a 50% mean for academic performance. Assessing
the academic literacy of Foundation programme students using the PTEEP does
appear to matter in terms of lower PTEEP scores predicting the numbers of students
13
falling below 50% mean, but matters less in terms of higher PTEEP scores relating to
higher academic performance than it does for mainstream students.
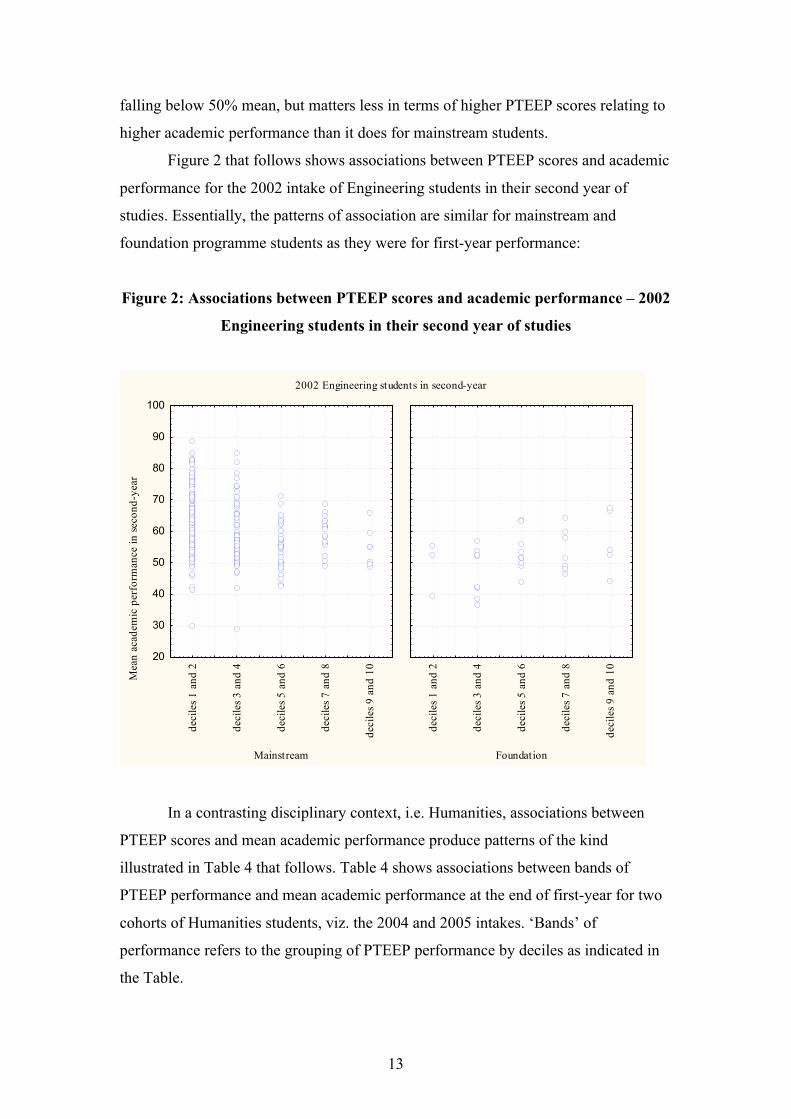
Figure 2 that follows shows associations between PTEEP scores and academic
performance for the 2002 intake of Engineering students in their second year of
studies. Essentially, the patterns of association are similar for mainstream and
foundation programme students as they were for first-year performance:
Figure 2: Associations between PTEEP scores and academic performance – 2002
Engineering students in their second year of studies
2002 Engineering students in second-year
Mea
n ac
adem
ic p
erfo
rman
ce in
seco
nd-y
ear
Mainstream
deci
les 1
and
2
deci
les 3
and
4
deci
les 5
and
6
deci
les 7
and
8
deci
les 9
and
10
20
30
40
50
60
70
80
90
100
Foundation
deci
les 1
and
2
deci
les 3
and
4
deci
les 5
and
6
deci
les 7
and
8
deci
les 9
and
10
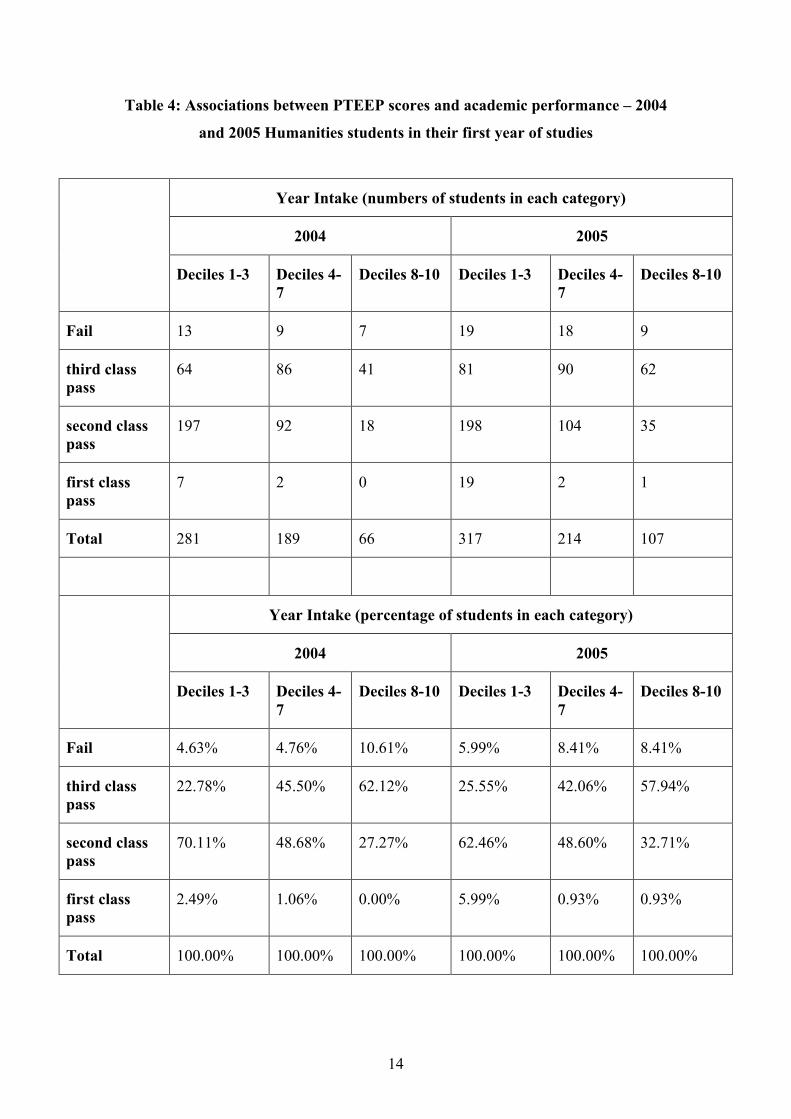
In a contrasting disciplinary context, i.e. Humanities, associations between
PTEEP scores and mean academic performance produce patterns of the kind
illustrated in Table 4 that follows. Table 4 shows associations between bands of
PTEEP performance and mean academic performance at the end of first-year for two
cohorts of Humanities students, viz. the 2004 and 2005 intakes. ‘Bands’ of
performance refers to the grouping of PTEEP performance by deciles as indicated in
the Table.
14
Table 4: Associations between PTEEP scores and academic performance – 2004
and 2005 Humanities students in their first year of studies
Year Intake (numbers of students in each category)
2004 2005
Deciles 1-3 Deciles 4-7
Deciles 8-10 Deciles 1-3 Deciles 4-7
Deciles 8-10
Fail 13 9 7 19 18 9
third class pass
64 86 41 81 90 62
second class pass
197 92 18 198 104 35
first class pass
7 2 0 19 2 1
Total 281 189 66 317 214 107
Year Intake (percentage of students in each category)
2004 2005
Deciles 1-3 Deciles 4-7
Deciles 8-10 Deciles 1-3 Deciles 4-7
Deciles 8-10
Fail 4.63% 4.76% 10.61% 5.99% 8.41% 8.41%
third class pass
22.78% 45.50% 62.12% 25.55% 42.06% 57.94%
second class pass
70.11% 48.68% 27.27% 62.46% 48.60% 32.71%
first class pass
2.49% 1.06% 0.00% 5.99% 0.93% 0.93%
Total 100.00% 100.00% 100.00% 100.00% 100.00% 100.00%
15
From Table 4, it is clear that approximately 70% of Deciles 1-3 students in both years
achieved mean second or first class pass scores and between approximately 65% and
70% of the Deciles 8-10 students scored third class passes or failed. In Humanities,
higher ranked PTEEP performance seems associated with a higher level of pass;
lower ranked PTEEP performance associated with a lower level of pass. Furthermore,
the mean academic performance levels of the Deciles 1-3 students are statistically
significantly higher than the mean academic performance levels of both of the other
two groups. This suggests that in an environment of competition for academic places
in this Faculty, the Deciles 1-3 students would be more likely to be academically
successful (albeit that data is limited here to the first year of study). The two studies
above represent investigations conducted using a trend level approach to assessing
associations between PTEEP and subsequent academic performance.
The third study described below represents an attempt to explore the impact of
teaching and learning on student performance on the PTEEP. The context for the
study was a postgraduate Engineering course in Project Management, where students
wrote the PTEEP at the commencement of their studies and again at the conclusion of
their study programme. The principal aim of this process was to assess the extent to
which students’ academic literacy assessed by the PTEEP could be said to have
altered or remained stable after a programme of study, i.e. did ‘good’ or ‘poor’
performance on the PTEEP remain stable or improve at the second administration of
the test? The second aim of this study was to explore the extent to which the PTEEP
could be used to identify academic literacy strengths and weaknesses in a group of
students, i.e. could performance on the test be used to guide teaching and learning?
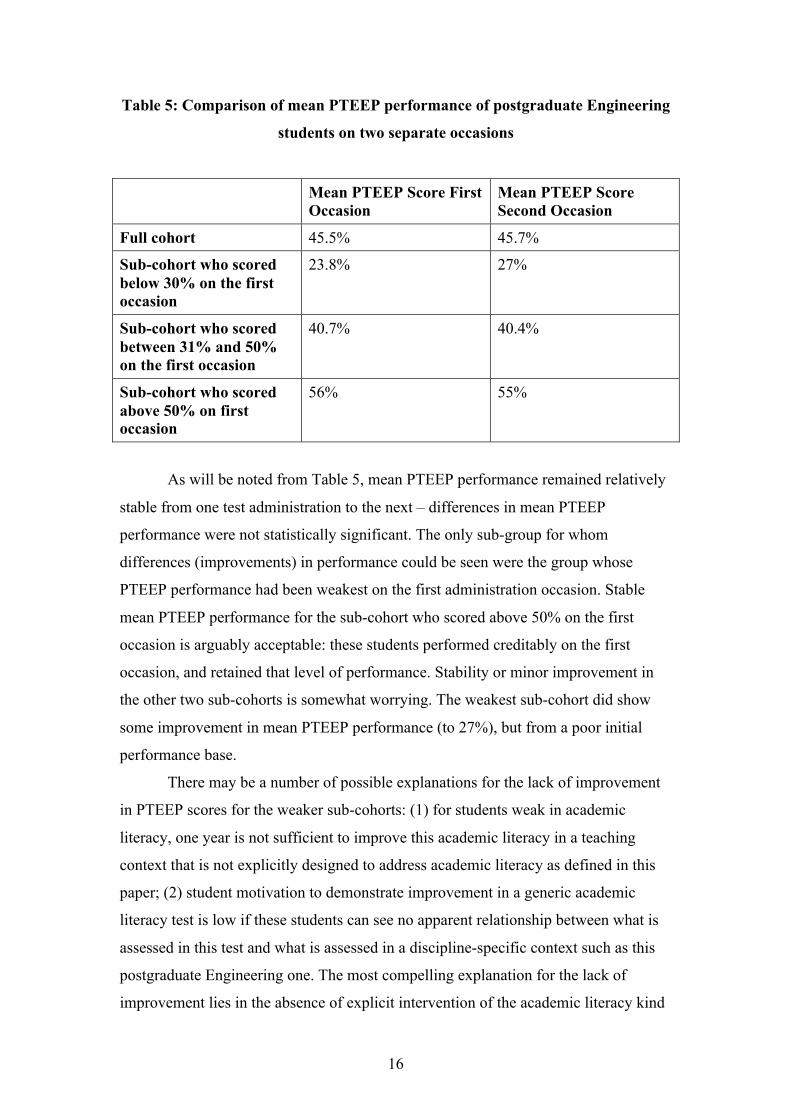
Table 5 below shows the differences in mean PTEEP performance for the
2005 cohort of postgraduate Engineering students who wrote the test on two
occasions in the academic year:
16
Table 5: Comparison of mean PTEEP performance of postgraduate Engineering
students on two separate occasions
Mean PTEEP Score First Occasion
Mean PTEEP Score Second Occasion
Full cohort 45.5% 45.7%
Sub-cohort who scored below 30% on the first occasion
23.8% 27%
Sub-cohort who scored between 31% and 50% on the first occasion
40.7% 40.4%
Sub-cohort who scored above 50% on first occasion
56% 55%
As will be noted from Table 5, mean PTEEP performance remained relatively
stable from one test administration to the next – differences in mean PTEEP
performance were not statistically significant. The only sub-group for whom
differences (improvements) in performance could be seen were the group whose
PTEEP performance had been weakest on the first administration occasion. Stable
mean PTEEP performance for the sub-cohort who scored above 50% on the first
occasion is arguably acceptable: these students performed creditably on the first
occasion, and retained that level of performance. Stability or minor improvement in
the other two sub-cohorts is somewhat worrying. The weakest sub-cohort did show
some improvement in mean PTEEP performance (to 27%), but from a poor initial
performance base.
There may be a number of possible explanations for the lack of improvement
in PTEEP scores for the weaker sub-cohorts: (1) for students weak in academic
literacy, one year is not sufficient to improve this academic literacy in a teaching
context that is not explicitly designed to address academic literacy as defined in this
paper; (2) student motivation to demonstrate improvement in a generic academic
literacy test is low if these students can see no apparent relationship between what is
assessed in this test and what is assessed in a discipline-specific context such as this
postgraduate Engineering one. The most compelling explanation for the lack of
improvement lies in the absence of explicit intervention of the academic literacy kind
17
assessed by the PTEEP in the programme of teaching and learning these students
were registered for. Conventional coursework per se proved insufficient to change
their scores on an academic literacy test.
Particular approaches to academic reading, writing and thinking that appeared
to be weakest for the group of students as a whole (data available from these authors)
were: (1) metaphorical expression – students’ capacity to understand and use
analogous, “pictorial” and non-literal language and reasoning; (2) text genre –
students’ capacity to understand that writers have different “audiences” and purposes
for writing, and that these influence what and how they write; (3) own voice –
students’ capacity to produce their own logical argument, structure this argument and
use appropriate language in its formulation. However, these weaknesses in an
academic literacy sense were not explicitly addressed in the teaching programme.
Course lecturers did not engage with the discipline-specific meanings and
consequences of, for example, students’ test weaknesses in analogous reasoning, text
genre, or capacity to produce structured argument. Nor was course assessment in the
postgraduate Engineering context explicitly related to the assessment embodied in the
academic literacy test. So it may be that assessing students’ academic literacy for
learning improvement does not necessarily ‘matter’ – unless this assessment is tied to
direct teaching interventions aimed at addressing weaknesses identified.
4. Concluding discussion
We return to the title of our paper and consider again whether an assessment of the
academic literacy of entry-level Higher Education students matters. We have explored
the notion of what is meant by ‘matters’ at a number of levels in this paper. Firstly,
we have considered the extent to which an assessment of generic academic literacy,
such as the PTEEP, is regarded by Higher Education academics as having validity, i.e.
we have considered the face validity of the PTEEP, and have observed that the
theoretical grounding of the construct of the PTEEP in international studies of
language assessment and of student learning helps to establish this validity. We have
also noted that the participation by interdisciplinary national teams in the
development and operationalisation of the construct of the PTEEP further assists in
establishing both face and, in so far as this is systematically considered and
articulated, also content validity. At an empirical level, we have reported on the
18
reliability of the PTEEP and the coherence of the construct and its sub-constructs. We
have argued that there appears to be some empirical support for the division of the
construct into its constituent parts, but that there also appears to be some degree of
overlap amongst the constituents. We have also presented evidence that some
question-types on the test might of themselves be sufficient to assess students’
academic literacy, but that there are grounds for arguing that reading-response type
questions (multi-choice questions) assess different kinds of academic literacy to
writing-response type questions (productive elements in the PTEEP).
Secondly, we have assessed the extent to which assessments such as the
PTEEP ‘matter’ in terms of their having associations with subsequent student
academic performance. Large-scale studies of the kind described in Engineering and
Humanities contexts in this paper suggest that differing levels of performance on the
PTEEP are associated with differing levels of academic performance across both
mainstream and foundation programme provision. In the mainstream context, higher
scores on the PTEEP appear to be associated with academic performance scores and
lower scores on the PTEEP with lower academic performance. In the foundation
programme context, lower scores on the PTEEP appear to have some association with
lower scores academically. Higher scores on the PTEEP are less associated with
higher academic performance scores than they were for mainstream students, but are
more likely to be predictive of success than failure for foundation programme
students.
Smaller-scale studies of the kind reported on in the postgraduate Engineering
context, where explorations of a direct relationship between PTEEP and academic
performance were attempted, provide no significant evidence that PTEEP scores
improve after a period of academic study. At face-value, however, there would seem
to be evidence of improvement in PTEEP performance for those students who
performed poorly on the PTEEP at the first time of writing. We conclude that PTEEP
performance may not ‘matter’ unless it is explicitly addressed in the context of
discipline-specific curricula and unless the academic literacy assessed in the PTEEP is
integrated into the teaching, learning and assessment of the disciplinary programme.
19
5. Bibliography
AARP. 2007. The Placement Test in English for Educational Purposes: the Tea Test.
Alternative Admissions Research Project, University of Cape Town. Available
at http://www.aarp.ac.za. Accessed 20 November 2007.
Arce-Ferrer, A.J. & Castillo, I.B. 2006. Investigating postgraduate college admission
interviews: Generalisability theory, reliability and incremental predictive
validity. Journal of Hispanic higher education 6 (2): 118–134.
Bachman, L.F. & Palmer, A.S. 1996. Language testing in practice. Hong Kong:
Oxford University Press.
British Council. 2007. The International Language Testing System (IELTS). The
British Council: United Kingdom.
Clemans, W.V., Lunneborg, C.E. & Raju, N.S. 2004. Professor Paul Horst’s legacy:
A differential prediction model for effective guidance in course selection.
Educational measurement: issues and practice 23 (3): 23–30.
Cliff, A.F., Yeld, N. & Hanslo, M. 2003. Assessing the academic literacy skills of
entry-level students, using the Placement Test in English for Educational
Purposes (PTEEP). Bi-annual conference of the European Association for
Research in Learning and Instruction (EARLI), Padova, Italy.
Cliff, A., Hanslo, M., Ramaboa, K. & Visser, A. 2005. Third annual report to the
Health Sciences Consortium on the use of Health Sciences Placement Tests.
AARP Research Report, University of Cape Town.
Cliff, A.F. & Yeld, N. 2006. Test domains and constructs: academic literacy. In H.
Griesel (ed.) Access and entry level benchmarks: the national benchmark tests
project. Pretoria: Higher Education South Africa: 19–27.
Cliffordson, C. 2006. Selection effects on applications and admissions to Medical
Education with regular and step-wise admission procedures. Scandinavian
journal of educational research 50 (4): 463–482.
ETS. 2007. The Scholastic Aptitude Test (SAT). Educational Testing Service.
Princeton: USA.
ETS. 2007. Test of English as a Foreign Language (TOEFL). Educational Testing
Service. Princeton: USA.
GMAC. 2007. The Graduate Management Admission Test (GMAT). Graduate
Management Admission Council. Virginia: USA.
20
Houston, M., Knox, H. & Rimmer, R. 2007. Wider access and progression among
full-time students. Higher education 53: 107–146.
Marton, F. & Säljö, R. 1976a. On qualitative differences in learning: I – Outcome and
process. British journal of educational psychology 46: 4–11.
Marton, F. & Säljö, R. 1976b. On qualitative differences in learning: II – Outcome as
a function of the learner’s conception of the task. British journal of
educational psychology 46: 115–127.
Marton, F. & Säljö, R. 1984. Approaches to learning. In F. Marton, D. Hounsell & N.
J. Entwistle (eds.) The experience of learning. Edinburgh: Scottish Academic
Press: 36–55.
Meyer, J.H.F. 1991. Study orchestration: the manifestation, interpretation and
consequences of contextualised approaches to studying. Higher education 22:
297–316.
SATAP. 2007. Standardised Assessment Test for Access and Placement: Language.
SATAP Development Group.
Shivpuri, S., Schmitt, N., Oswald, F.L. & Kim, B.H. 2006. Individual differences in
academic growth: do they exist, and can we predict them? Journal of college
student development 47 (1): 69–86.
Stricker, L.J. 2004. The performance of native speakers of English and ESL speakers
on the computer-based TOEFL and GRE general test. Language testing 21 (2):
146–173.
UAL 2007. The Test of Academic Literacy Levels. Unit for Academic Literacy,
University of Pretoria. Available at
http://web.up.ac.za/default.asp?ipkCategoryID=2388&subid=2388&ipklookid
=9 and http://web.up.ac.za/UserFiles/Sample%20Test%20TALL.pdf .
Accessed 17 September 2007.
Van der Slik, F. & Weideman, A. 2005. The refinement of a test of academic literacy.
Per linguam 21 (1): 23–35.
Weideman, A. 2003. Assessing and developing academic literacy. Per linguam 19 (1
& 2): 55–65.
Weideman, A. 2006. Transparency and accountability in applied linguistics. Southern
African linguistics and applied language studies 24 (1): 71–86.
21
Yeld, N. 2001. Equity, assessment and language of learning: key issues for higher
education selection and access in South Africa. Unpublished PhD Thesis,
University of Cape Town.
Related Documents