European Journal of Business, Economics and Accountancy Vol. 4, No. 8, 2016 ISSN 2056-6018 Progressive Academic Publishing, UK Page 46 www.idpublications.org THE APPLICATION OF TOTAL QUALITY MANAGEMENT (TQM) APPROACHES AND TOOLS IN ENHANCING GOAL ATTAINMENT IN THE NIGERIAN BREWERY MANUFACTURING FIRMS: A SURVEY OF SELECTED BREWERY ANUFACTURING FIRMS IN NIGERIA Sev Joseph Teryima, Ph.D, MBA, B.Sc, FABRM, MIMC Emakwu John & Dewua Philip Associate Professor, Department of Business Management Faculty of Management Sciences, Benue State University Makurdi, NIGERIA ABSTRACT The objective of the study is to determine the Impact of Total Quality Management (TQM) Application both technique/tools and its implementation strategies in enhancing organizational goal attainment in the Brewery Manufacturing Firms in Nigeria. The population of the study comprises three (3) Brewery firms in Nigeria namely, Nigerian Brewery Plc, Guinness Nigeria Plc and Submiller Brewery totaled at 4827. The sample size is 369 and was determined using Taro Yamane formula. Bowley’s allocation formula is used in determining company’s individual sample size. Both primary and secondary data sources ar e adopted. Construct validity is determined on TQM tools/techniques such as Benchmarking, outsourcing, speed, quality functional deployment, Taguchi technique, cause and effect diagrams, and statistical quality control amongst others. Bartlett test of sphericity and Kaiser- Meyer-Olkin test is adopted to measure sampling adequacy in which a value of 0.466 was obtained revealing that the sample is adequate. Multiple regression is used in the test of the two (2) formulated hypotheses. The test revealed that TQM tools have significant impact on the attainment of organizational goals such as high market share, profit attainment, customer satisfaction, quality product. The other finding shows that, application of implementation strategies of TQM such as top management commitment, education and retraining employees, adoption of modern supervision methods amongst others will lead to goal attainment. The paper recommends that continuous improvement on quality standards, processes, methodologies, strategies are essential ingredients for TQM and organizational goal attainment. Additionally, Executive Managers should focus on what matters most to customers in order to attain profit goals, market share and customer satisfaction goals amongst others in order to be productive. Keywords: Total Quality Management, TQM Tools, Goal Attainment, Manufacturing firms, TQM Implementation Strategies. INTRODUCTION An important development that has revolutionalized operations and productivity in modern organizations is Total Quality Management (TQM). All around us, in manufacturing industries, oil companies, banks, trading houses and service organizations, we see the results of applying or not applying TQM (Yalokwu, 2000): - Organizations that adopt TQM as a way of life, and not just as a management only, programmes end up being relatively more successful than those that do not incorporate TQM in their system of doing things. More so, increasing level of competition among organizations has brought about rapid innovation and

Welcome message from author
This document is posted to help you gain knowledge. Please leave a comment to let me know what you think about it! Share it to your friends and learn new things together.
Transcript
European Journal of Business, Economics and Accountancy Vol. 4, No. 8, 2016 ISSN 2056-6018
Progressive Academic Publishing, UK Page 46 www.idpublications.org
THE APPLICATION OF TOTAL QUALITY MANAGEMENT (TQM)
APPROACHES AND TOOLS IN ENHANCING GOAL ATTAINMENT
IN THE NIGERIAN BREWERY MANUFACTURING FIRMS: A
SURVEY OF SELECTED BREWERY ANUFACTURING FIRMS IN
NIGERIA
Sev Joseph Teryima, Ph.D, MBA, B.Sc, FABRM, MIMC
Emakwu John & Dewua Philip Associate Professor, Department of Business Management
Faculty of Management Sciences, Benue State University
Makurdi, NIGERIA
ABSTRACT
The objective of the study is to determine the Impact of Total Quality Management (TQM)
Application both technique/tools and its implementation strategies in enhancing
organizational goal attainment in the Brewery Manufacturing Firms in Nigeria. The
population of the study comprises three (3) Brewery firms in Nigeria namely, Nigerian
Brewery Plc, Guinness Nigeria Plc and Submiller Brewery totaled at 4827. The sample size is
369 and was determined using Taro Yamane formula. Bowley’s allocation formula is used in
determining company’s individual sample size. Both primary and secondary data sources are
adopted. Construct validity is determined on TQM tools/techniques such as Benchmarking,
outsourcing, speed, quality functional deployment, Taguchi technique, cause and effect
diagrams, and statistical quality control amongst others. Bartlett test of sphericity and Kaiser-
Meyer-Olkin test is adopted to measure sampling adequacy in which a value of 0.466 was
obtained revealing that the sample is adequate. Multiple regression is used in the test of the
two (2) formulated hypotheses. The test revealed that TQM tools have significant impact on
the attainment of organizational goals such as high market share, profit attainment, customer
satisfaction, quality product. The other finding shows that, application of implementation
strategies of TQM such as top management commitment, education and retraining
employees, adoption of modern supervision methods amongst others will lead to goal
attainment. The paper recommends that continuous improvement on quality standards,
processes, methodologies, strategies are essential ingredients for TQM and organizational
goal attainment. Additionally, Executive Managers should focus on what matters most to
customers in order to attain profit goals, market share and customer satisfaction goals
amongst others in order to be productive.
Keywords: Total Quality Management, TQM Tools, Goal Attainment, Manufacturing firms,
TQM Implementation Strategies.
INTRODUCTION
An important development that has revolutionalized operations and productivity in modern
organizations is Total Quality Management (TQM). All around us, in manufacturing
industries, oil companies, banks, trading houses and service organizations, we see the results
of applying or not applying TQM (Yalokwu, 2000): - Organizations that adopt TQM as a way
of life, and not just as a management only, programmes end up being relatively more
successful than those that do not incorporate TQM in their system of doing things. More so,
increasing level of competition among organizations has brought about rapid innovation and
European Journal of Business, Economics and Accountancy Vol. 4, No. 8, 2016 ISSN 2056-6018
Progressive Academic Publishing, UK Page 47 www.idpublications.org
changes in the modern societies. Organizations that learn to search creativity for the future
can transform themselves to advantage when they confront changing competitive
environment. Therefore, strategic planners, must be able to identify the cause of changes (be
it both technological, social changes and quality improvements etc) that will influence
organization performance. Many organizations planners that under estimate the impact of
such changes, quality improvements, and their performance will be affected (Eke 2004).
Maiturare (2010) maintains that, the increasing economic globalization of the 1980s, made
possible in part by advanced information technologies, created a scenario whereby the U.S
manufacturing sector fell prey to more competitive producers, particularly in Japan. In
response to massive market share gains achieved by Japanese companies during the late 1970
and 1980, U.S producers scrambled to adopt quality and productivity techniques that might
restore their competiveness. Indeed, Deming’s philosophies and systems were finally
recognized in the United State, and Deming himself became a highly-sought-after lecturer
and author. The “Deming Management Method” became the model for many American
corporations eager to improve. Consequently, Total Quality Management (TQM), the phrase
applied to quality initiatives proffered by Deming, Juran, Crobsy, Feiganbaum, Shewhart,
Ishikawa, Taguchi and other management gurus, became a staple of American enterprise by
the late 1980s. Since then, the concept has become a global phenomenon being applied by
companies in both the developed and the developing world. Over the years, several studies
have been undertaken on the application of TQM in Business Organization in Nigeria. In
Nigeria, companies especially in the oil sector and the financial service industry attempted to
adopt the TQM philosophy in their organizations. Such organizations include Nigerian
National Petroleum Corporation (NNPC), Mobil oil Nigeria plc, banking organizations,
cement manufacturing industries, pharmaceuticals amongst others. For example, Irechukwu
(2010) and Maiturare (2010) conclude that, the level of success among organizations that
have implemented TQM in Nigeria is high considering the fact that thirty-two (32) out of
thirty five (35) organizations that implemented were successful.
Total Quality Management (TQM) according to Dale Besterfield, Carol Besterfield- Michna,
Glen Besterfield and Mary Besterfield-Sacre (2006) is defined as both a philosophy and a set
of guiding principles that represents the foundation of a continuously improving organization.
It is the application of quantitative methods and human resources to improve all the processes
within an organization and exceed customer need now and in the future. TQM integrates
fundamental management techniques, existing improvement efforts, and technical tools under
a disciplined approach.
Yalokwu (2006) defines Total Quality Management (TQM) as a long term effort by an
organization to change its own management approach towards the production of goods and
services that continuously meet customers’ requirements at the lowest cost possible by
releasing the potentials of all organizational resources. TQM is about changing the way
things are done thereafter. To improve performance continuously at lowest cost, people need
to know what to do, hoe to do it, have the right tools to do it, be able to measure performance
and receive feed-back on current levels of achievement.
To Stoner, Freeman and Gilbert Jnr (2000). Total Quality Management (TQM) means that
the organization’s culture is defined by and supports the constant attainment of customer
satisfaction through an integrated system of tools, techniques and training. This involves the
continuous improvement of organizational processes, resulting in high quality products and
European Journal of Business, Economics and Accountancy Vol. 4, No. 8, 2016 ISSN 2056-6018
Progressive Academic Publishing, UK Page 48 www.idpublications.org
services. TQM provides all this by adhering to a set of general principles (Kanji, 1996), they
include: -
I. Delight the customer (Customer Orientation): – The first principle focuses on
customers and asks “what would delight them”? This implies understanding needs –
both of product and service, tangible and intangible; agreeing with their requirement
and meeting them. Delight here means, being best at what matters most to customers,
which usually changes overtime. “The core concepts of TQM that relates to delight the
customer are “customer satisfaction” and internal customers are real”.
II. Management by Facts: - Knowing the current performance levels of our products or
services in our customers’ hands and that of all employees is the first stage of being
able to improve. If we know where we are starting from we are able to tell we are
improving. “The core concept that relates to Management by fact is “all work is a
process” and measurement”.
III. People based Management: - Knowing what to do, how to do it and getting feedback
on performance is one part of encouraging people to take responsibility for the quality
of their own work; and involvement and commitment to customer satisfaction are the
ways to bring this about. This third principle of TQM recognized those good systems,
standards, and technology in them will not mean quality. Therefore the role of people
is vital and essential. “The core concepts that relate people based management are
“teamwork” and people make quality”.
IV. Continuous Improvement: - Here TQM is seen as not an isolated programme or a
project. It is a management process that recognized that however much we may
improve, our competitor will continue to improve and our customers will expect more
from us. “The core concepts that relates to company’s continuous improvement are
“the continuous improvement cycle” and prevention”.
V. Produce at lowest cost: - This means that quality is built into the products and services
at a relatively lower cost than other suppliers. This includes preventing any kind of
failure from happening and eliminating financial and time wastage. Lowest cost does
not necessary means at the lowest price. It should mean at the lowest cost to the
organization as a whole.
David Garvin (1989), a specialist in the area of quality control argues that quality can be used
in a strategic way to compete effectively and that an appropriate quality strategy would take
into consideration various dimensions of quality. The dimensions are: -
a) Performance – This involves the various operating characteristics of the product (i.e
the primary product characteristics such as the brightness of the picture), sound and
longevity of the picture tube in the case of a television set), (Hostage, 1975).
b) Features – These are the secondary characteristics, added features that are
supplemental to the basic operating characteristic. In automobile for example, we have
remote control, a stereo CD player would be an additional feature.
c) Reliability – This refers to consistency of performance over time, average time for the
unit to fail. It is the degree of dependability and trustworthiness of the benefit of the
product for a long period of time. It addressed the probability that the product will
work without interruption or breaking down (Schiller, 1988).
d) Conformance – The degree to which the product conforms to pre-established
specifications. All quality products are expected to precisely meet the set standards.
e) Durability – Useful life including repairs of the product. Simply it measures the length
of time that a product performs before a replacement becomes necessary. The
European Journal of Business, Economics and Accountancy Vol. 4, No. 8, 2016 ISSN 2056-6018
Progressive Academic Publishing, UK Page 49 www.idpublications.org
durability of home appliances such as a washing machine can range from 10 to 15
years (Fins, 1989).
f) Serviceability – This refers to the promptness, courtesy, proficiency and the ease of
repair when the product breaks down and is sent for repairs. It is simply resolution of
problems and complaints.
g) Response – Human-to-Human interface, such as the courtesy of the dealer.
h) Aesthetics – This is the sensory characteristics such as the exterior finish. The
aesthetics aspect of a product is comparatively subjective in nature and refers to its
impact on the human senses such as how it looks, feels, sounds, tastes depending upon
the type of product (Labich, 1989). Automobile companies e.g. Honda, Toyota,
Mercedeze Benze, Peugeot etc make sure that in addition to the functional quality,
their automobile are all aesthetically attractive.
i) Perceived Quality – An equally important dimension of quality is the perception of the
quality of the product in the minds of the consumer example, Honda products, Sony
Walkman, and Rolex watches are perceived to be of high quality items by consumers.
Adams (1972) identified the following as service quality dimensions. These
dimensions are:-
1) Timeliness – performed in promised period of time.
2) Courtesy – performed cheerfully.
3) Consistency – giving all customers similar experience each time.
4) Convenience – accessibility to customers.
5) Completeness – fully serviced, as required.
6) Accuracy – performed correctly each time (Hitt, Ireland and Hoskisson, 2001).
Organizations with extensive and successful quality improvement programs tend to
rely on these above product and service dimensions in order to attain their goals with cross-
functional work teams and self-directed or empowered work teams put in place; Garvin
(1987).
STATEMENT OF THE PROBLEM
In spite of the numerous success recorded by organizations in product production and service
delivery (i.e oil companies, cement companies, breweries firms, pharmaceuticals companies,
banking firms etc) there are still many companies that attempted a variety of quality
improvement efforts by adopting Total Quality Management (TQM) techniques and tools
such as benchmarking, outsourcing, speed, Quality function deployment (QFD), Taguchi
techniques, flow diagram, Pareto analysis, cause-and-effect diagrams, Statistical Process
Control and ISO 9000, but they have not achieved any or most of the expected outcomes of
high profit, increased market share amongst others. Some quality experts like Deming’s,
Juran, and Crosby believed that the most important factor in the success or failure of TQM
effort is the genuiness of the organizational commitment. It is therefore imperative to X-ray
and see exactly the reason leading to unsatisfactory trends despite quality techniques
application by these organizations.
OBJECTIVES OF THE STUDY
i. To determine the impact of Total Quality Management (TQM) techniques/tools
application in attaining the goals of Breweries manufacturing organizations in Nigeria.
ii. To determine the strategies to be adopted for effective implementation of Total Quality
Management (TQM) in order to attain organizational goals.
European Journal of Business, Economics and Accountancy Vol. 4, No. 8, 2016 ISSN 2056-6018
Progressive Academic Publishing, UK Page 50 www.idpublications.org
RESEARCH QUESTIONS
i. To what extent have the techniques and tools of Total Quality Management (TQM)
impacted on goal attainment of Breweries manufacturing organizations?
ii. To what extent have there been effective implementation of Total Quality Management
(TQM) strategies in attainment of organizational goals?
RESEARCH HYPOTHESES
Ho1 Total Quality Management (TQM) techniques and tools adopted by Breweries
manufacturing organization in Nigeria have not impacted on the attainment of
organizational goals.
Ho2 Breweries manufacturing organizations in Nigeria have not adopted strategies for
effective implementation of Total Quality Management (TQM) to facilitate attainment
of organizational goals.
REVIEW OF RELATED LITERATURE
Origin of Total Quality Management (TQM)
Total Quality Management (TQM) as we know it today was introduced in the 1930s by the
American Statistician Dr. W. Edwards Deming who developed full systems of quality control
in the United States of America (USA). Deming held very strong views on how to achieve
excellence in manufacturing while he was still in the USA. But having been ignored for
several years, he relocated to Japan where his views on TQM were quickly adopted. In 1948,
Deming conducted his first seminar in Japan on TQM. In 1950, the Japanese Standard
Association was formed and in the following year, the Deming Award Scheme for Total
Quality started. Deming’s work in Japan was successful and it contributed greatly to Japan’s
post World War II technological breakthrough. It was not until the USA government
perceived the great success that Deming achieved in Japan that TQM was adopted in the
USA and other western countries.
Another contributor to TQM was Dr. Joseph. M. Juran, like Deming, he started his research
in America and in 1954 he made his first tour of Japan. In fact, 1950’s in Japan were a period
of consolidating the home markets, adding value to products and copying ideas from the rest
of the world. The low-cost based of the 1960’s enabled Japan to export world-wide,
continuously adapting to and exploiting markets. The western perception of Japan was still
one of poor-quality goods.
In the following twenty years, the perception of Japanese goods and services changed to one
of reliability, good value for money, with the result that the economic balance of power had
shifted to Japan and the East in such industries as motor vehicles, shipbuilding, electrical
appliances, electronic consumer goods, textile, banking and financial services, photography,
video, matchmaking and many others.
A parallel course in the United States showed a flow development of conventional quality
control techniques with the appearance of quality circles during the mid-1960s. During the
period, Philip B. Crosby introduced the Zero-defects concept as a performance standard
within the framework of his quality absolutes. It was not until the end of the 1970s that the
first fortune 500 companies took on the organization wide quality management processes and
European Journal of Business, Economics and Accountancy Vol. 4, No. 8, 2016 ISSN 2056-6018
Progressive Academic Publishing, UK Page 51 www.idpublications.org
Tom Peters revitalized total quality management concepts through his book, “in search for
excellence”.
In the United Kingdom in 1963, the National Productivity council promoted quality
management through its forward-looking: “Right first time”.
In 1978, the national strategy or quality was developed based on the government’s notion that
£10 (Ten Billion Pound Sterling) was being wasted every year due to bad quality production.
The capping went out with the labour government in 1979 but was replaced four years later
with the National Quality campaign which since then been the most sustained programme of
its kind in UK history.
In countries like Nigeria, TQM as we know it today is a relatively late comer, having taken
shape only within the last two decades. For long, emphasis had been on quantity and not
quality, hence people often say that Nigeria is a seller market. However, with increasing
globalization and dumping of goods from the developed countries into the Nigeria market,
the local manufacturers are becoming more responsive towards the improvement of product
quality. For example, the West African Milk Company, African timber and plywood
industries and Eleganza industries now manufacture products better in quality than their
closed substitutes hither to import into Nigeria. Even in the services sector such as banking,
education and consultancy, the issue of quality is becoming more recognized than in the past;
Yalokwu (2006).
TOTAL QUALITY MANAGEMENT (TQM) TOOLS AND TECHNIQUES
According to Oakland (1990), Total Quality Management (TQM) requires a new-ending
process of continuous improvement. The end goal is perfection, which may never be
achieved but is always sought. The concept of continuous improvement has become the
corner stone of the Japanese use the term “kaizen” to describe the ongoing process of
continuous improvement. The concept of continuous improvement and TQM requires a
complete overhaul of management philosophy and organizational structure; managers can
rely on several specific tools and techniques for improving quality.
Griffins (1997) identify some of the following approaches and methodologies for quality
improvement as discussed below;
a) Benchmarking: - This is the process of learning how other firms do exceptionally high
quality things. It is the continuous process of comparing a company’s strategy, products and
processes with such other similar organizations who are the best in that class in order to
learn how they achieved excellence and then setting out with changes in strategies, products
and processes to match and then surpass them. A bench mark demonstrates the degree to
which the customers of other similar organizations are satisfied. It identifies the highest
degree of customer satisfaction (Rogers, 1998). The goal is to beat such an organization in
performance.
According to Kotter (1980) some of the best known market leaders in various firms in
operations and production bench marked are General motors in (Automobiles), Kodak in
(photography), IBM in (Computers), Xerox in (copying) and Procter and Gamble in
(consumer package goods).
The benchmarking process usually involves the following steps:-
i. Identify a critical area in your own organization that needs improvement.
European Journal of Business, Economics and Accountancy Vol. 4, No. 8, 2016 ISSN 2056-6018
Progressive Academic Publishing, UK Page 52 www.idpublications.org
ii. Identify some other organization which excels in quality in that area.
iii. That organization would then become your benchmark for that area for
improvement. Study the organization carefully and especially its benchmark activity.
iv. Analyze the data so gathered from the benchmark organization and compare it with
your own activity.
v. Improve the critical area at your own organization.
b) Outsourcing: - This is the process of subcontracting services and operations to other
firms that can do them cheaper or better (or both). If a business performs each and every one
of its own administrative and business services and operations, it is almost certain to be doing
at least some of them in an inefficient and/or low quality manner. If those areas can be
identified and outsources, the firm will save money and realize a higher-quality service or
operations. For example, almost all multinational corporations operating in Nigeria
outsources recruitment service to Auther Anderson consulting firm, KPMG and
Pricewaterhouse.
c) Speed: - Speed refers to time needed by the organization to get something
accomplished without sacrificing its quality. An organization which produces faster
distributes faster and adapts to new ways of doing things faster will be ahead of competition.
A good illustration of the power of speed comes from General Electric. At one point the firm
needed six plants and three weeks to produce and deliver customer-made industrial circuit-
breaker boxes. By making speed a priority, the same product can now be delivered in three
days and only a single plant is involved.
d) ISO 9000: - This is a useful technique for improving quality. ISO 9000 refers to a set
of quality standards created by the international organization for standardization. There are
five set of standards covering areas such as product testing, employee training, record
keeping, supplier relations, and repair policies and procedures. Firms that want to meet these
standards apply for certification and are audited by a firm chosen by the organizations
domestic affiliate (in the United States, this is the American National Standards Institute).
These auditors review every aspect of the firms’ business operations in relation to the
standards.
e) Statistical Quality Control (SQC):- SQC is primarily concerned with managing
quality. It is a set of specific statistical techniques that can be used to monitor quality.
Acceptance sampling involves sampling finished goods to ensure that quality standard has
been met. Acceptance sampling is effective only when the correct percentage of products that
should be tested (for example, 2.5 or 25 percent) is determined. This decision is especially
important when the test renders the product useless.
Another SQC method is in-process sampling. In-process sampling involves evaluating
products during production so that needed changes can be made. For example, the painting
department of a furniture company might periodically check the tint of the paint it is using.
The company can then adjust the color as necessary to conform to customers standards. The
advantage of in-processes sampling is that, it allows problems to be detected before they
accumulate (Kanji and Asher, 1993).
f) Quality Function Deployment (QFD): - The Quality function deployment defines the
relationship between the customer’s desire and the products supplied. Defining the
relationship clearly is the first step in building a world-class production system. Then the
products and processes can be built with features desired by the customers.
g) Taguchi Technique: - Named after a Japanese engineer, Genichi Taguchi. This
approach is built around three concepts, namely, quality robustness, quality loss factor and
target oriented quality.
European Journal of Business, Economics and Accountancy Vol. 4, No. 8, 2016 ISSN 2056-6018
Progressive Academic Publishing, UK Page 53 www.idpublications.org
“Quality robust” products would continue to retain their quality even in adverse
manufacturing and environmental conditions. Taguchi’s idea is to remove the “effects” of
adverse conditions instead of removing the causes. Removing causes can sometimes be very
costly and time consuming, and hence it may be cheaper and faster to remove such effects.
The “quality loss functions” (QLF) identifies all costs connected with poor quality including
the costs of customer dissatisfaction, warranties service scraps, waste and repairs and
possibly some social costs. The quality loss function is defined as:-
L = Loss
D = Deviations from the target value
C = Cost of avoiding the deviations
Shows that the further the product is from the target value, the more severe the loss.
“Target-Oriented quality” is a philosophy of continuous improvement to bring the product up
to the most realistic but high quality target.
h) Flow Diagrams: - A flow diagram serves as a visual representation of a system or a
process and it allows one to see the flow of steps in a process from the beginning to the end,
and serves as a kind of a road map for locating and solving problems for improving quality.
i) Pareto Analysis: - Wilfred Pareto, a nineteenth century economist suggested that 80
percent of the problems are the result of only 20 percent of the causes. Pareto Analysis
organized errors, problems or defects so that attention can be focused on the most important
problems according to the degree of their important problem area. The idea is to classify
these problems according to the degree of their importance so that the most important
problems can be resolved first. The 80-20 rule, as stated above, suggests that by removing 20
percent of the causes, 80 percent of the errors can be removed. For example, if 80 percent of
the machine breakdown from 20 percent of the machines, then attention should be focused on
these 20 percent machine.
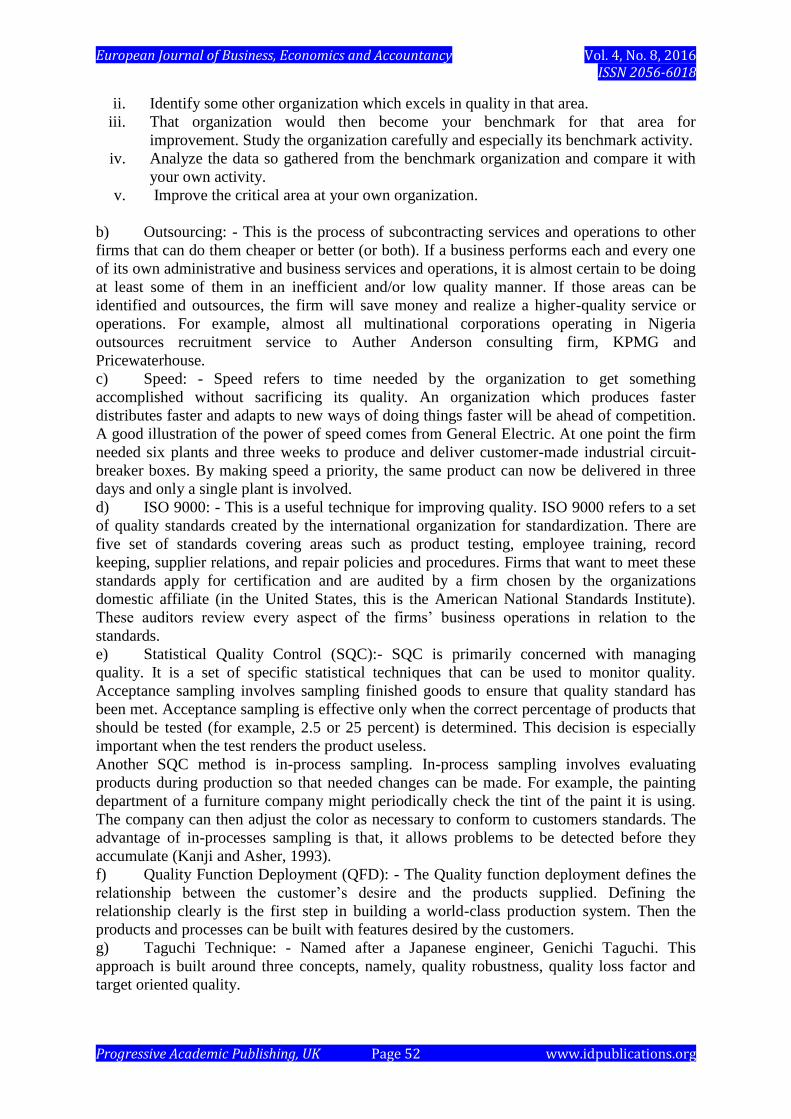
j) Cause-and-Effect Diagrams: - The cause-and-effect diagrams offer a structured
approach to problem solving. (See diagram 1-1a). These are also known as “fish bone
diagrams” because of their shape. The diagrams help to organize problem solving efforts by
providing several layers of categories that may be factors in causing problems. The four main
such categories are methods, manpower, materials and machines. Each category can then
provide more information about specific causes of problems in that category. A sample fish
bone diagram is shown below (diagram 1-1a).
Figure 1-1a – cause and effect diagrams
Cause Cause
Cause Cause
Cause Cause
Cause
Cause Cause
Cause Cause
Figure 1-1b – cause -and -effect diagrams
Materials Methods
Man Power
Effect
Machines
European Journal of Business, Economics and Accountancy Vol. 4, No. 8, 2016 ISSN 2056-6018
Progressive Academic Publishing, UK Page 54 www.idpublications.org
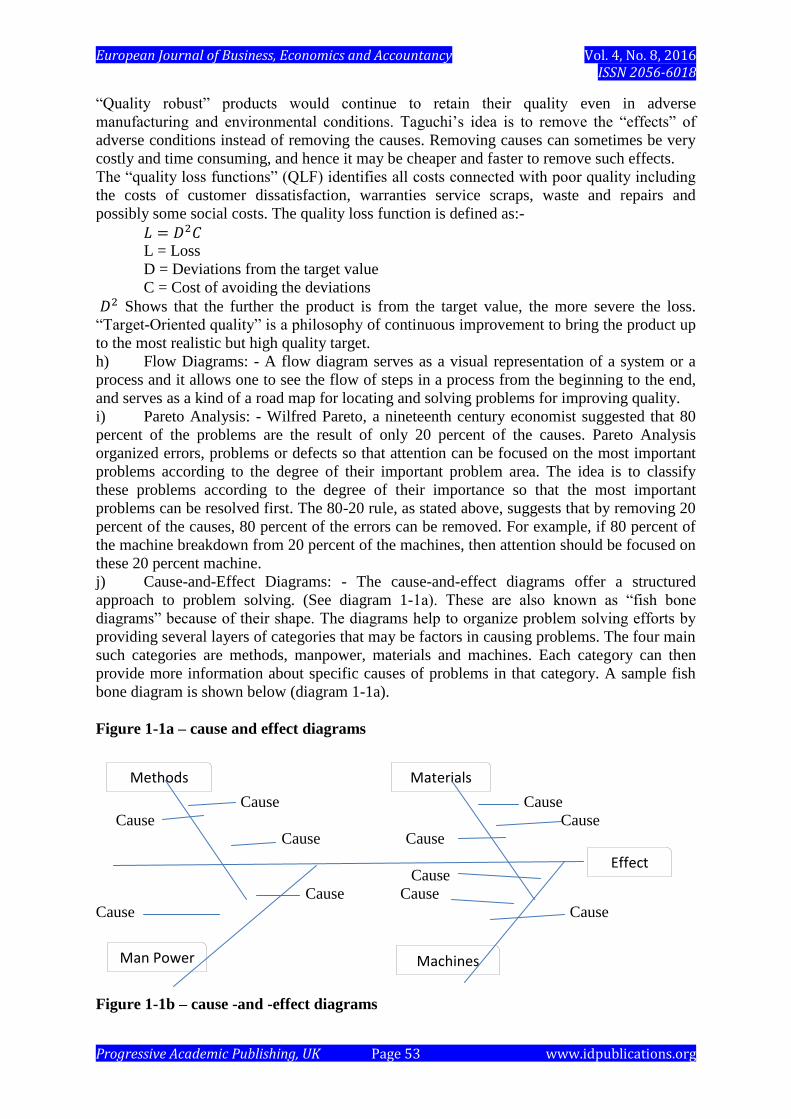
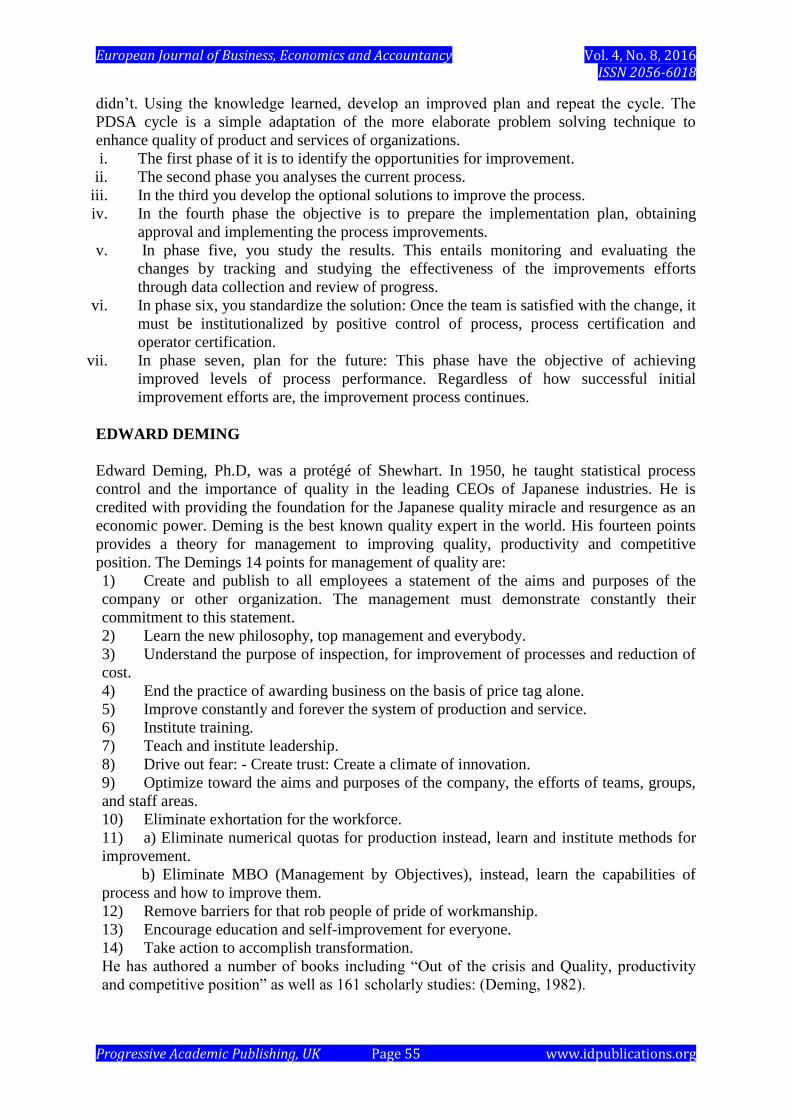
Overbooking Inadequate supply Uncomfortable seat
Policies of magazines
Poor check-in inadequate food
Policies Mistagged
Baggs
Understaffed Mechanical delay Broken Luggage
Ticket counters on plane
Understaffed De-Tcing equipment
Crew Poorly Trained Not available
Crew
Let us take an example of the problem of a dissatisfied airline passenger to illustrate these
technique. Each bone in the fishbone structure represents a possible source of error. When
such a chart is properly built and with enough detail, then the possible quality, problems are
highlighted and proper steps can be taken to solve these problems to the customers’
satisfaction.
TOTAL QUALITY MANAGEMENT (TQM) GURUS
WALTER SHEWHART
Walter. A. Shewhart Ph.D., spent his professional career at Western Electric and Bell
Telephone Laboratories, both division of AT & T. He developed control chart theory with
control limits, assignable and chance causes of variation, and rational subgroups. In 1931, he
authored economic control of quality of manufactured product, which is regarded as a
complete and thorough work of the basic principles of quality control. He also developed the
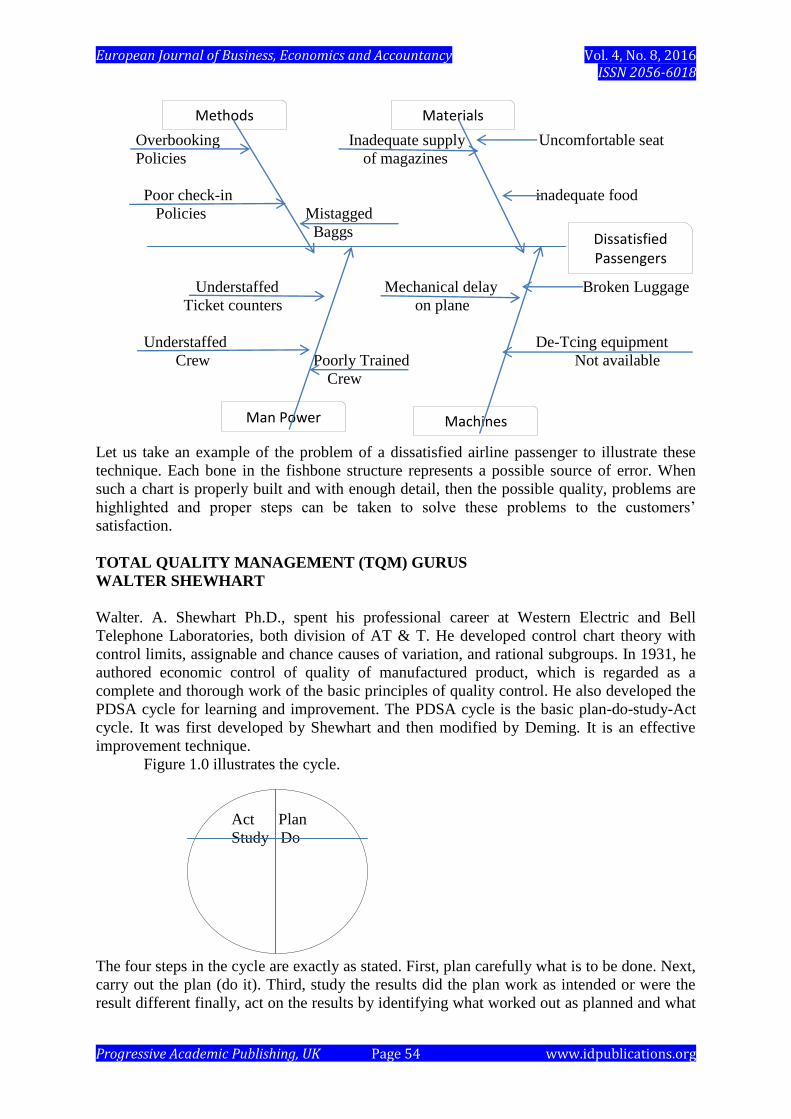
PDSA cycle for learning and improvement. The PDSA cycle is the basic plan-do-study-Act
cycle. It was first developed by Shewhart and then modified by Deming. It is an effective
improvement technique.
Figure 1.0 illustrates the cycle.
Act Plan
Study Do
The four steps in the cycle are exactly as stated. First, plan carefully what is to be done. Next,
carry out the plan (do it). Third, study the results did the plan work as intended or were the
result different finally, act on the results by identifying what worked out as planned and what
Methods Materials
Man Power
Dissatisfied Passengers
Machines
European Journal of Business, Economics and Accountancy Vol. 4, No. 8, 2016 ISSN 2056-6018
Progressive Academic Publishing, UK Page 55 www.idpublications.org
didn’t. Using the knowledge learned, develop an improved plan and repeat the cycle. The
PDSA cycle is a simple adaptation of the more elaborate problem solving technique to
enhance quality of product and services of organizations.
i. The first phase of it is to identify the opportunities for improvement.
ii. The second phase you analyses the current process.
iii. In the third you develop the optional solutions to improve the process.
iv. In the fourth phase the objective is to prepare the implementation plan, obtaining
approval and implementing the process improvements.
v. In phase five, you study the results. This entails monitoring and evaluating the
changes by tracking and studying the effectiveness of the improvements efforts
through data collection and review of progress.
vi. In phase six, you standardize the solution: Once the team is satisfied with the change, it
must be institutionalized by positive control of process, process certification and
operator certification.
vii. In phase seven, plan for the future: This phase have the objective of achieving
improved levels of process performance. Regardless of how successful initial
improvement efforts are, the improvement process continues.
EDWARD DEMING
Edward Deming, Ph.D, was a protégé of Shewhart. In 1950, he taught statistical process
control and the importance of quality in the leading CEOs of Japanese industries. He is
credited with providing the foundation for the Japanese quality miracle and resurgence as an
economic power. Deming is the best known quality expert in the world. His fourteen points
provides a theory for management to improving quality, productivity and competitive
position. The Demings 14 points for management of quality are:
1) Create and publish to all employees a statement of the aims and purposes of the
company or other organization. The management must demonstrate constantly their
commitment to this statement.
2) Learn the new philosophy, top management and everybody.
3) Understand the purpose of inspection, for improvement of processes and reduction of
cost.
4) End the practice of awarding business on the basis of price tag alone.
5) Improve constantly and forever the system of production and service.
6) Institute training.
7) Teach and institute leadership.
8) Drive out fear: - Create trust: Create a climate of innovation.
9) Optimize toward the aims and purposes of the company, the efforts of teams, groups,
and staff areas.
10) Eliminate exhortation for the workforce.
11) a) Eliminate numerical quotas for production instead, learn and institute methods for
improvement.
b) Eliminate MBO (Management by Objectives), instead, learn the capabilities of
process and how to improve them.
12) Remove barriers for that rob people of pride of workmanship.
13) Encourage education and self-improvement for everyone.
14) Take action to accomplish transformation.
He has authored a number of books including “Out of the crisis and Quality, productivity
and competitive position” as well as 161 scholarly studies: (Deming, 1982).
European Journal of Business, Economics and Accountancy Vol. 4, No. 8, 2016 ISSN 2056-6018
Progressive Academic Publishing, UK Page 56 www.idpublications.org
JOSEPH JURAN
Joseph. M. Juran, Ph.D, worked at Western Electric from 1924 to 1941. There he was
exposed to the concepts of Shewhart. Juran travelled to Japan in 1954 to teach quality
management. He emphasized the necessity for management at all levels to be committed to
the quality effort with hands-on involvement. He recommended achieving breakthrough
results. The Juran Trilogy for managing quality is carried out by the three inter-related
processes of planning, control and improvement.
i. Quality planning is the process for preparing to meet quality goals.
ii. Quality control is the process for meeting quality goals during operations.
iii. Quality improvement is the process for breaking through to unprecedented levels of
performance.
In 1951, the first edition of Juran’s quality control hand book was published.
ARMAND FEIGANBAUM
Armand. V. Feiganbaum, Ph.D, argues that total quality control is necessary to achieve
productivity, market penetration, and competitive advantage. Quality begins by identifying
the customers’ requirements and ends with a product or service in the hands of a satisfied
customer. In addition to customer satisfaction, some of Feiganbaum’s quality principles are
genuine management involvement, employee involvement, first line supervision leadership,
and company’s wide quality control. In 1951, he anchored Total Quality control.
KAORU ISHIKAWA
Kaoru Ishikawa, Ph.D, studied under Deming, Juran and Feiganbaum. He borrowed the total
quality control concept and adapted it for the Japanese. In addition, he authored SPC texts in
Japanese and in English. Ishikawa is best known for the development of the cause and effect
diagram which is sometimes called an Ishikawa diagram. He developed the quality circle
concept in Japan whereby work groups, including their supervisor, were trained in SPC
concepts. The groups then met to identify and solve the problem in their work environment,
(Ishikawa, 1985).
PHILIP CROSBY
Authored his first book, “Quality is free”, in 1971, which was translated into 15 languages. It
sold 1.5 million copies and changed the way management looked at quality. He argued that
“doing it right the first time” is less expensive than the cost of detecting and correcting
nonconformities’. In 1984, he authored quality without tears which contained his four
absolutes of quality management. The absolutes are: -
Quality means conformance to requirements not elegance: Crobsy dispels the myth
that quality is simple a feeling of excellence. “Requirements must be clearly stated so that
they cannot be misunderstood.
There is no such thing as a quality problem: Problem must be identified by the
individuals or departments that cause them. There are accounting problems, manufacturing
problems, design problems, front desk problems and so on. Quality originates in functional
department, not in the quality department and the burden of responsibility for such problems
lies with the functional departments. The quality department should measure conformance,
report results and lead the drive to develop positive attitude toward quality improvement.
European Journal of Business, Economics and Accountancy Vol. 4, No. 8, 2016 ISSN 2056-6018
Progressive Academic Publishing, UK Page 57 www.idpublications.org
There is no such thing as the Economics of quality: It is always cheaper to do the job
right the first time. Crosby supports the premise that “economist of quality” has no meaning.
Quality is free. What costs money are all the action that involve not doing jobs right the first
time.
The only performance standard is Zero Defects (ZD). Zero defects is a performance
standard of craft person regardless of his or her assignment. The point of ZD is do it right the
first time. That means concentrating on preventing defects rather than just finding and fixing
them.
GENICHI TAGUCHI
Genichi Taguchi, Ph.D, developed his loss function concept that combines cost, target, and
variations into one metric. Because the loss function is reactive, he developed the signal to
noise ratio as a proactive equivalent. The cornerstone of Taguchi’s philosophy is the robust
design of parameters and tolerances. It is built on the simplification and use of traditional
design of requirements. (Taguchi, 1986).
STRATEGIES FOR IMPLEMENTATION OF TOTAL QUALITY MANAGEMENT
(TQM)
As noted by Oakland (1995), the vehicle for achieving a solid and vigorous organization is
Total Quality Management. It covers the entire organization, all the people and all the
functions, including external organization and suppliers. The task of implementing TQM
must be taken with all seriousness. The core of TQM must be customer-supplier interfaces,
both internally and externally, and the fact is that at interface there are processes to convert
inputs to outputs. Clearly, there must be commitment to building in quality through
management of the inputs and processes.
Berry (1991) and Dale (1994) maintains that top management of organization be helped to
understand the needs to be totally committed to quality and implement the vision
consistently. Some American and Japanese “Gurus” of quality have each set down a number
of points or absolutes – words of wisdom in management and leadership – and many
organizations are using these to establish a policy based on quality. The strategies adopted by
organization for quality implementations are:
a) The organization needs long term commitment to constant improvement.
b) Adopt the philosophy of Zero-errors/defects to change the culture to right first time.
c) Train the people to understand the customer-supplier relationships.
d) Do not buy products or services on the bases of price alone, look at the total cost.
e) Recognize that improvement of the systems needs to be managed.
f) Adopt modern methods of supervision and training to eliminate fear.
g) Eliminate barriers between departments by managing the process, improve
communications.
h) Constantly educate and retrain develop the experts in the business.
i) Develop a systematic approach to manage the implementation of TQM.
j) Empower workers sincerely and completely.
k) Establish mutual trust.
l) Do not ignore middle management.
m) Provide employees with business information.
n) Ensure that employees are capable.
o) Commitment and policy.
European Journal of Business, Economics and Accountancy Vol. 4, No. 8, 2016 ISSN 2056-6018
Progressive Academic Publishing, UK Page 58 www.idpublications.org
p) Creating or changing the culture/: That is the beliefs, behaviors, norms, dominant value,
rules and climate of the organization.
q) Effective leadership is necessary: This starts with CEO vision and develops into
strategy for implementation.
r) Senior management that focuses on needs of customers and promotes the mission,
vision and values of the company throughout the organization is necessary. Critical
processes that need attention and improvement must be identified and the resources and
trade off are made available for TQM implementation.
s) Union/Management Relations: This is a major stumbling block in implementing TQM
which is traditional adversarial relationship between unions and management and then
to educate its members as to how cooperation will affect the organization. This includes
what its members can expect and how working conditions and job security might
change. Labour must carefully select members for such a programme and have a
positive attitude. TQM programme must be separated from collective bargaining. One
can state unequivocally that TQM has come to stay in work organizations in both
developed and developing countries because of its usefulness to all organizational
stakeholders. Still, for TQM to be successful, all organizational members including top
management, other managers and workers have to be fully involved. The need for
committed leadership and fellowship through team work is considered as essential
ingredients for success and excellent performance.
OBSTACLES FOR TQM IMPLEMENTATION
Once an organization embarks on TQM, there will be obstacle to its successful
implementation. The first common nine (9) obstacles identified by Nwachukwu (2000)
include;
a) Lack of management commitment.
b) Inability to change organizational culture.
c) Improper planning.
d) Lack of continuous training and education.
e) Incompatible organizational structure and isolated individual and departments.
f) Ineffective measurement techniques and lack of access of data and results.
g) Paying inadequate attention to internal and external customers.
h) Inadequate use of empowerment and teamwork.
i) Failure to continually improve.
GOAL OF AN ORGANISATION
According to Etzioni (1964), the goal of an organization is an expectation. It is something the
organization is trying to accomplish. The goals of an organization will determine the nature
of its inputs and outputs, the series of activities through which the outputs are achieved and
the interaction with its external environment. Examples of organizational goals include;
market share goals, profit goals, product goals, sales goals, inventory goals, production goals,
formal goals, and informal goals, satisfaction of interest, consumer goals, and investment in
organizational viability amongst others. Some of the functions of goals include;
a) Goals provide a standard of performance.
b) Goals serve as basis for planning and management control related to the activities of that
organization.
c) Goals serve as guidelines for decision making and justification of action taken.
European Journal of Business, Economics and Accountancy Vol. 4, No. 8, 2016 ISSN 2056-6018
Progressive Academic Publishing, UK Page 59 www.idpublications.org
d) Goals influence the structure of the organization and help determine the nature of
technology employed.
e) Goals help mobilize commitment of individuals and groups for the activities of the
organization.
f) Goals give an indication of what the organization is really like.
g) Goals serve as basis for the evaluation of change and organizational development.
h) Goals are the basis for the objectives and policies of the organization.
METHODOLOGICAL FRAMEWORK
For this study, the researcher adopted a quasi-experimental or survey research design. This
design is suitable in the sense that, there are no real experiments carried out with human
beings who are the study subjects in this case. The design suitability is seen in fact that it
involves taking a sample of elements from a population of interest which is measured at a
single point in time (Baridam, 2001: 57).
The population for this study comprises of selected Breweries companies in Nigeria namely
Nigeria Breweries plc Iganmu, Lagos with total employee population of 3195, Guinness
Breweries Nigeria plc Ikeja with total employee population of 1332, Submiller plc Hero large
Beer, Anambra State Nigerian with total employee population of 300. This altogether makes
a total staff population size of 4827.
The selection of the firms bordered on factors such as size of employee, scope of operation,
age, assets base and quality. This will enable us to establish the impact of application of Total
Quality Management (TQM) approaches and tools in enhancing goal attainment (i.e profit
attainment, high market share, consumer satisfaction goals, product goals, sales goals,
inventory goals, production goals, formal goals, and informal goals, amongst others) in the
three (3) breweries firm in Nigeria. The choice of the breweries employed judgmental
sampling techniques. Primary source of data collection especially questionnaire will be
administered to obtain viable information on the subject matter of TQM using 5- point Likert
rating scale of Strongly Agree (SA), Agree (A), Undecided (U), Disagree (D) and Strongly
Disagree (SD).
To scientifically generate a sample size, the Yamane’s formula (1964) was applied.
According to Baridam (2001), this formula can be used for a homogeneous population like
the one in this study. The formula is stated below: -
Where n = Sample size
e = level of significance
N = Population size
1 = Constant value
A total population size of 4827 obtained from three (3) Breweries firms under study at
0.05 level of significance as shown below;
European Journal of Business, Economics and Accountancy Vol. 4, No. 8, 2016 ISSN 2056-6018
Progressive Academic Publishing, UK Page 60 www.idpublications.org
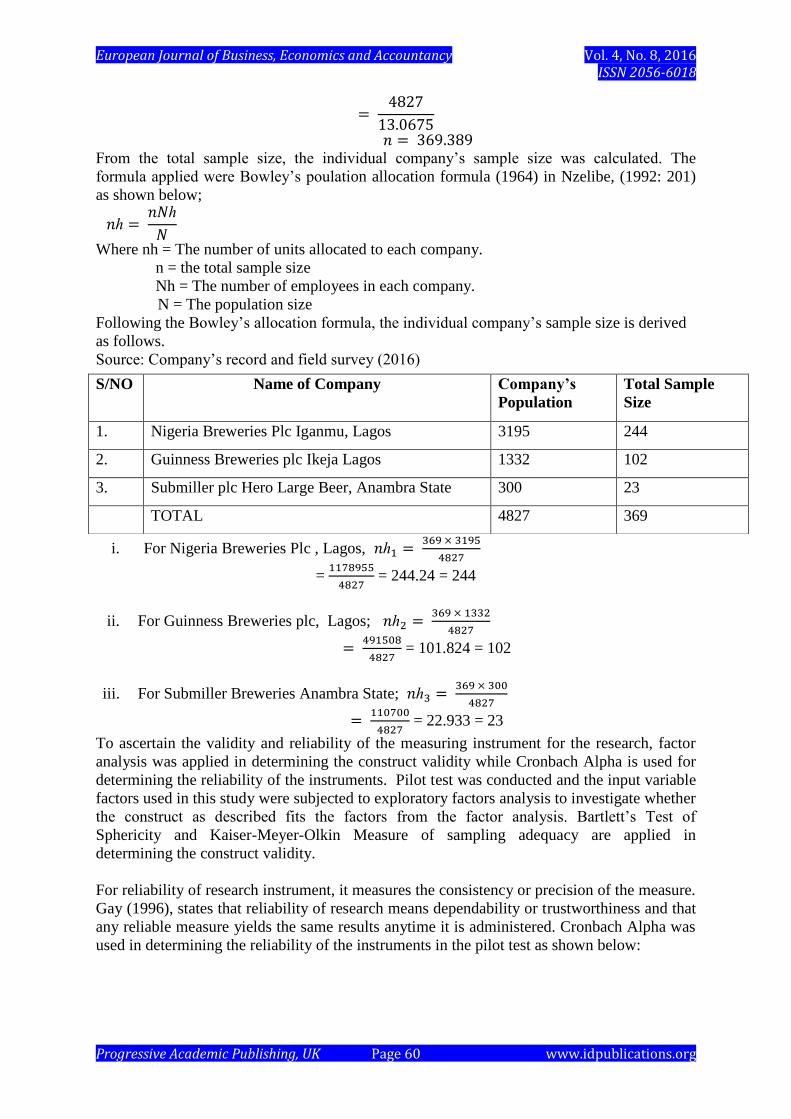
From the total sample size, the individual company’s sample size was calculated. The
formula applied were Bowley’s poulation allocation formula (1964) in Nzelibe, (1992: 201)
as shown below;
Where nh = The number of units allocated to each company.
n = the total sample size
Nh = The number of employees in each company.
N = The population size
Following the Bowley’s allocation formula, the individual company’s sample size is derived
as follows.
Source: Company’s record and field survey (2016)
i. For Nigeria Breweries Plc , Lagos,
=
= 244.24 = 244
ii. For Guinness Breweries plc, Lagos;
= 101.824 = 102
iii. For Submiller Breweries Anambra State;
= 22.933 = 23
To ascertain the validity and reliability of the measuring instrument for the research, factor
analysis was applied in determining the construct validity while Cronbach Alpha is used for
determining the reliability of the instruments. Pilot test was conducted and the input variable
factors used in this study were subjected to exploratory factors analysis to investigate whether
the construct as described fits the factors from the factor analysis. Bartlett’s Test of
Sphericity and Kaiser-Meyer-Olkin Measure of sampling adequacy are applied in
determining the construct validity.
For reliability of research instrument, it measures the consistency or precision of the measure.
Gay (1996), states that reliability of research means dependability or trustworthiness and that
any reliable measure yields the same results anytime it is administered. Cronbach Alpha was
used in determining the reliability of the instruments in the pilot test as shown below:
S/NO Name of Company Company’s
Population
Total Sample
Size
1. Nigeria Breweries Plc Iganmu, Lagos 3195 244
2. Guinness Breweries plc Ikeja Lagos 1332 102
3. Submiller plc Hero Large Beer, Anambra State 300 23
TOTAL 4827 369
European Journal of Business, Economics and Accountancy Vol. 4, No. 8, 2016 ISSN 2056-6018
Progressive Academic Publishing, UK Page 61 www.idpublications.org
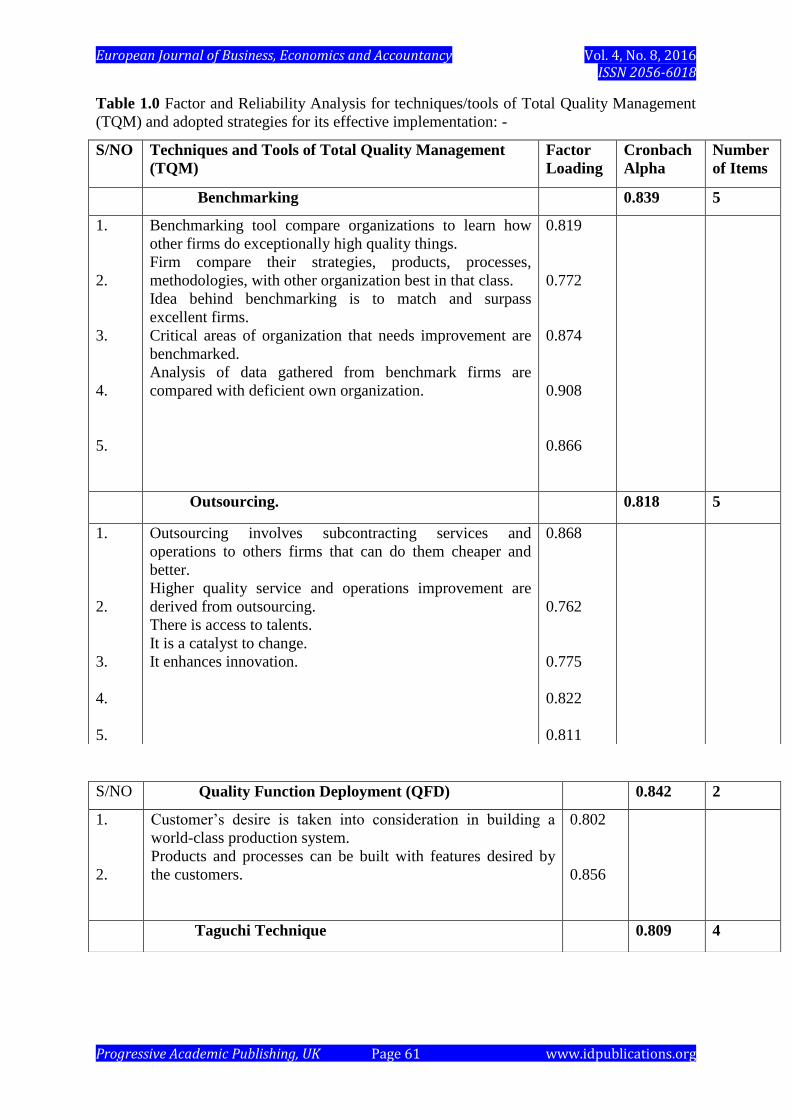
Table 1.0 Factor and Reliability Analysis for techniques/tools of Total Quality Management
(TQM) and adopted strategies for its effective implementation: -
S/NO Techniques and Tools of Total Quality Management
(TQM)
Factor
Loading
Cronbach
Alpha
Number
of Items
Benchmarking 0.839 5
1.
2.
3.
4.
5.
Benchmarking tool compare organizations to learn how
other firms do exceptionally high quality things.
Firm compare their strategies, products, processes,
methodologies, with other organization best in that class.
Idea behind benchmarking is to match and surpass
excellent firms.
Critical areas of organization that needs improvement are
benchmarked.
Analysis of data gathered from benchmark firms are
compared with deficient own organization.
0.819
0.772
0.874
0.908
0.866
Outsourcing. 0.818 5
1.
2.
3.
4.
5.
Outsourcing involves subcontracting services and
operations to others firms that can do them cheaper and
better.
Higher quality service and operations improvement are
derived from outsourcing.
There is access to talents.
It is a catalyst to change.
It enhances innovation.
0.868
0.762
0.775
0.822
0.811
S/NO Quality Function Deployment (QFD) 0.842 2
1.
2.
Customer’s desire is taken into consideration in building a
world-class production system.
Products and processes can be built with features desired by
the customers.
0.802
0.856
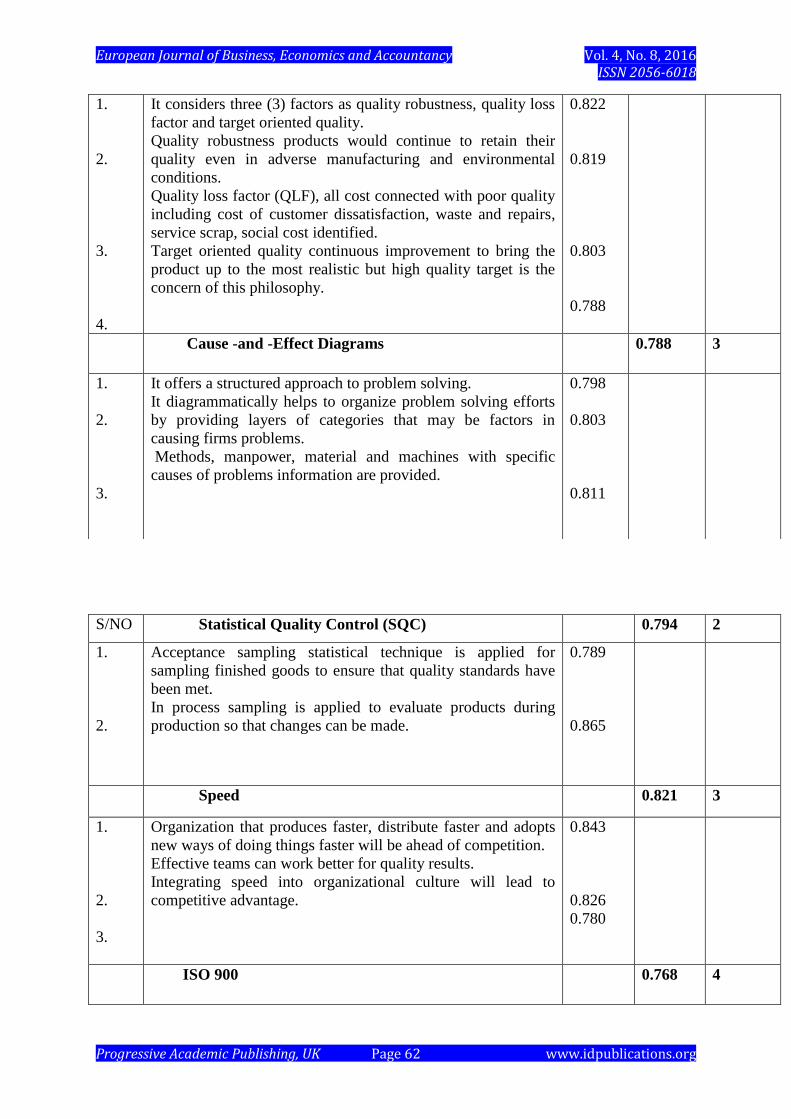
Taguchi Technique 0.809 4
European Journal of Business, Economics and Accountancy Vol. 4, No. 8, 2016 ISSN 2056-6018
Progressive Academic Publishing, UK Page 62 www.idpublications.org
1.
2.
3.
4.
It considers three (3) factors as quality robustness, quality loss
factor and target oriented quality.
Quality robustness products would continue to retain their
quality even in adverse manufacturing and environmental
conditions.
Quality loss factor (QLF), all cost connected with poor quality
including cost of customer dissatisfaction, waste and repairs,
service scrap, social cost identified.
Target oriented quality continuous improvement to bring the
product up to the most realistic but high quality target is the
concern of this philosophy.
0.822
0.819
0.803
0.788
Cause -and -Effect Diagrams 0.788 3
1.
2.
3.
It offers a structured approach to problem solving.
It diagrammatically helps to organize problem solving efforts
by providing layers of categories that may be factors in
causing firms problems.
Methods, manpower, material and machines with specific
causes of problems information are provided.
0.798
0.803
0.811
S/NO Statistical Quality Control (SQC) 0.794 2
1.
2.
Acceptance sampling statistical technique is applied for
sampling finished goods to ensure that quality standards have
been met.
In process sampling is applied to evaluate products during
production so that changes can be made.
0.789
0.865
Speed 0.821 3
1.
2.
3.
Organization that produces faster, distribute faster and adopts
new ways of doing things faster will be ahead of competition.
Effective teams can work better for quality results.
Integrating speed into organizational culture will lead to
competitive advantage.
0.843
0.826
0.780
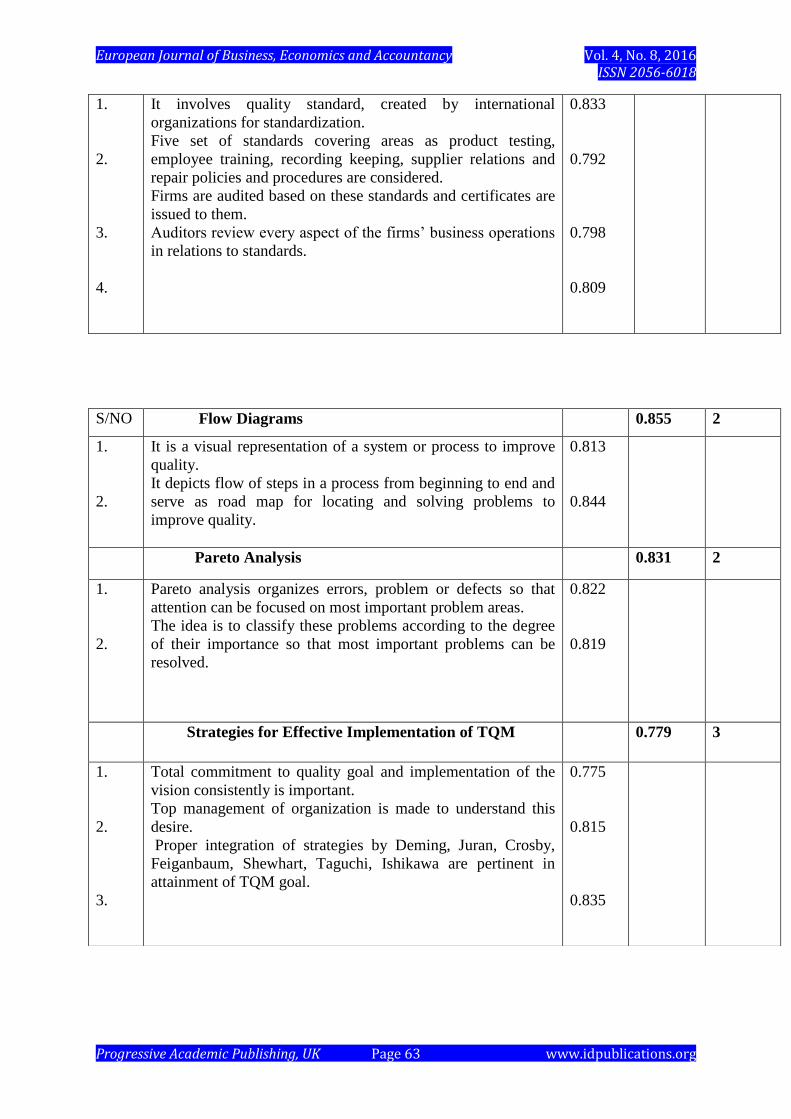
ISO 900 0.768 4
European Journal of Business, Economics and Accountancy Vol. 4, No. 8, 2016 ISSN 2056-6018
Progressive Academic Publishing, UK Page 63 www.idpublications.org
1.
2.
3.
4.
It involves quality standard, created by international
organizations for standardization.
Five set of standards covering areas as product testing,
employee training, recording keeping, supplier relations and
repair policies and procedures are considered.
Firms are audited based on these standards and certificates are
issued to them.
Auditors review every aspect of the firms’ business operations
in relations to standards.
0.833
0.792
0.798
0.809
S/NO Flow Diagrams 0.855 2
1.
2.
It is a visual representation of a system or process to improve
quality.
It depicts flow of steps in a process from beginning to end and
serve as road map for locating and solving problems to
improve quality.
0.813
0.844
Pareto Analysis 0.831 2
1.
2.
Pareto analysis organizes errors, problem or defects so that
attention can be focused on most important problem areas.
The idea is to classify these problems according to the degree
of their importance so that most important problems can be
resolved.
0.822
0.819
Strategies for Effective Implementation of TQM 0.779 3
1.
2.
3.
Total commitment to quality goal and implementation of the
vision consistently is important.
Top management of organization is made to understand this
desire.
Proper integration of strategies by Deming, Juran, Crosby,
Feiganbaum, Shewhart, Taguchi, Ishikawa are pertinent in
attainment of TQM goal.
0.775
0.815
0.835
European Journal of Business, Economics and Accountancy Vol. 4, No. 8, 2016 ISSN 2056-6018
Progressive Academic Publishing, UK Page 64 www.idpublications.org
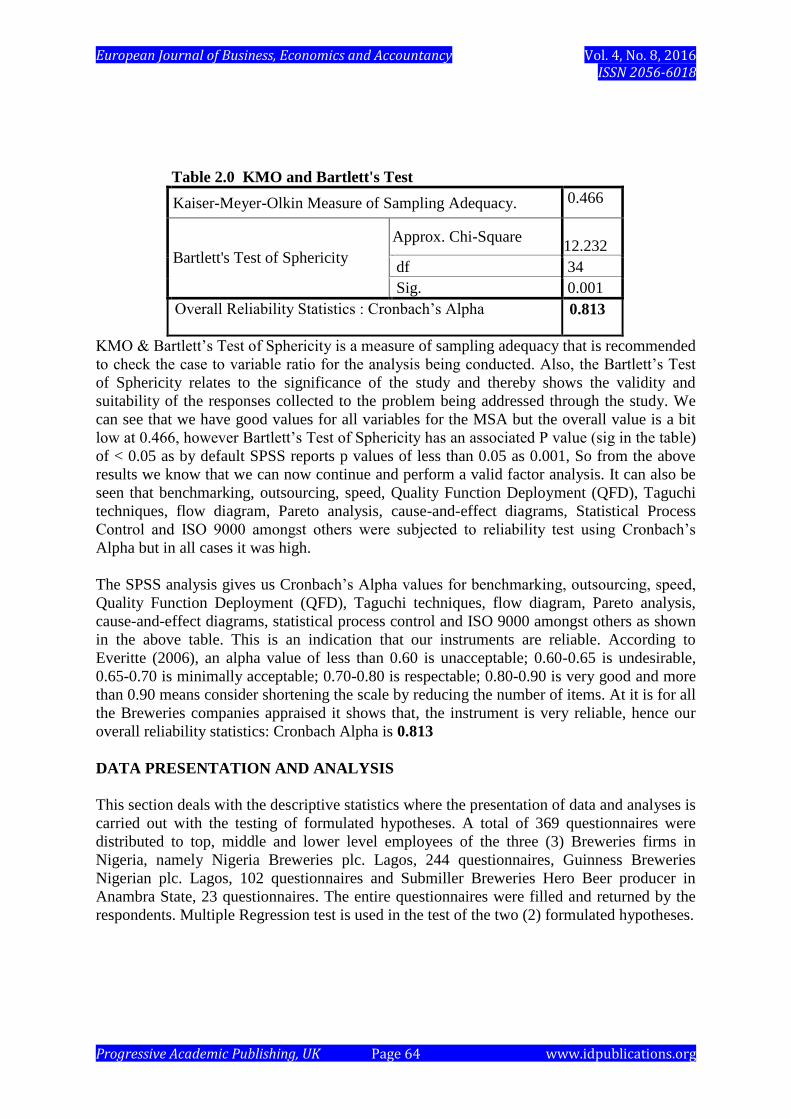
Table 2.0 KMO and Bartlett's Test
Kaiser-Meyer-Olkin Measure of Sampling Adequacy. 0.466
Bartlett's Test of Sphericity
Approx. Chi-Square
12.232
df 34
Sig. 0.001
Overall Reliability Statistics : Cronbach’s Alpha 0.813
KMO & Bartlett’s Test of Sphericity is a measure of sampling adequacy that is recommended
to check the case to variable ratio for the analysis being conducted. Also, the Bartlett’s Test
of Sphericity relates to the significance of the study and thereby shows the validity and
suitability of the responses collected to the problem being addressed through the study. We
can see that we have good values for all variables for the MSA but the overall value is a bit
low at 0.466, however Bartlett’s Test of Sphericity has an associated P value (sig in the table)
of < 0.05 as by default SPSS reports p values of less than 0.05 as 0.001, So from the above
results we know that we can now continue and perform a valid factor analysis. It can also be
seen that benchmarking, outsourcing, speed, Quality Function Deployment (QFD), Taguchi
techniques, flow diagram, Pareto analysis, cause-and-effect diagrams, Statistical Process
Control and ISO 9000 amongst others were subjected to reliability test using Cronbach’s
Alpha but in all cases it was high.
The SPSS analysis gives us Cronbach’s Alpha values for benchmarking, outsourcing, speed,
Quality Function Deployment (QFD), Taguchi techniques, flow diagram, Pareto analysis,
cause-and-effect diagrams, statistical process control and ISO 9000 amongst others as shown
in the above table. This is an indication that our instruments are reliable. According to
Everitte (2006), an alpha value of less than 0.60 is unacceptable; 0.60-0.65 is undesirable,
0.65-0.70 is minimally acceptable; 0.70-0.80 is respectable; 0.80-0.90 is very good and more
than 0.90 means consider shortening the scale by reducing the number of items. At it is for all
the Breweries companies appraised it shows that, the instrument is very reliable, hence our
overall reliability statistics: Cronbach Alpha is 0.813
DATA PRESENTATION AND ANALYSIS
This section deals with the descriptive statistics where the presentation of data and analyses is
carried out with the testing of formulated hypotheses. A total of 369 questionnaires were
distributed to top, middle and lower level employees of the three (3) Breweries firms in
Nigeria, namely Nigeria Breweries plc. Lagos, 244 questionnaires, Guinness Breweries
Nigerian plc. Lagos, 102 questionnaires and Submiller Breweries Hero Beer producer in
Anambra State, 23 questionnaires. The entire questionnaires were filled and returned by the
respondents. Multiple Regression test is used in the test of the two (2) formulated hypotheses.
European Journal of Business, Economics and Accountancy Vol. 4, No. 8, 2016 ISSN 2056-6018
Progressive Academic Publishing, UK Page 65 www.idpublications.org
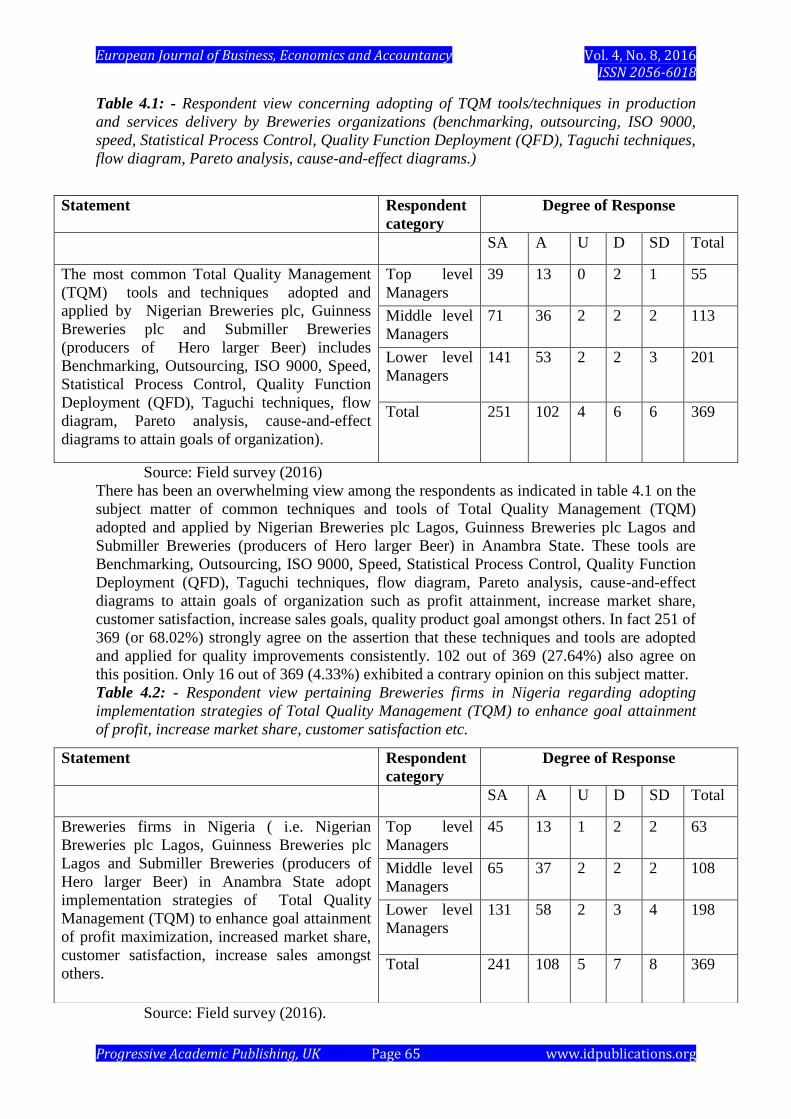
Table 4.1: - Respondent view concerning adopting of TQM tools/techniques in production
and services delivery by Breweries organizations (benchmarking, outsourcing, ISO 9000,
speed, Statistical Process Control, Quality Function Deployment (QFD), Taguchi techniques,
flow diagram, Pareto analysis, cause-and-effect diagrams.)
Source: Field survey (2016)
There has been an overwhelming view among the respondents as indicated in table 4.1 on the
subject matter of common techniques and tools of Total Quality Management (TQM)
adopted and applied by Nigerian Breweries plc Lagos, Guinness Breweries plc Lagos and
Submiller Breweries (producers of Hero larger Beer) in Anambra State. These tools are
Benchmarking, Outsourcing, ISO 9000, Speed, Statistical Process Control, Quality Function
Deployment (QFD), Taguchi techniques, flow diagram, Pareto analysis, cause-and-effect
diagrams to attain goals of organization such as profit attainment, increase market share,
customer satisfaction, increase sales goals, quality product goal amongst others. In fact 251 of
369 (or 68.02%) strongly agree on the assertion that these techniques and tools are adopted
and applied for quality improvements consistently. 102 out of 369 (27.64%) also agree on
this position. Only 16 out of 369 (4.33%) exhibited a contrary opinion on this subject matter.
Table 4.2: - Respondent view pertaining Breweries firms in Nigeria regarding adopting
implementation strategies of Total Quality Management (TQM) to enhance goal attainment
of profit, increase market share, customer satisfaction etc.
Source: Field survey (2016).
Statement Respondent
category
Degree of Response
SA A U D SD Total
The most common Total Quality Management
(TQM) tools and techniques adopted and
applied by Nigerian Breweries plc, Guinness
Breweries plc and Submiller Breweries
(producers of Hero larger Beer) includes
Benchmarking, Outsourcing, ISO 9000, Speed,
Statistical Process Control, Quality Function
Deployment (QFD), Taguchi techniques, flow
diagram, Pareto analysis, cause-and-effect
diagrams to attain goals of organization).
Top level
Managers
39 13 0 2 1 55
Middle level
Managers
71 36 2 2 2 113
Lower level
Managers
141 53 2 2 3 201
Total 251 102 4 6 6 369
Statement Respondent
category
Degree of Response
SA A U D SD Total
Breweries firms in Nigeria ( i.e. Nigerian
Breweries plc Lagos, Guinness Breweries plc
Lagos and Submiller Breweries (producers of
Hero larger Beer) in Anambra State adopt
implementation strategies of Total Quality
Management (TQM) to enhance goal attainment
of profit maximization, increased market share,
customer satisfaction, increase sales amongst
others.
Top level
Managers
45 13 1 2 2 63
Middle level
Managers
65 37 2 2 2 108
Lower level
Managers
131 58 2 3 4 198
Total 241 108 5 7 8 369
European Journal of Business, Economics and Accountancy Vol. 4, No. 8, 2016 ISSN 2056-6018
Progressive Academic Publishing, UK Page 66 www.idpublications.org
With regards to the opinion of respondents on the adoption of implementation strategies by
Breweries firms to enhance goal attainment of profit maximization, increased market share,
customer satisfaction, increase sales amongst others, about 241 of 369 (or 65.31%)
respondents strongly agree on this notion. 108 out of 369 (29.26%) also agree on this subject
matter. Only 20 out of 369 respondents (or 5.42%) felt otherwise. These strategies include
long term commitment to constant improvement, adopting philosophy of zero-errors/defects
to change the culture of training the people to understand the customer-supplier relationship,
adopting modern methods of supervision and training, constant education and retraining.
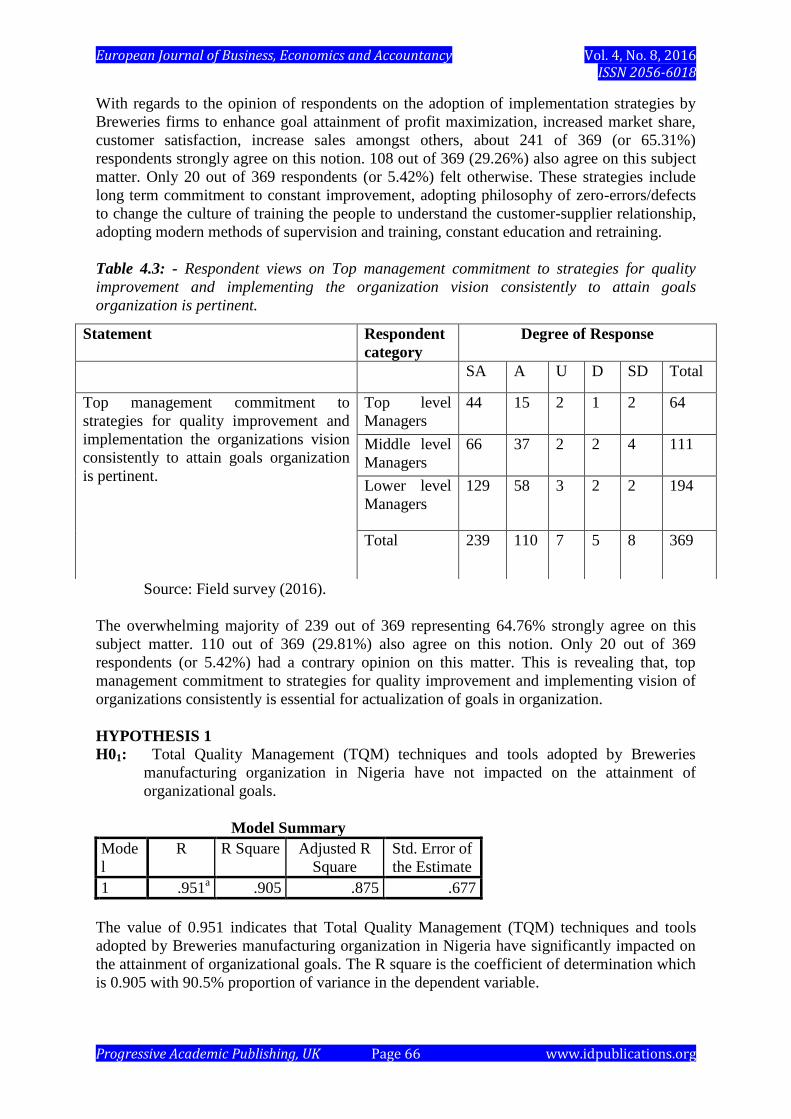
Table 4.3: - Respondent views on Top management commitment to strategies for quality
improvement and implementing the organization vision consistently to attain goals
organization is pertinent.
Source: Field survey (2016).
The overwhelming majority of 239 out of 369 representing 64.76% strongly agree on this
subject matter. 110 out of 369 (29.81%) also agree on this notion. Only 20 out of 369
respondents (or 5.42%) had a contrary opinion on this matter. This is revealing that, top
management commitment to strategies for quality improvement and implementing vision of
organizations consistently is essential for actualization of goals in organization.
HYPOTHESIS 1
H01: Total Quality Management (TQM) techniques and tools adopted by Breweries
manufacturing organization in Nigeria have not impacted on the attainment of
organizational goals.
Model Summary
Mode
l
R R Square Adjusted R
Square
Std. Error of
the Estimate
1 .951a .905 .875 .677
The value of 0.951 indicates that Total Quality Management (TQM) techniques and tools
adopted by Breweries manufacturing organization in Nigeria have significantly impacted on
the attainment of organizational goals. The R square is the coefficient of determination which
is 0.905 with 90.5% proportion of variance in the dependent variable.
Statement Respondent
category
Degree of Response
SA A U D SD Total
Top management commitment to
strategies for quality improvement and
implementation the organizations vision
consistently to attain goals organization
is pertinent.
Top level
Managers
44 15 2 1 2 64
Middle level
Managers
66 37 2 2 4 111
Lower level
Managers
129 58 3 2 2 194
Total 239 110 7 5 8 369
European Journal of Business, Economics and Accountancy Vol. 4, No. 8, 2016 ISSN 2056-6018
Progressive Academic Publishing, UK Page 67 www.idpublications.org
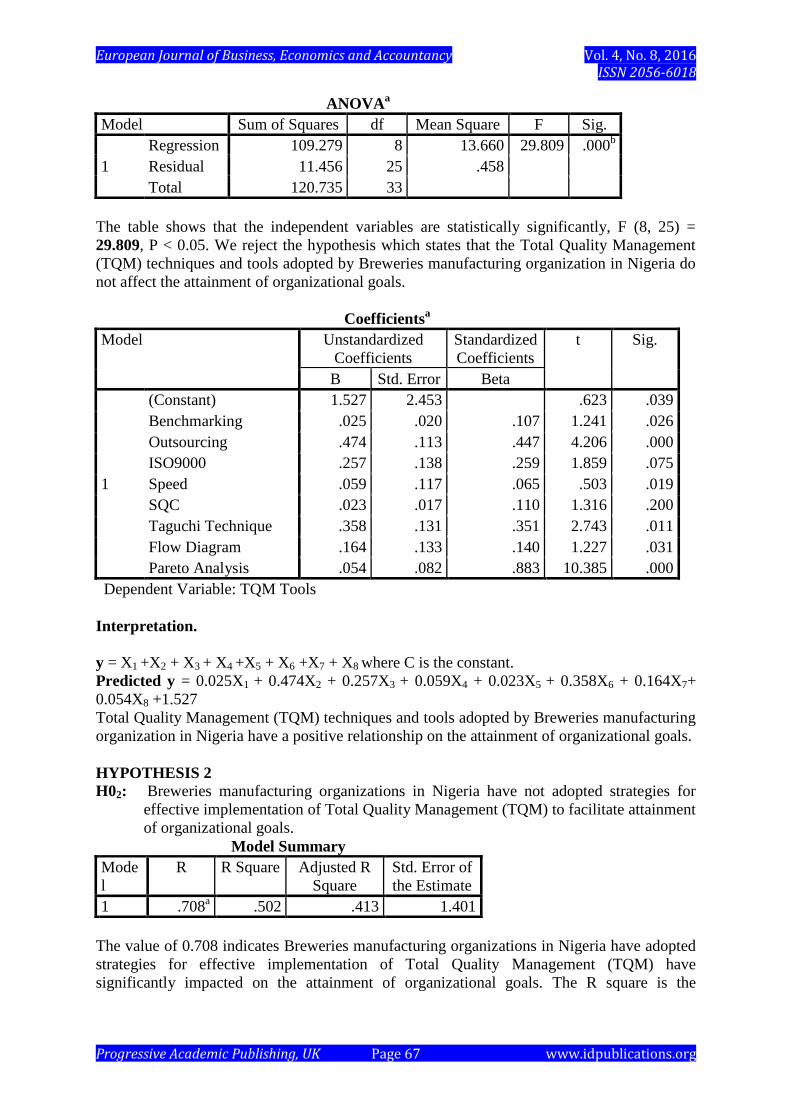
ANOVAa
Model Sum of Squares df Mean Square F Sig.
1
Regression 109.279 8 13.660 29.809 .000b
Residual 11.456 25 .458
Total 120.735 33
The table shows that the independent variables are statistically significantly, F (8, 25) =
29.809, P < 0.05. We reject the hypothesis which states that the Total Quality Management
(TQM) techniques and tools adopted by Breweries manufacturing organization in Nigeria do
not affect the attainment of organizational goals.
Coefficientsa
Model Unstandardized
Coefficients
Standardized
Coefficients
t Sig.
B Std. Error Beta
1
(Constant) 1.527 2.453 .623 .039
Benchmarking .025 .020 .107 1.241 .026
Outsourcing .474 .113 .447 4.206 .000
ISO9000 .257 .138 .259 1.859 .075
Speed .059 .117 .065 .503 .019
SQC .023 .017 .110 1.316 .200
Taguchi Technique .358 .131 .351 2.743 .011
Flow Diagram .164 .133 .140 1.227 .031
Pareto Analysis .054 .082 .883 10.385 .000
Dependent Variable: TQM Tools
Interpretation.
y = X1 +X2 + X3 + X4 +X5 + X6 +X7 + X8 where C is the constant.
Predicted y = 0.025X1 + 0.474X2 + 0.257X3 + 0.059X4 + 0.023X5 + 0.358X6 + 0.164X7+
0.054X8 +1.527
Total Quality Management (TQM) techniques and tools adopted by Breweries manufacturing
organization in Nigeria have a positive relationship on the attainment of organizational goals.
HYPOTHESIS 2
H02: Breweries manufacturing organizations in Nigeria have not adopted strategies for
effective implementation of Total Quality Management (TQM) to facilitate attainment
of organizational goals.
Model Summary
Mode
l
R R Square Adjusted R
Square
Std. Error of
the Estimate
1 .708a .502 .413 1.401
The value of 0.708 indicates Breweries manufacturing organizations in Nigeria have adopted
strategies for effective implementation of Total Quality Management (TQM) have
significantly impacted on the attainment of organizational goals. The R square is the
European Journal of Business, Economics and Accountancy Vol. 4, No. 8, 2016 ISSN 2056-6018
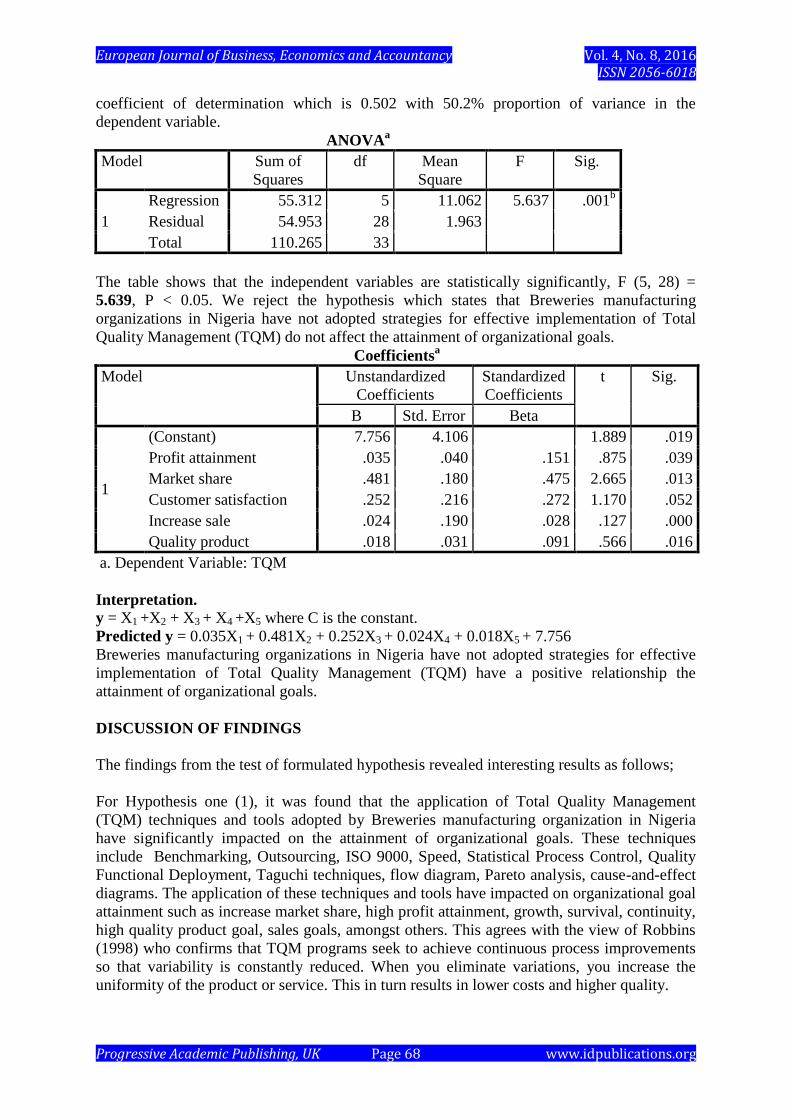
Progressive Academic Publishing, UK Page 68 www.idpublications.org
coefficient of determination which is 0.502 with 50.2% proportion of variance in the
dependent variable.
ANOVAa
Model Sum of
Squares
df Mean
Square
F Sig.
1
Regression 55.312 5 11.062 5.637 .001b
Residual 54.953 28 1.963
Total 110.265 33
The table shows that the independent variables are statistically significantly, F (5, 28) =
5.639, P < 0.05. We reject the hypothesis which states that Breweries manufacturing
organizations in Nigeria have not adopted strategies for effective implementation of Total
Quality Management (TQM) do not affect the attainment of organizational goals.
Coefficientsa
Model Unstandardized
Coefficients
Standardized
Coefficients
t Sig.
B Std. Error Beta
1
(Constant) 7.756 4.106 1.889 .019
Profit attainment .035 .040 .151 .875 .039
Market share .481 .180 .475 2.665 .013
Customer satisfaction .252 .216 .272 1.170 .052
Increase sale .024 .190 .028 .127 .000
Quality product .018 .031 .091 .566 .016
a. Dependent Variable: TQM
Interpretation. y = X1 +X2 + X3 + X4 +X5 where C is the constant.
Predicted y = 0.035X1 + 0.481X2 + 0.252X3 + 0.024X4 + 0.018X5 + 7.756
Breweries manufacturing organizations in Nigeria have not adopted strategies for effective
implementation of Total Quality Management (TQM) have a positive relationship the
attainment of organizational goals.
DISCUSSION OF FINDINGS
The findings from the test of formulated hypothesis revealed interesting results as follows;
For Hypothesis one (1), it was found that the application of Total Quality Management
(TQM) techniques and tools adopted by Breweries manufacturing organization in Nigeria
have significantly impacted on the attainment of organizational goals. These techniques
include Benchmarking, Outsourcing, ISO 9000, Speed, Statistical Process Control, Quality
Functional Deployment, Taguchi techniques, flow diagram, Pareto analysis, cause-and-effect
diagrams. The application of these techniques and tools have impacted on organizational goal
attainment such as increase market share, high profit attainment, growth, survival, continuity,
high quality product goal, sales goals, amongst others. This agrees with the view of Robbins
(1998) who confirms that TQM programs seek to achieve continuous process improvements
so that variability is constantly reduced. When you eliminate variations, you increase the
uniformity of the product or service. This in turn results in lower costs and higher quality.
European Journal of Business, Economics and Accountancy Vol. 4, No. 8, 2016 ISSN 2056-6018
Progressive Academic Publishing, UK Page 69 www.idpublications.org
The search for never ending improvement in quality production and service delivery requires
a circular approach rather than a linear one. This requires that management plan-Do-check-
Act (PDCA). In this case, Management plans a change, does it, checks results and depending
on the outcome, acts to standardize the change or begin the cycle of improvement of products
and services again with new information. This cycle treats all organizational processes as
being in a constant state of improvement. This continuous improvement has helped increased
productivity.
Mcshane and Gilnow (2000) maintain that taking TQM decisions regarding the techniques
and tools may require employee improvement. This is particularly true for complex decision
where employees possess relevant information. Employees are closer to customers and
production activities, so they often know where the company can save money, improve
products or service quality and realized unused opportunities. They may come up with the
right technique or tool to be adopted to enhance quality of product and service. This can lead
to a more accurate definition of the problem. Identity more and better solutions and more
likely to select the best option to facilitate goal attainment in organization by adopting the
more suitable TQM technique or tool.
The implication of the above position is that the Breweries firms should set up a competent
team to diagnose consistently to know the type of TQM technique or tool to be adopted at a
particular time to improve product and service quality in order to attain organizational goal as
desired. Having a budget for this noble task is essential as well.
Akpeyi (1996:8) presents TQM approach as the current “bride” of management which must
be wooed by all entrepreneurs in Nigeria, who value profitability, effectiveness, employee
loyalty, suitable growth and development as well as continued existence and relevance.
According to Arene (1995), Nigeria believe that they can practice TQM provided that the
culture of discipline, resolute commitment and refusal to be swayed by the first difficulties
that may be encountered are overcome, establishing a reliable data and information base and
role model behavior is imbibed.
Gatiss (1996:44) also confirms that, the introduction of TQM in the operations of Royal mail
considerably improved the financial earnings of the firms. Eke (2004) also confirms that
Total Quality Management in Nigeria Breweries Plc was introduced in order;
- To take care of increasing customers demand
- To maintain competitive advantage
- To manage more effectively and increase its productivity and profitability.
- To actualize the company vision of being the world class beverage
manufacturing company
The outcome attained from this was high market share, high profit and customer satisfaction.
For Hypothesis two (2) it was found that pertinent strategies for effective implementation of
TQM to facilitate attainment of organizational goal is adopted by Brewery firms in Nigeria.
Some of these strategies: include; long term commitment to constant improvement, adoption
of modern methods of supervision and training to eliminate fear, educating and retraining
employees, providing information on business to employees amongst others. This confirms
the views of Aluko, Odugbesan, Gbadamosi, and Osuagwu (2007) who confirms that major
factors are responsible to failure of organization in an attempt to implementing Total Quality
Management (TQM) strategies; these include;
i. Failure to build customer expectation and needs into daily organizational activities.
ii. Inability to move away from traditional results-oriented management style,
European Journal of Business, Economics and Accountancy Vol. 4, No. 8, 2016 ISSN 2056-6018
Progressive Academic Publishing, UK Page 70 www.idpublications.org
iii. Failure to fully integrate key functions like marketing into quality improvement
activities.
iv. Unrealistically high expectation of quick results
v. The bureaucratization of quality efforts
vi. Failure to redesign traditional reward structures and organizational objectives to bring
them into line with the new quality initiative.
vii. Failure to recognize a strong linkage between quality objectives and increased
employee population amongst others.
The implication of the above scenario is that for successful performance of TQM, the
following element of success be applied;
i. A decentralization of decision making responsibility to a well-trained problem solving
labour force (i.e. employee participation in decision making).
ii. A linkage of reward and measurement system, both formal and informal to support
these new directions.
iii. A reasonable focus and in building organizational routines that link as many units and
level in the firms as possible by identifying and meeting customer’s needs, wants,
desires and expectation.
iv. Sustained top management leadership for total quality practice and active use of their
own daily management operations.
v. Methodologically improving the quality of all business processes and strategies from
an internal and external customer perspective, amongst other.
Cole (1993) maintains that a successful approach to implementing Total Quality Management
(TQM) in organization is guided by the industry, size, technology, length of product cycle,
competitive environment, and type of customers and unique history of a given organization
amongst others.
CONCLUSION AND RECOMMENDATION
Total Quality Management (TQM) culture has come to stay. Organization that seeks for
sustainable competitive advantage should endeavor to adopt TQM principle of customer
orientation, management by facts; people based management, continuous improvement and
producing at lower cost. A TQM team to determine which technique and tool to be adopted at
a particular time be put in place to ensure focus and realization of organizational goals. Top
management commitment and leaderships on a daily basis by organization is also crucial.
Based on the above, the paper recommendations are as follows;
a) What matters most to customers i.e. customer orientation should be seriously taken into
consideration when making TQM decisions that require the application of its
techniques or tools such as benchmarking, outsourcing, statistical quality control
(SQC), speed etc by the organization’s management. This is so because the products
are meant to be consumed by the customers; thereby they should be treated as the
“King”. Quality is defined by the customers or client and customers’ requirement
should be the ultimate purpose.
b) Employee involvement on issues relating to sharing information, knowledge, rewards
i.e participate management to guarantee sound and effective decision making to yield
quality products and services delivery in Breweries manufacturing firms is important.
Hence this will lead to goal attainment of high market share, high profit attainment,
growth and customer satisfaction amongst others. Organizations’ management should
consider this with all seriousness.
c) Breweries manufacturing firms in Nigeria should endeavor to constitute self-directed
work teams with autonomy over the execution of tasks and to control key variance in
European Journal of Business, Economics and Accountancy Vol. 4, No. 8, 2016 ISSN 2056-6018
Progressive Academic Publishing, UK Page 71 www.idpublications.org
the work process that will hinder high quality attainment in product and service
delivery. Adopted procedure for discharging tasks should not be compromised by
them in order to enhance organizational effectiveness.
d) Sustain top management leadership for total quality practice and commitment is
essential for quality goal attainment by Breweries manufacturing firms.
e) Training and retraining of employees to update their knowledge and skills in order to
enhance improvements through strategies on consistent basis is essential for effective
management of Breweries firms.
f) Management of breweries firms should be totally committed to the total quality policy
or strategies guidelines.
g) Employees should aim to ensure that TQM system is the prevention of errors, not their
detection and corrections.
h) Quality assurance departments to be constituted to review and measure performance
indices, including the quality process involved, as well as the delivery of final product
or service.
i) Periodic evaluation (i.e biannually, quarterly) of the quality standards, processes in line
with the perceptions of the consumers is important to enhance sustainability of the
organization.
j) Continuous improvement of quality standards, processes, methodologies, strategies is
an essential ingredient for TQM and organizational goal attainment.
REFERENCES
Adam Everett, E. (1972). “An Analysis of Changes in performance quality with operant
conditioning procedures, Journal of Applied Psychology”. Vol. 56, no.6 pp480-486.
Akpeyi, J.J. (1996). Total Quality Management-A Tool for Organizational Excellence,
Journal of Nigeria Institute of Management, Vol 32, NO1, Jan-March.
Aluko, M, Odugbesan, O, Gbadamosi, G, and Osuagwu, L. (2007). Business policy and
strategy. Third Edition; Lagos:Longman Nigeria Plc.
Arene, V.N. (1995)NNPC embraces Total Quality Management; Napecter, 2nd
Quarter, Vol
16, No.2, P.16.
Baridam, D. (2001). Research Methods in Administrative Science. Choba-Port-Harcourt,
University of Port Hracourt Publishing House.
Berry, T.H. (1991). Managing the total quality transformation. Newyork: MCGraw-Hill
Book Company.
Crosby, Philip, B. (1984). Quality without Tears. New York: MCGraw – Hill Book
Company.
Crosby, Philip, B. (1979). Quality is free. New York: MCGraw – Hill Book Publishers.
Dale Besterfield, Carol Basterfield-Michna, Glen Besterfield and Mary Besterfield-Sacre
(2006). Total Quality Management, 3rd
Edition; India: Pearson Education.
Dale, B.G. (ed)(1994). “Managing Quality”, London: Prentice Hall Publisher.
Dean, J.W. and Evans, J.R. (1994). Total Quality Management, Organization and Society; St
Paul, Minnessota: West publishing company.
Deming, Edward, W. (1982). Quality, Productivity and Competitive Position. Cambridge,
MA: Massachusetts Institute of Technology.
Eke, A.O. (2004). Applicability of Benchmarking as a Total Quality Management tool in
manufacturing firms in Nigeria; A Ph.D Thesis Submitted to Department of
Management, University of Nigeria, Nsukka, 2004.
Everitte, B.S. (2006). The Cambridge Dictionary of Statistics. 3rd
Edition; New York:
Cambridge University press.
European Journal of Business, Economics and Accountancy Vol. 4, No. 8, 2016 ISSN 2056-6018
Progressive Academic Publishing, UK Page 72 www.idpublications.org
Etzioni, A. (1964) Modern Organization. New York: Preventice Hall Inc.
Feigenbaum, A.V. (1961). Total Quality Control. New York: MCGraw – Hill Book
Company.
Fins Antnio. N. (1989). “A untility that’s all charged up over quality,” Businee Week, Feb
13, PP.94A-94D
Garvin David, A (1987). “Competing on the Eight Dimensions of Quality”, Harvard Business
Review, November-December, pp101-109.
Garvin, D. (1988). Managed Quality: The Strategic and Competitive Edge, New York: The
Free Press.
Gatiss, G.F. (1996). Total Quality Management: A Total Approach. London:Cassell.
Griffins, R.W. (1997). Management. 5th
Edition; New York: Prentice Hall Publishing.
Hitt, M.A., Ireland, R.D and Hoskisson, R.E. (2001). Strategic Management, 4th
Edition;
Cincinnatti, OH: Southwestern Publishing.
Hostage, G.M. (1975). “Quality Control in a Service Business; Harvard Business review,
July-August, pp98-106.”
Irechukwu, Nkechi Eugenia (2010). “Quality Improvement in a global competitive market
place. Success story from Nigeria”, International Journal of Business and
Management, Vol.5 No.1 January.
Ishikawa, K. (1985). What is Total Quality Control.? Englewood Cliffs, NJ: Prentice Hall.
Inc.
Juran, J. M. (1989). Juran on Leadership for Quality: An Executive Handbook, 4th
Edition,
New York: MCGraw – Hill Book Company.
Juran, Joseph. M. (1980). Quality control Handbook, 4th
Edition, New York: MCGraw – Hill
Book Publishers.
Kainji, G.K and Asher, M (1993). Total Quality Management Process: A Systematic
Approach. Carflax : Abingdon.
Kotter, J.P. (1979). Organizations: Test, Cases and readings on Management of
organizational design and change. Irwin, Homewood, III.
Labich Kenneth (1989). “Hot Company, Warm Culture,” fortune, feb.27, pp.74-78.
Lewin, K. (1951). Force Field Theory in Social Science. New York: Harper and Row.
Maiturare, M.N (2010). Total Quality Management in Business Organizations: A review of
Implementation Techniques. Abuja Journal of Administration and Management,
Vol.7, No.1.
Mcshane, S.L and Van Glinow, M.A (2000). Organizational Behaviour, Boston: McGrawHill
Publishers.
Nwachukwu, C. C. (2000). Management Theory and practice; Revised Edition, Port
Harcourt: African-FEP Publishers Limited.
Oakland, John. S. (1990). Total Quality Management. Oxford: Butterworth-Heinemann.
Roberts, H.V. and Sergesketter, B.F. (1993).Quality is personal, New York: The Free Press.
Robbins .S.P (1989). Organizational Behaviour: Concepts, Controversies and Applications;
International Edition; New Jersey: Prentice Hall.
Rogers Hank (1998). Benchmarking your plant against TQM best-practices plants. Part 2,
“Quality Progress”, April, pp249-254.
Stoner, J.A.F, Freeman, R.E and Gilbert D.R Jr (2000). Management. 6th
Edition; New Delhi:
Prentice Hall of India Private Limited.
Schiller Tachary (1988). “The Refrigerator that has GE feeling the heat.”, Business week,
April, 25 Ira C.
Taguch, G. (1986). Introduction of Quality Engineering. Tokyo: Asian productivity
Organization.
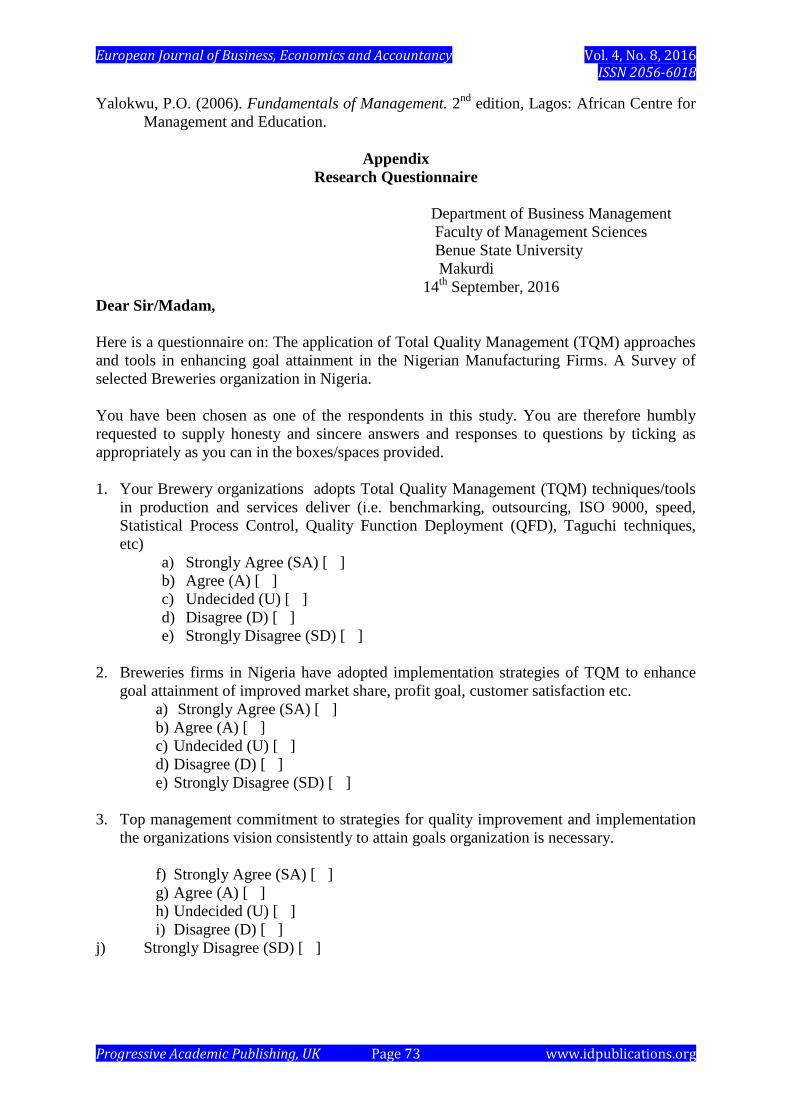
European Journal of Business, Economics and Accountancy Vol. 4, No. 8, 2016 ISSN 2056-6018
Progressive Academic Publishing, UK Page 73 www.idpublications.org
Yalokwu, P.O. (2006). Fundamentals of Management. 2nd
edition, Lagos: African Centre for
Management and Education.
Appendix
Research Questionnaire
Department of Business Management
Faculty of Management Sciences
Benue State University
Makurdi
14th
September, 2016
Dear Sir/Madam,
Here is a questionnaire on: The application of Total Quality Management (TQM) approaches
and tools in enhancing goal attainment in the Nigerian Manufacturing Firms. A Survey of
selected Breweries organization in Nigeria.
You have been chosen as one of the respondents in this study. You are therefore humbly
requested to supply honesty and sincere answers and responses to questions by ticking as
appropriately as you can in the boxes/spaces provided.
1. Your Brewery organizations adopts Total Quality Management (TQM) techniques/tools
in production and services deliver (i.e. benchmarking, outsourcing, ISO 9000, speed,
Statistical Process Control, Quality Function Deployment (QFD), Taguchi techniques,
etc)
a) Strongly Agree (SA) [ ]
b) Agree (A) [ ]
c) Undecided (U) [ ]
d) Disagree (D) [ ]
e) Strongly Disagree (SD) [ ]
2. Breweries firms in Nigeria have adopted implementation strategies of TQM to enhance
goal attainment of improved market share, profit goal, customer satisfaction etc.
a) Strongly Agree (SA) [ ]
b) Agree (A) [ ]
c) Undecided (U) [ ]
d) Disagree (D) [ ]
e) Strongly Disagree (SD) [ ]
3. Top management commitment to strategies for quality improvement and implementation
the organizations vision consistently to attain goals organization is necessary.
f) Strongly Agree (SA) [ ]
g) Agree (A) [ ]
h) Undecided (U) [ ]
i) Disagree (D) [ ]
j) Strongly Disagree (SD) [ ]
Related Documents