Experimental Astronomy (2004) 17: 19–34 C Springer 2005 THE ALLEN TELESCOPE ARRAY DAVID DEBOER 1,∗ , ROB ACKERMANN 1 , LEO BLITZ 2 , DOUGLAS BOCK 2 , GEOFFREY BOWER 2 , MICHAEL DAVIS 1 , JOHN DREHER 1 , GREG ENGARGIOLA 2 , MATT FLEMING 2 , GIRMAY-KELETA 1 , GERRY HARP 1 , JOHN LUGTEN 2 , JILL TARTER 1 , DOUG THORNTON 2 , NIKLAS WADEFALK 3 , SANDER WEINREB 3 and WILLIAM J. WELCH 2 1 SETI Institute, 2035 Landings Drive, Mountain View, CA 94043, U.S.A.; 2 Radio Astronomy Laboratory, University of California, Berkeley, CA 94720, U.S.A.; 3 JPL/Caltech, 4800 Oak Grove Road, Pasadena, CA 91109, U.S.A. ( ∗ author for correspondence, e-mail: [email protected]) (Received 17 August 2004; accepted 4 October 2004) Abstract. The Allen Telescope Array, a joint project between the SETI Institute and the Radio Astronomy Laboratory at the University of California Berkeley, is currently under development and construction at the Hat Creek Radio Observatory in northern California. It will consist of 350 6.1-m offset Gregorian antennas in a fairly densely packed configuration, with minimum baselines of less than 10 m and a maximum baseline of about 900 m. The dual-polarization frequency range spans from about 500 MHz to 11 GHz, both polarizations of which are transported back from each antenna. The first generation processor will provide 32 synthesized beams of 104 MHz bandwidth, eight at each of four tunings, as well as outputs for a full-polarization correlator at two of the tunings at the same bandwidth. This paper provides a general description of the Allen Telescope Array. Keywords: array technology, radio astronomy, SETI 1. Introduction Two primary efforts in astronomy today are to achieve a greater number of degrees of freedom available to a telescope and to increase the net surface area collecting signal from the cosmos. The first broad class of issues (the available degrees of freedom) is meant here to mean many receiving elements (e.g., feeds for a radio telescope or pixels for an optical telescope) as well as flexibility in observing modes (e.g. spectral diversity, spatial diversity, processing power,...). The second effort is just raw surface area which equates with improved sensitivity and the ability to detect and map ever fainter sources. As a “large-N” array (that is, comprising many antennas), the Allen Telescope Array addresses both of these efforts (Welch and Dreher, 2000; DeBoer and Bock, 2004). The Allen Telescope Array is leveraging developments in low-cost, ultra- widebandwidth microwave electronics, high-speed digital electronics and “mid- quantity” production techniques. The goal is to lower the per element cost

Welcome message from author
This document is posted to help you gain knowledge. Please leave a comment to let me know what you think about it! Share it to your friends and learn new things together.
Transcript
Experimental Astronomy (2004) 17: 19–34 C© Springer 2005
THE ALLEN TELESCOPE ARRAY
DAVID DEBOER1,∗, ROB ACKERMANN1, LEO BLITZ2, DOUGLAS BOCK2,GEOFFREY BOWER2, MICHAEL DAVIS1, JOHN DREHER1, GREG
ENGARGIOLA2, MATT FLEMING2, GIRMAY-KELETA1, GERRY HARP1,JOHN LUGTEN2, JILL TARTER1, DOUG THORNTON2, NIKLAS WADEFALK3,
SANDER WEINREB3 and WILLIAM J. WELCH2
1SETI Institute, 2035 Landings Drive, Mountain View, CA 94043, U.S.A.; 2Radio AstronomyLaboratory, University of California, Berkeley, CA 94720, U.S.A.; 3JPL/Caltech, 4800 Oak Grove
Road, Pasadena, CA 91109, U.S.A.(∗author for correspondence, e-mail: [email protected])
(Received 17 August 2004; accepted 4 October 2004)
Abstract. The Allen Telescope Array, a joint project between the SETI Institute and the RadioAstronomy Laboratory at the University of California Berkeley, is currently under development andconstruction at the Hat Creek Radio Observatory in northern California. It will consist of 350 6.1-moffset Gregorian antennas in a fairly densely packed configuration, with minimum baselines of lessthan 10 m and a maximum baseline of about 900 m. The dual-polarization frequency range spansfrom about 500 MHz to 11 GHz, both polarizations of which are transported back from each antenna.The first generation processor will provide 32 synthesized beams of 104 MHz bandwidth, eight ateach of four tunings, as well as outputs for a full-polarization correlator at two of the tunings at thesame bandwidth. This paper provides a general description of the Allen Telescope Array.
Keywords: array technology, radio astronomy, SETI
1. Introduction
Two primary efforts in astronomy today are to achieve a greater number of degreesof freedom available to a telescope and to increase the net surface area collectingsignal from the cosmos. The first broad class of issues (the available degrees offreedom) is meant here to mean many receiving elements (e.g., feeds for a radiotelescope or pixels for an optical telescope) as well as flexibility in observing modes(e.g. spectral diversity, spatial diversity, processing power,. . .). The second effortis just raw surface area which equates with improved sensitivity and the ability todetect and map ever fainter sources. As a “large-N” array (that is, comprising manyantennas), the Allen Telescope Array addresses both of these efforts (Welch andDreher, 2000; DeBoer and Bock, 2004).
The Allen Telescope Array is leveraging developments in low-cost, ultra-widebandwidth microwave electronics, high-speed digital electronics and “mid-quantity” production techniques. The goal is to lower the per element cost
20 D. DEBOER ET AL.
sufficiently to be able to afford to build a significant array on a relatively mod-est budget and, concurrently, make it better by incorporating additional flexibility(degrees of freedom) with these new technologies. These improvements come fromutilizing many receivers (in radio astronomy, many receivers has meant on the orderof 20–30 – we intend to emplace 350 or more antennas each with dual-polarizationreceivers), bringing back the entire ∼11 GHz of analog bandwidth, and incor-porating many, concurrently-used radio-astronomical “back-ends” (the equipmentthat accepts the raw data stream and produces the scientific data-product). The netresult is a telescope that will have unprecedented radio-imaging capability, signif-icant sensitivity and very productive multitasking capability (several independentobserving programs concurrently utilizing the entire array).
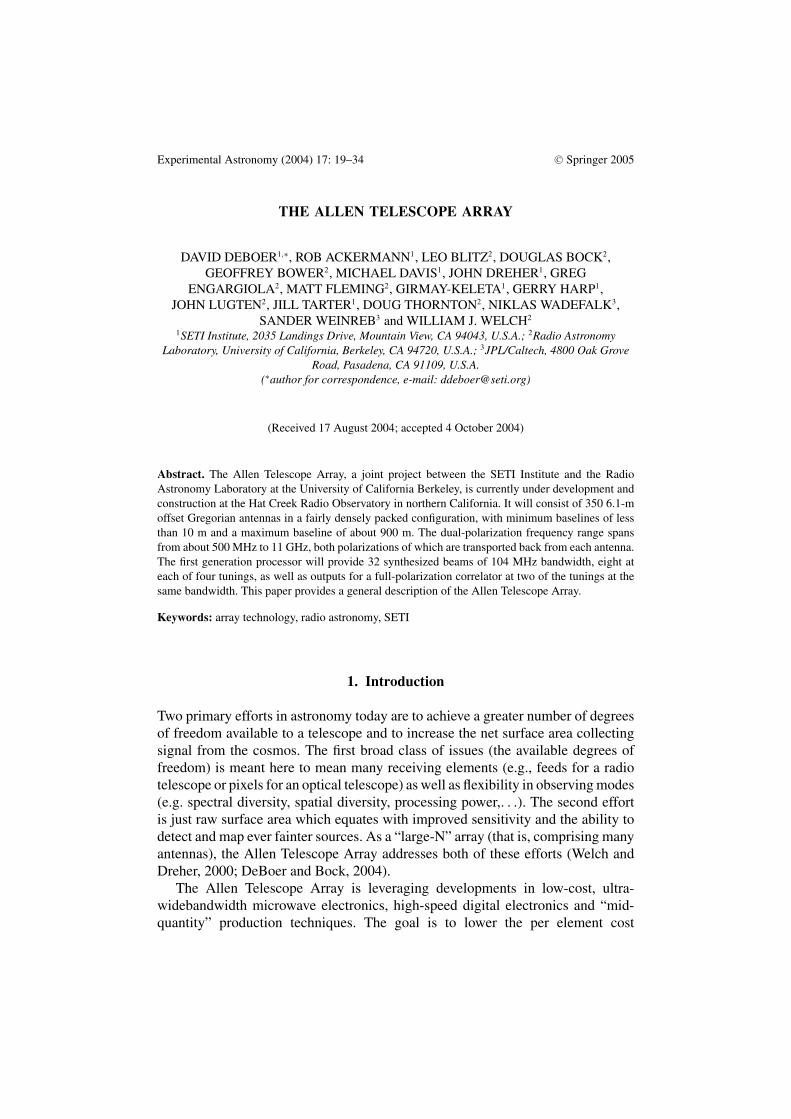
The Allen Telescope Array is a joint project of the SETI Institute (Search forExtraTerrestrial Intelligence, Mountain View, CA) and the Radio Astronomy Lab atthe University of California, Berkeley. Conceived in a series of meetings convenedby the SETI Institute in 1997–1999, the instrument was originally called the OneHectare Telescope (1hT), after its 104 square meters of collecting area. Thanksto the generosity of the Paul G. Allen Foundations (Seattle, WA), the telescopehas been funded through the research and development and initial constructionphases. Named for its first and primary benefactor, the Allen Telescope Array isunder construction, with the first three antennas currently in place (Figure 1) and aschedule that calls for 33 antennas in 2004, 206 antennas by the summer of 2006,
Figure 1. The three antennas currently under test at the Hat Creek Radio Observatory.
THE ALLEN TELESCOPE ARRAY 21
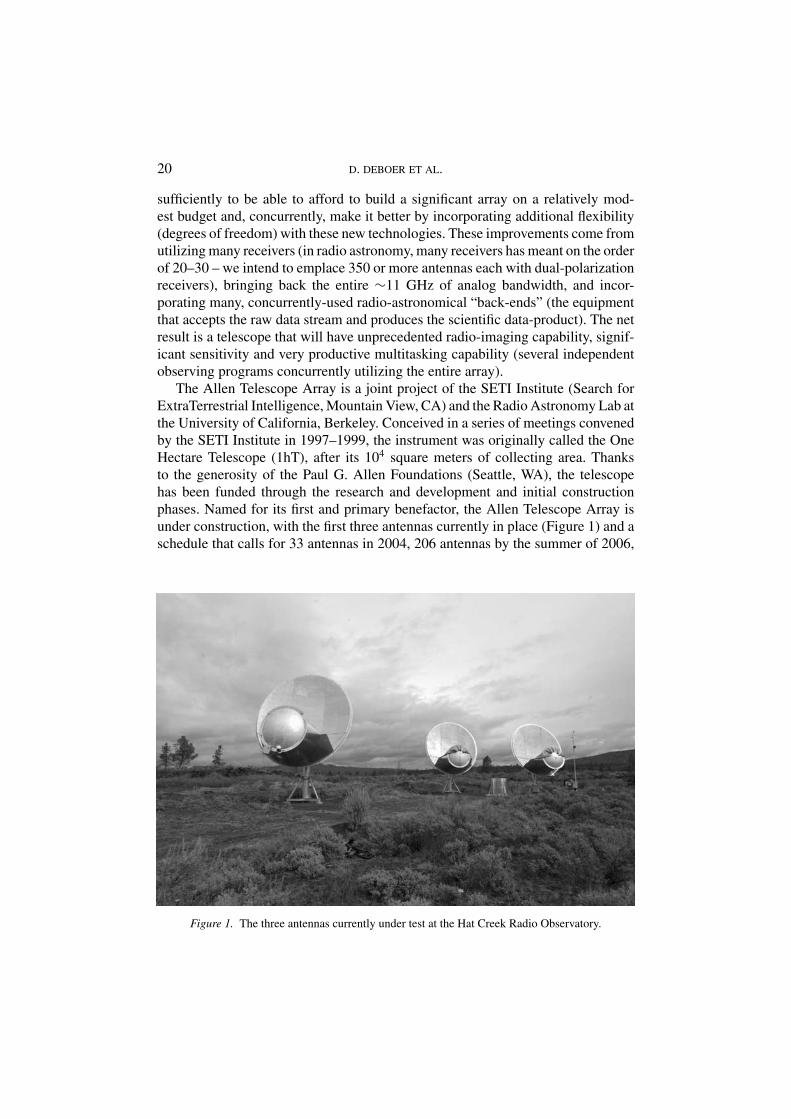
Figure 2. Rendering of the completed ATA-350 at the Hat Creek Radio Observatory.
and 350 antennas sometime later in the decade. Figure 2 shows a rendering of howthe 350 dishes will look at the Hat Creek Radio Observatory.
The SETI Institute is a private, nonprofit organization dedicated to scientificresearch, education and public outreach. Founded in 1984, the Institute today em-ploys more than 100 scientists, educators and support staff. The mission of the SETIInstitute is to explore, understand and explain the origin, nature and prevalence oflife in the universe. In pursuing this mission, the Institute is involved in numerousprograms across a wide breadth of disciplines.
The Radio Astronomy Laboratory (RAL) at the University of California,Berkeley, has pioneered radio astronomy for more than 40 years, supported bythe National Science Foundation, the State of California, and in its early days bythe Office of Naval Research. During that time, the RAL has made major inno-vations in radio astronomy instrumentation and fundamental discoveries in radioastronomy. The first large filter bank spectrometer with a radio astronomical ap-plication was built for use on the 85-foot centimeter-wave telescope at Hat Creek.The RAL also built the first millimeter-wave array for astronomical observations.In the last 20 years, the RAL has concentrated its efforts on providing outstandingmillimeter-wave radio imaging.
22 D. DEBOER ET AL.
2. Antenna
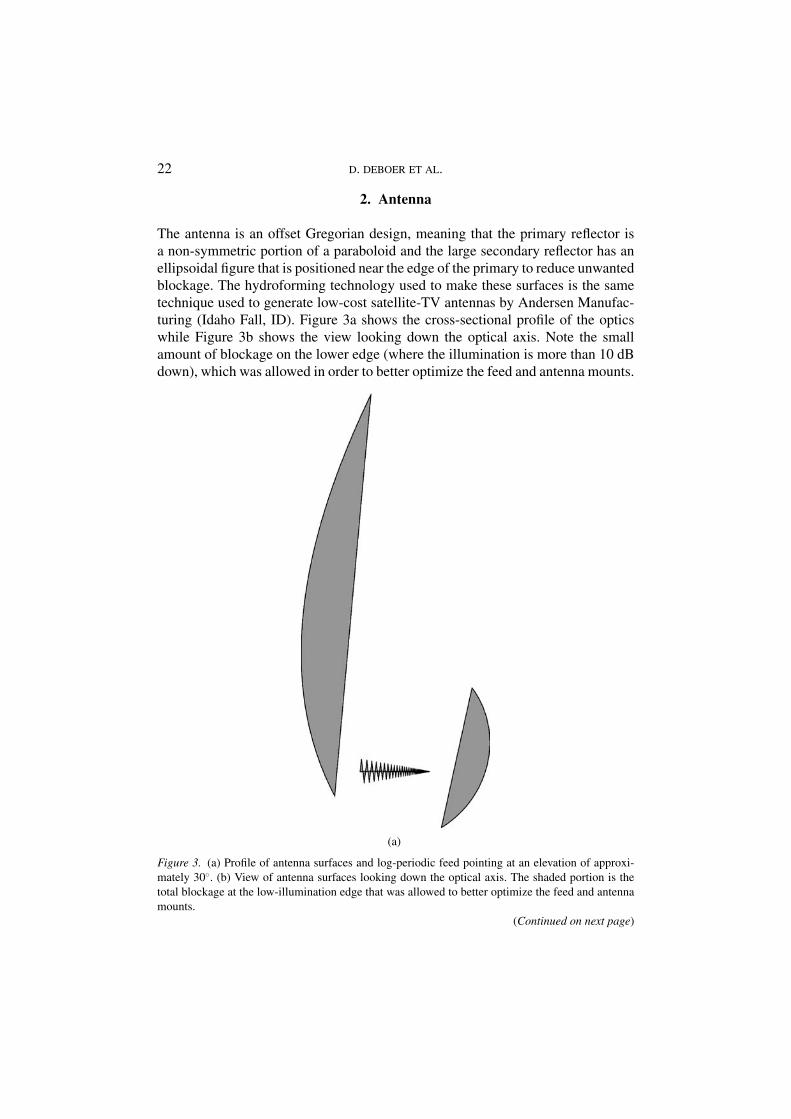
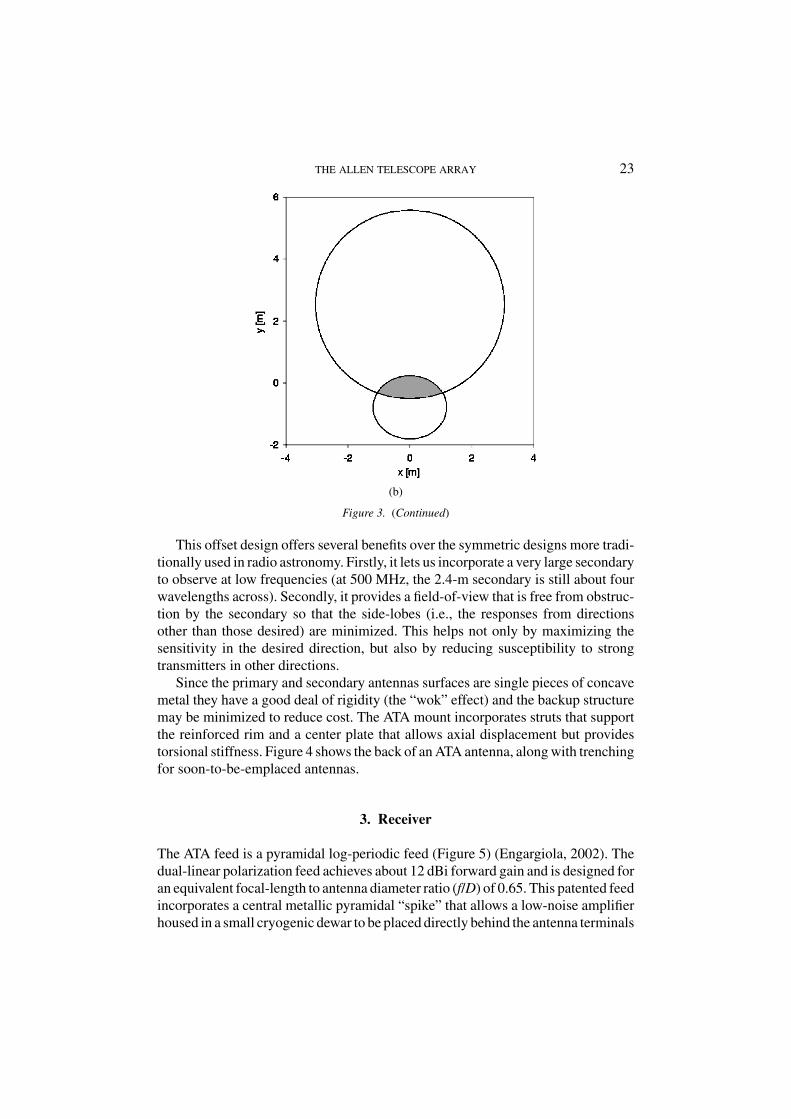
The antenna is an offset Gregorian design, meaning that the primary reflector isa non-symmetric portion of a paraboloid and the large secondary reflector has anellipsoidal figure that is positioned near the edge of the primary to reduce unwantedblockage. The hydroforming technology used to make these surfaces is the sametechnique used to generate low-cost satellite-TV antennas by Andersen Manufac-turing (Idaho Fall, ID). Figure 3a shows the cross-sectional profile of the opticswhile Figure 3b shows the view looking down the optical axis. Note the smallamount of blockage on the lower edge (where the illumination is more than 10 dBdown), which was allowed in order to better optimize the feed and antenna mounts.
(a)
Figure 3. (a) Profile of antenna surfaces and log-periodic feed pointing at an elevation of approxi-mately 30◦. (b) View of antenna surfaces looking down the optical axis. The shaded portion is thetotal blockage at the low-illumination edge that was allowed to better optimize the feed and antennamounts.
(Continued on next page)
THE ALLEN TELESCOPE ARRAY 23
(b)
Figure 3. (Continued)
This offset design offers several benefits over the symmetric designs more tradi-tionally used in radio astronomy. Firstly, it lets us incorporate a very large secondaryto observe at low frequencies (at 500 MHz, the 2.4-m secondary is still about fourwavelengths across). Secondly, it provides a field-of-view that is free from obstruc-tion by the secondary so that the side-lobes (i.e., the responses from directionsother than those desired) are minimized. This helps not only by maximizing thesensitivity in the desired direction, but also by reducing susceptibility to strongtransmitters in other directions.
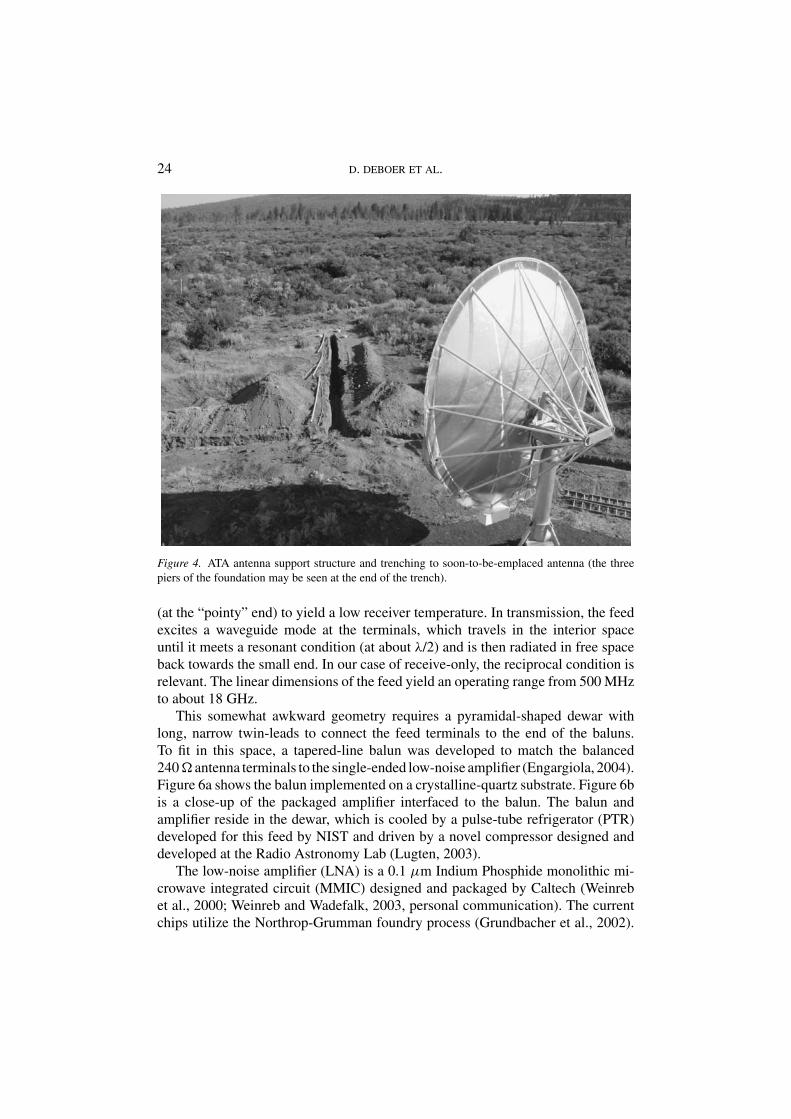
Since the primary and secondary antennas surfaces are single pieces of concavemetal they have a good deal of rigidity (the “wok” effect) and the backup structuremay be minimized to reduce cost. The ATA mount incorporates struts that supportthe reinforced rim and a center plate that allows axial displacement but providestorsional stiffness. Figure 4 shows the back of an ATA antenna, along with trenchingfor soon-to-be-emplaced antennas.
3. Receiver
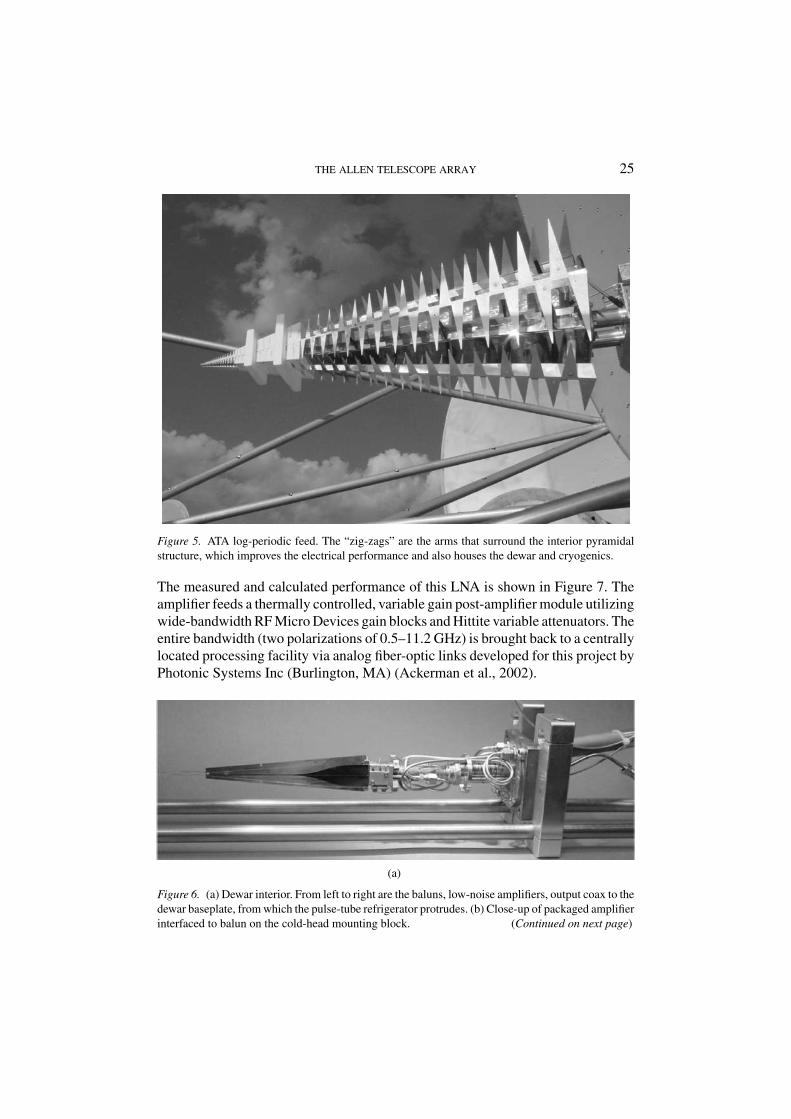
The ATA feed is a pyramidal log-periodic feed (Figure 5) (Engargiola, 2002). Thedual-linear polarization feed achieves about 12 dBi forward gain and is designed foran equivalent focal-length to antenna diameter ratio (f/D) of 0.65. This patented feedincorporates a central metallic pyramidal “spike” that allows a low-noise amplifierhoused in a small cryogenic dewar to be placed directly behind the antenna terminals
24 D. DEBOER ET AL.
Figure 4. ATA antenna support structure and trenching to soon-to-be-emplaced antenna (the threepiers of the foundation may be seen at the end of the trench).
(at the “pointy” end) to yield a low receiver temperature. In transmission, the feedexcites a waveguide mode at the terminals, which travels in the interior spaceuntil it meets a resonant condition (at about λ/2) and is then radiated in free spaceback towards the small end. In our case of receive-only, the reciprocal condition isrelevant. The linear dimensions of the feed yield an operating range from 500 MHzto about 18 GHz.
This somewhat awkward geometry requires a pyramidal-shaped dewar withlong, narrow twin-leads to connect the feed terminals to the end of the baluns.To fit in this space, a tapered-line balun was developed to match the balanced240� antenna terminals to the single-ended low-noise amplifier (Engargiola, 2004).Figure 6a shows the balun implemented on a crystalline-quartz substrate. Figure 6bis a close-up of the packaged amplifier interfaced to the balun. The balun andamplifier reside in the dewar, which is cooled by a pulse-tube refrigerator (PTR)developed for this feed by NIST and driven by a novel compressor designed anddeveloped at the Radio Astronomy Lab (Lugten, 2003).
The low-noise amplifier (LNA) is a 0.1 µm Indium Phosphide monolithic mi-crowave integrated circuit (MMIC) designed and packaged by Caltech (Weinrebet al., 2000; Weinreb and Wadefalk, 2003, personal communication). The currentchips utilize the Northrop-Grumman foundry process (Grundbacher et al., 2002).
THE ALLEN TELESCOPE ARRAY 25
Figure 5. ATA log-periodic feed. The “zig-zags” are the arms that surround the interior pyramidalstructure, which improves the electrical performance and also houses the dewar and cryogenics.
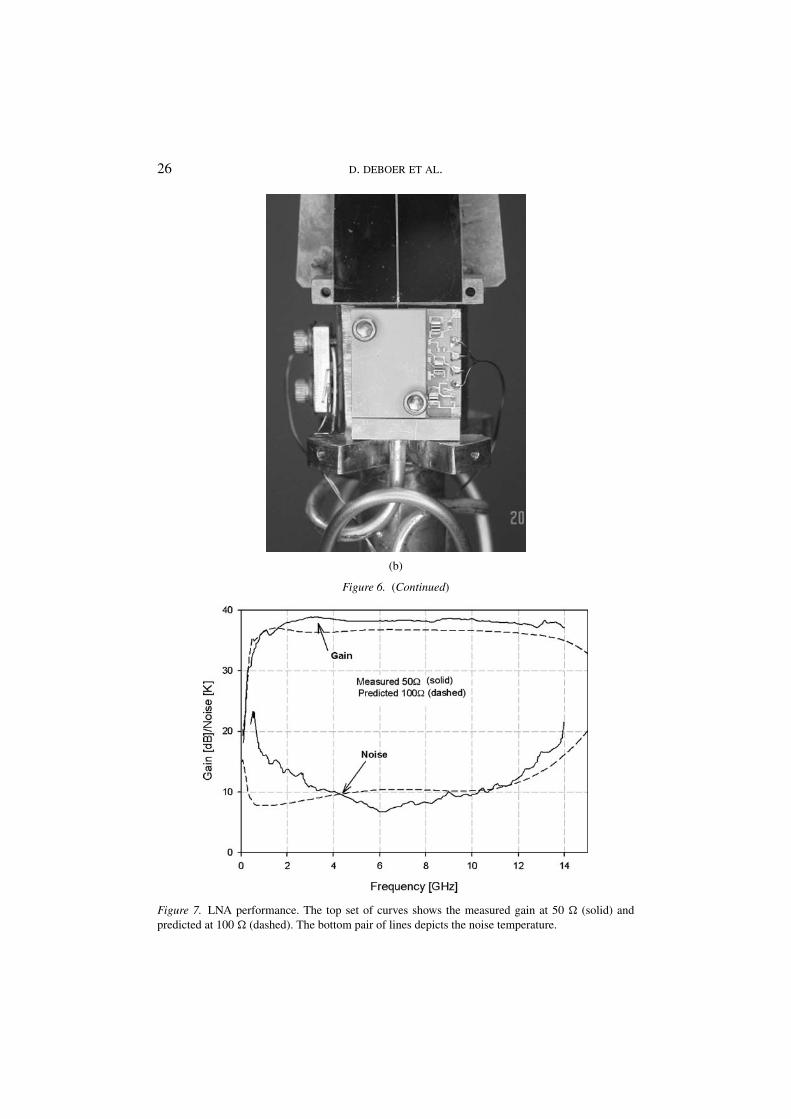
The measured and calculated performance of this LNA is shown in Figure 7. Theamplifier feeds a thermally controlled, variable gain post-amplifier module utilizingwide-bandwidth RF Micro Devices gain blocks and Hittite variable attenuators. Theentire bandwidth (two polarizations of 0.5–11.2 GHz) is brought back to a centrallylocated processing facility via analog fiber-optic links developed for this project byPhotonic Systems Inc (Burlington, MA) (Ackerman et al., 2002).
(a)
Figure 6. (a) Dewar interior. From left to right are the baluns, low-noise amplifiers, output coax to thedewar baseplate, from which the pulse-tube refrigerator protrudes. (b) Close-up of packaged amplifierinterfaced to balun on the cold-head mounting block. (Continued on next page)
26 D. DEBOER ET AL.
(b)
Figure 6. (Continued)
Figure 7. LNA performance. The top set of curves shows the measured gain at 50 � (solid) andpredicted at 100 � (dashed). The bottom pair of lines depicts the noise temperature.
THE ALLEN TELESCOPE ARRAY 27
4. Signal path and observing
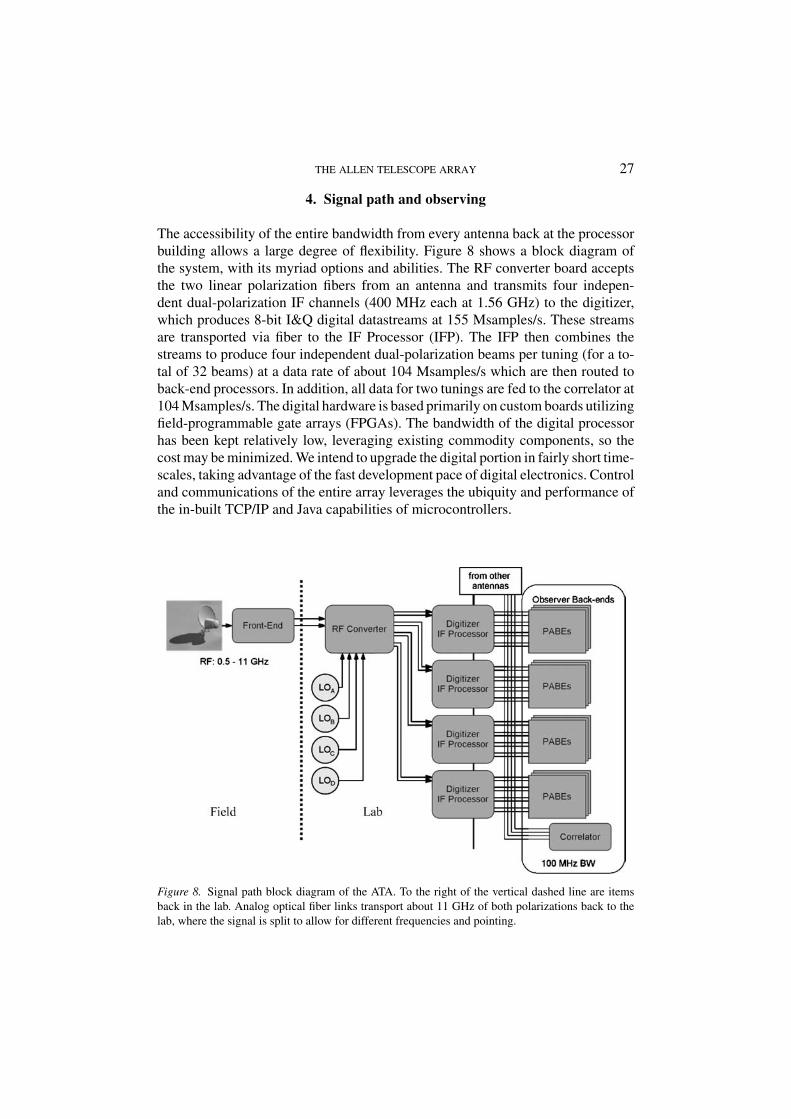
The accessibility of the entire bandwidth from every antenna back at the processorbuilding allows a large degree of flexibility. Figure 8 shows a block diagram ofthe system, with its myriad options and abilities. The RF converter board acceptsthe two linear polarization fibers from an antenna and transmits four indepen-dent dual-polarization IF channels (400 MHz each at 1.56 GHz) to the digitizer,which produces 8-bit I&Q digital datastreams at 155 Msamples/s. These streamsare transported via fiber to the IF Processor (IFP). The IFP then combines thestreams to produce four independent dual-polarization beams per tuning (for a to-tal of 32 beams) at a data rate of about 104 Msamples/s which are then routed toback-end processors. In addition, all data for two tunings are fed to the correlator at104 Msamples/s. The digital hardware is based primarily on custom boards utilizingfield-programmable gate arrays (FPGAs). The bandwidth of the digital processorhas been kept relatively low, leveraging existing commodity components, so thecost may be minimized. We intend to upgrade the digital portion in fairly short time-scales, taking advantage of the fast development pace of digital electronics. Controland communications of the entire array leverages the ubiquity and performance ofthe in-built TCP/IP and Java capabilities of microcontrollers.
Figure 8. Signal path block diagram of the ATA. To the right of the vertical dashed line are itemsback in the lab. Analog optical fiber links transport about 11 GHz of both polarizations back to thelab, where the signal is split to allow for different frequencies and pointing.
28 D. DEBOER ET AL.
The outputs from the IFP’s are then passed to one of several types of backends.The phased array back ends (PABEs) and correlator may all be used concurrently.The typical observing mode will have the astronomers at the Radio AstronomyLab stepping through large-scale surveys using the correlator, while those at theSETI Institute will use two tunings and several of the beams to simultaneouslyconduct multiple observations of stars. Other astronomers may concurrently useother beams to conduct other observing programs, for example, pulsar searchesand monitoring.
As a joint project intended for large surveys, this commensal use of the array isparamount and is enabled by the large field-of-view, wide bandwidth brought backto the lab, and flexible digital hardware. This allows the SETI Institute to conduct thefull-time, full-sensitivity targeted search for extraterrestrial technological signalsconcurrently with Radio Astronomy Lab-conducted wide surveys of HI using thecorrelator. In addition, other back-ends (e.g., a Beowulf-cluster spectrometer) canutilize other available beams. The “scarce” resources will be the pointing directionof the antennas (of which there is one, unless sub-arrays are used, which is possibledown to arbitrary sub-arrays of one antenna) and the tunings (of which there arefour). The data-streams from all the antennas for both polarizations for two tuningsare also sent to the correlator, allowing images of the entire field-of-view at twoindependent frequencies at full polarization to be formed. This constrains four ofthe 32 beams, which are still available to other back-ends but are phased to pointto boresight.
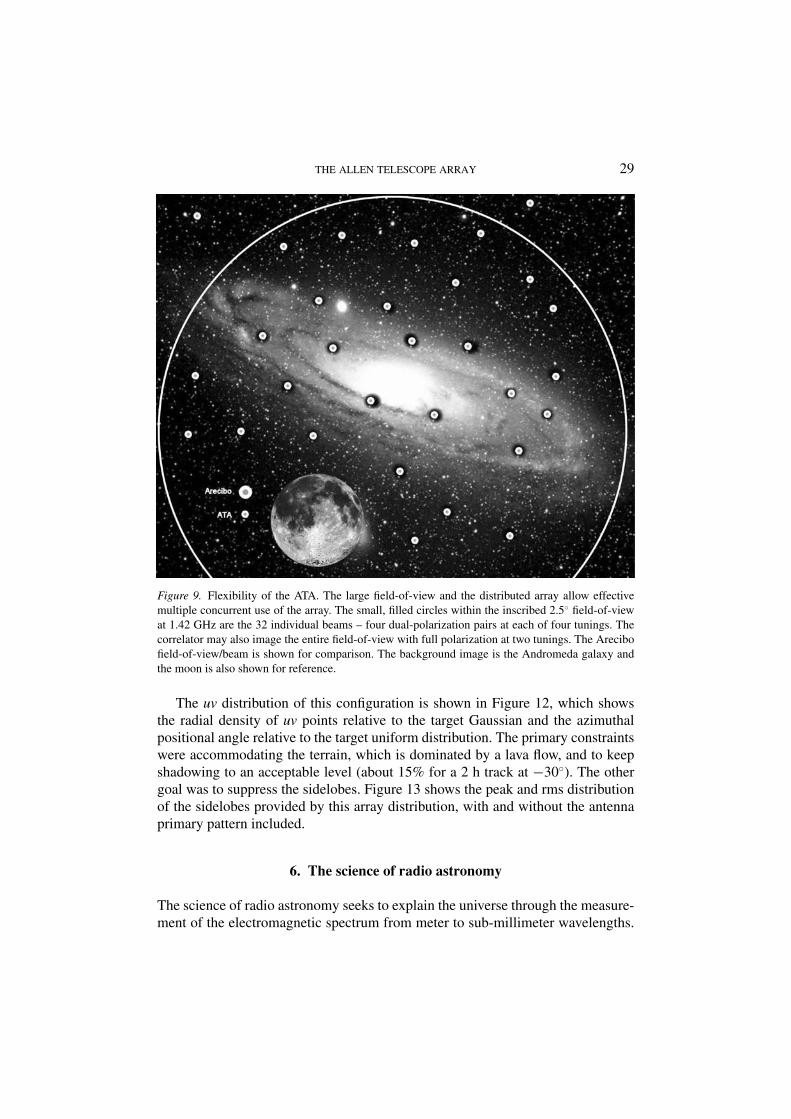
Figure 9 indicates the multiple-use capability. The large circle circumscribedover the Andromeda galaxy is the 3-dB field-of-view of the ATA at 1.420 GHz(contrasted with the Arecibo field-of-view) and the 32 smaller circles are the in-dependent ATA beams (contrasted with the Arecibo resolution, which is the sameas its field-of-view). These beams can point anywhere in the sky, however theywill typically point within the main beam of the primary (although allowing beamsto follow strong RFI sources out of the field-of-view may have benefits for RFImitigation). In addition, as stated, the correlator can image the entire field-of-viewat two independent frequencies. The moon is also shown for reference.
5. Array configuration
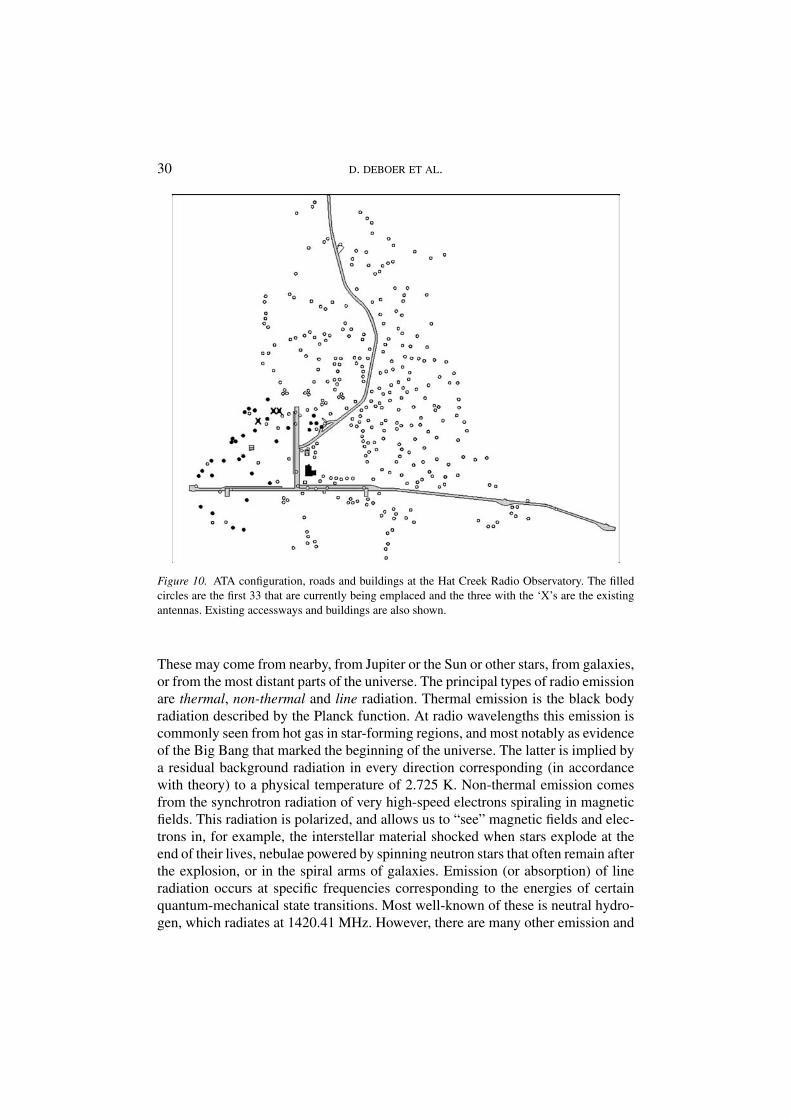
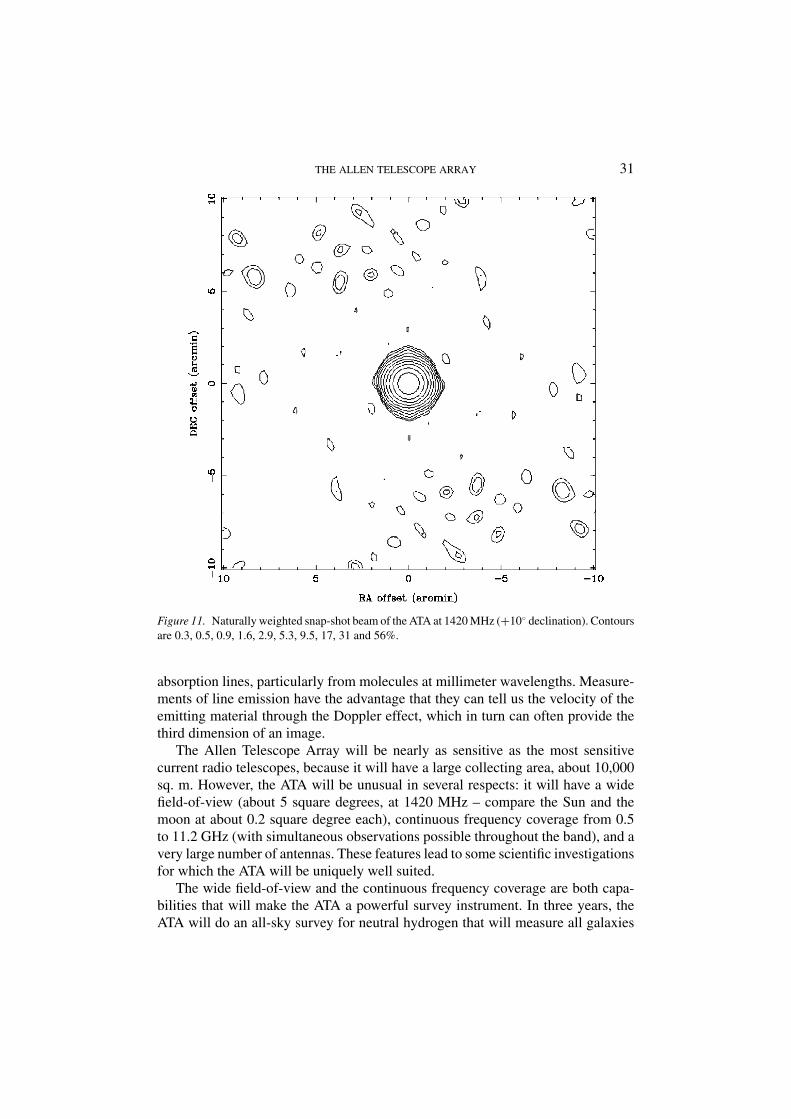
Given the large number of antennas, the imaging of the ATA will be unprecedentedin radio astronomy. Figure 10 shows the intended configuration of the full ATA andsome of the existing infrastructure of roads and buildings at Hat Creek. The filledcircles are the positions of the first 33 antennas and the “X’ed” circles are the existingthree antennas. The resulting beam is shown in Figure 11. The minimum baselinesare about 9.8 m (notice the close groups of three antennas) and the maximum base-line is about 870 m. The beam is round at +10◦ declination (about 78′′ with naturalweighting) and then increases to about 100′′×78′′ at 90◦ and 200′′×78′′ at −30◦.
THE ALLEN TELESCOPE ARRAY 29
Figure 9. Flexibility of the ATA. The large field-of-view and the distributed array allow effectivemultiple concurrent use of the array. The small, filled circles within the inscribed 2.5◦ field-of-viewat 1.42 GHz are the 32 individual beams – four dual-polarization pairs at each of four tunings. Thecorrelator may also image the entire field-of-view with full polarization at two tunings. The Arecibofield-of-view/beam is shown for comparison. The background image is the Andromeda galaxy andthe moon is also shown for reference.
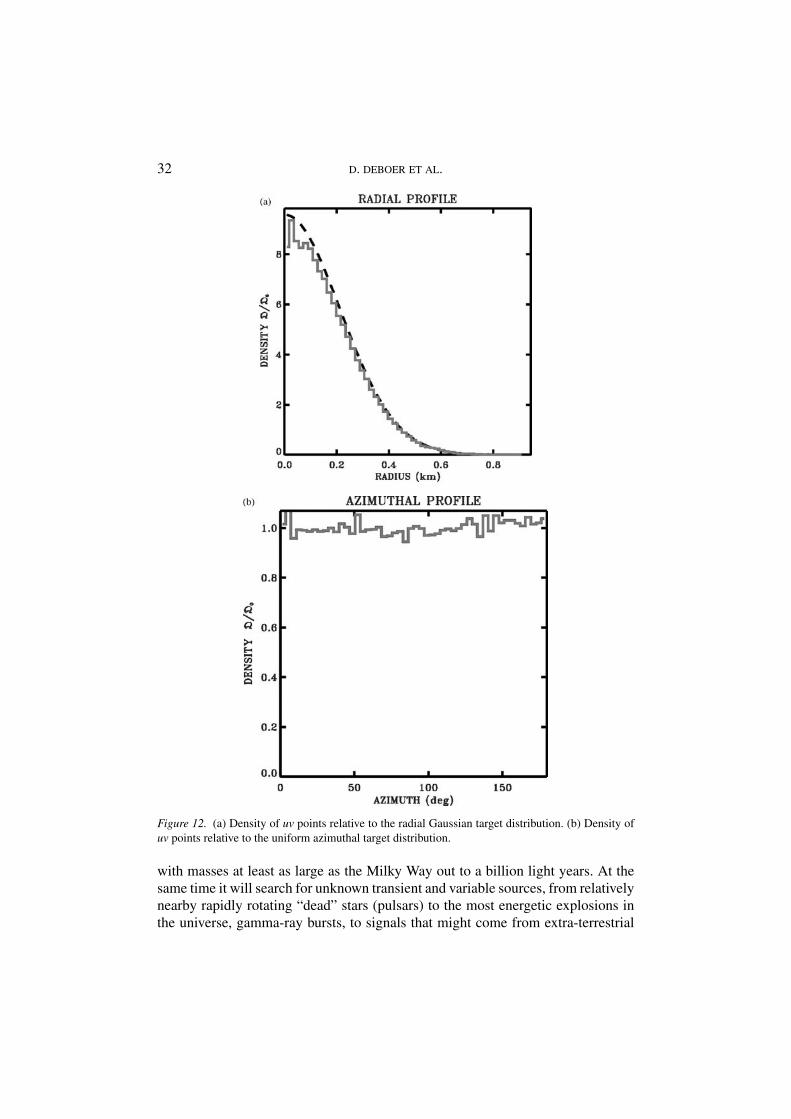
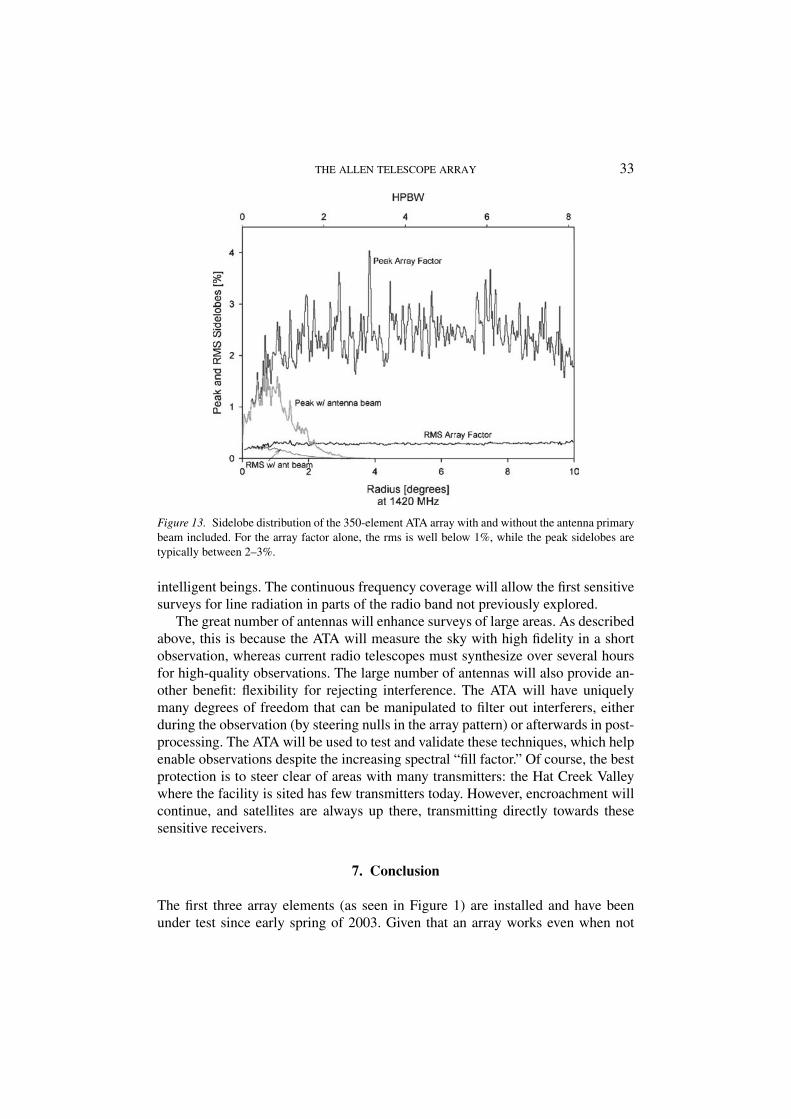
The uv distribution of this configuration is shown in Figure 12, which showsthe radial density of uv points relative to the target Gaussian and the azimuthalpositional angle relative to the target uniform distribution. The primary constraintswere accommodating the terrain, which is dominated by a lava flow, and to keepshadowing to an acceptable level (about 15% for a 2 h track at −30◦). The othergoal was to suppress the sidelobes. Figure 13 shows the peak and rms distributionof the sidelobes provided by this array distribution, with and without the antennaprimary pattern included.
6. The science of radio astronomy
The science of radio astronomy seeks to explain the universe through the measure-ment of the electromagnetic spectrum from meter to sub-millimeter wavelengths.
30 D. DEBOER ET AL.
Figure 10. ATA configuration, roads and buildings at the Hat Creek Radio Observatory. The filledcircles are the first 33 that are currently being emplaced and the three with the ‘X’s are the existingantennas. Existing accessways and buildings are also shown.
These may come from nearby, from Jupiter or the Sun or other stars, from galaxies,or from the most distant parts of the universe. The principal types of radio emissionare thermal, non-thermal and line radiation. Thermal emission is the black bodyradiation described by the Planck function. At radio wavelengths this emission iscommonly seen from hot gas in star-forming regions, and most notably as evidenceof the Big Bang that marked the beginning of the universe. The latter is implied bya residual background radiation in every direction corresponding (in accordancewith theory) to a physical temperature of 2.725 K. Non-thermal emission comesfrom the synchrotron radiation of very high-speed electrons spiraling in magneticfields. This radiation is polarized, and allows us to “see” magnetic fields and elec-trons in, for example, the interstellar material shocked when stars explode at theend of their lives, nebulae powered by spinning neutron stars that often remain afterthe explosion, or in the spiral arms of galaxies. Emission (or absorption) of lineradiation occurs at specific frequencies corresponding to the energies of certainquantum-mechanical state transitions. Most well-known of these is neutral hydro-gen, which radiates at 1420.41 MHz. However, there are many other emission and
THE ALLEN TELESCOPE ARRAY 31
Figure 11. Naturally weighted snap-shot beam of the ATA at 1420 MHz (+10◦ declination). Contoursare 0.3, 0.5, 0.9, 1.6, 2.9, 5.3, 9.5, 17, 31 and 56%.
absorption lines, particularly from molecules at millimeter wavelengths. Measure-ments of line emission have the advantage that they can tell us the velocity of theemitting material through the Doppler effect, which in turn can often provide thethird dimension of an image.
The Allen Telescope Array will be nearly as sensitive as the most sensitivecurrent radio telescopes, because it will have a large collecting area, about 10,000sq. m. However, the ATA will be unusual in several respects: it will have a widefield-of-view (about 5 square degrees, at 1420 MHz – compare the Sun and themoon at about 0.2 square degree each), continuous frequency coverage from 0.5to 11.2 GHz (with simultaneous observations possible throughout the band), and avery large number of antennas. These features lead to some scientific investigationsfor which the ATA will be uniquely well suited.
The wide field-of-view and the continuous frequency coverage are both capa-bilities that will make the ATA a powerful survey instrument. In three years, theATA will do an all-sky survey for neutral hydrogen that will measure all galaxies
32 D. DEBOER ET AL.
Figure 12. (a) Density of uv points relative to the radial Gaussian target distribution. (b) Density ofuv points relative to the uniform azimuthal target distribution.
with masses at least as large as the Milky Way out to a billion light years. At thesame time it will search for unknown transient and variable sources, from relativelynearby rapidly rotating “dead” stars (pulsars) to the most energetic explosions inthe universe, gamma-ray bursts, to signals that might come from extra-terrestrial
THE ALLEN TELESCOPE ARRAY 33
Figure 13. Sidelobe distribution of the 350-element ATA array with and without the antenna primarybeam included. For the array factor alone, the rms is well below 1%, while the peak sidelobes aretypically between 2–3%.
intelligent beings. The continuous frequency coverage will allow the first sensitivesurveys for line radiation in parts of the radio band not previously explored.
The great number of antennas will enhance surveys of large areas. As describedabove, this is because the ATA will measure the sky with high fidelity in a shortobservation, whereas current radio telescopes must synthesize over several hoursfor high-quality observations. The large number of antennas will also provide an-other benefit: flexibility for rejecting interference. The ATA will have uniquelymany degrees of freedom that can be manipulated to filter out interferers, eitherduring the observation (by steering nulls in the array pattern) or afterwards in post-processing. The ATA will be used to test and validate these techniques, which helpenable observations despite the increasing spectral “fill factor.” Of course, the bestprotection is to steer clear of areas with many transmitters: the Hat Creek Valleywhere the facility is sited has few transmitters today. However, encroachment willcontinue, and satellites are always up there, transmitting directly towards thesesensitive receivers.
7. Conclusion
The first three array elements (as seen in Figure 1) are installed and have beenunder test since early spring of 2003. Given that an array works even when not
34 D. DEBOER ET AL.
“completely finished,” the construction of the Allen Telescope Array is staged toyield scientific output at the earliest possible point. The first phase is to produceanother 30 antennas (with total equivalent collecting area of a 34-m antenna) bythe end of 2004, with observations by both the SETI Institute, which will conducta SETI survey of the galactic plane, and the Radio Astronomy Lab, which willuse a correlator (recently funded by the National Science Foundation and currentlyunder construction) to image the sky commencing shortly thereafter. Some of thefirst projects will be to map the neutral hydrogen in dwarf galaxies and thus measurethe dark matter through the effect of its gravity on the dynamics of the system, tolook for polyatomic molecules in interstellar molecular clouds, and to try to detectemission from primordial deuterium. The next stage is to build about 200 antennasby mid-2006 and before the end of the decade it is expected that the full complementof 350 antennas will be productively probing the skies. Future funding will thenbe sought to enhance the telescope still further, so that this flexible instrument willalways remain on the cusp of discovery.
References
Ackerman, E., Cox, C., Dreher, J., Davis, M. and DeBoer, D.: 2002, ‘Fiber-Optic Antenna Remotingfor Radioastronomy Applications’, URSI 27th General Assembly, Maastricht.
DeBoer, D. and Bock, D.: 2004, IEEE Microwave Theor. Tech. Magazine June, 46–53.Engargiola, G.: 2002, ‘Non-planar log-periodic antenna feed for integration with a cryogenic mi-
crowave amplifier’, Antennas and Propagation Symposium Digest, June 16–21, 2002, SanAntonio, TX.
Engargiola, G.: 2004, ‘Tapered microstrip balun for integrating a low noise amplifier with a nonplanarlog periodic antenna’, Rev. Sci. Instr. 74(12).
Grundbacher, R., Lai, R., Barsky, M., Tsai, R., Gaier, T., Weinreb, S., Dawson, D., Bautista, J.J., Davis, J. F., Erickson, N., Block, T. and Oki, A.: 2002, ‘InP HEMT Devices and MMICsfor Cryogenic Low Noise Amplifiers from X-band to W-band’, Indium Phosphide and RelatedMaterials Conference, 2002. IPRM. 14th, 12–16 May 2002, pp. 455–458.
Lugten, J. B.: 2003, Adv. Cryog. Eng. 49, 1367–1372.Weinreb, S., Gaier, T., Fernandez, J. E., Erickson, N. and Wielgus, J.: 2000, ‘Cryogenic Low Noise
Amplifiers’, GaAs2000 Symposium, Paris, October 2.Welch, W. J. and Dreher, J. W.: 2000, Proc. SPIE 4015, 8–18.
Related Documents