Ecological Engineering 13 (1999) 199 – 234 The agricultural biome of Biosphere 2: Structure, composition and function Bruno D.V. Marino a, *, Tilak Ram Mahato b , John W. Druitt b , Linda Leigh b,1 , Guanghui Lin b , Robert M. Russell c , Francesco N. Tubiello b,2 a Department of Earth and Planetary Sciences, Har6ard Uni6ersity, 20 Oxford Street, Cambridge, MA 02138, USA b Biosphere 2 Center, Inc., P.O. Box 689, Oracle, AZ 85623, USA c Jean Mayer USDA Human Nutrition Research Center on Aging, Tufts Uni6ersity, 711 Washington Street, Boston, MA 02111, USA Received 13 March 1997; received in revised form 19 December 1997; accepted 23 December 1997 Abstract The agricultural mesocosm of Biosphere 2, known as the Intensive Agricultural Biome (IAB), provided food for the inhabitants of the facility during two periods of material closure between 1991 and 1994 (Mission I, September 26, 1991 to September 26, 1993, eight-person crew; Mission II, March 6, 1994 to September 17, 1994, seven-person crew). The design and operation of the mesocosm and preliminary results for food production of the IAB are described for both periods. The overall rate of crop production for the 0.22 ha area (soil depth of 1 m; soil and atmospheric volumes of approximately 2000 m 3 and 38 000 m 3 , respectively) sustained both crews. Overall production rates in Biosphere 2 exceeded those characteristic of fertile agricultural land in the most efficient agrarian communities, despite comparatively lower light levels, lack of insect pollinators and unusually dense insect pests. Crop yields were markedly higher for Mission II than for Mission I due, in part, to experience and improvements based on the first closure. The health of the Biospherians is briefly discussed in the context of a low-calorie (1800–2200 kcal day -1 per person for * Corresponding author. 1 Present address: Systems Ecology and Energy Analysis Program, Dept. of Environmental Engineer- ing Sciences, University of Florida, Gainesville, FL 32611, USA. 2 Present address: Columbia University and NASA-Goddard Institute for Space Studies, 2800 Broadway, New York, NY 10025, USA. 0925-8574/99/$ - see front matter © 1999 Elsevier Science B.V. All rights reserved. PII:S0925-8574(98)00100-1

Welcome message from author
This document is posted to help you gain knowledge. Please leave a comment to let me know what you think about it! Share it to your friends and learn new things together.
Transcript

Ecological Engineering 13 (1999) 199–234
The agricultural biome of Biosphere 2:Structure, composition and function
Bruno D.V. Marino a,*, Tilak Ram Mahato b,John W. Druitt b, Linda Leigh b,1, Guanghui Lin b,
Robert M. Russell c, Francesco N. Tubiello b,2
a Department of Earth and Planetary Sciences, Har6ard Uni6ersity, 20 Oxford Street, Cambridge,MA 02138, USA
b Biosphere 2 Center, Inc., P.O. Box 689, Oracle, AZ 85623, USAc Jean Mayer USDA Human Nutrition Research Center on Aging, Tufts Uni6ersity,
711 Washington Street, Boston, MA 02111, USA
Received 13 March 1997; received in revised form 19 December 1997; accepted 23 December 1997
Abstract
The agricultural mesocosm of Biosphere 2, known as the Intensive Agricultural Biome(IAB), provided food for the inhabitants of the facility during two periods of material closurebetween 1991 and 1994 (Mission I, September 26, 1991 to September 26, 1993, eight-personcrew; Mission II, March 6, 1994 to September 17, 1994, seven-person crew). The design andoperation of the mesocosm and preliminary results for food production of the IAB aredescribed for both periods. The overall rate of crop production for the 0.22 ha area (soildepth of 1 m; soil and atmospheric volumes of approximately 2000 m3 and 38 000 m3,respectively) sustained both crews. Overall production rates in Biosphere 2 exceeded thosecharacteristic of fertile agricultural land in the most efficient agrarian communities, despitecomparatively lower light levels, lack of insect pollinators and unusually dense insect pests.Crop yields were markedly higher for Mission II than for Mission I due, in part, toexperience and improvements based on the first closure. The health of the Biospherians isbriefly discussed in the context of a low-calorie (1800–2200 kcal day−1 per person for
* Corresponding author.1 Present address: Systems Ecology and Energy Analysis Program, Dept. of Environmental Engineer-
ing Sciences, University of Florida, Gainesville, FL 32611, USA.2 Present address: Columbia University and NASA-Goddard Institute for Space Studies, 2800
Broadway, New York, NY 10025, USA.
0925-8574/99/$ - see front matter © 1999 Elsevier Science B.V. All rights reserved.
PII: S0925 -8574 (98 )00100 -1

B.D.V. Marino et al. / Ecological Engineering 13 (1999) 199–234200
Mission I and 2200–2400 kcal day−1 for Mission II), nutrient-dense diet characteristic of theBiosphere 2 food paradigm. High productivity and biodiversity were due to many factorsincluding high resolution climate control, hyper-intensive agricultural practices, selection andplanting of food crops adapted to humid, tropical and sub-tropical conditions, nutrientrecycling, intensive pest management, and the superambient levels of atmospheric CO2
(concentrations up to 4500 ppmv were reported during the 1991 to 1994 occupations).Radiation use efficiency (RUE) for wheat for both periods and a post-Mission II plantingwere comparable to RUEs observed in other experimental elevated CO2 settings such asControlled Ecological Life Support Systems (CELSS) and Free Air CO2 Enrichment studies(FACE) even though yields were comparatively lower due to low light levels. Integratedmanagement of pests, soil conditions and agricultural practices were key factors in thesustainability of the IAB resulting in minimization of plant loss due to insect herbivory,nematode infestation and reduction in the quality of IAB soils. The use of soils rather thanhydroponic systems for the IAB had significant consequences for CO2, N2O and O2
concentrations in the Biosphere 2 atmosphere and rendered primary regeneration technolo-gies ineffective over the periods of closure. The initial high organic carbon content of theIAB soils prescribed by the designers proved to be the largest single source of CO2 and thelargest sink for O2. The choice of a soil-based compared to a hydroponic-based agriculturalsystem contributed to the accumulation of N2O to levels as high as 300 times currentambient levels (approximately 310 ppbv). The IAB of Biosphere 2 has the potential, withsystem improvement, to be a high-yielding, self-sustaining agricultural mesocosm suited fora variety of research endeavors. © 1999 Elsevier Science B.V. All rights reserved.
Keywords: Agricultural mesocosm; Elevated CO2; Closed system research; Biosphere 2; Sustainableagriculture
1. Introduction
Can a synthetic, enclosed, soil-based agricultural field system be constructed andmanaged to simulate the production ecology of the worlds most intensive andproductive agrarian systems? This was the challenge for the designers and operatorsof the Biosphere 2 agricultural mesocosm. The key outcome for the IntensiveAgricultural Biome (IAB) of Mission I and Mission II, in the context of the‘Human Experiment,’ was simply that sufficient, but not optimal, quantities of foodwere produced to sustain the eight Biospherians of Mission I for 2 years and theseven member crew of Mission II for about 6 months (e.g. Glenn et al., 1990; Allen,1991; Silverstone and Nelson, 1996). The health consequences of the food supplyfor Mission I have been described by Walford et al. (1992, 1995, 1996). The goal ofthis report is to examine the structure, composition and function of the IAB in thecontext of a support facility for human sustainability under conditions of materialclosure. Where possible, comparisons are made for Mission I and Mission II andfor subsequent results.
The key elements of the IAB were: (1) a soil bed of large volume allowingintensive farming of diverse crops; (2) an irrigation system that met the moisturerequirements of diverse crops; (3) an animal system that minimized plant waste and

B.D.V. Marino et al. / Ecological Engineering 13 (1999) 199–234 201
provided a source of dietary fat and protein; (4) a wastewater system thatsupported anaerobic and aerobic subsystems; (5) a lagoon-based wetland farming(i.e. wetland rice paddy) and fish farming system (i.e. Tilapia); (6) a watermanagement system linked to the potable water supply and to the general watersupply of the whole Biosphere 2 facility; and (7) an air duct system that allowedthe atmosphere of Biosphere 2 to be passed through the soil column for purifica-tion. The biological elements employed in the function of the IAB includedpollinators, beneficial insects and higher vertebrates, cultivated earthworms, bio-logically active soil and selected cultivars of crop species for consumption. Theextent to which these systems functioned successfully as individual componentsand as an integrated complex was variable and is discussed below. The manage-ment practices of the IAB with respect to planting and harvesting, control ofinsect predation and weeds, application and manipulation of water and nutrientsand maintenance of soil characteristics were clearly of critical importance inobtaining optimal crop yields. Effective integrated pest management (IPM) wasrequired; toxic pesticides were not allowed in the facility. The production ecologyand crop yields of Mission I and Mission II approaches differed and are dis-cussed.
Biosphere 2 began construction in 1986 and commenced the first closure onSeptember 26, 1991, which lasted 2 years. A transition period of 6 monthsfollowed Mission I after which Mission II began on March 6, 1994, and lastedabout 6 months. A summary of the history of the facility is provided by severalarticles in this special issue (Allen and Nelson, 1999; Marino and Odum, 1999).During the transition between Missions, emphasis was placed on addition offood crops, particularly banana and papaya to provide more abundant foodresources relative to Mission I as well as on upgrading and expanding existingtechnical systems. The integrity of the atmosphere appeared to remain largelyintact during the transition preceding the start of Mission II based on decreasesin sulfur hexaflouride (SF6) concentrations in the enclosed atmosphere; shortlyafter Mission II began closure was broken briefly by exchange of air via thelung safety glass and airlocks, resulting in approximately a 15% exchange ofinside with outside air. Leak rates for the Biosphere 2 facility during the closureperiods were estimated at about 10% per year (Dempster, 1994).
In this paper, comparisons of production ecology, crop productivity and nutri-tional status of the crews are made using data in the open literature as well asarchived data in the historic databases maintained by Biosphere 2. In Section 2,the facility and its physical and mechanical components are described followedby a description of the biological components in Section 3. Section 4 discussesresults for crop yields, production rates and nutrition followed by the effective-ness of IPM practices and an evaluation of the regeneration technologies. Sec-tion 5 concludes with a discussion of the overall success of IAB food productionin the context of a human life support system, insights relevant to CELSSstudies and future research potential in the area of sustainable agriculture.
B.D.V. Marino et al. / Ecological Engineering 13 (1999) 199–234202
2. Design and description
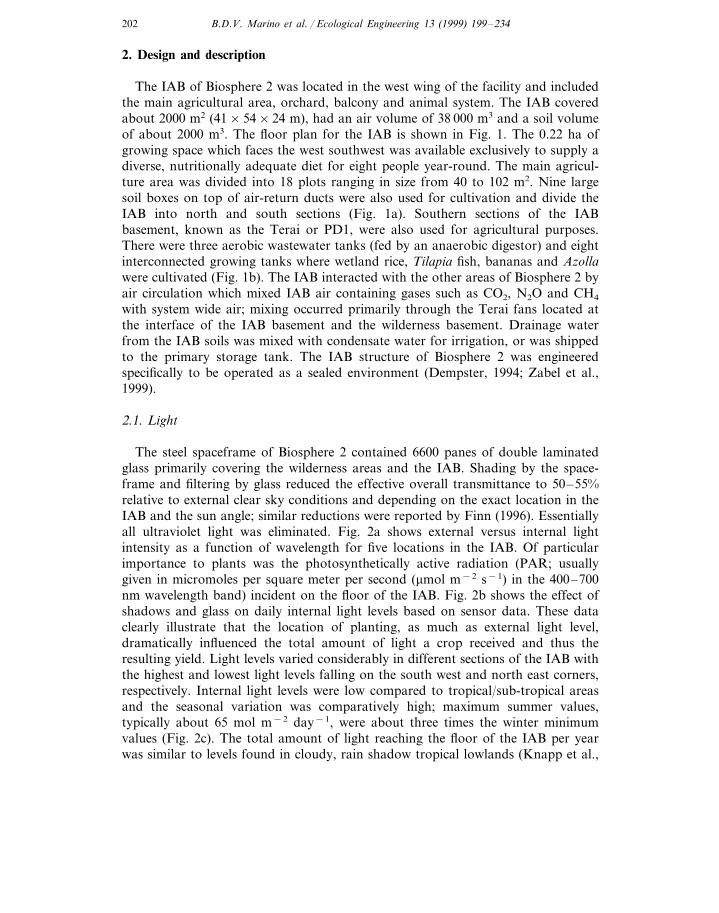
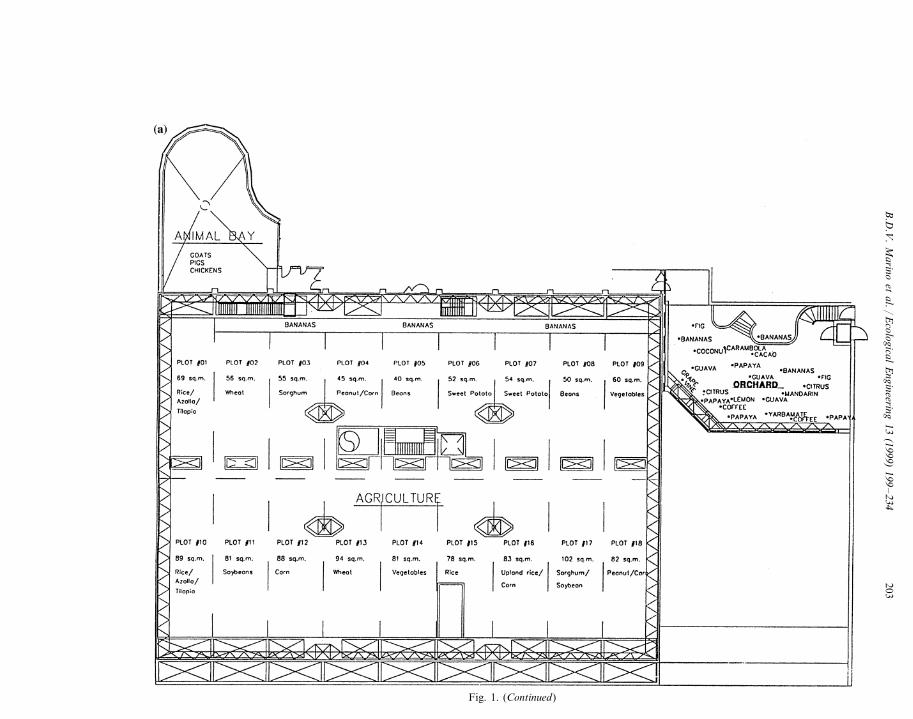
The IAB of Biosphere 2 was located in the west wing of the facility and includedthe main agricultural area, orchard, balcony and animal system. The IAB coveredabout 2000 m2 (41×54×24 m), had an air volume of 38 000 m3 and a soil volumeof about 2000 m3. The floor plan for the IAB is shown in Fig. 1. The 0.22 ha ofgrowing space which faces the west southwest was available exclusively to supply adiverse, nutritionally adequate diet for eight people year-round. The main agricul-ture area was divided into 18 plots ranging in size from 40 to 102 m2. Nine largesoil boxes on top of air-return ducts were also used for cultivation and divide theIAB into north and south sections (Fig. 1a). Southern sections of the IABbasement, known as the Terai or PD1, were also used for agricultural purposes.There were three aerobic wastewater tanks (fed by an anaerobic digestor) and eightinterconnected growing tanks where wetland rice, Tilapia fish, bananas and Azollawere cultivated (Fig. 1b). The IAB interacted with the other areas of Biosphere 2 byair circulation which mixed IAB air containing gases such as CO2, N2O and CH4
with system wide air; mixing occurred primarily through the Terai fans located atthe interface of the IAB basement and the wilderness basement. Drainage waterfrom the IAB soils was mixed with condensate water for irrigation, or was shippedto the primary storage tank. The IAB structure of Biosphere 2 was engineeredspecifically to be operated as a sealed environment (Dempster, 1994; Zabel et al.,1999).
2.1. Light
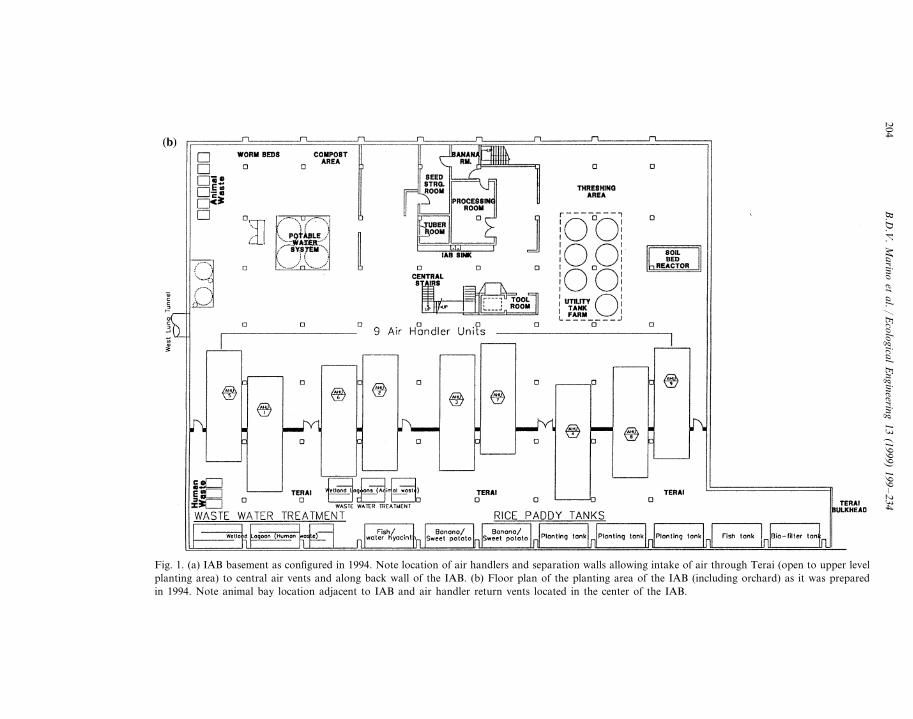
The steel spaceframe of Biosphere 2 contained 6600 panes of double laminatedglass primarily covering the wilderness areas and the IAB. Shading by the space-frame and filtering by glass reduced the effective overall transmittance to 50–55%relative to external clear sky conditions and depending on the exact location in theIAB and the sun angle; similar reductions were reported by Finn (1996). Essentiallyall ultraviolet light was eliminated. Fig. 2a shows external versus internal lightintensity as a function of wavelength for five locations in the IAB. Of particularimportance to plants was the photosynthetically active radiation (PAR; usuallygiven in micromoles per square meter per second (mmol m−2 s−1) in the 400–700nm wavelength band) incident on the floor of the IAB. Fig. 2b shows the effect ofshadows and glass on daily internal light levels based on sensor data. These dataclearly illustrate that the location of planting, as much as external light level,dramatically influenced the total amount of light a crop received and thus theresulting yield. Light levels varied considerably in different sections of the IAB withthe highest and lowest light levels falling on the south west and north east corners,respectively. Internal light levels were low compared to tropical/sub-tropical areasand the seasonal variation was comparatively high; maximum summer values,typically about 65 mol m−2 day−1, were about three times the winter minimumvalues (Fig. 2c). The total amount of light reaching the floor of the IAB per yearwas similar to levels found in cloudy, rain shadow tropical lowlands (Knapp et al.,
B.D
.V.
Marino
etal./
Ecological
Engineering
13(1999)
199–
234203
Fig. 1. (Continued)
B.D
.V.
Marino
etal./
Ecological
Engineering
13(1999)
199–
234204
Fig. 1. (a) IAB basement as configured in 1994. Note location of air handlers and separation walls allowing intake of air through Terai (open to upper levelplanting area) to central air vents and along back wall of the IAB. (b) Floor plan of the planting area of the IAB (including orchard) as it was preparedin 1994. Note animal bay location adjacent to IAB and air handler return vents located in the center of the IAB.

B.D.V. Marino et al. / Ecological Engineering 13 (1999) 199–234 205
Fig. 2. (a) External and internal irradiance given in W nm−1 m−2 measured on 5 February 1994, at thetimes indicated; data for internal locations were selected to reflect maximum and minimum light levels.The measurements were made with a LI-COR LI-1800 Spectroradiometer under clear sky conditions. (b)IAB daily light levels as a function of sensor location. Dotted line represents external light; solid linerepresents internal light sensor in the space frame; dashed line represents sensor located just above theIAB planting surface showing shadow effects which further attenuated the light field. The contributionof internal lights to plant growth (solid and dashed line for night time intervals), based on available data,was minimal. (c) Seasonal change in external (dotted line) and internal light levels (dashed and solidlines) from November 1993 to May 1995.
B.D.V. Marino et al. / Ecological Engineering 13 (1999) 199–234206
1980). While the original design goal was to maximize PAR in the Biosphere 2facility, multiple spaceframe shadow effects (as seen in Fig. 2b) resulted in a lightfield that was weaker than anticipated. The reduction in light and the consequencesfor crop productivity and human health were addressed by the addition of artificiallighting after termination of Mission 1. The artificial lighting system in the IABagricultural area consisted of 196 fixtures; each contained a 1000-W high pressuresodium lamp. While the original intent of using artificial light was to increase totaldaily light received, according to available records they were not consistently useddue to crop damage in some areas of the IAB, noise and cost. Their contributionto plant growth, based on available records, is estimated to have been minimal.
2.2. IAB soils
The mineral portion of the IAB soil was obtained from a nearby cattle tank(Wilson Pond) consisting of a clay loam soil with about 5% organic matter. Thefinal soil design, by volume, called for 70% Wilson Pond soil, 15% coarse peat, and15% commercial, weakly composted mulch. As a consequence, the final mix isestimated to have had about 8–10% organic matter (approximately 5% organiccarbon) by volume. The organic-rich nature of the soil was specified by somemembers of the design team of the IAB, according to internal reports, based on theidea that the more organic matter, the better for overall plant vigor and health. Thesand fraction of the soil was less than 10% when tested in mid-1995, and consistedalmost exclusively of very fine sand. The thickness of the soil column ranged from
Fig. 2. (Continued)

B.D.V. Marino et al. / Ecological Engineering 13 (1999) 199–234 207
about 80 to 110 cm. The presence of montmorillonite clay in the source soils causedshrinking and swelling; vertisol-type cracks developed which could open up to 5 cmacross. In addition, the hard texture of the original IAB soil was difficult to work.The composition and texture of the IAB soils changed throughout the period andare discussed below. The IAB soils eventually became unacceptably saline requiringrepeated flushes with clean water as described below. Improvements made in 1994and 1995 consisted of automatic mixing valves, in-line TDS sensors and theaddition of reverse osmosis (RO) water to supplement condensate reserves resultingin high quality water for irrigation of the IAB and the wilderness biomes.
2.3. Soil bed reactor
The IAB (orchard excluded) was built based on the design concept of a soil bedreactor (SBR). The approach is based on decomposition of atmospheric compoundsby soil microorganisms (Bohn and Bohn, 1986) or by adsorption as they areintroduced by forced air through the soil matrix. The biogeochemistry of soils iscomplex (e.g. Schlegel, 1974) producing sources and sinks for a variety of naturallyoccurring and anthropogenically influenced atmospheric gases (e.g. McElroy, 1983;Rheeburgh et al., 1993) and trace contaminants (Bohn, 1972; Khalil and Ras-mussen, 1989). The technology has been variously described (e.g. Prokop andBohn, 1985; Bohn and Bohn, 1988) but not on the scale of the IAB. Preliminary laband field work to support development of the Biosphere 2 soil bed reactordemonstrated that the effectiveness of such a system would be difficult to controland predict since removal efficiency for a given compound depended on soilmoisture, soil composition and physical characteristics, flow rate, plant cover andsoil microbial ecology (Frye et al., 1990). The use of the soil bed reactor in anagricultural setting could also result in increased efflux of CO2, other gases andparticulates to the atmosphere from the soil column as well as influence cropproductivity; these effects would render the soil bed reactor unsuitable under theprevailing atmospheric composition of high CO2 and the pressing demand foroptimal crop yield. There were 24 sub-soil air vents attached to blowers designed topush 5000 cfm of air into the thin air plenum formed by cinder blocks at the baseof the soil. However, the SBR was activated for only a very brief period duringMission I and Mission II for testing and was not used for the purpose of airpurification.
2.4. Compost
In the Biosphere 2 approach to life support and sustainability, composting was toserve as the primary vehicle for recycling of solid waste, particularly IAB biomass.However, composting emerged as a questionable practice in Biosphere 2 where thesoil was initially rich in nutrients and carbon. Under closed conditions in a systemwith high atmospheric CO2 and diminishing oxygen the objective quickly became areduction in respired CO2 rather than an increase as occurs during decompositionof compost. Dry storage of biomass was employed instead of allowing compost
B.D.V. Marino et al. / Ecological Engineering 13 (1999) 199–234208
decomposition. A consequence of not composting was the propagation of weeds,particularly during Mission I, which were added back to the soil in viable formalong with shredded biomass.
2.5. Climate control
Temperature and humidity in the agriculture biome were controlled by nine airhandler units in the IAB basement that circulated air continuously according to aspecified protocol (Fig. 1b). An air handler consisted of coils (water pipes)surrounded by a metal jacket, an intake fan and a controller that modulated aircirculation and thermal energy exchange. The air intake end faced south and theexhaust faced the north thereby forcing the air toward the main agricultural area.Hot, chilled, and tower water were pumped through sealed pipelines from theEnergy Center in a closed loop (Zabel et al., 1999). The air was sucked in from thebasement and upper IAB into the air handler and passed over the heated or cooledcoils. The treated air was then delivered to the biome through nine air vents locatedat the middle of the IAB, one for each air handler (Fig. 1a). Condensation of wateroccurred in the air handlers fitted for chilled water and was used for irrigation andas a source for potable water. Environmental sensors including light (quantum andpyranometer), temperature and relative humidity sensors were abundant during theperiod of study, however, the corrosive environment and inadequate maintenanceresulted in incomplete records. In addition, up to 15°C difference between temper-ature and 15% difference between relative humidity sensors depending on location(e.g. spaceframe, balcony, crop level in different locations) within the IAB intro-duced unavoidable ambiguities in defining operating environmental conditions.
2.6. Water management system
The main reservoirs of water in the IAB were the Utility Tank Farm (UTF),sub-soil tanks, condensate tanks and potable water tanks in the IAB basement,Tilapia and Azolla tanks and wastewater (human and animal) holding tanks andlagoons in the basement and Terai areas (Fig. 1b). In addition, a large amount ofwater was also stored within the soil mass and plant tissues. Irrigation water for theIAB was primarily a mixture of condensate water, waste water effluent and sub-soildrainage water. Condensate water was produced and collected from the air handlerunits in the IAB basement and stored in three 7560 l tanks. The air handler unitsalso supplied potable water to the habitat. After Mission I an ‘Allen Bradley’(Allen-Bradley PLC 5/40) computer-based system for switching valves was installedallowing control of each system depending on specified supply and demand.Sub-soil drainage water was collected in 7560 l tanks in the IAB basement that alsoreceived treated wastewater from the human and animal lagoons. When all thesub-soil drainage tanks were filled to capacity, the water overflowed to a smallplastic trough through an overflow outlet and excess water was pumped to theprimary storage in the south lung. Modifications after Mission I allowed forcondensate, RO or a mixture of the two, to be used for the IAB irrigation
B.D.V. Marino et al. / Ecological Engineering 13 (1999) 199–234 209
depending upon their production and availability. Primary storage water was usedto feed the RO machines to produce a higher quality water for IAB use.
The Terai (Nepalese word for lowland) was intended to be a key wastewaterrecycling area which consisted of three aerobic human waste treatment lagoons,three animal waste treatment lagoons, five growing tanks, two fish tanks and onebiofilter tank (Fig. 1b). Three aerobic waste water treatment tanks in the Teraicontained various plants that were grown for the purpose of water purification afteranaerobic digestion of solids (fecal matter) and production of animal fodder basedon the general approach of Wolverton (1980). In this approach, human and animalfeces and urine are made directly available for aquatic plant growth (e.g. waterhyacinth) and other lagoon based plant communities (urine and feces are oftenseparated before treatment in these systems). This was to play an important role inthe recycling system since we estimate that at least 30 kg of nitrogen from humanwaste per year were produced by eight persons; the inclusion of animal wastegreatly increased nitrogen input. Few data are available to assess the efficacy of thewastewater treatment system (Nelson et al., 1994, 1999); however, as discussed inSection 4, the level of nitrate in the primary storage water and in the IAB irrigationwater rose dramatically during the periods of closure indicating inadequate controlof nitrogen recycling. The eight connected tanks were used for production of rice,banana, Tilapia and Azolla, which were fed to the fish and chickens. As of 1996, themain aquatic plant species were Canna edulis, Ipmoea aquatica, Eichhornia crassipes,and Typha spp. Biomass from these lagoons was harvested for animal fodder oradded to the soil after shredding. The potable water system which included anozone/hydrogen peroxide treatment step, also located in the IAB basement, pro-duced water of variable quality as discussed below.
3. Biotic components of the IAB
3.1. Culti6ar choices for Mission 1 and Mission 2
As a self-sustaining life support system the goal of the IAB design and manage-ment was to support up to 10 resident crew members for potentially indefiniteperiods. A key factor in the success of this goal was the selection of crop speciesand cultivars for high yield and adaptability. Cultivars were acquired and tested,first in the on-site greenhouse complex and/or in the Environmental ResearchLaboratory, University of Arizona, and then inside the IAB. By the time of the firstclosure the IAB had already been planted and several crops harvested to allow theincoming resident crew immediate sustenance and a functioning, established agri-cultural system (Silverstone and Nelson, 1996). Many factors were considered incultivar selection including dietary requirements for protein, fat and carbohydrateas well as an adequate supply of minerals and nutrients; USDA minimum dailyrequirements were used as guidelines. High yielding cultivars of staple plants werechosen for the limited planting area. Resistance to disease and pest infestation wasparamount since the high humidity and temperature were ideal conditions for
B.D.V. Marino et al. / Ecological Engineering 13 (1999) 199–234210
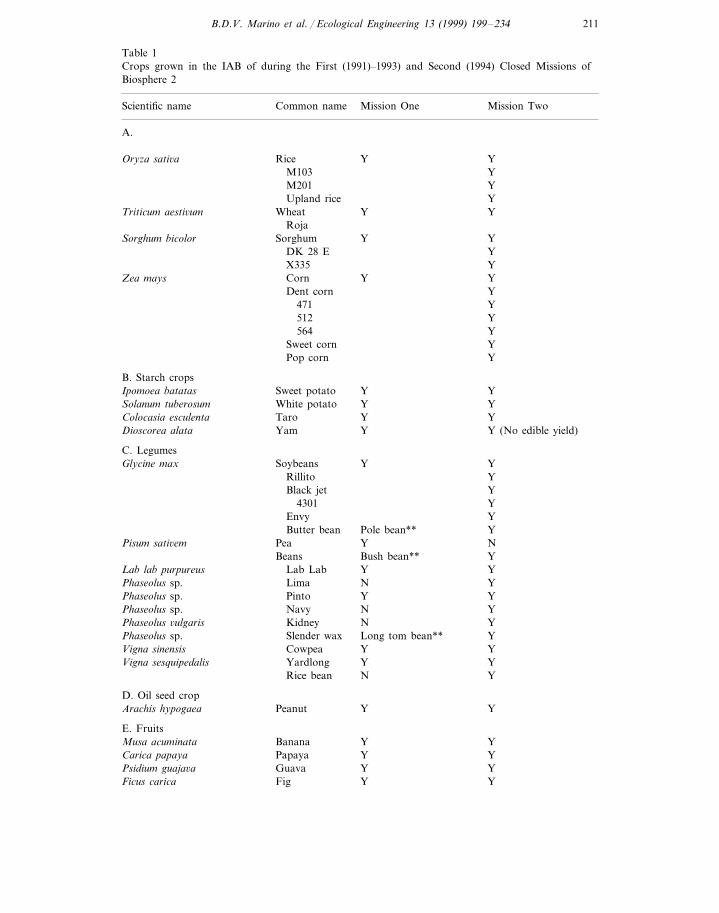
serious and devastating insect predation. In addition, early maturity was animportant consideration since it was desirable to achieve three to four crops perplanting area per year. A wide variety of crops were desirable in order to addvariety to the kitchen table. The cultivar list for Missions I and II are given inTables 1 and 2, respectively. Foods grown during the missions were comprised ofcereal grains, starch crops, legumes, fruits and vegetables. A limited amount ofmeat, eggs, milk and fish were also produced from the animal system and byaquaculture. The diet was largely vegetarian, calorically restricted and of low-fatcontent for both missions (Walford et al., 1992).
3.2. Integrated pest management plan
Pest management was an integral part of crop production. Since Biosphere 2 wasa small-scale sealed environment, use of toxic chemical compounds was strictlyprohibited. The challenge for Biosphere 2 agriculture was to maintain plant healthin the face of little or no wind (needed for pollination), high temperature andhumidity (an ideal environment for insect pests) and no synthetic pesticides. Severalpractices were adopted based on the use of pest resistant cultivars, crop rotation,the introduction of beneficial insects, biological control, environmental manipula-tion, human intervention and the use of emulsions of natural products and water(called safe sprays). Crop cultivation on a rotational basis with diverse crops wasenvisioned as one of the most important features of a long-term sustainable system.
4. Results and discussion
4.1. Yields for Mission I and II
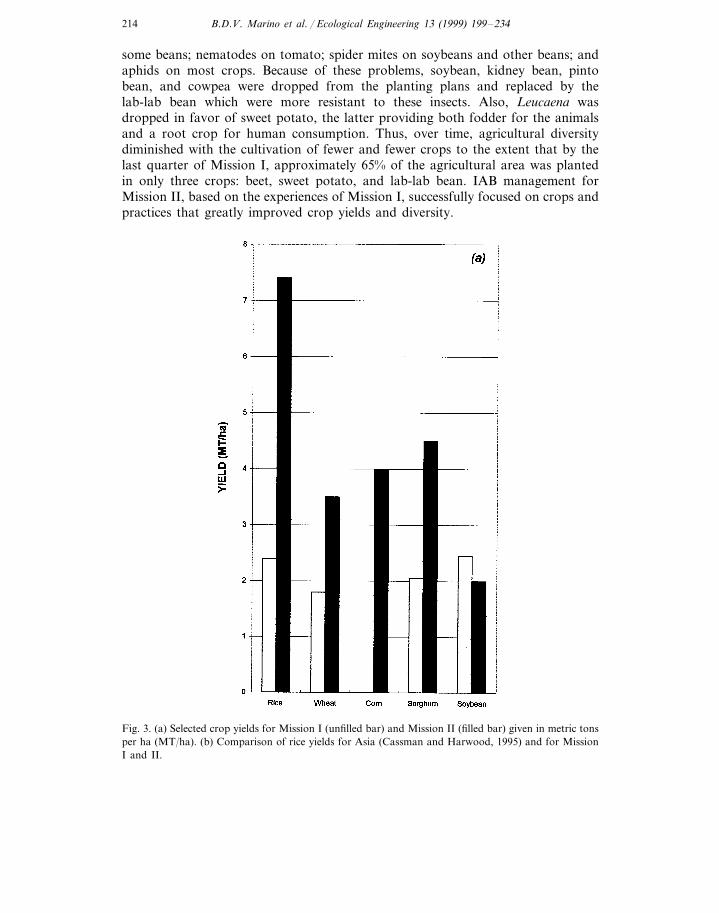
From September 1991 to September 1994 the major foods for human consump-tion were banana, lab-lab bean, beet, cabbage, carrot, eggplant, papaya, rice,wheat, sorghum, squash and sweet potato. The crop yield data show that the yieldsfor Mission II were consistently higher than those for Mission I. Rice, wheat,sorghum, and beet root yields increased by 208, 94, 120 and 343%, respectivelyduring Mission II (Fig. 3a). The corn crop failed during Mission I whereas theMission II yield proved to be one of the most impressive and successful crops forBiosphere 2. One exception, as seen in Fig. 3a, was the yield for soybean. Soybeanyield for Mission II was 18% lower than the yield for Mission I due to increasedspacing of the soybean plants to allow inter-cropping with sorghum plants. How-ever, sorghum grain yields for Mission II exceeded those of Mission I (by about120%) even under inter-cropping conditions.
During Mission I there were increasing difficulties with production as theMission progressed. Increased pests and disease organisms caused decreases inyields for many of the crops. Wheat and sorghum yields were significantly dimin-ished; wheat by Pythium spp., a fungus, and sorghum by a fungus that has not yetbeen identified. Other problems included broadmite on white potato, cowpea, and
B.D.V. Marino et al. / Ecological Engineering 13 (1999) 199–234 211
Table 1Crops grown in the IAB of during the First (1991)–1993) and Second (1994) Closed Missions ofBiosphere 2
Common name Mission One Mission TwoScientific name
A.
YOryza sati6a Rice YM103 Y
YM201Upland rice Y
YTriticum aesti6um Wheat YRoja
Y YSorghumSorghum bicolorDK 28 E Y
YX335YZea mays Corn YYDent corn
471 YY512
564 YSweet corn Y
YPop corn
B. Starch cropsYIpomoea batatas Sweet potato Y
YSolanum tuberosum White potato YY YTaroColocasia esculenta
Y (No edible yield)Dioscorea alata Yam Y
C. LegumesYGlycine max Soybeans YYRillito
Black jet YY4301YEnvy
Pole bean**Butter bean YY NPeaPisum sati6emBush bean**Beans Y
YLab lab purpureus Lab Lab YNPhaseolus sp. Lima YY YPintoPhaseolus sp.NPhaseolus sp. Navy YNPhaseolus 6ulgaris Kidney YLong tom bean** YSlender waxPhaseolus sp.
Cowpea Y YVigna sinensisYVigna sesquipedalis Yardlong Y
Rice bean YN
D. Oil seed cropYArachis hypogaea Peanut Y
E. FruitsYMusa acuminata Banana YYYPapayaCarica papaya
YPsidium guaja6a Guava YYFicus carica Fig Y

B.D.V. Marino et al. / Ecological Engineering 13 (1999) 199–234212
Table 1 (Continued)
Scientific name Mission TwoCommon name Mission One
Citrus aurantiifolia Lime YYCitrus limon Lemon YYCitrus reticulata YOrange YAnanas comosus Pineapple YY
YFortunella japonica Kumquat YMalus pumila Apple Y Y (hardly any yield)Fragaria sp. Strawberry Y (No harvest)YMusa sp. Plantain Y (Probably from TRF) N
F. VegetablesLycopersicum esculentum YTomato YBeta 6ulgaris Beets YYDacus carota YCarrots YBrassica sp. Mustard leaf N YBeta 6ulgaris 6ar.cicla Swisschard YYBrassica oleraceae acephala Kale Y NBrassica oleraceae caulorapa Kohlrabi NY
YOriental greens YLactuca sati6a Lettuce YYRaphanus sati6us Radish Y YBrassica rapa Turnip YYAllium cepa YOnion YAllium sati6um Garlic YNBrassica oleraceaebotrytis YCabbage YAbelmoschus esculentus Okra YNSolanum melongena YEgg plant YLuffa cylindrica Sponge gourd YNCucurbita pepo Summer squash YYCucurbita maxima Winter squash Y NCucurbita moschata Pumpkin YNCucumis sati6us Cucumber Y Y
RamboPickling
Brassica sp. Pak choi YYLagenaria siceraria Bottle gourd N YCucurbita pepo Zucchini YNCapsicum annum Bell pepper YYCapsicum sp. P. pepper YY
G. Herbs, spices, beveragesCymbopogon citratus Lemon grass YYOriganum sp. YOregano ??Mentha spp. Mint YYOcimum basilicum YBasil ??Coriandrum sati6um Coriander ?? YPetroselinum crispum Parsley Y??Capsicum frutescens Chili pepper Y YRosmarinus officinalis Rosemary Y??Allium schoenoprasum YChives YFoeniculum 6ulgare Fennel Y??Ginger officinale Ginger ?? YCurcuma longa Turmeric NYCoffea arabica Coffee YYIlex paraguayensis Yarbamate YY
H. MiscellaneousSaccharum officinarum Sugar cane Y (No harvest)YManihot esculenta Y (No harvest)Topioca N

B.D.V. Marino et al. / Ecological Engineering 13 (1999) 199–234 213
Table 2Plants of the IAB orchard, terai and balcony
Mission OneScientific name Common name Mission Two
A. OrchardYEriobotrya japonica Loquat N
YYFigFicus caricaYCarica papaya Papaya YYCitrus spp. Citrus Y
YPsidium guaja6a Guava YY NCoconutCocos nucifera
NTheobroma cacao Cacao YNYStar fruit (carambola)A6errhoa carambola
YMusa spp. Banana YYVitis sp. Grape N
Pineapple NAnanas comosus Y
BeveragesYCoffea arabica Coffee Y
YYarbamateIlex paraguayensis Y
B. Main balconyNMalus pumila Apple Y
YMusa acuminata Banana YY YCitrusCitrus spp.
YFicus carica Fig YNYGrapeVitis sp.
YFortunella japonica Kumquat NYCarica papaya Papaya Y
C. TeraiNMalus pumila Apple Y
YMalpighia glabra Acerola NY YBananaMusa acuminataYTheobroma cacao Cacao N
YAnnona muricata Prickly custard apple YYFicus carica Fig YY YGuavaPsidium guaja6a
Grape fruit Y YCitrus paradisiNYKumquatFortunella japonicaYCitrus sinensis Orange YYCarica papaya Papaya Y
YLaurus nobilis Bay tree NBeverages
Coffee Y YCoffea arabicaYCamellia sinensis Tea YY YYarbamateIlex paraguayensis
D. Main IABPapaya Y YCarica papaya
B.D.V. Marino et al. / Ecological Engineering 13 (1999) 199–234214
some beans; nematodes on tomato; spider mites on soybeans and other beans; andaphids on most crops. Because of these problems, soybean, kidney bean, pintobean, and cowpea were dropped from the planting plans and replaced by thelab-lab bean which were more resistant to these insects. Also, Leucaena wasdropped in favor of sweet potato, the latter providing both fodder for the animalsand a root crop for human consumption. Thus, over time, agricultural diversitydiminished with the cultivation of fewer and fewer crops to the extent that by thelast quarter of Mission I, approximately 65% of the agricultural area was plantedin only three crops: beet, sweet potato, and lab-lab bean. IAB management forMission II, based on the experiences of Mission I, successfully focused on crops andpractices that greatly improved crop yields and diversity.
Fig. 3. (a) Selected crop yields for Mission I (unfilled bar) and Mission II (filled bar) given in metric tonsper ha (MT/ha). (b) Comparison of rice yields for Asia (Cassman and Harwood, 1995) and for MissionI and II.

B.D.V. Marino et al. / Ecological Engineering 13 (1999) 199–234 215
Fig. 3. (Continued)
Based on available data, yields for rice for Mission II were higher than averagerice yields for the most efficient agrarian communities of Indonesia, SouthernChina, and Bangladesh (Cassman and Harwood, 1995) (Fig. 3b). In general, totalagricultural production in these areas supports a maximum of three persons peracre while the IAB, for both periods of closure, provided food for seven to eightpersons on just over half an acre (e.g. Harwood, 1993). Yields for the IAB were allthe more dramatic given that the IAB was operated for a short period of time andwith comparatively lower light; it seems reasonable to assume that higher yieldsmay yet be possible with additional refinement of production ecology and systemimprovement. Foliar gas exchange for several agricultural species and observedyields for wheat grown under conditions similar to those of Missions I and IIsupport this view. Results for an experiment with spring wheat carried out in the1995–96 winter season are described below.
B.D.V. Marino et al. / Ecological Engineering 13 (1999) 199–234216
Two C3 agricultural species (wheat and beans) and one C4 species were inten-sively studied during growth under changing CO2 concentrations (350 to about2000 ppmv) from February 25 to June 10, 1995 to assess plant physiologicalfunction under IAB growing conditions similar to those experienced during the twoperiods of closure. Photosynthetic CO2 assimilation, stomatal conductance, ratio ofinternal to atmospheric CO2 concentration (Ci/Ca), water use efficiency (WUE) anddark respiration were measured on mature leaves of the selected species with aLI-6200 portable photosynthesis system. The C4 perennial grass (Pennisetum pur-puretum) showed no significant change in assimilation rate when CO2 increasedfrom 350 to 2000 mmol mol−1. However, wheat (Triticum aesti6um) increasedassimilation rate when CO2 changed from 350 to 1000 mmol mol−1, up toapproximately 40 mmol m−2 s−1. Pinto bean (Phasolus 6ulgaris) showed a linearincrease in assimilation rate over the entire range from 350 to 2000 mmol mol−1
suggesting that photosynthetic rate did not reach saturation. The photosyntheticrates achieved for T. aesti6um were higher than those reported for wheat in at leastone study (e.g. Wheeler et al., 1996) and similar to leaf photosynthetic ratesmeasured in NASA-CELSS growth chambers under comparable CO2 concentra-tions (Bugbee and Monje, 1992). The saturation concentration of CO2 was similarat approximately 1200–1500 mmol mol−1 in the IAB and in typical CELSS studies(Wheeler et al., 1996). The average enhancement in CO2 assimilation rate for adoubling of CO2 from 350 to 700 mmol mol−1 observed for C4 and C3 plants grownin the IAB was comparable to that found in previous studies. For example, Greeret al. (1995) found a 5% increase in assimilation for selected C4 species and a 37%increase in assimilation for selected C3 species in a pasture. The comparability ofphysiological results for both field and IAB grown plants suggests that the unusualconditions of the IAB (i.e. varying CO2, relatively low light, high nutrients andlarge diurnal change in CO2 concentrations) did not significantly affect plantgrowth at the leaf level; however, effects on plant development and reproductionare not known (e.g. Bugbee et al., 1994; Grodzinski et al., 1996). The wide varietyof plants with species-specific responses to CO2 levels support the conclusion thathigh biodiversity was advantageous to increased crop growth given that the levelsof CO2 and other environmental conditions varied considerably. C3 plants, asexpected, were the benefactors of increased CO2 while C4 plants showed modestincreases in CO2 assimilation. Maize and sorghum were the only C4 plants grownin the IAB with high carbohydrate value. High CO2 levels, as a consequence of thehigh organic carbon concentration of the soil, was advantageous for a wide varietyof C3 crop species and explains, in part, the high yields observed for the IABrelative to crops grown in the field at ambient levels of CO2 (approximately 360mmol mol−1). Bugbee et al. (1994) reported that increasing CO2 from 340 to 1200ppmv increased seed yield by 30–40%, consistent with observations for the IABplants.
The low light intensity field of the IAB compared to ideal field conditions andhigh-productivity CELSS growth chambers was an important limitation to cropgrowth and yield. As discussed earlier, the amount of light that reached the plantsin Biosphere 2 was attenuated by as much as 55% relative to external light. Further
B.D.V. Marino et al. / Ecological Engineering 13 (1999) 199–234 217
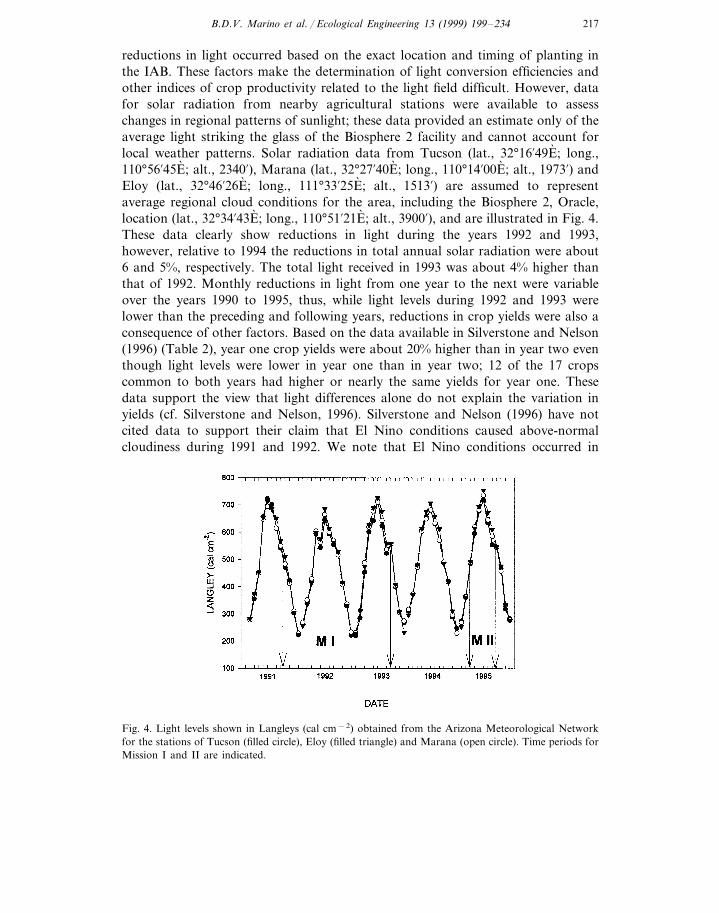
reductions in light occurred based on the exact location and timing of planting inthe IAB. These factors make the determination of light conversion efficiencies andother indices of crop productivity related to the light field difficult. However, datafor solar radiation from nearby agricultural stations were available to assesschanges in regional patterns of sunlight; these data provided an estimate only of theaverage light striking the glass of the Biosphere 2 facility and cannot account forlocal weather patterns. Solar radiation data from Tucson (lat., 32°16%49E; long.,110°56%45E; alt., 2340%), Marana (lat., 32°27%40E; long., 110°14%00E; alt., 1973%) andEloy (lat., 32°46%26E; long., 111°33%25E; alt., 1513%) are assumed to representaverage regional cloud conditions for the area, including the Biosphere 2, Oracle,location (lat., 32°34%43E; long., 110°51%21E; alt., 3900%), and are illustrated in Fig. 4.These data clearly show reductions in light during the years 1992 and 1993,however, relative to 1994 the reductions in total annual solar radiation were about6 and 5%, respectively. The total light received in 1993 was about 4% higher thanthat of 1992. Monthly reductions in light from one year to the next were variableover the years 1990 to 1995, thus, while light levels during 1992 and 1993 werelower than the preceding and following years, reductions in crop yields were also aconsequence of other factors. Based on the data available in Silverstone and Nelson(1996) (Table 2), year one crop yields were about 20% higher than in year two eventhough light levels were lower in year one than in year two; 12 of the 17 cropscommon to both years had higher or nearly the same yields for year one. Thesedata support the view that light differences alone do not explain the variation inyields (cf. Silverstone and Nelson, 1996). Silverstone and Nelson (1996) have notcited data to support their claim that El Nino conditions caused above-normalcloudiness during 1991 and 1992. We note that El Nino conditions occurred in
Fig. 4. Light levels shown in Langleys (cal cm−2) obtained from the Arizona Meteorological Networkfor the stations of Tucson (filled circle), Eloy (filled triangle) and Marana (open circle). Time periods forMission I and II are indicated.
B.D.V. Marino et al. / Ecological Engineering 13 (1999) 199–234218
1991–1992 and 1994–1995 (Kumar and Hoerling, 1997). In any case, simulationswith a wheat model parameterized for IAB conditions indicated that differences of5% in solar radiation among growing seasons were unlikely to generate largedifferences in crop yields.
Given the scarcity of data on light quality inside the IAB, a valid approach toanalyzing crop yields in Biosphere 2 was the integration of observed data andmodel simulations. In a companion paper, Tubiello et al. (1999) present simulationsof wheat data relative to a 1995 growth experiment in the IAB with Yecora Rojo,a spring wheat cultivar used in FACE studies by Kimball et al. (1995). Dataanalyses with the model suggest that, although yield levels in Biosphere 2 werelimited by low total light integrals, photosynthetic efficiencies inside the IAB,calculated as total dry matter production per unit absorbed radiation (i.e. g mol−1
photon), or radiation use efficiency (RUE), were in fact intermediate betweenoptimal field conditions and NASA-CELSS growth chambers (Tubiello et al.,1999). The same model simulations suggest that the important factors increasingphotosynthetic efficiency inside the IAB were higher than ambient CO2 concentra-tions (in agreement with our previous discussion), and the ratio of diffuse-to-directlight falling above the crop canopy. This suggestion has never been formulated forthe IAB, although it is known that the photosynthetic efficiency of crops grown ingreenhouses characterized by high diffuse light fractions is often higher than in thefield (Sinclair et al., 1992). The wheat yield was more than 50% lower than optimalfield growth data relative to the same cultivar, Yecora Rojo, collected at theFree-Air CO2 Enrichment (FACE) experiment station at Maricopa, AZ, during thesame period due to low light characteristic of the IAB environment. Actual cropyields and rates of production for the IAB and typical CELSS and FACEexperiments are given in Table 3. Thus, the growing environment of the IAB, asconstructed and managed, successfully supported plant growth with RUEs similarto those of hydroponically-based systems typical of CELSS and soil-based fieldapproaches as used in FACE experiments but yields were likely to have been higherwith an increased light field. A different space frame design, higher transmittanceglass and large reflective panels could improve the light field significantly.
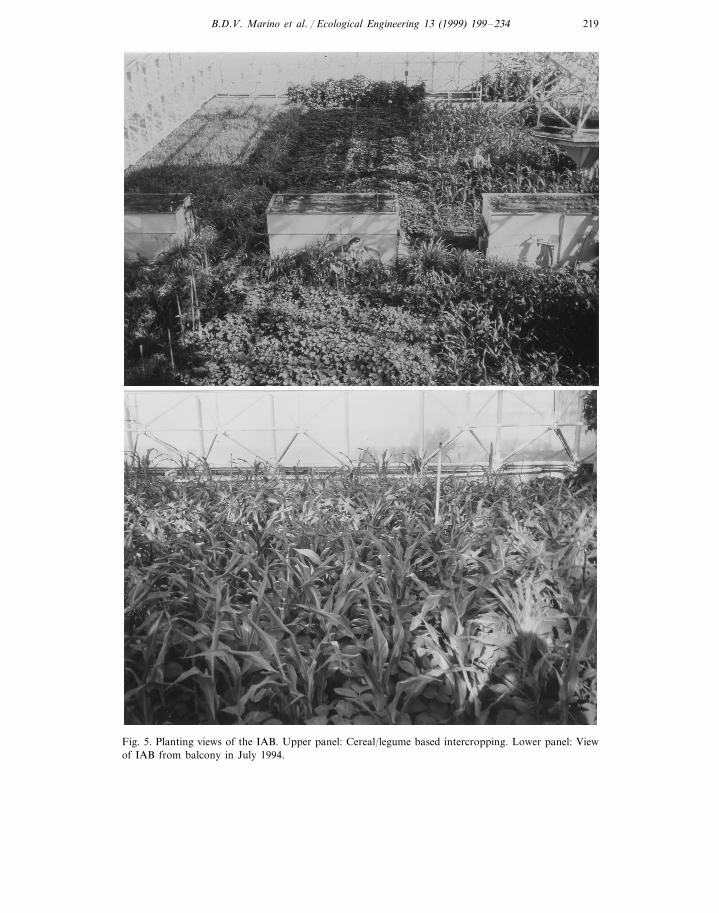
Intensive food production techniques employed in the IAB during the Missionswere multiple cropping rather than mono-cropping, cereal–legume inter-cropping(see Fig. 5 for views of the IAB) mixed cropping, polyculture and immediatecultivation of a new crop after the previous crop was harvested. Higher crop yieldsfor Mission II resulted from improved technical knowledge based on Mission Iexperiences, practical field experience, correct cultivation methods and effectiveartificial pollination. Simple but important details of planting at the best time, landpreparation, proper plant spacing, suitable irrigation methods and weed manage-ment figured largely in the successful crop production of Mission II. For example,rice and sorghum grain yields were greatly improved by shaking the inflorescencewith a stick facilitating the pollination process even though they are self pollinatedcrops. Cultivation of corn was impossible without artificial pollination because theIAB lacked sufficient wind and pollinators (pollinators introduced for Mission Iand later for Mission II did not survive); plant spacing and ground irrigation
B.D.V. Marino et al. / Ecological Engineering 13 (1999) 199–234 219
Fig. 5. Planting views of the IAB. Upper panel: Cereal/legume based intercropping. Lower panel: Viewof IAB from balcony in July 1994.

B.D.V. Marino et al. / Ecological Engineering 13 (1999) 199–234220
Table 3Comparisons of plant productivity for selected IAB and CELSS cropsa
SorghumCornRiceWheat
Mission IYear Oneb
0.240Yield (kg m−2) 0.290.220Growing period (days) 127 121 134
0.0023Production rate (kg m−2 00.0017 0.0017day−1)
Year Twoc
0Yield (kg m−2) 0.14 0.2 0.170Growing period (days) 108 121 1340 0.0016Production rate (kg m−2 0.0012 0.0016
day−1)
Mission IId
0.45Yield (kg m−2) 0.35 0.74 0.4102Growing period (days) 115 122 116
0.00380.006Production rate (kg m−2 day−1) 0.00390.003
Post-Mission IIe
NANAYield (kg m−2) NA0.479Growing period (days) 133Production rate (kg m−2 day−1) 0.0036
CELSSNAYield (kg m−2) 0.76 (S.D. 0.18) NA
Growing period (days) 86Production rate (kg m−2 day−1) 0.0097 (S.D. 2.7)
a Wheeler et al. (1996), data represent four growth experiments under continuous or 20-h photoperi-ods with PPF of 509–930 mmol m−2 s−1 and CO2 concentrations of 1000–1200 ppmv.
b CO2 concentrations ranged from a maximum of approximately 3200 ppmv to a minimum of 1200ppmv.
c CO2 concentrations ranged from a maximum of approximately 4000 ppmv to a minimum of 2000ppmv.
d CO2 concentrations ranged from a maximum of approximately 3500 ppmv to a minimum of 850ppmv.
e See text for experimental details.
methods were crucial for successful corn cultivation. Corn failure during Mission Ioccurred, apparently, due to plant crowding, washing off of the pollen grains by theoverhead watering system and experience with the artificial pollination process.Clearly, higher yields for Mission II were also due to effective integrated pestmanagement. Crop damage by insect pests was minimized during Mission IIcompared to Mission I as described below. Based on the available records the crewof Mission II expended about 50% of the crew time used for agriculture by theMission I crew, in part, by employing improvements in the operation and functionof the IAB based on previous experience.

B.D.V. Marino et al. / Ecological Engineering 13 (1999) 199–234 221
4.2. Nutrition for Mission I and II
The IAB provided sufficient nutrients to sustain the inhabitants of Mission I andII demonstrating that the IAB design and management was high yielding in thecontext of human sustainability. Most all of the inhabitants were taking vitaminand mineral supplements on at least an intermittent basis. Thus, it is not known ifthe plants grown in Biosphere 2 alone would have provided adequate amounts ofmicronutrients (vitamins and minerals, phytochemicals), since the plants weregrown under altered light (i.e. no UV), soil and gaseous environmental conditions.An analysis of the nutrient content of foods grown in Biosphere 2 was, to ourknowledge, never undertaken. While large differences in proximate compositionbetween Biosphere 2 grown and field grown plants are not expected, subtledifferences could be important over long periods of time. Plants grown undervarious CELSS conditions (hydroponic growth) were found to have minor differ-ences in proximate composition (Wheeler et al., 1994).
The nutritional and health status and summary of the medical problems encoun-tered for Mission I have been described by Walford et al. (1992, 1995, 1996).According to these studies, the inhabitants of Mission I adapted to a low-calorie(1800–2200 kcal day−1 per person) diet by weight reductions of 18 and 20% formales and females, respectively (Walford et al., 1992). Most of the weight lossoccurred during the first 6 months of enclosure, when caloric intake averaged 1780cal (cf. Silverstone and Nelson, 1996). Nutrients other than calories were reportedas nutritionally adequate, although as stated above, the inhabitants were alsoingesting vitamin and micronutrient supplements. Weight loss occurred in everymember of the crew by 8 months after closure and did not substantially increasethereafter even though caloric intake increased to about 2000–2200 kcal day−1 perperson from the initial levels of about 1780 kcal day−1 per person. Concurrent withweight loss and body mass index (weight/(height)2), lower serum cholesterols,systolic and diastolic blood pressures, leukocyte counts and blood sugars were alsoobserved, similar to observations reported in animal experiments and humanstarvation experiments (Walford et al., 1992; Hoffer, 1994).
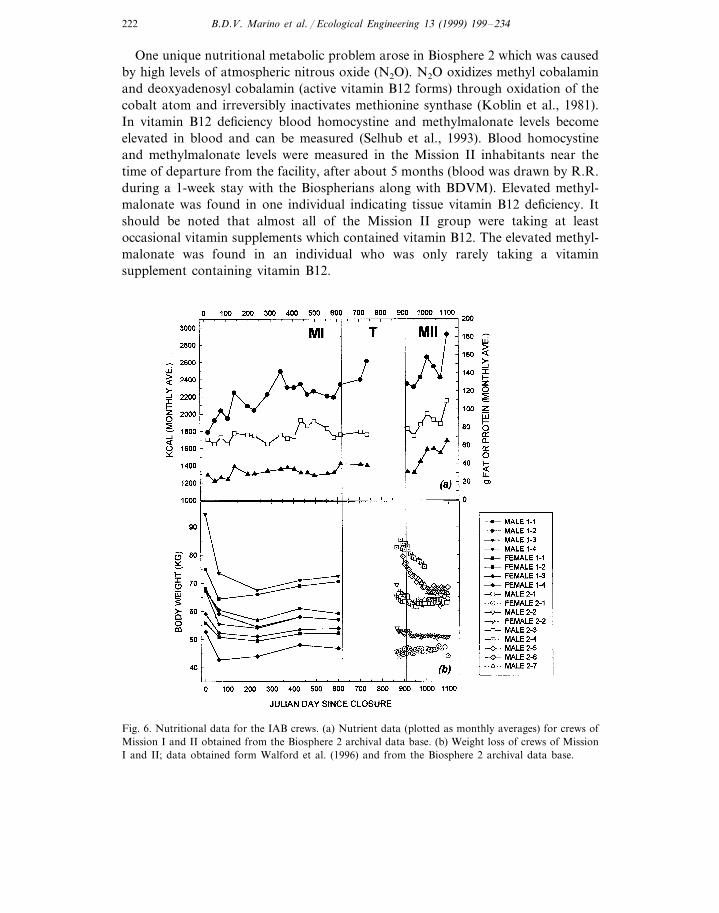
In the second group of inhabitants, rudimentary food intake data were obtainedwhile inside the facility allowing for estimates of group averages of nutrientconsumption. Specifically, the harvested crops were weighed and the amountremaining in bulk was also weighed. However, plate waste was not accounted forand data on food intake of individual inhabitants were not collected. Thus, onlycrude estimates of macronutrient and micronutrient intakes from food could bemade. Caloric intakes were adequate to maintain body weight for Mission IIinhabitants after an initial, small weight loss during the first several weeks ofenclosure. They were also taking variable amounts of vitamin and mineral supple-ments; no strict protocol was followed. Fig. 6a shows monthly average calorie,protein and fat consumption for the crews of both Mission I and Mission II (datawere obtained from the Biosphere 2 data archive); Fig. 6b shows data for bodyweight of both groups. Less weight loss occurred in Mission II inhabitants (about5.2%) compared to Mission I inhabitants (about 18–20%) primarily due to bettercrop variety and production.
B.D.V. Marino et al. / Ecological Engineering 13 (1999) 199–234222
One unique nutritional metabolic problem arose in Biosphere 2 which was causedby high levels of atmospheric nitrous oxide (N2O). N2O oxidizes methyl cobalaminand deoxyadenosyl cobalamin (active vitamin B12 forms) through oxidation of thecobalt atom and irreversibly inactivates methionine synthase (Koblin et al., 1981).In vitamin B12 deficiency blood homocystine and methylmalonate levels becomeelevated in blood and can be measured (Selhub et al., 1993). Blood homocystineand methylmalonate levels were measured in the Mission II inhabitants near thetime of departure from the facility, after about 5 months (blood was drawn by R.R.during a 1-week stay with the Biospherians along with BDVM). Elevated methyl-malonate was found in one individual indicating tissue vitamin B12 deficiency. Itshould be noted that almost all of the Mission II group were taking at leastoccasional vitamin supplements which contained vitamin B12. The elevated methyl-malonate was found in an individual who was only rarely taking a vitaminsupplement containing vitamin B12.
Fig. 6. Nutritional data for the IAB crews. (a) Nutrient data (plotted as monthly averages) for crews ofMission I and II obtained from the Biosphere 2 archival data base. (b) Weight loss of crews of MissionI and II; data obtained form Walford et al. (1996) and from the Biosphere 2 archival data base.
B.D.V. Marino et al. / Ecological Engineering 13 (1999) 199–234 223
Another potential problem which was not assessed in either group of inhabitantswas that of possible vitamin D deficiency. Since almost all ultraviolet light wasprevented from entering Biosphere 2 due to adsorption of these wavelengths by theglass panels, skin synthesis of vitamin D would not take place. It is possible thatintermittent vitamin D supplementation was sufficient to prevent deficiency of thisvitamin, however, vitamin D levels were not measured. The cases presented abovefor vitamin intake emphasize the importance of careful monitoring of importantmetabolites to ensure adequate supply levels for long-term projects as well as theneed for compositional analysis of foodstuffs grown under atypical conditions.
4.3. Integrated pest management for Mission I and II
Pest management was an integral part of optimizing crop production for bothMissions, however, the rapid growth and establishment of two species, the crazy ant(Paratrechina longicornis) and the Australian cockroach (Periplaneta australasiae),according to available records, imposed a harsher consequence for Mission I thanfor Mission II (Silverstone and Nelson, 1996). Agricultural pests were not purpose-fully introduced into Biosphere 2 but rather gained entry during construction andinitial planting of the Biosphere 2 flora. There were many species of harmful insectpests in the IAB that caused significant damage to crops particularly duringMission I when densities of some pests were dramatic, growing well beyond theirnatural densities due to favorable year-round environmental conditions, nutrient-rich soil and the absence of natural enemies. For example, the cockroach, notnormally an agricultural pest, grazed heavily on a wide variety of crops, particularlyripe papaya, tomato, bananas, squash, eggplant flowers, new crop seedlings ortransplants and leaves of the sweet potato and cabbage. As of June 1994, the ratioof insect and mite pests to natural enemies favored the pests by about 5:1, asituation that does not typically occur in nature or in agricultural settings (J.Litsinger, report on file, 1994). A summary of the pests present during Mission I aredescribed in Silverstone and Nelson (1996). The yield reduction due to pests wasdramatic; the broad mite and powdery mildew (the main plant diseases of the IABrecorded in October, 1993) destroyed entire plantings. As of early 1996, IAB insectpests included cockroaches, aphids, crazy ants, broadmites, spidermites, pill bugs,sow bugs, mealybugs, scale insects, leaf hoppers, white fly, flea beetle, bananaweevil, psyllids, crickets, collembola, symphilids, and nematodes. Some naturalenemies to these pests were present including spiders and introduced insects asdescribed below. Pollinators remained absent since Mission I primarily due topredation by ants and cockroaches; introduced bee colonies did not surviveprobably also due to ant predation.
To combat insect pests a number of beneficial insects were introduced in the IABas part of a biological insect control program before and during Missions I and II.They were (J. Litsinger, report on file, 1994): Hippodamia con6ergens—Coccinellidbeetle (aphid predator), Cryptolaemus montrouzieri—lady beetle (mealybug preda-tor), Chrysoperla rufilabris—green lacewing (aphid predator), Orius tristicolor—an-thocorid minute pirate bug (thrips predator), Lysiphlebus testaceipes—braconid
B.D.V. Marino et al. / Ecological Engineering 13 (1999) 199–234224
wasp (aphid parasite), Leptomastix dactylopii— encrytid wasp (mealybug parasite),Metaphycus hel6olus—encrytid wasp (black scale parasite), Nasomia 6itripennis—Pteromalid wasp (house fly parasite), Diglyphus isaea—eulophid wasp (leaf minerparasite), Aphytis melinus—aphelinid wasp (red scale parasite), Encarsia formosa—aphelinid wasp (white fly parasite), Ambylyseius melinus—phytoseiid mite (thripspredator), Phytoseiulus persimilis—Phytoseiid mite (spider mite predator), metasei-ulus occidentalis—phytoseiid mite (mite and thrips predator), Neoseiulus californi-cus—phytoseiid mite (spider mite predator) and Amblyseius barkeri—phytoseiidmite (spider and broadmite predator). Of the above introduced predators, however,few became established for a variety of reasons, including extinction of target pests,behavioral traits that were incompatible with a greenhouse environment anddestruction by ant predation. However, the predatory mite, Amblyseius cucumeriswas reared on a large scale and released in the IAB regularly during Mission II andwas highly effective for broadmite control. Also introduced were 50 toads (Bufomarinus) and 40 Toke Geckos (Gekko gecko) for the control of the cockroach; bothof these populations appear to have diminished significantly since introduction.
A large number of roaches were trapped using a glass jar. In addition, a 0.3-mtall aluminum sheet was implanted around the planting area for some plots toprevent the entry of roaches and mice onto the cropping area. Manual removal ofaphids, mealy bugs and scale insects by washing with water, pruning and trimmingproved to be highly effective.
Twenty different genera and species of plant parasitic nematodes were detected inBiosphere 2 soils during surveys completed in 1993 and 1995 (M. McClure, reportson file). A total of 70 sites were sampled in the IAB and orchard, nearly all ofwhich had been sampled during the 1993 survey. One exotic nematode species,Radopholus similis (burrowing), was identified on a single banana plant. A newspecies, Hemicycliophora biosphaera n. spp., (Chitamber et al., 1997) was also foundin the IAB soils. The nematode problem was actively managed during Mission II byplanting areas of high nematode density with less susceptible crop species such asrice, corn, and sorghum. Also effective against nematode populations was theconversion of dry-land plots into wetland rice paddy plots.
4.4. Agricultural production
The cultivation of crops on a rotational basis proved to be of great benefit inagricultural pest mitigation along with the biological approaches discussed above.Cereals, vegetables and root and tuber crops were rotated with legumes in order tominimize the pest infestation while adding nitrogen to the soil. Intercroppingmethods of crop cultivation were also extensively employed. Cereal/cereal (e.g.upland rice with corn) or cereal/legume (e.g. sorghum with soybean, corn withbeans or peanuts) based intercropping was practiced and was very successful duringMission II. The crop yield per unit area increased dramatically which ultimatelyincreased the food intake and diversity. Crops with intrinsic insect repellingsubstances such as garlic and onions were also planted in alternate rows in someareas to repel and minimize the insect damage to the main crops.

B.D.V. Marino et al. / Ecological Engineering 13 (1999) 199–234 225
It is likely that crop productivity could have been further improved by increasedusage of transplantation rather than by direct seeding. IAB crops were planted bydirect seeding (except for paddy rice) for both periods of closure, however, anumber of problems emerged with this approach. Often, crops were over seededresulting in poor stands due to reduced germination and damage to seedlings bypillbugs and cockroaches as well as by simultaneous emergence of weeds. Studiescarried out in the analog greenhouse with IAB species using a transplantationapproach demonstrated the potential for increased yield in part due to moreefficient use of field plots resulting from the 2- to 3-week lag time betweengermination in trays and transplantation in the field plot.
4.5. Regeneration technologies
Regenerative technologies linked to the IAB were a combination of biologicaland physio-chemical approaches to treat waste water (urine and feces), to producepotable water and water for replenishment of the primary storage supply, to recycleplant inedible waste by composting and ingestion by animals, to supply andmodulate the nutrient composition of the IAB soil, and to modify the compositionof the atmosphere. The systems employed by the designers of Biosphere 2 weretechnologically simple and of much larger scale compared to analogous systemsenvisioned for space habitations or space travel consisting typically of a variety ofhighly engineered physio-chemical processes and microbially-based biological sys-tems (e.g. Binot et al., 1994; Barta and Henninger, 1994; Strayer and Cook, 1995;Finger and Alzaraki, 1995). Results for regeneration of water, air and soil andrecycling of biomass are discussed below.
4.6. Water quality
A nutrient supply system for the IAB was not specified for the periods of closure;nutrients supplied to the plants were derived exclusively from the irrigation waterplus nutrients contained in mulch and animal manure (Silverstone and Nelson,1996; Nelson et al., 1999). The salinity of the irrigation water was as high as 2000mg l−1 total dissolved solids (TDS), as measured by conductivity, and contained upto 100 ppm nitrogen, measured as nitrate, by March of 1995. Nitrate concentra-tions of about 20 ppm and 40 ppm were measured in February of 1993 and Marchof 1994, respectively. The reason for the saline and nutrient-rich water was anineffective water recycling system. Water for irrigation of the IAB, as discussedabove, came from a variety of sources including the wastewater system (human andanimal feces, urine and other waste streams), IAB sub-soil water, condensateproduced from air handlers, indirect additions from the primary storage or acombination. The primary storage reservoir received untreated sub-soil drainagewater primarily from the IAB and the wilderness biomes. In the case of the primarystorage, the water quality declined over time due to ineffective methods forreleasing fresh water from brine on a large scale, a process that clearly would havebeen necessary for long-term closure, that would have eliminated the need for RO

B.D.V. Marino et al. / Ecological Engineering 13 (1999) 199–234226
Fig. 7. Flush of IAB soils (indicated by plot c as shown in Fig. 1a) with treated well water to removesalts. Bars show initial (solid) and final (open) salinity (measured by electrical conductivity); solid lineshows amount of water used for each plot.
machines and that would have provided ample high quality water for IABirrigation. Indirect application of primary storage water and direct application ofwastewater effluent delivered high concentrations of nutrients and salts to the IABsoils. Missions I and II irrigation water for the IAB was routinely saline and richin nitrate and other nutrients, conditions which can affect plant productivity(Loomis and Connor, 1992). Subsequent to Mission II, a program of supplyingrelatively pure water collected from air handler condensate pans was implementedto assess the water production capacity of Biosphere 2 relative to the fresh waterneeds of the biota. Results from these periods of operation clearly indicated thatduring the summer months fresh water supply by condensation alone was notadequate; RO units were subsequently added, as discussed previously. The conse-quence of these changes was a dramatic increase in water quality delivered to theagricultural plants and the Biosphere 2 biota as a whole. The entire primary storagewater supply was exchanged with fresh, treated well water during the summer of1995. Current operating criteria specifies the total dissolved solids (TDS) set-pointfor the IAB irrigation water at 50 mg l−1; higher values indicate contamination andan alarm condition is initiated.
Increased salinity and nutrients in the IAB irrigation water greatly influenced theinorganic composition of the IAB soils. The accumulation of salts could be seen onthe surface of IAB soil in the form of a white crust. A soil salinity survey performedin 1995 clearly showed that most of the IAB plots were too saline for optimal plantgrowth. Reclamation of soil was effected by leaching with local well water of about0.28 mS cm−1 salinity. The pre-leaching salinity level of soils, amount of waterused for leaching and salinity level after leaching are shown in Fig. 7. The resultsclearly show that the soil salinity was effectively reduced by leaching with good

B.D.V. Marino et al. / Ecological Engineering 13 (1999) 199–234 227
quality water. Thus, in the context of a productive agricultural mesocosm, the soilquality was sustainable, but only with an adequate supply of fresh water producedby importation, as employed here, or by effective recycling of used water. Higherwater quality during Missions I and II likely would have produced higher cropyields.
The effective processing of solid wastes, particularly human and animal feces, iscrucial to a successful regenerative life support system. As described previously, theanimal and human waste system was based on previous work by Wolverton (1980)employing plant and aquatic lagoons. Few data are available to assess the effective-ness of this system in reducing levels of organic and inorganic compounds (Silver-stone and Nelson, 1996; Nelson et al., 1999). Given the observed levels of salinityin the IAB soils and the very high levels of inorganic nitrogen present in theprimary storage reservoir it appears that the marsh system did not exert asignificant level of control over these constituents resulting in increasing storage ofinorganic nitrogen rather than effective recycling. Moreover, based on analyses ofthe potable water available for testing in 1994, it is unlikely that the wastewatersystem in conjunction with the water purification systems produced pathogen-freedrinking water. An examination of the waste water effluent was undertaken in late1994 under normal operating conditions of the waste water treatment system toassess water quality. The results of the study revealed the presence of protozoanparasites (Giardia and Cryptosporidium) as well as evidence of contamination byenteric viruses. High levels of coliforms and fecal coliforms were also detected.Since this effluent was routinely used to irrigate crops and subsequently routed tothe primary storage tank the transmission of these pathogens to all water reservoirswas highly likely and thus posed a health hazard by water contact to those involvedin agricultural and food processing activities. An examination of the potable waterproduced under normal operating conditions revealed the presence of the sameenteric protozoan parasites and coliforms above the accepted safe levels for humanconsumption. The waste water treatment system and associated water purificationsystems were therefore not only ineffective in controlling nutrients and salts butevidently did not eliminate pathogens from the fecal waste stream. This is notsurprising as the plant-based system utilized was not developed to produce microbi-ologically safe effluent for potable water or for crop irrigation; additional steps suchas heat treatment are required to eliminate health hazards (Wolverton, 1980;Wolverton et al., 1983). The addition of a PeroxPure ozone/hydrogen perioxidetreatment system was incorporated in the purification scheme to further sanitize thepotable water and may have proved effective for Mission I inhabitants based onhuman health data presented by Walford et al. (1996) in which illness due to poorwater quality was not reported.
4.7. The soil and ambient atmosphere
The trace gas records for the two periods of closure for the Biosphere 2atmosphere have been discussed by Marino and Odum (1999). Here we address theatmospheric impacts of the IAB operation and management. The agricultural soils
B.D.V. Marino et al. / Ecological Engineering 13 (1999) 199–234228
were enriched in organic carbon, as discussed previously, and thus were the largestsource of CO2 to the atmosphere. The loss of atmospheric oxygen from Biosphere2 has also been documented (Severinghaus et al., 1994), although, as for CO2, aquantitative treatment of the stoichiometry is not possible based on available data.However, it is clear that the addition of large amounts of organic carbon to theIAB soil was inconsistent with project goals since the quality of the air proved tobe a life threatening and difficult ecosystem management problem being too low inO2 (reduction from 21 to 14% by January 1993) and too high in CO2 (as high as5000 ppmv) (Walford et al., 1996). The high organic carbon content of the IABsoils increased the overall levels of CO2 in the Biosphere 2 atmosphere year-roundand had a negative impact on the coral reef due to acidification of the ocean waterby the elevated CO2. While the elevated CO2 atmosphere enhanced the growth ofagricultural plants (as well as of wilderness plants) the reduction in atmospheric O2
was inconsistent with the goals of a life support system. The imbalance was duesimply to consumption of O2 by soil microbial activity (resulting in CO2 which thenwas sequestered by the concrete) over the net production of O2 by photosynthesis;the problem was worsened during the winter months when light levels were lowest.A reduction in the initial loading of soil organic carbon in the IAB soils would havediminished these problems. A chemical scrubber was employed to reduce the overallatmospheric CO2 concentration. The byproduct of the scrubber (calcium carbonate(CaCO3)) was removed during the summer of 1995 due to lack of effectivetechnology for conversion to CO2 (initially planned but not tested or implemented;Nelson et al., 1994), storage space constraints and health hazards.
While the soils of the IAB started with known additions of organic carbon,changes in soil organic carbon (SOC) content within the soil column through timewere not well documented. A downward trend for SOC is noted based on analysesperformed in 1993 (Franco-Vizcanzo et al., report on file), 1994 (E. Kelly, CSU;report on file) and 1995 (in house analyses; report on file). Using average values forcombined plot and profile analyses, %SOC decreased from about 3.2% (0–12 cm;plots 1, 2, 7, 8, 12, 16, 17) to about 2.8% (0–10 cm; plots 1–18) 1994) to 1.88%(0–90 cm; single column profile of plot 10) as measured in 1993, 1994 and 1995,respectively. Thus, the high flux of soil CO2 initially observed for the IAB soils hasdiminished since 1991, and, depending on environmental conditions and agricul-tural practices, will likely continue to diminish and thus lessen the associatedproblems discussed above. As a guide to production and consumption of the IABsoil trace gases (methane, nitrous oxide and carbon dioxide) under conditionssimilar to those for Mission I and II, samples were collected from different depthsduring transient closures in 1995 under variable CO2 concentrations using a gassampling probe at depth and analyzed for fixed gases by gas chromatography.Based on the results of these studies given in Table 4, the IAB soils were a majorsource of CO2 to the atmosphere, a sink for CH4 and primarily a source for N2O(the largest N2O flux was found in the Biosphere 2 rain forest during the periodssampled, followed by the IAB). The atmospheric levels of N2O rose steadilythroughout Mission I and II reaching as high as 100 ppmv, nearly 300 times higherthan current ambient levels. In the absence of a simulated stratosphere and/oradditional sinks for N2O, the increasing trend for this gas was expectable.

B.D.V. Marino et al. / Ecological Engineering 13 (1999) 199–234 229
Table 4The range of flux of different gases in the IAB (mmol m−2 s−1)
CH4N2O CO2
−2.33×10⁻³Minimum −1.13×10⁻³ 8.21×10⁻²
6.82×10⁻¹Maximum −1.71×10−41.53×10−3
The soil bed reactor has been described as an effective device for purifying the airof problematic compounds resulting from outgassing and other sources (Nelson etal., 1994), however, no data are available to evaluate its effectiveness. DuringMission II and thereafter the soil bed reactor was not used under closed conditionsdue to uncertainties in the performance of the system and possible health hazardssuch as increased particulates that might act as allergens, increased N2O and CO2,and possibly further reductions in atmospheric O2. Thus, the SBR concept remainsunproved at this scale. The apparent reduction in some atmospheric contaminants,such as volatile organic compounds, during Mission I could have been due toadsorption of certain compounds by the massive surface area of glass, metal, carpetand concrete or to atmospheric removal by rain and moisture. Plants are alsoknown to remove a variety of organic compounds by introduction into stomatalpores (e.g. Porter, 1994).
5. Conclusions
As a food production facility to sustain human health the agricultural mesocosmof Biosphere 2 was very successful as a result of intensive farming practices, highbiodiversity, high nutrient and CO2 levels for growth and adequate water supply.However, as an integrated life-support facility, regeneration technologies that werein place during the first 3 years of operation were not effective in recycling water,solid and atmospheric excesses. The flaws in these systems could be easily over-come. Overall, the system was a remarkable success given the scale and require-ments for operation. Stored waste products imply that regeneration,physio-chemical or bioregenerative, were not fully functional. Conversion ofbiomass to CO2 was not needed over the time period examined due to the largebuffer of available carbon in soils and the biota; the opposite problem of sequester-ing CO2 was not adequately solved during either mission. Biosphere 2 accumulatedvery large amounts of stored waste in the primary storage facility as salts and othernutrients, stockpiles of wood as storage of carbon and very large amounts ofCaCO3 as stockpiles of removed CO2, a clear indication that internal recycling wasactually quite low, not complete or 100%, as indicated elsewhere (Nelson et al.,1994; Silverstone and Nelson, 1996). Major improvements needed for long-term,closed-system operation include: (1) a CO2 control system that could sequester andrelease CO2 upon demand (2) efficient evaporators or similar technology to recoverfresh water from brine; (3) balancing of soil organic carbon content and associated
B.D.V. Marino et al. / Ecological Engineering 13 (1999) 199–234230
soil CO2 flux with production of O2 by modifying soils and/or standing biomass; (4)an effective potable water treatment system; and (5) integrated control over nutrientflows between soil and water reservoirs. Presumably, these systems would have beenupgraded over the envisioned 100-year life time of the project based on results fromMissions I and II.
Although one of the original motivations for the Biosphere 2 project was todevelop an application for habitation of the Mars surface (e.g. MacCallum et al.,1991) the Biosphere 2 IAB and associated systems shared little with prevailingapproaches for life support systems in space which are conceptually based onattaining a balance between CO2 and O2 production and consumption. In thisapproach the need for re-supply of O2 and exportation of CO2 is eliminated (i.e.Controlled Ecological Life Support Systems (CELSS), e.g. Averner, 1989; Kliss etal., 1994; Binot et al., 1994; Gitelson and Okladnikov, 1994, 1996; and AdvancedLife Support research (ALS), e.g. Barta and Henninger, 1996; Henninger et al.,1996). These approaches also relied on intensive monitoring of plant function (i.e.photosynthesis and respiration) and the use of models to maximize plant yield andcontrol gas exchange (e.g. Wheeler et al., 1993; Volk et al., 1995). In the case ofBiosphere 2, as illustrated above, external O2 was supplied as a liquefied gas (threeinjections were made in 1993, two in 1994 and one in 1995) and internal CO2 wasremoved by chemical scrubbing for both Missions I and II; no plant physiologicaldata for agricultural plants, nor of IAB system wide cycling (carbon, water,nutrients) have been reported (cf. Nelson et al., 1994; Silverstone and Nelson,1996). The primary differences were the use of natural soil versus hydroponic mediafor plant growth, scale (e.g. the air volume of the IAB is about 300 times that ofthe NASA Biomass Production Chamber; Wheeler, 1992), regenerative technologiesand mission goals. The large scale and complex mechanical and biological nature ofBiosphere 2 relative to CELSS facilities render many comparisons difficult; how-ever, some insights are of potential relevance to space programs.
For example, the crop diversity achieved in Biosphere 2 demonstrated the healthand aesthetic advantages of a soil system versus a strictly hydroponic one in whicha small number of crops are grown, usually in monoculture. Inclusion of hydro-ponic systems, bioreactors and other solid waste processors in the IAB, as well astesting of solid matrix analogs to a lunar or Martian regolith (Nelson et al., 1994;Spomer, 1994; Ming and Henninger, 1994; Barta and Henninger, 1996), could beemployed in the future in the context of related CELSS research. High CO2
concentrations, ideally generated from soil organic matter or from a specifiedimbalance between total respiration and consumption in a closed ecological system,will be advantageous for crop productivity, especially for C3 crops, many of whichare high carbohydrate yielding. Higher photosynthetic rates imply higher O2
production but loss of O2 by CO2 sequestration by concrete (see Severinghaus et al.,1994, for estimates of CO2 uptake by concrete) or other O2 sinks must be known.The IAB and perhaps habitat of Biosphere 2 could be viewed as an advanced,large-scale, soil-based, human-rated test facility for development of a combinationof biological and physio-chemical life support technologies, much like the currentclosed system program of the Human Rated Test Facility, Johnson Space Center,under development (e.g. Henninger et al., 1996).
B.D.V. Marino et al. / Ecological Engineering 13 (1999) 199–234 231
What did we learn about sustainability under varying environmental conditions?High crop and edible plant biodiversity was the single consistent factor in thedesign, planning, construction and operation of the IAB, clearly adding to the wellbeing and overall nutrition of the crews and perhaps improved ecosystem function(Naeem et al., 1994). In the context of studies of sustainable agriculture, a futurewith high CO2 and high nutrient availability could enhance the overall yields andbiodiversity of C3 based sustainable agricultural systems providing sufficient wateris available. Unlike the concentrations of CO2 in the Biosphere 2 atmosphere, theEarth’s atmosphere is not likely to exceed 4000 ppmv over the coming decades(IPCC, 1996); however, it is clear that this system, with modification, could be usedto study aspects of agricultural sustainability under simulated future conditions(CO2, temperature, nutrients, etc.) providing a unique approach to the study ofagriculture and global change research (e.g. Marino, 1997).
Acknowledgements
We would like to acknowledge and thank the entire staff of Biosphere 2 whoassisted us in retrieving documents from the archival data base, verification oftechnical data and who provided comments on drafts of this paper. In particular wethank Bernd Zabel for assistance with engineering details, Taber MacCullum andJane Poynter for insights into the operation and function of Biosphere 2 duringMission I, and Hewitt Stuart for preparation of figures and drawings.
References
Allen, J., 1991. Biosphere 2: The Human Experiment. Penguin, New York.Allen, J., Nelson, M., 1999. Biospherics and Biosphere 2, Mission One (1991–1993). Ecol. Eng. 13,
15–29.Averner, M.M., 1989. Lunar base agriculture: soils for plant growth. In: Ming, D.W., Ming, D.L.H.
(Eds.), Controlled Ecological Life Support System. Am. Soc. Agron., Crop Sci. Soc. Am. and SoilSci. Soc. of Am, Madison, WI.
Barta, D.J., Henninger, D.L., 1994. Regenerative life support systems—why do we need them? Adv.Space Res. 14 (11), 403–410.
Barta, D.J., Henninger, D.L., 1996. Johnson Space Center’s regenerative life support systems test bed.Adv. Space Res. 18 (1/2), 211–221.
Binot, R.A., Tamponnet, C., Lasseur, C., 1994. Biological life support for manned missions by ESA.Adv. Space Res. 14 (11), 71–74.
Bohn, H.L., 1972. Soil adsorption of air pollutants. J. Environ. Qual. 1, 372–377.Bohn, H.L., Bohn, R.K., 1986. Soil bed scrubbing of fugitive gas releases. J. Environ. Sci. Health 21,
561–569.Bohn, H.L., Bohn, R.K., 1988. Soil beds weed out air pollutants. Chem. Eng., April, 73–76.Bugbee, B., Monje, O., 1992. Bioscience 42 (7), 494–502.Bugbee, B., Spanarkel, B., Johnson, S., Monje, O., Koerner, G., 1994. CO2 crop growth enhancement
and toxicity in wheat and rice. Adv. Space Res. 14 (11), 257–267.Cassman, K.G., Harwood, R.R., 1995. The nature of agricultural systems: food security and environ-
mental balance. Food Policy 20 (5), 439–454.
B.D.V. Marino et al. / Ecological Engineering 13 (1999) 199–234232
Chitamber, J.J., Mahato, T.R., McClure, M.A., Marino, B.D.V., 1997. Description of Hemicycliophorabiosphaera n. sp. from Arizona (Nemata: Criconematidae). J. Nematol. 29 (3), 329–335.
Dempster, W.F., 1994. Methods for measurement and control of leakage in CELSS and their applicationand performance in the Biosphere 2 facility. Adv. Space Res. 14 (11), 331–335.
Finger, B.W., Alazraki, M.P., 1995. Development and integration of a breadboard-scale aerobicbioreactor to regenerate nutrients from inedible crop residues. SAE International, Warrendale, PA.
Finn, M., 1996. The mangrove mesocosm of Biosphere 2: Design, establishment and preliminary results.Ecol. Eng. 6, 21–56.
Frye, R.J., Welsh, D., Berry, T., Stevenson, B., 1990. A review of soil bed reactor research conductedat the environmental research laboratory for Biosphere 2. Environmental Research Laboratories,Tucson, AZ.
Gitelson, J.I., Okladnikov, Y.N., 1994. Man as a component of a closed ecological life support system.Life Supp. Biosph. Sci. 1, 73–81.
Gitelson, J.I., Okladnikov, Y.N., 1996. Consistency of gas exchange of man and plants in a closedecological system: lines of attack on the problem. Adv. Space Res. 18 (1/2), 205–210.
Glenn, E., Clement, C., Brannon, P., Leigh, L., 1990. Sustainable food production for a complete diet.HortScience 25 (12), 1507–1511.
Greer, D.H., Lang, W.A., Campbell, B.D., 1995. Photosynthetic responses of thirteen pasture species toelevated CO2 and temperature. Aust. J. Plant Physiol. 22, 713–722.
Grodzinski, B., Woodrow, L., Leonardos, E.D., Dixon, M., Tsujita, M.J., 1996. Plant responses to shortand long term exposures to high carbon dioxide levels in closed environments. Adv. Space Res. 18(4/5), 203–211.
Harwood, R.R. 1993. There is no away. In: Biosphere 2 Newsletter. Space Biosphere Ventures, Oracle,AZ.
Henninger, D.L., Tri, T.O., Packham, N.J.C., 1996. NASA’s advanced life support systems human-ratedtest facility. Adv. Space Res. 18 (1/2), 223–232.
Hoffer, L.J., 1994. Composition weight loss during starvation. In: Shils, M.E., Olson, J.A., Shike, M.(Eds.), Modern Nutrition in Health and Disease, 8th edn., Vol. 56.
IPCC, 1996. Climate change, 1995: In: Watson, R.T., Zinyowera, M.C., Moss, R.H. (Eds.), Impacts,Adaptations and Mitigations of Climate Change. Cambridge University Press, Cambridge.
Khalil, M.A.K., Rasmussen, R.A., 1989. The potential of soils as a sink of chlorofluorocarbons andother man-made chlorocarbons. Geophys. Res. Lett. 16 (7), 679–682.
Kimball, B.A., Pinter, P.J. Jr, Garcia, R.L., LaMorte, R.L., Wall, G.W., Hunsaker, D.J., Wechsung, G.,Wechsung, F., Kartschall, T., 1995. Productivity and water use of wheat under free-air CO2
enrichment. Global Change Biol. 1, 429–442.Kliss, M., MacElroy, R., Borchers, B., Farrance, M., Nelson, T., Blackwell, C., Yendler, B., Tremor, J.,
1994. Controlled ecological life support systems (CELSS) flight experimentation. Adv. Space Res. 14(11), 69–69.
Knapp, C.L., Stoffel, T.L., Whitaker, G.D., 1980. Long-term monthly averages of solar radiation,temperature, degree days and global KT for 248 weather stations. Solar Energy Research Institute,Golden, CO.
Koblin, D.D., Watson, J.E., Deadly, J.E., 1981. Inactivation of methionine synthase by nitrous oxide inmice. Anesthesiology 54 (4), 3180–3234.
Kumar, A.., Hoerling, M.P., 1997. Interpretation and implications of the observed inter-El Ninovariability. J. Clim. 10 (1), 83–91.
Loomis, R.S., Connor, D.K., 1992. Crop Ecology, Productivity and Management in AgriculturalSystems. Cambridge University Press, Cambridge.
MacCallum, T., Nelson, M., Leigh, L., Alling, A., Alvarez-Romo, N., 1991. The Biosphere 2 project:application for space exploration and Mars settlement. In: Stoker, C. (Ed.), The Case for Mars IV.American Astronautical Society, San Diego, CA.
Marino, B.D.V., 1997. The agricultural mesocosm of Biosphere 2: An experimental study of sustainabil-ity. In: Bassam, L. (Eds.), FAO International Conference on Sustainable Agriculture for Food,Energy and Industry, 1997, Germany.
B.D.V. Marino et al. / Ecological Engineering 13 (1999) 199–234 233
Marino, B.D.V., Odum, H.T., 1999. Biosphere 2. Introduction and research progress. Ecol. Eng. 13,3–14.
McElroy, M.B., 1983. Atmospheric composition: Influence of biology. Planet. Space Sci. 31, 1065–1074.Ming, D.W., Henninger, D.L., 1994. Use of lunar regolith as a substrate for plant growth. Adv. Space
Res. 14 (11), 435–443.Naeem, S., Thompson, L.J., Lawler, S.P., Lawton, J.H., Woodfin, R.M., 1994. Declining biodiversity
can alter the performance of ecosystems. Nature 368, 734–737.Nelson, M., Dempster, W., Alvarez-Romo, N., MacCallum, T., 1994. Atmospheric dynamics bioregen-
erative technologies in a soil-based ecological life support system: initial results from Biosphere 2.Adv. Space Res. 14 (11), 417–426.
Nelson, M., Finn, M., Wilson, C., Zabel, B., van Thillo, M., Hawes, P., Fernandez, R., 1999.Bioregenerative recycling of wastewater in Biosphere 2 using a created wetland: Two year results.Ecol. Eng. 13, 189–197.
Porter, J.R., 1994. Toluene removal from air by Dieffenbachia in a closed environment. Adv. Space Res.14 (11), 99–103.
Prokop, W.H., Bohn, H.L., 1985. Soil bed system for control of rendering plant odors. JAPCA 35,1332–1338.
Rheeburgh, W.S., Whalen, S.C., Alpperin, M.J., 1993. The role of methylotrophy in the global methanebudget. In: Murrell, J.C., Murrell, D.P.K. (Eds.), Microbrial Growth on C-1 Compounds. Intercept,UK.
Schlegel, H.G, 1974. Production, modification and consumption of atmospheric trace gases by microor-ganisms. Tellus XXVI, 11–20.
Selhub, J., Jacques, P.F., Wilson, W.F., Rush, D., Rosenberg, I.H., 1993. Vitamin status and intake asprimary determinants of homocysteinemia in an elderly population. J. Am. Med. Assoc. 270 (22),2693–2698.
Severinghaus, J.P., Broecker, W.S., Dempster, W.F., MacCallum, T., Wahlen, M., 1994. Oxygen loss inBiosphere 2. EOS Trans. Am. Geophys. Union 75 (33), 35–37.
Silverstone, S.E., Nelson, M., 1996. Food production and nutrition in Biosphere 2: Results from the firstmission September 1991 to September 1993. Adv. Space Res. 18 (4/5), 49–61.
Sinclair, T.R., Shiraiwa, T., Hammer, G.L., 1992. Variation in crop radiation-use efficiency withincreased diffuse radiation. Crop Sci. 32, 1281–1284.
Spomer, L.A., 1994. Use of planetary soils within CELSS: the plant viewpoint. Adv. Space Res. 14 (11),411–416.
Strayer, R.F., Cook, K., 1995. Recycling plant nutrients at NASA’s KSC-CELSS breadboard project:Biological performance of the breadboard-scale aerobic bioreactor during two runs. ASE Interna-tional, Warrendale, PA.
Tubiello, F.N., Mahato, T., Morton, T., Druitt, J.W., Volk, T., Marino, B.D.V., 1999. Growing wheatin the Biosphere 2 under elevated CO2: Observations and modelling. Ecol. Eng. 13, 273–286.
Volk, T., Bugbee, B., Wheeler, R.H., 1995. An approach to crop modelling with the energy cascade. LifeSupp. Biosph. Sci. 1, 119–127.
Walford, R.L., Harris, S.B., Gunion, M.W., 1992. The calorically restricted low-fat nutrient-dense dietin Biosphere 2 significantly lowers blood glucose, total leukocyte count, cholesterol, and bloodpressure in humans. Proc. Natl. Acad. Sci. USA 89, 11533–11537.
Walford, R.L., Weber, L.J., Panov, S., 1995. Caloric restriction and aging as viewed from Biosphere 2.Receptor 5, 29–33.
Walford, R.L., Bechtel, R.B., MacCallum, T., Paglia, D.E., Weber, L.J., 1996. Biospheric medicine asviewed from the two-year first closure of Biosphere 2. Aviat. Space Environ. Med. 67 (7), 609–617.
Wheeler, R.M., 1992. Gas-exchange measurements using a large, closed plant growth chamber.HortScience 27 (7), 777–780.
Wheeler, R.M., Corey, K.A., Sager, J.C., Knott, W.M., 1993. Gas exchange characteristics of wheatstands grown in a closed, controlled environment. Crop Sci. 33, 161–168.
Wheeler, R.M., Mackowiak, C.L., Sager, J.C., Knott, W.M., Berry, W.L., 1994. Proximate nutritionalcomposition of CELSS crops grown at different CO2 partial pressures. Adv. Space Res. 14 (11),171–176.

B.D.V. Marino et al. / Ecological Engineering 13 (1999) 199–234234
Wheeler, R.M., Mackowiak, C.L., Stutte, G.W., Sager, J.C., Yorio, N.C., Ruffe, L.M., Fortson, R.E.,Dreschel, T.W., Knott, W.M., Core, K.A., 1996. NASA’s biomass production chamber: a testbed forbioregenerative life support studies. Adv. Space Res. 18 (4/5), 215–224.
Wolverton, B.C. 1980. Higher plants for recycling human waste into food, potable water, and revitalizedair in a closed life support system. NASA report.
Wolverton, B.C., McDonald, R.C., Duffer, E., 1983. Microorganisms and higher plants for waste watertreatment. J. Environ. Qual. 12, 36–45.
Zabel, B., Hawes, P., Stuart, H., Marino, B.D.V., 1999. Construction and engineering of a createdenvironment: Overview of the Biosphere 2 closed system. Ecol. Eng. 13, 43–63.
.
Related Documents