The Competitiveness Report 2017 Africa Public Disclosure Authorized Public Disclosure Authorized Public Disclosure Authorized Public Disclosure Authorized

Welcome message from author
This document is posted to help you gain knowledge. Please leave a comment to let me know what you think about it! Share it to your friends and learn new things together.
Transcript
The Competitiveness Report 2017Africa
Pub
lic D
iscl
osur
e A
utho
rized
Pub
lic D
iscl
osur
e A
utho
rized
Pub
lic D
iscl
osur
e A
utho
rized
Pub
lic D
iscl
osur
e A
utho
rized


Insight Report
The Africa Competitiveness Report 2017Addressing Africa’s Demographic Dividend

ii | The Africa Competitiveness Report 2017
TERMS OF USE AND DISCLAIMER
The Africa Competitiveness Report 2017 (herein: “Report”) presents information and data that were compiled and/or collected by the World Economic Forum (all information and data referred herein as “Data”). Data in this Report is subject to change without notice.
The terms country and nation as used in this Report do not in all cases refer to a territorial entity that is a state as understood by international law and practice. The terms cover well-defined, geographically self-contained economic areas that may not be states but for which statistical data are maintained on a separate and independent basis.
Although the World Economic Forum takes every reasonable step to ensure that the Data thus compiled and/or collected is accurately reflected in this Report, the World Economic Forum, its agents, officers, and employees: (i) provide the Data “as is, as available” and without warranty of any kind, either express or implied, including, without limitation, warranties of merchantability, fitness for a particular purpose and non-infringement; (ii) make no representations, express or implied, as to the accuracy of the Data contained in this Report or its suitability for any particular purpose; (iii) accept no liability for any use of the said Data or reliance placed on it, in particular, for any interpretation, decisions, or actions based on the Data in this Report.
Other parties may have ownership interests in some of the Data contained in this Report. The World Economic Forum in no way represents or warrants that it owns or controls all rights in all Data, and the World Economic Forum will not be liable to users for any claims brought against users by third parties in connection with their use of any Data. The World Economic Forum, its agents, officers, and employees do not endorse or in any respect warrant any third-party products or services by virtue of any Data, material, or content referred to or included in this Report.
Users shall not infringe upon the integrity of the Data and in particular shall refrain from any act of alteration of the Data that intentionally affects its nature or accuracy. If the Data is materially transformed by the user, this must be stated explicitly along with the required source citation. For Data compiled by parties other than the World Economic Forum, as specified in the “Technical Notes and Sources” section of this Report, users must refer to these parties’ terms of use, in particular concerning the attribution, distribution, and reproduction of the Data. When Data for which the World Economic Forum is the source (herein “World Economic Forum Data”), as specified in the “Technical Notes and Sources” section of this Report, is distributed or reproduced, it must appear accurately and be attributed to the World Economic Forum. This source attribution requirement is attached to any use of Data, whether obtained directly from the World Economic Forum or from a user. Users who make World Economic Forum Data available to other users through any type of distribution or download environment agree to make reasonable efforts to communicate and promote compliance by their end users with these terms.
Users who intend to sell World Economic Forum Data as part of a database or as a standalone product must first obtain the permission from the World Economic Forum ([email protected]).
The Africa Competitiveness Report 2017 is a special project within the framework of the World Economic Forum’s Global Competitiveness and Risks Team. It is the result of collaboration between the World Economic Forum, the International Bank for Reconstruction and Development/the World Bank, and the African Development Bank.
Visit The Africa Competitiveness Report page at www.weforum.org/acr.
World Economic Forum Geneva Copyright© 2017 by the World Economic Forum with the support of the International Bank for Reconstruction and Development/the World Bank and the African Development Bank
All rights reserved. No part of this publication may be reproduced, stored in a retrieval system, or transmitted, in any form or by any means, electronic, mechanical, photocopying, or otherwise without the prior permission of the World Economic Forum.
ISBN-13: 978-1-944835-09-5
This report is printed on paper suitable for recycling and made from fully managed and sustainable forest sources.
Copyediting: Hope SteeleDesign and layout: Neil Weinberg
The Africa Competitiveness Report 2017 | iii
Contents
Preface ......................................................................................................................................................................................................v
by Akinwumi Adesina (African Development Bank), Jim Yong Kim (World Bank Group), and Klaus Schwab (World Economic Forum)
Acknowledgments ...................................................................................................................................................................................vii
Contributors ..............................................................................................................................................................................................ix
Partner Institutes ......................................................................................................................................................................................xi
Overview ..................................................................................................................................................................................................xiii
PART 1: ADDRESSING AFRICA’S DEMOGRAPHIC DIVIDEND
1.1 Tracking Progress in Africa’s Competitiveness: Removing Obstacles to Reap the Demographic Dividend ............................ 3
by Roberto Crotti and Margareta Drzeniek Hanouz (World Economic Forum), El-hadj M. Bah and Audrey Verdier-Chouchane (African Development Bank), and Barak Hoffman (World Bank)
1.2 Jobs in Africa: Designing Better Policies Tailored to Countries’ Circumstances ....................................................................... 35
by Barak Hoffman and Jean Michel Marchat (World Bank)
1.3 Competitive African Cities for Better Living Standards ................................................................................................................ 53
by El-hadj M. Bah and Audrey Verdier-Chouchane (African Development Bank)
PART 2: COUNTRY PROFILES
How to Read the Country Profiles ........................................................................................................................................................ 75
Technical Notes and Sources ................................................................................................................................................................ 77
Index of Countries .................................................................................................................................................................................. 87
Country Profiles ...................................................................................................................................................................................... 88
About the Authors ................................................................................................................................................................................ 159

The Africa Competitiveness Report 2017 | v
PrefaceAkinwumi AdesinaPresident, African Development Bank Group
Jim Yong KimPresident, World Bank Group
Klaus SchwabExecutive Chairman, World Economic Forum
The 2017 edition of The Africa Competitiveness Report comes out at a challenging time for the continent. In recent years, growth in several African countries has been subdued after more than a decade of solid expansion. The slowdown is largely due to the protracted low commodity prices as well as the reduced growth in emerging markets such as China, and in advanced economies. However, this situation has also given impetus to reforms and economic diversification. The strong economic performance of a number of African countries demonstrates Africa’s resilience and brings optimism about Africa’s future growth prospects.
Looking ahead, the continent’s young and increasing population presents an unprecedented opportunity to spur rapid development. A growing labor force and a large and emerging consumer market hold the promise of significant growth opportunities. Yet challenges to reaping these potential gains and achieving greater shared prosperity remain. Most economies in the region still need to promote more productive activities that generate quality employment opportunities for their growing populations and contribute to improving the livelihoods of African people. Africa can make this happen, and decisions and actions taken today will determine whether governments and the private sector in the region can meet the growing economic and social aspirations of its population.
Published on a biennial basis, The Africa Competitiveness Report highlights areas requiring policy action and investment to ensure that Africa lays a solid foundation for sustained and inclusive growth. The Report, which is the result of a long-standing collaboration, leverages the knowledge and expertise of the African Development Bank, the World Bank Group, and the World Economic Forum to present a joint policy vision that can help Africa transform its economies.
By conducting a comprehensive analysis of Africa’s most pressing competitiveness challenges, the Report discusses the barriers and challenges to putting Africa’s economies onto a solid footing and helping them to achieve sustainable, broad-
based growth, taking into account rapid demographic changes. Africa’s working-age population is expected to soar by 450 million people, or close to 70 percent, by 2035. The Report examines how this population growth can either help to achieve broader shared prosperity and improve the livelihood of African people or become a source of fragility, social tension, and economic hardships. It does so by examining the potential of Africa’s fast-growing youth population to catalyze economic development through accelerating rates of job creation. It also discusses the potential of cities to transform, strengthen, and diversify Africa’s economies by creating more dynamic urban manufacturing and service sectors. The Report emphasizes the importance of ensuring that the youth of today and tomorrow possess the skills they need to build vibrant and inclusive economies. It further delivers detailed competitiveness profiles for 35 African countries, and provides a comprehensive summary of the drivers of productivity and competitiveness within the continent.
We hope that this year’s Report will stimulate discussion among development stakeholders to bring about sustained growth and shared prosperity in Africa. Well-targeted investments in physical and human capital will be key factors that need to be further reinforced by a sound institutional framework and an enabling business environment. Businesses can advocate for reforms that enhance firm productivity and engage in a dialogue with policymakers about the type of reforms required for firms to prosper. Governments can ensure sustained investments in infrastructure, health, and education; provide the legal and regulatory framework for a sound business environment for trade and investment; and, most importantly, ensure that policies and their implementation are consistent across time and national boundaries.
Africa’s growing young population offers the prospect of transforming the continent. The analysis in the 2017 Africa Competitiveness Report aims to contribute toward seizing this opportunity for Africa’s current and future generations.

The Africa Competitiveness Report 2017 | vii
The Africa Competitiveness Report 2017 was prepared by a joint team comprised of Margareta Drzeniek Hanouz, Ciara Browne, Roberto Crotti, and Liana Melchenko from the World Economic Forum; Barak Hoffman and Jean Michel Marchat from the World Bank; and El-hadj M. Bah, and Audrey Verdier-Chouchane from the African Development Bank.
The work was carried out under the general direction of Richard Samans, Managing Director at the World Economic Forum; Anabel Gonzales, Senior Director of Global Trade and Competitiveness Practice; Shantayanan Devarajan, Chief Economist for the Middle East and North Africa Region, and Albert Zeufack, Chief Economist for sub-Saharan Africa at the World Bank; and Abebe Shimeles, Acting Director Macroeconomic Policy, Forecasting and Research Department at the African Development Bank.
We are similarly grateful to all staff from our institutions who have worked so hard to make this joint report possible and who have provided comments at different stages of the report preparation. In particular, we thank Issa Faye, John Anyanwu, and Anthony Simpasa from the African Development Bank for their invaluable guidance and comments; and Anna von Wachenfelt (Consultant) and Zeke Geh (Consultant) for their excellent research assistance. We would like to acknowledge the contribution of colleagues from the Complex of Private
Sector, Infrastructure and Industrialization; the Macroeconomic Policy, Forecasting and Research Department; and the Statistics Department, who have provided comments on the chapter. Administrative assistance was also provided by Eve Kra and Abiana Nelson. Laetitia Yattien-Amiguet and Justin Kabasele proposed high-quality services in designing the cover.
From the World Bank, we thank Najy Benhassine, Shantayanan Devarajan, Anabel Gonzalez, Catherine Masinde, Rashmi Shankar, Klaus Tilmes, and Albert Zeufack for their enthusiastic support of the World Bank’s participation in The Africa Competitiveness Report. We also thank our peer reviewers: Paul Brenton, César Calderón, Youssouf Kiendrebeogo, and Jacques Morisset for their extremely helpful guidance. We similarly appreciate the inputs and suggestions we received from Jonathan Coony, Lucy Fye, and James Seward. We would like to express our gratitude to Irene Marguerite Nnomo Ayinda-Mah for her invaluable administrative support.
From the World Economic Forum, we thank Silja Baller, Oliver Cann, Piyamit Bing Chomprasob, Gemma Corrigan, Attilio Di Battista, Thierry Geiger, Daniel Gomez Gaviria, Max Hall, Elsie Kanza, Till Leopold, Vanessa Moungar, Patrick McGee, Vesselina Stefanova Ratcheva, Dieynaba Tandian, Huguette Umutoni, Stephanie Verrin, and Saadia Zahidi.
Acknowledgments


The Africa Competitiveness Report 2017 | ix
AT THE WORLD ECONOMIC FORUM
Richard Samans
Head of the Centre for the Global Agenda, Member of the Managing Board
Margareta Drzeniek Hanouz
Head of Global Competitiveness and Risks, Member of the Executive Committee
Ciara Browne
Head of Partnerships, Global Competitiveness and Risks
Roberto Crotti
Economist, Global Competitiveness and Risks Team
Elsie Kanza
Head of Africa, Member of the Executive Committee
Liana Melchenko
Acting Head of Partnerships, Economic Growth and Social Inclusion, Global Competitiveness and Risks
AT THE WORLD BANK GROUP
Anabel Gonzalez
Senior Director, Trade and Competitiveness Global Practice
Klaus Tilmes
Director, Trade and Competitiveness Global Practice
Shantayanan Devarajan
Chief Economist, Middle East and North Africa Region
Albert Zeufack
Chief Economist, Sub-Saharan Africa Region
Jean Michel Marchat
Lead Economist, Trade and Competitiveness Global Practice
Barak Hoffman
Consultant, Trade and Competitiveness Global Practice
AT THE AFRICAN DEVELOPMENT BANK
Abebe Shimeles
Acting Director, Macroeconomic Policy, Forecasting and Research Department
Issa Faye
Officer in Charge, African Development Institute & Manager, Microeconomic, Institutional & Development Impact Division
John Anyanwu
Lead Research Economist, Macroeconomic Policy, Forecasting and Research Department
Audrey Verdier-Chouchane
Chief Research Economist, Microeconomic, Institutional & Development Impact Division
El-hadj Mamadou Bah
Principal Research Economist, Microeconomic, Institutional & Development Impact Division
Contributors
The Africa Competitiveness Report 2017 is the result of collaboration between the World Economic Forum, the World Bank, and the African Development Bank.

The Africa Competitiveness Report 2017 | xi
Partner InstitutesThe World Economic Forum’s Global Competitiveness and Risks Team is pleased to acknowledge and thank the following organizations as valued Partner Institutes, without which the realization of The Africa Competitiveness Report 2017 would not have been feasible:
AlgeriaCentre de Recherche en Economie Appliquée pour le
Développement (CREAD)Mohamed Yassine Ferfera, DirectorKhaled Menna, Research Fellow
BeninInstitut de Recherche Empirique en Economie Politique (IREEP)Richard Houessou, Research AssociateRomaric Samson, Research AssistantLéonard Wantchekon, Director
BotswanaBotswana National Productivity CentreLetsogile Batsetswe, Research Consultant and StatisticianBaeti Molake, Executive DirectorPhumzile Thobokwe, Manager, Information and Research Services
Department
BurundiFaculty of Economics and Management, Research Centre for
Economic and Social Development (CURDES), National University of Burundi
Ferdinand Bararuzunza, Director of the CentreGilbert Niyongabo, Head of DepartmentLéonidas Ndayizeye, Dean of the Faculty
CameroonComité de Compétitivité (SELPI)Lucien Sanzouango, Permanent SecretaryGuy Yakana, Expert JuniorSamuel Znoumsi, Expert Senior
Cape VerdeCenter for Applied Statistics and Econometrics Research – INOVEJúlio Delgado, DirectorJerónimo Freire, Project ManagerJosé Mendes, Chief Executive Officer
ChadGroupe de Recherches Alternatives et de Monitoring du Projet
Pétrole-Tchad-Cameroun (GRAMP-TC)Antoine Doudjidingao, ResearcherGilbert Maoundonodji, DirectorCeline Nénodji Mbaipeur, Programme Officer
Congo, Democratic Republic ofCongo-Invest Consulting (CIC)Teza Bila, Managing DirectorAlphonse Mande, Project CoordinatorDaddy Nsiku, Project Coordinator
Côte d’IvoireChamber of Commerce and Industry of Côte d’IvoireMarie-Gabrielle Boka Varlet, General ManagerAnzoumane Diabakate, Head of CommunicationJean-Rock Kouadio-Kirine, Head of Territories and sustainable
development
EgyptThe Egyptian Center for Economic Studies (ECES)Abla Abdel Latif, Executive Director and Director of ResearchMohsen Adel, ConsultantMaye Ehab, Economist
EthiopiaAfrican Institute of Management, Development and GovernanceTegegne Teka, Senior ExpertAdugna Girma, Operations Manager
GabonConfédération Patronale GabonaiseMadeleine E. Berre, PresidentRegis Loussou Kiki, General SecretaryGina Eyama Ondo, Assistant General Secretary
Gambia, TheGambia Economic and Social Development Research Institute
(GESDRI)Makaireh A. Njie, Director
GhanaAssociation of Ghana Industries (AGI)James Asare-Adjei, PresidentJohn Defor, Senior Policy OfficerSeth Twum-Akwaboah, Chief Executive Officer
KenyaInstitute for Development Studies, University of NairobiPaul Kamau, Senior Research FellowDorothy McCormick, Research ProfessorWinnie Mitullah, Director and Associate Research Professor
LesothoPrivate Sector Foundation of LesothoNthati Mapitsi, ResearcherThabo Qhesi, Chief Executive OfficerKutloano Sello, President, Researcher
MadagascarCentre of Economic Studies, University of AntananarivoRavelomanana Mamy Raoul, DirectorRazato Rarijaona Simon, Executive Secretary
MalawiMalawi Confederation of Chambers of Commerce and IndustryHope Chavula, Manager, Head, Public Private DialogueChancellor L. Kaferapanjira, Chief Executive Officer
MaliGroupe de Recherche en Economie Appliquée et Théorique
(GREAT)Massa Coulibaly, Executive Director
MauritaniaMauritania Bicom-Service CommercialOumou El Khairy Youssouf, Administrative Financial DirectorOusmane Samb, Technical and Marketing DirectorHabib Sy, Analyst

xii | The Africa Competitiveness Report 2017
ZimbabweFulham Economics, HarareA. M. Hawkins, Chairman
Liberia and Sierra LeoneFJP Development and Management ConsultantsOmodele R. N. Jones, Chief Executive Officer
MauritiusBoard of Investment, MauritiusManaesha Fowdar, Investment Executive, CompetitivenessKen Poonoosamy, Managing Director
Business MauritiusRaj Makoond, Director
MoroccoConfédération Générale des Entreprises du Maroc (CGEM)Meriem Bensalah Cheqroun, PresidentSi Mohamed Elkhatib, Project Head, Commission Climat des Affaires
et Partenariat Public PrivéAhmed Rahhou, President, Commission Climat des Affaires et
Partenariat Public Privé
MozambiqueEconPolicy Research Group, Lda.Peter Coughlin, DirectorMwikali Kieti, Project Coordinator
NamibiaInstitute for Public Policy Research (IPPR)Graham Hopwood, Executive DirectorLeon Kufa, Research AssociateLizaan van Wyk, Research Associate
NigeriaNigerian Economic Summit Group (NESG)Olaoye Jaiyeola, Chief Executive OfficerOlajiire Onatade-Abati, Research AnalystWilson Erumebor, Research Analyst
RwandaPrivate Sector Federation (PSF)Benjamin Gasamagera, ChairmanFiona Uwera, Head of Research and Policy Analysis
SenegalCentre de Recherches Economiques Appliquées (CREA), University
of DakarAhmadou Aly Mbaye, DirectorNdiack Fall, Deputy DirectorYoussou Camara, Administrative Staff
South AfricaBusiness Leadership South AfricaFriede Dowie, General ManagerThero Setiloane, Chief Executive Officer
Business Unity South AfricaKhanyisile Kweyama, Chief Executive OfficerOlivier Serrao, Director, Economic Policy
TanzaniaPolicy Research for Development, REPOACornel Jahari, Assistant ResearcherBlandina Kilama, Senior ResearcherDonald Mmari, Executive Director
TunisiaInstitut Arabe des Chefs d’EntreprisesAhmed Bouzguenda, PresidentMajdi Hassen, Executive Counsellor
UgandaKabano Research and Development CentreRobert Apunyo, Program ManagerDelius Asiimwe, Executive DirectorAnna Namboonze, Research Associate
ZambiaInstitute of Economic and Social Research (INESOR), University of
ZambiaPatricia Funjika, Research FellowJolly Kamwanga, Senior Research Fellow and Project CoordinatorMubiana Macwan’gi, Director and Professor
Partner Institutes

The Africa Competitiveness Report 2017 | xiii
The 2017 edition of The Africa Competitiveness Report comes out at a transitional time for the region. Low commodity prices and reduced growth in emerging markets and advanced economies have contributed to slow growth in the majority of African countries, following a decade of sustained GDP growth (above 5 percent).1 However, slower GDP growth has also given impetus to reforms and economic diversification in some countries. Such reforms continue to be necessary because of the demographic changes the continent is undergoing. Africa is expected to double its population over the next 25 years, and it is the only region in the world where the working-age population is projected to continue expanding beyond 2035.2 Africa is also urbanizing rapidly, and more than half of its population will live in cities over the same period. Such rapid growth of Africa’s working-age population has been hailed as a possible boost to regional economic growth. However, there is no teleology leading from population growth to job creation. The incidence of unemployment and underemployment among African youth is high.3 Absent a policy environment that supports rapid job creation, large youth and working-age cohorts can constitute a potential source of social and political vulnerability.
Economists, policymakers, and business leaders largely agree that slow progress in raising competitiveness and productivity are at the heart of the limited ability of African economies to offer better employment opportunities. A significant body of analysis has identified the main bottlenecks to improving these factors. These have also been identified and discussed in previous editions of The Africa Competitiveness Report. The 2011 edition focused on how to reinforce managerial skills and higher education, the 2013 edition discussed export diversification, and the 2015 edition examined constraints to structural transformation. This year’s Report leverages the research and expertise in job creation and urbanization that have been carried out by its partner organizations—the African Development Bank, the World Bank, and the World Economic Forum—to explore what policies need to be implemented to enable Africa to reap its potential demographic dividend.
Tracking Progress in Africa’s CompetitivenessChapter 1.1 provides an update of Africa’s competitiveness performance, based on 2015 and 2016 data. This analysis is conducted at both the aggregate and country levels as assessed by the Global Competitiveness Index (GCI). Trends in Africa’s competitiveness remain largely stagnant: the overall Africa GCI score is substantially the same as the one reported in 2015 and has only improved by 5 percent since 2008. Most competitiveness challenges highlighted in the Africa Competitiveness Report series since its first publication, almost 10 years ago, persist. These include large infrastructure deficits, significant skill mismatches, slow adoption of new technologies, and weak institutions. These factors, in addition to weak financial sector development and low levels of regional trade and integration, emerge as the main bottlenecks that prevent African economies from offering an environment that facilitates better employment and entrepreneurship opportunities to its citizens as well.4
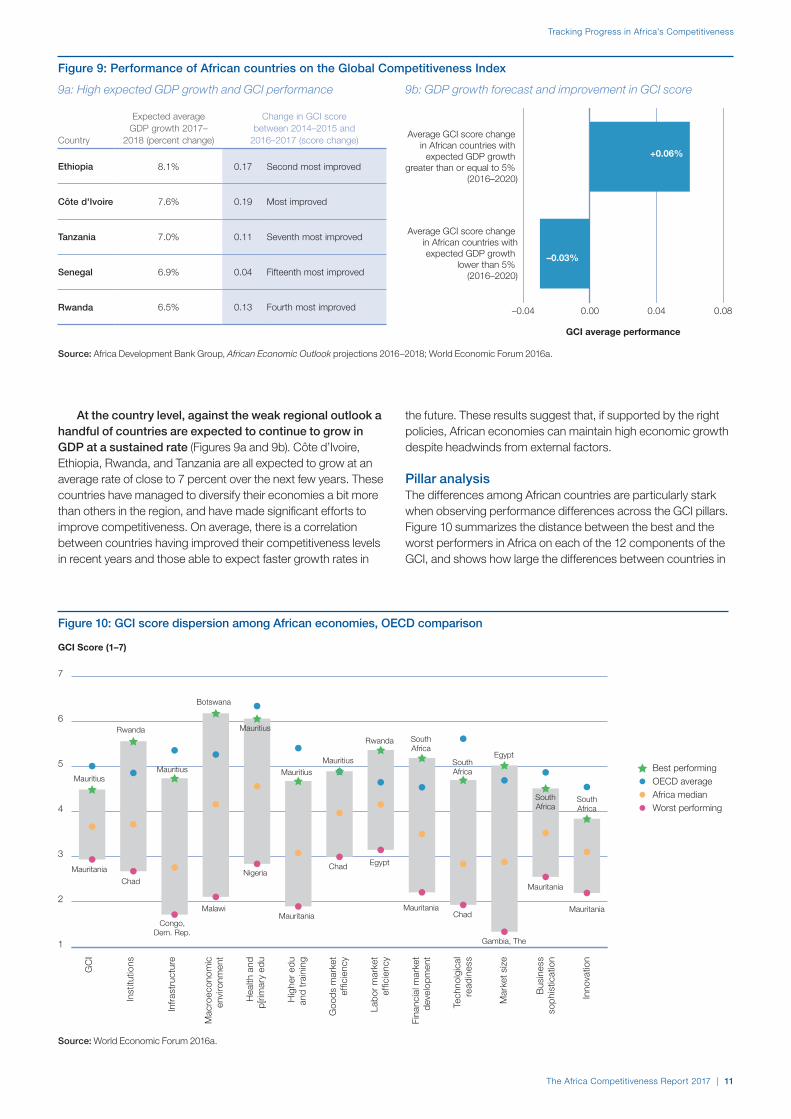
These broad trends notwithstanding, Africa has made significant progress on a number of crucial competitiveness dimensions over the past decade. The positive trends on governance and the business environment, highlighted by the 2015 edition of The Africa Competitiveness Report, for the most part, are continuing, especially in areas such as the quality of macroeconomic policy and human capital development. Progress on health and literacy has been particularly remarkable: in a decade, child mortality sharply declined from 83 to 47 percent, and primary school enrollment has grown to above 80 percent. Moreover, a number of countries in Africa are making impressive progress in improving their competitiveness: Côte d’Ivoire, Ethiopia, Rwanda, and Tanzania, for example, have all improved their competitiveness ranking by five places or more since 2015, and their real GDP is forecasted to grow close to or above 7 percent over the next few years. Not surprisingly, these countries are also those that are trying to diversify their economies more, relative to others in the region. Diverging country trajectories reinforce wide regional competitiveness disparities: the most competitive African economy, Mauritius, at 45th globally, is ranked more than 90 places higher than the lowest one, Mauritania, at 137th. Similar patterns are identified across the 12 pillars, looking both at performance level and changes over time.
Overview
In this Report, competitiveness constitutes the factors, institutions, and policies that determine a country’s level of productivity. Productivity, in turn, sets the sustainable level and path of prosperity that a country can achieve.

xiv | The Africa Competitiveness Report 2017
shortages of other urban infrastructure such as electricity, transport networks, and water and sewerage systems. A key factor contributing to those shortages is the outdated and inadequate urban plans that fail to take into account the social, political, economic, and environmental contexts of urban development in Africa.
Beyond the standard recommendations to reduce the infrastructure deficit; improve the business environment though better institutions, governance, and regulatory frameworks; and increase the availability of skills, this chapter makes three specific recommendations to improve competitiveness of African cities. First, governments or city officials need to update their cities’ urban plans to reflect local realities. Second, investment in housing construction is critical to reduce the large housing backlogs in various cities and improve the lives of urban dwellers. Finally, creating special economic zones can be an effective tool to jump start manufacturing, increase exports, and create jobs. However, strategic planning with special attention to comparative advantage and linkages with the rest of the economy is necessary for achieving the potential benefits of industrial parks.
The need for faster policy implementationEchoing the recommendations from the series of consultations that culminated with the “Competitiveness Action Agenda”,6 following the launch of the 2015 Africa Competitiveness Report, the main roadblocks for Africa’s economic development remain slow progress in improving education quality, building infrastructure (especially in cities), adopting new technologies, deepening capital markets, and accelerating the rate of structural change.
All these factors, however, require long processes to be modified and will manifest their impact only many years from now, while the need to offer better opportunities to the large and growing cohorts of young African people is imminent. Therefore, this Report reinforces the urgency of starting the reform process right away to ensure better prospects for the next generation.
More efforts and emphasis should be put on policy implementation, rather than policy definition, to circumvent one of the main weaknesses of Africa’s development programs. Strengthening institutions is therefore a necessary pre-condition to enable faster and incisive policy implementation and to spark private-sector action. Despite progress that has been made in some countries, the average quality of public and private institutions remains low and represents an overarching hindrance to the implementation of reforms. More specifically, as discussed in Chapter 1.2, development programs in Africa in general, and particularly in fragile and conflict-affected states, take a long time to be executed. Against this backdrop, better public and private institutions as well as coordination and dialogue is needed to speed up the reform process.
In addition, the Report provides some specific short-term policies recommendations.
First, it proposes adopting sector-specific policies to increase labor demand. Chapters 1.2 and 1.3 emphasize the need to focus on labor-intensive sectors, such as agribusiness and construction, in order to speed up job creation. With improved access to finance, stronger linkages and coordination among actors in their value chains, and training, these sectors have the potential to create a large number of skilled and unskilled jobs. Agribusiness development also will help accelerate the growth of Africa’s manufacturing sector.
Jobs in Africa: Designing Better Policies Tailored to Countries’ CircumstancesThe working-age population in Africa is expected to grow by close to 70 percent, or by approximately 450 million people, between 2015 and 2035. If current trends continue, only about 100 million of them can expect to find stable employment opportunities. Countries that are able to enact policies conducive to job creation are likely to reap significant benefits from this rapid population growth. Those that fail to implement such policies are likely to suffer demographic vulnerabilities resulting from large numbers of unemployed and/or underemployed youth.
New research is providing governments in the region with insights into how they can address the coming rise in the working-age populations. African countries will need to find ways to expand aggregate demand for labor and improve supply-side factors at the same time. Beyond the traditional prescriptions—such as stable macroeconomic policy, a supportive investment climate, and improving the quality of human and physical capital—countries can facilitate more rapid and better job creation as well as accelerate the development of their manufacturing sector by implementing policies suited to their specific circumstances. Since almost all new jobs in Africa today are in agriculture and microenterprises, improving the business environment in these sectors is a high priority. Fragile countries can create jobs as well as promote growth and stability through targeted support to vulnerable regions and/or populations. Open trade policies and developing value chain links to extractive sectors are crucial for encouraging diversification and job creation in resource-rich countries. Finally, policies that foster regional trade and integration can be a major source of new jobs as well as improve firm-level productivity and economic competitiveness.
Competitive African Cities for Better Living StandardsRapid population growth and urbanization are putting significant pressure on the urban infrastructure of African cities. The demographic transition, characterized by the youth bulge, requires sharp increases in job creation and infrastructure, including affordable housing in urban centers. For cities to play their role as poles of economic growth and providers of quality jobs, they need to become more competitive. This chapter focuses on the constraints and opportunities for creating competitive African cities and eventually improving the living standards of urban dwellers. In other words, it focuses on policy options for improving the livelihood of African people in a context of population and urban growth and highly resonate with the African Development Bank’s High 5s.5
Comparing African cities along several indicators of economic progress—namely population dynamics, income and growth performance, employment, and the costs of housing and utilities—reveals interesting findings. For instance, over 2000–16, cities in economies dominated by natural resources experienced very fast growth in per capita GDP, yet they were less successful in improving households’ disposable incomes. In addition, high employment growth has not necessarily translated into higher household disposable income, indicating a slow growth in wages and/or a fast increase in the number of households. A number of cities witnessed an explosion of slums and large housing backlogs that not only undermines household welfare but also increases matching costs between employers and employees and hinders labor productivity. The negative effects of housing shortages are compounded by
Overview
The Africa Competitiveness Report 2017 | xv
Notes 1 AfDB 2016.
2 UN DESA 2015.
3 In Northern Africa unemployment is at 29.3 percent. In sub-Saharan Africa unemployment is at 10.8 percent, but the vast majority of new job creation is in self-employment or in microenterprises. ILO 2016.
4 For example, although the use of mobile phones grew to 94 subscriptions per 100 people in 2015, broadband mobile subscriptions are still as low as 26 per 100 people.
5 The AfDB five priority areas, referred to as the High 5s are: (1) Light up and Power Africa, (2) Feed Africa; (3) Industrialize Africa; (4) Integrate Africa; and (5) Improve the Livelihood of African People.
6 World Economic Forum, AfDB, OECD, and World Bank 2016.
ReferencesAfDB. 2016. African Economic Outlook 2016: Sustainable Cities
and Structural Transformation. Available at http://www.africaneconomicoutlook.org/en/home.
ILO (International Labour Organization). 2016. “World Employment and Social Outlook Trends 2016: Africa Briefing Note.” Available at http://www.ilo.org/wcmsp5/groups/public/---africa/---ro-addis_ababa/documents/genericdocument/wcms_444480.pdf
UN DESA (United Nations Department of Economic and Social Affairs). 2015. World Population Prospects, the 2015 Revision. Population Division. Available at https://esa.un.org/unpd/wpp/
World Economic Forum, AfDB, OECD, and World Bank (World Economic Forum, African Development Bank, Organisation for Economic Co-operation and Development, and World Bank). 2016. “An Action Agenda for Africa’s Competitiveness.” World Economic Forum Document. Geneva: World Economic Forum. Available at http://www3.weforum.org/docs/Africa_Competitiveness_2016.pdf.
Moreover, because small and micro-businesses represent the most important source of labor demand, policies tailored to the needs of this segment of the private sector is particularly necessary. Specifically, those firms require better access to finance, capacity building, and linkages to value chains.
Second, it suggests improving the competitiveness of cities through better urban planning. Outdated and inadequate urban plans are preventing African cities from benefiting from rapid urbanization and associated economies of scale. New urban planning should take into account recent economic, demographic, and urban developments. Advanced planning can lower infrastructure costs and increasing density can help address the issue of urban gridlock with its associated productivity costs, and can reduce the urban sprawl that is putting pressure on agricultural land and the environment. Moreover, the creation of special economic zones with better linkages to the rest of the economy can promote job creation and increased productivity through the higher growth of firms. However, the creation of these zones should be an integral part of the urban planning efforts in order to maximize the competitiveness outcomes, including job creation.
Third, it recommends reducing the housing backlog to improve the lives of urban dwellers, create jobs, and enhance productivity. Because of its extensive linkages with manufacturing, financial sector, and other service subsectors, residential housing construction in developing countries is very labor intensive and has high output multiplier effects. To address bottlenecks in the sector, better urban planning with adapted building codes, efficient regulation with reduced procedures and costs, improved governance, and better coordination between stakeholders will be necessary. Moreover, capacity building and financing for small and medium-sized developers can improve their productivity and their ability to deliver large-scale housing programs.
Fourth, it advises reducing the growing skills mismatch through effective technical vocational education and training (TVET) programs and better regional cooperation. Policies, cited above, aimed at increasing labor demand will not be effective at increasing youth employment if the supply of skills is not adequately addressed. There is a growing shortage of technicians, engineers, and other high-skilled workers. This can be addressed through better emphasis and reforms of TVET programs that can supply the skills demanded by the labor market. Moreover, the upcoming increased demand for education services due to larger populations will require more trained teachers. Regional coordination among African countries to adopt common standards and recognition of qualifications, as well as reforms of immigration policies for skilled workers, can help the continent prevent shortages of teachers in the short run.
Following the discussions above, the final section of the Report provides detailed competitiveness profiles for the 35 African countries included in the World Economic Forum’s Global Competitiveness Index that allow for a detailed assessment country-specific context and unique challenges. These profiles present the detailed rankings that underlie the broader global competitiveness rankings.
Overview


Part 1Addressing Africa’s Demographic Dividend


Chapter 1.1
Tracking Progress in Africa’s Competitiveness: Removing Obstacles to Reap the Demographic DividendRoberto CrottiMargareta Drzeniek HanouzWorld Economic Forum
El-hadj M. BahAudrey Verdier-ChouchaneAfrican Development Bank
Barak HoffmanWorld Bank
This edition of The Africa Competitiveness Report comes out at a time of reduced enthusiasm about African growth prospects. The robust expansion experienced by the region over the past two decades may not continue over the next few years, reducing expectations about the continent’s employment outlook. Since the publication of the last Africa Competitiveness Report in 2015, the region’s growth prospects have been affected by multiple external shocks: for example, oil exporters such as Nigeria have begun to be affected by lower oil prices over the past few years, and other mineral exporters,1 such as South Africa, have been hit by the slowdown of emerging economies, especially China. From 2004 to 2014, the region as a whole averaged a growth above 5 percent a year, but it is now about 2.2 percent. Growth is expected to pick up in 2018 but will most likely remain below 4 percent over the next few years. Over that same period, growth of GDP per capita, however—the main indicator of economic development—was well above 5 percent only between 2004 and 2007.2 Relatively few jobs have been added to African economies over almost 20 years of strong output expansion, mainly because of an overreliance on the primary sector (mineral extraction and agricultural products), little diversification, and low productivity. From 2004 to 2014, employment grew by only 1.7 percent in total—an average of less than 0.2 percent a year.3 This level of job creation has been barely sufficient to absorb the approximately 100 million additional African workers aged 20–59 who entered the job market in this period,4 which meant that the formal unemployment rate remained virtually unchanged amid continuing high rates of informal and vulnerable employment.
Over the next decade, both GDP and the working-age population are expected to increase by about 3 percent per year.5 If it was possible to increase employment by only 1 percent in the past decade, when GDP growth was higher, it could be harder to add jobs over the next few years when economic performance is expected to be softer. Looking ahead, the main question for Africa will be how to improve its competitiveness while absorbing a continuously expanding labor force in a scenario of lower growth.
Moving toward a demographic dividend or social fragility?The phrase demographic dividend captures how a population structure characterized by more people of working age and fewer dependents (children and elders) can boost economic growth simply because a larger share of the population is productive. However, even when the demographics are suitable for such a scenario, in the context of a weaker economic outlook, questions remain about the ability of African economies to provide such opportunities. If the low GDP growth and low employment expectations are confirmed, African economies could face the risk that a larger unemployed young population could become a source of instability in already fragile societies.
The capacity to offer African people greater opportunities and better living conditions will largely depend on how successful the region is at increasing competitiveness. Persistently low productivity levels and stagnant competitiveness—issues that this Report has been raising for almost a decade—are underlying causes of insufficient private-sector development and structural transformation that are at the root of Africa’s limited ability to offer higher paid jobs. Although the current picture for the region as a whole looks
The Africa Competitiveness Report 2017 | 3

Chapter 1.1
challenging, there are wide variations among countries: some have made great strides in some important dimensions of competitiveness—such as better health conditions; sounder macroeconomic policies; more efficient and open goods markets; and, in some cases, stronger institutions, which have started to build the foundations for more resilient economies and better opportunities for the next generation.
The advent of the Fourth Industrial Revolution (4IR) is adding complexity to the future of African economies and their employment outcomes.6 On one hand, Africa could capture the opportunities offered by the new economy, leapfrogging directly to a more digital and service-based development model. On the other hand, Africa could find it harder to develop a manufacturing sector because automatization may reduce the relevance of low labor cost advantages, while at the same time the new production systems will require greater coordination and sophistication to participate in global value chains.7 The combination of reduced relevance of low labor costs (enhanced by automatization) and African technological backwardness may prevent Africa from linking into value chains and hinder its structural transformation.
Previous editions of this Report have looked at diversification and regional transformation, and demonstrated how Africa’s diversification from agriculture is occurring mainly via the service sector, often in lower-value-added segments, rather than by building a solid manufacturing sector. This year’s edition focuses on how the minor and incomplete structural change that has taken place in Africa so far has resulted in limited employment opportunities and the promise of a demographic dividend has not yet been realized.
After providing a working understanding of the concept of the demographic dividend, this chapter analyzes the competitiveness landscape at the regional and subregional levels, comparing trends and highlighting variations across countries and over time, while taking into account demographic changes and related challenges. This analysis will inform the process of further developing the Action Agenda for Africa’s Competitiveness, which aims to make concrete recommendations from public-private consultations on how to improve specific channels of competitiveness (see Box 1 for a summary of this Action Agenda).
Box 1: An Action Agenda for Africa’s competitiveness challenge
International organizations, nongovernmental organizations, and academic research agree that improving competitiveness and productivity in Africa is needed to improve living standards. Previous editions of The Africa Competitiveness Report have tracked progress made on the drivers of competitiveness and discussed various ways to boost the continent’s competitiveness. For example, the 2011 Report examined Africa’s human resources—in particular, considering how to reinforce managerial skills and higher education to increase the capacity to generate, transfer, and utilize new knowledge, especially among women. The 2013 Report looked at how export diversification would be important to reduce vulnerability to commodity price swings—tightening regional integration was identified as instrumental to diversification, along with simplifying import-export procedures and investing in upgrading information and communication technologies (ICTs), energy, and transportation infrastructure.
The 2015 Report discussed the sustainability of Africa de-industrializing and becoming more reliant on a service-driven development model. It suggested that to increase sectoral productivity and structural change, African economies should start by developing agri-value chains and increasing access to land through land reform. At the same time, tapping into global value chains and creating backward linkages would depend on trade facilitation, investment policies, better infrastructure, and finance.
This analysis was complemented by a year of public-private consultations on how to improve competitiveness in the region. This process, called the Action Agenda for Africa’s Competitiveness,1 resulted in specific recommendations in eight areas:
1. Strengthen institutions and governance by using more effectively government services online to raise efficiency, and simplifying administrative procedures to reduce corruption and increase transparency.
2. Develop a common regional infrastructure strategy by increasing air travel coordination, standardizing railway systems and water supply systems, and creating autonomous funds that ensure infrastructure maintenance.
3. Improve skills development by reforming and harmonizing curricula to match demand for skills; establishing regional training centers of excellence; increasing technical vocational education and training; and supporting the school-to-market transition by creating linkages between training, education, and the business sector.
4. Facilitate the movement of goods, services, and people by introducing common business and single-entry tourist visas, establishing an information-sharing and revenue collection mechanism, and harmonizing standards.
5. Champion small and medium-sized enterprises (SMEs), investing in building their capacity to formalize, adopt accounting standards, and integrate in regional value chains.
6. Improve access to financing and integrate financial markets by enabling the cross-listing of firms in different stock markets, developing non-banking finance (e.g., venture capital funds, private equity), and establishing credit reference bureaus to reduce information asymmetry.
7. Promote regional trade through regional and global value chains by identifying sectors with comparative advantages and regional complementarities and developing export support services.
8. Improve productivity and profitability in the agriculture sector by developing rural infrastructure, removing restrictions on the acquisition and transfer of land property and bank lending; promote mechanization through credit, subsidies, and tax relief to facilitate the acquisition of machinery; increase the development of high-yield seeds through regional R&D and improve extension services to facilitate the adoption of new seeds and farming technologies and techniques; and develop support mechanisms for small farmers’ organizations, cooperatives, and associations to give them greater voice in the market.
Note
1 For the full list of recommendations and details of the program, see http://www3.weforum.org/docs/Africa_Competitiveness_2016.pdf.
Source: World Economic Forum et al. 2016.
4 | The Africa Competitiveness Report 2017

Tracking Progress in Africa’s Competitiveness
The demographic dividend in AfricaOver the past 30 years, Africa’s population has almost doubled, growing from about 550 million in 1985 to 1.2 billion in 2015.8 Going forward, the United Nation’s World Population Prospects, the 2015 Revision estimates that East and West Africa will continue growing at a similar rate in the future, bringing these two areas to almost double their population every 25 years.9 In almost all regions of Africa (except the Southern part), all segments of populations grow, but with a faster increase of the 15- to 39-year old cohort. The Southern Africa region instead will see a relative aging of the population, with an increase of the cohort aged 40+ and little growth of the younger cohorts. Overall, Africa’s population is expanding at a fast rate and its working-age population (15–64) has been increasing more than its total population since the 1990s. The upshot is that today Africa is the only region in the world where the working-age population is expected to continue expanding well beyond 2035, especially sub-Saharan Africa (see Figures 1a and 1b).
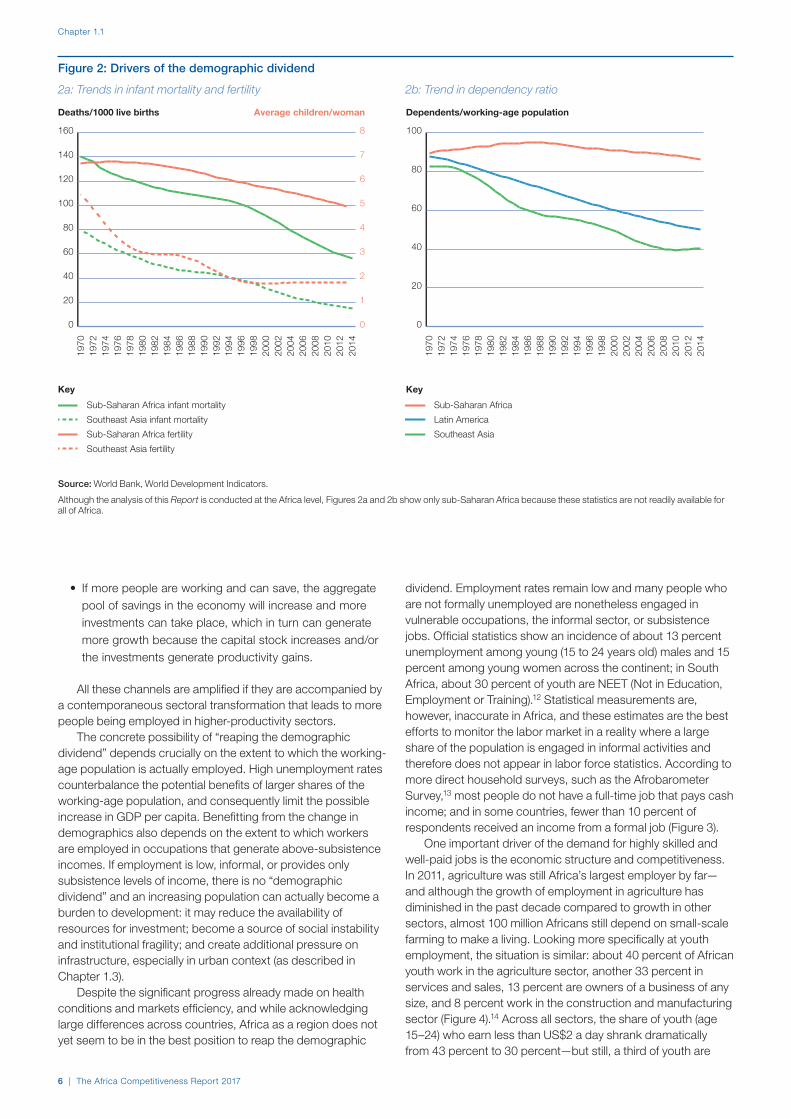
These trends in population have been sustained by improving health conditions with declining but still high fertility rates. One of the most successful Millennium Development Goals has been the reduction in child mortality by two-thirds between 1990 and 2015. Although more needs to be done, Africa has seen significant progress in reducing child mortality, which fell from 140 infant deaths per 1,000 live births to 56 between 1970 and 2014 (Figure 2a).
Fertility has also declined in Africa, from an average of about seven children per woman in 1970 to under five in 2015. However, this decline has been slow enough that—combined with the reduction in mortality—population growth in Africa has remained the fastest in the world. In economies where the
demographic dividend has taken place, fertility fell to fewer than three children per woman, so that dependency ratios (the share of children and elders to the working-age population) fell to less than 60 percent. In Africa, the persistently high fertility rate and dependency ratios that remain about 80 percent raise questions about the actual status of the demographic transition in Africa.
Assuming that such demographic change is taking place, the demographic dividend can generate competitiveness and additional growth through four main channels:10
• Output per capita can increase simply because a larger share of people is working. Since GDP per capita equals (Productivity) × (Employed workers)/[(Employed workers) + (Non-employed)], if the number of employed workers is proportional to the number of working-age population, the growth in GDP per capita is equal to the change in productivity plus the change in the share of employed workers to total population. Even if productivity remains constant, GDP per capita growth will be equal to the change in the share of employed workers.
• As birth rates decrease, families can invest more funds on education and health for each child, who will in turn become more skilled and productive once they enter the labor force.
• Because younger individuals tend to be more productive than older individuals, a larger share of young adults in the employed labor force tends to generate some productivity gain.11
–0.04
–0.03
–0.02
–0.01
0.00
0.01
0.02
0.03
0.04
2055
2050
2045
2040
2035
2030
2025
2020
2015
2010
2005
2000
1995
1990
1985
1980
1975
1970
1965
1960
1955
1950
Percent
0
300
600
900
1200
1500
2055
2050
2045
2040
2035
2030
2025
2020
2015
2010
2005
2000
1995
1990
1985
1980
1975
1970
1965
1960
1955
1950
Millions
Key
Sub-Saharan Africa
Southeast Asia
Latin America
Source: Author’s calculations, based on UN DESA, Population Division, 2015.
Although the analysis in this Report is conducted at the Africa level, (including both sub-Saharan Africa and North Africa), Figures 1a and 1b show only sub-Saharan Africa because it drives most of projected population growth after 2020.
Figure 1: Trend in working-age population (15–64) in Africa
1a: Working-age population (total) 1b: Change in working-age population share
The Africa Competitiveness Report 2017 | 5
Chapter 1.1
• If more people are working and can save, the aggregate pool of savings in the economy will increase and more investments can take place, which in turn can generate more growth because the capital stock increases and/or the investments generate productivity gains.
All these channels are amplified if they are accompanied by a contemporaneous sectoral transformation that leads to more people being employed in higher-productivity sectors.
The concrete possibility of “reaping the demographic dividend” depends crucially on the extent to which the working-age population is actually employed. High unemployment rates counterbalance the potential benefits of larger shares of the working-age population, and consequently limit the possible increase in GDP per capita. Benefitting from the change in demographics also depends on the extent to which workers are employed in occupations that generate above-subsistence incomes. If employment is low, informal, or provides only subsistence levels of income, there is no “demographic dividend” and an increasing population can actually become a burden to development: it may reduce the availability of resources for investment; become a source of social instability and institutional fragility; and create additional pressure on infrastructure, especially in urban context (as described in Chapter 1.3).
Despite the significant progress already made on health conditions and markets efficiency, and while acknowledging large differences across countries, Africa as a region does not yet seem to be in the best position to reap the demographic
dividend. Employment rates remain low and many people who are not formally unemployed are nonetheless engaged in vulnerable occupations, the informal sector, or subsistence jobs. Official statistics show an incidence of about 13 percent unemployment among young (15 to 24 years old) males and 15 percent among young women across the continent; in South Africa, about 30 percent of youth are NEET (Not in Education, Employment or Training).12 Statistical measurements are, however, inaccurate in Africa, and these estimates are the best efforts to monitor the labor market in a reality where a large share of the population is engaged in informal activities and therefore does not appear in labor force statistics. According to more direct household surveys, such as the Afrobarometer Survey,13 most people do not have a full-time job that pays cash income; and in some countries, fewer than 10 percent of respondents received an income from a formal job (Figure 3).
One important driver of the demand for highly skilled and well-paid jobs is the economic structure and competitiveness. In 2011, agriculture was still Africa’s largest employer by far—and although the growth of employment in agriculture has diminished in the past decade compared to growth in other sectors, almost 100 million Africans still depend on small-scale farming to make a living. Looking more specifically at youth employment, the situation is similar: about 40 percent of African youth work in the agriculture sector, another 33 percent in services and sales, 13 percent are owners of a business of any size, and 8 percent work in the construction and manufacturing sector (Figure 4).14 Across all sectors, the share of youth (age 15–24) who earn less than US$2 a day shrank dramatically from 43 percent to 30 percent—but still, a third of youth are
0
20
40
60
80
100
120
140
160
2014
2012
2010
2008
2006
2004
2002
2000
1998
1996
1994
1992
1990
1988
1986
1984
1982
1980
1978
1976
1974
1972
1970
Deaths/1000 live births Average children/woman
Key
Sub-Saharan Africa infant mortality
Southeast Asia infant mortality
Sub-Saharan Africa fertility
Southeast Asia fertility
0
1
2
3
4
5
6
7
8
0
20
40
60
80
100
2014
2012
2010
2008
2006
2004
2002
2000
1998
1996
1994
1992
1990
1988
1986
1984
1982
1980
1978
1976
1974
1972
1970
Dependents/working-age population
Key
Sub-Saharan Africa
Latin America
Southeast Asia
Source: World Bank, World Development Indicators.
Although the analysis of this Report is conducted at the Africa level, Figures 2a and 2b show only sub-Saharan Africa because these statistics are not readily available for all of Africa.
Figure 2: Drivers of the demographic dividend
2a: Trends in infant mortality and fertility 2b: Trend in dependency ratio
6 | The Africa Competitiveness Report 2017

Tracking Progress in Africa’s Competitiveness
poor and almost 60 percent of them earn less than US$3 a day.15
Employment growth in manufacturing, finance, tourism, and logistics are encouraging but not yet creating sufficient jobs to realize the demographic dividend. Migration statistics also show how young Africans under 30 are looking for better opportunities than their economies can offer. Migration of this cohort increased from around 24.3 million in 2005 to 32.6 million in 2015.16 Most of these people are searching for better job opportunities. About two-thirds (16.4 million) moved within Africa, especially to Côte d’Ivoire, Ethiopia, Kenya, Nigeria, and South Africa; another third (9.2 million) moved to Europe.17
How can more and better employment opportunities be created? And can it be done quickly enough to reap a demographic dividend, especially when growth is low? Based on the experience of Southeast Asia and Latin America, the demographic dividend window—the period during which the share of working-age population grows—is expected to last approximately 50 years. For Africa, given its still-high fertility levels, it may last longer. However, the first generation that could determine a demographic dividend scenario has already been born.
Africa needs to act now to put in place the structural changes necessary to build the foundations of more resilient and prosperous societies. It will not be possible to create employment and increase living standards without first boosting productivity, which in turn will allow economies to become more sophisticated and diversified across value chains. To make this happen, Africa needs to develop a
0
20
40
60
80
100
Percent
Gui
nea
Mal
iLe
osth
oB
urun
diN
iger
iaTo
goB
urki
na F
aso
Zam
bia
Sen
egal
Ben
inS
ierr
a Le
one
Côt
e d'
Ivoi
reS
waz
iland
Cam
eroo
nLi
bya
Zim
babw
eS
udan
Moz
ambi
que
Bot
swan
aTa
nzan
iaM
alaw
iM
adag
asca
rK
enya
Uga
nda
Nam
ibia
Egy
ptM
oroc
coS
outh
Afri
caTu
nisi
aC
ape
Verd
eA
lger
iaN
iger
Gha
naM
aurit
ius
Source: Afrobarometer, Round 5 (2011–13).
Figure 3: Respondents with a full-time job that pays cash income
0
20
40
60
80
100
Thousands
Key
■ 1990 ■ 2000 ■ 2010
Agr
icul
ture
Min
ing
Man
ufac
turin
g
Util
ities
Con
stru
ctio
n
Trad
e, to
uris
m
Tran
spor
t, st
orag
e
Fina
nce,
r.e.
, bus
ines
s se
rv.
Gov
. ser
vice
s
Com
mun
ity &
soc
ial s
erv.
–4
–2
0
2
4
6
8
10
Percent
Key
■ 1990–2000 ■ 2001–2010
Agr
icul
ture
Min
ing
Man
ufac
turin
g
Util
ities
Con
stru
ctio
n
Trad
e, to
uris
m
Tran
spor
t, st
orag
e
Fina
nce,
r.e.
, bus
ines
s se
rv.
Gov
. ser
vice
s
Com
mun
ity &
soc
ial s
erv.
Sources: The Groningen Growth and Development Centre (GGDC) 10-Sector Database, http://www.rug.nl/ggdc/productivity/10-sector/; de Vries et al. 2013.
Figure 4: Employment by sector
4a: Number of workers 4b: Growth in workers
The Africa Competitiveness Report 2017 | 7
Chapter 1.1
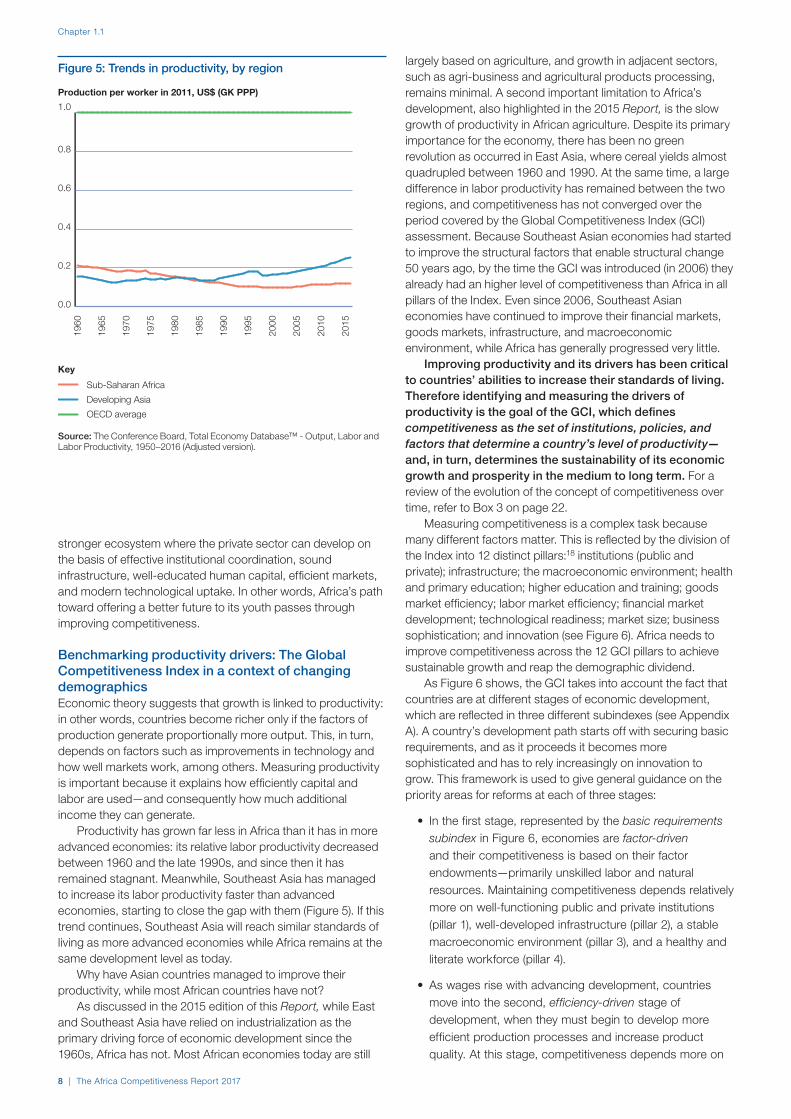
largely based on agriculture, and growth in adjacent sectors, such as agri-business and agricultural products processing, remains minimal. A second important limitation to Africa’s development, also highlighted in the 2015 Report, is the slow growth of productivity in African agriculture. Despite its primary importance for the economy, there has been no green revolution as occurred in East Asia, where cereal yields almost quadrupled between 1960 and 1990. At the same time, a large difference in labor productivity has remained between the two regions, and competitiveness has not converged over the period covered by the Global Competitiveness Index (GCI) assessment. Because Southeast Asian economies had started to improve the structural factors that enable structural change 50 years ago, by the time the GCI was introduced (in 2006) they already had an higher level of competitiveness than Africa in all pillars of the Index. Even since 2006, Southeast Asian economies have continued to improve their financial markets, goods markets, infrastructure, and macroeconomic environment, while Africa has generally progressed very little.
Improving productivity and its drivers has been critical to countries’ abilities to increase their standards of living. Therefore identifying and measuring the drivers of productivity is the goal of the GCI, which defines competitiveness as the set of institutions, policies, and factors that determine a country’s level of productivity—and, in turn, determines the sustainability of its economic growth and prosperity in the medium to long term. For a review of the evolution of the concept of competitiveness over time, refer to Box 3 on page 22.
Measuring competitiveness is a complex task because many different factors matter. This is reflected by the division of the Index into 12 distinct pillars:18 institutions (public and private); infrastructure; the macroeconomic environment; health and primary education; higher education and training; goods market efficiency; labor market efficiency; financial market development; technological readiness; market size; business sophistication; and innovation (see Figure 6). Africa needs to improve competitiveness across the 12 GCI pillars to achieve sustainable growth and reap the demographic dividend.
As Figure 6 shows, the GCI takes into account the fact that countries are at different stages of economic development, which are reflected in three different subindexes (see Appendix A). A country’s development path starts off with securing basic requirements, and as it proceeds it becomes more sophisticated and has to rely increasingly on innovation to grow. This framework is used to give general guidance on the priority areas for reforms at each of three stages:
• In the first stage, represented by the basic requirements subindex in Figure 6, economies are factor-driven and their competitiveness is based on their factor endowments—primarily unskilled labor and natural resources. Maintaining competitiveness depends relatively more on well-functioning public and private institutions (pillar 1), well-developed infrastructure (pillar 2), a stable macroeconomic environment (pillar 3), and a healthy and literate workforce (pillar 4).
• As wages rise with advancing development, countries move into the second, efficiency-driven stage of development, when they must begin to develop more efficient production processes and increase product quality. At this stage, competitiveness depends more on
0.0
0.2
0.4
0.6
0.8
1.0
2015
2010
2005
2000
1995
1990
1985
1980
1975
1970
1965
1960
Production per worker in 2011, US$ (GK PPP)
Key
Sub-Saharan Africa
Developing Asia
OECD average
Source: The Conference Board, Total Economy Database™ - Output, Labor and Labor Productivity, 1950–2016 (Adjusted version).
Figure 5: Trends in productivity, by region
stronger ecosystem where the private sector can develop on the basis of effective institutional coordination, sound infrastructure, well-educated human capital, efficient markets, and modern technological uptake. In other words, Africa’s path toward offering a better future to its youth passes through improving competitiveness.
Benchmarking productivity drivers: The Global Competitiveness Index in a context of changing demographicsEconomic theory suggests that growth is linked to productivity: in other words, countries become richer only if the factors of production generate proportionally more output. This, in turn, depends on factors such as improvements in technology and how well markets work, among others. Measuring productivity is important because it explains how efficiently capital and labor are used—and consequently how much additional income they can generate.
Productivity has grown far less in Africa than it has in more advanced economies: its relative labor productivity decreased between 1960 and the late 1990s, and since then it has remained stagnant. Meanwhile, Southeast Asia has managed to increase its labor productivity faster than advanced economies, starting to close the gap with them (Figure 5). If this trend continues, Southeast Asia will reach similar standards of living as more advanced economies while Africa remains at the same development level as today.
Why have Asian countries managed to improve their productivity, while most African countries have not?
As discussed in the 2015 edition of this Report, while East and Southeast Asia have relied on industrialization as the primary driving force of economic development since the 1960s, Africa has not. Most African economies today are still
8 | The Africa Competitiveness Report 2017

Tracking Progress in Africa’s Competitiveness
higher education and training (pillar 5), an efficient goods and services market (pillar 6), frictionless labor markets (pillar 7), developed financial markets (pillar 8), the ability to make use of the latest technological developments (pillar 9), and the size of the domestic and foreign markets available to the country’s companies (pillar 10).
• As countries move into the third, innovation-driven stage, they are able to sustain higher wages and the associated
level of productivity only if their businesses are able to compete with new and unique products and services. At this stage, companies must compete by using the most sophisticated management methods (pillar 11) and innovation (pillar 12).
The GCI classifies most African economies as factor-driven (Figure 7),19 suggesting that their competitiveness agenda should prioritize the fundamentals as the first necessary step
Figure 6: The structure of the GCI
Pillar 5. Higher education
and training
Pillar 6. Goods market efficiency
Pillar 7. Labor market efficiency
Pillar 8. Financial market
development
Pillar 9. Technological readiness
Pillar 10. Market size
Pillar 11. Business sophistication
Pillar 12. Innovation
Pillar 1. Institutions
Pillar 2. Infrastructure
Pillar 3. Macroeconomic environment
Pillar 4. Health and primary education
Key for
factor-driveneconomies
Key for
efficiency-driveneconomies
Key for
innovation-driveneconomies
Pillar 1. Institutions
Pillar 2. Infrastructure
Pillar 3. Macroeconomic
environment
Pillar 4. Health and primary
education
Pillar 11. Business sophistication
Pillar 12. Innovation
Pillar 5. Higher education and
training
Pillar 6. Goods market efficiency
Pillar 7. Labor market efficiency
Pillar 8. Financial market
development
Pillar 9. Technological readiness
Pillar 10. Market size
Basic requirements subindex
Efficiency enhancers subindex
Innovation and sophistication factors subindex
GLOBAL COMPETITIVENESS INDEX
Figure 7: African countries in the sample, by stage of development
Stage African countries Subindex weights
Stage 1 (factor-driven)GDP per capita <US$2,000
Mauritania, Benin, Burundi, Cameroon, Chad, Congo, Democratic Rep., Côte d’Ivoire, Ethiopia, Gambia, The, Ghana, Kenya, Lesotho, Liberia, Madagascar, Malawi, Mali, Mozambique, Rwanda, Senegal, Sierra Leone, Tanzania, Uganda, Zambia, Zimbabwe
Basic requirements (60%), Efficiency enhancers (35%)
Transition from 1 to 2 GDP per capita US$2,000–US$3,000
Algeria, Botswana, Gabon, Nigeria Basic requirements (between 40% and 60%), Efficiency enhancers (between 35% and 50%)
Stage 2 (efficiency-driven) GDP per capita US$3,000–US$9,000
Egypt, Morocco, Tunisia, Cape Verde, Namibia, South Africa
Basic requirements (40%), Efficiency enhancers (50%)
Transition from 2 to 3 GDP per capita US$9,000–US$17,000
Mauritius Basic requirements (between 20% and 40%), Efficiency enhancers (50%), Innovation factors (between 10% and 30%)
Stage 3 (innovation-driven) GDP per capita >US$17,000
——— Basic requirements (20%), Efficiency enhancers (50%), Innovation factors (30%)
Source: World Economic Forum 2016a.
The Africa Competitiveness Report 2017 | 9

Chapter 1.1
toward improving productivity. Four countries (Algeria, Botswana, Gabon, and Nigeria) are currently transitioning to the second (efficiency-driven) stage of development, and seven others have already reached that stage, where higher education and market efficiencies (goods, labor, and financial) play a more prominent role. Mauritius is currently the only African country transitioning to the innovation-driven stage. It is important to bear in mind that these classifications serve only as guidelines, and defining a holistic competitiveness agenda with clear policy suggestions should be based on a deeper country analysis that takes into account specific contexts and challenges.
The next section assesses Africa’s overall competitiveness and compares it with other relevant regions and countries. It covers the 35 African economies included in The Global Competitiveness Report 2016–2017 (GCR). The sample has changed slightly from the last edition of this Report: Democratic Republic of Congo was included in the GCR for the first time, and three previously covered countries—Guinea, Seychelles, and Swaziland—were omitted because of insufficient data from the Executive Opinion Survey, on which parts of the GCI are based.
Africa’s performance in an international contextThis section assesses Africa’s overall regional competitiveness performance over time and in comparison with other regions.20 A regional perspective is valuable because several African countries share development bottlenecks, and region-wide progress may have a positive effect on the development of individual economies through positive externalities from more dynamic neighboring economies.
Overall, Africa’s competitiveness performance has again stagnated, and the continent has fallen further behind advanced economies. Figure 8a compares the average of the
23 African economies included in the GCI since 2007 against the average of the 35 Organization of Economic Co-operation and Development (OECD) economies, representing the world’s most advanced economies, and Southeast Asia, the region that has developed most over the past 10 years while still sharing some characteristics with African economies.
Despite a 5 percent improvement, compared to 10 years ago in its GCI absolute score (Figure 8b), Africa’s gap with OECD countries has closed by less than 2 points in that time, and has started widening again this year (see Figure 8a). In contrast, the group of five economies of the Association of Southeast Asian Nation (ASEAN) assessed by the GCI—which are starting from a stronger position—have more quickly reduced their gap with advanced economies, with improvements in productivity leading to higher standards of living. In Africa, standards of living have improved only slightly compared with 10 years ago, reflecting lack of progress in creating a more conducive environment for private-sector development and economic transformation. In the past two years there has been even less dynamism in African economies, which have registered virtually no change in competitiveness performance.
Within the continent, East Africa, although starting from a low base, is the subregion that has managed to improve its competitiveness performance the most (it has gained 8 percent in score since 2007), followed by Southern Africa (it has gained 6 percent since 2007). West Africa and North Africa, after a short period of improvement, are today at the same level of competitiveness they used to be 10 years ago.
Similarly, competitiveness performances vary considerably between those economies that have traditionally relied heavily on mineral exports,21 which have registered almost no progress, and more diversified economies that have improved their average competitiveness score by about 5 percent.
Figure 8: Global Competitiveness Index, by region
8a: Ten-year trend 8b: Percent change
0
20
40
60
80
100
2016
–201
7
2015
–201
6
2014
–201
5
2013
–201
4
2012
–201
3
2011
–201
2
2010
–201
1
2009
–201
0
2008
–200
9
2007
–200
8
Relative distance from the OECD average
Key
Africa
ASEAN–5
OECD
1 2 3 4 5 6 7
Africa avg. score since ACR 2015
Africa avg. score since 2008
Units
Key
■ 2016–2017 ■ Previous period
+5%
0%
Source: World Economic Forum, The Global Competitiveness Report, various editions.
10 | The Africa Competitiveness Report 2017
Tracking Progress in Africa’s Competitiveness
1
2
3
4
5
6
7
Best performingOECD averageAfrica median Worst performing
MauritiusMauritius
Mauritius
Mauritius
Mauritius
Rwanda
Botswana
RwandaSouthAfrica
SouthAfrica
SouthAfrica
SouthAfrica
Egypt
Mauritania
Congo,Dem. Rep.
Nigeria
Mauritania
Chad Egypt
Malawi
Chad
MauritaniaChad
Mauritania
Mauritania
Gambia, The
Inno
vatio
n
Bus
ines
sso
phi
stic
atio
n
Mar
ket s
ize
Tech
nolg
ical
read
ines
s
Fina
ncia
l mar
ket
dev
elop
men
t
Lab
or m
arke
tef
ficie
ncy
Goo
ds
mar
ket
effic
ienc
y
Hig
her
edu
and
trai
ning
Hea
lth a
ndp[
rimar
y ed
u
Mac
roec
onom
icen
viro
nmen
t
Infr
astr
uctu
re
Inst
itutio
ns
GC
I
GCI Score (1–7)
Source: World Economic Forum 2016a.
Figure 10: GCI score dispersion among African economies, OECD comparison
At the country level, against the weak regional outlook a handful of countries are expected to continue to grow in GDP at a sustained rate (Figures 9a and 9b). Côte d’Ivoire, Ethiopia, Rwanda, and Tanzania are all expected to grow at an average rate of close to 7 percent over the next few years. These countries have managed to diversify their economies a bit more than others in the region, and have made significant efforts to improve competitiveness. On average, there is a correlation between countries having improved their competitiveness levels in recent years and those able to expect faster growth rates in
the future. These results suggest that, if supported by the right policies, African economies can maintain high economic growth despite headwinds from external factors.
Pillar analysisThe differences among African countries are particularly stark when observing performance differences across the GCI pillars. Figure 10 summarizes the distance between the best and the worst performers in Africa on each of the 12 components of the GCI, and shows how large the differences between countries in
Country
Expected average GDP growth 2017–
2018 (percent change)
Change in GCI score between 2014–2015 and
2016–2017 (score change)
Ethiopia 8.1% 0.17 Second most improved
Côte d'Ivoire 7.6% 0.19 Most improved
Tanzania 7.0% 0.11 Seventh most improved
Senegal 6.9% 0.04 Fifteenth most improved
Rwanda 6.5% 0.13 Fourth most improved –0.04 0.00 0.04 0.08
Average GCI score change in African countries withexpected GDP growth
lower than 5% (2016–2020)
Average GCI score change in African countries with
expected GDP growth greater than or equal to 5%
(2016–2020)
GCI average performance
+0.06%
–0.03%
Source: Africa Development Bank Group, African Economic Outlook projections 2016–2018; World Economic Forum 2016a.
Figure 9: Performance of African countries on the Global Competitiveness Index
9a: High expected GDP growth and GCI performance 9b: GDP growth forecast and improvement in GCI score
The Africa Competitiveness Report 2017 | 11
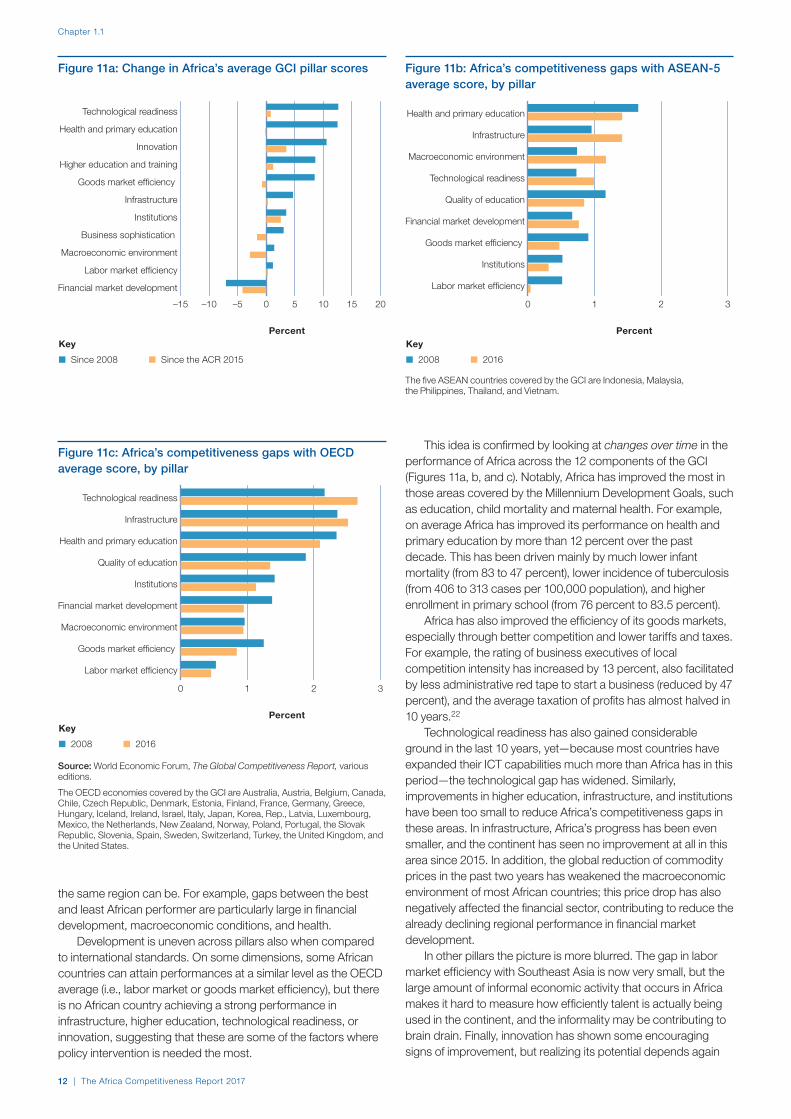
Chapter 1.1
the same region can be. For example, gaps between the best and least African performer are particularly large in financial development, macroeconomic conditions, and health.
Development is uneven across pillars also when compared to international standards. On some dimensions, some African countries can attain performances at a similar level as the OECD average (i.e., labor market or goods market efficiency), but there is no African country achieving a strong performance in infrastructure, higher education, technological readiness, or innovation, suggesting that these are some of the factors where policy intervention is needed the most.
This idea is confirmed by looking at changes over time in the performance of Africa across the 12 components of the GCI (Figures 11a, b, and c). Notably, Africa has improved the most in those areas covered by the Millennium Development Goals, such as education, child mortality and maternal health. For example, on average Africa has improved its performance on health and primary education by more than 12 percent over the past decade. This has been driven mainly by much lower infant mortality (from 83 to 47 percent), lower incidence of tuberculosis (from 406 to 313 cases per 100,000 population), and higher enrollment in primary school (from 76 percent to 83.5 percent).
Africa has also improved the efficiency of its goods markets, especially through better competition and lower tariffs and taxes. For example, the rating of business executives of local competition intensity has increased by 13 percent, also facilitated by less administrative red tape to start a business (reduced by 47 percent), and the average taxation of profits has almost halved in 10 years.22
Technological readiness has also gained considerable ground in the last 10 years, yet—because most countries have expanded their ICT capabilities much more than Africa has in this period—the technological gap has widened. Similarly, improvements in higher education, infrastructure, and institutions have been too small to reduce Africa’s competitiveness gaps in these areas. In infrastructure, Africa’s progress has been even smaller, and the continent has seen no improvement at all in this area since 2015. In addition, the global reduction of commodity prices in the past two years has weakened the macroeconomic environment of most African countries; this price drop has also negatively affected the financial sector, contributing to reduce the already declining regional performance in financial market development.
In other pillars the picture is more blurred. The gap in labor market efficiency with Southeast Asia is now very small, but the large amount of informal economic activity that occurs in Africa makes it hard to measure how efficiently talent is actually being used in the continent, and the informality may be contributing to brain drain. Finally, innovation has shown some encouraging signs of improvement, but realizing its potential depends again
The five ASEAN countries covered by the GCI are Indonesia, Malaysia, the Philippines, Thailand, and Vietnam.
–15 –10 –5 0 5 10 15 20
since last report
since 2008
Financial market development
Labor market efficiency
Macroeconomic environment
Business sophistication
Institutions
Infrastructure
Goods market efficiency
Higher education and training
Innovation
Health and primary education
Technological readiness
Key
■ Since 2008 ■ Since the ACR 2015
Percent
Figure 11a: Change in Africa’s average GCI pillar scores
0 1 2 3
2016a
2008a
Labor market efficiency
Institutions
Goods market efficiency
Financial market development
Quality of education
Technological readiness
Macroeconomic environment
Infrastructure
Health and primary education
Key
■ 2008 ■ 2016
Percent
Figure 11b: Africa’s competitiveness gaps with ASEAN-5 average score, by pillar
Source: World Economic Forum, The Global Competitiveness Report, various editions.
The OECD economies covered by the GCI are Australia, Austria, Belgium, Canada, Chile, Czech Republic, Denmark, Estonia, Finland, France, Germany, Greece, Hungary, Iceland, Ireland, Israel, Italy, Japan, Korea, Rep., Latvia, Luxembourg, Mexico, the Netherlands, New Zealand, Norway, Poland, Portugal, the Slovak Republic, Slovenia, Spain, Sweden, Switzerland, Turkey, the United Kingdom, and the United States.
0 1 2 3
2008a
2016a
Labor market efficiency
Goods market efficiency
Macroeconomic environment
Financial market development
Institutions
Quality of education
Health and primary education
Infrastructure
Technological readiness
Key
■ 2008 ■ 2016
Percent
Figure 11c: Africa’s competitiveness gaps with OECD average score, by pillar
12 | The Africa Competitiveness Report 2017
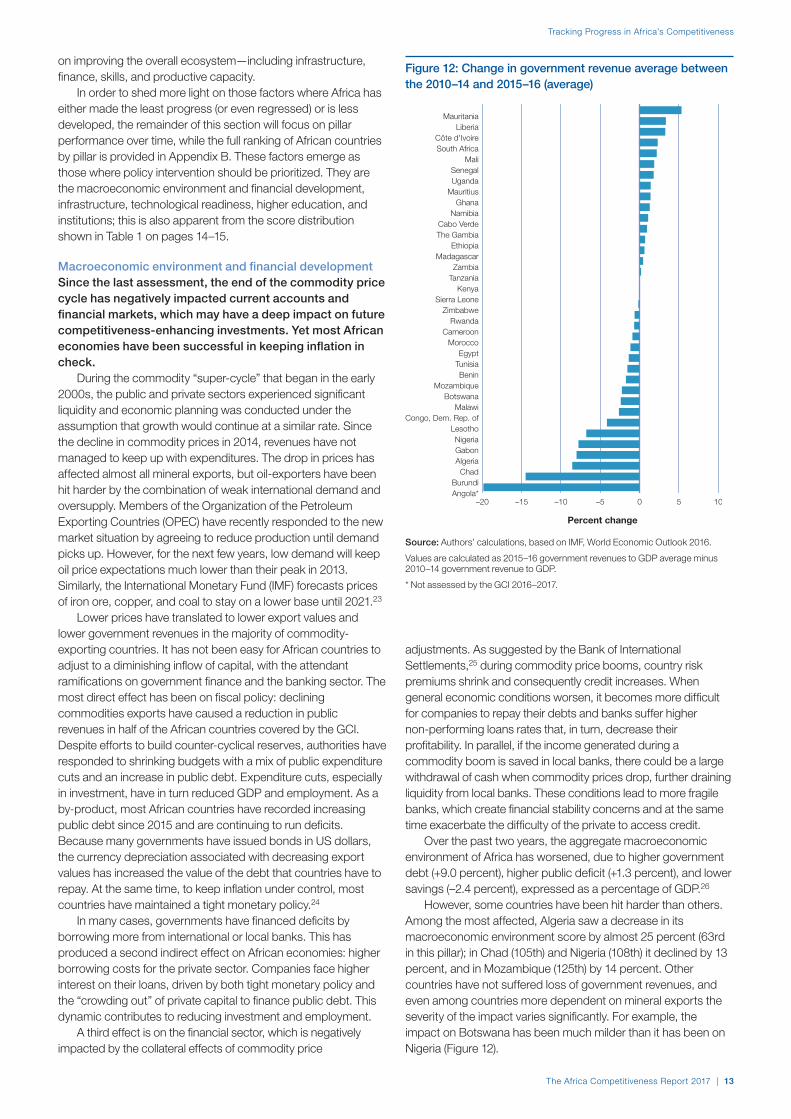
Tracking Progress in Africa’s Competitiveness
on improving the overall ecosystem—including infrastructure, finance, skills, and productive capacity.
In order to shed more light on those factors where Africa has either made the least progress (or even regressed) or is less developed, the remainder of this section will focus on pillar performance over time, while the full ranking of African countries by pillar is provided in Appendix B. These factors emerge as those where policy intervention should be prioritized. They are the macroeconomic environment and financial development, infrastructure, technological readiness, higher education, and institutions; this is also apparent from the score distribution shown in Table 1 on pages 14–15.
Macroeconomic environment and financial developmentSince the last assessment, the end of the commodity price cycle has negatively impacted current accounts and financial markets, which may have a deep impact on future competitiveness-enhancing investments. Yet most African economies have been successful in keeping inflation in check.
During the commodity “super-cycle” that began in the early 2000s, the public and private sectors experienced significant liquidity and economic planning was conducted under the assumption that growth would continue at a similar rate. Since the decline in commodity prices in 2014, revenues have not managed to keep up with expenditures. The drop in prices has affected almost all mineral exports, but oil-exporters have been hit harder by the combination of weak international demand and oversupply. Members of the Organization of the Petroleum Exporting Countries (OPEC) have recently responded to the new market situation by agreeing to reduce production until demand picks up. However, for the next few years, low demand will keep oil price expectations much lower than their peak in 2013. Similarly, the International Monetary Fund (IMF) forecasts prices of iron ore, copper, and coal to stay on a lower base until 2021.23
Lower prices have translated to lower export values and lower government revenues in the majority of commodity-exporting countries. It has not been easy for African countries to adjust to a diminishing inflow of capital, with the attendant ramifications on government finance and the banking sector. The most direct effect has been on fiscal policy: declining commodities exports have caused a reduction in public revenues in half of the African countries covered by the GCI. Despite efforts to build counter-cyclical reserves, authorities have responded to shrinking budgets with a mix of public expenditure cuts and an increase in public debt. Expenditure cuts, especially in investment, have in turn reduced GDP and employment. As a by-product, most African countries have recorded increasing public debt since 2015 and are continuing to run deficits. Because many governments have issued bonds in US dollars, the currency depreciation associated with decreasing export values has increased the value of the debt that countries have to repay. At the same time, to keep inflation under control, most countries have maintained a tight monetary policy.24
In many cases, governments have financed deficits by borrowing more from international or local banks. This has produced a second indirect effect on African economies: higher borrowing costs for the private sector. Companies face higher interest on their loans, driven by both tight monetary policy and the “crowding out” of private capital to finance public debt. This dynamic contributes to reducing investment and employment.
A third effect is on the financial sector, which is negatively impacted by the collateral effects of commodity price
adjustments. As suggested by the Bank of International Settlements,25 during commodity price booms, country risk premiums shrink and consequently credit increases. When general economic conditions worsen, it becomes more difficult for companies to repay their debts and banks suffer higher non-performing loans rates that, in turn, decrease their profitability. In parallel, if the income generated during a commodity boom is saved in local banks, there could be a large withdrawal of cash when commodity prices drop, further draining liquidity from local banks. These conditions lead to more fragile banks, which create financial stability concerns and at the same time exacerbate the difficulty of the private to access credit.
Over the past two years, the aggregate macroeconomic environment of Africa has worsened, due to higher government debt (+9.0 percent), higher public deficit (+1.3 percent), and lower savings (–2.4 percent), expressed as a percentage of GDP.26
However, some countries have been hit harder than others. Among the most affected, Algeria saw a decrease in its macroeconomic environment score by almost 25 percent (63rd in this pillar); in Chad (105th) and Nigeria (108th) it declined by 13 percent, and in Mozambique (125th) by 14 percent. Other countries have not suffered loss of government revenues, and even among countries more dependent on mineral exports the severity of the impact varies significantly. For example, the impact on Botswana has been much milder than it has been on Nigeria (Figure 12).
–20 –15 –10 –5 0 5 10Angola*Burundi
ChadAlgeriaGabonNigeria
LesothoCongo, Dem. Rep. of
MalawiBotswana
MozambiqueBenin
TunisiaEgypt
MoroccoCameroon
RwandaZimbabwe
Sierra LeoneKenya
TanzaniaZambia
MadagascarEthiopia
The GambiaCabo Verde
NamibiaGhana
MauritiusUgandaSenegal
MaliSouth AfricaCôte d'Ivoire
LiberiaMauritania
Percent change
Source: Authors’ calculations, based on IMF, World Economic Outlook 2016.
Values are calculated as 2015–16 government revenues to GDP average minus 2010–14 government revenue to GDP.
* Not assessed by the GCI 2016–2017.
Figure 12: Change in government revenue average between the 2010–14 and 2015–16 (average)
The Africa Competitiveness Report 2017 | 13

Chapter 1.1
Basic requirements
Efficiency enhancers
Innovation and sophistication factors
CountryGlobal
Competitiveness Index1st pillar:
Institutions2nd pillar:
Infrastructure
3rd pillar: Macroeconomic
environment
4th pillar: Health and primary
education Country
5th pillar: Higher
education and training
6th pillar: Goods market
efficiency
7th pillar: Labor market
efficiency
8th pillar: Financial market
development
9th pillar: Technological
readiness10th pillar: Market size
11th pillar: Business
sophistication 12th pillar: Innovation
MIDDLE INCOME MIDDLE INCOME (cont’d.)
Mauritius 4.49 4.50 4.74 4.89 6.06 Mauritius 4.68 4.89 4.39 4.28 4.16 2.71 4.35 3.33
South Africa 4.47 4.46 4.18 4.52 4.30 South Africa 4.21 4.76 3.94 5.19 4.70 4.89 4.51 3.84
Botswana 4.29 4.50 3.49 6.18 4.66 Botswana 4.07 4.29 4.54 3.99 3.57 2.88 3.61 3.22
Morocco 4.19 4.21 4.25 5.07 5.63 Morocco 3.55 4.37 3.54 3.79 3.69 4.26 3.81 3.11
Namibia 4.01 4.47 4.09 4.58 4.56 Namibia 3.32 4.23 4.61 4.22 3.56 2.76 3.72 3.28
Tunisia 3.92 3.81 3.73 4.16 5.92 Tunisia 4.01 3.93 3.24 3.21 3.72 3.78 3.61 3.03
Cape Verde 3.76 3.96 3.39 4.01 5.92 Cape Verde 4.14 4.07 3.67 3.37 3.75 1.37 3.52 3.10
Senegal 3.74 3.96 3.01 4.27 4.18 Senegal 3.29 4.19 3.97 3.71 3.16 2.92 3.85 3.48
Ghana 3.67 3.94 2.87 2.89 4.64 Ghana 3.77 4.15 4.22 3.78 3.38 3.70 3.91 3.31
Egypt 3.67 3.64 3.36 2.68 5.45 Egypt 3.26 3.95 3.15 3.38 3.26 5.02 3.70 2.74
Zambia 3.60 4.02 2.43 4.00 4.21 Zambia 2.99 4.20 3.99 3.78 2.83 3.24 3.54 3.33
Lesotho 3.57 4.17 2.61 5.33 3.49 Lesotho 3.03 4.17 3.95 2.61 2.66 1.90 3.50 2.94
Middle-income average 3.95 4.14 3.51 4.38 4.92 Middle-income average 3.69 4.27 3.93 3.77 3.54 3.29 3.80 3.23
LOW INCOME LOW INCOME (cont’d.)
Rwanda 4.40 5.56 3.34 4.51 5.54 Rwanda 3.22 4.67 5.36 4.59 3.24 2.44 3.96 3.56
Kenya 3.89 3.64 3.34 3.56 4.65 Kenya 3.85 4.23 4.61 4.20 3.55 3.73 4.23 3.83
Ethiopia 3.76 3.85 2.76 4.52 4.71 Ethiopia 2.78 4.00 4.24 3.50 2.42 3.83 3.66 3.39
Uganda 3.68 3.54 2.43 4.59 4.58 Uganda 2.73 3.91 4.65 3.87 2.77 3.37 3.48 3.25
Tanzania 3.67 3.76 2.67 4.62 4.23 Tanzania 2.60 3.92 4.33 3.54 2.59 3.72 3.53 3.19
Gambia, The 3.47 4.18 3.41 2.82 3.84 Gambia, The 3.38 4.20 4.49 3.52 2.92 1.34 3.84 2.99
Benin 3.46 3.53 2.22 3.95 4.63 Benin 3.08 3.72 4.42 3.46 2.48 2.58 3.39 3.21
Mali 3.46 3.50 2.86 4.95 2.99 Mali 2.92 3.97 3.77 3.42 2.84 2.82 3.37 3.15
Liberia 3.20 3.80 2.61 3.28 3.09 Liberia 2.73 4.17 4.21 3.88 2.43 1.69 3.66 3.16
Sierra Leone 3.16 3.24 2.32 3.55 4.09 Sierra Leone 2.56 3.77 3.79 3.10 2.41 2.08 3.14 2.59
Mozambique 3.12 3.15 2.47 3.48 3.48 Mozambique 2.28 3.87 3.98 2.97 2.54 2.99 3.19 2.84
Malawi 3.07 3.54 1.88 2.11 4.56 Malawi 2.61 3.80 4.53 3.25 2.25 2.54 3.28 2.81
Low-income average 3.53 3.77 2.69 3.83 4.20 Low-income average 2.90 4.02 4.36 3.61 2.70 2.76 3.56 3.16
FRAGILE FRAGILE (cont’d.)
Côte d’Ivoire 3.86 3.82 3.61 4.73 3.70 Côte d’Ivoire 3.35 4.16 4.18 3.87 3.38 3.40 3.67 3.38
Zimbabwe 3.40 3.34 2.49 4.12 4.56 Zimbabwe 3.15 3.54 3.37 3.07 2.72 2.71 3.17 2.61
Madagascar 3.32 3.09 1.96 4.11 4.31 Madagascar 2.85 3.80 4.39 3.13 2.48 2.88 3.31 3.11
Burundi 3.05 2.88 1.92 3.54 4.75 Burundi 2.29 3.62 4.13 2.56 2.01 1.69 3.07 2.54
Mauritania 2.94 2.81 2.18 4.02 3.83 Mauritania 1.90 3.21 3.25 2.21 2.31 2.42 2.55 2.19
Fragile average 3.32 3.19 2.43 4.10 4.23 Fragile average 2.71 3.67 3.86 2.97 2.58 2.62 3.15 2.77
OIL-EXPORTING OIL-EXPORTING (cont’d.)
Algeria 3.98 3.50 3.27 4.82 5.71 Algeria 3.86 3.51 3.24 2.88 3.07 4.72 3.31 2.92
Gabon 3.78 3.72 3.09 5.55 4.84 Gabon 2.97 3.73 3.88 3.49 3.06 2.81 3.16 2.70
Cameroon 3.58 3.49 2.15 4.24 4.67 Cameroon 3.43 3.97 4.16 3.65 2.59 3.29 3.48 3.18
Nigeria 3.39 3.28 2.09 4.01 2.84 Nigeria 2.86 4.07 4.53 3.69 3.14 4.99 3.61 2.89
Congo, Democratic Rep. 3.28 3.29 1.72 4.79 3.48 Congo, Democratic Rep. 2.77 3.71 4.40 3.24 2.29 3.16 3.16 2.84
Chad 2.94 2.68 1.75 4.06 3.83 Chad 2.20 2.99 3.78 2.88 1.93 2.75 2.70 2.49
Oil-exporting average 3.49 3.32 2.34 4.58 4.23 Oil-exporting average 3.02 3.66 4.00 3.30 2.68 3.62 3.24 2.84
(Continued)Source: World Economic Forum 2016a.
Colors are based on the score distribution of each pillar at the global level. Scores are computed on a 1-to-7 scale.
Table 1: The Global Competitiveness Index 2016–2017, selected pillars: Score dispersion among African economies
14 | The Africa Competitiveness Report 2017

Tracking Progress in Africa’s Competitiveness
Basic requirements
Efficiency enhancers
Innovation and sophistication factors
CountryGlobal
Competitiveness Index1st pillar:
Institutions2nd pillar:
Infrastructure
3rd pillar: Macroeconomic
environment
4th pillar: Health and primary
education Country
5th pillar: Higher
education and training
6th pillar: Goods market
efficiency
7th pillar: Labor market
efficiency
8th pillar: Financial market
development
9th pillar: Technological
readiness10th pillar: Market size
11th pillar: Business
sophistication 12th pillar: Innovation
MIDDLE INCOME MIDDLE INCOME (cont’d.)
Mauritius 4.49 4.50 4.74 4.89 6.06 Mauritius 4.68 4.89 4.39 4.28 4.16 2.71 4.35 3.33
South Africa 4.47 4.46 4.18 4.52 4.30 South Africa 4.21 4.76 3.94 5.19 4.70 4.89 4.51 3.84
Botswana 4.29 4.50 3.49 6.18 4.66 Botswana 4.07 4.29 4.54 3.99 3.57 2.88 3.61 3.22
Morocco 4.19 4.21 4.25 5.07 5.63 Morocco 3.55 4.37 3.54 3.79 3.69 4.26 3.81 3.11
Namibia 4.01 4.47 4.09 4.58 4.56 Namibia 3.32 4.23 4.61 4.22 3.56 2.76 3.72 3.28
Tunisia 3.92 3.81 3.73 4.16 5.92 Tunisia 4.01 3.93 3.24 3.21 3.72 3.78 3.61 3.03
Cape Verde 3.76 3.96 3.39 4.01 5.92 Cape Verde 4.14 4.07 3.67 3.37 3.75 1.37 3.52 3.10
Senegal 3.74 3.96 3.01 4.27 4.18 Senegal 3.29 4.19 3.97 3.71 3.16 2.92 3.85 3.48
Ghana 3.67 3.94 2.87 2.89 4.64 Ghana 3.77 4.15 4.22 3.78 3.38 3.70 3.91 3.31
Egypt 3.67 3.64 3.36 2.68 5.45 Egypt 3.26 3.95 3.15 3.38 3.26 5.02 3.70 2.74
Zambia 3.60 4.02 2.43 4.00 4.21 Zambia 2.99 4.20 3.99 3.78 2.83 3.24 3.54 3.33
Lesotho 3.57 4.17 2.61 5.33 3.49 Lesotho 3.03 4.17 3.95 2.61 2.66 1.90 3.50 2.94
Middle-income average 3.95 4.14 3.51 4.38 4.92 Middle-income average 3.69 4.27 3.93 3.77 3.54 3.29 3.80 3.23
LOW INCOME LOW INCOME (cont’d.)
Rwanda 4.40 5.56 3.34 4.51 5.54 Rwanda 3.22 4.67 5.36 4.59 3.24 2.44 3.96 3.56
Kenya 3.89 3.64 3.34 3.56 4.65 Kenya 3.85 4.23 4.61 4.20 3.55 3.73 4.23 3.83
Ethiopia 3.76 3.85 2.76 4.52 4.71 Ethiopia 2.78 4.00 4.24 3.50 2.42 3.83 3.66 3.39
Uganda 3.68 3.54 2.43 4.59 4.58 Uganda 2.73 3.91 4.65 3.87 2.77 3.37 3.48 3.25
Tanzania 3.67 3.76 2.67 4.62 4.23 Tanzania 2.60 3.92 4.33 3.54 2.59 3.72 3.53 3.19
Gambia, The 3.47 4.18 3.41 2.82 3.84 Gambia, The 3.38 4.20 4.49 3.52 2.92 1.34 3.84 2.99
Benin 3.46 3.53 2.22 3.95 4.63 Benin 3.08 3.72 4.42 3.46 2.48 2.58 3.39 3.21
Mali 3.46 3.50 2.86 4.95 2.99 Mali 2.92 3.97 3.77 3.42 2.84 2.82 3.37 3.15
Liberia 3.20 3.80 2.61 3.28 3.09 Liberia 2.73 4.17 4.21 3.88 2.43 1.69 3.66 3.16
Sierra Leone 3.16 3.24 2.32 3.55 4.09 Sierra Leone 2.56 3.77 3.79 3.10 2.41 2.08 3.14 2.59
Mozambique 3.12 3.15 2.47 3.48 3.48 Mozambique 2.28 3.87 3.98 2.97 2.54 2.99 3.19 2.84
Malawi 3.07 3.54 1.88 2.11 4.56 Malawi 2.61 3.80 4.53 3.25 2.25 2.54 3.28 2.81
Low-income average 3.53 3.77 2.69 3.83 4.20 Low-income average 2.90 4.02 4.36 3.61 2.70 2.76 3.56 3.16
FRAGILE FRAGILE (cont’d.)
Côte d’Ivoire 3.86 3.82 3.61 4.73 3.70 Côte d’Ivoire 3.35 4.16 4.18 3.87 3.38 3.40 3.67 3.38
Zimbabwe 3.40 3.34 2.49 4.12 4.56 Zimbabwe 3.15 3.54 3.37 3.07 2.72 2.71 3.17 2.61
Madagascar 3.32 3.09 1.96 4.11 4.31 Madagascar 2.85 3.80 4.39 3.13 2.48 2.88 3.31 3.11
Burundi 3.05 2.88 1.92 3.54 4.75 Burundi 2.29 3.62 4.13 2.56 2.01 1.69 3.07 2.54
Mauritania 2.94 2.81 2.18 4.02 3.83 Mauritania 1.90 3.21 3.25 2.21 2.31 2.42 2.55 2.19
Fragile average 3.32 3.19 2.43 4.10 4.23 Fragile average 2.71 3.67 3.86 2.97 2.58 2.62 3.15 2.77
OIL-EXPORTING OIL-EXPORTING (cont’d.)
Algeria 3.98 3.50 3.27 4.82 5.71 Algeria 3.86 3.51 3.24 2.88 3.07 4.72 3.31 2.92
Gabon 3.78 3.72 3.09 5.55 4.84 Gabon 2.97 3.73 3.88 3.49 3.06 2.81 3.16 2.70
Cameroon 3.58 3.49 2.15 4.24 4.67 Cameroon 3.43 3.97 4.16 3.65 2.59 3.29 3.48 3.18
Nigeria 3.39 3.28 2.09 4.01 2.84 Nigeria 2.86 4.07 4.53 3.69 3.14 4.99 3.61 2.89
Congo, Democratic Rep. 3.28 3.29 1.72 4.79 3.48 Congo, Democratic Rep. 2.77 3.71 4.40 3.24 2.29 3.16 3.16 2.84
Chad 2.94 2.68 1.75 4.06 3.83 Chad 2.20 2.99 3.78 2.88 1.93 2.75 2.70 2.49
Oil-exporting average 3.49 3.32 2.34 4.58 4.23 Oil-exporting average 3.02 3.66 4.00 3.30 2.68 3.62 3.24 2.84
(Continued)
Table 1: The Global Competitiveness Index 2016–2017, selected pillars (continued)
The Africa Competitiveness Report 2017 | 15

Chapter 1.1
In general, countries that have put in place sound fiscal and monetary policies—keeping inflation, debt, and current accounts in check—have tended to see improvements in their macroeconomic environment, counterbalancing the negative effects of shrinking revenues. This is an aspect where many African countries have improved significantly, having better control of inflation and government accounts compared to 20 years ago, and in some cases achieving a performance in line with advanced economies. For example, despite a significant reduction of government revenue and consequential doubling debt over the past two years, Gabon (25th) still has a low inflation rate, relatively high national savings, and a contained budget deficit. Botswana, also impacted by shrinking mineral exports, ranks 10th globally thanks to good management of its resource fund, low public debt and inflation, and high national savings. As a result, Botswana and Gabon, followed by Mauritius, have developed the soundest macroeconomic environments in Africa.
As discussed above, macroeconomic conditions in general and public revenue in particular are having a significant impact on the banking sector. Not surprisingly, the countries where the soundness of banks assessment has declined the most are those affected the most by commodity price adjustments: Lesotho (137th), Botswana (68th), Gabon (89th), Nigeria (83rd), and Chad (130th) are the five countries that have lost most ground in terms of banks’ soundness.
Beyond the specific banking channel, financial markets in Africa—despite some efforts to increase depth27—have generally become less strong. More than half of the countries assessed by the GCI have seen their performance decline in the financial market development pillar compared to two years ago, and a total of 19 countries rank lower than the 100th position. South Africa (ranked 11th in this pillar) is the only strong regional financial center, and its banks have not yet been affected significantly by commodity price shocks; it ranks 2nd
in the soundness of its banks. Rwanda’s financial market (32nd) is continuing the progress it began in 2008 after a liquidity crisis forced the government to intervene; since then, the country’s banks have taken considerable steps forward to improve their breadth and update their financial products offerings. Yet Rwanda remains at a considerable distance from South Africa in terms of size and depth, and its banks have been somewhat affected by declining government revenues.
How does macroeconomic and financial development impact the chance of reaping the demographic dividend? The simultaneous reduction in public funds (Figure 13), due to government budget cuts, and in private funds, due to lower bank credit availability, will translate into less availability of finance for infrastructure building, innovation, skills development, and company expansion. This in turn limits the employment opportunity outlook and the skills level of the workforce in the longer run. At the same time, increased volatility in financial markets might further discourage private investments and capital inflow on the continent, hindering economic activity and employment prospects.
InfrastructureThe development of transport and energy infrastructure has stagnated, widening the gap with advanced economies and developing Asia. Africa’s performance in transport infrastructure quality has dropped by 6 percent while ASEAN has, on average, improved by 7 percent. As a result, the gap between Africa and ASEAN has almost doubled in the last decade. Similarly, the assessment of African executives of the quality of the energy supply has dropped by almost 3 percent over the past 10 years, increasing the gap with OECD and ASEAN by a proportional amount.
Physical capital has built up in Africa, especially after the mid-2000s, but on a much slower trajectory than in other developing areas such as developing Asia (Figure 14). Progress
0
10
20
30
40
50
60
70
80
2014
2012
2010
2008
2006
2004
2002
2000
1998
1996
1994
1992
1990
1988
1986
1984
1982
1980
2011 US$ PPP
Key
Africa
Southeast Asia
Source: World Bank, World Development Indicators, http://data.worldbank.org/data-catalog/world-development-indicators
Figure 14: Physical capital stock per person employed
10
20
30
40
50
60
70
80
2020
2018
2016
2014
2012
2010
2008
2006
2004
2002
2000
Units
Key
General government gross debt (% GDP)
General government total expenditure (% GDP)
General government revenue (% GDP)
Source: IMF, World Economic Outlook, October 2016.
Figure 13: Trends in public finance, sub-Saharan Africa aggregate
16 | The Africa Competitiveness Report 2017

Tracking Progress in Africa’s Competitiveness
has differed widely across types of fixed capital: the region’s development of water, electricity, and transport infrastructure has been reported as “limited” or “disappointing” by various international organizations,28 although comparatively better outcomes have been seen in telephony and communication and, to some extent, sanitation. Overall, infrastructure continues to be rated as one of the top three constraints for Africa’s development.
According to the opinion of African business leaders, only the quality of roads has improved over the past 10 years, while the quality of ports, airports, and electricity infrastructure has remained poor (see Figure 15). In some cases new investments are just sufficient to keep up with increasing demand but not sufficient to reach the level required to support economic growth. For example, electricity production has expanded overall but is at the same per capita level as it was in 2007.
Certainly, financial limits remain an important constraint, especially in a low-growth scenario. Public-sector intervention is necessary to finance transport and electricity infrastructure because this type of infrastructure is complex and often requires large investments, making it less attractive to private-sector involvement, especially when weak institutions lack the capacity to lead effective coordination. The particular financial characteristics of transport and energy projects explain why it was not possible for these sectors to achieve the same fast development and private-sector participation observed in telecommunication infrastructure building (see the next section). Even while acknowledging these challenges and public budget constraints, the total investment in infrastructure is insufficient to bridge the infrastructure gap. According to a recent report, the public and private sectors together have invested an average of US$90 billion a year between 2012 and 2015;29 in contrast, the Chinese government alone is planning to invest about US$240 billion a year over the next
three years to improve its infrastructure.30 Regulatory or institutional bottlenecks are at times more problematic hurdles than scarcity of financial means. The African Development Bank has been encountering significant difficulties in disbursing its loans and grants, half of which are committed to infrastructure building. From 93.8 percent of the total funds allocated in 2012, disbursement declined to 70.1 percent in 2014.31
Tighter public budgets and banking sector liquidity will make financing gaps even wider, raising the need for new solutions. Recent experience in Africa shows that private-sector investment and public-private partnerships have played only a marginal role in building transport and utility infrastructure, so new models for public finance have to be found. The first step could be the optimization of existing resources: as suggested by a case study in Nigeria, public-private partnerships, at times effective, can also sometimes lead to “waste of resources due to project delay and cost escalation”— which slows the completion of infrastructure projects.32 Other possible solutions that emerged from the series of Africa competitiveness workshops (see Box 1) in 2016 include pooling public resources by developing a common regional infrastructure strategy and standardizing railway and water supply systems.
As can be seen by looking at infrastructure quality in single countries, intra-regional differences are very large, and at the same time best performers in Africa lag significantly behind international averages. Transport infrastructure (a subset of the overall infrastructure pillar) is well developed only in South Africa (30th); while in Morocco (47th), the second-best performer in Africa, is already about 15 percent less sound than in the OECD average, and Chad’s infrastructure (136th) is about 50 percent less efficient than that of Morocco, and more than 60 percent less efficient than the OECD average. Namibia, Kenya, and Ghana (the fourth-, fifth-, and sixth-best African performers) have average scores that are 5 to 30 percent lower than the level attained by Morocco. Most countries are not closing these gaps: over the past 10 years only South Africa and Botswana have managed to reduce the gap in transport infrastructure with the advanced economies.
The results vary considerably by type of infrastructure, however. Across Africa, electricity is the least developed type, as evidenced by the frequent power crises registered in 2015 and 2016 in many African countries, including Ghana, Kenya, Nigeria, and South Africa. Several African countries are also particularly underdeveloped in aviation infrastructure, as indicated by their very low air traffic and by security concerns: lack of competition has kept travelling by plane very expensive,33 and security concerns have caused 108 airlines from 14 African countries to be banned from European Union airspace.34 These facts show that the bottlenecks in air transport are not limited to airport construction, but extend to market regulation, plane maintenance and upgrading, and business management.
On a more positive note, in the quality of seaports and roads, some African countries perform relatively well: the quality of roads in Namibia and ports in South Africa is in line with average levels in advanced economies. Yet the gaps within the region on these dimensions are outstanding (Figure 16). Although lack of data precludes a complete assessment of the situation in each country, it is still problematic in most: 13 of the 31 countries assessed by
1
2
3
4
5
6
7
Qualityof electricity
supply
Qualityof air
transport infrastructure
Qualityof port
infrastructure
Qualityof roads
Kw( in thousands)
0
3
6
9
12
15
18
Electricityproductionper capita
Score (1–7)
Key
■ 2007–2008 ■ 2014–2015 ■ 2016–2017
Source: Authors’ calculations, based on World Economic Forum, Executive Opinion Survey, various editions; and CIA Factbook, various years.
Figure 15: Trends in selected Infrastructure indicators, Africa average
The Africa Competitiveness Report 2017 | 17
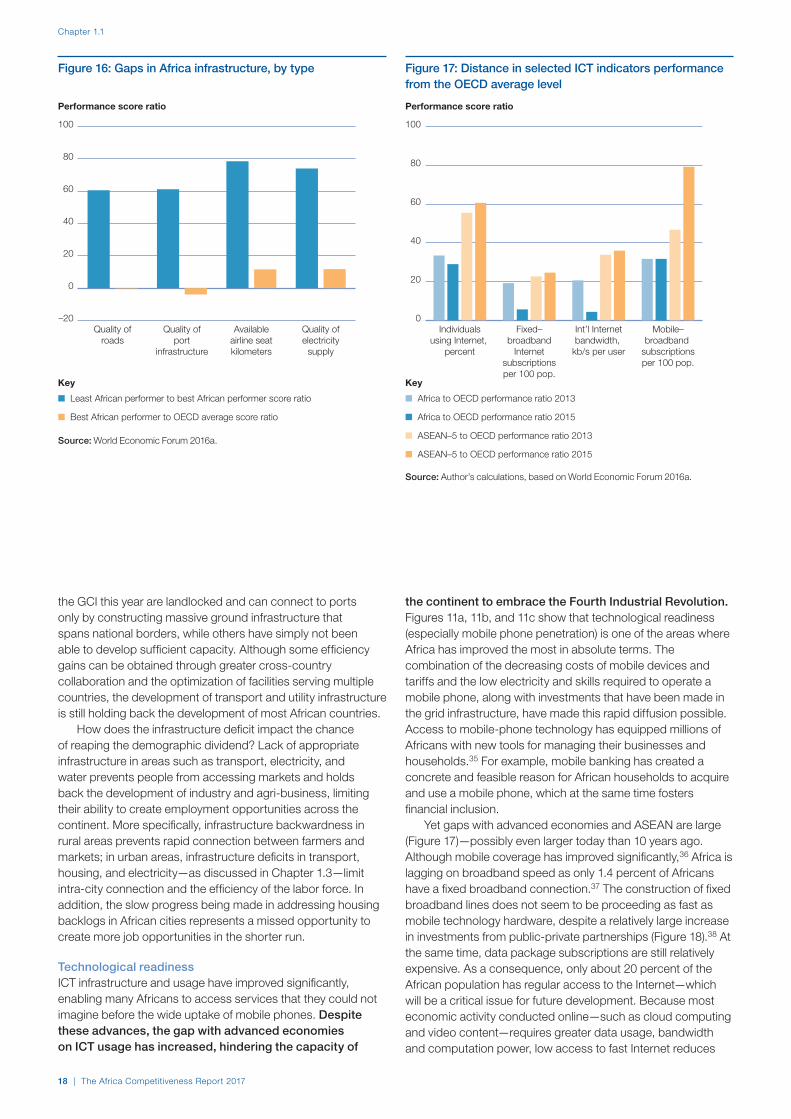
Chapter 1.1
the GCI this year are landlocked and can connect to ports only by constructing massive ground infrastructure that spans national borders, while others have simply not been able to develop sufficient capacity. Although some efficiency gains can be obtained through greater cross-country collaboration and the optimization of facilities serving multiple countries, the development of transport and utility infrastructure is still holding back the development of most African countries.
How does the infrastructure deficit impact the chance of reaping the demographic dividend? Lack of appropriate infrastructure in areas such as transport, electricity, and water prevents people from accessing markets and holds back the development of industry and agri-business, limiting their ability to create employment opportunities across the continent. More specifically, infrastructure backwardness in rural areas prevents rapid connection between farmers and markets; in urban areas, infrastructure deficits in transport, housing, and electricity—as discussed in Chapter 1.3—limit intra-city connection and the efficiency of the labor force. In addition, the slow progress being made in addressing housing backlogs in African cities represents a missed opportunity to create more job opportunities in the shorter run.
Technological readinessICT infrastructure and usage have improved significantly, enabling many Africans to access services that they could not imagine before the wide uptake of mobile phones. Despite these advances, the gap with advanced economies on ICT usage has increased, hindering the capacity of
the continent to embrace the Fourth Industrial Revolution. Figures 11a, 11b, and 11c show that technological readiness (especially mobile phone penetration) is one of the areas where Africa has improved the most in absolute terms. The combination of the decreasing costs of mobile devices and tariffs and the low electricity and skills required to operate a mobile phone, along with investments that have been made in the grid infrastructure, have made this rapid diffusion possible. Access to mobile-phone technology has equipped millions of Africans with new tools for managing their businesses and households.35 For example, mobile banking has created a concrete and feasible reason for African households to acquire and use a mobile phone, which at the same time fosters financial inclusion.
Yet gaps with advanced economies and ASEAN are large (Figure 17)—possibly even larger today than 10 years ago. Although mobile coverage has improved significantly,36 Africa is lagging on broadband speed as only 1.4 percent of Africans have a fixed broadband connection.37 The construction of fixed broadband lines does not seem to be proceeding as fast as mobile technology hardware, despite a relatively large increase in investments from public-private partnerships (Figure 18).38 At the same time, data package subscriptions are still relatively expensive. As a consequence, only about 20 percent of the African population has regular access to the Internet—which will be a critical issue for future development. Because most economic activity conducted online—such as cloud computing and video content—requires greater data usage, bandwidth and computation power, low access to fast Internet reduces
–20
0
20
40
60
80
100
Quality ofelectricity
supply
Availableairline seatkilometers
Quality ofport
infrastructure
Quality ofroads
Performance score ratio
Key
■ Least African performer to best African performer score ratio
■ Best African performer to OECD average score ratio
Source: World Economic Forum 2016a.
Figure 16: Gaps in Africa infrastructure, by type
Mobile–broadband
subscriptionsper 100 pop.
Int’l Internetbandwidth,
kb/s per user
Fixed–broadband
Internetsubscriptionsper 100 pop.
Individualsusing Internet,
percent
Key
■ Africa to OECD performance ratio 2013
■ Africa to OECD performance ratio 2015
■ ASEAN–5 to OECD performance ratio 2013
■ ASEAN–5 to OECD performance ratio 2015
0
20
40
60
80
100
Performance score ratio
Source: Author’s calculations, based on World Economic Forum 2016a.
Figure 17: Distance in selected ICT indicators performance from the OECD average level
18 | The Africa Competitiveness Report 2017
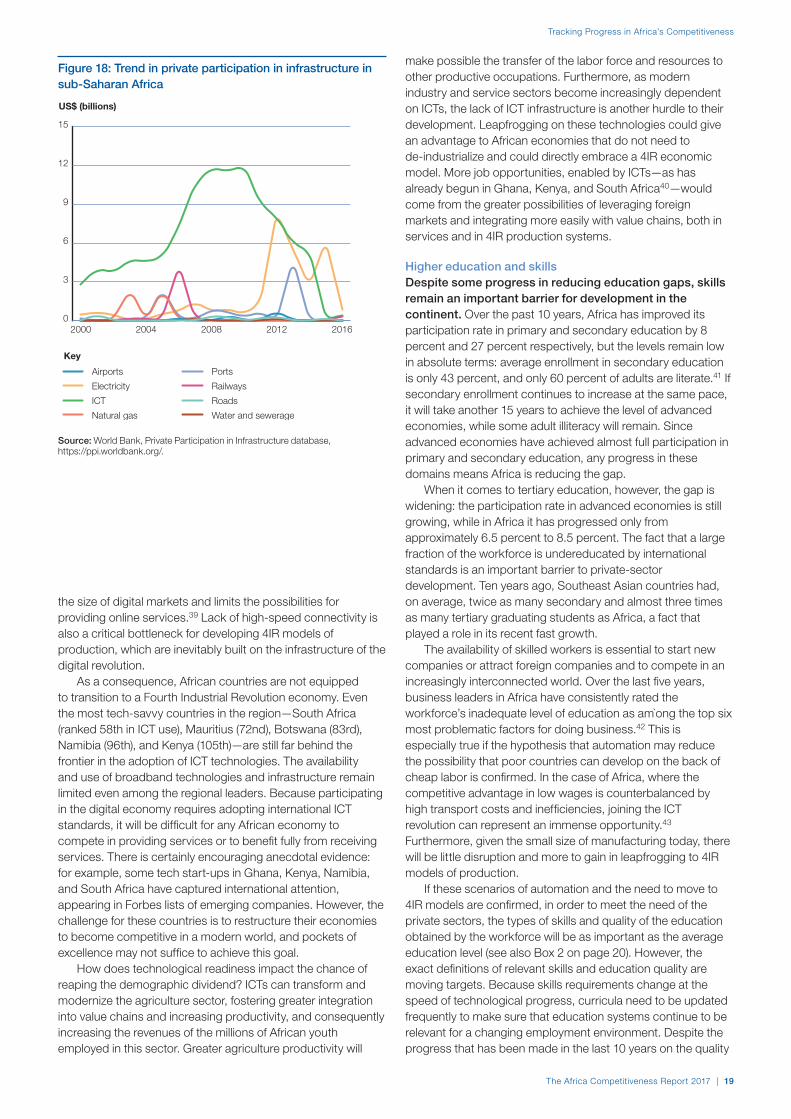
Tracking Progress in Africa’s Competitiveness
the size of digital markets and limits the possibilities for providing online services.39 Lack of high-speed connectivity is also a critical bottleneck for developing 4IR models of production, which are inevitably built on the infrastructure of the digital revolution.
As a consequence, African countries are not equipped to transition to a Fourth Industrial Revolution economy. Even the most tech-savvy countries in the region—South Africa (ranked 58th in ICT use), Mauritius (72nd), Botswana (83rd), Namibia (96th), and Kenya (105th)—are still far behind the frontier in the adoption of ICT technologies. The availability and use of broadband technologies and infrastructure remain limited even among the regional leaders. Because participating in the digital economy requires adopting international ICT standards, it will be difficult for any African economy to compete in providing services or to benefit fully from receiving services. There is certainly encouraging anecdotal evidence: for example, some tech start-ups in Ghana, Kenya, Namibia, and South Africa have captured international attention, appearing in Forbes lists of emerging companies. However, the challenge for these countries is to restructure their economies to become competitive in a modern world, and pockets of excellence may not suffice to achieve this goal.
How does technological readiness impact the chance of reaping the demographic dividend? ICTs can transform and modernize the agriculture sector, fostering greater integration into value chains and increasing productivity, and consequently increasing the revenues of the millions of African youth employed in this sector. Greater agriculture productivity will
make possible the transfer of the labor force and resources to other productive occupations. Furthermore, as modern industry and service sectors become increasingly dependent on ICTs, the lack of ICT infrastructure is another hurdle to their development. Leapfrogging on these technologies could give an advantage to African economies that do not need to de-industrialize and could directly embrace a 4IR economic model. More job opportunities, enabled by ICTs—as has already begun in Ghana, Kenya, and South Africa40—would come from the greater possibilities of leveraging foreign markets and integrating more easily with value chains, both in services and in 4IR production systems.
Higher education and skillsDespite some progress in reducing education gaps, skills remain an important barrier for development in the continent. Over the past 10 years, Africa has improved its participation rate in primary and secondary education by 8 percent and 27 percent respectively, but the levels remain low in absolute terms: average enrollment in secondary education is only 43 percent, and only 60 percent of adults are literate.41 If secondary enrollment continues to increase at the same pace, it will take another 15 years to achieve the level of advanced economies, while some adult illiteracy will remain. Since advanced economies have achieved almost full participation in primary and secondary education, any progress in these domains means Africa is reducing the gap.
When it comes to tertiary education, however, the gap is widening: the participation rate in advanced economies is still growing, while in Africa it has progressed only from approximately 6.5 percent to 8.5 percent. The fact that a large fraction of the workforce is undereducated by international standards is an important barrier to private-sector development. Ten years ago, Southeast Asian countries had, on average, twice as many secondary and almost three times as many tertiary graduating students as Africa, a fact that played a role in its recent fast growth.
The availability of skilled workers is essential to start new companies or attract foreign companies and to compete in an increasingly interconnected world. Over the last five years, business leaders in Africa have consistently rated the workforce’s inadequate level of education as am`ong the top six most problematic factors for doing business.42 This is especially true if the hypothesis that automation may reduce the possibility that poor countries can develop on the back of cheap labor is confirmed. In the case of Africa, where the competitive advantage in low wages is counterbalanced by high transport costs and inefficiencies, joining the ICT revolution can represent an immense opportunity.43 Furthermore, given the small size of manufacturing today, there will be little disruption and more to gain in leapfrogging to 4IR models of production.
If these scenarios of automation and the need to move to 4IR models are confirmed, in order to meet the need of the private sectors, the types of skills and quality of the education obtained by the workforce will be as important as the average education level (see also Box 2 on page 20). However, the exact definitions of relevant skills and education quality are moving targets. Because skills requirements change at the speed of technological progress, curricula need to be updated frequently to make sure that education systems continue to be relevant for a changing employment environment. Despite the progress that has been made in the last 10 years on the quality
0
3
6
9
12
15
20162012200820042000
US$ (billions)
Airports
Electricity
ICT
Natural gas
Ports
Railways
Roads
Water and sewerage
Key
Source: World Bank, Private Participation in Infrastructure database, https://ppi.worldbank.org/.
Figure 18: Trend in private participation in infrastructure in sub-Saharan Africa
The Africa Competitiveness Report 2017 | 19

Chapter 1.1
Box 2: Increasing education quality to bridge the skills mismatch
Availability of quality job opportunities, especially those requiring higher skills, is central for reaping Africa’s demographic dividend. Yet the large bulk of Africa’s youth are neither employed nor in education or training (NEET). This group encompasses over a third of youth in countries such as Namibia, South Africa, and Tanzania, and over two-fifths of young women in Egypt (40.7%) and Algeria (34.7%),1 while many more are in unpaid or vulnerable employment. At the same time, employment in high-skilled occupations is not increasing: compared to the pre-global financial crisis period (2003–06), employment in Africa has increased in low-skilled occupations by about 9.5 percent but decreased in medium- and high-skilled occupations by 5 percent and 0.2 percent respectively (Figure A).2 Many highly educated people struggle to find relevant job opportunities even in middle-income countries. For instance, unemployment levels among workers holding a tertiary education degree are as high as 18.5 percent in Morocco, 19.9 percent in Mauritius, 23 percent in Algeria, 30.1 percent in Tunisia, and 31.1 percent in Egypt.
Although data limitations on both labor demand and supply factors impede a comprehensive evaluation of African job markets, there is sufficient evidence to indicate that the quality of education plays an important role in determining such outcome. The Global Competitiveness Index shows that education quality in Africa is low and improvements are taking place at a much lower rate than increases in enrollment.
Lack of qualified teachers (see Box 2 in Chapter 1.2), limited funding, and unequipped and overcrowded classrooms reduce the quality education in elementary schools, leading to a significant proportion of children not learning basic literacy or numeracy skills by fifth or sixth grade (Figure B).3 Consequently, students often lack the building blocks necessary for maximizing further investment in education, exacerbating the deficiencies of secondary and tertiary school systems.
In addition, curricula are often outdated and do not provide the students with the new skills needed by modern economies.4 Skills in higher demand in future are likely to include computer literacy, coding, and creativity, but only now are only few countries (i.e., South Africa) are starting to consider introducing compulsory computer classes in secondary school.5
As a consequence, Africa’s skills gap at the secondary level is high. According to local business executives, in most African countries, the students graduating from secondary school do not possess, on average, the skills companies need.6 Even Africa’s best-performing country, Rwanda, attains a score that is only about 60 percent of Switzerland’s (the global best performer) and business leaders struggle to find the type of talent they need.
More has to be done to equip young Africans with the relevant skills that will enable them to compete in increasingly interconnected and technology-dense labor markets. Effective public-private collaboration such as the Regional Skills Project can contribute to reduce skill-gaps at national and regional level.7
Notes
1 Data for Egypt are from ILO 2016; data for Algeria are from the ILOSTAT database, and refer to 2014.
2 The latest ILO statistics refer to the period 2013–15.
3 These figures are calculated by the Center for Universal Education at Brookings using data from regional examinations, such as the Programme d’Analyse des Systèmes Educatifs de la CONFEMEN (PASEC) and the Southern and Eastern Africa Consortium for Monitoring Educational Quality (SACMEQ), as well as national assessments of 4th or 5th grade students.
4 World Economic Forum 2016b.
5 Government of South Africa 2016.
6 The skills gap refers to the indicator derived from the World Economic Forum’s Executive Opinion Survey question: “In your country, to what extent do graduating students possess the skills needed by businesses at the following levels: Secondary education (1 = not at all; 7 = to a great extent)”.
7 For details about this project, see https://www.weforum.org/projects/closing-the-skills-gap-regional-skills-projects.
Source: Authors’ calculations, based on the International Labour Organization (ILO) ILOSTAT database, available at http://ilo.org/global/statistics-and-databases/lang--en/index.htm
-0.10
-0.05
0.00
0.05
0.10
Low skillsMedium skillsHigh skills
Percent change as a ratio to total employment
Figure A: Change between 2003–06 average and 2013–15 average in employment by skill level
0 10 20 30 40 50 60 70 80
ZambiaEthiopiaNigeria
Côte d’IvoireGhana
South AfricaUganda
BeninChad
MozambiqueAfrica average
ZimbabweBurkina
BotswanaSenegalTanzania
KenyaMauritius
GabonCameroon
Madagascar
Percent
Key
■ Math ■ Overall
Figure B: Enrolled students who are not learning
Source: Loeb 2016.
20 | The Africa Competitiveness Report 2017

Tracking Progress in Africa’s Competitiveness
of primary and management schools and training, on this front also the divide between Africa and advanced economies remains large (Figure 19).
At the country level, there are encouraging trends in some African economies but gaps remain large. Mauritius (ranking 52nd), South Africa (77th), and Botswana (88th) lead the higher education and training pillar. Kenya (97th) and Ghana (99th) follow closely, while in most of the other Africa countries significant gaps remain: Cameroon (105th), the region’s sixth-best performer, is four basis points below Ghana at 5th place, and the lowest-ranked country scores are only half of the score of leader Mauritius (Figure 20).
Mauritius has managed to improve its talent pool past South Africa. Despite hosting six of the top 15 African universities,44 South Africa’s skills level is not improving sufficiently. It increased its secondary and tertiary enrollment rates by only a relatively small amount, while in Mauritius both enrollment rates increased significantly. Over the past 10 years, South Africa’s higher education quality levels have decreased relative to the expectations of employers, while in Mauritius they have improved steadily.
Other countries showing positive trends include Ghana, one of the most improved on both a ten-year and a two-year horizon. Cameroon, Botswana, and Ethiopia have also improved, although to a lesser extent. The progress made in all four countries points to the possibility of positive employability outcomes in at least some African countries. Even here, however, the challenge will be to improve the type and intensity of skills of young Africans to enable them to compete in a more integrated, digital, and technological savvy world, while continuing to make education more inclusive and increase participation by reaching rural and other less-served areas.
How does higher education and training impact the chance of reaping the demographic dividend? The link between skills
0
20
40
60
80
100
2016
–201
7
2015
–201
6
2014
–201
5
2013
–201
4
2012
–201
3
2011
–201
2
2010
–201
1
2009
–201
0
2008
–200
9
OECD average level
Key
South Africa
Ghana
Ethiopia
Cameroon
Botswana
Mauritius
Source: World Economic Forum, The Global Competitiveness Report, various editions.
Figure 20: Trend in higher education, selected African countries
and employability is straightforward. The level and quality of education directly impacts the likelihood of being hired or, to some extent, becoming an entrepreneur. Because new generations of Africans will increasingly be more exposed to international competition and the effects of digitalization, their
Figure 19: Education in Africa and OECD average, selected indicators
19a: Quantity of education indicators 19b: Quality of education indicators
0
20
40
60
80
100
Tertieryenrollmentrate (gross)
Secondaryenrollmentrate (gross)
Primaryenrollmentrate (net)
Key
■ Africa 2007–2008
■ Africa 2016–2017
■ OECD 2016–2017
Performance score ratio
1
2
3
4
5
6
7
Extent ofstaff
training
Quality ofmanagement
schools
Quality ofmath andscience
education
Quality of the education
system
Quality ofprimary
education
Score (1–7 scale)
Source: World Economic Forum 2016a.
The Africa Competitiveness Report 2017 | 21

Chapter 1.1
employment possibilities will crucially depend on the level, type, and quality of their skills.
InstitutionsThe quality of institutions in Africa remains low but is slowly improving. However, this improvement could experience a severe setback if leaders are not able to respond to the demand of the growing young population for better economic opportunities. A combination of small improvements in Africa’s institutional quality and lower standards in advanced economies has reduced the gap between the OECD average and Africa’s performance on this dimension (Figure 21). Although starting from a low base and although some countries remain very fragile, governments across Africa have started to mature and are now better equipped to coordinate economic activity than they used to be. Less instability and better policy coordination may boost investors’ confidence and private-sector development. This new maturity offers some cautious optimism that African economies will be able to move past the ending of the commodity super-cycle and begin to rely on a more diversified growth model.
The recent positive trend should not, however, overshadow the significant problems that persist in most African countries. On protecting property rights, for example, despite some progress there is still the need to guarantee asset control to the owner—especially in agricultural land, which remains a problem for improving agricultural productivity in many countries.45 Similarly, although slowly being curbed, corruption remains very widespread and impacts several aspects of economic activity including infrastructure building, which tends to be much slower, more costly, and more inefficient than in other regions.46
Remarkably, despite the instability in parts of North Africa, and terrorism activity in several areas of Africa, the average security levels of the group of African countries assessed by the GCI has remained virtually unchanged since the 2015 assessment.
At the country level, although institutions remain fragile in most countries, in more than half of them business leaders see some small improvement compared to two years ago.
Southern African countries (Botswana, Lesotho, Mauritius, Namibia, and South Africa) and Rwanda continue to lead the African ranking for institutional quality, all appearing in the upper half of the global rankings. In terms of performance dynamic, Figure 22 shows changes in institutional quality over the past couple of years. Geography or economic diversification does not determine common trends across countries in any group. Some countries (such as Lesotho and Mali) are improving because they are emerging from a particularly dire situation; some (such as Nigeria) are going through economic headwinds, and others (such as Tanzania) are energized by recent elections. In Ethiopia, because the data are antecedent to July 2016, when Oromo protests expanded, figures reflect improvements in public-sector efficacy gained over the previous two years. The next few years will test the capacity of African institutions to respond to growing young populations without the windfall of high commodity exports. Further institutional strengthening will be a key factor in determining whether the path leads toward more prosperity or toward social and economic collapse.
Box 3: The concept of competitiveness over time
The concept of a country’s competitiveness has radically changed over time. In the mid-1980s, the term was mainly understood as a country’s ability to trade internationally and to compete with other countries in international markets.1 At that time, the focus of competitiveness moved from the firm level to the country level with the idea of maximizing returns on a country’s own resources and benefitting from comparative advantages. In the 1990s, Paul Krugman (1994) referred to competitiveness as an agenda too heavily focused on trade, which had become “a dangerous obsession.” He challenged the idea that countries have to compete with one another like companies, asserting that such idea can eventually lead to trade wars and protectionism and move governments away from adopting adequate macroeconomic policies. By 1995, the concept of competitiveness had evolved to encompass some elements of productivity and efficiency.2
“Competitiveness” has turned out to be another way of saying “economic growth” or “productivity” and no longer has something to do with international competition. The World Economic Forum—which has pioneered work on competitiveness since 1979, with Klaus Schwab’s publication of the Report on the Competitiveness of European Industry 19793—defined competitiveness as the capacity of the national economy to achieve sustained economic growth over the medium term, controlling for the current level of economic development;4 it focused on institutions, suitable policies, and economic characteristics to promote such growth. The World Economic Forum proposed measuring competitiveness by integrating two subindexes into the single Global Competitiveness Index: (1) the macroeconomic aspect of competitiveness, based on Jeffrey Sachs’s Growth Development Index,5 and (2) the micro/business aspect of competitiveness, based on Michael Porter’s Business Competitiveness Index.6 Starting in 2004, with the contribution of Sala-i-Martín,7 the concept of competitiveness became intrinsically linked to productivity and was defined as the set of institutions, policies, and factors that determine the level of productivity of a country. This was measured on the basis of the Global Competitiveness Index methodology, using 12 pillars and 115 indicators at the country level, to provide a comprehensive picture of a country’s productivity. Throughout The Africa Competitiveness Report, competitiveness is understood and measured according to this concept. In Chapter 1.3 of this Report, the notion of a competitive city is also closely linked to factors that determine its level of productivity. It is defined as an urban area that offers affordable housing and adequate infrastructure for private-sector development, decent job creation, and a better quality of life. In both its national and city level articulation, competitiveness/productivity is considered as a means to achieve better quality of life and social welfare
Notes
1 Scott and Lodge 1985; OECD 1992; Tyson 1992.
2 Competitiveness Advisory Group 1995; Porter 1990.
3 World Economic Forum 1979.
4 World Economic Forum 1997.
5 World Economic Forum 2001.
6 World Economic Forum 2008.
7 Sala-i-Martín and Artadi 2004.
22 | The Africa Competitiveness Report 2017

Tracking Progress in Africa’s Competitiveness
Figure 22: Institutions’ performance in Africa
22a: Institutions pillar score
1 2 3 4 5 6 7
Chad
Mauritania
Burundi
Madagascar
Mozambique
Sierra Leone
Nigeria
Zimbabwe
Cameroon
Algeria
Mali
Malawi
Uganda
Egypt
Kenya
Gabon
Tanzania
Tunisia
Côte d'Ivoire
Ethiopia
Ghana
Cape Verde
Senegal
Zambia
Lesotho
Gambia, The
Morocco
South Africa
Namibia
Botswana
Mauritius
Rwanda
Institutional pillar score (1–7 scale)–0.10 –0.06 –0.02 0.02 0.06 0.10
Malawi
Sierra Leone
Gambia, The
Zambia
Kenya
Mauritius
Burundi
Madagascar
Cameroon
South Africa
Mozambique
Gabon
Morocco
Botswana
Chad
Zimbabwe
Cape Verde
Mauritania
Ghana
Algeria
Tunisia
Senegal
Côte d'Ivoire
Namibia
Rwanda
Egypt
Uganda
Tanzania
Lesotho
Nigeria
Mali
Ethiopia
Percent change
Source: World Economic Forum 2015, 2016a.
22b: Percentage change since 2015
1
2
3
4
5
6
7
2016–20172014–20152007–2008
1
2
3
4
5
6
7
2016–20172014–20152007–2008
1
2
3
4
5
6
7
2016–20172014–20152007–2008
1
2
3
4
5
6
7
2016–20172014–20152007–2008
Source: World Economic Forum, The Global Competitiveness Report, various editions.
The five ASEAN countries covered by the GCI are Indonesia, Malaysia, the Philippines, Thailand, and Vietnam. The OECD economies covered by the GCI are Australia, Austria, Belgium, Canada, Chile, Czech Republic, Denmark, Estonia, Finland, France, Germany, Greece, Hungary, Iceland, Ireland, Israel, Italy, Japan, Korea, Rep., Latvia, Luxembourg, Mexico, the Netherlands, New Zealand, Norway, Poland, Portugal, the Slovak Republic, Slovenia, Spain, Sweden, Switzerland, Turkey, the United Kingdom, and the United States.
Figure 21: Trend in public institutions quality factors, Africa average
21c: Ethics and corruption
21b: Property rights21a: Public-sector performance
21d: Security
Key
OECD
Africa constant
ASEAN–5
The Africa Competitiveness Report 2017 | 23

Chapter 1.1
How do institutions impact the chance of reaping the demographic dividend? Sound and accountable institutions are the backbone of a functioning society; they provide stability and the implementation of policy programs that support youth in the short run and modernization in the longer run. Political leadership is particularly needed in this phase of African development, which is characterized by high population growth and economic slowdown. Offering better economic opportunities and credible development strategies for African youth will be crucial to avoid a situation where many will join destabilizing political movements that could lead to social breakdown.
The most problematic factors for doing business in AfricaTo capture the concerns of business leaders, every year the World Economic Forum conducts the Executive Opinion Survey, asking business leaders around the world to rate the factors they consider most problematic for doing business in their country. Their perceptions are captured through a section of the Executive Opinion Survey, and published every year in The Global Competitiveness Report as an integral part of assessing countries, complementing the Index benchmarking. From a list of 16 factors, respondents are asked to rank their top five (Figure 23).
In 2016, access to financing was again considered the most problematic factor for doing business in Africa, followed by corruption. These two factors have topped the list every year since 2012. However, tax rates emerged as the third-ranked concern, a significantly higher priority in 2016 than it had been in the past four years. This could reflect the fact that governments are looking for new sources of financing (such as increasing taxes) to balance public budgets. Falling to fourth
place, yet remaining a very important obstacle, is the insufficient supply of infrastructure.
Rising in the list of concerns for African executives, albeit not yet ranking as particularly severe, are foreign currency regulations and difficulties in innovating. The growing concern here reflects the attempts of central banks to manage exchange rates in response to capital flow fluctuations, and the reality that innovation has started to affect the success of businesses in developing countries as much as it does in advanced economies.
ConclusionsThis chapter has assessed Africa’s progress on the 12 drivers composing the Global Competitiveness Index, as an input into the debate about how to improve the employment outlook for African youth.
Analyzing the results of 35 African economies included in The Global Competitiveness Report 2016–2017 reveals that African competitiveness is still lower than in other regions and convergence has stagnated. The insufficient progress made by African countries on needed structural reforms during the past decades of sustained growth has put Africa on a weaker footing, less able to respond to a less positive economic outlook going forward and less well-equipped to take advantage of the demographic shifts that will increase the shares of the continent’s young population.
Over the past decades, employment in Africa has not kept up with output expansions. Now that the continent’s growth prospects have shrunk, many African economies are struggling to provide sufficient job opportunities to meet the needs of the burgeoning workforce.
A mix of short-term solutions and longer-term strategies is needed so that population growth does not become a source
0.00 0.05 0.10 0.15 0.20
Poor public health
Government instability/coups
Crime and theft
Restrictive labor regulations
Tax regulations
Insufficient capacity to innovate
Poor work ethic in national labor force
Foreign currency regulations
Inflation
Inadequately educated workforce
Policy instability
Inadequate supply of infrastructure
Inefficient government bureaucracy
Tax rates
Corruption
Access to financingKey
■ 2016
■ 2015
■ 2014
Source: World Economic Forum, Executive Opinion Survey 2014, 2015, 2016.
From the list of factors above, respondents were asked to select the five most problematic for doing business in their country and to rank them between 1 (most problematic) and 5. The bars in the figures show the responses weighted according to their rankings. MPF = most problematic factors.
Figure 23: The most problematic factors for doing business in Africa
24 | The Africa Competitiveness Report 2017

Tracking Progress in Africa’s Competitiveness
of instability but a competitive advantage. As also highlighted by the African Development Bank’s Strategy for Jobs for Youth in Africa 2016–2025,47 in order to attain concrete results for youth employment, policymakers should move away from one-off specific projects and move toward an “ecosystem approach.” Structural reforms and investments in competitiveness-enhancing factors are of paramount importance to improve the business environment and consequently Africa’s capacity to develop a stronger private sector with more productive and better paid opportunities for youth.
As highlighted in previous editions of The Africa Competitiveness Report, most African countries need to reinforce their basic requirements—such as sound institutions, adequate infrastructure, and a healthy and educated workforce—to establish a solid basis for sustainable growth and economic diversification. At the same time, with the advent of the 4IR, technological readiness is becoming a necessary factor even for economies that are still developing. Both basic requirements and technological readiness emerge as the areas where Africa maintains biggest gaps with the most advanced economies (OECD) and also with some emerging regions (such as Southeast Asia)
Although the aggregate picture is less positive than it was two years ago, there are some positive stories. Côte d’Ivoire, Ethiopia, Rwanda, and Tanzania have improved their competitiveness levels and are all expected to continue growing their GDP at close to 7 percent over the next few years. The larger economies are, conversely, struggling relatively more. South Africa, while it continues to be one of the two most competitive economies in the region, has slowed its progress and growth expectations; Nigeria, hit hard by commodity price shocks, has seen its competitiveness decline while recovering from 2016’s GDP contraction. In general, as anticipated in 2015 edition of the Report, mineral exporters have performed less well than more diversified economies. Even within the countries heavily relying on mineral exports, there are significant differences in competitiveness performance, depending on how well these countries have invested during the years of high prices.
Having identified the main competitiveness challenges, the following chapters discuss specific aspects that impact the economic perspective of African youth. Chapter 1.2 offers an overview on policies that African countries can adopt to address potential vulnerabilities coming from the coming rise in working-age populations. Chapter 1.3 studies the competitiveness of African cities and examines bottlenecks and opportunities for youth employment in the specific context of the African urban environment.
Notes 1 Some of the main minerals exported by African economies include:
copper (Democratic Republic of Congo and Zambia), iron (Liberia, Sierra Leone, and South Africa), coal (Mozambique and South Africa), diamonds (Angola, Botswana, Namibia, South Africa), gold (Burkina Faso, Ghana, Mali, South Africa, and Tanzania), and platinum (South Africa).
2 GDP growth statistics are from Africa Development Bank Group, African Economic Outlook 2017, available at http://dataportal.opendataforafrica.org/xedzxdg/afdb-socio-economic-database-1960-2016. GDP per capita statistics are authors’ calculations, based on aggregated sub-Saharan PPP evaluation of GDP per capita levels from IMF, World Economic Outlook, October 2016 edition online.
3 Author’s calculations, based on employment statistics “employment to population ratio, 15+, total (%) (modeled ILO estimate),” provided by the World Bank, World Development Indicators online, October 2016.
4 Author’s calculations, based on UN-DESA population statistics.
5 UN DESA and AfDB. African Economic Outlook estimates.
6 The Fourth Industrial Revolution (4IR) can be referred to as the global transformation characterized by the convergence of digital, physical, and biological technologies, built on the infrastructure of the digital revolution, which will enable transition to entirely new systems of production, consumption communication, transport, energy generation, and human interaction. For a more complete examination and discussion, see Schwab 2016.
7 AfDB 2014b.
8 Population projection estimates are from UN DESA, World Population Prospects, the 2015 Revision, available at https://esa.un.org/unpd/wpp/.
9 UN DESA, World Population Prospects, the 2015 Revision, available at https://esa.un.org/unpd/wpp/.
10 AfDB et al. 2016.
11 Aiyar et al. 2016.
12 ILO Key Indicators of the Labour Market (KILM), available at http://www.ilo.org/global/statistics-and-databases/research-and-databases/kilm/lang--en/index.htm.
13 Afrobarometer is a pan-African, non-partisan research network that conducts public attitude surveys on democracy, governance, economic conditions, and related issues in more than 35 countries in Africa. The data used in this chapter are from Round 5 of the Afrobarometer Survey, conducted between 2011 and 2013, interviewing about 50,000 households in 34 countries. For further information refer to http://www.afrobarometer.org/.
14 AfDB et al. 2012; data based on Gallup World Poll, 2010, available at http://www.gallup.com/services/170945/world-poll.aspx.
15 ILO modelled estimates, employment by sex, age and economic class, November 2016. See the ILOSTAT database at http://www.ilo.org/global/statistics-and-databases/lang--en/index.htm.
16 UN DESA, World Population Prospects, the 2015 Revision, available at https://esa.un.org/unpd/wpp/.
17 AfDB 2014a.
18 The 12 pillars are measured using both quantitative data from public sources (such as inflation, Internet penetration, life expectancy, and school enrollment rates) and data from the World Economic Forum’s Executive Opinion Survey (the Survey), conducted annually among top executives in all of the countries assessed. The Survey provides crucial data on a number of qualitative issues (e.g., corruption, confidence in the public sector, quality of schools) for which no hard data exist.
19 In order to capture the resource intensity of an economy, we use as a proxy the exports of mineral products as a share of overall exports according to the sector classification developed by the International Trade Centre in their Trade Performance Index. In addition to crude oil and gas, this category contains all metal ores and other minerals as well as petroleum products, liquefied gas, coal, and precious stones. The data used cover 2009 through 2013 or the most recent year available. Further information can be found at http://legacy.intracen.org/appli1/TradeCom/Documents/ TradeCompMap-Trade%20Performance%20Index-Technical%20 Notes-EN.pdf.
20 To be able to track regional progress across time, we take the average of those African economies assessed in the GCI in all the years from 2008 to 2016: Algeria, Botswana, Burundi, Cameroon, Chad, Egypt, Ethiopia, The Gambia, Kenya, Lesotho, Madagascar, Mali, Morocco, Mauritius, Mozambique, Namibia, Nigeria, Senegal, South Africa, Tanzania, Uganda, Zambia, and Zimbabwe.
21 In this context, high mineral exporters are those countries for which minerals (fuels and metals) represent more than 35 percent of their total exports. Analysis is based on International Trade Center statistics.
22 World Economic Forum’s Executive Opinion Summary, various editions.
23 IMF 2016a.
The Africa Competitiveness Report 2017 | 25

Chapter 1.1
24 The 2015 IMF World Economic Outlook,October edition, shows that loose monetary policy in countries where commodity prices dropped and the exchange rate depreciated may lead to high inflation and limited growth. When commodity prices drop, the reduced inflow of capital from exports causes a depreciation of the exchange rate. In countries with a developed manufacturing sector, the depreciation of the exchange rate would make non-mineral exports cheaper; therefore, after an adjustment period, increased non-mineral exports would counterbalance the loss in mineral exports. However, in countries where minerals’ share of exports is very large, the exchange rate depreciation is not sufficient to boost non-mineral exports; at the same time, imports become more expensive and trigger inflationary pressure. In addition, De Gregorio (2016) notes: “The pass-through from exchange rate to inflation depends on the credibility of monetary policy.” Under these circumstances, loose monetary policy would have a limited effect on productive investments, and would only inject liquidity, which would lead to inflation and little growth. Inflation would lead to instability, which would hamper growth—hence in these circumstances the IMF recommends a policy of keeping inflation under control.
25 Christensen 2016.
26 IMF 2016a.
27 AfDB 2015b.
28 See for example IMF 2016a and AfDB 2016a.
29 ICA 2016.
30 Lockett 2016.
31 AfDB 2015a.
32 Omoregie and Radford 2006.
33 The Economist 2016b.
34 The Economist 2016a.
35 We refer here to Internet banking, digital money exchange systems, information exchange, and the possibility of communicating with others.
36 In South Africa in 2015, almost all the population was covered by either a mobile or a 3G signal. However, on average in the region coverage is only 85 percent for cell phones, not significantly higher than five years ago, while 3G has grown threefold in that time to 56 percent.
37 Data are from the International Telecommunication Union (ITU)’s World Telecommunication/ICT Indicators Database, December 2016 edition, available at http://www.itu.int/en/ITU-D/Statistics/Pages/publications/wtid.aspx.
38 According to the World Bank Private Participation in Infrastructure database, available at https://ppi.worldbank.org/data, there were over 2,000 private participation projects for a total of over US$160,000 billion in South Africa. ICT 66 percent and electricity (19 percent) account for the great majority of these investments.
39 Lewin et al. 2009.
40 IYF 2013.
41 World Bank, World Development Indicators database, available at http://data.worldbank.org/.
42 World Economic Forum, Executive Opinion Survey, 2012, 2013, 2014, 2015, and 2016.
43 Escribano et al. 2010.
44 According to the Times Higher Education World University Rankings, available at https://www.timeshighereducation.com/world-university-rankings/best-universities-in-africa-2016.
45 Augustinus and Deininger 2005.
46 AfDB 2014c.
47 AfDB 2016b.
ReferencesAfDB (African Development Bank). 2014a. African Development Report 2014
Regional Integration for Inclusive Growth. Abidjan: African Development Bank.
———. 2014b. “Global Value Chains and Africa’s Integration into the Global Economy.” In Annual Report 2013, Chapter 2. Tunis, Tunisia: AfDB.
———. 2014c. Study on Road Infrastructure Costs: Analysis of Unit Costs and Cost Overruns of Road Infrastructure Projects in Africa. AfDB Market Study Series. Available at https://www.afdb.org/fileadmin/uploads/afdb/Documents/Publications/Study_on_Road_Infrastructure_Costs-_Analysis_of_Unit_Costs_and_Cost_Overruns_of_Road_Infrastructure_Projects_in_Africa.pdf.
———. 2015a. Annual Report 2014. Abidjan, Côte d’Ivoire: AfDB. Available at https://www.afdb.org/fileadmin/uploads/afdb/Documents/Generic-Documents/Annual_Report_2014_-Full.pdf.
———. 2015b. “The Banking System in Africa: Main Facts and Challenges.” Africa Economic Brief Chief Economist Complex 6 (5). Available at http://www.afdb.org/fileadmin/uploads/afdb/Documents/Knowledge/AEB_Vol_6_Issue_5_2015_The_Banking_System_in_Africa__Main_Facts_and_Challenges-10_2015.pdf.
———. 2016a. Africa Infrastructure Development Index 2016. Available at http://www.afdb.org/fileadmin/uploads/afdb/Documents/Publications/Africa_Infrastructure_Development_May_2016.pdf.
———. 2016b. Jobs for Youth in Africa: Strategy for Creating 25 Million Jobs and Equipping 40 Million Youth 2016–2025. AfDB. Available at https://www.afdb.org/fileadmin/uploads/afdb/Documents/Boards-Documents/Bank_Group_Strategy_for_Jobs_for_Youth_in_Africa_2016-2025_Rev_2.pdf—.
———. African Economic Outlook 2017. Available at http://dataportal.opendataforafrica.org/xedzxdg/afdb-socio-economic-database-1960-2016.
AfDB, OECD, and UNDP (African Development Bank, Organisation for Economic Co-operation and Development, and United Nations Development Programme). 2014. African Economic Outlook 2014: Global Value Chains and Africa’s Industrialisation. Paris: OECD Publishing. Available at http://www.africaneconomicoutlook.org/en/.
———. 2016. African Economic Outlook 2016: Sustainable Cities and Structural Transformation. Available at http://www.africaneconomicoutlook.org/en/home.
AfDB, OECD, UNDP, and UNECA (African Development Bank, Organisation for Economic Co-operation and Development, United Nations Development Programme, and United Nations Economic Commission for Africa). 2012. African Economic Outlook 2012: Special Theme: Promoting Youth Employment. Paris: OECD Publishing.
Afrobarometer. Round 5 (2011–13) database. Available at http://www.afrobarometer.org/data/merged-data.
Aiyar, S., C. Ebeke, and X. Shao. 2016. “The Impact of Workforce Aging on European Productivity.” IMF Working Paper WP/16/238. Washington, DC: IMF. Available at https://www.imf.org/external/pubs/ft/wp/2016/wp16238.pdf.
Augustinus, C. and K. Deininger. 2005. “Innovations in Land Tenure, Reform & Registration in Africa.” Presentation at the UNDP-International Land Coalition Workshop: Land Rights for African Development: From Knowledge to Action, Nairobi, October 31–November 3, 2005. Available at https://dlc.dlib.indiana.edu/dlc/bitstream/handle/10535/709/HabitatBank.pdf?sequence=1.
Christensen, B. V. 2016. “Challenges of Low Commodity Prices for Africa.” BIS Papers No. 87. BIS (Bank for International Settlements), Monetary and Economic Department, September. Available at http://www.bis.org/publ/bppdf/bispap87.pdf.
CIA (Central Intelligence Agency). The World Factbook. Available at https://www.cia.gov/library/publications/the-world-factbook.
Competitiveness Advisory Group—Ciampi Group. 1995. Enhancing European Competitiveness. First report to the President of the Commission, the Prime Ministers and the Heads of State. Available at http://aei.pitt.edu/2866/1/2866.pdf.
The Conference Board. No date. Total Economy Database™ - Output, Labor and Labor Productivity, 1950–2016 (Adjusted version). Available at https://www.conference-board.org/data/economydatabase/index.cfm?id=27762.
De Gregorio, J. 2016. “Large Depreciations: Recent Experience in Historical Perspective.” Peterson Institute for International Economics Working Paper No. 16-8. Available at https://papers.ssrn.com/sol3/papers.cfm?abstract_id=2781038.
The Economist. 2016a. “Departure Delayed.” The Economist, February 13. Available at http://www.economist.com/news/middle-east-and-africa/21692871-africa-ripe-air-travel-pity-its-governments-are-holding-it.
26 | The Africa Competitiveness Report 2017

Tracking Progress in Africa’s Competitiveness
———. 2016b. “Let Africans Fly.” The Economist, February 11. Available at http://www.economist.com/news/leaders/21692882-air-travel-africa-needlessly-hard-and-costly-open-skies-would-make-it-cheaper-let-africans.
Escribano, A., J. L. Guasch, and J. Pena. 2010. “Assessing the Impact of Infrastructure Quality on Firm Productivity in Africa: Cross-Country Comparisons Based on Investment Climate Surveys from 1999 to 2005.” Policy Research Working Paper No. WPS 5191. Washington, DC: World Bank.
GGDC (Groningen Growth and Development Centre). No date. 10-Sector Database. Available at http://www.rug.nl/ggdc/productivity/10-sector/.
Government of South Africa, Department of Higher Education and Training. 2016. List of Occupations in High Demand: 2015. Government Gazette No. 34, January 19, 2016. Available at http://www.dhet.gov.za/Gazette/Government%20Gazette%20No%2039604,%2019%20January%202016.%20List%20of%20Occupations%20in%20High%20Demand%202015.pdf.
ICA (The Infrastructure Consortium for Africa). 2016. Infrastructure Financing Trends in Africa – 2015. Abidjan, Côte d’Ivoire: ICA . Available at https://www.icafrica.org/fileadmin/documents/Annual_Reports/ICA_2015_annual_report.pdf.
ILO (International Labour Organization). ILOSTAT ILO Database of Labour Statistics. Available at http://ilo.org/global/statistics-and-databases/lang--en/index.htm.
———. 2016. “World Employment and Social Outlook Trends 2016: Africa Briefing Note.” Available at http://www.ilo.org/wcmsp5/groups/public/---africa/---ro-addis_ababa/documents/genericdocument/wcms_444480.pdf.
IMF (International Monetary Fund). 2016a. Regional Economic Outlook: Sub-Saharan Africa Multispeed Growth. October 2016. Washington, DC: IMF. Available at https://www.imf.org/external/pubs/ft/reo/2016/afr/eng/pdf/sreo1016.pdf.
———. 2016b. World Economic Outlook database, October edition. Washington, DC: IMF. Available at http://www.imf.org/external/ns/cs.aspx?id=28.
ITU (International Telecommunication Union). 2017. World Telecommunication/ICT Indicators Database 2016, 20th Edition/December 2016. Available at http://www.itu.int/en/ITU-D/Statistics/Pages/publications/wtid.aspx.
IYF (International Youth Foundation). 2013. Analysis of ICT-Enabled Youth Employment in Ghana, Kenya, and South Africa. Baltimore, MD: International Youth Foundation. Available at http://www.iyfnet.org/library/analysis-ict-enabled-youth-employment-ghana-kenya-south-africa .
Krugman, P. 1994. “Competitiveness: A Dangerous Obsession.” Foreign Affairs 73 (2).
Lewin, D., B. Williamson, and M. Cave. 2009. “Regulating Next Generation Fixed Access to Telecommunications Services.” info 11 (4): 3–18.
Lockett, H. 2016. “China Plans Rmb4.7tn in Infrastructure Funding.” Financial Times, May 11. Available at https://www.ft.com/content/ec3df7f3-1254-3da6-8ee9-e2434391bf15.
Loeb, S. 2016. “Half the People Working in Schools Aren’t Classroom Teachers—So What?” Brookings Report, January 14. Available at https://www.brookings.edu/research/half-the-people-working-in-schools-arent-classroom-teachers-so-what/.
OECD (Organisation for Economic Co-operation and Development). 1992. Technology and the Economy: The Key Relationships. Paris: OECD.
Omoregie, A. and D. Radford. 2006. “Infrastructure Delays and Cost Escalation: Causes and Effects in Nigeria. “ Conference paper, Proceedings of the Sixth International Postgraduate Research Conference, 79–93. Available at http://www.irbnet.de/daten/iconda/CIB_DC26986.pdf.
Porter, M. E. 1990. The Competitive Advantage of Nations. New York: Free Press.
Sala-i-Martín, X. and E. V. Artadi. 2004. “The Global Competitiveness Index.” In The Global Competitiveness Report 2004–2005. Geneva: World Economic Forum. 51–80.
Schwab, K. 2016. The Fourth Industrial Revolution. Geneva: World Economic Forum. Available at https://www.amazon.com/Fourth-Industrial-Revolution-Klaus-Schwab/dp/1944835008.
Scott, B. R. and G. C. Lodge. 1985. “US Competitiveness in the World Economy.” The International Executive 27 (1): 26–26.
Tyson, L. 1992. Who’s Bashing Whom? Trade Conflict in High-Technology Industries. Washington, DC: Institute of International Economics.
UN DESA (United Nations Department of Economic and Social Affairs). 2015. World Population Prospects, the 2015 Revision. Population Division. Available at https://esa.un.org/unpd/wpp/
World Bank. World Development Indicators database. Available at http://data.worldbank.org/.
World Economic Forum. 1979. Report on the Competitiveness of European Industry 1979. Geneva: World Economic Forum.
———. 1997. The Global Competitiveness Report 1997. Geneva: World Economic Forum.
———. 2001. The Global Competitiveness Report 2001–2002. Geneva
———. 2006. The Global Competitiveness Report 2006–2007. Geneva: World Economic Forum.
———. 2008. The Global Competitiveness Report 2008–2009. Geneva: World Economic Forum.
———. 2009. The Global Competitiveness Report 2009–2010. Geneva: World Economic Forum.
———. 2010. The Global Competitiveness Report 2010–2011. Geneva: World Economic Forum.
———. 2011. The Global Competitiveness Report 2011–2012. Geneva: World Economic Forum.
———. 2013. The Global Competitiveness Report 2013–2014. Geneva: World Economic Forum.
———. 2014. The Global Competitiveness Report 2014–2015. Geneva: World Economic Forum.
———. 2015. The Global Competitiveness Report 2015–2016. Geneva: World Economic Forum.
———. 2016a. The Global Competitiveness Report 2016–2017. Geneva: World Economic Forum.
———. 2016b. The Future of Jobs, Employment, Skills and Workforce Strategy for the 4IR. Geneva: World Economic Forum..
World Economic Forum, African Development Bank, and the World Bank. 2013. The Africa Competitiveness Report 2013. Geneva: World Economic Forum.
———. 2015. The Africa Competitiveness Report 2015. Geneva: World Economic Forum.
World Economic Forum, AfDB, OECD, and World Bank (World Economic Forum, African Development Bank, Organisation for Economic Co-operation and Development, and World Bank). 2016. “An Action Agenda for Africa’s Competitiveness.” World Economic Forum Document. Geneva: World Economic Forum. Available at http://www3.weforum.org/docs/Africa_Competitiveness_2016.pdf.
The Africa Competitiveness Report 2017 | 27


Tracking Progress in Africa’s Competitiveness
The Africa Competitiveness Report 2017 | 29
This appendix presents the structure of the Global Competitiveness Index 2016–2017 (GCI). The numbering of the indicator matches the numbering of the data tables. The number preceding the period indicates to which pillar the indicator belongs (e.g., indicator 1.11 belongs to the 1st pillar and indicator 9.04 belongs to the 9th pillar).
The computation of the GCI is based on successive aggregations of scores from the indicator level (i.e., the most disaggregated level) all the way up to the overall GCI score. Unless noted otherwise, we use an arithmetic mean to aggregate individual indicators within a category.a For the higher aggregation levels, we use the percentage shown next to each category. This percentage represents the category’s weight within its immediate parent category. Reported percentages are rounded to the nearest integer, but exact figures are used in the calculation of the GCI. For example, the score a country achieves in the 11th pillar accounts for 50 percent of this country’s score in the innovation and sophistication factors subindex, irrespective of the country’s stage of development. Similarly, the score achieved on the transport infrastructure subpillar accounts for 50 percent of the score of the infrastructure pillar.
Unlike the case for the lower levels of aggregation, the weight put on each of the three subindexes (basic requirements, efficiency enhancers, and innovation and sophistication factors) is not fixed. Instead, it depends on each country’s stage of development, as discussed in the chapter.b For instance, in the case of Burundi—a country in the first stage of development—the score in the basic requirements subindex accounts for 60 percent of its overall GCI score, while it represents just 40 percent of the overall GCI score of Egypt, a country in the second stage of development. For countries in transition between stages, the weighting applied to each subindex is reported in the corresponding profile at the end of this volume. For instance, in the case of Gabon, currently in transition from stage 1 to stage 2, the weight on each subindex is 51.5 percent, 41.4 percent, and 7.1 percent, respectively, as reported in the country profile on page 181 of The Global Competitiveness Report 2016–2017.
Indicators that are not derived from the Executive Opinion Survey (the Survey) are identified by an asterisk (*) in the following pages. The Technical Notes and Sources section at the end of the Report provides detailed information about each of these indicators. To make the aggregation possible,
Appendix A: Computation and structure of the Global Competitiveness Index 2016–2017
the indicators are converted to a 1-to-7 scale in order to align them with the Survey results. We apply a min-max transformation, which preserves the order of, and the relative distance between, country scores.c
Indicators that are followed by the designation “1/2” enter the GCI in two different pillars. In order to avoid double counting, we assign a half-weight to each instance.d
Weight (%) within immediate parent category
BASIC REQUIREMENTS .............................. 20–60% b
1st pillar: Institutions .......................................... 25%A. Public institutions ...............................................................75%
1. Property rights .................................................................20% 1.01 Property rights 1.02 Intellectual property protection 1/2
2. Ethics and corruption .......................................................20% 1.03 Diversion of public funds 1.04 Public trust in politicians 1.05 Irregular payments and bribes
3. Undue influence ...............................................................20% 1.06 Judicial independence 1.07 Favoritism in decisions of government officials
4. Government efficiency ......................................................20% 1.08 Wastefulness of government spending 1.09 Burden of government regulation 1.10 Efficiency of legal framework in settling disputes 1.11 Efficiency of legal framework in challenging regulations 1.12 Transparency of government policymaking
5. Security ............................................................................20% 1.13 Business costs of terrorism 1.14 Business costs of crime and violence 1.15 Organized crime 1.16 Reliability of police services
B. Private institutions ..............................................................25%
1. Corporate ethics ..............................................................50% 1.17 Ethical behavior of firms
2. Accountability ..................................................................50% 1.18 Strength of auditing and reporting standards 1.19 Efficacy of corporate boards 1.20 Protection of minority shareholders’ interests 1.21 Strength of investor protection*
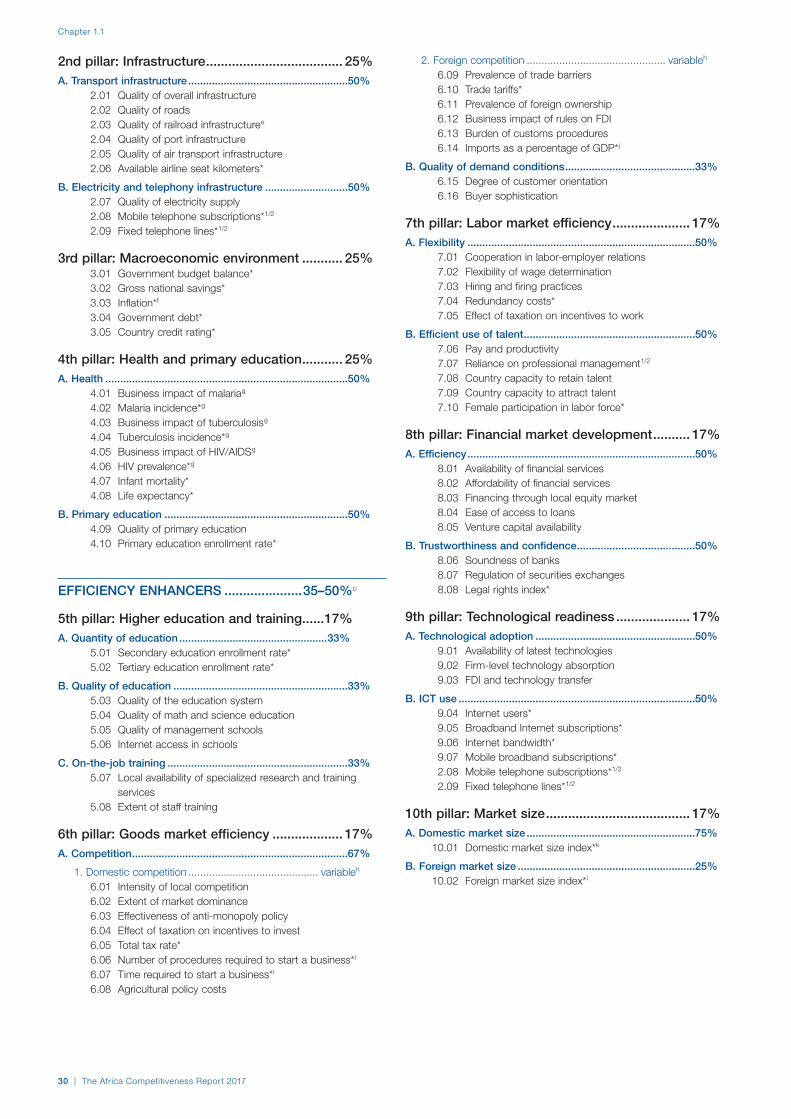
Chapter 1.1
30 | The Africa Competitiveness Report 2017
2nd pillar: Infrastructure ..................................... 25%A. Transport infrastructure ......................................................50%
2.01 Quality of overall infrastructure 2.02 Quality of roads 2.03 Quality of railroad infrastructure e
2.04 Quality of port infrastructure 2.05 Quality of air transport infrastructure 2.06 Available airline seat kilometers*
B. Electricity and telephony infrastructure ............................50% 2.07 Quality of electricity supply 2.08 Mobile telephone subscriptions* 1/2
2.09 Fixed telephone lines* 1/2
3rd pillar: Macroeconomic environment ........... 25% 3.01 Government budget balance* 3.02 Gross national savings* 3.03 Inflation* f
3.04 Government debt* 3.05 Country credit rating*
4th pillar: Health and primary education ........... 25%A. Health ..................................................................................50%
4.01 Business impact of malaria g
4.02 Malaria incidence* g
4.03 Business impact of tuberculosis g
4.04 Tuberculosis incidence* g
4.05 Business impact of HIV/AIDS g
4.06 HIV prevalence* g
4.07 Infant mortality* 4.08 Life expectancy*
B. Primary education ..............................................................50% 4.09 Quality of primary education 4.10 Primary education enrollment rate*
EFFICIENCY ENHANCERS .....................35–50% b
5th pillar: Higher education and training......17%A. Quantity of education ..................................................33%
5.01 Secondary education enrollment rate* 5.02 Tertiary education enrollment rate*
B. Quality of education ...........................................................33% 5.03 Quality of the education system 5.04 Quality of math and science education 5.05 Quality of management schools 5.06 Internet access in schools
C. On-the-job training .............................................................33% 5.07 Local availability of specialized research and training
services 5.08 Extent of staff training
6th pillar: Goods market efficiency ................... 17%A. Competition .........................................................................67%
1. Domestic competition ............................................ variable h
6.01 Intensity of local competition 6.02 Extent of market dominance 6.03 Effectiveness of anti-monopoly policy 6.04 Effect of taxation on incentives to invest 6.05 Total tax rate* 6.06 Number of procedures required to start a business* i
6.07 Time required to start a business* i
6.08 Agricultural policy costs
2. Foreign competition ............................................... variable h
6.09 Prevalence of trade barriers 6.10 Trade tariffs* 6.11 Prevalence of foreign ownership 6.12 Business impact of rules on FDI 6.13 Burden of customs procedures 6.14 Imports as a percentage of GDP* j
B. Quality of demand conditions ............................................33% 6.15 Degree of customer orientation 6.16 Buyer sophistication
7th pillar: Labor market efficiency ..................... 17%A. Flexibility .............................................................................50%
7.01 Cooperation in labor-employer relations 7.02 Flexibility of wage determination 7.03 Hiring and firing practices 7.04 Redundancy costs* 7.05 Effect of taxation on incentives to work
B. Efficient use of talent ..........................................................50% 7.06 Pay and productivity 7.07 Reliance on professional management 1/2
7.08 Country capacity to retain talent 7.09 Country capacity to attract talent 7.10 Female participation in labor force*
8th pillar: Financial market development .......... 17%A. Efficiency .............................................................................50%
8.01 Availability of financial services 8.02 Affordability of financial services 8.03 Financing through local equity market 8.04 Ease of access to loans 8.05 Venture capital availability
B. Trustworthiness and confidence ........................................50% 8.06 Soundness of banks 8.07 Regulation of securities exchanges 8.08 Legal rights index*
9th pillar: Technological readiness .................... 17%A. Technological adoption ......................................................50%
9.01 Availability of latest technologies 9.02 Firm-level technology absorption 9.03 FDI and technology transfer
B. ICT use ................................................................................50% 9.04 Internet users* 9.05 Broadband Internet subscriptions* 9.06 Internet bandwidth* 9.07 Mobile broadband subscriptions* 2.08 Mobile telephone subscriptions* 1/2
2.09 Fixed telephone lines* 1/2
10th pillar: Market size ....................................... 17%A. Domestic market size .........................................................75%
10.01 Domestic market size index* k
B. Foreign market size ............................................................25% 10.02 Foreign market size index* l

Tracking Progress in Africa’s Competitiveness
The Africa Competitiveness Report 2017 | 31
INNOVATION AND SOPHISTICATION FACTORS ........................................................ 5–30% b
11th pillar: Business sophistication ................. 50% 11.01 Local supplier quantity 11.02 Local supplier quality 11.03 State of cluster development 11.04 Nature of competitive advantage 11.05 Value chain breadth 11.06 Control of international distribution 11.07 Production process sophistication 11.08 Extent of marketing 11.09 Willingness to delegate authority 7.07 Reliance on professional management 1/2
12th pillar: R&D Innovation ................................ 50% 12.01 Capacity for innovation 12.02 Quality of scientific research institutions 12.03 Company spending on R&D 12.04 University-industry collaboration in R&D 12.05 Government procurement of advanced technology
products 12.06 Availability of scientists and engineers 12.07 PCT patent applications* 1.02 Intellectual property protection 1/2
NOTES a Formally, for a category i composed of K indicators, we have:
categoryiK
�k=1
indicatorkK
�
b As described in the chapter, the weights are as specified below. Refer to Table 2 of the chapter for country classification according to stage of development:
Stage of development
Factor-driven stage (1)
Transition from stage 1
to stage 2
Efficiency-driven
stage (2)
Transition from stage 2
to stage 3
Innovation-driven
stage (3)
GDP per capita (US$) thresholds*
<2,000 2,000–2,999 3,000–8,999 9,000–17,000 >17,000
Weight for basic requirements
60% 40–60% 40% 20–40% 20%
Weight for efficiency enhancers
35% 35–50% 50% 50% 50%
Weight for innovation and sophistication factors
5% 5–10% 10% 10–30% 30%
* For economies with a high dependency on mineral resources, GDP per capita is not the sole criterion for the determination of the stage of development. See text for details.
c Formally, we have:
6 x country score – sample minimum
+ 1 ( sample maximum – sample minimum ) The sample minimum and sample maximum are, respectively, the lowest
and highest country scores in the sample of economies covered by the GCI. In some instances, adjustments were made to account for extreme outliers. For those indicators for which a higher value indicates a worse outcome (e.g., disease incidence, government debt), the transformation formula takes the following form, thus ensuring that 1 and 7 still corresponds to the worst and best possible outcomes, respectively:
– 6 x country score – sample minimum
+ 7 ( sample maximum – sample minimum )
d For those categories that contain one or several half-weight variables, country scores are computed as follows:
(sum of scores on full-weight variables) 1 3 (sum of scores on half-weight variables)
(count of full-weight variables) 1 3 (count of half-weight variables)
e “N/Appl.” is used for economies where there is no regular train service or where the network covers only a negligible portion of the territory. Assessment of the existence of a network was conducted by the World Economic Forum based on various sources.
f In order to capture the idea that both high inflation and deflation are detrimental, inflation enters the model in a U-shaped manner as follows: for values of inflation between 0.5 and 2.9 percent, a country receives the highest possible score of 7. Outside this range, scores decrease linearly as they move away from these values.
g The impact of malaria, tuberculosis, and HIV/AIDS on competitiveness depends not only on their respective incidence rates but also on how costly they are for business. Therefore, in order to estimate the impact of each of the three diseases, we combine its incidence rate with the Survey question on its perceived cost to businesses. To combine these data we first take the ratio of each country’s disease incidence rate relative to the highest incidence rate in the whole sample. The inverse of this ratio is then multiplied by each country’s score on the related Survey question. This product is then normalized to a 1-to-7 scale. Note that countries with zero reported incidence receive a 7, regardless of their scores on the related Survey question. In the case of malaria, countries receive a 7 if the World Health Organization (WHO) has classified them as malaria-free countries or included them in the supplementary list of areas where malaria has never existed or has disappeared without specific measures.
h The competition subpillar is the weighted average of two components: domestic competition and foreign competition. In both components, the included indicators provide an indication of the extent to which competition is distorted. The relative importance of these distortions depends on the relative size of domestic versus foreign competition. This interaction between the domestic market and the foreign market is captured by the way we determine the weights of the two components. Domestic competition is the sum of consumption (C), investment (I), government spending (G), and exports (X), while foreign competition is equal to imports (M). Thus we assign a weight of (C + I + G + X)/(C + I + G + X + M) to domestic competition and a weight of M/(C + I + G + X + M) to foreign competition.
i Indicators 6.06 and 6.07 combine to form one single indicator.
j For indicators 6.14, imports as a percentage of GDP, we first apply a log-transformation and then a min-max transformation.
k The size of the domestic market is constructed by taking the natural log of the sum of the gross domestic product valued at purchased power parity (PPP) plus the total value (PPP estimates) of imports of goods and services, minus the total value (PPP estimates) of exports of goods and services. Data are then normalized on a 1-to-7 scale. PPP estimates of imports and exports are obtained by taking the product of exports as a percentage of GDP and GDP valued at PPP. The underlying data are reported in the data tables section (see Tables 10.03, 6.14, and 10.04).
l The size of the foreign market is estimated as the natural log of the total value (PPP estimates) of exports of goods and services, normalized on a 1-to-7 scale. PPP estimates of exports are obtained by taking the product of exports as a percentage of GDP and GDP valued at PPP. The underlying data are reported in the data tables.
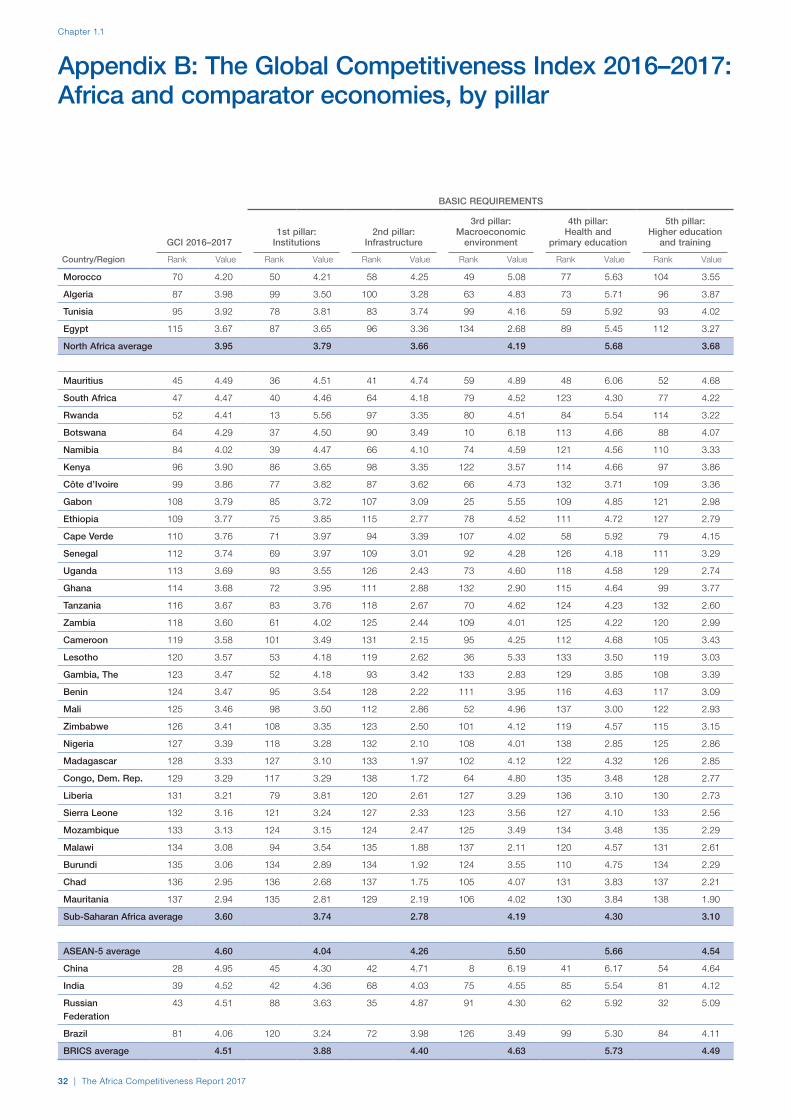
Chapter 1.1
BASIC REQUIREMENTS EFFICIENCY ENHANCERSINNOVATION AND
SOPHISTICATION FACTORS
GCI 2016–20171st pillar:
Institutions2nd pillar:
Infrastructure
3rd pillar: Macroeconomic
environment
4th pillar: Health and
primary education
5th pillar: Higher education
and training
6th pillar: Goods market
efficiency
7th pillar: Labor market
efficiency
8th pillar: Financial market
development
9th pillar: Technological
readiness10th pillar: Market size
11th pillar: Business
sophistication 12th pillar: Innovation
Country/Region Rank Value Rank Value Rank Value Rank Value Rank Value Rank Value Country/Region Rank Value Rank Value Rank Value Rank Value Rank Value Rank Value Rank Value
Morocco 70 4.20 50 4.21 58 4.25 49 5.08 77 5.63 104 3.55 Morocco 64 4.38 124 3.55 83 3.79 81 3.69 55 4.26 76 3.82 96 3.11
Algeria 87 3.98 99 3.50 100 3.28 63 4.83 73 5.71 96 3.87 Algeria 133 3.52 132 3.25 132 2.89 108 3.08 36 4.73 121 3.31 112 2.93
Tunisia 95 3.92 78 3.81 83 3.74 99 4.16 59 5.92 93 4.02 Tunisia 113 3.93 133 3.24 119 3.21 80 3.73 69 3.79 101 3.61 104 3.03
Egypt 115 3.67 87 3.65 96 3.36 134 2.68 89 5.45 112 3.27 Egypt 112 3.95 135 3.15 111 3.39 99 3.26 25 5.03 85 3.71 122 2.75
North Africa average 3.95 3.79 3.66 4.19 5.68 3.68 North Africa average 3.94 3.30 3.32 3.44 4.45 3.61 2.96
Mauritius 45 4.49 36 4.51 41 4.74 59 4.89 48 6.06 52 4.68 Mauritius 26 4.90 57 4.39 44 4.29 66 4.17 118 2.71 37 4.36 67 3.34
South Africa 47 4.47 40 4.46 64 4.18 79 4.52 123 4.30 77 4.22 South Africa 28 4.77 97 3.94 11 5.19 49 4.70 30 4.89 30 4.52 35 3.85
Rwanda 52 4.41 13 5.56 97 3.35 80 4.51 84 5.54 114 3.22 Rwanda 35 4.68 7 5.37 32 4.60 100 3.25 127 2.45 64 3.97 47 3.56
Botswana 64 4.29 37 4.50 90 3.49 10 6.18 113 4.66 88 4.07 Botswana 73 4.29 36 4.54 66 3.99 86 3.58 105 2.89 100 3.61 84 3.22
Namibia 84 4.02 39 4.47 66 4.10 74 4.59 121 4.56 110 3.33 Namibia 79 4.23 32 4.61 49 4.22 87 3.56 113 2.76 83 3.73 74 3.29
Kenya 96 3.90 86 3.65 98 3.35 122 3.57 114 4.66 97 3.86 Kenya 77 4.23 31 4.62 50 4.20 89 3.55 70 3.74 47 4.23 36 3.83
Côte d’Ivoire 99 3.86 77 3.82 87 3.62 66 4.73 132 3.71 109 3.36 Côte d’Ivoire 92 4.16 75 4.19 75 3.88 94 3.39 80 3.40 89 3.68 61 3.38
Gabon 108 3.79 85 3.72 107 3.09 25 5.55 109 4.85 121 2.98 Gabon 125 3.74 101 3.89 103 3.50 109 3.06 112 2.81 131 3.17 124 2.71
Ethiopia 109 3.77 75 3.85 115 2.77 78 4.52 111 4.72 127 2.79 Ethiopia 105 4.01 70 4.24 102 3.51 131 2.43 66 3.83 93 3.67 57 3.40
Cape Verde 110 3.76 71 3.97 94 3.39 107 4.02 58 5.92 79 4.15 Cape Verde 97 4.08 116 3.67 112 3.37 78 3.76 137 1.37 108 3.52 98 3.11
Senegal 112 3.74 69 3.97 109 3.01 92 4.28 126 4.18 111 3.29 Senegal 84 4.20 94 3.97 88 3.71 103 3.17 103 2.92 70 3.86 50 3.48
Uganda 113 3.69 93 3.55 126 2.43 73 4.60 118 4.58 129 2.74 Uganda 115 3.91 29 4.66 77 3.88 118 2.78 81 3.38 111 3.49 77 3.26
Ghana 114 3.68 72 3.95 111 2.88 132 2.90 115 4.64 99 3.77 Ghana 93 4.16 72 4.23 85 3.78 95 3.39 72 3.70 68 3.91 69 3.32
Tanzania 116 3.67 83 3.76 118 2.67 70 4.62 124 4.23 132 2.60 Tanzania 114 3.93 62 4.33 98 3.55 125 2.59 71 3.73 106 3.53 88 3.20
Zambia 118 3.60 61 4.02 125 2.44 109 4.01 125 4.22 120 2.99 Zambia 83 4.20 90 4.00 84 3.78 115 2.83 88 3.25 105 3.55 66 3.34
Cameroon 119 3.58 101 3.49 131 2.15 95 4.25 112 4.68 105 3.43 Cameroon 109 3.97 76 4.16 91 3.66 124 2.60 85 3.29 112 3.49 90 3.18
Lesotho 120 3.57 53 4.18 119 2.62 36 5.33 133 3.50 119 3.03 Lesotho 88 4.18 96 3.96 134 2.61 123 2.67 132 1.90 110 3.50 111 2.95
Gambia, The 123 3.47 52 4.18 93 3.42 133 2.83 129 3.85 108 3.39 Gambia, The 82 4.21 46 4.49 100 3.52 112 2.92 138 1.34 71 3.85 106 3.00
Benin 124 3.47 95 3.54 128 2.22 111 3.95 116 4.63 117 3.09 Benin 126 3.72 50 4.42 106 3.47 129 2.48 123 2.59 116 3.39 86 3.21
Mali 125 3.46 98 3.50 112 2.86 52 4.96 137 3.00 122 2.93 Mali 110 3.97 112 3.77 109 3.42 113 2.84 111 2.83 118 3.38 92 3.16
Zimbabwe 126 3.41 108 3.35 123 2.50 101 4.12 119 4.57 115 3.15 Zimbabwe 132 3.54 127 3.37 126 3.08 120 2.73 117 2.72 130 3.17 129 2.61
Nigeria 127 3.39 118 3.28 132 2.10 108 4.01 138 2.85 125 2.86 Nigeria 98 4.07 37 4.54 89 3.69 105 3.15 26 4.99 99 3.61 113 2.90
Madagascar 128 3.33 127 3.10 133 1.97 102 4.12 122 4.32 126 2.85 Madagascar 120 3.81 56 4.40 121 3.13 128 2.49 107 2.89 120 3.32 97 3.11
Congo, Dem. Rep. 129 3.29 117 3.29 138 1.72 64 4.80 135 3.48 128 2.77 Congo, Dem. Rep. 127 3.72 53 4.41 117 3.24 134 2.30 95 3.17 132 3.17 115 2.85
Liberia 131 3.21 79 3.81 120 2.61 127 3.29 136 3.10 130 2.73 Liberia 90 4.17 74 4.21 74 3.89 130 2.43 134 1.70 90 3.67 91 3.16
Sierra Leone 132 3.16 121 3.24 127 2.33 123 3.56 127 4.10 133 2.56 Sierra Leone 123 3.77 110 3.79 123 3.11 132 2.41 131 2.08 133 3.15 130 2.59
Mozambique 133 3.13 124 3.15 124 2.47 125 3.49 134 3.48 135 2.29 Mozambique 118 3.88 92 3.98 128 2.98 127 2.54 102 2.99 128 3.19 117 2.84
Malawi 134 3.08 94 3.54 135 1.88 137 2.11 120 4.57 131 2.61 Malawi 119 3.81 38 4.53 115 3.26 135 2.26 125 2.54 122 3.28 120 2.81
Burundi 135 3.06 134 2.89 134 1.92 124 3.55 110 4.75 134 2.29 Burundi 130 3.62 78 4.13 135 2.57 137 2.01 135 1.69 135 3.07 131 2.55
Chad 136 2.95 136 2.68 137 1.75 105 4.07 131 3.83 137 2.21 Chad 137 3.00 111 3.79 133 2.88 138 1.93 115 2.76 137 2.70 134 2.49
Mauritania 137 2.94 135 2.81 129 2.19 106 4.02 130 3.84 138 1.90 Mauritania 136 3.21 131 3.26 137 2.21 133 2.32 128 2.42 138 2.56 137 2.20
Sub-Saharan Africa average 3.60 3.74 2.78 4.19 4.30 3.10 Sub-Saharan Africa average 4.00 4.19 3.55 2.91 2.89 3.53 3.09
ASEAN-5 average 4.60 4.04 4.26 5.50 5.66 4.54 ASEAN-5 average 4.52 4.23 4.36 3.95 5.14 4.31 3.76
China 28 4.95 45 4.30 42 4.71 8 6.19 41 6.17 54 4.64 China 56 4.43 39 4.53 56 4.16 74 3.96 1 7.00 34 4.41 30 4.04
India 39 4.52 42 4.36 68 4.03 75 4.55 85 5.54 81 4.12 India 60 4.39 84 4.10 38 4.41 110 2.99 3 6.43 35 4.39 29 4.05
Russian Federation
43 4.51 88 3.63 35 4.87 91 4.30 62 5.92 32 5.09 Russian Federation
87 4.19 49 4.43 108 3.43 62 4.30 6 5.90 72 3.85 56 3.40
Brazil 81 4.06 120 3.24 72 3.98 126 3.49 99 5.30 84 4.11 Brazil 128 3.70 117 3.67 93 3.63 59 4.37 8 5.73 63 4.01 100 3.10
BRICS average 4.51 3.88 4.40 4.63 5.73 4.49 BRICS average 4.18 4.18 3.91 3.91 6.26 4.16 3.65
32 | The Africa Competitiveness Report 2017
Appendix B: The Global Competitiveness Index 2016–2017: Africa and comparator economies, by pillar
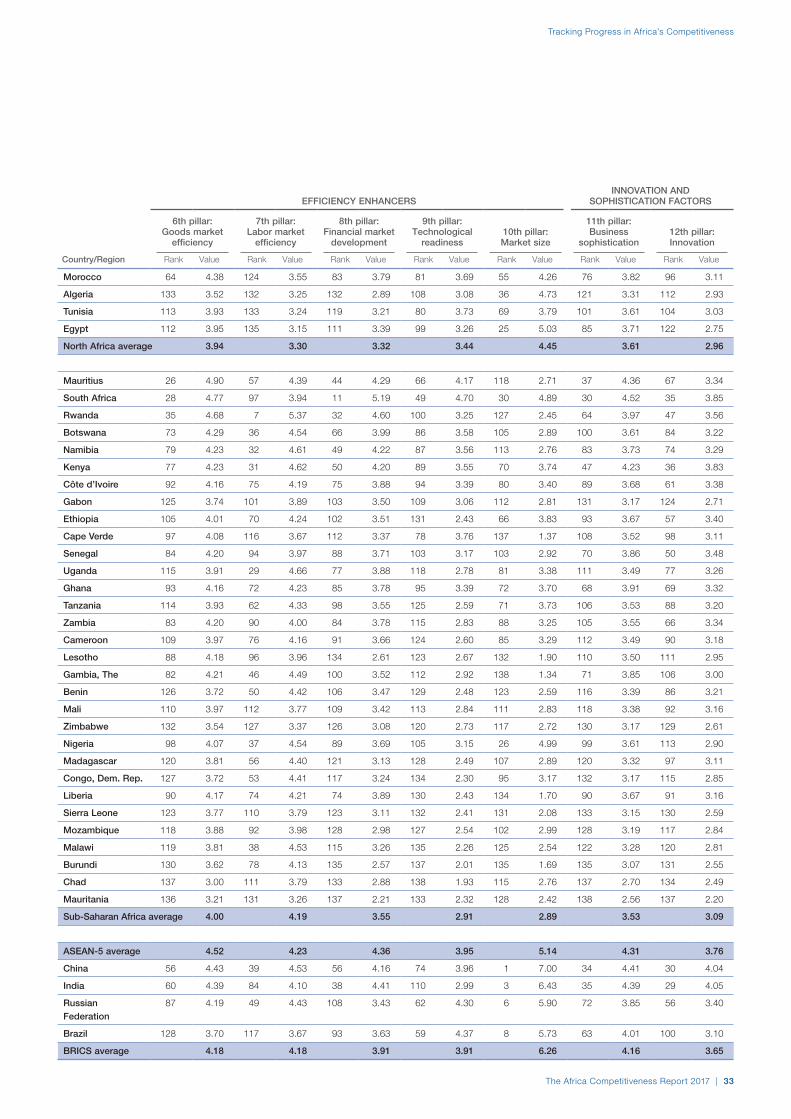
Tracking Progress in Africa’s Competitiveness
BASIC REQUIREMENTS EFFICIENCY ENHANCERSINNOVATION AND
SOPHISTICATION FACTORS
GCI 2016–20171st pillar:
Institutions2nd pillar:
Infrastructure
3rd pillar: Macroeconomic
environment
4th pillar: Health and
primary education
5th pillar: Higher education
and training
6th pillar: Goods market
efficiency
7th pillar: Labor market
efficiency
8th pillar: Financial market
development
9th pillar: Technological
readiness10th pillar: Market size
11th pillar: Business
sophistication 12th pillar: Innovation
Country/Region Rank Value Rank Value Rank Value Rank Value Rank Value Rank Value Country/Region Rank Value Rank Value Rank Value Rank Value Rank Value Rank Value Rank Value
Morocco 70 4.20 50 4.21 58 4.25 49 5.08 77 5.63 104 3.55 Morocco 64 4.38 124 3.55 83 3.79 81 3.69 55 4.26 76 3.82 96 3.11
Algeria 87 3.98 99 3.50 100 3.28 63 4.83 73 5.71 96 3.87 Algeria 133 3.52 132 3.25 132 2.89 108 3.08 36 4.73 121 3.31 112 2.93
Tunisia 95 3.92 78 3.81 83 3.74 99 4.16 59 5.92 93 4.02 Tunisia 113 3.93 133 3.24 119 3.21 80 3.73 69 3.79 101 3.61 104 3.03
Egypt 115 3.67 87 3.65 96 3.36 134 2.68 89 5.45 112 3.27 Egypt 112 3.95 135 3.15 111 3.39 99 3.26 25 5.03 85 3.71 122 2.75
North Africa average 3.95 3.79 3.66 4.19 5.68 3.68 North Africa average 3.94 3.30 3.32 3.44 4.45 3.61 2.96
Mauritius 45 4.49 36 4.51 41 4.74 59 4.89 48 6.06 52 4.68 Mauritius 26 4.90 57 4.39 44 4.29 66 4.17 118 2.71 37 4.36 67 3.34
South Africa 47 4.47 40 4.46 64 4.18 79 4.52 123 4.30 77 4.22 South Africa 28 4.77 97 3.94 11 5.19 49 4.70 30 4.89 30 4.52 35 3.85
Rwanda 52 4.41 13 5.56 97 3.35 80 4.51 84 5.54 114 3.22 Rwanda 35 4.68 7 5.37 32 4.60 100 3.25 127 2.45 64 3.97 47 3.56
Botswana 64 4.29 37 4.50 90 3.49 10 6.18 113 4.66 88 4.07 Botswana 73 4.29 36 4.54 66 3.99 86 3.58 105 2.89 100 3.61 84 3.22
Namibia 84 4.02 39 4.47 66 4.10 74 4.59 121 4.56 110 3.33 Namibia 79 4.23 32 4.61 49 4.22 87 3.56 113 2.76 83 3.73 74 3.29
Kenya 96 3.90 86 3.65 98 3.35 122 3.57 114 4.66 97 3.86 Kenya 77 4.23 31 4.62 50 4.20 89 3.55 70 3.74 47 4.23 36 3.83
Côte d’Ivoire 99 3.86 77 3.82 87 3.62 66 4.73 132 3.71 109 3.36 Côte d’Ivoire 92 4.16 75 4.19 75 3.88 94 3.39 80 3.40 89 3.68 61 3.38
Gabon 108 3.79 85 3.72 107 3.09 25 5.55 109 4.85 121 2.98 Gabon 125 3.74 101 3.89 103 3.50 109 3.06 112 2.81 131 3.17 124 2.71
Ethiopia 109 3.77 75 3.85 115 2.77 78 4.52 111 4.72 127 2.79 Ethiopia 105 4.01 70 4.24 102 3.51 131 2.43 66 3.83 93 3.67 57 3.40
Cape Verde 110 3.76 71 3.97 94 3.39 107 4.02 58 5.92 79 4.15 Cape Verde 97 4.08 116 3.67 112 3.37 78 3.76 137 1.37 108 3.52 98 3.11
Senegal 112 3.74 69 3.97 109 3.01 92 4.28 126 4.18 111 3.29 Senegal 84 4.20 94 3.97 88 3.71 103 3.17 103 2.92 70 3.86 50 3.48
Uganda 113 3.69 93 3.55 126 2.43 73 4.60 118 4.58 129 2.74 Uganda 115 3.91 29 4.66 77 3.88 118 2.78 81 3.38 111 3.49 77 3.26
Ghana 114 3.68 72 3.95 111 2.88 132 2.90 115 4.64 99 3.77 Ghana 93 4.16 72 4.23 85 3.78 95 3.39 72 3.70 68 3.91 69 3.32
Tanzania 116 3.67 83 3.76 118 2.67 70 4.62 124 4.23 132 2.60 Tanzania 114 3.93 62 4.33 98 3.55 125 2.59 71 3.73 106 3.53 88 3.20
Zambia 118 3.60 61 4.02 125 2.44 109 4.01 125 4.22 120 2.99 Zambia 83 4.20 90 4.00 84 3.78 115 2.83 88 3.25 105 3.55 66 3.34
Cameroon 119 3.58 101 3.49 131 2.15 95 4.25 112 4.68 105 3.43 Cameroon 109 3.97 76 4.16 91 3.66 124 2.60 85 3.29 112 3.49 90 3.18
Lesotho 120 3.57 53 4.18 119 2.62 36 5.33 133 3.50 119 3.03 Lesotho 88 4.18 96 3.96 134 2.61 123 2.67 132 1.90 110 3.50 111 2.95
Gambia, The 123 3.47 52 4.18 93 3.42 133 2.83 129 3.85 108 3.39 Gambia, The 82 4.21 46 4.49 100 3.52 112 2.92 138 1.34 71 3.85 106 3.00
Benin 124 3.47 95 3.54 128 2.22 111 3.95 116 4.63 117 3.09 Benin 126 3.72 50 4.42 106 3.47 129 2.48 123 2.59 116 3.39 86 3.21
Mali 125 3.46 98 3.50 112 2.86 52 4.96 137 3.00 122 2.93 Mali 110 3.97 112 3.77 109 3.42 113 2.84 111 2.83 118 3.38 92 3.16
Zimbabwe 126 3.41 108 3.35 123 2.50 101 4.12 119 4.57 115 3.15 Zimbabwe 132 3.54 127 3.37 126 3.08 120 2.73 117 2.72 130 3.17 129 2.61
Nigeria 127 3.39 118 3.28 132 2.10 108 4.01 138 2.85 125 2.86 Nigeria 98 4.07 37 4.54 89 3.69 105 3.15 26 4.99 99 3.61 113 2.90
Madagascar 128 3.33 127 3.10 133 1.97 102 4.12 122 4.32 126 2.85 Madagascar 120 3.81 56 4.40 121 3.13 128 2.49 107 2.89 120 3.32 97 3.11
Congo, Dem. Rep. 129 3.29 117 3.29 138 1.72 64 4.80 135 3.48 128 2.77 Congo, Dem. Rep. 127 3.72 53 4.41 117 3.24 134 2.30 95 3.17 132 3.17 115 2.85
Liberia 131 3.21 79 3.81 120 2.61 127 3.29 136 3.10 130 2.73 Liberia 90 4.17 74 4.21 74 3.89 130 2.43 134 1.70 90 3.67 91 3.16
Sierra Leone 132 3.16 121 3.24 127 2.33 123 3.56 127 4.10 133 2.56 Sierra Leone 123 3.77 110 3.79 123 3.11 132 2.41 131 2.08 133 3.15 130 2.59
Mozambique 133 3.13 124 3.15 124 2.47 125 3.49 134 3.48 135 2.29 Mozambique 118 3.88 92 3.98 128 2.98 127 2.54 102 2.99 128 3.19 117 2.84
Malawi 134 3.08 94 3.54 135 1.88 137 2.11 120 4.57 131 2.61 Malawi 119 3.81 38 4.53 115 3.26 135 2.26 125 2.54 122 3.28 120 2.81
Burundi 135 3.06 134 2.89 134 1.92 124 3.55 110 4.75 134 2.29 Burundi 130 3.62 78 4.13 135 2.57 137 2.01 135 1.69 135 3.07 131 2.55
Chad 136 2.95 136 2.68 137 1.75 105 4.07 131 3.83 137 2.21 Chad 137 3.00 111 3.79 133 2.88 138 1.93 115 2.76 137 2.70 134 2.49
Mauritania 137 2.94 135 2.81 129 2.19 106 4.02 130 3.84 138 1.90 Mauritania 136 3.21 131 3.26 137 2.21 133 2.32 128 2.42 138 2.56 137 2.20
Sub-Saharan Africa average 3.60 3.74 2.78 4.19 4.30 3.10 Sub-Saharan Africa average 4.00 4.19 3.55 2.91 2.89 3.53 3.09
ASEAN-5 average 4.60 4.04 4.26 5.50 5.66 4.54 ASEAN-5 average 4.52 4.23 4.36 3.95 5.14 4.31 3.76
China 28 4.95 45 4.30 42 4.71 8 6.19 41 6.17 54 4.64 China 56 4.43 39 4.53 56 4.16 74 3.96 1 7.00 34 4.41 30 4.04
India 39 4.52 42 4.36 68 4.03 75 4.55 85 5.54 81 4.12 India 60 4.39 84 4.10 38 4.41 110 2.99 3 6.43 35 4.39 29 4.05
Russian Federation
43 4.51 88 3.63 35 4.87 91 4.30 62 5.92 32 5.09 Russian Federation
87 4.19 49 4.43 108 3.43 62 4.30 6 5.90 72 3.85 56 3.40
Brazil 81 4.06 120 3.24 72 3.98 126 3.49 99 5.30 84 4.11 Brazil 128 3.70 117 3.67 93 3.63 59 4.37 8 5.73 63 4.01 100 3.10
BRICS average 4.51 3.88 4.40 4.63 5.73 4.49 BRICS average 4.18 4.18 3.91 3.91 6.26 4.16 3.65
The Africa Competitiveness Report 2017 | 33

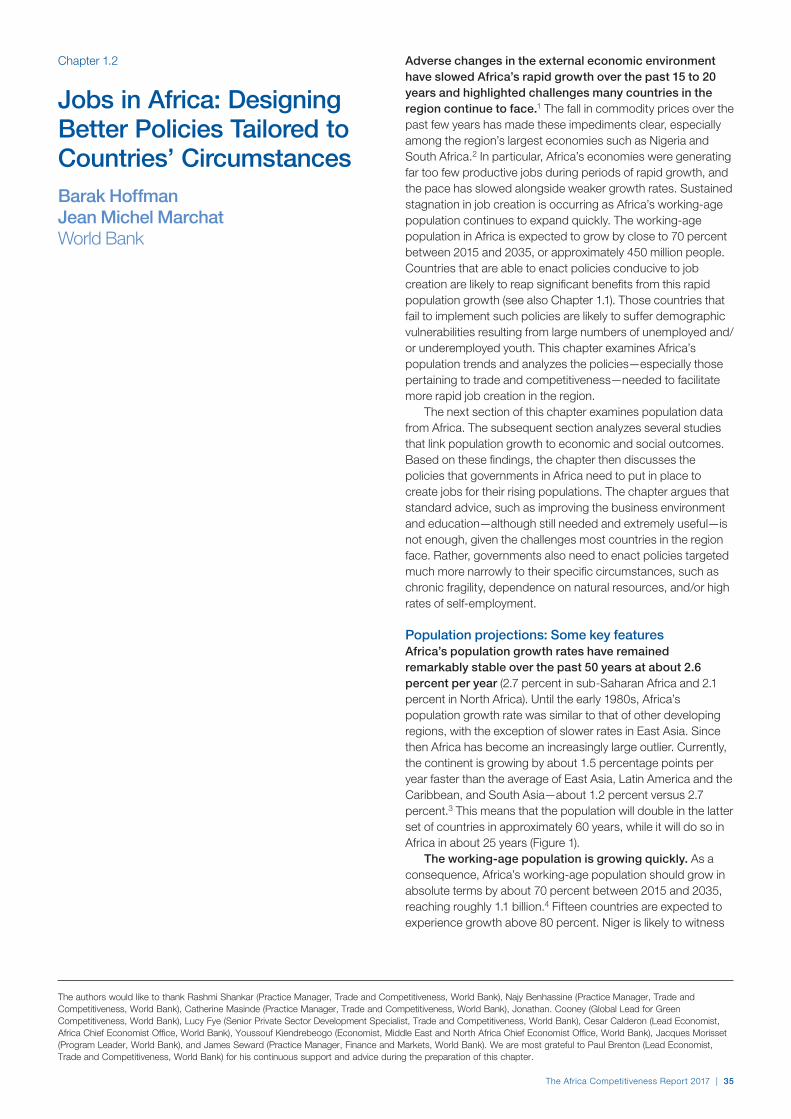
Chapter 1.2
Jobs in Africa: Designing Better Policies Tailored to Countries’ CircumstancesBarak HoffmanJean Michel MarchatWorld Bank
Adverse changes in the external economic environment have slowed Africa’s rapid growth over the past 15 to 20 years and highlighted challenges many countries in the region continue to face.1 The fall in commodity prices over the past few years has made these impediments clear, especially among the region’s largest economies such as Nigeria and South Africa.2 In particular, Africa’s economies were generating far too few productive jobs during periods of rapid growth, and the pace has slowed alongside weaker growth rates. Sustained stagnation in job creation is occurring as Africa’s working-age population continues to expand quickly. The working-age population in Africa is expected to grow by close to 70 percent between 2015 and 2035, or approximately 450 million people. Countries that are able to enact policies conducive to job creation are likely to reap significant benefits from this rapid population growth (see also Chapter 1.1). Those countries that fail to implement such policies are likely to suffer demographic vulnerabilities resulting from large numbers of unemployed and/or underemployed youth. This chapter examines Africa’s population trends and analyzes the policies—especially those pertaining to trade and competitiveness—needed to facilitate more rapid job creation in the region.
The next section of this chapter examines population data from Africa. The subsequent section analyzes several studies that link population growth to economic and social outcomes. Based on these findings, the chapter then discusses the policies that governments in Africa need to put in place to create jobs for their rising populations. The chapter argues that standard advice, such as improving the business environment and education—although still needed and extremely useful—is not enough, given the challenges most countries in the region face. Rather, governments also need to enact policies targeted much more narrowly to their specific circumstances, such as chronic fragility, dependence on natural resources, and/or high rates of self-employment.
Population projections: Some key featuresAfrica’s population growth rates have remained remarkably stable over the past 50 years at about 2.6 percent per year (2.7 percent in sub-Saharan Africa and 2.1 percent in North Africa). Until the early 1980s, Africa’s population growth rate was similar to that of other developing regions, with the exception of slower rates in East Asia. Since then Africa has become an increasingly large outlier. Currently, the continent is growing by about 1.5 percentage points per year faster than the average of East Asia, Latin America and the Caribbean, and South Asia—about 1.2 percent versus 2.7 percent.3 This means that the population will double in the latter set of countries in approximately 60 years, while it will do so in Africa in about 25 years (Figure 1).
The working-age population is growing quickly. As a consequence, Africa’s working-age population should grow in absolute terms by about 70 percent between 2015 and 2035, reaching roughly 1.1 billion.4 Fifteen countries are expected to experience growth above 80 percent. Niger is likely to witness
The authors would like to thank Rashmi Shankar (Practice Manager, Trade and Competitiveness, World Bank), Najy Benhassine (Practice Manager, Trade and Competitiveness, World Bank), Catherine Masinde (Practice Manager, Trade and Competitiveness, World Bank), Jonathan. Cooney (Global Lead for Green Competitiveness, World Bank), Lucy Fye (Senior Private Sector Development Specialist, Trade and Competitiveness, World Bank), Cesar Calderon (Lead Economist, Africa Chief Economist Office, World Bank), Youssouf Kiendrebeogo (Economist, Middle East and North Africa Chief Economist Office, World Bank), Jacques Morisset (Program Leader, World Bank), and James Seward (Practice Manager, Finance and Markets, World Bank). We are most grateful to Paul Brenton (Lead Economist, Trade and Competitiveness, World Bank) for his continuous support and advice during the preparation of this chapter.
The Africa Competitiveness Report 2017 | 35

Chapter 1.2
the highest growth of its working age population: 129 percent (Figure A1 in Appendix A). Cumulative population growth is highly concentrated in a small number of countries. Democratic Republic of Congo, Egypt, Ethiopia, Nigeria, and countries that make up the East African Community account for 55 percent of the total growth.5
The working-age population as a share of total population is likely to increase slightly over 2015–35, from 57 percent to about 61 percent (Figure 2). However, only a few countries will see the share of their working-age population rise to between 65 and 70 percent by 2035, 6 a range historically associated with a demographic dividend (i.e., accelerated economic growth rates due, in part, to a growing working-age population share).7 The reason the observed rapid population growth is not leading to a faster rising share of the working-age population is that fertility rates remain high in most African countries, even among those with falling infant mortality rates.8 Falling infant mortality rates combined with sustained high fertility rates will cause younger cohorts to be larger than their predecessors and the share of the working age population will not rise. This is occurring in many African countries at the moment.
Africa’s population is urbanizing rapidly. About 40 percent of Africans currently live in urban areas; that proportion is likely to reach 50 percent by 2030. Perhaps more impressive is the rate of growth of the region’s 20 largest cities (Figure A2 of the Appendix). On average, they are expected to grow by about 50 percent between 2010 and 2025,9 from an average size of 4.5 million people to 6.6 million. Ouagadougou has the highest expected growth rate, 126 percent. Dar es Salaam, Nairobi, Kinshasa, and Luanda are projected to grow by over 70 percent. By 2025, Kinshasa and Lagos should each have approximately 15 million people, followed closely by Cairo.
Chapter 1.3 on competitive cities by the African Development Bank examines the challenges and opportunities urbanization creates in detail.
Migration remains important. A traditional response to large population growth and limited economic opportunity is migration. In 2013, sub-Saharan Africa’s emigrant population was estimated to be about 23.2 million people, or close to 2.5 percent of the population, while for North Africa it was estimated to be around 9 million persons, or 5.1 percent of the population.10 Current estimates show that about half of Africa’s migrants stay within the continent and the other half are concentrated in France, Saudi Arabia, the United Kingdom, and the United States. Côte d’Ivoire and South Africa are the top destinations for migrants within Africa. Cape Verde, Eritrea, Equatorial Guinea, Sao Tome and Principe, and Seychelles have the largest share of their population as migrants, while the largest absolute number are from Algeria, Burkina Faso, Egypt, Morocco, Somalia, and Sudan.11
The job gap—the difference between the number of people looking for jobs and the number of jobs likely to exist—under current policies is likely to be large over the coming decades. Based on recent trends and International Monetary Fund (IMF) projections, Fox et al. forecast that between 2010 and 2020, 75 percent of new entrants to the labor market will work either in agriculture or household enterprises (e.g., self-employment and microenterprises).12 Just over 20 percent will work for wages in the service sector, and only about 4–5 percent will find a wage-paying job in the industrial sector. If these trends continue, and despite migration, only about 100 million of the expected 450 million person increase in the size of the working-age population by 2035 can expect to find a stable wage-paying job. In addition, the largest projected growth in the working-age population is
50
55
60
65
70
75
2050
2040
2030
2020
2010
2000
1990
1980
1970
1960Key
East Asia and Pacific
Latin America and the Caribbean
Middle East exclduing North Africa
South Asia
Africa
Percent of total population
Source: World Bank, World Health Nutrition and Population Statistics: Population Estimates and Projections, October 2016 update.
Figure 2: Working-age population by region, 1960–2050
Source: World Bank, World Development Indicators, February 2017 update.
Countries are weighted by their population.
Figure 1: Population growth by region, 1970–2015
0
1
2
3
4
2015
2010
2005
2000
1995
1990
1985
1980
1975
1970
Key
East Asia and Pacific
Latin America and the Caribbean
Middle East exclduing North Africa
South Asia
Africa
Percent
36 | The Africa Competitiveness Report 2017
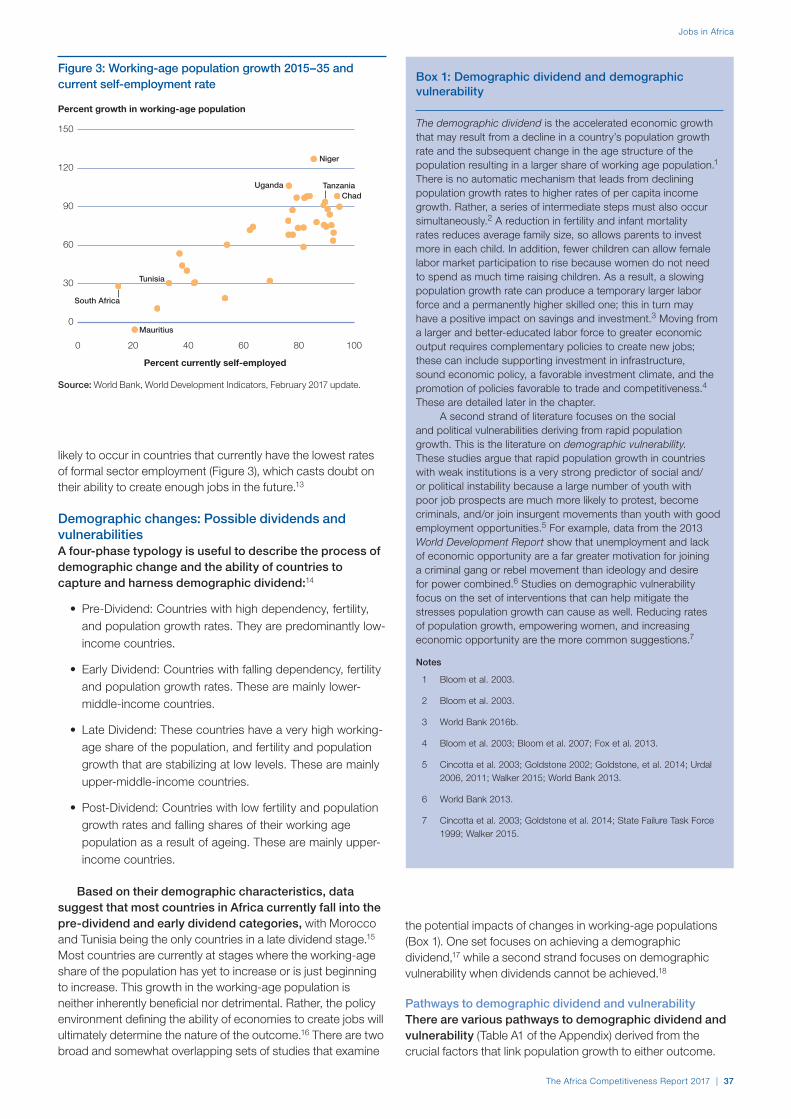
Jobs in Africa
likely to occur in countries that currently have the lowest rates of formal sector employment (Figure 3), which casts doubt on their ability to create enough jobs in the future.13
Demographic changes: Possible dividends and vulnerabilitiesA four-phase typology is useful to describe the process of demographic change and the ability of countries to capture and harness demographic dividend:14
• Pre-Dividend: Countries with high dependency, fertility, and population growth rates. They are predominantly low-income countries.
• Early Dividend: Countries with falling dependency, fertility and population growth rates. These are mainly lower-middle-income countries.
• Late Dividend: These countries have a very high working-age share of the population, and fertility and population growth that are stabilizing at low levels. These are mainly upper-middle-income countries.
• Post-Dividend: Countries with low fertility and population growth rates and falling shares of their working age population as a result of ageing. These are mainly upper-income countries.
Based on their demographic characteristics, data suggest that most countries in Africa currently fall into the pre-dividend and early dividend categories, with Morocco and Tunisia being the only countries in a late dividend stage.15 Most countries are currently at stages where the working-age share of the population has yet to increase or is just beginning to increase. This growth in the working-age population is neither inherently beneficial nor detrimental. Rather, the policy environment defining the ability of economies to create jobs will ultimately determine the nature of the outcome.16 There are two broad and somewhat overlapping sets of studies that examine
Box 1: Demographic dividend and demographic vulnerability
The demographic dividend is the accelerated economic growth that may result from a decline in a country’s population growth rate and the subsequent change in the age structure of the population resulting in a larger share of working age population.1 There is no automatic mechanism that leads from declining population growth rates to higher rates of per capita income growth. Rather, a series of intermediate steps must also occur simultaneously.2 A reduction in fertility and infant mortality rates reduces average family size, so allows parents to invest more in each child. In addition, fewer children can allow female labor market participation to rise because women do not need to spend as much time raising children. As a result, a slowing population growth rate can produce a temporary larger labor force and a permanently higher skilled one; this in turn may have a positive impact on savings and investment.3 Moving from a larger and better-educated labor force to greater economic output requires complementary policies to create new jobs; these can include supporting investment in infrastructure, sound economic policy, a favorable investment climate, and the promotion of policies favorable to trade and competitiveness.4 These are detailed later in the chapter.
A second strand of literature focuses on the social and political vulnerabilities deriving from rapid population growth. This is the literature on demographic vulnerability.These studies argue that rapid population growth in countries with weak institutions is a very strong predictor of social and/or political instability because a large number of youth with poor job prospects are much more likely to protest, become criminals, and/or join insurgent movements than youth with good employment opportunities.5 For example, data from the 2013 World Development Report show that unemployment and lack of economic opportunity are a far greater motivation for joining a criminal gang or rebel movement than ideology and desire for power combined.6 Studies on demographic vulnerability focus on the set of interventions that can help mitigate the stresses population growth can cause as well. Reducing rates of population growth, empowering women, and increasing economic opportunity are the more common suggestions.7
Notes
1 Bloom et al. 2003.
2 Bloom et al. 2003.
3 World Bank 2016b.
4 Bloom et al. 2003; Bloom et al. 2007; Fox et al. 2013.
5 Cincotta et al. 2003; Goldstone 2002; Goldstone, et al. 2014; Urdal 2006, 2011; Walker 2015; World Bank 2013.
6 World Bank 2013.
7 Cincotta et al. 2003; Goldstone et al. 2014; State Failure Task Force 1999; Walker 2015.
the potential impacts of changes in working-age populations (Box 1). One set focuses on achieving a demographic dividend,17 while a second strand focuses on demographic vulnerability when dividends cannot be achieved.18
Pathways to demographic dividend and vulnerabilityThere are various pathways to demographic dividend and vulnerability (Table A1 of the Appendix) derived from the crucial factors that link population growth to either outcome.
0 20 40 60 80 100
0
30
60
90
120
150
Percent growth in working-age population
Percent currently self-employed
South Africa
Mauritius
Tunisia
Niger
UgandaChad
Tanzania
Source: World Bank, World Development Indicators, February 2017 update.
Figure 3: Working-age population growth 2015–35 and current self-employment rate
The Africa Competitiveness Report 2017 | 37

Chapter 1.2
and Sierra Leone—have above-average working-age population growth. Average working-age population growth in fragile countries is 77 percent; it is 60 percent in non-fragile ones.21
Data also suggest an inverse relation between the projected working-age population growth through 2035 and the basic requirements subindex of the World Economic Forum’s Global Competitiveness Index (Figure 5). Countries with a high working-age population growth appear to lack key foundations of competitiveness compared to those with low population growth rates. This is perhaps not that surprising. First, education and health outcomes among poor children from large families are likely to be lower than among those for smaller families, all else being equal. Second, high fertility rates correlate negatively with women’s empowerment, and the latter correlates positively with economic development.22 Third, women’s empowerment correlates positively with the quality of governance.23 As a result, it is logical that high rates of working-age population growth may correlate negatively with economic competitiveness in Africa.
Correlation between fragility and population growth does not imply clear causality from one to the other. Rather, there is an endogenous relationship between the two and other factors can mediate the relationship as well, such as the quality of governance. A similar relationship exists between population growth and competitiveness. On the one hand, Walker’s meta-analysis of the causes of demographic vulnerability finds that “rapid population growth is a leading cause” of state fragility.24 On the other hand, Goldstone et al. argue that rapid population growth can be one manifestation of fragility and poor economic competitiveness:
In the best-case scenario (scenario 1 in Table A1), to achieve a demographic dividend, reductions in fertility and mortality occur alongside an increase in per child spending on health and education, higher levels of female labor force participation, and a policy environment conducive to job creation. These factors lead to a one-generation rapid rise in overall GDP growth as the youth bulge enters the labor force and to a permanent rise in the rate of per capita growth. East Asia is the best example of this type of outcome.19 In the case of Africa, where most of the countries are in a pre-dividend stage, a decline in fertility is a key prerequisite for reaching any kind of demographic dividend.
Alternatively, the most likely pathway to a demographic vulnerability (scenario 4 in Table A1) is a fall in infant mortality alone, which leads to rapid and sustained increases in population growth rates in a poor policy environment, causing each younger age cohort to be larger than the one preceding it and rising competition for scarce economic opportunity.20 Several countries in Africa are following this path.
The current situationData suggest that the countries in Africa with the largest projected working-age population growth are also those least able to deal with the pressures that emanate from it (Figures 3–5). In general, countries with high working-age population growth are typically more fragile than those with low working-age population growth rates (Figure 4), although there are a few outliers (e.g., Central African Republic and Libya are very fragile, but they have relatively low population growth rates). Moreover, all but three countries on the World Bank’s list of fragile countries in Africa—Central African Republic, Comoros,
0 30 60 90 120 150
0
30
60
90
120
150
Percent
Rank in the Fragile States Index
Libya
Tunisia
Niger
UgandaChad
Central African Republic
Mali
South AfricaMauritius
Source: World Bank, World Health Nutrition and Population Statistics: Population Estimates and Projections, October 2016 update.
The Fragile States Index (formerly the Failed States Index) assesses states’ vulnerability to conflict or collapse, ranking all sovereign states with membership in the United Nations where there are enough data available for analysis. Ranking is based on the sum of scores for 12 indicators; each indicator is scored on a scale of 0 to 10, with 0 being the lowest intensity (most stable) and 10 being the highest intensity (least stable). The Fragile States Index is compiled by The Fund for Peace and is available at http://fsi.fundforpeace.org/.
Figure 4: Working-age population growth (2015–35) and fragility
2.5 3.0 3.5 4.0 4.5 5.0
0
20
40
60
80
100
Percent
Basic requirements components of global competitiveness subindex score
MauritiusTunisia
Nigeria
Uganda
Chad
Guinea
Mali
South Africa
Angola
Gabon
Rwanda
Malawi
Namibia
Source: World Bank, World Health Nutrition and Population Statistics: Population estimates and projections, October 2016 update and World Economic Forum, Global Competitiveness Index.
The World Economic Forum’s Global Competitiveness Index is based on three subindexes, in line with three main stages of development: basic requirements, efficiency enhancers, and innovation and sophistication factors. The basic requirements subindex, considered here, is built around four pillars: institutions, infrastructure, macroeconomic environment, and health and primary education.
Figure 5: Population growth and basic requirements of competitiveness
38 | The Africa Competitiveness Report 2017

Jobs in Africa
the benefits of large youth cohorts and the chance to reap a demographic dividend are in general only realized when a country’s government is able to provide political stability, strong support for education through secondary and vocational education, increasing employment in the formal sector and stable macro-economic conditions. These are also the conditions that are conducive to falling fertility and progress through the demographic transition, and are the conditions that fragile states most lack. . . . 25
Which countries are best placed to achieve a demographic dividend and which are more likely to encounter stress from rapid population growth? High-quality policy and high projected growth rates offer best opportunity for demographic dividend. Figure 5 suggests that Namibia, Rwanda, and perhaps Gabon seem to be well prepared at the moment. By contrast, high projected growth rates and weak policies are a likely indicator of possible demographic vulnerability. This may constitutes the case for countries in the upper left side of Figure 5, such as Angola, Chad, Guinea, Malawi, Mali, and Uganda.
Policies to foster jobsRapid growth in Africa’s working-age population is occurring in a context of low levels of productivity among the existing labor force. Average labor productivity in Africa is well below the levels observed in East Asia, Latin America and the Caribbean, and Central and Eastern Europe and somewhat below levels in South Asia (Figure 6).
A large literature examines why productivity in Africa is lower than it is in other regions of the world.26 Bigsten and Soderbom find that firms in African manufacturing have low
rates of investment, tend to lack access to credit, and encounter high costs to export. Bigsten and Soderbom argue:
Countries that cannot break out of the current situation—in which most manufacturing firms focus on supplying the domestic market with low value-added products—are unlikely to see a significant expansion of jobs in the manufacturing sector or to have manufacturing play a major role in reducing poverty.27
To create new jobs, firms in Africa must increase productivity. Productivity is a function of human and physical capital accumulation, the investment climate, and the level of efficiency in which an economy utilizes its inputs (i.e., total factor productivity). It thus classically follows that countries that wish to have more productive economies need to first invest in human and physical capital, and to employ both types of capital efficiently. Africa’s generally weak productivity may reflect, at a minimum, low levels of education and investment.
Africa’s combined level of human and physical capital accumulation is lower than all other regions of the world. Figure 7 plots rates of investment (specifically, gross capital formation) and secondary school enrollment rates by region. Although investment-to-GDP rates are somewhat below the average for some other regions, secondary school enrollment rates are far below all other regions.28 The quality of education in Africa is also generally low. For example, according to the Brookings Institution’s Africa Learning Barometer, only about one-third of children enrolled in schools are able to “read or write fluently or successfully complete basic numeracy tasks” in the countries the database covers (see Box 2).29
0
20
40
60
80
100
South Asia
Middle East
(excluding North Africa)
Latin Americaand the
Caribbean
East Asiaand
Pacific
Central and
Eastern Europe
Africa
Annual output/worker (US$ PPP, in thousands)
Source: The Conference Board Total Economy Database, available at https://www.conferenceboard.org/data/economydatabase/index.cfm?id=27762.
Labor productivity measures annual output per person employed in 2015 in US dollars at purchasing power parity. High labor productivity in the Middle East reflects the economic importance of the extractive sector. Extractive industries tend to have high output per person, but limited employment opportunities.
Figure 6: Estimates of average labor productivity across regions, 2015
0
20
40
60
80
100
AfricaSouth Asia
Middle East excluding
North Africa
Latin America and the
Caribbean
East Asia and
Pacific
Key
■ Investment/GDP ■ Gross secondary school enrollment rate
Percent
Source: World Bank, World Development Indicators, February 2017 update.
Figure 7: Comparative enrollment and investment rates
The Africa Competitiveness Report 2017 | 39

Chapter 1.2
Population growth brings about additional demand for education services. Sustainable Development Goal (SDG) 4, which calls for universal secondary as well as primary education by 2030, aims for pupil-teacher ratios of no more than 40:1 and 25:1 for primary and secondary levels, respectively. Using population forecasts and SDG target enrollment ratios, along with current numbers of teachers and expected teachers’ attrition rates, it is possible to estimate the number of teachers that will be needed in the future. Table A shows that that, by 2030, Africa will need to have hired approximately 19 million teachers to achieve SDG 4, compared
to the current 8 million. This is a 250 percent increase over the current number of teachers. Of these 19 million, countries will need to replace about 9 million because of attrition; the other 10 million are needed to accommodate increases in enrollment rates and decreases in pupil-teacher ratios. The largest increase, by far, is for new secondary school teachers in sub-Saharan Africa. There are currently about 2.2 million secondary school teachers in sub-Saharan Africa. To meet SDG 4 by 2030 will require hiring close to 11 million new ones. Countries in North Africa will need to nearly double their current number of teachers to meet this goal.
Box 2: More and better teachers will be needed in the future
Table A: Total number of teachers needed in Africa to meet SDG 4 by 2030 (thousands)
School level Current (2014)Number
needed by 2030Replacement
for attrition New Percent increase
Primary
Northern Africa 912 844 694 150 93%
Sub-Saharan Africa 3,799 6,288 3,885 2,403 166%
Subtotal 4,711 7,132 4,579 2,553 151%
Secondary
Northern Africa 1,039 1,845 1,087 758 178%
Sub-Saharan Africa 2,247 10,755 3,673 7,083 479%
Subtotal 3,286 12,600 4,760 7,841 383%
Total
Northern Africa 1,951 2,689 1,781 908 138%
Sub-Saharan Africa 6,046 17,043 7,558 9,486 282%
Total 7,997 19,732 9,339 10,394 247% Source: Authors, based on UNESCO Institute for Statistics.
The required number of new teachers would be less forbidding if attrition rates among could be reduced. According to current projections, over 9 million teachers will leave the profession in the next 15 years and need to be replaced. The drivers of such high attrition rates include family responsibilities,1 low pay,and poor working conditions (i.e., large classes and deficient facilities and equipment).2
Notes
1 Teachers for EFA 2010.
2 According to UNESCO Institute for Statistic’s (UIS) research, in 19 of 23 sub-Saharan African countries studied, more than 60 percent of schools lack access to electricity; in 10 of the countries, more than 60 percent of schools lack access to water; in seven countries, more than half of schools lack access to toilets. UNESCO 2012.
A complementary and now standard way to analyze the policies that governments need to put in place to promote job creation is to examine impediments to business creation from the perspectives of employers or the perceived quality of the investment climate. Figure 8 reports Enterprise Survey data from Africa and the rest of the world on the biggest business obstacles for all firms. The data show that access to finance and poor supply of electricity (see Box 3 for examples) are perceived as the biggest obstacles to business growth in Africa. On average, these two impediments account for about 34.8 percent of responses over the last decade. These two factors are perceived to be more problematic for the business environment in Africa than they are in other regions.30
Based in part on the previous data, academics, professionals, and international organizations have developed a standard and familiar set of recommendations to encourage more rapid job creation in Africa that typically include:
0
5
10
15
20
25
Cou
rts
Labo
r re
gula
tions
Lice
nsin
g P
erm
its
Inad
quat
ely
educ
ated
wor
kfor
ce
Tran
spor
tatio
n
Tax
adm
inis
trat
ion
Cus
tom
s, tr
ade
regu
latio
ns
Crim
e, th
eft,
diso
rder
Acc
ess
to la
nd
Cor
rupt
ion
Tax
Rat
es
Pra
ctic
es o
f the
Info
rmal
Sec
tor
Pol
itica
l Ins
tabi
lity
Ele
ctric
ity
Acc
ess
to F
inan
ce
Percent of respondents
Key
■ Africa ■ Rest of the world
Source: World Bank Enterprise Surveys.
Averages are reported for 46 countries in Africa and 95 countries from the rest of the world. Surveys cover the 2006–16 period.
Figure 8: Most importance obstacles to firms’ growth
40 | The Africa Competitiveness Report 2017
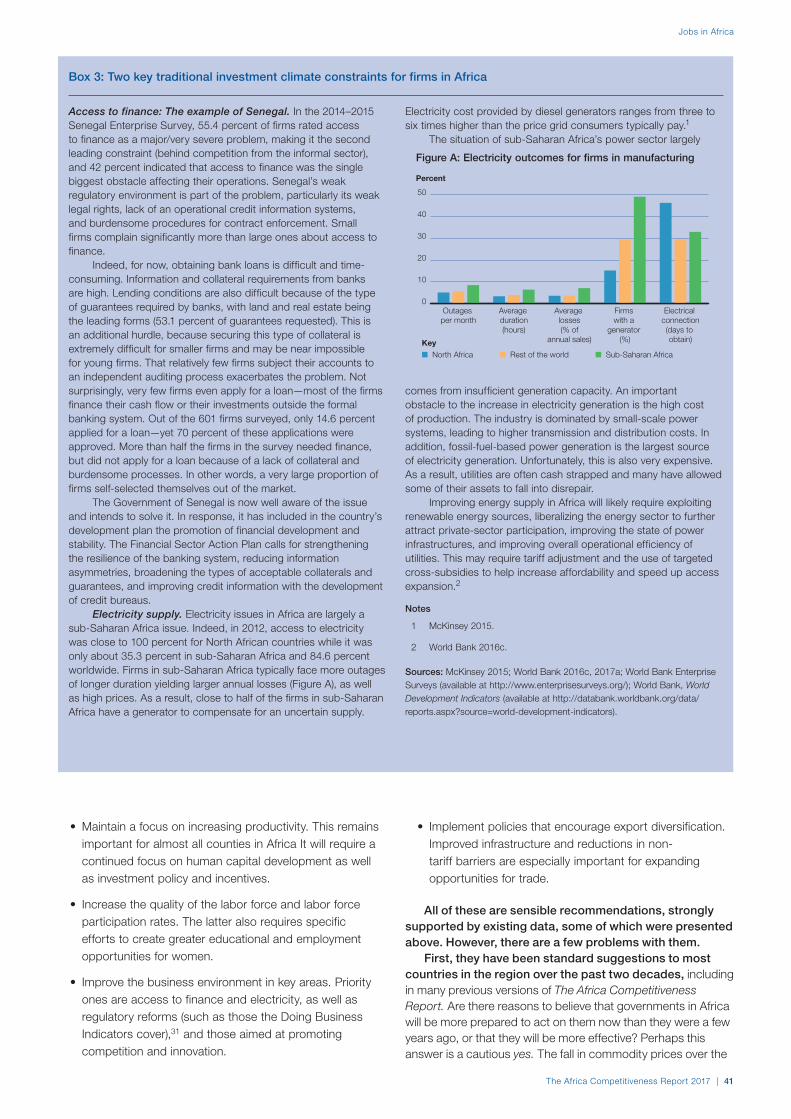
Jobs in Africa
• Maintain a focus on increasing productivity. This remains important for almost all counties in Africa It will require a continued focus on human capital development as well as investment policy and incentives.
• Increase the quality of the labor force and labor force participation rates. The latter also requires specific efforts to create greater educational and employment opportunities for women.
• Improve the business environment in key areas. Priority ones are access to finance and electricity, as well as regulatory reforms (such as those the Doing Business Indicators cover),31 and those aimed at promoting competition and innovation.
• Implement policies that encourage export diversification. Improved infrastructure and reductions in non-tariff barriers are especially important for expanding opportunities for trade.
All of these are sensible recommendations, strongly supported by existing data, some of which were presented above. However, there are a few problems with them.
First, they have been standard suggestions to most countries in the region over the past two decades, including in many previous versions of The Africa Competitiveness Report. Are there reasons to believe that governments in Africa will be more prepared to act on them now than they were a few years ago, or that they will be more effective? Perhaps this answer is a cautious yes. The fall in commodity prices over the
Access to finance: The example of Senegal. In the 2014–2015 Senegal Enterprise Survey, 55.4 percent of firms rated access to finance as a major/very severe problem, making it the second leading constraint (behind competition from the informal sector), and 42 percent indicated that access to finance was the single biggest obstacle affecting their operations. Senegal’s weak regulatory environment is part of the problem, particularly its weak legal rights, lack of an operational credit information systems, and burdensome procedures for contract enforcement. Small firms complain significantly more than large ones about access to finance.
Indeed, for now, obtaining bank loans is difficult and time-consuming. Information and collateral requirements from banks are high. Lending conditions are also difficult because of the type of guarantees required by banks, with land and real estate being the leading forms (53.1 percent of guarantees requested). This is an additional hurdle, because securing this type of collateral is extremely difficult for smaller firms and may be near impossible for young firms. That relatively few firms subject their accounts to an independent auditing process exacerbates the problem. Not surprisingly, very few firms even apply for a loan—most of the firms finance their cash flow or their investments outside the formal banking system. Out of the 601 firms surveyed, only 14.6 percent applied for a loan—yet 70 percent of these applications were approved. More than half the firms in the survey needed finance, but did not apply for a loan because of a lack of collateral and burdensome processes. In other words, a very large proportion of firms self-selected themselves out of the market.
The Government of Senegal is now well aware of the issue and intends to solve it. In response, it has included in the country’s development plan the promotion of financial development and stability. The Financial Sector Action Plan calls for strengthening the resilience of the banking system, reducing information asymmetries, broadening the types of acceptable collaterals and guarantees, and improving credit information with the development of credit bureaus.
Electricity supply. Electricity issues in Africa are largely a sub-Saharan Africa issue. Indeed, in 2012, access to electricity was close to 100 percent for North African countries while it was only about 35.3 percent in sub-Saharan Africa and 84.6 percent worldwide. Firms in sub-Saharan Africa typically face more outages of longer duration yielding larger annual losses (Figure A), as well as high prices. As a result, close to half of the firms in sub-Saharan Africa have a generator to compensate for an uncertain supply.
Electricity cost provided by diesel generators ranges from three to six times higher than the price grid consumers typically pay.1
The situation of sub-Saharan Africa’s power sector largely
comes from insufficient generation capacity. An important obstacle to the increase in electricity generation is the high cost of production. The industry is dominated by small-scale power systems, leading to higher transmission and distribution costs. In addition, fossil-fuel-based power generation is the largest source of electricity generation. Unfortunately, this is also very expensive. As a result, utilities are often cash strapped and many have allowed some of their assets to fall into disrepair.
Improving energy supply in Africa will likely require exploiting renewable energy sources, liberalizing the energy sector to further attract private-sector participation, improving the state of power infrastructures, and improving overall operational efficiency of utilities. This may require tariff adjustment and the use of targeted cross-subsidies to help increase affordability and speed up access expansion.2
Notes
1 McKinsey 2015.
2 World Bank 2016c.
Sources: McKinsey 2015; World Bank 2016c, 2017a; World Bank Enterprise Surveys (available at http://www.enterprisesurveys.org/); World Bank, World Development Indicators (available at http://databank.worldbank.org/data/reports.aspx?source=world-development-indicators).
Box 3: Two key traditional investment climate constraints for firms in Africa
0
10
20
30
40
50
Electrical connection(days to obtain)
Firms with a
generator (%)
Average losses(% of
annual sales)
Average duration(hours)
Outages per month
Percent
Key■ North Africa ■ Rest of the world ■ Sub-Saharan Africa
Figure A: Electricity outcomes for firms in manufacturing
The Africa Competitiveness Report 2017 | 41

Chapter 1.2
past few years has revealed the underlying fragility of many African economies. It was easy to ignore these weaknesses when headline growth rates and revenue levels were high. They are more difficult to ignore now. Moreover, governance along a range of dimensions, such as macroeconomic policy and political stability, has been steadily improving for a number of years in Africa. In addition, governments in the region are aware of the potentially destabilizing impact of growing idle youth populations.32 Awareness alone does not signal imminent action, yet it does provide a useful starting point for constructive policy dialogue.
Second, the more important problem with the aforementioned recommendations is that they tend to apply best to countries that already have reasonably dynamic private sectors and effective public-sector institutions. They do not apply well to fragile countries or to countries where the vast majority of labor market entrants face no realistic alternative to self-employment or employment in microenterprises, yet most countries on the African continent fit into either or even both of these categories. In addition,
resource-rich countries also tend to have challenges to job creation that standard prescriptions are likely to overlook.
Finally, besides the issue of applicability to existing situations on the continent, the recommendations above also tend to neglect the capacity for regional integration and intra-African trade to spur job creation as well as the potential of microenterprises and agroindustry. These areas are discussed below.
Policies targeted at fragile and conflict-affected statesAfrica is host to more than half of all the fragile and conflict-affected states in the world (19 out of 35 countries).33 With the exception of Libya, all of them (18) are in sub-Saharan Africa and most are in a pre-demographic dividend situation. Hence, fragile and conflict-affected states are a class of countries of special relevance for the continent. From a private-sector perspective, fragility results in a very risky environment shaped by pervasive market and government failures that increase costs, reduce demand, and compromise the appropriability of investment returns because of policy uncertainty or corruption.34 Job creation is a difficult task in these environments.
Traditional programs in fragile and conflict-affected states tend to be modest in scope and scale. As a result, they often fail to have a significant material impact on job creation and private-sector development.35 They tend to have a limited impact because they often do not have a coherent focus on sustainability. Short-term public works programs are an obvious example. Fixing local infrastructure is unlikely on its own to lead to a thriving local private sector. As a result, when the funding ends, local economic activity slumps. Furthermore, the standard advice to improve the business environment, the quality of education, and/or build government capacity alone is insufficient for these countries. First, fragile and conflict-affected states have weak capacity, which implies that policies may take a long time to be executed, yet these countries face immediate economic, political, and social challenges that need to be addressed right away to maintain stability in the short and medium term. Second, even if governments are serious about enacting reforms, the private sector may not respond until it is convinced the policies are effective and credible.
For these reasons, governments and international development agencies argue that there is a need to enact targeted sets of policies that can focus on ensuring political and social stability in the short term alongside broader, longer-term institutional reforms (Box 4).36 More specifically, according to the World Bank’s Integrated Framework for Jobs in Fragile and Conflict Situations:37
• The fundamental prescription of ensuring that education, macro/fiscal and investment policies, and business environment reforms are properly implemented remains valid. However, it makes sense to adopt a “jobs and fragility lens” to ensure that these reforms will lead to job creation and/or reduce fragility in the short to medium term.
• Active labor market programs might have an important role to play in fragile and conflict-affected states. Programs addressing inadequate skills, insufficient
Box 4: Examples of programs for fragile and conflict-affected states
The literature on conflict and development offers a number of examples of programs that have been effective in very fragile states.1 A number of promising approaches exist:
The United Nation’s Policy for Post-Conflict Employment Creation, Income Generation, and Reintegration offers a sophisticated and integrated approach to supporting sustainable job creation efforts in fragile and conflict-affected states.2 It recommends a three-track approach. Track A targets conflict-affected populations and focuses on stability, security, and short-term labor-intensive public works programs. Track B aims to consolidate peace through rebuilding communities, rehabilitating infrastructure, enhancing local government capacity, and creating local-level employment opportunities. Track C, which operates simultaneously with Tracks A and B, focuses on sustainability through activities to foster private-sector development, such as through improvements in the business environment.
Dudwick et al. promote value chain development as a source of employment creation in fragile and conflict-affected states “because value chains don’t depend on government interventions or officials.” As a result, as “long as there is a modicum of security and some market activity beyond a black market, market development can begin immediately after a crisis or conflict.” They further claim that because value chain development helps restore “legitimate market links and relationships of trust among different social groups in fragile and post conflict environments, value chain development offers both economic and peace-building benefits.”3 They cite a number of successful examples from fragile and conflict-affected states in Africa, including fisheries as well as gums and resin in Somalia, cotton and shea butter in South Sudan, and cotton in northern Uganda.
Notes
1 See, for example, Blattman et al. 2014; Holmes et al. 2013; World Bank 2011a, 2014.
2 UN 2009.
3 Dudwick et al. 2013, p. 61.
42 | The Africa Competitiveness Report 2017
Jobs in Africa
information about job opportunities, and limited mobility can prove useful.
• Targeted policies that promote job creation or increase the quality of jobs are likely to be appropriate. Programs helping to address obstacles facing vulnerable groups (such as women at risk of being cut out of the labor market, ex-combatants and youth at risk of engaging in violence, or the displaced) and targeted interventions promoting investments and growth in certain subsectors, value chains, or geographic regions are particularly worthwhile to consider.
Policies targeted at resource-rich countriesResource-rich countries face distinct challenges in large-scale job creation: production linkages with the rest of the economy are relatively limited and direct employment creation in the resource sector is often minimal.38 Africa has a number of resource-rich countries. Apart from Algeria and Libya, all of them (16) are in sub-Saharan Africa.39 With the exception of Algeria and Libya, which are in the early stages of the demographic dividend, they are all in the pre-dividend stage of the process.
Usually policymakers wish to limit the size of the natural resource sector and diversify their economy. This is the result of the instability of returns from commodities and the resulting problems of unemployment and output loss during periods of low prices; a perception that the rate of technological change in resource-dependent activities may be lower than in manufactures or services; and, finally, concerns that resource-intensive production may promote rent-seeking activities, lower growth rates, and increase the risk of conflict.40
Although country specifics vary widely, existing research suggests specific types of policies that can be useful in supporting economic diversification, creating jobs, and helping countries avoid a potential resource curse in resource-rich countries. They include:41
• The key prescription of ensuring that macro/fiscal and investment policies and business environment reforms are properly implemented remains valid. Sound macroeconomic management is paramount to contain boom-bust commodity cycles, and exchange rate policy should be geared toward avoiding long periods of overvaluation. Business environment reforms that contribute to improve firms’ environment are critical to ensure a level playing field and to limit opportunities for rent-capture.
• Trade policy needs to remain fairly open (limited protection, openness to foreign direct investment to foster spillover, participation in trade agreements to ensure a level playing field) to make sure that new activities compatible with changes in comparative advantage can emerge.
• Policies that focus on developing human and physical capital and improved governance need to be supported and implemented.
• Finally, targeted vertical/sector-level policies—in line with comparative advantages for traded sectors—to develop linkages from natural resources sectors to the rest of the
economy can prove useful. These can include specific infrastructure investments, tax measures and incentives, mechanisms to promote technology-upgrading, support for access to external markets, support for value chain development for countries whose wealth is based on agricultural commodities, and support for linkages development to non-extractive sectors (see Box 5). All these activities should have a gender angle to create conditions underlying a potential demographic dividend.
Policies to facilitate regional integration and tradeCurrently, most African countries have small domestic markets and limited, although growing, purchasing power. Many countries are also landlocked, thereby compounding their limited size. For these reasons, firms in Africa often cannot achieve efficiency gains resulting from economies of scale by producing for domestic markets alone. Rather, greater regional integration is crucial for improving firm productivity in Africa. As of now, integration of African economies is limited, as shown by the low scores on the various dimensions of the Africa Regional Integration Index (Figure 9). Even trade integration, which has the highest score of 0.54, is low.
Trade and regional integration can become a major source of job creation and improved well-being in Africa. Closer trade links can stabilize food markets, reduce consumer prices, create economies of scale that will help increase the
Box 5: Small- and medium-sized enterprises linkages programs
A first step toward a long-term path of economic diversification—but one that can yield quick results in terms of job creation—is the implementation of linkages programs. The International Finance Corporation (IFC) has been implementing such programs in recent years.
Typically, African small- and medium-sized enterprises (SMEs) can be key drivers of growth and job creation provided they receive appropriate support. However, they are often held back by a lack of knowledge, resources, and technical expertise. In addition, they also often lack the financial resources necessary to acquire new technologies or skills. Linkages programs create business opportunities for SMEs at national, regional, and/or community levels through the IFC’s relationship with large corporate entities in which it has invested. These programs help SMEs adopt practices and systems to satisfy the standards required by these large corporations. When large firms source locally, SMEs are provided with income-generating opportunities, so they can improve their productivity and create jobs.
For example, a linkages program in Guinea involved local supplier development, the creation of local management training market and capacity building for training firms, and improved access to information on opportunities in the mining sector. In 2012, after five years of existence, (1) over 700 new jobs were created in local businesses as a part of the mining sector’s supply chain, (2) US$9.1 million in new contracts were signed between local businesses and international mining companies, and (3) over 100 local SMEs received training and individualized coaching. All of this took place in a remote part of Guinea where business opportunities and jobs were rare.
Sources: Dodd 2013; IFC 2009.
The Africa Competitiveness Report 2017 | 43

Chapter 1.2
competitiveness of Africa’s private sector, and foster the development of regional value chains.42
The current situation in this area is difficult because the cost of moving goods between countries remains high, transit times are uncertain, and delays can be exceptionally long. Africa has the weakest performance of any region in the 2016 Logistics Performance Index (LPI),43 and it ranks low on Doing Business indicators of time and cost of trade.44 In part, this poor showing is a result of insufficient infrastructure, especially transport, telecommunications, and energy. However, empirical evidence suggests that only about a quarter of the delays along major transport corridors are a result of inadequate and/or low-quality physical infrastructure. Non-tariff barriers and poor trade facilitation, by contrast, account for the remaining 75 percent.45 Research therefore suggests that to achieve the job gains resulting from greater intra-Africa trade and regional integrations, countries should:
• Improve efforts at trade facilitation alongside building more physical infrastructure that links regional markets. Infrastructure creation is also crucial for supporting the growth of Africa’s manufacturing sector.
• Ease regulation on small traders, many of whom are women, by “simplifying border procedures, limiting the number of agencies at the border . . . increasing the professionalism of officials . . . and assisting in the spread of new technologies such as cross-border mobile banking.”46
• Encourage regional trade by eliminating onerous non-tariff barriers; reducing bans on exports; and improving customs performance, coordination, and trade logistics. For example, greater regional trade in agriculture
holds the promise of creating many new jobs in agro-processing and a wide range of services, such as transport, distribution, and retailing. Similarly, the apparel sector—a traditionally female employment–intensive manufacturing sector—could benefit from such measures.
• Support trade in services. Service exports can help improve access to crucial services necessary to increase productivity, such as healthcare, education, and other professional services.47 Exports of services are particularly important for landlocked countries for which opportunities to diversify into the export of manufactures are more limited by the high costs of transporting goods.48 Some countries in Africa already export a far greater level of high value-added services, such as communication and finance, than most other countries at their level of income (see Box 6 on trade in services). This should be encouraged.
• Ease restrictions on freedom of movement in Africa. This can help improve firm productivity on the continent because it would allow employers to be better able to attract high-quality talent. Countries that face shortages of essential service providers, such as teachers and healthcare professionals, would also benefit from allowing greater freedom of movement because this would help improve the quality and productivity of labor (see Box 2 on the need for more teachers in Africa).
• Finally, improve regional integration. Better integration can contribute to job creation by facilitating the development of labor-intensive regional value chains for manufactured exports.49 Countries in Africa can improve progress on regional integration by designing more flexible integration agreements and focusing on areas where countries can more easily reach policy consensus. Recent improvements in border efficiency and easing regulations in trade in services in the East African Community are two prominent examples.
Policies targeted at microenterprises, agriculture, and agroindustryGiven projected demographic patterns and under existing policies, around 75 percent of new entrants in the labor market are likely to work in microenterprises or agriculture. Hence, there is a need to enact programs that target specifically the needs of these types of firms. A new set of studies explicitly recognizes this reality.50
MicroenterprisesMicroenterprises are an important source of employment for people with low levels of education, as these firms are typically labor intensive and require fewer technical skills than more established firms. Although their contribution to total production is small, they constitute the largest number of businesses in Africa. Microenterprises are an especially important source of female economic empowerment because barriers to entry into the labor market are often lower among these firms than they are in more formal ones.
Financial and macroeconomic
integration
Free movement of people Productive integration
Regional infrastructure
Trade Integration
0.2
0.4
0.6
0.8
1.0
Source: AU et al. 2016.
The Regional Integration Index is made up of five dimensions (trade integration, regional infrastructure, productive integration, free movement of people, and financial and macroeconomic integration) and 16 underlying indicators. Dimension scores range from 0 (low) to 1 (high). Values reported are the average of the eight regional economic communities of the continent. The eight communities are CEN-SAD (Community of Sahel–Saharan States), COMESA (Common Market for Eastern and Southern Africa), EAC (East African Community), ECCAS (Economic Community of Central African States), ECOWAS (Economic Community of West African States), IGAD (Intergovernmental Authority on Development), SADC (Southern African Development Community), and UMA (Arab Maghreb Union).
Figure 9: African Regional Integration Index
44 | The Africa Competitiveness Report 2017
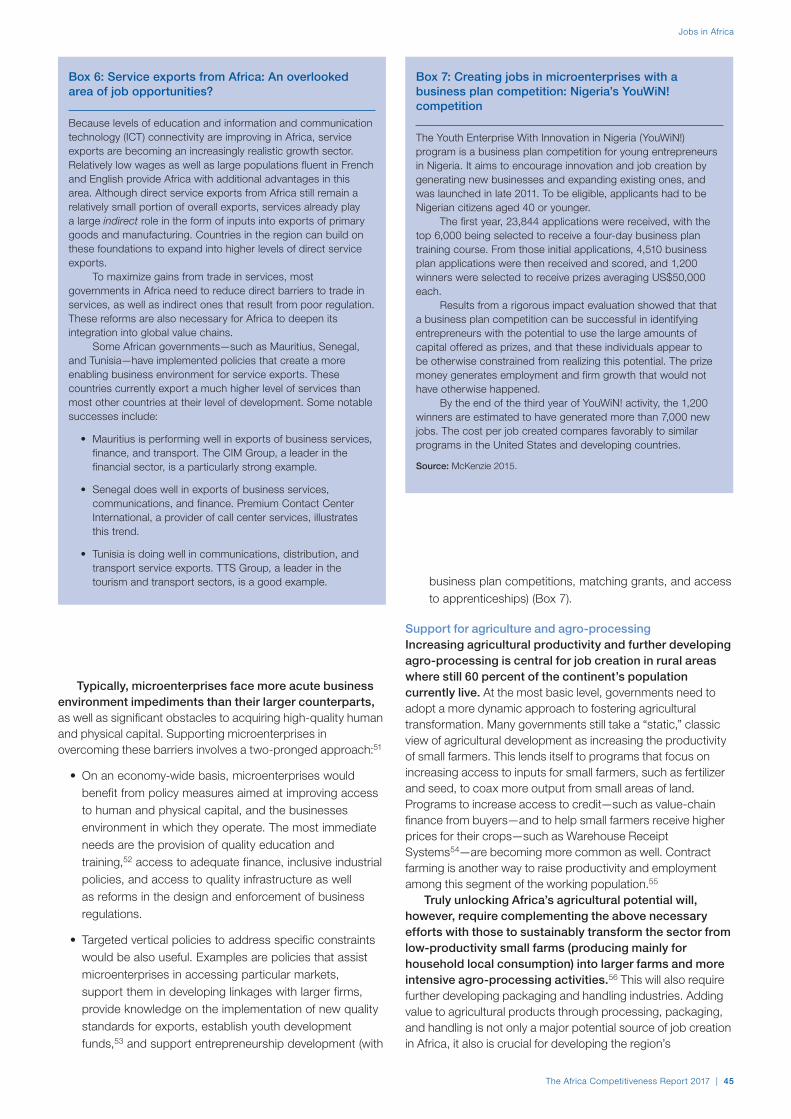
Jobs in Africa
Typically, microenterprises face more acute business environment impediments than their larger counterparts, as well as significant obstacles to acquiring high-quality human and physical capital. Supporting microenterprises in overcoming these barriers involves a two-pronged approach:51
• On an economy-wide basis, microenterprises would benefit from policy measures aimed at improving access to human and physical capital, and the businesses environment in which they operate. The most immediate needs are the provision of quality education and training,52 access to adequate finance, inclusive industrial policies, and access to quality infrastructure as well as reforms in the design and enforcement of business regulations.
• Targeted vertical policies to address specific constraints would be also useful. Examples are policies that assist microenterprises in accessing particular markets, support them in developing linkages with larger firms, provide knowledge on the implementation of new quality standards for exports, establish youth development funds,53 and support entrepreneurship development (with
business plan competitions, matching grants, and access to apprenticeships) (Box 7).
Support for agriculture and agro-processingIncreasing agricultural productivity and further developing agro-processing is central for job creation in rural areas where still 60 percent of the continent’s population currently live. At the most basic level, governments need to adopt a more dynamic approach to fostering agricultural transformation. Many governments still take a “static,” classic view of agricultural development as increasing the productivity of small farmers. This lends itself to programs that focus on increasing access to inputs for small farmers, such as fertilizer and seed, to coax more output from small areas of land. Programs to increase access to credit—such as value-chain finance from buyers—and to help small farmers receive higher prices for their crops—such as Warehouse Receipt Systems54—are becoming more common as well. Contract farming is another way to raise productivity and employment among this segment of the working population.55
Truly unlocking Africa’s agricultural potential will, however, require complementing the above necessary efforts with those to sustainably transform the sector from low-productivity small farms (producing mainly for household local consumption) into larger farms and more intensive agro-processing activities.56 This will also require further developing packaging and handling industries. Adding value to agricultural products through processing, packaging, and handling is not only a major potential source of job creation in Africa, it also is crucial for developing the region’s
Box 6: Service exports from Africa: An overlooked area of job opportunities?
Because levels of education and information and communication technology (ICT) connectivity are improving in Africa, service exports are becoming an increasingly realistic growth sector. Relatively low wages as well as large populations fluent in French and English provide Africa with additional advantages in this area. Although direct service exports from Africa still remain a relatively small portion of overall exports, services already play a large indirect role in the form of inputs into exports of primary goods and manufacturing. Countries in the region can build on these foundations to expand into higher levels of direct service exports.
To maximize gains from trade in services, most governments in Africa need to reduce direct barriers to trade in services, as well as indirect ones that result from poor regulation. These reforms are also necessary for Africa to deepen its integration into global value chains.
Some African governments—such as Mauritius, Senegal, and Tunisia—have implemented policies that create a more enabling business environment for service exports. These countries currently export a much higher level of services than most other countries at their level of development. Some notable successes include:
• Mauritius is performing well in exports of business services, finance, and transport. The CIM Group, a leader in the financial sector, is a particularly strong example.
• Senegal does well in exports of business services, communications, and finance. Premium Contact Center International, a provider of call center services, illustrates this trend.
• Tunisia is doing well in communications, distribution, and transport service exports. TTS Group, a leader in the tourism and transport sectors, is a good example.
Box 7: Creating jobs in microenterprises with a business plan competition: Nigeria’s YouWiN! competition
The Youth Enterprise With Innovation in Nigeria (YouWiN!) program is a business plan competition for young entrepreneurs in Nigeria. It aims to encourage innovation and job creation by generating new businesses and expanding existing ones, and was launched in late 2011. To be eligible, applicants had to be Nigerian citizens aged 40 or younger.
The first year, 23,844 applications were received, with the top 6,000 being selected to receive a four-day business plan training course. From those initial applications, 4,510 business plan applications were then received and scored, and 1,200 winners were selected to receive prizes averaging US$50,000 each.
Results from a rigorous impact evaluation showed that that a business plan competition can be successful in identifying entrepreneurs with the potential to use the large amounts of capital offered as prizes, and that these individuals appear to be otherwise constrained from realizing this potential. The prize money generates employment and firm growth that would not have otherwise happened.
By the end of the third year of YouWiN! activity, the 1,200 winners are estimated to have generated more than 7,000 new jobs. The cost per job created compares favorably to similar programs in the United States and developing countries.
Source: McKenzie 2015.
The Africa Competitiveness Report 2017 | 45

Chapter 1.2
manufacturing sector. This requires developing a proper enabling environment for agro-processing,57 which can be based on three layers of interventions:
• The first layer includes essential enablers for the sector. Reforming trade policies are central to improving industrial competitiveness because they may lower costs of production and facilitate market access. At a minimum, this requires governments to set reasonable tariffs and limit the use of non-tariff barriers. Improving infrastructure (transportation, water and sanitation, electricity, communications, and irrigation) is also a high priority for creating competitive agro-processing firms. Not unexpectedly, ensuring proper access to finance (see the earlier discussion) is also key to ensure firms can invest and remain competitive. Finally, land is a key asset for the sector. Reforms in areas such as title, leasing, and rental are vital to ensure accessible land for large farms and agroindustries.58
• A second of set of interventions requires raising standards and regulations to international best practices because this will facilitate export competitiveness. Fostering and providing incentives for research and development and the use of technology is essential to ensure the competitiveness of the sector as well.
• A final layer includes supportive business regulations. Access to business development services, such as finance, accounting, marketing management, economics, law, and other technical expertise, plays an important role in helping firms to become more productive and competitive. Finally, vertical linkages (between enterprises at different levels of the supply chain) should be encouraged and policy support should be directed toward the formation of farmer groups so as to reduce the risk of insufficient supply and to generate income.
ConclusionsProjections suggest that Africa’s working-age population will grow massively over the next two decades. Approximately 450 million Africans will enter the labor force over this time period. This is close to three times the current number of people who work for steady wage-paying jobs in the region. If the status quo endures, only about 100 million of these new entrants to the labor force will find a steady wage-paying job. The other nearly 350 million will need to resort to self-employment or employment in microenterprises. To expect this new generation of increasingly educated and urban youth to quietly accept scarce economic opportunity is risky.
Fortunately, new research is providing governments in the region with insight into how they can address the coming rise in their working-age populations. This chapter argues that beyond the traditional—though still valid and required—prescriptions (such as providing stable macroeconomic policy and a supportive investment climate; improving the quality of human and physical capital; and promoting measures to foster a reduction in fertility), countries can facilitate increased job creation by implementing specific policies more suited to their particular circumstances:
• For fragile and conflict-affected states, targeted support to vulnerable regions and/or populations such as women can be both stabilizing—via the creation of jobs—and growth enhancing.
• For resource-rich countries, open trade policies and developing value chain links to natural resource sectors (be they agricultural commodities or extractives) can encourage diversification and job creation.
• Fostering regional trade and integration is a major potential source of jobs, can help improve firm-level productivity and economic competitiveness, and support the development of manufacturing.
• Support of microenterprises and agroindustry, key sectors of job creation in Africa, is absolutely needed but requires sector-specific interventions to increase productivity. Access to finance and appropriate skills is crucial for the former. Developing the latter requires reforms that envision agriculture not as a subsistence activity, but as a potentially dynamic commercial sector.
Developing and effectively implementing these policies to help attain a demographic dividend takes time. If countries wait until today’s youth reach working age, it will probably already be too late to avoid demographic vulnerabilities.
Notes 1 Africa here includes sub-Saharan Africa and North Africa (including
Algeria, Egypt, Libya, Morocco, and Tunisia).
2 For example, the average yearly price of crude oil (Brent) went from US$98.9 per barrel in 2014 to US$44 per barrel in 2016; World Bank 2017b.
3 Data are from the World Bank’s World Development Indicators. See https://datahelpdesk.worldbank.org/knowledgebase/articles/906519-world-bank-country-and-lending-groups for a list of the countries in each World Bank group.
4 The working-age population is defined as those aged 15 to 64.
5 Countries in the East African Community are Burundi, Kenya, Rwanda, Tanzania, and Uganda.
6 These countries are Algeria, Botswana, Cape Verde, Djibouti, Egypt, Lesotho, Libya, Mauritius, Morocco, Seychelles, South Africa, and Tunisia.
7 For example, this is low compared to East Asia, the region that benefitted most from a demographic dividend with a working-age share of its population reaching just over 70 percent. By contrast, under current projections, the working-age share of Africa’s population is likely to rise slowly to about 65 percent by 2050 (The Rand Corporation 2002). Therefore, Africa’s demographic dividend, even under ideal conditions, is likely to be more modest than that of East Asia (Bloom et al. 2007; Cleland 2012; Eastwood and Lipton 2011).
8 Although infant mortality rates are, on average, higher in Africa than they are in other parts of the world, the gap is narrowing rapidly—especially since 2000. Africa remains, however, a large outlier in fertility rates (Bongaarts and Casterline 2013). Whereas East Asia, Latin America and the Caribbean, the Middle East, and South Asia have converged to an average fertility rate of about 2.5, Africa’s is twice as large. This is not only because Africa is poorer, on average, than other regions. Controlling for infant mortality rates, countries in Africa have a fertility rate that is 20 percent higher than those outside it. Several other factors may explain this, such as a high demand for children, unmet needs for family planning, a relatively young age at first union, obstacles to contraception, and limited family planning services (World Bank 2010).
9 UN Habitat 2014.
46 | The Africa Competitiveness Report 2017

Jobs in Africa
10 World Bank 2016a. World Bank (2011a, 2016a) notes that migration data from Africa are generally of low quality: “Data on migration in Africa are often missing, out of date, or inconsistent with definitions used in other countries. Intraregional migration flows are often informal and not captured in official statistics” (World Bank 2016a). Hence, although the broad trends are probably valid, numbers have to be interpreted with caution.
11 World Bank 2011b, 2016a.
12 Fox et al. 2013.
13 Figure 3 presents simple correlation results. The relationship even strengthens when controlling for real GDP per capita.
14 World Bank 2016b.
15 World Bank 2016b.
16 Bloom et al. 2003.
17 Bloom et al. 2003; Gribble and Bremner 2012; Filmer and Fox 2012; Fox et al. 2013.
18 Cincotta, et al. 2003; Goldstone 2002; Goldstone et al. 2014; Urdal 2005, 2006; Walker 2015.
19 Bloom et al. 2003.
20 Goldstone et al. 2014; Walker 2015.
21 Difference in means test has a p-value of 0.051.
22 Duflo 2012.
23 King and Mason 2001.
24 Walker 2015, p. 24. Walker backs up this claim from additional information from the Fragile States Index (FSI; see Figure 4 note for FSI calculations). According to Walker’s analysis, “Of the 10 states ranked highest on the 2014 FSI, all scored 8.6 or higher [out of a maximum of 10] for ‘demographic pressures;’ five scored 9.0 or higher. Each of the 20 countries that scored highest for state fragility are experiencing a high rate of population growth”; Walker 2015, p. 23.
25 Goldstone et al. 2014, p. 126.
26 See Ramachandran et al. 2009; and Iacovone et al. 2013 and Ramachandran 2014 for a synthesis.
27 Bigsten and Soderbom 2006, p. 261.
28 As mentioned earlier in this chapter, Africa also lags behind other regions on a range of health indicators as well.
29 See https://www.brookings.edu/interactives/africa-learning-barometer/. The issue is often further compounded by difficulties in early childhood development that create further difficulties for children.
30 Perception data have well-known limitations. Among others, cultural differences or differences in expectations about how the investment climate should look can affect perceptions. Hence cross-country comparisons of such data can be difficult and results have to be treated carefully. In addition, firms’ heterogeneity may bias the perception generation mechanism. For example, the views of managers of existing enterprises might not reflect the obstacles that potential entrepreneurs and new entrants may have to deal with. However, although these concerns are real, they should not be overdone. Typically, most firms’ perceptions line up historically relatively well with the reality of every day businesses: that is, they still provide useful information. See Clarke 2011.
31 Details about the World Bank’s Doing Business publication and database are available at http://www.doingbusiness.org/.
32 The proliferation of youth development funds is perhaps the clearest manifestation of this concern; see Ahaibwe and Kasiyre 2015.
33 The May 2016 World Bank list of fragile and conflict-affected states in Africa includes Burundi, Central African Republic, Chad, Comoros, Côte d’Ivoire, Democratic Republic of Congo, Eritrea, The Gambia, Guinea-Bissau, Liberia, Libya, Madagascar, Mali, Sierra Leone, Somalia, South Sudan, Sudan, Togo, and Zimbabwe. See the Harmonized List of Fragile Situations FY16 at http://pubdocs.worldbank.org/en/700521437416355449/FCSlist-FY16-Final-712015.pdf.
34 World Bank 2016d, p. 6.
35 Examples of these programs are:
• short-term labor-intensive programs, such as Community-Driven Development, and Disarmament, Demobilization, and Reintegration, that focus on public works and repairing infrastructure;
• skills training sometimes, unfortunately, without concomitant efforts to determine true local skills needs;
• short-term public works programs combined with efforts to improve the national business climate and/or build government capacity.
36 Pritchett and de Weijer 2010.
37 World Bank 2016d.
38 Gelb 2010.
39 These include Algeria, Angola, Cameroon, Chad, Côte d’Ivoire, Democratic Republic of Congo, Equatorial Guinea, Gabon, Guinea, Liberia, Mali, Mauritania, Niger, Nigeria, Republic of Congo, Sudan, and Zambia (IMF 2012, p. 48).
40 Martin 2007.
41 Arezki et al., eds. 2012; Gelb 2010; Martin 2007.
42 Brenton, ed. 2012; Brenton and Isik, eds. 2012; Brenton et al., eds. 2013; Brenton and Hoffman, eds. 2015; Dihel and Grover, eds. 2016.
43 The World Bank’s Logistics Performance Index (LPI) is based on a worldwide survey of operators (global freight forwarders and express carriers), providing feedback on the logistics “friendliness” of countries. The LPI consists of both qualitative and quantitative measures. It covered 160 countries in 2016. The best region is Europe and Central Asia with a 2016 LPI score of 3.23 while Africa has the lowest score: 2.49. Details about the LPI can be found at http://lpi.worldbank.org/.
44 For example, for sub-Saharan Africa—because of border compliance—it takes, on average, 144 hours to import and 103 hours to export goods across borders, whereas the time needed to import and export is much less in other regions. Similarly, the cost of trading across borders is higher in sub-Saharan African than it is in other regions. Although the performance of North Africa countries is better in some areas than in others—for example, on average it takes 188 hours to import but 64.3 hours to export goods across borders—the continent as a whole does not fare well.
45 Brenton and Isik, eds. 2012.
46 Brenton and Isik, eds. 2012, p. 2.
47 Dihel and Grover, eds. 2016.
48 Brenton et al. 2012, p. 123.
49 Brenton and Isik, eds. 2012. The development of labor-intensive light manufactures is also an important possible venue for job creation in Africa. Countries such as Senegal, with the creation of a new industrial zone in Diamniadio, and Côte d’Ivoire, with the creation of massive enhancing infrastructures, are making a push to develop this sector. Tunisia and Morocco have sizeable industrial sectors. Possible actions to further develop the sector, besides trade policy and investment climate reforms, may include the development of industrial parks, the support of key input industries, and training and entrepreneurship development. On this see Dinh et al. 2012
50 Dudwick et al. 2013; Fox et al. 2013; Reeg 2015.
51 Reeg 2015.
52 A pressing area that governments in Africa need to address to help foster job creation for urban youth is changes in education systems. Not only do far too few children in Africa receive the types of basic education in areas such as literacy and numeracy they need to acquire to be economically productive, but even those who do obtain secondary and tertiary education often receive training in areas where there is little labor demand. University education in many African countries trains students to join the government or other large bureaucracies even though there are very few jobs in these areas. In addition, technical and vocational education systems tend to receive inadequate funding and curricula tend not to provide the type of training that entrepreneurs need to be successful. Rather, educational institutions need to provide training in areas such as market analysis, financial literacy, and small business management. Ramachandran et al. 2009 go as far as to argue that the main credit constraint for entrepreneurs and microenterprises in Africa is not a shortage of capital but poor financial literacy, market analysis, and business development skills.
The Africa Competitiveness Report 2017 | 47

Chapter 1.2
53 Youth development funds are a potentially useful way to enhance the quality of self-employment and of employment in microenterprises (see Ahaibwe and Kasiyre 2015 for a recent review). Although details vary across countries, a common approach is to provide young entrepreneurs with grant or loan finance to create and/or expand a small business. These funds can have great appeal to governments because they allow them to address an important social concern—lack of youth economic opportunity—through programs that are relatively easy to implement. So far, the impact of these funds, in general, has been relatively modest because they treat some causes of youth underemployment (i.e., lack of access to finance), yet often ignore arguably more binding constraints (e.g., lack of skills). As a result, youth development funds tend to be more successful when they pair access to finance with necessary business management and/or vocational skills.
54 A warehouse receipt system enables farmers to deposit storable goods in exchange for a warehouse receipt. This is a document issued by warehouse operators as evidence that specified commodities of stated quantity and quality have been deposited at a particular location. Usually prices slump right after harvesting time. By deciding to sell the goods at a later time, when prices have picked up, the depositor can avoid price risk.
55 In contract farming, a farmer and a buyer agree to a price and/or quantity at the end of a harvest. In exchange, a farmer may receive credit, inputs, and/or technical assistance. However, to date, contract farming has sometimes proven difficult to implement in many countries in Africa due, in part, to high monitoring costs and/or poor legal systems. High monitoring costs may make it difficult for buyers to detect side selling, for example, while poor legal systems may render post-harvest contract enforcement difficult.
56 Risks from climate change are expected to increase in coming decades, particularly in low-income countries where adaptive capacity is weaker. This threatens food security and agriculture’s pivotal role in rural livelihoods and broad-based development, and allows inefficient/unclean technologies to be used in productive sectors, making them less competitive. Innovative solutions have been developed (e.g., clean tech revolution) to counteract this. Many farmers increasingly rely on the application of existing techniques in new ways that have been adapted for developing country conditions with novel business models (for example, drip irrigation, solar-powered pumping, weather forecast by micro-region, and remote monitoring and sensing of crops). To implement these new applications, the participation of local SMEs and entrepreneurs is essential. Instruments such as the Climate Innovation Centers that support local private sectors to commercialize climate-friendly products for local markets are a promising tool. For more on Climate Innovation Centers see http://www.infodev.org/climate.
57 Da Silva et al. 2009.
58 Improving land security is also vital for accessing credit. Governments in many countries in Africa are sometimes reluctant to engage in these efforts not only because they are costly and difficult, but also because they raise sensitive political issues. In addition, some argue that land reform can lead to exploitation and landlessness. While these are valid concerns and reform efforts ought to take into account the potential for exploitation, they do not justify maintaining a status quo. In addition, concerns about loss of access to land as a result of creating markets for it offers only an incomplete analysis. Creating thriving agro-processing firms in Africa that can compete with imports requires, among other factors, high quality and consistent agricultural products. Larger farms are a central part of this solution.
ReferencesAfDB (African Development Bank). 2014. African Development Report 2014.
Abidjan: African Development Bank.
Ahaibwe, G. and I. Kasirye. 2015. Creating Youth Employment through Entrepreneurship Financing. Kampala: Economic Policy Research Center.
Arezki, R., T. Gylfason, and A. Sy, eds. 2012. Beyond the Curse: Policies to Harness the Power of Natural Resource. Washington, DC: International Monetary Fund.
AU, AfDB, and UNECA (African Union, African Development Bank, and United Nations Economic Commission for Africa). 2016. Africa Regional Integration Index Report 2016. Abidjan, Côte d’Ivoire: AU, AfDB, and UNECA.
Bigsten, A. and M. Soderbom. 2006. “What Have We Learned from a Decade of Manufacturing Enterprise Surveys in Africa?” World Bank Research Observer 21 (2): 241–65.
Blattman, C., N. Fiala, and S. Martinez. 2014. “Generating Skilled Self-Employment in Developing Countries.” The Quarterly Journal of Economics 129 (2): 697–752.
Bloom, D., D. Canning, G. Fink, and J. Finlay. 2007. Realizing the Demographic Dividend. Cambridge, MA: Program on the Global Demography of Aging, Harvard University.
Bloom, D., D. Canning, and J. Sevilla. 2003. The Demographic Dividend. Santa Monica, CA: The Rand Corporation.
Bongaarts, J. and J. Castreline. 2013. “Fertility Transition: Is sub-Saharan Africa Different?” Population Development Review 38 (Supplement 1): 153–68.
Brenton, P., ed. 2012. Africa Can Help Feed Africa. Washington, DC: World Bank.
Brenton P., N. Dihel, L. Hinkle, and N. Strychacz. 2012. “Africa’s Trade in Services and the Opportunities and Risks of Economic Partnership Agreements.” In De-Fragmenting Africa, P. Brenton and G. Isik, eds. Washington, DC: World Bank.
Brenton, P., E. Gamberoni, and C. Sear, eds. 2013. Women and Trade in Africa. Washington, DC: World Bank.
Brenton, P. and G. Isik, eds. 2012. De-Fragmenting Africa. Washington, DC: World Bank.
Brenton, P. and B. Hoffman. 2015. “Introduction.” In Brenton and Hoffman, eds., The Political Economy of Regional Integration in Sub-Saharan Africa. Washington, DC: The World Bank.
Brenton, P. and B. Hoffman, eds. 2015. The Political Economy of Regional Integration in Sub-Saharan Africa. Washington, DC: World Bank.
Cincotta, R., R. Engelman, and D. Anastasion. 2003. The Security Demographic. Washington, DC: Population Services International.
Clarke, G. 2011. “Are Managers’ Perceptions about Constraints Reliable? Evidence from a Natural Experiment in South Africa.” Journal of Globalization and Development 2: 1–28.
Cleland, J. 2012. Will Africa Benefit from a Demographic Dividend? Oxford, UK: Health and Education Advice and Resource Team.
Da Silva, C. A., D. Baker, A. W. Shepherd, C. Jenane, and S. Miranda-da-Cruz. 2009. Agro-Industries for Development. Wallingford, Oxfordshire, UK and Cambridge, MA: FAO and UNIDO.
Dihel, N. and A. Grover, eds. 2016. The Unexplored Potential of Trade in Services in Africa. Washington, DC: World Bank.
Dinh, H. T., V. Palmade, V. Chandra, and F. Cossar. 2012. Light Manufacturing in Africa: Targeted Policies to Enhance Private Investment and Create Jobs. Washington, DC: World Bank.
Dodd, D. 2013. Bridging the Gap between Small Businesses and Mining Companies to Increase Local Impact in Guinea. Washington, DC: IFC Solutions/Stories of Impact.
Dudwick, N. and R. Srinivasan with J. Cuesta and D. Mandani. 2013. Creating Jobs in Africa’s Fragile States. Washington, DC: World Bank.
Duflo, E. 2012. “Women Empowerment and Economic Development.” Journal of Economic Literature 29: 1051–79.
Eastwood, R. and M. Lipton. 2011. “Demographic Transition in Africa.” Population Studies 65 (1): 9–35.
Filmer, D. and L. Fox. 2014. Youth Employment in Sub-Saharan Africa. Washington, DC: World Bank.
Fox, L., C. Haines, J. Huerta Muñoz, and A. Thomas. 2013. Africa’s Got Work to Do: Employment Prospects in the New Century. Washington, DC: International Monetary Fund.
Gelb, A. 2010. Economic Diversification in Resource Rich Countries. Mimeo, Center for Global Development, Washington, DC.
Goldstone, J. 2002. “Population and Security.” Journal of International Affairs 56 (1): 3–21.
Goldstone, J., M. Marshall, and H. Root. 2014. “Demographic Growth in Dangerous Places.” International Area Studies Review 17: 120–33.
Gribble, J. and J. Bremner. 2012. Achieving a Demographic Dividend. Washington, DC: Population Reference Bureau.
Holmes, R., A. McCord, and J. Hagen-Zanker with G. Bergh and F. Zanker. 2013. What Is the Evidence on Employment Creation on Stability and Poverty in Fragile States? London: Overseas Development Institute.
48 | The Africa Competitiveness Report 2017

Jobs in Africa
Iacovone, L., V. Ramachandran, and M. Schmidt. 2013. “Stunted Growth: Why Don’t African Firms Create More Jobs?” Working Paper 353. Washington, DC: Center for Global Development.
IFC (International Finance Corporation). 2009. The IFC Oil, Gas and Mining Linkages Program. Washington, DC: IFC.
IMF (International Monetary Fund). 2012. Macroeconomic Frameworks for Resource Rich Countries. Washington, DC: IMF.
King, E. and A. Mason. 2001 Engendering Development through Gender Equality in Rights, Resources, and Voices. Washington, DC: World Bank.
MacKinsey & Company. 2015. Brighter Africa: The Growth Potential of the Sub-Saharan Electricity Sector. McKinsey & Company. Available at https://www.icafrica.org/fileadmin/documents/Knowledge/Energy/McKensey-Brighter_Africa_The_growth_potential_of_the_sub-Saharan_electricity_sector.pdf.
Martin, W. 2007. “Outgrowing Resource Dependence: Theory and Developments.” In Natural Resources: Neither Curse nor Destiny, D. Lederman and W. F. Maloney, eds. Palo Alto, CA and Washington, DC: Stanford University Press and World Bank.
McKenzie, D. 2015. “Creating Jobs through a Business Plan Competition: Evidence from Nigeria’s YouWiN! Competition.” Finance & PSD Impact Note No. 33. Washington, DC: World Bank.
Pritchett, L. and F. de Weijer. 2010. Fragile States. Washington, DC: World Bank.
Ramachandran, V. 2014. Productivity, Jobs and Growth in Africa: Six Pieces of the Puzzle. DPRU Policy Brief: PB 14/41, University of Cape Town.
Ramachandran, V., A. Gelb, and S. Manju. 2009. Africa’s Private Sector: What’s Wrong with the Business Environment and What to Do about It. Washington, DC: Center for Global Development.
The Rand Corporation. 2002. Banking the “Demographic Dividend.” Santa Monica, CA: The Rand Corporation.
Reeg, C. 2015. “Micro and Small Enterprises as Drivers for Job Creation and Decent Work.” German Institute for Development Discussion Paper 10/2015. Bonn: German Institute for Development.
Seedat, M., A. Van Niekerk, R. Jewkes, S. Suffla, and K. Ratele. 2009. “Violence and Injuries in South Africa.” The Lancet 374 (9694): 1011–22.
State Failure Task Force. 1999. State Failure Task Force: Phase Two Findings. College Park, MD: Center for International Development and Conflict Management.
Teachers for EFA. 2010. Teacher Attrition in Sub-Saharan Africa. Paris: UNESCO.
UN (United Nations). 2009. United Nation’s Policy for Post-Conflict Employment Creation, Income Generation, and Reintegration. Geneva: United Nations.
UN Habitat. 2014. The State of African Cities 2014. Nairobi: UN Habitat.
UNESCO. 2012. School and Teaching Resources in sub-Saharan Africa. Paris: UNESCO.
Urdal, H. 2005. “People vs. Malthus.” Journal of Peace Research 42 (4): 417–34.
———. 2006. “A Clash of Generations.” International Studies Quarterly (50): 607–29.
Walker, R. 2015. Demographic Vulnerability. Washington, DC: The Population Institute.
World Bank. 2010. Determinants and Consequences of High Fertility: A Synopsis of the Evidence. Mimeo. Washington, DC: World Bank.
———. 2011a. World Development Report 2011: Conflict and Development. Washington, DC: World Bank.
———. 2011b. Leveraging Migration for Africa. Washington, DC: World Bank.
———. 2013. World Development Report 2013: Jobs. Washington, DC: The World Bank.
———. 2014. World Bank Assistance to Low-Income Fragile and Conflict-Affected States. Washington, DC: World Bank.
———. 2016a. Migration and Remittances Fact Book 2016. Washington, DC: World Bank.
———. 2016b. Global Monitoring Report 2015/2016: Development Goals in an Era of Demographic Change. Washington, DC: World Bank.
———. 2016c. Making Power Affordable for Africa and Viable for Its Utilities. Washington, DC: World Bank.
———. 2016d. An Integrated Framework for Jobs in Fragile and Conflict Situations. Washington, DC: World Bank.
———. 2017a. Republic of Senegal: An Assessment of the Investment Climate, Washington, DC: World Bank.
———. 2017b. World Bank Commodities Price Data, March 2, 2017 Issue, Washington, DC: World Bank.
The Africa Competitiveness Report 2017 | 49


Jobs in Africa
The Africa Competitiveness Report 2017 | 51
Appendix: Supplemental table and figures
0 20 40 60 80 100 120
0
30
60
90
120
150
Percent
Mauritius
Tunisia
Niger
UgandaChad
Morocco
Percent
Source: World Bank, World Health Nutrition and Population Statistics: Population Estimates and Projections, October 2016 update
Figure A1: Working-age population growth in Africa: 2015–35
0
5
10
15
20
Millions Percent growth
Key
■ Population 2010 ■ Population 2025 ● Growth
Cap
e To
wn
Joha
nnes
burg
Cas
abla
nca
Ale
xand
ria
Alg
iers
Dou
ala
Dak
ar
Lago
s
Ibad
an
Acc
ra
Abi
djan
Kha
rtou
m
Add
is A
baba
Luan
da
Kin
shas
a
Nai
robi
Dar
es
Sal
aam
Oua
gado
ugou
Kan
o
Cai
ro
0
30
60
90
120
Source: UN Habitat 2014.
Figure A2: Population growth of the 20 largest cities in Africa: 2010–25
Table A1: Paths to demographic dividend and vulnerability
ScenarioReduction in child mortality
Reduction in fertility
Per child spending
Female labor force participate Policy environment Outcome Example
1 Yes Yes Up Up Supportive for jobs One generation demographic dividend
East Asia
2 Yes Yes Up Up Not supportive for jobs Temporary vulnerability due to youth bulge
Latin America
3 Yes No No change No change Supportive for jobs Demographic dividend; difficult to maintain because youth cohorts are growing
None
4 Yes No No change No change Not supportive for jobs Ever-growing cohorts of poorly employed youth; likely to lead to political/social instability
Nigeria


Chapter 1.3
Competitive African Cities for Better Living StandardsEl-hadj M. BahAudrey Verdier-ChouchaneAfrican Development Bank
Rapid population growth and urbanization are putting significant pressure on the infrastructure of African cities. The population has grown at an annual rate of 2.53 percent from 1950 to 2015 and is predicted to increase from 1.18 billion in 2015 to 2.44 billion in 2050.1 At the same time, the continent is experiencing rapid urbanization, at the rate of 3.5 percent during the period 2000–15. It is estimated that by 2030 more than 50 percent of the population in Africa will be living in cities, and this percentage is expected to increase even further, to reach over 60 percent by 2050.2 The expected demographic transition, characterized by a decline in fertility and mortality rates, will translate into a large labor force living in urban centers. This demographic transition has the potential to turn into a demographic dividend that will increase economic growth and living standards, or it could become a source of social instability if appropriate policies are not implemented (see Chapter 1.1).
Two key implications of the demographic transition are sharp increases in the need for job creation and for urban infrastructure (including affordable housing). It is estimated that although about 10–12 million young people enter the labor market each year, only 3 million formal jobs are created. Thus many African cities face situations where large numbers of the population are either unemployed or underemployed, and are often engaged in informal self-employment. Moreover, African cities experience shortages of transport networks; electricity, water, and sewer systems; and affordable housing. These shortages reduce productivity by limiting the creation and growth of firms and hence lower labor demand.
For cities to play their role as poles of economic growth and providers of quality jobs, they need to become more competitive. Indeed, urbanization can contribute to structural transformation and, by extension, improved competitiveness through economic linkages and social innovation. The concentration of people in urban areas can create economies of scale and facilitate innovation through the concentration of high-skilled and talented workers. Economic development can be enhanced through extended and improved urban services; foreign direct investment (FDI) in urban corridors; and social development through the provision of cost-efficient transport systems, safer housing, social safety nets, and an enhanced businesses environment.3 Furthermore—through increased and improved connectivity, technology, and know-how transfer—urbanization can raise productivity and produce more attractive areas for investments.4
This chapter focuses on the constraints and opportunities for creating competitive African cities that will be required to reap the demographic dividend and, ultimately, improve the living standards of urban dwellers. It is noted that there is no consensus on the meaning of a competitive city. The World Bank notes that a competitive city is “a city that successfully facilitates its firms and industries to create jobs, raise productivity, and increase incomes of citizens over time,”5 while the World Economic Forum adds the dimension of sustainability.6 The Forum states that competitiveness is “the set of factors—policies, institutions,
The authors gratefully acknowledge the very useful comments provided by Celestin Monga, Chief Economist/Vice President, Economic Governance and Knowledge Management, AfDB; Abebe Shimeles, Acting Director, Macroeconomic Policy, Forecasting and Research Department; Issa Faye, Officer in Charge, African Development Institute & Manager, AfDB Microeconomic, Institutional & Development Impact Division; John Anyanwu, Lead Research Economist, Macroeconomic Policy, Forecasting and Research Department; and Anthony Simpasa, Chief Research Economist, Macroeconomic Policy, Debt Sustainability & Forecasting Division. Thanks also go to Research Seminar participants at the AfDB. In particular, the authors would like to thank Charlotte Karagueuzian, Anna von Wachenfelt, and Zeke Geh (AfDB Consultants) for their excellent research assistance.
The Africa Competitiveness Report 2017 | 53
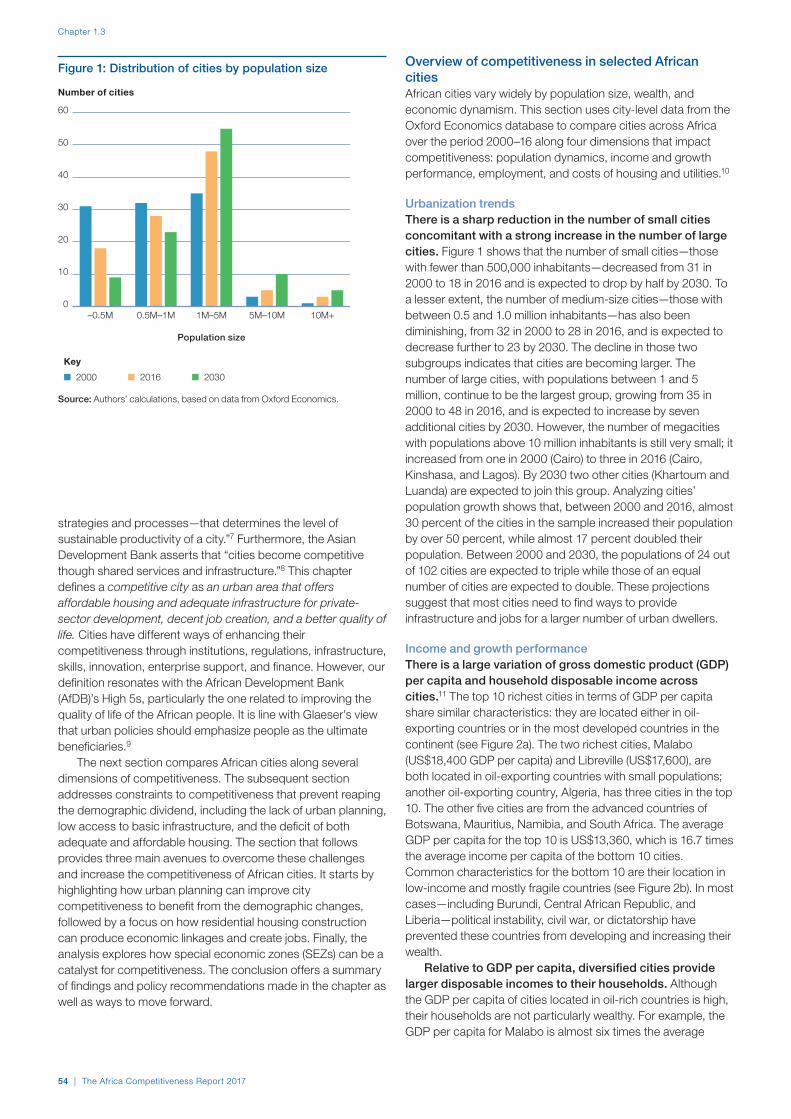
Chapter 1.3
Overview of competitiveness in selected African citiesAfrican cities vary widely by population size, wealth, and economic dynamism. This section uses city-level data from the Oxford Economics database to compare cities across Africa over the period 2000–16 along four dimensions that impact competitiveness: population dynamics, income and growth performance, employment, and costs of housing and utilities.10
Urbanization trendsThere is a sharp reduction in the number of small cities concomitant with a strong increase in the number of large cities. Figure 1 shows that the number of small cities—those with fewer than 500,000 inhabitants—decreased from 31 in 2000 to 18 in 2016 and is expected to drop by half by 2030. To a lesser extent, the number of medium-size cities—those with between 0.5 and 1.0 million inhabitants—has also been diminishing, from 32 in 2000 to 28 in 2016, and is expected to decrease further to 23 by 2030. The decline in those two subgroups indicates that cities are becoming larger. The number of large cities, with populations between 1 and 5 million, continue to be the largest group, growing from 35 in 2000 to 48 in 2016, and is expected to increase by seven additional cities by 2030. However, the number of megacities with populations above 10 million inhabitants is still very small; it increased from one in 2000 (Cairo) to three in 2016 (Cairo, Kinshasa, and Lagos). By 2030 two other cities (Khartoum and Luanda) are expected to join this group. Analyzing cities’ population growth shows that, between 2000 and 2016, almost 30 percent of the cities in the sample increased their population by over 50 percent, while almost 17 percent doubled their population. Between 2000 and 2030, the populations of 24 out of 102 cities are expected to triple while those of an equal number of cities are expected to double. These projections suggest that most cities need to find ways to provide infrastructure and jobs for a larger number of urban dwellers.
Income and growth performanceThere is a large variation of gross domestic product (GDP) per capita and household disposable income across cities.11 The top 10 richest cities in terms of GDP per capita share similar characteristics: they are located either in oil-exporting countries or in the most developed countries in the continent (see Figure 2a). The two richest cities, Malabo (US$18,400 GDP per capita) and Libreville (US$17,600), are both located in oil-exporting countries with small populations; another oil-exporting country, Algeria, has three cities in the top 10. The other five cities are from the advanced countries of Botswana, Mauritius, Namibia, and South Africa. The average GDP per capita for the top 10 is US$13,360, which is 16.7 times the average income per capita of the bottom 10 cities. Common characteristics for the bottom 10 are their location in low-income and mostly fragile countries (see Figure 2b). In most cases—including Burundi, Central African Republic, and Liberia—political instability, civil war, or dictatorship have prevented these countries from developing and increasing their wealth.
Relative to GDP per capita, diversified cities provide larger disposable incomes to their households. Although the GDP per capita of cities located in oil-rich countries is high, their households are not particularly wealthy. For example, the GDP per capita for Malabo is almost six times the average
Source: Authors’ calculations, based on data from Oxford Economics.
Figure 1: Distribution of cities by population size
10
20
30
40
50
60
10M+5M–10M1M–5M0.5M–1M–0.5M
Number of cities
0
Population size
Key
■ 2000 ■ 2016 ■ 2030
strategies and processes—that determines the level of sustainable productivity of a city.”7 Furthermore, the Asian Development Bank asserts that “cities become competitive though shared services and infrastructure.”8 This chapter defines a competitive city as an urban area that offers affordable housing and adequate infrastructure for private-sector development, decent job creation, and a better quality of life. Cities have different ways of enhancing their competitiveness through institutions, regulations, infrastructure, skills, innovation, enterprise support, and finance. However, our definition resonates with the African Development Bank (AfDB)’s High 5s, particularly the one related to improving the quality of life of the African people. It is line with Glaeser’s view that urban policies should emphasize people as the ultimate beneficiaries.9
The next section compares African cities along several dimensions of competitiveness. The subsequent section addresses constraints to competitiveness that prevent reaping the demographic dividend, including the lack of urban planning, low access to basic infrastructure, and the deficit of both adequate and affordable housing. The section that follows provides three main avenues to overcome these challenges and increase the competitiveness of African cities. It starts by highlighting how urban planning can improve city competitiveness to benefit from the demographic changes, followed by a focus on how residential housing construction can produce economic linkages and create jobs. Finally, the analysis explores how special economic zones (SEZs) can be a catalyst for competitiveness. The conclusion offers a summary of findings and policy recommendations made in the chapter as well as ways to move forward.
54 | The Africa Competitiveness Report 2017
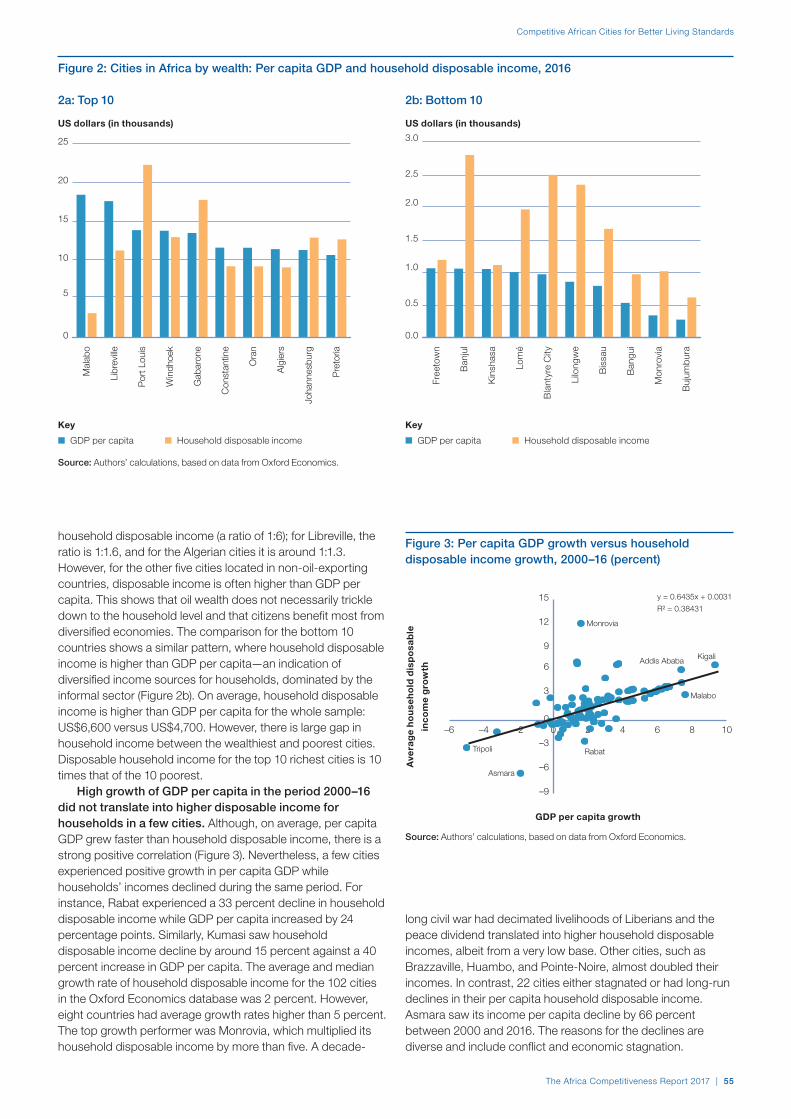
Competitive African Cities for Better Living Standards
household disposable income (a ratio of 1:6); for Libreville, the ratio is 1:1.6, and for the Algerian cities it is around 1:1.3. However, for the other five cities located in non-oil-exporting countries, disposable income is often higher than GDP per capita. This shows that oil wealth does not necessarily trickle down to the household level and that citizens benefit most from diversified economies. The comparison for the bottom 10 countries shows a similar pattern, where household disposable income is higher than GDP per capita—an indication of diversified income sources for households, dominated by the informal sector (Figure 2b). On average, household disposable income is higher than GDP per capita for the whole sample: US$6,600 versus US$4,700. However, there is large gap in household income between the wealthiest and poorest cities. Disposable household income for the top 10 richest cities is 10 times that of the 10 poorest.
High growth of GDP per capita in the period 2000–16 did not translate into higher disposable income for households in a few cities. Although, on average, per capita GDP grew faster than household disposable income, there is a strong positive correlation (Figure 3). Nevertheless, a few cities experienced positive growth in per capita GDP while households’ incomes declined during the same period. For instance, Rabat experienced a 33 percent decline in household disposable income while GDP per capita increased by 24 percentage points. Similarly, Kumasi saw household disposable income decline by around 15 percent against a 40 percent increase in GDP per capita. The average and median growth rate of household disposable income for the 102 cities in the Oxford Economics database was 2 percent. However, eight countries had average growth rates higher than 5 percent. The top growth performer was Monrovia, which multiplied its household disposable income by more than five. A decade-
0
5
10
15
20
25
Pre
toria
Joha
nnes
burg
Alg
iers
Ora
n
Con
stan
tine
Gab
aron
e
Win
dhoe
k
Por
t Lou
is
Libr
eville
Mal
abo
US dollars (in thousands)
Key
■ GDP per capita ■ Household disposable income
0.0
0.5
1.0
1.5
2.0
2.5
3.0
Buj
umb
ura
Mon
rovi
a
Ban
gui
Bis
sau
Lilo
ngw
e
Bla
ntyr
e C
ity
Lom
é
Kin
shas
a
Ban
jul
Free
tow
n
US dollars (in thousands)
Key
■ GDP per capita ■ Household disposable income
Source: Authors’ calculations, based on data from Oxford Economics.
Figure 2: Cities in Africa by wealth: Per capita GDP and household disposable income, 2016
2a: Top 10 2b: Bottom 10
–9
–6
–3
0
3
6
9
12
15
–6 –4 –2 0 2 4 6 8 10
Aver
age
hous
ehol
d di
spos
able
inco
me
grow
th
GDP per capita growth
y = 0.6435x + 0.0031
R² = 0.38431
Monrovia
KigaliAddis Ababa
Malabo
Asmara
Tripoli Rabat
Source: Authors’ calculations, based on data from Oxford Economics.
Figure 3: Per capita GDP growth versus household disposable income growth, 2000–16 (percent)
long civil war had decimated livelihoods of Liberians and the peace dividend translated into higher household disposable incomes, albeit from a very low base. Other cities, such as Brazzaville, Huambo, and Pointe-Noire, almost doubled their incomes. In contrast, 22 cities either stagnated or had long-run declines in their per capita household disposable income. Asmara saw its income per capita decline by 66 percent between 2000 and 2016. The reasons for the declines are diverse and include conflict and economic stagnation.
The Africa Competitiveness Report 2017 | 55

Chapter 1.3
slow growth while Nigeria’s economy is highly dependent on oil price fluctuations.
The correlation between employment growth and growth of household disposable income, despite being positive, is fairly moderate (Figure 5). For example, both Lusaka and Kigali saw increases in employment of more than 10 percent on average over the 16-year period. However, while Kigali had a very strong growth in household income (6.9 percent) and per capita GDP (9.3 percent), Lusaka saw a modest growth in household income of 2.6 percent and per capital GDP of 3.8 percent. Employment grew strongly in Bamako (7.8 percent) and Yamoussoukro (6.3 percent) while household incomes declined, on average, by 2.0 percent and 0.1 percent, respectively.
For employment growth to translate into higher disposable income for households, an increase in wages must accompany the rise of employment. Another issue relevant for Africa is the dramatic increase in the total number of households. Although the average cumulative growth of employment is 79.5 percent, the number of households grew on average by 75 percent. This implies that employment growth barely stayed ahead of growth in the number of households. Other factors, such as income taxes and the high incidence of informality, may explain the low correlation between household wealth and employment. Unfortunately, the database does not contain information on these variables.
Housing and utilities costsOn average, households spend 21 percent of their disposable income on housing and utility costs, although there is a large variation across cities. The share ranges from 8 percent in Nairobi to 39 percent in Polokwane. In general, South Africans spend more than citizens of all other African nations on these items. Although this is an important
0
2
4
6
8
10
12
Kum
asi
Mal
abo
Kitw
e
Mw
anza
Ad
dis
Aba
ba
Dar
Es
Sal
aam
Win
dho
ek
Mon
rovi
a
Ab
uja
Yam
ouss
oukr
o
Dak
ar
Kha
rtou
m
Nou
akch
ott
Bla
ntyr
e C
ity
Bam
ako
Buj
umb
ura
Lilo
ngw
e
Oua
gad
ougo
u
Kig
ali
Lusa
ka
Percent
–1.0
–0.5
0.0
0.5
1.0
1.5
2.0
Por
t Eliz
abet
h
Kim
ber
ley
Zar
ia
Mas
eru
Kad
una
Por
t Lou
is
Blo
emfo
ntei
n
Dur
ban
Ban
gui
Mai
dug
uri
Trip
oli
Fès
Ab
eoku
ta
Cap
e To
wn
Jos
Kan
o
Ilorin
Djib
outi
Ant
anan
ariv
o
Joha
nnes
bur
g
Percent
Source: Authors’ calculations, based on data from Oxford Economics.
Figure 4: Employment growth, 2000–16
4a: Top performers 4b: Bottom performers
–2 0 2 4 6 8 10 12
–10
–5
0
5
10
15
Ho
use
ho
ld d
isp
osa
ble
inc
om
e g
row
th
Employment growth
y = 0.2376x + 0.0119
R² = 0.0467Monrovia
Pointe-NoireBrazzaville Huambo Luamda
Kigali
Lukasa
Ouagadougou
Asmara
TripoliBamako
Addis Ababa
Source: Authors’ calculations, based on data from Oxford Economics.
Figure 5: Employment growth versus household disposable income growth, 2000–16
Growth in employmentFor the 102 African cities studied, employment grew on average by 3.4 percent per year for the period 2000–16, with large variation across countries. The top 20 cities for job creation all had yearly employment growth rates ranging from 5.03 percent in Kumasi to 10.74 percent in Lusaka (Figure 4a). This group includes cities at different levels of income and geographic location. On the other end, the rates for the bottom performers varied between –0.88 percent in Port Elizabeth to 1.65 percent in Johannesburg (Figure 4b). The bottom performers include several cities in South Africa and Nigeria. South Africa’s economy has experienced a decade of
56 | The Africa Competitiveness Report 2017
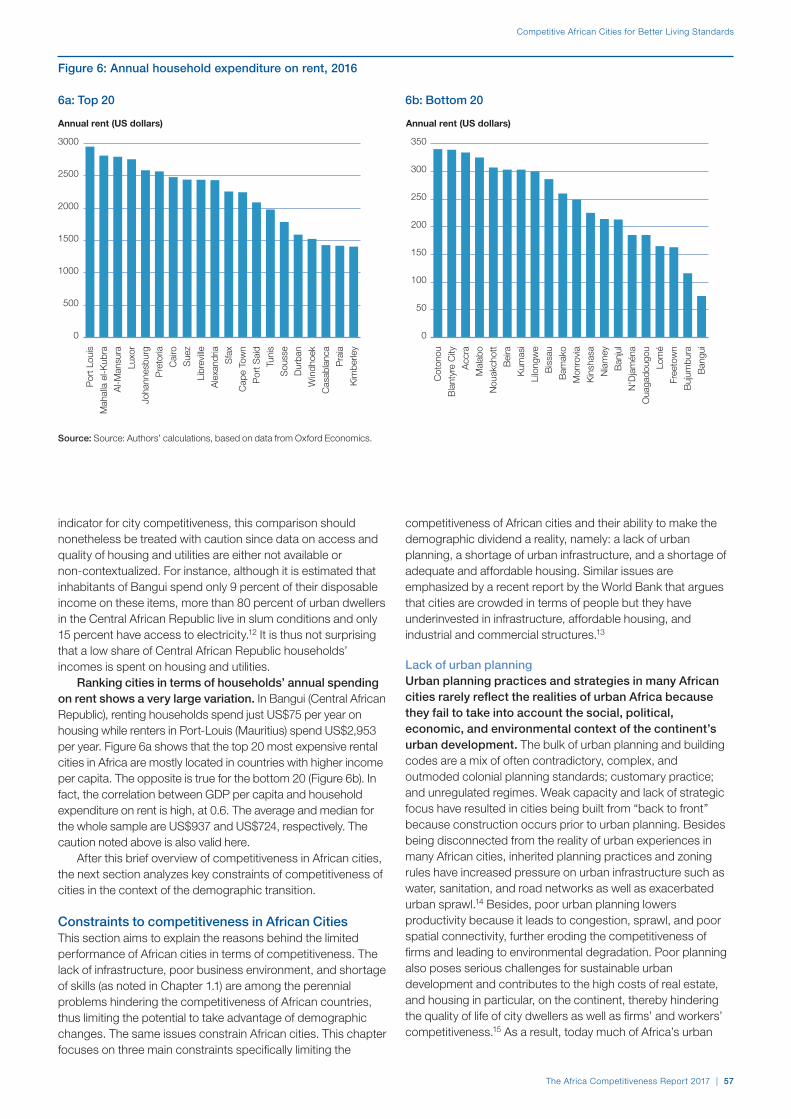
Competitive African Cities for Better Living Standards
indicator for city competitiveness, this comparison should nonetheless be treated with caution since data on access and quality of housing and utilities are either not available or non-contextualized. For instance, although it is estimated that inhabitants of Bangui spend only 9 percent of their disposable income on these items, more than 80 percent of urban dwellers in the Central African Republic live in slum conditions and only 15 percent have access to electricity.12 It is thus not surprising that a low share of Central African Republic households’ incomes is spent on housing and utilities.
Ranking cities in terms of households’ annual spending on rent shows a very large variation. In Bangui (Central African Republic), renting households spend just US$75 per year on housing while renters in Port-Louis (Mauritius) spend US$2,953 per year. Figure 6a shows that the top 20 most expensive rental cities in Africa are mostly located in countries with higher income per capita. The opposite is true for the bottom 20 (Figure 6b). In fact, the correlation between GDP per capita and household expenditure on rent is high, at 0.6. The average and median for the whole sample are US$937 and US$724, respectively. The caution noted above is also valid here.
After this brief overview of competitiveness in African cities, the next section analyzes key constraints of competitiveness of cities in the context of the demographic transition.
Constraints to competitiveness in African CitiesThis section aims to explain the reasons behind the limited performance of African cities in terms of competitiveness. The lack of infrastructure, poor business environment, and shortage of skills (as noted in Chapter 1.1) are among the perennial problems hindering the competitiveness of African countries, thus limiting the potential to take advantage of demographic changes. The same issues constrain African cities. This chapter focuses on three main constraints specifically limiting the
competitiveness of African cities and their ability to make the demographic dividend a reality, namely: a lack of urban planning, a shortage of urban infrastructure, and a shortage of adequate and affordable housing. Similar issues are emphasized by a recent report by the World Bank that argues that cities are crowded in terms of people but they have underinvested in infrastructure, affordable housing, and industrial and commercial structures.13
Lack of urban planningUrban planning practices and strategies in many African cities rarely reflect the realities of urban Africa because they fail to take into account the social, political, economic, and environmental context of the continent’s urban development. The bulk of urban planning and building codes are a mix of often contradictory, complex, and outmoded colonial planning standards; customary practice; and unregulated regimes. Weak capacity and lack of strategic focus have resulted in cities being built from “back to front” because construction occurs prior to urban planning. Besides being disconnected from the reality of urban experiences in many African cities, inherited planning practices and zoning rules have increased pressure on urban infrastructure such as water, sanitation, and road networks as well as exacerbated urban sprawl.14 Besides, poor urban planning lowers productivity because it leads to congestion, sprawl, and poor spatial connectivity, further eroding the competitiveness of firms and leading to environmental degradation. Poor planning also poses serious challenges for sustainable urban development and contributes to the high costs of real estate, and housing in particular, on the continent, thereby hindering the quality of life of city dwellers as well as firms’ and workers’ competitiveness.15 As a result, today much of Africa’s urban
Source: Source: Authors’ calculations, based on data from Oxford Economics.
Figure 6: Annual household expenditure on rent, 2016
6a: Top 20 6b: Bottom 20
0
500
1000
1500
2000
2500
3000
Kim
berle
y
Pra
ia
Cas
abla
nca
Win
dhoe
k
Dur
ban
Sou
sse
Tuni
s
Por
t Sai
d
Cap
e To
wn
Sfa
x
Ale
xand
ria
Libr
eville
Sue
z
Cai
ro
Pre
toria
Joha
nnes
burg
Luxo
r
Al-M
ansu
ra
Mah
alla
el-K
ubra
Por
t Lou
is
Annual rent (US dollars)
0
50
100
150
200
250
300
350
Ban
gui
Buj
umbu
ra
Free
tow
n
Lom
é
Oua
gado
ugou
N'D
jam
éna
Ban
jul
Nia
mey
Kin
shas
a
Mon
rovi
a
Bam
ako
Bis
sau
Lilo
ngw
e
Kum
asi
Bei
ra
Nou
akch
ott
Mal
abo
Acc
ra
Bla
ntyr
e C
ity
Cot
onou
Annual rent (US dollars)
The Africa Competitiveness Report 2017 | 57

Chapter 1.3
Africans. The largest infrastructure deficit of the continent is in the power sector: over 570 million people, or about 54 percent of Africans, do not have access to energy.16 Power consumption in Africa remains very low, at 570 kilowatt hours per capita (181 kilowatts in sub-Saharan Africa, excluding South Africa). This represents only a fraction of power consumption in both developed and emerging economies (see Table 1). Similar problems plague the continent’s information and communication technology (ICT) network, water and sanitation, and transport network (Box 1). All these constraints limit job creation and the economic opportunities needed to reap the demographic dividend.
Africa’s infrastructure shortfall has been widely identified as a major bottleneck for doing business across the continent. It increases indirect costs of manufacturers, making them less competitive vis-a-vis their peers from other world regions. Regular power outages remain a major infrastructure bottleneck that plagues businesses. Moreover, lack of access to a reliable electricity supply increases the use of environmentally unfriendly alternatives such as diesel-powered generators.
Deficit of adequate and affordable housingAfrica’s rapid urbanization and population growth has led to a severe affordable housing shortage and a rise in informal settlements. Today, over 330 million Africans live in slum conditions. The housing backlog is estimated to be over 51 million affordable housing units, with 17 countries experiencing a housing backlog of over 1 million units.17 On one hand, countries such as Botswana, Mauritius, and Tunisia have no housing deficit, while Nigeria is estimated to have a housing shortage of at least 17 million units, the highest in the continent (Table 2). The socioeconomic impact of the housing shortage is clear. It causes overcrowding, increases the incidence of diseases, and hinders the provision of basic social and public services such as water, sanitation, education, and physical safety. In such a situation, high population growth and a youth bulge tend to be liabilities rather than dividends.
In addition to the shortage of adequate housing, affordability is a major issue facing households across
Table 1: Africa’s infrastructure deficit compared with the rest of the world
Infrastructure Afri
ca
Sou
th A
sia
Latin
Am
eric
a an
d th
e C
arib
bean
OE
CD
cou
ntrie
s
Access to electricity (% of population) 46 78 96 100
Electric power consumption (kWh per capita)
570 655 2,071 8,082
Improved water source (% of population with access)
72 92 95 93
Improved sanitation facilities (% of population with access)
39 45 83 98
Source: ADB Statistics Department based on data from the World Bank, World Development Indicators, AFREC (The African Energy Commission), the WHO/UNICEF Joint Monitoring Programme for Water Supply and Sanitation, and the International Energy Agency, latest year available.
expansion is occurring through an unplanned and low-density transformation of rural land into urban land.
Low access to basic infrastructure servicesAfrica suffers from a severe infrastructure deficit. The continent’s infrastructure deficit is a major impediment to the continent’s growth because it hinders domestic private investments, deters FDI, impedes industrialization, reduces productivity, and limits the provision of services. Consequently this deficit hinders the improvement of the quality of life of
Box 1: Productivity killer: The increasing costs of congestion in Nairobi
Nairobi is a prime example of the difficulties of congestion facing fast-growing African cities, where traffic has become one of the biggest issues in terms of productivity. The Kenyan capital, whose economy grew with 6 percent in 2016, is one of the fastest-growing economies of the continent and has simultaneously seen rapid rates of urbanization. Although the population of Nairobi Metropolitan Area was around 6,658,000 in 2009, it is estimated that it will reach approximately 14 million by 2030.1 At the same time, car-based transportation more than doubled between 2012 and 2016, reaching 700,000, with estimates of up to 9 million car users by 2050.2 Combining this with low levels of infrastructure investments, an inherited colonial infrastructure, and a spatial-economic structure with an almost exclusive focus on the central business district have created a situation where most citizens spend at least two hours commuting each day,3 with a large impact on the city’s competitiveness.
The consequences have been plentiful. Nairobi’s traffic problems cause increased costs, longer travel times, lower economic productivity, and a substantial negative impact on health and the environment. It is expected that the congestion leads to an estimated US$578,000 a day of lost productivity in the city, and as many as 13,000 people killed in road accidents a year.4 Moreover, should the city keep adding cars at the current rate without expanding its infrastructure, the average speed of driving will be cut in half by 2030, to 20 kilometers an hour (so it will take twice as long to get anywhere).5 Another related problem is the deteriorating air quality in the city, where 30 percent more diesel is burned today than it was five years ago. The bad air quality also stems from the fact that few cars are new: the large majority of cars are old ones imported from Japan and Europe. Following this, respiratory diseases are one now the number one type of disease in Kenya.6 To curb the massive congestion, several initiatives are needed, including the construction of new ring roads, re-engineering of the public transportation system and investing in rail services, developing multiple city centers, and using smart technology to control road traffic.
Notes
1 Gachanja 2015.
2 MacGregor et al. 2014.
3 Gachanja 2015; Otuki 2017.
4 Gachanja 2015; McGregor et al. 2014.
5 Honan 2016.
6 Vidal 2016.
Source: Authors, based on Gachanja, 2015; Honan, 2016; McGregor and Doya, 2014: Otuki, 2017; and Vidal, 2016.
58 | The Africa Competitiveness Report 2017

Competitive African Cities for Better Living Standards
focuses on the spillover effects of residential housing investment. It specifically shows that residential investment is an enabler of housing provision, job creation, and economic growth. Finally, it discusses the provision of an attractive business environment through the creation of special economic zones (SEZs), which are recognized as a way to support competitive private-sector development. This section does not specifically discuss policies dealing with the shortage of infrastructure such as power and transport systems nor the financing mechanisms to fill this gap, which have been more extensively discussed elsewhere.22
Urban planning to lay the foundations of competitive citiesThe adoption of comprehensive and up-to-date urban plans that reflect recent economic and demographic developments is crucial for laying the foundations of competitive cities better equipped to benefit from urbanization. UNECA (2017) highlights that urbanization and industrialization can be closely associated in a mutually beneficial
African cities. A substantial number of households cannot afford an entry-level home supplied by the market. A recent African Development Bank (AfDB) study estimates that 81.5 million households can only afford a house that costs US$3,750 or less.18 Besides providing jobs for the continent’s unemployed youth and building a solid industrial base, closing the housing gap would significantly contribute toward Sustainable Development Goal 11 of making cities safe and sustainable.
The reasons for the shortage of affordable and adequate housing can be traced throughout the steps of the housing delivery value chains. Lack of urban planning and adequate building standards are causing a shortage of urban land, resulting in high prices and urban sprawl. Direct and indirect evidence shows that land use regulations, defined in urban plans, explain the majority of the differences in housing supply across space.19 These regulations create market failures that prevent the housing market from functioning properly as theory would suggest, especially the no-arbitrage equilibrium condition.20 An overreliance on imported building materials, and monopoly pricing in some cases, contribute to very high prices. The dominance of small- and medium-sized developers and artisanal construction methods with low capacity lengthens construction time, lowers quality, increases construction costs, and limits the supply of housing (Box 2). Lack of financing for developers and housing customers, along with high financing costs for those that qualify for loans, add to the overall housing costs. All these issues are amplified by inadequate institutional and regulatory frameworks and poor governance.21 This constitutes an environment not conducive for reaping the demographic dividend.
Increasing African city competitiveness for making the demographic dividend a realityThis section provides policy recommendations for how to leverage the competitiveness of African cities to address the challenges related to demographic changes. First, concrete and immediate policies for adequate urban planning addressing the demographic issues and economic changing landscape of African cities are discussed. Next the section
Table 2: Housing backlogs in selected countries
Country
Housing backlog
(millions of units)
Central African Rep. 1.0
Ethiopia 1.0
Cameroon 1.2
Algeria 1.2
Zimbabwe 1.3
Zambia 1.5
Uganda 1.6
Ghana 1.7
Angola 1.9
Country
Housing backlog
(millions of units)
Madagascar 2.0
Mozambique 2.0
Kenya 2.0
South Africa 2.3
Tanzania 3.0
Congo, Dem. Rep. 3.0
Egypt 3.5
Nigeria 17.0
Source: Faye et al. forthcoming (2017).
Box 2: The shortage of skills in the Kenya construction sector
In the construction sector, both skilled and unskilled labor together generally represent 30 percent of overall construction costs. Whereas unskilled labor is often widely available, there is a shortage of skilled workers, especially well-trained technicians such as carpenters, electricians, general construction workers, plumbers, and—in some countries—architects and engineers. These skills shortages are having a negative impact on housing costs and quality.1 In turn, the poor-quality supply and high cost of housing undermine countries’ productivity by reducing labor market flexibility, increasing mortgage spending, and preventing investment from being redirected toward more productive activities.
In Kenya, the Federation of Master Builders, representing 2,500 contractors, highlights the important skills gap in the adequacy, productivity, and quality of human resources. This is largely the result of high training costs that are not affordable for many young people, but the curricula of most training institutions are also out of touch with industry needs. In consequence, local artisans construct housing units without respecting building codes, increasing the cost of construction and limiting their ability to construct decent, safe dwellings. A shortage of managerial skills was also cited as a big constraint to scaling up affordable housing delivery. Habitat for Humanity in Kenya observes that the lack of training and skills locks low-income households into a cycle of poor-quality, self-built housing.2 They plead for policymakers to expand the technical and vocational training of youth in the skills needed by the construction and manufacturing sectors, ideally in close partnership with the private sector to ensure that needs are identified correctly and training is delivered effectively. It is of utmost importance to have the right skills mix throughout the housing supply chain because it means faster construction with less rework and hence results in lower construction costs.
Notes
1 Faye et al. forthcoming (2017).
2 Habitat for Humanity in Kenya 2014.
Source: Faye et al. forthcoming (2017).
The Africa Competitiveness Report 2017 | 59
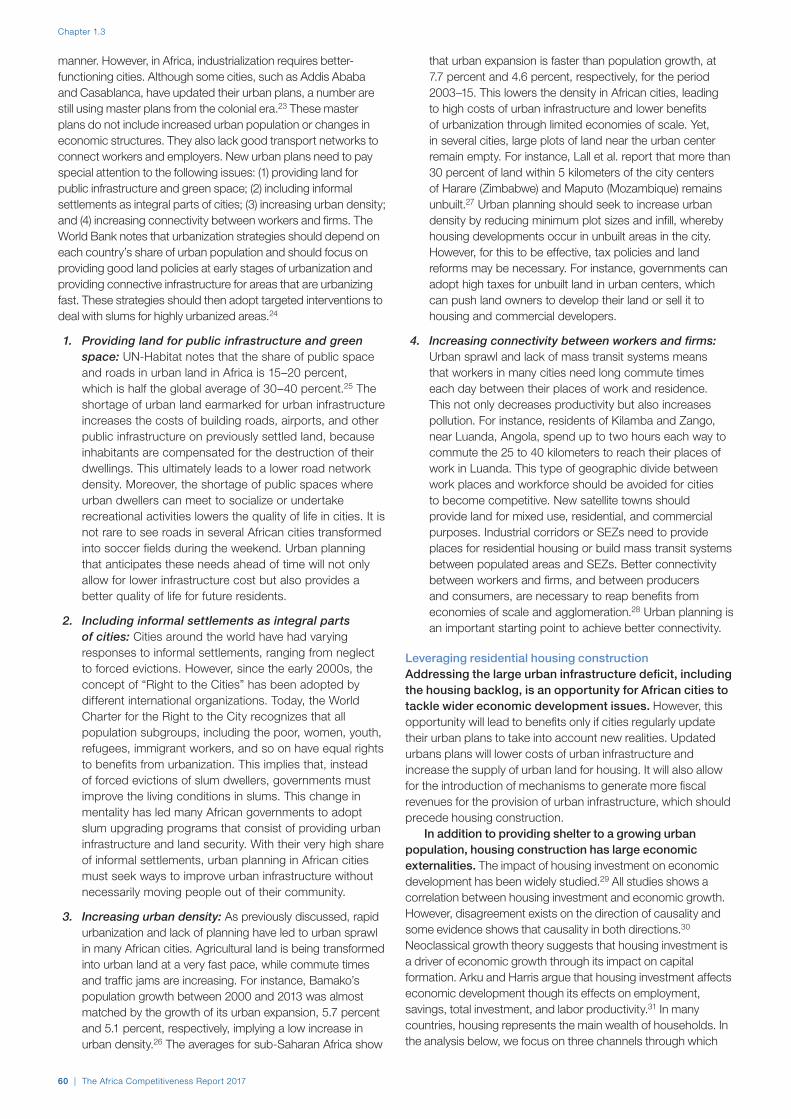
Chapter 1.3
manner. However, in Africa, industrialization requires better-functioning cities. Although some cities, such as Addis Ababa and Casablanca, have updated their urban plans, a number are still using master plans from the colonial era.23 These master plans do not include increased urban population or changes in economic structures. They also lack good transport networks to connect workers and employers. New urban plans need to pay special attention to the following issues: (1) providing land for public infrastructure and green space; (2) including informal settlements as integral parts of cities; (3) increasing urban density; and (4) increasing connectivity between workers and firms. The World Bank notes that urbanization strategies should depend on each country’s share of urban population and should focus on providing good land policies at early stages of urbanization and providing connective infrastructure for areas that are urbanizing fast. These strategies should then adopt targeted interventions to deal with slums for highly urbanized areas.24
1. Providing land for public infrastructure and green space: UN-Habitat notes that the share of public space and roads in urban land in Africa is 15–20 percent, which is half the global average of 30–40 percent.25 The shortage of urban land earmarked for urban infrastructure increases the costs of building roads, airports, and other public infrastructure on previously settled land, because inhabitants are compensated for the destruction of their dwellings. This ultimately leads to a lower road network density. Moreover, the shortage of public spaces where urban dwellers can meet to socialize or undertake recreational activities lowers the quality of life in cities. It is not rare to see roads in several African cities transformed into soccer fields during the weekend. Urban planning that anticipates these needs ahead of time will not only allow for lower infrastructure cost but also provides a better quality of life for future residents.
2. Including informal settlements as integral parts of cities: Cities around the world have had varying responses to informal settlements, ranging from neglect to forced evictions. However, since the early 2000s, the concept of “Right to the Cities” has been adopted by different international organizations. Today, the World Charter for the Right to the City recognizes that all population subgroups, including the poor, women, youth, refugees, immigrant workers, and so on have equal rights to benefits from urbanization. This implies that, instead of forced evictions of slum dwellers, governments must improve the living conditions in slums. This change in mentality has led many African governments to adopt slum upgrading programs that consist of providing urban infrastructure and land security. With their very high share of informal settlements, urban planning in African cities must seek ways to improve urban infrastructure without necessarily moving people out of their community.
3. Increasing urban density: As previously discussed, rapid urbanization and lack of planning have led to urban sprawl in many African cities. Agricultural land is being transformed into urban land at a very fast pace, while commute times and traffic jams are increasing. For instance, Bamako’s population growth between 2000 and 2013 was almost matched by the growth of its urban expansion, 5.7 percent and 5.1 percent, respectively, implying a low increase in urban density.26 The averages for sub-Saharan Africa show
that urban expansion is faster than population growth, at 7.7 percent and 4.6 percent, respectively, for the period 2003–15. This lowers the density in African cities, leading to high costs of urban infrastructure and lower benefits of urbanization through limited economies of scale. Yet, in several cities, large plots of land near the urban center remain empty. For instance, Lall et al. report that more than 30 percent of land within 5 kilometers of the city centers of Harare (Zimbabwe) and Maputo (Mozambique) remains unbuilt.27 Urban planning should seek to increase urban density by reducing minimum plot sizes and infill, whereby housing developments occur in unbuilt areas in the city. However, for this to be effective, tax policies and land reforms may be necessary. For instance, governments can adopt high taxes for unbuilt land in urban centers, which can push land owners to develop their land or sell it to housing and commercial developers.
4. Increasing connectivity between workers and firms: Urban sprawl and lack of mass transit systems means that workers in many cities need long commute times each day between their places of work and residence. This not only decreases productivity but also increases pollution. For instance, residents of Kilamba and Zango, near Luanda, Angola, spend up to two hours each way to commute the 25 to 40 kilometers to reach their places of work in Luanda. This type of geographic divide between work places and workforce should be avoided for cities to become competitive. New satellite towns should provide land for mixed use, residential, and commercial purposes. Industrial corridors or SEZs need to provide places for residential housing or build mass transit systems between populated areas and SEZs. Better connectivity between workers and firms, and between producers and consumers, are necessary to reap benefits from economies of scale and agglomeration.28 Urban planning is an important starting point to achieve better connectivity.
Leveraging residential housing constructionAddressing the large urban infrastructure deficit, including the housing backlog, is an opportunity for African cities to tackle wider economic development issues. However, this opportunity will lead to benefits only if cities regularly update their urban plans to take into account new realities. Updated urbans plans will lower costs of urban infrastructure and increase the supply of urban land for housing. It will also allow for the introduction of mechanisms to generate more fiscal revenues for the provision of urban infrastructure, which should precede housing construction.
In addition to providing shelter to a growing urban population, housing construction has large economic externalities. The impact of housing investment on economic development has been widely studied.29 All studies shows a correlation between housing investment and economic growth. However, disagreement exists on the direction of causality and some evidence shows that causality in both directions.30 Neoclassical growth theory suggests that housing investment is a driver of economic growth through its impact on capital formation. Arku and Harris argue that housing investment affects economic development though its effects on employment, savings, total investment, and labor productivity.31 In many countries, housing represents the main wealth of households. In the analysis below, we focus on three channels through which
60 | The Africa Competitiveness Report 2017
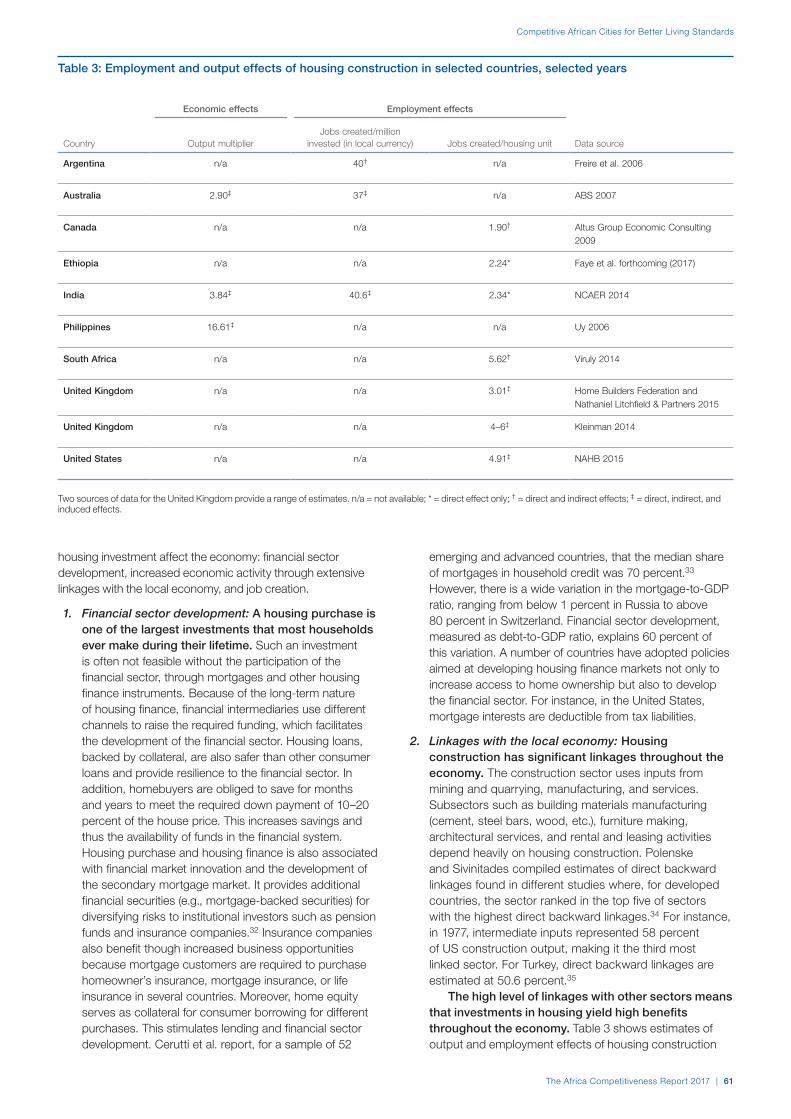
Competitive African Cities for Better Living Standards
housing investment affect the economy: financial sector development, increased economic activity through extensive linkages with the local economy, and job creation.
1. Financial sector development: A housing purchase is one of the largest investments that most households ever make during their lifetime. Such an investment is often not feasible without the participation of the financial sector, through mortgages and other housing finance instruments. Because of the long-term nature of housing finance, financial intermediaries use different channels to raise the required funding, which facilitates the development of the financial sector. Housing loans, backed by collateral, are also safer than other consumer loans and provide resilience to the financial sector. In addition, homebuyers are obliged to save for months and years to meet the required down payment of 10–20 percent of the house price. This increases savings and thus the availability of funds in the financial system. Housing purchase and housing finance is also associated with financial market innovation and the development of the secondary mortgage market. It provides additional financial securities (e.g., mortgage-backed securities) for diversifying risks to institutional investors such as pension funds and insurance companies.32 Insurance companies also benefit though increased business opportunities because mortgage customers are required to purchase homeowner’s insurance, mortgage insurance, or life insurance in several countries. Moreover, home equity serves as collateral for consumer borrowing for different purchases. This stimulates lending and financial sector development. Cerutti et al. report, for a sample of 52
emerging and advanced countries, that the median share of mortgages in household credit was 70 percent.33 However, there is a wide variation in the mortgage-to-GDP ratio, ranging from below 1 percent in Russia to above 80 percent in Switzerland. Financial sector development, measured as debt-to-GDP ratio, explains 60 percent of this variation. A number of countries have adopted policies aimed at developing housing finance markets not only to increase access to home ownership but also to develop the financial sector. For instance, in the United States, mortgage interests are deductible from tax liabilities.
2. Linkages with the local economy: Housing construction has significant linkages throughout the economy. The construction sector uses inputs from mining and quarrying, manufacturing, and services. Subsectors such as building materials manufacturing (cement, steel bars, wood, etc.), furniture making, architectural services, and rental and leasing activities depend heavily on housing construction. Polenske and Sivinitades compiled estimates of direct backward linkages found in different studies where, for developed countries, the sector ranked in the top five of sectors with the highest direct backward linkages.34 For instance, in 1977, intermediate inputs represented 58 percent of US construction output, making it the third most linked sector. For Turkey, direct backward linkages are estimated at 50.6 percent.35
The high level of linkages with other sectors means that investments in housing yield high benefits throughout the economy. Table 3 shows estimates of output and employment effects of housing construction
Table 3: Employment and output effects of housing construction in selected countries, selected years
Economic effects Employment effects
Country Output multiplierJobs created/million
invested (in local currency) Jobs created/housing unit Data source
Argentina n/a 40† n/a Freire et al. 2006
Australia 2.90‡ 37‡ n/a ABS 2007
Canada n/a n/a 1.90† Altus Group Economic Consulting 2009
Ethiopia n/a n/a 2.24* Faye et al. forthcoming (2017)
India 3.84‡ 40.6‡ 2.34* NCAER 2014
Philippines 16.61‡ n/a n/a Uy 2006
South Africa n/a n/a 5.62† Viruly 2014
United Kingdom n/a n/a 3.01‡ Home Builders Federation and Nathaniel Litchfield & Partners 2015
United Kingdom n/a n/a 4–6‡ Kleinman 2014
United States n/a n/a 4.91‡ NAHB 2015
Two sources of data for the United Kingdom provide a range of estimates. n/a = not available; * = direct effect only; † = direct and indirect effects; ‡ = direct, indirect, and induced effects.
The Africa Competitiveness Report 2017 | 61

Chapter 1.3
from various studies. A study by UN-Habitat and ILO finds that the output multiplier of housing construction is between two and three times the initial investments in most developing countries.36 This is confirmed by a recent study on India noting that residential construction generates an output multiplier of 3.84 when considering both indirect and induced effects.37 Numbers reported by Uy for the Philippines are an order of magnitude higher.38 In the United States and Canada, the economic impact of residential housing construction was estimated by assessing the additional income and taxes generated by the construction of a given number housing of units. The National Association of Home Builders (NAHB) in the United States estimates that the construction of 100 single-family homes in a typical local area generates US$28.7 million in local income and US$3.6 million in local taxes.39 Similarly, the estimate for Canada is CA$33 million (about US$24 million).40 Because of its large multiplier effects, residential construction is seen as leading indicator of economic activity. In the United States, housing starts (total new private housing units started) is a key economic indicator published monthly to gauge the direction of the economy.
3. Job creation: A key factor behind the high-output multipliers observed across countries is the labor intensity of the construction sector as a whole and of residential housing in particular. In the Organisation of Economic Co-operation and Development (OECD) countries, the construction sector employed 36.4 million people in 2016. For the United States alone, the sector employed 10.3 million people as of December 2016.41 The sector is also a big employer in South Africa, with 1.4 million employees in 2016. The sector is one of the most labor intensive in developing countries. Housing construction creates direct, indirect, and induced employment.42 Estimates for full-time equivalent (FTE) direct jobs per housing unit constructed are 2.24 in Ethiopia and 2.34 for India.43 Considering direct and indirect jobs, the estimates are 1.90 FTE jobs for Canada and 5.62 jobs for South Africa.44 Including induced effects, the estimate for the United States is 4.91 FTE jobs per housing unit and 3 to 6 FTE jobs for the United Kingdom.45 There are also estimates of employment creation per million of local currency invested in housing. The estimates shown in Table 3 are all around 40 FTE jobs per million. It is 40 for Argentina (direct and indirect), 37 in Australia (overall effects), and 40.6 in India (overall effects).
These numbers show that investment in housing construction will be crucial for increasing job creation in African cities. Estimates by Faye et al. show that addressing the huge shortage of over 51 million housing units across the continent would add 288 million jobs over 10 years or 29 million per year, on average.46 Given the projected increase in population and labor force presented in Chapter 1.2, housing construction will be critical for Africa to benefit from the demographic dividend.
Housing construction and city competitivenessInvestment in residential housing construction will lead to job creation, financial sector development, and economic growth; in turn, these are expected to increase city competitiveness in Africa and facilitate the materialization
of the demographic dividend. Moreover, the extensive linkages of the construction sector imply that productivity growth in housing construction will spill over into other sectors in manufacturing and services, thus lifting overall productivity. For example, Ethiopia’s Integrated Housing Development Program has been important for job creation, manufacturing development, and economic growth in general. The program is not seen as just a tool to address housing shortages but also as part of the broader development policy.
Another important link between housing construction and city competitiveness is through government revenues. Housing and land assets, being immobile, are easier to tax to generate revenues for local and national governments. The revenues can then be used to improve urban infrastructure and address social programs, such as upgrading slums. A policy of land value capture is needed to rationalize the use of land and for budgetary reasons. However, it would need a lot of upstream effort for land demarcation, registration, titling, and valuation. Improving urban infrastructure will facilitate the movement of people in cities and reduce the high productivity costs of transport gridlock. Other inputs can also be taxed for addressing challenges in the housing sector. In Morocco, a small tax on cement is used to constitute a guarantee fund for low-income housing and to support the program of slums elimination (“Villes sans bidonvilles”). This fund has been successful in increasing mortgage access for households in the informal sector and reducing the number of slums in the country.
Special economic zones for competitive African cities Special economic zones (SEZs) are a practical way to circumvent poor business environment limiting private-sector development and competitiveness in many cities. The recommendation to improve the business environment in Africa has been made for decades, yet African businesses are still constrained with inadequate regulatory frameworks, lack of energy, poor distribution systems, and poor access to finance. The supply of adequate infrastructure and simplification of regulatory business systems in a specific urban area can enhance private-sector development and increase job creation, hence improving city competitiveness. The analysis in this chapter takes into account lessons learned from various parts of the world with the purpose of identifying factors of success and sharing lessons, focusing on city-wide SEZs. It acknowledges that SEZs need not only a coherent and flexible policy environment, but also competitive urban locations with sufficient quality infrastructure together with a capable financial system. Successful SEZs, as observed in China, support, in turn, the economic development and industrialization of the city where they operate.47 The analysis therefore explores the opportunities and challenges faced by city-wide SEZs in Africa and discusses policy recommendations to improve their implementation.
The benefits of special economic zones for city competitivenessSEZs are perceived to be a means of enhancing the competitiveness of the local economy by reducing production costs, increasing trade and investment, and creating jobs within national economies. Through reduced regulatory burden, tax incentives, and low tariffs, SEZs provide a more favorable business environment, facilitate access to new markets, and encourage the concentration of industrial growth (see Box 3). They are eventually able to attract more FDI through favorable policies and locations, thereby triggering industrial
62 | The Africa Competitiveness Report 2017

Competitive African Cities for Better Living Standards
policymaking, the use of preferential trade agreement, specialization, and insular geography.54
A few African countries have established a city-wide SEZ model (as opposed to the Mauritius nation-wide model) and are performing particularly well. They have successfully harnessed the concentration of production in the cities where they have been operating, and are seeing subsequent economic integration resulting from growing urbanization.55 For example, targeted annual investments for SEZ developments in Ethiopia and the creation of industrial parks for textiles in that country amount to US$1 billion over next decade.56 Industrial parks are supported by a strong commitment from the Ethiopian government, which has considered SEZs to be an essential part of the industrialization process of the country since 2007 and has provided, in this context, various financial and technical partnerships.57 For instance, as of 2015, the Bole Lemi Industrial Zone in Addis-Ababa was hosting 12 international textile-related companies
Box 3: Definition and main characteristics of special economic zones
Special economic zones (SEZs) are designated areas where economic regulations are different from those of the rest of the country. The term refers to free trade zones, free ports, export processing zones, free enterprises zones, industrial parks, economic cooperative zones, or specialized zones (science and technology parks, petrochemical zones, logistics zones). All SEZs share the following four characteristics: (1) construction relies on attracting and utilizing foreign capital; (2) the main forms of companies are joint ventures with foreign capital, partnerships, and wholly foreign-owned enterprises; (3) products are primarily export-oriented; and (4) government-led infrastructure development is sufficiently advanced and progress is being made toward a market-based economic system. According to the Foreign Investment Advisory Service (FIAS),1 SEZs are typically established with the goal of achieving one or more of the following objectives: (1) attract foreign direct investment, (2) serve as a “pressure valve” to alleviate large-scale unemployment, (3) support a wider economic reform strategy, and (4) act as an experimental laboratory for the application of new policies and approaches.
Note
1 FAIS 2008.
Source: Authors, based on FIAS 2008 and Woolfrey 2013.
Box 4: Successful Chinese special economic zones: Favorable policies and adequate location in cities
The standard model of special economic zones (SEZs) developed in China are government-run export enclaves offering low taxation and appropriate logistical and infrastructure incentives to enterprises, most of them focusing on light manufacturing and shipping. The central government decided to establish the first four SEZs to act as experimental laboratories for reducing poverty and promoting growth. The initial success with SEZs in Shenzhen (in southeast China) was replicated in other parts of the country and has played a key role in China’s overall economic development. Chinese SEZs eventually expanded across an entire city or province. Among the key success factors of Shenzhen are its favorable public policies and the location of the city (near the sea and close to Hong Kong SAR, an international center for finance, trade, transportation, and travel), making it the most open and export-oriented city in China. Location is key, which reinforces the importance of urban planning.
In the early 1980s, China’s SEZs accounted for around 60 percent of the country’s foreign direct investment (FDI) and 5 percent of its gross domestic product (GDP). They also increased the share of the industrial sector in GDP as well as the standards of living of the Chinese population.1 In terms of foreign investment, SEZs improved and extended the scale, quality, and channels of attracting investments through favorable policies and locations. For example, FDI in Shenzhen increased from US$5.5 million in 1979 to US$5.3 billion in 2012,2 and its total exports and imports reached US$537.4 billion in 2013, an increase of 15.1 percent over the previous year.3 According to World Bank, the city of Shenzhen has experienced the fastest growth of all Chinese cities and attracted a large young labor force specializing in electronic goods into the city.4
Notes
1 Zeng 2015.
2 China Statistics Press 2013.
3 UNDP and IPRCC 2015.
4 World Bank 2009.
Source: Authors, based on Tao et al. 2016.
spillover as well as promoting technology transfer and contributing to human upgrading at the local level through the development of backward and forward linkages.48 Furthermore, they create waged employment and promote exports together with enhanced foreign exchange earnings, and economic diversification.49 Currently, around 3,000 SEZs operate in more than 130 countries, mainly in the developing world. They have created 70 million jobs and raised US$500 billion annually in direct trade-related value addition.50
In China, SEZs have been associated with rapid economic growth in the 1990s and 2000s, exports revenues, technological and skills spillovers, employment creation, and economic linkages at the local level (Box 4). As such, SEZs stand as a clear way to reap demographic dividends in competitive cities. This success story has set the stage for a basic SEZ policy model guiding subsequent SEZ implementation across the developing world.51
African countries started implementing SEZs in the 1970s but the process accelerated in the 1990s–2000s, following the Mauritian success (see Table 4 on page 64). Many of the African SEZs focus on textile, apparel, and agro-processing industries. As of 2008, the Foreign Investment Advisory Service (FIAS) identified 114 SEZs in sub-Saharan Africa and 53 in Egypt.52 In Mauritius, SEZs’ development contributed to the country’s structural transformation, the diversification of quantity and quality of exports increased, and job creation in terms of both quantity and diversity of items exported.53 According to Baissac, the success of Mauritian SEZs is partly the result of appropriate government
The Africa Competitiveness Report 2017 | 63

Chapter 1.3
and has created around 3,000 jobs.58 In terms of employment creation, the Thema Export Processing Zone in Ghana and the Tangier Free Zone in Morocco are other successful examples. Thema’s SEZ, which houses over 200 companies, including Nestle and L’Oréal, had created about 30,000 jobs by the end of 2012, of which only 1,000 were held by expatriates. Nearly 522 companies were established in Tangier, representing US$830 million in investments, and more than 50,000 direct jobs by end of 2010.59
African SEZs have, nonetheless, generally underperformed their counterparts in other developing countries (Table 5). They generated lower amounts of investment, exports, and employment as well as less economic diversification, technological upgrading, and structural transformation.60 Reasons for the underperformance of African SEZs include many political factors such as poor governance, lack of adequate institutional framework and coordination, weak political commitment and implementation capacity, and policy unpredictability, as well as a lack of proper monitoring and evaluation mechanisms. The following section discusses three important factors needed to enhance the performance of
Table 4: Overview of SEZs in Africa by decade of launch
Sector
Decade Country Agro-processing Textile Apparel Service Mining, Oil & Gas Others
1970s
Liberia l l l
Mauritius l l
Senegal l l l
Egypt l l
1980s
Djibouti l l l
Togo l l l
1990s
Algeria l l
Cameroon l l
Ghana l l l l
Kenya l l
Madagascar l l
Malawi l l l
Morocco l l l
Mozambique l
Namibia l l l
Nigeria l l l
Seychelles l l l
Tunisia l l l
Zimbabwe l l l l
Burundi, Cape Verde, Equatorial Guinea, Rwanda, Sudan and Uganda
2000s Botswana, Democratic Republic of Congo, Eritrea, Ethiopia, Gabon, the Gambia, Mali, Mauritania, South Africa, Tanzania, and Zambia
Source: Tao et al. 2016.
Table 5: SEZ employment creation and exports worldwide, by region
Region
Employment (millions of workers)
Exports (US$ millions)
Sub-Saharan Africa 1.0 8,605
Asia and the Pacific 61.1 510,666
Americas 3.1 72,636
Central and East Europe and Central Asia 1.6 89,666
Middle East and North Africa 1.5 169,459
Source: FIAS 2008.
64 | The Africa Competitiveness Report 2017
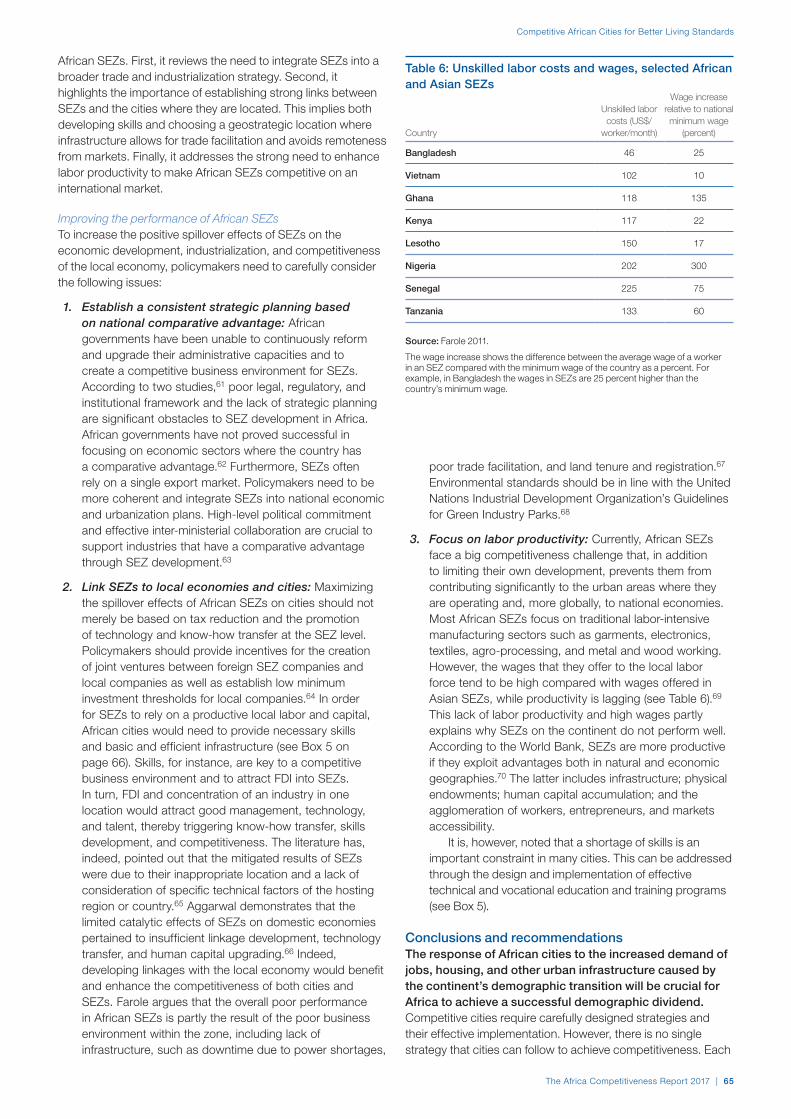
Competitive African Cities for Better Living Standards
African SEZs. First, it reviews the need to integrate SEZs into a broader trade and industrialization strategy. Second, it highlights the importance of establishing strong links between SEZs and the cities where they are located. This implies both developing skills and choosing a geostrategic location where infrastructure allows for trade facilitation and avoids remoteness from markets. Finally, it addresses the strong need to enhance labor productivity to make African SEZs competitive on an international market.
Improving the performance of African SEZsTo increase the positive spillover effects of SEZs on the economic development, industrialization, and competitiveness of the local economy, policymakers need to carefully consider the following issues:
1. Establish a consistent strategic planning based on national comparative advantage: African governments have been unable to continuously reform and upgrade their administrative capacities and to create a competitive business environment for SEZs. According to two studies,61 poor legal, regulatory, and institutional framework and the lack of strategic planning are significant obstacles to SEZ development in Africa. African governments have not proved successful in focusing on economic sectors where the country has a comparative advantage.62 Furthermore, SEZs often rely on a single export market. Policymakers need to be more coherent and integrate SEZs into national economic and urbanization plans. High-level political commitment and effective inter-ministerial collaboration are crucial to support industries that have a comparative advantage through SEZ development.63
2. Link SEZs to local economies and cities: Maximizing the spillover effects of African SEZs on cities should not merely be based on tax reduction and the promotion of technology and know-how transfer at the SEZ level. Policymakers should provide incentives for the creation of joint ventures between foreign SEZ companies and local companies as well as establish low minimum investment thresholds for local companies.64 In order for SEZs to rely on a productive local labor and capital, African cities would need to provide necessary skills and basic and efficient infrastructure (see Box 5 on page 66). Skills, for instance, are key to a competitive business environment and to attract FDI into SEZs. In turn, FDI and concentration of an industry in one location would attract good management, technology, and talent, thereby triggering know-how transfer, skills development, and competitiveness. The literature has, indeed, pointed out that the mitigated results of SEZs were due to their inappropriate location and a lack of consideration of specific technical factors of the hosting region or country.65 Aggarwal demonstrates that the limited catalytic effects of SEZs on domestic economies pertained to insufficient linkage development, technology transfer, and human capital upgrading.66 Indeed, developing linkages with the local economy would benefit and enhance the competitiveness of both cities and SEZs. Farole argues that the overall poor performance in African SEZs is partly the result of the poor business environment within the zone, including lack of infrastructure, such as downtime due to power shortages,
poor trade facilitation, and land tenure and registration.67 Environmental standards should be in line with the United Nations Industrial Development Organization’s Guidelines for Green Industry Parks.68
3. Focus on labor productivity: Currently, African SEZs face a big competitiveness challenge that, in addition to limiting their own development, prevents them from contributing significantly to the urban areas where they are operating and, more globally, to national economies. Most African SEZs focus on traditional labor-intensive manufacturing sectors such as garments, electronics, textiles, agro-processing, and metal and wood working. However, the wages that they offer to the local labor force tend to be high compared with wages offered in Asian SEZs, while productivity is lagging (see Table 6).69 This lack of labor productivity and high wages partly explains why SEZs on the continent do not perform well. According to the World Bank, SEZs are more productive if they exploit advantages both in natural and economic geographies.70 The latter includes infrastructure; physical endowments; human capital accumulation; and the agglomeration of workers, entrepreneurs, and markets accessibility.
It is, however, noted that a shortage of skills is an important constraint in many cities. This can be addressed through the design and implementation of effective technical and vocational education and training programs (see Box 5).
Conclusions and recommendationsThe response of African cities to the increased demand of jobs, housing, and other urban infrastructure caused by the continent’s demographic transition will be crucial for Africa to achieve a successful demographic dividend. Competitive cities require carefully designed strategies and their effective implementation. However, there is no single strategy that cities can follow to achieve competitiveness. Each
Table 6: Unskilled labor costs and wages, selected African and Asian SEZs
Country
Unskilled labor costs (US$/
worker/month)
Wage increase relative to national minimum wage
(percent)
Bangladesh 46 25
Vietnam 102 10
Ghana 118 135
Kenya 117 22
Lesotho 150 17
Nigeria 202 300
Senegal 225 75
Tanzania 133 60
Source: Farole 2011.
The wage increase shows the difference between the average wage of a worker in an SEZ compared with the minimum wage of the country as a percent. For example, in Bangladesh the wages in SEZs are 25 percent higher than the country’s minimum wage.
The Africa Competitiveness Report 2017 | 65
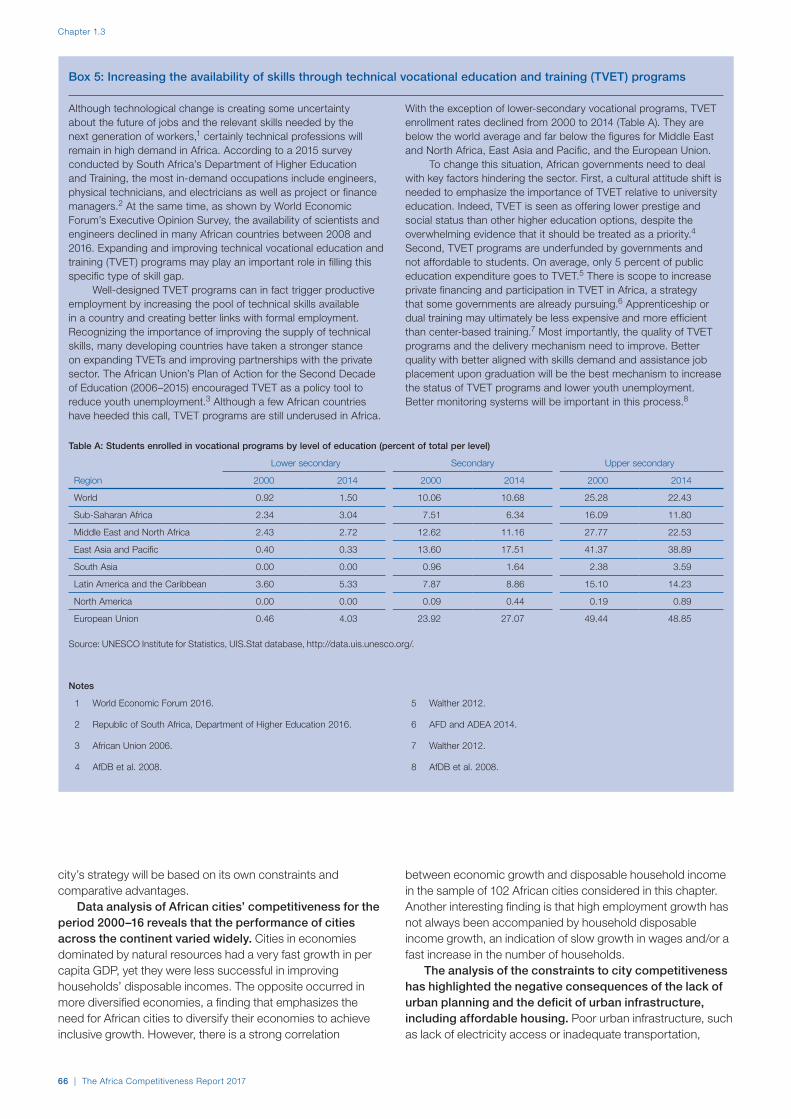
Chapter 1.3
Box 5: Increasing the availability of skills through technical vocational education and training (TVET) programs
Although technological change is creating some uncertainty about the future of jobs and the relevant skills needed by the next generation of workers,1 certainly technical professions will remain in high demand in Africa. According to a 2015 survey conducted by South Africa’s Department of Higher Education and Training, the most in-demand occupations include engineers, physical technicians, and electricians as well as project or finance managers.2 At the same time, as shown by World Economic Forum’s Executive Opinion Survey, the availability of scientists and engineers declined in many African countries between 2008 and 2016. Expanding and improving technical vocational education and training (TVET) programs may play an important role in filling this specific type of skill gap.
Well-designed TVET programs can in fact trigger productive employment by increasing the pool of technical skills available in a country and creating better links with formal employment. Recognizing the importance of improving the supply of technical skills, many developing countries have taken a stronger stance on expanding TVETs and improving partnerships with the private sector. The African Union’s Plan of Action for the Second Decade of Education (2006–2015) encouraged TVET as a policy tool to reduce youth unemployment.3 Although a few African countries have heeded this call, TVET programs are still underused in Africa.
With the exception of lower-secondary vocational programs, TVET enrollment rates declined from 2000 to 2014 (Table A). They are below the world average and far below the figures for Middle East and North Africa, East Asia and Pacific, and the European Union.
To change this situation, African governments need to deal with key factors hindering the sector. First, a cultural attitude shift is needed to emphasize the importance of TVET relative to university education. Indeed, TVET is seen as offering lower prestige and social status than other higher education options, despite the overwhelming evidence that it should be treated as a priority.4 Second, TVET programs are underfunded by governments and not affordable to students. On average, only 5 percent of public education expenditure goes to TVET.5 There is scope to increase private financing and participation in TVET in Africa, a strategy that some governments are already pursuing.6 Apprenticeship or dual training may ultimately be less expensive and more efficient than center-based training.7 Most importantly, the quality of TVET programs and the delivery mechanism need to improve. Better quality with better aligned with skills demand and assistance job placement upon graduation will be the best mechanism to increase the status of TVET programs and lower youth unemployment. Better monitoring systems will be important in this process.8
Table A: Students enrolled in vocational programs by level of education (percent of total per level)
Lower secondary Secondary Upper secondary
Region 2000 2014 2000 2014 2000 2014
World 0.92 1.50 10.06 10.68 25.28 22.43
Sub-Saharan Africa 2.34 3.04 7.51 6.34 16.09 11.80
Middle East and North Africa 2.43 2.72 12.62 11.16 27.77 22.53
East Asia and Pacific 0.40 0.33 13.60 17.51 41.37 38.89
South Asia 0.00 0.00 0.96 1.64 2.38 3.59
Latin America and the Caribbean 3.60 5.33 7.87 8.86 15.10 14.23
North America 0.00 0.00 0.09 0.44 0.19 0.89
European Union 0.46 4.03 23.92 27.07 49.44 48.85
Source: UNESCO Institute for Statistics, UIS.Stat database, http://data.uis.unesco.org/.
Notes
1 World Economic Forum 2016.
2 Republic of South Africa, Department of Higher Education 2016.
3 African Union 2006.
4 AfDB et al. 2008.
5 Walther 2012.
6 AFD and ADEA 2014.
7 Walther 2012.
8 AfDB et al. 2008.
city’s strategy will be based on its own constraints and comparative advantages.
Data analysis of African cities’ competitiveness for the period 2000–16 reveals that the performance of cities across the continent varied widely. Cities in economies dominated by natural resources had a very fast growth in per capita GDP, yet they were less successful in improving households’ disposable incomes. The opposite occurred in more diversified economies, a finding that emphasizes the need for African cities to diversify their economies to achieve inclusive growth. However, there is a strong correlation
between economic growth and disposable household income in the sample of 102 African cities considered in this chapter. Another interesting finding is that high employment growth has not always been accompanied by household disposable income growth, an indication of slow growth in wages and/or a fast increase in the number of households.
The analysis of the constraints to city competitiveness has highlighted the negative consequences of the lack of urban planning and the deficit of urban infrastructure, including affordable housing. Poor urban infrastructure, such as lack of electricity access or inadequate transportation,
66 | The Africa Competitiveness Report 2017
Competitive African Cities for Better Living Standards
reduces business formation and productivity. Combined with poor urban planning and rapid urban population growth, a number of cities have witnessed an explosion of slums and large housing backlogs. This housing shortage not only lowers household welfare but also increases matching costs between employers and employees and hinders labor productivity. Another factor contributing to the lack of competitiveness is the poor business environment that is a result of heavy regulation, widespread corruption, and low access to finance. Moreover, the issue of youth unemployment is becoming acute in a number of cities. Included in these constraints, among the perennial major factors contributing to the lack of competitiveness of African economies are insufficient infrastructure development, insufficient human capital, and weak governance. Addressing these obstacles will certainly improve the competitiveness of countries in general and of cities in particular. In addition, African cities must create jobs and provide decent affordable housing for their growing urban population in order to achieve a demographic dividend.
Up-to-date and adequate urban planning is necessary not only to address the large shortage of affordable housing in cities but also to increase the density of transport networks at lower costs, thereby increasing the connectivity between workers and firms, and between producers and consumers. This will ultimately help firms benefit from economies of scale and agglomeration. The analysis also indicates that residential housing investment is important for city competitiveness: it not only provides shelter for the growing urban population but also creates a large number of jobs. It is a very labor intensive sector with extensive backward linkages, including linkages with the financial sector.
Job creation requires policies that address both the supply and demand sides of labor markets, and must include special emphasis on the housing sector and the development of city-wide SEZs. Policies should increase the supply of a skilled workforce and reduce the skills mismatch. On the demand side, policies favoring the development of the private sector are required. This chapter focuses on policies to circumvent the constraints of the poor business environment and places special emphasis on labor-intensive sectors, particularly housing. Another recommendation would be to improve the business environment and build better infrastructure in specific urban areas to create successful SEZs as a catalyst for competitive private-sector development. The chapter has provided a thorough analysis of the reasons for the success and failure of SEZs around the world and in Africa in particular, with a spotlight on city-wide SEZs. It has shown that the success of the SEZs and their positive spillover effects on the local economy depends on careful planning and understanding of comparative advantage as well as linkages between the particular SEZ and the rest of economy. In other words, policymakers should avoid geographic and economic isolation and should pay special attention to labor markets, including skills and capital costs in urban areas where SEZs are located.
Notes 1 UN Population Division, World Population Prospects, 2015 revision.
2 UN-Habitat and UNECA 2015.
3 AfDB et al. 2016.
4 Collier 2016.
5 World Bank 2015.
6 World Economic Forum 2014.
7 World Economic Forum 2014.
8 Choe and Roberts 2011.
9 Glaeser 2007.
10 The database is available for 102 cities from 49 African countries (see the list in the Appendix) and includes demographic, economic, and labor market variables as well as detailed household income distribution. The database compiles data from different sources but also uses macroeconomic models to make forecasts for up to 2030. For further information, please consult http://www.oxfordeconomics.com/forecasts-and-models/cities/middle-east-and-african-cities-and-regions/overview.
11 GDP = wages + interest + rent + profits – net factor income from abroad + capital consumption allowance + indirect business taxes. Household income includes wages, interest income going to households, and rent earned by households. A big difference between household income and GDP is the amount of profits earned by firms.
12 Faye et al. forthcoming (2017); World Bank WDI online database.
13 Lall et al. 2017.
14 AfDB et al. 2016.
15 Faye et al. forthcoming (2017).
16 AfDB 2016.
17 Faye et al. forthcoming (2017).
18 Faye et al. forthcoming (2017).
19 Glaeser and Ward 2006; Katz and Rosen 1987.
20 Glaeser 2007.
21 Faye et al. forthcoming (2017).
22 AfDB et al. 2016; AfDB 2016.
23 AfDB et al. 2016.
24 World Bank 2009.
25 UN-Habitat 2013.
26 Atlas of Urban Expansion.
27 Lall et al. 2016.
28 Collier 2016.
29 Arku and Harris 2005; Burns and Grebler 1977; Chen and Zhu, 2008; Dolin et al. 2013; Leung 2004; Lopes et al. 2002; Polenske and Sivinitades 1990; Terzi and Bolen, 2007; Turin 1973; Wells 1985.
30 Chen and Zhu 2008.
31 Arku and Harris 2005.
32 Dubel 2007.
33 Cerutti et al. 2015.
34 Polenske and Sivinitades 1990.
35 Coban et al. 2015.
36 UN-Habitat and ILO 1995.
37 NCAER 2014.
38 Uy 2006.
39 Home Builders Federation and Nathaniel Litchfield & Partners 2015.
40 Altus 2009.
41 OECD statistics, Employment by activity. Available at https://data.oecd.org/emp/employment-by-activity.htm.
42 Induced employment is the consequence of construction. For example, to construct a house, a carpenter (direct job) is needed; furniture is also bought, providing (indirect) employment. The people who have these jobs have salaries they spend on consumer goods, services, transport, and so on. This spending generates demand for goods and service. To satisfy this demand you need employees—hence the induced employment.
The Africa Competitiveness Report 2017 | 67
Chapter 1.3
43 Faye et al., forthcoming (2017); NCAER 2014.
44 Altus Group Economic Consulting 2009; Viruly 2014.
45 Estimates for constructing single-family homes are much higher than those for multifamily rental apartments. See Home Builders Federation and Nathaniel Litchfield & Partners 2015; Kleinman 2014; NAHB 2015.
46 Faye et al. forthcoming (2017).
47 Farole 2011.
48 O’ Flaherty 2008.
49 Cheesman 2012.
50 Cheesman 2012.
51 Brautigam and Xiaoyang 2011; Gupta et al. 2010.
52 FIAS 2008.
53 Aggarwal 2004.
54 Baissac 2011; Sawkut et al. 2009.
55 World Bank 2009.
56 Davidson 2015.
57 UNDP and IPRCC 2015.
58 UNDP and IPRCC 2015.
59 Woolfrey 2013.
60 FIAS 2008; Woolfrey 2013; Zeng 2012.
61 Auty 2011; Zeng 2012.
62 Farole 2011.
63 Farole 2011.
64 Farole 2011.
65 Brautigam and Xiaoyang 2011.
66 Aggarwal 2004.
67 Farole 2011.
68 https://www.unido.org/fileadmin/user_media/Services/Green_Industry/web_policies_green_industry.pdf.
69 Farole 2011.
70 World Bank 2009.
ReferencesABS (Australian Bureau of Statistics). 2007. “The Construction Industry’s
Linkages with the Economy.” Belconnen, Australian Capital Territory. Available at http://www.abs.gov.au/Ausstats/[email protected]/94713ad445ff1425ca25682000192af2/ed6220072793785eca256b360003228f!OpenDocument.
AfDB (African Development Bank). 2016. “The New Deal on Energy in Africa: A transformative partnership to light up and power Africa by 2025.” Abidjan, Côte d’Ivoire: AfDB. Available at https://www.afdb.org/fileadmin/uploads/afdb/Documents/Generic-Documents/Brochure_New_Deal_2_red.pdf.
AfDB, OECD, UNDP, and UNECA (African Development Bank, Organisation for Economic Co-operation and Development, United Nations Development Programme, and United Nations Economic Commission for Africa). 2008. African Economic Outlook: Developing Technical and Vocational Skills in Africa. Paris: OECD Publishing.
———. 2016. African Economic Outlook: Sustainable Cities and Structural Transformation. Paris: OECD Publishing.
AFD and ADEA (Agence Française de Développement and Association for the Development of Education in Africa). 2014. The Financing of Vocational Training in Africa: Roles and Specificities of Vocational Training Funds.
African Union. 2006. Second Decade of Education for Africa (2006–2015): Draft Plan of Action. Addis Ababa: African Union. Available at http://www.adea-comed.org/IMG/pdf/SECOND_DECADE_OF_EDUCATION_FOR.pdf.
Aggarwal, A. 2004. “Export Processing Zones in India: Analysis of the Export Performance.” Indian Council for Research on International Economic Relations (ICRIER) Working Paper No. 148. New Delhi: ICRIER.
Arku, G. and R. Harris. 2005. “Housing as a Tool of Economic Development since 1929.” International Journal of Urban and Regional Research 29 (4): 895–915.
Altus Group Economic Consulting. 2009. “Economic Impacts of Residential Construction.” Report for the Canada Mortgage and Housing Corporation, Ottawa. Available at http://www2.hamilton.ca/NR/rdonlyres/1F84E3C3-009A-46AF-B95E-7F6D3F05D697/0/Jun17Item88iieconomicimpact.pdf.
Atlas of Urban Expansion. Available at http://www.atlasofurbanexpansion.org/.
Auty, R. 2011. “Early Reform Zones: Catalysts for Dynamic Market Economies in Africa.” In Special Economic Zones: Progress, Emerging Challenges, and Future Directions, T. Farole, and G. Akinci, eds. Washington, DC: World Bank. 207–24.
Baissac, C. 2011. “Brief History of SEZs and Overview of Policy Debates.” In Special Economic Zones in Africa: Comparing Performance and Learning from Global Experience, T. Farole, ed. Washington, DC: World Bank. 23–57.
Brautigam, D. and T. Xiaoyang. 2011. “African Shenzhen: China’s Special Economic Zones in Africa.” Modern African Studies 49 (1): 27–54.
Burns, L. S. and L. Grebler. 1977. The Housing of Nations. London: Palgrave Macmillan.
Cerutti E., J. Dagher, and G. Dell’Ariccia. 2015. “Housing Finance and Real-Estate Booms: A Cross-Country Perspective.” IMF Staff Discussion Note 15/12. Washington, DC: International Monetary Fund. Available at https://www.imf.org/external/pubs/ft/sdn/2015/sdn1512.pdf.
Cheesman, A. 2012. Special Economic Zones & Development: Geography and Linkages in the Indian EOU Scheme. Development Planning Unit, The Bartlett, University College London, Working Paper No. 145, July.
Chen, J. and A. Zhu. 2008. “The Relationship Between Housing Investment and Economic Growth in China: A Panel Analysis Using Quarterly Provincial Data.” Uppsala University Working Paper, Sweden. Available at http://www.diva-portal.org/smash/get/diva2:128349/FULLTEXT01.pdf.
China Statistics Press. 2013. Shenzhen Statistical Yearbook 2013. Shenzhen: Chinese Statistics Press.
Choe, K. A. and B. H. Roberts. 2011. Competitive Cities in the 21st Century: Cluster-Based Local Economic Development. Manila: Asian Development Bank.
Çoban, O., E. Üstündaĝ, and A. Çoban. 2015. “The Structural Analysis of Construction Sector of Turkey and Its Effects on the Selected Macroeconomic Indicators.” Copernican Journal of Finance and Accounting 4 (1): 27–44.
Collier, P. 2016. “African Urbanisation: An Analytical Policy Guide”. Policy paper, International Growth Centre, London.
Davidson, W. 2015. “Ethiopia Plans Export Hubs with $10 Billion Factory Parks.” Bloomberg, May 18, Update May 19. Available at https://www.bloomberg.com/news/articles/2015-05-18/ethiopia-plans-manufacturing-hub-with-10-billion-factory-parks.
Dubel, H. 2007. “Does Housing Finance Promote Economic and Social Development in Emerging Markets?” Study commissioned by the International Finance Corporation, Washington, DC. Available at http://www.hofinet.org/documents/doc.aspx?id=260.
Farole, T. 2011. Special Economic Zones in Africa: Comparing Performance and Learning from Global Experiences. Washington, DC: World Bank.
Faye, I., E. Bah, and Z. Geh. Forthcoming (2017). Housing Market Dynamics in Africa. Basingstoke: Palgrave Macmillan.
FIAS (Foreign Investment Advisory Service). 2008. Special Economic Zones: Performance, Lessons Learned and Implication for Zone Development. Washington, DC: The World Bank. Available at http://documents.worldbank.org/curated/en/343901468330977533/pdf/458690WP0Box331s0April200801PUBLIC1.pdf.
Freire, M., M. Gautier, and O. Hassler. 2006. “Review of Argentina’s Housing Sector: Options for Affordable Housing Policy.” World Bank Working Paper. Washington, DC: World Bank.
Gachanja, J. 2015. “Mitigating Road Traffic Congestion in the Nairobi Metropolitan Region.” The Kenya Institute for Public Policy Research and Analysis (KIPPRA) Policy Brief No. 2/2015, Kenya. Available at http://kippra.or.ke/downloads/Mitigating%20transport%20congestion%20in%20Nairobi.pdf.
68 | The Africa Competitiveness Report 2017
Competitive African Cities for Better Living Standards
Glaeser, E. L. 2007. “The Economic Approach to Cities.” NBER Working Paper No. 13696. National Bureau of Economic Research.
Glaeser, E. L. and B. Ward. 2006 “The Causes and Consequences of Land Use Regulation: Evidence from Greater Boston.” NBER Working Paper No. 12601. National Bureau of Economic Research.
Gupta, S., A. C. Gupta, and R. Goyal. 2010. “SEZs in India: Export Performance and Future Prospects.” In Special Economic Zones in India: (China’s Way of Development), P. Arunachalam, ed. New Delhi: Serials Publications.
Habitat for Humanity in Kenya. 2014. http://www.habitat.org/where-we-build/kenya.
Home Builders Federation and Nathaniel Litchfield & Partners. 2015. “The Economic Footprint of UK House Building.” London: Home Builders Federation and Nathaniel Litchfield & Partners. Available at http://www.hbf.co.uk/?eID=dam_frontend_push&docID=24568&filename=Economic_Fotprint_BPF_Report_March_2015_WEB_01.pdf.
Honan, E. 2016. “Nairobi Looks to Africa’s First Bike-Share Scheme to Tackle Congestion.” Financial Times, August 5. Available at https://www.ft.com/content/6133a0f0-5a5b-11e6-8d05-4eaa66292c32.
IEA (International Energy Agency). 2013. World Energy Outlook 2013. Paris: OECD/IEA.
Katz, L. and K. T. Rosen. 1987. “The Interjurisdictional Effects of Growth Controls on Housing Prices.” Journal of Law and Economics 30 (1): 149–60.
Kleinman, M. 2014. “Measuring Jobs from the Housing Programme.” Appendix 3 of Progress Report. London City Government. Available at https://www.london.gov.uk/moderngov/documents/s38594/Measuring%20Jobs_Appendix%203.pdf.
Lall, S. V., J. V. Henderson, and A. J. Venables. 2016. Africa’s Cities: Opening Doors to the World. Washington, DC: World Bank.
Leung, C. 2004. “Macroeconomics and Housing: A Review of the Literature.” Journal of Housing Economics 13: 249–67.
Lopes, J., L. Ruddock, and F. L. Ribeiro. 2002. “Investment in Construction and Economic Growth in Developing Countries.” Building Research and Information 3: 152–9.
McGregor, S. and D. M. Doya. 2014. “Traffic Costs Nairobi $570,000 a Day as No.2 Africa Hub Clogs.” Bloomberg, April 12. Available at https://www.bloomberg.com/news/articles/2014-03-25/nairobi-traffic-loses-570-000-a-day-as-no-2-africa-hub.
NAHB (National Association of Home Builders). 2015. “The Economic Impact of Home Building in a Typical State: Income, Jobs, and Taxes Generated.” Washington, DC: NAHB. Available at https://www.nahb.org/~/media/Sites/NAHB/Economic%20studies/1-REPORT_local_20150318115955.ashx?la=en.
NCAER (National Council of Applied Economic Research). 2014. “Impact of Investments in the Housing Sector on GDP and Employment in the Indian Economy.” New Delhi, India: NCAER. Available at http://mhupa.gov.in/writereaddata/UploadFile/Impact_of_Housing_on_GDP_Employment_FULL_REPORT.pdf.
O’Flaherty, D. D. 2008. “Understanding Dynamic Linkages and Technology Spillover from Korea’s Masan Free Export Zone.” Master’s Thesis, Department of Globalization and International Development, University of Ottawa.
Otuki, N. 2017. “German Firm Wins SH1.4bn Deal for Nairobi Traffic Lights.” Business Daily, January 15. Available at http://www.businessdailyafrica.com/Corporate-News/German-firm-wins-Sh1-4bn-deal-for-Nairobi-traffic-lights/539550-3518356-item-0-871dviz/index.html.
Oxford Economics. African and Middle Eastern Cities Forecasts. Available at http://www.oxfordeconomics.com/forecasts-and-models/cities/middle-east-and-african-cities-and-regions/overview.
Polenske, K. R. and P. Sivitanides. 1990. “Linkages in the Construction Sector.” The Annals of Regional Science 24 (2): 147–61.
Republic of South Africa, Department of Higher Education. 2016. “List of Occupations in High Demand: 2015.” Department of Higher Education and Training.” Government Notices, Government Gazette, January 19. Available at http://www.gpwonline.co.za/Pages/default.aspx.
Sawkut, R., S. Vinesh, and F. Sooraj. 2009. “The Net Contribution of the Mauritian Export Processing Zone Using Cost-Benefit Analysis.” Journal of Development Economics 21 (3): 379–92.
Tao, Y., Y. Yuan, and M. Li. 2016. “Chinese Special Economic Zones: Lessons for Africa.” Africa Economic Brief 7 (6). Côte d’Ivoire: AfDB.
Terzi, F. and F. Bolen. 2007. “The Impacts of Housing on Economic Development.” Paper presented at the 14th Annual European Real Estate Society Conference, London, June 27–30.
Turin, D A. 1973. The Construction Industry: Its Economic Significance and its Role in Development. London: UCERG.
UNDP and IPRCC (United Nations Development Programme and International Poverty Reduction Center in China). 2015. If Africa Builds Nests, Will the Birds Come? Comparative Study on Special Economic Zones in Africa and China. Working Paper Series No. 06.2015. Beijing: IPRCC and UNDP China. Available at http://www.cn.undp.org/content/china/en/home/library/south-south-cooperation/if-africa-builds-nests--will-the-birds-come-.html/
UNECA (United Nations Economic Commission for Africa). 2017. Economic Report on Africa 2017: Urbanization and Industrialization for Africa’s Transformation. Addis Ababa: UNECA.
UNESCO Institute for Statistics. UIS.Stat database. Available at http://data.uis.unesco.org/.
UN-Habitat. 2013. Streets as Public Spaces and Drivers of Urban Prosperity. Nairobi: UN-Habitat.
UN-Habitat and ILO (International Labor Organization). 1995. Shelter Provision and Employment Generation. Nairobi and Geneva: United Nations Human Settlements Programme and International Labor Organization.
UN-Habitat and UNECA (United Nations Economic Commission for Africa). 2015. Towards an African Urban Agenda. Nairobi: UN-Habitat.
UN Population Division, World Population Prospects, 2015 revision. Available at http://www.un.org/en/development/desa/publications/world-population-prospects-2015-revision.html.
Uy, W. J. 2006. “Medium-Rise Housing: The Philippines Experience.” Paper presented at the 5th Asian Forum, January 18–20, 2006, Tokyo, Japan.
Vidal, J. 2016. ‘There’s No Escape’: Nairobi’s Air Pollution Sparks Africa Health Warning.” The Guardian, July 10. Available at https://www.theguardian.com/cities/2016/jul/10/no-escape-nairobi-air-pollution-sparks-africa-health-warning.
Viruly, F. 2014. “What Are the Derived Social Benefits of Occupying Affordable Housing in South Africa? A Social Audit Conducted on Residential Units Built by International Housing Solutions.” Study commissioned by International Housing Solutions, Gauteng, South Africa. Available at http://www.ihsinvestments.co.za/wp-content/uploads/2015/07/2012_IHS-Final-Report-1.pdf.
Walther, R. 2012. “The Financing and Costs of Technical and Vocational Skills Development (TVSD): The Case of Africa.” Presentation at the Third International Congress on TVET, Shanghai, May 13–16, 2012. Available at http://www.unesco.org/education/TVET2012/parallel-sessions-day1/3/R-Walther.pdf.
Wells, J. 1985. “The Role of Construction in Economic Growth and Development.” Habitat International 9 (1): 55–70.
Woolfrey, S. 2013. “Special Economic Zones and Regional Integration in Africa.” tralac Working Paper No. S13WP10/2013. Stellenbosch: tralac.
World Bank. World Development Indicators (online). Washington, DC: World Bank.
———. 2009. World Development Report 2009: Reshaping Economic Geography. Washington, DC: World Bank.
———. 2015. Competitive Cities for Jobs and Growth: What, Who, and How. Washington, DC: World Bank.
World Economic Forum. 2014. “The Competitiveness of Cities.” Report of the Global Agenda Council on Competitiveness. Cologny/Geneva: World Economic Forum.
———. 2016. The Future of Jobs: Employment, Skills and Workforce Strategy for the Fourth Industrial Revolution. Geneva: World Economic Forum.
Zeng, D. Z. 2012. “SEZs in Africa: Putting the Cart in Front of the Horse?” Let’s Talk Development, Blog. Washington DC: World Bank.
———. 2015. Global Experiences with Special Economic Zones – With a Focus on China and Africa. Trace and Competitiveness Global Practice, Washington, DC: World Bank.
The Africa Competitiveness Report 2017 | 69

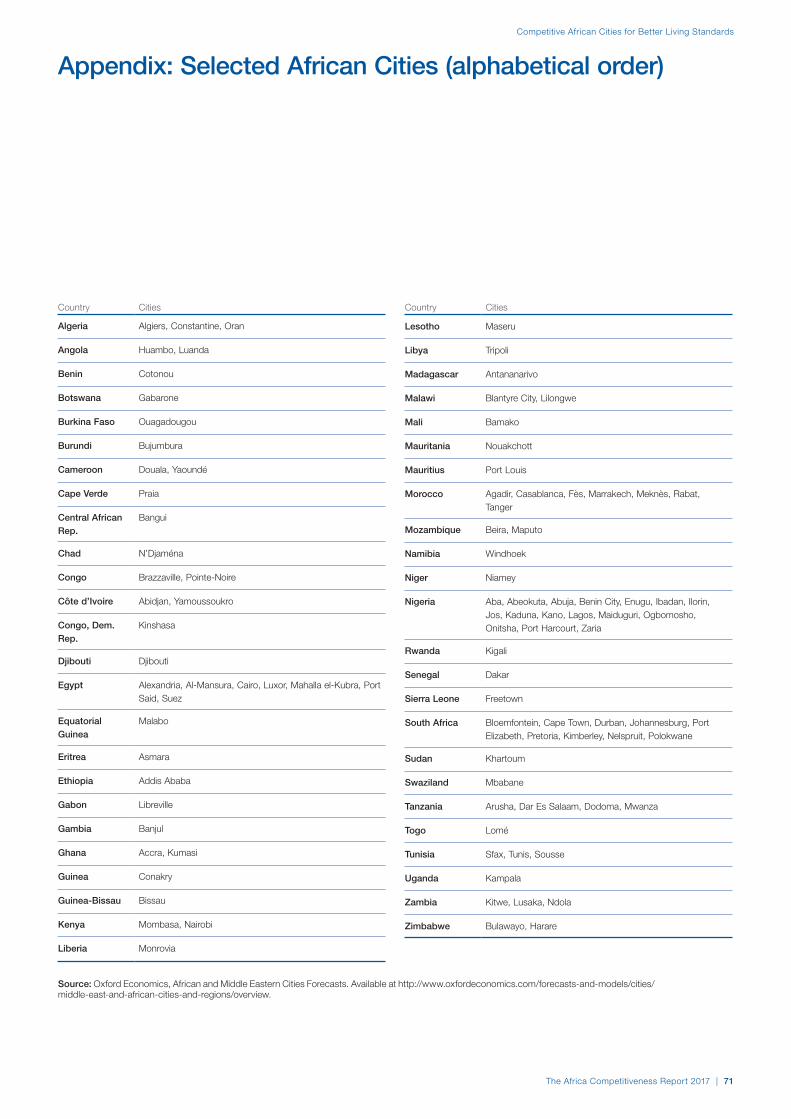
Competitive African Cities for Better Living Standards
Appendix: Selected African Cities (alphabetical order)
Country Cities
Algeria Algiers, Constantine, Oran
Angola Huambo, Luanda
Benin Cotonou
Botswana Gabarone
Burkina Faso Ouagadougou
Burundi Bujumbura
Cameroon Douala, Yaoundé
Cape Verde Praia
Central African Rep.
Bangui
Chad N’Djaména
Congo Brazzaville, Pointe-Noire
Côte d’Ivoire Abidjan, Yamoussoukro
Congo, Dem. Rep.
Kinshasa
Djibouti Djibouti
Egypt Alexandria, Al-Mansura, Cairo, Luxor, Mahalla el-Kubra, Port Said, Suez
Equatorial Guinea
Malabo
Eritrea Asmara
Ethiopia Addis Ababa
Gabon Libreville
Gambia Banjul
Ghana Accra, Kumasi
Guinea Conakry
Guinea-Bissau Bissau
Kenya Mombasa, Nairobi
Liberia Monrovia
Country Cities
Lesotho Maseru
Libya Tripoli
Madagascar Antananarivo
Malawi Blantyre City, Lilongwe
Mali Bamako
Mauritania Nouakchott
Mauritius Port Louis
Morocco Agadir, Casablanca, Fès, Marrakech, Meknès, Rabat, Tanger
Mozambique Beira, Maputo
Namibia Windhoek
Niger Niamey
Nigeria Aba, Abeokuta, Abuja, Benin City, Enugu, Ibadan, Ilorin, Jos, Kaduna, Kano, Lagos, Maiduguri, Ogbomosho, Onitsha, Port Harcourt, Zaria
Rwanda Kigali
Senegal Dakar
Sierra Leone Freetown
South Africa Bloemfontein, Cape Town, Durban, Johannesburg, Port Elizabeth, Pretoria, Kimberley, Nelspruit, Polokwane
Sudan Khartoum
Swaziland Mbabane
Tanzania Arusha, Dar Es Salaam, Dodoma, Mwanza
Togo Lomé
Tunisia Sfax, Tunis, Sousse
Uganda Kampala
Zambia Kitwe, Lusaka, Ndola
Zimbabwe Bulawayo, Harare
Source: Oxford Economics, African and Middle Eastern Cities Forecasts. Available at http://www.oxfordeconomics.com/forecasts-and-models/cities/ middle-east-and-african-cities-and-regions/overview.
The Africa Competitiveness Report 2017 | 71


Part 2Country Profiles

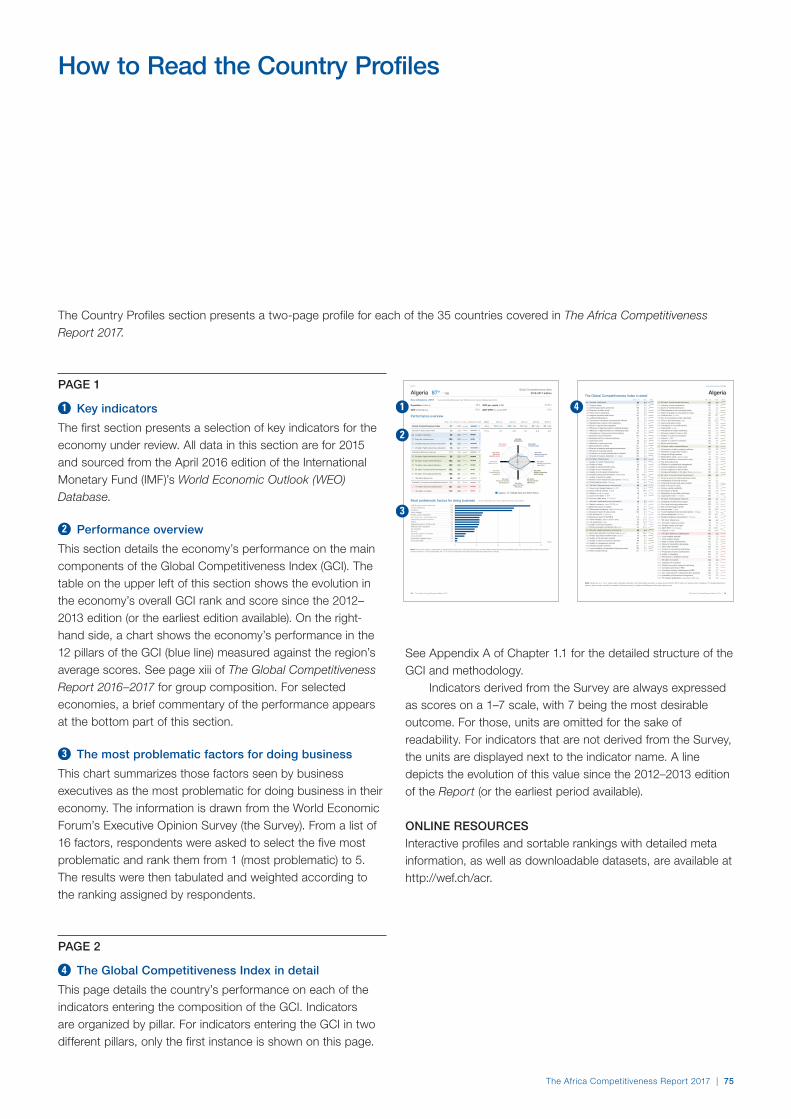
How to Read the Country Profiles
The Country Profiles section presents a two-page profile for each of the 35 countries covered in The Africa Competitiveness Report 2017.
PAGE 1
Key indicators
The first section presents a selection of key indicators for the economy under review. All data in this section are for 2015 and sourced from the April 2016 edition of the International Monetary Fund (IMF)’s World Economic Outlook (WEO) Database.
Performance overview
This section details the economy’s performance on the main components of the Global Competitiveness Index (GCI). The table on the upper left of this section shows the evolution in the economy’s overall GCI rank and score since the 2012–2013 edition (or the earliest edition available). On the right-hand side, a chart shows the economy’s performance in the 12 pillars of the GCI (blue line) measured against the region’s average scores. See page xiii of The Global Competitiveness Report 2016–2017 for group composition. For selected economies, a brief commentary of the performance appears at the bottom part of this section.
The most problematic factors for doing business
This chart summarizes those factors seen by business executives as the most problematic for doing business in their economy. The information is drawn from the World Economic Forum’s Executive Opinion Survey (the Survey). From a list of 16 factors, respondents were asked to select the five most problematic and rank them from 1 (most problematic) to 5. The results were then tabulated and weighted according to the ranking assigned by respondents.
PAGE 2
The Global Competitiveness Index in detail
This page details the country’s performance on each of the indicators entering the composition of the GCI. Indicators are organized by pillar. For indicators entering the GCI in two different pillars, only the first instance is shown on this page.
Edition 2012-13 2013-14 2014-15 2015-16 2016-17
Rank 110 / 144 100 / 148 79 / 144 87 / 140 87 / 138
Score 3.7 3.8 4.1 4.0 4.0
Most problematic factors for doing business
Performance overview
Note: From the list of factors, respondents to the World Economic Forum's Executive Opinion Survey were asked to select the five most problematic factors for doing business in their country and torank them between 1 (most problematic) and 5. The score corresponds to the responses weighted according to their rankings.
Rank / 138 Score (1-7) Trend Distance from best
Global Competitiveness Index 87 4.0Subindex A: Basic requirements 88 4.3
99 3.5 1st pillar: Institutions
100 3.32nd pillar: Infrastructure
63 4.8 3rd pillar: Macroeconomic environment
73 5.7 4th pillar: Health and primary education
Subindex B: Efficiency enhancers 110 3.6
96 3.9 5th pillar: Higher education and training
133 3.5 6th pillar: Goods market efficiency
132 3.2 7th pillar: Labor market efficiency
132 2.9 8th pillar: Financial market development
108 3.1 9th pillar: Technological readiness
36 4.7 10th pillar: Market size
Subindex C: Innovation and sophistication factors 119 3.1
121 3.3 11th pillar: Business sophistication
112 2.9 12th pillar: Innovation
1234567
1st pillar:Institutions
2nd pillar:Infrastructure
3rd pillar:Macroeconomicenvironment
4th pillar:Health and primaryeducation
5th pillar:Higher educationand training
6th pillar:Goods marketefficiency7th pillar:
Labor marketefficiency
8th pillar:Financial market
development
9th pillar:Technological
readiness
10th pillar:Market size
11th pillar:Business
sophistication
12th pillar:Innovation
11111111222223333344444
Algeria Middle East and North Africa
Source: World Economic Forum, Executive Opinion Survey 2016
17.513.713.36.56.25.75.75.75.65.34.64.52.52.20.60.5
Inefficient government bureaucracyAccess to financingCorruptionPolicy instabilityForeign currency regulationsPoor work ethic in national labor forceInadequately educated workforceInflationInadequate supply of infrastructureRestrictive labor regulationsTax regulationsTax ratesInsufficient capacity to innovateCrime and theftGovernment instability/coupsPoor public health
0 5 10 15 20
score
Global Competitiveness Index2016-2017 edition
Key Indicators, 2015
Population (millions)
GDP (US$ billions)
GDP per capita (US$)
GDP (PPP) % world GDP
Algeria 87 / 138th
Source: International Monetary Fund; World Economic Outlook Database (April 2016)
39.9
172.3
4318.1
0.51
88 | The Africa Competitiveness Report 2017
Part 2
The Global Competitiveness Index in detail
Note: Values are on a 1-to-7 scale unless indicated otherwise. Trend lines depict evolution in values since the 2012-2013 edition (or earliest edition available). For detailed definitions,sources, and periods, consult the interactive Country/Economy Profiles and Rankings at http://gcr.weforum.org/
Rank / 138 Value Trend Rank / 138 Value Trend
99 3.5 1st pillar: Institutions1.01 Property rights 117 3.61.02 Intellectual property protection 108 3.41.03 Diversion of public funds 81 3.31.04 Public trust in politicians 83 2.81.05 Irregular payments and bribes 101 3.31.06 Judicial independence 94 3.41.07 Favoritism in decisions of government officials 70 3.01.08 Wastefulness of government spending 75 3.11.09 Burden of government regulation 86 3.21.10 Efficiency of legal framework in settling disputes 67 3.61.11 Efficiency of legal framework in challenging regs 75 3.41.12 Transparency of government policymaking 127 3.21.13 Business costs of terrorism 102 4.51.14 Business costs of crime and violence 71 4.61.15 Organized crime 80 4.61.16 Reliability of police services 60 4.71.17 Ethical behavior of firms 107 3.41.18 Strength of auditing and reporting standards 135 3.11.19 Efficacy of corporate boards 136 3.41.20 Protection of minority shareholders’ interests 100 3.71.21 Strength of investor protection 0-10 (best) 133 3.3
100 3.32nd pillar: Infrastructure2.01 Quality of overall infrastructure 101 3.32.02 Quality of roads 96 3.22.03 Quality of railroad infrastructure 57 3.02.04 Quality of port infrastructure 105 3.22.05 Quality of air transport infrastructure 117 3.22.06 Available airline seat kilometers millions/week 64 233.22.07 Quality of electricity supply 92 4.02.08 Mobile-cellular telephone subscriptions /100 pop. 77 113.02.09 Fixed-telephone lines /100 pop. 89 8.0
63 4.8 3rd pillar: Macroeconomic environment3.01 Government budget balance % GDP 135 -15.33.02 Gross national savings % GDP 10 34.63.03 Inflation annual % change 99 4.83.04 Government debt % GDP 4 8.73.05 Country credit rating 0-100 (best) 70 -
73 5.7 4th pillar: Health and primary education4.01 Malaria incidence cases/100,000 pop. 11 0.14.02 Business impact of malaria 45 4.54.03 Tuberculosis incidence cases/100,000 pop. 86 78.04.04 Business impact of tuberculosis 125 4.04.05 HIV prevalence % adult pop. 1 0.14.06 Business impact of HIV/AIDS 113 4.34.07 Infant mortality deaths/1,000 live births 93 21.94.08 Life expectancy years 65 74.84.09 Quality of primary education 102 3.34.10 Primary education enrollment rate net % 40 97.3
96 3.9 5th pillar: Higher education and training5.01 Secondary education enrollment rate gross % 46 99.95.02 Tertiary education enrollment rate gross % 78 34.65.03 Quality of the education system 85 3.45.04 Quality of math and science education 99 3.55.05 Quality of management schools 127 3.35.06 Internet access in schools 124 3.15.07 Local availability of specialized training services 120 3.65.08 Extent of staff training 131 3.1
133 3.5 6th pillar: Goods market efficiency6.01 Intensity of local competition 136 3.86.02 Extent of market dominance 87 3.46.03 Effectiveness of anti-monopoly policy 113 3.16.04 Effect of taxation on incentives to invest 92 3.46.05 Total tax rate % profits 135 72.76.06 No. of procedures to start a business 126 126.07 Time to start a business days 103 20.06.08 Agricultural policy costs 112 3.26.09 Prevalence of non-tariff barriers 125 3.66.10 Trade tariffs % duty 127 13.86.11 Prevalence of foreign ownership 132 3.16.12 Business impact of rules on FDI 135 3.06.13 Burden of customs procedures 114 3.46.14 Imports % GDP 85 36.06.15 Degree of customer orientation 130 3.76.16 Buyer sophistication 90 3.1
132 3.2 7th pillar: Labor market efficiency7.01 Cooperation in labor-employer relations 115 3.87.02 Flexibility of wage determination 113 4.37.03 Hiring and firing practices 111 3.37.04 Redundancy costs weeks of salary 74 17.37.05 Effect of taxation on incentives to work 89 3.77.06 Pay and productivity 122 3.37.07 Reliance on professional management 135 3.07.08 Country capacity to retain talent 116 2.77.09 Country capacity to attract talent 125 2.27.10 Female participation in the labor force ratio to men 136 0.24
132 2.9 8th pillar: Financial market development8.01 Financial services meeting business needs 131 3.18.02 Affordability of financial services 95 3.58.03 Financing through local equity market 124 2.58.04 Ease of access to loans 122 2.98.05 Venture capital availability 85 2.68.06 Soundness of banks 123 3.68.07 Regulation of securities exchanges 129 3.08.08 Legal rights index 0-10 (best) 108 2
108 3.1 9th pillar: Technological readiness9.01 Availability of latest technologies 125 3.79.02 Firm-level technology absorption 128 3.69.03 FDI and technology transfer 121 3.69.04 Internet users % pop. 95 38.29.05 Fixed-broadband Internet subscriptions /100 pop. 84 5.69.06 Internet bandwidth kb/s/user 80 30.19.07 Mobile-broadband subscriptions /100 pop. 85 40.1
36 4.7 10th pillar: Market size10.01 Domestic market size index 33 4.610.02 Foreign market size index 43 5.110.03 GDP (PPP) PPP $ billions 33 578.710.04 Exports % GDP 102 24.0
121 3.3 11th pillar: Business sophistication11.01 Local supplier quantity 108 4.011.02 Local supplier quality 130 3.411.03 State of cluster development 115 3.111.04 Nature of competitive advantage 93 3.111.05 Value chain breadth 109 3.411.06 Control of international distribution 112 3.011.07 Production process sophistication 108 3.211.08 Extent of marketing 125 3.711.09 Willingness to delegate authority 124 3.1
112 2.9 12th pillar: Innovation12.01 Capacity for innovation 112 3.712.02 Quality of scientific research institutions 99 3.412.03 Company spending on R&D 113 2.812.04 University-industry collaboration in R&D 120 2.712.05 Gov't procurement of advanced tech. products 105 2.912.06 Availability of scientists and engineers 81 3.812.07 PCT patent applications applications/million pop. 94 0.2
Algeria
The Africa Competitiveness Report 2017 | 89
Country/Economy Profiles
See Appendix A of Chapter 1.1 for the detailed structure of the GCI and methodology.
Indicators derived from the Survey are always expressed as scores on a 1–7 scale, with 7 being the most desirable outcome. For those, units are omitted for the sake of readability. For indicators that are not derived from the Survey, the units are displayed next to the indicator name. A line depicts the evolution of this value since the 2012–2013 edition of the Report (or the earliest period available).
ONLINE RESOURCESInteractive profiles and sortable rankings with detailed meta information, as well as downloadable datasets, are available at http://wef.ch/acr.
The Africa Competitiveness Report 2017 | 75

The Africa Competitiveness Report 2017 | 77
This section provides detailed definitions and sources for all the indicators that enter the Global Competitiveness Index 2016–2017 (GCI). The data used represent the best available estimates at the time The Global Competitiveness Report 2016–2017 was prepared. It is possible that some data will have been updated or revised by the sources after publication. The title of each indicator appears on the first line, preceded by its number to allow for quick reference. Below is a description of each indicator or, in the case of Executive Opinion Survey data, the full question and associated answers. If necessary, additional information is provided underneath.
Pillar 1: Institutions
1.01 Property rights
In your country, to what extent are property rights, including financial assets, protected? [1 = not at all; 7 = to a great extent] | 2015–16 weighted average
Source: World Economic Forum, Executive Opinion Survey. For more details, refer to Chapter 1.3 of The Global Competitiveness Report 2016–2017.
1.02 Intellectual property protection
In your country, to what extent is intellectual property protected? [1 = not at all; 7 = to a great extent] | 2015–16 weighted average
Source: World Economic Forum, Executive Opinion Survey. For more details, refer to Chapter 1.3 of The Global Competitiveness Report 2016–2017.
1.03 Diversion of public funds
In your country, how common is illegal diversion of public funds to companies, individuals, or groups? [1 = very commonly occurs; 7 = never occurs] | 2015–16 weighted average
Source: World Economic Forum, Executive Opinion Survey. For more details, refer to Chapter 1.3 of The Global Competitiveness Report 2016–2017.
1.04 Public trust in politicians
In your country, how do you rate the ethical standards of politicians? [1 = extremely low; 7 = extremely high] | 2015–16 weighted average
Source: World Economic Forum, Executive Opinion Survey. For more details, refer to Chapter 1.3 of The Global Competitiveness Report 2016–2017.
1.05 Irregular payments and bribes
Average score across the five components of the following Executive Opinion Survey question: In your country, how common is it for firms to make undocumented extra payments or bribes connected with (a) imports and exports; (b) public utilities; (c) annual tax payments; (d) awarding of public contracts and licenses; (e) obtaining favorable judicial decisions? In each case, the answer ranges from 1 [very common] to 7 [never occurs] | 2015–16 weighted average
Source: World Economic Forum, Executive Opinion Survey. For more details, refer to Chapter 1.3 of The Global Competitiveness Report 2016–2017.
1.06 Judicial independence
In your country, how independent is the judicial system from influences of the government, individuals, or companies? [1 = not independent at all; 7 = entirely independent] | 2015–16 weighted average
Source: World Economic Forum, Executive Opinion Survey. For more details, refer to Chapter 1.3 of The Global Competitiveness Report 2016–2017.
1.07 Favoritism in decisions of government officials
In your country, to what extent do government officials show favoritism to well-connected firms and individuals when deciding upon policies and contracts? [1 = show favoritism to a great extent; 7 = do not show favoritism at all] | 2015–16 weighted average
Source: World Economic Forum, Executive Opinion Survey. For more details, refer to Chapter 1.3 of The Global Competitiveness Report 2016–2017.
1.08 Wastefulness of government spending
In your country, how efficiently does the government spend public revenue? [1 = extremely inefficient; 7 = extremely efficient in providing goods and services] | 2013–14 weighted average
Source: World Economic Forum, Executive Opinion Survey. For more details, refer to Chapter 1.3 of The Global Competitiveness Report 2016–2017.
1.09 Burden of government regulation
In your country, how burdensome is it for companies to comply with public administration’s requirements (e.g., permits, regulations, reporting)? [1 = extremely burdensome; 7 = not burdensome at all] | 2015–16 weighted average
Source: World Economic Forum, Executive Opinion Survey. For more details, refer to Chapter 1.3 of The Global Competitiveness Report 2016–2017.
1.10 Efficiency of legal framework in settling disputes
In your country, how efficient are the legal and judicial systems for companies in settling disputes? [1 = extremely inefficient; 7 = extremely efficient] | 2015–16 weighted average
Source: World Economic Forum, Executive Opinion Survey. For more details, refer to Chapter 1.3 of The Global Competitiveness Report 2016–2017.
Technical Notes and Sources

Technical Notes and Sources
78 | The Africa Competitiveness Report 2017
1.11 Efficiency of legal framework in challenging regulations
In your country, how easy is it for private businesses to challenge government actions and/or regulations through the legal system? [1 = extremely difficult; 7 = extremely easy] | 2015–16 weighted average
Source: World Economic Forum, Executive Opinion Survey. For more details, refer to Chapter 1.3 of The Global Competitiveness Report 2016–2017.
1.12 Transparency of government policymaking
In your country, how easy is it for companies to obtain information about changes in government policies and regulations affecting their activities? [1 = extremely difficult; 7 = extremely easy] | 2015–16 weighted average
Source: World Economic Forum, Executive Opinion Survey. For more details, refer to Chapter 1.3 of The Global Competitiveness Report 2016–2017.
1.13 Business costs of terrorism
In your country, to what extent does the threat of terrorism impose costs on businesses? [1 = to a great extent, imposes huge costs; 7 = no costs at all] | 2015–16 weighted average
Source: World Economic Forum, Executive Opinion Survey. For more details, refer to Chapter 1.3 of The Global Competitiveness Report 2016–2017.
1.14 Business costs of crime and violence
In your country, to what extent does the incidence of crime and violence impose costs on businesses? [1 = to a great extent, imposes huge costs; 7 = no costs at all] | 2015–16 weighted average
Source: World Economic Forum, Executive Opinion Survey. For more details, refer to Chapter 1.3 of The Global Competitiveness Report 2016–2017.
1.15 Organized crime
In your country, to what extent does organized crime (mafia-oriented racketeering, extortion) impose costs on businesses? [1 = to a great extent, imposes huge costs; 7 = no costs at all] | 2015–16 weighted average
Source: World Economic Forum, Executive Opinion Survey. For more details, refer to Chapter 1.3 of The Global Competitiveness Report 2016–2017.
1.16 Reliability of police services
In your country, to what extent can police services be relied upon to enforce law and order? [1 = not at all; 7 = to a great extent] | 2016
Source: World Economic Forum, Executive Opinion Survey. For more details, refer to Chapter 1.3 of The Global Competitiveness Report 2016–2017.
1.17 Ethical behavior of firms
In your country, how do you rate the corporate ethics of companies (ethical behavior in interactions with public officials, politicians, and other firms)? [1 = extremely poor—among the worst in the world; 7 = excellent—among the best in the world] | 2015–16 weighted average
Source: World Economic Forum, Executive Opinion Survey. For more details, refer to Chapter 1.3 of The Global Competitiveness Report 2016–2017.
1.18 Strength of auditing and reporting standards
In your country, how strong are financial auditing and reporting standards? [1 = extremely weak; 7 = extremely strong] | 2015–16 weighted average
Source: World Economic Forum, Executive Opinion Survey. For more details, refer to Chapter 1.3 of The Global Competitiveness Report 2016–2017.
1.19 Efficacy of corporate boards
In your country, to what extent is management accountable to investors and boards of directors? [1 = not at all; 7 = to a great extent] | 2015–16 weighted average
Source: World Economic Forum, Executive Opinion Survey. For more details, refer to Chapter 1.3 of The Global Competitiveness Report 2016–2017.
1.20 Protection of minority shareholders’ interests
In your country, to what extent are the interests of minority shareholders protected by the legal system? [1 = not protected at all; 7 = fully protected] | 2015–16 weighted average
Source: World Economic Forum, Executive Opinion Survey. For more details, refer to Chapter 1.3 of The Global Competitiveness Report 2016–2017.
1.21 Strength of investor protection
Strength of Investor Protection Index on a 0–10 (best) scale | 2015
This variable is a combination of the Extent of disclosure index (transparency of transactions), the Extent of director liability index (liability for self-dealing), and the Ease of shareholder suit index (shareholders’ ability to sue officers and directors for misconduct). For more details about the methodology employed and the assumptions made to compute this indicator, visit http://www.doingbusiness.org/methodologysurveys/.
Source: World Bank/International Finance Corporation, Doing Business 2016: Measuring Regulatory Quality and Efficiency
Pillar 2: Infrastructure
2.01 Quality of overall infrastructure
How do you assess the general state of infrastructure (e.g., transport, communications, and energy) in your country? [1 = extremely underdeveloped—among the worst in the world; 7 = extensive and efficient—among the best in the world] | 2015–16 weighted average
Source: World Economic Forum, Executive Opinion Survey. For more details, refer to Chapter 1.3 of The Global Competitiveness Report 2016–2017.
2.02 Quality of roads
In your country, how is the quality (extensiveness and condition) of road infrastructure [1 = extremely poor—among the worst in the world; 7 = extremely good—among the best in the world] | 2015–16 weighted average
Source: World Economic Forum, Executive Opinion Survey. For more details, refer to Chapter 1.3 of The Global Competitiveness Report 2016–2017.
2.03 Quality of railroad infrastructure
In your country, how is the quality (extensiveness and condition) of the railroad system [1 = extremely poor—among the worst in the world; 7 = extremely good—among the best in the world] | 2015–16 weighted average
For economies where there is no regular train service or where the network covers only a negligible portion of the territory this indicator is not used in the calculation, and in the Country Profiles of these economies, N/Appl is used for this indicator.
Source: World Economic Forum, Executive Opinion Survey. For more details, refer to Chapter 1.3 of The Global Competitiveness Report 2016–2017.
2.04 Quality of port infrastructure
In your country, how is the quality (extensiveness and condition) of seaports (for landlocked countries, assess access to seaports) [1 = extremely poor—among the worst in the world; 7 = extremely good—among the best in the world] | 2015–16 weighted average
Source: World Economic Forum, Executive Opinion Survey. For more details, refer to Chapter 1.3 of The Global Competitiveness Report 2016–2017.

Technical Notes and Sources
The Africa Competitiveness Report 2017 | 79
2.05 Quality of air transport infrastructure
In your country, how is the quality (extensiveness and condition) of airports [1 = extremely poor—among the worst in the world; 7 = extremely good—among the best in the world] | 2015–16 weighted average
Source: World Economic Forum, Executive Opinion Survey. For more details, refer to Chapter 1.3 of The Global Competitiveness Report 2016–2017.
2.06 Available airline seat kilometers
Airline seat kilometers (in millions) available on all flights (domestic and international service) originating in country per week (year average) | Monthly average for 2016
This indicator measures the total passenger-carrying capacity of all scheduled flights, including domestic flights, originating in a country. It is computed by multiplying the number of seats available on each flight by the flight distance in kilometers and summing the result across all scheduled flights in a week. The final value represents the weekly average for the year (Jan–Dec), taking into account flights scheduled beforehand by airline companies.
Source: International Air Transport Association, SRS Analyser
2.07 Quality of electricity supply
In your country, how reliable is the electricity supply (lack of interruptions and lack of voltage fluctuations)? [1 = extremely unreliable; 7 = extremely reliable] | 2015–16 weighted average
Source: World Economic Forum, Executive Opinion Survey. For more details, refer to Chapter 1.3 of The Global Competitiveness Report 2016–2017.
2.08 Mobile-cellular telephone subscriptions
Number of mobile-cellular telephone subscriptions per 100 population | 2015
Mobile-cellular telephone subscriptions refers to the number of subscriptions to a public mobile telephone service that provides access to the public switched telephone network (PSTN) using cellular technology. It includes both the number of postpaid subscriptions and the number of active prepaid accounts (i.e., that have been active during the past three months). It includes all mobile-cellular subscriptions that offer voice communications. It excludes subscriptions via data cards or USB modems, subscriptions to public mobile data services, and private trunked mobile radio, telepoint, radio paging, and telemetry services.
Source: International Telecommunication Union, ITU World Telecommunication/ICT Indicators June 2016 (June 2016 edition)
2.09 Fixed-telephone lines
Number of fixed-telephone lines per 100 population | 2015
Fixed-telephone subscriptions refers to the sum of active analogue fixed-telephone lines, voice over IP (VoIP) subscriptions, fixed wireless local loop (WLL) subscriptions, ISDN voice-channel equivalents, and fixed-public payphones. It includes all accesses over fixed infrastructure supporting voice telephony using copper wire, voice services using Internet Protocol (IP) delivered over fixed (wired)-broadband infrastructure (e.g., DSL, fiber optic), and voice services provided over coaxial-cable television networks (cable modem). It also includes WLL connections, which are defined as services provided by licensed fixed-line telephone operators that provide last-mile access to the subscriber using radio technology, when the call is then routed over a fixed-line telephone network (and not a mobile-cellular network). In the case of VoIP, it refers to subscriptions that offer the ability to place and receive calls at any time and do not require a computer. VoIP is also known as voice-over broadband (VoB), and includes subscriptions through fixed-wireless, DSL, cable, fiber optic, and other fixed-broadband platforms that provide fixed telephony using IP.
Source: International Telecommunication Union, ITU World Telecommunication/ICT Indicators June 2016 (June 2016 edition)
Pillar 3: Macroeconomic environment
3.01 Government budget balance
General government budget balance as a percentage of GDP | 2015
General government budget balance is calculated as general government revenue minus total expenditure. This is a core Government Finance Statistics (GFS) balance that measures the extent to which the general government is either putting financial resources at the disposal of other sectors in the economy and nonresidents (net lending), or utilizing the financial resources generated by other sectors and nonresidents (net borrowing). This balance may be viewed as an indicator of the financial impact of general government activity on the rest of the economy and nonresidents. Revenue consists of taxes, social contributions, grants receivable, and other revenue. Revenue increases a government’s net worth, which is the difference between its assets and liabilities. General government total expenditure consists of total expenses and the net acquisition of nonfinancial assets.
Source: International Monetary Fund, World Economic Outlook Database (April 2016 edition)
3.02 Gross national savings
Gross national savings as a percentage of GDP | 2015 or most recent year available
Gross national savings is expressed as a ratio of gross national savings in current local currency and GDP in current local currency. It corresponds to gross disposable income less final consumption expenditure after taking account of an adjustment for pension funds. For many economies, the estimates of national savings are built up from national accounts data on gross domestic investment and from balance of payments–based data on net foreign investment.
Sources: International Monetary Fund, World Economic Outlook Database (April 2016 edition); US Central Intelligence Agency, The World Factbook (accessed August 12, 2016); national sources
3.03 Inflation
Annual percent change in consumer price index (year average) | 2015 or most recent year available
Source: International Monetary Fund, World Economic Outlook Database (April 2016 edition)
3.04 Government debt
Gross general government debt as a percentage of GDP | 2015 or most recent year available
Gross debt consists of all liabilities that require payment or payments of interest and/or principal by the debtor to the creditor at a date or dates in the future. This includes debt liabilities in the form of special drawing rights, currency and deposits, debt securities, loans, insurance, pensions and standardized guarantee schemes, and other accounts payable. Thus all liabilities in the Government Finance Statistics Manual (GFSM) 2001 system are debt, except for equity and investment fund shares, financial derivatives, and employee stock options. For Australia, Belgium, Canada, Hong Kong SAR, Iceland, New Zealand, and Sweden, government debt coverage also includes insurance technical reserves, following the GFSM 2001 definition.
Source: International Monetary Fund, World Economic Outlook Database (April 2016 edition) and Article IV Consultation Staff Reports
3.05 Country credit rating
Institutional Investor’s Country Credit Ratings™ assessing the probability of sovereign debt default on a 0–100 (lowest probability) scale | March 2016
Institutional Investor’s Country Credit Ratings™ developed by Institutional Investor are based on information provided by senior economists and sovereign-debt analysts at leading global banks and money management and security firms. Twice a year, the respondents grade each country on a scale of 0 to 100, with 100 representing the least chance of default.
Source: Institutional Investor’s “Country Credit Ratings” is a trademark of Institutional Investor, LLC. No further copying or transmission of this material is allowed without the express written permission of Institutional Investor [email protected]. Copyright © Institutional Investor, LLC 2016.
Technical Notes and Sources
80 | The Africa Competitiveness Report 2017
Pillar 4: Health and primary education
4.01 Malaria incidence
Estimated number of malaria cases per 100,000 population | 2013 or most recent year available
For economies that: (1) were declared free of malaria by the World Health Organization (WHO) (except in the case of Hong Kong SAR, for which malaria assessment is from CDC); (2) are included in the WHO’s supplementary list of areas where malaria has never existed or has disappeared without specific measures; or (3) are currently in the prevention of reintroduction phase as identified by the WHO, this indicator is excluded from the calculation of the GCI.
In the Country profiles of these economies, the following abbreviations are used: M.F. for malaria-free economies; P.R. means the economy is in the prevention of reintroduction phase; and S.L. means the economy is on the WHO’s supplementary list.
Sources: The World Health Organization, World Malaria Report 2012 and 2015 editions; United States Centers for Disease Control and Prevention (CDC), Malaria Information and Prophylaxis information (accessed July 29, 2016).
4.02 Business impact of malaria
How serious an impact do you consider malaria will have on your company in the next five years (e.g., death, disability, medical and funeral expenses, productivity and absenteeism, recruitment and training expenses, revenues)? [1 = a serious impact; 7 = no impact at all] | 2013–14 weighted average
For economies that are considered free of malaria; that are included in the World Health Organization’s supplementary list; or that are in the prevention of reintroduction phase (see indicator 4.01 above), this indicator is excluded from the calculation of the GCI. In the Country Profiles of these economies, N/Appl. is used for this indicator.
Source: World Economic Forum, Executive Opinion Survey. For more details, refer to Chapter 1.3 of The Global Competitiveness Report 2016–2017.
4.03 Tuberculosis incidence
Estimated number of tuberculosis cases per 100,000 population | 2014 or most recent year available
Incidence of tuberculosis is the estimated number of new pulmonary, smear positive, and extra-pulmonary tuberculosis cases.
Sources: The World Bank, World Development Indicators (accessed May19, 2016); national sources
4.04 Business impact of tuberculosis
How serious an impact do you consider tuberculosis will have on your company in the next five years (e.g., death, disability, medical and funeral expenses, productivity and absenteeism, recruitment and training expenses, revenues)? [1 = a serious impact; 7 = no impact at all] | 2013–14 weighted average
Source: World Economic Forum, Executive Opinion Survey. For more details, refer to Chapter 1.3 of The Global Competitiveness Report 2016–2017.
4.05 HIV prevalence
HIV prevalence as a percentage of adults aged 15–49 years | 2014 or most recent year available
HIV prevalence refers to the percentage of people aged 15–49 who are infected with HIV at a particular point in time, no matter when infection occurred. Economies with a prevalence rate equal to or less than 0.2 percent are all ranked first.
Sources: The World Bank, World Development Indicators (accessed May 18, 2015, and May 19, 2016); UNAIDS, UNAIDS Global Report on the Global AIDS Epidemic (2008, 2010, 2012, and 2013 editions); UNAIDS, IUNAIDS Gap Report 2014; national sources
4.06 Business impact of HIV/AIDS
How serious an impact do you consider HIV/AIDS will have on your company in the next five years (e.g., death, disability, medical and funeral expenses, productivity and absenteeism, recruitment and training expenses, revenues)? [1 = a serious impact; 7 = no impact at all] | 2013–14 weighted average
Source: World Economic Forum, Executive Opinion Survey. For more details, refer to Chapter 1.3 of The Global Competitiveness Report 2016–2017.
4.07 Infant mortality
Infant (children aged 0–12 months) mortality per 1,000 live births | 2015 or most recent year available
Infant mortality rate is the number of infants dying before reaching one year of age per 1,000 live births in a given year.
Sources: The World Bank, World Development Indicators (accessed July 5, 2016); national sources
4.08 Life expectancy
Life expectancy at birth (years) | 2014
Life expectancy at birth indicates the number of years a newborn infant would live if prevailing patterns of mortality at the time of its birth were to stay the same throughout its life.
Sources: The World Bank, World Development Indicators (accessed July 5, 2016); national sources
4.09 Quality of primary education
In your country, how do you assess the quality of primary education [1 = extremely poor—among the worst in the world; 7 = excellent—among the best in the world] | 2015–16 weighted average
Source: World Economic Forum, Executive Opinion Survey. For more details, refer to Chapter 1.3 of The Global Competitiveness Report 2016–2017.
4.10 Primary education enrollment rate
Net primary education enrollment rate | 2014 or most recent year available
The reported value corresponds to the ratio of children of official primary school age (as defined by the national education system) who are enrolled in primary school. Primary education (ISCED level 1) provides children with basic reading, writing, and mathematics skills along with an elementary understanding of such subjects as history, geography, natural science, social science, art, and music.
Sources: UNESCO Institute for Statistics, Data Centre (accessed July 12, 2016); Organisation for Economic Co-operation and Development (OECD), Education at a Glance 2015; UNICEF; national sources
Pillar 5: Higher education and training
5.01 Secondary education enrollment rate
Gross secondary education enrollment rate | 2014 or most recent year available
The reported value corresponds to the ratio of total secondary enrollment, regardless of age, to the population of the age group that officially corresponds to the secondary education level. Secondary education (ISCED levels 2 and 3) completes the provision of basic education that began at the primary level, and aims to lay the foundations for lifelong learning and human development by offering more subject- or skills-oriented instruction using more specialized teachers.
Sources: UNESCO Institute for Statistics, Data Centre (accessed July 12, 2016); national sources

Technical Notes and Sources
The Africa Competitiveness Report 2017 | 81
5.02 Tertiary education enrollment rate
Gross tertiary education enrollment rate | 2014 or most recent year available
The reported value corresponds to the ratio of total tertiary enrollment, regardless of age, to the population of the age group that officially corresponds to the tertiary education level. Tertiary education (ISCED levels 5 and 6), whether or not leading to an advanced research qualification, normally requires, as a minimum condition of admission, the successful completion of education at the secondary level.
Sources: UNESCO Institute for Statistics, Data Centre (accessed July 12, 2016); national sources
5.03 Quality of the education system
In your country, how well does the education system meet the needs of a competitive economy? [1 = not well at all; 7 = extremely well] | 2015–16 weighted average
Source: World Economic Forum, Executive Opinion Survey. For more details, refer to Chapter 1.3 of The Global Competitiveness Report 2016–2017.
5.04 Quality of math and science education
In your country, how do you assess the quality of math and science education? [1 = extremely poor—among the worst in the world; 7 = excellent—among the best in the world] | 2015–16 weighted average
Source: World Economic Forum, Executive Opinion Survey. For more details, refer to Chapter 1.3 of The Global Competitiveness Report 2016–2017.
5.05 Quality of management schools
In your country, how do you assess the quality of management schools? [1 = extremely poor—among the worst in the world; 7 = excellent—among the best in the world] | 2015–16 weighted average
Source: World Economic Forum, Executive Opinion Survey. For more details, refer to Chapter 1.3 of The Global Competitiveness Report 2016–2017.
5.06 Internet access in schools
In your country, to what extent is the Internet used in schools for learning purposes? [1 = not at all; 7 = to a great extent] | 2015–16 weighted average
Source: World Economic Forum, Executive Opinion Survey. For more details, refer to Chapter 1.3 of The Global Competitiveness Report 2016–2017.
5.07 Local availability of specialized training services
vIn your country, how available are high-quality, professional training services? [1 = not available at all; 7 = widely available] | 2015–16 weighted average
Source: World Economic Forum, Executive Opinion Survey. For more details, refer to Chapter 1.3 of The Global Competitiveness Report 2016–2017.
5.08 Extent of staff training
In your country, to what extent do companies invest in training and employee development? [1 = not at all; 7 = to a great extent] | 2015–16 weighted average
Source: World Economic Forum, Executive Opinion Survey. For more details, refer to Chapter 1.3 of The Global Competitiveness Report 2016–2017.
Pillar 6: Goods market efficiency
6.01 Intensity of local competition
In your country, how intense is competition in the local markets? [1 = not intense at all; 7 = extremely intense] | 2015–16 weighted average
Source: World Economic Forum, Executive Opinion Survey. For more details, refer to Chapter 1.3 of The Global Competitiveness Report 2016–2017.
6.02 Extent of market dominance
In your country, how do you characterize corporate activity? [1 = dominated by a few business groups; 7 = spread among many firms] | 2015–16 weighted average
Source: World Economic Forum, Executive Opinion Survey. For more details, refer to Chapter 1.3 of The Global Competitiveness Report 2016–2017.
6.03 Effectiveness of anti-monopoly policy
In your country, how effective are anti-monopoly policies at ensuring fair competition? [1 = not effective at all; 7 = extremely effective] | 2015–16 weighted average
Source: World Economic Forum, Executive Opinion Survey. For more details, refer to Chapter 1.3 of The Global Competitiveness Report 2016–2017.
6.04 Effect of taxation on incentives to invest
In your country, to what extent do taxes reduce the incentive to invest? [1 = to a great extent; 7 = not at all] | 2015–16 weighted average
Source: World Economic Forum, Executive Opinion Survey. For more details, refer to Chapter 1.3 of The Global Competitiveness Report 2016–2017.
6.05 Total tax rate
This variable is a combination of profit tax (% of profits), labor tax and contribution (% of profits), and other taxes (% of profits) | 2015
The total tax rate measures the amount of taxes and mandatory contributions payable by a business in the second year of operation, expressed as a share of commercial profits. The total amount of taxes is the sum of five different types of taxes and contributions payable after accounting for deductions and exemptions: profit or corporate income tax, social contributions and labor taxes paid by the employer, property taxes, turnover taxes, and other small taxes. For more details about the methodology employed and the assumptions made to compute this indicator, visit http://www.doingbusiness.org/methodologysurveys/.
Source: World Bank/International Finance Corporation, Doing Business 2016: Measuring Regulatory Quality and Efficiency
6.06 Number of procedures required to start a business
Number of procedures required to start a business | 2015
For details about the methodology employed and the assumptions made to compute this indicator, visit http://www.doingbusiness.org/methodologysurveys/.
Source: World Bank/International Finance Corporation, Doing Business 2016: Measuring Regulatory Quality and Efficiency
6.07 Time required to start a business
Number of days required to start a business | 2015
For details about the methodology employed and the assumptions made to compute this indicator, visit http://www.doingbusiness.org/methodologysurveys/.
Source: World Bank/International Finance Corporation, Doing Business 2016: Measuring Regulatory Quality and Efficiency

Technical Notes and Sources
82 | The Africa Competitiveness Report 2017
6.08 Agricultural policy costs
In your country, how do you assess the agricultural policy? [1 = excessively burdensome for the economy; 7 = balances well the interests of taxpayers, consumers, and producers] | 2015–16 weighted average
Source: World Economic Forum, Executive Opinion Survey. For more details, refer to Chapter 1.3 of The Global Competitiveness Report 2016–2017.
6.09 Prevalence of non-tariff barriers
In your country, to what extent do non-tariff barriers (e.g., health and product standards, technical and labeling requirements, etc.) limit the ability of imported goods to compete in the domestic market? [1 = strongly limit; 7 = do not limit at all] | 2015–16 weighted average
Source: World Economic Forum, Executive Opinion Survey. For more details, refer to Chapter 1.3 of The Global Competitiveness Report 2016–2017.
6.10 Trade tariffs
Trade-weighted average tariff rate | 2015 or most recent year available
An applied tariff is a customs duty that is levied on imports of merchandise goods. This indicator is calculated as a weighted average of all the applied tariff rates, including preferential rates that a country applies to the rest of the world. The weights are the trade patterns of the importing country’s reference group.
Sources: International Trade Centre; Trade Competitiveness Map Data
6.11 Prevalence of foreign ownership
In your country, how prevalent is foreign ownership of companies? [1 = extremely rare; 7 = extremely prevalent] | 2015–16 weighted average
Source: World Economic Forum, Executive Opinion Survey. For more details, refer to Chapter 1.3 of The Global Competitiveness Report 2016–2017.
6.12 Business impact of rules on FDI
In your country, how restrictive are rules and regulations on foreign direct investment (FDI)? [1 = extremely restrictive; 7 = not restrictive at all] | 2015–16 weighted average
Source: World Economic Forum, Executive Opinion Survey. For more details, refer to Chapter 1.3 of The Global Competitiveness Report 2016–2017.
6.13 Burden of customs procedures
In your country, how efficient are customs procedures (related to the entry and exit of merchandise)? [1 = extremely inefficient; 7 = extremely efficient] | 2015–16 weighted average
Source: World Economic Forum, Executive Opinion Survey. For more details, refer to Chapter 1.3 of The Global Competitiveness Report 2016–2017.
6.14 Imports as a percentage of GDP
Imports of goods and services as a percentage of gross domestic product | 2015 or most recent year available
Total imports is the sum of total imports of merchandise and commercial services.
Sources: World Trade Organization, Online Statistics Database (accessed June 08, 2016); International Monetary Fund, World Economic Outlook Database (April 2016 edition); national sources
6.15 Degree of customer orientation
In your country, how well do companies treat customers? [1 = poorly—mostly indifferent to customer satisfaction; 7 = extremely well—highly responsive to customers and seek customer retention] | 2015–16 weighted average
Source: World Economic Forum, Executive Opinion Survey. For more details, refer to Chapter 1.3 of The Global Competitiveness Report 2016–2017.
6.16 Buyer sophistication
In your country, on what basis do buyers make purchasing decisions? [1 = based solely on the lowest price; 7 = based on sophisticated performance attributes] | 2015–16 weighted average
Source: World Economic Forum, Executive Opinion Survey. For more details, refer to Chapter 1.3 of The Global Competitiveness Report 2016–2017.
Pillar 7: Labor market efficiency
7.01 Cooperation in labor-employer relations
In your country, how do you characterize labor-employer relations? [1 = generally confrontational; 7 = generally cooperative] | 2015–16 weighted average
Source: World Economic Forum, Executive Opinion Survey. For more details, refer to Chapter 1.3 of The Global Competitiveness Report 2016–2017.
7.02 Flexibility of wage determination
In your country, how are wages generally set? [1 = by a centralized bargaining process; 7 = by each individual company] | 2015–16 weighted average
Source: World Economic Forum, Executive Opinion Survey. For more details, refer to Chapter 1.3 of The Global Competitiveness Report 2016–2017.
7.03 Hiring and firing practices
In your country, to what extent do regulations allow flexible hiring and firing of workers? [1 = not at all; 7 = to a great extent] | 2015–16 weighted average
Source: World Economic Forum, Executive Opinion Survey. For more details, refer to Chapter 1.3 of The Global Competitiveness Report 2016–2017.
7.04 Redundancy costs
Redundancy costs in weeks of salary | 2015
This variable estimates the cost of advance notice requirements, severance payments, and penalties due when terminating a redundant worker, expressed in weekly wages. For more details about the methodology employed and the assumptions made to compute this indicator, visit http://www.doingbusiness.org/methodologysurveys/.
Sources: World Bank/International Finance Corporation, Doing Business 2016: Measuring Regulatory Quality and Efficiency; World Economic Forum’s calculations
7.05 Effect of taxation on incentives to work
In your country, to what extent do taxes and social contributions reduce the incentive to work? [1 = to a great extent; 7 = not at all] | 2015–16 weighted average
Source: World Economic Forum, Executive Opinion Survey. For more details, refer to Chapter 1.3 of The Global Competitiveness Report 2016–2017.
7.06 Pay and productivity
In your country, to what extent is pay related to employee productivity? [1 = not at all; 7 = to a great extent] | 2015–16 weighted average
Source: World Economic Forum, Executive Opinion Survey. For more details, refer to Chapter 1.3 of The Global Competitiveness Report 2016–2017.
7.07 Reliance on professional management
In your country, who holds senior management positions in companies? [1 = usually relatives or friends without regard to merit; 7 = mostly professional managers chosen for merit and qualifications] | 2015–16 weighted average
Source: World Economic Forum, Executive Opinion Survey. For more details, refer to Chapter 1.3 of The Global Competitiveness Report 2016–2017.
Technical Notes and Sources
The Africa Competitiveness Report 2017 | 83
7.08 Country capacity to retain talent
To what extent does your country retain talented people? [1 = not at all—the best and brightest leave to pursue opportunities abroad; 7 = to a great extent—the best and brightest stay and pursue opportunities in the country] | 2015–16 weighted average
Source: World Economic Forum, Executive Opinion Survey. For more details, refer to Chapter 1.3 of The Global Competitiveness Report 2016–2017.
7.09 Country capacity to attract talent
To what extent does your country attract talented people from abroad? [1 = not at all; 7 = to a great extent—the country attracts the best and brightest from around the world] | 2015–16 weighted average
Source: World Economic Forum, Executive Opinion Survey. For more details, refer to Chapter 1.3 of The Global Competitiveness Report 2016–2017.
7.10 Female participation in the labor force
Ratio of women to men in the labor force | 2015
This measure is the percentage of women aged 15–64 participating in the labor force divided by the percentage of men aged 15–64 participating in the labor force.
Sources: International Labour Organization, Key Indicators of the Labour Markets, 9th Edition; national sources
Pillar 8: Financial market development
8.01 Financial services meeting business needs
In your country, to what extent does the financial sector provide the products and services that meet the needs of businesses? [1 = not at all; 7 = to a great extent] | 2015–16 weighted average
Source: World Economic Forum, Executive Opinion Survey. For more details, refer to Chapter 1.3 of The Global Competitiveness Report 2016–2017.
8.02 Affordability of financial services
In your country, to what extent does the cost of financial services (e.g., insurance, loans, trade finance) impede business activity? [1 = impedes business to a great extent; 7 = not at all] | 2015–16 weighted average
Source: World Economic Forum, Executive Opinion Survey. For more details, refer to Chapter 1.3 of The Global Competitiveness Report 2016–2017.
8.03 Financing through local equity market
In your country, to what extent can companies raise money by issuing shares and/or bonds on the capital market? [1 = not at all; 7 = to a great extent] | 2015–16 weighted average
Source: World Economic Forum, Executive Opinion Survey. For more details, refer to Chapter 1.3 of The Global Competitiveness Report 2016–2017.
8.04 Ease of access to loans
In your country, how easy is it for businesses to obtain a bank loan? [1 = extremely difficult; 7 = extremely easy] | 2016
Source: World Economic Forum, Executive Opinion Survey. For more details, refer to Chapter 1.3 of The Global Competitiveness Report 2016–2017.
8.05 Venture capital availability
In your country, how easy is it for start-up entrepreneurs with innovative but risky projects to obtain equity funding? [1 = extremely difficult; 7 = extremely easy] | 2015–16 weighted average
Source: World Economic Forum, Executive Opinion Survey. For more details, refer to Chapter 1.3 of The Global Competitiveness Report 2016–2017.
8.06 Soundness of banks
In your country, how do you assess the soundness of banks? [1 = extremely low—banks may require recapitalization; 7 = extremely high—banks are generally healthy with sound balance sheets] | 2015–16 weighted average
Source: World Economic Forum, Executive Opinion Survey. For more details, refer to Chapter 1.3 of The Global Competitiveness Report 2016–2017.
8.07 Regulation of securities exchanges
In your country, to what extent do regulators ensure the stability of the financial market? [1 = not at all; 7 = to a great extent] | 2015–16 weighted average
Source: World Economic Forum, Executive Opinion Survey. For more details, refer to Chapter 1.3 of The Global Competitiveness Report 2016–2017.
8.08 Legal rights index
Degree of legal protection of borrowers’ and lenders’ rights on a 0–12 (best) scale | 2015
This index measures the degree to which collateral and bankruptcy laws protect borrowers’ and lenders’ rights and thus facilitate lending. For more details about the methodology employed and the assumptions made to compute this indicator, visit http://www.doingbusiness.org/methodologysurveys/.
Source: World Bank/International Finance Corporation, Doing Business 2016: Measuring Regulatory Quality and Efficiency
Pillar 9: Technological readiness
9.01 Availability of latest technologies
In your country, to what extent are the latest technologies available? [1 = not at all; 7 = to a great extent] | 2015–16 weighted average
Source: World Economic Forum, Executive Opinion Survey. For more details, refer to Chapter 1.3 of The Global Competitiveness Report 2016–2017.
9.02 Firm-level technology absorption
In your country, to what extent do businesses adopt the latest technologies? [1 = not at all; 7 = to a great extent] | 2016
Source: World Economic Forum, Executive Opinion Survey. For more details, refer to Chapter 1.3 of The Global Competitiveness Report 2016–2017.
9.03 FDI and technology transfer
To what extent does foreign direct investment (FDI) bring new technology into your country? [1 = not at all; 7 = to a great extent] | 2015–16 weighted average
Source: World Economic Forum, Executive Opinion Survey. For more details, refer to Chapter 1.3 of The Global Competitiveness Report 2016–2017.
9.04 Internet users
Percentage of individuals using the Internet | 2015
Individuals using the Internet refers to people who used the Internet from any location and for any purpose, irrespective of the device and network used, in the last three months. It can be via a computer (i.e., desktop computer, laptop computer or tablet, or similar handheld computer), mobile phone, games machine, digital TV, etc. Access can be via a fixed or mobile network.
Source: International Telecommunication Union, ITU World Telecommunication/ICT Indicators June 2016 (June 2016 edition)

Technical Notes and Sources
84 | The Africa Competitiveness Report 2017
9.05 Fixed-broadband Internet subscriptions
Fixed-broadband Internet subscriptions per 100 population | 2015 or most recent year available
Fixed (wired)-broadband subscriptions refers to the number of subscriptions for high-speed access to the public Internet (a TCP/IP connection). Highspeed access is defined as downstream speeds equal to, or greater than, 256 kbit/s. Fixed (wired)-broadband includes cable modem, DSL, fiber, and other fixed (wired)-broadband technologies—such as Ethernet LAN, and broadband over powerline (BPL) communications. Subscriptions with access to data communications (including the Internet) via mobile-cellular networks are excluded.
Source: International Telecommunication Union, ITU World Telecommunication/ICT Indicators June 2016 (June 2016 edition)
9.06 Internet bandwidth
International Internet bandwidth (kb/s) per Internet user | 2015 or most recent year available
International Internet bandwidth refers to the total used capacity of international Internet bandwidth, in megabits per second (Mbit/s). It is measured as the sum of used capacity of all Internet exchanges offering international bandwidth. If capacity is asymmetric, then the incoming capacity is used. International Internet bandwidth (kbit/s) per Internet user is calculated by converting the speed from megabits to kilobits per second and dividing by the total number of Internet users.
Source: International Telecommunication Union, ITU World Telecommunication/ICT Indicators June 2016 (June 2016 edition)
9.07 Mobile-broadband subscriptions
Active mobile-broadband subscriptions per 100 population | 2015
Active mobile-broadband subscriptions refers to the sum of standard mobile-broadband subscriptions and dedicated mobile-broadband data subscriptions to the public Internet. It covers actual subscribers, not potential subscribers, even though the latter may have broadband-enabled handsets. Standard mobile-broadband subscriptions refers to active mobile-cellular subscriptions with advertised data speeds of 256 kbit/s or greater that allow access to the greater Internet via HTTP and that have been used to set up an Internet data connection using Internet Protocol (IP) in the past three months. Standard SMS and MMS messaging do not count as an active Internet data connection, even if the messages are delivered via IP. Dedicated mobile-broadband data subscriptions refers to subscriptions to dedicated data services (over a mobile network) that allow access to the greater Internet and that are purchased separately from voice services, either as a standalone service (e.g., using a data card such as a USB modem/dongle) or as an add-on data package to voice services that requires an additional subscription. All dedicated mobile-broadband subscriptions with recurring subscription fees are included regardless of actual use. Prepaid mobile-broadband plans require use if there is no monthly subscription. This indicator could also include mobile WiMAX subscriptions.
Source: International Telecommunication Union, ITU World Telecommunication/ICT Indicators June 2016 (June 2016 edition)
Pillar 10: Market size
10.01 Domestic market size index
Sum of gross domestic product plus value of imports of goods and services, minus value of exports of goods and services, normalized on a 1–7 (best) scale | 2015 or most recent year available
The size of the domestic market is calculated as the natural log of the sum of the gross domestic product valued at PPP plus the total value (PPP estimates) of imports of goods and services, minus the total value (PPP estimates) of exports of goods and services. Data are then normalized on a 1–7 scale. PPP estimates of imports and exports are obtained by taking the product of exports as a percentage of GDP and GDP valued at PPP.
Source: World Economic Forum. For more details, refer to the Appendix of Chapter 1.1 of this Report
10.02 Foreign market size index
Value of exports of goods and services, normalized on a 1–7 (best) scale | 2015 or most recent year available
The size of the foreign market is estimated as the natural log of the total value (PPP estimates) of exports of goods and services, normalized on a 1–7 scale. PPP estimates of exports are obtained by taking the product of exports as a percentage of GDP and GDP valued at PPP.
Source: World Economic Forum. For more details, refer to the Appendix of Chapter 1.1 of this Report
10.03 GDP (PPP)
Gross domestic product valued at purchasing power parity in billions of international dollars | 2015
Source: International Monetary Fund, World Economic Outlook Database (April 2016 edition)
10.04 Exports as a percentage of GDP
Exports of goods and services as a percentage of gross domestic product | 2015 or most recent year available
Total exports is the sum of total exports of merchandise and commercial services.
Sources: World Trade Organization, Online Statistics Database (accessed June 08, 2016); International Monetary Fund, World Economic Outlook Database (April 2016 edition); national sources
Pillar 11: Business sophistication
11.01 Local supplier quantity
In your country, how numerous are local suppliers? [1 = largely nonexistent; 7 = extremely numerous] | 2015–16 weighted average
Source: World Economic Forum, Executive Opinion Survey. For more details, refer to Chapter 1.3 of The Global Competitiveness Report 2016–2017.
11.02 Local supplier quality
In your country, how do you assess the quality of local suppliers? [1 = extremely poor quality; 7 = extremely high quality] | 2015–16 weighted average
Source: World Economic Forum, Executive Opinion Survey. For more details, refer to Chapter 1.3 of The Global Competitiveness Report 2016–2017.
11.03 State of cluster development
In your country, how widespread are well-developed and deep clusters (geographic concentrations of firms, suppliers, producers of related products and services, and specialized institutions in a particular field)? [1 = nonexistent; 7 = widespread in many fields] | 2015–16 weighted average
Source: World Economic Forum, Executive Opinion Survey. For more details, refer to Chapter 1.3 of The Global Competitiveness Report 2016–2017.
11.04 Nature of competitive advantage
On what is the competitive advantage of your country’s companies in international markets based? [1 = primarily low-cost labor or natural resources; 7 = primarily unique products and processes] | 2015–16 weighted average
Source: World Economic Forum, Executive Opinion Survey. For more details, refer to Chapter 1.3 of The Global Competitiveness Report 2016–2017.

Technical Notes and Sources
The Africa Competitiveness Report 2017 | 85
11.05 Value chain breadth
In your country, how broad is companies’ presence in the value chain? [1 = narrow, primarily involved in individual steps of the value chain (e.g., resource extraction or production); 7 = broad, present across the entire value chain (e.g., including production, marketing, distribution, design, etc.)] | 2015–16 weighted average
Source: World Economic Forum, Executive Opinion Survey. For more details, refer to Chapter 1.3 of The Global Competitiveness Report 2016–2017.
11.06 Control of international distribution
In your country, to what extent do domestic companies control the international distribution of their products? [1 = not at all; 7 = to a great extent] | 2015–16 weighted average
Source: World Economic Forum, Executive Opinion Survey. For more details, refer to Chapter 1.3 of The Global Competitiveness Report 2016–2017.
11.07 Production process sophistication
In your country, how sophisticated are production processes? [1 = not at all—production uses labor-intensive processes; 7 = highly—production uses latest technologies] | 2015–16 weighted average
Source: World Economic Forum, Executive Opinion Survey. For more details, refer to Chapter 1.3 of The Global Competitiveness Report 2016–2017.
11.08 Extent of marketing
In your country, how successful are companies in using marketing to differentiate their products and services? [1 = not successful at all; 7 = extremely successful] | 2015–16 weighted average
Source: World Economic Forum, Executive Opinion Survey. For more details, refer to Chapter 1.3 of The Global Competitiveness Report 2016–2017.
11.09 Willingness to delegate authority
In your country, how do you assess the willingness to delegate authority to subordinates? [1 = not willing at all—senior management takes all important decisions; 7 = very willing—authority is mostly delegated to business unit heads and other lower-level managers] | 2013–14 weighted average
Source: World Economic Forum, Executive Opinion Survey. For more details, refer to Chapter 1.3 of The Global Competitiveness Report 2016–2017.
Pillar 12: Innovation
12.01 Capacity for innovation
In your country, to what extent do companies have the capacity to innovate? [1 = not at all; 7 = to a great extent] | 2015–16 weighted average
Source: World Economic Forum, Executive Opinion Survey. For more details, refer to Chapter 1.3 of The Global Competitiveness Report 2016–2017.
12.02 Quality of scientific research institutions
In your country, how do you assess the quality of scientific research institutions? [1 = extremely poor—among the worst in the world; 7 = extremely good—among the best in the world] | 2015–16 weighted average
Source: World Economic Forum, Executive Opinion Survey. For more details, refer to Chapter 1.3 of The Global Competitiveness Report 2016–2017.
12.03 Company spending on R&D
In your country, to what extent do companies invest in research and development (R&D)? [1 = do not invest at all in R&D; 7 = invest heavily in R&D] | 2015–16 weighted average
Source: World Economic Forum, Executive Opinion Survey. For more details, refer to Chapter 1.3 of The Global Competitiveness Report 2016–2017.
12.04 University-industry collaboration in R&D
In your country, to what extent do business and universities collaborate on research and development (R&D)? [1 = do not collaborate at all; 7 = collaborate extensively] | 2016
Source: World Economic Forum, Executive Opinion Survey. For more details, refer to Chapter 1.3 of The Global Competitiveness Report 2016–2017.
12.05 Government procurement of advanced technology products
In your country, to what extent do government purchasing decisions foster innovation? [1 = not at all; 7 = to a great extent] | 2015–16 weighted average
Source: World Economic Forum, Executive Opinion Survey. For more details, refer to Chapter 1.3 of The Global Competitiveness Report 2016–2017.
12.06 Availability of scientists and engineers
In your country, to what extent are scientists and engineers available? [1 = not available at all; 7 = widely available] | 2015–16 weighted average
Source: World Economic Forum, Executive Opinion Survey. For more details, refer to Chapter 1.3 of The Global Competitiveness Report 2016–2017.
12.07 PCT patent applications
Number of applications filed under the Patent Cooperation Treaty (PCT) per million population | 2012–2013 average
This indicator measures the total count of applications filed under the Patent Cooperation Treaty (PCT), by priority date and inventor nationality, using fractional count if an application is filed by multiple inventors. The average count of applications filed in 2012 and 2013 is divided by population figures for 2013.
In the absence of reliable data on PCT applications for Taiwan, China and Hong Kong SAR, two advanced economies that are not signatories of the Treaty, the number of applications is estimated as follows: first, we compute the average number of all utility patent applications filed with the United States Patents and Trademarks Office (USPTO) for 2012 and 2013. We then compute the average number of PCT applications for 2012 and 2013, before computing the ratio of the two averages (1.67). For the computation of the two averages, only economies with a two-year average number of at least 100 USPTO applications and 50 PCT applications are considered. Taiwan, China and Hong Kong are excluded in both cases. We then divide the 2012–2013 average number of USPTO applications filed by residents of Taiwan, China (20,766) and Hong Kong (1,118), respectively, by the ratio above in order to produce estimates for PCT applications. As a final step, we compute the estimates per million population—that is, 531.6 for Taiwan, China and 92.6 for Hong Kong. The estimates are used in the computation of the respective Innovation pillar scores of the two economies.
Sources: World Intellectual Property Organization (WIPO) PCT Data, sourced from Organisation for Economic Co-operation and Development (OECD), Patent Database (situation as of June 2016), http://www.oecd.org/sti/inno/oecdpatentdatabases.htm; for population: International Monetary Fund, World Economic Outlook Database (April 2016 edition); World Economic Forum’s calculations.


The Africa Competitiveness Report 2017 | 87
Index of Countries
Country Page
Algeria 88
Benin 90
Botswana 92
Burundi 94
Cameroon 96
Cape Verde 98
Chad 100
Congo, Democratic Rep. 102
Côte d'Ivoire 104
Egypt 106
Ethiopia 108
Gabon 110
Country Page
Gambia, The 112
Ghana 114
Kenya 116
Lesotho 118
Liberia 120
Madagascar 122
Malawi 124
Mali 126
Mauritania 128
Mauritius 130
Morocco 132
Mozambique 134
Country Page
Namibia 136
Nigeria 138
Rwanda 140
Senegal 142
Sierra Leone 144
South Africa 146
Tanzania 148
Tunisia 150
Uganda 152
Zambia 154
Zimbabwe 156
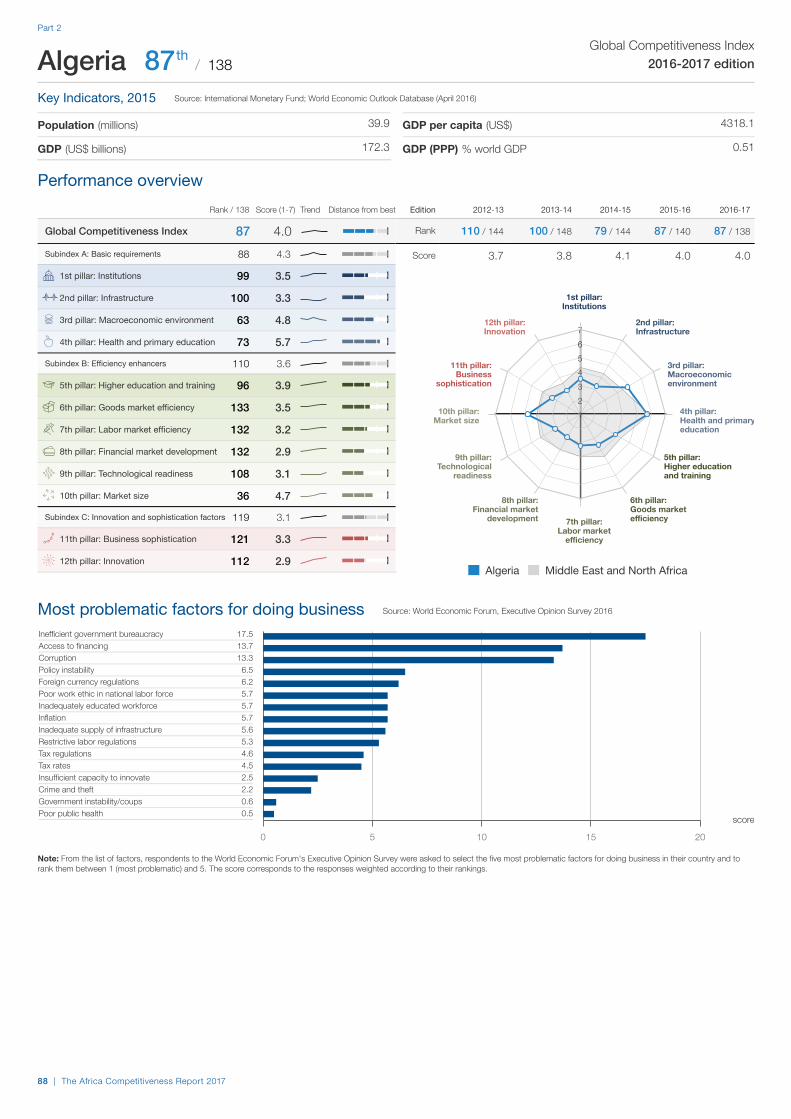
Edition 2012-13 2013-14 2014-15 2015-16 2016-17
Rank 110 / 144 100 / 148 79 / 144 87 / 140 87 / 138
Score 3.7 3.8 4.1 4.0 4.0
Most problematic factors for doing business
Performance overview
Note: From the list of factors, respondents to the World Economic Forum's Executive Opinion Survey were asked to select the five most problematic factors for doing business in their country and torank them between 1 (most problematic) and 5. The score corresponds to the responses weighted according to their rankings.
The Global Competitiveness Index in detail
Rank / 138 Score (1-7) Trend Distance from best
Global Competitiveness Index 87 4.0Subindex A: Basic requirements 88 4.3
99 3.5 1st pillar: Institutions
100 3.32nd pillar: Infrastructure
63 4.8 3rd pillar: Macroeconomic environment
73 5.7 4th pillar: Health and primary education
Subindex B: Efficiency enhancers 110 3.6
96 3.9 5th pillar: Higher education and training
133 3.5 6th pillar: Goods market efficiency
132 3.2 7th pillar: Labor market efficiency
132 2.9 8th pillar: Financial market development
108 3.1 9th pillar: Technological readiness
36 4.7 10th pillar: Market size
Subindex C: Innovation and sophistication factors 119 3.1
121 3.3 11th pillar: Business sophistication
112 2.9 12th pillar: Innovation
1234567
1st pillar:Institutions
2nd pillar:Infrastructure
3rd pillar:Macroeconomicenvironment
4th pillar:Health and primaryeducation
5th pillar:Higher educationand training
6th pillar:Goods marketefficiency7th pillar:
Labor marketefficiency
8th pillar:Financial market
development
9th pillar:Technological
readiness
10th pillar:Market size
11th pillar:Business
sophistication
12th pillar:Innovation
Algeria Middle East and North Africa
Source: World Economic Forum, Executive Opinion Survey 2016
17.513.713.3
6.56.25.75.75.75.65.34.64.52.52.20.60.5
Inefficient government bureaucracyAccess to financingCorruptionPolicy instabilityForeign currency regulationsPoor work ethic in national labor forceInadequately educated workforceInflationInadequate supply of infrastructureRestrictive labor regulationsTax regulationsTax ratesInsufficient capacity to innovateCrime and theftGovernment instability/coupsPoor public health
0 5 10 15 20
score
Global Competitiveness Index2016-2017 edition
Key Indicators, 2015
Population (millions)
GDP (US$ billions)
GDP per capita (US$)
GDP (PPP) % world GDP
Algeria 87 / 138th
Source: International Monetary Fund; World Economic Outlook Database (April 2016)
39.9
172.3
4318.1
0.51
88 | The Africa Competitiveness Report 2017
Part 2

The Global Competitiveness Index in detail
Note: Values are on a 1-to-7 scale unless indicated otherwise. Trend lines depict evolution in values since the 2012-2013 edition (or earliest edition available). For detailed definitions,sources, and periods, consult the interactive Country/Economy Profiles and Rankings at http://gcr.weforum.org/
Rank / 138 Value Trend Rank / 138 Value Trend
99 3.5 1st pillar: Institutions1.01 Property rights 117 3.61.02 Intellectual property protection 108 3.41.03 Diversion of public funds 81 3.31.04 Public trust in politicians 83 2.81.05 Irregular payments and bribes 101 3.31.06 Judicial independence 94 3.41.07 Favoritism in decisions of government officials 70 3.01.08 Wastefulness of government spending 75 3.11.09 Burden of government regulation 86 3.21.10 Efficiency of legal framework in settling disputes 67 3.61.11 Efficiency of legal framework in challenging regs 75 3.41.12 Transparency of government policymaking 127 3.21.13 Business costs of terrorism 102 4.51.14 Business costs of crime and violence 71 4.61.15 Organized crime 80 4.61.16 Reliability of police services 60 4.71.17 Ethical behavior of firms 107 3.41.18 Strength of auditing and reporting standards 135 3.11.19 Efficacy of corporate boards 136 3.41.20 Protection of minority shareholders’ interests 100 3.71.21 Strength of investor protection 0-10 (best) 133 3.3
100 3.32nd pillar: Infrastructure2.01 Quality of overall infrastructure 101 3.32.02 Quality of roads 96 3.22.03 Quality of railroad infrastructure 57 3.02.04 Quality of port infrastructure 105 3.22.05 Quality of air transport infrastructure 117 3.22.06 Available airline seat kilometers millions/week 64 233.22.07 Quality of electricity supply 92 4.02.08 Mobile-cellular telephone subscriptions /100 pop. 77 113.02.09 Fixed-telephone lines /100 pop. 89 8.0
63 4.8 3rd pillar: Macroeconomic environment3.01 Government budget balance % GDP 135 -15.33.02 Gross national savings % GDP 10 34.63.03 Inflation annual % change 99 4.83.04 Government debt % GDP 4 8.73.05 Country credit rating 0-100 (best) 70 -
73 5.7 4th pillar: Health and primary education4.01 Malaria incidence cases/100,000 pop. 11 0.14.02 Business impact of malaria 45 4.54.03 Tuberculosis incidence cases/100,000 pop. 86 78.04.04 Business impact of tuberculosis 125 4.04.05 HIV prevalence % adult pop. 1 0.14.06 Business impact of HIV/AIDS 113 4.34.07 Infant mortality deaths/1,000 live births 93 21.94.08 Life expectancy years 65 74.84.09 Quality of primary education 102 3.34.10 Primary education enrollment rate net % 40 97.3
96 3.9 5th pillar: Higher education and training5.01 Secondary education enrollment rate gross % 46 99.95.02 Tertiary education enrollment rate gross % 78 34.65.03 Quality of the education system 85 3.45.04 Quality of math and science education 99 3.55.05 Quality of management schools 127 3.35.06 Internet access in schools 124 3.15.07 Local availability of specialized training services 120 3.65.08 Extent of staff training 131 3.1
133 3.5 6th pillar: Goods market efficiency6.01 Intensity of local competition 136 3.86.02 Extent of market dominance 87 3.46.03 Effectiveness of anti-monopoly policy 113 3.16.04 Effect of taxation on incentives to invest 92 3.46.05 Total tax rate % profits 135 72.76.06 No. of procedures to start a business 126 126.07 Time to start a business days 103 20.06.08 Agricultural policy costs 112 3.26.09 Prevalence of non-tariff barriers 125 3.66.10 Trade tariffs % duty 127 13.86.11 Prevalence of foreign ownership 132 3.16.12 Business impact of rules on FDI 135 3.06.13 Burden of customs procedures 114 3.46.14 Imports % GDP 85 36.06.15 Degree of customer orientation 130 3.76.16 Buyer sophistication 90 3.1
132 3.2 7th pillar: Labor market efficiency7.01 Cooperation in labor-employer relations 115 3.87.02 Flexibility of wage determination 113 4.37.03 Hiring and firing practices 111 3.37.04 Redundancy costs weeks of salary 74 17.37.05 Effect of taxation on incentives to work 89 3.77.06 Pay and productivity 122 3.37.07 Reliance on professional management 135 3.07.08 Country capacity to retain talent 116 2.77.09 Country capacity to attract talent 125 2.27.10 Female participation in the labor force ratio to men 136 0.24
132 2.9 8th pillar: Financial market development8.01 Financial services meeting business needs 131 3.18.02 Affordability of financial services 95 3.58.03 Financing through local equity market 124 2.58.04 Ease of access to loans 122 2.98.05 Venture capital availability 85 2.68.06 Soundness of banks 123 3.68.07 Regulation of securities exchanges 129 3.08.08 Legal rights index 0-10 (best) 108 2
108 3.1 9th pillar: Technological readiness9.01 Availability of latest technologies 125 3.79.02 Firm-level technology absorption 128 3.69.03 FDI and technology transfer 121 3.69.04 Internet users % pop. 95 38.29.05 Fixed-broadband Internet subscriptions /100 pop. 84 5.69.06 Internet bandwidth kb/s/user 80 30.19.07 Mobile-broadband subscriptions /100 pop. 85 40.1
36 4.7 10th pillar: Market size10.01 Domestic market size index 33 4.610.02 Foreign market size index 43 5.110.03 GDP (PPP) PPP $ billions 33 578.710.04 Exports % GDP 102 24.0
121 3.3 11th pillar: Business sophistication11.01 Local supplier quantity 108 4.011.02 Local supplier quality 130 3.411.03 State of cluster development 115 3.111.04 Nature of competitive advantage 93 3.111.05 Value chain breadth 109 3.411.06 Control of international distribution 112 3.011.07 Production process sophistication 108 3.211.08 Extent of marketing 125 3.711.09 Willingness to delegate authority 124 3.1
112 2.9 12th pillar: Innovation12.01 Capacity for innovation 112 3.712.02 Quality of scientific research institutions 99 3.412.03 Company spending on R&D 113 2.812.04 University-industry collaboration in R&D 120 2.712.05 Gov't procurement of advanced tech. products 105 2.912.06 Availability of scientists and engineers 81 3.812.07 PCT patent applications applications/million pop. 94 0.2
Algeria
The Africa Competitiveness Report 2017 | 89
Country Profiles

Edition 2012-13 2013-14 2015-16 2016-17
Rank 119 / 144 130 / 148 122 / 140 124 / 138
Score 3.6 3.4 3.5 3.5
Most problematic factors for doing business
Performance overview
Note: From the list of factors, respondents to the World Economic Forum's Executive Opinion Survey were asked to select the five most problematic factors for doing business in their country and torank them between 1 (most problematic) and 5. The score corresponds to the responses weighted according to their rankings.
The Global Competitiveness Index in detail
Rank / 138 Score (1-7) Trend Distance from best
Global Competitiveness Index 124 3.5Subindex A: Basic requirements 122 3.6
95 3.5 1st pillar: Institutions
128 2.22nd pillar: Infrastructure
111 4.0 3rd pillar: Macroeconomic environment
116 4.6 4th pillar: Health and primary education
Subindex B: Efficiency enhancers 125 3.3
117 3.1 5th pillar: Higher education and training
126 3.7 6th pillar: Goods market efficiency
50 4.4 7th pillar: Labor market efficiency
106 3.5 8th pillar: Financial market development
129 2.5 9th pillar: Technological readiness
123 2.6 10th pillar: Market size
Subindex C: Innovation and sophistication factors 107 3.3
116 3.4 11th pillar: Business sophistication
86 3.2 12th pillar: Innovation
1234567
1st pillar:Institutions
2nd pillar:Infrastructure
3rd pillar:Macroeconomicenvironment
4th pillar:Health and primaryeducation
5th pillar:Higher educationand training
6th pillar:Goods marketefficiency7th pillar:
Labor marketefficiency
8th pillar:Financial market
development
9th pillar:Technological
readiness
10th pillar:Market size
11th pillar:Business
sophistication
12th pillar:Innovation
Benin Sub-Saharan Africa
Source: World Economic Forum, Executive Opinion Survey 2016
21.419.816.5
7.47.44.94.63.32.72.62.21.91.81.31.11.0
Access to financingCorruptionTax ratesTax regulationsInefficient government bureaucracyRestrictive labor regulationsPoor work ethic in national labor forceInadequate supply of infrastructureInsufficient capacity to innovatePolicy instabilityInflationCrime and theftForeign currency regulationsInadequately educated workforceGovernment instability/coupsPoor public health
0 6 12 18 24
score
Global Competitiveness Index2016-2017 edition
Key Indicators, 2015
Population (millions)
GDP (US$ billions)
GDP per capita (US$)
GDP (PPP) % world GDP
Benin 124 / 138th
Source: International Monetary Fund; World Economic Outlook Database (April 2016)
10.9
8.5
780.1
0.02
90 | The Africa Competitiveness Report 2017
Part 2

The Global Competitiveness Index in detail
Note: Values are on a 1-to-7 scale unless indicated otherwise. Trend lines depict evolution in values since the 2012-2013 edition (or earliest edition available). For detailed definitions,sources, and periods, consult the interactive Country/Economy Profiles and Rankings at http://gcr.weforum.org/
Rank / 138 Value Trend Rank / 138 Value Trend
95 3.5 1st pillar: Institutions1.01 Property rights 105 3.81.02 Intellectual property protection 83 3.81.03 Diversion of public funds 104 2.91.04 Public trust in politicians 82 2.81.05 Irregular payments and bribes 132 2.51.06 Judicial independence 96 3.41.07 Favoritism in decisions of government officials 66 3.11.08 Wastefulness of government spending 68 3.21.09 Burden of government regulation 81 3.31.10 Efficiency of legal framework in settling disputes 77 3.51.11 Efficiency of legal framework in challenging regs 81 3.21.12 Transparency of government policymaking 114 3.51.13 Business costs of terrorism 97 4.71.14 Business costs of crime and violence 82 4.31.15 Organized crime 103 4.21.16 Reliability of police services 86 4.11.17 Ethical behavior of firms 97 3.51.18 Strength of auditing and reporting standards 126 3.61.19 Efficacy of corporate boards 75 4.81.20 Protection of minority shareholders’ interests 108 3.61.21 Strength of investor protection 0-10 (best) 117 4.0
128 2.22nd pillar: Infrastructure2.01 Quality of overall infrastructure 127 2.42.02 Quality of roads 114 2.92.03 Quality of railroad infrastructure 100 1.62.04 Quality of port infrastructure 85 3.72.05 Quality of air transport infrastructure 118 3.22.06 Available airline seat kilometers millions/week 127 15.02.07 Quality of electricity supply 134 1.72.08 Mobile-cellular telephone subscriptions /100 pop. 113 85.62.09 Fixed-telephone lines /100 pop. 115 1.8
111 4.0 3rd pillar: Macroeconomic environment3.01 Government budget balance % GDP 123 -7.93.02 Gross national savings % GDP 86 16.73.03 Inflation annual % change 44 0.33.04 Government debt % GDP 45 37.53.05 Country credit rating 0-100 (best) 119 -
116 4.6 4th pillar: Health and primary education4.01 Malaria incidence cases/100,000 pop. 62 29249.54.02 Business impact of malaria 62 3.44.03 Tuberculosis incidence cases/100,000 pop. 78 61.04.04 Business impact of tuberculosis 128 3.94.05 HIV prevalence % adult pop. 106 1.14.06 Business impact of HIV/AIDS 125 3.94.07 Infant mortality deaths/1,000 live births 129 64.24.08 Life expectancy years 125 59.54.09 Quality of primary education 120 2.94.10 Primary education enrollment rate net % 62 95.9
117 3.1 5th pillar: Higher education and training5.01 Secondary education enrollment rate gross % 114 54.45.02 Tertiary education enrollment rate gross % 108 15.45.03 Quality of the education system 131 2.45.04 Quality of math and science education 102 3.55.05 Quality of management schools 103 3.85.06 Internet access in schools 122 3.25.07 Local availability of specialized training services 65 4.35.08 Extent of staff training 123 3.4
126 3.7 6th pillar: Goods market efficiency6.01 Intensity of local competition 89 4.86.02 Extent of market dominance 82 3.56.03 Effectiveness of anti-monopoly policy 127 2.76.04 Effect of taxation on incentives to invest 128 2.76.05 Total tax rate % profits 125 63.36.06 No. of procedures to start a business 76 76.07 Time to start a business days 73 12.06.08 Agricultural policy costs 114 3.26.09 Prevalence of non-tariff barriers 133 3.26.10 Trade tariffs % duty 107 9.96.11 Prevalence of foreign ownership 114 3.76.12 Business impact of rules on FDI 96 4.26.13 Burden of customs procedures 118 3.36.14 Imports % GDP 69 40.86.15 Degree of customer orientation 67 4.76.16 Buyer sophistication 134 2.2
50 4.4 7th pillar: Labor market efficiency7.01 Cooperation in labor-employer relations 101 4.17.02 Flexibility of wage determination 33 5.47.03 Hiring and firing practices 83 3.67.04 Redundancy costs weeks of salary 42 11.67.05 Effect of taxation on incentives to work 75 3.87.06 Pay and productivity 116 3.37.07 Reliance on professional management 124 3.47.08 Country capacity to retain talent 111 2.87.09 Country capacity to attract talent 97 2.97.10 Female participation in the labor force ratio to men 8 0.97
106 3.5 8th pillar: Financial market development8.01 Financial services meeting business needs 105 3.78.02 Affordability of financial services 114 3.18.03 Financing through local equity market 79 3.48.04 Ease of access to loans 130 2.68.05 Venture capital availability 129 2.08.06 Soundness of banks 95 4.48.07 Regulation of securities exchanges 110 3.68.08 Legal rights index 0-10 (best) 46 6
129 2.5 9th pillar: Technological readiness9.01 Availability of latest technologies 126 3.69.02 Firm-level technology absorption 103 4.19.03 FDI and technology transfer 127 3.39.04 Internet users % pop. 131 6.89.05 Fixed-broadband Internet subscriptions /100 pop. 111 0.79.06 Internet bandwidth kb/s/user 126 3.09.07 Mobile-broadband subscriptions /100 pop. 136 4.2
123 2.6 10th pillar: Market size10.01 Domestic market size index 122 2.410.02 Foreign market size index 124 3.310.03 GDP (PPP) PPP $ billions 122 22.910.04 Exports % GDP 96 25.9
116 3.4 11th pillar: Business sophistication11.01 Local supplier quantity 116 3.911.02 Local supplier quality 86 4.111.03 State of cluster development 99 3.311.04 Nature of competitive advantage 94 3.011.05 Value chain breadth 95 3.511.06 Control of international distribution 121 2.911.07 Production process sophistication 137 2.411.08 Extent of marketing 86 4.211.09 Willingness to delegate authority 126 3.1
86 3.2 12th pillar: Innovation12.01 Capacity for innovation 34 4.712.02 Quality of scientific research institutions 78 3.712.03 Company spending on R&D 97 3.012.04 University-industry collaboration in R&D 98 3.112.05 Gov't procurement of advanced tech. products 83 3.112.06 Availability of scientists and engineers 104 3.512.07 PCT patent applications applications/million pop. 121 0.0
Benin
The Africa Competitiveness Report 2017 | 91
Country Profiles

Edition 2012-13 2013-14 2014-15 2015-16 2016-17
Rank 79 / 144 74 / 148 74 / 144 71 / 140 64 / 138
Score 4.1 4.1 4.2 4.2 4.3
Most problematic factors for doing business
Performance overview
Note: From the list of factors, respondents to the World Economic Forum's Executive Opinion Survey were asked to select the five most problematic factors for doing business in their country and torank them between 1 (most problematic) and 5. The score corresponds to the responses weighted according to their rankings.
The Global Competitiveness Index in detail
Rank / 138 Score (1-7) Trend Distance from best
Global Competitiveness Index 64 4.3Subindex A: Basic requirements 55 4.7
37 4.5 1st pillar: Institutions
90 3.52nd pillar: Infrastructure
10 6.2 3rd pillar: Macroeconomic environment
113 4.7 4th pillar: Health and primary education
Subindex B: Efficiency enhancers 84 3.9
88 4.1 5th pillar: Higher education and training
73 4.3 6th pillar: Goods market efficiency
36 4.5 7th pillar: Labor market efficiency
66 4.0 8th pillar: Financial market development
86 3.6 9th pillar: Technological readiness
105 2.9 10th pillar: Market size
Subindex C: Innovation and sophistication factors 90 3.4
100 3.6 11th pillar: Business sophistication
84 3.2 12th pillar: Innovation
1234567
1st pillar:Institutions
2nd pillar:Infrastructure
3rd pillar:Macroeconomicenvironment
4th pillar:Health and primaryeducation
5th pillar:Higher educationand training
6th pillar:Goods marketefficiency7th pillar:
Labor marketefficiency
8th pillar:Financial market
development
9th pillar:Technological
readiness
10th pillar:Market size
11th pillar:Business
sophistication
12th pillar:Innovation
Botswana Sub-Saharan Africa
Source: World Economic Forum, Executive Opinion Survey 2016
16.213.310.810.1
9.58.68.17.93.82.82.81.91.51.40.70.6
Poor work ethic in national labor forceAccess to financingInadequately educated workforceInadequate supply of infrastructureInefficient government bureaucracyRestrictive labor regulationsInsufficient capacity to innovateCorruptionCrime and theftPolicy instabilityInflationTax ratesPoor public healthGovernment instability/coupsForeign currency regulationsTax regulations
0 5 10 15 20
score
Global Competitiveness Index2016-2017 edition
Key Indicators, 2015
Population (millions)
GDP (US$ billions)
GDP per capita (US$)
GDP (PPP) % world GDP
Botswana 64 / 138th
Source: International Monetary Fund; World Economic Outlook Database (April 2016)
2.1
12.9
6041.0
0.03
92 | The Africa Competitiveness Report 2017
Part 2

The Global Competitiveness Index in detail
Note: Values are on a 1-to-7 scale unless indicated otherwise. Trend lines depict evolution in values since the 2012-2013 edition (or earliest edition available). For detailed definitions,sources, and periods, consult the interactive Country/Economy Profiles and Rankings at http://gcr.weforum.org/
Rank / 138 Value Trend Rank / 138 Value Trend
37 4.5 1st pillar: Institutions1.01 Property rights 36 5.01.02 Intellectual property protection 56 4.31.03 Diversion of public funds 39 4.31.04 Public trust in politicians 38 3.91.05 Irregular payments and bribes 46 4.61.06 Judicial independence 41 4.71.07 Favoritism in decisions of government officials 44 3.61.08 Wastefulness of government spending 26 4.11.09 Burden of government regulation 67 3.51.10 Efficiency of legal framework in settling disputes 29 4.71.11 Efficiency of legal framework in challenging regs 30 4.41.12 Transparency of government policymaking 34 4.71.13 Business costs of terrorism 34 5.81.14 Business costs of crime and violence 83 4.31.15 Organized crime 54 5.21.16 Reliability of police services 50 4.81.17 Ethical behavior of firms 40 4.41.18 Strength of auditing and reporting standards 59 4.81.19 Efficacy of corporate boards 52 5.01.20 Protection of minority shareholders’ interests 42 4.41.21 Strength of investor protection 0-10 (best) 73 5.5
90 3.52nd pillar: Infrastructure2.01 Quality of overall infrastructure 77 4.02.02 Quality of roads 62 4.12.03 Quality of railroad infrastructure 51 3.22.04 Quality of port infrastructure 109 3.02.05 Quality of air transport infrastructure 89 4.02.06 Available airline seat kilometers millions/week 132 8.32.07 Quality of electricity supply 108 3.32.08 Mobile-cellular telephone subscriptions /100 pop. 9 169.02.09 Fixed-telephone lines /100 pop. 92 7.8
10 6.2 3rd pillar: Macroeconomic environment3.01 Government budget balance % GDP 35 -1.63.02 Gross national savings % GDP 6 37.13.03 Inflation annual % change 41 3.03.04 Government debt % GDP 11 17.83.05 Country credit rating 0-100 (best) 45 -
113 4.7 4th pillar: Health and primary education4.01 Malaria incidence cases/100,000 pop. 27 45.04.02 Business impact of malaria 38 4.84.03 Tuberculosis incidence cases/100,000 pop. 130 385.04.04 Business impact of tuberculosis 132 3.74.05 HIV prevalence % adult pop. 137 25.24.06 Business impact of HIV/AIDS 133 3.24.07 Infant mortality deaths/1,000 live births 109 34.84.08 Life expectancy years 113 64.44.09 Quality of primary education 73 4.04.10 Primary education enrollment rate net % 98 91.0
88 4.1 5th pillar: Higher education and training5.01 Secondary education enrollment rate gross % 91 83.95.02 Tertiary education enrollment rate gross % 89 27.55.03 Quality of the education system 66 3.75.04 Quality of math and science education 87 3.85.05 Quality of management schools 107 3.75.06 Internet access in schools 106 3.65.07 Local availability of specialized training services 72 4.25.08 Extent of staff training 48 4.2
73 4.3 6th pillar: Goods market efficiency6.01 Intensity of local competition 50 5.36.02 Extent of market dominance 109 3.26.03 Effectiveness of anti-monopoly policy 63 3.76.04 Effect of taxation on incentives to invest 26 4.56.05 Total tax rate % profits 26 25.16.06 No. of procedures to start a business 108 96.07 Time to start a business days 127 48.06.08 Agricultural policy costs 49 4.16.09 Prevalence of non-tariff barriers 45 4.66.10 Trade tariffs % duty 80 6.46.11 Prevalence of foreign ownership 27 5.36.12 Business impact of rules on FDI 60 4.76.13 Burden of customs procedures 48 4.56.14 Imports % GDP 44 54.06.15 Degree of customer orientation 124 3.96.16 Buyer sophistication 76 3.3
36 4.5 7th pillar: Labor market efficiency7.01 Cooperation in labor-employer relations 69 4.47.02 Flexibility of wage determination 75 4.97.03 Hiring and firing practices 62 3.97.04 Redundancy costs weeks of salary 96 21.77.05 Effect of taxation on incentives to work 22 4.67.06 Pay and productivity 100 3.67.07 Reliance on professional management 43 4.67.08 Country capacity to retain talent 58 3.77.09 Country capacity to attract talent 36 3.97.10 Female participation in the labor force ratio to men 20 0.93
66 4.0 8th pillar: Financial market development8.01 Financial services meeting business needs 65 4.38.02 Affordability of financial services 83 3.68.03 Financing through local equity market 52 3.98.04 Ease of access to loans 69 3.98.05 Venture capital availability 72 2.88.06 Soundness of banks 68 4.88.07 Regulation of securities exchanges 59 4.58.08 Legal rights index 0-10 (best) 68 5
86 3.6 9th pillar: Technological readiness9.01 Availability of latest technologies 84 4.49.02 Firm-level technology absorption 76 4.49.03 FDI and technology transfer 93 4.09.04 Internet users % pop. 99 27.59.05 Fixed-broadband Internet subscriptions /100 pop. 101 1.89.06 Internet bandwidth kb/s/user 104 11.49.07 Mobile-broadband subscriptions /100 pop. 45 67.3
105 2.9 10th pillar: Market size10.01 Domestic market size index 112 2.510.02 Foreign market size index 93 4.010.03 GDP (PPP) PPP $ billions 107 34.810.04 Exports % GDP 25 56.4
100 3.6 11th pillar: Business sophistication11.01 Local supplier quantity 120 3.911.02 Local supplier quality 105 3.811.03 State of cluster development 93 3.411.04 Nature of competitive advantage 74 3.411.05 Value chain breadth 107 3.411.06 Control of international distribution 98 3.211.07 Production process sophistication 94 3.511.08 Extent of marketing 102 4.111.09 Willingness to delegate authority 98 3.4
84 3.2 12th pillar: Innovation12.01 Capacity for innovation 87 3.912.02 Quality of scientific research institutions 96 3.512.03 Company spending on R&D 86 3.112.04 University-industry collaboration in R&D 72 3.412.05 Gov't procurement of advanced tech. products 39 3.612.06 Availability of scientists and engineers 107 3.512.07 PCT patent applications applications/million pop. 97 0.2
Botswana
The Africa Competitiveness Report 2017 | 93
Country Profiles
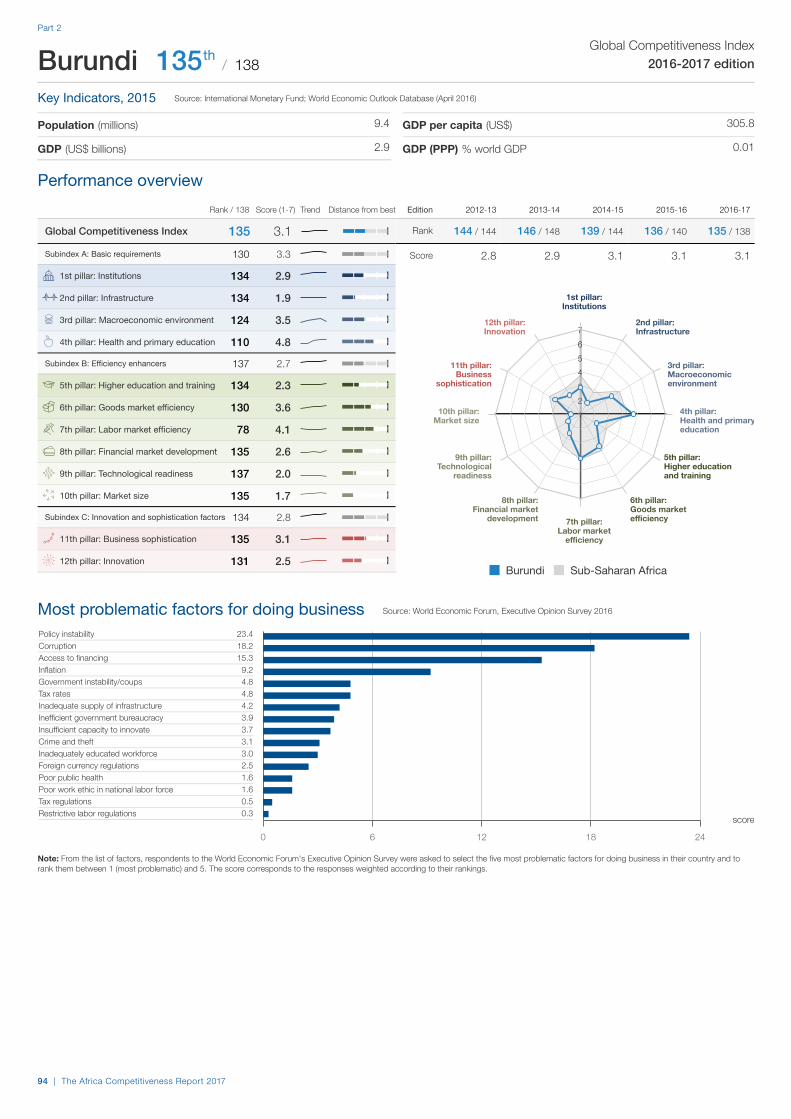
Edition 2012-13 2013-14 2014-15 2015-16 2016-17
Rank 144 / 144 146 / 148 139 / 144 136 / 140 135 / 138
Score 2.8 2.9 3.1 3.1 3.1
Most problematic factors for doing business
Performance overview
Note: From the list of factors, respondents to the World Economic Forum's Executive Opinion Survey were asked to select the five most problematic factors for doing business in their country and torank them between 1 (most problematic) and 5. The score corresponds to the responses weighted according to their rankings.
The Global Competitiveness Index in detail
Rank / 138 Score (1-7) Trend Distance from best
Global Competitiveness Index 135 3.1Subindex A: Basic requirements 130 3.3
134 2.9 1st pillar: Institutions
134 1.92nd pillar: Infrastructure
124 3.5 3rd pillar: Macroeconomic environment
110 4.8 4th pillar: Health and primary education
Subindex B: Efficiency enhancers 137 2.7
134 2.3 5th pillar: Higher education and training
130 3.6 6th pillar: Goods market efficiency
78 4.1 7th pillar: Labor market efficiency
135 2.6 8th pillar: Financial market development
137 2.0 9th pillar: Technological readiness
135 1.7 10th pillar: Market size
Subindex C: Innovation and sophistication factors 134 2.8
135 3.1 11th pillar: Business sophistication
131 2.5 12th pillar: Innovation
1234567
1st pillar:Institutions
2nd pillar:Infrastructure
3rd pillar:Macroeconomicenvironment
4th pillar:Health and primaryeducation
5th pillar:Higher educationand training
6th pillar:Goods marketefficiency7th pillar:
Labor marketefficiency
8th pillar:Financial market
development
9th pillar:Technological
readiness
10th pillar:Market size
11th pillar:Business
sophistication
12th pillar:Innovation
Burundi Sub-Saharan Africa
Source: World Economic Forum, Executive Opinion Survey 2016
23.418.215.3
9.24.84.84.23.93.73.13.02.51.61.60.50.3
Policy instabilityCorruptionAccess to financingInflationGovernment instability/coupsTax ratesInadequate supply of infrastructureInefficient government bureaucracyInsufficient capacity to innovateCrime and theftInadequately educated workforceForeign currency regulationsPoor public healthPoor work ethic in national labor forceTax regulationsRestrictive labor regulations
0 6 12 18 24
score
Global Competitiveness Index2016-2017 edition
Key Indicators, 2015
Population (millions)
GDP (US$ billions)
GDP per capita (US$)
GDP (PPP) % world GDP
Burundi 135 / 138th
Source: International Monetary Fund; World Economic Outlook Database (April 2016)
9.4
2.9
305.8
0.01
94 | The Africa Competitiveness Report 2017
Part 2

The Global Competitiveness Index in detail
Note: Values are on a 1-to-7 scale unless indicated otherwise. Trend lines depict evolution in values since the 2012-2013 edition (or earliest edition available). For detailed definitions,sources, and periods, consult the interactive Country/Economy Profiles and Rankings at http://gcr.weforum.org/
Rank / 138 Value Trend Rank / 138 Value Trend
134 2.9 1st pillar: Institutions1.01 Property rights 135 2.81.02 Intellectual property protection 136 2.71.03 Diversion of public funds 131 2.11.04 Public trust in politicians 88 2.61.05 Irregular payments and bribes 115 3.01.06 Judicial independence 135 1.71.07 Favoritism in decisions of government officials 107 2.51.08 Wastefulness of government spending 116 2.31.09 Burden of government regulation 102 3.01.10 Efficiency of legal framework in settling disputes 104 3.01.11 Efficiency of legal framework in challenging regs 113 2.71.12 Transparency of government policymaking 133 2.81.13 Business costs of terrorism 108 4.41.14 Business costs of crime and violence 119 3.31.15 Organized crime 124 3.31.16 Reliability of police services 136 2.21.17 Ethical behavior of firms 129 2.91.18 Strength of auditing and reporting standards 115 3.81.19 Efficacy of corporate boards 76 4.81.20 Protection of minority shareholders’ interests 113 3.51.21 Strength of investor protection 0-10 (best) 96 4.7
134 1.92nd pillar: Infrastructure2.01 Quality of overall infrastructure 133 2.22.02 Quality of roads 117 2.92.03 Quality of railroad infrastructure N/Appl. N/Appl.2.04 Quality of port infrastructure 123 2.32.05 Quality of air transport infrastructure 134 2.62.06 Available airline seat kilometers millions/week 136 1.42.07 Quality of electricity supply 129 2.12.08 Mobile-cellular telephone subscriptions /100 pop. 134 46.22.09 Fixed-telephone lines /100 pop. 132 0.2
124 3.5 3rd pillar: Macroeconomic environment3.01 Government budget balance % GDP 118 -6.93.02 Gross national savings % GDP 137 -4.43.03 Inflation annual % change 105 5.63.04 Government debt % GDP 47 38.43.05 Country credit rating 0-100 (best) 117 -
110 4.8 4th pillar: Health and primary education4.01 Malaria incidence cases/100,000 pop. 52 12942.84.02 Business impact of malaria 64 3.34.03 Tuberculosis incidence cases/100,000 pop. 99 126.04.04 Business impact of tuberculosis 126 3.94.05 HIV prevalence % adult pop. 106 1.14.06 Business impact of HIV/AIDS 121 3.94.07 Infant mortality deaths/1,000 live births 126 54.14.08 Life expectancy years 131 56.74.09 Quality of primary education 125 2.74.10 Primary education enrollment rate net % 64 95.4
134 2.3 5th pillar: Higher education and training5.01 Secondary education enrollment rate gross % 130 37.95.02 Tertiary education enrollment rate gross % 130 4.45.03 Quality of the education system 125 2.75.04 Quality of math and science education 94 3.65.05 Quality of management schools 114 3.65.06 Internet access in schools 136 1.95.07 Local availability of specialized training services 137 2.65.08 Extent of staff training 134 3.0
130 3.6 6th pillar: Goods market efficiency6.01 Intensity of local competition 123 4.46.02 Extent of market dominance 85 3.56.03 Effectiveness of anti-monopoly policy 109 3.26.04 Effect of taxation on incentives to invest 121 2.96.05 Total tax rate % profits 81 40.36.06 No. of procedures to start a business 11 36.07 Time to start a business days 15 4.06.08 Agricultural policy costs 135 2.66.09 Prevalence of non-tariff barriers 130 3.46.10 Trade tariffs % duty 98 9.66.11 Prevalence of foreign ownership 134 2.96.12 Business impact of rules on FDI 132 3.26.13 Burden of customs procedures 119 3.36.14 Imports % GDP 92 34.56.15 Degree of customer orientation 122 3.96.16 Buyer sophistication 138 1.8
78 4.1 7th pillar: Labor market efficiency7.01 Cooperation in labor-employer relations 114 3.87.02 Flexibility of wage determination 18 5.87.03 Hiring and firing practices 117 3.27.04 Redundancy costs weeks of salary 68 15.97.05 Effect of taxation on incentives to work 108 3.47.06 Pay and productivity 134 2.97.07 Reliance on professional management 128 3.37.08 Country capacity to retain talent 131 2.27.09 Country capacity to attract talent 134 1.87.10 Female participation in the labor force ratio to men 4 1.03
135 2.6 8th pillar: Financial market development8.01 Financial services meeting business needs 134 2.78.02 Affordability of financial services 109 3.28.03 Financing through local equity market 131 2.38.04 Ease of access to loans 133 2.48.05 Venture capital availability 114 2.28.06 Soundness of banks 131 3.18.07 Regulation of securities exchanges 134 2.58.08 Legal rights index 0-10 (best) 108 2
137 2.0 9th pillar: Technological readiness9.01 Availability of latest technologies 137 2.99.02 Firm-level technology absorption 138 2.99.03 FDI and technology transfer 132 3.29.04 Internet users % pop. 134 4.99.05 Fixed-broadband Internet subscriptions /100 pop. 133 0.09.06 Internet bandwidth kb/s/user 118 5.79.07 Mobile-broadband subscriptions /100 pop. 131 7.6
135 1.7 10th pillar: Market size10.01 Domestic market size index 132 1.710.02 Foreign market size index 138 1.810.03 GDP (PPP) PPP $ billions 132 7.710.04 Exports % GDP 138 5.0
135 3.1 11th pillar: Business sophistication11.01 Local supplier quantity 134 3.511.02 Local supplier quality 132 3.311.03 State of cluster development 128 2.911.04 Nature of competitive advantage 115 2.811.05 Value chain breadth 120 3.211.06 Control of international distribution 117 3.011.07 Production process sophistication 132 2.611.08 Extent of marketing 134 3.411.09 Willingness to delegate authority 133 2.8
131 2.5 12th pillar: Innovation12.01 Capacity for innovation 133 3.212.02 Quality of scientific research institutions 136 2.212.03 Company spending on R&D 125 2.612.04 University-industry collaboration in R&D 115 2.812.05 Gov't procurement of advanced tech. products 111 2.712.06 Availability of scientists and engineers 122 3.212.07 PCT patent applications applications/million pop. 121 0.0
Burundi
The Africa Competitiveness Report 2017 | 95
Country Profiles
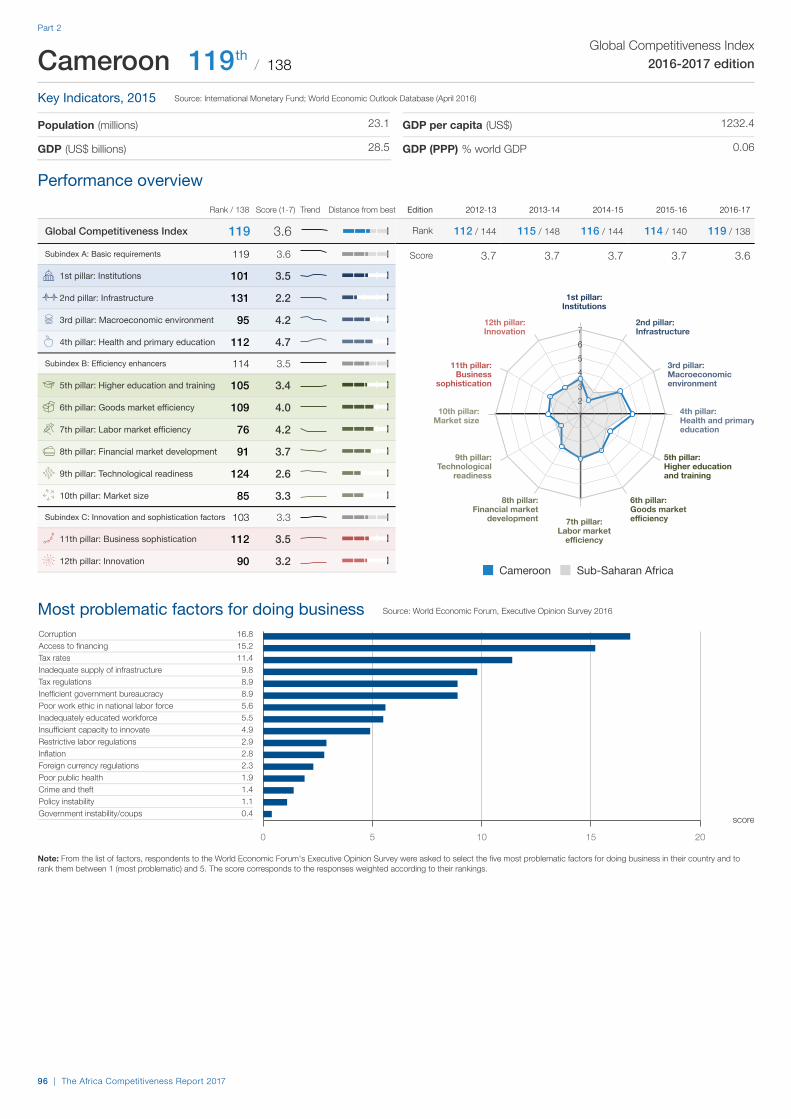
Edition 2012-13 2013-14 2014-15 2015-16 2016-17
Rank 112 / 144 115 / 148 116 / 144 114 / 140 119 / 138
Score 3.7 3.7 3.7 3.7 3.6
Most problematic factors for doing business
Performance overview
Note: From the list of factors, respondents to the World Economic Forum's Executive Opinion Survey were asked to select the five most problematic factors for doing business in their country and torank them between 1 (most problematic) and 5. The score corresponds to the responses weighted according to their rankings.
The Global Competitiveness Index in detail
Rank / 138 Score (1-7) Trend Distance from best
Global Competitiveness Index 119 3.6Subindex A: Basic requirements 119 3.6
101 3.5 1st pillar: Institutions
131 2.22nd pillar: Infrastructure
95 4.2 3rd pillar: Macroeconomic environment
112 4.7 4th pillar: Health and primary education
Subindex B: Efficiency enhancers 114 3.5
105 3.4 5th pillar: Higher education and training
109 4.0 6th pillar: Goods market efficiency
76 4.2 7th pillar: Labor market efficiency
91 3.7 8th pillar: Financial market development
124 2.6 9th pillar: Technological readiness
85 3.3 10th pillar: Market size
Subindex C: Innovation and sophistication factors 103 3.3
112 3.5 11th pillar: Business sophistication
90 3.2 12th pillar: Innovation
1234567
1st pillar:Institutions
2nd pillar:Infrastructure
3rd pillar:Macroeconomicenvironment
4th pillar:Health and primaryeducation
5th pillar:Higher educationand training
6th pillar:Goods marketefficiency7th pillar:
Labor marketefficiency
8th pillar:Financial market
development
9th pillar:Technological
readiness
10th pillar:Market size
11th pillar:Business
sophistication
12th pillar:Innovation
Cameroon Sub-Saharan Africa
Source: World Economic Forum, Executive Opinion Survey 2016
16.815.211.4
9.88.98.95.65.54.92.92.82.31.91.41.10.4
CorruptionAccess to financingTax ratesInadequate supply of infrastructureTax regulationsInefficient government bureaucracyPoor work ethic in national labor forceInadequately educated workforceInsufficient capacity to innovateRestrictive labor regulationsInflationForeign currency regulationsPoor public healthCrime and theftPolicy instabilityGovernment instability/coups
0 5 10 15 20
score
Global Competitiveness Index2016-2017 edition
Key Indicators, 2015
Population (millions)
GDP (US$ billions)
GDP per capita (US$)
GDP (PPP) % world GDP
Cameroon 119 / 138th
Source: International Monetary Fund; World Economic Outlook Database (April 2016)
23.1
28.5
1232.4
0.06
96 | The Africa Competitiveness Report 2017
Part 2

The Global Competitiveness Index in detail
Note: Values are on a 1-to-7 scale unless indicated otherwise. Trend lines depict evolution in values since the 2012-2013 edition (or earliest edition available). For detailed definitions,sources, and periods, consult the interactive Country/Economy Profiles and Rankings at http://gcr.weforum.org/
Rank / 138 Value Trend Rank / 138 Value Trend
101 3.5 1st pillar: Institutions1.01 Property rights 85 4.11.02 Intellectual property protection 60 4.31.03 Diversion of public funds 126 2.31.04 Public trust in politicians 72 3.01.05 Irregular payments and bribes 123 2.91.06 Judicial independence 111 3.01.07 Favoritism in decisions of government officials 98 2.71.08 Wastefulness of government spending 85 2.81.09 Burden of government regulation 78 3.41.10 Efficiency of legal framework in settling disputes 66 3.61.11 Efficiency of legal framework in challenging regs 71 3.41.12 Transparency of government policymaking 67 4.11.13 Business costs of terrorism 124 3.61.14 Business costs of crime and violence 103 3.91.15 Organized crime 95 4.31.16 Reliability of police services 69 4.31.17 Ethical behavior of firms 118 3.21.18 Strength of auditing and reporting standards 119 3.71.19 Efficacy of corporate boards 69 4.91.20 Protection of minority shareholders’ interests 75 4.01.21 Strength of investor protection 0-10 (best) 108 4.3
131 2.22nd pillar: Infrastructure2.01 Quality of overall infrastructure 134 2.22.02 Quality of roads 130 2.52.03 Quality of railroad infrastructure 82 2.42.04 Quality of port infrastructure 112 3.02.05 Quality of air transport infrastructure 130 2.72.06 Available airline seat kilometers millions/week 97 58.12.07 Quality of electricity supply 128 2.12.08 Mobile-cellular telephone subscriptions /100 pop. 127 71.82.09 Fixed-telephone lines /100 pop. 106 4.5
95 4.2 3rd pillar: Macroeconomic environment3.01 Government budget balance % GDP 109 -5.83.02 Gross national savings % GDP 92 16.03.03 Inflation annual % change 1 2.83.04 Government debt % GDP 28 33.53.05 Country credit rating 0-100 (best) 96 -
112 4.7 4th pillar: Health and primary education4.01 Malaria incidence cases/100,000 pop. 60 22834.04.02 Business impact of malaria 55 3.84.03 Tuberculosis incidence cases/100,000 pop. 117 220.04.04 Business impact of tuberculosis 121 4.14.05 HIV prevalence % adult pop. 126 4.84.06 Business impact of HIV/AIDS 118 4.04.07 Infant mortality deaths/1,000 live births 128 57.14.08 Life expectancy years 132 55.54.09 Quality of primary education 61 4.24.10 Primary education enrollment rate net % 94 91.6
105 3.4 5th pillar: Higher education and training5.01 Secondary education enrollment rate gross % 113 56.45.02 Tertiary education enrollment rate gross % 111 11.95.03 Quality of the education system 79 3.65.04 Quality of math and science education 63 4.35.05 Quality of management schools 47 4.65.06 Internet access in schools 94 3.85.07 Local availability of specialized training services 67 4.35.08 Extent of staff training 74 3.8
109 4.0 6th pillar: Goods market efficiency6.01 Intensity of local competition 88 4.86.02 Extent of market dominance 49 3.96.03 Effectiveness of anti-monopoly policy 90 3.46.04 Effect of taxation on incentives to invest 105 3.26.05 Total tax rate % profits 104 48.86.06 No. of procedures to start a business 41 56.07 Time to start a business days 87 15.06.08 Agricultural policy costs 78 3.76.09 Prevalence of non-tariff barriers 131 3.36.10 Trade tariffs % duty 132 14.66.11 Prevalence of foreign ownership 64 4.56.12 Business impact of rules on FDI 83 4.46.13 Burden of customs procedures 108 3.46.14 Imports % GDP 111 29.76.15 Degree of customer orientation 94 4.36.16 Buyer sophistication 123 2.7
76 4.2 7th pillar: Labor market efficiency7.01 Cooperation in labor-employer relations 100 4.17.02 Flexibility of wage determination 79 4.97.03 Hiring and firing practices 46 4.17.04 Redundancy costs weeks of salary 88 19.97.05 Effect of taxation on incentives to work 34 4.47.06 Pay and productivity 115 3.47.07 Reliance on professional management 125 3.37.08 Country capacity to retain talent 119 2.67.09 Country capacity to attract talent 108 2.67.10 Female participation in the labor force ratio to men 44 0.88
91 3.7 8th pillar: Financial market development8.01 Financial services meeting business needs 91 4.08.02 Affordability of financial services 103 3.28.03 Financing through local equity market 86 3.38.04 Ease of access to loans 98 3.48.05 Venture capital availability 103 2.48.06 Soundness of banks 93 4.48.07 Regulation of securities exchanges 101 3.88.08 Legal rights index 0-10 (best) 46 6
124 2.6 9th pillar: Technological readiness9.01 Availability of latest technologies 120 3.89.02 Firm-level technology absorption 110 4.09.03 FDI and technology transfer 117 3.69.04 Internet users % pop. 112 20.79.05 Fixed-broadband Internet subscriptions /100 pop. 131 0.19.06 Internet bandwidth kb/s/user 137 1.09.07 Mobile-broadband subscriptions /100 pop. 135 4.3
85 3.3 10th pillar: Market size10.01 Domestic market size index 83 3.210.02 Foreign market size index 105 3.710.03 GDP (PPP) PPP $ billions 86 72.610.04 Exports % GDP 120 17.8
112 3.5 11th pillar: Business sophistication11.01 Local supplier quantity 101 4.211.02 Local supplier quality 104 3.811.03 State of cluster development 105 3.211.04 Nature of competitive advantage 120 2.711.05 Value chain breadth 99 3.511.06 Control of international distribution 99 3.211.07 Production process sophistication 121 2.911.08 Extent of marketing 51 4.611.09 Willingness to delegate authority 107 3.4
90 3.2 12th pillar: Innovation12.01 Capacity for innovation 44 4.412.02 Quality of scientific research institutions 88 3.612.03 Company spending on R&D 85 3.112.04 University-industry collaboration in R&D 91 3.212.05 Gov't procurement of advanced tech. products 91 3.012.06 Availability of scientists and engineers 110 3.412.07 PCT patent applications applications/million pop. 110 0.0
Cameroon
The Africa Competitiveness Report 2017 | 97
Country Profiles

Edition 2012-13 2013-14 2014-15 2015-16 2016-17
Rank 122 / 144 122 / 148 114 / 144 112 / 140 110 / 138
Score 3.5 3.5 3.7 3.7 3.8
Most problematic factors for doing business
Performance overview
Note: From the list of factors, respondents to the World Economic Forum's Executive Opinion Survey were asked to select the five most problematic factors for doing business in their country and torank them between 1 (most problematic) and 5. The score corresponds to the responses weighted according to their rankings.
The Global Competitiveness Index in detail
Rank / 138 Score (1-7) Trend Distance from best
Global Competitiveness Index 110 3.8Subindex A: Basic requirements 89 4.3
71 4.0 1st pillar: Institutions
94 3.42nd pillar: Infrastructure
107 4.0 3rd pillar: Macroeconomic environment
58 5.9 4th pillar: Health and primary education
Subindex B: Efficiency enhancers 121 3.4
79 4.1 5th pillar: Higher education and training
97 4.1 6th pillar: Goods market efficiency
116 3.7 7th pillar: Labor market efficiency
112 3.4 8th pillar: Financial market development
78 3.8 9th pillar: Technological readiness
137 1.4 10th pillar: Market size
Subindex C: Innovation and sophistication factors 105 3.3
108 3.5 11th pillar: Business sophistication
98 3.1 12th pillar: Innovation
1234567
1st pillar:Institutions
2nd pillar:Infrastructure
3rd pillar:Macroeconomicenvironment
4th pillar:Health and primaryeducation
5th pillar:Higher educationand training
6th pillar:Goods marketefficiency7th pillar:
Labor marketefficiency
8th pillar:Financial market
development
9th pillar:Technological
readiness
10th pillar:Market size
11th pillar:Business
sophistication
12th pillar:Innovation
Cape Verde Sub-Saharan Africa
Source: World Economic Forum, Executive Opinion Survey 2016
21.617.211.3
9.87.56.96.44.34.03.03.02.21.70.50.50.1
Access to financingTax ratesInefficient government bureaucracyTax regulationsRestrictive labor regulationsInadequately educated workforceInadequate supply of infrastructureInsufficient capacity to innovateCrime and theftPoor work ethic in national labor forceCorruptionPoor public healthInflationForeign currency regulationsGovernment instability/coupsPolicy instability
0 6 12 18 24
score
Global Competitiveness Index2016-2017 edition
Key Indicators, 2015
Population (millions)
GDP (US$ billions)
GDP per capita (US$)
GDP (PPP) % world GDP
Cape Verde 110 / 138th
Source: International Monetary Fund; World Economic Outlook Database (April 2016)
0.5
1.6
3038.5
0.00
98 | The Africa Competitiveness Report 2017
Part 2
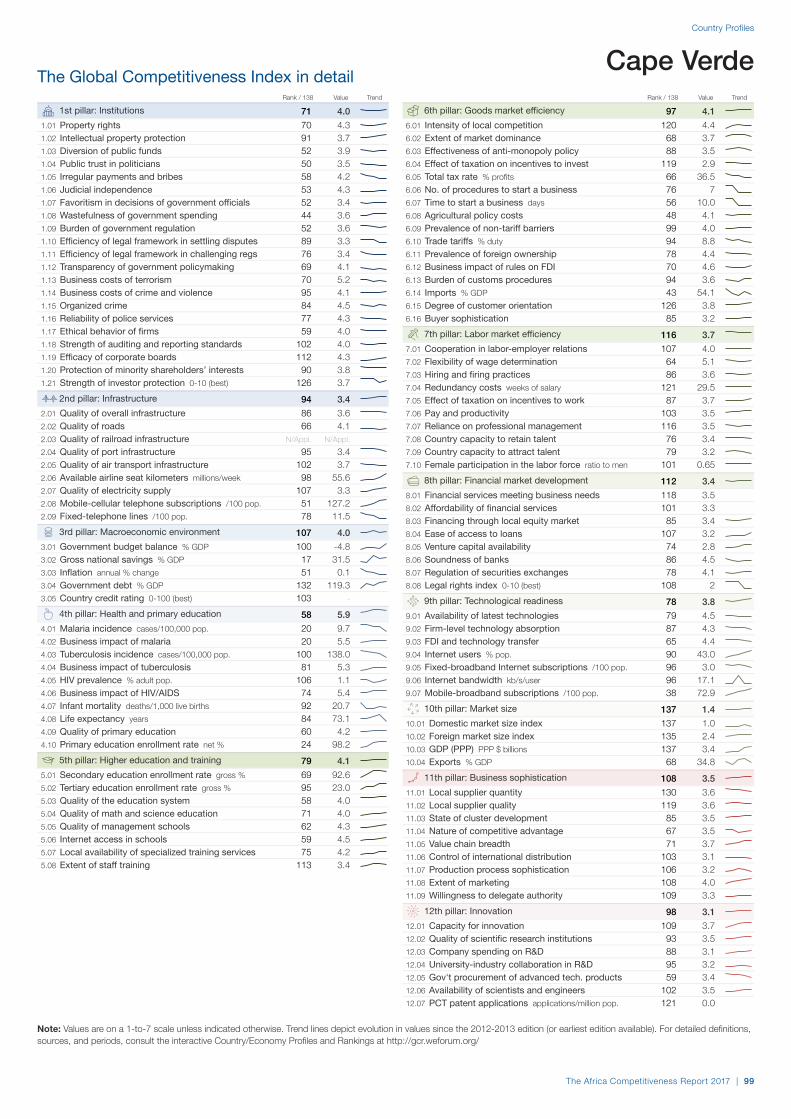
The Global Competitiveness Index in detail
Note: Values are on a 1-to-7 scale unless indicated otherwise. Trend lines depict evolution in values since the 2012-2013 edition (or earliest edition available). For detailed definitions,sources, and periods, consult the interactive Country/Economy Profiles and Rankings at http://gcr.weforum.org/
Rank / 138 Value Trend Rank / 138 Value Trend
71 4.0 1st pillar: Institutions1.01 Property rights 70 4.31.02 Intellectual property protection 91 3.71.03 Diversion of public funds 52 3.91.04 Public trust in politicians 50 3.51.05 Irregular payments and bribes 58 4.21.06 Judicial independence 53 4.31.07 Favoritism in decisions of government officials 52 3.41.08 Wastefulness of government spending 44 3.61.09 Burden of government regulation 52 3.61.10 Efficiency of legal framework in settling disputes 89 3.31.11 Efficiency of legal framework in challenging regs 76 3.41.12 Transparency of government policymaking 69 4.11.13 Business costs of terrorism 70 5.21.14 Business costs of crime and violence 95 4.11.15 Organized crime 84 4.51.16 Reliability of police services 77 4.31.17 Ethical behavior of firms 59 4.01.18 Strength of auditing and reporting standards 102 4.01.19 Efficacy of corporate boards 112 4.31.20 Protection of minority shareholders’ interests 90 3.81.21 Strength of investor protection 0-10 (best) 126 3.7
94 3.42nd pillar: Infrastructure2.01 Quality of overall infrastructure 86 3.62.02 Quality of roads 66 4.12.03 Quality of railroad infrastructure N/Appl. N/Appl.2.04 Quality of port infrastructure 95 3.42.05 Quality of air transport infrastructure 102 3.72.06 Available airline seat kilometers millions/week 98 55.62.07 Quality of electricity supply 107 3.32.08 Mobile-cellular telephone subscriptions /100 pop. 51 127.22.09 Fixed-telephone lines /100 pop. 78 11.5
107 4.0 3rd pillar: Macroeconomic environment3.01 Government budget balance % GDP 100 -4.83.02 Gross national savings % GDP 17 31.53.03 Inflation annual % change 51 0.13.04 Government debt % GDP 132 119.33.05 Country credit rating 0-100 (best) 103 -
58 5.9 4th pillar: Health and primary education4.01 Malaria incidence cases/100,000 pop. 20 9.74.02 Business impact of malaria 20 5.54.03 Tuberculosis incidence cases/100,000 pop. 100 138.04.04 Business impact of tuberculosis 81 5.34.05 HIV prevalence % adult pop. 106 1.14.06 Business impact of HIV/AIDS 74 5.44.07 Infant mortality deaths/1,000 live births 92 20.74.08 Life expectancy years 84 73.14.09 Quality of primary education 60 4.24.10 Primary education enrollment rate net % 24 98.2
79 4.1 5th pillar: Higher education and training5.01 Secondary education enrollment rate gross % 69 92.65.02 Tertiary education enrollment rate gross % 95 23.05.03 Quality of the education system 58 4.05.04 Quality of math and science education 71 4.05.05 Quality of management schools 62 4.35.06 Internet access in schools 59 4.55.07 Local availability of specialized training services 75 4.25.08 Extent of staff training 113 3.4
97 4.1 6th pillar: Goods market efficiency6.01 Intensity of local competition 120 4.46.02 Extent of market dominance 68 3.76.03 Effectiveness of anti-monopoly policy 88 3.56.04 Effect of taxation on incentives to invest 119 2.96.05 Total tax rate % profits 66 36.56.06 No. of procedures to start a business 76 76.07 Time to start a business days 56 10.06.08 Agricultural policy costs 48 4.16.09 Prevalence of non-tariff barriers 99 4.06.10 Trade tariffs % duty 94 8.86.11 Prevalence of foreign ownership 78 4.46.12 Business impact of rules on FDI 70 4.66.13 Burden of customs procedures 94 3.66.14 Imports % GDP 43 54.16.15 Degree of customer orientation 126 3.86.16 Buyer sophistication 85 3.2
116 3.7 7th pillar: Labor market efficiency7.01 Cooperation in labor-employer relations 107 4.07.02 Flexibility of wage determination 64 5.17.03 Hiring and firing practices 86 3.67.04 Redundancy costs weeks of salary 121 29.57.05 Effect of taxation on incentives to work 87 3.77.06 Pay and productivity 103 3.57.07 Reliance on professional management 116 3.57.08 Country capacity to retain talent 76 3.47.09 Country capacity to attract talent 79 3.27.10 Female participation in the labor force ratio to men 101 0.65
112 3.4 8th pillar: Financial market development8.01 Financial services meeting business needs 118 3.58.02 Affordability of financial services 101 3.38.03 Financing through local equity market 85 3.48.04 Ease of access to loans 107 3.28.05 Venture capital availability 74 2.88.06 Soundness of banks 86 4.58.07 Regulation of securities exchanges 78 4.18.08 Legal rights index 0-10 (best) 108 2
78 3.8 9th pillar: Technological readiness9.01 Availability of latest technologies 79 4.59.02 Firm-level technology absorption 87 4.39.03 FDI and technology transfer 65 4.49.04 Internet users % pop. 90 43.09.05 Fixed-broadband Internet subscriptions /100 pop. 96 3.09.06 Internet bandwidth kb/s/user 96 17.19.07 Mobile-broadband subscriptions /100 pop. 38 72.9
137 1.4 10th pillar: Market size10.01 Domestic market size index 137 1.010.02 Foreign market size index 135 2.410.03 GDP (PPP) PPP $ billions 137 3.410.04 Exports % GDP 68 34.8
108 3.5 11th pillar: Business sophistication11.01 Local supplier quantity 130 3.611.02 Local supplier quality 119 3.611.03 State of cluster development 85 3.511.04 Nature of competitive advantage 67 3.511.05 Value chain breadth 71 3.711.06 Control of international distribution 103 3.111.07 Production process sophistication 106 3.211.08 Extent of marketing 108 4.011.09 Willingness to delegate authority 109 3.3
98 3.1 12th pillar: Innovation12.01 Capacity for innovation 109 3.712.02 Quality of scientific research institutions 93 3.512.03 Company spending on R&D 88 3.112.04 University-industry collaboration in R&D 95 3.212.05 Gov't procurement of advanced tech. products 59 3.412.06 Availability of scientists and engineers 102 3.512.07 PCT patent applications applications/million pop. 121 0.0
Cape Verde
The Africa Competitiveness Report 2017 | 99
Country Profiles

Edition 2012-13 2013-14 2014-15 2015-16 2016-17
Rank 139 / 144 148 / 148 143 / 144 139 / 140 136 / 138
Score 3.1 2.9 2.8 3.0 2.9
Most problematic factors for doing business
Performance overview
Note: From the list of factors, respondents to the World Economic Forum's Executive Opinion Survey were asked to select the five most problematic factors for doing business in their country and torank them between 1 (most problematic) and 5. The score corresponds to the responses weighted according to their rankings.
The Global Competitiveness Index in detail
Rank / 138 Score (1-7) Trend Distance from best
Global Competitiveness Index 136 2.9Subindex A: Basic requirements 135 3.1
136 2.7 1st pillar: Institutions
137 1.82nd pillar: Infrastructure
105 4.1 3rd pillar: Macroeconomic environment
131 3.8 4th pillar: Health and primary education
Subindex B: Efficiency enhancers 135 2.8
137 2.2 5th pillar: Higher education and training
137 3.0 6th pillar: Goods market efficiency
111 3.8 7th pillar: Labor market efficiency
133 2.9 8th pillar: Financial market development
138 1.9 9th pillar: Technological readiness
115 2.8 10th pillar: Market size
Subindex C: Innovation and sophistication factors 137 2.6
137 2.7 11th pillar: Business sophistication
134 2.5 12th pillar: Innovation
1234567
1st pillar:Institutions
2nd pillar:Infrastructure
3rd pillar:Macroeconomicenvironment
4th pillar:Health and primaryeducation
5th pillar:Higher educationand training
6th pillar:Goods marketefficiency7th pillar:
Labor marketefficiency
8th pillar:Financial market
development
9th pillar:Technological
readiness
10th pillar:Market size
11th pillar:Business
sophistication
12th pillar:Innovation
Chad Sub-Saharan Africa
Source: World Economic Forum, Executive Opinion Survey 2016
20.416.413.110.0
6.65.35.14.84.33.83.52.12.01.70.90.1
Access to financingCorruptionTax ratesInadequate supply of infrastructureInefficient government bureaucracyInadequately educated workforcePoor work ethic in national labor forceCrime and theftInsufficient capacity to innovatePolicy instabilityTax regulationsPoor public healthInflationRestrictive labor regulationsGovernment instability/coupsForeign currency regulations
0 6 12 18 24
score
Global Competitiveness Index2016-2017 edition
Key Indicators, 2015
Population (millions)
GDP (US$ billions)
GDP per capita (US$)
GDP (PPP) % world GDP
Chad 136 / 138th
Source: International Monetary Fund; World Economic Outlook Database (April 2016)
11.6
10.9
941.9
0.03
100 | The Africa Competitiveness Report 2017
Part 2

The Global Competitiveness Index in detail
Note: Values are on a 1-to-7 scale unless indicated otherwise. Trend lines depict evolution in values since the 2012-2013 edition (or earliest edition available). For detailed definitions,sources, and periods, consult the interactive Country/Economy Profiles and Rankings at http://gcr.weforum.org/
Rank / 138 Value Trend Rank / 138 Value Trend
136 2.7 1st pillar: Institutions1.01 Property rights 133 3.01.02 Intellectual property protection 133 2.81.03 Diversion of public funds 137 1.61.04 Public trust in politicians 105 2.41.05 Irregular payments and bribes 136 2.11.06 Judicial independence 130 2.21.07 Favoritism in decisions of government officials 113 2.31.08 Wastefulness of government spending 100 2.61.09 Burden of government regulation 95 3.21.10 Efficiency of legal framework in settling disputes 105 3.01.11 Efficiency of legal framework in challenging regs 114 2.71.12 Transparency of government policymaking 135 2.71.13 Business costs of terrorism 136 2.61.14 Business costs of crime and violence 123 3.01.15 Organized crime 128 3.11.16 Reliability of police services 124 2.91.17 Ethical behavior of firms 135 2.71.18 Strength of auditing and reporting standards 136 2.81.19 Efficacy of corporate boards 134 3.71.20 Protection of minority shareholders’ interests 130 3.31.21 Strength of investor protection 0-10 (best) 120 3.8
137 1.82nd pillar: Infrastructure2.01 Quality of overall infrastructure 137 1.72.02 Quality of roads 127 2.62.03 Quality of railroad infrastructure N/Appl. N/Appl.2.04 Quality of port infrastructure 131 2.02.05 Quality of air transport infrastructure 125 2.92.06 Available airline seat kilometers millions/week 130 10.22.07 Quality of electricity supply 131 1.92.08 Mobile-cellular telephone subscriptions /100 pop. 137 40.22.09 Fixed-telephone lines /100 pop. 136 0.1
105 4.1 3rd pillar: Macroeconomic environment3.01 Government budget balance % GDP 102 -4.93.02 Gross national savings % GDP 105 14.43.03 Inflation annual % change 66 3.63.04 Government debt % GDP 50 39.33.05 Country credit rating 0-100 (best) 135 -
131 3.8 4th pillar: Health and primary education4.01 Malaria incidence cases/100,000 pop. 53 13983.94.02 Business impact of malaria 70 2.84.03 Tuberculosis incidence cases/100,000 pop. 106 159.04.04 Business impact of tuberculosis 135 3.44.05 HIV prevalence % adult pop. 121 2.54.06 Business impact of HIV/AIDS 132 3.44.07 Infant mortality deaths/1,000 live births 137 85.04.08 Life expectancy years 136 51.64.09 Quality of primary education 129 2.54.10 Primary education enrollment rate net % 124 84.4
137 2.2 5th pillar: Higher education and training5.01 Secondary education enrollment rate gross % 138 22.45.02 Tertiary education enrollment rate gross % 134 3.45.03 Quality of the education system 129 2.55.04 Quality of math and science education 121 2.85.05 Quality of management schools 131 3.15.06 Internet access in schools 138 1.75.07 Local availability of specialized training services 130 3.35.08 Extent of staff training 136 2.9
137 3.0 6th pillar: Goods market efficiency6.01 Intensity of local competition 137 3.66.02 Extent of market dominance 138 2.16.03 Effectiveness of anti-monopoly policy 135 2.56.04 Effect of taxation on incentives to invest 129 2.66.05 Total tax rate % profits 127 63.56.06 No. of procedures to start a business 108 96.07 Time to start a business days 131 60.06.08 Agricultural policy costs 125 3.06.09 Prevalence of non-tariff barriers 135 3.16.10 Trade tariffs % duty 131 14.36.11 Prevalence of foreign ownership 131 3.16.12 Business impact of rules on FDI 129 3.26.13 Burden of customs procedures 137 2.46.14 Imports % GDP 83 36.96.15 Degree of customer orientation 138 3.06.16 Buyer sophistication 131 2.3
111 3.8 7th pillar: Labor market efficiency7.01 Cooperation in labor-employer relations 130 3.57.02 Flexibility of wage determination 88 4.87.03 Hiring and firing practices 105 3.37.04 Redundancy costs weeks of salary 50 13.07.05 Effect of taxation on incentives to work 99 3.67.06 Pay and productivity 136 2.57.07 Reliance on professional management 137 2.47.08 Country capacity to retain talent 112 2.77.09 Country capacity to attract talent 90 3.07.10 Female participation in the labor force ratio to men 63 0.82
133 2.9 8th pillar: Financial market development8.01 Financial services meeting business needs 135 2.78.02 Affordability of financial services 134 2.48.03 Financing through local equity market 126 2.58.04 Ease of access to loans 131 2.68.05 Venture capital availability 132 2.08.06 Soundness of banks 130 3.28.07 Regulation of securities exchanges 132 2.88.08 Legal rights index 0-10 (best) 46 6
138 1.9 9th pillar: Technological readiness9.01 Availability of latest technologies 138 2.79.02 Firm-level technology absorption 137 3.19.03 FDI and technology transfer 136 2.89.04 Internet users % pop. 137 2.79.05 Fixed-broadband Internet subscriptions /100 pop. 128 0.19.06 Internet bandwidth kb/s/user 130 2.69.07 Mobile-broadband subscriptions /100 pop. 138 1.4
115 2.8 10th pillar: Market size10.01 Domestic market size index 111 2.510.02 Foreign market size index 118 3.410.03 GDP (PPP) PPP $ billions 113 30.510.04 Exports % GDP 101 24.5
137 2.7 11th pillar: Business sophistication11.01 Local supplier quantity 104 4.111.02 Local supplier quality 136 3.011.03 State of cluster development 136 2.611.04 Nature of competitive advantage 129 2.411.05 Value chain breadth 137 2.411.06 Control of international distribution 138 2.311.07 Production process sophistication 138 2.011.08 Extent of marketing 136 3.211.09 Willingness to delegate authority 135 2.4
134 2.5 12th pillar: Innovation12.01 Capacity for innovation 132 3.212.02 Quality of scientific research institutions 127 2.612.03 Company spending on R&D 127 2.612.04 University-industry collaboration in R&D 128 2.612.05 Gov't procurement of advanced tech. products 123 2.612.06 Availability of scientists and engineers 136 2.712.07 PCT patent applications applications/million pop. 121 0.0
Chad
The Africa Competitiveness Report 2017 | 101
Country Profiles

Edition 2016-17
Rank 129 / 138
Score 3.3
Most problematic factors for doing business
Performance overview
Note: From the list of factors, respondents to the World Economic Forum's Executive Opinion Survey were asked to select the five most problematic factors for doing business in their country and torank them between 1 (most problematic) and 5. The score corresponds to the responses weighted according to their rankings.
The Global Competitiveness Index in detail
Rank / 138 Score (1-7) Trend Distance from best
Global Competitiveness Index 129 3.3Subindex A: Basic requirements 128 3.3
117 3.3 1st pillar: Institutions
138 1.72nd pillar: Infrastructure
64 4.8 3rd pillar: Macroeconomic environment
135 3.5 4th pillar: Health and primary education
Subindex B: Efficiency enhancers 127 3.3
128 2.8 5th pillar: Higher education and training
127 3.7 6th pillar: Goods market efficiency
53 4.4 7th pillar: Labor market efficiency
117 3.2 8th pillar: Financial market development
134 2.3 9th pillar: Technological readiness
95 3.2 10th pillar: Market size
Subindex C: Innovation and sophistication factors 125 3.0
132 3.2 11th pillar: Business sophistication
115 2.8 12th pillar: Innovation
1234567
1st pillar:Institutions
2nd pillar:Infrastructure
3rd pillar:Macroeconomicenvironment
4th pillar:Health and primaryeducation
5th pillar:Higher educationand training
6th pillar:Goods marketefficiency7th pillar:
Labor marketefficiency
8th pillar:Financial market
development
9th pillar:Technological
readiness
10th pillar:Market size
11th pillar:Business
sophistication
12th pillar:Innovation
Congo, Democratic Rep. Sub-Saharan Africa
Source: World Economic Forum, Executive Opinion Survey 2016
18.416.713.412.1
8.77.94.54.33.82.62.52.21.20.80.60.5
Access to financingCorruptionInadequate supply of infrastructureTax ratesTax regulationsPolicy instabilityInadequately educated workforceRestrictive labor regulationsPoor work ethic in national labor forceGovernment instability/coupsInsufficient capacity to innovateInefficient government bureaucracyPoor public healthInflationCrime and theftForeign currency regulations
0 5 10 15 20
score
Global Competitiveness Index2016-2017 edition
Key Indicators, 2015
Population (millions)
GDP (US$ billions)
GDP per capita (US$)
GDP (PPP) % world GDP
Congo, Democratic Rep. 129 / 138th
Source: International Monetary Fund; World Economic Outlook Database (April 2016)
81.7
38.9
475.9
0.06
102 | The Africa Competitiveness Report 2017
Part 2

The Global Competitiveness Index in detail
Note: Values are on a 1-to-7 scale unless indicated otherwise. Trend lines depict evolution in values since the 2012-2013 edition (or earliest edition available). For detailed definitions,sources, and periods, consult the interactive Country/Economy Profiles and Rankings at http://gcr.weforum.org/
Rank / 138 Value Trend Rank / 138 Value Trend
117 3.3 1st pillar: Institutions1.01 Property rights 114 3.71.02 Intellectual property protection 106 3.51.03 Diversion of public funds 113 2.61.04 Public trust in politicians 102 2.41.05 Irregular payments and bribes 131 2.61.06 Judicial independence 131 2.21.07 Favoritism in decisions of government officials 89 2.81.08 Wastefulness of government spending n/a n/a1.09 Burden of government regulation 53 3.61.10 Efficiency of legal framework in settling disputes 85 3.31.11 Efficiency of legal framework in challenging regs 120 2.61.12 Transparency of government policymaking 102 3.71.13 Business costs of terrorism 59 5.41.14 Business costs of crime and violence 89 4.21.15 Organized crime 88 4.31.16 Reliability of police services 100 3.71.17 Ethical behavior of firms 128 3.01.18 Strength of auditing and reporting standards 132 3.51.19 Efficacy of corporate boards 84 4.71.20 Protection of minority shareholders’ interests 85 3.81.21 Strength of investor protection 0-10 (best) 133 3.3
138 1.72nd pillar: Infrastructure2.01 Quality of overall infrastructure 136 1.92.02 Quality of roads 137 2.12.03 Quality of railroad infrastructure 101 1.52.04 Quality of port infrastructure 124 2.32.05 Quality of air transport infrastructure 127 2.82.06 Available airline seat kilometers millions/week 108 38.32.07 Quality of electricity supply 136 1.62.08 Mobile-cellular telephone subscriptions /100 pop. 132 53.02.09 Fixed-telephone lines /100 pop. 138 0.0
64 4.8 3rd pillar: Macroeconomic environment3.01 Government budget balance % GDP 3 1.93.02 Gross national savings % GDP 129 5.53.03 Inflation annual % change 1 1.03.04 Government debt % GDP 12 18.83.05 Country credit rating 0-100 (best) 134 -
135 3.5 4th pillar: Health and primary education4.01 Malaria incidence cases/100,000 pop. 61 28046.04.02 Business impact of malaria N/Appl. n/a4.03 Tuberculosis incidence cases/100,000 pop. 128 325.04.04 Business impact of tuberculosis n/a n/a4.05 HIV prevalence % adult pop. 104 1.04.06 Business impact of HIV/AIDS n/a n/a4.07 Infant mortality deaths/1,000 live births 135 74.54.08 Life expectancy years 126 58.74.09 Quality of primary education 86 3.64.10 Primary education enrollment rate net % 115 87.0
128 2.8 5th pillar: Higher education and training5.01 Secondary education enrollment rate gross % 122 43.55.02 Tertiary education enrollment rate gross % 125 6.65.03 Quality of the education system 113 3.05.04 Quality of math and science education 84 3.85.05 Quality of management schools 108 3.75.06 Internet access in schools 130 2.95.07 Local availability of specialized training services 119 3.65.08 Extent of staff training 116 3.4
127 3.7 6th pillar: Goods market efficiency6.01 Intensity of local competition 102 4.76.02 Extent of market dominance 106 3.36.03 Effectiveness of anti-monopoly policy 93 3.46.04 Effect of taxation on incentives to invest 100 3.26.05 Total tax rate % profits 118 54.66.06 No. of procedures to start a business 54 66.07 Time to start a business days 67 11.06.08 Agricultural policy costs 127 3.06.09 Prevalence of non-tariff barriers 136 2.96.10 Trade tariffs % duty 112 10.26.11 Prevalence of foreign ownership 51 4.86.12 Business impact of rules on FDI 65 4.76.13 Burden of customs procedures 110 3.46.14 Imports % GDP 119 24.76.15 Degree of customer orientation 103 4.26.16 Buyer sophistication 136 2.0
53 4.4 7th pillar: Labor market efficiency7.01 Cooperation in labor-employer relations 88 4.27.02 Flexibility of wage determination 58 5.27.03 Hiring and firing practices 102 3.47.04 Redundancy costs weeks of salary 35 10.37.05 Effect of taxation on incentives to work 23 4.67.06 Pay and productivity 137 2.47.07 Reliance on professional management 93 3.87.08 Country capacity to retain talent 121 2.67.09 Country capacity to attract talent 96 2.97.10 Female participation in the labor force ratio to men 6 0.99
117 3.2 8th pillar: Financial market development8.01 Financial services meeting business needs 129 3.28.02 Affordability of financial services 127 2.88.03 Financing through local equity market 134 2.38.04 Ease of access to loans 119 3.08.05 Venture capital availability 96 2.58.06 Soundness of banks 126 3.48.07 Regulation of securities exchanges 97 3.88.08 Legal rights index 0-10 (best) 46 6
134 2.3 9th pillar: Technological readiness9.01 Availability of latest technologies 130 3.49.02 Firm-level technology absorption 125 3.79.03 FDI and technology transfer 124 3.59.04 Internet users % pop. 136 3.89.05 Fixed-broadband Internet subscriptions /100 pop. 137 0.09.06 Internet bandwidth kb/s/user 138 0.49.07 Mobile-broadband subscriptions /100 pop. 129 8.5
95 3.2 10th pillar: Market size10.01 Domestic market size index 88 3.010.02 Foreign market size index 110 3.610.03 GDP (PPP) PPP $ billions 90 62.910.04 Exports % GDP 122 16.6
132 3.2 11th pillar: Business sophistication11.01 Local supplier quantity 122 3.811.02 Local supplier quality 114 3.711.03 State of cluster development 116 3.011.04 Nature of competitive advantage 127 2.411.05 Value chain breadth 136 2.511.06 Control of international distribution 137 2.311.07 Production process sophistication 136 2.411.08 Extent of marketing 39 4.811.09 Willingness to delegate authority n/a n/a
115 2.8 12th pillar: Innovation12.01 Capacity for innovation 106 3.712.02 Quality of scientific research institutions 107 3.212.03 Company spending on R&D 114 2.812.04 University-industry collaboration in R&D 113 2.912.05 Gov't procurement of advanced tech. products 130 2.412.06 Availability of scientists and engineers 103 3.512.07 PCT patent applications applications/million pop. 121 0.0
Congo, Democratic Rep.
The Africa Competitiveness Report 2017 | 103
Country Profiles

Edition 2012-13 2013-14 2014-15 2015-16 2016-17
Rank 131 / 144 126 / 148 115 / 144 91 / 140 99 / 138
Score 3.4 3.5 3.7 3.9 3.9
Most problematic factors for doing business
Performance overview
Note: From the list of factors, respondents to the World Economic Forum's Executive Opinion Survey were asked to select the five most problematic factors for doing business in their country and torank them between 1 (most problematic) and 5. The score corresponds to the responses weighted according to their rankings.
The Global Competitiveness Index in detail
Rank / 138 Score (1-7) Trend Distance from best
Global Competitiveness Index 99 3.9Subindex A: Basic requirements 104 4.0
77 3.8 1st pillar: Institutions
87 3.62nd pillar: Infrastructure
66 4.7 3rd pillar: Macroeconomic environment
132 3.7 4th pillar: Health and primary education
Subindex B: Efficiency enhancers 96 3.7
109 3.4 5th pillar: Higher education and training
92 4.2 6th pillar: Goods market efficiency
75 4.2 7th pillar: Labor market efficiency
75 3.9 8th pillar: Financial market development
94 3.4 9th pillar: Technological readiness
80 3.4 10th pillar: Market size
Subindex C: Innovation and sophistication factors 75 3.5
89 3.7 11th pillar: Business sophistication
61 3.4 12th pillar: Innovation
1234567
1st pillar:Institutions
2nd pillar:Infrastructure
3rd pillar:Macroeconomicenvironment
4th pillar:Health and primaryeducation
5th pillar:Higher educationand training
6th pillar:Goods marketefficiency7th pillar:
Labor marketefficiency
8th pillar:Financial market
development
9th pillar:Technological
readiness
10th pillar:Market size
11th pillar:Business
sophistication
12th pillar:Innovation
Côte d'Ivoire Sub-Saharan Africa
Source: World Economic Forum, Executive Opinion Survey 2016
22.017.515.214.8
6.34.74.63.02.72.12.02.01.61.10.30.1
Access to financingCorruptionInefficient government bureaucracyTax ratesInadequate supply of infrastructureInadequately educated workforceCrime and theftInflationRestrictive labor regulationsInsufficient capacity to innovateTax regulationsPoor work ethic in national labor forcePolicy instabilityGovernment instability/coupsForeign currency regulationsPoor public health
0 6 12 18 24
score
Global Competitiveness Index2016-2017 edition
Key Indicators, 2015
Population (millions)
GDP (US$ billions)
GDP per capita (US$)
GDP (PPP) % world GDP
Côte d'Ivoire 99 / 138th
Source: International Monetary Fund; World Economic Outlook Database (April 2016)
23.7
31.2
1314.7
0.07
104 | The Africa Competitiveness Report 2017
Part 2

The Global Competitiveness Index in detail
Note: Values are on a 1-to-7 scale unless indicated otherwise. Trend lines depict evolution in values since the 2012-2013 edition (or earliest edition available). For detailed definitions,sources, and periods, consult the interactive Country/Economy Profiles and Rankings at http://gcr.weforum.org/
Rank / 138 Value Trend Rank / 138 Value Trend
77 3.8 1st pillar: Institutions1.01 Property rights 72 4.21.02 Intellectual property protection 90 3.71.03 Diversion of public funds 82 3.31.04 Public trust in politicians 48 3.61.05 Irregular payments and bribes 88 3.61.06 Judicial independence 87 3.61.07 Favoritism in decisions of government officials 62 3.21.08 Wastefulness of government spending 39 3.71.09 Burden of government regulation 27 4.01.10 Efficiency of legal framework in settling disputes 41 4.21.11 Efficiency of legal framework in challenging regs 63 3.61.12 Transparency of government policymaking 50 4.41.13 Business costs of terrorism 84 4.91.14 Business costs of crime and violence 106 3.81.15 Organized crime 127 3.21.16 Reliability of police services 87 4.11.17 Ethical behavior of firms 73 3.81.18 Strength of auditing and reporting standards 98 4.11.19 Efficacy of corporate boards 80 4.81.20 Protection of minority shareholders’ interests 68 4.11.21 Strength of investor protection 0-10 (best) 120 3.8
87 3.62nd pillar: Infrastructure2.01 Quality of overall infrastructure 60 4.22.02 Quality of roads 42 4.72.03 Quality of railroad infrastructure 71 2.72.04 Quality of port infrastructure 28 5.22.05 Quality of air transport infrastructure 38 5.22.06 Available airline seat kilometers millions/week 93 65.52.07 Quality of electricity supply 100 3.62.08 Mobile-cellular telephone subscriptions /100 pop. 62 119.32.09 Fixed-telephone lines /100 pop. 118 1.3
66 4.7 3rd pillar: Macroeconomic environment3.01 Government budget balance % GDP 70 -3.23.02 Gross national savings % GDP 87 16.43.03 Inflation annual % change 1 1.23.04 Government debt % GDP 34 34.73.05 Country credit rating 0-100 (best) 93 -
132 3.7 4th pillar: Health and primary education4.01 Malaria incidence cases/100,000 pop. 67 37459.84.02 Business impact of malaria 40 4.64.03 Tuberculosis incidence cases/100,000 pop. 109 165.04.04 Business impact of tuberculosis 119 4.14.05 HIV prevalence % adult pop. 124 3.54.06 Business impact of HIV/AIDS 107 4.54.07 Infant mortality deaths/1,000 live births 132 66.64.08 Life expectancy years 135 51.64.09 Quality of primary education 69 4.14.10 Primary education enrollment rate net % 131 74.7
109 3.4 5th pillar: Higher education and training5.01 Secondary education enrollment rate gross % 125 40.15.02 Tertiary education enrollment rate gross % 119 8.75.03 Quality of the education system 49 4.15.04 Quality of math and science education 43 4.65.05 Quality of management schools 51 4.55.06 Internet access in schools 98 3.75.07 Local availability of specialized training services 46 4.75.08 Extent of staff training 37 4.4
92 4.2 6th pillar: Goods market efficiency6.01 Intensity of local competition 95 4.86.02 Extent of market dominance 79 3.56.03 Effectiveness of anti-monopoly policy 76 3.66.04 Effect of taxation on incentives to invest 118 2.96.05 Total tax rate % profits 116 51.96.06 No. of procedures to start a business 22 46.07 Time to start a business days 42 7.06.08 Agricultural policy costs 19 4.66.09 Prevalence of non-tariff barriers 128 3.46.10 Trade tariffs % duty 105 9.96.11 Prevalence of foreign ownership 46 5.06.12 Business impact of rules on FDI 57 4.86.13 Burden of customs procedures 68 4.16.14 Imports % GDP 76 38.76.15 Degree of customer orientation 88 4.46.16 Buyer sophistication 104 2.9
75 4.2 7th pillar: Labor market efficiency7.01 Cooperation in labor-employer relations 58 4.57.02 Flexibility of wage determination 67 5.07.03 Hiring and firing practices 65 3.87.04 Redundancy costs weeks of salary 53 13.17.05 Effect of taxation on incentives to work 29 4.47.06 Pay and productivity 82 3.87.07 Reliance on professional management 63 4.37.08 Country capacity to retain talent 61 3.67.09 Country capacity to attract talent 48 3.77.10 Female participation in the labor force ratio to men 102 0.65
75 3.9 8th pillar: Financial market development8.01 Financial services meeting business needs 104 3.78.02 Affordability of financial services 90 3.58.03 Financing through local equity market 44 4.18.04 Ease of access to loans 126 2.78.05 Venture capital availability 77 2.78.06 Soundness of banks 66 4.98.07 Regulation of securities exchanges 67 4.48.08 Legal rights index 0-10 (best) 46 6
94 3.4 9th pillar: Technological readiness9.01 Availability of latest technologies 59 4.99.02 Firm-level technology absorption 69 4.59.03 FDI and technology transfer 60 4.59.04 Internet users % pop. 110 21.09.05 Fixed-broadband Internet subscriptions /100 pop. 117 0.59.06 Internet bandwidth kb/s/user 120 5.29.07 Mobile-broadband subscriptions /100 pop. 84 40.4
80 3.4 10th pillar: Market size10.01 Domestic market size index 84 3.210.02 Foreign market size index 81 4.210.03 GDP (PPP) PPP $ billions 81 78.610.04 Exports % GDP 64 35.4
89 3.7 11th pillar: Business sophistication11.01 Local supplier quantity 96 4.211.02 Local supplier quality 71 4.311.03 State of cluster development 131 2.811.04 Nature of competitive advantage 99 3.011.05 Value chain breadth 74 3.711.06 Control of international distribution 123 2.911.07 Production process sophistication 83 3.611.08 Extent of marketing 53 4.611.09 Willingness to delegate authority 83 3.6
61 3.4 12th pillar: Innovation12.01 Capacity for innovation 58 4.312.02 Quality of scientific research institutions 45 4.212.03 Company spending on R&D 45 3.612.04 University-industry collaboration in R&D 86 3.312.05 Gov't procurement of advanced tech. products 70 3.212.06 Availability of scientists and engineers 77 3.912.07 PCT patent applications applications/million pop. 107 0.0
Côte d’Ivoire
The Africa Competitiveness Report 2017 | 105
Country Profiles

Edition 2012-13 2013-14 2014-15 2015-16 2016-17
Rank 107 / 144 118 / 148 119 / 144 116 / 140 115 / 138
Score 3.7 3.6 3.6 3.7 3.7
Most problematic factors for doing business
Performance overview
Note: From the list of factors, respondents to the World Economic Forum's Executive Opinion Survey were asked to select the five most problematic factors for doing business in their country and torank them between 1 (most problematic) and 5. The score corresponds to the responses weighted according to their rankings.
The Global Competitiveness Index in detail
Egypt remains stable at 115th position this year. To create growth andemployment, Egypt could build on its large market size (25th); its businesssector, which by some accounts appears more sophisticated than those ofneighboring countries (85th); and its geographical proximity to the largeEuropean market. To do so, Egypt needs to step up its reform efforts andaddress the major rigidities that plague its goods, labor, and financialmarkets, on which the country ranks 112th, 135th, and 111th, respectively.
Other priorities include higher education and training (112th), which is belowthe performance of peer economies, particularly in terms of quality (134th);as well as the overall security situation (133rd), which remains fragile andimposes significant cost for business. Support for reform efforts comes fromthe recent drop in oil prices that could open up the fiscal space toconsolidate the public budget by reducing energy subsidies, which make upa significant part of the public spending.
Rank / 138 Score (1-7) Trend Distance from best
Global Competitiveness Index 115 3.7Subindex A: Basic requirements 117 3.8
87 3.6 1st pillar: Institutions
96 3.42nd pillar: Infrastructure
134 2.7 3rd pillar: Macroeconomic environment
89 5.5 4th pillar: Health and primary education
Subindex B: Efficiency enhancers 100 3.7
112 3.3 5th pillar: Higher education and training
112 4.0 6th pillar: Goods market efficiency
135 3.2 7th pillar: Labor market efficiency
111 3.4 8th pillar: Financial market development
99 3.3 9th pillar: Technological readiness
25 5.0 10th pillar: Market size
Subindex C: Innovation and sophistication factors 111 3.2
85 3.7 11th pillar: Business sophistication
122 2.7 12th pillar: Innovation
1234567
1st pillar:Institutions
2nd pillar:Infrastructure
3rd pillar:Macroeconomicenvironment
4th pillar:Health and primaryeducation
5th pillar:Higher educationand training
6th pillar:Goods marketefficiency7th pillar:
Labor marketefficiency
8th pillar:Financial market
development
9th pillar:Technological
readiness
10th pillar:Market size
11th pillar:Business
sophistication
12th pillar:Innovation
Egypt Middle East and North Africa
Source: World Economic Forum, Executive Opinion Survey 2015
21.012.510.2
8.47.75.55.45.44.34.13.93.23.12.71.70.9
Policy instabilityGovernment instability/coupsAccess to financingForeign currency regulationsCorruptionInadequate supply of infrastructurePoor work ethic in national labor forceInadequately educated workforceCrime and theftRestrictive labor regulationsTax ratesInflationTax regulationsInefficient government bureaucracyInsufficient capacity to innovatePoor public health
0 6 12 18 24
score
Global Competitiveness Index2016-2017 edition
Key Indicators, 2015
Population (millions)
GDP (US$ billions)
GDP per capita (US$)
GDP (PPP) % world GDP
Egypt 115 / 138th
Source: International Monetary Fund; World Economic Outlook Database (April 2016)
88.4
330.8
3740.2
0.92
106 | The Africa Competitiveness Report 2017
Part 2

The Global Competitiveness Index in detail
Note: Values are on a 1-to-7 scale unless indicated otherwise. Trend lines depict evolution in values since the 2012-2013 edition (or earliest edition available). For detailed definitions,sources, and periods, consult the interactive Country/Economy Profiles and Rankings at http://gcr.weforum.org/
Rank / 138 Value Trend Rank / 138 Value Trend
87 3.6 1st pillar: Institutions1.01 Property rights 100 3.91.02 Intellectual property protection 124 3.21.03 Diversion of public funds 67 3.51.04 Public trust in politicians 84 2.81.05 Irregular payments and bribes 64 4.11.06 Judicial independence 47 4.51.07 Favoritism in decisions of government officials 28 4.11.08 Wastefulness of government spending 122 2.21.09 Burden of government regulation 63 3.51.10 Efficiency of legal framework in settling disputes 81 3.41.11 Efficiency of legal framework in challenging regs 72 3.41.12 Transparency of government policymaking 97 3.71.13 Business costs of terrorism 135 2.71.14 Business costs of crime and violence 124 2.91.15 Organized crime 119 3.71.16 Reliability of police services 114 3.31.17 Ethical behavior of firms 77 3.81.18 Strength of auditing and reporting standards 84 4.31.19 Efficacy of corporate boards 131 3.91.20 Protection of minority shareholders’ interests 83 3.91.21 Strength of investor protection 0-10 (best) 101 4.5
96 3.42nd pillar: Infrastructure2.01 Quality of overall infrastructure 108 3.12.02 Quality of roads 107 3.02.03 Quality of railroad infrastructure 73 2.62.04 Quality of port infrastructure 58 4.32.05 Quality of air transport infrastructure 52 4.82.06 Available airline seat kilometers millions/week 41 590.12.07 Quality of electricity supply 102 3.52.08 Mobile-cellular telephone subscriptions /100 pop. 82 111.02.09 Fixed-telephone lines /100 pop. 95 7.4
134 2.7 3rd pillar: Macroeconomic environment3.01 Government budget balance % GDP 132 -11.73.02 Gross national savings % GDP 121 10.93.03 Inflation annual % change 130 11.03.04 Government debt % GDP 117 87.73.05 Country credit rating 0-100 (best) 98 -
89 5.5 4th pillar: Health and primary education4.01 Malaria incidence cases/100,000 pop. N/Appl. P.R.4.02 Business impact of malaria 1 6.84.03 Tuberculosis incidence cases/100,000 pop. 38 15.04.04 Business impact of tuberculosis 16 6.74.05 HIV prevalence % adult pop. 1 0.14.06 Business impact of HIV/AIDS 1 6.94.07 Infant mortality deaths/1,000 live births 91 20.34.08 Life expectancy years 93 71.14.09 Quality of primary education 134 2.14.10 Primary education enrollment rate net % 28 98.0
112 3.3 5th pillar: Higher education and training5.01 Secondary education enrollment rate gross % 85 86.15.02 Tertiary education enrollment rate gross % 81 31.75.03 Quality of the education system 135 2.15.04 Quality of math and science education 130 2.65.05 Quality of management schools 138 2.55.06 Internet access in schools 133 2.65.07 Local availability of specialized training services 136 2.75.08 Extent of staff training 137 2.7
112 4.0 6th pillar: Goods market efficiency6.01 Intensity of local competition 127 4.26.02 Extent of market dominance 103 3.36.03 Effectiveness of anti-monopoly policy 78 3.66.04 Effect of taxation on incentives to invest 84 3.46.05 Total tax rate % profits 96 45.06.06 No. of procedures to start a business 76 76.07 Time to start a business days 48 8.06.08 Agricultural policy costs 130 2.96.09 Prevalence of non-tariff barriers 100 4.06.10 Trade tariffs % duty 126 13.66.11 Prevalence of foreign ownership 125 3.46.12 Business impact of rules on FDI 114 3.86.13 Burden of customs procedures 80 3.86.14 Imports % GDP 120 24.76.15 Degree of customer orientation 55 4.96.16 Buyer sophistication 116 2.8
135 3.2 7th pillar: Labor market efficiency7.01 Cooperation in labor-employer relations 96 4.17.02 Flexibility of wage determination 72 5.07.03 Hiring and firing practices 61 3.97.04 Redundancy costs weeks of salary 129 36.97.05 Effect of taxation on incentives to work 104 3.47.06 Pay and productivity 125 3.27.07 Reliance on professional management 133 3.17.08 Country capacity to retain talent 104 2.97.09 Country capacity to attract talent 103 2.77.10 Female participation in the labor force ratio to men 133 0.31
111 3.4 8th pillar: Financial market development8.01 Financial services meeting business needs 54 4.58.02 Affordability of financial services 72 3.88.03 Financing through local equity market 58 3.88.04 Ease of access to loans 136 1.98.05 Venture capital availability 98 2.58.06 Soundness of banks 70 4.88.07 Regulation of securities exchanges 105 3.78.08 Legal rights index 0-10 (best) 108 2
99 3.3 9th pillar: Technological readiness9.01 Availability of latest technologies 117 3.99.02 Firm-level technology absorption 121 3.89.03 FDI and technology transfer 71 4.49.04 Internet users % pop. 96 35.99.05 Fixed-broadband Internet subscriptions /100 pop. 87 4.59.06 Internet bandwidth kb/s/user 105 11.39.07 Mobile-broadband subscriptions /100 pop. 72 50.7
25 5.0 10th pillar: Market size10.01 Domestic market size index 19 5.110.02 Foreign market size index 49 5.010.03 GDP (PPP) PPP $ billions 23 1047.910.04 Exports % GDP 132 11.2
85 3.7 11th pillar: Business sophistication11.01 Local supplier quantity 64 4.511.02 Local supplier quality 106 3.811.03 State of cluster development 32 4.311.04 Nature of competitive advantage 89 3.211.05 Value chain breadth 72 3.711.06 Control of international distribution 116 3.011.07 Production process sophistication 105 3.211.08 Extent of marketing 121 3.811.09 Willingness to delegate authority 34 4.2
122 2.7 12th pillar: Innovation12.01 Capacity for innovation 135 3.112.02 Quality of scientific research institutions 128 2.612.03 Company spending on R&D 133 2.412.04 University-industry collaboration in R&D 137 2.412.05 Gov't procurement of advanced tech. products 72 3.212.06 Availability of scientists and engineers 46 4.312.07 PCT patent applications applications/million pop. 74 0.8
Egypt
The Africa Competitiveness Report 2017 | 107
Country Profiles

Edition 2012-13 2013-14 2014-15 2015-16 2016-17
Rank 121 / 144 127 / 148 118 / 144 109 / 140 109 / 138
Score 3.6 3.5 3.6 3.7 3.8
Most problematic factors for doing business
Performance overview
Note: From the list of factors, respondents to the World Economic Forum's Executive Opinion Survey were asked to select the five most problematic factors for doing business in their country and torank them between 1 (most problematic) and 5. The score corresponds to the responses weighted according to their rankings.
The Global Competitiveness Index in detail
Rank / 138 Score (1-7) Trend Distance from best
Global Competitiveness Index 109 3.8Subindex A: Basic requirements 106 4.0
75 3.9 1st pillar: Institutions
115 2.82nd pillar: Infrastructure
78 4.5 3rd pillar: Macroeconomic environment
111 4.7 4th pillar: Health and primary education
Subindex B: Efficiency enhancers 117 3.5
127 2.8 5th pillar: Higher education and training
105 4.0 6th pillar: Goods market efficiency
70 4.2 7th pillar: Labor market efficiency
102 3.5 8th pillar: Financial market development
131 2.4 9th pillar: Technological readiness
66 3.8 10th pillar: Market size
Subindex C: Innovation and sophistication factors 74 3.5
93 3.7 11th pillar: Business sophistication
57 3.4 12th pillar: Innovation
1234567
1st pillar:Institutions
2nd pillar:Infrastructure
3rd pillar:Macroeconomicenvironment
4th pillar:Health and primaryeducation
5th pillar:Higher educationand training
6th pillar:Goods marketefficiency7th pillar:
Labor marketefficiency
8th pillar:Financial market
development
9th pillar:Technological
readiness
10th pillar:Market size
11th pillar:Business
sophistication
12th pillar:Innovation
Ethiopia Sub-Saharan Africa
Source: World Economic Forum, Executive Opinion Survey 2016
14.410.710.4
9.37.37.16.96.45.64.74.24.23.62.22.00.9
CorruptionAccess to financingForeign currency regulationsTax ratesInefficient government bureaucracyInadequate supply of infrastructureInflationTax regulationsGovernment instability/coupsPoor work ethic in national labor forceInsufficient capacity to innovateInadequately educated workforceCrime and theftPolicy instabilityRestrictive labor regulationsPoor public health
0 4 8 12 16
score
Global Competitiveness Index2016-2017 edition
Key Indicators, 2015
Population (millions)
GDP (US$ billions)
GDP per capita (US$)
GDP (PPP) % world GDP
Ethiopia 109 / 138th
Source: International Monetary Fund; World Economic Outlook Database (April 2016)
89.8
61.6
686.6
0.14
108 | The Africa Competitiveness Report 2017
Part 2

The Global Competitiveness Index in detail
Note: Values are on a 1-to-7 scale unless indicated otherwise. Trend lines depict evolution in values since the 2012-2013 edition (or earliest edition available). For detailed definitions,sources, and periods, consult the interactive Country/Economy Profiles and Rankings at http://gcr.weforum.org/
Rank / 138 Value Trend Rank / 138 Value Trend
75 3.9 1st pillar: Institutions1.01 Property rights 90 4.01.02 Intellectual property protection 88 3.81.03 Diversion of public funds 49 4.01.04 Public trust in politicians 41 3.81.05 Irregular payments and bribes 93 3.51.06 Judicial independence 73 3.81.07 Favoritism in decisions of government officials 34 3.91.08 Wastefulness of government spending 55 3.41.09 Burden of government regulation 55 3.61.10 Efficiency of legal framework in settling disputes 55 4.01.11 Efficiency of legal framework in challenging regs 53 3.71.12 Transparency of government policymaking 98 3.71.13 Business costs of terrorism 117 4.21.14 Business costs of crime and violence 91 4.11.15 Organized crime 93 4.31.16 Reliability of police services 92 3.91.17 Ethical behavior of firms 63 3.91.18 Strength of auditing and reporting standards 112 3.81.19 Efficacy of corporate boards 132 3.81.20 Protection of minority shareholders’ interests 91 3.81.21 Strength of investor protection 0-10 (best) 129 3.5
115 2.82nd pillar: Infrastructure2.01 Quality of overall infrastructure 94 3.42.02 Quality of roads 83 3.72.03 Quality of railroad infrastructure 48 3.42.04 Quality of port infrastructure 90 3.52.05 Quality of air transport infrastructure 105 3.72.06 Available airline seat kilometers millions/week 52 398.32.07 Quality of electricity supply 104 3.42.08 Mobile-cellular telephone subscriptions /100 pop. 136 42.82.09 Fixed-telephone lines /100 pop. 124 0.9
78 4.5 3rd pillar: Macroeconomic environment3.01 Government budget balance % GDP 52 -2.53.02 Gross national savings % GDP 36 27.03.03 Inflation annual % change 129 10.13.04 Government debt % GDP 70 48.63.05 Country credit rating 0-100 (best) 123 -
111 4.7 4th pillar: Health and primary education4.01 Malaria incidence cases/100,000 pop. 46 3919.24.02 Business impact of malaria 33 5.04.03 Tuberculosis incidence cases/100,000 pop. 116 207.04.04 Business impact of tuberculosis 114 4.34.05 HIV prevalence % adult pop. 111 1.24.06 Business impact of HIV/AIDS 116 4.24.07 Infant mortality deaths/1,000 live births 117 41.44.08 Life expectancy years 115 64.04.09 Quality of primary education 107 3.14.10 Primary education enrollment rate net % 120 85.8
127 2.8 5th pillar: Higher education and training5.01 Secondary education enrollment rate gross % 133 36.25.02 Tertiary education enrollment rate gross % 121 8.15.03 Quality of the education system 83 3.55.04 Quality of math and science education 97 3.55.05 Quality of management schools 120 3.55.06 Internet access in schools 99 3.75.07 Local availability of specialized training services 101 3.95.08 Extent of staff training 99 3.6
105 4.0 6th pillar: Goods market efficiency6.01 Intensity of local competition 135 3.96.02 Extent of market dominance 58 3.86.03 Effectiveness of anti-monopoly policy 57 3.86.04 Effect of taxation on incentives to invest 50 3.96.05 Total tax rate % profits 46 32.16.06 No. of procedures to start a business 122 116.07 Time to start a business days 98 19.06.08 Agricultural policy costs 45 4.16.09 Prevalence of non-tariff barriers 123 3.66.10 Trade tariffs % duty 122 13.06.11 Prevalence of foreign ownership 109 3.86.12 Business impact of rules on FDI 117 3.76.13 Burden of customs procedures 96 3.66.14 Imports % GDP 77 38.46.15 Degree of customer orientation 132 3.76.16 Buyer sophistication 60 3.5
70 4.2 7th pillar: Labor market efficiency7.01 Cooperation in labor-employer relations 117 3.87.02 Flexibility of wage determination 116 4.27.03 Hiring and firing practices 87 3.67.04 Redundancy costs weeks of salary 84 19.17.05 Effect of taxation on incentives to work 50 4.27.06 Pay and productivity 79 3.87.07 Reliance on professional management 107 3.67.08 Country capacity to retain talent 63 3.67.09 Country capacity to attract talent 43 3.87.10 Female participation in the labor force ratio to men 41 0.88
102 3.5 8th pillar: Financial market development8.01 Financial services meeting business needs 113 3.68.02 Affordability of financial services 70 3.88.03 Financing through local equity market 61 3.78.04 Ease of access to loans 79 3.78.05 Venture capital availability 35 3.48.06 Soundness of banks 116 3.88.07 Regulation of securities exchanges 94 3.88.08 Legal rights index 0-10 (best) 97 3
131 2.4 9th pillar: Technological readiness9.01 Availability of latest technologies 123 3.79.02 Firm-level technology absorption 130 3.59.03 FDI and technology transfer 102 3.99.04 Internet users % pop. 127 11.69.05 Fixed-broadband Internet subscriptions /100 pop. 113 0.79.06 Internet bandwidth kb/s/user 134 2.09.07 Mobile-broadband subscriptions /100 pop. 123 11.9
66 3.8 10th pillar: Market size10.01 Domestic market size index 61 3.810.02 Foreign market size index 96 3.910.03 GDP (PPP) PPP $ billions 65 161.610.04 Exports % GDP 133 10.8
93 3.7 11th pillar: Business sophistication11.01 Local supplier quantity 131 3.611.02 Local supplier quality 121 3.611.03 State of cluster development 84 3.511.04 Nature of competitive advantage 59 3.611.05 Value chain breadth 55 3.911.06 Control of international distribution 45 4.011.07 Production process sophistication 84 3.611.08 Extent of marketing 122 3.811.09 Willingness to delegate authority 108 3.4
57 3.4 12th pillar: Innovation12.01 Capacity for innovation 104 3.712.02 Quality of scientific research institutions 70 3.812.03 Company spending on R&D 39 3.812.04 University-industry collaboration in R&D 39 3.812.05 Gov't procurement of advanced tech. products 50 3.512.06 Availability of scientists and engineers 73 3.912.07 PCT patent applications applications/million pop. 114 0.0
Ethiopia
The Africa Competitiveness Report 2017 | 109
Country Profiles

Edition 2012-13 2013-14 2014-15 2015-16 2016-17
Rank 99 / 144 112 / 148 106 / 144 103 / 140 108 / 138
Score 3.8 3.7 3.7 3.8 3.8
Most problematic factors for doing business
Performance overview
Note: From the list of factors, respondents to the World Economic Forum's Executive Opinion Survey were asked to select the five most problematic factors for doing business in their country and torank them between 1 (most problematic) and 5. The score corresponds to the responses weighted according to their rankings.
The Global Competitiveness Index in detail
Rank / 138 Score (1-7) Trend Distance from best
Global Competitiveness Index 108 3.8Subindex A: Basic requirements 91 4.3
85 3.7 1st pillar: Institutions
107 3.12nd pillar: Infrastructure
25 5.6 3rd pillar: Macroeconomic environment
109 4.8 4th pillar: Health and primary education
Subindex B: Efficiency enhancers 122 3.3
121 3.0 5th pillar: Higher education and training
125 3.7 6th pillar: Goods market efficiency
101 3.9 7th pillar: Labor market efficiency
103 3.5 8th pillar: Financial market development
109 3.1 9th pillar: Technological readiness
112 2.8 10th pillar: Market size
Subindex C: Innovation and sophistication factors 128 2.9
131 3.2 11th pillar: Business sophistication
124 2.7 12th pillar: Innovation
1234567
1st pillar:Institutions
2nd pillar:Infrastructure
3rd pillar:Macroeconomicenvironment
4th pillar:Health and primaryeducation
5th pillar:Higher educationand training
6th pillar:Goods marketefficiency7th pillar:
Labor marketefficiency
8th pillar:Financial market
development
9th pillar:Technological
readiness
10th pillar:Market size
11th pillar:Business
sophistication
12th pillar:Innovation
Gabon Sub-Saharan Africa
Source: World Economic Forum, Executive Opinion Survey 2016
17.715.311.9
9.27.87.56.35.85.64.94.91.01.00.70.50.0
Access to financingInadequately educated workforceInadequate supply of infrastructureInefficient government bureaucracyCorruptionRestrictive labor regulationsPoor work ethic in national labor forceInsufficient capacity to innovateTax regulationsTax ratesInflationForeign currency regulationsCrime and theftPolicy instabilityPoor public healthGovernment instability/coups
0 5 10 15 20
score
Global Competitiveness Index2016-2017 edition
Key Indicators, 2015
Population (millions)
GDP (US$ billions)
GDP per capita (US$)
GDP (PPP) % world GDP
Gabon 108 / 138th
Source: International Monetary Fund; World Economic Outlook Database (April 2016)
1.9
14.3
7735.9
0.03
110 | The Africa Competitiveness Report 2017
Part 2

The Global Competitiveness Index in detail
Note: Values are on a 1-to-7 scale unless indicated otherwise. Trend lines depict evolution in values since the 2012-2013 edition (or earliest edition available). For detailed definitions,sources, and periods, consult the interactive Country/Economy Profiles and Rankings at http://gcr.weforum.org/
Rank / 138 Value Trend Rank / 138 Value Trend
85 3.7 1st pillar: Institutions1.01 Property rights 83 4.11.02 Intellectual property protection 102 3.61.03 Diversion of public funds 100 2.91.04 Public trust in politicians 71 3.01.05 Irregular payments and bribes 98 3.51.06 Judicial independence 108 3.11.07 Favoritism in decisions of government officials 78 3.01.08 Wastefulness of government spending 66 3.21.09 Burden of government regulation 79 3.41.10 Efficiency of legal framework in settling disputes 84 3.41.11 Efficiency of legal framework in challenging regs 97 3.01.12 Transparency of government policymaking 61 4.31.13 Business costs of terrorism 61 5.41.14 Business costs of crime and violence 73 4.61.15 Organized crime 73 4.91.16 Reliability of police services 90 3.91.17 Ethical behavior of firms 82 3.71.18 Strength of auditing and reporting standards 100 4.11.19 Efficacy of corporate boards 32 5.41.20 Protection of minority shareholders’ interests 63 4.11.21 Strength of investor protection 0-10 (best) 120 3.8
107 3.12nd pillar: Infrastructure2.01 Quality of overall infrastructure 119 2.92.02 Quality of roads 121 2.82.03 Quality of railroad infrastructure 64 2.82.04 Quality of port infrastructure 101 3.22.05 Quality of air transport infrastructure 108 3.62.06 Available airline seat kilometers millions/week 111 33.32.07 Quality of electricity supply 114 2.92.08 Mobile-cellular telephone subscriptions /100 pop. 10 168.92.09 Fixed-telephone lines /100 pop. 120 1.1
25 5.6 3rd pillar: Macroeconomic environment3.01 Government budget balance % GDP 48 -2.33.02 Gross national savings % GDP 9 34.83.03 Inflation annual % change 55 0.13.04 Government debt % GDP 62 43.93.05 Country credit rating 0-100 (best) 89 -
109 4.8 4th pillar: Health and primary education4.01 Malaria incidence cases/100,000 pop. 55 20738.64.02 Business impact of malaria 66 3.24.03 Tuberculosis incidence cases/100,000 pop. 134 444.04.04 Business impact of tuberculosis 105 4.44.05 HIV prevalence % adult pop. 125 3.94.06 Business impact of HIV/AIDS 117 4.14.07 Infant mortality deaths/1,000 live births 113 36.14.08 Life expectancy years 114 64.44.09 Quality of primary education 87 3.64.10 Primary education enrollment rate net % 67 95.2
121 3.0 5th pillar: Higher education and training5.01 Secondary education enrollment rate gross % 115 53.35.02 Tertiary education enrollment rate gross % 120 8.45.03 Quality of the education system 116 2.95.04 Quality of math and science education 95 3.65.05 Quality of management schools 98 3.85.06 Internet access in schools 121 3.25.07 Local availability of specialized training services 128 3.45.08 Extent of staff training 84 3.7
125 3.7 6th pillar: Goods market efficiency6.01 Intensity of local competition 134 4.06.02 Extent of market dominance 131 2.86.03 Effectiveness of anti-monopoly policy 103 3.36.04 Effect of taxation on incentives to invest 65 3.76.05 Total tax rate % profits 97 45.76.06 No. of procedures to start a business 76 76.07 Time to start a business days 128 50.06.08 Agricultural policy costs 122 3.16.09 Prevalence of non-tariff barriers 132 3.36.10 Trade tariffs % duty 124 13.46.11 Prevalence of foreign ownership 23 5.46.12 Business impact of rules on FDI 72 4.66.13 Burden of customs procedures 92 3.66.14 Imports % GDP 106 30.56.15 Degree of customer orientation 118 3.96.16 Buyer sophistication 94 3.0
101 3.9 7th pillar: Labor market efficiency7.01 Cooperation in labor-employer relations 98 4.17.02 Flexibility of wage determination 101 4.57.03 Hiring and firing practices 98 3.47.04 Redundancy costs weeks of salary 80 18.87.05 Effect of taxation on incentives to work 21 4.67.06 Pay and productivity 131 3.17.07 Reliance on professional management 97 3.87.08 Country capacity to retain talent 93 3.27.09 Country capacity to attract talent 59 3.57.10 Female participation in the labor force ratio to men 92 0.70
103 3.5 8th pillar: Financial market development8.01 Financial services meeting business needs 122 3.48.02 Affordability of financial services 128 2.78.03 Financing through local equity market 87 3.38.04 Ease of access to loans 118 3.08.05 Venture capital availability 118 2.28.06 Soundness of banks 89 4.48.07 Regulation of securities exchanges 96 3.88.08 Legal rights index 0-10 (best) 46 6
109 3.1 9th pillar: Technological readiness9.01 Availability of latest technologies 113 4.09.02 Firm-level technology absorption 107 4.19.03 FDI and technology transfer 113 3.79.04 Internet users % pop. 104 23.59.05 Fixed-broadband Internet subscriptions /100 pop. 114 0.69.06 Internet bandwidth kb/s/user 107 8.59.07 Mobile-broadband subscriptions /100 pop. 99 33.1
112 2.8 10th pillar: Market size10.01 Domestic market size index 110 2.510.02 Foreign market size index 111 3.610.03 GDP (PPP) PPP $ billions 108 34.610.04 Exports % GDP 85 30.1
131 3.2 11th pillar: Business sophistication11.01 Local supplier quantity 133 3.511.02 Local supplier quality 124 3.511.03 State of cluster development 132 2.811.04 Nature of competitive advantage 100 3.011.05 Value chain breadth 132 2.911.06 Control of international distribution 134 2.711.07 Production process sophistication 126 2.811.08 Extent of marketing 120 3.811.09 Willingness to delegate authority 121 3.2
124 2.7 12th pillar: Innovation12.01 Capacity for innovation 118 3.612.02 Quality of scientific research institutions 109 3.212.03 Company spending on R&D 117 2.712.04 University-industry collaboration in R&D 130 2.612.05 Gov't procurement of advanced tech. products 119 2.712.06 Availability of scientists and engineers 134 2.812.07 PCT patent applications applications/million pop. 85 0.4
Gabon
The Africa Competitiveness Report 2017 | 111
Country Profiles
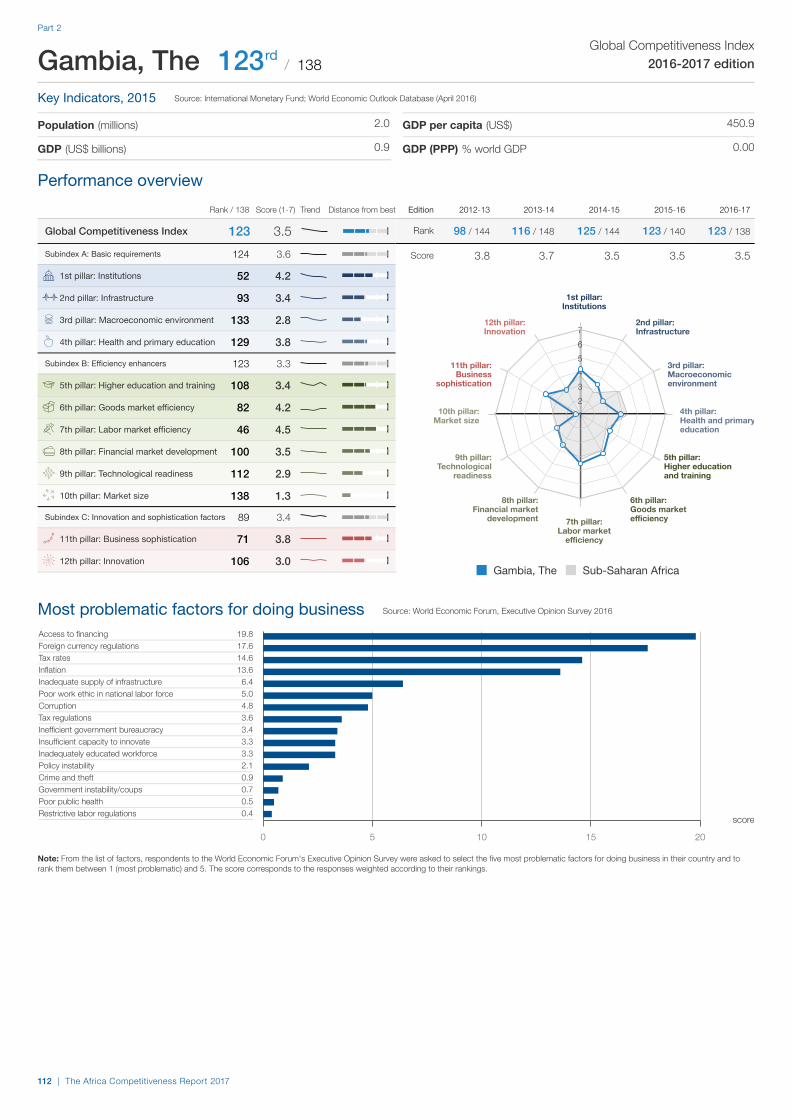
Edition 2012-13 2013-14 2014-15 2015-16 2016-17
Rank 98 / 144 116 / 148 125 / 144 123 / 140 123 / 138
Score 3.8 3.7 3.5 3.5 3.5
Most problematic factors for doing business
Performance overview
Note: From the list of factors, respondents to the World Economic Forum's Executive Opinion Survey were asked to select the five most problematic factors for doing business in their country and torank them between 1 (most problematic) and 5. The score corresponds to the responses weighted according to their rankings.
The Global Competitiveness Index in detail
Rank / 138 Score (1-7) Trend Distance from best
Global Competitiveness Index 123 3.5Subindex A: Basic requirements 124 3.6
52 4.2 1st pillar: Institutions
93 3.42nd pillar: Infrastructure
133 2.8 3rd pillar: Macroeconomic environment
129 3.8 4th pillar: Health and primary education
Subindex B: Efficiency enhancers 123 3.3
108 3.4 5th pillar: Higher education and training
82 4.2 6th pillar: Goods market efficiency
46 4.5 7th pillar: Labor market efficiency
100 3.5 8th pillar: Financial market development
112 2.9 9th pillar: Technological readiness
138 1.3 10th pillar: Market size
Subindex C: Innovation and sophistication factors 89 3.4
71 3.8 11th pillar: Business sophistication
106 3.0 12th pillar: Innovation
1234567
1st pillar:Institutions
2nd pillar:Infrastructure
3rd pillar:Macroeconomicenvironment
4th pillar:Health and primaryeducation
5th pillar:Higher educationand training
6th pillar:Goods marketefficiency7th pillar:
Labor marketefficiency
8th pillar:Financial market
development
9th pillar:Technological
readiness
10th pillar:Market size
11th pillar:Business
sophistication
12th pillar:Innovation
Gambia, The Sub-Saharan Africa
Source: World Economic Forum, Executive Opinion Survey 2016
19.817.614.613.6
6.45.04.83.63.43.33.32.10.90.70.50.4
Access to financingForeign currency regulationsTax ratesInflationInadequate supply of infrastructurePoor work ethic in national labor forceCorruptionTax regulationsInefficient government bureaucracyInsufficient capacity to innovateInadequately educated workforcePolicy instabilityCrime and theftGovernment instability/coupsPoor public healthRestrictive labor regulations
0 5 10 15 20
score
Global Competitiveness Index2016-2017 edition
Key Indicators, 2015
Population (millions)
GDP (US$ billions)
GDP per capita (US$)
GDP (PPP) % world GDP
Gambia, The 123 / 138rd
Source: International Monetary Fund; World Economic Outlook Database (April 2016)
2.0
0.9
450.9
0.00
112 | The Africa Competitiveness Report 2017
Part 2

The Global Competitiveness Index in detail
Note: Values are on a 1-to-7 scale unless indicated otherwise. Trend lines depict evolution in values since the 2012-2013 edition (or earliest edition available). For detailed definitions,sources, and periods, consult the interactive Country/Economy Profiles and Rankings at http://gcr.weforum.org/
Rank / 138 Value Trend Rank / 138 Value Trend
52 4.2 1st pillar: Institutions1.01 Property rights 75 4.21.02 Intellectual property protection 86 3.81.03 Diversion of public funds 45 4.11.04 Public trust in politicians 44 3.71.05 Irregular payments and bribes 68 4.01.06 Judicial independence 93 3.51.07 Favoritism in decisions of government officials 33 3.91.08 Wastefulness of government spending 27 4.01.09 Burden of government regulation 15 4.41.10 Efficiency of legal framework in settling disputes 45 4.21.11 Efficiency of legal framework in challenging regs 56 3.61.12 Transparency of government policymaking 42 4.51.13 Business costs of terrorism 62 5.41.14 Business costs of crime and violence 37 5.31.15 Organized crime 38 5.51.16 Reliability of police services 48 4.91.17 Ethical behavior of firms 58 4.01.18 Strength of auditing and reporting standards 90 4.21.19 Efficacy of corporate boards 59 5.01.20 Protection of minority shareholders’ interests 77 4.01.21 Strength of investor protection 0-10 (best) 126 3.7
93 3.42nd pillar: Infrastructure2.01 Quality of overall infrastructure 82 3.72.02 Quality of roads 74 3.92.03 Quality of railroad infrastructure N/Appl. N/Appl.2.04 Quality of port infrastructure 68 4.02.05 Quality of air transport infrastructure 79 4.12.06 Available airline seat kilometers millions/week 128 13.22.07 Quality of electricity supply 101 3.52.08 Mobile-cellular telephone subscriptions /100 pop. 39 131.32.09 Fixed-telephone lines /100 pop. 110 2.3
133 2.8 3rd pillar: Macroeconomic environment3.01 Government budget balance % GDP 115 -6.53.02 Gross national savings % GDP 130 4.63.03 Inflation annual % change 116 6.83.04 Government debt % GDP 121 91.63.05 Country credit rating 0-100 (best) 130 -
129 3.8 4th pillar: Health and primary education4.01 Malaria incidence cases/100,000 pop. 59 22819.24.02 Business impact of malaria 54 3.84.03 Tuberculosis incidence cases/100,000 pop. 114 174.04.04 Business impact of tuberculosis 87 5.14.05 HIV prevalence % adult pop. 120 1.84.06 Business impact of HIV/AIDS 79 5.34.07 Infant mortality deaths/1,000 live births 123 47.94.08 Life expectancy years 123 60.24.09 Quality of primary education 62 4.24.10 Primary education enrollment rate net % 135 67.9
108 3.4 5th pillar: Higher education and training5.01 Secondary education enrollment rate gross % 111 57.55.02 Tertiary education enrollment rate gross % 135 3.15.03 Quality of the education system 40 4.35.04 Quality of math and science education 104 3.45.05 Quality of management schools 68 4.25.06 Internet access in schools 96 3.75.07 Local availability of specialized training services 64 4.35.08 Extent of staff training 88 3.7
82 4.2 6th pillar: Goods market efficiency6.01 Intensity of local competition 85 4.86.02 Extent of market dominance 52 3.96.03 Effectiveness of anti-monopoly policy 39 4.16.04 Effect of taxation on incentives to invest 72 3.66.05 Total tax rate % profits 125 63.36.06 No. of procedures to start a business 76 76.07 Time to start a business days 107 25.06.08 Agricultural policy costs 9 5.06.09 Prevalence of non-tariff barriers 77 4.36.10 Trade tariffs % duty 130 14.36.11 Prevalence of foreign ownership 49 4.96.12 Business impact of rules on FDI 58 4.86.13 Burden of customs procedures 53 4.46.14 Imports % GDP 42 54.26.15 Degree of customer orientation 62 4.76.16 Buyer sophistication 117 2.7
46 4.5 7th pillar: Labor market efficiency7.01 Cooperation in labor-employer relations 66 4.47.02 Flexibility of wage determination 24 5.67.03 Hiring and firing practices 52 4.07.04 Redundancy costs weeks of salary 107 26.07.05 Effect of taxation on incentives to work 45 4.27.06 Pay and productivity 56 4.27.07 Reliance on professional management 49 4.67.08 Country capacity to retain talent 67 3.57.09 Country capacity to attract talent 55 3.67.10 Female participation in the labor force ratio to men 42 0.88
100 3.5 8th pillar: Financial market development8.01 Financial services meeting business needs 85 4.08.02 Affordability of financial services 69 3.88.03 Financing through local equity market 122 2.68.04 Ease of access to loans 120 2.98.05 Venture capital availability 102 2.48.06 Soundness of banks 76 4.78.07 Regulation of securities exchanges 86 4.08.08 Legal rights index 0-10 (best) 86 4
112 2.9 9th pillar: Technological readiness9.01 Availability of latest technologies 98 4.39.02 Firm-level technology absorption 91 4.29.03 FDI and technology transfer 92 4.09.04 Internet users % pop. 122 17.19.05 Fixed-broadband Internet subscriptions /100 pop. 123 0.29.06 Internet bandwidth kb/s/user 100 13.39.07 Mobile-broadband subscriptions /100 pop. 125 10.0
138 1.3 10th pillar: Market size10.01 Domestic market size index 138 1.010.02 Foreign market size index 136 2.410.03 GDP (PPP) PPP $ billions 138 3.310.04 Exports % GDP 67 34.9
71 3.8 11th pillar: Business sophistication11.01 Local supplier quantity 67 4.511.02 Local supplier quality 64 4.311.03 State of cluster development 60 3.811.04 Nature of competitive advantage 69 3.511.05 Value chain breadth 76 3.711.06 Control of international distribution 94 3.311.07 Production process sophistication 111 3.111.08 Extent of marketing 101 4.111.09 Willingness to delegate authority 49 3.9
106 3.0 12th pillar: Innovation12.01 Capacity for innovation 60 4.212.02 Quality of scientific research institutions 113 3.112.03 Company spending on R&D 100 2.912.04 University-industry collaboration in R&D 127 2.612.05 Gov't procurement of advanced tech. products 32 3.812.06 Availability of scientists and engineers 128 3.012.07 PCT patent applications applications/million pop. 81 0.4
Gambia, The
The Africa Competitiveness Report 2017 | 113
Country Profiles

Edition 2012-13 2013-14 2014-15 2015-16 2016-17
Rank 103 / 144 114 / 148 111 / 144 119 / 140 114 / 138
Score 3.8 3.7 3.7 3.6 3.7
Most problematic factors for doing business
Performance overview
Note: From the list of factors, respondents to the World Economic Forum's Executive Opinion Survey were asked to select the five most problematic factors for doing business in their country and torank them between 1 (most problematic) and 5. The score corresponds to the responses weighted according to their rankings.
The Global Competitiveness Index in detail
Rank / 138 Score (1-7) Trend Distance from best
Global Competitiveness Index 114 3.7Subindex A: Basic requirements 121 3.6
72 3.9 1st pillar: Institutions
111 2.92nd pillar: Infrastructure
132 2.9 3rd pillar: Macroeconomic environment
115 4.6 4th pillar: Health and primary education
Subindex B: Efficiency enhancers 91 3.8
99 3.8 5th pillar: Higher education and training
93 4.2 6th pillar: Goods market efficiency
72 4.2 7th pillar: Labor market efficiency
85 3.8 8th pillar: Financial market development
95 3.4 9th pillar: Technological readiness
72 3.7 10th pillar: Market size
Subindex C: Innovation and sophistication factors 67 3.6
68 3.9 11th pillar: Business sophistication
69 3.3 12th pillar: Innovation
1234567
1st pillar:Institutions
2nd pillar:Infrastructure
3rd pillar:Macroeconomicenvironment
4th pillar:Health and primaryeducation
5th pillar:Higher educationand training
6th pillar:Goods marketefficiency7th pillar:
Labor marketefficiency
8th pillar:Financial market
development
9th pillar:Technological
readiness
10th pillar:Market size
11th pillar:Business
sophistication
12th pillar:Innovation
Ghana Sub-Saharan Africa
Source: World Economic Forum, Executive Opinion Survey 2016
18.014.414.0
8.87.06.56.35.54.94.53.71.91.71.60.70.5
Access to financingCorruptionTax ratesForeign currency regulationsInflationTax regulationsInadequate supply of infrastructurePolicy instabilityPoor work ethic in national labor forceInsufficient capacity to innovateInefficient government bureaucracyCrime and theftPoor public healthInadequately educated workforceRestrictive labor regulationsGovernment instability/coups
0 5 10 15 20
score
Global Competitiveness Index2016-2017 edition
Key Indicators, 2015
Population (millions)
GDP (US$ billions)
GDP per capita (US$)
GDP (PPP) % world GDP
Ghana 114 / 138th
Source: International Monetary Fund; World Economic Outlook Database (April 2016)
26.9
36.0
1340.4
0.10
114 | The Africa Competitiveness Report 2017
Part 2

The Global Competitiveness Index in detail
Note: Values are on a 1-to-7 scale unless indicated otherwise. Trend lines depict evolution in values since the 2012-2013 edition (or earliest edition available). For detailed definitions,sources, and periods, consult the interactive Country/Economy Profiles and Rankings at http://gcr.weforum.org/
Rank / 138 Value Trend Rank / 138 Value Trend
72 3.9 1st pillar: Institutions1.01 Property rights 68 4.31.02 Intellectual property protection 78 3.91.03 Diversion of public funds 90 3.11.04 Public trust in politicians 67 3.11.05 Irregular payments and bribes 109 3.11.06 Judicial independence 46 4.61.07 Favoritism in decisions of government officials 83 2.91.08 Wastefulness of government spending 49 3.51.09 Burden of government regulation 62 3.51.10 Efficiency of legal framework in settling disputes 44 4.21.11 Efficiency of legal framework in challenging regs 44 3.91.12 Transparency of government policymaking 85 3.91.13 Business costs of terrorism 88 4.81.14 Business costs of crime and violence 88 4.21.15 Organized crime 82 4.61.16 Reliability of police services 58 4.71.17 Ethical behavior of firms 64 3.91.18 Strength of auditing and reporting standards 93 4.21.19 Efficacy of corporate boards 56 5.01.20 Protection of minority shareholders’ interests 52 4.21.21 Strength of investor protection 0-10 (best) 63 5.7
111 2.92nd pillar: Infrastructure2.01 Quality of overall infrastructure 103 3.22.02 Quality of roads 86 3.52.03 Quality of railroad infrastructure 96 1.82.04 Quality of port infrastructure 82 3.72.05 Quality of air transport infrastructure 92 4.02.06 Available airline seat kilometers millions/week 78 120.82.07 Quality of electricity supply 126 2.22.08 Mobile-cellular telephone subscriptions /100 pop. 43 129.72.09 Fixed-telephone lines /100 pop. 123 1.0
132 2.9 3rd pillar: Macroeconomic environment3.01 Government budget balance % GDP 104 -5.03.02 Gross national savings % GDP 95 15.63.03 Inflation annual % change 133 17.23.04 Government debt % GDP 105 73.33.05 Country credit rating 0-100 (best) 111 -
115 4.6 4th pillar: Health and primary education4.01 Malaria incidence cases/100,000 pop. 63 30985.64.02 Business impact of malaria 56 3.74.03 Tuberculosis incidence cases/100,000 pop. 109 165.04.04 Business impact of tuberculosis 101 4.64.05 HIV prevalence % adult pop. 117 1.54.06 Business impact of HIV/AIDS 91 4.94.07 Infant mortality deaths/1,000 live births 119 42.84.08 Life expectancy years 121 61.34.09 Quality of primary education 97 3.44.10 Primary education enrollment rate net % 95 91.1
99 3.8 5th pillar: Higher education and training5.01 Secondary education enrollment rate gross % 100 71.05.02 Tertiary education enrollment rate gross % 107 15.65.03 Quality of the education system 60 3.95.04 Quality of math and science education 93 3.75.05 Quality of management schools 53 4.55.06 Internet access in schools 95 3.75.07 Local availability of specialized training services 53 4.65.08 Extent of staff training 64 4.0
93 4.2 6th pillar: Goods market efficiency6.01 Intensity of local competition 72 5.16.02 Extent of market dominance 50 3.96.03 Effectiveness of anti-monopoly policy 91 3.46.04 Effect of taxation on incentives to invest 80 3.46.05 Total tax rate % profits 49 32.76.06 No. of procedures to start a business 94 86.07 Time to start a business days 81 14.06.08 Agricultural policy costs 77 3.76.09 Prevalence of non-tariff barriers 61 4.56.10 Trade tariffs % duty 111 10.26.11 Prevalence of foreign ownership 40 5.16.12 Business impact of rules on FDI 73 4.56.13 Burden of customs procedures 79 3.86.14 Imports % GDP 52 50.66.15 Degree of customer orientation 93 4.36.16 Buyer sophistication 120 2.7
72 4.2 7th pillar: Labor market efficiency7.01 Cooperation in labor-employer relations 59 4.57.02 Flexibility of wage determination 92 4.77.03 Hiring and firing practices 29 4.47.04 Redundancy costs weeks of salary 131 49.87.05 Effect of taxation on incentives to work 46 4.27.06 Pay and productivity 99 3.67.07 Reliance on professional management 35 4.77.08 Country capacity to retain talent 48 3.87.09 Country capacity to attract talent 45 3.87.10 Female participation in the labor force ratio to men 7 0.97
85 3.8 8th pillar: Financial market development8.01 Financial services meeting business needs 90 4.08.02 Affordability of financial services 110 3.28.03 Financing through local equity market 66 3.78.04 Ease of access to loans 104 3.38.05 Venture capital availability 105 2.48.06 Soundness of banks 87 4.58.07 Regulation of securities exchanges 92 3.98.08 Legal rights index 0-10 (best) 28 7
95 3.4 9th pillar: Technological readiness9.01 Availability of latest technologies 115 3.99.02 Firm-level technology absorption 95 4.29.03 FDI and technology transfer 80 4.29.04 Internet users % pop. 105 23.59.05 Fixed-broadband Internet subscriptions /100 pop. 120 0.39.06 Internet bandwidth kb/s/user 128 2.89.07 Mobile-broadband subscriptions /100 pop. 48 66.8
72 3.7 10th pillar: Market size10.01 Domestic market size index 72 3.510.02 Foreign market size index 68 4.510.03 GDP (PPP) PPP $ billions 73 114.710.04 Exports % GDP 51 42.4
68 3.9 11th pillar: Business sophistication11.01 Local supplier quantity 65 4.511.02 Local supplier quality 95 4.011.03 State of cluster development 45 4.011.04 Nature of competitive advantage 79 3.311.05 Value chain breadth 57 3.911.06 Control of international distribution 92 3.311.07 Production process sophistication 90 3.511.08 Extent of marketing 66 4.411.09 Willingness to delegate authority 57 3.9
69 3.3 12th pillar: Innovation12.01 Capacity for innovation 69 4.112.02 Quality of scientific research institutions 81 3.712.03 Company spending on R&D 59 3.412.04 University-industry collaboration in R&D 88 3.312.05 Gov't procurement of advanced tech. products 45 3.612.06 Availability of scientists and engineers 76 3.912.07 PCT patent applications applications/million pop. 108 0.0
Ghana
The Africa Competitiveness Report 2017 | 115
Country Profiles

Edition 2012-13 2013-14 2014-15 2015-16 2016-17
Rank 106 / 144 96 / 148 90 / 144 99 / 140 96 / 138
Score 3.7 3.8 3.9 3.9 3.9
Most problematic factors for doing business
Performance overview
Note: From the list of factors, respondents to the World Economic Forum's Executive Opinion Survey were asked to select the five most problematic factors for doing business in their country and torank them between 1 (most problematic) and 5. The score corresponds to the responses weighted according to their rankings.
The Global Competitiveness Index in detail
Rank / 138 Score (1-7) Trend Distance from best
Global Competitiveness Index 96 3.9Subindex A: Basic requirements 115 3.8
86 3.6 1st pillar: Institutions
98 3.32nd pillar: Infrastructure
122 3.6 3rd pillar: Macroeconomic environment
114 4.7 4th pillar: Health and primary education
Subindex B: Efficiency enhancers 75 4.0
97 3.9 5th pillar: Higher education and training
77 4.2 6th pillar: Goods market efficiency
31 4.6 7th pillar: Labor market efficiency
50 4.2 8th pillar: Financial market development
89 3.6 9th pillar: Technological readiness
70 3.7 10th pillar: Market size
Subindex C: Innovation and sophistication factors 40 4.0
47 4.2 11th pillar: Business sophistication
36 3.8 12th pillar: Innovation
1234567
1st pillar:Institutions
2nd pillar:Infrastructure
3rd pillar:Macroeconomicenvironment
4th pillar:Health and primaryeducation
5th pillar:Higher educationand training
6th pillar:Goods marketefficiency7th pillar:
Labor marketefficiency
8th pillar:Financial market
development
9th pillar:Technological
readiness
10th pillar:Market size
11th pillar:Business
sophistication
12th pillar:Innovation
Kenya Sub-Saharan Africa
Source: World Economic Forum, Executive Opinion Survey 2016
17.813.711.5
9.68.17.36.15.84.13.93.32.82.11.71.30.9
CorruptionTax ratesAccess to financingInefficient government bureaucracyInadequate supply of infrastructurePolicy instabilityInflationCrime and theftInsufficient capacity to innovateTax regulationsPoor work ethic in national labor forceRestrictive labor regulationsInadequately educated workforcePoor public healthForeign currency regulationsGovernment instability/coups
0 5 10 15 20
score
Global Competitiveness Index2016-2017 edition
Key Indicators, 2015
Population (millions)
GDP (US$ billions)
GDP per capita (US$)
GDP (PPP) % world GDP
Kenya 96 / 138th
Source: International Monetary Fund; World Economic Outlook Database (April 2016)
44.2
61.4
1388.5
0.13
116 | The Africa Competitiveness Report 2017
Part 2

The Global Competitiveness Index in detail
Note: Values are on a 1-to-7 scale unless indicated otherwise. Trend lines depict evolution in values since the 2012-2013 edition (or earliest edition available). For detailed definitions,sources, and periods, consult the interactive Country/Economy Profiles and Rankings at http://gcr.weforum.org/
Rank / 138 Value Trend Rank / 138 Value Trend
86 3.6 1st pillar: Institutions1.01 Property rights 59 4.41.02 Intellectual property protection 76 4.01.03 Diversion of public funds 89 3.11.04 Public trust in politicians 78 2.91.05 Irregular payments and bribes 113 3.01.06 Judicial independence 62 4.01.07 Favoritism in decisions of government officials 92 2.71.08 Wastefulness of government spending 62 3.31.09 Burden of government regulation 36 3.91.10 Efficiency of legal framework in settling disputes 56 3.91.11 Efficiency of legal framework in challenging regs 50 3.81.12 Transparency of government policymaking 55 4.31.13 Business costs of terrorism 137 2.61.14 Business costs of crime and violence 128 2.81.15 Organized crime 125 3.31.16 Reliability of police services 93 3.91.17 Ethical behavior of firms 78 3.81.18 Strength of auditing and reporting standards 86 4.31.19 Efficacy of corporate boards 43 5.11.20 Protection of minority shareholders’ interests 62 4.11.21 Strength of investor protection 0-10 (best) 96 4.7
98 3.32nd pillar: Infrastructure2.01 Quality of overall infrastructure 56 4.32.02 Quality of roads 61 4.22.03 Quality of railroad infrastructure 61 2.82.04 Quality of port infrastructure 64 4.22.05 Quality of air transport infrastructure 48 4.82.06 Available airline seat kilometers millions/week 62 264.42.07 Quality of electricity supply 96 3.92.08 Mobile-cellular telephone subscriptions /100 pop. 121 80.72.09 Fixed-telephone lines /100 pop. 134 0.2
122 3.6 3rd pillar: Macroeconomic environment3.01 Government budget balance % GDP 126 -8.43.02 Gross national savings % GDP 104 14.43.03 Inflation annual % change 115 6.63.04 Government debt % GDP 77 52.73.05 Country credit rating 0-100 (best) 94 -
114 4.7 4th pillar: Health and primary education4.01 Malaria incidence cases/100,000 pop. 54 14488.44.02 Business impact of malaria 42 4.54.03 Tuberculosis incidence cases/100,000 pop. 121 246.04.04 Business impact of tuberculosis 100 4.64.05 HIV prevalence % adult pop. 127 5.34.06 Business impact of HIV/AIDS 119 4.04.07 Infant mortality deaths/1,000 live births 111 35.54.08 Life expectancy years 120 61.64.09 Quality of primary education 76 3.94.10 Primary education enrollment rate net % 122 84.9
97 3.9 5th pillar: Higher education and training5.01 Secondary education enrollment rate gross % 106 67.65.02 Tertiary education enrollment rate gross % 132 4.05.03 Quality of the education system 35 4.45.04 Quality of math and science education 68 4.15.05 Quality of management schools 45 4.65.06 Internet access in schools 87 3.95.07 Local availability of specialized training services 41 4.85.08 Extent of staff training 43 4.3
77 4.2 6th pillar: Goods market efficiency6.01 Intensity of local competition 19 5.66.02 Extent of market dominance 60 3.86.03 Effectiveness of anti-monopoly policy 71 3.76.04 Effect of taxation on incentives to invest 71 3.66.05 Total tax rate % profits 69 37.16.06 No. of procedures to start a business 122 116.07 Time to start a business days 109 26.06.08 Agricultural policy costs 54 4.06.09 Prevalence of non-tariff barriers 90 4.26.10 Trade tariffs % duty 97 9.66.11 Prevalence of foreign ownership 59 4.76.12 Business impact of rules on FDI 86 4.46.13 Burden of customs procedures 76 3.96.14 Imports % GDP 108 30.36.15 Degree of customer orientation 58 4.86.16 Buyer sophistication 97 3.0
31 4.6 7th pillar: Labor market efficiency7.01 Cooperation in labor-employer relations 95 4.27.02 Flexibility of wage determination 45 5.37.03 Hiring and firing practices 44 4.17.04 Redundancy costs weeks of salary 15 6.47.05 Effect of taxation on incentives to work 70 3.97.06 Pay and productivity 74 3.97.07 Reliance on professional management 69 4.37.08 Country capacity to retain talent 53 3.77.09 Country capacity to attract talent 35 3.97.10 Female participation in the labor force ratio to men 51 0.86
50 4.2 8th pillar: Financial market development8.01 Financial services meeting business needs 59 4.58.02 Affordability of financial services 96 3.58.03 Financing through local equity market 28 4.58.04 Ease of access to loans 50 4.38.05 Venture capital availability 64 2.98.06 Soundness of banks 88 4.58.07 Regulation of securities exchanges 61 4.58.08 Legal rights index 0-10 (best) 28 7
89 3.6 9th pillar: Technological readiness9.01 Availability of latest technologies 47 5.29.02 Firm-level technology absorption 35 5.19.03 FDI and technology transfer 48 4.69.04 Internet users % pop. 84 45.69.05 Fixed-broadband Internet subscriptions /100 pop. 119 0.39.06 Internet bandwidth kb/s/user 71 40.19.07 Mobile-broadband subscriptions /100 pop. 116 15.5
70 3.7 10th pillar: Market size10.01 Domestic market size index 65 3.610.02 Foreign market size index 86 4.010.03 GDP (PPP) PPP $ billions 68 141.910.04 Exports % GDP 125 15.6
47 4.2 11th pillar: Business sophistication11.01 Local supplier quantity 25 4.911.02 Local supplier quality 52 4.411.03 State of cluster development 39 4.211.04 Nature of competitive advantage 52 3.811.05 Value chain breadth 42 4.211.06 Control of international distribution 67 3.711.07 Production process sophistication 63 3.911.08 Extent of marketing 30 4.911.09 Willingness to delegate authority 37 4.1
36 3.8 12th pillar: Innovation12.01 Capacity for innovation 36 4.612.02 Quality of scientific research institutions 49 4.212.03 Company spending on R&D 31 4.112.04 University-industry collaboration in R&D 26 4.512.05 Gov't procurement of advanced tech. products 19 4.012.06 Availability of scientists and engineers 40 4.412.07 PCT patent applications applications/million pop. 93 0.2
Kenya
The Africa Competitiveness Report 2017 | 117
Country Profiles
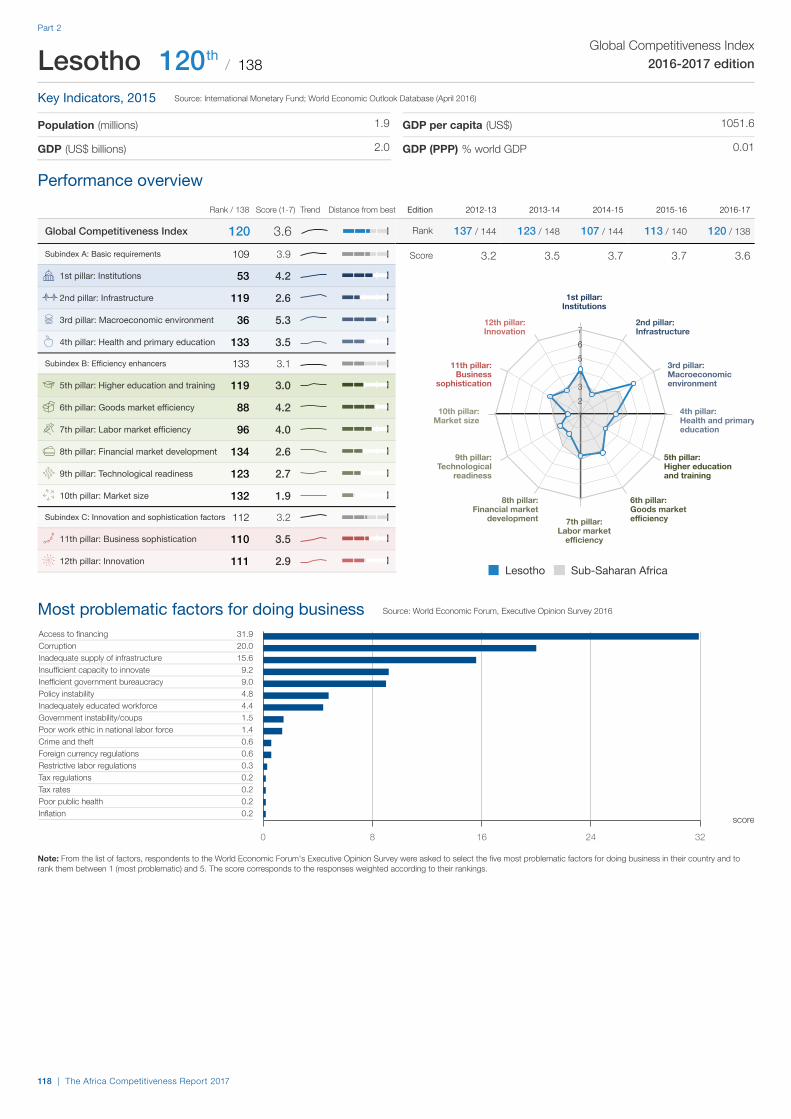
Edition 2012-13 2013-14 2014-15 2015-16 2016-17
Rank 137 / 144 123 / 148 107 / 144 113 / 140 120 / 138
Score 3.2 3.5 3.7 3.7 3.6
Most problematic factors for doing business
Performance overview
Note: From the list of factors, respondents to the World Economic Forum's Executive Opinion Survey were asked to select the five most problematic factors for doing business in their country and torank them between 1 (most problematic) and 5. The score corresponds to the responses weighted according to their rankings.
The Global Competitiveness Index in detail
Rank / 138 Score (1-7) Trend Distance from best
Global Competitiveness Index 120 3.6Subindex A: Basic requirements 109 3.9
53 4.2 1st pillar: Institutions
119 2.62nd pillar: Infrastructure
36 5.3 3rd pillar: Macroeconomic environment
133 3.5 4th pillar: Health and primary education
Subindex B: Efficiency enhancers 133 3.1
119 3.0 5th pillar: Higher education and training
88 4.2 6th pillar: Goods market efficiency
96 4.0 7th pillar: Labor market efficiency
134 2.6 8th pillar: Financial market development
123 2.7 9th pillar: Technological readiness
132 1.9 10th pillar: Market size
Subindex C: Innovation and sophistication factors 112 3.2
110 3.5 11th pillar: Business sophistication
111 2.9 12th pillar: Innovation
1234567
1st pillar:Institutions
2nd pillar:Infrastructure
3rd pillar:Macroeconomicenvironment
4th pillar:Health and primaryeducation
5th pillar:Higher educationand training
6th pillar:Goods marketefficiency7th pillar:
Labor marketefficiency
8th pillar:Financial market
development
9th pillar:Technological
readiness
10th pillar:Market size
11th pillar:Business
sophistication
12th pillar:Innovation
Lesotho Sub-Saharan Africa
Source: World Economic Forum, Executive Opinion Survey 2016
31.920.015.6
9.29.04.84.41.51.40.60.60.30.20.20.20.2
Access to financingCorruptionInadequate supply of infrastructureInsufficient capacity to innovateInefficient government bureaucracyPolicy instabilityInadequately educated workforceGovernment instability/coupsPoor work ethic in national labor forceCrime and theftForeign currency regulationsRestrictive labor regulationsTax regulationsTax ratesPoor public healthInflation
0 8 16 24 32
score
Global Competitiveness Index2016-2017 edition
Key Indicators, 2015
Population (millions)
GDP (US$ billions)
GDP per capita (US$)
GDP (PPP) % world GDP
Lesotho 120 / 138th
Source: International Monetary Fund; World Economic Outlook Database (April 2016)
1.9
2.0
1051.6
0.01
118 | The Africa Competitiveness Report 2017
Part 2
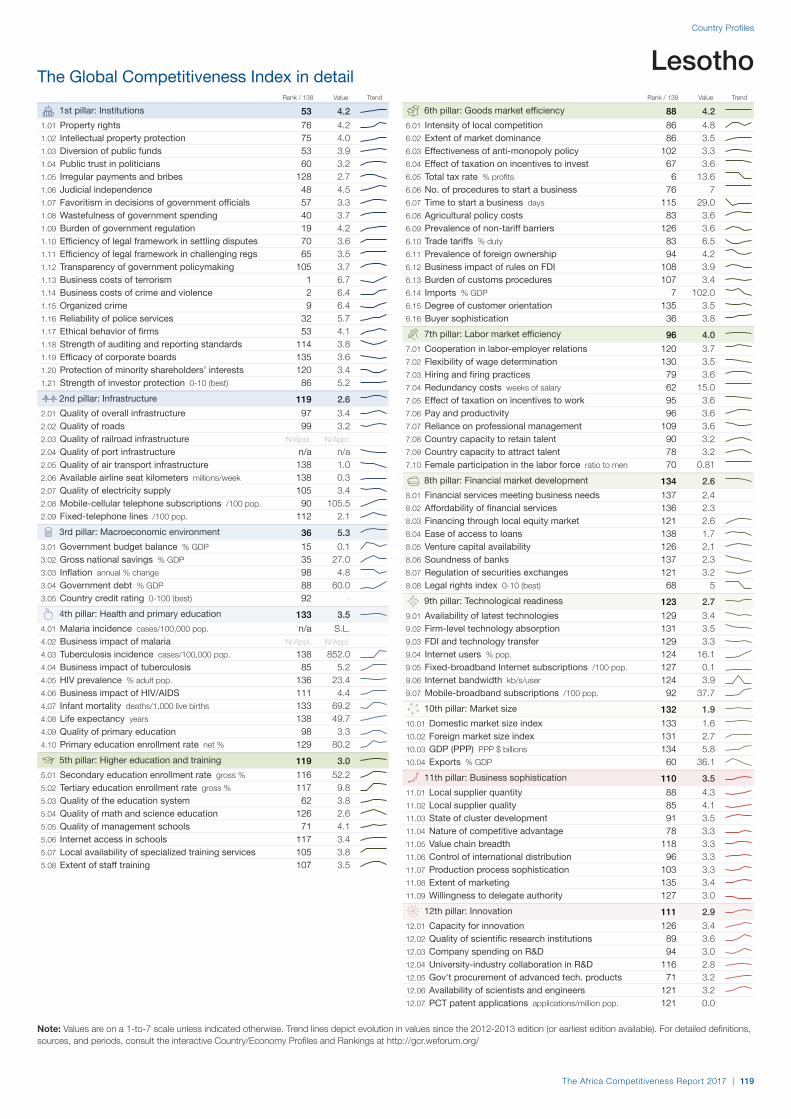
The Global Competitiveness Index in detail
Note: Values are on a 1-to-7 scale unless indicated otherwise. Trend lines depict evolution in values since the 2012-2013 edition (or earliest edition available). For detailed definitions,sources, and periods, consult the interactive Country/Economy Profiles and Rankings at http://gcr.weforum.org/
Rank / 138 Value Trend Rank / 138 Value Trend
53 4.2 1st pillar: Institutions1.01 Property rights 76 4.21.02 Intellectual property protection 75 4.01.03 Diversion of public funds 53 3.91.04 Public trust in politicians 60 3.21.05 Irregular payments and bribes 128 2.71.06 Judicial independence 48 4.51.07 Favoritism in decisions of government officials 57 3.31.08 Wastefulness of government spending 40 3.71.09 Burden of government regulation 19 4.21.10 Efficiency of legal framework in settling disputes 70 3.61.11 Efficiency of legal framework in challenging regs 65 3.51.12 Transparency of government policymaking 105 3.71.13 Business costs of terrorism 1 6.71.14 Business costs of crime and violence 2 6.41.15 Organized crime 9 6.41.16 Reliability of police services 32 5.71.17 Ethical behavior of firms 53 4.11.18 Strength of auditing and reporting standards 114 3.81.19 Efficacy of corporate boards 135 3.61.20 Protection of minority shareholders’ interests 120 3.41.21 Strength of investor protection 0-10 (best) 86 5.2
119 2.62nd pillar: Infrastructure2.01 Quality of overall infrastructure 97 3.42.02 Quality of roads 99 3.22.03 Quality of railroad infrastructure N/Appl. N/Appl.2.04 Quality of port infrastructure n/a n/a2.05 Quality of air transport infrastructure 138 1.02.06 Available airline seat kilometers millions/week 138 0.32.07 Quality of electricity supply 105 3.42.08 Mobile-cellular telephone subscriptions /100 pop. 90 105.52.09 Fixed-telephone lines /100 pop. 112 2.1
36 5.3 3rd pillar: Macroeconomic environment3.01 Government budget balance % GDP 15 0.13.02 Gross national savings % GDP 35 27.03.03 Inflation annual % change 98 4.83.04 Government debt % GDP 88 60.03.05 Country credit rating 0-100 (best) 92 -
133 3.5 4th pillar: Health and primary education4.01 Malaria incidence cases/100,000 pop. n/a S.L.4.02 Business impact of malaria N/Appl. N/Appl.4.03 Tuberculosis incidence cases/100,000 pop. 138 852.04.04 Business impact of tuberculosis 85 5.24.05 HIV prevalence % adult pop. 136 23.44.06 Business impact of HIV/AIDS 111 4.44.07 Infant mortality deaths/1,000 live births 133 69.24.08 Life expectancy years 138 49.74.09 Quality of primary education 98 3.34.10 Primary education enrollment rate net % 129 80.2
119 3.0 5th pillar: Higher education and training5.01 Secondary education enrollment rate gross % 116 52.25.02 Tertiary education enrollment rate gross % 117 9.85.03 Quality of the education system 62 3.85.04 Quality of math and science education 126 2.65.05 Quality of management schools 71 4.15.06 Internet access in schools 117 3.45.07 Local availability of specialized training services 105 3.85.08 Extent of staff training 107 3.5
88 4.2 6th pillar: Goods market efficiency6.01 Intensity of local competition 86 4.86.02 Extent of market dominance 86 3.56.03 Effectiveness of anti-monopoly policy 102 3.36.04 Effect of taxation on incentives to invest 67 3.66.05 Total tax rate % profits 6 13.66.06 No. of procedures to start a business 76 76.07 Time to start a business days 115 29.06.08 Agricultural policy costs 83 3.66.09 Prevalence of non-tariff barriers 126 3.66.10 Trade tariffs % duty 83 6.56.11 Prevalence of foreign ownership 94 4.26.12 Business impact of rules on FDI 108 3.96.13 Burden of customs procedures 107 3.46.14 Imports % GDP 7 102.06.15 Degree of customer orientation 135 3.56.16 Buyer sophistication 36 3.8
96 4.0 7th pillar: Labor market efficiency7.01 Cooperation in labor-employer relations 120 3.77.02 Flexibility of wage determination 130 3.57.03 Hiring and firing practices 79 3.67.04 Redundancy costs weeks of salary 62 15.07.05 Effect of taxation on incentives to work 95 3.67.06 Pay and productivity 96 3.67.07 Reliance on professional management 109 3.67.08 Country capacity to retain talent 90 3.27.09 Country capacity to attract talent 78 3.27.10 Female participation in the labor force ratio to men 70 0.81
134 2.6 8th pillar: Financial market development8.01 Financial services meeting business needs 137 2.48.02 Affordability of financial services 136 2.38.03 Financing through local equity market 121 2.68.04 Ease of access to loans 138 1.78.05 Venture capital availability 126 2.18.06 Soundness of banks 137 2.38.07 Regulation of securities exchanges 121 3.28.08 Legal rights index 0-10 (best) 68 5
123 2.7 9th pillar: Technological readiness9.01 Availability of latest technologies 129 3.49.02 Firm-level technology absorption 131 3.59.03 FDI and technology transfer 129 3.39.04 Internet users % pop. 124 16.19.05 Fixed-broadband Internet subscriptions /100 pop. 127 0.19.06 Internet bandwidth kb/s/user 124 3.99.07 Mobile-broadband subscriptions /100 pop. 92 37.7
132 1.9 10th pillar: Market size10.01 Domestic market size index 133 1.610.02 Foreign market size index 131 2.710.03 GDP (PPP) PPP $ billions 134 5.810.04 Exports % GDP 60 36.1
110 3.5 11th pillar: Business sophistication11.01 Local supplier quantity 88 4.311.02 Local supplier quality 85 4.111.03 State of cluster development 91 3.511.04 Nature of competitive advantage 78 3.311.05 Value chain breadth 118 3.311.06 Control of international distribution 96 3.311.07 Production process sophistication 103 3.311.08 Extent of marketing 135 3.411.09 Willingness to delegate authority 127 3.0
111 2.9 12th pillar: Innovation12.01 Capacity for innovation 126 3.412.02 Quality of scientific research institutions 89 3.612.03 Company spending on R&D 94 3.012.04 University-industry collaboration in R&D 116 2.812.05 Gov't procurement of advanced tech. products 71 3.212.06 Availability of scientists and engineers 121 3.212.07 PCT patent applications applications/million pop. 121 0.0
Lesotho
The Africa Competitiveness Report 2017 | 119
Country Profiles
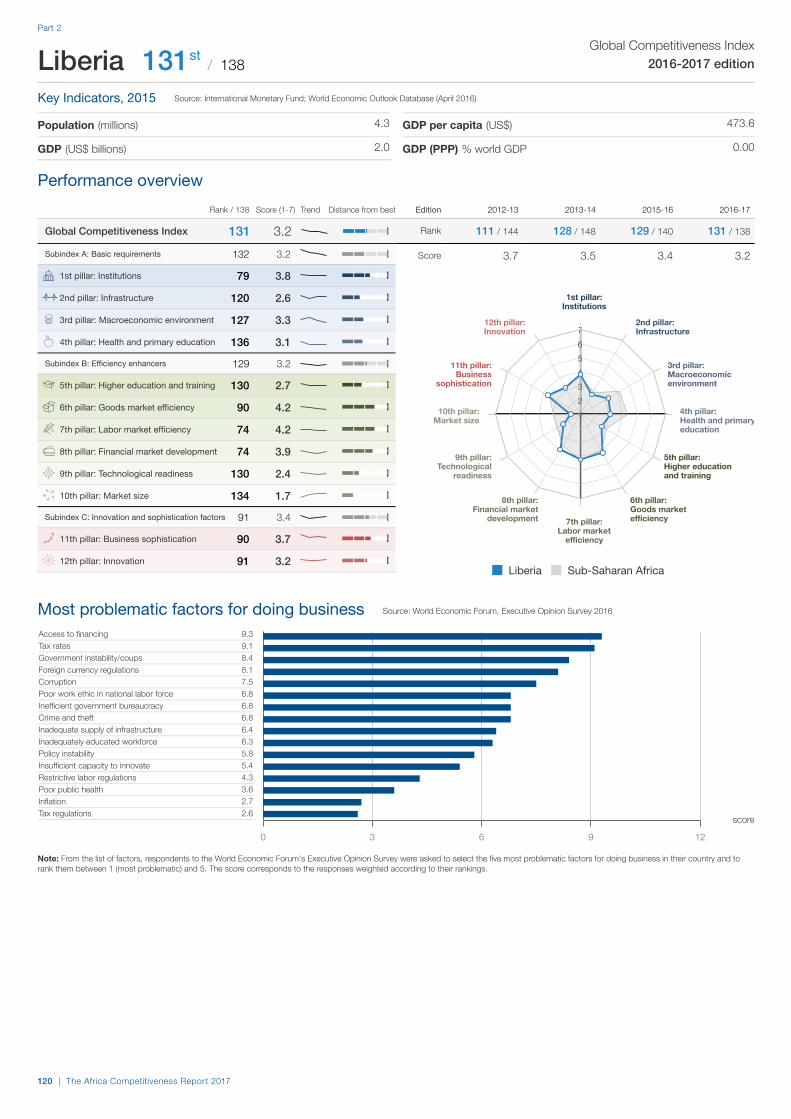
Edition 2012-13 2013-14 2015-16 2016-17
Rank 111 / 144 128 / 148 129 / 140 131 / 138
Score 3.7 3.5 3.4 3.2
Most problematic factors for doing business
Performance overview
Note: From the list of factors, respondents to the World Economic Forum's Executive Opinion Survey were asked to select the five most problematic factors for doing business in their country and torank them between 1 (most problematic) and 5. The score corresponds to the responses weighted according to their rankings.
The Global Competitiveness Index in detail
Rank / 138 Score (1-7) Trend Distance from best
Global Competitiveness Index 131 3.2Subindex A: Basic requirements 132 3.2
79 3.8 1st pillar: Institutions
120 2.62nd pillar: Infrastructure
127 3.3 3rd pillar: Macroeconomic environment
136 3.1 4th pillar: Health and primary education
Subindex B: Efficiency enhancers 129 3.2
130 2.7 5th pillar: Higher education and training
90 4.2 6th pillar: Goods market efficiency
74 4.2 7th pillar: Labor market efficiency
74 3.9 8th pillar: Financial market development
130 2.4 9th pillar: Technological readiness
134 1.7 10th pillar: Market size
Subindex C: Innovation and sophistication factors 91 3.4
90 3.7 11th pillar: Business sophistication
91 3.2 12th pillar: Innovation
1234567
1st pillar:Institutions
2nd pillar:Infrastructure
3rd pillar:Macroeconomicenvironment
4th pillar:Health and primaryeducation
5th pillar:Higher educationand training
6th pillar:Goods marketefficiency7th pillar:
Labor marketefficiency
8th pillar:Financial market
development
9th pillar:Technological
readiness
10th pillar:Market size
11th pillar:Business
sophistication
12th pillar:Innovation
Liberia Sub-Saharan Africa
Source: World Economic Forum, Executive Opinion Survey 2016
9.39.18.48.17.56.86.86.86.46.35.85.44.33.62.72.6
Access to financingTax ratesGovernment instability/coupsForeign currency regulationsCorruptionPoor work ethic in national labor forceInefficient government bureaucracyCrime and theftInadequate supply of infrastructureInadequately educated workforcePolicy instabilityInsufficient capacity to innovateRestrictive labor regulationsPoor public healthInflationTax regulations
0 3 6 9 12
score
Global Competitiveness Index2016-2017 edition
Key Indicators, 2015
Population (millions)
GDP (US$ billions)
GDP per capita (US$)
GDP (PPP) % world GDP
Liberia 131 / 138st
Source: International Monetary Fund; World Economic Outlook Database (April 2016)
4.3
2.0
473.6
0.00
120 | The Africa Competitiveness Report 2017
Part 2
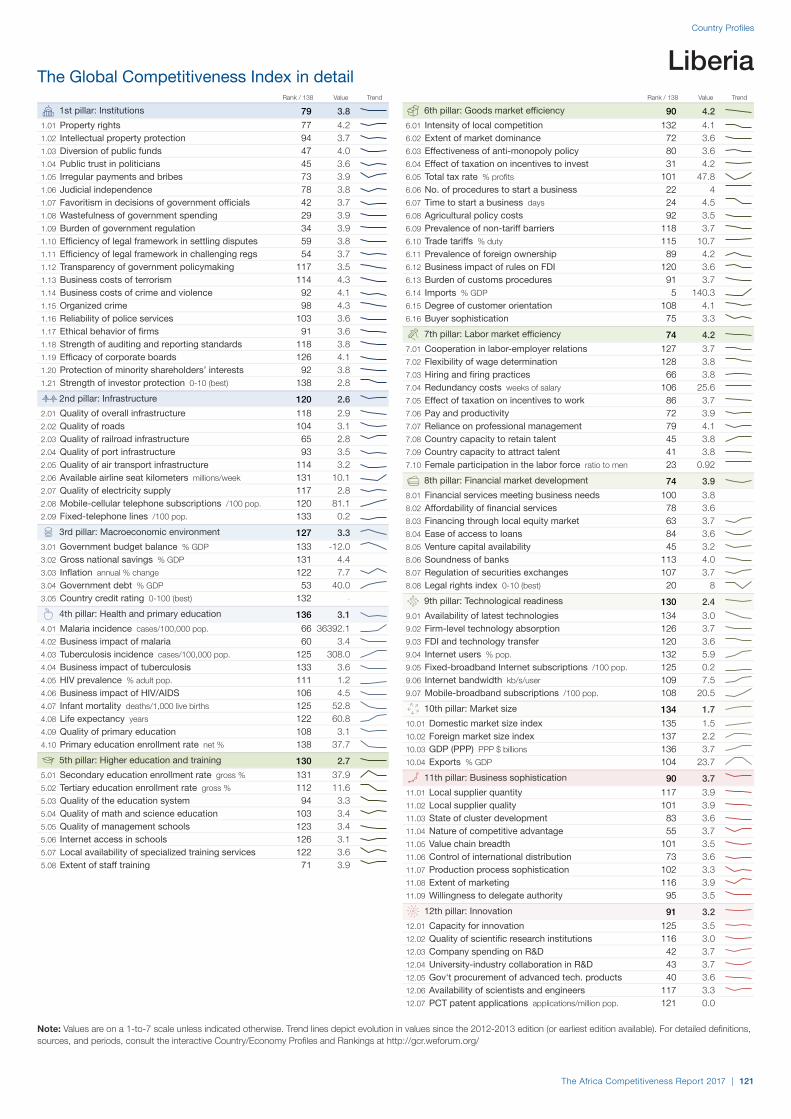
The Global Competitiveness Index in detail
Note: Values are on a 1-to-7 scale unless indicated otherwise. Trend lines depict evolution in values since the 2012-2013 edition (or earliest edition available). For detailed definitions,sources, and periods, consult the interactive Country/Economy Profiles and Rankings at http://gcr.weforum.org/
Rank / 138 Value Trend Rank / 138 Value Trend
79 3.8 1st pillar: Institutions1.01 Property rights 77 4.21.02 Intellectual property protection 94 3.71.03 Diversion of public funds 47 4.01.04 Public trust in politicians 45 3.61.05 Irregular payments and bribes 73 3.91.06 Judicial independence 78 3.81.07 Favoritism in decisions of government officials 42 3.71.08 Wastefulness of government spending 29 3.91.09 Burden of government regulation 34 3.91.10 Efficiency of legal framework in settling disputes 59 3.81.11 Efficiency of legal framework in challenging regs 54 3.71.12 Transparency of government policymaking 117 3.51.13 Business costs of terrorism 114 4.31.14 Business costs of crime and violence 92 4.11.15 Organized crime 98 4.31.16 Reliability of police services 103 3.61.17 Ethical behavior of firms 91 3.61.18 Strength of auditing and reporting standards 118 3.81.19 Efficacy of corporate boards 126 4.11.20 Protection of minority shareholders’ interests 92 3.81.21 Strength of investor protection 0-10 (best) 138 2.8
120 2.62nd pillar: Infrastructure2.01 Quality of overall infrastructure 118 2.92.02 Quality of roads 104 3.12.03 Quality of railroad infrastructure 65 2.82.04 Quality of port infrastructure 93 3.52.05 Quality of air transport infrastructure 114 3.22.06 Available airline seat kilometers millions/week 131 10.12.07 Quality of electricity supply 117 2.82.08 Mobile-cellular telephone subscriptions /100 pop. 120 81.12.09 Fixed-telephone lines /100 pop. 133 0.2
127 3.3 3rd pillar: Macroeconomic environment3.01 Government budget balance % GDP 133 -12.03.02 Gross national savings % GDP 131 4.43.03 Inflation annual % change 122 7.73.04 Government debt % GDP 53 40.03.05 Country credit rating 0-100 (best) 132 -
136 3.1 4th pillar: Health and primary education4.01 Malaria incidence cases/100,000 pop. 66 36392.14.02 Business impact of malaria 60 3.44.03 Tuberculosis incidence cases/100,000 pop. 125 308.04.04 Business impact of tuberculosis 133 3.64.05 HIV prevalence % adult pop. 111 1.24.06 Business impact of HIV/AIDS 106 4.54.07 Infant mortality deaths/1,000 live births 125 52.84.08 Life expectancy years 122 60.84.09 Quality of primary education 108 3.14.10 Primary education enrollment rate net % 138 37.7
130 2.7 5th pillar: Higher education and training5.01 Secondary education enrollment rate gross % 131 37.95.02 Tertiary education enrollment rate gross % 112 11.65.03 Quality of the education system 94 3.35.04 Quality of math and science education 103 3.45.05 Quality of management schools 123 3.45.06 Internet access in schools 126 3.15.07 Local availability of specialized training services 122 3.65.08 Extent of staff training 71 3.9
90 4.2 6th pillar: Goods market efficiency6.01 Intensity of local competition 132 4.16.02 Extent of market dominance 72 3.66.03 Effectiveness of anti-monopoly policy 80 3.66.04 Effect of taxation on incentives to invest 31 4.26.05 Total tax rate % profits 101 47.86.06 No. of procedures to start a business 22 46.07 Time to start a business days 24 4.56.08 Agricultural policy costs 92 3.56.09 Prevalence of non-tariff barriers 118 3.76.10 Trade tariffs % duty 115 10.76.11 Prevalence of foreign ownership 89 4.26.12 Business impact of rules on FDI 120 3.66.13 Burden of customs procedures 91 3.76.14 Imports % GDP 5 140.36.15 Degree of customer orientation 108 4.16.16 Buyer sophistication 75 3.3
74 4.2 7th pillar: Labor market efficiency7.01 Cooperation in labor-employer relations 127 3.77.02 Flexibility of wage determination 128 3.87.03 Hiring and firing practices 66 3.87.04 Redundancy costs weeks of salary 106 25.67.05 Effect of taxation on incentives to work 86 3.77.06 Pay and productivity 72 3.97.07 Reliance on professional management 79 4.17.08 Country capacity to retain talent 45 3.87.09 Country capacity to attract talent 41 3.87.10 Female participation in the labor force ratio to men 23 0.92
74 3.9 8th pillar: Financial market development8.01 Financial services meeting business needs 100 3.88.02 Affordability of financial services 78 3.68.03 Financing through local equity market 63 3.78.04 Ease of access to loans 84 3.68.05 Venture capital availability 45 3.28.06 Soundness of banks 113 4.08.07 Regulation of securities exchanges 107 3.78.08 Legal rights index 0-10 (best) 20 8
130 2.4 9th pillar: Technological readiness9.01 Availability of latest technologies 134 3.09.02 Firm-level technology absorption 126 3.79.03 FDI and technology transfer 120 3.69.04 Internet users % pop. 132 5.99.05 Fixed-broadband Internet subscriptions /100 pop. 125 0.29.06 Internet bandwidth kb/s/user 109 7.59.07 Mobile-broadband subscriptions /100 pop. 108 20.5
134 1.7 10th pillar: Market size10.01 Domestic market size index 135 1.510.02 Foreign market size index 137 2.210.03 GDP (PPP) PPP $ billions 136 3.710.04 Exports % GDP 104 23.7
90 3.7 11th pillar: Business sophistication11.01 Local supplier quantity 117 3.911.02 Local supplier quality 101 3.911.03 State of cluster development 83 3.611.04 Nature of competitive advantage 55 3.711.05 Value chain breadth 101 3.511.06 Control of international distribution 73 3.611.07 Production process sophistication 102 3.311.08 Extent of marketing 116 3.911.09 Willingness to delegate authority 95 3.5
91 3.2 12th pillar: Innovation12.01 Capacity for innovation 125 3.512.02 Quality of scientific research institutions 116 3.012.03 Company spending on R&D 42 3.712.04 University-industry collaboration in R&D 43 3.712.05 Gov't procurement of advanced tech. products 40 3.612.06 Availability of scientists and engineers 117 3.312.07 PCT patent applications applications/million pop. 121 0.0
Liberia
The Africa Competitiveness Report 2017 | 121
Country Profiles

Edition 2012-13 2013-14 2014-15 2015-16 2016-17
Rank 130 / 144 132 / 148 130 / 144 130 / 140 128 / 138
Score 3.4 3.4 3.4 3.3 3.3
Most problematic factors for doing business
Performance overview
Note: From the list of factors, respondents to the World Economic Forum's Executive Opinion Survey were asked to select the five most problematic factors for doing business in their country and torank them between 1 (most problematic) and 5. The score corresponds to the responses weighted according to their rankings.
The Global Competitiveness Index in detail
Rank / 138 Score (1-7) Trend Distance from best
Global Competitiveness Index 128 3.3Subindex A: Basic requirements 127 3.4
127 3.1 1st pillar: Institutions
133 2.02nd pillar: Infrastructure
102 4.1 3rd pillar: Macroeconomic environment
122 4.3 4th pillar: Health and primary education
Subindex B: Efficiency enhancers 128 3.3
126 2.9 5th pillar: Higher education and training
120 3.8 6th pillar: Goods market efficiency
56 4.4 7th pillar: Labor market efficiency
121 3.1 8th pillar: Financial market development
128 2.5 9th pillar: Technological readiness
107 2.9 10th pillar: Market size
Subindex C: Innovation and sophistication factors 114 3.2
120 3.3 11th pillar: Business sophistication
97 3.1 12th pillar: Innovation
1234567
1st pillar:Institutions
2nd pillar:Infrastructure
3rd pillar:Macroeconomicenvironment
4th pillar:Health and primaryeducation
5th pillar:Higher educationand training
6th pillar:Goods marketefficiency7th pillar:
Labor marketefficiency
8th pillar:Financial market
development
9th pillar:Technological
readiness
10th pillar:Market size
11th pillar:Business
sophistication
12th pillar:Innovation
Madagascar Sub-Saharan Africa
Source: World Economic Forum, Executive Opinion Survey 2016
21.014.712.610.6
7.85.14.74.43.93.23.23.12.52.30.70.2
Policy instabilityCorruptionAccess to financingGovernment instability/coupsTax ratesTax regulationsInadequately educated workforceInadequate supply of infrastructureInsufficient capacity to innovateInflationForeign currency regulationsCrime and theftInefficient government bureaucracyPoor work ethic in national labor forcePoor public healthRestrictive labor regulations
0 6 12 18 24
score
Global Competitiveness Index2016-2017 edition
Key Indicators, 2015
Population (millions)
GDP (US$ billions)
GDP per capita (US$)
GDP (PPP) % world GDP
Madagascar 128 / 138th
Source: International Monetary Fund; World Economic Outlook Database (April 2016)
24.2
9.7
401.8
0.03
122 | The Africa Competitiveness Report 2017
Part 2

The Global Competitiveness Index in detail
Note: Values are on a 1-to-7 scale unless indicated otherwise. Trend lines depict evolution in values since the 2012-2013 edition (or earliest edition available). For detailed definitions,sources, and periods, consult the interactive Country/Economy Profiles and Rankings at http://gcr.weforum.org/
Rank / 138 Value Trend Rank / 138 Value Trend
127 3.1 1st pillar: Institutions1.01 Property rights 127 3.21.02 Intellectual property protection 107 3.41.03 Diversion of public funds 111 2.61.04 Public trust in politicians 108 2.21.05 Irregular payments and bribes 127 2.71.06 Judicial independence 126 2.51.07 Favoritism in decisions of government officials 104 2.61.08 Wastefulness of government spending 110 2.41.09 Burden of government regulation 94 3.21.10 Efficiency of legal framework in settling disputes 122 2.71.11 Efficiency of legal framework in challenging regs 128 2.51.12 Transparency of government policymaking 137 2.61.13 Business costs of terrorism 96 4.81.14 Business costs of crime and violence 111 3.61.15 Organized crime 115 3.81.16 Reliability of police services 123 2.91.17 Ethical behavior of firms 110 3.31.18 Strength of auditing and reporting standards 125 3.61.19 Efficacy of corporate boards 103 4.41.20 Protection of minority shareholders’ interests 135 3.01.21 Strength of investor protection 0-10 (best) 90 5.0
133 2.02nd pillar: Infrastructure2.01 Quality of overall infrastructure 122 2.72.02 Quality of roads 138 2.02.03 Quality of railroad infrastructure 95 1.82.04 Quality of port infrastructure 94 3.52.05 Quality of air transport infrastructure 122 3.22.06 Available airline seat kilometers millions/week 110 33.42.07 Quality of electricity supply 130 1.92.08 Mobile-cellular telephone subscriptions /100 pop. 135 46.02.09 Fixed-telephone lines /100 pop. 121 1.0
102 4.1 3rd pillar: Macroeconomic environment3.01 Government budget balance % GDP 82 -3.73.02 Gross national savings % GDP 101 14.93.03 Inflation annual % change 120 7.43.04 Government debt % GDP 37 35.63.05 Country credit rating 0-100 (best) 125 -
122 4.3 4th pillar: Health and primary education4.01 Malaria incidence cases/100,000 pop. 47 5090.84.02 Business impact of malaria 61 3.44.03 Tuberculosis incidence cases/100,000 pop. 120 235.04.04 Business impact of tuberculosis 107 4.44.05 HIV prevalence % adult pop. 60 0.34.06 Business impact of HIV/AIDS 86 5.04.07 Infant mortality deaths/1,000 live births 112 35.94.08 Life expectancy years 110 65.14.09 Quality of primary education 112 3.04.10 Primary education enrollment rate net % 130 77.1
126 2.9 5th pillar: Higher education and training5.01 Secondary education enrollment rate gross % 129 38.45.02 Tertiary education enrollment rate gross % 131 4.25.03 Quality of the education system 115 2.95.04 Quality of math and science education 82 3.85.05 Quality of management schools 82 4.05.06 Internet access in schools 104 3.65.07 Local availability of specialized training services 98 3.95.08 Extent of staff training 96 3.6
120 3.8 6th pillar: Goods market efficiency6.01 Intensity of local competition 110 4.66.02 Extent of market dominance 123 3.06.03 Effectiveness of anti-monopoly policy 133 2.66.04 Effect of taxation on incentives to invest 99 3.36.05 Total tax rate % profits 73 38.16.06 No. of procedures to start a business 108 96.07 Time to start a business days 77 13.06.08 Agricultural policy costs 113 3.26.09 Prevalence of non-tariff barriers 134 3.16.10 Trade tariffs % duty 90 7.76.11 Prevalence of foreign ownership 97 4.26.12 Business impact of rules on FDI 105 4.06.13 Burden of customs procedures 120 3.26.14 Imports % GDP 68 42.86.15 Degree of customer orientation 78 4.56.16 Buyer sophistication 130 2.4
56 4.4 7th pillar: Labor market efficiency7.01 Cooperation in labor-employer relations 94 4.27.02 Flexibility of wage determination 90 4.87.03 Hiring and firing practices 70 3.77.04 Redundancy costs weeks of salary 59 14.77.05 Effect of taxation on incentives to work 58 4.07.06 Pay and productivity 111 3.57.07 Reliance on professional management 103 3.77.08 Country capacity to retain talent 105 2.97.09 Country capacity to attract talent 71 3.37.10 Female participation in the labor force ratio to men 11 0.95
121 3.1 8th pillar: Financial market development8.01 Financial services meeting business needs 103 3.78.02 Affordability of financial services 122 2.98.03 Financing through local equity market 117 2.78.04 Ease of access to loans 121 2.98.05 Venture capital availability 89 2.68.06 Soundness of banks 104 4.28.07 Regulation of securities exchanges 126 3.28.08 Legal rights index 0-10 (best) 97 3
128 2.5 9th pillar: Technological readiness9.01 Availability of latest technologies 121 3.89.02 Firm-level technology absorption 89 4.39.03 FDI and technology transfer 108 3.89.04 Internet users % pop. 135 4.29.05 Fixed-broadband Internet subscriptions /100 pop. 132 0.19.06 Internet bandwidth kb/s/user 102 12.49.07 Mobile-broadband subscriptions /100 pop. 128 9.0
107 2.9 10th pillar: Market size10.01 Domestic market size index 105 2.610.02 Foreign market size index 106 3.710.03 GDP (PPP) PPP $ billions 106 35.410.04 Exports % GDP 69 34.6
120 3.3 11th pillar: Business sophistication11.01 Local supplier quantity 95 4.211.02 Local supplier quality 108 3.711.03 State of cluster development 110 3.111.04 Nature of competitive advantage 131 2.311.05 Value chain breadth 124 3.111.06 Control of international distribution 130 2.811.07 Production process sophistication 130 2.611.08 Extent of marketing 105 4.011.09 Willingness to delegate authority 80 3.6
97 3.1 12th pillar: Innovation12.01 Capacity for innovation 81 4.012.02 Quality of scientific research institutions 90 3.612.03 Company spending on R&D 81 3.212.04 University-industry collaboration in R&D 73 3.412.05 Gov't procurement of advanced tech. products 107 2.812.06 Availability of scientists and engineers 92 3.712.07 PCT patent applications applications/million pop. 105 0.1
Madagascar
The Africa Competitiveness Report 2017 | 123
Country Profiles

Edition 2012-13 2013-14 2014-15 2015-16 2016-17
Rank 129 / 144 136 / 148 132 / 144 135 / 140 134 / 138
Score 3.4 3.3 3.2 3.2 3.1
Most problematic factors for doing business
Performance overview
Note: From the list of factors, respondents to the World Economic Forum's Executive Opinion Survey were asked to select the five most problematic factors for doing business in their country and torank them between 1 (most problematic) and 5. The score corresponds to the responses weighted according to their rankings.
The Global Competitiveness Index in detail
Rank / 138 Score (1-7) Trend Distance from best
Global Competitiveness Index 134 3.1Subindex A: Basic requirements 137 3.0
94 3.5 1st pillar: Institutions
135 1.92nd pillar: Infrastructure
137 2.1 3rd pillar: Macroeconomic environment
120 4.6 4th pillar: Health and primary education
Subindex B: Efficiency enhancers 130 3.2
131 2.6 5th pillar: Higher education and training
119 3.8 6th pillar: Goods market efficiency
38 4.5 7th pillar: Labor market efficiency
115 3.3 8th pillar: Financial market development
135 2.3 9th pillar: Technological readiness
125 2.5 10th pillar: Market size
Subindex C: Innovation and sophistication factors 121 3.0
122 3.3 11th pillar: Business sophistication
120 2.8 12th pillar: Innovation
1234567
1st pillar:Institutions
2nd pillar:Infrastructure
3rd pillar:Macroeconomicenvironment
4th pillar:Health and primaryeducation
5th pillar:Higher educationand training
6th pillar:Goods marketefficiency7th pillar:
Labor marketefficiency
8th pillar:Financial market
development
9th pillar:Technological
readiness
10th pillar:Market size
11th pillar:Business
sophistication
12th pillar:Innovation
Malawi Sub-Saharan Africa
Source: World Economic Forum, Executive Opinion Survey 2016
14.212.611.211.1
9.99.17.96.24.94.33.92.31.60.60.30.0
Access to financingInflationCorruptionInadequate supply of infrastructureForeign currency regulationsInefficient government bureaucracyTax ratesPolicy instabilityInadequately educated workforceCrime and theftPoor work ethic in national labor forceInsufficient capacity to innovateTax regulationsRestrictive labor regulationsGovernment instability/coupsPoor public health
0 4 8 12 16
score
Global Competitiveness Index2016-2017 edition
Key Indicators, 2015
Population (millions)
GDP (US$ billions)
GDP per capita (US$)
GDP (PPP) % world GDP
Malawi 134 / 138th
Source: International Monetary Fund; World Economic Outlook Database (April 2016)
18.1
6.4
354.3
0.02
124 | The Africa Competitiveness Report 2017
Part 2

The Global Competitiveness Index in detail
Note: Values are on a 1-to-7 scale unless indicated otherwise. Trend lines depict evolution in values since the 2012-2013 edition (or earliest edition available). For detailed definitions,sources, and periods, consult the interactive Country/Economy Profiles and Rankings at http://gcr.weforum.org/
Rank / 138 Value Trend Rank / 138 Value Trend
94 3.5 1st pillar: Institutions1.01 Property rights 96 4.01.02 Intellectual property protection 119 3.31.03 Diversion of public funds 119 2.51.04 Public trust in politicians 115 2.11.05 Irregular payments and bribes 108 3.11.06 Judicial independence 57 4.11.07 Favoritism in decisions of government officials 114 2.31.08 Wastefulness of government spending 101 2.61.09 Burden of government regulation 76 3.41.10 Efficiency of legal framework in settling disputes 100 3.11.11 Efficiency of legal framework in challenging regs 78 3.31.12 Transparency of government policymaking 94 3.81.13 Business costs of terrorism 8 6.21.14 Business costs of crime and violence 120 3.31.15 Organized crime 83 4.51.16 Reliability of police services 96 3.81.17 Ethical behavior of firms 99 3.51.18 Strength of auditing and reporting standards 81 4.41.19 Efficacy of corporate boards 61 5.01.20 Protection of minority shareholders’ interests 104 3.61.21 Strength of investor protection 0-10 (best) 96 4.7
135 1.92nd pillar: Infrastructure2.01 Quality of overall infrastructure 125 2.52.02 Quality of roads 112 2.92.03 Quality of railroad infrastructure 94 1.82.04 Quality of port infrastructure 130 2.22.05 Quality of air transport infrastructure 136 2.42.06 Available airline seat kilometers millions/week 133 8.12.07 Quality of electricity supply 125 2.32.08 Mobile-cellular telephone subscriptions /100 pop. 138 35.32.09 Fixed-telephone lines /100 pop. 131 0.3
137 2.1 3rd pillar: Macroeconomic environment3.01 Government budget balance % GDP 112 -5.93.02 Gross national savings % GDP 132 4.13.03 Inflation annual % change 134 21.93.04 Government debt % GDP 115 83.43.05 Country credit rating 0-100 (best) 128 -
120 4.6 4th pillar: Health and primary education4.01 Malaria incidence cases/100,000 pop. 56 20964.04.02 Business impact of malaria 67 3.14.03 Tuberculosis incidence cases/100,000 pop. 118 227.04.04 Business impact of tuberculosis 131 3.74.05 HIV prevalence % adult pop. 130 10.04.06 Business impact of HIV/AIDS 136 3.14.07 Infant mortality deaths/1,000 live births 121 43.44.08 Life expectancy years 119 62.74.09 Quality of primary education 132 2.44.10 Primary education enrollment rate net % 36 97.5
131 2.6 5th pillar: Higher education and training5.01 Secondary education enrollment rate gross % 127 39.55.02 Tertiary education enrollment rate gross % 138 0.85.03 Quality of the education system 100 3.25.04 Quality of math and science education 125 2.75.05 Quality of management schools 133 3.05.06 Internet access in schools 132 2.65.07 Local availability of specialized training services 123 3.55.08 Extent of staff training 65 3.9
119 3.8 6th pillar: Goods market efficiency6.01 Intensity of local competition 113 4.66.02 Extent of market dominance 125 2.96.03 Effectiveness of anti-monopoly policy 111 3.16.04 Effect of taxation on incentives to invest 117 2.96.05 Total tax rate % profits 57 34.56.06 No. of procedures to start a business 94 86.07 Time to start a business days 123 38.06.08 Agricultural policy costs 104 3.36.09 Prevalence of non-tariff barriers 31 4.86.10 Trade tariffs % duty 109 9.96.11 Prevalence of foreign ownership 50 4.86.12 Business impact of rules on FDI 64 4.76.13 Burden of customs procedures 104 3.56.14 Imports % GDP 53 49.96.15 Degree of customer orientation 116 4.06.16 Buyer sophistication 129 2.4
38 4.5 7th pillar: Labor market efficiency7.01 Cooperation in labor-employer relations 102 4.17.02 Flexibility of wage determination 36 5.47.03 Hiring and firing practices 74 3.77.04 Redundancy costs weeks of salary 71 16.67.05 Effect of taxation on incentives to work 98 3.67.06 Pay and productivity 101 3.67.07 Reliance on professional management 54 4.57.08 Country capacity to retain talent 88 3.27.09 Country capacity to attract talent 95 3.07.10 Female participation in the labor force ratio to men 5 1.01
115 3.3 8th pillar: Financial market development8.01 Financial services meeting business needs 115 3.58.02 Affordability of financial services 138 2.18.03 Financing through local equity market 101 3.08.04 Ease of access to loans 127 2.78.05 Venture capital availability 136 1.78.06 Soundness of banks 94 4.48.07 Regulation of securities exchanges 93 3.98.08 Legal rights index 0-10 (best) 68 5
135 2.3 9th pillar: Technological readiness9.01 Availability of latest technologies 131 3.39.02 Firm-level technology absorption 132 3.49.03 FDI and technology transfer 130 3.39.04 Internet users % pop. 129 9.39.05 Fixed-broadband Internet subscriptions /100 pop. 136 0.09.06 Internet bandwidth kb/s/user 132 2.49.07 Mobile-broadband subscriptions /100 pop. 114 16.6
125 2.5 10th pillar: Market size10.01 Domestic market size index 123 2.310.02 Foreign market size index 126 3.210.03 GDP (PPP) PPP $ billions 124 20.410.04 Exports % GDP 106 23.0
122 3.3 11th pillar: Business sophistication11.01 Local supplier quantity 107 4.011.02 Local supplier quality 133 3.311.03 State of cluster development 129 2.911.04 Nature of competitive advantage 122 2.611.05 Value chain breadth 129 3.011.06 Control of international distribution 133 2.811.07 Production process sophistication 129 2.711.08 Extent of marketing 103 4.111.09 Willingness to delegate authority 84 3.6
120 2.8 12th pillar: Innovation12.01 Capacity for innovation 123 3.512.02 Quality of scientific research institutions 119 3.012.03 Company spending on R&D 112 2.812.04 University-industry collaboration in R&D 122 2.712.05 Gov't procurement of advanced tech. products 102 2.912.06 Availability of scientists and engineers 100 3.612.07 PCT patent applications applications/million pop. 119 0.0
Malawi
The Africa Competitiveness Report 2017 | 125
Country Profiles

Edition 2012-13 2013-14 2014-15 2015-16 2016-17
Rank 128 / 144 135 / 148 128 / 144 127 / 140 125 / 138
Score 3.4 3.3 3.4 3.4 3.5
Most problematic factors for doing business
Performance overview
Note: From the list of factors, respondents to the World Economic Forum's Executive Opinion Survey were asked to select the five most problematic factors for doing business in their country and torank them between 1 (most problematic) and 5. The score corresponds to the responses weighted according to their rankings.
The Global Competitiveness Index in detail
Rank / 138 Score (1-7) Trend Distance from best
Global Competitiveness Index 125 3.5Subindex A: Basic requirements 123 3.6
98 3.5 1st pillar: Institutions
112 2.92nd pillar: Infrastructure
52 5.0 3rd pillar: Macroeconomic environment
137 3.0 4th pillar: Health and primary education
Subindex B: Efficiency enhancers 124 3.3
122 2.9 5th pillar: Higher education and training
110 4.0 6th pillar: Goods market efficiency
112 3.8 7th pillar: Labor market efficiency
109 3.4 8th pillar: Financial market development
113 2.8 9th pillar: Technological readiness
111 2.8 10th pillar: Market size
Subindex C: Innovation and sophistication factors 109 3.3
118 3.4 11th pillar: Business sophistication
92 3.2 12th pillar: Innovation
1234567
1st pillar:Institutions
2nd pillar:Infrastructure
3rd pillar:Macroeconomicenvironment
4th pillar:Health and primaryeducation
5th pillar:Higher educationand training
6th pillar:Goods marketefficiency7th pillar:
Labor marketefficiency
8th pillar:Financial market
development
9th pillar:Technological
readiness
10th pillar:Market size
11th pillar:Business
sophistication
12th pillar:Innovation
Mali Sub-Saharan Africa
Source: World Economic Forum, Executive Opinion Survey 2016
27.113.7
6.96.76.76.46.35.04.33.73.72.72.61.61.41.2
Access to financingCorruptionPolicy instabilityTax ratesInefficient government bureaucracyInadequately educated workforceInadequate supply of infrastructureGovernment instability/coupsRestrictive labor regulationsTax regulationsPoor work ethic in national labor forceInsufficient capacity to innovateCrime and theftPoor public healthInflationForeign currency regulations
0 7 14 21 28
score
Global Competitiveness Index2016-2017 edition
Key Indicators, 2015
Population (millions)
GDP (US$ billions)
GDP per capita (US$)
GDP (PPP) % world GDP
Mali 125 / 138th
Source: International Monetary Fund; World Economic Outlook Database (April 2016)
16.3
13.1
801.8
0.03
126 | The Africa Competitiveness Report 2017
Part 2

The Global Competitiveness Index in detail
Note: Values are on a 1-to-7 scale unless indicated otherwise. Trend lines depict evolution in values since the 2012-2013 edition (or earliest edition available). For detailed definitions,sources, and periods, consult the interactive Country/Economy Profiles and Rankings at http://gcr.weforum.org/
Rank / 138 Value Trend Rank / 138 Value Trend
98 3.5 1st pillar: Institutions1.01 Property rights 113 3.71.02 Intellectual property protection 82 3.91.03 Diversion of public funds 75 3.41.04 Public trust in politicians 59 3.21.05 Irregular payments and bribes 125 2.81.06 Judicial independence 84 3.71.07 Favoritism in decisions of government officials 56 3.31.08 Wastefulness of government spending 71 3.21.09 Burden of government regulation 73 3.41.10 Efficiency of legal framework in settling disputes 63 3.71.11 Efficiency of legal framework in challenging regs 68 3.51.12 Transparency of government policymaking 101 3.71.13 Business costs of terrorism 126 3.21.14 Business costs of crime and violence 113 3.61.15 Organized crime 114 3.91.16 Reliability of police services 102 3.61.17 Ethical behavior of firms 103 3.51.18 Strength of auditing and reporting standards 134 3.31.19 Efficacy of corporate boards 102 4.41.20 Protection of minority shareholders’ interests 121 3.41.21 Strength of investor protection 0-10 (best) 129 3.5
112 2.92nd pillar: Infrastructure2.01 Quality of overall infrastructure 128 2.42.02 Quality of roads 97 3.22.03 Quality of railroad infrastructure 84 2.22.04 Quality of port infrastructure 125 2.32.05 Quality of air transport infrastructure 110 3.52.06 Available airline seat kilometers millions/week 112 32.32.07 Quality of electricity supply 116 2.82.08 Mobile-cellular telephone subscriptions /100 pop. 31 139.62.09 Fixed-telephone lines /100 pop. 122 1.0
52 5.0 3rd pillar: Macroeconomic environment3.01 Government budget balance % GDP 43 -2.13.02 Gross national savings % GDP 65 21.23.03 Inflation annual % change 1 1.43.04 Government debt % GDP 42 36.33.05 Country credit rating 0-100 (best) 126 -
137 3.0 4th pillar: Health and primary education4.01 Malaria incidence cases/100,000 pop. 69 42725.04.02 Business impact of malaria 65 3.24.03 Tuberculosis incidence cases/100,000 pop. 75 58.04.04 Business impact of tuberculosis 123 4.04.05 HIV prevalence % adult pop. 115 1.44.06 Business impact of HIV/AIDS 122 3.94.07 Infant mortality deaths/1,000 live births 135 74.54.08 Life expectancy years 128 58.04.09 Quality of primary education 106 3.14.10 Primary education enrollment rate net % 137 59.4
122 2.9 5th pillar: Higher education and training5.01 Secondary education enrollment rate gross % 121 43.55.02 Tertiary education enrollment rate gross % 124 6.95.03 Quality of the education system 101 3.25.04 Quality of math and science education 101 3.55.05 Quality of management schools 91 3.85.06 Internet access in schools 100 3.75.07 Local availability of specialized training services 88 4.15.08 Extent of staff training 111 3.5
110 4.0 6th pillar: Goods market efficiency6.01 Intensity of local competition 121 4.46.02 Extent of market dominance 37 4.16.03 Effectiveness of anti-monopoly policy 66 3.76.04 Effect of taxation on incentives to invest 81 3.46.05 Total tax rate % profits 102 48.36.06 No. of procedures to start a business 41 56.07 Time to start a business days 53 8.56.08 Agricultural policy costs 80 3.76.09 Prevalence of non-tariff barriers 122 3.66.10 Trade tariffs % duty 104 9.96.11 Prevalence of foreign ownership 122 3.56.12 Business impact of rules on FDI 119 3.66.13 Burden of customs procedures 117 3.36.14 Imports % GDP 109 30.16.15 Degree of customer orientation 107 4.16.16 Buyer sophistication 125 2.6
112 3.8 7th pillar: Labor market efficiency7.01 Cooperation in labor-employer relations 84 4.27.02 Flexibility of wage determination 117 4.27.03 Hiring and firing practices 53 3.97.04 Redundancy costs weeks of salary 55 13.67.05 Effect of taxation on incentives to work 79 3.87.06 Pay and productivity 120 3.37.07 Reliance on professional management 121 3.47.08 Country capacity to retain talent 74 3.57.09 Country capacity to attract talent 72 3.37.10 Female participation in the labor force ratio to men 114 0.62
109 3.4 8th pillar: Financial market development8.01 Financial services meeting business needs 128 3.38.02 Affordability of financial services 119 3.08.03 Financing through local equity market 96 3.18.04 Ease of access to loans 93 3.48.05 Venture capital availability 88 2.68.06 Soundness of banks 118 3.88.07 Regulation of securities exchanges 115 3.58.08 Legal rights index 0-10 (best) 46 6
113 2.8 9th pillar: Technological readiness9.01 Availability of latest technologies 109 4.09.02 Firm-level technology absorption 117 3.99.03 FDI and technology transfer 106 3.89.04 Internet users % pop. 128 10.39.05 Fixed-broadband Internet subscriptions /100 pop. 134 0.09.06 Internet bandwidth kb/s/user 136 1.39.07 Mobile-broadband subscriptions /100 pop. 111 18.8
111 2.8 10th pillar: Market size10.01 Domestic market size index 103 2.610.02 Foreign market size index 120 3.410.03 GDP (PPP) PPP $ billions 104 35.810.04 Exports % GDP 111 20.3
118 3.4 11th pillar: Business sophistication11.01 Local supplier quantity 103 4.111.02 Local supplier quality 115 3.711.03 State of cluster development 92 3.411.04 Nature of competitive advantage 102 3.011.05 Value chain breadth 128 3.011.06 Control of international distribution 108 3.111.07 Production process sophistication 123 2.911.08 Extent of marketing 118 3.911.09 Willingness to delegate authority 113 3.3
92 3.2 12th pillar: Innovation12.01 Capacity for innovation 117 3.612.02 Quality of scientific research institutions 74 3.712.03 Company spending on R&D 69 3.312.04 University-industry collaboration in R&D 97 3.112.05 Gov't procurement of advanced tech. products 57 3.412.06 Availability of scientists and engineers 101 3.512.07 PCT patent applications applications/million pop. 121 0.0
Mali
The Africa Competitiveness Report 2017 | 127
Country Profiles

Edition 2012-13 2013-14 2014-15 2015-16 2016-17
Rank 134 / 144 141 / 148 141 / 144 138 / 140 137 / 138
Score 3.3 3.2 3.0 3.0 2.9
Most problematic factors for doing business
Performance overview
Note: From the list of factors, respondents to the World Economic Forum's Executive Opinion Survey were asked to select the five most problematic factors for doing business in their country and torank them between 1 (most problematic) and 5. The score corresponds to the responses weighted according to their rankings.
The Global Competitiveness Index in detail
Rank / 138 Score (1-7) Trend Distance from best
Global Competitiveness Index 137 2.9Subindex A: Basic requirements 131 3.2
135 2.8 1st pillar: Institutions
129 2.22nd pillar: Infrastructure
106 4.0 3rd pillar: Macroeconomic environment
130 3.8 4th pillar: Health and primary education
Subindex B: Efficiency enhancers 138 2.6
138 1.9 5th pillar: Higher education and training
136 3.2 6th pillar: Goods market efficiency
131 3.3 7th pillar: Labor market efficiency
137 2.2 8th pillar: Financial market development
133 2.3 9th pillar: Technological readiness
128 2.4 10th pillar: Market size
Subindex C: Innovation and sophistication factors 138 2.4
138 2.6 11th pillar: Business sophistication
137 2.2 12th pillar: Innovation
1234567
1st pillar:Institutions
2nd pillar:Infrastructure
3rd pillar:Macroeconomicenvironment
4th pillar:Health and primaryeducation
5th pillar:Higher educationand training
6th pillar:Goods marketefficiency7th pillar:
Labor marketefficiency
8th pillar:Financial market
development
9th pillar:Technological
readiness
10th pillar:Market size
11th pillar:Business
sophistication
12th pillar:Innovation
Mauritania Sub-Saharan Africa
Source: World Economic Forum, Executive Opinion Survey 2016
24.017.914.612.1
5.03.93.73.53.12.72.72.51.31.30.90.7
Access to financingCorruptionTax ratesInflationInadequate supply of infrastructureInefficient government bureaucracyTax regulationsForeign currency regulationsPoor work ethic in national labor forceInadequately educated workforceGovernment instability/coupsRestrictive labor regulationsPoor public healthInsufficient capacity to innovatePolicy instabilityCrime and theft
0 6 12 18 24
score
Global Competitiveness Index2016-2017 edition
Key Indicators, 2015
Population (millions)
GDP (US$ billions)
GDP per capita (US$)
GDP (PPP) % world GDP
Mauritania 137 / 138th
Source: International Monetary Fund; World Economic Outlook Database (April 2016)
3.7
4.8
1282.3
0.01
128 | The Africa Competitiveness Report 2017
Part 2

The Global Competitiveness Index in detail
Note: Values are on a 1-to-7 scale unless indicated otherwise. Trend lines depict evolution in values since the 2012-2013 edition (or earliest edition available). For detailed definitions,sources, and periods, consult the interactive Country/Economy Profiles and Rankings at http://gcr.weforum.org/
Rank / 138 Value Trend Rank / 138 Value Trend
135 2.8 1st pillar: Institutions1.01 Property rights 136 2.71.02 Intellectual property protection 134 2.81.03 Diversion of public funds 95 3.01.04 Public trust in politicians 43 3.81.05 Irregular payments and bribes 138 1.91.06 Judicial independence 119 2.81.07 Favoritism in decisions of government officials 48 3.51.08 Wastefulness of government spending 95 2.61.09 Burden of government regulation 91 3.21.10 Efficiency of legal framework in settling disputes 131 2.41.11 Efficiency of legal framework in challenging regs 132 2.31.12 Transparency of government policymaking 134 2.81.13 Business costs of terrorism 129 3.21.14 Business costs of crime and violence 117 3.41.15 Organized crime 129 3.11.16 Reliability of police services 137 2.11.17 Ethical behavior of firms 138 2.51.18 Strength of auditing and reporting standards 137 2.51.19 Efficacy of corporate boards 138 2.21.20 Protection of minority shareholders’ interests 138 2.31.21 Strength of investor protection 0-10 (best) 108 4.3
129 2.22nd pillar: Infrastructure2.01 Quality of overall infrastructure 138 1.62.02 Quality of roads 135 2.32.03 Quality of railroad infrastructure 90 2.02.04 Quality of port infrastructure 115 2.92.05 Quality of air transport infrastructure 135 2.42.06 Available airline seat kilometers millions/week 129 11.72.07 Quality of electricity supply 122 2.42.08 Mobile-cellular telephone subscriptions /100 pop. 110 89.32.09 Fixed-telephone lines /100 pop. 119 1.3
106 4.0 3rd pillar: Macroeconomic environment3.01 Government budget balance % GDP 76 -3.53.02 Gross national savings % GDP 91 16.33.03 Inflation annual % change 37 0.53.04 Government debt % GDP 112 78.13.05 Country credit rating 0-100 (best) 131 -
130 3.8 4th pillar: Health and primary education4.01 Malaria incidence cases/100,000 pop. 45 1813.84.02 Business impact of malaria 50 4.04.03 Tuberculosis incidence cases/100,000 pop. 96 111.04.04 Business impact of tuberculosis 136 3.44.05 HIV prevalence % adult pop. 98 0.74.06 Business impact of HIV/AIDS 128 3.74.07 Infant mortality deaths/1,000 live births 130 65.14.08 Life expectancy years 118 63.04.09 Quality of primary education 138 2.04.10 Primary education enrollment rate net % 132 74.4
138 1.9 5th pillar: Higher education and training5.01 Secondary education enrollment rate gross % 135 29.95.02 Tertiary education enrollment rate gross % 128 5.65.03 Quality of the education system 137 2.15.04 Quality of math and science education 132 2.55.05 Quality of management schools 137 2.65.06 Internet access in schools 135 2.25.07 Local availability of specialized training services 138 2.55.08 Extent of staff training 138 2.2
136 3.2 6th pillar: Goods market efficiency6.01 Intensity of local competition 101 4.76.02 Extent of market dominance 137 2.16.03 Effectiveness of anti-monopoly policy 137 2.46.04 Effect of taxation on incentives to invest 131 2.56.05 Total tax rate % profits 134 71.36.06 No. of procedures to start a business 54 66.07 Time to start a business days 48 8.06.08 Agricultural policy costs 105 3.36.09 Prevalence of non-tariff barriers 138 2.66.10 Trade tariffs % duty 110 9.96.11 Prevalence of foreign ownership 129 3.26.12 Business impact of rules on FDI 136 2.76.13 Burden of customs procedures 133 2.96.14 Imports % GDP 40 54.76.15 Degree of customer orientation 137 3.16.16 Buyer sophistication 137 1.9
131 3.3 7th pillar: Labor market efficiency7.01 Cooperation in labor-employer relations 63 4.47.02 Flexibility of wage determination 108 4.47.03 Hiring and firing practices 69 3.87.04 Redundancy costs weeks of salary 36 10.47.05 Effect of taxation on incentives to work 81 3.87.06 Pay and productivity 138 2.17.07 Reliance on professional management 138 2.17.08 Country capacity to retain talent 103 2.97.09 Country capacity to attract talent 129 2.17.10 Female participation in the labor force ratio to men 124 0.46
137 2.2 8th pillar: Financial market development8.01 Financial services meeting business needs 138 2.38.02 Affordability of financial services 135 2.38.03 Financing through local equity market 135 2.18.04 Ease of access to loans 134 2.18.05 Venture capital availability 128 2.08.06 Soundness of banks 135 2.48.07 Regulation of securities exchanges 135 2.48.08 Legal rights index 0-10 (best) 108 2
133 2.3 9th pillar: Technological readiness9.01 Availability of latest technologies 132 3.39.02 Firm-level technology absorption 134 3.49.03 FDI and technology transfer 138 2.49.04 Internet users % pop. 125 15.29.05 Fixed-broadband Internet subscriptions /100 pop. 121 0.29.06 Internet bandwidth kb/s/user 135 1.59.07 Mobile-broadband subscriptions /100 pop. 105 23.1
128 2.4 10th pillar: Market size10.01 Domestic market size index 127 2.210.02 Foreign market size index 125 3.210.03 GDP (PPP) PPP $ billions 127 16.310.04 Exports % GDP 72 33.1
138 2.6 11th pillar: Business sophistication11.01 Local supplier quantity 124 3.811.02 Local supplier quality 138 2.611.03 State of cluster development 135 2.711.04 Nature of competitive advantage 137 2.111.05 Value chain breadth 138 2.411.06 Control of international distribution 132 2.811.07 Production process sophistication 135 2.511.08 Extent of marketing 138 2.111.09 Willingness to delegate authority 136 2.4
137 2.2 12th pillar: Innovation12.01 Capacity for innovation 138 2.112.02 Quality of scientific research institutions 137 2.112.03 Company spending on R&D 138 1.912.04 University-industry collaboration in R&D 81 3.312.05 Gov't procurement of advanced tech. products 133 2.412.06 Availability of scientists and engineers 138 2.312.07 PCT patent applications applications/million pop. 121 0.0
Mauritania
The Africa Competitiveness Report 2017 | 129
Country Profiles

Edition 2012-13 2013-14 2014-15 2015-16 2016-17
Rank 54 / 144 45 / 148 39 / 144 46 / 140 45 / 138
Score 4.4 4.4 4.5 4.4 4.5
Most problematic factors for doing business
Performance overview
Note: From the list of factors, respondents to the World Economic Forum's Executive Opinion Survey were asked to select the five most problematic factors for doing business in their country and torank them between 1 (most problematic) and 5. The score corresponds to the responses weighted according to their rankings.
The Global Competitiveness Index in detail
Rank / 138 Score (1-7) Trend Distance from best
Global Competitiveness Index 45 4.5Subindex A: Basic requirements 39 5.1
36 4.5 1st pillar: Institutions
41 4.72nd pillar: Infrastructure
59 4.9 3rd pillar: Macroeconomic environment
48 6.1 4th pillar: Health and primary education
Subindex B: Efficiency enhancers 62 4.2
52 4.7 5th pillar: Higher education and training
26 4.9 6th pillar: Goods market efficiency
57 4.4 7th pillar: Labor market efficiency
44 4.3 8th pillar: Financial market development
66 4.2 9th pillar: Technological readiness
118 2.7 10th pillar: Market size
Subindex C: Innovation and sophistication factors 48 3.8
37 4.4 11th pillar: Business sophistication
67 3.3 12th pillar: Innovation
1234567
1st pillar:Institutions
2nd pillar:Infrastructure
3rd pillar:Macroeconomicenvironment
4th pillar:Health and primaryeducation
5th pillar:Higher educationand training
6th pillar:Goods marketefficiency7th pillar:
Labor marketefficiency
8th pillar:Financial market
development
9th pillar:Technological
readiness
10th pillar:Market size
11th pillar:Business
sophistication
12th pillar:Innovation
Mauritius Sub-Saharan Africa
Source: World Economic Forum, Executive Opinion Survey 2016
16.916.113.711.1
8.57.27.14.94.62.42.01.71.11.11.00.6
Inefficient government bureaucracyInsufficient capacity to innovateInadequately educated workforceCorruptionInadequate supply of infrastructureAccess to financingPoor work ethic in national labor forceInflationRestrictive labor regulationsPolicy instabilityTax ratesGovernment instability/coupsTax regulationsCrime and theftPoor public healthForeign currency regulations
0 5 10 15 20
score
Global Competitiveness Index2016-2017 edition
Key Indicators, 2015
Population (millions)
GDP (US$ billions)
GDP per capita (US$)
GDP (PPP) % world GDP
Mauritius 45 / 138th
Source: International Monetary Fund; World Economic Outlook Database (April 2016)
1.3
11.6
9218.4
0.02
130 | The Africa Competitiveness Report 2017
Part 2

The Global Competitiveness Index in detail
Note: Values are on a 1-to-7 scale unless indicated otherwise. Trend lines depict evolution in values since the 2012-2013 edition (or earliest edition available). For detailed definitions,sources, and periods, consult the interactive Country/Economy Profiles and Rankings at http://gcr.weforum.org/
Rank / 138 Value Trend Rank / 138 Value Trend
36 4.5 1st pillar: Institutions1.01 Property rights 39 5.01.02 Intellectual property protection 45 4.51.03 Diversion of public funds 56 3.91.04 Public trust in politicians 61 3.11.05 Irregular payments and bribes 45 4.61.06 Judicial independence 33 5.01.07 Favoritism in decisions of government officials 71 3.01.08 Wastefulness of government spending 46 3.61.09 Burden of government regulation 39 3.81.10 Efficiency of legal framework in settling disputes 28 4.71.11 Efficiency of legal framework in challenging regs 31 4.41.12 Transparency of government policymaking 28 4.81.13 Business costs of terrorism 28 5.91.14 Business costs of crime and violence 43 5.21.15 Organized crime 22 5.81.16 Reliability of police services 52 4.81.17 Ethical behavior of firms 41 4.41.18 Strength of auditing and reporting standards 57 4.81.19 Efficacy of corporate boards 35 5.31.20 Protection of minority shareholders’ interests 34 4.71.21 Strength of investor protection 0-10 (best) 29 6.5
41 4.72nd pillar: Infrastructure2.01 Quality of overall infrastructure 42 4.62.02 Quality of roads 44 4.72.03 Quality of railroad infrastructure N/Appl. N/Appl.2.04 Quality of port infrastructure 63 4.22.05 Quality of air transport infrastructure 53 4.82.06 Available airline seat kilometers millions/week 67 199.92.07 Quality of electricity supply 50 5.42.08 Mobile-cellular telephone subscriptions /100 pop. 30 140.62.09 Fixed-telephone lines /100 pop. 35 30.3
59 4.9 3rd pillar: Macroeconomic environment3.01 Government budget balance % GDP 75 -3.43.02 Gross national savings % GDP 69 20.43.03 Inflation annual % change 1 1.33.04 Government debt % GDP 85 58.13.05 Country credit rating 0-100 (best) 57 -
48 6.1 4th pillar: Health and primary education4.01 Malaria incidence cases/100,000 pop. n/a M.F.4.02 Business impact of malaria N/Appl. N/Appl.4.03 Tuberculosis incidence cases/100,000 pop. 50 22.04.04 Business impact of tuberculosis 52 6.04.05 HIV prevalence % adult pop. 102 0.94.06 Business impact of HIV/AIDS 70 5.64.07 Infant mortality deaths/1,000 live births 66 11.84.08 Life expectancy years 76 74.24.09 Quality of primary education 46 4.54.10 Primary education enrollment rate net % 56 96.2
52 4.7 5th pillar: Higher education and training5.01 Secondary education enrollment rate gross % 57 97.95.02 Tertiary education enrollment rate gross % 73 38.75.03 Quality of the education system 47 4.25.04 Quality of math and science education 41 4.65.05 Quality of management schools 46 4.65.06 Internet access in schools 67 4.25.07 Local availability of specialized training services 56 4.55.08 Extent of staff training 32 4.6
26 4.9 6th pillar: Goods market efficiency6.01 Intensity of local competition 48 5.36.02 Extent of market dominance 101 3.36.03 Effectiveness of anti-monopoly policy 37 4.16.04 Effect of taxation on incentives to invest 8 5.36.05 Total tax rate % profits 19 22.46.06 No. of procedures to start a business 41 56.07 Time to start a business days 34 6.06.08 Agricultural policy costs 47 4.16.09 Prevalence of non-tariff barriers 37 4.76.10 Trade tariffs % duty 3 0.76.11 Prevalence of foreign ownership 57 4.76.12 Business impact of rules on FDI 37 5.16.13 Burden of customs procedures 36 4.76.14 Imports % GDP 36 60.06.15 Degree of customer orientation 32 5.16.16 Buyer sophistication 34 3.8
57 4.4 7th pillar: Labor market efficiency7.01 Cooperation in labor-employer relations 35 4.87.02 Flexibility of wage determination 102 4.57.03 Hiring and firing practices 37 4.37.04 Redundancy costs weeks of salary 37 10.67.05 Effect of taxation on incentives to work 14 5.07.06 Pay and productivity 50 4.37.07 Reliance on professional management 53 4.57.08 Country capacity to retain talent 49 3.87.09 Country capacity to attract talent 32 4.07.10 Female participation in the labor force ratio to men 108 0.64
44 4.3 8th pillar: Financial market development8.01 Financial services meeting business needs 43 4.68.02 Affordability of financial services 44 4.28.03 Financing through local equity market 43 4.18.04 Ease of access to loans 43 4.38.05 Venture capital availability 62 3.08.06 Soundness of banks 59 5.28.07 Regulation of securities exchanges 65 4.48.08 Legal rights index 0-10 (best) 46 6
66 4.2 9th pillar: Technological readiness9.01 Availability of latest technologies 57 4.99.02 Firm-level technology absorption 51 4.79.03 FDI and technology transfer 61 4.59.04 Internet users % pop. 78 50.19.05 Fixed-broadband Internet subscriptions /100 pop. 55 15.79.06 Internet bandwidth kb/s/user 76 33.99.07 Mobile-broadband subscriptions /100 pop. 93 37.0
118 2.7 10th pillar: Market size10.01 Domestic market size index 120 2.410.02 Foreign market size index 108 3.610.03 GDP (PPP) PPP $ billions 120 24.610.04 Exports % GDP 45 44.0
37 4.4 11th pillar: Business sophistication11.01 Local supplier quantity 33 4.811.02 Local supplier quality 53 4.411.03 State of cluster development 40 4.111.04 Nature of competitive advantage 42 4.111.05 Value chain breadth 28 4.511.06 Control of international distribution 36 4.211.07 Production process sophistication 42 4.411.08 Extent of marketing 43 4.711.09 Willingness to delegate authority 42 4.1
67 3.3 12th pillar: Innovation12.01 Capacity for innovation 52 4.312.02 Quality of scientific research institutions 84 3.612.03 Company spending on R&D 56 3.412.04 University-industry collaboration in R&D 93 3.212.05 Gov't procurement of advanced tech. products 60 3.412.06 Availability of scientists and engineers 86 3.812.07 PCT patent applications applications/million pop. 65 1.6
Mauritius
The Africa Competitiveness Report 2017 | 131
Country Profiles

Edition 2012-13 2013-14 2014-15 2015-16 2016-17
Rank 70 / 144 77 / 148 72 / 144 72 / 140 70 / 138
Score 4.1 4.1 4.2 4.2 4.2
Most problematic factors for doing business
Performance overview
Note: From the list of factors, respondents to the World Economic Forum's Executive Opinion Survey were asked to select the five most problematic factors for doing business in their country and torank them between 1 (most problematic) and 5. The score corresponds to the responses weighted according to their rankings.
The Global Competitiveness Index in detail
Rank / 138 Score (1-7) Trend Distance from best
Global Competitiveness Index 70 4.2Subindex A: Basic requirements 51 4.8
50 4.2 1st pillar: Institutions
58 4.32nd pillar: Infrastructure
49 5.1 3rd pillar: Macroeconomic environment
77 5.6 4th pillar: Health and primary education
Subindex B: Efficiency enhancers 88 3.9
104 3.6 5th pillar: Higher education and training
64 4.4 6th pillar: Goods market efficiency
124 3.5 7th pillar: Labor market efficiency
83 3.8 8th pillar: Financial market development
81 3.7 9th pillar: Technological readiness
55 4.3 10th pillar: Market size
Subindex C: Innovation and sophistication factors 86 3.5
76 3.8 11th pillar: Business sophistication
96 3.1 12th pillar: Innovation
1234567
1st pillar:Institutions
2nd pillar:Infrastructure
3rd pillar:Macroeconomicenvironment
4th pillar:Health and primaryeducation
5th pillar:Higher educationand training
6th pillar:Goods marketefficiency7th pillar:
Labor marketefficiency
8th pillar:Financial market
development
9th pillar:Technological
readiness
10th pillar:Market size
11th pillar:Business
sophistication
12th pillar:Innovation
Morocco Middle East and North Africa
Source: World Economic Forum, Executive Opinion Survey 2016
15.413.012.711.511.010.5
5.85.75.33.92.51.11.10.40.10.0
Access to financingInadequately educated workforceInefficient government bureaucracyTax ratesInsufficient capacity to innovateCorruptionTax regulationsInadequate supply of infrastructurePoor work ethic in national labor forceRestrictive labor regulationsForeign currency regulationsPoor public healthInflationCrime and theftGovernment instability/coupsPolicy instability
0 4 8 12 16
score
Global Competitiveness Index2016-2017 edition
Key Indicators, 2015
Population (millions)
GDP (US$ billions)
GDP per capita (US$)
GDP (PPP) % world GDP
Morocco 70 / 138th
Source: International Monetary Fund; World Economic Outlook Database (April 2016)
33.5
103.1
3078.6
0.24
132 | The Africa Competitiveness Report 2017
Part 2

The Global Competitiveness Index in detail
Note: Values are on a 1-to-7 scale unless indicated otherwise. Trend lines depict evolution in values since the 2012-2013 edition (or earliest edition available). For detailed definitions,sources, and periods, consult the interactive Country/Economy Profiles and Rankings at http://gcr.weforum.org/
Rank / 138 Value Trend Rank / 138 Value Trend
50 4.2 1st pillar: Institutions1.01 Property rights 46 4.71.02 Intellectual property protection 55 4.31.03 Diversion of public funds 48 4.01.04 Public trust in politicians 53 3.41.05 Irregular payments and bribes 74 3.91.06 Judicial independence 83 3.71.07 Favoritism in decisions of government officials 47 3.51.08 Wastefulness of government spending 43 3.61.09 Burden of government regulation 57 3.61.10 Efficiency of legal framework in settling disputes 71 3.61.11 Efficiency of legal framework in challenging regs 64 3.61.12 Transparency of government policymaking 49 4.51.13 Business costs of terrorism 43 5.71.14 Business costs of crime and violence 29 5.41.15 Organized crime 31 5.71.16 Reliability of police services 28 5.81.17 Ethical behavior of firms 80 3.71.18 Strength of auditing and reporting standards 65 4.61.19 Efficacy of corporate boards 78 4.81.20 Protection of minority shareholders’ interests 46 4.31.21 Strength of investor protection 0-10 (best) 90 5.0
58 4.32nd pillar: Infrastructure2.01 Quality of overall infrastructure 50 4.52.02 Quality of roads 55 4.42.03 Quality of railroad infrastructure 37 3.92.04 Quality of port infrastructure 38 4.82.05 Quality of air transport infrastructure 55 4.72.06 Available airline seat kilometers millions/week 48 474.42.07 Quality of electricity supply 53 5.32.08 Mobile-cellular telephone subscriptions /100 pop. 53 126.92.09 Fixed-telephone lines /100 pop. 98 6.5
49 5.1 3rd pillar: Macroeconomic environment3.01 Government budget balance % GDP 93 -4.33.02 Gross national savings % GDP 16 32.03.03 Inflation annual % change 1 1.63.04 Government debt % GDP 92 63.73.05 Country credit rating 0-100 (best) 69 -
77 5.6 4th pillar: Health and primary education4.01 Malaria incidence cases/100,000 pop. n/a M.F.4.02 Business impact of malaria N/Appl. N/Appl.4.03 Tuberculosis incidence cases/100,000 pop. 94 106.04.04 Business impact of tuberculosis 69 5.74.05 HIV prevalence % adult pop. 1 0.14.06 Business impact of HIV/AIDS 61 5.74.07 Infant mortality deaths/1,000 live births 96 23.74.08 Life expectancy years 80 74.04.09 Quality of primary education 118 2.94.10 Primary education enrollment rate net % 22 98.4
104 3.6 5th pillar: Higher education and training5.01 Secondary education enrollment rate gross % 101 69.15.02 Tertiary education enrollment rate gross % 92 24.65.03 Quality of the education system 119 2.85.04 Quality of math and science education 72 4.05.05 Quality of management schools 76 4.15.06 Internet access in schools 109 3.65.07 Local availability of specialized training services 83 4.15.08 Extent of staff training 126 3.2
64 4.4 6th pillar: Goods market efficiency6.01 Intensity of local competition 70 5.16.02 Extent of market dominance 64 3.76.03 Effectiveness of anti-monopoly policy 84 3.56.04 Effect of taxation on incentives to invest 36 4.16.05 Total tax rate % profits 106 49.16.06 No. of procedures to start a business 22 46.07 Time to start a business days 56 10.06.08 Agricultural policy costs 14 4.76.09 Prevalence of non-tariff barriers 124 3.66.10 Trade tariffs % duty 113 10.46.11 Prevalence of foreign ownership 53 4.86.12 Business impact of rules on FDI 39 5.06.13 Burden of customs procedures 60 4.36.14 Imports % GDP 67 43.26.15 Degree of customer orientation 75 4.66.16 Buyer sophistication 84 3.2
124 3.5 7th pillar: Labor market efficiency7.01 Cooperation in labor-employer relations 122 3.77.02 Flexibility of wage determination 47 5.37.03 Hiring and firing practices 103 3.37.04 Redundancy costs weeks of salary 91 20.77.05 Effect of taxation on incentives to work 54 4.17.06 Pay and productivity 114 3.47.07 Reliance on professional management 84 4.07.08 Country capacity to retain talent 91 3.27.09 Country capacity to attract talent 68 3.47.10 Female participation in the labor force ratio to men 132 0.34
83 3.8 8th pillar: Financial market development8.01 Financial services meeting business needs 95 3.98.02 Affordability of financial services 80 3.68.03 Financing through local equity market 48 4.08.04 Ease of access to loans 87 3.68.05 Venture capital availability 91 2.68.06 Soundness of banks 61 5.18.07 Regulation of securities exchanges 37 5.18.08 Legal rights index 0-10 (best) 108 2
81 3.7 9th pillar: Technological readiness9.01 Availability of latest technologies 50 5.09.02 Firm-level technology absorption 63 4.69.03 FDI and technology transfer 58 4.59.04 Internet users % pop. 67 57.19.05 Fixed-broadband Internet subscriptions /100 pop. 93 3.49.06 Internet bandwidth kb/s/user 92 18.39.07 Mobile-broadband subscriptions /100 pop. 88 39.3
55 4.3 10th pillar: Market size10.01 Domestic market size index 49 4.110.02 Foreign market size index 55 4.810.03 GDP (PPP) PPP $ billions 55 273.510.04 Exports % GDP 70 34.5
76 3.8 11th pillar: Business sophistication11.01 Local supplier quantity 51 4.611.02 Local supplier quality 73 4.211.03 State of cluster development 79 3.611.04 Nature of competitive advantage 103 3.011.05 Value chain breadth 78 3.711.06 Control of international distribution 71 3.611.07 Production process sophistication 85 3.611.08 Extent of marketing 78 4.311.09 Willingness to delegate authority 81 3.6
96 3.1 12th pillar: Innovation12.01 Capacity for innovation 94 3.812.02 Quality of scientific research institutions 112 3.112.03 Company spending on R&D 95 3.012.04 University-industry collaboration in R&D 100 3.112.05 Gov't procurement of advanced tech. products 86 3.012.06 Availability of scientists and engineers 67 4.012.07 PCT patent applications applications/million pop. 66 1.5
Morocco
The Africa Competitiveness Report 2017 | 133
Country Profiles

Edition 2012-13 2013-14 2014-15 2015-16 2016-17
Rank 138 / 144 137 / 148 133 / 144 133 / 140 133 / 138
Score 3.2 3.3 3.2 3.2 3.1
Most problematic factors for doing business
Performance overview
Note: From the list of factors, respondents to the World Economic Forum's Executive Opinion Survey were asked to select the five most problematic factors for doing business in their country and torank them between 1 (most problematic) and 5. The score corresponds to the responses weighted according to their rankings.
The Global Competitiveness Index in detail
Rank / 138 Score (1-7) Trend Distance from best
Global Competitiveness Index 133 3.1Subindex A: Basic requirements 133 3.2
124 3.2 1st pillar: Institutions
124 2.52nd pillar: Infrastructure
125 3.5 3rd pillar: Macroeconomic environment
134 3.5 4th pillar: Health and primary education
Subindex B: Efficiency enhancers 131 3.1
135 2.3 5th pillar: Higher education and training
118 3.9 6th pillar: Goods market efficiency
92 4.0 7th pillar: Labor market efficiency
128 3.0 8th pillar: Financial market development
127 2.5 9th pillar: Technological readiness
102 3.0 10th pillar: Market size
Subindex C: Innovation and sophistication factors 124 3.0
128 3.2 11th pillar: Business sophistication
117 2.8 12th pillar: Innovation
1234567
1st pillar:Institutions
2nd pillar:Infrastructure
3rd pillar:Macroeconomicenvironment
4th pillar:Health and primaryeducation
5th pillar:Higher educationand training
6th pillar:Goods marketefficiency7th pillar:
Labor marketefficiency
8th pillar:Financial market
development
9th pillar:Technological
readiness
10th pillar:Market size
11th pillar:Business
sophistication
12th pillar:Innovation
Mozambique Sub-Saharan Africa
Source: World Economic Forum, Executive Opinion Survey 2016
15.512.312.210.1
9.36.85.85.84.83.93.62.62.32.11.61.3
CorruptionPolicy instabilityAccess to financingForeign currency regulationsInefficient government bureaucracyInflationTax ratesInadequate supply of infrastructureInadequately educated workforceCrime and theftRestrictive labor regulationsGovernment instability/coupsPoor public healthTax regulationsPoor work ethic in national labor forceInsufficient capacity to innovate
0 4 8 12 16
score
Global Competitiveness Index2016-2017 edition
Key Indicators, 2015
Population (millions)
GDP (US$ billions)
GDP per capita (US$)
GDP (PPP) % world GDP
Mozambique 133 / 138rd
Source: International Monetary Fund; World Economic Outlook Database (April 2016)
28.0
15.0
534.9
0.03
134 | The Africa Competitiveness Report 2017
Part 2

The Global Competitiveness Index in detail
Note: Values are on a 1-to-7 scale unless indicated otherwise. Trend lines depict evolution in values since the 2012-2013 edition (or earliest edition available). For detailed definitions,sources, and periods, consult the interactive Country/Economy Profiles and Rankings at http://gcr.weforum.org/
Rank / 138 Value Trend Rank / 138 Value Trend
124 3.2 1st pillar: Institutions1.01 Property rights 116 3.61.02 Intellectual property protection 128 3.21.03 Diversion of public funds 124 2.41.04 Public trust in politicians 93 2.61.05 Irregular payments and bribes 117 3.01.06 Judicial independence 112 2.91.07 Favoritism in decisions of government officials 110 2.41.08 Wastefulness of government spending 91 2.71.09 Burden of government regulation 90 3.21.10 Efficiency of legal framework in settling disputes 102 3.01.11 Efficiency of legal framework in challenging regs 122 2.61.12 Transparency of government policymaking 122 3.41.13 Business costs of terrorism 112 4.31.14 Business costs of crime and violence 118 3.31.15 Organized crime 121 3.61.16 Reliability of police services 127 2.81.17 Ethical behavior of firms 126 3.11.18 Strength of auditing and reporting standards 124 3.61.19 Efficacy of corporate boards 122 4.11.20 Protection of minority shareholders’ interests 125 3.41.21 Strength of investor protection 0-10 (best) 86 5.2
124 2.52nd pillar: Infrastructure2.01 Quality of overall infrastructure 123 2.62.02 Quality of roads 133 2.42.03 Quality of railroad infrastructure 78 2.42.04 Quality of port infrastructure 92 3.52.05 Quality of air transport infrastructure 113 3.42.06 Available airline seat kilometers millions/week 104 42.82.07 Quality of electricity supply 118 2.82.08 Mobile-cellular telephone subscriptions /100 pop. 126 74.22.09 Fixed-telephone lines /100 pop. 128 0.3
125 3.5 3rd pillar: Macroeconomic environment3.01 Government budget balance % GDP 113 -6.03.02 Gross national savings % GDP 138 -13.13.03 Inflation annual % change 1 2.43.04 Government debt % GDP 108 74.83.05 Country credit rating 0-100 (best) 116 -
134 3.5 4th pillar: Health and primary education4.01 Malaria incidence cases/100,000 pop. 65 34170.74.02 Business impact of malaria 59 3.64.03 Tuberculosis incidence cases/100,000 pop. 135 551.04.04 Business impact of tuberculosis 120 4.14.05 HIV prevalence % adult pop. 131 10.64.06 Business impact of HIV/AIDS 129 3.64.07 Infant mortality deaths/1,000 live births 127 56.74.08 Life expectancy years 133 55.04.09 Quality of primary education 135 2.14.10 Primary education enrollment rate net % 110 87.6
135 2.3 5th pillar: Higher education and training5.01 Secondary education enrollment rate gross % 137 24.55.02 Tertiary education enrollment rate gross % 126 6.05.03 Quality of the education system 123 2.75.04 Quality of math and science education 128 2.65.05 Quality of management schools 135 2.95.06 Internet access in schools 128 3.15.07 Local availability of specialized training services 134 3.05.08 Extent of staff training 132 3.1
118 3.9 6th pillar: Goods market efficiency6.01 Intensity of local competition 117 4.56.02 Extent of market dominance 120 3.06.03 Effectiveness of anti-monopoly policy 128 2.76.04 Effect of taxation on incentives to invest 83 3.46.05 Total tax rate % profits 65 36.16.06 No. of procedures to start a business 116 106.07 Time to start a business days 98 19.06.08 Agricultural policy costs 106 3.36.09 Prevalence of non-tariff barriers 109 3.96.10 Trade tariffs % duty 88 7.66.11 Prevalence of foreign ownership 69 4.56.12 Business impact of rules on FDI 79 4.46.13 Burden of customs procedures 100 3.56.14 Imports % GDP 19 77.46.15 Degree of customer orientation 134 3.66.16 Buyer sophistication 109 2.9
92 4.0 7th pillar: Labor market efficiency7.01 Cooperation in labor-employer relations 123 3.77.02 Flexibility of wage determination 114 4.37.03 Hiring and firing practices 96 3.57.04 Redundancy costs weeks of salary 130 37.57.05 Effect of taxation on incentives to work 63 4.07.06 Pay and productivity 133 2.97.07 Reliance on professional management 126 3.37.08 Country capacity to retain talent 77 3.47.09 Country capacity to attract talent 57 3.67.10 Female participation in the labor force ratio to men 1 1.11
128 3.0 8th pillar: Financial market development8.01 Financial services meeting business needs 124 3.48.02 Affordability of financial services 123 2.98.03 Financing through local equity market 116 2.78.04 Ease of access to loans 105 3.28.05 Venture capital availability 113 2.38.06 Soundness of banks 110 4.18.07 Regulation of securities exchanges 111 3.68.08 Legal rights index 0-10 (best) 127 1
127 2.5 9th pillar: Technological readiness9.01 Availability of latest technologies 124 3.79.02 Firm-level technology absorption 118 3.99.03 FDI and technology transfer 101 3.99.04 Internet users % pop. 130 9.09.05 Fixed-broadband Internet subscriptions /100 pop. 129 0.19.06 Internet bandwidth kb/s/user 116 6.19.07 Mobile-broadband subscriptions /100 pop. 126 9.4
102 3.0 10th pillar: Market size10.01 Domestic market size index 96 2.810.02 Foreign market size index 109 3.610.03 GDP (PPP) PPP $ billions 110 33.210.04 Exports % GDP 77 32.5
128 3.2 11th pillar: Business sophistication11.01 Local supplier quantity 129 3.611.02 Local supplier quality 135 3.211.03 State of cluster development 114 3.111.04 Nature of competitive advantage 108 2.911.05 Value chain breadth 119 3.311.06 Control of international distribution 119 2.911.07 Production process sophistication 128 2.711.08 Extent of marketing 119 3.911.09 Willingness to delegate authority 118 3.2
117 2.8 12th pillar: Innovation12.01 Capacity for innovation 121 3.512.02 Quality of scientific research institutions 122 2.812.03 Company spending on R&D 105 2.912.04 University-industry collaboration in R&D 87 3.312.05 Gov't procurement of advanced tech. products 85 3.112.06 Availability of scientists and engineers 125 3.112.07 PCT patent applications applications/million pop. 121 0.0
Mozambique
The Africa Competitiveness Report 2017 | 135
Country Profiles

Edition 2012-13 2013-14 2014-15 2015-16 2016-17
Rank 92 / 144 90 / 148 88 / 144 85 / 140 84 / 138
Score 3.9 3.9 4.0 4.0 4.0
Most problematic factors for doing business
Performance overview
Note: From the list of factors, respondents to the World Economic Forum's Executive Opinion Survey were asked to select the five most problematic factors for doing business in their country and torank them between 1 (most problematic) and 5. The score corresponds to the responses weighted according to their rankings.
The Global Competitiveness Index in detail
Rank / 138 Score (1-7) Trend Distance from best
Global Competitiveness Index 84 4.0Subindex A: Basic requirements 75 4.4
39 4.5 1st pillar: Institutions
66 4.12nd pillar: Infrastructure
74 4.6 3rd pillar: Macroeconomic environment
121 4.6 4th pillar: Health and primary education
Subindex B: Efficiency enhancers 94 3.8
110 3.3 5th pillar: Higher education and training
79 4.2 6th pillar: Goods market efficiency
32 4.6 7th pillar: Labor market efficiency
49 4.2 8th pillar: Financial market development
87 3.6 9th pillar: Technological readiness
113 2.8 10th pillar: Market size
Subindex C: Innovation and sophistication factors 77 3.5
83 3.7 11th pillar: Business sophistication
74 3.3 12th pillar: Innovation
1234567
1st pillar:Institutions
2nd pillar:Infrastructure
3rd pillar:Macroeconomicenvironment
4th pillar:Health and primaryeducation
5th pillar:Higher educationand training
6th pillar:Goods marketefficiency7th pillar:
Labor marketefficiency
8th pillar:Financial market
development
9th pillar:Technological
readiness
10th pillar:Market size
11th pillar:Business
sophistication
12th pillar:Innovation
Namibia Sub-Saharan Africa
Source: World Economic Forum, Executive Opinion Survey 2016
17.714.810.310.2
7.26.56.35.65.04.63.02.82.32.01.00.9
Access to financingInadequately educated workforceInefficient government bureaucracyPoor work ethic in national labor forceCorruptionInflationInsufficient capacity to innovateTax ratesRestrictive labor regulationsInadequate supply of infrastructureCrime and theftForeign currency regulationsTax regulationsPolicy instabilityGovernment instability/coupsPoor public health
0 5 10 15 20
score
Global Competitiveness Index2016-2017 edition
Key Indicators, 2015
Population (millions)
GDP (US$ billions)
GDP per capita (US$)
GDP (PPP) % world GDP
Namibia 84 / 138th
Source: International Monetary Fund; World Economic Outlook Database (April 2016)
2.2
12.8
5776.9
0.02
136 | The Africa Competitiveness Report 2017
Part 2

The Global Competitiveness Index in detail
Note: Values are on a 1-to-7 scale unless indicated otherwise. Trend lines depict evolution in values since the 2012-2013 edition (or earliest edition available). For detailed definitions,sources, and periods, consult the interactive Country/Economy Profiles and Rankings at http://gcr.weforum.org/
Rank / 138 Value Trend Rank / 138 Value Trend
39 4.5 1st pillar: Institutions1.01 Property rights 34 5.21.02 Intellectual property protection 40 4.71.03 Diversion of public funds 58 3.81.04 Public trust in politicians 46 3.61.05 Irregular payments and bribes 60 4.21.06 Judicial independence 30 5.21.07 Favoritism in decisions of government officials 69 3.01.08 Wastefulness of government spending 72 3.21.09 Burden of government regulation 32 4.01.10 Efficiency of legal framework in settling disputes 33 4.61.11 Efficiency of legal framework in challenging regs 25 4.51.12 Transparency of government policymaking 32 4.81.13 Business costs of terrorism 14 6.21.14 Business costs of crime and violence 90 4.21.15 Organized crime 60 5.11.16 Reliability of police services 65 4.41.17 Ethical behavior of firms 45 4.31.18 Strength of auditing and reporting standards 33 5.31.19 Efficacy of corporate boards 65 4.91.20 Protection of minority shareholders’ interests 30 4.91.21 Strength of investor protection 0-10 (best) 63 5.7
66 4.12nd pillar: Infrastructure2.01 Quality of overall infrastructure 45 4.52.02 Quality of roads 23 5.22.03 Quality of railroad infrastructure 50 3.22.04 Quality of port infrastructure 24 5.32.05 Quality of air transport infrastructure 57 4.62.06 Available airline seat kilometers millions/week 105 41.52.07 Quality of electricity supply 46 5.52.08 Mobile-cellular telephone subscriptions /100 pop. 97 102.12.09 Fixed-telephone lines /100 pop. 94 7.6
74 4.6 3rd pillar: Macroeconomic environment3.01 Government budget balance % GDP 111 -5.93.02 Gross national savings % GDP 74 19.63.03 Inflation annual % change 60 3.43.04 Government debt % GDP 21 27.23.05 Country credit rating 0-100 (best) 64 -
121 4.6 4th pillar: Health and primary education4.01 Malaria incidence cases/100,000 pop. 36 370.44.02 Business impact of malaria 41 4.64.03 Tuberculosis incidence cases/100,000 pop. 136 561.04.04 Business impact of tuberculosis 127 3.94.05 HIV prevalence % adult pop. 133 16.04.06 Business impact of HIV/AIDS 131 3.44.07 Infant mortality deaths/1,000 live births 106 32.84.08 Life expectancy years 112 64.74.09 Quality of primary education 88 3.54.10 Primary education enrollment rate net % 105 89.7
110 3.3 5th pillar: Higher education and training5.01 Secondary education enrollment rate gross % 108 64.85.02 Tertiary education enrollment rate gross % 118 9.35.03 Quality of the education system 92 3.35.04 Quality of math and science education 114 3.15.05 Quality of management schools 115 3.65.06 Internet access in schools 115 3.45.07 Local availability of specialized training services 108 3.85.08 Extent of staff training 44 4.3
79 4.2 6th pillar: Goods market efficiency6.01 Intensity of local competition 103 4.76.02 Extent of market dominance 91 3.46.03 Effectiveness of anti-monopoly policy 48 3.96.04 Effect of taxation on incentives to invest 30 4.26.05 Total tax rate % profits 17 21.36.06 No. of procedures to start a business 116 106.07 Time to start a business days 132 66.06.08 Agricultural policy costs 39 4.26.09 Prevalence of non-tariff barriers 41 4.66.10 Trade tariffs % duty 82 6.46.11 Prevalence of foreign ownership 38 5.16.12 Business impact of rules on FDI 77 4.56.13 Burden of customs procedures 57 4.36.14 Imports % GDP 26 66.36.15 Degree of customer orientation 131 3.76.16 Buyer sophistication 54 3.6
32 4.6 7th pillar: Labor market efficiency7.01 Cooperation in labor-employer relations 62 4.47.02 Flexibility of wage determination 89 4.87.03 Hiring and firing practices 88 3.67.04 Redundancy costs weeks of salary 31 9.67.05 Effect of taxation on incentives to work 31 4.47.06 Pay and productivity 90 3.77.07 Reliance on professional management 47 4.67.08 Country capacity to retain talent 51 3.87.09 Country capacity to attract talent 40 3.87.10 Female participation in the labor force ratio to men 37 0.89
49 4.2 8th pillar: Financial market development8.01 Financial services meeting business needs 49 4.68.02 Affordability of financial services 68 3.88.03 Financing through local equity market 59 3.78.04 Ease of access to loans 74 3.88.05 Venture capital availability 84 2.68.06 Soundness of banks 40 5.68.07 Regulation of securities exchanges 38 5.18.08 Legal rights index 0-10 (best) 68 5
87 3.6 9th pillar: Technological readiness9.01 Availability of latest technologies 51 5.09.02 Firm-level technology absorption 66 4.59.03 FDI and technology transfer 72 4.49.04 Internet users % pop. 106 22.39.05 Fixed-broadband Internet subscriptions /100 pop. 102 1.79.06 Internet bandwidth kb/s/user 87 22.59.07 Mobile-broadband subscriptions /100 pop. 53 62.1
113 2.8 10th pillar: Market size10.01 Domestic market size index 115 2.510.02 Foreign market size index 112 3.610.03 GDP (PPP) PPP $ billions 117 25.310.04 Exports % GDP 54 40.4
83 3.7 11th pillar: Business sophistication11.01 Local supplier quantity 136 3.411.02 Local supplier quality 90 4.011.03 State of cluster development 73 3.711.04 Nature of competitive advantage 61 3.611.05 Value chain breadth 94 3.611.06 Control of international distribution 90 3.411.07 Production process sophistication 80 3.611.08 Extent of marketing 90 4.211.09 Willingness to delegate authority 75 3.6
74 3.3 12th pillar: Innovation12.01 Capacity for innovation 71 4.112.02 Quality of scientific research institutions 92 3.512.03 Company spending on R&D 51 3.512.04 University-industry collaboration in R&D 89 3.312.05 Gov't procurement of advanced tech. products 58 3.412.06 Availability of scientists and engineers 105 3.512.07 PCT patent applications applications/million pop. 92 0.2
Namibia
The Africa Competitiveness Report 2017 | 137
Country Profiles
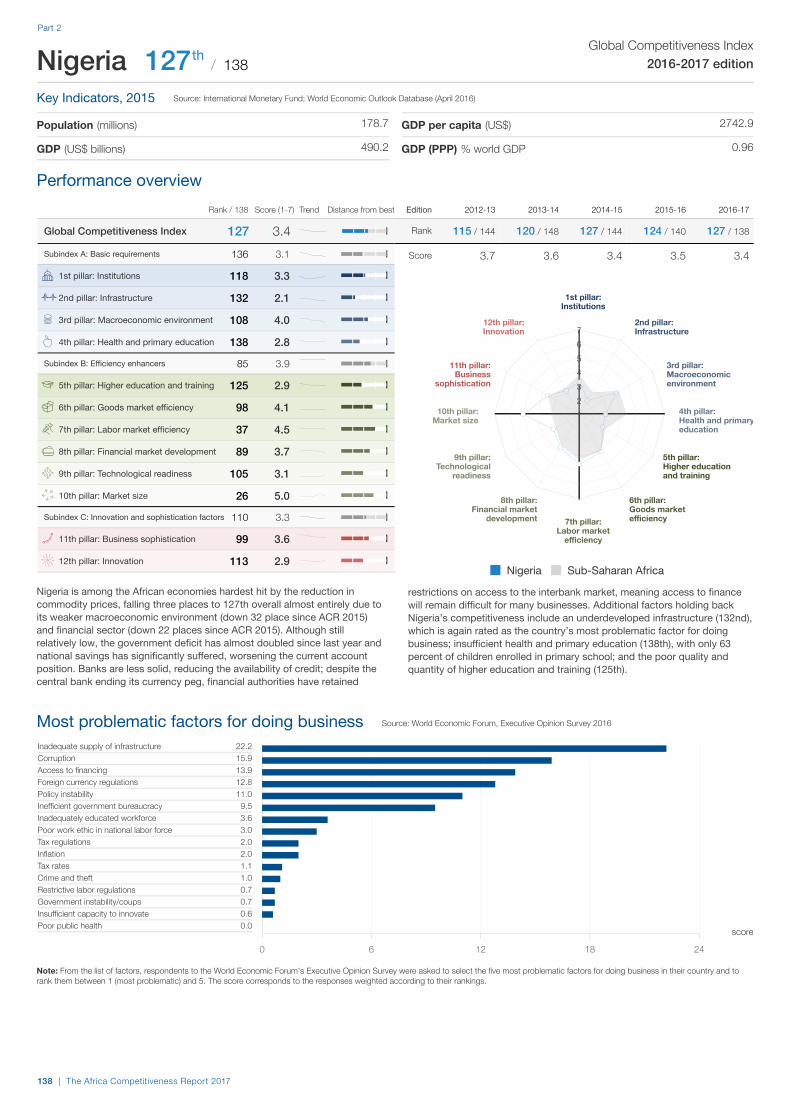
Edition 2012-13 2013-14 2014-15 2015-16 2016-17
Rank 115 / 144 120 / 148 127 / 144 124 / 140 127 / 138
Score 3.7 3.6 3.4 3.5 3.4
Most problematic factors for doing business
Performance overview
Note: From the list of factors, respondents to the World Economic Forum's Executive Opinion Survey were asked to select the five most problematic factors for doing business in their country and torank them between 1 (most problematic) and 5. The score corresponds to the responses weighted according to their rankings.
The Global Competitiveness Index in detail
Nigeria is among the African economies hardest hit by the reduction in commodity prices, falling three places to 127th overall almost entirely due to its weaker macroeconomic environment (down 32 place since ACR 2015) and financial sector (down 22 places since ACR 2015). Although still relatively low, the government deficit has almost doubled since last year and national savings has significantly suffered, worsening the current account position. Banks are less solid, reducing the availability of credit; despite the central bank ending its currency peg, financial authorities have retained
restrictions on access to the interbank market, meaning access to finance will remain difficult for many businesses. Additional factors holding back Nigeria’s competitiveness include an underdeveloped infrastructure (132nd), which is again rated as the country’s most problematic factor for doing business; insufficient health and primary education (138th), with only 63 percent of children enrolled in primary school; and the poor quality and quantity of higher education and training (125th).
Rank / 138 Score (1-7) Trend Distance from best
Global Competitiveness Index 127 3.4Subindex A: Basic requirements 136 3.1
118 3.3 1st pillar: Institutions
132 2.12nd pillar: Infrastructure
108 4.0 3rd pillar: Macroeconomic environment
138 2.8 4th pillar: Health and primary education
Subindex B: Efficiency enhancers 85 3.9
125 2.9 5th pillar: Higher education and training
98 4.1 6th pillar: Goods market efficiency
37 4.5 7th pillar: Labor market efficiency
89 3.7 8th pillar: Financial market development
105 3.1 9th pillar: Technological readiness
26 5.0 10th pillar: Market size
Subindex C: Innovation and sophistication factors 110 3.3
99 3.6 11th pillar: Business sophistication
113 2.9 12th pillar: Innovation
1234567
1st pillar:Institutions
2nd pillar:Infrastructure
3rd pillar:Macroeconomicenvironment
4th pillar:Health and primaryeducation
5th pillar:Higher educationand training
6th pillar:Goods marketefficiency7th pillar:
Labor marketefficiency
8th pillar:Financial market
development
9th pillar:Technological
readiness
10th pillar:Market size
11th pillar:Business
sophistication
12th pillar:Innovation
Nigeria Sub-Saharan Africa
Source: World Economic Forum, Executive Opinion Survey 2016
22.215.913.912.811.0
9.53.63.02.02.01.11.00.70.70.60.0
Inadequate supply of infrastructureCorruptionAccess to financingForeign currency regulationsPolicy instabilityInefficient government bureaucracyInadequately educated workforcePoor work ethic in national labor forceTax regulationsInflationTax ratesCrime and theftRestrictive labor regulationsGovernment instability/coupsInsufficient capacity to innovatePoor public health
0 6 12 18 24
score
Global Competitiveness Index2016-2017 edition
Key Indicators, 2015
Population (millions)
GDP (US$ billions)
GDP per capita (US$)
GDP (PPP) % world GDP
Nigeria 127 / 138th
Source: International Monetary Fund; World Economic Outlook Database (April 2016)
178.7
490.2
2742.9
0.96
138 | The Africa Competitiveness Report 2017
Part 2

The Global Competitiveness Index in detail
Note: Values are on a 1-to-7 scale unless indicated otherwise. Trend lines depict evolution in values since the 2012-2013 edition (or earliest edition available). For detailed definitions,sources, and periods, consult the interactive Country/Economy Profiles and Rankings at http://gcr.weforum.org/
Rank / 138 Value Trend Rank / 138 Value Trend
118 3.3 1st pillar: Institutions1.01 Property rights 95 4.01.02 Intellectual property protection 112 3.41.03 Diversion of public funds 127 2.21.04 Public trust in politicians 131 1.71.05 Irregular payments and bribes 129 2.61.06 Judicial independence 76 3.81.07 Favoritism in decisions of government officials 127 2.11.08 Wastefulness of government spending 126 2.21.09 Burden of government regulation 107 3.01.10 Efficiency of legal framework in settling disputes 86 3.31.11 Efficiency of legal framework in challenging regs 85 3.21.12 Transparency of government policymaking 113 3.51.13 Business costs of terrorism 132 3.01.14 Business costs of crime and violence 121 3.11.15 Organized crime 110 4.01.16 Reliability of police services 121 3.01.17 Ethical behavior of firms 117 3.21.18 Strength of auditing and reporting standards 56 4.91.19 Efficacy of corporate boards 49 5.11.20 Protection of minority shareholders’ interests 50 4.21.21 Strength of investor protection 0-10 (best) 20 6.8
132 2.12nd pillar: Infrastructure2.01 Quality of overall infrastructure 132 2.32.02 Quality of roads 126 2.62.03 Quality of railroad infrastructure 103 1.52.04 Quality of port infrastructure 117 2.82.05 Quality of air transport infrastructure 119 3.22.06 Available airline seat kilometers millions/week 55 318.02.07 Quality of electricity supply 137 1.42.08 Mobile-cellular telephone subscriptions /100 pop. 118 82.22.09 Fixed-telephone lines /100 pop. 137 0.1
108 4.0 3rd pillar: Macroeconomic environment3.01 Government budget balance % GDP 86 -4.03.02 Gross national savings % GDP 116 12.03.03 Inflation annual % change 125 9.03.04 Government debt % GDP 7 11.53.05 Country credit rating 0-100 (best) 88 -
138 2.8 4th pillar: Health and primary education4.01 Malaria incidence cases/100,000 pop. 64 33243.94.02 Business impact of malaria 58 3.64.03 Tuberculosis incidence cases/100,000 pop. 127 322.04.04 Business impact of tuberculosis 91 5.04.05 HIV prevalence % adult pop. 123 3.24.06 Business impact of HIV/AIDS 105 4.54.07 Infant mortality deaths/1,000 live births 134 69.44.08 Life expectancy years 134 52.84.09 Quality of primary education 124 2.84.10 Primary education enrollment rate net % 136 63.8
125 2.9 5th pillar: Higher education and training5.01 Secondary education enrollment rate gross % 120 43.85.02 Tertiary education enrollment rate gross % 114 10.45.03 Quality of the education system 118 2.85.04 Quality of math and science education 124 2.75.05 Quality of management schools 94 3.85.06 Internet access in schools 129 3.15.07 Local availability of specialized training services 91 4.15.08 Extent of staff training 68 3.9
98 4.1 6th pillar: Goods market efficiency6.01 Intensity of local competition 75 5.06.02 Extent of market dominance 66 3.76.03 Effectiveness of anti-monopoly policy 124 2.86.04 Effect of taxation on incentives to invest 27 4.26.05 Total tax rate % profits 55 33.36.06 No. of procedures to start a business 107 96.07 Time to start a business days 119 30.86.08 Agricultural policy costs 43 4.16.09 Prevalence of non-tariff barriers 30 4.86.10 Trade tariffs % duty 102 9.76.11 Prevalence of foreign ownership 52 4.86.12 Business impact of rules on FDI 33 5.16.13 Burden of customs procedures 132 2.96.14 Imports % GDP 137 13.66.15 Degree of customer orientation 123 3.96.16 Buyer sophistication 93 3.0
37 4.5 7th pillar: Labor market efficiency7.01 Cooperation in labor-employer relations 86 4.27.02 Flexibility of wage determination 40 5.47.03 Hiring and firing practices 16 4.87.04 Redundancy costs weeks of salary 64 15.47.05 Effect of taxation on incentives to work 11 5.17.06 Pay and productivity 71 3.97.07 Reliance on professional management 33 4.87.08 Country capacity to retain talent 80 3.37.09 Country capacity to attract talent 50 3.77.10 Female participation in the labor force ratio to men 83 0.76
89 3.7 8th pillar: Financial market development8.01 Financial services meeting business needs 101 3.78.02 Affordability of financial services 132 2.58.03 Financing through local equity market 46 4.18.04 Ease of access to loans 129 2.68.05 Venture capital availability 130 2.08.06 Soundness of banks 83 4.58.07 Regulation of securities exchanges 49 4.78.08 Legal rights index 0-10 (best) 46 6
105 3.1 9th pillar: Technological readiness9.01 Availability of latest technologies 97 4.39.02 Firm-level technology absorption 83 4.39.03 FDI and technology transfer 73 4.39.04 Internet users % pop. 83 47.49.05 Fixed-broadband Internet subscriptions /100 pop. 135 0.09.06 Internet bandwidth kb/s/user 127 3.09.07 Mobile-broadband subscriptions /100 pop. 107 21.0
26 5.0 10th pillar: Market size10.01 Domestic market size index 21 5.010.02 Foreign market size index 51 4.910.03 GDP (PPP) PPP $ billions 22 1091.710.04 Exports % GDP 134 10.4
99 3.6 11th pillar: Business sophistication11.01 Local supplier quantity 44 4.711.02 Local supplier quality 103 3.811.03 State of cluster development 88 3.511.04 Nature of competitive advantage 128 2.411.05 Value chain breadth 106 3.411.06 Control of international distribution 127 2.911.07 Production process sophistication 115 3.111.08 Extent of marketing 58 4.511.09 Willingness to delegate authority 88 3.6
113 2.9 12th pillar: Innovation12.01 Capacity for innovation 77 4.012.02 Quality of scientific research institutions 126 2.712.03 Company spending on R&D 96 3.012.04 University-industry collaboration in R&D 123 2.712.05 Gov't procurement of advanced tech. products 97 2.912.06 Availability of scientists and engineers 88 3.812.07 PCT patent applications applications/million pop. 112 0.0
Nigeria
The Africa Competitiveness Report 2017 | 139
Country Profiles

Edition 2012-13 2013-14 2014-15 2015-16 2016-17
Rank 63 / 144 66 / 148 62 / 144 58 / 140 52 / 138
Score 4.2 4.2 4.3 4.3 4.4
Most problematic factors for doing business
Performance overview
Note: From the list of factors, respondents to the World Economic Forum's Executive Opinion Survey were asked to select the five most problematic factors for doing business in their country and torank them between 1 (most problematic) and 5. The score corresponds to the responses weighted according to their rankings.
The Global Competitiveness Index in detail
Rank / 138 Score (1-7) Trend Distance from best
Global Competitiveness Index 52 4.4Subindex A: Basic requirements 53 4.7
13 5.6 1st pillar: Institutions
97 3.32nd pillar: Infrastructure
80 4.5 3rd pillar: Macroeconomic environment
84 5.5 4th pillar: Health and primary education
Subindex B: Efficiency enhancers 81 3.9
114 3.2 5th pillar: Higher education and training
35 4.7 6th pillar: Goods market efficiency
7 5.4 7th pillar: Labor market efficiency
32 4.6 8th pillar: Financial market development
100 3.2 9th pillar: Technological readiness
127 2.4 10th pillar: Market size
Subindex C: Innovation and sophistication factors 54 3.8
64 4.0 11th pillar: Business sophistication
47 3.6 12th pillar: Innovation
1234567
1st pillar:Institutions
2nd pillar:Infrastructure
3rd pillar:Macroeconomicenvironment
4th pillar:Health and primaryeducation
5th pillar:Higher educationand training
6th pillar:Goods marketefficiency7th pillar:
Labor marketefficiency
8th pillar:Financial market
development
9th pillar:Technological
readiness
10th pillar:Market size
11th pillar:Business
sophistication
12th pillar:Innovation
Rwanda Sub-Saharan Africa
Source: World Economic Forum, Executive Opinion Survey 2016
21.217.814.8
9.89.37.85.43.93.52.01.11.00.90.70.70.2
Access to financingInadequately educated workforceTax ratesInsufficient capacity to innovateTax regulationsInadequate supply of infrastructurePoor work ethic in national labor forceForeign currency regulationsInflationInefficient government bureaucracyPolicy instabilityCorruptionGovernment instability/coupsRestrictive labor regulationsPoor public healthCrime and theft
0 6 12 18 24
score
Global Competitiveness Index2016-2017 edition
Key Indicators, 2015
Population (millions)
GDP (US$ billions)
GDP per capita (US$)
GDP (PPP) % world GDP
Rwanda 52 / 138nd
Source: International Monetary Fund; World Economic Outlook Database (April 2016)
11.3
8.3
731.5
0.02
140 | The Africa Competitiveness Report 2017
Part 2

The Global Competitiveness Index in detail
Note: Values are on a 1-to-7 scale unless indicated otherwise. Trend lines depict evolution in values since the 2012-2013 edition (or earliest edition available). For detailed definitions,sources, and periods, consult the interactive Country/Economy Profiles and Rankings at http://gcr.weforum.org/
Rank / 138 Value Trend Rank / 138 Value Trend
13 5.6 1st pillar: Institutions1.01 Property rights 22 5.71.02 Intellectual property protection 28 5.31.03 Diversion of public funds 16 5.61.04 Public trust in politicians 7 5.71.05 Irregular payments and bribes 20 5.91.06 Judicial independence 25 5.51.07 Favoritism in decisions of government officials 9 5.21.08 Wastefulness of government spending 4 5.71.09 Burden of government regulation 2 5.51.10 Efficiency of legal framework in settling disputes 11 5.51.11 Efficiency of legal framework in challenging regs 14 5.11.12 Transparency of government policymaking 9 5.91.13 Business costs of terrorism 9 6.21.14 Business costs of crime and violence 5 6.31.15 Organized crime 6 6.41.16 Reliability of police services 6 6.41.17 Ethical behavior of firms 21 5.31.18 Strength of auditing and reporting standards 40 5.21.19 Efficacy of corporate boards 27 5.51.20 Protection of minority shareholders’ interests 23 5.01.21 Strength of investor protection 0-10 (best) 79 5.3
97 3.32nd pillar: Infrastructure2.01 Quality of overall infrastructure 41 4.62.02 Quality of roads 31 5.02.03 Quality of railroad infrastructure N/Appl. N/Appl.2.04 Quality of port infrastructure 104 3.22.05 Quality of air transport infrastructure 56 4.62.06 Available airline seat kilometers millions/week 120 24.42.07 Quality of electricity supply 90 4.22.08 Mobile-cellular telephone subscriptions /100 pop. 128 70.52.09 Fixed-telephone lines /100 pop. 135 0.1
80 4.5 3rd pillar: Macroeconomic environment3.01 Government budget balance % GDP 61 -2.83.02 Gross national savings % GDP 120 11.23.03 Inflation annual % change 1 2.53.04 Government debt % GDP 33 34.63.05 Country credit rating 0-100 (best) 110 -
84 5.5 4th pillar: Health and primary education4.01 Malaria incidence cases/100,000 pop. 50 11462.34.02 Business impact of malaria 37 4.84.03 Tuberculosis incidence cases/100,000 pop. 81 63.04.04 Business impact of tuberculosis 84 5.34.05 HIV prevalence % adult pop. 122 2.84.06 Business impact of HIV/AIDS 97 4.74.07 Infant mortality deaths/1,000 live births 105 31.14.08 Life expectancy years 116 64.04.09 Quality of primary education 52 4.34.10 Primary education enrollment rate net % 59 96.1
114 3.2 5th pillar: Higher education and training5.01 Secondary education enrollment rate gross % 128 39.15.02 Tertiary education enrollment rate gross % 122 7.55.03 Quality of the education system 46 4.25.04 Quality of math and science education 54 4.45.05 Quality of management schools 59 4.35.06 Internet access in schools 64 4.45.07 Local availability of specialized training services 92 4.15.08 Extent of staff training 55 4.1
35 4.7 6th pillar: Goods market efficiency6.01 Intensity of local competition 77 5.06.02 Extent of market dominance 34 4.26.03 Effectiveness of anti-monopoly policy 26 4.56.04 Effect of taxation on incentives to invest 29 4.26.05 Total tax rate % profits 51 33.06.06 No. of procedures to start a business 76 76.07 Time to start a business days 28 5.56.08 Agricultural policy costs 5 5.26.09 Prevalence of non-tariff barriers 68 4.46.10 Trade tariffs % duty 100 9.76.11 Prevalence of foreign ownership 61 4.66.12 Business impact of rules on FDI 8 5.76.13 Burden of customs procedures 11 5.46.14 Imports % GDP 84 36.36.15 Degree of customer orientation 37 5.16.16 Buyer sophistication 88 3.1
7 5.4 7th pillar: Labor market efficiency7.01 Cooperation in labor-employer relations 18 5.37.02 Flexibility of wage determination 28 5.57.03 Hiring and firing practices 13 4.87.04 Redundancy costs weeks of salary 47 13.07.05 Effect of taxation on incentives to work 9 5.27.06 Pay and productivity 45 4.47.07 Reliance on professional management 31 4.97.08 Country capacity to retain talent 20 4.77.09 Country capacity to attract talent 14 4.97.10 Female participation in the labor force ratio to men 2 1.05
32 4.6 8th pillar: Financial market development8.01 Financial services meeting business needs 66 4.38.02 Affordability of financial services 73 3.78.03 Financing through local equity market 70 3.68.04 Ease of access to loans 64 4.08.05 Venture capital availability 37 3.38.06 Soundness of banks 78 4.68.07 Regulation of securities exchanges 36 5.18.08 Legal rights index 0-10 (best) 4 11
100 3.2 9th pillar: Technological readiness9.01 Availability of latest technologies 49 5.19.02 Firm-level technology absorption 52 4.79.03 FDI and technology transfer 37 4.89.04 Internet users % pop. 119 18.09.05 Fixed-broadband Internet subscriptions /100 pop. 124 0.29.06 Internet bandwidth kb/s/user 119 5.79.07 Mobile-broadband subscriptions /100 pop. 104 25.9
127 2.4 10th pillar: Market size10.01 Domestic market size index 125 2.310.02 Foreign market size index 130 2.810.03 GDP (PPP) PPP $ billions 123 20.410.04 Exports % GDP 129 12.2
64 4.0 11th pillar: Business sophistication11.01 Local supplier quantity 82 4.311.02 Local supplier quality 76 4.211.03 State of cluster development 41 4.111.04 Nature of competitive advantage 51 3.911.05 Value chain breadth 73 3.711.06 Control of international distribution 88 3.411.07 Production process sophistication 101 3.411.08 Extent of marketing 69 4.411.09 Willingness to delegate authority 64 3.8
47 3.6 12th pillar: Innovation12.01 Capacity for innovation 54 4.312.02 Quality of scientific research institutions 80 3.712.03 Company spending on R&D 65 3.312.04 University-industry collaboration in R&D 78 3.312.05 Gov't procurement of advanced tech. products 8 4.412.06 Availability of scientists and engineers 70 4.012.07 PCT patent applications applications/million pop. 116 0.0
Rwanda
The Africa Competitiveness Report 2017 | 141
Country Profiles
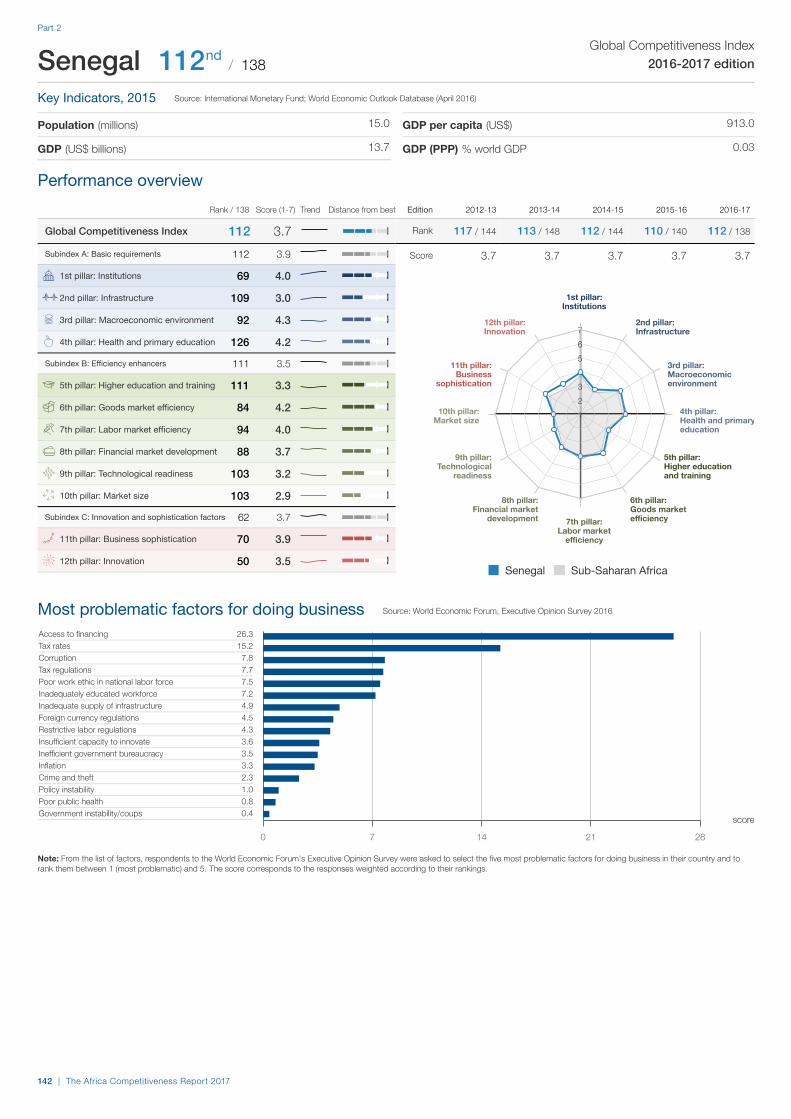
Edition 2012-13 2013-14 2014-15 2015-16 2016-17
Rank 117 / 144 113 / 148 112 / 144 110 / 140 112 / 138
Score 3.7 3.7 3.7 3.7 3.7
Most problematic factors for doing business
Performance overview
Note: From the list of factors, respondents to the World Economic Forum's Executive Opinion Survey were asked to select the five most problematic factors for doing business in their country and torank them between 1 (most problematic) and 5. The score corresponds to the responses weighted according to their rankings.
The Global Competitiveness Index in detail
Rank / 138 Score (1-7) Trend Distance from best
Global Competitiveness Index 112 3.7Subindex A: Basic requirements 112 3.9
69 4.0 1st pillar: Institutions
109 3.02nd pillar: Infrastructure
92 4.3 3rd pillar: Macroeconomic environment
126 4.2 4th pillar: Health and primary education
Subindex B: Efficiency enhancers 111 3.5
111 3.3 5th pillar: Higher education and training
84 4.2 6th pillar: Goods market efficiency
94 4.0 7th pillar: Labor market efficiency
88 3.7 8th pillar: Financial market development
103 3.2 9th pillar: Technological readiness
103 2.9 10th pillar: Market size
Subindex C: Innovation and sophistication factors 62 3.7
70 3.9 11th pillar: Business sophistication
50 3.5 12th pillar: Innovation
1234567
1st pillar:Institutions
2nd pillar:Infrastructure
3rd pillar:Macroeconomicenvironment
4th pillar:Health and primaryeducation
5th pillar:Higher educationand training
6th pillar:Goods marketefficiency7th pillar:
Labor marketefficiency
8th pillar:Financial market
development
9th pillar:Technological
readiness
10th pillar:Market size
11th pillar:Business
sophistication
12th pillar:Innovation
Senegal Sub-Saharan Africa
Source: World Economic Forum, Executive Opinion Survey 2016
26.315.2
7.87.77.57.24.94.54.33.63.53.32.31.00.80.4
Access to financingTax ratesCorruptionTax regulationsPoor work ethic in national labor forceInadequately educated workforceInadequate supply of infrastructureForeign currency regulationsRestrictive labor regulationsInsufficient capacity to innovateInefficient government bureaucracyInflationCrime and theftPolicy instabilityPoor public healthGovernment instability/coups
0 7 14 21 28
score
Global Competitiveness Index2016-2017 edition
Key Indicators, 2015
Population (millions)
GDP (US$ billions)
GDP per capita (US$)
GDP (PPP) % world GDP
Senegal 112 / 138nd
Source: International Monetary Fund; World Economic Outlook Database (April 2016)
15.0
13.7
913.0
0.03
142 | The Africa Competitiveness Report 2017
Part 2
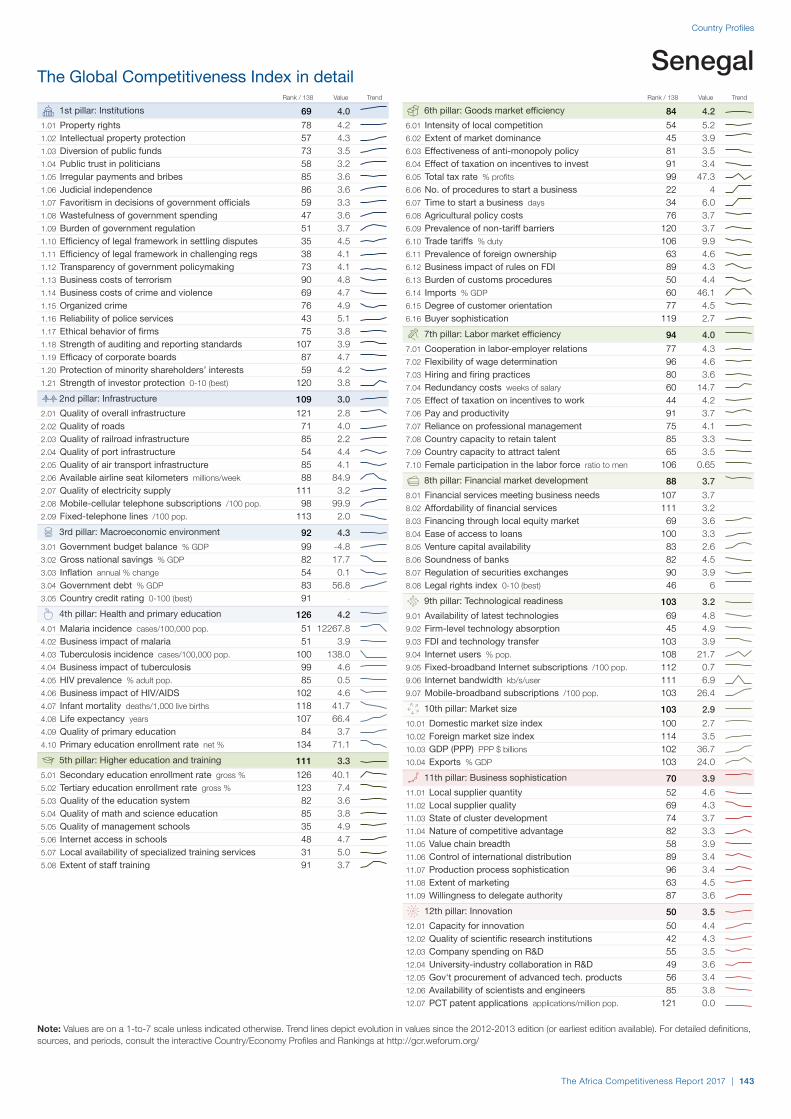
The Global Competitiveness Index in detail
Note: Values are on a 1-to-7 scale unless indicated otherwise. Trend lines depict evolution in values since the 2012-2013 edition (or earliest edition available). For detailed definitions,sources, and periods, consult the interactive Country/Economy Profiles and Rankings at http://gcr.weforum.org/
Rank / 138 Value Trend Rank / 138 Value Trend
69 4.0 1st pillar: Institutions1.01 Property rights 78 4.21.02 Intellectual property protection 57 4.31.03 Diversion of public funds 73 3.51.04 Public trust in politicians 58 3.21.05 Irregular payments and bribes 85 3.61.06 Judicial independence 86 3.61.07 Favoritism in decisions of government officials 59 3.31.08 Wastefulness of government spending 47 3.61.09 Burden of government regulation 51 3.71.10 Efficiency of legal framework in settling disputes 35 4.51.11 Efficiency of legal framework in challenging regs 38 4.11.12 Transparency of government policymaking 73 4.11.13 Business costs of terrorism 90 4.81.14 Business costs of crime and violence 69 4.71.15 Organized crime 76 4.91.16 Reliability of police services 43 5.11.17 Ethical behavior of firms 75 3.81.18 Strength of auditing and reporting standards 107 3.91.19 Efficacy of corporate boards 87 4.71.20 Protection of minority shareholders’ interests 59 4.21.21 Strength of investor protection 0-10 (best) 120 3.8
109 3.02nd pillar: Infrastructure2.01 Quality of overall infrastructure 121 2.82.02 Quality of roads 71 4.02.03 Quality of railroad infrastructure 85 2.22.04 Quality of port infrastructure 54 4.42.05 Quality of air transport infrastructure 85 4.12.06 Available airline seat kilometers millions/week 88 84.92.07 Quality of electricity supply 111 3.22.08 Mobile-cellular telephone subscriptions /100 pop. 98 99.92.09 Fixed-telephone lines /100 pop. 113 2.0
92 4.3 3rd pillar: Macroeconomic environment3.01 Government budget balance % GDP 99 -4.83.02 Gross national savings % GDP 82 17.73.03 Inflation annual % change 54 0.13.04 Government debt % GDP 83 56.83.05 Country credit rating 0-100 (best) 91 -
126 4.2 4th pillar: Health and primary education4.01 Malaria incidence cases/100,000 pop. 51 12267.84.02 Business impact of malaria 51 3.94.03 Tuberculosis incidence cases/100,000 pop. 100 138.04.04 Business impact of tuberculosis 99 4.64.05 HIV prevalence % adult pop. 85 0.54.06 Business impact of HIV/AIDS 102 4.64.07 Infant mortality deaths/1,000 live births 118 41.74.08 Life expectancy years 107 66.44.09 Quality of primary education 84 3.74.10 Primary education enrollment rate net % 134 71.1
111 3.3 5th pillar: Higher education and training5.01 Secondary education enrollment rate gross % 126 40.15.02 Tertiary education enrollment rate gross % 123 7.45.03 Quality of the education system 82 3.65.04 Quality of math and science education 85 3.85.05 Quality of management schools 35 4.95.06 Internet access in schools 48 4.75.07 Local availability of specialized training services 31 5.05.08 Extent of staff training 91 3.7
84 4.2 6th pillar: Goods market efficiency6.01 Intensity of local competition 54 5.26.02 Extent of market dominance 45 3.96.03 Effectiveness of anti-monopoly policy 81 3.56.04 Effect of taxation on incentives to invest 91 3.46.05 Total tax rate % profits 99 47.36.06 No. of procedures to start a business 22 46.07 Time to start a business days 34 6.06.08 Agricultural policy costs 76 3.76.09 Prevalence of non-tariff barriers 120 3.76.10 Trade tariffs % duty 106 9.96.11 Prevalence of foreign ownership 63 4.66.12 Business impact of rules on FDI 89 4.36.13 Burden of customs procedures 50 4.46.14 Imports % GDP 60 46.16.15 Degree of customer orientation 77 4.56.16 Buyer sophistication 119 2.7
94 4.0 7th pillar: Labor market efficiency7.01 Cooperation in labor-employer relations 77 4.37.02 Flexibility of wage determination 96 4.67.03 Hiring and firing practices 80 3.67.04 Redundancy costs weeks of salary 60 14.77.05 Effect of taxation on incentives to work 44 4.27.06 Pay and productivity 91 3.77.07 Reliance on professional management 75 4.17.08 Country capacity to retain talent 85 3.37.09 Country capacity to attract talent 65 3.57.10 Female participation in the labor force ratio to men 106 0.65
88 3.7 8th pillar: Financial market development8.01 Financial services meeting business needs 107 3.78.02 Affordability of financial services 111 3.28.03 Financing through local equity market 69 3.68.04 Ease of access to loans 100 3.38.05 Venture capital availability 83 2.68.06 Soundness of banks 82 4.58.07 Regulation of securities exchanges 90 3.98.08 Legal rights index 0-10 (best) 46 6
103 3.2 9th pillar: Technological readiness9.01 Availability of latest technologies 69 4.89.02 Firm-level technology absorption 45 4.99.03 FDI and technology transfer 103 3.99.04 Internet users % pop. 108 21.79.05 Fixed-broadband Internet subscriptions /100 pop. 112 0.79.06 Internet bandwidth kb/s/user 111 6.99.07 Mobile-broadband subscriptions /100 pop. 103 26.4
103 2.9 10th pillar: Market size10.01 Domestic market size index 100 2.710.02 Foreign market size index 114 3.510.03 GDP (PPP) PPP $ billions 102 36.710.04 Exports % GDP 103 24.0
70 3.9 11th pillar: Business sophistication11.01 Local supplier quantity 52 4.611.02 Local supplier quality 69 4.311.03 State of cluster development 74 3.711.04 Nature of competitive advantage 82 3.311.05 Value chain breadth 58 3.911.06 Control of international distribution 89 3.411.07 Production process sophistication 96 3.411.08 Extent of marketing 63 4.511.09 Willingness to delegate authority 87 3.6
50 3.5 12th pillar: Innovation12.01 Capacity for innovation 50 4.412.02 Quality of scientific research institutions 42 4.312.03 Company spending on R&D 55 3.512.04 University-industry collaboration in R&D 49 3.612.05 Gov't procurement of advanced tech. products 56 3.412.06 Availability of scientists and engineers 85 3.812.07 PCT patent applications applications/million pop. 121 0.0
Senegal
The Africa Competitiveness Report 2017 | 143
Country Profiles

Edition 2012-13 2013-14 2014-15 2015-16 2016-17
Rank 143 / 144 144 / 148 138 / 144 137 / 140 132 / 138
Score 2.8 3.0 3.1 3.1 3.2
Most problematic factors for doing business
Performance overview
Note: From the list of factors, respondents to the World Economic Forum's Executive Opinion Survey were asked to select the five most problematic factors for doing business in their country and torank them between 1 (most problematic) and 5. The score corresponds to the responses weighted according to their rankings.
The Global Competitiveness Index in detail
Rank / 138 Score (1-7) Trend Distance from best
Global Competitiveness Index 132 3.2Subindex A: Basic requirements 129 3.3
121 3.2 1st pillar: Institutions
127 2.32nd pillar: Infrastructure
123 3.6 3rd pillar: Macroeconomic environment
127 4.1 4th pillar: Health and primary education
Subindex B: Efficiency enhancers 134 3.0
133 2.6 5th pillar: Higher education and training
123 3.8 6th pillar: Goods market efficiency
110 3.8 7th pillar: Labor market efficiency
123 3.1 8th pillar: Financial market development
132 2.4 9th pillar: Technological readiness
131 2.1 10th pillar: Market size
Subindex C: Innovation and sophistication factors 130 2.9
133 3.1 11th pillar: Business sophistication
130 2.6 12th pillar: Innovation
1234567
1st pillar:Institutions
2nd pillar:Infrastructure
3rd pillar:Macroeconomicenvironment
4th pillar:Health and primaryeducation
5th pillar:Higher educationand training
6th pillar:Goods marketefficiency7th pillar:
Labor marketefficiency
8th pillar:Financial market
development
9th pillar:Technological
readiness
10th pillar:Market size
11th pillar:Business
sophistication
12th pillar:Innovation
Sierra Leone Sub-Saharan Africa
Source: World Economic Forum, Executive Opinion Survey 2016
18.113.111.2
7.97.86.75.95.25.25.14.33.12.32.01.90.2
Access to financingCorruptionInadequate supply of infrastructureInflationTax ratesForeign currency regulationsCrime and theftPoor work ethic in national labor forceInadequately educated workforcePoor public healthInefficient government bureaucracyInsufficient capacity to innovatePolicy instabilityTax regulationsRestrictive labor regulationsGovernment instability/coups
0 5 10 15 20
score
Global Competitiveness Index2016-2017 edition
Key Indicators, 2015
Population (millions)
GDP (US$ billions)
GDP per capita (US$)
GDP (PPP) % world GDP
Sierra Leone 132 / 138nd
Source: International Monetary Fund; World Economic Outlook Database (April 2016)
6.3
4.2
659.4
0.01
144 | The Africa Competitiveness Report 2017
Part 2

The Global Competitiveness Index in detail
Note: Values are on a 1-to-7 scale unless indicated otherwise. Trend lines depict evolution in values since the 2012-2013 edition (or earliest edition available). For detailed definitions,sources, and periods, consult the interactive Country/Economy Profiles and Rankings at http://gcr.weforum.org/
Rank / 138 Value Trend Rank / 138 Value Trend
121 3.2 1st pillar: Institutions1.01 Property rights 121 3.51.02 Intellectual property protection 122 3.31.03 Diversion of public funds 116 2.51.04 Public trust in politicians 87 2.61.05 Irregular payments and bribes 134 2.41.06 Judicial independence 124 2.71.07 Favoritism in decisions of government officials 111 2.41.08 Wastefulness of government spending 76 3.01.09 Burden of government regulation 80 3.41.10 Efficiency of legal framework in settling disputes 88 3.31.11 Efficiency of legal framework in challenging regs 124 2.51.12 Transparency of government policymaking 104 3.71.13 Business costs of terrorism 100 4.71.14 Business costs of crime and violence 105 3.81.15 Organized crime 101 4.21.16 Reliability of police services 107 3.51.17 Ethical behavior of firms 119 3.21.18 Strength of auditing and reporting standards 117 3.81.19 Efficacy of corporate boards 110 4.41.20 Protection of minority shareholders’ interests 124 3.41.21 Strength of investor protection 0-10 (best) 79 5.3
127 2.32nd pillar: Infrastructure2.01 Quality of overall infrastructure 129 2.42.02 Quality of roads 122 2.82.03 Quality of railroad infrastructure N/Appl. N/Appl.2.04 Quality of port infrastructure 111 3.02.05 Quality of air transport infrastructure 128 2.72.06 Available airline seat kilometers millions/week 134 7.72.07 Quality of electricity supply 127 2.22.08 Mobile-cellular telephone subscriptions /100 pop. 109 89.52.09 Fixed-telephone lines /100 pop. 130 0.3
123 3.6 3rd pillar: Macroeconomic environment3.01 Government budget balance % GDP 95 -4.43.02 Gross national savings % GDP 133 3.93.03 Inflation annual % change 124 9.03.04 Government debt % GDP 67 46.13.05 Country credit rating 0-100 (best) 133 -
127 4.1 4th pillar: Health and primary education4.01 Malaria incidence cases/100,000 pop. 68 39584.44.02 Business impact of malaria 69 2.94.03 Tuberculosis incidence cases/100,000 pop. 126 310.04.04 Business impact of tuberculosis 116 4.24.05 HIV prevalence % adult pop. 115 1.44.06 Business impact of HIV/AIDS 112 4.34.07 Infant mortality deaths/1,000 live births 138 87.14.08 Life expectancy years 137 50.94.09 Quality of primary education 119 2.94.10 Primary education enrollment rate net % 31 97.9
133 2.6 5th pillar: Higher education and training5.01 Secondary education enrollment rate gross % 123 43.45.02 Tertiary education enrollment rate gross % 137 2.25.03 Quality of the education system 110 3.05.04 Quality of math and science education 123 2.75.05 Quality of management schools 129 3.25.06 Internet access in schools 134 2.45.07 Local availability of specialized training services 131 3.35.08 Extent of staff training 105 3.5
123 3.8 6th pillar: Goods market efficiency6.01 Intensity of local competition 131 4.16.02 Extent of market dominance 126 2.96.03 Effectiveness of anti-monopoly policy 131 2.66.04 Effect of taxation on incentives to invest 90 3.46.05 Total tax rate % profits 42 31.06.06 No. of procedures to start a business 54 66.07 Time to start a business days 56 10.06.08 Agricultural policy costs 115 3.26.09 Prevalence of non-tariff barriers 116 3.76.10 Trade tariffs % duty 128 13.86.11 Prevalence of foreign ownership 66 4.56.12 Business impact of rules on FDI 78 4.56.13 Burden of customs procedures 122 3.26.14 Imports % GDP 39 56.46.15 Degree of customer orientation 121 3.96.16 Buyer sophistication 128 2.4
110 3.8 7th pillar: Labor market efficiency7.01 Cooperation in labor-employer relations 104 4.17.02 Flexibility of wage determination 105 4.47.03 Hiring and firing practices 77 3.77.04 Redundancy costs weeks of salary 135 75.57.05 Effect of taxation on incentives to work 90 3.77.06 Pay and productivity 121 3.37.07 Reliance on professional management 105 3.77.08 Country capacity to retain talent 96 3.07.09 Country capacity to attract talent 89 3.17.10 Female participation in the labor force ratio to men 9 0.97
123 3.1 8th pillar: Financial market development8.01 Financial services meeting business needs 127 3.38.02 Affordability of financial services 129 2.78.03 Financing through local equity market 114 2.78.04 Ease of access to loans 128 2.68.05 Venture capital availability 127 2.18.06 Soundness of banks 120 3.78.07 Regulation of securities exchanges 119 3.48.08 Legal rights index 0-10 (best) 68 5
132 2.4 9th pillar: Technological readiness9.01 Availability of latest technologies 135 3.09.02 Firm-level technology absorption 123 3.79.03 FDI and technology transfer 125 3.49.04 Internet users % pop. 138 2.59.05 Fixed-broadband Internet subscriptions /100 pop. n/a n/a9.06 Internet bandwidth kb/s/user 133 2.09.07 Mobile-broadband subscriptions /100 pop. 117 15.2
131 2.1 10th pillar: Market size10.01 Domestic market size index 130 1.910.02 Foreign market size index 134 2.710.03 GDP (PPP) PPP $ billions 131 10.010.04 Exports % GDP 115 19.6
133 3.1 11th pillar: Business sophistication11.01 Local supplier quantity 106 4.111.02 Local supplier quality 131 3.411.03 State of cluster development 120 3.011.04 Nature of competitive advantage 121 2.711.05 Value chain breadth 131 2.911.06 Control of international distribution 135 2.711.07 Production process sophistication 134 2.511.08 Extent of marketing 132 3.511.09 Willingness to delegate authority 110 3.3
130 2.6 12th pillar: Innovation12.01 Capacity for innovation 127 3.312.02 Quality of scientific research institutions 135 2.312.03 Company spending on R&D 128 2.512.04 University-industry collaboration in R&D 126 2.612.05 Gov't procurement of advanced tech. products 78 3.112.06 Availability of scientists and engineers 129 3.012.07 PCT patent applications applications/million pop. 106 0.1
Sierra Leone
The Africa Competitiveness Report 2017 | 145
Country Profiles
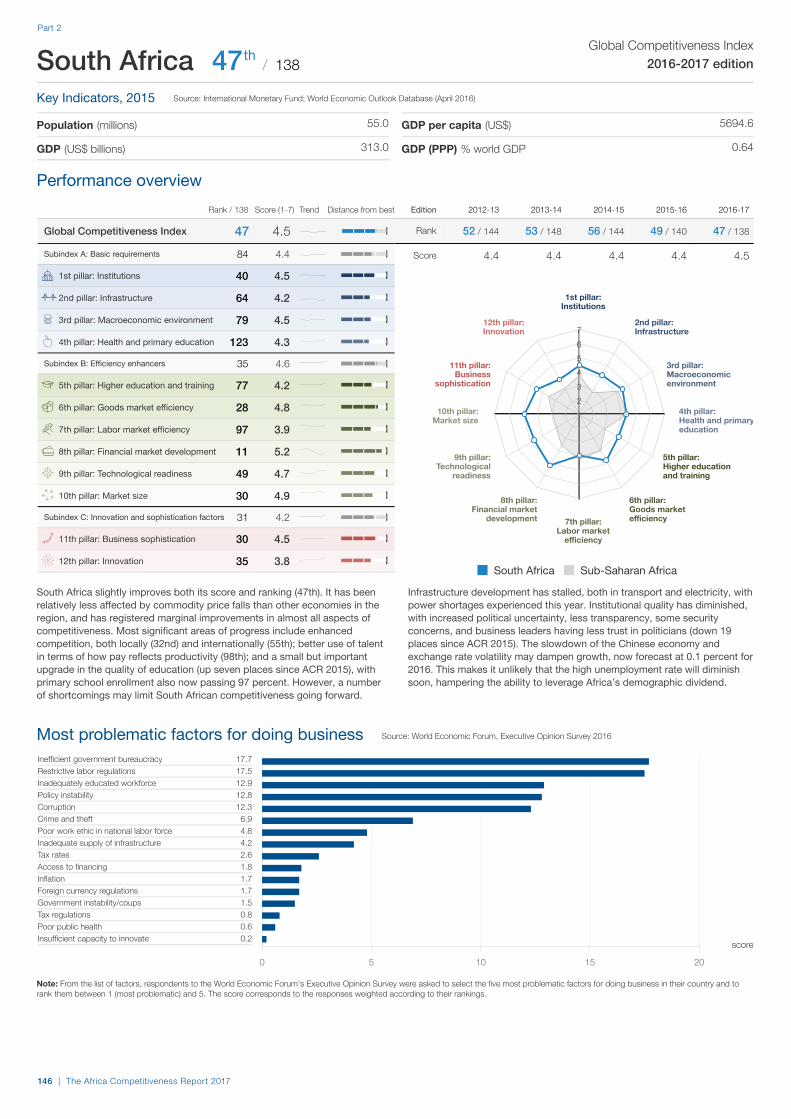
Edition 2012-13 2013-14 2014-15 2015-16 2016-17
Rank 52 / 144 53 / 148 56 / 144 49 / 140 47 / 138
Score 4.4 4.4 4.4 4.4 4.5
Most problematic factors for doing business
Performance overview
Note: From the list of factors, respondents to the World Economic Forum's Executive Opinion Survey were asked to select the five most problematic factors for doing business in their country and torank them between 1 (most problematic) and 5. The score corresponds to the responses weighted according to their rankings.
The Global Competitiveness Index in detail
South Africa slightly improves both its score and ranking (47th). It has been relatively less affected by commodity price falls than other economies in the region, and has registered marginal improvements in almost all aspects of competitiveness. Most significant areas of progress include enhanced competition, both locally (32nd) and internationally (55th); better use of talent in terms of how pay reflects productivity (98th); and a small but important upgrade in the quality of education (up seven places since ACR 2015), with primary school enrollment also now passing 97 percent. However, a number of shortcomings may limit South African competitiveness going forward.
Infrastructure development has stalled, both in transport and electricity, with power shortages experienced this year. Institutional quality has diminished, with increased political uncertainty, less transparency, some security concerns, and business leaders having less trust in politicians (down 19 places since ACR 2015). The slowdown of the Chinese economy and exchange rate volatility may dampen growth, now forecast at 0.1 percent for 2016. This makes it unlikely that the high unemployment rate will diminish soon, hampering the ability to leverage Africa’s demographic dividend.
Rank / 138 Score (1-7) Trend Distance from best
Global Competitiveness Index 47 4.5Subindex A: Basic requirements 84 4.4
40 4.5 1st pillar: Institutions
64 4.22nd pillar: Infrastructure
79 4.5 3rd pillar: Macroeconomic environment
123 4.3 4th pillar: Health and primary education
Subindex B: Efficiency enhancers 35 4.6
77 4.2 5th pillar: Higher education and training
28 4.8 6th pillar: Goods market efficiency
97 3.9 7th pillar: Labor market efficiency
11 5.2 8th pillar: Financial market development
49 4.7 9th pillar: Technological readiness
30 4.9 10th pillar: Market size
Subindex C: Innovation and sophistication factors 31 4.2
30 4.5 11th pillar: Business sophistication
35 3.8 12th pillar: Innovation
1234567
1st pillar:Institutions
2nd pillar:Infrastructure
3rd pillar:Macroeconomicenvironment
4th pillar:Health and primaryeducation
5th pillar:Higher educationand training
6th pillar:Goods marketefficiency7th pillar:
Labor marketefficiency
8th pillar:Financial market
development
9th pillar:Technological
readiness
10th pillar:Market size
11th pillar:Business
sophistication
12th pillar:Innovation
South Africa Sub-Saharan Africa
Source: World Economic Forum, Executive Opinion Survey 2016
17.717.512.912.812.3
6.94.84.22.61.81.71.71.50.80.60.2
Inefficient government bureaucracyRestrictive labor regulationsInadequately educated workforcePolicy instabilityCorruptionCrime and theftPoor work ethic in national labor forceInadequate supply of infrastructureTax ratesAccess to financingInflationForeign currency regulationsGovernment instability/coupsTax regulationsPoor public healthInsufficient capacity to innovate
0 5 10 15 20
score
Global Competitiveness Index2016-2017 edition
Key Indicators, 2015
Population (millions)
GDP (US$ billions)
GDP per capita (US$)
GDP (PPP) % world GDP
South Africa 47 / 138th
Source: International Monetary Fund; World Economic Outlook Database (April 2016)
55.0
313.0
5694.6
0.64
146 | The Africa Competitiveness Report 2017
Part 2
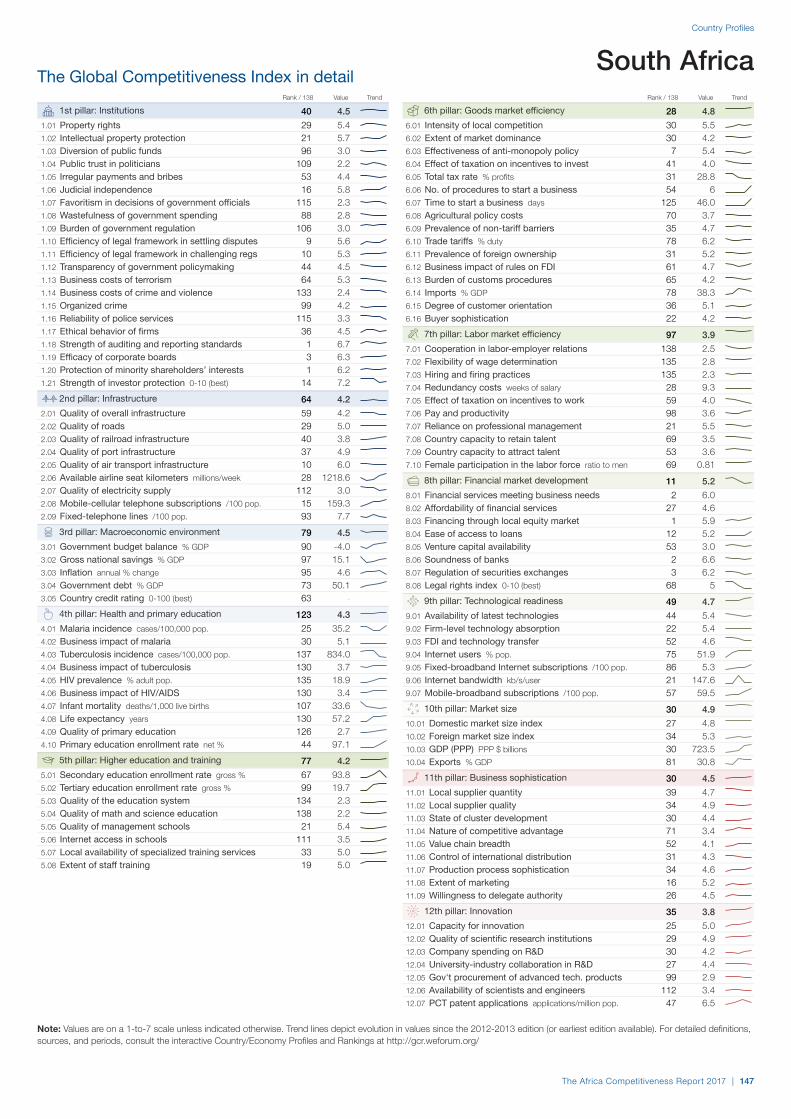
The Global Competitiveness Index in detail
Note: Values are on a 1-to-7 scale unless indicated otherwise. Trend lines depict evolution in values since the 2012-2013 edition (or earliest edition available). For detailed definitions,sources, and periods, consult the interactive Country/Economy Profiles and Rankings at http://gcr.weforum.org/
Rank / 138 Value Trend Rank / 138 Value Trend
40 4.5 1st pillar: Institutions1.01 Property rights 29 5.41.02 Intellectual property protection 21 5.71.03 Diversion of public funds 96 3.01.04 Public trust in politicians 109 2.21.05 Irregular payments and bribes 53 4.41.06 Judicial independence 16 5.81.07 Favoritism in decisions of government officials 115 2.31.08 Wastefulness of government spending 88 2.81.09 Burden of government regulation 106 3.01.10 Efficiency of legal framework in settling disputes 9 5.61.11 Efficiency of legal framework in challenging regs 10 5.31.12 Transparency of government policymaking 44 4.51.13 Business costs of terrorism 64 5.31.14 Business costs of crime and violence 133 2.41.15 Organized crime 99 4.21.16 Reliability of police services 115 3.31.17 Ethical behavior of firms 36 4.51.18 Strength of auditing and reporting standards 1 6.71.19 Efficacy of corporate boards 3 6.31.20 Protection of minority shareholders’ interests 1 6.21.21 Strength of investor protection 0-10 (best) 14 7.2
64 4.22nd pillar: Infrastructure2.01 Quality of overall infrastructure 59 4.22.02 Quality of roads 29 5.02.03 Quality of railroad infrastructure 40 3.82.04 Quality of port infrastructure 37 4.92.05 Quality of air transport infrastructure 10 6.02.06 Available airline seat kilometers millions/week 28 1218.62.07 Quality of electricity supply 112 3.02.08 Mobile-cellular telephone subscriptions /100 pop. 15 159.32.09 Fixed-telephone lines /100 pop. 93 7.7
79 4.5 3rd pillar: Macroeconomic environment3.01 Government budget balance % GDP 90 -4.03.02 Gross national savings % GDP 97 15.13.03 Inflation annual % change 95 4.63.04 Government debt % GDP 73 50.13.05 Country credit rating 0-100 (best) 63 -
123 4.3 4th pillar: Health and primary education4.01 Malaria incidence cases/100,000 pop. 25 35.24.02 Business impact of malaria 30 5.14.03 Tuberculosis incidence cases/100,000 pop. 137 834.04.04 Business impact of tuberculosis 130 3.74.05 HIV prevalence % adult pop. 135 18.94.06 Business impact of HIV/AIDS 130 3.44.07 Infant mortality deaths/1,000 live births 107 33.64.08 Life expectancy years 130 57.24.09 Quality of primary education 126 2.74.10 Primary education enrollment rate net % 44 97.1
77 4.2 5th pillar: Higher education and training5.01 Secondary education enrollment rate gross % 67 93.85.02 Tertiary education enrollment rate gross % 99 19.75.03 Quality of the education system 134 2.35.04 Quality of math and science education 138 2.25.05 Quality of management schools 21 5.45.06 Internet access in schools 111 3.55.07 Local availability of specialized training services 33 5.05.08 Extent of staff training 19 5.0
28 4.8 6th pillar: Goods market efficiency6.01 Intensity of local competition 30 5.56.02 Extent of market dominance 30 4.26.03 Effectiveness of anti-monopoly policy 7 5.46.04 Effect of taxation on incentives to invest 41 4.06.05 Total tax rate % profits 31 28.86.06 No. of procedures to start a business 54 66.07 Time to start a business days 125 46.06.08 Agricultural policy costs 70 3.76.09 Prevalence of non-tariff barriers 35 4.76.10 Trade tariffs % duty 78 6.26.11 Prevalence of foreign ownership 31 5.26.12 Business impact of rules on FDI 61 4.76.13 Burden of customs procedures 65 4.26.14 Imports % GDP 78 38.36.15 Degree of customer orientation 36 5.16.16 Buyer sophistication 22 4.2
97 3.9 7th pillar: Labor market efficiency7.01 Cooperation in labor-employer relations 138 2.57.02 Flexibility of wage determination 135 2.87.03 Hiring and firing practices 135 2.37.04 Redundancy costs weeks of salary 28 9.37.05 Effect of taxation on incentives to work 59 4.07.06 Pay and productivity 98 3.67.07 Reliance on professional management 21 5.57.08 Country capacity to retain talent 69 3.57.09 Country capacity to attract talent 53 3.67.10 Female participation in the labor force ratio to men 69 0.81
11 5.2 8th pillar: Financial market development8.01 Financial services meeting business needs 2 6.08.02 Affordability of financial services 27 4.68.03 Financing through local equity market 1 5.98.04 Ease of access to loans 12 5.28.05 Venture capital availability 53 3.08.06 Soundness of banks 2 6.68.07 Regulation of securities exchanges 3 6.28.08 Legal rights index 0-10 (best) 68 5
49 4.7 9th pillar: Technological readiness9.01 Availability of latest technologies 44 5.49.02 Firm-level technology absorption 22 5.49.03 FDI and technology transfer 52 4.69.04 Internet users % pop. 75 51.99.05 Fixed-broadband Internet subscriptions /100 pop. 86 5.39.06 Internet bandwidth kb/s/user 21 147.69.07 Mobile-broadband subscriptions /100 pop. 57 59.5
30 4.9 10th pillar: Market size10.01 Domestic market size index 27 4.810.02 Foreign market size index 34 5.310.03 GDP (PPP) PPP $ billions 30 723.510.04 Exports % GDP 81 30.8
30 4.5 11th pillar: Business sophistication11.01 Local supplier quantity 39 4.711.02 Local supplier quality 34 4.911.03 State of cluster development 30 4.411.04 Nature of competitive advantage 71 3.411.05 Value chain breadth 52 4.111.06 Control of international distribution 31 4.311.07 Production process sophistication 34 4.611.08 Extent of marketing 16 5.211.09 Willingness to delegate authority 26 4.5
35 3.8 12th pillar: Innovation12.01 Capacity for innovation 25 5.012.02 Quality of scientific research institutions 29 4.912.03 Company spending on R&D 30 4.212.04 University-industry collaboration in R&D 27 4.412.05 Gov't procurement of advanced tech. products 99 2.912.06 Availability of scientists and engineers 112 3.412.07 PCT patent applications applications/million pop. 47 6.5
South Africa
The Africa Competitiveness Report 2017 | 147
Country Profiles

Edition 2012-13 2013-14 2014-15 2015-16 2016-17
Rank 120 / 144 125 / 148 121 / 144 120 / 140 116 / 138
Score 3.6 3.5 3.6 3.6 3.7
Most problematic factors for doing business
Performance overview
Note: From the list of factors, respondents to the World Economic Forum's Executive Opinion Survey were asked to select the five most problematic factors for doing business in their country and torank them between 1 (most problematic) and 5. The score corresponds to the responses weighted according to their rankings.
The Global Competitiveness Index in detail
Rank / 138 Score (1-7) Trend Distance from best
Global Competitiveness Index 116 3.7Subindex A: Basic requirements 114 3.8
83 3.8 1st pillar: Institutions
118 2.72nd pillar: Infrastructure
70 4.6 3rd pillar: Macroeconomic environment
124 4.2 4th pillar: Health and primary education
Subindex B: Efficiency enhancers 119 3.5
132 2.6 5th pillar: Higher education and training
114 3.9 6th pillar: Goods market efficiency
62 4.3 7th pillar: Labor market efficiency
98 3.5 8th pillar: Financial market development
125 2.6 9th pillar: Technological readiness
71 3.7 10th pillar: Market size
Subindex C: Innovation and sophistication factors 96 3.4
106 3.5 11th pillar: Business sophistication
88 3.2 12th pillar: Innovation
1234567
1st pillar:Institutions
2nd pillar:Infrastructure
3rd pillar:Macroeconomicenvironment
4th pillar:Health and primaryeducation
5th pillar:Higher educationand training
6th pillar:Goods marketefficiency7th pillar:
Labor marketefficiency
8th pillar:Financial market
development
9th pillar:Technological
readiness
10th pillar:Market size
11th pillar:Business
sophistication
12th pillar:Innovation
Tanzania Sub-Saharan Africa
Source: World Economic Forum, Executive Opinion Survey 2016
18.714.814.511.8
6.55.95.44.13.93.73.12.42.31.41.20.0
Access to financingTax ratesInadequate supply of infrastructureCorruptionInefficient government bureaucracyTax regulationsInflationCrime and theftInsufficient capacity to innovateInadequately educated workforcePoor work ethic in national labor forceRestrictive labor regulationsForeign currency regulationsPolicy instabilityPoor public healthGovernment instability/coups
0 5 10 15 20
score
Global Competitiveness Index2016-2017 edition
Key Indicators, 2015
Population (millions)
GDP (US$ billions)
GDP per capita (US$)
GDP (PPP) % world GDP
Tanzania 116 / 138th
Source: International Monetary Fund; World Economic Outlook Database (April 2016)
47.7
44.9
941.8
0.12
148 | The Africa Competitiveness Report 2017
Part 2
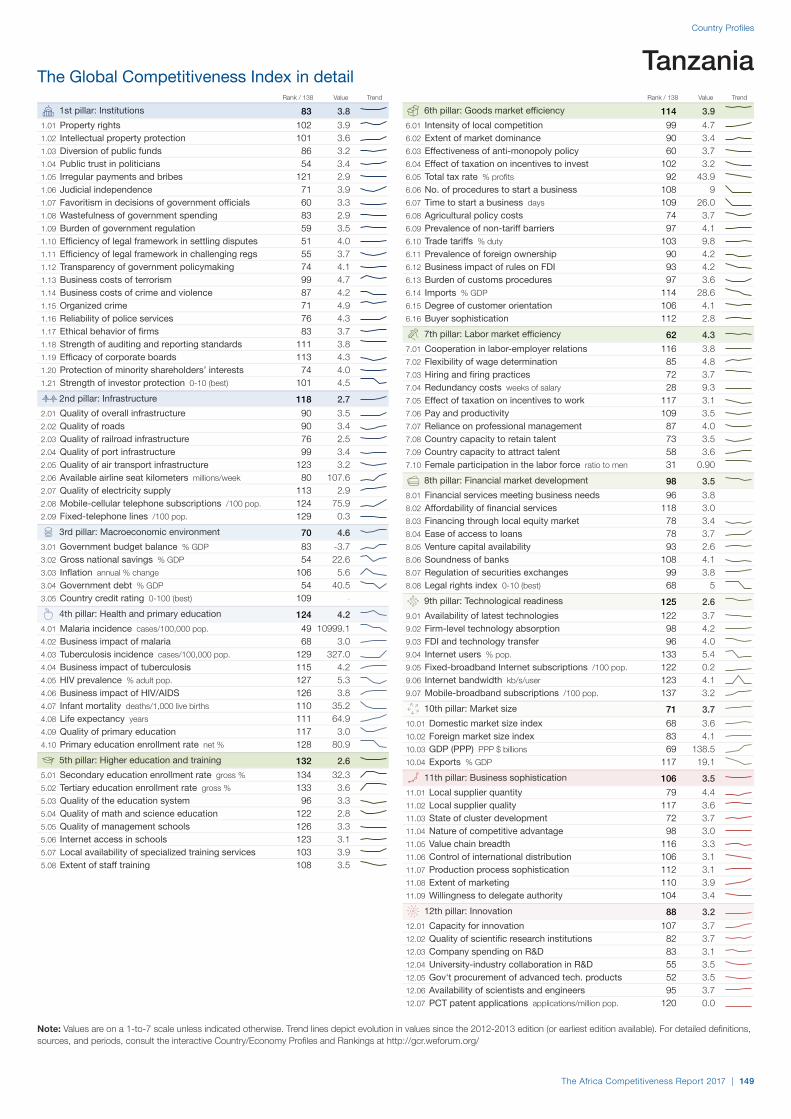
The Global Competitiveness Index in detail
Note: Values are on a 1-to-7 scale unless indicated otherwise. Trend lines depict evolution in values since the 2012-2013 edition (or earliest edition available). For detailed definitions,sources, and periods, consult the interactive Country/Economy Profiles and Rankings at http://gcr.weforum.org/
Rank / 138 Value Trend Rank / 138 Value Trend
83 3.8 1st pillar: Institutions1.01 Property rights 102 3.91.02 Intellectual property protection 101 3.61.03 Diversion of public funds 86 3.21.04 Public trust in politicians 54 3.41.05 Irregular payments and bribes 121 2.91.06 Judicial independence 71 3.91.07 Favoritism in decisions of government officials 60 3.31.08 Wastefulness of government spending 83 2.91.09 Burden of government regulation 59 3.51.10 Efficiency of legal framework in settling disputes 51 4.01.11 Efficiency of legal framework in challenging regs 55 3.71.12 Transparency of government policymaking 74 4.11.13 Business costs of terrorism 99 4.71.14 Business costs of crime and violence 87 4.21.15 Organized crime 71 4.91.16 Reliability of police services 76 4.31.17 Ethical behavior of firms 83 3.71.18 Strength of auditing and reporting standards 111 3.81.19 Efficacy of corporate boards 113 4.31.20 Protection of minority shareholders’ interests 74 4.01.21 Strength of investor protection 0-10 (best) 101 4.5
118 2.72nd pillar: Infrastructure2.01 Quality of overall infrastructure 90 3.52.02 Quality of roads 90 3.42.03 Quality of railroad infrastructure 76 2.52.04 Quality of port infrastructure 99 3.42.05 Quality of air transport infrastructure 123 3.22.06 Available airline seat kilometers millions/week 80 107.62.07 Quality of electricity supply 113 2.92.08 Mobile-cellular telephone subscriptions /100 pop. 124 75.92.09 Fixed-telephone lines /100 pop. 129 0.3
70 4.6 3rd pillar: Macroeconomic environment3.01 Government budget balance % GDP 83 -3.73.02 Gross national savings % GDP 54 22.63.03 Inflation annual % change 106 5.63.04 Government debt % GDP 54 40.53.05 Country credit rating 0-100 (best) 109 -
124 4.2 4th pillar: Health and primary education4.01 Malaria incidence cases/100,000 pop. 49 10999.14.02 Business impact of malaria 68 3.04.03 Tuberculosis incidence cases/100,000 pop. 129 327.04.04 Business impact of tuberculosis 115 4.24.05 HIV prevalence % adult pop. 127 5.34.06 Business impact of HIV/AIDS 126 3.84.07 Infant mortality deaths/1,000 live births 110 35.24.08 Life expectancy years 111 64.94.09 Quality of primary education 117 3.04.10 Primary education enrollment rate net % 128 80.9
132 2.6 5th pillar: Higher education and training5.01 Secondary education enrollment rate gross % 134 32.35.02 Tertiary education enrollment rate gross % 133 3.65.03 Quality of the education system 96 3.35.04 Quality of math and science education 122 2.85.05 Quality of management schools 126 3.35.06 Internet access in schools 123 3.15.07 Local availability of specialized training services 103 3.95.08 Extent of staff training 108 3.5
114 3.9 6th pillar: Goods market efficiency6.01 Intensity of local competition 99 4.76.02 Extent of market dominance 90 3.46.03 Effectiveness of anti-monopoly policy 60 3.76.04 Effect of taxation on incentives to invest 102 3.26.05 Total tax rate % profits 92 43.96.06 No. of procedures to start a business 108 96.07 Time to start a business days 109 26.06.08 Agricultural policy costs 74 3.76.09 Prevalence of non-tariff barriers 97 4.16.10 Trade tariffs % duty 103 9.86.11 Prevalence of foreign ownership 90 4.26.12 Business impact of rules on FDI 93 4.26.13 Burden of customs procedures 97 3.66.14 Imports % GDP 114 28.66.15 Degree of customer orientation 106 4.16.16 Buyer sophistication 112 2.8
62 4.3 7th pillar: Labor market efficiency7.01 Cooperation in labor-employer relations 116 3.87.02 Flexibility of wage determination 85 4.87.03 Hiring and firing practices 72 3.77.04 Redundancy costs weeks of salary 28 9.37.05 Effect of taxation on incentives to work 117 3.17.06 Pay and productivity 109 3.57.07 Reliance on professional management 87 4.07.08 Country capacity to retain talent 73 3.57.09 Country capacity to attract talent 58 3.67.10 Female participation in the labor force ratio to men 31 0.90
98 3.5 8th pillar: Financial market development8.01 Financial services meeting business needs 96 3.88.02 Affordability of financial services 118 3.08.03 Financing through local equity market 78 3.48.04 Ease of access to loans 78 3.78.05 Venture capital availability 93 2.68.06 Soundness of banks 108 4.18.07 Regulation of securities exchanges 99 3.88.08 Legal rights index 0-10 (best) 68 5
125 2.6 9th pillar: Technological readiness9.01 Availability of latest technologies 122 3.79.02 Firm-level technology absorption 98 4.29.03 FDI and technology transfer 96 4.09.04 Internet users % pop. 133 5.49.05 Fixed-broadband Internet subscriptions /100 pop. 122 0.29.06 Internet bandwidth kb/s/user 123 4.19.07 Mobile-broadband subscriptions /100 pop. 137 3.2
71 3.7 10th pillar: Market size10.01 Domestic market size index 68 3.610.02 Foreign market size index 83 4.110.03 GDP (PPP) PPP $ billions 69 138.510.04 Exports % GDP 117 19.1
106 3.5 11th pillar: Business sophistication11.01 Local supplier quantity 79 4.411.02 Local supplier quality 117 3.611.03 State of cluster development 72 3.711.04 Nature of competitive advantage 98 3.011.05 Value chain breadth 116 3.311.06 Control of international distribution 106 3.111.07 Production process sophistication 112 3.111.08 Extent of marketing 110 3.911.09 Willingness to delegate authority 104 3.4
88 3.2 12th pillar: Innovation12.01 Capacity for innovation 107 3.712.02 Quality of scientific research institutions 82 3.712.03 Company spending on R&D 83 3.112.04 University-industry collaboration in R&D 55 3.512.05 Gov't procurement of advanced tech. products 52 3.512.06 Availability of scientists and engineers 95 3.712.07 PCT patent applications applications/million pop. 120 0.0
Tanzania
The Africa Competitiveness Report 2017 | 149
Country Profiles

Edition 2013-14 2014-15 2015-16 2016-17
Rank 83 / 148 87 / 144 92 / 140 95 / 138
Score 4.1 4.0 3.9 3.9
Most problematic factors for doing business
Performance overview
Note: From the list of factors, respondents to the World Economic Forum's Executive Opinion Survey were asked to select the five most problematic factors for doing business in their country and torank them between 1 (most problematic) and 5. The score corresponds to the responses weighted according to their rankings.
The Global Competitiveness Index in detail
Rank / 138 Score (1-7) Trend Distance from best
Global Competitiveness Index 95 3.9Subindex A: Basic requirements 79 4.4
78 3.8 1st pillar: Institutions
83 3.72nd pillar: Infrastructure
99 4.2 3rd pillar: Macroeconomic environment
59 5.9 4th pillar: Health and primary education
Subindex B: Efficiency enhancers 103 3.7
93 4.0 5th pillar: Higher education and training
113 3.9 6th pillar: Goods market efficiency
133 3.2 7th pillar: Labor market efficiency
119 3.2 8th pillar: Financial market development
80 3.7 9th pillar: Technological readiness
69 3.8 10th pillar: Market size
Subindex C: Innovation and sophistication factors 104 3.3
101 3.6 11th pillar: Business sophistication
104 3.0 12th pillar: Innovation
1234567
1st pillar:Institutions
2nd pillar:Infrastructure
3rd pillar:Macroeconomicenvironment
4th pillar:Health and primaryeducation
5th pillar:Higher educationand training
6th pillar:Goods marketefficiency7th pillar:
Labor marketefficiency
8th pillar:Financial market
development
9th pillar:Technological
readiness
10th pillar:Market size
11th pillar:Business
sophistication
12th pillar:Innovation
Tunisia Middle East and North Africa
Source: World Economic Forum, Executive Opinion Survey 2016
18.113.811.7
7.46.45.95.95.75.04.94.74.34.01.60.50.1
Inefficient government bureaucracyPolicy instabilityCorruptionRestrictive labor regulationsAccess to financingTax ratesForeign currency regulationsPoor work ethic in national labor forceTax regulationsInadequate supply of infrastructureInsufficient capacity to innovateGovernment instability/coupsInadequately educated workforceInflationPoor public healthCrime and theft
0 5 10 15 20
score
Global Competitiveness Index2016-2017 edition
Key Indicators, 2015
Population (millions)
GDP (US$ billions)
GDP per capita (US$)
GDP (PPP) % world GDP
Tunisia 95 / 138th
Source: International Monetary Fund; World Economic Outlook Database (April 2016)
11.1
43.6
3922.7
0.11
150 | The Africa Competitiveness Report 2017
Part 2
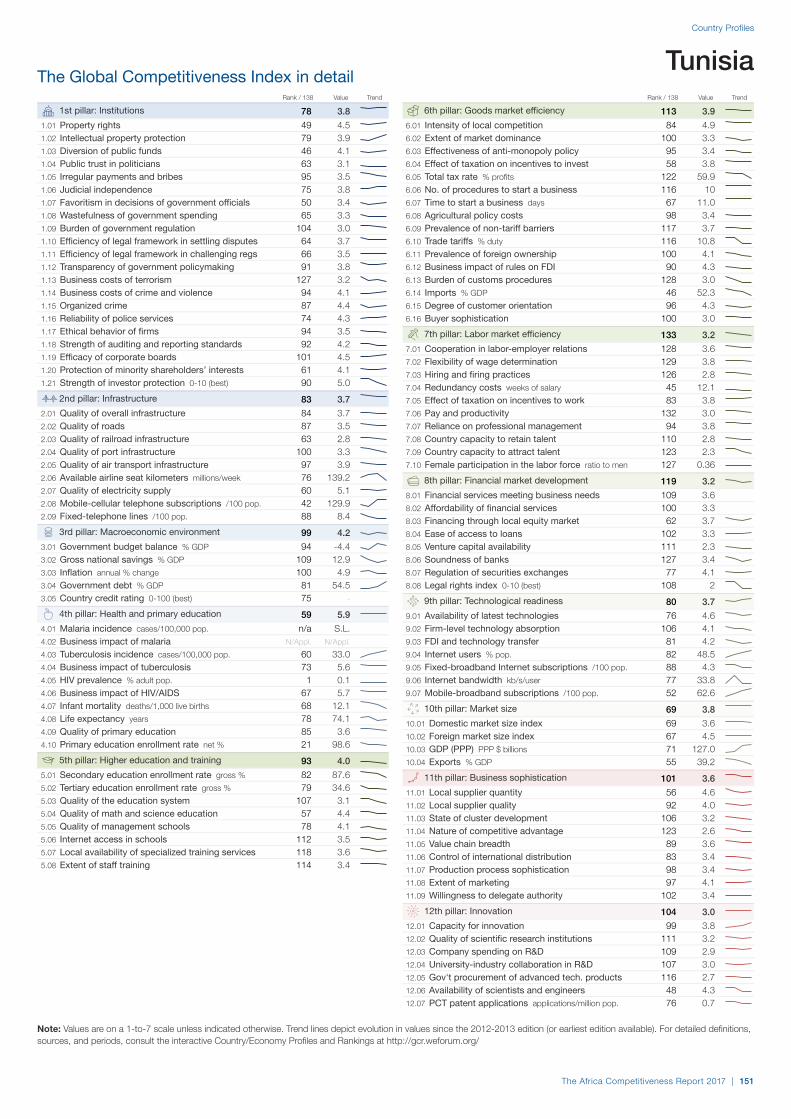
The Global Competitiveness Index in detail
Note: Values are on a 1-to-7 scale unless indicated otherwise. Trend lines depict evolution in values since the 2012-2013 edition (or earliest edition available). For detailed definitions,sources, and periods, consult the interactive Country/Economy Profiles and Rankings at http://gcr.weforum.org/
Rank / 138 Value Trend Rank / 138 Value Trend
78 3.8 1st pillar: Institutions1.01 Property rights 49 4.51.02 Intellectual property protection 79 3.91.03 Diversion of public funds 46 4.11.04 Public trust in politicians 63 3.11.05 Irregular payments and bribes 95 3.51.06 Judicial independence 75 3.81.07 Favoritism in decisions of government officials 50 3.41.08 Wastefulness of government spending 65 3.31.09 Burden of government regulation 104 3.01.10 Efficiency of legal framework in settling disputes 64 3.71.11 Efficiency of legal framework in challenging regs 66 3.51.12 Transparency of government policymaking 91 3.81.13 Business costs of terrorism 127 3.21.14 Business costs of crime and violence 94 4.11.15 Organized crime 87 4.41.16 Reliability of police services 74 4.31.17 Ethical behavior of firms 94 3.51.18 Strength of auditing and reporting standards 92 4.21.19 Efficacy of corporate boards 101 4.51.20 Protection of minority shareholders’ interests 61 4.11.21 Strength of investor protection 0-10 (best) 90 5.0
83 3.72nd pillar: Infrastructure2.01 Quality of overall infrastructure 84 3.72.02 Quality of roads 87 3.52.03 Quality of railroad infrastructure 63 2.82.04 Quality of port infrastructure 100 3.32.05 Quality of air transport infrastructure 97 3.92.06 Available airline seat kilometers millions/week 76 139.22.07 Quality of electricity supply 60 5.12.08 Mobile-cellular telephone subscriptions /100 pop. 42 129.92.09 Fixed-telephone lines /100 pop. 88 8.4
99 4.2 3rd pillar: Macroeconomic environment3.01 Government budget balance % GDP 94 -4.43.02 Gross national savings % GDP 109 12.93.03 Inflation annual % change 100 4.93.04 Government debt % GDP 81 54.53.05 Country credit rating 0-100 (best) 75 -
59 5.9 4th pillar: Health and primary education4.01 Malaria incidence cases/100,000 pop. n/a S.L.4.02 Business impact of malaria N/Appl. N/Appl.4.03 Tuberculosis incidence cases/100,000 pop. 60 33.04.04 Business impact of tuberculosis 73 5.64.05 HIV prevalence % adult pop. 1 0.14.06 Business impact of HIV/AIDS 67 5.74.07 Infant mortality deaths/1,000 live births 68 12.14.08 Life expectancy years 78 74.14.09 Quality of primary education 85 3.64.10 Primary education enrollment rate net % 21 98.6
93 4.0 5th pillar: Higher education and training5.01 Secondary education enrollment rate gross % 82 87.65.02 Tertiary education enrollment rate gross % 79 34.65.03 Quality of the education system 107 3.15.04 Quality of math and science education 57 4.45.05 Quality of management schools 78 4.15.06 Internet access in schools 112 3.55.07 Local availability of specialized training services 118 3.65.08 Extent of staff training 114 3.4
113 3.9 6th pillar: Goods market efficiency6.01 Intensity of local competition 84 4.96.02 Extent of market dominance 100 3.36.03 Effectiveness of anti-monopoly policy 95 3.46.04 Effect of taxation on incentives to invest 58 3.86.05 Total tax rate % profits 122 59.96.06 No. of procedures to start a business 116 106.07 Time to start a business days 67 11.06.08 Agricultural policy costs 98 3.46.09 Prevalence of non-tariff barriers 117 3.76.10 Trade tariffs % duty 116 10.86.11 Prevalence of foreign ownership 100 4.16.12 Business impact of rules on FDI 90 4.36.13 Burden of customs procedures 128 3.06.14 Imports % GDP 46 52.36.15 Degree of customer orientation 96 4.36.16 Buyer sophistication 100 3.0
133 3.2 7th pillar: Labor market efficiency7.01 Cooperation in labor-employer relations 128 3.67.02 Flexibility of wage determination 129 3.87.03 Hiring and firing practices 126 2.87.04 Redundancy costs weeks of salary 45 12.17.05 Effect of taxation on incentives to work 83 3.87.06 Pay and productivity 132 3.07.07 Reliance on professional management 94 3.87.08 Country capacity to retain talent 110 2.87.09 Country capacity to attract talent 123 2.37.10 Female participation in the labor force ratio to men 127 0.36
119 3.2 8th pillar: Financial market development8.01 Financial services meeting business needs 109 3.68.02 Affordability of financial services 100 3.38.03 Financing through local equity market 62 3.78.04 Ease of access to loans 102 3.38.05 Venture capital availability 111 2.38.06 Soundness of banks 127 3.48.07 Regulation of securities exchanges 77 4.18.08 Legal rights index 0-10 (best) 108 2
80 3.7 9th pillar: Technological readiness9.01 Availability of latest technologies 76 4.69.02 Firm-level technology absorption 106 4.19.03 FDI and technology transfer 81 4.29.04 Internet users % pop. 82 48.59.05 Fixed-broadband Internet subscriptions /100 pop. 88 4.39.06 Internet bandwidth kb/s/user 77 33.89.07 Mobile-broadband subscriptions /100 pop. 52 62.6
69 3.8 10th pillar: Market size10.01 Domestic market size index 69 3.610.02 Foreign market size index 67 4.510.03 GDP (PPP) PPP $ billions 71 127.010.04 Exports % GDP 55 39.2
101 3.6 11th pillar: Business sophistication11.01 Local supplier quantity 56 4.611.02 Local supplier quality 92 4.011.03 State of cluster development 106 3.211.04 Nature of competitive advantage 123 2.611.05 Value chain breadth 89 3.611.06 Control of international distribution 83 3.411.07 Production process sophistication 98 3.411.08 Extent of marketing 97 4.111.09 Willingness to delegate authority 102 3.4
104 3.0 12th pillar: Innovation12.01 Capacity for innovation 99 3.812.02 Quality of scientific research institutions 111 3.212.03 Company spending on R&D 109 2.912.04 University-industry collaboration in R&D 107 3.012.05 Gov't procurement of advanced tech. products 116 2.712.06 Availability of scientists and engineers 48 4.312.07 PCT patent applications applications/million pop. 76 0.7
Tunisia
The Africa Competitiveness Report 2017 | 151
Country Profiles

Edition 2012-13 2013-14 2014-15 2015-16 2016-17
Rank 123 / 144 129 / 148 122 / 144 115 / 140 113 / 138
Score 3.5 3.4 3.6 3.7 3.7
Most problematic factors for doing business
Performance overview
Note: From the list of factors, respondents to the World Economic Forum's Executive Opinion Survey were asked to select the five most problematic factors for doing business in their country and torank them between 1 (most problematic) and 5. The score corresponds to the responses weighted according to their rankings.
The Global Competitiveness Index in detail
Rank / 138 Score (1-7) Trend Distance from best
Global Competitiveness Index 113 3.7Subindex A: Basic requirements 116 3.8
93 3.5 1st pillar: Institutions
126 2.42nd pillar: Infrastructure
73 4.6 3rd pillar: Macroeconomic environment
118 4.6 4th pillar: Health and primary education
Subindex B: Efficiency enhancers 109 3.6
129 2.7 5th pillar: Higher education and training
115 3.9 6th pillar: Goods market efficiency
29 4.7 7th pillar: Labor market efficiency
77 3.9 8th pillar: Financial market development
118 2.8 9th pillar: Technological readiness
81 3.4 10th pillar: Market size
Subindex C: Innovation and sophistication factors 95 3.4
111 3.5 11th pillar: Business sophistication
77 3.3 12th pillar: Innovation
1234567
1st pillar:Institutions
2nd pillar:Infrastructure
3rd pillar:Macroeconomicenvironment
4th pillar:Health and primaryeducation
5th pillar:Higher educationand training
6th pillar:Goods marketefficiency7th pillar:
Labor marketefficiency
8th pillar:Financial market
development
9th pillar:Technological
readiness
10th pillar:Market size
11th pillar:Business
sophistication
12th pillar:Innovation
Uganda Sub-Saharan Africa
Source: World Economic Forum, Executive Opinion Survey 2016
16.114.511.911.411.2
5.75.44.74.64.53.22.72.51.20.40.4
CorruptionTax ratesInflationAccess to financingInadequate supply of infrastructureForeign currency regulationsPoor work ethic in national labor forceTax regulationsInadequately educated workforceInefficient government bureaucracyInsufficient capacity to innovatePolicy instabilityCrime and theftPoor public healthRestrictive labor regulationsGovernment instability/coups
0 5 10 15 20
score
Global Competitiveness Index2016-2017 edition
Key Indicators, 2015
Population (millions)
GDP (US$ billions)
GDP per capita (US$)
GDP (PPP) % world GDP
Uganda 113 / 138rd
Source: International Monetary Fund; World Economic Outlook Database (April 2016)
39.9
24.7
620.2
0.07
152 | The Africa Competitiveness Report 2017
Part 2

The Global Competitiveness Index in detail
Note: Values are on a 1-to-7 scale unless indicated otherwise. Trend lines depict evolution in values since the 2012-2013 edition (or earliest edition available). For detailed definitions,sources, and periods, consult the interactive Country/Economy Profiles and Rankings at http://gcr.weforum.org/
Rank / 138 Value Trend Rank / 138 Value Trend
93 3.5 1st pillar: Institutions1.01 Property rights 73 4.21.02 Intellectual property protection 104 3.51.03 Diversion of public funds 117 2.51.04 Public trust in politicians 98 2.41.05 Irregular payments and bribes 118 3.01.06 Judicial independence 89 3.61.07 Favoritism in decisions of government officials 101 2.61.08 Wastefulness of government spending 103 2.51.09 Burden of government regulation 43 3.71.10 Efficiency of legal framework in settling disputes 60 3.81.11 Efficiency of legal framework in challenging regs 70 3.51.12 Transparency of government policymaking 63 4.31.13 Business costs of terrorism 123 3.71.14 Business costs of crime and violence 112 3.61.15 Organized crime 109 4.11.16 Reliability of police services 88 4.01.17 Ethical behavior of firms 89 3.61.18 Strength of auditing and reporting standards 97 4.11.19 Efficacy of corporate boards 50 5.11.20 Protection of minority shareholders’ interests 93 3.81.21 Strength of investor protection 0-10 (best) 86 5.2
126 2.42nd pillar: Infrastructure2.01 Quality of overall infrastructure 98 3.42.02 Quality of roads 88 3.52.03 Quality of railroad infrastructure 99 1.62.04 Quality of port infrastructure 121 2.52.05 Quality of air transport infrastructure 120 3.22.06 Available airline seat kilometers millions/week 102 45.62.07 Quality of electricity supply 103 3.42.08 Mobile-cellular telephone subscriptions /100 pop. 133 50.42.09 Fixed-telephone lines /100 pop. 125 0.8
73 4.6 3rd pillar: Macroeconomic environment3.01 Government budget balance % GDP 67 -2.93.02 Gross national savings % GDP 83 17.73.03 Inflation annual % change 108 5.83.04 Government debt % GDP 36 35.43.05 Country credit rating 0-100 (best) 95 -
118 4.6 4th pillar: Health and primary education4.01 Malaria incidence cases/100,000 pop. 58 21438.24.02 Business impact of malaria 63 3.34.03 Tuberculosis incidence cases/100,000 pop. 107 161.04.04 Business impact of tuberculosis 110 4.34.05 HIV prevalence % adult pop. 129 7.34.06 Business impact of HIV/AIDS 135 3.14.07 Infant mortality deaths/1,000 live births 114 37.74.08 Life expectancy years 127 58.54.09 Quality of primary education 122 2.84.10 Primary education enrollment rate net % 82 93.7
129 2.7 5th pillar: Higher education and training5.01 Secondary education enrollment rate gross % 136 27.65.02 Tertiary education enrollment rate gross % 129 4.55.03 Quality of the education system 90 3.45.04 Quality of math and science education 116 3.15.05 Quality of management schools 100 3.85.06 Internet access in schools 125 3.15.07 Local availability of specialized training services 79 4.15.08 Extent of staff training 95 3.6
115 3.9 6th pillar: Goods market efficiency6.01 Intensity of local competition 45 5.36.02 Extent of market dominance 117 3.16.03 Effectiveness of anti-monopoly policy 108 3.26.04 Effect of taxation on incentives to invest 114 3.06.05 Total tax rate % profits 66 36.56.06 No. of procedures to start a business 135 156.07 Time to start a business days 112 27.06.08 Agricultural policy costs 75 3.76.09 Prevalence of non-tariff barriers 48 4.66.10 Trade tariffs % duty 101 9.76.11 Prevalence of foreign ownership 28 5.36.12 Business impact of rules on FDI 31 5.26.13 Burden of customs procedures 66 4.16.14 Imports % GDP 93 34.46.15 Degree of customer orientation 86 4.46.16 Buyer sophistication 126 2.5
29 4.7 7th pillar: Labor market efficiency7.01 Cooperation in labor-employer relations 49 4.67.02 Flexibility of wage determination 11 6.07.03 Hiring and firing practices 41 4.17.04 Redundancy costs weeks of salary 23 8.77.05 Effect of taxation on incentives to work 94 3.77.06 Pay and productivity 106 3.57.07 Reliance on professional management 83 4.07.08 Country capacity to retain talent 95 3.17.09 Country capacity to attract talent 92 3.07.10 Female participation in the labor force ratio to men 15 0.95
77 3.9 8th pillar: Financial market development8.01 Financial services meeting business needs 84 4.08.02 Affordability of financial services 120 3.08.03 Financing through local equity market 81 3.48.04 Ease of access to loans 55 4.18.05 Venture capital availability 97 2.58.06 Soundness of banks 77 4.78.07 Regulation of securities exchanges 68 4.48.08 Legal rights index 0-10 (best) 46 6
118 2.8 9th pillar: Technological readiness9.01 Availability of latest technologies 105 4.19.02 Firm-level technology absorption 102 4.19.03 FDI and technology transfer 75 4.39.04 Internet users % pop. 115 19.29.05 Fixed-broadband Internet subscriptions /100 pop. 118 0.39.06 Internet bandwidth kb/s/user 121 4.69.07 Mobile-broadband subscriptions /100 pop. 112 18.3
81 3.4 10th pillar: Market size10.01 Domestic market size index 78 3.310.02 Foreign market size index 103 3.710.03 GDP (PPP) PPP $ billions 80 79.910.04 Exports % GDP 121 16.9
111 3.5 11th pillar: Business sophistication11.01 Local supplier quantity 48 4.711.02 Local supplier quality 122 3.611.03 State of cluster development 89 3.511.04 Nature of competitive advantage 114 2.811.05 Value chain breadth 103 3.411.06 Control of international distribution 125 2.911.07 Production process sophistication 125 2.811.08 Extent of marketing 79 4.311.09 Willingness to delegate authority 123 3.1
77 3.3 12th pillar: Innovation12.01 Capacity for innovation 83 3.912.02 Quality of scientific research institutions 97 3.412.03 Company spending on R&D 87 3.112.04 University-industry collaboration in R&D 40 3.812.05 Gov't procurement of advanced tech. products 48 3.512.06 Availability of scientists and engineers 74 3.912.07 PCT patent applications applications/million pop. 117 0.0
Uganda
The Africa Competitiveness Report 2017 | 153
Country Profiles

Edition 2012-13 2013-14 2014-15 2015-16 2016-17
Rank 102 / 144 93 / 148 96 / 144 96 / 140 118 / 138
Score 3.8 3.9 3.9 3.9 3.6
Most problematic factors for doing business
Performance overview
Note: From the list of factors, respondents to the World Economic Forum's Executive Opinion Survey were asked to select the five most problematic factors for doing business in their country and torank them between 1 (most problematic) and 5. The score corresponds to the responses weighted according to their rankings.
The Global Competitiveness Index in detail
Rank / 138 Score (1-7) Trend Distance from best
Global Competitiveness Index 118 3.6Subindex A: Basic requirements 118 3.7
61 4.0 1st pillar: Institutions
125 2.42nd pillar: Infrastructure
109 4.0 3rd pillar: Macroeconomic environment
125 4.2 4th pillar: Health and primary education
Subindex B: Efficiency enhancers 115 3.5
120 3.0 5th pillar: Higher education and training
83 4.2 6th pillar: Goods market efficiency
90 4.0 7th pillar: Labor market efficiency
84 3.8 8th pillar: Financial market development
115 2.8 9th pillar: Technological readiness
88 3.2 10th pillar: Market size
Subindex C: Innovation and sophistication factors 88 3.4
105 3.5 11th pillar: Business sophistication
66 3.3 12th pillar: Innovation
1234567
1st pillar:Institutions
2nd pillar:Infrastructure
3rd pillar:Macroeconomicenvironment
4th pillar:Health and primaryeducation
5th pillar:Higher educationand training
6th pillar:Goods marketefficiency7th pillar:
Labor marketefficiency
8th pillar:Financial market
development
9th pillar:Technological
readiness
10th pillar:Market size
11th pillar:Business
sophistication
12th pillar:Innovation
Zambia Sub-Saharan Africa
Source: World Economic Forum, Executive Opinion Survey 2016
18.313.612.010.1
7.85.75.25.24.74.13.82.82.71.91.11.0
Access to financingTax ratesCorruptionInflationPoor work ethic in national labor forceForeign currency regulationsPolicy instabilityInefficient government bureaucracyTax regulationsInadequate supply of infrastructureRestrictive labor regulationsCrime and theftInsufficient capacity to innovatePoor public healthInadequately educated workforceGovernment instability/coups
0 5 10 15 20
score
Global Competitiveness Index2016-2017 edition
Key Indicators, 2015
Population (millions)
GDP (US$ billions)
GDP per capita (US$)
GDP (PPP) % world GDP
Zambia 118 / 138th
Source: International Monetary Fund; World Economic Outlook Database (April 2016)
16.2
21.9
1350.2
0.06
154 | The Africa Competitiveness Report 2017
Part 2

The Global Competitiveness Index in detail
Note: Values are on a 1-to-7 scale unless indicated otherwise. Trend lines depict evolution in values since the 2012-2013 edition (or earliest edition available). For detailed definitions,sources, and periods, consult the interactive Country/Economy Profiles and Rankings at http://gcr.weforum.org/
Rank / 138 Value Trend Rank / 138 Value Trend
61 4.0 1st pillar: Institutions1.01 Property rights 53 4.51.02 Intellectual property protection 64 4.21.03 Diversion of public funds 74 3.41.04 Public trust in politicians 68 3.01.05 Irregular payments and bribes 96 3.51.06 Judicial independence 67 4.01.07 Favoritism in decisions of government officials 87 2.81.08 Wastefulness of government spending 48 3.61.09 Burden of government regulation 47 3.71.10 Efficiency of legal framework in settling disputes 49 4.11.11 Efficiency of legal framework in challenging regs 58 3.61.12 Transparency of government policymaking 53 4.41.13 Business costs of terrorism 37 5.81.14 Business costs of crime and violence 67 4.71.15 Organized crime 63 5.01.16 Reliability of police services 112 3.41.17 Ethical behavior of firms 48 4.21.18 Strength of auditing and reporting standards 109 3.91.19 Efficacy of corporate boards 54 5.01.20 Protection of minority shareholders’ interests 58 4.21.21 Strength of investor protection 0-10 (best) 79 5.3
125 2.42nd pillar: Infrastructure2.01 Quality of overall infrastructure 100 3.32.02 Quality of roads 85 3.52.03 Quality of railroad infrastructure 74 2.62.04 Quality of port infrastructure 128 2.22.05 Quality of air transport infrastructure 121 3.22.06 Available airline seat kilometers millions/week 107 38.52.07 Quality of electricity supply 120 2.52.08 Mobile-cellular telephone subscriptions /100 pop. 125 74.52.09 Fixed-telephone lines /100 pop. 126 0.7
109 4.0 3rd pillar: Macroeconomic environment3.01 Government budget balance % GDP 124 -8.13.02 Gross national savings % GDP 19 31.13.03 Inflation annual % change 128 10.13.04 Government debt % GDP 78 52.93.05 Country credit rating 0-100 (best) 90 -
125 4.2 4th pillar: Health and primary education4.01 Malaria incidence cases/100,000 pop. 57 20990.64.02 Business impact of malaria 53 3.94.03 Tuberculosis incidence cases/100,000 pop. 133 406.04.04 Business impact of tuberculosis 111 4.34.05 HIV prevalence % adult pop. 132 12.44.06 Business impact of HIV/AIDS 123 3.94.07 Infant mortality deaths/1,000 live births 120 43.34.08 Life expectancy years 124 60.04.09 Quality of primary education 100 3.34.10 Primary education enrollment rate net % 112 87.4
120 3.0 5th pillar: Higher education and training5.01 Secondary education enrollment rate gross % 132 37.05.02 Tertiary education enrollment rate gross % 136 2.25.03 Quality of the education system 53 4.15.04 Quality of math and science education 96 3.65.05 Quality of management schools 95 3.85.06 Internet access in schools 107 3.65.07 Local availability of specialized training services 63 4.45.08 Extent of staff training 77 3.8
83 4.2 6th pillar: Goods market efficiency6.01 Intensity of local competition 63 5.26.02 Extent of market dominance 73 3.66.03 Effectiveness of anti-monopoly policy 99 3.36.04 Effect of taxation on incentives to invest 88 3.46.05 Total tax rate % profits 11 18.66.06 No. of procedures to start a business 54 66.07 Time to start a business days 46 7.56.08 Agricultural policy costs 66 3.86.09 Prevalence of non-tariff barriers 57 4.56.10 Trade tariffs % duty 114 10.66.11 Prevalence of foreign ownership 11 5.66.12 Business impact of rules on FDI 35 5.16.13 Burden of customs procedures 102 3.56.14 Imports % GDP 82 37.06.15 Degree of customer orientation 98 4.36.16 Buyer sophistication 124 2.7
90 4.0 7th pillar: Labor market efficiency7.01 Cooperation in labor-employer relations 73 4.37.02 Flexibility of wage determination 52 5.27.03 Hiring and firing practices 34 4.37.04 Redundancy costs weeks of salary 132 50.57.05 Effect of taxation on incentives to work 88 3.77.06 Pay and productivity 93 3.77.07 Reliance on professional management 73 4.27.08 Country capacity to retain talent 65 3.57.09 Country capacity to attract talent 39 3.97.10 Female participation in the labor force ratio to men 46 0.87
84 3.8 8th pillar: Financial market development8.01 Financial services meeting business needs 88 4.08.02 Affordability of financial services 117 3.08.03 Financing through local equity market 64 3.78.04 Ease of access to loans 94 3.48.05 Venture capital availability 116 2.28.06 Soundness of banks 109 4.18.07 Regulation of securities exchanges 69 4.38.08 Legal rights index 0-10 (best) 28 7
115 2.8 9th pillar: Technological readiness9.01 Availability of latest technologies 102 4.19.02 Firm-level technology absorption 100 4.29.03 FDI and technology transfer 76 4.39.04 Internet users % pop. 110 21.09.05 Fixed-broadband Internet subscriptions /100 pop. 126 0.19.06 Internet bandwidth kb/s/user 125 3.29.07 Mobile-broadband subscriptions /100 pop. 119 13.8
88 3.2 10th pillar: Market size10.01 Domestic market size index 89 3.010.02 Foreign market size index 94 3.910.03 GDP (PPP) PPP $ billions 91 62.710.04 Exports % GDP 92 28.8
105 3.5 11th pillar: Business sophistication11.01 Local supplier quantity 81 4.411.02 Local supplier quality 126 3.511.03 State of cluster development 68 3.711.04 Nature of competitive advantage 119 2.711.05 Value chain breadth 111 3.411.06 Control of international distribution 120 2.911.07 Production process sophistication 122 2.911.08 Extent of marketing 91 4.211.09 Willingness to delegate authority 47 4.0
66 3.3 12th pillar: Innovation12.01 Capacity for innovation 84 3.912.02 Quality of scientific research institutions 85 3.612.03 Company spending on R&D 78 3.212.04 University-industry collaboration in R&D 60 3.512.05 Gov't procurement of advanced tech. products 42 3.612.06 Availability of scientists and engineers 59 4.112.07 PCT patent applications applications/million pop. 115 0.0
Zambia
The Africa Competitiveness Report 2017 | 155
Country Profiles
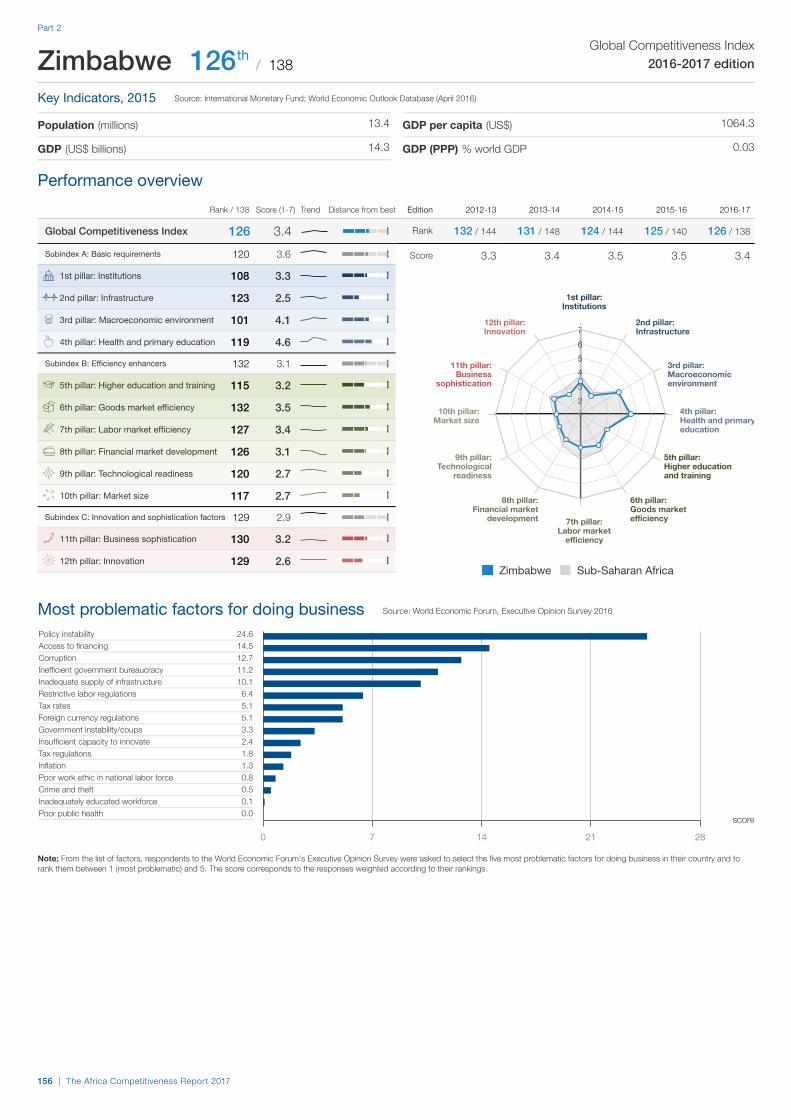
Edition 2012-13 2013-14 2014-15 2015-16 2016-17
Rank 132 / 144 131 / 148 124 / 144 125 / 140 126 / 138
Score 3.3 3.4 3.5 3.5 3.4
Most problematic factors for doing business
Performance overview
Note: From the list of factors, respondents to the World Economic Forum's Executive Opinion Survey were asked to select the five most problematic factors for doing business in their country and torank them between 1 (most problematic) and 5. The score corresponds to the responses weighted according to their rankings.
The Global Competitiveness Index in detail
Rank / 138 Score (1-7) Trend Distance from best
Global Competitiveness Index 126 3.4Subindex A: Basic requirements 120 3.6
108 3.3 1st pillar: Institutions
123 2.52nd pillar: Infrastructure
101 4.1 3rd pillar: Macroeconomic environment
119 4.6 4th pillar: Health and primary education
Subindex B: Efficiency enhancers 132 3.1
115 3.2 5th pillar: Higher education and training
132 3.5 6th pillar: Goods market efficiency
127 3.4 7th pillar: Labor market efficiency
126 3.1 8th pillar: Financial market development
120 2.7 9th pillar: Technological readiness
117 2.7 10th pillar: Market size
Subindex C: Innovation and sophistication factors 129 2.9
130 3.2 11th pillar: Business sophistication
129 2.6 12th pillar: Innovation
1234567
1st pillar:Institutions
2nd pillar:Infrastructure
3rd pillar:Macroeconomicenvironment
4th pillar:Health and primaryeducation
5th pillar:Higher educationand training
6th pillar:Goods marketefficiency7th pillar:
Labor marketefficiency
8th pillar:Financial market
development
9th pillar:Technological
readiness
10th pillar:Market size
11th pillar:Business
sophistication
12th pillar:Innovation
Zimbabwe Sub-Saharan Africa
Source: World Economic Forum, Executive Opinion Survey 2016
24.614.512.711.210.1
6.45.15.13.32.41.81.30.80.50.10.0
Policy instabilityAccess to financingCorruptionInefficient government bureaucracyInadequate supply of infrastructureRestrictive labor regulationsTax ratesForeign currency regulationsGovernment instability/coupsInsufficient capacity to innovateTax regulationsInflationPoor work ethic in national labor forceCrime and theftInadequately educated workforcePoor public health
0 7 14 21 28
score
Global Competitiveness Index2016-2017 edition
Key Indicators, 2015
Population (millions)
GDP (US$ billions)
GDP per capita (US$)
GDP (PPP) % world GDP
Zimbabwe 126 / 138th
Source: International Monetary Fund; World Economic Outlook Database (April 2016)
13.4
14.3
1064.3
0.03
156 | The Africa Competitiveness Report 2017
Part 2

The Global Competitiveness Index in detail
Note: Values are on a 1-to-7 scale unless indicated otherwise. Trend lines depict evolution in values since the 2012-2013 edition (or earliest edition available). For detailed definitions,sources, and periods, consult the interactive Country/Economy Profiles and Rankings at http://gcr.weforum.org/
Rank / 138 Value Trend Rank / 138 Value Trend
108 3.3 1st pillar: Institutions1.01 Property rights 137 2.61.02 Intellectual property protection 97 3.61.03 Diversion of public funds 109 2.71.04 Public trust in politicians 134 1.61.05 Irregular payments and bribes 99 3.41.06 Judicial independence 115 2.91.07 Favoritism in decisions of government officials 133 1.91.08 Wastefulness of government spending 127 2.11.09 Burden of government regulation 130 2.41.10 Efficiency of legal framework in settling disputes 83 3.41.11 Efficiency of legal framework in challenging regs 112 2.71.12 Transparency of government policymaking 112 3.51.13 Business costs of terrorism 5 6.41.14 Business costs of crime and violence 65 4.81.15 Organized crime 41 5.51.16 Reliability of police services 108 3.51.17 Ethical behavior of firms 108 3.41.18 Strength of auditing and reporting standards 50 4.91.19 Efficacy of corporate boards 83 4.71.20 Protection of minority shareholders’ interests 73 4.01.21 Strength of investor protection 0-10 (best) 73 5.5
123 2.52nd pillar: Infrastructure2.01 Quality of overall infrastructure 111 3.12.02 Quality of roads 101 3.22.03 Quality of railroad infrastructure 83 2.32.04 Quality of port infrastructure 106 3.22.05 Quality of air transport infrastructure 107 3.62.06 Available airline seat kilometers millions/week 121 23.22.07 Quality of electricity supply 124 2.32.08 Mobile-cellular telephone subscriptions /100 pop. 115 84.82.09 Fixed-telephone lines /100 pop. 111 2.2
101 4.1 3rd pillar: Macroeconomic environment3.01 Government budget balance % GDP 26 -1.23.02 Gross national savings % GDP 136 -4.33.03 Inflation annual % change 109 -2.43.04 Government debt % GDP 79 53.03.05 Country credit rating 0-100 (best) 137 -
119 4.6 4th pillar: Health and primary education4.01 Malaria incidence cases/100,000 pop. 48 6559.24.02 Business impact of malaria 35 4.94.03 Tuberculosis incidence cases/100,000 pop. 123 278.04.04 Business impact of tuberculosis 113 4.34.05 HIV prevalence % adult pop. 134 16.74.06 Business impact of HIV/AIDS 120 3.94.07 Infant mortality deaths/1,000 live births 122 46.64.08 Life expectancy years 129 57.54.09 Quality of primary education 50 4.44.10 Primary education enrollment rate net % 119 85.9
115 3.2 5th pillar: Higher education and training5.01 Secondary education enrollment rate gross % 118 47.65.02 Tertiary education enrollment rate gross % 127 5.95.03 Quality of the education system 51 4.15.04 Quality of math and science education 64 4.35.05 Quality of management schools 102 3.85.06 Internet access in schools 116 3.45.07 Local availability of specialized training services 86 4.15.08 Extent of staff training 90 3.7
132 3.5 6th pillar: Goods market efficiency6.01 Intensity of local competition 90 4.86.02 Extent of market dominance 112 3.26.03 Effectiveness of anti-monopoly policy 92 3.46.04 Effect of taxation on incentives to invest 115 3.06.05 Total tax rate % profits 50 32.86.06 No. of procedures to start a business 108 96.07 Time to start a business days 137 90.06.08 Agricultural policy costs 137 2.36.09 Prevalence of non-tariff barriers 70 4.46.10 Trade tariffs % duty 133 14.66.11 Prevalence of foreign ownership 106 4.06.12 Business impact of rules on FDI 138 2.26.13 Burden of customs procedures 131 3.06.14 Imports % GDP 75 39.86.15 Degree of customer orientation 117 4.06.16 Buyer sophistication 115 2.8
127 3.4 7th pillar: Labor market efficiency7.01 Cooperation in labor-employer relations 108 4.07.02 Flexibility of wage determination 134 2.97.03 Hiring and firing practices 134 2.37.04 Redundancy costs weeks of salary 136 82.37.05 Effect of taxation on incentives to work 53 4.17.06 Pay and productivity 123 3.37.07 Reliance on professional management 42 4.77.08 Country capacity to retain talent 129 2.47.09 Country capacity to attract talent 124 2.37.10 Female participation in the labor force ratio to men 36 0.89
126 3.1 8th pillar: Financial market development8.01 Financial services meeting business needs 126 3.48.02 Affordability of financial services 137 2.28.03 Financing through local equity market 102 3.08.04 Ease of access to loans 125 2.88.05 Venture capital availability 137 1.78.06 Soundness of banks 128 3.38.07 Regulation of securities exchanges 95 3.88.08 Legal rights index 0-10 (best) 68 5
120 2.7 9th pillar: Technological readiness9.01 Availability of latest technologies 108 4.09.02 Firm-level technology absorption 115 3.99.03 FDI and technology transfer 134 2.89.04 Internet users % pop. 123 16.49.05 Fixed-broadband Internet subscriptions /100 pop. 107 1.19.06 Internet bandwidth kb/s/user 114 6.49.07 Mobile-broadband subscriptions /100 pop. 90 39.0
117 2.7 10th pillar: Market size10.01 Domestic market size index 114 2.510.02 Foreign market size index 122 3.410.03 GDP (PPP) PPP $ billions 115 28.110.04 Exports % GDP 100 24.7
130 3.2 11th pillar: Business sophistication11.01 Local supplier quantity 126 3.711.02 Local supplier quality 123 3.611.03 State of cluster development 134 2.711.04 Nature of competitive advantage 124 2.511.05 Value chain breadth 134 2.811.06 Control of international distribution 136 2.611.07 Production process sophistication 131 2.611.08 Extent of marketing 124 3.711.09 Willingness to delegate authority 89 3.6
129 2.6 12th pillar: Innovation12.01 Capacity for innovation 129 3.312.02 Quality of scientific research institutions 110 3.212.03 Company spending on R&D 132 2.412.04 University-industry collaboration in R&D 134 2.512.05 Gov't procurement of advanced tech. products 137 2.112.06 Availability of scientists and engineers 118 3.212.07 PCT patent applications applications/million pop. 101 0.1
Zimbabwe
The Africa Competitiveness Report 2017 | 157
Country Profiles


The Africa Competitiveness Report 2017 | 159
About the Authors
El-hadj M. BahEl-hadj M. Bah is a Principal Research Economist in the Macroeconomics Policy, Forecasting and Research Department at the African Development Bank. His two main functions are conducting research on development issues and evaluating the development outcomes of private-sector operations. Before joining the Bank, he was Lecturer of Economics at the University of Auckland. He received his BSc in Industrial Engineering with a specialization in Project Management from the Mohammadia School of Engineers (Rabat, Morocco). He obtained an MSE in Industrial Engineering and a PhD in Economics from Arizona State University. His research interests are in the areas of macroeconomics, economic development, labor economics, and international economics. Dr Bah has published numerous journal articles and made several paper presentations. His research has been published in journals such as the Journal of Development Economics, Macroeconomic Dynamics, the Journal of Comparative Economics, the B.E. Journal of Macroeconomics, the Journal of Comparative Economics, Comparative Economic Studies, and Emerging Markets Finance and Trade.
Roberto CrottiRoberto Crotti is an Economist with the Global Competitiveness and Risk Team at the World Economic Forum. His responsibilities include competitiveness research, policy briefs, and management of country benchmarking tools. He is responsible for the competitiveness assessment of Africa and CIS countries, as well as industry analysis of the travel & tourism sector. His main areas of expertise are applied quantitative methods for policy evaluation, economic growth, and development economics. Prior to joining the Forum, he worked in the private consulting sector. Mr Crotti holds a five-year degree in Economics/Economic Policy from Università Cattolica del Sacro Cuore in Milan, Italy, and an MA degree in Economics from Boston University and he is currently pursuing his doctorate in Development Economics at the Graduate Institute of International Studies (Geneva).
Margareta Drzeniek HanouzMargareta Drzeniek Hanouz is Head of the Global Competitiveness and Risks Team and Lead Economist at the World Economic Forum, where she leads the work related to Competitiveness and Global Risks. In this capacity, she is lead author of The Global Competitiveness Report and The Global Risks Report, two flagship publications of the World Economic Forum. Previously she oversaw the economic modeling for some of the Forum’s scenario projects and was charged with developing the economics section of the program for the World Economic Forum’s Annual Meeting in Davos. Before joining the Forum, Dr Drzeniek Hanouz worked for several years with the International Trade Centre in Geneva, where she was in charge of relations with Central and Eastern European countries. Her areas of expertise include national competitiveness, private-sector development, international trade, economics of the MENA and CIS regions, and risks and resilience. Dr Drzeniek Hanouz received a Diploma in Economics from the University of Münster and holds a PhD in International Economics from the University of Bochum, both in Germany.
Barak HoffmanBarak Hoffman is a Public Sector Specialist at the World Bank. His work focuses on the political economy of development in Africa. Prior to joining the World Bank, he was the Director of the Center for Democracy and Civil Society at Georgetown University. He also has worked as an Economist at the United States Agency for International Development, the United States Department of the Treasury, and the United States Federal Reserve Bank, and was a Research Fellow at Stanford University’s Center on Democracy, Development, and the Rule of Law. He holds a PhD in Political Science from the University of California, San Diego.

160 | The Africa Competitiveness Report 2017
Audrey Verdier-ChouchaneAudrey Verdier-Chouchane is Chief Research Economist in the Macroeconomics Policy, Forecasting and Research Department at the African Development Bank. Prior to joining the Bank in 2004, Dr Verdier-Chouchane taught Macroeconomics and Development Economics at the University of Nice, France, where she obtained a PhD in Economics and a Master in Macro-dynamics and International Finance. Apart from her previous publications on financial development and growth, her research interests include the analysis and measurement of poverty and inequalities in Africa, areas in which she has extensively published. She has coordinated and contributed to many flagship publications within the African Development Bank, such as the African Economic Outlook, the African Development Report, and The Africa Competitiveness Report in collaboration with sister institutions.
Jean Michel MarchatJean Michel Marchat is a Lead Economist in the Trade and Competitiveness Global Practice at the World Bank. His work focuses on growth, trade, and firm data analysis. In his current capacity, he is leading key research work (investment climate reports, trade policy analytics, and country development strategies), assists World Bank teams in the design of lending operations, and provides policy advice to several countries in West Africa and the Middle East. Prior to this, he worked in the MENA and Africa regions of the World Bank on trade facilitation and export development programs, and on SME development while leading major analytical work on regional integration and the investment climate. Before joining the World Bank Group, in the early 2000s, he worked for several years in Kazakhstan as an advisor for Macroeconomics, Forecasting and Trade in the Ministry of Economy. He holds a PhD in Economics and a Master in Development Economics from CERDI, Auvergne University, France. He also attended executive education at the Harvard Kennedy School.
About the Authors

World Economic Forum91-93 route de la CapiteCH-1223 Cologny/GenevaSwitzerland
Tel +41 (0) 22 869 1212Fax +41 (0) 22 786 2744
The publication of this year’s Africa Competitiveness Report comes out at a transitional time. After 15 years of sustained growth rate, averaging about 5 percent, low commodity prices and reduced growth in the global economy have dampened the economic outlook for the continent. Africa’s GDP is still growing and countries can count on a young and expanding population to inject new dynamism into their economies. However, providing sufficient job opportunities to the additional almost 450 million working-age Africans over the next 20 years will be challenging.
The most daunting task for Africa will be to simultaneously advance its structural reform agenda, which will bear fruit several years from now, and respond to the immediate need for better job opportunities for the next generation of young Africans. In the short run, given the importance of agriculture and microenterprises for new employment opportunities, improving the business environment in these sectors is a high priority, possibly making better use of value chains’ linkages and trade openness. Furthermore, the growing population and urbanization are putting additional pressure on the already-insufficient urban infrastructure and housing supply. The Report discusses possible responses to these issues, such as updating urban planning and improving the efficiency of the construction sector to create employment.
While addressing the pressing need for jobs in the short term, the Report reaffirms the urgency of tackling some of the most significant and persistent constraints to Africa’s competitiveness to ensure higher prosperity going forward. Infrastructure deficits, skill mismatches, the slow adoption of new technologies, and weak institutions are among the main barriers to improving productivity in general, and in the agriculture and service sectors in particular.
To achieve multiple goals at the same time and move the economic agenda forward, better public and private coordination and dialogue are needed to speed up the reform process and make the outcomes better and more sustainable.
Published on a biennial basis, this is the sixth edition of the Report that addresses areas requiring policy action and investment to ensure that Africa lays the foundation for sustained growth. It leverages the knowledge and expertise of the African Development Bank, the World Bank, and the World Economic Forum, presenting a unified vision of the policy challenges that must be implemented if Africa is to succeed in boosting its competitiveness and providing better economic prospects for its citizens. Also included are detailed competitiveness profiles for 35 African countries, providing a comprehensive summary of their competitive strengths and weaknesses. The Africa Competitiveness Report 2017 is an invaluable tool for policymakers, business strategists, development partners, and other key stakeholders, as well as essential reading for all those with an interest in the region.
Related Documents


