Lifetime Data Anal (2009) 15:330–342 DOI 10.1007/s10985-009-9111-y The additive hazards model with high-dimensional regressors Torben Martinussen · Thomas H. Scheike Received: 4 July 2008 / Accepted: 7 January 2009 / Published online: 28 January 2009 © Springer Science+Business Media, LLC 2009 Abstract This paper considers estimation and prediction in the Aalen additive hazards model in the case where the covariate vector is high-dimensional such as gene expression measurements. Some form of dimension reduction of the covariate space is needed to obtain useful statistical analyses. We study the partial least squares regression method. It turns out that it is naturally adapted to this setting via the so-called Krylov sequence. The resulting PLS estimator is shown to be consistent provided that the number of terms included is taken to be equal to the number of relevant compo- nents in the regression model. A standard PLS algorithm can also be constructed, but it turns out that the resulting predictor can only be related to the original covariates via time-dependent coefficients. The methods are applied to a breast cancer data set with gene expression recordings and to the well known primary biliary cirrhosis clinical data. Keywords Aalen’s additive model · High-dimensional covariates · Krylov sequence · Partial least squares regression 1 Introduction DNA microarray technology provides simultaneous measurements on expression levels for possibly thousands of genes, which gives potential powerful information T. Martinussen (B ) Department of Biostatistics, University of Southern Denmark, J.B. Winsløws Vej 9 B, 5000 Odense C, Denmark e-mail: [email protected] T. H. Scheike Department of Biostatistics, University of Copenhagen, Øster Farimagsgade 5 B, 1014 Copenhagen K, Denmark e-mail: [email protected] 123

Welcome message from author
This document is posted to help you gain knowledge. Please leave a comment to let me know what you think about it! Share it to your friends and learn new things together.
Transcript

Lifetime Data Anal (2009) 15:330–342DOI 10.1007/s10985-009-9111-y
The additive hazards model with high-dimensionalregressors
Torben Martinussen · Thomas H. Scheike
Received: 4 July 2008 / Accepted: 7 January 2009 / Published online: 28 January 2009© Springer Science+Business Media, LLC 2009
Abstract This paper considers estimation and prediction in the Aalen additivehazards model in the case where the covariate vector is high-dimensional such asgene expression measurements. Some form of dimension reduction of the covariatespace is needed to obtain useful statistical analyses. We study the partial least squaresregression method. It turns out that it is naturally adapted to this setting via the so-calledKrylov sequence. The resulting PLS estimator is shown to be consistent provided thatthe number of terms included is taken to be equal to the number of relevant compo-nents in the regression model. A standard PLS algorithm can also be constructed, butit turns out that the resulting predictor can only be related to the original covariates viatime-dependent coefficients. The methods are applied to a breast cancer data set withgene expression recordings and to the well known primary biliary cirrhosis clinicaldata.
Keywords Aalen’s additive model · High-dimensional covariates ·Krylov sequence · Partial least squares regression
1 Introduction
DNA microarray technology provides simultaneous measurements on expressionlevels for possibly thousands of genes, which gives potential powerful information
T. Martinussen (B)Department of Biostatistics, University of Southern Denmark, J.B. Winsløws Vej 9 B,5000 Odense C, Denmarke-mail: [email protected]
T. H. ScheikeDepartment of Biostatistics, University of Copenhagen, Øster Farimagsgade 5 B,1014 Copenhagen K, Denmarke-mail: [email protected]
123

Lifetime Data Anal (2009) 15:330–342 331
about various phenotypic data from the patient. For example, success has already beendemonstrated in molecular classification of cancer, but there has been less emphasisin dealing with other types of phenotypic data such as patient survival time or timeto cancer relapse. In this paper we consider the problem of how to link such high-dimensional gene-expression data to the timing of an event such as death. The basicproblem of how to relate a high-dimensional covariate to an outcome in general hasbeen considered by a large number of authors in different fields. Several classes oftechniques exist. Some of these are principal component regression (PCR), partialleast squares (PLS), and various regularization techniques such as ridge regressionand the LASSO; see for example Hastie et al. (2001) for a review.
In the context of survival data some kind of modification of these techniques isneeded due to the possible censoring of the failure time data. Interest has centeredon developing the similar techniques for Cox’s regression model. Park et al. (2002),Li and Gui (2004), Nguyen and Rocke (2002) and the recent Nygård et al. (2008)considered various implementations of PLS methods. van Houwelingen et al. (2006)suggested a ridge regression technique. Pawitan et al. (2004) suggested a model wheregene effects where modelled by random effects while Bair et al. (2006) considered aversion of the supervised PCR technique. Huang et al. (2006) considered the accel-erated failure time model that can also be fitted by standard least squares techniquesusing synthetic data or by the Stute estimator.
We argue that the additive hazards model (Lin and Ying 1994; Martinussen andScheike 2006) fits nicely into the framework of partial least squares regression dueto the additive structure of the model and because estimation for this model is doneusing least squares methods (Martinussen and Scheike 2006). Other recent work thathas considered the additive hazards model are Ma et al. (2006) that considered PCR,and Ma and Huang (2007) that developed a LASSO. One drawback of the PCR isthat it only considers the variability of the covariates, while the PLS method aimsmore directly at prediction by considering the relationship between the covariates andresponse. It turns out that PLS is most naturally implemented in this setting via theKrylov sequence, which gives a closed form expression of the estimate of the regres-sion parameters. This estimator is shown to be consistent provided that the numberof terms included is taken to be equal to the number of relevant components in theregression model. We also study the standard PLS algorithm implementation for theadditive hazards model. Due to the orthogonalization of the score components, whichis made at each point in time, it is only possible to express the resulting predictor viathe original covariates using time-dependent coefficients, however. We show that thisimplementation of the PLS is equivalent to the general Li and Gui (2004) approach. Wealso suggest a modified version of the standard PLS algorithm that avoids the orthog-onalization. In the context of uncensored data all three variants of the PLS procedureare equivalent, Helland (1988, 1990).
Leng and Ma (2007) and Martinussen and Scheike (2008) suggested a least squarescriterion for the additive risk model that we use to evaluate the fit of the model and alsouse it to cross-validate the methods. One advantage of the suggested procedures is thatthey are very simple to implement and that no modelling of the censoring distributionis needed.
123

332 Lifetime Data Anal (2009) 15:330–342
We apply the PLS prediction approach, the PCR method of Ma et al. (2006) anda ridge regression method to the Sørlie data (Sørlie et al., 2003). These data, whichwere also considered by Bøvelsta et al. (2007), contains gene expression measure-ments from 115 women with breast cancer. We use the 551 genes introduced by Sørlieet al. (2003). The methods are also applied to the well known primary biliary cirrhosisclinical data (Fleming and Harrington 1991).
2 Additive risk model and partial least squares
2.1 Additive risk model
Let T be the survival time of interest with conditional hazard function !(t; X) giventhe p-dimensional covariate vector X . In practice, T may be right-censored by U sothat we observe (T = T !U," = I (T " U ), X). Let (Ti ,"i , Xi ) be n iid replicatesso that the i th counting process Ni (t) = I (Ti " t,"i = 1) has intensity
#i (t) = Yi (t)!(t; Xi ) (1)
where Yi (t) = I (t " Ti ) is the at risk indicator. With a slight abuse of notation wenow let X denote the n # p matrix with i th row equal to X T
i .We consider the Lin and Ying version (Lin and Ying 1994) of the Aalen additive
hazards model:
!(t; Xi ) = !0(t) + X Ti $,
where the baseline hazard !0(t) is an unknown locally integrable time-dependentfunction. Put
S = n$1n!
i=1
%"
0
Yi (t)#Xi $ X(t)
$%2dt = n$1
%"
0
X T (t)G(t)X (t) dt,
s = n$1n!
i=1
%"
0
#Xi $ X(t)
$d Ni (t)dt = n$1
%"
0
X T (t)G(t)d N (t),
where
X(t) = 1Y·(t)
Y T (t)X (t), G(t) = I $ 1Y·(t)
Y (t)Y T (t),
Y (t) = (Y1(t), . . . , Yn(t))T , Y·(t) = %i Yi (t), N (t) = (N1(t), . . . , Nn(t))T , and
X (t) is the n # p matrix with i th row equal to Yi (t)X Ti . Also, a%2 is short for aaT
for a vector a. We assume that all counting processes are observed in the time-interval[0, % ], where % is some finite time-point. The usual least squares estimator of $ followsfrom (the normal-equations):
123

Lifetime Data Anal (2009) 15:330–342 333
S$ = s,
i.e.
$ = S$1s.
From the Doob–Meyer decomposition of N (t) it follows that
s = S$ + n$1
%"
0
X T (t)G(t)d M(t),
where M is the counting process martingale
M(t) = N (t) $t"
0
Y (s)!0(s) ds $t"
0
X (s) ds$.
The assumptions from Lin and Ying (1994) concerning the asymptotic behavior of theestimator are adopted throughout the rest of the paper. Letting n tend to infinity, wethen see that
& = '$,
where & and ' are the limits in probability as n & ' of s and S, respectively.
2.2 Partial least squares via the Krylov sequence
One way of defining an PLS estimator for the additive hazards model is via the Krylovsequence, see Helland (1988), Helland and Almøy (1994) and Naik and Tsai (2000).The Krylov sequence corresponding to q PLS-components is given by
R =&
s, Ss, . . . , Sq$1s'
,
which converges in probability to the p # q-matrix
R =&&,'&, . . . , 'q$1&
',
as n & '. We define the PLS estimator of $ for the additive hazards model as
$pls = R(RT S R)$1 RT s.
We show below that this estimator is a consistent estimator of $ as n tends to infinity.We assume that ' has full rank p. Let the spectral decomposition of ' be
123

334 Lifetime Data Anal (2009) 15:330–342
p!
j=1
( j e j eTj ,
where (1, . . . ,(p denotes the eigenvalues and {e1, . . . , ep} is an orthonormal basisof eigenvectors. It follows that
& =p!
j=1
(eTj & )e j .
We now assume that a K exists such that exactly K of the eigenvectors {e j } havenon-zero components along & , and by rotating in eigenspaces with coinciding eigen-values we can assume that the eigenvalues corresponding to these relevant eigenvec-tors are all different (Helland 1990; p. 101). By reordering of the terms in the spectraldecomposition of ' we thus get the unique representation
$ =K!
j=1
(eT
j &
( j
)
e j ,
where all the ( j ’s are distinct. The vectors e1, . . . , eK are called the relevant eigen-vectors.
Proposition 1 If q = K then it follows that $pls is a consistent estimator $.
Proof We have that $pls converges in probability to
R(RT 'R)$1 RT & = Q$
with
Q = R(RT 'R)$1 RT '
being the orthogonal projection onto the space SK spanned by R using the inner prod-uct defined by '. According to (Helland 1990; Theorem 1), SK is also spanned by therelevant eigenvectors e1, . . . , eK and thus $ ( SK , which completes the proof. )*
Defining the PLS based on the Krylov-sequence gives the predictor expressed viathe original (high-dimensional) covariate vector. A lower dimensional (q-dimensional)predictor can be obtained as follows. Let {w1, . . . , wq} be the Gram-Schmidt orthog-onalization of {s, Ss, . . . , Sq$1s}. In the classical setting of uncensored data,
Xw = {Xw1, . . . , Xwq} (2)
spans the same space as the so-called PLS-scores, see Helland (1988). Let $GS be theestimated coefficients when fitting the additive hazards model with X replaced by Xw.It then holds that
123

Lifetime Data Anal (2009) 15:330–342 335
Xw$GS = X $pls.
Note that Xw and $GS are of dimension n # q and q # 1, respectively, with q << p.
2.3 Classical definition of the PLS estimator
The PLS estimator for uncensored data is usually defined via an algorithm givingsome scores and loadings. First the response and the explanatory variables are centered(eliminating the intercept term). The first PLS component, the first score, is a linearcombination of the original (centered) X ’s with coefficients equal to the empiricalcorrelation between the response and the explanatory variables. Then a regressioncoefficient, the first loading, to this first score is determined by least squares, andresiduals are calculated both for the response and the explanatory variables using thisfirst score with its corresponding loading. The algorithm proceeds in this way untilq scores and corresponding loadings have been obtained. For uncensored data wecould denote the (centered) explanatory variables and response by E0 = G0 X andf0 = G0 y, respectively. Here G0 is the projection matrix projecting on the orthogonalspace spanned by the intercept term. The kth step of the PLS-algorithm is then definedas
Vk = Ek$1wk, wk = ETk$1 fk$1,
fk = Gk Gk$1 · · · G1G0 y, Ek = Gk Gk$1 · · · G1G0 X,
ak = V Tk fk$1
V Tk Vk
, Gk = I $ Vk(V Tk Vk)
$1V Tk
giving the PLS predictor
a1V1 + · · · + aq Vq
taking q steps. Here, (V1, . . . , Vq) and (a1, . . . , aq) are the scores and loadings, respec-tively. For uncensored data this way of defining PLS is equivalent to the definition viathe Krylov sequence, and it also holds that
{V1, . . . , Vq}, and {Xw1, . . . , Xwq}
span the same space, see Helland (1988, 1990).The above algorithm cannot be applied directly to survival data, however, as it does
not distinguish between censored and uncensored observations. For the consideredadditive hazards model it is, however, natural to apply the algorithm in the followingway. Put G0(t) = G(t) and
E0(t) = G0(t)X, f0(t) = G0(t)d N (t),
that is we take d N (t) as the response variable keeping in mind the Doob–Meyerdecomposition
123

336 Lifetime Data Anal (2009) 15:330–342
d N (t) = Y (t)!0(t) dt + X (t)$ dt + d M(t),
where the martingale M(t) can be thought of as the error term. Then the kth step is:
Vk(t) = Ek$1(t)wk, wk =%*
0ET
k$1(t) fk$1(t),
fk(t) = Gk(t)Gk$1(t) · · · G1(t)G0(t)d N (t),
Ek(t) = Gk(t)Gk$1(t) · · · G1(t)G0(t)X,
ak =* %
0 V Tk (t) fk$1(t)* %
0 V Tk (t)Vk(t) dt
, Gk(t) = I $ Vk(t)+
V Tk (t)Vk(t)
,$1V T
k (t)
giving the predictor
a1V1(t) + · · · + aq Vq(t). (3)
A drawback of this predictor is, however, that it can only be expressed as a linear com-bination of the original explanatory variables via time-dependent coefficients exceptin the case with q = 1, where the predictor (3) coincides with the predictor definedvia the Krylov sequence. Instead of using the predictor (3), one may use the predictorbased on the components
{Xw1, . . . , Xwq}.
As mentioned above, this predictor coincides with (3) in the case of uncensored data,but they do not coincide in our case here. A variant of this is instead to use
{Xw+1, . . . , Xw+
q},
where
w+k = diag
-./
.0
1
2%"
0
ETk$1, j (t)Ek$1, j (t) dt
3
4$1
5.6
.7
%"
0
ETk$1(t) fk$1(t),
see Garthwaite (1994).
3 The Li and Gui estimator for the additive risk model
Li and Gui (2004) suggested an PLS type algorithm for any type of regression datafollowing Garthwaite (1994), and they applied it in the Cox model setting. It proceedsin the following way for the situation that we consider. Fit, for j = 1, . . . , p, model
!0(t) + X j$(1)j .
123

Lifetime Data Anal (2009) 15:330–342 337
leading to the least squares estimates (Lin and Ying 1994)
$(1)j =
1
2%"
0
X Tj (t)G0(t)X j (t)dt
3
4$1 %"
0
X Tj (t)G0(t)d N .
The first component is then obtained by
V1(t) =p!
j=1
c(1)j $
(1)j Z (1)
j (t),
where Z (1)j (t) = G0(t)X j and the c(1)
j ’s denote weights, see the below display (4) for
a concrete choice. Define G1(t) as the projection onto the orthogonal space spannedby V1(t) and let Z (2)
j (t) = G1(t)Z (1)j (t). Now fit the models
!0(t) + V1(t)$1 + Z (2)j (t)$(2)
j , j = 1, . . . , p,
giving the estimates
$(2)j =
1
2%"
0
X Tj (t)G1(t)G0(t)X j (t)dt
3
4$1 %"
0
X Tj (t)G1(t)G0(t)d N , j = 1, . . . , p,
since V T1 (t)G1(t)G0(t) = 0. The second component is then obtained by
V2(t) =p!
j=1
c(2)j $
(2)j Z (2)
j (t),
where the c(2)j ’s denote weights. Now proceed in this way until q components have
been obtained. According to Garthwaite (1994), different weights have little impacton the performance of this procedure. One choice of weights is
c(k)j =
%"
0
X Tj (t)Gk$1(t) · · · G1(t)G0(t)X j (t)dt, (4)
which then gives the same algorithm as described in Sect. 2.3, that is, producingthe components {V1(t), . . . , Vk(t)}. The Li and Gui algorithm thus suffers the samedrawback as the traditional PLS algorithm in the considered setting, that is, the finalpredictor cannot be expressed by the original explanatory variables due to the orthog-onalization that takes place at each point in time.
123
338 Lifetime Data Anal (2009) 15:330–342
4 Cross validation for the additive risk model
The number q of elements in the Krylov sequence or the number of factors in thePLS algorithm is usually determined by some sort of cross validation procedure. Oneproblem with the additive hazards model, however, is that there is no simple likelihoodor partial likelihood to work with as is the case for Cox’s regression model. We hereuse a least squares criterion, similarly to the partial likelihood for Cox’s regressionmodel, for the additive hazards model (1):
L($) = $T8"
X T (t)G(t)X (t)dt9
$ $ 2$T8"
X T (t)G(t)d N (t)9
. (5)
This was suggested by Leng and Ma (2007) and independently by Martinussen andScheike (2008) that also provided further motivation. Based on this criterion it is easyto formulate the LASSO and ridge regression for the additive hazards model, Marti-nussen and Scheike (2008). The ridge regression estimator, which will be consideredin the applications given in the next section, has a closed form expression as
$RR = {S + ) I }$1s,
where ) denotes the tuning parameter to be chosen using for instance cross validation.It is worth noting that a closed form expression for the ridge estimator cannot givenin the case of the Cox-model.
Based on the above least squares criterion we can decide on the tuning parametersof the various procedures using for example V-fold cross-validation such as the crite-rion suggested by Wahba (1990) and used by Verweij and Van Houwelingen (1993) inthe context of Cox’s regression model. Specifically this splits the data into V groupsand then choose the tuning parameter as the one that minimizes
CV (d) = V $1V!
k=1
L(k)($($k)).
where L(k)($) denotes the least squares (5) criterion for the k-th fold, while $($k) isthe prediction leaving the k-th fold out. Just as for ordinary least squares the cross-validation criterion thus measures the fit in the kth group when estimates are based onthe remaining data.
5 Applications
We now apply the different methods to two quite different data-sets. The first examplecontains a high-dimensional regressor and in the second example we consider alower-dimensional regressor. For both examples we study the performance of thePCR-method of Ma et al. (2006), the Krylov-PLS (just denoted PLS) and the ridgeregression estimator. For the PBC data we also give the results for the least squares esti-mator as it can be calculated in that setting. The other variants of the PLS considered
123

Lifetime Data Anal (2009) 15:330–342 339
in this paper gave similar or slightly worse results as the Krylov-PLS (results notshown).
5.1 The Sørlie data
We first consider the Sørlie data (Sørlie et al. 2003) that was also studied inBøvelsta et al. (2007). The data contains gene expression measurements from 115women with breast cancer. We use the 551 genes introduced by Sørlie et al. (2003).Nygård et al. (2008) considered a PLS version in the context of Cox’s regression modeland compared their implementation to that of Park et al. (2002), results for these dataare given in Bøvelstad et al. (2007).
There are different ways of summarizing results, we use one of the approaches sug-gested in Bøvelstad et al. (2007). We split the data in a training set of size 2/3 of thedata, and use the remaining 1/3 as a test set to evaluate the fit. To assess how well themodel predicts the outcome in a manner that does not depend on the underlying modelwe consider the log-rank test approach. That is based on computing a prognostic indexfor the test data based on the predictions from the training data
*i = xTi $train
for each patient. We subsequently group the test data into a high and a low risk groupbased on the prognostic index and compute the log-rank test. The larger the chi-squaretest statistic obtained from this procedure the better the separation. We report thep-values on a log10 scale. This procedure will depend on the choice of the training set,and we consider 50 randomly chosen training sets all of size 2/3 of the data. For eachthese splits 10-fold cross-validation was carried out to determine the tuning parameterfor each of the considered methods. Figure 1 displays the results using box-plots.
It is seen from Fig. 1 that PLS, PCR and ridge-regression behave quite similarlyfor these data. It is, however, worth noting that they all outperform those consideredin Bøvelstad et al. (2007) (compare Fig. 1 to the upper right panel of Fig. 2 in Bøvelstadet al. (2007)) indicating that the additive model is more appropriate than the Cox modelin this setting.
5.2 The PBC data
The PBC dataset described in Fleming and Harrington (1991) originates from a MayoClinic trial in primary biliary cirrhosis (PBC) of the liver and was conducted between1974 and 1984. A total of 418 patients are included in the dataset and were followeduntil death or censoring. In addition to time at risk and censoring indicator, 18 covari-ates are recorded for this study. We here consider the complete case data consisting of276 patients as was also done in Ma et al. (2006). Note that the number of covariatesare rather small compared to the Sørlie data.
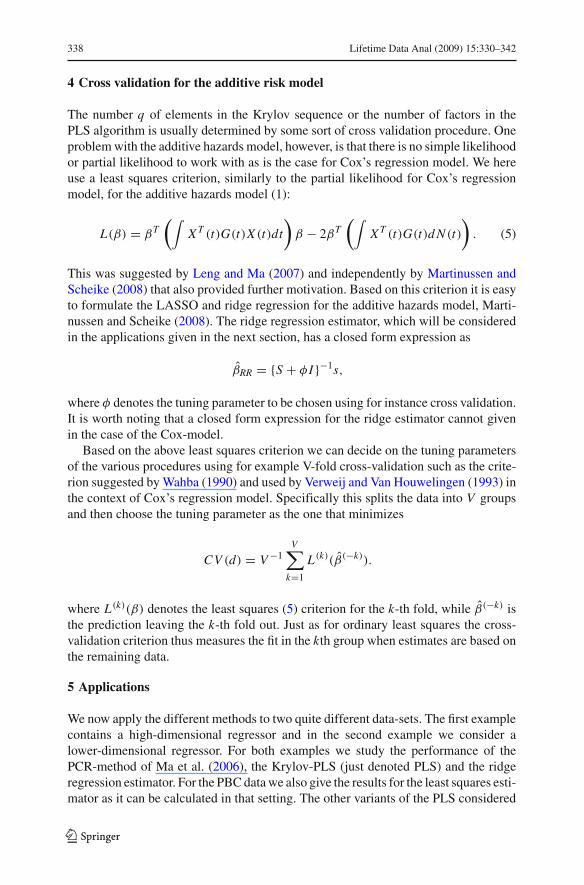
As for the Sørlie data, we computed the chi-square test statistics for the log-rank test approach based on a training set of 2/3 of the data and a test-set of theremaining 1/3 of the data, and considered 50 randomly chosen training sets. We used
123

340 Lifetime Data Anal (2009) 15:330–342
PLS PCR Ridge
!5!4
!3!2
!1
Fig. 1 Sørlie data. Boxplots of p-values on log10 scale based on log-rank test statistics
LS PLS PCR Ridge
4060
8010
0
Fig. 2 PBC data. Boxplots of log-rank test statistics
10 fold cross validation to determine the tuning parameters for each of these splits. Thelog-rank test was based on four groups instead of two due to the larger sample sizeand we consider the actual value of the test-statistic instead of the p-value as the latterones were sometimes very small. Figure 2 shows the box-plots of the chi-square teststatistics. For these data, we see that PLS is superior to the other approaches with leastsquares estimator doing worst.
When we considered the entire PBC data and did a four group log-rank test basedon the risk-score we got the value 226 of the chi-square test statistic using the PLS.As a comparison, the PCR of Ma et al. (2006) gives a chi-square test statistic value
123

Lifetime Data Anal (2009) 15:330–342 341
0 10 12
0.0
0.2
0.4
0.6
0.8
1.0
PBC data
8642
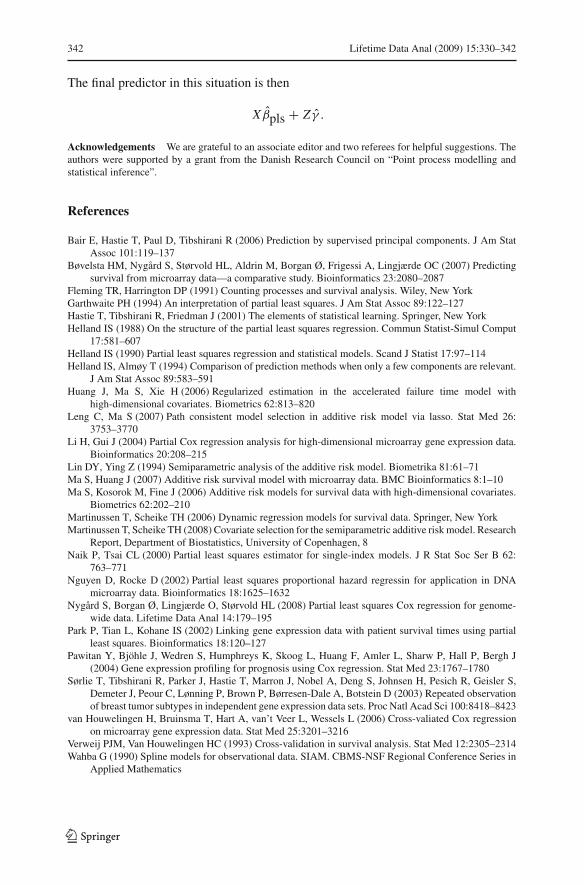
Fig. 3 PBC data. Kaplan–Meier curves for the risk groups defined by the quartiles of the PLS-Krylovpredictor
equal to 161. Finally, we show the Kaplan–Meier survival curves based on the riskpredictions using the full data. These are shown in Fig. 3 based on the Krylov-PLS,but the other methods result in similar survival curves.
6 Remarks
We have shown how the PLS is easy to implement in the context of the additive riskmodel. The similar techniques for Cox’s regression models are generally more difficultto work with because of the iterative estimation structure. The various definitions ofthe PLS, which are all equivalent in the uncensored data case, give different predic-tions in the considered case. We prefer the definition via the Krylov-sequence as theresulting predictor can also be expressed via the original (high-dimensional) covariatevector, which facilitates interpretation.
It is often the case that one also has a lower dimensional covariate vector containingvariates such as age, treatment and so on that should also be taken into account. Theseshould be treated differently as outlined in the following. Assume that we have twoset of designs X and Z with the first corresponding to a high-dimensional covariatevector such as gene expression measurements, and with the second corresponding to alower dimensional covariate vector. Then we can define the PLS regression as we didin Sect. 2.2, but with G(t) in the definition of s and S replaced by G(Y,Z)(t), where
G(Y,Z)(t){Y (t), Z(t)} = 0.
The regression coefficients + corresponding to Z is then given by
+ =
-/
0
%"
0
Z(t)T G(t)Z(t) dt
56
7
$1 %"
0
Z(t)T G(t):
d N (t) $ X (t)$pls dt;
.
123
342 Lifetime Data Anal (2009) 15:330–342
The final predictor in this situation is then
X $pls + Z + .
Acknowledgements We are grateful to an associate editor and two referees for helpful suggestions. Theauthors were supported by a grant from the Danish Research Council on “Point process modelling andstatistical inference”.
References
Bair E, Hastie T, Paul D, Tibshirani R (2006) Prediction by supervised principal components. J Am StatAssoc 101:119–137
Bøvelsta HM, Nygård S, Størvold HL, Aldrin M, Borgan Ø, Frigessi A, Lingjærde OC (2007) Predictingsurvival from microarray data—a comparative study. Bioinformatics 23:2080–2087
Fleming TR, Harrington DP (1991) Counting processes and survival analysis. Wiley, New YorkGarthwaite PH (1994) An interpretation of partial least squares. J Am Stat Assoc 89:122–127Hastie T, Tibshirani R, Friedman J (2001) The elements of statistical learning. Springer, New YorkHelland IS (1988) On the structure of the partial least squares regression. Commun Statist-Simul Comput
17:581–607Helland IS (1990) Partial least squares regression and statistical models. Scand J Statist 17:97–114Helland IS, Almøy T (1994) Comparison of prediction methods when only a few components are relevant.
J Am Stat Assoc 89:583–591Huang J, Ma S, Xie H (2006) Regularized estimation in the accelerated failure time model with
high-dimensional covariates. Biometrics 62:813–820Leng C, Ma S (2007) Path consistent model selection in additive risk model via lasso. Stat Med 26:
3753–3770Li H, Gui J (2004) Partial Cox regression analysis for high-dimensional microarray gene expression data.
Bioinformatics 20:208–215Lin DY, Ying Z (1994) Semiparametric analysis of the additive risk model. Biometrika 81:61–71Ma S, Huang J (2007) Additive risk survival model with microarray data. BMC Bioinformatics 8:1–10Ma S, Kosorok M, Fine J (2006) Additive risk models for survival data with high-dimensional covariates.
Biometrics 62:202–210Martinussen T, Scheike TH (2006) Dynamic regression models for survival data. Springer, New YorkMartinussen T, Scheike TH (2008) Covariate selection for the semiparametric additive risk model. Research
Report, Department of Biostatistics, University of Copenhagen, 8Naik P, Tsai CL (2000) Partial least squares estimator for single-index models. J R Stat Soc Ser B 62:
763–771Nguyen D, Rocke D (2002) Partial least squares proportional hazard regressin for application in DNA
microarray data. Bioinformatics 18:1625–1632Nygård S, Borgan Ø, Lingjærde O, Størvold HL (2008) Partial least squares Cox regression for genome-
wide data. Lifetime Data Anal 14:179–195Park P, Tian L, Kohane IS (2002) Linking gene expression data with patient survival times using partial
least squares. Bioinformatics 18:120–127Pawitan Y, Bjöhle J, Wedren S, Humphreys K, Skoog L, Huang F, Amler L, Sharw P, Hall P, Bergh J
(2004) Gene expression profiling for prognosis using Cox regression. Stat Med 23:1767–1780Sørlie T, Tibshirani R, Parker J, Hastie T, Marron J, Nobel A, Deng S, Johnsen H, Pesich R, Geisler S,
Demeter J, Peour C, Lønning P, Brown P, Børresen-Dale A, Botstein D (2003) Repeated observationof breast tumor subtypes in independent gene expression data sets. Proc Natl Acad Sci 100:8418–8423
van Houwelingen H, Bruinsma T, Hart A, van’t Veer L, Wessels L (2006) Cross-valiated Cox regressionon microarray gene expression data. Stat Med 25:3201–3216
Verweij PJM, Van Houwelingen HC (1993) Cross-validation in survival analysis. Stat Med 12:2305–2314Wahba G (1990) Spline models for observational data. SIAM. CBMS-NSF Regional Conference Series in
Applied Mathematics
123
Related Documents