TITRE The 4 th Annual Report on Monitoring the Electricity and Natural Gas Markets Main insights Alberto Pototschnig Lord Mogg Director, ACER President, CEER Chairman, ACER Board of Regulators Martin Godfried Bart Vereecke Team Leader, ACER Team Leader, ACER Brussels, 30 November 2015

Welcome message from author
This document is posted to help you gain knowledge. Please leave a comment to let me know what you think about it! Share it to your friends and learn new things together.
Transcript
TITRE
The 4th Annual Report on Monitoring the Electricity and Natural Gas Markets
Main insights
Alberto Pototschnig Lord Mogg
Director, ACER President, CEER
Chairman, ACER Board of Regulators
Martin Godfried Bart Vereecke
Team Leader, ACER Team Leader, ACER
Brussels, 30 November 2015
2
The Market Monitoring Report provides an in-depth year-on-year analysis of developments in the IEM and on the remaining barriers to its well-functioning, formulating recommendations
Reports are available at: http://www.acer.europa.eu/Electricity/Market%20monitoring/Pages/default.aspx

3
Context
Integrating the IEM
Network
capacities
calculation for
trade
Use of the
network
Wholesale
markets
Retail
markets
Consumer
benefits

Outline
.Electricity and gas wholesale markets
.Electricity and gas retail markets
.Consumer protection and empowerment
4

Outline
.Electricity and gas wholesale markets.Electricity wholesale markets.Gas wholesale markets
.Electricity and gas retail markets
.Consumer protection and empowerment
5
6
Electricity wholesale markets – developments
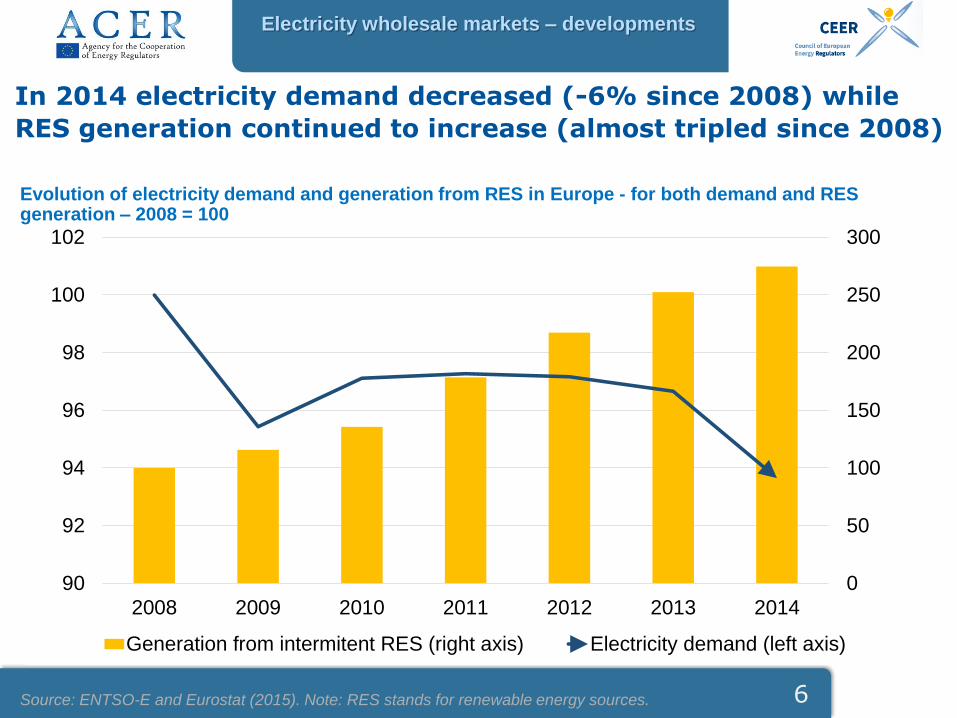
In 2014 electricity demand decreased (-6% since 2008) while
RES generation continued to increase (almost tripled since 2008)
Evolution of electricity demand and generation from RES in Europe - for both demand and RES generation – 2008 = 100
Source: ENTSO-E and Eurostat (2015). Note: RES stands for renewable energy sources.
0
50
100
150
200
250
300
90
92
94
96
98
100
102
2008 2009 2010 2011 2012 2013 2014
Generation from intermitent RES (right axis) Electricity demand (left axis)
7
Electricity wholesale markets – developments
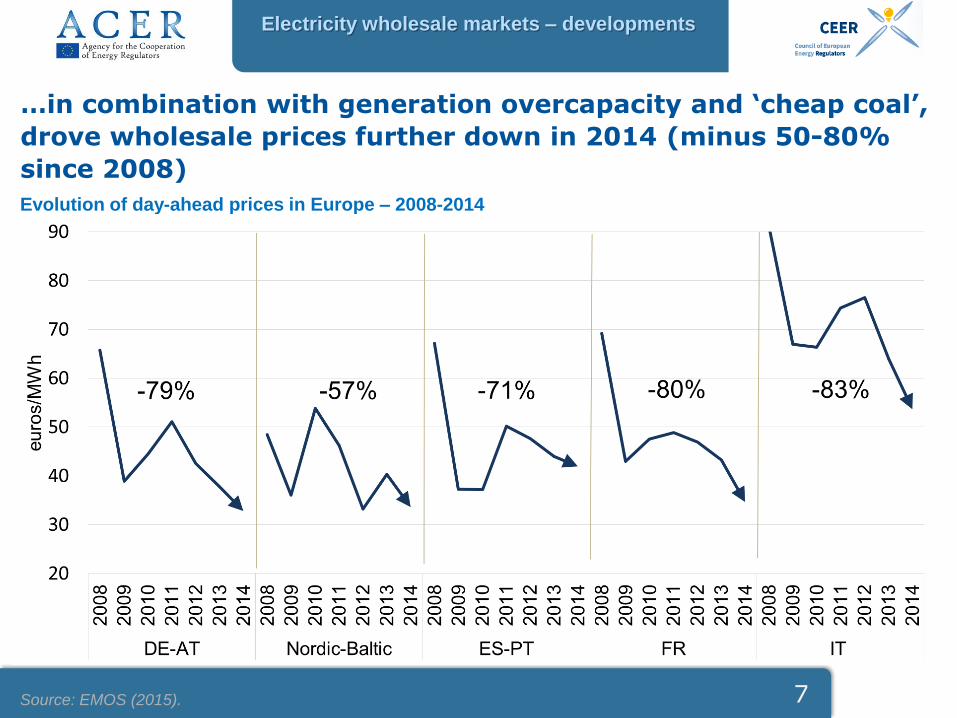
…in combination with generation overcapacity and ‘cheap coal’,
drove wholesale prices further down in 2014 (minus 50-80%
since 2008)
Evolution of day-ahead prices in Europe – 2008-2014
Source: EMOS (2015).

8
Electricity wholesale markets – network capacity
calculation for trade
Ratio between available net transport capacities (NTC) and aggregated thermal
capacity of interconnectors – 2014 (% - MW)
Electricity exchanges inside zones and those originating from cross-zonal exchanges should compete for the capacity of the network elements on equal terms
Source: Data provided by NRAs through the ERI (2015), EMOS, ENTSO-E (2015) and ACER calculations.
0%
20%
40%
60%
80%
100%
AT->CZ DE->FR CH->DE DE->PL
Indicated direction Opposite direction
9
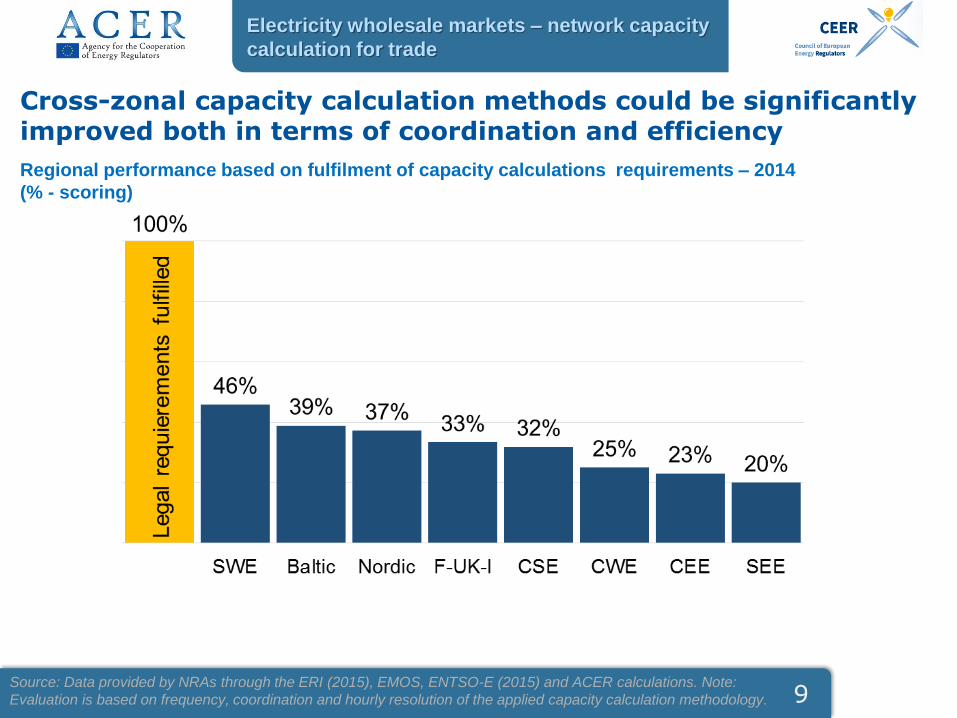
Electricity wholesale markets – network capacity
calculation for trade
Regional performance based on fulfilment of capacity calculations requirements – 2014
(% - scoring)
Cross-zonal capacity calculation methods could be significantly improved both in terms of coordination and efficiency
Source: Data provided by NRAs through the ERI (2015), EMOS, ENTSO-E (2015) and ACER calculations. Note:
Evaluation is based on frequency, coordination and hourly resolution of the applied capacity calculation methodology.
10
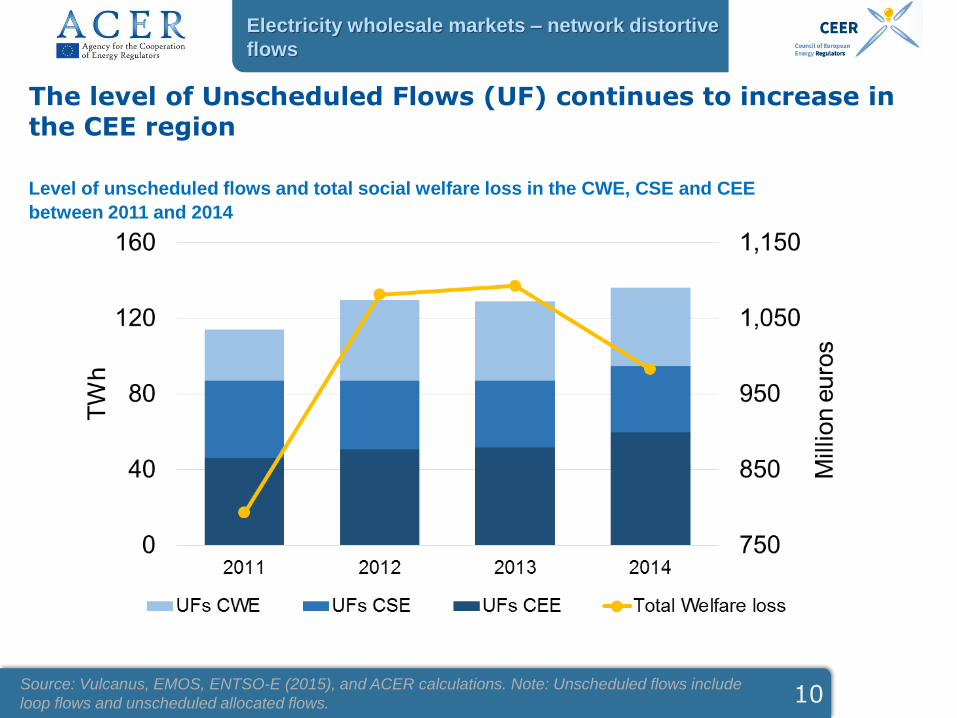
Electricity wholesale markets – network distortive
flows
The level of Unscheduled Flows (UF) continues to increase in the CEE region
Level of unscheduled flows and total social welfare loss in the CWE, CSE and CEE
between 2011 and 2014
Source: Vulcanus, EMOS, ENTSO-E (2015), and ACER calculations. Note: Unscheduled flows include
loop flows and unscheduled allocated flows.

11
Electricity wholesale markets – network
Recommendations – use of the network
More capacity could be made commercially available by
. Performing more coordinated capacity calculation in all timeframes
. Implementing flow-based capacity calculation methods where
appropriate
. Ensuring a more equal treatment of internal and cross-zonal
exchanges through:
» a comprehensive review of bidding zones
» improve capacity calculation methods.
12
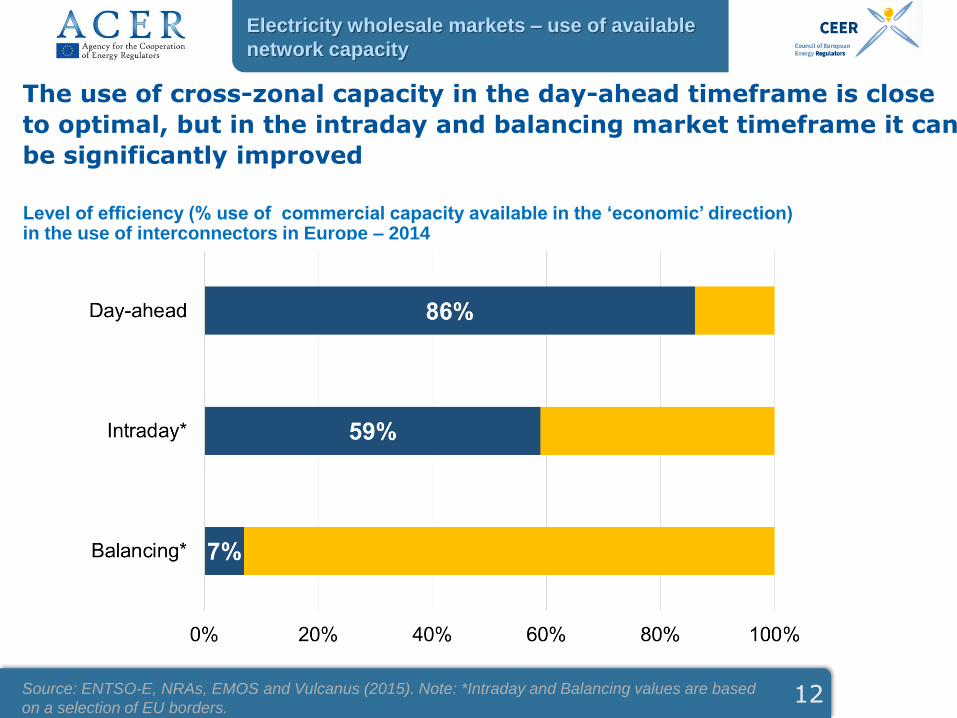
Electricity wholesale markets – use of available
network capacity
The use of cross-zonal capacity in the day-ahead timeframe is close
to optimal, but in the intraday and balancing market timeframe it can
be significantly improved
Level of efficiency (% use of commercial capacity available in the ‘economic’ direction) in the use of interconnectors in Europe – 2014
Source: ENTSO-E, NRAs, EMOS and Vulcanus (2015). Note: *Intraday and Balancing values are based
on a selection of EU borders.
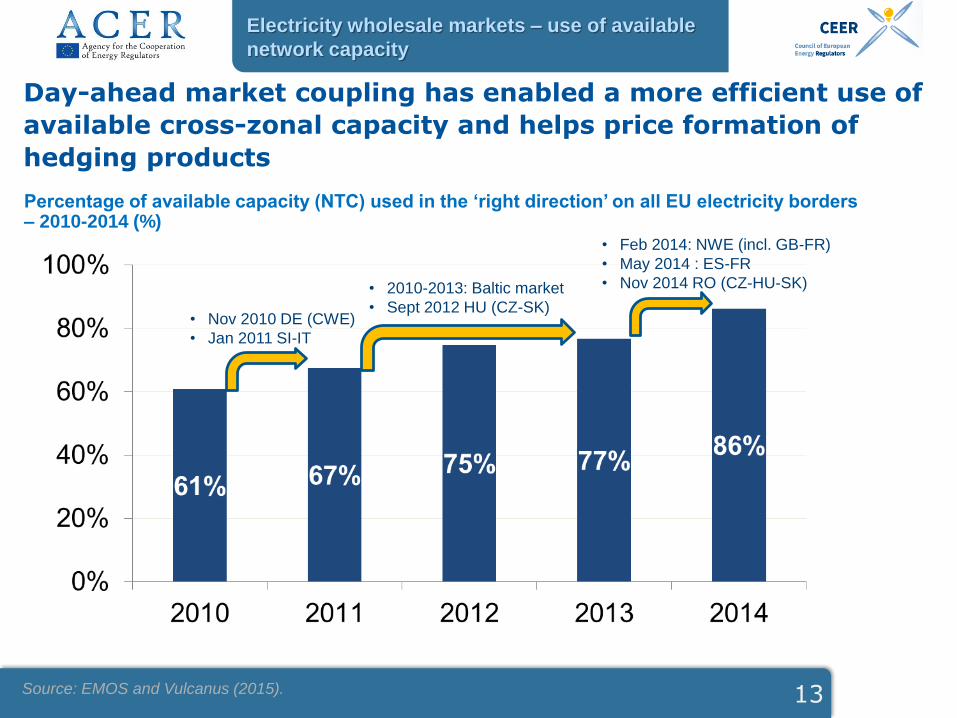
• Nov 2010 DE (CWE)
• Jan 2011 SI-IT
• 2010-2013: Baltic market
• Sept 2012 HU (CZ-SK)
• Feb 2014: NWE (incl. GB-FR)
• May 2014 : ES-FR
• Nov 2014 RO (CZ-HU-SK)
13
Electricity wholesale markets – use of available
network capacity
Day-ahead market coupling has enabled a more efficient use of
available cross-zonal capacity and helps price formation of
hedging products
Percentage of available capacity (NTC) used in the ‘right direction’ on all EU electricity borders – 2010-2014 (%)
Source: EMOS and Vulcanus (2015).
14
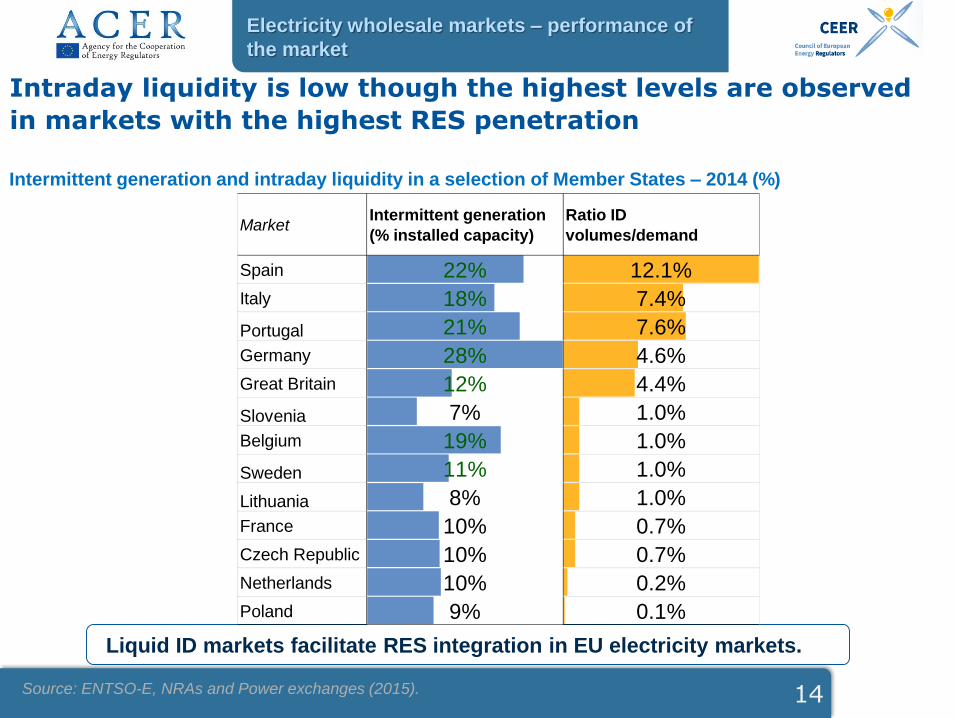
Electricity wholesale markets – performance of
the market
Intraday liquidity is low though the highest levels are observed
in markets with the highest RES penetration
Source: ENTSO-E, NRAs and Power exchanges (2015).
Intermittent generation and intraday liquidity in a selection of Member States – 2014 (%)
Liquid ID markets facilitate RES integration in EU electricity markets.
MarketIntermittent generation
(% installed capacity)
Ratio ID
volumes/demand
Spain 22% 12.1%
Italy 18% 7.4%
Portugal 21% 7.6%
Germany 28% 4.6%
Great Britain 12% 4.4%
Slovenia 7% 1.0%
Belgium 19% 1.0%
Sweden 11% 1.0%
Lithuania 8% 1.0%
France 10% 0.7%
Czech Republic 10% 0.7%
Netherlands 10% 0.2%
Poland 9% 0.1%

15
Electricity wholesale markets – performance of
the market
The costs of balancing services are becoming a relevant part of
the energy bill. Cross-zonal exchanges of balancing services can
reduce costs…Overall costs of balancing (capacity and energy) and imbalance charges over national electricity demand in a selection of European markets – 2014 (euros/MWh)
Source: NRAs (2015).
0
1
2
3
4
5
6
0
1
2
3
4
5
6
SK CZ RO HU AT PT ES CH GB DE NL PL FR
eu
ros/M
Wh
Balancing energy costs Balancing capacity procurement costs Imbalance charges
16
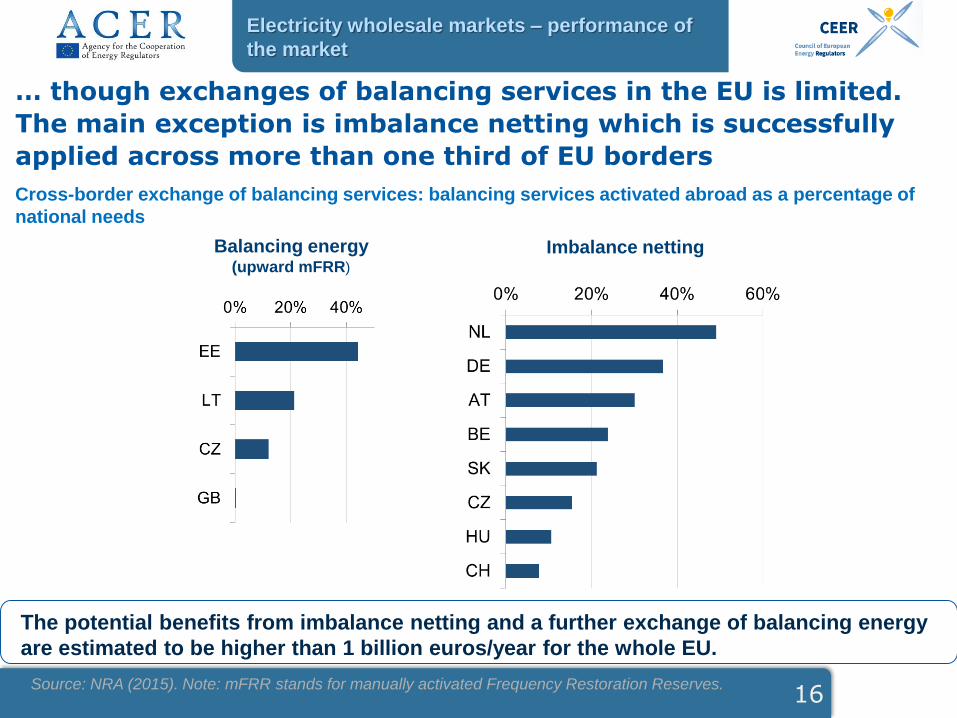
Electricity wholesale markets – performance of
the market
… though exchanges of balancing services in the EU is limited.
The main exception is imbalance netting which is successfully
applied across more than one third of EU borders
Cross-border exchange of balancing services: balancing services activated abroad as a percentage of
national needs
Balancing energy (upward mFRR)
Imbalance netting
The potential benefits from imbalance netting and a further exchange of balancing energy
are estimated to be higher than 1 billion euros/year for the whole EU.
Source: NRA (2015). Note: mFRR stands for manually activated Frequency Restoration Reserves.
17
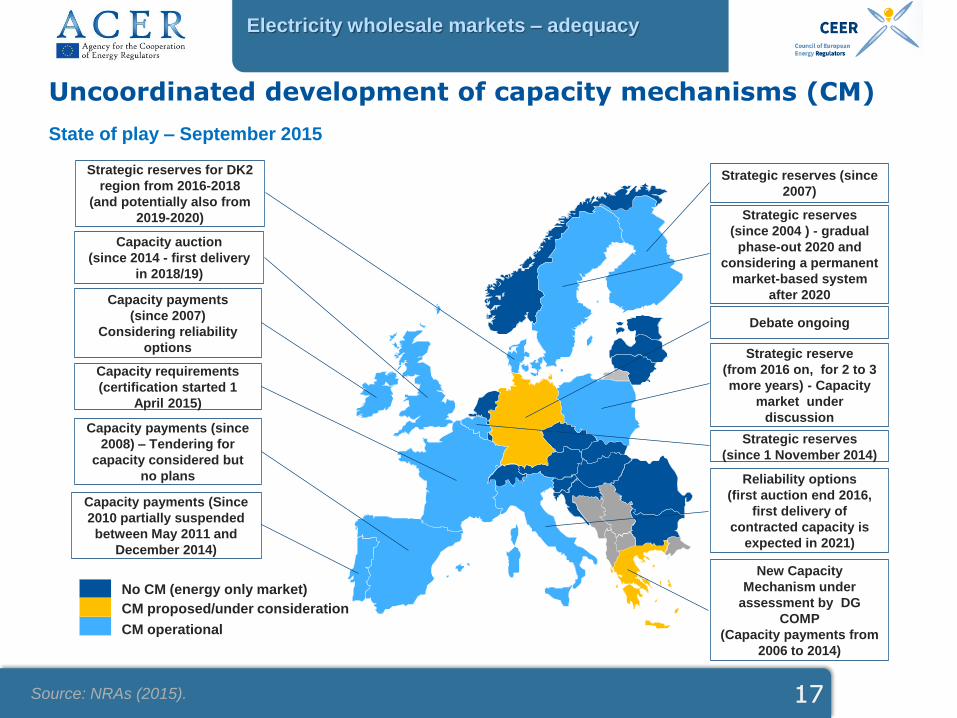
Electricity wholesale markets – adequacy
17
Uncoordinated development of capacity mechanisms (CM)
Source: NRAs (2015).
Strategic reserves
(since 2004 ) - gradual
phase-out 2020 and
considering a permanent
market-based system
after 2020
New Capacity
Mechanism under
assessment by DG
COMP
(Capacity payments from
2006 to 2014)
Capacity payments (since
2008) – Tendering for
capacity considered but
no plans
No CM (energy only market)
CM operational
Reliability options
(first auction end 2016,
first delivery of
contracted capacity is
expected in 2021)
Strategic reserve
(from 2016 on, for 2 to 3
more years) - Capacity
market under
discussion
CM proposed/under consideration
Capacity requirements
(certification started 1
April 2015)
Capacity auction
(since 2014 - first delivery
in 2018/19)
Capacity payments
(since 2007)
Considering reliability
options
Capacity payments (Since
2010 partially suspended
between May 2011 and
December 2014)
Strategic reserves (since
2007)
Debate ongoing
Strategic reserves for DK2
region from 2016-2018
(and potentially also from
2019-2020)
Strategic reserves
(since 1 November 2014)
State of play – September 2015

.Use of the day-ahead cross-border capacities can be further improved by
» Implementing market coupling on the remaining borders (12 out of 40 borders)
. Intraday liquidity can be further improved by
» Moving gate-closure-time closer to real time
» Applying balancing responsibility to renewable resources
» Aligning intraday and balancing market time units
» Ensuring TSOs perform intraday capacity recalculation
» Ensuring imbalance charges fully reflect the costs of balancing
. Efficiency in the provision of balancing services can be further improved by
» Ensuring that imbalancing charges reflect the value of flexibility
» Implement the balancing network code
. When considering or implementing capacity mechanisms
» Remove the remaining barriers in “energy only markets”
» Coordinate national SoS approaches including a pan-European wide coordinated
adequacy assessment
» When implementing capacity mechanisms, do not distort the IEM
18
Electricity wholesale markets
Recommendations

Outline
.Electricity and gas wholesale markets.Electricity wholesale markets.Gas wholesale markets
.Electricity and gas retail markets
.Consumer protection and empowerment
19

Renegotiation of existing long-term contracts to
include hub indexations
Lower demand within the EU
Lower demand for LNG globally
Still, in many MSs long term contracts drive the
price
Gas wholesale markets
Gas price formation is more and more driven by gas-on-gas competition factors
The completion of the gas IEM is progressing, but national markets are at different stages of development
Enhanced infrastructure interconnectivity
But some MSs still depend on one supply source
Hub development progresses
But some MSs have illiquid hubs
Supported by…
20
Overall EU gas wholesale prices decreased in 2014, also driven by lower oil prices
Comparison of selected EU MSs hub and cross-border import prices – 2012 to 2014 (euros/MWh)

21.7
25.0
23.5
28.6
0 50
2014
2012
PSV MA NCG MA
There is an increasing price convergence among EU hubs as well as a narrowing gap between hub and long-term contract prices
21
Comparison of Italian and German hub and border import prices – 2012 to 2014 – yearly
average price in euros/MWh
Convergence among hubs
3.6
1.8
Gas wholesale markets
Source: ACER estimates based on Eurostat Comext, BAFA and Platts.
25.4
34.5
23.5
28.6
0 50
2014
2012
PSV MA IT lt
5.9
1.9
Convergence among hubs and long-term contract prices
23.3
29.0
21.7
25.0
0 50
2014
2012
NCG MA DE lt
4
1.6
22
Price levels are also impacted by the level of development of hubs
Gas wholesale markets
Advanced hubs:
NBP and TTF
Broad liquidity
Sizeable forward
markets which
contribute to their role in
supply hedging
Larger presence of
financial players
Price reference for
other EU hubs and for
long-term contracts
indexation
Advancing hubs:
NWE region
Ongoing increasing
liquidity
More reliant on spot
products and balancing
operations
Progress on supply
hedging role although
relatively lower liquidity
levels for longer-term
products results in weaker
price risk management
role
Developing hubs:
CEE region
Illiquid hubs:
SSE, Iberia, Baltic
Improving liquidity from a
lower base taking
advantage of enhanced
interconnectivity
Liquidity partially driven by
market obligations imposed
on incumbents
Markets still significantly
more reliant on long-term
contracts
Markets chiefly relying
on long-term contracts
Embryonic organised
market places
Benchmark of gas market places
22

Gas wholesale markets
As a result, MSs supply sourcing costs are further converging, although some differences persist leading to welfare losses
Price levels are
higher in those
regions with
• less developed
hubs
• weaker inter-
connection
• less
competitive
market frames
Source: ACER estimates based on NRA input, Eurostat Comext, BAFA, Platts.
<1 euro/MWh
1-3 euro/MWh
>3 euro/MWh
* Suppliers’ sourcing costs take into account both border import and diverse hub product prices. A weighted average of monthly sourcing costs and demand is performed to obtain the yearly figure.
23
2014 calculated gas sourcing cost* compared to TTF (= 23.7 € /MWh)

2012-2014 estimated gross welfare losses – index variation
Welfare losses have decreased substantially over the last three years
Gas wholesale markets
Reasons are:
• Hub
development &
hub price
convergence
• Price
indexation in
long term
contracts
through hub
instead of oil
references
• Demand drop
Source: ACER estimates based on Eurostat Comext, BAFA, Platts and NRAs guidance. 24

. Eliminate barriers hindering hub progress and new market entry
» Simplify access terms and licensing
» Reconsider security of supply obligations applied to financial entities
» Promote the transfer of prevailing physical delivery points at the flange into VTPs
» Force the use of hubs for setting balancing mechanisms
.Promote further development of hubs in order to facilitate the shift of gas supply
from bilateral long-term contracts to shorter-term hub-based transactions
» Promote further the development of diversified trading products at hubs
» Foster cross-country hub cooperation: assess via cost benefit analysis suitability
of market merging projects
25
Gas wholesale markets
Recommendations regarding hub development

26
Gas wholesale markets
Example: non traditional direction capacity
expansion on key CEE borders – 2010-2015
Recent infrastructure investments, in particular in reverse flow capabilities, are bearing fruit
Reverse-flow capabilities and new
IPs deliver increased security of
supply through increased gas
flow flexibility and facilitated
market integration of CEE
internally but also with NWE
Additionally, several physically uni-
directional IPs offer backhaul
services which facilitates market
functioning
More integrated markets stimulate
competition and reduce dependency
on gas from a single source
South-South East Europe and Baltic
regions need catching up
Source: ENTSOG.
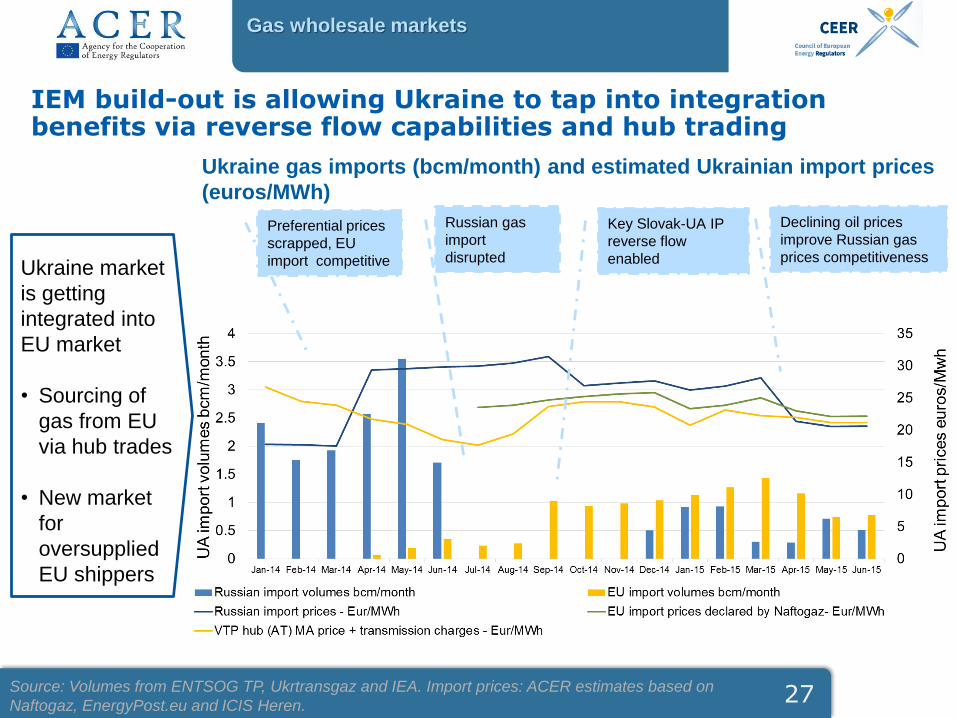
Ukraine gas imports (bcm/month) and estimated Ukrainian import prices
(euros/MWh)
IEM build-out is allowing Ukraine to tap into integration benefits via reverse flow capabilities and hub trading
Source: Volumes from ENTSOG TP, Ukrtransgaz and IEA. Import prices: ACER estimates based on
Naftogaz, EnergyPost.eu and ICIS Heren.
Preferential prices
scrapped, EU
import competitive
Russian gas
import
disrupted
Key Slovak-UA IP
reverse flow
enabled
Declining oil prices
improve Russian gas
prices competitivenessUkraine market
is getting
integrated into
EU market
• Sourcing of
gas from EU
via hub trades
• New market
for
oversupplied
EU shippers
Gas wholesale markets
27

. Push selected investments to alleviate infrastructure bottlenecks
» Meet the GTM diversification target of three different supply sources
» Fully implement investments enabling reverse flows on IPs
» Have a regional perspective for infrastructure projects
. Implement network code provisions in order to facilitate competition and the
well-functioning of gas markets.
28
Recommendations regarding infrastructure development
Gas wholesale markets

Outline
.Electricity and gas wholesale markets
.Electricity and gas retail markets
.Consumer protection and empowerment
29
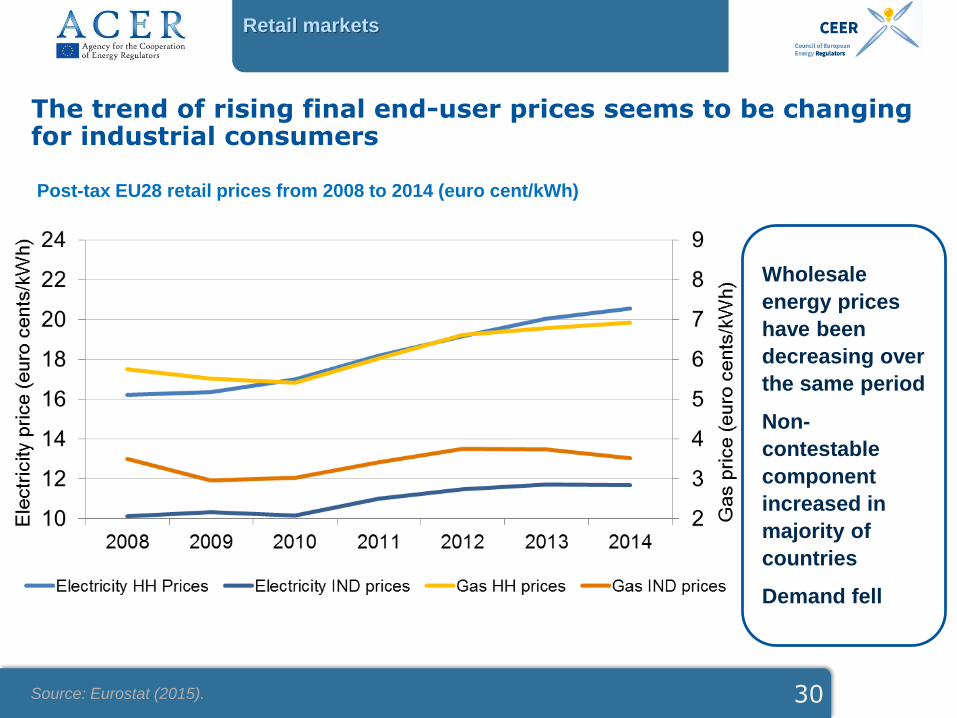
30
The trend of rising final end-user prices seems to be changing for industrial consumers
Post-tax EU28 retail prices from 2008 to 2014 (euro cent/kWh)
Retail markets
Wholesale
energy prices
have been
decreasing over
the same period
Non-
contestable
component
increased in
majority of
countries
Demand fell
Source: Eurostat (2015).

Industry benefits much more from retail competition than household consumers
31
Relationship between the wholesale price and the energy component of the retail electricity price for
households and industrial consumers in a selection of countries 2008 to 2014 - (euros/MWh)
Ind
us
try
Retail markets
Source: ACER Database, Eurostat, NRAs and European power exchanges data (2014) and
ACER calculations.
Ho
us
eh
old
s
32
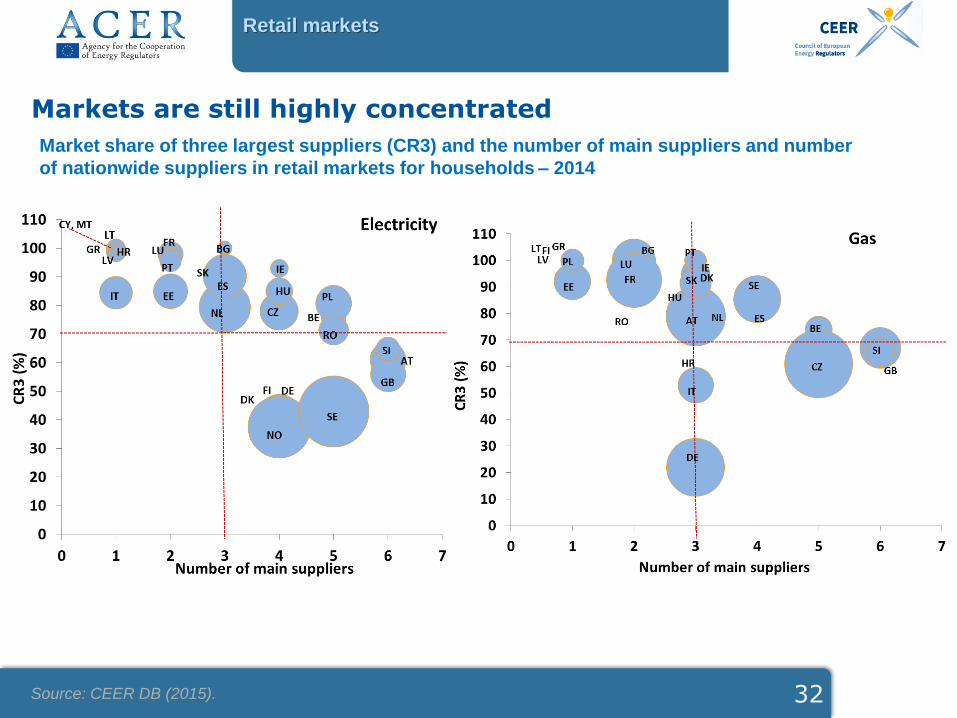
Markets are still highly concentrated
Market share of three largest suppliers (CR3) and the number of main suppliers and number
of nationwide suppliers in retail markets for households – 2014
Retail markets
Source: CEER DB (2015).

RES and other non-contestable charges represent a larger part of the final household bill, more in electricity than in gas…
33
Retail markets
Post-tax retail price breakdown – incumbents’ standard offers for households in capital cities – 2012-
2014 (%)
Source: ACER retail database and information from NRAs (2014).
Electricity Gas
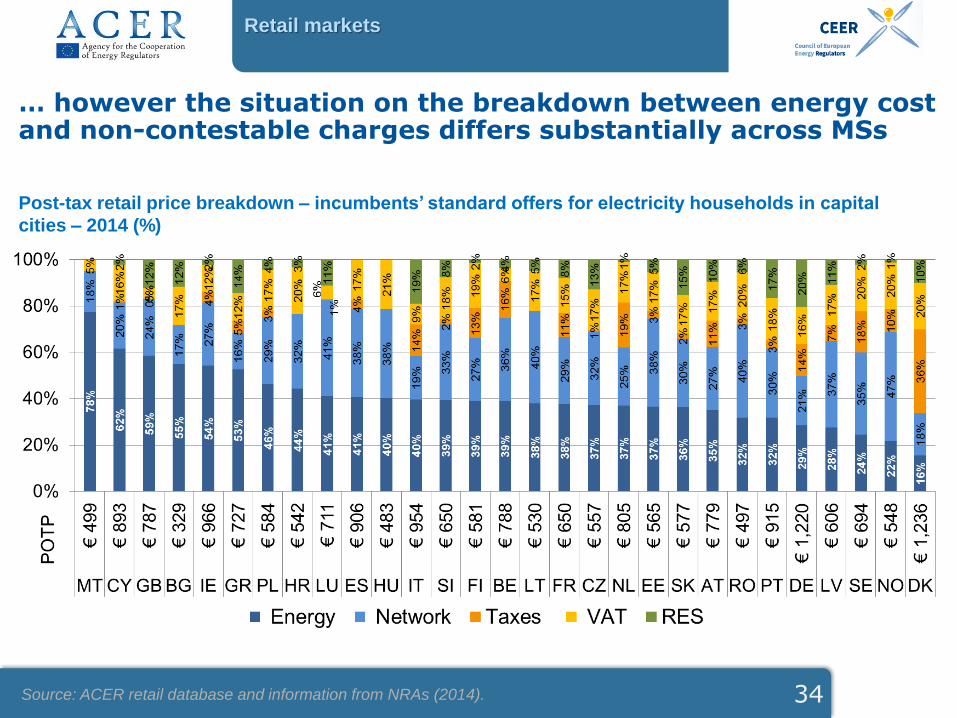
… however the situation on the breakdown between energy cost and non-contestable charges differs substantially across MSs
34
Retail markets
Post-tax retail price breakdown – incumbents’ standard offers for electricity households in capital
cities – 2014 (%)
Source: ACER retail database and information from NRAs (2014).
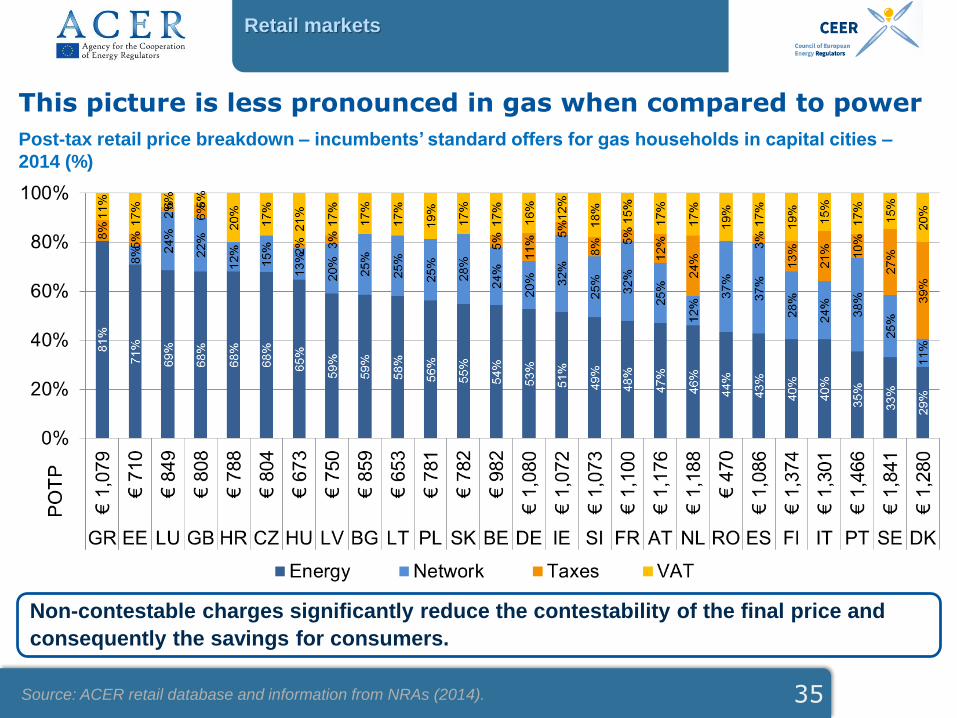
This picture is less pronounced in gas when compared to power
35
Retail markets
Post-tax retail price breakdown – incumbents’ standard offers for gas households in capital cities –
2014 (%)
Source: ACER retail database and information from NRAs (2014).
Non-contestable charges significantly reduce the contestability of the final price and
consequently the savings for consumers.
36
Retail markets
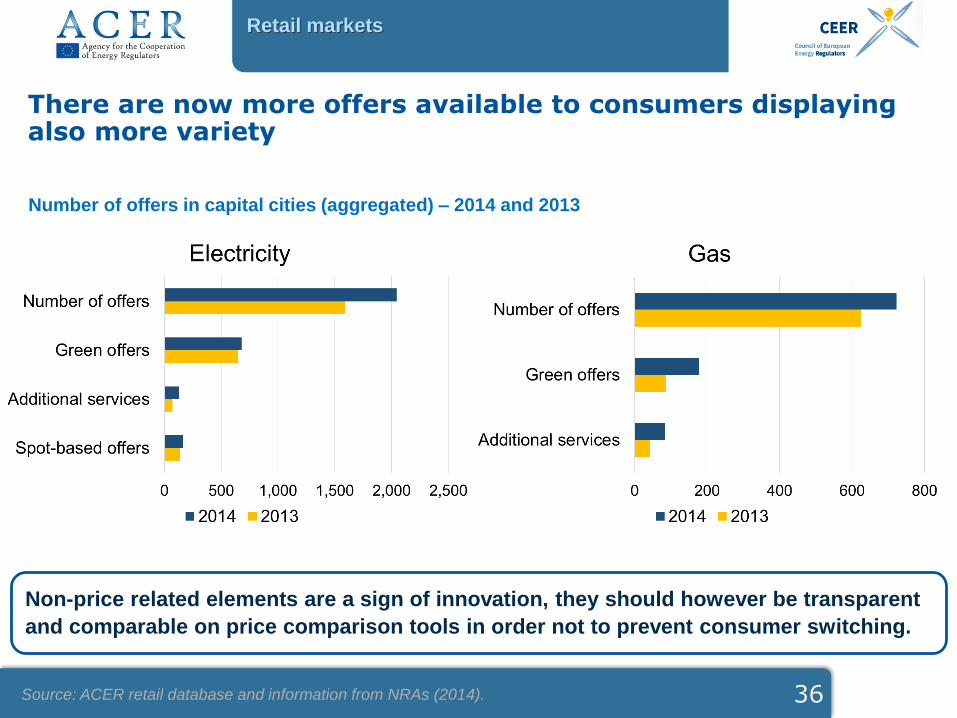
There are now more offers available to consumers displaying also more variety
Number of offers in capital cities (aggregated) – 2014 and 2013
Non-price related elements are a sign of innovation, they should however be transparent
and comparable on price comparison tools in order not to prevent consumer switching.
Source: ACER retail database and information from NRAs (2014).
37
Retail markets
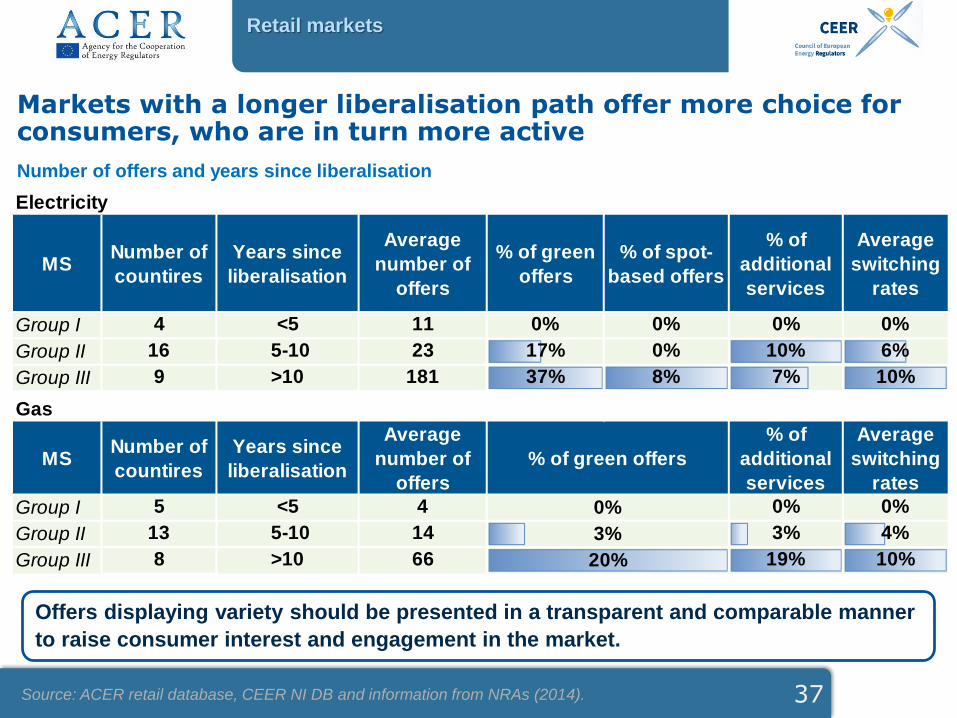
Markets with a longer liberalisation path offer more choice for consumers, who are in turn more active
Number of offers and years since liberalisation
Offers displaying variety should be presented in a transparent and comparable manner
to raise consumer interest and engagement in the market.
Source: ACER retail database, CEER NI DB and information from NRAs (2014).
Electricity
MSNumber of
countires
Years since
liberalisation
Average
number of
offers
% of green
offers
% of spot-
based offers
% of
additional
services
Average
switching
rates
Group I 4 <5 11 0% 0% 0% 0%
Group II 16 5-10 23 17% 0% 10% 6%
Group III 9 >10 181 37% 8% 7% 10%
Gas
MSNumber of
countires
Years since
liberalisation
Average
number of
offers
% of
additional
services
Average
switching
rates
Group I 5 <5 4 0% 0%
Group II 13 5-10 14 3% 4%
Group III 8 >10 66 19% 10%
% of green offers
0%
3%
20%

38
Retail markets
Higher savings are one of the switching triggers
Potential savings to electricity and gas consumers and switching rates
Consumers should be aware of switching possibilities and of potential savings
available. Complexity of switching procedures may reduce the perceived savings
potential and prevent consumers from switching.
Source: ACER retail database and information from NRAs (2014).
Most competitive retail household
markets
• Finland
• Norway
• Sweden
• the Netherlands
• Great Britain
• Great Britain
• The Netherlands
• The Czech Republic
• Slovenia
• Spain
Weak competitive retail household
markets
• Latvia
• Bulgaria
• Cyprus
• Lithuania
• Greece
• Latvia
Differences in relative competition levels in MSs can be observed
39
Electricity
Gas
Creation of sufficient
competition by
• Promoting
consumer
engagement
• Removing entry
barriers to foster
market conditions
attracting new
suppliers
competing for
consumers
Source: ACER retail database and information from NRAs (2014)
Retail markets
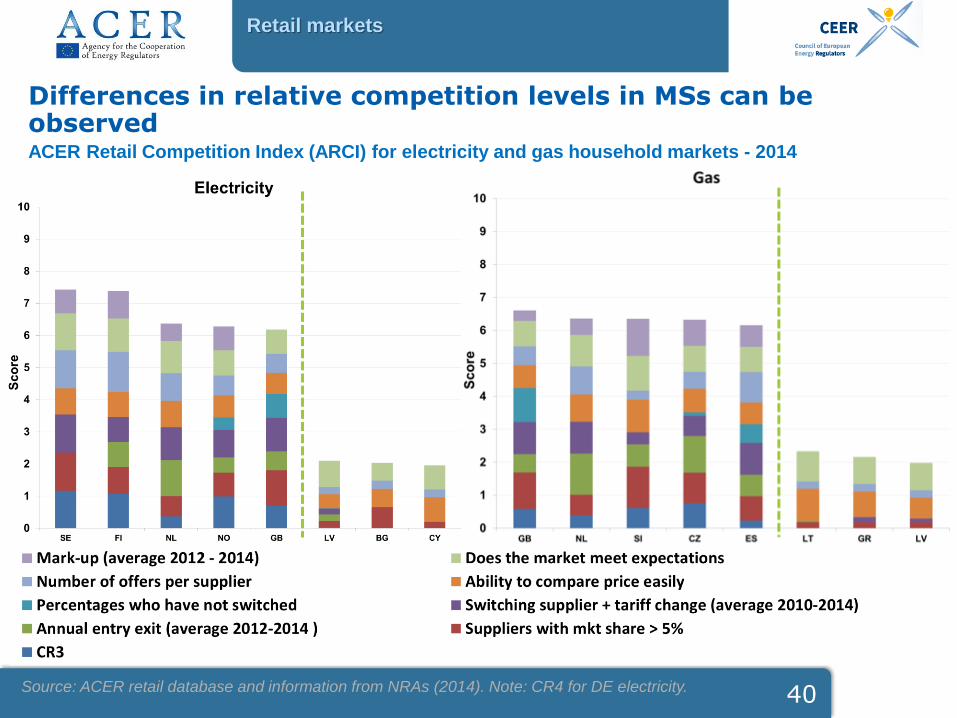
Differences in relative competition levels in MSs can be observed
40
ACER Retail Competition Index (ARCI) for electricity and gas household markets - 2014
Source: ACER retail database and information from NRAs (2014). Note: CR4 for DE electricity.
Retail markets
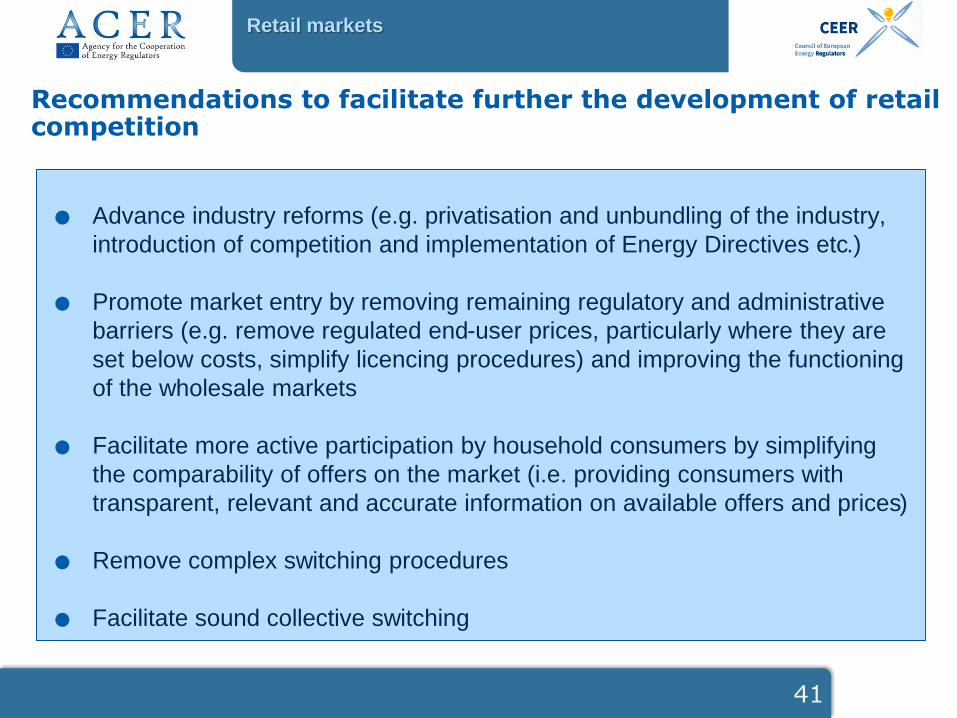
. Advance industry reforms (e.g. privatisation and unbundling of the industry,
introduction of competition and implementation of Energy Directives etc.)
. Promote market entry by removing remaining regulatory and administrative
barriers (e.g. remove regulated end-user prices, particularly where they are
set below costs, simplify licencing procedures) and improving the functioning
of the wholesale markets
. Facilitate more active participation by household consumers by simplifying
the comparability of offers on the market (i.e. providing consumers with
transparent, relevant and accurate information on available offers and prices)
. Remove complex switching procedures
. Facilitate sound collective switching
41
Retail markets
Recommendations to facilitate further the development of retail competition
Outline
.Wholesale electricity and gas markets
.Electricity and gas retail markets
.Consumer protection and empowerment
42

Source: CEER database, National Indicators (2014).
Consumer protection and empowerment
Public service obligation
. Supplier of Last Resort (SoLR) obligation transposed into national
legislation in all MSs, except FR, LV and MT (electricity) and BG, FR,
GR, PL and SI (gas)
. SoLRs apply for varied and multiple situations:
» Supplier failure
» Payment difficulties
» Consumer inactivity
. Differences in number of households supplied by SoLR
» 100% in CY, RO (electricity) and HR (gas)
» ~0% in many, e.g. AT, GR, IE, LV, LT, LU, NL, PL, SK
» 53% in PT and ES (electricity)
43
Source: CEER database, National Indicators (2014).
Consumer protection and empowerment
Electricity Gas
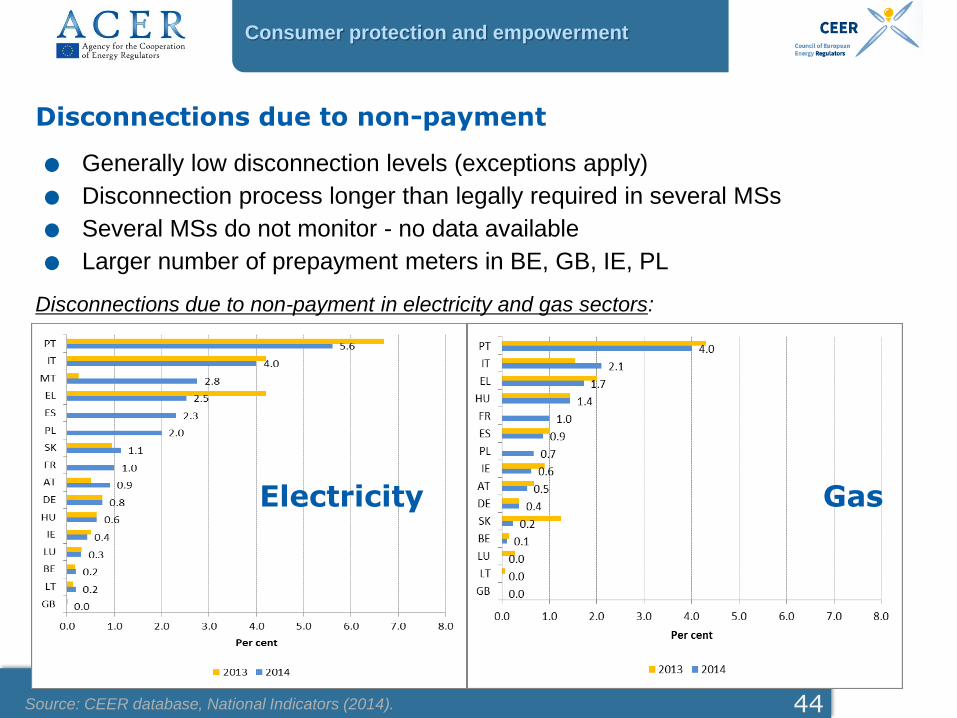
Disconnections due to non-payment
. Generally low disconnection levels (exceptions apply). Disconnection process longer than legally required in several MSs. Several MSs do not monitor - no data available. Larger number of prepayment meters in BE, GB, IE, PL
Disconnections due to non-payment in electricity and gas sectors:
44

Source: CEER database, National Indicators (2014)
Consumer protection and empowerment
Vulnerable customers
. Due to different definitions of the concept, the number of vulnerable
customers is hard (impossible) to count!
» Implicit definition: definition of vulnerable customers in existing
energy-specific and social security laws (14 MSs)
» Explicit definition: clear statements on criteria for vulnerability in
legal/regulatory framework (18 MSs)
Examples of explicit definition:
BULGARIA ... household clients who receive target assistance for electric power, heat energy or
natural gas under the Act on Social Assistance and the legislative normative
instruments on its implementation.
FINLAND …If the default on payment is caused by user’s financial difficulties due to serious
illness, unemployment or other special cause,…the supply of electricity may be cut at
the earliest 2 months after due date of payment.
GREAT BRITAIN Consumers who are significantly less able than a typical consumer to protect or
represent their interests in the energy market; who are more likely to suffer
(substantial) detriment. The needs of the following particular groups must be taken
into account: retired, disabled, chronically ill, on low incomes, or those living in rural
areas.
45
Source: CEER database, National Indicators (2014).
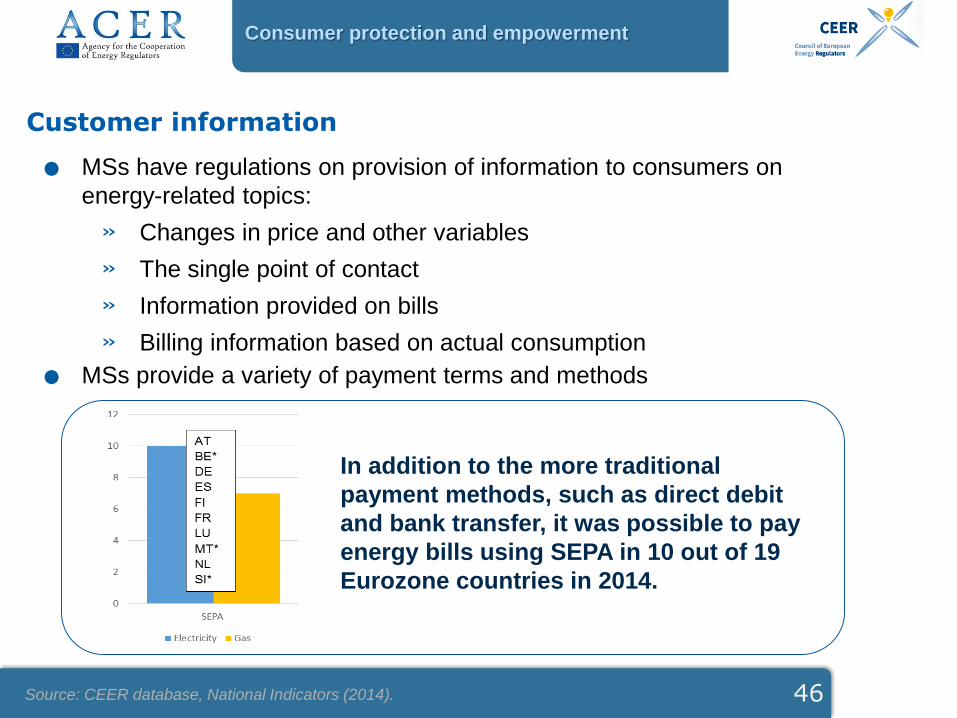
Consumer protection and empowerment
In addition to the more traditional
payment methods, such as direct debit
and bank transfer, it was possible to pay
energy bills using SEPA in 10 out of 19
Eurozone countries in 2014.
Customer information. MSs have regulations on provision of information to consumers on
energy-related topics:
» Changes in price and other variables
» The single point of contact
» Information provided on bills
» Billing information based on actual consumption. MSs provide a variety of payment terms and methods
46

Source: CEER Database, National Indicators (2014-2015).
< 10 % of household customers
10 - 50 % of household customers
> 50 % of household customersApproximately
half of the
Member States
have minimum
technical and
other
requirements in
their legislation
to ensure benefit
for consumers
Consumer protection and empowerment
Smart meters
Share of household customers equipped with smart meters for electricity in 2014
47

Source: CEER database, National Indicators (2014)
Consumer protection and empowerment
“Price, contract or billingrelated issues” ~ 58 %
“Service related issues” ~ 26 %
“Others” ~ 12 %
Consumer complaints
EU average share of final household customer complaints addressed directly to NRAs, weighted by total number of complaints (electricity: in total 62,728 complaints)
Invoicing / billing and
debt collection34%
Price / tariff
13%Contracts and
sales11%
Unfair commercial
practices
8%
Provider
change / switching
7%
Quality of
supply6%
Disconnection
due to no or late payment
5%
Metering
4%
unclassified
4%
Connection to the grid
3%
Customer
services2%
Activation
2%
Redress
1%
48

Source: CEER database, National Indicators (2014).
Consumer protection and empowerment
DSO Service Quality
. New monitoring data on 4 key distribution services:
» Time to provide a price offer for a grid connection
» Time to connect a customer to the network in the case of minor
works
» Time to disconnect following a customer request
» Maximum duration of a planned supply interruption. Data from 20 MSs suggests that DSOs lag behind CEER
recommendations to a small degree. Most room for improvement in time to connect a customer to the
network in the case of minor works
49

Consumer protection and empowerment
Conclusions
. Supplier of last resort widely implemented with varying roles.. Process for disconnection due to non-payment is longer than legally required,
but only half of NRAs (16 MSs) are able to provide disconnection rates.
Prepayment meters are available only in a few MSs.. The concept of vulnerable customers exists in the majority of MSs, however,
comparison between countries is limited due to the vast differences in the
definition.. MSs have a variety of regulations concerning the provision of customer
information.. Roll-out of smart meter progresses; nevertheless, it is still in its infancy in
large number of MSs.. Significant number of consumers use established and extensive complaint
handling mechanisms. The majority of complaints refer to price, contract or
billing related issues.. Time to connect a customer to the grid and activate energy supply seems too
long in some MSs.
50

Recommendations
. A supplier of last resort (either in gas and/or electricity) still needs to be
appointed in some jurisdictions.
. Need for minimum technical functionalities and other requirements for smart
meters to ensure benefits to consumers in many MSs.
. Further monitoring is required from a number of NRAs in several areas:
» Disconnections for non-payment
» Number and type of complaints addressed by consumers
» Key distribution services
Consumer protection and empowerment
51

Thank you for your
attention
Thank you for your attention
52
www.acer.europa.eu
Source: CEER database, National Indicators (2014).
Consumer protection and empowerment
Consumer complaints(BACK-UP SLIDE!!!)
Share of types of final household customer complaints addressed to NRAs (electricity, total number of complaints per 100,000 customers in brackets)
0%
10%
20%
30%
40%
50%
60%
70%
80%
90%
100%
unclassified
others (Unfair commercial practices; Provider change / switching; Customer services; Redress; Activation)
grid-, disconnection- or metering issues (Connection to the grid; Metering; Quality of supply; Disconnection due to no or late payment)
price-, contract- or billing-issues (Invoicing / billing and debt collection; Price / tariff; Contracts and sales)
Related Documents