A&A 400, 161–183 (2003) DOI: 10.1051/0004-6361:20021690 c ESO 2003 Astronomy & Astrophysics The 3-D ionization structure of NGC 6818: A Planetary Nebula threatened by recombination S. Benetti 1 , E. Cappellaro 2 , R. Ragazzoni 3 , F. Sabbadin 1 , and M. Turatto 1 1 INAF - Osservatorio Astronomico di Padova, vicolo dell’Osservatorio 5, 35122 Padova, Italy 2 INAF - Osservatorio Astronomico di Capodimonte, via Moiariello 11, 80131 Napoli, Italy 3 INAF - Osservatorio Astrofisico di Arcetri, Largo E. Fermi 5, 50125, Italy Received 24 September 2002 / Accepted 11 November 2002 Abstract. Long-slit NTT+EMMI echellograms of NGC 6818 (the Little Gem) at nine equally spaced position angles, reduced according to the 3-D methodology introduced by Sabbadin et al. (2000a,b), allowed us to derive: the expansion law, the di- agnostics and ionic radial profiles, the distance and the central star parameters, the nebular photo-ionization model, the 3-D reconstruction in He II, [O III] and [N II], the multicolor projection and a series of movies. The Little Gem results to be a young (3500 years), optically thin (quasi–thin in some directions) double shell ( M ion 0.13 M ) at a distance of 1.7 kpc, seen almost equatorial on: a tenuous and patchy spherical envelope (r 0.090 pc) encircles a dense and inhomogeneous tri-axial ellipsoid (a/2 0.077 pc, a/b 1.25, b/c 1.15) characterized by a hole along the major axis and a pair of equatorial, thick moustaches. NGC 6818 is at the start of the recombination phase following the luminosity decline of the 0.625 M central star, which has recently exhausted the hydrogen shell nuclear burning and is rapidly moving toward the white dwarf domain (log T ∗ 5.22 K; log L ∗ /L 3.1). The nebula is destined to become thicker and thicker, with an increasing fraction of neutral, dusty gas in the outermost layers. Only over some hundreds of years the plasma rarefaction due to the expansion will prevail against the slower and slower stellar decline, leading to a gradual re-growing of the ionization front. The exciting star of NGC 6818 (m V 17.06) is a visual binary: a faint, red companion (m V 17.73) appears at 0.09 arcsec in PA = 190 ◦ , corresponding to a separation ≥150 AU and to an orbital period ≥1500 years. Key words. planetary nebulae: individual: NGC 6818 – ISM: kinematics and dynamics 1. Introduction It is widely accepted that an “aged” star of low to medium mass (1.0 M < M MS < 8.0 M ) which is evolving toward the white dwarf region of the H–R diagram, first expels and then ionizes the surface layers, thus generating the Planetary Nebula (PN) phenomenology (Paczynski 1970; Aller 1984; Pottasch 1984; Osterbrock 1989). Thanks to the advent of sophisticate photo-ionization codes (Harrington 1989; Pequignot 1997; Ferland et al. 1998), we now know in detail the physical effects produced by any UV Send offprint requests to: S. Benetti, e-mail: [email protected] Based on observations made with ESO Telescopes at the La Silla Observatories, under programme ID 65.I-0524, and on observations made with the NASA/ESA Hubble Space Telescope, obtained from the data archive at the Space Telescope Institute (observing programs GO 7501 and GO 8773; P.I. Arsen Hajian). STScI is operated by the association of Universities for Research in Astronomy, Inc. un- der the NASA contract NAS 5-26555. We have applied the photo- ionization code CLOUDY, developed at the Institute of Astronomy of the Cambridge University. flux on any gas distribution and composition. Conversely, the situation is quite disappointing for a true nebula, due to projec- tion limitations: on the one hand the HST imagery has strongly enhanced the ground-based evidences of the PNe complexity, on the other hand the observational data are still interpreted in terms of approximate structures and unrealistic assumptions for the physical conditions, like T e = constant and Ne = constant all over the object (more comments are in Aller 1984, 1990, 1994). In order to overcome the wide gap between theory and prac- tice, the apparent, bi-dimensional nebular image should be de- projected, and the accurate spatial distribution of the gas recov- ered. To this end we have developed an original procedure based on high dispersion spectra: the PN being an extended and ex- panding plasma, the position, thickness and density of each el- ementary volume can be, in principle, obtained from the radial velocity, width and flux of the corresponding emission. We first apply a tomographic analysis, which reconstructs the ionic dis- tribution in the nebular slices covered by the spectrograph slit, and then assemble all the tomographic maps by means of a Article published by EDP Sciences and available at http://www.aanda.org or http://dx.doi.org/10.1051/0004-6361:20021690

Welcome message from author
This document is posted to help you gain knowledge. Please leave a comment to let me know what you think about it! Share it to your friends and learn new things together.
Transcript
A&A 400, 161–183 (2003)DOI: 10.1051/0004-6361:20021690c© ESO 2003
Astronomy&
Astrophysics
The 3-D ionization structure of NGC 6818: A Planetary Nebulathreatened by recombination�
S. Benetti1, E. Cappellaro2, R. Ragazzoni3, F. Sabbadin1, and M. Turatto1
1 INAF - Osservatorio Astronomico di Padova, vicolo dell’Osservatorio 5, 35122 Padova, Italy2 INAF - Osservatorio Astronomico di Capodimonte, via Moiariello 11, 80131 Napoli, Italy3 INAF - Osservatorio Astrofisico di Arcetri, Largo E. Fermi 5, 50125, Italy
Received 24 September 2002 / Accepted 11 November 2002
Abstract. Long-slit NTT+EMMI echellograms of NGC 6818 (the Little Gem) at nine equally spaced position angles, reducedaccording to the 3-D methodology introduced by Sabbadin et al. (2000a,b), allowed us to derive: the expansion law, the di-agnostics and ionic radial profiles, the distance and the central star parameters, the nebular photo-ionization model, the 3-Dreconstruction in He II, [O III] and [N II], the multicolor projection and a series of movies. The Little Gem results to be a young(3500 years), optically thin (quasi–thin in some directions) double shell (Mion � 0.13 M�) at a distance of 1.7 kpc, seen almostequatorial on: a tenuous and patchy spherical envelope (r � 0.090 pc) encircles a dense and inhomogeneous tri-axial ellipsoid(a/2 � 0.077 pc, a/b � 1.25, b/c � 1.15) characterized by a hole along the major axis and a pair of equatorial, thick moustaches.NGC 6818 is at the start of the recombination phase following the luminosity decline of the 0.625 M� central star, which hasrecently exhausted the hydrogen shell nuclear burning and is rapidly moving toward the white dwarf domain (log T∗ � 5.22 K;log L∗/L� � 3.1). The nebula is destined to become thicker and thicker, with an increasing fraction of neutral, dusty gas in theoutermost layers. Only over some hundreds of years the plasma rarefaction due to the expansion will prevail against the slowerand slower stellar decline, leading to a gradual re-growing of the ionization front. The exciting star of NGC 6818 (mV �17.06)is a visual binary: a faint, red companion (mV � 17.73) appears at 0.09 arcsec in PA = 190◦, corresponding to a separation≥150 AU and to an orbital period ≥1500 years.
Key words. planetary nebulae: individual: NGC 6818 – ISM: kinematics and dynamics
1. Introduction
It is widely accepted that an “aged” star of low to medium mass(1.0 M� < MMS < 8.0 M�) which is evolving toward the whitedwarf region of the H–R diagram, first expels and then ionizesthe surface layers, thus generating the Planetary Nebula (PN)phenomenology (Paczynski 1970; Aller 1984; Pottasch 1984;Osterbrock 1989).
Thanks to the advent of sophisticate photo-ionization codes(Harrington 1989; Pequignot 1997; Ferland et al. 1998), wenow know in detail the physical effects produced by any UV
Send offprint requests to: S. Benetti,e-mail: [email protected]� Based on observations made with ESO Telescopes at the La Silla
Observatories, under programme ID 65.I-0524, and on observationsmade with the NASA/ESA Hubble Space Telescope, obtained fromthe data archive at the Space Telescope Institute (observing programsGO 7501 and GO 8773; P.I. Arsen Hajian). STScI is operated bythe association of Universities for Research in Astronomy, Inc. un-der the NASA contract NAS 5-26555. We have applied the photo-ionization code CLOUDY, developed at the Institute of Astronomy ofthe Cambridge University.
flux on any gas distribution and composition. Conversely, thesituation is quite disappointing for a true nebula, due to projec-tion limitations: on the one hand the HST imagery has stronglyenhanced the ground-based evidences of the PNe complexity,on the other hand the observational data are still interpreted interms of approximate structures and unrealistic assumptions forthe physical conditions, like Te = constant and Ne = constantall over the object (more comments are in Aller 1984, 1990,1994).
In order to overcome the wide gap between theory and prac-tice, the apparent, bi-dimensional nebular image should be de-projected, and the accurate spatial distribution of the gas recov-ered.
To this end we have developed an original procedure basedon high dispersion spectra: the PN being an extended and ex-panding plasma, the position, thickness and density of each el-ementary volume can be, in principle, obtained from the radialvelocity, width and flux of the corresponding emission. We firstapply a tomographic analysis, which reconstructs the ionic dis-tribution in the nebular slices covered by the spectrograph slit,and then assemble all the tomographic maps by means of a
Article published by EDP Sciences and available at http://www.aanda.org or http://dx.doi.org/10.1051/0004-6361:20021690
162 S. Benetti et al.: The Planetary Nebula NGC 6818
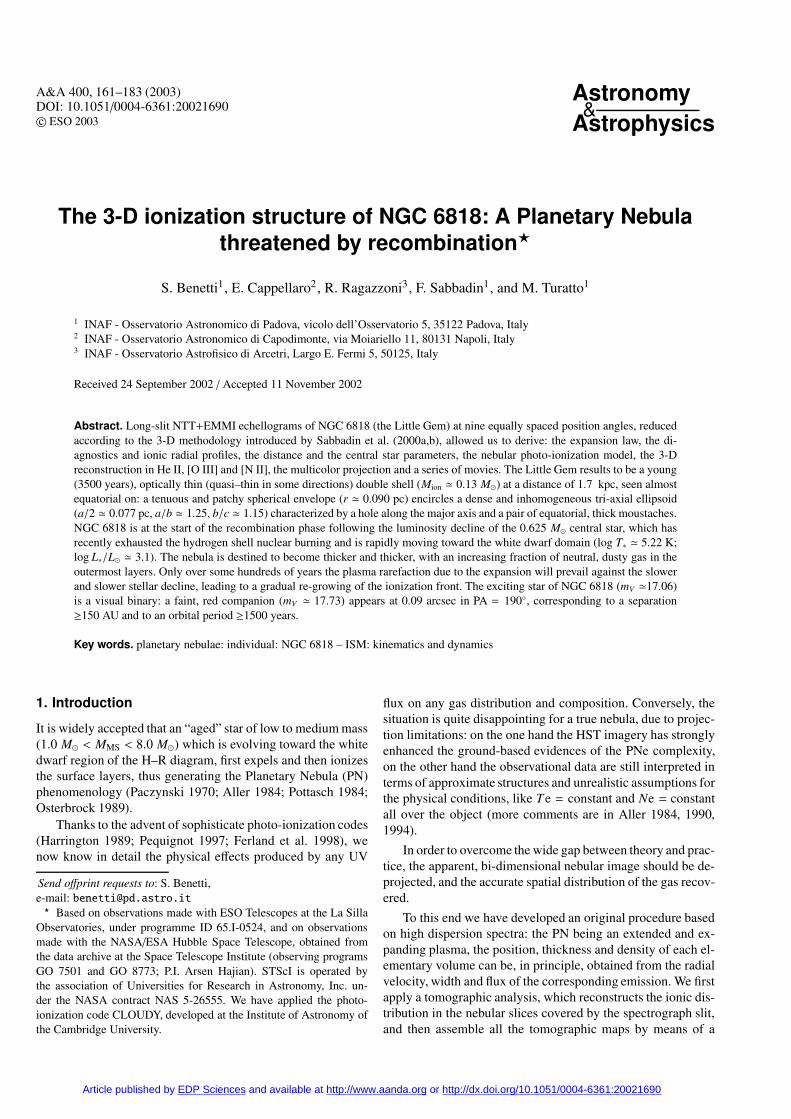
Fig. 1. WFPC2 archive images of NGC 6818 in [O III] (left) and [N II] (right). The binary nature of the central star is shown in the enlargementat the bottom. North is up and East to the left.
3-D rendering procedure for studying the morphology, physicalconditions, ionization, spatial structure and evolutionary status.
The rationale of the method and the earliest, rough resultsbased on plate echellograms go back to Sabbadin et al. (1985,1987). More recent, “quantitative” observations (i.e. using alinear detector) concern NGC 40 and NGC 1501, both objectscovered at moderate spectral resolution, R � 20 000−25 000,with the Echelle + 1.82 m telescope of Padua Observatory atAsiago, Cima Ekar (Sabbadin et al. 2000a,b; Ragazzoni et al.2001; hereafter Papers I to III, respectively).
At the same time we have carried out a survey of twodozen PNe and proto-PNe in both hemispheres with ESONTT+EMMI (spectral range λλ3900–7900 Å, R = 60 000,spatial resolution �1.0 arcsec) and the Telescopio NazionaleGalileo (TNG)+SARG (spectral range λλ4600–8000 Å, R =115 000, spatial resolution �0.7 arcsec). The observed samplecovers a variety of morphologies, kinematics and evolutionaryphases, including NGC 2392 (the Eskimo nebula), NGC 3132(the Eight-Burst n.), NGC 3242 (the Ghost of Jupiter n.),NGC 6210 (the Turtle n.), NGC 6543 (the Cat’s Eye n.),NGC 6751 (the Glowing Eye n.), NGC 6826 (the Blinking n.),NGC 7009 (the Saturn n.), NGC 7662 (the Blue Snowball n.),IC 418 (the Spirograph n.), He 2-47 (the Starfish n.), MyCn 18(the Hourglass n.), MZ 3 (the Ant n.), and as many un-dubbed,but equally exciting targets.
The 3-D ionization structure of NGC 6565 has been pre-sented by Turatto et al. (2002, Paper IV); here we discuss thecase of NGC 6818 (PNG 025.8-17.9, Acker et al. 1992).
The paper is structured as follows: Sect. 2 introduces thenebula, Sect. 3 presents the observational material and the re-duction procedure, Sect. 4 is dedicated to the gas kinematics,
Sect. 5 concerns the radial profile of the physical conditions(electron temperature and electron density from forbidden lineratios), in Sect. 6 the ionization structure and the overall gasdistribution are discussed, in Sect. 7 we derive the nebular dis-tance, mass and age, in Sect. 8 the central star parameters aregiven, Sect. 9 contains the application of the photo-ionizationmodel (CLOUDY), Sect. 10 describes the 3-D structure of thenebula in different ions, and Sect. 11 presents a short discussionand the conclusions.
2. The nebula
The HST/WFPC2 appearance of the high excitation PNNGC 6818 (sometimes called the Little Gem) is shown inFig. 1: in [O III] “a roughly spherical outer envelope as wellas a brighter vase-shaped interior bubble. There is a prominentorifice to the North and a smaller one to the South, along themajor axis, probably caused by a blow-out from a fast wind”(Rubin et al. 1998). A few dark filaments and knots are alsopresent.
The [N II] emission mainly occurs in two irregular equa-torial “moustaches” and in a multitude of condensations (insome cases presenting a sort of radially arranged cometary tail),which are brighter in the southern part of the nebula.
The striking HST multicolor reproduction by ArsenHajian & Yervant Terzian (http://ad.usno.navy.mil/pne/gallery.html) highlights the composite envelope struc-ture and the large stratification of the radiation withinNGC 6818.
Rubin et al. (1998) reported the presence of two faintstars, roughly 2–4 arcsec N and NE of the central star, which
S. Benetti et al.: The Planetary Nebula NGC 6818 163
could be physically associated to it. A careful analysis of theWFPC2 frames allowed us to unveil the true binary nature ofthe central star: the red, faint companion is at a distance of0.093(±0.004) arcsec in position angle (PA) = 190(±2)◦ (seethe enlargement at the bottom of Fig. 1).
Following Weedman (1968) our nebula is a prolatespheroid (an ellipse rotated about the major axis) of moderateellipticity (axial ratio 3:2) observed perpendicular to the majoraxis, whereas Sabbadin (1984) suggests a somewhat opticallythick prolate spheroid in a early evolutionary phase, seen al-most pole-on. According to Hyung et al. (1999), a definitivestatement on the geometry must wait for more adequate kine-matical data, due to the complexity of NGC 6818.
To this end we have secured a series of long-slit, radi-ally arranged echellograms. They were analysed with the 3-Dmethodology described in Papers I to IV.
3. The observational material and the reductiontechnique
Nine echellograms of NGC 6818 (exposure time 600 s; spec-tral resolution 60 000 with a slit 1.0 arcsec wide) have been ob-tained on July 29, 2000 at the ESO NTT in photometric skyconditions and seeing between 0.7 and 1.0 arcsec. We haveused a 40 arcsec long slit centered on the exciting star for allthe selected PA, ranging from 10◦ to 170◦ with a constant stepof 20◦. Since we do not insert an interference filter (as normallydone by the other observers to isolate a single order), each spec-trum covers 80 echelle orders (λ3967 Å of [Ne III] to λ7751 Åof [Ar III]), and provides the spatio–kinematical structure of agood two dozen nebular emissions, representing all the mainionic species.
The reduction method follows conceptually the standardprocedure, including bias, flat field, distortion correction,wavelength and flux calibration, and is carefully described inPaper IV.
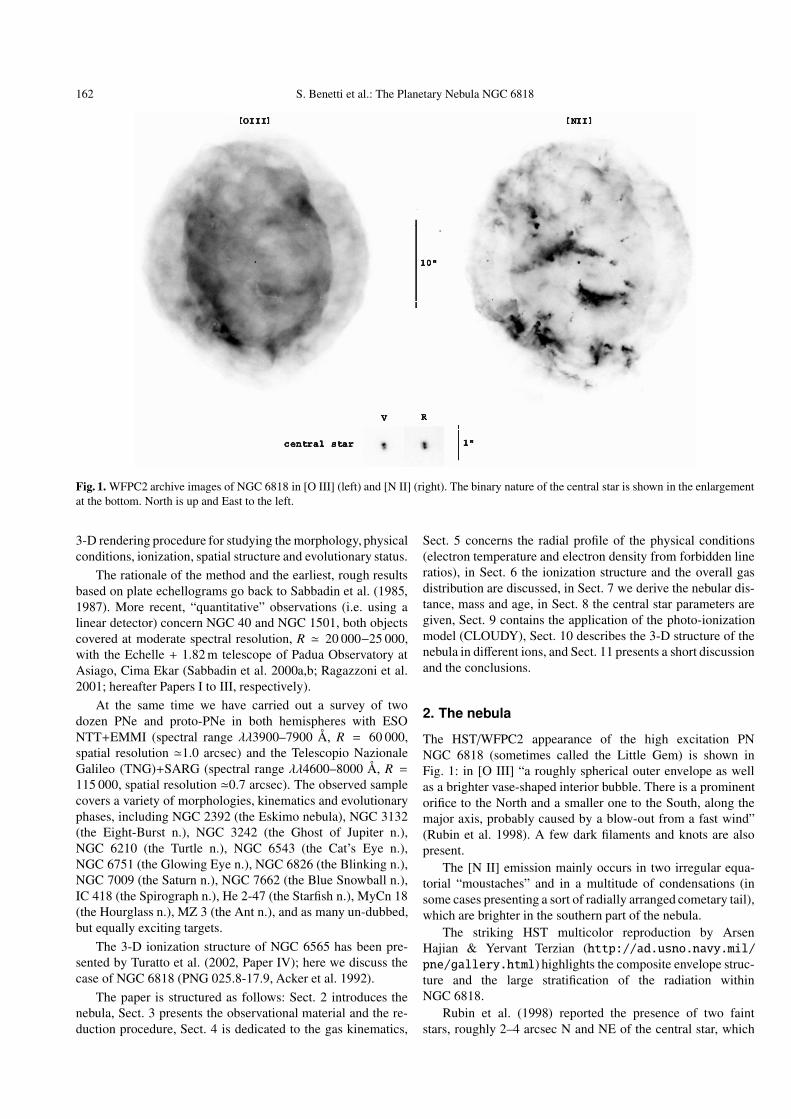
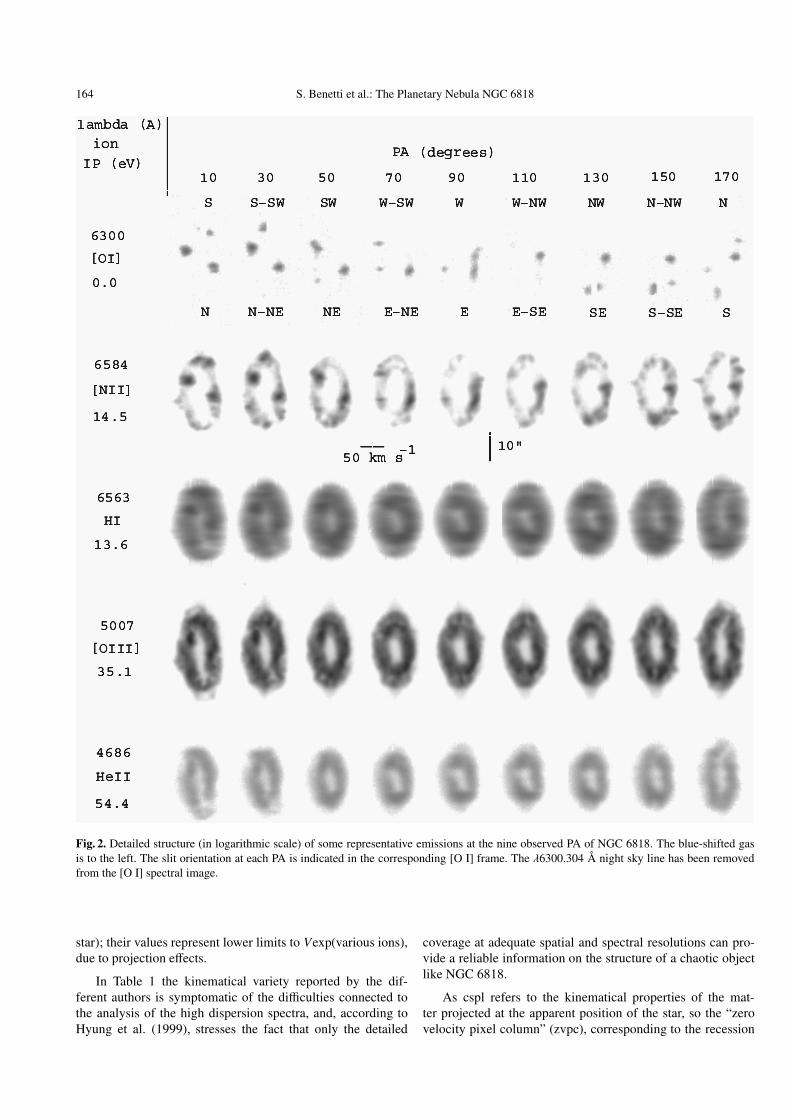
Figure 2 illustrates the detailed structure in [O I] (λ6300 Å),[N II] (λ6584 Å), H I (λ6563 Å), [O III] (λ5007 Å) and He II(λ4686 Å) at the observed PA. NGC 6818 exhibits a complexionization structure:– [O I] is only seen in the outermost regions, in the form ofdistinct condensations, which in some cases are symmetricallyarranged (the moustaches), otherwise single (like the cometaryknot in PA = 150◦, southern edge);– the low ionization [N II] emission forms a double envelopeof inhomogeneous structure from PA = 50◦ to PA = 130◦, anda single, elongated and distorted ring from PA = 150◦ to PA= 30◦. The presence of FLIERS (fast, low ionization emittingregions), as introduced by Balick et al. (1993, see also Corradiet al. 1996), is not confirmed here: although some isolatedspikes present a faint, high velocity tail, the overall [N II] emis-sion of NGC 6818 can be understood in terms of “normal” neb-ular regions simply shadowed by some inner and dense layercausing the ionization drop in the outer plasma;– the Hα line (central row in Fig. 2) is characterized by avery blurred appearance (due to a combination of thermalmotions plus fine structure plus expansion velocity gradient),masking the detailed distribution of the ionized gas. The same
effect is also present in He I and He II, but it is particularly dam-aging for Hα, the reference emission in both the radial electrondensity and ionization determinations (Paper IV);– λ5007 Å of [O III] (a mean-high excitation ion), by far thestrongest line in the optical region, highlights the double en-velope structure of NGC 6818: the inner shell (better seen be-tween PA = 50◦ and PA = 130◦) is an irregular ellipsoid brokenalong the major axis (N-S direction) whose equatorial, denserregions are identified by the “moustaches”. The line-tilt be-tween PA = 90◦ and PA = 110◦ suggests that we are misalignedwith both the intermediate and the minor axes of the inner el-lipsoid, and that the line of the nodes is at PA � 60◦. The outershell is almost un-tilted, spherical, holed at North and South,and circumscribes the internal one;– the He II emission (bottom row in Fig. 2) marks the high-est excitation nebular regions, mainly constituted by the innershell. Note the blurred appearance of λ4686 Å, essentially dueto the thirteen fine structure components.The first, qualitative picture of the spatial structure comingfrom the echellograms confirms the indications already ob-tained from the imaging (Sect. 2).
4. The gas kinematics
According to Papers I to IV, the expansion velocity (Vexp) ofthe ionized gas can be derived from the analysis of the “centralstar pixel line” (cspl) in the different ions. The cspl is parallel tothe dispersion, selects the nebular material projected at the ap-parent position of the star (whose motion is purely radial) andis the same in all the frames, the slit being radially arranged.Thus, in order to improve the S/N of the faintest emissions, thenine echellograms have been combined.
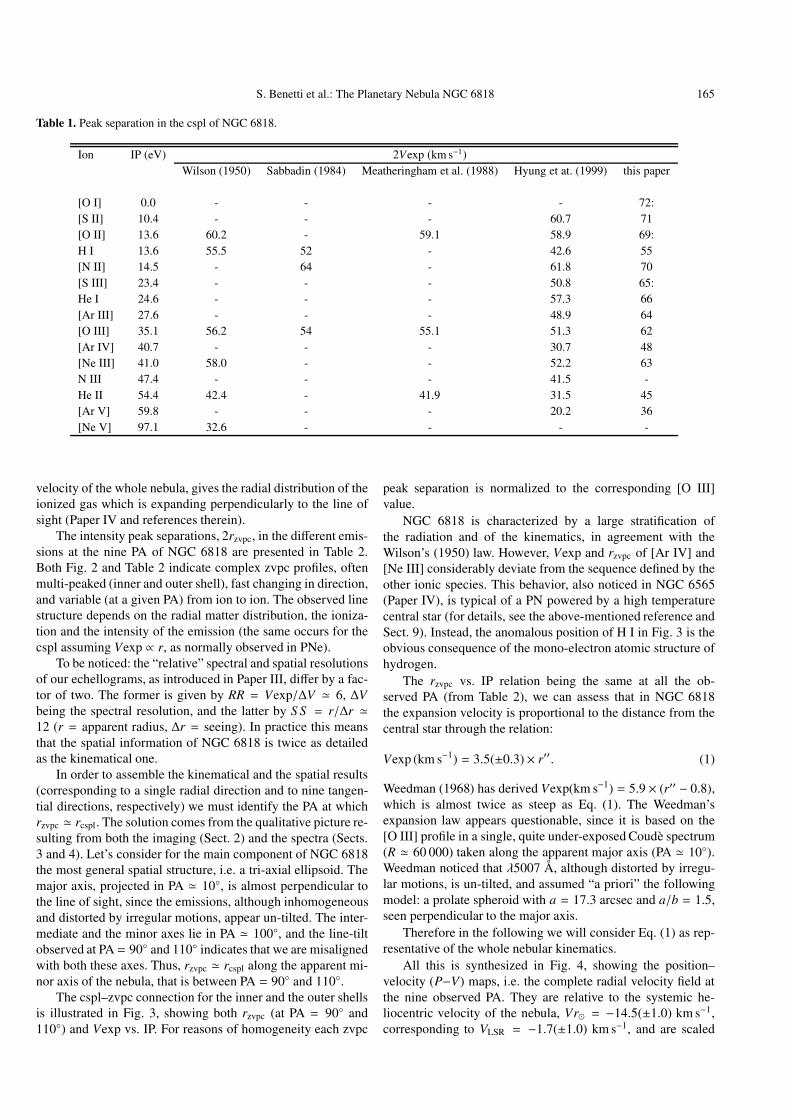
The results are contained in the last column of Table 1,where the ions are put in order of increasing ionization poten-tial (IP). Typical errors are 1.5 km s−1 for the strongest forbid-den emissions (like λ6584 Å of [N II] and λ5007 Å of [O III])to 3.0 km s−1 for the faintest ones (in particular: λ6300 Å of[O I], because of the knotty structure, and λ7319.87 Å of [O II],which is partially blended with λ7318.79 Å also belonging tothe O+ red quartet). The corresponding uncertainties for therecombination lines are: 2.5 km s−1 for λ6563 Å (H I), and2.0 km s−1 for λ5876 Å (He I) and λ4686 Å (He II).
Columns 3 to 6 of Table 1 report the kinematical resultsfrom the literature. In detail:– Wilson (1950) obtained a single Coude spectrum ofNGC 6818 (without de-rotator) at spectral resolution R �30 000;– Sabbadin (1984) observed the nebula at four PA (long-slitechellograms at R � 15 000);– Meatheringham et al. (1988, long-slit echellograms at un-specified position, R � 26 000) also measured the width at10% maximum intensity of λ5007 Å obtaining 2Vexp[O III] =87.6 km s−1 (following Dopita et al. 1985, this corresponds tothe largest expansion velocity of the gas);– Hyung et al. (1999, R � 33 000) studied four bright regionslocated along the apparent minor and major axes (4–5 arcsecEast and West, and 9–10 arcsec North and South of the central
164 S. Benetti et al.: The Planetary Nebula NGC 6818
Fig. 2. Detailed structure (in logarithmic scale) of some representative emissions at the nine observed PA of NGC 6818. The blue-shifted gasis to the left. The slit orientation at each PA is indicated in the corresponding [O I] frame. The λ6300.304 Å night sky line has been removedfrom the [O I] spectral image.
star); their values represent lower limits to Vexp(various ions),due to projection effects.
In Table 1 the kinematical variety reported by the dif-ferent authors is symptomatic of the difficulties connected tothe analysis of the high dispersion spectra, and, according toHyung et al. (1999), stresses the fact that only the detailed
coverage at adequate spatial and spectral resolutions can pro-vide a reliable information on the structure of a chaotic objectlike NGC 6818.
As cspl refers to the kinematical properties of the mat-ter projected at the apparent position of the star, so the “zerovelocity pixel column” (zvpc), corresponding to the recession
S. Benetti et al.: The Planetary Nebula NGC 6818 165
Table 1. Peak separation in the cspl of NGC 6818.
Ion IP (eV) 2Vexp (km s−1)Wilson (1950) Sabbadin (1984) Meatheringham et al. (1988) Hyung et at. (1999) this paper
[O I] 0.0 - - - - 72:[S II] 10.4 - - - 60.7 71[O II] 13.6 60.2 - 59.1 58.9 69:H I 13.6 55.5 52 - 42.6 55[N II] 14.5 - 64 - 61.8 70[S III] 23.4 - - - 50.8 65:He I 24.6 - - - 57.3 66[Ar III] 27.6 - - - 48.9 64[O III] 35.1 56.2 54 55.1 51.3 62[Ar IV] 40.7 - - - 30.7 48[Ne III] 41.0 58.0 - - 52.2 63N III 47.4 - - - 41.5 -He II 54.4 42.4 - 41.9 31.5 45[Ar V] 59.8 - - - 20.2 36[Ne V] 97.1 32.6 - - - -
velocity of the whole nebula, gives the radial distribution of theionized gas which is expanding perpendicularly to the line ofsight (Paper IV and references therein).
The intensity peak separations, 2rzvpc, in the different emis-sions at the nine PA of NGC 6818 are presented in Table 2.Both Fig. 2 and Table 2 indicate complex zvpc profiles, oftenmulti-peaked (inner and outer shell), fast changing in direction,and variable (at a given PA) from ion to ion. The observed linestructure depends on the radial matter distribution, the ioniza-tion and the intensity of the emission (the same occurs for thecspl assuming Vexp ∝ r, as normally observed in PNe).
To be noticed: the “relative” spectral and spatial resolutionsof our echellograms, as introduced in Paper III, differ by a fac-tor of two. The former is given by RR = Vexp/∆V � 6, ∆Vbeing the spectral resolution, and the latter by S S = r/∆r �12 (r = apparent radius, ∆r = seeing). In practice this meansthat the spatial information of NGC 6818 is twice as detailedas the kinematical one.
In order to assemble the kinematical and the spatial results(corresponding to a single radial direction and to nine tangen-tial directions, respectively) we must identify the PA at whichrzvpc � rcspl. The solution comes from the qualitative picture re-sulting from both the imaging (Sect. 2) and the spectra (Sects.3 and 4). Let’s consider for the main component of NGC 6818the most general spatial structure, i.e. a tri-axial ellipsoid. Themajor axis, projected in PA � 10◦, is almost perpendicular tothe line of sight, since the emissions, although inhomogeneousand distorted by irregular motions, appear un-tilted. The inter-mediate and the minor axes lie in PA � 100◦, and the line-tiltobserved at PA = 90◦ and 110◦ indicates that we are misalignedwith both these axes. Thus, rzvpc � rcspl along the apparent mi-nor axis of the nebula, that is between PA = 90◦ and 110◦.
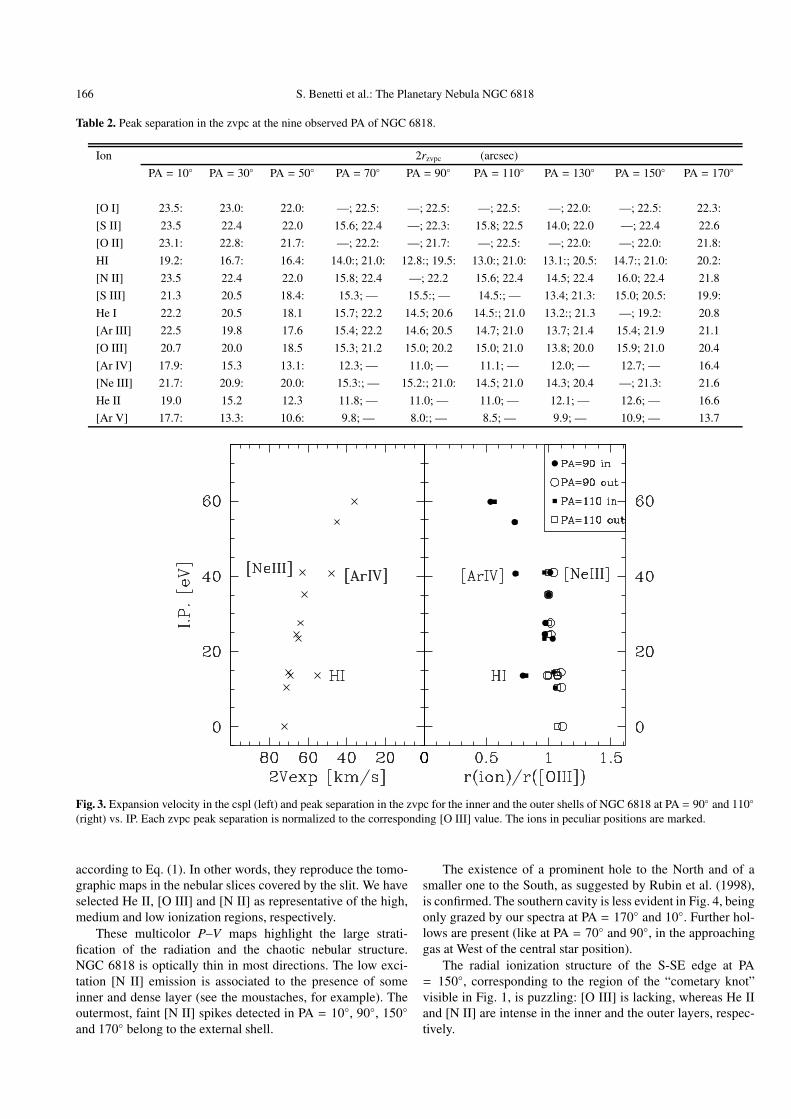
The cspl–zvpc connection for the inner and the outer shellsis illustrated in Fig. 3, showing both rzvpc (at PA = 90◦ and110◦) and Vexp vs. IP. For reasons of homogeneity each zvpc
peak separation is normalized to the corresponding [O III]value.
NGC 6818 is characterized by a large stratification ofthe radiation and of the kinematics, in agreement with theWilson’s (1950) law. However, Vexp and rzvpc of [Ar IV] and[Ne III] considerably deviate from the sequence defined by theother ionic species. This behavior, also noticed in NGC 6565(Paper IV), is typical of a PN powered by a high temperaturecentral star (for details, see the above-mentioned reference andSect. 9). Instead, the anomalous position of H I in Fig. 3 is theobvious consequence of the mono-electron atomic structure ofhydrogen.
The rzvpc vs. IP relation being the same at all the ob-served PA (from Table 2), we can assess that in NGC 6818the expansion velocity is proportional to the distance from thecentral star through the relation:
Vexp (km s−1) = 3.5(±0.3)× r′′. (1)
Weedman (1968) has derived Vexp(km s−1) = 5.9 × (r′′ − 0.8),which is almost twice as steep as Eq. (1). The Weedman’sexpansion law appears questionable, since it is based on the[O III] profile in a single, quite under-exposed Coude spectrum(R � 60 000) taken along the apparent major axis (PA � 10◦).Weedman noticed that λ5007 Å, although distorted by irregu-lar motions, is un-tilted, and assumed “a priori” the followingmodel: a prolate spheroid with a = 17.3 arcsec and a/b = 1.5,seen perpendicular to the major axis.
Therefore in the following we will consider Eq. (1) as rep-resentative of the whole nebular kinematics.
All this is synthesized in Fig. 4, showing the position–velocity (P−V) maps, i.e. the complete radial velocity field atthe nine observed PA. They are relative to the systemic he-liocentric velocity of the nebula, Vr� = −14.5(±1.0) km s−1,corresponding to VLSR = −1.7(±1.0) km s−1, and are scaled
166 S. Benetti et al.: The Planetary Nebula NGC 6818
Table 2. Peak separation in the zvpc at the nine observed PA of NGC 6818.
Ion 2rzvpc (arcsec)
PA = 10◦ PA = 30◦ PA = 50◦ PA = 70◦ PA = 90◦ PA = 110◦ PA = 130◦ PA = 150◦ PA = 170◦
[O I] 23.5: 23.0: 22.0: —; 22.5: —; 22.5: —; 22.5: —; 22.0: —; 22.5: 22.3:
[S II] 23.5 22.4 22.0 15.6; 22.4 —; 22.3: 15.8; 22.5 14.0; 22.0 —; 22.4 22.6
[O II] 23.1: 22.8: 21.7: —; 22.2: —; 21.7: —; 22.5: —; 22.0: —; 22.0: 21.8:
HI 19.2: 16.7: 16.4: 14.0:; 21.0: 12.8:; 19.5: 13.0:; 21.0: 13.1:; 20.5: 14.7:; 21.0: 20.2:
[N II] 23.5 22.4 22.0 15.8; 22.4 —; 22.2 15.6; 22.4 14.5; 22.4 16.0; 22.4 21.8
[S III] 21.3 20.5 18.4: 15.3; — 15.5:; — 14.5:; — 13.4; 21.3: 15.0; 20.5: 19.9:
He I 22.2 20.5 18.1 15.7; 22.2 14.5; 20.6 14.5:; 21.0 13.2:; 21.3 —; 19.2: 20.8
[Ar III] 22.5 19.8 17.6 15.4; 22.2 14.6; 20.5 14.7; 21.0 13.7; 21.4 15.4; 21.9 21.1
[O III] 20.7 20.0 18.5 15.3; 21.2 15.0; 20.2 15.0; 21.0 13.8; 20.0 15.9; 21.0 20.4
[Ar IV] 17.9: 15.3 13.1: 12.3; — 11.0; — 11.1; — 12.0; — 12.7; — 16.4
[Ne III] 21.7: 20.9: 20.0: 15.3:; — 15.2:; 21.0: 14.5; 21.0 14.3; 20.4 —; 21.3: 21.6
He II 19.0 15.2 12.3 11.8; — 11.0; — 11.0; — 12.1; — 12.6; — 16.6
[Ar V] 17.7: 13.3: 10.6: 9.8; — 8.0:; — 8.5; — 9.9; — 10.9; — 13.7
Fig. 3. Expansion velocity in the cspl (left) and peak separation in the zvpc for the inner and the outer shells of NGC 6818 at PA = 90◦ and 110◦
(right) vs. IP. Each zvpc peak separation is normalized to the corresponding [O III] value. The ions in peculiar positions are marked.
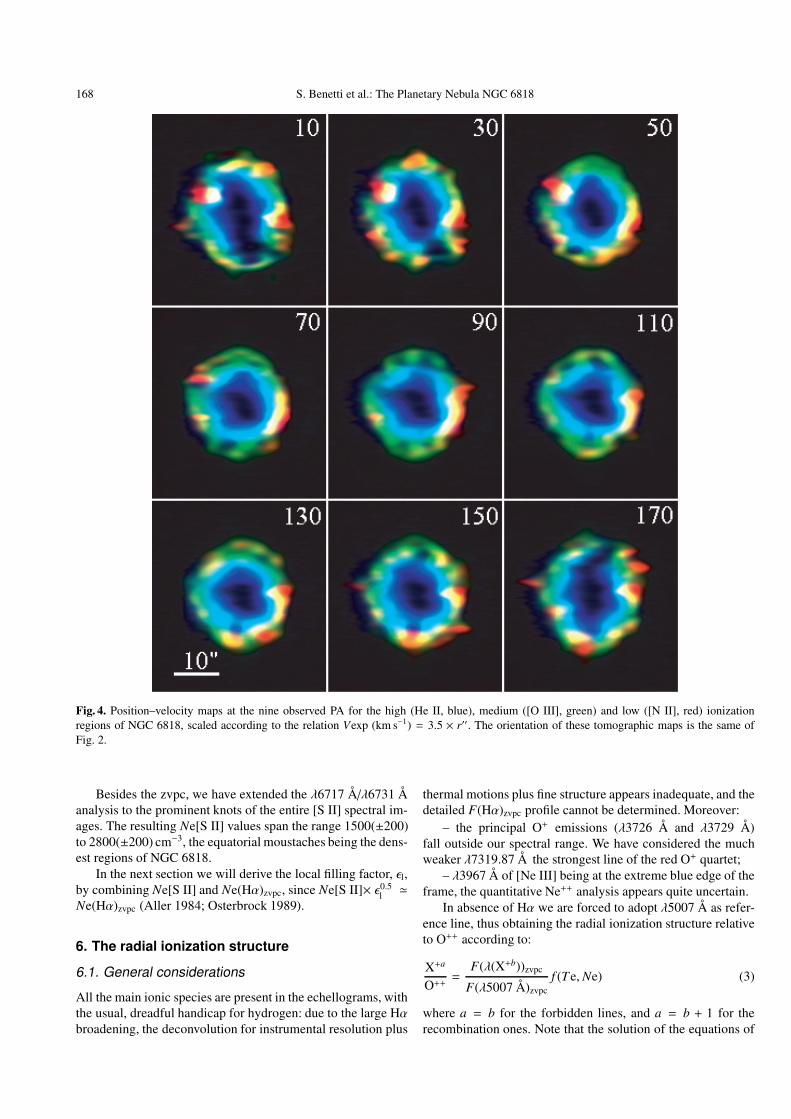
according to Eq. (1). In other words, they reproduce the tomo-graphic maps in the nebular slices covered by the slit. We haveselected He II, [O III] and [N II] as representative of the high,medium and low ionization regions, respectively.
These multicolor P–V maps highlight the large strati-fication of the radiation and the chaotic nebular structure.NGC 6818 is optically thin in most directions. The low exci-tation [N II] emission is associated to the presence of someinner and dense layer (see the moustaches, for example). Theoutermost, faint [N II] spikes detected in PA = 10◦, 90◦, 150◦and 170◦ belong to the external shell.
The existence of a prominent hole to the North and of asmaller one to the South, as suggested by Rubin et al. (1998),is confirmed. The southern cavity is less evident in Fig. 4, beingonly grazed by our spectra at PA = 170◦ and 10◦. Further hol-lows are present (like at PA = 70◦ and 90◦, in the approachinggas at West of the central star position).
The radial ionization structure of the S-SE edge at PA= 150◦, corresponding to the region of the “cometary knot”visible in Fig. 1, is puzzling: [O III] is lacking, whereas He IIand [N II] are intense in the inner and the outer layers, respec-tively.
S. Benetti et al.: The Planetary Nebula NGC 6818 167
In summary: although some spectral features of the north-ern and southern holes can be tentatively interpreted in terms ofionized gas moderately accelerated by some blowing-up agent(as suggested by Rubin et al. 1998), the linear expansion lawhere adopted represents a valid approximation of the overallnebular kinematics.
5. The physical conditions
5.1. General considerations
We can obtain the Te radial profile from the diagnostic line ra-tios of ions in p2 or p4 configurations (like [O III] and [N II]),and the Ne radial distribution from both the diagnostics ofions in p3 configuration (like [S II]) and the absolute Hα flux.According to Paper IV, the zvpc, which is independent on theexpansion velocity field, must be used.
In the specific case of NGC 6818 the large Hα broadening(due to thermal motions, fine structure and expansion veloc-ity gradient) prevents the accurate determination of F(Hα)zvpc
(and then of Ne(Hα)). Thus, in this section Te[O III], Te[N II]and Ne[S II] are derived from the corresponding line intensityratios. Later on (Sect. 6.3) we will illustrate the adopted es-camotage providing F(Hα)zvpc and Ne(Hα) from the observedradial ionization structure and the assumption O/H = constantacross the nebula.
5.2. Interstellar absorption
First of all the observed line intensities must be corrected forinterstellar absorption according to:
logI(λ)corr
I(λ)obs= fλ c(Hβ) (2)
where fλ is the interstellar extinction coefficient given bySeaton (1979). The logarithmic extinction at Hβ, c(Hβ), isnormally obtained by comparing the observed Balmer decre-ment (in particular Hα/Hβ) to the intrinsic value given byBrocklehurst (1971) and Hummer & Storey (1987). The es-timates of c(Hβ) (from the Balmer ratio) reported in the lit-erature for NGC 6818 span the range 0.25 (Aller & Czyzak1983, Liu & Danziger 1993) to 0.41 (Collins et al. 1961).Moreover, Tylenda et al. (1992) and Condon et al. (1999) ob-tained c(Hβ) = 0.33 and 0.40, respectively, from the radioto Hβ fluxes.
Thanks to the excellent spatial and spectral accuraciesachieved by the superposition technique used (±0.15 arcsec and±1.0 km s−1, respectively) we can extend the Hα/Hβ analysis tothe whole spectral image, as recently introduced (Paper IV) inthe study of NGC 6565, a compact, dust embedded PN exhibit-ing a complex c(Hβ) profile. The results are less dramatic forNGC 6818, since the blurred appearance of both Hα and Hβlimits the resolution: besides some indications of a soft de-cline in the innermost regions (likely caused by a local in-crease of Te), the spectral maps appear quite homogeneous atHα/Hβ = 3.73(±0.06), corresponding to c(Hβ) = 0.37(±0.03)(for the case B of Baker & Menzel 1938, Te = 12 000 K andlog Ne = 3.00; Brocklehurst 1971; Aller 1984; Hummer &Storey 1987).
5.3. Te[O III], Te[N II] and Ne[S II]
First we obtain Te[O III] from λ5007 Å/λ4363 Å, the line ratiobeing almost independent on Ne for Ne < 104 cm−3. Ne[S II]is then derived from λ6717 Å/λ6731 Å (using Te[O III] to takeinto account the weak dependence of the ratio on Te). Last,Te[N II] comes from λ6584 Å/λ5755 Å (adopting Ne[S II] forits weak dependence on the electron density).
Although the resulting Te[O III], Te[N II] and Ne[S II]profiles rapidly change with PA, as expected of the chaoticstructure of NGC 6818, nevertheless there are some commonfeatures. In order to highlight both the differences and theanalogies we have selected two PA close to the apparent majoraxis (PA = 10◦ and PA = 30◦) and two PA close to the apparentminor axis (PA = 90◦ and PA = 110◦) as representative of thewhole nebular phenomenology.
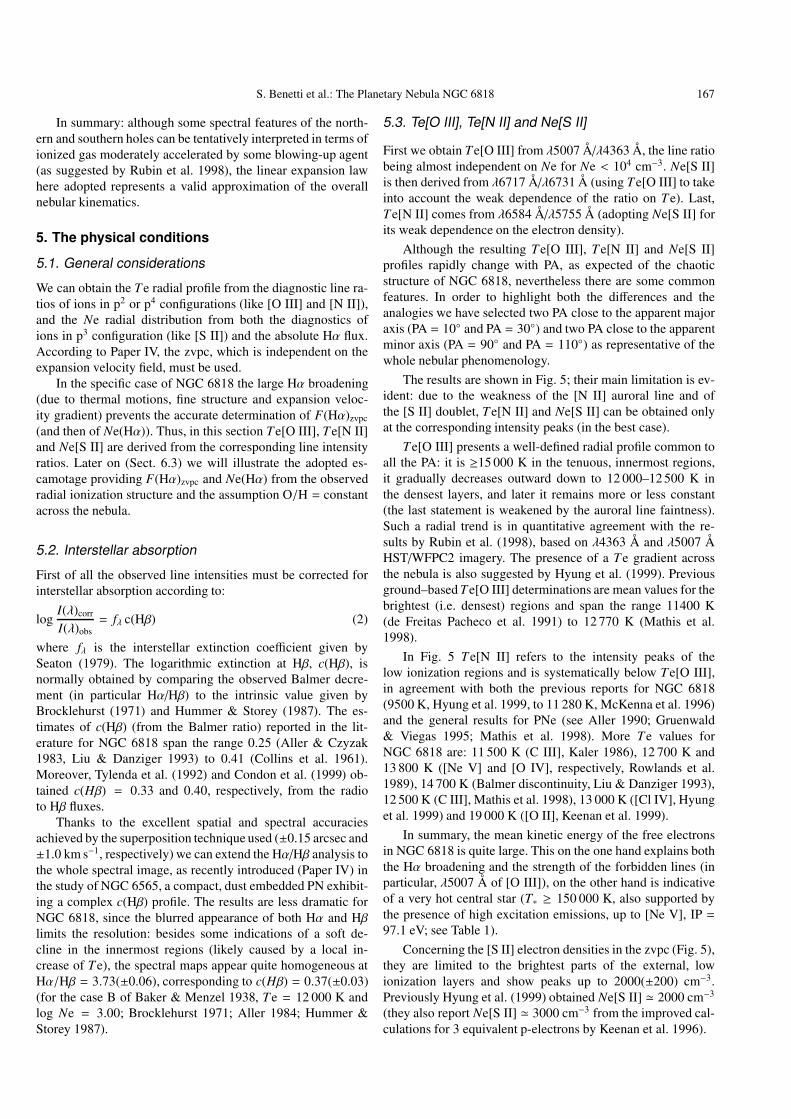
The results are shown in Fig. 5; their main limitation is ev-ident: due to the weakness of the [N II] auroral line and ofthe [S II] doublet, Te[N II] and Ne[S II] can be obtained onlyat the corresponding intensity peaks (in the best case).
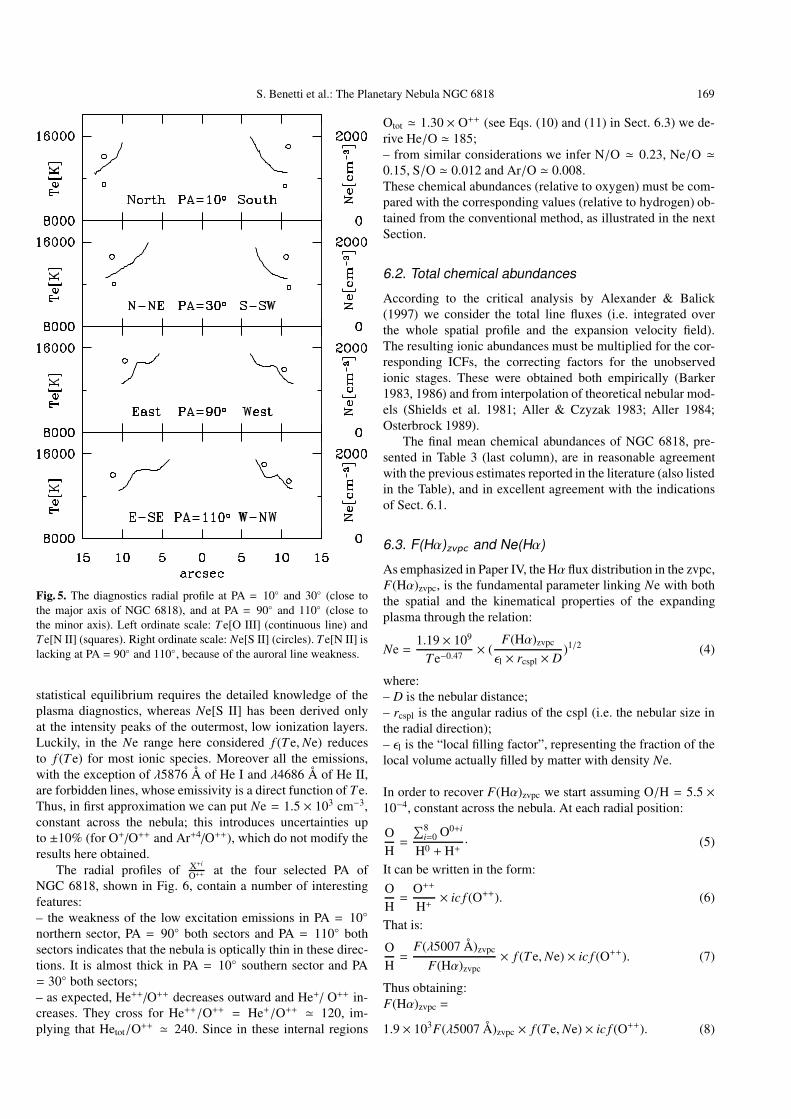
Te[O III] presents a well-defined radial profile common toall the PA: it is ≥15 000 K in the tenuous, innermost regions,it gradually decreases outward down to 12 000–12 500 K inthe densest layers, and later it remains more or less constant(the last statement is weakened by the auroral line faintness).Such a radial trend is in quantitative agreement with the re-sults by Rubin et al. (1998), based on λ4363 Å and λ5007 ÅHST/WFPC2 imagery. The presence of a Te gradient acrossthe nebula is also suggested by Hyung et al. (1999). Previousground–based Te[O III] determinations are mean values for thebrightest (i.e. densest) regions and span the range 11400 K(de Freitas Pacheco et al. 1991) to 12 770 K (Mathis et al.1998).
In Fig. 5 Te[N II] refers to the intensity peaks of thelow ionization regions and is systematically below Te[O III],in agreement with both the previous reports for NGC 6818(9500 K, Hyung et al. 1999, to 11 280 K, McKenna et al. 1996)and the general results for PNe (see Aller 1990; Gruenwald& Viegas 1995; Mathis et al. 1998). More Te values forNGC 6818 are: 11 500 K (C III], Kaler 1986), 12 700 K and13 800 K ([Ne V] and [O IV], respectively, Rowlands et al.1989), 14 700 K (Balmer discontinuity, Liu & Danziger 1993),12 500 K (C III], Mathis et al. 1998), 13 000 K ([Cl IV], Hyunget al. 1999) and 19 000 K ([O II], Keenan et al. 1999).
In summary, the mean kinetic energy of the free electronsin NGC 6818 is quite large. This on the one hand explains boththe Hα broadening and the strength of the forbidden lines (inparticular, λ5007 Å of [O III]), on the other hand is indicativeof a very hot central star (T∗ ≥ 150 000 K, also supported bythe presence of high excitation emissions, up to [Ne V], IP =97.1 eV; see Table 1).
Concerning the [S II] electron densities in the zvpc (Fig. 5),they are limited to the brightest parts of the external, lowionization layers and show peaks up to 2000(±200) cm−3.Previously Hyung et al. (1999) obtained Ne[S II] � 2000 cm−3
(they also report Ne[S II] � 3000 cm−3 from the improved cal-culations for 3 equivalent p-electrons by Keenan et al. 1996).
168 S. Benetti et al.: The Planetary Nebula NGC 6818
Fig. 4. Position–velocity maps at the nine observed PA for the high (He II, blue), medium ([O III], green) and low ([N II], red) ionizationregions of NGC 6818, scaled according to the relation Vexp (km s−1) = 3.5 × r′′. The orientation of these tomographic maps is the same ofFig. 2.
Besides the zvpc, we have extended the λ6717 Å/λ6731 Åanalysis to the prominent knots of the entire [S II] spectral im-ages. The resulting Ne[S II] values span the range 1500(±200)to 2800(±200) cm−3, the equatorial moustaches being the dens-est regions of NGC 6818.
In the next section we will derive the local filling factor, εl,by combining Ne[S II] and Ne(Hα)zvpc, since Ne[S II]× ε0.5
l �Ne(Hα)zvpc (Aller 1984; Osterbrock 1989).
6. The radial ionization structure
6.1. General considerations
All the main ionic species are present in the echellograms, withthe usual, dreadful handicap for hydrogen: due to the large Hαbroadening, the deconvolution for instrumental resolution plus
thermal motions plus fine structure appears inadequate, and thedetailed F(Hα)zvpc profile cannot be determined. Moreover:
– the principal O+ emissions (λ3726 Å and λ3729 Å)fall outside our spectral range. We have considered the muchweaker λ7319.87 Å the strongest line of the red O+ quartet;
– λ3967 Å of [Ne III] being at the extreme blue edge of theframe, the quantitative Ne++ analysis appears quite uncertain.
In absence of Hα we are forced to adopt λ5007 Å as refer-ence line, thus obtaining the radial ionization structure relativeto O++ according to:
X+a
O++=
F(λ(X+b))zvpc
F(λ5007 Å)zvpcf (Te,Ne) (3)
where a = b for the forbidden lines, and a = b + 1 for therecombination ones. Note that the solution of the equations of
S. Benetti et al.: The Planetary Nebula NGC 6818 169
Fig. 5. The diagnostics radial profile at PA = 10◦ and 30◦ (close tothe major axis of NGC 6818), and at PA = 90◦ and 110◦ (close tothe minor axis). Left ordinate scale: T e[O III] (continuous line) andT e[N II] (squares). Right ordinate scale: Ne[S II] (circles). T e[N II] islacking at PA = 90◦ and 110◦, because of the auroral line weakness.
statistical equilibrium requires the detailed knowledge of theplasma diagnostics, whereas Ne[S II] has been derived onlyat the intensity peaks of the outermost, low ionization layers.Luckily, in the Ne range here considered f (Te,Ne) reducesto f (Te) for most ionic species. Moreover all the emissions,with the exception of λ5876 Å of He I and λ4686 Å of He II,are forbidden lines, whose emissivity is a direct function of Te.Thus, in first approximation we can put Ne = 1.5 × 103 cm−3,constant across the nebula; this introduces uncertainties upto ±10% (for O+/O++ and Ar+4/O++), which do not modify theresults here obtained.
The radial profiles of X+i
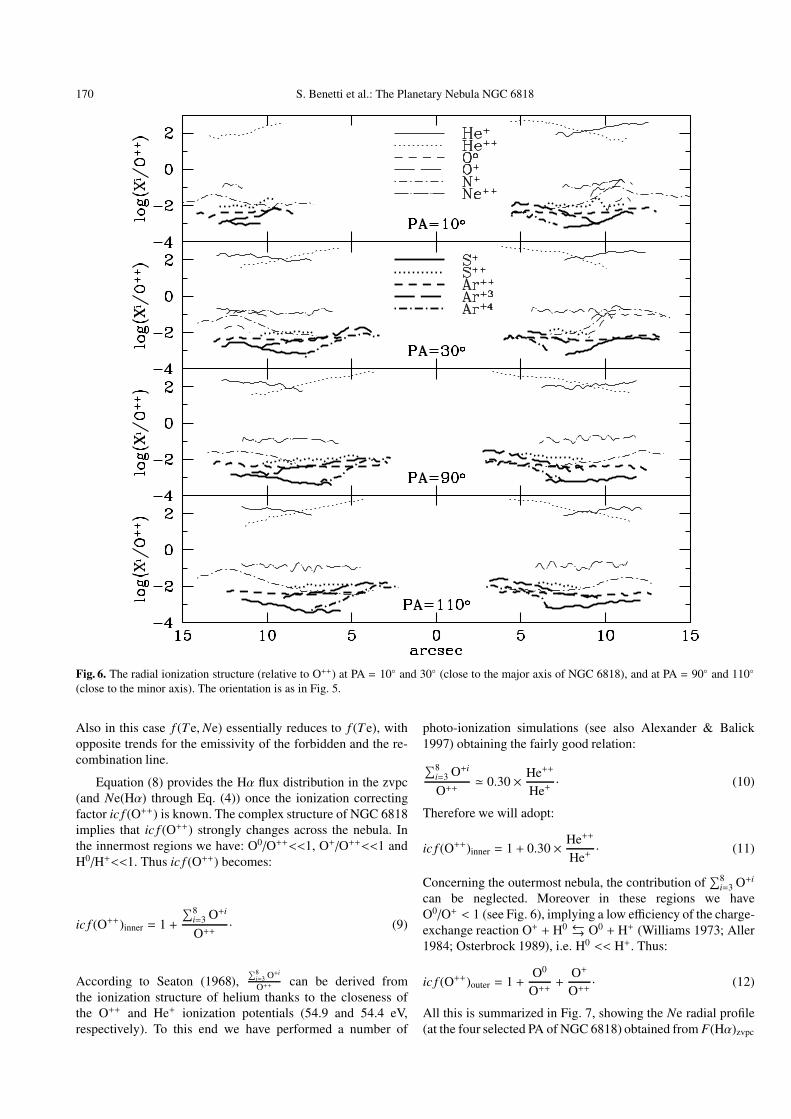
O++ at the four selected PA ofNGC 6818, shown in Fig. 6, contain a number of interestingfeatures:– the weakness of the low excitation emissions in PA = 10◦northern sector, PA = 90◦ both sectors and PA = 110◦ bothsectors indicates that the nebula is optically thin in these direc-tions. It is almost thick in PA = 10◦ southern sector and PA= 30◦ both sectors;– as expected, He++/O++ decreases outward and He+/ O++ in-creases. They cross for He++/O++ = He+/O++ � 120, im-plying that Hetot/O++ � 240. Since in these internal regions
Otot � 1.30 × O++ (see Eqs. (10) and (11) in Sect. 6.3) we de-rive He/O � 185;– from similar considerations we infer N/O � 0.23, Ne/O �0.15, S/O � 0.012 and Ar/O � 0.008.These chemical abundances (relative to oxygen) must be com-pared with the corresponding values (relative to hydrogen) ob-tained from the conventional method, as illustrated in the nextSection.
6.2. Total chemical abundances
According to the critical analysis by Alexander & Balick(1997) we consider the total line fluxes (i.e. integrated overthe whole spatial profile and the expansion velocity field).The resulting ionic abundances must be multiplied for the cor-responding ICFs, the correcting factors for the unobservedionic stages. These were obtained both empirically (Barker1983, 1986) and from interpolation of theoretical nebular mod-els (Shields et al. 1981; Aller & Czyzak 1983; Aller 1984;Osterbrock 1989).
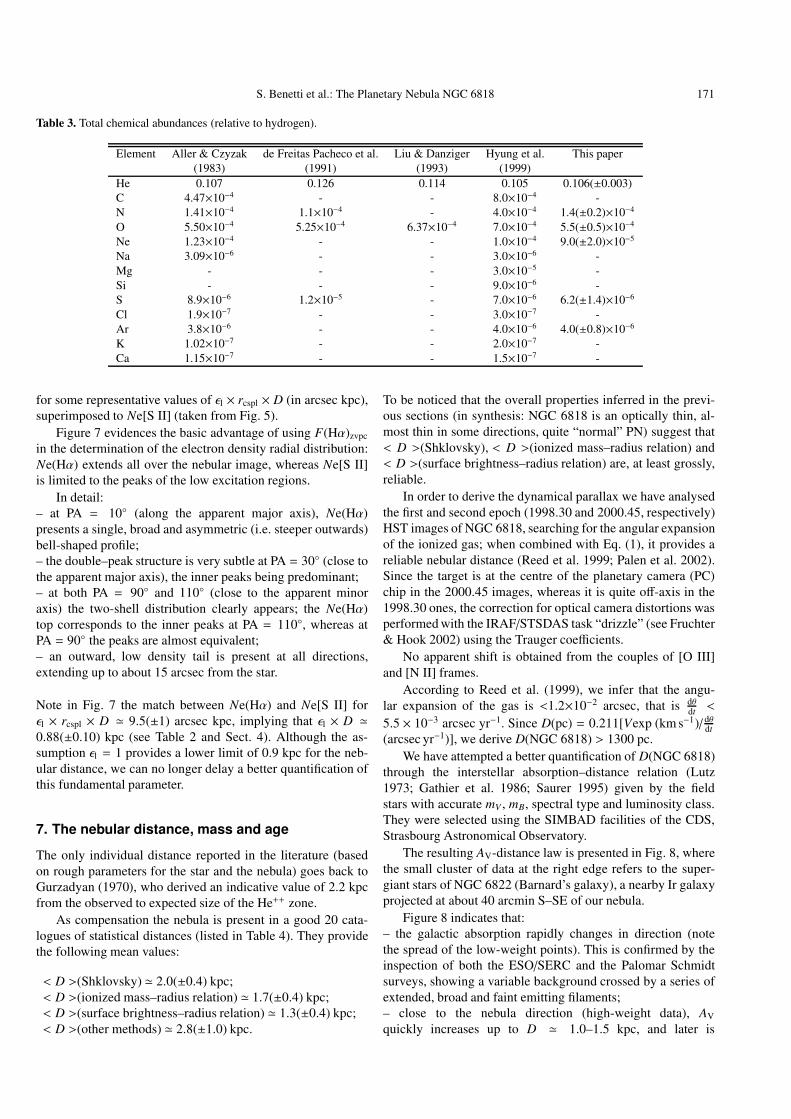
The final mean chemical abundances of NGC 6818, pre-sented in Table 3 (last column), are in reasonable agreementwith the previous estimates reported in the literature (also listedin the Table), and in excellent agreement with the indicationsof Sect. 6.1.
6.3. F(Hα)zvpc and Ne(Hα)
As emphasized in Paper IV, the Hα flux distribution in the zvpc,F(Hα)zvpc, is the fundamental parameter linking Ne with boththe spatial and the kinematical properties of the expandingplasma through the relation:
Ne =1.19 × 10⁹
Te−0.47× (
F(Hα)zvpc
εl × rcspl × D)1/2 (4)
where:– D is the nebular distance;– rcspl is the angular radius of the cspl (i.e. the nebular size inthe radial direction);– εl is the “local filling factor”, representing the fraction of thelocal volume actually filled by matter with density Ne.
In order to recover F(Hα)zvpc we start assuming O/H = 5.5 ×10⁻⁴, constant across the nebula. At each radial position:
OH=
∑8i=0 O0+i
H0 + H+· (5)
It can be written in the form:
OH=
O++
H+× ic f (O++). (6)
That is:
OH=
F(λ5007 Å)zvpc
F(Hα)zvpc× f (Te,Ne) × ic f (O++). (7)
Thus obtaining:F(Hα)zvpc =
1.9 × 10³F(λ5007 Å)zvpc × f (Te,Ne) × ic f (O++). (8)
170 S. Benetti et al.: The Planetary Nebula NGC 6818
Fig. 6. The radial ionization structure (relative to O++) at PA = 10◦ and 30◦ (close to the major axis of NGC 6818), and at PA = 90◦ and 110◦
(close to the minor axis). The orientation is as in Fig. 5.
Also in this case f (Te,Ne) essentially reduces to f (Te), withopposite trends for the emissivity of the forbidden and the re-combination line.
Equation (8) provides the Hα flux distribution in the zvpc(and Ne(Hα) through Eq. (4)) once the ionization correctingfactor ic f (O++) is known. The complex structure of NGC 6818implies that ic f (O++) strongly changes across the nebula. Inthe innermost regions we have: O0/O++<<1, O+/O++<<1 andH0/H+<<1. Thus ic f (O++) becomes:
ic f (O++)inner = 1 +
∑8i=3 O+i
O++· (9)
According to Seaton (1968),∑8
i=3 O+i
O++ can be derived fromthe ionization structure of helium thanks to the closeness ofthe O++ and He+ ionization potentials (54.9 and 54.4 eV,respectively). To this end we have performed a number of
photo-ionization simulations (see also Alexander & Balick1997) obtaining the fairly good relation:
∑8i=3 O+i
O++� 0.30 × He++
He+· (10)
Therefore we will adopt:
ic f (O++)inner = 1 + 0.30 × He++
He+· (11)
Concerning the outermost nebula, the contribution of∑8
i=3 O+i
can be neglected. Moreover in these regions we haveO0/O+ < 1 (see Fig. 6), implying a low efficiency of the charge-exchange reaction O+ + H0 ←→ O0 + H+ (Williams 1973; Aller1984; Osterbrock 1989), i.e. H0 << H+. Thus:
ic f (O++)outer = 1 +O0
O+++
O+
O++· (12)
All this is summarized in Fig. 7, showing the Ne radial profile(at the four selected PA of NGC 6818) obtained from F(Hα)zvpc
S. Benetti et al.: The Planetary Nebula NGC 6818 171
Table 3. Total chemical abundances (relative to hydrogen).
Element Aller & Czyzak de Freitas Pacheco et al. Liu & Danziger Hyung et al. This paper(1983) (1991) (1993) (1999)
He 0.107 0.126 0.114 0.105 0.106(±0.003)C 4.47×10⁻⁴ - - 8.0×10⁻⁴ -N 1.41×10⁻⁴ 1.1×10⁻⁴ - 4.0×10⁻⁴ 1.4(±0.2)×10−4
O 5.50×10⁻⁴ 5.25×10⁻⁴ 6.37×10⁻⁴ 7.0×10⁻⁴ 5.5(±0.5)×10−4
Ne 1.23×10⁻⁴ - - 1.0×10⁻⁴ 9.0(±2.0)×10−5
Na 3.09×10⁻⁶ - - 3.0×10⁻⁶ -Mg - - - 3.0×10⁻⁵ -Si - - - 9.0×10⁻⁶ -S 8.9×10⁻⁶ 1.2×10⁻⁵ - 7.0×10⁻⁶ 6.2(±1.4)×10−6
Cl 1.9×10⁻⁷ - - 3.0×10⁻⁷ -Ar 3.8×10⁻⁶ - - 4.0×10⁻⁶ 4.0(±0.8)×10−6
K 1.02×10⁻⁷ - - 2.0×10⁻⁷ -Ca 1.15×10⁻⁷ - - 1.5×10⁻⁷ -
for some representative values of εl × rcspl × D (in arcsec kpc),superimposed to Ne[S II] (taken from Fig. 5).
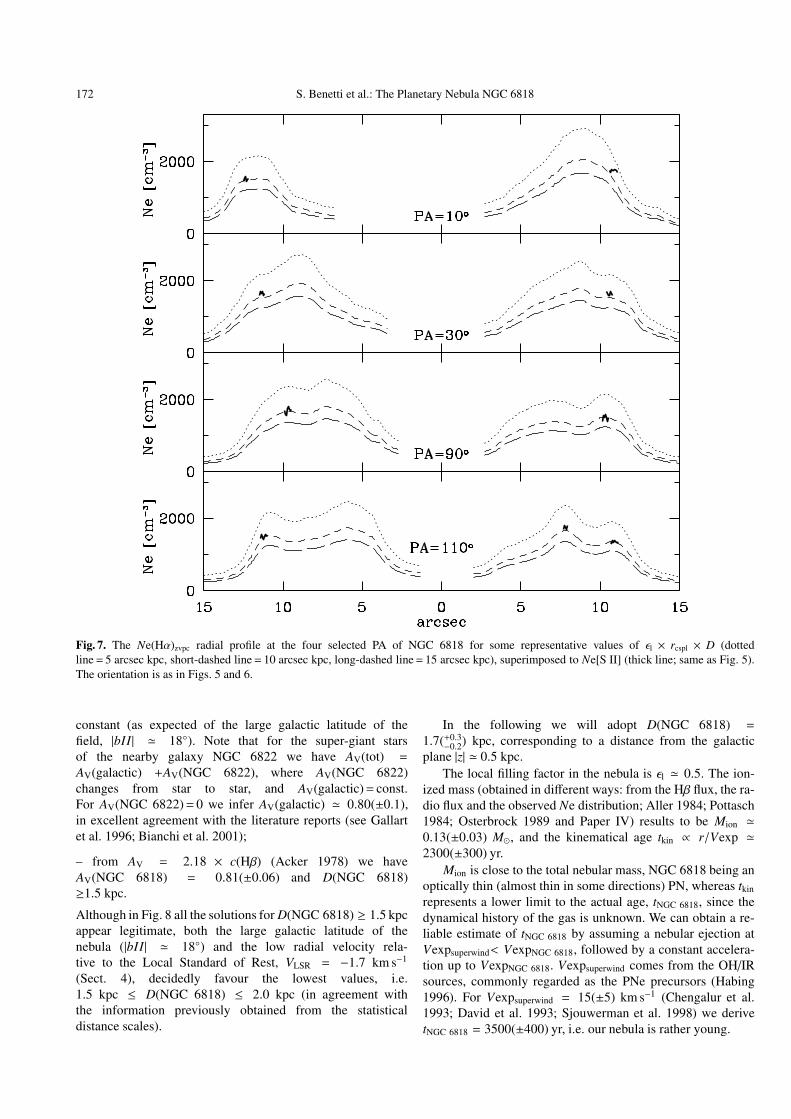
Figure 7 evidences the basic advantage of using F(Hα)zvpc
in the determination of the electron density radial distribution:Ne(Hα) extends all over the nebular image, whereas Ne[S II]is limited to the peaks of the low excitation regions.
In detail:– at PA = 10◦ (along the apparent major axis), Ne(Hα)presents a single, broad and asymmetric (i.e. steeper outwards)bell-shaped profile;– the double–peak structure is very subtle at PA = 30◦ (close tothe apparent major axis), the inner peaks being predominant;– at both PA = 90◦ and 110◦ (close to the apparent minoraxis) the two-shell distribution clearly appears; the Ne(Hα)top corresponds to the inner peaks at PA = 110◦, whereas atPA = 90◦ the peaks are almost equivalent;– an outward, low density tail is present at all directions,extending up to about 15 arcsec from the star.
Note in Fig. 7 the match between Ne(Hα) and Ne[S II] forεl × rcspl × D � 9.5(±1) arcsec kpc, implying that εl × D �0.88(±0.10) kpc (see Table 2 and Sect. 4). Although the as-sumption εl = 1 provides a lower limit of 0.9 kpc for the neb-ular distance, we can no longer delay a better quantification ofthis fundamental parameter.
7. The nebular distance, mass and age
The only individual distance reported in the literature (basedon rough parameters for the star and the nebula) goes back toGurzadyan (1970), who derived an indicative value of 2.2 kpcfrom the observed to expected size of the He++ zone.
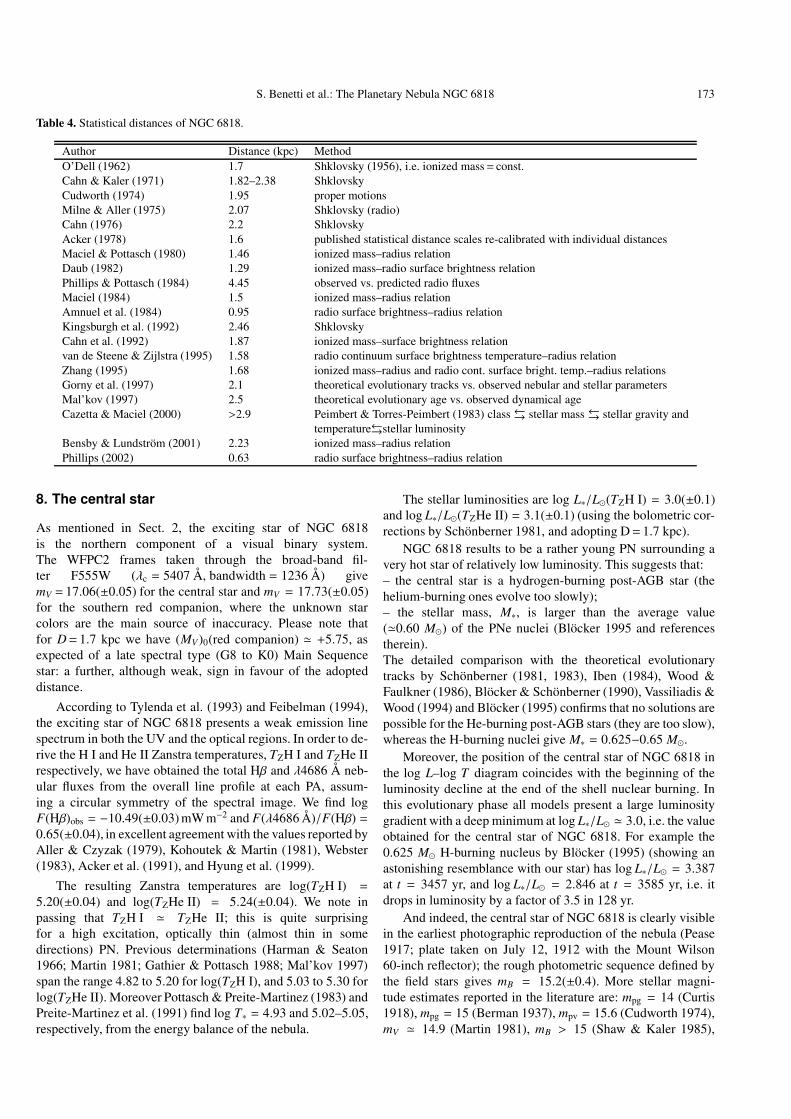
As compensation the nebula is present in a good 20 cata-logues of statistical distances (listed in Table 4). They providethe following mean values:
< D >(Shklovsky) � 2.0(±0.4) kpc;< D >(ionized mass–radius relation) � 1.7(±0.4) kpc;< D >(surface brightness–radius relation) � 1.3(±0.4) kpc;< D >(other methods) � 2.8(±1.0) kpc.
To be noticed that the overall properties inferred in the previ-ous sections (in synthesis: NGC 6818 is an optically thin, al-most thin in some directions, quite “normal” PN) suggest that< D >(Shklovsky), < D >(ionized mass–radius relation) and< D >(surface brightness–radius relation) are, at least grossly,reliable.
In order to derive the dynamical parallax we have analysedthe first and second epoch (1998.30 and 2000.45, respectively)HST images of NGC 6818, searching for the angular expansionof the ionized gas; when combined with Eq. (1), it provides areliable nebular distance (Reed et al. 1999; Palen et al. 2002).Since the target is at the centre of the planetary camera (PC)chip in the 2000.45 images, whereas it is quite off-axis in the1998.30 ones, the correction for optical camera distortions wasperformed with the IRAF/STSDAS task “drizzle” (see Fruchter& Hook 2002) using the Trauger coefficients.
No apparent shift is obtained from the couples of [O III]and [N II] frames.
According to Reed et al. (1999), we infer that the angu-lar expansion of the gas is <1.2×10⁻² arcsec, that is dθ
dt <
5.5 × 10⁻³ arcsec yr−1. Since D(pc) = 0.211[Vexp (km s−1)/ dθdt(arcsec yr−1)], we derive D(NGC 6818) > 1300 pc.
We have attempted a better quantification of D(NGC 6818)through the interstellar absorption–distance relation (Lutz1973; Gathier et al. 1986; Saurer 1995) given by the fieldstars with accurate mV , mB, spectral type and luminosity class.They were selected using the SIMBAD facilities of the CDS,Strasbourg Astronomical Observatory.
The resulting AV-distance law is presented in Fig. 8, wherethe small cluster of data at the right edge refers to the super-giant stars of NGC 6822 (Barnard’s galaxy), a nearby Ir galaxyprojected at about 40 arcmin S–SE of our nebula.
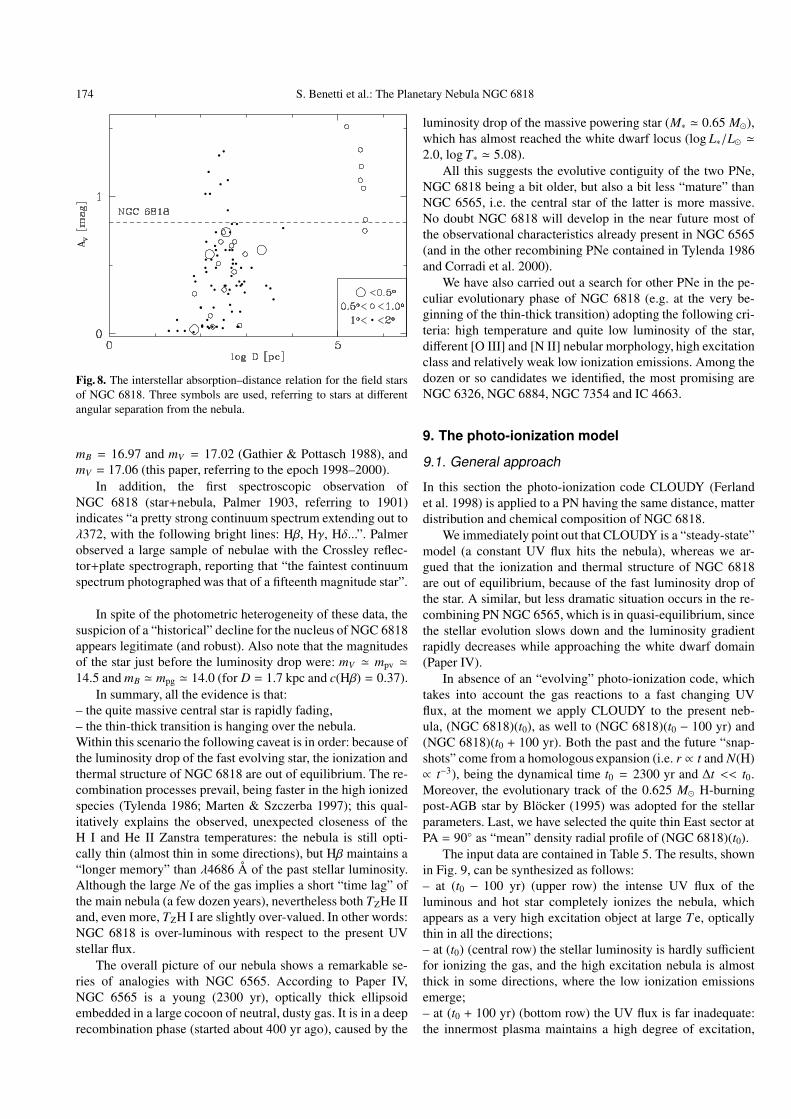
Figure 8 indicates that:– the galactic absorption rapidly changes in direction (notethe spread of the low-weight points). This is confirmed by theinspection of both the ESO/SERC and the Palomar Schmidtsurveys, showing a variable background crossed by a series ofextended, broad and faint emitting filaments;– close to the nebula direction (high-weight data), AV
quickly increases up to D � 1.0–1.5 kpc, and later is
172 S. Benetti et al.: The Planetary Nebula NGC 6818
Fig. 7. The Ne(Hα)zvpc radial profile at the four selected PA of NGC 6818 for some representative values of εl × rcspl × D (dottedline= 5 arcsec kpc, short-dashed line= 10 arcsec kpc, long-dashed line= 15 arcsec kpc), superimposed to Ne[S II] (thick line; same as Fig. 5).The orientation is as in Figs. 5 and 6.
constant (as expected of the large galactic latitude of thefield, |bII| � 18◦). Note that for the super-giant starsof the nearby galaxy NGC 6822 we have AV(tot) =
AV(galactic) +AV(NGC 6822), where AV(NGC 6822)changes from star to star, and AV(galactic)= const.For AV(NGC 6822)= 0 we infer AV(galactic) � 0.80(±0.1),in excellent agreement with the literature reports (see Gallartet al. 1996; Bianchi et al. 2001);
– from AV = 2.18 × c(Hβ) (Acker 1978) we haveAV(NGC 6818) = 0.81(±0.06) and D(NGC 6818)≥1.5 kpc.
Although in Fig. 8 all the solutions for D(NGC 6818) ≥ 1.5 kpcappear legitimate, both the large galactic latitude of thenebula (|bII| � 18◦) and the low radial velocity rela-tive to the Local Standard of Rest, VLSR = −1.7 km s−1
(Sect. 4), decidedly favour the lowest values, i.e.1.5 kpc ≤ D(NGC 6818) ≤ 2.0 kpc (in agreement withthe information previously obtained from the statisticaldistance scales).
In the following we will adopt D(NGC 6818) =
1.7(+0.3−0.2) kpc, corresponding to a distance from the galactic
plane |z| � 0.5 kpc.The local filling factor in the nebula is εl � 0.5. The ion-
ized mass (obtained in different ways: from the Hβ flux, the ra-dio flux and the observed Ne distribution; Aller 1984; Pottasch1984; Osterbrock 1989 and Paper IV) results to be Mion �0.13(±0.03) M�, and the kinematical age tkin ∝ r/Vexp �2300(±300) yr.
Mion is close to the total nebular mass, NGC 6818 being anoptically thin (almost thin in some directions) PN, whereas tkin
represents a lower limit to the actual age, tNGC 6818, since thedynamical history of the gas is unknown. We can obtain a re-liable estimate of tNGC 6818 by assuming a nebular ejection atVexpsuperwind< VexpNGC 6818, followed by a constant accelera-tion up to VexpNGC 6818. Vexpsuperwind comes from the OH/IRsources, commonly regarded as the PNe precursors (Habing1996). For Vexpsuperwind = 15(±5) km s−1 (Chengalur et al.1993; David et al. 1993; Sjouwerman et al. 1998) we derivetNGC 6818 = 3500(±400) yr, i.e. our nebula is rather young.
S. Benetti et al.: The Planetary Nebula NGC 6818 173
Table 4. Statistical distances of NGC 6818.
Author Distance (kpc) MethodO’Dell (1962) 1.7 Shklovsky (1956), i.e. ionized mass= const.Cahn & Kaler (1971) 1.82–2.38 ShklovskyCudworth (1974) 1.95 proper motionsMilne & Aller (1975) 2.07 Shklovsky (radio)Cahn (1976) 2.2 ShklovskyAcker (1978) 1.6 published statistical distance scales re-calibrated with individual distancesMaciel & Pottasch (1980) 1.46 ionized mass–radius relationDaub (1982) 1.29 ionized mass–radio surface brightness relationPhillips & Pottasch (1984) 4.45 observed vs. predicted radio fluxesMaciel (1984) 1.5 ionized mass–radius relationAmnuel et al. (1984) 0.95 radio surface brightness–radius relationKingsburgh et al. (1992) 2.46 ShklovskyCahn et al. (1992) 1.87 ionized mass–surface brightness relationvan de Steene & Zijlstra (1995) 1.58 radio continuum surface brightness temperature–radius relationZhang (1995) 1.68 ionized mass–radius and radio cont. surface bright. temp.–radius relationsGorny et al. (1997) 2.1 theoretical evolutionary tracks vs. observed nebular and stellar parametersMal’kov (1997) 2.5 theoretical evolutionary age vs. observed dynamical ageCazetta & Maciel (2000) >2.9 Peimbert & Torres-Peimbert (1983) class←→ stellar mass ←→ stellar gravity and
temperature←→stellar luminosityBensby & Lundstrom (2001) 2.23 ionized mass–radius relationPhillips (2002) 0.63 radio surface brightness–radius relation
8. The central star
As mentioned in Sect. 2, the exciting star of NGC 6818is the northern component of a visual binary system.The WFPC2 frames taken through the broad-band fil-ter F555W (λc = 5407 Å, bandwidth = 1236 Å) givemV = 17.06(±0.05) for the central star and mV = 17.73(±0.05)for the southern red companion, where the unknown starcolors are the main source of inaccuracy. Please note thatfor D= 1.7 kpc we have (MV )0(red companion) � +5.75, asexpected of a late spectral type (G8 to K0) Main Sequencestar: a further, although weak, sign in favour of the adopteddistance.
According to Tylenda et al. (1993) and Feibelman (1994),the exciting star of NGC 6818 presents a weak emission linespectrum in both the UV and the optical regions. In order to de-rive the H I and He II Zanstra temperatures, TZH I and TZHe IIrespectively, we have obtained the total Hβ and λ4686 Å neb-ular fluxes from the overall line profile at each PA, assum-ing a circular symmetry of the spectral image. We find logF(Hβ)obs = −10.49(±0.03) mW m−2 and F(λ4686 Å)/F(Hβ) =0.65(±0.04), in excellent agreement with the values reported byAller & Czyzak (1979), Kohoutek & Martin (1981), Webster(1983), Acker et al. (1991), and Hyung et al. (1999).
The resulting Zanstra temperatures are log(TZH I) =
5.20(±0.04) and log(TZHe II) = 5.24(±0.04). We note inpassing that TZH I � TZHe II; this is quite surprisingfor a high excitation, optically thin (almost thin in somedirections) PN. Previous determinations (Harman & Seaton1966; Martin 1981; Gathier & Pottasch 1988; Mal’kov 1997)span the range 4.82 to 5.20 for log(TZH I), and 5.03 to 5.30 forlog(TZHe II). Moreover Pottasch & Preite-Martinez (1983) andPreite-Martinez et al. (1991) find log T∗ = 4.93 and 5.02–5.05,respectively, from the energy balance of the nebula.
The stellar luminosities are log L∗/L�(TZH I) = 3.0(±0.1)and log L∗/L�(TZHe II) = 3.1(±0.1) (using the bolometric cor-rections by Schonberner 1981, and adopting D= 1.7 kpc).
NGC 6818 results to be a rather young PN surrounding avery hot star of relatively low luminosity. This suggests that:– the central star is a hydrogen-burning post-AGB star (thehelium-burning ones evolve too slowly);– the stellar mass, M∗, is larger than the average value(�0.60 M�) of the PNe nuclei (Blocker 1995 and referencestherein).The detailed comparison with the theoretical evolutionarytracks by Schonberner (1981, 1983), Iben (1984), Wood &Faulkner (1986), Blocker & Schonberner (1990), Vassiliadis &Wood (1994) and Blocker (1995) confirms that no solutions arepossible for the He-burning post-AGB stars (they are too slow),whereas the H-burning nuclei give M∗ = 0.625−0.65 M�.
Moreover, the position of the central star of NGC 6818 inthe log L–log T diagram coincides with the beginning of theluminosity decline at the end of the shell nuclear burning. Inthis evolutionary phase all models present a large luminositygradient with a deep minimum at log L∗/L� � 3.0, i.e. the valueobtained for the central star of NGC 6818. For example the0.625 M� H-burning nucleus by Blocker (1995) (showing anastonishing resemblance with our star) has log L∗/L� = 3.387at t = 3457 yr, and log L∗/L� = 2.846 at t = 3585 yr, i.e. itdrops in luminosity by a factor of 3.5 in 128 yr.
And indeed, the central star of NGC 6818 is clearly visiblein the earliest photographic reproduction of the nebula (Pease1917; plate taken on July 12, 1912 with the Mount Wilson60-inch reflector); the rough photometric sequence defined bythe field stars gives mB = 15.2(±0.4). More stellar magni-tude estimates reported in the literature are: mpg = 14 (Curtis1918), mpg = 15 (Berman 1937), mpv = 15.6 (Cudworth 1974),mV � 14.9 (Martin 1981), mB > 15 (Shaw & Kaler 1985),
174 S. Benetti et al.: The Planetary Nebula NGC 6818
Fig. 8. The interstellar absorption–distance relation for the field starsof NGC 6818. Three symbols are used, referring to stars at differentangular separation from the nebula.
mB = 16.97 and mV = 17.02 (Gathier & Pottasch 1988), andmV = 17.06 (this paper, referring to the epoch 1998–2000).
In addition, the first spectroscopic observation ofNGC 6818 (star+nebula, Palmer 1903, referring to 1901)indicates “a pretty strong continuum spectrum extending out toλ372, with the following bright lines: Hβ, Hγ, Hδ...”. Palmerobserved a large sample of nebulae with the Crossley reflec-tor+plate spectrograph, reporting that “the faintest continuumspectrum photographed was that of a fifteenth magnitude star”.
In spite of the photometric heterogeneity of these data, thesuspicion of a “historical” decline for the nucleus of NGC 6818appears legitimate (and robust). Also note that the magnitudesof the star just before the luminosity drop were: mV � mpv �14.5 and mB � mpg � 14.0 (for D = 1.7 kpc and c(Hβ) = 0.37).
In summary, all the evidence is that:– the quite massive central star is rapidly fading,– the thin-thick transition is hanging over the nebula.Within this scenario the following caveat is in order: because ofthe luminosity drop of the fast evolving star, the ionization andthermal structure of NGC 6818 are out of equilibrium. The re-combination processes prevail, being faster in the high ionizedspecies (Tylenda 1986; Marten & Szczerba 1997); this qual-itatively explains the observed, unexpected closeness of theH I and He II Zanstra temperatures: the nebula is still opti-cally thin (almost thin in some directions), but Hβ maintains a“longer memory” than λ4686 Å of the past stellar luminosity.Although the large Ne of the gas implies a short “time lag” ofthe main nebula (a few dozen years), nevertheless both TZHe IIand, even more, TZH I are slightly over-valued. In other words:NGC 6818 is over-luminous with respect to the present UVstellar flux.
The overall picture of our nebula shows a remarkable se-ries of analogies with NGC 6565. According to Paper IV,NGC 6565 is a young (2300 yr), optically thick ellipsoidembedded in a large cocoon of neutral, dusty gas. It is in a deeprecombination phase (started about 400 yr ago), caused by the
luminosity drop of the massive powering star (M∗ � 0.65 M�),which has almost reached the white dwarf locus (log L∗/L� �2.0, log T∗ � 5.08).
All this suggests the evolutive contiguity of the two PNe,NGC 6818 being a bit older, but also a bit less “mature” thanNGC 6565, i.e. the central star of the latter is more massive.No doubt NGC 6818 will develop in the near future most ofthe observational characteristics already present in NGC 6565(and in the other recombining PNe contained in Tylenda 1986and Corradi et al. 2000).
We have also carried out a search for other PNe in the pe-culiar evolutionary phase of NGC 6818 (e.g. at the very be-ginning of the thin-thick transition) adopting the following cri-teria: high temperature and quite low luminosity of the star,different [O III] and [N II] nebular morphology, high excitationclass and relatively weak low ionization emissions. Among thedozen or so candidates we identified, the most promising areNGC 6326, NGC 6884, NGC 7354 and IC 4663.
9. The photo-ionization model
9.1. General approach
In this section the photo-ionization code CLOUDY (Ferlandet al. 1998) is applied to a PN having the same distance, matterdistribution and chemical composition of NGC 6818.
We immediately point out that CLOUDY is a “steady-state”model (a constant UV flux hits the nebula), whereas we ar-gued that the ionization and thermal structure of NGC 6818are out of equilibrium, because of the fast luminosity drop ofthe star. A similar, but less dramatic situation occurs in the re-combining PN NGC 6565, which is in quasi-equilibrium, sincethe stellar evolution slows down and the luminosity gradientrapidly decreases while approaching the white dwarf domain(Paper IV).
In absence of an “evolving” photo-ionization code, whichtakes into account the gas reactions to a fast changing UVflux, at the moment we apply CLOUDY to the present neb-ula, (NGC 6818)(t0), as well to (NGC 6818)(t0 − 100 yr) and(NGC 6818)(t0 + 100 yr). Both the past and the future “snap-shots” come from a homologous expansion (i.e. r ∝ t and N(H)∝ t−3), being the dynamical time t0 = 2300 yr and ∆t << t0.Moreover, the evolutionary track of the 0.625 M� H-burningpost-AGB star by Blocker (1995) was adopted for the stellarparameters. Last, we have selected the quite thin East sector atPA = 90◦ as “mean” density radial profile of (NGC 6818)(t0).
The input data are contained in Table 5. The results, shownin Fig. 9, can be synthesized as follows:– at (t0 − 100 yr) (upper row) the intense UV flux of theluminous and hot star completely ionizes the nebula, whichappears as a very high excitation object at large Te, opticallythin in all the directions;– at (t0) (central row) the stellar luminosity is hardly sufficientfor ionizing the gas, and the high excitation nebula is almostthick in some directions, where the low ionization emissionsemerge;– at (t0 + 100 yr) (bottom row) the UV flux is far inadequate:the innermost plasma maintains a high degree of excitation,
S. Benetti et al.: The Planetary Nebula NGC 6818 175
but the external layers are thick, with prominent [O I], [O II],[N II] and [S II] lines. Note that the outermost parts of the“steady” photo-ionization model are neutral, whereas arerecombining in a “true” evolving nebula (they create a fainthalo embedding the main object).
Although these results call for caution due to the photo-ionization model limitations, nevertheless they support the evo-lutive scenario of the previous sections: NGC 6818 is a PN atthe very beginning of the recombination phase.
A direct confirmation is expected of the detailed analysis ofthe equatorial moustaches, representing the densest and bright-est (i.e. thickest) regions of NGC 6818 (Sect. 5.3). To this endwe have first de-projected the spectral images through Eq. (1),and then repeated the complete procedure already applied tothe zvpc.
9.2. Equatorial moustaches
Let’s consider the southern, approaching moustache in PA =10◦. The de-projected radial profiles of the main emissions, thediagnostics and the Xi
O++ ionic abundances are shown in Fig. 10.
We are particularly interested to λ6300 Å of [O I], mark-ing the neutral (or almost neutral) nebular layers, where theefficiency of the resonant charge-exchange reaction O+ +H0 ←→O0+H+ largely increases (Williams 1973). Note that on the onehand the [O I] line is very sensitive to the physical conditions,on the other hand no precise information is yet available for theelectron temperature of the external, neutral (or almost neutral)gas dominated by the recombination and cooling processes. Wearbitrarily adopt Te(almost neutral gas) = 8000 K, which islower than Te(ionized gas), but not enough low to compromisethe [O I] emissivity (a choice supported by the large kineticenergy of the free electrons in NGC 6818; see Sect. 5.3).
Moreover, referring to the ionization correcting factoric f (O++)outer of Sect. 6.3, it includes H0, whose contribu-tion comes from the equilibrium condition O+/O0 � 0.82 ×(H+/H0), valid for O0 > O+, i.e. in the nebular regions affectedby the O+ + H0 ←→ O0 + H+ reaction (Williams 1973; Stancilet al. 1999).
The observational results of Fig. 10 must be comparedwith the “steady” photo-ionization model of the moustachepresented in Fig. 11 (the stellar parameters obviously refer totime t0 of Table 5).
Besides the general features common to all the direc-tions (i.e. the decreasing Te[O III] radial profile, Te[N II] <Te[O III], He++/O++ = He+/O++ � 120, Ne(Hα) = Ne[S II]for (εl × rcspl × D) � 9.5 arcsec kpc, and so on), the mous-tache of NGC 6818 (Fig. 10) exhibits a remarkable peculiarity:the external layers are partially neutral, and the outward ion-ization decline is very smooth, as expected of a recombiningregion. On the contrary, the “steady” photo-ionization modelin Fig. 11 predicts an abrupt ionization fall (to be noticed:the photo-ionization model at (t0 − 100 yr), not shown here,indicates that a century ago the moustache was optically thin tothe UV stellar flux).
The Ne depletion rate for recombination is given by:
dNe/dt = −αB × Ne × N(H+) (13)
where αB is the recombination coefficient (Storey & Hummer1995). Integrating Eq. (13) and assuming Ne = 1.15 × N(H+),we obtain:
t = 1.15 × Ne(t0 − t) − Ne(t0)αB × Ne(t0 − t) × Ne(t0)
(14)
which provides the time t elapsed from the beginning of the re-combination once are known Ne(t0), the present electron den-sity, and Ne(t0 − t), the electron density at the start of theprocess.
The application of Eq. (14) to the external parts of the“true” moustache (Fig. 10) furnishes t = 30–60 yr (t = 60–120 yr and 20–40 yr for Te(almost neutral gas)= 5000 K and12 000 K, respectively). In spite of the heavy assumptions, thisagrees with all the previous evidences suggesting that the re-combination phase has just begun in NGC 6818.
10. The 3-D morpho-kinematical structure
10.1. General
The reconstruction of the gas distribution in the nebular slicescovered by the slit was introduced in Papers I and II. In the caseof NGC 6818 we have selected λ4686 Å of He II, λ5007 Å of[O III] and λ6584 Å of [N II] as representative of the high,mean and low ionization regions, respectively. Note that Hα,the marker of the whole ionized gas distribution, cannot be uti-lized because of the blurred appearance.
The spectral images of the forbidden lines have been de-convolved for seeing, spectral resolution and thermal mo-tions, while also fine structure has been taken into account forλ4686 Å of He II. They all were de-projected through Eq. (1),and assembled by means of the 3-D rendering procedure de-scribed in Paper III.
In order to reproduce the spatial structure on the paper weadopt the usual method: a series of opaque reconstructions ofthe nebula seen from different directions, separated by 15◦.Each couple forms a stereoscopic pair providing a 3-D viewof NGC 6818.
The novelties are represented by the multicolor projectionand the movies.
10.2. Opaque reconstruction
For reasons of space we only present the opaque reconstruc-tion in He II, [O III] and [N II] for a rotation of 180◦ aroundthe East–West axis (close to the minor axis). This is shown inFigs. 12 to 16, where the upper–right panel corresponds to thenebula seen from the Earth (West is up and North to the left, toallow the reader the stereo-view).
The high excitation layers of NGC 6818 (Fig. 12) form aninhomogeneous shell seen almost equatorial on, open–endedat North and South; it merges in a closed ellipsoid at lowerλ4686 Å fluxes.
176 S. Benetti et al.: The Planetary Nebula NGC 6818
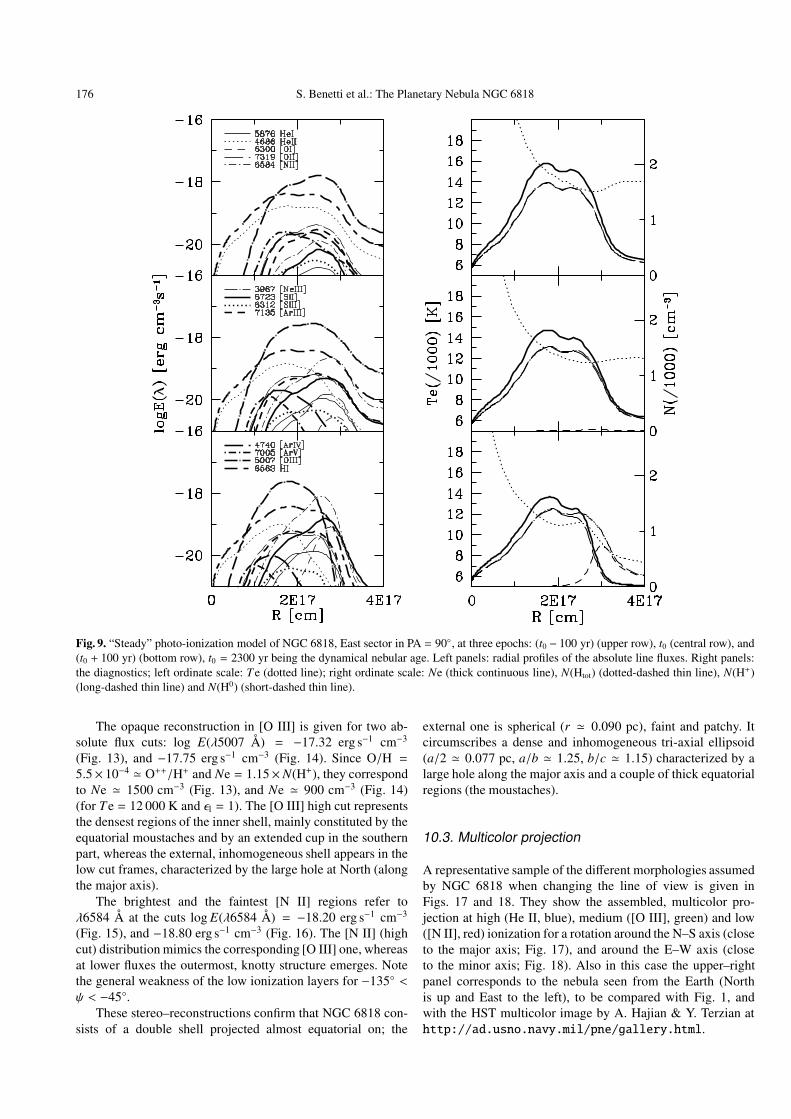
Fig. 9. “Steady” photo-ionization model of NGC 6818, East sector in PA = 90◦, at three epochs: (t0 − 100 yr) (upper row), t0 (central row), and(t0 + 100 yr) (bottom row), t0 = 2300 yr being the dynamical nebular age. Left panels: radial profiles of the absolute line fluxes. Right panels:the diagnostics; left ordinate scale: T e (dotted line); right ordinate scale: Ne (thick continuous line), N(Htot) (dotted-dashed thin line), N(H+)(long-dashed thin line) and N(H0) (short-dashed thin line).
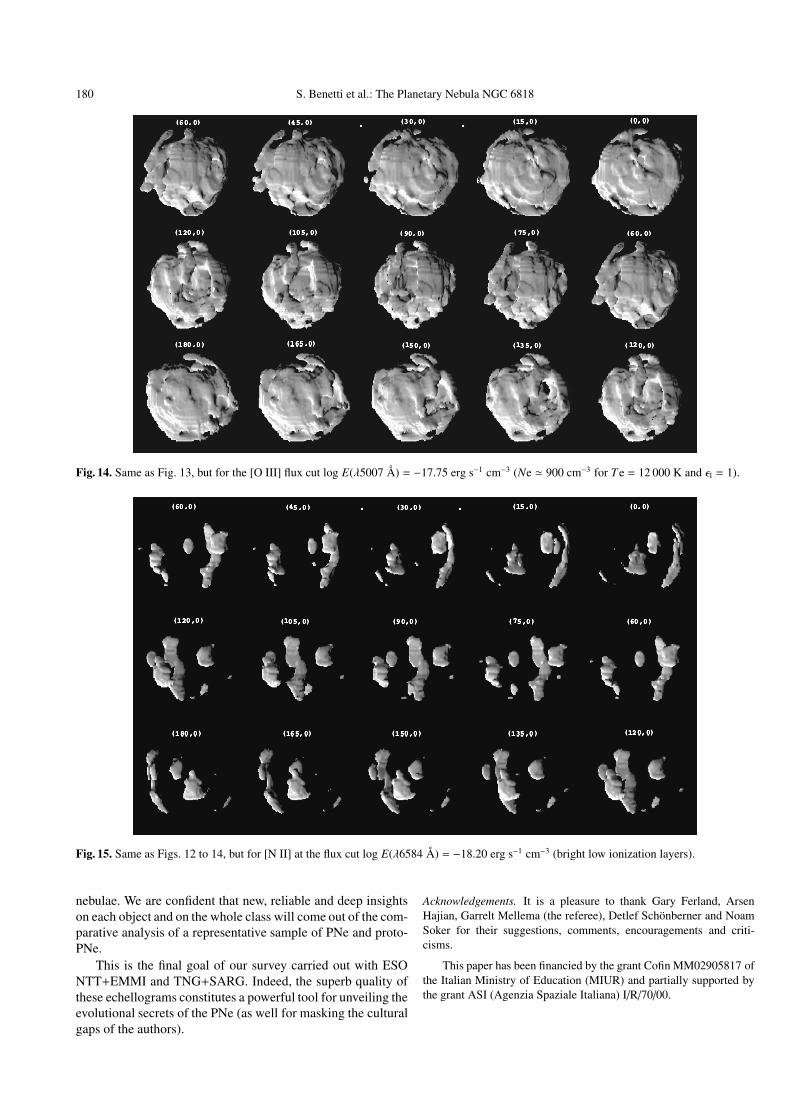
The opaque reconstruction in [O III] is given for two ab-solute flux cuts: log E(λ5007 Å) = −17.32 erg s−1 cm−3
(Fig. 13), and −17.75 erg s−1 cm−3 (Fig. 14). Since O/H =5.5× 10⁻⁴ � O++/H+ and Ne = 1.15×N(H+), they correspondto Ne � 1500 cm−3 (Fig. 13), and Ne � 900 cm−3 (Fig. 14)(for Te = 12 000 K and εl = 1). The [O III] high cut representsthe densest regions of the inner shell, mainly constituted by theequatorial moustaches and by an extended cup in the southernpart, whereas the external, inhomogeneous shell appears in thelow cut frames, characterized by the large hole at North (alongthe major axis).
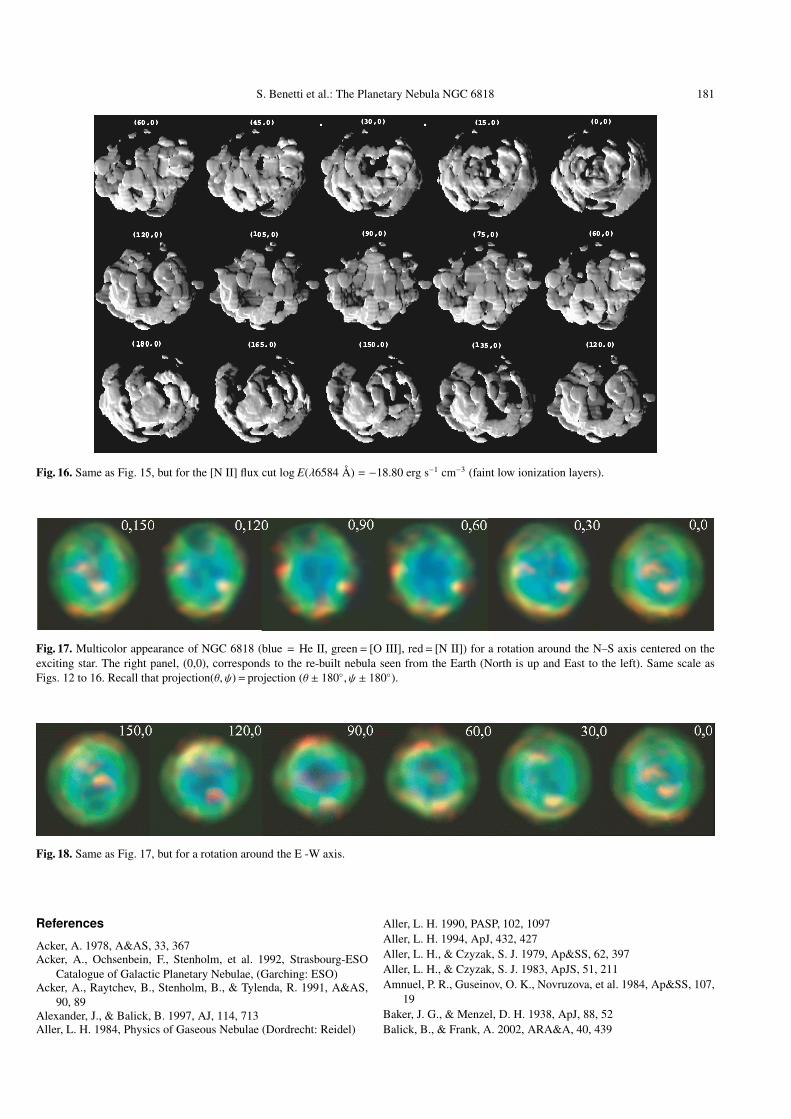
The brightest and the faintest [N II] regions refer toλ6584 Å at the cuts log E(λ6584 Å) = −18.20 erg s−1 cm−3
(Fig. 15), and −18.80 erg s−1 cm−3 (Fig. 16). The [N II] (highcut) distribution mimics the corresponding [O III] one, whereasat lower fluxes the outermost, knotty structure emerges. Notethe general weakness of the low ionization layers for −135◦ <ψ < −45◦.
These stereo–reconstructions confirm that NGC 6818 con-sists of a double shell projected almost equatorial on; the
external one is spherical (r � 0.090 pc), faint and patchy. Itcircumscribes a dense and inhomogeneous tri-axial ellipsoid(a/2 � 0.077 pc, a/b � 1.25, b/c � 1.15) characterized by alarge hole along the major axis and a couple of thick equatorialregions (the moustaches).
10.3. Multicolor projection
A representative sample of the different morphologies assumedby NGC 6818 when changing the line of view is given inFigs. 17 and 18. They show the assembled, multicolor pro-jection at high (He II, blue), medium ([O III], green) and low([N II], red) ionization for a rotation around the N–S axis (closeto the major axis; Fig. 17), and around the E–W axis (closeto the minor axis; Fig. 18). Also in this case the upper–rightpanel corresponds to the nebula seen from the Earth (Northis up and East to the left), to be compared with Fig. 1, andwith the HST multicolor image by A. Hajian & Y. Terzian athttp://ad.usno.navy.mil/pne/gallery.html.
S. Benetti et al.: The Planetary Nebula NGC 6818 177
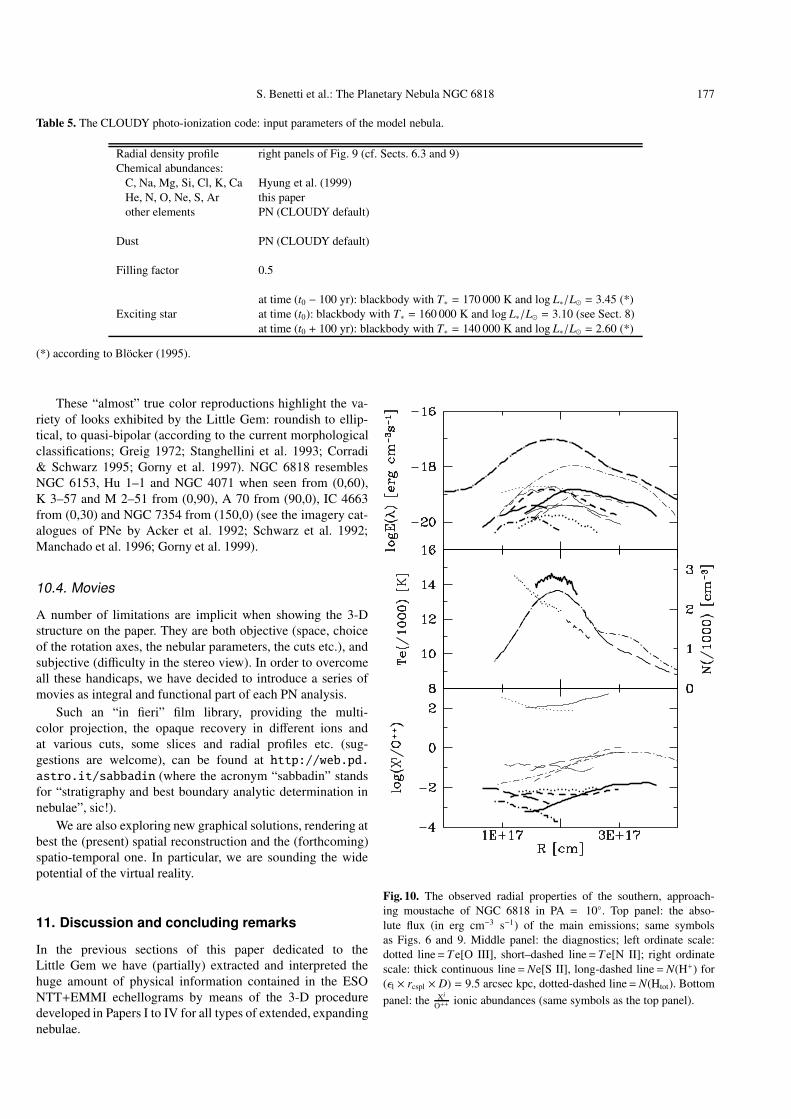
Table 5. The CLOUDY photo-ionization code: input parameters of the model nebula.
Radial density profile right panels of Fig. 9 (cf. Sects. 6.3 and 9)Chemical abundances:
C, Na, Mg, Si, Cl, K, Ca Hyung et al. (1999)He, N, O, Ne, S, Ar this paperother elements PN (CLOUDY default)
Dust PN (CLOUDY default)
Filling factor 0.5
at time (t0 − 100 yr): blackbody with T∗ = 170 000 K and log L∗/L� = 3.45 (*)Exciting star at time (t0): blackbody with T∗ = 160 000 K and log L∗/L� = 3.10 (see Sect. 8)
at time (t0 + 100 yr): blackbody with T∗ = 140 000 K and log L∗/L� = 2.60 (*)
(*) according to Blocker (1995).
These “almost” true color reproductions highlight the va-riety of looks exhibited by the Little Gem: roundish to ellip-tical, to quasi-bipolar (according to the current morphologicalclassifications; Greig 1972; Stanghellini et al. 1993; Corradi& Schwarz 1995; Gorny et al. 1997). NGC 6818 resemblesNGC 6153, Hu 1–1 and NGC 4071 when seen from (0,60),K 3–57 and M 2–51 from (0,90), A 70 from (90,0), IC 4663from (0,30) and NGC 7354 from (150,0) (see the imagery cat-alogues of PNe by Acker et al. 1992; Schwarz et al. 1992;Manchado et al. 1996; Gorny et al. 1999).
10.4. Movies
A number of limitations are implicit when showing the 3-Dstructure on the paper. They are both objective (space, choiceof the rotation axes, the nebular parameters, the cuts etc.), andsubjective (difficulty in the stereo view). In order to overcomeall these handicaps, we have decided to introduce a series ofmovies as integral and functional part of each PN analysis.
Such an “in fieri” film library, providing the multi-color projection, the opaque recovery in different ions andat various cuts, some slices and radial profiles etc. (sug-gestions are welcome), can be found at http://web.pd.astro.it/sabbadin (where the acronym “sabbadin” standsfor “stratigraphy and best boundary analytic determination innebulae”, sic!).
We are also exploring new graphical solutions, rendering atbest the (present) spatial reconstruction and the (forthcoming)spatio-temporal one. In particular, we are sounding the widepotential of the virtual reality.
11. Discussion and concluding remarks
In the previous sections of this paper dedicated to theLittle Gem we have (partially) extracted and interpreted thehuge amount of physical information contained in the ESONTT+EMMI echellograms by means of the 3-D proceduredeveloped in Papers I to IV for all types of extended, expandingnebulae.
Fig. 10. The observed radial properties of the southern, approach-ing moustache of NGC 6818 in PA = 10◦. Top panel: the abso-lute flux (in erg cm−3 s−1) of the main emissions; same symbolsas Figs. 6 and 9. Middle panel: the diagnostics; left ordinate scale:dotted line= T e[O III], short–dashed line= T e[N II]; right ordinatescale: thick continuous line=Ne[S II], long-dashed line=N(H+) for(εl × rcspl × D) = 9.5 arcsec kpc, dotted-dashed line=N(Htot). Bottompanel: the Xi
O++ ionic abundances (same symbols as the top panel).
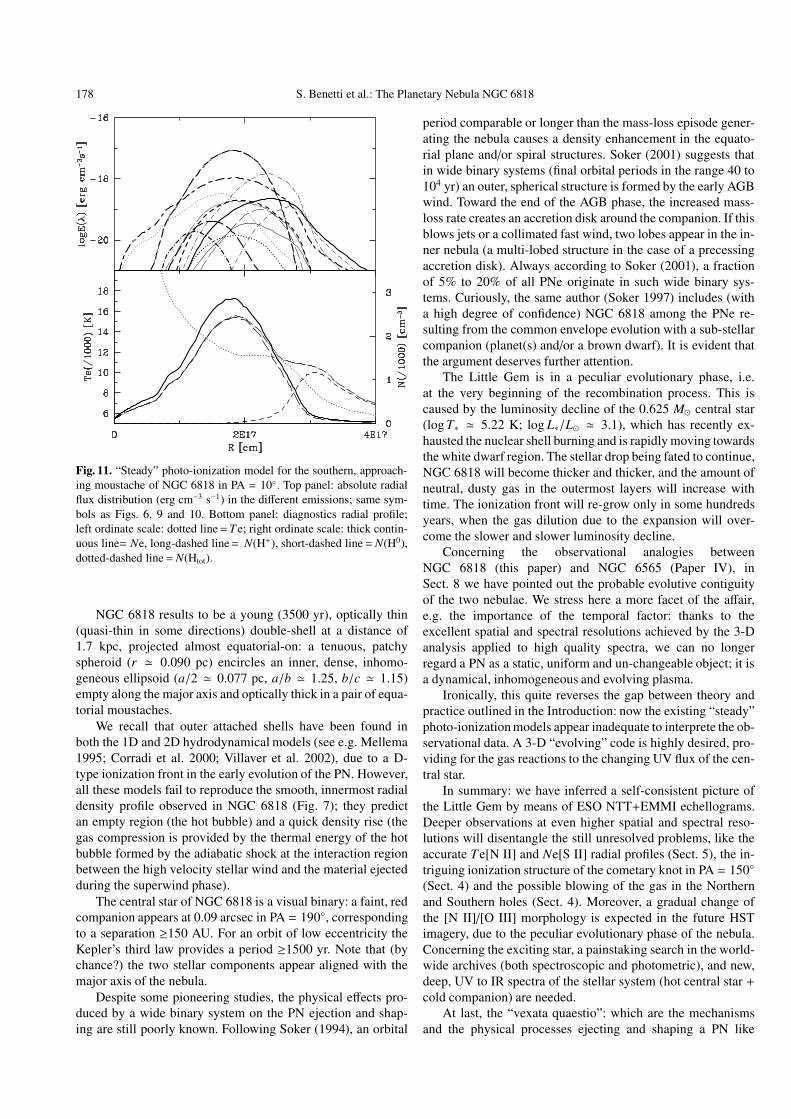
178 S. Benetti et al.: The Planetary Nebula NGC 6818
Fig. 11. “Steady” photo-ionization model for the southern, approach-ing moustache of NGC 6818 in PA = 10◦. Top panel: absolute radialflux distribution (erg cm−3 s−1) in the different emissions; same sym-bols as Figs. 6, 9 and 10. Bottom panel: diagnostics radial profile;left ordinate scale: dotted line=T e; right ordinate scale: thick contin-uous line= Ne, long-dashed line= N(H+), short-dashed line=N(H0),dotted-dashed line=N(Htot).
NGC 6818 results to be a young (3500 yr), optically thin(quasi-thin in some directions) double-shell at a distance of1.7 kpc, projected almost equatorial-on: a tenuous, patchyspheroid (r � 0.090 pc) encircles an inner, dense, inhomo-geneous ellipsoid (a/2 � 0.077 pc, a/b � 1.25, b/c � 1.15)empty along the major axis and optically thick in a pair of equa-torial moustaches.
We recall that outer attached shells have been found inboth the 1D and 2D hydrodynamical models (see e.g. Mellema1995; Corradi et al. 2000; Villaver et al. 2002), due to a D-type ionization front in the early evolution of the PN. However,all these models fail to reproduce the smooth, innermost radialdensity profile observed in NGC 6818 (Fig. 7); they predictan empty region (the hot bubble) and a quick density rise (thegas compression is provided by the thermal energy of the hotbubble formed by the adiabatic shock at the interaction regionbetween the high velocity stellar wind and the material ejectedduring the superwind phase).
The central star of NGC 6818 is a visual binary: a faint, redcompanion appears at 0.09 arcsec in PA = 190◦, correspondingto a separation ≥150 AU. For an orbit of low eccentricity theKepler’s third law provides a period ≥1500 yr. Note that (bychance?) the two stellar components appear aligned with themajor axis of the nebula.
Despite some pioneering studies, the physical effects pro-duced by a wide binary system on the PN ejection and shap-ing are still poorly known. Following Soker (1994), an orbital
period comparable or longer than the mass-loss episode gener-ating the nebula causes a density enhancement in the equato-rial plane and/or spiral structures. Soker (2001) suggests thatin wide binary systems (final orbital periods in the range 40 to104 yr) an outer, spherical structure is formed by the early AGBwind. Toward the end of the AGB phase, the increased mass-loss rate creates an accretion disk around the companion. If thisblows jets or a collimated fast wind, two lobes appear in the in-ner nebula (a multi-lobed structure in the case of a precessingaccretion disk). Always according to Soker (2001), a fractionof 5% to 20% of all PNe originate in such wide binary sys-tems. Curiously, the same author (Soker 1997) includes (witha high degree of confidence) NGC 6818 among the PNe re-sulting from the common envelope evolution with a sub-stellarcompanion (planet(s) and/or a brown dwarf). It is evident thatthe argument deserves further attention.
The Little Gem is in a peculiar evolutionary phase, i.e.at the very beginning of the recombination process. This iscaused by the luminosity decline of the 0.625 M� central star(log T∗ � 5.22 K; log L∗/L� � 3.1), which has recently ex-hausted the nuclear shell burning and is rapidly moving towardsthe white dwarf region. The stellar drop being fated to continue,NGC 6818 will become thicker and thicker, and the amount ofneutral, dusty gas in the outermost layers will increase withtime. The ionization front will re-grow only in some hundredsyears, when the gas dilution due to the expansion will over-come the slower and slower luminosity decline.
Concerning the observational analogies betweenNGC 6818 (this paper) and NGC 6565 (Paper IV), inSect. 8 we have pointed out the probable evolutive contiguityof the two nebulae. We stress here a more facet of the affair,e.g. the importance of the temporal factor: thanks to theexcellent spatial and spectral resolutions achieved by the 3-Danalysis applied to high quality spectra, we can no longerregard a PN as a static, uniform and un-changeable object; it isa dynamical, inhomogeneous and evolving plasma.
Ironically, this quite reverses the gap between theory andpractice outlined in the Introduction: now the existing “steady”photo-ionization models appear inadequate to interprete the ob-servational data. A 3-D “evolving” code is highly desired, pro-viding for the gas reactions to the changing UV flux of the cen-tral star.
In summary: we have inferred a self-consistent picture ofthe Little Gem by means of ESO NTT+EMMI echellograms.Deeper observations at even higher spatial and spectral reso-lutions will disentangle the still unresolved problems, like theaccurate Te[N II] and Ne[S II] radial profiles (Sect. 5), the in-triguing ionization structure of the cometary knot in PA = 150◦(Sect. 4) and the possible blowing of the gas in the Northernand Southern holes (Sect. 4). Moreover, a gradual change ofthe [N II]/[O III] morphology is expected in the future HSTimagery, due to the peculiar evolutionary phase of the nebula.Concerning the exciting star, a painstaking search in the world-wide archives (both spectroscopic and photometric), and new,deep, UV to IR spectra of the stellar system (hot central star +cold companion) are needed.
At last, the “vexata quaestio”: which are the mechanismsand the physical processes ejecting and shaping a PN like
S. Benetti et al.: The Planetary Nebula NGC 6818 179
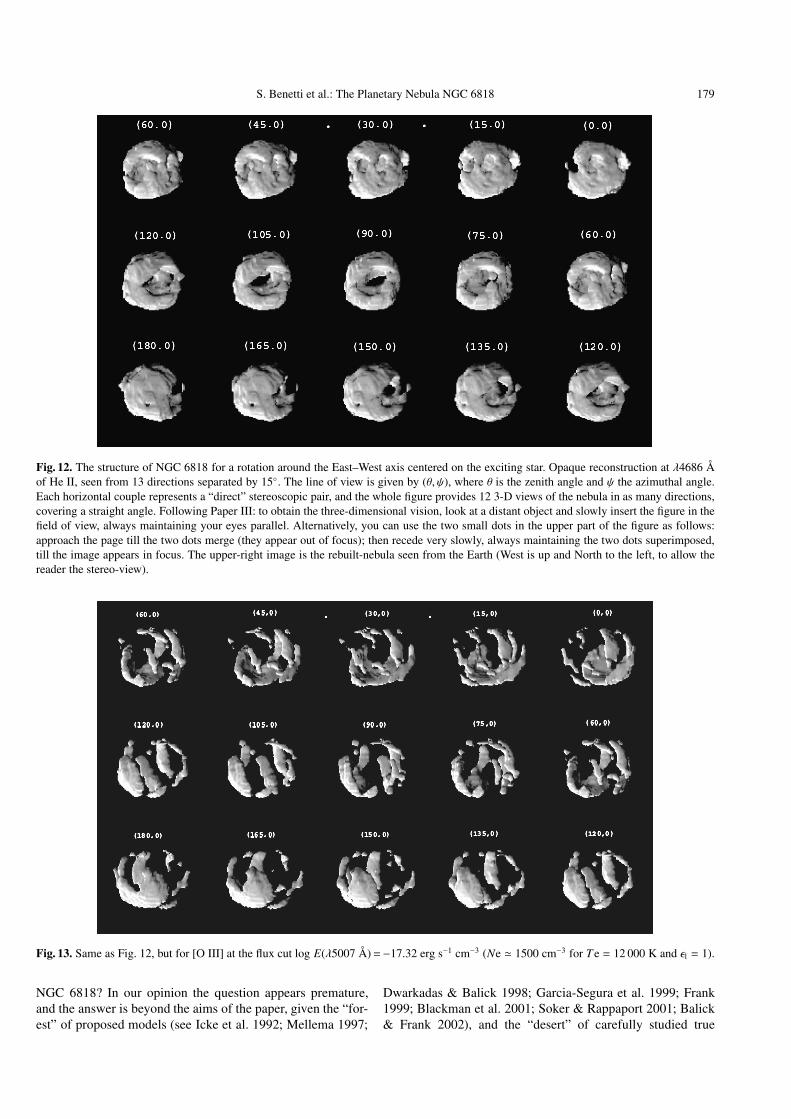
Fig. 12. The structure of NGC 6818 for a rotation around the East–West axis centered on the exciting star. Opaque reconstruction at λ4686 Åof He II, seen from 13 directions separated by 15◦. The line of view is given by (θ, ψ), where θ is the zenith angle and ψ the azimuthal angle.Each horizontal couple represents a “direct” stereoscopic pair, and the whole figure provides 12 3-D views of the nebula in as many directions,covering a straight angle. Following Paper III: to obtain the three-dimensional vision, look at a distant object and slowly insert the figure in thefield of view, always maintaining your eyes parallel. Alternatively, you can use the two small dots in the upper part of the figure as follows:approach the page till the two dots merge (they appear out of focus); then recede very slowly, always maintaining the two dots superimposed,till the image appears in focus. The upper-right image is the rebuilt-nebula seen from the Earth (West is up and North to the left, to allow thereader the stereo-view).
Fig. 13. Same as Fig. 12, but for [O III] at the flux cut log E(λ5007 Å)=−17.32 erg s−1 cm−3 (Ne � 1500 cm−3 for T e = 12 000 K and εl = 1).
NGC 6818? In our opinion the question appears premature,and the answer is beyond the aims of the paper, given the “for-est” of proposed models (see Icke et al. 1992; Mellema 1997;
Dwarkadas & Balick 1998; Garcia-Segura et al. 1999; Frank1999; Blackman et al. 2001; Soker & Rappaport 2001; Balick& Frank 2002), and the “desert” of carefully studied true
180 S. Benetti et al.: The Planetary Nebula NGC 6818
Fig. 14. Same as Fig. 13, but for the [O III] flux cut log E(λ5007 Å) = −17.75 erg s−1 cm−3 (Ne � 900 cm−3 for T e = 12 000 K and εl = 1).
Fig. 15. Same as Figs. 12 to 14, but for [N II] at the flux cut log E(λ6584 Å) = −18.20 erg s−1 cm−3 (bright low ionization layers).
nebulae. We are confident that new, reliable and deep insightson each object and on the whole class will come out of the com-parative analysis of a representative sample of PNe and proto-PNe.
This is the final goal of our survey carried out with ESONTT+EMMI and TNG+SARG. Indeed, the superb quality ofthese echellograms constitutes a powerful tool for unveiling theevolutional secrets of the PNe (as well for masking the culturalgaps of the authors).
Acknowledgements. It is a pleasure to thank Gary Ferland, ArsenHajian, Garrelt Mellema (the referee), Detlef Schonberner and NoamSoker for their suggestions, comments, encouragements and criti-cisms.
This paper has been financied by the grant Cofin MM02905817 ofthe Italian Ministry of Education (MIUR) and partially supported bythe grant ASI (Agenzia Spaziale Italiana) I/R/70/00.
S. Benetti et al.: The Planetary Nebula NGC 6818 181
Fig. 16. Same as Fig. 15, but for the [N II] flux cut log E(λ6584 Å) = −18.80 erg s−1 cm−3 (faint low ionization layers).
Fig. 17. Multicolor appearance of NGC 6818 (blue = He II, green= [O III], red= [N II]) for a rotation around the N–S axis centered on theexciting star. The right panel, (0,0), corresponds to the re-built nebula seen from the Earth (North is up and East to the left). Same scale asFigs. 12 to 16. Recall that projection(θ, ψ)= projection (θ ± 180◦, ψ ± 180◦).
Fig. 18. Same as Fig. 17, but for a rotation around the E -W axis.
References
Acker, A. 1978, A&AS, 33, 367Acker, A., Ochsenbein, F., Stenholm, et al. 1992, Strasbourg-ESO
Catalogue of Galactic Planetary Nebulae, (Garching: ESO)Acker, A., Raytchev, B., Stenholm, B., & Tylenda, R. 1991, A&AS,
90, 89Alexander, J., & Balick, B. 1997, AJ, 114, 713Aller, L. H. 1984, Physics of Gaseous Nebulae (Dordrecht: Reidel)
Aller, L. H. 1990, PASP, 102, 1097Aller, L. H. 1994, ApJ, 432, 427Aller, L. H., & Czyzak, S. J. 1979, Ap&SS, 62, 397Aller, L. H., & Czyzak, S. J. 1983, ApJS, 51, 211Amnuel, P. R., Guseinov, O. K., Novruzova, et al. 1984, Ap&SS, 107,
19Baker, J. G., & Menzel, D. H. 1938, ApJ, 88, 52Balick, B., & Frank, A. 2002, ARA&A, 40, 439
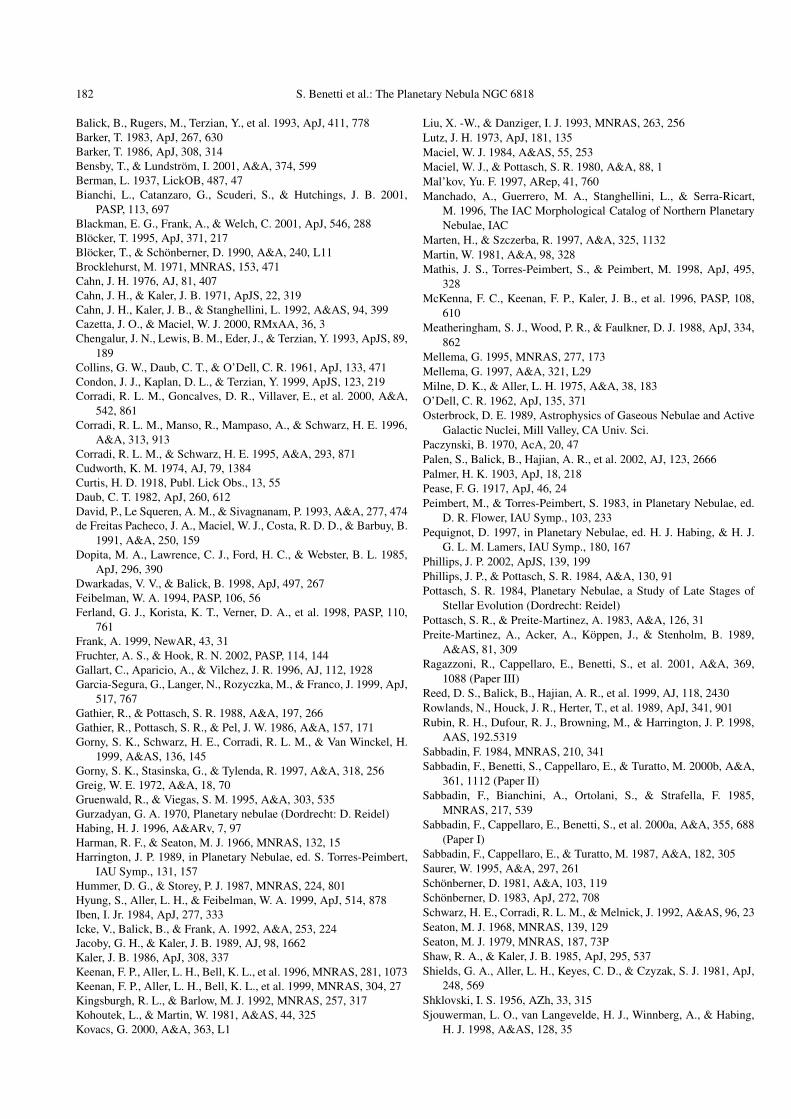
182 S. Benetti et al.: The Planetary Nebula NGC 6818
Balick, B., Rugers, M., Terzian, Y., et al. 1993, ApJ, 411, 778Barker, T. 1983, ApJ, 267, 630Barker, T. 1986, ApJ, 308, 314Bensby, T., & Lundstrom, I. 2001, A&A, 374, 599Berman, L. 1937, LickOB, 487, 47Bianchi, L., Catanzaro, G., Scuderi, S., & Hutchings, J. B. 2001,
PASP, 113, 697Blackman, E. G., Frank, A., & Welch, C. 2001, ApJ, 546, 288Blocker, T. 1995, ApJ, 371, 217Blocker, T., & Schonberner, D. 1990, A&A, 240, L11Brocklehurst, M. 1971, MNRAS, 153, 471Cahn, J. H. 1976, AJ, 81, 407Cahn, J. H., & Kaler, J. B. 1971, ApJS, 22, 319Cahn, J. H., Kaler, J. B., & Stanghellini, L. 1992, A&AS, 94, 399Cazetta, J. O., & Maciel, W. J. 2000, RMxAA, 36, 3Chengalur, J. N., Lewis, B. M., Eder, J., & Terzian, Y. 1993, ApJS, 89,
189Collins, G. W., Daub, C. T., & O’Dell, C. R. 1961, ApJ, 133, 471Condon, J. J., Kaplan, D. L., & Terzian, Y. 1999, ApJS, 123, 219Corradi, R. L. M., Goncalves, D. R., Villaver, E., et al. 2000, A&A,
542, 861Corradi, R. L. M., Manso, R., Mampaso, A., & Schwarz, H. E. 1996,
A&A, 313, 913Corradi, R. L. M., & Schwarz, H. E. 1995, A&A, 293, 871Cudworth, K. M. 1974, AJ, 79, 1384Curtis, H. D. 1918, Publ. Lick Obs., 13, 55Daub, C. T. 1982, ApJ, 260, 612David, P., Le Squeren, A. M., & Sivagnanam, P. 1993, A&A, 277, 474de Freitas Pacheco, J. A., Maciel, W. J., Costa, R. D. D., & Barbuy, B.
1991, A&A, 250, 159Dopita, M. A., Lawrence, C. J., Ford, H. C., & Webster, B. L. 1985,
ApJ, 296, 390Dwarkadas, V. V., & Balick, B. 1998, ApJ, 497, 267Feibelman, W. A. 1994, PASP, 106, 56Ferland, G. J., Korista, K. T., Verner, D. A., et al. 1998, PASP, 110,
761Frank, A. 1999, NewAR, 43, 31Fruchter, A. S., & Hook, R. N. 2002, PASP, 114, 144Gallart, C., Aparicio, A., & Vilchez, J. R. 1996, AJ, 112, 1928Garcia-Segura, G., Langer, N., Rozyczka, M., & Franco, J. 1999, ApJ,
517, 767Gathier, R., & Pottasch, S. R. 1988, A&A, 197, 266Gathier, R., Pottasch, S. R., & Pel, J. W. 1986, A&A, 157, 171Gorny, S. K., Schwarz, H. E., Corradi, R. L. M., & Van Winckel, H.
1999, A&AS, 136, 145Gorny, S. K., Stasinska, G., & Tylenda, R. 1997, A&A, 318, 256Greig, W. E. 1972, A&A, 18, 70Gruenwald, R., & Viegas, S. M. 1995, A&A, 303, 535Gurzadyan, G. A. 1970, Planetary nebulae (Dordrecht: D. Reidel)Habing, H. J. 1996, A&ARv, 7, 97Harman, R. F., & Seaton, M. J. 1966, MNRAS, 132, 15Harrington, J. P. 1989, in Planetary Nebulae, ed. S. Torres-Peimbert,
IAU Symp., 131, 157Hummer, D. G., & Storey, P. J. 1987, MNRAS, 224, 801Hyung, S., Aller, L. H., & Feibelman, W. A. 1999, ApJ, 514, 878Iben, I. Jr. 1984, ApJ, 277, 333Icke, V., Balick, B., & Frank, A. 1992, A&A, 253, 224Jacoby, G. H., & Kaler, J. B. 1989, AJ, 98, 1662Kaler, J. B. 1986, ApJ, 308, 337Keenan, F. P., Aller, L. H., Bell, K. L., et al. 1996, MNRAS, 281, 1073Keenan, F. P., Aller, L. H., Bell, K. L., et al. 1999, MNRAS, 304, 27Kingsburgh, R. L., & Barlow, M. J. 1992, MNRAS, 257, 317Kohoutek, L., & Martin, W. 1981, A&AS, 44, 325Kovacs, G. 2000, A&A, 363, L1
Liu, X. -W., & Danziger, I. J. 1993, MNRAS, 263, 256Lutz, J. H. 1973, ApJ, 181, 135Maciel, W. J. 1984, A&AS, 55, 253Maciel, W. J., & Pottasch, S. R. 1980, A&A, 88, 1Mal’kov, Yu. F. 1997, ARep, 41, 760Manchado, A., Guerrero, M. A., Stanghellini, L., & Serra-Ricart,
M. 1996, The IAC Morphological Catalog of Northern PlanetaryNebulae, IAC
Marten, H., & Szczerba, R. 1997, A&A, 325, 1132Martin, W. 1981, A&A, 98, 328Mathis, J. S., Torres-Peimbert, S., & Peimbert, M. 1998, ApJ, 495,
328McKenna, F. C., Keenan, F. P., Kaler, J. B., et al. 1996, PASP, 108,
610Meatheringham, S. J., Wood, P. R., & Faulkner, D. J. 1988, ApJ, 334,
862Mellema, G. 1995, MNRAS, 277, 173Mellema, G. 1997, A&A, 321, L29Milne, D. K., & Aller, L. H. 1975, A&A, 38, 183O’Dell, C. R. 1962, ApJ, 135, 371Osterbrock, D. E. 1989, Astrophysics of Gaseous Nebulae and Active
Galactic Nuclei, Mill Valley, CA Univ. Sci.Paczynski, B. 1970, AcA, 20, 47Palen, S., Balick, B., Hajian, A. R., et al. 2002, AJ, 123, 2666Palmer, H. K. 1903, ApJ, 18, 218Pease, F. G. 1917, ApJ, 46, 24Peimbert, M., & Torres-Peimbert, S. 1983, in Planetary Nebulae, ed.
D. R. Flower, IAU Symp., 103, 233Pequignot, D. 1997, in Planetary Nebulae, ed. H. J. Habing, & H. J.
G. L. M. Lamers, IAU Symp., 180, 167Phillips, J. P. 2002, ApJS, 139, 199Phillips, J. P., & Pottasch, S. R. 1984, A&A, 130, 91Pottasch, S. R. 1984, Planetary Nebulae, a Study of Late Stages of
Stellar Evolution (Dordrecht: Reidel)Pottasch, S. R., & Preite-Martinez, A. 1983, A&A, 126, 31Preite-Martinez, A., Acker, A., Koppen, J., & Stenholm, B. 1989,
A&AS, 81, 309Ragazzoni, R., Cappellaro, E., Benetti, S., et al. 2001, A&A, 369,
1088 (Paper III)Reed, D. S., Balick, B., Hajian, A. R., et al. 1999, AJ, 118, 2430Rowlands, N., Houck, J. R., Herter, T., et al. 1989, ApJ, 341, 901Rubin, R. H., Dufour, R. J., Browning, M., & Harrington, J. P. 1998,
AAS, 192.5319Sabbadin, F. 1984, MNRAS, 210, 341Sabbadin, F., Benetti, S., Cappellaro, E., & Turatto, M. 2000b, A&A,
361, 1112 (Paper II)Sabbadin, F., Bianchini, A., Ortolani, S., & Strafella, F. 1985,
MNRAS, 217, 539Sabbadin, F., Cappellaro, E., Benetti, S., et al. 2000a, A&A, 355, 688
(Paper I)Sabbadin, F., Cappellaro, E., & Turatto, M. 1987, A&A, 182, 305Saurer, W. 1995, A&A, 297, 261Schonberner, D. 1981, A&A, 103, 119Schonberner, D. 1983, ApJ, 272, 708Schwarz, H. E., Corradi, R. L. M., & Melnick, J. 1992, A&AS, 96, 23Seaton, M. J. 1968, MNRAS, 139, 129Seaton, M. J. 1979, MNRAS, 187, 73PShaw, R. A., & Kaler, J. B. 1985, ApJ, 295, 537Shields, G. A., Aller, L. H., Keyes, C. D., & Czyzak, S. J. 1981, ApJ,
248, 569Shklovski, I. S. 1956, AZh, 33, 315Sjouwerman, L. O., van Langevelde, H. J., Winnberg, A., & Habing,
H. J. 1998, A&AS, 128, 35
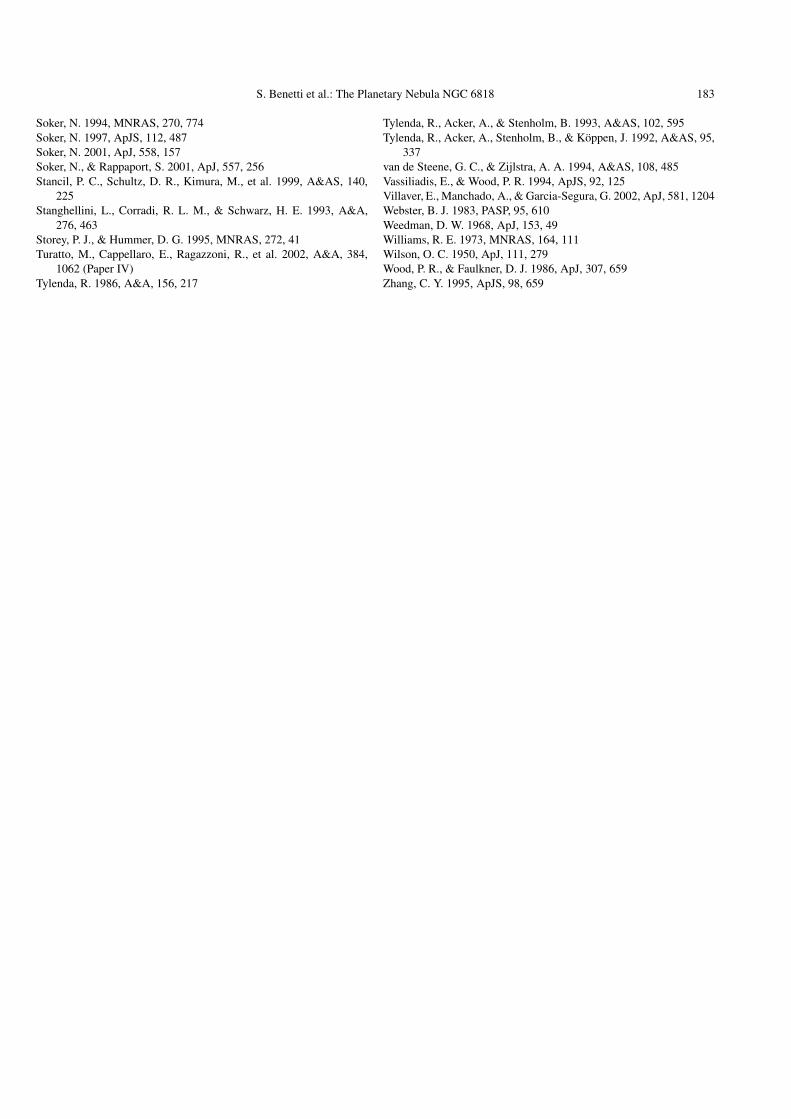
S. Benetti et al.: The Planetary Nebula NGC 6818 183
Soker, N. 1994, MNRAS, 270, 774Soker, N. 1997, ApJS, 112, 487Soker, N. 2001, ApJ, 558, 157Soker, N., & Rappaport, S. 2001, ApJ, 557, 256Stancil, P. C., Schultz, D. R., Kimura, M., et al. 1999, A&AS, 140,
225Stanghellini, L., Corradi, R. L. M., & Schwarz, H. E. 1993, A&A,
276, 463Storey, P. J., & Hummer, D. G. 1995, MNRAS, 272, 41Turatto, M., Cappellaro, E., Ragazzoni, R., et al. 2002, A&A, 384,
1062 (Paper IV)Tylenda, R. 1986, A&A, 156, 217
Tylenda, R., Acker, A., & Stenholm, B. 1993, A&AS, 102, 595Tylenda, R., Acker, A., Stenholm, B., & Koppen, J. 1992, A&AS, 95,
337van de Steene, G. C., & Zijlstra, A. A. 1994, A&AS, 108, 485Vassiliadis, E., & Wood, P. R. 1994, ApJS, 92, 125Villaver, E., Manchado, A., & Garcia-Segura, G. 2002, ApJ, 581, 1204Webster, B. J. 1983, PASP, 95, 610Weedman, D. W. 1968, ApJ, 153, 49Williams, R. E. 1973, MNRAS, 164, 111Wilson, O. C. 1950, ApJ, 111, 279Wood, P. R., & Faulkner, D. J. 1986, ApJ, 307, 659Zhang, C. Y. 1995, ApJS, 98, 659
Related Documents