Feature Article English Edition No.38 May 2011 34 Feature Article Testing Electrified Drivetrains for Vehicles without the Battery or Engine. Norm Newberger, Bryce Johnson The hybrid electric vehicle (HEV) is becoming a sustainable vehicle architecture with the US government pouring 14.4 billion [1] into stimulus projects that support drivetrains of new vehicles that are hybrid or battery powered (BEV). Both the series hybrid and BEV have 100% of propulsion energy coming from electricity. The series hybrid uses an internal combustion engine (ICE) to power a generator that produces electricity. The parallel hybrid powers the vehicle by a mechanical combination of electric motors and ICE. In all cases, the drivetrain needs an electric motor, a traction battery and an auxiliary method of obtaining electricity. These auxiliary power units (APU) are typically a downsized, highly efficient ICE or fuel cells for a zero emissions alternative. Horiba’s Virtual Engine (VE) and Virtual Battery (VB) are HIL [2] products that allow electric motor based drivetrain development without waiting for the new battery pack and ICE to become available. Relevant product features for HEV development are discussed in terms of form, function, and verification with data. INTRODUCTION Historically, the verification, validation & controller calibration of vehicles was brought in from the proving grounds to the laboratory using chassis dynamometer simulating the road. Figure 1 illustrates this concept using HORIBA’s automation system (STARS) and dynamometer controller (SPARC). The difficulty here is that the entire vehicle needs to have all its intended components in a pre-production state. By expanding the simulation capabilities of the dynamometer controller to include simulation of missing subsystems not under development, subsystem or component testing can occur anywhere a dynamometer can be conveniently connected, Figure 2 illustrates this concept for the physical ISG [4] electric motor being developed for a HEV. The vehicle’s kinematic characteristics, tires, differential, transmission, and torque converter are simulated for their power flow to result in torque or speed set points to the dynamometer attached to the ICE crankshaft output. This configuration suffers form the lack of availability of the ICE and battery pack intended for the vehicle. Both are high value, sophisticated subsystems undergoing their own development process involving different parts of the organization and supplier network. E-motors are also being considered at other locations in the drivetrain. They can be located in the wheels, differential, transmission, or front end accessory drive (FEAD) in addition to the end of the crankshaft. These various alternatives add to the complexity of integration and calibration for the vehicle, thus requiring very early testing in the development process. The power of the battery pack can be simulated by controlling the voltage output of a high power, programmable DC to DC converter using a real time model of the battery chemistry. Additionally, the torque output of the ICE can be simulated by a real time model of the ICE combustion process and mechanical configuration. Figure 3 illustrates the use of a VB and VE with actual hardware to produce the electrical and mechanical power. This report will point out VB and VE implementation, relevant features exclusively for HEV development, and comparisons to measured data from real battery packs and ICE.

Welcome message from author
This document is posted to help you gain knowledge. Please leave a comment to let me know what you think about it! Share it to your friends and learn new things together.
Transcript
Fe
at
ur
e
Ar
ti
cl
e
English Edition No.38 May 201134
Feature Article
Testing Electrified Drivetrains for Vehicles without the Battery or Engine.
Norm Newberger, Bryce Johnson
The hybrid electric vehicle (HEV) is becoming a sustainable vehicle architecture with the US government pouring 14.4 billion[1] into stimulus projects that support drivetrains of new vehicles that are hybrid or battery powered (BEV). Both the series hybrid and BEV have 100% of propulsion energy coming from electricity. The series hybrid uses an internal combustion engine (ICE) to power a generator that produces electricity. The parallel hybrid powers the vehicle by a mechanical combination of electric motors and ICE. In all cases, the drivetrain needs an electric motor, a traction battery and an auxiliary method of obtaining electricity. These auxiliary power units (APU) are typically a downsized, highly efficient ICE or fuel cells for a zero emissions alternative. Horiba’s Virtual Engine (VE) and Virtual Battery (VB) are HIL[2] products that allow electric motor based drivetrain development without waiting for the new battery pack and ICE to become available. Relevant product features for HEV development are discussed in terms of form, function, and verification with data.
INTRODUCTION
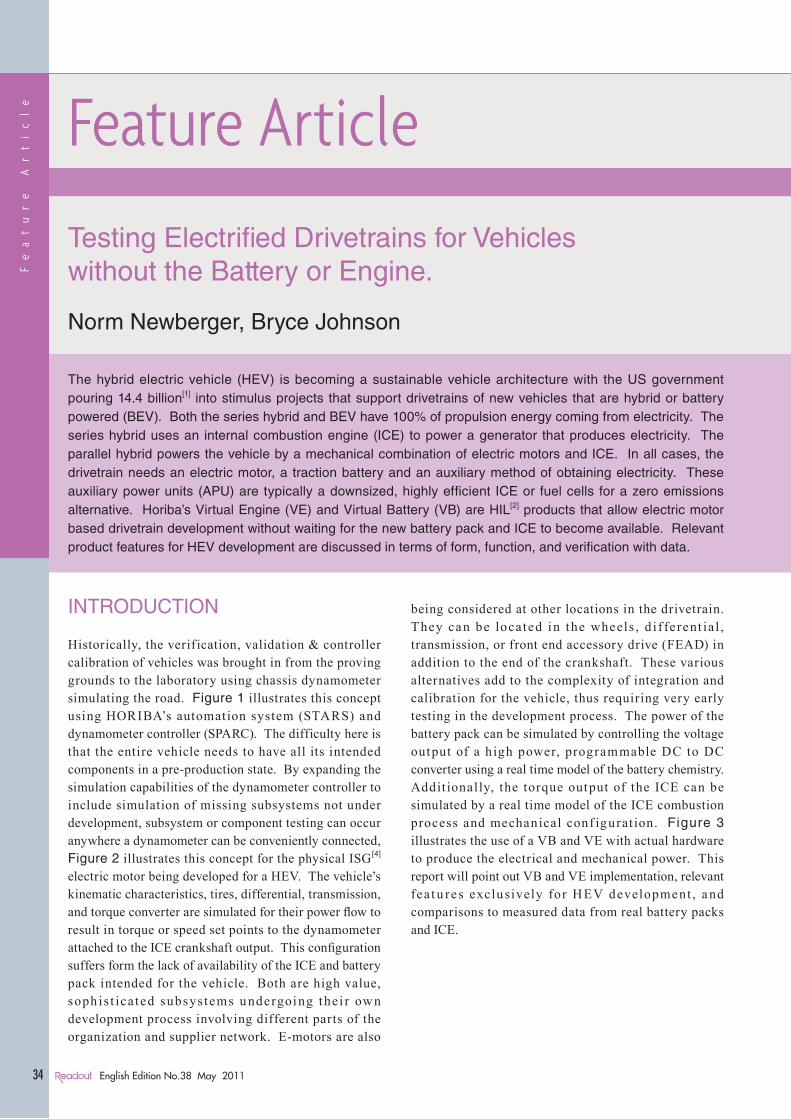
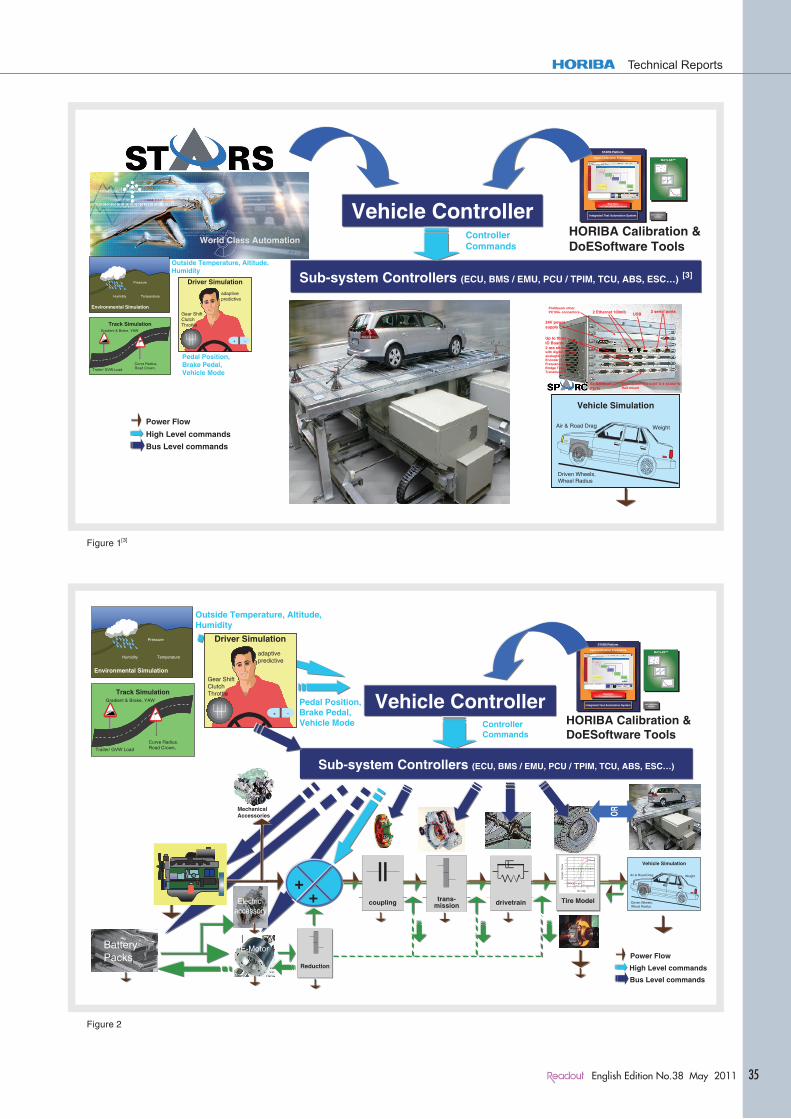
Historically, the verification, validation & controller calibration of vehicles was brought in from the proving grounds to the laboratory using chassis dynamometer simulating the road. Figure 1 illustrates this concept using HORIBA’s automation system (STARS) and dynamometer controller (SPARC). The difficulty here is that the entire vehicle needs to have all its intended components in a pre-production state. By expanding the simulation capabilities of the dynamometer controller to include simulation of missing subsystems not under development, subsystem or component testing can occur anywhere a dynamometer can be conveniently connected, Figure 2 illustrates this concept for the physical ISG [4] electric motor being developed for a HEV. The vehicle’s kinematic characteristics, tires, differential, transmission, and torque converter are simulated for their power flow to result in torque or speed set points to the dynamometer attached to the ICE crankshaft output. This configuration suffers form the lack of availability of the ICE and battery pack intended for the vehicle. Both are high value, soph is t icated subsystems u ndergoing thei r ow n development process involving different parts of the organization and supplier network. E-motors are also
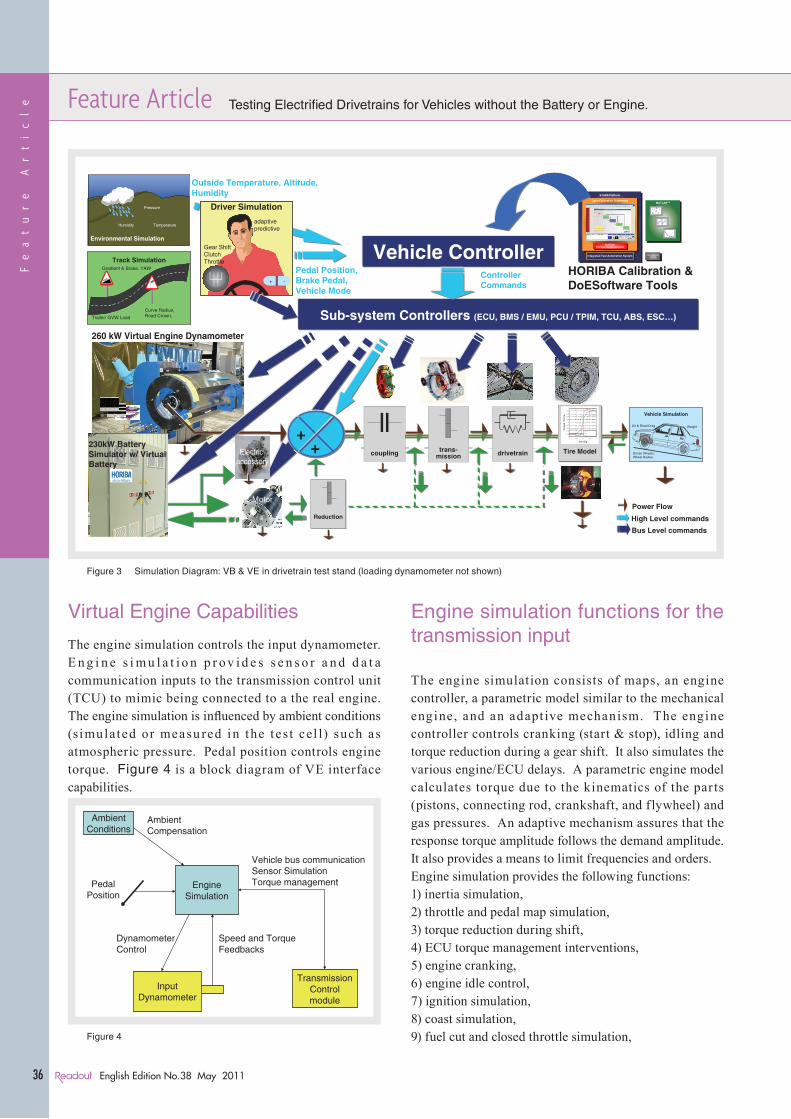
being considered at other locations in the drivetrain. They can be located in the wheels , d i f fe rent ia l , transmission, or front end accessory drive (FEAD) in addition to the end of the crankshaft. These various alternatives add to the complexity of integration and calibration for the vehicle, thus requiring very early testing in the development process. The power of the battery pack can be simulated by controlling the voltage output of a h igh power, programmable DC to DC converter using a real time model of the battery chemistry. Addit ionally, the torque output of the ICE can be simulated by a real time model of the ICE combustion process and mechanical conf igurat ion. Figure 3 illustrates the use of a VB and VE with actual hardware to produce the electrical and mechanical power. This report will point out VB and VE implementation, relevant feat u res exclusively for HEV development , and comparisons to measured data from real battery packs and ICE.
English Edition No.38 May 2011
Technical Reports
35
Feature Article
Testing Electrified Drivetrains for Vehicles without the Battery or Engine.
Norm Newberger, Bryce Johnson
The hybrid electric vehicle (HEV) is becoming a sustainable vehicle architecture with the US government pouring 14.4 billion[1] into stimulus projects that support drivetrains of new vehicles that are hybrid or battery powered (BEV). Both the series hybrid and BEV have 100% of propulsion energy coming from electricity. The series hybrid uses an internal combustion engine (ICE) to power a generator that produces electricity. The parallel hybrid powers the vehicle by a mechanical combination of electric motors and ICE. In all cases, the drivetrain needs an electric motor, a traction battery and an auxiliary method of obtaining electricity. These auxiliary power units (APU) are typically a downsized, highly efficient ICE or fuel cells for a zero emissions alternative. Horiba’s Virtual Engine (VE) and Virtual Battery (VB) are HIL[2] products that allow electric motor based drivetrain development without waiting for the new battery pack and ICE to become available. Relevant product features for HEV development are discussed in terms of form, function, and verification with data.
Integrated Test Automation System
STARS Platform
Open Calibration Framework
Real-TimeTest Execution Environment
MATLAB™
Power Flow
High Level commands
Bus Level commands
24V power supply
Up to three IO Boards 2 are shown with digital (20) and analogI/O (8). Encoder (1), Frequency(2), & Bridge Type Transducers
6x CANbus Ports
2 Ethernet 100mb USB2 serial ports
Profibusor other PC104+ connectors
Small (5.800”H X 6.555”D X 10.860”W)Rail mount
Vehicle Controller
Sub-system Controllers (ECU, BMS / EMU, PCU / TPIM, TCU, ABS, ESC…) [3]
Controller Commands
ECU CalibrationConsole
HORIBA Calibration & DoESoftware ToolsWorld Class Automation
Pedal Position, Brake Pedal, Vehicle Mode
Environmental Simulation
Pressure
TemperatureHumidity
Outside Temperature, Altitude, Humidity
Trailer/ GVW Load
Curve Radius, Road Crown,
Track SimulationGradient & Brake, YAW
10%
Driver Simulation
adaptive predictive
Gear ShiftClutchThrottle
+ -
R 1 3
2 4
5
Vehicle Simulation
Weight
Driven Wheels, Wheel Radius
Air & Road Drag
Figure 1[3]
MATLAB™
ECU CalibrationConsole
HORIBA Calibration & DoESoftware Tools
Integrated Test Automation System
STARS Platform
Open Calibration Framework
Real-TimeTest Execution Environment
Pedal Position, Brake Pedal, Vehicle Mode
Environmental Simulation
Pressure
TemperatureHumidity
Outside Temperature, Altitude, Humidity
Trailer/ GVW Load
Curve Radius, Road Crown,
Track SimulationGradient & Brake, YAW
10%
Driver Simulation
adaptive predictive
Gear ShiftClutchThrottle
+ -
R 1 3
2 4
5
Vehicle Simulation
Weight
Driven Wheels, Wheel Radius
Air & Road Drag
Vehicle Controller
Sub-system Controllers (ECU, BMS / EMU, PCU / TPIM, TCU, ABS, ESC…)
E-MotorBattery Packs
Electric accessory
++
Controller Commands
Power Flow
High Level commands
Bus Level commands
ORMechanicalAccessories
ReductionReduction
coupling drivetraintrans-mission
Tire Model
-1 -0.5 0 0.5 11
-0.8
-0.6
0.8
1
tire slip
torq
ue /
forc
e
-0.4
-0.2
0
0.2
0.4
0.6
Figure 2
Fe
at
ur
e
Ar
ti
cl
e
English Edition No.38 May 201136
Feature Article Testing Electrified Drivetrains for Vehicles without the Battery or Engine.
Virtual Engine Capabilities
The engine simulation controls the input dynamometer. E n g i n e s i m u l a t i o n p r o v i d e s s e n s o r a n d d a t a communication inputs to the transmission control unit (TCU) to mimic being connected to a the real engine. The engine simulation is influenced by ambient conditions (simulated or measu red in the tes t cel l) such as atmospheric pressure. Pedal position controls engine torque. Figure 4 is a block diagram of VE interface capabilities.
EngineSimulation
InputDynamometer
TransmissionControlmodule
PedalPosition
Speed and Torque Feedbacks
Vehicle bus communicationSensor SimulationTorque management
Ambient Compensation
Dynamometer Control
AmbientConditions
Figure 4
Engine simulation functions for the transmission input
The engine simulation consists of maps, an engine controller, a parametric model similar to the mechanical engine, and an adapt ive mechanism. The engine controller controls cranking (start & stop), idling and torque reduction during a gear shift. It also simulates the various engine/ECU delays. A parametric engine model calculates torque due to the kinematics of the parts (pistons, connecting rod, crankshaft, and f lywheel) and gas pressures. An adaptive mechanism assures that the response torque amplitude follows the demand amplitude. It also provides a means to limit frequencies and orders.Engine simulation provides the following functions:1) inertia simulation,2) throttle and pedal map simulation,3) torque reduction during shift,4) ECU torque management interventions,5) engine cranking,6) engine idle control,7) ignition simulation,8) coast simulation,9) fuel cut and closed throttle simulation,
230kW Battery Simulator w/ Virtual Battery
MATLAB™
ECU CalibrationConsole
HORIBA Calibration & DoESoftware Tools
Pedal Position, Brake Pedal, Vehicle Mode
Environmental Simulation
Pressure
TemperatureHumidity
Outside Temperature, Altitude, Humidity
Trailer/ GVW Load
Curve Radius, Road Crown,
Track SimulationGradient & Brake, YAW
10%
Driver Simulation
adaptive predictive
Gear ShiftClutchThrottle
+ -
R 1 3
2 4
5
Vehicle Simulation
Weight
Driven Wheels, Wheel Radius
Air & Road Drag
260 kW Virtual Engine Dynamometer
Integrated Test Automation System
STARS Platform
Open Calibration Framework
Real-TimeTest Execution EnvironmentVehicle Controller
Sub-system Controllers (ECU, BMS / EMU, PCU / TPIM, TCU, ABS, ESC…)
E-Motor
Electric accessory
++
Controller Commands
Power Flow
High Level commands
Bus Level commands
Reduction
coupling drivetraintrans-mission
Tire Model
-1 -0.5 0 0.5 11
-0.8
-0.6
0.8
1
tire slip
torq
ue /
forc
e
-0.4
-0.2
0
0.2
0.4
0.6
Figure 3 Simulation Diagram: VB & VE in drivetrain test stand (loading dynamometer not shown)
Feature Article Testing Electrified Drivetrains for Vehicles without the Battery or Engine.
English Edition No.38 May 2011
Technical Reports
37
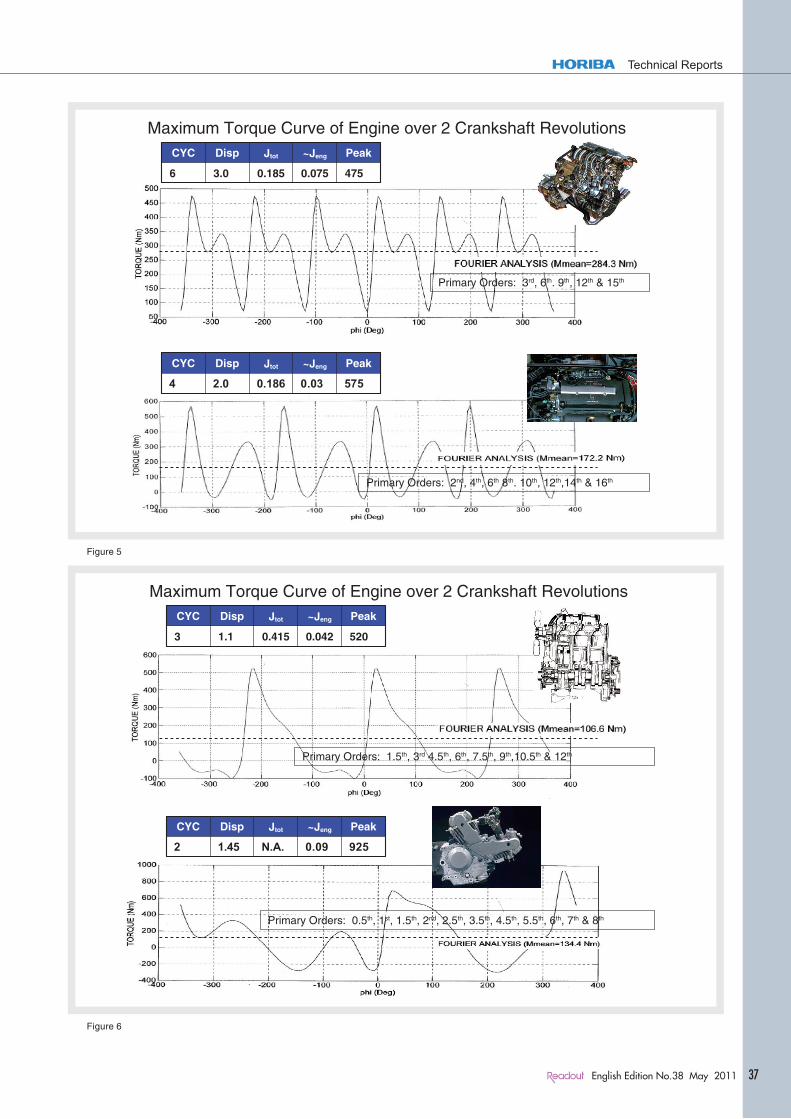
Maximum Torque Curve of Engine over 2 Crankshaft Revolutions
4750.0750.1853.06
Peak~JengJtotDispCYC
PeakJtotCYC ~JengDisp
5750.030.1862.04
Primary Orders: 3rd, 6th. 9th, 12th & 15th
Primary Orders: 2nd, 4th, 6th 8th. 10th, 12th,14th & 16th
Figure 5
Maximum Torque Curve of Engine over 2 Crankshaft Revolutions
5200.0420.4151.13
Peak~JengJtotDispCYC
PeakJtotCYC ~JengDisp
9250.09N.A.1.452
Primary Orders: 1.5th, 3rd 4.5th, 6th, 7.5th, 9th,10.5th & 12th
Primary Orders: 0.5th, 1st, 1.5th, 2nd, 2.5th, 3.5th, 4.5th, 5.5th, 6th, 7th & 8th
Figure 6
Fe
at
ur
e
Ar
ti
cl
e
English Edition No.38 May 201138
Feature Article Testing Electrified Drivetrains for Vehicles without the Battery or Engine.
10) engine torque pulse simulation (ETPS) from the combustion process,
11) cylinder firing reduction,12) front end accessory & generator loading, and13) ambient condition adjustment.
ETPS includes simulation of fuel type (gasoline, diesel) and boost (turbo-charged, super charged or normally aspirated). Two and four cycle engines are supported from 1 to 16 cylinders. The following two figures show torque pulse waveforms at peak power of ICE engines being refined for HEV. These are characteristic torque signatures of the engine’s mechanical configuration.
Pedal map simulation
Current generation engine technology uses f ly-by-wire throttle control. This imposes additional simulation responsibility on the engine simulation to reproduce the demand from the “gas” pedal to throttle demand in the engine simulation. Typically this requires a set of maps found in the ECU to interpret pedal demand into throttle position. The throttle position is then sent to an engine map to create the proper engine torque output. Pedal mapping is highly dependent on vehicle calibration. Figure 7 shows an open loop approximation of pedal to throttle simulation.
ECU
Pedal
Pot
Engine
EngineTorque
ThrottleActuator
ThrottleDelay
EngineDelay
ECUMaps
SimulationPedal
Demand
DetentDelay
Transshift
FuelCutDelay
FuelCut
Fuel cutArray
Figure 7
Engine torque map simulation
An engine is typically throttle controlled. Based on the throttle setting and the current engine speed, the engine will produce a given torque. On the other hand, a dynamometer is speed or torque controlled. Unlike an engine, the electric dynamometer can produce maximum torque at zero speed. Some method is required in the
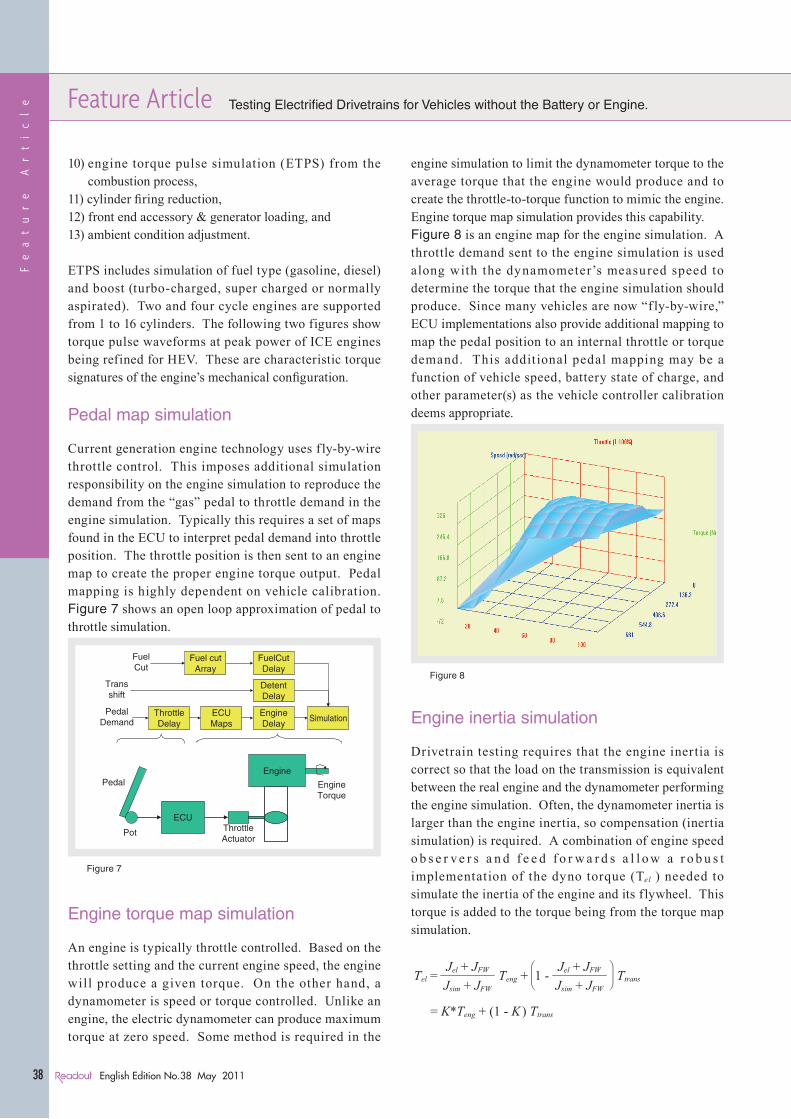
engine simulation to limit the dynamometer torque to the average torque that the engine would produce and to create the throttle-to-torque function to mimic the engine. Engine torque map simulation provides this capability.Figure 8 is an engine map for the engine simulation. A throttle demand sent to the engine simulation is used along with the dynamometer’s measured speed to determine the torque that the engine simulation should produce. Since many vehicles are now “f ly-by-wire,” ECU implementations also provide additional mapping to map the pedal position to an internal throttle or torque demand. This addit ional pedal mapping may be a function of vehicle speed, battery state of charge, and other parameter(s) as the vehicle controller calibration deems appropriate.
Figure 8
Engine inertia simulation
Drivetrain testing requires that the engine inertia is correct so that the load on the transmission is equivalent between the real engine and the dynamometer performing the engine simulation. Often, the dynamometer inertia is larger than the engine inertia, so compensation (inertia simulation) is required. A combination of engine speed o b s e r v e r s a n d f e e d f o r w a r d s a l l o w a r o b u s t implementation of the dyno torque (Tel ) needed to simulate the inertia of the engine and its f lywheel. This torque is added to the torque being from the torque map simulation.
Jsim + JFW
Jel + JFW
Jsim + JFW
Jel + JFWTel = Teng + 1 - Ttrans
= K*Teng + (1 - K ) Ttrans
⎝――⎛
⎠――⎞
Feature Article Testing Electrified Drivetrains for Vehicles without the Battery or Engine.
English Edition No.38 May 2011
Technical Reports
39
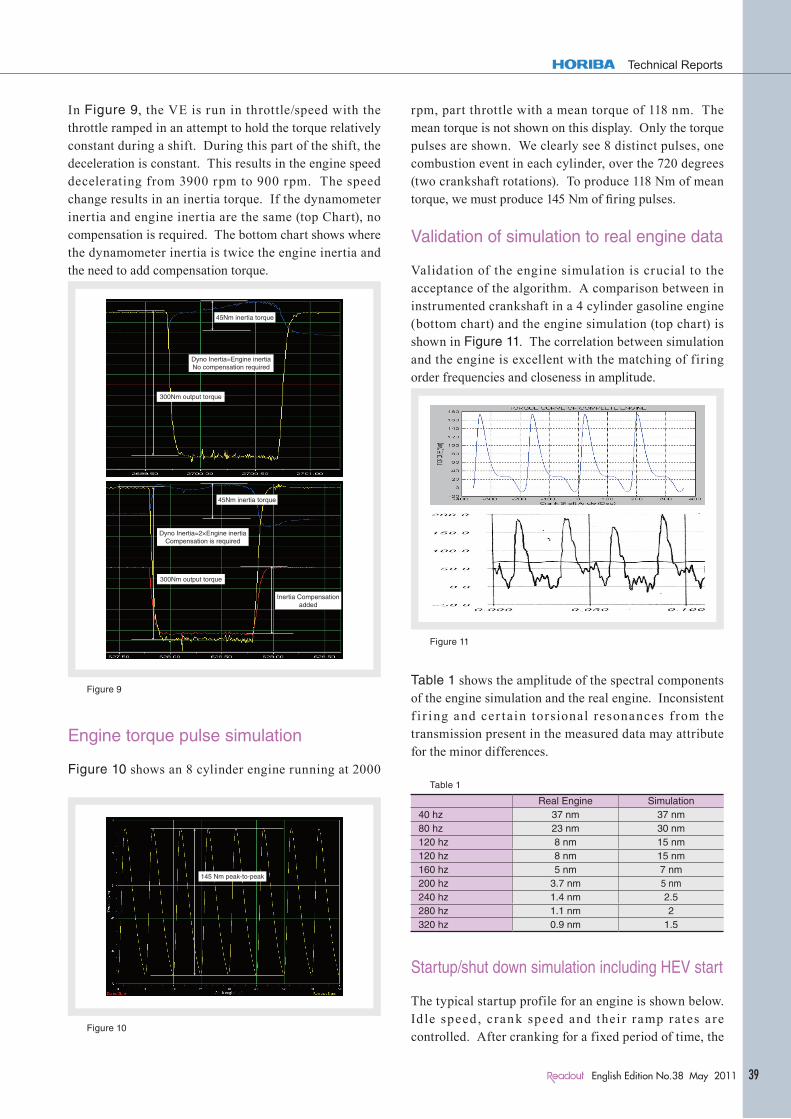
In Figure 9, the VE is run in throttle/speed with the throttle ramped in an attempt to hold the torque relatively constant during a shift. During this part of the shift, the deceleration is constant. This results in the engine speed decelerating from 3900 rpm to 900 rpm. The speed change results in an inertia torque. If the dynamometer inertia and engine inertia are the same (top Chart), no compensation is required. The bottom chart shows where the dynamometer inertia is twice the engine inertia and the need to add compensation torque.
45Nm inertia torque
Dyno Inertia=Engine inertiaNo compensation required
300Nm output torque
45Nm inertia torque
Dyno Inertia=2×Engine inertiaCompensation is required
300Nm output torque
Inertia Compensationadded
Figure 9
Engine torque pulse simulation
Figure 10 shows an 8 cylinder engine running at 2000
rpm, part throttle with a mean torque of 118 nm. The mean torque is not shown on this display. Only the torque pulses are shown. We clearly see 8 distinct pulses, one combustion event in each cylinder, over the 720 degrees (two crankshaft rotations). To produce 118 Nm of mean torque, we must produce 145 Nm of firing pulses.
Validation of simulation to real engine data
Validation of the engine simulation is crucial to the acceptance of the algorithm. A comparison between in instrumented crankshaft in a 4 cylinder gasoline engine (bottom chart) and the engine simulation (top chart) is shown in Figure 11. The correlation between simulation and the engine is excellent with the matching of firing order frequencies and closeness in amplitude.
Figure 11
Table 1 shows the amplitude of the spectral components of the engine simulation and the real engine. Inconsistent f i r ing and cer tain torsional resonances f rom the transmission present in the measured data may attribute for the minor differences.
Table 1
Real Engine Simulation40 hz 37 nm 37 nm80 hz 23 nm 30 nm120 hz 8 nm 15 nm120 hz 8 nm 15 nm160 hz 5 nm 7 nm200 hz 3.7 nm 5 nm240 hz 1.4 nm 2.5280 hz 1.1 nm 2320 hz 0.9 nm 1.5
Startup/shut down simulation including HEV start
The typical startup profile for an engine is shown below. Id le speed , crank speed and thei r ramp rates a re controlled. After cranking for a fixed period of time, the
145 Nm peak-to-peak
Figure 10
Fe
at
ur
e
Ar
ti
cl
e
English Edition No.38 May 201140
Feature Article Testing Electrified Drivetrains for Vehicles without the Battery or Engine.
speed ramps up to idle speed and the idle speed controller takes over. Torque limits are placed on both cranking and idling. HEV startup for hybrids is easily parameterized by adjusting these parameters to shorter time intervals.
Idle Speed
CrankSpeed
Crank Time
Idle rampRate
Figure 12
Engine shutdown/coast is controlled by the ignition, engine map near zero speed and the StandStillSpeed value. The engine map determines what torque is applied to cause the engine to stop. The StandStillSpeed value determines when the dyno command is zeroed.
Idle Speed
Zero Speed
Standstill Speed
Figure 13
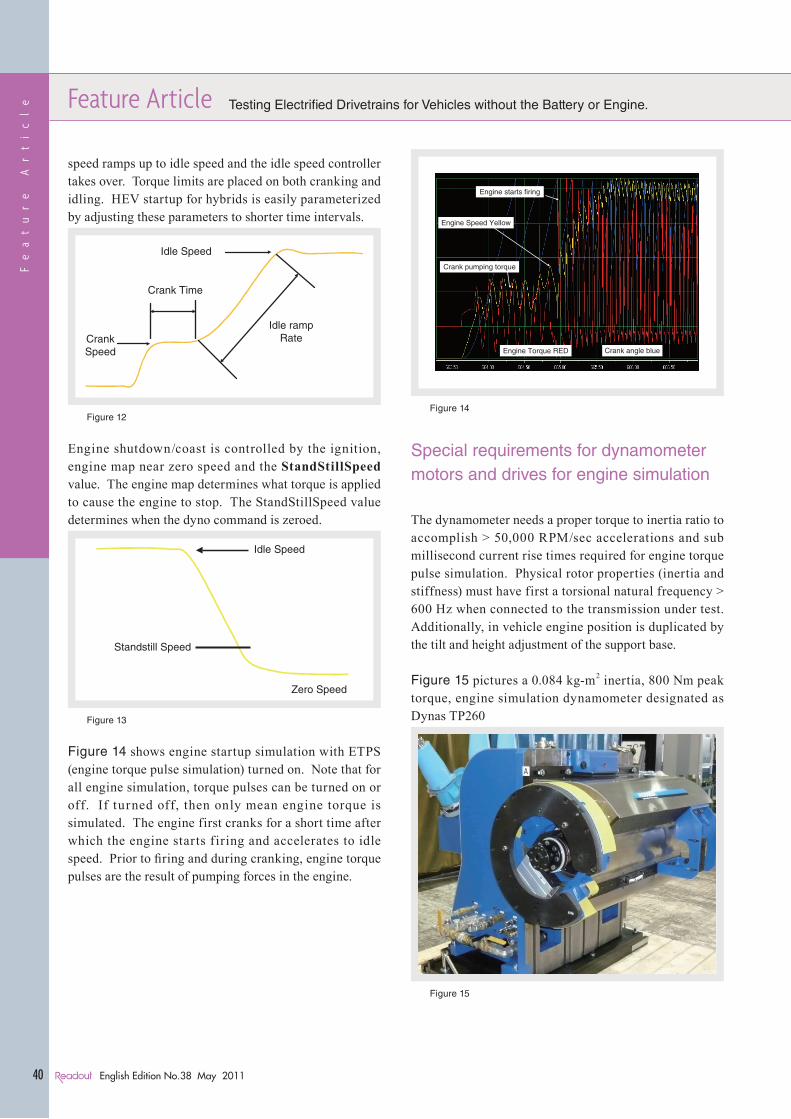
Figure 14 shows engine startup simulation with ETPS (engine torque pulse simulation) turned on. Note that for all engine simulation, torque pulses can be turned on or off. If turned off, then only mean engine torque is simulated. The engine first cranks for a short time after which the engine starts firing and accelerates to idle speed. Prior to firing and during cranking, engine torque pulses are the result of pumping forces in the engine.
Engine starts firing
Engine Speed Yellow
Crank pumping torque
Engine Torque RED Crank angle blue
Figure 14
Special requirements for dynamometer motors and drives for engine simulation
The dynamometer needs a proper torque to inertia ratio to accomplish > 50,000 RPM/sec accelerations and sub millisecond current rise times required for engine torque pulse simulation. Physical rotor properties (inertia and stiffness) must have first a torsional natural frequency > 600 Hz when connected to the transmission under test. Additionally, in vehicle engine position is duplicated by the tilt and height adjustment of the support base.
Figure 15 pictures a 0.084 kg-m2 inertia, 800 Nm peak torque, engine simulation dynamometer designated as Dynas TP260
Figure 15
Feature Article Testing Electrified Drivetrains for Vehicles without the Battery or Engine.
English Edition No.38 May 2011
Technical Reports
41
Battery simulation for HEV transmissions and drivetrains
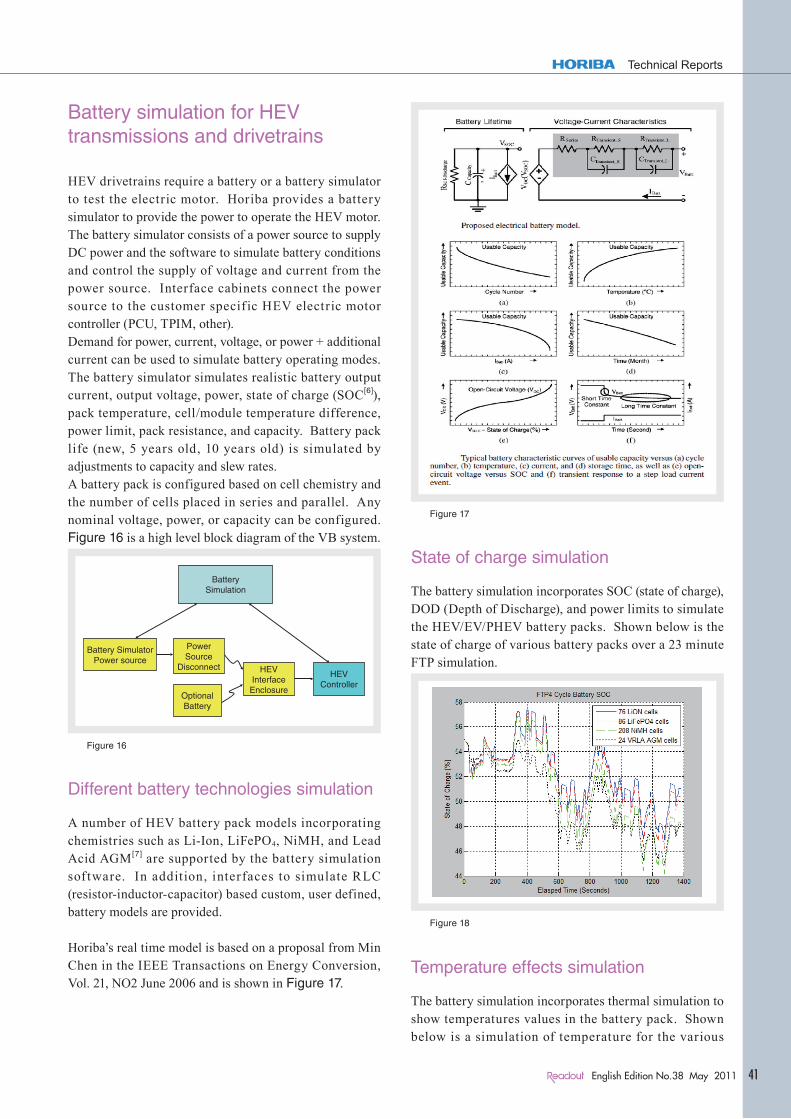
HEV drivetrains require a battery or a battery simulator to test the electric motor. Horiba provides a battery simulator to provide the power to operate the HEV motor. The battery simulator consists of a power source to supply DC power and the software to simulate battery conditions and control the supply of voltage and current from the power source. Interface cabinets connect the power source to the customer specif ic HEV electric motor controller (PCU, TPIM, other).Demand for power, current, voltage, or power + additional current can be used to simulate battery operating modes. The battery simulator simulates realistic battery output current, output voltage, power, state of charge (SOC[6]), pack temperature, cell/module temperature difference, power limit, pack resistance, and capacity. Battery pack life (new, 5 years old, 10 years old) is simulated by adjustments to capacity and slew rates.A battery pack is configured based on cell chemistry and the number of cells placed in series and parallel. Any nominal voltage, power, or capacity can be configured. Figure 16 is a high level block diagram of the VB system.
OptionalBattery
PowerSource
Disconnect HEVInterface
Enclosure
BatterySimulation
HEVController
Battery SimulatorPower source
Figure 16
Different battery technologies simulation
A number of HEV battery pack models incorporating chemistries such as Li-Ion, LiFePO4, NiMH, and Lead Acid AGM [7] are supported by the battery simulation sof tware. In addition, interfaces to simulate RLC (resistor-inductor-capacitor) based custom, user defined, battery models are provided.
Horiba’s real time model is based on a proposal from Min Chen in the IEEE Transactions on Energy Conversion, Vol. 21, NO2 June 2006 and is shown in Figure 17.
Figure 17
State of charge simulation
The battery simulation incorporates SOC (state of charge), DOD (Depth of Discharge), and power limits to simulate the HEV/EV/PHEV battery packs. Shown below is the state of charge of various battery packs over a 23 minute FTP simulation.
Figure 18
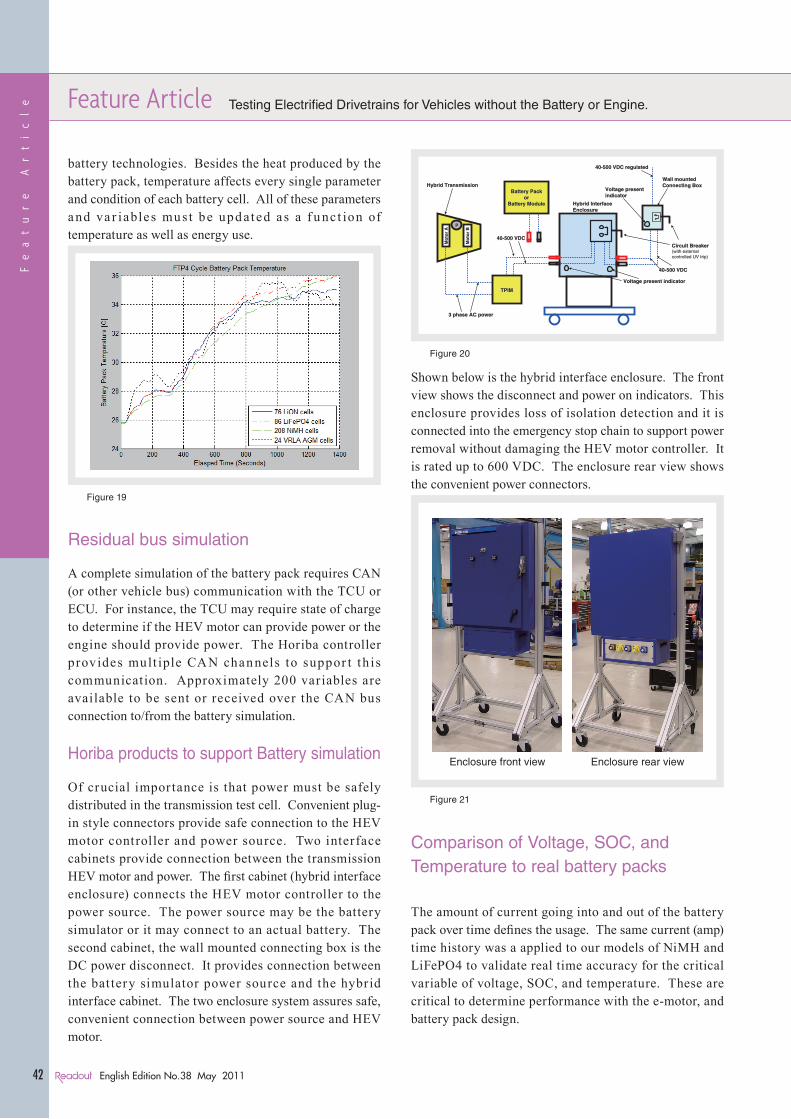
Temperature effects simulation
The battery simulation incorporates thermal simulation to show temperatures values in the battery pack. Shown below is a simulation of temperature for the various
Fe
at
ur
e
Ar
ti
cl
e
English Edition No.38 May 201142
Feature Article Testing Electrified Drivetrains for Vehicles without the Battery or Engine.
battery technologies. Besides the heat produced by the battery pack, temperature affects every single parameter and condition of each battery cell. All of these parameters and va r iables must be upd ated a s a f u nc t ion of temperature as well as energy use.
Figure 19
Residual bus simulation
A complete simulation of the battery pack requires CAN (or other vehicle bus) communication with the TCU or ECU. For instance, the TCU may require state of charge to determine if the HEV motor can provide power or the engine should provide power. The Horiba controller provides mult iple CAN chan nels to suppor t th is communication. Approximately 200 variables are available to be sent or received over the CAN bus connection to/from the battery simulation.
Horiba products to support Battery simulation
Of crucial importance is that power must be safely distributed in the transmission test cell. Convenient plug-in style connectors provide safe connection to the HEV motor controller and power source. Two interface cabinets provide connection between the transmission HEV motor and power. The first cabinet (hybrid interface enclosure) connects the HEV motor controller to the power source. The power source may be the battery simulator or it may connect to an actual battery. The second cabinet, the wall mounted connecting box is the DC power disconnect. It provides connection between the bat tery simulator power source and the hybrid interface cabinet. The two enclosure system assures safe, convenient connection between power source and HEV motor.
Wall mountedConnecting BoxWall mountedConnecting Box
40-500 VDC regulated40-500 VDC regulated
Voltage presentindicatorVoltage presentindicator
Voltage present indicatorVoltage present indicator
Mo
tor
A
Mo
tor
B
Mo
tor
A
Mo
tor
B
3 phase AC power3 phase AC power
Hybrid Interface EnclosureHybrid Interface Enclosure
Circuit Breaker(with external controlled UV trip)
Circuit Breaker(with external controlled UV trip)
40-500 VDC40-500 VDC
40-500 VDC40-500 VDC
Battery Packor
Battery Module
Battery Packor
Battery Module
Hybrid TransmissionHybrid Transmission
TPIMTPIM
PP
Figure 20
Shown below is the hybrid interface enclosure. The front view shows the disconnect and power on indicators. This enclosure provides loss of isolation detection and it is connected into the emergency stop chain to support power removal without damaging the HEV motor controller. It is rated up to 600 VDC. The enclosure rear view shows the convenient power connectors.
Enclosure front view Enclosure rear view
Figure 21
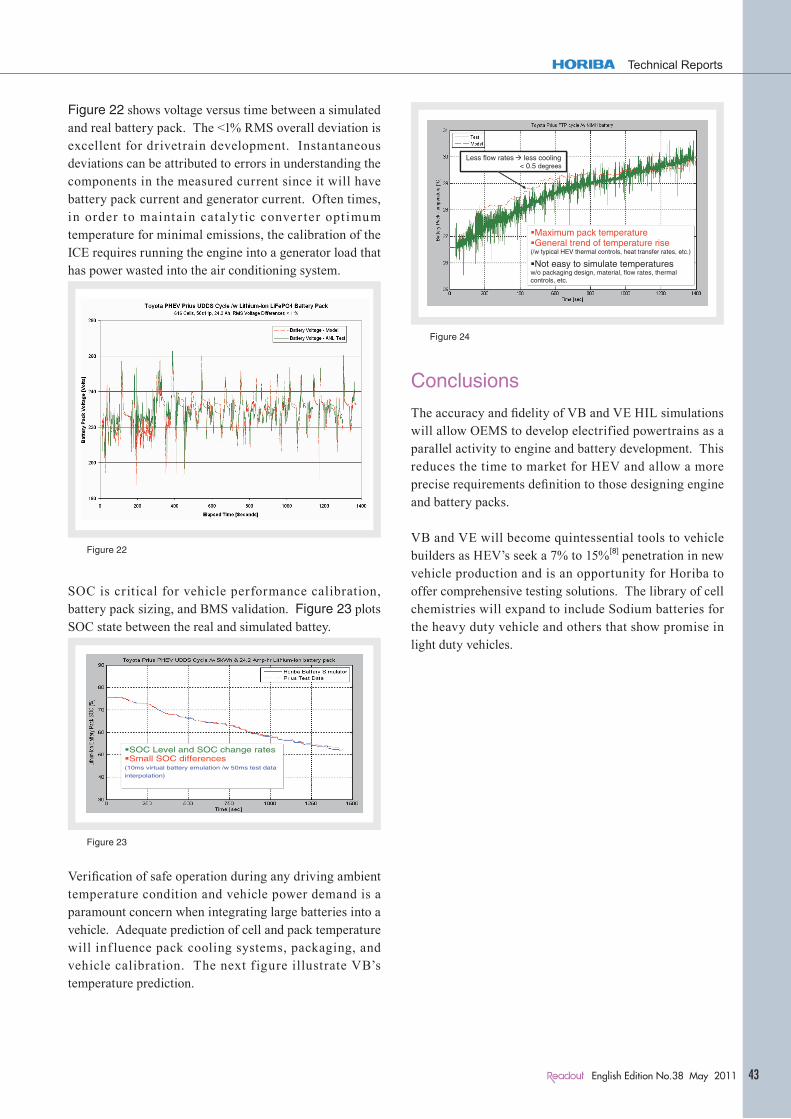
Comparison of Voltage, SOC, and Temperature to real battery packs
The amount of current going into and out of the battery pack over time defines the usage. The same current (amp) time history was a applied to our models of NiMH and LiFePO4 to validate real time accuracy for the critical variable of voltage, SOC, and temperature. These are critical to determine performance with the e-motor, and battery pack design.
Feature Article Testing Electrified Drivetrains for Vehicles without the Battery or Engine.
English Edition No.38 May 2011
Technical Reports
43
Figure 22 shows voltage versus time between a simulated and real battery pack. The <1% RMS overall deviation is excellent for drivetrain development. Instantaneous deviations can be attributed to errors in understanding the components in the measured current since it will have battery pack current and generator current. Often times, in order to maintain cataly t ic conver ter opt imum temperature for minimal emissions, the calibration of the ICE requires running the engine into a generator load that has power wasted into the air conditioning system.
Figure 22
SOC is critical for vehicle performance calibration, battery pack sizing, and BMS validation. Figure 23 plots SOC state between the real and simulated battey.
SOC Level and SOC change ratesSmall SOC differences
(10ms virtual battery emulation /w 50ms test data
interpolation)
Figure 23
Verification of safe operation during any driving ambient temperature condition and vehicle power demand is a paramount concern when integrating large batteries into a vehicle. Adequate prediction of cell and pack temperature will inf luence pack cooling systems, packaging, and vehicle calibration. The next f igure illustrate VB’s temperature prediction.
(/w typical HEV thermal controls, heat transfer rates, etc.)
Maximum pack temperatureGeneral trend of temperature rise
Not easy to simulate temperaturesw/o packaging design, material, flow rates, thermal controls, etc.
Less flow rates less cooling< 0.5 degrees
Figure 24
Conclusions
The accuracy and fidelity of VB and VE HIL simulations will allow OEMS to develop electrified powertrains as a parallel activity to engine and battery development. This reduces the time to market for HEV and allow a more precise requirements definition to those designing engine and battery packs.
VB and VE will become quintessential tools to vehicle builders as HEV’s seek a 7% to 15%[8] penetration in new vehicle production and is an opportunity for Horiba to offer comprehensive testing solutions. The library of cell chemistries will expand to include Sodium batteries for the heavy duty vehicle and others that show promise in light duty vehicles.
Fe
at
ur
e
Ar
ti
cl
e
English Edition No.38 May 201144
Feature Article Testing Electrified Drivetrains for Vehicles without the Battery or Engine.
References
[1] IDtechex,com “Hybrid and Pure Electric Cars 2010-2020” Research Report
[2] HIL commonly referred to as hardware in the loop where something physical is used to create power, or run programs, or create a response but inputs and outputs are simulated from a mathematical model of their real end use condition.
[3] ECU, Engine Control Unit; BMS / EMS , Battery Management System + Energy Management System; PCU/TPIM, Power Control Unit aka Traction Power Inverter Module aka Integrated Power Electronics....; TCU, Transmission Control Unit; ABS, Anti-lock Braking System,; ESC, Electronic Stability Control
[4] Integrated Starter and Generator (ISG) is an electric motor attached to the crankshaft of the ICE that acts as motor to star t the engine and as a generator of electricity when the ICE is running. Since it is directly on the crankshaft, this becomes a parallel hybrid vehicle. Electric motors used vehicle propulsion are cal led E-MOTORS to dist inguish thei r unique construction and power output.
[5] CYC = Number of cylinders, DISP = displacement (combustion volume), Jtot = Total inertia (engine + f lywheel), Jeng = Inertia of crankshaft mechanism, Mmean= Rated / Published torque rating of engine, Peak = Largest torque produced as a pu lse in combustion process
[6] SOC - State of Charge is a calculation of the BMS showing charge availability of the battery pack
[7] AGM - Absorbed glass mat and Gel Batteries are classifications for low maintenance valve regulated lead acid (VRLA) battery
[8] Various predictions from research institutes, auto analysts for HEV, PHEV, EV market volume by 2015 as part of total vehicle production in the USA.

Feature Article Testing Electrified Drivetrains for Vehicles without the Battery or Engine.
English Edition No.38 May 2011
Technical Reports
45
Bryce JohnsonPrinciple EngineerAutomotive Test SystemsHORIBA Instruments Inc.
Norm NewbergerManagerDrivetrain TechnologyAutomotive Test SystemsHORIBA Instruments Inc.
Related Documents