ESCUELA TÉCNICA SUPERIOR DE INGENIERÍAS AGRARIAS DEPARTAMENTO DE INGENIERÍA AGRÍCOLA Y FORESTAL, TECNOLOGÍA DE LOS ALIMENTOS TESIS DOCTORAL TESIS DOCTORAL TESIS DOCTORAL TESIS DOCTORAL Chemical characterization of differential sensory compounds in alcoholic and non-alcoholic lager beers. Effects of dealcoholization process. Presentada por Cristina Andrés Iglesias para optar al grado de Doctor por la Universidad de Valladolid Dirigida por: Dr. Carlos A. Blanco Fuentes Dr. Olimpio Montero Domínguez

Welcome message from author
This document is posted to help you gain knowledge. Please leave a comment to let me know what you think about it! Share it to your friends and learn new things together.
Transcript

ESCUELA TÉCNICA SUPERIOR DE INGENIERÍAS AGRARIAS
DEPARTAMENTO DE INGENIERÍA AGRÍCOLA Y FORESTAL,
TECNOLOGÍA DE LOS ALIMENTOS
TESIS DOCTORALTESIS DOCTORALTESIS DOCTORALTESIS DOCTORAL
Chemical characterization of
differential sensory compounds in alcoholic and
non-alcoholic lager beers. Effects of
dealcoholization process.
Presentada por Cristina Andrés Iglesias para optar al grado de Doctor
por la Universidad de Valladolid
Dirigida por:
Dr. Carlos A. Blanco Fuentes
Dr. Olimpio Montero Domínguez

ESCUELA TÉCNICA SUPERIOR DE INGENIERÍAS AGRARIAS
DEPARTAMENTO DE INGENIERÍA AGRÍCOLA Y FORESTAL,
TECNOLOGÍA DE LOS ALIMENTOS
TESIS DOCTORALTESIS DOCTORALTESIS DOCTORALTESIS DOCTORAL
Caracterización química de compuestos
sensoriales diferenciales en cervezas lager con y
sin alcohol. Efectos del proceso de
desalcoholización.
Presentada por Cristina Andrés Iglesias para optar al grado de Doctor
por la Universidad de Valladolid
Dirigida por:
Dr. Carlos A. Blanco Fuentes
Dr. Olimpio Montero Domínguez

Memoria para optar al grado de Doctor,
con Mención de Doctorado Internacional
presentada por la Ingeniera Agrícola
Cristina Andrés Iglesias
Siendo los directores en la Universidad de Valladolid
Dr. Carlos A. Blanco Fuentes
y
Dr. Olimpio Montero Dominguez
Y el supervisor en University of Chemistry and Technology,
Prague
Department of Biotechnology
Prof. Pavel Dostálek
Valladolid, 7 Julio de 2015


UNIVERSIDAD DE VALLADOLID
ESCUELA DE TÉCNICA SUPERIOR DE INGENIERÍAS AGRARIAS
Secretaría
La presente tesis doctoral queda registrada en el folio número
______ del correspondiente libro de registro número _____.
Valladolid, a ___ de Julio de 2015
Fdo. El encargado de registro


Carlos A. Blanco Fuentes Profesor Titular de Universidad
Departamento de Ingeniería Agrícola y Forestal Área Tecnología de los Alimentos
Universidad de Valladolid y
Olimpio Montero Domínguez Científico Titular de OPIs (CSIC)
Centre for Biotechnology Development (CDB) Valladolid
Certifican:
Que la Ingeniera Agrícola CRISTINA ANDRÉS IGLESIAS ha realizado en el Departamento de Ingeniería Agrícola y Forestal, Área de Tecnología de los
Alimentos de la Universidad de Valladolid, bajo nuestra dirección, el trabajo que, para optar al grado de Doctorado Internacional, presenta
con el título “Chemical characterization differential sensory compounds in alcoholic and non-alcoholic lager beers. Effects of the dealcoholization
process” cuyo título en castellano es “Caracterización química de compuestos sensoriales diferenciales en cervezas lager con y sin alcohol.
Efectos del proceso de desalcoholización”, siendo el Prof. Pavel Dostálek supervisor durante la estancia realizada en University of Chemistry and
Tecnology, Prague
Valladolid, a 7 de Julio de 2015
Fdo. Carlos A. Blanco Fuentes Fdo. Olimpio Montero Domínguez


A mi madreA mi madreA mi madreA mi madre

TABLE OF CONTENTS
INTRODUCTION
Antecedentes / Background ……………………………………………………………….. 19
Objetivos / Aims ……………………………………………………………………………….. 23
Resumen / Summary …………………………………………………………………………. 27
Metodología y resultados / Methodology and results ………………………………… 31
Conclusiones / Conclusions …………………………………………………………………. 39
List of publications related to this thesis …………………………………………………… 43
Alcohol free beer production processes …………………………………………………. 44
Low-alcohol beers: Flavour compounds, defects and improvement strategies … 61
New trends in beer flavour compound analysis ………………………………………… 87
SECTION 1.
BEER ANALYSIS AND CHARACTERIZATION WITH UPLC-QToF-MS
Chapter 1.1……………………………………………………………………………………… 107
Mass spectrometry-based metabolomics approach to determine differential metabolites between regular and non-alcohol beers
Chapter 1.2 ……………………………………………………………………………………... 141
Validation of UPLC-MS metabolomics for the differentiation of regular to non-alcoholic beers (previous results)
SECTION 2.
BEER VOLATILE PROFILE CHARACTERIZATION BY HS-SPME-GC-MS
Chapter 2.1……………………………………………………………………………………… 153
Profiling of Czech and Spanish beers regarding content of alcohols, esters and
acids by HS-SPME-GC-MS
Chapter 2.2 …………………………………………………………………………………….. 175
Comparison of Czech and Spanish lager beers, based on the content of selected carbonyl compounds, using HS-SPME-GC-MS

SECTION 3.
BEER VOLATILE COMPOUND CHANGES DURING LAB-SCALE DEALCOHOLIZATION PROCESS
Chapter 3.1 …….............................................................................................................. 199
Volatile compound profiling in commercial lager regular beers and derived alcohol free beers after vacuum distillation dealcoholization
Chapter 3.2 …………………………………………………………………………………….. 223
Simulation and flavour compounds analysis of dealcoholized beer via one-step vacuum distillation
Acknowledgments ……………………………………………………………………………. 251
About the author ………………………………………………………………………………. 252

INTRODUCTION

Antecedentes / Background
19
Antecedentes
La cerveza es parte de la cultura Mediterránea desde hace miles de años
en España. En los últimos años ha aumentado el interés en esta bebida. Un hecho evidente es el que ha provocado la formación de microcervecerías,
existiendo actualmente 203 registradas en el Registro General de Sanidad a 31 de Diciembre de 2013, siendo un total de 221 cervecerías (Cerveceros
de España, 2013; The Brewers of Europe, 2014).
Según el último informe socioeconómico del sector de la cerveza en España de 2013 se cifró el consumo de cerveza per cápita en 46.3 litros, un
2.6% menos que en 2012, manteniéndonos con esta cifra por debajo del consumo promedio de la Unión Europea (65 litros), aunque en el tercer
trimestre de 2013 la venta de cerveza aumentó por primera vez en los últimos cinco años (Cerveceros de España, 2013).
España continúa siendo el cuarto país productor de cerveza en la Unión Europea, por detrás de Alemania, Reino Unido y Polonia, ocupando la
décima posición a nivel mundial (Cerveceros de España, 2013; The Brewers of Europe, 2014).
Respecto a la cerveza sin alcohol, España es el primer país productor y
consumidor de este tipo de cerveza de la Unión Europea. Según los últimos datos disponibles, incluso duplica el dato de Francia, segundo país que
más cerveza sin alcohol consume, con un 6.6% del total (Cerveceros de España, 2013).
Las exportaciones de cerveza elaborada por las compañías españolas
aumentaron en 2013 el 10% con respecto al año 2012, hasta alcanzar el total de 1.3 millones de hectolitros comercializados, duplicando la cifra de
hace cuatro años. A pesar de estos datos, ocupamos el decimosegundo lugar en datos de 2013 en exportaciones de cerveza. En cuanto a las
importaciones, también aumentaron un 16% en 2013, siendo España el quinto país a nivel de importaciones, por detrás de Reino Unido, Alemania,
Francia e Italia (Cerveceros de España, 2013; The Brewers of Europe).
El sector cervecero, contribuye a la creación de más de 257.000 puestos
de trabajo; además, mediante los impuestos relacionados con el consumo de cerveza, el Estado ingresa cerca de 3.400 millones de euros (Cerveceros
de España, 2013).

Antecedentes / Background
20
References
Cerveceros de España (2013). Informe socioeconómico del sector de la cerveza en España 2013. In: http://www.cerveceros.org/pdf/CE_ Informe
_socieconomico_2013.pdf.
The Brewers of Europe (2014). Beer statistics 2014 edition. In:
http://www.brewersofeurope.org/uploads/mycmsfiles/documents/publications/2014/statistics_2014_web_2.pdf.

Antecedentes / Background
21
Background
Beer is part of the Mediterranean culture since thousands of years in Spain.
In the last few years an increasing interest for this beverage has brought the formation of microbreweries on and 203 are already registered in the
General Health Register at 31st of December of 2013, the total breweries summing up to 221 (Cerveceros de España, 2013; The Brewers of Europe,
2014).
According to the last socioeconomic report of the beer industry in Spain from 2013, beer consumption per capita amounted to 46.3 L, 2.6 % less than
in 2012, this amount keeping Spain below the average consume in the European Union (65 L), even though in the third trimester of 2013, beer sales
increased for the first time in the last five years (Cerveceros de España, 2013).
Spain is the fourth country of the EU in the beer producer range, behind Germany, United Kingdom and Poland, occupying the tenth position
worldwide (Cerveceros de España, 2013; The Brewers of Europe, 2014).
Regarding alcohol free beer, according to the latest data available, Spain is the first producer and consumer country of this kind of beer in the EU,
even doubling the consumer in France, which is the second country of the EU, Spain consurmers representing 6.6 % of the total (Cerveceros de España,
2013).
Beer exportations from Spanish companies increased by 10 % in 2013 in relation to 2012, amounting to 1.3 millions of hectoliters marketed and
doubling the amount of four years ago. Despite these data, Spain occupies the twelfth position in EU regarding beer exports (data from 2013).
Importations also increased by 16 % in 2013, being Spain being the fifth country behind United Kingdom, Germany, France and Italy (Cerveceros
de España, 2013; The Brewers of Europe, 2014).
In Spain, beer industry contributes to the creation of more than 257.000 jobs,
and through taxes related to beer consumtion the Spanish government income is close to 3,400 million €.

Antecedentes / Background
22
References
Cerveceros de España (2013). Informe socioeconómico del sector de la cerveza en España 2013. In: http://www.cerveceros.org/pdf/CE_ Informe
_socieconomico_2013.pdf.
The Brewers of Europe (2014). Beer statistics 2014 edition. In:
http://www.brewersofeurope.org/uploads/mycmsfiles/documents/publications/2014/statistics_2014_web_2.pdf.

Obejtivos / Aims
23
Objetivos
Objetivo general
Proveer a la industria cervecera de una información útil sobre las
diferencias químicas entre cervezas lager con alcohol (regulares) y sin alcohol que le permita mejorar la calidad de las cervezas sin alcohol.
Objetivos específicos
1) Comparar los principales compuestos del flavor en cervezas lager comerciales con y sin alcohol mediante diferentes técnicas analíticas.
Dado que en la composición química de la cerveza hay compuestos con
diferentes volatilidades que contribuyen a las características organolépticas de la cerveza, este objetivo se abordó utilizando dos
técnicas análiticas, cromatografía de gases y cromatografía líquida. Así pues, este objetivo puede subdividirse a su vez en dos subobjetivos:
1.1) Validar una metodología de cromatografía de líquidos de alta eficacia acoplada a espectrometría de masas de tiempo de vuelo (UPLC-
QToF-MS) que permitiera determinar compuestos solubles diferenciales entre cervezas con y sin alcohol, para lo que se midieron muestras de
cerveza con dos tratamientos.
1.2) Establecer correlaciones entre los perfiles aromáticos y del sabor establecidos por compuestos volátiles de cervezas lager de diferente
origen con y sin alcohol. Para ello se utilizó microextracción en fase sólida en espacio de cabeza y cromatografía de gases acoplada a
espectrometría de masas (HS-SPME/GC-MS). Esta técnica nos permitirá determinar las principales diferencias basadas en el contenido de
alcoholes, ésteres, ácidos y compuestos carbonílicos.
2) Aplicar metodologías metabolómicas basadas en el análisis estadístico multivariante de los datos cromatográficos y espectrométicos a la
diferenciación entre cervezas con y sin alcohol, y a la determinación de los compuestos diferenciales sin un conocimiento previo de su
composición química (inespecífica).
Este objetivo se abordó a partir de los datos obtenidos mediante el análisis
UPLC-QToF-MS principalmente, aunque el análisis estadístico multivariante se aplicó también a los compuestos volátiles determinados mediante las

Obejtivos / Aims
24
medidas GC-MS para establecer su contribución a la diferenciación entre las cervezas con y sin alcohol.
3) Evaluar a nivel de laboratorio, pero buscando la mayor semenjanza
posible al proceso de extracción del etanol utilizado en las industrias cerveceras, la influencia de las condiciones del proceso de
desalcoholización a vacío en las posibles pérdidas o modificaciones de compuestos volátiles en el producto obtenido (cerveza final
desalcoholizada) con respecto al producto de partida.
Dentro de este objetivo pueden considerarse tres subobjetivos:
3.1) Validar un sistema experimental de desalcoholización mediante
destilación a vacío controlada, lo más similar posible al utilizado en la industria cervecera, para la recogida sistemática de muestras, tanto de la
propia cerveza como del destilado.
3.2) Estudiar el efecto que ejercen la presión y la temperatura utilizadas durante el proceso de desalcoholización sobre los contenidos de
compuestos volátiles de aroma y sabor de las cervezas.
3.3) Establecer un marco algorítmico que permita simular los cambios en
los compuestos volátiles en el proceso de desalcoholización mediante una comparación de los resultados obtenidos experimentalmente y
teóricamente. Para ello se utilizó el software de simulación de procesos HYSYS.
Obejtivos / Aims
25
Aims
General aim
To provide the brew industry useful information regarding chemical
differences between alcohol (regular) and alcohol-free lager beers that serve to improve alcohol-free beer organoleptic qualities.
Specific aims
1) To compare the main compounds related to flavor in commercial alcoholic and alcohol-free lager beers by means of diverse analytical
techniques.
Because of the chemical composition of beer is constituted by compounds with different volatility that contribute to its organoleptic characteristics, this
aim was accomplished by using gas and liquid chromatography. Hence, two subaims can be drawn:
1.1) To validate a methodology of ultrahigh performance liquid chromatography coupled to mass spectrometry (UPLC-QToF-MS) for the
assessment of differential soluble compounds between alcoholic and alcohol-free beers. Two treatments of beer samples were used.
1.2) To establish correlations between the volatile chemical profiles and
the taste characteristics of alcoholic and alcohol-free lager beers from two different manufacturing origins. Head-space solid phase microextraction
along with gas chromatography coupled to mass spectrometry (HS-SPME/GC-MS) was used for chemical analysis. Differences regarding
alcohols, esters, acids and carbonilyc compounds were determined.
2) To apply a metabolimics methodology based on the multivariate statistical analysis of chromatographic and mass spectrometric data to
the differentiation between alcoholic and alcohol-free lager beers, as well as to the determination of differential compounds without a
previous knowledge of the chemical composition (an untargeted approach).
This aim was primarily accomplished by using the data obtained in the
UPLC-QToF-MS analysis. However, the multivariate statistical analysis was also applied to the volatiles determined by means of GC-MS in order to

Obejtivos / Aims
26
establish their contribution to the differences between beers from two manufacturing origins.
3) To evaluate at a laboratory scale, but intending to resemble as much as
possible the dealcoholization process at an industrial scale, the influence of conditions used in the vacuum dealcoholization process on the
potential losses and modifications of volatile compounds that result in the final product (dealcoholized beer) as compared to the original
product.
Three different sub-objectives can be drawn:
3.1) To validate an experimental setup for vacuum dealcoholization that
is suitable for continuous sampling of beer and distillate fractions.
3.2) To assess the effect of pressure and temperature used in the dealcoholization process on the main volatile compounds that influence
the beer flavor.
3.3) To develop an algorithm that allows to fit the experimental data to a
teorethical framework. The chemical process simulation software HYSYS (Aspen Inc.) was used for this aim.
Resumen / Summary
27
Resumen
La presente tesis doctoral se ha centrado en el estudio de los compuestos
característicos del aroma y sabor de cervezas lager con y sin alcohol, así como en el estudio de aquellos compuestos diferenciales entre ambos
tipos de cerveza y su modificación durante el proceso de desalcoholización a vacío, que es el más utilizado por la industria Española.
En la introducción se recoge el estado-del-arte de los sistemas utilizados en
la producción de cerveza sin alcohol, los factores que afectan a las características organolépticas de las cervezas sin alcohol en relación a las
cervezas no desalcoholizadas (regulares), así como las técnicas analíticas mas habitualmente usadas en el análisis químico de cerveza.
La parte experimental de esta tesis está dividida en tres secciones principales:
- Sección 1: recoge la metodología y los resultados del análisis
comparativo no específico mediante UPLC-QToF-MS de los compuestos de cervezas con y sin alcohol comerciales para
determinar las diferencias entre ellas utilizando una metodología metabolomica.
- Sección 2: aporta los resultados del análisis y caracterización del
perfil de compuestos volátiles de varios tipos diferentes de cervezas con y sin alcohol comerciales mediante HS-SPME-GC-MS. En esta
sección se incluye una comparación entre cervezas de producción española y checa.
- Sección 3: describe la puesta a punto de una metodología de
desalcoholizacion a vacío a escala de laboratorio para el estudio de los cambios que tienen lugar en compuestos relacionados con
el flavor de cervezas comerciales, mediante su determinación antes, durante y después del proceso. La cerveza original y el
producto resultante de la destilación se analizaron mediante HS-SPME-GC-MS. Se seleccionaron dos de las muestras de cerveza
para toma de muestras durante el proceso y los resultados se trasnfirieron al programa de simulación de procesos HYSYS (Aspen
inc.). Los resultados del experimento se ajustaron mediante el programa de simulación a modelos teóricos del proceso de

Resumen / Summary
28
destilación con el objetivo de comprobar su validez para predecir los cambios del perfil aromático a cualquier temperatura y presión.
Resumen / Summary
29
Summary
This thesis has focused on the study of the characteristic flavour compounds
of commercial lager regular (alcoholic) and alcohol-free beers, with special emphasis in the differential flavour compounds between both beer types,
and in those volatile compounds that are removed during the vacuum distillation process, which is the alcohol free beer production process more
frequently used by Spanish breweries.
In the Introduction, the state-of-the-art of the methods and systems used in alcohol-free beer production is described, the main factors affecting the
organolepthic characteristics of alcohol-free beers as compared to alcoholic beers are reported in a published review by the authors, and,
finally, the analytical techniques currently used in beer compound analysis are reviewed in a published paper.
The experimental work of this thesis is reporte in three sections, each containing the corresponding papers thar are either already published or
submitted:
- Section 1: this section tackles with the methodology and results of an untargeted comparative analysis of commercial beer compounds
by using UPLC-QToF-MS measurements and a metabolomics approach for differentiation between regular and alcohol-free
beers.
- Section 2: reports the methodology used and results obtained in the analysis and profile characterization of volatile flavour compounds
in diverse commercial regular and non alcohol beers by HS-SPME-GC-MS. Beers produced in Czech Republic and Spain are
compared.
- Section 3: covers the methodology used and results obtained in a lab-scale set up of a dealcoholization process by vacuum distillation
for routine sampling before, during and after the process. Volatile compound analysis of original beers, distillates and residual
dealcoholized product was carried out by HS-SPME/GC-MS. Sixteen beers were used in these experiments. From these sixteen beers, two
of them were chosen for sampling at different time periods during the process and analytical data were transferred to the chemical
process simulation software HYSYS (Aspen Inc.). Experimental results
Resumen / Summary
30
were fit using the simulation program to a theoretical model with the aim to determine whether such model could be used in predicting
the changes in the volatile profile at given pressure and temperature during the dealcoholization process.

Metodología y Resultados / Methodology and Results
31
Metodología y resultados destacados
El primer objetivo de esta tesis fue descubrir si se podía distinguir entre cervezas sin alcohol y con alcohol usando presentes metodologías
basadas en el análisis cromatográfico y espectrometría de masas. Determinar los principales compuestos que contribuyen a establecer tales
diferencias fue un segundo objetivo concurrente. La combinación de medidas cromatográficas y de espectrometría de masas con el análisis
estadístico multivariante de los datos adquiridos en el análisis instrumental se ha mostrado como una herramienta poderosa para tal tipo de estudios
(Cajka et al. 2010, 2011). Puesto que la composición química de la cerveza comporta compuestos con diversas propiedades químicas (e.g. presión de
vapor e solubilidad en agua), se usaron dos técnicas cromatográficas en este estudio, nominalmente cromatografía de gases y de líquidos, pero la
detección con espectrometría de masas de los compuestros eluidos se usó en ambos casos porque la espectrometría de masas ofrece la posibilidad
de detectar casi todos y cada uno de los compuestos además de una segunda dimensión separativa. Además, para validar los resultados
obtenidos con la metodología indicada, se llevaron a cabo también procedimientos instrumentales y estadísticos de análisis de datos (ANOVA)
convencionales. Se da a continuación una descripción más detallada de la metodología usada y los resultados de este trabajo de tesis:
1) Se usaron cervezas regulares (alcohólicas) y sin alcohol de las mismas
cervecerías, esto es cervezas sin alcohol y las alcohólicas de las que aquellas son obtenidas. Se incluyeron cervezas comerciales nacionales
(españolas) y de importación. 2) En una primera tanda de experimentos (Sección 1), se analizaron
muestras de cerveza mediante cromatografía líquida de ultra-resolución acoplada a espectrometría de masas (UPLC-MS) para
determinar los metabolitos no volátiles diferenciales y su contribución a las diferencias entre cervezas sin alcohol y cervezas regulares. Para
ello, las muestras fueron pre-tratadas mediante dos procedimientos distintos. Uno de los tratamientos conllevó la extracción con
acetonitrilo para precipitar las proteínas dado que las proteínas no entraban en los objetivos del estudio además de provocar
interferencias en el análisis de moléculas pequeñas (< 1200 Da). Un segundo tratamiento implicó una extracción con diclorometano según
el método Bligh & Dyer, el cual tenía el objetivo de valorar si los compuestos lipídicos aportaban una base química mejor que el

Metodología y Resultados / Methodology and Results
32
extracto completo, el cual puede contener azúcares y hasta
tetrapéptidos, para la separación estadística entre los dos tipos de cervezas.
3) Las muestras se analizaron mediante UPLC-MS usando un equipo Acquity™ Ultra-Performance Liquid Chromatography y un
espectrómetro de masas SYNAPT HDMS G2 (Waters, Manchester, UK). El sistema cromatográfico estaba compuesto de un sistema binario de
bombas y un muestreador termostatizado; y el espectrómetro de masas tenía una fuente de ionización por electroespray (ESI) y un
analizador de tiempo de vuelo con una trampa de quadrupolo. Los datos adquiridos fueron analizados a continuación usando el análisis
por componentes principales (PCA) y el análisis discriminante ortogonal basado en mínimos cuadrados parciales (OPLS-DA).
4) Una segunda ronda de experimentos conllevó la comparación de cervezas sin alcohol y alcohólicas (regulares) en relación a su perfil de
volátiles. Se usaron cervezas españolas y checas en este estudio (Sección 2). El propósito de este estudio fue establecer diferencias en
relación al material y el proceso de fabricación de las distintas cervezas. Los compuestos volátiles se extrajeron usando
microextracción en fase sólida con espacio en cabeza (HS-SPME). A continuación los extractos fueron analizados mediante cromatografía
de gases con detección por espectrometría de masas (GC-MS). Se usó un enfoque distinto para los análisis de dos tipos distintos de
compuestos. Por una parte, se midió el contenido diferencial de alcoholes, ésteres y ácidos. Y, por otra parte, se analizaron los
compuestos carbonílicos ya que este tipo de compuestos requieren previa derivatización para poder ser analizados mediante GC-MS. En
estos análisis se usó un equipo de cromatografía de gases Agilent GC 6890N (Agilent Technologies, USA) con un detector de espectrometría
de masas de quadrupolo sencillo Agilent 5975B, Inert MSD (Agilent Technologies, USA), y el cromatógrafo de gases estaba acoplado a un
muestrador HS-SPME (COMBI PAL CTC Analytics, CH). Los compuestos separados se cuantificaron usando estándares comerciales. Tras la
cuantificación, se hicieron tratamientos estadísticos de los datos adquiridos según los métodos ANOVA y PCA.
5) En un tercer conjunto de experimentos (Sección 3), se llevó a cabo un proceso de desalcoholización a escala de laboratorio para conseguir
datos sobre los factores que influyen en los cambios de volátiles entre cervezas sin alcohol y alcohólicas. Se diseñó una metodología para el
muestreo de cerveza y destilados a diferentes tiempos durante el
Metodología y Resultados / Methodology and Results
33
proceso en un sistema de destilación a vacío a escala de laboratorio.
Las muestras de cervezas fueron destiladas a 102 mbar y 50ºC y a 200 mbar y 67ºC. 16 cervezas comerciales fueron sometidas a este
proceso. Se tomaron muestras de la cerveza original, del destilado a lo largo del proceso de destilación (fase inicial, fase media y fase final), y
del producto final tras la desalcoholización. Las muestras se analizaron mediante GC-MS según se indicó anteriormente. Se puso a punto un
método manual HS-SPME para la extracción de volátiles en los productos iniciales y finales. Se analizaron también cervezas sin alcohol
comerciales en estos experimentos. Y los datos GC-MS fueron sometidos a PCA.
Finalmente, a partir de los resultados obtenidos en el proceso de destilación a vacío a escala de laboratorio mencionado, se
seleccionaron 2 cervezas para hacer una comparación entre los datos experimentales y la tendencia en los cambios de volátiles según un
modelo de balance de materia usando el software de procesos HYSIS (Aspen inc.). Para el balance de materia, se tomaron diferentes
tiempos, 0, 15, 30, 45 y 60 minutos, como referencia para el proceso de destilación. Para cada muestra de cerveza y cada tiempo, se midieron
el peso y el volumen. Este procedimiento se hizo para ambas presiones y temperaturas: 102 mbar/50ºC y 200 mbar/67ºC. La simulación del
proceso se llevó a cabo con el paquete Wilson-2. Las variables 1 y 2, que se asocian a los parámetros de interacción binaria de la ecuación
de estado, fueron mejoradas para corregir los errores de la simulación.
Referencias
Cajka, T., Riddellova, K., Tomaniova, M., & Hajslova, J. (2010). Recognition of beer brand based on multivariate analysis of volatile fingerprint. Journal of Chromatography A, 1217, 4195–4203.
Cajka, T., Riddellova, K., Tomaniova, M., & Hajslova, J. (2011). Ambient mass spectrometry employing a DART ion source for metabolomic fingerprinting/profiling: A powerful tool for beer origin recognition.
Metabolomics, 7, 500–508.

Metodología y Resultados / Methodology and Results
34
Resultados Destacados
1) La precipitación de proteínas con acetonitrilo frío permitió realizar
un tratamiento simple y apropiado de las muestras para UPLC-MS. 2) Las cervezas con y sin alcohol se encontraron en grupos separados
en los scoreplots obtenidos después del análisis estadístico PCA para los datos de UPLC-MS.
3) Varios iso-α-ácidos junto con compuestos relacionados con
azúcares mostraron jugar un papel importante en la distinción entre
cervezas con y sin alcohol. 4) La composición volátil de las cervezas está relacionada con el
proceso de producción y materias primas utilizadas para ello, como se indica mediante las diferencias encontradas entre cervezas
checas y españolas. 5) Un total de 31 compuestos volatiles pudieron ser identificados en
cervezas checas y españolas. Entre ellos, 11 ésteres, 7 alcoholes, 3 ácidos, 3 aldehídos lineares, 4 aldehídos de Strecker, 1 aldehído
heterocíclico y 2 cetonas fueron cuantificados. 6) Las cervezas sin alcohol mostraron un contenido extremadamete
bajo de compuestos carbonílicos comparadas con las cervezas con alcohol, este hecho es contribuyó principalmente en las
diferencias entre ambos tipos de cervezas en el análisis por componentes principales.
7) El análisis de los datos de GC-MS mediante métodos estadísticos multivariantes (principalmente PCA) permitió distinguir entre
cervezas con alcohol, sus correspondientes cervezas sin alcohol comerciales y las cervezas desalcoholizadas mediante destilación a
vacío a escala de laboratorio con respecto al perfil de compuestos volátiles.
8) La tendencia de evaporación de los compuestos volátiles, excepto del 2-feniletanol, mostró una buena concordancia entre los datos
experimentales y los balances de material disponibles en la simulación por ordenador.
Metodología y Resultados / Methodology and Results
35
Methodology and results
The first aim of this thesis work was to find out whether non-alcoholic beers could be distinguished from alcoholic beers by taking advantage of
present methodologies based on chromatographic and mass spectrometric analysis. To determine main compounds that contribute to
establish such differences was a concurrent aim. The combination of chromatographic and mass spectrometric measurements with multivariate
statistical analysis of acquired data has been shown as a powerful tool to accomplish such type of studies (Cajka et al. 2010, 2011). Because of beer
chemical composition encompasses compounds with diverse chemical properties (e.g. vapor pressure and water solubility), two chromatographic
techniques were used in this study, namely gas and liquid chromatography, but with mass spectrometry detection of the compounds eluting from the
chromatographic column in both cases because mass spectrometry offers the possibility of detecting almost every compound in addition to a second
dimension regarding compound separation. Furthermore, in order to validate the results obtained with the aforementioned methodology,
classical analytical and statistical (ANOVA) procedures were also conducted. A more detailed description of the work thesis methodology
and results is pointed out below:
1) Regular and alcohol free beers from the same breweries, that is related alcoholic and non-alcoholic beers, were used in this study. They
included imported and national (Spanish) commercial beers. 2) In a first experimental approach (Section 1), beer samples were
analyzed by ultra- performance liquid chromatography coupled to mass spectrometry (ULPC-MS) to determine the differential non-volatile
metabolites and their contribution to alcoholic and non-alcoholic differences. To achieve this, samples were pretreated by two different
procedures. One treatment encompassed acetonitrile extraction to precipitate proteins given that proteins were out of the scope of this
study besides rising interferences in the analysis of small molecules (< 1200 Da). A second treatment was conducted that involved a Bligh
and Dyer dicloromethane extraction, this treatment had the objective to assess whether the lipid compounds afforded a chemical base for
non-alcoholic and alcoholic beer statistical separation better than the whole extract, which may also contain sugars and small peptides
(currently up to tetrapeptides).
Metodología y Resultados / Methodology and Results
36
Samples were then analyzed by UPLC-MS using an Acquity™ Ultra-
Performance Liquid Chromatograph and a SYNAPT HDMS G2 mass spectrometer (WATERS, Manchester, UK). The chromatographic system
had a binary pump system and a thermostated autosampler; and the mass spectrometer had an electrospray ionization source (ESI) and a
time-of-flight mass analyzer with a quadrupole trap (QToF). Acquired data were afterwards analyzed using principal component analysis
(PCA) and orthogonal partial least squares discriminant analysis (OPLS-DA).
3) A second experimental approach encompassed alcoholic and non-alcoholic beer comparison in regard to their volatile profile. Spanish
and Czech beers were used in this study (Section 2). The aim of these experiments was to stablish differences regarding both the raw
materials and beer production processes. Volatile compounds were extracted by using head-space solid phase microextraction (HS-SPME).
Following, extracts were analyzed by gas chromatography with mass spectrometric detection (GC-MS). The analyses were separately
focused in two specific compound types. On one hand, the differential contents of alcohols, esters and acids were assessed. On the other
hand, carbonyl compounds were analyzed because these compounds require to be derivatized for GC-MS analysis. Equipment used in these
experiments was a gas chromatograph (Agilent GC 6890N – Agilent Technologies, USA) equipped with a quadrupole mass spectrometer
detector (Agilent 5975B, Inert MSD – Agilent Technologies, USA), and the gas chromatograph was coupled to a headspace solid phase
microextraction (HS-SPME) autosampler (COMBI PAL CTC Analytics, CH). Separated compounds were quantified using commercial
standards. After quantification, ANOVA and PCA statistics was conducted.
4) In a third experimental set (Section 3), a laboratory scale dealcoholization process was carried out to gain data into the factors
influencing the volatile changes between alcoholic and non-alcoholic beers. A methodology for beer sampling and distillate sampling at
different times during the distillation in a laboratory scale vacuum distillation process was designed. At first, samples were distillated at 102
mbar pressure and 50ºC and subsequently at 200 mbar and 67ºC. 16 commercial beers were brought under this process. From each beer,
commercial beer samples, distillate samples throughout the vacuum distillation process (inicial phase, medium phase and final phase), and
final product samples (‘dealcoholized beer’) were collected. Samples
Metodología y Resultados / Methodology and Results
37
were analyzed by GC-MS as indicated above. A manual HS-SPME
method was set up to volatile extraction in the initial and final beer products. Also, some available commercial alcohol free beers were
analyzed. Multivariate statistical analysis was applied to GC-MS data. Finally, after the results obtained in the laboratory scale vacuum
distillation process mentioned above, 2 beers were selected to perform a comparison between experimental data and the expected trend in
volatile changes according to a material balance modelling using the computer process software HYSIS (Aspen inc.) To carry out this material
balance, different times were taken as reference, 0, 15, 30, 45 and 60 minutes. For each beer sample and each time, samples were taken,
weight and volume measured before and after the lab-scale vacuum distillation process. This was performance for both pressures and
temperatures: 102 mbar/50ºC and 200 mbar/67ºC. Process simulation was carried out with Wilson-2 property packet. Variables 1 and 2, which
correspond to the binary interaction parameters of the equation of state, were improved to correct the simulation errors.
References
Cajka, T., Riddellova, K., Tomaniova, M., & Hajslova, J. (2010). Recognition of beer brand based on multivariate analysis of volatile fingerprint. Journal of
Chromatography A, 1217, 4195–4203.
Cajka, T., Riddellova, K., Tomaniova, M., & Hajslova, J. (2011). Ambient mass spectrometry employing a DART ion source for metabolomic fingerprinting/profiling: A powerful tool for beer origin recognition.
Metabolomics, 7, 500–508.
Metodología y Resultados / Methodology and Results
38
Result
1) Protein precipitation with cold acetonitrile was found to afford a
single and proper beer sample treatment for UPLC-MS analysis. 2) Non-alcoholic and alcoholic beers were separately grouped in the
scoreplots obtained after PCA statistics of the UPLC-MS data. 3) Diverse iso-α-acids along with sugar related compounds were shown
to play an important role in distinguishing between non-alcoholic and alcoholic beers.
4) Volatile composition of beers is related to the production process and raw material used for it as indicated by differences between
Spanish and Czech beers. 5) A total of 31 volatile compounds could be identified in Spanish and
Czech beers. Among them 11 esters, 7 alcohols, 3 acids, 3 linear aldehydes, 4 Strecker aldehydes, 1 heterocyclic aldehyde and 2
ketones were quantified. 6) Non-alcoholic beers exhibited an extremely low content of carbonyl
compounds as compared to alcoholic beers, this factor being the main contributor to beer differences between both beer types in
principal component analysis. 7) Analysis of GC-MS data by multivariate statistical methods (mainly
PCA) allows to distinguishing between commercial alcoholic beers, their related commercial non-alcoholic beers and lab-scale
dealcoholized beers by vacuum distillation in regards to their volatile compound profile.
8) The evaporation trend of all volatile compounds, apart from 2-phenyl-ethanol, showed good agreement between experimental
data and available material balance models in the computational simulation.

Conclusiones / Conclusions
39
Conclusiones
1. Utilizando cromatografía líquida de alta eficacia-espactrometría de
masas (UPLC-MS), combinada con analisis estadíastico multivariante de los datos obtenidos, se realizó una diferenciación entre cervezas
con y sin alcohol. Los compuestos diferenciales pertenencían principalmente a la fración no volátil.
2. Mediante análisis por ULPC-MS, se encontró que los compuestos que mayoritariamente contribuyen a estas diferencias fueron iso-α-acidos,
isoxantohumol y azúcares. Siete compuestos han sido identificados por primera vez en cervezas, los cuales parece que contribuyen también a
estas diferencias entre cervezas con y sin alcohol, estos compuestos son, desoxi-tetrahidro-iso-cohumulona, desoxi-iso-co-humulona,
desdimetil-octahidro-iso-cohumulona, desdimetil-n/ad-humulinona, desoxi-tetrahidro-n/ad-humulona y dihidro-iso-cohumulinona.
3. La combinación de UPLC-MS y el análisis estadístico multivariante pueden ser aplicados a un mayor número de muestras de cerveza,
dando por válido este método para la diferenciación del perfil del flavor entre cervezas con y sin alcohol.
4. La técnica de análisis de microextración en fase sólida en espacio de cabeza-cromatografía de gases-espectrometría de masas (HS-SPME-
GC-MS) se ha aplicó a un total de 28 muestras de cervezas lager diferentes. Los resultados confirmaron diferentes perfiles de flavor con
respecto a la nacionalidad así como cuando se comparan cervezas con y sin alcohol. Con respecto a la nacionalidad, las diferencias
encontradas se atribuyen principalmente al contenido en acetatos, que fue mayor en las cervezas checas que en las españolas. Sin
embargo, las diferencias encontradas entre cervezas con y sin alcohol provenían principalmente del contenido en alcoholes (diferentes al
etanol). Solamente una cerveza sin alcohol mostró un perfil de flavor cercano al de las cervezas con alcohol, esta cerveza se fabrica
utilizando una levadura especial que es incapaz de fermentar maltosa y maltotriosa. Además, el compuesto 2,3-butanodiol exibió un alto
contenido en las cervezas españolas, mientras que no fué encontrado en las cervezas checas.
5. El prefil de compuestos carbonílicos de las mismas 28 muestras de cerveza fué analizado mediante HS-SPME-GC-MS mostrando que la
mayor contribución a la diferenciación de cervezas provenía del (E)-

Conclusiones / Conclusions
40
non-2-enal, que fué encontrado en las cervezas checas en mayor
concentración que en las españolas, y también del diacetilo, que exibió el comportamiento opuesto. Las cervezas sin alcohol
presentaron un contenido muy bajo en compuestos carbonílicos, siendo este factor el que contribuyó principalmente a la diferenciación
entre cervezas con y sin alcohol. 6. Siete compuestos volatiles fueron elegidos como compuestos del flavor
claves para las medidas de los experimentos de desalcoholización a escala de laboratorio realizados a dos presiones diferentes y
correspondientes sus temperaturas. 7. Valores similares (mg/l) de los compuestos analizados fueron obtenidos
utilizando la técnica analítica de HS-SPME-GC-MS en diferentes equipos.
8. Se observaron grandes pérdidas de compuestos volatiles en las cervezas sin alcohol, lo que nos lleva a sugerir que aplicando un
métodod de dealcoholización térmico, se debería implementar a escala industrial algún sistema adicional para recuperar los
compuestos aromáticos perdidos, y así mejorar las características organolépticas del producto final.
9. Aunque requirió menos tiempo en el experimento, se observaron mayores pérdidas de compuestos volatiles cuando se realizó a 200
mbar y 67ºC. 10. Por primera vez se ha probado el estudio de resultados experimentales
contra modelos teóricos, por medio de una herramienta de simulación para el proceso de desalcholización de cerveza. Los datos
experimentales se ajustaron a los coeficientes binarions de interacción termodinámica en la Ecuación de Estado Wilson. Aunque se necesita
más investigación en este sentido, el modelo de simulación ha sido aplicado con éxito para 6 de los 7 compuestos analizados.

Conclusiones / Conclusions
41
Conclusions
1. Ultra performance liquid chromatography-mass spectrometry (ULPC-MS) combined with multivariate statistical analysis of generated data
was able to differentiate between regular and non-alcohol beers, the differential compounds mainly pertaining to the non-volatile
compound fraction. 2. By ULPC-MS analysis, compounds that contribute to the differences
were found to be mainly iso-α-acids, isoxanthohumol and sugar. Seven
new compounds were reported for the first time which seem to also
contribute to differences between non-alcoholic and regular beers, and they are desoxy-tetrahydro-iso-cohumulone, desoxy-iso-co-
humulone, desdimethyl-octahydro-iso-cohumulone, desdimethyl-n/ad-humulinone, desoxy-tetrahydro-n/ad-humulone, dihydro-iso-
cohumulinone. 3. The combination of UPLC-MS and multivariate statistical analyses can
be applied to a large number of beer samples as a suitable method to find out differences in the flavor profile between non-alcoholic beers and regular beers.
4. Headspace solid phase microextraction-gas chromatography-mass spectrometry (HS-SPME-GC-MS) analysis was applied to 28 different
lager beer samples. Results confirm different flavor profiles regarding production nationality as well as regular versus non-alcoholic beers.
Concerning nationality, differences were mainly attributed to the content of acetates, which were higher in Czech samples than in
Spanish ones. However, differences between regular and alcohol free beers mainly came from the content of alcohols other than ethanol.
Only one non-alcoholic beer showed a flavor profile close to regular ones, this beer being made by using a special yeast that is unable to
metabolize maltose and maltotriose. In addition, 2,3-butanediol exhibited a high concentration in Spanish beers while depleted in
Czech ones. 5. The carbonyl compound profile of the same 28 beer samples analyzed
by HS-SPME-GC-MS showed that the main contribution to beer differentiation came from (E)-non-2-enal, which was found in higher
concentration in Czech beers than in Spanish ones, and diacetyl, which exhibited the opposite behaviour. Non-alcoholic beers
presented a very low carbonyl compound content, this factor
Conclusiones / Conclusions
42
contributing with a high weigh to the differentiation between non-
alcoholic and regular beers by multivariate statistical analysis. 6. Seven volatiles were chosen as key flavor compounds according to HS-
SPME-GC-MS measurements for lab-scale dealcoholization experiments at two different pressures and their correspondent temperatures.
7. Similar values (mg/l) were obtained using the HS-SPME-GC-MS analytical method in different experimental setup for the compounds
measured. 8. High losses of volatile compounds were observed in non-alcoholic
beers, which lead us to suggest that in thermal dealcoholization at industrial scale, some additional system to recover the aroma
compounds should be implemented in order to improve the organoleptic characteristics of the residual product by further addition.
9. Although less time is needed in the experiment, high losses of the volatile compounds analyzed were reported when 200 mbar at 67ºC
was applied to. 10. For the first time we have tested experimental results against theoretical
models by means of a computational simulation tool for the beer dealcoholization process. Experimental data were fit to the
thermodynamic binary interaction coefficients of a Wilson Equation of State. Although, more research is needed in this sense, we succeeded
in the simulation model for six of the seven compounds analyzed.
List of publications related to the thesis
43
List of publications related to this thesis
Low-alcohol beers: Flavour compounds, defects and improvement strategies. Critical reviews in food science and nutrition. Critical Reviews in Food Science and
Nutrition, DOI: 10.1080/10408398. 2012.733979 (2014)
New trends in beer flavour compounds analysis. Journal of the Science of Food and Agriculture, 95: 1571-1576 (2015).
Mass spectrometry-based metabolomics approach to determine differential metabolites between regular and low-alcohol beers. Food Chemistry, 157: 205-212
(2014).
Profiling of Czech and Spanish beers based on alcohols, esters and acids content by
HS-SPME-GC-MS. Submitted to: Journal of Food Science, april 2015.
Comparison of Czech and Spanish lager beers, based on the content of selected carbonyl compounds, using HS-SPME-GC-MS. Submitted to: LWT-Food Science and Technology, april 2015.
Simulation and flavor compounds analysis of dealcoholized beer via one-step vacuum distillation. Submitted to: Food Research International, may 2015.
Volatile compound profiling in commercial lager regular beers and derived alcohol free beers after vacuum distillation dealcoholization. Submitted to: Food Chemistry,
june 2015.

INTRODUCTION Alcohol Free Beer Prduction Processes
44
Alcohol free beer production processes
ALCOHOL FREE BEER PORDUCTION METHODS
There is a suitable range of processes for producing non-alcoholic (ethanol content less than 0.5 % alcohol by volume) or low alcohol beer (ethanol
content less than 1.0 % alcohol by volume)(Catarino et al., 2007).
The main goal in the production of low-alcohol and alcohol-free beers is to get the organoleptic characteristics to be as close as possible to those of
regular beers. This achievement far from being got because especially non alcoholic beers suffer from having an artificial and dull flavour,
inappropriate body and incorrect foaming properties. For these reasons, the current processes used to produce low and non-alcoholic beers require
of increased technological and economic concerns (Sohrabvandi et al., 2010b)
Non-alcoholic beer can be produced by removing the ethanol from a
completely fermented product or by fermentation-free brewing in which no yeast is added to the wort. In this process the fermentation stage is
eliminated. However, in this case the expected sensory characteristics of the final product must be improved by using different additives
(Sohrabvandi et al., 2010b).
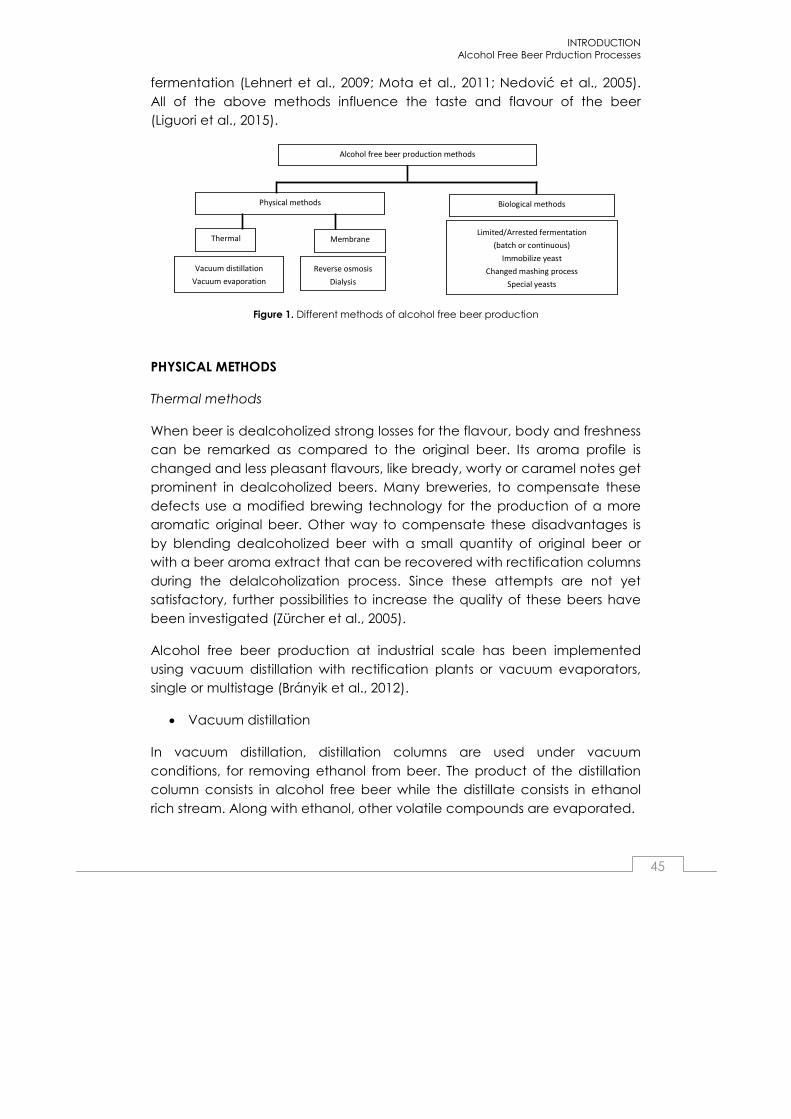
In Figure 1, current alcohol free beer production processes are shown. Briefly
said, there are two main different methods to produce alcohol free beers, by ethanol removal or by restricted ethanol formation. Removing the
ethanol from a completely fermented beer can be achieved by heat treatment processes that are vacuum evaporation and distillation (Belisario-
Sanchez et al., 2009) and by membrane based processes including reverse osmosis (Catarino et al., 2007; Labanda et al., 2009; Pilipovik and Riverol,
2005) and dialysis (Petkovska et al., 1997). These afrorementioned methods are widely applied in beer dealcoholization (Brányik et al., 2012). Restricting
or controlling ethanol formation during brewing (biological methods) can be achieved by either (i) changed mashing process, (ii) arrested (limited)
fermentation process (Narziss et al., 1992; Perpète and Collin, 1999), (iii) use of special yeasts (Narziss et al., 1992; Nevoigt et al., 2002; Selecký et al.,
2008; Sohrabvandi et al., 2010c; Strejc et al., 2013) and (iiii) continuous
INTRODUCTION Alcohol Free Beer Prduction Processes
45
fermentation (Lehnert et al., 2009; Mota et al., 2011; Nedović et al., 2005).
All of the above methods influence the taste and flavour of the beer (Liguori et al., 2015).
Figure 1. Different methods of alcohol free beer production
PHYSICAL METHODS
Thermal methods
When beer is dealcoholized strong losses for the flavour, body and freshness can be remarked as compared to the original beer. Its aroma profile is
changed and less pleasant flavours, like bready, worty or caramel notes get prominent in dealcoholized beers. Many breweries, to compensate these
defects use a modified brewing technology for the production of a more aromatic original beer. Other way to compensate these disadvantages is
by blending dealcoholized beer with a small quantity of original beer or with a beer aroma extract that can be recovered with rectification columns
during the delalcoholization process. Since these attempts are not yet satisfactory, further possibilities to increase the quality of these beers have
been investigated (Zürcher et al., 2005).
Alcohol free beer production at industrial scale has been implemented
using vacuum distillation with rectification plants or vacuum evaporators, single or multistage (Brányik et al., 2012).
• Vacuum distillation
In vacuum distillation, distillation columns are used under vacuum
conditions, for removing ethanol from beer. The product of the distillation column consists in alcohol free beer while the distillate consists in ethanol
rich stream. Along with ethanol, other volatile compounds are evaporated.
Vacuum distillation
Vacuum evaporation
Reverse osmosis
Dialysis
Alcohol free beer production methods
Physical methods Biological methods
Thermal Membrane Limited/Arrested fermentation
(batch or continuous)
Immobilize yeast
Changed mashing process
Special yeasts

INTRODUCTION Alcohol Free Beer Prduction Processes
46
In a continuous rectification plant, beer is initially preheated and filtered in a
plate exchanger, following it by degassed with the simultaneous liberation of volatile compounds in a vacuum degasser. The dealcoholization is made
in a rectifying column where beer flows down at a temperature between 43-48ºC in a section called stripping section and vapor is in counter current
contact. The vapor is generated from alcohol free beer in a reboiler, a heating exchanger is used to vaporize some of the bottom liquid and
redirected into the column; this brings a selective separation of alcohol from the product. Alcohol rich vapors pass from the stripping section of the
column to the rectifying section, where they are condensed. Finally alcohol free beer is cooled and the aroma components from CO2 (degassed step)
recovered by spraying with dealcoholized beer or water, and redirecting them into dealcoholized beer (Brányik et al., 2012; Montanari et al., 2009).
• Vacuum evaporation
At present, in order to shorten the ethanol removal, regular beer flows
through these vacuum devices as a thin film with large surface area in an extremely short residence time, which results in an improved product quality
(Brányik et al., 2012).
Three different thin film evaporators systems exists, the one which produces
a thin liquid film in a mechanical cone with rotational movement (Figure 2), the spinning cone column (SCC) systems (Figure 3), and the falling film
evaporator that do not contain moving parts (Figure 4).
Figure 2. Rotating thin film evaporator with one rotating cone, (1) feed tube and injection nozzle, (2) product tube, (3) vapors, (4) steam, (5) condensate (Brányik et al., 2012).
Figure 3. Vapour and liquid flow through the spinning cone column distillation system (SCC): (1) rotating shaft, (2) fixed cone, (3) rotating cone, (4) fin, (5) liquid beer flow, (6) vapor flow, (7) external wall (Brányik et al., 2012).
4
5
3
1 2

INTRODUCTION Alcohol Free Beer Prduction Processes
47
The rotating evaporator (Figure 2) uses steam as heating medium and
operates at temperatures from 35 to 60ºC. Once beer gets into the system, centrifugal force spreads it over the entire heating surface in a thin layer.
This system can achieve a production capacity of 100 hl/h with a 12 cones system (Brányik et al., 2012).
Centrifugal distillation is a worldwide popular method for removing ethanol
from alcoholic beverages. This process is a variation of vacuum distillation, in which a column with a special design, the spinning cone column (SCC)is
used. SCC (Figure 3) consists in a gas–liquid counter-current device where the stripping medium (e.g. water vapour) extracts the ethanol from the
beverage (Catarino and Mendes, 2011). The system contains two series of inverted cones, one of them fixed to the column wall and other rotating
one attached to a central rotating axis (Brányik et al., 2012; Catarino and Mendes, 2011).
In the SCC beer is fed from the top and driven by gravity reaching this way
the first rotating cone, whitch by spinning get the beer into a thin layer. The vapor flows upward passing over the surface of the liquid film and
collecting ethanol and other volatile compounds (Brányik et al., 2012; Montanari et al., 2009). In SCC there is no rectification or enrichment as in
typical distillation (Catarino and Mendes, 2011).
beer
dealcoholized
beer
heating steam
inlet
condensate
vapor separator
dealcoholized
beer
vapor flow
Figure 4. Falling film evaporator system. Font, (Brányik et al., 2012)
INTRODUCTION Alcohol Free Beer Prduction Processes
48
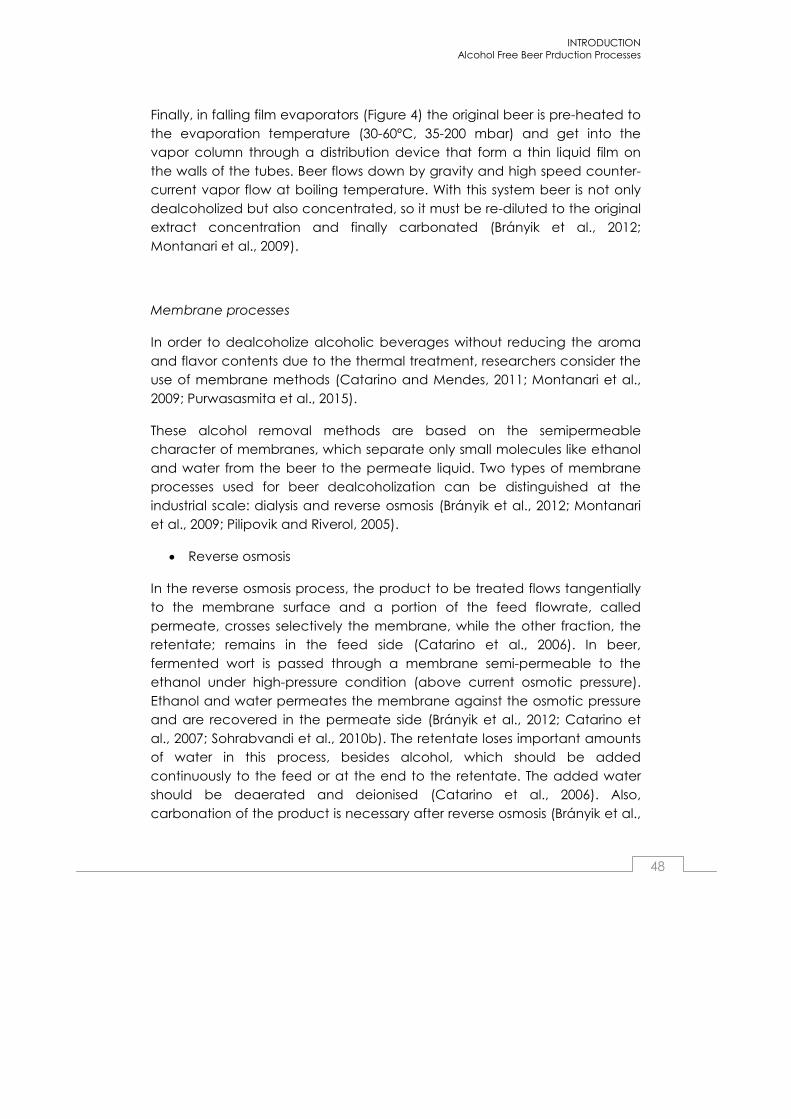
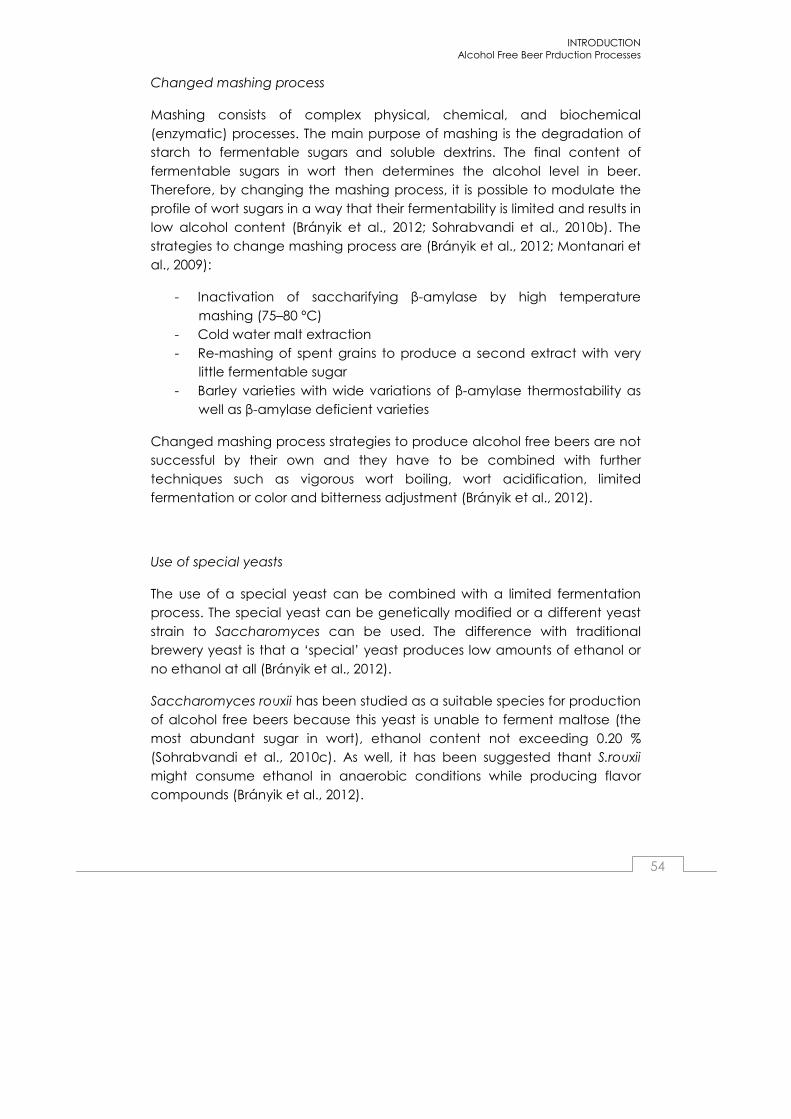
Finally, in falling film evaporators (Figure 4) the original beer is pre-heated to
the evaporation temperature (30-60ºC, 35-200 mbar) and get into the vapor column through a distribution device that form a thin liquid film on
the walls of the tubes. Beer flows down by gravity and high speed counter-current vapor flow at boiling temperature. With this system beer is not only
dealcoholized but also concentrated, so it must be re-diluted to the original extract concentration and finally carbonated (Brányik et al., 2012;
Montanari et al., 2009).
Membrane processes
In order to dealcoholize alcoholic beverages without reducing the aroma
and flavor contents due to the thermal treatment, researchers consider the use of membrane methods (Catarino and Mendes, 2011; Montanari et al.,
2009; Purwasasmita et al., 2015).
These alcohol removal methods are based on the semipermeable character of membranes, which separate only small molecules like ethanol
and water from the beer to the permeate liquid. Two types of membrane processes used for beer dealcoholization can be distinguished at the
industrial scale: dialysis and reverse osmosis (Brányik et al., 2012; Montanari et al., 2009; Pilipovik and Riverol, 2005).
• Reverse osmosis
In the reverse osmosis process, the product to be treated flows tangentially to the membrane surface and a portion of the feed flowrate, called
permeate, crosses selectively the membrane, while the other fraction, the retentate; remains in the feed side (Catarino et al., 2006). In beer,
fermented wort is passed through a membrane semi-permeable to the ethanol under high-pressure condition (above current osmotic pressure).
Ethanol and water permeates the membrane against the osmotic pressure and are recovered in the permeate side (Brányik et al., 2012; Catarino et
al., 2007; Sohrabvandi et al., 2010b). The retentate loses important amounts of water in this process, besides alcohol, which should be added
continuously to the feed or at the end to the retentate. The added water should be deaerated and deionised (Catarino et al., 2006). Also,
carbonation of the product is necessary after reverse osmosis (Brányik et al.,

INTRODUCTION Alcohol Free Beer Prduction Processes
49
2012). It is expected that other molecules, longer than ethanol such as
aroma and flavor compounds, will mostly remain at the retentate side of the membrane (Brányik et al., 2012; Catarino et al., 2006). However,
dealcoholization by reverse osmosis not only removes volatile low molecular weight components such as water or alcohol, but low molecular flavor and
aroma components as well as organic acids or simple sugars are removed too (Sohrabvandi et al., 2010b). Nanofiltration and reverse osmosis are
based in the same technique but reverse osmosis requires more pressure (Catarino, 2010).
• Dyalisis
Dialysis process is based on the diffusive exchange of substances from
different liquids through a semipermeable membrane (Montanari et al., 2009).
When dialysis is employed for low alcohol beer production the semipermeable membrane acts as a molecular barrier permeable only to
certain molecules. Permeability depends on the pore size and surface properties. When the process is performed into water, some water will
diffuse from dialysate into beer (Brányik et al., 2012; Sohrabvandi et al., 2010b). This process usually operates at low temperatures (1-6 ºC) and when
a differential transmembrane pressure is applied (13-60 kPa) in order to suppress water diffusion into beer, the process is often called diafiltration
(Brányik et al., 2012).
Although the final dealcoholized beer may contain as little as 0.5 % alcohol, a selective removal of ethanol cannot be achieved because of
components of beer, such as higher alcohols and esters, are also removed from the beer by dialysis (Brányik et al., 2012; Montanari et al., 2009;
Sohrabvandi et al., 2010b).
Other membrane techniques
• Vacuum membrane distillation
Vacuum membrane distillation is a membrane process but in which the
membrane is not directly involved in separation. An hydrophobic membrane is employed and acts as a physical barrier between the two
phases to prevent the aqueous feed phase passing through and creates a

INTRODUCTION Alcohol Free Beer Prduction Processes
50
liquid–vapor interface at the membrane pores (Diban et al., 2009).
Selectivity is determined by the liquid–vapor equilibrium, thus the component with the highest partial pressure has the highest permeation
rate. In the case of an ethanol/water mixture, both components can be transported through the membrane but since the ethanol has higher vapor
pressure, the permeation rate of ethanol is always relatively higher than the rate of water permeation (Purwasasmita et al., 2015). For dealcoholized
beer, a non-porous membrane has been used.
The main advantage of this technology is the low operating temperature and pressure, thus limiting the thermal damage to components, such as
aroma and flavour compound losses (Liguori et al., 2015).
• Osmotic distillation
Osmotic distillation involves the transport of volatile components from an
aqueous solution (feed) into another liquid solution (stripping agent) capable of absorbing these components (Liguori et al., 2013). Osmotic
distillation is an isothermal membrane process, which allows the separation of volatiles between feed and stripping streams by means of vapor pressure
differences. A hydrophobic microporous membrane is used and the solutions penetration into the membrane pores is prevented. In beer
dealcoholization, the mechanism of ethanol transport by osmotic distillation process consists of ethanol evaporation from the feed stream at the
membrane surface, the diffusion through the membrane porous, and the condensation into the stripping agent (Liguori et al., 2015; Liguori et al.,
2013; Sohrabvandi et al., 2010b).
• Pervaporation: successful aroma recovery method
Pervaporation is one of the most effective membrane processes for aroma recovery in beverages, the membranes used in the process are very
selective for several chemical groups important in the aroma profiles of beverages (Olmo et al., 2014). Thus, in the case of beer, the process is used
to separate beer aroma using semipermeable membranes. The permeate phase (beer aroma) exits as vapor in the low pressure permeate side, then is
condensed and reintroduced into the final product. The retentate (beer) keeps other components and may be used by other process or recycled for
further separation (Olmo et al., 2014).
INTRODUCTION Alcohol Free Beer Prduction Processes
51
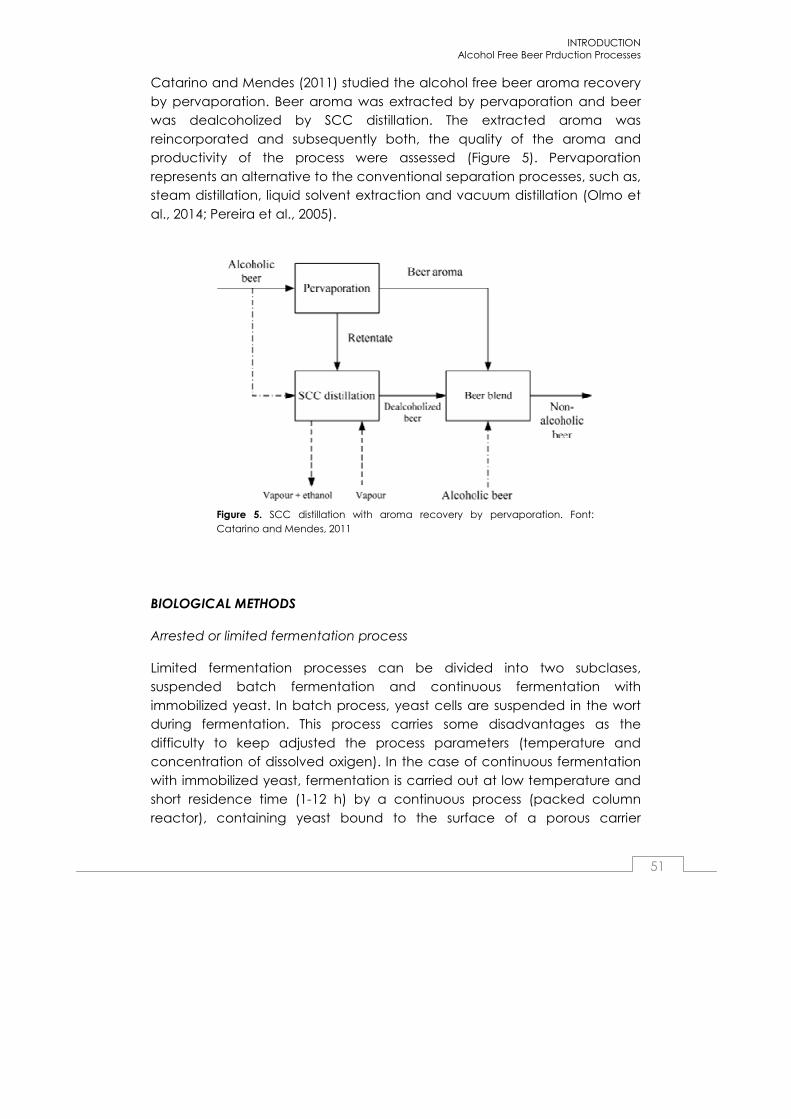
Catarino and Mendes (2011) studied the alcohol free beer aroma recovery
by pervaporation. Beer aroma was extracted by pervaporation and beer was dealcoholized by SCC distillation. The extracted aroma was
reincorporated and subsequently both, the quality of the aroma and productivity of the process were assessed (Figure 5). Pervaporation
represents an alternative to the conventional separation processes, such as, steam distillation, liquid solvent extraction and vacuum distillation (Olmo et
al., 2014; Pereira et al., 2005).
Figure 5. SCC distillation with aroma recovery by pervaporation. Font: Catarino and Mendes, 2011
BIOLOGICAL METHODS
Arrested or limited fermentation process
Limited fermentation processes can be divided into two subclases, suspended batch fermentation and continuous fermentation with
immobilized yeast. In batch process, yeast cells are suspended in the wort during fermentation. This process carries some disadvantages as the
difficulty to keep adjusted the process parameters (temperature and concentration of dissolved oxigen). In the case of continuous fermentation
with immobilized yeast, fermentation is carried out at low temperature and short residence time (1-12 h) by a continuous process (packed column
reactor), containing yeast bound to the surface of a porous carrier

INTRODUCTION Alcohol Free Beer Prduction Processes
52
(Sohrabvandi et al., 2010b). Continuous fermentation with immobilized yeast
to produce alcohol free beers is detailed below.
In particular, beers produced by means of arrested fermentation are usually criticized for different defects such as lack of fruity aroma, strong worty
flavour, sometimes obtrusive and papery (Liguori et al., 2015; Narziss et al., 1992). Limited or arrested fermentation process is based on the reduction of
the ethanol production in the first stages of fermentation. This can be achieved by two different ways either: removing the yeasts before full
attenuation, by removing the yeast cells or by rapidly cooling the fermented wort (arrested fermentation), or limiting the fermentation where
conditions for restrained yeast metabolism are created (limited fermentation) (Brányik et al., 2012; Mota et al., 2011; Sohrabvandi et al.,
2010b).
The most practical tool to suppress yeast metabolism (limited fermentation) is the ‘cold contact process’. During cold contact process alcohol free
beers are produced started from wort (normal or low gravity) cooled to 0-1 ºC. Usually, this process combines long fermentation time (up to 24 h) with
low temperatures (0-5 ºC) thus limiting fermentation. Sometimes, high temperatures (15-20 ºC) are combined with short fermentation times (0.5-8
h). In any case, the fermentation is restricted, ethanol production is slow, but other biochemical processes (formation of higher alcohols, esters and
reduction of carbonyl compounds) exhibit moderate activities (Brányik et al., 2012; Montanari et al., 2009; Perpète and Collin, 1999). Cold contact
process can be applied in free mass yeast or in immobilized yeast (Montanari et al., 2009).
Immobilized yeast
Investigation on the continuous culture of free and immobilized yeast for beer production has been motivated by the advantages such as lower
capital, production and manpower costs (Brányik et al., 2012; Willaert and Nedovic, 2006). The application of systems employing immobilized brewer’s
yeast cells have been successfully applied in the production of alcohol-free beer and in the secondary fermentation of lager beer (Bezbradica et al.,
2007; Lehnert et al., 2009; van Iersel et al., 1999). In immobilized technology, as the biomass concentration increase an accelerate transformation of

INTRODUCTION Alcohol Free Beer Prduction Processes
53
wort can be achieve, being this a potential advantage (Brányik et al.,
2012).
Various carrier types can be used for immobilised cell technology such as k-Carrageenan (Šmogrovičová and Dömény, 1999), PVA particles
(Bezbradica et al., 2007), spent grains (Lehnert et al., 2009), Ca-alginate, porous glass or corncobs, among them, inert carrier types of immobilization
by adsorption (DAE-cellulose, wood chips, spent grains) are prevailing toward the entrapment methods (Brányik et al., 2005; Mota et al., 2011; van
Iersel et al., 2000; van Iersel et al., 1999; Verbelen et al., 2006).
Continuous fermentation with immobilized yeast
The application of systems employing immobilized brewer’s yeast cells has
successfully been applied in the production of alcohol-free beer and in the secondary fermentation of lager beer (Bezbradica et al., 2007; Lehnert et
al., 2009; van Iersel et al., 1999).
Two main reactor types have been considered in continuous fermentations: packed-bed reactor and gas-lift reactor (Mota et al., 2011).
Different yeast strains, reactor design and carrier material on the flavour active compounds for producing alcohol free beers by continuous
immobilized fermentation, as well as the influence of the different parameters as flow or oxygen supply has been investigated and combined
by different authors (Brányik et al., 2005; Lehnert et al., 2008b; Mota et al., 2011; Nedović et al., 2005; van Iersel et al., 2000).
The concentration of higher alcohols and esters in continuously fermented
using immobilized yeast under optimized conditions is satisfactory and comparable with commercial alcohol-free beers. Also, carbonyl reduction
has been reported to be satisfactory (Brányik et al., 2012)
This alcohol free beer production techniques usually are complemented with changed mashing process and use of special yeast.
INTRODUCTION Alcohol Free Beer Prduction Processes
54
Changed mashing process
Mashing consists of complex physical, chemical, and biochemical
(enzymatic) processes. The main purpose of mashing is the degradation of starch to fermentable sugars and soluble dextrins. The final content of
fermentable sugars in wort then determines the alcohol level in beer. Therefore, by changing the mashing process, it is possible to modulate the
profile of wort sugars in a way that their fermentability is limited and results in low alcohol content (Brányik et al., 2012; Sohrabvandi et al., 2010b). The
strategies to change mashing process are (Brányik et al., 2012; Montanari et al., 2009):
- Inactivation of saccharifying β-amylase by high temperature
mashing (75–80 ºC) - Cold water malt extraction
- Re-mashing of spent grains to produce a second extract with very little fermentable sugar
- Barley varieties with wide variations of β-amylase thermostability as well as β-amylase deficient varieties
Changed mashing process strategies to produce alcohol free beers are not successful by their own and they have to be combined with further
techniques such as vigorous wort boiling, wort acidification, limited fermentation or color and bitterness adjustment (Brányik et al., 2012).
Use of special yeasts
The use of a special yeast can be combined with a limited fermentation process. The special yeast can be genetically modified or a different yeast
strain to Saccharomyces can be used. The difference with traditional brewery yeast is that a ‘special’ yeast produces low amounts of ethanol or
no ethanol at all (Brányik et al., 2012).
Saccharomyces rouxii has been studied as a suitable species for production of alcohol free beers because this yeast is unable to ferment maltose (the
most abundant sugar in wort), ethanol content not exceeding 0.20 % (Sohrabvandi et al., 2010c). As well, it has been suggested thant S.rouxii
might consume ethanol in anaerobic conditions while producing flavor compounds (Brányik et al., 2012).

INTRODUCTION Alcohol Free Beer Prduction Processes
55
The most important genus other than Saccharomyces used for industrial
production of alcohol free beers is Saccharomycodes ludwigii. Controlled fermentation is succesfully carried out by this yeast because of the disability
to ferment maltose and maltotriose. This yeast showed a significant high level of volatile compounds although typical worty off-flavor still remained
(Brányik et al., 2012; Montanari et al., 2009).
On the other hand, random mutagenesis by ultraviolet irradiation has led to the isolation of non-recombinant yeast strains with defects in the
tricarboxylic acid cycle, thus producing elevated quantities of organic acids. Also, yeast strains with gene deletions in the same cycle have been
developed, they rendering results in alcohol free beer production similar to strains obtained by random mutagenesis (Brányik et al., 2012; Narvátil et al.,
2002; Selecký et al., 2008). Other attempt in genetic engineering was the overexpression of glycerol-3-phosphate dehydrogenase gene in
Saccharomyces pastorianus yeast to reduce ethanol content in beer, however, the concentration of several other by products (acetoin, diacetyl
and acetaldehyde) increased (Nevoigt et al., 2002).
Recently, the isolation of brewing yeast mutants of Saccharomyces pastorianus overproducing isoamyl alcohol and isoamyl acetate has been
studied for production of alcohol free beer. The stability of these strains during serial re-pitching and the effect of technologically process
parameters such as fermentation temperature and pitching rate on the production of flavouring compounds during alcohol free beer production
was evaluated (Strejc et al., 2013).

INTRODUCTION Alcohol Free Beer Prduction Processes
56
Table 1. Summary of the main advantages and disadvantages of alcohol free beer production processes
Dealcoholization process Advantages Disadvantages
Remove alcohol from beer completely; Expensive system device;
The alcohol commercialize separate; High running costs;
Continuous and automatic operation; Thermal damage to beer
Short start-up periode;
Flexible volume and input beer composition
Minimal termal impact;
Easy operation
Low residence time; Loss of aroma compounds;
High contact area between liquid and vapour; Decrease in the quality of final product flavour
Low pressure drop in the column;
Moderate temperatures
No oxygen in the system;
Can reach ethanol content below 0.05 % ABV
Cheap in construction;Multi-stage system first stage operates at hight temperature (60ºC).
Easy to clean; Significant loss of volatile compounds, need to be rectified
No oxygen transfer into the system;
Lowest acquisition and operation costs;
Energy saving with multi-stage, reusing heating vapours
Operate continuous ;
Dealcoholization to ≤ 0.1 %
Less thermal impact on beer; Significant capital;
Operated automatically; Significant running costs
Operated in a flexible manner
Production of beer ≤ 0.5 % ABV;Dilution of final beer concentrate with pure water may change the quality of beer;
Low energy consumption; No feasible economically for ≤ 0.45 % AVB
Low temperature can be used(0-5ºC)
Minimum impact in beer degradation;
Costs lower than for reverse osmosis, no need of port-carbonating if flow rate is above the
saturation level of CO2
Characteristic sweet flavour;
Usually a combination of strategies is needed
Low sugar content in wort; Sweet flavour in beer;
Restricting ethanol formation Combine with other techniques
Operates with traditional brewery equipment;Hard to achieve low alcohol levels with proper conversion from wort to beer;
Beers with acceptable aromatic characteristics; Accurate analytical control;
Highest volatile productionWorty off-flavour attributed to insufficient aldehyde reduction capacity
High volatile content; Consumers' negative attitude to genetic modified yeasts;
Identical process of a standard beer Worty off-flavours;
Cleaning
Process optimization;
Need of special equipment
Vacuum rectification plant Need of aroma redirection or blending
General Thermal Processes
Centrifugal evaporator Oxigen potencial risk
Spinning cone column
Falling film evaporator
General Membrane Processes
Reverse osmosis
Dialysis High losses of aroma compounds
Biological Methods Can be produced with a traditional brewery plant
Changed mashing process
Limited fermentation
Special yeasts
Continuous fermentationGood volatile compound formation and reduction of carbonyl compounds;
References
Belisario-Sanchez, Y.Y., Taboada-Rodriguez, A., Marin-Iniesta, F., Lopez-
Gomez, A., (2009). Dealcoholized wines by spinning cone column distillation: phenolic compounds and antioxidant activity measured by
the 1,1-diphenyl-2-picrylhydrazyl method. J Agric Food Chem 57(15), 6770-6778.

INTRODUCTION Alcohol Free Beer Prduction Processes
57
Bezbradica, D., Obradovic, B., Leskosek-Cukalovic, I., Bugarski, B., Nedovic,
V., (2007). Immobilization of yeast cells in PVA particles for beer fermentation. Process Biochemistry 42(9), 1348-1351.
Brányik, T., Silva, D.P., Baszczyňski, M., Lehnert, R., Almeida e Silva, J.B.,
(2012). A review of methods of low alcohol and alcohol-free beer production. Journal of Food Engineering 108(4), 493-506.
Brányik, T., Vicente, A.A., Dostálek, P., Teixeira, J.A., (2005). Continuous Beer
Fermentation Using Immobilized Yeast Cell Bioreactor Systems. Biotechnology Progress 21(3), 653-663.
Catarino, M., Mendes, A., (2011). Non-alcoholic beer—A new industrial process. Separation and Purification Technology 79(3), 342-351.
Catarino, M., Mendes, A., Madeira, L., Ferreira, A., (2006). Beer
dealcoholization by reverse osmosis. Desalination 200(1-3), 397-399.
Catarino, M., Mendes, A., Madeira, L.M., Ferreira, A., (2007). Alcohol Removal From Beer by Reverse Osmosis. Separation Science and
Technology 42(13), 3011-3027.
Catarino, M.D., (2010). Production of non-alcoholic beer with
reincorporation of original aroma compounds Department of Chemical Engineering. University of Porto, Faculty of Engineering p. 235.
Diban, N., Voinea, O.C., Urtiaga, A., Ortiz, I., (2009). Vacuum membrane
distillation of the main pear aroma compound: Experimental study and mass transfer modeling. Journal of Membrane Science 326(1), 64-75.
Labanda, J., Vichi, S., Llorens, J., López-Tamames, E., (2009). Membrane
separation technology for the reduction of alcoholic degree of a white model wine. LWT - Food Science and Technology 42(8), 1390-1395.
Lehnert, R., Kuřec, M., Brányik, T., Teixeira, J.A., (2008). Effect of Oxygen Supply on Flavor Formation During Continuous Alcohol-free Beer
Production: A Model Study. Journal of the American Society of Brewing Chemists 66, 233-238.
Lehnert, R., Novak, P., Macieira, F., Kurec, M., Teixeira, J.A., Branyik, T.,
(2009). Optimisation of lab-scale continuous alcohol-free beer production. Czech Journal of Food Sciences 27(4), 267-275.
INTRODUCTION Alcohol Free Beer Prduction Processes
58
Liguori, L., De Francesco, G., Russo, P., Perretti, G., Albanese, D., Di Matteo,
M., (2015). Production and characterization of alcohol-free beer by membrane process. Food and Bioproducts Processing 94(0), 158-168.
Liguori, L., Russo, P., Albanese, D., Di Matteo, M., (2013). Evolution of quality
parameters during red wine dealcoholization by osmotic distillation. Food Chemistry 140(1–2), 68-75.
Montanari, L., Marconi, O., Mayer, H., Fantozzi, P., (2009). Chapter 6 -
Production of Alcohol-Free Beer, in: Preedy, V.R. (Ed.), Beer in Health and Disease Prevention. Academic Press, San Diego, pp. 61-75.
Mota, A., Novák, P., Macieira, F., Vicente, A.A., Teixeira, J.A., Šmogrovicová, D., Brányik, T., (2011). Formation of flavor-active compounds during
continuous alcohol-free beer production: The influence of yeast strain, reactor configuration and carrier type. Journal of the American Society
of Brewing Chemist 69, 1-7.
Narvátil, M., Dömény, Z., Šturdík, E., Šmogrovičová, D., Gemeiner, P., (2002). Production of non-alcoholic beer using free and immobilized cells of
Saccharomyces cerevisiae deficient in the tricarboxylic acid cycle. Biotechnology and Applied Biochemistry 35, 133–140.
Narziss, L., Miedaner, H., Kern, E., Leibhard, M., (1992). Technology and
composition of non-alcoholic beers. Processes using arrested fermentation. Brauwelt International 4 396–410.
Nedović, V., Willaert, R., Leskošek-Čukalović, I., Obradović, B., Bugarski, B., (2005). Beer Production Using Immobilised Cells, in: Nedović, V., Willaert,
R. (Eds.), Applications of Cell Immobilisation Biotechnology. Springer Netherlands, pp. 259-273.
Nevoigt, E., Pilger, R., Mast-Gerlach, E., Schmidt, U., Freihammer, S.,
Eschenbrenner, M., Garbe, L., Stahl, U., (2002). Genetic engineering of brewing yeast to reduce the content of ethanol in beer. FEMS Yeast
Research 2(2), 225-232.
Olmo, Á.d., Blanco, C.A., Palacio, L., Prádanos, P., Hernández, A., (2014). Pervaporation methodology for improving alcohol-free beer quality
through aroma recovery. Journal of Food Engineering 133(0), 1-8.

INTRODUCTION Alcohol Free Beer Prduction Processes
59
Pereira, C.C., Rufino, J.R.M., Habert, A.C., Nobrega, R., Cabral, L.M.C.,
Borges, C.P., (2005). Aroma compounds recovery of tropical fruit juice by pervaporation: membrane material selection and process evaluation.
Journal of Food Engineering 66(1), 77-87.
Perpète, P., Collin, S., (1999). Fate of worty flavours in a cold contact fermentation. Food Chemistry 66, 359-363.
Petkovska, M., Leskošek, I., Nedović, V., (1997). Analysis of Mass Transfer in
Beer Diafiltration with Cellulose-Based and Polysulfone Membranes. Food and Bioproducts Processing 75(4), 247-252.
Pilipovik, M., Riverol, C., ( 2005). Assessing dealcoholization systems based on reverse osmosis. Journal of Food Engineering 69, 437-441.
Purwasasmita, M., Kurnia, D., Mandias, F.C., Khoiruddin, Wenten, I.G., (2015).
Beer dealcoholization using non-porous membrane distillation. Food and Bioproducts Processing 94(0), 180-186.
Selecký, R., Šmogrovičová, D., Sulo, P., (2008). Beer with reduced ethanol
content produced using Saccharomyces cerevisiae yeasts deficient in various tricarboxylic acid cycle enzymes. Journal of the Institute of
Brewing 114, 97-101.
Šmogrovičová, D., Dömény, Z., (1999). Beer volatile by-product formation at
different fermentation temperature using immobilised yeasts. Process Biochemistry 34(8), 785-794.
Sohrabvandi, S., Mousavi, S.M., Razavi, S.H., Mortazavian, A.M., Rezaei, K.,
(2010a). Alcohol-free Beer: Methods of Production, Sensorial Defects, and Healthful Effects. Food Reviews International 26(4), 335-352.
Sohrabvandi, S., Razavi, S.H., Mousavi, S.M., Mortazavian, A.M., (2010b).
Characteristics of different brewer’s yeast strains used for non-alcoholic beverage fermentation in media containing different fermentable
sugars. Iranian Journal of Biotechnology 8, 178-185.
Strejc, J., Siříšťová, L., Karabín, M., Almeida e Silva, J.B., Brányik, T., (2013).
Production of alcohol-free beer with elevated amounts of flavouring compounds using lager yeast mutants. Journal of the Institute of Brewing
119(3), 149-155.
INTRODUCTION Alcohol Free Beer Prduction Processes
60
van Iersel, M.F.M., Brouwer–Post, E., Rombouts, F.M., Abee, T., (2000).
Influence of yeast immobilization on fermentation and aldehyde reduction during the production of alcohol-free beer. Enzyme and
Microbial Technology 26(8), 602-607.
van Iersel, M.F.M., van Dieren, B., Rombouts, F.M., Abee, T., (1999). Flavor formation and cell physiology during the production of alcohol-free beer
with immobilized Saccharomyces cerevisiae. Enzyme and Microbial Technology 24(7), 407-411.
Verbelen, P., De Schutter, D., Delvaux, F., Verstrepen, K., Delvaux, F., (2006).
Immobilized yeast cell systems for continuous fermentation applications. Biotechnology Letters 28(19), 1515-1525.
Willaert, R., Nedovic, V.A., (2006). Primary beer fermentation by immobilised yeast—a review on flavour formation and control strategies. Journal of
Chemical Technology & Biotechnology 81(8), 1353-1367.
Zürcher, A., Jakob, M., Back, W., (2005). Improvements in flavor and colloidal stability of alcohol free beers, Proceedings of the European
Brewing Convention Congress, Prague, Czech Republic.

Low-alcohol beers: Flavour
compounds, defects and improvement
strategies
By
Carlos A. Blanco*, Cristina Andrés-Iglesias and Olimpio Montero 1
Dpto. Ingeniería Agrícola y Forestal (Área de Tecnología de los Alimentos). E.T.S.
Ingenierías Agrarias. Universidad de Valladolid, 34004 Palencia, Spain
1 Centre for Biotechnology Development (CDB), CSIC. Boecillo’s Technological Park, Av. Francisco Vallés, 8. 47151 – Boecillo, Valladolid, Spain
PUBLISHED ONLINE IN:
Critical Reviews in Food Science and Nutrition
DOI: 10.1080/10408398.2012.733979

INTRODUCTION Low Alcohol Beers: Flavour compounds, defects and Improvement Strategies
62
Abstract
Beer consumers are accustomed to a product that offers a pleasant and
well-defined taste. However, in alcohol-free and alcohol-reduced beers these characteristics are totally different from those in regular beer.
Therefore, it is important to evaluate and determine the different flavour compounds that affect organoleptic characteristics to obtain a product
that does not contain off-flavours, or taste of grass or wort. The taste defects in alcohol-free beer are mainly attributed to loss of aromatic esters,
insufficient aldehydes, reduction or loss of different alcohols, and an indeterminate change in any of its compounds during the dealcoholization
process. The dealcoholization processes that are commonly used to reduce the alcohol content in beer are shown, as well as the negative
consequences of these processes to beer flavour. Possible strategies to circumvent such negative consequences are suggested.
Keywords: beer, dealcoholization, taste, off-flavours.
INTRODUCTION
Beer is a beverage brewed principally from malt, hops and water, and the
mixture is fermented by using yeast. It is one of the most popular drinks worldwide (Lehnert et al., 2008), its popularity arising from its pleasant
sensory attributes, together with favourable nutritional characteristics for light-to-moderate consumption (Sohrabvandi et al., 2010).
Low-alcohol beer is a beer with very low or no alcohol content. The alcohol
by volume (ABV) limits depend on laws in different countries. In most of the EU countries beers with low alcohol content are divided into alcohol free
beers (AFBs) less than or equal to 0.5% (ABV) and low-alcohol beers (LABs) with no more than 1.2% ABV. In the United States alcohol-free beer means
that there is no alcohol present, while the upper limit of 0.5% ABV corresponds to so-called non-alcoholic beer or ‘‘near-beer’’ (Brányik et al.,
2012).
Although it is still a minor product of the brewing industry, the increasing production of low-alcohol beers worldwide reflects the global trend for a
healthier lifestyle (Lehnert et al., 2009) and civil reasons (Catarino, et al.,

INTRODUCTION Low Alcohol Beers: Flavour compounds, defects and Improvement Strategies
63
2009). Alcohol-free beers are recommended for specific groups of people
such as pregnant women, sporting professionals, people with cardiovascular and hepatic pathologies, and people on medication.
(Sohrabvandi et al., 2010; García et al., 2004). On the other hand, the market for non-alcoholic brews has experienced an increase over the last
five-to-ten years, mainly because of new drink/driving rules, health and religious concerns (Catarino and Mendes, 2011; Sohrabvandi et al., 2010;
Caluwaerts, 1995). However, some of the low-alcohol beers that are commercially available are not popular with consumers because of their
lack of aroma and flavour (compounds) (Catarino et al., 2009).
At present, there are several methods for the production of low-alcohol beers (Sohrabvandi et al., 2010; Brányik et al., 2012):
a) To remove the ethanol from a completely fermented beverage by using
several separation processes. The most common separation processes used for beverages dealcoholization are heat treatment and
membrane-based processes (Catarino et al., 2007). Heat treatment processes comprise of evaporation and distillation or steam stripping,
both under vacuum conditions (Belisario-Sánchez et al., 2009). Membrane based processes include reverse osmosis, nanofiltration,
dialysis and pervaporation (Labanda et al., 2009). The industrial methods widely applied for beer dealcoholization are vacuum evaporation,
vacuum distillation, dialysis and reverse osmosis (Brányik et al., 2012). Removal of alcohol from regular beer using processes that encompass
extreme conditions such as distillation or evaporation can cause the loss of the original aroma (owing to chemical and physical reactions)
(Lehnert et al., 2009; Catarino et al., 2009).
b) To control alcohol formation during brewing (Lehnert et al., 2009). This
can be achieved by either restricting ethanol formation or shortening the fermentation process. Obtaining low alcohol content via interrupted
fermentation is accompanied by low contents of aroma and flavour compounds. In order to avoid these shortcomings processes have been
developed for low ethanol production that involve the use of special or immobilized yeasts as well the use of low sugar raw materials (Catarino
and Mendes, 2011).
Hence, the standing issue in the production of low-alcohol beers in terms of organoleptic characteristics is the achievement of a product ‘as close as
possible’ to regular beer (Sohrabvandi et al., 2010). Beer flavour results from
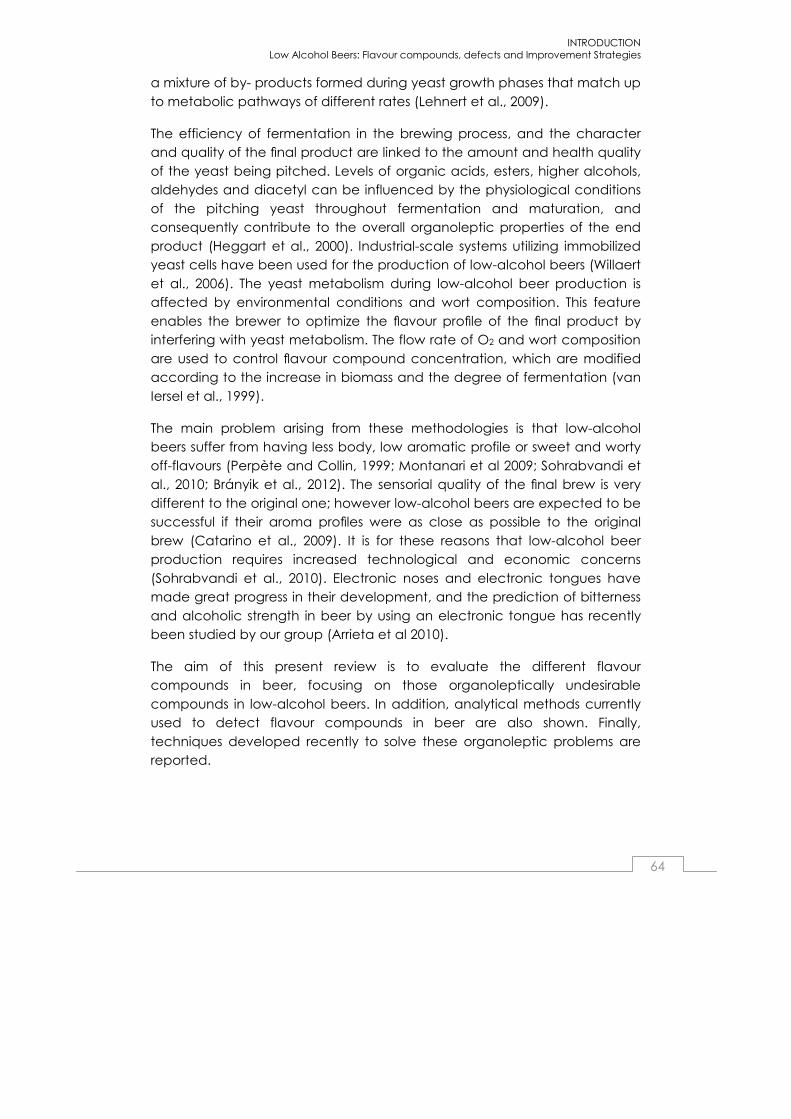
INTRODUCTION Low Alcohol Beers: Flavour compounds, defects and Improvement Strategies
64
a mixture of by- products formed during yeast growth phases that match up
to metabolic pathways of different rates (Lehnert et al., 2009).
The efficiency of fermentation in the brewing process, and the character and quality of the final product are linked to the amount and health quality
of the yeast being pitched. Levels of organic acids, esters, higher alcohols, aldehydes and diacetyl can be influenced by the physiological conditions
of the pitching yeast throughout fermentation and maturation, and consequently contribute to the overall organoleptic properties of the end
product (Heggart et al., 2000). Industrial-scale systems utilizing immobilized yeast cells have been used for the production of low-alcohol beers (Willaert
et al., 2006). The yeast metabolism during low-alcohol beer production is affected by environmental conditions and wort composition. This feature
enables the brewer to optimize the flavour profile of the final product by interfering with yeast metabolism. The flow rate of O2 and wort composition
are used to control flavour compound concentration, which are modified according to the increase in biomass and the degree of fermentation (van
Iersel et al., 1999).
The main problem arising from these methodologies is that low-alcohol beers suffer from having less body, low aromatic profile or sweet and worty
off-flavours (Perpète and Collin, 1999; Montanari et al 2009; Sohrabvandi et al., 2010; Brányik et al., 2012). The sensorial quality of the final brew is very
different to the original one; however low-alcohol beers are expected to be successful if their aroma profiles were as close as possible to the original
brew (Catarino et al., 2009). It is for these reasons that low-alcohol beer production requires increased technological and economic concerns
(Sohrabvandi et al., 2010). Electronic noses and electronic tongues have made great progress in their development, and the prediction of bitterness
and alcoholic strength in beer by using an electronic tongue has recently been studied by our group (Arrieta et al 2010).
The aim of this present review is to evaluate the different flavour compounds in beer, focusing on those organoleptically undesirable
compounds in low-alcohol beers. In addition, analytical methods currently used to detect flavour compounds in beer are also shown. Finally,
techniques developed recently to solve these organoleptic problems are reported.
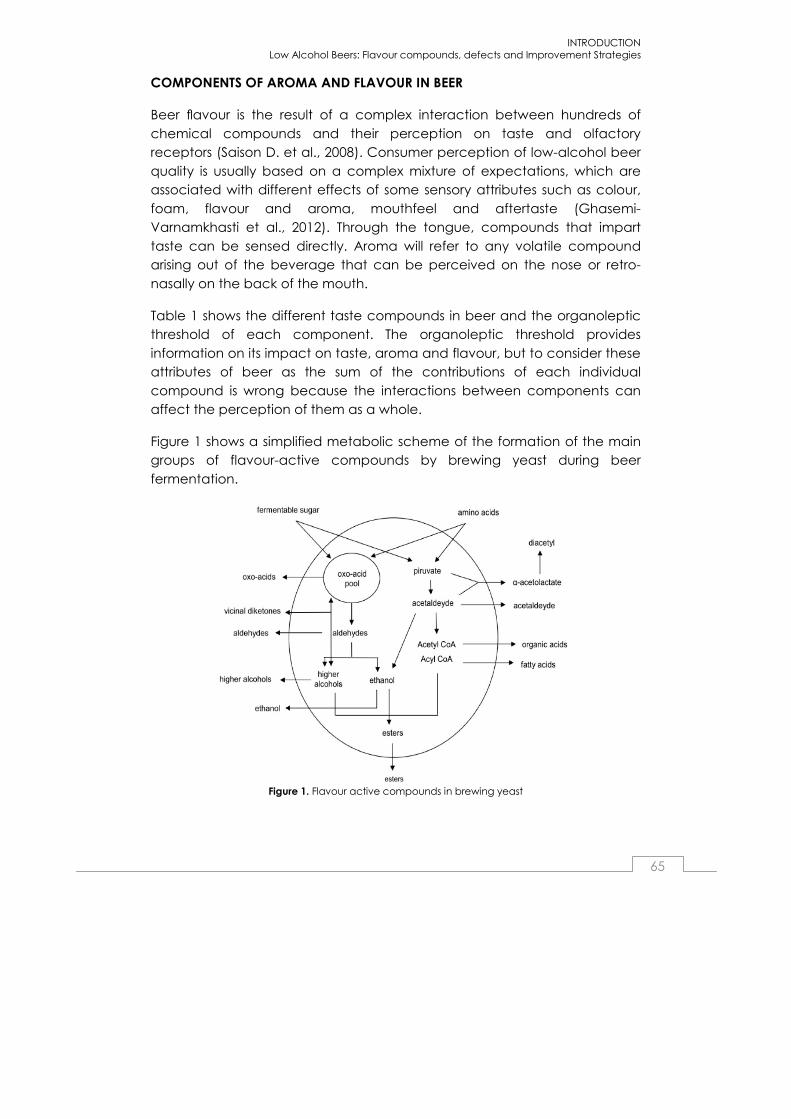
INTRODUCTION Low Alcohol Beers: Flavour compounds, defects and Improvement Strategies
65
COMPONENTS OF AROMA AND FLAVOUR IN BEER
Beer flavour is the result of a complex interaction between hundreds of
chemical compounds and their perception on taste and olfactory receptors (Saison D. et al., 2008). Consumer perception of low-alcohol beer
quality is usually based on a complex mixture of expectations, which are associated with different effects of some sensory attributes such as colour,
foam, flavour and aroma, mouthfeel and aftertaste (Ghasemi-Varnamkhasti et al., 2012). Through the tongue, compounds that impart
taste can be sensed directly. Aroma will refer to any volatile compound arising out of the beverage that can be perceived on the nose or retro-
nasally on the back of the mouth.
Table 1 shows the different taste compounds in beer and the organoleptic threshold of each component. The organoleptic threshold provides
information on its impact on taste, aroma and flavour, but to consider these attributes of beer as the sum of the contributions of each individual
compound is wrong because the interactions between components can affect the perception of them as a whole.
Figure 1 shows a simplified metabolic scheme of the formation of the main groups of flavour-active compounds by brewing yeast during beer
fermentation.
Figure 1. Flavour active compounds in brewing yeast
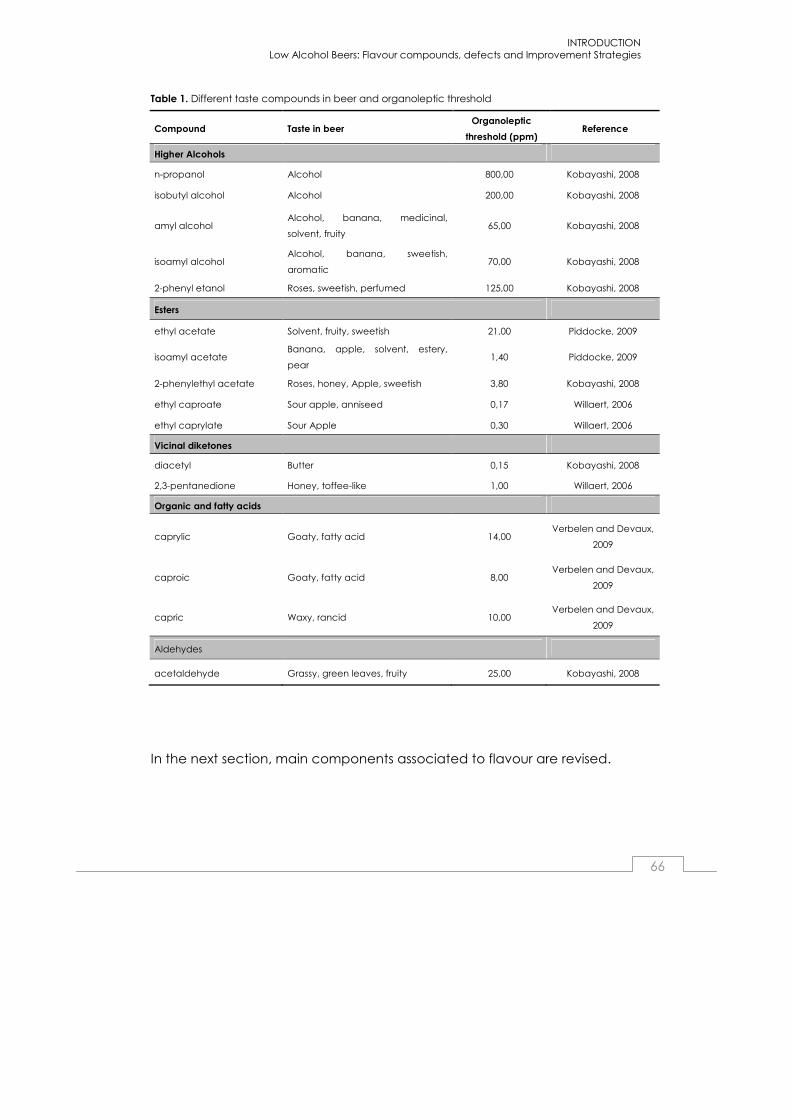
INTRODUCTION Low Alcohol Beers: Flavour compounds, defects and Improvement Strategies
66
Table 1. Different taste compounds in beer and organoleptic threshold
Compound Taste in beer Organoleptic
threshold (ppm) Reference
Higher Alcohols
n-propanol Alcohol 800,00 Kobayashi, 2008
isobutyl alcohol Alcohol 200,00 Kobayashi, 2008
amyl alcohol Alcohol, banana, medicinal,
solvent, fruity 65,00 Kobayashi, 2008
isoamyl alcohol Alcohol, banana, sweetish,
aromatic 70,00 Kobayashi, 2008
2-phenyl etanol Roses, sweetish, perfumed 125,00 Kobayashi, 2008
Esters
ethyl acetate Solvent, fruity, sweetish 21,00 Piddocke, 2009
isoamyl acetate Banana, apple, solvent, estery,
pear 1,40 Piddocke, 2009
2-phenylethyl acetate Roses, honey, Apple, sweetish 3,80 Kobayashi, 2008
ethyl caproate Sour apple, anniseed 0,17 Willaert, 2006
ethyl caprylate Sour Apple 0,30 Willaert, 2006
Vicinal diketones
diacetyl Butter 0,15 Kobayashi, 2008
2,3-pentanedione Honey, toffee-like 1,00 Willaert, 2006
Organic and fatty acids
caprylic Goaty, fatty acid 14,00 Verbelen and Devaux,
2009
caproic Goaty, fatty acid 8,00 Verbelen and Devaux,
2009
capric Waxy, rancid 10,00 Verbelen and Devaux,
2009
Aldehydes
acetaldehyde Grassy, green leaves, fruity 25,00 Kobayashi, 2008
In the next section, main components associated to flavour are revised.
INTRODUCTION Low Alcohol Beers: Flavour compounds, defects and Improvement Strategies
67
Alcohols and phenols
During the aerobic growth of S. cerevisiae, both sugars and ethanol can be
used as carbon and energy sources. Sugars can be metabolized via two different energy-producing pathways, oxidation or fermentation, the
predominance of each one being dependent on the sugar concentration in the medium. The fermentative metabolism of glucose occurs when the
glucose concentration is high enough, then ethanol and other alcohols are produced in this way (Blanco et al., 2008). Ethanol is an enhancer of some
flavours such as those that lead to a sweet taste; and it is also a precursor of flavour-active esters. Furthermore, ethanol is also known to have a key role
in the formation of the characteristic background flavour of beer, apart from giving a warming sensation to the mouth and stomach. In low-
alcohol beers, a partial loss of flavour is inevitable as ethanol is removed by using different methods of dealcoholization. Therefore, low-alcohol beers
lack the flavour components produced via fermentation in an appropriate concentration and balance (harmony) (Sohrabvandi et al., 2010;
Caluwaerts, 1995). During primary beer fermentation, the major fraction of the volatile compounds are constituted by several higher alcohols, other
than ethanol (Brányik et al., 2008), which are produced by yeast cells as by-products (Willaert et al., 2006). The final concentration of higher alcohols is
determined by the efficiency of the corresponding amino acid uptake and sugar utilization rate (Brányik et al., 2008). Higher alcohols can be classified
into aliphatic and aromatic alcohols. The main aliphatic alcohols are n-propanol, isobutanol, 2-methylbutanol (amylalcohol) and 3-methylbutanol
(isoamyl alcohol), and the main aromatic alcohols are 2-phenylethanol, tyrosol and tryptophol (Willaert et al., 2006).
Higher alcohols are synthesized by yeast during fermentation via the
catabolic and anabolic pathways (amino acid metabolism) (Willaert et al., 2006). The immediate precursors are 2-oxo acids. Along the anabolic route,
the 2-oxo acids derive from carbohydrate metabolism. Along the catabolic route (Ehrlich), the 2-oxo acids are formed through transamination of an
amino acid. These are decarboxylated to form aldehydes, which are subsequently reduced to form the corresponding alcohols (Hazelwood et
al., 2008). Wort composition and yeast strain fermentation conditions significantly influence the combination and levels of the higher alcohols
that are formed (Willaert et al., 2006). The contribution of each biosynthetic pathway becomes in turn influenced by wort amino acid composition, the
fermentation stage and yeast strain (Eden et al., 2001). For n-propanol the
INTRODUCTION Low Alcohol Beers: Flavour compounds, defects and Improvement Strategies
68
anabolic route is the only one possible contributing to its formation since
there is no corresponding amino acid (Boulton and Quain, 2001).
High levels of nutrients (amino acids, oxygen, lipids, zinc) or increased temperature and agitation are conditions that promote yeast cell growth
and stimulate the production of higher alcohols. Conversely, conditions which impose constraints to yeast growth, such as low temperature and
high CO2 pressure, decrease higher alcohol production to some extent (Willaert et al., 2006). García (1994) and Hough (1981) describe the level of
oxygen, pH and temperature as the main parameters that influence higher alcohol production. While higher alcohol concentrations impart off-flavours,
low concentrations make an essential contribution to the flavours and aromas (Hazelwood et al., 2008) hence, by changing these fermentation
parameters, different higher alcohols related to flavours can be obtained in beer. Some of the characteristic flavours provided by higher alcohols in
beer are:
a) Aliphatic higher alcohols contribute to the ‘alcoholic’ or ‘solvent’ aroma of beer and produce a warm mouthfeel (Willaert et al., 2006), the most
significant contribution is owed to n-propanol, iso-butanol and isoamyl alcohols (2-methyl and 3-methyl butanol) (Brányik et al., 2008). N-
propanol and 2-methylpropanol may cause ‘rough’ flavours and harshness of beer, amyl alcohols (2- and 3-methylbutanol) cause ‘fruity’
flavours (Šmogrovičová and Dömény, 1999). Isobutyl alcohol has an undesirable effect on beer quality when its concentration exceeds 20%
of the total concentration of three alcohols: n-propanol, isobutanol, and amyl alcohol (Kobayashi et al., 2008).
b) The aromatic alcohol 2-phenylethanol causes ‘sweet’ or ‘rose’ flavours in beer (Šmogrovičová and Dömény, 1999), and makes a positive
contribution to the beer aroma, whereas the aromas produced by tyrosol and tryptophol are undesirable (Willaert et al., 2006). Some
monophenols present an unpleasant phenolic-like flavour, while others provide pleasant vanilla-like and smokey flavours. Vanillin was included
in the reference standards for the beer flavour terminology system at a later stage (Sterckx et al., 2011).
Recently, it was shown that 4-vinylguaiacol contributes to the overall flavour
of certain beer styles with a clove-like aroma (Vanbeneden et al., 2008), whereas 4-vinylsyringol may play a role in aged beer flavour (Callemien et
al., 2006).
INTRODUCTION Low Alcohol Beers: Flavour compounds, defects and Improvement Strategies
69
Esters
The synthesis of aroma-active esters during beer brewing is of great
importance because they represent a large group of flavour active compounds that confer a fruity-flowery aroma (Lehnert et al., 2008; Brányik
et al., 2008; Šmogrovičová and Dömény, 1999). Esters can have very low flavour thresholds and a major impact on the overall flavour. The major
esters can be subdivided into acetate esters and medium-chain fatty acid ethyl esters (Willaert et al., 2006).
The first group comprises acetate esters such as ethyl acetate (fruity,
solvent-like), isoamyl acetate (banana) and phenylethyl acetate (roses, honey, apple). Ethyl acetate represents approximately one third of all esters
in beers (Šmogrovičová and Dömény, 1999).
The second group of esters includes, among others, ethyl caproate and
ethyl caprylate (both apple-like) (Brányik et al., 2008; Lehnert et al., 2008; Verstrepen et al., 2003).
Ester production by alcohol-acid reaction takes place in yeast
fermentation as a CoA mediated reaction, both types of compounds being products of yeast metabolism (Garcia et al., 1994; Brányik et al.,
2008). Two factors are of fundamental importance for the rate of ester formation: the availability of the two substrates (acetyl/acyl-CoA and
alcohols) and the activity of enzymes (mostly alcohol acyltransferases) involved in the formation of esters. Consequently, the control of ester
formation is difficult because many factors are involved in the regulation of enzyme activity or substrate availability (Lehnert et al., 2008). There are
some additional factors that have an influence on ester production. These are temperature, CO2 concentration or its pressure inside the fermenter, the
presence of oxygen in the wort, pH and amino acid concentration (Garcia et al., 1994). A thoughtful adaptation of these parameters allows brewers to
steer ester concentrations and thus to control the fruity character of their beers (Verstrepen et al., 2003).
The relationship between total higher alcohols and total ester
concentrations is an important indicator in evaluating beer flavour. Table 2 shows the relationship among aminoacids, their related higher alcohols and
esters. It indicates whether the beer presents a more alcoholic or fruity character (Catarino et al., 2009). The overall flavour of beer depends on the
relative contents of these compounds. The optimum higher alcohols-to-

INTRODUCTION Low Alcohol Beers: Flavour compounds, defects and Improvement Strategies
70
esters ratio for lagers is 4:1 to 4.7:1 (Šmogrovičová and Dömény, 1999). The
presence of different esters can have a synergistic effect on the individual flavours, which means that esters can also have a positive effect on beer
flavour, below their individual threshold concentrations. Volatile esters are common trace compounds in beer but are extremely important for
flavour profile: they are desirable at low concentrations but undesirable at high concentrations (Verstrepen et al.,2003; Zhu et al., 2010). Moreover,
the fact that most esters are present at concentrations around the threshold value implies that minor changes in concentration may have dramatic
effects on beer flavour (Sterckx et al., 2011; Petersen et al., 2004). This problem has become very clear with the introduction of modern brewing
practices (Verstrepen et al., 2003).
Table 2. Formation sequence from amino acids to alcohols and esters
Amino acids Higher alcohols Esters
Valine isobutanol isobutyl acetate
Leucine 3-metilbutanol
(isoamyl alcohol) isoamyl acetate
Isoleucine 2-methylbutanol
(amyl alcohol) amyl acetate
Phenylalanine 2-phenylethanol phenyl ethyl acetate
Carbonyl compounds
Carbonyl compounds can originate from raw materials, alcoholic fermentation or from a wide range of chemical reactions such as lipid
oxidation, Maillard reaction, Strecker degradation and aldol condensation. Despite their concentrations being generally very low in beer, these
compounds make an important and mostly unwanted contribution to flavour profile because of their low flavour thresholds. Moreover, the
quantification of some carbonyl compounds can be used for the evaluation of a complete and proper fermentation. As a result, the
quantitative determination of the volatile carbonyl content is very important (Saison et al., 2009). The most important carbonyl compounds involved in
the aroma and taste profile of beer are vicinal diketones and aldehydes:
Ketones: the concentrations of two vicinal diketones (VDK), 2,3-
butanedione (diacetyl) and 2,3-pentanedione, of which diacetyl is more flavour-active, are of critical importance for beer flavour (Brányik et al.,
2008). Vicinal diketones are produced as by-products of the synthesis pathway of some amino acids during fermentation (Willaert et al., 2006).
INTRODUCTION Low Alcohol Beers: Flavour compounds, defects and Improvement Strategies
71
Diacetyl and 2,3-pentanedione results from the chemical oxidative
decarboxylation of excess α-acetolactate and α-acetohydroxybutyrate, which are leaked to the extracellular environment from the valine
biosynthetic pathway. The rate of vicinal diketones formation is limited by such chemical conversions. Acetoin and 2,3-butanediol are formed by
yeast through a reductive reaction after diacetyl is reassimilated at the end of the main fermentation and maturation phases. Both compounds have
relative high flavour thresholds. It seems that various enzymatic systems of the brewing yeast are involved in the reduction of vicinal diketones
(Bamforth and Kanauchi, 2004; Van Bergen et al., 2005). Diacetyl is sensorily more important than 2,3-pentanedione (Willaert et al., 2006). It has a strong
“butterscotch” aroma in concentrations above the flavour threshold, which is 0.10-0.15 ppm for lager beers (Brányik et al., 2008), it being
approximately 10 times lower than that of pentanedione (Willaert et al., 2006). Diacetyl and 2,3-pentanedione have characteristic aromas and
tastes described as ‘buttery’, ‘honey’ or ‘toffee-like’. At levels above 1 ppm it becomes increasingly ‘cheese-like’ and sharp (Šmogrovičová and
Dömény, 1999).
Aldehydes: aldehydes arise in beer mainly during wort production (mashing, boiling). They are partially formed during fermentation from the yeast oxo-
acid pool via the anabolic process and from exogenous amino acids via the catabolic pathway (Brányik et al., 2008). In typical lager beers, ethanol
significantly increases aldehyde retention, leading to lower perception of the worty character. In alcohol-free beers, both the absence of ethanol
and the higher level of mono and disaccharides such as maltose intensify such undesirable flavours (Perpète and Collin, 2000).
Acetaldehyde is the predominant carbonyl compound present in beer,
representing approximately 60% of the total aldehydes (Guido et al., 2008). Its level varies during fermentation and ageing and usually lies within the
range 2–20 mg/L (Šmogrovičová and Dömény, 1999). In alcohol-free beers 3-methylthiopropionaldehyde seems to be the key compound responsible
for the worty off-flavour. The difficulty of extracting this compound by the usual headspace technique can explain why previous works have not
provided evidence of it. At present, it seems that the organoleptic properties of alcohol-free beers are bonded to the synergic interaction of 3-
and 2-methylbutanal to sulphur containing degradation products stemming from methional. Indeed, differences between alcohol-free and regular
beers could arise from the solubilization of such compounds by ethanol

INTRODUCTION Low Alcohol Beers: Flavour compounds, defects and Improvement Strategies
72
(Perpète and Collin, 2000). Aldehydes have flavour threshold
concentrations significantly lower than their corresponding alcohols. Almost without exception they have unpleasant flavours and aromas described as
‘grassy’, ‘fruity’, ‘green leaves’ and ‘cardboard’, depending on the real compound (Boulton and Quain, 2001).
Organic and fatty acids
The presence of 110 organic and short-chain fatty acids has been reported in beer (Boulton and Quain, 2001). A large portion of the total organic acids
(ca. 50%) is derived from the wort, while the rest is produced or transformed as a result of yeast metabolism (Yamauchi et al., 1995). The majority of
organic acids are derived directly from pyruvate, but there are organic acids with a short carbon skeleton which derive both from the incomplete
turnover of the tricarboxylic acid cycle that occurs during anaerobic growth of yeast (Brányik et al., 2008; Boulton and Quain, 2001; Wales et al.,
1980). Short-chain fatty acids (pyruvic, acetic, lactic, citric, succinic, malic,) impart a bitter flavour to beer. Long-chain fatty acids are primarily
originated from wort and are undesirable for the taste of beer and foam stability (Brányik et al., 2008). Medium-chain fatty acids (caproic, caprylic
and capric acid) afford off-flavours, characterized as rancid goaty flavour often called “caprylic” flavour (Boulton and Quain, 2001; Šmogrovičová
and Dömény, 1999). This undesirable flavour normally arises from an excess of acid formation during fermentation or maturation. Their production is
influenced mainly by the yeast strain used, wort composition, aeration and temperature. During maturation, the duration of the process, temperature
used, and physiological state of yeasts are critical factors that determine yeast autolysis and concurrent release of fatty acids. Analyzing this group of
compounds is recognized as a valuable method to monitor the maturation progress (Horák et al., 2008).
In general, organic acids have sour flavours and contribute to the lowering
of pH that occurs during fermentation (Boulton and Quain, 2001). In addition to sourness, individual organic acids are reported to have
characteristic flavours, which are dependent on the production method and conditions. For example, succinic is described as having a salty or bitter
taste (Whiting, 1976). Short chain fatty acids are usually present in beer at total concentrations of 20–150 ppm. Butyric and iso-butyric acids may
cause a ‘butyric’ or ‘rancid’ flavour at a concentration above 6 ppm;
INTRODUCTION Low Alcohol Beers: Flavour compounds, defects and Improvement Strategies
73
valeric and iso-valeric acids cause ‘old hop’ and ‘cheesy’ flavours
(Šmogrovičová and Dömény, 1999). Usual contents of organic acids in regular beers are 100-200 ppm for pyruvic, 10-50 ppm for acetic, 50-300
ppm for lactic, 100-150 ppm for citric, 50-150 ppm for succinic and 30-50 ppm for malic (Boulton and Quain, 2001; Coote and Kirsop, 1974; Klopper et
al., 1986). The total of fatty acids in regular beers (caprylic, caproic and capric acids) represent about 75-80% (Boulton and Quain, 2001) and their
concentration thresholds are approximately 5 ppm for caproic acid and 10 ppm for caprylic and capric acids. Lauric acid may cause ‘soapy’ flavors at
a concentration higher than 6 ppm (Šmogrovičová and Dömény, 1999). The strategy for the control of the production of these acids is based on the
regulation of yeast growth (Yamauchi et al., 1995; Brányik et al., 2008).
FLAVOUR DEFECTS IN ALCOHOL-FREE BEER
When producing low-alcohol beer, it is important to maintain the natural
flavour of a regular beer. Unfortunately, the taste of the final product is not currently as good as that of regular alcoholic beer (Sohrabvandi et al.,
2010). Taste defects in low-alcohol beer are due to an undesirable effect derived from the main ways of eliminating or reducing the ethanol in beer.
These processes are responsible for the characteristic sensorial defects in the final product. Thus, beer in which alcohol production has been
prevented or reduced at an early stage of fermentation is dull and inharmonious in taste and has an immature flavour. The fermentation
activity can be prevented quickly by rapid cooling to 0ºC, pasteurization and/or by the removal of yeast from fermenting wort (Brányik et al., 2012).
Its flavour profile is characterized by worty off-flavours and a lack of the pleasant fruity (estery) aroma found in regular beers (Sohrabvandi et al.,
2010; Perpète and Collin, 1999) due to insufficient wort aldehyde reduction and a lack of fusel alcohols and ester production (Lehnert et al., 2009).
Besides, beer dealcoholized by ethanol removal is characterized by a loss of volatiles (higher alcohols, esters) accompanying ethanol removal
(Lehnert et al., 2009). Thus, when using thermal processes low-alcohol beer suffers heat damage and aroma and flavour compounds, more volatile
than ethanol, are evaporated. The vacuum distillation process consists of two stages: evaporation under high vacuum followed by cold
condensation. Both thin film evaporators and atomizing evaporators with vacuum chamber have been used, as well as the combination of both
methods. In this case, flavour compounds should be restored after

INTRODUCTION Low Alcohol Beers: Flavour compounds, defects and Improvement Strategies
74
dealcoholization (Sohrabvandi et al., 2010). Using an aroma recovery unit,
6% and 20% of the originally present higher alcohols and esters, are respectively returned (Brányik et al., 2012). Low-alcohol beers produced by
a membrane process have less body and a low aromatic profile. The membrane process can be divided into dialysis and reverse osmosis. Dialysis
operates at a low temperature and uses the selectivity of a semi-permeable membrane. Certain molecules pass through the membrane into the dialysis
medium, depending on the pore size and surface properties of the membrane (Sohrabvandi et al., 2010; Brányik et al., 2012). In this case, other
components of beer besides ethanol, such as higher alcohols and esters, are almost completely removed (Brányik et al., 2012). In the reverse osmosis
process, beer is passed through a semi-permeable membrane under high pressure conditions (Sohrabvandi et al., 2010). In this case, besides the losses
of volatiles, other large molecules such as aroma and flavour compounds are removed (Brányik et al., 2012). .
Ethanol contributes directly to the flavour of beer, giving rise to a warming
character and flavour perception of other beer components (Huges et al., 2001). Ethanol increases aldehyde retention, leading to a lower perception
of the worty taste. In regular beers the retention of aldehydes is 32-39% as opposed to 8-12% retention in alcohol-free beers (Brányik et al., 2012).
Some aldehydes present in wort have high flavour potency (3-
methylbutanal, 2-methylbutanal, hexanal, heptanal, etc.) (Brányik et al., 2008). Acetaldehyde causes ‘green vegetation’ or ‘vegetable’ flavour at
concentrations of 20–25 ppm (Šmogrovičová and Dömény, 1999).
Wort carbonyls contribute largely to the unpleasant worty taste detected
particularly in low-alcohol beer produced by limited fermentation. The yeast metabolism reduces these substances to less flavour active ones (Lehnert et
al., 2009; Brányik et al., 2008). During batch fermentations aldehyde reduction is relatively rapid, but it may not be sufficient at the speed of the
limited fermentation in continuous systems (Lehnert et al., 2008). In fact, a good compromise was reached between alcohol formation and carbonyl
reduction by optimizing the residence time and temperature of the continuous low-alcohol beer production process (Lehnert et al., 2008;
Brányik et al., 2008).
Whole fatty acids are undesirable components of beers in two ways. First of all from the point of view of taste and the secondly due to their potential to
adversely affect foam performance (Boulton and Quain, 2001).

INTRODUCTION Low Alcohol Beers: Flavour compounds, defects and Improvement Strategies
75
Furthermore, the pH value and taste of beer are greatly influenced by its
organic/inorganic acid content (Zhu et al., 2010; Haddad et al., 2008).
The most significant impact of low-alcohol beer produced by removing ethanol is that part of the volatile fraction, such as higher alcohols and
esters, both good flavour components of beer, disappears. All dealcoholization technologies lead to significant losses of volatiles, although
minimal losses occur in the case of the membrane process. These flavour imperfections increased the need to correct them, for example with
additives (Brányik et al., 2012).
The colour of beer is also affected by the dealcoholization processes. The thermal process tends to highten the colour, while membrane processes
decrease the colour of low-alcohol beers. Whatever the dealcoholization method used, bitterness and foam stability are usually impaired (Brányik et
al., 2012) and beers are more prone to microbial contamination due to the low ethanol content as well as the presence of fermentable sugars. This
feature has to do with the positive synergistic effect of ethanol during the pasteurization of beer. Thus, since low-alcohol beers need higher
pasteurization temperatures, an adverse influence on flavour characteristics and colloidal stability of the beer is caused. Indeed, when low-alcohol
beers are produced by restricted fermentation procedures, beers with high fermentable sugar content are obtained and, hence, they are prone to be
contaminated more easily (Sohrabvandi et al., 2010). The diacetyl/pentanedione ratio can reflect the relationship between flavours
and microbes in beer. The diacetyl/pentanedione ratio was found to be approximately 1 when microorganisms were not detected, but polluted
beer was found to have a higher ratio. Pentanedione was reduced significantly once the beer was highly contaminated by microbes during
fermentation, whereas a prominent increase of diacetyl was recorded concurrently. When the concentration of diacetyl in beer exceeded the
endurable threshold, the consumers were able to detect the presence of diacetyl when tasting (Tian, 2010).
Furthermore, it has been pointed out that contamination with spoilage microorganisms might result in off-flavours such as rotten eggs, cooked
cabbage, celery-like flavour, vinegary flavour, phenolic flavour, lactic acid, diacetyl and acetaldehyde (Sohrabvandi et al., 2010).
INTRODUCTION Low Alcohol Beers: Flavour compounds, defects and Improvement Strategies
76
POSSIBLE SOLUTION STRATEGIES
If ethanol productivity were the only quality criterion, it would be relatively
easy to control and optimize the brewing process. However, during beer production, the well-balanced aroma and flavour of the final product are
equally or even more important than efficient fermentation and high ethanol yield. Presently, different strategies to solve this problem are being
investigated because of the great economic importance for breweries.
• Control strategies based on the manipulation of parameters during fermentation.
Van Iersel et al. (1999) research reveals that anaerobic conditions inhibit microorganism growth and stimulate ester production, whereas oxygen
stimulates growth but may cause oxidative off-flavours. By increasing the temperature, yeast metabolism and ester production will increase. By the
introduction of regular aerobic intervals, an optimum can be reached between the supply of oxygen for yeast growth and the prevention of
oxidation of the low-alcohol beer (Willaert et al., 2006; Lenhert et al., 2009). By changing the mashing process, it is possible to modulate the profile of
wort sugar to obtain a limited fermentability and hence, a low alcohol content. This can be achieved, for example, with a high mashing
temperature (75-80ºC) causing a ß-amilase inactivation. The flavour of these beers is good; however, some worty flavours have been reported (Brányik
et al., 2012). Nowadays, temperature, feed volume, wort gravity, wort composition, residence time, and aeration are the main parameters
considered for optimisation in order to find a constant and optimum well-balanced taste in low-alcohol beer (Willaert et al., 2006; Lenhert et al.,
2009).
• Use of special yeast strains that form less ethanol during complete fermentation of wort sugars.
The reduction of ethanol production could be achieved by metabolic
engineering of the carbon flux in yeast resulting in an increased formation of other fermentation products such as glycerol. However, only by-products
that do not disturb the taste of beer are acceptable. Nevoigt et al. (2002) explains that the GPD1 gene encoding the glycerol-3-phosphate
dehydrogenase was overexpressed in an industrial lager brewing yeast (Saccharomyces cerevisiae ssp. Carlsbergensis) to reduce the content of
ethanol in beer. The amount of glycerol was increased 5.6 times and

INTRODUCTION Low Alcohol Beers: Flavour compounds, defects and Improvement Strategies
77
ethanol was decreased by 18% when compared to the wild-type.
Overexpression of GPD1 does not affect the consumption of wort sugars. Minor changes in the concentration of higher alcohols, esters and fatty
acids could only be observed in beer produced by GPD1. However, the concentrations of several other by-products, particularly acetoin, diacetyl
and acetaldehyde, were considerably increased.
Other Saccharomyces strains have been studied in order to make low-alcohol beers. Saccharomyces ludwigii at low temperature and low density
can be applied in controlled fermentation due to its inability to ferment maltose (the most abundant sugar in wort) and maltotriose.
Saccharomyces ludwigii showed a higher volatile compounds formation (higher alcohol and esters), in spite of remaining off-flavours (aldehyde and
diacetyl) (Mohammadi et al., 2011; Brányik et al., 2012).
In controlled fermentation it is important to perform a selection of yeast strain as well as the operation conditions used in each dealcoholization
process. All the factors involved will determine the sensory quality of the final alcohol-free beer.
• Emerging technologies to produce non-alcoholic beers by removing ethanol from a completely fermented beer.
Some technologies have been developed as a complement to thermal
dealcoholization to decrease the thermal damage and loss of volatiles. Aroma recovery systems allow the beer to be rectified with the aroma
compounds, which can be commercial or elaborated from processed beer (Lipnizki et al. 2002). Nowadays, many of them are based on the recovery
of natural aroma compounds from beer (Catarino and Mendes, 2011).
Pervaporation is a newly developed process that considers the extraction of aromas from multicomponent mixtures. Thus, She and Hwang (2006)
analyzed the effect of pervaporation operating conditions (concentration and temperature) and the membrane properties on the separation of
multicomponent mixtures representing real flavour systems. On the other hand, they reported the recovery of key flavour compounds (alcohols,
esters and aldehydes) from real solutions (apple essences, orange aroma and black tea distillate), by using different membranes. Catarino et al. 2009
developed a process to extract aromas from the original beer by using a POMS (polyoctylmethylsiloxane) membrane. Seven aroma compounds
were selected to characterize the beer profile, four alcohols (ethanol,
INTRODUCTION Low Alcohol Beers: Flavour compounds, defects and Improvement Strategies
78
propanol, isobutanol, and isoamyl alcohol), two esters (ethyl acetate and
isoamyl acetate) and one aldehyde (acetaldehyde). This beer aroma is intended to correct the aroma profile of the same beer after a
dealcoholization process. The results show that pervaporation is an effective process for recovering aroma compounds from beer.
An industrial process by using spinning cone column distillation for
producing non-alcoholic beer (ethanol < 0.5 vol%) with improved flavour profile has been recently investigated by Catarino and Mendes (2011). This
process is a variation of vacuum distillation, which uses a column with a special design, the spinning cone column (SCC). SCC consists of a gas-
liquid countercurrent device where the stripping medium (e.g. water vapour) extracts the ethanol from the beverage. The dealcoholized beer is
blended with fresh alcoholic beer and natural extracted aroma compounds. These aroma compounds are obtained by pervaporation of
the original beer, using polyoctylmethylsiloxane/polyetherimide (POMS/PEI) membranes. The main advantages of SCC distillation comprise low
residence time, high contact area between liquid and vapour, low pressure in the column and moderate temperatures, which minimizes the thermal
impact on beer.
However, most of these strategies involve difficulties due to the control exerted by the laws of some countries in relation to the alcoholic phase
separated during the processes of dealcoholization (ej: distillation process).
CONCLUSIONS
In recent years, there has been an increased market share for low-alcohol
beers. This is mainly due to health and safety reasons and increasingly strict social regulations. Low-alcohol beer consumers seek a product as close as
possible to normal beer, but the dealcoholization features give these kinds of beers an artificial and immature taste. When ethanol is removed from
regular beer, there are basically four consequences for low-alcohol beers:
• In incompleted fermentation, carbonyl compounds are reduced
only slightly, therefore confering unpleasant flavours.
• A lack of flavour due to the elimination of both ethanol and other alcohols during the dealcoholization process.
INTRODUCTION Low Alcohol Beers: Flavour compounds, defects and Improvement Strategies
79
• Some favourable compounds are missing because ethanol operates
as a solvent.
• Low-alcohol beer contamination with spoilage microorganisms increase due to the lack of ethanol.
For these reasons, low-alcohol beers have given rise to social,
technological, and economical interests, which will require a comprehensive analysis of these flavour compounds.
In this review, we have shown the flavour compounds of beer, in order to
determine those associated with sensorial defects of taste in low-alcohol beer.
Acknowledgements:
CSIC collaboration in the analysis with the mass spectrometer (UPLC-QToF-MS) is gratefully acknowledged.
Financial support from Junta de Castilla y León (VA332A12-2) is gratefully acknowledged.
References
Arrieta, A. A., Rodríguez-Méndez, M. L., de Saja, J. A., Blanco, C. A. and Nimubona, D. (2010). Prediction of bitterness and alcoholic strength in
beer using an electronic tongue. Food Chemistry, 123: 642-646.
Bamforth, C.W. and Kanauchi, M. (2004). Enzymology of vicinal diketone reduction in brewer´s yeast. Journal of the Institute of Brewing. 110: 83-93.
Belisario-Sánchez, Y.Y., Taboada-Rodríguez, A., Marín-Iniesta, F. and López-
Gómez, A. (2009). Dealcoholized wines by spinning cone column distillation: phenolic compounds and antioxidant activity measured by
the 1, 1-diphenyl-2-picrylhydrazyl method. Journal of Agricultural and Food Chemistry. 57 (15): 6770-6778.
INTRODUCTION Low Alcohol Beers: Flavour compounds, defects and Improvement Strategies
80
Blanco, C.A. and Rayo, J. (2008). Improving industrial full-scale production
of baker´s yeast by optimizing aeration control. Journal of AOAC International, 91 (3): 607-613.
Boulton, C. and Quain, D. (2001). The biochemistry of fermentation. In:
Brewing yeast and fermentation, pp 69-142. Eds., Blackwell Science, Oxford, U.K.
Brányik, T. Silva, D.P., Baszczyn ̌ski, M., Lehnert, R. and Almeida e Silva, J.B.
(2012). A review of methods of low alcohol and alcohol-free beer production. Journal of Food Engineering. 108: 493-506.
Brányik, T., Vicente, A.A., Dostálek,P. and Teixeira, J.A. (2008). A review of flavor formation in continuous beer fermentations. The Institute of
Brewing & Distilling, 114 (1): 3-13.
Callemien, D., Dasnoy, S. and Collin, S. (2006). Identification of a stale-beer-like odorant in extracts of naturally aged beer. Journal of
Agricultural and Food Chemistry, 54(4): 1409–1413.
Caluwaerts, H.J.J. (1995). Process for the manufacture of an alcohol-free beer having the organoleptic properties of a lager type pale beer. U.S.
Patent 5, 384,135.
Catarino, M., Mendes, A., Madeira, L.M. and Ferreira, A. (2007). Alcohol
removal from beer by reverse osmosis. Separation Science and Technology, 42 (13): 3011–3027.
Catarino, M., Ferreira, A. and Mendes, A. (2009). Study and optimization of
aroma recovery from beer by pervaporation. Journal of Membrane Science, 341: 51–59.
Catarino, M. and Mendes, A. (2011). Non-alcoholic beer—A new industrial
process. Separation and Purification Technology, 79: 342– 351.
Coote, N. and Kirsop, B.H. (1974). The content of some organic acids in beer
and other fermented media. Journal of the Institute of brewing, 80: 474-483.
Eden, A., Van Nedervelde, L., Drukker, M., Benvenisty, N. and Debourg, A.
(2001). Involvement of branched-chain amino acid aminotransferases in the production of fusel alcohols during

INTRODUCTION Low Alcohol Beers: Flavour compounds, defects and Improvement Strategies
81
fermentation in yeast. Applied Microbiology and Biotechnology, 55:
296-300.
Hazelwood, L.A., Daran, J-M., van Maris, A.J.A, Pronk, J.T. and Dickinson, J.R. The Ehrlich pathway for fusel alcohol production: a century of research
on Saccharomyces cerevisiae metabolism. Applied and Environmental Microbiology, 74: 2259-2266.
Heggart, H., Margaritis, A., Stewart, R., Pikington, H., Sobczak, J. and Russell,
I. (2000). Measurement of brewing yeast viability and vitality: a review of methods. Technical Quarterly – Master Brewers Association of America,
37(4): 409–430.
Klopper, W. J., Angelino, S.A.G.F., Tuning, B. and Vermeire, H.A. (1986).
Organic acids and glycerol in beer. Journal of the Institute of Brew, 92: 225-228.
Kobayashi, M., Shimizu, H. and Shioya, S. (2008) Beer volatile compounds
and their application to low-malt beer fermentation. Journal of Bioscience and Bioengineering, 106 (4): 317–323.
García, A.A., Cancho Grande, B. and Gandara, J.S. (2004). Development
of rapid method based on solid-phase extraction and liquid chromatography with ultraviolet absorbance detection for the
determination of polyphenols in alcohol-free beers. Journal of Chromatography, 1054: 175–180.
García, A.I., García, L.A. and Díaz, M. (1994). Fusel alcohols production in beer fermentation. Process Biochemistry, 29: 303-309.
Ghasemi-Varnamkhasti, M., Mohtasebi, S.S., Rodriguez-Mendez, M.L.,
Lozano, J., Razavi, S.H., Ahmadi, H. and Apetrei, C. (2012). Classification of non-alcoholic beer based on aftertaste sensory evaluation by
chemometric tools. Expert Systems with Applications, 39: 4315-4327.
Guido, L., Rajendram, R. and Barros, A.A. (2008). Pitching yeast and beer flavour: In: Beer in health and disease prevention. Preedy, V.R., Ed.,
Academic Press, USA.
Haddad, R., Sparrapan, R., Kotiaho, T. and Eberlin, M.N. (2008). Easy
Ambient Sonic-Spray Ionization-Membrane Interface Mass Spectrometry

INTRODUCTION Low Alcohol Beers: Flavour compounds, defects and Improvement Strategies
82
for Direct Analysis of Solution Constituents. Analytical Chemistry, 80: 898–
903.
Horák, T., C ̌ulík, J., Jurková, M., C ̌ejka, P. and Kellner, V. (2008).
Determination of free medium-chain fatty acids in beer by stirbar
sorptive extraction. Journal of Chromatography A, 1196–1197: 96–99.
Hough, J.S., Briggs, D.E., Stevens, R. and Young, T.W. (1981). Metabolism of wort by yeast. In: Malting and Brewing science, vol II, Hopped wart and
beer, pp 566-641. An Aspen Publication, Ed., Chapman and Hall, New York.
Labanda, J., Vichi, J., Llorens, J. and López-Tamames, E. (2009). Membrane separation tehcnology for the reduction of alcoholic degree of a white
model wine. LWT- Food Science and Technology, 42(8): 1390-1395.
Lehnert, R., Kuřec, M. and Brányik, T. (2008). Effect of oxygen supply on flavor formation during continuous alcohol-free beer production: A
model study. American Society of Brewing Chemisys, 66(4): 233-238.
Lehnert, R., Novák, P., Macieira, F., Kuřec, M., Teixeira, J.A. and Brányik, T. (2009). Optimisation of lab-scale continuous alcohol-free beer
production. Czech Journal Food Science, 27: 267–275.
Lipnizki, F., Olsson, J. and Trägårdh, G. (2002). Scale-up of pervaporation for
the recovery of natural aroma compounds in the food industry. Part 1. Simulation and Performance. Journal of Food Engineering, 54: 183–195.
Mohammadi, A., Razavi, S.H., Mousavi, S.M. and Rezaei, K. (2011). A
comparision between sugarconsumption and ethanol production in wort by immobilized Saccharomyces cerevisiae, Saccharomyces ludwigii,
Saccharomyces rouxii on brewer´s spent grain. Brazilian Journal of Microbiology, 42: 605-615.
Montanari, L., Marconi, O., Mayer, H. and Fantozzi, P. (2009). Production of
alcohol-free beer. In: Beer in Health and Disease Prevention, pp. 61–75. Preedy, V.R., Eds., Elsevier Inc., Burlington, MA.
Nevoigt, E., Pilger, R., Mast-Gerlach, E., Schmidt, U., Freihammer, S., Eschenbrenner, M., Garbe, L. and Stahl, U. (2002). Genetic engineering
of brewing yeast to reduce the content of ethanol in beer. FEMS Yeast Research, 2: 225-232.

INTRODUCTION Low Alcohol Beers: Flavour compounds, defects and Improvement Strategies
83
Perpète P. and Collin S. (1999). Contribution of 3-
methylthiopropionaldehyde to the worty flavor of alcoholfree beers. Journal of Agricultural and Food Chemistry, 47: 2374–2378.
Perpète P. and Collin S., (2000), Infuence of beer ethanol content on the
wort flavour perception. Food Chemistry, 71: 379-385.
Petersen E. E., Margaritis A., Stewart R. J., Pilkington P. H. and Mensour N. A. (2004). The effects of wort valine concentration on the total diacetyl
profile and levels late in batch fermentations with brewing yeast Saccharomyces carlsbergensis. Journal of the American Society
of Brewing Chemists, 62: 131-139.
Piddocke, M.P. (2009). The effect of high gravity on brewer's yeast
metabolism- physiological studies and "-omics" analyses. PhD thesis. Technical University of Denmark, Department of Systems Biology.
Saison, D., De Schutter, D.P., Delvaux, F. and Delvaux, F.R. (2008).
Optimisation of a complete method for the analysis of volatiles involved in the flavor stability of beer by solid-phase microextraction in
combination with gas chromatography and mass spectrometry. Journal of Chromatography A, 1190: 342-349.
Saison, D., De Schutter, D.P., Delvaux, F. and Delvaux, F.R. (2009).
Determination of carbonyl compounds in beer by derivatisation and headspace solid-phase microextraction in combination with gas
chromatography and mass spectrometry. Journal of Chromatography A, 1216: 5061-5068.
She, M. and Hwang, S.T. (2006). Recovery of key components from real flavour concentrates by pervaporation. Journal of Membrane Science,
279: 86-93.
Šmogrovičová, D. and Dömény, Z. (1999). Beer volatile by-product formation at different fermentation temperature using immobilised
yeasts. Process Biochemistry, 34: 785–794.
Sohrabvandi, S., Mousavi, S.M., Razavi, S.H., Mortazavian, A.M. and Rezaei, K. (2010). Alcohol-free beer: Methods of production, sensorial defects,
and healthful effects. Food Reviews International, 26: 335–352.
INTRODUCTION Low Alcohol Beers: Flavour compounds, defects and Improvement Strategies
84
Sterckx F. L., Missiaen J., Saison D., Delvaux F. R. (2011). Contribution of
monophenols to beer flavour based on flavour thresholds, interactions and recombination experiments. Food Chemistry, 126: 1679-1685.
Tian, J. (2010). Determination of several flavours in beer with headspace
sampling–gas chromatography. Food Chemistry, 123: 1318–1321.
Vanbeneden, N., Gils, F., Delvaux, F. and Delvaux, F. R. (2008). Formation of 4-vinyl and 4-ethyl derivatives from hydroxycinnamic acids: Occurrence
of volatile phenolic flavour compounds in beer and distribution of Pad1-activity among brewing yeasts. Food Chemistry, 107(1): 221–230.
Van Bergen, B., Sheppard, J.D. and Jardim, A. (2005). Purification, identification and characterisation of diacetil reductase enzymes in ale
and lager brewing yeast. In: Proceedings of the European Brewing Convention Congress, Prague, pp 139/1-139/6. IRL Press, Eds., Oxford.
Van Iersel, M.F.M., van Dieren, B., Rombouts, F.M. and Abee, T. (1999). Flavor
formation and cell physiology during the production of alcohol-free beer with immobilized Saccharomyces cerevisiae. Enzyme and Microbial
Technology, 24: 407-411.
Verbelen, P.J and Devaux, F.R. (2009). Brewing yeast in action: beer fermentation. In: Applied Mycology, pp 110-136. Rai, M and Bridge, P.D.,
Eds., CAB International, UK.
Verstrepen, K. J., Derdelinckx, G. and Delvaux, F. R. (2003). Esters in beer-
part.1: The fermentation process: more than ethanol formation. Cerevisia, 28: 41-49.
Verstrepen, K.J., Derdelinckx, G., Dufour, J.P., Winderickxm J., Thevelein,
J.M., Pretorius, I.S. and Delvaux, F.R. (2003). Flavour-active esters: adding fruitiness to beer. Journal of Bioscience and Bioenergy, 96: 110–118.
Wales, D.S., Cartledge, T.G. and Lloyd, D. (1980). Effects of
glucoserepression and anaerobiosis on the activities and subcellular distribution of tricarboxylic acid cycle and associated enzymes in
Saccharomyces carlsbergensis. Journal of general microbiology, 116: 93-98.

INTRODUCTION Low Alcohol Beers: Flavour compounds, defects and Improvement Strategies
85
Whiting, G.C. (1976) Organic acid metabolism by yeast during fermentation
of alcoholic beverages: a review. Journal of the Institute of Brewing, 82: 84-92.
Willaert, R. and Nedovic, V.A. (2006). Primary beer fermentation by
immobilized yeast – a review on flavour formation and control strategies. Journal of Chemical Technology and Biotechnology, 81: 1353–1367.
Zhu, L., Zhong Hu, Z., Gerardo Gamez, G., Wai Siang Law, W., HuanWen
Chen, H., ShuiPing Yang, S., Konstantin Chingin, K., Roman, M., Balabin, R., Rui Wang, R., TingTing Zhang, T. and Renato Zenobi, R. (2010).
Simultaneous sampling of volatile and non-volatile analytes in beer for fast fingerprinting by extractive electrospray ionization mass
spectrometry. Analysis of Bioanalytical Chemistry, 398: 405–413.


New trends in beer flavour compound
analysis
By
Cristina Andrés-Iglesias a, Olimpio Montero b, Daniel Sancho a and Carlos A. Blanco a
a Departamento Ingeniería Agrícola y Forestal (Área de Tecnología de los Alimentos), ETS Ingenierías Agrarias, Universidad de Valladolid, 34004 Palencia,
Spain.
b Centre for Biotechnology Development (CDB), CSIC, Boecillo’s Technological Park, 47151 Boecillo, Valladolid, Spain.
PUBLISHED IN:
Journal of the Science of Food and Agriculture
95:1571-1576, 2015

INTRODUCTION New Trends in Beer Flavour Compound Analysis
88
Summary
As the beer market is steadily expanding, it is important for the brewing
industry to offer consumers a product with the best organoleptic characteristics, flavour being one of the key characteristics of beer. New
trends in instrumental methods of beer flavour analysis are described. In addition to successfully applied methods in beer analysis such as
chromatography, spectroscopy, nuclear magnetic resonance, mass spectrometry or electronic nose and tongue techniques, among others,
sample extraction and preparation such as derivatization or microextraction methods are also reviewed.
Keywords: beer, analytical methods, flavour compounds, chromatography,
spectrometry, spectroscopy.
INTRODUCTION
Beer sensory characteristics and quality are deeply influenced by the raw materials (water, malt, hop and yeast) and the brewing process. Malt is the
major contributor of flavours and colour to beer and the main source of sensory quality variation.1 Taste and basic sensory attributes such as
bitterness and body represent the main attributes of beer and have great importance in consumer preferences.1,2 More than 800 flavouring agents
have been found to contribute to flavour formation in beer. Many of these compounds are not key flavour compounds although some of them
introduce a background perception that plays an important role in the overall impression of the beer flavour.3 Besides water and ethanol,
carbohydrates are beer major components. Other important compounds are proteins, organic acids, amino acids, hop components, and salts.4
Levels of organic acids, esters, higher alcohols, aldehydes and ketones (including importantly diacetyl) can contribute to the overall organoleptic
properties of the final beer5 and can be measured. Among them, esters and higher alcohols are favourable to the organoleptic characteristic of
beer; however, an excessive quantity of aldehyde and ketone derivatives causes unpleasant flavours.4
Analysis of beer flavour compounds has been constantly optimised to
obtain better results in relation to sensitivity and specificity. Improvements

INTRODUCTION New Trends in Beer Flavour Compound Analysis
89
regarding minimal sample preparation, covering a wide range of
compounds from the same chemical group or minimised interaction between factors involved in the technique have been attained.6
After the recent expansion of the beer market, the brewing industry faces
the challenge of offering products with improved organoleptic characteristics to consumers. Apart from regular beers, low-alcohol beers
are increasing their share in the worldwide production, which may reflect the global trend for healthier lifestyles and/or an increased degree of
cultural acceptability.7 Therefore, it is important to evaluate and determine the different flavour compounds in regular beers, as well as the
characteristic off-flavours of derived beers, with different analytical techniques to improve the sensory quality of beer during its production
stages and storage. The aim of this study is thus to outline the new trends in analytical methods used to determine flavour compounds in beer.
METHODOLOGICAL TRENDS
Although the different analytical techniques described below can be used separately, most of them are linked together and used in a combined way.
Chromatographic Methods
• Gas chromatography and extraction methods
Gas chromatography-flame ion detector (GC-FID) or gas chromatography-mass spectrometry (GC-MS) is currently used to measure volatile compound
concentrations in beer. Mass spectrometers with electron impact ionization (EI) and quadrupole or ion trap analyzers6,8-15 are used by a number of
research groups, but electrospray ionization (ESI) coupled to time of flight (ToF) mass spectrometers has also been used.15,16 Ethers, esters, acids,
aldehydes, ketones, alcohols, sulphur compounds, hydrocarbon compounds, alicyclic compounds, heterocyclic compounds and aromatic
compounds can be measured simultaneously by using GC-MS methods.9 Direct injection is not suitable for the quantitative analysis of beer samples in
GC because they contain large amounts of non-volatile compounds that may damage the column.11 Hence, gas chromatographic methods for
analyzing flavour compounds in beer can involve different methods of sample preparation.17 Several extraction methods are currently used before
injection. In headspace-gas chromatography (HS-GC), the vapour (gas)
INTRODUCTION New Trends in Beer Flavour Compound Analysis
90
phase in contact with a condensed (liquid or solid) phase is analyzed by
GC.18 Headspace GC has been widely used for the analysis of volatile aroma compounds in beer,19 free fatty acids, alcohols and acetates,18 as
well as several off-flavours including diacetyl, pentanedione, acetoin and acetaldehyde.20
As early as 1994, Battistutta et al.21 used methods based on solid-phase
extraction (SPE) with C18 bonded-phases. More recently, Horák et al.22 used SPE as the reference extraction method for free fatty acids in a comparison
with other two methods, namely solid-phase microextraction (SPME) and stir bar sorptive extraction (SBSE). Recoveries were similar for SPE and SPME, but
SPME was shown to be preferred because of simplicity of use and low cost. Also Rodrigues et al.23 have used SPE in a study to assess the variation of
volatiles owing to beer deterioration. In spite of SPE being very selective and offering the possibility of covering a wide range of compound types, SPME
has become very popular due to its easy to use, high sensitivity, reproducibility and low cost. SPME was developed by Arthur and Pawliszyn
and shown to have applicability in volatile analysis,22,24 specially in combination with head-space (HS-SPME).22 It requires neither solvents nor
previous sample preparation and is feasible in terms of automatization. These procedures are quite fast, minimize volumes of organic solvents and
lead to a good recovery and a high reproducibility. Moreover, SPME attracted great attention due to its capability to analyse at the part per
billion (ppb) levels.25 In present SPME techniques, the analyte contained in the sample is adsorbed onto an immobilized polycoated fiber bound to a
fine needle, and subsequently desorbed by heating in the inlet of the GC or GC/MS device; SPME becoming therefore a fast, sensitive, and solvent-free
method.9 Conventional SPME has some drawbacks such as fiber fragility and low sorption capacity.26 However, this technique has successfully been
applied to the determination of some flavour compounds in beer such as organic and fatty acids, alcohols, esters, monophenols, and carbonyl
compounds.8,11 Campillo et al.27 also used HS-SPME as the extraction method to determine very low detection threshold compounds such as
volatile organic sulphur and selenium compounds in beer, previous to measurement by GC coupled to atomic emission detector. Similarly,
Charry-Parra et al.14 optimized HS-SPME coupled to gas chromatography-mass spectrometry-flame ionization detector (GC-MS-FID) to determine nine
important volatile flavour compounds in beer, including higher alcohols (n-propanol, 2-methyl 1-propanol, 2-methyl and 3-methyl butanol and 2-
phenyl ethanol), esters (ethyl acetate, isoamyl acetate and 2-phenylethyl
INTRODUCTION New Trends in Beer Flavour Compound Analysis
91
acetate) and aldehydes (acetaldehyde), some of them with
concentrations at trace levels. The SPME fiber used in the latter two studies was carboxen/polydimethylsiloxane (CAR/PDMS) and polydimethylsiloxane
(PDMS) respectively. Two different fibers were used because the fiber coating polarity and volatility characteristics determine the chemical
nature of the extracted analytes, and a wider range of analytes was thus extracted by combining the two fiber coatings.14 CAR/PDMS is being shown
as the fiber coating with a higher applicability. Thus, Gonçalves et al.28 have recently developed a HS-SPME-GC-MS method using
divinylbencen/carboxen on polydimethylsiloxane (DVB/CAR/PDMS) for the analysis of the volatile metabolic pattern of raw materials utilized in beer
production. This method is shown to detect up to 152 volatiles of a wide compound survey. Mendes et al.29 compared SPE, SPME and
microextraction by packed sorbents (MEPS) methodologies for volatiles and semi-volatiles analysis from wine. The main characteristics of these
techniques are comparatively outlined by these authors. SPE with LiChrolut EN sorbent was found to extract the highest number of compounds,
whereas SPME with DVB/CAR/PDMS coating exhibited the highest sensitivity. The three techniques rendered high extraction efficiency for esters and
higher alcohols, but a rather low efficiency for fatty acids.
Even though SPME is used at present by a high number of researchers, and methodology optimization is an ongoing process,14,28,30,31 other extraction
and preconcentration techniques have also been developed and tested for beer volatiles. Hrivňák et al.32 reported a solid-phase microcolumn
extraction (SPMCE) method to analyze a broad spectrum of beer aroma in one sample run; alcohols and esters were detected with this method. Stir
bar sorptive extraction (SBSE), with both thermal desorption and solvent back extraction, has been applied by Horák et al. to the analysis of
esters33,34,35 and free fatty acids.17,22,35 This research group has also compared this technique with different extraction methods. Results of these
studies point out that SBSE is comparable to SPME regarding recovery and linearity for esters and medium-chain fatty acids; SBSE was able to recover
long-chain fatty acids with a similar yield to that of SPE whereas they are not adsorbed into SPME. Conversely, SBSE is not well suited for alcohols. The
main drawback of SBSE is shown to require a rather long extraction time (Table 1).
Although the HS sampling technique has an advantage over direct
injection in which only the volatile compounds in the sample are injected,

INTRODUCTION New Trends in Beer Flavour Compound Analysis
92
its sensitivity is low.10 Optimizations of the HS-SPME-GC analysis have been
developed by studying the effects of the analysis parameters. Recently, Rodriguez-Bencomo et al.5 have studied the influence of sample volume,
extraction temperature and extraction time, and their interaction on the extraction of beer volatile compounds. While extraction time seems to be
the less influent parameter, increasing the sample volume causes the preconcentration of compounds and recovery improvement. Although it
has been observed that the effects of the temperature and time depend on the type of compound, some volatile compounds tend to increase with
rising temperature while less volatile compounds do the contrary owing to increase in the vapour pressure.
The direct injection drawbacks are not only due to column damage, but
more importantly, to the difficulty in detecting certain compounds without prior derivatization. Derivatization methods have been developed for
detecting carbonyl compounds in beer, which are very difficult to analyze by general methodologies because of their extremely low concentrations,
their low volatility and high reactivity owing to the polar carbonyl group, and the presence of more abundant esters and alcohols.12 Several
extraction methodologies have been applied to carbonyl compounds in beer, including liquid–liquid extraction, distillation or sorbent extraction.
Despite obtaining valuable results with these procedures, they are complex, time consuming and not highly selective. Therefore, derivatization has
become a necessary method to overcome these drawbacks.36 Two common derivatization reagents used in GC-MS are 2,4-
dinitrophenylhydrazine (DNPH) and O-(2,3,4,5,6-pentafluorobenzyl)hydroxylamine (PFBOA).37 Indeed, the methodology that
is mainly used in the brewing industry for the analysis of carbonyl compounds is headspace solid-phase microextraction (HS-SPME) with gas
chromatography coupled to mass spectrometric detection (GC–MS) after derivatization with PFBHA.13 Lehnert et al.38 used this technique to determine
aldehydes in alcohol-free beer. Later, Grosso Pacheco et al.39 determined the main vicinal diketones present in beer using a novel membraneless
extraction module for the chromatographic analysis.

INTRODUCTION New Trends in Beer Flavour Compound Analysis
93
Table1. Summary of methods used in beer flavour analysis
Technique Compounds Advantages DisadvantagesExt ract ion
HS Volatiles, thermolabile compounds
Good repeatability, fast , sensit ive, small
sample amounts, minimal sample
preparation, easy to apply, used in
combination with other extract ion
techniques
Low detect ion limits, HS-t rap system
reduces the detect ion limit
SPE
Semi-volat ile to non-volat ile,
nonpolar to polar, and ionizable
analytes
Quite fast, minimize volume of organic
solvents, good recovery and
reproducibility
Use of solvents, difficult to put on
line
SPME
Volatiles and semivolat iles
(alcohols, esters, vicinal diketones,
carbonyl compounds, fatty acids,
sulphur compounds, monophenols)
Simplicity, repeatability, solvent free,
low t ime consumption, low cost, high
sensivity, reproducibility, connected on
line
Fiber is fragile, careful manipulation,
poor recovery of long chain free
fatty acids (derivat ization needed),
charged analytes not efficient ly
extracted
SBSE
Volatiles and semivolat iles (sulfur
compounds, esters, carbonyl
compounds, medium to long chain
fatty acids, terpenoids)
Robust, solvent free (thermal
desorpt ion) or small volume of organic
solvents (solvent back ext raction), low
sensit ivity, very low cost , no trace
concentration levels
Poor recovery for long-chain
alcohols, long t ime consuming
SPMCE Low to high boiling compounds
Amount of extracted analytes is
proport ional to sample volume, keep
the compound rat io in the sample,
direct thermal desorption into GC
available, automation is feasible
Few trapping materials available,
no comparative reports
Liquid-Liquid
Extraction
Volatiles, high molecular weight
compounds
Fully developed, covering a wide range
of compounds
Environmental unfriendly, long t ime
consuming, degradat ion possible
Technique Compounds Advantages DisadvantagesAnalysis
GC-FID Flavor compounds Robust, reproducibility, low cost
Sample preparat ion required,
standards needed for
identification, compounds with
high vapour pressure cannot be
measured
GC-MS Flavor compoundsRobust, reproducibility, identification is
feasible without standards
Sample preparat ion required,
compounds with high vapor
pressure cannot be measured
LC-MS
Hop acids, aflatoxins, amines,
oligosaccharides, semi-volatile
compounds
Linearity, good repeatabilityDerivatization of volat ile
compounds and solvents required
NMRHop acids, carbohydrates,
oligosaccharides, aromatic profile
Limited sample preparation, non
destructive, rapid analysis
Expensive, complex operat ion and
data analysis
EESI-MSVolatile and semi/non-volatile
compounds
No sample pret reatment, reduced t ime,
automation
Foam reduces aerosol droplet
formation, ext raction yield depends
on flow rate of desorption gas,
gradual signal loss of volatile
compounds
Electronic
Nose (EN)
Aroma profiles, electronic
fingerprint , identification of simple
or complex mixtures.
High sensit ivity, small amount of sample,
speed of analysis
Not very selective to part icular kind
of compounds, aroma response
depends on the sensor used
INTRODUCTION New Trends in Beer Flavour Compound Analysis
94
• Liquid chromatography
Many studies have been conducted on beer analysis by liquid
chromatography (LC). Iso-α-acids are currently analysed by high-performance liquid chromatography (HPLC) with UV detection;40
aflatoxins41 and amines42 have also been analysed by liquid LC-MS, among others. However, only a few studies have specifically dealt with beer flavour
compounds. Aldehydes (acetaldehyde, methylpropanal and furfural) were analysed by HPLC with spectrophotometric detection (HPLC-UV); however,
prior derivatization with 2,4-dinitrophenylhydrazine (DNPH) and further
extraction of the derivatives by gas-diffusion microextraction (GDME), a
rapid extraction method for volatile and semi-volatile compounds, was
necessary.36 Moreover, LC–atmospheric pressure chemical ionization–MS in negative ion mode was also used in this study to confirm the presence of
the DNPH derivatives of carbonylic compounds in beer, this methodology being able to discriminate aldehydes from ketones.36 Derivatization with 4-
nitro-o-phenylenediamine (NPDA) and UV detection at 257 nm has been
used for diacetyl analysis by HPLC, this method showing an efficient
chromatographic separation, excellent linearity and good repeatability.43
Even though not directly related to the volatile fraction of beer composition,it should be mentioned that high-performance anion
exchange chromatography coupled with pulsed ampero- metric detection has been applied after optimization to quantify oligosaccharides in beer.
This method has been shown to allow the determination of mannose, maltose, maltotriose, maltotetraose, maltopentaose, maltohexaose and
maltoheptaose content in a single chromatographic run without any pre-treatment.20
Spectroscopic and spectrometric methods
• Nuclear magnetic resonance
Nuclear magnetic resonance (NMR) spectroscopy permits analysis of low concentrations of analytes, even in complex matrices such as beer, and it is
a non-destructive technique that can selectively detect a large number of compounds simultaneously.3 Owing to spectroscopic overlap, LC in
combination with NMR and MS has also proven to be useful for further characterization of the aromatic profile in ale and lager beers.44 Nord et al.4

INTRODUCTION New Trends in Beer Flavour Compound Analysis
95
used this technique successfully to quantify certain aminoacids and organic
acids in beer. High-resolution NMR spectroscopy is used in the brewing industry to evaluate the composition of beer and its raw materials, the
composition being then correlated with a variety of quality parameters. Furthermore, this technique has been used to monitor the chemical
changes occurring in lager beer during ageing.45 At present, work is undertaken by NMR-related research groups to develop valid models of
correlation between NMR data and sensorial data with the aim to confidently evaluate sensorial properties of the final product. 46
• Mass spectrometry
Inductively coupled plasma-mass spectrometry has been used for the
determination and comparison of the elemental fingerprint profile of40 commercial beer samples. Fourteen trace elements were monitored and
the40 beer samples were clearly differentiated.47
Extractive electrospray ionization (EESI) coupled to MS has been demonstrated to allow the direct and rapid detection of both volatile and
non-volatile analytes in the gas phase, in solution or in aerosol samples, without any sample pre-treatment. This technique has been applied to
beer, and volatile esters, free fatty acids, non-volatile amino acids and organic/inorganic acids were simultaneously detected and identified
according to their MS-MS data.15
At present, MS in combination with metabolomics approaches is being used to measure small molecules (< 1200 Da) in beer with the focus to
characterize different beer-related features.48
Quadrupole time-of-flight mass spectrometry (QToF-MS) with ESI coupled to
ultra-performance liquid chromatography (UPLC) is being used to analyse
different taste compounds in regular beers.48 Ambient MS employing direct
analysis in real time (DART) ion source coupled to high-resolution ToF-MS has
recently been used as a suitable tool to determine original components from raw materials, products originating during malting and brewing and
products of fermentation. Amino acids and derivatives of saccharides were detected in positive ion mode, and organic acids including bitter hop
components in negative ionic mode. Hence the DART-ToF-MS technique permits the determination of beer origin recognition by recording
INTRODUCTION New Trends in Beer Flavour Compound Analysis
96
metabolomic fingerprints or profiles of ionizable compounds generated
under ambient conditions with only degassing preparation.16
Techniques which mimic human senses
• Electronic tongue
Electronic and bioelectronic tongues are emerging analytical technologies,
simulating the taste detection modality of the human tongue by means of electrochemical sensors or biosensor array.49 Work using electronic tongue is
mainly focused towards the differentiation and characterization of
beers.50,51 Ghasemi-Varnamkhasti et al.50 used a bioelectronic tongue applying cyclic voltammetry to discriminate and classify regular and
alcohol-free beers satisfactorily. An electronic tongue based on voltammetry with chemically modified electrodes has been used by the
authors’ group51 to prove that electrochemical signals provided by the array are related to beer properties such as bitterness and alcohol degree.
The importance of these bitterness compounds in providing the typical bitter taste to beer has been recently pointed out.52 Electrochemical
multisensors can be utilized to quantify the content in beer of ascorbic, citric and malic acids by using an electronic tongue,53 as well as ferulic,
galic and sinapic acids by employing a bioelectonic tongue.54
• Electronic Nose
Electronic noses based on coupling of headspace (HS) with a mass
spectrometer (MS) have been used to classify and characterize a series of beers from different factories according to their production site and
chemical composition, this technique providing information about compounds responsible for this differentiation.55 By HS-MS electronic nose
analysis, it is possible to relate these differential compounds to the presence and abundance of ions of known characteristic compounds in beer.
Clear flavour differences between regular and alcohol-free beers have
been detected using electronic nose, as shown by work of Ghasemi-Varnamkhasti et al.56,57 A metal oxide semiconductor-based electronic nose
was used and the results showed the capability of the electronic nose system to evaluate the aroma fingerprint changes in beers during the aging
process.56

INTRODUCTION New Trends in Beer Flavour Compound Analysis
97
Electronic tongue and nose are promising analytical tools in brewery
application. Indeed, by continuous monitoring of the odour and taste during brewing it is expected that beer quality can be controlled more
successfully by the brewers.51,58
CONCLUSIONS
Gas chromatography is the most widely used analytical technique in the
determination of flavour compounds; this technique coupled with MS permits a simultaneous measurement of different flavour molecules.
However this technique involves the use of an extraction method, the most successful being HS-SPME for beer volatile compounds although
derivatization is necessary for low or non-volatile concentration compound detection. Other spectrometry-related analytical methods can be coupled
with gas or liquid chromatography.
The newest instrumental analytical techniques such as electronic nose and tongue are valuable tools for the evaluation of beer aroma and taste
fingerprint. Main characteristics of techniques reviewed here are outlined in Table 1.
Owing to the comparatively low flavour quality of alcohol-free beer, social,
technological and economic concerns about developing an improved taste in alcohol-free beer are mounting. Hence, a comprehensive analysis
of beer chemical composition is required. Application of new analytical methods to this purpose is consequently necessary for an improved
characterization of subtle differences between alcohol-free and regular beers. In this sense, metabolomics affords a new and powerful analytical
tool, which may speed up the determination of chemical differences between beers through a comprehensive and untargeted characterization
of beer chemical composition. Metabolomics-related analytical platforms like time of flight mass spectrometry (ToF-MS) coupled with UPLC as well as
NMR methods are therefore becoming of relevance in beer analysis.
Acknowledgements
Financial support from Junta de Castilla y León (VA332A12-2) is gratefully
acknowledged. The authors thank the valuable improvements afforded by
INTRODUCTION New Trends in Beer Flavour Compound Analysis
98
anonymous reviewers’ comments.
References
1 Donadini G, Fumi MD and Newby-Clark IR, Consumers' preference and sensory profile of bottom fermented red beers of the Italian market.
Food Res Int 58:69-80 (2014). 2 Sester C, Dacremont C, Deroy O and Valentin D, Investigating
consumers’ representations of beers through a free association task: A comparison between packaging and blind conditions. Food Qual
Prefer 28:475-483 (2013). 3 Sohrabvandi S, Mortazavian AM and Rezaei K, Advanced analytical
methods for the analysis of chemical and microbiological properties of beer. J Food Drug Anal 19:202-222 (2011).
4 Nord LI, Vaag P and Duus J Ø, Quantification of organic and amino acids in beer by 1H-NMR spectroscopy. Anal Chem 76:4790-4798
(2004). 5 Heggart H, Margaritis A, Stewart R, Pikington H, Sobczak J and Russell I,
Measurement of brewing yeast viability and vitality: a review of methods. Technical Quarterly – Master Brewers Association of
America 37:409-430 (2000). 6 Rodriguez-Bercomo JJ, Muñoz-Gonzalez C, Martín-Álvarez PJ, Lázaro E,
Mancebo R, Catañé X and Pozo-Bayón MA, Optimization of a HS-SPME-GC-MS procedure for beer volatile profiling using response
surface methodology: application to follow aroma stability of beers under different storage conditions. Food Anal Methods 5:1386-1397
(2012). 7 Blanco CA, Andrés-Iglesias C and Montero O, Low-alcohol beers:
Flavour compounds, defects and improvement strategies. Crit Rev Food Sci Nutr DOI:10.1080/10408398.2012.733979 (in press).
8 Saison D, De Schutter DP, Delvaux F and Delvaux FR Optimisation of a complete method for the analysis of volatiles involved in the flavor
stability of beer by solid-phase microextraction in combination with gas chromatography and mass spectrometry. J Chromatogr A
1190:342-349 (2008). 9 Sterckx FL, Saison D and Delvaux FR, Determination of volatile
monophenols in beer using acetylation and headspace solid-phase microextraction in combination with gas chromatography and mass
spectrometry. Anal Chim Acta 676:53-59 (2010).

INTRODUCTION New Trends in Beer Flavour Compound Analysis
99
10 Pinho O, Ferreira IMPLVO and Santos LHMLM, Method optimization by
solid-phase microextraction in combination with gas chromatography with mass spectrometry for analysis of beer volatile fraction. J
Chromatogr A 1121:145–153 (2006). 11 Kobayashi M, Shimizu H and Shioya S, Beer volatile compounds and
their application to low-malt beer fermentation. J Biosci Bioeng 106:317–323 (2008).
12 Saison D, De Schutter DP, Delvaux F and Delvaux FR, Determination of carbonyl compounds in beer by derivatisation and headspace solid-
phase microextraction in combination with gas chromatography and mass spectrometry. J Chromatogr A 1216: 5061-5068 (2009).
13 Schmarr H, Potouridis T, Ganss S, Sang W, Köpp B and Fischer U, Analysis of carbonyl compounds via headspace solid-phase microextraction
with on-fiberderivatization and gas chromatographic-ion trap tandem mass spectrometric determination of their O-(2,3,4,5,6-
pentafluorobenzyl) oxime derivatives. Anal ChimActa 617:119-131 (2008).
14 Charry-Parra G, DeJesús-Echevarria M and Perez FJ, Beer volatile analysis: optimization of HS/SPME coupled to GC/MS/FID. J Food Sci
76:205-211 (2011). 15 Zhu L, Zhong Hu Z, Gerardo Gamez G, Wai Siang Law W, HuanWen
Chen H, ShuiPing Yang S, Konstantin Chingin K, Roman M, Balabin R, Rui Wang R, TingTing Zhang T and Renato Zenobi R, Simultaneous
sampling of volatile and non-volatile analytes in beer for fast fingerprinting by extractive electrospray ionization mass spectrometry.
Anal Bioanal Chem 398:405–413 (2010). 16 Cajka T, Riddellova K, Tomaniova M and Hajslova J, Ambient mass
spectrometry employing a DART ion source for metabolomic fingerprinting/profiling: a powerful tool for beer origin recognition.
Metabolomics 7:500–508 (2011). 17 Horák T, Čulík J, Jurková M, Čejka P and Kellner V, Determination of free
medium-chain fatty acids in beer by stir bar sorptive extraction. J Chromatogr A 1196–1197: 96–99 (2008).
18 Kolb B and Ettre LS, Types of headspace analysis, in Static headspace-gas chromatography: Theory and practice, ed. by John Wiley & Sons.
New Jersey, pp.3-9 (2006). 19 Šmogrovičová D and Dömény Z, Beer volatile by-product formation at
different fermentation temperature using immobilised yeasts. Process Biochem 34:785-794 (1999).

INTRODUCTION New Trends in Beer Flavour Compound Analysis
100
20 Tian J, Determination of several flavours in beer with headspace
sampling–gas chromatography. Food Chem 123:1318-1321 (2010). 21 Battistutta F, Buiatti S, Zenarola C and Zironi R, Rapid analysis of free
medium-chain fatty acids and related ethyl esters in beer using SPE and HRGC. J High Res Chromatogr 17:662-664 (1994).
22 Horák T, Čulík J, Čejka P, Jurková M, Kellner V, Dvořák J and Hašková D, Analysis of free fatty acids in beer: Comparison of solid-phase
extraction, solid-phase microextraction and stir bar sorptive extraction. J Agric Food Chem 57:11081-11085 (2009).
23 Rodrigues JA, Barros AS, Carvalho B, Brandão T, Gil AM and Silva Ferreira AC, Evaluation of beer deterioration by gas chromatography-
mass spectrometry/multivariate analysis: A rapid tool for assessing beer composition. J Chromatogr A 1218:990-996 (2011).
24 Pawliszyn J, Solid Phase Microextraction-Theory and Practice. Wiley–VCH Inc., New York, 245p. (1997).
25 Zhu JY and Chai XS, Some recent developments in headspace gas chromatography. Curr Anal Chem 1:79-83 (2005).
26 Bigham S, Medlar J, Kabir A, Shende C, Alli A and Malik A, Sol-gel capillary microextraction. Anal Chem 74:752-761 (2002).
27 Campillo N, Peñalver R, López-García I and Hernández-Córdoba M, Headspace solid-phase microextraction for the determination of
volatile organic sulphur and selenium compounds in beers, wines and spirits using gas chromatography and atomic emission detection. J
Chromatogr A 1216:6735–6740 (2009). 28 Gonçalves JL, Figueira JA, Rodrigues FP, Ornelas LP, Branco RN, Silva CL
and Câmara JS, A powerful methodological approach combining headspace solid phase microextraction, mass spectrometry and
multivariate analysis for profiling the volatile metabolomic pattern of beer starting raw materials. Food Chem 160:266-280 (2014).
29 Mendes B, Gonçalves J and Câmara JS, Effectiveness of high-throughput miniaturized sorbent-and solid phase microextraction
techniques combined with gas chromatography-mass spectrometry analysis for a rapid screening of volatile and semi-volatile composition
of wines-A comparative study. Talanta 88:79-94 (2012). 30 Riu-Aumatell M, Miró P, Serra-Cayuela A, Buxaderas S and López-
Tamames E, Assessment of the aroma profiles of low-alcohol beers using HS-SPME-GC-MS. Food Res Int 57:196-202 (2014).
31 Rossi S, Sileoni V, Perretti G and Marconi O, Characterization of the volatile profiles of beer using headspace solid-phase microextraction

INTRODUCTION New Trends in Beer Flavour Compound Analysis
101
and gas chromatography-mass spectrometry. J Sci Food Agric 94:919-
928 (2014). 32 Hrivňák J, Šmogrovičová D, Lakatošová D and Nádaský P Technical
Note – Analysis of beer aroma compounds by solid-phase microcolumn extraction. J Inst Brew 116: 167–169 (2010).
33 Horák T, Kellner V, Čulík J, Jurková M and Čejka P, Determination of some beer flavours by stir bar sorptive extraction and solvent back
extraction. J Inst Brew 113:154-158 (2007). 34 Horák T, Čulík J, Kellner V, Jurková M, Čejka P, Hašková D and Dvořák J,
Analysis of selected esters in beer: comparison of solid-phase microextraction and stir bar sorptive extraction. J Inst Brew 116:81-85
(2010). 35 Horák T, Čulík J, Kellner V, Čejka P, Hašková D, Jurková M and Dvořák J,
Determination of selected beer flavours: comparison of a stir bar sorptive extraction and a steam distillation procedure. J Inst Brew
117:617-621 (2011). 36 Moreira Gonçalves L, Magalhães PJ, Valente IM, Grosso Pacheco J,
Dostálek P, Sýkora D, Rodrigues JA and Araújo Barros A, Analysis of aldehydes in beer by gas-diffusion microextraction: Characterization
by high-performance liquid chromatography–diode-array detection–atmospheric pressure chemical ionization–mass spectrometry. J
Chromatogr 1217:3717–3722 (2010). 37 Vesely P, Lusk L, Basarova G, Seabrooks J and Ryder D Analysis of
aldehydes in beer using solid-phase microextraction with on-fiber derivatization and gas chromatography/mass spectrometry. J Agric
Food Chem 51:6941–6944 (2003). 38 Lehnert R, Novák P, Macieira F, Kuřec M, Teixeira JA and Brányik T,
Optimisation of lab-scale continuous alcohol-free beer production. Czech J Food Sci 27:267–275 (2009).
39 Grosso Pacheco J, Valente MI, Moreira Gonçalves L, Magalhaes PJ, Rodrigues JA and Araújo Barros A, Development of a membraneless
extraction module for the extraction of volatile compounds: Application in the chromatographic analysis of vicinal diketones in
beer. Talanta 81:372–376 (2010). 40 Blanco CA, Nimubona D. and Caballero I, Prediction of the ageing of
commercial lager beerduring storage based on the degradation of iso--acids. J Sci Food Agric 94:1988-1993 (2014).
41 Benesova K, Belakova S, Mikulikova R and Svoboda Z, Monitoring of selected aflatoxins in brewing materials and beer by liquid
chromatography/mass spectrometry. Food Control 25:626-630 (2012).
INTRODUCTION New Trends in Beer Flavour Compound Analysis
102
42 Kakigi Y, Yamashita A, Icho T and Mochizuki N, Simultaneous analysis of
heterocyclic amines in beer and beer-like drinks by hydrophilic interaction liquid chromatography-tandem mass spectrometry.
Bunseki Kagaru 61:391-396 (2012). 43 Li PL, Zhu YC, He S, Fan JQ, Hu QB and Cao YS, Development and
validation of a high-performance liquid chromatography method for the determination of diacetyl in beer using 4-Nitro-o-
phenylenediamine as the derivatization reagent. J Agric Food Chem 60:3013-3019 (2012).
44 Duarte I, Barros A, Belton PS, Righelato R, Spraul M, Humpfer E and Gil AM, High-resolution nuclear magnetic resonance spectroscopy and
multivariate analysis for the characterization of beer. J Agric Food Chem 50:2475-2481 (2002).
45 Rodrigues JA, Barros AS and Carvalho B, Probing beer aging chemistry by nuclear magnetic resonance and multivariate analysis. Anal Chim
Acta 02:178-187 (2011). 46 Rodrigues JE and Gil AM, NMR methods for beer characterization and
quality control. Magn Reson Chem 49:S37-S45 (2011). 47 Mahmood N, Petraco N and He Y, Elemental fingerprint profile of beer
samples constructed using 14 elements determined by inductively coupled-plasma mass spectrometry (ICP-MS): multivariation analysis
and potential application to forensic sample comparision. Anal Bioanal Chem 402:861-869 (2012).
48 Andrés-Iglesias C, Blanco C.A, Blanco J, and Montero O, Mass spectrometry-based metabolomics approach to determine
differential metabolites between regular and low-alcohol beers. Food Chem 157:205–212 (2014).
49 Ghasemi-Varnamkhasti M, Mohtasebi SS, Rodriguez-Mendez ML, Siadat M, Ahmadi H and Razavi SH, Electronic and bioelectronic tongues,
two promising analytical tools for the quality evaluation of non alcoholic beer. Trends Food Sci Tech 22:245-248 (2011).
50 Ghasemi-Varnamkhasti M, Rodriguez-Mendez ML, Mohtasebi SS, Apetrei C, Lozano J, Ahmadi H, Razavi SH and de Saja JA Monitoring
the aging of beers using a bioelectronic tongue. Food Control 25:216-224 (2012).
51 Arrieta AA, Rodríguez-Méndez ML, de Saja JA, Blanco CA and Nimubona D, Prediction of bitterness and alcoholic strength in beer
using an electronic tongue. Food Chem 123:642–646 (2010). 52 Caballero I, Blanco, CA and Porras M, Iso-α-acids, Bitterness and Lost of
Beer Quality during Storage. Trends Food Sci Tech 26:21-30 (2012).

INTRODUCTION New Trends in Beer Flavour Compound Analysis
103
53 Escobar JD, Alcañiz M, Masot R, Fuentes A, Bataller R, Soto J and Barat
JM, Quantification of organic acids using voltammetric tongues. Food Chem 138:814–820 (2013).
54 Cetó X, Céspedes F and del Valle M, Assessment of Individual Polyphenol Content in Beer by Means of a Voltammetric BioElectronic
Tongue. Electroanal 25:68-76 (2013). 55 Vera L, Acena L, Guasch J, Boque R, Mestres M and Busto O,
Characterization and classification of the aroma of beer samples by means of an MS e-nose and chemometric tools. Anal Bioanal Chem
399:2073-2081 (2011). 56 Ghasemi-Varnamkhasti M, Mohtasebi SS, Siadat M, Lozano J, Ahmadi
H, Razavi SH and Dicko A, Aging fingerprint characterization of beer using electronic nose. Sensors Actuact B-Chem 159:51-59 (2011).
57 Ghasemi-Varnamkhasti M, Mohtasebi SS, Siadat M, Razavi SH, Ahmadi H and Dicko A, Discriminatory power assessment of the sensor array of
an electronic nose system for the detection of non alcoholic beer aging. Czech Food Sci 30:236-240 (2012).
58 Ghasemi-Varnamkhasti M, Mohtasebi SS, Rodriguez-Mendez ML, Lozano J, Razavi SH,Ahmadi H, Potential application of electronic
nose technology in brewery. Trends Food Sci Tech 22:245-248 (2011).


SECTIONSECTIONSECTIONSECTION 1. 1. 1. 1.
BEER ANALYSIS AND
CHARACTERIZATION
WITH UPLC-QToF-MS

Chapter 1.1
Mass spectrometry-based
metabolomics approach to determine
differential metabolites between
regular and non-alcohol beers
By
Cristina Andrés-Iglesiasa, Carlos A. Blancoa, Jorge Blancoa, Olimpio Montero b,*
a Departamento de Ingeniería Agrícola y Forestal (Área de Tecnología de los Alimentos), ETS Ingenierías Agrarias, (Universidad de Valladolid) Avda. de Madrid 44,
34004 Palencia, Spain
b Centre for Biotechnology Development (CDB), Spanish Council for Scientific Research (CSIC), Francisco Vallés 8, Boecillo’s Technological Park, 47151 Boecillo
(Valladolid), Spain
PUBLISHED IN:
Food chemistry
157: 105-212, 2014

SECTION 1. Beer Analysis and Characterization with UPLC-QToF-MS Chapter 1.1
108
Abstract
Non-alcohol beers show taste deficiencies in relation to regular (alcohol)
beers as shown by consumer evaluation. In this study, multivariate statistical analysis of data obtained by ultra-performance liquid chromatography–
mass spectrometry (UPLC–MS) measurements was applied to determining differential metabolites between two regular (R1 and R2) and their related
low- and non-alcohol beers (F1 and F2, respectively) from a Spanish manufacturer, as well as between F1 and F2 and two non-alcohol beers (F3
and F4) from a non-Spanish producer. Principal component analysis (PCA) of data from UPLC–MS measurements with electrospray ionization in
negative mode was able to separate the six beers. Sugar content was 6-fold and 2-fold higher in F2 and F1 than in R2 and R1, respectively.
Isoxanthohumol and hop acid contents decreased in F2 as compared with R2 but kept in F1 similar to R1. Results are discussed in relation to valued
taste characteristics of each beer type.
Keywords: Non-alcohol beer, Regular beer, UPLC–ESI/MS, Differential
metabolites
INTRODUCTION
Beer represents a widely popular alcoholic beverage with a high world
production rate (Cajka, Riddellova, Tomaniova, & Hajslova, 2010; Lehnert, Kurek, Brányik, & Teixeira, 2008; Sohrabvandi, Mousavi, Razavi,
Mortazavian, & Rezaei, 2010). Moderate beer drinking has several healthful benefits, reducing risks of coronary diseases, heart attack,
diabetes, and overall mortality. Besides alcohol, valuable cereal and hop-related substances found in beer have positive effects that contribute to a
healthy balanced diet, such as no cholesterol content, low energy and free sugar content, high antioxidant level, anxiolytic, soluble fiber content and
essential vitamins and minerals (Brányik, Silva, Baszczynški, Lehnert, & Almeida e Silva, 2012; Negri, DiSanti, & Tabach, 2010). However, there are
risks for health associated to alcohol consuming for heavy drinkers, individuals with heightened heart reactivity, teenagers, car drivers, and
even to a low level in some special situations like pregnancy and breastfeeding (Ray, McGeary, Marshall, & Hutchison, 2006). Hence,
low-alcohol lager beers (LALBs) can offer several opportunities to marketers
SECTION 1. Beer Analysis and Characterization with UPLC-QToF-MS Chapter 1.1
109
because of their negative impact of alcohol consumption while beneficial
effects of healthy beer components still remain (Brányik et al., 2012; Ghasemi-Varnamkhasti et al., 2012; Valls-Belles et al., 2008).
Beer flavour comprises a combination of odor and taste impressions that is a
significant factor in consumer acceptance (Horák et al., 2010). The standing issue in the production of LALBs in terms of organoleptic characteristics is the
achievement of a product ‘as close as possible’ to regular beer (Blanco, Andrés-Iglesias, & Montero, 2014). In LALBs produced by removing alcohol
of the related regular beer (dealcoholization) through thermal processes, loss of volatile aroma compounds (higher alcohols and esters) and
associated flavors can also take place as a side-effect (Brányik et al., 2012). Conversely, LALBs produced by interrupted or restricted fermentation
are often characterized by worty off-flavors and lack of the pleasant fruity (estery) aroma (Perpète & Collin, 1999; Sohrabvandi et al., 2010), which are
originated as a consequence of insufficient aldehyde reduction, lack of fusel alcohols and ester production (Lehnert et al., 2009). These compound
losses and/or by-product formation that arise throughout the processes of LALBs’ production contribute to generate rather unpleasant taste
characteristics, which affect negatively the LALBs’ consumption. Therefore, in order to attain the objective of ‘‘as close as possible’’ to regular beer in
LALBs’ production it is of great interest to identify those compounds that make the difference between regular beers and LALBs, which are assumed
to contribute to these losses of flavor and taste pleasant characteristics. Even though the major compound classes that are involved in the flavor
and taste losses have been identified by experience-driven classical analytical methods (Pinho, Ferreira, & Santos, 2006; Zhu et al., 2010), a new
methodological focusing of the problem is a demanding issue for a thorough assessment of differences in composition profile between regular
and low alcohol beers. Additionally, comparison between low-alcohol beers from different origin and production method may allow gaining
insights on what compounds can contribute to a better acceptance.
New methods based on mass spectrometry (MS) measurements along with multivariate statistical analysis of data generated in the MS measurements
permit untargeted comparison of beer composition. This analytical focusing may overcome the constraints of an experience-based point of view.
Indeed, recently ambient mass spectrometry (MS) employing a direct analysis in real time (DART) ion source along with multivariate statistical
methods have successfully been shown as a tool for beer origin recognition

SECTION 1. Beer Analysis and Characterization with UPLC-QToF-MS Chapter 1.1
110
(Cajka, Riddellova, Tomaniova, & Hajslova, 2011). Untargeted profiling
through a MS-driven metabolomic approach has also been used recently as the methodology of choice by Heuberger et al. (2012) to characterize
the storage temperature on non-volatile small molecules of beer and its oxidation effects. Farag, Porzel, Schmidt, and Wessjohann (2012) used
metabolomics methods based in two platforms, NMR and MS, to profile metabolites of different commercial cultivars of Humulus lupulus L. (hop);
both platforms pointed out similar cultivar segregation in principal component analysis (PCA), with bitter acids being the main chemicals
drawing differences between cultivars. Analytical platforms using different instrumental techniques are expected to provide complementary data that
contribute to bring about a full view of a given subject, a task that cannot be tackled by any platform alone; however, MS is acknowledged to be
more sensitive and accessible to any laboratory or facility than NMR, with compound identification from ion (m/z) data being also easier (Farag et al.,
2012). Additionally, GC–MS applicability is reduced to compounds with a low vapor pressure while LC–MS analysis is applicable to a broad range of
compounds (Manach, Hubert, Llorach, & Scalbert, 2009). Multivariate statistical methods (PCA) have also been applied to mass spectrometry
measurements to ascertain changes in volatile fingerprint between beer brands and during aging (Cajka et al., 2010; Rodrigues et al., 2011). These
methods can be applied to LALBs’ chemical composition analysis for attempting to differentiate the potential compounds that contribute to the
organoleptic characteristics with regard to regular beers. In this study, two regular (alcoholic) beers and their counterpart low-alcohol (≤ 1% alcohol by
volume) and alcohol-free (≤ 0.1% alcohol by volume) beers from a Spanish manufacturer, all of them being of lager type, were analyzed by ultra-
performance liquid chromatography coupled to quadruple time of flight mass spectrometry (UPLC–MS-QToF) with electrospray ionization
source (ESI), and their chemical composition compared using principal component analysis (PCA) with the aim to determine whether differences
arose between the analyzed beers. Additionally, MS data from each low-alcohol and alcohol-free beer and its related regular beer were compared
through orthogonal-partial least squares discriminant analysis (O-PLS-DA) to find out their possible differential compounds. Furthermore, in order to
ascertain whether there are differences in chemical composition between Spanish and foreign LALBs, one low-alcohol beer and one alcohol-free beer
from foreign manufacturers were analyzed and included in the statistical analysis-based comparison.
SECTION 1. Beer Analysis and Characterization with UPLC-QToF-MS Chapter 1.1
111
MATERIALS AND METHODS
Beer selection and reagents
A set of 6 glass bottled lager beers purchased in a local market on March
2012 were analyzed; this set comprised 4 beers from a Spanish manufacturer, which included 2 regular (alcohol) beers (R1 and R2) and
their related 2 non-alcohol beers obtained by a similar industrial under vacuum dealcoholization procedure (F1, a low-alcohol beer with 0.35%
alcohol content and pH 4.03, is obtained from R1, and F2, an alcohol-free beer with 0.04% alcohol content and pH 3.96, is obtained from R2); they
all were from the same commercial batch. R1 (6.50% alcohol content and pH 4.12) is produced with an extract concentration higher than R2 (5.50%
alcohol content and pH 4.08). Additionally, one low-alcohol beer (F4, manufactured in Germany, with 0.45% alcohol content and pH 4.19) and
one alcohol-free beer (F3, manufactured in The Netherlands, 0.04% alcohol content and pH 3.99) were analyzed in the same experiment. Samples were
stored in a refrigerator (4 ˚C) between purchasing and their analysis by about one month later. All samples were measured by triplicate.
Methanol and acetonitrile (Optima LC/MS), and dichloromethane (HPLC grade) solvents were purchased from Fisher Scientific. Formic acid, acetic
acid and ammonium acetate (pro analysi, ACS, Reag. Ph Eur) were purchased from Merck KGaA (Darmstadt, Germany). Milli-Q water was
directly obtained in our laboratory with Direct-Q™ 5 equipment (Millipore S.A.S., Molsheim, France).
Sample treatment
Two mL samples of each beer were transferred to amber polyethylene vials and sonicated for 10 min in a Fisher Scientific ultrasonic bath FB15060 for
CO2 removal. Three different beer glass bottles were used for every beer sampling. Beer samples were submitted to two separate treatments: (i) 200
µL of cold acetonitrile were added to a 200 µL aliquot of every beer sample, vortexed and centrifugated at 3600 rpm (1203 g) for 10 min at 4 ˚C
(5415R Eppendorf centrifuge), then about 180 µL of the supernatant were transferred to a new Eppendorf-like polyethylene vial and kept at 4 ˚C until
instrumental analysis, these samples will be further referred to as untreated samples (UNTS); (ii) an aliquot of 200 µL of each sample was used for lipid
extraction by the classical method of Bligh and Dyer (1959) (B&D), but using
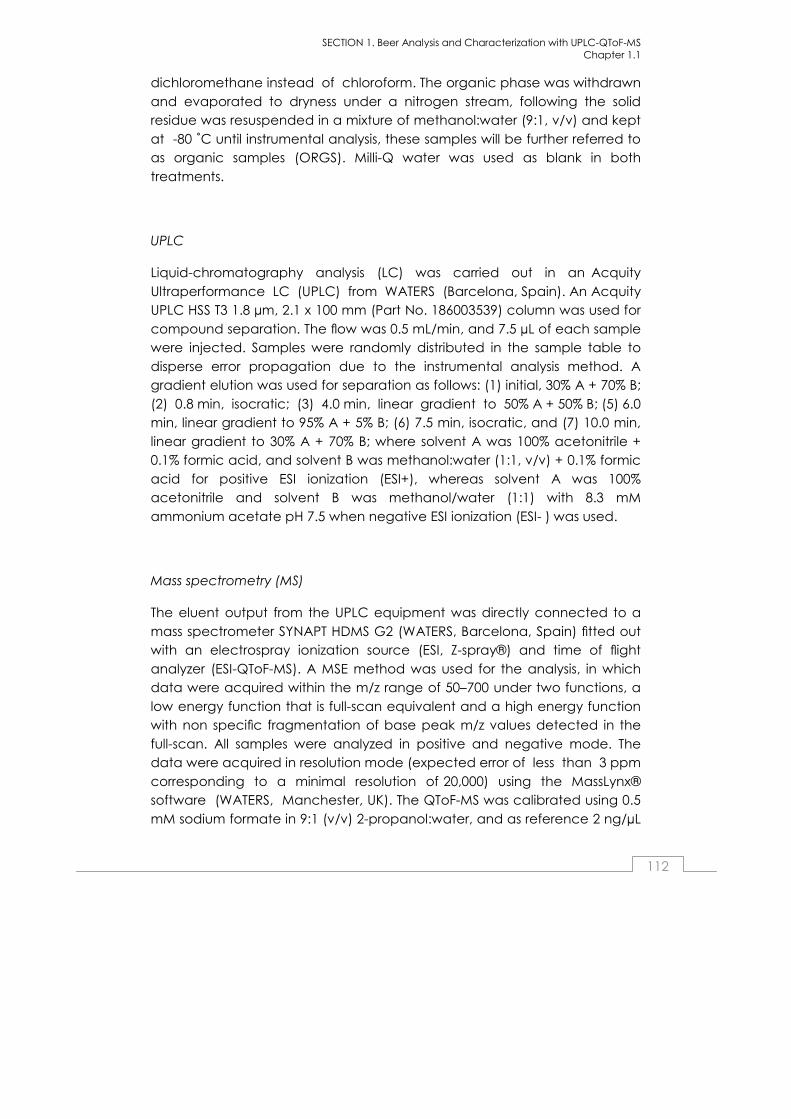
SECTION 1. Beer Analysis and Characterization with UPLC-QToF-MS Chapter 1.1
112
dichloromethane instead of chloroform. The organic phase was withdrawn
and evaporated to dryness under a nitrogen stream, following the solid residue was resuspended in a mixture of methanol:water (9:1, v/v) and kept
at -80 ˚C until instrumental analysis, these samples will be further referred to as organic samples (ORGS). Milli-Q water was used as blank in both
treatments.
UPLC
Liquid-chromatography analysis (LC) was carried out in an Acquity
Ultraperformance LC (UPLC) from WATERS (Barcelona, Spain). An Acquity UPLC HSS T3 1.8 µm, 2.1 x 100 mm (Part No. 186003539) column was used for
compound separation. The flow was 0.5 mL/min, and 7.5 µL of each sample were injected. Samples were randomly distributed in the sample table to
disperse error propagation due to the instrumental analysis method. A gradient elution was used for separation as follows: (1) initial, 30% A + 70% B;
(2) 0.8 min, isocratic; (3) 4.0 min, linear gradient to 50% A + 50% B; (5) 6.0 min, linear gradient to 95% A + 5% B; (6) 7.5 min, isocratic, and (7) 10.0 min,
linear gradient to 30% A + 70% B; where solvent A was 100% acetonitrile + 0.1% formic acid, and solvent B was methanol:water (1:1, v/v) + 0.1% formic
acid for positive ESI ionization (ESI+), whereas solvent A was 100% acetonitrile and solvent B was methanol/water (1:1) with 8.3 mM
ammonium acetate pH 7.5 when negative ESI ionization (ESI- ) was used.
Mass spectrometry (MS)
The eluent output from the UPLC equipment was directly connected to a
mass spectrometer SYNAPT HDMS G2 (WATERS, Barcelona, Spain) fitted out with an electrospray ionization source (ESI, Z-spray®) and time of flight
analyzer (ESI-QToF-MS). A MSE method was used for the analysis, in which data were acquired within the m/z range of 50–700 under two functions, a
low energy function that is full-scan equivalent and a high energy function with non specific fragmentation of base peak m/z values detected in the
full-scan. All samples were analyzed in positive and negative mode. The data were acquired in resolution mode (expected error of less than 3 ppm
corresponding to a minimal resolution of 20,000) using the MassLynx® software (WATERS, Manchester, UK). The QToF-MS was calibrated using 0.5
mM sodium formate in 9:1 (v/v) 2-propanol:water, and as reference 2 ng/µL

SECTION 1. Beer Analysis and Characterization with UPLC-QToF-MS Chapter 1.1
113
Leucine-Enkephalin (Leu-Enk) in 50:50 (v/v) acetonitrile:water with 0.1%
formic acid was used. Other parameters were: capillary voltage, 0.7 V; cone voltage, 18 V; source temperature, 90 ˚C; desolvation temperature,
350 ˚C; cone gas (N2 ), 30 mL/h; and desolvation gas (N2 ), 800 L/h. Argon was used as the collision gas with a collision energy ramped between 25
and 40 V for the high energy measurements (MSE ).
Data analysis
A three-dimensional data array (Pareto-scaled array) comprising the
variables beer sample (including the blanks), retention time_m/z values (molecular features), and normalized (scaled to Pareto variance) signal
intensity of the m/z value was generated after UPLC–MS data were processed by using MarkerLynx® software (WATERS, Manchester, UK).
Following, m/z values were manually checked and those being present in the blank samples considered as noise or contaminants and excluded. The
resulting data arrays were used afterwards for multivariate statistical analysis. The method parameters were fitted as follow: analysis type, peak
detection; initial retention time, 0.10 min; final retention time, 6.00 min; low mass, 50 Da; high mass, 700 Da; XIC window (Da), 0.02; peak width at
5% height (sec), 15.00; peak-to-peak baseline noise, 300.00; marker intensity threshold (counts), 1000; mass window, 0.02; retention time
window, 0.20; noise elimination level, 3.00; deisotope data, yes; replicate % minimum, 66.00%. The Extended Statistics (XS) application included in the
MarkerLynx® software was used as the tool for the multivariate statistical analysis. The XS application includes principal component analysis (PCA)
and orthogonal partial least squares discriminant analysis (O-PLS-DA) tools of the SIMCA-P+ software package (Umetrics EZ info 2.0; Umea, Sweden).
PCA model quality is defined by the statistical parameters R2X(cum), which explains variability of X-variables, and Q2(cum), which indicates the model
predictive capability (Eriksson et al., 2006). Significant variations (p < 0.05) between beers (factor) for every compound (selection variable)
corresponding to selected features (time_m/z) were determined by multiple range test comparison, where the chromatographic peak areas
were considered the independent variable, after One-way ANOVA with Student–Newman–Keuls test, without previous normalization, using
StatGraphics Plus 5.0 software.

SECTION 1. Beer Analysis and Characterization with UPLC-QToF-MS Chapter 1.1
114
RESULTS AND DISCUSSION
Representative base peak chromatograms (BPIs) obtained in positive (ESI+)
and negative (ESI-) mode of UNTS and ORGS are shown in Supplementary Fig. S1 for R1, R2, F1 and F2 samples. Differences in the chromatogram were
only appreciated visually for the F2 beer. Major peaks eluted over the first three minutes in negative mode, which suggests that these peaks were
brought about by relatively polar compounds. Differential m/z values could not be appreciated in the average mass spectra (Fig. 1), the use of
multivariate statistical analysis of UPLC-MS data being therefore necessary to find out subtle differences between samples. However, m/z values
corresponding to compounds known to be present in beer were clearly appreciated in the average mass spectra obtained in negative mode (Fig.
1, right panels). Taking this into account detailed manual analysis of the chromatogram was carried out, which pointed out that most relevant m/z
values were concentrated within the region from 0.0 to 4.0 min, whereas from 6.00 to 10.00 min most chromatographic peaks are elicited by noise or
are also found in the blank; hence, this chromatographic region (6-10 min) was not considered in the MarkerLynx® data analysis.
After blank metabolites (molecular features) were removed, 238 and
137 metabolites (molecular features) were obtained in the untreated samples (UNTS) for ESI+ and ESI-, respectively; whereas 159 and 105
metabolites (molecular features) were obtained in the organic samples (ORGS) for ESI+ and ESI-, respectively. Principal Component Analysis (PCA)
produces a set of new orthogonal variables (axis), which are called principal components, and which result from linear combinations of the
original variables (Berrueta, Alonso-Salces, & Héberger, 2007; Ghasemi-Varnamkhasti et al., 2012; Manach et al., 2009). By means of this method we
aimed at differentiating regular from low-alcohol and alcohol-free beers as well as to determine which the best analytical conditions (UNTS versus
ORGS, and ESI+ versus ESI-) for their differentiation are. The score plots resulting from PCA of the LC-MS-QToF data are illustrated in Fig. 2A and B for
ESI+ (UNTS and ORGS, respectively) and Fig. 2C and D for ESI- (UNTS and ORGS, respectively). PCA of data generated with positive ionization from
UNTS was unable to distinguish between regular beers, but PCAs of data obtained by negative ionization clearly separated both regular beers
between them as well as from low-alcohol and alcohol-free beers. Component 1 (t [1]) explained variation in all PCAs from 51% in UNTS with
ESI+ to 66% in UNTS with ESI- (Table 1), and this component also accounted

SECTION 1. Beer Analysis and Characterization with UPLC-QToF-MS Chapter 1.1
115
for low-alcohol and alcohol-free beers separation, the samples being
almost linearly distributed through this component axes with a significant contribution from other components only in F1 (ORGS+ and UNTS-) or F2
(ORGS-). Maximal separation was found to occur between F1 and F4 in all cases. Conversely, other components showed a significant effect on
separation between the two regular beers. Differences between related beers, that is, R1/F1 and R2/F2, were mainly established by components 3, 4
and 5, depending on the sample treatment and ionization mode though contribution from component 1 was also relevant as indicated above.
According to our results, the best analytical conditions for beer comparison after principal component analysis (PCA) of mass spectrometry
measurements seem to be those involving negative ionization (ESI-) with lipid extraction (ORGS).
In order to find out differential metabolites between related beers, data
from ORGS and UNTS analyzed with ESI- were compared by orthogonal partial least squares discriminant analysis (O-PLS-DA) using the model
developed in PCA for the pairs of beers R1/F1, R2/F2, F1/F4 (low-alcohol beers) and F2/F3 (alcohol-free beers), and differential metabolites within
every beer pair were obtained from the respective S-Plot generated by the software (these for the R1/F1 and R2/F2 pairs are shown in Supplementary
Fig. S2). Compounds selected in this way are illustrated in Table 2, where the beer within each compared pair for which the compound was shown to be
a differential one is indicated. Four criteria were applied for compound ascription to a given molecular feature: (i) the m/z value should provide a
well-defined chromatographic peak and not to be present in the blanks; (ii) elemental composition should fit the isotopic distribution in the mass
spectrum within less than 5 ppm as provided by the Elemental Composition tool of the MassLynx® software; (iii) the elemental composition should also fit
the elemental composition within 10 ppm of the candidate compounds found by search in the literature (Cajka et al., 2011; Farag et al., 2012;
Intelmann, Haseleu, & Hofmann, 2009; Vanhoenacker, De Keukeleire, & Sandra, 2004; Cĕslová, Holcăpek, Fidler, Drštičková, & Lísa, 2009) or on-line
available databases METLIN, LipidMaps and KEGG; and (iv) fragment m/z should be detected in the high energy function (MSE). For compounds that
had previously been reported in the bibliography to be beer components their ascription to a given m/z was considered as an identification, whereas
for compounds that have not been previously identified and reported in the bibliography as beer components their ascription to a given m/z in
this study is underscored as “tentative identification” because it is
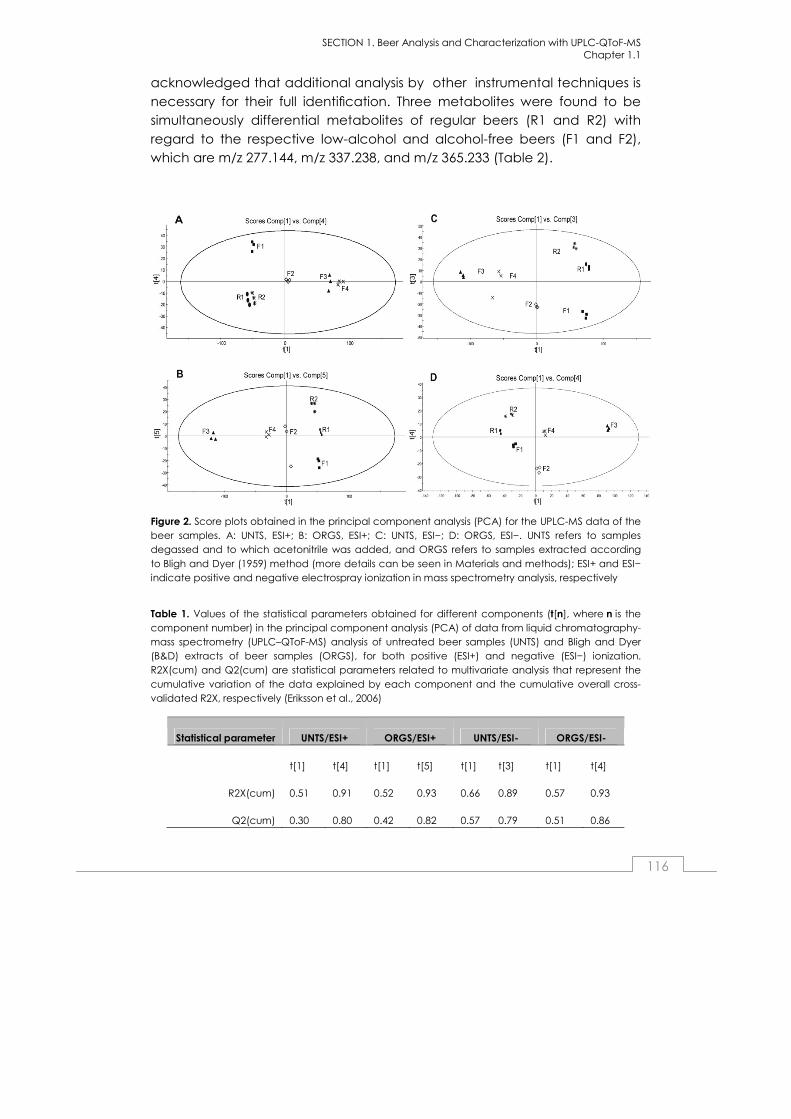
SECTION 1. Beer Analysis and Characterization with UPLC-QToF-MS Chapter 1.1
116
acknowledged that additional analysis by other instrumental techniques is
necessary for their full identification. Three metabolites were found to be simultaneously differential metabolites of regular beers (R1 and R2) with
regard to the respective low-alcohol and alcohol-free beers (F1 and F2), which are m/z 277.144, m/z 337.238, and m/z 365.233 (Table 2).
Figure 2. Score plots obtained in the principal component analysis (PCA) for the UPLC-MS data of the beer samples. A: UNTS, ESI+; B: ORGS, ESI+; C: UNTS, ESI−; D: ORGS, ESI−. UNTS refers to samples degassed and to which acetonitrile was added, and ORGS refers to samples extracted according to Bligh and Dyer (1959) method (more details can be seen in Materials and methods); ESI+ and ESI− indicate positive and negative electrospray ionization in mass spectrometry analysis, respectively
Table 1. Values of the statistical parameters obtained for different components (t[n], where n is the component number) in the principal component analysis (PCA) of data from liquid chromatography-mass spectrometry (UPLC–QToF-MS) analysis of untreated beer samples (UNTS) and Bligh and Dyer (B&D) extracts of beer samples (ORGS), for both positive (ESI+) and negative (ESI−) ionization. R2X(cum) and Q2(cum) are statistical parameters related to multivariate analysis that represent the cumulative variation of the data explained by each component and the cumulative overall cross-validated R2X, respectively (Eriksson et al., 2006)
Statistical parameter UNTS/ESI+ ORGS/ESI+ UNTS/ESI- ORGS/ESI-
t[1] t[4] t[1] t[5] t[1] t[3] t[1] t[4]
R2X(cum) 0.51 0.91 0.52 0.93 0.66 0.89 0.57 0.93
Q2(cum) 0.30 0.80 0.42 0.82 0.57 0.79 0.51 0.86
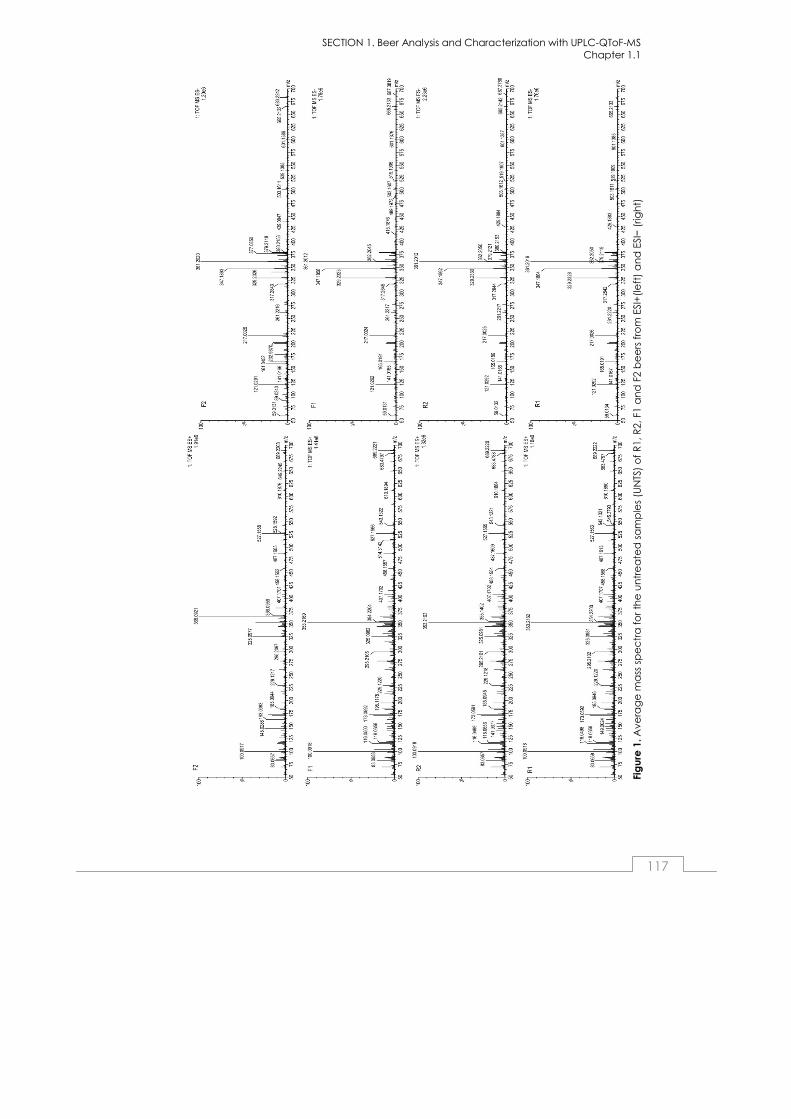
SECTION 1. Beer Analysis and Characterization with UPLC-QToF-MS Chapter 1.1
117
Fig
ure
1. A
vera
ge
ma
ss s
pe
ctr
a f
or
the
un
tre
ate
d s
am
ple
s (U
NTS
) o
f R
1, R
2, F
1 a
nd
F2
be
ers
fro
m E
SI+
(le
ft)
an
d E
SI−
(rig
ht)

SECTION 1. Beer Analysis and Characterization with UPLC-QToF-MS Chapter 1.1
118
Differential metabolites between low-alcohol/alcohol-free and regular
beers were found to mainly fall within the representative compounds of the nonvolatile fraction and with a medium polar nature (Farag et al., 2012;
Vanhoenacker et al., 2004), which are hop acids, isoxanthohumol and sugars (Table 2). All these compounds were detected as the deprotonated
ion ([M-H]-). Some of them were also shown as differential metabolites in the statistical analysis of data from positive ionization, but only the compounds
with a high content could be detected as the protonated ion ([M+H]+); this fact might explain the poor separation of beers obtained in the
corresponding PCA. The content of representative metabolites in a chromatographic peak area basis is shown in Fig.3. Statistical significant
differences (p < 0.05) were obtained for all the compounds when the pairs of beers indicated above were compared apart from anhydrohexose, an
unknown compound with m/z 317.1386, desoxy-iso-n/ad-humulone, iso-cohumulone, and dihydro-iso-cohumulone in the R1/F1 beer pair (see also
Supplementary Table S5). Two peaks were elicited in the extracted ion chromatogram (EIC) for m/z 353.1389 centered at 1.20 and 3.40 min (Fig. 4,
upper panel), which were ascribed to isoxanthohumol and xanthohumol, respectively. Fragmentation of these isomers was only slightly different (data
not shown), both isomers rendering two major fragments at m/z 233.08, m/z 165.09 and m/z 119.05 (Cĕslová et al., 2009). F2, F3 and F4 beers showed a
content of isoxanthohumol (in a chromatographic peak area basis) significantly lower than its content in R1, R2 and F1 (Fig. 3 and
Supplementary Table S5). Because of isoxanthohumol, which isomerizes from xanthohumol, is known to be the precursor of the potent
phytoestrogen 8-prenylnaringenin (m/z 339.1227 for [M-H]-, which eluted at 1.73 min, data on this compound are shown in Supplementary Table S5)
besides to have potent anti-inflammatory properties (Chadwick, Pauli, & Farnsworth, 2006; Gil-Ramírez et al., 2012), it might be of interest to keep the
content of isoxanthohumol in non-alcoholic beers as high as possible, as it happens in F1. Since F1 and F2 are produced by the same dealcoholization
procedure, there may be a factor (likely a higher temperature or exposure time) that differs between the F1 and F2 production processes and leads to
depletion of isoxanthohumol in F2 as compared to F1. The content of both glucose and anhydrohexose (m/z 179.0557 and m/ 161.0450, respectively)
was significantly higher in F2, F3 and F4 than in R1, R2 and F1; however these sugars were only shown by PCA to be differential metabolites of F2 with
regard to R2 and of F3 with regard to F2. This fact might have been motivated by a higher weight of other compounds (m/z) in the PCA and O-
PLS-DA components, which may have led to these m/z values remaining

SECTION 1. Beer Analysis and Characterization with UPLC-QToF-MS Chapter 1.1
119
hindered. The higher sugar content, besides depletion of hop bitter acid
content and other factors (Heuberger et al., 2012), may explain the sweet taste that is currently observed in low-alcohol and, particularly, in alcohol-
free beers by consumers.
Figure 3. Contents of representative differential metabolites in a chromatographic peak area basis. Nomenclature: 1, desdimethyl-octahydro-isocohumulone; 2, anhydrohexoxe; 3, glucose; 4, m/z 317.1386; 5, desoxy-iso-cohumulone; 6, desoxy-iso-n/ad-humulone; 7, dihydro-iso-co-humulone, 8, iso-xanthohumol; 9, m/z 377.0844; 10, dihydro-n/ad-humulinone; 11, iso-cohumulone 12, iso-n/ad-humulone; 13, co-humulone; and 14, n/ad-humulone. Please note the different Y-axes scale
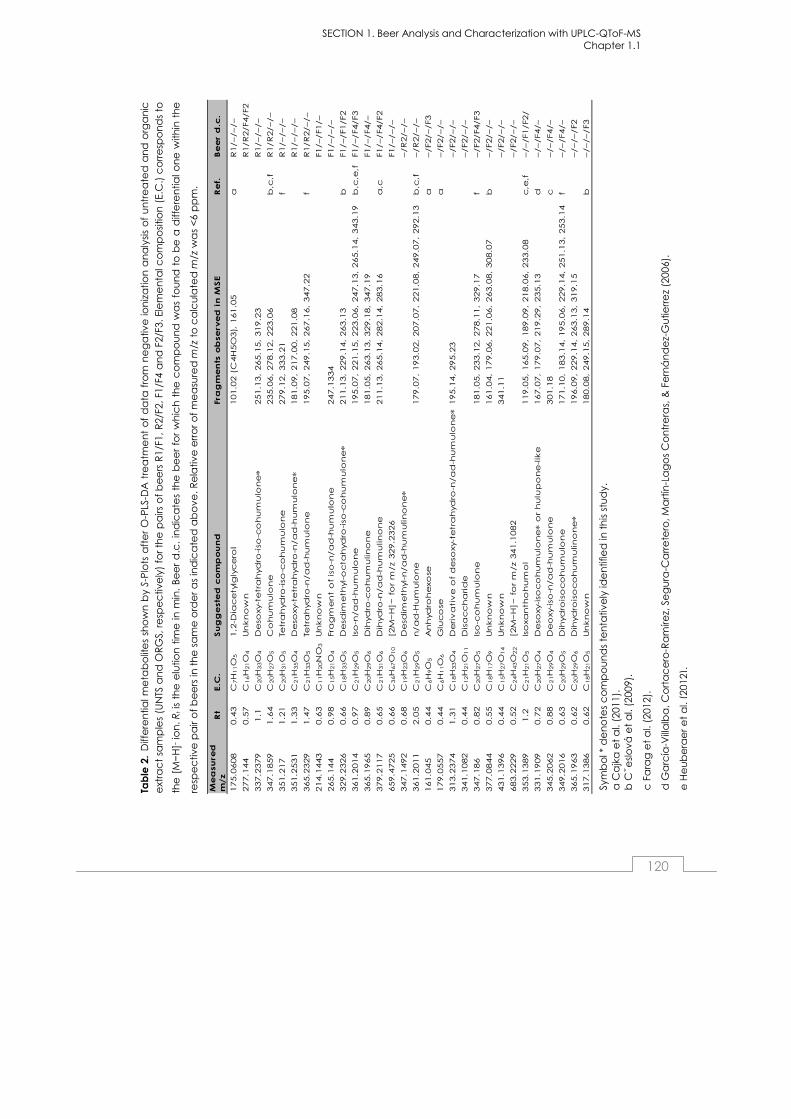
SECTION 1. Beer Analysis and Characterization with UPLC-QToF-MS Chapter 1.1
120
Tab
le 2
. D
iffe
ren
tial m
eta
bo
lite
s sh
ow
n b
y S-
Plo
ts a
fte
r O
-PLS
-DA
tre
atm
en
t o
f d
ata
fro
m n
eg
ativ
e io
niz
atio
n a
na
lysi
s o
f u
ntr
ea
ted
an
d o
rga
nic
ext
rac
t sa
mp
les
(UN
TS a
nd
OR
GS,
re
spe
ctiv
ely
) fo
r th
e p
airs
of
be
ers
R1/
F1, R
2/F2
, F1/
F4 a
nd
F2/
F3. E
lem
en
tal c
om
po
sitio
n (
E.C
.) c
orr
esp
on
ds
to
the
[M−H
]− io
n. R
t is
the
elu
tion
tim
e in
min
. B
ee
r d
.c.
ind
ica
tes
the
be
er
for
wh
ich
th
e c
om
po
un
d w
as
fou
nd
to
be
a d
iffe
ren
tial o
ne
with
in t
he
resp
ec
tive
pa
ir o
f b
ee
rs in
th
e s
am
e o
rde
r a
s in
dic
ate
d a
bo
ve. R
ela
tive
err
or
of
me
asu
red
m/z
to
ca
lcu
late
d m
/z w
as
<6
pp
m.
Sym
bo
l * d
en
ote
s c
om
po
un
ds
ten
tativ
ely
ide
ntifi
ed
in t
his
stu
dy.
a
Ca
jka
et
al.
(201
1).
b C
ˇesl
ová
et
al.
(200
9).
c F
ara
g e
t a
l. (2
012)
.
d G
arc
ía-V
illa
lba
, Co
rta
ce
ro-R
am
írez,
Se
gu
ra-C
arr
ete
ro, M
art
ín-L
ag
os
Co
ntr
era
s, &
Fe
rná
nd
ez-
Gu
tierr
ez
(200
6).
e H
eu
be
rge
r e
t a
l. (2
012)
.
Me
asu
red
m
/z
Rt
E.C
.Su
gg
est
ed
co
mp
ou
nd
Fra
gm
en
ts o
bse
rve
d i
n M
SE
Re
f.B
ee
r d
.c.
175.0
608
0.4
3C
7H
11O
51,2
-Dia
ce
tylg
lyc
ero
l101.0
2 (
C4H
5O
3),
161.0
5a
R1/–/–/–
277.1
44
0.5
7C
16H
21O
4U
nkn
ow
nR
1/R
2/F4/F2
337.2
379
1.1
C2
0H
33O
4D
eso
xy-t
etr
ah
yd
ro-iso
-co
hu
mu
lon
e∗
251.1
3,
265.1
5,
319.2
3R
1/–/–/–
347.1
859
1.6
4C
20H
27O
5C
oh
um
ulo
ne
235.0
6,
278.1
2,
223.0
6b
,c,f
R1/R
2/–/–
351.2
17
1.2
1C
20H
31O
5Te
tra
hyd
ro-iso
-co
hu
mu
lon
e279.1
2,
333.2
1f
R1/–/–/–
351.2
531
1.3
3C
21H
35O
4D
eso
xy-t
etr
ah
yd
ro-n
/a
d-h
um
ulo
ne∗
181.0
9,
217.0
0,
221.0
8R
1/–/–/–
365.2
329
1.4
7C
21H
33O
5Te
tra
hyd
ro-n
/a
d-h
um
ulo
ne
195.0
7,
249.1
5,
267.1
6,
347.2
2f
R1/R
2/–/–
214.1
443
0.6
3C
11H
20N
O3
Un
kn
ow
nF1/–/F1/–
265.1
44
0.9
8C
15H
21O
4Fra
gm
en
t o
f is
o-n
/a
d-h
um
ulo
ne
247.1
334
F1/–/–/–
329.2
326
0.6
6C
18H
33O
5D
esd
ime
thyl-o
cta
hyd
ro-iso
-co
hu
mu
lon
e∗
211.1
3,
229.1
4,
263.1
3b
F1/–/F1/F2
361.2
014
0.9
7C
21H
29O
5Is
o-n
/a
d-h
um
ulo
ne
195.0
7,
221.1
5,
223.0
6,
247.1
3,
265.1
4,
343.1
9b
,c,e
,fF1/–/F4/F3
365.1
965
0.8
9C
20H
29O
6D
ihyd
ro-c
oh
um
ulin
on
e181.0
5,
263.1
3,
329.1
8,
347.1
9F1/–/F4/–
379.2
117
0.6
5C
21H
31O
6D
ihyd
ro-n
/a
d-h
um
ulin
on
e211.1
3,
265.1
4,
282.1
4,
283.1
6a
,cF1/–/F4/F2
659.4
725
0.6
6C
36H
67O
10
[2M
−H
]− f
or
m/z 3
29.2
326
F1/–/–/–
347.1
492
0.6
8C
19H
23O
6D
esd
ime
thyl-n
/a
d-h
um
ulin
on
e∗
–/R
2/–/–
361.2
011
2.0
5C
21H
29O
5n
/a
d-H
um
ulo
ne
179.0
7,
193.0
2,
207.0
7,
221.0
8,
249.0
7,
292.1
3b
,c,f
–/R
2/–/–
161.0
45
0.4
4C
6H
9O
5A
nh
yd
roh
exo
sea
–/F2/–/F3
179.0
557
0.4
4C
6H
11O
6G
luc
ose
a–/F2/–/–
313.2
374
1.3
1C
18H
33O
4D
eriv
ati
ve
of
de
soxy-t
etr
ah
yd
ro-n
/a
d-h
um
ulo
ne∗
195.1
4,
295.2
3–/F2/–/–
341.1
082
0.4
4C
12H
21O
11
Dis
ac
ch
arid
e–/F2/–/–
347.1
86
0.8
2C
20H
27O
5Is
o-c
oh
um
ulo
ne
181.0
5,
233.1
2,
278.1
1,
329.1
7f
–/F2/F4/F3
377.0
844
0.5
5C
18H
17O
9U
nkn
ow
n161.0
4,
179.0
6,
221.0
6,
263.0
8,
308.0
7b
–/F2/–/–
431.1
396
0.4
4C
15H
27O
14
Un
kn
ow
n341.1
1–/F2/–/–
683.2
229
0.5
2C
24H
43O
22
[2M
−H
]− f
or
m/z 3
41.1
082
–/F2/–/–
353.1
389
1.2
C2
1H
21O
5Is
oxa
nth
oh
um
ol
119.0
5,
165.0
9,
189.0
9,
218.0
6,
233.0
8c
,e,f
–/–/F1/F2/
331.1
909
0.7
2C
20H
27O
4D
eso
xy-iso
co
hu
mu
lon
e∗ o
r h
ulu
po
ne
-lik
e167.0
7,
179.0
7,
219.2
9,
235.1
3d
–/–/F4/–
345.2
062
0.8
8C
21H
29O
4D
eo
xy-iso
-n/a
d-h
um
ulo
ne
301.1
8c
–/–/F4/–
349.2
016
0.6
3C
20H
29O
5D
ihyd
rois
oc
oh
um
ulo
ne
171.1
0,
183.1
4,
195.0
6,
229.1
4,
251.1
3,
253.1
4f
–/–/F4/–
365.1
963
0.6
2C
20H
29O
6D
ihyd
rois
oc
oh
um
ulin
on
e∗
196.0
9,
229.1
4,
263.1
3,
319.1
5–/–/–/F2
317.1
386
0.6
2C
18H
21O
5U
nkn
ow
n180.0
8,
249.1
5,
289.1
4b
–/–/–/F3

SECTION 1. Beer Analysis and Characterization with UPLC-QToF-MS Chapter 1.1
121
Regarding hop acids, two peaks were also obtained in the EIC of main a-
acid m/z (Fig. 4, middle and lower panels), the iso-forms eluting earlier. Iso-a-acids can be distinguished from a-acids because they exhibit a
slightly different fragmentation pattern. Whereas the fragments of m/z 292.131 (n/ad-humulone) and m/z 278.118 (co-humulone) predominate in
the fragmentation spectrum of α-acids it is observed as a minor fragment in the fragmentation spectrum of iso-a-acids (Intelmann et al., 2009;
Vanhoenacker et al., 2004). Furthermore, the fragments of m/z 193.0501 and m/z 181.0501 are characteristics of a-acids and iso-α-acids,
respectively (see Supplementary Fig. S3). Co-and n/ad-forms can in turn be distinguished by the difference of 14.0157 amu (–CH2–) between them in
the respective m/z values of the [M-H]- ion and concurrent fragments. Even though the n- and ad-forms could be separated in a recently published
study by the authors using HPLC with UV detection (Nimubona, Blanco, Caballero, Rojas, & Andres-Iglesias, 2013), the elution system used in the
present study could not chromatographically separate them; hence, both forms (n and ad) are further considered together here. Iso-n/ad-humulone
(m/z 361.2015) was found to be the most abundant α-acid within the differential metabolites (Fig. 3), and it was significantly reduced in F2 as
compared to R2, but the opposite trend was found in regard to F1 and R1. This iso-a-acid was also significantly reduced in F3 and F4 as compared to
F2 and F1, respectively (see Supplementary Table S5). The content of iso-co-humulone (in a chromatographic peak area basis) seems to be somewhat
lower than the iso-n/ad-humulone content, but no significant differences (p > 0.05) were observed for iso-co-humulone between the pairs of beers R1/F1
and F2/F3. Vanhoenacker et al. (2004, in Table 3) reported a reduction of co-isomers to n-isomers of iso-a-acids in a non-alcoholic beer (31.0%/55.4%,
co/n) with respect to regular lager beers (34.2%/51.8%, mean value from 5 beers, co/n). Because of the iso-α-acid co-isomers are the main contributors
to bitterness (Intelmann et al., 2009), the observed decrease in isocohumulone content along with higher sugar content, as shown above,
is likely a determinant factor in depletion of bitterness in low-alcohol and alcohol-free beers. Tetrahydro-iso-a-acids were also shown to be differential
metabolites of regular to non-alcohol beers, with a higher content in the regular beers (Fig. 3). Conversely, humulinone and its derivatives were found
to be differential metabolites of alcohol-free beers (Table 2) because of a lower content in these beers than in regular and low-alcohol beers.
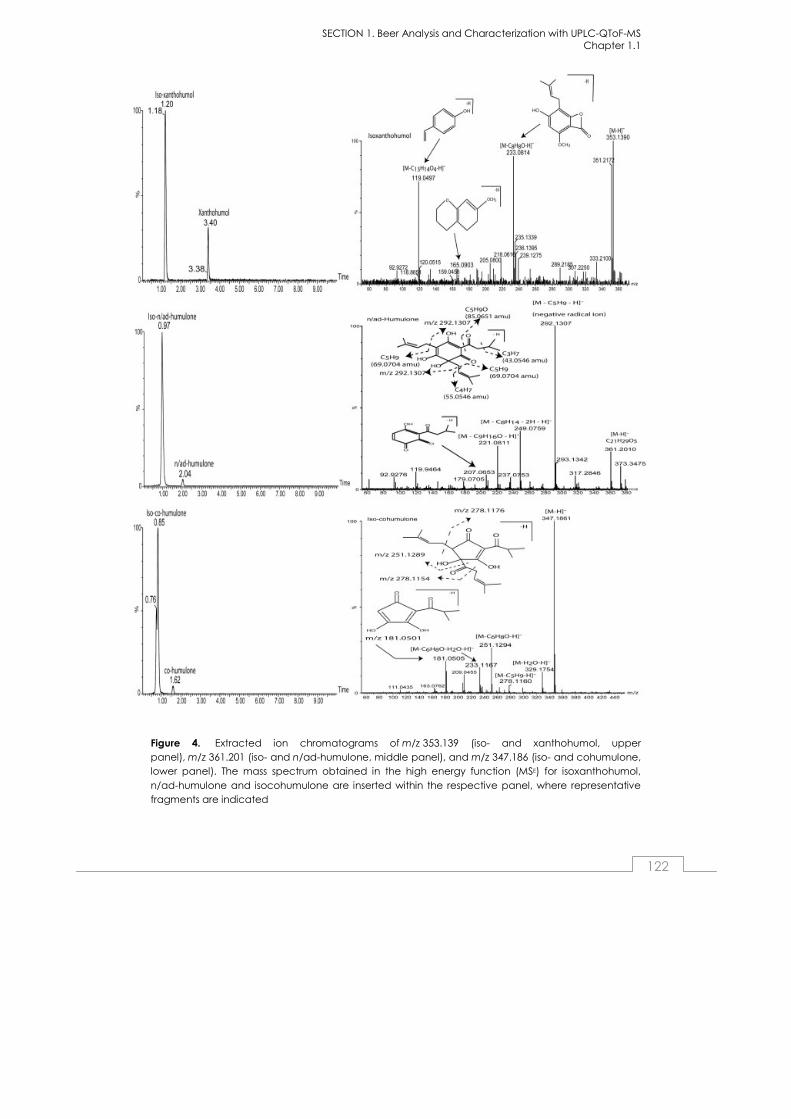
SECTION 1. Beer Analysis and Characterization with UPLC-QToF-MS Chapter 1.1
122
Figure 4. Extracted ion chromatograms of m/z 353.139 (iso- and xanthohumol, upper panel), m/z 361.201 (iso- and n/ad-humulone, middle panel), and m/z 347.186 (iso- and cohumulone, lower panel). The mass spectrum obtained in the high energy function (MSE) for isoxanthohumol, n/ad-humulone and isocohumulone are inserted within the respective panel, where representative fragments are indicated

SECTION 1. Beer Analysis and Characterization with UPLC-QToF-MS Chapter 1.1
123
A set of a-acids-related compounds are tentatively identified in this study
for the first time according to their exact mass, although further research is acknowledged to be necessary for their unequivocal characterization. Two
m/z values (337.2379 and 351.2531) are tentatively identified as deoxy-derivatives (-O+2H, -13.9791 amu) of tetrahydro-iso-cohumulone and
tetrahydro-n/ad-humulone (Table 2). Surprisingly, these compounds seem to be lost in the dealcoholization process as they are shown to be differential
metabolites of R2 to F2, with a significant lower content in the non-alcohol beers (Fig. 3). Moreover, n/ad-humulone and a compound tentatively
identified here as its desdimethyl-derivative (m/z 347.1492) were also found to be differential metabolites of R2 to F2. A compound with m/z 347.1492,
which is lower by -30.0468 amu (–2CH3) than that of n/ad-humulinone, is tentatively identified as desdimethyl-n/ad-humulinone, this compound
being shown as a differential metabolite of R2 (Table 2). A chemical structure is proposed for these compounds in Supplementary Fig. S4. Deoxy-
humulone, deoxy-co-humulone, 4-deoxy-humulone, and 4-deoxy-cohumulone are reported in the NAPRALERT® database (Farnsworth, 2003)
as chemical constituents of hops, but from our knowledge they have not been reported as beer compounds yet. Likewise, a compound with m/z
329.2326, whose proposed structure is illustrated in Supplementary Fig. S4, was shown by PCA as a differential metabolite of non-alcohol F1 and F2
beers (Table 2); this compound cannot be derived from oxidation during storage or sample management as it is a reduced form of isocohumulone.
All these compounds deserve further research, as indicated above, to ascertain their actual chemical structure as well as the properties they
confer to beer, if any.
CONCLUSIONS
The combination of mass spectrometry analysis with multivariate statistical
analysis is pointed out here as a suitable method to find out differential metabolites between regular and non-alcohol beers. Such metabolites
mainly pertain to the non-volatile compound fraction. This methodology is expected to be also applicable to the determination of differential
metabolites between non-alcohol beers from different origin. High sugar content along with decreased iso-a-acid and isoxanthohumol contents
seem to be a differential feature of alcohol-free beers (< 0.1 %) as compared with regular and low-alcohol beers (< 1.0 %). New compounds
are reported here for the first time which seem to also contribute to
SECTION 1. Beer Analysis and Characterization with UPLC-QToF-MS Chapter 1.1
124
differences in chemical composition of non-alcohol beers with regard to
regular beers. These compounds are desoxy-tetrahydro-iso-cohumulone with m/z 337.2379; desoxy-iso-co-humulone with m/z 331.1909; desdimethyl-
octahydro-iso-cohumulone with m/z 329.2326; desdimethyl-n/ad-humulinone with m/z 347.1492; desoxy-tetrahydro-n/ad-humulone with m/z
351.2531; dihydro-iso-cohumulinone with m/z 365.1963; and a compound with m/z 313.2374 that is compatible with a derivative of desoxy-tetrahy-
dro-n/ad-humulone (-38.157 uma). Their actual structure and properties remain to be elucidated by further research.
Acknowledgements
Financial support from the Junta de Castilla y León (VA332A12-2) is gratefully acknowledged. ADE Parques Tecnológicos is acknowledged for
laboratory facilities at Bioincubadora.
Supplementary data
Supplementary data associate with this article can be found at the end of
this Chapter.
References
Berrueta, L. A., Alonso-Salces, R. M., & Héberger, K. (2007). Supervised
pattern recognition in food analysis. Journal of Chromatography A, 1158, 196–214.
Blanco, C.A., Andrés-Iglesias, C., & Montero, O. (2014). Low alcohol beers:
Flavour compounds, defects and improvement strategies. Critical Reviews in Food Science and Nutrition. DOI:
10.1080/10408398.2012.733979.
Bligh, E. G., & Dyer, W. J. (1959). A rapid method for total lipid extraction and purification. Canadian Journal of Biochemistry, 37, 911–917.

SECTION 1. Beer Analysis and Characterization with UPLC-QToF-MS Chapter 1.1
125
Brányik, T., Silva, D. P., Baszczynški, M., Lehnert, R., & Almeida e Silva, J. B.
(2012). A review of methods of low alcohol and alcohol-free beer production. Journal of Food Engineering, 108, 493–506.
Cajka, T., Riddellova, K., Tomaniova, M., & Hajslova, J. (2010). Recognition of
beer brand based on multivariate analysis of volatile fingerprint. Journal of Chromatography A, 1217, 4195–4203.
Cajka, T., Riddellova, K., Tomaniova, M., & Hajslova, J. (2011). Ambient mass
spectrometry employing a DART ion source for metabolomic fingerprinting/profiling: A powerful tool for beer origin recognition.
Metabolomics, 7, 500–508.
Cĕslová, L., Holčapek, M., Fidler, M., Dršticˇková, J., & Lísa, M. (2009).
Characterization of prenylflavonoids and hop bitter acids in various classes of Czech beers and hop extracts using high-performance liquid
chromatography–mass spectrometry. Journal of Chromatography A, 1216, 7249–7257.
Chadwick, L. R., Pauli, G. F., & Farnsworth, N. R. (2006). The pharmacognosy
of Humulus lupulus L. (hops) with an emphasis on estrogenic properties. Phytomedicine, 13, 119–131.
Eriksson, L., Johansson, E., Kottanech-Wold, N, Trygg, J., Wikström, C., &
Wold, S. (2006). Multi- and Megavariate Data Analysis Part I: Basic Principles and Applications (2nd Ed.) Umetrics Academy, training in
multivariate technology ISBN-13: 978–91-973730-2-9. S-907 19. Umeå, Sweden.
Farag, M. A., Porzel, A., Schmidt, J., & Wessjohann, L. A. (2012). Metabolite profiling and fingerprinting of commercial cultivars of Humulus lupulus L.
(hop): A comparison of MS and NMR methods in metabolomics. Metabolomics, 8, 492–507.
Farnsworth, W.R. (2003). A database of world literature of Natural Products,
Program for Collaborative Research in the Pharmaceutical Sciences, College of Pharmacy, University of Illinois at Chicago. Ed. NAPRALERT®.
García-Villalba, R., Cortacero-Ramírez, N., Segura-Carretero, A., Martín-
Lagos Contreras, J. A., & Fernández-Gutierrez, A. (2006). Analysis of hop acids and their oxidized derivatives and iso-a-acids in beer by Capillary
SECTION 1. Beer Analysis and Characterization with UPLC-QToF-MS Chapter 1.1
126
Electrophoresis-Electrospray Ionization Mass Spectrometry. Journal of
Agricultural and Food Chemistry, 54, 5400–5409.
Ghasemi-Varnamkhasti, M., Mohtasebi, S. S., Rodriguez-Mendez, M. L., Lozano, J., Razavi, S. H., Ahmadi, H., et al. (2012). Classification of non-
alcoholic beer based on aftertaste sensory evaluation by chemometric tools. Expert System with Applications, 39, 4315–4327.
Gil-Ramírez, A., Mendiola, J. A., Arranz, E., Ruíz-Rodríguez, A., Reglero, G.,
Ibáñez, E., et al. (2012). Highly isoxanthohumol enriched hop extract obtained by pressurized hot water extraction (PHWE). Chemical and
functional characterization. Innovative Food Science and Emerging Technologies, 16, 54–60.
Heuberger, A. L., Broeckling, C. D., Lewis, M. R., Salazar, L., Bouckaert, P., & Prenni, J. E. (2012). Metabolomic profiling of beer reveals effect of
temperature on non-volatile small molecules during short-term storage. Food Chemistry, 135, 1284–1289.
Horák, T., Cŭlík, J., Kellner, V., Jurková, M., Cĕjka, P., Hašková, D., et al.
(2010). Analysis of selected esters in beer: Comparison of Solid Phase Microextraction and Stir Bar Sorptive Extraction. Journal of the Institute of
Brewing, 116(1), 81–85.
Intelmann, D., Haseleu, G., & Hofmann, T. (2009). LC–MS/MS quantitation of hop-derived bitter compounds in beer using the ECHO technique.
Journal of Agricultural and Food Chemistry, 57, 1172–1182.
Lehnert, R., Kurek, M., Brányik, T., & Teixeira, J. A. (2008). Effect of oxygen
supply on flavour formation during continuous alcohol-free beer production: A model study. Journal of the American Socienty of
Brewing Chemists, 66, 233–238.
Lehnert, R., Novák, P., Macieira, F., Kurˇec, M., Teixeira, J. A., & Brányik, T. (2009). Optimisation of lab-scale continuous alcohol-free beer
production. Czech Journal of Food Science, 27, 267–275.
Manach, C., Hubert, J., Llorach, R., & Scalbert, A. (2009). The complex links between dietary phytochemicals and human health deciphered by
metabolomics. Molecular Nutrition & Food Research, 53, 1303–1315.
SECTION 1. Beer Analysis and Characterization with UPLC-QToF-MS Chapter 1.1
127
Negri, G., DiSanti, D., & Tabach, R. (2010). Bitter acids from hydroethanolic
extracts of Humulus lupulus, L. Cannabaceae, used as anxiolytic. Brazilian Journal of Pharmacognosy, 20(6), 850–859.
Nimubona, D., Blanco, C. A., Caballero, I., Rojas, A., & Andres-Iglesias, C.
(2013). An approximate shelf life prediction of elaborated lager beer in terms of degradation of its iso-a-acids. Journal of Food
Engineering, 116, 138–143.
Perpète, P., & Collin, S. (1999). Contribution of 3-methylthiopropionaldehyde to the worty flavor of alcoholfree beers. Journal of Agricultural and Food
Chemistry, 47, 2374–2378.
Pinho, O., Ferreira, I. M. P. L. V. O., & Santos, L. H. M. L. M. (2006). Method
optimization by solid-phase microextraction in combination with gas chromatography with mass spectrometry for analysis of beer volatile
fraction. Journal of Chromatography, A, 1121, 145–153.
Ray, L. A., McGeary, J., Marshall, E., & Hutchison, K. E. (2006). Risk factors for alcohol misuse: Examining heart rate reactivity to alcohol, alcohol
sensitivity, and personality constructs. Addictive Behaviors, 31, 1959–1973.
Rodrigues, J. A., Barros, A. S., Carvalho, B., Brandão, T., Gil, A. M., & Ferreira, A. C. S. (2011). Evaluation of beer deterioration by gas
chromatography-mass spectrometry/multivariate analysis: A rapid tool for assessing beer composition. Journal of Chromatography A, 1218, 990–
996.
Sohrabvandi, S., Mousavi, S. M., Razavi, S. H., Mortazavian, A. M., & Rezaei,
K. (2010). Alcohol-free beer: Methods of production, sensorial defects and healthful effects. Foods Reviews International, 26(4), 335–352.
Valls-Belles, V., Torres, M. C., Boix, L., Muñiz, P., Gonzalez-Sanjose, M. L., &
Codoñer-Franch, P. (2008). a-Tocopherol, MDA-HNE and 8-OHdG levels in liver and heart mitocondria of adryamicin-treated rats fed with
alcohol-free beer. Toxicology, 249, 97–101.
Vanhoenacker, G., De Keukeleire, D., & Sandra, P. (2004). Analysis of iso-a-acids and reduced iso-a-acids in beer by direct injection and liquid
chromatography with ultraviolet absorbance detection or with mass spectrometry. Journal of Chromatography A, 1035, 53–61.
SECTION 1. Beer Analysis and Characterization with UPLC-QToF-MS Chapter 1.1
128
Zhu, L., Hu, Z., Gamez, G., Wai Law, W. S., Chen, H. W., Yang, S. P., et al.
(2010). Simultaneous sampling of volatile and non-volatile analytes in beer for fast fingerprinting by extractive electrospray ionization mass
spectrometry. Analytical and Bioanalytical Chemistry, 398, 405–413.

SECTION 1. Beer Analysis and Characterization with UPLC-QToF-MS Chapter 1.1
129
SUPPLEMENTARY DATA ASSOCIATED WITH THIS ARTICLE
Fig
ure
S1.
Ba
se p
ea
k c
hro
ma
tog
ram
s (B
PI)
fo
r R
1, R
2, F
1 a
nd
F2
sam
ple
s m
ea
sure
d in
ESI
+ m
od
e (
left
pa
ne
ls)
an
d E
SI-
mo
de
(rig
ht
pa
ne
ls).
Up
pe
r p
an
els
are
fro
m u
ntr
ea
ted
sa
mp
les
(UN
TS)
an
d lo
we
r p
an
els
are
fro
m o
rga
nic
ext
rac
ts (
OR
GS)
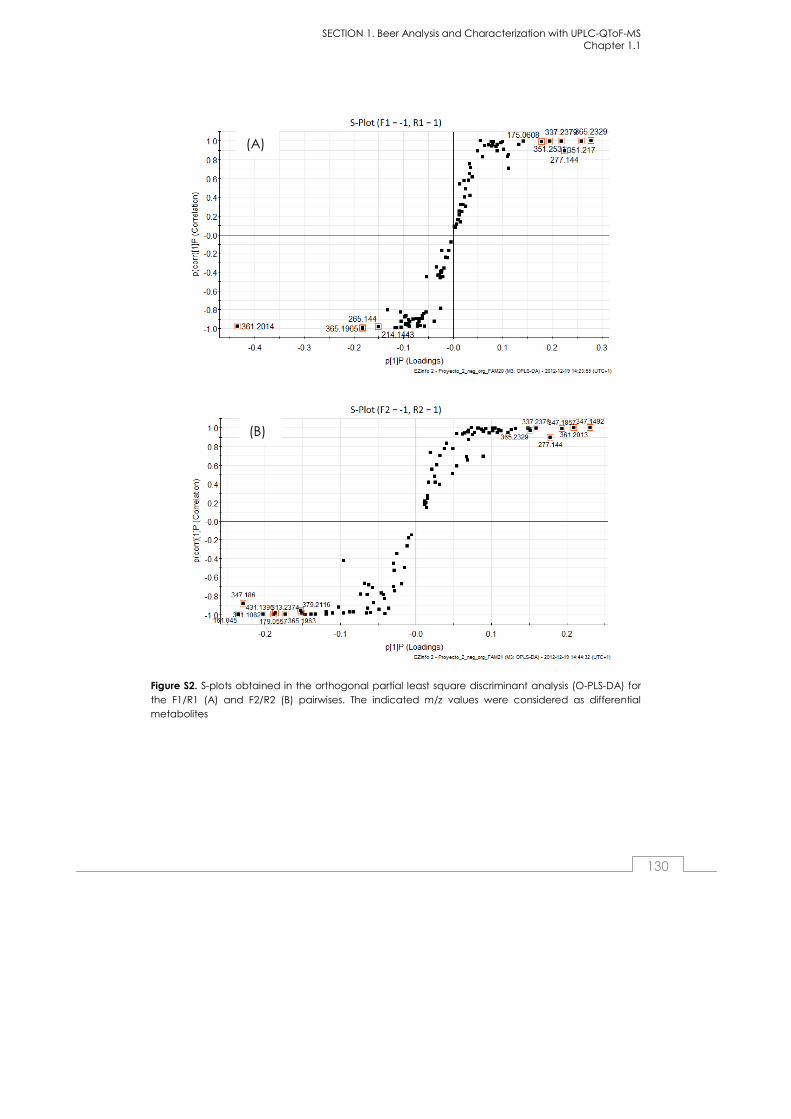
SECTION 1. Beer Analysis and Characterization with UPLC-QToF-MS Chapter 1.1
130
Figure S2. S-plots obtained in the orthogonal partial least square discriminant analysis (O-PLS-DA) for the F1/R1 (A) and F2/R2 (B) pairwises. The indicated m/z values were considered as differential metabolites
(A)
(B)

SECTION 1. Beer Analysis and Characterization with UPLC-QToF-MS Chapter 1.1
131
Figure S3. Fragmentation spectra of iso-co-humulone (upper panel) and co-humulone (lower panel) for comparative purpose on the relative intensity of the peak at m/z 278.118 between the two co-humulone isomers. Similar results can be depicted for iso-n/ad-humulone and n/ad-humulone in regard to m/z 292.129
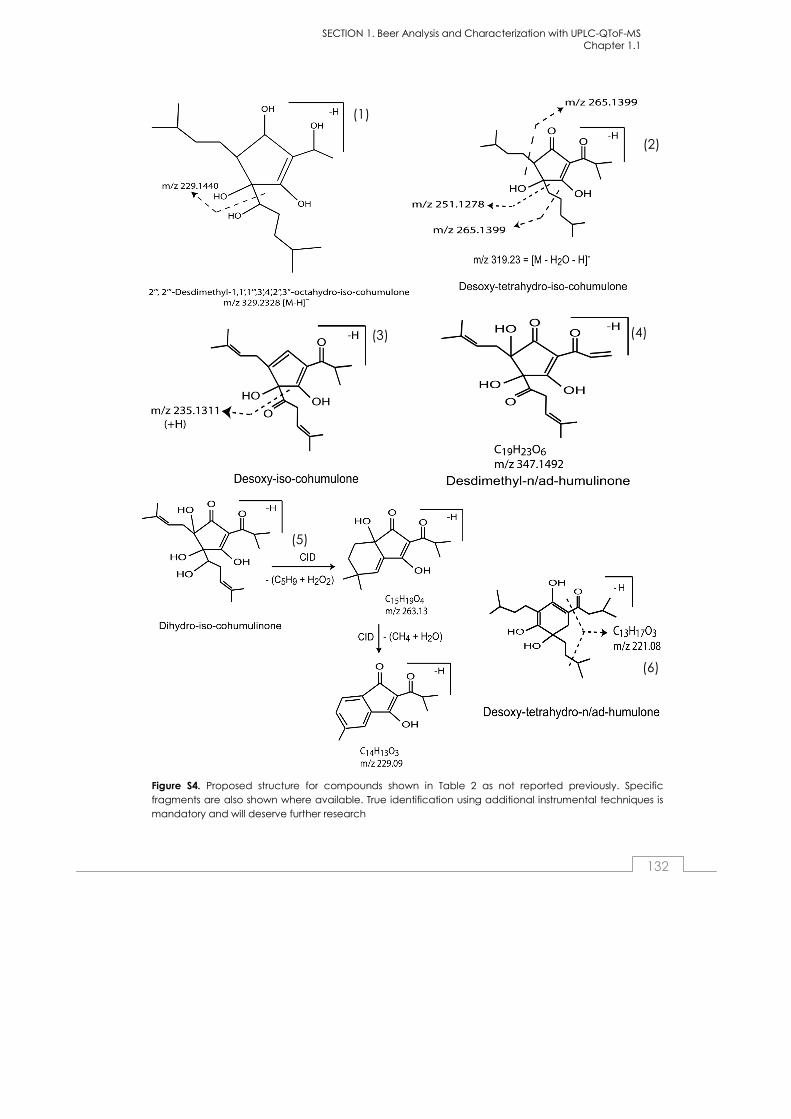
SECTION 1. Beer Analysis and Characterization with UPLC-QToF-MS Chapter 1.1
132
(1)
(2)
(3) (4)
(5)
(6)
Figure S4. Proposed structure for compounds shown in Table 2 as not reported previously. Specific fragments are also shown where available. True identification using additional instrumental techniques is mandatory and will deserve further research
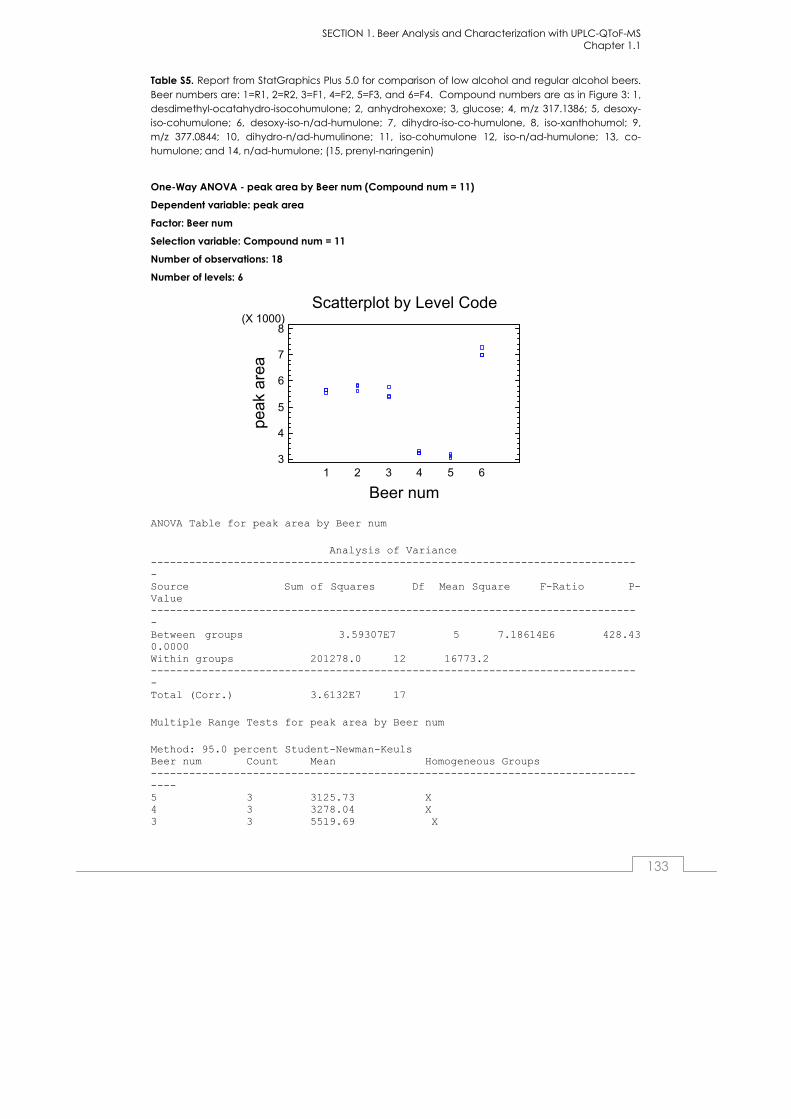
SECTION 1. Beer Analysis and Characterization with UPLC-QToF-MS Chapter 1.1
133
Table S5. Report from StatGraphics Plus 5.0 for comparison of low alcohol and regular alcohol beers. Beer numbers are: 1=R1, 2=R2, 3=F1, 4=F2, 5=F3, and 6=F4. Compound numbers are as in Figure 3: 1, desdimethyl-ocatahydro-isocohumulone; 2, anhydrohexoxe; 3, glucose; 4, m/z 317.1386; 5, desoxy-iso-cohumulone; 6, desoxy-iso-n/ad-humulone; 7, dihydro-iso-co-humulone, 8, iso-xanthohumol; 9, m/z 377.0844; 10, dihydro-n/ad-humulinone; 11, iso-cohumulone 12, iso-n/ad-humulone; 13, co-humulone; and 14, n/ad-humulone; (15, prenyl-naringenin)
One-Way ANOVA - peak area by Beer num (Compound num = 11)
Dependent variable: peak area
Factor: Beer num
Selection variable: Compound num = 11
Number of observations: 18
Number of levels: 6
1 2 3 4 5 6
Scatterplot by Level Code
3
4
5
6
7
8(X 1000)
peak a
rea
Beer num
ANOVA Table for peak area by Beer num
Analysis of Variance
----------------------------------------------------------------------------
-
Source Sum of Squares Df Mean Square F-Ratio P-
Value
----------------------------------------------------------------------------
-
Between groups 3.59307E7 5 7.18614E6 428.43
0.0000
Within groups 201278.0 12 16773.2
----------------------------------------------------------------------------
-
Total (Corr.) 3.6132E7 17
Multiple Range Tests for peak area by Beer num
Method: 95.0 percent Student-Newman-Keuls
Beer num Count Mean Homogeneous Groups
----------------------------------------------------------------------------
----
5 3 3125.73 X
4 3 3278.04 X
3 3 5519.69 X

SECTION 1. Beer Analysis and Characterization with UPLC-QToF-MS Chapter 1.1
134
1 3 5612.44 X
2 3 5757.15 X
6 3 7074.35 X
One-Way ANOVA - peak area by Beer num (Compound num = 12)
Dependent variable: peak area
Factor: Beer num
Selection variable: Compound num =12
Number of observations: 18
Number of levels: 6
1 2 3 4 5 6
Scatterplot by Level Code
4300
5300
6300
7300
8300
9300
peak a
rea
Beer num
ANOVA Table for peak area by Beer num
Analysis of Variance
----------------------------------------------------------------------------
-
Source Sum of Squares Df Mean Square F-Ratio P-
Value
----------------------------------------------------------------------------
-
Between groups 4.68399E7 5 9.36799E6 216.38
0.0000
Within groups 519528.0 12 43294.0
----------------------------------------------------------------------------
-
Total (Corr.) 4.73595E7 17
Multiple Range Tests for peak area by Beer num
Method: 95.0 percent Student-Newman-Keuls
Beer num Count Mean Homogeneous Groups
----------------------------------------------------------------------------
----
5 3 4436.14 X
4 3 4832.62 X
1 3 6999.44 X
3 3 7432.57 X
6 3 8315.14 X
2 3 8649.95 X
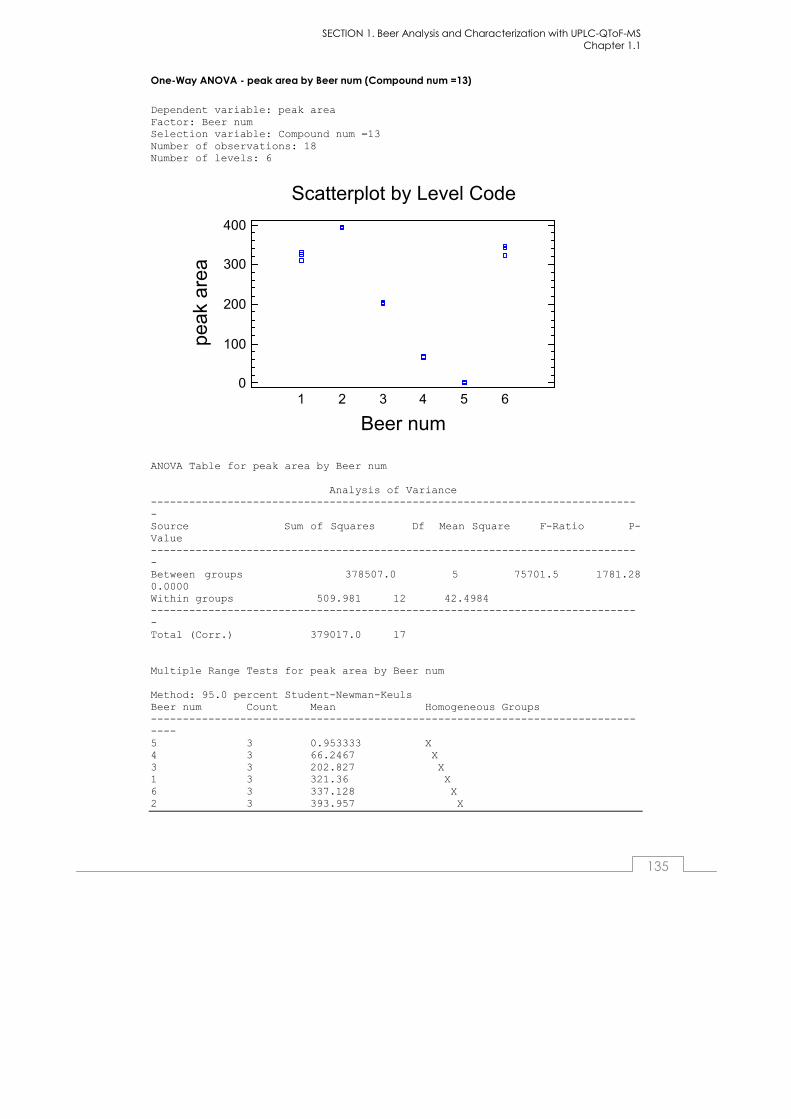
SECTION 1. Beer Analysis and Characterization with UPLC-QToF-MS Chapter 1.1
135
One-Way ANOVA - peak area by Beer num (Compound num =13)
Dependent variable: peak area
Factor: Beer num
Selection variable: Compound num =13
Number of observations: 18
Number of levels: 6
1 2 3 4 5 6
Scatterplot by Level Code
0
100
200
300
400
peak a
rea
Beer num
ANOVA Table for peak area by Beer num
Analysis of Variance
----------------------------------------------------------------------------
-
Source Sum of Squares Df Mean Square F-Ratio P-
Value
----------------------------------------------------------------------------
-
Between groups 378507.0 5 75701.5 1781.28
0.0000
Within groups 509.981 12 42.4984
----------------------------------------------------------------------------
-
Total (Corr.) 379017.0 17
Multiple Range Tests for peak area by Beer num
Method: 95.0 percent Student-Newman-Keuls
Beer num Count Mean Homogeneous Groups
----------------------------------------------------------------------------
----
5 3 0.953333 X
4 3 66.2467 X
3 3 202.827 X
1 3 321.36 X
6 3 337.128 X
2 3 393.957 X

SECTION 1. Beer Analysis and Characterization with UPLC-QToF-MS Chapter 1.1
136
One-Way ANOVA - peak area by Beer num (Compound num = 14)
Dependent variable: peak area
Factor: Beer num
Selection variable: Compound num = 14
Number of observations: 18
Number of levels: 6
1 2 3 4 5 6
Scatterplot by Level Code
0
100
200
300
400
500
600
pe
ak a
rea
Beer num
ANOVA Table for peak area by Beer num
Analysis of Variance
----------------------------------------------------------------------------
-
Source Sum of Squares Df Mean Square F-Ratio P-
Value
----------------------------------------------------------------------------
-
Between groups 701156.0 5 140231.0 1500.23
0.0000
Within groups 1121.68 12 93.4732
----------------------------------------------------------------------------
-
Total (Corr.) 702278.0 17
Multiple Range Tests for peak area by Beer num
Method: 95.0 percent Student-Newman-Keuls
Beer num Count Mean Homogeneous Groups
----------------------------------------------------------------------------
----
6 3 0.0 X
5 3 0.0 X
4 3 97.69 X
3 3 299.207 X
1 3 400.137 X
2 3 508.567 X
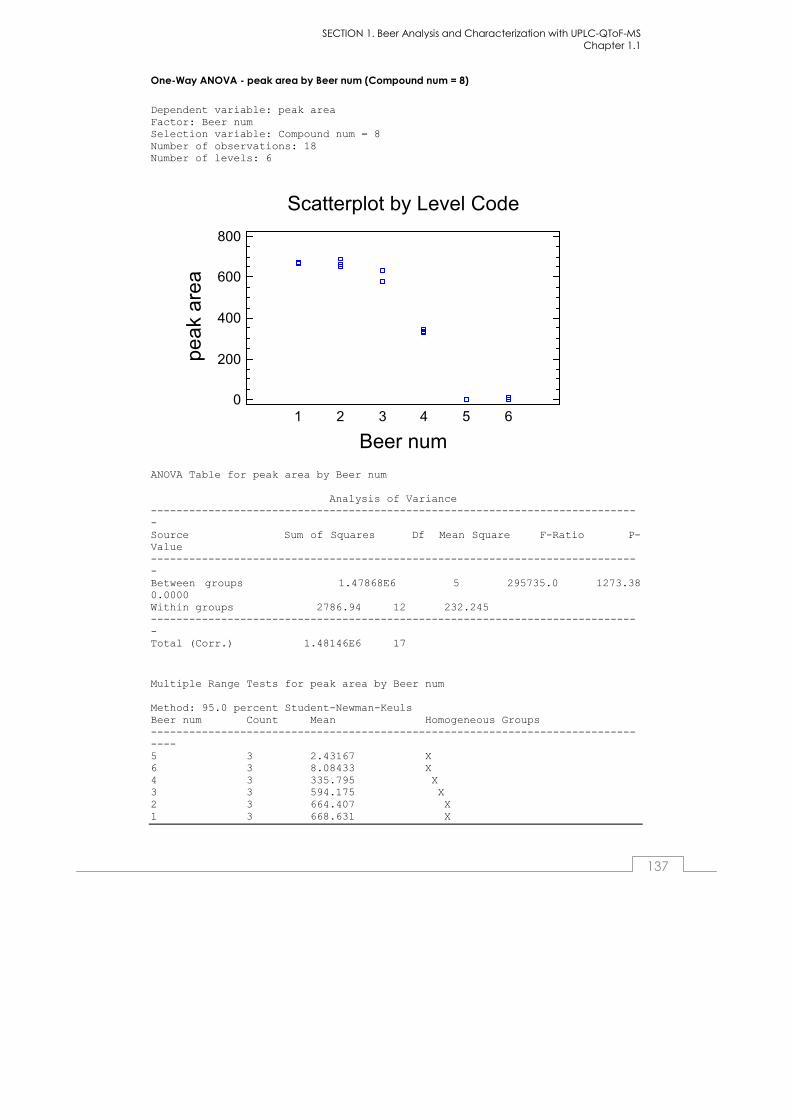
SECTION 1. Beer Analysis and Characterization with UPLC-QToF-MS Chapter 1.1
137
One-Way ANOVA - peak area by Beer num (Compound num = 8)
Dependent variable: peak area
Factor: Beer num
Selection variable: Compound num = 8
Number of observations: 18
Number of levels: 6
1 2 3 4 5 6
Scatterplot by Level Code
0
200
400
600
800
pe
ak a
rea
Beer num
ANOVA Table for peak area by Beer num
Analysis of Variance
----------------------------------------------------------------------------
-
Source Sum of Squares Df Mean Square F-Ratio P-
Value
----------------------------------------------------------------------------
-
Between groups 1.47868E6 5 295735.0 1273.38
0.0000
Within groups 2786.94 12 232.245
----------------------------------------------------------------------------
-
Total (Corr.) 1.48146E6 17
Multiple Range Tests for peak area by Beer num
Method: 95.0 percent Student-Newman-Keuls
Beer num Count Mean Homogeneous Groups
----------------------------------------------------------------------------
----
5 3 2.43167 X
6 3 8.08433 X
4 3 335.795 X
3 3 594.175 X
2 3 664.407 X
1 3 668.631 X

SECTION 1. Beer Analysis and Characterization with UPLC-QToF-MS Chapter 1.1
138
One-Way ANOVA - peak area by Beer num (Compound num =15)
Dependent variable: peak area
Factor: Beer num
Selection variable: Compound num =15
Number of observations: 18
Number of levels: 6
1 2 3 4 5 6
Scatterplot by Level Code
0
10
20
30
40
50
peak a
rea
Beer num
ANOVA Table for peak area by Beer num
Analysis of Variance
----------------------------------------------------------------------------
-
Source Sum of Squares Df Mean Square F-Ratio P-
Value
----------------------------------------------------------------------------
-
Between groups 5228.92 5 1045.78 347.95
0.0000
Within groups 36.0671 12 3.00559
----------------------------------------------------------------------------
-
Total (Corr.) 5264.99 17
Multiple Range Tests for peak area by Beer num
Method: 95.0 percent Student-Newman-Keuls
Beer num Count Mean Homogeneous Groups
----------------------------------------------------------------------------
----
5 3 0.0 X
6 3 0.0 X
4 3 15.5367 X
2 3 35.4733 X
3 3 36.56 X
1 3 40.5 X
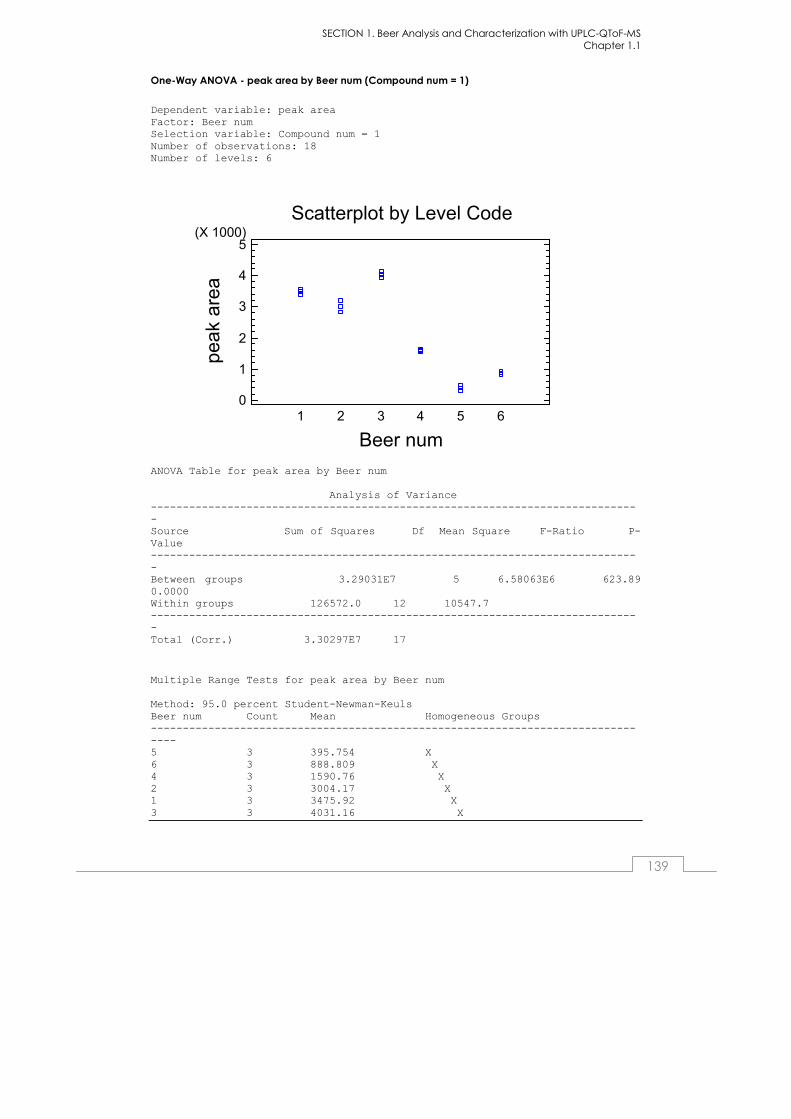
SECTION 1. Beer Analysis and Characterization with UPLC-QToF-MS Chapter 1.1
139
One-Way ANOVA - peak area by Beer num (Compound num = 1)
Dependent variable: peak area
Factor: Beer num
Selection variable: Compound num = 1
Number of observations: 18
Number of levels: 6
1 2 3 4 5 6
Scatterplot by Level Code
0
1
2
3
4
5(X 1000)
peak a
rea
Beer num
ANOVA Table for peak area by Beer num
Analysis of Variance
----------------------------------------------------------------------------
-
Source Sum of Squares Df Mean Square F-Ratio P-
Value
----------------------------------------------------------------------------
-
Between groups 3.29031E7 5 6.58063E6 623.89
0.0000
Within groups 126572.0 12 10547.7
----------------------------------------------------------------------------
-
Total (Corr.) 3.30297E7 17
Multiple Range Tests for peak area by Beer num
Method: 95.0 percent Student-Newman-Keuls
Beer num Count Mean Homogeneous Groups
----------------------------------------------------------------------------
----
5 3 395.754 X
6 3 888.809 X
4 3 1590.76 X
2 3 3004.17 X
1 3 3475.92 X
3 3 4031.16 X

Chapter 1.2
Validation of UPLC-MS metabolomics
for the differentiation of regular to
non-alcoholic beers (previous results)
UNPUBLISHED DATA
SECTION 1. Beer Analysis and Characterization with UPLC-QToF-MS Chapter 1.2
142
INTRODUCTION
Beer is a very complex matrix containing volatile, non-volatile and semi-
volatile metabolites, many of them contributing to its flavor (Gonçalves et al., 2014). Considering the complexity of flavor compounds in beer, the
different beer types can be reflected by its chemical compound profile. Many of these compounds are originating from the raw materials, namely
malted barley and hop, or hop derived products that impart aromas and the typical bitter taste (Gonçalves et al., 2014).
When producing alcohol free beer, the taste of the final product,
depending on the production method, has some organoleptic defects such as immature or poor flavor profile and emergence of some off
flavours. In addition to taste defects, there are increased risk of freezing, improper foaming and higher risk of microbial contamination (Blanco et al.,
2014; Sohrabvandi et al., 2010)
Based on our previous work and the acceptance of the results published on
it (Andrés-Iglesias et al., 2014), we decide to extent the study by increasing the number of beer samples with the aim to assess whether the
metabolomics could be validated as a general methodology to differentiate regular from non-alcoholic beer samples and find the
differential metabolites.
MATERIALS AND METHODS
Beer samples
A set of 10 bottled lager beers was chosen for the analysis. All beers were
purchased from a local market as fresh as possible. This set comprises 4 regular alcoholic beers (R1 to R4), their 4 related non-alcoholic beers
obtained by vacuum distillation dealcoholization process (F1 to F4), and two imported non-alcoholic beers , one from Holland (F5) and other from
Germany (F6). Low alcohol beer samples with %ABV lower than 1.0% correspond to samples F3, F4 and F6. Samples F1, F2 and F5 correspond to
alcohol free beers with %ABV lower than 0.1%.
Sample treatments and UPLC-QToF-MS analysis, data acquisition and statistical analysis were carried out by using the same procedures as in our
previous study (Andrés-Iglesias et al., 2014). However, in this experiment, the UPLC method was slightly modified by extending the time of some of the
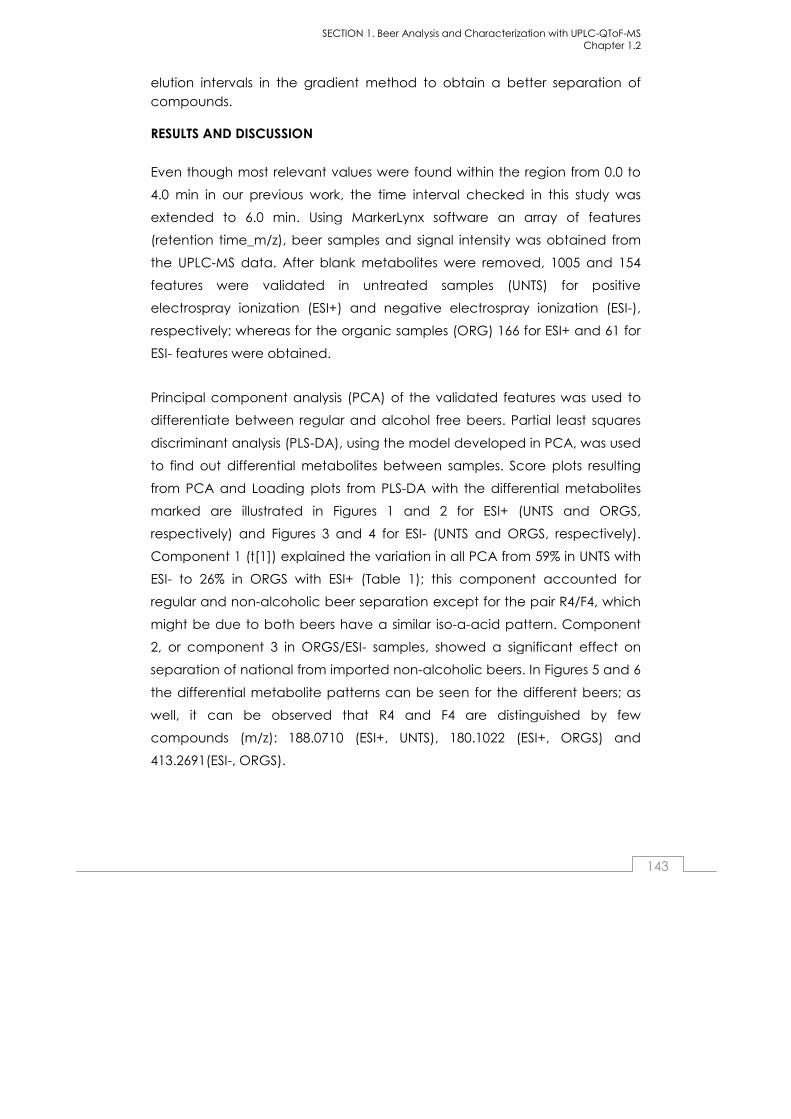
SECTION 1. Beer Analysis and Characterization with UPLC-QToF-MS Chapter 1.2
143
elution intervals in the gradient method to obtain a better separation of
compounds.
RESULTS AND DISCUSSION
Even though most relevant values were found within the region from 0.0 to
4.0 min in our previous work, the time interval checked in this study was
extended to 6.0 min. Using MarkerLynx software an array of features
(retention time_m/z), beer samples and signal intensity was obtained from
the UPLC-MS data. After blank metabolites were removed, 1005 and 154
features were validated in untreated samples (UNTS) for positive
electrospray ionization (ESI+) and negative electrospray ionization (ESI-),
respectively; whereas for the organic samples (ORG) 166 for ESI+ and 61 for
ESI- features were obtained.
Principal component analysis (PCA) of the validated features was used to
differentiate between regular and alcohol free beers. Partial least squares
discriminant analysis (PLS-DA), using the model developed in PCA, was used
to find out differential metabolites between samples. Score plots resulting
from PCA and Loading plots from PLS-DA with the differential metabolites
marked are illustrated in Figures 1 and 2 for ESI+ (UNTS and ORGS,
respectively) and Figures 3 and 4 for ESI- (UNTS and ORGS, respectively).
Component 1 (t[1]) explained the variation in all PCA from 59% in UNTS with
ESI- to 26% in ORGS with ESI+ (Table 1); this component accounted for
regular and non-alcoholic beer separation except for the pair R4/F4, which
might be due to both beers have a similar iso-α-acid pattern. Component
2, or component 3 in ORGS/ESI- samples, showed a significant effect on
separation of national from imported non-alcoholic beers. In Figures 5 and 6
the differential metabolite patterns can be seen for the different beers; as
well, it can be observed that R4 and F4 are distinguished by few
compounds (m/z): 188.0710 (ESI+, UNTS), 180.1022 (ESI+, ORGS) and
413.2691(ESI-, ORGS).

SECTION 1. Beer Analysis and Characterization with UPLC-QToF-MS Chapter 1.2
144
Table 1. Values of the statistical parameters obtained in the PCA analysis of data from UPLC-MS of untreated samples (UNTS) and extracts of beer samples (ORGS), for positive (ESI+) and negative ionization (ESI-). R2X (cum) represents the cumulative variation of the data explained by each component and Q2 (cum) the cumulative overall cross-validated R2X.
Statistical parameter t[1] t[2] t[1] t[2] t[1] t[2] t[1] t[3]R2X (cum) 0.30 0.43 0.26 0.40 0.34 0.59 0.30 0.52Q2 (cum) 0.20 0.29 0.17 0.25 0.25 0.48 0.17 0.26
ESI+UNTS ORG
ESI-UNTS ORG
Figure 1. Score plot obtained in the PCA of the UPLC-MS data (upper panel) and loadings plot (lower panel) obtained after PLS-DA for ESI+ and UNTS. Features indicated in the loadings plot were found to correspond to differential metabolites.
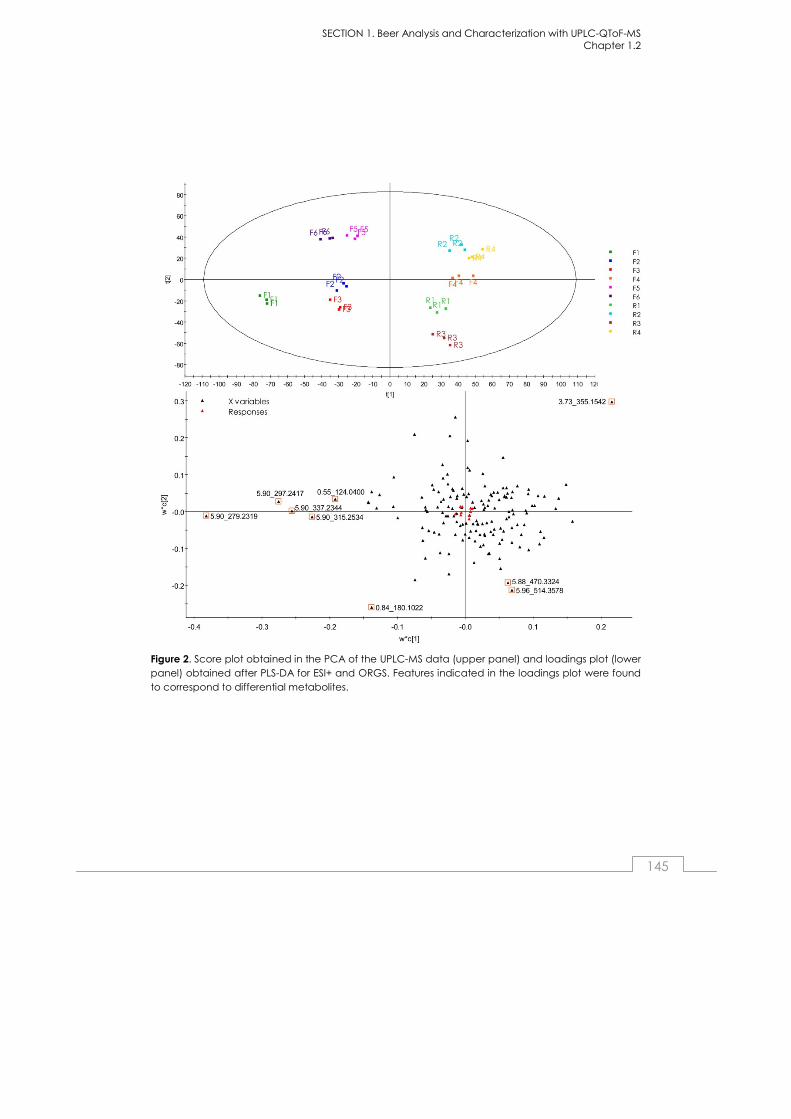
SECTION 1. Beer Analysis and Characterization with UPLC-QToF-MS Chapter 1.2
145
Figure 2. Score plot obtained in the PCA of the UPLC-MS data (upper panel) and loadings plot (lower panel) obtained after PLS-DA for ESI+ and ORGS. Features indicated in the loadings plot were found to correspond to differential metabolites.

SECTION 1. Beer Analysis and Characterization with UPLC-QToF-MS Chapter 1.2
146
Figure 3. . Score plot obtained in the PCA of the UPLC-MS data (upper panel) and loadings plot (lower panel) obtained after PLS-DA for ESI- and UNTS. Features indicated in the loadings plot were found to correspond to differential metabolites.

SECTION 1. Beer Analysis and Characterization with UPLC-QToF-MS Chapter 1.2
147
Figure 4. . Score plot obtained in the PCA of the UPLC-MS data (upper panel) and loadings plot(lower panel) obtained after PLS-DA for ESI- and ORGS. Features indicated in the loadings plot were found to correspond to differential metabolites.
Differential metabolite identification has been based in the results of our previous work (Andrés-Iglesias et al., 2014), so we have been guided by the
ESI- results. The differential metabolites found and their abundance in the different samples for all analysis can be seen in Figures 5 and 6. In the case
of UNTS with ESI- the differential compounds that are in higher concentration in regular beers than in non-alcoholic beers are (m/z):
164.0713, 229.1555, desdimethyl-octahydro-iso-cohumulone (m/z 329.2335) and 327.2173 (329.2335 – 2H). The compound anhydrohexose (m/z
161.0452) shows higher concentration in non-alcoholic beers than in regular ones, which can be attributed to the dealcoholization method used. Some
compounds make a differentiation between related beers, such as

SECTION 1. Beer Analysis and Characterization with UPLC-QToF-MS Chapter 1.2
148
tetrahydro-n/ad-humulone (m/z 365.2330), which is found in the pairs R1/F1
and R3/F3, both samples from the same brewery, so it can be related to the variety of hop used. Also, tetrahydro-iso-cohumulone (m/z 351.2175) and
tetrahydro-iso-humulone (m/z 365.2333) are not found in samples F2, F5 and F6. Finally, the compound dihydro-co-humulinone (m/z 365.1962) showed a
high concentration in F5 and F6 while the lowest concentration was found in R1 and R3 (Figure 6). As mentioned above the profile of the pair R4/F4 is
very similar.
For ORGS with ESI-, the profile of differential compounds is also mainly
realted to iso-α-acids although colupulone (m/z 399.2529, C25H36O4) was
also shown as differential compound in this sample treatment. This latter
compound is found in F2 but not in its related R2, and also it is found in
higher concentration in F5 and F3 than in their related regular beers.
Furtherly, asparginyl-phenylalanina (m/z 278.1149) and gamma-glutamyl-
phenylalanine (m/z 292.1305) are found in high concentrations in non-
alcoholic beers F1, F3 and F4. This high content of phenylalanine derivatives
might explain the high concentration of 2-phenylethanol found in non-
alcoholic beers (Andrés-Iglesias et al., 2015). Cohumulone (m/z 347.18856)
and iso-n/ad-humulone (m/z 361.2010) showed the highest concentrations
in F2, F5 and F6, which may suggest that to impart a more bitter taste some
hop extracts are added to the non-alcoholic beers.
In ESI+, results are very similar from UNTS to ORGS, although for ORGS R2X
and Q2 statistical values are better. In the case of UNTS, the compound with
m/z 166.0869 stand out due to the high concentration shown in non-
alcoholic beers as compared to regular beers. Also, the pair R4/F4 has 3
representative compounds with m/z 360.1930, 471.2245 and 475.2923. In
ORGS samples, the differential compound with m/z 355.1542 corresponds to
xanthohumol, this compound exhibiting high concentrations in R2, R4, F4
and F5. The compound with m/z 279.2319 showed a concentration in most
of the non-alcoholic beers higher than in regular ones. Finally, the
compounds with m/z 470.3324 and 514.3578 were found to likely be
characteristic compounds of R3.
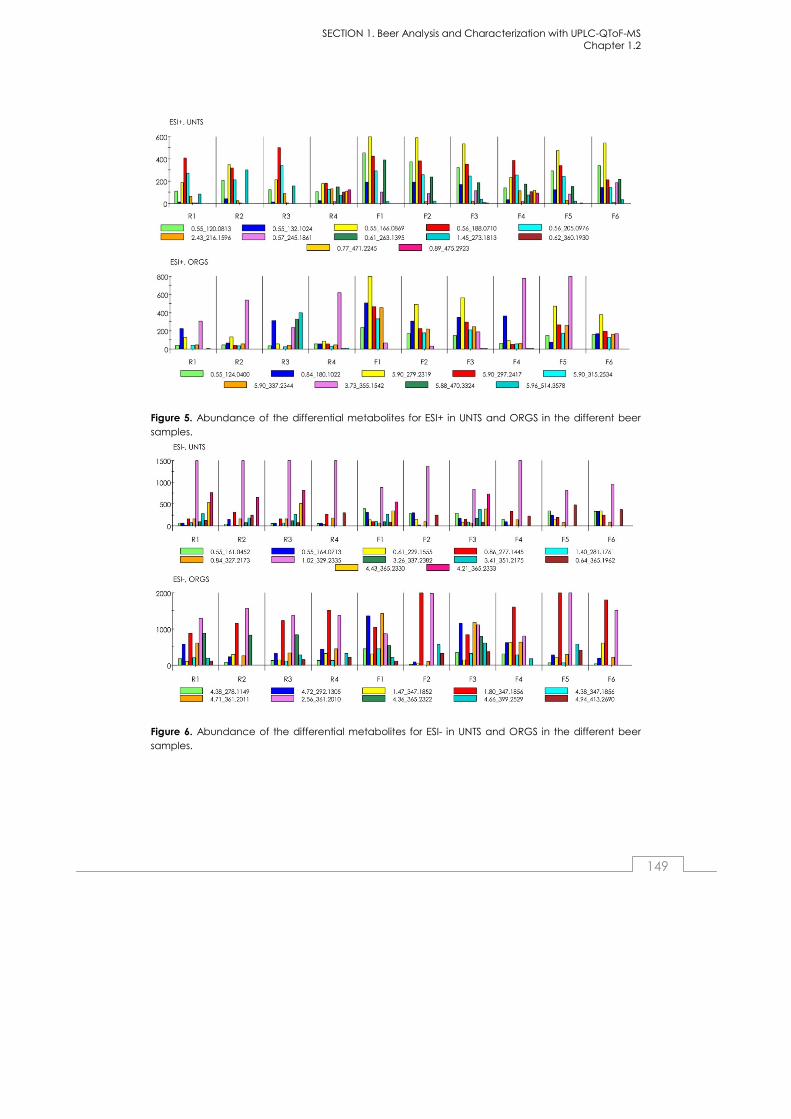
SECTION 1. Beer Analysis and Characterization with UPLC-QToF-MS Chapter 1.2
149
Figure 5. Abundance of the differential metabolites for ESI+ in UNTS and ORGS in the different beer samples.
Figure 6. Abundance of the differential metabolites for ESI- in UNTS and ORGS in the different beer samples.
SECTION 1. Beer Analysis and Characterization with UPLC-QToF-MS Chapter 1.2
150
CONCLUSIONS
The combination of UPLC-MS-QToF analysis and statistical analysis of the obtained data was found to be a suitable method to distinguish between
regular (alcoholic) and non-alcoholic beers according to the flavor profile.
Most of the compounds found as related to the differences between non-
alcoholic and regular beers were coincident with the compounds found in our previous work (Andres-Iglesias et al. 2014), and they are mainly iso-α-
acids.
Bibliography
Andrés-Iglesias C., García-Serna J., Montero O., Blanco C.A. (2015). Simulation and flavour compound analysis of dealcoholized beer via
one-step vacuum distillation (submit in Food Research International). Thesis Chapter 3.2.
Andrés-Iglesias C., Blanco C.A., Blanco J., Montero O. (2014). Mass spectrometry-based metabolomics approach to determine differential
metabolites between regular and non-alcohol beers. Food Chemistry 157: 205-212.
Gonçalves J.L, Figueira J.A., Rodrigues F.P., Ornelas L.P., Branco R.N., Silva
C., Câmara J.S. (2014). A powerfull methodological approach combining headspace solid phase microextraction, mass spectrometry
and multivatiate analysis for profiling the volatile metabolomic pattern of beer starting raw materials. Food Chemistry, 160: 266-280.
Sohrabvandi S., Mousavi S.M., Razavi S.H., Mortazavian A.M., Rezaei K.
(2010). Alcohol-free Beer: Methods of Production, Sensorial Defects, and Healthful Effects. Food Reviews International, 26: 335-352.

SECTIONSECTIONSECTIONSECTION 2.2.2.2.
BEER VOLATILE
PROFILE
CHARACTERIZATION
BY HS-SPME-GC-MS

Chapter 2.1
Profiling of Czech and Spanish beers
regarding content of alcohols, esters
and acids by HS-SPME-GC-MS
By
Cristina Andrés-Iglesias a,b, Jakub Nešpor a, Marcel Karabín a, Olimpio Montero c, Carlos A. Blanco b,
Pavel Dostálek a,*
aDepartment of Biotechnology, Faculty of Food and Biochemical Technology, University of Chemistry and Technology, Prague, Technická 5, 166 28 Prague 6-
Dejvice, Czech Republic
bDepartamento de Ingeniería Agrícola y Forestal (Área de Tecnologia de los Alimentos), E.T.S. Ingenierías Agrarias, Universidad de Valladolid, Avda. de Madrid
44, 34004 Palencia, España
cCentre for Biothechnology Development (CDB), Spanish Council for Scientific Research (CSIC), Francisco Vallés 8, Boecillo´s Technological Park, 47151 Boecillo, Valladolid, Spain
SUBMITTED TO:
JOURNAL OF FOOD SCIENCE
April 2015

SECTION 2. Beer Volatile Profile Characterization by HS-SPME-GC-MS Chapter 2.1
154
Abstract
Beer represents a widely popular alcoholic beverage with high global
production. For consumer acceptance, a significant factor is its flavour and taste. Due to the importance of volatile compounds on beer flavours, the
objective of this study was to characterize the volatile fraction profile of different Czech and Spanish beers. This study is focused on higher alcohols
that impart a solvent like aroma and warm mouthfeel, esters with fruity flowery aroma and acids that can negatively influence beer flavour.
Headspace solid-phase microextraction and gas-chromatography mass
spectrometry was used to compare 28 industrial lager beer samples of 3 main different types: regular, dark and non-alcoholic. A total of 44 volatile
compounds were identified, and 21 of them quantified. The main significant difference between Spanish and Czech beers was the concentration of 2,3-
butanediol. Factor analysis showed five principal components, each factor being mainly related to a particular class of compounds. Two factors
explained more than 60% of the variability and were related to higher alcohols and acetates. The country of origin of the beer can be
distinguished by principal component analysis, with the exception of non-alcoholic beers.
Keywords: beer, flavor, gas chromatography, mass spectrometry, volatile
compounds, alcohol free beer
INTRODUCTION
Beer, one of the most popular alcoholic beverages worldwide, is a very complex matrix of constituents derived from raw materials, particularly
barley malt, water and hops and modified by fermentation with yeast (Riu-Aumatell et al., 2014; Tian, 2010). Sometimes, a small portion of barley malt
can be replaced by wheat or corn in the brewing process (Gonçalves et al., 2014).
Non-alcoholic beer is still a minor product of the brewing industry although
its market has experienced an increase over the past few years (Blanco et al., 2014). However, low-alcohol beers suffer from having less body, low
aromatic profile, and sweet or worty off-flavours (Brányik et al., 2012;

SECTION 2. Beer Volatile Profile Characterization by HS-SPME-GC-MS Chapter 2.1
155
Montanari et al., 2009; Sohrabvandi et al., 2010). Because of this deficit in
aroma and flavour compounds, the sensorial quality of the final beer is very different to classical beer, which makes commercially available low-alcohol
beers unattractive to consumers. However low-alcohol beers could be successful if their aroma profiles were as close as possible to conventionaly
produced beers (Blanco et al., 2014; Catarino et al., 2009). It is for this reason that low-alcohol beer production requires increased technological
and economic inputs (Sohrabvandi et al., 2010).
Flavour of beer is a mixture of a wide range of volatile and non-volatile compounds (da Silva et al., 2008; Haefliger and Jeckelmann, 2013; Rossi et
al., 2014). Formation of the chemical compounds characteristically associated with flavour is a complex phenomenon, strongly influenced by
the quality of raw materials (Riu-Aumatell et al., 2014; Rodriguez-Bencomo et al., 2012). Flavour components are formed during different stages of the
brewing process (mashing, boiling and fermentation), their profile therefore being dependent on technological procedures and metabolism of the
particular yeast strain used, while other compounds are formed during the aging of beer (da Silva et al., 2008; Haefliger and Jeckelmann, 2013; Parker,
2012; Rossi et al., 2014).
Beer flavour substances make a major contribution to the quality of the final product and also have great importance in consumers’ preferences (Pinho
et al., 2006; Riu-Aumatell et al., 2014; Rodriguez-Bencomo et al., 2012). More than 1000 compounds belonging to heterogeneous groups have been
identified in beer, including a large number of volatile compounds associated with flavour (Riu-Aumatell et al., 2014). The main classes of
volatile compounds are alcohols, esters, aldehydes, ketones, hydrocarbons and organic acids (da Silva et al., 2008; da Silva et al., 2012; Pinho et al.,
2006; Rossi et al., 2014). Some volatiles contribute greatly to beer flavour, while other volatiles are important merely in developing the background
flavour of the product (Parker, 2012; Pinho et al., 2006; Riu-Aumatell et al., 2014). Several different chemical mechanisms are known to contribute to
the generation of powerful sensory active compounds in beer, and a given chemical mechanism may impart, simultaneously, positive and negative
aromas to beer (Rodrigues et al., 2011). Among all flavour compounds, ethanol and higher alcohols provide an alcoholic or solvent-like aroma and
a warm mouthfeel; some of them can cause ‘rough’ flavours and harshness while other compounds confer ‘fruit, sweet and rose’ flavours, the final
balance being concentration dependent. Esters represent a large group of

SECTION 2. Beer Volatile Profile Characterization by HS-SPME-GC-MS Chapter 2.1
156
flavour-active compounds conferring a ‘fruity-flowery’ aroma to beer. Short-
chain organic acids contribute to the reduction in pH during fermentation and give a ‘sour’ taste to beer. Medium-chain fatty acids are considered
undesirable for beer foam stability and flavour (Blanco et al., 2014; Branyik et al., 2008; Rossi et al., 2014).
In non-alcoholic beer, the content of these flavour substances are affected
by the different methods of alcohol-free beer production. The most common process technology for Spanish beers is vacuum distillation, while
Czech beers are produced mainly by a different limited fermentation process, or by using special yeasts, although vacuum distillation is used by
some producers. Beer dealcoholized by vacuum distillation promotes an unbalaced content of volatile compounds in the final beer, with the loss of
78% of higher alcohols and almost 100% of esters. Beer dealcoholized by biological techniques that lead to limited ethanol formation during
fermentation is often characterized by worty off-flavours (Brányik et al., 2012).
Considering the nature and concentrations of the chemical species
involved, gas chromatography mass spectrometry (GC-MS) seems to be the optimal technique for identification and quantification of aroma
compounds (Andrés-Iglesias et al., 2014; da Silva et al., 2008; da Silva et al., 2012; De Schutter et al., 2008; Kleinová and Klejdus, 2014; Saison et al., 2008;
Vesely et al., 2003). However, a proper isolation and concentration technique should be applied before the chromatographic analysis due to
the presence of many beer components, such as sugars, which can cause serious damage to the chromatographic system (da Silva et al., 2012). Solid-
phase microextraction (SPME) has arisen as an efficient extraction and pre-concentration method because of its simplicity, low cost and selectivity, in
addition to minimal sample requirements (Štěrba et al., 2011). Fully automated techniques are also available, making SPME a reliable
alternative to traditional sample preparation techniques (Andrés-Iglesias et al., 2014; Gonçalves et al., 2014; Rodriguez-Bencomo et al., 2012).
Solid-phase microextraction (SPME) offers the chance to simultaneously perform the extraction and concentration steps (Pinho et al., 2006). During
SPME, the analytes are adsorbed onto the surface of the extracting fibre, which is coated with an appropriate sorbent. The fibre can be directly
immersed into the sample (DI – direct immersing) or into the gas phase above the sample (HS), the latter procedure being preferable for the
analysis of volatile compounds in beer (Kleinová and Klejdus, 2014).

SECTION 2. Beer Volatile Profile Characterization by HS-SPME-GC-MS Chapter 2.1
157
Following an appropriate volatile extraction time, the fiber is placed into the
GC injection port.
HS-SPME has been used successfully in recent years in the analysis of a range of volatile compounds in different beverages such as wine, spirits and
whisky (Dong et al., 2013; Saison et al., 2008). In the case of beer, several methodologies have been published in which SPME has been optimized to
analyse a large range of volatile compounds or specific groups of sensorially active compounds, such as sulphur compounds and carbonyl
compounds, as well as the volatile fraction of wort (Charry-Parra et al., 2011; da Silva et al., 2012; Rodriguez-Bencomo et al., 2012; Rossi et al., 2014).
The aim of this study was to determine and quantitativelycompare the
alcohol, ester and acid fractions in Czech and Spanish lager beers. A comparison based on the country of origin and other parameters such as
alcohol content, different brewing processes or the 3 main types of beers, regular (that included all pale beers: special, high quality, pilsen and regular
lagers), dark and non-alcoholic beers, has been carried out to assess the influence of these parameters on flavour properties. Regular, dark and non-
alcoholic beers, dealcoholized using different technologies, were analyzed using an automated HS-SPME coupled to GC-MS.
MATERIALS AND METHODS
Sample preparation
Thirteen beers from Spain, including one non-alcoholic and fifteen Czech
beers, plus three non-alcoholic beers of different commercial brands, were obtained from local markets. The alcoholic beers (including low-alcohol
ones) contained between 3.5 and 7.5 % alcohol by volume (ABV). Among the non-alcoholic beers, the Spanish one contained 0.01% and all Czech
beers up to 0.5 % ABV. Beer samples were stored at 4ºC until analysis. A volume (250 ml) of each beer was placed in 500 ml glass bottles and
agitated in a shaker for 5 minutes to reduce the CO2 content. Subsequently, for GC-MS analysis, 20 ml dark vials sealed with PTFE–silicone septa (Supelco,
USA) were used for sample preparation. Vials contained 2 g of NaCl (Penta, CZ), 10 ml of beer and 100 µl of an internal standard solution (IS) comprising
11.74 ppm heptanoic acid ethyl ester (Aldrich, DE; ≥ 99 % purity) and 25.43 ppm 3-octanol (Aldrich, USA; ≥ 99 % purity). The vials were agitated for 30
seconds to dissolve the NaCl and homogenize the sample.

SECTION 2. Beer Volatile Profile Characterization by HS-SPME-GC-MS Chapter 2.1
158
Gas chromatography-mass spectrometry (GC-MS) equipment
Volatile compounds were separated and detected by a single gas
chromatograph (Agilent GC 6890N – Agilent Technologies, USA) equipped with a quadrupole mass spectrometer detector (Agilent 5975B, Inert MSD –
Agilent Technologies, USA). The GC was coupled to a headspace solid phase microextraction (HS-SPME) autosampler (COMBI PAL CTC Analytics,
Switzerland). Chromatographic separation data were acquired using an InnoWax 30 m × 0.25 mm × 0.25 µm capillary column (Agilent Technologies,
USA). Extraction and concentration of the volatile compounds were carried out using an 85 µm Carboxen®/polydimethylsiloxan (CAR/PDMS) fiber
(Sulpeco, USA).
Analysis of volatile compounds
The volatile composition of beer samples was measured in triplicate. Solid
phase microextraction of compounds was performed at 50°C for 30 minutes. The desorption was achieved in the injector of the GC, in splitless
mode, for 10 min, and the temperature was set at 260°C as indicated by the manufacturer for the CAR–PDMS fiber. Carrier gas was helium at a
constant flow of 1.0 mL/min.
The oven temperature was programmed as follows: initial temperature was set at 30°C and kept for 10 min, followed by three ramps in which the
temperature was raised at 2°C/min to 52°C and kept at this temperature for 2 minutes. The temperature was then raised at 2°C/min to 65°C, and held
for 2 minutes. Finally the temperature was increased at 5°C/min to 250°C and this temperature was held for 3 minutes.
The ionization energy was 70 eV, and detection and data acquisition were performed in scan mode from 20 to 500 Da. For identification, data
obtained in the GC-MS analysis were compared with m/z values compiled in the NIST MS Search spectrum library, version 2.0 (National Institute of
Standards and Technology, USA).
Validation of compound identification was carried out by comparison of their MS spectra and their retention times with standards. Quantification was
carried out using IS and standard calibration curves for 2-methylbutanol (purity ≥ 98 %), 3-methylbutanol (≥ 98,5 %), 2-furanmethanol (≥ 98 %), 2-
phenylethanol (≥ 99 %), linalool (≥ 97 %), ethyl acetate (99,7 %), propyl
SECTION 2. Beer Volatile Profile Characterization by HS-SPME-GC-MS Chapter 2.1
159
acetate (≥ 98 %), ethyl butyrate (≥ 98 %), ethyl hexanoate (≥ 99 %), ethyl
octanoate (≥ 98 %), ethyl decanoate (≥ 99 %), ethyl hexadecanoate (≥ 97 %), phenyl ethyl acetate (≥ 99 %) and ethyl tetradecanoate (≥ 99 %) (Fluka,
Germany), 2-methyl propanol (≥ 99 %), 2,3-butanediol (≥ 98 %), isobutyl acetate (≥ 99 %) and 3-methylbutyl acetate (≥ 98 %) (Sigma-Aldrich, USA),
caprylic acid (≥ 99,5 %), caproic acid (≥ 98 %) (Aldrich, USA), and capric acid (≥ 99 %) (Alfa Aesar, USA).
Statistical analysis
Statistica 12 software (StatSoft, Inc., Tulsa, OK, USA) was used to perform the statistical analysis of the chromatographic data. One-way analysis of
variance (ANOVA) followed by t-test was used to compare the profile of Czech and Spanish beers based on alcohols, esters and acids contents.
Significant differences were considered at a level of p < 0.05. Factorial analysis was used to explain the differences between beers by their
principal components, factors or eigenvalues that explain the maximal variability as well as variable contributions to such differences. Results of the
principal component (factor) analysis were verified by cluster analysis.
RESULTS AND DISCUSSION
A total of 28 lager beers were analyzed, among them 13 beers that were
produced in Spain (samples 1 to 13) and 15 beers of Czech origin (samples 14 to 28) (Table 1). A total of 44 volatile compounds were identified, and 21
of them quantified by peak area. The volatiles profile consisted of 11 esters (ethyl acetate, n-propyl acetate, isobutyl acetate, ethyl butyrate, isoamyl
acetate, ethyl caproate, ethyl caprylate, ethyl caprate, phenyl ethyl acetate, ethyl tetradecanoate and ethyl hexanoate), 7 alcohols (2-
methylpropanol, 2 and 3-methylbutanol, 2,3-butanediol, 2-furanmethanol, linalool and phenylethyl alcohol) and 3 acids (caprylic, caproic and capric
acids). A typical total ion chromatogram (TIC) of volatile compounds of a Spanish regular beer is shown in Fig.1.
Based on the concentration of each compound (Tables 2 and 3),
differences relating to the country of origin and type of beer were established.
SECTION 2. Beer Volatile Profile Characterization by HS-SPME-GC-MS Chapter 2.1
160
Differences in concentration of volatile compounds in beers
The main fraction of volatile compounds in beer, apart from ethanol, is
comprised of higher alcohols formed during primary beer fermentation (Blanco et al., 2014). Higher alcohols are the immediate precursors of most
flavour active esters, so formation of higher alcohols needs to be controlled to ensure optimal ester production (Gonçalves et al., 2014). Alcohol
concentrations in all Spanish beers were higher than ester concentrations, especially SP-9 (186.66 mg/l) and SP-12 (184.74 mg/l), the highest alcohol
content beers (Table 1). Conversely, for some Czech beers, the concentration of esters was found to be higher than the alcohol
concentration, CZ-14 with 184.33 mg/l and CZ-15 with 124.99 mg/l of total esters being the most representative (Table 1). Accordingly, Spanish beers
present a more alcoholic character whereas Czech beers a more fruity character. This characteristic profile of Spanish beers can be due to the use
of high gravity wort, the use of surrogates, or a combination of both (Lei et al., 2013; Piddocke et al., 2009).
The profile and levels of higher alcohols are notably influenced by wort
composition and yeast fermentation conditions. For 2-methylpropanol, amyl alcohols and 2-phenylethanol, differences based on the country of origin
and type of beer have been found. For regular and dark beers, the above alcohol concentrations in Spanish beers, with average values of 12.12, 31.05
and 32.26 mg/l respectively, were higher than in Czech beers (5.81, 16.70 and 18.96 mg/l, respectively).
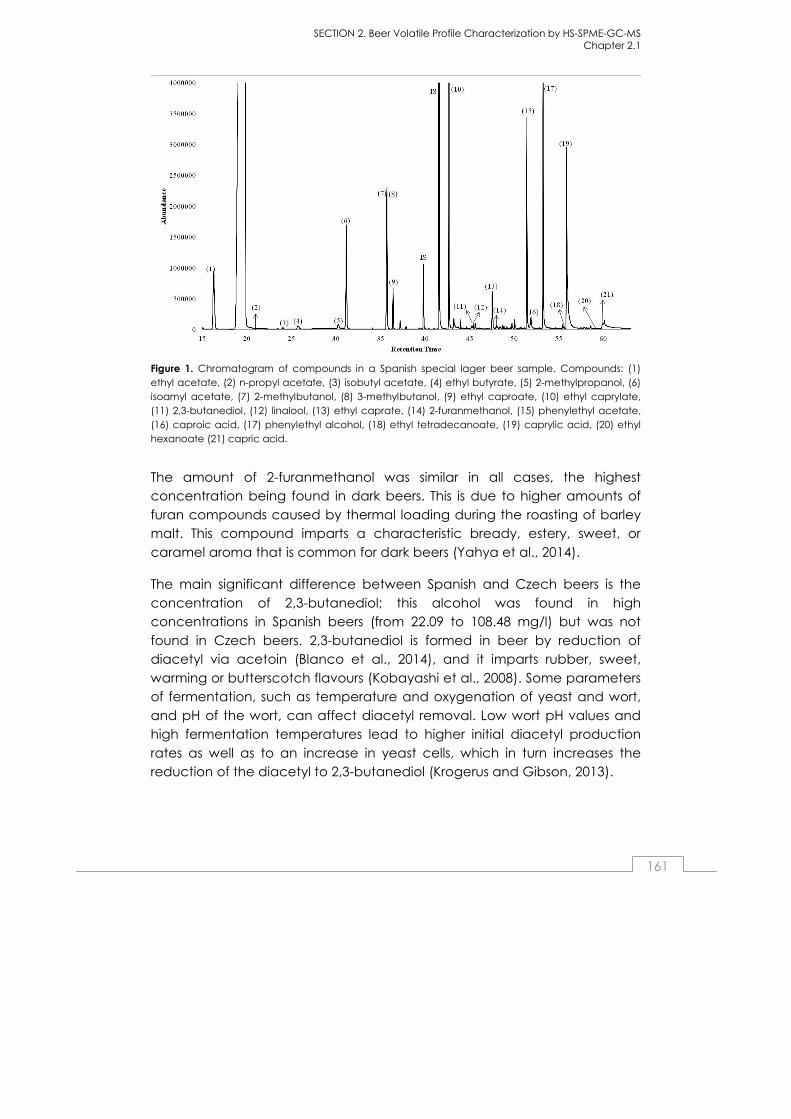
SECTION 2. Beer Volatile Profile Characterization by HS-SPME-GC-MS Chapter 2.1
161
Figure 1. Chromatogram of compounds in a Spanish special lager beer sample. Compounds: (1) ethyl acetate, (2) n-propyl acetate, (3) isobutyl acetate, (4) ethyl butyrate, (5) 2-methylpropanol, (6) isoamyl acetate, (7) 2-methylbutanol, (8) 3-methylbutanol, (9) ethyl caproate, (10) ethyl caprylate, (11) 2,3-butanediol, (12) linalool, (13) ethyl caprate, (14) 2-furanmethanol, (15) phenylethyl acetate, (16) caproic acid, (17) phenylethyl alcohol, (18) ethyl tetradecanoate, (19) caprylic acid, (20) ethyl hexanoate (21) capric acid.
The amount of 2-furanmethanol was similar in all cases, the highest concentration being found in dark beers. This is due to higher amounts of
furan compounds caused by thermal loading during the roasting of barley malt. This compound imparts a characteristic bready, estery, sweet, or
caramel aroma that is common for dark beers (Yahya et al., 2014).
The main significant difference between Spanish and Czech beers is the
concentration of 2,3-butanediol; this alcohol was found in high concentrations in Spanish beers (from 22.09 to 108.48 mg/l) but was not
found in Czech beers. 2,3-butanediol is formed in beer by reduction of diacetyl via acetoin (Blanco et al., 2014), and it imparts rubber, sweet,
warming or butterscotch flavours (Kobayashi et al., 2008). Some parameters of fermentation, such as temperature and oxygenation of yeast and wort,
and pH of the wort, can affect diacetyl removal. Low wort pH values and high fermentation temperatures lead to higher initial diacetyl production
rates as well as to an increase in yeast cells, which in turn increases the reduction of the diacetyl to 2,3-butanediol (Krogerus and Gibson, 2013).
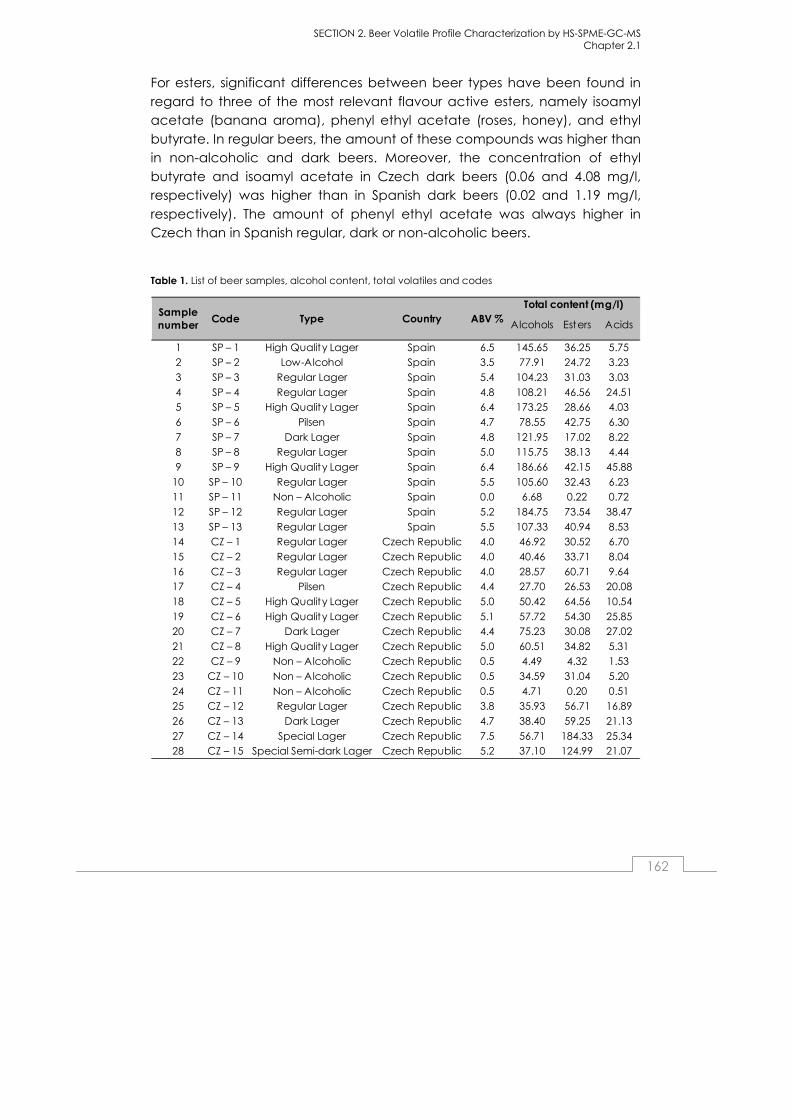
SECTION 2. Beer Volatile Profile Characterization by HS-SPME-GC-MS Chapter 2.1
162
For esters, significant differences between beer types have been found in
regard to three of the most relevant flavour active esters, namely isoamyl acetate (banana aroma), phenyl ethyl acetate (roses, honey), and ethyl
butyrate. In regular beers, the amount of these compounds was higher than in non-alcoholic and dark beers. Moreover, the concentration of ethyl
butyrate and isoamyl acetate in Czech dark beers (0.06 and 4.08 mg/l, respectively) was higher than in Spanish dark beers (0.02 and 1.19 mg/l,
respectively). The amount of phenyl ethyl acetate was always higher in Czech than in Spanish regular, dark or non-alcoholic beers.
Table 1. List of beer samples, alcohol content, total volatiles and codes
Alcohols Esters Acids
1 SP – 1 High Quality Lager Spain 6.5 145.65 36.25 5.75
2 SP – 2 Low-Alcohol Spain 3.5 77.91 24.72 3.23
3 SP – 3 Regular Lager Spain 5.4 104.23 31.03 3.03
4 SP – 4 Regular Lager Spain 4.8 108.21 46.56 24.51
5 SP – 5 High Quality Lager Spain 6.4 173.25 28.66 4.03
6 SP – 6 Pilsen Spain 4.7 78.55 42.75 6.30
7 SP – 7 Dark Lager Spain 4.8 121.95 17.02 8.22
8 SP – 8 Regular Lager Spain 5.0 115.75 38.13 4.44
9 SP – 9 High Quality Lager Spain 6.4 186.66 42.15 45.88
10 SP – 10 Regular Lager Spain 5.5 105.60 32.43 6.23
11 SP – 11 Non – Alcoholic Spain 0.0 6.68 0.22 0.72
12 SP – 12 Regular Lager Spain 5.2 184.75 73.54 38.47
13 SP – 13 Regular Lager Spain 5.5 107.33 40.94 8.53
14 CZ – 1 Regular Lager Czech Republic 4.0 46.92 30.52 6.70
15 CZ – 2 Regular Lager Czech Republic 4.0 40.46 33.71 8.04
16 CZ – 3 Regular Lager Czech Republic 4.0 28.57 60.71 9.64
17 CZ – 4 Pilsen Czech Republic 4.4 27.70 26.53 20.08
18 CZ – 5 High Quality Lager Czech Republic 5.0 50.42 64.56 10.54
19 CZ – 6 High Quality Lager Czech Republic 5.1 57.72 54.30 25.85
20 CZ – 7 Dark Lager Czech Republic 4.4 75.23 30.08 27.02
21 CZ – 8 High Quality Lager Czech Republic 5.0 60.51 34.82 5.31
22 CZ – 9 Non – Alcoholic Czech Republic 0.5 4.49 4.32 1.53
23 CZ – 10 Non – Alcoholic Czech Republic 0.5 34.59 31.04 5.20
24 CZ – 11 Non – Alcoholic Czech Republic 0.5 4.71 0.20 0.51
25 CZ – 12 Regular Lager Czech Republic 3.8 35.93 56.71 16.89
26 CZ – 13 Dark Lager Czech Republic 4.7 38.40 59.25 21.13
27 CZ – 14 Special Lager Czech Republic 7.5 56.71 184.33 25.34
28 CZ – 15 Special Semi-dark Lager Czech Republic 5.2 37.10 124.99 21.07
Sample number
Code Type Country ABV %Total content (mg/l)
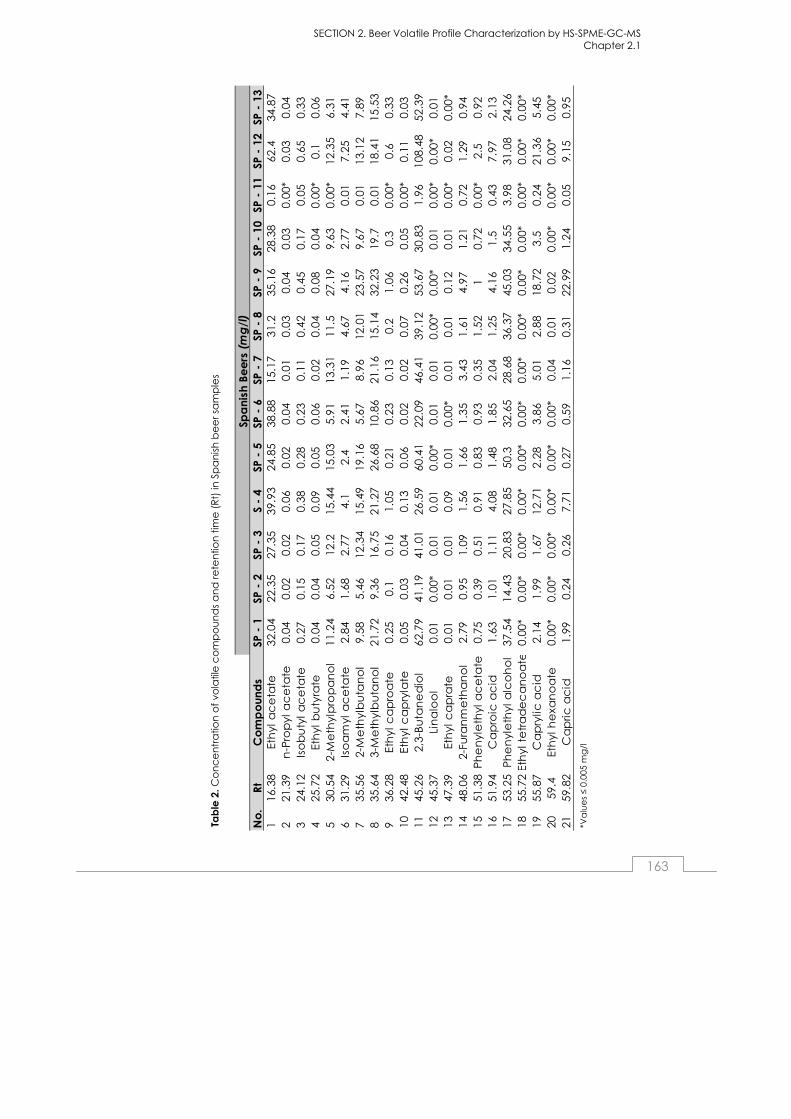
SECTION 2. Beer Volatile Profile Characterization by HS-SPME-GC-MS Chapter 2.1
163
Tab
le 2
. Co
nc
en
tra
tion
of
vola
tile
co
mp
ou
nd
s a
nd
re
ten
tion
tim
e (
Rt)
in S
pa
nis
h b
ee
r sa
mp
les
*Va
lue
s ≤
0.00
5 m
g/l
No
.R
tC
om
po
un
ds
SP -
1SP
- 2
SP -
3S
- 4
SP -
5SP
- 6
SP -
7SP
- 8
SP -
9SP
- 1
0SP
- 1
1SP
- 1
2SP
- 1
31
16.3
8Et
hyl
ac
eta
te32
.04
22.3
527
.35
39.9
324
.85
38.8
815
.17
31.2
35.1
628
.38
0.16
62.4
34.8
72
21.3
9n
-Pro
pyl
ac
eta
te0.
040.
020.
020.
060.
020.
040.
010.
030.
040.
030.
00*
0.03
0.04
324
.12
Iso
bu
tyl a
ce
tate
0.27
0.15
0.17
0.38
0.28
0.23
0.11
0.4
20.
450.
170.
050.
650.
334
25.7
2Et
hyl
bu
tyra
te0.
040.
040.
050.
090.
050.
060.
020.
040.
080.
040.
00*
0.1
0.06
530
.54
2-M
eth
ylp
rop
an
ol
11.2
46.
5212
.215
.44
15.0
35.
9113
.31
11.5
27.1
99.
630.
00*
12.3
56.
316
31.2
9Is
oa
myl
ac
eta
te2.
841.
682.
774.
12.
42.
411.
194.
674.
162.
770.
017.
254.
417
35.5
62-
Me
thyl
bu
tan
ol
9.58
5.46
12.3
415
.49
19.1
65.
678.
96
12.0
123
.57
9.67
0.01
13.1
27.
898
35.6
43-
Me
thyl
bu
tan
ol
21.7
29.
3616
.75
21.2
726
.68
10.8
621
.16
15.1
432
.23
19.7
0.01
18.4
115
.53
936
.28
Eth
yl c
ap
roa
te0.
250.
10.
161.
050.
210.
230.
130.
21.
060.
30.
00*
0.6
0.33
1042
.48
Eth
yl c
ap
ryla
te0.
050.
030.
040.
130.
060.
020.
020
.07
0.26
0.05
0.00
*0.
110.
0311
45.2
62,
3-B
uta
ne
dio
l62
.79
41.1
941
.01
26.5
960
.41
22.0
946
.41
39.1
253
.67
30.8
31.
9610
8.48
52.3
912
45.3
7Li
na
loo
l0.
010.
00*
0.01
0.01
0.00
*0.
010.
010.
00*
0.00
*0.
010.
00*
0.00
*0.
0113
47.3
9Et
hyl
ca
pra
te0.
010.
010.
010.
090.
010.
00*
0.01
0.01
0.12
0.01
0.00
*0.
020.
00*
1448
.06
2-Fu
ran
me
tha
no
l2.
790.
951.
091.
561.
661.
353.
431.
614.
971.
210.
721.
290.
9415
51.3
8P
he
nyl
eth
yl a
ce
tate
0.75
0.39
0.51
0.91
0.83
0.93
0.35
1.52
10.
720.
00*
2.5
0.92
1651
.94
Ca
pro
ic a
cid
1.63
1.01
1.11
4.08
1.48
1.85
2.04
1.25
4.16
1.5
0.43
7.97
2.13
1753
.25
Ph
en
yle
thyl
alc
oh
ol
37.5
414
.43
20.8
327
.85
50.3
32.6
528
.68
36.3
745
.03
34.5
53.
9831
.08
24.2
618
55.7
2Et
hyl
te
tra
de
ca
no
ate
0.00
*0.
00*
0.00
*0.
00*
0.00
*0.
00*
0.00
*0.
00*
0.00
*0.
00*
0.00
*0.
00*
0.00
*19
55.8
7C
ap
rylic
ac
id2.
141.
991.
6712
.71
2.28
3.86
5.01
2.88
18.7
23.
50.
2421
.36
5.45
2059
.4Et
hyl
he
xan
oa
te0.
00*
0.00
*0.
00*
0.00
*0.
00*
0.00
*0.
040.
010.
020.
00*
0.00
*0.
00*
0.00
*21
59.8
2C
ap
ric a
cid
1.99
0.24
0.26
7.71
0.27
0.59
1.16
0.31
22.9
91.
240.
059.
150.
95
Spa
nis
h B
ee
rs (
mg
/l)
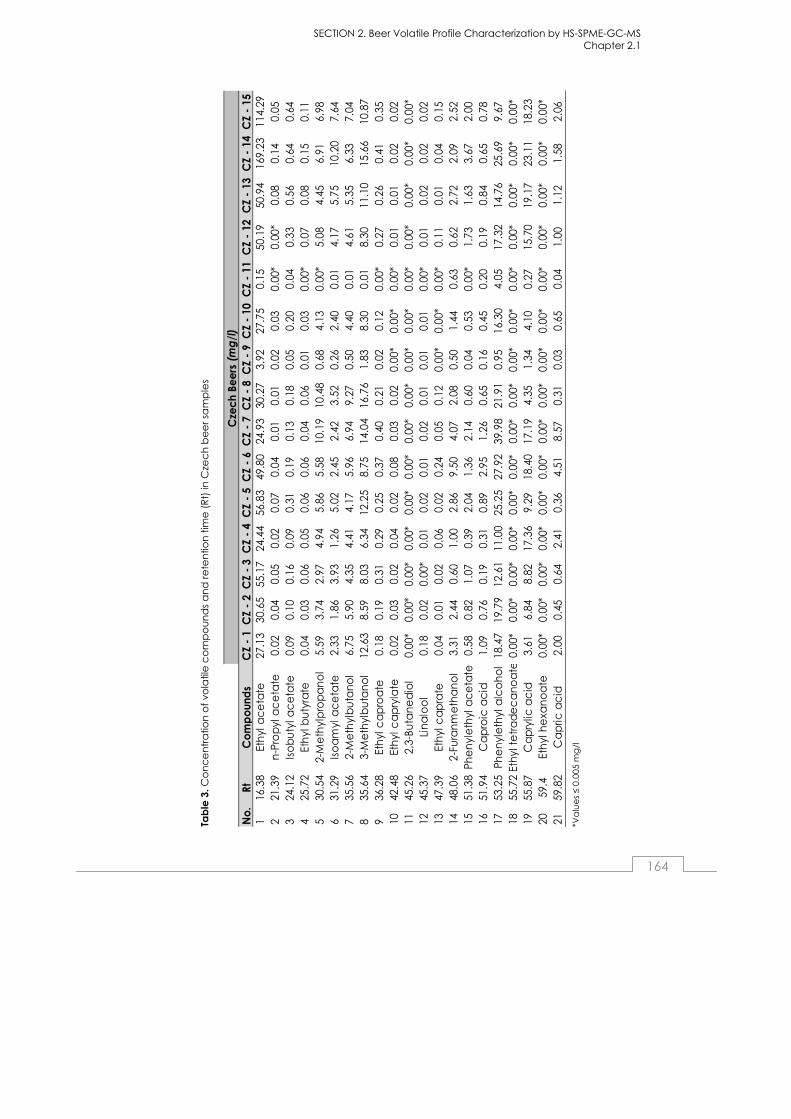
SECTION 2. Beer Volatile Profile Characterization by HS-SPME-GC-MS Chapter 2.1
164
No.
RtC
omp
ound
sC
Z -
1C
Z -
2C
Z -
3C
Z -
4C
Z -
5C
Z -
6C
Z -
7C
Z -
8C
Z -
9C
Z -
10C
Z -
11C
Z -
12C
Z -
13C
Z -
14C
Z -
151
16.3
8Et
hyl
ac
eta
te27
.13
30.6
555
.17
24.4
456
.83
49.8
024
.93
30.2
73.
9227
.75
0.15
50.1
950
.94
169.
2311
4.29
221
.39
n-P
rop
yl a
ce
tate
0.02
0.04
0.05
0.02
0.07
0.04
0.01
0.01
0.02
0.03
0.00
*0.
00*
0.08
0.14
0.05
324
.12
Iso
bu
tyl a
ce
tate
0.09
0.10
0.16
0.09
0.31
0.19
0.13
0.18
0.05
0.20
0.04
0.33
0.56
0.64
0.64
425
.72
Eth
yl b
uty
rate
0.04
0.03
0.06
0.05
0.06
0.06
0.04
0.06
0.01
0.03
0.00
*0.
070.
080.
150.
115
30.5
42-
Me
thyl
pro
pa
no
l5.
593.
742.
974.
945.
865.
5810
.19
10.4
80.
684.
130.
00*
5.08
4.45
6.91
6.98
631
.29
Iso
am
yl a
ce
tate
2.33
1.86
3.93
1.26
5.02
2.45
2.42
3.52
0.26
2.40
0.01
4.17
5.75
10.2
07.
647
35.5
62-
Me
thyl
bu
tan
ol
6.75
5.90
4.35
4.41
4.17
5.96
6.94
9.27
0.50
4.40
0.01
4.61
5.35
6.33
7.04
835
.64
3-M
eth
ylb
uta
no
l12
.63
8.59
8.03
6.34
12.2
58.
7514
.04
16.7
61.
838.
300.
018.
3011
.10
15.6
610
.87
936
.28
Eth
yl c
ap
roa
te0.
180.
190.
310.
290.
250.
370.
400.
210.
020.
120.
00*
0.27
0.26
0.41
0.35
1042
.48
Eth
yl c
ap
ryla
te0.
020.
030.
020.
040.
020.
080.
030.
020.
00*
0.00
*0.
00*
0.01
0.01
0.02
0.02
1145
.26
2,3-
Buta
ne
dio
l0.
00*
0.00
*0.
00*
0.00
*0.
00*
0.00
*0.
00*
0.00
*0.
00*
0.00
*0.
00*
0.00
*0.
00*
0.00
*0.
00*
1245
.37
Lin
alo
ol
0.18
0.02
0.00
*0.
010.
020.
010.
020.
010.
010.
010.
00*
0.01
0.02
0.02
0.02
1347
.39
Eth
yl c
ap
rate
0.04
0.01
0.02
0.06
0.02
0.24
0.05
0.12
0.00
*0.
00*
0.00
*0.
110.
010.
040.
1514
48.0
62-
Fura
nm
eth
an
ol
3.31
2.44
0.60
1.00
2.86
9.50
4.07
2.08
0.50
1.44
0.63
0.62
2.72
2.09
2.52
1551
.38
Phe
nyl
eth
yl a
ce
tate
0.58
0.82
1.07
0.39
2.04
1.36
2.14
0.60
0.04
0.53
0.00
*1.
731.
633.
672.
0016
51.9
4C
ap
roic
ac
id1.
090.
760.
190.
310.
892.
951.
260.
650.
160.
450.
200.
190.
840.
650.
7817
53.2
5Ph
en
yle
thyl
alc
oh
ol
18.4
719
.79
12.6
111
.00
25.2
527
.92
39.9
821
.91
0.95
16.3
04.
0517
.32
14.7
625
.69
9.67
1855
.72
Eth
yl t
etr
ad
ec
an
oa
te0.
00*
0.00
*0.
00*
0.00
*0.
00*
0.00
*0.
00*
0.00
*0.
00*
0.00
*0.
00*
0.00
*0.
00*
0.00
*0.
00*
1955
.87
Ca
pry
lic a
cid
3.61
6.84
8.82
17.3
69.
2918
.40
17.1
94.
351.
344.
100.
2715
.70
19.1
723
.11
18.2
320
59.4
Eth
yl h
exa
no
ate
0.00
*0.
00*
0.00
*0.
00*
0.00
*0.
00*
0.00
*0.
00*
0.00
*0.
00*
0.00
*0.
00*
0.00
*0.
00*
0.00
*21
59.8
2C
ap
ric a
cid
2.00
0.45
0.64
2.41
0.36
4.51
8.57
0.31
0.03
0.65
0.04
1.00
1.12
1.58
2.06
Cze
ch B
eers
(m
g/l
)
Tab
le 3
. Co
nc
en
tra
tion
of
vola
tile
co
mp
ou
nd
s a
nd
re
ten
tion
tim
e (
Rt)
in C
zec
h b
ee
r sa
mp
les
*Va
lue
s ≤
0.00
5 m
g/l
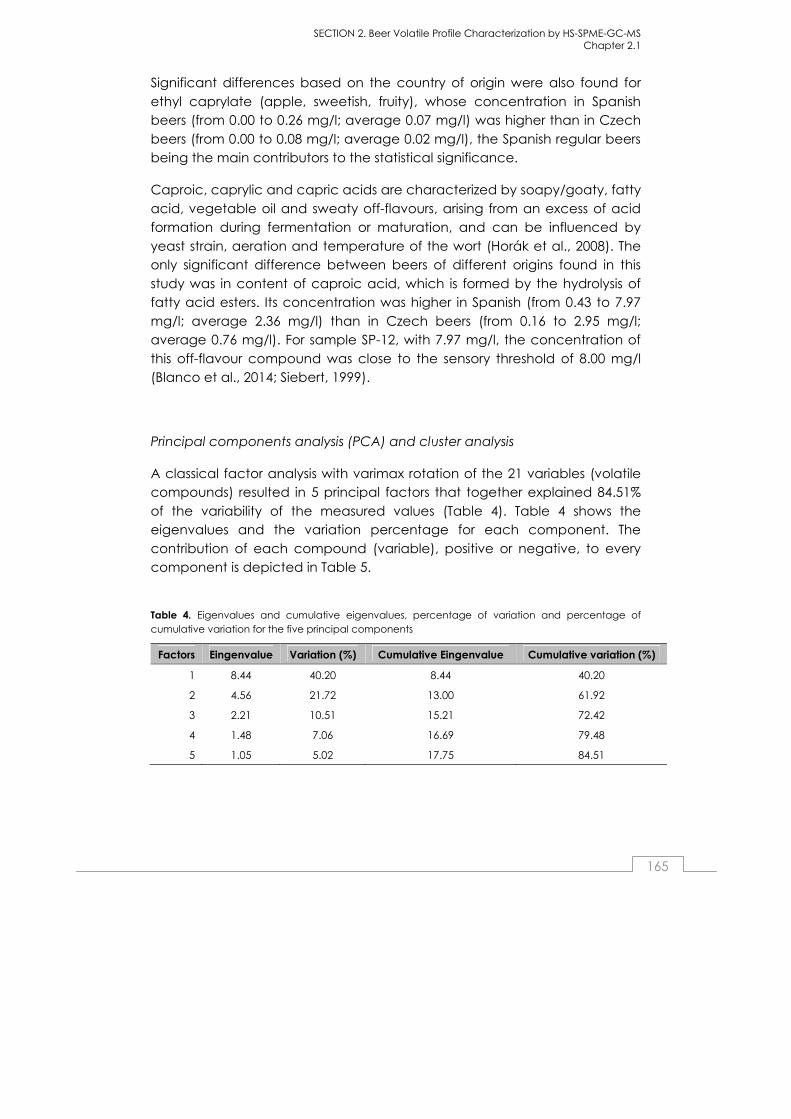
SECTION 2. Beer Volatile Profile Characterization by HS-SPME-GC-MS Chapter 2.1
165
Significant differences based on the country of origin were also found for
ethyl caprylate (apple, sweetish, fruity), whose concentration in Spanish beers (from 0.00 to 0.26 mg/l; average 0.07 mg/l) was higher than in Czech
beers (from 0.00 to 0.08 mg/l; average 0.02 mg/l), the Spanish regular beers being the main contributors to the statistical significance.
Caproic, caprylic and capric acids are characterized by soapy/goaty, fatty
acid, vegetable oil and sweaty off-flavours, arising from an excess of acid formation during fermentation or maturation, and can be influenced by
yeast strain, aeration and temperature of the wort (Horák et al., 2008). The only significant difference between beers of different origins found in this
study was in content of caproic acid, which is formed by the hydrolysis of fatty acid esters. Its concentration was higher in Spanish (from 0.43 to 7.97
mg/l; average 2.36 mg/l) than in Czech beers (from 0.16 to 2.95 mg/l; average 0.76 mg/l). For sample SP-12, with 7.97 mg/l, the concentration of
this off-flavour compound was close to the sensory threshold of 8.00 mg/l (Blanco et al., 2014; Siebert, 1999).
Principal components analysis (PCA) and cluster analysis
A classical factor analysis with varimax rotation of the 21 variables (volatile compounds) resulted in 5 principal factors that together explained 84.51%
of the variability of the measured values (Table 4). Table 4 shows the eigenvalues and the variation percentage for each component. The
contribution of each compound (variable), positive or negative, to every component is depicted in Table 5.
Table 4. Eigenvalues and cumulative eigenvalues, percentage of variation and percentage of cumulative variation for the five principal components
Factors Eingenvalue Variation (%) Cumulative Eingenvalue Cumulative variation (%)
1 8.44 40.20 8.44 40.20
2 4.56 21.72 13.00 61.92
3 2.21 10.51 15.21 72.42
4 1.48 7.06 16.69 79.48
5 1.05 5.02 17.75 84.51

SECTION 2. Beer Volatile Profile Characterization by HS-SPME-GC-MS Chapter 2.1
166
Factor 1 explained 40.20% of the variation (Table 4) with loading factors
ranging from -0.0821 to 0.9204. This factor can be related to the formation of higher alcohols. The maximum contributions to this factor came from 2-
phenylethanol, 2-methylpropanol and amyl alcohols (2 and 3-methylbutanol) (Table 5). These alcohols are formed by reduction of Stecker
aldehydes and this depends on the degradation of different free amino acids during fermentation (Vanderhaegen et al., 2006), the content of the
indicated alcohols therefore being determined by the related amino acid content in the wort extract, along with the particular fermentation process.
Hence, Factor 1 is likely to be associated with the metabolism of amino acids during fermentation, connected with attenuation of the wort (higher
alcohols formed in the beer fusel). For Factor 2, which explains 21.72% of the variation, loadings varied from -0.2074 to 0.9590. The most important volatile
compounds contributing positively to this factor were all acetates: ethyl acetate, ethyl butanoate, isobuthyl acetate, n-propyl acetate, phenyl ethyl
acetate and isoamyl acetate. This feature could be related to either its correlation with acetic acid and acetaldehyde formation during beer
production or to specific lipid metabolism of the particular yeast strain used by each brewery; some may be connected with the metabolism of
fermented sugars (Verstrepen et al., 2003). For Factor 3, loadings varied from -0.4941 to 0.8519, and this factor represents 10.51% of the variation. The
most important contributors to this factor were 2-furanmethanol followed by ethyl caprate. Factor 4 explained 7.06% of the variation, and loadings for
this factor varied from -0.2304 to 0.9410. Because the main contributors to this factor are ethyltetradecanoate and linalool, both compounds derived
from hops, this factor could be associated with variations caused by the different varieties of hops used or different ways of hopping during the
brewing process. Finally, Factor 5 explained 5.02% of the variation, with loading factors ranging from -0.2055 to 0.7322. The principal contributors to
this factor were capric and caproic acids, ethyl caproate and ethyl caprylate, all of which are formed during fermentation, with minor
contributions from other short-chain organic acids.
The scatterplot resulting from PCA is used to visualize beer sample grouping, as illustrated in Fig. 2. Factors 1 and 2 shows the samples can be separated
into 3 groups according to their volatile compound content. The first group contains the majority of Spanish beers and falls within the negative side of
Factor 2; 2 Czech beers from the same brewery (CZ-7 and CZ-8) are included in this group, which means their volatiles profile was similar to the
volatiles profile for the Spanish beers. A second group contained Czech

SECTION 2. Beer Volatile Profile Characterization by HS-SPME-GC-MS Chapter 2.1
167
beers, all of them being located on the positive side of Factor 2. Therefore,
these results indicate that the most relevant volatile compounds in the differentiation of beers by country of origin are acetates.
A third group, located on the right side of the scatterplot, and hence being
Factor 1 that primarily contributed to its separation, consists only of non-alcoholic beers. Four non-alcoholic beers produced using different
processes were analyzed. CZ-11 and SP-11 were dealcoholized by vacuum distillation, and as shown in Fig. 2, both are located together within the
group. The other non-alcoholic beer included in this third group is CZ-9; this beer was made by limited fermentation using wort with reduced levels of
fermentable sugars and a short fermentation time. Fermentation activity was subsequently stopped by cooling the wort (Brányik et al., 2012).
Table 5. Main beer volatile compounds and their contribution to (loading) every factor (principal components)
Compounds Factor 1 Factor 2 Factor 3 Factor 4 Factor 5
Ethyl acetate -0.0484 0.9545 0.1105 0.0973 -0.0374
Carpic Acid 0.4232 0.0815 0.3523 -0.0394 0.7318
Caproic Acid 0.4114 0.1689 -0.0821 -0.0890 0.7322
2-Phenylethanol 0.8725 0.1650 0.0903 -0.1445 0.0852
Ethyl tetradecanoate -0.0821 0.1052 0.1103 0.9410 0.0733
Caprylic acid -0.0725 0.6883 0.4262 -0.0199 0.4419
Ethyl hexanoate 0.5937 -0.2074 0.1949 0.0564 0.0193
2-Methylpropanol 0.8604 0.0938 0.0867 0.0022 0.4304
Ethyl butyrate 0.0993 0.9189 0.0670 0.1082 0.3012
Isobutyl acetate 0.1871 0.8526 -0.1204 0.0434 0.3324
n-Propyl acetate 0.0693 0.8412 0.1246 -0.2304 -0.1714
Phenylethyl acetate 0.0582 0.9096 0.1202 -0.0205 0.0563
Isoamyl acetate 0.1102 0.9590 -0.0649 0.1032 0.1460
2-Methylbutanol 0.8383 0.1301 -0.0234 0.0223 0.4313
3-Methylbutanol 0.9204 0.2157 -0.0193 0.0384 0.2316
Ethyl caproate 0.3867 0.3614 0.2394 -0.0652 0.7141
Ethyl caprylate 0.5897 0.0548 0.2224 -0.1226 0.7006
2.3-Butanediol 0.6299 -0.0021 -0.4941 -0.1364 0.4161
Linalool 0.0215 -0.0344 0.0799 0.7842 -0.2055
Ethyl caprate -0.0422 0.2042 0.7625 0.2267 0.3806
2-Furanmethanol 0.2950 0.0717 0.8519 0.0527 0.0616 Loadings greater than 0.7000 are marked in bold
Factor. load (Varimax normalized)
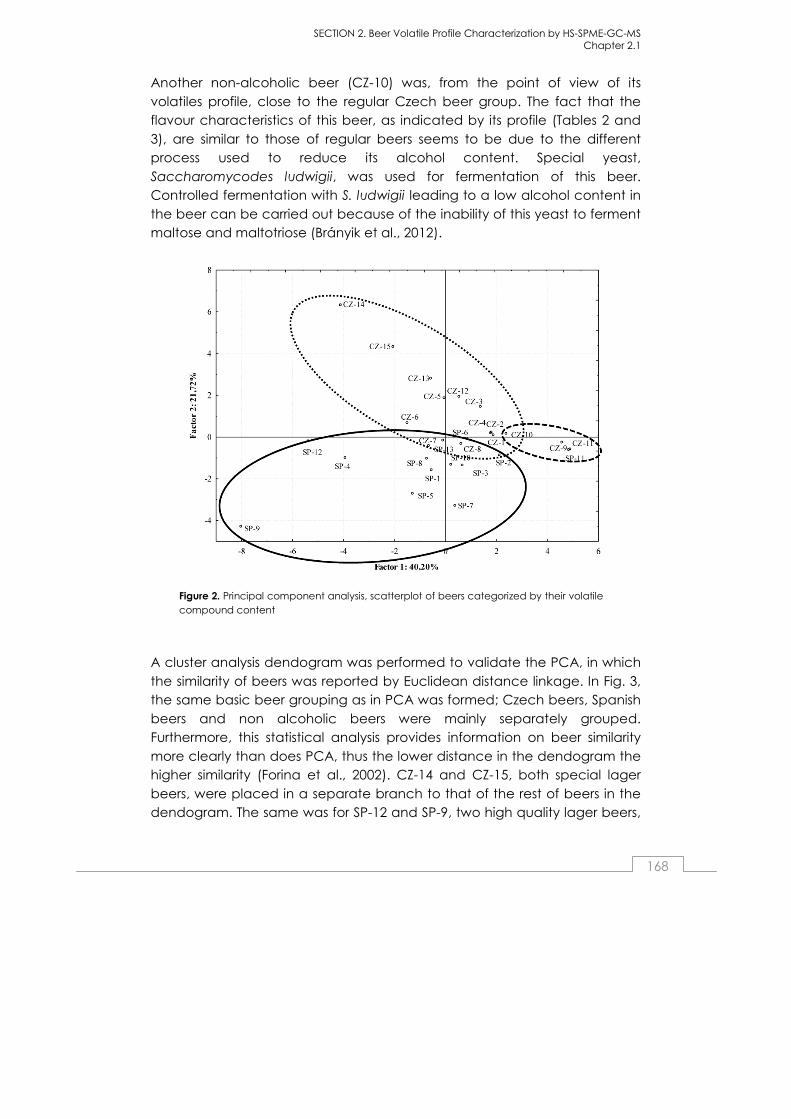
SECTION 2. Beer Volatile Profile Characterization by HS-SPME-GC-MS Chapter 2.1
168
Another non-alcoholic beer (CZ-10) was, from the point of view of its
volatiles profile, close to the regular Czech beer group. The fact that the flavour characteristics of this beer, as indicated by its profile (Tables 2 and
3), are similar to those of regular beers seems to be due to the different process used to reduce its alcohol content. Special yeast,
Saccharomycodes ludwigii, was used for fermentation of this beer. Controlled fermentation with S. ludwigii leading to a low alcohol content in
the beer can be carried out because of the inability of this yeast to ferment maltose and maltotriose (Brányik et al., 2012).
Figure 2. Principal component analysis, scatterplot of beers categorized by their volatile compound content
A cluster analysis dendogram was performed to validate the PCA, in which
the similarity of beers was reported by Euclidean distance linkage. In Fig. 3, the same basic beer grouping as in PCA was formed; Czech beers, Spanish
beers and non alcoholic beers were mainly separately grouped. Furthermore, this statistical analysis provides information on beer similarity
more clearly than does PCA, thus the lower distance in the dendogram the higher similarity (Forina et al., 2002). CZ-14 and CZ-15, both special lager
beers, were placed in a separate branch to that of the rest of beers in the dendogram. The same was for SP-12 and SP-9, two high quality lager beers,

SECTION 2. Beer Volatile Profile Characterization by HS-SPME-GC-MS Chapter 2.1
169
whose branches were separate from those of other regular beers, although
to a lesser extent than CZ-14 and CZ-15 branches.
Figure 3. Dendrogram of the cluster analysis
CONCLUSIONS
In this study, we describe a comparative analysis of volatile compounds between Czech and Spanish beers, using HS-SPME-GC-MS. 44 volatile
compounds were detected and 21 of them identified and quantified in 28 samples of different types of lager beers: regular (including all pale beers:
special, high quality, pilsen and regular lagers), dark and non-alcoholic beers. Results confirm that the volatiles profiles of Czech, Spanish and non-
alcoholic beers are different. Factor analysis showed five principal components contributed to establish differences between Spanish, Czech
and low-alcohol beers, each factor being mainly related to a particular class of compound. Two factors explained more than 60% of the variability
and were related to higher alcohols (Factor 1) and acetates (Factor 2). The PCA scatterplot showed that differences based on country of origin were
mostly due to the contents of 2,3-butanediol and acetates. Non-alcoholic beers had very low levels of volatile compounds and appeared in a
different group, with the exception of a non-alcoholic Czech beer made with a special yeast that is unable to metabolize maltose and maltotriose;
this beer had a volatiles profile closer to that of regular beers. Cluster
SECTION 2. Beer Volatile Profile Characterization by HS-SPME-GC-MS Chapter 2.1
170
analysis was able to distinguish between two dark Czech and two special
Spanish beers from other regular beers by locating them on separate branches in the dendrogram.
Acknowledgments
Supported by the Ministry of Education, Youth and Sports of the Czech Republic, Project No. MSM 6046137305, and Research Centre, Projects No.
1M0570.
References
Andrés-Iglesias C, Montero O, Sancho D, Blanco CA. 2014. New trends in
beer flavour compound analysis. J Sci Food Agric 95: 1571-1576.
Blanco CA, Andrés-Iglesias C, Montero O. 2014. Low-alcohol beers: Flavour compounds, defects and improvement strategies. Crit Rev Food Sci Nutr.
DOI: 10.1080/10408398.2012.733979
Brányik T, Silva DP, Baszczyňski M, Lehnert R, Almeida e Silva JB. 2012. A review of methods of low alcohol and alcohol-free beer production. J
Food Eng 108(4):493-506.
Brányik T, Vicente AA, Dostálek P, Teixeira JA. 2008. A Review of Flavour
Formation in Continuous Beer Fermentations. J Inst Brew 114(1):3-13.
Catarino M, Ferreira A, Mendes A. 2009. Study and optimization of aroma recovery from beer by pervaporation. J Membr Sci 341(1–2):51-9.
Charry-Parra G, De jesus-Echevarria M, Perez FJ. 2011. Beer volatile analysis:
optimization of HS/SPME coupled to GC/MS/FID. J Food Sci 76(2):C205-11.
da Silva GA, Augusto F, Poppi RJ. 2008. Exploratory analysis of the volatile profile of beers by HS–SPME–GC. Food Chem 111(4):1057-63.
da Silva GA, Maretto DA, Bolini HMA, Teófilo RF, Augusto F, Poppi RJ. 2012.
Correlation of quantitative sensorial descriptors and chromatographic signals of beer using multivariate calibration strategies. Food Chem
134(3):1673-81.
SECTION 2. Beer Volatile Profile Characterization by HS-SPME-GC-MS Chapter 2.1
171
De Schutter DP, Saison D, Delvaux F, Derdelinckx G, Rock JM, Neven H,
Delvaux FR. 2008. Optimisation of wort volatile analysis by headspace solid-phase microextraction in combination with gas chromatography
and mass spectrometry. J Chromatogr A 1179(2):75-80.
Dong L, Piao Y, Zhang X, Zhao C, Hou Y, Shi Z. 2013. Analysis of volatile compounds from a malting process using headspace solid-phase micro-
extraction and GC–MS. Food Res Int 51(2):783-9.
Forina M, Armanino C, Raggio V. 2002. Clustering with dendrograms on interpretation variables. Anal Chim Acta 454(1):13-9.
Gonçalves JL, Figueira JA, Rodrigues FP, Ornelas LP, Branco RN, Silva CL, Camara JS. 2014. A powerful methodological approach combining
headspace solid phase microextraction, mass spectrometry and multivariate analysis for profiling the volatile metabolomic pattern of
beer starting raw materials. Food Chem 160:266-80.
Haefliger OP, Jeckelmann N. 2013. Stripping of aroma compounds during beer fermentation monitored in real-time using an automatic
cryotrapping sampling system and fast gas chromatography/mass spectrometry. Anal Methods 5(17):4409-18.
Horák T, Čulík J, Jurková M, Čejka P, Kellner V. 2008. Determination of free
medium-chain fatty acids in beer by stir bar sorptive extraction. J Chromatogr A 1196–1197:96-9.
Kleinová J, Klejdus B. 2014. Determination of Volatiles in Beer using Solid-Phase Microextraction in Combination with Gas Chromatography/Mass
Spectrometry. Czech J Food Sci 32:241–8.
Kobayashi M, Shimizu H, Shioya S. 2008. Beer Volatile Compounds and Their Application to Low-Malt Beer Fermentation. J Biosci Bioeng 106(4):317-23.
Krogerus K, Gibson BR. 2013. 125th Anniversary Review: Diacetyl and its
control during brewery fermentation. J Inst Brew 119(3):86-97.
Lei H, Zhao H, Zhao M. 2013. Proteases supplementation to high gravity
worts enhances fermentation performance of brewer's yeast. Biochem Eng J 77(0):1-6.

SECTION 2. Beer Volatile Profile Characterization by HS-SPME-GC-MS Chapter 2.1
172
Montanari L, Marconi O, Mayer H, Fantozzi P. 2009. Chapter 6 - Production
of Alcohol-Free Beer. In: Preedy VR, editor. Beer in Health and Disease Prevention. San Diego: Academic Press. p. 61-75.
Parker DK. 2012. Beer: production, sensory characteristics and sensory
analysis. In: Piggott J, editor. Alcoholic Beverages: Woodhead Publishing. p. 133-58.
Piddocke MP, Kreisz S, Heldt-Hansen HP, Nielsen KF, Olsson L. 2009.
Physiological characterization of brewer's yeast in high-gravity beer fermentations with glucose or maltose syrups as adjuncts. Appl Microbiol
Biotechnol 84(3):453-64.
Pinho O, Ferreira IMPLVO, Santos LHMLM. 2006. Method optimization by
solid-phase microextraction in combination with gas chromatography with mass spectrometry for analysis of beer volatile fraction. J
Chromatogr A 1121(2):145-53.
Riu-Aumatell M, Miró P, Serra-Cayuela A, Buxaderas S, López-Tamames E. 2014. Assessment of the aroma profiles of low-alcohol beers using HS-
SPME–GC-MS. Food Res Int 57(0):196-202.
Rodrigues JA, Barros AS, Carvalho B, Brandao T, Gil AM, Ferreira AC. 2011. Evaluation of beer deterioration by gas chromatography-mass
spectrometry/multivariate analysis: a rapid tool for assessing beer composition. J Chromatogr A 1218(7):990-6.
Rodriguez-Bencomo J, Muñoz-González C, Martín-Álvarez P, Lázaro E, Mancebo R, Castañé X, Pozo-Bayón M. 2012. Optimization of a HS-SPME-
GC-MS Procedure for Beer Volatile Profiling Using Response Surface Methodology: Application to Follow Aroma Stability of Beers Under
Different Storage Conditions. Food Anal Method 5(6):1386-97.
Rossi S, Sileoni V, Perretti G, Marconi O. 2014. Characterization of the volatile profiles of beer using headspace solid-phase microextraction and gas
chromatography–mass spectrometry. J Sci Food Agr 94(5):919-28.
Saison D, De Schutter DP, Delvaux F, Delvaux FR. 2008. Optimisation of a complete method for the analysis of volatiles involved in the flavour
stability of beer by solid-phase microextraction in combination with gas chromatography and mass spectrometry. J Chromatogr A 1190(1-2):342-
9.

SECTION 2. Beer Volatile Profile Characterization by HS-SPME-GC-MS Chapter 2.1
173
Siebert KJ. 1999. Modeling the flavor thresholds of organic acids in beer as a
function of their molecular properties. Food Qual Prefer 10(2):129-37.
Sohrabvandi S, Mousavi SM, Razavi SH, Mortazavian AM, Rezaei K. 2010. Alcohol-free Beer: Methods of Production, Sensorial Defects, and
Healthful Effects. Food Rev Int 26(4):335-52.
Štěrba K, Dostálek P, Karabín M. 2011. Moderní postupy využívané při přípravě vzorků pro stanovení alkoholů, esterů a kyselin v pivu. Chem listy
105: 603-10.
Tian J. 2010. Application of static headspace gas chromatography for
determination of acetaldehyde in beer. J Food Comp Anal 23(5):475-9.
Vanderhaegen B, Neven H, Verachtert H, Derdelinckx G. 2006. The chemistry of beer aging – a critical review. Food Chem 95(3):357-81.
Verstrepen KJ, Derdelinckx G, Dufour J-P, Winderickx J, Thevelein JM,
Pretorius IS, Delvaux FR. 2003. Flavor-active esters: Adding fruitiness to beer. J Biosci Bioeng 96(2):110-8.
Vesely P, Lusk L, Basarova G, Seabrooks J, Ryder D. 2003. Analysis of aldehydes in beer using solid-phase microextraction with on-fiber
derivatization and gas chromatography/mass spectrometry. J Agr Food Chem 51(24):6941-4.
Yahya H, Linforth RST, Cook DJ. 2014. Flavour generation during commercial
barley and malt roasting operations: A time course study. Food Chem 145(0):378-87.

Chapter 2.2
Comparison of Czech and Spanish lager
beers, based on the content of selected
carbonyl compounds, using HS-SPME-
GC-MS
By
Cristina Andrés-Iglesias a,b, Jakub Nešpor a, Marcel Karabína, Olimpio Montero c, Carlos A. Blanco b, Pavel
Dostálek a,*
a Department of Biotechnology, Faculty of Food and Biochemical Technology, University of Chemistry and Technology, Prague, Technická 5, 166 28 Prague 6-
Dejvice, Czech Republic
b Departamento de Ingeniería Agrícola y Forestal (Área de Tecnologia de los Alimentos), E.T.S. Ingenierías Agrarias, Universidad de Valladolid, Avda. de Madrid 44, 34004 Palencia, España
c Centre for Biothechnology Development (CDB), Spanish Council for Scientific Research (CSIC), Francisco Vallés 8, Boecillo´s Technological Park, 47151 Boecillo,
Valladolid, Spain
SUBMITTED TO:
LWT-FOOD SCIENCE AND TECHNOLOGY
April 2015
SECTION 2. Beer Volatile Profile Characterization by HS-SPME-GC-MS Chapter 2.2
176
Abstract
Beer is one from the most popular alcoholic beverages with high
global production. For consumer acceptance, a significant factor is its flavour and odour combinations, and taste impressions. Carbonyl
compounds play an important function as indicators of the deterioration of flavour and aroma of beers. The aim of this study is to characterize the
carbonyl compound profile in different Czech and Spanish beers, based on identification and quantification of ten carbonyl compounds formed
by different pathways: three linear aldehydes, 4 Strecker aldehydes, 1 heterocyclic aldehyde and 2 ketones.
Headspace solid-phase microextraction and gas-chromatography
mass spectrometry were used to compare 28 industrial lager beer samples of three main different types: pale, dark and non-alcoholic
beers. On-fiber derivatization with O-(2,3,4,5,6-pentafluorobenzyl) hydroxylamine (PFBOA) was used to achieve satisfactory recovery and
sensitivity.
The main significant difference between Spanish and Czech beers was
the concentration of (E)-non-2-enal and diacetyl. Factor analysis showed three principal components, two of them explaining more than 76% of
the variability and were related to ANOVA significant difference analysis based on the nationality and type of beer. Two factors explained more
than 76% of variability and were related to Strecker aldehydes and Maillard products.
Keywords: alcohol free beer, flavour, aroma, derivatization,
chromatography.
INTRODUCTION
The most appreciated sensory characteristics of beer is fresh flavour
(Bravo et al., 2008), and flavour stability is thus an important quality criterion for beer, and a concern for the brewing industry (Guido et al.,
2004; Moreira, Meireles, Brandao, & de Pinho, 2013; Saison et al., 2010).

SECTION 2. Beer Volatile Profile Characterization by HS-SPME-GC-MS Chapter 2.2
177
Carbonyl compounds are considered to play an important role in flavour
and aroma deterioration of beers because they comprise a diverse mix of unwanted off-flavours (Moreira et al., 2013). These compounds can
originate from raw materials, alcoholic fermentation, or a wide range of chemical reactions such as lipid oxidation, Maillard reactions, Strecker
degradation, aldol condensations of saturated aldehydes or degradation of bitter acids during beer processing and/or storage of the
final product (da Costa et al., 2004; Gonçalves et al., 2014; Moreira et al., 2013; Saison, De Schutter, Delvaux, & Delvaux, 2009). The resulting
carbonyls may bind during fermentation to form adducts with carbon dioxide. Decomposition of these adducts of beer, together with iso-α-
bitter acid degradation, is a major factor in the increase in carbonyl compound content during storage of beer (Baert, De Clippeleer,
Hughes, De Cooman, & Aerts, 2012). This indicates that fresh bottled beer is not in a steady state of chemical equilibrium (Baert et al., 2012) and
can change its chemical composition during storage, where, among other compounds, oxygen plays a key role (Hempel, O'Sullivan,
Papkovsky, & Kerry, 2013).
Despite carbonyl compound concentrations being generally very low in fresh beer, these compounds make an important and mostly unwanted
contribution to the flavour profile because of their particular sensory descriptors and low flavour thresholds (Blanco, Andrés-Iglesias, &
Montero, 2014; Saison, De Schutter, Delvaux, et al., 2009). The off-flavours that typically develop in aged beer include cardboard, sweet and
toffee notes (Guido et al., 2004). Some aldehydes and ketones, identified in the raw materials, have been considered as the most important
factors in the deterioration of beer flavour and formation of off-flavours (Bueno, Zapata, & Ferreira, 2014; Gonçalves et al., 2014; Rossi, Sileoni,
Perretti, & Marconi, 2014).
Aldehydes that significantly influence the flavour of beer, besides acetaldehyde, can be classified into three groups: Strecker aldehydes,
aldehydes of Maillard reactions, and fatty acid oxidation aldehydes (Rossi et al., 2014). Aldehydes arise in beer, mainly during wort production
(mashing and boiling), and are derived from the autoxidation and enzymatic oxidation of the double carbon-carbon bond of unsaturated
fatty acids present in malt. They are also partially formed during fermentation from the yeast oxo-acid pool via anabolic processes and

SECTION 2. Beer Volatile Profile Characterization by HS-SPME-GC-MS Chapter 2.2
178
from exogenous amino acids via the catabolic pathway (Branyik,
Vicente, Dostalek, & Teixeira, 2008).
Almost without exception, aldehydes have unpleasant flavours and aromas described as grassy, fruity, green leaves and cardboard,
depending on the compound (Boulton & Quain, 2001). For example, linear aldehydes (from hexanal to decanal) provide grassy, green, citrus
and fatty odour characteristics (Gonçalves et al., 2014).
Strecker degradation of the amino acids valine, isoleucine, leucine and phenylalanine during wort boiling may be partially responsible for the
formation of 2-methylpropanal, 2-methylbutanal, 3-methylbutanal, and phenylacetaldehyde. Additionally, the Strecker reaction can also occur
during aging, directly in the bottle (Rossi et al., 2014). Strecker aldehydes formed during aging are 2-methylpropanal, 2-methylbutanal, 3-
methylbutanal, benzaldehyde, phenylacetaldehyde and methional (Saison et al., 2010). 2-Methylbutanal and 3-methylbutanal are described
as potent flavour compounds, perceived as malty and chocolate-like, as is benzaldehyde with an almond/acre odour (Gonçalves et al., 2014).
Some of them can be considered as suitable markers for beer oxidation (Vanderhaegen, Neven, Verachtert, & Derdelinckx, 2006).
Many heterocyclic compounds found in malts, worts and aged beers are well known products of the Maillard reaction between sugars and
amino acids (Vanderhaegen et al., 2006). The predominant compounds are 5-hydroxymethylfurfural derived from hexoses, and furfural derived
from pentoses (Rossi et al., 2014). Maillard compounds are responsible for the development of bready, sweet and wine-like flavour notes during
beer staling (Vanderhaegen et al., 2006).
Concerning fatty acid oxidation, aldehydes are generally released during the mashing process in the brewhouse and during beer storage.
(E)-Non-2-enal and hexanal are the most well-known products of lipid oxidation (Rossi et al., 2014). (E)-Non-2-enal has very low odour thresholds
(Gonçalves et al., 2014) and is most frequently cited as the cause of unpleasant ‘cardboard’ (Saison et al., 2010) or rancid butter off-flavours
(Svoboda et al., 2011) in stored beer. Its concentration was, however, repeatedly seen to increase during aging to levels above the flavour
threshold (approximately 0.03 µg/l) (Baert et al., 2012).

SECTION 2. Beer Volatile Profile Characterization by HS-SPME-GC-MS Chapter 2.2
179
Ketones also play an important role in the flavour of beer. Among the
ketones, particular attention should be paid to the two vicinal diketones, 2,3-butanedione (diacetyl) and 2,3-pentanedione, of which diacetyl is
more flavour-active, and they are of critical importance for beer flavour (Blanco et al., 2014; Branyik et al., 2008). They are produced as by-
products of the biosynthetic pathway of the amino acids valine and isoleucine during primary fermentation (Willaert & Nedovic, 2006). At the
end of the main fermentation, and during maturation, the vicinal diketones are reabsorbed and reduced by yeast to volatile compounds
with relatively high thresholds (Rossi et al., 2014). Diacetyl and 2,3-pentanedione can also be formed during aging, for example, by
decomposition of remaining acetolactic acid (Inoue, 2009), and may even exceed its flavour threshold (Saison et al., 2010). Diacetyl has butter
or butterscotch-like flavours, with a flavour threshold around 0.1 - 0.2 mg/l for lager beers, although flavour thresholds as low as 14 - 6 µg/l have
been reported (Krogerus & Gibson, 2013). 2,3-Pentanedione has characteristic aromas described as honey or toffee-like, with a higher
flavour threshold of around 0.9 - 1.0 mg/l (Smogrovicova & Domeny, 1999; Willaert & Nedovic, 2006).
Quantification of some carbonyl compounds can be used for evaluation
of a complete and proper fermentation. As a result, the quantitative determination of volatile carbonyl content is very important for beer
quality (Saison, De Schutter, Delvaux, et al., 2009). Gas chromatography-mass spectrometry (GC-MS) seems to be the optimal technique for
identification and quantification of carbonyl compounds (da Silva et al., 2012; Dong et al., 2013; Vesely, Lusk, Basarova, Seabrooks, & Ryder,
2003). However, a proper isolation and concentration technique must be applied before the chromatographic analysis, because many non-
volatile beer components, such as sugars, can cause serious damage to the chromatographic system (Andrés-Iglesias, Montero, Sancho, &
Blanco, 2014; da Silva et al., 2012). In the case of beer, several methodologies have been published in which head space (HS) solid
phase microextraction (SPME) has been optimized to analyse a large range of volatile compounds, such as the volatile fraction of raw
materials and wort or the volatile compounds in beer (Charry-Parra, DeJesus-Echevarria, & Perez, 2011; Gonçalves et al., 2014; Moreira et al.,
2013; Riu-Aumatell, Miro, Serra-Cayuela, Buxaderas, & Lopez-Tamames, 2014; Rodriguez-Bencomo et al., 2012).

SECTION 2. Beer Volatile Profile Characterization by HS-SPME-GC-MS Chapter 2.2
180
Given their low volatility, high reactivity owing to the polar carbonyl
group, low concentration and the presence of more abundant esters and alcohols, identification and quantification of carbonyl compounds
by general methodologies is a difficult task (Rossi et al., 2014; Saison, De Schutter, Delvaux, et al., 2009). Therefore, derivatization has become the
easiest, most successful and necessary method to overcome these drawbacks in order to achieve satisfactory recovery and sensitivity
(Andrés-Iglesias et al., 2014). When derivatizationis applied, three strategies can be followed: use of the derivatization reagent in solution
combined with headspace sampling, use of the derivatization reagent in solution combined with direct immersion SPME, or on-fiber derivatization
by loading the derivatization agent onto the fibre and subsequent exposure to the HS of the sample (Saison, De Schutter, Delvaux, et al.,
2009). With on fiber derivatization using O-(2,3,4,5,6-pentafluorobenzyl) hydroxylamine (PFBOA), the reagent selectively reacts with carbonyl
groups of aldehydes and ketones. This reaction leads to the formation of two oxime isomers for each carbonyl compound. These PFBOA
derivatives show a more selective signal than does carbonyl compounds without derivatization (Rossi et al., 2014). Other derivatization reagents,
such as 2,4-dinitrophenylhydrazine (DNPH) or O-(2,3,4,5,6-pentafluorophenyl)methylhydroxylamine hydrochloride (PFBHA), can
also be used (Andrés-Iglesias et al., 2014; Vesely et al., 2003).
In this study, HS-SPME-GC-MS, with prior derivatization by PFBOA, has been successfully applied to the analysis of carbonyl compounds in
Spanish and Czech beers. This methodology and statistical analysis were used to identify, quantify and compare carbonyl compounds in relation
to the country of origin or production processes, in 28 different types of lager beers: pale (including special, high quality, pilsen and regular
lagers), dark and non-alcoholic beers (produced using different technologies).
MATERIALS AND METHODS
Sample and derivatization reagent preparation
Thirteen beers from Spain, including a non-alcoholic one, and fifteen Czech beers, including three non-alcoholic ones of different commercial
brands, were obtained from several local markets. Beers were purchased
SECTION 2. Beer Volatile Profile Characterization by HS-SPME-GC-MS Chapter 2.2
181
as fresh as possible to avoid long storage periods. The alcoholic beers
contained between 3.5 and 6.7 % alcohol by volume (ABV). Among the non-alcoholic beers, the Spanish one contained less than 0.01 % ABV,
and all Czech beers up to 0.5 % ABV. Beer samples were stored at 4ºC until the analysis. 250 ml of each beer were placed in 500 ml glass bottles
and agitated in a shaker for 5 minutes to reduce the CO2 content. Subsequently, for GC-MS analysis, the same number of vials with beer
samples as those of derivatization reagent solution was prepared. 20 ml dark vials sealed with PTFE-silicone septa (Supelco, USA) were used for
sample and derivatization reagent preparation.
For beer samples, vials were loaded with 2.5 g of NaCl (Penta, CZ), 10 ml of beer and 100 µl of an internal standard solution (IS) containing 52.6
ppm 3-fluorobenzaldehyde (Sigma-Aldrich, USA; ≥ 97 % purity). For derivatization reagent, vials contained 2.5 g of NaCl (Penta, CZ), 10 ml of
demineralized water from Mili-Q water Milipore purification system (Milipore, Bedford, USA) and 200 µl of 5978 ppm o-(2,3,4,5,6-
pentafluorobenzyl)hydroxylamine hydrochloride (PFBOA) (Fluka, Germany; ≥ 99 % purity) solution. All vials were stirred for 1 minute to
dissolve the NaCl and to homogenize the sample and derivatization reagent solution.
Gas chromatography-mass spectrometry (GC-MS) equipment
Carbonyl compounds were separated and detected by gas chromatograph (Agilent GC 6890N – Agilent Technologies, USA)
equipped with a quadrupole mass spectrometer detector (Agilent 5975B, Inert MSD – Agilent Technologies, USA). The gas chromatograph
was coupled to a headspace solid phase microextraction (HS-SPME) autosampler (COMBI PAL CTC Analytics, CH). Chromatographic
separations were performed using a HP-5MS 30 m × 0.25 mm × 0.25 µm capillary column (Agilent Technologies, USA). Derivatization process,
extraction and concentration of carbonyl compounds were carried out with 50/30 µm divinylbenzene/ Carboxen®/polydimethylsiloxan
(DVB/CAR/PDMS) fiber (Sulpeco, USA).
Analysis of carbonyl compounds. On-fiber derivatization.
The concentrations of carbonyls in beer samples were measured in triplicate. Head space solid phase microextraction of compounds was
performed at 50°C. The first step was coating of the SPME fiber with

SECTION 2. Beer Volatile Profile Characterization by HS-SPME-GC-MS Chapter 2.2
182
PFBOA for 20 minutes. The coated fibre was subsequently transferred to
the head space of a vial containing degassed beer and held for 60 minutes. Compound desorption was achieved in the injector of the GC
chromatograph in splitless mode for 5 minutes, and the temperature was set at 250°C. Carrier gas was helium at a constant flow rate of 1.1 ml/min.
The oven temperature was programmed as follows: the temperature was
initially set at 40°C and increased at 10°C/min to 140°C, then the temperature was raised at 7°C/min to 250°C, this temperature was held
for 14 minutes, and finally the temperature was increased at 20°C/min to 300°C and this temperature was held for 2 minutes.
The ionization energy was 70 eV, and detection and data acquisition
were performed in scan mode from 20 to 500 Da. For identification, data obtained in the GC-MS analysis were compared with m/z values
compiled in the spectrum library NIST MS Search version 2.0 (National Institute of Standards and Technology, USA).
Validation of compound identification was carried out by comparison of their MS spectra and retention times, with standards. Quantification was
done in SIM mode using quantification ion (m/z=181) and was carried out using standard calibration curves for 2-methylpropanal (≥ 99 %), 3-
methylbutanal (≥ 97 %), (E)-non-2-enal (≥ 97 %), 2,4-pentadione (≥ 97 %) and diacetyl (≥ 97 %) (Sigma-Aldrich, USA), 2-methylbutanal (≥ 97 %)
(Fluka, Germany), heptanal (≥ 97 %), octanal (≥ 98 %), furfural (≥ 98 %) and benzaldehyde (≥ 98 %) (Alfa Aesar, Germany). In order to eliminate
instrumental variations, the peak area of each compound (single peak or double derivative, Figure 1) was normalized to the peak area of the
internal standard – 3-fluorobenzaldehyde (double derivative, Figure 1), the normalized values being then used for statistical analyses.
Statistical analysis
Statistical analysis of the chromatographic data was performed with
Statistica 12 software (StatSoft, Inc., Tulsa, OK, USA). One-way analysis of variance (ANOVA) followed by t-test was used to compare the profile of
beers based on their country of origin and type (regular beers, dark beers and non-alcoholic beers). Significant differences were considered
at a level of p < 0.05. Factorial analysis was used to explain differences between beers by their principal components, factors or eigenvalues
SECTION 2. Beer Volatile Profile Characterization by HS-SPME-GC-MS Chapter 2.2
183
that explain the maximal variability as well as the contribution of each
variable to the factors.
RESULTS AND DISCUSSION
A total of 28 lager beers were analyzed, among them 13 beers were
produced in Spain (samples 1 to 13) and 15 beers were of Czech origin (samples 14 to 28) (Table 1). The carbonyl compound profile consisted of:
3 linear aldehydes ((E)-non-2-enal, heptanal and octanal), 4 Strecker aldehydes (2-methylpropanal, 2-methylbutanal, 3-methylbutanal and
benzaldehyde), 1 heterocyclic aldehyde (furfural) and 2 ketones (2,3-butanedione and 2,3-pentadione). A typical total ion chromatogram
(TIC) of carbonyl compounds of a Spanish regular beer is shown in Fig.1.
HS-SPME-GC-MS analysis of the different types of beer provided the carbonyl compound profile for each sample (Table 2 and Table 3).
Differences in concentration of carbonyl compounds in beers
Flavour stability of beer due to the formation of carbonyl compounds is highly dependent on storage temperature, pH, oxygen level and
exposure to ultraviolet light (Ochiai, Sasamoto, Daishima, Heiden, & Hoffmann, 2003). Some of these compounds originate in the raw
materials; others are formed during beer production and can increase during aging. The presence of these compounds above their threshold
indicates problems in brewing technology and/or storage of beer. A list of carbonyl compounds studied, their flavour thresholds, formation
pathways and flavour descriptors are shown in Table 4.
Results (Table 2 and 3) show that the average concentrations of 2-methylbutanal, 3-methylbutanal, benzaldehyde, furfural, heptanal, (E)-
non-2-enal and 2,3-pentadione in Czech beers were higher than in Spanish beers. For the rest of the carbonyl compounds (2-
methylpropanal, octanal and diacetyl) their concentrations were higher in Spanish beers.
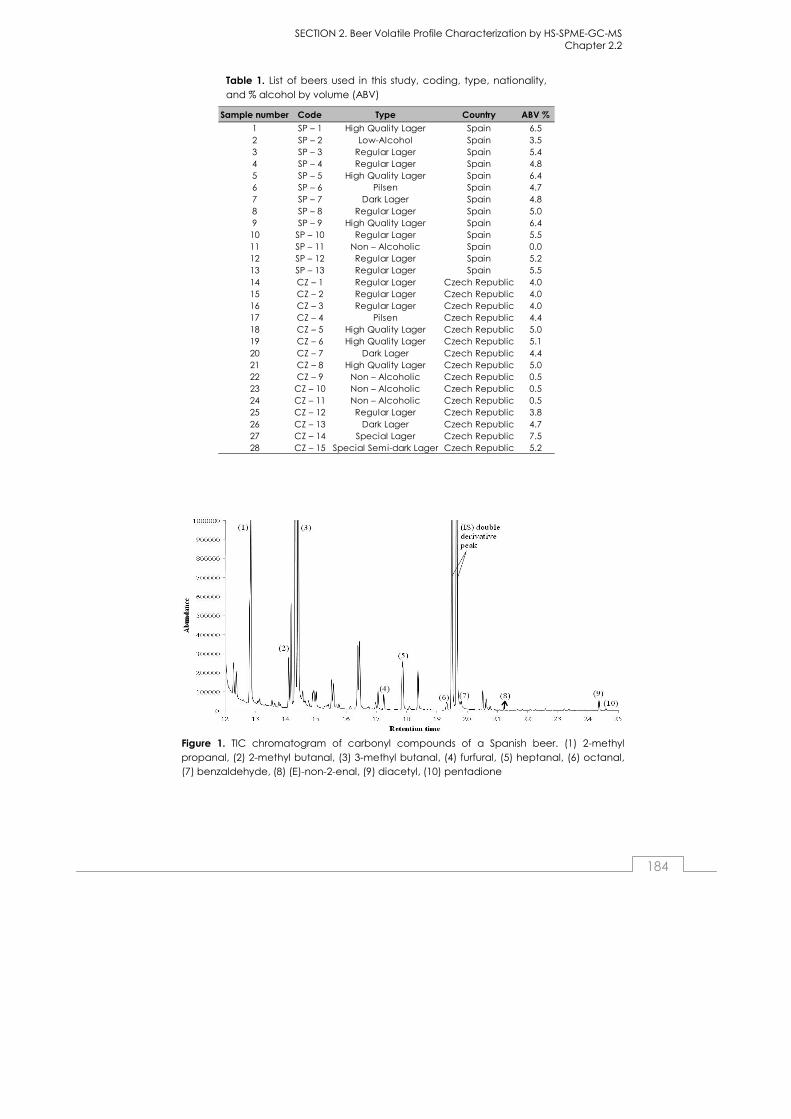
SECTION 2. Beer Volatile Profile Characterization by HS-SPME-GC-MS Chapter 2.2
184
Table 1. List of beers used in this study, coding, type, nationality, and % alcohol by volume (ABV)
1 SP – 1 High Quality Lager Spain 6.52 SP – 2 Low-Alcohol Spain 3.53 SP – 3 Regular Lager Spain 5.44 SP – 4 Regular Lager Spain 4.85 SP – 5 High Quality Lager Spain 6.46 SP – 6 Pilsen Spain 4.77 SP – 7 Dark Lager Spain 4.88 SP – 8 Regular Lager Spain 5.09 SP – 9 High Quality Lager Spain 6.410 SP – 10 Regular Lager Spain 5.511 SP – 11 Non – Alcoholic Spain 0.012 SP – 12 Regular Lager Spain 5.213 SP – 13 Regular Lager Spain 5.514 CZ – 1 Regular Lager Czech Republic 4.015 CZ – 2 Regular Lager Czech Republic 4.016 CZ – 3 Regular Lager Czech Republic 4.017 CZ – 4 Pilsen Czech Republic 4.418 CZ – 5 High Quality Lager Czech Republic 5.019 CZ – 6 High Quality Lager Czech Republic 5.120 CZ – 7 Dark Lager Czech Republic 4.421 CZ – 8 High Quality Lager Czech Republic 5.022 CZ – 9 Non – Alcoholic Czech Republic 0.523 CZ – 10 Non – Alcoholic Czech Republic 0.524 CZ – 11 Non – Alcoholic Czech Republic 0.525 CZ – 12 Regular Lager Czech Republic 3.826 CZ – 13 Dark Lager Czech Republic 4.727 CZ – 14 Special Lager Czech Republic 7.528 CZ – 15 Special Semi-dark Lager Czech Republic 5.2
Sample number Code Type Country ABV %
Figure 1. TIC chromatogram of carbonyl compounds of a Spanish beer. (1) 2-methyl propanal, (2) 2-methyl butanal, (3) 3-methyl butanal, (4) furfural, (5) heptanal, (6) octanal, (7) benzaldehyde, (8) (E)-non-2-enal, (9) diacetyl, (10) pentadione

SECTION 2. Beer Volatile Profile Characterization by HS-SPME-GC-MS Chapter 2.2
185
No
.Rt
Co
mp
oun
ds
SP-1
SP-2
SP-3
S-4
SP-5
SP-6
SP-7
SP-8
SP-9
SP-1
0SP
-11
SP-1
2SP
-13
112
.32-
Me
thyl
pro
pa
na
l2.
428.
4714
.10
4.40
5.63
11.5
022
9.00
19.1
217
.87
12.2
91.
7130
.83
10.0
92
13.7
2-M
eth
ylb
uta
na
l*3.
182.
563.
381.
803.
047.
1060
.41
6.26
6.28
4.18
1.67
6.03
5.24
313
.83-
Me
thyl
bu
tan
al*
2.30
2.18
3.79
2.51
4.45
5.01
47.2
36.
688.
224.
560.
979.
914.
034
16.7
Furf
ura
l20
.29
38.5
944
.80
38.2
830
.01
32.9
020
2.22
24.5
910
0.06
86.2
924
.48
129.
3221
.08
517
.4H
ep
tan
al
0.42
0.13
0.16
0.32
0.56
0.44
2.45
0.55
0.40
0.34
0.28
0.64
0.23
618
.8O
cta
na
l0.
250.
050.
060.
120.
150.
300.
790.
180.
150.
110.
180.
200.
077
19.3
Be
nza
lde
hyd
e11
.55
13.1
112
.86
13.0
212
.82
8.72
16.9
68.
6320
.35
16.1
29.
6318
.07
8.41
821
.3( E
)-N
on
-2-e
na
l0.
220.
110.
170.
370.
260.
311.
810.
730.
550.
440.
090.
830.
259
23.9
2-3
Bu
tan
ed
ion
e (
dia
ce
tyl)
*12
.67
7.17
8.15
20.4
120
.48
14.6
552
.19
12.9
012
9.49
90.6
210
.14
88.7
919
.58
1024
.12.
3-P
en
tan
ed
ion
e*
32.1
415
.67
23.8
544
.46
51.8
536
.96
112.
8032
.41
281.
2822
3.21
24.6
025
2.76
53.9
5
No
.Rt
Co
mp
oun
ds
CZ-
1C
Z-2
CZ-
3C
Z-4
CZ-
5C
Z-6
CZ-
7C
Z-8
CZ-
9C
Z-10
CZ-
11C
Z-12
CZ-
13C
Z-14
CZ-
151
12.3
2-M
eth
ylp
rop
an
al
11.1
611
.26
8.72
14.5
018
.54
15.5
357
.96
38.1
628
.39
4.63
4.97
8.15
49.4
935
.75
53.2
82
13.7
2-M
eth
ylb
uta
na
l*4.
296.
624.
739.
006.
958.
2834
.51
9.92
15.8
83.
163.
343.
3025
.17
10.8
429
.55
313
.83-
Me
thyl
bu
tan
al*
6.94
7.05
6.11
10.0
97.
549.
9138
.20
13.6
327
.14
3.57
3.68
4.33
22.0
313
.15
32.3
84
16.7
Furf
ura
l42
.69
100.
3678
.37
48.6
553
.20
46.9
317
4.39
97.3
290
.26
13.2
145
.68
31.6
285
.59
81.1
384
.17
517
.4H
ep
tan
al
0.65
0.87
0.57
0.81
0.76
0.79
1.43
1.33
1.39
0.20
0.30
0.35
0.81
1.11
1.32
618
.8O
cta
na
l0.
140.
190.
120.
170.
150.
170.
330.
230.
230.
040.
080.
110.
190.
290.
357
19.3
Be
nza
lde
hyd
e12
.81
18.5
912
.74
13.6
614
.25
14.1
921
.76
15.0
318
.85
9.77
14.9
611
.61
15.9
116
.13
15.5
08
21.3
(E
)-N
on
-2-e
na
l3.
625.
253.
603.
864.
034.
016.
144.
245.
322.
774.
223.
284.
494.
554.
389
23.9
2-3
Bu
tan
ed
ion
e (
dia
ce
tyl)
*3.
445.
184.
013.
614.
214.
1214
.12
5.71
8.68
2.25
4.28
6.78
8.17
14.7
416
.11
1024
.12,
3-P
en
tan
ed
ion
e66
.98
127.
2297
.70
179.
3410
9.09
159.
8834
5.64
114.
0814
2.57
16.6
639
.25
60.4
012
0.70
220.
7717
6.90
Spa
nish
Be
ers
(µ
g/l
)
Cze
ch
Bee
rs (
µg
/l)
* D
ou
ble
de
riva
tive
with
PFB
OA
* D
ou
ble
de
riva
tive
with
PFB
OA
Tab
le 2
. Co
nc
en
tra
tion
s o
f c
arb
on
yl c
om
po
un
ds
an
d t
he
ir re
ten
tion
tim
e (
Rt)
as
de
term
ine
d in
Sp
an
ish
be
er
sam
ple
s
Tab
le 3
. Co
nc
en
tra
tion
s o
f c
arb
on
yl c
om
po
un
ds
an
d t
he
ir re
ten
tion
tim
e (
Rt)
as
de
term
ine
d in
Cze
ch
be
er
sam
ple
s
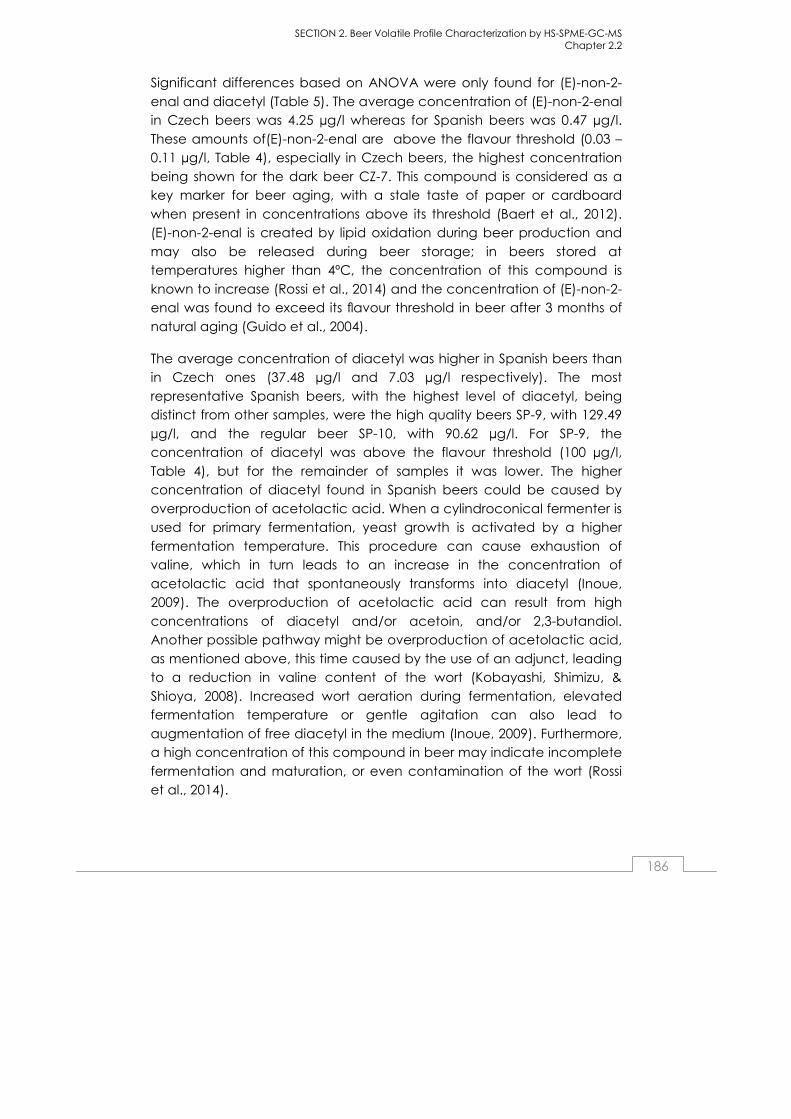
SECTION 2. Beer Volatile Profile Characterization by HS-SPME-GC-MS Chapter 2.2
186
Significant differences based on ANOVA were only found for (E)-non-2-
enal and diacetyl (Table 5). The average concentration of (E)-non-2-enal in Czech beers was 4.25 µg/l whereas for Spanish beers was 0.47 µg/l.
These amounts of(E)-non-2-enal are above the flavour threshold (0.03 – 0.11 µg/l, Table 4), especially in Czech beers, the highest concentration
being shown for the dark beer CZ-7. This compound is considered as a key marker for beer aging, with a stale taste of paper or cardboard
when present in concentrations above its threshold (Baert et al., 2012). (E)-non-2-enal is created by lipid oxidation during beer production and
may also be released during beer storage; in beers stored at temperatures higher than 4ºC, the concentration of this compound is
known to increase (Rossi et al., 2014) and the concentration of (E)-non-2-enal was found to exceed its flavour threshold in beer after 3 months of
natural aging (Guido et al., 2004).
The average concentration of diacetyl was higher in Spanish beers than in Czech ones (37.48 µg/l and 7.03 µg/l respectively). The most
representative Spanish beers, with the highest level of diacetyl, being distinct from other samples, were the high quality beers SP-9, with 129.49
µg/l, and the regular beer SP-10, with 90.62 µg/l. For SP-9, the concentration of diacetyl was above the flavour threshold (100 µg/l,
Table 4), but for the remainder of samples it was lower. The higher concentration of diacetyl found in Spanish beers could be caused by
overproduction of acetolactic acid. When a cylindroconical fermenter is used for primary fermentation, yeast growth is activated by a higher
fermentation temperature. This procedure can cause exhaustion of valine, which in turn leads to an increase in the concentration of
acetolactic acid that spontaneously transforms into diacetyl (Inoue, 2009). The overproduction of acetolactic acid can result from high
concentrations of diacetyl and/or acetoin, and/or 2,3-butandiol. Another possible pathway might be overproduction of acetolactic acid,
as mentioned above, this time caused by the use of an adjunct, leading to a reduction in valine content of the wort (Kobayashi, Shimizu, &
Shioya, 2008). Increased wort aeration during fermentation, elevated fermentation temperature or gentle agitation can also lead to
augmentation of free diacetyl in the medium (Inoue, 2009). Furthermore, a high concentration of this compound in beer may indicate incomplete
fermentation and maturation, or even contamination of the wort (Rossi et al., 2014).

SECTION 2. Beer Volatile Profile Characterization by HS-SPME-GC-MS Chapter 2.2
187
In non-alcoholic beers, the average concentrations of particular
carbonyl compounds were lower or similar in comparison to their concentration in regular beers. SP-11, which was produced by vacuum
distillation, had the lowest concentrations of 2-methylpropanal, 2-methylbutanal, 3-methylbutanal and (E)-non-2-enal in comparison with
the other alcohol free beers. CZ-11, produced by vacuum distillation, and CZ-10, produced by the special yeast Saccharomycodes ludwigii,
had similar low concentrations of carbonyl compounds, with the lowest concentrations of furfural, octanal, diacetyl and 2,3-pentanedione being
shown by CZ-10. In the case of CZ-9, a non-alcoholic beer produced by limited fermentation using a mashing process that reduces fermentable
sugars in the wort, and a short fermentation time, the concentration of carbonyl compounds was close to that in regular beers (Tables 2 and 3).
This fact could be due, at least partly, to the special wort used for the production of this beer. As for other beers studied, the concentration of
(E)-non-2-enal in non-alcoholic beers was at the limit of the flavour threshold (3.10 µg/l), but in this case, the absence of ethanol and a
higher level of mono and disaccharides could have intensified its undesirable flavour (Perpete & Collin, 2000). Measured data showed
significant differences between types of beers (non-alcoholic, dark and regular), and particularly dark beers when comparing with non-alcoholic
and regular beers. These significant differences were related to 2-methylpropanal, 2 and 3-methylbutanal, furfural, heptanal and octanal.
Some beer aldehydes, such as heptanal and octanal, produced by lipooxygenases and hydroperoxide isomerases from cereal grains, are
formed during the malting process (Riu-Aumatell et al., 2014). The different malt used for dark beer production and the roasting process at
higher temperatures can increase the concentration of these carbonyl compounds. Roasting temperatures that are responsible for different
colours of malt because of Maillard reactions most likely lead to the formation of more Maillard intermediates, which become reactive
substrates during aging of dark beers (Bart., Filip, Luk, Hubert, & R., 2007; Riu-Aumatell et al., 2014).

SECTION 2. Beer Volatile Profile Characterization by HS-SPME-GC-MS Chapter 2.2
188
Na
me
Gro
up
sTh
resh
old
(µg
/l)
Form
atio
n /
De
scrip
tion
Fla
vor
de
scrip
tors
2-M
eth
ylp
rop
an
al
Ste
cke
r
ald
eh
yd
e86
- 1
000
Pro
du
ce
d t
hro
ug
h t
he
Str
ec
ker d
eg
rad
atio
n o
f th
e a
min
o a
cid
va
line
; ma
y b
e re
lea
sed
by
th
e o
xid
ativ
e
de
gra
da
tion
of
isoh
um
ulo
ne
s; c
om
po
ne
nt
of
ag
ed
be
er a
nd
ina
pp
rop
riate
sto
rag
e o
f th
e f
inish
ed
be
er i
n
ad
dic
tion
to
oxy
ge
n e
xpo
sure
; cre
atio
n b
y in
suff
icie
nt
bo
iling
of
wo
rt (
too
litt
le e
va
po
ratio
n).
Gra
iny
, Va
rnish
, Fru
ity (
1, 4
)
2-M
eth
ylb
uta
na
l St
ec
ker
ald
eh
yd
e45
- 1
250
Pro
du
ce
d t
hro
ug
h t
he
Str
ec
ker d
eg
rad
atio
n o
f th
e a
min
o a
cid
iso
leu
cin
e; i
nc
rea
sed
fo
rma
tion
at
hig
h
oxy
ge
n c
on
ce
ntr
atio
ns,
ina
pp
rop
riate
sto
rag
e o
f th
e f
inish
ed
be
er (
oxy
ge
n).
Alm
on
d, A
pp
le-li
ke, M
alty
(1,
4)
3-M
eth
ylb
uta
na
l St
ec
ker
ald
eh
yd
e56
- 6
00P
rod
uc
ed
th
rou
gh
th
e S
tre
cke
r de
gra
da
tion
of
the
am
ino
ac
id le
uc
in; c
om
po
ne
nt
of
ag
ed
be
er a
nd
ina
pp
rop
riate
sto
rag
e o
f th
e f
inish
ed
be
er,
as
we
ll a
s o
xyg
en
exp
osu
re, i
nd
ica
tor f
or t
he
rma
l lo
ad
Ma
lty, C
ho
co
late
, Ch
erry
,
Alm
on
d (
1, 4
)
Ben
zald
eh
yd
eSt
ec
ker
ald
eh
yd
e51
5 -
2000
Inc
rea
sed
fo
rma
tion
with
hig
h o
xyg
en
co
nc
en
tra
tion
s d
urin
g b
rew
ing
an
d p
ac
kag
ing
as
we
ll a
s
ina
pp
rop
riate
sto
rag
e o
f th
e f
inish
ed
be
er,
co
mp
on
en
t in
ag
ed
be
er
Alm
on
d, C
he
rry, S
ton
e (
1, 4
)
He
pta
na
lLi
ne
ar a
lde
hy
de
75 -
80
Cre
ate
d b
y t
he
de
gre
da
tion
(e
nzy
ma
tic, a
uto
- o
r ph
oto
oxi
da
tive
) of
the
fa
tty
ac
id o
leic
ac
id d
urin
g
ag
ing
.A
lde
hy
de
, Vin
ou
s, B
itte
r (2)
Oc
tan
al
Lin
ea
r ald
eh
yd
e40
Cre
ate
d b
y t
he
de
gre
da
tion
(e
nzy
ma
tic, a
uto
- o
r ph
oto
oxi
da
tive
) of
the
fa
tty
ac
id o
leic
ac
id d
urin
g
ag
ing
.
Ald
eh
yd
ic, O
ran
ge
pe
el,
Bitt
er
(2, 4
)
Furf
ura
lH
ete
roc
yc
lic
co
mp
ou
nd
1500
0 -
1500
00P
rod
uc
t o
f th
e M
ailla
rd re
ac
tion
, fo
rme
d d
urin
g b
oilin
g, i
nd
ica
tor f
or f
lav
or i
nst
ab
ility
in b
ee
r, c
om
po
ne
nt
of
ag
ed
be
er
Ca
ram
el,
Bre
ad
y, C
oo
ked
me
at
(1, 4
)
(E)-
No
n-2
-en
al
Lin
ea
r ald
eh
yd
e0.
03 -
0.1
1
Ca
n b
e c
rea
ted
by
au
to-o
xid
atio
n o
r an
en
zym
atic
oxi
da
tion
of
lino
leic
ac
id a
nd
lin
ole
nic
ac
id w
ith
lipo
xyg
en
ase
s d
urin
g m
ash
ing
an
d m
alti
ng
, also
cre
ate
d b
y t
he
rea
ctio
n b
etw
ee
n h
ep
tan
al a
nd
ac
eta
lde
hy
de
, (E
)-n
on
-2-e
na
l ca
n e
nzi
ma
tica
lly b
e re
du
ce
d b
y y
ea
st u
sing
an
en
zym
e t
ha
t a
cts
like
an
ald
eh
yd
e re
du
cta
se; d
ec
rea
ses
sign
ica
ntly
aft
er 3
6h o
f fe
rme
nta
tion
; in
ap
pro
pria
te s
tora
ge
of
the
finish
ed
be
er i
nc
rea
ses
its le
ve
l
Ca
rdb
oa
rd, P
ap
ery
, Cu
cu
mb
er
(1, 2
, 3, 4
)
2,3-
Buta
ne
dio
ne
(Dia
ce
tyl)
Ke
ton
e10
0 -
200
Fro
m α
-ac
eto
hy
dro
xy a
cid
sth
at
are
exc
rete
d d
urin
g f
erm
en
tatio
n b
y y
ea
st c
ells
to
th
e w
ort
wh
ere
th
ey
un
de
rgo
sp
on
tan
eo
us
oxi
da
tive
de
ca
rbo
xyla
tion
to
dia
ce
tyl;
oc
cu
rs a
t th
e e
nd
of
the
co
nv
en
tion
al m
ain
pe
riod
of
ferm
en
tatio
n a
nd
du
ring
th
e m
atu
ratio
n o
f b
ee
r; fo
rma
tion
co
rrela
tes
to t
he
am
ino
ac
id
co
nte
nt
in w
ort
; ma
y b
e f
orm
ed
in p
ac
kag
ed
be
er a
s a
resu
lt o
f M
ailla
rd re
ac
tion
s o
r oxi
da
tion
of
ac
eto
in
an
d 2
,3-b
uta
ne
dio
l; to
o s
ho
rt m
atu
ratio
n, p
oo
r ye
ast
vita
lity
, to
o m
an
y re
pitc
he
s, o
ld y
ea
st, y
ea
st s
tore
d
too
lon
g a
lso in
cre
ase
s d
iac
ety
l co
nte
nt;
ca
n b
e f
orm
ed
by
co
nta
min
atio
n w
ith s
om
e m
icro
org
an
isms.
Butt
ers
co
tch
, Bu
tte
ry, B
utt
erm
ilk,
Ra
nc
id (
2, 3
, 4, 5
)
2,3-
Pe
nta
ne
dio
ne
K
eto
ne
900
- 10
00In
term
ed
iate
pro
du
ct
du
ring
th
e s
yn
the
sis o
f v
alin
e a
nd
iso
leu
cin
e; c
an
be
fo
rme
d b
y b
ac
teria
l in
fec
tion
.M
old
y, W
oo
d-li
ke (
5)
Tab
le 4
. Ca
rbo
nyl
co
mp
ou
nd
s st
ud
ied
, fla
vou
r th
resh
old
, fo
rma
tion
in b
ee
r a
nd
fla
vou
r d
esc
ripto
rs
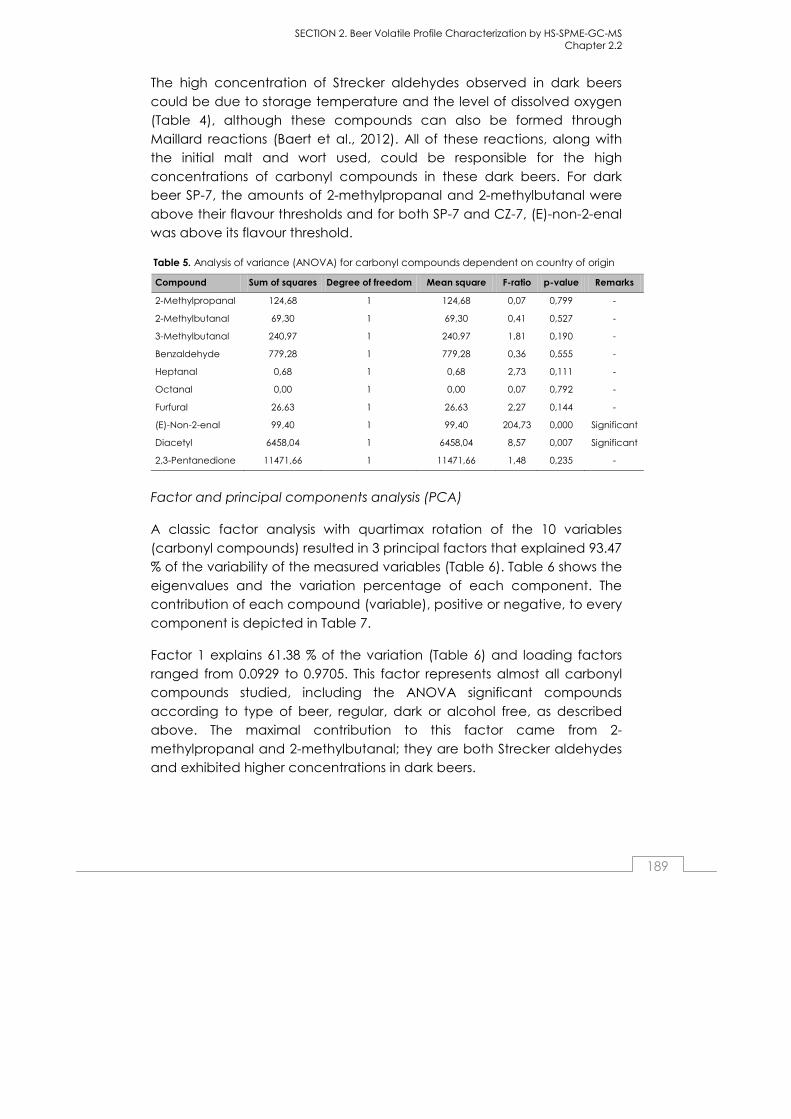
SECTION 2. Beer Volatile Profile Characterization by HS-SPME-GC-MS Chapter 2.2
189
The high concentration of Strecker aldehydes observed in dark beers
could be due to storage temperature and the level of dissolved oxygen (Table 4), although these compounds can also be formed through
Maillard reactions (Baert et al., 2012). All of these reactions, along with the initial malt and wort used, could be responsible for the high
concentrations of carbonyl compounds in these dark beers. For dark beer SP-7, the amounts of 2-methylpropanal and 2-methylbutanal were
above their flavour thresholds and for both SP-7 and CZ-7, (E)-non-2-enal was above its flavour threshold.
Table 5. Analysis of variance (ANOVA) for carbonyl compounds dependent on country of origin
Compound Sum of squares Degree of freedom Mean square F-ratio p-value Remarks
2-Methylpropanal 124,68 1 124,68 0,07 0,799 -
2-Methylbutanal 69,30 1 69,30 0,41 0,527 -
3-Methylbutanal 240,97 1 240,97 1,81 0,190 -
Benzaldehyde 779,28 1 779,28 0,36 0,555 -
Heptanal 0,68 1 0,68 2,73 0,111 -
Octanal 0,00 1 0,00 0,07 0,792 -
Furfural 26,63 1 26,63 2,27 0,144 -
(E)-Non-2-enal 99,40 1 99,40 204,73 0,000 Significant
Diacetyl 6458,04 1 6458,04 8,57 0,007 Significant
2,3-Pentanedione 11471,66 1 11471,66 1,48 0,235 -
Factor and principal components analysis (PCA)
A classic factor analysis with quartimax rotation of the 10 variables
(carbonyl compounds) resulted in 3 principal factors that explained 93.47 % of the variability of the measured variables (Table 6). Table 6 shows the
eigenvalues and the variation percentage of each component. The contribution of each compound (variable), positive or negative, to every
component is depicted in Table 7.
Factor 1 explains 61.38 % of the variation (Table 6) and loading factors
ranged from 0.0929 to 0.9705. This factor represents almost all carbonyl compounds studied, including the ANOVA significant compounds
according to type of beer, regular, dark or alcohol free, as described above. The maximal contribution to this factor came from 2-
methylpropanal and 2-methylbutanal; they are both Strecker aldehydes and exhibited higher concentrations in dark beers.
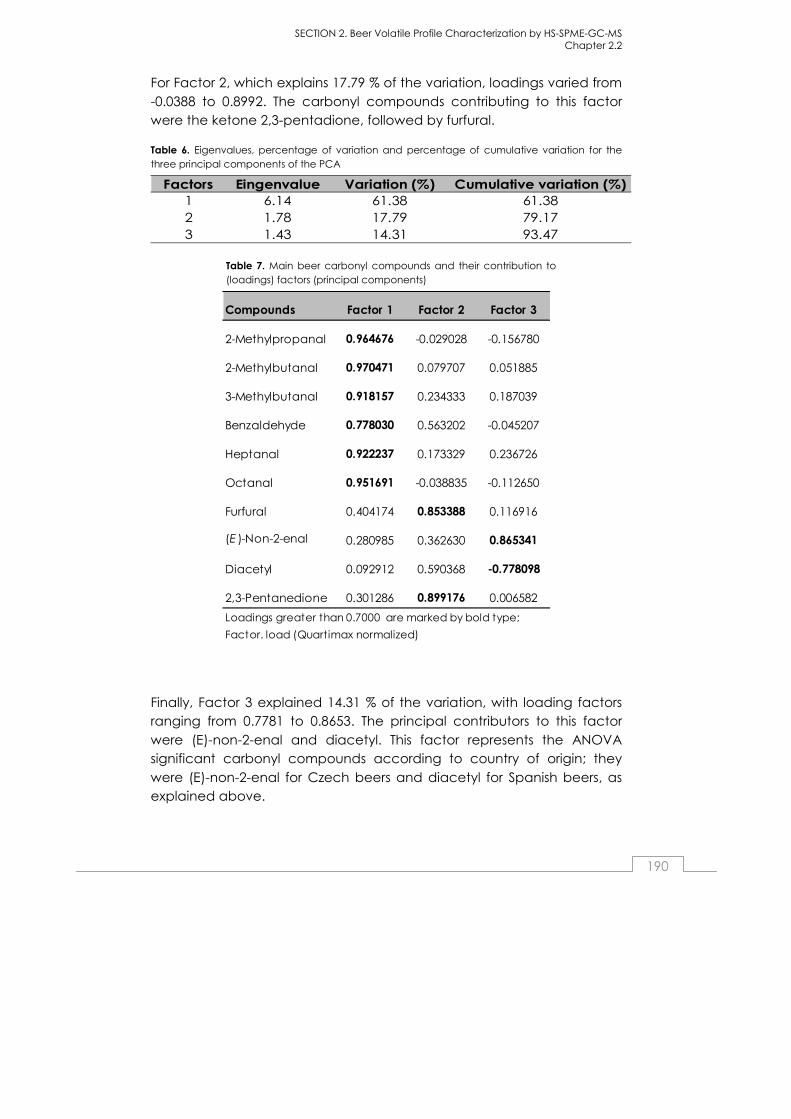
SECTION 2. Beer Volatile Profile Characterization by HS-SPME-GC-MS Chapter 2.2
190
For Factor 2, which explains 17.79 % of the variation, loadings varied from
-0.0388 to 0.8992. The carbonyl compounds contributing to this factor were the ketone 2,3-pentadione, followed by furfural.
Table 6. Eigenvalues, percentage of variation and percentage of cumulative variation for the three principal components of the PCA
Factors Eingenvalue Variation (%) Cumulative variation (%)1 6.14 61.38 61.382 1.78 17.79 79.173 1.43 14.31 93.47
Table 7. Main beer carbonyl compounds and their contribution to (loadings) factors (principal components)
Compounds Factor 1 Factor 2 Factor 3
2-Methylpropanal 0.964676 -0.029028 -0.156780
2-Methylbutanal 0.970471 0.079707 0.051885
3-Methylbutanal 0.918157 0.234333 0.187039
Benzaldehyde 0.778030 0.563202 -0.045207
Heptanal 0.922237 0.173329 0.236726
Octanal 0.951691 -0.038835 -0.112650
Furfural 0.404174 0.853388 0.116916
(E )-Non-2-enal 0.280985 0.362630 0.865341
Diacetyl 0.092912 0.590368 -0.778098
2,3-Pentanedione 0.301286 0.899176 0.006582
Loadings greater than 0.7000 are marked by bold type;
Factor. load (Quartimax normalized)
Finally, Factor 3 explained 14.31 % of the variation, with loading factors ranging from 0.7781 to 0.8653. The principal contributors to this factor
were (E)-non-2-enal and diacetyl. This factor represents the ANOVA significant carbonyl compounds according to country of origin; they
were (E)-non-2-enal for Czech beers and diacetyl for Spanish beers, as explained above.

SECTION 2. Beer Volatile Profile Characterization by HS-SPME-GC-MS Chapter 2.2
191
The scatterplot resulting from PCA analysis (Fig. 2) was used to visualize
beer sample grouping. Factor 1 and Factor 3 show that the samples could be separated in 2 main groups according to their carbonyl
compound content. One group contained Spanish beers and fell on the positive side of Factor 3. Another group contained Czech beers, all of
which were located on the negative side of Factor 3. Therefore, these results point out that the most relevant carbonyl compounds in the
differentiation of beers by country of origin are diacetyl for Spanish beers and (E)-non-2-enal for Czech beers. SP-7 and CZ-7 were shown to be
clearly separated from the respective SP and CZ groups; these dark beers were characterized by the substantially high concentration of most
of the carbonyl compounds, but in particular furfural, 2,3-pentanedione and 2-methylpropanal.
Figure 2. PCA - scatterplot of beers sorted by their carbonyl compound content
CONCLUSIONS
In this study, we report a comparative analysis of carbonyl compounds in Czech and Spanish beers. Ten carbonyl compounds were identified and
quantified in 28 samples of different types of lager beers. Results confirm that the carbonyl compound profile of Czech and Spanish beers is
SECTION 2. Beer Volatile Profile Characterization by HS-SPME-GC-MS Chapter 2.2
192
different, mainly being due to the concentrations of (E)-non-2-enal and
diacetyl. Factor analysis showed 3 principal components contributed to the differences between Spanish and Czech beers, each factor being
mainly related to significant differences with regard to country of origin and type of beer. Two factors explained about 76 % of variability and
were related to Strecker aldehydes (Factor 1) and (E)-non-2-enal and diacetyl contents (Factor 3). Factor 2 describes Maillard products, such
as furfural and 2,3-pentadione, which are present in dark beers. The PCA scatterplot showed that differences based on nationality were due to
Factor 3, which was mainly contributed by (E)-Non-2-enal and diacetyl. Non-alcoholic beers had a very low content of carbonyl compounds,
with the exception of a non-alcoholic Czech beer (CZ-9) that is made by arrested or limited fermentation using a mashing process that reduces
fermentable sugars in the wort, and a short fermentation time; this beer had a carbonyl compound profile closer to that of regular beers.
Acknowledgments
Supported by the Ministry of Education, Youth and Sports of the Czech Republic, Project No. MSM 6046137305, and Research Centre, Projects
No. 1M0570.
References
Andrés-Iglesias, C., Montero, O., Sancho, D., & Blanco, C. A. (2014). New
trends in beer flavour compound analysis. Journal of the Science of Food and Agriculture, DOI:10.1002/jsfa.6905.
Baert, J. J., De Clippeleer, J., Hughes, P. S., De Cooman, L., & Aerts, G.
(2012). On the Origin of Free and Bound Staling Aldehydes in Beer. Journal of Agricultural and Food Chemistry, 60(46), 11449-11472.
Bart., V., Filip, D., Luk, D., Hubert, V., & R., D. F. (2007). Aging
characteristics of different beer types. Food Chemistry, 103(2), 404-412.
Blanco, C. A., Andrés-Iglesias, C., & Montero, O. ( 2014). Low-alcohol
beers: Flavour compounds, defects and improvement strategies.
SECTION 2. Beer Volatile Profile Characterization by HS-SPME-GC-MS Chapter 2.2
193
Critical Reviews in Food Science and Nutrition. doi:
DOI:10.1080/10408398.2012.733979.
Boulton, C., & Quain, D. (2001). The biochemistry of fermentation. In B. Science (Ed.), Brewing yeast and fermentation (pp. 69-142). Oxford,
U.K.
Branyik, T., Vicente, A. A., Dostalek, P., & Teixeira, J. A. (2008). A review of flavour formation in continuous beer fermentations. Journal of the
Institute of Brewing, 114(1), 3-13.
Bravo, A., Herrera, J. C., Scherer, E., Ju-Nam, Y., Ruebsam, H., Madrid, J.,
& Rangel-Aldao, R. (2008). Formation of alpha-dicarbonyl compounds in beer during storage of Pilsner. Journal of Agricultural and Food
Chemistry, 56(11), 4134-4144.
Bueno, M., Zapata, J., & Ferreira, V. (2014). Simultaneous determination of free and bonded forms of odor-active carbonyls in wine using a
headspace solid phase microextraction strategy. Journal of Chromatography A, 1369, 33-42.
Charry-Parra, G., DeJesus-Echevarria, M., & Perez, F. J. (2011). Beer
Volatile Analysis: Optimization of HS/SPME Coupled to GC/MS/FID. Journal of Food Science, 76(2), C205-C211.
da Costa, M. S., Goncalves, C., Ferreira, A., Ibsen, C., de Pinho, P. G., & Ferreira, A. C. S. (2004). Further insights into the role of methional and
phenylacetaldehyde in lager beer flavor stability. Journal of Agricultural and Food Chemistry, 52(26), 7911-7917.
da Silva, G. A., Maretto, D. A., Bolini, H. M. A., Teofilo, R. F., Augusto, F., &
Poppi, R. J. (2012). Correlation of quantitative sensorial descriptors and chromatographic signals of beer using multivariate calibration
strategies. Food Chemistry, 134(3), 1673-1681.
Dong, L., Piao, Y., Zhang, X., Zhao, C., Hou, Y., & Shi, Z. (2013). Analysis of volatile compounds from a malting process using headspace solid-
phase micro-extraction and GC-MS. Food Research International, 51(2), 783-789.
Gonçalves, J. L., Figueira, J. A., Rodrigues, F. P., Ornelas, L. P., Branco, R. N., Silva, C. L., & Camara, J. S. (2014). A powerful methodological
SECTION 2. Beer Volatile Profile Characterization by HS-SPME-GC-MS Chapter 2.2
194
approach combining headspace solid phase microextraction, mass
spectrometry and multivariate analysis for profiling the volatile metabolomic pattern of beer starting raw materials. Food Chemistry,
160, 266-280.
Guido, L. F., Carneiro, J. R., Santos, J. R., Almeida, P. J., Rodrigues, J. A., & Barros, A. A. (2004). Simultaneous determination of E-2-nonenal and
beta-damascenone in beer by reversed-phase liquid chromatography with UV detection. Journal of Chromatography A, 1032(1-2), 17-22.
Guido, L. F., Rajendram, R., & Barros, A. A. (2009). Pitching Yeast and
Beer Flavor. In V. R. Preedy (Ed.), Beer in health and disease prevention. London, UK: Academic Press.
Hempel, A., O'Sullivan, M. G., Papkovsky, D. B., & Kerry, J. P. (2013). Use of optical oxygen sensors to monitor residual oxygen in pre- and post-
pasteurised bottled beer and its effect on sensory attributes and product acceptability during simulated commercial storage. LWT -
Food Science and Technology, 50(1), 226-231.
Inoue, T. (2009). Beer. In A. S. o. B. Chemists (Ed.), Diacetyl in Fermented Foods and Beverages (Vol. 115, pp. 45-75): Blackwell Publishing Ltd.
Kobayashi, M., Shimizu, H., & Shioya, S. (2008). Beer Volatile Compounds
and Their Application to Low-Malt Beer Fermentation. Journal of Bioscience and Bioengineering, 106(4), 317-323.
Krogerus, K., & Gibson, B. R. (2013). 125th Anniversary Review: Diacetyl and its control during brewery fermentation. Journal of the Institute of
Brewing, 119(3), 86-97.
Meilgaard, M. C. (1975). Flavor Chemistry of Beer Part II: Flavor and Threshold of 239 Aroma Volatiles. (Vol. 12, 151-168): MBAA Technical
Quarterly.
Moreira, N., Meireles, S., Brandao, T., & de Pinho, P. G. (2013). Optimization of the HS-SPME-GC-IT/MS method using a central
composite design for volatile carbonyl compounds determination in beers. Talanta, 117, 523-531.
Ochiai, N., Sasamoto, K., Daishima, S., Heiden, A. C., & Hoffmann, A. (2003). Determination of stale-flavor carbonyl compounds in beer by stir

SECTION 2. Beer Volatile Profile Characterization by HS-SPME-GC-MS Chapter 2.2
195
bar sorptive extraction with in-situ derivatization and thermal
desorption-gas chromatography-mass spectrometry. Journal of Chromatography A, 986(1), 101-110.
Perpete, P., & Collin, S. (2000). Influence of beer ethanol content on the
wort flavour perception. Food Chemistry, 71(3), 379-385.
Riu-Aumatell, M., Miro, P., Serra-Cayuela, A., Buxaderas, S., & Lopez-Tamames, E. (2014). Assessment of the aroma profiles of low-alcohol
beers using HS-SPME-GC-MS. Food Research International, 57, 196-202.
Rodriguez-Bencomo, J. J., Munoz-Gonzalez, C., Jose Martin-Alvarez, P.,
Lazaro, E., Mancebo, R., Castane, X., & Angeles Pozo-Bayon, M. (2012). Optimization of a HS-SPME-GC-MS Procedure for Beer Volatile Profiling
Using Response Surface Methodology: Application to Follow Aroma Stability of Beers Under Different Storage Conditions. Food Analytical
Methods, 5(6), 1386-1397.
Rossi, S., Sileoni, V., Perretti, G., & Marconi, O. (2014). Characterization of the volatile profiles of beer using headspace solid-phase
microextraction and gas chromatography-mass spectrometry. Journal of the Science of Food and Agriculture, 94(5), 919-928.
Saison, D., De Schutter, D. P., Delvaux, F., & Delvaux, F. R. (2009).
Determination of carbonyl compounds in beer by derivatisation and headspace solid-phase microextraction in combination with gas
chromatography and mass spectrometry. Journal of Chromatography A, 1216(26), 5061-5068.
Saison, D., De Schutter, D. P., Uyttenhove, B., Delvaux, F., & Delvaux, F. R. (2009). Contribution of staling compounds to the aged flavour of lager
beer by studying their flavour thresholds. Food Chemistry, 114(4), 1206-1215.
Saison, D., De Schutter, D. P., Vanbeneden, N., Daenen, L., Delvaux, F., &
Delvaux, F. R. (2010). Decrease of Aged Beer Aroma by the Reducing Activity of Brewing Yeast. Journal of Agricultural and Food Chemistry,
58(5), 3107-3115.
Smogrovicova, D., & Domeny, Z. (1999). Beer volatile by-product formation at different fermentation temperature using immobilised
yeasts. Process Biochemistry, 34(8), 785-794.

SECTION 2. Beer Volatile Profile Characterization by HS-SPME-GC-MS Chapter 2.2
196
Svoboda, Z., Mikulikova, R., Belakova, S., Benesova, K., Marova, I., &
Nesvadba, Z. (2011). Optimization of Modern Analytical SPME and SPDE Methods for Determination of Trans-2-nonenal in Barley, Malt and Beer.
Chromatographia, 73, S157-S161.
Vanderhaegen, B., Neven, H., Verachtert, H., & Derdelinckx, G. (2006). The chemistry of beer aging - a critical review. Food Chemistry, 95(3),
357-381.
Vesely, P., Lusk, L., Basarova, G., Seabrooks, J., & Ryder, D. (2003). Analysis of aldehydes in beer using solid-phase microextraction with on-
fiber derivatization and gas chromatography/mass spectrometry. Journal of Agricultural and Food Chemistry, 51(24), 6941-6944.
Willaert, R., & Nedovic, V. A. (2006). Primary beer fermentation by immobilised yeast - a review on flavour formation and control
strategies. Journal of Chemical Technology and Biotechnology, 81(8), 1353-1367.

SECTIONSECTIONSECTIONSECTION 3. 3. 3. 3.
BEER VOLATILE
COMPOUND
CHANGES DURING
LAB-SCALE
DEALCOHOLIZATION
PROCESS

Chapter 3.1
Volatile compound profiling in
commercial lager regular beers and
derived alcohol free beers after vacuum
distillation dealcoholization
By
Cristina Andrés-Iglesiasa, Carlos A. Blancoa*, Juan
García-Sernab, Valentín Pandoc, Olimpio Monterod a Departamento de Ingeniería Agrícola y Forestal (Área de Tecnologia de los Alimentos), E.T.S. Ingenierías Agrarias, Universidad de Valladolid, Avda. de Madrid
44, 34004 Palencia, España
b High Pressure Processes Group, Department of Chemical Engineering and Environmental Tech., University of Valladolid, 47011 Valladolid, Spain c Departamento de Estadística e Investigación Operativa, E.T.S. Ingenierías.
Agrarias, Universidad de Valladolid, Avda. de Madrid 44, 34004 Palencia, España
d Centre for Biothechnology Development (CDB), Spanish Council for Scientific Research (CSIC), Francisco Vallés 8, Boecillo´s Technological Park, 47151 Boecillo,
Valladolid, Spain
SUBMITTED TO:
FOOD CHEMISTRY
June 2015
SECTION 3. Beer volatile Compounds Changes during Lab-scale Dealcoholization Process Chapter 3.1
Abstract
Alcohol free beers are characterized by less aroma and body than regular
ones. Seven flavor compounds were chosen as indicators in dealcoholization experiments at 102 mbar and 200 mbar. Compounds were
analyzed by HS-SPME-GC-MS. Also, content in aroma related compounds were compared between commercial regular and alcohol free beers. In
dealcoholization experiments by vacuum distillation most of the compounds were shown to be evaporated in the first vapor fraction. The
compounds that mainly remained in alcohol free beers were amyl alcohols and 2-phenylethanol; this might explain their characteristic sweet and, to a
lesser extent, fruity and flowery flavors. Regular beers were mainly characterized by 1-butanol, amyl alcohols and ethyl acetate. Beers
dealcoholized at 102 mbar are characterized by a high concentration of 2-phenylethanol. Beers dealcoholized at 200 mbar and commercial non-
alcoholic beers had a similar flavor profile, which is characterized by low concentrations of the compounds used as indicators.
Keywords: flavor compounds, dealcoholization, aroma, GC-MS, alcohol
free beers
INTRODUCTION
Beer is one of the most widespread and popular consumed drinks
worldwide (Lehnert, Kuřec, & Brányik, 2008; Rossi, Sileoni, Perretti, & Marconi, 2014). Beer popularity arises from its pleasant organoleptic and favorable
nutritional characteristics for moderate consume (Blanco, Andrés-Iglesias, & Montero, 2014; Sohrabvandi, Mousavi, Razavi, Mortazavian, & Rezaei, 2010).
The increasing worldwide production of alcohol-free beers reflects the global trend for a healthier lifestyle (Lehnert, Kuřec, & Brányik, 2008). Low
alcohol beers are a good source of nutrients such as vitamins, minerals, soluble fiber and antioxidants (Brányik, Silva, Baszczyňski, Lehnert, & Almeida
e Silva, 2012; Liguori, De Francesco, Russo, Perretti, Albanese, & Di Matteo, 2015) and therefore, recommended for specific groups of people
(pregnant women, sporting professionals, people with cardiovascular and hepatic pathologies, and people on medication) (Blanco, Andrés-Iglesias,
& Montero, 2014; Sohrabvandi, Mousavi, Razavi, Mortazavian, & Rezaei,
SECTION 3. Beer volatile Compounds behave during Lab-scale Dealcoholization Process Chapter 3.1
201
2010). Also, drink/driving rules and religious concerns have increased the market of this beverage (Catarino and Mendes, 2011; Sohrabvandi et al.,
2010).
Low-alcohol beer is a beer with very low or no alcohol content. In most of
the EU countries beers with low alcohol content are divided into alcohol free beers, with less than or equal to 0.5 % alcohol by volume (ABV), and
low-alcohol beers, with no more than 1.2 % ABV (Blanco, Andrés-Iglesias, & Montero, 2014; Brányik, Silva, Baszczyňski, Lehnert, & Almeida e Silva, 2012).
Flavor compounds in beer are very important as they make a major
contribution to the quality of the final product. A large number of volatile compounds have been identified in beer such as alcohols, esters, acids,
aldehydes, ketones, hydrocarbons, ethers, sulfur compounds, alicyclic compounds, aromatic compounds or heterocyclic compounds (Andrés-
Iglesias, Blanco, Blanco, & Montero, 2014; Charry-Parra, DeJesus-Echevarria, & Perez, 2011; Moreira, Meireles, Brandao, & de Pinho, 2013; Riu-Aumatell,
Miro, Serra-Cayuela, Buxaderas, & Lopez-Tamames, 2014; Rossi, Sileoni, Perretti, & Marconi, 2014; Saison, De Schutter, Delvaux, & Delvaux, 2009).
In the case of low alcohol beers, the methods used to reduce ethanol
content play a key role in the final composition of the product (Riu-Aumatell, Miro, Serra-Cayuela, Buxaderas, & Lopez-Tamames, 2014). The
methods of non-alcohol beer production can involve physical and biological procedures. Physical methods require considerable investments
into the special equipment for alcohol removal and involve either thermal (evaporation or distillation) or membrane processes (reverse osmosis or
dialysis). Thermal methods cause light caramel flavour and high volatile compounds losses, while membrane based processes cause less body and
low aromatic profile of beer (Liguori, De Francesco, Russo, Perretti, Albanese, & Di Matteo, 2015). Biological methods such as continuous
fermentation, use of special yeast or immobilized yeast, are usually performed in traditional brewery plants. Biological methods tend to
produce non-alcoholic beers with less flavor and characterized by worty off-flavors (Brányik, Silva, Baszczyňski, Lehnert, & Almeida e Silva, 2012;
Catarino & Mendes, 2011; Liguori, De Francesco, Russo, Perretti, Albanese, & Di Matteo, 2015; Riu-Aumatell, Miro, Serra-Cayuela, Buxaderas, & Lopez-
Tamames, 2014).
To analyze volatile compound concentrations in beer, gas
chromatography-mass spectrometry (GC-MS) is currently used and several
SECTION 3. Beer volatile Compounds behave during Lab-scale Dealcoholization Process Chapter 3.1
202
volatile compounds can be measured simultaneously (Andrés-Iglesias, Montero, Sancho, & Blanco, 2015). However, direct injection is not suitable
for the quantitative analysis of beer samples in GC because they contain large amounts of non-volatile compounds that may damage the column
(Kobayashi, Shimizu, & Shioya, 2008). Hence several methods of sample extraction and concentration for analyzing flavor compounds in beer have
been recently reviewed by Andrés-Iglesias, Montero, Sancho and Blanco (2015). Among them, solid phase microextracion (SPME) has become very
popular due to its ease of use, high sensitivity, reproducibility, low cost and injection into a single uninterrupted process. SPME, especially in
combination with head-space (HS), has shown to have applicability to the analysis of volatile compounds (Andrés-Iglesias, Montero, Sancho, & Blanco,
2015; Gonçalves, Figueira, Rodrigues, Ornelas, Branco, Silva, et al., 2014; Rossi, Sileoni, Perretti, & Marconi, 2014).
Few existing research is focused on the volatile composition of low alcohol beers (Riu-Aumatell, Miro, Serra-Cayuela, Buxaderas, & Lopez-Tamames,
2014) and, in particular, how the thermal dealcoholization process influences the final product composition (Montanari, Marconi, Mayer, &
Fantozzi, 2009; Zürcher, Jakob, & Back, 2005). In order to augment this knowledge, this study aimed at gaining insights into the chemical changes
that can occur and affect to flavor characteristics during beer dealcoholization by a distillation-like process. We have studied different
moments of the dealcoholization process in which these volatile compounds can suffer changes. Finally we compare the volatile profile of
commercial regular beer from the same brands low-alcohol beers.
MATERIALS AND METHODS
Samples and lab-scale vacuum distillation set-up in dealcoholization
experiments
In this study 16 lager beers of different commercial brands were chosen, 10 from Spain (1-10) and 6 from other countries (11-16), also 11 non alcoholic
and alcohol free beers from Spain and other countries of the same commercial brands as the relative regular ones were analyzed to compare
results (Table 1). All regular beers contained from 4.6 % to 6.5 % alcohol by volume (ABV) (Table 1), and all beers were obtained as fresh as possible
from a local market. Regular beer bottles were stored at 4ºC until laboratory

SECTION 3. Beer volatile Compounds behave during Lab-scale Dealcoholization Process Chapter 3.1
203
scale vacuum dealcoholisation process. 400 ml of beer were placed in 1 l flask of the vacuum distillation system for each experiment; the flask was
covered with a black plastic material to avoid the light oxidation of compounds in the sample. Subsequently, 10 µl of antifoam emulsion (E-900,
AFCA) were added to reduce the foam and CO2 content.
The experiments of beer dealcoholization by laboratory scale vacuum
distillation were done at 2 different vacuum pressures and water bath temperatures. The temperature needed in the water bath is directly related
to the total pressure by the phase equilibrium of the system. Thus, a first set of experiments was conducted at 102 mbar and 50ºC (reference pressure
used by several Spanish breweries to produce alcohol free beer), and a second set of experiments was conducted at 200 mbar and 67ºC because
this pressure has been used in previous studies by other authors.
A rotavapor R-215 equipped with a vacuum pump V-700, a vacuum controller V-850 and a diagonal condenser (BÜCHI Labortechnik AG,
Switzerland) was used. A specially high vacuum valve designed to recover the distillate fractions (Afora ICT, S.L., Spain) was incorporated to the
equipment. The rotary flask rotation was fixed at 20 rpm and remained constant in all experiments. Each dealcoholization process was stopped
once the distillate volume reached the amount calculated by Equation [1] (Table 1). This volume was divided into 3 different fractions that were
recovered with a calibrated high vacuum valve into 2 ml vials for chromatography (Agilent Technologies, USA). These fractions were taken
during the experiment timecourse, at the beginning (A1), in the middle (A2) and at the end (A3) of the process.
Total distillate volume = (% ABV sample x 400 ml) / 100 [1]
The same steps were done for all experiments. At the beginning of each experiment the water batch was refilled until the same volume if necessary,
once the batch reached the temperature the experiment started at the same rpm indicated above, the pressure was reached immediately and
remained constant (±1 mbar) over the whole experiment as controlled by the vacuum controller.
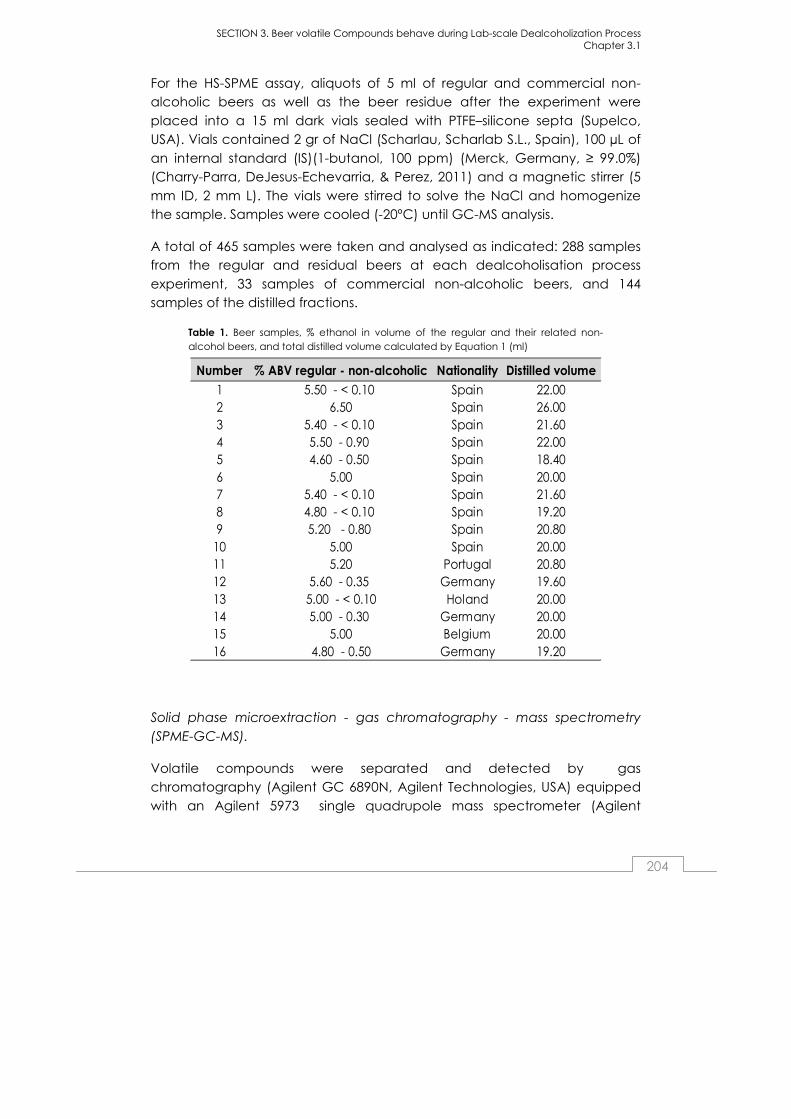
SECTION 3. Beer volatile Compounds behave during Lab-scale Dealcoholization Process Chapter 3.1
204
For the HS-SPME assay, aliquots of 5 ml of regular and commercial non-alcoholic beers as well as the beer residue after the experiment were
placed into a 15 ml dark vials sealed with PTFE–silicone septa (Supelco, USA). Vials contained 2 gr of NaCl (Scharlau, Scharlab S.L., Spain), 100 µL of
an internal standard (IS)(1-butanol, 100 ppm) (Merck, Germany, ≥ 99.0%) (Charry-Parra, DeJesus-Echevarria, & Perez, 2011) and a magnetic stirrer (5
mm ID, 2 mm L). The vials were stirred to solve the NaCl and homogenize the sample. Samples were cooled (-20ºC) until GC-MS analysis.
A total of 465 samples were taken and analysed as indicated: 288 samples from the regular and residual beers at each dealcoholisation process
experiment, 33 samples of commercial non-alcoholic beers, and 144 samples of the distilled fractions.
Table 1. Beer samples, % ethanol in volume of the regular and their related non-alcohol beers, and total distilled volume calculated by Equation 1 (ml)
Number % ABV regular - non-alcoholic Nationality Distilled volume
1 5.50 - < 0.10 Spain 22.002 6.50 Spain 26.003 5.40 - < 0.10 Spain 21.604 5.50 - 0.90 Spain 22.005 4.60 - 0.50 Spain 18.406 5.00 Spain 20.007 5.40 - < 0.10 Spain 21.608 4.80 - < 0.10 Spain 19.209 5.20 - 0.80 Spain 20.80
10 5.00 Spain 20.0011 5.20 Portugal 20.8012 5.60 - 0.35 Germany 19.6013 5.00 - < 0.10 Holand 20.0014 5.00 - 0.30 Germany 20.0015 5.00 Belgium 20.0016 4.80 - 0.50 Germany 19.20
Solid phase microextraction - gas chromatography - mass spectrometry
(SPME-GC-MS).
Volatile compounds were separated and detected by gas chromatography (Agilent GC 6890N, Agilent Technologies, USA) equipped
with an Agilent 5973 single quadrupole mass spectrometer (Agilent

SECTION 3. Beer volatile Compounds behave during Lab-scale Dealcoholization Process Chapter 3.1
205
Technologies, USA). A headspace solid phase microextraction (HS-SPME) equipment (Supelco, USA) with 100 µm polydimethylsiloxan (PDMS) fiber
(Sulpeco, USA) was used for the extraction and concentration of the volatile compounds in beer samples. Prior to use, the SPME fibre was
conditioned at 250 ºC for 30 minutes in the GC injector, according to the manufacturer’s instructions. Blank runs of the fiber were completed before
sampling each day to ensure no carry-over of analytes according to manufacturer instructions. The chromatographic separations were
accomplished using a BP-1 30 m × 0.32 mm × 1 µm capillary column (SGE Analytical Science, Australia). Samples from distilled fractions were injected
directly without extraction by HS-SPME.
Analysis of volatile compounds
The volatile composition of beer samples and distillates was measured by
triplicate.
For beer samples, the solid phase microextraction (SPME) fibre was
manually inserted into the sample vial headspace during 45 minutes at 30°C. After extraction, the fibre was retracted prior to removal from the
sample vial and immediately inserted into the GC injector port for desorption at 250 ºC (as indicated by the manufacturer for PDMS fibre)
during 15 minutes in splitless mode. Carrier gas was helium at a constant flow of 1.2 ml/min. For distilled fractions 1 µl was injected in split mode (1:10),
and carrier gas helium was at constant flow of 1 ml/min. The oven temperature was programmed as follows in both cases: initial temperature
was set at 35 °C and kept for 7 min, this was followed by 2 ramps in which temperature was risen at 8 °C/min to 200 °C and kept this temperature for 5
minutes, and then temperature was risen at 10 °C/min to 250 °C, this temperature being kept for 10 minutes (only 3 minutes were kept for direct
injection of the distillate fractions).The ionization energy was 70 eV, and detection and data acquisition were performed in scan mode from 37 to
350 Da. Data analysis was performed using the MSD Chemstation Data Analysis Software (Agilent Technologies, USA). For compound identification
data obtained in the GC-MS analysis were compared with m/z values compiled in the spectrum library WILEY.
Validation of compound identification was carried out by comparison of
their MS spectra and their retention time with standards. Quantification was

SECTION 3. Beer volatile Compounds behave during Lab-scale Dealcoholization Process Chapter 3.1
206
carried out using standard calibration curves for 2-methylbutanol (≥ 99.0 %), 3-methylbutanol (≥ 99.0 %), 2-phenylethanol (≥ 99.0 %), ethyl acetate (≥ 99.5
%), isobutanol (≥ 99.0 %) (these from Sigma, USA), 1-propanol (≥ 99.5 %) (Fluka, Sigma-Aldrich, USA), and isoamyl acetate (≥ 99.0 %) (Fisher Scientist,
UK). Previously, peak areas of all compounds were normalized to the peak area of the IS at 100 mg/l. Since 1-propanol co-eluted with ethanol, the
area of the extracted ion chromatogram (EIC) for the ion with m/z 60.05 and retention time of 3.10 minutes was used for quantification of this
compound.
Statistical analysis
Principal component analysis (PCA) was carried out with Statistica 8
software in order to correlate the information regarding the volatile compounds analyzed and all beer samples.
RESULTS AND DISCUSSION
In the first part of the study, HS-SPME and the GC-MS methods were developed for a good recovery of the samples by following some of pre-
existing methods (Charry-Parra, DeJesus-Echevarria, & Perez, 2011; da Silva, Augusto, & Poppi, 2008; Pinho, Ferreira, & Santos, 2006; Rodriguez-Bencomo,
Muñoz-González, Martín-Álvarez, Lázaro, Mancebo, Castañé, et al., 2012; Saison, De Schutter, Delvaux, & Delvaux, 2008). The amount of NaCl used,
heating of the sample, oven temperature ramps and stabilization of the fiber and the headspace were optimized to achieve good intensity,
reproducibility and repeatability in 5 sequential injections of the same sample.
With the optimized method, a total of 45 compounds were identified in regular beer samples according to WILEY library m/z matching (Table 2).
Example of total ion current (TIC) chromatograms of a regular beer prior to
distillation, the same beer after the distillation experiment, and their complementary alcohol free beer are shown in Figure 1.
Principal component analysis (PCA) was used as a first approach to find out
whether significant differences between beers as related to variables there

SECTION 3. Beer volatile Compounds behave during Lab-scale Dealcoholization Process Chapter 3.1
207
existed (Figure 2). PCA shows a clear differentiation between beer samples. Regular beers are in the positive right side of the scoreplot, and mainly
characterized by the high content of isobutanol, amyl alcohols (2 and 3-methylbutanol) and, to a lesser extent, by ethyl acetate and 1-propanol.
Commercial alcohol free beers are situated on the opposite side within the PCA scoreplot, this fact becoming motivated by the low content of all
volatile compounds analyzed. The dealcoholized beer residues at 200 mbar are localized close to the alcohol free beers but grouped separately within
the scoreplot. This can be attributed to loss of volatile compounds, mainly 1-propanol, isobutanol and 2- and 3-methylbutanol. Dealcoholized beer
product at 102 mbar are located on the top on the scoreplot and characterized mainly by high amounts of 2-phenylethanol, and low
amounts of isoamyl and ethyl acetates.
Commercial regular (R) and alcohol free (F) beer comparison
It is well known that the volatile profile of non alcoholic beer changes during
the dealcoholization processes, and some compounds are reported to undergo high losses as compared to regular beers (Montanari, Marconi,
Mayer, & Fantozzi, 2009; Riu-Aumatell, Miro, Serra-Cayuela, Buxaderas, & Lopez-Tamames, 2014). Hence, as expected, losses of volatile compounds
were found for all alcohol free beers as well as for the dealcoholized beer residues in both experiments as compared to the related regular beers.
Average values (mg/l) of each compound studied in regular and non-alcoholic beers are shown in Table 3.
Table 3. Flavor compounds used as indicators in the comparison (average content) between R (regular) and F (non-alcoholic beers). Flavor threshold and flavor description are also included
CompoundAverage in R
samples (mg/l)Average in F
samples (mg/l)Threshold
levelFlavor description References
1-Propanol 13.06 0.00 700-800 Alcoholic, solvent-like 1,2,3Ethyl acetate 17.74 0.11 21-30 Fruity, solvent-like 1,4Isobutanol 12.58 1.57 100-160 Alcoholic, malty, solvent-like 1,2,3
3-Methylbutanol 46.07 2.96 50-70Alcoholic, banana, sweet, aromatic, malty, v inous, pungent
1,2,3
2-Methylbutanol 15.90 0.79 50-65Malty, alcoholic, v inous, banana, sweetish, solvent, medicinal
1,2,3
Isoamyl acetate 1.92 0.13 0.6-1.4Fruity, banana, pear, solvent, estery, apple, sweet
1,4
2-Phenylethanol 38.80 13.11 25-40Alcoholic, flowery, honey-like, roses, sweet
1,2,3
(1)Blanco et al., 2014; (2)Guido et al., 2009; (3)Kobavashi et al., 2008; (4)Verstrepen et al., 2003

SECTION 3. Beer volatile Compounds behave during Lab-scale Dealcoholization Process Chapter 3.1
208
Co
mp
ou
nd
s%
Pr
ob
ab
ility
RtM
WC
ha
rac
teris
tic fr
ag
me
nts
(%
ab
un
da
nc
e)
1-P
rop
an
ol
35
3.1
060
.09
60
.15
(2
6);
59.1
5 (
64
); 58
.05
(2);
57
.25
(3
); 55
.05
(3
); 4
5.1
(1
00);
44
.1 (
8);
43.
1 (
51)
; 42
.15
(7
2);
41.1
(41
); 4
0.0
5
(6);
39.
1 (
29)
; 38
.15
(9
); 3
7.1
5 (3
)Et
hyl
ac
eta
te9
04.
45
88.0
58
8.1
(3
); 7
3.1
(3
); 7
0.1
(1
0); 6
1.1
(1
4);
45.
1 (
13);
44
.1 (
3);
43.
1 (
100
)
Iso
bu
tan
ol
80
5.0
774
.07
74
.1 (
8);
73
.1 (
2);
59.
1 (
2);
57.2
(4)
; 56
.2 (
6);
55
.1 (
7);
45.
1 (
5); 4
4.1
(9)
; 43
.1 (
10
0); 4
2.2
(6
0);
41.
2 (
78)
; 39
.1
(33
); 38
.1 (
6)Et
hyl
pro
pa
no
ate
64
8.4
91
02.
07
75
.1 (
16
); 7
4.1
(1
7); 7
3.1
(1
0);
57.
1 (
100
) ;5
5.2
(2
); 45
.1 (
13);
44
.1 (
3);
43.
1 (
6);
42.1
(3)
n-P
rop
yl a
ce
tate
72
8.6
61
02.
07
73
.1 (
9);
61
.2 (
28
); 59
.2 (
5); 4
3.1
(1
00)
; 42
.2 (
15
); 4
1.2
(1
6); 3
9.1
(7
)
3-M
eth
ylb
uta
no
l9
09.
96
88.0
97
1.2
(3
); 7
0.2
(5
3);
69.2
(6)
; 57
.2 (
20
); 5
6.2
(10
); 5
5.2
(1
00)
; 53
.1 (
4);
46
.1 (
4);
45.
1 (
14)
; 44
.1 (
5);
43.
2 (
55)
; 42
.2
(72
); 41
.1 (
73);
40
.2 (
6)
2-M
eth
ylb
uta
no
l8
31
0.0
288
.09
70
.2 (
42
); 5
9.2
(3
); 58
.1 (
4); 5
7.2
(8
6);
56.
2 (
85);
55
.2 (
36
); 53
.2 (
4); 4
5.1
(7
); 4
3.1
(1
5);
42.1
(20
); 4
1.2
(1
00);
3
9.1
(3
2);
38.
2 (
3)
Iso
bu
tyl a
ce
tate
78
11
.13
11
6.0
88
6.3
(2
) ;7
4.1
(2
); 7
3.1
(1
3); 7
1 (
2);
61.1
(2)
; 57
.2 (
6);
56
.2 (
25
); 55
(4
); 4
4.1
(9
); 43
.1 (
100
); 4
2 (7
); 4
1.1
(2
1);
40
.0 (
4);
39
.1 (
13
)
Eth
yl b
utir
ate
97
12
.06
11
6.0
81
01
.2 (
12
); 89
.1 (
18);
88.
1 (
62)
; 73
.2 (
24
); 7
1.1
(1
00);
70
.2 (
17)
; 61
.1 (
13
); 6
0.1
(2
3); 4
5.1
(2
3);
44.
2 (
9);
43.2
(9
3);
42.1
(28
); 4
1.1
(4
4);
39.2
(22
)
Iso
am
yl a
ce
tate
78
14
.49
13
0.1
08
7.1
(1
0);
73.
1 (
5);
71.2
(3)
; 70
.2 (
46
); 6
9.2
(6)
; 61
.1 (
11
); 5
6.1
(2
); 55
.1 (
38);
44
.1 (
2);
43.
1 (
100
); 4
2.2
(1
6); 4
1.1
(1
8);
39.1
(10
)Et
hyl
pe
nta
no
ate
58
15
.14
13
0.1
08
8.1
0 (
10
0); 8
5.1
5 (
90)
; 87
.10
(6
8);
60.1
0 (
56
); 4
1.1
0 (4
5);
70.
10
(33
); 7
3.0
5 (
30);
10
1.1
5 (2
3)
1-P
en
thyl
ac
eta
te3
81
5.5
11
30.
10
43
.20
(1
00)
; 42
.20
(4
3); 4
1.1
0 (
30
); 55
.20
(3
0);
61.
10
(29
); 7
0.2
0 (2
9)
Iso
pe
nth
yl is
ob
uta
no
ate
5
71
5.6
01
58.
13
71
(1
00);
43
.15
(7
6), 4
1.1
0 (
70
); 56
.15
(6
6);
57.1
0 (5
0);
89.
25
(44
)
3-M
eth
yl 4
-he
pta
no
ne
91
15
.89
12
8.1
27
1.1
0 (
10
0); 5
7.1
0 (
98)
; 43
.20
(9
0),
41.1
0 (
76
); 3
9.1
0 (2
8);
85.
20
(19
), 1
28.
20
(25
)
Ca
pro
ic a
cid
53
17
.79
11
6.0
88
7.1
(1
9);
74.
1 (
7);
73.2
(48
); 7
0.1
(7
); 6
9.1
(4)
; 61
(9
); 6
0.1
(1
00);
57
.1 (
9);
56.
1 (
12);
55
.2 (
21
); 45
.2 (
18);
43
.1
(21
); 42
.1 (
17);
41
.1 (
39
); 39
.2 (
29)
Eth
yl c
ap
roa
te9
61
7.8
71
44.
12
10
1.1
(2
9);
99.2
(59
); 8
8.1
(1
00);
87
.2 (
10
); 73
.1 (
33);
71
.2 (
29)
; 70
.1 (
34
); 6
9.2
(1
1); 6
1.1
(2
3);
60.
1 (
39)
; 55
.1
(24
); 45
.1 (
16);
43
.2 (
65
); 42
.1 (
28);
41
.2 (
40)
; 39
.1 (
20
)
Pe
ntil
bu
tira
te6
41
8.1
51
58.
13
43
.10
(1
00)
; 71
.20
(9
4), 7
0.2
0 (
56
), 41
.20
(4
9),
55.
10
(31
), 4
2.2
0 (2
5),
40
.20
(11
)
He
xyl a
ce
tate
80
18
.22
14
4.1
28
4.1
5 (
20
); 69
.15
(1
9);
67.1
5 (1
8);
56.
15
(47
); 5
5.1
(3
0); 4
3.0
5 (
10
0); 4
2.1
5 (
25)
; 41
.15
(3
5);
39.1
(17
)
Me
thyl
he
xan
oa
te4
61
8.3
01
42.
10
55
.10
(1
00)
; 41
.20
(5
4); 3
9.1
0 (
43
); 67
.10
(3
5);
74.
20
(28
); 8
2.2
0 (4
7);
95
.10
(39
); 1
11.
30
(50
); 1
13.
0(2
5);
127
.20
(4
5)
2-E
thyl
he
xan
ol
80
18
.48
13
0.1
45
7.1
0 (
10
0); 4
1.1
0 (
54)
; 43
.20
(3
5);
55.2
0 (
30
); 5
6.1
0 (2
5);
70.
20
(30
); 8
3.2
0 (
28)
1-o
cta
no
l 9
01
9.2
01
30.
23
85
.1 (
3);
84
.2 (
43
); 83
.2 (
43);
82
.1 (
9);
71.
2 (
9); 7
0.2
(6
0);
69.
2 (
69)
; 68
.1 (
23
); 6
7.1
(9
); 57
.2 (
37);
56.
2 (
93)
; 55
.1
(10
0); 5
4.2
(9
); 5
3.2
(1
0)
Eth
yl h
ep
tan
oa
te9
01
9.7
41
58.
13
11
5.2
(2
8);
113
.2 (
43
); 10
1.1
(4
6);
89.
2 (
15)
; 88
.1 (
10
0); 7
3.1
(3
4);
70.
1 (
32)
; 69
.1 (
18
); 6
1 (3
1);
60.
1 (
47)
; 55
.2
(37
); 45
.1 (
18);
44.
1 (
21)
; 43
.1 (
54
); 42
.2 (
16);
41
.1 (
61
); 39
.2 (
26)
No
na
na
l 7
21
9.8
11
42.
24
98
.1 (
31
); 9
5.1
(1
7); 8
2.2
(1
8);
81.
1 (
24);
71
.1 (
17
); 70
.1 (
32);
69
.2 (
31)
; 68
(1
7);
67.2
(32
); 5
7.2
(5
7); 5
6.2
(4
1);
5
5.2
(5
4);
54.
1 (
14)
; 44
.2 (
42
); 4
3.1
(65
); 4
2.2
(2
6);
41.2
(10
0);
39.
1 (
35)
Tab
le 2
. Vo
latil
e c
om
po
un
ds
ide
ntif
ied
in b
ee
r sa
mp
les.
Re
ten
tion
tim
e (
Rt)
, pro
ba
bili
ty o
f c
om
po
un
d id
en
tific
atio
n (
% p
rob
ab
ility
as
pro
vid
ed
by
the
inst
rum
en
t so
ftw
are
), m
ole
cu
lar
we
igh
t (M
W)
an
d t
he
ch
ara
cte
ristic
ion
s w
ith t
he
ir c
orr
esp
on
de
nt
ab
un
da
nc
e
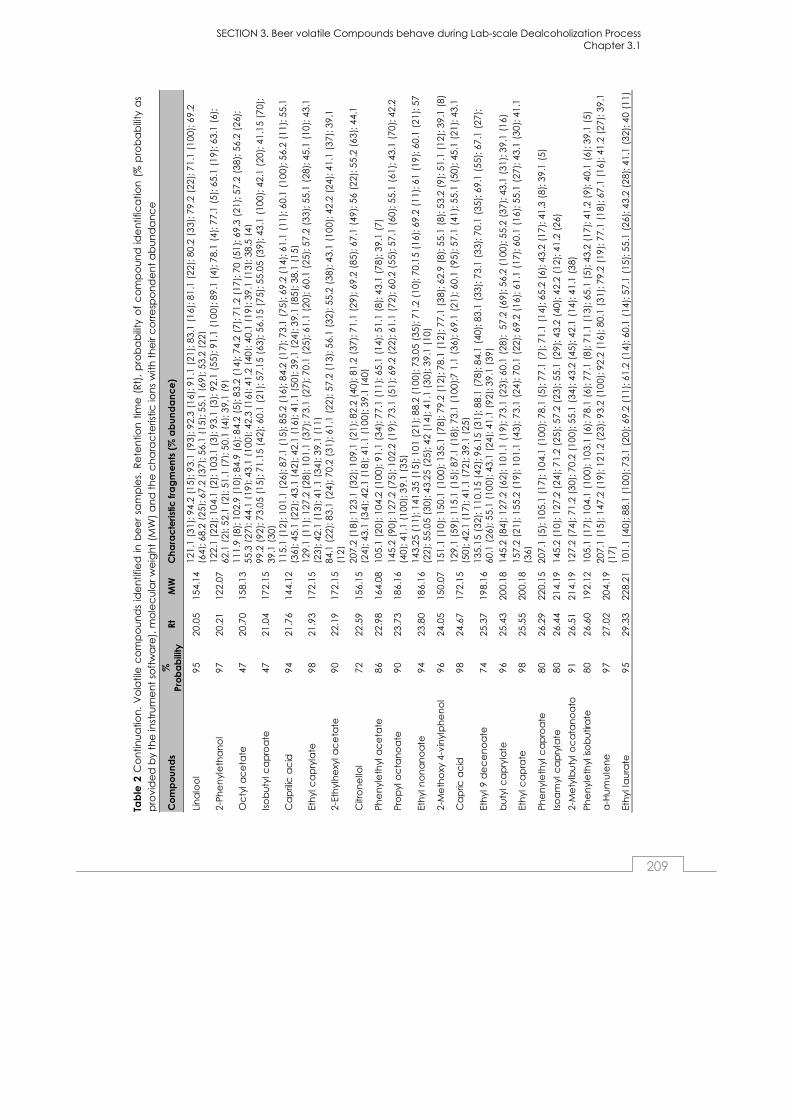
SECTION 3. Beer volatile Compounds behave during Lab-scale Dealcoholization Process Chapter 3.1
209
Co
mp
ou
nd
s%
Pr
ob
ab
ility
RtM
WC
ha
rac
teris
tic fr
ag
me
nts
(%
ab
un
da
nc
e)
Lin
alo
ol
95
20.0
515
4.14
121
.1 (
31);
94.2
(1
5); 9
3.1
(93
); 92
.3 (
16)
; 91
.1 (
21);
83.1
(1
6); 8
1.1
(22
); 80
.2 (
33)
; 79
.2 (
22);
71.1
(1
00);
69.
2 (6
4);
68.2
(2
5); 6
7.2
(37
); 56
.1 (
15)
; 55
.1 (
69);
53.
2 (
22)
2-Ph
en
yle
tha
no
l9
720
.21
122.
0712
2.1
(22
); 10
4.1
(2)
; 10
3.1
(3);
93.1
(3
); 92
.1 (
55)
; 91.
1 (1
00)
; 89
.1 (
4); 7
8.1
(4);
77.
1 (5
); 65
.1 (
19)
; 63
.1 (
6);
62.1
(2)
; 52
.1 (
2); 5
1.1
(7)
; 50.
1 (4
); 3
9.1
(9)
Oc
tyl a
ce
tate
47
20.7
015
8.13
111
.9 (
8); 1
02.9
(1
0); 8
4.9
(6)
; 84.
2 (5
); 8
3.2
(14
); 74
.2 (
7); 7
1.2
(17
); 70
(51
); 69
.3 (
21);
57.
2 (3
8);
56.2
(26
);
55.3
(27
); 4
4.1
(19
); 43
.1 (
100
); 42
.3 (
16)
; 41
.2 (
40);
40.1
(1
9); 3
9.1
(13
); 38
.5 (
4)
Iso
bu
tyl c
ap
roa
te4
721
.04
172.
1599
.2 (
92);
73.
05 (
15)
; 71
.15
(42)
; 60
.1 (
21);
57.
15 (
63);
56.
15 (
75)
; 55
.05
(39)
; 43
.1 (
100
); 42
.1 (
20);
41.
15 (
70)
; 39
.1 (
30)
Ca
pril
ic a
cid
94
21.7
614
4.12
115
.1 (
12);
101
.1 (
26);
87.
1 (1
5); 8
5.2
(16
); 8
4.2
(17)
; 73
.1 (
75);
69.
2 (1
4); 6
1.1
(11
); 6
0.1
(100
); 5
6.2
(11
); 55
.1
(36
); 45
.1 (
22)
; 43
.1 (
42);
42.1
(1
6); 4
1.1
(50
); 3
9.1
(2
4); 3
9.1
(85
); 38
.1 (
15)
Eth
yl c
ap
ryla
te9
821
.93
172.
1512
9.1
(11
); 12
7.2
(28
); 1
01.1
(37
); 7
3.1
(27
); 70
.1 (
25);
61.
1 (2
0);
60.1
(25
); 5
7.2
(33
); 55
.1 (
28);
45.
1 (1
0);
43.1
(2
3);
42.1
(1
3); 4
1.1
(34
); 39
.1 (
11)
2-Et
hyl
he
xyl a
ce
tate
90
22.1
917
2.15
84.1
(22
); 8
3.1
(24
); 70
.2 (
31);
61.
1 (2
2);
57.2
(1
3); 5
6.1
(32
); 55
.2 (
38);
43.
1 (1
00)
; 42
.2 (
24);
41.1
(3
7); 3
9.1
(1
2)
Citr
on
ello
l7
222
.59
156.
1520
7.2
(18
); 12
3.1
(32
); 1
09.1
(21
); 8
2.2
(40
); 81
.2 (
37);
71.
1 (2
9);
69.2
(85
); 6
7.1
(49
); 56
(2
2); 5
5.2
(63
); 44
.1
(24
); 43
.1 (
34)
; 42
.1 (
18);
41.1
(1
00);
39.
1 (4
0)
Phe
nyl
eth
yl a
ce
tate
86
22.9
816
4.08
105
.1 (
20);
104
.2 (
100
); 91
.1 (
34);
77.
1 (1
1);
65.1
(14
); 5
1.1
(8);
43
.1 (
78)
; 39
.1 (
7)
Pro
pyl
oc
tan
oa
te9
023
.73
186.
1614
5.2
(90
); 12
7.2
(75
); 1
02.2
(19
); 7
3.1
(51
); 69
.2 (
22);
61.
1 (7
2);
60.2
(55
); 5
7.1
(60
); 55
.1 (
61);
43.
1 (7
0);
42.2
(4
0);
41.1
(1
00);
39.
1 (3
5)
Eth
yl n
on
an
oa
te9
423
.80
186.
1614
3.2
5 (1
1); 1
41.
35 (
15)
; 10
1 (2
1);
88.2
(10
0);
73.0
5 (
35);
71.
2 (1
0); 7
0.1
5 (1
6);
69.2
(11
); 6
1 (1
9);
60.
1 (2
1); 5
7
(22
); 55
.05
(30)
; 43.
25 (
25);
42
(14
); 41
.1 (
30)
; 39
.1 (
10)
2-M
eth
oxy
4-v
inyl
ph
en
ol
96
24.0
515
0.07
151
.1 (
10);
150
.1 (
100
); 13
5.1
(78
); 79
.2 (
12)
; 78
.1 (
12);
77.1
(3
8); 6
2.9
(8)
; 55.
1 (8
); 5
3.2
(9);
51.1
(1
2); 3
9.1
(8)
Ca
pric
ac
id9
824
.67
172.
1512
9.1
(59
); 11
5.1
(15
); 8
7.1
(18)
; 73
.1 (
100
);7 1
.1 (
36);
69.
1 (2
1);
60.1
(95
); 5
7.1
(41
); 55
.1 (
50);
45.
1 (2
1);
43.1
(5
0);
42.1
(1
7); 4
1.1
(72
); 39
.1 (
25)
Eth
yl 9
de
ce
no
ate
7
425
.37
198.
1613
5.1
5 (3
2); 1
10.
15 (
42)
; 96
.15
(31)
; 88
.1 (
78);
84
.1 (
40)
; 83
.1 (
33);
73.
1 (3
3); 7
0.1
(35
); 6
9.1
(55)
; 67
.1 (
27);
60
.1 (
26);
55.
1 (1
00)
; 43
.1 (
24);
41.1
(9
2); 3
9.1
(39
)
bu
tyl c
ap
ryla
te9
625
.43
200.
1814
5.2
(84
); 12
7.2
(62
); 1
01.1
(19
); 7
3.1
(23
); 60
.1 (
28);
57
.2 (
69);
56.
2 (
100
); 5
5.2
(37
); 43
.1 (
31);
39.
1 (1
6)
Eth
yl c
ap
rate
98
25.5
520
0.18
157
.2 (
21);
155
.2 (
19);
101
.1 (
43);
73.
1 (2
4);
70.1
(22
); 6
9.2
(16
); 61
.1 (
17);
60.
1 (1
6);
55.1
(27
); 4
3.1
(30
); 41
.1
(36
)
Phe
nyl
eth
yl c
ap
roa
te8
026
.29
220.
1520
7.1
(5)
; 105
.1 (
17)
; 10
4.1
(100
); 7
8.1
(5);
77.
1 (7
); 71
.1 (
14)
; 65
.2 (
6); 4
3.2
(17
); 41
.3 (
8); 3
9.1
(5)
Iso
am
yl c
ap
ryla
te8
026
.44
214.
1914
5.2
(10
); 12
7.2
(24
); 7
1.2
(25)
; 57
.2 (
23);
55.
1 (2
9); 4
3.2
(40
); 4
2.2
(1
2); 4
1.2
(26
)
2-M
ety
lbu
tyl o
ca
tan
oa
to9
126
.51
214.
1912
7.2
(74
); 71
.2 (
30)
; 70
.2 (
100)
; 55
.1 (
34);
43.
2 (4
5); 4
2.1
(14
); 4
1.1
(38)
Phe
nyl
eth
yl is
ob
utir
ate
80
26.6
019
2.12
105
.1 (
17);
104
.1 (
100
); 10
3.1
(6)
; 78.
1 (6
); 7
7.1
(8);
71.1
(1
3); 6
5.1
(5)
; 43.
2 (1
7);
41.2
(9)
; 40
.1 (
6); 3
9.1
(5)
α-H
um
ule
ne
97
27.0
220
4.19
207
.1 (
15);
147
.2 (
19);
121
.2 (
23);
93.
2 (1
00)
; 92
.2 (
16);
80.1
(3
1); 7
9.2
(19
); 77
.1 (
18)
; 67
.1 (
16);
41.
2 (
27)
; 39
.1
(17
)
Eth
yl la
ura
te9
529
.33
228.
2110
1.1
(40
); 88
.1 (
100
); 7
3.1
(20)
; 69
.2 (
11);
61.
2 (1
4); 6
0.1
(14
); 5
7.1
(15
); 55
.1 (
26);
43.
2 (2
8); 4
1.1
(32
); 4
0 (1
1)
Tab
le 2
Co
ntin
ua
tion
. V
ola
tile
co
mp
ou
nd
s id
en
tifie
d in
be
er
sam
ple
s. R
ete
ntio
n t
ime
(R
t),
pro
ba
bili
ty o
f c
om
po
un
d i
de
ntif
ica
tion
(%
pro
ba
bili
ty a
s
pro
vid
ed
by
the
inst
rum
en
t so
ftw
are
), m
ole
cu
lar
we
igh
t (M
W)
an
d t
he
ch
ara
cte
ristic
ion
s w
ith t
he
ir c
orr
esp
on
de
nt
ab
un
da
nc
e
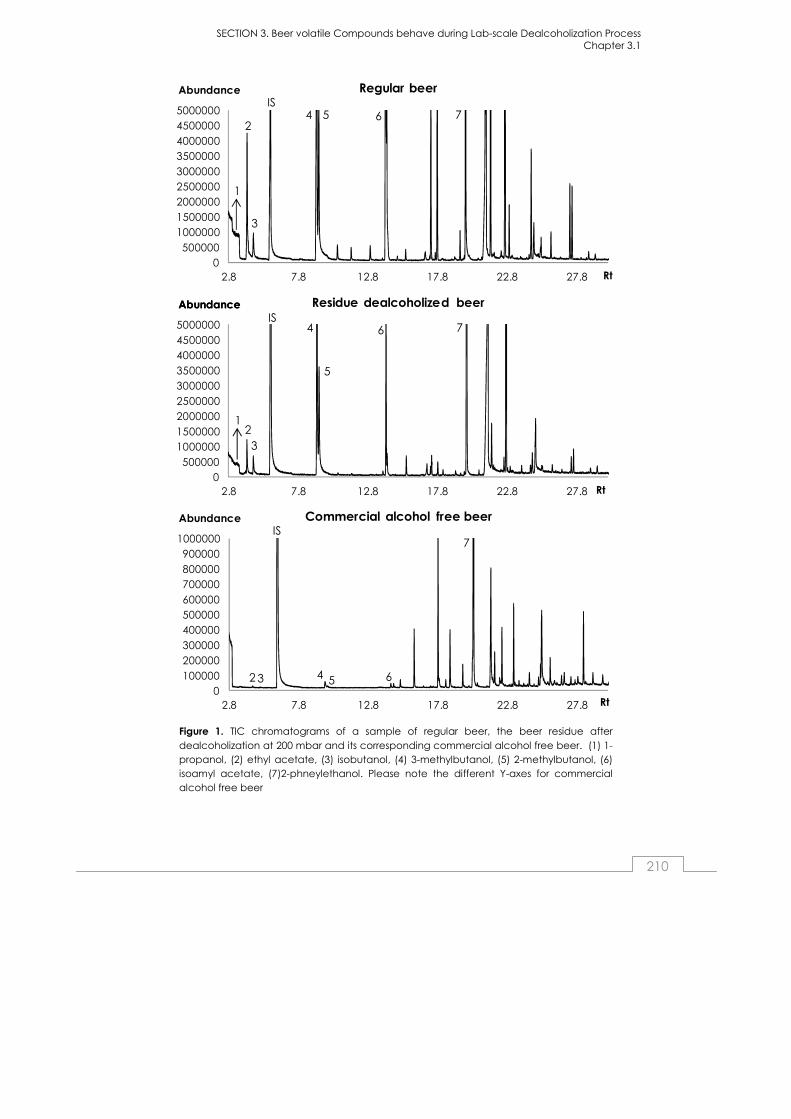
SECTION 3. Beer volatile Compounds behave during Lab-scale Dealcoholization Process Chapter 3.1
210
0500000
10000001500000
200000025000003000000
35000004000000
45000005000000
2.8 7.8 12.8 17.8 22.8 27.8 Rt
Regular beerAbundance
0500000
10000001500000
20000002500000
30000003500000
40000004500000
5000000
2.8 7.8 12.8 17.8 22.8 27.8 Rt
Residue dealcoholized beerAbundanceAbundance
1
2
2
IS
IS
3
3
0100000
200000300000
400000500000600000
700000800000
9000001000000
2.8 7.8 12.8 17.8 22.8 27.8 Rt
Commercial alcohol free beerAbundanceIS
4
1
32
4
4 5
5
5 6
6
6
7
7
7
Figure 1. TIC chromatograms of a sample of regular beer, the beer residue after dealcoholization at 200 mbar and its corresponding commercial alcohol free beer. (1) 1-propanol, (2) ethyl acetate, (3) isobutanol, (4) 3-methylbutanol, (5) 2-methylbutanol, (6) isoamyl acetate, (7)2-phneylethanol. Please note the different Y-axes for commercial alcohol free beer
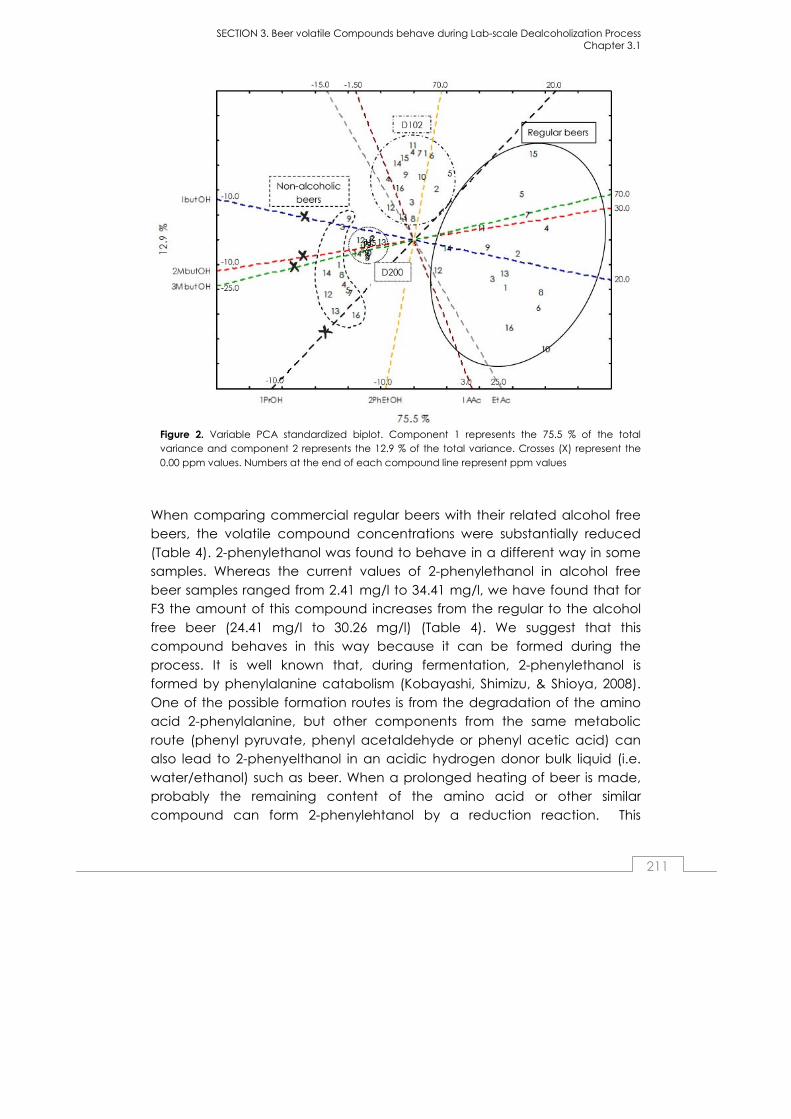
SECTION 3. Beer volatile Compounds behave during Lab-scale Dealcoholization Process Chapter 3.1
211
Figure 2. Variable PCA standardized biplot. Component 1 represents the 75.5 % of the total variance and component 2 represents the 12.9 % of the total variance. Crosses (X) represent the 0.00 ppm values. Numbers at the end of each compound line represent ppm values
When comparing commercial regular beers with their related alcohol free beers, the volatile compound concentrations were substantially reduced
(Table 4). 2-phenylethanol was found to behave in a different way in some samples. Whereas the current values of 2-phenylethanol in alcohol free
beer samples ranged from 2.41 mg/l to 34.41 mg/l, we have found that for F3 the amount of this compound increases from the regular to the alcohol
free beer (24.41 mg/l to 30.26 mg/l) (Table 4). We suggest that this compound behaves in this way because it can be formed during the
process. It is well known that, during fermentation, 2-phenylethanol is formed by phenylalanine catabolism (Kobayashi, Shimizu, & Shioya, 2008).
One of the possible formation routes is from the degradation of the amino acid 2-phenylalanine, but other components from the same metabolic
route (phenyl pyruvate, phenyl acetaldehyde or phenyl acetic acid) can also lead to 2-phenyelthanol in an acidic hydrogen donor bulk liquid (i.e.
water/ethanol) such as beer. When a prolonged heating of beer is made, probably the remaining content of the amino acid or other similar
compound can form 2-phenylehtanol by a reduction reaction. This
SECTION 3. Beer volatile Compounds behave during Lab-scale Dealcoholization Process Chapter 3.1
212
compound is related to alcoholic, flowery, honey-like, roses or sweet flavors (Table 3), the concentration of this compound in regular beers are in the
flavor threshold in most cases and for R2, R4, R5, R6, R7, R9 and R15 above 40 mg/l (Table 4), which means that this compound should be noticed
particularly in these samples. Also, for the non-alcoholic beers F3 and F9, the concentration of 2-phenylethanol is notably high (30.26 and 34.41 mg/l,
respectively) as compared to the other compounds, this can suggest an unbalance flavor profile based on sweet and flowery aromas for this non-
alcoholic beers.1-propanol and ethyl acetate were almost completely depleted in alcohol free beers likely due to their low boiling temperatures
(33.6 and 52.2 ºC for 1-propanol at 102 and 200 mbar, respectively, and 13.7 and 32.3 ºC for ethyl acetate at 102 and 200 mbar, respectively). In
comparison to regular beers, where concentrations ranged from 9.40 mg/l to 20.29 mg/l for 1-propanol, and between 8.82 mg/l and 30.39 mg/l for
ethyl acetate, in all alcohol free beer samples 1-propanol values were < 0.005 mg/l and ethyl acetate ranged from < 0.005 to 0.41 mg/l (Table 4). In
regular beer samples R4, R10, R13 and R15 the ethyl acetate content is above its flavor threshold (20-25 mg/l). Accordingly, the high losses
observed in both compounds in alcohol free beers suggest that the alcoholic, fruity and solvent-like flavor character is also lost (Table 3).
Amyl alcohols (2- and 3-methylbutanol) are characterized mainly by alcoholic, banana, sweet, malty or vinous flavors (Table 3), and high losses
are reported during the dealcoholization process by different authors (Brányik, Silva, Baszczyňski, Lehnert, & Almeida e Silva, 2012; Catarino &
Mendes, 2011; Montanari, Marconi, Mayer, & Fantozzi, 2009). In our case, F16 exhibited the highest concentration of these compounds (7.74 mg/l for
3-methylbutanol and 2.05 mg/l for 2-methylbutanol), whereas the lowest concentrations were found in F1 (0.12 mg/l and 0.06 mg/l for 2- and 3-
methylbutanol, respectively). Regarding this fact, the concentration of these compounds in F16 and F5 is higher than in other samples and also
higher than for the other compounds studied, this can suggest that the sweet and fruity character can be enhanced in these beers. In regular
beers, concentration of these compounds ranged from 31.31 mg/l for R14 to 59.46 mg/l for R5 (Table 4); further, for R2, R4, R5, R7 and R8, all of them
Spanish beers, the concentration of 3-methylbuthanol is in the flavor threshold (Table 3), this can be associated to the method of production
concerning to the high gravity wort used as well as the yeast strain used. Finally, also for isoamyl acetate losses are found in spite of its initial
concentration in regular beers is not too high. Amounts of this compound in
SECTION 3. Beer volatile Compounds behave during Lab-scale Dealcoholization Process Chapter 3.1
213
regular beers ranged from 0.80 mg/l (R5) to 3.99 mg/l (R6). In the alcohol free beers analyzed, concentration of this compound decreased to values
of 0.51 mg/l (F16) and 0.05 (F1, F3, F9 and F14) due to the dealcoholization process (Table 4). Isoamyl acetate is mainly related to its characteristic
banana and pear flavor. The concentration threshold of this compound is low (Table 3) and can therefore be specially noticed in beer; in addition to
it, some of the beer samples analyzed contained it above the flavor threshold (R1, R6, R8, R9, R10, R13, R14 and R16), which can be likely due to
the adjuncts used, such as corn, rice or wheat, and also to wort production by a high gravity method (Verstrepen, Derdelinckx, Dufour, Winderickx,
Thevelein, Pretorius, & Delvaux, 2003).
Results of this study corroborate therefore the results shown in studies by Riu-
Aumatell et al (2014), Montanari et al. (2009) and Pinho et al. (2006), where different volatile compounds of alcohol free beers and regular beers were
assessed, and lower volatile compound concentrations in non-alcoholic beer samples were found than in regular beers.
Dealcoholized beer residue at lab-scale vacuum distillation process (D102
and D200) against commercial alcohol free beer results (F)
Results show that for the lab-scale dealcoholization process at 102 mbar
and 50ºC (D102), the volatile compound losses are less than in the case of the experiment at 200 mbar and 67ºC (D200). Only for isoamyl acetate
losses are similar to, or even lower than, the ones reported in commercial alcohol free beers, with concentrations from 0.05 mg/l to 0.18 mg/l in D200
samples and from 0.09 mg/l to 0.39 mg/l in D102 samples (Table 4).
For the other compounds, high differences regarding to the concentration of 1-propanol in F and the experiments D102 and D200 exist. For F beers
values of less than 0.005 mg/l were found, while concentrations between 4.02 and 10.38 mg/l and between 4.25 and 6.78 mg/l were found for D102
and D200 experimental samples, respectively (Table 4). Also, high decrease in the amount of ethyl acetate was found in commercial alcohol free beers
(0.12 mg/l, average) as compared to experimental samples, with values of 0.69 – 3.53 mg/l for D102 samples and 0.25 –2.62 mg/l for D200 samples
(Table 4). Regarding to amyl alcohols, the concentration obtained at D200 (averages of 8.35 mg/l for 3-methylbutanol and 2.88 mg/l for 2-
methylbuthanol) is also lower than the concentration at D102 (averages of

SECTION 3. Beer volatile Compounds behave during Lab-scale Dealcoholization Process Chapter 3.1
214
21.27 and 8.01 mg/l, respectively), in commercial non-alcoholic beers is even lower.
This behavior can suggest that the pressure and temperature applied to the dealcoholization process caused similar effects to those observed in
commercial low alcohol beers, but if high pressure and therefore temperature is used, compound losses increase for a given residential time.
For D102 samples the concentration of 2-phenylethanol increases with
respect to its concentration in R samples in all cases. For D200 samples the compound concentration is lower than for D100 samples and therefore
lower than for their related R samples (Table 4). Looking at these results, it can be postulated that this compound is initially evaporated to some
extent, but after a given moment of the distillation process, as a consequence of the effect of time and temperature, the compound is
generated chemically, as explained above.
Regarding the general lab-scale dealcoholization process, we suggest that this process is nearly comparable to the industrial ones. However, since the
volatile compound concentration measured in the remaining raw material in the present experiments is higher than the concentration found in
commercial alcohol free beers, it might be that the residence time of the sample being dealcoholized in these study experiments was not enough to
reduce the ethanol content to less than 1% of the low alcohol commercial beers, and, hence, some volatile compounds were evaporated to a limited
extent.
Regarding to the final product, that is, the dealcoholized product, the
experiment D200 leads to a final product more similar to the commercial alcohol free beers according to the volatile compound concentrations, as
it is indicated by the PCA scoreplot (Figure 2).
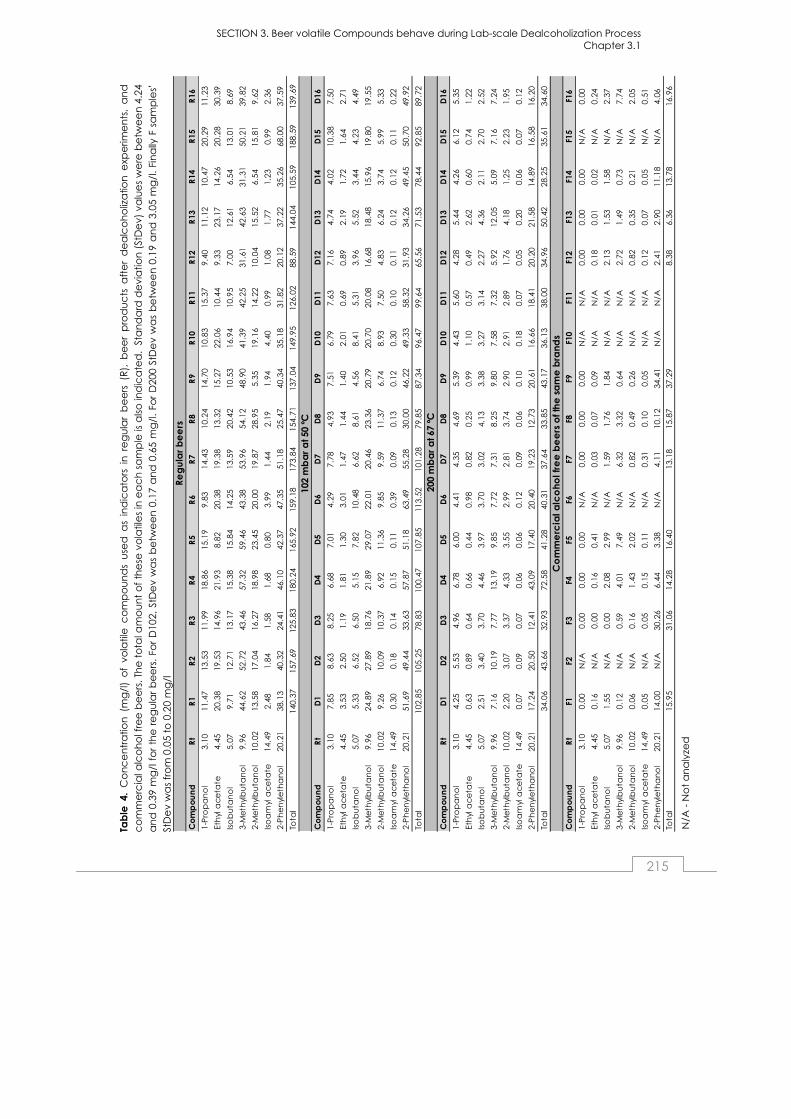
SECTION 3. Beer volatile Compounds behave during Lab-scale Dealcoholization Process Chapter 3.1
215
N/A
- N
ot
an
aly
zed
Co
mp
ou
nd
Rt
R1
R2
R3
R4
R5
R6
R7
R8
R9
R10
R11
R12
R13
R14
R15
R16
1-P
rop
an
ol
3.10
11.4
713
.53
11.9
918
.86
15.1
99.
8314
.43
10.2
414
.70
10.8
315
.37
9.40
11.1
210
.47
20.2
911
.23
Eth
yl a
ce
tate
4.45
20.3
819
.53
14.9
621
.93
8.82
20.3
819
.38
13.3
215
.27
22.0
610
.44
9.33
23.1
714
.26
20.2
830
.39
Iso
bu
tan
ol
5.07
9.71
12.7
113
.17
15.3
815
.84
14.2
513
.59
20.4
210
.53
16.9
410
.95
7.00
12.6
16.
5413
.01
8.69
3-M
eth
ylb
uta
no
l9.
9644
.62
52.7
243
.46
57.3
259
.46
43.3
853
.96
54.1
248
.90
41.3
942
.25
31.6
142
.63
31.3
150
.21
39.8
2
2-M
eth
ylb
uta
no
l10
.02
13.5
817
.04
16.2
718
.98
23.4
520
.00
19.8
728
.95
5.35
19.1
614
.22
10.0
415
.52
6.54
15.8
19.
62
Iso
am
yl a
ce
tate
14.4
92.
481.
841.
581.
680.
803.
991.
442.
191.
944.
400.
991.
081.
771.
230.
992.
36
2-P
he
nyl
eth
an
ol
20.2
138
.13
40.3
224
.41
46.1
042
.37
47.3
551
.18
25.4
740
.34
35.1
831
.82
20.1
237
.22
35.2
668
.00
37.5
9
Tota
l 14
0.37
157.
6912
5.83
180.
2416
5.92
159.
1817
3.84
154.
7113
7.04
149.
9512
6.02
88.5
914
4.04
105.
5918
8.59
139.
69
Co
mp
ou
nd
Rt
D1
D2
D3
D4
D5
D6
D7
D8
D9
D10
D11
D12
D13
D14
D15
D16
1-P
rop
an
ol
3.10
7.85
8.63
8.25
6.68
7.01
4.29
7.78
4.93
7.51
6.79
7.63
7.16
4.74
4.02
10.3
87.
50
Eth
yl a
ce
tate
4.45
3.53
2.50
1.19
1.81
1.30
3.01
1.47
1.44
1.40
2.01
0.69
0.89
2.19
1.72
1.64
2.71
Iso
bu
tan
ol
5.07
5.33
6.52
6.50
5.15
7.82
10.4
86.
628.
614.
568.
415.
313.
965.
523.
444.
234.
49
3-M
eth
ylb
uta
no
l9.
9624
.89
27.8
918
.76
21.8
929
.07
22.0
120
.46
23.3
620
.79
20.7
020
.08
16.6
818
.48
15.9
619
.80
19.5
5
2-M
eth
ylb
uta
no
l10
.02
9.26
10.0
910
.37
6.92
11.3
69.
859.
5911
.37
6.74
8.93
7.50
4.83
6.24
3.74
5.99
5.33
Iso
am
yl a
ce
tate
14.4
90.
300.
180.
140.
150.
110.
390.
090.
130.
120.
300.
100.
110.
120.
120.
110.
22
2-P
he
nyl
eth
an
ol
20.2
151
.69
49.4
433
.63
57.8
751
.18
63.4
955
.28
30.0
046
.22
49.3
358
.32
31.9
334
.26
49.4
550
.70
49.9
2
Tota
l 10
2.85
105.
2578
.83
100.
4710
7.85
113.
5210
1.28
79.8
587
.34
96.4
799
.64
65.5
671
.53
78.4
492
.85
89.7
2
Co
mp
ou
nd
Rt
D1
D2
D3
D4
D5
D6
D7
D8
D9
D10
D11
D12
D13
D14
D15
D16
1-P
rop
an
ol
3.10
4.25
5.53
4.96
6.78
6.00
4.41
4.35
4.69
5.39
4.43
5.60
4.28
5.44
4.26
6.12
5.35
Eth
yl a
ce
tate
4.45
0.63
0.89
0.64
0.66
0.44
0.98
0.82
0.25
0.99
1.10
0.57
0.49
2.62
0.60
0.74
1.22
Iso
bu
tan
ol
5.07
2.51
3.40
3.70
4.46
3.97
3.70
3.02
4.13
3.38
3.27
3.14
2.27
4.36
2.11
2.70
2.52
3-M
eth
ylb
uta
no
l9.
967.
1610
.19
7.77
13.1
99.
857.
727.
318.
259.
807.
587.
325.
9212
.05
5.09
7.16
7.24
2-M
eth
ylb
uta
no
l10
.02
2.20
3.07
3.37
4.33
3.55
2.99
2.81
3.74
2.90
2.91
2.89
1.76
4.18
1.25
2.23
1.95
Iso
am
yl a
ce
tate
14.4
90.
070.
090.
070.
060.
060.
120.
090.
060.
100.
180.
070.
050.
200.
060.
070.
12
2-P
he
nyl
eth
an
ol
20.2
117
.24
20.5
012
.41
43.0
917
.40
20.4
019
.23
12.7
320
.61
16.6
618
.41
20.2
021
.58
14.8
916
.58
16.2
0
Tota
l 34
.06
43.6
632
.93
72.5
841
.28
40.3
137
.64
33.8
543
.17
36.1
338
.00
34.9
650
.42
28.2
535
.61
34.6
0
Co
mp
ou
nd
Rt
F1F2
F3F4
F5F6
F7F8
F9F1
0F1
1F1
2F1
3F1
4F1
5F1
6
1-P
rop
an
ol
3.10
0.00
N/A
0.00
0.00
0.00
N/A
0.00
0.00
0.00
N/A
N/A
0.00
0.00
0.00
N/A
0.00
Eth
yl a
ce
tate
4.45
0.16
N/A
0.00
0.16
0.41
N/A
0.03
0.07
0.09
N/A
N/A
0.18
0.01
0.02
N/A
0.24
Iso
bu
tan
ol
5.07
1.55
N/A
0.00
2.08
2.99
N/A
1.59
1.76
1.84
N/A
N/A
2.13
1.53
1.58
N/A
2.37
3-M
eth
ylb
uta
no
l9.
960.
12N
/A0.
594.
017.
49N
/A6.
323.
320.
64N
/AN
/A2.
721.
490.
73N
/A7.
74
2-M
eth
ylb
uta
no
l10
.02
0.06
N/A
0.16
1.43
2.02
N/A
0.82
0.49
0.26
N/A
N/A
0.82
0.35
0.21
N/A
2.05
Iso
am
yl a
ce
tate
14.4
90.
05N
/A0.
050.
150.
11N
/A0.
310.
100.
05N
/AN
/A0.
120.
070.
05N
/A0.
51
2-P
he
nyl
eth
an
ol
20.2
114
.00
N/A
30.2
66.
443.
38N
/A4.
1110
.12
34.4
1N
/AN
/A2.
412.
9011
.18
N/A
4.06
Tota
l 15
.95
31.0
614
.28
16.4
013
.18
15.8
737
.29
8.38
6.36
13.7
816
.96
Re
gu
lar
be
ers
102
mb
ar
at 5
0 ºC
200
mb
ar
at 6
7 ºC
Co
mm
erc
ial a
lco
ho
l fre
e b
ee
rs o
f th
e s
am
e b
ran
ds
Tab
le 4
. C
on
ce
ntr
atio
n (
mg
/l)
of
vola
tile
co
mp
ou
nd
s u
sed
as
ind
ica
tors
in
re
gu
lar
be
ers
(R
), b
ee
r p
rod
uc
ts a
fte
r d
ea
lco
ho
liza
tion
exp
erim
en
ts,
an
d
co
mm
erc
ial a
lco
ho
l fre
e b
ee
rs. T
he
to
tal a
mo
un
t o
f th
ese
vo
latil
es
in e
ac
h s
am
ple
is a
lso
ind
ica
ted
. St
an
da
rd d
evi
atio
n (
StD
ev)
va
lue
s w
ere
be
twe
en
4.2
4
an
d 0
.39
mg
/l f
or
the
re
gu
lar
be
ers
. Fo
r D
102,
StD
ev
wa
s b
etw
ee
n 0
.17
an
d 0
.65
mg
/l.
For
D20
0 St
De
v w
as
be
twe
en
0.1
9 a
nd
3.0
5 m
g/l
. Fi
na
lly F
sa
mp
les’
StD
ev
wa
s fr
om
0.0
5 to
0.2
0 m
g/l

SECTION 3. Beer volatile Compounds behave during Lab-scale Dealcoholization Process Chapter 3.1
216
Beer distilled fractions analysis (A1, A2 and A3)
Beer distilled fractions were collected at different stages of the process to
evaluate the volatile compounds losses, and their changes at 102 and 200 mbar. For both experiments the highest losses of the volatile compounds
seem to have taken place from 13.45 to 19.21 minutes in the 102 mbar experiment and from 6.44 to 14.10 minutes in the 200 mbar experiment, that
is in the fraction A1 (Table 5). Tables 6 and 7 show the concentration of the volatile compounds analyzed in the distilled fractions at both pressures and
temperatures. Of all volatile compounds studied, the ones that exhibited the highest concentrations in the distillated fractions (which means the
highest losses) are the amyl alcohols (2-methylbutanol and 3-methylbutanol). As these compounds are in high concentration in regular
beers, its characteristic flavor (Table 3), as mentioned above, is likely to be conserved in non-alcoholic beers.
Table 5. Distillation time for A1, A2 and A3 fractions, and vapor temperature when each fraction was collected
Sample t (min) T (ºC) t (min) T (ºC) t (min) T (ºC) t (min) T (ºC) t (min) T (ºC) t (min) T (ºC)1 15.26 27 24.23 32 29.25 33 11.37 38 15.53 42 20.25 432 16.45 30 23.07 31 31.40 34 12.15 37 16.44 38 22.00 403 14.15 27 23.44 33 29.48 36 9.15 39 12.40 42 16.03 424 15.30 29 21.59 32 30.02 35 9.33 44 13.12 50 17.07 515 14.21 28 22.16 32 28.23 34 13.07 30 18.16 32 22.23 336 15.12 27 22.32 33 27.12 35 14.10 30 18.32 31 23.12 327 14.56 26 21.51 32 29.25 33 10.44 36 14.41 37 18.31 388 13.51 30 19.01 32 25.44 34 10.51 44 13.19 51 15.44 519 15.16 27 22.11 31 29.15 34 10.21 37 14.10 38 18.15 4010 13.48 31 20.53 34 28.18 35 11.06 36 17.13 37 23.25 3811 19.21 28 28.35 31 37.26 31 11.45 31 16.31 32 21.05 3712 13.45 33 19.08 36 23.51 37 9.17 43 11.55 44 14.14 5113 17.29 26 25.50 30 33.48 31 6.44 48 9.01 50 11.33 5014 14.27 27 23.01 30 30.42 31 10.53 35 14.14 39 17.03 4015 13.56 33 19.15 35 24.17 34 9.54 38 13.07 40 16.21 4216 15.41 26 22.36 32 29.15 33 10.42 35 14.31 35 18.51 36
102 mbar, 50 ºC 200 mbar, 67 ºCA1 A2 A3 A1 A2 A3
The concentration of volatile compounds measured in subsequent fractions decreases gradually, from fractions A1 to A3, which means that high
concentrations of these compounds are evaporated in the initial fraction. This can suggest that, although industrial scale thermal dealcoholization

SECTION 3. Beer volatile Compounds behave during Lab-scale Dealcoholization Process Chapter 3.1
217
processes are done over very short times, loss of these volatile compounds cannot be avoided when using a thermal dealcoholization process.
CONCLUSIONS
The HS-SPME-GC-MS analytical method allowed us to identify 45 volatile
compounds in regular beers samples, and 7 of them were used as key volatile compounds in the lab-scale dealcoholization experiments.
High losses of volatile compounds have been reported during the lab-scale
vacuum dealcoholization process and also when commercial regular beers and their related non-alcoholic beers were compared. The main losses
were found over the initial period of the dealcoholization experiments; and, hence, although the system is only nearly comparable to the industrial scale
ones, our results suggest that the volatile compound behavior is likely to be also comparable. For this reason, due to the high losses of volatile
compounds reported in non-alcoholic beers, we suggest that in thermal dealcoholization at industrial scale, some additional system to recover the
aroma compounds should be implemented in order to furtherly improve the organoleptic characteristics of the final product by adding them to it.
Our results indicate that 2-phenylethanol is initially evaporated to some extent and afterwards produced in the process by chemical reactions due
to the extended residence time and temperature. In alcohol free beer F3, the amount of this compound is higher than in its related regular beer. This
can be a signal of overheating or overtiming in the dealcoholization process.
Finally, although less time is needed in the experiment, high losses of the
volatile compounds analyzed are reported for D200 samples. Commercial non alcoholic/alcohol free beers contained concentrations of all
compounds studied, even lower than in the dealcoholized beer product.
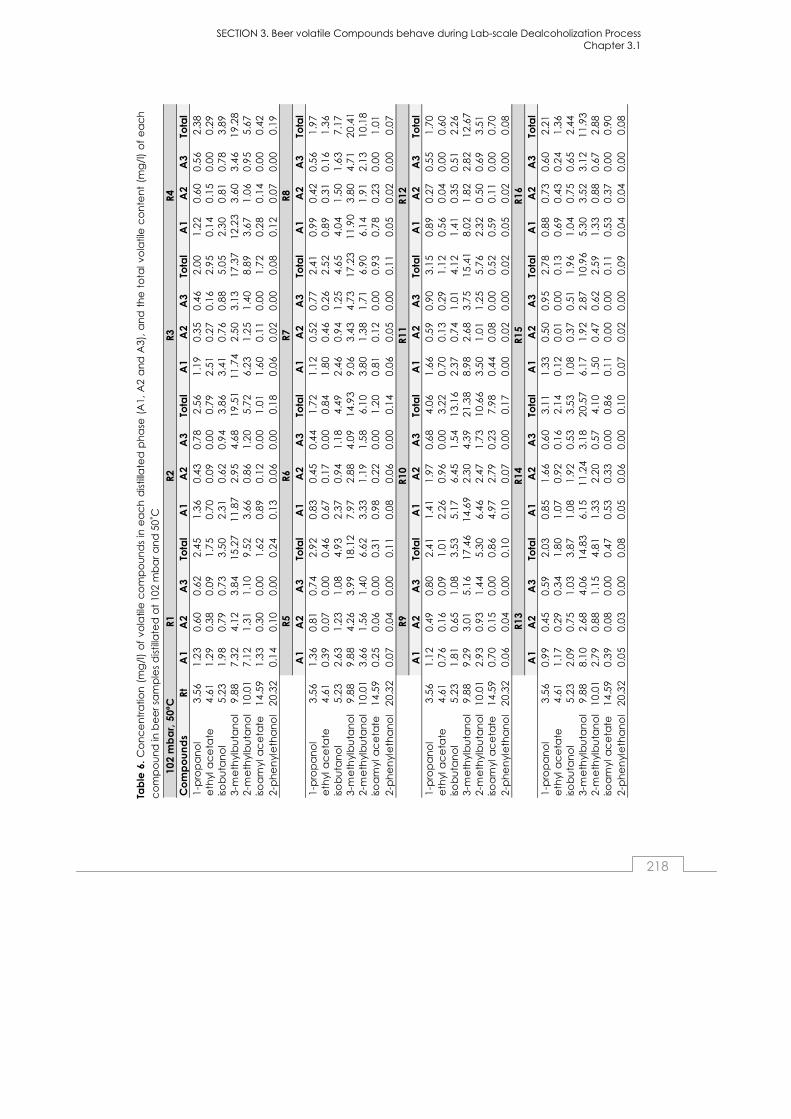
SECTION 3. Beer volatile Compounds behave during Lab-scale Dealcoholization Process Chapter 3.1
218
Tab
le 6
. C
on
ce
ntr
atio
n (
mg
/l)
of
vola
tile
co
mp
ou
nd
s in
ea
ch
dis
tilla
ted
ph
ase
(A
1, A
2 a
nd
A3)
, a
nd
th
e t
ota
l vo
latil
e c
on
ten
t (m
g/l
) o
f e
ac
h
co
mp
ou
nd
in b
ee
r sa
mp
les
dis
tilla
ted
at
102
mb
ar
an
d 5
0˚C
Co
mp
ou
nd
sRt
A1
A2
A3
Tota
l A
1A
2A
3To
tal
A1
A2
A3
Tota
l A
1A
2A
3To
tal
1-p
rop
an
ol
3.5
61
.23
0.6
00
.62
2.4
51
.36
0.4
30
.78
2.5
61
.19
0.3
50
.46
2.0
01
.22
0.6
00
.56
2.3
8e
thyl
ac
eta
te4
.61
1.2
90
.38
0.0
91
.75
0.7
00
.09
0.0
00
.79
2.5
10
.27
0.1
62
.95
0.1
40
.15
0.0
00
.29
isob
uta
no
l5
.23
1.9
80
.79
0.7
33
.50
2.3
10
.62
0.9
43
.86
3.4
10
.76
0.8
85
.05
2.3
00
.81
0.7
83
.89
3-m
eth
ylb
uta
no
l9
.88
7.3
24
.12
3.8
41
5.2
71
1.8
72
.95
4.6
81
9.5
11
1.7
42
.50
3.1
31
7.3
71
2.2
33
.60
3.4
61
9.2
82
-me
thyl
bu
tan
ol
10
.01
7.1
21
.31
1.1
09
.52
3.6
60
.86
1.2
05
.72
6.2
31
.25
1.4
08
.89
3.6
71
.06
0.9
55
.67
isoa
myl
ac
eta
te1
4.5
91
.33
0.3
00
.00
1.6
20
.89
0.1
20
.00
1.0
11
.60
0.1
10
.00
1.7
20
.28
0.1
40
.00
0.4
22
-ph
en
yle
tha
no
l2
0.3
20
.14
0.1
00
.00
0.2
40
.13
0.0
60
.00
0.1
80
.06
0.0
20
.00
0.0
80
.12
0.0
70
.00
0.1
9
A1
A2
A3
Tota
l A
1A
2A
3To
tal
A1
A2
A3
Tota
l A
1A
2A
3To
tal
1-p
rop
an
ol
3.5
61
.36
0.8
10
.74
2.9
20
.83
0.4
50
.44
1.7
21
.12
0.5
20
.77
2.4
10
.99
0.4
20
.56
1.9
7e
thyl
ac
eta
te4
.61
0.3
90
.07
0.0
00
.46
0.6
70
.17
0.0
00
.84
1.8
00
.46
0.2
62
.52
0.8
90
.31
0.1
61
.36
isob
uta
no
l5
.23
2.6
31
.23
1.0
84
.93
2.3
70
.94
1.1
84
.49
2.4
60
.94
1.2
54
.65
4.0
41
.50
1.6
37
.17
3-m
eth
ylb
uta
no
l9
.88
9.8
84
.26
3.9
91
8.1
27
.97
2.8
84
.09
14
.93
9.0
63
.43
4.7
31
7.2
31
1.9
03
.80
4.7
12
0.4
12
-me
thyl
bu
tan
ol
10
.01
3.6
61
.56
1.4
06
.62
3.3
31
.19
1.5
86
.10
3.8
01
.38
1.7
16
.90
6.1
41
.91
2.1
31
0.1
8iso
am
yl a
ce
tate
14
.59
0.2
50
.06
0.0
00
.31
0.9
80
.22
0.0
01
.20
0.8
10
.12
0.0
00
.93
0.7
80
.23
0.0
01
.01
2-p
he
nyl
eth
an
ol
20
.32
0.0
70
.04
0.0
00
.11
0.0
80
.06
0.0
00
.14
0.0
60
.05
0.0
00
.11
0.0
50
.02
0.0
00
.07
A1
A2
A3
Tota
l A
1A
2A
3To
tal
A1
A2
A3
Tota
l A
1A
2A
3To
tal
1-p
rop
an
ol
3.5
61
.12
0.4
90
.80
2.4
11
.41
1.9
70
.68
4.0
61
.66
0.5
90
.90
3.1
50
.89
0.2
70
.55
1.7
0e
thyl
ac
eta
te4
.61
0.7
60
.16
0.0
91
.01
2.2
60
.96
0.0
03
.22
0.7
00
.13
0.2
91
.12
0.5
60
.04
0.0
00
.60
isob
uta
no
l5
.23
1.8
10
.65
1.0
83
.53
5.1
76
.45
1.5
41
3.1
62
.37
0.7
41
.01
4.1
21
.41
0.3
50
.51
2.2
63
-me
thyl
bu
tan
ol
9.8
89
.29
3.0
15
.16
17
.46
14
.69
2.3
04
.39
21
.38
8.9
82
.68
3.7
51
5.4
18
.02
1.8
22
.82
12
.67
2-m
eth
ylb
uta
no
l1
0.0
12
.93
0.9
31
.44
5.3
06
.46
2.4
71
.73
10
.66
3.5
01
.01
1.2
55
.76
2.3
20
.50
0.6
93
.51
isoa
myl
ac
eta
te1
4.5
90
.70
0.1
50
.00
0.8
64
.97
2.7
90
.23
7.9
80
.44
0.0
80
.00
0.5
20
.59
0.1
10
.00
0.7
02
-ph
en
yle
tha
no
l2
0.3
20
.06
0.0
40
.00
0.1
00
.10
0.0
70
.00
0.1
70
.00
0.0
20
.00
0.0
20
.05
0.0
20
.00
0.0
8
A1
A2
A3
Tota
l A
1A
2A
3To
tal
A1
A2
A3
Tota
l A
1A
2A
3To
tal
1-p
rop
an
ol
3.5
60
.99
0.4
50
.59
2.0
30
.85
1.6
60
.60
3.1
11
.33
0.5
00
.95
2.7
80
.88
0.7
30
.60
2.2
1e
thyl
ac
eta
te4
.61
1.1
70
.29
0.3
41
.80
1.0
70
.92
0.1
62
.14
0.1
20
.01
0.0
00
.13
0.6
90
.43
0.2
41
.36
isob
uta
no
l5
.23
2.0
90
.75
1.0
33
.87
1.0
81
.92
0.5
33
.53
1.0
80
.37
0.5
11
.96
1.0
40
.75
0.6
52
.44
3-m
eth
ylb
uta
no
l9
.88
8.1
02
.68
4.0
61
4.8
36
.15
11
.24
3.1
82
0.5
76
.17
1.9
22
.87
10
.96
5.3
03
.52
3.1
21
1.9
32
-me
thyl
bu
tan
ol
10
.01
2.7
90
.88
1.1
54
.81
1.3
32
.20
0.5
74
.10
1.5
00
.47
0.6
22
.59
1.3
30
.88
0.6
72
.88
isoa
myl
ac
eta
te1
4.5
90
.39
0.0
80
.00
0.4
70
.53
0.3
30
.00
0.8
60
.11
0.0
00
.00
0.1
10
.53
0.3
70
.00
0.9
02
-ph
en
yle
tha
no
l2
0.3
20
.05
0.0
30
.00
0.0
80
.05
0.0
60
.00
0.1
00
.07
0.0
20
.00
0.0
90
.04
0.0
40
.00
0.0
8
102
mb
ar,
50º
C
R6
R1R2
R3R4
R5 R9R1
0R1
1R1
2
R13
R14
R7R8
R15
R16
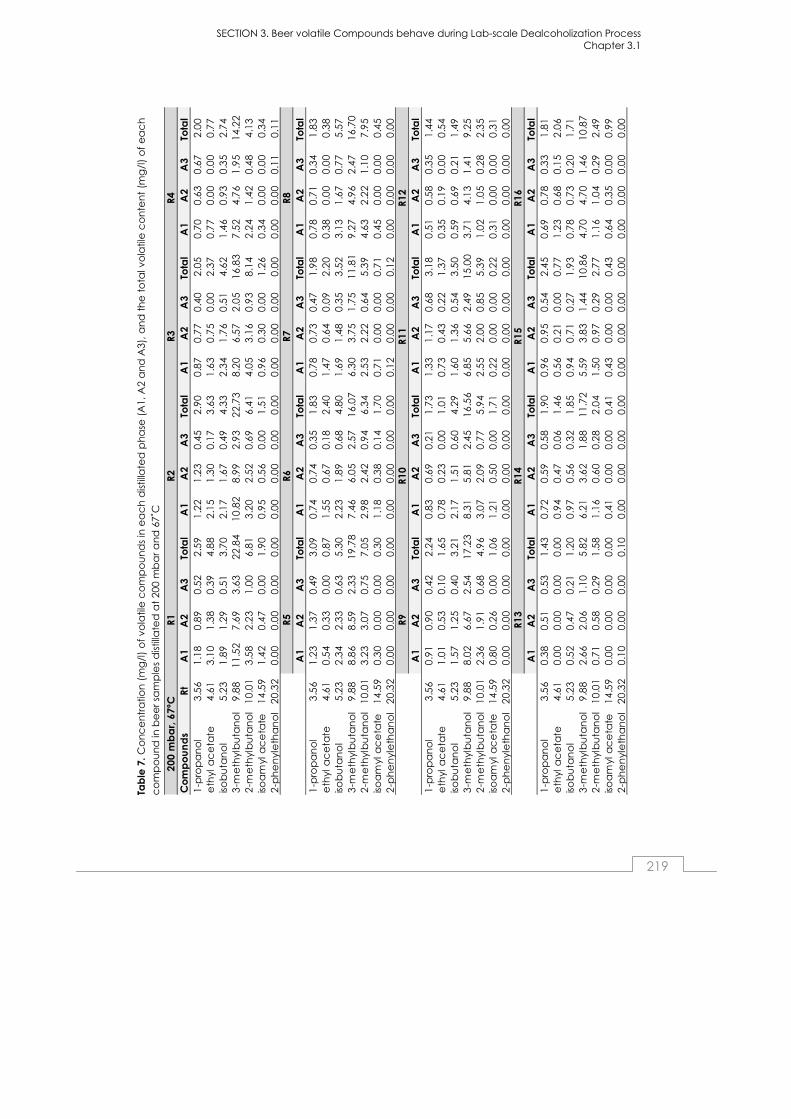
SECTION 3. Beer volatile Compounds behave during Lab-scale Dealcoholization Process Chapter 3.1
219
Tab
le 7
. Co
nc
en
tra
tion
(m
g/l
) o
f vo
latil
e c
om
po
un
ds
in e
ac
h d
istil
late
d p
ha
se (
A1,
A2
an
d A
3), a
nd
th
e t
ota
l vo
latil
e c
on
ten
t (m
g/l
) o
f e
ac
h
co
mp
ou
nd
in b
ee
r sa
mp
les
dis
tilla
ted
at
200
mb
ar
an
d 6
7˚C
Co
mp
ou
nd
sRt
A1
A2
A3
Tota
l A
1A
2A
3To
tal
A1
A2
A3
Tota
l A
1A
2A
3To
tal
1-p
rop
an
ol
3.5
61
.18
0.8
90
.52
2.5
91
.22
1.2
30.
45
2.9
00
.87
0.7
70
.40
2.0
50
.70
0.6
30
.67
2.0
0e
thyl
ac
eta
te4
.61
3.1
01
.38
0.3
94
.88
2.1
51
.30
0.1
73
.63
1.6
30
.75
0.0
02
.37
0.7
70
.00
0.0
00
.77
isob
uta
no
l5
.23
1.8
91
.29
0.5
13
.70
2.1
71
.67
0.4
94
.33
2.3
41
.76
0.5
14
.62
1.4
60
.93
0.3
52
.74
3-m
eth
ylb
uta
no
l9
.88
11
.52
7.6
93
.63
22
.84
10
.82
8.9
92.
93
22
.73
8.2
06
.57
2.0
51
6.8
37
.52
4.7
61
.95
14
.22
2-m
eth
ylb
uta
no
l1
0.0
13
.58
2.2
31
.00
6.8
13
.20
2.5
20.
69
6.4
14
.05
3.1
60
.93
8.1
42
.24
1.4
20
.48
4.1
3iso
am
yl a
ce
tate
14
.59
1.4
20
.47
0.0
01
.90
0.9
50
.56
0.0
01
.51
0.9
60
.30
0.0
01
.26
0.3
40
.00
0.0
00
.34
2-p
he
nyl
eth
an
ol
20
.32
0.0
00
.00
0.0
00
.00
0.0
00
.00
0.0
00
.00
0.0
00
.00
0.0
00
.00
0.0
00
.00
0.1
10
.11
A1
A2
A3
Tota
l A
1A
2A
3To
tal
A1
A2
A3
Tota
l A
1A
2A
3To
tal
1-p
rop
an
ol
3.5
61
.23
1.3
70
.49
3.0
90
.74
0.7
40.
35
1.8
30
.78
0.7
30
.47
1.9
80
.78
0.7
10
.34
1.8
3e
thyl
ac
eta
te4
.61
0.5
40
.33
0.0
00
.87
1.5
50
.67
0.1
82
.40
1.4
70
.64
0.0
92
.20
0.3
80
.00
0.0
00
.38
isob
uta
no
l5
.23
2.3
42
.33
0.6
35
.30
2.2
31
.89
0.6
84
.80
1.6
91
.48
0.3
53
.52
3.1
31
.67
0.7
75
.57
3-m
eth
ylb
uta
no
l9
.88
8.8
68
.59
2.3
31
9.7
87
.46
6.0
52.
57
16
.07
6.3
03
.75
1.7
51
1.8
19
.27
4.9
62
.47
16
.70
2-m
eth
ylb
uta
no
l1
0.0
13
.23
3.0
70
.75
7.0
52
.98
2.4
20.
94
6.3
42
.53
2.2
20
.64
5.3
94
.63
2.2
21
.10
7.9
5iso
am
yl a
ce
tate
14
.59
0.3
00
.00
0.0
00
.30
1.1
80
.38
0.1
41
.70
0.7
10
.00
0.0
00
.71
0.4
50
.00
0.0
00
.45
2-p
he
nyl
eth
an
ol
20
.32
0.0
00
.00
0.0
00
.00
0.0
00
.00
0.0
00
.00
0.1
20
.00
0.0
00
.12
0.0
00
.00
0.0
00
.00
A1
A2
A3
Tota
l A
1A
2A
3To
tal
A1
A2
A3
Tota
l A
1A
2A
3To
tal
1-p
rop
an
ol
3.5
60
.91
0.9
00
.42
2.2
40
.83
0.6
90.
21
1.7
31
.33
1.1
70
.68
3.1
80
.51
0.5
80
.35
1.4
4e
thyl
ac
eta
te4
.61
1.0
10
.53
0.1
01
.65
0.7
80
.23
0.0
01
.01
0.7
30
.43
0.2
21
.37
0.3
50
.19
0.0
00
.54
isob
uta
no
l5
.23
1.5
71
.25
0.4
03
.21
2.1
71
.51
0.6
04
.29
1.6
01
.36
0.5
43
.50
0.5
90
.69
0.2
11
.49
3-m
eth
ylb
uta
no
l9
.88
8.0
26
.67
2.5
41
7.2
38
.31
5.8
12.
45
16
.56
6.8
55
.66
2.4
91
5.0
03
.71
4.1
31
.41
9.2
52
-me
thyl
bu
tan
ol
10
.01
2.3
61
.91
0.6
84
.96
3.0
72
.09
0.7
75
.94
2.5
52
.00
0.8
55
.39
1.0
21
.05
0.2
82
.35
isoa
myl
ac
eta
te1
4.5
90
.80
0.2
60
.00
1.0
61
.21
0.5
00.
00
1.7
10
.22
0.0
00
.00
0.2
20
.31
0.0
00
.00
0.3
12
-ph
en
yle
tha
no
l2
0.3
20
.00
0.0
00
.00
0.0
00
.00
0.0
00.
00
0.0
00
.00
0.0
00
.00
0.0
00
.00
0.0
00
.00
0.0
0
A1
A2
A3
Tota
l A
1A
2A
3To
tal
A1
A2
A3
Tota
l A
1A
2A
3To
tal
1-p
rop
an
ol
3.5
60
.38
0.5
10
.53
1.4
30
.72
0.5
90.
58
1.9
00
.96
0.9
50
.54
2.4
50
.69
0.7
80
.33
1.8
1e
thyl
ac
eta
te4
.61
0.0
00
.00
0.0
00
.00
0.9
40
.47
0.0
61
.46
0.5
60
.21
0.0
00
.77
1.2
30
.68
0.1
52
.06
isob
uta
no
l5
.23
0.5
20
.47
0.2
11
.20
0.9
70
.56
0.3
21
.85
0.9
40
.71
0.2
71
.93
0.7
80
.73
0.2
01
.71
3-m
eth
ylb
uta
no
l9
.88
2.6
62
.06
1.1
05
.82
6.2
13
.62
1.8
81
1.7
25
.59
3.8
31
.44
10
.86
4.7
04
.70
1.4
61
0.8
72
-me
thyl
bu
tan
ol
10
.01
0.7
10
.58
0.2
91
.58
1.1
60
.60
0.2
82
.04
1.5
00
.97
0.2
92
.77
1.1
61
.04
0.2
92
.49
isoa
myl
ac
eta
te1
4.5
90
.00
0.0
00
.00
0.0
00
.41
0.0
00.
00
0.4
10
.43
0.0
00
.00
0.4
30
.64
0.3
50
.00
0.9
92
-ph
en
yle
tha
no
l2
0.3
20
.10
0.0
00
.00
0.1
00
.00
0.0
00.
00
0.0
00
.00
0.0
00
.00
0.0
00
.00
0.0
00
.00
0.0
0
R16
200
mb
ar,
67º
C
R9R1
0R1
1R1
2
R13
R14
R15
R1R2
R3R4
R5R6
R7R8
SECTION 3. Beer volatile Compounds behave during Lab-scale Dealcoholization Process Chapter 3.1
220
References
Andrés-Iglesias, C., Blanco, C. A., Blanco, J., & Montero, O. (2014). Mass
spectrometry-based metabolomics approach to determine differential metabolites between regular and non-alcohol beers. Food Chemistry,
157, 205-212.
Andrés-Iglesias, C., Montero, O., Sancho, D., & Blanco, C. A. (2015). New trends in beer flavour compound analysis. Journal of the Science of
Food and Agriculture, 95, 1571–1576.
Blanco, C. A., Andrés-Iglesias, C., & Montero, O. (2014). Low-alcohol beers: Flavour compounds, defects and improvement strategies. Critical
Reviews in Food Science and Nutrition. DOI: 10.1080/ 10408398.2012.733979.
Brányik, T., Silva, D. P., Baszczyňski, M., Lehnert, R., & Almeida e Silva, J. B. (2012). A review of methods of low alcohol and alcohol-free beer
production. Journal of Food Engineering, 108(4), 493-506.
Catarino, M., & Mendes, A. (2011). Non-alcoholic beer—A new industrial process. Separation and Purification Technology, 79(3), 342-351.
Charry-Parra, G., DeJesus-Echevarria, M., & Perez, F. J. (2011). Beer Volatile
Analysis: Optimization of HS/SPME Coupled to GC/MS/FID. Journal of Food Science, 76(2), C205-C211.
da Silva, G. A., Augusto, F., & Poppi, R. J. (2008). Exploratory analysis of the volatile profile of beers by HS-SPME–GC. Food Chemistry, 111, 1057–
1063.
Gonçalves, J. L., Figueira, J. A., Rodrigues, F. P., Ornelas, L. P., Branco, R. N., Silva, C. L., & Camara, J. S. (2014). A powerful methodological
approach combining headspace solid phase microextraction, mass spectrometry and multivariate analysis for profiling the volatile
metabolomic pattern of beer starting raw materials. Food Chemistry, 160, 266-280.
Guido, L., Rajendram, R., & Barros, A. (2009). Pitching Yeast and Beer Flavor -
In: Beer in Health and Disease Prevention. Ed.: Preedy, V. London: Academic Press, 22-32.
SECTION 3. Beer volatile Compounds behave during Lab-scale Dealcoholization Process Chapter 3.1
221
Kobayashi, M., Shimizu, H., & Shioya, S. (2008). Beer volatile compounds and their application to low-malt beer fermentation. Journal of Bioscience
and Bioengineering, 106, 317-323.
Lehnert, R., Kuřec, M., & Brányik, T. (2008). Effect of oxygen supply on flavor
formation during continuous alcohol-free beer production: A model study. American Society of Brewing Chemists, 66, 233-238.
Liguori, L., De Francesco, G., Russo, P., Perretti, G., Albanese, D., & Di
Matteo, M. (2015). Production and characterization of alcohol-free beer by membrane process. Food and Bioproducts Processing, 94(0),
158-168.
Montanari, L., Marconi, O., Mayer, H., & Fantozzi, P. (2009). Chapter 6 - Production of Alcohol-Free Beer. In V. R. Preedy (Ed.), Beer in Health
and Disease Prevention, (pp. 61-75). San Diego: Academic Press.
Moreira, N., Meireles, S., Brandao, T., & de Pinho, P. G. (2013). Optimization
of the HS-SPME-GC-IT/MS method using a central composite design for volatile carbonyl compounds determination in beers. Talanta, 117, 523-
531.
Pinho, O., Ferreira, I. M. P. L. V. O., & Santos, L. H. M. L. M. (2006). Method optimization by solid-phase microextraction in combination with gas
chromatography with mass spectrometry for analysis of beer volatile fraction. Journal of Chromatography A, 1121(2), 145-153.
Riu-Aumatell, M., Miro, P., Serra-Cayuela, A., Buxaderas, S., & Lopez-
Tamames, E. (2014). Assessment of the aroma profiles of low-alcohol beers using HS-SPME-GC-MS. Food Research International, 57, 196-202.
Rodriguez-Bencomo, J., Muñoz-González, C., Martín-Álvarez, P., Lázaro, E., Mancebo, R., Castañé, X., & Pozo-Bayón, M. (2012). Optimization of a
HS-SPME-GC-MS Procedure for Beer Volatile Profiling Using Response Surface Methodology: Application to Follow Aroma Stability of Beers
Under Different Storage Conditions. Food Analytical Methods, 5(6), 1386-1397.
Rossi, S., Sileoni, V., Perretti, G., & Marconi, O. (2014). Characterization of the
volatile profiles of beer using headspace solid-phase microextraction and gas chromatography-mass spectrometry. Journal of the Science of
Food and Agriculture, 94(5), 919-928.

SECTION 3. Beer volatile Compounds behave during Lab-scale Dealcoholization Process Chapter 3.1
222
Saison, D., De Schutter, D. P., Delvaux, F., & Delvaux, F. R. (2008). Optimisation of a complete method for the analysis of volatiles involved
in the flavour stability of beer by solid-phase microextraction in combination with gas chromatography and mass spectrometry.
Journal of Chromatography A, 1190(1–2), 342-349.
Saison, D., De Schutter, D. P., Delvaux, F., & Delvaux, F. R. (2009).
Determination of carbonyl compounds in beer by derivatisation and headspace solid-phase microextraction in combination with gas
chromatography and mass spectrometry. Journal of Chromatography A, 1216(26), 5061-5068.
Sohrabvandi, S., Mousavi, S. M., Razavi, S. H., Mortazavian, A. M., & Rezaei,
K. (2010). Alcohol-free beer: Methods of production, sensorial defects, and healthful effects. Food Reviews International, 26, 335-352.
Zürcher, A., Jakob, M., & Back, W. (2005). Improvements in flavor and
colloidal stability of alcohol free beers. In Proceedings of the European Brewing Convention Congress). Prague, Czech Republic.
Verstrepen, K.J., Derdelinckx, G., Dufour, J.P., Winderickx, J., Thevelein, J.M., Pretorius, I.S., & Delvaux F.R. (2003). Flavor-active esters: Adding fruitness
to beer. Journal of Bioscience and Bioengineering 96, 110-118.

Chapter 3.2
Simulation and flavor compounds
analysis of dealcoholized beer via one-
step vacuum distillation
By
Cristina Andrés-Iglesias a, Juan García-Serna b, Olimpio Montero c, Carlos A. Blanco, a,*
a Departamento de Ingeniería Agrícola y Forestal (Área de Tecnologia de los Alimentos), E.T.S. Ingenierías Agrarias, Universidad de Valladolid, Avda. de Madrid
44, 34004 Palencia, España
b High Pressure Processes Group, Department of Chemical Engineering and Environmental Tech., University of Valladolid, 47011 Valladolid, Spain c Centre for Biothechnology Development (CDB), Spanish Council for Scientific Research (CSIC), Francisco Vallés 8, Boecillo´s Technological Park, 47151 Boecillo,
Valladolid, Spain
SUBMITTED TO:
FOOD RESEARCH INTERNATIONAL
May 2015
SECTION 3: Beer Volatile Compounds Changes during Lab-scale Dealcoholization Process Chapter 3.2
224
Abstract
The coupled operation of vacuum distillation process to produce alcohol
free beer at laboratory scale and Aspen HYSYS simulation software was studied to define the chemical changes during the dealcoholization
process in the aroma profiles of 2 different lager beers.
At the lab-scale process, 2 different parameters were chosen to
dealcoholize beer samples, 102 mbar at 50ºC and 200 mbar at 67ºC. Samples taken at different steps of the process were analyzed by HS-SPME-
GC-MS focusing on the concentration of 7 flavor compounds, 5 alcohols and 2 esters. For simulation process, the EoS parameters of the Wilson-2
property package were adjusted to the experimental data and one more pressure was tested (60 mbar).
Simulation methods represent a viable alternative to predict results of the
volatile compound composition of a final dealcoholized beer.
Keywords: alcohol-free beer; Aspen HYSYS simulation; dealcoholization;
volatile compounds; flavor perception; HS-SPME.
INTRODUCTION
The market of non-alcoholic brews has experienced a significant
improvement during the past years motivated mainly by highly competitive markets, driving/drinking rules, health conditions incompatible with alcohol
consumption and/or religious reasons (Andrés-Iglesias, Montero, Sancho, & Blanco, 2014; Blanco, Andrés-Iglesias, & Montero, 2014; Catarino & Mendes,
2011). Similarly, it is well-known that beer has positive effects and a whole range of properties, such as no fat or cholesterol content, free sugar
content, high antioxidant, magnesium and soluble fiber content (Brányik, Silva, Baszczyňski, Lehnert, & Almeida e Silva, 2012), plus it provides essential
vitamins and minerals contributing to a healthy balanced diet (Andrés-Iglesias, Blanco, Blanco, & Montero, 2014; Bamforth, 2001).
Beer aroma profile is made by many volatile organic compounds at very
low concentration (ppm level), which are responsible for its unique flavor (Catarino, Mendes, Madeira, & Ferreira, 2007). Levels of different chemical
SECTION 3: Beer Volatile Compounds Changes during Lab-scale Dealcoholization Process Chapter 3.2
225
compounds, such as alcohols, esters, aldehydes, ketones, organic acids
and phenols, can be found on beer composition, giving a specific flavor that contributes to the overall organoleptic properties of the final beer
(Karlsson & Trägårdh, 1997). Among them, esters and alcohols are the main groups of aroma compounds. Esters are responsible of sweet and fruity
flavors of beer, while alcohols confer it an alcoholic, fruity and immature flavor (Andrés-Iglesias et al., 2014; Catarino, Ferreira, & Mendes, 2009).
In low-alcohol and/or alcohol-free beer production, the different
techniques used have to be able to reach the maximum alcohol by volume (ABV) established by the different countries legal regulations. In the majority
of EU countries beers with low alcohol content are divided into alcohol-free beers (≤ 0.5 % ABV) and low-alcohol beers (≤ 1.2 % ABV). In Spain, alcohol
free beers are divided in non-alcohol beers (≤ 1.0 % ABV) and ‘0.0 %’ beers (≤ 0.1 % ABV). However, in the United States there should not be alcohol
present in alcohol-free beers, while 0.5% ABV corresponds to the upper limit of non-alcoholic beers or ‘near-beers’ (Olmo, Blanco, Palacio, Prádanos, &
Hernández, 2014).
At present, there are several methods for low alcohol beer production
(Blanco et al., 2014). The strategies can be divided into two main groups: biological and physical methods (Brányik et al., 2012; Montanari, Marconi,
Mayer, & Fantozzi, 2009; Olmo et al., 2014). While physical methods withdraw the ethanol from a fermented beer, biological methods aim at
controlling the alcohol production during the fermentation process (Zürcher, Jakob, & Back, 2005).
Biological methods can be achieved by either restricting ethanol formation
or shortening the fermentation process. Obtaining low alcohol content via interrupted fermentation is accompanied by low contents of aroma and
flavor compounds, and their products are often characterized by worty off-flavors. They are usually performed in traditional brewery equipment and
hence do not require additional investments (Brányik et al., 2012; Catarino & Mendes, 2011).
Other processes to avoid these limitations include the use of special or
immobilized yeasts as well the use of low sugar raw materials (Catarino & Mendes, 2011; Pickering, 2000). The use of special yeasts for a low alcohol
beer production process increases the costs with the need of yeast selection, or genetic modification of the production organisms. However,
suitable selected yeasts can contribute significantly to the product sensorial

SECTION 3: Beer Volatile Compounds Changes during Lab-scale Dealcoholization Process Chapter 3.2
226
quality improvement. Alcohol free beer production processes by continuous
fermentation with immobilized yeast is based on limited alcohol formation, which requires special equipment and material. In this latter case, high
investment costs are required but are justified by a higher productivity of continuous processes. In general, producing alcohol-free beer by biological
methods makes impossible the production of alcohol-free beers with alcohol content close to zero (Brányik et al., 2012).
Physical methods require considerable investments into the special
equipment for alcohol removal (Brányik et al., 2012). The most common separation processes used for beer dealcoholization are membrane-based
processes and heat treatment (Catarino et al., 2007). Membrane-based processes include reverse osmosis, nanofiltration, dialysis and pervaporation
(Labanda, Vichi, Llorens, & López-Tamames, 2009). Heat treatment processes comprise evaporation and distillation, both under vacuum
conditions to preserve the organoleptic properties by avoiding undesired secondary reactions (Belisario-Sánchez, Taboada-Rodriguez, Marin-Iniesta,
& López-Gómez, 2009). Furthermore, thermal processes to remove alcohol from regular beers can cause the loss of the original aroma (Blanco et al.,
2014; Catarino et al., 2009) but their advantage is that they can remove ethanol from beers to levels close to cero (Brányik et al., 2012).
Among these physical methods, for large scale dealcoholization the vacuum evaporation is the most economic process (Zürcher et al., 2005).
Distillation is a separation operation based on differences in volatility. If a mixture containing substances that differ in their volatility is brought to
ebullition, the composition of the vapors released will be different from that of the boiling liquid. After condensation, the vapors constitute the
“distillate”. The remaining liquid is called “residue” (Berk, 2013). The application of vacuum to distillation process enables to reduce the
evaporation temperature and thus the thermal stress to beer (Zürcher et al., 2005). If the pressure is reduced, alcohol can be drawn off at much lower
temperature (Brányik et al., 2012). Thermal processes to produce alcohol free beers are performed at temperatures between 30 and 60 ˚C at
pressures of 60 to 200 mbar (Sohrabvandi, Mousavi, Razavi, Mortazavian, & Rezaei, 2010; Zürcher et al., 2005). The deterioration of beer quality by
thermal dealcoholization depends mainly on the evaporation temperature and the period of exposure (Brányik et al., 2012).
It is well known that most of the aroma compounds are lost in alcohol free
beers during production by thermal processes. The aroma profile is clearly
SECTION 3: Beer Volatile Compounds Changes during Lab-scale Dealcoholization Process Chapter 3.2
227
damaged and other, less pleasant flavors, like bready, worty or caramel
notes can appear (Blanco et al., 2014; Catarino et al., 2009; Lehnert et al., 2009; Sohrabvandi et al., 2010). To compensate these disadvantages many
breweries use a modified brewing technology for the production of a more aromatic original beer. Another attempt to compensate sensory
disadvantages is by blending dealcoholized beer with a small quantity of original beer or a beer aroma extract that can be recovered in
evaporation plants with rectification columns. Since these attempts are not yet satisfactory further possibilities to improve the quality of these beers
have been investigated (Zürcher et al., 2005).
Owing to beer chemical compounds characterization, analysis of beer flavor compounds has been constantly optimized to obtain better results in
relation to sensitivity and specificity (Andrés-Iglesias et al., 2014). Gas chromatography-mass spectrometry (GC-MS) is currently used to measure
volatile compound concentrations in beer. Ethers, esters, acids, aldehydes, ketones, alcohols, sulfur compounds, hydrocarbon compounds, alicyclic
compounds, heterocyclic compounds and aromatic compounds can be measured simultaneously by using GC-MS methods (Andrés-Iglesias et al.,
2014). The combination of solid phase microextraction (SPME) with gas chromatography (GC) or gas chromatography-mass spectrometry (GC–
MS) has proven to be a sensitive and precise method for the analysis of different classes of volatile compounds (Dong et al., 2013).
Beer dealcoholization via vacuum distillation in a batch system can be assumed as a differential distillation at reduced pressure. The principles of
differential distillation are well established since the beginning of chemical engineering knowledge. Thus, this type of distillation is often known as
“Rayleigh distillation”. Lord Rayleigh’s law is based on a dynamic material balance to the volatile compound of a two component mixture coupled to
the global mass balance (Berk, 2013). Extending the balance to a multicomponent mixture was studied in deep by several authors such as
Lang et al. (1994) and, Yatim et al. (1993) who modified the process for the addition of an extractive agent, or including sieves. An interesting
comparative study was conducted by Zürcher et al. (2005) using lab scale batch and continuous distillation as well as an industrial scale plant. They
investigated the beer dealcoholization at 60 and 150 mbar, following a number of compounds, e.g. ethanol, 1-propanol, ethyl acetate, 2-
methylpropanol, 3-methylpropanol and several esters. However, they did not simulate the process.
SECTION 3: Beer Volatile Compounds Changes during Lab-scale Dealcoholization Process Chapter 3.2
228
In addition, several authors have investigated the simulation of spirits
production by this process. Claus and Berglund studied fruit brandy distillation using a batch column distillation. They simulated the process
using CHEMCAD with good results using NRTL (Non-Random Two Liquids) equation of state (EoS) together with UNIFAC parameters (Claus & Berglund,
2005, 2009). On the other hand, Gaiser et al. simulated the whisky still distillation process using Aspen Plus selecting the NRTL-2 property package
of that software, claiming that this EoS provides a good approximation for ethanol-water azeotrope (Gaiser et al., 2002).
Low alcohol and alcohol free beer consumption is increasing year by year,
and often, these types of beverages are known to have a poor flavor profile in comparison to the original beer. In this sense, it becomes important
to adjust the flavor of non-alcoholic beers to that of regular ones understanding how the dealcoholization process modify it, providing the
scientific info is scarce.
In this work, we have combined lab scale differential vacuum distillation,
aroma compound analysis and simulation to shed light to this process. The main objective is to test a simulation environment that can explain the lab
results, so that, it can be extrapolated to a similar process at industrial scale. For this, we have selected two model beers, one from Spain and one from
Germany and adjusted the interaction parameters of a thermodynamic model. To our knowledge, this is the first time that it is done for beers.
MATERIALS AND METHODS
Samples and vacuum distillation dealcoholization experiments
Two different big-scale lager beer brands were chosen for the study, one from Spain (S) and another one from Germany (G). Both of them were lager
alcoholic beers containing 5.5 and 4.8 % alcohol by volume (ABV) respectively, and were obtained as fresh as possible from the local market.
Beer bottles were stored at 4ºC until dealcoholization process. 400 mL of beer were weighted and placed in 1 L flask of the vacuum distillation
system for each experiment; the flask was covered with a black plastic material to avoid the light oxidation in the sample. Subsequently, 10 µL of
antifoam emulsion (E-900, AFCA) were added to reduce the foam and CO2
content.

SECTION 3: Beer Volatile Compounds Changes during Lab-scale Dealcoholization Process Chapter 3.2
229
The experiments of beer dealcoholization by laboratory scale vacuum
distillation were done at two different vacuum pressures and water bath temperatures. The temperature needed in the water bath is directly related
to the total pressure by the phase equilibrium of the system, and slightly higher to assure enough heat transfer. Thus, the first set of experiments was
conducted at 102 mbar and 50ºC (corresponding to a saturation temperature of pure water, 46.2ºC) and the second set at 200 mbar and
67ºC (corresponding to a saturation temperature of pure water, 60.1ºC), A Rotavapor R-215 with vacuum pump V-700, vacuum controller V-850 and
diagonal condenser (BÜCHI Labortechnik AG, Switzerland) was used. The flask rotation was fixed at 20 rpm and remained constant in all experiments.
Each dealcoholization process was stopped at the times of 15, 30, 45 and 60 minutes to analyze the different volatile compounds evaporated along
with the ethanol at different times of the dealcoholization process. At the end of the distillation process, the residual beer was cooled in glass bottles
and weighted for the material balance calculation.
For all experiments the same steps were done. At the beginning of each experiment the water batch was refilled until the same volume if necessary,
once the batch reached the temperature the experiment started at the rpm indicated above, the pressure was reached immediately and
remained constant (±1) in all experiments and controlled by the vacuum controller.
For the GC-MS analysis 15 mL dark vials sealed with PTFE–silicone septa (Supelco, USA) were used for sample preparation. Vials contained 2 gr of
NaCl (Scharlau, Scharlab S.L., Spain) and 5 mL of beer were stirred to solve the NaCl and homogenize the sample. A total of 60 samples were taken
and analyzed from the original beers, and from residual beers at each time and dealcoholization process experiments.
Gas chromatography-mass spectrometry (GC-MS) equipment
Volatile compounds were separated and detected by a gas chromatography (Agilent GC 6890N, Agilent Technologies, USA) equipped
with mass spectrometer (Agilent 5973, Agilent Technologies, USA) single quadrupole detector. A headspace solid phase microextraction (HS-SPME)
manual equipment (Supelco, USA) was used for the extraction and concentration of the volatile compounds, which was carried out with 100

SECTION 3: Beer Volatile Compounds Changes during Lab-scale Dealcoholization Process Chapter 3.2
230
µm polydimethylsiloxan (PDMS) fiber (Sulpeco, USA). Prior to use, the SPME
fibre was conditioned at 250ºC for 30 minutes in the GC injector, according to the manofacturer’s instructions. Blank runs were completed, before
sampling, each day to ensure no carry-over of analytes. Chromatographic separations were accomplished using a BP-1 30 m × 0.32 mm × 1 µm
capillary column (SGE Analytical Science, Australia).
Analysis of volatile compounds
The volatile composition of beer samples was measured by triplicate. Solid
phase microextraction of compounds was performed at 30°C for 45 minutes. The desorption was achieved in the injector of the GC
chromatograph in splitless mode for 15 min, and the temperature was set at 250°C as indicated by the manufacturer for PDMS fibre. Carrier gas was
helium at a constant flow of 1.2 mL/min.
The oven temperature was programmed as follows: initial temperature was set at 35°C and kept for 7 min, this was followed by 2 ramps in which
temperature was risen at 8°C/min to 200°C and kept this temperature for 5 minutes, and then temperature was risen at 10°C/min to 250°C, this
temperature being kept for 10 minutes.
The ionization energy was 70 eV, and detection and data acquisition were
performed in scan mode from 37 to 350 Da. For identification data obtained in the GC-MS analysis were compared with m/z values compiled
in the spectrum library WILEY. Validation of compound identification was carried out by comparison of MS spectra and retention times with those of
commercial standards. Quantification was carried out by using standard calibration curves of 2-methylbutanol (≥ 99.0 %), 3-methylbutanol (≥ 99.0 %),
2-phenylethanol (≥ 99.0 %), ethyl acetate (≥ 99.5 %), isobutanol (≥ 99.0 %) from Sigma, USA. 1-Propanol ≥ 99.5 % (Fluka, Sigma-Aldrich, USA) and
isoamyl acetate ≥ 99.0 % (Fisher, UK). Since 1-propanol co-eluted with ethanol, the extracted ion chromatogram (EIC) for the ion with m/z 60.05
and retention time of 3.10 minutes was used for quantification of this compound.
SECTION 3: Beer Volatile Compounds Changes during Lab-scale Dealcoholization Process Chapter 3.2
231
HYSYS simulation and parameters
In order to simulate the system under study for the batch distillation of beer
the following assumptions were considered:
• The vacuum is done almost instantly and at t=0 the system is at the
constant desired vacuum pressure. • Liquid composition is homogeneous and heat is uniformly distributed.
• The flask has been simulated by a cylinder to simplify level calculation.
• The heat flux for each data point is determined to match the time required for a certain vaporization volume. This is because the Rotavapor
system can provide different heat flux depending on a number of variables (water level, flask location, ambient temperature, rotation
speed, etc.). • No reaction occurs in the bulk liquid.
The simulations have been carried out using HYSYS simulation software
(Aspen inc. product) as it has a powerful non-steady state simulation tool.
Wilson-2 property package was chosen in order to simulate the non-ideal behavior of the liquid phase, while ideal gas is considered for the gas phase
(as it was under reduced pressure conditions).
The main simulation process flow diagram is depicted in Fig.1. The main
distillation vessel (V-101) has one feed stream-5 (virtual for simulation purposes set at almost zero flow), one heat source (Q-100), one liquid outlet
stream-3 (virtual for simulation purposes set at almost zero flow) and one vapor outlet stream-2 (main distillation outlet).
The main calculations were carried out using an Excel spreadsheet to
determine the conversion between ppm and molar fraction values from experimental conditions to the simulation and vice versa.
The main components simulated were: sucrose, ethanol, ethyl acetate, 1-
propanol, isobutanol, isoamyl acetate, 2-methylbutanol, 3-methylbutanol, 2-phenylethanol, water and nitrogen.

SECTION 3: Beer Volatile Compounds Changes during Lab-scale Dealcoholization Process Chapter 3.2
232
Figure 1. HYSYS simulation model for a differential vacuum distillation
Sucrose was used as a simulation trick to increment the density of water
targeting the real value of 1010 kg/m3, for that purpose a concentration of 3% wt. was used in all simulation experiments. Nitrogen was used for
simulation purposes mimicking the atmosphere of the Rotavapor.
Initial values for compositions of the liquid were inserted in the “hold-up”
values of the distillation vessel. The total pressure of stream-2 was fixed to the experimental absolute pressure, coinciding with the vessel initial
pressure (i.e. 102 and 200 mbar).
As indicated in the assumptions, the heat flux was estimated to match the mass evaporated at each time sample point. This way, the simulation time is
not as important as the evaporated mass, that is used as the x-axis variable as percentage of mass evaporated (%vapor). Thus, all experiments were
carried out until 15, 30, 45 and 60 min, time when the dealcoholization process was stopped and the samples were collected. The % of vapor
fraction (% Vf) was calculated as the percentage of initial mass of the beer minus the mass at the different points of the simulation until the last mass (at
60 minutes of simulation) divided by the initial mass. Although the traditional ASTM D-86 curves for petroleum distillation are carried out in volume, in this
case, mass was preferred to overcome density variations (ASTM-International, 2012). Furthermore, the heat flux could have varied along with
the experiment. For this reason, we have considered this variable more accurate than experimental time itself. In addition to this, results could be
transferred to a real vacuum distillation process with better scale-up chances.
The developed software is available free in the web page of the research
group of High Pressure Processes of the University of Valladolid (http://hpp.uva.es/software/) in the section for ‘Beer Distillation’.

SECTION 3: Beer Volatile Compounds Changes during Lab-scale Dealcoholization Process Chapter 3.2
233
RESULTS AND DISCUSSION
Two lager beers were investigated in this study, one sample from Spain (S)
and the other sample from Germany (G). Both samples were dealcoholized by vacuum distillation at laboratory scale at 2 different pressures and
temperatures, 102 mbar, 50ºC and 200 mbar, 67ºC. A total of 45 compounds were identified, and 7 of them quantified by peak area. The
profile of quantified volatiles consisted of 5 alcohols (1-propanol, 2-methylpropanol, 2-methylbutanol, 3-methylbutanol and 2-phenylethanol)
and 2 esters (ethyl acetate and isoamyl acetate). A typical total ion chromatogram (TIC) of a regular beer sample and its dealcoholized beer
by laboratory scale vacuum distillation process is shown in Fig. 2.
Final ethanol content calculated by ASPEN HYSYS simulation
During the differential distillation process, the most volatile fraction
(ethanolic fraction) abandons the system in first place together with an increasing amount of water. In this work, we have focused on the analysis of
the beer, rather than the evaporated volatile fraction (ethanolic fraction).
Nevertheless, the concentration of ethanol in the ethanolic fraction in
alcohol by volume percentage (% ABV) has been estimated by simulation at the two experimental pressures, 102 mbar and 200 mbar and an
additional reduced pressure of 60 mbar.
The initial point (IP) was the labeled alcohol content of each beer 4.7% for G and 5.5 % for S. The concentration of ethanol in the beer phase exhibited
an exponential-like decay against the vapor fraction (Fig. 3). The % of vapor fractions at their correspondent times in the experiment are shown in Table
1.
Table 1. Percentage of the vapor fractions (% Vf) of S and G samples and its correspondent times, for both lab-scale vacuum distillation processes and the averages (%)
Time, min 0.00 15.00 30.00 45.00 60.00S 102 mbar 0.00 7.46 9.55 13.40 15.76
S 200 mbar 0.00 6.17 10.14 15.12 19.22
G 102 mbar 0.00 5.70 9.00 14.40 17.60
G 200 mbar 0.00 10.80 13.40 14.80 18.90
Average (% Vf) 0.00 7.53 10.52 14.43 17.87
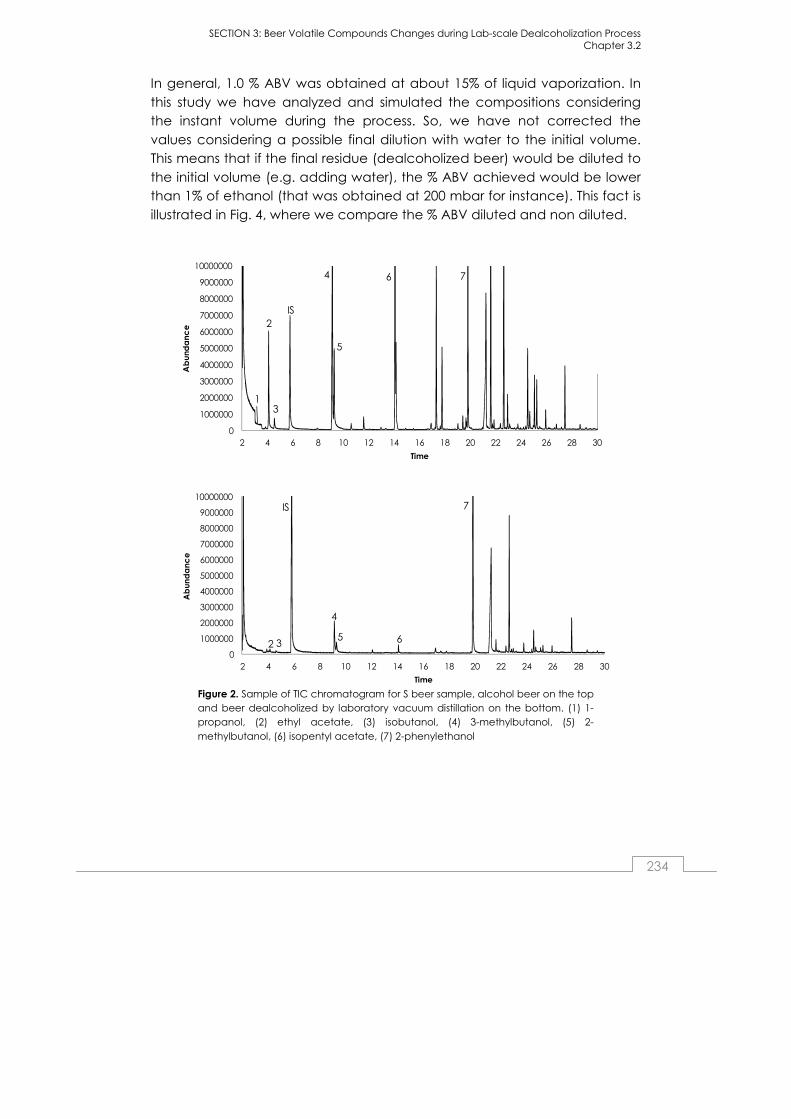
SECTION 3: Beer Volatile Compounds Changes during Lab-scale Dealcoholization Process Chapter 3.2
234
In general, 1.0 % ABV was obtained at about 15% of liquid vaporization. In
this study we have analyzed and simulated the compositions considering the instant volume during the process. So, we have not corrected the
values considering a possible final dilution with water to the initial volume. This means that if the final residue (dealcoholized beer) would be diluted to
the initial volume (e.g. adding water), the % ABV achieved would be lower than 1% of ethanol (that was obtained at 200 mbar for instance). This fact is
illustrated in Fig. 4, where we compare the % ABV diluted and non diluted.
Figure 2. Sample of TIC chromatogram for S beer sample, alcohol beer on the top and beer dealcoholized by laboratory vacuum distillation on the bottom. (1) 1-propanol, (2) ethyl acetate, (3) isobutanol, (4) 3-methylbutanol, (5) 2-methylbutanol, (6) isopentyl acetate, (7) 2-phenylethanol
0
1000000
2000000
3000000
4000000
5000000
6000000
7000000
8000000
9000000
10000000
2 4 6 8 10 12 14 16 18 20 22 24 26 28 30
Ab
und
an
ce
Time
4
IS
5
6 7
1
2
3
0
1000000
2000000
3000000
4000000
5000000
6000000
7000000
8000000
9000000
10000000
2 4 6 8 10 12 14 16 18 20 22 24 26 28 30
Ab
un
da
nc
e
Time
2 3
4
IS
5 6
7
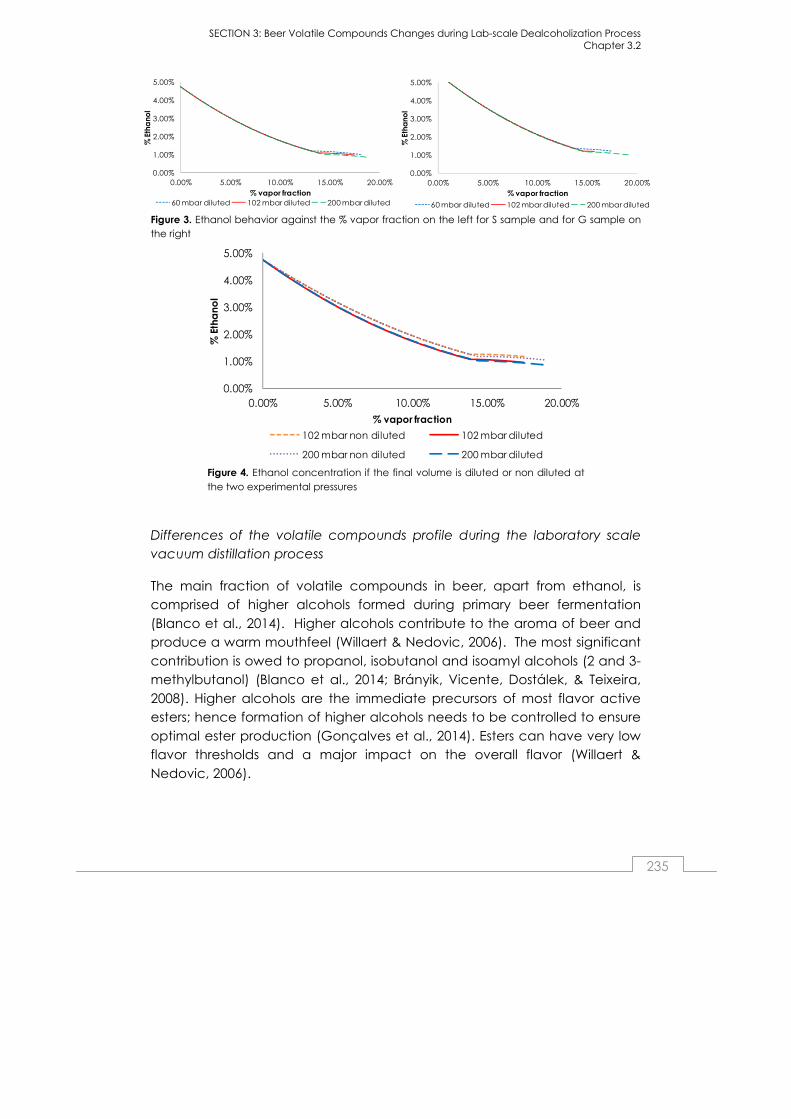
SECTION 3: Beer Volatile Compounds Changes during Lab-scale Dealcoholization Process Chapter 3.2
235
Figure 3. Ethanol behavior against the % vapor fraction on the left for S sample and for G sample on the right
0.00%
1.00%
2.00%
3.00%
4.00%
5.00%
0.00% 5.00% 10.00% 15.00% 20.00%
% E
tha
no
l
% vapor fraction
102 mbar non diluted 102 mbar diluted
200 mbar non diluted 200 mbar diluted Figure 4. Ethanol concentration if the final volume is diluted or non diluted at the two experimental pressures
Differences of the volatile compounds profile during the laboratory scale vacuum distillation process
The main fraction of volatile compounds in beer, apart from ethanol, is comprised of higher alcohols formed during primary beer fermentation
(Blanco et al., 2014). Higher alcohols contribute to the aroma of beer and produce a warm mouthfeel (Willaert & Nedovic, 2006). The most significant
contribution is owed to propanol, isobutanol and isoamyl alcohols (2 and 3-methylbutanol) (Blanco et al., 2014; Brányik, Vicente, Dostálek, & Teixeira,
2008). Higher alcohols are the immediate precursors of most flavor active esters; hence formation of higher alcohols needs to be controlled to ensure
optimal ester production (Gonçalves et al., 2014). Esters can have very low flavor thresholds and a major impact on the overall flavor (Willaert &
Nedovic, 2006).
0.00%
1.00%
2.00%
3.00%
4.00%
5.00%
0.00% 5.00% 10.00% 15.00% 20.00%
% E
tha
nol
% vapor fraction60 mbar diluted 102 mbar diluted 200 mbar diluted
0.00%
1.00%
2.00%
3.00%
4.00%
5.00%
0.00% 5.00% 10.00% 15.00% 20.00%
% E
tha
nol
% vapor fraction
60 mbar diluted 102 mbar diluted 200 mbar diluted
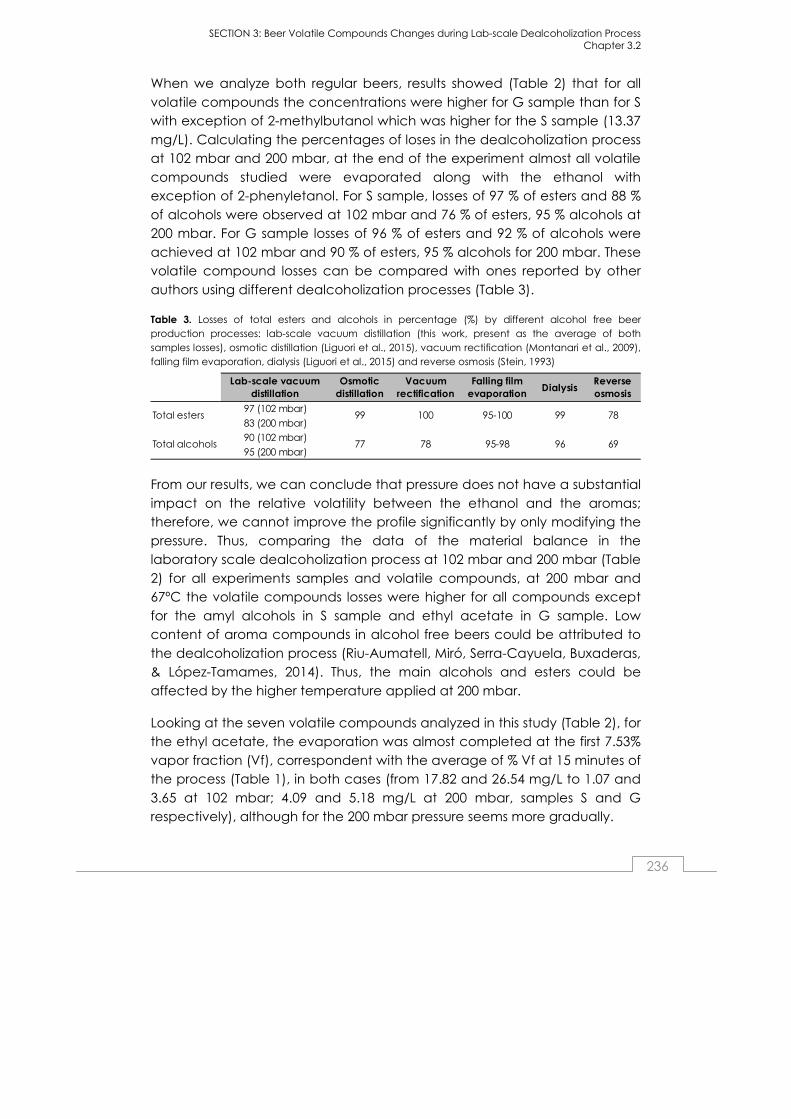
SECTION 3: Beer Volatile Compounds Changes during Lab-scale Dealcoholization Process Chapter 3.2
236
When we analyze both regular beers, results showed (Table 2) that for all
volatile compounds the concentrations were higher for G sample than for S with exception of 2-methylbutanol which was higher for the S sample (13.37
mg/L). Calculating the percentages of loses in the dealcoholization process at 102 mbar and 200 mbar, at the end of the experiment almost all volatile
compounds studied were evaporated along with the ethanol with exception of 2-phenyletanol. For S sample, losses of 97 % of esters and 88 %
of alcohols were observed at 102 mbar and 76 % of esters, 95 % alcohols at 200 mbar. For G sample losses of 96 % of esters and 92 % of alcohols were
achieved at 102 mbar and 90 % of esters, 95 % alcohols for 200 mbar. These volatile compound losses can be compared with ones reported by other
authors using different dealcoholization processes (Table 3).
Table 3. Losses of total esters and alcohols in percentage (%) by different alcohol free beer production processes: lab-scale vacuum distillation (this work, present as the average of both samples losses), osmotic distillation (Liguori et al., 2015), vacuum rectification (Montanari et al., 2009), falling film evaporation, dialysis (Liguori et al., 2015) and reverse osmosis (Stein, 1993)
Lab-scale vacuum distillation
Osmotic distillation
Vacuum rectification
Falling film evaporation
DialysisReverse osmosis
97 (102 mbar)
83 (200 mbar)
90 (102 mbar)
95 (200 mbar)Total alcohols 77 78 95-98 96 69
Total esters 99 100 95-100 99 78
From our results, we can conclude that pressure does not have a substantial
impact on the relative volatility between the ethanol and the aromas; therefore, we cannot improve the profile significantly by only modifying the
pressure. Thus, comparing the data of the material balance in the laboratory scale dealcoholization process at 102 mbar and 200 mbar (Table
2) for all experiments samples and volatile compounds, at 200 mbar and 67ºC the volatile compounds losses were higher for all compounds except
for the amyl alcohols in S sample and ethyl acetate in G sample. Low content of aroma compounds in alcohol free beers could be attributed to
the dealcoholization process (Riu-Aumatell, Miró, Serra-Cayuela, Buxaderas, & López-Tamames, 2014). Thus, the main alcohols and esters could be
affected by the higher temperature applied at 200 mbar.
Looking at the seven volatile compounds analyzed in this study (Table 2), for the ethyl acetate, the evaporation was almost completed at the first 7.53%
vapor fraction (Vf), correspondent with the average of % Vf at 15 minutes of the process (Table 1), in both cases (from 17.82 and 26.54 mg/L to 1.07 and
3.65 at 102 mbar; 4.09 and 5.18 mg/L at 200 mbar, samples S and G respectively), although for the 200 mbar pressure seems more gradually.

SECTION 3: Beer Volatile Compounds Changes during Lab-scale Dealcoholization Process Chapter 3.2
237
SIM
EXP
St D
ev
SIM
EXP
St D
ev
SIM
EXP
St D
ev
SIM
EXP
St D
ev
SIM
EXP
St D
ev
102
mb
ar,
50º
CR
t
1-P
rop
an
ol
3.10
5.56
5.56
1.53
4.20
2.09
0.65
3.18
0.00
0.20
1.24
0.00
0.19
0.62
0.00
0.10
Eth
yl a
ce
tate
4.13
17.8
217
.82
1.44
1.48
1.07
0.67
0.65
1.23
0.00
0.15
0.86
0.00
0.07
0.54
0.00
Iso
bu
tan
ol
4.60
9.41
9.41
4.65
5.62
4.97
4.73
4.33
4.68
1.81
2.32
3.67
1.99
1.64
3.26
1.90
3-M
eth
ylb
uta
no
l9.
1140
.99
40.9
90.
1624
.83
17.4
40.
1519
.18
17.1
50.
0410
.27
11.5
10.
097.
307.
330.
052-
Me
thyl
bu
tan
ol
9.27
13.3
713
.37
1.49
7.71
5.26
1.24
5.77
5.29
1.18
2.85
3.55
0.81
1.93
1.93
0.50
Iso
pe
nty
l ac
eta
te14
.09
1.92
1.92
4.22
0.35
0.11
5.56
0.14
0.10
2.87
0.02
0.09
2.97
0.00
0.09
1.02
2-P
he
nyl
eth
an
ol
19.8
234
.01
34.0
14.
8637
.10
40.4
67.
0837
.98
48.7
69.
3039
.54
62.0
47.
7840
.14
85.2
83.
90
102
mb
ar,
50º
CR
t
1-P
rop
an
ol
3.10
8.93
8.93
2.64
6.91
6.99
0.72
4.13
0.00
0.35
1.04
0.00
0.39
0.20
0.00
0.18
Eth
yl a
ce
tate
4.13
26.5
426
.54
3.41
3.75
3.65
1.25
1.05
2.93
0.00
0.20
1.06
0.00
0.07
0.45
0.00
Iso
bu
tan
ol
4.60
10.4
710
.47
5.28
6.84
6.88
4.18
4.43
4.32
2.18
2.08
2.88
8.13
1.11
2.87
3.00
3-M
eth
ylb
uta
no
l9.
1143
.77
43.7
70.
3728
.25
27.8
50.
0718
.37
13.6
90.
078.
644.
920.
054.
635.
130.
132-
Me
thyl
bu
tan
ol
9.27
11.5
411
.54
1.38
7.21
7.48
0.73
4.45
3.49
0.40
1.88
1.12
0.41
0.89
1.22
0.37
Iso
pe
nty
l ac
eta
te14
.09
2.58
2.58
6.34
0.65
0.27
1.20
0.15
0.16
1.58
0.01
0.13
2.14
0.00
0.11
1.24
2-P
he
nyl
eth
an
ol
19.8
237
.69
37.6
95.
5740
.03
53.9
53.
8141
.49
56.9
29.
5343
.14
69.5
78.
4643
.68
75.1
72.
04
SIM
EXP
St D
ev
SIM
EXP
St D
ev
SIM
EXP
St D
ev
SIM
EXP
St D
ev
SIM
EXP
St D
ev
200
mb
ar,
67º
CR
t
1-P
rop
an
ol
3.10
5.56
5.56
1.53
5.56
3.58
0.66
4.91
2.51
0.20
3.34
0.00
0.20
1.25
0.00
0.10
Eth
yl a
ce
tate
4.13
17.8
217
.82
1.44
2.99
4.09
0.67
0.79
1.19
0.54
0.22
0.86
0.00
0.07
0.46
0.00
Iso
bu
tan
ol
4.60
9.41
9.41
2.19
5.60
4.88
1.32
3.06
4.25
2.50
1.40
3.67
2.11
0.53
3.03
1.58
3-M
eth
ylb
uta
no
l9.
1140
.99
40.9
90.
2226
.58
20.4
40.
0615
.71
16.9
00.
097.
8911
.51
0.05
3.34
7.35
0.05
2-M
eth
ylb
uta
no
l9.
2713
.37
13.3
71.
278.
406.
440.
874.
705.
181.
322.
173.
550.
660.
802.
200.
23Is
op
en
tyl a
ce
tate
14.0
91.
921.
923.
370.
630.
202.
820.
170.
125.
640.
020.
091.
790.
000.
070.
712-
Ph
en
yl e
tha
no
l19
.82
34.0
134
.01
1.72
36.6
343
.36
6.60
38.2
853
.41
10.8
339
.66
62.0
47.
8840
.17
70.6
53.
60
200
mb
ar,
67º
CR
t
1-P
rop
an
ol
3.10
8.93
8.93
2.64
6.40
0.00
0.72
3.85
0.00
0.35
4.05
0.00
0.39
0.88
0.00
0.18
Eth
yl a
ce
tate
4.13
26.5
426
.54
3.41
0.90
5.18
0.00
0.35
1.24
0.00
0.34
2.91
0.00
0.10
2.73
0.00
Iso
bu
tan
ol
4.60
10.4
710
.47
2.48
2.43
5.07
1.32
1.22
3.46
1.58
1.24
1.93
1.02
0.36
1.82
1.08
3-M
eth
ylb
uta
no
l9.
1143
.77
43.7
70.
3112
.11
19.9
50.
306.
509.
480.
086.
645.
040.
102.
182.
940.
062-
Me
thyl
bu
tan
ol
9.27
11.5
411
.54
0.81
2.85
4.85
0.81
1.43
2.29
0.53
1.45
1.17
0.35
0.40
0.64
0.18
Iso
pe
nty
l ac
eta
te14
.09
2.58
2.58
4.53
0.11
0.49
6.07
0.02
0.16
1.62
0.02
0.09
0.62
0.00
0.08
0.63
2-P
he
nyl
eth
an
ol
19.8
237
.69
37.6
94.
9042
.27
54.9
74.
0043
.47
62.5
88.
2543
.27
59.4
17.
7243
.98
59.9
75.
07
S, 0 m
inS, 15 min
S, 30 min
S, 45 min
S, 60 min
G, 0 min
G, 15 m
inG, 30 m
inG, 45 m
inG, 60 m
in
S, 0 m
inS, 15 min
S, 30 min
S, 45 min
S, 60 min
G, 0 min
G, 15 m
inG, 30 m
inG, 45 m
inG, 60 m
in
Tab
le 2
. R
ete
ntio
n t
ime
(R
t),
co
nc
en
tra
tion
of
vola
tile
co
mp
ou
nd
s (m
g/L
) d
ela
co
ho
lize
d a
t 10
2 m
ab
r, 50
ªC
an
d 2
00 m
ba
r, 6
7ºC
in
the
exp
erim
en
t (E
XP
), in
sim
ula
tion
s (S
IM)
an
d t
he
sta
nd
ard
de
via
tion
of
the
exp
erim
en
tal v
alu
e (
StD
ev)
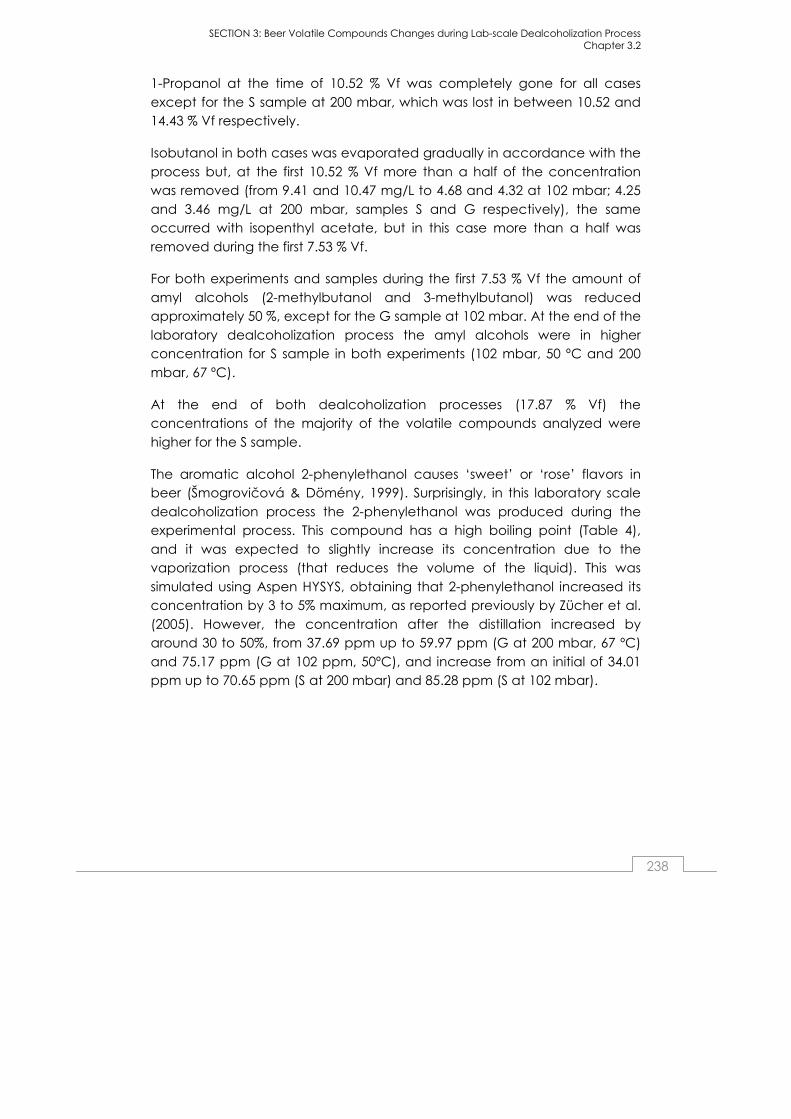
SECTION 3: Beer Volatile Compounds Changes during Lab-scale Dealcoholization Process Chapter 3.2
238
1-Propanol at the time of 10.52 % Vf was completely gone for all cases
except for the S sample at 200 mbar, which was lost in between 10.52 and 14.43 % Vf respectively.
Isobutanol in both cases was evaporated gradually in accordance with the
process but, at the first 10.52 % Vf more than a half of the concentration was removed (from 9.41 and 10.47 mg/L to 4.68 and 4.32 at 102 mbar; 4.25
and 3.46 mg/L at 200 mbar, samples S and G respectively), the same occurred with isopenthyl acetate, but in this case more than a half was
removed during the first 7.53 % Vf.
For both experiments and samples during the first 7.53 % Vf the amount of
amyl alcohols (2-methylbutanol and 3-methylbutanol) was reduced approximately 50 %, except for the G sample at 102 mbar. At the end of the
laboratory dealcoholization process the amyl alcohols were in higher concentration for S sample in both experiments (102 mbar, 50 ºC and 200
mbar, 67 ºC).
At the end of both dealcoholization processes (17.87 % Vf) the concentrations of the majority of the volatile compounds analyzed were
higher for the S sample.
The aromatic alcohol 2-phenylethanol causes ‘sweet’ or ‘rose’ flavors in beer (Šmogrovičová & Dömény, 1999). Surprisingly, in this laboratory scale
dealcoholization process the 2-phenylethanol was produced during the experimental process. This compound has a high boiling point (Table 4),
and it was expected to slightly increase its concentration due to the vaporization process (that reduces the volume of the liquid). This was
simulated using Aspen HYSYS, obtaining that 2-phenylethanol increased its concentration by 3 to 5% maximum, as reported previously by Zücher et al.
(2005). However, the concentration after the distillation increased by around 30 to 50%, from 37.69 ppm up to 59.97 ppm (G at 200 mbar, 67 ºC)
and 75.17 ppm (G at 102 ppm, 50ºC), and increase from an initial of 34.01 ppm up to 70.65 ppm (S at 200 mbar) and 85.28 ppm (S at 102 mbar).
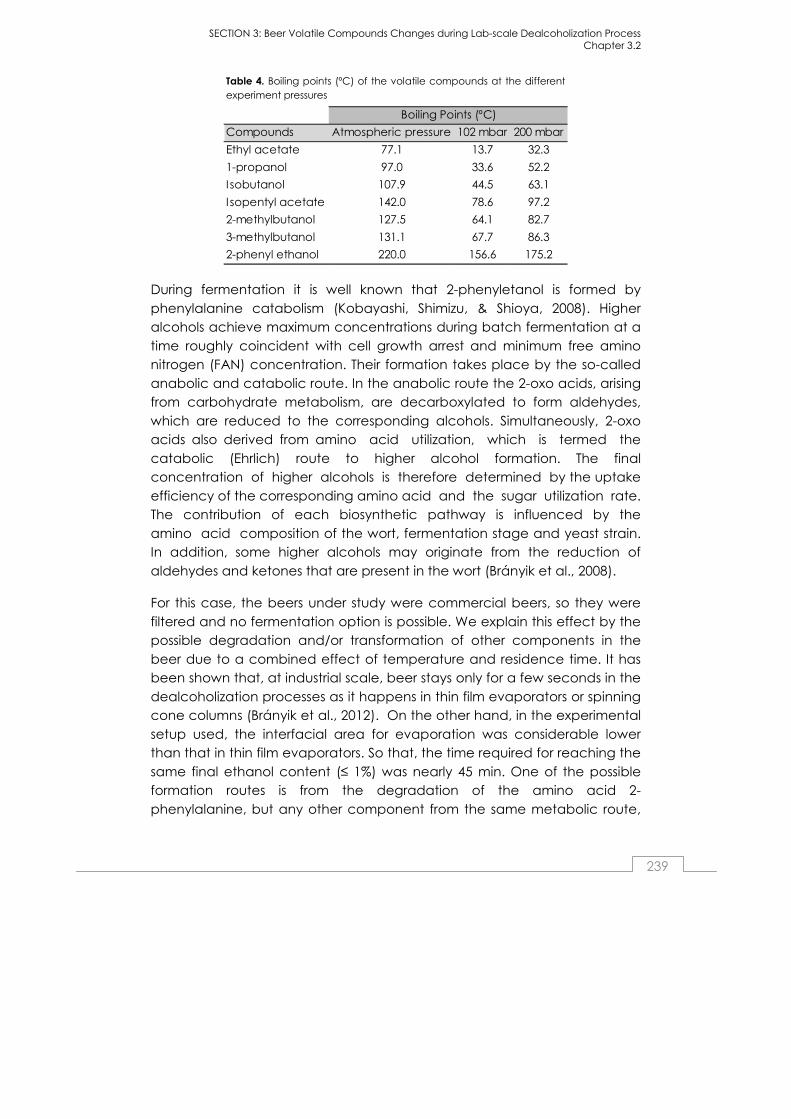
SECTION 3: Beer Volatile Compounds Changes during Lab-scale Dealcoholization Process Chapter 3.2
239
Table 4. Boiling points (ºC) of the volatile compounds at the different experiment pressures
Compounds Atmospheric pressure 102 mbar 200 mbar
Ethyl acetate 77.1 13.7 32.3
1-propanol 97.0 33.6 52.2
Isobutanol 107.9 44.5 63.1
Isopentyl acetate 142.0 78.6 97.2
2-methylbutanol 127.5 64.1 82.7
3-methylbutanol 131.1 67.7 86.3
2-phenyl ethanol 220.0 156.6 175.2
Boiling Points (ºC)
During fermentation it is well known that 2-phenyletanol is formed by
phenylalanine catabolism (Kobayashi, Shimizu, & Shioya, 2008). Higher alcohols achieve maximum concentrations during batch fermentation at a
time roughly coincident with cell growth arrest and minimum free amino nitrogen (FAN) concentration. Their formation takes place by the so-called
anabolic and catabolic route. In the anabolic route the 2-oxo acids, arising from carbohydrate metabolism, are decarboxylated to form aldehydes,
which are reduced to the corresponding alcohols. Simultaneously, 2-oxo acids also derived from amino acid utilization, which is termed the
catabolic (Ehrlich) route to higher alcohol formation. The final concentration of higher alcohols is therefore determined by the uptake
efficiency of the corresponding amino acid and the sugar utilization rate. The contribution of each biosynthetic pathway is influenced by the
amino acid composition of the wort, fermentation stage and yeast strain. In addition, some higher alcohols may originate from the reduction of
aldehydes and ketones that are present in the wort (Brányik et al., 2008).
For this case, the beers under study were commercial beers, so they were
filtered and no fermentation option is possible. We explain this effect by the possible degradation and/or transformation of other components in the
beer due to a combined effect of temperature and residence time. It has been shown that, at industrial scale, beer stays only for a few seconds in the
dealcoholization processes as it happens in thin film evaporators or spinning cone columns (Brányik et al., 2012). On the other hand, in the experimental
setup used, the interfacial area for evaporation was considerable lower than that in thin film evaporators. So that, the time required for reaching the
same final ethanol content (≤ 1%) was nearly 45 min. One of the possible formation routes is from the degradation of the amino acid 2-
phenylalanine, but any other component from the same metabolic route,

SECTION 3: Beer Volatile Compounds Changes during Lab-scale Dealcoholization Process Chapter 3.2
240
e.g. phenyl pyruvate, phenyl acetaldehyde or phenyl acetic acid can lead
to 2-phenyethanol in an acidic hydrogen donor bulk liquid (i.e. water/ethanol) such as beer. When a prolonged heating of beer is made,
probably the remained content of this amino acid or other similar compound forms the compound by reaction, so 2-phenylethanol can be
used as a marker of overheating or overtiming for beer dealcoholization processes.
Simulation results and thermodynamic parameters
In order to demonstrate the feasibility of a dynamic Aspen HYSYS simulation for the dealcoholization process, several thermodynamic packages were
studied. In this case, it was necessary to consider an EoS with interaction in liquid phase, such as NRTL or Wilson. For our simulation the best results were
found using Wilson-2 thermodynamic package from HYSYS database.
However, the simulation deviations against the experimental results were unacceptable using the parameters direct from the software. Thus, we
have performed a fit of the selected binary interaction coefficients for the main measured compounds at 15 min, and then the simulation was tested
to check whether the system was able to predict or not the other experimental data points.
The best fit parameters for Wilson-2 Element-1 and Element-2 (i.e. interaction parameters according to Aspen HYSYS nomenclature) are listed in Table 5
and Table 6 (see also Fig. 5 and Fig. 6 for component concentration graphs).
The predictions for the seven compounds analyzed were very acceptable,
with an average absolute deviations (determined as the absolute value of the simulated instant concentration minus the experimental instant
concentration, divided by the initial value of the concentration) were between 6.9 and 15.1 % for both S and G beers (excluding the values of 2-
phenylethanol that behaves oddly). The values obtained by simulation (SIM) and experimentation (EXP) are listed in Table 2 (see also Fig. 5 and Fig. 6).
For the case of 2-phenylethanol it is clear that the component is generated
by reaction, so the simulation cannot predict it as the assumption 5 (see section 2.4) is not fulfilled.
SECTION 3: Beer Volatile Compounds Changes during Lab-scale Dealcoholization Process Chapter 3.2
241
Considering the difficulty of the analysis and the system itself we can
accept the simulation values for prediction. This is the first time, to our knowledge, that beer is dealcoholized and the experimental values are fit
to a simulation and thermodynamic model aimed at creating a prediction tool.
From our point of view, the prediction could be improved by studying the
kinetics of formation of 2-phenylethanol and by studying a pilot scale plant using a short-residence time equipment (such as falling fill evaporator), but
this is out of the scope of this paper. Nevertheless, 2-phenylethanol appeared from 15 min on, so this means that the thermodynamic approach
is valid for times below that time that indicates that it could be used for simulation of short residence time pieces of equipment.
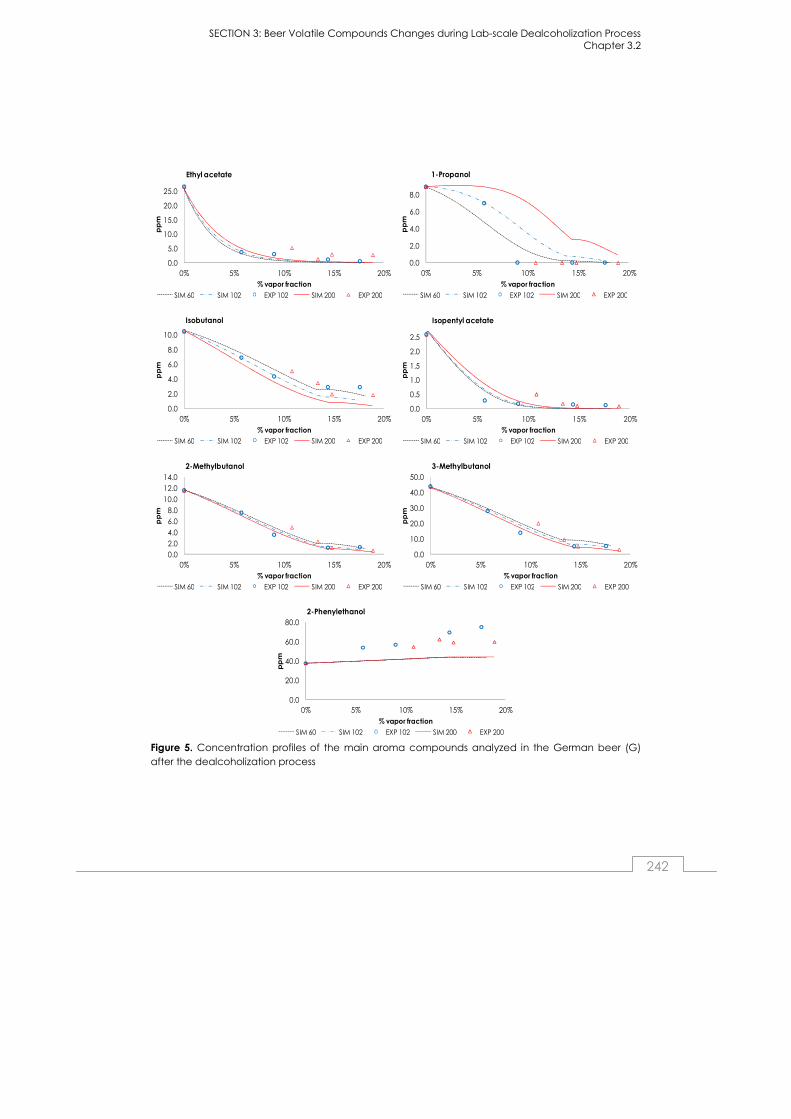
SECTION 3: Beer Volatile Compounds Changes during Lab-scale Dealcoholization Process Chapter 3.2
242
Figure 5. Concentration profiles of the main aroma compounds analyzed in the German beer (G) after the dealcoholization process
0.0
5.0
10.0
15.0
20.0
25.0
0% 5% 10% 15% 20%
pp
m
% vapor fraction
Ethyl acetate
SIM 60 SIM 102 EXP 102 SIM 200 EXP 200
0.0
2.0
4.0
6.0
8.0
0% 5% 10% 15% 20%
pp
m
% vapor fraction
1-Propanol
SIM 60 SIM 102 EXP 102 SIM 200 EXP 200
0.0
2.0
4.0
6.0
8.0
10.0
0% 5% 10% 15% 20%
pp
m
% vapor fraction
Isobutanol
SIM 60 SIM 102 EXP 102 SIM 200 EXP 200
0.0
0.5
1.0
1.5
2.0
2.5
0% 5% 10% 15% 20%
pp
m
% vapor fraction
Isopentyl acetate
SIM 60 SIM 102 EXP 102 SIM 200 EXP 200
0.0
2.0
4.0
6.0
8.0
10.0
12.0
14.0
0% 5% 10% 15% 20%
pp
m
% vapor fraction
2-Methylbutanol
SIM 60 SIM 102 EXP 102 SIM 200 EXP 200
0.0
10.0
20.0
30.0
40.0
50.0
0% 5% 10% 15% 20%
pp
m
% vapor fraction
3-Methylbutanol
SIM 60 SIM 102 EXP 102 SIM 200 EXP 200
0.0
20.0
40.0
60.0
80.0
0% 5% 10% 15% 20%
pp
m
% vapor fraction
2-Phenylethanol
SIM 60 SIM 102 EXP 102 SIM 200 EXP 200

SECTION 3: Beer Volatile Compounds Changes during Lab-scale Dealcoholization Process Chapter 3.2
243
Figure 6. Concentration profiles of the main aroma compounds analyzed in the Spanish beer (S) after the dealcoholization process
0.0
5.0
10.0
15.0
20.0
25.0
0% 5% 10% 15% 20%
pp
m
% vapor fraction
Ethyl acetate
SIM 60 SIM 102 EXP 102 SIM 200 EXP 200
0.0
2.0
4.0
6.0
8.0
0% 5% 10% 15% 20%
pp
m
% vapor fraction
1-Propanol
SIM 60 SIM 102 EXP 102 SIM 200 EXP 200
0.0
2.0
4.0
6.0
8.0
10.0
0% 5% 10% 15% 20%
pp
m
% vapor fraction
Isobutanol
SIM 60 SIM 102 EXP 102 SIM 200 EXP 200
0.0
0.5
1.0
1.5
2.0
2.5
0% 5% 10% 15% 20%
pp
m
% vapor fraction
Isopentyl actate
SIM 60 SIM 102 EXP 102 SIM 200 EXP 200
0.0
2.0
4.0
6.0
8.0
10.0
12.0
14.0
0% 5% 10% 15% 20%
pp
m
% vapor fraction
2-Methylbutanol
SIM 60 SIM 102 EXP 102 SIM 200 EXP 200
0.0
10.0
20.0
30.0
40.0
50.0
0% 5% 10% 15% 20%
pp
m
% vapor fraction
3-Methylbutanol
SIM 60 SIM 102 EXP 102 SIM 200 EXP 200
0.0
20.0
40.0
60.0
80.0
0% 5% 10% 15% 20%
pp
m
% vapor fraction
2-Phenylethanol
SIM 60 SIM 102 EXP 102 SIM 200 EXP 200

SECTION 3: Beer Volatile Compounds Changes during Lab-scale Dealcoholization Process Chapter 3.2
244
Suc
rose
Eth
an
ol
Eth
yl
ac
eta
te1-
Pro
pa
no
lIs
ob
uta
no
lIs
op
en
tyl
ac
eta
te2-
Me
thyl
bu
tan
ol
3-M
eth
ylb
uta
no
l2-
Phe
nyl
eth
an
ol
Wa
ter
Nitr
og
en
Suc
rose
0.00
000.
0000
0.00
000.
0000
0.00
000.
0000
0.00
000.
0000
0.0
000
0.00
000.
0000
Eth
an
ol
0.00
000.
0000
-539
.018
92
066.
8071
1159
.78
32-3
062.
4265
0.00
00-1
074
.748
50.
0000
-69.
6372
0.00
00Et
hyl
ac
eta
te0.
0000
-398
.817
10.
0000
-123
9.20
720.
0000
0.00
000.
0000
0.00
000.
0000
0.00
000.
0000
1-Pr
op
an
ol
0.00
00-2
845.
3418
202.
2973
0.00
00-1
28.8
943
0.00
000.
0000
-12
41.7
217
0.00
00-5
57.7
540
0.00
00Is
ob
uta
no
l0.
0000
-167
5.74
650.
0000
-29.
2113
0.00
000.
0000
0.00
00-4
42.
0855
0.00
00-2
47.3
062
0.00
00Is
op
en
tyl a
ce
tate
0.00
003
724.
3137
0.00
000.
0000
0.00
000.
0000
0.00
000.
0000
0.00
00-1
319.
7350
0.00
002-
Me
thyl
bu
tan
ol
0.00
000.
0000
0.00
000.
0000
0.00
000.
0000
0.00
000.
0000
0.0
000
0.00
000.
0000
3-M
eth
ylb
uta
no
l0.
0000
314.
4464
0.00
0084
3.85
7824
3.39
930.
0000
0.00
000.
000
00.
0000
-462
.449
30.
0000
2-Ph
en
yle
tha
no
l0.
0000
0.00
000.
0000
0.00
000.
0000
0.00
000.
0000
0.00
000.
000
00.
0000
0.00
00W
ate
r0.
0000
346.
1512
0.00
0062
5.51
55-1
633
.29
24-1
716.
3821
0.0
000
-21
02.8
264
0.00
000.
0000
0.00
00N
itro
ge
n0.
0000
0.00
000.
0000
0.00
000.
0000
0.00
000.
0000
0.00
000.
000
00.
0000
0.00
00
Tab
le 6
. Est
ima
ted
pa
ram
ete
rs f
or E
lem
en
t-2
of
Wils
on
-2 e
qu
atio
n in
HY
SYS
Tab
le 5
. Est
ima
ted
pa
ram
ete
rs f
or E
lem
en
t-1
of
Wils
on
-2 e
qu
atio
n in
HY
SYS
Suc
rose
Eth
an
ol
Eth
yl
ac
eta
te1-
Pro
pa
no
lIs
ob
uta
no
lIs
op
en
tyl
ac
eta
te2-
Me
thyl
bu
tan
ol
3-M
eth
ylb
uta
no
l2-
Phe
nyl
eth
an
ol
Wa
ter
Nitr
og
en
Suc
rose
0.00
00
0.0
000
0.0
000
0.00
000.
0000
0.0
000
0.0
000
0.0
000
0.0
000
0.0
000
0.00
00Et
ha
no
l0.
000
00.
000
01
.133
0-5
.942
7-3
.38
488.
488
10
.000
02
.676
40
.000
0-0
.050
30.
0000
Eth
yl a
ce
tate
0.00
00
0.5
856
0.0
000
3.02
960.
0000
0.0
000
0.0
000
0.0
000
0.0
000
0.0
000
0.00
001-
Pro
pa
no
l0.
000
08.
016
0-0
.829
60.
0000
0.91
300.
000
00
.000
03
.035
80.
000
01
.191
90.
0000
Iso
bu
tan
ol
0.00
00
4.8
034
0.0
000
-0.7
573
0.00
000.
000
00
.000
00
.000
00.
000
00
.000
00.
0000
Iso
pe
nty
l ac
eta
te0.
000
0-1
1.42
14
0.0
000
0.00
000.
0000
0.0
000
0.0
000
0.0
000
0.0
000
2.1
182
0.00
002-
Me
thyl
bu
tan
ol
0.00
00
0.0
000
0.0
000
0.00
000.
0000
0.0
000
0.0
000
0.0
000
0.0
000
0.0
000
0.00
003-
Me
thyl
bu
tan
ol
0.00
00
-0.7
256
0.0
000
-2.0
368
0.00
000.
000
00
.000
00
.000
00
.000
00
.000
00.
0000
2-Ph
en
yle
tha
no
l0.
000
00.
000
00
.000
00.
0000
0.00
000.
000
00
.000
00
.000
00.
000
00
.000
00.
0000
Wa
ter
0.00
00
-2.5
035
0.0
000
-4.7
405
0.00
00-2
.11
820
.000
00
.000
00.
000
00
.000
00.
0000
Nitr
og
en
0.00
00
0.0
000
0.0
000
0.00
000.
0000
0.0
000
0.0
000
0.0
000
0.0
000
0.0
000
0.00
00

SECTION 3: Beer Volatile Compounds Changes during Lab-scale Dealcoholization Process Chapter 3.2
245
CONCLUSIONS
Low alcohol and free alcohol beers from thermal dealcoholization (e.g.
vacuum distillation) lack of the flavor and aroma compounds that the original beers possess. Literature data on this is scarce and, so far, no
simulation tools to predict the compositions during the dealcoholization process have been published.
In this study, we have observed how flavor compounds analyzed vanished to very low concentration levels during the lab-scale vacuum distillation
process during 60 min at vaporization level of around 20 % in mass.
Two pressures were checked (102 and 200 mbar) at two corresponding temperatures (50 and 67 ºC respectively). In general, results were similar, but
slightly more flavor disappearing was measured at 200 mbar.
An unexpectedly high concentration of 2-phenylethanol after the process has been found. The reasons for this result are not yet entirely understood,
however it indicates that one of several reactions of other phenolics of the metabolic route were involved and produced it, increasing its
concentration around 30 to 50 %, due to a combined effect of temperature and residence time.
For the first time we have tested a simulation tool for beer dealcoholization against the laboratory results, fitting the thermodynamic binary interaction
coefficients of a Wilson Equation of State. Although, more research is needed in this sense, we succeed in simulation the behavior of six
components, i.e. 2-methylbutanol, 3-methylbutanol, ethyl acetate, 2-phenylethanol, isobutanol and 1-propanol together with the ABV % using
Aspen HYSYS with Wilson-2 EoS and a set of binary interaction parameters. Although the residence time in differential bath vacuum distillation if very
high compared to the industrial thin film evaporators, the simulation tool should be valid, as the thermodynamic behavior does not depend on the
residence time.
To sum up, the adjusted parameters of the simulation process are the key to overview the behavior of any beer sample and their volatile compounds
profile at different temperatures, times and pressures, for real processes such as vacuum distillation or thin film evaporators.
SECTION 3: Beer Volatile Compounds Changes during Lab-scale Dealcoholization Process Chapter 3.2
246
Acknowledgements
The authors acknowledge the Spanish Economy and Competitiveness
Ministry, Project Reference: ENE2012-33613 and the regional government (Junta de Castilla y León), Project Reference: VA330U13 and VA332A12-2
for funding.
References Andrés-Iglesias, C., Blanco, C. A., Blanco, J., & Montero, O. (2014). Mass
spectrometry-based metabolomics approach to determine differential
metabolites between regular and non-alcohol beers. Food Chemistry, 157, 205-212.
Andrés-Iglesias, C., Montero, O., Sancho, D., & Blanco, C. A. (2014). New trends in beer flavour compound analysis. Journal of the Science of
Food and Agriculture, 95, 1571-1576.
ASTM-International. (2012). ASTM D86-12. In W. Conshohocken (Ed.), Standard Test Method for Distillation of Petroleum Products at
Atmospheric Pressure.
Bamforth, C. W. (2001). Nutritional aspects of beer—a review. Nutrition Research, 22(1), 227-237.
Belisario-Sánchez, Y. Y., Taboada-Rodriguez, A., Marin-Iniesta, F., & López-Gómez, A. (2009). Dealcoholized wines by spinning cone column
distillation: phenolic compounds and antioxidant activity measured by the 1,1-diphenyl-2-picrylhydrazyl method. Journal of Agriculture and
Food Chemistry, 57(15), 6770-6778.
Berk, Z. (2013). Chapter 13 - Distillation. In Z. Berk (Ed.), Food Process Engineering and Technology (Second Edition) (pp. 329-352). San Diego:
Academic Press.
Blanco, C. A., Andrés-Iglesias, C., & Montero, O. (2014). Low-alcohol beers: Flavour compounds, defects and improvement strategies. Critical
Reviews in Food Science and Nutrition. DOI: 10.1080/10408398.2012.733979

SECTION 3: Beer Volatile Compounds Changes during Lab-scale Dealcoholization Process Chapter 3.2
247
Brányik, T., Silva, D. P., Baszczyňski, M., Lehnert, R., & Almeida e Silva, J. B.
(2012). A review of methods of low alcohol and alcohol-free beer production. Journal of Food Engineering, 108(4), 493-506.
Brányik, T., Vicente, A. A., Dostálek, P., & Teixeira, J. A. (2008). A review of
flavour formation in continuous beer fermentations. Journal of the Institute of Brewing, 114(1), 3-13.
Catarino, M., Ferreira, A., & Mendes, A. (2009). Study and optimization of aroma recovery from beer by pervaporation. Journal of Membrane
Science, 341(1–2), 51-59.
Catarino, M., & Mendes, A. (2011). Non-alcoholic beer—A new industrial process. Separation and Purification Technology, 79(3), 342-351.
Catarino, M., Mendes, A., Madeira, L. M., & Ferreira, A. (2007). Alcohol
Removal From Beer by Reverse Osmosis. Separation Science and Technology, 42(13), 3011-3027.
Claus, M. J., & Berglund, K. A. (2005). Fruit brandy production by batch column distillation with reflux. Journal of Food Process Engineering,
28(1), 53-67.
Claus, M. J., & Berglund, K. A. (2009). Defining still parameters using CHEMCAD batch distillation model for modeling fruit spirits distillations.
Journal of Food Process Engineering, 32(6), 881-892.
Dong, L., Piao, Y., Zhang, X., Zhao, C., Hou, Y., & Shi, Z. (2013). Analysis of volatile compounds from a malting process using headspace solid-
phase micro-extraction and GC–MS. Food Research International, 51(2), 783-789.
Gaiser, M., Bell, G. M., Lim, A. W., Roberts, N. A., Faraday, D. B. F., Schulz, R. A., & Grob, R. (2002). Computer simulation of a continuous whisky still.
Journal of Food Engineering, 51(1), 27-31.
Gonçalves, J. L., Figueira, J. A., Rodrigues, F. P., Ornelas, L. P., Branco, R. N., Silva, C. L., & Camara, J. S. (2014). A powerful methodological
approach combining headspace solid phase microextraction, mass spectrometry and multivariate analysis for profiling the volatile
metabolomic pattern of beer starting raw materials. Food Chemistry, 160, 266-280.

SECTION 3: Beer Volatile Compounds Changes during Lab-scale Dealcoholization Process Chapter 3.2
248
Karlsson, H. O. E., & Trägårdh, G. (1997). Aroma recovery during beverage
processing. Journal of Food Engineering, 34(2), 159-178.
Kobayashi, M., Shimizu, H., & Shioya, S. (20 08). Beer volatile compounds and their application to low-malt beer fermentation. Journal of Bioscience
and Bioengineering, 106, 317-323.
Labanda, J., Vichi, S., Llorens, J., & López-Tamames, E. (2009). Membrane
separation technology for the reduction of alcoholic degree of a white model wine. LWT - Food Science and Technology, 42(8), 1390-1395.
Lehnert, R., Novak, P., Macieira, F., Kurec, M., Teixeira, J. A., & Branyik, T.
(2009). Optimisation of lab-scale continuous alcohol-free beer production. Czech Journal of Food Sciences, 27(4), 267-275.
Liguori, L., De Francesco, G., Russo, P., Perretti, G., Albanese, D., & Di
Matteo, M. (2015). Production and characterization of alcohol-free beer by membrane process. Food and Bioproducts Processing, 94(0),
158-168.
Montanari, L., Marconi, O., Mayer, H., & Fantozzi, P. (2009). Chapter 6 -
Production of Alcohol-Free Beer. In V. R. Preedy (Ed.), Beer in Health and Disease Prevention (pp. 61-75). San Diego: Academic Press.
Olmo, Á. d., Blanco, C. A., Palacio, L., Prádanos, P., & Hernández, A. (2014).
Pervaporation methodology for improving alcohol-free beer quality through aroma recovery. Journal of Food Engineering, 133(0), 1-8.
Pickering, G. J. (2000). Low- and Reduced-alcohol Wine: A Review. Journal
of Wine Research, 11(2), 129-144.
Riu-Aumatell, M., Miró, P., Serra-Cayuela, A., Buxaderas, S., & López-
Tamames, E. (2014). Assessment of the aroma profiles of low-alcohol beers using HS-SPME–GC-MS. Food Research International, 57(0), 196-
202.
Šmogrovičová, D., & Dömény, Z. (1999). Beer volatile by-product formation at different fermentation temperature using immobilised yeasts. Process
Biochemistry, 34(8), 785-794.
Sohrabvandi, S., Mousavi, S. M., Razavi, S. H., Mortazavian, A. M., & Rezaei, K. (2010). Alcohol-free Beer: Methods of Production, Sensorial Defects,
and Healthful Effects. Food Reviews International, 26(4), 335-352.
SECTION 3: Beer Volatile Compounds Changes during Lab-scale Dealcoholization Process Chapter 3.2
249
Stein, W. (1993). Dealcoholization of beer. Technical Quarterly Master
Brewers Association of Americas, 30, 54-57.
Willaert, R., & Nedovic, V. A. (2006). Primary beer fermentation by immobilised yeast—a review on flavour formation and control
strategies. Journal of Chemical Technology & Biotechnology, 81(8), 1353-1367.
Zürcher, A., Jakob, M., & Back, W. (2005). Improvements in flavor and colloidal stability of alcohol free beers. Paper presented at the
Proceedings of the European Brewing Convention Congress, Prague, Czech Republic.


Acknowledgments
251
Acknowledgments
First of all, I would like to thank my parents for all their support throughout my
life and in these thesis years, especially my mother because she is always there when needed and has made me the person I am today.
I really appreciate and acknowledge my supervisors, Dr. Olimpio Montero
and Dr. Carlos A. Blanco, for their scientific contribution on this thesis, for their thorough supervision, their dedicated time and great support.
I also want to acknowledge my supervisor at Prague, Prof. Pavel Dostálek, for giving me the opportunity to carry out my work at the University of
Chemistry and Tecnology, for his teachings on beer, quality and production.
I would like to express my gratitude to Hijos de Rivera S.A. for my one year of financial support. Also, ADE Parques Tecnológicos is acknowledged for the
laboratory facilities at Bioincubadora and my laboratory colleague Marta for her help.
My thanks go also to all of my laboratory colleagues from Laboratorio de
Técnicas Instrumentales, Valladolid (a special mention to Nora Carrera and Marta Ozores) and from the University of Chemistry and Tecnology, Prague
that contributed to the good development of my research work. To all of you thanks for your teaching, help and support.
I acknowledge Juan García Serna for his kindness, help, time, and support and for sharing his knowledge with me.
I would like to show my appreciation to Anna Lawrenson for her English
lessons and helping me with the English reviews.
To my family and all my close friends, thanks for their support, friendship and trust, and for the good moments beyond work. Finally, to Víctor, thanks for
his unconditional support, for his strength and encouragement, his patience in most difficult moments and for always being there for me.
About the author
252
About the author Since I was a child I always wanted to be
a scientist. I remember asking my parents to buy me a microscope to see my bood
cells. I wanted to see them as the ones
that appeared in the cartoons on TV about the human body, but of course I
couldn’t. I didn’t mind because I wanted to see every single thing in my
microscope. Every holiday, I wanted to
visit the astronomic, nature, or whatever science museum, even if I didn’t know the exact name.
When I grew up, I wanted to sale in a boat and go with the National
Geographic teams to discover the ocean and sea animals I loved, but finally as a teenager I discovered cooking and food chemistry once I started my degree,
so I decided to focus my life on that.
I studied my degree in a University where everyone studied wine because it is in
a very famous wine region, but I thought, what would happen I if studied beer? Every time I went out with friends most people were drinking beer, so why not?
And I started to do it. First, I focused on poliphenols in beer and now, during my
last 4 years of life I have been delving into the flavoring compounds in beer.
During this ‘beer part of my life’ I also have meet al lot of new and awesome people, some of them now being very cose friends. From Spain to London and
finally the Czech Republic, in different ways, all of them, friends and laboratory colleagues, have helped me and given me the courage to contuinue on this
path.
Anyway… laboratory analytical techniques, chemistry, why production
processes and raw materials can change beer flavors, let’s try this way instead of that, changing methods until everything is perfect with few economical
resources and always asking why, why, why until you get the answer.
This has been one of the most important and significant parts of my life, practicing and learning in different laboratories from great people. For all that, I
hope I can continue working on this all my life. I’ll love to have a job in a
scientific laboratory. Learning about new methods, developing analytical techniques, fixing apparatus when something goes wrong, getting the results,
writing papers and finally being the person I want to be.

Curriculum Vitae
253
FORMACIÓN ACADÉMICA
Doctoranda por la Universidad de Valladolid (2011-2015). Departamento de Ingeniería
Agrícola y Forestal. Área de Tecnología de los alimentos.
Máster de Investigación en Ingeniería para el Desarrollo Agroforestal (2008/2010, Universidad
de Valladolid).
Ingeniero Técnico Agrícola especialidad Industrias Agrarias y Alimentarias (2002/2007,
Universidad de Salamanca).
FORMACIÓN COMPLEMENTARIA
Cursos y jornadas impartidos por la Universidad de Valladolid:
- 2015 Jornada ‘Resolución de problemas en cromatografía y espactrometría de
masas. Programas Easy Choice’.
- 2012 Curso sobre Industria Agroalimentaria: seguridad y calidad alimentaria.
- 2011 Curso sobre elaboración artesanal de cerveza.
- 2010 Curso sobre aplicación de la biotecnología a la Industria Agroalimentaria.
2008 Curso ‘Evaluación de Impacto Ambiental’. Organizado por el COITA.
2008 Curso ‘Agente de Desarrollo Local’. Curso del servicio público de empleo.
Cursos impartidos por la Universidad de Salamanca:
- 2008 Principios y tecnología de la extrusión. Aplicaciones en la industria alimentaria.
EXPERIENCIA PROFESIONAL
University of Chemistry and Technology, Prague. Departamento de Biotecnología. Beca
Doctoral para realizar tareas de investigación basadas en técnicas de análisis de
compuestos aromáticos en cerveza (09/2014-12/2014).
Laboratorio de Técnicas Instrumentales (LTI). Donde he realizado parte de la investigación de
mi Doctorado en compuestos aromáticos, utilizando técnicas analíticas de Cromatografía
de Gases con detector de llama (GC/FID) y Cromatografía de Gases con detector de
Masas (GC/MS). (04/2013-06/2014).
Centro para el Desarrollo de la Biotecnología (CDB, CSIC). Ayudante científica en la actividad
de investigación y desarrollo experimental (01/2013).
Beca de Doctorado: “Caracterización mediante análisis metabolómico de los
compuestos, moléculas de pequeño tamaño, que ejercen un efecto diferencial en el
sabor de la cerveza sin alcohol” para el que se utilizó un equipo de cromatografía de
líquidos - espectrometría de masas (UPLC-QTof-MS) (04/2011- 03/2012).
ITAGRA. Beca de colaboración en proyectos de investigación a cargo del proyecto:
“Desarrollo de análisis y experiencias de laboratorio y de campo en suelos, cultivos
agrícolas y especies forestales” (11/2010- 03/2011).
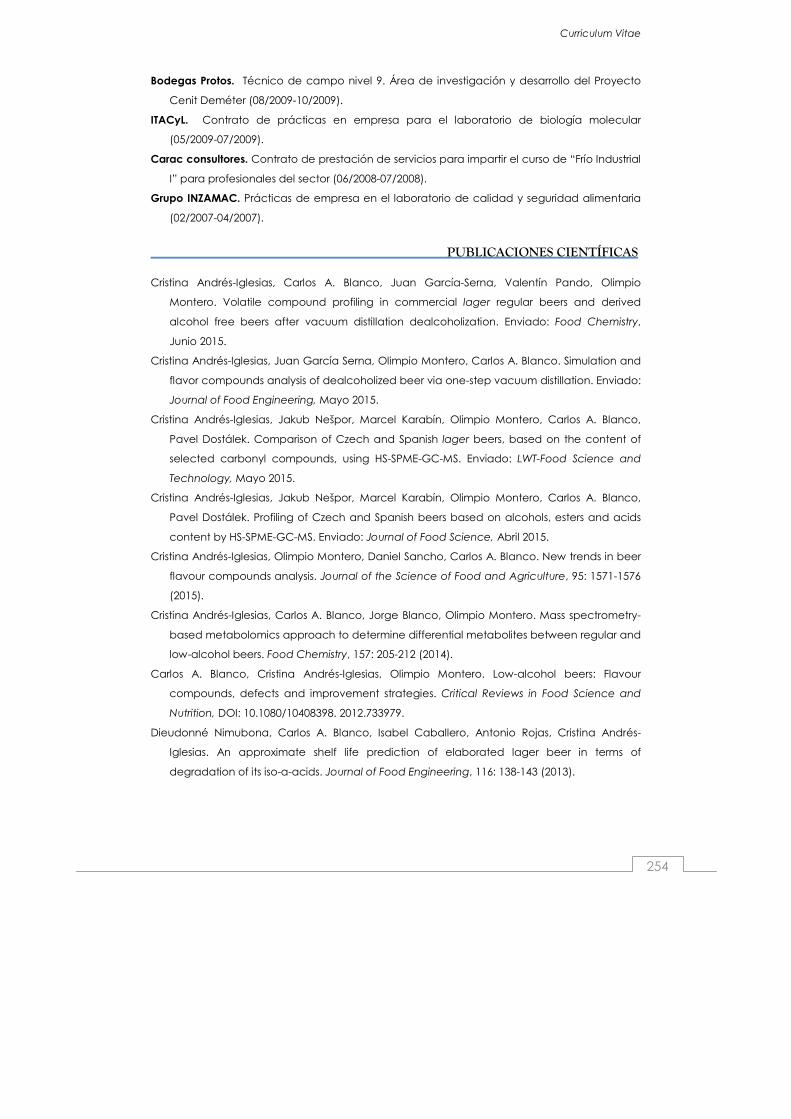
Curriculum Vitae
254
Bodegas Protos. Técnico de campo nivel 9. Área de investigación y desarrollo del Proyecto
Cenit Deméter (08/2009-10/2009).
ITACyL. Contrato de prácticas en empresa para el laboratorio de biología molecular
(05/2009-07/2009).
Carac consultores. Contrato de prestación de servicios para impartir el curso de “Frío Industrial
I” para profesionales del sector (06/2008-07/2008).
Grupo INZAMAC. Prácticas de empresa en el laboratorio de calidad y seguridad alimentaria
(02/2007-04/2007).
PUBLICACIONES CIENTÍFICAS
Cristina Andrés-Iglesias, Carlos A. Blanco, Juan García-Serna, Valentín Pando, Olimpio
Montero. Volatile compound profiling in commercial lager regular beers and derived
alcohol free beers after vacuum distillation dealcoholization. Enviado: Food Chemistry,
Junio 2015.
Cristina Andrés-Iglesias, Juan García Serna, Olimpio Montero, Carlos A. Blanco. Simulation and
flavor compounds analysis of dealcoholized beer via one-step vacuum distillation. Enviado:
Journal of Food Engineering, Mayo 2015.
Cristina Andrés-Iglesias, Jakub Nešpor, Marcel Karabín, Olimpio Montero, Carlos A. Blanco,
Pavel Dostálek. Comparison of Czech and Spanish lager beers, based on the content of
selected carbonyl compounds, using HS-SPME-GC-MS. Enviado: LWT-Food Science and
Technology, Mayo 2015.
Cristina Andrés-Iglesias, Jakub Nešpor, Marcel Karabín, Olimpio Montero, Carlos A. Blanco,
Pavel Dostálek. Profiling of Czech and Spanish beers based on alcohols, esters and acids
content by HS-SPME-GC-MS. Enviado: Journal of Food Science, Abril 2015.
Cristina Andrés-Iglesias, Olimpio Montero, Daniel Sancho, Carlos A. Blanco. New trends in beer
flavour compounds analysis. Journal of the Science of Food and Agriculture, 95: 1571-1576
(2015).
Cristina Andrés-Iglesias, Carlos A. Blanco, Jorge Blanco, Olimpio Montero. Mass spectrometry-
based metabolomics approach to determine differential metabolites between regular and
low-alcohol beers. Food Chemistry, 157: 205-212 (2014).
Carlos A. Blanco, Cristina Andrés-Iglesias, Olimpio Montero. Low-alcohol beers: Flavour
compounds, defects and improvement strategies. Critical Reviews in Food Science and
Nutrition, DOI: 10.1080/10408398. 2012.733979.
Dieudonné Nimubona, Carlos A. Blanco, Isabel Caballero, Antonio Rojas, Cristina Andrés-
Iglesias. An approximate shelf life prediction of elaborated lager beer in terms of
degradation of its iso-α-acids. Journal of Food Engineering, 116: 138-143 (2013).

Curriculum Vitae
255
PUBLICACIONES EN REVISTAS DIVULGATIVAS
Carlos A. Blanco Fuentes, Jorge Blanco Gallego, Cristina Andrés Iglesias, Olimpo Montero.
Metodologías para la producción de cerveza de muy bajo grado alcohólico. Cerveza y
malta, 201: 18-24 (2014).
CONGRESOS
Cristina Andrés-Iglesias, Jakub Nešpor, Marcel Karabín, Olimpio Montero, Carlos A. Blanco,
Pavel Dostálek. Volatile compounds analysis in alcohol free beers produced by different
techniques. VIII Congreso CYTA/CESIA, Badajoz. Libro de Ponencias y Comunicaciones,
ISBN: 978-84-606-6881-7, pag. 17 (2015).
Carlos A. Blanco, Isabel Caballero, David Rodríguez-Lázaro, Abel Fernández, Olimpio Montero,
Cristina Andrés-Iglesias. Estudio de la microbiota presente en cervezas lager sin alcohol. VIII
Congreso CYTA/CESIA, Badajoz. Libro de Ponencias y Comunicaciones, ISBN: 978-84-606-
6881-7, pag. 28 (2015).
Cristina Andrés-Iglesias, Olimpio Montero, Carlos A. Blanco. Aplicación de la metabolómica a
la caracterización de compuestos diferenciales en cervezas lager. VII Congreso Español
de Ingeniería de los Alimentos, Ciudad Real. Actas del VII Congreso Español de Ingeniería
de Alimentos [CD], ISBN: 978-84-695-4196-8 (2012).
IDIOMAS
Inglés: First Certificate in English. Experiencia profesional en Londres (National Insurance
Number: TN 08 06 84 F).
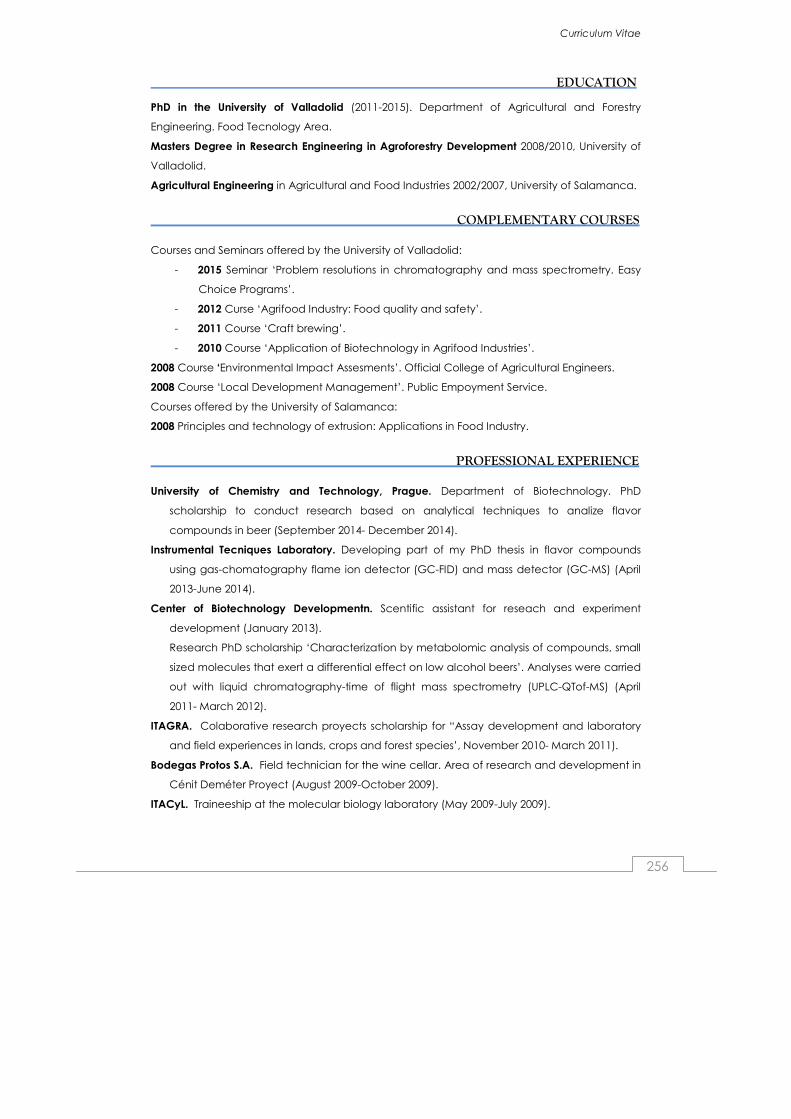
Curriculum Vitae
256
EDUCATION
PhD in the University of Valladolid (2011-2015). Department of Agricultural and Forestry
Engineering. Food Tecnology Area.
Masters Degree in Research Engineering in Agroforestry Development 2008/2010, University of
Valladolid.
Agricultural Engineering in Agricultural and Food Industries 2002/2007, University of Salamanca.
COMPLEMENTARY COURSES
Courses and Seminars offered by the University of Valladolid:
- 2015 Seminar ‘Problem resolutions in chromatography and mass spectrometry. Easy
Choice Programs’.
- 2012 Curse ‘Agrifood Industry: Food quality and safety’.
- 2011 Course ‘Craft brewing’.
- 2010 Course ‘Application of Biotechnology in Agrifood Industries’.
2008 Course ‘Environmental Impact Assesments’. Official College of Agricultural Engineers.
2008 Course ‘Local Development Management’. Public Empoyment Service.
Courses offered by the University of Salamanca:
2008 Principles and technology of extrusion: Applications in Food Industry.
PROFESSIONAL EXPERIENCE
University of Chemistry and Technology, Prague. Department of Biotechnology. PhD
scholarship to conduct research based on analytical techniques to analize flavor
compounds in beer (September 2014- December 2014).
Instrumental Tecniques Laboratory. Developing part of my PhD thesis in flavor compounds
using gas-chomatography flame ion detector (GC-FID) and mass detector (GC-MS) (April
2013-June 2014).
Center of Biotechnology Developmentn. Scentific assistant for reseach and experiment
development (January 2013).
Research PhD scholarship ‘Characterization by metabolomic analysis of compounds, small
sized molecules that exert a differential effect on low alcohol beers’. Analyses were carried
out with liquid chromatography-time of flight mass spectrometry (UPLC-QTof-MS) (April
2011- March 2012).
ITAGRA. Colaborative research proyects scholarship for “Assay development and laboratory
and field experiences in lands, crops and forest species’, November 2010- March 2011).
Bodegas Protos S.A. Field technician for the wine cellar. Area of research and development in
Cénit Deméter Proyect (August 2009-October 2009).
ITACyL. Traineeship at the molecular biology laboratory (May 2009-July 2009).

Curriculum Vitae
257
Carac Consultant. Teacher of ‘Industrial Refrigeration I’ course.
INZAMAC Group. Traineeship at the food quality and safety laboratory (February 2007-April
2007).
SCIENTIFIC PUBLICATIONS
Cristina Andrés-Iglesias, Carlos A. Blanco, Juan García-Serna, Valentín Pando, Olimpio
Montero. Volatile compound profiling in commercial lager regular beers and derived
alcohol free beers after vacuum distillation dealcoholization. Submitted to: Food Chemistry,
june 2015.
Cristina Andrés-Iglesias, Juan García Serna, Olimpio Montero, Carlos A. Blanco. Simulation and
flavor compounds analysis of dealcoholized beer via one-step vacuum distillation.
Submitted to: Journal of Food Engineering, may 2015.
Cristina Andrés-Iglesias, Jakub Nešpor, Marcel Karabín, Olimpio Montero, Carlos A. Blanco,
Pavel Dostálek. Comparison of Czech and Spanish lager beers, based on the content of
selected carbonyl compounds, using HS-SPME-GC-MS. Submitted to: LWT-Food Science
and Technology, april 2015.
Cristina Andrés-Iglesias, Jakub Nešpor, Marcel Karabín, Olimpio Montero, Carlos A. Blanco,
Pavel Dostálek. Profiling of Czech and Spanish beers based on alcohols, esters and acids
content by HS-SPME-GC-MS. Submitted to: Journal of Food Science, april 2015.
Cristina Andrés-Iglesias, Olimpio Montero, Daniel Sancho, Carlos A. Blanco. New trends in beer
flavour compounds analysis. Journal of the Science of Food and Agriculture, 95: 1571-1576
(2015).
Cristina Andrés-Iglesias, Carlos A. Blanco, Jorge Blanco, Olimpio Montero. Mass spectrometry-
based metabolomics approach to determine differential metabolites between regular and
low-alcohol beers. Food Chemistry, 157: 205-212 (2014).
Carlos A. Blanco, Cristina Andrés-Iglesias, Olimpio Montero. Low-alcohol beers: Flavour
compounds, defects and improvement strategies. Critical reviews in food science and
nutrition. Critical Reviews in Food Science and Nutrition, DOI: 10.1080/10408398.
2012.733979.
Dieudonné Nimubona, Carlos A. Blanco, Isabel Caballero, Antonio Rojas, Cristina Andrés-
Iglesias. An approximate shelf life prediction of elaborated lager beer in terms of
degradation of its iso-α-acids. Journal of Food Engineering, 116: 138-143 (2013).
PUBLICATIONS FOR INFORMATIVE JOURNALS
Carlos A. Blanco Fuentes, Jorge Blanco Gallego, Cristina Andrés Iglesias, Olimpo Montero.
Metodologías para la producción de cerveza de muy bajo grado alcohólico. Cerveza y
malta, 201: 18-24 (2014).
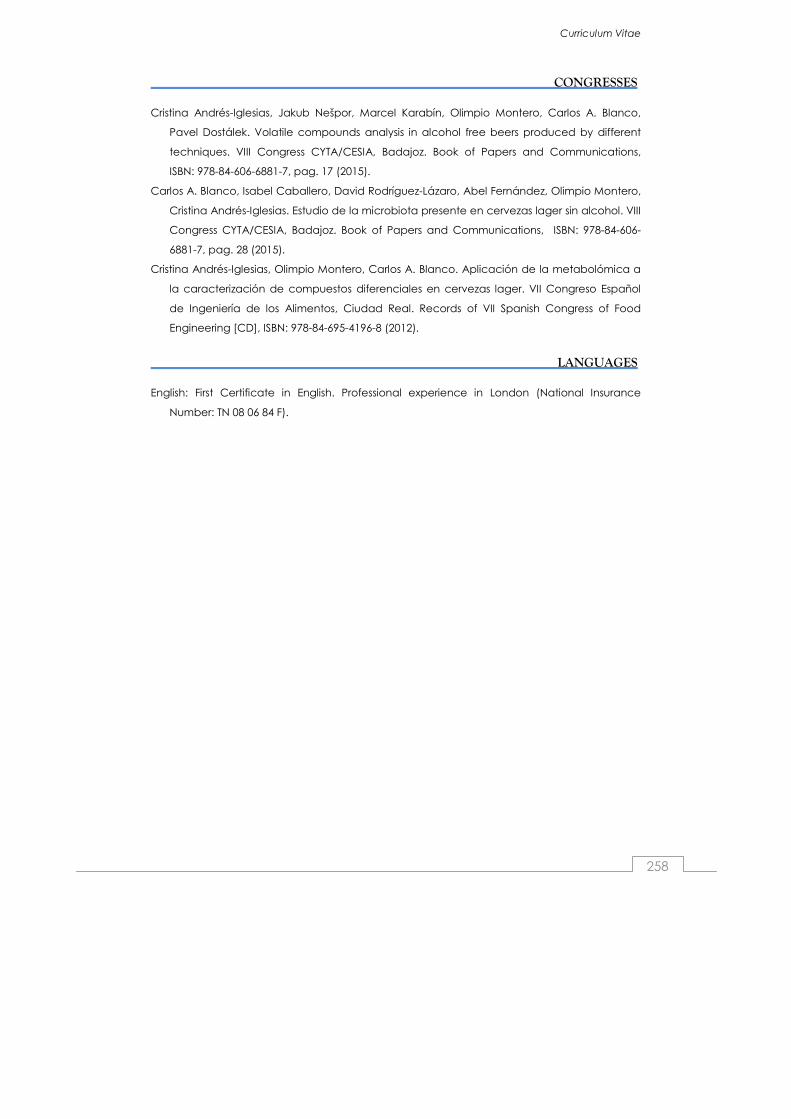
Curriculum Vitae
258
CONGRESSES
Cristina Andrés-Iglesias, Jakub Nešpor, Marcel Karabín, Olimpio Montero, Carlos A. Blanco,
Pavel Dostálek. Volatile compounds analysis in alcohol free beers produced by different
techniques. VIII Congress CYTA/CESIA, Badajoz. Book of Papers and Communications,
ISBN: 978-84-606-6881-7, pag. 17 (2015).
Carlos A. Blanco, Isabel Caballero, David Rodríguez-Lázaro, Abel Fernández, Olimpio Montero,
Cristina Andrés-Iglesias. Estudio de la microbiota presente en cervezas lager sin alcohol. VIII
Congress CYTA/CESIA, Badajoz. Book of Papers and Communications, ISBN: 978-84-606-
6881-7, pag. 28 (2015).
Cristina Andrés-Iglesias, Olimpio Montero, Carlos A. Blanco. Aplicación de la metabolómica a
la caracterización de compuestos diferenciales en cervezas lager. VII Congreso Español
de Ingeniería de los Alimentos, Ciudad Real. Records of VII Spanish Congress of Food
Engineering [CD], ISBN: 978-84-695-4196-8 (2012).
LANGUAGES
English: First Certificate in English. Professional experience in London (National Insurance
Number: TN 08 06 84 F).


Related Documents