Hong Kong College of Obstetricians and Gynaecologists Territory-Wide Audit in Obstetrics & Gynaecology 2014 HONG KONG COLLEGE OF OBSTETRICIANS & GYNAECOLOGISTS

Welcome message from author
This document is posted to help you gain knowledge. Please leave a comment to let me know what you think about it! Share it to your friends and learn new things together.
Transcript
Hong Kong College of Obstetricians and Gynaecologists
Territory-Wide Audit
in
Obstetrics & Gynaecology
2014
HONG KONG COLLEGE OF
OBSTETRICIANS & GYNAECOLOGISTS
Hong Kong College of Obstetricians and Gynaecologists
Territory-Wide Audit
in
Obstetrics & Gynaecology
2014
HONG KONG COLLEGE OF
OBSTETRICIANS & GYNAECOLOGISTS


2014
Hong Kong College of Obstetricians and Gynaecologists
Hong Kong College of
Obstetricians & Gynaecologists
Territory-wide Audit in Obstetrics & Gynaecology
CONTENTS
FOREWORD ...................................................................................................................... i AN OVERVIEW OF THE REPORT .................................................................................... iii
Territory-wide Audit 2014 ................................................................................................ iii Obstetric report ............................................................................................................... iii Gynaecological report ...................................................................................................... iv
Participating Hospitals in Obstetric Audit .............................................................................. vi Participating Hospitals in Gynaecological Audit ................................................................... viii
The Obstetric Report
General Information and Antenatal Complications
GENERAL OBSTETRIC STATISTICS ................................................................................ 1 AGE AND PARITY OF PARTURIENTS ............................................................................. 6 COMMON ANTENATAL COMPLICATIONS ..................................................................... 8
DIABETES MELLITUS .................................................................................................. 8 HYPERTENSIVE DISORDER IN PREGNANCY ............................................................ 12 CARDIAC DISEASES .................................................................................................. 17 PELVIC MASSES - OVARIAN CYSTS .......................................................................... 21 PELVIC MASSES – UTERINE FIBROIDS ..................................................................... 25 ANTEPARTUM HAEMORRHAGE ............................................................................... 29
BREECH PRESENTATION AT BIRTH ............................................................................. 33 EXTERNAL CEPAHLIC VERSION .................................................................................. 37 PARTURIENTS WITH PREVIOUS UTERINE SCAR ......................................................... 38
CASEAREAN SECTION UTERINE SCAR ..................................................................... 38 NON-CAESAREAN SECTION UTERINE SCAR ............................................................ 42
DOWN’S SYNDROME SCREENING ............................................................................... 45
Labout and Delivery
PRETERM LABOUR ....................................................................................................... 47 THREATENED PRETERM LABOUR ............................................................................ 50
PRE-TERM DELIVERY ................................................................................................... 53 POST-TERM DELIVERY ................................................................................................. 58 INDUCTION OF LABOUR .............................................................................................. 62 AUGMENTATION OF LABOUR ..................................................................................... 66 EPIDURAL ANALGESIA & ANAESTHESIA .................................................................. 70 DURATION OF LABOUR ................................................................................................ 74
Mode of Delivery SPONTANEOUS VERTEX DELIVERY ............................................................................ 77 VACUUM EXTRACTION ................................................................................................ 80 FORCEPS DELIVERY ..................................................................................................... 84 VAGINAL BREECH DELIVERY ..................................................................................... 87 CAESAREAN SECTION .................................................................................................. 90
SECOND STAGE CAESAREAN SECTION .............................................................................. 93
Puerperium and Post-Partum Complicatons
POSTPARTUM HAEMORRHAGE ................................................................................... 97 PLACENTA PREVIA ..................................................................................................... 104 PUERPERAL PYREXIA ................................................................................................ 108 PERINEAL LACERATION ............................................................................................ 111
MAJOR PERINEAL LACERATION ............................................................................ 111 UTERINE RUPTURE ..................................................................................................... 113
HYSTERECTOMY ......................................................................................................... 115
Baby Information and Outcome
INFORMATION ABOUT BABY ..................................................................................... 117 FETAL OUTCOME WITH RESPECT TO GESTATION .................................................... 119 INFANTS BORN WITH CONGENITAL ANOMALIES .................................................... 124 BIRTH ASPHYXIA ........................................................................................................ 127 BIRTH TRAUMA ........................................................................................................... 131 MAJOR NEONATAL INFECTIONS ................................................................................ 133 NEONATAL COMPLICATIONS ..................................................................................... 135
RESPIRATORY DISTRESS SYNDROME .................................................................... 135 INTRAVENTRICULAR HAEMORRHAGE .................................................................. 136 NECROTISING ENTEROCOLITIS .............................................................................. 136
Mortality Statistics
STILLBIRTHS ............................................................................................................... 137 NEONATAL DEATHS ................................................................................................... 140 MATERNAL COLLAPSE ............................................................................................... 143 MATERNAL DEATHS ................................................................................................... 147
Miscellaneous
MULTIPLE PREGNANCIES ........................................................................................... 150 FETAL REDUCTION .................................................................................................. 154
PREGNANCIES WITH NORMAL AND ABNORMAL ANTENATAL COURSE ................ 155 PREGNANCIES IN CHINESE AND NON-CHINESE ........................................................ 169 PREGNANCIES WITH DIFFERENT CONCEPTIONS ...................................................... 176
The Gynaecological Report
General Information
GENERAL GYNAECOLOGICAL STATISTICS ............................................................... 185 BACKGROUND INFORMATION OF THE RETURNED GYNAECOLOGICAL DATA ... 185 ADMISSION STATUS ................................................................................................ 185 DISCHARGE STATUS ................................................................................................ 185 STATUS AT ADMSSION ............................................................................................ 186 STATUS AT DISCHARGE .......................................................................................... 186
Diagnosis
SUMMARY OF DISTRIBUTION OF VARIOUS DIAGNOSES ......................................... 187 TEN COMMONEST DIAGNOSES ............................................................................... 188
DETAILED BREAKDOWN OF INDIVIDUAL DIAGNOSIS ............................................. 190 DISEASES OF VULVA, PERINEIUM AND URETHRA ................................................ 190 DISEASES OF VAGINA .............................................................................................. 190 DISEASES OF UTERINE CERVIX .............................................................................. 191 DISEASES OF UTERINE BODY .................................................................................. 191 DISEASES OF FALLOPIAN TUBES ............................................................................ 192 DISEASES OF OVARY ............................................................................................... 192 DISEASES OF BROAD LIGAMENTS AND PELVIC PERITONEUM ............................. 194 GENITAL DISPLACMENT/URINARY DISORDERS .................................................... 194 DISORDERS OF MENSTRUATION ............................................................................. 195 DISORDERS OF PREGNANCY AND REPRODUCTION .............................................. 196 NON-OBSTETRIC COMPLICATIONS IN PREGNANCY .............................................. 197 MISCELLANEOUS GYNAECOLOGICAL CONDITIONS ............................................. 197 MISCELLANEOUS NON-GYNAECOLOGICAL CONDITIONS .................................... 200
Treatment
SUMMARY OF DISTRIBUTION OF TREATMENT ........................................................ 201 TEN COMMONEST TREATMENT MODALITIES ....................................................... 202
DETAILED BREAKDOWN OF INDIVIDUAL TREATMENT .......................................... 203 MAJOR ABDOMINAL OPERATIONS ........................................................................ 203 MAJOR VAGINAL OPERATIONS .............................................................................. 211 MAJOR VULVAL OPERATIONS ............................................................................... 211 ENDOSCOPIC PROCEDURES .................................................................................... 212 HYSTEROSCOPIC PROCEDURES ............................................................................. 212 LAPAROSCOPIC PROCEDURES ............................................................................... 213 COLPOSCOPIC RELATED PROCEDURES ................................................................. 217 ASSISTED REPRODUCTIVE PROCEDURES .............................................................. 217 MINOR ABDOMINAL OPERATIONS ......................................................................... 218 OTHER MINOR VAGINAL/VULVAL OPERATIONS .................................................. 218 RADIOTHERAPY ...................................................................................................... 219 NON-OPERATIVE TREATMENT ............................................................................... 219
COMPLICATIONS ........................................................................................................ 220 COMPLICATION RATES IN RELATION WITH COMMON TYPES OF OPERATIONS . 222 COMPLICATIONS OF TUBAL SURGERY .................................................................. 224 COMPLICATIONS OF OVARIAN SURGERY ............................................................. 225 COMPLICATIONS OF MYOMECTOMY..................................................................... 226 COMPLICATIONS OF HYSTERECTOMY FOR BENIGN CONDITIONS ...................... 228 COMPLICATIONS OF HYSTERECTOMY FOR MALIGNANT CONDITIONS .............. 229 COMPLICATIONS OF RADICAL HYSTERECTOMY .................................................. 230
ANALYSIS ON HYSTERECTOMY ................................................................................ 231 MODES AND TYPES OF HYSTERECTOMY .............................................................. 231 CONDITIONS ASSOCIATED WITH SIMPLE HYSTERECTOMY ................................ 232
LENGTH OF HOSPITAL STAY ..................................................................................... 233 LENGTH OF STAY FOR MAJOR ABDOMINAL SURGERY ........................................ 234 LENGTH OF STAY FOR MAJOR VAGINAL AND VUVLAL SURGERY ..................... 237 LENGTH OF STAY FOR MINOR VAGINAL AND VULVAL SURGERY ..................... 238 LENGTH OF STAY FOR HYSTEROSCOPIC SURGERY.............................................. 238 LENGTH OF STAY FOR LAPAROSCOPIC SURGERY ................................................ 239 LENGTH OF STAY FOR LAPAROTOMY VERSUS LAPAROSCOPY .......................... 242
The Special Audit Report
INTRA-ABDOMINAL OPERATIONS ............................................................................ 245
SIMPLE HYSTERECTOMY FOR BENIGN CONDITIONS ........................................... 250 SIMPLE HYSTERECTOMY FOR MALIGNANT CONDITIONS ................................... 252 RADICAL HYSTERECTOMY .................................................................................... 254 MYOMECTOMY ....................................................................................................... 256 OVARIAN SURGERY ................................................................................................ 259 ECTOPIC PREGNANCY OPERATION ........................................................................ 263
Charts
Obstetric Charts
Figure O1 – Age distribution (with parity) of parturients ........................................................ 7
Figure O2 – Distribution of parity ........................................................................................... 7
Figure O3 – Fetal mortality rates in parturients with diabetes mellitus ................................. 15
Figure O4 – Fetal mortality rates in parturients with hypertension ....................................... 16
Figure O5 – Duration of labour with respect to parity ........................................................... 75
Figure O6 – Distribution of mode of delivery ....................................................................... 96
Figure O7 – Mode of delivery in different parity .................................................................. 96
Figure O8 – Distribution of gestation at delivery ................................................................ 118
Figure O9 – Distribution of birth weight at delivery ........................................................... 118
Figure O10 – Survival rate at 28 days of all live births in different gestation ranges .......... 121
Figure O11 – Survival rate at 28 days of all live births in different birth weight ranges ..... 121
Figure O12 – Stillbirth rate of all births in different gestation ranges ................................. 122
Figure O13 – Stillbirth rate of all births in different birth weight ranges ............................ 122
Figure O14 – Neonatal death rate of all live births in different gestation ranges ................ 123
Figure O15 – Neonatal death rate of all live births in different birth weight ranges ........... 123
Figure O16 – Normal and abnormal antenatal course ......................................................... 159
Figure O17 – Mode of delivery ............................................................................................ 159
Figure O18 – Preterm deliveries .......................................................................................... 160
Figure O19 – Low birth weight............................................................................................ 160
Figure O20 – Very low Apgar score .................................................................................... 161
Figure O21 – Stillbirth and neonatal death rate ................................................................... 161
Gynaecological Charts
Figure G1 – Age distribution of gynaecological inpatients admission ................................ 189
Figure G2 – Percentage of women admitted ........................................................................ 189
Figure G3 – Ovarian tumour: age distribution in number .................................................... 193
Figure G4 – Ovarian tumour: age distribution in percentage............................................... 193
Figure G5 – Age distribution of all pregnant women .......................................................... 198
Figure G6 – Pregnancy related problems by age groups ..................................................... 198
Figure G7 – Abnormal outcome of reported pregnancies .................................................... 199
Figure G8 – Abnormal outcome of all pregnancies in different age groups ........................ 199
Figure G9 – Types and routes of surgical treatment for benign ovarian cysts ..................... 207
Figure G10 – Types and routes of surgical treatment for ectopic pregnancies .................... 207
Figure G11 – Types and routes of surgical treatment for fibroids ....................................... 208
Figure G12 – Types of surgery for fibroids by age groups .................................................. 208
Figure G13 – Surgical treatment of uterine fibroid: age distribution in percentage ............ 209
Figure G14 – Routes of hysterectomy for fibroids: age distribution in percentage ............. 209
Figure G15 – Routes of myomectomy for fibroids: age distribution in percentage............. 210
Figure G16 – No. of admissions and average length of stay by age groups ........................ 236
Figure G17 – No. of admissions and total length of stay by age groups ............................. 236
Appendices
Appendix 1. List of Participating Hospitals/Institutes and Co-ordinators ........................... 265
Appendix 2. Lists of Committee and Subcommittee ........................................................... 266
Appendix 3. Obstetric Audit Form ...................................................................................... 268
Appendix 4. Gynaecology Audit Form ................................................................................ 270
Appendix 5. HKCOG Audit Guidelines For Coding (2004 Version) .................................. 271
FOREWORD
Clinical audit is a systemic analysis of the performance of an individual or an organisation’s clinical
work, with the aims to evaluate the efficacy of current practice and to identify areas of need for
improvement. It is also an integral part of clinical governance of each healthcare system in the
modern days. Since 1994, the Hong Kong College of Obstetricians and Gynaecologists has
conducted this 5 yearly Territory-wide audit in obstetrics and gynaecology, involving all public and
private hospitals in Hong Kong. The epidemiology, disease pattern, clinical management and
treatment outcomes for all obstetric deliveries and inpatient gynaecological care are being studied.
In this 5th report, as highlighted in the Overview, there are several changes compared with the
previous reports, such as inclusion of some new conditions. Trend analyses over the past decades on
various items were also made. Of note, on the obstetric side, the percentage of pregnant women aged
35 years old had been increasing, from 13.9% in 1994, to 24.2% in 2004, and 41.6% in 2014. With
the advancing maternal age, the incidence of gestational diabetes and hypertensive disorders also
increased, yet other the obstetric outcomes and complications in 2014 did not differ much from the
previous years. A significant improvement in the practice of Down syndrome screening was also
observed in 2014. Hence, the change in demographic situation of the parturients might have posed
different resource implication to the health-care providers. On the gynaecological side, the total
number of hospital admissions had increased by 14.5% compared with 2009, while the emergency
and day-care admissions had increased by 60% and 154% respectively. The number of elective
admission had dropped by 19%. At the same time, silent/ spontaneous miscarriage and threatened
miscarriage were the two most common diagnoses for hospital admissions, contributing over 20% of
cases. It is perhaps one of the areas where a closer look on whether the early pregnancy clinic can be
re-structured for better utilization of hospital resources.
This audit contains much important information about the O&G service in Hong Kong which are of
great value for the institutions and health-care providers. We have only just listed two areas for
stimulation of thoughts. It is important here to thank all the participating hospitals, Fellows,
Members and trainees who had helped in the collection of data. Without their contribution, the
College would not be able to continue this important exercise. The College is also indebted to Dr
YUEN Pong Mo and each member of the Working Group of this Audit/ Clinical Audit
sub-committee (page 190). It is through their hard work and endeavour that this 5th report can be
successfully compiled.
Professor LEUNG Tak Yeung Dr LEUNG Tse Ngong
President Chairman,
HKCOG Quality Assurance Committee
August 2020

iii
AN OVERVIEW OF THE REPORT
Territory-wide Audit 2014
The 2014 audit is the fifth audit exercise conducted by the Hong Kong College of
Obstetricians & Gynaecologists since 1994. As in previous audits, there were a number of
modification of the "Minimal Data Set" according to the change in practice and diagnostic criteria,
and expansion of some clinically important area. In the obstetric side, the diagnosis of impaired
glucose tolerance IGT was removed. The presence of ovarian cyst, uterine fibroids, non-caesarean
section uterine scar and the diagnosis of placenta praevia were included. Down's syndrome
screening using the OSCAR test or biochemical test was separated from the non-invasive fetal
DNA screening and testing for trisomy. Fetal reduction for high multiple pregnancy was included.
Post-partum haemorrhage was defined as blood loss > 500 ml following vaginal delivery or > 1000
ml following Caesarean delivery. Status of the amniotic fluid during labour was recorded and
perineal tear was categorised into 4 different grades. The occurrence of maternal collapse, defined
as an acute event involving the cardiorespiratory systems and/or brain, resulting in a reduced or
absent conscious level (and potentially death), at any stage in pregnancy and up to six weeks after
delivery was recorded and the definition of maternal death was specified (the death of a woman
while pregnant or within 42 days of termination of pregnancy, irrespective of the duration and site
of the pregnancy, from any cause related to or aggravated by the pregnancy or its management but
not from accidental or incidental causes). In the gynaecological side, new disease items were
added to diseases of broad ligaments and pelvic peritoneum, and diseases of pregnancy and
reproduction. Treatment coding for major abdominal operations for "benign and pre-malignant
conditions" and that for "malignant conditions" were combined as in laparoscopic procedures.
Laparoscopic and hysteroscopic procedures were separately coded. Complications were separated
into intra-operative/procedural and post-operative/procedural complications. An ad hoc audit on
intra-abdominal operation was conducted at the same time which looked into the details of all
intra-abdominal operations, be it done by laparotomy or laparoscopy. In all public hospital, both
the obstetric and gynaecological data were extracted from the Clinical Management System of the
Hospital Authority. Data from private hospitals were first recorded in the audit forms by individual
hospital and the forms were returned to the College for centralized data entry. A new web-based
database program was developed by commercial vendor via the Information Technology
Committee to capture both the obstetric and gynaecological data. Both the obstetric and
gynaecological data from the 2 sources were then combined together and the data analysis was
performed using Statistical Package foe the Social Science (SPSS)
Obstetric report
The total number of deliveries in the year 2014 was significantly decreased compared with
2009. The drop was a result of the decrease in non-Hong Kong residents, mainly from the Mainland
China, from 35,474 in 2009 to only 5,156 in 2014. In fact, the number of deliveries from Hong
Kong residents increased from 44,258 to 54,516. Thus the audit in 2014 reflected more the
characteristics and outcomes of the local Hong Kong parturients.
The proportion of parturients at or above 35 years old increased significantly to 42% and the
proportion of parturients at or above 40 years old and elderly primigravidae had nearly doubled. This
iv
was likely the major reason for the increase in the incidence of diabetes mellitus and hypertensive
disorders in pregnancy. The change in diagnostic criteria of gestational diabetes could also be
associated. The management of breech presentation and the incidences of other complications like
preterm delivery were similar to previous audits.
Some changes in the intrapartum management that were observed in 2009 persisted in 2014.
There was a further increase in the number of parturients undergoing induction of labour for social
reasons, which became the second most common indication followed by pre-labour rupture of
membranes. The number of instrumental deliveries further reduced, however unlike previous years,
the number of forceps deliveries increased. The increase in forceps deliveries could be related to the
emphasis in the need for special training in forceps deliveries by the College. The number of major
perineal injury was much high (3.3%) after forceps deliveries and may be related to the relative
lack of experience in this technique. As expected, the overall rate of caesarean sections slightly
dropped from 42.1% to 37.3% in 2009 because of the zero quota policy for doubly non-permanent
resident pregnant women. Previous caesarean sections remained the most common indication for
caesarean section, followed by social reasons.
The incidence of post-partum haemorrhage (PPH) increased to 5% and one maternal death
was associated with massive postpartum haemorrhage. Applications of compression uterine sutures
and the use of uterine balloon tamponade, which were first included in the current audit, were the
two most common interventions for the control of PPH, replacing uterine artery embolization and
internal iliac artery ligation. The incidence of maternal collapse in pregnancy was 0.02%.
The rates of stillbirth, congenital abnormality and birth trauma remained low in 2014.
However, the low incidence of birth trauma might still be under-reported as the diagnosis was made
not immediately after birth.
Gynaecological report
The total number of hospital admissions increased to over 80,000 in 2014. While the
number of elective admissions reduced, the number of day and emergency admissions increased.
Silent/Spontaneous miscarriage replaced first trimester termination of pregnancy to be the
most common indication for admissions, followed by threatened miscarriage. This was in contrast
to the running of Early Pregnancy Assessment Clinics in various public hospitals and the change in
the practice of medical evacuation for miscarriage. First trimester termination of pregnancy
became the third most common indication and the number dropped by almost 50% over the past 10
years. In contrast, the number of second trimester termination of pregnancy remained stable. The
number of subfertility, uterine fibroids and endometriotic cyst continued to decrease while that of
post-menopausal bleeding, endometrial polyp and menorrhagia increased dramatically. Although
the total number was not high, there was a consistent increase in the group of genital displacement
and urinary disorders over the years.
The number of admissions for major abdominal operations continued to decrease,
especially for benign conditions. While the number of laparoscopic operation increase slightly, that
of hysteroscopic operations almost doubled over the 10 years period. Major vaginal operation also
v
continued to increase. The number of robot-assisted procedures remained small and mostly
performed for malignant conditions. Abdominal approach was still the main surgical approach
for hysterectomy, but the proportions dropped to 50% in benign conditions and 57% in malignant
conditions. Laparoscopic approach was being utilized for hysterectomy in 34% and 29%
respectively. Less than 5% of the vaginal hysterectomies were performed in the absence of
prolapse. The number of assisted reproduction procedures seemed to plateau since 2009. Over
90% of the embryo-transfer were carried out using fresh embryos. Corresponding to the reduction
in the admission for first trimester termination of pregnancy, the number of suction termination of
pregnancy dropped over 50%. Similarly, the number of evacuation of uterus after miscarriage also
dropped by 40%. Concurrently, the use of prostaglandins tripled. This suggested the shift from
surgical to medical evacuation of uterus in both induced abortion and miscarriage.
Complications associated with operations remained low with a trend of reduction over the
10 years period, and the rate was higher in operations for malignant conditions. The overall
complication rate was 0.79%, with intra-operative complication rate being 0.24% and
post-operative complication rate being 0.58%. Re-admission with 28 days of surgery was the most
common complication. The overall incidence of inadvertent organ injury was only 0.09%, with
bowel injury being the most common. The overall thrombo-embolic complication was 0.01% and
that of haemorrhage with transfusion was 0.14%. There were more conversions to laparotomy in
2014. Hospital stay was shortened over the years with a mean of 1.9 days in 2014 and 50% of the
admissions were discharged on the same day. As expected, the hospital stay after minimal access
procedures was shorter compared to conventional surgery.
Intra-abdominal operation was performed in 9,912 (12.3%) admissions, 60% were
laparoscopic procedures and 36% were laparotomy. Closed method was the main primary trocar
entry technique for laparoscopic and robotic surgery, but the proportion was much higher in
laparoscopy. For laparotomy, suprapubic transverse incision was used in 47% and midline incision
in 36%, the latter was being used in 77% of malignant diseases, in contrast to < 20% in benign
conditions. Pelvic adhesions were present in 35% of the cases, and cohesive adhesions were
present in 8% and complete POD obliteration in 3-4%.
vi
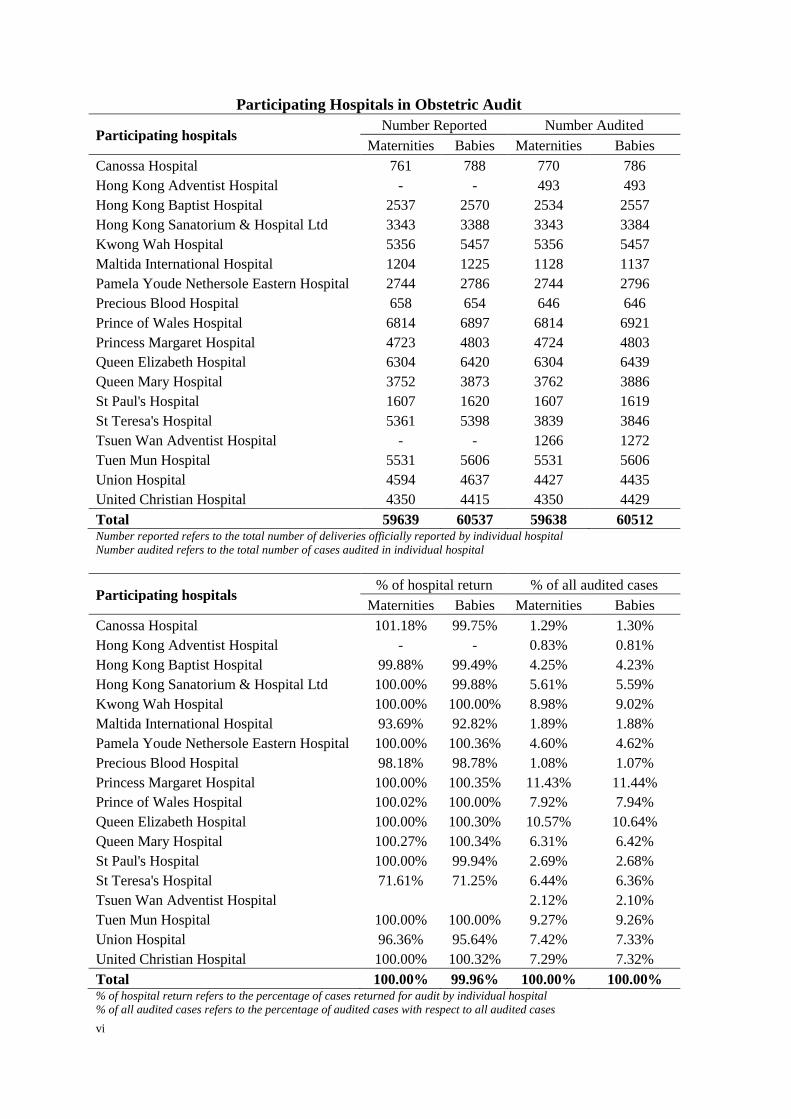
Participating Hospitals in Obstetric Audit
Participating hospitals Number Reported Number Audited
Maternities Babies Maternities Babies
Canossa Hospital 761 788 770 786
Hong Kong Adventist Hospital - - 493 493
Hong Kong Baptist Hospital 2537 2570 2534 2557
Hong Kong Sanatorium & Hospital Ltd 3343 3388 3343 3384
Kwong Wah Hospital 5356 5457 5356 5457
Maltida International Hospital 1204 1225 1128 1137
Pamela Youde Nethersole Eastern Hospital 2744 2786 2744 2796
Precious Blood Hospital 658 654 646 646
Prince of Wales Hospital 6814 6897 6814 6921
Princess Margaret Hospital 4723 4803 4724 4803
Queen Elizabeth Hospital 6304 6420 6304 6439
Queen Mary Hospital 3752 3873 3762 3886
St Paul's Hospital 1607 1620 1607 1619
St Teresa's Hospital 5361 5398 3839 3846
Tsuen Wan Adventist Hospital - - 1266 1272
Tuen Mun Hospital 5531 5606 5531 5606
Union Hospital 4594 4637 4427 4435
United Christian Hospital 4350 4415 4350 4429
Total 59639 60537 59638 60512 Number reported refers to the total number of deliveries officially reported by individual hospital
Number audited refers to the total number of cases audited in individual hospital
Participating hospitals % of hospital return % of all audited cases
Maternities Babies Maternities Babies
Canossa Hospital 101.18% 99.75% 1.29% 1.30%
Hong Kong Adventist Hospital - - 0.83% 0.81%
Hong Kong Baptist Hospital 99.88% 99.49% 4.25% 4.23%
Hong Kong Sanatorium & Hospital Ltd 100.00% 99.88% 5.61% 5.59%
Kwong Wah Hospital 100.00% 100.00% 8.98% 9.02%
Maltida International Hospital 93.69% 92.82% 1.89% 1.88%
Pamela Youde Nethersole Eastern Hospital 100.00% 100.36% 4.60% 4.62%
Precious Blood Hospital 98.18% 98.78% 1.08% 1.07%
Princess Margaret Hospital 100.00% 100.35% 11.43% 11.44%
Prince of Wales Hospital 100.02% 100.00% 7.92% 7.94%
Queen Elizabeth Hospital 100.00% 100.30% 10.57% 10.64%
Queen Mary Hospital 100.27% 100.34% 6.31% 6.42%
St Paul's Hospital 100.00% 99.94% 2.69% 2.68%
St Teresa's Hospital 71.61% 71.25% 6.44% 6.36%
Tsuen Wan Adventist Hospital 2.12% 2.10%
Tuen Mun Hospital 100.00% 100.00% 9.27% 9.26%
Union Hospital 96.36% 95.64% 7.42% 7.33%
United Christian Hospital 100.00% 100.32% 7.29% 7.32%
Total 100.00% 99.96% 100.00% 100.00% % of hospital return refers to the percentage of cases returned for audit by individual hospital
% of all audited cases refers to the percentage of audited cases with respect to all audited cases

viii
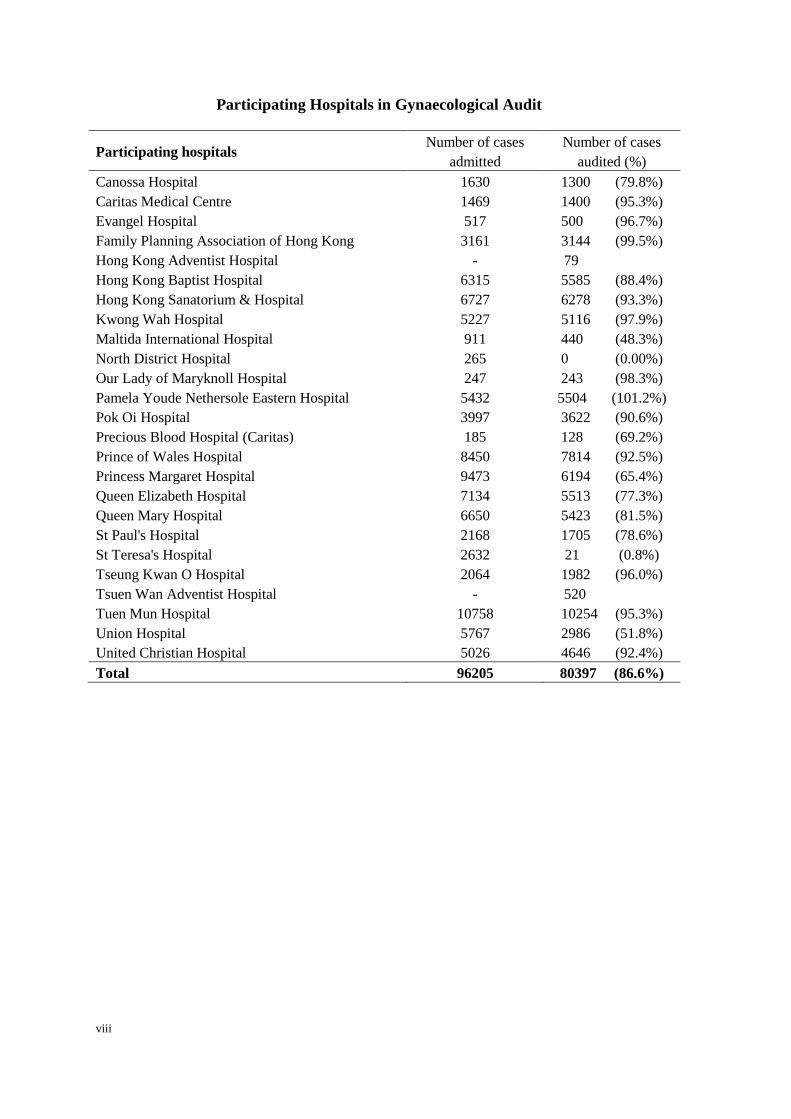
Participating Hospitals in Gynaecological Audit
Participating hospitals Number of cases
admitted
Number of cases
audited (%)
Canossa Hospital 1630 1300 (79.8%)
Caritas Medical Centre 1469 1400 (95.3%)
Evangel Hospital 517 500 (96.7%)
Family Planning Association of Hong Kong 3161 3144 (99.5%)
Hong Kong Adventist Hospital - 79
Hong Kong Baptist Hospital 6315 5585 (88.4%)
Hong Kong Sanatorium & Hospital 6727 6278 (93.3%)
Kwong Wah Hospital 5227 5116 (97.9%)
Maltida International Hospital 911 440 (48.3%)
North District Hospital 265 0 (0.00%)
Our Lady of Maryknoll Hospital 247 243 (98.3%)
Pamela Youde Nethersole Eastern Hospital 5432 5504 (101.2%)
Pok Oi Hospital 3997 3622 (90.6%)
Precious Blood Hospital (Caritas) 185 128 (69.2%)
Prince of Wales Hospital 8450 7814 (92.5%)
Princess Margaret Hospital 9473 6194 (65.4%)
Queen Elizabeth Hospital 7134 5513 (77.3%)
Queen Mary Hospital 6650 5423 (81.5%)
St Paul's Hospital 2168 1705 (78.6%)
St Teresa's Hospital 2632 21 (0.8%)
Tseung Kwan O Hospital 2064 1982 (96.0%)
Tsuen Wan Adventist Hospital - 520
Tuen Mun Hospital 10758 10254 (95.3%)
Union Hospital 5767 2986 (51.8%)
United Christian Hospital 5026 4646 (92.4%)
Total 96205 80397 (86.6%)


The Obstetric Report
2014

Obstetric Report
Territory-wide O&G Audit 1
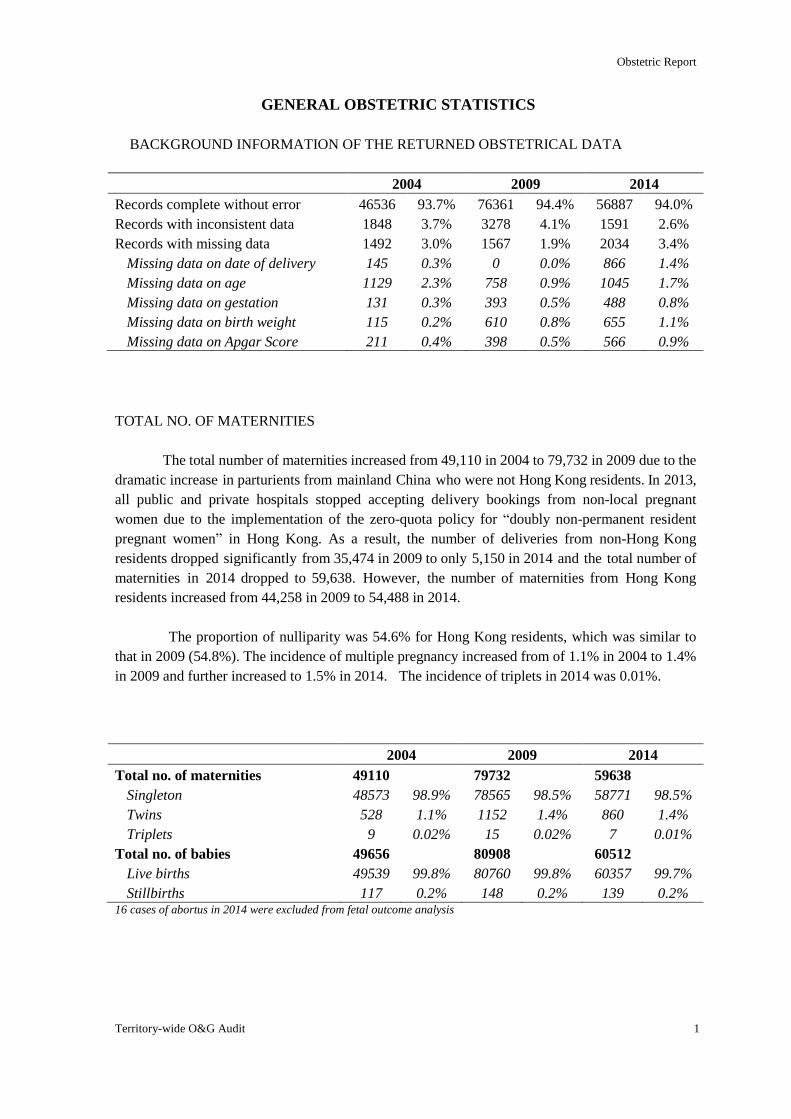
GENERAL OBSTETRIC STATISTICS
BACKGROUND INFORMATION OF THE RETURNED OBSTETRICAL DATA
2004 2009 2014
Records complete without error 46536 93.7% 76361 94.4% 56887 94.0%
Records with inconsistent data 1848 3.7% 3278 4.1% 1591 2.6%
Records with missing data 1492 3.0% 1567 1.9% 2034 3.4%
Missing data on date of delivery 145 0.3% 0 0.0% 866 1.4%
Missing data on age 1129 2.3% 758 0.9% 1045 1.7%
Missing data on gestation 131 0.3% 393 0.5% 488 0.8%
Missing data on birth weight 115 0.2% 610 0.8% 655 1.1%
Missing data on Apgar Score 211 0.4% 398 0.5% 566 0.9%
TOTAL NO. OF MATERNITIES
The total number of maternities increased from 49,110 in 2004 to 79,732 in 2009 due to the
dramatic increase in parturients from mainland China who were not Hong Kong residents. In 2013,
all public and private hospitals stopped accepting delivery bookings from non-local pregnant
women due to the implementation of the zero-quota policy for “doubly non-permanent resident
pregnant women” in Hong Kong. As a result, the number of deliveries from non-Hong Kong
residents dropped significantly from 35,474 in 2009 to only 5,150 in 2014 and the total number of
maternities in 2014 dropped to 59,638. However, the number of maternities from Hong Kong
residents increased from 44,258 in 2009 to 54,488 in 2014.
The proportion of nulliparity was 54.6% for Hong Kong residents, which was similar to
that in 2009 (54.8%). The incidence of multiple pregnancy increased from of 1.1% in 2004 to 1.4%
in 2009 and further increased to 1.5% in 2014. The incidence of triplets in 2014 was 0.01%.
2004 2009 2014
Total no. of maternities 49110 79732 59638
Singleton 48573 98.9% 78565 98.5% 58771 98.5%
Twins 528 1.1% 1152 1.4% 860 1.4%
Triplets 9 0.02% 15 0.02% 7 0.01%
Total no. of babies 49656 80908 60512
Live births 49539 99.8% 80760 99.8% 60357 99.7%
Stillbirths 117 0.2% 148 0.2% 139 0.2% 16 cases of abortus in 2014 were excluded from fetal outcome analysis
Obstetric Report
2 The Hong Kong College of Obstetricians and Gynaecologists
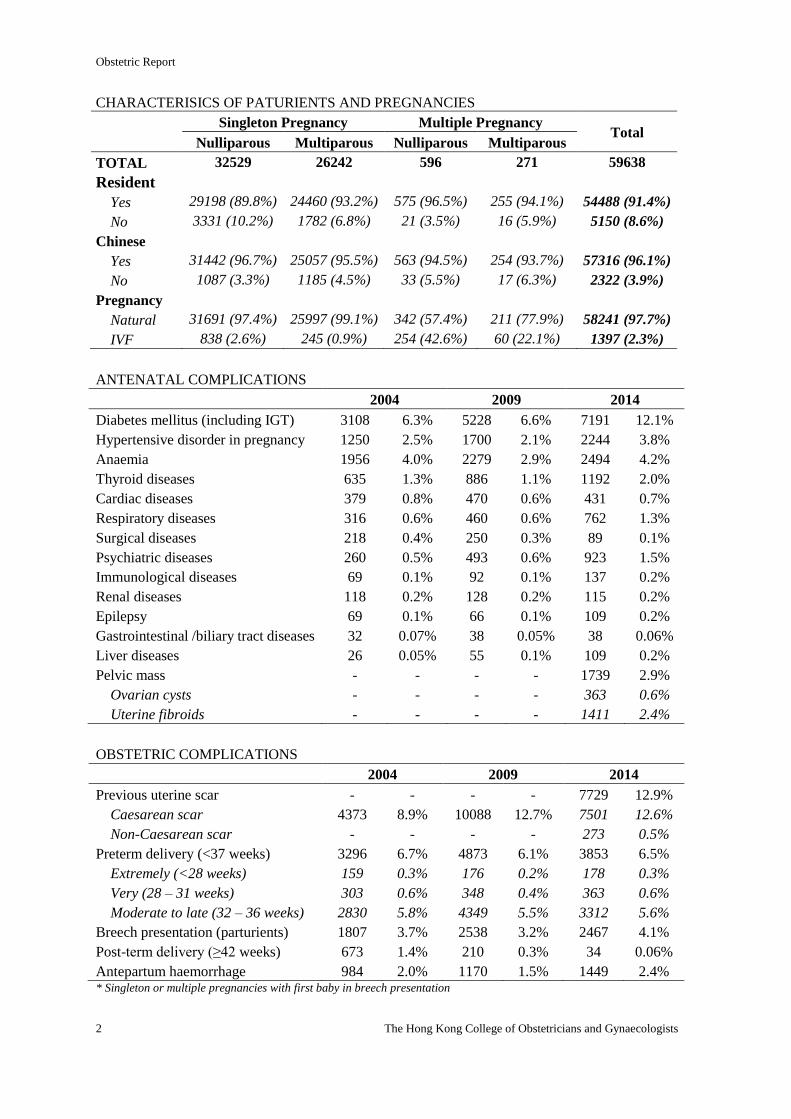
CHARACTERISICS OF PATURIENTS AND PREGNANCIES
Singleton Pregnancy Multiple Pregnancy Total
Nulliparous Multiparous Nulliparous Multiparous
TOTAL 32529 26242 596 271 59638
Resident
Yes 29198 (89.8%) 24460 (93.2%) 575 (96.5%) 255 (94.1%) 54488 (91.4%)
No 3331 (10.2%) 1782 (6.8%) 21 (3.5%) 16 (5.9%) 5150 (8.6%)
Chinese
Yes 31442 (96.7%) 25057 (95.5%) 563 (94.5%) 254 (93.7%) 57316 (96.1%)
No 1087 (3.3%) 1185 (4.5%) 33 (5.5%) 17 (6.3%) 2322 (3.9%)
Pregnancy
Natural 31691 (97.4%) 25997 (99.1%) 342 (57.4%) 211 (77.9%) 58241 (97.7%)
IVF 838 (2.6%) 245 (0.9%) 254 (42.6%) 60 (22.1%) 1397 (2.3%)
ANTENATAL COMPLICATIONS
2004 2009 2014
Diabetes mellitus (including IGT) 3108 6.3% 5228 6.6% 7191 12.1%
Hypertensive disorder in pregnancy 1250 2.5% 1700 2.1% 2244 3.8%
Anaemia 1956 4.0% 2279 2.9% 2494 4.2%
Thyroid diseases 635 1.3% 886 1.1% 1192 2.0%
Cardiac diseases 379 0.8% 470 0.6% 431 0.7%
Respiratory diseases 316 0.6% 460 0.6% 762 1.3%
Surgical diseases 218 0.4% 250 0.3% 89 0.1%
Psychiatric diseases 260 0.5% 493 0.6% 923 1.5%
Immunological diseases 69 0.1% 92 0.1% 137 0.2%
Renal diseases 118 0.2% 128 0.2% 115 0.2%
Epilepsy 69 0.1% 66 0.1% 109 0.2%
Gastrointestinal /biliary tract diseases 32 0.07% 38 0.05% 38 0.06%
Liver diseases 26 0.05% 55 0.1% 109 0.2%
Pelvic mass - - - - 1739 2.9%
Ovarian cysts - - - - 363 0.6%
Uterine fibroids - - - - 1411 2.4%
OBSTETRIC COMPLICATIONS
2004 2009 2014
Previous uterine scar - - - - 7729 12.9%
Caesarean scar 4373 8.9% 10088 12.7% 7501 12.6%
Non-Caesarean scar - - - - 273 0.5%
Preterm delivery (<37 weeks) 3296 6.7% 4873 6.1% 3853 6.5%
Extremely (<28 weeks) 159 0.3% 176 0.2% 178 0.3%
Very (28 – 31 weeks) 303 0.6% 348 0.4% 363 0.6%
Moderate to late (32 – 36 weeks) 2830 5.8% 4349 5.5% 3312 5.6%
Breech presentation (parturients) 1807 3.7% 2538 3.2% 2467 4.1%
Post-term delivery (≥42 weeks) 673 1.4% 210 0.3% 34 0.06%
Antepartum haemorrhage 984 2.0% 1170 1.5% 1449 2.4% * Singleton or multiple pregnancies with first baby in breech presentation
Obstetric Report
Territory-wide O&G Audit 3
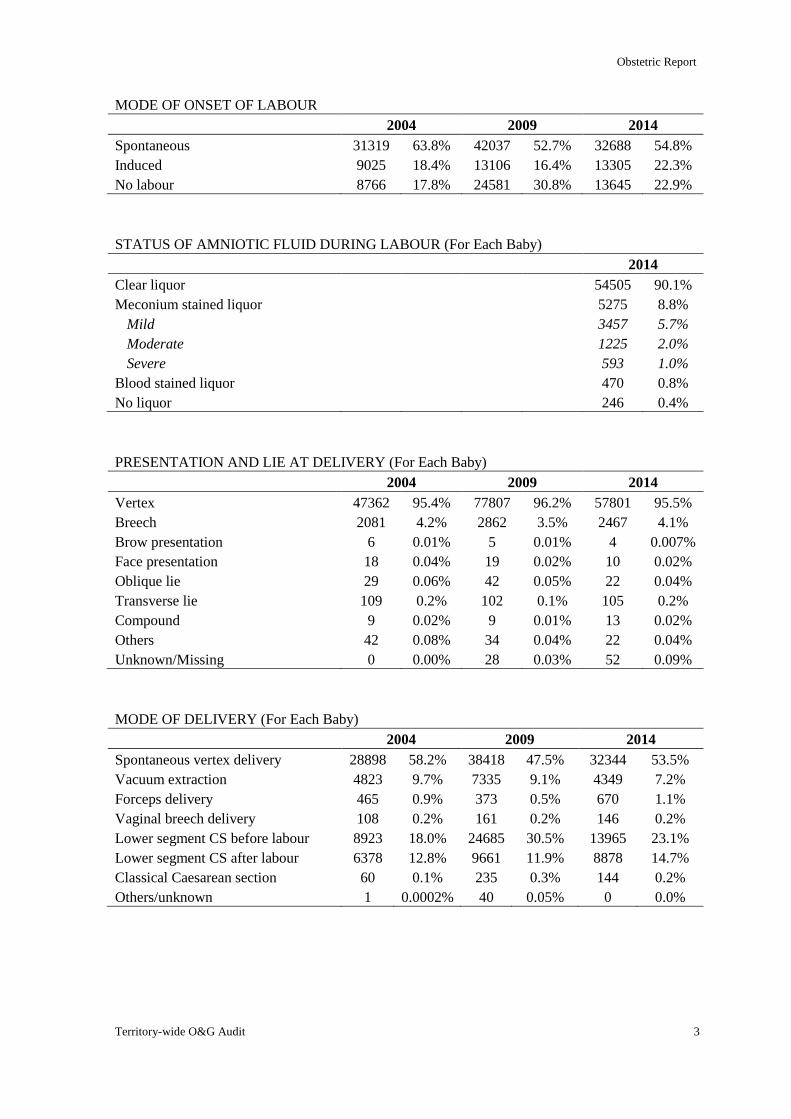
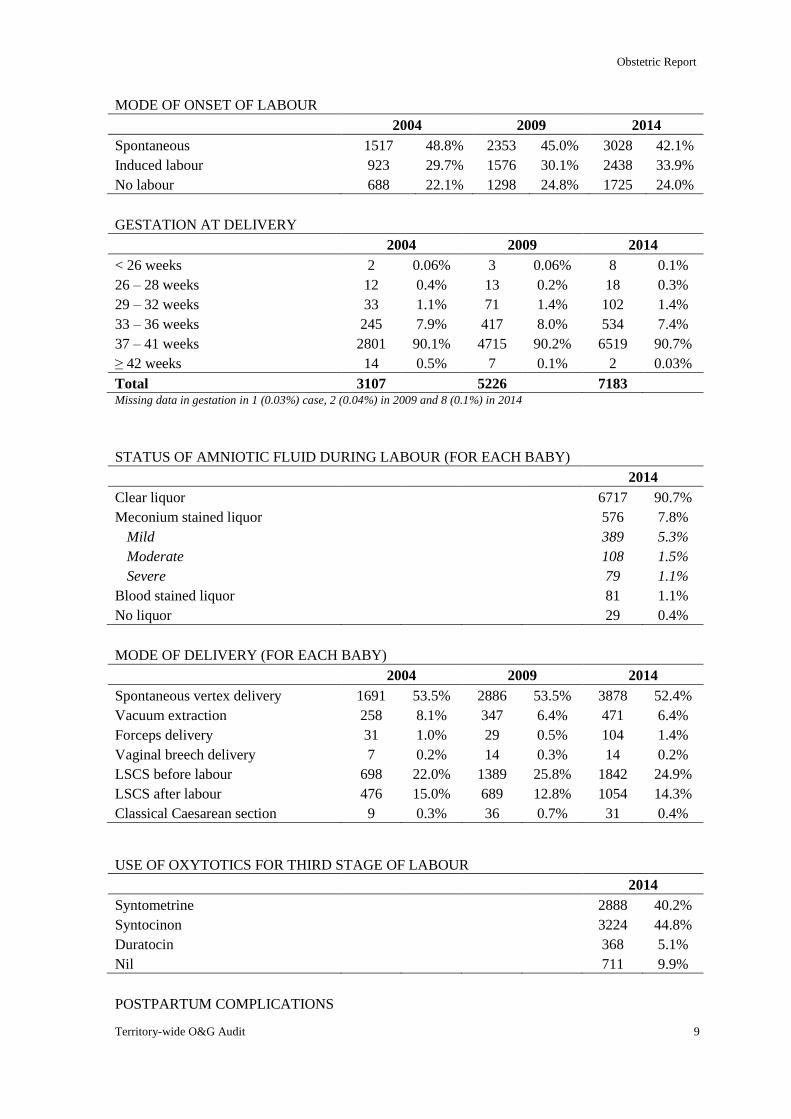
MODE OF ONSET OF LABOUR
2004 2009 2014
Spontaneous 31319 63.8% 42037 52.7% 32688 54.8%
Induced 9025 18.4% 13106 16.4% 13305 22.3%
No labour 8766 17.8% 24581 30.8% 13645 22.9%
STATUS OF AMNIOTIC FLUID DURING LABOUR (For Each Baby)
2014
Clear liquor 54505 90.1%
Meconium stained liquor 5275 8.8%
Mild 3457 5.7%
Moderate 1225 2.0%
Severe 593 1.0%
Blood stained liquor 470 0.8%
No liquor 246 0.4%
PRESENTATION AND LIE AT DELIVERY (For Each Baby)
2004 2009 2014
Vertex 47362 95.4% 77807 96.2% 57801 95.5%
Breech 2081 4.2% 2862 3.5% 2467 4.1%
Brow presentation 6 0.01% 5 0.01% 4 0.007%
Face presentation 18 0.04% 19 0.02% 10 0.02%
Oblique lie 29 0.06% 42 0.05% 22 0.04%
Transverse lie 109 0.2% 102 0.1% 105 0.2%
Compound 9 0.02% 9 0.01% 13 0.02%
Others 42 0.08% 34 0.04% 22 0.04%
Unknown/Missing 0 0.00% 28 0.03% 52 0.09%
MODE OF DELIVERY (For Each Baby)
2004 2009 2014
Spontaneous vertex delivery 28898 58.2% 38418 47.5% 32344 53.5%
Vacuum extraction 4823 9.7% 7335 9.1% 4349 7.2%
Forceps delivery 465 0.9% 373 0.5% 670 1.1%
Vaginal breech delivery 108 0.2% 161 0.2% 146 0.2%
Lower segment CS before labour 8923 18.0% 24685 30.5% 13965 23.1%
Lower segment CS after labour 6378 12.8% 9661 11.9% 8878 14.7%
Classical Caesarean section 60 0.1% 235 0.3% 144 0.2%
Others/unknown 1 0.0002% 40 0.05% 0 0.0%
Obstetric Report
4 The Hong Kong College of Obstetricians and Gynaecologists
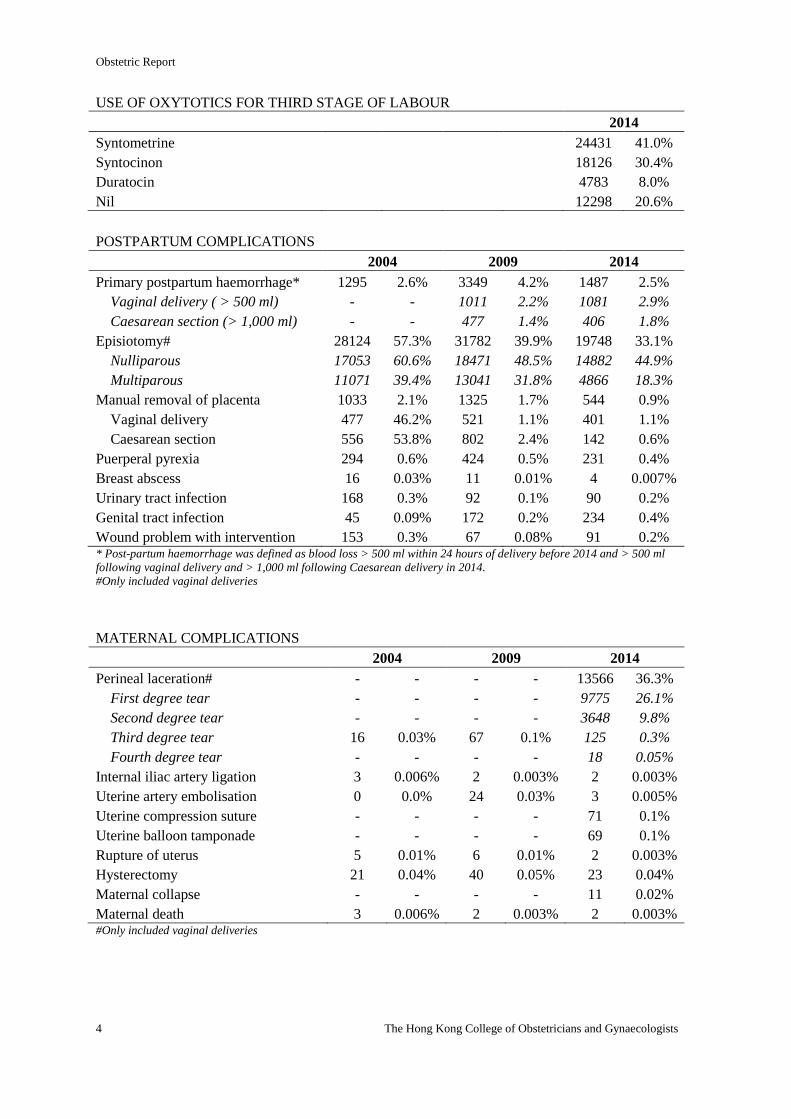
USE OF OXYTOTICS FOR THIRD STAGE OF LABOUR
2014
Syntometrine 24431 41.0%
Syntocinon 18126 30.4%
Duratocin 4783 8.0%
Nil 12298 20.6%
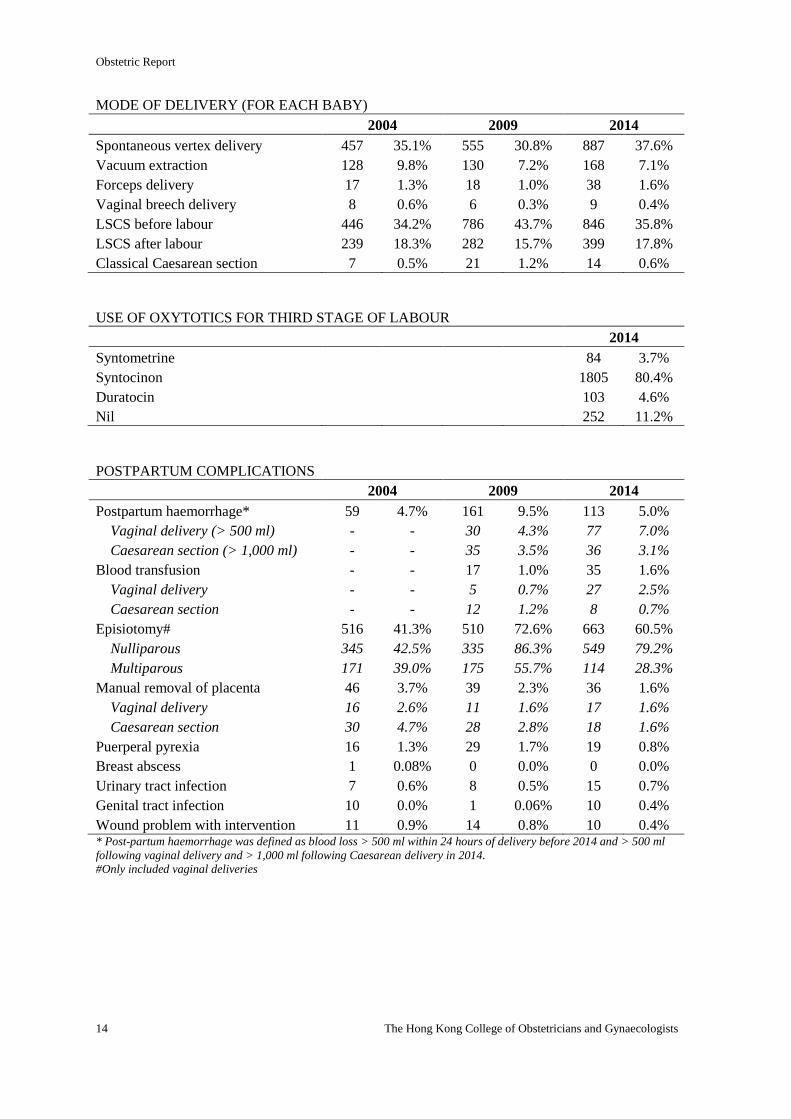
POSTPARTUM COMPLICATIONS
2004 2009 2014
Primary postpartum haemorrhage* 1295 2.6% 3349 4.2% 1487 2.5%
Vaginal delivery ( > 500 ml) - - 1011 2.2% 1081 2.9%
Caesarean section (> 1,000 ml) - - 477 1.4% 406 1.8%
Episiotomy# 28124 57.3% 31782 39.9% 19748 33.1%
Nulliparous 17053 60.6% 18471 48.5% 14882 44.9%
Multiparous 11071 39.4% 13041 31.8% 4866 18.3%
Manual removal of placenta 1033 2.1% 1325 1.7% 544 0.9%
Vaginal delivery 477 46.2% 521 1.1% 401 1.1%
Caesarean section 556 53.8% 802 2.4% 142 0.6%
Puerperal pyrexia 294 0.6% 424 0.5% 231 0.4%
Breast abscess 16 0.03% 11 0.01% 4 0.007%
Urinary tract infection 168 0.3% 92 0.1% 90 0.2%
Genital tract infection 45 0.09% 172 0.2% 234 0.4%
Wound problem with intervention 153 0.3% 67 0.08% 91 0.2% * Post-partum haemorrhage was defined as blood loss > 500 ml within 24 hours of delivery before 2014 and > 500 ml
following vaginal delivery and > 1,000 ml following Caesarean delivery in 2014.
#Only included vaginal deliveries
MATERNAL COMPLICATIONS
2004 2009 2014
Perineal laceration# - - - - 13566 36.3%
First degree tear - - - - 9775 26.1%
Second degree tear - - - - 3648 9.8%
Third degree tear 16 0.03% 67 0.1% 125 0.3%
Fourth degree tear - - - - 18 0.05%
Internal iliac artery ligation 3 0.006% 2 0.003% 2 0.003%
Uterine artery embolisation 0 0.0% 24 0.03% 3 0.005%
Uterine compression suture - - - - 71 0.1%
Uterine balloon tamponade - - - - 69 0.1%
Rupture of uterus 5 0.01% 6 0.01% 2 0.003%
Hysterectomy 21 0.04% 40 0.05% 23 0.04%
Maternal collapse - - - - 11 0.02%
Maternal death 3 0.006% 2 0.003% 2 0.003% #Only included vaginal deliveries
Obstetric Report
Territory-wide O&G Audit 5
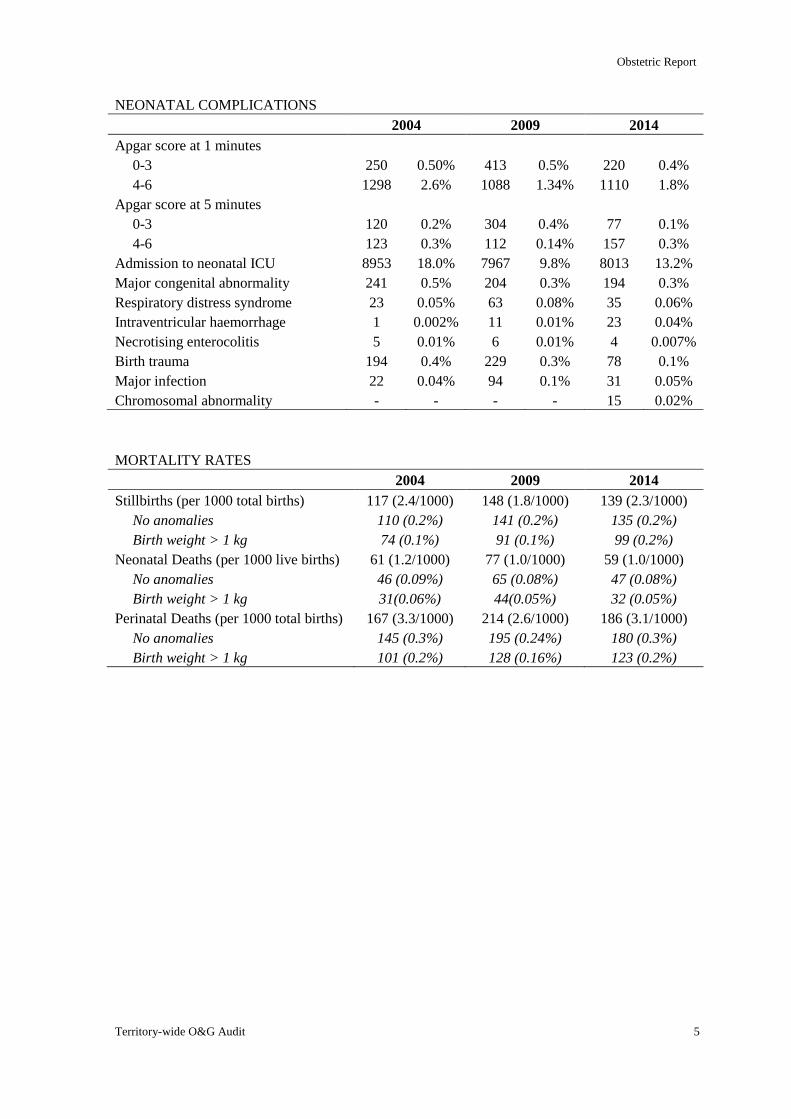
NEONATAL COMPLICATIONS
2004 2009 2014
Apgar score at 1 minutes
0-3
4-6
250
1298
0.50%
2.6%
413
1088
0.5%
1.34%
220
1110
0.4%
1.8%
Apgar score at 5 minutes
0-3
4-6
120
123
0.2%
0.3%
304
112
0.4%
0.14%
77
157
0.1%
0.3%
Admission to neonatal ICU 8953 18.0% 7967 9.8% 8013 13.2%
Major congenital abnormality 241 0.5% 204 0.3% 194 0.3%
Respiratory distress syndrome 23 0.05% 63 0.08% 35 0.06%
Intraventricular haemorrhage 1 0.002% 11 0.01% 23 0.04%
Necrotising enterocolitis 5 0.01% 6 0.01% 4 0.007%
Birth trauma 194 0.4% 229 0.3% 78 0.1%
Major infection 22 0.04% 94 0.1% 31 0.05%
Chromosomal abnormality - - - - 15 0.02%
MORTALITY RATES
2004 2009 2014
Stillbirths (per 1000 total births)
No anomalies
Birth weight > 1 kg
117 (2.4/1000)
110 (0.2%)
74 (0.1%)
148 (1.8/1000)
141 (0.2%)
91 (0.1%)
139 (2.3/1000)
135 (0.2%)
99 (0.2%)
Neonatal Deaths (per 1000 live births)
No anomalies
Birth weight > 1 kg
61 (1.2/1000)
46 (0.09%)
31(0.06%)
77 (1.0/1000)
65 (0.08%)
44(0.05%)
59 (1.0/1000)
47 (0.08%)
32 (0.05%)
Perinatal Deaths (per 1000 total births)
No anomalies
Birth weight > 1 kg
167 (3.3/1000)
145 (0.3%)
101 (0.2%)
214 (2.6/1000)
195 (0.24%)
128 (0.16%)
186 (3.1/1000)
180 (0.3%)
123 (0.2%)
Obstetric Report
6 The Hong Kong College of Obstetricians and Gynaecologists
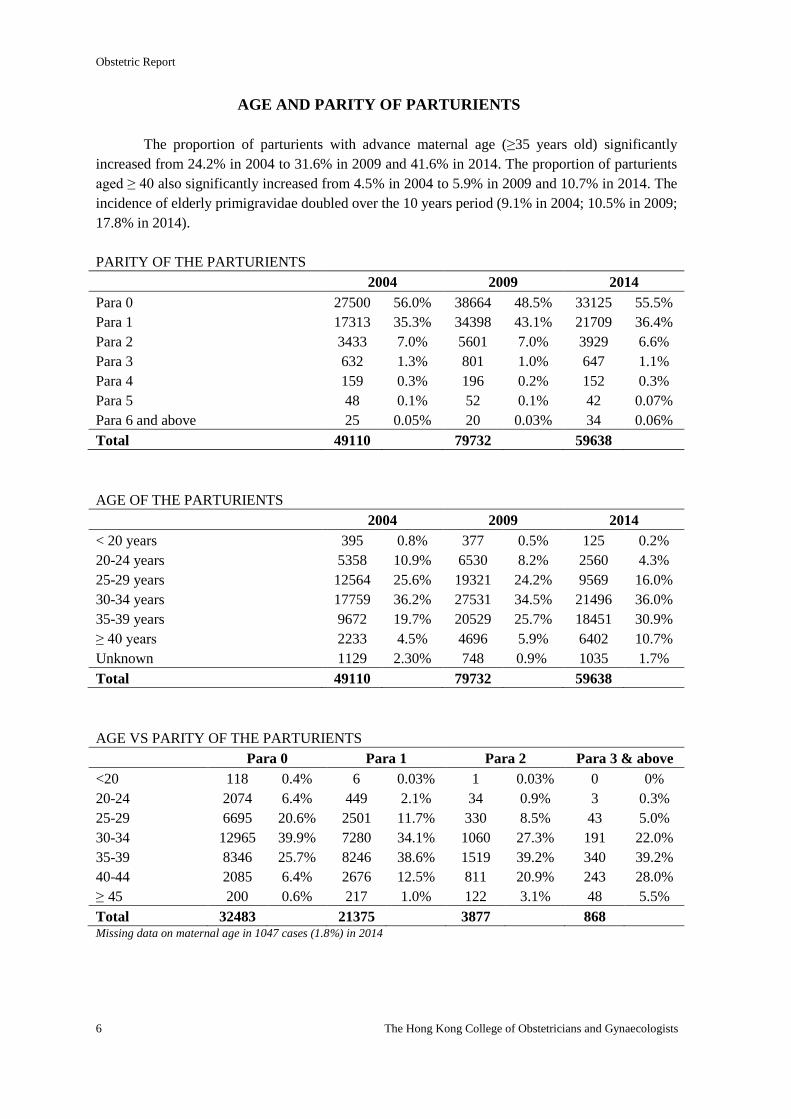
AGE AND PARITY OF PARTURIENTS
The proportion of parturients with advance maternal age (≥35 years old) significantly
increased from 24.2% in 2004 to 31.6% in 2009 and 41.6% in 2014. The proportion of parturients
aged ≥ 40 also significantly increased from 4.5% in 2004 to 5.9% in 2009 and 10.7% in 2014. The
incidence of elderly primigravidae doubled over the 10 years period (9.1% in 2004; 10.5% in 2009;
17.8% in 2014).
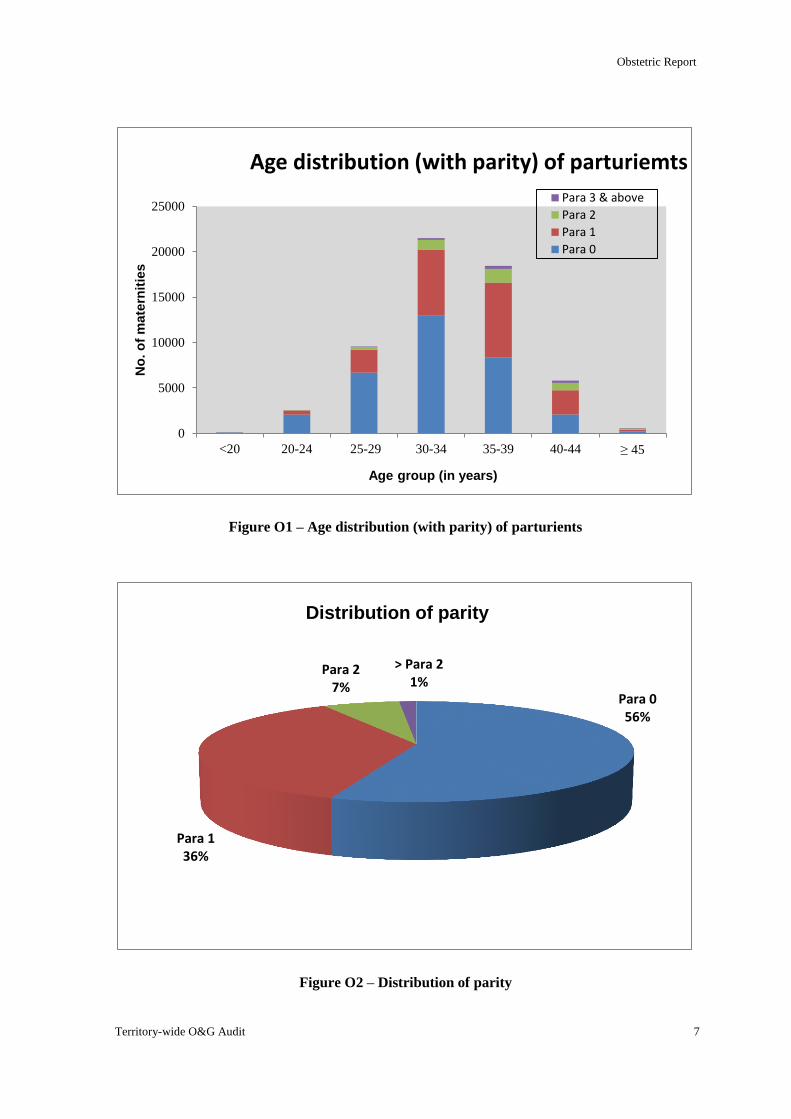
PARITY OF THE PARTURIENTS
2004 2009 2014
Para 0 27500 56.0% 38664 48.5% 33125 55.5%
Para 1 17313 35.3% 34398 43.1% 21709 36.4%
Para 2 3433 7.0% 5601 7.0% 3929 6.6%
Para 3 632 1.3% 801 1.0% 647 1.1%
Para 4 159 0.3% 196 0.2% 152 0.3%
Para 5 48 0.1% 52 0.1% 42 0.07%
Para 6 and above 25 0.05% 20 0.03% 34 0.06%
Total 49110 79732 59638
AGE OF THE PARTURIENTS
2004 2009 2014
< 20 years 395 0.8% 377 0.5% 125 0.2%
20-24 years 5358 10.9% 6530 8.2% 2560 4.3%
25-29 years 12564 25.6% 19321 24.2% 9569 16.0%
30-34 years 17759 36.2% 27531 34.5% 21496 36.0%
35-39 years 9672 19.7% 20529 25.7% 18451 30.9%
≥ 40 years 2233 4.5% 4696 5.9% 6402 10.7%
Unknown 1129 2.30% 748 0.9% 1035 1.7%
Total 49110 79732 59638
AGE VS PARITY OF THE PARTURIENTS
Para 0 Para 1 Para 2 Para 3 & above
<20 118 0.4% 6 0.03% 1 0.03% 0 0%
20-24 2074 6.4% 449 2.1% 34 0.9% 3 0.3%
25-29 6695 20.6% 2501 11.7% 330 8.5% 43 5.0%
30-34 12965 39.9% 7280 34.1% 1060 27.3% 191 22.0%
35-39 8346 25.7% 8246 38.6% 1519 39.2% 340 39.2%
40-44 2085 6.4% 2676 12.5% 811 20.9% 243 28.0%
≥ 45 200 0.6% 217 1.0% 122 3.1% 48 5.5%
Total 32483 21375 3877 868 Missing data on maternal age in 1047 cases (1.8%) in 2014
Obstetric Report
Territory-wide O&G Audit 7
Figure O1 – Age distribution (with parity) of parturients
Figure O2 – Distribution of parity
Para 0 56%
Para 1 36%
Para 2 7%
> Para 2 1%
Distribution of parity
0
5000
10000
15000
20000
25000
<20 20-24 25-29 30-34 35-39 40-44 ≥ 45
No
. o
f m
ate
rnit
ies
Age group (in years)
Age distribution (with parity) of parturiemts
Para 3 & above
Para 2
Para 1
Para 0
Obstetric Report
8 The Hong Kong College of Obstetricians and Gynaecologists
COMMON ANTENATAL COMPLICATIONS
DIABETES MELLITUS
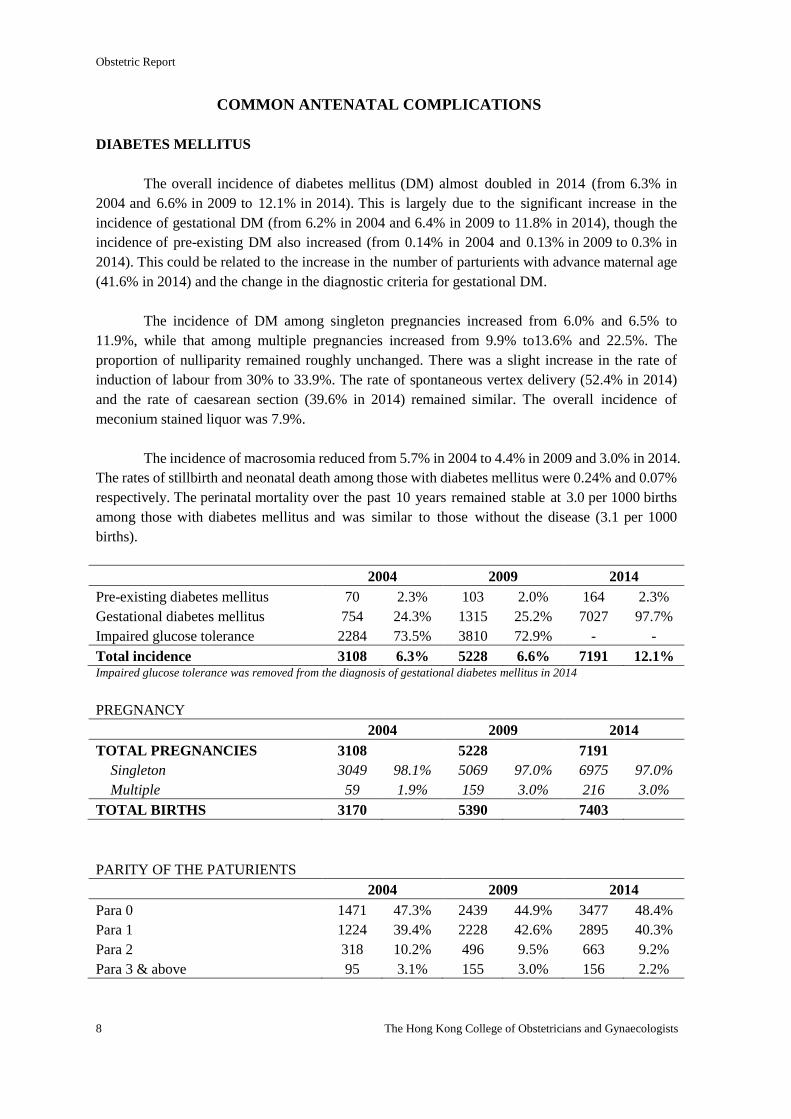
The overall incidence of diabetes mellitus (DM) almost doubled in 2014 (from 6.3% in
2004 and 6.6% in 2009 to 12.1% in 2014). This is largely due to the significant increase in the
incidence of gestational DM (from 6.2% in 2004 and 6.4% in 2009 to 11.8% in 2014), though the
incidence of pre-existing DM also increased (from 0.14% in 2004 and 0.13% in 2009 to 0.3% in
2014). This could be related to the increase in the number of parturients with advance maternal age
(41.6% in 2014) and the change in the diagnostic criteria for gestational DM.
The incidence of DM among singleton pregnancies increased from 6.0% and 6.5% to
11.9%, while that among multiple pregnancies increased from 9.9% to13.6% and 22.5%. The
proportion of nulliparity remained roughly unchanged. There was a slight increase in the rate of
induction of labour from 30% to 33.9%. The rate of spontaneous vertex delivery (52.4% in 2014)
and the rate of caesarean section (39.6% in 2014) remained similar. The overall incidence of
meconium stained liquor was 7.9%.
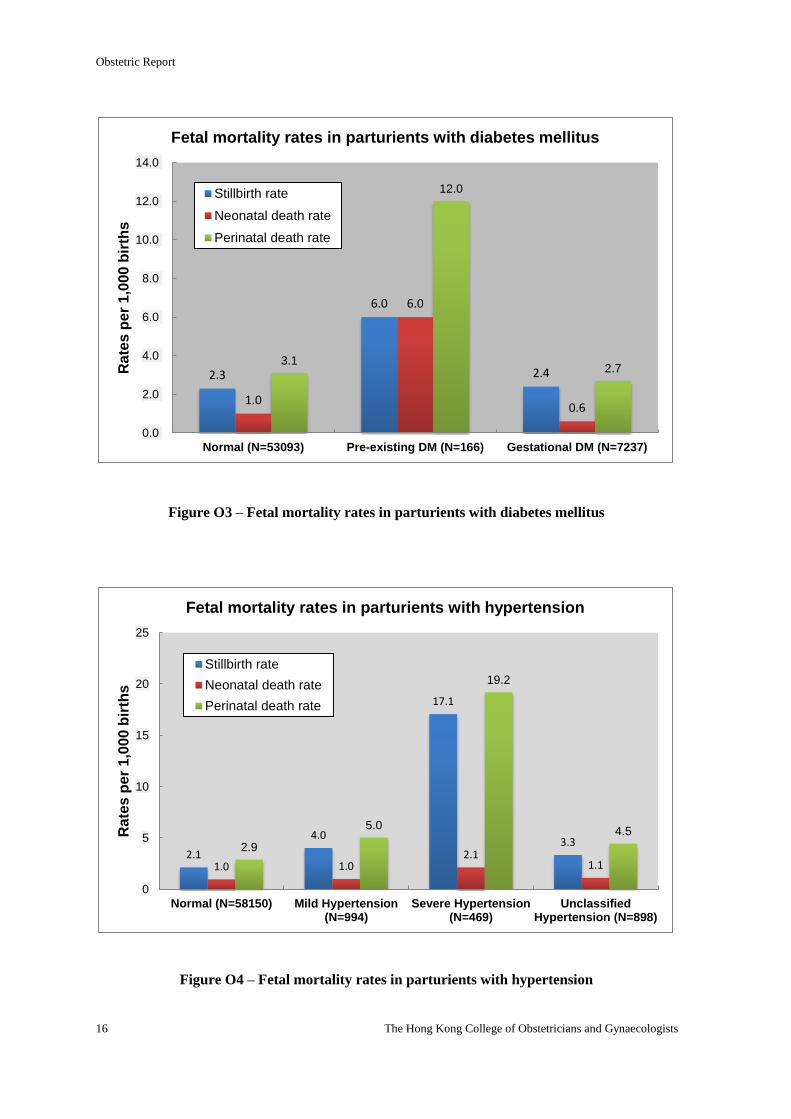
The incidence of macrosomia reduced from 5.7% in 2004 to 4.4% in 2009 and 3.0% in 2014.
The rates of stillbirth and neonatal death among those with diabetes mellitus were 0.24% and 0.07%
respectively. The perinatal mortality over the past 10 years remained stable at 3.0 per 1000 births
among those with diabetes mellitus and was similar to those without the disease (3.1 per 1000
births).
2004 2009 2014
Pre-existing diabetes mellitus 70 2.3% 103 2.0% 164 2.3%
Gestational diabetes mellitus 754 24.3% 1315 25.2% 7027 97.7%
Impaired glucose tolerance 2284 73.5% 3810 72.9% - -
Total incidence 3108 6.3% 5228 6.6% 7191 12.1% Impaired glucose tolerance was removed from the diagnosis of gestational diabetes mellitus in 2014
PREGNANCY
2004 2009 2014
TOTAL PREGNANCIES 3108 5228 7191
Singleton 3049 98.1% 5069 97.0% 6975 97.0%
Multiple 59 1.9% 159 3.0% 216 3.0%
TOTAL BIRTHS 3170 5390 7403
PARITY OF THE PATURIENTS
2004 2009 2014
Para 0 1471 47.3% 2439 44.9% 3477 48.4%
Para 1 1224 39.4% 2228 42.6% 2895 40.3%
Para 2 318 10.2% 496 9.5% 663 9.2%
Para 3 & above 95 3.1% 155 3.0% 156 2.2%
Obstetric Report
Territory-wide O&G Audit 9
MODE OF ONSET OF LABOUR
2004 2009 2014
Spontaneous 1517 48.8% 2353 45.0% 3028 42.1%
Induced labour 923 29.7% 1576 30.1% 2438 33.9%
No labour 688 22.1% 1298 24.8% 1725 24.0%
GESTATION AT DELIVERY
2004 2009 2014
< 26 weeks 2 0.06% 3 0.06% 8 0.1%
26 – 28 weeks 12 0.4% 13 0.2% 18 0.3%
29 – 32 weeks 33 1.1% 71 1.4% 102 1.4%
33 – 36 weeks 245 7.9% 417 8.0% 534 7.4%
37 – 41 weeks 2801 90.1% 4715 90.2% 6519 90.7%
≥ 42 weeks 14 0.5% 7 0.1% 2 0.03%
Total 3107 5226 7183 Missing data in gestation in 1 (0.03%) case, 2 (0.04%) in 2009 and 8 (0.1%) in 2014
STATUS OF AMNIOTIC FLUID DURING LABOUR (FOR EACH BABY)
2014
Clear liquor 6717 90.7%
Meconium stained liquor 576 7.8%
Mild 389 5.3%
Moderate 108 1.5%
Severe 79 1.1%
Blood stained liquor 81 1.1%
No liquor 29 0.4%
MODE OF DELIVERY (FOR EACH BABY)
2004 2009 2014
Spontaneous vertex delivery 1691 53.5% 2886 53.5% 3878 52.4%
Vacuum extraction 258 8.1% 347 6.4% 471 6.4%
Forceps delivery 31 1.0% 29 0.5% 104 1.4%
Vaginal breech delivery 7 0.2% 14 0.3% 14 0.2%
LSCS before labour 698 22.0% 1389 25.8% 1842 24.9%
LSCS after labour 476 15.0% 689 12.8% 1054 14.3%
Classical Caesarean section 9 0.3% 36 0.7% 31 0.4%
USE OF OXYTOTICS FOR THIRD STAGE OF LABOUR
2014
Syntometrine 2888 40.2%
Syntocinon 3224 44.8%
Duratocin 368 5.1%
Nil 711 9.9%
POSTPARTUM COMPLICATIONS
Obstetric Report
10 The Hong Kong College of Obstetricians and Gynaecologists
2004 2009 2014
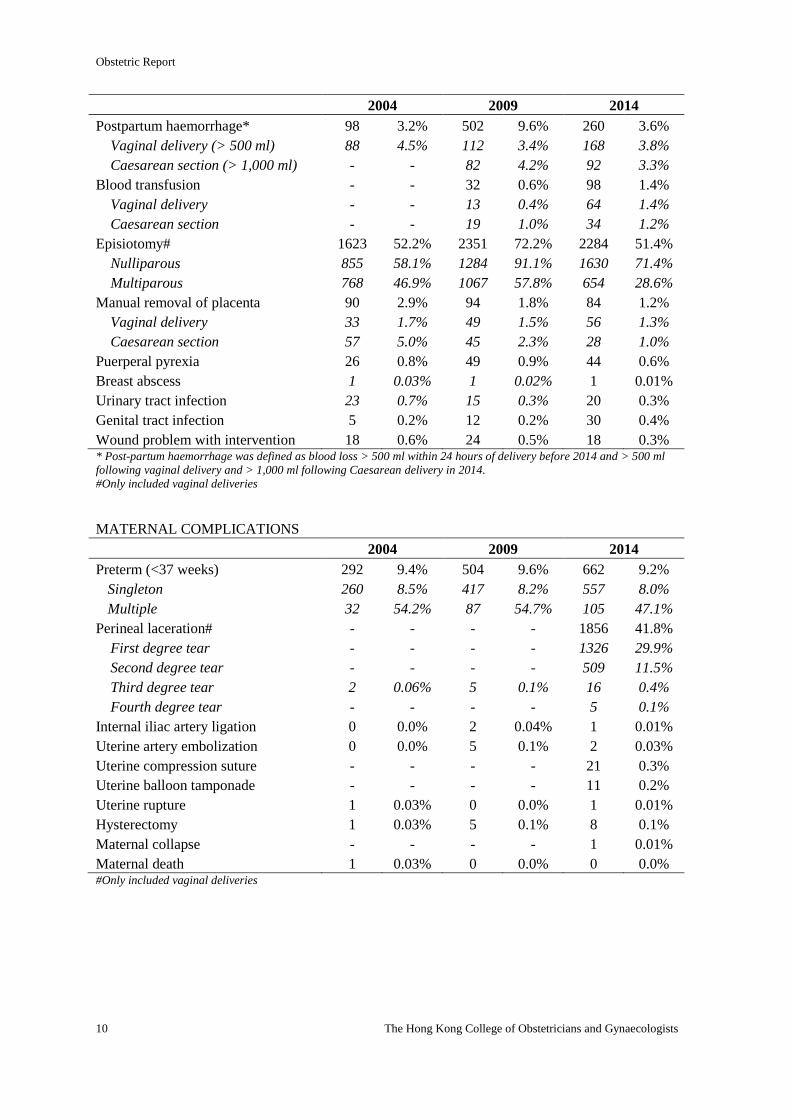
Postpartum haemorrhage* 98 3.2% 502 9.6% 260 3.6%
Vaginal delivery (> 500 ml) 88 4.5% 112 3.4% 168 3.8%
Caesarean section (> 1,000 ml) - - 82 4.2% 92 3.3%
Blood transfusion - - 32 0.6% 98 1.4%
Vaginal delivery - - 13 0.4% 64 1.4%
Caesarean section - - 19 1.0% 34 1.2%
Episiotomy# 1623 52.2% 2351 72.2% 2284 51.4%
Nulliparous 855 58.1% 1284 91.1% 1630 71.4%
Multiparous 768 46.9% 1067 57.8% 654 28.6%
Manual removal of placenta 90 2.9% 94 1.8% 84 1.2%
Vaginal delivery 33 1.7% 49 1.5% 56 1.3%
Caesarean section 57 5.0% 45 2.3% 28 1.0%
Puerperal pyrexia 26 0.8% 49 0.9% 44 0.6%
Breast abscess 1 0.03% 1 0.02% 1 0.01%
Urinary tract infection 23 0.7% 15 0.3% 20 0.3%
Genital tract infection 5 0.2% 12 0.2% 30 0.4%
Wound problem with intervention 18 0.6% 24 0.5% 18 0.3% * Post-partum haemorrhage was defined as blood loss > 500 ml within 24 hours of delivery before 2014 and > 500 ml
following vaginal delivery and > 1,000 ml following Caesarean delivery in 2014.
#Only included vaginal deliveries
MATERNAL COMPLICATIONS
2004 2009 2014
Preterm (<37 weeks) 292 9.4% 504 9.6% 662 9.2%
Singleton 260 8.5% 417 8.2% 557 8.0%
Multiple 32 54.2% 87 54.7% 105 47.1%
Perineal laceration# - - - - 1856 41.8%
First degree tear - - - - 1326 29.9%
Second degree tear - - - - 509 11.5%
Third degree tear 2 0.06% 5 0.1% 16 0.4%
Fourth degree tear - - - - 5 0.1%
Internal iliac artery ligation 0 0.0% 2 0.04% 1 0.01%
Uterine artery embolization 0 0.0% 5 0.1% 2 0.03%
Uterine compression suture - - - - 21 0.3%
Uterine balloon tamponade - - - - 11 0.2%
Uterine rupture 1 0.03% 0 0.0% 1 0.01%
Hysterectomy 1 0.03% 5 0.1% 8 0.1%
Maternal collapse - - - - 1 0.01%
Maternal death 1 0.03% 0 0.0% 0 0.0% #Only included vaginal deliveries
Obstetric Report
Territory-wide O&G Audit 11
FETAL OUTCOME
2004 2009 2014
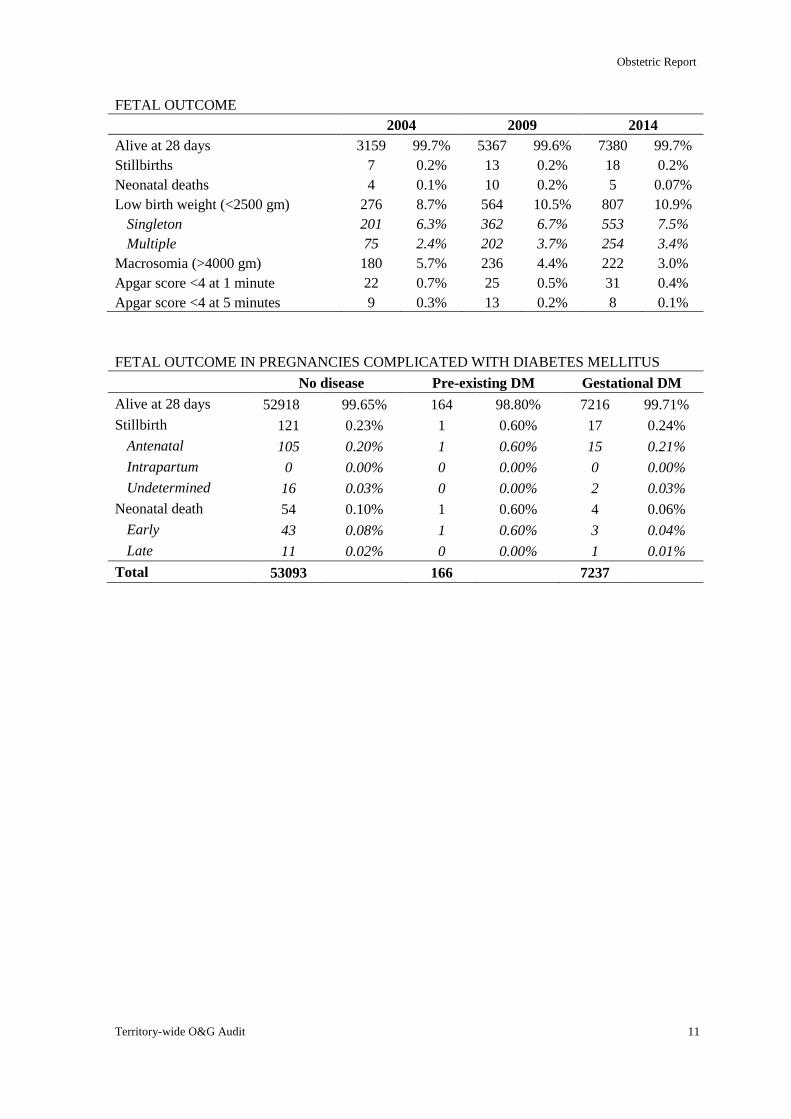
Alive at 28 days 3159 99.7% 5367 99.6% 7380 99.7%
Stillbirths 7 0.2% 13 0.2% 18 0.2%
Neonatal deaths 4 0.1% 10 0.2% 5 0.07%
Low birth weight (<2500 gm) 276 8.7% 564 10.5% 807 10.9%
Singleton 201 6.3% 362 6.7% 553 7.5%
Multiple 75 2.4% 202 3.7% 254 3.4%
Macrosomia (>4000 gm) 180 5.7% 236 4.4% 222 3.0%
Apgar score <4 at 1 minute 22 0.7% 25 0.5% 31 0.4%
Apgar score <4 at 5 minutes 9 0.3% 13 0.2% 8 0.1%
FETAL OUTCOME IN PREGNANCIES COMPLICATED WITH DIABETES MELLITUS
No disease Pre-existing DM Gestational DM
Alive at 28 days 52918 99.65% 164 98.80% 7216 99.71%
Stillbirth 121 0.23% 1 0.60% 17 0.24%
Antenatal 105 0.20% 1 0.60% 15 0.21%
Intrapartum 0 0.00% 0 0.00% 0 0.00%
Undetermined 16 0.03% 0 0.00% 2 0.03%
Neonatal death 54 0.10% 1 0.60% 4 0.06%
Early 43 0.08% 1 0.60% 3 0.04%
Late 11 0.02% 0 0.00% 1 0.01%
Total 53093 166 7237
Obstetric Report
12 The Hong Kong College of Obstetricians and Gynaecologists
HYPERTENSIVE DISORDER IN PREGNANCY
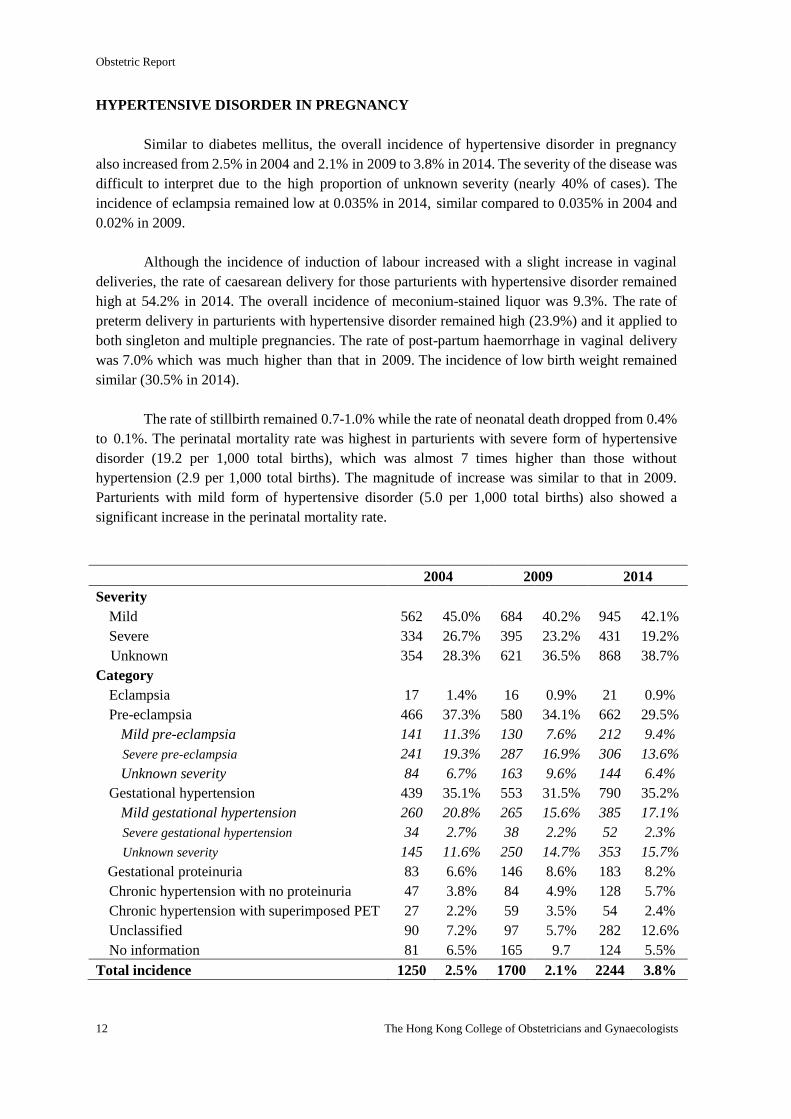
Similar to diabetes mellitus, the overall incidence of hypertensive disorder in pregnancy
also increased from 2.5% in 2004 and 2.1% in 2009 to 3.8% in 2014. The severity of the disease was
difficult to interpret due to the high proportion of unknown severity (nearly 40% of cases). The
incidence of eclampsia remained low at 0.035% in 2014, similar compared to 0.035% in 2004 and
0.02% in 2009.
Although the incidence of induction of labour increased with a slight increase in vaginal
deliveries, the rate of caesarean delivery for those parturients with hypertensive disorder remained
high at 54.2% in 2014. The overall incidence of meconium-stained liquor was 9.3%. The rate of
preterm delivery in parturients with hypertensive disorder remained high (23.9%) and it applied to
both singleton and multiple pregnancies. The rate of post-partum haemorrhage in vaginal delivery
was 7.0% which was much higher than that in 2009. The incidence of low birth weight remained
similar (30.5% in 2014).
The rate of stillbirth remained 0.7-1.0% while the rate of neonatal death dropped from 0.4%
to 0.1%. The perinatal mortality rate was highest in parturients with severe form of hypertensive
disorder (19.2 per 1,000 total births), which was almost 7 times higher than those without
hypertension (2.9 per 1,000 total births). The magnitude of increase was similar to that in 2009.
Parturients with mild form of hypertensive disorder (5.0 per 1,000 total births) also showed a
significant increase in the perinatal mortality rate.
2004 2009 2014
Severity
Mild 562 45.0% 684 40.2% 945 42.1%
Severe 334 26.7% 395 23.2% 431 19.2%
Unknown 354 28.3% 621 36.5% 868 38.7%
Category
Eclampsia 17 1.4% 16 0.9% 21 0.9%
Pre-eclampsia 466 37.3% 580 34.1% 662 29.5%
Mild pre-eclampsia 141 11.3% 130 7.6% 212 9.4%
Severe pre-eclampsia 241 19.3% 287 16.9% 306 13.6%
Unknown severity 84 6.7% 163 9.6% 144 6.4%
Gestational hypertension 439 35.1% 553 31.5% 790 35.2%
Mild gestational hypertension 260 20.8% 265 15.6% 385 17.1%
Severe gestational hypertension 34 2.7% 38 2.2% 52 2.3%
Unknown severity 145 11.6% 250 14.7% 353 15.7%
Gestational proteinuria 83 6.6% 146 8.6% 183 8.2%
Chronic hypertension with no proteinuria 47 3.8% 84 4.9% 128 5.7%
Chronic hypertension with superimposed PET 27 2.2% 59 3.5% 54 2.4%
Unclassified 90 7.2% 97 5.7% 282 12.6%
No information 81 6.5% 165 9.7 124 5.5%
Total incidence 1250 2.5% 1700 2.1% 2244 3.8%
Obstetric Report
Territory-wide O&G Audit 13
PREGNANCY
2004 2009 2014
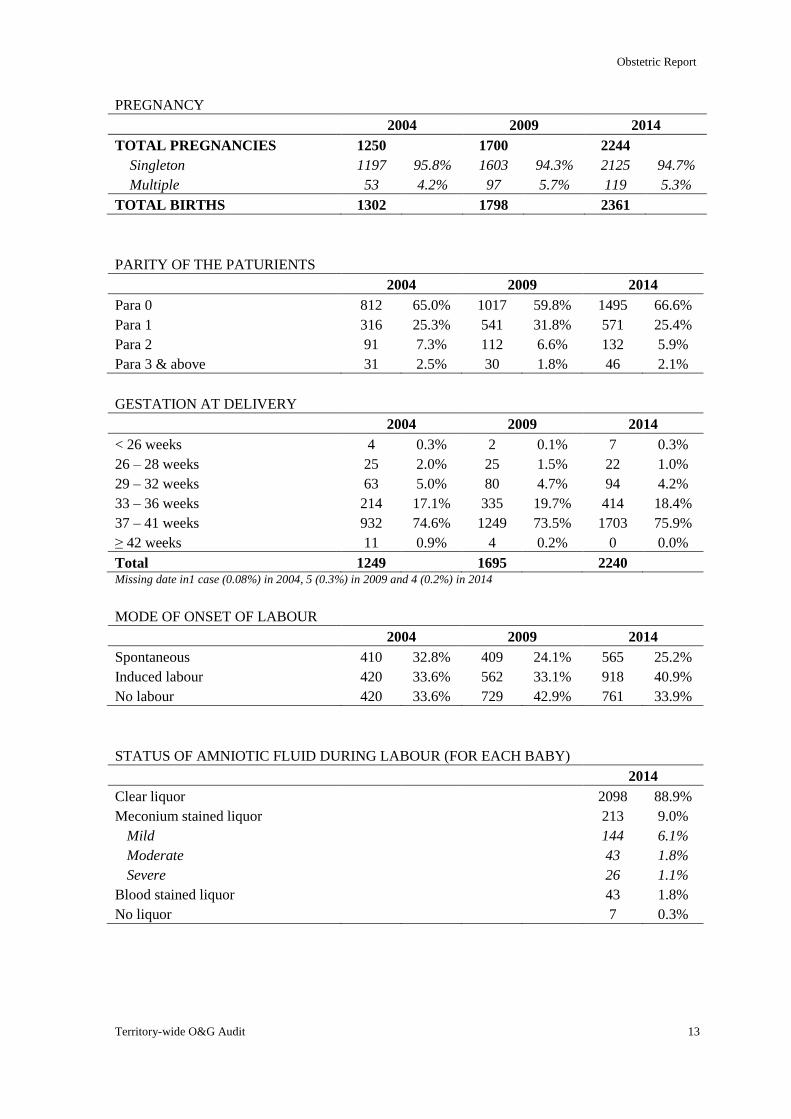
TOTAL PREGNANCIES 1250 1700 2244
Singleton 1197 95.8% 1603 94.3% 2125 94.7%
Multiple 53 4.2% 97 5.7% 119 5.3%
TOTAL BIRTHS 1302 1798 2361
PARITY OF THE PATURIENTS
2004 2009 2014
Para 0 812 65.0% 1017 59.8% 1495 66.6%
Para 1 316 25.3% 541 31.8% 571 25.4%
Para 2 91 7.3% 112 6.6% 132 5.9%
Para 3 & above 31 2.5% 30 1.8% 46 2.1%
GESTATION AT DELIVERY
2004 2009 2014
< 26 weeks 4 0.3% 2 0.1% 7 0.3%
26 – 28 weeks 25 2.0% 25 1.5% 22 1.0%
29 – 32 weeks 63 5.0% 80 4.7% 94 4.2%
33 – 36 weeks 214 17.1% 335 19.7% 414 18.4%
37 – 41 weeks 932 74.6% 1249 73.5% 1703 75.9%
≥ 42 weeks 11 0.9% 4 0.2% 0 0.0%
Total 1249 1695 2240 Missing date in1 case (0.08%) in 2004, 5 (0.3%) in 2009 and 4 (0.2%) in 2014
MODE OF ONSET OF LABOUR
2004 2009 2014
Spontaneous 410 32.8% 409 24.1% 565 25.2%
Induced labour 420 33.6% 562 33.1% 918 40.9%
No labour 420 33.6% 729 42.9% 761 33.9%
STATUS OF AMNIOTIC FLUID DURING LABOUR (FOR EACH BABY)
2014
Clear liquor 2098 88.9%
Meconium stained liquor 213 9.0%
Mild 144 6.1%
Moderate 43 1.8%
Severe 26 1.1%
Blood stained liquor 43 1.8%
No liquor 7 0.3%
Obstetric Report
14 The Hong Kong College of Obstetricians and Gynaecologists
MODE OF DELIVERY (FOR EACH BABY)
2004 2009 2014
Spontaneous vertex delivery 457 35.1% 555 30.8% 887 37.6%
Vacuum extraction 128 9.8% 130 7.2% 168 7.1%
Forceps delivery 17 1.3% 18 1.0% 38 1.6%
Vaginal breech delivery 8 0.6% 6 0.3% 9 0.4%
LSCS before labour 446 34.2% 786 43.7% 846 35.8%
LSCS after labour 239 18.3% 282 15.7% 399 17.8%
Classical Caesarean section 7 0.5% 21 1.2% 14 0.6%
USE OF OXYTOTICS FOR THIRD STAGE OF LABOUR
2014
Syntometrine 84 3.7%
Syntocinon 1805 80.4%
Duratocin 103 4.6%
Nil 252 11.2%
POSTPARTUM COMPLICATIONS
2004 2009 2014
Postpartum haemorrhage* 59 4.7% 161 9.5% 113 5.0%
Vaginal delivery (> 500 ml) - - 30 4.3% 77 7.0%
Caesarean section (> 1,000 ml) - - 35 3.5% 36 3.1%
Blood transfusion - - 17 1.0% 35 1.6%
Vaginal delivery - - 5 0.7% 27 2.5%
Caesarean section - - 12 1.2% 8 0.7%
Episiotomy# 516 41.3% 510 72.6% 663 60.5%
Nulliparous 345 42.5% 335 86.3% 549 79.2%
Multiparous 171 39.0% 175 55.7% 114 28.3%
Manual removal of placenta 46 3.7% 39 2.3% 36 1.6%
Vaginal delivery 16 2.6% 11 1.6% 17 1.6%
Caesarean section 30 4.7% 28 2.8% 18 1.6%
Puerperal pyrexia 16 1.3% 29 1.7% 19 0.8%
Breast abscess 1 0.08% 0 0.0% 0 0.0%
Urinary tract infection 7 0.6% 8 0.5% 15 0.7%
Genital tract infection 10 0.0% 1 0.06% 10 0.4%
Wound problem with intervention 11 0.9% 14 0.8% 10 0.4% * Post-partum haemorrhage was defined as blood loss > 500 ml within 24 hours of delivery before 2014 and > 500 ml
following vaginal delivery and > 1,000 ml following Caesarean delivery in 2014.
#Only included vaginal deliveries
Obstetric Report
Territory-wide O&G Audit 15
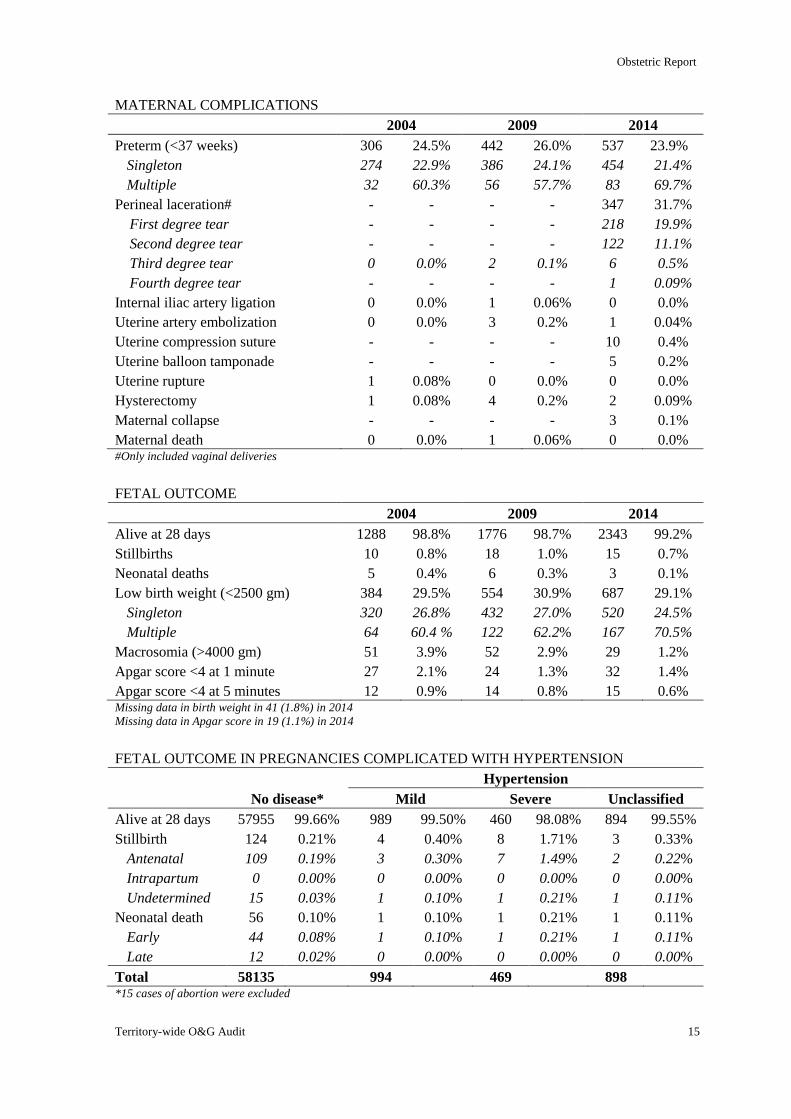
MATERNAL COMPLICATIONS
2004 2009 2014
Preterm (<37 weeks) 306 24.5% 442 26.0% 537 23.9%
Singleton 274 22.9% 386 24.1% 454 21.4%
Multiple 32 60.3% 56 57.7% 83 69.7%
Perineal laceration# - - - - 347 31.7%
First degree tear - - - - 218 19.9%
Second degree tear - - - - 122 11.1%
Third degree tear 0 0.0% 2 0.1% 6 0.5%
Fourth degree tear - - - - 1 0.09%
Internal iliac artery ligation 0 0.0% 1 0.06% 0 0.0%
Uterine artery embolization 0 0.0% 3 0.2% 1 0.04%
Uterine compression suture - - - - 10 0.4%
Uterine balloon tamponade - - - - 5 0.2%
Uterine rupture 1 0.08% 0 0.0% 0 0.0%
Hysterectomy 1 0.08% 4 0.2% 2 0.09%
Maternal collapse - - - - 3 0.1%
Maternal death 0 0.0% 1 0.06% 0 0.0% #Only included vaginal deliveries
FETAL OUTCOME
2004 2009 2014
Alive at 28 days 1288 98.8% 1776 98.7% 2343 99.2%
Stillbirths 10 0.8% 18 1.0% 15 0.7%
Neonatal deaths 5 0.4% 6 0.3% 3 0.1%
Low birth weight (<2500 gm) 384 29.5% 554 30.9% 687 29.1%
Singleton 320 26.8% 432 27.0% 520 24.5%
Multiple 64 60.4 % 122 62.2% 167 70.5%
Macrosomia (>4000 gm) 51 3.9% 52 2.9% 29 1.2%
Apgar score <4 at 1 minute 27 2.1% 24 1.3% 32 1.4%
Apgar score <4 at 5 minutes 12 0.9% 14 0.8% 15 0.6% Missing data in birth weight in 41 (1.8%) in 2014
Missing data in Apgar score in 19 (1.1%) in 2014
FETAL OUTCOME IN PREGNANCIES COMPLICATED WITH HYPERTENSION
Hypertension
No disease* Mild Severe Unclassified
Alive at 28 days 57955 99.66% 989 99.50% 460 98.08% 894 99.55%
Stillbirth 124 0.21% 4 0.40% 8 1.71% 3 0.33%
Antenatal 109 0.19% 3 0.30% 7 1.49% 2 0.22%
Intrapartum 0 0.00% 0 0.00% 0 0.00% 0 0.00%
Undetermined 15 0.03% 1 0.10% 1 0.21% 1 0.11%
Neonatal death 56 0.10% 1 0.10% 1 0.21% 1 0.11%
Early 44 0.08% 1 0.10% 1 0.21% 1 0.11%
Late 12 0.02% 0 0.00% 0 0.00% 0 0.00%
Total 58135 994 469 898 *15 cases of abortion were excluded
Obstetric Report
16 The Hong Kong College of Obstetricians and Gynaecologists
Figure O3 – Fetal mortality rates in parturients with diabetes mellitus
Figure O4 – Fetal mortality rates in parturients with hypertension
2.1
4.0
17.1
3.3
1.0 1.0 2.1
1.1
2.9
5.0
19.2
4.5
0
5
10
15
20
25
Normal (N=58150) Mild Hypertension(N=994)
Severe Hypertension(N=469)
UnclassifiedHypertension (N=898)
Rate
s p
er
1,0
00 b
irth
s
Fetal mortality rates in parturients with hypertension
Stillbirth rate
Neonatal death rate
Perinatal death rate
2.3
6.0
2.4
1.0
6.0
0.6
3.1
12.0
2.7
0.0
2.0
4.0
6.0
8.0
10.0
12.0
14.0
Normal (N=53093) Pre-existing DM (N=166) Gestational DM (N=7237)
Rate
s p
er
1,0
00 b
irth
s
Fetal mortality rates in parturients with diabetes mellitus
Stillbirth rate
Neonatal death rate
Perinatal death rate
Obstetric Report
Territory-wide O&G Audit 17
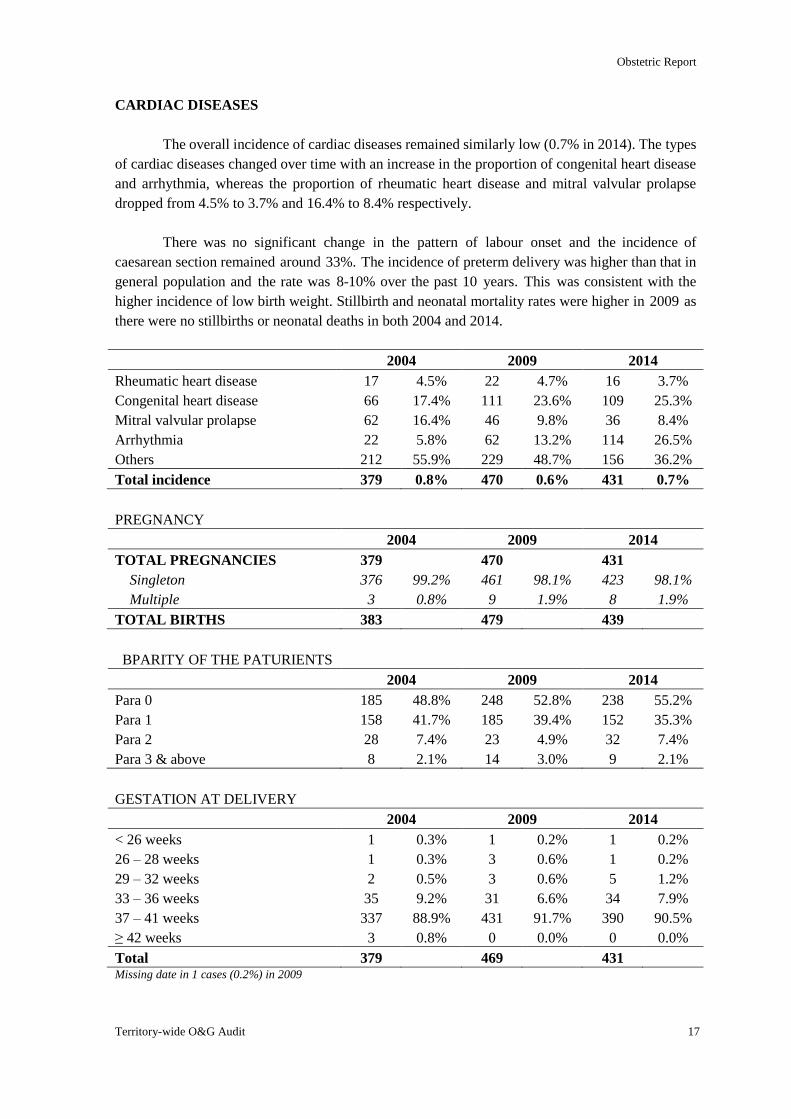
CARDIAC DISEASES
The overall incidence of cardiac diseases remained similarly low (0.7% in 2014). The types
of cardiac diseases changed over time with an increase in the proportion of congenital heart disease
and arrhythmia, whereas the proportion of rheumatic heart disease and mitral valvular prolapse
dropped from 4.5% to 3.7% and 16.4% to 8.4% respectively.
There was no significant change in the pattern of labour onset and the incidence of
caesarean section remained around 33%. The incidence of preterm delivery was higher than that in
general population and the rate was 8-10% over the past 10 years. This was consistent with the
higher incidence of low birth weight. Stillbirth and neonatal mortality rates were higher in 2009 as
there were no stillbirths or neonatal deaths in both 2004 and 2014.
2004 2009 2014
Rheumatic heart disease 17 4.5% 22 4.7% 16 3.7%
Congenital heart disease 66 17.4% 111 23.6% 109 25.3%
Mitral valvular prolapse 62 16.4% 46 9.8% 36 8.4%
Arrhythmia 22 5.8% 62 13.2% 114 26.5%
Others 212 55.9% 229 48.7% 156 36.2%
Total incidence 379 0.8% 470 0.6% 431 0.7%
PREGNANCY
2004 2009 2014
TOTAL PREGNANCIES 379 470 431
Singleton 376 99.2% 461 98.1% 423 98.1%
Multiple 3 0.8% 9 1.9% 8 1.9%
TOTAL BIRTHS 383 479 439
BPARITY OF THE PATURIENTS
2004 2009 2014
Para 0 185 48.8% 248 52.8% 238 55.2%
Para 1 158 41.7% 185 39.4% 152 35.3%
Para 2 28 7.4% 23 4.9% 32 7.4%
Para 3 & above 8 2.1% 14 3.0% 9 2.1%
GESTATION AT DELIVERY
2004 2009 2014
< 26 weeks 1 0.3% 1 0.2% 1 0.2%
26 – 28 weeks 1 0.3% 3 0.6% 1 0.2%
29 – 32 weeks 2 0.5% 3 0.6% 5 1.2%
33 – 36 weeks 35 9.2% 31 6.6% 34 7.9%
37 – 41 weeks 337 88.9% 431 91.7% 390 90.5%
≥ 42 weeks 3 0.8% 0 0.0% 0 0.0%
Total 379 469 431 Missing date in 1 cases (0.2%) in 2009
Obstetric Report
18 The Hong Kong College of Obstetricians and Gynaecologists
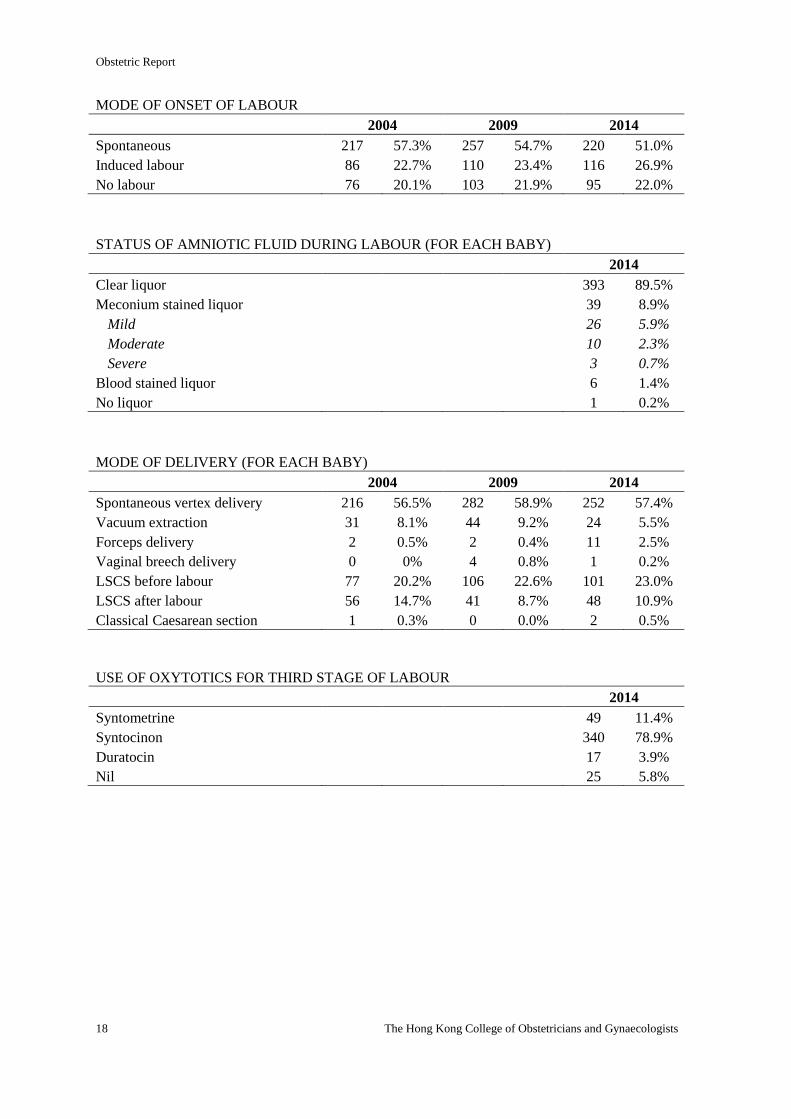
MODE OF ONSET OF LABOUR
2004 2009 2014
Spontaneous 217 57.3% 257 54.7% 220 51.0%
Induced labour 86 22.7% 110 23.4% 116 26.9%
No labour 76 20.1% 103 21.9% 95 22.0%
STATUS OF AMNIOTIC FLUID DURING LABOUR (FOR EACH BABY)
2014
Clear liquor 393 89.5%
Meconium stained liquor 39 8.9%
Mild 26 5.9%
Moderate 10 2.3%
Severe 3 0.7%
Blood stained liquor 6 1.4%
No liquor 1 0.2%
MODE OF DELIVERY (FOR EACH BABY)
2004 2009 2014
Spontaneous vertex delivery 216 56.5% 282 58.9% 252 57.4%
Vacuum extraction 31 8.1% 44 9.2% 24 5.5%
Forceps delivery 2 0.5% 2 0.4% 11 2.5%
Vaginal breech delivery 0 0% 4 0.8% 1 0.2%
LSCS before labour 77 20.2% 106 22.6% 101 23.0%
LSCS after labour 56 14.7% 41 8.7% 48 10.9%
Classical Caesarean section 1 0.3% 0 0.0% 2 0.5%
USE OF OXYTOTICS FOR THIRD STAGE OF LABOUR
2014
Syntometrine 49 11.4%
Syntocinon 340 78.9%
Duratocin 17 3.9%
Nil 25 5.8%
Obstetric Report
Territory-wide O&G Audit 19
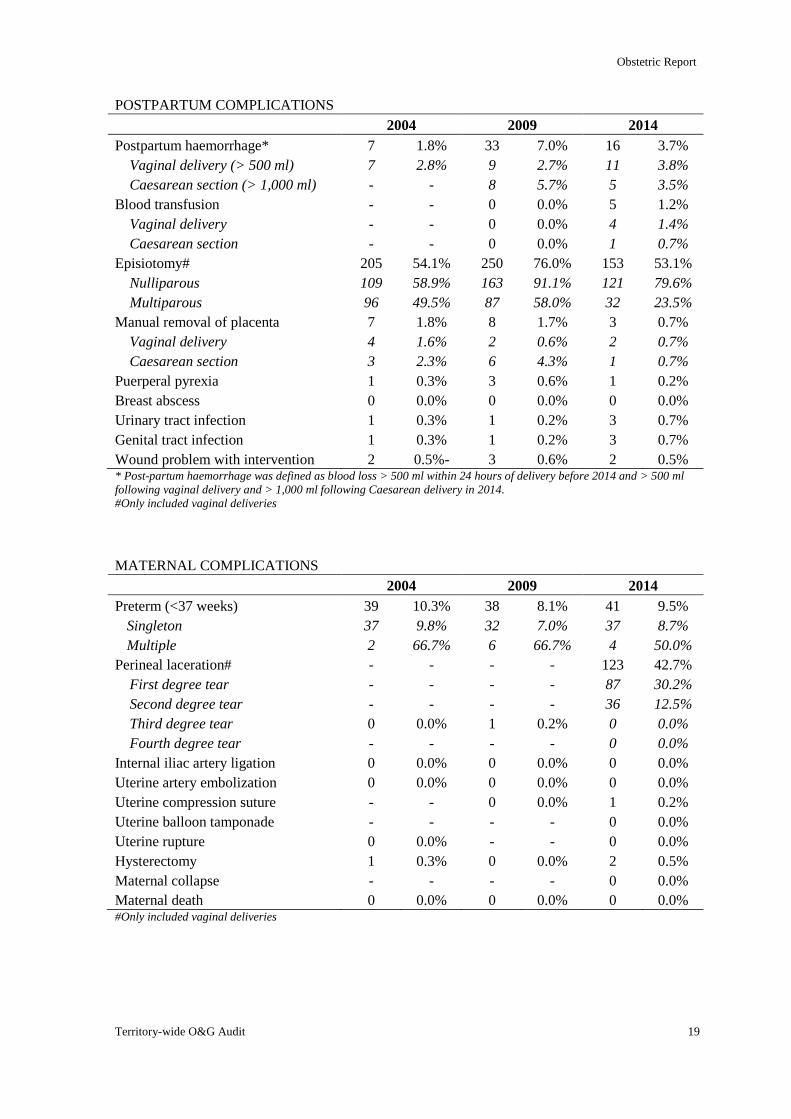
POSTPARTUM COMPLICATIONS
2004 2009 2014
Postpartum haemorrhage* 7 1.8% 33 7.0% 16 3.7%
Vaginal delivery (> 500 ml) 7 2.8% 9 2.7% 11 3.8%
Caesarean section (> 1,000 ml) - - 8 5.7% 5 3.5%
Blood transfusion - - 0 0.0% 5 1.2%
Vaginal delivery - - 0 0.0% 4 1.4%
Caesarean section - - 0 0.0% 1 0.7%
Episiotomy# 205 54.1% 250 76.0% 153 53.1%
Nulliparous 109 58.9% 163 91.1% 121 79.6%
Multiparous 96 49.5% 87 58.0% 32 23.5%
Manual removal of placenta 7 1.8% 8 1.7% 3 0.7%
Vaginal delivery 4 1.6% 2 0.6% 2 0.7%
Caesarean section 3 2.3% 6 4.3% 1 0.7%
Puerperal pyrexia 1 0.3% 3 0.6% 1 0.2%
Breast abscess 0 0.0% 0 0.0% 0 0.0%
Urinary tract infection 1 0.3% 1 0.2% 3 0.7%
Genital tract infection 1 0.3% 1 0.2% 3 0.7%
Wound problem with intervention 2 0.5%- 3 0.6% 2 0.5% * Post-partum haemorrhage was defined as blood loss > 500 ml within 24 hours of delivery before 2014 and > 500 ml
following vaginal delivery and > 1,000 ml following Caesarean delivery in 2014.
#Only included vaginal deliveries
MATERNAL COMPLICATIONS
2004 2009 2014
Preterm (<37 weeks) 39 10.3% 38 8.1% 41 9.5%
Singleton 37 9.8% 32 7.0% 37 8.7%
Multiple 2 66.7% 6 66.7% 4 50.0%
Perineal laceration# - - - - 123 42.7%
First degree tear - - - - 87 30.2%
Second degree tear - - - - 36 12.5%
Third degree tear 0 0.0% 1 0.2% 0 0.0%
Fourth degree tear - - - - 0 0.0%
Internal iliac artery ligation 0 0.0% 0 0.0% 0 0.0%
Uterine artery embolization 0 0.0% 0 0.0% 0 0.0%
Uterine compression suture - - 0 0.0% 1 0.2%
Uterine balloon tamponade - - - - 0 0.0%
Uterine rupture 0 0.0% - - 0 0.0%
Hysterectomy 1 0.3% 0 0.0% 2 0.5%
Maternal collapse - - - - 0 0.0%
Maternal death 0 0.0% 0 0.0% 0 0.0% #Only included vaginal deliveries
Obstetric Report
20 The Hong Kong College of Obstetricians and Gynaecologists
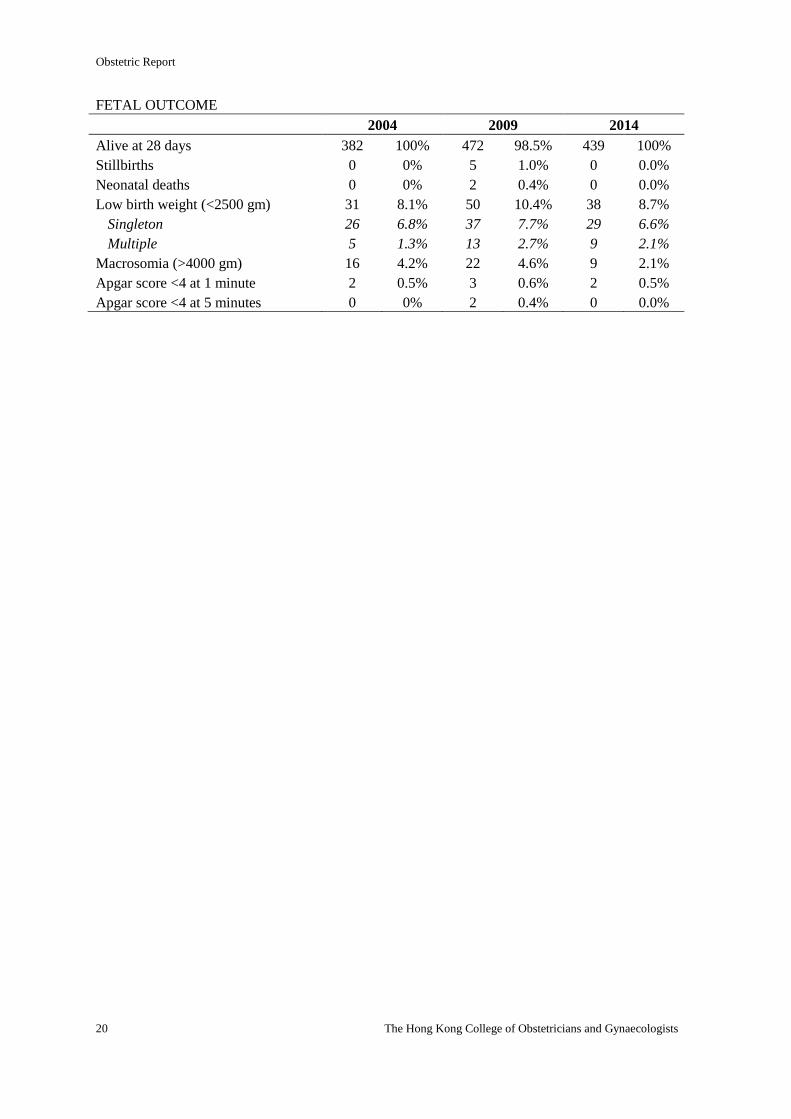
FETAL OUTCOME
2004 2009 2014
Alive at 28 days 382 100% 472 98.5% 439 100%
Stillbirths 0 0% 5 1.0% 0 0.0%
Neonatal deaths 0 0% 2 0.4% 0 0.0%
Low birth weight (<2500 gm) 31 8.1% 50 10.4% 38 8.7%
Singleton 26 6.8% 37 7.7% 29 6.6%
Multiple 5 1.3% 13 2.7% 9 2.1%
Macrosomia (>4000 gm) 16 4.2% 22 4.6% 9 2.1%
Apgar score <4 at 1 minute 2 0.5% 3 0.6% 2 0.5%
Apgar score <4 at 5 minutes 0 0% 2 0.4% 0 0.0%
Obstetric Report
Territory-wide O&G Audit 21
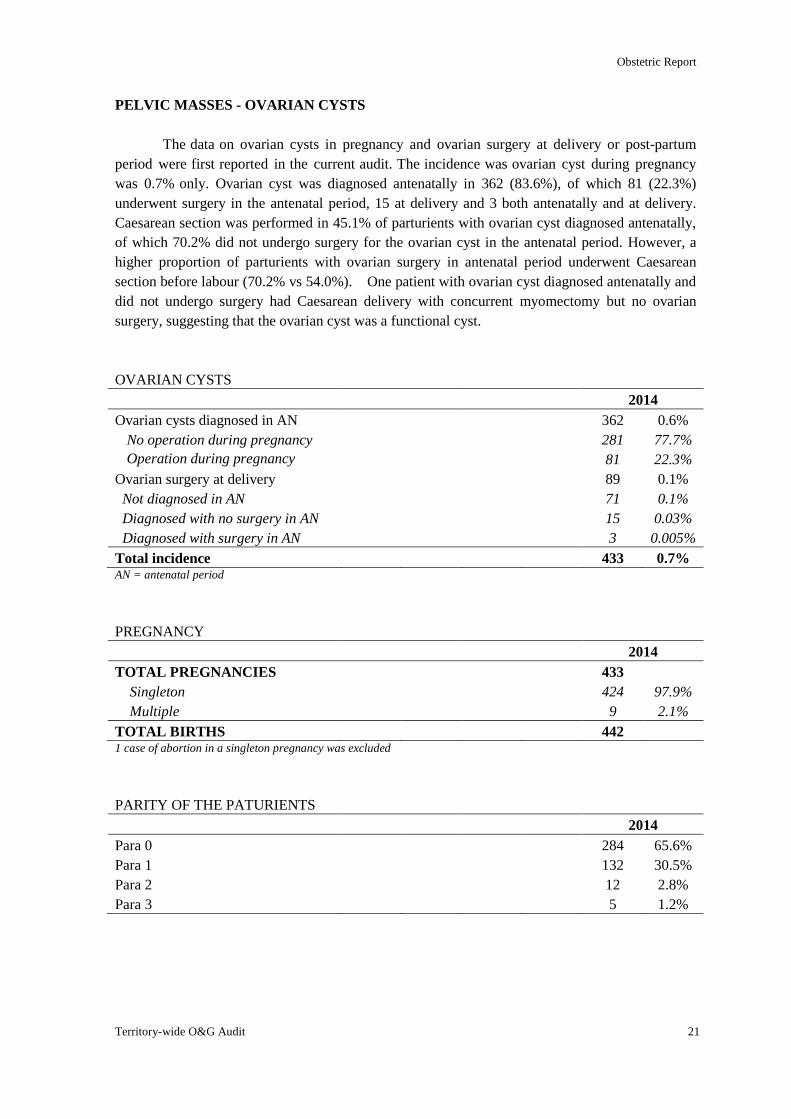
PELVIC MASSES - OVARIAN CYSTS
The data on ovarian cysts in pregnancy and ovarian surgery at delivery or post-partum
period were first reported in the current audit. The incidence was ovarian cyst during pregnancy
was 0.7% only. Ovarian cyst was diagnosed antenatally in 362 (83.6%), of which 81 (22.3%)
underwent surgery in the antenatal period, 15 at delivery and 3 both antenatally and at delivery.
Caesarean section was performed in 45.1% of parturients with ovarian cyst diagnosed antenatally,
of which 70.2% did not undergo surgery for the ovarian cyst in the antenatal period. However, a
higher proportion of parturients with ovarian surgery in antenatal period underwent Caesarean
section before labour (70.2% vs 54.0%). One patient with ovarian cyst diagnosed antenatally and
did not undergo surgery had Caesarean delivery with concurrent myomectomy but no ovarian
surgery, suggesting that the ovarian cyst was a functional cyst.
OVARIAN CYSTS
2014
Ovarian cysts diagnosed in AN 362 0.6%
No operation during pregnancy 281 77.7%
Operation during pregnancy 81 22.3%
Ovarian surgery at delivery 89 0.1%
Not diagnosed in AN 71 0.1%
Diagnosed with no surgery in AN 15 0.03%
Diagnosed with surgery in AN 3 0.005%
Total incidence 433 0.7% AN = antenatal period
PREGNANCY
2014
TOTAL PREGNANCIES 433
Singleton 424 97.9%
Multiple 9 2.1%
TOTAL BIRTHS 442 1 case of abortion in a singleton pregnancy was excluded
PARITY OF THE PATURIENTS
2014
Para 0 284 65.6%
Para 1 132 30.5%
Para 2 12 2.8%
Para 3 5 1.2%
Obstetric Report
22 The Hong Kong College of Obstetricians and Gynaecologists
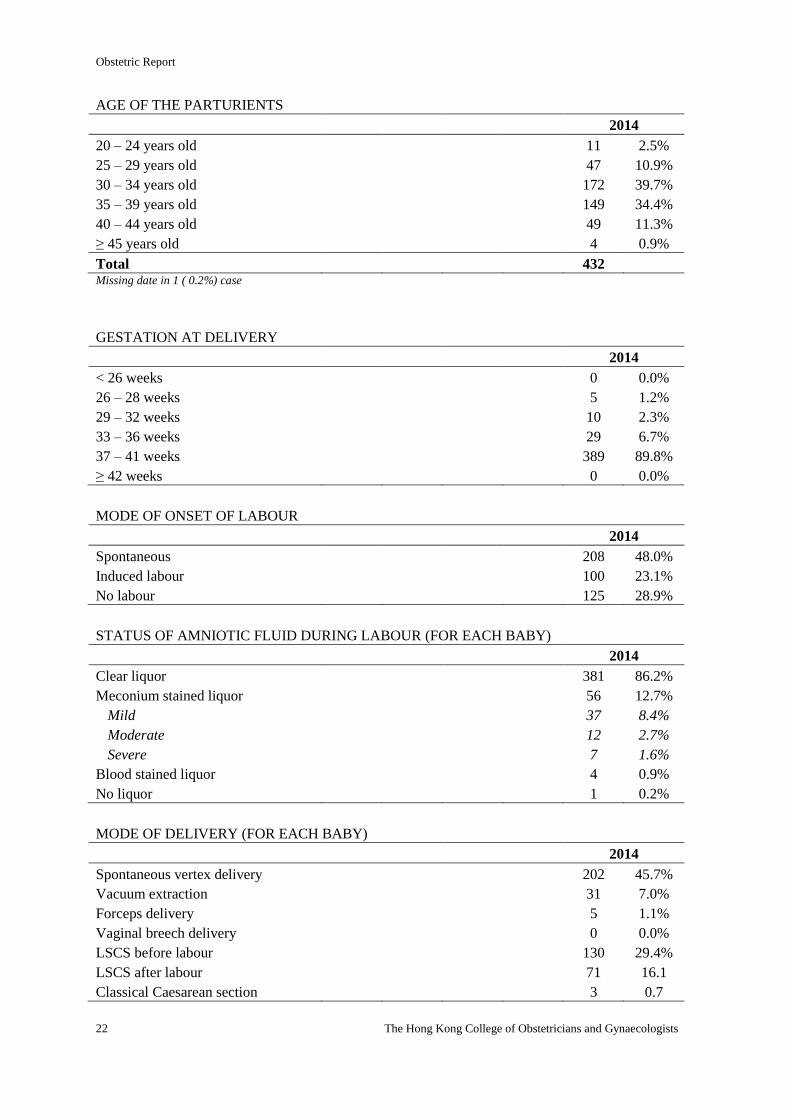
AGE OF THE PARTURIENTS
2014
20 – 24 years old 11 2.5%
25 – 29 years old 47 10.9%
30 – 34 years old 172 39.7%
35 – 39 years old 149 34.4%
40 – 44 years old 49 11.3%
≥ 45 years old 4 0.9%
Total 432 Missing date in 1 ( 0.2%) case
GESTATION AT DELIVERY
2014
< 26 weeks 0 0.0%
26 – 28 weeks 5 1.2%
29 – 32 weeks 10 2.3%
33 – 36 weeks 29 6.7%
37 – 41 weeks 389 89.8%
≥ 42 weeks 0 0.0%
MODE OF ONSET OF LABOUR
2014
Spontaneous 208 48.0%
Induced labour 100 23.1%
No labour 125 28.9%
STATUS OF AMNIOTIC FLUID DURING LABOUR (FOR EACH BABY)
2014
Clear liquor 381 86.2%
Meconium stained liquor 56 12.7%
Mild 37 8.4%
Moderate 12 2.7%
Severe 7 1.6%
Blood stained liquor 4 0.9%
No liquor 1 0.2%
MODE OF DELIVERY (FOR EACH BABY)
2014
Spontaneous vertex delivery 202 45.7%
Vacuum extraction 31 7.0%
Forceps delivery 5 1.1%
Vaginal breech delivery 0 0.0%
LSCS before labour 130 29.4%
LSCS after labour 71 16.1
Classical Caesarean section 3 0.7
Obstetric Report
Territory-wide O&G Audit 23
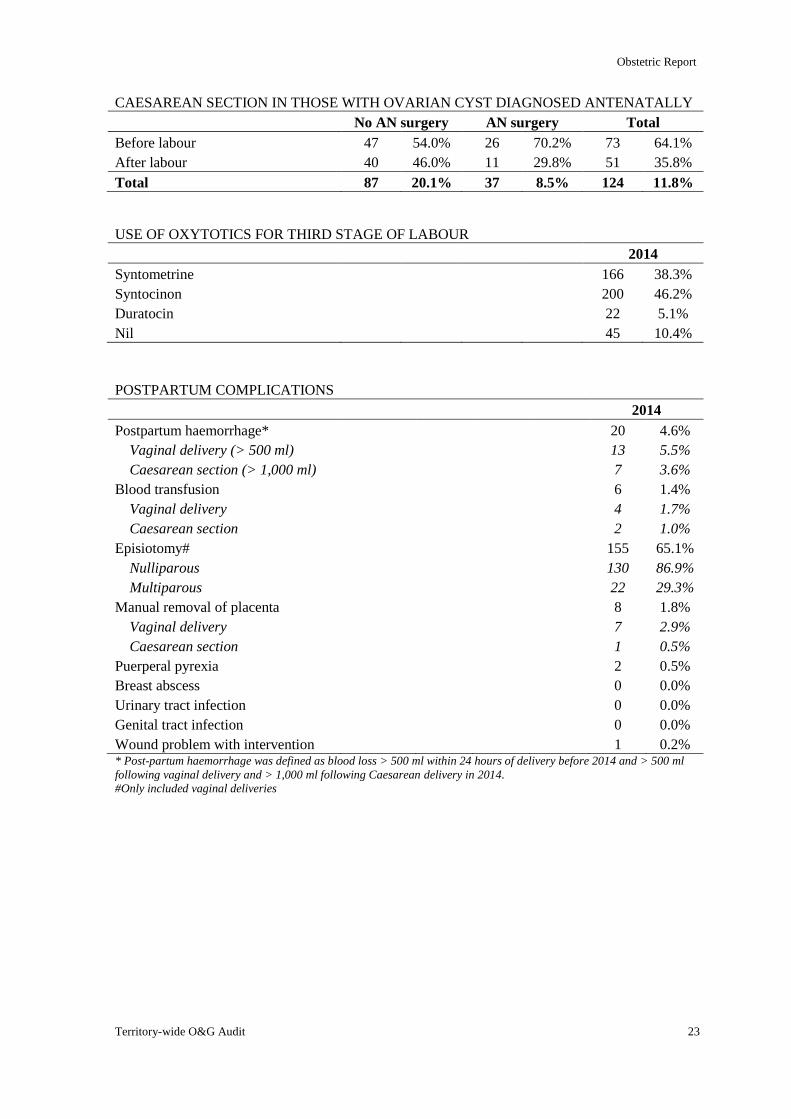
CAESAREAN SECTION IN THOSE WITH OVARIAN CYST DIAGNOSED ANTENATALLY
No AN surgery AN surgery Total
Before labour 47 54.0% 26 70.2% 73 64.1%
After labour 40 46.0% 11 29.8% 51 35.8%
Total 87 20.1% 37 8.5% 124 11.8%
USE OF OXYTOTICS FOR THIRD STAGE OF LABOUR
2014
Syntometrine 166 38.3%
Syntocinon 200 46.2%
Duratocin 22 5.1%
Nil 45 10.4%
POSTPARTUM COMPLICATIONS
2014
Postpartum haemorrhage* 20 4.6%
Vaginal delivery (> 500 ml) 13 5.5%
Caesarean section (> 1,000 ml) 7 3.6%
Blood transfusion 6 1.4%
Vaginal delivery 4 1.7%
Caesarean section 2 1.0%
Episiotomy# 155 65.1%
Nulliparous 130 86.9%
Multiparous 22 29.3%
Manual removal of placenta 8 1.8%
Vaginal delivery 7 2.9%
Caesarean section 1 0.5%
Puerperal pyrexia 2 0.5%
Breast abscess 0 0.0%
Urinary tract infection 0 0.0%
Genital tract infection 0 0.0%
Wound problem with intervention 1 0.2% * Post-partum haemorrhage was defined as blood loss > 500 ml within 24 hours of delivery before 2014 and > 500 ml
following vaginal delivery and > 1,000 ml following Caesarean delivery in 2014.
#Only included vaginal deliveries
Obstetric Report
24 The Hong Kong College of Obstetricians and Gynaecologists
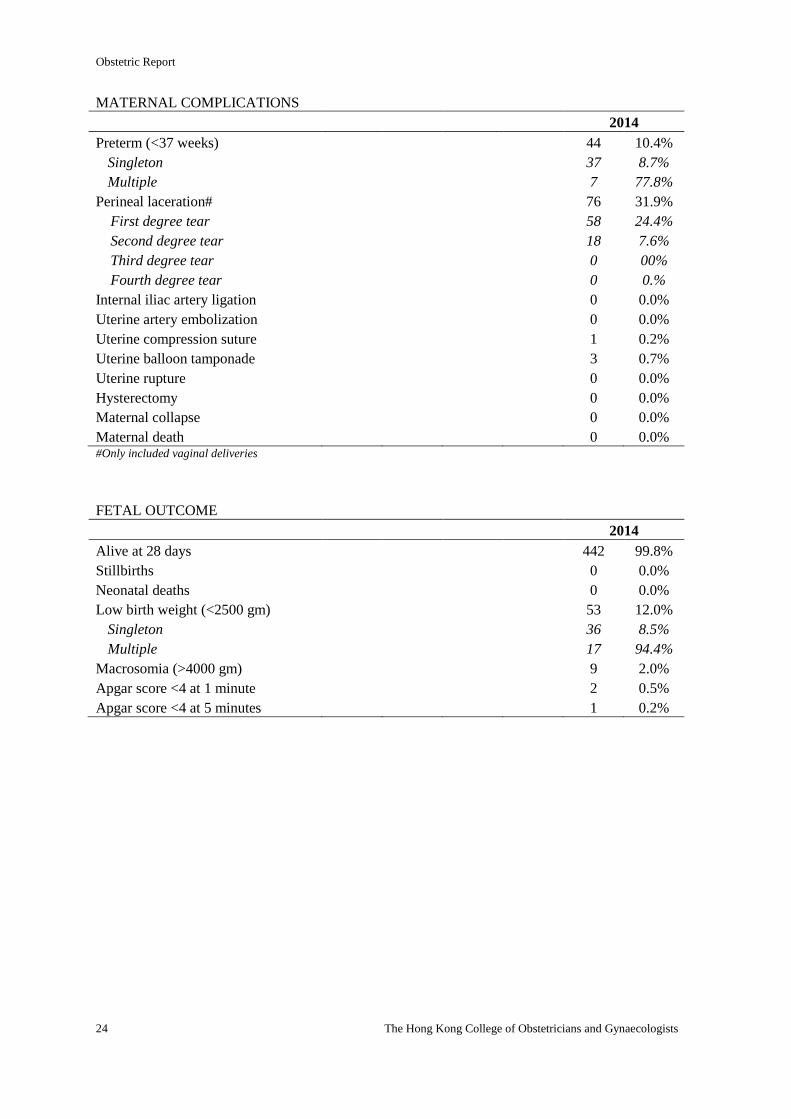
MATERNAL COMPLICATIONS
2014
Preterm (<37 weeks) 44 10.4%
Singleton 37 8.7%
Multiple 7 77.8%
Perineal laceration# 76 31.9%
First degree tear 58 24.4%
Second degree tear 18 7.6%
Third degree tear 0 00%
Fourth degree tear 0 0.%
Internal iliac artery ligation 0 0.0%
Uterine artery embolization 0 0.0%
Uterine compression suture 1 0.2%
Uterine balloon tamponade 3 0.7%
Uterine rupture 0 0.0%
Hysterectomy 0 0.0%
Maternal collapse 0 0.0%
Maternal death 0 0.0% #Only included vaginal deliveries
FETAL OUTCOME
2014
Alive at 28 days 442 99.8%
Stillbirths 0 0.0%
Neonatal deaths 0 0.0%
Low birth weight (<2500 gm) 53 12.0%
Singleton 36 8.5%
Multiple 17 94.4%
Macrosomia (>4000 gm) 9 2.0%
Apgar score <4 at 1 minute 2 0.5%
Apgar score <4 at 5 minutes 1 0.2%
Obstetric Report
Territory-wide O&G Audit 25
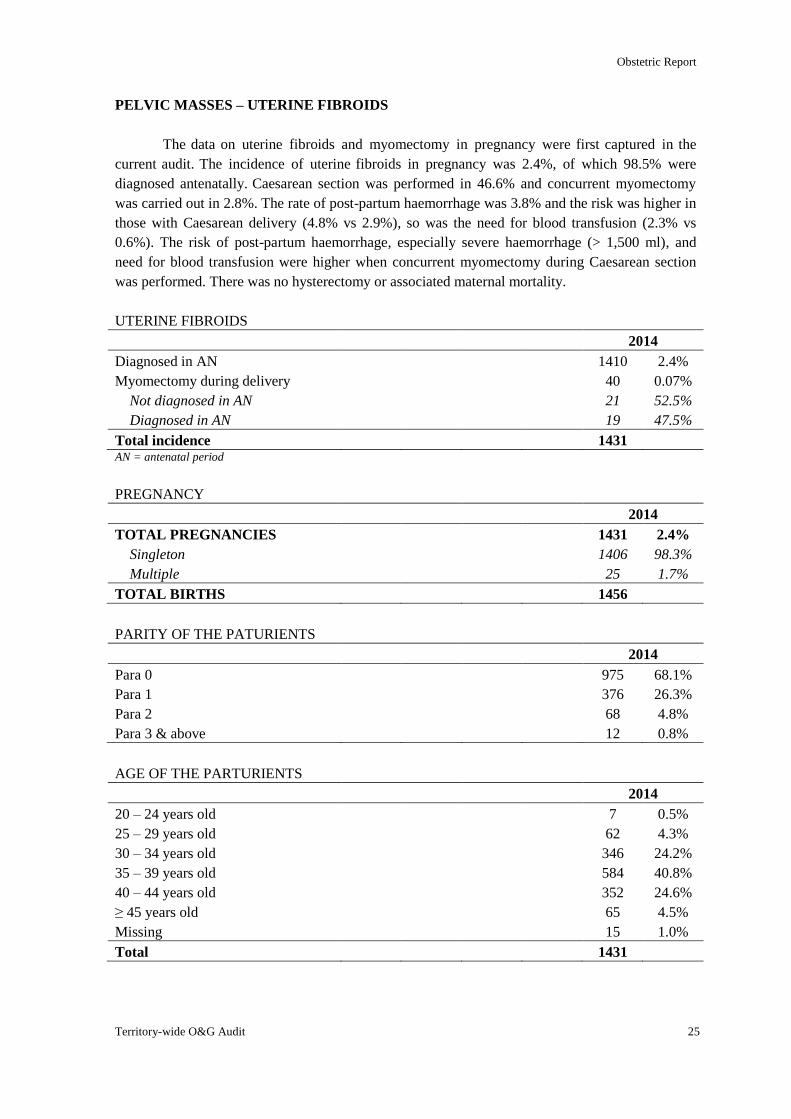
PELVIC MASSES – UTERINE FIBROIDS
The data on uterine fibroids and myomectomy in pregnancy were first captured in the
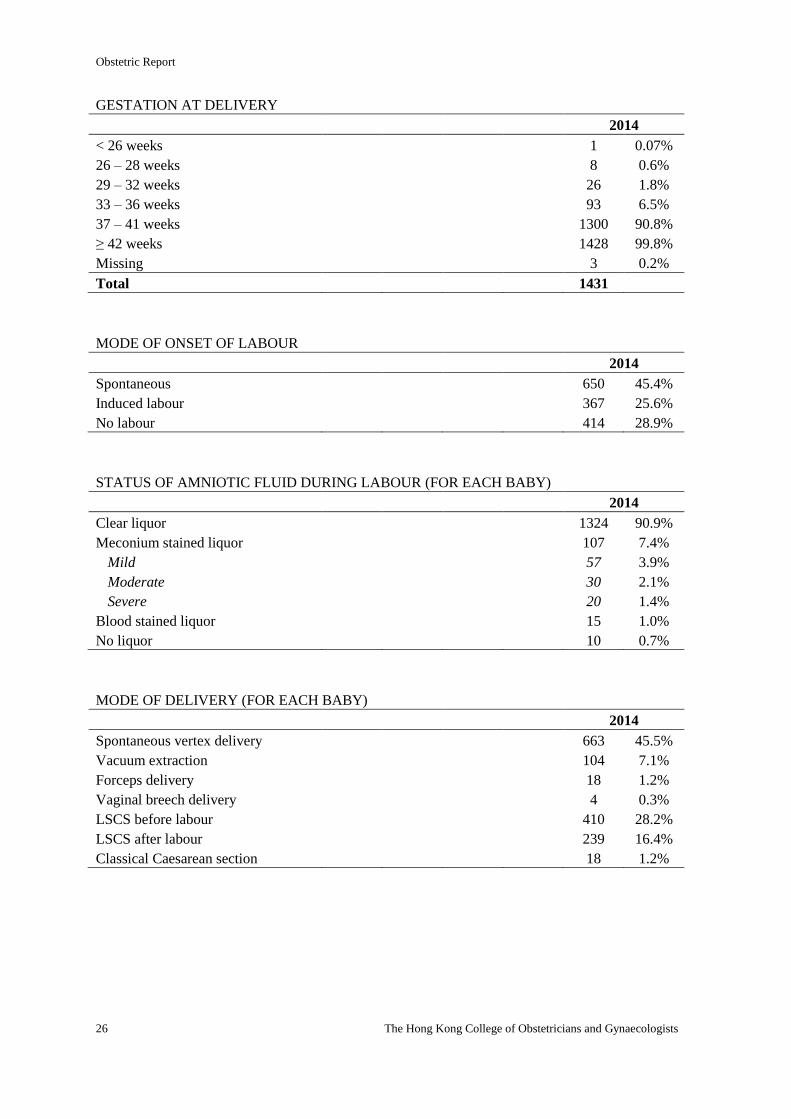
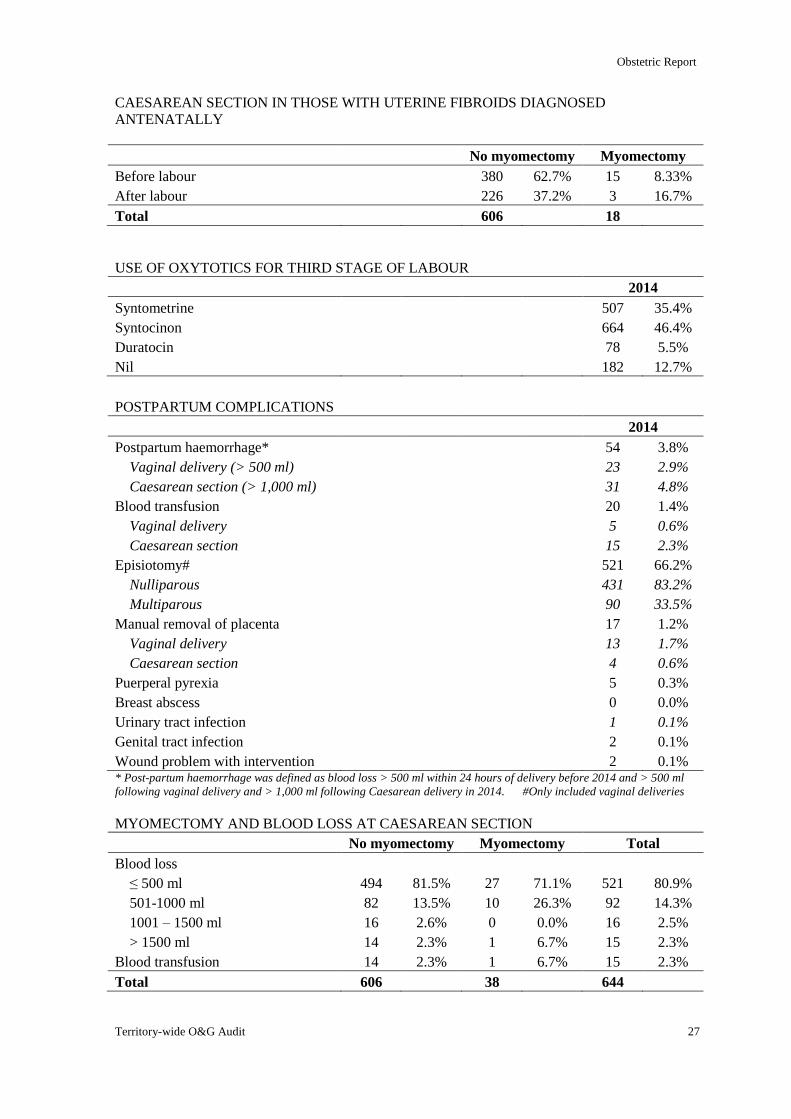
current audit. The incidence of uterine fibroids in pregnancy was 2.4%, of which 98.5% were
diagnosed antenatally. Caesarean section was performed in 46.6% and concurrent myomectomy
was carried out in 2.8%. The rate of post-partum haemorrhage was 3.8% and the risk was higher in
those with Caesarean delivery (4.8% vs 2.9%), so was the need for blood transfusion (2.3% vs
0.6%). The risk of post-partum haemorrhage, especially severe haemorrhage (> 1,500 ml), and
need for blood transfusion were higher when concurrent myomectomy during Caesarean section
was performed. There was no hysterectomy or associated maternal mortality.
UTERINE FIBROIDS
2014
Diagnosed in AN 1410 2.4%
Myomectomy during delivery 40 0.07%
Not diagnosed in AN 21 52.5%
Diagnosed in AN 19 47.5%
Total incidence 1431 AN = antenatal period
PREGNANCY
2014
TOTAL PREGNANCIES 1431 2.4%
Singleton 1406 98.3%
Multiple 25 1.7%
TOTAL BIRTHS 1456
PARITY OF THE PATURIENTS
2014
Para 0 975 68.1%
Para 1 376 26.3%
Para 2 68 4.8%
Para 3 & above 12 0.8%
AGE OF THE PARTURIENTS
2014
20 – 24 years old 7 0.5%
25 – 29 years old 62 4.3%
30 – 34 years old 346 24.2%
35 – 39 years old 584 40.8%
40 – 44 years old 352 24.6%
≥ 45 years old 65 4.5%
Missing 15 1.0%
Total 1431
Obstetric Report
26 The Hong Kong College of Obstetricians and Gynaecologists
GESTATION AT DELIVERY
2014
< 26 weeks 1 0.07%
26 – 28 weeks 8 0.6%
29 – 32 weeks 26 1.8%
33 – 36 weeks 93 6.5%
37 – 41 weeks 1300 90.8%
≥ 42 weeks 1428 99.8%
Missing 3 0.2%
Total 1431
MODE OF ONSET OF LABOUR
2014
Spontaneous 650 45.4%
Induced labour 367 25.6%
No labour 414 28.9%
STATUS OF AMNIOTIC FLUID DURING LABOUR (FOR EACH BABY)
2014
Clear liquor 1324 90.9%
Meconium stained liquor 107 7.4%
Mild 57 3.9%
Moderate 30 2.1%
Severe 20 1.4%
Blood stained liquor 15 1.0%
No liquor 10 0.7%
MODE OF DELIVERY (FOR EACH BABY)
2014
Spontaneous vertex delivery 663 45.5%
Vacuum extraction 104 7.1%
Forceps delivery 18 1.2%
Vaginal breech delivery 4 0.3%
LSCS before labour 410 28.2%
LSCS after labour 239 16.4%
Classical Caesarean section 18 1.2%
Obstetric Report
Territory-wide O&G Audit 27
CAESAREAN SECTION IN THOSE WITH UTERINE FIBROIDS DIAGNOSED
ANTENATALLY
No myomectomy Myomectomy
Before labour 380 62.7% 15 8.33%
After labour 226 37.2% 3 16.7%
Total 606 18
USE OF OXYTOTICS FOR THIRD STAGE OF LABOUR
2014
Syntometrine 507 35.4%
Syntocinon 664 46.4%
Duratocin 78 5.5%
Nil 182 12.7%
POSTPARTUM COMPLICATIONS
2014
Postpartum haemorrhage* 54 3.8%
Vaginal delivery (> 500 ml) 23 2.9%
Caesarean section (> 1,000 ml) 31 4.8%
Blood transfusion 20 1.4%
Vaginal delivery 5 0.6%
Caesarean section 15 2.3%
Episiotomy# 521 66.2%
Nulliparous 431 83.2%
Multiparous 90 33.5%
Manual removal of placenta 17 1.2%
Vaginal delivery 13 1.7%
Caesarean section 4 0.6%
Puerperal pyrexia 5 0.3%
Breast abscess 0 0.0%
Urinary tract infection 1 0.1%
Genital tract infection 2 0.1%
Wound problem with intervention 2 0.1% * Post-partum haemorrhage was defined as blood loss > 500 ml within 24 hours of delivery before 2014 and > 500 ml
following vaginal delivery and > 1,000 ml following Caesarean delivery in 2014. #Only included vaginal deliveries
MYOMECTOMY AND BLOOD LOSS AT CAESAREAN SECTION
No myomectomy Myomectomy Total
Blood loss
≤ 500 ml 494 81.5% 27 71.1% 521 80.9%
501-1000 ml 82 13.5% 10 26.3% 92 14.3%
1001 – 1500 ml 16 2.6% 0 0.0% 16 2.5%
> 1500 ml 14 2.3% 1 6.7% 15 2.3%
Blood transfusion 14 2.3% 1 6.7% 15 2.3%
Total 606 38 644
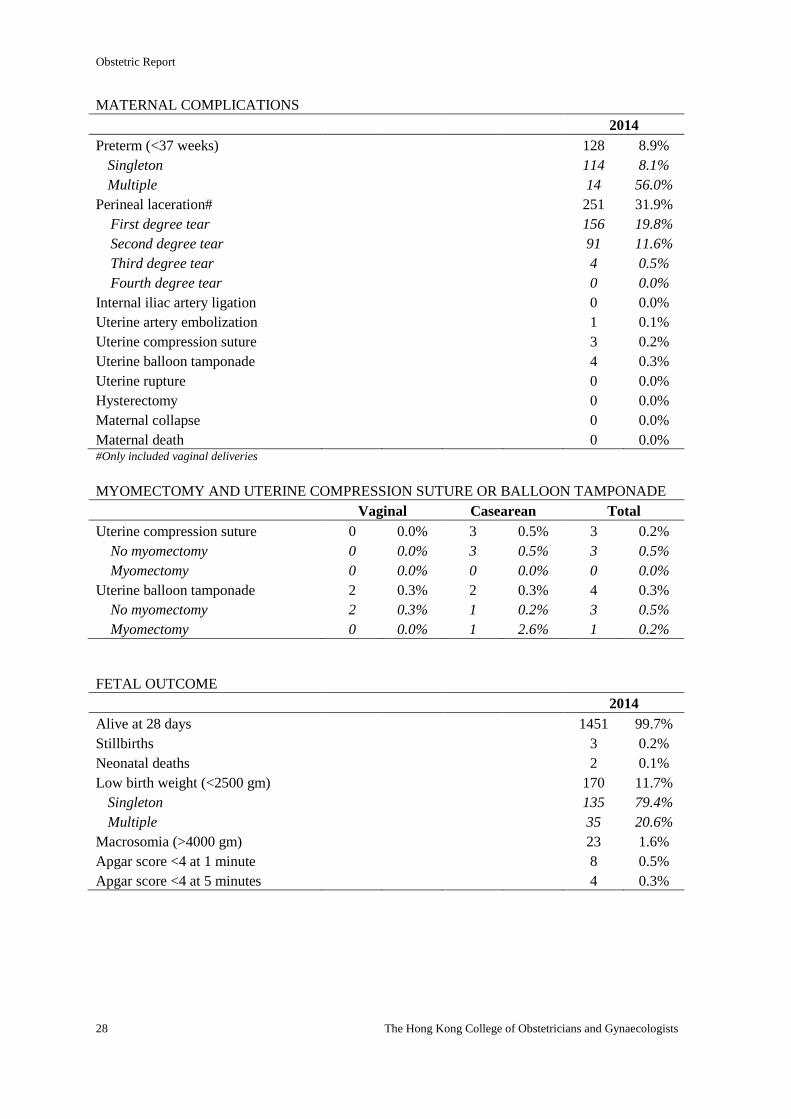
Obstetric Report
28 The Hong Kong College of Obstetricians and Gynaecologists
MATERNAL COMPLICATIONS
2014
Preterm (<37 weeks) 128 8.9%
Singleton 114 8.1%
Multiple 14 56.0%
Perineal laceration# 251 31.9%
First degree tear 156 19.8%
Second degree tear 91 11.6%
Third degree tear 4 0.5%
Fourth degree tear 0 0.0%
Internal iliac artery ligation 0 0.0%
Uterine artery embolization 1 0.1%
Uterine compression suture 3 0.2%
Uterine balloon tamponade 4 0.3%
Uterine rupture 0 0.0%
Hysterectomy 0 0.0%
Maternal collapse 0 0.0%
Maternal death 0 0.0% #Only included vaginal deliveries
MYOMECTOMY AND UTERINE COMPRESSION SUTURE OR BALLOON TAMPONADE
Vaginal Casearean Total
Uterine compression suture 0 0.0% 3 0.5% 3 0.2%
No myomectomy 0 0.0% 3 0.5% 3 0.5%
Myomectomy 0 0.0% 0 0.0% 0 0.0%
Uterine balloon tamponade 2 0.3% 2 0.3% 4 0.3%
No myomectomy 2 0.3% 1 0.2% 3 0.5%
Myomectomy 0 0.0% 1 2.6% 1 0.2%
FETAL OUTCOME
2014
Alive at 28 days 1451 99.7%
Stillbirths 3 0.2%
Neonatal deaths 2 0.1%
Low birth weight (<2500 gm) 170 11.7%
Singleton 135 79.4%
Multiple 35 20.6%
Macrosomia (>4000 gm) 23 1.6%
Apgar score <4 at 1 minute 8 0.5%
Apgar score <4 at 5 minutes 4 0.3%
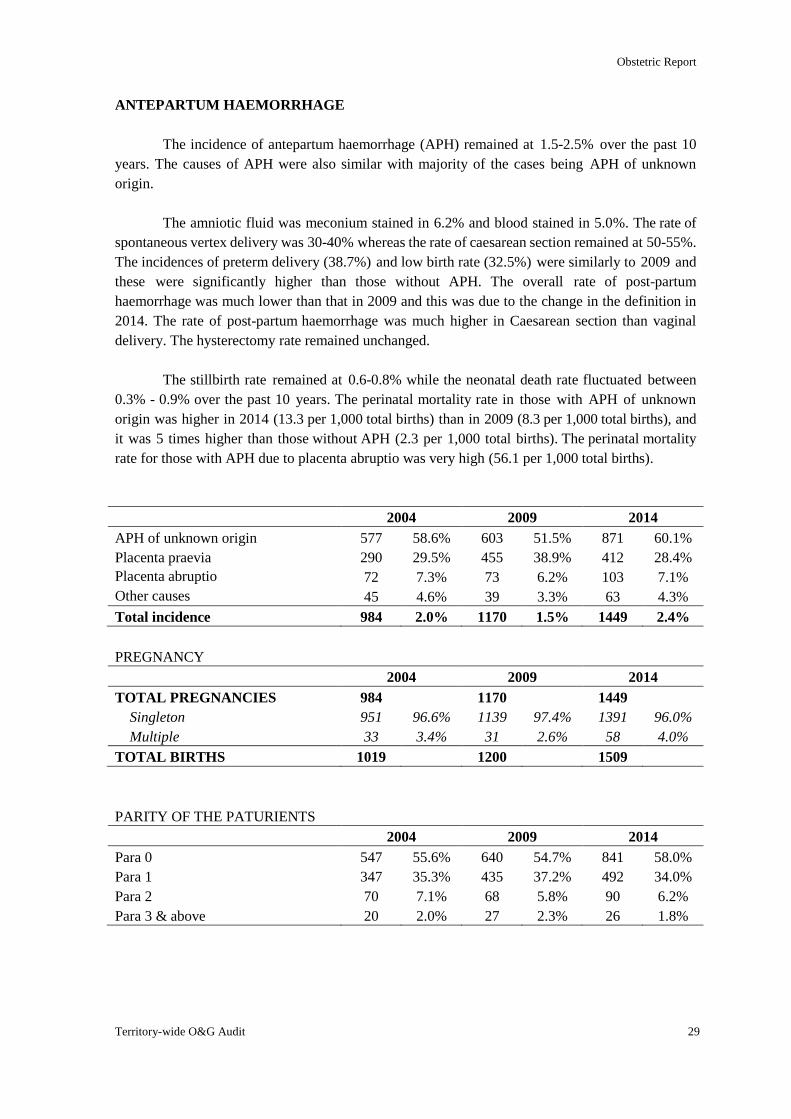
Obstetric Report
Territory-wide O&G Audit 29
ANTEPARTUM HAEMORRHAGE
The incidence of antepartum haemorrhage (APH) remained at 1.5-2.5% over the past 10
years. The causes of APH were also similar with majority of the cases being APH of unknown
origin.
The amniotic fluid was meconium stained in 6.2% and blood stained in 5.0%. The rate of
spontaneous vertex delivery was 30-40% whereas the rate of caesarean section remained at 50-55%.
The incidences of preterm delivery (38.7%) and low birth rate (32.5%) were similarly to 2009 and
these were significantly higher than those without APH. The overall rate of post-partum
haemorrhage was much lower than that in 2009 and this was due to the change in the definition in
2014. The rate of post-partum haemorrhage was much higher in Caesarean section than vaginal
delivery. The hysterectomy rate remained unchanged.
The stillbirth rate remained at 0.6-0.8% while the neonatal death rate fluctuated between
0.3% - 0.9% over the past 10 years. The perinatal mortality rate in those with APH of unknown
origin was higher in 2014 (13.3 per 1,000 total births) than in 2009 (8.3 per 1,000 total births), and
it was 5 times higher than those without APH (2.3 per 1,000 total births). The perinatal mortality
rate for those with APH due to placenta abruptio was very high (56.1 per 1,000 total births).
2004 2009 2014
APH of unknown origin 577 58.6% 603 51.5% 871 60.1%
Placenta praevia 290 29.5% 455 38.9% 412 28.4%
Placenta abruptio 72 7.3% 73 6.2% 103 7.1%
Other causes 45 4.6% 39 3.3% 63 4.3%
Total incidence 984 2.0% 1170 1.5% 1449 2.4%
PREGNANCY
2004 2009 2014
TOTAL PREGNANCIES 984 1170 1449
Singleton 951 96.6% 1139 97.4% 1391 96.0%
Multiple 33 3.4% 31 2.6% 58 4.0%
TOTAL BIRTHS 1019 1200 1509
PARITY OF THE PATURIENTS
2004 2009 2014
Para 0 547 55.6% 640 54.7% 841 58.0%
Para 1 347 35.3% 435 37.2% 492 34.0%
Para 2 70 7.1% 68 5.8% 90 6.2%
Para 3 & above 20 2.0% 27 2.3% 26 1.8%
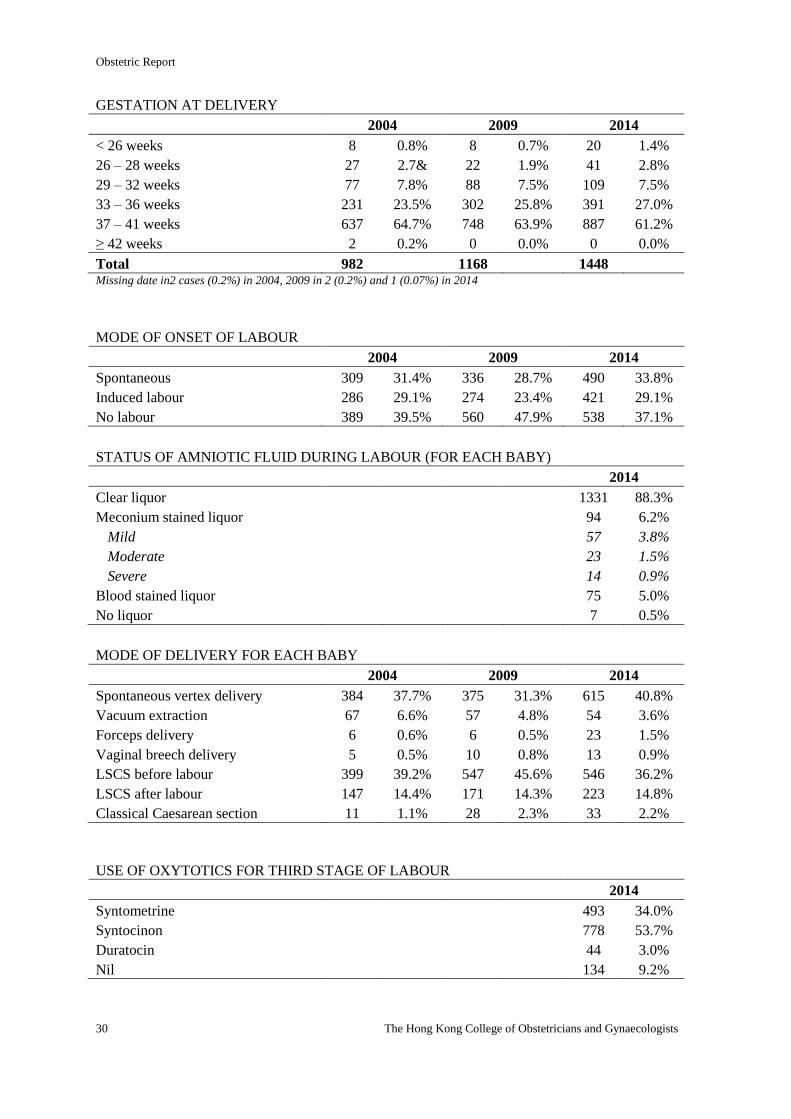
Obstetric Report
30 The Hong Kong College of Obstetricians and Gynaecologists
GESTATION AT DELIVERY
2004 2009 2014
< 26 weeks 8 0.8% 8 0.7% 20 1.4%
26 – 28 weeks 27 2.7& 22 1.9% 41 2.8%
29 – 32 weeks 77 7.8% 88 7.5% 109 7.5%
33 – 36 weeks 231 23.5% 302 25.8% 391 27.0%
37 – 41 weeks 637 64.7% 748 63.9% 887 61.2%
≥ 42 weeks 2 0.2% 0 0.0% 0 0.0%
Total 982 1168 1448 Missing date in2 cases (0.2%) in 2004, 2009 in 2 (0.2%) and 1 (0.07%) in 2014
MODE OF ONSET OF LABOUR
2004 2009 2014
Spontaneous 309 31.4% 336 28.7% 490 33.8%
Induced labour 286 29.1% 274 23.4% 421 29.1%
No labour 389 39.5% 560 47.9% 538 37.1%
STATUS OF AMNIOTIC FLUID DURING LABOUR (FOR EACH BABY)
2014
Clear liquor 1331 88.3%
Meconium stained liquor 94 6.2%
Mild 57 3.8%
Moderate 23 1.5%
Severe 14 0.9%
Blood stained liquor 75 5.0%
No liquor 7 0.5%
MODE OF DELIVERY FOR EACH BABY
2004 2009 2014
Spontaneous vertex delivery 384 37.7% 375 31.3% 615 40.8%
Vacuum extraction 67 6.6% 57 4.8% 54 3.6%
Forceps delivery 6 0.6% 6 0.5% 23 1.5%
Vaginal breech delivery 5 0.5% 10 0.8% 13 0.9%
LSCS before labour 399 39.2% 547 45.6% 546 36.2%
LSCS after labour 147 14.4% 171 14.3% 223 14.8%
Classical Caesarean section 11 1.1% 28 2.3% 33 2.2%
USE OF OXYTOTICS FOR THIRD STAGE OF LABOUR
2014
Syntometrine 493 34.0%
Syntocinon 778 53.7%
Duratocin 44 3.0%
Nil 134 9.2%
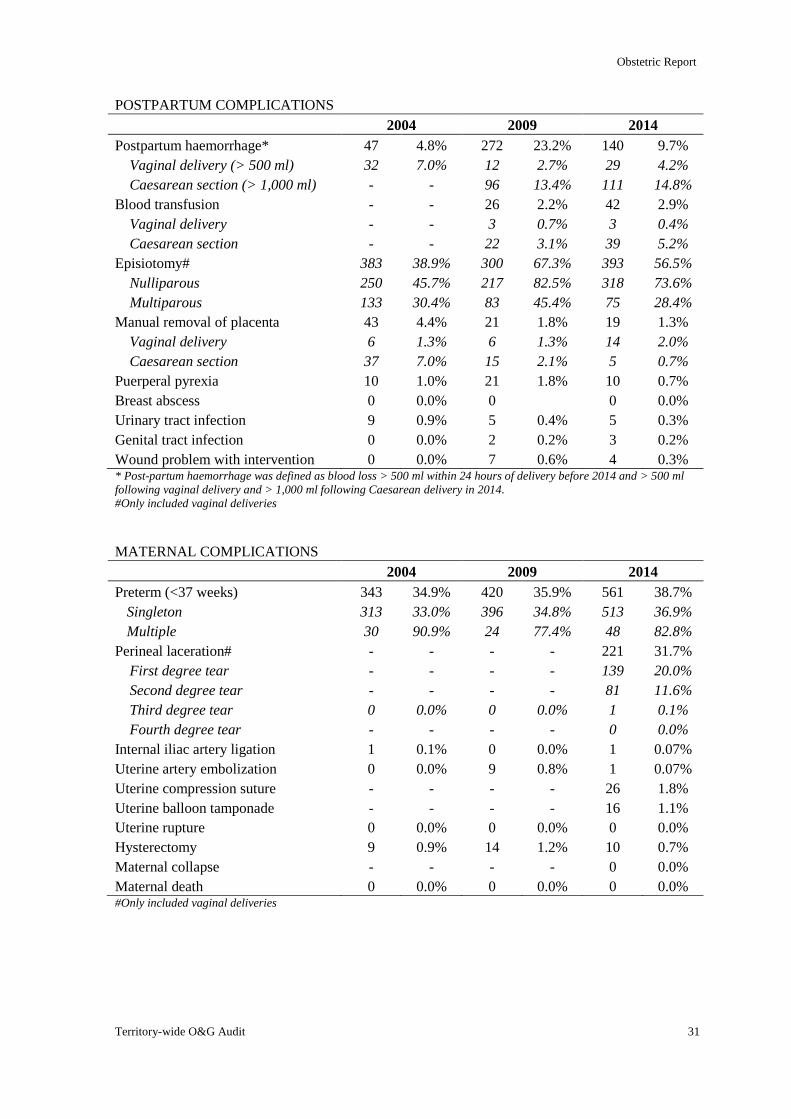
Obstetric Report
Territory-wide O&G Audit 31
POSTPARTUM COMPLICATIONS
2004 2009 2014
Postpartum haemorrhage* 47 4.8% 272 23.2% 140 9.7%
Vaginal delivery (> 500 ml) 32 7.0% 12 2.7% 29 4.2%
Caesarean section (> 1,000 ml) - - 96 13.4% 111 14.8%
Blood transfusion - - 26 2.2% 42 2.9%
Vaginal delivery - - 3 0.7% 3 0.4%
Caesarean section - - 22 3.1% 39 5.2%
Episiotomy# 383 38.9% 300 67.3% 393 56.5%
Nulliparous 250 45.7% 217 82.5% 318 73.6%
Multiparous 133 30.4% 83 45.4% 75 28.4%
Manual removal of placenta 43 4.4% 21 1.8% 19 1.3%
Vaginal delivery 6 1.3% 6 1.3% 14 2.0%
Caesarean section 37 7.0% 15 2.1% 5 0.7%
Puerperal pyrexia 10 1.0% 21 1.8% 10 0.7%
Breast abscess 0 0.0% 0 0 0.0%
Urinary tract infection 9 0.9% 5 0.4% 5 0.3%
Genital tract infection 0 0.0% 2 0.2% 3 0.2%
Wound problem with intervention 0 0.0% 7 0.6% 4 0.3% * Post-partum haemorrhage was defined as blood loss > 500 ml within 24 hours of delivery before 2014 and > 500 ml
following vaginal delivery and > 1,000 ml following Caesarean delivery in 2014.
#Only included vaginal deliveries
MATERNAL COMPLICATIONS
2004 2009 2014
Preterm (<37 weeks) 343 34.9% 420 35.9% 561 38.7%
Singleton 313 33.0% 396 34.8% 513 36.9%
Multiple 30 90.9% 24 77.4% 48 82.8%
Perineal laceration# - - - - 221 31.7%
First degree tear - - - - 139 20.0%
Second degree tear - - - - 81 11.6%
Third degree tear 0 0.0% 0 0.0% 1 0.1%
Fourth degree tear - - - - 0 0.0%
Internal iliac artery ligation 1 0.1% 0 0.0% 1 0.07%
Uterine artery embolization 0 0.0% 9 0.8% 1 0.07%
Uterine compression suture - - - - 26 1.8%
Uterine balloon tamponade - - - - 16 1.1%
Uterine rupture 0 0.0% 0 0.0% 0 0.0%
Hysterectomy 9 0.9% 14 1.2% 10 0.7%
Maternal collapse - - - - 0 0.0%
Maternal death 0 0.0% 0 0.0% 0 0.0% #Only included vaginal deliveries
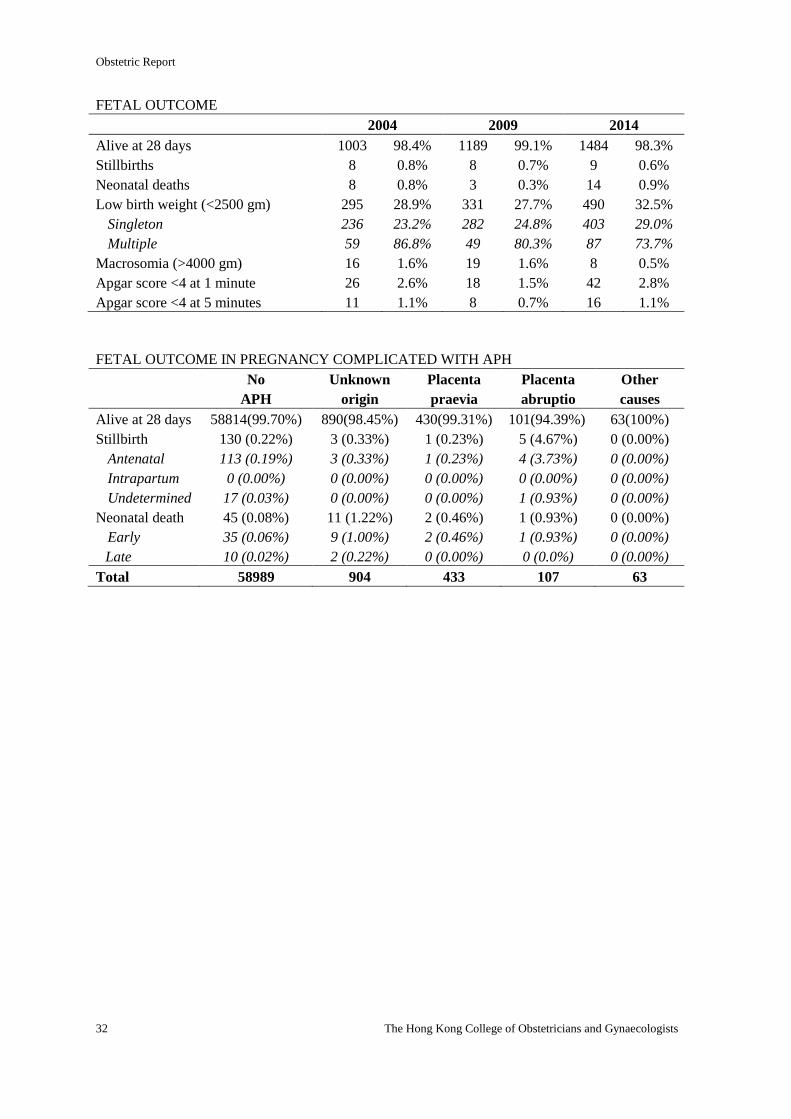
Obstetric Report
32 The Hong Kong College of Obstetricians and Gynaecologists
FETAL OUTCOME
2004 2009 2014
Alive at 28 days 1003 98.4% 1189 99.1% 1484 98.3%
Stillbirths 8 0.8% 8 0.7% 9 0.6%
Neonatal deaths 8 0.8% 3 0.3% 14 0.9%
Low birth weight (<2500 gm) 295 28.9% 331 27.7% 490 32.5%
Singleton 236 23.2% 282 24.8% 403 29.0%
Multiple 59 86.8% 49 80.3% 87 73.7%
Macrosomia (>4000 gm) 16 1.6% 19 1.6% 8 0.5%
Apgar score <4 at 1 minute 26 2.6% 18 1.5% 42 2.8%
Apgar score <4 at 5 minutes 11 1.1% 8 0.7% 16 1.1%
FETAL OUTCOME IN PREGNANCY COMPLICATED WITH APH
No
APH
Unknown
origin
Placenta
praevia
Placenta
abruptio
Other
causes
Alive at 28 days 58814(99.70%) 890(98.45%) 430(99.31%) 101(94.39%) 63(100%)
Stillbirth 130 (0.22%) 3 (0.33%) 1 (0.23%) 5 (4.67%) 0 (0.00%)
Antenatal 113 (0.19%) 3 (0.33%) 1 (0.23%) 4 (3.73%) 0 (0.00%)
Intrapartum 0 (0.00%) 0 (0.00%) 0 (0.00%) 0 (0.00%) 0 (0.00%)
Undetermined 17 (0.03%) 0 (0.00%) 0 (0.00%) 1 (0.93%) 0 (0.00%)
Neonatal death 45 (0.08%) 11 (1.22%) 2 (0.46%) 1 (0.93%) 0 (0.00%)
Early 35 (0.06%) 9 (1.00%) 2 (0.46%) 1 (0.93%) 0 (0.00%)
Late 10 (0.02%) 2 (0.22%) 0 (0.00%) 0 (0.0%) 0 (0.00%)
Total 58989 904 433 107 63
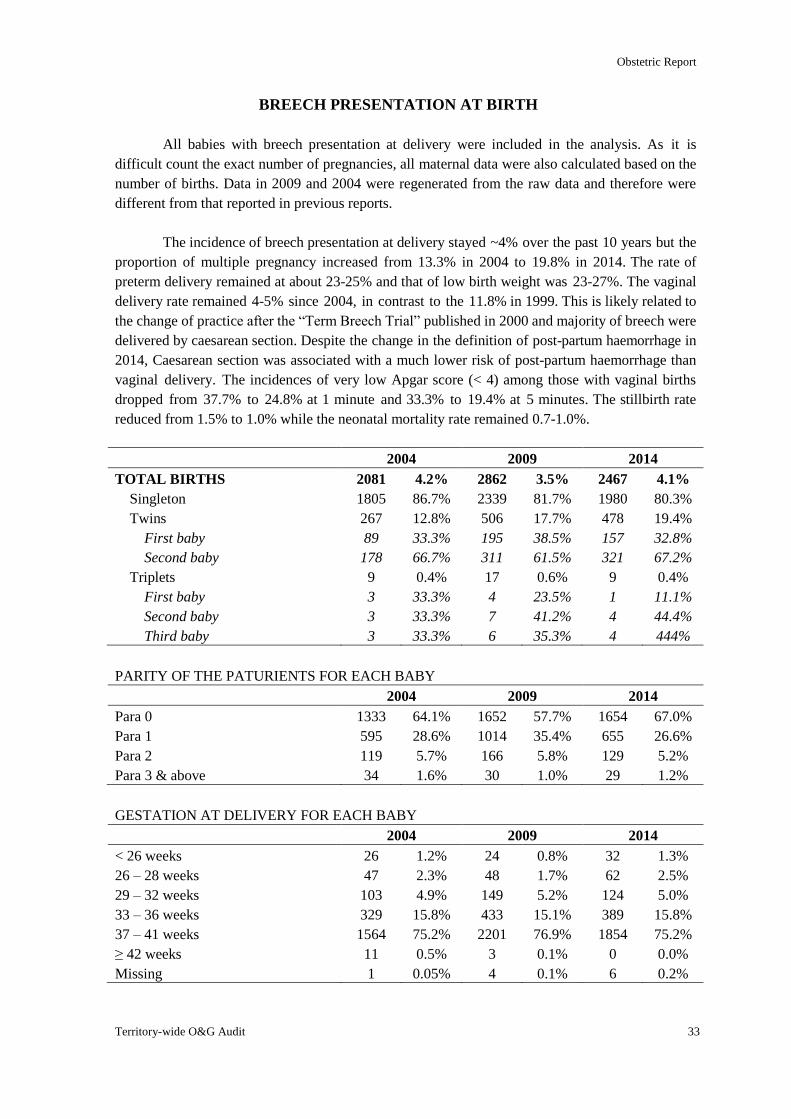
Obstetric Report
Territory-wide O&G Audit 33
BREECH PRESENTATION AT BIRTH
All babies with breech presentation at delivery were included in the analysis. As it is
difficult count the exact number of pregnancies, all maternal data were also calculated based on the
number of births. Data in 2009 and 2004 were regenerated from the raw data and therefore were
different from that reported in previous reports.
The incidence of breech presentation at delivery stayed ~4% over the past 10 years but the
proportion of multiple pregnancy increased from 13.3% in 2004 to 19.8% in 2014. The rate of
preterm delivery remained at about 23-25% and that of low birth weight was 23-27%. The vaginal
delivery rate remained 4-5% since 2004, in contrast to the 11.8% in 1999. This is likely related to
the change of practice after the “Term Breech Trial” published in 2000 and majority of breech were
delivered by caesarean section. Despite the change in the definition of post-partum haemorrhage in
2014, Caesarean section was associated with a much lower risk of post-partum haemorrhage than
vaginal delivery. The incidences of very low Apgar score (< 4) among those with vaginal births
dropped from 37.7% to 24.8% at 1 minute and 33.3% to 19.4% at 5 minutes. The stillbirth rate
reduced from 1.5% to 1.0% while the neonatal mortality rate remained 0.7-1.0%.
2004 2009 2014
TOTAL BIRTHS 2081 4.2% 2862 3.5% 2467 4.1%
Singleton 1805 86.7% 2339 81.7% 1980 80.3%
Twins 267 12.8% 506 17.7% 478 19.4%
First baby 89 33.3% 195 38.5% 157 32.8%
Second baby 178 66.7% 311 61.5% 321 67.2%
Triplets 9 0.4% 17 0.6% 9 0.4%
First baby 3 33.3% 4 23.5% 1 11.1%
Second baby 3 33.3% 7 41.2% 4 44.4%
Third baby 3 33.3% 6 35.3% 4 444%
PARITY OF THE PATURIENTS FOR EACH BABY
2004 2009 2014
Para 0 1333 64.1% 1652 57.7% 1654 67.0%
Para 1 595 28.6% 1014 35.4% 655 26.6%
Para 2 119 5.7% 166 5.8% 129 5.2%
Para 3 & above 34 1.6% 30 1.0% 29 1.2%
GESTATION AT DELIVERY FOR EACH BABY
2004 2009 2014
< 26 weeks 26 1.2% 24 0.8% 32 1.3%
26 – 28 weeks 47 2.3% 48 1.7% 62 2.5%
29 – 32 weeks 103 4.9% 149 5.2% 124 5.0%
33 – 36 weeks 329 15.8% 433 15.1% 389 15.8%
37 – 41 weeks 1564 75.2% 2201 76.9% 1854 75.2%
≥ 42 weeks 11 0.5% 3 0.1% 0 0.0%
Missing 1 0.05% 4 0.1% 6 0.2%
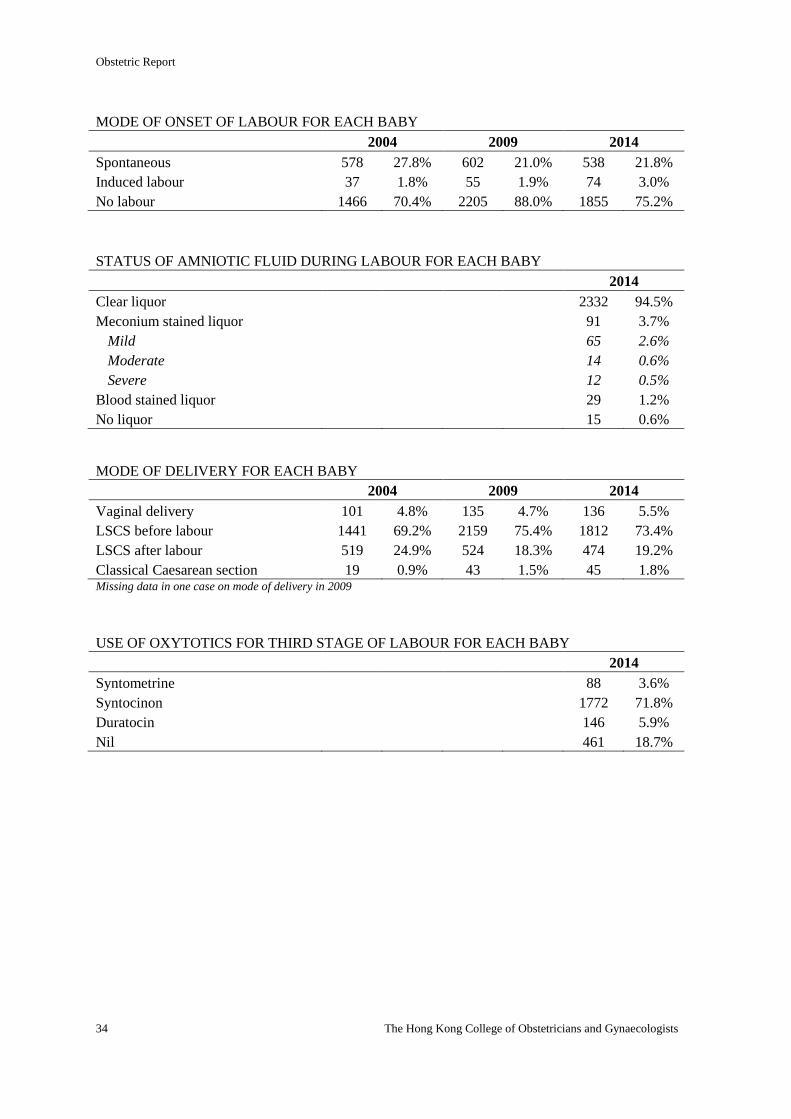
Obstetric Report
34 The Hong Kong College of Obstetricians and Gynaecologists
MODE OF ONSET OF LABOUR FOR EACH BABY
2004 2009 2014
Spontaneous 578 27.8% 602 21.0% 538 21.8%
Induced labour 37 1.8% 55 1.9% 74 3.0%
No labour 1466 70.4% 2205 88.0% 1855 75.2%
STATUS OF AMNIOTIC FLUID DURING LABOUR FOR EACH BABY
2014
Clear liquor 2332 94.5%
Meconium stained liquor 91 3.7%
Mild 65 2.6%
Moderate 14 0.6%
Severe 12 0.5%
Blood stained liquor 29 1.2%
No liquor 15 0.6%
MODE OF DELIVERY FOR EACH BABY
2004 2009 2014
Vaginal delivery 101 4.8% 135 4.7% 136 5.5%
LSCS before labour 1441 69.2% 2159 75.4% 1812 73.4%
LSCS after labour 519 24.9% 524 18.3% 474 19.2%
Classical Caesarean section 19 0.9% 43 1.5% 45 1.8% Missing data in one case on mode of delivery in 2009
USE OF OXYTOTICS FOR THIRD STAGE OF LABOUR FOR EACH BABY
2014
Syntometrine 88 3.6%
Syntocinon 1772 71.8%
Duratocin 146 5.9%
Nil 461 18.7%
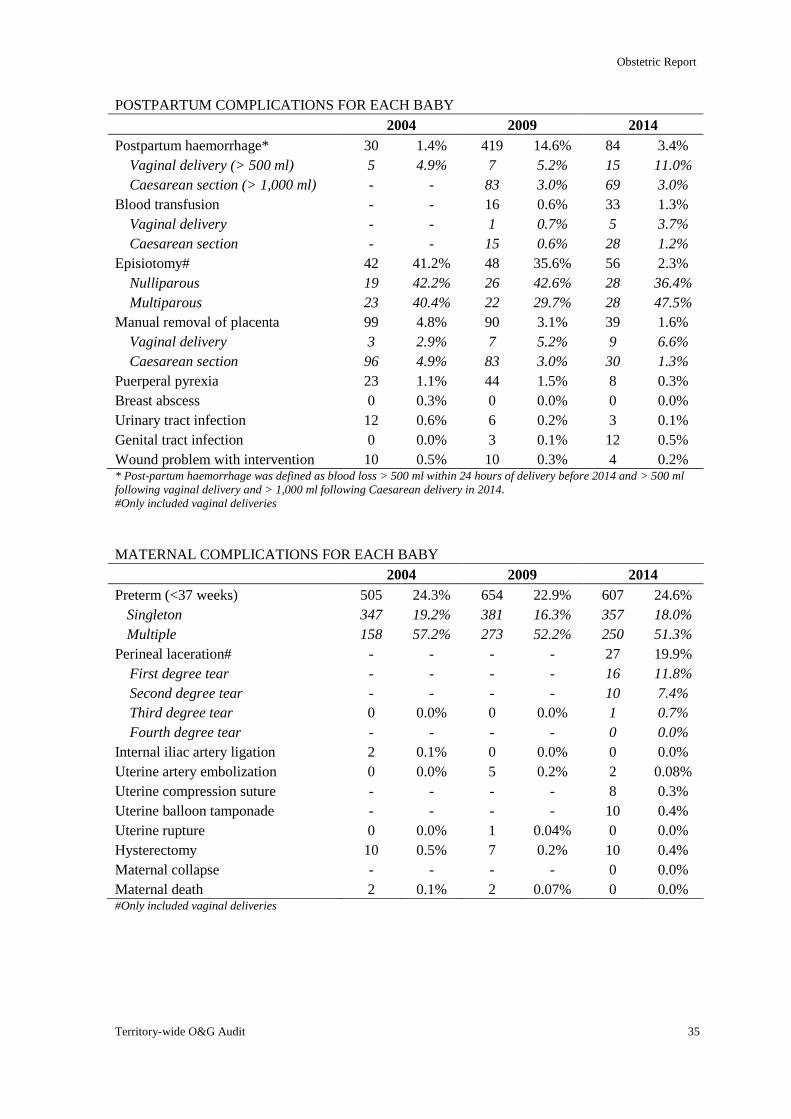
Obstetric Report
Territory-wide O&G Audit 35
POSTPARTUM COMPLICATIONS FOR EACH BABY
2004 2009 2014
Postpartum haemorrhage* 30 1.4% 419 14.6% 84 3.4%
Vaginal delivery (> 500 ml) 5 4.9% 7 5.2% 15 11.0%
Caesarean section (> 1,000 ml) - - 83 3.0% 69 3.0%
Blood transfusion - - 16 0.6% 33 1.3%
Vaginal delivery - - 1 0.7% 5 3.7%
Caesarean section - - 15 0.6% 28 1.2%
Episiotomy# 42 41.2% 48 35.6% 56 2.3%
Nulliparous 19 42.2% 26 42.6% 28 36.4%
Multiparous 23 40.4% 22 29.7% 28 47.5%
Manual removal of placenta 99 4.8% 90 3.1% 39 1.6%
Vaginal delivery 3 2.9% 7 5.2% 9 6.6%
Caesarean section 96 4.9% 83 3.0% 30 1.3%
Puerperal pyrexia 23 1.1% 44 1.5% 8 0.3%
Breast abscess 0 0.3% 0 0.0% 0 0.0%
Urinary tract infection 12 0.6% 6 0.2% 3 0.1%
Genital tract infection 0 0.0% 3 0.1% 12 0.5%
Wound problem with intervention 10 0.5% 10 0.3% 4 0.2% * Post-partum haemorrhage was defined as blood loss > 500 ml within 24 hours of delivery before 2014 and > 500 ml
following vaginal delivery and > 1,000 ml following Caesarean delivery in 2014.
#Only included vaginal deliveries
MATERNAL COMPLICATIONS FOR EACH BABY
2004 2009 2014
Preterm (<37 weeks) 505 24.3% 654 22.9% 607 24.6%
Singleton 347 19.2% 381 16.3% 357 18.0%
Multiple 158 57.2% 273 52.2% 250 51.3%
Perineal laceration# - - - - 27 19.9%
First degree tear - - - - 16 11.8%
Second degree tear - - - - 10 7.4%
Third degree tear 0 0.0% 0 0.0% 1 0.7%
Fourth degree tear - - - - 0 0.0%
Internal iliac artery ligation 2 0.1% 0 0.0% 0 0.0%
Uterine artery embolization 0 0.0% 5 0.2% 2 0.08%
Uterine compression suture - - - - 8 0.3%
Uterine balloon tamponade - - - - 10 0.4%
Uterine rupture 0 0.0% 1 0.04% 0 0.0%
Hysterectomy 10 0.5% 7 0.2% 10 0.4%
Maternal collapse - - - - 0 0.0%
Maternal death 2 0.1% 2 0.07% 0 0.0% #Only included vaginal deliveries
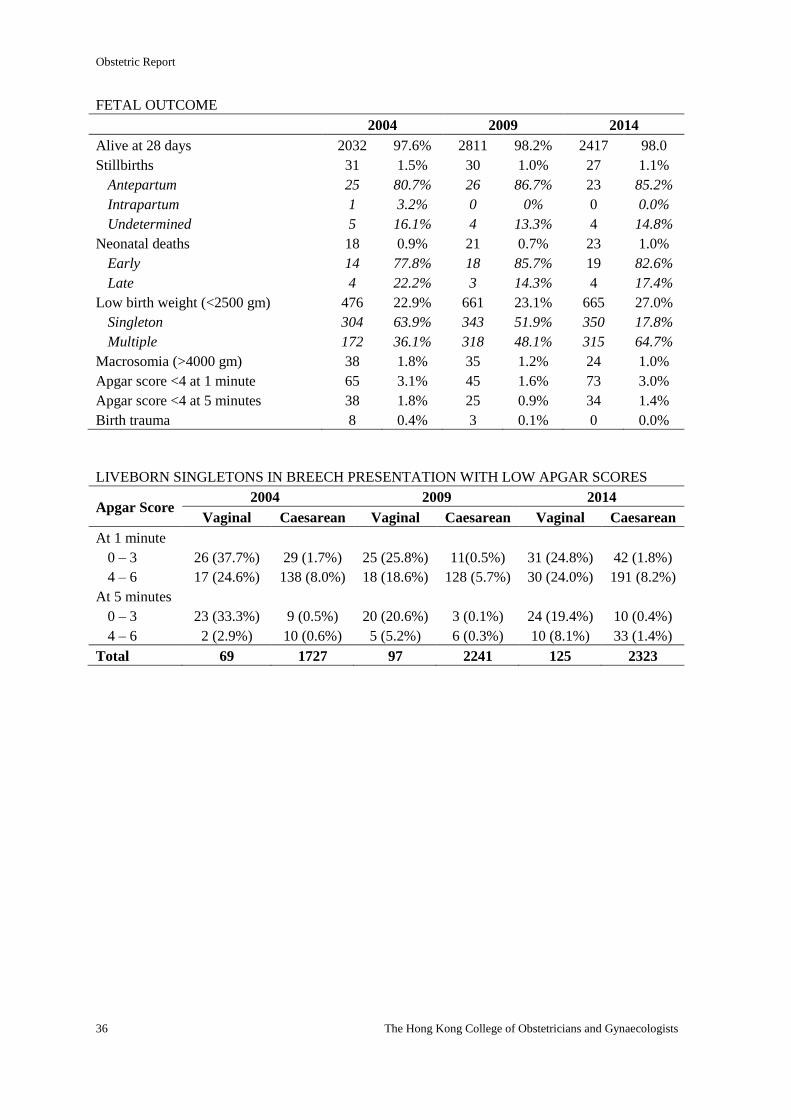
Obstetric Report
36 The Hong Kong College of Obstetricians and Gynaecologists
FETAL OUTCOME
2004 2009 2014
Alive at 28 days 2032 97.6% 2811 98.2% 2417 98.0
Stillbirths 31 1.5% 30 1.0% 27 1.1%
Antepartum 25 80.7% 26 86.7% 23 85.2%
Intrapartum 1 3.2% 0 0% 0 0.0%
Undetermined 5 16.1% 4 13.3% 4 14.8%
Neonatal deaths 18 0.9% 21 0.7% 23 1.0%
Early 14 77.8% 18 85.7% 19 82.6%
Late 4 22.2% 3 14.3% 4 17.4%
Low birth weight (<2500 gm) 476 22.9% 661 23.1% 665 27.0%
Singleton 304 63.9% 343 51.9% 350 17.8%
Multiple 172 36.1% 318 48.1% 315 64.7%
Macrosomia (>4000 gm) 38 1.8% 35 1.2% 24 1.0%
Apgar score <4 at 1 minute 65 3.1% 45 1.6% 73 3.0%
Apgar score <4 at 5 minutes 38 1.8% 25 0.9% 34 1.4%
Birth trauma 8 0.4% 3 0.1% 0 0.0%
LIVEBORN SINGLETONS IN BREECH PRESENTATION WITH LOW APGAR SCORES
Apgar Score 2004 2009 2014
Vaginal Caesarean Vaginal Caesarean Vaginal Caesarean
At 1 minute
0 – 3 26 (37.7%) 29 (1.7%) 25 (25.8%) 11(0.5%) 31 (24.8%) 42 (1.8%)
4 – 6 17 (24.6%) 138 (8.0%) 18 (18.6%) 128 (5.7%) 30 (24.0%) 191 (8.2%)
At 5 minutes
0 – 3 23 (33.3%) 9 (0.5%) 20 (20.6%) 3 (0.1%) 24 (19.4%) 10 (0.4%)
4 – 6 2 (2.9%) 10 (0.6%) 5 (5.2%) 6 (0.3%) 10 (8.1%) 33 (1.4%)
Total 69 1727 97 2241 125 2323
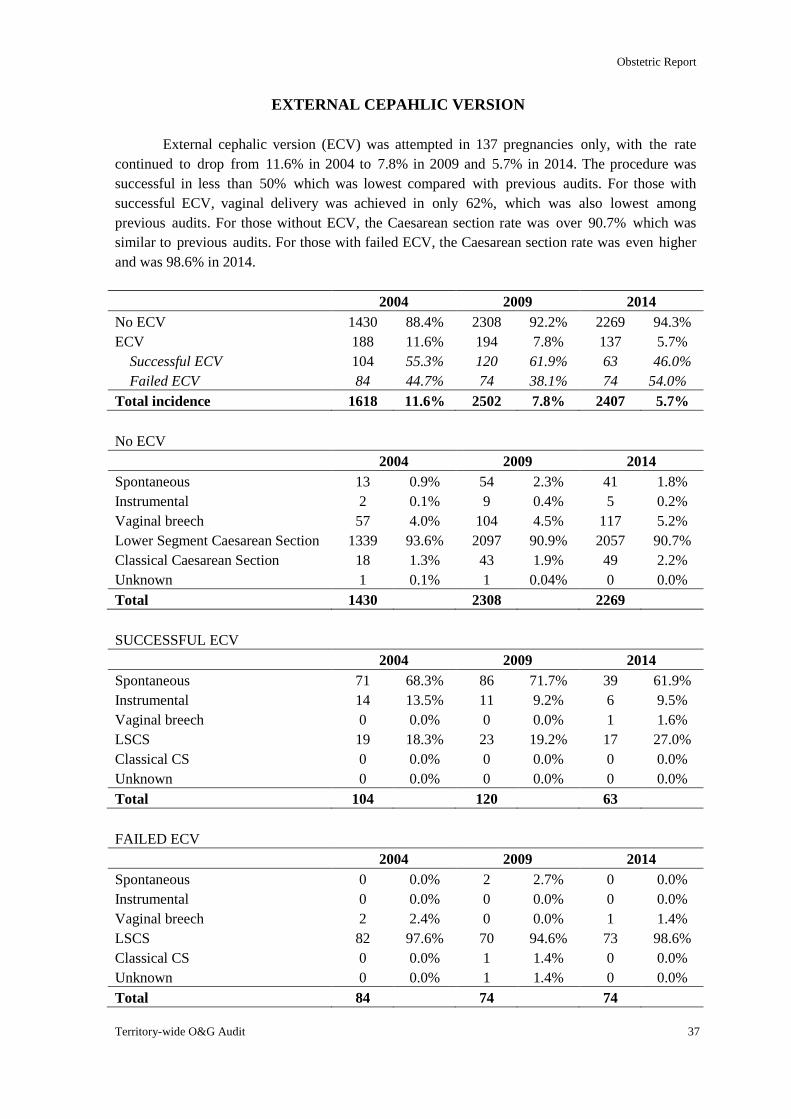
Obstetric Report
Territory-wide O&G Audit 37
EXTERNAL CEPAHLIC VERSION
External cephalic version (ECV) was attempted in 137 pregnancies only, with the rate
continued to drop from 11.6% in 2004 to 7.8% in 2009 and 5.7% in 2014. The procedure was
successful in less than 50% which was lowest compared with previous audits. For those with
successful ECV, vaginal delivery was achieved in only 62%, which was also lowest among
previous audits. For those without ECV, the Caesarean section rate was over 90.7% which was
similar to previous audits. For those with failed ECV, the Caesarean section rate was even higher
and was 98.6% in 2014.
2004 2009 2014
No ECV 1430 88.4% 2308 92.2% 2269 94.3%
ECV 188 11.6% 194 7.8% 137 5.7%
Successful ECV 104 55.3% 120 61.9% 63 46.0%
Failed ECV 84 44.7% 74 38.1% 74 54.0%
Total incidence 1618 11.6% 2502 7.8% 2407 5.7%
No ECV
2004 2009 2014
Spontaneous 13 0.9% 54 2.3% 41 1.8%
Instrumental 2 0.1% 9 0.4% 5 0.2%
Vaginal breech 57 4.0% 104 4.5% 117 5.2%
Lower Segment Caesarean Section 1339 93.6% 2097 90.9% 2057 90.7%
Classical Caesarean Section 18 1.3% 43 1.9% 49 2.2%
Unknown 1 0.1% 1 0.04% 0 0.0%
Total 1430 2308 2269
SUCCESSFUL ECV
2004 2009 2014
Spontaneous 71 68.3% 86 71.7% 39 61.9%
Instrumental 14 13.5% 11 9.2% 6 9.5%
Vaginal breech 0 0.0% 0 0.0% 1 1.6%
LSCS 19 18.3% 23 19.2% 17 27.0%
Classical CS 0 0.0% 0 0.0% 0 0.0%
Unknown 0 0.0% 0 0.0% 0 0.0%
Total 104 120 63
FAILED ECV
2004 2009 2014
Spontaneous 0 0.0% 2 2.7% 0 0.0%
Instrumental 0 0.0% 0 0.0% 0 0.0%
Vaginal breech 2 2.4% 0 0.0% 1 1.4%
LSCS 82 97.6% 70 94.6% 73 98.6%
Classical CS 0 0.0% 1 1.4% 0 0.0%
Unknown 0 0.0% 1 1.4% 0 0.0%
Total 84 74 74
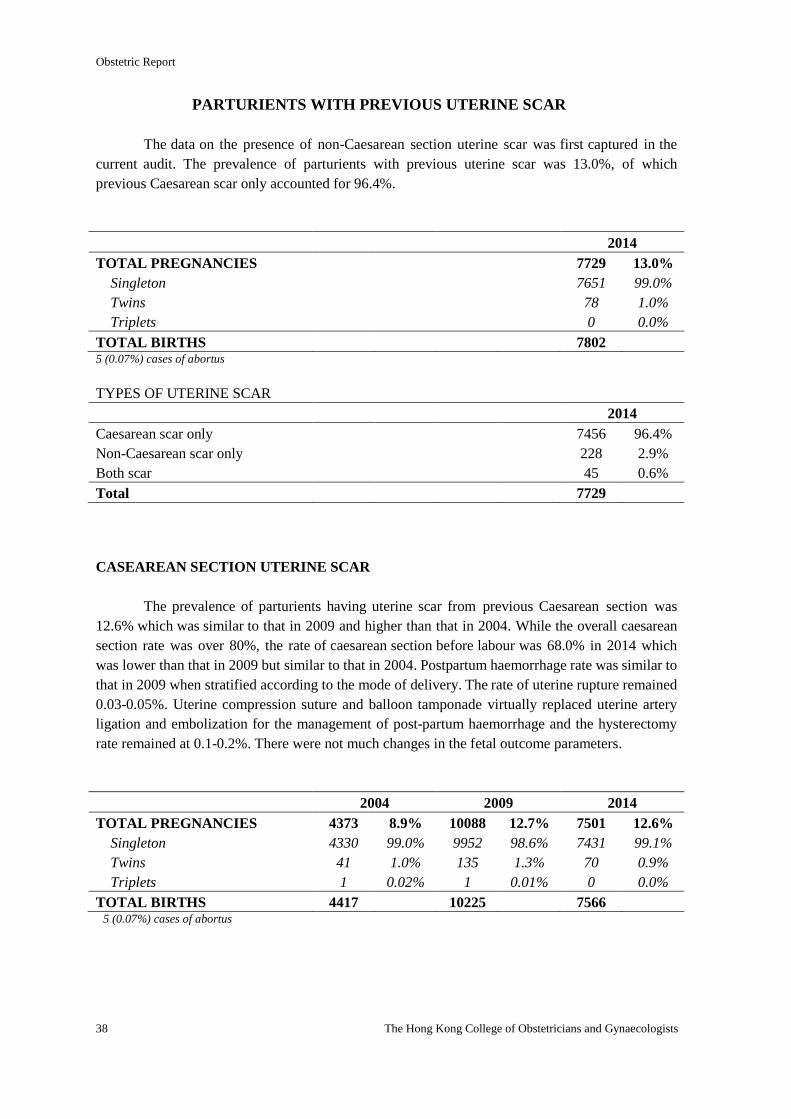
Obstetric Report
38 The Hong Kong College of Obstetricians and Gynaecologists
PARTURIENTS WITH PREVIOUS UTERINE SCAR
The data on the presence of non-Caesarean section uterine scar was first captured in the
current audit. The prevalence of parturients with previous uterine scar was 13.0%, of which
previous Caesarean scar only accounted for 96.4%.
2014
TOTAL PREGNANCIES 7729 13.0%
Singleton 7651 99.0%
Twins 78 1.0%
Triplets 0 0.0%
TOTAL BIRTHS 7802 5 (0.07%) cases of abortus
TYPES OF UTERINE SCAR
2014
Caesarean scar only 7456 96.4%
Non-Caesarean scar only 228 2.9%
Both scar 45 0.6%
Total 7729
CASEAREAN SECTION UTERINE SCAR
The prevalence of parturients having uterine scar from previous Caesarean section was
12.6% which was similar to that in 2009 and higher than that in 2004. While the overall caesarean
section rate was over 80%, the rate of caesarean section before labour was 68.0% in 2014 which
was lower than that in 2009 but similar to that in 2004. Postpartum haemorrhage rate was similar to
that in 2009 when stratified according to the mode of delivery. The rate of uterine rupture remained
0.03-0.05%. Uterine compression suture and balloon tamponade virtually replaced uterine artery
ligation and embolization for the management of post-partum haemorrhage and the hysterectomy
rate remained at 0.1-0.2%. There were not much changes in the fetal outcome parameters.
2004 2009 2014
TOTAL PREGNANCIES 4373 8.9% 10088 12.7% 7501 12.6%
Singleton 4330 99.0% 9952 98.6% 7431 99.1%
Twins 41 1.0% 135 1.3% 70 0.9%
Triplets 1 0.02% 1 0.01% 0 0.0%
TOTAL BIRTHS 4417 10225 7566 5 (0.07%) cases of abortus
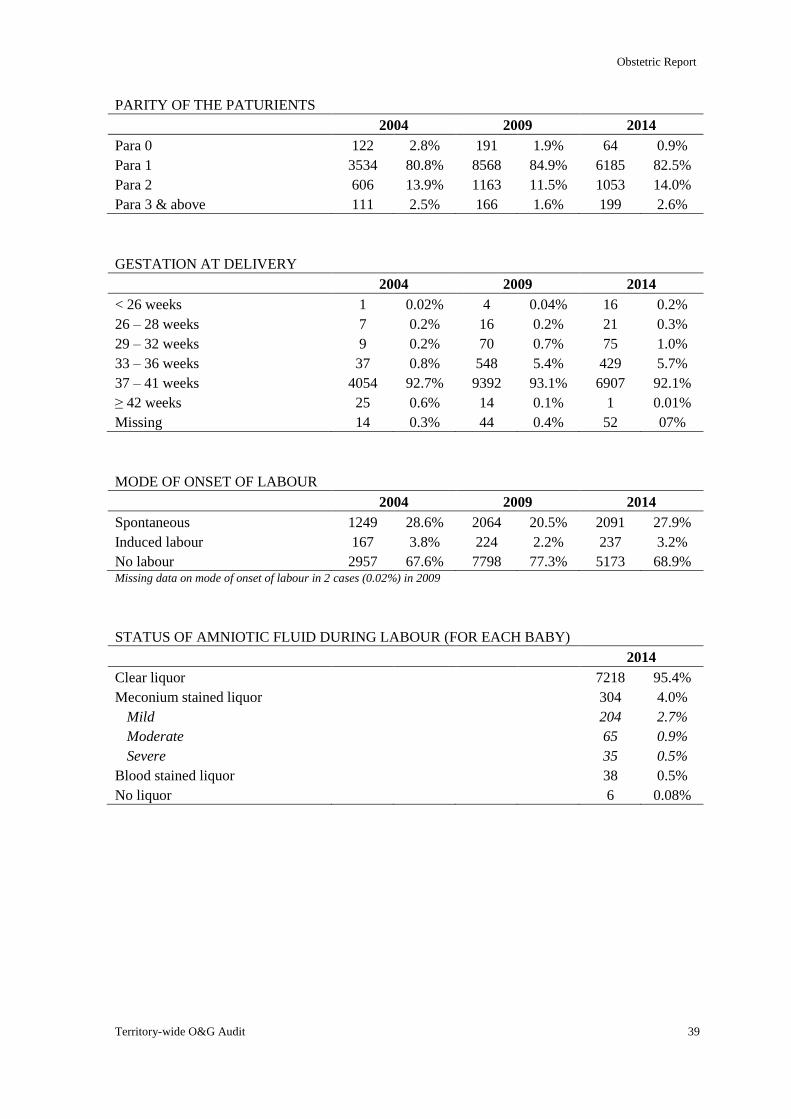
Obstetric Report
Territory-wide O&G Audit 39
PARITY OF THE PATURIENTS
2004 2009 2014
Para 0 122 2.8% 191 1.9% 64 0.9%
Para 1 3534 80.8% 8568 84.9% 6185 82.5%
Para 2 606 13.9% 1163 11.5% 1053 14.0%
Para 3 & above 111 2.5% 166 1.6% 199 2.6%
GESTATION AT DELIVERY
2004 2009 2014
< 26 weeks 1 0.02% 4 0.04% 16 0.2%
26 – 28 weeks 7 0.2% 16 0.2% 21 0.3%
29 – 32 weeks 9 0.2% 70 0.7% 75 1.0%
33 – 36 weeks 37 0.8% 548 5.4% 429 5.7%
37 – 41 weeks 4054 92.7% 9392 93.1% 6907 92.1%
≥ 42 weeks 25 0.6% 14 0.1% 1 0.01%
Missing 14 0.3% 44 0.4% 52 07%
MODE OF ONSET OF LABOUR
2004 2009 2014
Spontaneous 1249 28.6% 2064 20.5% 2091 27.9%
Induced labour 167 3.8% 224 2.2% 237 3.2%
No labour 2957 67.6% 7798 77.3% 5173 68.9% Missing data on mode of onset of labour in 2 cases (0.02%) in 2009
STATUS OF AMNIOTIC FLUID DURING LABOUR (FOR EACH BABY)
2014
Clear liquor 7218 95.4%
Meconium stained liquor 304 4.0%
Mild 204 2.7%
Moderate 65 0.9%
Severe 35 0.5%
Blood stained liquor 38 0.5%
No liquor 6 0.08%
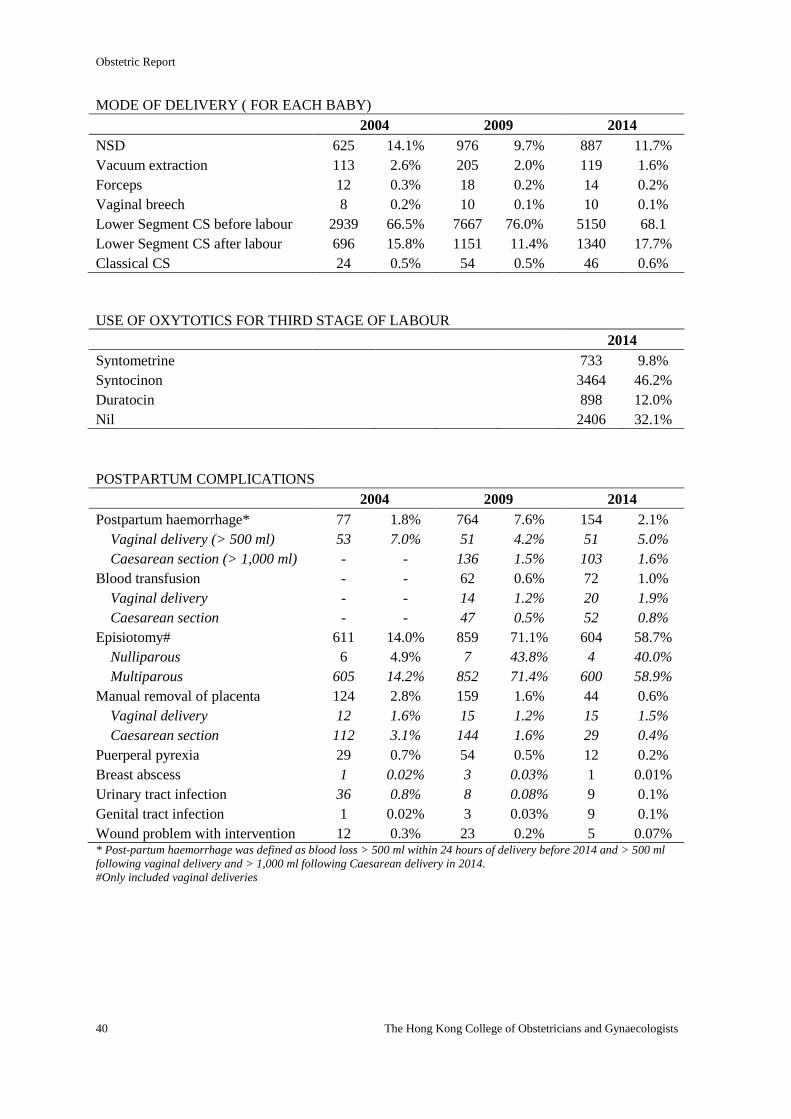
Obstetric Report
40 The Hong Kong College of Obstetricians and Gynaecologists
MODE OF DELIVERY ( FOR EACH BABY)
2004 2009 2014
NSD 625 14.1% 976 9.7% 887 11.7%
Vacuum extraction 113 2.6% 205 2.0% 119 1.6%
Forceps 12 0.3% 18 0.2% 14 0.2%
Vaginal breech 8 0.2% 10 0.1% 10 0.1%
Lower Segment CS before labour 2939 66.5% 7667 76.0% 5150 68.1
Lower Segment CS after labour 696 15.8% 1151 11.4% 1340 17.7%
Classical CS 24 0.5% 54 0.5% 46 0.6%
USE OF OXYTOTICS FOR THIRD STAGE OF LABOUR
2014
Syntometrine 733 9.8%
Syntocinon 3464 46.2%
Duratocin 898 12.0%
Nil 2406 32.1%
POSTPARTUM COMPLICATIONS
2004 2009 2014
Postpartum haemorrhage* 77 1.8% 764 7.6% 154 2.1%
Vaginal delivery (> 500 ml) 53 7.0% 51 4.2% 51 5.0%
Caesarean section (> 1,000 ml) - - 136 1.5% 103 1.6%
Blood transfusion - - 62 0.6% 72 1.0%
Vaginal delivery - - 14 1.2% 20 1.9%
Caesarean section - - 47 0.5% 52 0.8%
Episiotomy# 611 14.0% 859 71.1% 604 58.7%
Nulliparous 6 4.9% 7 43.8% 4 40.0%
Multiparous 605 14.2% 852 71.4% 600 58.9%
Manual removal of placenta 124 2.8% 159 1.6% 44 0.6%
Vaginal delivery 12 1.6% 15 1.2% 15 1.5%
Caesarean section 112 3.1% 144 1.6% 29 0.4%
Puerperal pyrexia 29 0.7% 54 0.5% 12 0.2%
Breast abscess 1 0.02% 3 0.03% 1 0.01%
Urinary tract infection 36 0.8% 8 0.08% 9 0.1%
Genital tract infection 1 0.02% 3 0.03% 9 0.1%
Wound problem with intervention 12 0.3% 23 0.2% 5 0.07% * Post-partum haemorrhage was defined as blood loss > 500 ml within 24 hours of delivery before 2014 and > 500 ml
following vaginal delivery and > 1,000 ml following Caesarean delivery in 2014.
#Only included vaginal deliveries
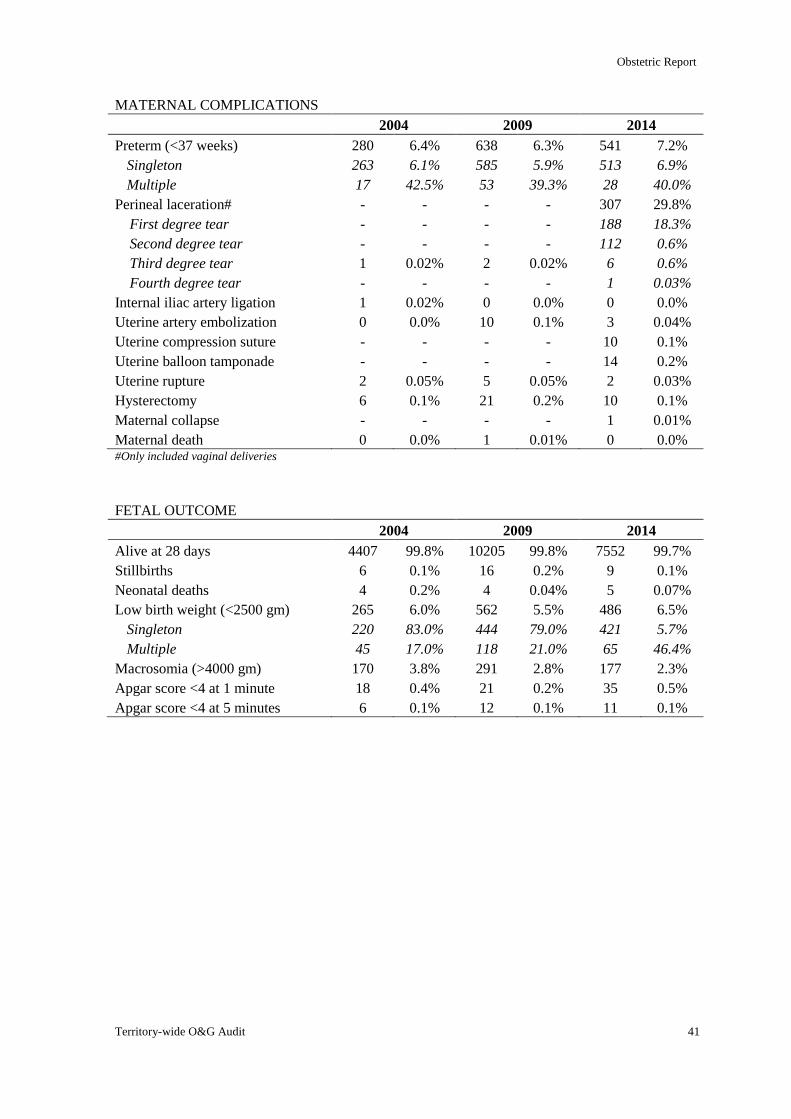
Obstetric Report
Territory-wide O&G Audit 41
MATERNAL COMPLICATIONS
2004 2009 2014
Preterm (<37 weeks) 280 6.4% 638 6.3% 541 7.2%
Singleton 263 6.1% 585 5.9% 513 6.9%
Multiple 17 42.5% 53 39.3% 28 40.0%
Perineal laceration# - - - - 307 29.8%
First degree tear - - - - 188 18.3%
Second degree tear - - - - 112 0.6%
Third degree tear 1 0.02% 2 0.02% 6 0.6%
Fourth degree tear - - - - 1 0.03%
Internal iliac artery ligation 1 0.02% 0 0.0% 0 0.0%
Uterine artery embolization 0 0.0% 10 0.1% 3 0.04%
Uterine compression suture - - - - 10 0.1%
Uterine balloon tamponade - - - - 14 0.2%
Uterine rupture 2 0.05% 5 0.05% 2 0.03%
Hysterectomy 6 0.1% 21 0.2% 10 0.1%
Maternal collapse - - - - 1 0.01%
Maternal death 0 0.0% 1 0.01% 0 0.0% #Only included vaginal deliveries
FETAL OUTCOME
2004 2009 2014
Alive at 28 days 4407 99.8% 10205 99.8% 7552 99.7%
Stillbirths 6 0.1% 16 0.2% 9 0.1%
Neonatal deaths 4 0.2% 4 0.04% 5 0.07%
Low birth weight (<2500 gm) 265 6.0% 562 5.5% 486 6.5%
Singleton 220 83.0% 444 79.0% 421 5.7%
Multiple 45 17.0% 118 21.0% 65 46.4%
Macrosomia (>4000 gm) 170 3.8% 291 2.8% 177 2.3%
Apgar score <4 at 1 minute 18 0.4% 21 0.2% 35 0.5%
Apgar score <4 at 5 minutes 6 0.1% 12 0.1% 11 0.1%
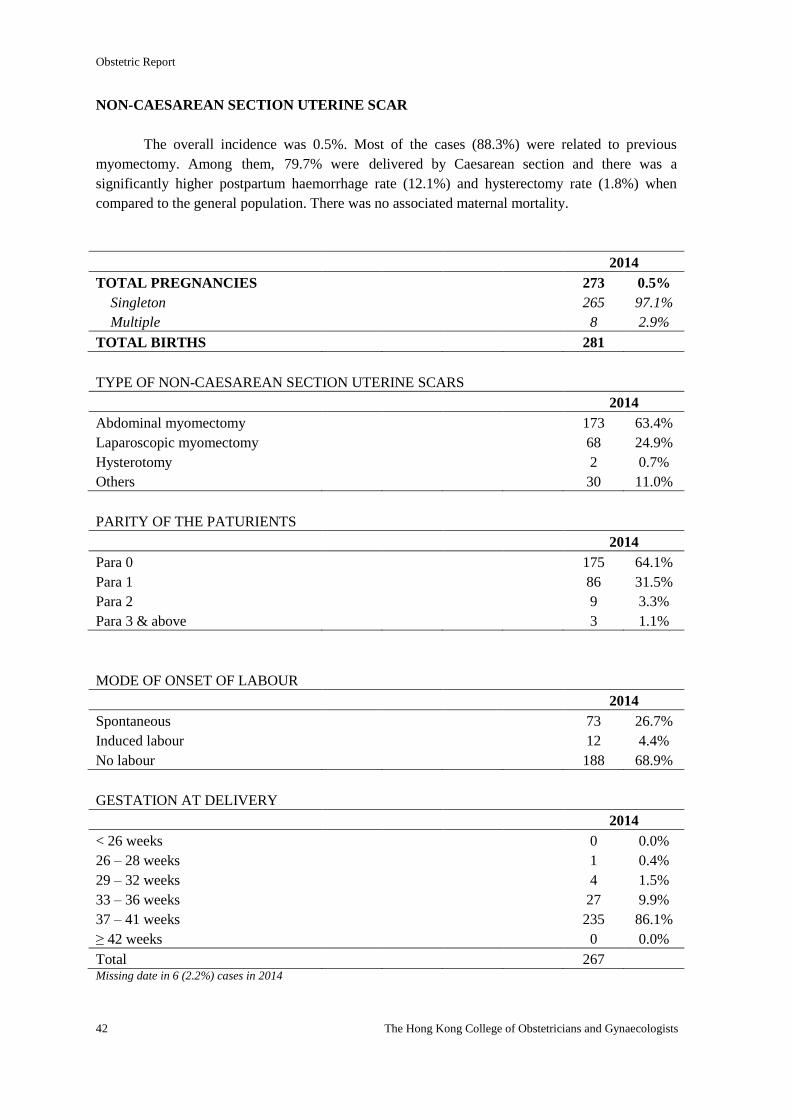
Obstetric Report
42 The Hong Kong College of Obstetricians and Gynaecologists
NON-CAESAREAN SECTION UTERINE SCAR
The overall incidence was 0.5%. Most of the cases (88.3%) were related to previous
myomectomy. Among them, 79.7% were delivered by Caesarean section and there was a
significantly higher postpartum haemorrhage rate (12.1%) and hysterectomy rate (1.8%) when
compared to the general population. There was no associated maternal mortality.
2014
TOTAL PREGNANCIES 273 0.5%
Singleton 265 97.1%
Multiple 8 2.9%
TOTAL BIRTHS 281
TYPE OF NON-CAESAREAN SECTION UTERINE SCARS
2014
Abdominal myomectomy 173 63.4%
Laparoscopic myomectomy 68 24.9%
Hysterotomy 2 0.7%
Others 30 11.0%
PARITY OF THE PATURIENTS
2014
Para 0 175 64.1%
Para 1 86 31.5%
Para 2 9 3.3%
Para 3 & above 3 1.1%
MODE OF ONSET OF LABOUR
2014
Spontaneous 73 26.7%
Induced labour 12 4.4%
No labour 188 68.9%
GESTATION AT DELIVERY
2014
< 26 weeks 0 0.0%
26 – 28 weeks 1 0.4%
29 – 32 weeks 4 1.5%
33 – 36 weeks 27 9.9%
37 – 41 weeks 235 86.1%
≥ 42 weeks 0 0.0%
Total 267 Missing date in 6 (2.2%) cases in 2014
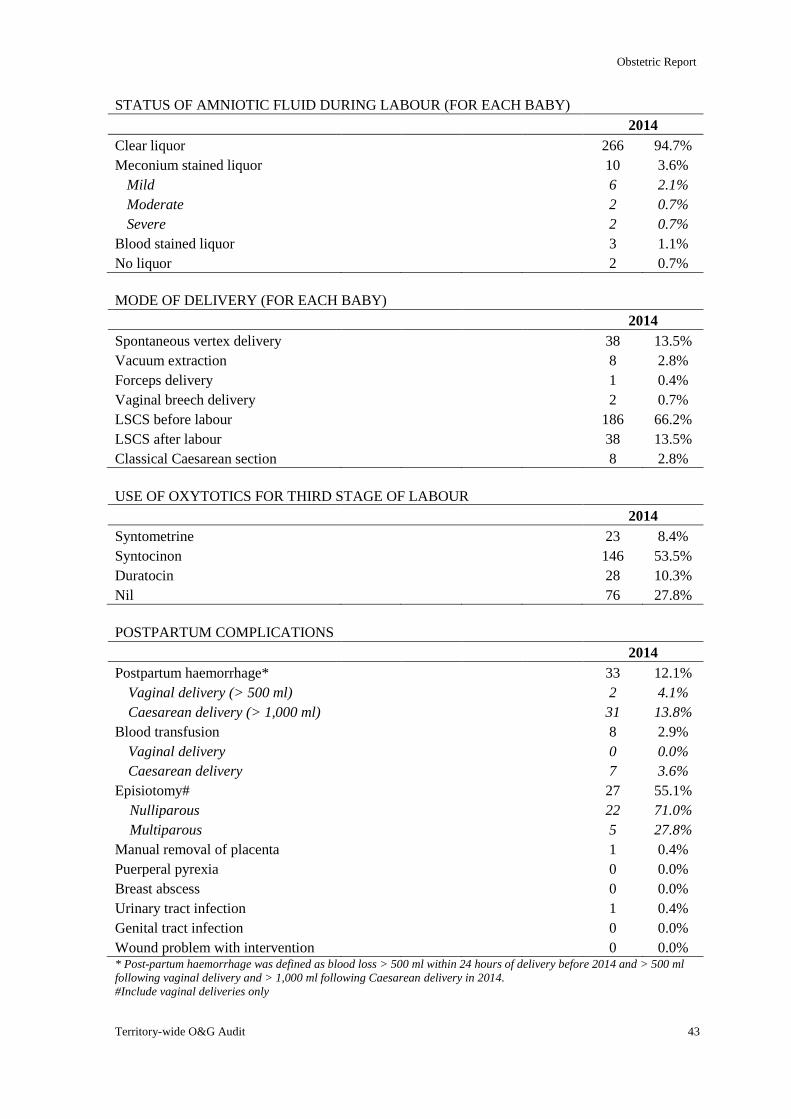
Obstetric Report
Territory-wide O&G Audit 43
STATUS OF AMNIOTIC FLUID DURING LABOUR (FOR EACH BABY)
2014
Clear liquor 266 94.7%
Meconium stained liquor 10 3.6%
Mild 6 2.1%
Moderate 2 0.7%
Severe 2 0.7%
Blood stained liquor 3 1.1%
No liquor 2 0.7%
MODE OF DELIVERY (FOR EACH BABY)
2014
Spontaneous vertex delivery 38 13.5%
Vacuum extraction 8 2.8%
Forceps delivery 1 0.4%
Vaginal breech delivery 2 0.7%
LSCS before labour 186 66.2%
LSCS after labour 38 13.5%
Classical Caesarean section 8 2.8%
USE OF OXYTOTICS FOR THIRD STAGE OF LABOUR
2014
Syntometrine 23 8.4%
Syntocinon 146 53.5%
Duratocin 28 10.3%
Nil 76 27.8%
POSTPARTUM COMPLICATIONS
2014
Postpartum haemorrhage* 33 12.1%
Vaginal delivery (> 500 ml) 2 4.1%
Caesarean delivery (> 1,000 ml) 31 13.8%
Blood transfusion 8 2.9%
Vaginal delivery 0 0.0%
Caesarean delivery 7 3.6%
Episiotomy# 27 55.1%
Nulliparous 22 71.0%
Multiparous 5 27.8%
Manual removal of placenta 1 0.4%
Puerperal pyrexia 0 0.0%
Breast abscess 0 0.0%
Urinary tract infection 1 0.4%
Genital tract infection 0 0.0%
Wound problem with intervention 0 0.0% * Post-partum haemorrhage was defined as blood loss > 500 ml within 24 hours of delivery before 2014 and > 500 ml
following vaginal delivery and > 1,000 ml following Caesarean delivery in 2014.
#Include vaginal deliveries only

Obstetric Report
44 The Hong Kong College of Obstetricians and Gynaecologists
MATERNAL COMPLICATIONS
2014
Preterm (<37 weeks) 32 11.7%
Singleton 29 10.9%
Multiple 3 37.5%
Perineal laceration# 14 28.6%
First degree tear 10 20.4%
Second degree tear 4 8.2%
Third degree tear 0 0.0%
Fourth degree tear 0 0.0%
Internal iliac artery ligation 0 0.0%
Uterine artery embolization 1 0.4%
Uterine compression suture 8 2.9%
Uterine balloon tamponade 3 1.1%
Uterine rupture 0 0.0%
Hysterectomy 5 1.8%
Maternal collapse 0 0.0%
Maternal death 0 0.0% Missing data in gestation in 6(2.2%) cases in 2014
FETAL OUTCOME
2014
Alive at 28 days 279 99.3%
Stillbirths 1 0.4%
Neonatal deaths 1 0.4%
Low birth weight (<2500 gm) 27 9.6%
Singleton 21 7.5%
Multiple 6 2.1%
Macrosomia (>4000 gm) 5 1.8%
Apgar score <4 at 1 minute 1 0.4%
Apgar score <4 at 5 minutes 1 0.4%
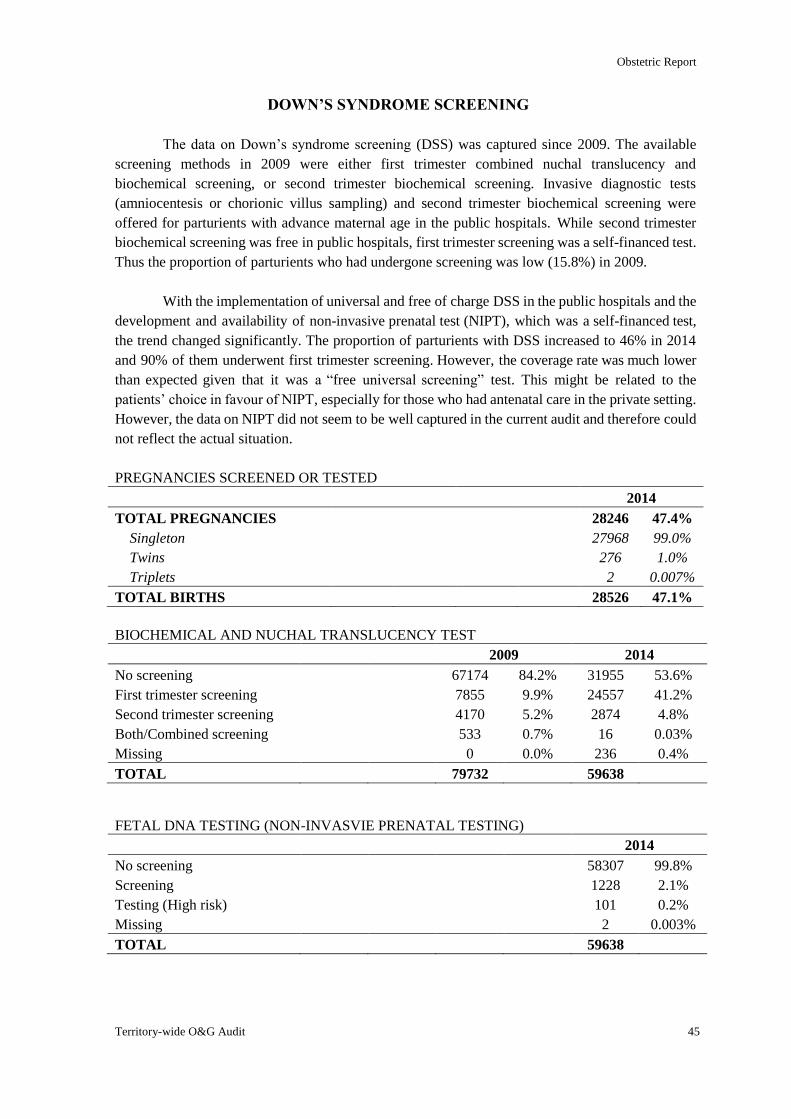
Obstetric Report
Territory-wide O&G Audit 45
DOWN’S SYNDROME SCREENING
The data on Down’s syndrome screening (DSS) was captured since 2009. The available
screening methods in 2009 were either first trimester combined nuchal translucency and
biochemical screening, or second trimester biochemical screening. Invasive diagnostic tests
(amniocentesis or chorionic villus sampling) and second trimester biochemical screening were
offered for parturients with advance maternal age in the public hospitals. While second trimester
biochemical screening was free in public hospitals, first trimester screening was a self-financed test.
Thus the proportion of parturients who had undergone screening was low (15.8%) in 2009.
With the implementation of universal and free of charge DSS in the public hospitals and the
development and availability of non-invasive prenatal test (NIPT), which was a self-financed test,
the trend changed significantly. The proportion of parturients with DSS increased to 46% in 2014
and 90% of them underwent first trimester screening. However, the coverage rate was much lower
than expected given that it was a “free universal screening” test. This might be related to the
patients’ choice in favour of NIPT, especially for those who had antenatal care in the private setting.
However, the data on NIPT did not seem to be well captured in the current audit and therefore could
not reflect the actual situation.
PREGNANCIES SCREENED OR TESTED
2014
TOTAL PREGNANCIES 28246 47.4%
Singleton 27968 99.0%
Twins 276 1.0%
Triplets 2 0.007%
TOTAL BIRTHS 28526 47.1%
BIOCHEMICAL AND NUCHAL TRANSLUCENCY TEST
2009 2014
No screening 67174 84.2% 31955 53.6%
First trimester screening 7855 9.9% 24557 41.2%
Second trimester screening 4170 5.2% 2874 4.8%
Both/Combined screening 533 0.7% 16 0.03%
Missing 0 0.0% 236 0.4%
TOTAL 79732 59638
FETAL DNA TESTING (NON-INVASVIE PRENATAL TESTING)
2014
No screening 58307 99.8%
Screening 1228 2.1%
Testing (High risk) 101 0.2%
Missing 2 0.003%
TOTAL 59638
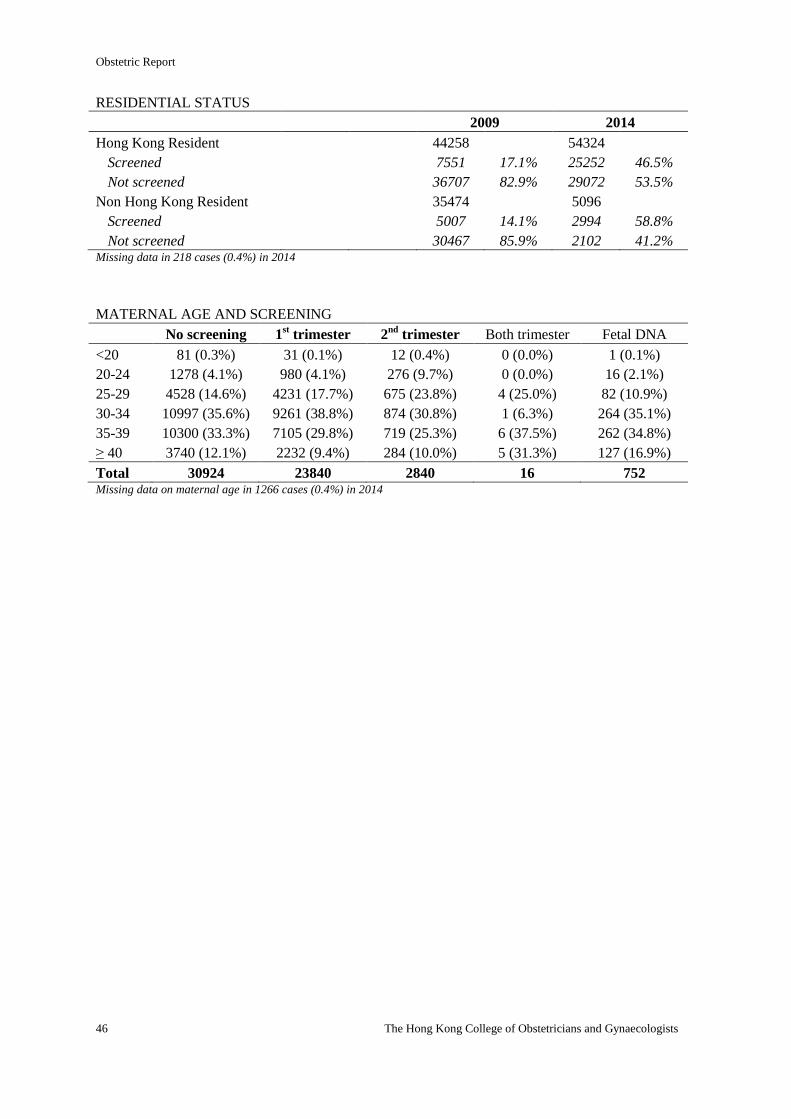
Obstetric Report
46 The Hong Kong College of Obstetricians and Gynaecologists
RESIDENTIAL STATUS
2009 2014
Hong Kong Resident 44258 54324
Screened 7551 17.1% 25252 46.5%
Not screened 36707 82.9% 29072 53.5%
Non Hong Kong Resident 35474 5096
Screened 5007 14.1% 2994 58.8%
Not screened 30467 85.9% 2102 41.2% Missing data in 218 cases (0.4%) in 2014
MATERNAL AGE AND SCREENING
No screening 1st trimester 2
nd trimester Both trimester Fetal DNA
<20 81 (0.3%) 31 (0.1%) 12 (0.4%) 0 (0.0%) 1 (0.1%)
20-24 1278 (4.1%) 980 (4.1%) 276 (9.7%) 0 (0.0%) 16 (2.1%)
25-29 4528 (14.6%) 4231 (17.7%) 675 (23.8%) 4 (25.0%) 82 (10.9%)
30-34 10997 (35.6%) 9261 (38.8%) 874 (30.8%) 1 (6.3%) 264 (35.1%)
35-39 10300 (33.3%) 7105 (29.8%) 719 (25.3%) 6 (37.5%) 262 (34.8%)
≥ 40 3740 (12.1%) 2232 (9.4%) 284 (10.0%) 5 (31.3%) 127 (16.9%)
Total 30924 23840 2840 16 752 Missing data on maternal age in 1266 cases (0.4%) in 2014
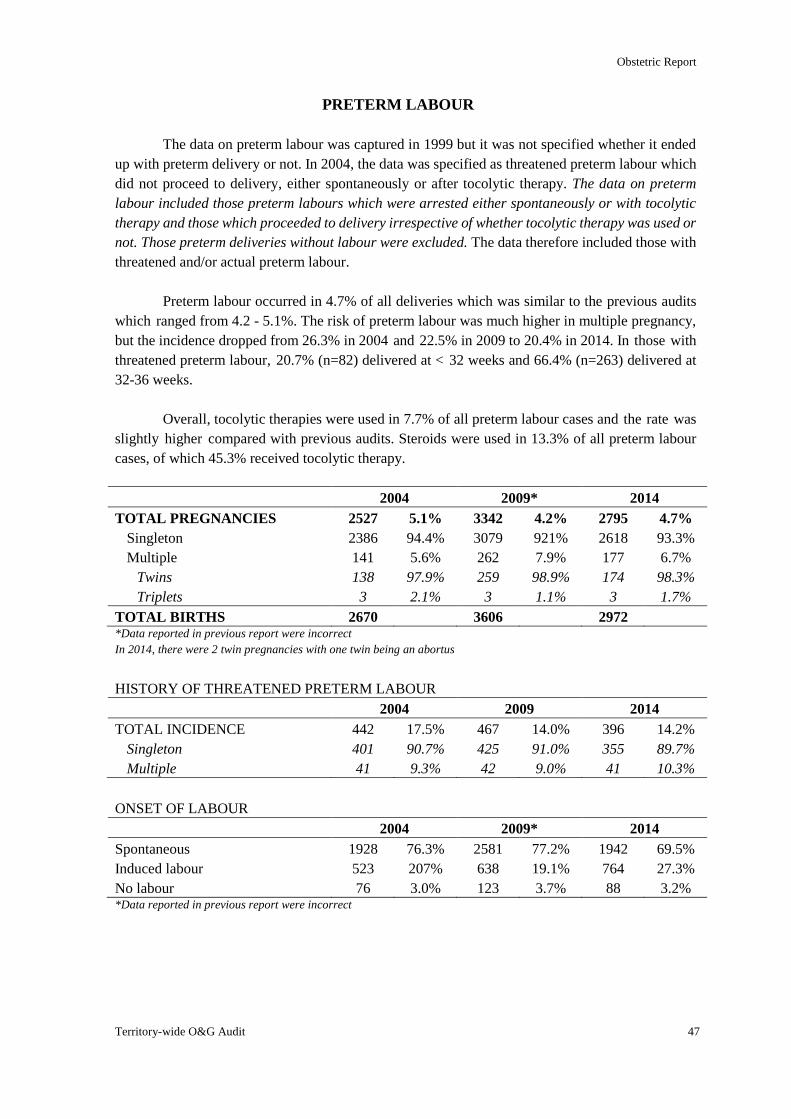
Obstetric Report
Territory-wide O&G Audit 47
PRETERM LABOUR
The data on preterm labour was captured in 1999 but it was not specified whether it ended
up with preterm delivery or not. In 2004, the data was specified as threatened preterm labour which
did not proceed to delivery, either spontaneously or after tocolytic therapy. The data on preterm
labour included those preterm labours which were arrested either spontaneously or with tocolytic
therapy and those which proceeded to delivery irrespective of whether tocolytic therapy was used or
not. Those preterm deliveries without labour were excluded. The data therefore included those with
threatened and/or actual preterm labour.
Preterm labour occurred in 4.7% of all deliveries which was similar to the previous audits
which ranged from 4.2 - 5.1%. The risk of preterm labour was much higher in multiple pregnancy,
but the incidence dropped from 26.3% in 2004 and 22.5% in 2009 to 20.4% in 2014. In those with
threatened preterm labour, 20.7% (n=82) delivered at < 32 weeks and 66.4% (n=263) delivered at
32-36 weeks.
Overall, tocolytic therapies were used in 7.7% of all preterm labour cases and the rate was
slightly higher compared with previous audits. Steroids were used in 13.3% of all preterm labour
cases, of which 45.3% received tocolytic therapy.
2004 2009* 2014
TOTAL PREGNANCIES 2527 5.1% 3342 4.2% 2795 4.7%
Singleton 2386 94.4% 3079 921% 2618 93.3%
Multiple 141 5.6% 262 7.9% 177 6.7%
Twins 138 97.9% 259 98.9% 174 98.3%
Triplets 3 2.1% 3 1.1% 3 1.7%
TOTAL BIRTHS 2670 3606 2972 *Data reported in previous report were incorrect
In 2014, there were 2 twin pregnancies with one twin being an abortus
HISTORY OF THREATENED PRETERM LABOUR
2004 2009 2014
TOTAL INCIDENCE 442 17.5% 467 14.0% 396 14.2%
Singleton 401 90.7% 425 91.0% 355 89.7%
Multiple 41 9.3% 42 9.0% 41 10.3%
ONSET OF LABOUR
2004 2009* 2014
Spontaneous 1928 76.3% 2581 77.2% 1942 69.5%
Induced labour 523 207% 638 19.1% 764 27.3%
No labour 76 3.0% 123 3.7% 88 3.2% *Data reported in previous report were incorrect
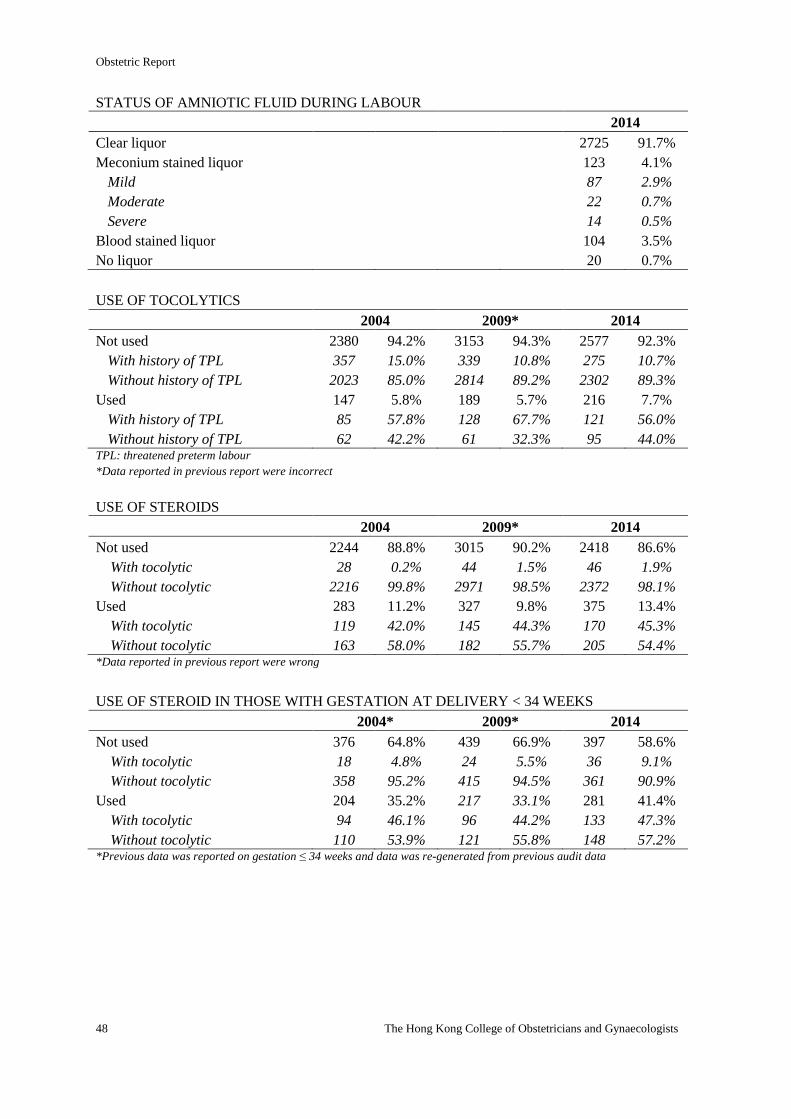
Obstetric Report
48 The Hong Kong College of Obstetricians and Gynaecologists
STATUS OF AMNIOTIC FLUID DURING LABOUR
2014
Clear liquor 2725 91.7%
Meconium stained liquor 123 4.1%
Mild 87 2.9%
Moderate 22 0.7%
Severe 14 0.5%
Blood stained liquor 104 3.5%
No liquor 20 0.7%
USE OF TOCOLYTICS
2004 2009* 2014
Not used 2380 94.2% 3153 94.3% 2577 92.3%
With history of TPL 357 15.0% 339 10.8% 275 10.7%
Without history of TPL 2023 85.0% 2814 89.2% 2302 89.3%
Used 147 5.8% 189 5.7% 216 7.7%
With history of TPL 85 57.8% 128 67.7% 121 56.0%
Without history of TPL 62 42.2% 61 32.3% 95 44.0% TPL: threatened preterm labour
*Data reported in previous report were incorrect
USE OF STEROIDS
2004 2009* 2014
Not used 2244 88.8% 3015 90.2% 2418 86.6%
With tocolytic 28 0.2% 44 1.5% 46 1.9%
Without tocolytic 2216 99.8% 2971 98.5% 2372 98.1%
Used 283 11.2% 327 9.8% 375 13.4%
With tocolytic 119 42.0% 145 44.3% 170 45.3%
Without tocolytic 163 58.0% 182 55.7% 205 54.4% *Data reported in previous report were wrong
USE OF STEROID IN THOSE WITH GESTATION AT DELIVERY < 34 WEEKS
2004* 2009* 2014
Not used 376 64.8% 439 66.9% 397 58.6%
With tocolytic 18 4.8% 24 5.5% 36 9.1%
Without tocolytic 358 95.2% 415 94.5% 361 90.9%
Used 204 35.2% 217 33.1% 281 41.4%
With tocolytic 94 46.1% 96 44.2% 133 47.3%
Without tocolytic 110 53.9% 121 55.8% 148 57.2% *Previous data was reported on gestation ≤ 34 weeks and data was re-generated from previous audit data
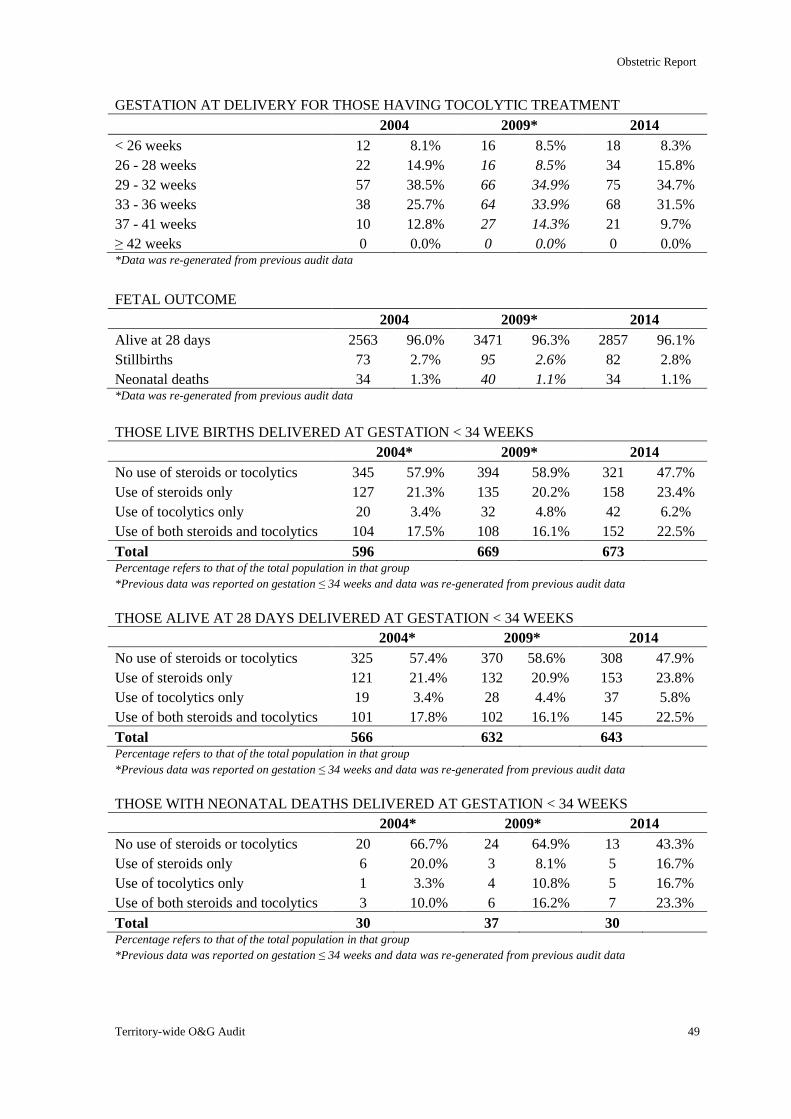
Obstetric Report
Territory-wide O&G Audit 49
GESTATION AT DELIVERY FOR THOSE HAVING TOCOLYTIC TREATMENT
2004 2009* 2014
< 26 weeks 12 8.1% 16 8.5% 18 8.3%
26 - 28 weeks 22 14.9% 16 8.5% 34 15.8%
29 - 32 weeks 57 38.5% 66 34.9% 75 34.7%
33 - 36 weeks 38 25.7% 64 33.9% 68 31.5%
37 - 41 weeks 10 12.8% 27 14.3% 21 9.7%
≥ 42 weeks 0 0.0% 0 0.0% 0 0.0% *Data was re-generated from previous audit data
FETAL OUTCOME
2004 2009* 2014
Alive at 28 days 2563 96.0% 3471 96.3% 2857 96.1%
Stillbirths 73 2.7% 95 2.6% 82 2.8%
Neonatal deaths 34 1.3% 40 1.1% 34 1.1% *Data was re-generated from previous audit data
THOSE LIVE BIRTHS DELIVERED AT GESTATION < 34 WEEKS
2004* 2009* 2014
No use of steroids or tocolytics 345 57.9% 394 58.9% 321 47.7%
Use of steroids only 127 21.3% 135 20.2% 158 23.4%
Use of tocolytics only 20 3.4% 32 4.8% 42 6.2%
Use of both steroids and tocolytics 104 17.5% 108 16.1% 152 22.5%
Total 596 669 673 Percentage refers to that of the total population in that group
*Previous data was reported on gestation ≤ 34 weeks and data was re-generated from previous audit data
THOSE ALIVE AT 28 DAYS DELIVERED AT GESTATION < 34 WEEKS
2004* 2009* 2014
No use of steroids or tocolytics 325 57.4% 370 58.6% 308 47.9%
Use of steroids only 121 21.4% 132 20.9% 153 23.8%
Use of tocolytics only 19 3.4% 28 4.4% 37 5.8%
Use of both steroids and tocolytics 101 17.8% 102 16.1% 145 22.5%
Total 566 632 643 Percentage refers to that of the total population in that group
*Previous data was reported on gestation ≤ 34 weeks and data was re-generated from previous audit data
THOSE WITH NEONATAL DEATHS DELIVERED AT GESTATION < 34 WEEKS
2004* 2009* 2014
No use of steroids or tocolytics 20 66.7% 24 64.9% 13 43.3%
Use of steroids only 6 20.0% 3 8.1% 5 16.7%
Use of tocolytics only 1 3.3% 4 10.8% 5 16.7%
Use of both steroids and tocolytics 3 10.0% 6 16.2% 7 23.3%
Total 30 37 30 Percentage refers to that of the total population in that group
*Previous data was reported on gestation ≤ 34 weeks and data was re-generated from previous audit data
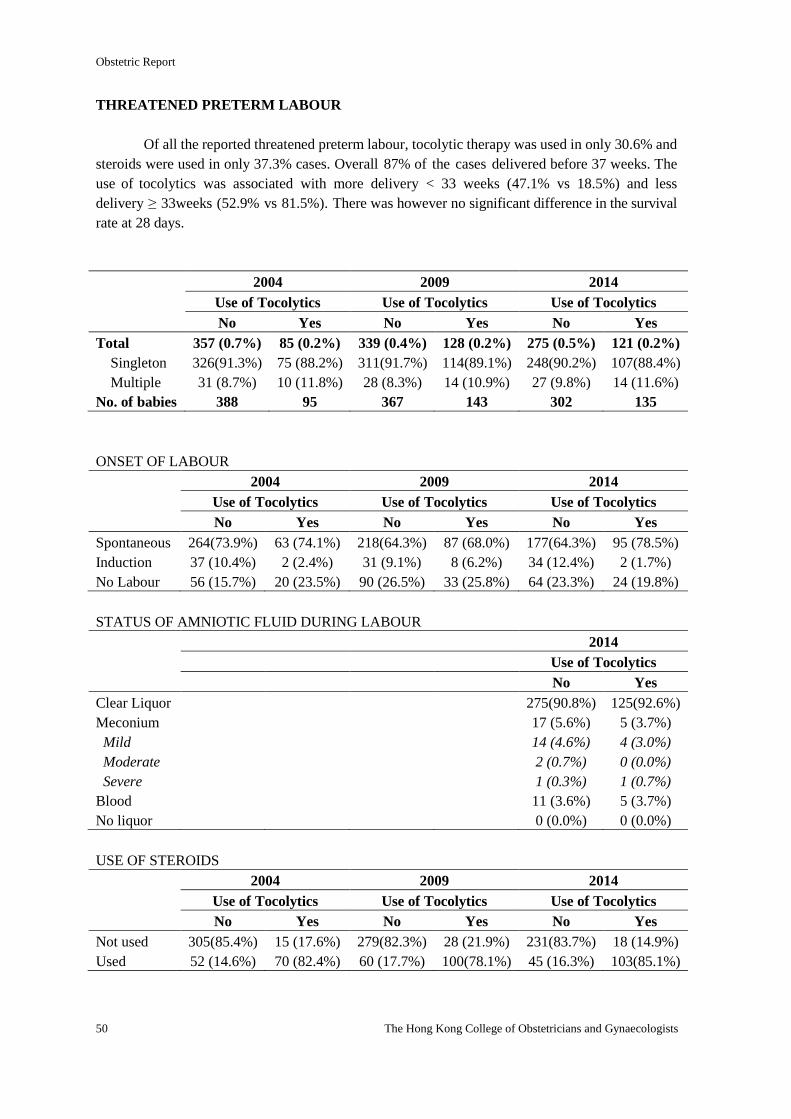
Obstetric Report
50 The Hong Kong College of Obstetricians and Gynaecologists
THREATENED PRETERM LABOUR
Of all the reported threatened preterm labour, tocolytic therapy was used in only 30.6% and
steroids were used in only 37.3% cases. Overall 87% of the cases delivered before 37 weeks. The
use of tocolytics was associated with more delivery < 33 weeks (47.1% vs 18.5%) and less
delivery ≥ 33weeks (52.9% vs 81.5%). There was however no significant difference in the survival
rate at 28 days.
2004 2009 2014
Use of Tocolytics Use of Tocolytics Use of Tocolytics
No Yes No Yes No Yes
Total 357 (0.7%) 85 (0.2%) 339 (0.4%) 128 (0.2%) 275 (0.5%) 121 (0.2%)
Singleton 326(91.3%) 75 (88.2%) 311(91.7%) 114(89.1%) 248(90.2%) 107(88.4%)
Multiple 31 (8.7%) 10 (11.8%) 28 (8.3%) 14 (10.9%) 27 (9.8%) 14 (11.6%)
No. of babies 388 95 367 143 302 135
ONSET OF LABOUR
2004 2009 2014
Use of Tocolytics Use of Tocolytics Use of Tocolytics
No Yes No Yes No Yes
Spontaneous 264(73.9%) 63 (74.1%) 218(64.3%) 87 (68.0%) 177(64.3%) 95 (78.5%)
Induction 37 (10.4%) 2 (2.4%) 31 (9.1%) 8 (6.2%) 34 (12.4%) 2 (1.7%)
No Labour 56 (15.7%) 20 (23.5%) 90 (26.5%) 33 (25.8%) 64 (23.3%) 24 (19.8%)
STATUS OF AMNIOTIC FLUID DURING LABOUR
2014
Use of Tocolytics
No Yes
Clear Liquor 275(90.8%) 125(92.6%)
Meconium 17 (5.6%) 5 (3.7%)
Mild 14 (4.6%) 4 (3.0%)
Moderate 2 (0.7%) 0 (0.0%)
Severe 1 (0.3%) 1 (0.7%)
Blood 11 (3.6%) 5 (3.7%)
No liquor 0 (0.0%) 0 (0.0%)
USE OF STEROIDS
2004 2009 2014
Use of Tocolytics Use of Tocolytics Use of Tocolytics
No Yes No Yes No Yes
Not used 305(85.4%) 15 (17.6%) 279(82.3%) 28 (21.9%) 231(83.7%) 18 (14.9%)
Used 52 (14.6%) 70 (82.4%) 60 (17.7%) 100(78.1%) 45 (16.3%) 103(85.1%)
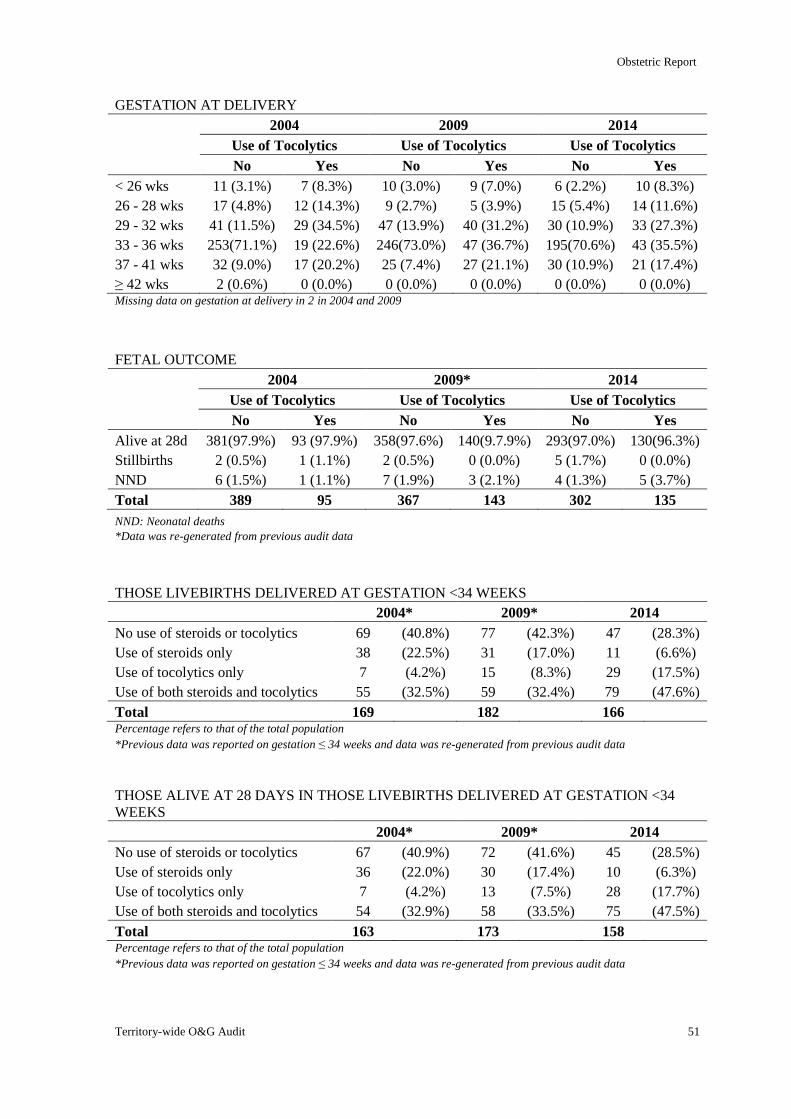
Obstetric Report
Territory-wide O&G Audit 51
GESTATION AT DELIVERY
2004 2009 2014
Use of Tocolytics Use of Tocolytics Use of Tocolytics
No Yes No Yes No Yes
< 26 wks 11 (3.1%) 7 (8.3%) 10 (3.0%) 9 (7.0%) 6 (2.2%) 10 (8.3%)
26 - 28 wks 17 (4.8%) 12 (14.3%) 9 (2.7%) 5 (3.9%) 15 (5.4%) 14 (11.6%)
29 - 32 wks 41 (11.5%) 29 (34.5%) 47 (13.9%) 40 (31.2%) 30 (10.9%) 33 (27.3%)
33 - 36 wks 253(71.1%) 19 (22.6%) 246(73.0%) 47 (36.7%) 195(70.6%) 43 (35.5%)
37 - 41 wks 32 (9.0%) 17 (20.2%) 25 (7.4%) 27 (21.1%) 30 (10.9%) 21 (17.4%)
≥ 42 wks 2 (0.6%) 0 (0.0%) 0 (0.0%) 0 (0.0%) 0 (0.0%) 0 (0.0%) Missing data on gestation at delivery in 2 in 2004 and 2009
FETAL OUTCOME
2004 2009* 2014
Use of Tocolytics Use of Tocolytics Use of Tocolytics
No Yes No Yes No Yes
Alive at 28d 381(97.9%) 93 (97.9%) 358(97.6%) 140(9.7.9%) 293(97.0%) 130(96.3%)
Stillbirths 2 (0.5%) 1 (1.1%) 2 (0.5%) 0 (0.0%) 5 (1.7%) 0 (0.0%)
NND 6 (1.5%) 1 (1.1%) 7 (1.9%) 3 (2.1%) 4 (1.3%) 5 (3.7%)
Total 389 95 367 143 302 135
NND: Neonatal deaths
*Data was re-generated from previous audit data
THOSE LIVEBIRTHS DELIVERED AT GESTATION <34 WEEKS
2004* 2009* 2014
No use of steroids or tocolytics 69 (40.8%) 77 (42.3%) 47 (28.3%)
Use of steroids only 38 (22.5%) 31 (17.0%) 11 (6.6%)
Use of tocolytics only 7 (4.2%) 15 (8.3%) 29 (17.5%)
Use of both steroids and tocolytics 55 (32.5%) 59 (32.4%) 79 (47.6%)
Total 169 182 166 Percentage refers to that of the total population *Previous data was reported on gestation ≤ 34 weeks and data was re-generated from previous audit data
THOSE ALIVE AT 28 DAYS IN THOSE LIVEBIRTHS DELIVERED AT GESTATION <34
WEEKS
2004* 2009* 2014
No use of steroids or tocolytics 67 (40.9%) 72 (41.6%) 45 (28.5%)
Use of steroids only 36 (22.0%) 30 (17.4%) 10 (6.3%)
Use of tocolytics only 7 (4.2%) 13 (7.5%) 28 (17.7%)
Use of both steroids and tocolytics 54 (32.9%) 58 (33.5%) 75 (47.5%)
Total 163 173 158 Percentage refers to that of the total population *Previous data was reported on gestation ≤ 34 weeks and data was re-generated from previous audit data
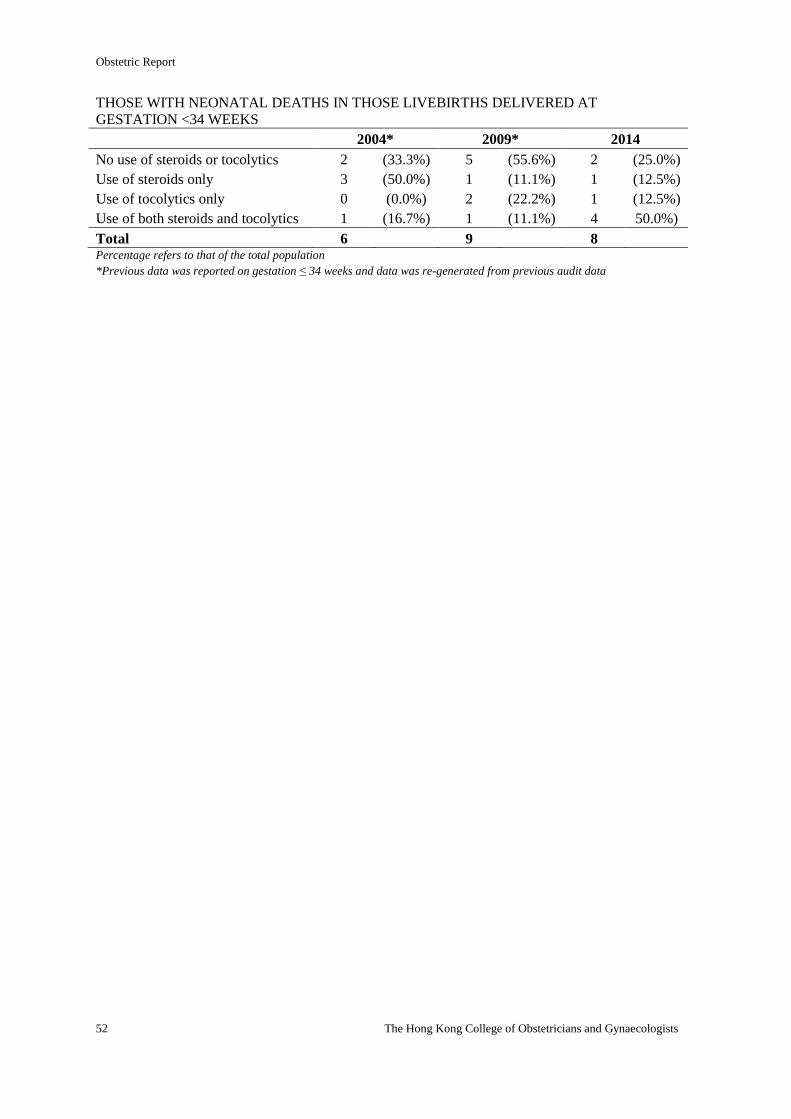
Obstetric Report
52 The Hong Kong College of Obstetricians and Gynaecologists
THOSE WITH NEONATAL DEATHS IN THOSE LIVEBIRTHS DELIVERED AT
GESTATION <34 WEEKS
2004* 2009* 2014
No use of steroids or tocolytics 2 (33.3%) 5 (55.6%) 2 (25.0%)
Use of steroids only 3 (50.0%) 1 (11.1%) 1 (12.5%)
Use of tocolytics only 0 (0.0%) 2 (22.2%) 1 (12.5%)
Use of both steroids and tocolytics 1 (16.7%) 1 (11.1%) 4 50.0%)
Total 6 9 8 Percentage refers to that of the total population *Previous data was reported on gestation ≤ 34 weeks and data was re-generated from previous audit data
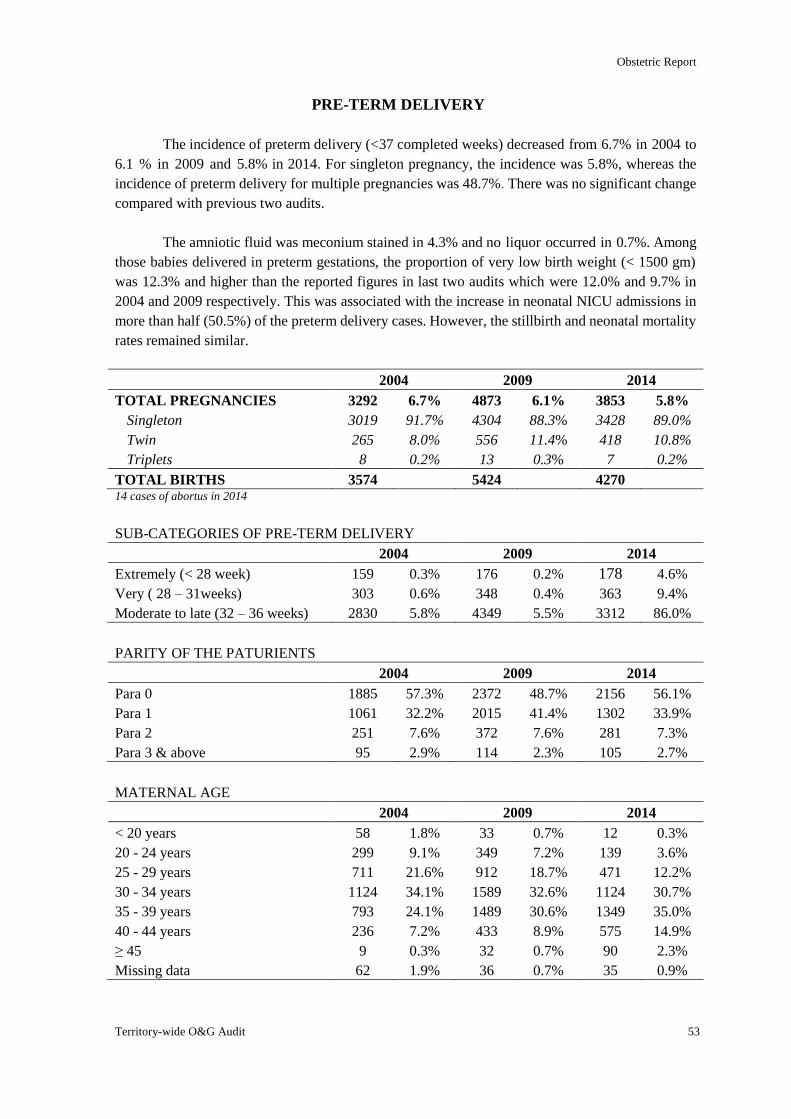
Obstetric Report
Territory-wide O&G Audit 53
PRE-TERM DELIVERY
The incidence of preterm delivery (<37 completed weeks) decreased from 6.7% in 2004 to
6.1 % in 2009 and 5.8% in 2014. For singleton pregnancy, the incidence was 5.8%, whereas the
incidence of preterm delivery for multiple pregnancies was 48.7%. There was no significant change
compared with previous two audits.
The amniotic fluid was meconium stained in 4.3% and no liquor occurred in 0.7%. Among
those babies delivered in preterm gestations, the proportion of very low birth weight (< 1500 gm)
was 12.3% and higher than the reported figures in last two audits which were 12.0% and 9.7% in
2004 and 2009 respectively. This was associated with the increase in neonatal NICU admissions in
more than half (50.5%) of the preterm delivery cases. However, the stillbirth and neonatal mortality
rates remained similar.
2004 2009 2014
TOTAL PREGNANCIES 3292 6.7% 4873 6.1% 3853 5.8%
Singleton 3019 91.7% 4304 88.3% 3428 89.0%
Twin 265 8.0% 556 11.4% 418 10.8%
Triplets 8 0.2% 13 0.3% 7 0.2%
TOTAL BIRTHS 3574 5424 4270 14 cases of abortus in 2014
SUB-CATEGORIES OF PRE-TERM DELIVERY
2004 2009 2014
Extremely (< 28 week) 159 0.3% 176 0.2% 178 4.6%
Very ( 28 – 31weeks) 303 0.6% 348 0.4% 363 9.4%
Moderate to late (32 – 36 weeks) 2830 5.8% 4349 5.5% 3312 86.0%
PARITY OF THE PATURIENTS
2004 2009 2014
Para 0 1885 57.3% 2372 48.7% 2156 56.1%
Para 1 1061 32.2% 2015 41.4% 1302 33.9%
Para 2 251 7.6% 372 7.6% 281 7.3%
Para 3 & above 95 2.9% 114 2.3% 105 2.7%
MATERNAL AGE
2004 2009 2014
< 20 years 58 1.8% 33 0.7% 12 0.3%
20 - 24 years 299 9.1% 349 7.2% 139 3.6%
25 - 29 years 711 21.6% 912 18.7% 471 12.2%
30 - 34 years 1124 34.1% 1589 32.6% 1124 30.7%
35 - 39 years 793 24.1% 1489 30.6% 1349 35.0%
40 - 44 years 236 7.2% 433 8.9% 575 14.9%
≥ 45 9 0.3% 32 0.7% 90 2.3%
Missing data 62 1.9% 36 0.7% 35 0.9%
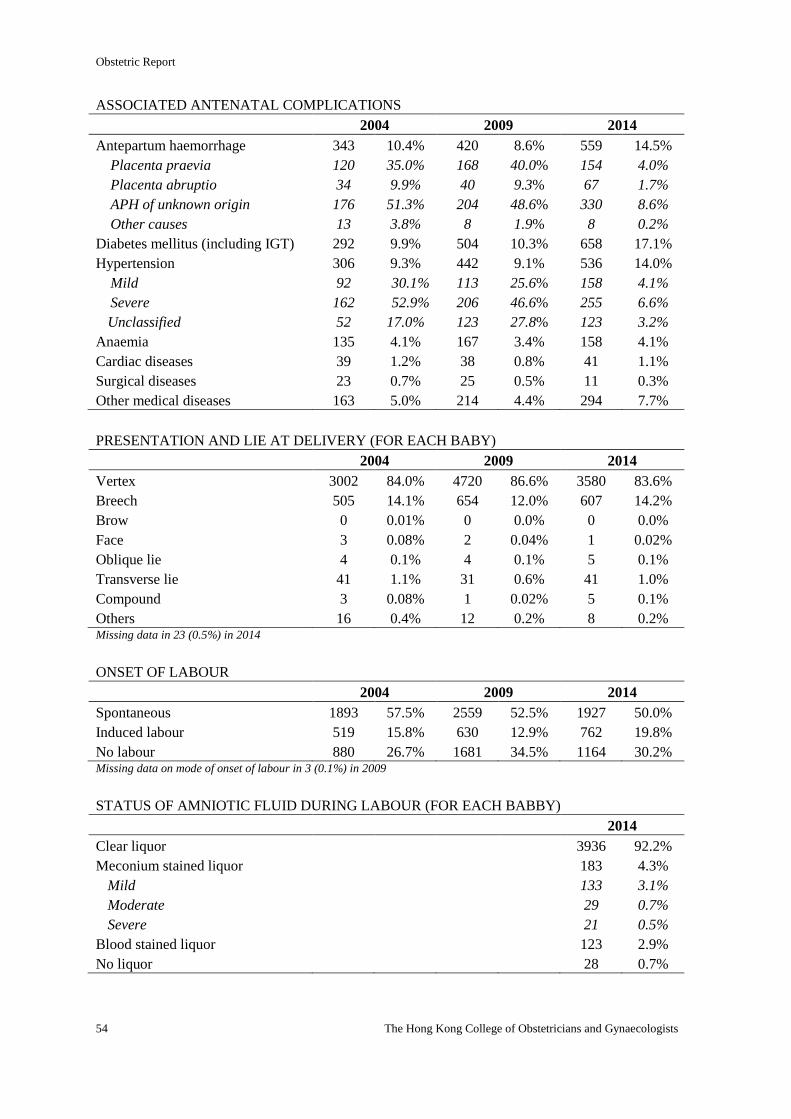
Obstetric Report
54 The Hong Kong College of Obstetricians and Gynaecologists
ASSOCIATED ANTENATAL COMPLICATIONS
2004 2009 2014
Antepartum haemorrhage 343 10.4% 420 8.6% 559 14.5%
Placenta praevia 120 35.0% 168 40.0% 154 4.0%
Placenta abruptio 34 9.9% 40 9.3% 67 1.7%
APH of unknown origin 176 51.3% 204 48.6% 330 8.6%
Other causes 13 3.8% 8 1.9% 8 0.2%
Diabetes mellitus (including IGT) 292 9.9% 504 10.3% 658 17.1%
Hypertension 306 9.3% 442 9.1% 536 14.0%
Mild 92 30.1% 113 25.6% 158 4.1%
Severe 162 52.9% 206 46.6% 255 6.6%
Unclassified 52 17.0% 123 27.8% 123 3.2%
Anaemia 135 4.1% 167 3.4% 158 4.1%
Cardiac diseases 39 1.2% 38 0.8% 41 1.1%
Surgical diseases 23 0.7% 25 0.5% 11 0.3%
Other medical diseases 163 5.0% 214 4.4% 294 7.7%
PRESENTATION AND LIE AT DELIVERY (FOR EACH BABY)
2004 2009 2014
Vertex 3002 84.0% 4720 86.6% 3580 83.6%
Breech 505 14.1% 654 12.0% 607 14.2%
Brow 0 0.01% 0 0.0% 0 0.0%
Face 3 0.08% 2 0.04% 1 0.02%
Oblique lie 4 0.1% 4 0.1% 5 0.1%
Transverse lie 41 1.1% 31 0.6% 41 1.0%
Compound 3 0.08% 1 0.02% 5 0.1%
Others 16 0.4% 12 0.2% 8 0.2% Missing data in 23 (0.5%) in 2014
ONSET OF LABOUR
2004 2009 2014
Spontaneous 1893 57.5% 2559 52.5% 1927 50.0%
Induced labour 519 15.8% 630 12.9% 762 19.8%
No labour 880 26.7% 1681 34.5% 1164 30.2% Missing data on mode of onset of labour in 3 (0.1%) in 2009
STATUS OF AMNIOTIC FLUID DURING LABOUR (FOR EACH BABBY)
2014
Clear liquor 3936 92.2%
Meconium stained liquor 183 4.3%
Mild 133 3.1%
Moderate 29 0.7%
Severe 21 0.5%
Blood stained liquor 123 2.9%
No liquor 28 0.7%
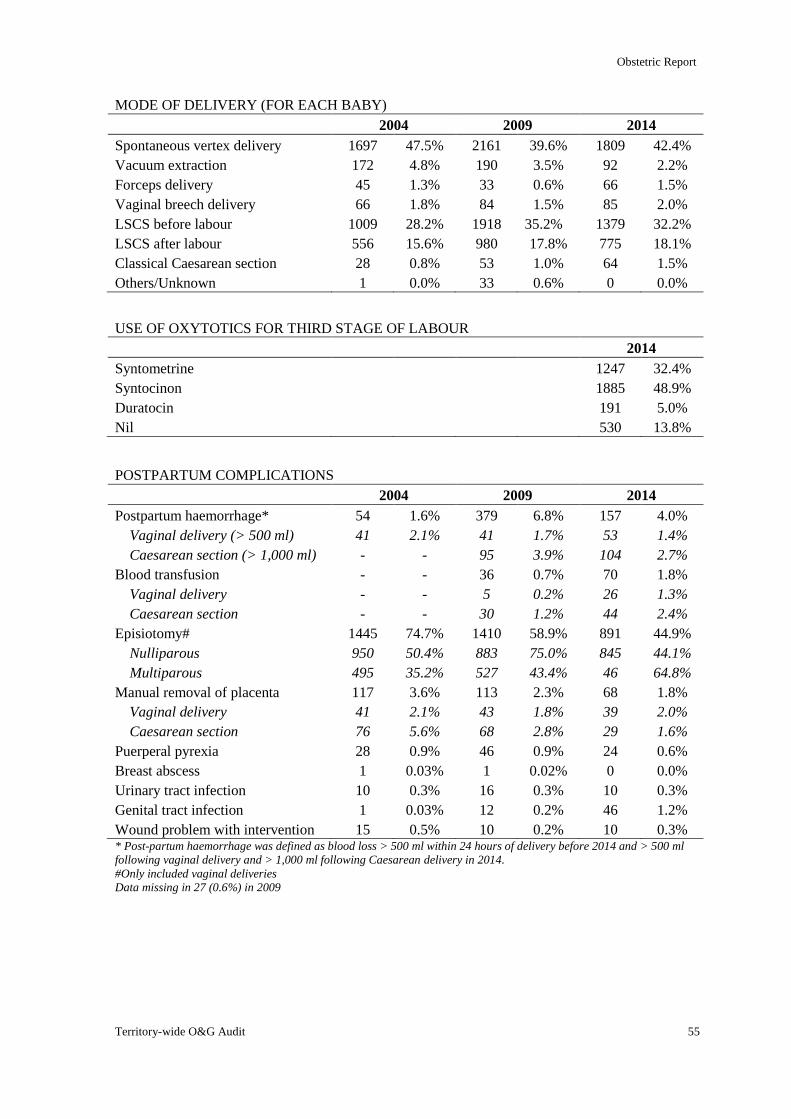
Obstetric Report
Territory-wide O&G Audit 55
MODE OF DELIVERY (FOR EACH BABY)
2004 2009 2014
Spontaneous vertex delivery 1697 47.5% 2161 39.6% 1809 42.4%
Vacuum extraction 172 4.8% 190 3.5% 92 2.2%
Forceps delivery 45 1.3% 33 0.6% 66 1.5%
Vaginal breech delivery 66 1.8% 84 1.5% 85 2.0%
LSCS before labour 1009 28.2% 1918 35.2% 1379 32.2%
LSCS after labour 556 15.6% 980 17.8% 775 18.1%
Classical Caesarean section 28 0.8% 53 1.0% 64 1.5%
Others/Unknown 1 0.0% 33 0.6% 0 0.0%
USE OF OXYTOTICS FOR THIRD STAGE OF LABOUR
2014
Syntometrine 1247 32.4%
Syntocinon 1885 48.9%
Duratocin 191 5.0%
Nil 530 13.8%
POSTPARTUM COMPLICATIONS
2004 2009 2014
Postpartum haemorrhage* 54 1.6% 379 6.8% 157 4.0%
Vaginal delivery (> 500 ml) 41 2.1% 41 1.7% 53 1.4%
Caesarean section (> 1,000 ml) - - 95 3.9% 104 2.7%
Blood transfusion - - 36 0.7% 70 1.8%
Vaginal delivery - - 5 0.2% 26 1.3%
Caesarean section - - 30 1.2% 44 2.4%
Episiotomy# 1445 74.7% 1410 58.9% 891 44.9%
Nulliparous 950 50.4% 883 75.0% 845 44.1%
Multiparous 495 35.2% 527 43.4% 46 64.8%
Manual removal of placenta 117 3.6% 113 2.3% 68 1.8%
Vaginal delivery 41 2.1% 43 1.8% 39 2.0%
Caesarean section 76 5.6% 68 2.8% 29 1.6%
Puerperal pyrexia 28 0.9% 46 0.9% 24 0.6%
Breast abscess 1 0.03% 1 0.02% 0 0.0%
Urinary tract infection 10 0.3% 16 0.3% 10 0.3%
Genital tract infection 1 0.03% 12 0.2% 46 1.2%
Wound problem with intervention 15 0.5% 10 0.2% 10 0.3% * Post-partum haemorrhage was defined as blood loss > 500 ml within 24 hours of delivery before 2014 and > 500 ml
following vaginal delivery and > 1,000 ml following Caesarean delivery in 2014.
#Only included vaginal deliveries
Data missing in 27 (0.6%) in 2009
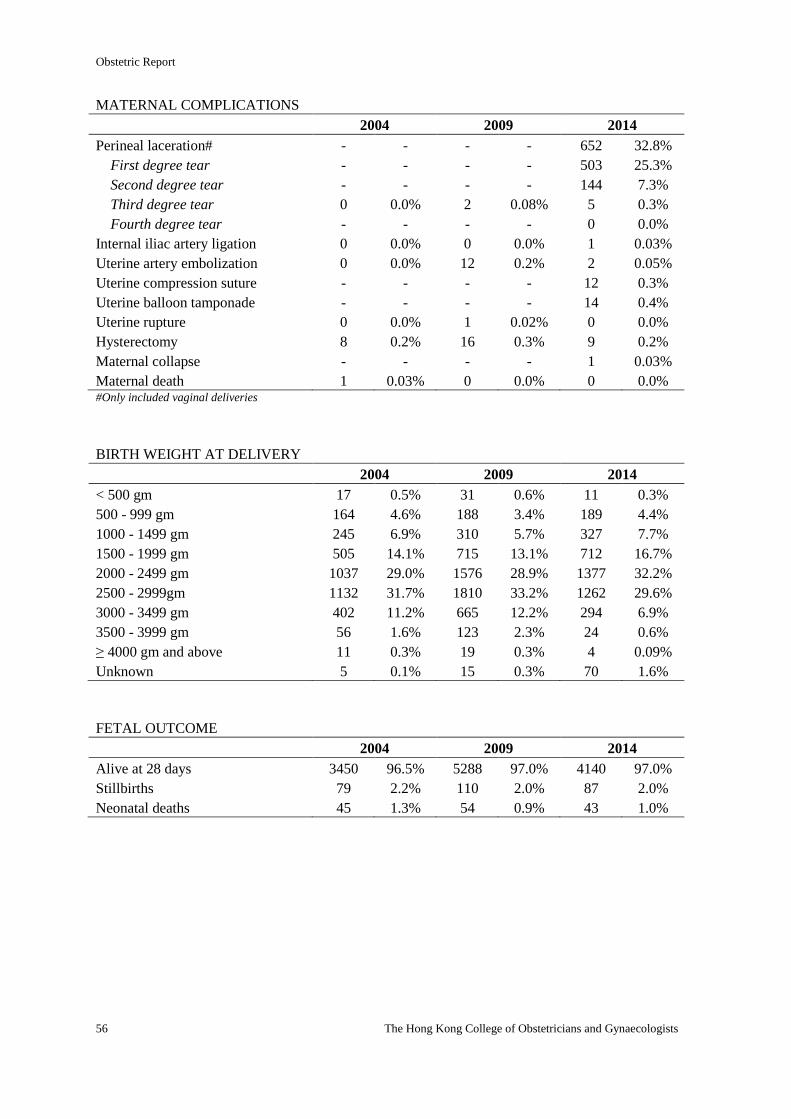
Obstetric Report
56 The Hong Kong College of Obstetricians and Gynaecologists
MATERNAL COMPLICATIONS
2004 2009 2014
Perineal laceration# - - - - 652 32.8%
First degree tear - - - - 503 25.3%
Second degree tear - - - - 144 7.3%
Third degree tear 0 0.0% 2 0.08% 5 0.3%
Fourth degree tear - - - - 0 0.0%
Internal iliac artery ligation 0 0.0% 0 0.0% 1 0.03%
Uterine artery embolization 0 0.0% 12 0.2% 2 0.05%
Uterine compression suture - - - - 12 0.3%
Uterine balloon tamponade - - - - 14 0.4%
Uterine rupture 0 0.0% 1 0.02% 0 0.0%
Hysterectomy 8 0.2% 16 0.3% 9 0.2%
Maternal collapse - - - - 1 0.03%
Maternal death 1 0.03% 0 0.0% 0 0.0% #Only included vaginal deliveries
BIRTH WEIGHT AT DELIVERY
2004 2009 2014
< 500 gm 17 0.5% 31 0.6% 11 0.3%
500 - 999 gm 164 4.6% 188 3.4% 189 4.4%
1000 - 1499 gm 245 6.9% 310 5.7% 327 7.7%
1500 - 1999 gm 505 14.1% 715 13.1% 712 16.7%
2000 - 2499 gm 1037 29.0% 1576 28.9% 1377 32.2%
2500 - 2999gm 1132 31.7% 1810 33.2% 1262 29.6%
3000 - 3499 gm 402 11.2% 665 12.2% 294 6.9%
3500 - 3999 gm 56 1.6% 123 2.3% 24 0.6%
≥ 4000 gm and above 11 0.3% 19 0.3% 4 0.09%
Unknown 5 0.1% 15 0.3% 70 1.6%
FETAL OUTCOME
2004 2009 2014
Alive at 28 days 3450 96.5% 5288 97.0% 4140 97.0%
Stillbirths 79 2.2% 110 2.0% 87 2.0%
Neonatal deaths 45 1.3% 54 0.9% 43 1.0%
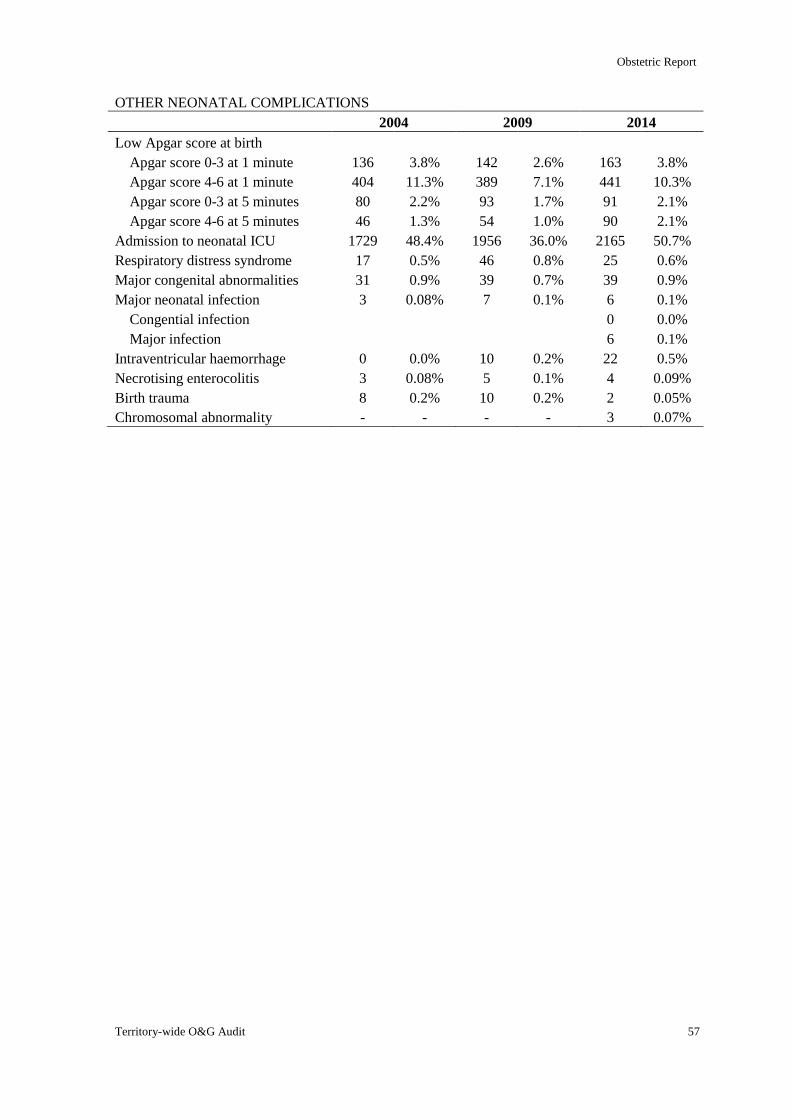
Obstetric Report
Territory-wide O&G Audit 57
OTHER NEONATAL COMPLICATIONS
2004 2009 2014
Low Apgar score at birth
Apgar score 0-3 at 1 minute 136 3.8% 142 2.6% 163 3.8%
Apgar score 4-6 at 1 minute 404 11.3% 389 7.1% 441 10.3%
Apgar score 0-3 at 5 minutes 80 2.2% 93 1.7% 91 2.1%
Apgar score 4-6 at 5 minutes 46 1.3% 54 1.0% 90 2.1%
Admission to neonatal ICU 1729 48.4% 1956 36.0% 2165 50.7%
Respiratory distress syndrome 17 0.5% 46 0.8% 25 0.6%
Major congenital abnormalities 31 0.9% 39 0.7% 39 0.9%
Major neonatal infection 3 0.08% 7 0.1% 6 0.1%
Congential infection 0 0.0%
Major infection 6 0.1%
Intraventricular haemorrhage 0 0.0% 10 0.2% 22 0.5%
Necrotising enterocolitis 3 0.08% 5 0.1% 4 0.09%
Birth trauma 8 0.2% 10 0.2% 2 0.05%
Chromosomal abnormality - - - - 3 0.07%
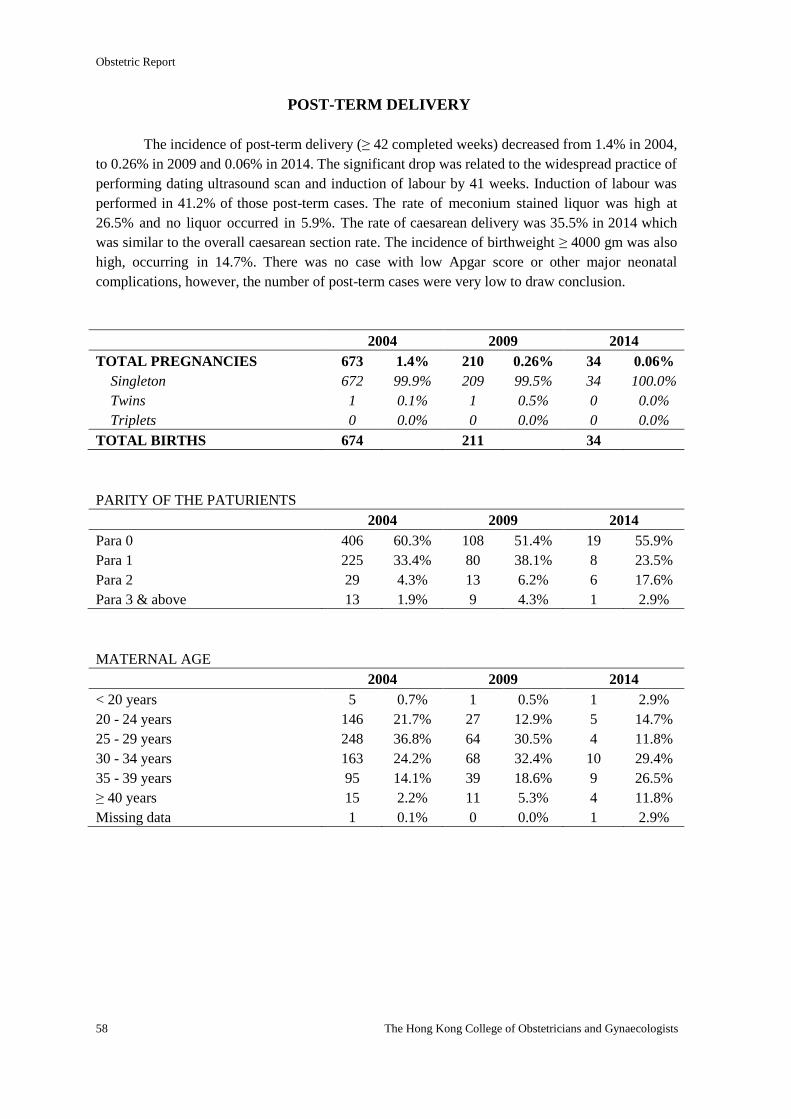
Obstetric Report
58 The Hong Kong College of Obstetricians and Gynaecologists
POST-TERM DELIVERY
The incidence of post-term delivery (≥ 42 completed weeks) decreased from 1.4% in 2004,
to 0.26% in 2009 and 0.06% in 2014. The significant drop was related to the widespread practice of
performing dating ultrasound scan and induction of labour by 41 weeks. Induction of labour was
performed in 41.2% of those post-term cases. The rate of meconium stained liquor was high at
26.5% and no liquor occurred in 5.9%. The rate of caesarean delivery was 35.5% in 2014 which
was similar to the overall caesarean section rate. The incidence of birthweight ≥ 4000 gm was also
high, occurring in 14.7%. There was no case with low Apgar score or other major neonatal
complications, however, the number of post-term cases were very low to draw conclusion.
2004 2009 2014
TOTAL PREGNANCIES 673 1.4% 210 0.26% 34 0.06%
Singleton 672 99.9% 209 99.5% 34 100.0%
Twins 1 0.1% 1 0.5% 0 0.0%
Triplets 0 0.0% 0 0.0% 0 0.0%
TOTAL BIRTHS 674 211 34
PARITY OF THE PATURIENTS
2004 2009 2014
Para 0 406 60.3% 108 51.4% 19 55.9%
Para 1 225 33.4% 80 38.1% 8 23.5%
Para 2 29 4.3% 13 6.2% 6 17.6%
Para 3 & above 13 1.9% 9 4.3% 1 2.9%
MATERNAL AGE
2004 2009 2014
< 20 years 5 0.7% 1 0.5% 1 2.9%
20 - 24 years 146 21.7% 27 12.9% 5 14.7%
25 - 29 years 248 36.8% 64 30.5% 4 11.8%
30 - 34 years 163 24.2% 68 32.4% 10 29.4%
35 - 39 years 95 14.1% 39 18.6% 9 26.5%
≥ 40 years 15 2.2% 11 5.3% 4 11.8%
Missing data 1 0.1% 0 0.0% 1 2.9%
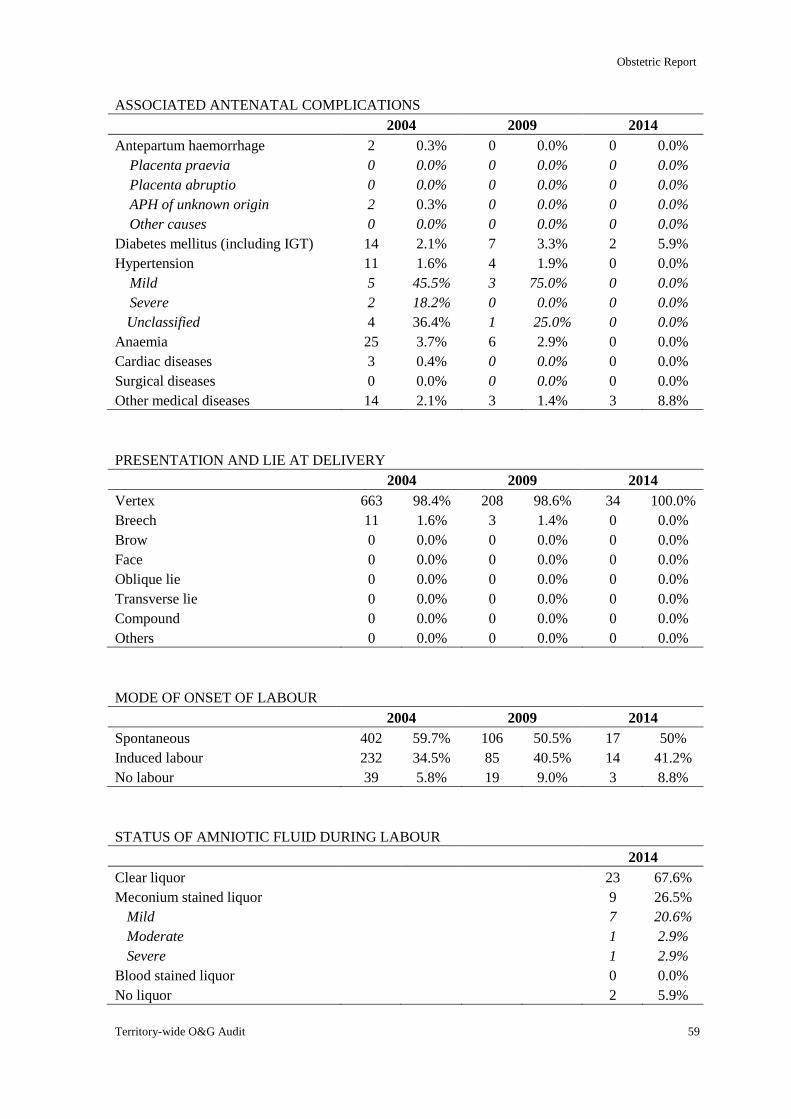
Obstetric Report
Territory-wide O&G Audit 59
ASSOCIATED ANTENATAL COMPLICATIONS
2004 2009 2014
Antepartum haemorrhage 2 0.3% 0 0.0% 0 0.0%
Placenta praevia 0 0.0% 0 0.0% 0 0.0%
Placenta abruptio 0 0.0% 0 0.0% 0 0.0%
APH of unknown origin 2 0.3% 0 0.0% 0 0.0%
Other causes 0 0.0% 0 0.0% 0 0.0%
Diabetes mellitus (including IGT) 14 2.1% 7 3.3% 2 5.9%
Hypertension 11 1.6% 4 1.9% 0 0.0%
Mild 5 45.5% 3 75.0% 0 0.0%
Severe 2 18.2% 0 0.0% 0 0.0%
Unclassified 4 36.4% 1 25.0% 0 0.0%
Anaemia 25 3.7% 6 2.9% 0 0.0%
Cardiac diseases 3 0.4% 0 0.0% 0 0.0%
Surgical diseases 0 0.0% 0 0.0% 0 0.0%
Other medical diseases 14 2.1% 3 1.4% 3 8.8%
PRESENTATION AND LIE AT DELIVERY
2004 2009 2014
Vertex 663 98.4% 208 98.6% 34 100.0%
Breech 11 1.6% 3 1.4% 0 0.0%
Brow 0 0.0% 0 0.0% 0 0.0%
Face 0 0.0% 0 0.0% 0 0.0%
Oblique lie 0 0.0% 0 0.0% 0 0.0%
Transverse lie 0 0.0% 0 0.0% 0 0.0%
Compound 0 0.0% 0 0.0% 0 0.0%
Others 0 0.0% 0 0.0% 0 0.0%
MODE OF ONSET OF LABOUR
2004 2009 2014
Spontaneous 402 59.7% 106 50.5% 17 50%
Induced labour 232 34.5% 85 40.5% 14 41.2%
No labour 39 5.8% 19 9.0% 3 8.8%
STATUS OF AMNIOTIC FLUID DURING LABOUR
2014
Clear liquor 23 67.6%
Meconium stained liquor 9 26.5%
Mild 7 20.6%
Moderate 1 2.9%
Severe 1 2.9%
Blood stained liquor 0 0.0%
No liquor 2 5.9%
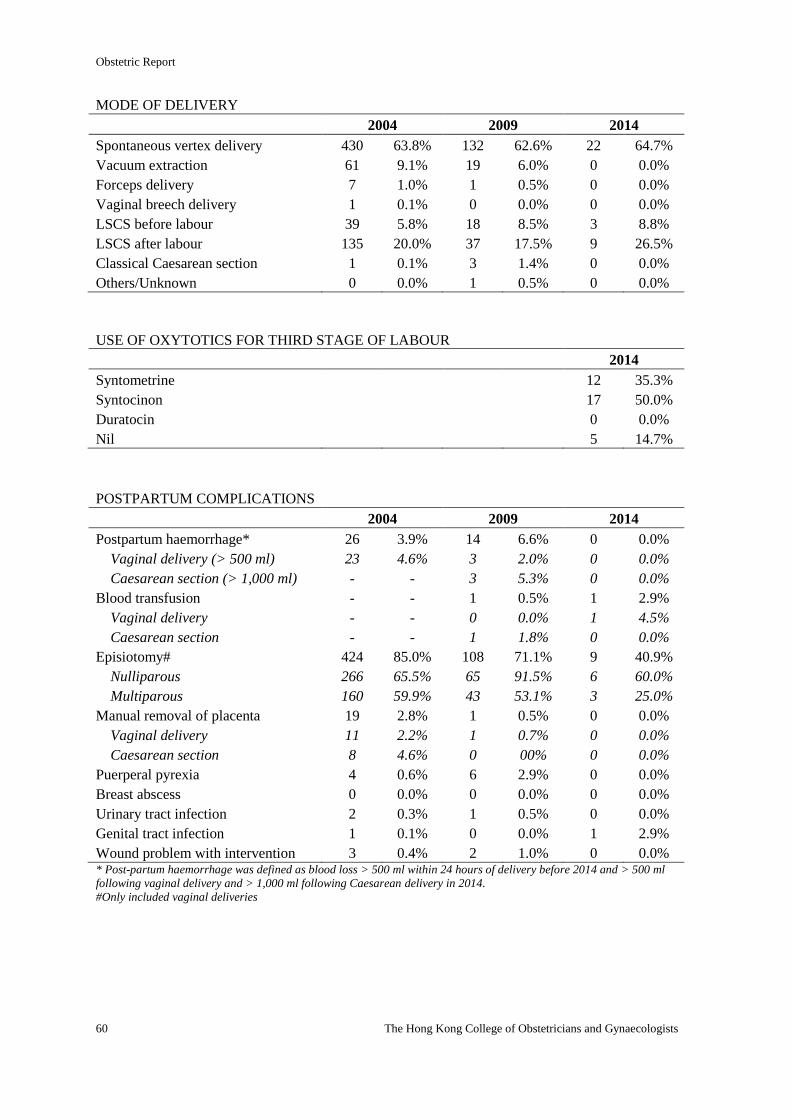
Obstetric Report
60 The Hong Kong College of Obstetricians and Gynaecologists
MODE OF DELIVERY
2004 2009 2014
Spontaneous vertex delivery 430 63.8% 132 62.6% 22 64.7%
Vacuum extraction 61 9.1% 19 6.0% 0 0.0%
Forceps delivery 7 1.0% 1 0.5% 0 0.0%
Vaginal breech delivery 1 0.1% 0 0.0% 0 0.0%
LSCS before labour 39 5.8% 18 8.5% 3 8.8%
LSCS after labour 135 20.0% 37 17.5% 9 26.5%
Classical Caesarean section 1 0.1% 3 1.4% 0 0.0%
Others/Unknown 0 0.0% 1 0.5% 0 0.0%
USE OF OXYTOTICS FOR THIRD STAGE OF LABOUR
2014
Syntometrine 12 35.3%
Syntocinon 17 50.0%
Duratocin 0 0.0%
Nil 5 14.7%
POSTPARTUM COMPLICATIONS
2004 2009 2014
Postpartum haemorrhage* 26 3.9% 14 6.6% 0 0.0%
Vaginal delivery (> 500 ml) 23 4.6% 3 2.0% 0 0.0%
Caesarean section (> 1,000 ml) - - 3 5.3% 0 0.0%
Blood transfusion - - 1 0.5% 1 2.9%
Vaginal delivery - - 0 0.0% 1 4.5%
Caesarean section - - 1 1.8% 0 0.0%
Episiotomy# 424 85.0% 108 71.1% 9 40.9%
Nulliparous 266 65.5% 65 91.5% 6 60.0%
Multiparous 160 59.9% 43 53.1% 3 25.0%
Manual removal of placenta 19 2.8% 1 0.5% 0 0.0%
Vaginal delivery 11 2.2% 1 0.7% 0 0.0%
Caesarean section 8 4.6% 0 00% 0 0.0%
Puerperal pyrexia 4 0.6% 6 2.9% 0 0.0%
Breast abscess 0 0.0% 0 0.0% 0 0.0%
Urinary tract infection 2 0.3% 1 0.5% 0 0.0%
Genital tract infection 1 0.1% 0 0.0% 1 2.9%
Wound problem with intervention 3 0.4% 2 1.0% 0 0.0% * Post-partum haemorrhage was defined as blood loss > 500 ml within 24 hours of delivery before 2014 and > 500 ml
following vaginal delivery and > 1,000 ml following Caesarean delivery in 2014.
#Only included vaginal deliveries
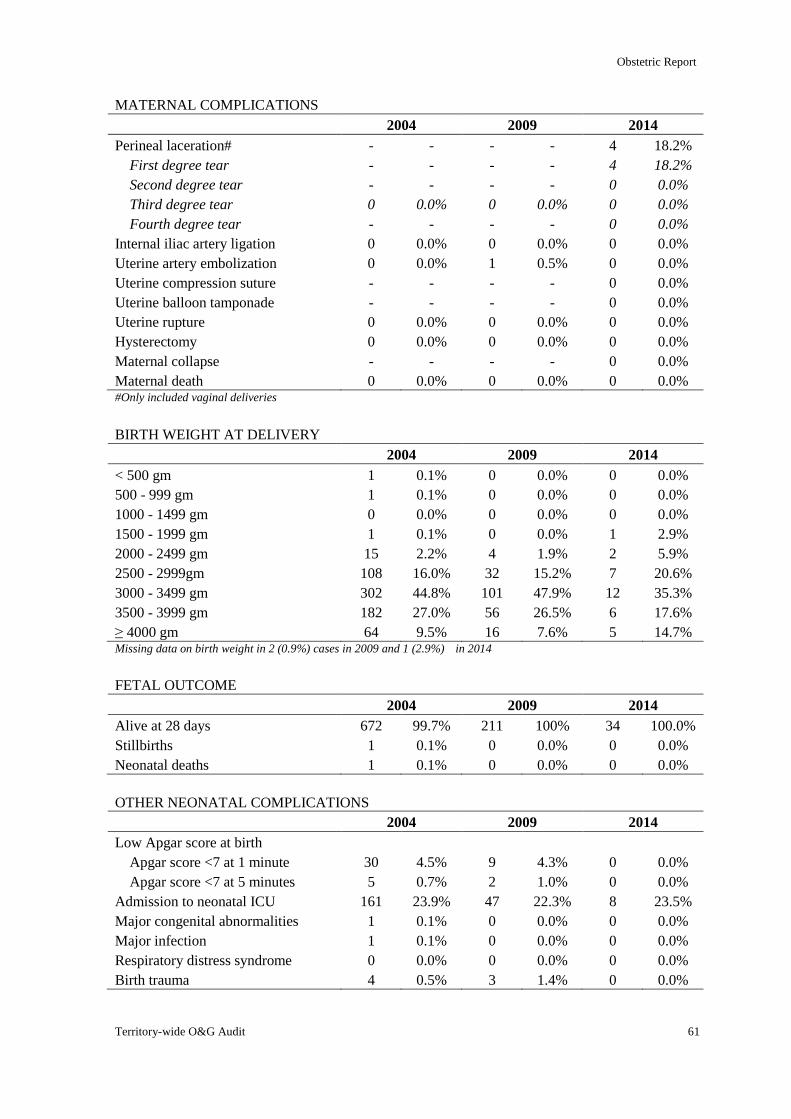
Obstetric Report
Territory-wide O&G Audit 61
MATERNAL COMPLICATIONS
2004 2009 2014
Perineal laceration# - - - - 4 18.2%
First degree tear - - - - 4 18.2%
Second degree tear - - - - 0 0.0%
Third degree tear 0 0.0% 0 0.0% 0 0.0%
Fourth degree tear - - - - 0 0.0%
Internal iliac artery ligation 0 0.0% 0 0.0% 0 0.0%
Uterine artery embolization 0 0.0% 1 0.5% 0 0.0%
Uterine compression suture - - - - 0 0.0%
Uterine balloon tamponade - - - - 0 0.0%
Uterine rupture 0 0.0% 0 0.0% 0 0.0%
Hysterectomy 0 0.0% 0 0.0% 0 0.0%
Maternal collapse - - - - 0 0.0%
Maternal death 0 0.0% 0 0.0% 0 0.0% #Only included vaginal deliveries
BIRTH WEIGHT AT DELIVERY
2004 2009 2014
< 500 gm 1 0.1% 0 0.0% 0 0.0%
500 - 999 gm 1 0.1% 0 0.0% 0 0.0%
1000 - 1499 gm 0 0.0% 0 0.0% 0 0.0%
1500 - 1999 gm 1 0.1% 0 0.0% 1 2.9%
2000 - 2499 gm 15 2.2% 4 1.9% 2 5.9%
2500 - 2999gm 108 16.0% 32 15.2% 7 20.6%
3000 - 3499 gm 302 44.8% 101 47.9% 12 35.3%
3500 - 3999 gm 182 27.0% 56 26.5% 6 17.6%
≥ 4000 gm 64 9.5% 16 7.6% 5 14.7% Missing data on birth weight in 2 (0.9%) cases in 2009 and 1 (2.9%) in 2014
FETAL OUTCOME
2004 2009 2014
Alive at 28 days 672 99.7% 211 100% 34 100.0%
Stillbirths 1 0.1% 0 0.0% 0 0.0%
Neonatal deaths 1 0.1% 0 0.0% 0 0.0%
OTHER NEONATAL COMPLICATIONS
2004 2009 2014
Low Apgar score at birth
Apgar score <7 at 1 minute 30 4.5% 9 4.3% 0 0.0%
Apgar score <7 at 5 minutes 5 0.7% 2 1.0% 0 0.0%
Admission to neonatal ICU 161 23.9% 47 22.3% 8 23.5%
Major congenital abnormalities 1 0.1% 0 0.0% 0 0.0%
Major infection 1 0.1% 0 0.0% 0 0.0%
Respiratory distress syndrome 0 0.0% 0 0.0% 0 0.0%
Birth trauma 4 0.5% 3 1.4% 0 0.0%
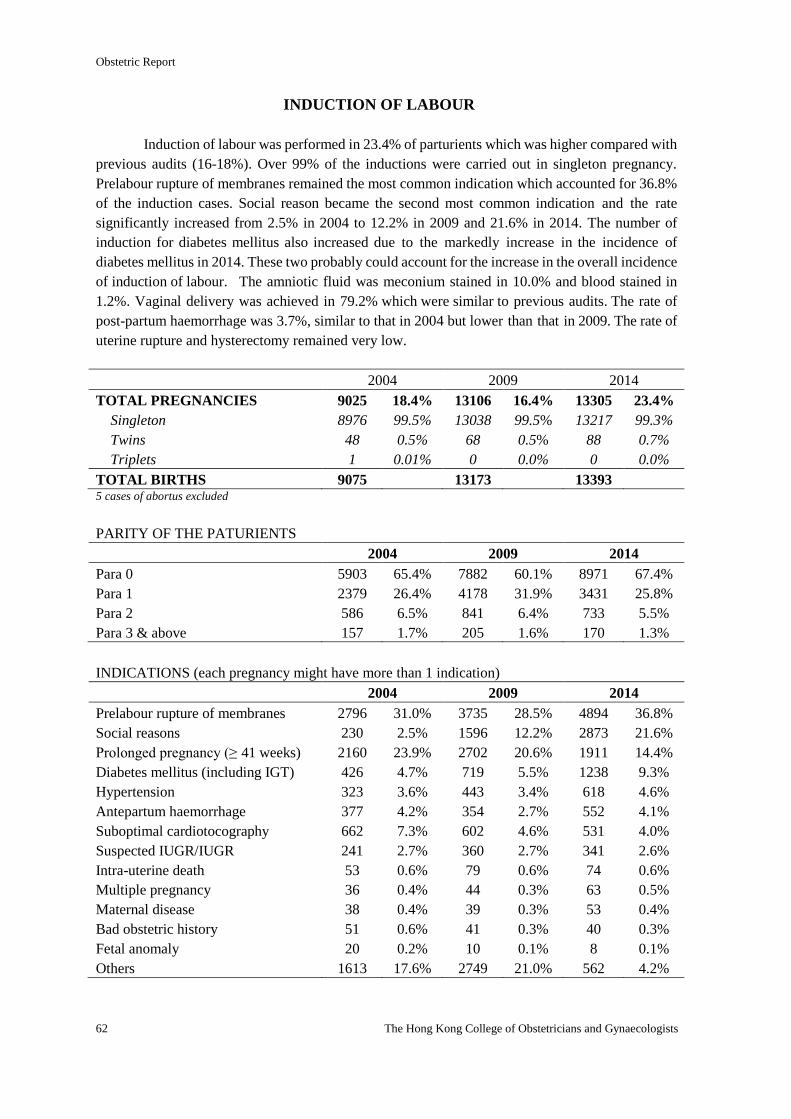
Obstetric Report
62 The Hong Kong College of Obstetricians and Gynaecologists
INDUCTION OF LABOUR
Induction of labour was performed in 23.4% of parturients which was higher compared with
previous audits (16-18%). Over 99% of the inductions were carried out in singleton pregnancy.
Prelabour rupture of membranes remained the most common indication which accounted for 36.8%
of the induction cases. Social reason became the second most common indication and the rate
significantly increased from 2.5% in 2004 to 12.2% in 2009 and 21.6% in 2014. The number of
induction for diabetes mellitus also increased due to the markedly increase in the incidence of
diabetes mellitus in 2014. These two probably could account for the increase in the overall incidence
of induction of labour. The amniotic fluid was meconium stained in 10.0% and blood stained in
1.2%. Vaginal delivery was achieved in 79.2% which were similar to previous audits. The rate of
post-partum haemorrhage was 3.7%, similar to that in 2004 but lower than that in 2009. The rate of
uterine rupture and hysterectomy remained very low.
2004 2009 2014
TOTAL PREGNANCIES 9025 18.4% 13106 16.4% 13305 23.4%
Singleton 8976 99.5% 13038 99.5% 13217 99.3%
Twins 48 0.5% 68 0.5% 88 0.7%
Triplets 1 0.01% 0 0.0% 0 0.0%
TOTAL BIRTHS 9075 13173 13393 5 cases of abortus excluded
PARITY OF THE PATURIENTS
2004 2009 2014
Para 0 5903 65.4% 7882 60.1% 8971 67.4%
Para 1 2379 26.4% 4178 31.9% 3431 25.8%
Para 2 586 6.5% 841 6.4% 733 5.5%
Para 3 & above 157 1.7% 205 1.6% 170 1.3%
INDICATIONS (each pregnancy might have more than 1 indication)
2004 2009 2014
Prelabour rupture of membranes 2796 31.0% 3735 28.5% 4894 36.8%
Social reasons 230 2.5% 1596 12.2% 2873 21.6%
Prolonged pregnancy (≥ 41 weeks) 2160 23.9% 2702 20.6% 1911 14.4%
Diabetes mellitus (including IGT) 426 4.7% 719 5.5% 1238 9.3%
Hypertension 323 3.6% 443 3.4% 618 4.6%
Antepartum haemorrhage 377 4.2% 354 2.7% 552 4.1%
Suboptimal cardiotocography 662 7.3% 602 4.6% 531 4.0%
Suspected IUGR/IUGR 241 2.7% 360 2.7% 341 2.6%
Intra-uterine death 53 0.6% 79 0.6% 74 0.6%
Multiple pregnancy 36 0.4% 44 0.3% 63 0.5%
Maternal disease 38 0.4% 39 0.3% 53 0.4%
Bad obstetric history 51 0.6% 41 0.3% 40 0.3%
Fetal anomaly 20 0.2% 10 0.1% 8 0.1%
Others 1613 17.6% 2749 21.0% 562 4.2%
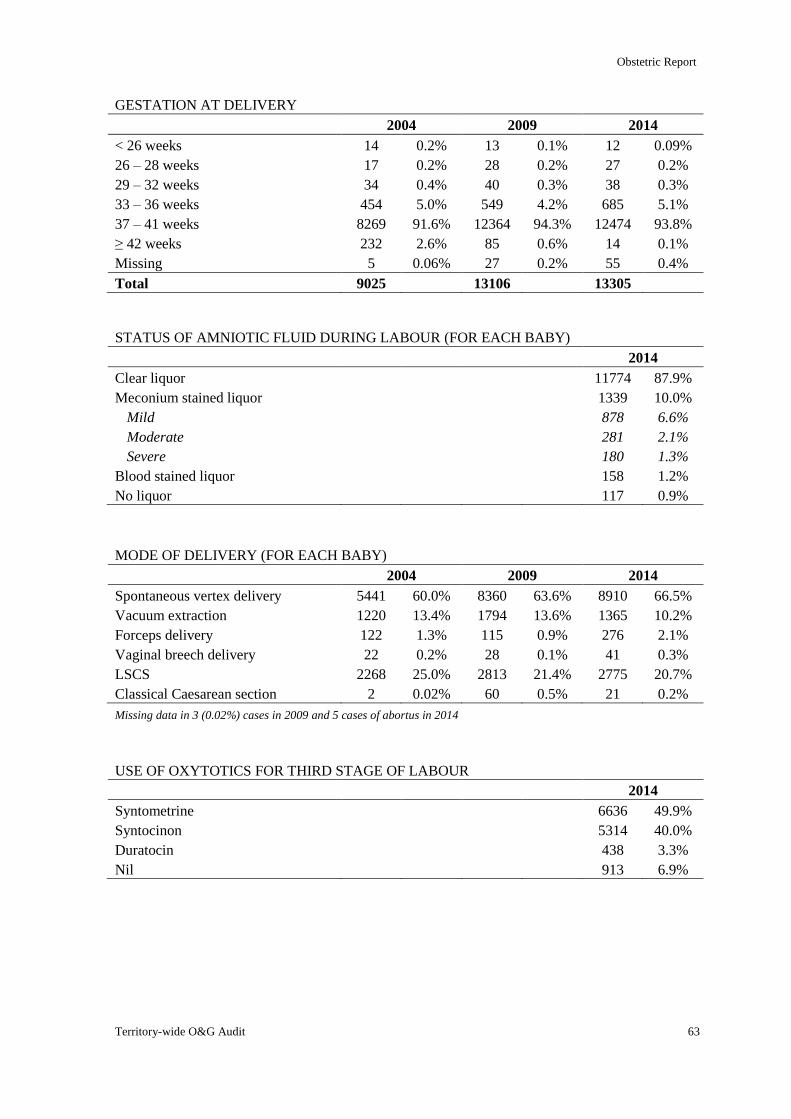
Obstetric Report
Territory-wide O&G Audit 63
GESTATION AT DELIVERY
2004 2009 2014
< 26 weeks 14 0.2% 13 0.1% 12 0.09%
26 – 28 weeks 17 0.2% 28 0.2% 27 0.2%
29 – 32 weeks 34 0.4% 40 0.3% 38 0.3%
33 – 36 weeks 454 5.0% 549 4.2% 685 5.1%
37 – 41 weeks 8269 91.6% 12364 94.3% 12474 93.8%
≥ 42 weeks 232 2.6% 85 0.6% 14 0.1%
Missing 5 0.06% 27 0.2% 55 0.4%
Total 9025 13106 13305
STATUS OF AMNIOTIC FLUID DURING LABOUR (FOR EACH BABY)
2014
Clear liquor 11774 87.9%
Meconium stained liquor 1339 10.0%
Mild 878 6.6%
Moderate 281 2.1%
Severe 180 1.3%
Blood stained liquor 158 1.2%
No liquor 117 0.9%
MODE OF DELIVERY (FOR EACH BABY)
2004 2009 2014
Spontaneous vertex delivery 5441 60.0% 8360 63.6% 8910 66.5%
Vacuum extraction 1220 13.4% 1794 13.6% 1365 10.2%
Forceps delivery 122 1.3% 115 0.9% 276 2.1%
Vaginal breech delivery 22 0.2% 28 0.1% 41 0.3%
LSCS 2268 25.0% 2813 21.4% 2775 20.7%
Classical Caesarean section 2 0.02% 60 0.5% 21 0.2%
Missing data in 3 (0.02%) cases in 2009 and 5 cases of abortus in 2014
USE OF OXYTOTICS FOR THIRD STAGE OF LABOUR
2014
Syntometrine 6636 49.9%
Syntocinon 5314 40.0%
Duratocin 438 3.3%
Nil 913 6.9%

Obstetric Report
64 The Hong Kong College of Obstetricians and Gynaecologists
POSTPARTUM COMPLICATIONS
2004 2009 2014
Postpartum haemorrhage* 349 3.9% 803 6.1% 498 3.7%
Vaginal delivery (> 500 ml) 334 4.9% 325 3.2% 432 3.2%
Caesarean section (> 1,000 ml) - - 82 2.9% 66 0.5%
Blood transfusion - - 83 0.6% 176 1.3%
Vaginal delivery - - 62 0.6% 143 1.4%
Caesarean section - - 21 0.7% 33 1.2%
Episiotomy# 5753 85.0% 7666 74.8% 6313 59.9%
Nulliparous 3776 64.0% 4929 89.3% 5071 77.8%
Multiparous 1993 63.8% 2737 57.9% 1244 30.9%
Manual removal of placenta 257 2.8% 224 1.7% 164 1.2%
Vaginal delivery 135 2.0% 148 1.4% 123 1.2%
Caesarean section 122 5.4% 76 2.7% 41 1.5%
Puerperal pyrexia 78 0.9% 168 1.3% 93 0.7%
Breast abscess 2 0.02% 2 0.02% 0 0.0%
Urinary tract infection 32 0.4% 30 0.2% 38 0.3%
Genital tract infection 10 0.1% 26 0.2% 122 0.9%
Wound problem with intervention 38 0.4% 45 0.3% 34 0.3% * Post-partum haemorrhage was defined as blood loss > 500 ml within 24 hours of delivery before 2014 and > 500 ml
following vaginal delivery and > 1,000 ml following Caesarean delivery in 2014.
#Only included vaginal deliveries
MATERNAL COMPLICATIONS
2004 2009 2014
Preterm (<37 weeks) 519 5.8% 630 4.8% 758 5.7%
Singleton 508 5.7% 612 4.7% 730 5.5%
Multiple 11 22.9% 18 26.5% 28 32.2%
Perineal laceration# - - - - 3477 33.0%
First degree tear - - - - 2373 22.5%
Second degree tear - - - - 1060 10.1%
Third degree tear 4 0.06% 19 0.1% 38 0.4%
Fourth degree tear - - - - 6 0.06%
Internal iliac artery ligation 0 0.0% 0 0.0% 0 0.0%
Uterine artery embolization 0 0.0% 3 0.02% 0 0.0%
Uterine compression suture - - - - 12 0.1%
Uterine balloon tamponade - - - - 19 0.1%
Uterine rupture 2 0.02% 0 0.0% 1 0.008%
Hysterectomy 3 0.03% 6 0.05% 3 0.02%
Maternal collapse - - - - 2 0.02%
Maternal death 1 0.01% 0 0.0% 1 0.008% #Only included vaginal deliveries

Obstetric Report
Territory-wide O&G Audit 65
FETAL OUTCOME
2004 2009 2014
Alive at 28 days 8999 99.2% 13083 99.3% 13303 99.4%
Stillbirths 63 0.7% 86 0.65% 79 0.6%
Neonatal deaths 13 0.1% 4 0.03% 6 0.04%
Low birth weights (< 2500 gm) 558 6.1% 812 6.2% 1010 7.5%
Singleton 521 93.4% 752 92.6% 922 91.3%
Multiple 37 6.6% 60 7.4% 88 8.7%
Macrosomia (> 4000 gm) 481 5.3% 476 3.6% 345 2.6%
Apgar score < 4 at 1 minute 74 0.8% 92 0.7% 90 0.7%
Apgar score < 4 at 5 minutes 54 0.6% 65 0.5% 55 0.4%
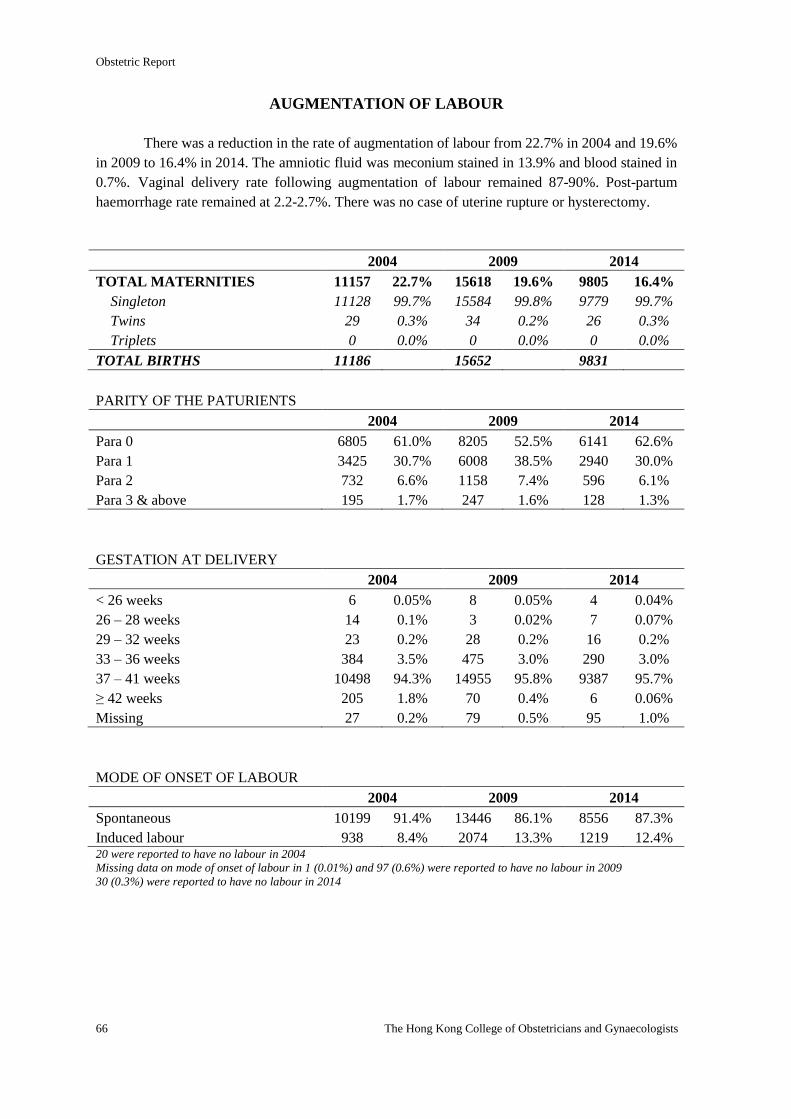
Obstetric Report
66 The Hong Kong College of Obstetricians and Gynaecologists
AUGMENTATION OF LABOUR
There was a reduction in the rate of augmentation of labour from 22.7% in 2004 and 19.6%
in 2009 to 16.4% in 2014. The amniotic fluid was meconium stained in 13.9% and blood stained in
0.7%. Vaginal delivery rate following augmentation of labour remained 87-90%. Post-partum
haemorrhage rate remained at 2.2-2.7%. There was no case of uterine rupture or hysterectomy.
2004 2009 2014
TOTAL MATERNITIES 11157 22.7% 15618 19.6% 9805 16.4%
Singleton 11128 99.7% 15584 99.8% 9779 99.7%
Twins 29 0.3% 34 0.2% 26 0.3%
Triplets 0 0.0% 0 0.0% 0 0.0%
TOTAL BIRTHS 11186 15652 9831
PARITY OF THE PATURIENTS
2004 2009 2014
Para 0 6805 61.0% 8205 52.5% 6141 62.6%
Para 1 3425 30.7% 6008 38.5% 2940 30.0%
Para 2 732 6.6% 1158 7.4% 596 6.1%
Para 3 & above 195 1.7% 247 1.6% 128 1.3%
GESTATION AT DELIVERY
2004 2009 2014
< 26 weeks 6 0.05% 8 0.05% 4 0.04%
26 – 28 weeks 14 0.1% 3 0.02% 7 0.07%
29 – 32 weeks 23 0.2% 28 0.2% 16 0.2%
33 – 36 weeks 384 3.5% 475 3.0% 290 3.0%
37 – 41 weeks 10498 94.3% 14955 95.8% 9387 95.7%
≥ 42 weeks 205 1.8% 70 0.4% 6 0.06%
Missing 27 0.2% 79 0.5% 95 1.0%
MODE OF ONSET OF LABOUR
2004 2009 2014
Spontaneous 10199 91.4% 13446 86.1% 8556 87.3%
Induced labour 938 8.4% 2074 13.3% 1219 12.4% 20 were reported to have no labour in 2004
Missing data on mode of onset of labour in 1 (0.01%) and 97 (0.6%) were reported to have no labour in 2009
30 (0.3%) were reported to have no labour in 2014
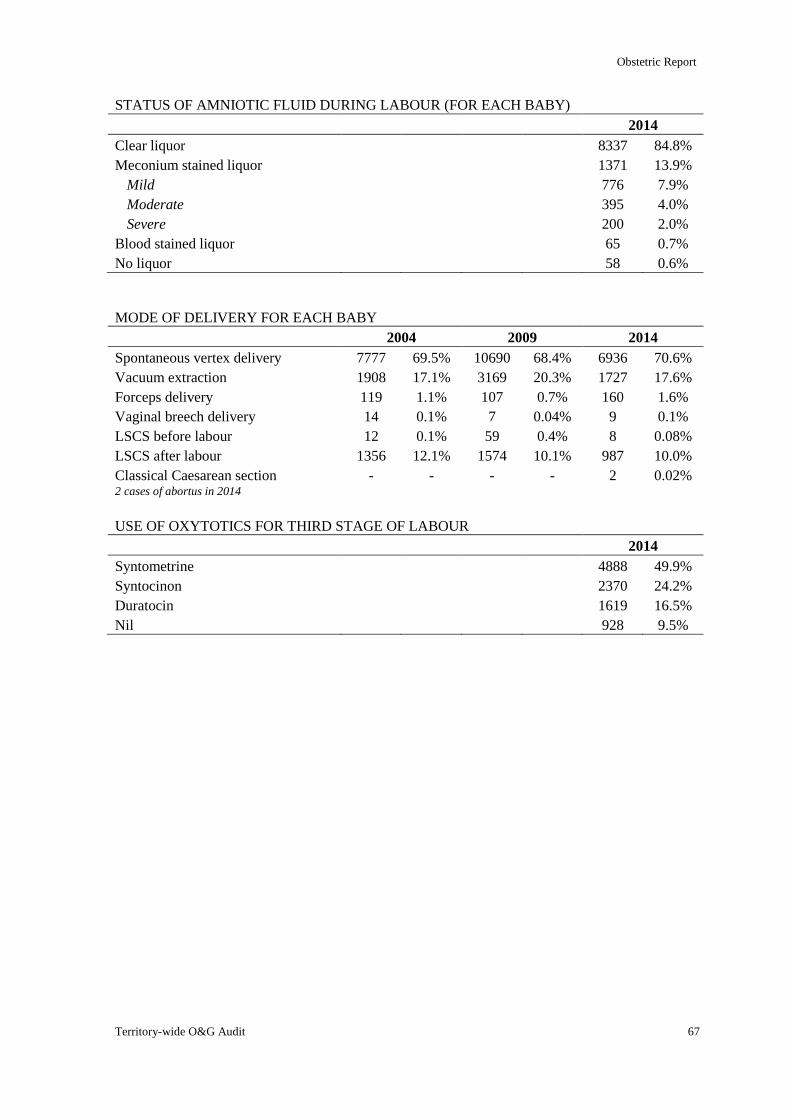
Obstetric Report
Territory-wide O&G Audit 67
STATUS OF AMNIOTIC FLUID DURING LABOUR (FOR EACH BABY)
2014
Clear liquor 8337 84.8%
Meconium stained liquor 1371 13.9%
Mild 776 7.9%
Moderate 395 4.0%
Severe 200 2.0%
Blood stained liquor 65 0.7%
No liquor 58 0.6%
MODE OF DELIVERY FOR EACH BABY
2004 2009 2014
Spontaneous vertex delivery 7777 69.5% 10690 68.4% 6936 70.6%
Vacuum extraction 1908 17.1% 3169 20.3% 1727 17.6%
Forceps delivery 119 1.1% 107 0.7% 160 1.6%
Vaginal breech delivery 14 0.1% 7 0.04% 9 0.1%
LSCS before labour 12 0.1% 59 0.4% 8 0.08%
LSCS after labour 1356 12.1% 1574 10.1% 987 10.0%
Classical Caesarean section - - - - 2 0.02% 2 cases of abortus in 2014
USE OF OXYTOTICS FOR THIRD STAGE OF LABOUR
2014
Syntometrine 4888 49.9%
Syntocinon 2370 24.2%
Duratocin 1619 16.5%
Nil 928 9.5%
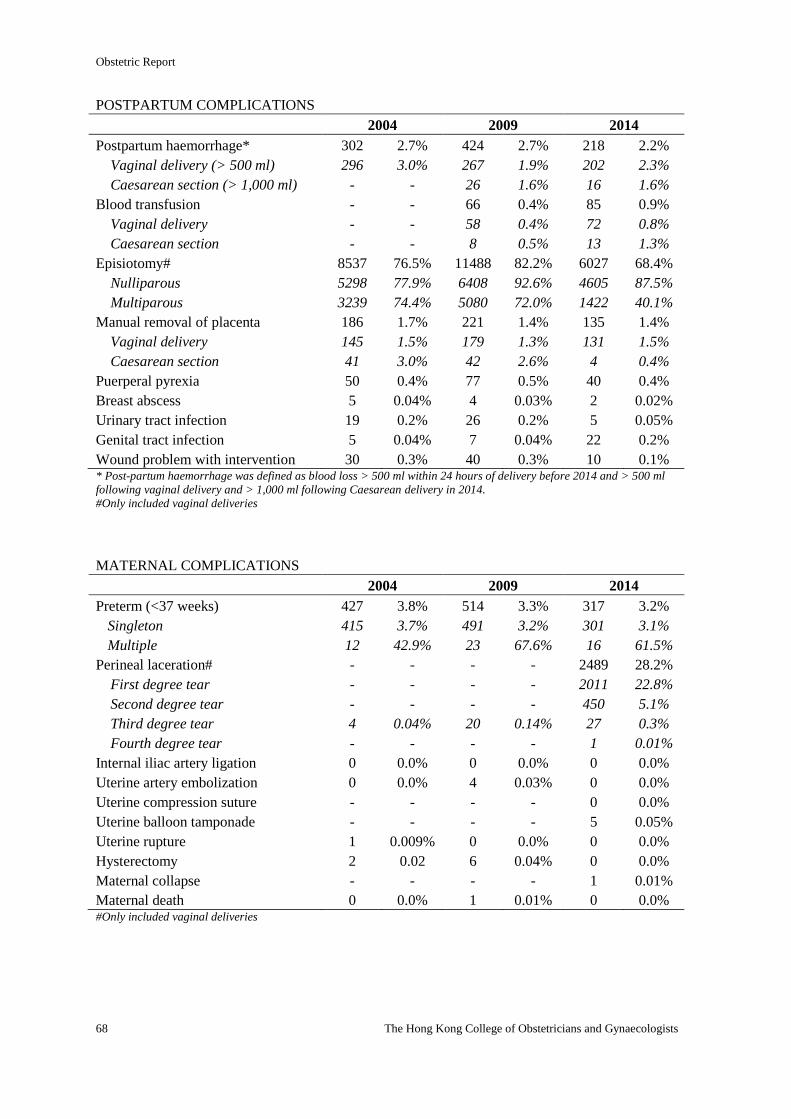
Obstetric Report
68 The Hong Kong College of Obstetricians and Gynaecologists
POSTPARTUM COMPLICATIONS
2004 2009 2014
Postpartum haemorrhage* 302 2.7% 424 2.7% 218 2.2%
Vaginal delivery (> 500 ml) 296 3.0% 267 1.9% 202 2.3%
Caesarean section (> 1,000 ml) - - 26 1.6% 16 1.6%
Blood transfusion - - 66 0.4% 85 0.9%
Vaginal delivery - - 58 0.4% 72 0.8%
Caesarean section - - 8 0.5% 13 1.3%
Episiotomy# 8537 76.5% 11488 82.2% 6027 68.4%
Nulliparous 5298 77.9% 6408 92.6% 4605 87.5%
Multiparous 3239 74.4% 5080 72.0% 1422 40.1%
Manual removal of placenta 186 1.7% 221 1.4% 135 1.4%
Vaginal delivery 145 1.5% 179 1.3% 131 1.5%
Caesarean section 41 3.0% 42 2.6% 4 0.4%
Puerperal pyrexia 50 0.4% 77 0.5% 40 0.4%
Breast abscess 5 0.04% 4 0.03% 2 0.02%
Urinary tract infection 19 0.2% 26 0.2% 5 0.05%
Genital tract infection 5 0.04% 7 0.04% 22 0.2%
Wound problem with intervention 30 0.3% 40 0.3% 10 0.1% * Post-partum haemorrhage was defined as blood loss > 500 ml within 24 hours of delivery before 2014 and > 500 ml
following vaginal delivery and > 1,000 ml following Caesarean delivery in 2014.
#Only included vaginal deliveries
MATERNAL COMPLICATIONS
2004 2009 2014
Preterm (<37 weeks) 427 3.8% 514 3.3% 317 3.2%
Singleton 415 3.7% 491 3.2% 301 3.1%
Multiple 12 42.9% 23 67.6% 16 61.5%
Perineal laceration# - - - - 2489 28.2%
First degree tear - - - - 2011 22.8%
Second degree tear - - - - 450 5.1%
Third degree tear 4 0.04% 20 0.14% 27 0.3%
Fourth degree tear - - - - 1 0.01%
Internal iliac artery ligation 0 0.0% 0 0.0% 0 0.0%
Uterine artery embolization 0 0.0% 4 0.03% 0 0.0%
Uterine compression suture - - - - 0 0.0%
Uterine balloon tamponade - - - - 5 0.05%
Uterine rupture 1 0.009% 0 0.0% 0 0.0%
Hysterectomy 2 0.02 6 0.04% 0 0.0%
Maternal collapse - - - - 1 0.01%
Maternal death 0 0.0% 1 0.01% 0 0.0% #Only included vaginal deliveries
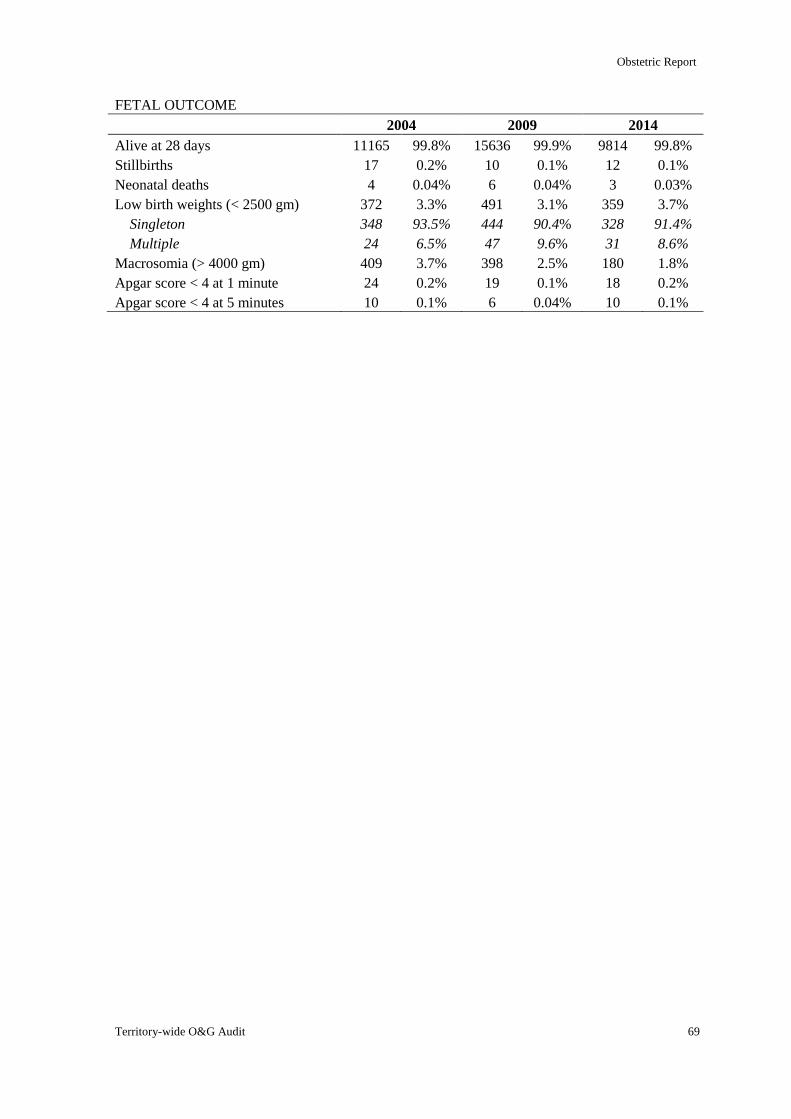
Obstetric Report
Territory-wide O&G Audit 69
FETAL OUTCOME
2004 2009 2014
Alive at 28 days 11165 99.8% 15636 99.9% 9814 99.8%
Stillbirths 17 0.2% 10 0.1% 12 0.1%
Neonatal deaths 4 0.04% 6 0.04% 3 0.03%
Low birth weights (< 2500 gm) 372 3.3% 491 3.1% 359 3.7%
Singleton 348 93.5% 444 90.4% 328 91.4%
Multiple 24 6.5% 47 9.6% 31 8.6%
Macrosomia (> 4000 gm) 409 3.7% 398 2.5% 180 1.8%
Apgar score < 4 at 1 minute 24 0.2% 19 0.1% 18 0.2%
Apgar score < 4 at 5 minutes 10 0.1% 6 0.04% 10 0.1%
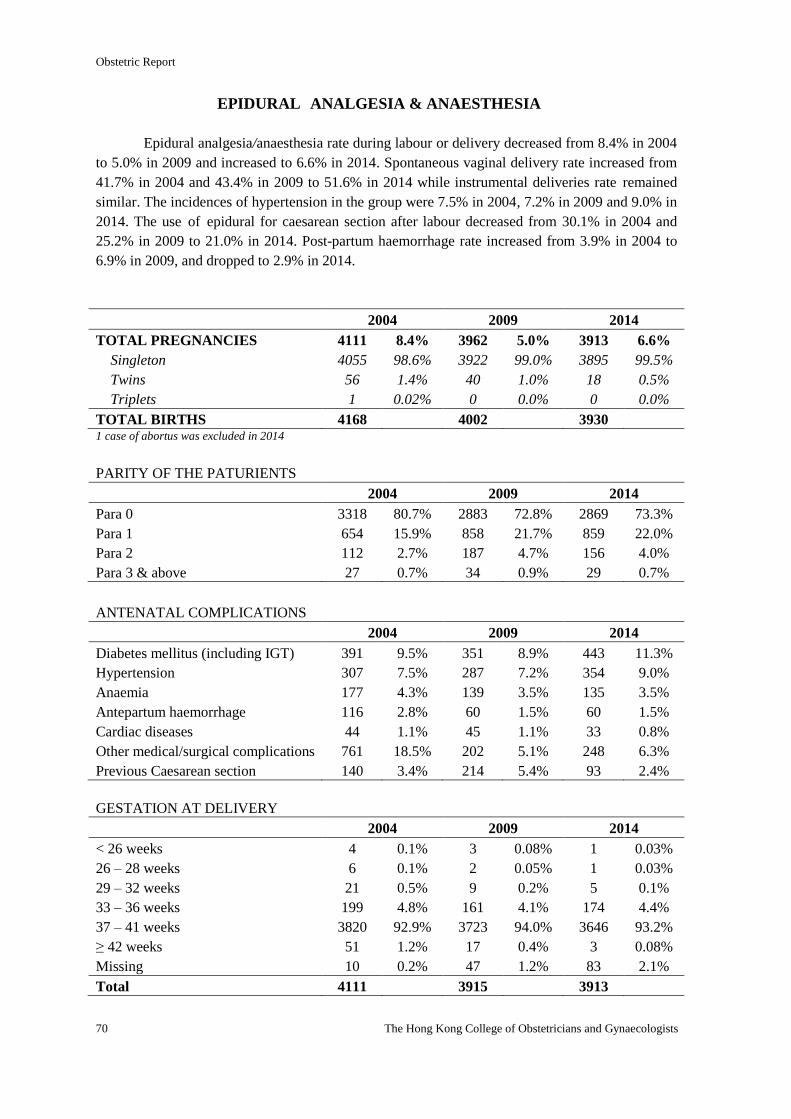
Obstetric Report
70 The Hong Kong College of Obstetricians and Gynaecologists
EPIDURAL ANALGESIA & ANAESTHESIA
Epidural analgesia/anaesthesia rate during labour or delivery decreased from 8.4% in 2004
to 5.0% in 2009 and increased to 6.6% in 2014. Spontaneous vaginal delivery rate increased from
41.7% in 2004 and 43.4% in 2009 to 51.6% in 2014 while instrumental deliveries rate remained
similar. The incidences of hypertension in the group were 7.5% in 2004, 7.2% in 2009 and 9.0% in
2014. The use of epidural for caesarean section after labour decreased from 30.1% in 2004 and
25.2% in 2009 to 21.0% in 2014. Post-partum haemorrhage rate increased from 3.9% in 2004 to
6.9% in 2009, and dropped to 2.9% in 2014.
2004 2009 2014
TOTAL PREGNANCIES 4111 8.4% 3962 5.0% 3913 6.6%
Singleton 4055 98.6% 3922 99.0% 3895 99.5%
Twins 56 1.4% 40 1.0% 18 0.5%
Triplets 1 0.02% 0 0.0% 0 0.0%
TOTAL BIRTHS 4168 4002 3930 1 case of abortus was excluded in 2014
PARITY OF THE PATURIENTS
2004 2009 2014
Para 0 3318 80.7% 2883 72.8% 2869 73.3%
Para 1 654 15.9% 858 21.7% 859 22.0%
Para 2 112 2.7% 187 4.7% 156 4.0%
Para 3 & above 27 0.7% 34 0.9% 29 0.7%
ANTENATAL COMPLICATIONS
2004 2009 2014
Diabetes mellitus (including IGT) 391 9.5% 351 8.9% 443 11.3%
Hypertension 307 7.5% 287 7.2% 354 9.0%
Anaemia 177 4.3% 139 3.5% 135 3.5%
Antepartum haemorrhage 116 2.8% 60 1.5% 60 1.5%
Cardiac diseases 44 1.1% 45 1.1% 33 0.8%
Other medical/surgical complications 761 18.5% 202 5.1% 248 6.3%
Previous Caesarean section 140 3.4% 214 5.4% 93 2.4%
GESTATION AT DELIVERY
2004 2009 2014
< 26 weeks 4 0.1% 3 0.08% 1 0.03%
26 – 28 weeks 6 0.1% 2 0.05% 1 0.03%
29 – 32 weeks 21 0.5% 9 0.2% 5 0.1%
33 – 36 weeks 199 4.8% 161 4.1% 174 4.4%
37 – 41 weeks 3820 92.9% 3723 94.0% 3646 93.2%
≥ 42 weeks 51 1.2% 17 0.4% 3 0.08%
Missing 10 0.2% 47 1.2% 83 2.1%
Total 4111 3915 3913
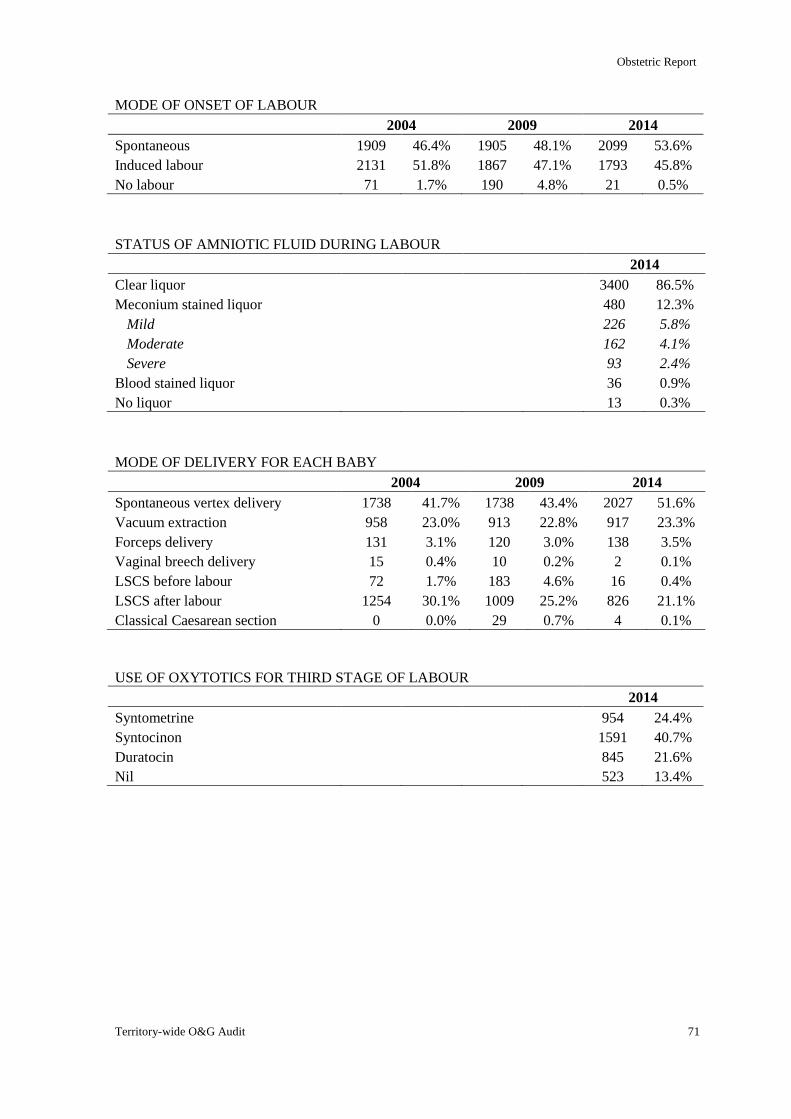
Obstetric Report
Territory-wide O&G Audit 71
MODE OF ONSET OF LABOUR
2004 2009 2014
Spontaneous 1909 46.4% 1905 48.1% 2099 53.6%
Induced labour 2131 51.8% 1867 47.1% 1793 45.8%
No labour 71 1.7% 190 4.8% 21 0.5%
STATUS OF AMNIOTIC FLUID DURING LABOUR
2014
Clear liquor 3400 86.5%
Meconium stained liquor 480 12.3%
Mild 226 5.8%
Moderate 162 4.1%
Severe 93 2.4%
Blood stained liquor 36 0.9%
No liquor 13 0.3%
MODE OF DELIVERY FOR EACH BABY
2004 2009 2014
Spontaneous vertex delivery 1738 41.7% 1738 43.4% 2027 51.6%
Vacuum extraction 958 23.0% 913 22.8% 917 23.3%
Forceps delivery 131 3.1% 120 3.0% 138 3.5%
Vaginal breech delivery 15 0.4% 10 0.2% 2 0.1%
LSCS before labour 72 1.7% 183 4.6% 16 0.4%
LSCS after labour 1254 30.1% 1009 25.2% 826 21.1%
Classical Caesarean section 0 0.0% 29 0.7% 4 0.1%
USE OF OXYTOTICS FOR THIRD STAGE OF LABOUR
2014
Syntometrine 954 24.4%
Syntocinon 1591 40.7%
Duratocin 845 21.6%
Nil 523 13.4%
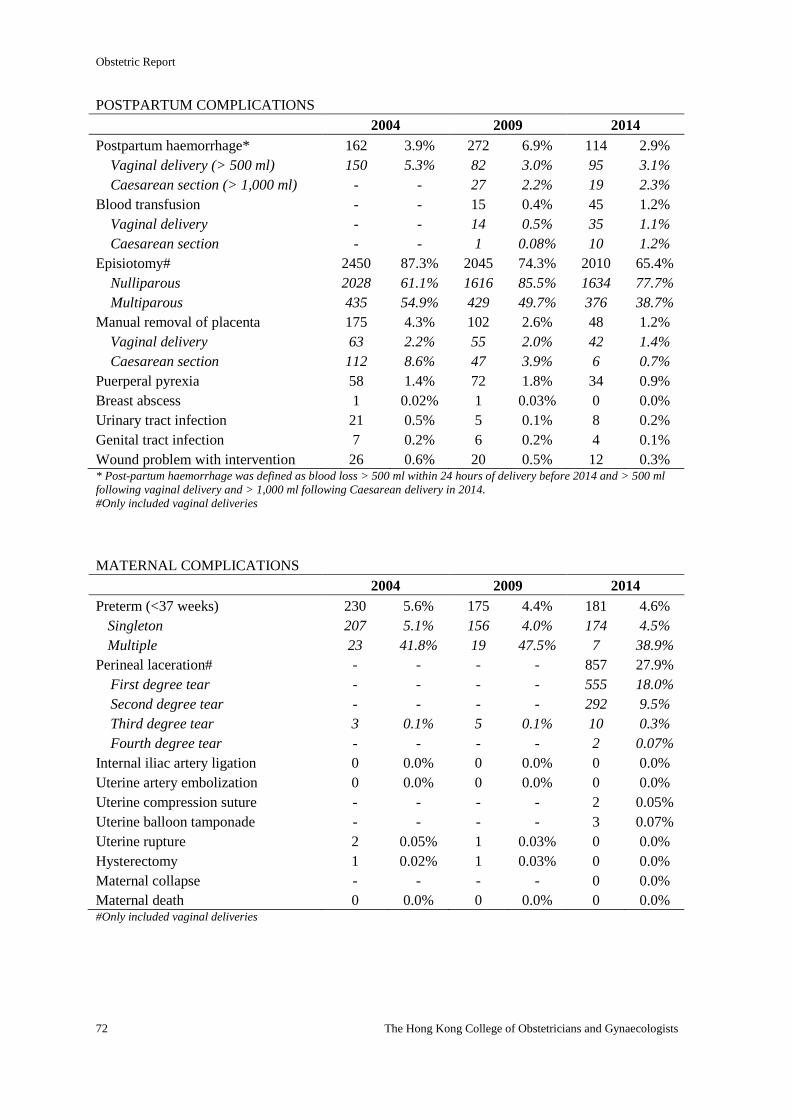
Obstetric Report
72 The Hong Kong College of Obstetricians and Gynaecologists
POSTPARTUM COMPLICATIONS
2004 2009 2014
Postpartum haemorrhage* 162 3.9% 272 6.9% 114 2.9%
Vaginal delivery (> 500 ml) 150 5.3% 82 3.0% 95 3.1%
Caesarean section (> 1,000 ml) - - 27 2.2% 19 2.3%
Blood transfusion - - 15 0.4% 45 1.2%
Vaginal delivery - - 14 0.5% 35 1.1%
Caesarean section - - 1 0.08% 10 1.2%
Episiotomy# 2450 87.3% 2045 74.3% 2010 65.4%
Nulliparous 2028 61.1% 1616 85.5% 1634 77.7%
Multiparous 435 54.9% 429 49.7% 376 38.7%
Manual removal of placenta 175 4.3% 102 2.6% 48 1.2%
Vaginal delivery 63 2.2% 55 2.0% 42 1.4%
Caesarean section 112 8.6% 47 3.9% 6 0.7%
Puerperal pyrexia 58 1.4% 72 1.8% 34 0.9%
Breast abscess 1 0.02% 1 0.03% 0 0.0%
Urinary tract infection 21 0.5% 5 0.1% 8 0.2%
Genital tract infection 7 0.2% 6 0.2% 4 0.1%
Wound problem with intervention 26 0.6% 20 0.5% 12 0.3% * Post-partum haemorrhage was defined as blood loss > 500 ml within 24 hours of delivery before 2014 and > 500 ml
following vaginal delivery and > 1,000 ml following Caesarean delivery in 2014.
#Only included vaginal deliveries
MATERNAL COMPLICATIONS
2004 2009 2014
Preterm (<37 weeks) 230 5.6% 175 4.4% 181 4.6%
Singleton 207 5.1% 156 4.0% 174 4.5%
Multiple 23 41.8% 19 47.5% 7 38.9%
Perineal laceration# - - - - 857 27.9%
First degree tear - - - - 555 18.0%
Second degree tear - - - - 292 9.5%
Third degree tear 3 0.1% 5 0.1% 10 0.3%
Fourth degree tear - - - - 2 0.07%
Internal iliac artery ligation 0 0.0% 0 0.0% 0 0.0%
Uterine artery embolization 0 0.0% 0 0.0% 0 0.0%
Uterine compression suture - - - - 2 0.05%
Uterine balloon tamponade - - - - 3 0.07%
Uterine rupture 2 0.05% 1 0.03% 0 0.0%
Hysterectomy 1 0.02% 1 0.03% 0 0.0%
Maternal collapse - - - - 0 0.0%
Maternal death 0 0.0% 0 0.0% 0 0.0% #Only included vaginal deliveries
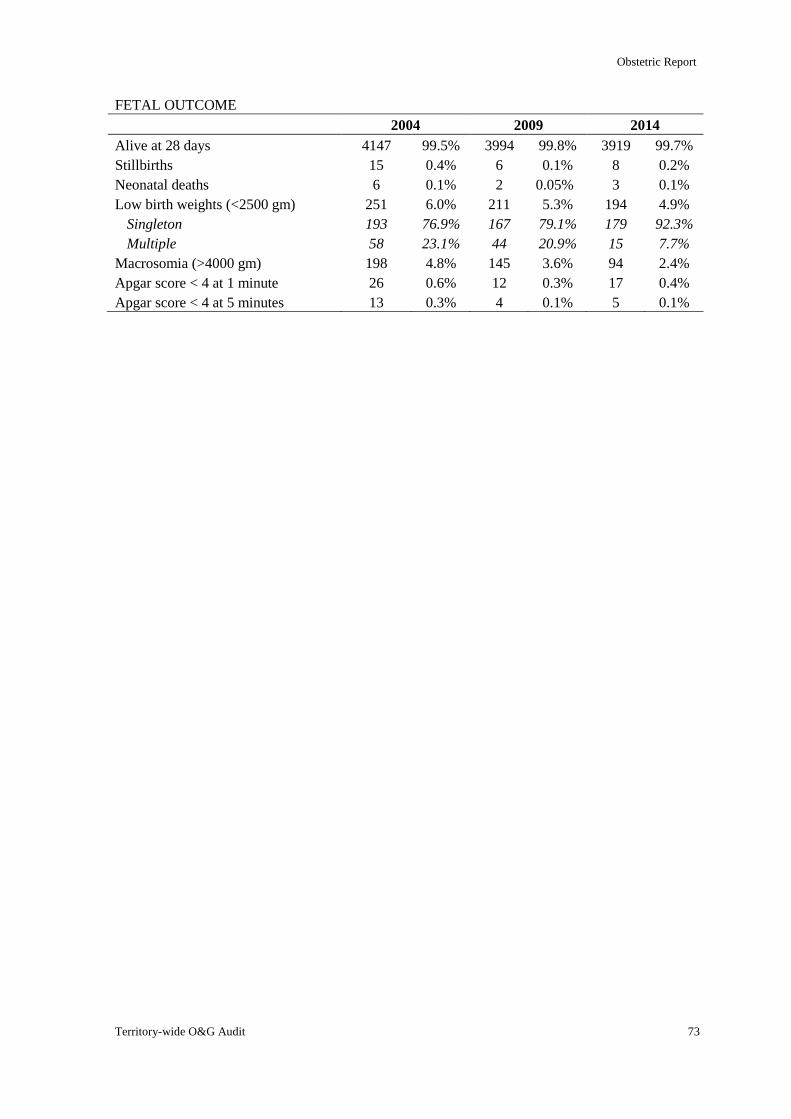
Obstetric Report
Territory-wide O&G Audit 73
FETAL OUTCOME
2004 2009 2014
Alive at 28 days 4147 99.5% 3994 99.8% 3919 99.7%
Stillbirths 15 0.4% 6 0.1% 8 0.2%
Neonatal deaths 6 0.1% 2 0.05% 3 0.1%
Low birth weights (<2500 gm) 251 6.0% 211 5.3% 194 4.9%
Singleton 193 76.9% 167 79.1% 179 92.3%
Multiple 58 23.1% 44 20.9% 15 7.7%
Macrosomia (>4000 gm) 198 4.8% 145 3.6% 94 2.4%
Apgar score < 4 at 1 minute 26 0.6% 12 0.3% 17 0.4%
Apgar score < 4 at 5 minutes 13 0.3% 4 0.1% 5 0.1%
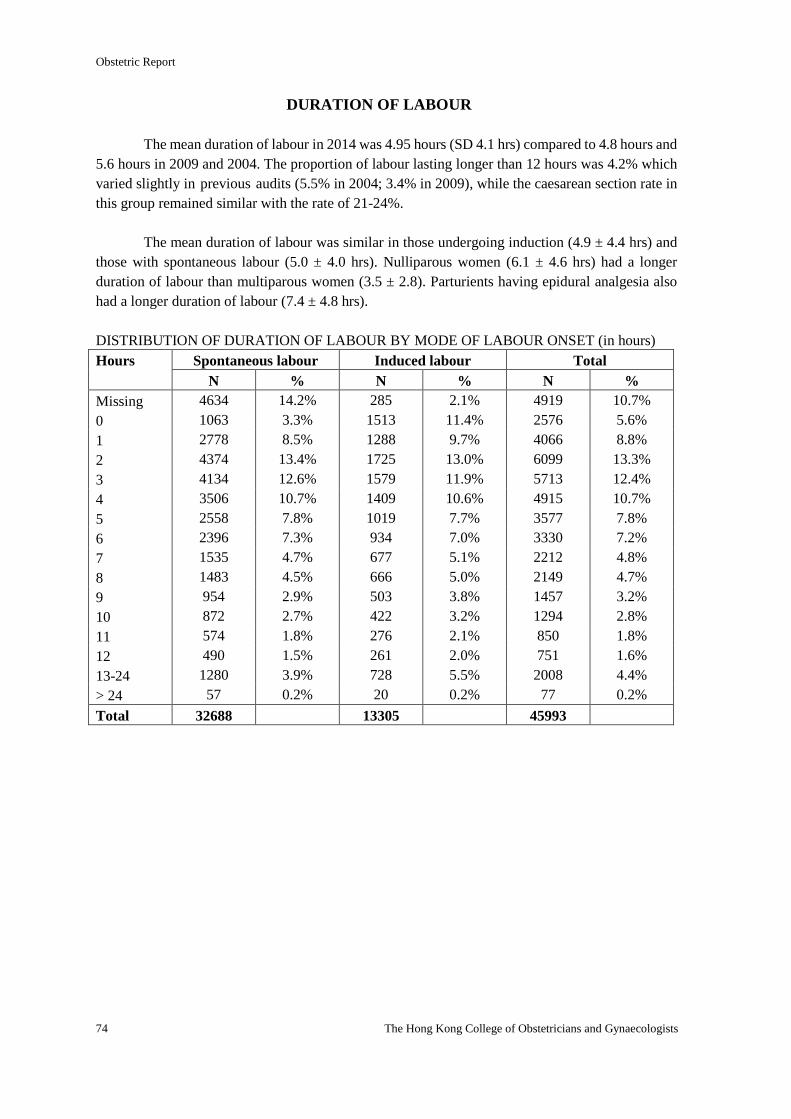
Obstetric Report
74 The Hong Kong College of Obstetricians and Gynaecologists
DURATION OF LABOUR
The mean duration of labour in 2014 was 4.95 hours (SD 4.1 hrs) compared to 4.8 hours and
5.6 hours in 2009 and 2004. The proportion of labour lasting longer than 12 hours was 4.2% which
varied slightly in previous audits (5.5% in 2004; 3.4% in 2009), while the caesarean section rate in
this group remained similar with the rate of 21-24%.
The mean duration of labour was similar in those undergoing induction (4.9 ± 4.4 hrs) and
those with spontaneous labour (5.0 ± 4.0 hrs). Nulliparous women (6.1 ± 4.6 hrs) had a longer
duration of labour than multiparous women (3.5 ± 2.8). Parturients having epidural analgesia also
had a longer duration of labour (7.4 ± 4.8 hrs).
DISTRIBUTION OF DURATION OF LABOUR BY MODE OF LABOUR ONSET (in hours)
Hours Spontaneous labour Induced labour Total
N % N % N %
Missing 4634 14.2% 285 2.1% 4919 10.7%
0 1063 3.3% 1513 11.4% 2576 5.6%
1 2778 8.5% 1288 9.7% 4066 8.8%
2 4374 13.4% 1725 13.0% 6099 13.3%
3 4134 12.6% 1579 11.9% 5713 12.4%
4 3506 10.7% 1409 10.6% 4915 10.7%
5 2558 7.8% 1019 7.7% 3577 7.8%
6 2396 7.3% 934 7.0% 3330 7.2%
7 1535 4.7% 677 5.1% 2212 4.8%
8 1483 4.5% 666 5.0% 2149 4.7%
9 954 2.9% 503 3.8% 1457 3.2%
10 872 2.7% 422 3.2% 1294 2.8%
11 574 1.8% 276 2.1% 850 1.8%
12 490 1.5% 261 2.0% 751 1.6%
13-24 1280 3.9% 728 5.5% 2008 4.4%
> 24 57 0.2% 20 0.2% 77 0.2%
Total 32688 13305 45993
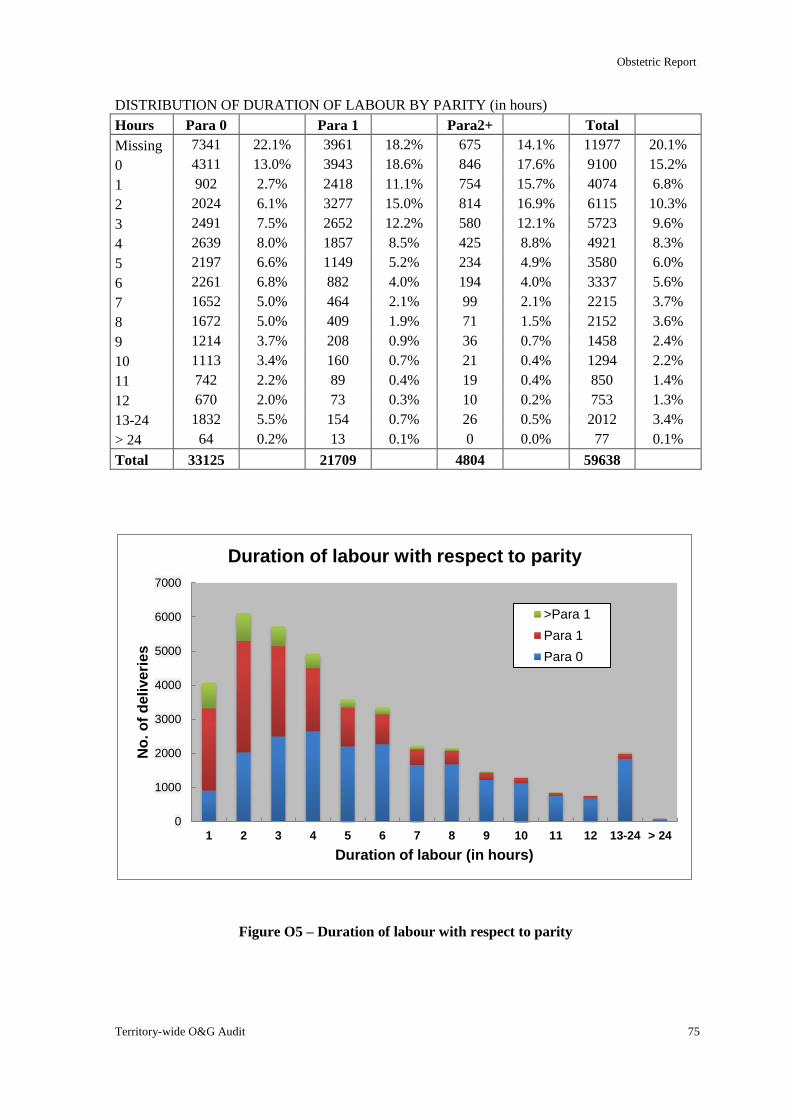
Obstetric Report
Territory-wide O&G Audit 75
0
1000
2000
3000
4000
5000
6000
7000
1 2 3 4 5 6 7 8 9 10 11 12 13-24 > 24
No
. o
f d
eli
ve
rie
s
Duration of labour (in hours)
Duration of labour with respect to parity
>Para 1
Para 1
Para 0
DISTRIBUTION OF DURATION OF LABOUR BY PARITY (in hours)
Hours Para 0 Para 1 Para2+ Total
Missing 7341 22.1% 3961 18.2% 675 14.1% 11977 20.1%
0 4311 13.0% 3943 18.6% 846 17.6% 9100 15.2%
1 902 2.7% 2418 11.1% 754 15.7% 4074 6.8%
2 2024 6.1% 3277 15.0% 814 16.9% 6115 10.3%
3 2491 7.5% 2652 12.2% 580 12.1% 5723 9.6%
4 2639 8.0% 1857 8.5% 425 8.8% 4921 8.3%
5 2197 6.6% 1149 5.2% 234 4.9% 3580 6.0%
6 2261 6.8% 882 4.0% 194 4.0% 3337 5.6%
7 1652 5.0% 464 2.1% 99 2.1% 2215 3.7%
8 1672 5.0% 409 1.9% 71 1.5% 2152 3.6%
9 1214 3.7% 208 0.9% 36 0.7% 1458 2.4%
10 1113 3.4% 160 0.7% 21 0.4% 1294 2.2%
11 742 2.2% 89 0.4% 19 0.4% 850 1.4%
12 670 2.0% 73 0.3% 10 0.2% 753 1.3%
13-24 1832 5.5% 154 0.7% 26 0.5% 2012 3.4%
> 24 64 0.2% 13 0.1% 0 0.0% 77 0.1%
Total 33125 21709 4804 59638
Figure O5 – Duration of labour with respect to parity
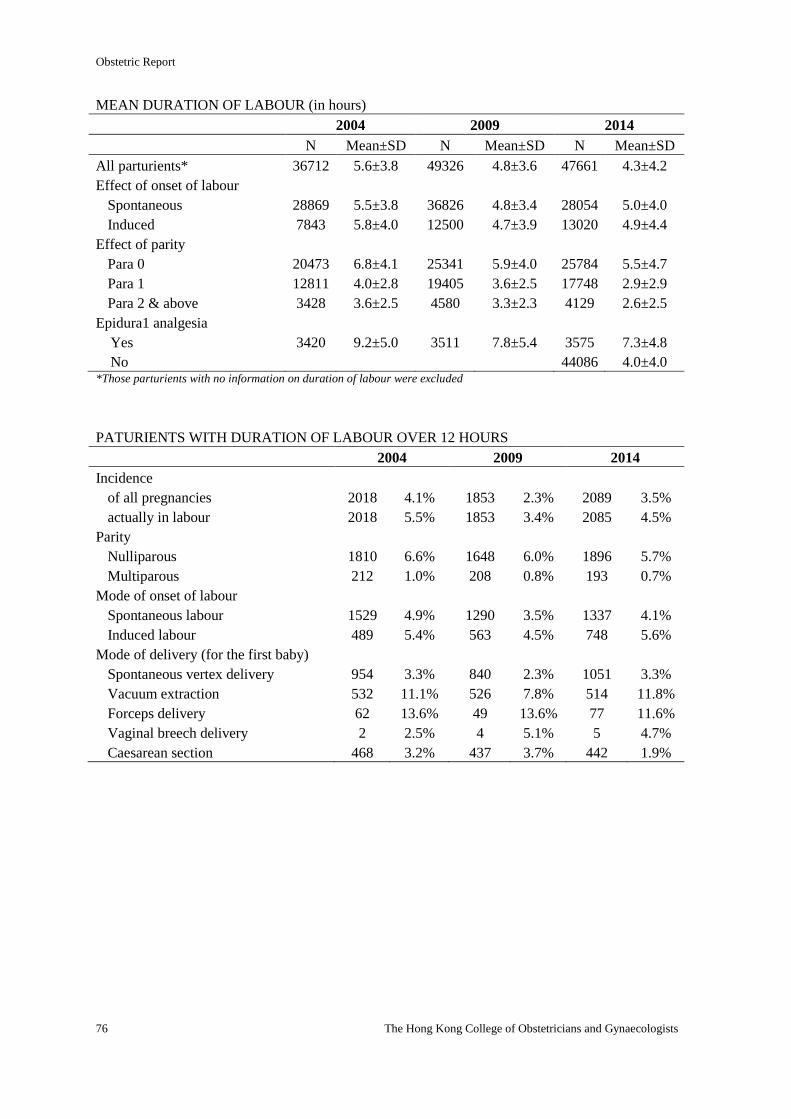
Obstetric Report
76 The Hong Kong College of Obstetricians and Gynaecologists
MEAN DURATION OF LABOUR (in hours)
2004 2009 2014
N Mean±SD N Mean±SD N Mean±SD
All parturients* 36712 5.6±3.8 49326 4.8±3.6 47661 4.3±4.2
Effect of onset of labour
Spontaneous 28869 5.5±3.8 36826 4.8±3.4 28054 5.0±4.0
Induced 7843 5.8±4.0 12500 4.7±3.9 13020 4.9±4.4
Effect of parity
Para 0 20473 6.8±4.1 25341 5.9±4.0 25784 5.5±4.7
Para 1 12811 4.0±2.8 19405 3.6±2.5 17748 2.9±2.9
Para 2 & above 3428 3.6±2.5 4580 3.3±2.3 4129 2.6±2.5
Epidura1 analgesia
Yes 3420 9.2±5.0 3511 7.8±5.4 3575 7.3±4.8
No 44086 4.0±4.0 *Those parturients with no information on duration of labour were excluded
PATURIENTS WITH DURATION OF LABOUR OVER 12 HOURS
2004 2009 2014
Incidence
of all pregnancies 2018 4.1% 1853 2.3% 2089 3.5%
actually in labour 2018 5.5% 1853 3.4% 2085 4.5%
Parity
Nulliparous 1810 6.6% 1648 6.0% 1896 5.7%
Multiparous 212 1.0% 208 0.8% 193 0.7%
Mode of onset of labour
Spontaneous labour 1529 4.9% 1290 3.5% 1337 4.1%
Induced labour 489 5.4% 563 4.5% 748 5.6%
Mode of delivery (for the first baby)
Spontaneous vertex delivery 954 3.3% 840 2.3% 1051 3.3%
Vacuum extraction 532 11.1% 526 7.8% 514 11.8%
Forceps delivery 62 13.6% 49 13.6% 77 11.6%
Vaginal breech delivery 2 2.5% 4 5.1% 5 4.7%
Caesarean section 468 3.2% 437 3.7% 442 1.9%
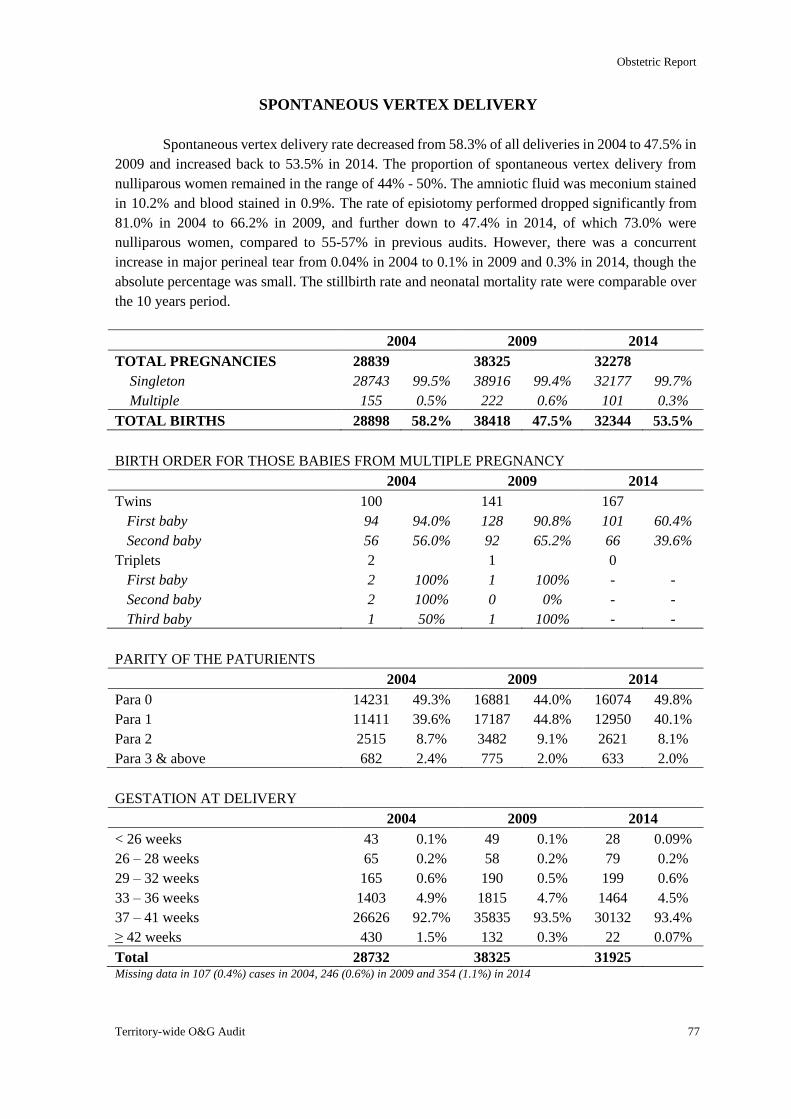
Obstetric Report
Territory-wide O&G Audit 77
SPONTANEOUS VERTEX DELIVERY
Spontaneous vertex delivery rate decreased from 58.3% of all deliveries in 2004 to 47.5% in
2009 and increased back to 53.5% in 2014. The proportion of spontaneous vertex delivery from
nulliparous women remained in the range of 44% - 50%. The amniotic fluid was meconium stained
in 10.2% and blood stained in 0.9%. The rate of episiotomy performed dropped significantly from
81.0% in 2004 to 66.2% in 2009, and further down to 47.4% in 2014, of which 73.0% were
nulliparous women, compared to 55-57% in previous audits. However, there was a concurrent
increase in major perineal tear from 0.04% in 2004 to 0.1% in 2009 and 0.3% in 2014, though the
absolute percentage was small. The stillbirth rate and neonatal mortality rate were comparable over
the 10 years period.
2004 2009 2014
TOTAL PREGNANCIES 28839 38325 32278
Singleton 28743 99.5% 38916 99.4% 32177 99.7%
Multiple 155 0.5% 222 0.6% 101 0.3%
TOTAL BIRTHS 28898 58.2% 38418 47.5% 32344 53.5%
BIRTH ORDER FOR THOSE BABIES FROM MULTIPLE PREGNANCY
2004 2009 2014
Twins 100 141 167
First baby 94 94.0% 128 90.8% 101 60.4%
Second baby 56 56.0% 92 65.2% 66 39.6%
Triplets 2 1 0
First baby 2 100% 1 100% - -
Second baby 2 100% 0 0% - -
Third baby 1 50% 1 100% - -
PARITY OF THE PATURIENTS
2004 2009 2014
Para 0 14231 49.3% 16881 44.0% 16074 49.8%
Para 1 11411 39.6% 17187 44.8% 12950 40.1%
Para 2 2515 8.7% 3482 9.1% 2621 8.1%
Para 3 & above 682 2.4% 775 2.0% 633 2.0%
GESTATION AT DELIVERY
2004 2009 2014
< 26 weeks 43 0.1% 49 0.1% 28 0.09%
26 – 28 weeks 65 0.2% 58 0.2% 79 0.2%
29 – 32 weeks 165 0.6% 190 0.5% 199 0.6%
33 – 36 weeks 1403 4.9% 1815 4.7% 1464 4.5%
37 – 41 weeks 26626 92.7% 35835 93.5% 30132 93.4%
≥ 42 weeks 430 1.5% 132 0.3% 22 0.07%
Total 28732 38325 31925 Missing data in 107 (0.4%) cases in 2004, 246 (0.6%) in 2009 and 354 (1.1%) in 2014
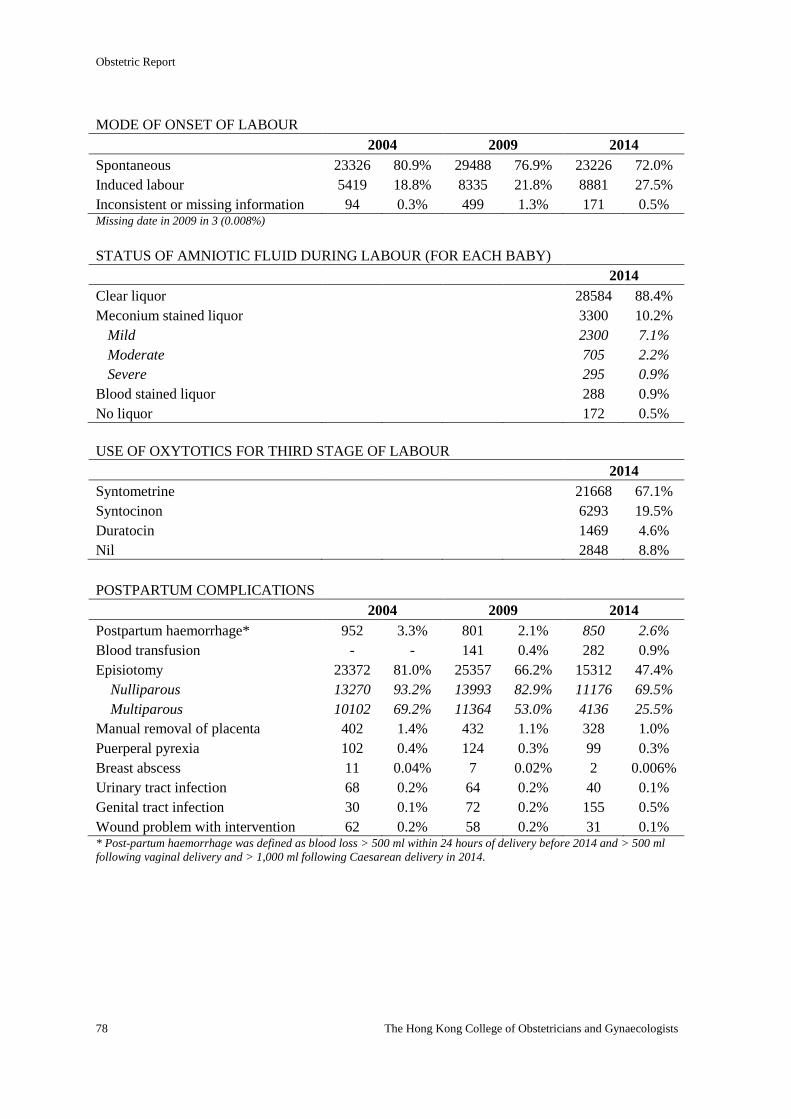
Obstetric Report
78 The Hong Kong College of Obstetricians and Gynaecologists
MODE OF ONSET OF LABOUR
2004 2009 2014
Spontaneous 23326 80.9% 29488 76.9% 23226 72.0%
Induced labour 5419 18.8% 8335 21.8% 8881 27.5%
Inconsistent or missing information 94 0.3% 499 1.3% 171 0.5% Missing date in 2009 in 3 (0.008%)
STATUS OF AMNIOTIC FLUID DURING LABOUR (FOR EACH BABY)
2014
Clear liquor 28584 88.4%
Meconium stained liquor 3300 10.2%
Mild 2300 7.1%
Moderate 705 2.2%
Severe 295 0.9%
Blood stained liquor 288 0.9%
No liquor 172 0.5%
USE OF OXYTOTICS FOR THIRD STAGE OF LABOUR
2014
Syntometrine 21668 67.1%
Syntocinon 6293 19.5%
Duratocin 1469 4.6%
Nil 2848 8.8%
POSTPARTUM COMPLICATIONS
2004 2009 2014
Postpartum haemorrhage* 952 3.3% 801 2.1% 850 2.6%
Blood transfusion - - 141 0.4% 282 0.9%
Episiotomy 23372 81.0% 25357 66.2% 15312 47.4%
Nulliparous 13270 93.2% 13993 82.9% 11176 69.5%
Multiparous 10102 69.2% 11364 53.0% 4136 25.5%
Manual removal of placenta 402 1.4% 432 1.1% 328 1.0%
Puerperal pyrexia 102 0.4% 124 0.3% 99 0.3%
Breast abscess 11 0.04% 7 0.02% 2 0.006%
Urinary tract infection 68 0.2% 64 0.2% 40 0.1%
Genital tract infection 30 0.1% 72 0.2% 155 0.5%
Wound problem with intervention 62 0.2% 58 0.2% 31 0.1% * Post-partum haemorrhage was defined as blood loss > 500 ml within 24 hours of delivery before 2014 and > 500 ml
following vaginal delivery and > 1,000 ml following Caesarean delivery in 2014.
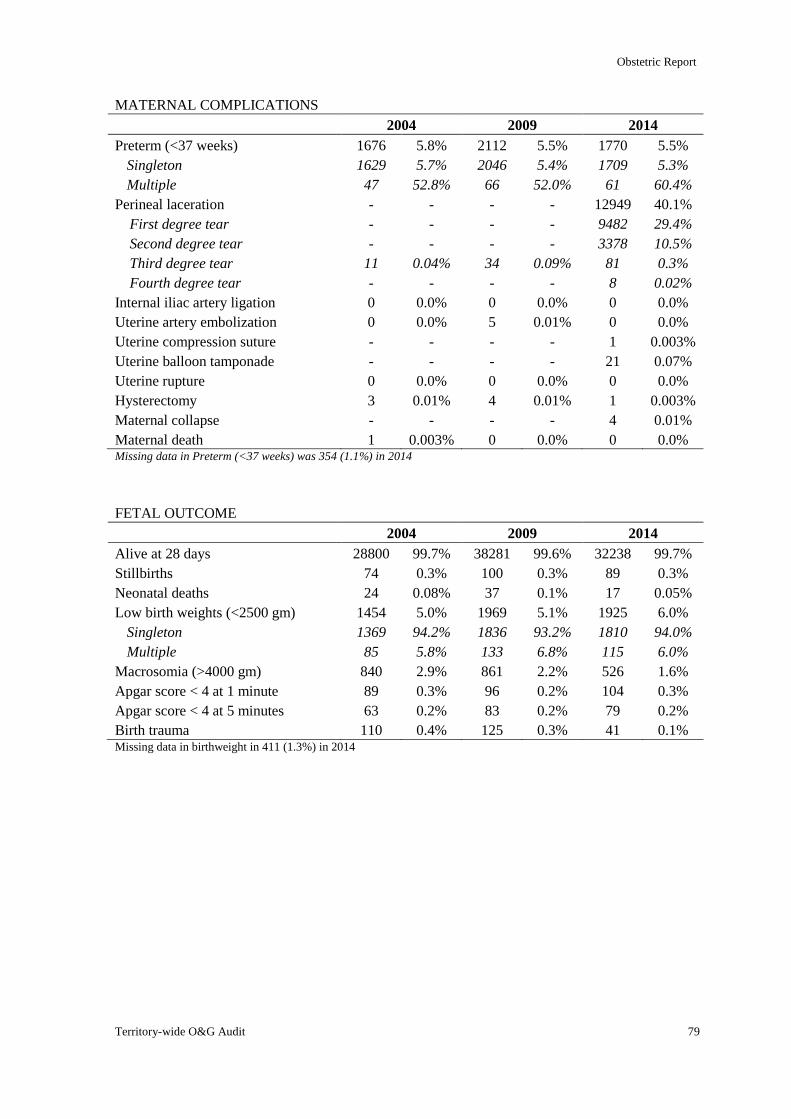
Obstetric Report
Territory-wide O&G Audit 79
MATERNAL COMPLICATIONS
2004 2009 2014
Preterm (<37 weeks) 1676 5.8% 2112 5.5% 1770 5.5%
Singleton 1629 5.7% 2046 5.4% 1709 5.3%
Multiple 47 52.8% 66 52.0% 61 60.4%
Perineal laceration - - - - 12949 40.1%
First degree tear - - - - 9482 29.4%
Second degree tear - - - - 3378 10.5%
Third degree tear 11 0.04% 34 0.09% 81 0.3%
Fourth degree tear - - - - 8 0.02%
Internal iliac artery ligation 0 0.0% 0 0.0% 0 0.0%
Uterine artery embolization 0 0.0% 5 0.01% 0 0.0%
Uterine compression suture - - - - 1 0.003%
Uterine balloon tamponade - - - - 21 0.07%
Uterine rupture 0 0.0% 0 0.0% 0 0.0%
Hysterectomy 3 0.01% 4 0.01% 1 0.003%
Maternal collapse - - - - 4 0.01%
Maternal death 1 0.003% 0 0.0% 0 0.0% Missing data in Preterm (<37 weeks) was 354 (1.1%) in 2014
FETAL OUTCOME
2004 2009 2014
Alive at 28 days 28800 99.7% 38281 99.6% 32238 99.7%
Stillbirths 74 0.3% 100 0.3% 89 0.3%
Neonatal deaths 24 0.08% 37 0.1% 17 0.05%
Low birth weights (<2500 gm) 1454 5.0% 1969 5.1% 1925 6.0%
Singleton 1369 94.2% 1836 93.2% 1810 94.0%
Multiple 85 5.8% 133 6.8% 115 6.0%
Macrosomia (>4000 gm) 840 2.9% 861 2.2% 526 1.6%
Apgar score < 4 at 1 minute 89 0.3% 96 0.2% 104 0.3%
Apgar score < 4 at 5 minutes 63 0.2% 83 0.2% 79 0.2%
Birth trauma 110 0.4% 125 0.3% 41 0.1% Missing data in birthweight in 411 (1.3%) in 2014
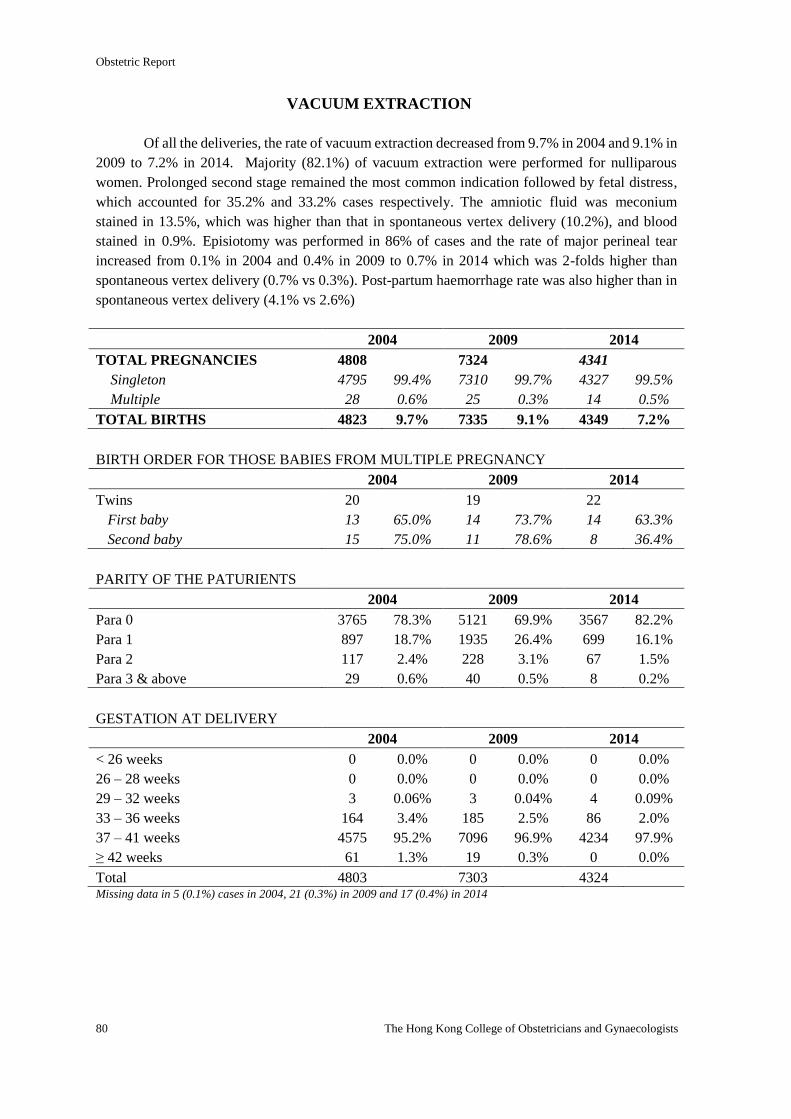
Obstetric Report
80 The Hong Kong College of Obstetricians and Gynaecologists
VACUUM EXTRACTION
Of all the deliveries, the rate of vacuum extraction decreased from 9.7% in 2004 and 9.1% in
2009 to 7.2% in 2014. Majority (82.1%) of vacuum extraction were performed for nulliparous
women. Prolonged second stage remained the most common indication followed by fetal distress,
which accounted for 35.2% and 33.2% cases respectively. The amniotic fluid was meconium
stained in 13.5%, which was higher than that in spontaneous vertex delivery (10.2%), and blood
stained in 0.9%. Episiotomy was performed in 86% of cases and the rate of major perineal tear
increased from 0.1% in 2004 and 0.4% in 2009 to 0.7% in 2014 which was 2-folds higher than
spontaneous vertex delivery (0.7% vs 0.3%). Post-partum haemorrhage rate was also higher than in
spontaneous vertex delivery (4.1% vs 2.6%)
2004 2009 2014
TOTAL PREGNANCIES 4808 7324 4341
Singleton 4795 99.4% 7310 99.7% 4327 99.5%
Multiple 28 0.6% 25 0.3% 14 0.5%
TOTAL BIRTHS 4823 9.7% 7335 9.1% 4349 7.2%
BIRTH ORDER FOR THOSE BABIES FROM MULTIPLE PREGNANCY
2004 2009 2014
Twins 20 19 22
First baby 13 65.0% 14 73.7% 14 63.3%
Second baby 15 75.0% 11 78.6% 8 36.4%
PARITY OF THE PATURIENTS
2004 2009 2014
Para 0 3765 78.3% 5121 69.9% 3567 82.2%
Para 1 897 18.7% 1935 26.4% 699 16.1%
Para 2 117 2.4% 228 3.1% 67 1.5%
Para 3 & above 29 0.6% 40 0.5% 8 0.2%
GESTATION AT DELIVERY
2004 2009 2014
< 26 weeks 0 0.0% 0 0.0% 0 0.0%
26 – 28 weeks 0 0.0% 0 0.0% 0 0.0%
29 – 32 weeks 3 0.06% 3 0.04% 4 0.09%
33 – 36 weeks 164 3.4% 185 2.5% 86 2.0%
37 – 41 weeks 4575 95.2% 7096 96.9% 4234 97.9%
≥ 42 weeks 61 1.3% 19 0.3% 0 0.0%
Total 4803 7303 4324 Missing data in 5 (0.1%) cases in 2004, 21 (0.3%) in 2009 and 17 (0.4%) in 2014
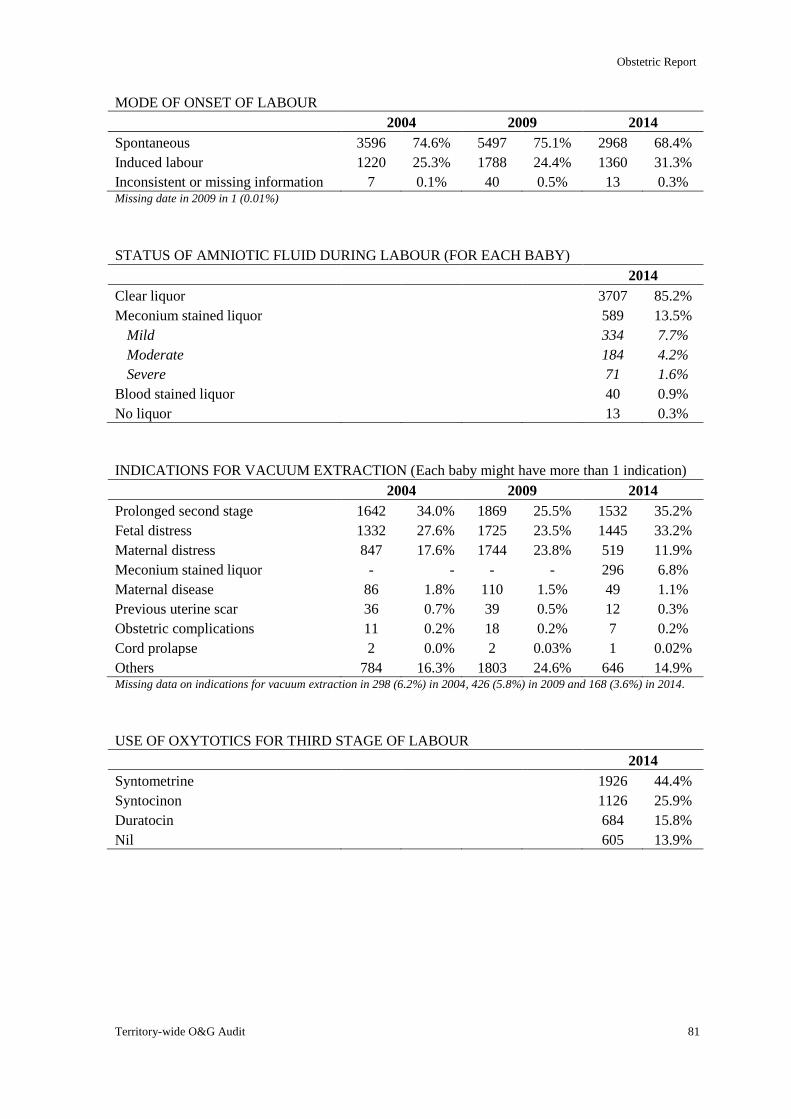
Obstetric Report
Territory-wide O&G Audit 81
MODE OF ONSET OF LABOUR
2004 2009 2014
Spontaneous 3596 74.6% 5497 75.1% 2968 68.4%
Induced labour 1220 25.3% 1788 24.4% 1360 31.3%
Inconsistent or missing information 7 0.1% 40 0.5% 13 0.3% Missing date in 2009 in 1 (0.01%)
STATUS OF AMNIOTIC FLUID DURING LABOUR (FOR EACH BABY)
2014
Clear liquor 3707 85.2%
Meconium stained liquor 589 13.5%
Mild 334 7.7%
Moderate 184 4.2%
Severe 71 1.6%
Blood stained liquor 40 0.9%
No liquor 13 0.3%
INDICATIONS FOR VACUUM EXTRACTION (Each baby might have more than 1 indication)
2004 2009 2014
Prolonged second stage 1642 34.0% 1869 25.5% 1532 35.2%
Fetal distress 1332 27.6% 1725 23.5% 1445 33.2%
Maternal distress 847 17.6% 1744 23.8% 519 11.9%
Meconium stained liquor - - - - 296 6.8%
Maternal disease 86 1.8% 110 1.5% 49 1.1%
Previous uterine scar 36 0.7% 39 0.5% 12 0.3%
Obstetric complications 11 0.2% 18 0.2% 7 0.2%
Cord prolapse 2 0.0% 2 0.03% 1 0.02%
Others 784 16.3% 1803 24.6% 646 14.9% Missing data on indications for vacuum extraction in 298 (6.2%) in 2004, 426 (5.8%) in 2009 and 168 (3.6%) in 2014.
USE OF OXYTOTICS FOR THIRD STAGE OF LABOUR
2014
Syntometrine 1926 44.4%
Syntocinon 1126 25.9%
Duratocin 684 15.8%
Nil 605 13.9%
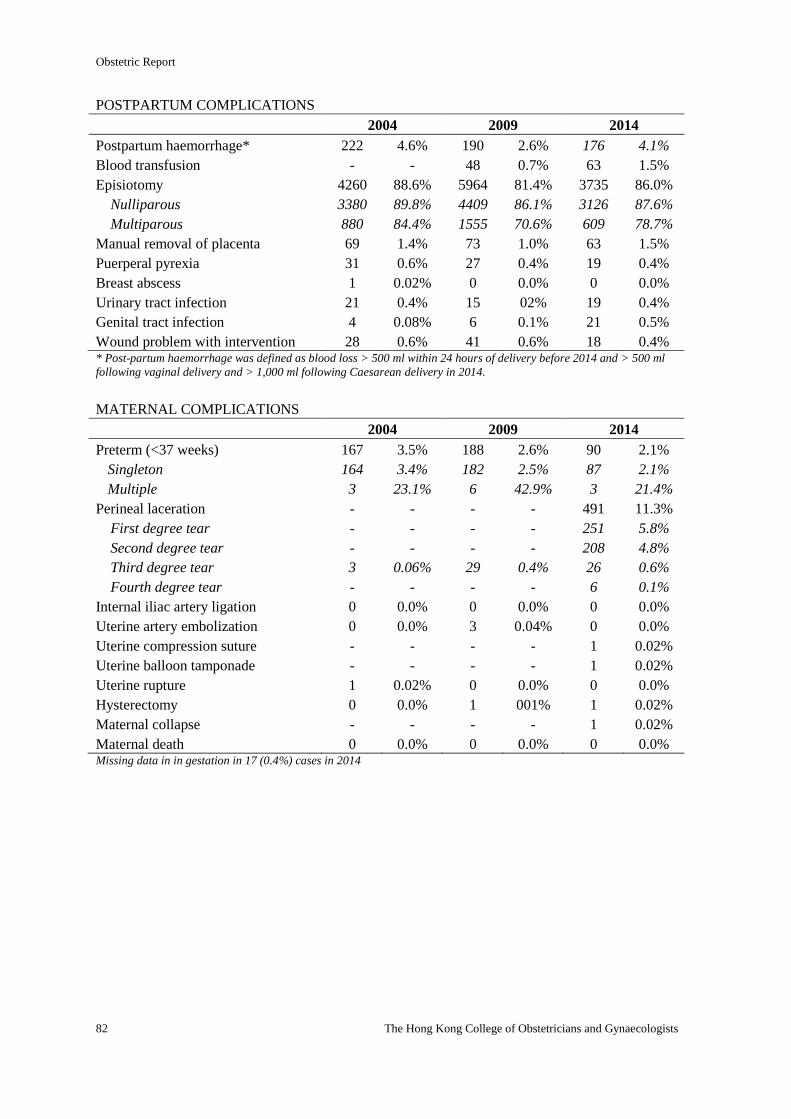
Obstetric Report
82 The Hong Kong College of Obstetricians and Gynaecologists
POSTPARTUM COMPLICATIONS
2004 2009 2014
Postpartum haemorrhage* 222 4.6% 190 2.6% 176 4.1%
Blood transfusion - - 48 0.7% 63 1.5%
Episiotomy 4260 88.6% 5964 81.4% 3735 86.0%
Nulliparous 3380 89.8% 4409 86.1% 3126 87.6%
Multiparous 880 84.4% 1555 70.6% 609 78.7%
Manual removal of placenta 69 1.4% 73 1.0% 63 1.5%
Puerperal pyrexia 31 0.6% 27 0.4% 19 0.4%
Breast abscess 1 0.02% 0 0.0% 0 0.0%
Urinary tract infection 21 0.4% 15 02% 19 0.4%
Genital tract infection 4 0.08% 6 0.1% 21 0.5%
Wound problem with intervention 28 0.6% 41 0.6% 18 0.4% * Post-partum haemorrhage was defined as blood loss > 500 ml within 24 hours of delivery before 2014 and > 500 ml
following vaginal delivery and > 1,000 ml following Caesarean delivery in 2014.
MATERNAL COMPLICATIONS
2004 2009 2014
Preterm (<37 weeks) 167 3.5% 188 2.6% 90 2.1%
Singleton 164 3.4% 182 2.5% 87 2.1%
Multiple 3 23.1% 6 42.9% 3 21.4%
Perineal laceration - - - - 491 11.3%
First degree tear - - - - 251 5.8%
Second degree tear - - - - 208 4.8%
Third degree tear 3 0.06% 29 0.4% 26 0.6%
Fourth degree tear - - - - 6 0.1%
Internal iliac artery ligation 0 0.0% 0 0.0% 0 0.0%
Uterine artery embolization 0 0.0% 3 0.04% 0 0.0%
Uterine compression suture - - - - 1 0.02%
Uterine balloon tamponade - - - - 1 0.02%
Uterine rupture 1 0.02% 0 0.0% 0 0.0%
Hysterectomy 0 0.0% 1 001% 1 0.02%
Maternal collapse - - - - 1 0.02%
Maternal death 0 0.0% 0 0.0% 0 0.0% Missing data in in gestation in 17 (0.4%) cases in 2014
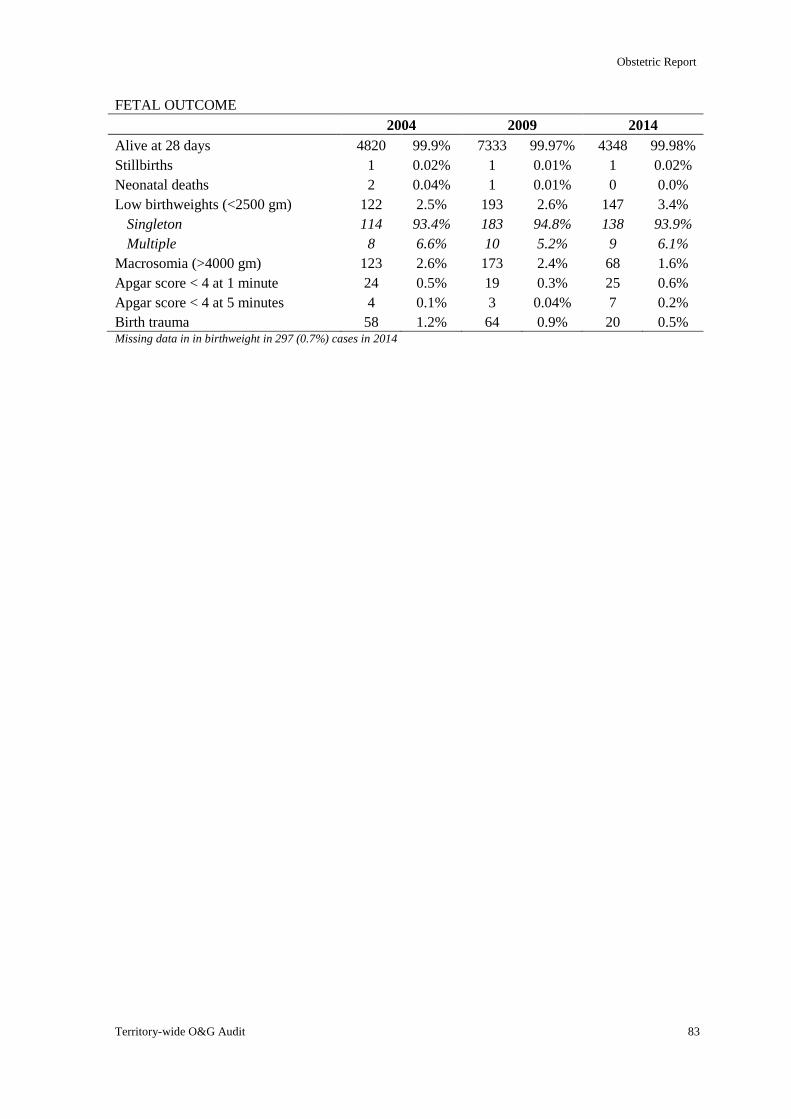
Obstetric Report
Territory-wide O&G Audit 83
FETAL OUTCOME
2004 2009 2014
Alive at 28 days 4820 99.9% 7333 99.97% 4348 99.98%
Stillbirths 1 0.02% 1 0.01% 1 0.02%
Neonatal deaths 2 0.04% 1 0.01% 0 0.0%
Low birthweights (<2500 gm) 122 2.5% 193 2.6% 147 3.4%
Singleton 114 93.4% 183 94.8% 138 93.9%
Multiple 8 6.6% 10 5.2% 9 6.1%
Macrosomia (>4000 gm) 123 2.6% 173 2.4% 68 1.6%
Apgar score < 4 at 1 minute 24 0.5% 19 0.3% 25 0.6%
Apgar score < 4 at 5 minutes 4 0.1% 3 0.04% 7 0.2%
Birth trauma 58 1.2% 64 0.9% 20 0.5% Missing data in in birthweight in 297 (0.7%) cases in 2014
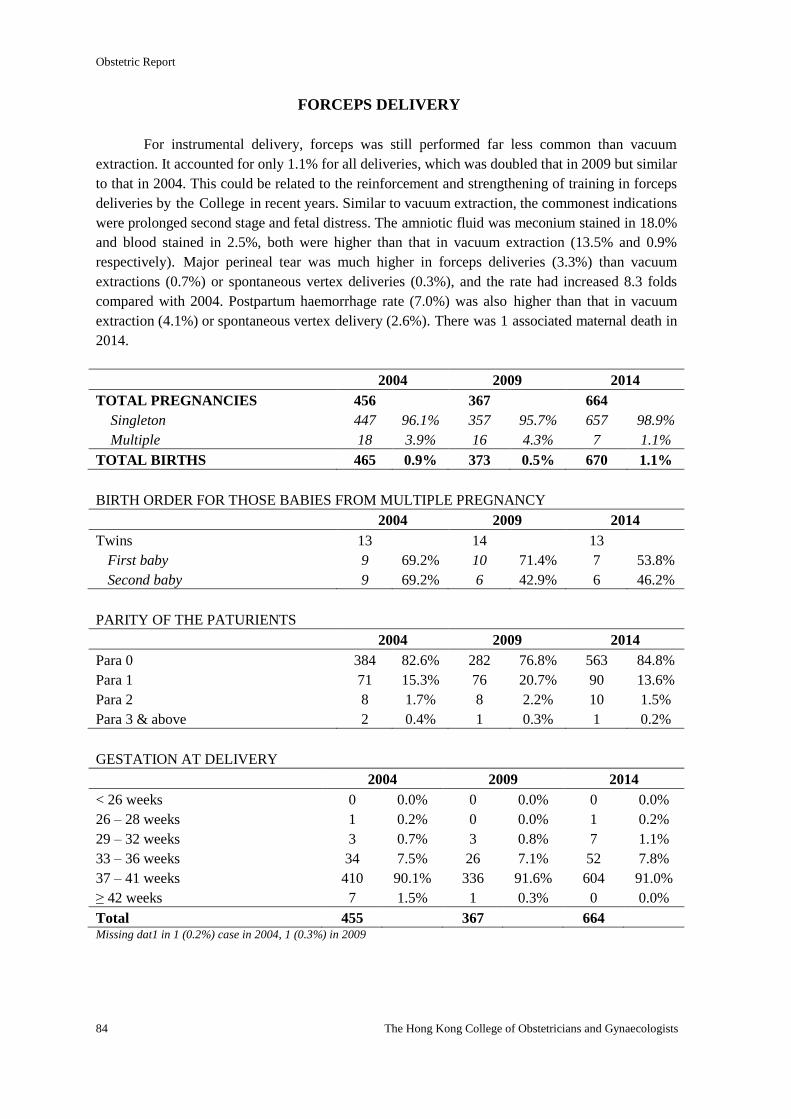
Obstetric Report
84 The Hong Kong College of Obstetricians and Gynaecologists
FORCEPS DELIVERY
For instrumental delivery, forceps was still performed far less common than vacuum
extraction. It accounted for only 1.1% for all deliveries, which was doubled that in 2009 but similar
to that in 2004. This could be related to the reinforcement and strengthening of training in forceps
deliveries by the College in recent years. Similar to vacuum extraction, the commonest indications
were prolonged second stage and fetal distress. The amniotic fluid was meconium stained in 18.0%
and blood stained in 2.5%, both were higher than that in vacuum extraction (13.5% and 0.9%
respectively). Major perineal tear was much higher in forceps deliveries (3.3%) than vacuum
extractions (0.7%) or spontaneous vertex deliveries (0.3%), and the rate had increased 8.3 folds
compared with 2004. Postpartum haemorrhage rate (7.0%) was also higher than that in vacuum
extraction (4.1%) or spontaneous vertex delivery (2.6%). There was 1 associated maternal death in
2014.
2004 2009 2014
TOTAL PREGNANCIES 456 367 664
Singleton 447 96.1% 357 95.7% 657 98.9%
Multiple 18 3.9% 16 4.3% 7 1.1%
TOTAL BIRTHS 465 0.9% 373 0.5% 670 1.1%
BIRTH ORDER FOR THOSE BABIES FROM MULTIPLE PREGNANCY
2004 2009 2014
Twins 13 14 13
First baby 9 69.2% 10 71.4% 7 53.8%
Second baby 9 69.2% 6 42.9% 6 46.2%
PARITY OF THE PATURIENTS
2004 2009 2014
Para 0 384 82.6% 282 76.8% 563 84.8%
Para 1 71 15.3% 76 20.7% 90 13.6%
Para 2 8 1.7% 8 2.2% 10 1.5%
Para 3 & above 2 0.4% 1 0.3% 1 0.2%
GESTATION AT DELIVERY
2004 2009 2014
< 26 weeks 0 0.0% 0 0.0% 0 0.0%
26 – 28 weeks 1 0.2% 0 0.0% 1 0.2%
29 – 32 weeks 3 0.7% 3 0.8% 7 1.1%
33 – 36 weeks 34 7.5% 26 7.1% 52 7.8%
37 – 41 weeks 410 90.1% 336 91.6% 604 91.0%
≥ 42 weeks 7 1.5% 1 0.3% 0 0.0%
Total 455 367 664 Missing dat1 in 1 (0.2%) case in 2004, 1 (0.3%) in 2009
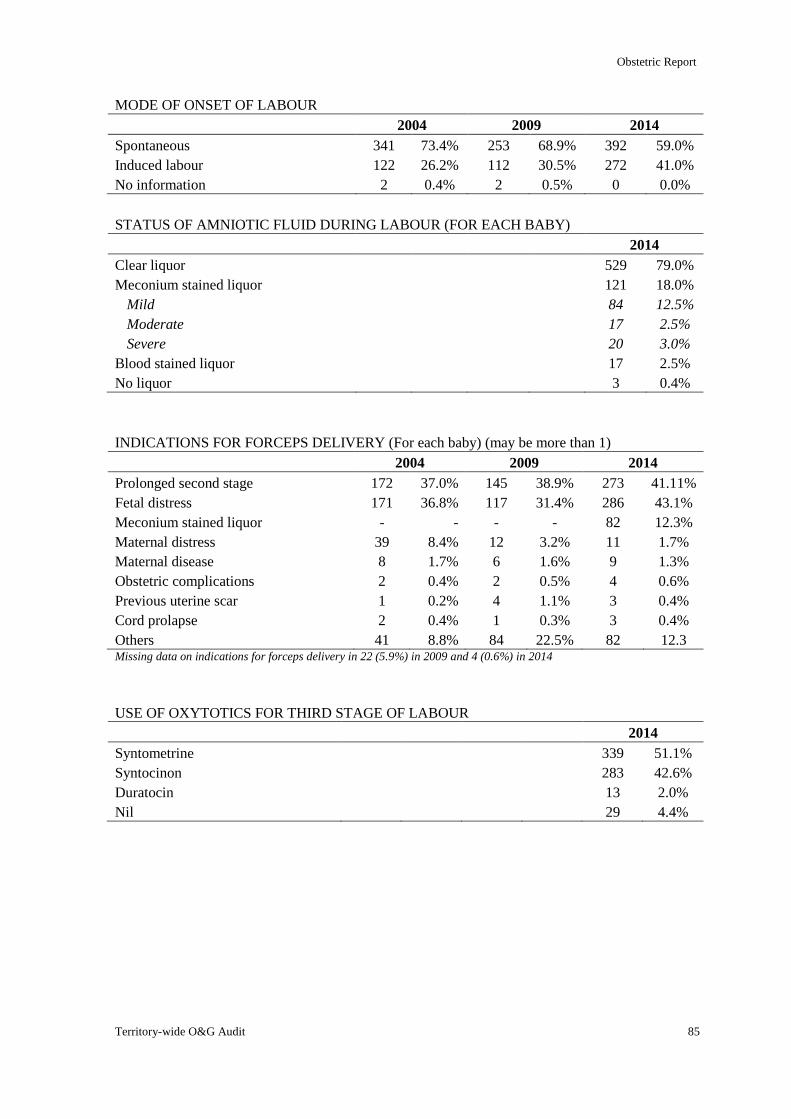
Obstetric Report
Territory-wide O&G Audit 85
MODE OF ONSET OF LABOUR
2004 2009 2014
Spontaneous 341 73.4% 253 68.9% 392 59.0%
Induced labour 122 26.2% 112 30.5% 272 41.0%
No information 2 0.4% 2 0.5% 0 0.0%
STATUS OF AMNIOTIC FLUID DURING LABOUR (FOR EACH BABY)
2014
Clear liquor 529 79.0%
Meconium stained liquor 121 18.0%
Mild 84 12.5%
Moderate 17 2.5%
Severe 20 3.0%
Blood stained liquor 17 2.5%
No liquor 3 0.4%
INDICATIONS FOR FORCEPS DELIVERY (For each baby) (may be more than 1)
2004 2009 2014
Prolonged second stage 172 37.0% 145 38.9% 273 41.11%
Fetal distress 171 36.8% 117 31.4% 286 43.1%
Meconium stained liquor - - - - 82 12.3%
Maternal distress 39 8.4% 12 3.2% 11 1.7%
Maternal disease 8 1.7% 6 1.6% 9 1.3%
Obstetric complications 2 0.4% 2 0.5% 4 0.6%
Previous uterine scar 1 0.2% 4 1.1% 3 0.4%
Cord prolapse 2 0.4% 1 0.3% 3 0.4%
Others 41 8.8% 84 22.5% 82 12.3 Missing data on indications for forceps delivery in 22 (5.9%) in 2009 and 4 (0.6%) in 2014
USE OF OXYTOTICS FOR THIRD STAGE OF LABOUR
2014
Syntometrine 339 51.1%
Syntocinon 283 42.6%
Duratocin 13 2.0%
Nil 29 4.4%
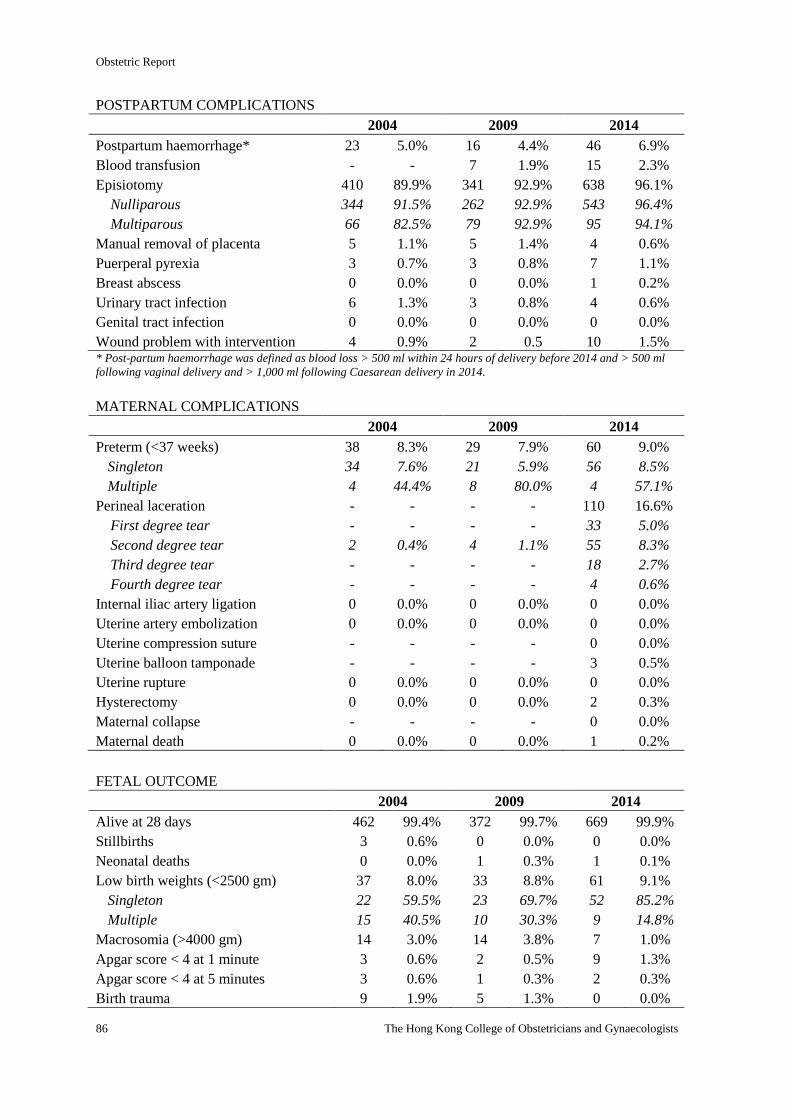
Obstetric Report
86 The Hong Kong College of Obstetricians and Gynaecologists
POSTPARTUM COMPLICATIONS
2004 2009 2014
Postpartum haemorrhage* 23 5.0% 16 4.4% 46 6.9%
Blood transfusion - - 7 1.9% 15 2.3%
Episiotomy 410 89.9% 341 92.9% 638 96.1%
Nulliparous 344 91.5% 262 92.9% 543 96.4%
Multiparous 66 82.5% 79 92.9% 95 94.1%
Manual removal of placenta 5 1.1% 5 1.4% 4 0.6%
Puerperal pyrexia 3 0.7% 3 0.8% 7 1.1%
Breast abscess 0 0.0% 0 0.0% 1 0.2%
Urinary tract infection 6 1.3% 3 0.8% 4 0.6%
Genital tract infection 0 0.0% 0 0.0% 0 0.0%
Wound problem with intervention 4 0.9% 2 0.5 10 1.5% * Post-partum haemorrhage was defined as blood loss > 500 ml within 24 hours of delivery before 2014 and > 500 ml
following vaginal delivery and > 1,000 ml following Caesarean delivery in 2014.
MATERNAL COMPLICATIONS
2004 2009 2014
Preterm (<37 weeks) 38 8.3% 29 7.9% 60 9.0%
Singleton 34 7.6% 21 5.9% 56 8.5%
Multiple 4 44.4% 8 80.0% 4 57.1%
Perineal laceration - - - - 110 16.6%
First degree tear - - - - 33 5.0%
Second degree tear 2 0.4% 4 1.1% 55 8.3%
Third degree tear - - - - 18 2.7%
Fourth degree tear - - - - 4 0.6%
Internal iliac artery ligation 0 0.0% 0 0.0% 0 0.0%
Uterine artery embolization 0 0.0% 0 0.0% 0 0.0%
Uterine compression suture - - - - 0 0.0%
Uterine balloon tamponade - - - - 3 0.5%
Uterine rupture 0 0.0% 0 0.0% 0 0.0%
Hysterectomy 0 0.0% 0 0.0% 2 0.3%
Maternal collapse - - - - 0 0.0%
Maternal death 0 0.0% 0 0.0% 1 0.2%
FETAL OUTCOME
2004 2009 2014
Alive at 28 days 462 99.4% 372 99.7% 669 99.9%
Stillbirths 3 0.6% 0 0.0% 0 0.0%
Neonatal deaths 0 0.0% 1 0.3% 1 0.1%
Low birth weights (<2500 gm) 37 8.0% 33 8.8% 61 9.1%
Singleton 22 59.5% 23 69.7% 52 85.2%
Multiple 15 40.5% 10 30.3% 9 14.8%
Macrosomia (>4000 gm) 14 3.0% 14 3.8% 7 1.0%
Apgar score < 4 at 1 minute 3 0.6% 2 0.5% 9 1.3%
Apgar score < 4 at 5 minutes 3 0.6% 1 0.3% 2 0.3%
Birth trauma 9 1.9% 5 1.3% 0 0.0%
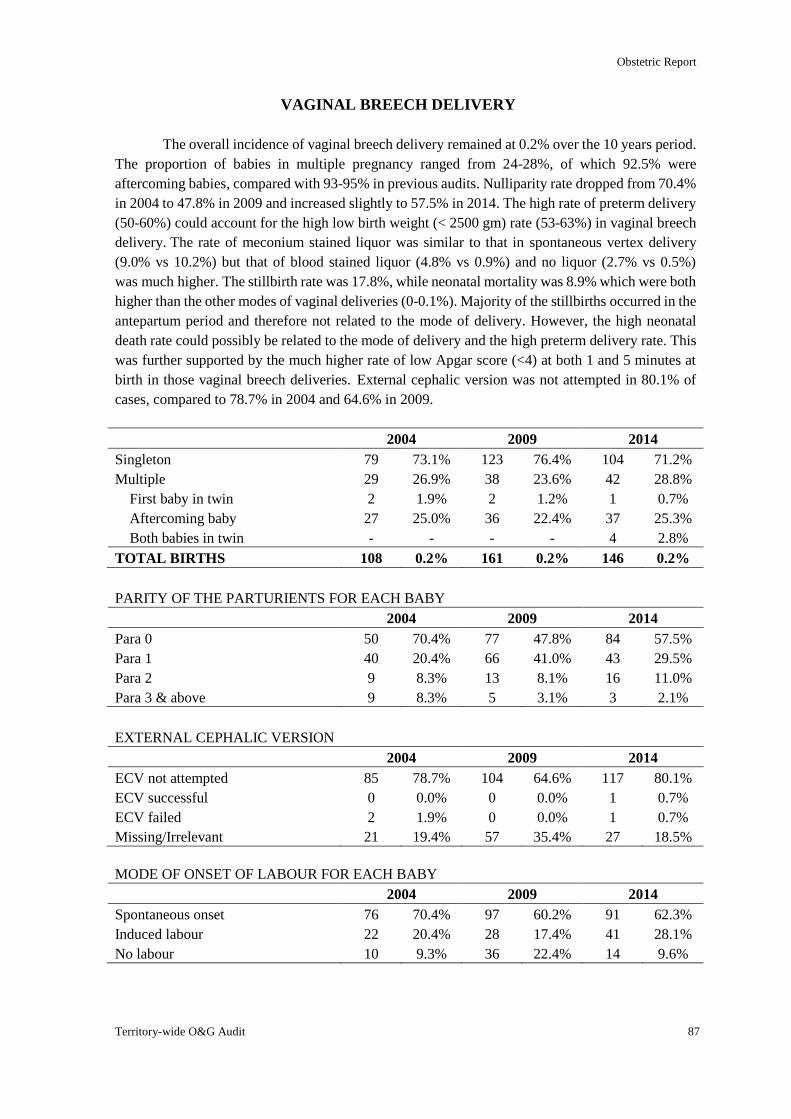
Obstetric Report
Territory-wide O&G Audit 87
VAGINAL BREECH DELIVERY
The overall incidence of vaginal breech delivery remained at 0.2% over the 10 years period.
The proportion of babies in multiple pregnancy ranged from 24-28%, of which 92.5% were
aftercoming babies, compared with 93-95% in previous audits. Nulliparity rate dropped from 70.4%
in 2004 to 47.8% in 2009 and increased slightly to 57.5% in 2014. The high rate of preterm delivery
(50-60%) could account for the high low birth weight (< 2500 gm) rate (53-63%) in vaginal breech
delivery. The rate of meconium stained liquor was similar to that in spontaneous vertex delivery
(9.0% vs 10.2%) but that of blood stained liquor (4.8% vs 0.9%) and no liquor (2.7% vs 0.5%)
was much higher. The stillbirth rate was 17.8%, while neonatal mortality was 8.9% which were both
higher than the other modes of vaginal deliveries (0-0.1%). Majority of the stillbirths occurred in the
antepartum period and therefore not related to the mode of delivery. However, the high neonatal
death rate could possibly be related to the mode of delivery and the high preterm delivery rate. This
was further supported by the much higher rate of low Apgar score (<4) at both 1 and 5 minutes at
birth in those vaginal breech deliveries. External cephalic version was not attempted in 80.1% of
cases, compared to 78.7% in 2004 and 64.6% in 2009.
2004 2009 2014
Singleton 79 73.1% 123 76.4% 104 71.2%
Multiple 29 26.9% 38 23.6% 42 28.8%
First baby in twin 2 1.9% 2 1.2% 1 0.7%
Aftercoming baby 27 25.0% 36 22.4% 37 25.3%
Both babies in twin - - - - 4 2.8%
TOTAL BIRTHS 108 0.2% 161 0.2% 146 0.2%
PARITY OF THE PARTURIENTS FOR EACH BABY
2004 2009 2014
Para 0 50 70.4% 77 47.8% 84 57.5%
Para 1 40 20.4% 66 41.0% 43 29.5%
Para 2 9 8.3% 13 8.1% 16 11.0%
Para 3 & above 9 8.3% 5 3.1% 3 2.1%
EXTERNAL CEPHALIC VERSION
2004 2009 2014
ECV not attempted 85 78.7% 104 64.6% 117 80.1%
ECV successful 0 0.0% 0 0.0% 1 0.7%
ECV failed 2 1.9% 0 0.0% 1 0.7%
Missing/Irrelevant 21 19.4% 57 35.4% 27 18.5%
MODE OF ONSET OF LABOUR FOR EACH BABY
2004 2009 2014
Spontaneous onset 76 70.4% 97 60.2% 91 62.3%
Induced labour 22 20.4% 28 17.4% 41 28.1%
No labour 10 9.3% 36 22.4% 14 9.6%
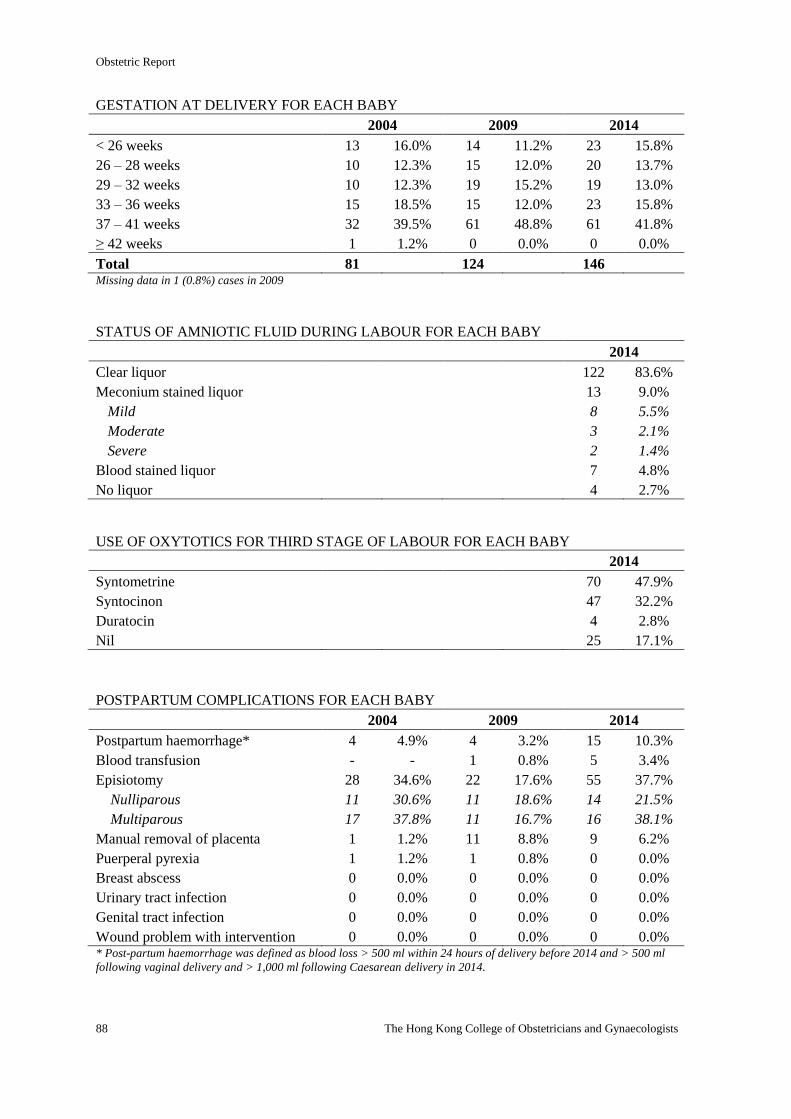
Obstetric Report
88 The Hong Kong College of Obstetricians and Gynaecologists
GESTATION AT DELIVERY FOR EACH BABY
2004 2009 2014
< 26 weeks 13 16.0% 14 11.2% 23 15.8%
26 – 28 weeks 10 12.3% 15 12.0% 20 13.7%
29 – 32 weeks 10 12.3% 19 15.2% 19 13.0%
33 – 36 weeks 15 18.5% 15 12.0% 23 15.8%
37 – 41 weeks 32 39.5% 61 48.8% 61 41.8%
≥ 42 weeks 1 1.2% 0 0.0% 0 0.0%
Total 81 124 146 Missing data in 1 (0.8%) cases in 2009
STATUS OF AMNIOTIC FLUID DURING LABOUR FOR EACH BABY
2014
Clear liquor 122 83.6%
Meconium stained liquor 13 9.0%
Mild 8 5.5%
Moderate 3 2.1%
Severe 2 1.4%
Blood stained liquor 7 4.8%
No liquor 4 2.7%
USE OF OXYTOTICS FOR THIRD STAGE OF LABOUR FOR EACH BABY
2014
Syntometrine 70 47.9%
Syntocinon 47 32.2%
Duratocin 4 2.8%
Nil 25 17.1%
POSTPARTUM COMPLICATIONS FOR EACH BABY
2004 2009 2014
Postpartum haemorrhage* 4 4.9% 4 3.2% 15 10.3%
Blood transfusion - - 1 0.8% 5 3.4%
Episiotomy 28 34.6% 22 17.6% 55 37.7%
Nulliparous 11 30.6% 11 18.6% 14 21.5%
Multiparous 17 37.8% 11 16.7% 16 38.1%
Manual removal of placenta 1 1.2% 11 8.8% 9 6.2%
Puerperal pyrexia 1 1.2% 1 0.8% 0 0.0%
Breast abscess 0 0.0% 0 0.0% 0 0.0%
Urinary tract infection 0 0.0% 0 0.0% 0 0.0%
Genital tract infection 0 0.0% 0 0.0% 0 0.0%
Wound problem with intervention 0 0.0% 0 0.0% 0 0.0% * Post-partum haemorrhage was defined as blood loss > 500 ml within 24 hours of delivery before 2014 and > 500 ml
following vaginal delivery and > 1,000 ml following Caesarean delivery in 2014.
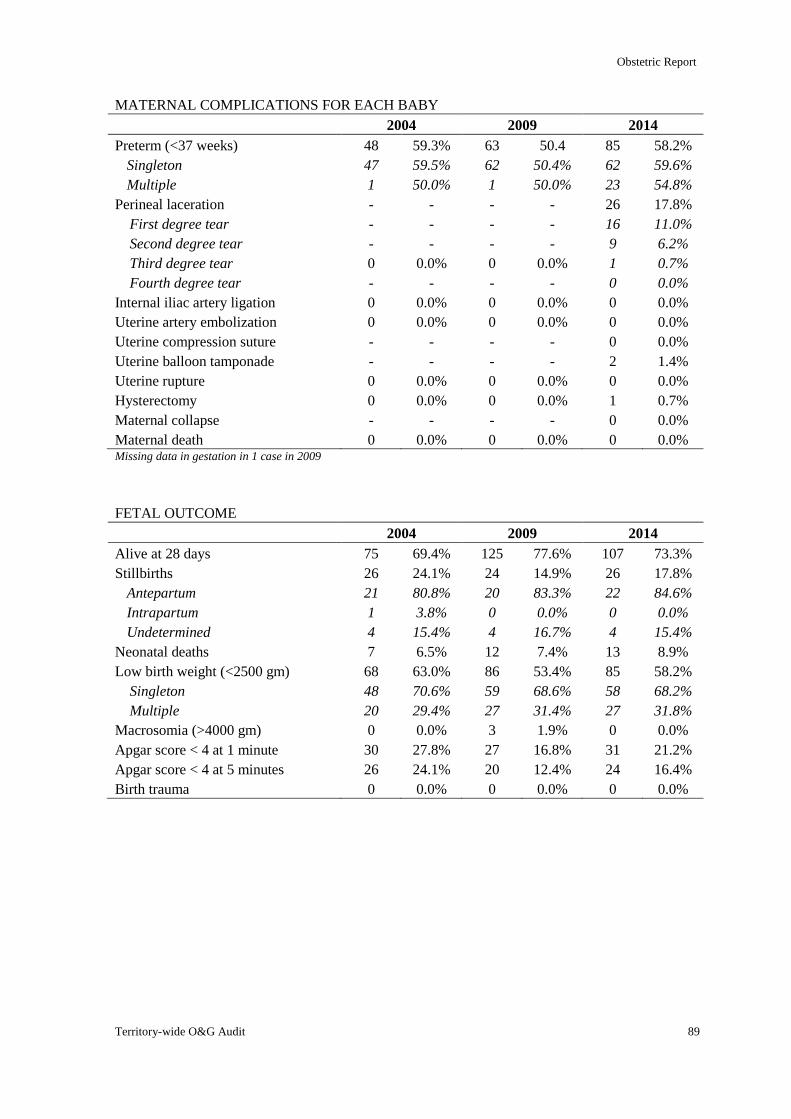
Obstetric Report
Territory-wide O&G Audit 89
MATERNAL COMPLICATIONS FOR EACH BABY
2004 2009 2014
Preterm (<37 weeks) 48 59.3% 63 50.4 85 58.2%
Singleton 47 59.5% 62 50.4% 62 59.6%
Multiple 1 50.0% 1 50.0% 23 54.8%
Perineal laceration - - - - 26 17.8%
First degree tear - - - - 16 11.0%
Second degree tear - - - - 9 6.2%
Third degree tear 0 0.0% 0 0.0% 1 0.7%
Fourth degree tear - - - - 0 0.0%
Internal iliac artery ligation 0 0.0% 0 0.0% 0 0.0%
Uterine artery embolization 0 0.0% 0 0.0% 0 0.0%
Uterine compression suture - - - - 0 0.0%
Uterine balloon tamponade - - - - 2 1.4%
Uterine rupture 0 0.0% 0 0.0% 0 0.0%
Hysterectomy 0 0.0% 0 0.0% 1 0.7%
Maternal collapse - - - - 0 0.0%
Maternal death 0 0.0% 0 0.0% 0 0.0% Missing data in gestation in 1 case in 2009
FETAL OUTCOME
2004 2009 2014
Alive at 28 days 75 69.4% 125 77.6% 107 73.3%
Stillbirths 26 24.1% 24 14.9% 26 17.8%
Antepartum 21 80.8% 20 83.3% 22 84.6%
Intrapartum 1 3.8% 0 0.0% 0 0.0%
Undetermined 4 15.4% 4 16.7% 4 15.4%
Neonatal deaths 7 6.5% 12 7.4% 13 8.9%
Low birth weight (<2500 gm) 68 63.0% 86 53.4% 85 58.2%
Singleton 48 70.6% 59 68.6% 58 68.2%
Multiple 20 29.4% 27 31.4% 27 31.8%
Macrosomia (>4000 gm) 0 0.0% 3 1.9% 0 0.0%
Apgar score < 4 at 1 minute 30 27.8% 27 16.8% 31 21.2%
Apgar score < 4 at 5 minutes 26 24.1% 20 12.4% 24 16.4%
Birth trauma 0 0.0% 0 0.0% 0 0.0%
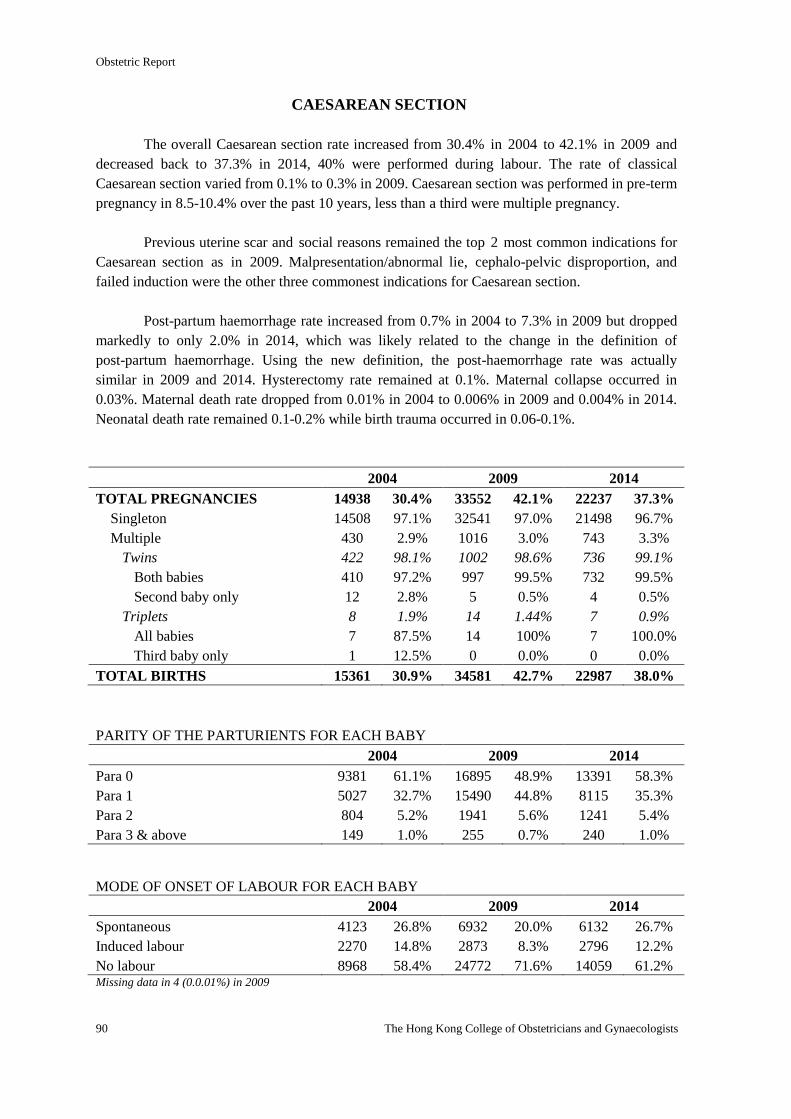
Obstetric Report
90 The Hong Kong College of Obstetricians and Gynaecologists
CAESAREAN SECTION
The overall Caesarean section rate increased from 30.4% in 2004 to 42.1% in 2009 and
decreased back to 37.3% in 2014, 40% were performed during labour. The rate of classical
Caesarean section varied from 0.1% to 0.3% in 2009. Caesarean section was performed in pre-term
pregnancy in 8.5-10.4% over the past 10 years, less than a third were multiple pregnancy.
Previous uterine scar and social reasons remained the top 2 most common indications for
Caesarean section as in 2009. Malpresentation/abnormal lie, cephalo-pelvic disproportion, and
failed induction were the other three commonest indications for Caesarean section.
Post-partum haemorrhage rate increased from 0.7% in 2004 to 7.3% in 2009 but dropped
markedly to only 2.0% in 2014, which was likely related to the change in the definition of
post-partum haemorrhage. Using the new definition, the post-haemorrhage rate was actually
similar in 2009 and 2014. Hysterectomy rate remained at 0.1%. Maternal collapse occurred in
0.03%. Maternal death rate dropped from 0.01% in 2004 to 0.006% in 2009 and 0.004% in 2014.
Neonatal death rate remained 0.1-0.2% while birth trauma occurred in 0.06-0.1%.
2004 2009 2014
TOTAL PREGNANCIES 14938 30.4% 33552 42.1% 22237 37.3%
Singleton 14508 97.1% 32541 97.0% 21498 96.7%
Multiple 430 2.9% 1016 3.0% 743 3.3%
Twins 422 98.1% 1002 98.6% 736 99.1%
Both babies 410 97.2% 997 99.5% 732 99.5%
Second baby only 12 2.8% 5 0.5% 4 0.5%
Triplets 8 1.9% 14 1.44% 7 0.9%
All babies 7 87.5% 14 100% 7 100.0%
Third baby only 1 12.5% 0 0.0% 0 0.0%
TOTAL BIRTHS 15361 30.9% 34581 42.7% 22987 38.0%
PARITY OF THE PARTURIENTS FOR EACH BABY
2004 2009 2014
Para 0 9381 61.1% 16895 48.9% 13391 58.3%
Para 1 5027 32.7% 15490 44.8% 8115 35.3%
Para 2 804 5.2% 1941 5.6% 1241 5.4%
Para 3 & above 149 1.0% 255 0.7% 240 1.0%
MODE OF ONSET OF LABOUR FOR EACH BABY
2004 2009 2014
Spontaneous 4123 26.8% 6932 20.0% 6132 26.7%
Induced labour 2270 14.8% 2873 8.3% 2796 12.2%
No labour 8968 58.4% 24772 71.6% 14059 61.2% Missing data in 4 (0.0.01%) in 2009
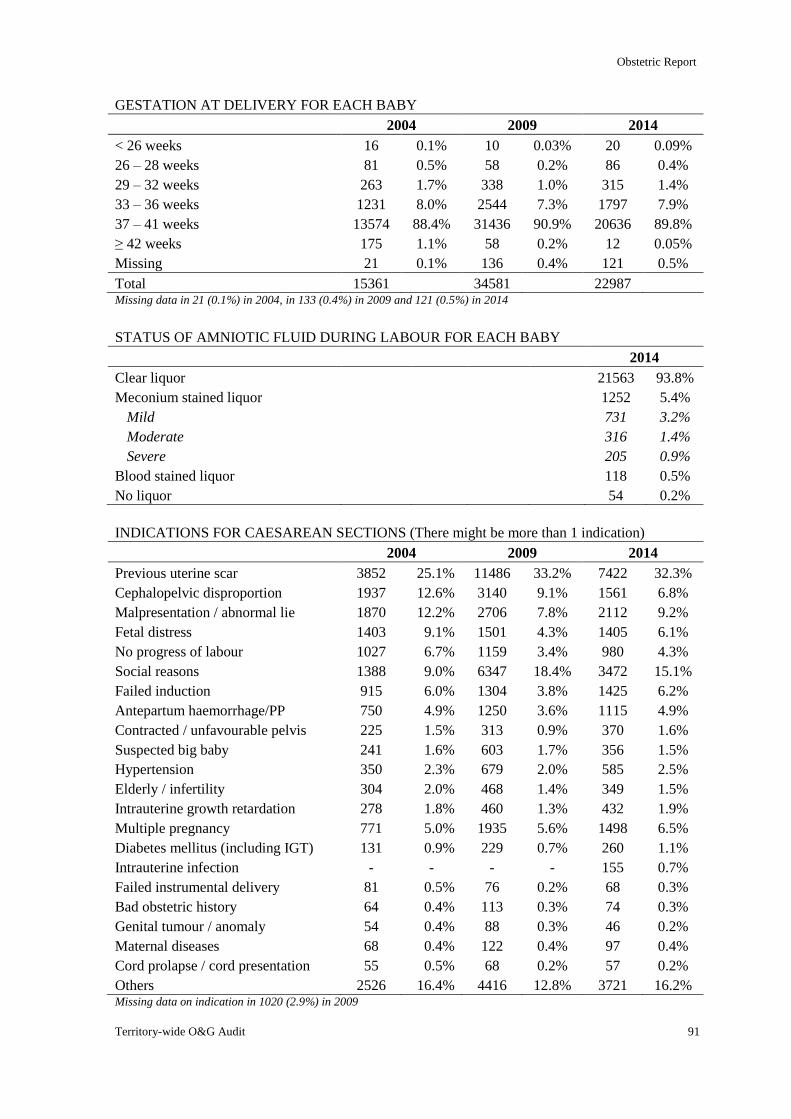
Obstetric Report
Territory-wide O&G Audit 91
GESTATION AT DELIVERY FOR EACH BABY
2004 2009 2014
< 26 weeks 16 0.1% 10 0.03% 20 0.09%
26 – 28 weeks 81 0.5% 58 0.2% 86 0.4%
29 – 32 weeks 263 1.7% 338 1.0% 315 1.4%
33 – 36 weeks 1231 8.0% 2544 7.3% 1797 7.9%
37 – 41 weeks 13574 88.4% 31436 90.9% 20636 89.8%
≥ 42 weeks 175 1.1% 58 0.2% 12 0.05%
Missing 21 0.1% 136 0.4% 121 0.5%
Total 15361 34581 22987 Missing data in 21 (0.1%) in 2004, in 133 (0.4%) in 2009 and 121 (0.5%) in 2014
STATUS OF AMNIOTIC FLUID DURING LABOUR FOR EACH BABY
2014
Clear liquor 21563 93.8%
Meconium stained liquor 1252 5.4%
Mild 731 3.2%
Moderate 316 1.4%
Severe 205 0.9%
Blood stained liquor 118 0.5%
No liquor 54 0.2%
INDICATIONS FOR CAESAREAN SECTIONS (There might be more than 1 indication)
2004 2009 2014
Previous uterine scar 3852 25.1% 11486 33.2% 7422 32.3%
Cephalopelvic disproportion 1937 12.6% 3140 9.1% 1561 6.8%
Malpresentation / abnormal lie 1870 12.2% 2706 7.8% 2112 9.2%
Fetal distress 1403 9.1% 1501 4.3% 1405 6.1%
No progress of labour 1027 6.7% 1159 3.4% 980 4.3%
Social reasons 1388 9.0% 6347 18.4% 3472 15.1%
Failed induction 915 6.0% 1304 3.8% 1425 6.2%
Antepartum haemorrhage/PP 750 4.9% 1250 3.6% 1115 4.9%
Contracted / unfavourable pelvis 225 1.5% 313 0.9% 370 1.6%
Suspected big baby 241 1.6% 603 1.7% 356 1.5%
Hypertension 350 2.3% 679 2.0% 585 2.5%
Elderly / infertility 304 2.0% 468 1.4% 349 1.5%
Intrauterine growth retardation 278 1.8% 460 1.3% 432 1.9%
Multiple pregnancy 771 5.0% 1935 5.6% 1498 6.5%
Diabetes mellitus (including IGT) 131 0.9% 229 0.7% 260 1.1%
Intrauterine infection - - - - 155 0.7%
Failed instrumental delivery 81 0.5% 76 0.2% 68 0.3%
Bad obstetric history 64 0.4% 113 0.3% 74 0.3%
Genital tumour / anomaly 54 0.4% 88 0.3% 46 0.2%
Maternal diseases 68 0.4% 122 0.4% 97 0.4%
Cord prolapse / cord presentation 55 0.5% 68 0.2% 57 0.2%
Others 2526 16.4% 4416 12.8% 3721 16.2% Missing data on indication in 1020 (2.9%) in 2009
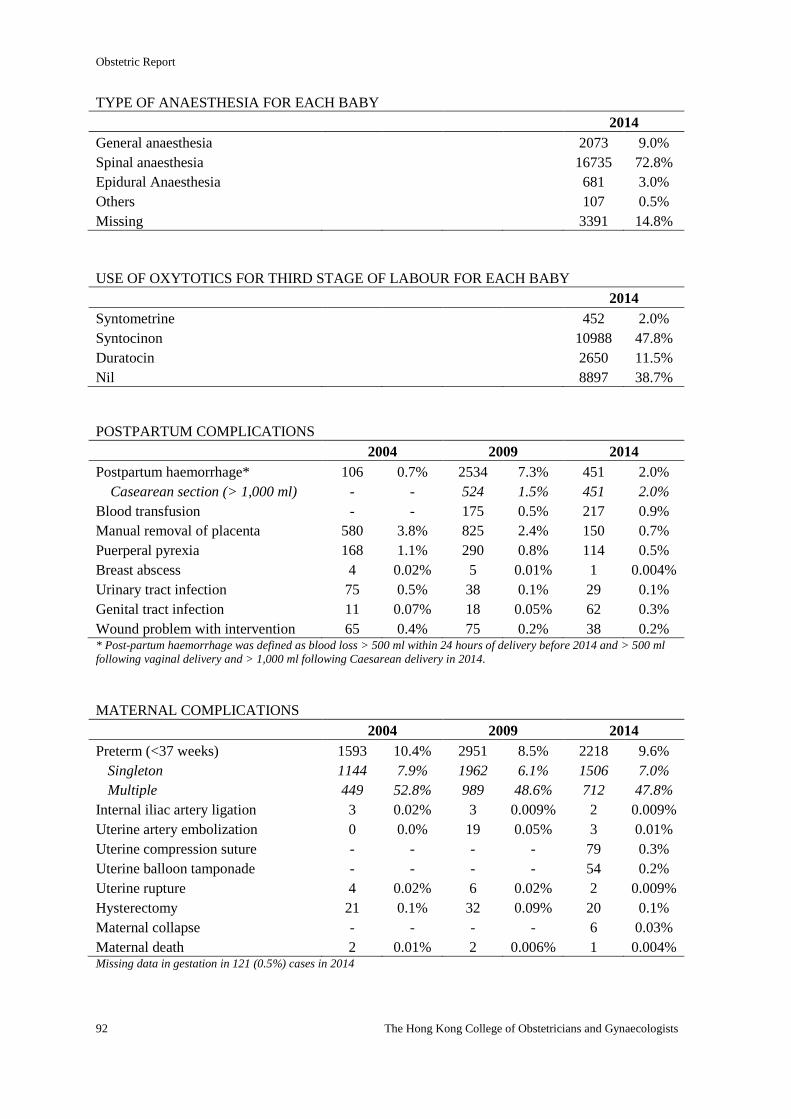
Obstetric Report
92 The Hong Kong College of Obstetricians and Gynaecologists
TYPE OF ANAESTHESIA FOR EACH BABY
2014
General anaesthesia 2073 9.0%
Spinal anaesthesia 16735 72.8%
Epidural Anaesthesia 681 3.0%
Others 107 0.5%
Missing 3391 14.8%
USE OF OXYTOTICS FOR THIRD STAGE OF LABOUR FOR EACH BABY
2014
Syntometrine 452 2.0%
Syntocinon 10988 47.8%
Duratocin 2650 11.5%
Nil 8897 38.7%
POSTPARTUM COMPLICATIONS
2004 2009 2014
Postpartum haemorrhage* 106 0.7% 2534 7.3% 451 2.0%
Casearean section (> 1,000 ml) - - 524 1.5% 451 2.0%
Blood transfusion - - 175 0.5% 217 0.9%
Manual removal of placenta 580 3.8% 825 2.4% 150 0.7%
Puerperal pyrexia 168 1.1% 290 0.8% 114 0.5%
Breast abscess 4 0.02% 5 0.01% 1 0.004%
Urinary tract infection 75 0.5% 38 0.1% 29 0.1%
Genital tract infection 11 0.07% 18 0.05% 62 0.3%
Wound problem with intervention 65 0.4% 75 0.2% 38 0.2% * Post-partum haemorrhage was defined as blood loss > 500 ml within 24 hours of delivery before 2014 and > 500 ml
following vaginal delivery and > 1,000 ml following Caesarean delivery in 2014.
MATERNAL COMPLICATIONS
2004 2009 2014
Preterm (<37 weeks) 1593 10.4% 2951 8.5% 2218 9.6%
Singleton 1144 7.9% 1962 6.1% 1506 7.0%
Multiple 449 52.8% 989 48.6% 712 47.8%
Internal iliac artery ligation 3 0.02% 3 0.009% 2 0.009%
Uterine artery embolization 0 0.0% 19 0.05% 3 0.01%
Uterine compression suture - - - - 79 0.3%
Uterine balloon tamponade - - - - 54 0.2%
Uterine rupture 4 0.02% 6 0.02% 2 0.009%
Hysterectomy 21 0.1% 32 0.09% 20 0.1%
Maternal collapse - - - - 6 0.03%
Maternal death 2 0.01% 2 0.006% 1 0.004% Missing data in gestation in 121 (0.5%) cases in 2014
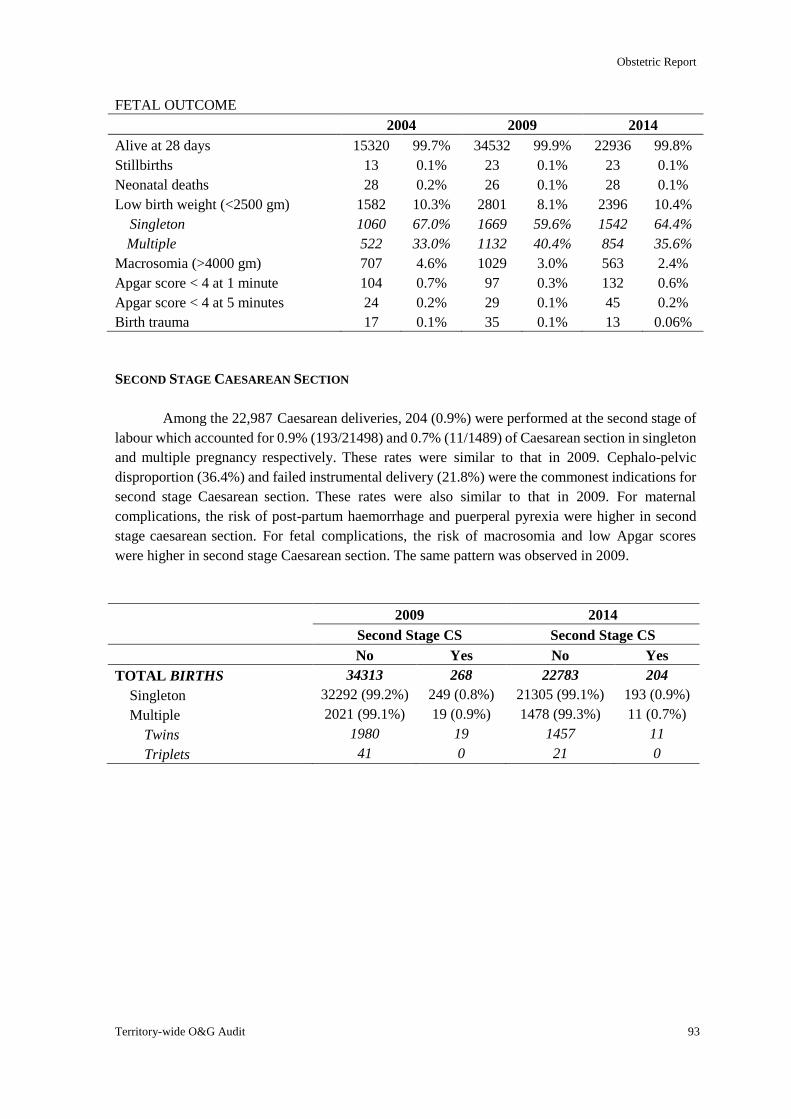
Obstetric Report
Territory-wide O&G Audit 93
FETAL OUTCOME
2004 2009 2014
Alive at 28 days 15320 99.7% 34532 99.9% 22936 99.8%
Stillbirths 13 0.1% 23 0.1% 23 0.1%
Neonatal deaths 28 0.2% 26 0.1% 28 0.1%
Low birth weight (<2500 gm) 1582 10.3% 2801 8.1% 2396 10.4%
Singleton 1060 67.0% 1669 59.6% 1542 64.4%
Multiple 522 33.0% 1132 40.4% 854 35.6%
Macrosomia (>4000 gm) 707 4.6% 1029 3.0% 563 2.4%
Apgar score < 4 at 1 minute 104 0.7% 97 0.3% 132 0.6%
Apgar score < 4 at 5 minutes 24 0.2% 29 0.1% 45 0.2%
Birth trauma 17 0.1% 35 0.1% 13 0.06%
SECOND STAGE CAESAREAN SECTION
Among the 22,987 Caesarean deliveries, 204 (0.9%) were performed at the second stage of
labour which accounted for 0.9% (193/21498) and 0.7% (11/1489) of Caesarean section in singleton
and multiple pregnancy respectively. These rates were similar to that in 2009. Cephalo-pelvic
disproportion (36.4%) and failed instrumental delivery (21.8%) were the commonest indications for
second stage Caesarean section. These rates were also similar to that in 2009. For maternal
complications, the risk of post-partum haemorrhage and puerperal pyrexia were higher in second
stage caesarean section. For fetal complications, the risk of macrosomia and low Apgar scores
were higher in second stage Caesarean section. The same pattern was observed in 2009.
2009 2014
Second Stage CS Second Stage CS
No Yes No Yes
TOTAL BIRTHS 34313 268 22783 204
Singleton 32292 (99.2%) 249 (0.8%) 21305 (99.1%) 193 (0.9%)
Multiple 2021 (99.1%) 19 (0.9%) 1478 (99.3%) 11 (0.7%)
Twins 1980 19 1457 11
Triplets 41 0 21 0
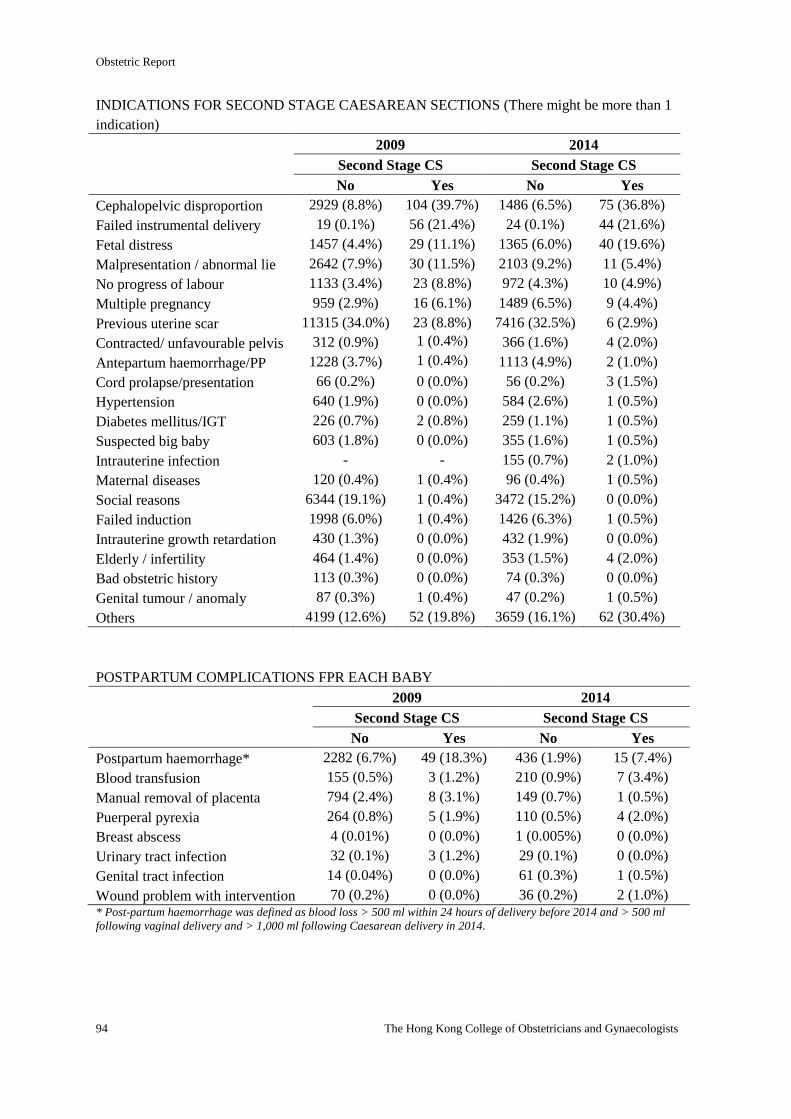
Obstetric Report
94 The Hong Kong College of Obstetricians and Gynaecologists
INDICATIONS FOR SECOND STAGE CAESAREAN SECTIONS (There might be more than 1
indication)
2009 2014
Second Stage CS Second Stage CS
No Yes No Yes
Cephalopelvic disproportion 2929 (8.8%) 104 (39.7%) 1486 (6.5%) 75 (36.8%)
Failed instrumental delivery 19 (0.1%) 56 (21.4%) 24 (0.1%) 44 (21.6%)
Fetal distress 1457 (4.4%) 29 (11.1%) 1365 (6.0%) 40 (19.6%)
Malpresentation / abnormal lie 2642 (7.9%) 30 (11.5%) 2103 (9.2%) 11 (5.4%)
No progress of labour 1133 (3.4%) 23 (8.8%) 972 (4.3%) 10 (4.9%)
Multiple pregnancy 959 (2.9%) 16 (6.1%) 1489 (6.5%) 9 (4.4%)
Previous uterine scar 11315 (34.0%) 23 (8.8%) 7416 (32.5%) 6 (2.9%)
Contracted/ unfavourable pelvis 312 (0.9%) 1 (0.4%) 366 (1.6%) 4 (2.0%)
Antepartum haemorrhage/PP 1228 (3.7%) 1 (0.4%) 1113 (4.9%) 2 (1.0%)
Cord prolapse/presentation 66 (0.2%) 0 (0.0%) 56 (0.2%) 3 (1.5%)
Hypertension 640 (1.9%) 0 (0.0%) 584 (2.6%) 1 (0.5%)
Diabetes mellitus/IGT 226 (0.7%) 2 (0.8%) 259 (1.1%) 1 (0.5%)
Suspected big baby 603 (1.8%) 0 (0.0%) 355 (1.6%) 1 (0.5%)
Intrauterine infection - - 155 (0.7%) 2 (1.0%)
Maternal diseases 120 (0.4%) 1 (0.4%) 96 (0.4%) 1 (0.5%)
Social reasons 6344 (19.1%) 1 (0.4%) 3472 (15.2%) 0 (0.0%)
Failed induction 1998 (6.0%) 1 (0.4%) 1426 (6.3%) 1 (0.5%)
Intrauterine growth retardation 430 (1.3%) 0 (0.0%) 432 (1.9%) 0 (0.0%)
Elderly / infertility 464 (1.4%) 0 (0.0%) 353 (1.5%) 4 (2.0%)
Bad obstetric history 113 (0.3%) 0 (0.0%) 74 (0.3%) 0 (0.0%)
Genital tumour / anomaly 87 (0.3%) 1 (0.4%) 47 (0.2%) 1 (0.5%)
Others 4199 (12.6%) 52 (19.8%) 3659 (16.1%) 62 (30.4%)
POSTPARTUM COMPLICATIONS FPR EACH BABY
2009 2014
Second Stage CS Second Stage CS
No Yes No Yes
Postpartum haemorrhage* 2282 (6.7%) 49 (18.3%) 436 (1.9%) 15 (7.4%)
Blood transfusion 155 (0.5%) 3 (1.2%) 210 (0.9%) 7 (3.4%)
Manual removal of placenta 794 (2.4%) 8 (3.1%) 149 (0.7%) 1 (0.5%)
Puerperal pyrexia 264 (0.8%) 5 (1.9%) 110 (0.5%) 4 (2.0%)
Breast abscess 4 (0.01%) 0 (0.0%) 1 (0.005%) 0 (0.0%)
Urinary tract infection 32 (0.1%) 3 (1.2%) 29 (0.1%) 0 (0.0%)
Genital tract infection 14 (0.04%) 0 (0.0%) 61 (0.3%) 1 (0.5%)
Wound problem with intervention 70 (0.2%) 0 (0.0%) 36 (0.2%) 2 (1.0%) * Post-partum haemorrhage was defined as blood loss > 500 ml within 24 hours of delivery before 2014 and > 500 ml
following vaginal delivery and > 1,000 ml following Caesarean delivery in 2014.
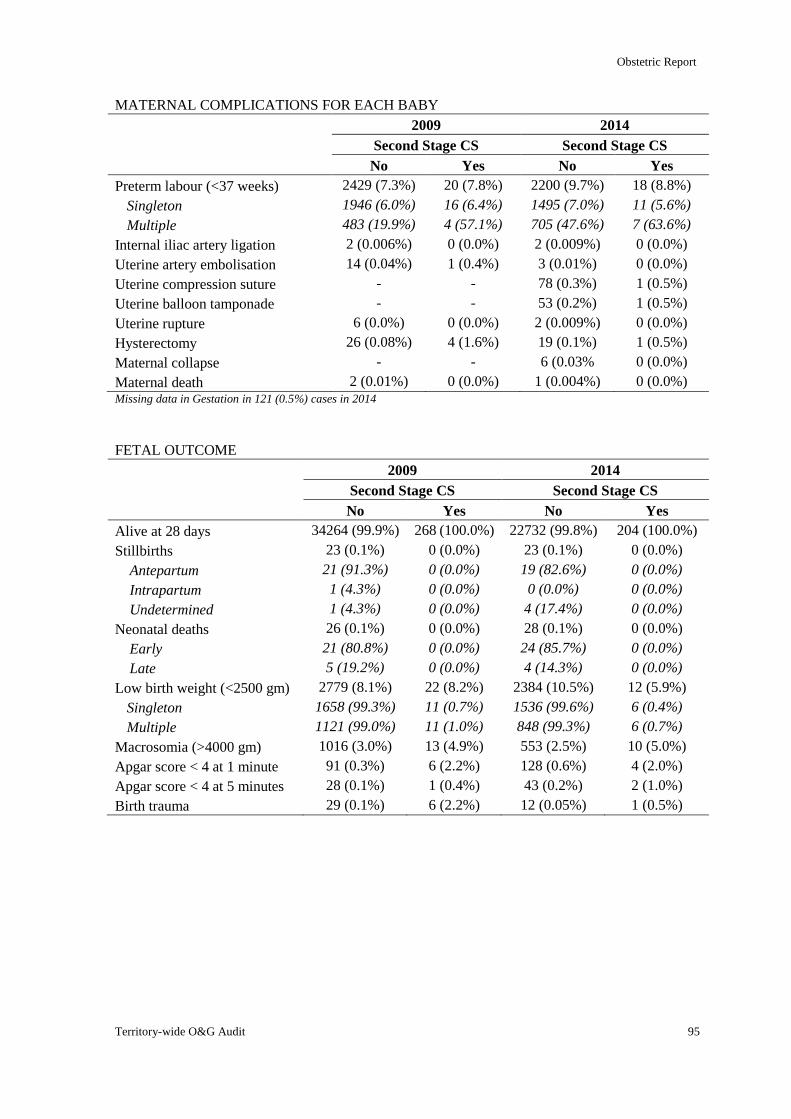
Obstetric Report
Territory-wide O&G Audit 95
MATERNAL COMPLICATIONS FOR EACH BABY
2009 2014
Second Stage CS Second Stage CS
No Yes No Yes
Preterm labour (<37 weeks) 2429 (7.3%) 20 (7.8%) 2200 (9.7%) 18 (8.8%)
Singleton 1946 (6.0%) 16 (6.4%) 1495 (7.0%) 11 (5.6%)
Multiple 483 (19.9%) 4 (57.1%) 705 (47.6%) 7 (63.6%)
Internal iliac artery ligation 2 (0.006%) 0 (0.0%) 2 (0.009%) 0 (0.0%)
Uterine artery embolisation 14 (0.04%) 1 (0.4%) 3 (0.01%) 0 (0.0%)
Uterine compression suture - - 78 (0.3%) 1 (0.5%)
Uterine balloon tamponade - - 53 (0.2%) 1 (0.5%)
Uterine rupture 6 (0.0%) 0 (0.0%) 2 (0.009%) 0 (0.0%)
Hysterectomy 26 (0.08%) 4 (1.6%) 19 (0.1%) 1 (0.5%)
Maternal collapse - - 6 (0.03% 0 (0.0%)
Maternal death 2 (0.01%) 0 (0.0%) 1 (0.004%) 0 (0.0%) Missing data in Gestation in 121 (0.5%) cases in 2014
FETAL OUTCOME
2009 2014
Second Stage CS Second Stage CS
No Yes No Yes
Alive at 28 days 34264 (99.9%) 268 (100.0%) 22732 (99.8%) 204 (100.0%)
Stillbirths 23 (0.1%) 0 (0.0%) 23 (0.1%) 0 (0.0%)
Antepartum 21 (91.3%) 0 (0.0%) 19 (82.6%) 0 (0.0%)
Intrapartum 1 (4.3%) 0 (0.0%) 0 (0.0%) 0 (0.0%)
Undetermined 1 (4.3%) 0 (0.0%) 4 (17.4%) 0 (0.0%)
Neonatal deaths 26 (0.1%) 0 (0.0%) 28 (0.1%) 0 (0.0%)
Early 21 (80.8%) 0 (0.0%) 24 (85.7%) 0 (0.0%)
Late 5 (19.2%) 0 (0.0%) 4 (14.3%) 0 (0.0%)
Low birth weight (<2500 gm) 2779 (8.1%) 22 (8.2%) 2384 (10.5%) 12 (5.9%)
Singleton 1658 (99.3%) 11 (0.7%) 1536 (99.6%) 6 (0.4%)
Multiple 1121 (99.0%) 11 (1.0%) 848 (99.3%) 6 (0.7%)
Macrosomia (>4000 gm) 1016 (3.0%) 13 (4.9%) 553 (2.5%) 10 (5.0%)
Apgar score < 4 at 1 minute 91 (0.3%) 6 (2.2%) 128 (0.6%) 4 (2.0%)
Apgar score < 4 at 5 minutes 28 (0.1%) 1 (0.4%) 43 (0.2%) 2 (1.0%)
Birth trauma 29 (0.1%) 6 (2.2%) 12 (0.05%) 1 (0.5%)
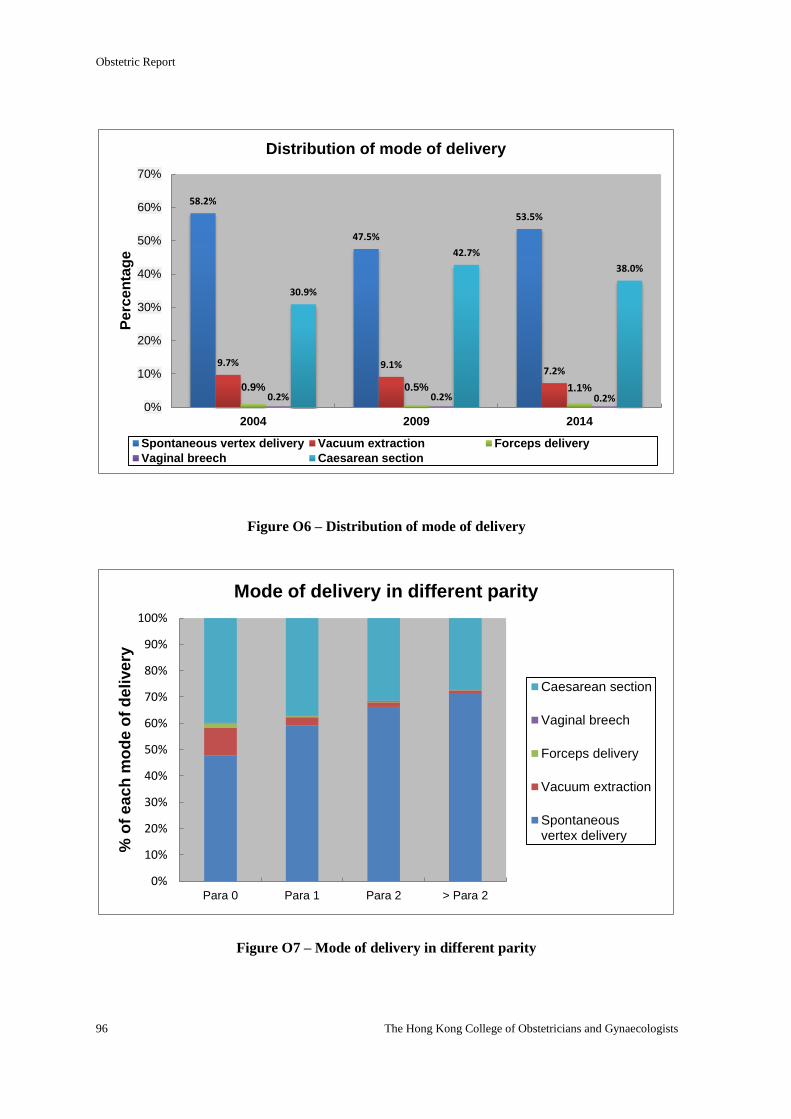
Obstetric Report
96 The Hong Kong College of Obstetricians and Gynaecologists
Figure O6 – Distribution of mode of delivery
Figure O7 – Mode of delivery in different parity
58.2%
47.5%
53.5%
9.7% 9.1% 7.2%
0.9% 0.5% 1.1% 0.2% 0.2% 0.2%
30.9%
42.7%
38.0%
0%
10%
20%
30%
40%
50%
60%
70%
2004 2009 2014
Pe
rce
nta
ge
Distribution of mode of delivery
Spontaneous vertex delivery Vacuum extraction Forceps delivery
Vaginal breech Caesarean section
0%
10%
20%
30%
40%
50%
60%
70%
80%
90%
100%
Para 0 Para 1 Para 2 > Para 2
% o
f e
ac
h m
od
e o
f d
eli
ve
ry
Mode of delivery in different parity
Caesarean section
Vaginal breech
Forceps delivery
Vacuum extraction
Spontaneousvertex delivery
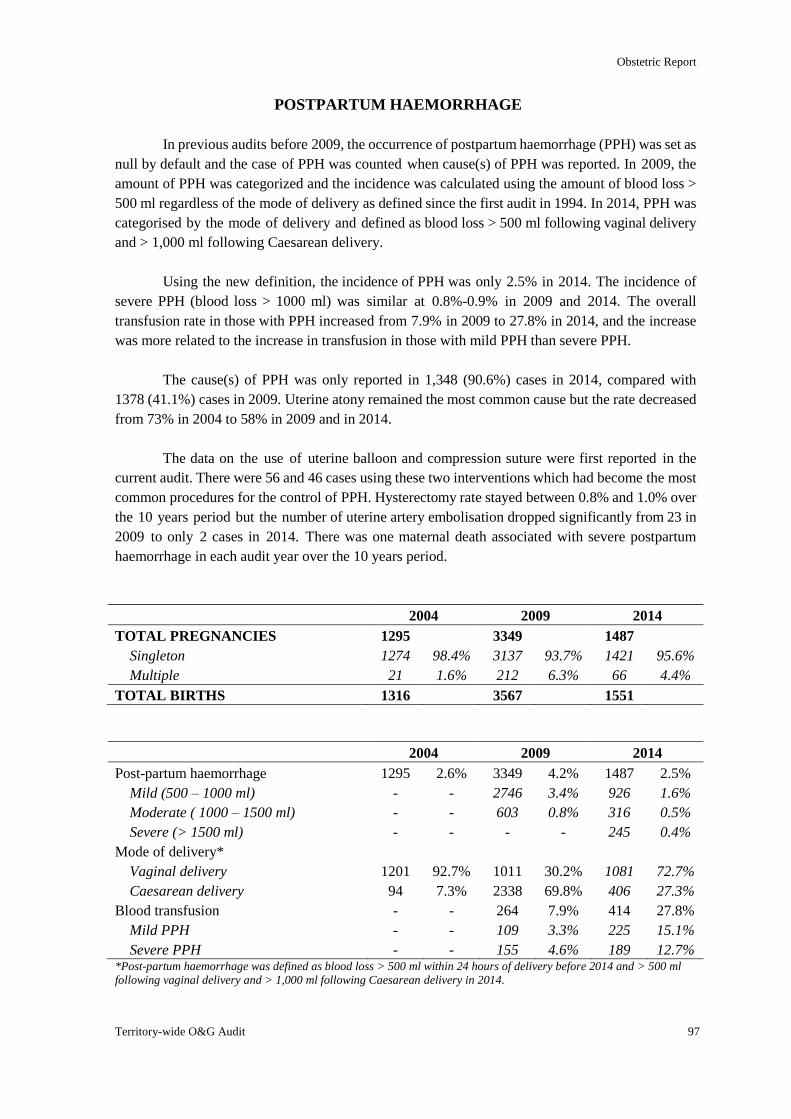
Obstetric Report
Territory-wide O&G Audit 97
POSTPARTUM HAEMORRHAGE
In previous audits before 2009, the occurrence of postpartum haemorrhage (PPH) was set as
null by default and the case of PPH was counted when cause(s) of PPH was reported. In 2009, the
amount of PPH was categorized and the incidence was calculated using the amount of blood loss >
500 ml regardless of the mode of delivery as defined since the first audit in 1994. In 2014, PPH was
categorised by the mode of delivery and defined as blood loss > 500 ml following vaginal delivery
and > 1,000 ml following Caesarean delivery.
Using the new definition, the incidence of PPH was only 2.5% in 2014. The incidence of
severe PPH (blood loss > 1000 ml) was similar at 0.8%-0.9% in 2009 and 2014. The overall
transfusion rate in those with PPH increased from 7.9% in 2009 to 27.8% in 2014, and the increase
was more related to the increase in transfusion in those with mild PPH than severe PPH.
The cause(s) of PPH was only reported in 1,348 (90.6%) cases in 2014, compared with
1378 (41.1%) cases in 2009. Uterine atony remained the most common cause but the rate decreased
from 73% in 2004 to 58% in 2009 and in 2014.
The data on the use of uterine balloon and compression suture were first reported in the
current audit. There were 56 and 46 cases using these two interventions which had become the most
common procedures for the control of PPH. Hysterectomy rate stayed between 0.8% and 1.0% over
the 10 years period but the number of uterine artery embolisation dropped significantly from 23 in
2009 to only 2 cases in 2014. There was one maternal death associated with severe postpartum
haemorrhage in each audit year over the 10 years period.
2004 2009 2014
TOTAL PREGNANCIES 1295 3349 1487
Singleton 1274 98.4% 3137 93.7% 1421 95.6%
Multiple 21 1.6% 212 6.3% 66 4.4%
TOTAL BIRTHS 1316 3567 1551
2004 2009 2014
Post-partum haemorrhage 1295 2.6% 3349 4.2% 1487 2.5%
Mild (500 – 1000 ml) - - 2746 3.4% 926 1.6%
Moderate ( 1000 – 1500 ml) - - 603 0.8% 316 0.5%
Severe (> 1500 ml) - - - - 245 0.4%
Mode of delivery*
Vaginal delivery 1201 92.7% 1011 30.2% 1081 72.7%
Caesarean delivery 94 7.3% 2338 69.8% 406 27.3%
Blood transfusion - - 264 7.9% 414 27.8%
Mild PPH - - 109 3.3% 225 15.1%
Severe PPH - - 155 4.6% 189 12.7% *Post-partum haemorrhage was defined as blood loss > 500 ml within 24 hours of delivery before 2014 and > 500 ml
following vaginal delivery and > 1,000 ml following Caesarean delivery in 2014.
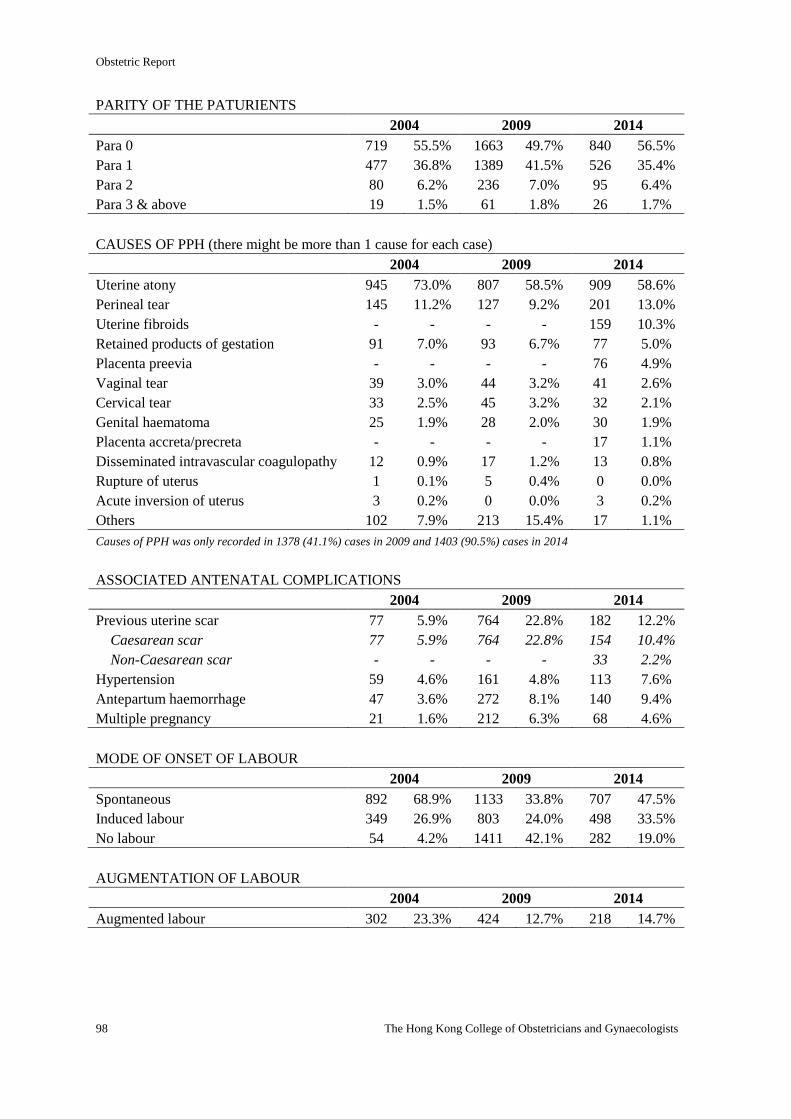
Obstetric Report
98 The Hong Kong College of Obstetricians and Gynaecologists
PARITY OF THE PATURIENTS
2004 2009 2014
Para 0 719 55.5% 1663 49.7% 840 56.5%
Para 1 477 36.8% 1389 41.5% 526 35.4%
Para 2 80 6.2% 236 7.0% 95 6.4%
Para 3 & above 19 1.5% 61 1.8% 26 1.7%
CAUSES OF PPH (there might be more than 1 cause for each case)
2004 2009 2014
Uterine atony 945 73.0% 807 58.5% 909 58.6%
Perineal tear 145 11.2% 127 9.2% 201 13.0%
Uterine fibroids - - - - 159 10.3%
Retained products of gestation 91 7.0% 93 6.7% 77 5.0%
Placenta preevia - - - - 76 4.9%
Vaginal tear 39 3.0% 44 3.2% 41 2.6%
Cervical tear 33 2.5% 45 3.2% 32 2.1%
Genital haematoma 25 1.9% 28 2.0% 30 1.9%
Placenta accreta/precreta - - - - 17 1.1%
Disseminated intravascular coagulopathy 12 0.9% 17 1.2% 13 0.8%
Rupture of uterus 1 0.1% 5 0.4% 0 0.0%
Acute inversion of uterus 3 0.2% 0 0.0% 3 0.2%
Others 102 7.9% 213 15.4% 17 1.1%
Causes of PPH was only recorded in 1378 (41.1%) cases in 2009 and 1403 (90.5%) cases in 2014
ASSOCIATED ANTENATAL COMPLICATIONS
2004 2009 2014
Previous uterine scar 77 5.9% 764 22.8% 182 12.2%
Caesarean scar 77 5.9% 764 22.8% 154 10.4%
Non-Caesarean scar - - - - 33 2.2%
Hypertension 59 4.6% 161 4.8% 113 7.6%
Antepartum haemorrhage 47 3.6% 272 8.1% 140 9.4%
Multiple pregnancy 21 1.6% 212 6.3% 68 4.6%
MODE OF ONSET OF LABOUR
2004 2009 2014
Spontaneous 892 68.9% 1133 33.8% 707 47.5%
Induced labour 349 26.9% 803 24.0% 498 33.5%
No labour 54 4.2% 1411 42.1% 282 19.0%
AUGMENTATION OF LABOUR
2004 2009 2014
Augmented labour 302 23.3% 424 12.7% 218 14.7%
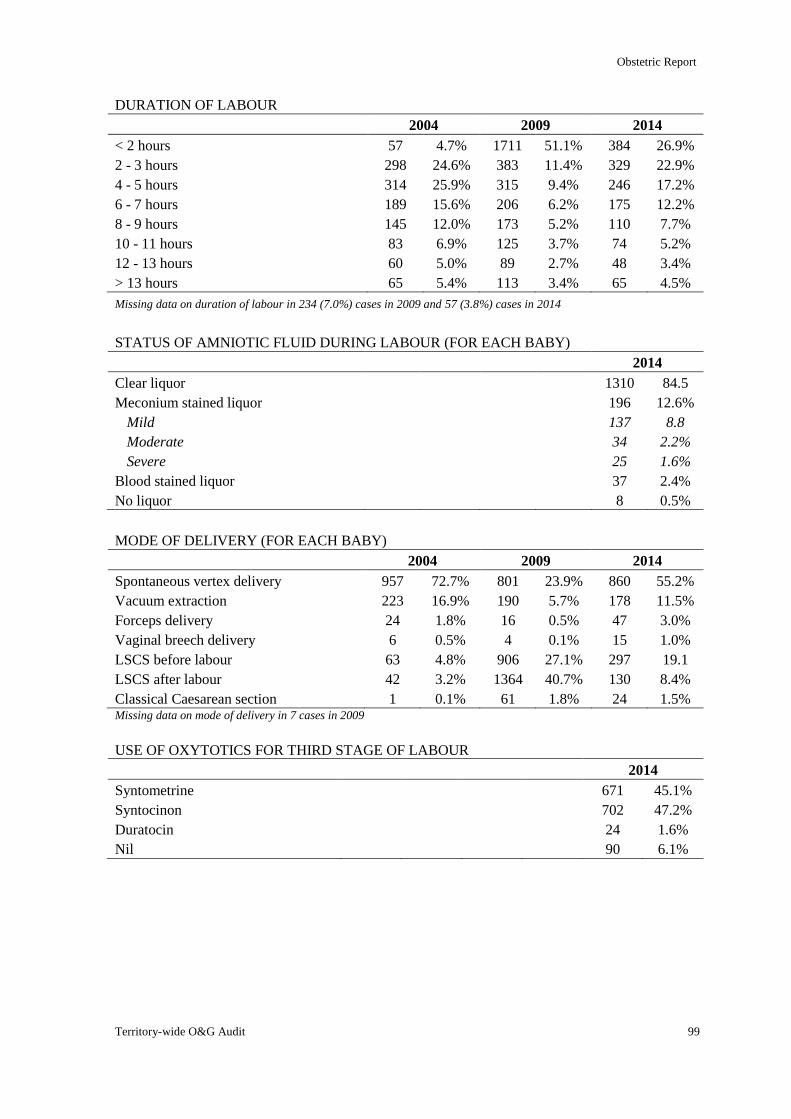
Obstetric Report
Territory-wide O&G Audit 99
DURATION OF LABOUR
2004 2009 2014
< 2 hours 57 4.7% 1711 51.1% 384 26.9%
2 - 3 hours 298 24.6% 383 11.4% 329 22.9%
4 - 5 hours 314 25.9% 315 9.4% 246 17.2%
6 - 7 hours 189 15.6% 206 6.2% 175 12.2%
8 - 9 hours 145 12.0% 173 5.2% 110 7.7%
10 - 11 hours 83 6.9% 125 3.7% 74 5.2%
12 - 13 hours 60 5.0% 89 2.7% 48 3.4%
> 13 hours 65 5.4% 113 3.4% 65 4.5%
Missing data on duration of labour in 234 (7.0%) cases in 2009 and 57 (3.8%) cases in 2014
STATUS OF AMNIOTIC FLUID DURING LABOUR (FOR EACH BABY)
2014
Clear liquor 1310 84.5
Meconium stained liquor 196 12.6%
Mild 137 8.8
Moderate 34 2.2%
Severe 25 1.6%
Blood stained liquor 37 2.4%
No liquor 8 0.5%
MODE OF DELIVERY (FOR EACH BABY)
2004 2009 2014
Spontaneous vertex delivery 957 72.7% 801 23.9% 860 55.2%
Vacuum extraction 223 16.9% 190 5.7% 178 11.5%
Forceps delivery 24 1.8% 16 0.5% 47 3.0%
Vaginal breech delivery 6 0.5% 4 0.1% 15 1.0%
LSCS before labour 63 4.8% 906 27.1% 297 19.1
LSCS after labour 42 3.2% 1364 40.7% 130 8.4%
Classical Caesarean section 1 0.1% 61 1.8% 24 1.5% Missing data on mode of delivery in 7 cases in 2009
USE OF OXYTOTICS FOR THIRD STAGE OF LABOUR
2014
Syntometrine 671 45.1%
Syntocinon 702 47.2%
Duratocin 24 1.6%
Nil 90 6.1%
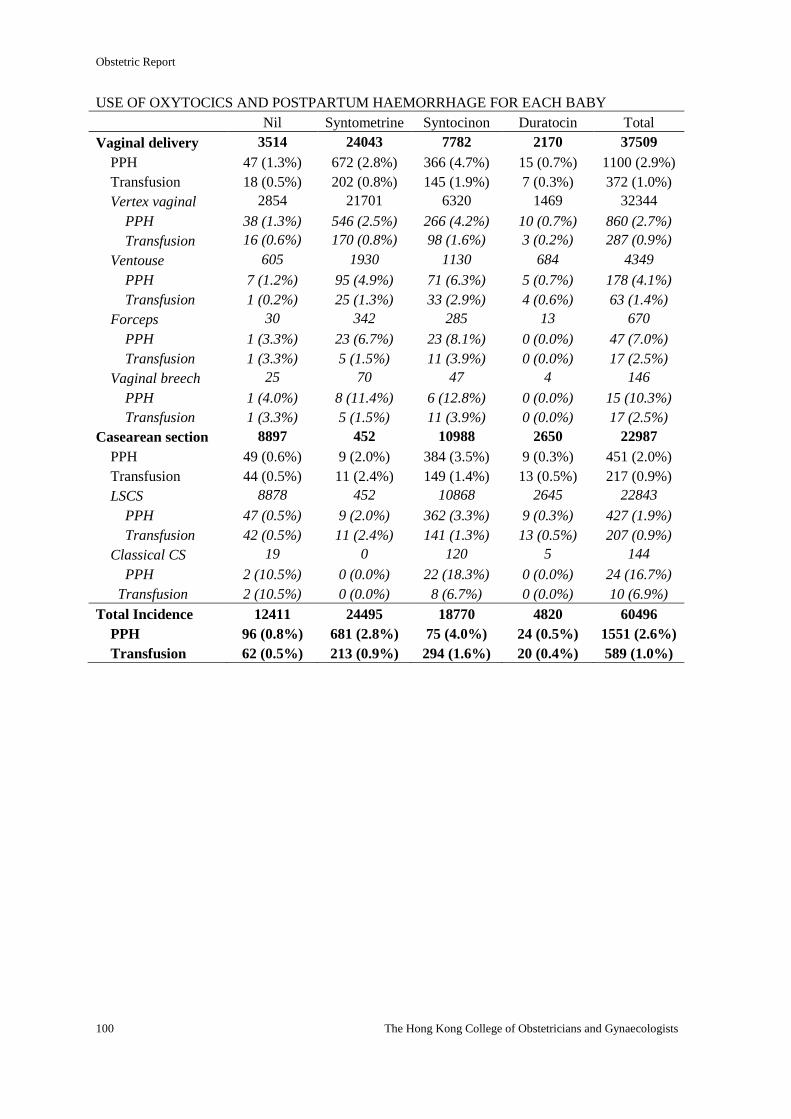
Obstetric Report
100 The Hong Kong College of Obstetricians and Gynaecologists
USE OF OXYTOCICS AND POSTPARTUM HAEMORRHAGE FOR EACH BABY
Nil Syntometrine Syntocinon Duratocin Total
Vaginal delivery 3514 24043 7782 2170 37509
PPH 47 (1.3%) 672 (2.8%) 366 (4.7%) 15 (0.7%) 1100 (2.9%)
Transfusion 18 (0.5%) 202 (0.8%) 145 (1.9%) 7 (0.3%) 372 (1.0%)
Vertex vaginal 2854 21701 6320 1469 32344
PPH 38 (1.3%) 546 (2.5%) 266 (4.2%) 10 (0.7%) 860 (2.7%)
Transfusion 16 (0.6%) 170 (0.8%) 98 (1.6%) 3 (0.2%) 287 (0.9%)
Ventouse 605 1930 1130 684 4349
PPH 7 (1.2%) 95 (4.9%) 71 (6.3%) 5 (0.7%) 178 (4.1%)
Transfusion 1 (0.2%) 25 (1.3%) 33 (2.9%) 4 (0.6%) 63 (1.4%)
Forceps 30 342 285 13 670
PPH 1 (3.3%) 23 (6.7%) 23 (8.1%) 0 (0.0%) 47 (7.0%)
Transfusion 1 (3.3%) 5 (1.5%) 11 (3.9%) 0 (0.0%) 17 (2.5%)
Vaginal breech 25 70 47 4 146
PPH 1 (4.0%) 8 (11.4%) 6 (12.8%) 0 (0.0%) 15 (10.3%)
Transfusion 1 (3.3%) 5 (1.5%) 11 (3.9%) 0 (0.0%) 17 (2.5%)
Casearean section 8897 452 10988 2650 22987
PPH 49 (0.6%) 9 (2.0%) 384 (3.5%) 9 (0.3%) 451 (2.0%)
Transfusion 44 (0.5%) 11 (2.4%) 149 (1.4%) 13 (0.5%) 217 (0.9%)
LSCS 8878 452 10868 2645 22843
PPH 47 (0.5%) 9 (2.0%) 362 (3.3%) 9 (0.3%) 427 (1.9%)
Transfusion 42 (0.5%) 11 (2.4%) 141 (1.3%) 13 (0.5%) 207 (0.9%)
Classical CS 19 0 120 5 144
PPH 2 (10.5%) 0 (0.0%) 22 (18.3%) 0 (0.0%) 24 (16.7%)
Transfusion 2 (10.5%) 0 (0.0%) 8 (6.7%) 0 (0.0%) 10 (6.9%)
Total Incidence 12411 24495 18770 4820 60496
PPH 96 (0.8%) 681 (2.8%) 75 (4.0%) 24 (0.5%) 1551 (2.6%)
Transfusion 62 (0.5%) 213 (0.9%) 294 (1.6%) 20 (0.4%) 589 (1.0%)
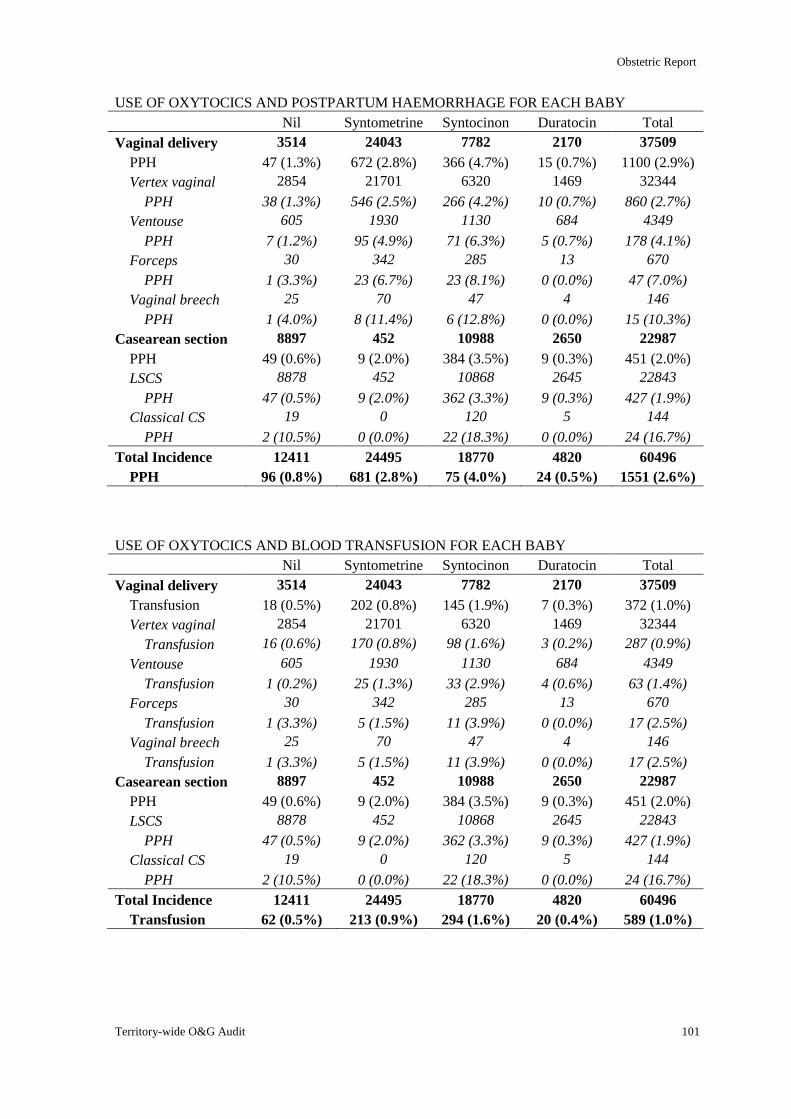
Obstetric Report
Territory-wide O&G Audit 101
USE OF OXYTOCICS AND POSTPARTUM HAEMORRHAGE FOR EACH BABY
Nil Syntometrine Syntocinon Duratocin Total
Vaginal delivery 3514 24043 7782 2170 37509
PPH 47 (1.3%) 672 (2.8%) 366 (4.7%) 15 (0.7%) 1100 (2.9%)
Vertex vaginal 2854 21701 6320 1469 32344
PPH 38 (1.3%) 546 (2.5%) 266 (4.2%) 10 (0.7%) 860 (2.7%)
Ventouse 605 1930 1130 684 4349
PPH 7 (1.2%) 95 (4.9%) 71 (6.3%) 5 (0.7%) 178 (4.1%)
Forceps 30 342 285 13 670
PPH 1 (3.3%) 23 (6.7%) 23 (8.1%) 0 (0.0%) 47 (7.0%)
Vaginal breech 25 70 47 4 146
PPH 1 (4.0%) 8 (11.4%) 6 (12.8%) 0 (0.0%) 15 (10.3%)
Casearean section 8897 452 10988 2650 22987
PPH 49 (0.6%) 9 (2.0%) 384 (3.5%) 9 (0.3%) 451 (2.0%)
LSCS 8878 452 10868 2645 22843
PPH 47 (0.5%) 9 (2.0%) 362 (3.3%) 9 (0.3%) 427 (1.9%)
Classical CS 19 0 120 5 144
PPH 2 (10.5%) 0 (0.0%) 22 (18.3%) 0 (0.0%) 24 (16.7%)
Total Incidence 12411 24495 18770 4820 60496
PPH 96 (0.8%) 681 (2.8%) 75 (4.0%) 24 (0.5%) 1551 (2.6%)
USE OF OXYTOCICS AND BLOOD TRANSFUSION FOR EACH BABY
Nil Syntometrine Syntocinon Duratocin Total
Vaginal delivery 3514 24043 7782 2170 37509
Transfusion 18 (0.5%) 202 (0.8%) 145 (1.9%) 7 (0.3%) 372 (1.0%)
Vertex vaginal 2854 21701 6320 1469 32344
Transfusion 16 (0.6%) 170 (0.8%) 98 (1.6%) 3 (0.2%) 287 (0.9%)
Ventouse 605 1930 1130 684 4349
Transfusion 1 (0.2%) 25 (1.3%) 33 (2.9%) 4 (0.6%) 63 (1.4%)
Forceps 30 342 285 13 670
Transfusion 1 (3.3%) 5 (1.5%) 11 (3.9%) 0 (0.0%) 17 (2.5%)
Vaginal breech 25 70 47 4 146
Transfusion 1 (3.3%) 5 (1.5%) 11 (3.9%) 0 (0.0%) 17 (2.5%)
Casearean section 8897 452 10988 2650 22987
PPH 49 (0.6%) 9 (2.0%) 384 (3.5%) 9 (0.3%) 451 (2.0%)
LSCS 8878 452 10868 2645 22843
PPH 47 (0.5%) 9 (2.0%) 362 (3.3%) 9 (0.3%) 427 (1.9%)
Classical CS 19 0 120 5 144
PPH 2 (10.5%) 0 (0.0%) 22 (18.3%) 0 (0.0%) 24 (16.7%)
Total Incidence 12411 24495 18770 4820 60496
Transfusion 62 (0.5%) 213 (0.9%) 294 (1.6%) 20 (0.4%) 589 (1.0%)
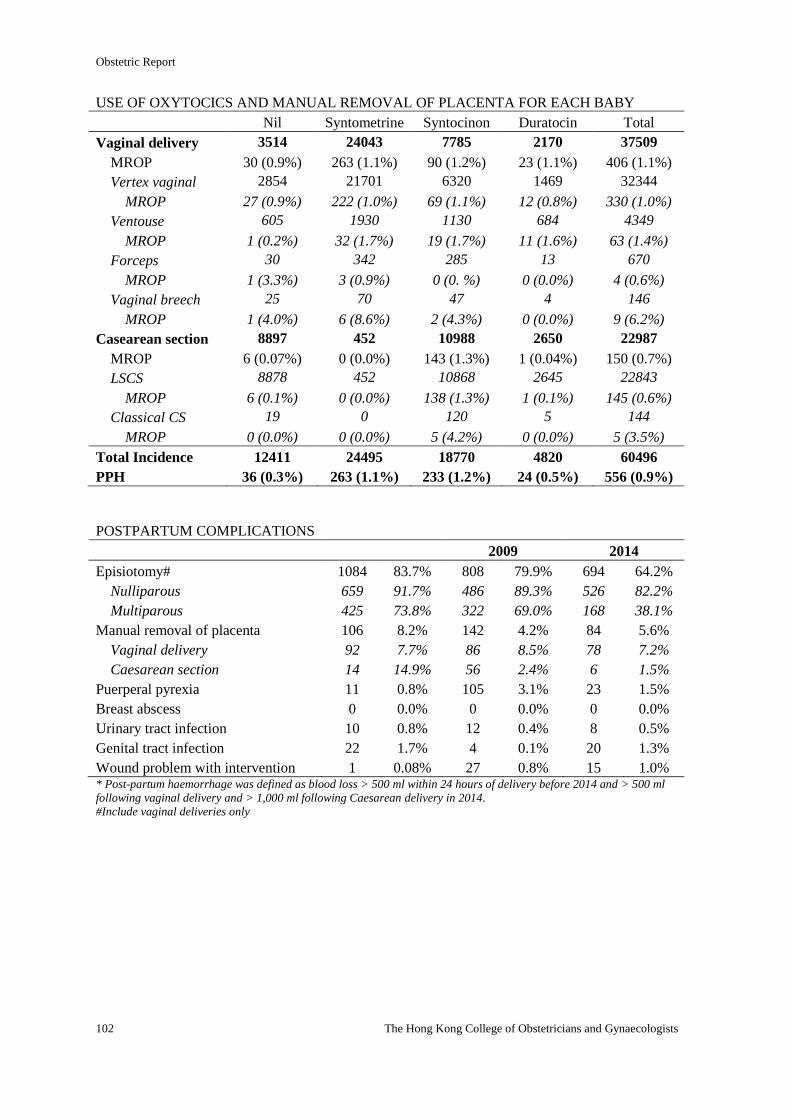
Obstetric Report
102 The Hong Kong College of Obstetricians and Gynaecologists
USE OF OXYTOCICS AND MANUAL REMOVAL OF PLACENTA FOR EACH BABY
Nil Syntometrine Syntocinon Duratocin Total
Vaginal delivery 3514 24043 7785 2170 37509
MROP 30 (0.9%) 263 (1.1%) 90 (1.2%) 23 (1.1%) 406 (1.1%)
Vertex vaginal 2854 21701 6320 1469 32344
MROP 27 (0.9%) 222 (1.0%) 69 (1.1%) 12 (0.8%) 330 (1.0%)
Ventouse 605 1930 1130 684 4349
MROP 1 (0.2%) 32 (1.7%) 19 (1.7%) 11 (1.6%) 63 (1.4%)
Forceps 30 342 285 13 670
MROP 1 (3.3%) 3 (0.9%) 0 (0. %) 0 (0.0%) 4 (0.6%)
Vaginal breech 25 70 47 4 146
MROP 1 (4.0%) 6 (8.6%) 2 (4.3%) 0 (0.0%) 9 (6.2%)
Casearean section 8897 452 10988 2650 22987
MROP 6 (0.07%) 0 (0.0%) 143 (1.3%) 1 (0.04%) 150 (0.7%)
LSCS 8878 452 10868 2645 22843
MROP 6 (0.1%) 0 (0.0%) 138 (1.3%) 1 (0.1%) 145 (0.6%)
Classical CS 19 0 120 5 144
MROP 0 (0.0%) 0 (0.0%) 5 (4.2%) 0 (0.0%) 5 (3.5%)
Total Incidence 12411 24495 18770 4820 60496
PPH 36 (0.3%) 263 (1.1%) 233 (1.2%) 24 (0.5%) 556 (0.9%)
POSTPARTUM COMPLICATIONS
2009 2014
Episiotomy# 1084 83.7% 808 79.9% 694 64.2%
Nulliparous 659 91.7% 486 89.3% 526 82.2%
Multiparous 425 73.8% 322 69.0% 168 38.1%
Manual removal of placenta 106 8.2% 142 4.2% 84 5.6%
Vaginal delivery 92 7.7% 86 8.5% 78 7.2%
Caesarean section 14 14.9% 56 2.4% 6 1.5%
Puerperal pyrexia 11 0.8% 105 3.1% 23 1.5%
Breast abscess 0 0.0% 0 0.0% 0 0.0%
Urinary tract infection 10 0.8% 12 0.4% 8 0.5%
Genital tract infection 22 1.7% 4 0.1% 20 1.3%
Wound problem with intervention 1 0.08% 27 0.8% 15 1.0% * Post-partum haemorrhage was defined as blood loss > 500 ml within 24 hours of delivery before 2014 and > 500 ml
following vaginal delivery and > 1,000 ml following Caesarean delivery in 2014.
#Include vaginal deliveries only
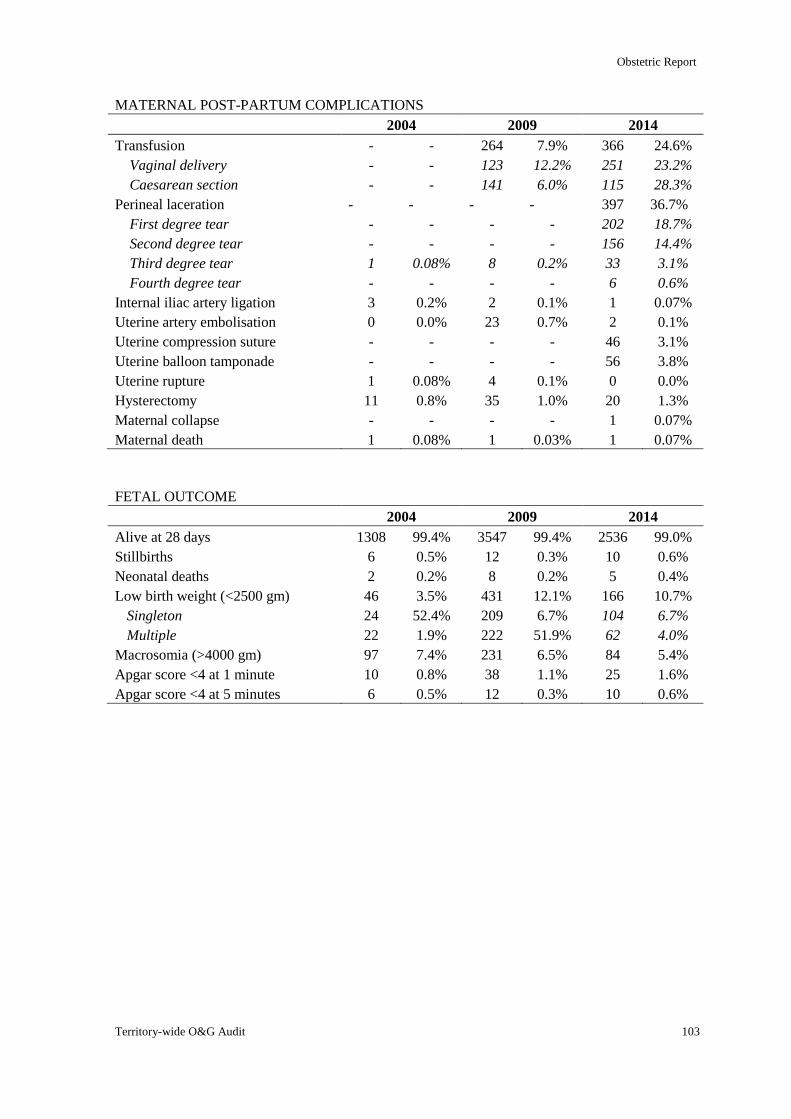
Obstetric Report
Territory-wide O&G Audit 103
MATERNAL POST-PARTUM COMPLICATIONS
2004 2009 2014
Transfusion - - 264 7.9% 366 24.6%
Vaginal delivery - - 123 12.2% 251 23.2%
Caesarean section - - 141 6.0% 115 28.3%
Perineal laceration - - - - 397 36.7%
First degree tear - - - - 202 18.7%
Second degree tear - - - - 156 14.4%
Third degree tear 1 0.08% 8 0.2% 33 3.1%
Fourth degree tear - - - - 6 0.6%
Internal iliac artery ligation 3 0.2% 2 0.1% 1 0.07%
Uterine artery embolisation 0 0.0% 23 0.7% 2 0.1%
Uterine compression suture - - - - 46 3.1%
Uterine balloon tamponade - - - - 56 3.8%
Uterine rupture 1 0.08% 4 0.1% 0 0.0%
Hysterectomy 11 0.8% 35 1.0% 20 1.3%
Maternal collapse - - - - 1 0.07%
Maternal death 1 0.08% 1 0.03% 1 0.07%
FETAL OUTCOME
2004 2009 2014
Alive at 28 days 1308 99.4% 3547 99.4% 2536 99.0%
Stillbirths 6 0.5% 12 0.3% 10 0.6%
Neonatal deaths 2 0.2% 8 0.2% 5 0.4%
Low birth weight (<2500 gm) 46 3.5% 431 12.1% 166 10.7%
Singleton 24 52.4% 209 6.7% 104 6.7%
Multiple 22 1.9% 222 51.9% 62 4.0%
Macrosomia (>4000 gm) 97 7.4% 231 6.5% 84 5.4%
Apgar score <4 at 1 minute 10 0.8% 38 1.1% 25 1.6%
Apgar score <4 at 5 minutes 6 0.5% 12 0.3% 10 0.6%
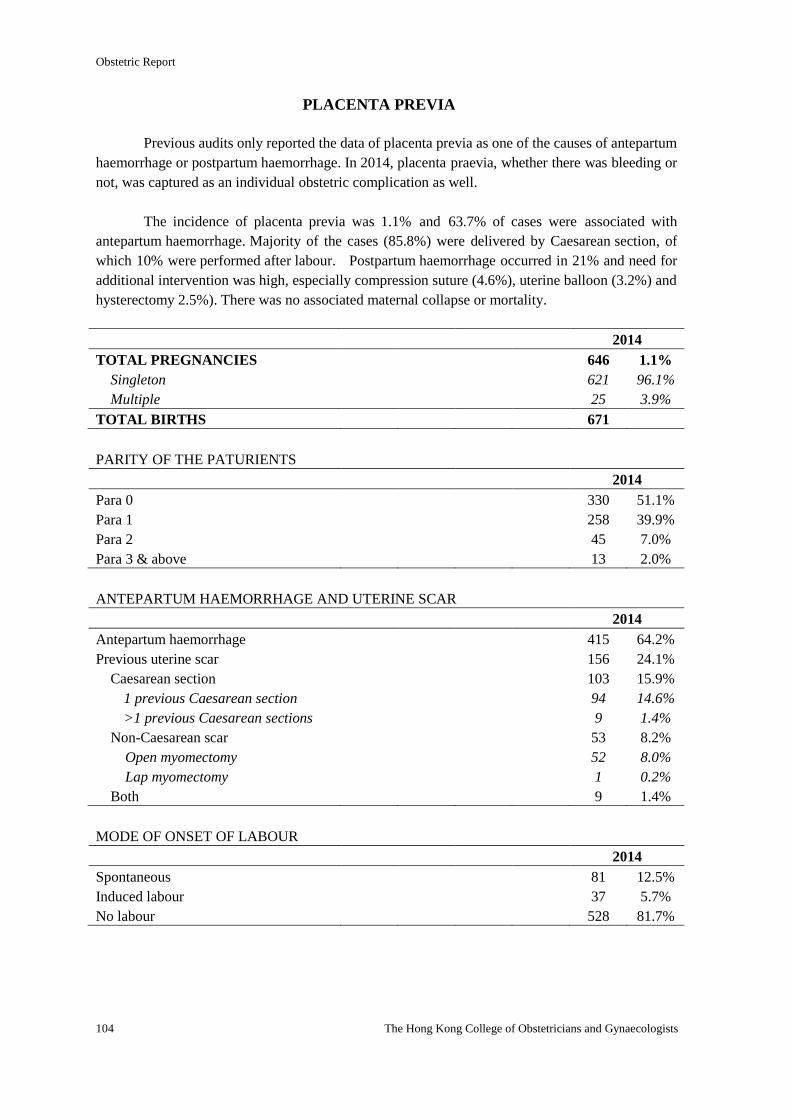
Obstetric Report
104 The Hong Kong College of Obstetricians and Gynaecologists
PLACENTA PREVIA
Previous audits only reported the data of placenta previa as one of the causes of antepartum
haemorrhage or postpartum haemorrhage. In 2014, placenta praevia, whether there was bleeding or
not, was captured as an individual obstetric complication as well.
The incidence of placenta previa was 1.1% and 63.7% of cases were associated with
antepartum haemorrhage. Majority of the cases (85.8%) were delivered by Caesarean section, of
which 10% were performed after labour. Postpartum haemorrhage occurred in 21% and need for
additional intervention was high, especially compression suture (4.6%), uterine balloon (3.2%) and
hysterectomy 2.5%). There was no associated maternal collapse or mortality.
2014
TOTAL PREGNANCIES 646 1.1%
Singleton 621 96.1%
Multiple 25 3.9%
TOTAL BIRTHS 671
PARITY OF THE PATURIENTS
2014
Para 0 330 51.1%
Para 1 258 39.9%
Para 2 45 7.0%
Para 3 & above 13 2.0%
ANTEPARTUM HAEMORRHAGE AND UTERINE SCAR
2014
Antepartum haemorrhage 415 64.2%
Previous uterine scar 156 24.1%
Caesarean section 103 15.9%
1 previous Caesarean section 94 14.6%
>1 previous Caesarean sections 9 1.4%
Non-Caesarean scar 53 8.2%
Open myomectomy 52 8.0%
Lap myomectomy 1 0.2%
Both 9 1.4%
MODE OF ONSET OF LABOUR
2014
Spontaneous 81 12.5%
Induced labour 37 5.7%
No labour 528 81.7%
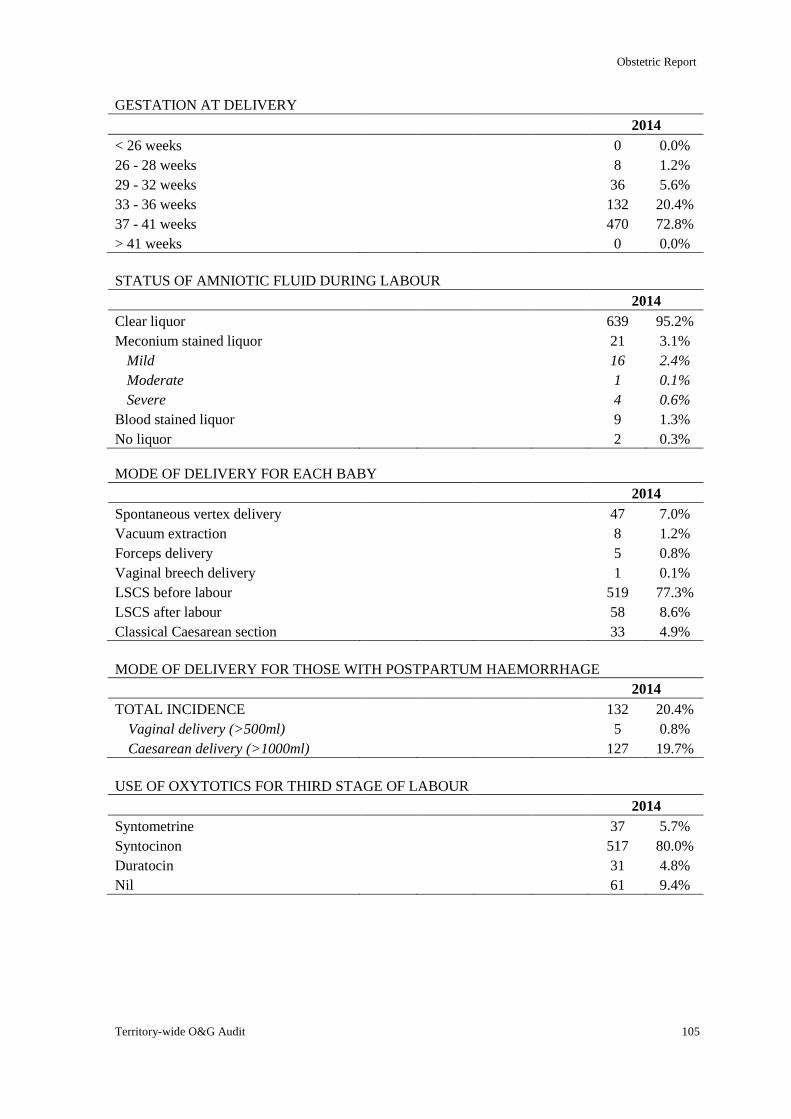
Obstetric Report
Territory-wide O&G Audit 105
GESTATION AT DELIVERY
2014
< 26 weeks 0 0.0%
26 - 28 weeks 8 1.2%
29 - 32 weeks 36 5.6%
33 - 36 weeks 132 20.4%
37 - 41 weeks 470 72.8%
> 41 weeks 0 0.0%
STATUS OF AMNIOTIC FLUID DURING LABOUR
2014
Clear liquor 639 95.2%
Meconium stained liquor 21 3.1%
Mild 16 2.4%
Moderate 1 0.1%
Severe 4 0.6%
Blood stained liquor 9 1.3%
No liquor 2 0.3%
MODE OF DELIVERY FOR EACH BABY
2014
Spontaneous vertex delivery 47 7.0%
Vacuum extraction 8 1.2%
Forceps delivery 5 0.8%
Vaginal breech delivery 1 0.1%
LSCS before labour 519 77.3%
LSCS after labour 58 8.6%
Classical Caesarean section 33 4.9%
MODE OF DELIVERY FOR THOSE WITH POSTPARTUM HAEMORRHAGE
2014
TOTAL INCIDENCE 132 20.4%
Vaginal delivery (>500ml) 5 0.8%
Caesarean delivery (>1000ml) 127 19.7%
USE OF OXYTOTICS FOR THIRD STAGE OF LABOUR
2014
Syntometrine 37 5.7%
Syntocinon 517 80.0%
Duratocin 31 4.8%
Nil 61 9.4%
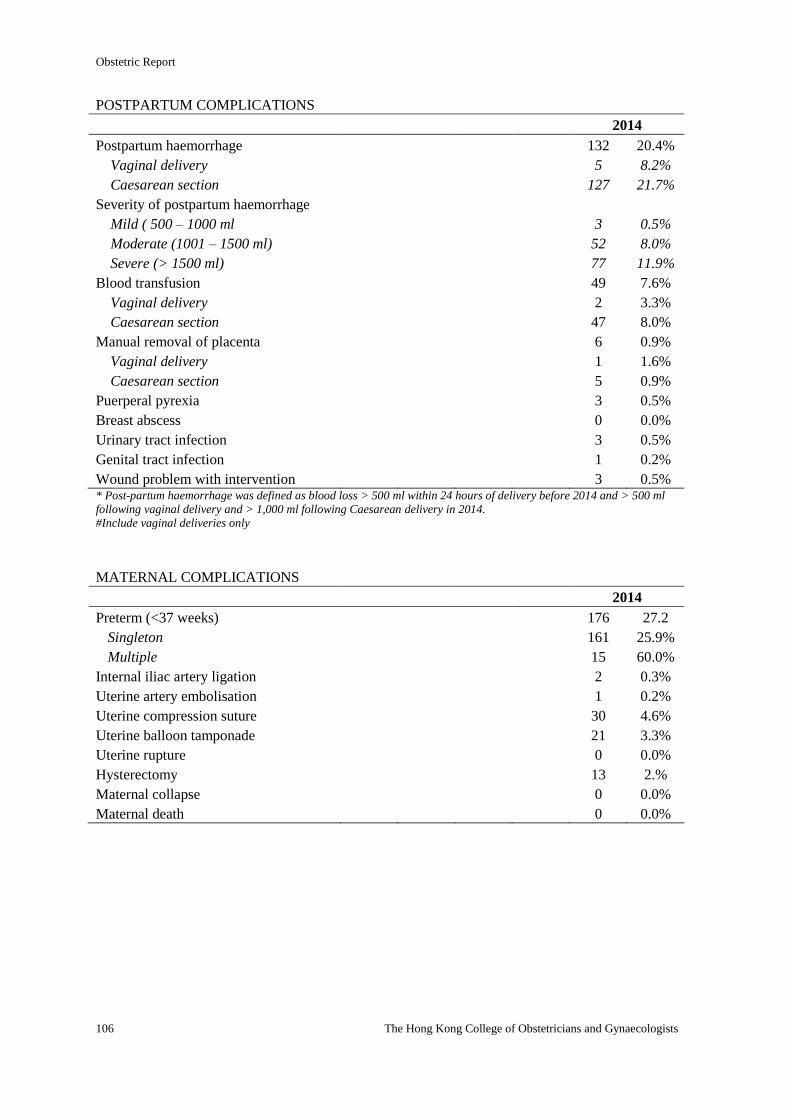
Obstetric Report
106 The Hong Kong College of Obstetricians and Gynaecologists
POSTPARTUM COMPLICATIONS
2014
Postpartum haemorrhage 132 20.4%
Vaginal delivery 5 8.2%
Caesarean section 127 21.7%
Severity of postpartum haemorrhage
Mild ( 500 – 1000 ml 3 0.5%
Moderate (1001 – 1500 ml) 52 8.0%
Severe (> 1500 ml) 77 11.9%
Blood transfusion 49 7.6%
Vaginal delivery 2 3.3%
Caesarean section 47 8.0%
Manual removal of placenta 6 0.9%
Vaginal delivery 1 1.6%
Caesarean section 5 0.9%
Puerperal pyrexia 3 0.5%
Breast abscess 0 0.0%
Urinary tract infection 3 0.5%
Genital tract infection 1 0.2%
Wound problem with intervention 3 0.5% * Post-partum haemorrhage was defined as blood loss > 500 ml within 24 hours of delivery before 2014 and > 500 ml
following vaginal delivery and > 1,000 ml following Caesarean delivery in 2014.
#Include vaginal deliveries only
MATERNAL COMPLICATIONS
2014
Preterm (<37 weeks) 176 27.2
Singleton 161 25.9%
Multiple 15 60.0%
Internal iliac artery ligation 2 0.3%
Uterine artery embolisation 1 0.2%
Uterine compression suture 30 4.6%
Uterine balloon tamponade 21 3.3%
Uterine rupture 0 0.0%
Hysterectomy 13 2.%
Maternal collapse 0 0.0%
Maternal death 0 0.0%
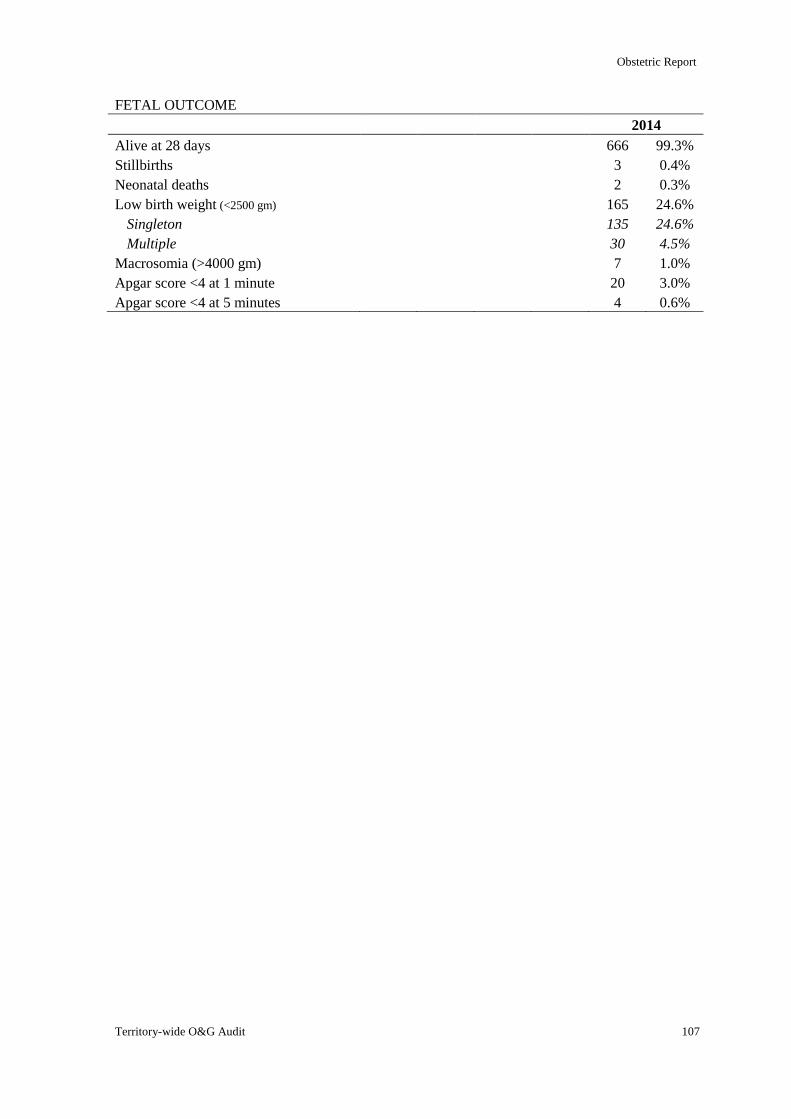
Obstetric Report
Territory-wide O&G Audit 107
FETAL OUTCOME
2014
Alive at 28 days 666 99.3%
Stillbirths 3 0.4%
Neonatal deaths 2 0.3%
Low birth weight (<2500 gm) 165 24.6%
Singleton 135 24.6%
Multiple 30 4.5%
Macrosomia (>4000 gm) 7 1.0%
Apgar score <4 at 1 minute 20 3.0%
Apgar score <4 at 5 minutes 4 0.6%
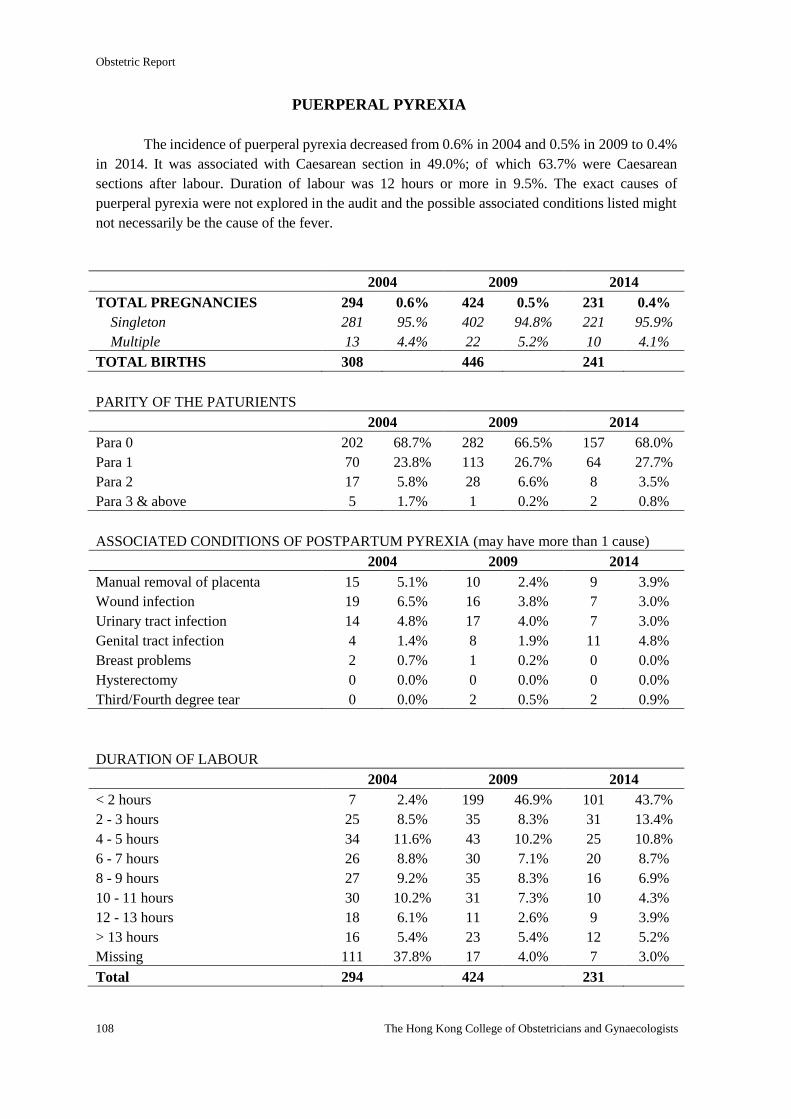
Obstetric Report
108 The Hong Kong College of Obstetricians and Gynaecologists
PUERPERAL PYREXIA
The incidence of puerperal pyrexia decreased from 0.6% in 2004 and 0.5% in 2009 to 0.4%
in 2014. It was associated with Caesarean section in 49.0%; of which 63.7% were Caesarean
sections after labour. Duration of labour was 12 hours or more in 9.5%. The exact causes of
puerperal pyrexia were not explored in the audit and the possible associated conditions listed might
not necessarily be the cause of the fever.
2004 2009 2014
TOTAL PREGNANCIES 294 0.6% 424 0.5% 231 0.4%
Singleton 281 95.% 402 94.8% 221 95.9%
Multiple 13 4.4% 22 5.2% 10 4.1%
TOTAL BIRTHS 308 446 241
PARITY OF THE PATURIENTS
2004 2009 2014
Para 0 202 68.7% 282 66.5% 157 68.0%
Para 1 70 23.8% 113 26.7% 64 27.7%
Para 2 17 5.8% 28 6.6% 8 3.5%
Para 3 & above 5 1.7% 1 0.2% 2 0.8%
ASSOCIATED CONDITIONS OF POSTPARTUM PYREXIA (may have more than 1 cause)
2004 2009 2014
Manual removal of placenta 15 5.1% 10 2.4% 9 3.9%
Wound infection 19 6.5% 16 3.8% 7 3.0%
Urinary tract infection 14 4.8% 17 4.0% 7 3.0%
Genital tract infection 4 1.4% 8 1.9% 11 4.8%
Breast problems 2 0.7% 1 0.2% 0 0.0%
Hysterectomy 0 0.0% 0 0.0% 0 0.0%
Third/Fourth degree tear 0 0.0% 2 0.5% 2 0.9%
DURATION OF LABOUR
2004 2009 2014
< 2 hours 7 2.4% 199 46.9% 101 43.7%
2 - 3 hours 25 8.5% 35 8.3% 31 13.4%
4 - 5 hours 34 11.6% 43 10.2% 25 10.8%
6 - 7 hours 26 8.8% 30 7.1% 20 8.7%
8 - 9 hours 27 9.2% 35 8.3% 16 6.9%
10 - 11 hours 30 10.2% 31 7.3% 10 4.3%
12 - 13 hours 18 6.1% 11 2.6% 9 3.9%
> 13 hours 16 5.4% 23 5.4% 12 5.2%
Missing 111 37.8% 17 4.0% 7 3.0%
Total 294 424 231
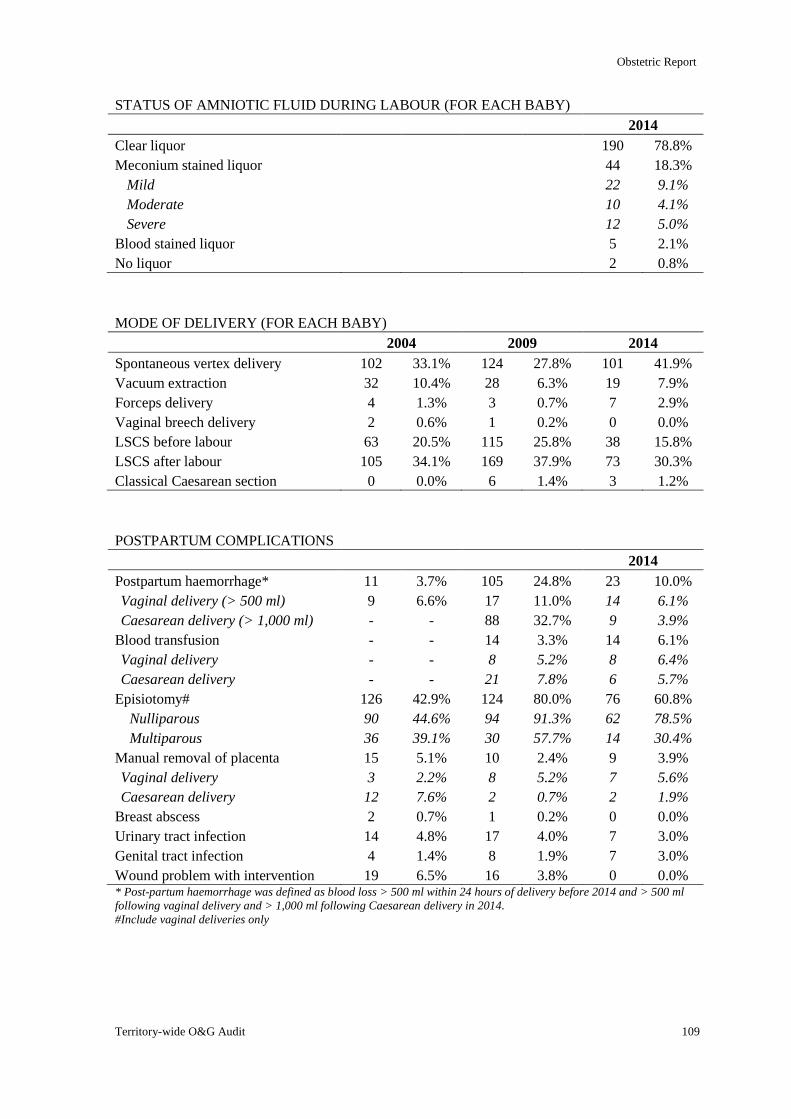
Obstetric Report
Territory-wide O&G Audit 109
STATUS OF AMNIOTIC FLUID DURING LABOUR (FOR EACH BABY)
2014
Clear liquor 190 78.8%
Meconium stained liquor 44 18.3%
Mild 22 9.1%
Moderate 10 4.1%
Severe 12 5.0%
Blood stained liquor 5 2.1%
No liquor 2 0.8%
MODE OF DELIVERY (FOR EACH BABY)
2004 2009 2014
Spontaneous vertex delivery 102 33.1% 124 27.8% 101 41.9%
Vacuum extraction 32 10.4% 28 6.3% 19 7.9%
Forceps delivery 4 1.3% 3 0.7% 7 2.9%
Vaginal breech delivery 2 0.6% 1 0.2% 0 0.0%
LSCS before labour 63 20.5% 115 25.8% 38 15.8%
LSCS after labour 105 34.1% 169 37.9% 73 30.3%
Classical Caesarean section 0 0.0% 6 1.4% 3 1.2%
POSTPARTUM COMPLICATIONS
2014
Postpartum haemorrhage* 11 3.7% 105 24.8% 23 10.0%
Vaginal delivery (> 500 ml) 9 6.6% 17 11.0% 14 6.1%
Caesarean delivery (> 1,000 ml) - - 88 32.7% 9 3.9%
Blood transfusion - - 14 3.3% 14 6.1%
Vaginal delivery - - 8 5.2% 8 6.4%
Caesarean delivery - - 21 7.8% 6 5.7%
Episiotomy# 126 42.9% 124 80.0% 76 60.8%
Nulliparous 90 44.6% 94 91.3% 62 78.5%
Multiparous 36 39.1% 30 57.7% 14 30.4%
Manual removal of placenta 15 5.1% 10 2.4% 9 3.9%
Vaginal delivery 3 2.2% 8 5.2% 7 5.6%
Caesarean delivery 12 7.6% 2 0.7% 2 1.9%
Breast abscess 2 0.7% 1 0.2% 0 0.0%
Urinary tract infection 14 4.8% 17 4.0% 7 3.0%
Genital tract infection 4 1.4% 8 1.9% 7 3.0%
Wound problem with intervention 19 6.5% 16 3.8% 0 0.0% * Post-partum haemorrhage was defined as blood loss > 500 ml within 24 hours of delivery before 2014 and > 500 ml
following vaginal delivery and > 1,000 ml following Caesarean delivery in 2014.
#Include vaginal deliveries only
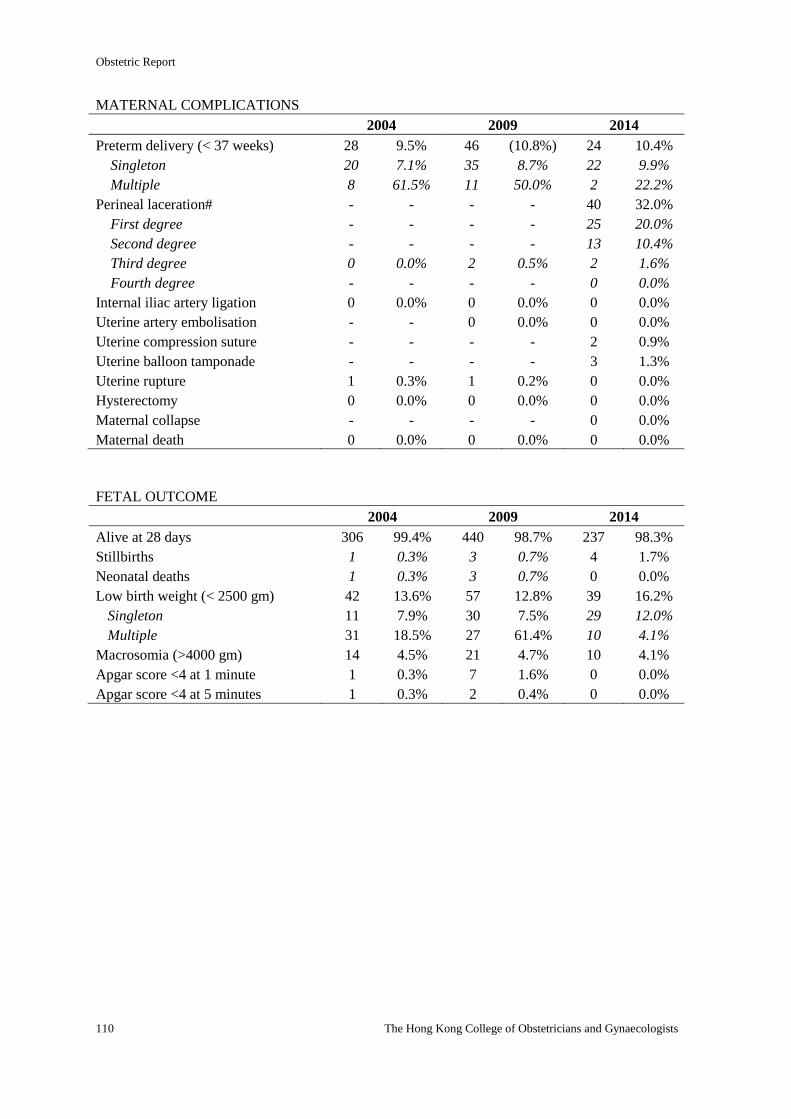
Obstetric Report
110 The Hong Kong College of Obstetricians and Gynaecologists
MATERNAL COMPLICATIONS
2004 2009 2014
Preterm delivery (< 37 weeks) 28 9.5% 46 (10.8%) 24 10.4%
Singleton 20 7.1% 35 8.7% 22 9.9%
Multiple 8 61.5% 11 50.0% 2 22.2%
Perineal laceration# - - - - 40 32.0%
First degree - - - - 25 20.0%
Second degree - - - - 13 10.4%
Third degree 0 0.0% 2 0.5% 2 1.6%
Fourth degree - - - - 0 0.0%
Internal iliac artery ligation 0 0.0% 0 0.0% 0 0.0%
Uterine artery embolisation - - 0 0.0% 0 0.0%
Uterine compression suture - - - - 2 0.9%
Uterine balloon tamponade - - - - 3 1.3%
Uterine rupture 1 0.3% 1 0.2% 0 0.0%
Hysterectomy 0 0.0% 0 0.0% 0 0.0%
Maternal collapse - - - - 0 0.0%
Maternal death 0 0.0% 0 0.0% 0 0.0%
FETAL OUTCOME
2004 2009 2014
Alive at 28 days 306 99.4% 440 98.7% 237 98.3%
Stillbirths 1 0.3% 3 0.7% 4 1.7%
Neonatal deaths 1 0.3% 3 0.7% 0 0.0%
Low birth weight (< 2500 gm) 42 13.6% 57 12.8% 39 16.2%
Singleton 11 7.9% 30 7.5% 29 12.0%
Multiple 31 18.5% 27 61.4% 10 4.1%
Macrosomia (>4000 gm) 14 4.5% 21 4.7% 10 4.1%
Apgar score <4 at 1 minute 1 0.3% 7 1.6% 0 0.0%
Apgar score <4 at 5 minutes 1 0.3% 2 0.4% 0 0.0%
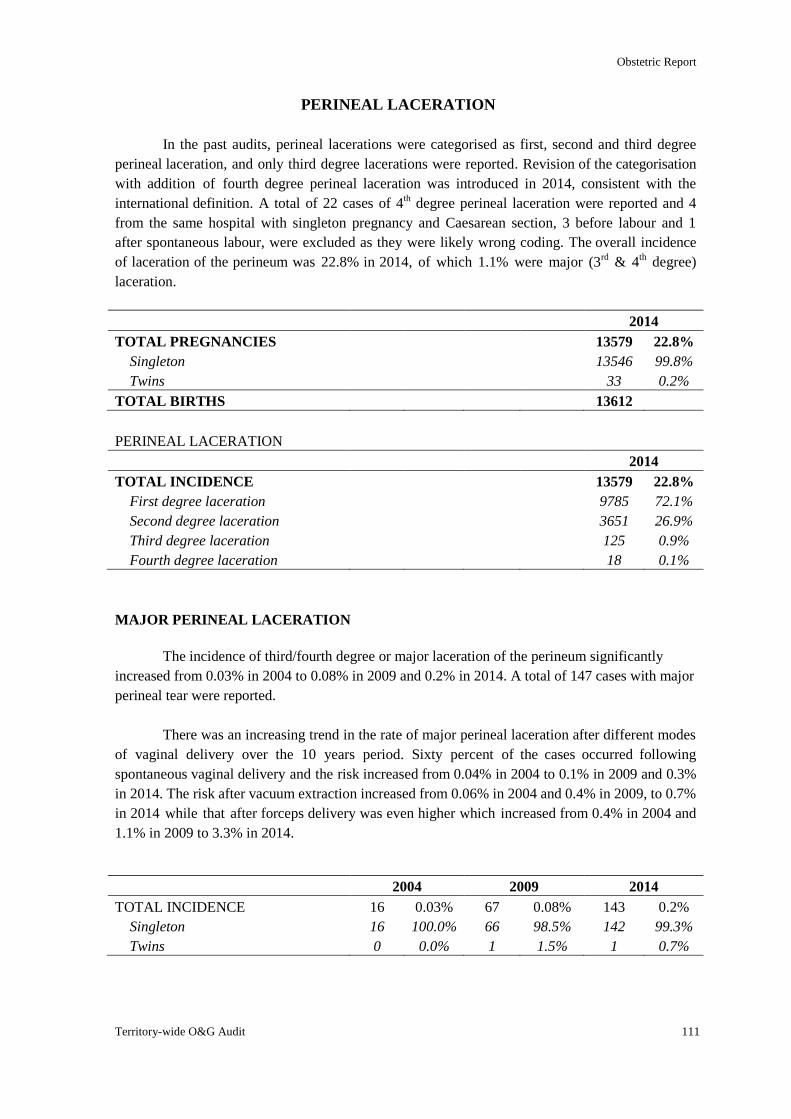
Obstetric Report
Territory-wide O&G Audit 111
PERINEAL LACERATION
In the past audits, perineal lacerations were categorised as first, second and third degree
perineal laceration, and only third degree lacerations were reported. Revision of the categorisation
with addition of fourth degree perineal laceration was introduced in 2014, consistent with the
international definition. A total of 22 cases of 4th degree perineal laceration were reported and 4
from the same hospital with singleton pregnancy and Caesarean section, 3 before labour and 1
after spontaneous labour, were excluded as they were likely wrong coding. The overall incidence
of laceration of the perineum was 22.8% in 2014, of which 1.1% were major (3rd
& 4th degree)
laceration.
2014
TOTAL PREGNANCIES 13579 22.8%
Singleton 13546 99.8%
Twins 33 0.2%
TOTAL BIRTHS 13612
PERINEAL LACERATION
2014
TOTAL INCIDENCE 13579 22.8%
First degree laceration 9785 72.1%
Second degree laceration 3651 26.9%
Third degree laceration 125 0.9%
Fourth degree laceration 18 0.1%
MAJOR PERINEAL LACERATION
The incidence of third/fourth degree or major laceration of the perineum significantly
increased from 0.03% in 2004 to 0.08% in 2009 and 0.2% in 2014. A total of 147 cases with major
perineal tear were reported.
There was an increasing trend in the rate of major perineal laceration after different modes
of vaginal delivery over the 10 years period. Sixty percent of the cases occurred following
spontaneous vaginal delivery and the risk increased from 0.04% in 2004 to 0.1% in 2009 and 0.3%
in 2014. The risk after vacuum extraction increased from 0.06% in 2004 and 0.4% in 2009, to 0.7%
in 2014 while that after forceps delivery was even higher which increased from 0.4% in 2004 and
1.1% in 2009 to 3.3% in 2014.
2004 2009 2014
TOTAL INCIDENCE 16 0.03% 67 0.08% 143 0.2%
Singleton 16 100.0% 66 98.5% 142 99.3%
Twins 0 0.0% 1 1.5% 1 0.7%
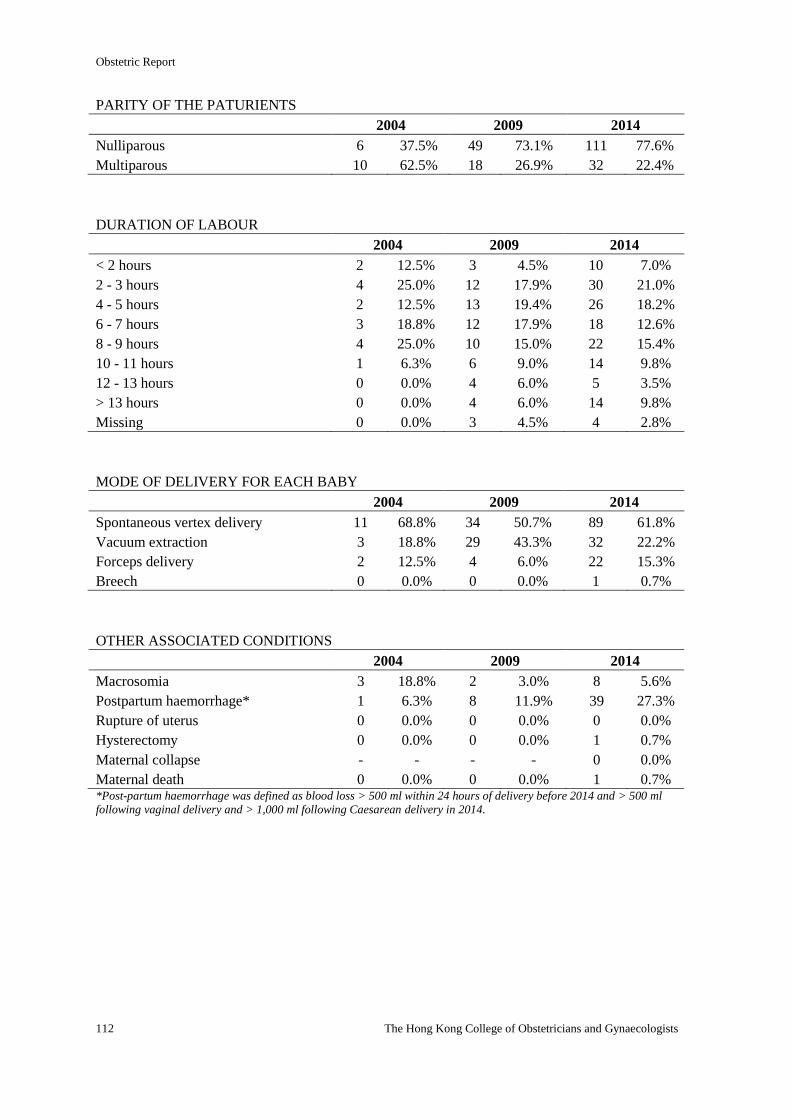
Obstetric Report
112 The Hong Kong College of Obstetricians and Gynaecologists
PARITY OF THE PATURIENTS
2004 2009 2014
Nulliparous 6 37.5% 49 73.1% 111 77.6%
Multiparous 10 62.5% 18 26.9% 32 22.4%
DURATION OF LABOUR
2004 2009 2014
< 2 hours 2 12.5% 3 4.5% 10 7.0%
2 - 3 hours 4 25.0% 12 17.9% 30 21.0%
4 - 5 hours 2 12.5% 13 19.4% 26 18.2%
6 - 7 hours 3 18.8% 12 17.9% 18 12.6%
8 - 9 hours 4 25.0% 10 15.0% 22 15.4%
10 - 11 hours 1 6.3% 6 9.0% 14 9.8%
12 - 13 hours 0 0.0% 4 6.0% 5 3.5%
> 13 hours 0 0.0% 4 6.0% 14 9.8%
Missing 0 0.0% 3 4.5% 4 2.8%
MODE OF DELIVERY FOR EACH BABY
2004 2009 2014
Spontaneous vertex delivery 11 68.8% 34 50.7% 89 61.8%
Vacuum extraction 3 18.8% 29 43.3% 32 22.2%
Forceps delivery 2 12.5% 4 6.0% 22 15.3%
Breech 0 0.0% 0 0.0% 1 0.7%
OTHER ASSOCIATED CONDITIONS
2004 2009 2014
Macrosomia 3 18.8% 2 3.0% 8 5.6%
Postpartum haemorrhage* 1 6.3% 8 11.9% 39 27.3%
Rupture of uterus 0 0.0% 0 0.0% 0 0.0%
Hysterectomy 0 0.0% 0 0.0% 1 0.7%
Maternal collapse - - - - 0 0.0%
Maternal death 0 0.0% 0 0.0% 1 0.7% *Post-partum haemorrhage was defined as blood loss > 500 ml within 24 hours of delivery before 2014 and > 500 ml
following vaginal delivery and > 1,000 ml following Caesarean delivery in 2014.
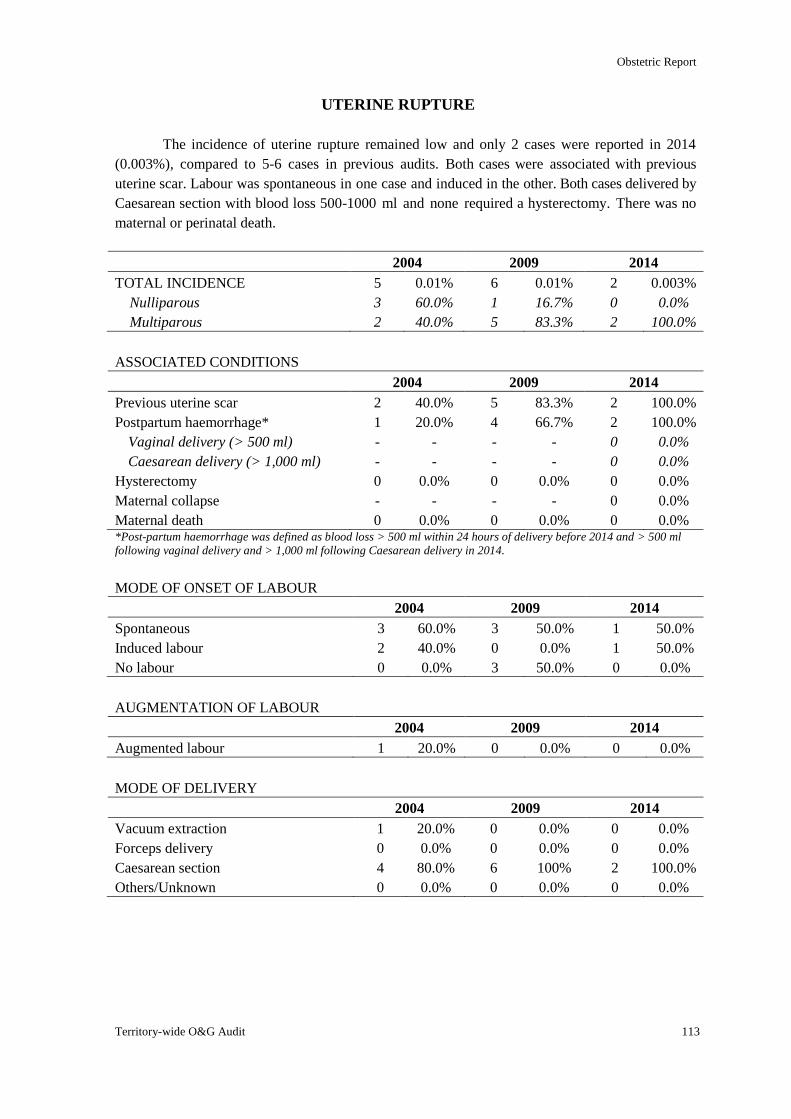
Obstetric Report
Territory-wide O&G Audit 113
UTERINE RUPTURE
The incidence of uterine rupture remained low and only 2 cases were reported in 2014
(0.003%), compared to 5-6 cases in previous audits. Both cases were associated with previous
uterine scar. Labour was spontaneous in one case and induced in the other. Both cases delivered by
Caesarean section with blood loss 500-1000 ml and none required a hysterectomy. There was no
maternal or perinatal death.
2004 2009 2014
TOTAL INCIDENCE 5 0.01% 6 0.01% 2 0.003%
Nulliparous 3 60.0% 1 16.7% 0 0.0%
Multiparous 2 40.0% 5 83.3% 2 100.0%
ASSOCIATED CONDITIONS
2004 2009 2014
Previous uterine scar 2 40.0% 5 83.3% 2 100.0%
Postpartum haemorrhage* 1 20.0% 4 66.7% 2 100.0%
Vaginal delivery (> 500 ml) - - - - 0 0.0%
Caesarean delivery (> 1,000 ml) - - - - 0 0.0%
Hysterectomy 0 0.0% 0 0.0% 0 0.0%
Maternal collapse - - - - 0 0.0%
Maternal death 0 0.0% 0 0.0% 0 0.0% *Post-partum haemorrhage was defined as blood loss > 500 ml within 24 hours of delivery before 2014 and > 500 ml
following vaginal delivery and > 1,000 ml following Caesarean delivery in 2014.
MODE OF ONSET OF LABOUR
2004 2009 2014
Spontaneous 3 60.0% 3 50.0% 1 50.0%
Induced labour 2 40.0% 0 0.0% 1 50.0%
No labour 0 0.0% 3 50.0% 0 0.0%
AUGMENTATION OF LABOUR
2004 2009 2014
Augmented labour 1 20.0% 0 0.0% 0 0.0%
MODE OF DELIVERY
2004 2009 2014
Vacuum extraction 1 20.0% 0 0.0% 0 0.0%
Forceps delivery 0 0.0% 0 0.0% 0 0.0%
Caesarean section 4 80.0% 6 100% 2 100.0%
Others/Unknown 0 0.0% 0 0.0% 0 0.0%

Obstetric Report
114 The Hong Kong College of Obstetricians and Gynaecologists
FETAL OUTCOME
2004 2009 2014
Alive at 28 days 5 100.0% 6 100% 2 100.0%
Stillbirth 0 0.0% 0 0.0% 0 0.0%
Neonatal death 0 0.0% 0 0.0% 0 0.0%
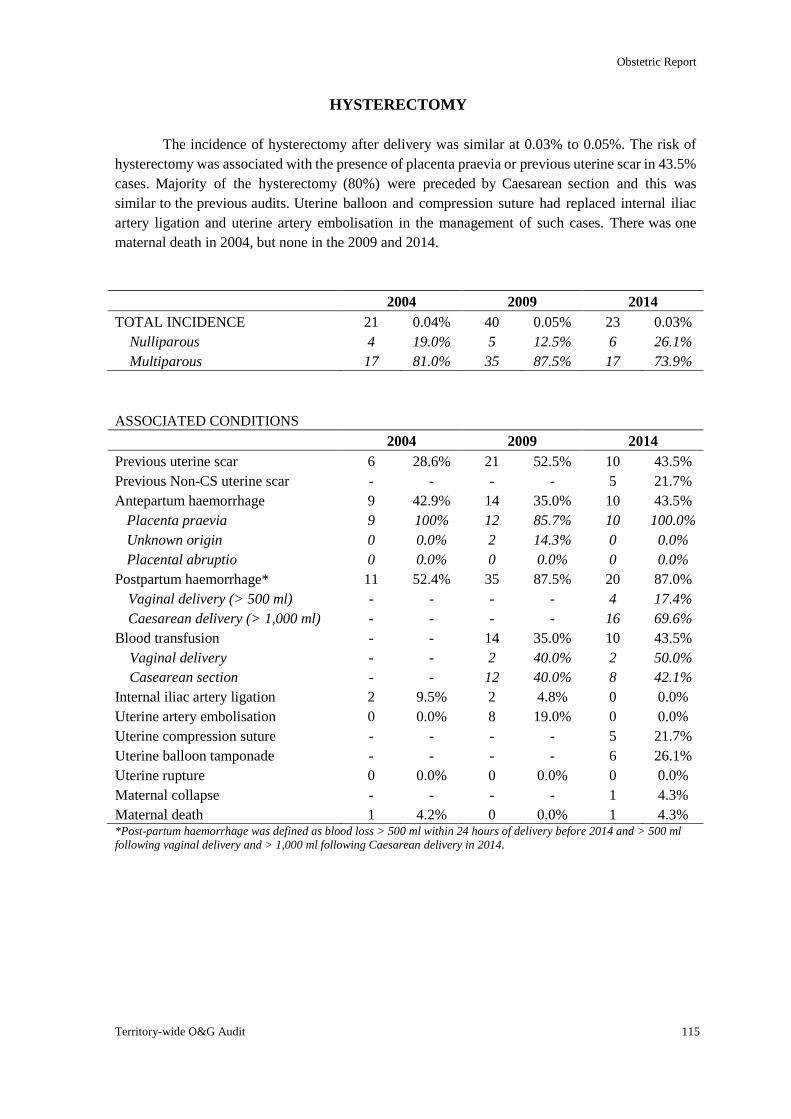
Obstetric Report
Territory-wide O&G Audit 115
HYSTERECTOMY
The incidence of hysterectomy after delivery was similar at 0.03% to 0.05%. The risk of
hysterectomy was associated with the presence of placenta praevia or previous uterine scar in 43.5%
cases. Majority of the hysterectomy (80%) were preceded by Caesarean section and this was
similar to the previous audits. Uterine balloon and compression suture had replaced internal iliac
artery ligation and uterine artery embolisation in the management of such cases. There was one
maternal death in 2004, but none in the 2009 and 2014.
2004 2009 2014
TOTAL INCIDENCE 21 0.04% 40 0.05% 23 0.03%
Nulliparous 4 19.0% 5 12.5% 6 26.1%
Multiparous 17 81.0% 35 87.5% 17 73.9%
ASSOCIATED CONDITIONS
2004 2009 2014
Previous uterine scar 6 28.6% 21 52.5% 10 43.5%
Previous Non-CS uterine scar - - - - 5 21.7%
Antepartum haemorrhage 9 42.9% 14 35.0% 10 43.5%
Placenta praevia 9 100% 12 85.7% 10 100.0%
Unknown origin 0 0.0% 2 14.3% 0 0.0%
Placental abruptio 0 0.0% 0 0.0% 0 0.0%
Postpartum haemorrhage* 11 52.4% 35 87.5% 20 87.0%
Vaginal delivery (> 500 ml) - - - - 4 17.4%
Caesarean delivery (> 1,000 ml) - - - - 16 69.6%
Blood transfusion - - 14 35.0% 10 43.5%
Vaginal delivery - - 2 40.0% 2 50.0%
Casearean section - - 12 40.0% 8 42.1%
Internal iliac artery ligation 2 9.5% 2 4.8% 0 0.0%
Uterine artery embolisation 0 0.0% 8 19.0% 0 0.0%
Uterine compression suture - - - - 5 21.7%
Uterine balloon tamponade - - - - 6 26.1%
Uterine rupture 0 0.0% 0 0.0% 0 0.0%
Maternal collapse - - - - 1 4.3%
Maternal death 1 4.2% 0 0.0% 1 4.3% *Post-partum haemorrhage was defined as blood loss > 500 ml within 24 hours of delivery before 2014 and > 500 ml
following vaginal delivery and > 1,000 ml following Caesarean delivery in 2014.
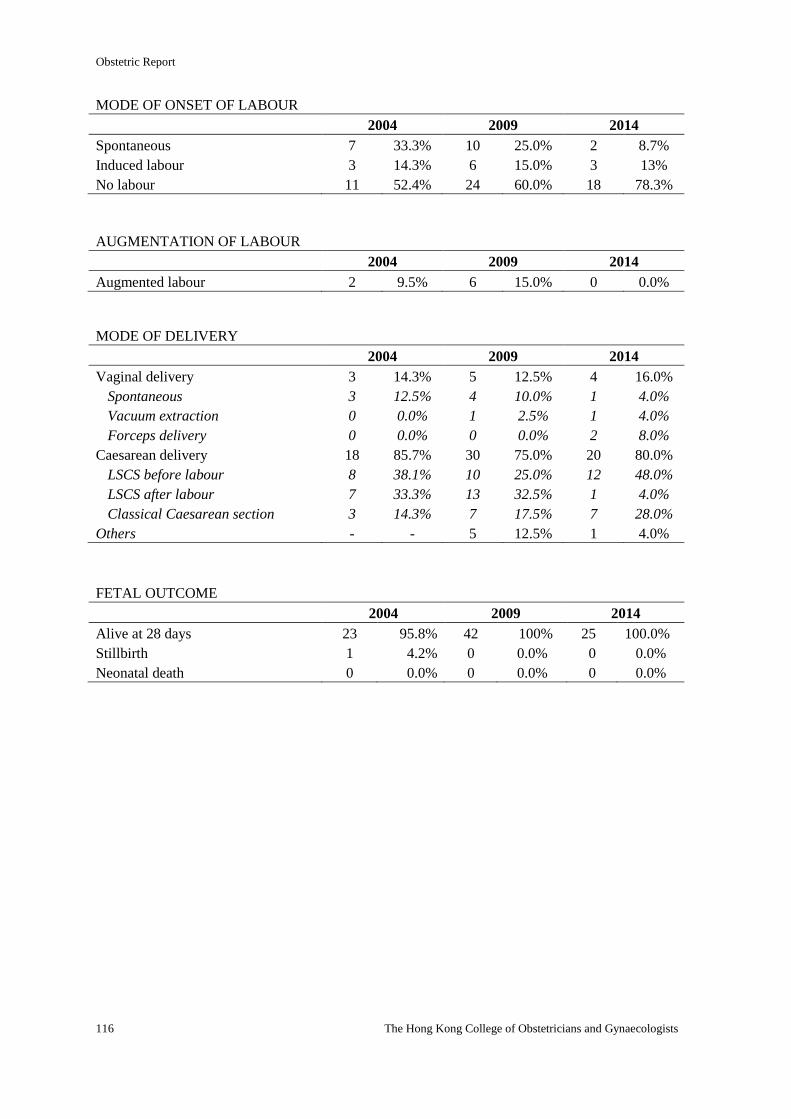
Obstetric Report
116 The Hong Kong College of Obstetricians and Gynaecologists
MODE OF ONSET OF LABOUR
2004 2009 2014
Spontaneous 7 33.3% 10 25.0% 2 8.7%
Induced labour 3 14.3% 6 15.0% 3 13%
No labour 11 52.4% 24 60.0% 18 78.3%
AUGMENTATION OF LABOUR
2004 2009 2014
Augmented labour 2 9.5% 6 15.0% 0 0.0%
MODE OF DELIVERY
2004 2009 2014
Vaginal delivery 3 14.3% 5 12.5% 4 16.0%
Spontaneous 3 12.5% 4 10.0% 1 4.0%
Vacuum extraction 0 0.0% 1 2.5% 1 4.0%
Forceps delivery 0 0.0% 0 0.0% 2 8.0%
Caesarean delivery 18 85.7% 30 75.0% 20 80.0%
LSCS before labour 8 38.1% 10 25.0% 12 48.0%
LSCS after labour 7 33.3% 13 32.5% 1 4.0%
Classical Caesarean section 3 14.3% 7 17.5% 7 28.0%
Others - - 5 12.5% 1 4.0%
FETAL OUTCOME
2004 2009 2014
Alive at 28 days 23 95.8% 42 100% 25 100.0%
Stillbirth 1 4.2% 0 0.0% 0 0.0%
Neonatal death 0 0.0% 0 0.0% 0 0.0%
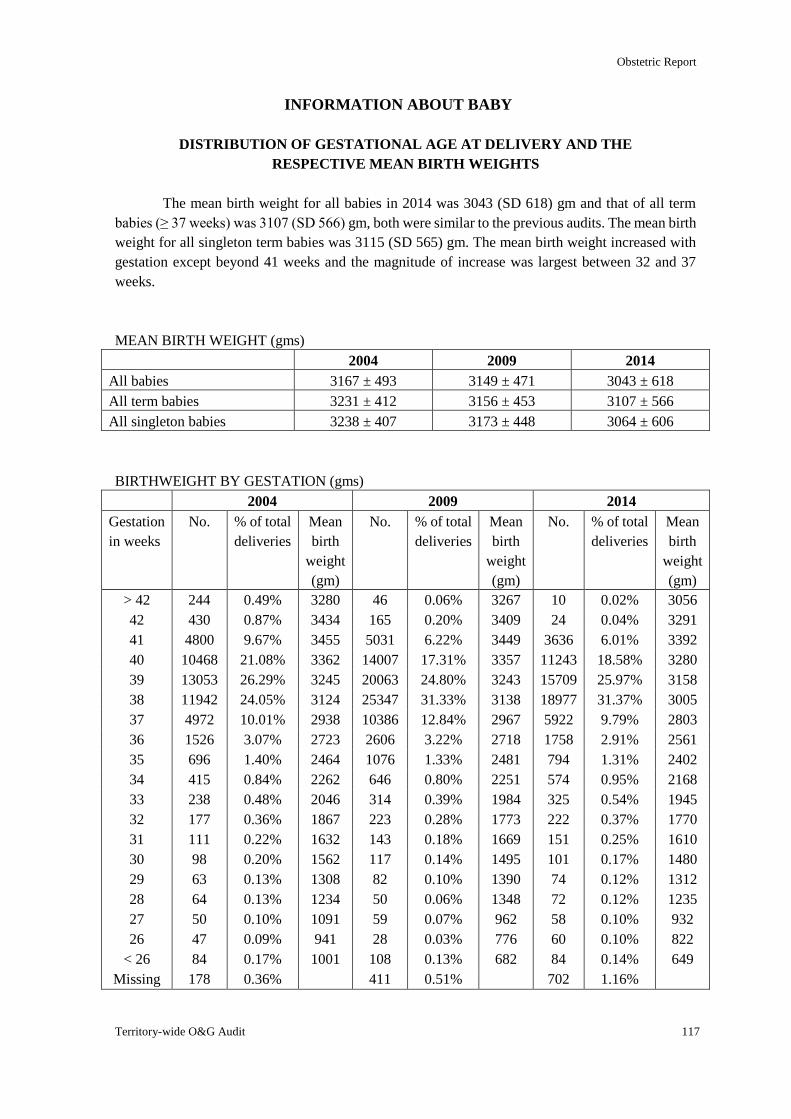
Obstetric Report
Territory-wide O&G Audit 117
INFORMATION ABOUT BABY
DISTRIBUTION OF GESTATIONAL AGE AT DELIVERY AND THE
RESPECTIVE MEAN BIRTH WEIGHTS
The mean birth weight for all babies in 2014 was 3043 (SD 618) gm and that of all term
babies (≥ 37 weeks) was 3107 (SD 566) gm, both were similar to the previous audits. The mean birth
weight for all singleton term babies was 3115 (SD 565) gm. The mean birth weight increased with
gestation except beyond 41 weeks and the magnitude of increase was largest between 32 and 37
weeks.
MEAN BIRTH WEIGHT (gms)
2004 2009 2014
All babies 3167 ± 493 3149 ± 471 3043 ± 618
All term babies 3231 ± 412 3156 ± 453 3107 ± 566
All singleton babies 3238 ± 407 3173 ± 448 3064 ± 606
BIRTHWEIGHT BY GESTATION (gms)
2004 2009 2014
Gestation
in weeks
No. % of total
deliveries
Mean
birth
weight
(gm)
No. % of total
deliveries
Mean
birth
weight
(gm)
No. % of total
deliveries
Mean
birth
weight
(gm)
> 42 244 0.49% 3280 46 0.06% 3267 10 0.02% 3056
42 430 0.87% 3434 165 0.20% 3409 24 0.04% 3291
41 4800 9.67% 3455 5031 6.22% 3449 3636 6.01% 3392
40 10468 21.08% 3362 14007 17.31% 3357 11243 18.58% 3280
39 13053 26.29% 3245 20063 24.80% 3243 15709 25.97% 3158
38 11942 24.05% 3124 25347 31.33% 3138 18977 31.37% 3005
37 4972 10.01% 2938 10386 12.84% 2967 5922 9.79% 2803
36 1526 3.07% 2723 2606 3.22% 2718 1758 2.91% 2561
35 696 1.40% 2464 1076 1.33% 2481 794 1.31% 2402
34 415 0.84% 2262 646 0.80% 2251 574 0.95% 2168
33 238 0.48% 2046 314 0.39% 1984 325 0.54% 1945
32 177 0.36% 1867 223 0.28% 1773 222 0.37% 1770
31 111 0.22% 1632 143 0.18% 1669 151 0.25% 1610
30 98 0.20% 1562 117 0.14% 1495 101 0.17% 1480
29 63 0.13% 1308 82 0.10% 1390 74 0.12% 1312
28 64 0.13% 1234 50 0.06% 1348 72 0.12% 1235
27 50 0.10% 1091 59 0.07% 962 58 0.10% 932
26 47 0.09% 941 28 0.03% 776 60 0.10% 822
< 26 84 0.17% 1001 108 0.13% 682 84 0.14% 649
Missing 178 0.36% 411 0.51% 702 1.16%
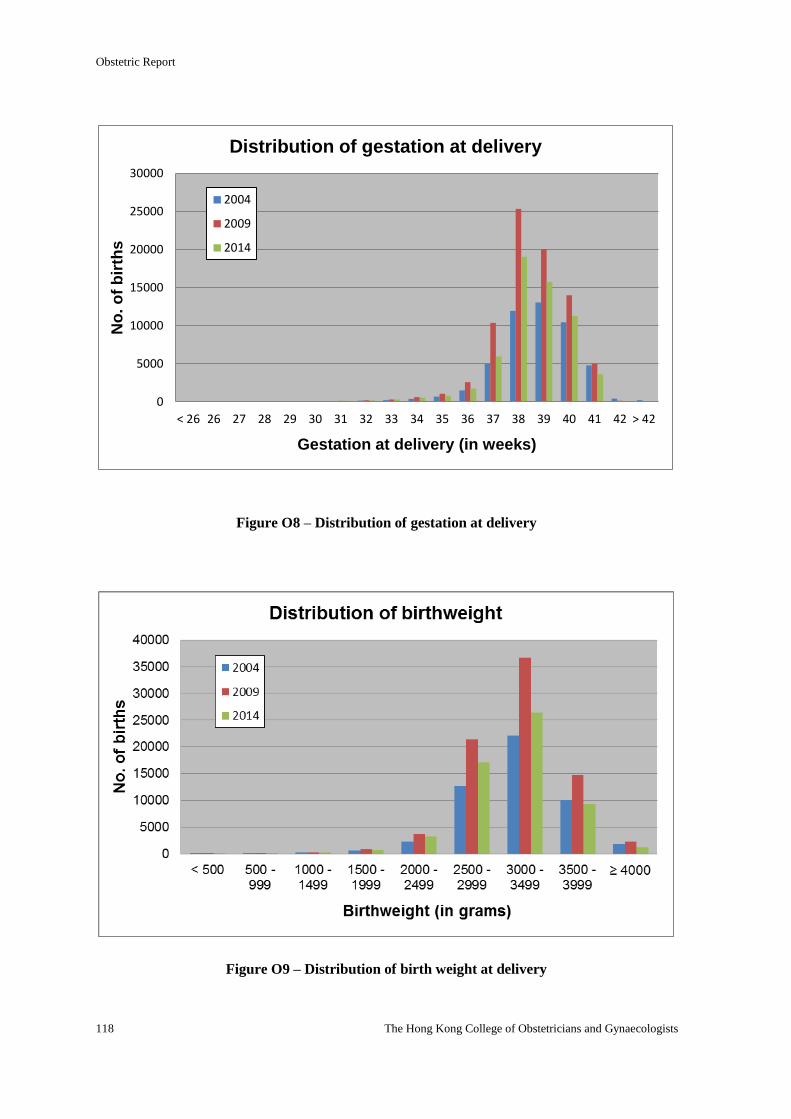
Obstetric Report
118 The Hong Kong College of Obstetricians and Gynaecologists
Figure O8 – Distribution of gestation at delivery
Figure O9 – Distribution of birth weight at delivery
0
5000
10000
15000
20000
25000
30000
< 26 26 27 28 29 30 31 32 33 34 35 36 37 38 39 40 41 42 > 42
No
. o
f b
irth
s
Gestation at delivery (in weeks)
Distribution of gestation at delivery
2004
2009
2014
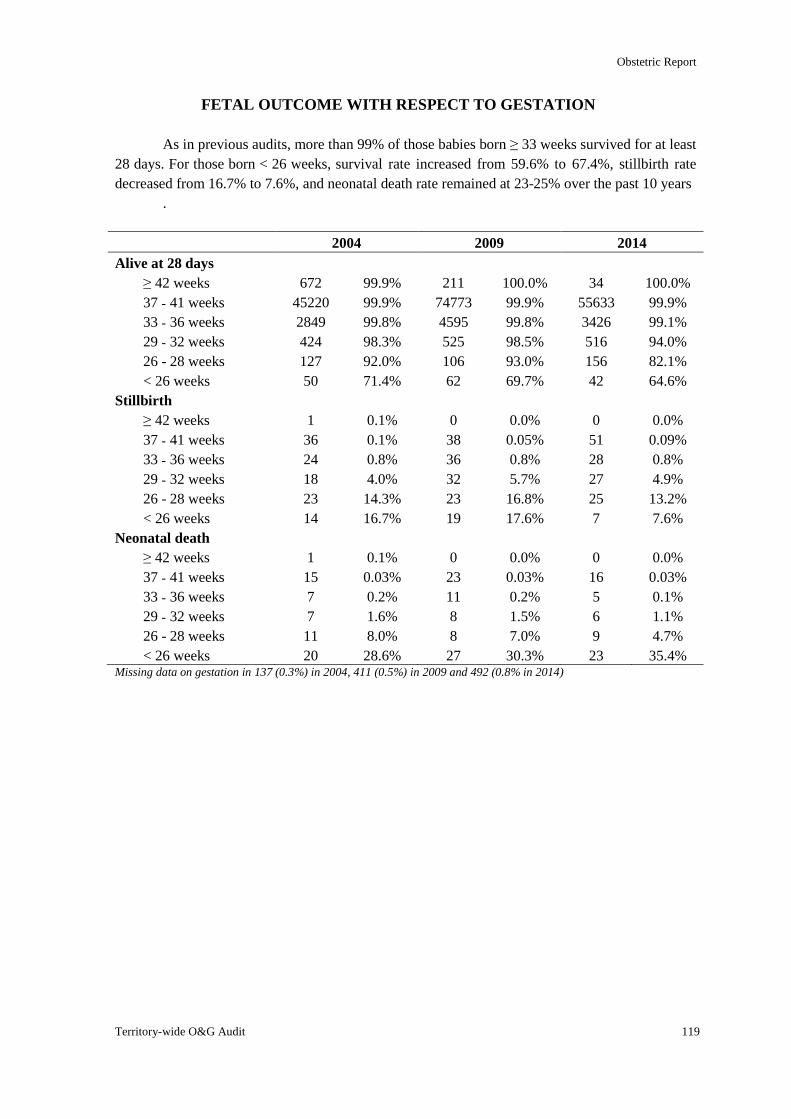
Obstetric Report
Territory-wide O&G Audit 119
FETAL OUTCOME WITH RESPECT TO GESTATION
As in previous audits, more than 99% of those babies born ≥ 33 weeks survived for at least
28 days. For those born < 26 weeks, survival rate increased from 59.6% to 67.4%, stillbirth rate
decreased from 16.7% to 7.6%, and neonatal death rate remained at 23-25% over the past 10 years
.
2004 2009 2014
Alive at 28 days
≥ 42 weeks 672 99.9% 211 100.0% 34 100.0%
37 - 41 weeks 45220 99.9% 74773 99.9% 55633 99.9%
33 - 36 weeks 2849 99.8% 4595 99.8% 3426 99.1%
29 - 32 weeks 424 98.3% 525 98.5% 516 94.0%
26 - 28 weeks 127 92.0% 106 93.0% 156 82.1%
< 26 weeks 50 71.4% 62 69.7% 42 64.6%
Stillbirth
≥ 42 weeks 1 0.1% 0 0.0% 0 0.0%
37 - 41 weeks 36 0.1% 38 0.05% 51 0.09%
33 - 36 weeks 24 0.8% 36 0.8% 28 0.8%
29 - 32 weeks 18 4.0% 32 5.7% 27 4.9%
26 - 28 weeks 23 14.3% 23 16.8% 25 13.2%
< 26 weeks 14 16.7% 19 17.6% 7 7.6%
Neonatal death
≥ 42 weeks 1 0.1% 0 0.0% 0 0.0%
37 - 41 weeks 15 0.03% 23 0.03% 16 0.03%
33 - 36 weeks 7 0.2% 11 0.2% 5 0.1%
29 - 32 weeks 7 1.6% 8 1.5% 6 1.1%
26 - 28 weeks 11 8.0% 8 7.0% 9 4.7%
< 26 weeks 20 28.6% 27 30.3% 23 35.4% Missing data on gestation in 137 (0.3%) in 2004, 411 (0.5%) in 2009 and 492 (0.8% in 2014)
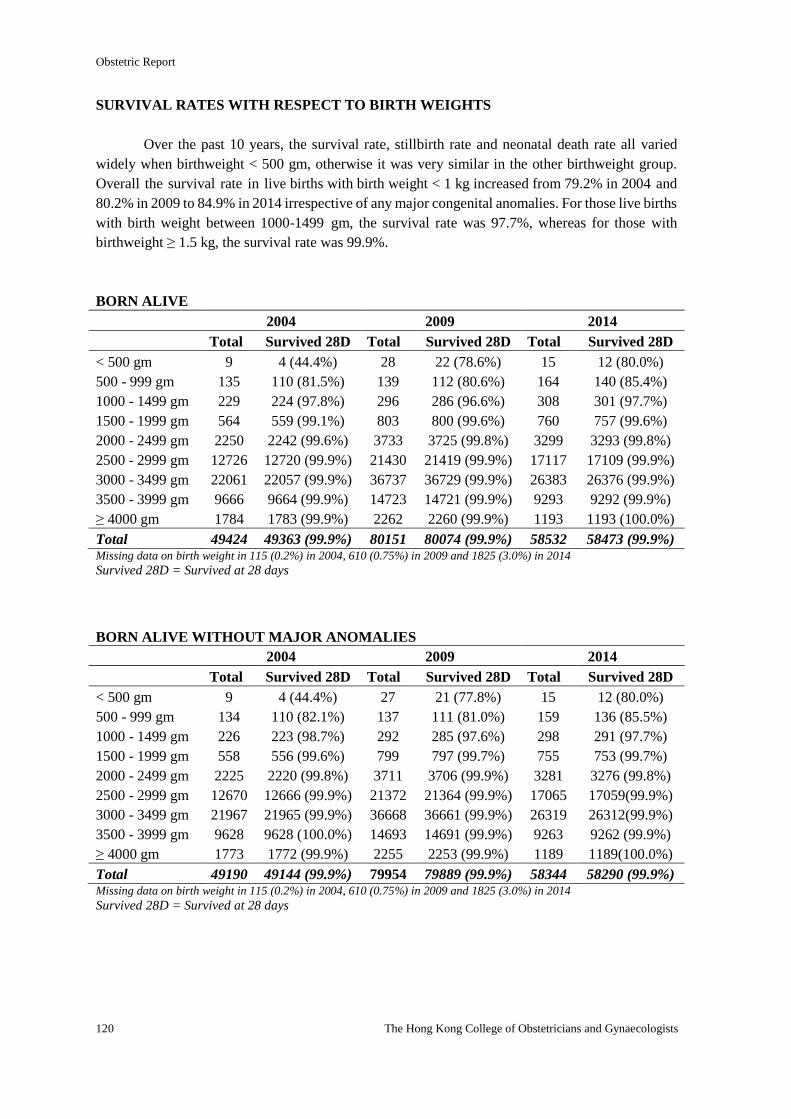
Obstetric Report
120 The Hong Kong College of Obstetricians and Gynaecologists
SURVIVAL RATES WITH RESPECT TO BIRTH WEIGHTS
Over the past 10 years, the survival rate, stillbirth rate and neonatal death rate all varied
widely when birthweight < 500 gm, otherwise it was very similar in the other birthweight group.
Overall the survival rate in live births with birth weight < 1 kg increased from 79.2% in 2004 and
80.2% in 2009 to 84.9% in 2014 irrespective of any major congenital anomalies. For those live births
with birth weight between 1000-1499 gm, the survival rate was 97.7%, whereas for those with
birthweight ≥ 1.5 kg, the survival rate was 99.9%.
BORN ALIVE
2004 2009 2014
Total Survived 28D Total Survived 28D Total Survived 28D
< 500 gm 9 4 (44.4%) 28 22 (78.6%) 15 12 (80.0%)
500 - 999 gm 135 110 (81.5%) 139 112 (80.6%) 164 140 (85.4%)
1000 - 1499 gm 229 224 (97.8%) 296 286 (96.6%) 308 301 (97.7%)
1500 - 1999 gm 564 559 (99.1%) 803 800 (99.6%) 760 757 (99.6%)
2000 - 2499 gm 2250 2242 (99.6%) 3733 3725 (99.8%) 3299 3293 (99.8%)
2500 - 2999 gm 12726 12720 (99.9%) 21430 21419 (99.9%) 17117 17109 (99.9%)
3000 - 3499 gm 22061 22057 (99.9%) 36737 36729 (99.9%) 26383 26376 (99.9%)
3500 - 3999 gm 9666 9664 (99.9%) 14723 14721 (99.9%) 9293 9292 (99.9%)
≥ 4000 gm 1784 1783 (99.9%) 2262 2260 (99.9%) 1193 1193 (100.0%)
Total 49424 49363 (99.9%) 80151 80074 (99.9%) 58532 58473 (99.9%) Missing data on birth weight in 115 (0.2%) in 2004, 610 (0.75%) in 2009 and 1825 (3.0%) in 2014
Survived 28D = Survived at 28 days
BORN ALIVE WITHOUT MAJOR ANOMALIES
2004 2009 2014
Total Survived 28D Total Survived 28D Total Survived 28D
< 500 gm 9 4 (44.4%) 27 21 (77.8%) 15 12 (80.0%)
500 - 999 gm 134 110 (82.1%) 137 111 (81.0%) 159 136 (85.5%)
1000 - 1499 gm 226 223 (98.7%) 292 285 (97.6%) 298 291 (97.7%)
1500 - 1999 gm 558 556 (99.6%) 799 797 (99.7%) 755 753 (99.7%)
2000 - 2499 gm 2225 2220 (99.8%) 3711 3706 (99.9%) 3281 3276 (99.8%)
2500 - 2999 gm 12670 12666 (99.9%) 21372 21364 (99.9%) 17065 17059(99.9%)
3000 - 3499 gm 21967 21965 (99.9%) 36668 36661 (99.9%) 26319 26312(99.9%)
3500 - 3999 gm 9628 9628 (100.0%) 14693 14691 (99.9%) 9263 9262 (99.9%)
≥ 4000 gm 1773 1772 (99.9%) 2255 2253 (99.9%) 1189 1189(100.0%)
Total 49190 49144 (99.9%) 79954 79889 (99.9%) 58344 58290 (99.9%) Missing data on birth weight in 115 (0.2%) in 2004, 610 (0.75%) in 2009 and 1825 (3.0%) in 2014
Survived 28D = Survived at 28 days
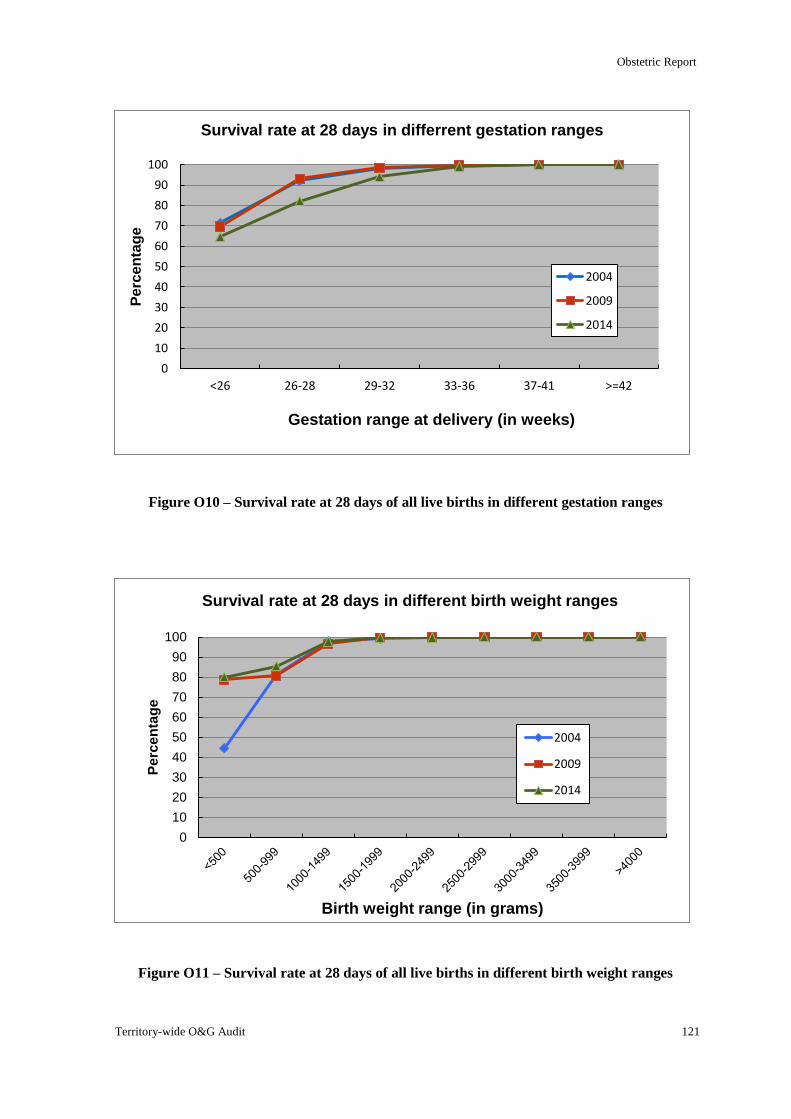
Obstetric Report
Territory-wide O&G Audit 121
Figure O10 – Survival rate at 28 days of all live births in different gestation ranges
Figure O11 – Survival rate at 28 days of all live births in different birth weight ranges
0
10
20
30
40
50
60
70
80
90
100
Pe
rce
nta
ge
Birth weight range (in grams)
Survival rate at 28 days in different birth weight ranges
2004
2009
2014
0
10
20
30
40
50
60
70
80
90
100
<26 26-28 29-32 33-36 37-41 >=42
Pe
rce
nta
ge
Gestation range at delivery (in weeks)
Survival rate at 28 days in differrent gestation ranges
2004
2009
2014
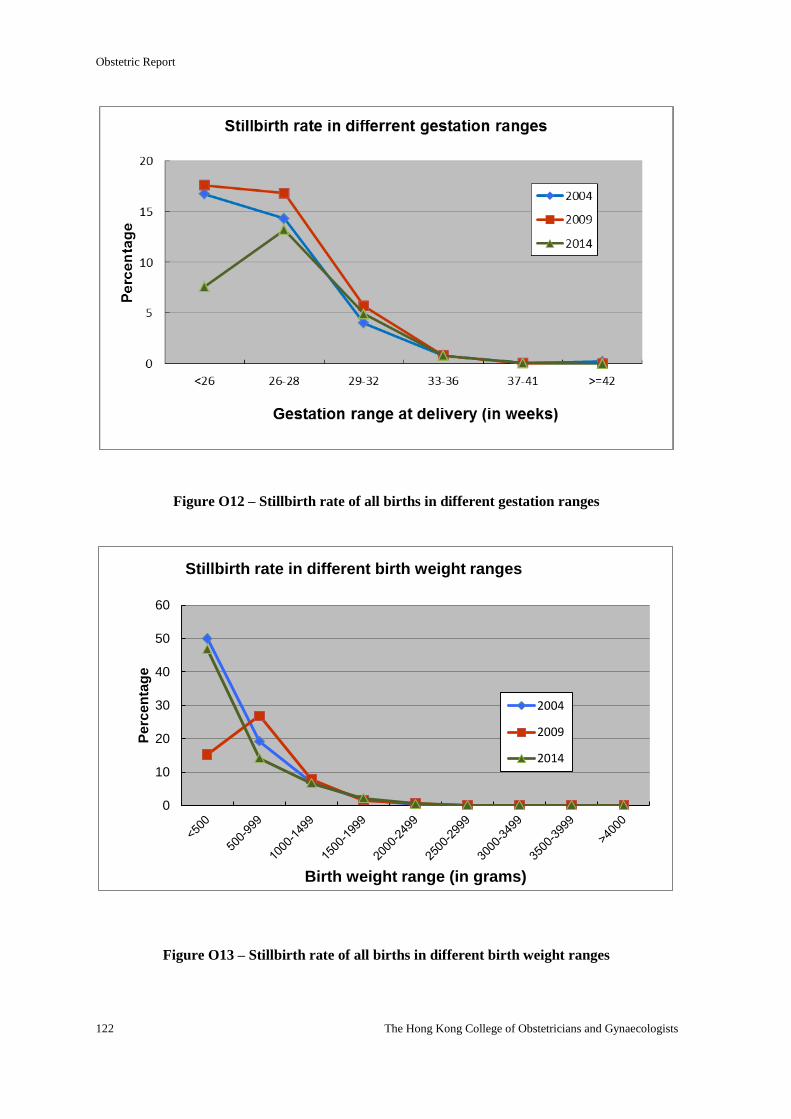
Obstetric Report
122 The Hong Kong College of Obstetricians and Gynaecologists
Figure O12 – Stillbirth rate of all births in different gestation ranges
Figure O13 – Stillbirth rate of all births in different birth weight ranges
0
10
20
30
40
50
60
Pe
rce
nta
ge
Birth weight range (in grams)
Stillbirth rate in different birth weight ranges
2004
2009
2014
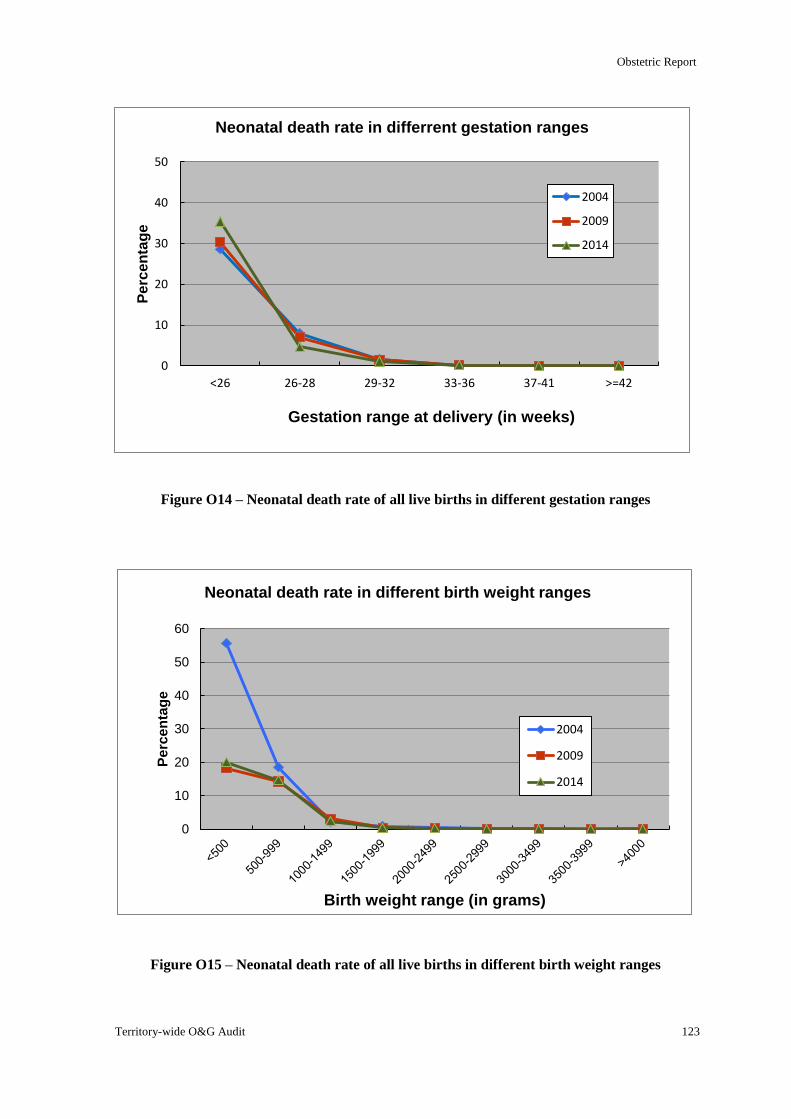
Obstetric Report
Territory-wide O&G Audit 123
Figure O14 – Neonatal death rate of all live births in different gestation ranges
Figure O15 – Neonatal death rate of all live births in different birth weight ranges
0
10
20
30
40
50
60
Pe
rce
nta
ge
Birth weight range (in grams)
Neonatal death rate in different birth weight ranges
2004
2009
2014
0
10
20
30
40
50
<26 26-28 29-32 33-36 37-41 >=42
Pe
rce
nta
ge
Gestation range at delivery (in weeks)
Neonatal death rate in differrent gestation ranges
2004
2009
2014
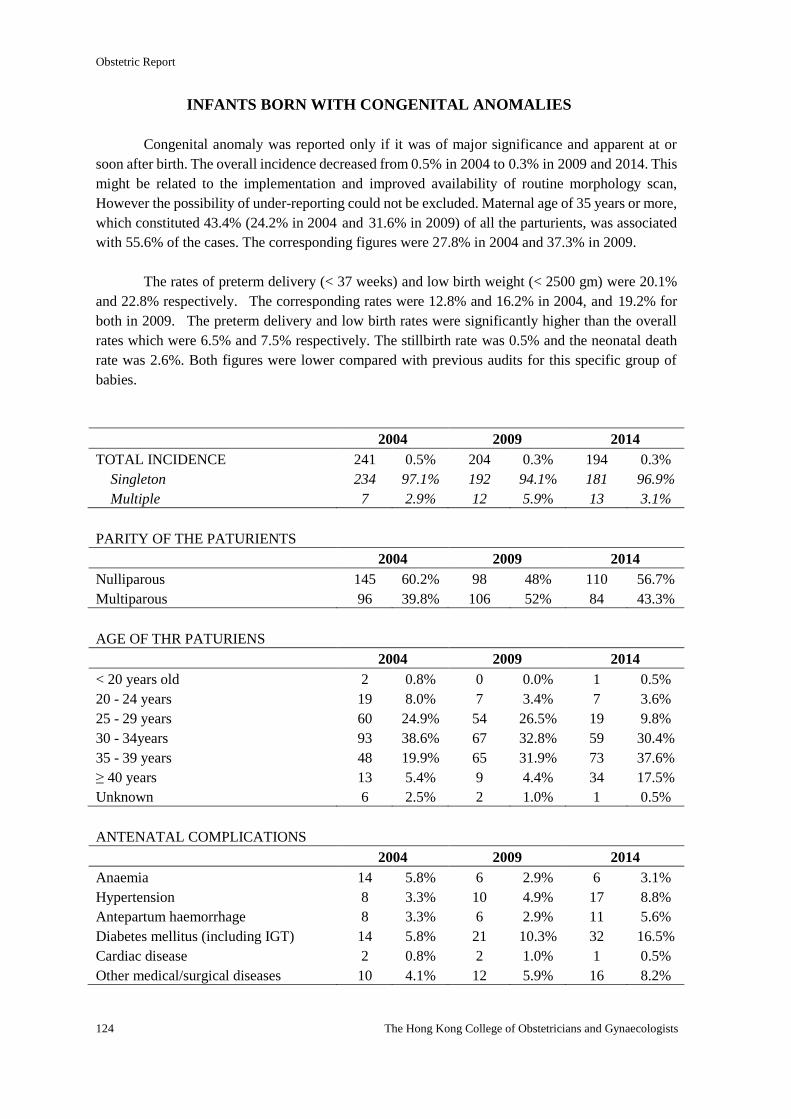
Obstetric Report
124 The Hong Kong College of Obstetricians and Gynaecologists
INFANTS BORN WITH CONGENITAL ANOMALIES
Congenital anomaly was reported only if it was of major significance and apparent at or
soon after birth. The overall incidence decreased from 0.5% in 2004 to 0.3% in 2009 and 2014. This
might be related to the implementation and improved availability of routine morphology scan,
However the possibility of under-reporting could not be excluded. Maternal age of 35 years or more,
which constituted 43.4% (24.2% in 2004 and 31.6% in 2009) of all the parturients, was associated
with 55.6% of the cases. The corresponding figures were 27.8% in 2004 and 37.3% in 2009.
The rates of preterm delivery (< 37 weeks) and low birth weight (< 2500 gm) were 20.1%
and 22.8% respectively. The corresponding rates were 12.8% and 16.2% in 2004, and 19.2% for
both in 2009. The preterm delivery and low birth rates were significantly higher than the overall
rates which were 6.5% and 7.5% respectively. The stillbirth rate was 0.5% and the neonatal death
rate was 2.6%. Both figures were lower compared with previous audits for this specific group of
babies.
2004 2009 2014
TOTAL INCIDENCE 241 0.5% 204 0.3% 194 0.3%
Singleton 234 97.1% 192 94.1% 181 96.9%
Multiple 7 2.9% 12 5.9% 13 3.1%
PARITY OF THE PATURIENTS
2004 2009 2014
Nulliparous 145 60.2% 98 48% 110 56.7%
Multiparous 96 39.8% 106 52% 84 43.3%
AGE OF THR PATURIENS
2004 2009 2014
< 20 years old 2 0.8% 0 0.0% 1 0.5%
20 - 24 years 19 8.0% 7 3.4% 7 3.6%
25 - 29 years 60 24.9% 54 26.5% 19 9.8%
30 - 34years 93 38.6% 67 32.8% 59 30.4%
35 - 39 years 48 19.9% 65 31.9% 73 37.6%
≥ 40 years 13 5.4% 9 4.4% 34 17.5%
Unknown 6 2.5% 2 1.0% 1 0.5%
ANTENATAL COMPLICATIONS
2004 2009 2014
Anaemia 14 5.8% 6 2.9% 6 3.1%
Hypertension 8 3.3% 10 4.9% 17 8.8%
Antepartum haemorrhage 8 3.3% 6 2.9% 11 5.6%
Diabetes mellitus (including IGT) 14 5.8% 21 10.3% 32 16.5%
Cardiac disease 2 0.8% 2 1.0% 1 0.5%
Other medical/surgical diseases 10 4.1% 12 5.9% 16 8.2%
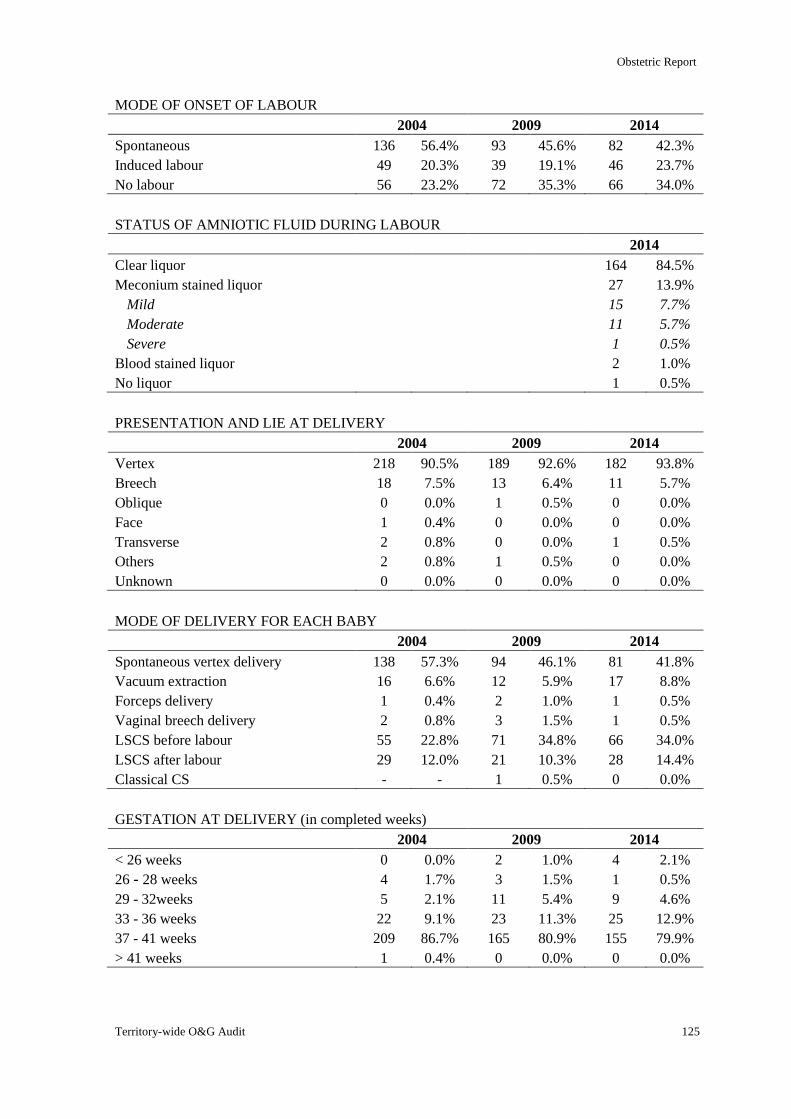
Obstetric Report
Territory-wide O&G Audit 125
MODE OF ONSET OF LABOUR
2004 2009 2014
Spontaneous 136 56.4% 93 45.6% 82 42.3%
Induced labour 49 20.3% 39 19.1% 46 23.7%
No labour 56 23.2% 72 35.3% 66 34.0%
STATUS OF AMNIOTIC FLUID DURING LABOUR
2014
Clear liquor 164 84.5%
Meconium stained liquor 27 13.9%
Mild 15 7.7%
Moderate 11 5.7%
Severe 1 0.5%
Blood stained liquor 2 1.0%
No liquor 1 0.5%
PRESENTATION AND LIE AT DELIVERY
2004 2009 2014
Vertex 218 90.5% 189 92.6% 182 93.8%
Breech 18 7.5% 13 6.4% 11 5.7%
Oblique 0 0.0% 1 0.5% 0 0.0%
Face 1 0.4% 0 0.0% 0 0.0%
Transverse 2 0.8% 0 0.0% 1 0.5%
Others 2 0.8% 1 0.5% 0 0.0%
Unknown 0 0.0% 0 0.0% 0 0.0%
MODE OF DELIVERY FOR EACH BABY
2004 2009 2014
Spontaneous vertex delivery 138 57.3% 94 46.1% 81 41.8%
Vacuum extraction 16 6.6% 12 5.9% 17 8.8%
Forceps delivery 1 0.4% 2 1.0% 1 0.5%
Vaginal breech delivery 2 0.8% 3 1.5% 1 0.5%
LSCS before labour 55 22.8% 71 34.8% 66 34.0%
LSCS after labour 29 12.0% 21 10.3% 28 14.4%
Classical CS - - 1 0.5% 0 0.0%
GESTATION AT DELIVERY (in completed weeks)
2004 2009 2014
< 26 weeks 0 0.0% 2 1.0% 4 2.1%
26 - 28 weeks 4 1.7% 3 1.5% 1 0.5%
29 - 32weeks 5 2.1% 11 5.4% 9 4.6%
33 - 36 weeks 22 9.1% 23 11.3% 25 12.9%
37 - 41 weeks 209 86.7% 165 80.9% 155 79.9%
> 41 weeks 1 0.4% 0 0.0% 0 0.0%
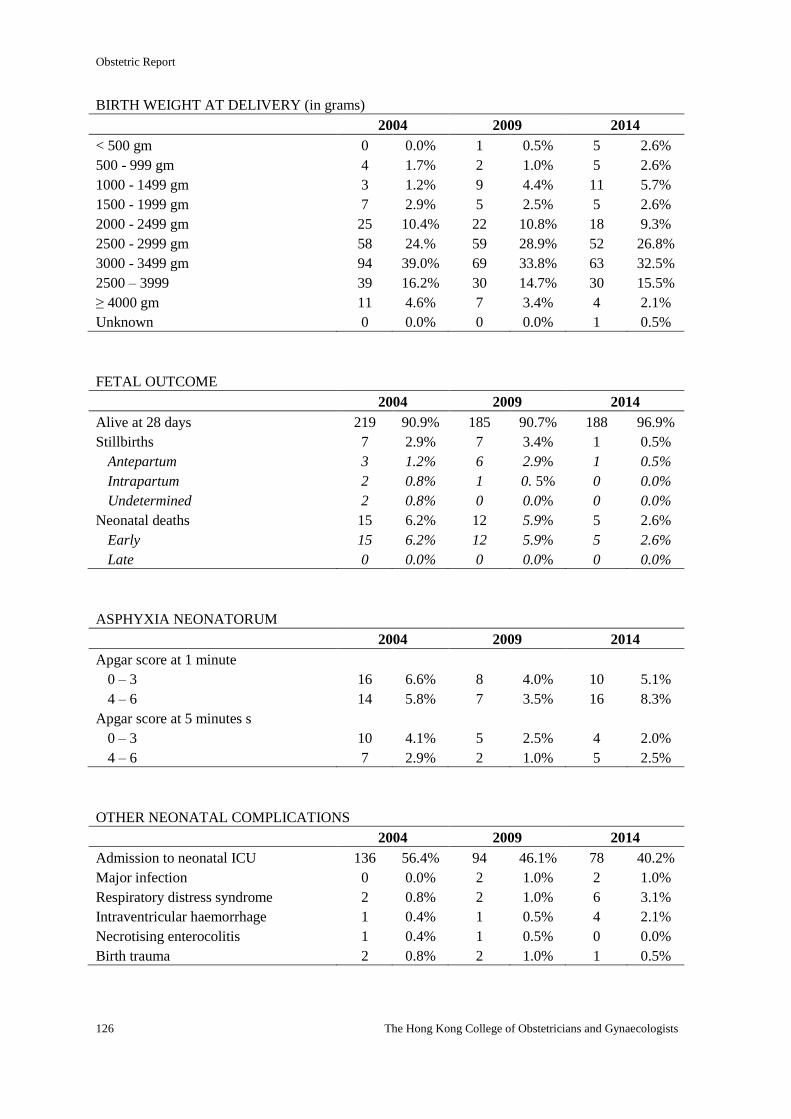
Obstetric Report
126 The Hong Kong College of Obstetricians and Gynaecologists
BIRTH WEIGHT AT DELIVERY (in grams)
2004 2009 2014
< 500 gm 0 0.0% 1 0.5% 5 2.6%
500 - 999 gm 4 1.7% 2 1.0% 5 2.6%
1000 - 1499 gm 3 1.2% 9 4.4% 11 5.7%
1500 - 1999 gm 7 2.9% 5 2.5% 5 2.6%
2000 - 2499 gm 25 10.4% 22 10.8% 18 9.3%
2500 - 2999 gm 58 24.% 59 28.9% 52 26.8%
3000 - 3499 gm 94 39.0% 69 33.8% 63 32.5%
2500 – 3999 39 16.2% 30 14.7% 30 15.5%
≥ 4000 gm 11 4.6% 7 3.4% 4 2.1%
Unknown 0 0.0% 0 0.0% 1 0.5%
FETAL OUTCOME
2004 2009 2014
Alive at 28 days 219 90.9% 185 90.7% 188 96.9%
Stillbirths 7 2.9% 7 3.4% 1 0.5%
Antepartum 3 1.2% 6 2.9% 1 0.5%
Intrapartum 2 0.8% 1 0. 5% 0 0.0%
Undetermined 2 0.8% 0 0.0% 0 0.0%
Neonatal deaths 15 6.2% 12 5.9% 5 2.6%
Early 15 6.2% 12 5.9% 5 2.6%
Late 0 0.0% 0 0.0% 0 0.0%
ASPHYXIA NEONATORUM
2004 2009 2014
Apgar score at 1 minute
0 – 3 16 6.6% 8 4.0% 10 5.1%
4 – 6 14 5.8% 7 3.5% 16 8.3%
Apgar score at 5 minutes s
0 – 3 10 4.1% 5 2.5% 4 2.0%
4 – 6 7 2.9% 2 1.0% 5 2.5%
OTHER NEONATAL COMPLICATIONS
2004 2009 2014
Admission to neonatal ICU 136 56.4% 94 46.1% 78 40.2%
Major infection 0 0.0% 2 1.0% 2 1.0%
Respiratory distress syndrome 2 0.8% 2 1.0% 6 3.1%
Intraventricular haemorrhage 1 0.4% 1 0.5% 4 2.1%
Necrotising enterocolitis 1 0.4% 1 0.5% 0 0.0%
Birth trauma 2 0.8% 2 1.0% 1 0.5%
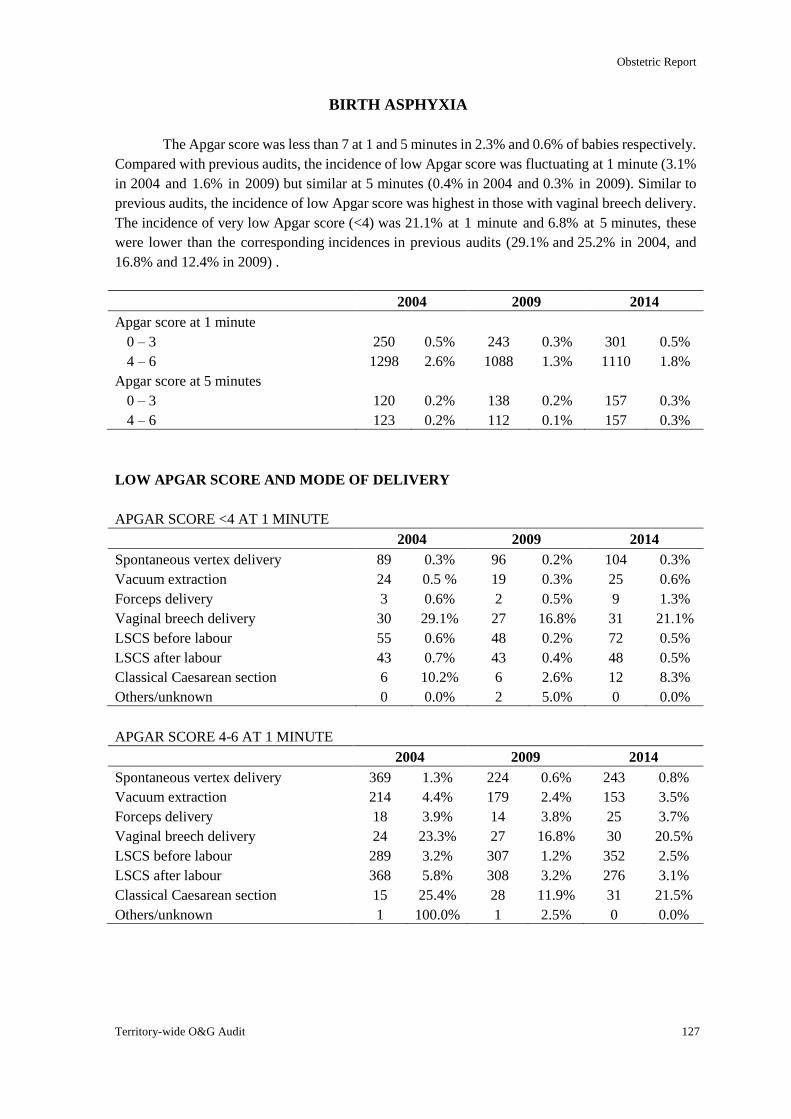
Obstetric Report
Territory-wide O&G Audit 127
BIRTH ASPHYXIA
The Apgar score was less than 7 at 1 and 5 minutes in 2.3% and 0.6% of babies respectively.
Compared with previous audits, the incidence of low Apgar score was fluctuating at 1 minute (3.1%
in 2004 and 1.6% in 2009) but similar at 5 minutes (0.4% in 2004 and 0.3% in 2009). Similar to
previous audits, the incidence of low Apgar score was highest in those with vaginal breech delivery.
The incidence of very low Apgar score (<4) was 21.1% at 1 minute and 6.8% at 5 minutes, these
were lower than the corresponding incidences in previous audits (29.1% and 25.2% in 2004, and
16.8% and 12.4% in 2009) .
2004 2009 2014
Apgar score at 1 minute
0 – 3 250 0.5% 243 0.3% 301 0.5%
4 – 6 1298 2.6% 1088 1.3% 1110 1.8%
Apgar score at 5 minutes
0 – 3 120 0.2% 138 0.2% 157 0.3%
4 – 6 123 0.2% 112 0.1% 157 0.3%
LOW APGAR SCORE AND MODE OF DELIVERY
APGAR SCORE <4 AT 1 MINUTE
2004 2009 2014
Spontaneous vertex delivery 89 0.3% 96 0.2% 104 0.3%
Vacuum extraction 24 0.5 % 19 0.3% 25 0.6%
Forceps delivery 3 0.6% 2 0.5% 9 1.3%
Vaginal breech delivery 30 29.1% 27 16.8% 31 21.1%
LSCS before labour 55 0.6% 48 0.2% 72 0.5%
LSCS after labour 43 0.7% 43 0.4% 48 0.5%
Classical Caesarean section 6 10.2% 6 2.6% 12 8.3%
Others/unknown 0 0.0% 2 5.0% 0 0.0%
APGAR SCORE 4-6 AT 1 MINUTE
2004 2009 2014
Spontaneous vertex delivery 369 1.3% 224 0.6% 243 0.8%
Vacuum extraction 214 4.4% 179 2.4% 153 3.5%
Forceps delivery 18 3.9% 14 3.8% 25 3.7%
Vaginal breech delivery 24 23.3% 27 16.8% 30 20.5%
LSCS before labour 289 3.2% 307 1.2% 352 2.5%
LSCS after labour 368 5.8% 308 3.2% 276 3.1%
Classical Caesarean section 15 25.4% 28 11.9% 31 21.5%
Others/unknown 1 100.0% 1 2.5% 0 0.0%
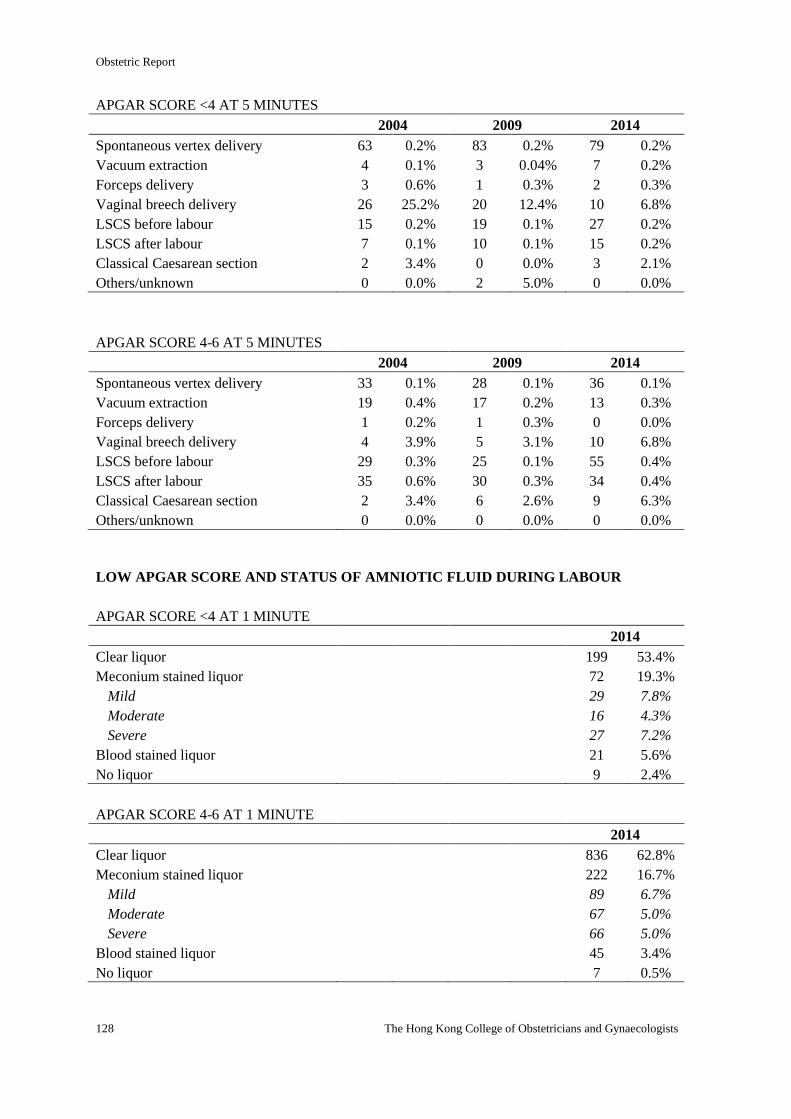
Obstetric Report
128 The Hong Kong College of Obstetricians and Gynaecologists
APGAR SCORE <4 AT 5 MINUTES
2004 2009 2014
Spontaneous vertex delivery 63 0.2% 83 0.2% 79 0.2%
Vacuum extraction 4 0.1% 3 0.04% 7 0.2%
Forceps delivery 3 0.6% 1 0.3% 2 0.3%
Vaginal breech delivery 26 25.2% 20 12.4% 10 6.8%
LSCS before labour 15 0.2% 19 0.1% 27 0.2%
LSCS after labour 7 0.1% 10 0.1% 15 0.2%
Classical Caesarean section 2 3.4% 0 0.0% 3 2.1%
Others/unknown 0 0.0% 2 5.0% 0 0.0%
APGAR SCORE 4-6 AT 5 MINUTES
2004 2009 2014
Spontaneous vertex delivery 33 0.1% 28 0.1% 36 0.1%
Vacuum extraction 19 0.4% 17 0.2% 13 0.3%
Forceps delivery 1 0.2% 1 0.3% 0 0.0%
Vaginal breech delivery 4 3.9% 5 3.1% 10 6.8%
LSCS before labour 29 0.3% 25 0.1% 55 0.4%
LSCS after labour 35 0.6% 30 0.3% 34 0.4%
Classical Caesarean section 2 3.4% 6 2.6% 9 6.3%
Others/unknown 0 0.0% 0 0.0% 0 0.0%
LOW APGAR SCORE AND STATUS OF AMNIOTIC FLUID DURING LABOUR
APGAR SCORE <4 AT 1 MINUTE
2014
Clear liquor 199 53.4%
Meconium stained liquor 72 19.3%
Mild 29 7.8%
Moderate 16 4.3%
Severe 27 7.2%
Blood stained liquor 21 5.6%
No liquor 9 2.4%
APGAR SCORE 4-6 AT 1 MINUTE
2014
Clear liquor 836 62.8%
Meconium stained liquor 222 16.7%
Mild 89 6.7%
Moderate 67 5.0%
Severe 66 5.0%
Blood stained liquor 45 3.4%
No liquor 7 0.5%
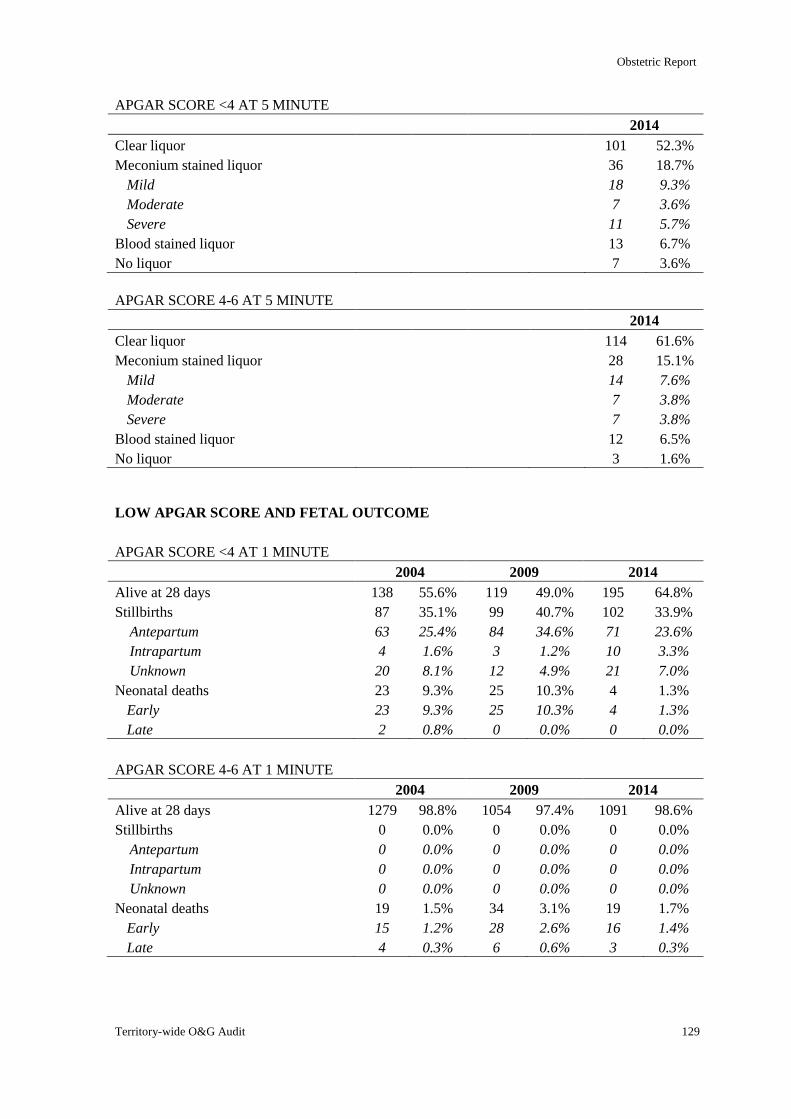
Obstetric Report
Territory-wide O&G Audit 129
APGAR SCORE <4 AT 5 MINUTE
2014
Clear liquor 101 52.3%
Meconium stained liquor 36 18.7%
Mild 18 9.3%
Moderate 7 3.6%
Severe 11 5.7%
Blood stained liquor 13 6.7%
No liquor 7 3.6%
APGAR SCORE 4-6 AT 5 MINUTE
2014
Clear liquor 114 61.6%
Meconium stained liquor 28 15.1%
Mild 14 7.6%
Moderate 7 3.8%
Severe 7 3.8%
Blood stained liquor 12 6.5%
No liquor 3 1.6%
LOW APGAR SCORE AND FETAL OUTCOME
APGAR SCORE <4 AT 1 MINUTE
2004 2009 2014
Alive at 28 days 138 55.6% 119 49.0% 195 64.8%
Stillbirths 87 35.1% 99 40.7% 102 33.9%
Antepartum 63 25.4% 84 34.6% 71 23.6%
Intrapartum 4 1.6% 3 1.2% 10 3.3%
Unknown 20 8.1% 12 4.9% 21 7.0%
Neonatal deaths 23 9.3% 25 10.3% 4 1.3%
Early 23 9.3% 25 10.3% 4 1.3%
Late 2 0.8% 0 0.0% 0 0.0%
APGAR SCORE 4-6 AT 1 MINUTE
2004 2009 2014
Alive at 28 days 1279 98.8% 1054 97.4% 1091 98.6%
Stillbirths 0 0.0% 0 0.0% 0 0.0%
Antepartum 0 0.0% 0 0.0% 0 0.0%
Intrapartum 0 0.0% 0 0.0% 0 0.0%
Unknown 0 0.0% 0 0.0% 0 0.0%
Neonatal deaths 19 1.5% 34 3.1% 19 1.7%
Early 15 1.2% 28 2.6% 16 1.4%
Late 4 0.3% 6 0.6% 3 0.3%
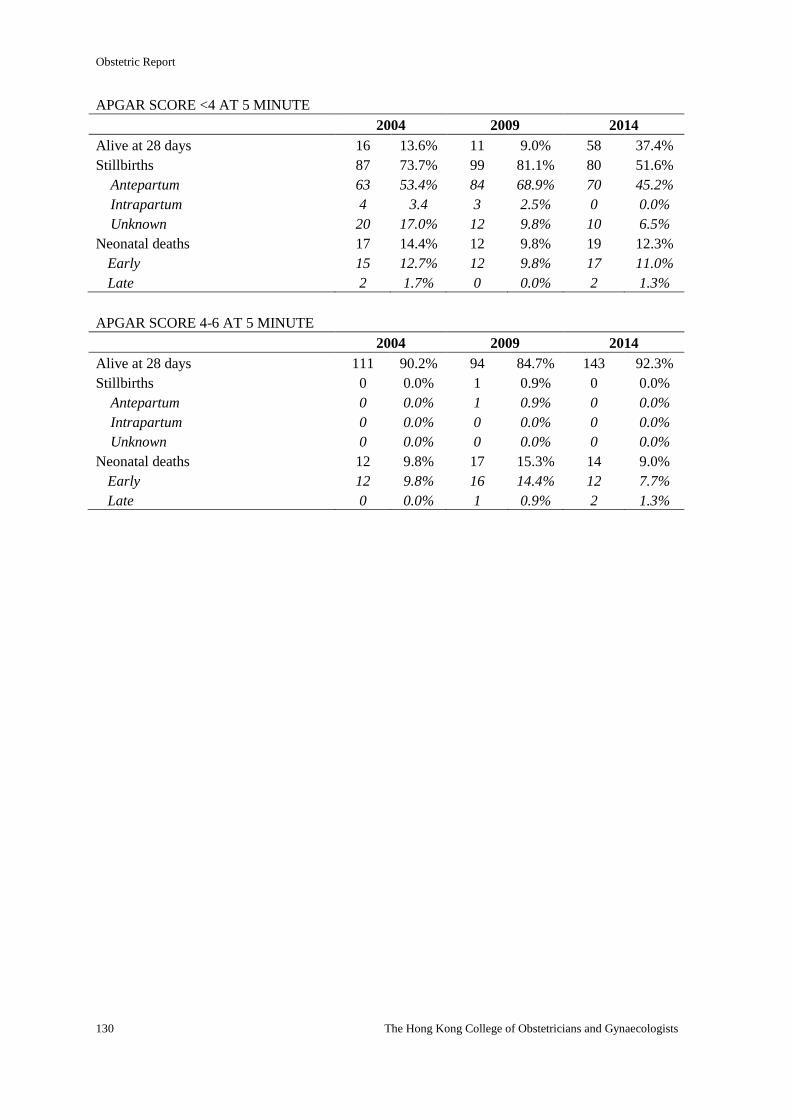
Obstetric Report
130 The Hong Kong College of Obstetricians and Gynaecologists
APGAR SCORE <4 AT 5 MINUTE
2004 2009 2014
Alive at 28 days 16 13.6% 11 9.0% 58 37.4%
Stillbirths 87 73.7% 99 81.1% 80 51.6%
Antepartum 63 53.4% 84 68.9% 70 45.2%
Intrapartum 4 3.4 3 2.5% 0 0.0%
Unknown 20 17.0% 12 9.8% 10 6.5%
Neonatal deaths 17 14.4% 12 9.8% 19 12.3%
Early 15 12.7% 12 9.8% 17 11.0%
Late 2 1.7% 0 0.0% 2 1.3%
APGAR SCORE 4-6 AT 5 MINUTE
2004 2009 2014
Alive at 28 days 111 90.2% 94 84.7% 143 92.3%
Stillbirths 0 0.0% 1 0.9% 0 0.0%
Antepartum 0 0.0% 1 0.9% 0 0.0%
Intrapartum 0 0.0% 0 0.0% 0 0.0%
Unknown 0 0.0% 0 0.0% 0 0.0%
Neonatal deaths 12 9.8% 17 15.3% 14 9.0%
Early 12 9.8% 16 14.4% 12 7.7%
Late 0 0.0% 1 0.9% 2 1.3%
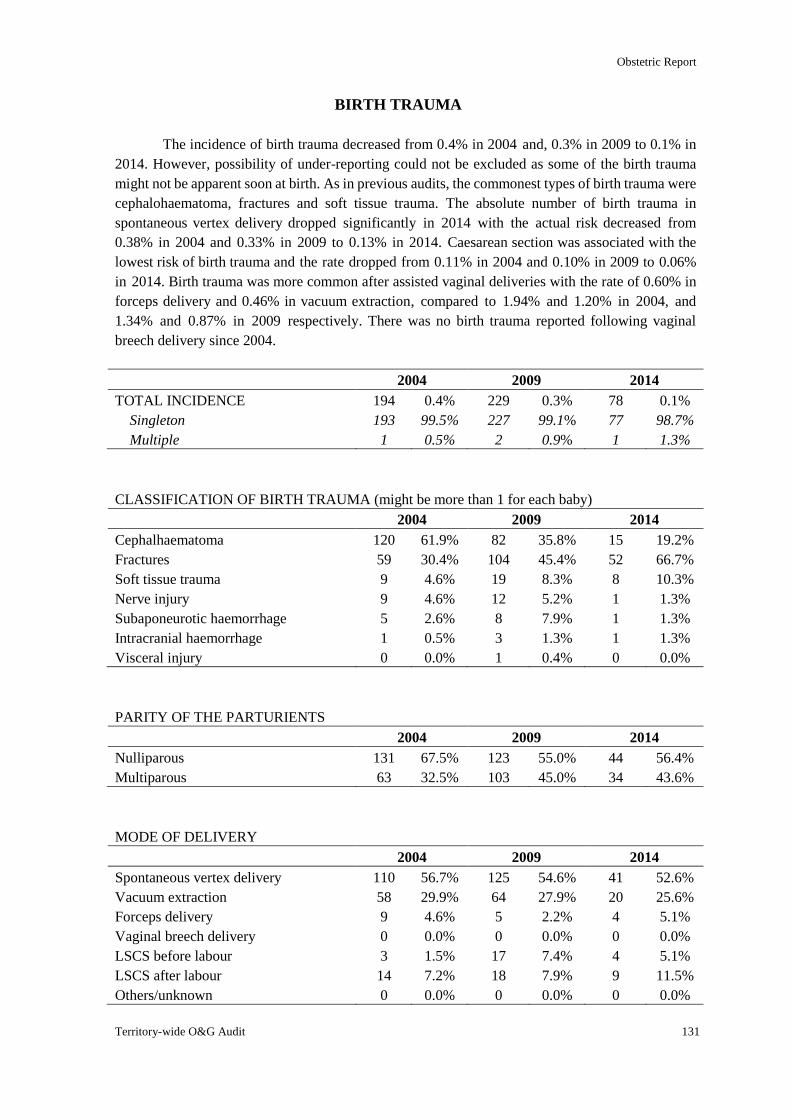
Obstetric Report
Territory-wide O&G Audit 131
BIRTH TRAUMA
The incidence of birth trauma decreased from 0.4% in 2004 and, 0.3% in 2009 to 0.1% in
2014. However, possibility of under-reporting could not be excluded as some of the birth trauma
might not be apparent soon at birth. As in previous audits, the commonest types of birth trauma were
cephalohaematoma, fractures and soft tissue trauma. The absolute number of birth trauma in
spontaneous vertex delivery dropped significantly in 2014 with the actual risk decreased from
0.38% in 2004 and 0.33% in 2009 to 0.13% in 2014. Caesarean section was associated with the
lowest risk of birth trauma and the rate dropped from 0.11% in 2004 and 0.10% in 2009 to 0.06%
in 2014. Birth trauma was more common after assisted vaginal deliveries with the rate of 0.60% in
forceps delivery and 0.46% in vacuum extraction, compared to 1.94% and 1.20% in 2004, and
1.34% and 0.87% in 2009 respectively. There was no birth trauma reported following vaginal
breech delivery since 2004.
2004 2009 2014
TOTAL INCIDENCE 194 0.4% 229 0.3% 78 0.1%
Singleton 193 99.5% 227 99.1% 77 98.7%
Multiple 1 0.5% 2 0.9% 1 1.3%
CLASSIFICATION OF BIRTH TRAUMA (might be more than 1 for each baby)
2004 2009 2014
Cephalhaematoma 120 61.9% 82 35.8% 15 19.2%
Fractures 59 30.4% 104 45.4% 52 66.7%
Soft tissue trauma 9 4.6% 19 8.3% 8 10.3%
Nerve injury 9 4.6% 12 5.2% 1 1.3%
Subaponeurotic haemorrhage 5 2.6% 8 7.9% 1 1.3%
Intracranial haemorrhage 1 0.5% 3 1.3% 1 1.3%
Visceral injury 0 0.0% 1 0.4% 0 0.0%
PARITY OF THE PARTURIENTS
2004 2009 2014
Nulliparous 131 67.5% 123 55.0% 44 56.4%
Multiparous 63 32.5% 103 45.0% 34 43.6%
MODE OF DELIVERY
2004 2009 2014
Spontaneous vertex delivery 110 56.7% 125 54.6% 41 52.6%
Vacuum extraction 58 29.9% 64 27.9% 20 25.6%
Forceps delivery 9 4.6% 5 2.2% 4 5.1%
Vaginal breech delivery 0 0.0% 0 0.0% 0 0.0%
LSCS before labour 3 1.5% 17 7.4% 4 5.1%
LSCS after labour 14 7.2% 18 7.9% 9 11.5%
Others/unknown 0 0.0% 0 0.0% 0 0.0%
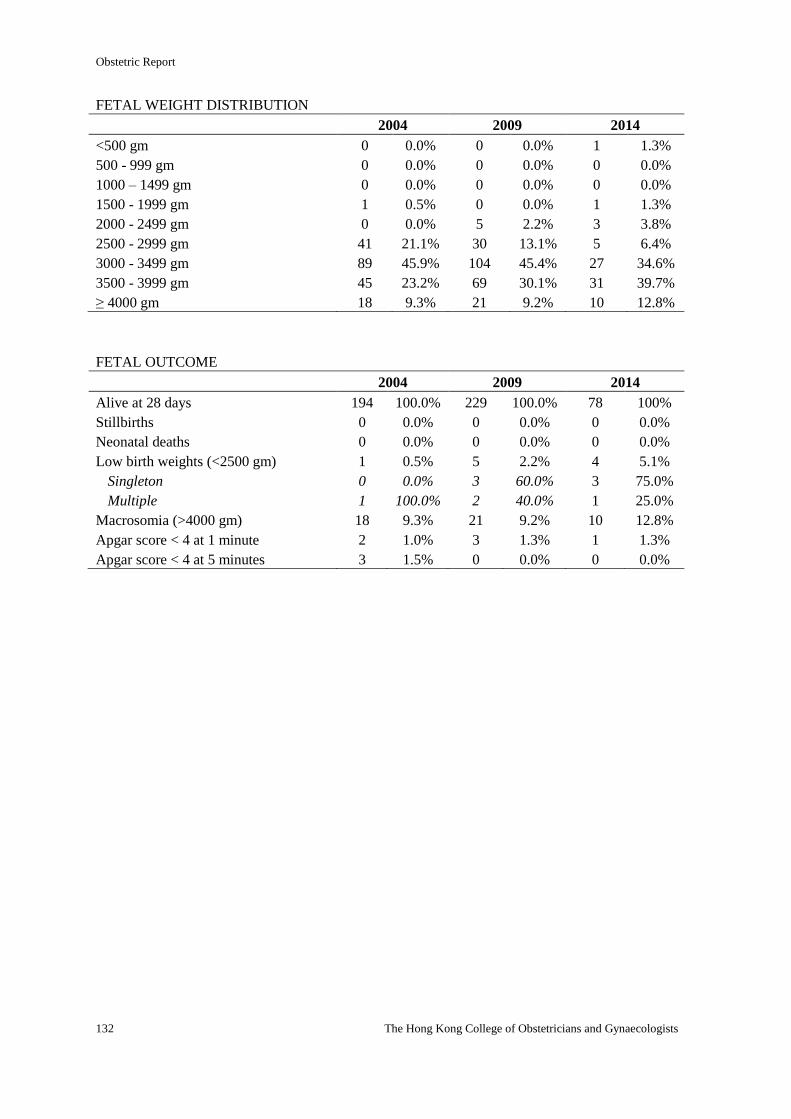
Obstetric Report
132 The Hong Kong College of Obstetricians and Gynaecologists
FETAL WEIGHT DISTRIBUTION
2004 2009 2014
<500 gm 0 0.0% 0 0.0% 1 1.3%
500 - 999 gm 0 0.0% 0 0.0% 0 0.0%
1000 – 1499 gm 0 0.0% 0 0.0% 0 0.0%
1500 - 1999 gm 1 0.5% 0 0.0% 1 1.3%
2000 - 2499 gm 0 0.0% 5 2.2% 3 3.8%
2500 - 2999 gm 41 21.1% 30 13.1% 5 6.4%
3000 - 3499 gm 89 45.9% 104 45.4% 27 34.6%
3500 - 3999 gm 45 23.2% 69 30.1% 31 39.7%
≥ 4000 gm 18 9.3% 21 9.2% 10 12.8%
FETAL OUTCOME
2004 2009 2014
Alive at 28 days 194 100.0% 229 100.0% 78 100%
Stillbirths 0 0.0% 0 0.0% 0 0.0%
Neonatal deaths 0 0.0% 0 0.0% 0 0.0%
Low birth weights (<2500 gm) 1 0.5% 5 2.2% 4 5.1%
Singleton 0 0.0% 3 60.0% 3 75.0%
Multiple 1 100.0% 2 40.0% 1 25.0%
Macrosomia (>4000 gm) 18 9.3% 21 9.2% 10 12.8%
Apgar score < 4 at 1 minute 2 1.0% 3 1.3% 1 1.3%
Apgar score < 4 at 5 minutes 3 1.5% 0 0.0% 0 0.0%
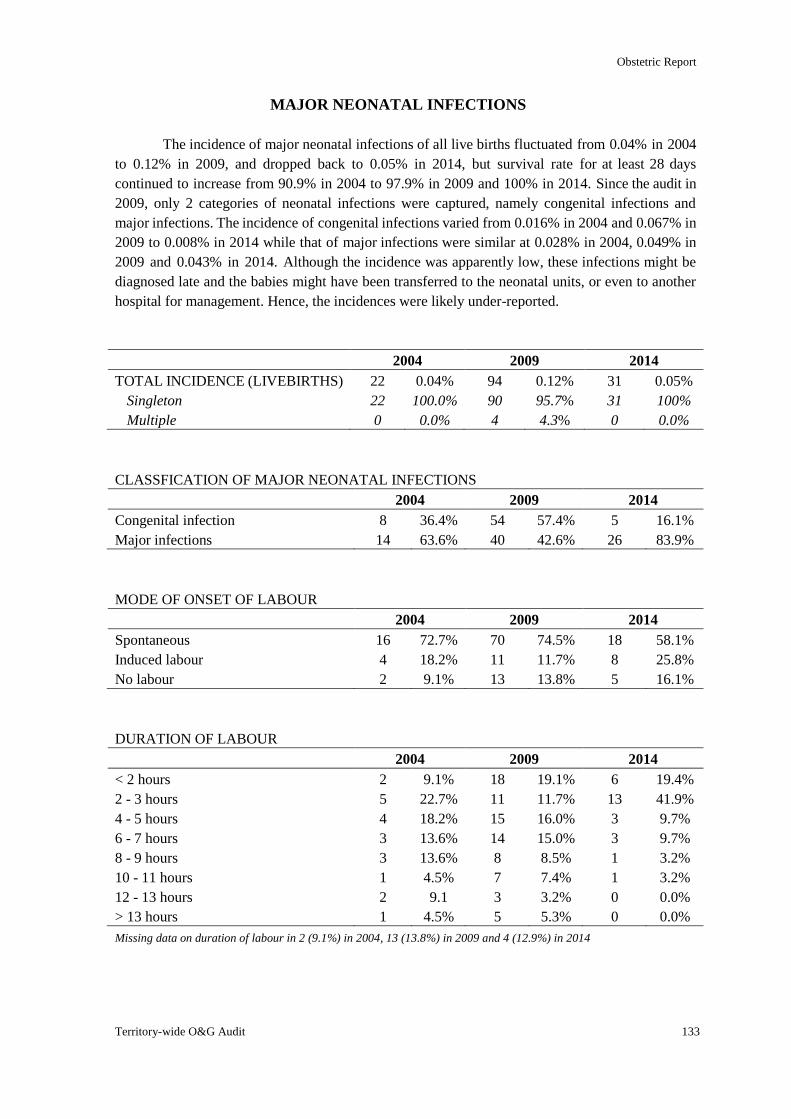
Obstetric Report
Territory-wide O&G Audit 133
MAJOR NEONATAL INFECTIONS
The incidence of major neonatal infections of all live births fluctuated from 0.04% in 2004
to 0.12% in 2009, and dropped back to 0.05% in 2014, but survival rate for at least 28 days
continued to increase from 90.9% in 2004 to 97.9% in 2009 and 100% in 2014. Since the audit in
2009, only 2 categories of neonatal infections were captured, namely congenital infections and
major infections. The incidence of congenital infections varied from 0.016% in 2004 and 0.067% in
2009 to 0.008% in 2014 while that of major infections were similar at 0.028% in 2004, 0.049% in
2009 and 0.043% in 2014. Although the incidence was apparently low, these infections might be
diagnosed late and the babies might have been transferred to the neonatal units, or even to another
hospital for management. Hence, the incidences were likely under-reported.
2004 2009 2014
TOTAL INCIDENCE (LIVEBIRTHS) 22 0.04% 94 0.12% 31 0.05%
Singleton 22 100.0% 90 95.7% 31 100%
Multiple 0 0.0% 4 4.3% 0 0.0%
CLASSFICATION OF MAJOR NEONATAL INFECTIONS
2004 2009 2014
Congenital infection 8 36.4% 54 57.4% 5 16.1%
Major infections 14 63.6% 40 42.6% 26 83.9%
MODE OF ONSET OF LABOUR
2004 2009 2014
Spontaneous 16 72.7% 70 74.5% 18 58.1%
Induced labour 4 18.2% 11 11.7% 8 25.8%
No labour 2 9.1% 13 13.8% 5 16.1%
DURATION OF LABOUR
2004 2009 2014
< 2 hours 2 9.1% 18 19.1% 6 19.4%
2 - 3 hours 5 22.7% 11 11.7% 13 41.9%
4 - 5 hours 4 18.2% 15 16.0% 3 9.7%
6 - 7 hours 3 13.6% 14 15.0% 3 9.7%
8 - 9 hours 3 13.6% 8 8.5% 1 3.2%
10 - 11 hours 1 4.5% 7 7.4% 1 3.2%
12 - 13 hours 2 9.1 3 3.2% 0 0.0%
> 13 hours 1 4.5% 5 5.3% 0 0.0%
Missing data on duration of labour in 2 (9.1%) in 2004, 13 (13.8%) in 2009 and 4 (12.9%) in 2014
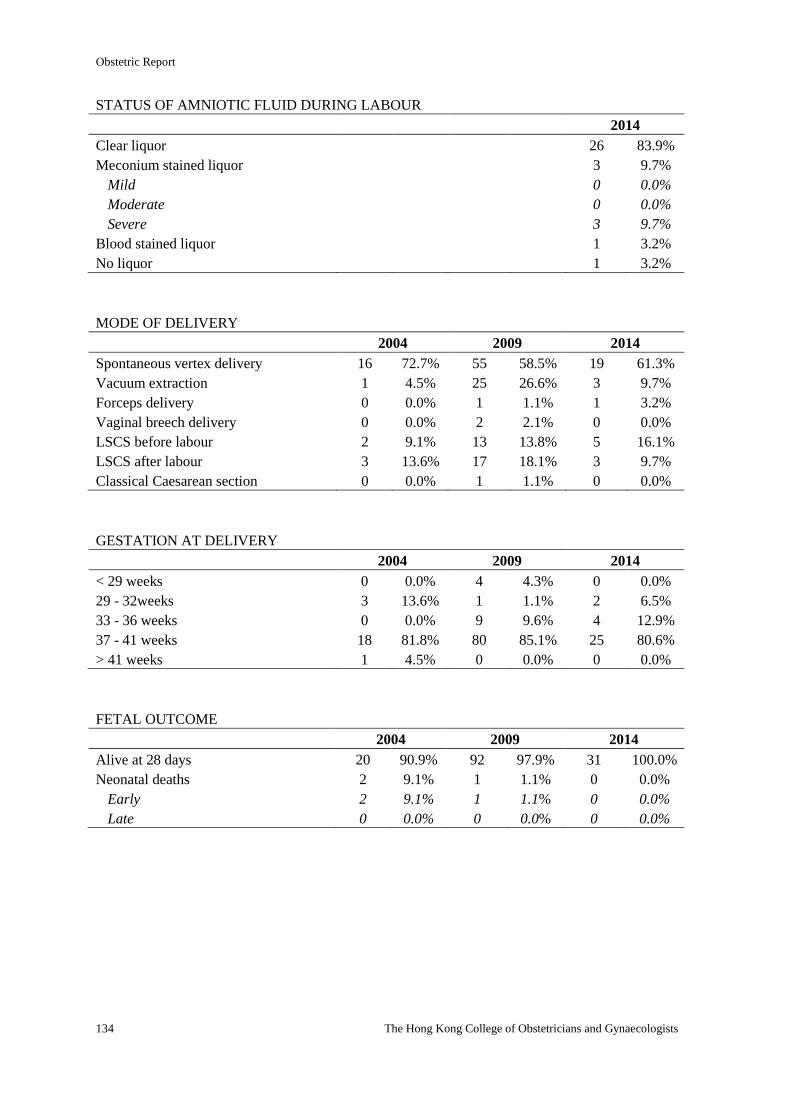
Obstetric Report
134 The Hong Kong College of Obstetricians and Gynaecologists
STATUS OF AMNIOTIC FLUID DURING LABOUR
2014
Clear liquor 26 83.9%
Meconium stained liquor 3 9.7%
Mild 0 0.0%
Moderate 0 0.0%
Severe 3 9.7%
Blood stained liquor 1 3.2%
No liquor 1 3.2%
MODE OF DELIVERY
2004 2009 2014
Spontaneous vertex delivery 16 72.7% 55 58.5% 19 61.3%
Vacuum extraction 1 4.5% 25 26.6% 3 9.7%
Forceps delivery 0 0.0% 1 1.1% 1 3.2%
Vaginal breech delivery 0 0.0% 2 2.1% 0 0.0%
LSCS before labour 2 9.1% 13 13.8% 5 16.1%
LSCS after labour 3 13.6% 17 18.1% 3 9.7%
Classical Caesarean section 0 0.0% 1 1.1% 0 0.0%
GESTATION AT DELIVERY
2004 2009 2014
< 29 weeks 0 0.0% 4 4.3% 0 0.0%
29 - 32weeks 3 13.6% 1 1.1% 2 6.5%
33 - 36 weeks 0 0.0% 9 9.6% 4 12.9%
37 - 41 weeks 18 81.8% 80 85.1% 25 80.6%
> 41 weeks 1 4.5% 0 0.0% 0 0.0%
FETAL OUTCOME
2004 2009 2014
Alive at 28 days 20 90.9% 92 97.9% 31 100.0%
Neonatal deaths 2 9.1% 1 1.1% 0 0.0%
Early 2 9.1% 1 1.1% 0 0.0%
Late 0 0.0% 0 0.0% 0 0.0%
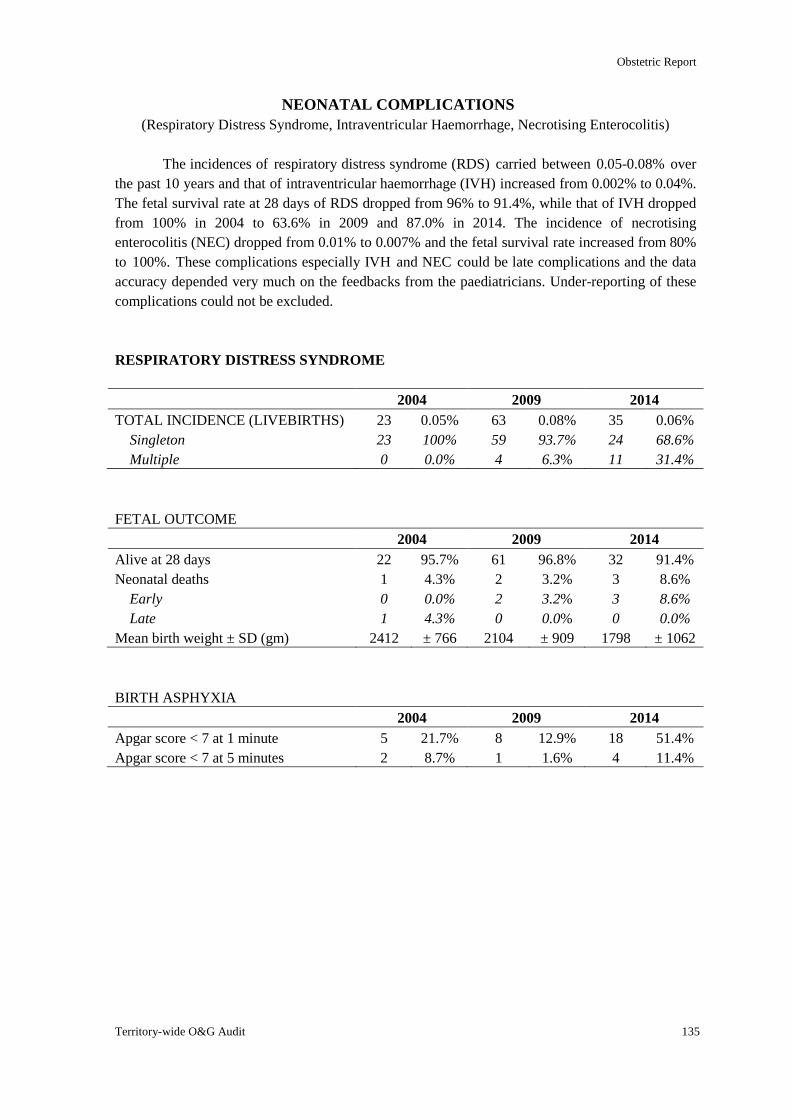
Obstetric Report
Territory-wide O&G Audit 135
NEONATAL COMPLICATIONS
(Respiratory Distress Syndrome, Intraventricular Haemorrhage, Necrotising Enterocolitis)
The incidences of respiratory distress syndrome (RDS) carried between 0.05-0.08% over
the past 10 years and that of intraventricular haemorrhage (IVH) increased from 0.002% to 0.04%.
The fetal survival rate at 28 days of RDS dropped from 96% to 91.4%, while that of IVH dropped
from 100% in 2004 to 63.6% in 2009 and 87.0% in 2014. The incidence of necrotising
enterocolitis (NEC) dropped from 0.01% to 0.007% and the fetal survival rate increased from 80%
to 100%. These complications especially IVH and NEC could be late complications and the data
accuracy depended very much on the feedbacks from the paediatricians. Under-reporting of these
complications could not be excluded.
RESPIRATORY DISTRESS SYNDROME
2004 2009 2014
TOTAL INCIDENCE (LIVEBIRTHS) 23 0.05% 63 0.08% 35 0.06%
Singleton 23 100% 59 93.7% 24 68.6%
Multiple 0 0.0% 4 6.3% 11 31.4%
FETAL OUTCOME
2004 2009 2014
Alive at 28 days 22 95.7% 61 96.8% 32 91.4%
Neonatal deaths 1 4.3% 2 3.2% 3 8.6%
Early 0 0.0% 2 3.2% 3 8.6%
Late 1 4.3% 0 0.0% 0 0.0%
Mean birth weight ± SD (gm) 2412 ± 766 2104 ± 909 1798 ± 1062
BIRTH ASPHYXIA
2004 2009 2014
Apgar score < 7 at 1 minute 5 21.7% 8 12.9% 18 51.4%
Apgar score < 7 at 5 minutes 2 8.7% 1 1.6% 4 11.4%
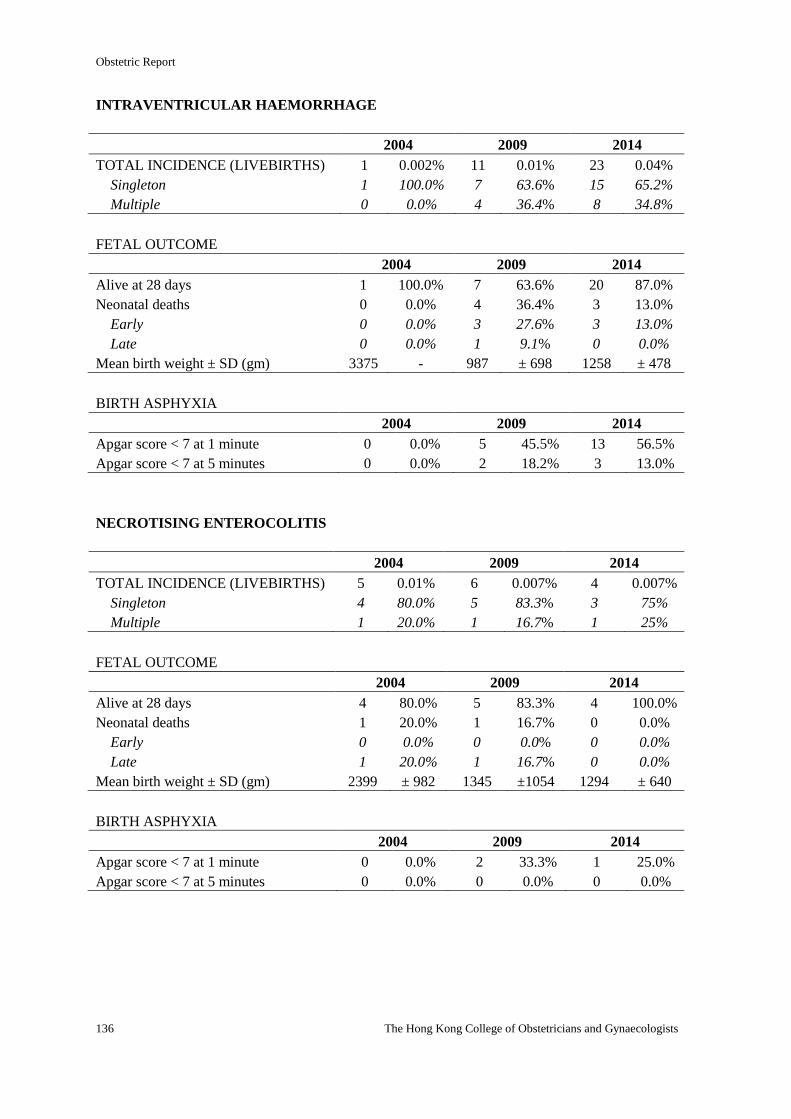
Obstetric Report
136 The Hong Kong College of Obstetricians and Gynaecologists
INTRAVENTRICULAR HAEMORRHAGE
2004 2009 2014
TOTAL INCIDENCE (LIVEBIRTHS) 1 0.002% 11 0.01% 23 0.04%
Singleton 1 100.0% 7 63.6% 15 65.2%
Multiple 0 0.0% 4 36.4% 8 34.8%
FETAL OUTCOME
2004 2009 2014
Alive at 28 days 1 100.0% 7 63.6% 20 87.0%
Neonatal deaths 0 0.0% 4 36.4% 3 13.0%
Early 0 0.0% 3 27.6% 3 13.0%
Late 0 0.0% 1 9.1% 0 0.0%
Mean birth weight ± SD (gm) 3375 - 987 ± 698 1258 ± 478
BIRTH ASPHYXIA
2004 2009 2014
Apgar score < 7 at 1 minute 0 0.0% 5 45.5% 13 56.5%
Apgar score < 7 at 5 minutes 0 0.0% 2 18.2% 3 13.0%
NECROTISING ENTEROCOLITIS
2004 2009 2014
TOTAL INCIDENCE (LIVEBIRTHS) 5 0.01% 6 0.007% 4 0.007%
Singleton 4 80.0% 5 83.3% 3 75%
Multiple 1 20.0% 1 16.7% 1 25%
FETAL OUTCOME
2004 2009 2014
Alive at 28 days 4 80.0% 5 83.3% 4 100.0%
Neonatal deaths 1 20.0% 1 16.7% 0 0.0%
Early 0 0.0% 0 0.0% 0 0.0%
Late 1 20.0% 1 16.7% 0 0.0%
Mean birth weight ± SD (gm) 2399 ± 982 1345 ±1054 1294 ± 640
BIRTH ASPHYXIA
2004 2009 2014
Apgar score < 7 at 1 minute 0 0.0% 2 33.3% 1 25.0%
Apgar score < 7 at 5 minutes 0 0.0% 0 0.0% 0 0.0%
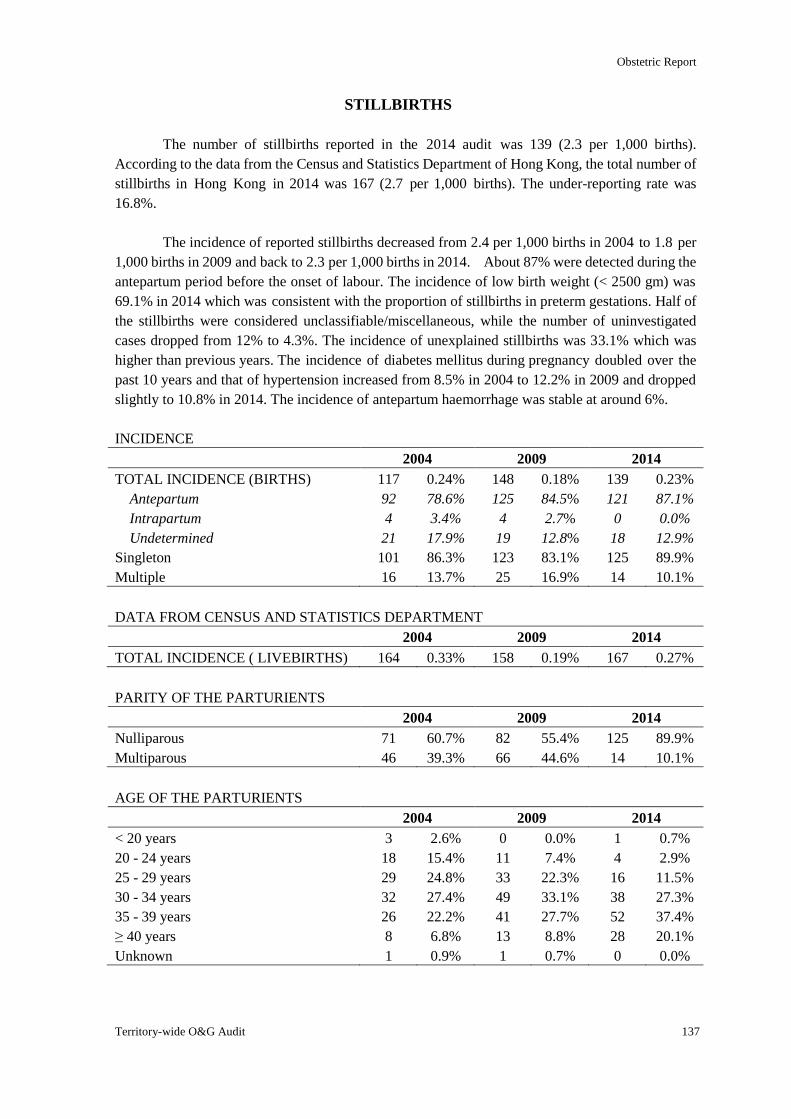
Obstetric Report
Territory-wide O&G Audit 137
STILLBIRTHS
The number of stillbirths reported in the 2014 audit was 139 (2.3 per 1,000 births).
According to the data from the Census and Statistics Department of Hong Kong, the total number of
stillbirths in Hong Kong in 2014 was 167 (2.7 per 1,000 births). The under-reporting rate was
16.8%.
The incidence of reported stillbirths decreased from 2.4 per 1,000 births in 2004 to 1.8 per
1,000 births in 2009 and back to 2.3 per 1,000 births in 2014. About 87% were detected during the
antepartum period before the onset of labour. The incidence of low birth weight (< 2500 gm) was
69.1% in 2014 which was consistent with the proportion of stillbirths in preterm gestations. Half of
the stillbirths were considered unclassifiable/miscellaneous, while the number of uninvestigated
cases dropped from 12% to 4.3%. The incidence of unexplained stillbirths was 33.1% which was
higher than previous years. The incidence of diabetes mellitus during pregnancy doubled over the
past 10 years and that of hypertension increased from 8.5% in 2004 to 12.2% in 2009 and dropped
slightly to 10.8% in 2014. The incidence of antepartum haemorrhage was stable at around 6%.
INCIDENCE
2004 2009 2014
TOTAL INCIDENCE (BIRTHS) 117 0.24% 148 0.18% 139 0.23%
Antepartum 92 78.6% 125 84.5% 121 87.1%
Intrapartum 4 3.4% 4 2.7% 0 0.0%
Undetermined 21 17.9% 19 12.8% 18 12.9%
Singleton 101 86.3% 123 83.1% 125 89.9%
Multiple 16 13.7% 25 16.9% 14 10.1%
DATA FROM CENSUS AND STATISTICS DEPARTMENT
2004 2009 2014
TOTAL INCIDENCE ( LIVEBIRTHS) 164 0.33% 158 0.19% 167 0.27%
PARITY OF THE PARTURIENTS
2004 2009 2014
Nulliparous 71 60.7% 82 55.4% 125 89.9%
Multiparous 46 39.3% 66 44.6% 14 10.1%
AGE OF THE PARTURIENTS
2004 2009 2014
< 20 years 3 2.6% 0 0.0% 1 0.7%
20 - 24 years 18 15.4% 11 7.4% 4 2.9%
25 - 29 years 29 24.8% 33 22.3% 16 11.5%
30 - 34 years 32 27.4% 49 33.1% 38 27.3%
35 - 39 years 26 22.2% 41 27.7% 52 37.4%
≥ 40 years 8 6.8% 13 8.8% 28 20.1%
Unknown 1 0.9% 1 0.7% 0 0.0%
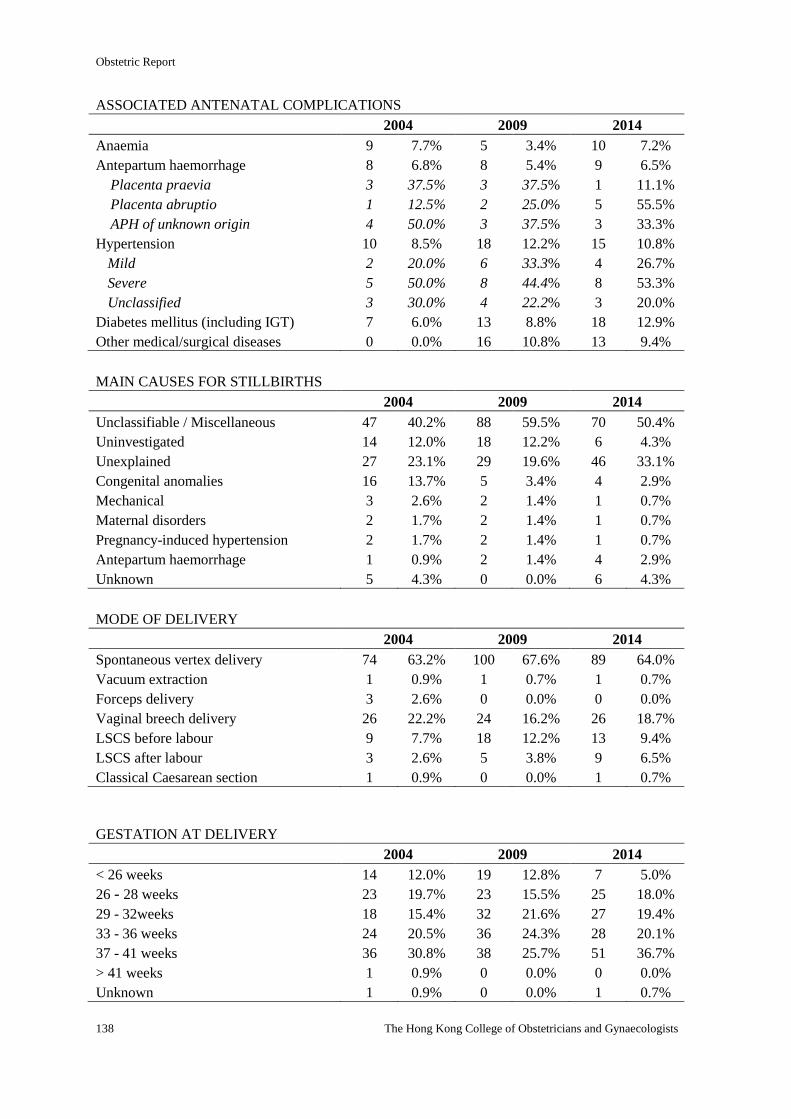
Obstetric Report
138 The Hong Kong College of Obstetricians and Gynaecologists
ASSOCIATED ANTENATAL COMPLICATIONS
2004 2009 2014
Anaemia 9 7.7% 5 3.4% 10 7.2%
Antepartum haemorrhage 8 6.8% 8 5.4% 9 6.5%
Placenta praevia 3 37.5% 3 37.5% 1 11.1%
Placenta abruptio 1 12.5% 2 25.0% 5 55.5%
APH of unknown origin 4 50.0% 3 37.5% 3 33.3%
Hypertension 10 8.5% 18 12.2% 15 10.8%
Mild 2 20.0% 6 33.3% 4 26.7%
Severe 5 50.0% 8 44.4% 8 53.3%
Unclassified 3 30.0% 4 22.2% 3 20.0%
Diabetes mellitus (including IGT) 7 6.0% 13 8.8% 18 12.9%
Other medical/surgical diseases 0 0.0% 16 10.8% 13 9.4%
MAIN CAUSES FOR STILLBIRTHS
2004 2009 2014
Unclassifiable / Miscellaneous 47 40.2% 88 59.5% 70 50.4%
Uninvestigated 14 12.0% 18 12.2% 6 4.3%
Unexplained 27 23.1% 29 19.6% 46 33.1%
Congenital anomalies 16 13.7% 5 3.4% 4 2.9%
Mechanical 3 2.6% 2 1.4% 1 0.7%
Maternal disorders 2 1.7% 2 1.4% 1 0.7%
Pregnancy-induced hypertension 2 1.7% 2 1.4% 1 0.7%
Antepartum haemorrhage 1 0.9% 2 1.4% 4 2.9%
Unknown 5 4.3% 0 0.0% 6 4.3%
MODE OF DELIVERY
2004 2009 2014
Spontaneous vertex delivery 74 63.2% 100 67.6% 89 64.0%
Vacuum extraction 1 0.9% 1 0.7% 1 0.7%
Forceps delivery 3 2.6% 0 0.0% 0 0.0%
Vaginal breech delivery 26 22.2% 24 16.2% 26 18.7%
LSCS before labour 9 7.7% 18 12.2% 13 9.4%
LSCS after labour 3 2.6% 5 3.8% 9 6.5%
Classical Caesarean section 1 0.9% 0 0.0% 1 0.7%
GESTATION AT DELIVERY
2004 2009 2014
< 26 weeks 14 12.0% 19 12.8% 7 5.0%
26 - 28 weeks 23 19.7% 23 15.5% 25 18.0%
29 - 32weeks 18 15.4% 32 21.6% 27 19.4%
33 - 36 weeks 24 20.5% 36 24.3% 28 20.1%
37 - 41 weeks 36 30.8% 38 25.7% 51 36.7%
> 41 weeks 1 0.9% 0 0.0% 0 0.0%
Unknown 1 0.9% 0 0.0% 1 0.7%
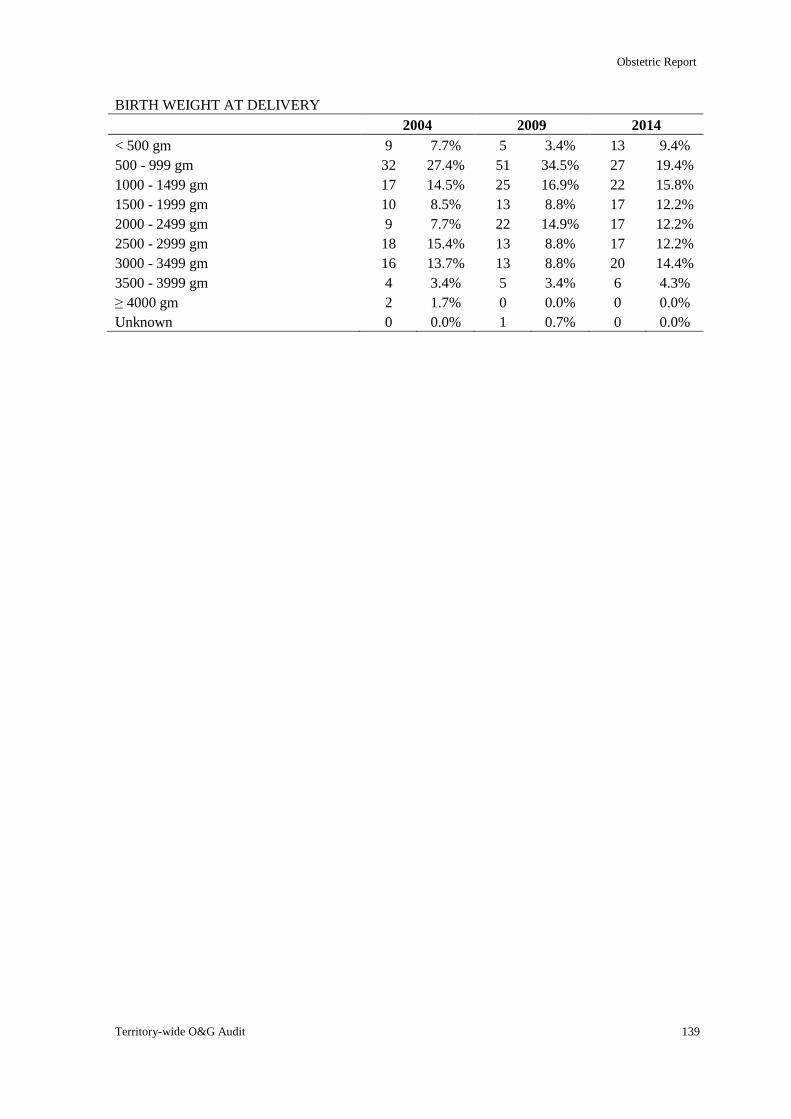
Obstetric Report
Territory-wide O&G Audit 139
BIRTH WEIGHT AT DELIVERY
2004 2009 2014
< 500 gm 9 7.7% 5 3.4% 13 9.4%
500 - 999 gm 32 27.4% 51 34.5% 27 19.4%
1000 - 1499 gm 17 14.5% 25 16.9% 22 15.8%
1500 - 1999 gm 10 8.5% 13 8.8% 17 12.2%
2000 - 2499 gm 9 7.7% 22 14.9% 17 12.2%
2500 - 2999 gm 18 15.4% 13 8.8% 17 12.2%
3000 - 3499 gm 16 13.7% 13 8.8% 20 14.4%
3500 - 3999 gm 4 3.4% 5 3.4% 6 4.3%
≥ 4000 gm 2 1.7% 0 0.0% 0 0.0%
Unknown 0 0.0% 1 0.7% 0 0.0%
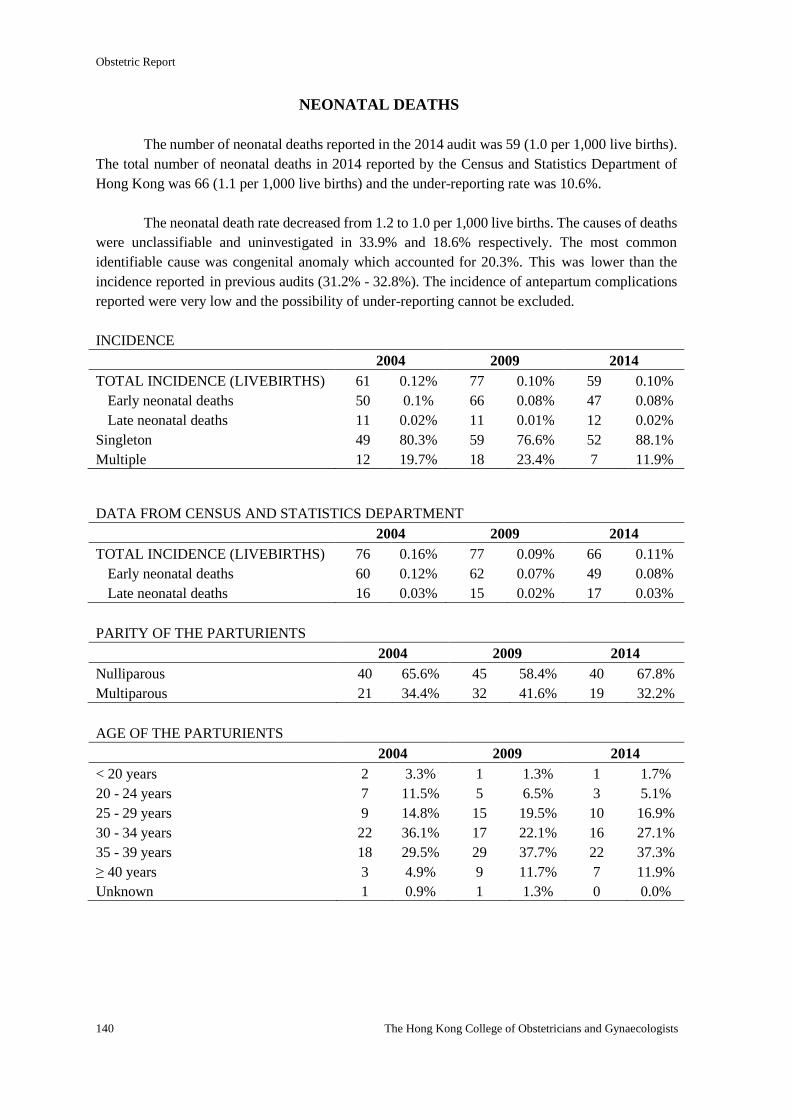
Obstetric Report
140 The Hong Kong College of Obstetricians and Gynaecologists
NEONATAL DEATHS
The number of neonatal deaths reported in the 2014 audit was 59 (1.0 per 1,000 live births).
The total number of neonatal deaths in 2014 reported by the Census and Statistics Department of
Hong Kong was 66 (1.1 per 1,000 live births) and the under-reporting rate was 10.6%.
The neonatal death rate decreased from 1.2 to 1.0 per 1,000 live births. The causes of deaths
were unclassifiable and uninvestigated in 33.9% and 18.6% respectively. The most common
identifiable cause was congenital anomaly which accounted for 20.3%. This was lower than the
incidence reported in previous audits (31.2% - 32.8%). The incidence of antepartum complications
reported were very low and the possibility of under-reporting cannot be excluded.
INCIDENCE
2004 2009 2014
TOTAL INCIDENCE (LIVEBIRTHS) 61 0.12% 77 0.10% 59 0.10%
Early neonatal deaths 50 0.1% 66 0.08% 47 0.08%
Late neonatal deaths 11 0.02% 11 0.01% 12 0.02%
Singleton 49 80.3% 59 76.6% 52 88.1%
Multiple 12 19.7% 18 23.4% 7 11.9%
DATA FROM CENSUS AND STATISTICS DEPARTMENT
2004 2009 2014
TOTAL INCIDENCE (LIVEBIRTHS) 76 0.16% 77 0.09% 66 0.11%
Early neonatal deaths 60 0.12% 62 0.07% 49 0.08%
Late neonatal deaths 16 0.03% 15 0.02% 17 0.03%
PARITY OF THE PARTURIENTS
2004 2009 2014
Nulliparous 40 65.6% 45 58.4% 40 67.8%
Multiparous 21 34.4% 32 41.6% 19 32.2%
AGE OF THE PARTURIENTS
2004 2009 2014
< 20 years 2 3.3% 1 1.3% 1 1.7%
20 - 24 years 7 11.5% 5 6.5% 3 5.1%
25 - 29 years 9 14.8% 15 19.5% 10 16.9%
30 - 34 years 22 36.1% 17 22.1% 16 27.1%
35 - 39 years 18 29.5% 29 37.7% 22 37.3%
≥ 40 years 3 4.9% 9 11.7% 7 11.9%
Unknown 1 0.9% 1 1.3% 0 0.0%
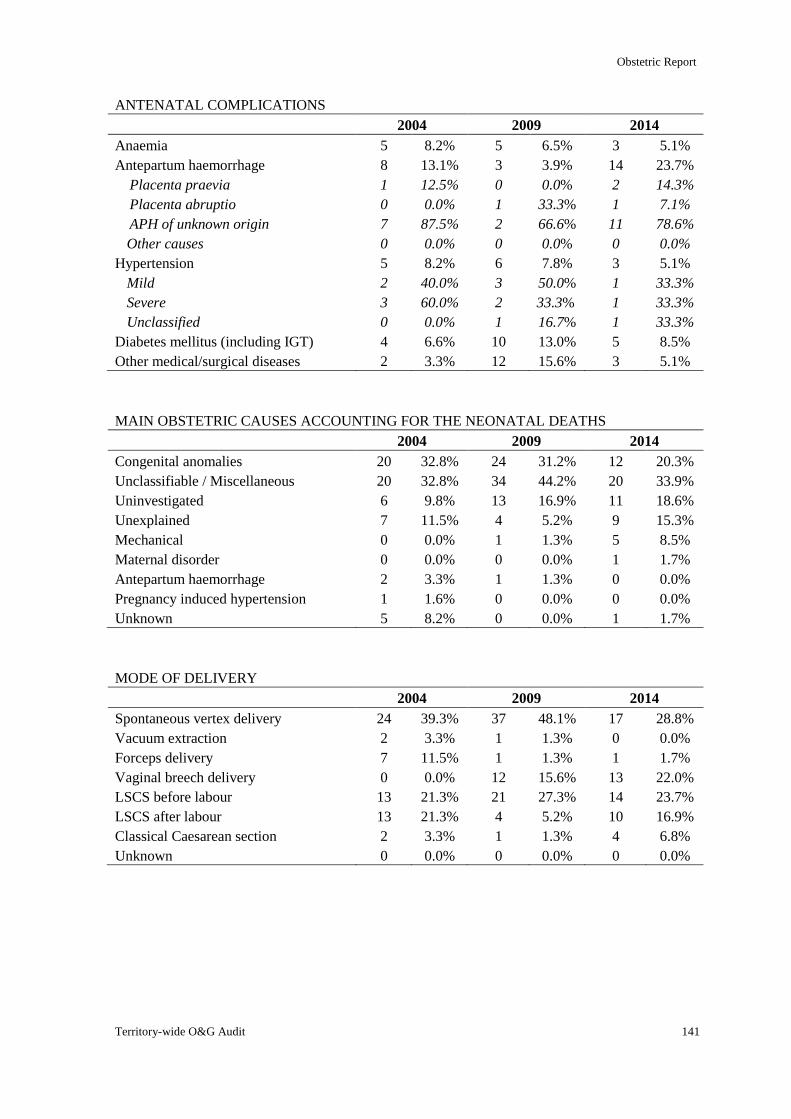
Obstetric Report
Territory-wide O&G Audit 141
ANTENATAL COMPLICATIONS
2004 2009 2014
Anaemia 5 8.2% 5 6.5% 3 5.1%
Antepartum haemorrhage 8 13.1% 3 3.9% 14 23.7%
Placenta praevia 1 12.5% 0 0.0% 2 14.3%
Placenta abruptio 0 0.0% 1 33.3% 1 7.1%
APH of unknown origin 7 87.5% 2 66.6% 11 78.6%
Other causes 0 0.0% 0 0.0% 0 0.0%
Hypertension 5 8.2% 6 7.8% 3 5.1%
Mild 2 40.0% 3 50.0% 1 33.3%
Severe 3 60.0% 2 33.3% 1 33.3%
Unclassified 0 0.0% 1 16.7% 1 33.3%
Diabetes mellitus (including IGT) 4 6.6% 10 13.0% 5 8.5%
Other medical/surgical diseases 2 3.3% 12 15.6% 3 5.1%
MAIN OBSTETRIC CAUSES ACCOUNTING FOR THE NEONATAL DEATHS
2004 2009 2014
Congenital anomalies 20 32.8% 24 31.2% 12 20.3%
Unclassifiable / Miscellaneous 20 32.8% 34 44.2% 20 33.9%
Uninvestigated 6 9.8% 13 16.9% 11 18.6%
Unexplained 7 11.5% 4 5.2% 9 15.3%
Mechanical 0 0.0% 1 1.3% 5 8.5%
Maternal disorder 0 0.0% 0 0.0% 1 1.7%
Antepartum haemorrhage 2 3.3% 1 1.3% 0 0.0%
Pregnancy induced hypertension 1 1.6% 0 0.0% 0 0.0%
Unknown 5 8.2% 0 0.0% 1 1.7%
MODE OF DELIVERY
2004 2009 2014
Spontaneous vertex delivery 24 39.3% 37 48.1% 17 28.8%
Vacuum extraction 2 3.3% 1 1.3% 0 0.0%
Forceps delivery 7 11.5% 1 1.3% 1 1.7%
Vaginal breech delivery 0 0.0% 12 15.6% 13 22.0%
LSCS before labour 13 21.3% 21 27.3% 14 23.7%
LSCS after labour 13 21.3% 4 5.2% 10 16.9%
Classical Caesarean section 2 3.3% 1 1.3% 4 6.8%
Unknown 0 0.0% 0 0.0% 0 0.0%
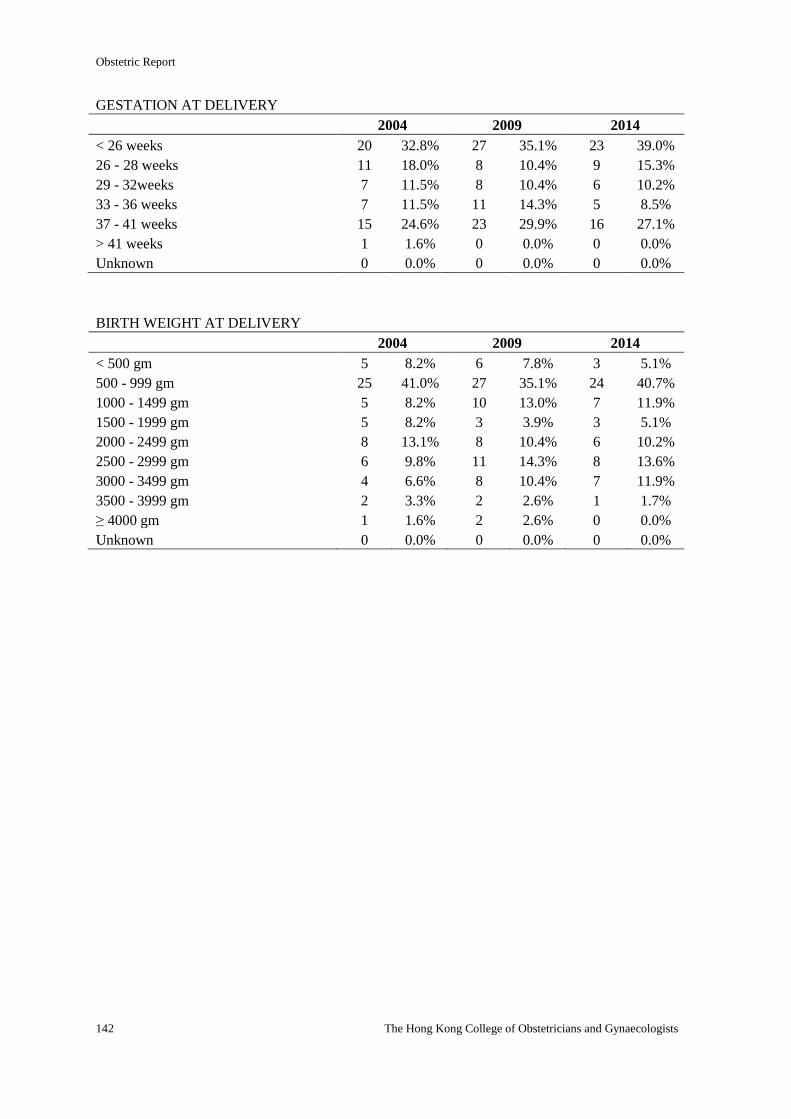
Obstetric Report
142 The Hong Kong College of Obstetricians and Gynaecologists
GESTATION AT DELIVERY
2004 2009 2014
< 26 weeks 20 32.8% 27 35.1% 23 39.0%
26 - 28 weeks 11 18.0% 8 10.4% 9 15.3%
29 - 32weeks 7 11.5% 8 10.4% 6 10.2%
33 - 36 weeks 7 11.5% 11 14.3% 5 8.5%
37 - 41 weeks 15 24.6% 23 29.9% 16 27.1%
> 41 weeks 1 1.6% 0 0.0% 0 0.0%
Unknown 0 0.0% 0 0.0% 0 0.0%
BIRTH WEIGHT AT DELIVERY
2004 2009 2014
< 500 gm 5 8.2% 6 7.8% 3 5.1%
500 - 999 gm 25 41.0% 27 35.1% 24 40.7%
1000 - 1499 gm 5 8.2% 10 13.0% 7 11.9%
1500 - 1999 gm 5 8.2% 3 3.9% 3 5.1%
2000 - 2499 gm 8 13.1% 8 10.4% 6 10.2%
2500 - 2999 gm 6 9.8% 11 14.3% 8 13.6%
3000 - 3499 gm 4 6.6% 8 10.4% 7 11.9%
3500 - 3999 gm 2 3.3% 2 2.6% 1 1.7%
≥ 4000 gm 1 1.6% 2 2.6% 0 0.0%
Unknown 0 0.0% 0 0.0% 0 0.0%
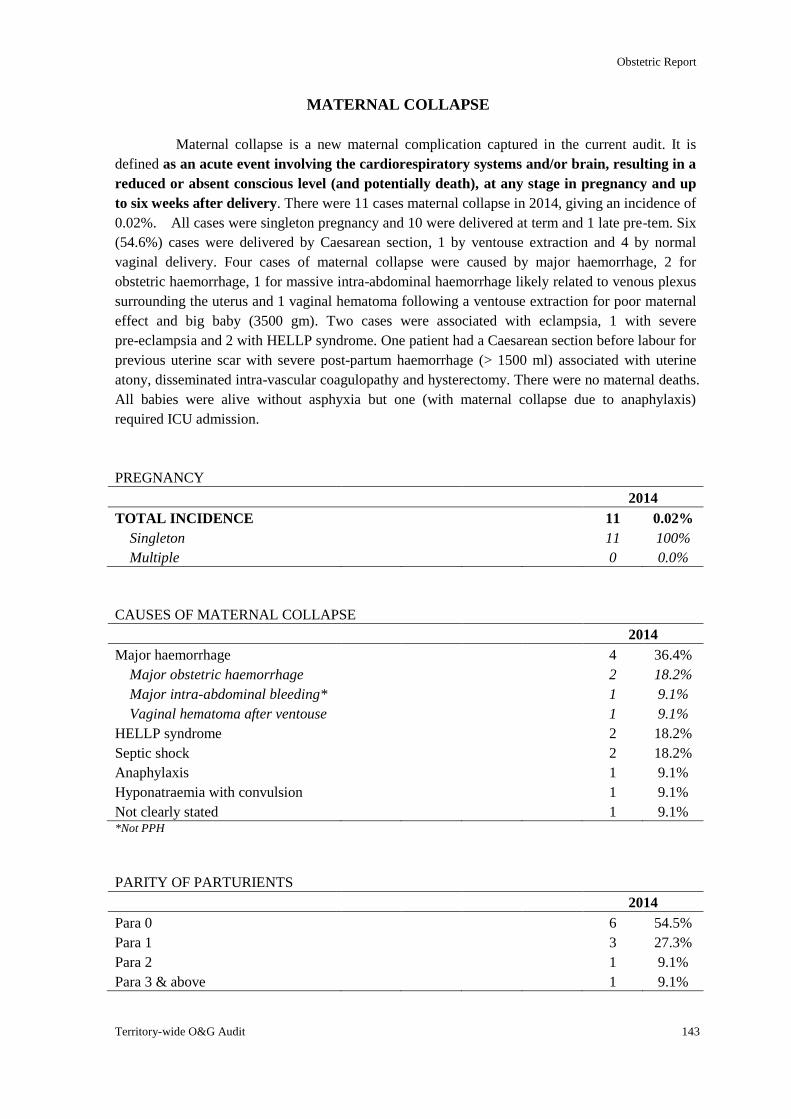
Obstetric Report
Territory-wide O&G Audit 143
MATERNAL COLLAPSE
Maternal collapse is a new maternal complication captured in the current audit. It is
defined as an acute event involving the cardiorespiratory systems and/or brain, resulting in a
reduced or absent conscious level (and potentially death), at any stage in pregnancy and up
to six weeks after delivery. There were 11 cases maternal collapse in 2014, giving an incidence of
0.02%. All cases were singleton pregnancy and 10 were delivered at term and 1 late pre-tem. Six
(54.6%) cases were delivered by Caesarean section, 1 by ventouse extraction and 4 by normal
vaginal delivery. Four cases of maternal collapse were caused by major haemorrhage, 2 for
obstetric haemorrhage, 1 for massive intra-abdominal haemorrhage likely related to venous plexus
surrounding the uterus and 1 vaginal hematoma following a ventouse extraction for poor maternal
effect and big baby (3500 gm). Two cases were associated with eclampsia, 1 with severe
pre-eclampsia and 2 with HELLP syndrome. One patient had a Caesarean section before labour for
previous uterine scar with severe post-partum haemorrhage (> 1500 ml) associated with uterine
atony, disseminated intra-vascular coagulopathy and hysterectomy. There were no maternal deaths.
All babies were alive without asphyxia but one (with maternal collapse due to anaphylaxis)
required ICU admission.
PREGNANCY
2014
TOTAL INCIDENCE 11 0.02%
Singleton 11 100%
Multiple 0 0.0%
CAUSES OF MATERNAL COLLAPSE
2014
Major haemorrhage 4 36.4%
Major obstetric haemorrhage 2 18.2%
Major intra-abdominal bleeding* 1 9.1%
Vaginal hematoma after ventouse 1 9.1%
HELLP syndrome 2 18.2%
Septic shock 2 18.2%
Anaphylaxis 1 9.1%
Hyponatraemia with convulsion 1 9.1%
Not clearly stated 1 9.1% *Not PPH
PARITY OF PARTURIENTS
2014
Para 0 6 54.5%
Para 1 3 27.3%
Para 2 1 9.1%
Para 3 & above 1 9.1%
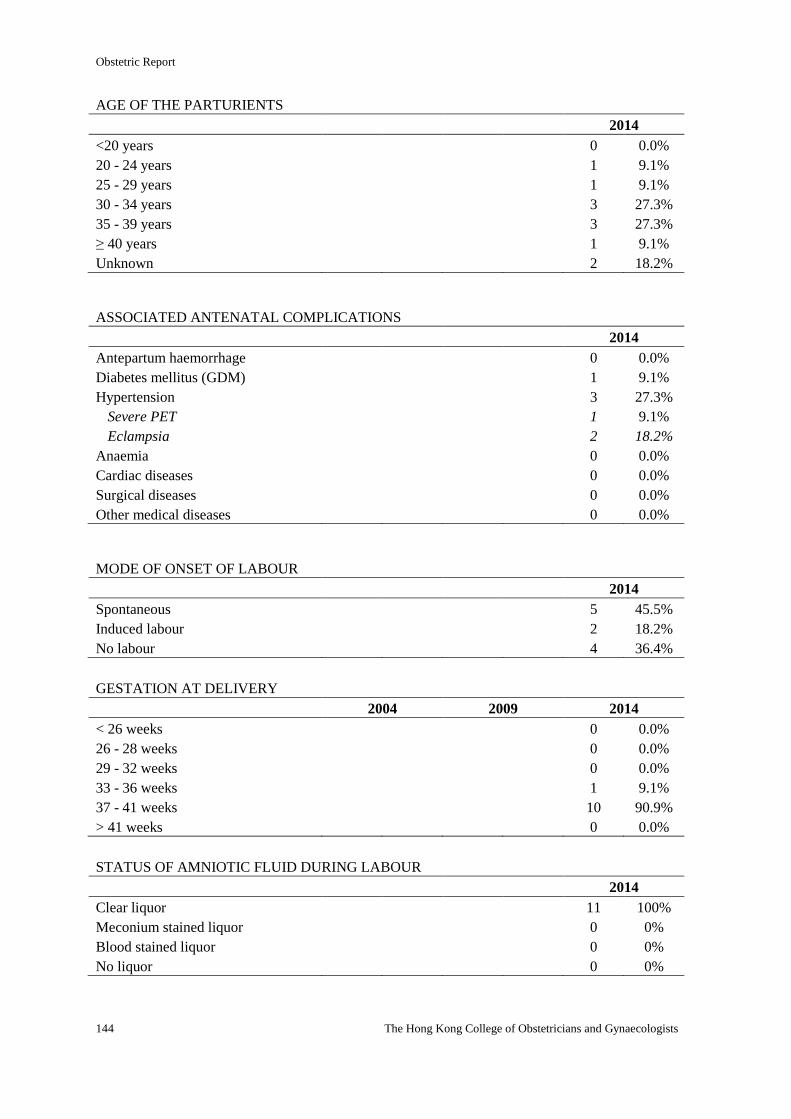
Obstetric Report
144 The Hong Kong College of Obstetricians and Gynaecologists
AGE OF THE PARTURIENTS
2014
<20 years 0 0.0%
20 - 24 years 1 9.1%
25 - 29 years 1 9.1%
30 - 34 years 3 27.3%
35 - 39 years 3 27.3%
≥ 40 years 1 9.1%
Unknown 2 18.2%
ASSOCIATED ANTENATAL COMPLICATIONS
2014
Antepartum haemorrhage 0 0.0%
Diabetes mellitus (GDM) 1 9.1%
Hypertension 3 27.3%
Severe PET 1 9.1%
Eclampsia 2 18.2%
Anaemia 0 0.0%
Cardiac diseases 0 0.0%
Surgical diseases 0 0.0%
Other medical diseases 0 0.0%
MODE OF ONSET OF LABOUR
2014
Spontaneous 5 45.5%
Induced labour 2 18.2%
No labour 4 36.4%
GESTATION AT DELIVERY
2004 2009 2014
< 26 weeks 0 0.0%
26 - 28 weeks 0 0.0%
29 - 32 weeks 0 0.0%
33 - 36 weeks 1 9.1%
37 - 41 weeks 10 90.9%
> 41 weeks 0 0.0%
STATUS OF AMNIOTIC FLUID DURING LABOUR
2014
Clear liquor 11 100%
Meconium stained liquor 0 0%
Blood stained liquor 0 0%
No liquor 0 0%
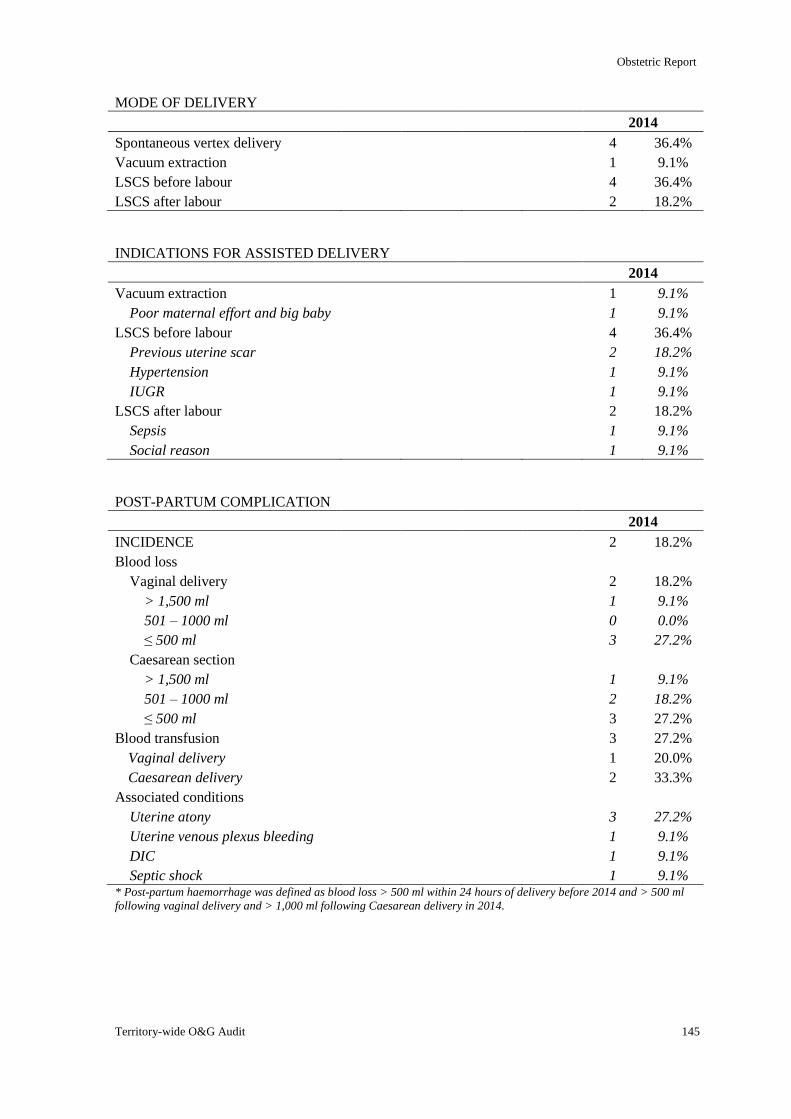
Obstetric Report
Territory-wide O&G Audit 145
MODE OF DELIVERY
2014
Spontaneous vertex delivery 4 36.4%
Vacuum extraction 1 9.1%
LSCS before labour 4 36.4%
LSCS after labour 2 18.2%
INDICATIONS FOR ASSISTED DELIVERY
2014
Vacuum extraction 1 9.1%
Poor maternal effort and big baby 1 9.1%
LSCS before labour 4 36.4%
Previous uterine scar 2 18.2%
Hypertension 1 9.1%
IUGR 1 9.1%
LSCS after labour 2 18.2%
Sepsis 1 9.1%
Social reason 1 9.1%
POST-PARTUM COMPLICATION
2014
INCIDENCE 2 18.2%
Blood loss
Vaginal delivery 2 18.2%
> 1,500 ml 1 9.1%
501 – 1000 ml 0 0.0%
≤ 500 ml 3 27.2%
Caesarean section
> 1,500 ml 1 9.1%
501 – 1000 ml 2 18.2%
≤ 500 ml 3 27.2%
Blood transfusion 3 27.2%
Vaginal delivery 1 20.0%
Caesarean delivery 2 33.3%
Associated conditions
Uterine atony 3 27.2%
Uterine venous plexus bleeding 1 9.1%
DIC 1 9.1%
Septic shock 1 9.1% * Post-partum haemorrhage was defined as blood loss > 500 ml within 24 hours of delivery before 2014 and > 500 ml
following vaginal delivery and > 1,000 ml following Caesarean delivery in 2014.
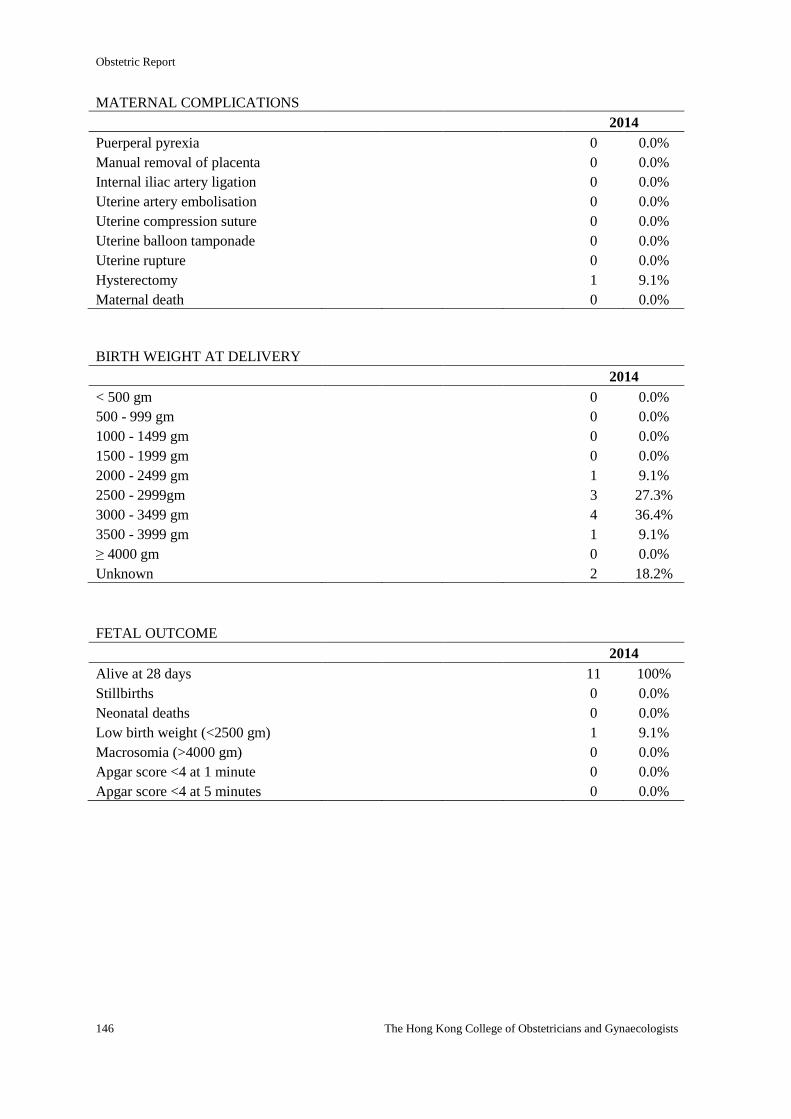
Obstetric Report
146 The Hong Kong College of Obstetricians and Gynaecologists
MATERNAL COMPLICATIONS
2014
Puerperal pyrexia 0 0.0%
Manual removal of placenta 0 0.0%
Internal iliac artery ligation 0 0.0%
Uterine artery embolisation 0 0.0%
Uterine compression suture 0 0.0%
Uterine balloon tamponade 0 0.0%
Uterine rupture 0 0.0%
Hysterectomy 1 9.1%
Maternal death 0 0.0%
BIRTH WEIGHT AT DELIVERY
2014
< 500 gm 0 0.0%
500 - 999 gm 0 0.0%
1000 - 1499 gm 0 0.0%
1500 - 1999 gm 0 0.0%
2000 - 2499 gm 1 9.1%
2500 - 2999gm 3 27.3%
3000 - 3499 gm 4 36.4%
3500 - 3999 gm 1 9.1%
≥ 4000 gm 0 0.0%
Unknown 2 18.2%
FETAL OUTCOME
2014
Alive at 28 days 11 100%
Stillbirths 0 0.0%
Neonatal deaths 0 0.0%
Low birth weight (<2500 gm) 1 9.1%
Macrosomia (>4000 gm) 0 0.0%
Apgar score <4 at 1 minute 0 0.0%
Apgar score <4 at 5 minutes 0 0.0%
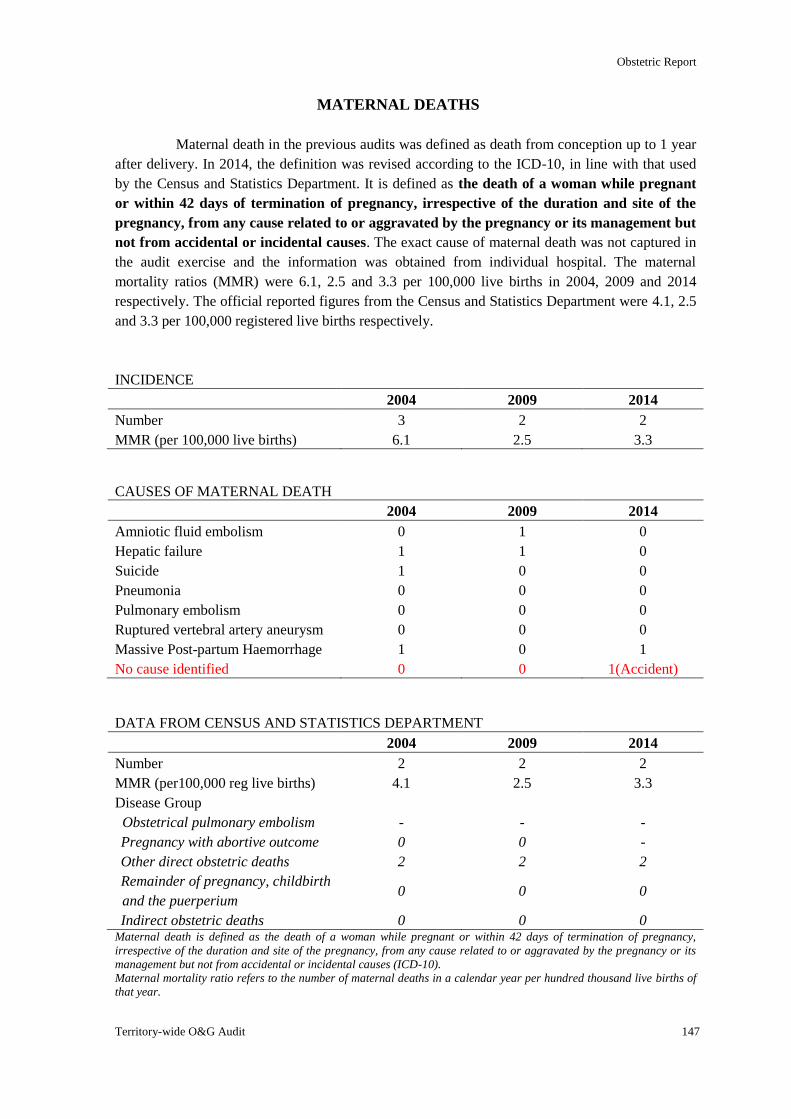
Obstetric Report
Territory-wide O&G Audit 147
MATERNAL DEATHS
Maternal death in the previous audits was defined as death from conception up to 1 year
after delivery. In 2014, the definition was revised according to the ICD-10, in line with that used
by the Census and Statistics Department. It is defined as the death of a woman while pregnant
or within 42 days of termination of pregnancy, irrespective of the duration and site of the
pregnancy, from any cause related to or aggravated by the pregnancy or its management but
not from accidental or incidental causes. The exact cause of maternal death was not captured in
the audit exercise and the information was obtained from individual hospital. The maternal
mortality ratios (MMR) were 6.1, 2.5 and 3.3 per 100,000 live births in 2004, 2009 and 2014
respectively. The official reported figures from the Census and Statistics Department were 4.1, 2.5
and 3.3 per 100,000 registered live births respectively.
INCIDENCE
2004 2009 2014
Number 3 2 2
MMR (per 100,000 live births) 6.1 2.5 3.3
CAUSES OF MATERNAL DEATH
2004 2009 2014
Amniotic fluid embolism 0 1 0
Hepatic failure 1 1 0
Suicide 1 0 0
Pneumonia 0 0 0
Pulmonary embolism 0 0 0
Ruptured vertebral artery aneurysm 0 0 0
Massive Post-partum Haemorrhage 1 0 1
No cause identified 0 0 1(Accident)
DATA FROM CENSUS AND STATISTICS DEPARTMENT
2004 2009 2014
Number 2 2 2
MMR (per100,000 reg live births) 4.1 2.5 3.3
Disease Group
Obstetrical pulmonary embolism - - -
Pregnancy with abortive outcome 0 0 -
Other direct obstetric deaths 2 2 2
Remainder of pregnancy, childbirth
and the puerperium 0 0 0
Indirect obstetric deaths 0 0 0 Maternal death is defined as the death of a woman while pregnant or within 42 days of termination of pregnancy,
irrespective of the duration and site of the pregnancy, from any cause related to or aggravated by the pregnancy or its
management but not from accidental or incidental causes (ICD-10).
Maternal mortality ratio refers to the number of maternal deaths in a calendar year per hundred thousand live births of
that year.
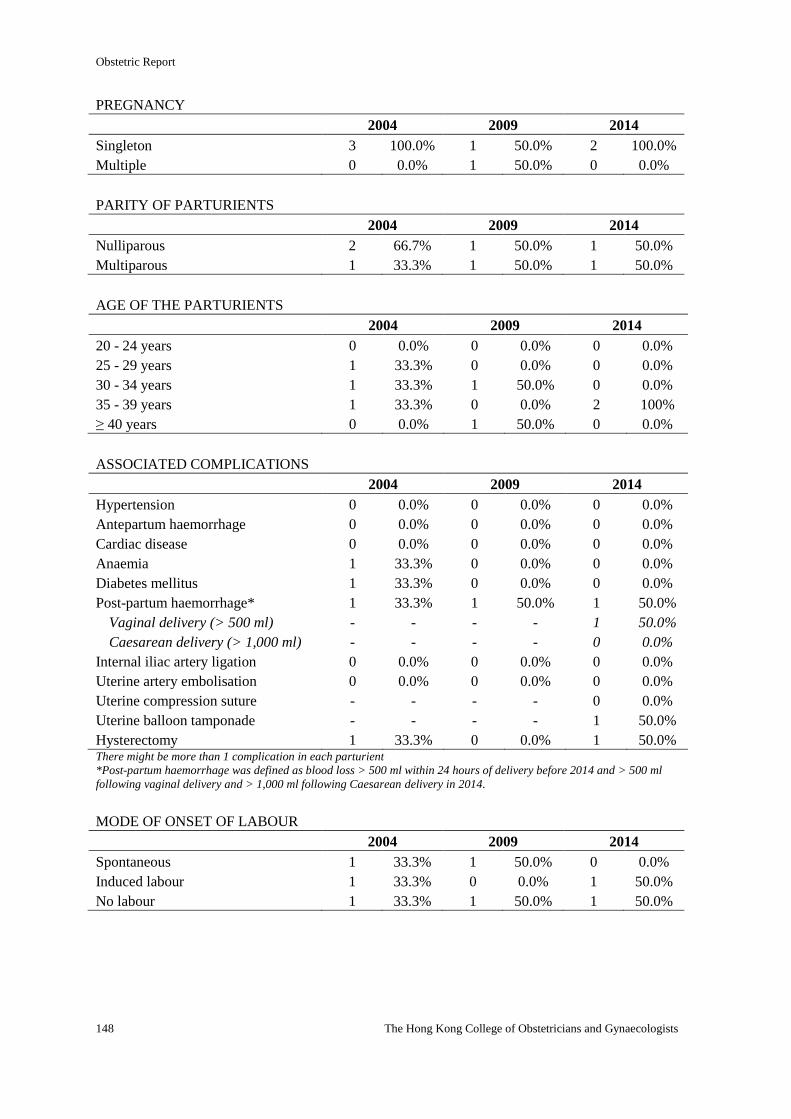
Obstetric Report
148 The Hong Kong College of Obstetricians and Gynaecologists
PREGNANCY
2004 2009 2014
Singleton 3 100.0% 1 50.0% 2 100.0%
Multiple 0 0.0% 1 50.0% 0 0.0%
PARITY OF PARTURIENTS
2004 2009 2014
Nulliparous 2 66.7% 1 50.0% 1 50.0%
Multiparous 1 33.3% 1 50.0% 1 50.0%
AGE OF THE PARTURIENTS
2004 2009 2014
20 - 24 years 0 0.0% 0 0.0% 0 0.0%
25 - 29 years 1 33.3% 0 0.0% 0 0.0%
30 - 34 years 1 33.3% 1 50.0% 0 0.0%
35 - 39 years 1 33.3% 0 0.0% 2 100%
≥ 40 years 0 0.0% 1 50.0% 0 0.0%
ASSOCIATED COMPLICATIONS
2004 2009 2014
Hypertension 0 0.0% 0 0.0% 0 0.0%
Antepartum haemorrhage 0 0.0% 0 0.0% 0 0.0%
Cardiac disease 0 0.0% 0 0.0% 0 0.0%
Anaemia 1 33.3% 0 0.0% 0 0.0%
Diabetes mellitus 1 33.3% 0 0.0% 0 0.0%
Post-partum haemorrhage* 1 33.3% 1 50.0% 1 50.0%
Vaginal delivery (> 500 ml) - - - - 1 50.0%
Caesarean delivery (> 1,000 ml) - - - - 0 0.0%
Internal iliac artery ligation 0 0.0% 0 0.0% 0 0.0%
Uterine artery embolisation 0 0.0% 0 0.0% 0 0.0%
Uterine compression suture - - - - 0 0.0%
Uterine balloon tamponade - - - - 1 50.0%
Hysterectomy 1 33.3% 0 0.0% 1 50.0% There might be more than 1 complication in each parturient
*Post-partum haemorrhage was defined as blood loss > 500 ml within 24 hours of delivery before 2014 and > 500 ml
following vaginal delivery and > 1,000 ml following Caesarean delivery in 2014.
MODE OF ONSET OF LABOUR
2004 2009 2014
Spontaneous 1 33.3% 1 50.0% 0 0.0%
Induced labour 1 33.3% 0 0.0% 1 50.0%
No labour 1 33.3% 1 50.0% 1 50.0%
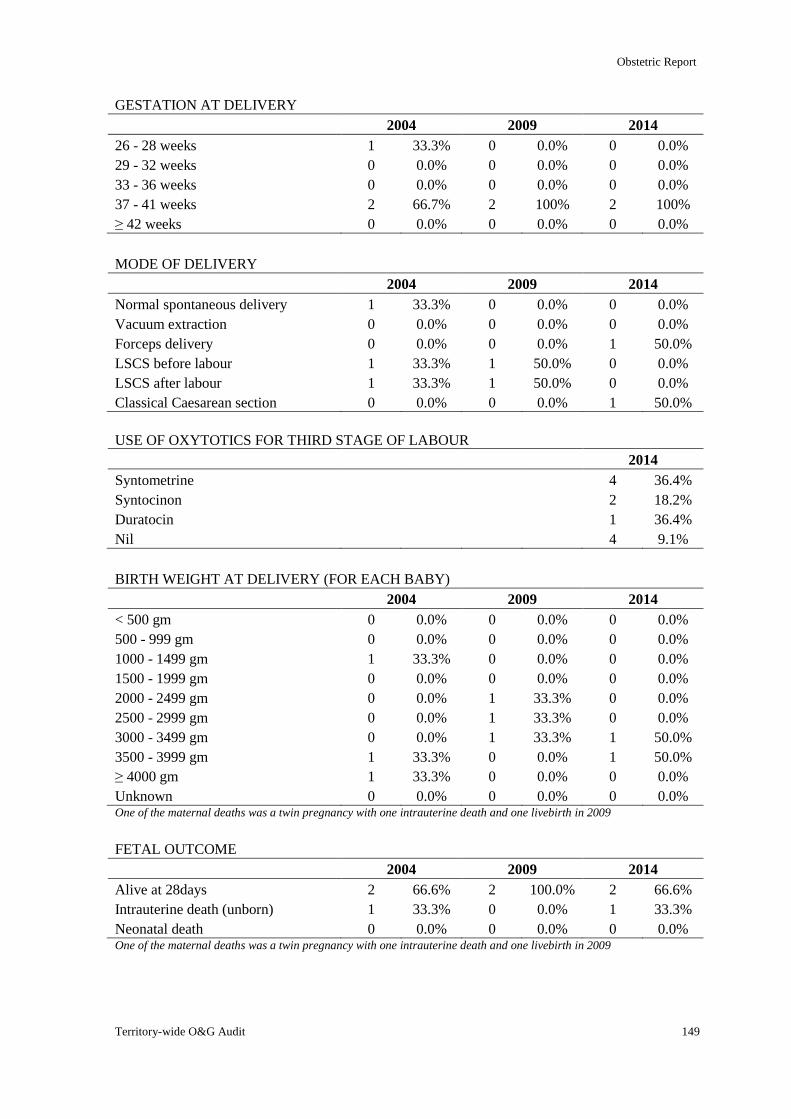
Obstetric Report
Territory-wide O&G Audit 149
GESTATION AT DELIVERY
2004 2009 2014
26 - 28 weeks 1 33.3% 0 0.0% 0 0.0%
29 - 32 weeks 0 0.0% 0 0.0% 0 0.0%
33 - 36 weeks 0 0.0% 0 0.0% 0 0.0%
37 - 41 weeks 2 66.7% 2 100% 2 100%
≥ 42 weeks 0 0.0% 0 0.0% 0 0.0%
MODE OF DELIVERY
2004 2009 2014
Normal spontaneous delivery 1 33.3% 0 0.0% 0 0.0%
Vacuum extraction 0 0.0% 0 0.0% 0 0.0%
Forceps delivery 0 0.0% 0 0.0% 1 50.0%
LSCS before labour 1 33.3% 1 50.0% 0 0.0%
LSCS after labour 1 33.3% 1 50.0% 0 0.0%
Classical Caesarean section 0 0.0% 0 0.0% 1 50.0%
USE OF OXYTOTICS FOR THIRD STAGE OF LABOUR
2014
Syntometrine 4 36.4%
Syntocinon 2 18.2%
Duratocin 1 36.4%
Nil 4 9.1%
BIRTH WEIGHT AT DELIVERY (FOR EACH BABY)
2004 2009 2014
< 500 gm 0 0.0% 0 0.0% 0 0.0%
500 - 999 gm 0 0.0% 0 0.0% 0 0.0%
1000 - 1499 gm 1 33.3% 0 0.0% 0 0.0%
1500 - 1999 gm 0 0.0% 0 0.0% 0 0.0%
2000 - 2499 gm 0 0.0% 1 33.3% 0 0.0%
2500 - 2999 gm 0 0.0% 1 33.3% 0 0.0%
3000 - 3499 gm 0 0.0% 1 33.3% 1 50.0%
3500 - 3999 gm 1 33.3% 0 0.0% 1 50.0%
≥ 4000 gm 1 33.3% 0 0.0% 0 0.0%
Unknown 0 0.0% 0 0.0% 0 0.0% One of the maternal deaths was a twin pregnancy with one intrauterine death and one livebirth in 2009
FETAL OUTCOME
2004 2009 2014
Alive at 28days 2 66.6% 2 100.0% 2 66.6%
Intrauterine death (unborn) 1 33.3% 0 0.0% 1 33.3%
Neonatal death 0 0.0% 0 0.0% 0 0.0% One of the maternal deaths was a twin pregnancy with one intrauterine death and one livebirth in 2009
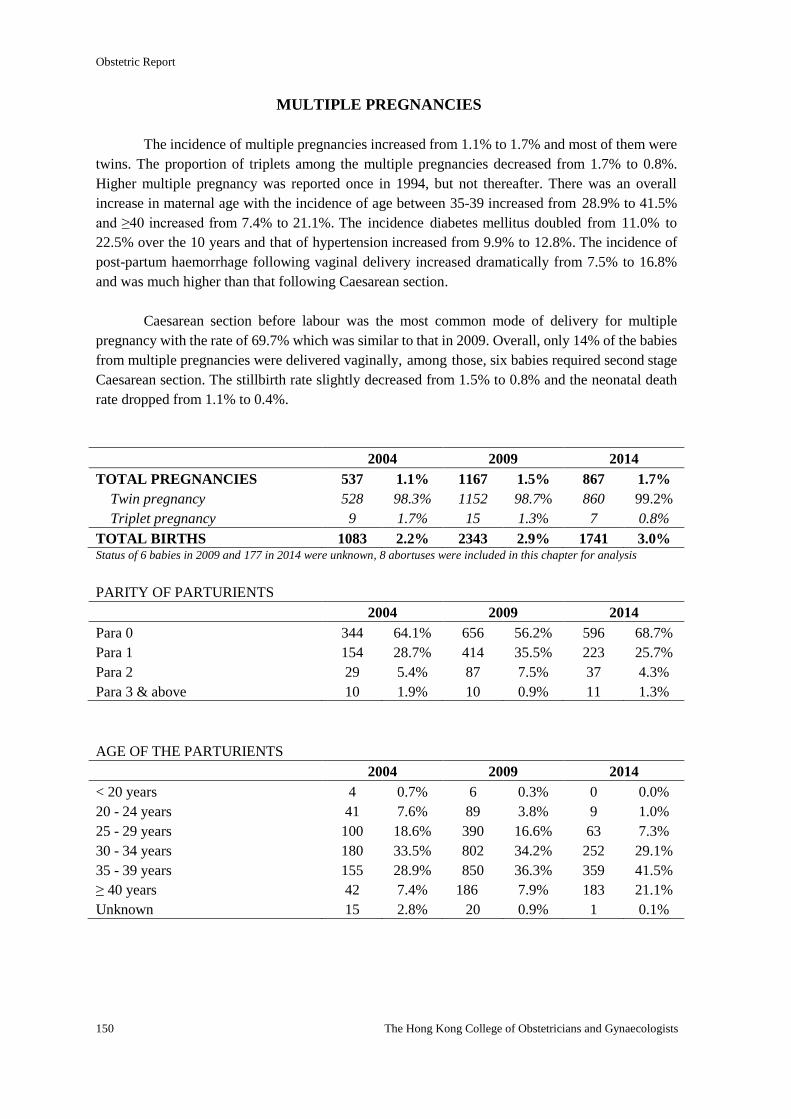
Obstetric Report
150 The Hong Kong College of Obstetricians and Gynaecologists
MULTIPLE PREGNANCIES
The incidence of multiple pregnancies increased from 1.1% to 1.7% and most of them were
twins. The proportion of triplets among the multiple pregnancies decreased from 1.7% to 0.8%.
Higher multiple pregnancy was reported once in 1994, but not thereafter. There was an overall
increase in maternal age with the incidence of age between 35-39 increased from 28.9% to 41.5%
and ≥40 increased from 7.4% to 21.1%. The incidence diabetes mellitus doubled from 11.0% to
22.5% over the 10 years and that of hypertension increased from 9.9% to 12.8%. The incidence of
post-partum haemorrhage following vaginal delivery increased dramatically from 7.5% to 16.8%
and was much higher than that following Caesarean section.
Caesarean section before labour was the most common mode of delivery for multiple
pregnancy with the rate of 69.7% which was similar to that in 2009. Overall, only 14% of the babies
from multiple pregnancies were delivered vaginally, among those, six babies required second stage
Caesarean section. The stillbirth rate slightly decreased from 1.5% to 0.8% and the neonatal death
rate dropped from 1.1% to 0.4%.
2004 2009 2014
TOTAL PREGNANCIES 537 1.1% 1167 1.5% 867 1.7%
Twin pregnancy 528 98.3% 1152 98.7% 860 99.2%
Triplet pregnancy 9 1.7% 15 1.3% 7 0.8%
TOTAL BIRTHS 1083 2.2% 2343 2.9% 1741 3.0% Status of 6 babies in 2009 and 177 in 2014 were unknown, 8 abortuses were included in this chapter for analysis
PARITY OF PARTURIENTS
2004 2009 2014
Para 0 344 64.1% 656 56.2% 596 68.7%
Para 1 154 28.7% 414 35.5% 223 25.7%
Para 2 29 5.4% 87 7.5% 37 4.3%
Para 3 & above 10 1.9% 10 0.9% 11 1.3%
AGE OF THE PARTURIENTS
2004 2009 2014
< 20 years 4 0.7% 6 0.3% 0 0.0%
20 - 24 years 41 7.6% 89 3.8% 9 1.0%
25 - 29 years 100 18.6% 390 16.6% 63 7.3%
30 - 34 years 180 33.5% 802 34.2% 252 29.1%
35 - 39 years 155 28.9% 850 36.3% 359 41.5%
≥ 40 years 42 7.4% 186 7.9% 183 21.1%
Unknown 15 2.8% 20 0.9% 1 0.1%
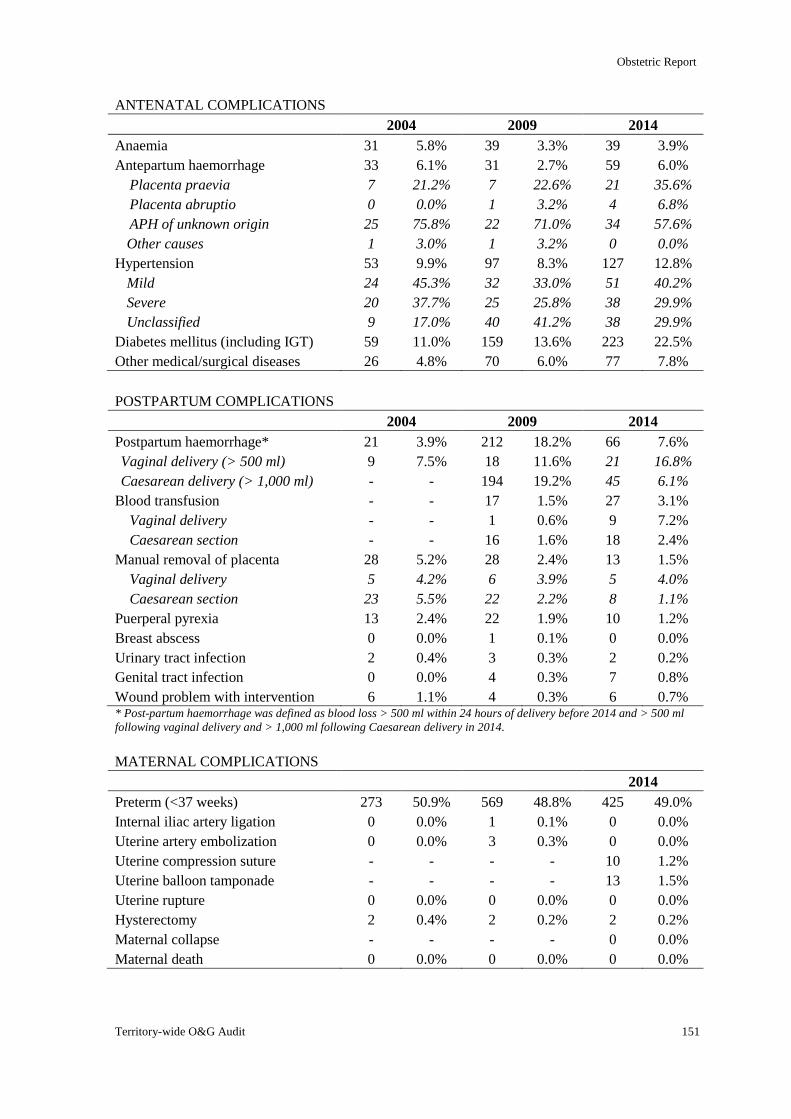
Obstetric Report
Territory-wide O&G Audit 151
ANTENATAL COMPLICATIONS
2004 2009 2014
Anaemia 31 5.8% 39 3.3% 39 3.9%
Antepartum haemorrhage 33 6.1% 31 2.7% 59 6.0%
Placenta praevia 7 21.2% 7 22.6% 21 35.6%
Placenta abruptio 0 0.0% 1 3.2% 4 6.8%
APH of unknown origin 25 75.8% 22 71.0% 34 57.6%
Other causes 1 3.0% 1 3.2% 0 0.0%
Hypertension 53 9.9% 97 8.3% 127 12.8%
Mild 24 45.3% 32 33.0% 51 40.2%
Severe 20 37.7% 25 25.8% 38 29.9%
Unclassified 9 17.0% 40 41.2% 38 29.9%
Diabetes mellitus (including IGT) 59 11.0% 159 13.6% 223 22.5%
Other medical/surgical diseases 26 4.8% 70 6.0% 77 7.8%
POSTPARTUM COMPLICATIONS
2004 2009 2014
Postpartum haemorrhage* 21 3.9% 212 18.2% 66 7.6%
Vaginal delivery (> 500 ml) 9 7.5% 18 11.6% 21 16.8%
Caesarean delivery (> 1,000 ml) - - 194 19.2% 45 6.1%
Blood transfusion - - 17 1.5% 27 3.1%
Vaginal delivery - - 1 0.6% 9 7.2%
Caesarean section - - 16 1.6% 18 2.4%
Manual removal of placenta 28 5.2% 28 2.4% 13 1.5%
Vaginal delivery 5 4.2% 6 3.9% 5 4.0%
Caesarean section 23 5.5% 22 2.2% 8 1.1%
Puerperal pyrexia 13 2.4% 22 1.9% 10 1.2%
Breast abscess 0 0.0% 1 0.1% 0 0.0%
Urinary tract infection 2 0.4% 3 0.3% 2 0.2%
Genital tract infection 0 0.0% 4 0.3% 7 0.8%
Wound problem with intervention 6 1.1% 4 0.3% 6 0.7% * Post-partum haemorrhage was defined as blood loss > 500 ml within 24 hours of delivery before 2014 and > 500 ml
following vaginal delivery and > 1,000 ml following Caesarean delivery in 2014.
MATERNAL COMPLICATIONS
2014
Preterm (<37 weeks) 273 50.9% 569 48.8% 425 49.0%
Internal iliac artery ligation 0 0.0% 1 0.1% 0 0.0%
Uterine artery embolization 0 0.0% 3 0.3% 0 0.0%
Uterine compression suture - - - - 10 1.2%
Uterine balloon tamponade - - - - 13 1.5%
Uterine rupture 0 0.0% 0 0.0% 0 0.0%
Hysterectomy 2 0.4% 2 0.2% 2 0.2%
Maternal collapse - - - - 0 0.0%
Maternal death 0 0.0% 0 0.0% 0 0.0%
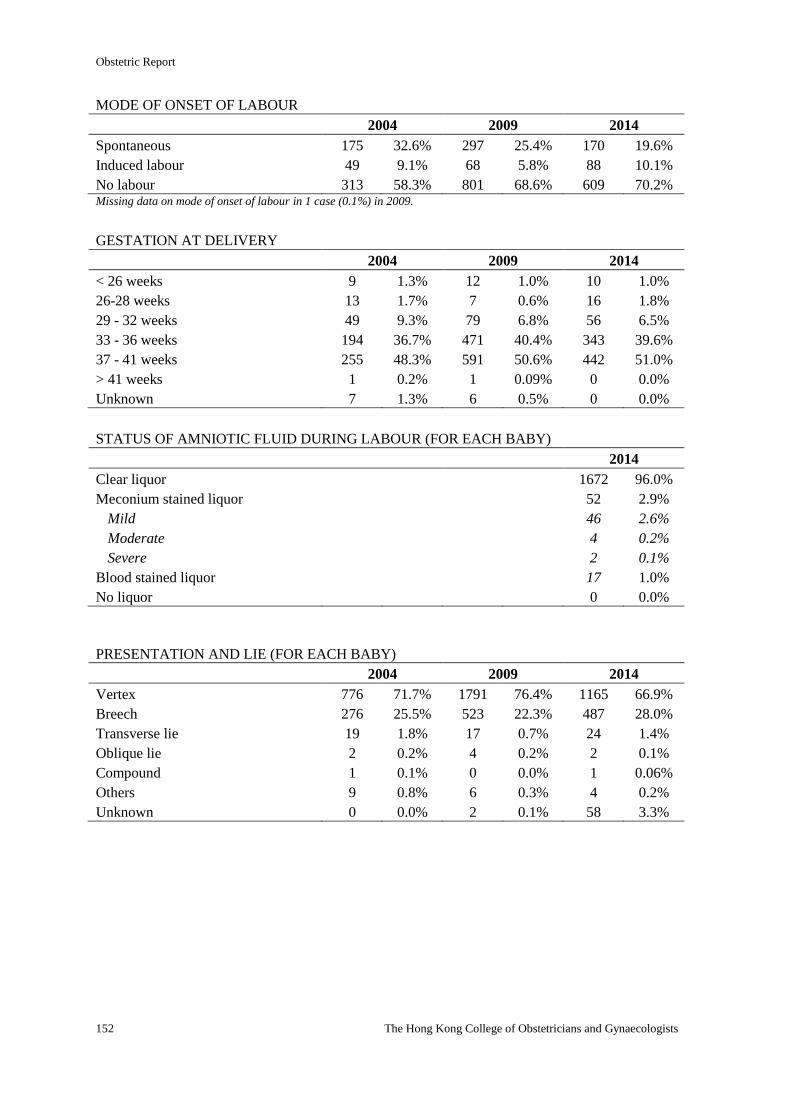
Obstetric Report
152 The Hong Kong College of Obstetricians and Gynaecologists
MODE OF ONSET OF LABOUR
2004 2009 2014
Spontaneous 175 32.6% 297 25.4% 170 19.6%
Induced labour 49 9.1% 68 5.8% 88 10.1%
No labour 313 58.3% 801 68.6% 609 70.2% Missing data on mode of onset of labour in 1 case (0.1%) in 2009.
GESTATION AT DELIVERY
2004 2009 2014
< 26 weeks 9 1.3% 12 1.0% 10 1.0%
26-28 weeks 13 1.7% 7 0.6% 16 1.8%
29 - 32 weeks 49 9.3% 79 6.8% 56 6.5%
33 - 36 weeks 194 36.7% 471 40.4% 343 39.6%
37 - 41 weeks 255 48.3% 591 50.6% 442 51.0%
> 41 weeks 1 0.2% 1 0.09% 0 0.0%
Unknown 7 1.3% 6 0.5% 0 0.0%
STATUS OF AMNIOTIC FLUID DURING LABOUR (FOR EACH BABY)
2014
Clear liquor 1672 96.0%
Meconium stained liquor 52 2.9%
Mild 46 2.6%
Moderate 4 0.2%
Severe 2 0.1%
Blood stained liquor 17 1.0%
No liquor 0 0.0%
PRESENTATION AND LIE (FOR EACH BABY)
2004 2009 2014
Vertex 776 71.7% 1791 76.4% 1165 66.9%
Breech 276 25.5% 523 22.3% 487 28.0%
Transverse lie 19 1.8% 17 0.7% 24 1.4%
Oblique lie 2 0.2% 4 0.2% 2 0.1%
Compound 1 0.1% 0 0.0% 1 0.06%
Others 9 0.8% 6 0.3% 4 0.2%
Unknown 0 0.0% 2 0.1% 58 3.3%
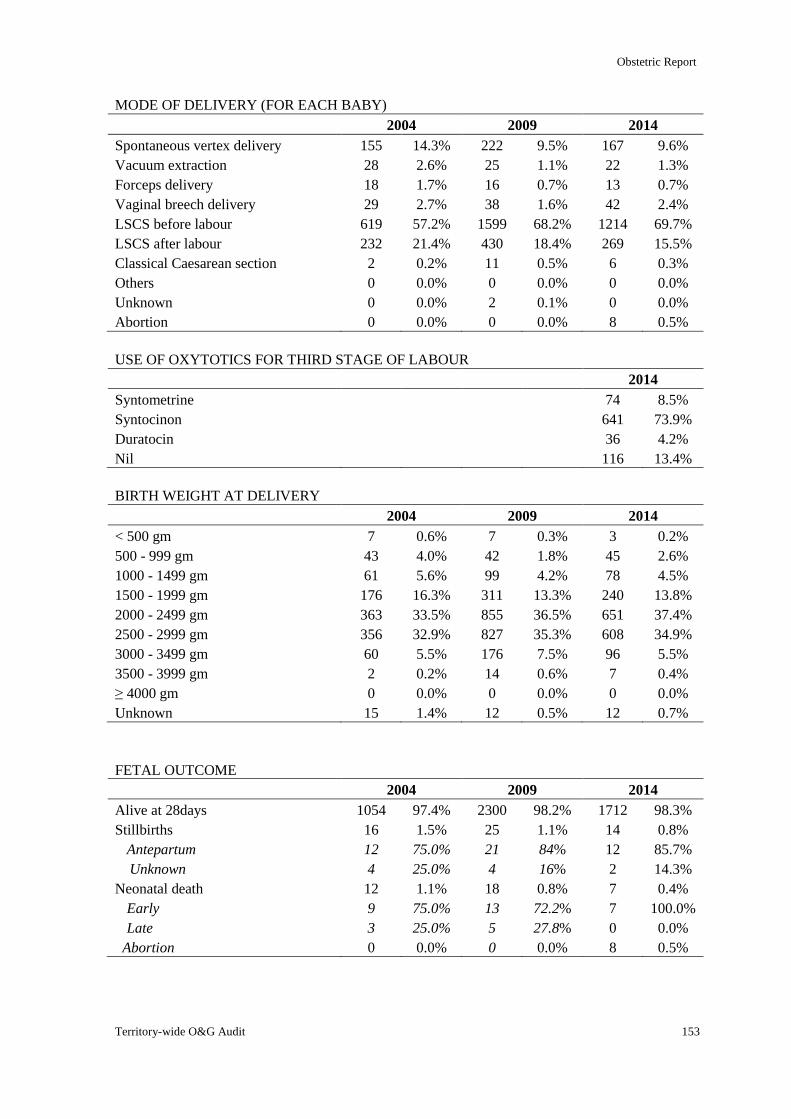
Obstetric Report
Territory-wide O&G Audit 153
MODE OF DELIVERY (FOR EACH BABY)
2004 2009 2014
Spontaneous vertex delivery 155 14.3% 222 9.5% 167 9.6%
Vacuum extraction 28 2.6% 25 1.1% 22 1.3%
Forceps delivery 18 1.7% 16 0.7% 13 0.7%
Vaginal breech delivery 29 2.7% 38 1.6% 42 2.4%
LSCS before labour 619 57.2% 1599 68.2% 1214 69.7%
LSCS after labour 232 21.4% 430 18.4% 269 15.5%
Classical Caesarean section 2 0.2% 11 0.5% 6 0.3%
Others 0 0.0% 0 0.0% 0 0.0%
Unknown 0 0.0% 2 0.1% 0 0.0%
Abortion 0 0.0% 0 0.0% 8 0.5%
USE OF OXYTOTICS FOR THIRD STAGE OF LABOUR
2014
Syntometrine 74 8.5%
Syntocinon 641 73.9%
Duratocin 36 4.2%
Nil 116 13.4%
BIRTH WEIGHT AT DELIVERY
2004 2009 2014
< 500 gm 7 0.6% 7 0.3% 3 0.2%
500 - 999 gm 43 4.0% 42 1.8% 45 2.6%
1000 - 1499 gm 61 5.6% 99 4.2% 78 4.5%
1500 - 1999 gm 176 16.3% 311 13.3% 240 13.8%
2000 - 2499 gm 363 33.5% 855 36.5% 651 37.4%
2500 - 2999 gm 356 32.9% 827 35.3% 608 34.9%
3000 - 3499 gm 60 5.5% 176 7.5% 96 5.5%
3500 - 3999 gm 2 0.2% 14 0.6% 7 0.4%
≥ 4000 gm 0 0.0% 0 0.0% 0 0.0%
Unknown 15 1.4% 12 0.5% 12 0.7%
FETAL OUTCOME
2004 2009 2014
Alive at 28days 1054 97.4% 2300 98.2% 1712 98.3%
Stillbirths 16 1.5% 25 1.1% 14 0.8%
Antepartum 12 75.0% 21 84% 12 85.7%
Unknown 4 25.0% 4 16% 2 14.3%
Neonatal death 12 1.1% 18 0.8% 7 0.4%
Early 9 75.0% 13 72.2% 7 100.0%
Late 3 25.0% 5 27.8% 0 0.0%
Abortion 0 0.0% 0 0.0% 8 0.5%
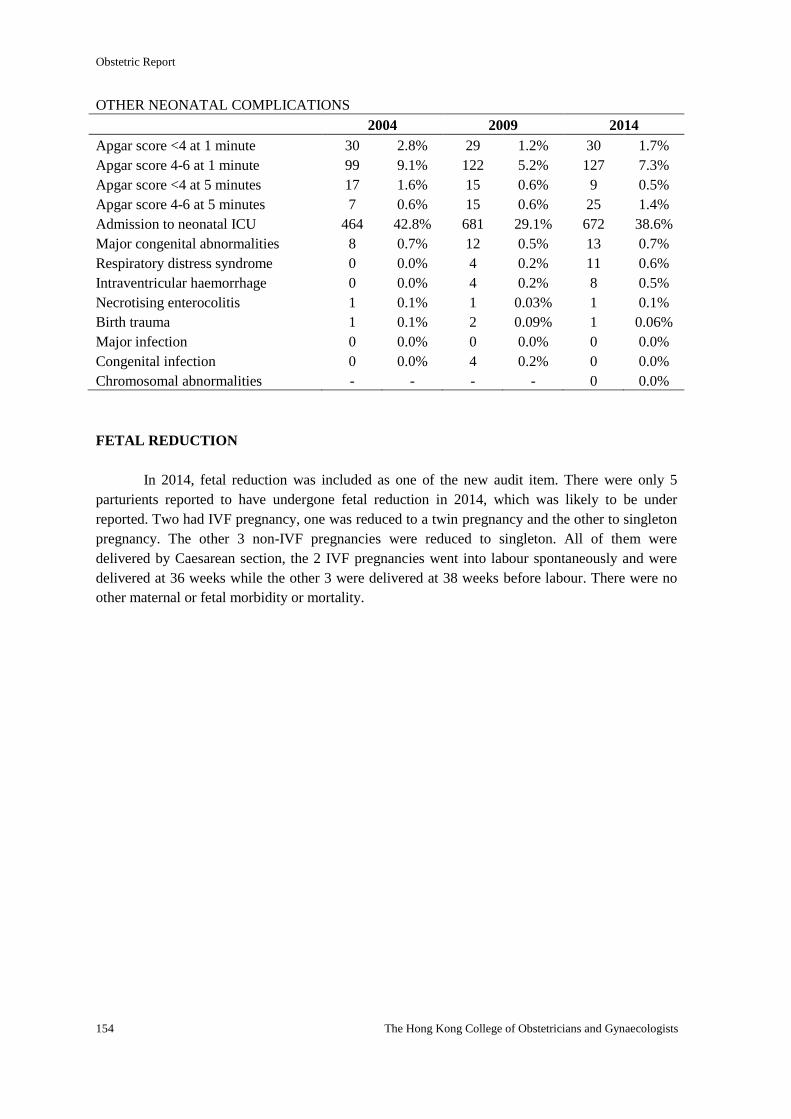
Obstetric Report
154 The Hong Kong College of Obstetricians and Gynaecologists
OTHER NEONATAL COMPLICATIONS
2004 2009 2014
Apgar score <4 at 1 minute 30 2.8% 29 1.2% 30 1.7%
Apgar score 4-6 at 1 minute 99 9.1% 122 5.2% 127 7.3%
Apgar score <4 at 5 minutes 17 1.6% 15 0.6% 9 0.5%
Apgar score 4-6 at 5 minutes 7 0.6% 15 0.6% 25 1.4%
Admission to neonatal ICU 464 42.8% 681 29.1% 672 38.6%
Major congenital abnormalities 8 0.7% 12 0.5% 13 0.7%
Respiratory distress syndrome 0 0.0% 4 0.2% 11 0.6%
Intraventricular haemorrhage 0 0.0% 4 0.2% 8 0.5%
Necrotising enterocolitis 1 0.1% 1 0.03% 1 0.1%
Birth trauma 1 0.1% 2 0.09% 1 0.06%
Major infection 0 0.0% 0 0.0% 0 0.0%
Congenital infection 0 0.0% 4 0.2% 0 0.0%
Chromosomal abnormalities - - - - 0 0.0%
FETAL REDUCTION
In 2014, fetal reduction was included as one of the new audit item. There were only 5
parturients reported to have undergone fetal reduction in 2014, which was likely to be under
reported. Two had IVF pregnancy, one was reduced to a twin pregnancy and the other to singleton
pregnancy. The other 3 non-IVF pregnancies were reduced to singleton. All of them were
delivered by Caesarean section, the 2 IVF pregnancies went into labour spontaneously and were
delivered at 36 weeks while the other 3 were delivered at 38 weeks before labour. There were no
other maternal or fetal morbidity or mortality.
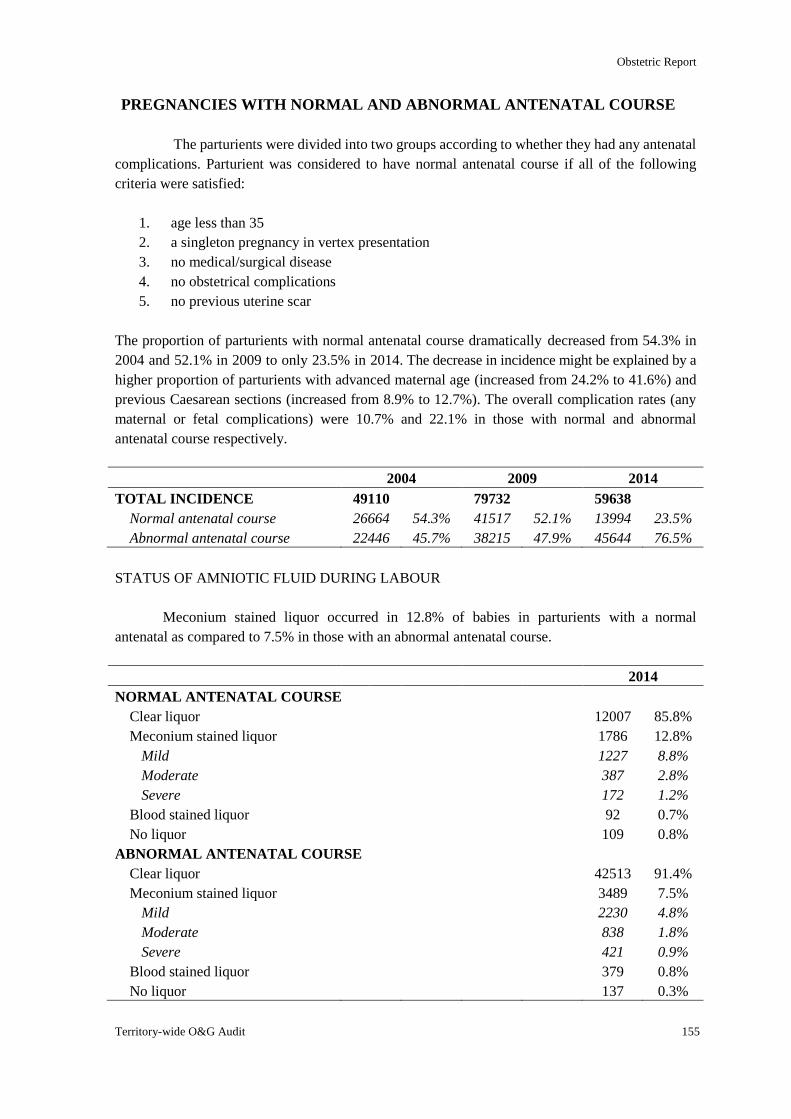
Obstetric Report
Territory-wide O&G Audit 155
PREGNANCIES WITH NORMAL AND ABNORMAL ANTENATAL COURSE
The parturients were divided into two groups according to whether they had any antenatal
complications. Parturient was considered to have normal antenatal course if all of the following
criteria were satisfied:
1. age less than 35
2. a singleton pregnancy in vertex presentation
3. no medical/surgical disease
4. no obstetrical complications
5. no previous uterine scar
The proportion of parturients with normal antenatal course dramatically decreased from 54.3% in
2004 and 52.1% in 2009 to only 23.5% in 2014. The decrease in incidence might be explained by a
higher proportion of parturients with advanced maternal age (increased from 24.2% to 41.6%) and
previous Caesarean sections (increased from 8.9% to 12.7%). The overall complication rates (any
maternal or fetal complications) were 10.7% and 22.1% in those with normal and abnormal
antenatal course respectively.
2004 2009 2014
TOTAL INCIDENCE 49110 79732 59638
Normal antenatal course 26664 54.3% 41517 52.1% 13994 23.5%
Abnormal antenatal course 22446 45.7% 38215 47.9% 45644 76.5%
STATUS OF AMNIOTIC FLUID DURING LABOUR
Meconium stained liquor occurred in 12.8% of babies in parturients with a normal
antenatal as compared to 7.5% in those with an abnormal antenatal course.
2014
NORMAL ANTENATAL COURSE
Clear liquor 12007 85.8%
Meconium stained liquor 1786 12.8%
Mild 1227 8.8%
Moderate 387 2.8%
Severe 172 1.2%
Blood stained liquor 92 0.7%
No liquor 109 0.8%
ABNORMAL ANTENATAL COURSE
Clear liquor 42513 91.4%
Meconium stained liquor 3489 7.5%
Mild 2230 4.8%
Moderate 838 1.8%
Severe 421 0.9%
Blood stained liquor 379 0.8%
No liquor 137 0.3%
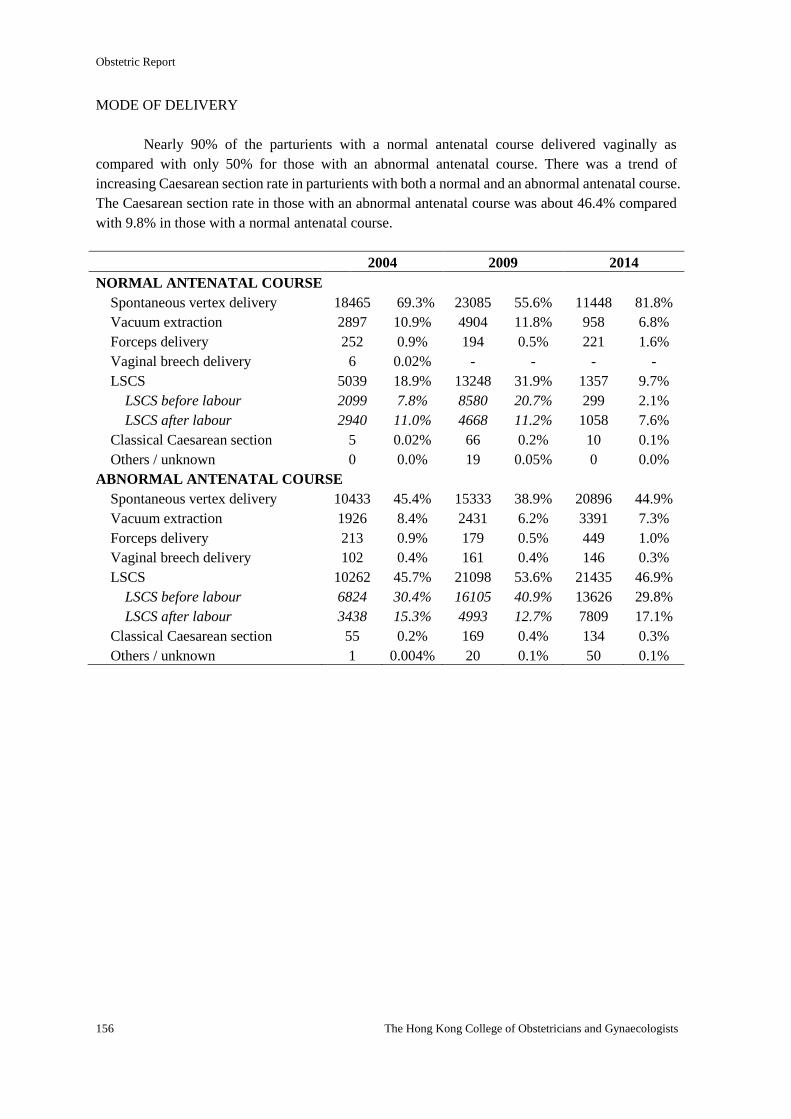
Obstetric Report
156 The Hong Kong College of Obstetricians and Gynaecologists
MODE OF DELIVERY
Nearly 90% of the parturients with a normal antenatal course delivered vaginally as
compared with only 50% for those with an abnormal antenatal course. There was a trend of
increasing Caesarean section rate in parturients with both a normal and an abnormal antenatal course.
The Caesarean section rate in those with an abnormal antenatal course was about 46.4% compared
with 9.8% in those with a normal antenatal course.
2004 2009 2014
NORMAL ANTENATAL COURSE
Spontaneous vertex delivery 18465 69.3% 23085 55.6% 11448 81.8%
Vacuum extraction 2897 10.9% 4904 11.8% 958 6.8%
Forceps delivery 252 0.9% 194 0.5% 221 1.6%
Vaginal breech delivery 6 0.02% - - - -
LSCS 5039 18.9% 13248 31.9% 1357 9.7%
LSCS before labour 2099 7.8% 8580 20.7% 299 2.1%
LSCS after labour 2940 11.0% 4668 11.2% 1058 7.6%
Classical Caesarean section 5 0.02% 66 0.2% 10 0.1%
Others / unknown 0 0.0% 19 0.05% 0 0.0%
ABNORMAL ANTENATAL COURSE
Spontaneous vertex delivery 10433 45.4% 15333 38.9% 20896 44.9%
Vacuum extraction 1926 8.4% 2431 6.2% 3391 7.3%
Forceps delivery 213 0.9% 179 0.5% 449 1.0%
Vaginal breech delivery 102 0.4% 161 0.4% 146 0.3%
LSCS 10262 45.7% 21098 53.6% 21435 46.9%
LSCS before labour 6824 30.4% 16105 40.9% 13626 29.8%
LSCS after labour 3438 15.3% 4993 12.7% 7809 17.1%
Classical Caesarean section 55 0.2% 169 0.4% 134 0.3%
Others / unknown 1 0.004% 20 0.1% 50 0.1%
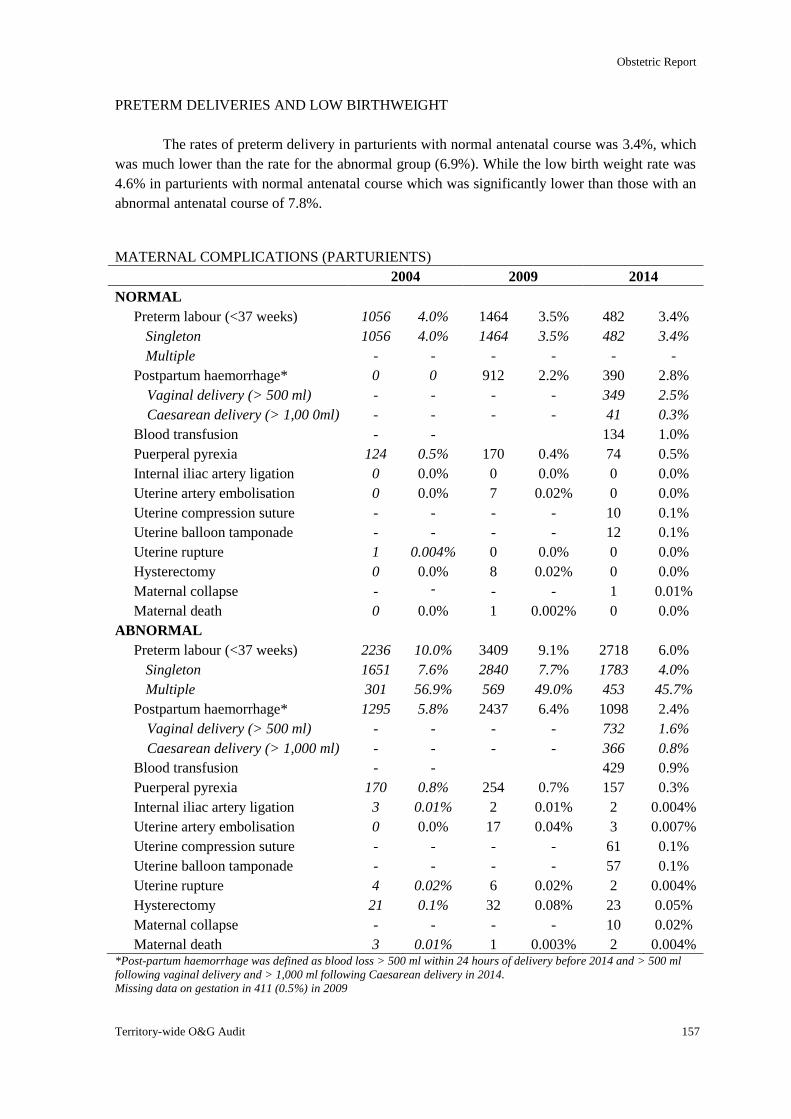
Obstetric Report
Territory-wide O&G Audit 157
PRETERM DELIVERIES AND LOW BIRTHWEIGHT
The rates of preterm delivery in parturients with normal antenatal course was 3.4%, which
was much lower than the rate for the abnormal group (6.9%). While the low birth weight rate was
4.6% in parturients with normal antenatal course which was significantly lower than those with an
abnormal antenatal course of 7.8%.
MATERNAL COMPLICATIONS (PARTURIENTS)
2004 2009 2014
NORMAL
Preterm labour (<37 weeks) 1056 4.0% 1464 3.5% 482 3.4%
Singleton 1056 4.0% 1464 3.5% 482 3.4%
Multiple - - - - - -
Postpartum haemorrhage* 0 0 912 2.2% 390 2.8%
Vaginal delivery (> 500 ml) - - - - 349 2.5%
Caesarean delivery (> 1,00 0ml) - - - - 41 0.3%
Blood transfusion - - 134 1.0%
Puerperal pyrexia 124 0.5% 170 0.4% 74 0.5%
Internal iliac artery ligation 0 0.0% 0 0.0% 0 0.0%
Uterine artery embolisation 0 0.0% 7 0.02% 0 0.0%
Uterine compression suture - - - - 10 0.1%
Uterine balloon tamponade - - - - 12 0.1%
Uterine rupture 1 0.004% 0 0.0% 0 0.0%
Hysterectomy 0 0.0% 8 0.02% 0 0.0%
Maternal collapse - - - - 1 0.01%
Maternal death 0 0.0% 1 0.002% 0 0.0%
ABNORMAL
Preterm labour (<37 weeks) 2236 10.0% 3409 9.1% 2718 6.0%
Singleton 1651 7.6% 2840 7.7% 1783 4.0%
Multiple 301 56.9% 569 49.0% 453 45.7%
Postpartum haemorrhage* 1295 5.8% 2437 6.4% 1098 2.4%
Vaginal delivery (> 500 ml) - - - - 732 1.6%
Caesarean delivery (> 1,000 ml) - - - - 366 0.8%
Blood transfusion - - 429 0.9%
Puerperal pyrexia 170 0.8% 254 0.7% 157 0.3%
Internal iliac artery ligation 3 0.01% 2 0.01% 2 0.004%
Uterine artery embolisation 0 0.0% 17 0.04% 3 0.007%
Uterine compression suture - - - - 61 0.1%
Uterine balloon tamponade - - - - 57 0.1%
Uterine rupture 4 0.02% 6 0.02% 2 0.004%
Hysterectomy 21 0.1% 32 0.08% 23 0.05%
Maternal collapse - - - - 10 0.02%
Maternal death 3 0.01% 1 0.003% 2 0.004% *Post-partum haemorrhage was defined as blood loss > 500 ml within 24 hours of delivery before 2014 and > 500 ml
following vaginal delivery and > 1,000 ml following Caesarean delivery in 2014.
Missing data on gestation in 411 (0.5%) in 2009
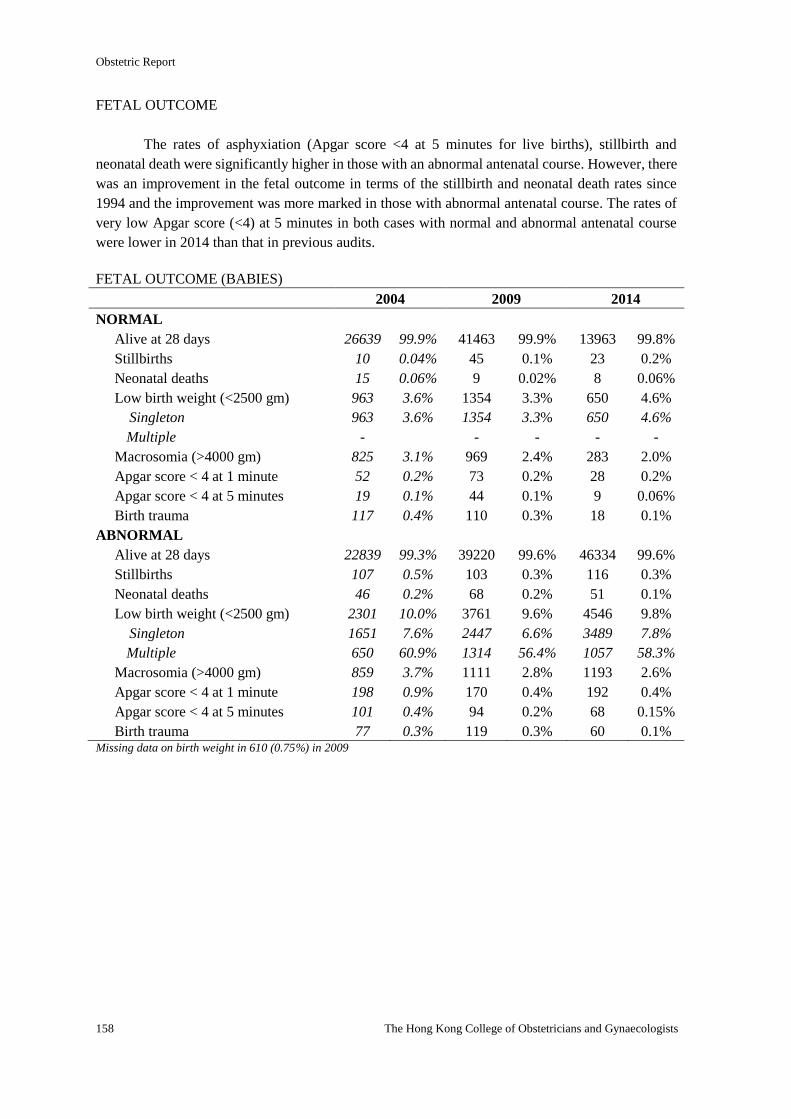
Obstetric Report
158 The Hong Kong College of Obstetricians and Gynaecologists
FETAL OUTCOME
The rates of asphyxiation (Apgar score <4 at 5 minutes for live births), stillbirth and
neonatal death were significantly higher in those with an abnormal antenatal course. However, there
was an improvement in the fetal outcome in terms of the stillbirth and neonatal death rates since
1994 and the improvement was more marked in those with abnormal antenatal course. The rates of
very low Apgar score (<4) at 5 minutes in both cases with normal and abnormal antenatal course
were lower in 2014 than that in previous audits.
FETAL OUTCOME (BABIES)
2004 2009 2014
NORMAL
Alive at 28 days 26639 99.9% 41463 99.9% 13963 99.8%
Stillbirths 10 0.04% 45 0.1% 23 0.2%
Neonatal deaths 15 0.06% 9 0.02% 8 0.06%
Low birth weight (<2500 gm) 963 3.6% 1354 3.3% 650 4.6%
Singleton 963 3.6% 1354 3.3% 650 4.6%
Multiple - - - - -
Macrosomia (>4000 gm) 825 3.1% 969 2.4% 283 2.0%
Apgar score < 4 at 1 minute 52 0.2% 73 0.2% 28 0.2%
Apgar score < 4 at 5 minutes 19 0.1% 44 0.1% 9 0.06%
Birth trauma 117 0.4% 110 0.3% 18 0.1%
ABNORMAL
Alive at 28 days 22839 99.3% 39220 99.6% 46334 99.6%
Stillbirths 107 0.5% 103 0.3% 116 0.3%
Neonatal deaths 46 0.2% 68 0.2% 51 0.1%
Low birth weight (<2500 gm) 2301 10.0% 3761 9.6% 4546 9.8%
Singleton 1651 7.6% 2447 6.6% 3489 7.8%
Multiple 650 60.9% 1314 56.4% 1057 58.3%
Macrosomia (>4000 gm) 859 3.7% 1111 2.8% 1193 2.6%
Apgar score < 4 at 1 minute 198 0.9% 170 0.4% 192 0.4%
Apgar score < 4 at 5 minutes 101 0.4% 94 0.2% 68 0.15%
Birth trauma 77 0.3% 119 0.3% 60 0.1% Missing data on birth weight in 610 (0.75%) in 2009
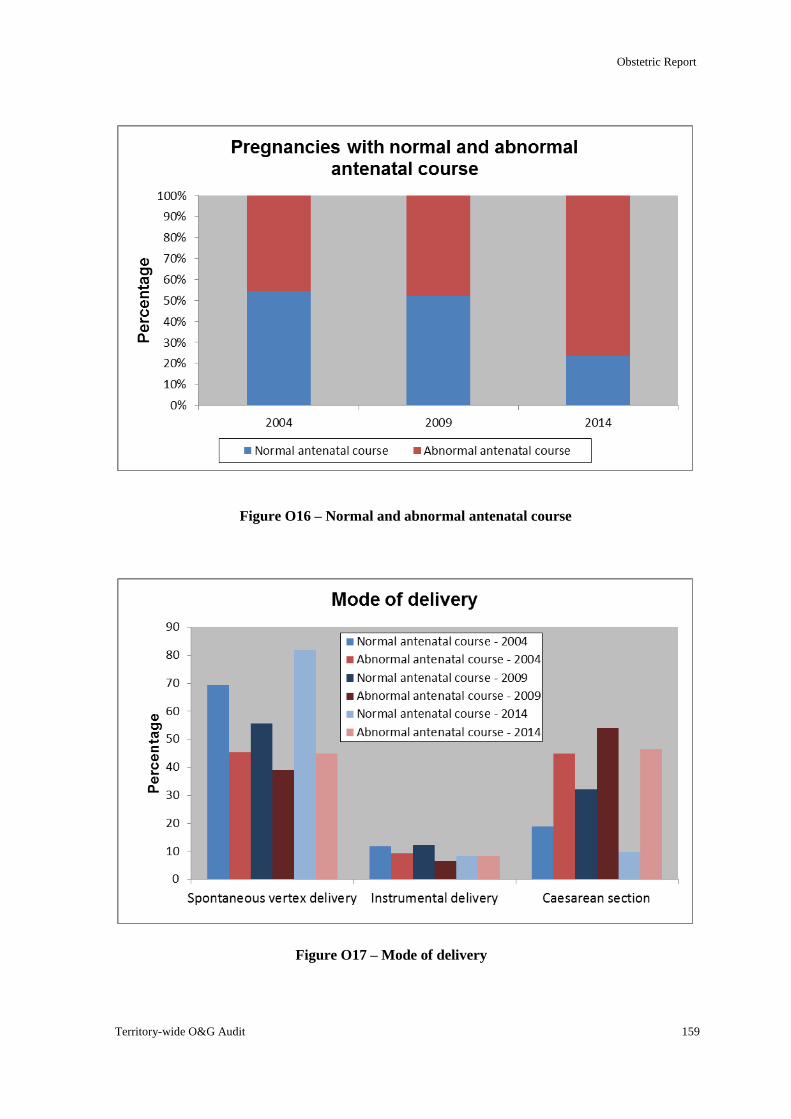
Obstetric Report
Territory-wide O&G Audit 159
Figure O16 – Normal and abnormal antenatal course
Figure O17 – Mode of delivery
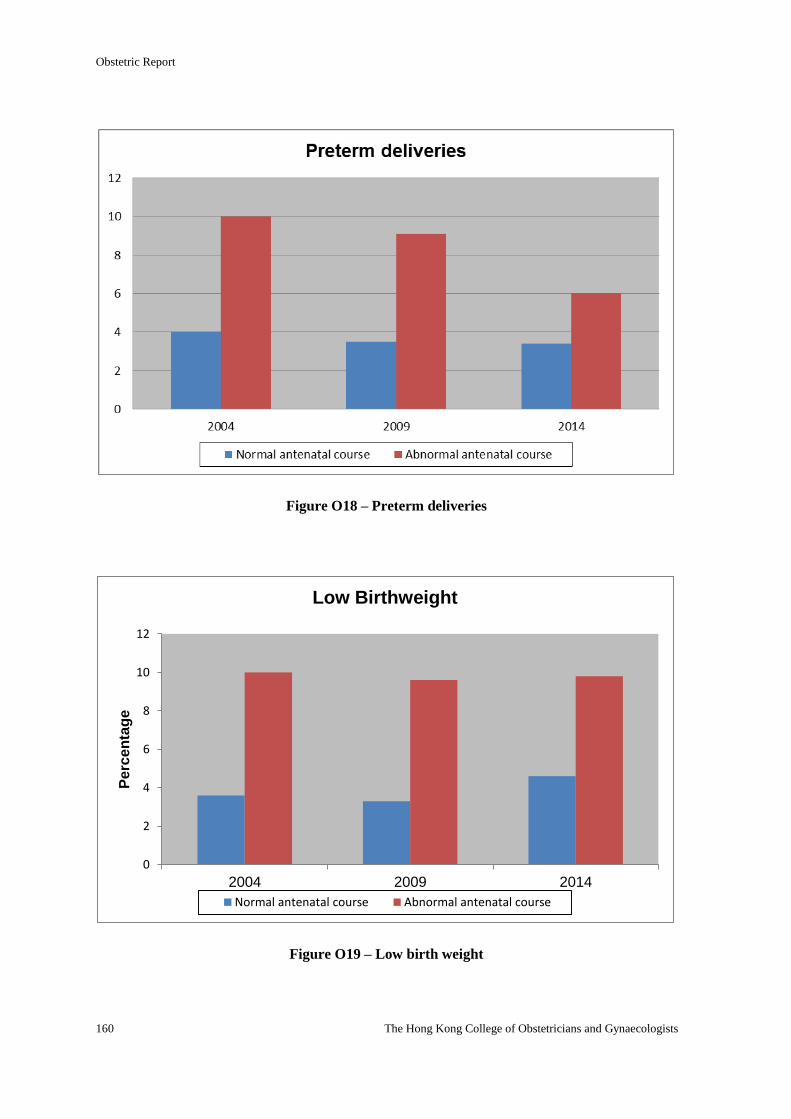
Obstetric Report
160 The Hong Kong College of Obstetricians and Gynaecologists
Figure O18 – Preterm deliveries
Figure O19 – Low birth weight
0
2
4
6
8
10
12
2004 2009 2014
Pe
rce
nta
ge
Low Birthweight
Normal antenatal course Abnormal antenatal course
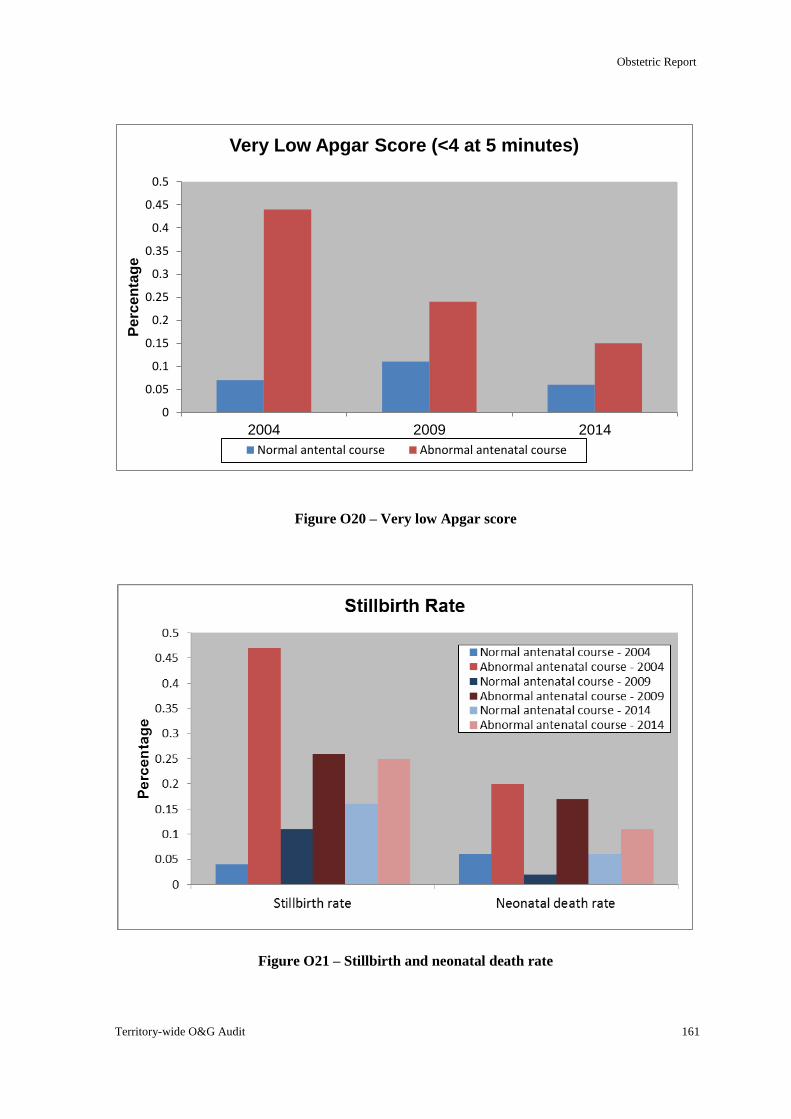
Obstetric Report
Territory-wide O&G Audit 161
Figure O20 – Very low Apgar score
Figure O21 – Stillbirth and neonatal death rate
0
0.05
0.1
0.15
0.2
0.25
0.3
0.35
0.4
0.45
0.5
2004 2009 2014
Pe
rce
nta
ge
Very Low Apgar Score (<4 at 5 minutes)
Normal antental course Abnormal antenatal course
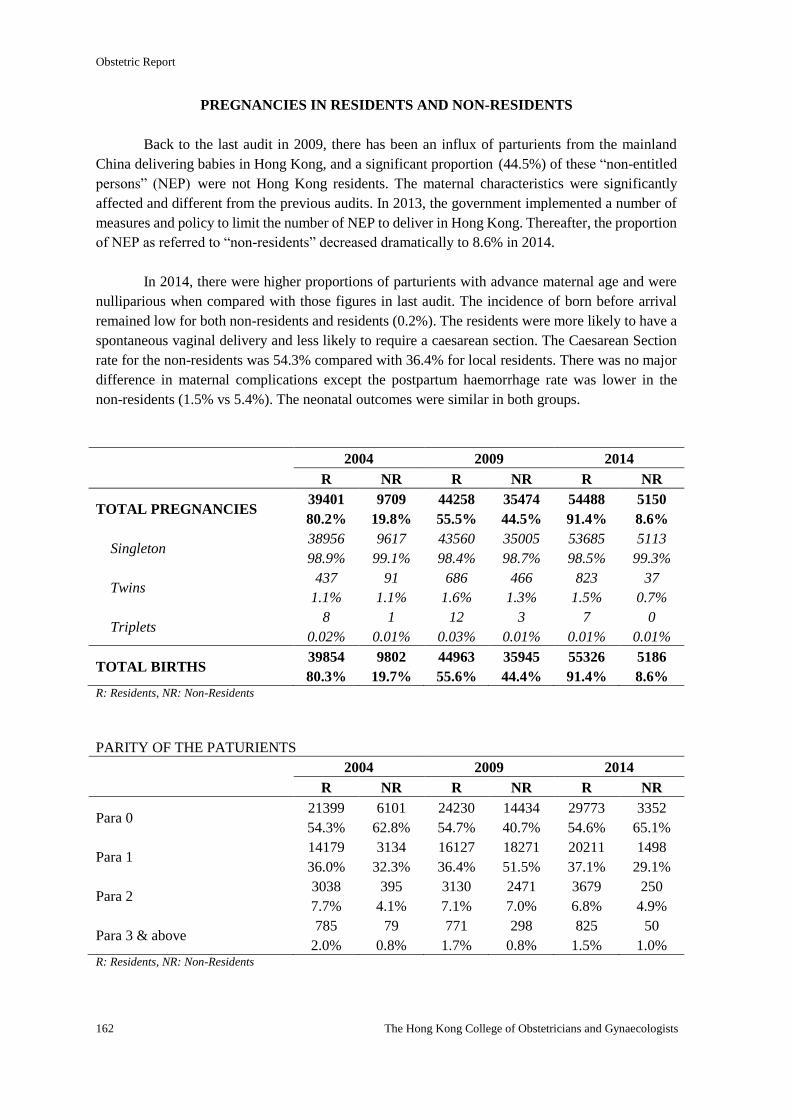
Obstetric Report
162 The Hong Kong College of Obstetricians and Gynaecologists
PREGNANCIES IN RESIDENTS AND NON-RESIDENTS
Back to the last audit in 2009, there has been an influx of parturients from the mainland
China delivering babies in Hong Kong, and a significant proportion (44.5%) of these “non-entitled
persons” (NEP) were not Hong Kong residents. The maternal characteristics were significantly
affected and different from the previous audits. In 2013, the government implemented a number of
measures and policy to limit the number of NEP to deliver in Hong Kong. Thereafter, the proportion
of NEP as referred to “non-residents” decreased dramatically to 8.6% in 2014.
In 2014, there were higher proportions of parturients with advance maternal age and were
nulliparious when compared with those figures in last audit. The incidence of born before arrival
remained low for both non-residents and residents (0.2%). The residents were more likely to have a
spontaneous vaginal delivery and less likely to require a caesarean section. The Caesarean Section
rate for the non-residents was 54.3% compared with 36.4% for local residents. There was no major
difference in maternal complications except the postpartum haemorrhage rate was lower in the
non-residents (1.5% vs 5.4%). The neonatal outcomes were similar in both groups.
2004 2009 2014
R NR R NR R NR
TOTAL PREGNANCIES 39401
80.2%
9709
19.8%
44258
55.5%
35474
44.5%
54488
91.4%
5150
8.6%
Singleton 38956
98.9%
9617
99.1%
43560
98.4%
35005
98.7%
53685
98.5%
5113
99.3%
Twins 437
1.1%
91
1.1%
686
1.6%
466
1.3%
823
1.5%
37
0.7%
Triplets 8
0.02%
1
0.01%
12
0.03%
3
0.01%
7
0.01%
0
0.01%
TOTAL BIRTHS 39854
80.3%
9802
19.7%
44963
55.6%
35945
44.4%
55326
91.4%
5186
8.6% R: Residents, NR: Non-Residents
PARITY OF THE PATURIENTS
2004 2009 2014
R NR R NR R NR
Para 0 21399
54.3%
6101
62.8%
24230
54.7%
14434
40.7%
29773
54.6%
3352
65.1%
Para 1 14179
36.0%
3134
32.3%
16127
36.4%
18271
51.5%
20211
37.1%
1498
29.1%
Para 2 3038
7.7%
395
4.1%
3130
7.1%
2471
7.0%
3679
6.8%
250
4.9%
Para 3 & above 785
2.0%
79
0.8%
771
1.7%
298
0.8%
825
1.5%
50
1.0% R: Residents, NR: Non-Residents
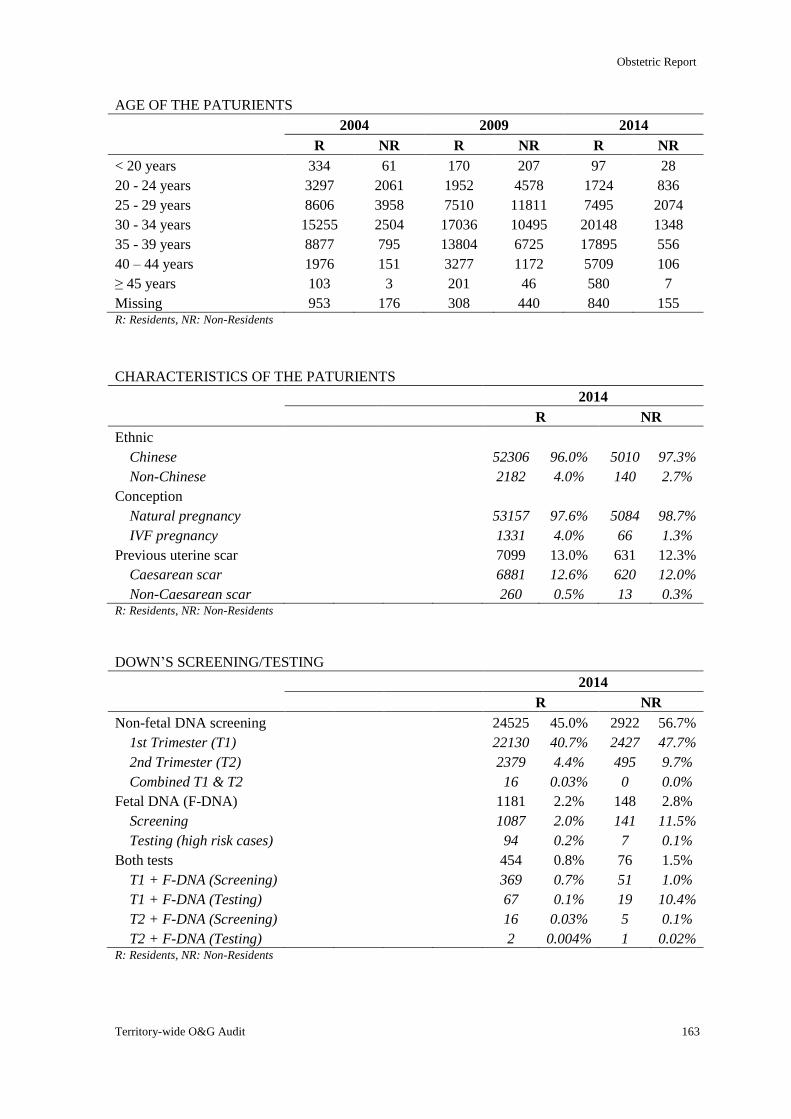
Obstetric Report
Territory-wide O&G Audit 163
AGE OF THE PATURIENTS
2004 2009 2014
R NR R NR R NR
< 20 years 334 61 170 207 97 28
20 - 24 years 3297 2061 1952 4578 1724 836
25 - 29 years 8606 3958 7510 11811 7495 2074
30 - 34 years 15255 2504 17036 10495 20148 1348
35 - 39 years 8877 795 13804 6725 17895 556
40 – 44 years 1976 151 3277 1172 5709 106
≥ 45 years 103 3 201 46 580 7
Missing 953 176 308 440 840 155 R: Residents, NR: Non-Residents
CHARACTERISTICS OF THE PATURIENTS
2014
R NR
Ethnic
Chinese 52306 96.0% 5010 97.3%
Non-Chinese 2182 4.0% 140 2.7%
Conception
Natural pregnancy 53157 97.6% 5084 98.7%
IVF pregnancy 1331 4.0% 66 1.3%
Previous uterine scar 7099 13.0% 631 12.3%
Caesarean scar 6881 12.6% 620 12.0%
Non-Caesarean scar 260 0.5% 13 0.3% R: Residents, NR: Non-Residents
DOWN’S SCREENING/TESTING
2014
R NR
Non-fetal DNA screening 24525 45.0% 2922 56.7%
1st Trimester (T1) 22130 40.7% 2427 47.7%
2nd Trimester (T2) 2379 4.4% 495 9.7%
Combined T1 & T2 16 0.03% 0 0.0%
Fetal DNA (F-DNA) 1181 2.2% 148 2.8%
Screening 1087 2.0% 141 11.5%
Testing (high risk cases) 94 0.2% 7 0.1%
Both tests 454 0.8% 76 1.5%
T1 + F-DNA (Screening) 369 0.7% 51 1.0%
T1 + F-DNA (Testing) 67 0.1% 19 10.4%
T2 + F-DNA (Screening) 16 0.03% 5 0.1%
T2 + F-DNA (Testing) 2 0.004% 1 0.02% R: Residents, NR: Non-Residents
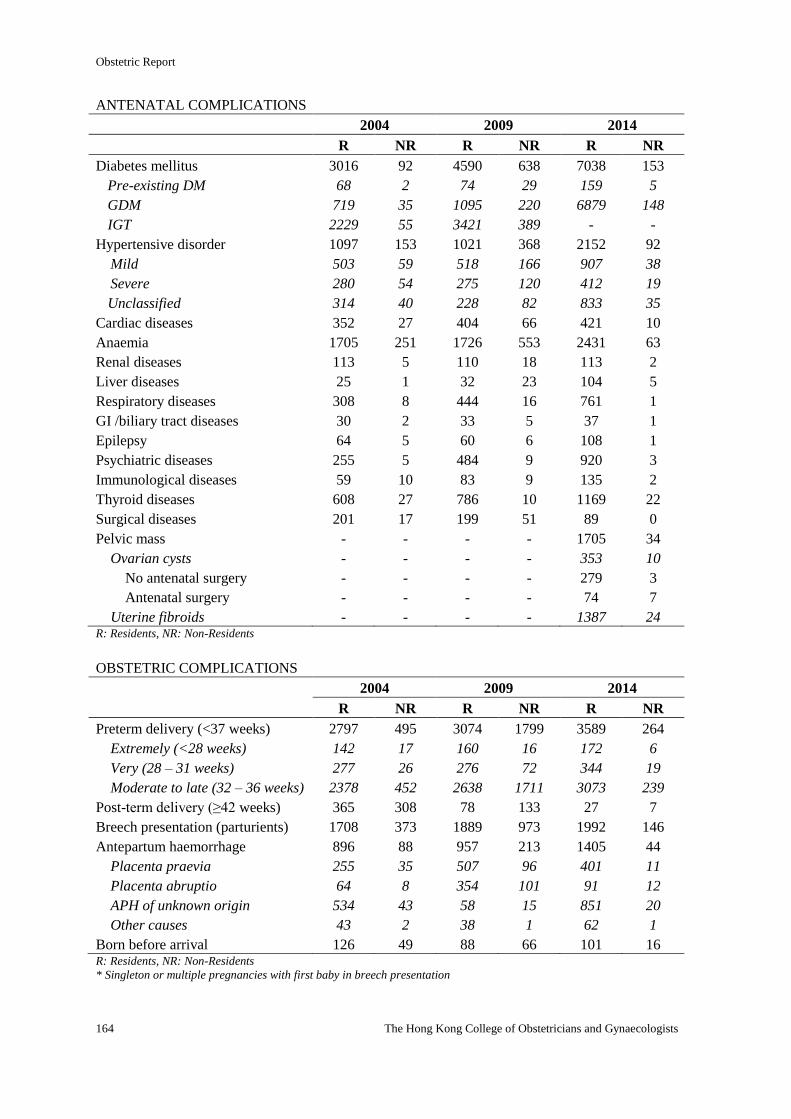
Obstetric Report
164 The Hong Kong College of Obstetricians and Gynaecologists
ANTENATAL COMPLICATIONS
2004 2009 2014
R NR R NR R NR
Diabetes mellitus 3016 92 4590 638 7038 153
Pre-existing DM 68 2 74 29 159 5
GDM 719 35 1095 220 6879 148
IGT 2229 55 3421 389 - -
Hypertensive disorder 1097 153 1021 368 2152 92
Mild 503 59 518 166 907 38
Severe 280 54 275 120 412 19
Unclassified 314 40 228 82 833 35
Cardiac diseases 352 27 404 66 421 10
Anaemia 1705 251 1726 553 2431 63
Renal diseases 113 5 110 18 113 2
Liver diseases 25 1 32 23 104 5
Respiratory diseases 308 8 444 16 761 1
GI /biliary tract diseases 30 2 33 5 37 1
Epilepsy 64 5 60 6 108 1
Psychiatric diseases 255 5 484 9 920 3
Immunological diseases 59 10 83 9 135 2
Thyroid diseases 608 27 786 10 1169 22
Surgical diseases 201 17 199 51 89 0
Pelvic mass - - - - 1705 34
Ovarian cysts - - - - 353 10
No antenatal surgery - - - - 279 3
Antenatal surgery - - - - 74 7
Uterine fibroids - - - - 1387 24 R: Residents, NR: Non-Residents
OBSTETRIC COMPLICATIONS
2004 2009 2014
R NR R NR R NR
Preterm delivery (<37 weeks) 2797 495 3074 1799 3589 264
Extremely (<28 weeks) 142 17 160 16 172 6
Very (28 – 31 weeks) 277 26 276 72 344 19
Moderate to late (32 – 36 weeks) 2378 452 2638 1711 3073 239
Post-term delivery (≥42 weeks) 365 308 78 133 27 7
Breech presentation (parturients) 1708 373 1889 973 1992 146
Antepartum haemorrhage 896 88 957 213 1405 44
Placenta praevia 255 35 507 96 401 11
Placenta abruptio 64 8 354 101 91 12
APH of unknown origin 534 43 58 15 851 20
Other causes 43 2 38 1 62 1
Born before arrival 126 49 88 66 101 16 R: Residents, NR: Non-Residents
* Singleton or multiple pregnancies with first baby in breech presentation
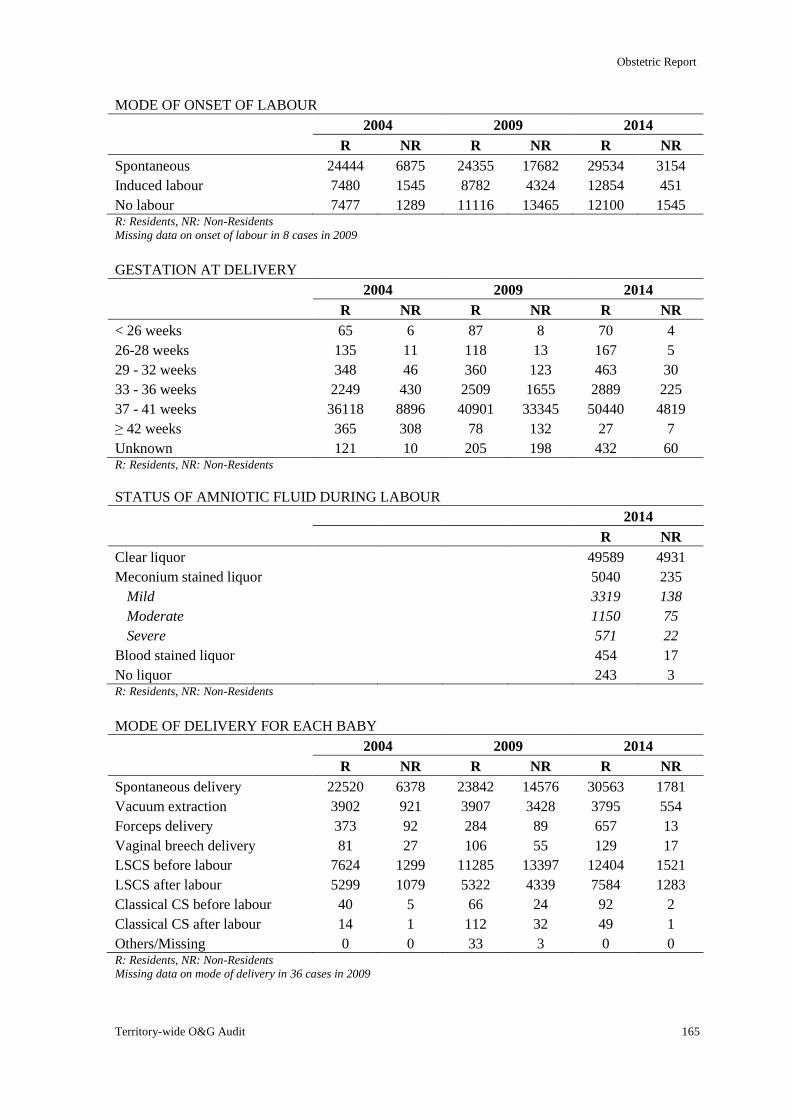
Obstetric Report
Territory-wide O&G Audit 165
MODE OF ONSET OF LABOUR
2004 2009 2014
R NR R NR R NR
Spontaneous 24444 6875 24355 17682 29534 3154
Induced labour 7480 1545 8782 4324 12854 451
No labour 7477 1289 11116 13465 12100 1545 R: Residents, NR: Non-Residents
Missing data on onset of labour in 8 cases in 2009
GESTATION AT DELIVERY
2004 2009 2014
R NR R NR R NR
< 26 weeks 65 6 87 8 70 4
26-28 weeks 135 11 118 13 167 5
29 - 32 weeks 348 46 360 123 463 30
33 - 36 weeks 2249 430 2509 1655 2889 225
37 - 41 weeks 36118 8896 40901 33345 50440 4819
≥ 42 weeks 365 308 78 132 27 7
Unknown 121 10 205 198 432 60 R: Residents, NR: Non-Residents
STATUS OF AMNIOTIC FLUID DURING LABOUR
2014
R NR
Clear liquor 49589 4931
Meconium stained liquor 5040 235
Mild 3319 138
Moderate 1150 75
Severe 571 22
Blood stained liquor 454 17
No liquor 243 3 R: Residents, NR: Non-Residents
MODE OF DELIVERY FOR EACH BABY
2004 2009 2014
R NR R NR R NR
Spontaneous delivery 22520 6378 23842 14576 30563 1781
Vacuum extraction 3902 921 3907 3428 3795 554
Forceps delivery 373 92 284 89 657 13
Vaginal breech delivery 81 27 106 55 129 17
LSCS before labour 7624 1299 11285 13397 12404 1521
LSCS after labour 5299 1079 5322 4339 7584 1283
Classical CS before labour 40 5 66 24 92 2
Classical CS after labour 14 1 112 32 49 1
Others/Missing 0 0 33 3 0 0 R: Residents, NR: Non-Residents
Missing data on mode of delivery in 36 cases in 2009
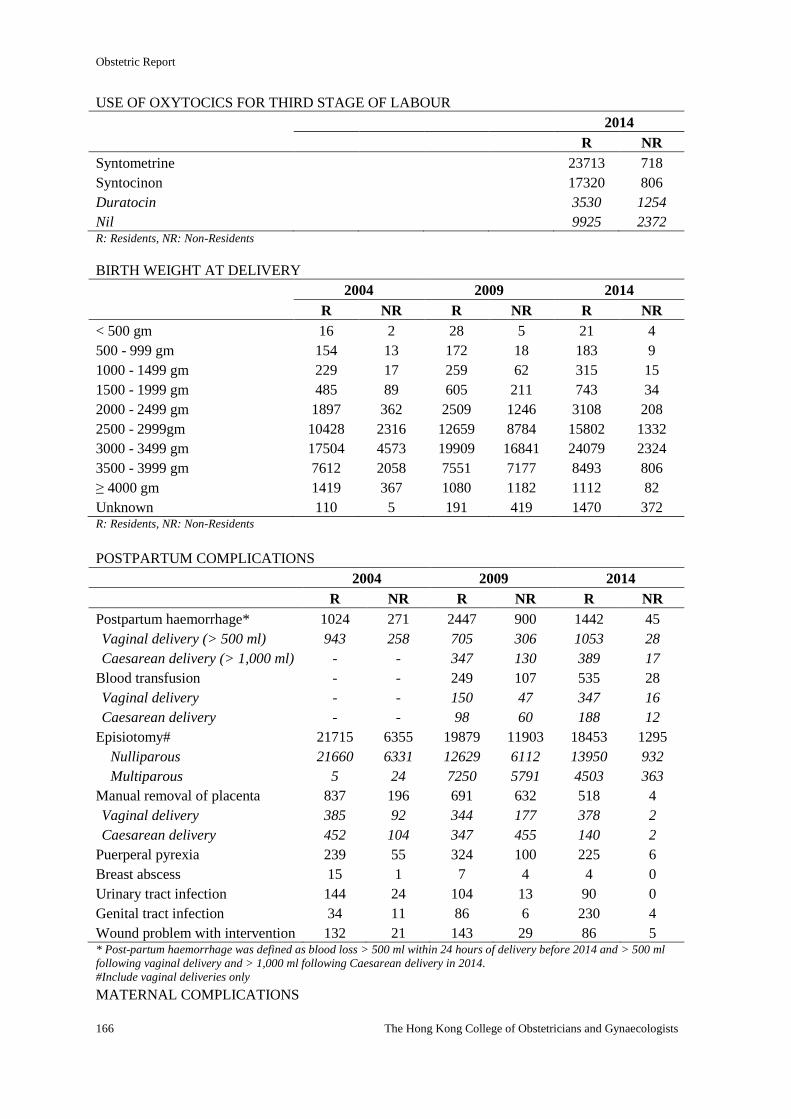
Obstetric Report
166 The Hong Kong College of Obstetricians and Gynaecologists
USE OF OXYTOCICS FOR THIRD STAGE OF LABOUR
2014
R NR
Syntometrine 23713 718
Syntocinon 17320 806
Duratocin 3530 1254
Nil 9925 2372 R: Residents, NR: Non-Residents
BIRTH WEIGHT AT DELIVERY
2004 2009 2014
R NR R NR R NR
< 500 gm 16 2 28 5 21 4
500 - 999 gm 154 13 172 18 183 9
1000 - 1499 gm 229 17 259 62 315 15
1500 - 1999 gm 485 89 605 211 743 34
2000 - 2499 gm 1897 362 2509 1246 3108 208
2500 - 2999gm 10428 2316 12659 8784 15802 1332
3000 - 3499 gm 17504 4573 19909 16841 24079 2324
3500 - 3999 gm 7612 2058 7551 7177 8493 806
≥ 4000 gm 1419 367 1080 1182 1112 82
Unknown 110 5 191 419 1470 372 R: Residents, NR: Non-Residents
POSTPARTUM COMPLICATIONS
2004 2009 2014
R NR R NR R NR
Postpartum haemorrhage* 1024 271 2447 900 1442 45
Vaginal delivery (> 500 ml) 943 258 705 306 1053 28
Caesarean delivery (> 1,000 ml) - - 347 130 389 17
Blood transfusion - - 249 107 535 28
Vaginal delivery - - 150 47 347 16
Caesarean delivery - - 98 60 188 12
Episiotomy# 21715 6355 19879 11903 18453 1295
Nulliparous 21660 6331 12629 6112 13950 932
Multiparous 5 24 7250 5791 4503 363
Manual removal of placenta 837 196 691 632 518 4
Vaginal delivery 385 92 344 177 378 2
Caesarean delivery 452 104 347 455 140 2
Puerperal pyrexia 239 55 324 100 225 6
Breast abscess 15 1 7 4 4 0
Urinary tract infection 144 24 104 13 90 0
Genital tract infection 34 11 86 6 230 4
Wound problem with intervention 132 21 143 29 86 5 * Post-partum haemorrhage was defined as blood loss > 500 ml within 24 hours of delivery before 2014 and > 500 ml
following vaginal delivery and > 1,000 ml following Caesarean delivery in 2014.
#Include vaginal deliveries only
MATERNAL COMPLICATIONS
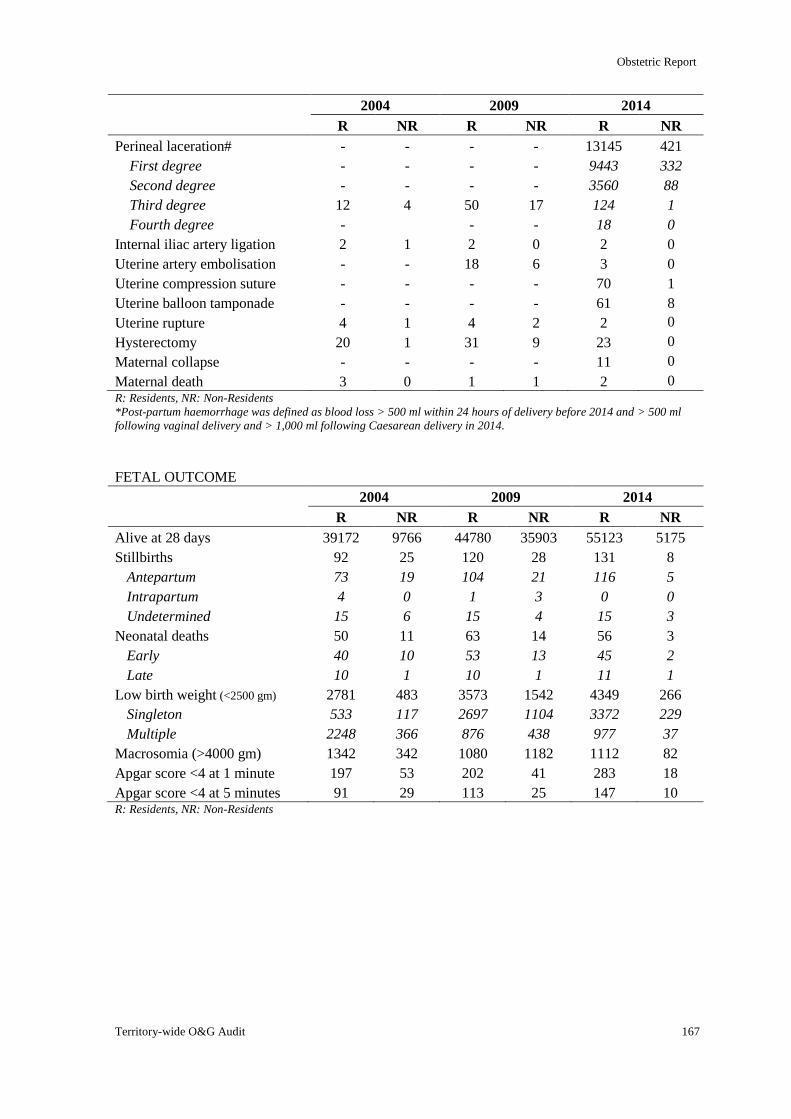
Obstetric Report
Territory-wide O&G Audit 167
2004 2009 2014
R NR R NR R NR
Perineal laceration# - - - - 13145 421
First degree - - - - 9443 332
Second degree - - - - 3560 88
Third degree 12 4 50 17 124 1
Fourth degree - - - 18 0
Internal iliac artery ligation 2 1 2 0 2 0
Uterine artery embolisation - - 18 6 3 0
Uterine compression suture - - - - 70 1
Uterine balloon tamponade - - - - 61 8
Uterine rupture 4 1 4 2 2 0
Hysterectomy 20 1 31 9 23 0
Maternal collapse - - - - 11 0
Maternal death 3 0 1 1 2 0 R: Residents, NR: Non-Residents
*Post-partum haemorrhage was defined as blood loss > 500 ml within 24 hours of delivery before 2014 and > 500 ml
following vaginal delivery and > 1,000 ml following Caesarean delivery in 2014.
FETAL OUTCOME
2004 2009 2014
R NR R NR R NR
Alive at 28 days 39172 9766 44780 35903 55123 5175
Stillbirths 92 25 120 28 131 8
Antepartum 73 19 104 21 116 5
Intrapartum 4 0 1 3 0 0
Undetermined 15 6 15 4 15 3
Neonatal deaths 50 11 63 14 56 3
Early 40 10 53 13 45 2
Late 10 1 10 1 11 1
Low birth weight (<2500 gm) 2781 483 3573 1542 4349 266
Singleton 533 117 2697 1104 3372 229
Multiple 2248 366 876 438 977 37
Macrosomia (>4000 gm) 1342 342 1080 1182 1112 82
Apgar score <4 at 1 minute 197 53 202 41 283 18
Apgar score <4 at 5 minutes 91 29 113 25 147 10 R: Residents, NR: Non-Residents
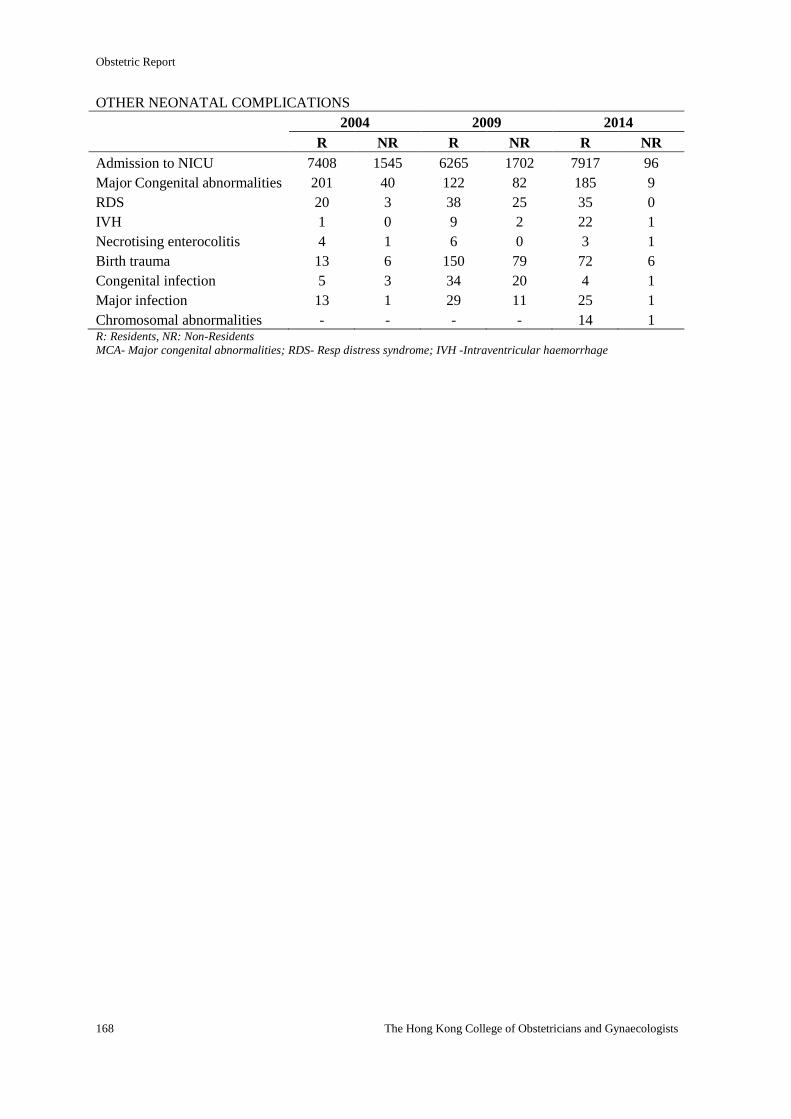
Obstetric Report
168 The Hong Kong College of Obstetricians and Gynaecologists
OTHER NEONATAL COMPLICATIONS
2004 2009 2014
R NR R NR R NR
Admission to NICU 7408 1545 6265 1702 7917 96
Major Congenital abnormalities 201 40 122 82 185 9
RDS 20 3 38 25 35 0
IVH 1 0 9 2 22 1
Necrotising enterocolitis 4 1 6 0 3 1
Birth trauma 13 6 150 79 72 6
Congenital infection 5 3 34 20 4 1
Major infection 13 1 29 11 25 1
Chromosomal abnormalities - - - - 14 1 R: Residents, NR: Non-Residents MCA- Major congenital abnormalities; RDS- Resp distress syndrome; IVH -Intraventricular haemorrhage
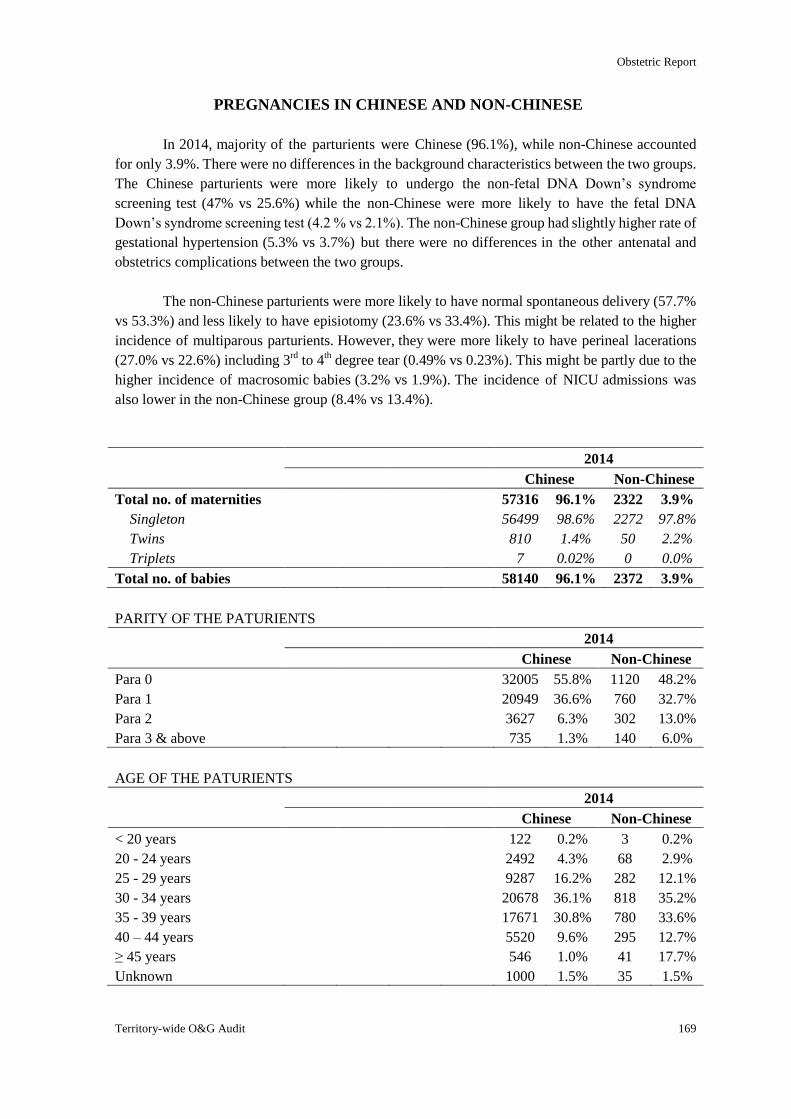
Obstetric Report
Territory-wide O&G Audit
169
PREGNANCIES IN CHINESE AND NON-CHINESE
In 2014, majority of the parturients were Chinese (96.1%), while non-Chinese accounted
for only 3.9%. There were no differences in the background characteristics between the two groups.
The Chinese parturients were more likely to undergo the non-fetal DNA Down’s syndrome
screening test (47% vs 25.6%) while the non-Chinese were more likely to have the fetal DNA
Down’s syndrome screening test (4.2 % vs 2.1%). The non-Chinese group had slightly higher rate of
gestational hypertension (5.3% vs 3.7%) but there were no differences in the other antenatal and
obstetrics complications between the two groups.
The non-Chinese parturients were more likely to have normal spontaneous delivery (57.7%
vs 53.3%) and less likely to have episiotomy (23.6% vs 33.4%). This might be related to the higher
incidence of multiparous parturients. However, they were more likely to have perineal lacerations
(27.0% vs 22.6%) including 3rd
to 4th degree tear (0.49% vs 0.23%). This might be partly due to the
higher incidence of macrosomic babies (3.2% vs 1.9%). The incidence of NICU admissions was
also lower in the non-Chinese group (8.4% vs 13.4%).
2014
Chinese Non-Chinese
Total no. of maternities 57316 96.1% 2322 3.9%
Singleton 56499 98.6% 2272 97.8%
Twins 810 1.4% 50 2.2%
Triplets 7 0.02% 0 0.0%
Total no. of babies 58140 96.1% 2372 3.9%
PARITY OF THE PATURIENTS
2014
Chinese Non-Chinese
Para 0 32005 55.8% 1120 48.2%
Para 1 20949 36.6% 760 32.7%
Para 2 3627 6.3% 302 13.0%
Para 3 & above 735 1.3% 140 6.0%
AGE OF THE PATURIENTS
2014
Chinese Non-Chinese
< 20 years 122 0.2% 3 0.2%
20 - 24 years 2492 4.3% 68 2.9%
25 - 29 years 9287 16.2% 282 12.1%
30 - 34 years 20678 36.1% 818 35.2%
35 - 39 years 17671 30.8% 780 33.6%
40 – 44 years 5520 9.6% 295 12.7%
≥ 45 years 546 1.0% 41 17.7%
Unknown 1000 1.5% 35 1.5%
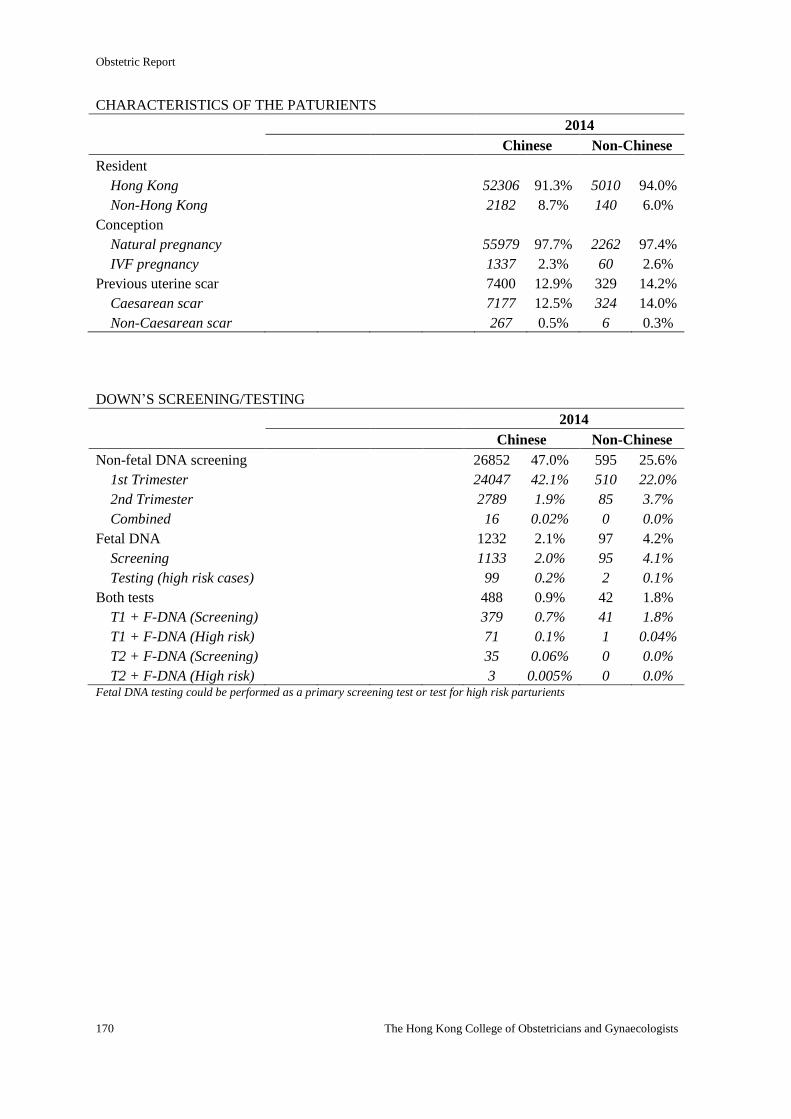
Obstetric Report
170 The Hong Kong College of Obstetricians and Gynaecologists
CHARACTERISTICS OF THE PATURIENTS
2014
Chinese Non-Chinese
Resident
Hong Kong 52306 91.3% 5010 94.0%
Non-Hong Kong 2182 8.7% 140 6.0%
Conception
Natural pregnancy 55979 97.7% 2262 97.4%
IVF pregnancy 1337 2.3% 60 2.6%
Previous uterine scar 7400 12.9% 329 14.2%
Caesarean scar 7177 12.5% 324 14.0%
Non-Caesarean scar 267 0.5% 6 0.3%
DOWN’S SCREENING/TESTING
2014
Chinese Non-Chinese
Non-fetal DNA screening 26852 47.0% 595 25.6%
1st Trimester 24047 42.1% 510 22.0%
2nd Trimester 2789 1.9% 85 3.7%
Combined 16 0.02% 0 0.0%
Fetal DNA 1232 2.1% 97 4.2%
Screening 1133 2.0% 95 4.1%
Testing (high risk cases) 99 0.2% 2 0.1%
Both tests 488 0.9% 42 1.8%
T1 + F-DNA (Screening) 379 0.7% 41 1.8%
T1 + F-DNA (High risk) 71 0.1% 1 0.04%
T2 + F-DNA (Screening) 35 0.06% 0 0.0%
T2 + F-DNA (High risk) 3 0.005% 0 0.0% Fetal DNA testing could be performed as a primary screening test or test for high risk parturients
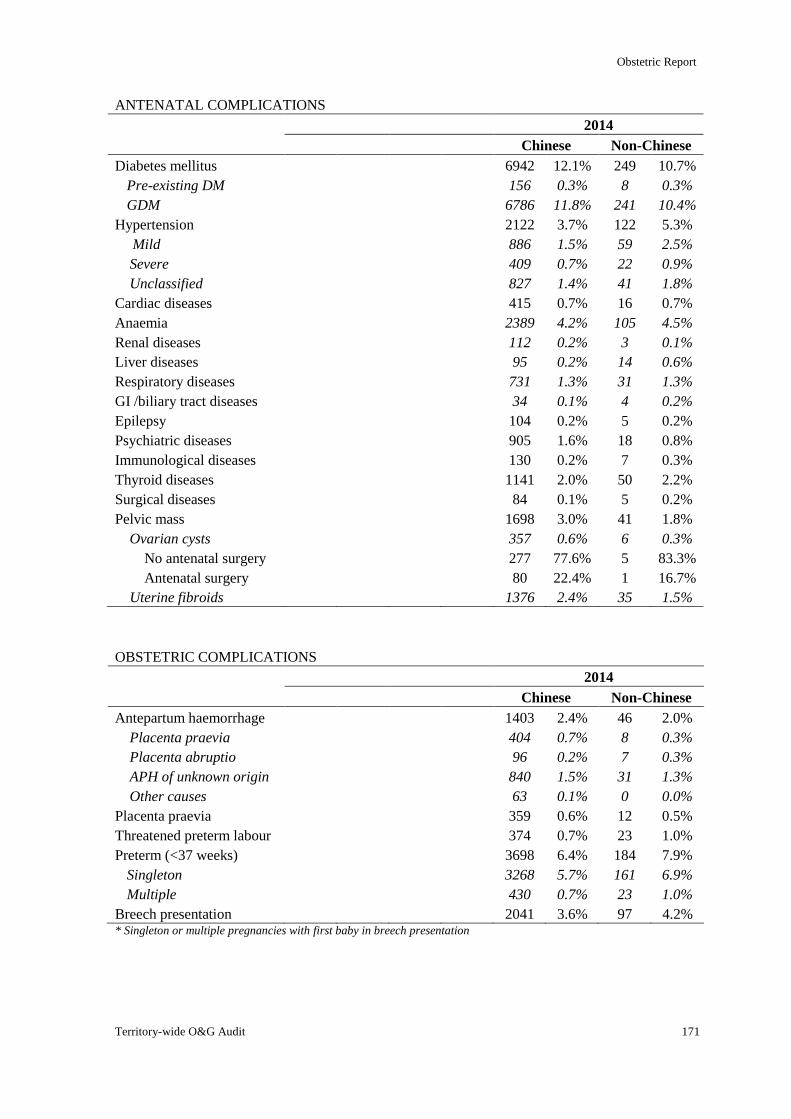
Obstetric Report
Territory-wide O&G Audit 171
ANTENATAL COMPLICATIONS
2014
Chinese Non-Chinese
Diabetes mellitus 6942 12.1% 249 10.7%
Pre-existing DM 156 0.3% 8 0.3%
GDM 6786 11.8% 241 10.4%
Hypertension 2122 3.7% 122 5.3%
Mild 886 1.5% 59 2.5%
Severe 409 0.7% 22 0.9%
Unclassified 827 1.4% 41 1.8%
Cardiac diseases 415 0.7% 16 0.7%
Anaemia 2389 4.2% 105 4.5%
Renal diseases 112 0.2% 3 0.1%
Liver diseases 95 0.2% 14 0.6%
Respiratory diseases 731 1.3% 31 1.3%
GI /biliary tract diseases 34 0.1% 4 0.2%
Epilepsy 104 0.2% 5 0.2%
Psychiatric diseases 905 1.6% 18 0.8%
Immunological diseases 130 0.2% 7 0.3%
Thyroid diseases 1141 2.0% 50 2.2%
Surgical diseases 84 0.1% 5 0.2%
Pelvic mass 1698 3.0% 41 1.8%
Ovarian cysts 357 0.6% 6 0.3%
No antenatal surgery 277 77.6% 5 83.3%
Antenatal surgery 80 22.4% 1 16.7%
Uterine fibroids 1376 2.4% 35 1.5%
OBSTETRIC COMPLICATIONS
2014
Chinese Non-Chinese
Antepartum haemorrhage 1403 2.4% 46 2.0%
Placenta praevia 404 0.7% 8 0.3%
Placenta abruptio 96 0.2% 7 0.3%
APH of unknown origin 840 1.5% 31 1.3%
Other causes 63 0.1% 0 0.0%
Placenta praevia 359 0.6% 12 0.5%
Threatened preterm labour 374 0.7% 23 1.0%
Preterm (<37 weeks) 3698 6.4% 184 7.9%
Singleton 3268 5.7% 161 6.9%
Multiple 430 0.7% 23 1.0%
Breech presentation 2041 3.6% 97 4.2% * Singleton or multiple pregnancies with first baby in breech presentation
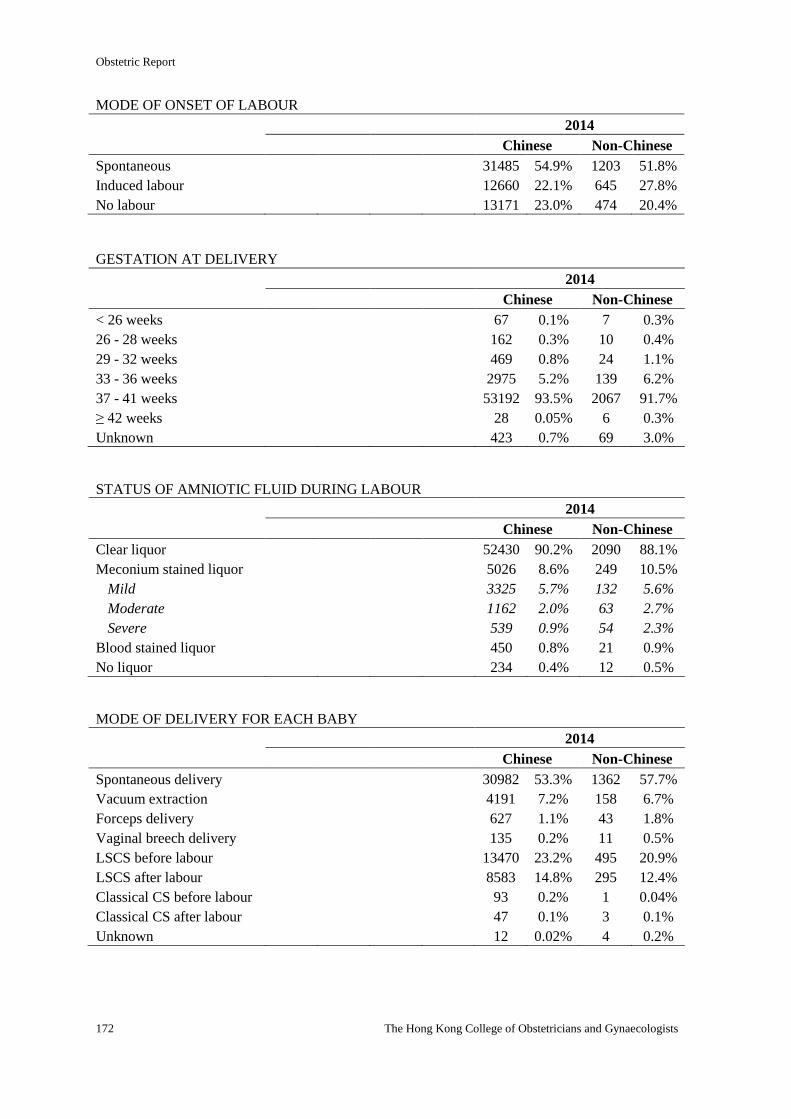
Obstetric Report
172 The Hong Kong College of Obstetricians and Gynaecologists
MODE OF ONSET OF LABOUR
2014
Chinese Non-Chinese
Spontaneous 31485 54.9% 1203 51.8%
Induced labour 12660 22.1% 645 27.8%
No labour 13171 23.0% 474 20.4%
GESTATION AT DELIVERY
2014
Chinese Non-Chinese
< 26 weeks 67 0.1% 7 0.3%
26 - 28 weeks 162 0.3% 10 0.4%
29 - 32 weeks 469 0.8% 24 1.1%
33 - 36 weeks 2975 5.2% 139 6.2%
37 - 41 weeks 53192 93.5% 2067 91.7%
≥ 42 weeks 28 0.05% 6 0.3%
Unknown 423 0.7% 69 3.0%
STATUS OF AMNIOTIC FLUID DURING LABOUR
2014
Chinese Non-Chinese
Clear liquor 52430 90.2% 2090 88.1%
Meconium stained liquor 5026 8.6% 249 10.5%
Mild 3325 5.7% 132 5.6%
Moderate 1162 2.0% 63 2.7%
Severe 539 0.9% 54 2.3%
Blood stained liquor 450 0.8% 21 0.9%
No liquor 234 0.4% 12 0.5%
MODE OF DELIVERY FOR EACH BABY
2014
Chinese Non-Chinese
Spontaneous delivery 30982 53.3% 1362 57.7%
Vacuum extraction 4191 7.2% 158 6.7%
Forceps delivery 627 1.1% 43 1.8%
Vaginal breech delivery 135 0.2% 11 0.5%
LSCS before labour 13470 23.2% 495 20.9%
LSCS after labour 8583 14.8% 295 12.4%
Classical CS before labour 93 0.2% 1 0.04%
Classical CS after labour 47 0.1% 3 0.1%
Unknown 12 0.02% 4 0.2%
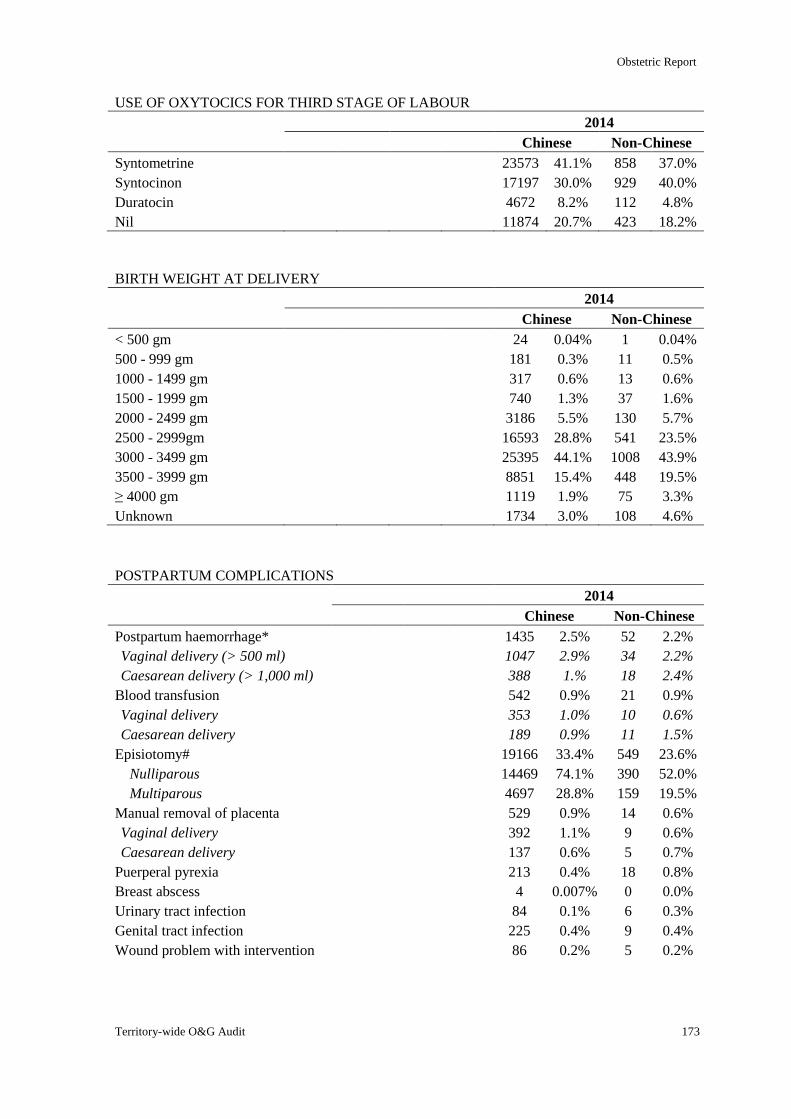
Obstetric Report
Territory-wide O&G Audit 173
USE OF OXYTOCICS FOR THIRD STAGE OF LABOUR
2014
Chinese Non-Chinese
Syntometrine 23573 41.1% 858 37.0%
Syntocinon 17197 30.0% 929 40.0%
Duratocin 4672 8.2% 112 4.8%
Nil 11874 20.7% 423 18.2%
BIRTH WEIGHT AT DELIVERY
2014
Chinese Non-Chinese
< 500 gm 24 0.04% 1 0.04%
500 - 999 gm 181 0.3% 11 0.5%
1000 - 1499 gm 317 0.6% 13 0.6%
1500 - 1999 gm 740 1.3% 37 1.6%
2000 - 2499 gm 3186 5.5% 130 5.7%
2500 - 2999gm 16593 28.8% 541 23.5%
3000 - 3499 gm 25395 44.1% 1008 43.9%
3500 - 3999 gm 8851 15.4% 448 19.5%
≥ 4000 gm 1119 1.9% 75 3.3%
Unknown 1734 3.0% 108 4.6%
POSTPARTUM COMPLICATIONS
2014
Chinese Non-Chinese
Postpartum haemorrhage* 1435 2.5% 52 2.2%
Vaginal delivery (> 500 ml) 1047 2.9% 34 2.2%
Caesarean delivery (> 1,000 ml) 388 1.% 18 2.4%
Blood transfusion 542 0.9% 21 0.9%
Vaginal delivery 353 1.0% 10 0.6%
Caesarean delivery 189 0.9% 11 1.5%
Episiotomy# 19166 33.4% 549 23.6%
Nulliparous 14469 74.1% 390 52.0%
Multiparous 4697 28.8% 159 19.5%
Manual removal of placenta 529 0.9% 14 0.6%
Vaginal delivery 392 1.1% 9 0.6%
Caesarean delivery 137 0.6% 5 0.7%
Puerperal pyrexia 213 0.4% 18 0.8%
Breast abscess 4 0.007% 0 0.0%
Urinary tract infection 84 0.1% 6 0.3%
Genital tract infection 225 0.4% 9 0.4%
Wound problem with intervention 86 0.2% 5 0.2%
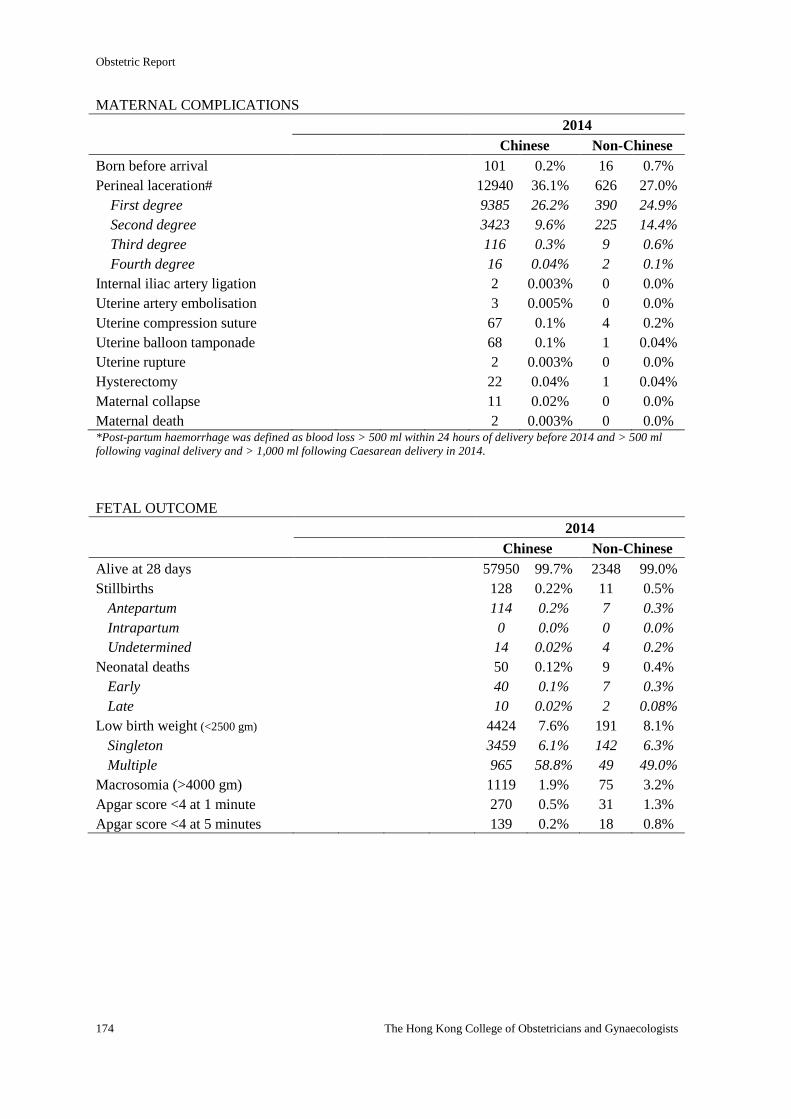
Obstetric Report
174 The Hong Kong College of Obstetricians and Gynaecologists
MATERNAL COMPLICATIONS
2014
Chinese Non-Chinese
Born before arrival 101 0.2% 16 0.7%
Perineal laceration# 12940 36.1% 626 27.0%
First degree 9385 26.2% 390 24.9%
Second degree 3423 9.6% 225 14.4%
Third degree 116 0.3% 9 0.6%
Fourth degree 16 0.04% 2 0.1%
Internal iliac artery ligation 2 0.003% 0 0.0%
Uterine artery embolisation 3 0.005% 0 0.0%
Uterine compression suture 67 0.1% 4 0.2%
Uterine balloon tamponade 68 0.1% 1 0.04%
Uterine rupture 2 0.003% 0 0.0%
Hysterectomy 22 0.04% 1 0.04%
Maternal collapse 11 0.02% 0 0.0%
Maternal death 2 0.003% 0 0.0% *Post-partum haemorrhage was defined as blood loss > 500 ml within 24 hours of delivery before 2014 and > 500 ml
following vaginal delivery and > 1,000 ml following Caesarean delivery in 2014.
FETAL OUTCOME
2014
Chinese Non-Chinese
Alive at 28 days 57950 99.7% 2348 99.0%
Stillbirths 128 0.22% 11 0.5%
Antepartum 114 0.2% 7 0.3%
Intrapartum 0 0.0% 0 0.0%
Undetermined 14 0.02% 4 0.2%
Neonatal deaths 50 0.12% 9 0.4%
Early 40 0.1% 7 0.3%
Late 10 0.02% 2 0.08%
Low birth weight (<2500 gm) 4424 7.6% 191 8.1%
Singleton 3459 6.1% 142 6.3%
Multiple 965 58.8% 49 49.0%
Macrosomia (>4000 gm) 1119 1.9% 75 3.2%
Apgar score <4 at 1 minute 270 0.5% 31 1.3%
Apgar score <4 at 5 minutes 139 0.2% 18 0.8%
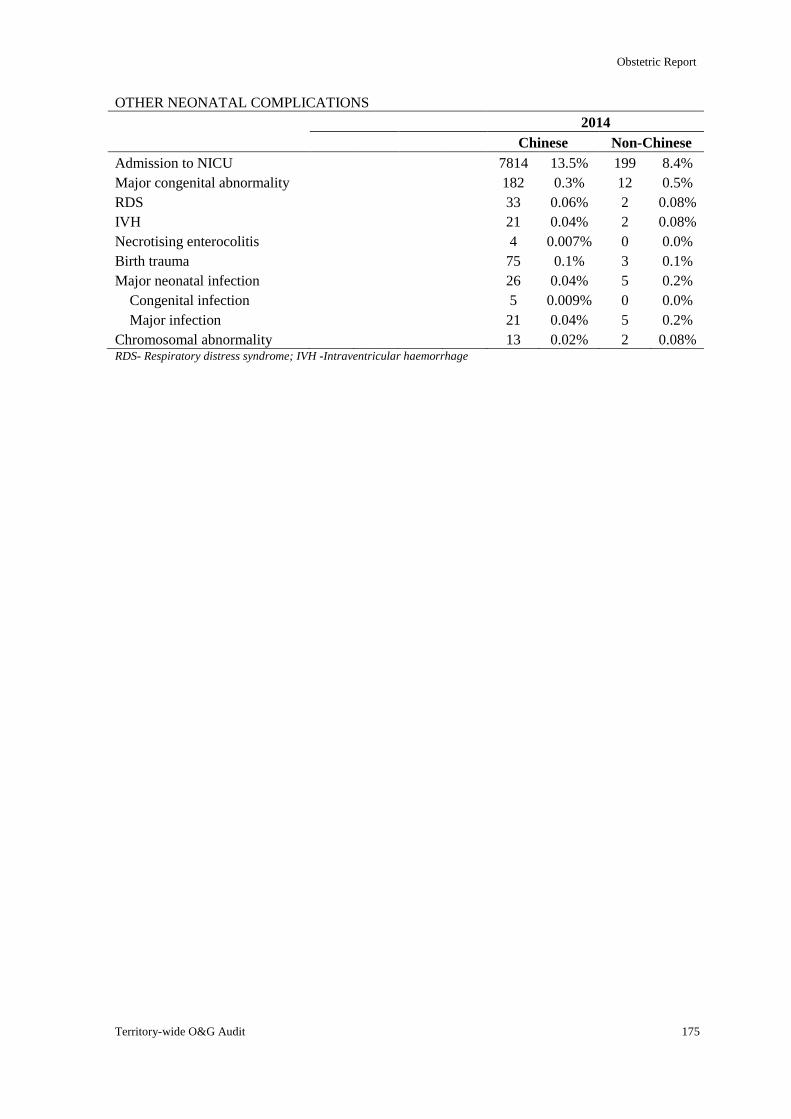
Obstetric Report
Territory-wide O&G Audit 175
OTHER NEONATAL COMPLICATIONS
2014
Chinese Non-Chinese
Admission to NICU 7814 13.5% 199 8.4%
Major congenital abnormality 182 0.3% 12 0.5%
RDS 33 0.06% 2 0.08%
IVH 21 0.04% 2 0.08%
Necrotising enterocolitis 4 0.007% 0 0.0%
Birth trauma 75 0.1% 3 0.1%
Major neonatal infection 26 0.04% 5 0.2%
Congenital infection 5 0.009% 0 0.0%
Major infection 21 0.04% 5 0.2%
Chromosomal abnormality 13 0.02% 2 0.08% RDS- Respiratory distress syndrome; IVH -Intraventricular haemorrhage
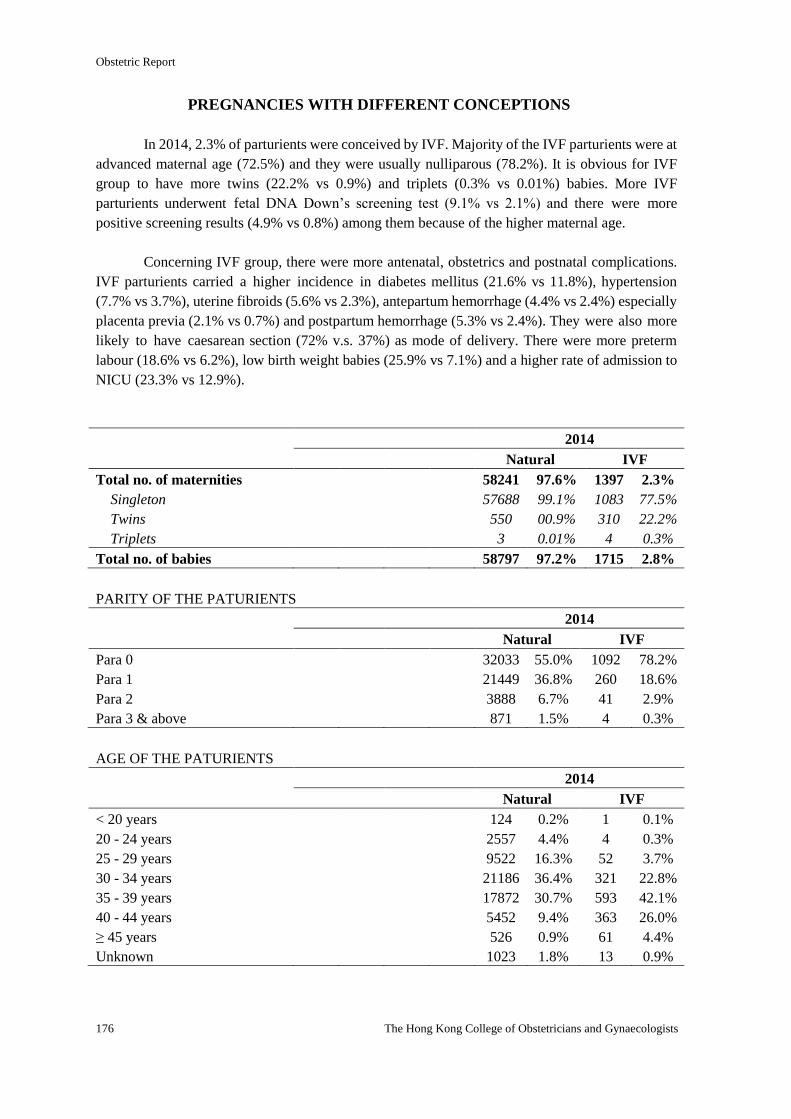
Obstetric Report
176 The Hong Kong College of Obstetricians and Gynaecologists
PREGNANCIES WITH DIFFERENT CONCEPTIONS
In 2014, 2.3% of parturients were conceived by IVF. Majority of the IVF parturients were at
advanced maternal age (72.5%) and they were usually nulliparous (78.2%). It is obvious for IVF
group to have more twins (22.2% vs 0.9%) and triplets (0.3% vs 0.01%) babies. More IVF
parturients underwent fetal DNA Down’s screening test (9.1% vs 2.1%) and there were more
positive screening results (4.9% vs 0.8%) among them because of the higher maternal age.
Concerning IVF group, there were more antenatal, obstetrics and postnatal complications.
IVF parturients carried a higher incidence in diabetes mellitus (21.6% vs 11.8%), hypertension
(7.7% vs 3.7%), uterine fibroids (5.6% vs 2.3%), antepartum hemorrhage (4.4% vs 2.4%) especially
placenta previa (2.1% vs 0.7%) and postpartum hemorrhage (5.3% vs 2.4%). They were also more
likely to have caesarean section (72% v.s. 37%) as mode of delivery. There were more preterm
labour (18.6% vs 6.2%), low birth weight babies (25.9% vs 7.1%) and a higher rate of admission to
NICU (23.3% vs 12.9%).
2014
Natural IVF
Total no. of maternities 58241 97.6% 1397 2.3%
Singleton 57688 99.1% 1083 77.5%
Twins 550 00.9% 310 22.2%
Triplets 3 0.01% 4 0.3%
Total no. of babies 58797 97.2% 1715 2.8%
PARITY OF THE PATURIENTS
2014
Natural IVF
Para 0 32033 55.0% 1092 78.2%
Para 1 21449 36.8% 260 18.6%
Para 2 3888 6.7% 41 2.9%
Para 3 & above 871 1.5% 4 0.3%
AGE OF THE PATURIENTS
2014
Natural IVF
< 20 years 124 0.2% 1 0.1%
20 - 24 years 2557 4.4% 4 0.3%
25 - 29 years 9522 16.3% 52 3.7%
30 - 34 years 21186 36.4% 321 22.8%
35 - 39 years 17872 30.7% 593 42.1%
40 - 44 years 5452 9.4% 363 26.0%
≥ 45 years 526 0.9% 61 4.4%
Unknown 1023 1.8% 13 0.9%
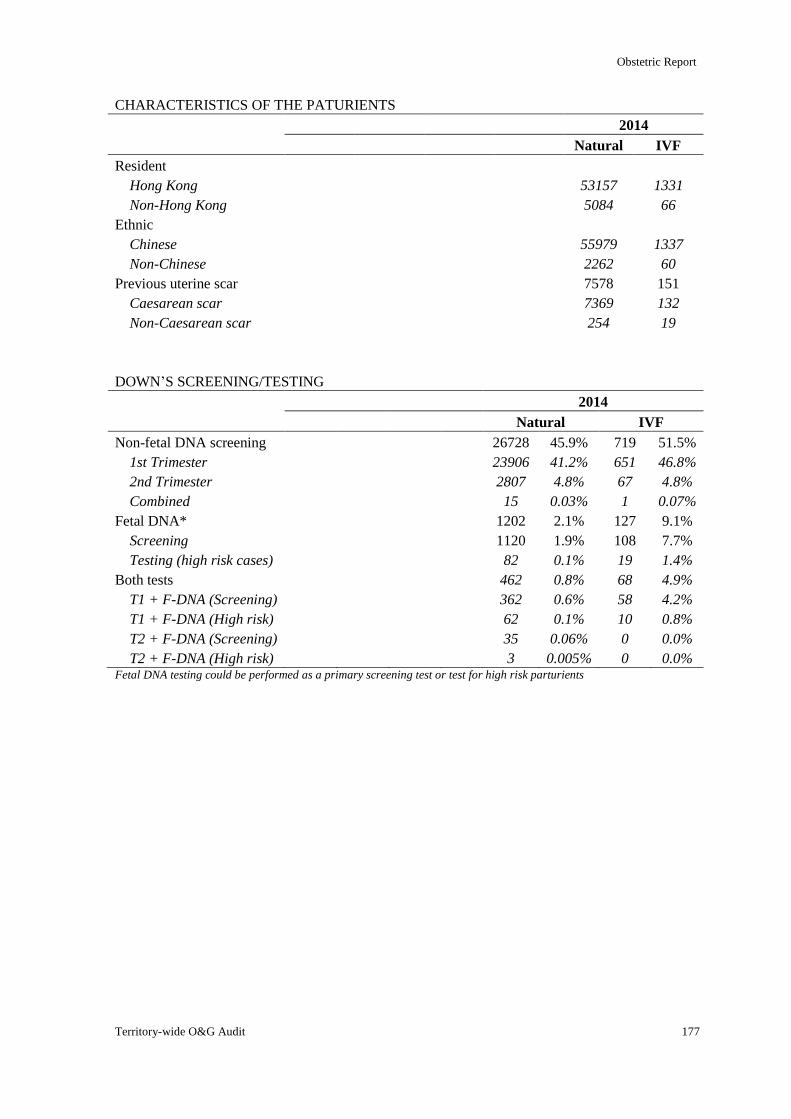
Obstetric Report
Territory-wide O&G Audit 177
CHARACTERISTICS OF THE PATURIENTS
2014
Natural IVF
Resident
Hong Kong 53157 1331
Non-Hong Kong 5084 66
Ethnic
Chinese 55979 1337
Non-Chinese 2262 60
Previous uterine scar 7578 151
Caesarean scar 7369 132
Non-Caesarean scar 254 19
DOWN’S SCREENING/TESTING
2014
Natural IVF
Non-fetal DNA screening 26728 45.9% 719 51.5%
1st Trimester 23906 41.2% 651 46.8%
2nd Trimester 2807 4.8% 67 4.8%
Combined 15 0.03% 1 0.07%
Fetal DNA* 1202 2.1% 127 9.1%
Screening 1120 1.9% 108 7.7%
Testing (high risk cases) 82 0.1% 19 1.4%
Both tests 462 0.8% 68 4.9%
T1 + F-DNA (Screening) 362 0.6% 58 4.2%
T1 + F-DNA (High risk) 62 0.1% 10 0.8%
T2 + F-DNA (Screening) 35 0.06% 0 0.0%
T2 + F-DNA (High risk) 3 0.005% 0 0.0% Fetal DNA testing could be performed as a primary screening test or test for high risk parturients
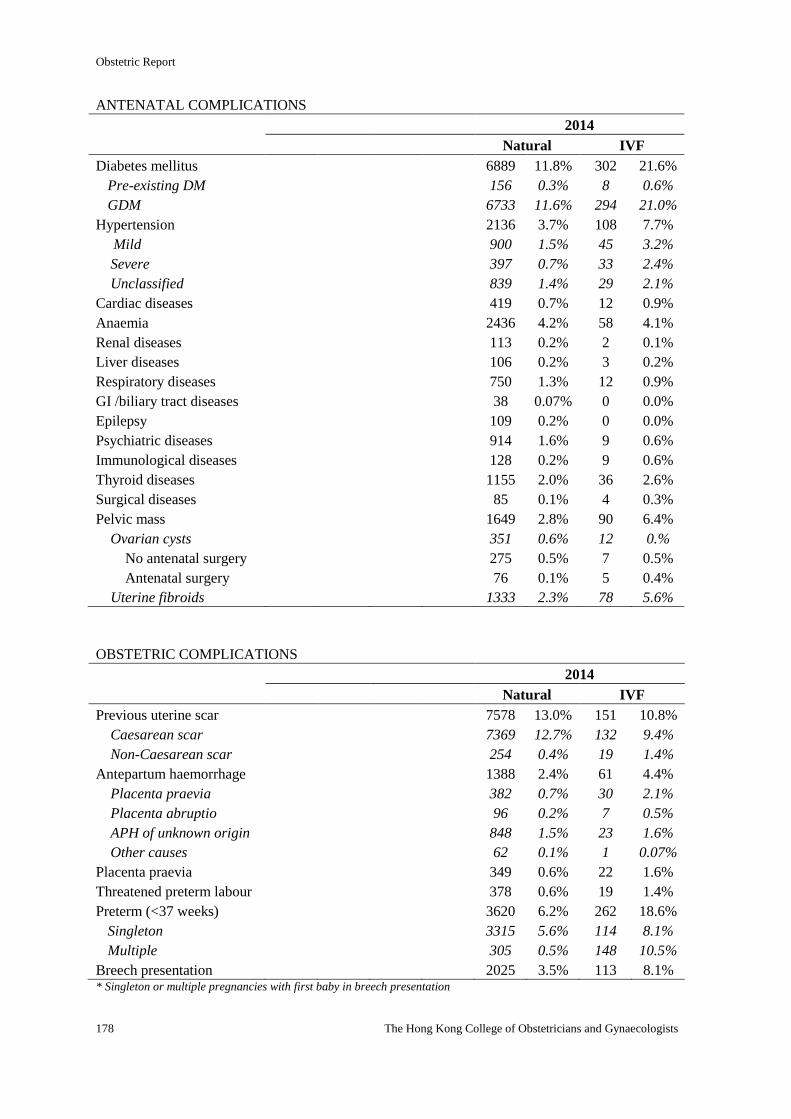
Obstetric Report
178 The Hong Kong College of Obstetricians and Gynaecologists
ANTENATAL COMPLICATIONS
2014
Natural IVF
Diabetes mellitus 6889 11.8% 302 21.6%
Pre-existing DM 156 0.3% 8 0.6%
GDM 6733 11.6% 294 21.0%
Hypertension 2136 3.7% 108 7.7%
Mild 900 1.5% 45 3.2%
Severe 397 0.7% 33 2.4%
Unclassified 839 1.4% 29 2.1%
Cardiac diseases 419 0.7% 12 0.9%
Anaemia 2436 4.2% 58 4.1%
Renal diseases 113 0.2% 2 0.1%
Liver diseases 106 0.2% 3 0.2%
Respiratory diseases 750 1.3% 12 0.9%
GI /biliary tract diseases 38 0.07% 0 0.0%
Epilepsy 109 0.2% 0 0.0%
Psychiatric diseases 914 1.6% 9 0.6%
Immunological diseases 128 0.2% 9 0.6%
Thyroid diseases 1155 2.0% 36 2.6%
Surgical diseases 85 0.1% 4 0.3%
Pelvic mass 1649 2.8% 90 6.4%
Ovarian cysts 351 0.6% 12 0.%
No antenatal surgery 275 0.5% 7 0.5%
Antenatal surgery 76 0.1% 5 0.4%
Uterine fibroids 1333 2.3% 78 5.6%
OBSTETRIC COMPLICATIONS
2014
Natural IVF
Previous uterine scar 7578 13.0% 151 10.8%
Caesarean scar 7369 12.7% 132 9.4%
Non-Caesarean scar 254 0.4% 19 1.4%
Antepartum haemorrhage 1388 2.4% 61 4.4%
Placenta praevia 382 0.7% 30 2.1%
Placenta abruptio 96 0.2% 7 0.5%
APH of unknown origin 848 1.5% 23 1.6%
Other causes 62 0.1% 1 0.07%
Placenta praevia 349 0.6% 22 1.6%
Threatened preterm labour 378 0.6% 19 1.4%
Preterm (<37 weeks) 3620 6.2% 262 18.6%
Singleton 3315 5.6% 114 8.1%
Multiple 305 0.5% 148 10.5%
Breech presentation 2025 3.5% 113 8.1% * Singleton or multiple pregnancies with first baby in breech presentation
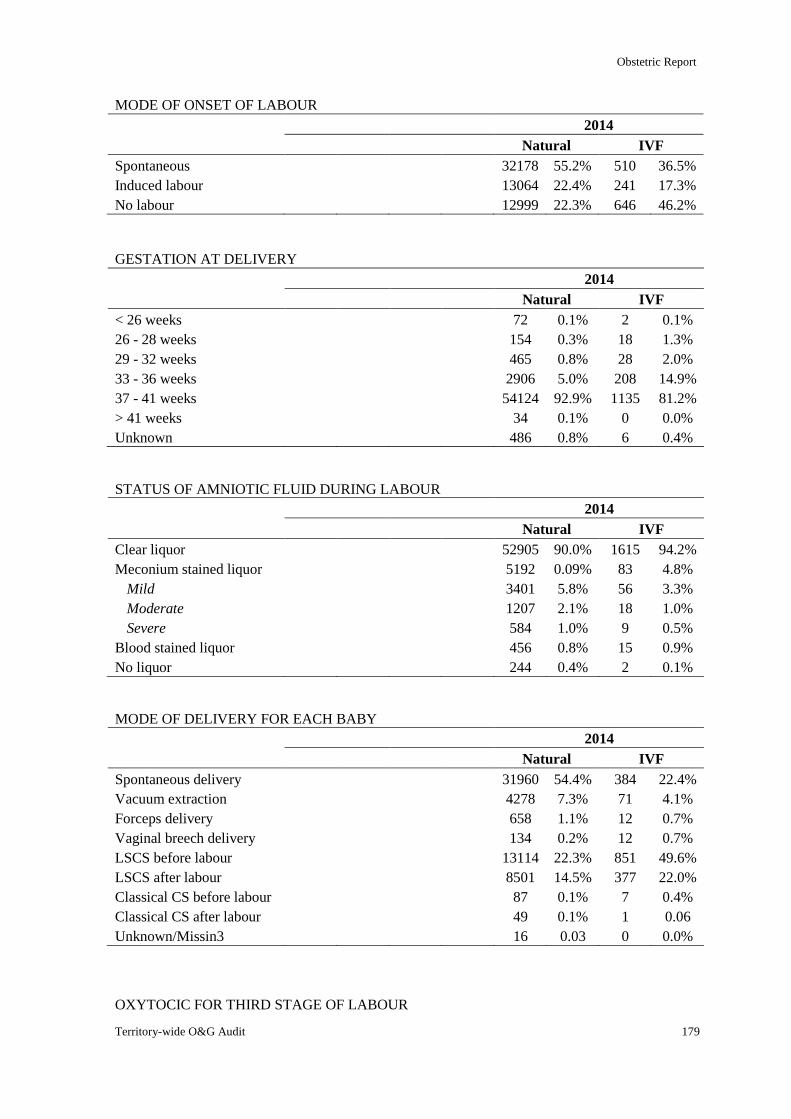
Obstetric Report
Territory-wide O&G Audit 179
MODE OF ONSET OF LABOUR
2014
Natural IVF
Spontaneous 32178 55.2% 510 36.5%
Induced labour 13064 22.4% 241 17.3%
No labour 12999 22.3% 646 46.2%
GESTATION AT DELIVERY
2014
Natural IVF
< 26 weeks 72 0.1% 2 0.1%
26 - 28 weeks 154 0.3% 18 1.3%
29 - 32 weeks 465 0.8% 28 2.0%
33 - 36 weeks 2906 5.0% 208 14.9%
37 - 41 weeks 54124 92.9% 1135 81.2%
> 41 weeks 34 0.1% 0 0.0%
Unknown 486 0.8% 6 0.4%
STATUS OF AMNIOTIC FLUID DURING LABOUR
2014
Natural IVF
Clear liquor 52905 90.0% 1615 94.2%
Meconium stained liquor 5192 0.09% 83 4.8%
Mild 3401 5.8% 56 3.3%
Moderate 1207 2.1% 18 1.0%
Severe 584 1.0% 9 0.5%
Blood stained liquor 456 0.8% 15 0.9%
No liquor 244 0.4% 2 0.1%
MODE OF DELIVERY FOR EACH BABY
2014
Natural IVF
Spontaneous delivery 31960 54.4% 384 22.4%
Vacuum extraction 4278 7.3% 71 4.1%
Forceps delivery 658 1.1% 12 0.7%
Vaginal breech delivery 134 0.2% 12 0.7%
LSCS before labour 13114 22.3% 851 49.6%
LSCS after labour 8501 14.5% 377 22.0%
Classical CS before labour 87 0.1% 7 0.4%
Classical CS after labour 49 0.1% 1 0.06
Unknown/Missin3 16 0.03 0 0.0%
OXYTOCIC FOR THIRD STAGE OF LABOUR
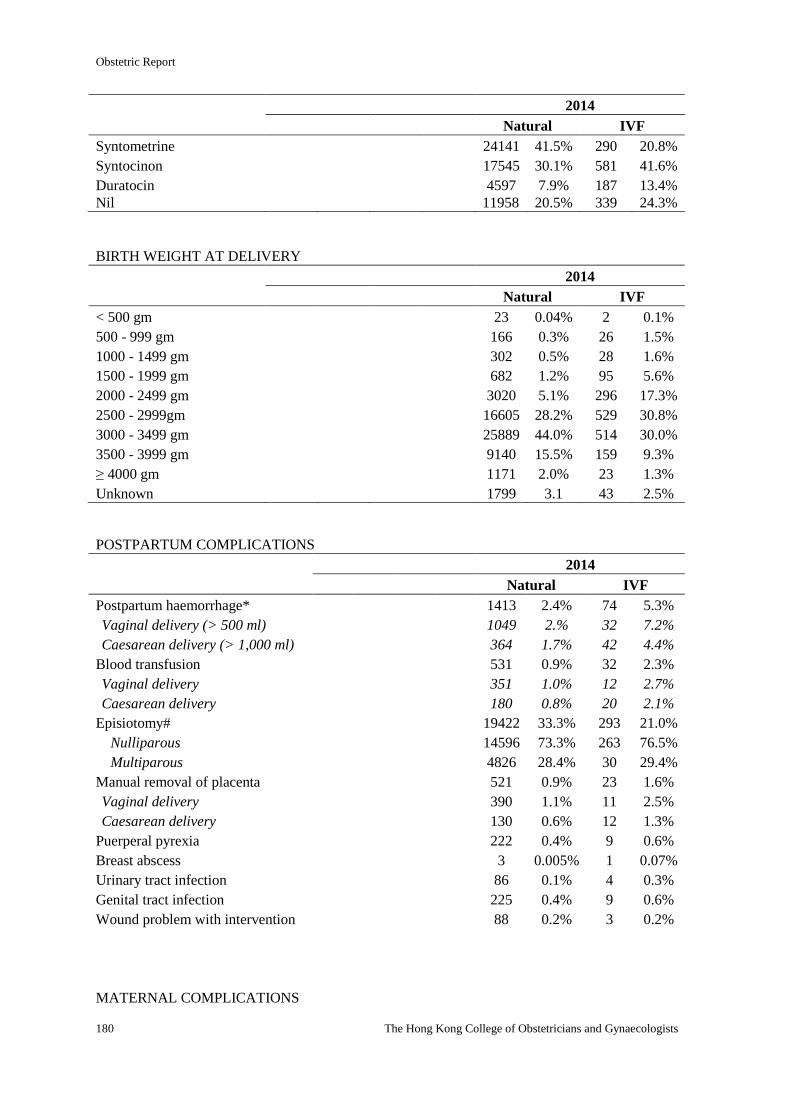
Obstetric Report
180 The Hong Kong College of Obstetricians and Gynaecologists
2014
Natural IVF
Syntometrine 24141 41.5% 290 20.8%
Syntocinon 17545 30.1% 581 41.6%
Duratocin 4597 7.9% 187 13.4%
Nil 11958 20.5% 339 24.3%
BIRTH WEIGHT AT DELIVERY
2014
Natural IVF
< 500 gm 23 0.04% 2 0.1%
500 - 999 gm 166 0.3% 26 1.5%
1000 - 1499 gm 302 0.5% 28 1.6%
1500 - 1999 gm 682 1.2% 95 5.6%
2000 - 2499 gm 3020 5.1% 296 17.3%
2500 - 2999gm 16605 28.2% 529 30.8%
3000 - 3499 gm 25889 44.0% 514 30.0%
3500 - 3999 gm 9140 15.5% 159 9.3%
≥ 4000 gm 1171 2.0% 23 1.3%
Unknown 1799 3.1 43 2.5%
POSTPARTUM COMPLICATIONS
2014
Natural IVF
Postpartum haemorrhage* 1413 2.4% 74 5.3%
Vaginal delivery (> 500 ml) 1049 2.% 32 7.2%
Caesarean delivery (> 1,000 ml) 364 1.7% 42 4.4%
Blood transfusion 531 0.9% 32 2.3%
Vaginal delivery 351 1.0% 12 2.7%
Caesarean delivery 180 0.8% 20 2.1%
Episiotomy# 19422 33.3% 293 21.0%
Nulliparous 14596 73.3% 263 76.5%
Multiparous 4826 28.4% 30 29.4%
Manual removal of placenta 521 0.9% 23 1.6%
Vaginal delivery 390 1.1% 11 2.5%
Caesarean delivery 130 0.6% 12 1.3%
Puerperal pyrexia 222 0.4% 9 0.6%
Breast abscess 3 0.005% 1 0.07%
Urinary tract infection 86 0.1% 4 0.3%
Genital tract infection 225 0.4% 9 0.6%
Wound problem with intervention 88 0.2% 3 0.2%
MATERNAL COMPLICATIONS
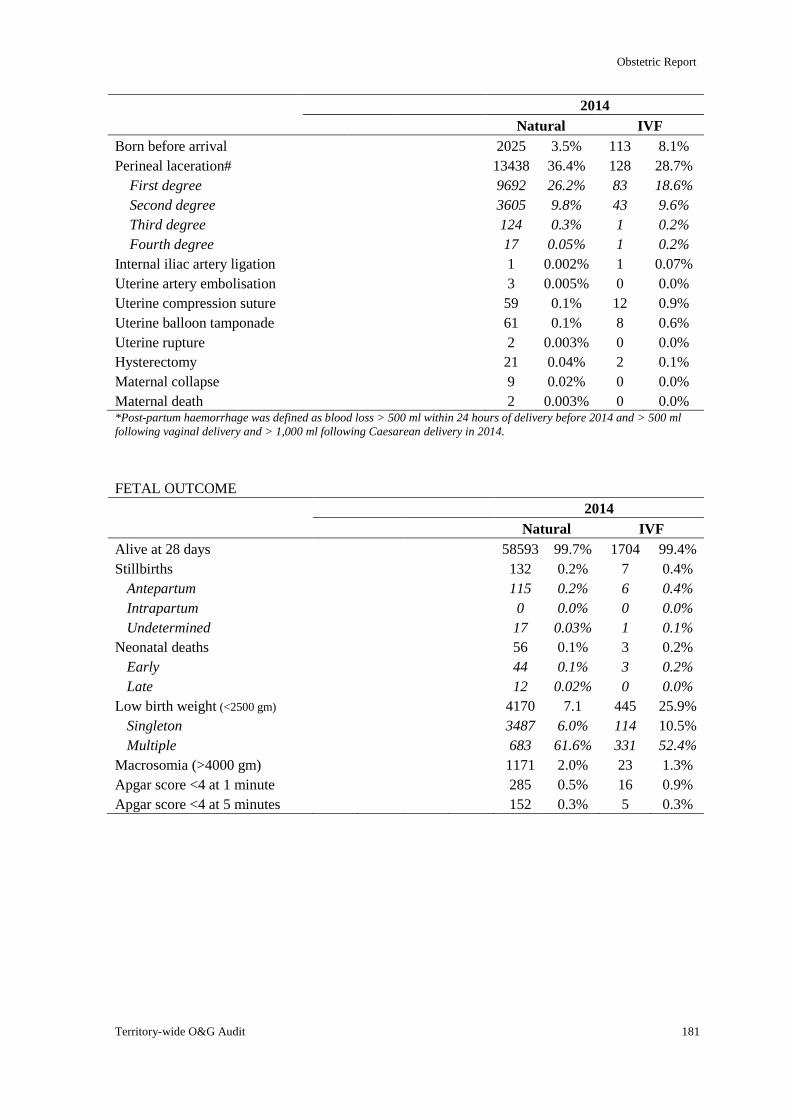
Obstetric Report
Territory-wide O&G Audit 181
2014
Natural IVF
Born before arrival 2025 3.5% 113 8.1%
Perineal laceration# 13438 36.4% 128 28.7%
First degree 9692 26.2% 83 18.6%
Second degree 3605 9.8% 43 9.6%
Third degree 124 0.3% 1 0.2%
Fourth degree 17 0.05% 1 0.2%
Internal iliac artery ligation 1 0.002% 1 0.07%
Uterine artery embolisation 3 0.005% 0 0.0%
Uterine compression suture 59 0.1% 12 0.9%
Uterine balloon tamponade 61 0.1% 8 0.6%
Uterine rupture 2 0.003% 0 0.0%
Hysterectomy 21 0.04% 2 0.1%
Maternal collapse 9 0.02% 0 0.0%
Maternal death 2 0.003% 0 0.0% *Post-partum haemorrhage was defined as blood loss > 500 ml within 24 hours of delivery before 2014 and > 500 ml
following vaginal delivery and > 1,000 ml following Caesarean delivery in 2014.
FETAL OUTCOME
2014
Natural IVF
Alive at 28 days 58593 99.7% 1704 99.4%
Stillbirths 132 0.2% 7 0.4%
Antepartum 115 0.2% 6 0.4%
Intrapartum 0 0.0% 0 0.0%
Undetermined 17 0.03% 1 0.1%
Neonatal deaths 56 0.1% 3 0.2%
Early 44 0.1% 3 0.2%
Late 12 0.02% 0 0.0%
Low birth weight (<2500 gm) 4170 7.1 445 25.9%
Singleton 3487 6.0% 114 10.5%
Multiple 683 61.6% 331 52.4%
Macrosomia (>4000 gm) 1171 2.0% 23 1.3%
Apgar score <4 at 1 minute 285 0.5% 16 0.9%
Apgar score <4 at 5 minutes 152 0.3% 5 0.3%
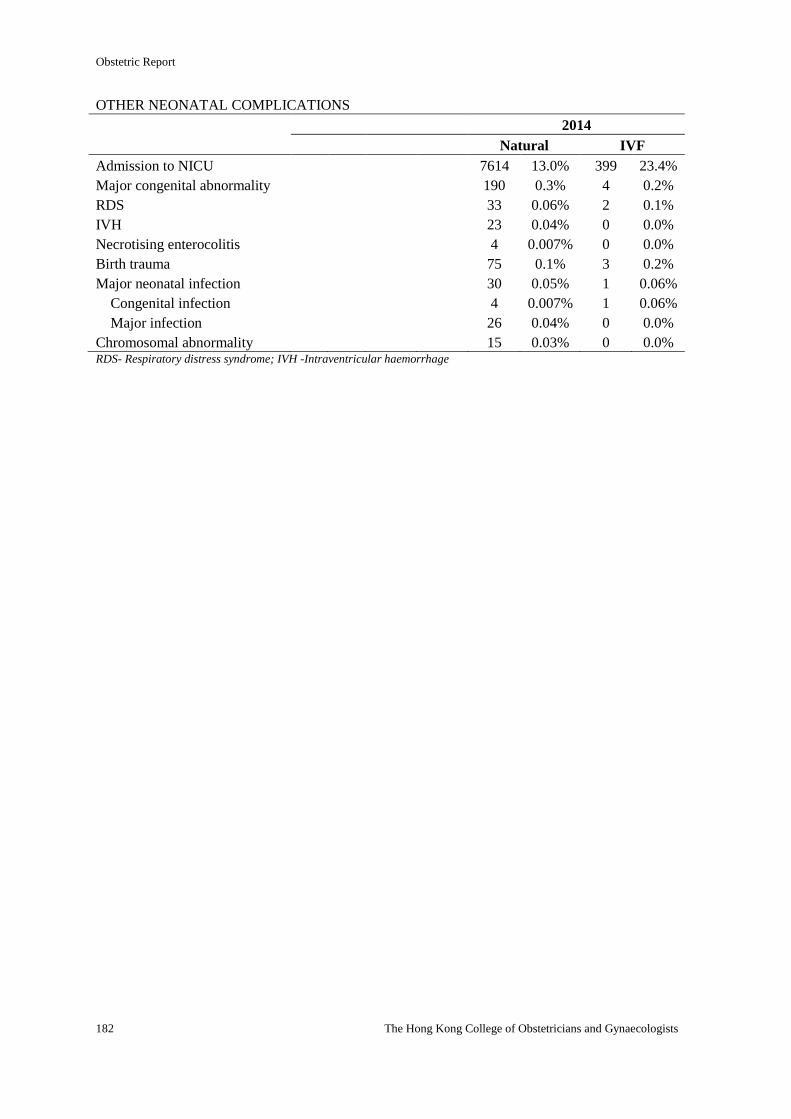
Obstetric Report
182 The Hong Kong College of Obstetricians and Gynaecologists
OTHER NEONATAL COMPLICATIONS
2014
Natural IVF
Admission to NICU 7614 13.0% 399 23.4%
Major congenital abnormality 190 0.3% 4 0.2%
RDS 33 0.06% 2 0.1%
IVH 23 0.04% 0 0.0%
Necrotising enterocolitis 4 0.007% 0 0.0%
Birth trauma 75 0.1% 3 0.2%
Major neonatal infection 30 0.05% 1 0.06%
Congenital infection 4 0.007% 1 0.06%
Major infection 26 0.04% 0 0.0%
Chromosomal abnormality 15 0.03% 0 0.0% RDS- Respiratory distress syndrome; IVH -Intraventricular haemorrhage
The Gynaecological Report
2014

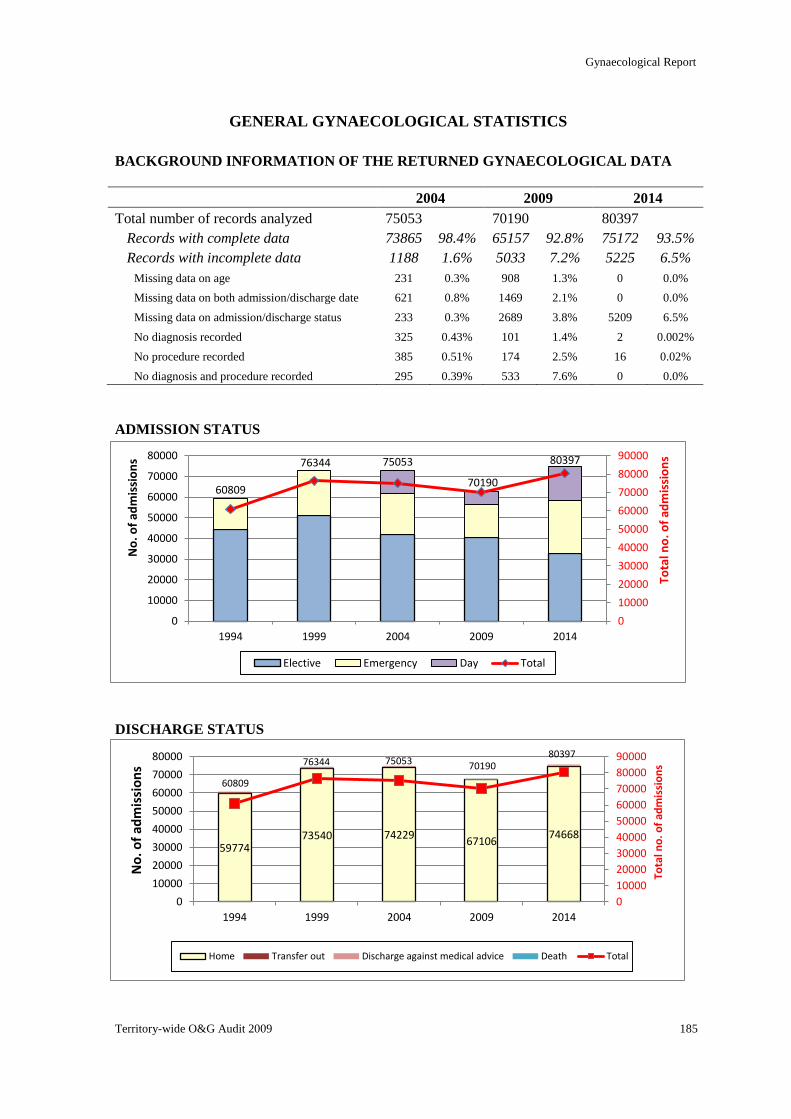
Gynaecological Report
Territory-wide O&G Audit 2009 185
59774 73540 74229
67106 74668
60809
76344 75053 70190 80397
0
10000
20000
30000
40000
50000
60000
70000
80000
90000
0
10000
20000
30000
40000
50000
60000
70000
80000
1994 1999 2004 2009 2014
Tota
l no
. of
adm
issi
on
s
No
. of
adm
issi
on
s
Home Transfer out Discharge against medical advice Death Total
60809
76344 75053
70190
80397
0
10000
20000
30000
40000
50000
60000
70000
80000
90000
0
10000
20000
30000
40000
50000
60000
70000
80000
1994 1999 2004 2009 2014
Tota
l no
. of
adm
issi
on
s
No
. of
adm
issi
on
s
Elective Emergency Day Total
GENERAL GYNAECOLOGICAL STATISTICS
BACKGROUND INFORMATION OF THE RETURNED GYNAECOLOGICAL DATA
2004 2009 2014
Total number of records analyzed 75053 70190 80397
Records with complete data 73865 98.4% 65157 92.8% 75172 93.5%
Records with incomplete data 1188 1.6% 5033 7.2% 5225 6.5%
Missing data on age 231 0.3% 908 1.3% 0 0.0%
Missing data on both admission/discharge date 621 0.8% 1469 2.1% 0 0.0%
Missing data on admission/discharge status 233 0.3% 2689 3.8% 5209 6.5%
No diagnosis recorded 325 0.43% 101 1.4% 2 0.002%
No procedure recorded 385 0.51% 174 2.5% 16 0.02%
No diagnosis and procedure recorded 295 0.39% 533 7.6% 0 0.0%
ADMISSION STATUS
DISCHARGE STATUS
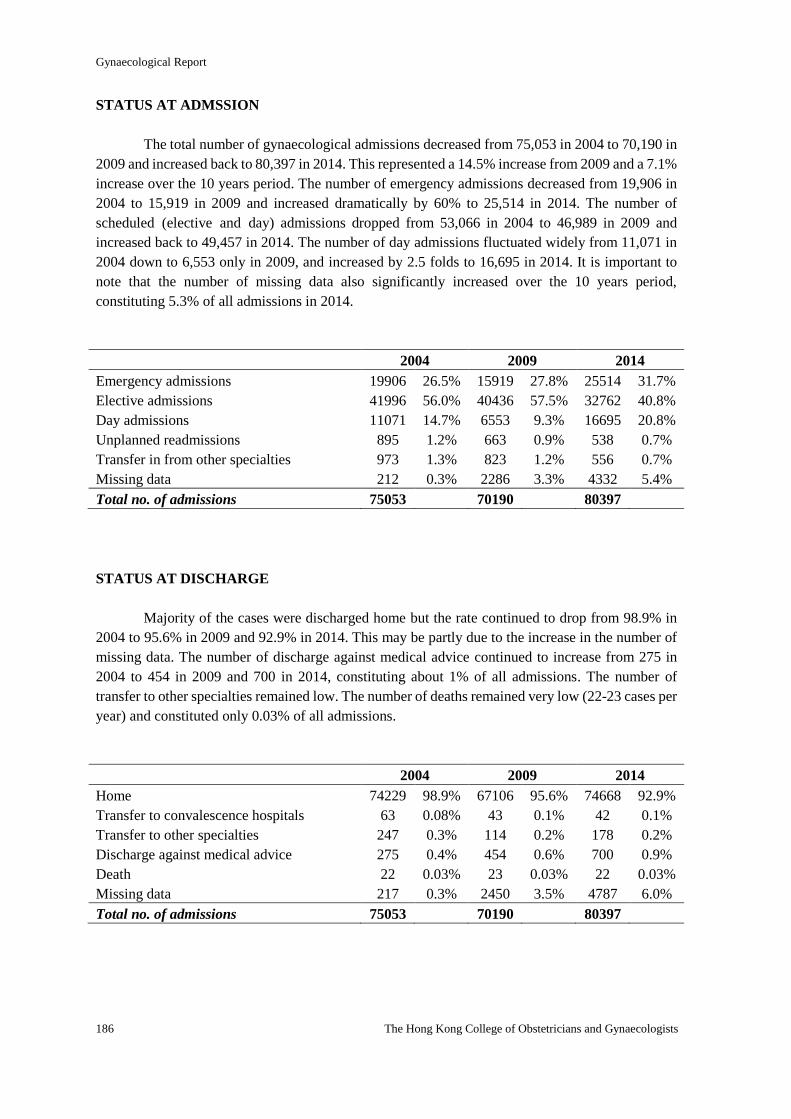
Gynaecological Report
186 The Hong Kong College of Obstetricians and Gynaecologists
STATUS AT ADMSSION
The total number of gynaecological admissions decreased from 75,053 in 2004 to 70,190 in
2009 and increased back to 80,397 in 2014. This represented a 14.5% increase from 2009 and a 7.1%
increase over the 10 years period. The number of emergency admissions decreased from 19,906 in
2004 to 15,919 in 2009 and increased dramatically by 60% to 25,514 in 2014. The number of
scheduled (elective and day) admissions dropped from 53,066 in 2004 to 46,989 in 2009 and
increased back to 49,457 in 2014. The number of day admissions fluctuated widely from 11,071 in
2004 down to 6,553 only in 2009, and increased by 2.5 folds to 16,695 in 2014. It is important to
note that the number of missing data also significantly increased over the 10 years period,
constituting 5.3% of all admissions in 2014.
2004 2009 2014
Emergency admissions 19906 26.5% 15919 27.8% 25514 31.7%
Elective admissions 41996 56.0% 40436 57.5% 32762 40.8%
Day admissions 11071 14.7% 6553 9.3% 16695 20.8%
Unplanned readmissions 895 1.2% 663 0.9% 538 0.7%
Transfer in from other specialties 973 1.3% 823 1.2% 556 0.7%
Missing data 212 0.3% 2286 3.3% 4332 5.4%
Total no. of admissions 75053 70190 80397
STATUS AT DISCHARGE
Majority of the cases were discharged home but the rate continued to drop from 98.9% in
2004 to 95.6% in 2009 and 92.9% in 2014. This may be partly due to the increase in the number of
missing data. The number of discharge against medical advice continued to increase from 275 in
2004 to 454 in 2009 and 700 in 2014, constituting about 1% of all admissions. The number of
transfer to other specialties remained low. The number of deaths remained very low (22-23 cases per
year) and constituted only 0.03% of all admissions.
2004 2009 2014
Home 74229 98.9% 67106 95.6% 74668 92.9%
Transfer to convalescence hospitals 63 0.08% 43 0.1% 42 0.1%
Transfer to other specialties 247 0.3% 114 0.2% 178 0.2%
Discharge against medical advice 275 0.4% 454 0.6% 700 0.9%
Death 22 0.03% 23 0.03% 22 0.03%
Missing data 217 0.3% 2450 3.5% 4787 6.0%
Total no. of admissions 75053 70190 80397
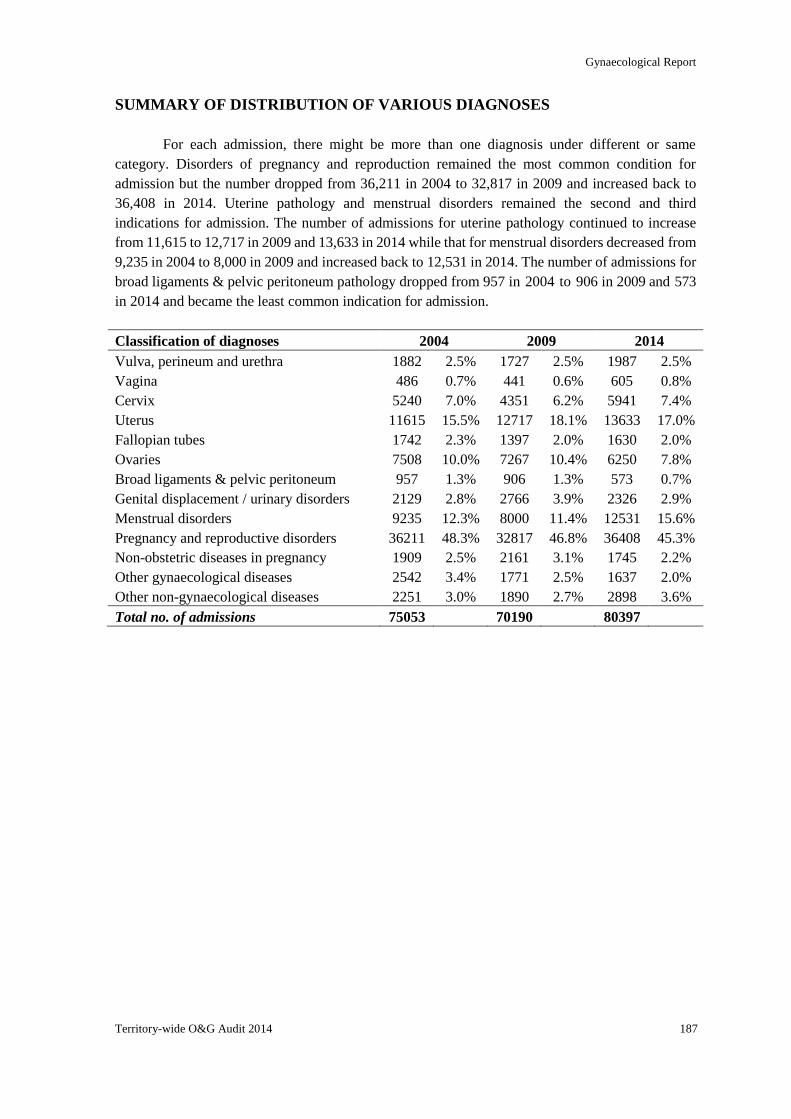
Gynaecological Report
Territory-wide O&G Audit 2014 187
SUMMARY OF DISTRIBUTION OF VARIOUS DIAGNOSES
For each admission, there might be more than one diagnosis under different or same
category. Disorders of pregnancy and reproduction remained the most common condition for
admission but the number dropped from 36,211 in 2004 to 32,817 in 2009 and increased back to
36,408 in 2014. Uterine pathology and menstrual disorders remained the second and third
indications for admission. The number of admissions for uterine pathology continued to increase
from 11,615 to 12,717 in 2009 and 13,633 in 2014 while that for menstrual disorders decreased from
9,235 in 2004 to 8,000 in 2009 and increased back to 12,531 in 2014. The number of admissions for
broad ligaments & pelvic peritoneum pathology dropped from 957 in 2004 to 906 in 2009 and 573
in 2014 and became the least common indication for admission.
Classification of diagnoses 2004 2009 2014
Vulva, perineum and urethra 1882 2.5% 1727 2.5% 1987 2.5%
Vagina 486 0.7% 441 0.6% 605 0.8%
Cervix 5240 7.0% 4351 6.2% 5941 7.4%
Uterus 11615 15.5% 12717 18.1% 13633 17.0%
Fallopian tubes 1742 2.3% 1397 2.0% 1630 2.0%
Ovaries 7508 10.0% 7267 10.4% 6250 7.8%
Broad ligaments & pelvic peritoneum 957 1.3% 906 1.3% 573 0.7%
Genital displacement / urinary disorders 2129 2.8% 2766 3.9% 2326 2.9%
Menstrual disorders 9235 12.3% 8000 11.4% 12531 15.6%
Pregnancy and reproductive disorders 36211 48.3% 32817 46.8% 36408 45.3%
Non-obstetric diseases in pregnancy 1909 2.5% 2161 3.1% 1745 2.2%
Other gynaecological diseases 2542 3.4% 1771 2.5% 1637 2.0%
Other non-gynaecological diseases 2251 3.0% 1890 2.7% 2898 3.6%
Total no. of admissions 75053 70190 80397
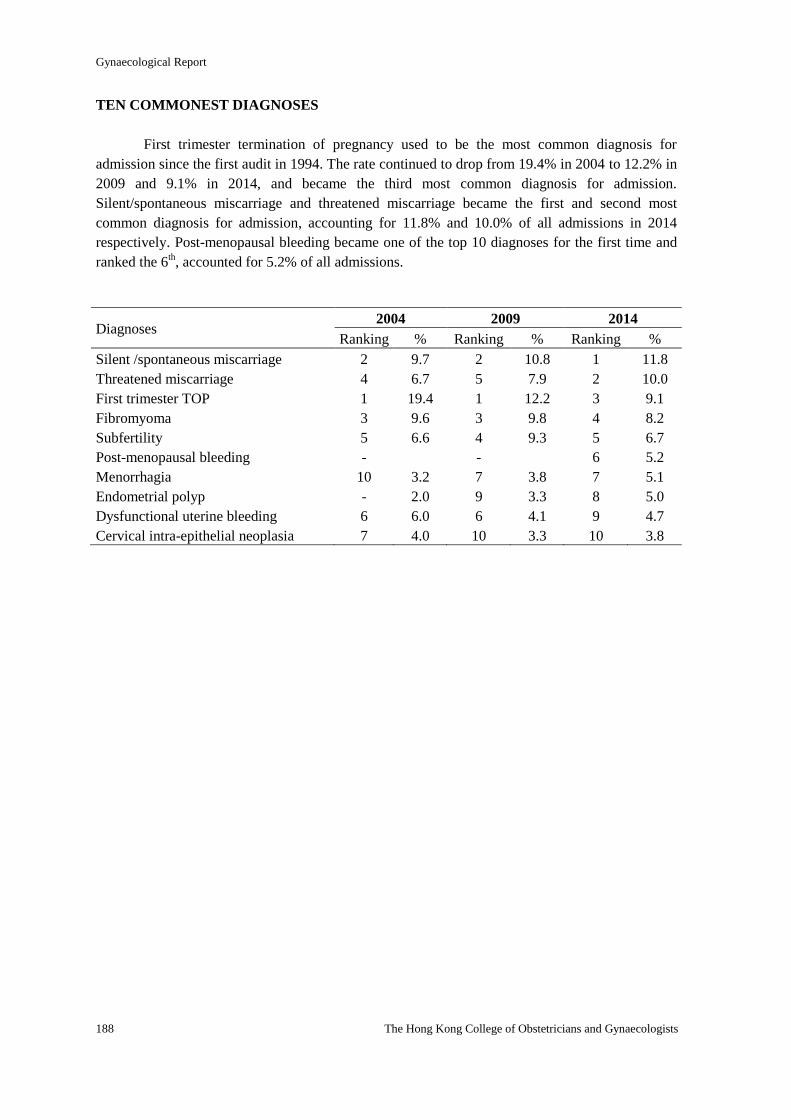
Gynaecological Report
188 The Hong Kong College of Obstetricians and Gynaecologists
TEN COMMONEST DIAGNOSES
First trimester termination of pregnancy used to be the most common diagnosis for
admission since the first audit in 1994. The rate continued to drop from 19.4% in 2004 to 12.2% in
2009 and 9.1% in 2014, and became the third most common diagnosis for admission.
Silent/spontaneous miscarriage and threatened miscarriage became the first and second most
common diagnosis for admission, accounting for 11.8% and 10.0% of all admissions in 2014
respectively. Post-menopausal bleeding became one of the top 10 diagnoses for the first time and
ranked the 6th, accounted for 5.2% of all admissions.
Diagnoses 2004 2009 2014
Ranking % Ranking % Ranking %
Silent /spontaneous miscarriage 2 9.7 2 10.8 1 11.8
Threatened miscarriage 4 6.7 5 7.9 2 10.0
First trimester TOP 1 19.4 1 12.2 3 9.1
Fibromyoma 3 9.6 3 9.8 4 8.2
Subfertility 5 6.6 4 9.3 5 6.7
Post-menopausal bleeding - - 6 5.2
Menorrhagia 10 3.2 7 3.8 7 5.1
Endometrial polyp - 2.0 9 3.3 8 5.0
Dysfunctional uterine bleeding 6 6.0 6 4.1 9 4.7
Cervical intra-epithelial neoplasia 7 4.0 10 3.3 10 3.8
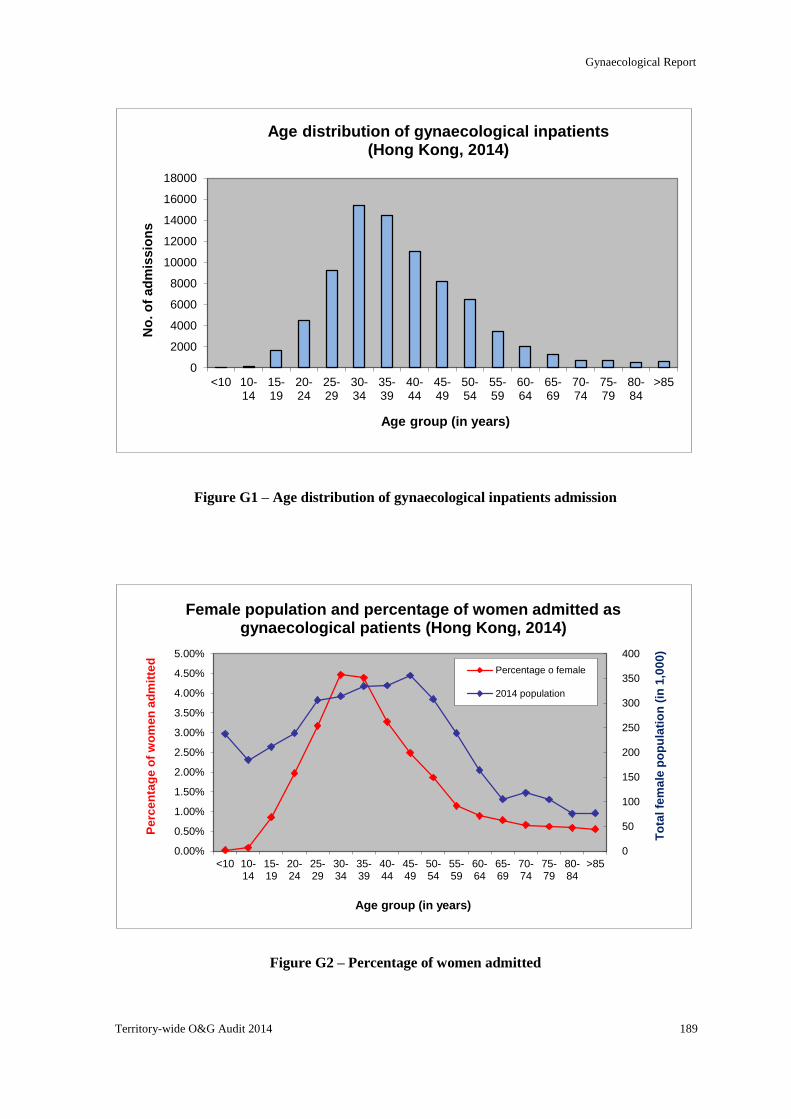
Gynaecological Report
Territory-wide O&G Audit 2014 189
0
2000
4000
6000
8000
10000
12000
14000
16000
18000
<10 10-14
15-19
20-24
25-29
30-34
35-39
40-44
45-49
50-54
55-59
60-64
65-69
70-74
75-79
80-84
>85
No
. o
f ad
mis
sio
ns
Age group (in years)
Age distribution of gynaecological inpatients (Hong Kong, 2014)
0
50
100
150
200
250
300
350
400
0.00%
0.50%
1.00%
1.50%
2.00%
2.50%
3.00%
3.50%
4.00%
4.50%
5.00%
<10 10-14
15-19
20-24
25-29
30-34
35-39
40-44
45-49
50-54
55-59
60-64
65-69
70-74
75-79
80-84
>85
To
tal fe
ma
le p
op
ula
tio
n (
in 1
,00
0)
Pe
rce
nta
ge
of
wo
me
n a
dm
itte
d
Age group (in years)
Female population and percentage of women admitted as gynaecological patients (Hong Kong, 2014)
Percentage o female
2014 population
Figure G1 – Age distribution of gynaecological inpatients admission
Figure G2 – Percentage of women admitted
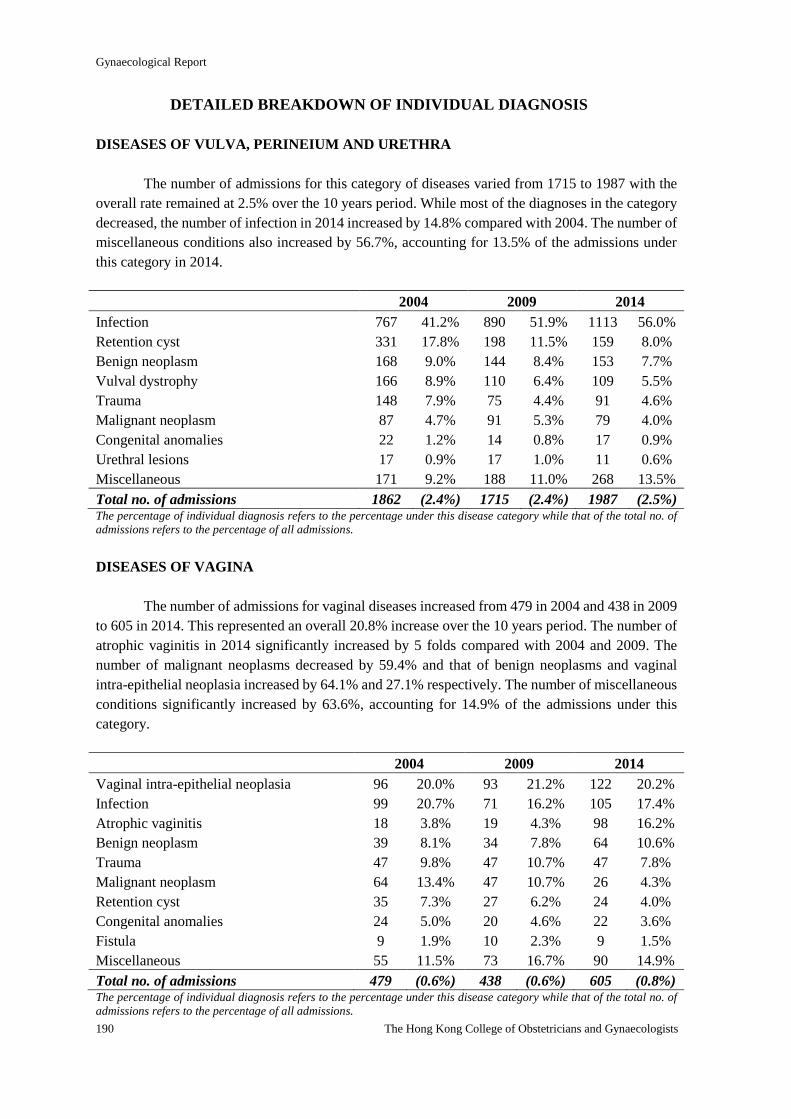
Gynaecological Report
190 The Hong Kong College of Obstetricians and Gynaecologists
DETAILED BREAKDOWN OF INDIVIDUAL DIAGNOSIS
DISEASES OF VULVA, PERINEIUM AND URETHRA
The number of admissions for this category of diseases varied from 1715 to 1987 with the
overall rate remained at 2.5% over the 10 years period. While most of the diagnoses in the category
decreased, the number of infection in 2014 increased by 14.8% compared with 2004. The number of
miscellaneous conditions also increased by 56.7%, accounting for 13.5% of the admissions under
this category in 2014.
2004 2009 2014
Infection 767 41.2% 890 51.9% 1113 56.0%
Retention cyst 331 17.8% 198 11.5% 159 8.0%
Benign neoplasm 168 9.0% 144 8.4% 153 7.7%
Vulval dystrophy 166 8.9% 110 6.4% 109 5.5%
Trauma 148 7.9% 75 4.4% 91 4.6%
Malignant neoplasm 87 4.7% 91 5.3% 79 4.0%
Congenital anomalies 22 1.2% 14 0.8% 17 0.9%
Urethral lesions 17 0.9% 17 1.0% 11 0.6%
Miscellaneous 171 9.2% 188 11.0% 268 13.5%
Total no. of admissions 1862 (2.4%) 1715 (2.4%) 1987 (2.5%) The percentage of individual diagnosis refers to the percentage under this disease category while that of the total no. of
admissions refers to the percentage of all admissions.
DISEASES OF VAGINA
The number of admissions for vaginal diseases increased from 479 in 2004 and 438 in 2009
to 605 in 2014. This represented an overall 20.8% increase over the 10 years period. The number of
atrophic vaginitis in 2014 significantly increased by 5 folds compared with 2004 and 2009. The
number of malignant neoplasms decreased by 59.4% and that of benign neoplasms and vaginal
intra-epithelial neoplasia increased by 64.1% and 27.1% respectively. The number of miscellaneous
conditions significantly increased by 63.6%, accounting for 14.9% of the admissions under this
category.
2004 2009 2014
Vaginal intra-epithelial neoplasia 96 20.0% 93 21.2% 122 20.2%
Infection 99 20.7% 71 16.2% 105 17.4%
Atrophic vaginitis 18 3.8% 19 4.3% 98 16.2%
Benign neoplasm 39 8.1% 34 7.8% 64 10.6%
Trauma 47 9.8% 47 10.7% 47 7.8%
Malignant neoplasm 64 13.4% 47 10.7% 26 4.3%
Retention cyst 35 7.3% 27 6.2% 24 4.0%
Congenital anomalies 24 5.0% 20 4.6% 22 3.6%
Fistula 9 1.9% 10 2.3% 9 1.5%
Miscellaneous 55 11.5% 73 16.7% 90 14.9%
Total no. of admissions 479 (0.6%) 438 (0.6%) 605 (0.8%) The percentage of individual diagnosis refers to the percentage under this disease category while that of the total no. of
admissions refers to the percentage of all admissions.
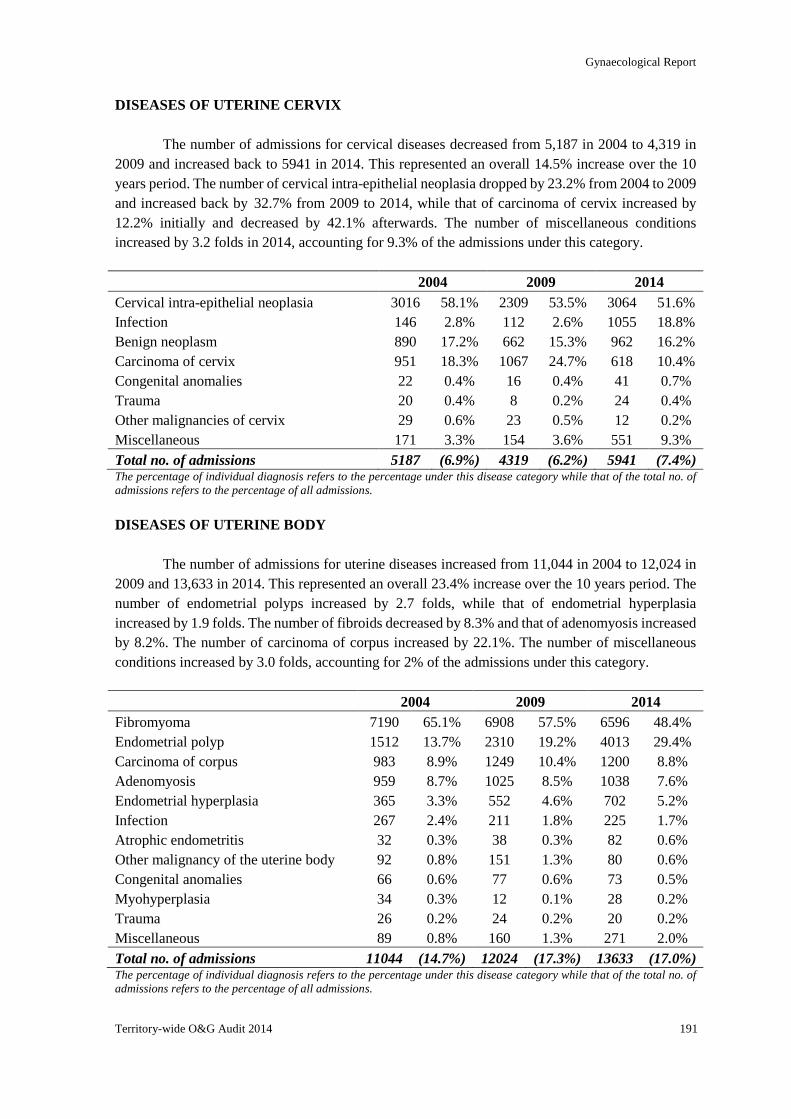
Gynaecological Report
Territory-wide O&G Audit 2014 191
DISEASES OF UTERINE CERVIX
The number of admissions for cervical diseases decreased from 5,187 in 2004 to 4,319 in
2009 and increased back to 5941 in 2014. This represented an overall 14.5% increase over the 10
years period. The number of cervical intra-epithelial neoplasia dropped by 23.2% from 2004 to 2009
and increased back by 32.7% from 2009 to 2014, while that of carcinoma of cervix increased by
12.2% initially and decreased by 42.1% afterwards. The number of miscellaneous conditions
increased by 3.2 folds in 2014, accounting for 9.3% of the admissions under this category.
2004 2009 2014
Cervical intra-epithelial neoplasia 3016 58.1% 2309 53.5% 3064 51.6%
Infection 146 2.8% 112 2.6% 1055 18.8%
Benign neoplasm 890 17.2% 662 15.3% 962 16.2%
Carcinoma of cervix 951 18.3% 1067 24.7% 618 10.4%
Congenital anomalies 22 0.4% 16 0.4% 41 0.7%
Trauma 20 0.4% 8 0.2% 24 0.4%
Other malignancies of cervix 29 0.6% 23 0.5% 12 0.2%
Miscellaneous 171 3.3% 154 3.6% 551 9.3%
Total no. of admissions 5187 (6.9%) 4319 (6.2%) 5941 (7.4%) The percentage of individual diagnosis refers to the percentage under this disease category while that of the total no. of
admissions refers to the percentage of all admissions.
DISEASES OF UTERINE BODY
The number of admissions for uterine diseases increased from 11,044 in 2004 to 12,024 in
2009 and 13,633 in 2014. This represented an overall 23.4% increase over the 10 years period. The
number of endometrial polyps increased by 2.7 folds, while that of endometrial hyperplasia
increased by 1.9 folds. The number of fibroids decreased by 8.3% and that of adenomyosis increased
by 8.2%. The number of carcinoma of corpus increased by 22.1%. The number of miscellaneous
conditions increased by 3.0 folds, accounting for 2% of the admissions under this category.
2004 2009 2014
Fibromyoma 7190 65.1% 6908 57.5% 6596 48.4%
Endometrial polyp 1512 13.7% 2310 19.2% 4013 29.4%
Carcinoma of corpus 983 8.9% 1249 10.4% 1200 8.8%
Adenomyosis 959 8.7% 1025 8.5% 1038 7.6%
Endometrial hyperplasia 365 3.3% 552 4.6% 702 5.2%
Infection 267 2.4% 211 1.8% 225 1.7%
Atrophic endometritis 32 0.3% 38 0.3% 82 0.6%
Other malignancy of the uterine body 92 0.8% 151 1.3% 80 0.6%
Congenital anomalies 66 0.6% 77 0.6% 73 0.5%
Myohyperplasia 34 0.3% 12 0.1% 28 0.2%
Trauma 26 0.2% 24 0.2% 20 0.2%
Miscellaneous 89 0.8% 160 1.3% 271 2.0%
Total no. of admissions 11044 (14.7%) 12024 (17.3%) 13633 (17.0%) The percentage of individual diagnosis refers to the percentage under this disease category while that of the total no. of
admissions refers to the percentage of all admissions.
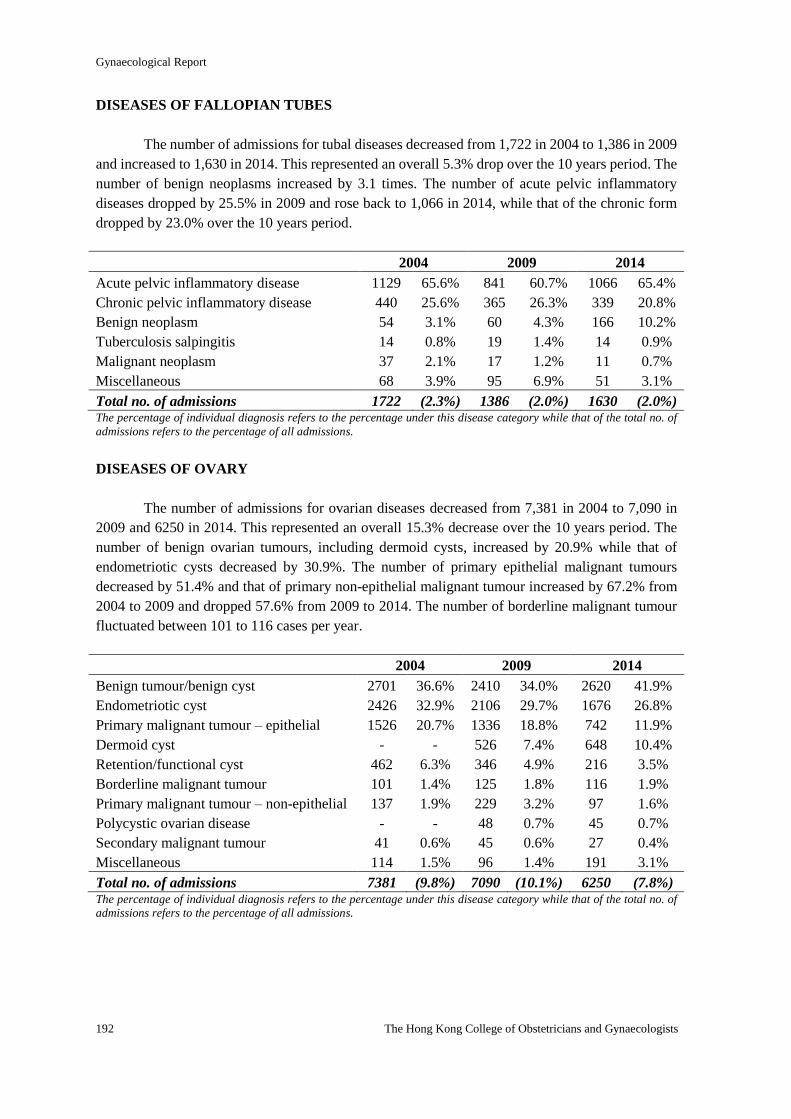
Gynaecological Report
192 The Hong Kong College of Obstetricians and Gynaecologists
DISEASES OF FALLOPIAN TUBES
The number of admissions for tubal diseases decreased from 1,722 in 2004 to 1,386 in 2009
and increased to 1,630 in 2014. This represented an overall 5.3% drop over the 10 years period. The
number of benign neoplasms increased by 3.1 times. The number of acute pelvic inflammatory
diseases dropped by 25.5% in 2009 and rose back to 1,066 in 2014, while that of the chronic form
dropped by 23.0% over the 10 years period.
2004 2009 2014
Acute pelvic inflammatory disease 1129 65.6% 841 60.7% 1066 65.4%
Chronic pelvic inflammatory disease 440 25.6% 365 26.3% 339 20.8%
Benign neoplasm 54 3.1% 60 4.3% 166 10.2%
Tuberculosis salpingitis 14 0.8% 19 1.4% 14 0.9%
Malignant neoplasm 37 2.1% 17 1.2% 11 0.7%
Miscellaneous 68 3.9% 95 6.9% 51 3.1%
Total no. of admissions 1722 (2.3%) 1386 (2.0%) 1630 (2.0%) The percentage of individual diagnosis refers to the percentage under this disease category while that of the total no. of
admissions refers to the percentage of all admissions.
DISEASES OF OVARY
The number of admissions for ovarian diseases decreased from 7,381 in 2004 to 7,090 in
2009 and 6250 in 2014. This represented an overall 15.3% decrease over the 10 years period. The
number of benign ovarian tumours, including dermoid cysts, increased by 20.9% while that of
endometriotic cysts decreased by 30.9%. The number of primary epithelial malignant tumours
decreased by 51.4% and that of primary non-epithelial malignant tumour increased by 67.2% from
2004 to 2009 and dropped 57.6% from 2009 to 2014. The number of borderline malignant tumour
fluctuated between 101 to 116 cases per year.
2004 2009 2014
Benign tumour/benign cyst 2701 36.6% 2410 34.0% 2620 41.9%
Endometriotic cyst 2426 32.9% 2106 29.7% 1676 26.8%
Primary malignant tumour – epithelial 1526 20.7% 1336 18.8% 742 11.9%
Dermoid cyst - - 526 7.4% 648 10.4%
Retention/functional cyst 462 6.3% 346 4.9% 216 3.5%
Borderline malignant tumour 101 1.4% 125 1.8% 116 1.9%
Primary malignant tumour – non-epithelial 137 1.9% 229 3.2% 97 1.6%
Polycystic ovarian disease - - 48 0.7% 45 0.7%
Secondary malignant tumour 41 0.6% 45 0.6% 27 0.4%
Miscellaneous 114 1.5% 96 1.4% 191 3.1%
Total no. of admissions 7381 (9.8%) 7090 (10.1%) 6250 (7.8%) The percentage of individual diagnosis refers to the percentage under this disease category while that of the total no. of
admissions refers to the percentage of all admissions.
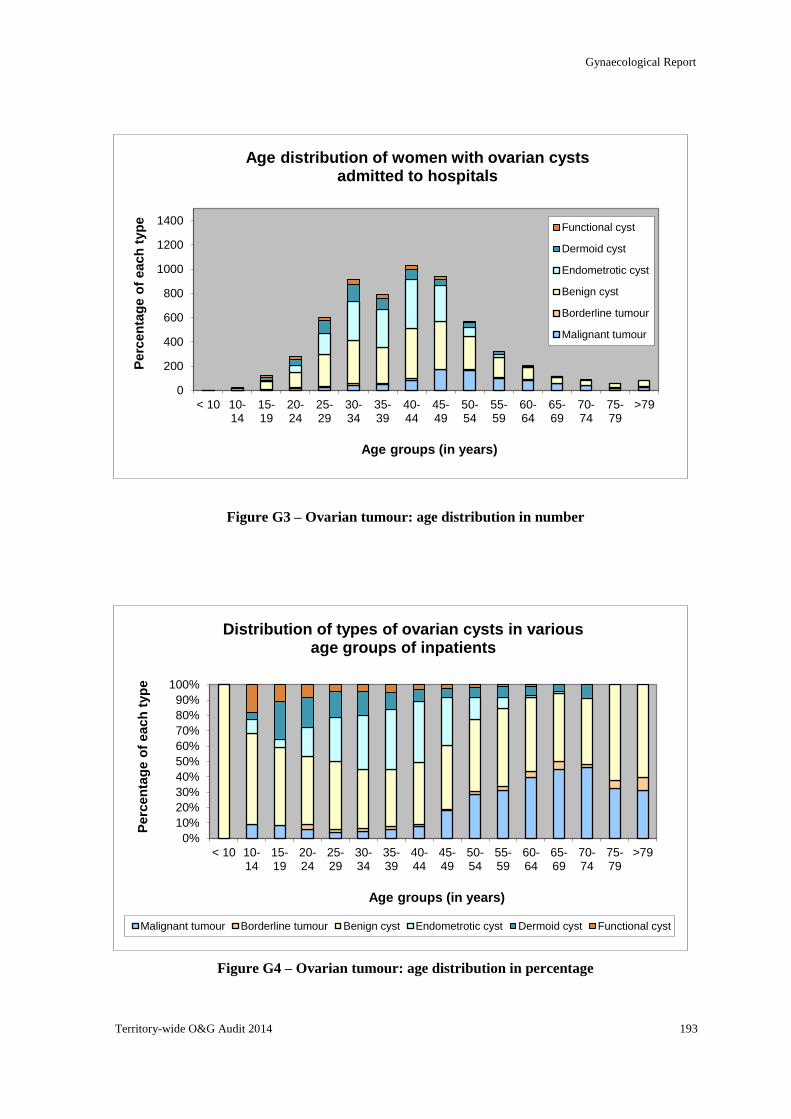
Gynaecological Report
Territory-wide O&G Audit 2014 193
0
200
400
600
800
1000
1200
1400
< 10 10-14
15-19
20-24
25-29
30-34
35-39
40-44
45-49
50-54
55-59
60-64
65-69
70-74
75-79
>79
Perc
en
tag
e o
f each
typ
e
Age groups (in years)
Age distribution of women with ovarian cysts admitted to hospitals
Functional cyst
Dermoid cyst
Endometrotic cyst
Benign cyst
Borderline tumour
Malignant tumour
0%
10%
20%
30%
40%
50%
60%
70%
80%
90%
100%
< 10 10-14
15-19
20-24
25-29
30-34
35-39
40-44
45-49
50-54
55-59
60-64
65-69
70-74
75-79
>79
Perc
en
tag
e o
f each
typ
e
Age groups (in years)
Distribution of types of ovarian cysts in various age groups of inpatients
Malignant tumour Borderline tumour Benign cyst Endometrotic cyst Dermoid cyst Functional cyst
Figure G3 – Ovarian tumour: age distribution in number
Figure G4 – Ovarian tumour: age distribution in percentage
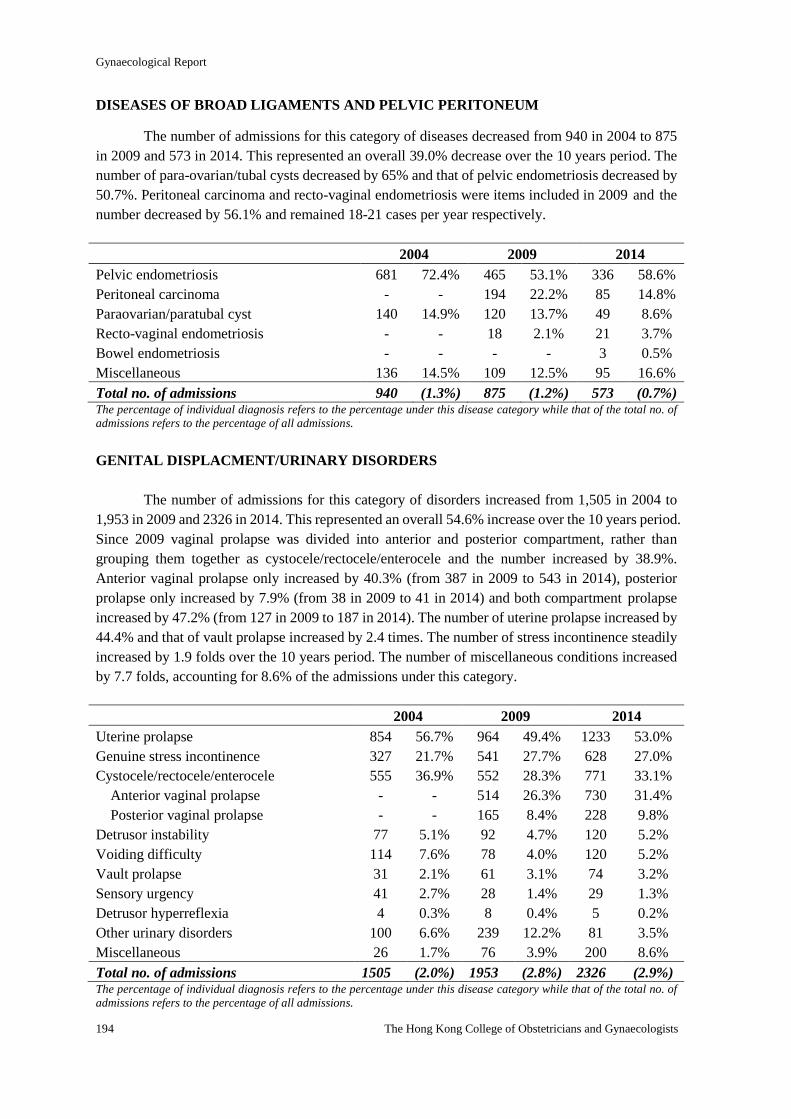
Gynaecological Report
194 The Hong Kong College of Obstetricians and Gynaecologists
DISEASES OF BROAD LIGAMENTS AND PELVIC PERITONEUM
The number of admissions for this category of diseases decreased from 940 in 2004 to 875
in 2009 and 573 in 2014. This represented an overall 39.0% decrease over the 10 years period. The
number of para-ovarian/tubal cysts decreased by 65% and that of pelvic endometriosis decreased by
50.7%. Peritoneal carcinoma and recto-vaginal endometriosis were items included in 2009 and the
number decreased by 56.1% and remained 18-21 cases per year respectively.
2004 2009 2014
Pelvic endometriosis 681 72.4% 465 53.1% 336 58.6%
Peritoneal carcinoma - - 194 22.2% 85 14.8%
Paraovarian/paratubal cyst 140 14.9% 120 13.7% 49 8.6%
Recto-vaginal endometriosis - - 18 2.1% 21 3.7%
Bowel endometriosis - - - - 3 0.5%
Miscellaneous 136 14.5% 109 12.5% 95 16.6%
Total no. of admissions 940 (1.3%) 875 (1.2%) 573 (0.7%) The percentage of individual diagnosis refers to the percentage under this disease category while that of the total no. of
admissions refers to the percentage of all admissions.
GENITAL DISPLACMENT/URINARY DISORDERS
The number of admissions for this category of disorders increased from 1,505 in 2004 to
1,953 in 2009 and 2326 in 2014. This represented an overall 54.6% increase over the 10 years period.
Since 2009 vaginal prolapse was divided into anterior and posterior compartment, rather than
grouping them together as cystocele/rectocele/enterocele and the number increased by 38.9%.
Anterior vaginal prolapse only increased by 40.3% (from 387 in 2009 to 543 in 2014), posterior
prolapse only increased by 7.9% (from 38 in 2009 to 41 in 2014) and both compartment prolapse
increased by 47.2% (from 127 in 2009 to 187 in 2014). The number of uterine prolapse increased by
44.4% and that of vault prolapse increased by 2.4 times. The number of stress incontinence steadily
increased by 1.9 folds over the 10 years period. The number of miscellaneous conditions increased
by 7.7 folds, accounting for 8.6% of the admissions under this category.
2004 2009 2014
Uterine prolapse 854 56.7% 964 49.4% 1233 53.0%
Genuine stress incontinence 327 21.7% 541 27.7% 628 27.0%
Cystocele/rectocele/enterocele 555 36.9% 552 28.3% 771 33.1%
Anterior vaginal prolapse - - 514 26.3% 730 31.4%
Posterior vaginal prolapse - - 165 8.4% 228 9.8%
Detrusor instability 77 5.1% 92 4.7% 120 5.2%
Voiding difficulty 114 7.6% 78 4.0% 120 5.2%
Vault prolapse 31 2.1% 61 3.1% 74 3.2%
Sensory urgency 41 2.7% 28 1.4% 29 1.3%
Detrusor hyperreflexia 4 0.3% 8 0.4% 5 0.2%
Other urinary disorders 100 6.6% 239 12.2% 81 3.5%
Miscellaneous 26 1.7% 76 3.9% 200 8.6%
Total no. of admissions 1505 (2.0%) 1953 (2.8%) 2326 (2.9%) The percentage of individual diagnosis refers to the percentage under this disease category while that of the total no. of
admissions refers to the percentage of all admissions.
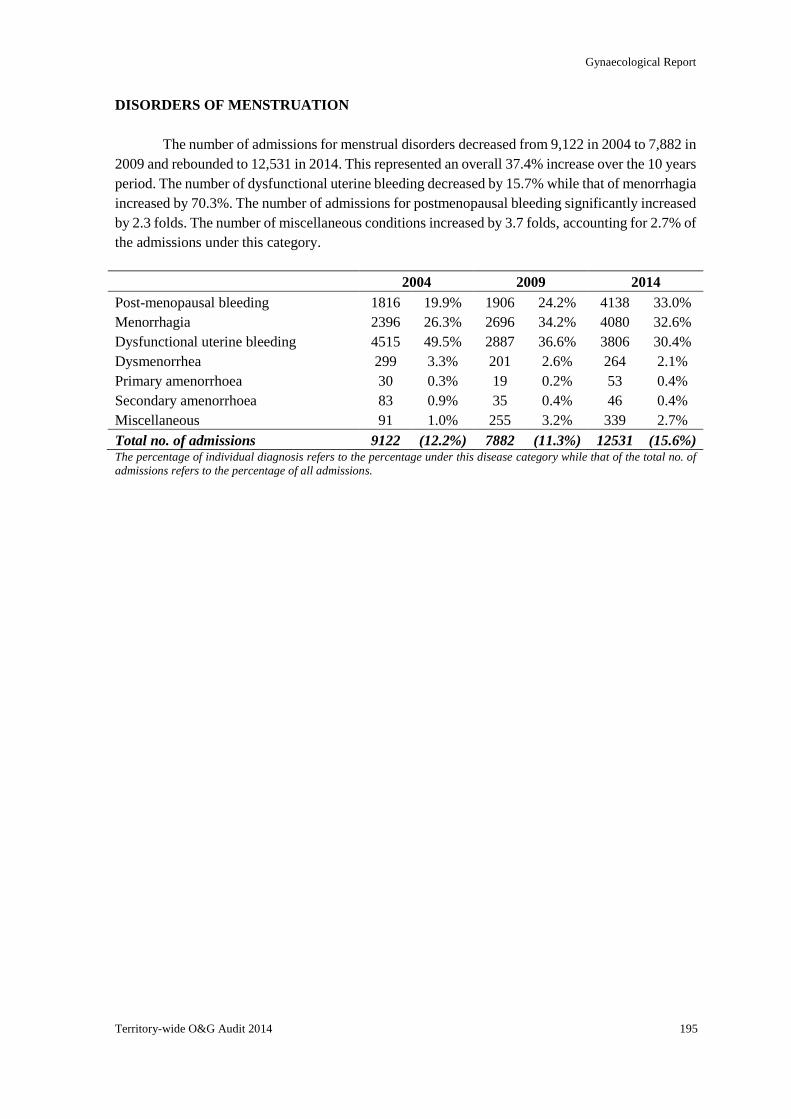
Gynaecological Report
Territory-wide O&G Audit 2014 195
DISORDERS OF MENSTRUATION
The number of admissions for menstrual disorders decreased from 9,122 in 2004 to 7,882 in
2009 and rebounded to 12,531 in 2014. This represented an overall 37.4% increase over the 10 years
period. The number of dysfunctional uterine bleeding decreased by 15.7% while that of menorrhagia
increased by 70.3%. The number of admissions for postmenopausal bleeding significantly increased
by 2.3 folds. The number of miscellaneous conditions increased by 3.7 folds, accounting for 2.7% of
the admissions under this category.
2004 2009 2014
Post-menopausal bleeding 1816 19.9% 1906 24.2% 4138 33.0%
Menorrhagia 2396 26.3% 2696 34.2% 4080 32.6%
Dysfunctional uterine bleeding 4515 49.5% 2887 36.6% 3806 30.4%
Dysmenorrhea 299 3.3% 201 2.6% 264 2.1%
Primary amenorrhoea 30 0.3% 19 0.2% 53 0.4%
Secondary amenorrhoea 83 0.9% 35 0.4% 46 0.4%
Miscellaneous 91 1.0% 255 3.2% 339 2.7%
Total no. of admissions 9122 (12.2%) 7882 (11.3%) 12531 (15.6%) The percentage of individual diagnosis refers to the percentage under this disease category while that of the total no. of
admissions refers to the percentage of all admissions.
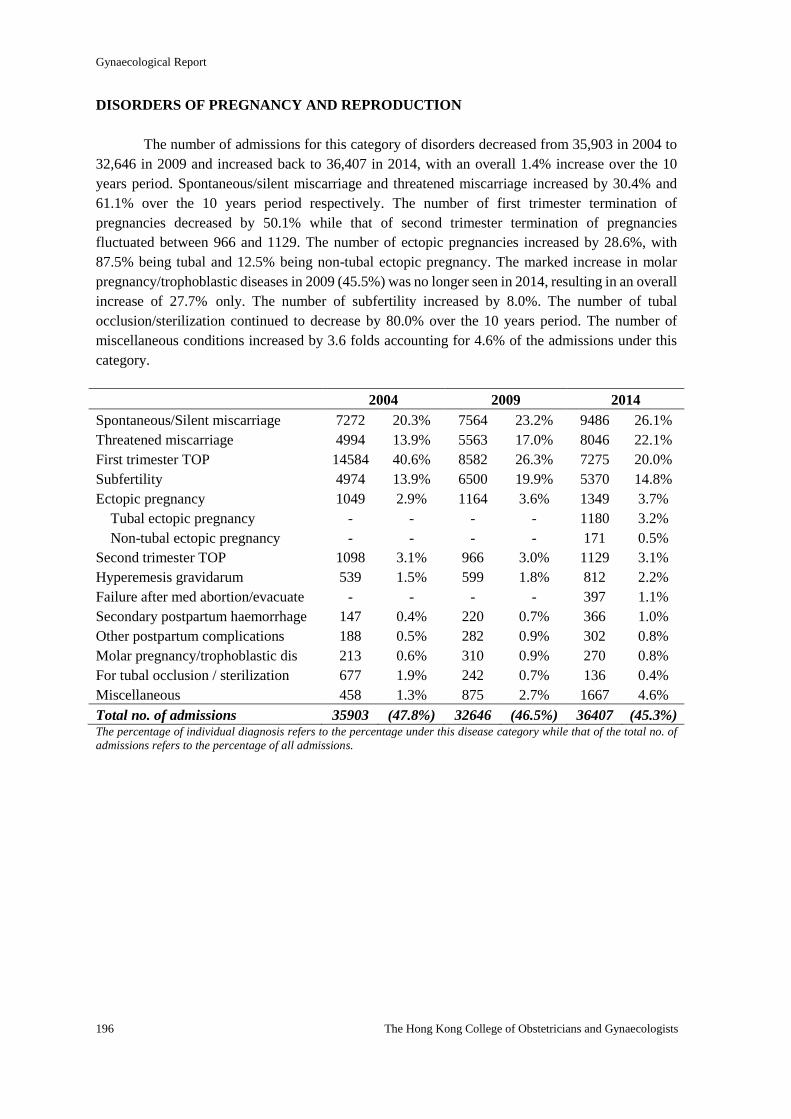
Gynaecological Report
196 The Hong Kong College of Obstetricians and Gynaecologists
DISORDERS OF PREGNANCY AND REPRODUCTION
The number of admissions for this category of disorders decreased from 35,903 in 2004 to
32,646 in 2009 and increased back to 36,407 in 2014, with an overall 1.4% increase over the 10
years period. Spontaneous/silent miscarriage and threatened miscarriage increased by 30.4% and
61.1% over the 10 years period respectively. The number of first trimester termination of
pregnancies decreased by 50.1% while that of second trimester termination of pregnancies
fluctuated between 966 and 1129. The number of ectopic pregnancies increased by 28.6%, with
87.5% being tubal and 12.5% being non-tubal ectopic pregnancy. The marked increase in molar
pregnancy/trophoblastic diseases in 2009 (45.5%) was no longer seen in 2014, resulting in an overall
increase of 27.7% only. The number of subfertility increased by 8.0%. The number of tubal
occlusion/sterilization continued to decrease by 80.0% over the 10 years period. The number of
miscellaneous conditions increased by 3.6 folds accounting for 4.6% of the admissions under this
category.
2004 2009 2014
Spontaneous/Silent miscarriage 7272 20.3% 7564 23.2% 9486 26.1%
Threatened miscarriage 4994 13.9% 5563 17.0% 8046 22.1%
First trimester TOP 14584 40.6% 8582 26.3% 7275 20.0%
Subfertility 4974 13.9% 6500 19.9% 5370 14.8%
Ectopic pregnancy 1049 2.9% 1164 3.6% 1349 3.7%
Tubal ectopic pregnancy - - - - 1180 3.2%
Non-tubal ectopic pregnancy - - - - 171 0.5%
Second trimester TOP 1098 3.1% 966 3.0% 1129 3.1%
Hyperemesis gravidarum 539 1.5% 599 1.8% 812 2.2%
Failure after med abortion/evacuate - - - - 397 1.1%
Secondary postpartum haemorrhage 147 0.4% 220 0.7% 366 1.0%
Other postpartum complications 188 0.5% 282 0.9% 302 0.8%
Molar pregnancy/trophoblastic dis 213 0.6% 310 0.9% 270 0.8%
For tubal occlusion / sterilization 677 1.9% 242 0.7% 136 0.4%
Miscellaneous 458 1.3% 875 2.7% 1667 4.6%
Total no. of admissions 35903 (47.8%) 32646 (46.5%) 36407 (45.3%) The percentage of individual diagnosis refers to the percentage under this disease category while that of the total no. of
admissions refers to the percentage of all admissions.
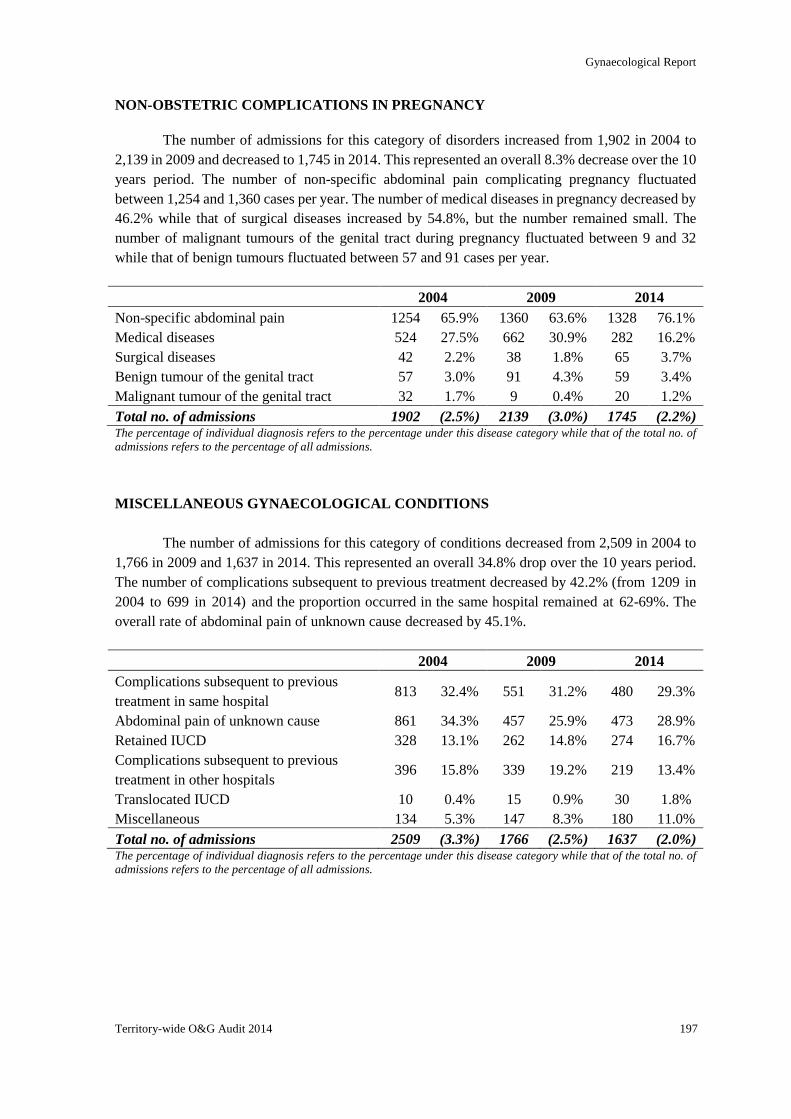
Gynaecological Report
Territory-wide O&G Audit 2014 197
NON-OBSTETRIC COMPLICATIONS IN PREGNANCY
The number of admissions for this category of disorders increased from 1,902 in 2004 to
2,139 in 2009 and decreased to 1,745 in 2014. This represented an overall 8.3% decrease over the 10
years period. The number of non-specific abdominal pain complicating pregnancy fluctuated
between 1,254 and 1,360 cases per year. The number of medical diseases in pregnancy decreased by
46.2% while that of surgical diseases increased by 54.8%, but the number remained small. The
number of malignant tumours of the genital tract during pregnancy fluctuated between 9 and 32
while that of benign tumours fluctuated between 57 and 91 cases per year.
2004 2009 2014
Non-specific abdominal pain 1254 65.9% 1360 63.6% 1328 76.1%
Medical diseases 524 27.5% 662 30.9% 282 16.2%
Surgical diseases 42 2.2% 38 1.8% 65 3.7%
Benign tumour of the genital tract 57 3.0% 91 4.3% 59 3.4%
Malignant tumour of the genital tract 32 1.7% 9 0.4% 20 1.2%
Total no. of admissions 1902 (2.5%) 2139 (3.0%) 1745 (2.2%) The percentage of individual diagnosis refers to the percentage under this disease category while that of the total no. of
admissions refers to the percentage of all admissions.
MISCELLANEOUS GYNAECOLOGICAL CONDITIONS
The number of admissions for this category of conditions decreased from 2,509 in 2004 to
1,766 in 2009 and 1,637 in 2014. This represented an overall 34.8% drop over the 10 years period.
The number of complications subsequent to previous treatment decreased by 42.2% (from 1209 in
2004 to 699 in 2014) and the proportion occurred in the same hospital remained at 62-69%. The
overall rate of abdominal pain of unknown cause decreased by 45.1%.
2004 2009 2014
Complications subsequent to previous
treatment in same hospital 813 32.4% 551 31.2% 480 29.3%
Abdominal pain of unknown cause 861 34.3% 457 25.9% 473 28.9%
Retained IUCD 328 13.1% 262 14.8% 274 16.7%
Complications subsequent to previous
treatment in other hospitals 396 15.8% 339 19.2% 219 13.4%
Translocated IUCD 10 0.4% 15 0.9% 30 1.8%
Miscellaneous 134 5.3% 147 8.3% 180 11.0%
Total no. of admissions 2509 (3.3%) 1766 (2.5%) 1637 (2.0%) The percentage of individual diagnosis refers to the percentage under this disease category while that of the total no. of
admissions refers to the percentage of all admissions.
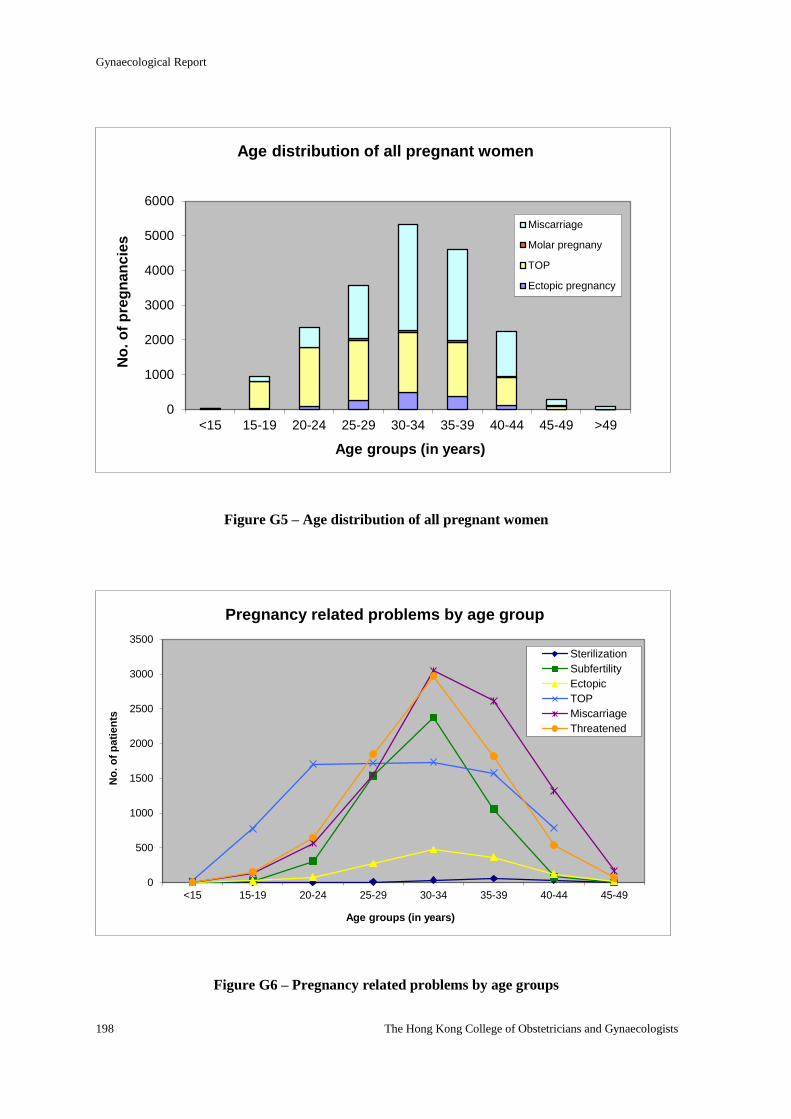
Gynaecological Report
198 The Hong Kong College of Obstetricians and Gynaecologists
Figure G5 – Age distribution of all pregnant women
Figure G6 – Pregnancy related problems by age groups
0
1000
2000
3000
4000
5000
6000
<15 15-19 20-24 25-29 30-34 35-39 40-44 45-49 >49
No
. o
f p
reg
nan
cie
s
Age groups (in years)
Age distribution of all pregnant women
Miscarriage
Molar pregnany
TOP
Ectopic pregnancy
0
500
1000
1500
2000
2500
3000
3500
<15 15-19 20-24 25-29 30-34 35-39 40-44 45-49
No
. o
f p
ati
en
ts
Age groups (in years)
Pregnancy related problems by age group
Sterilization
Subfertility
Ectopic
TOP
Miscarriage
Threatened
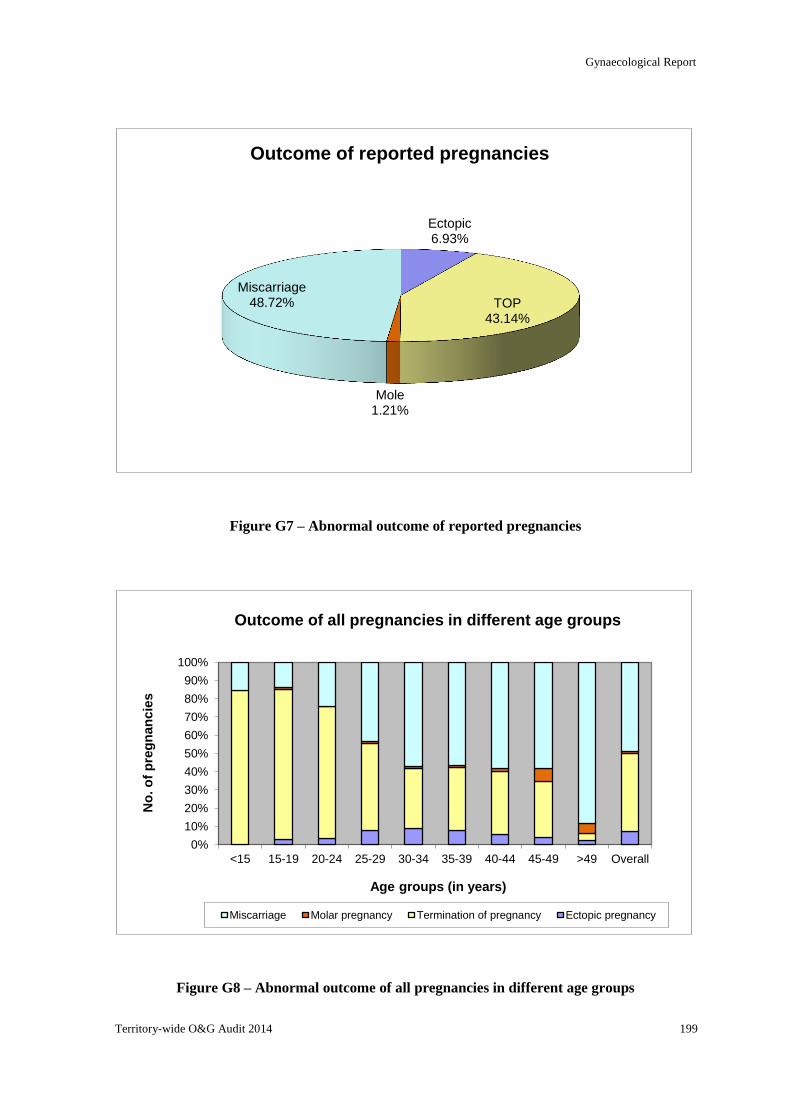
Gynaecological Report
Territory-wide O&G Audit 2014 199
Figure G7 – Abnormal outcome of reported pregnancies
Figure G8 – Abnormal outcome of all pregnancies in different age groups
Ectopic 6.93%
TOP 43.14%
Mole 1.21%
Miscarriage 48.72%
Outcome of reported pregnancies
0%
10%
20%
30%
40%
50%
60%
70%
80%
90%
100%
<15 15-19 20-24 25-29 30-34 35-39 40-44 45-49 >49 Overall
No
. o
f p
reg
nan
cie
s
Age groups (in years)
Outcome of all pregnancies in different age groups
Miscarriage Molar pregnancy Termination of pregnancy Ectopic pregnancy
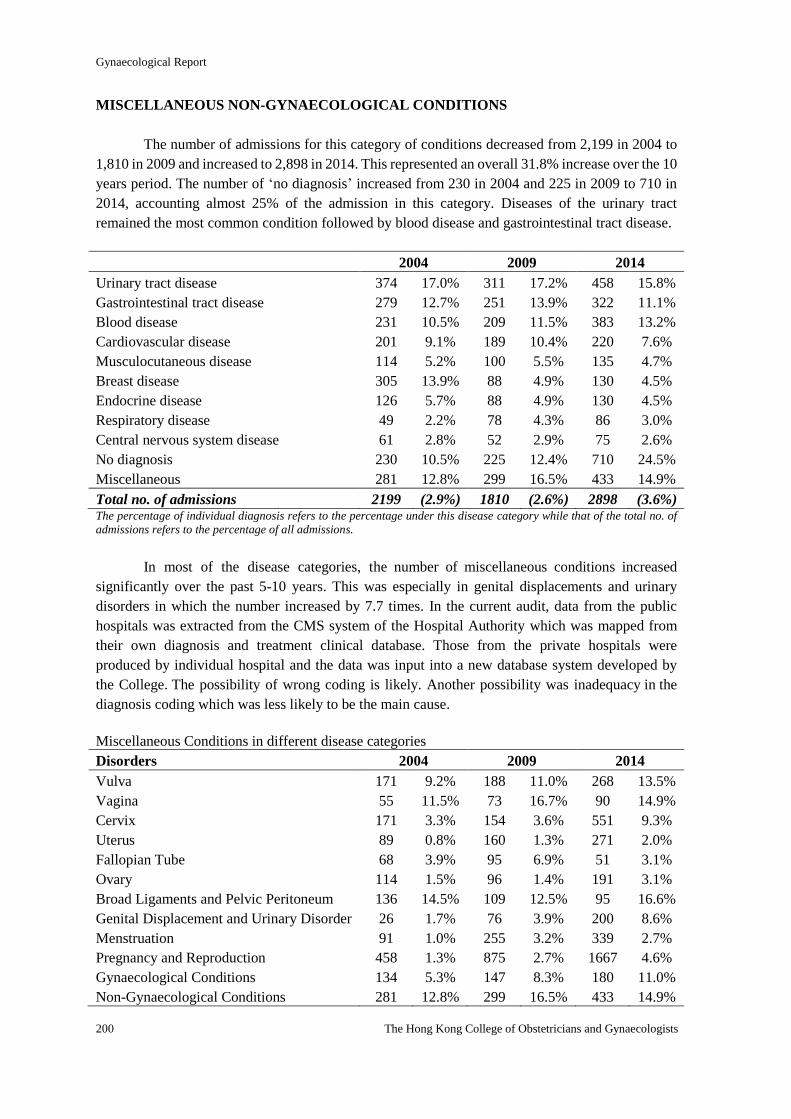
Gynaecological Report
200 The Hong Kong College of Obstetricians and Gynaecologists
MISCELLANEOUS NON-GYNAECOLOGICAL CONDITIONS
The number of admissions for this category of conditions decreased from 2,199 in 2004 to
1,810 in 2009 and increased to 2,898 in 2014. This represented an overall 31.8% increase over the 10
years period. The number of ‘no diagnosis’ increased from 230 in 2004 and 225 in 2009 to 710 in
2014, accounting almost 25% of the admission in this category. Diseases of the urinary tract
remained the most common condition followed by blood disease and gastrointestinal tract disease.
2004 2009 2014
Urinary tract disease 374 17.0% 311 17.2% 458 15.8%
Gastrointestinal tract disease 279 12.7% 251 13.9% 322 11.1%
Blood disease 231 10.5% 209 11.5% 383 13.2%
Cardiovascular disease 201 9.1% 189 10.4% 220 7.6%
Musculocutaneous disease 114 5.2% 100 5.5% 135 4.7%
Breast disease 305 13.9% 88 4.9% 130 4.5%
Endocrine disease 126 5.7% 88 4.9% 130 4.5%
Respiratory disease 49 2.2% 78 4.3% 86 3.0%
Central nervous system disease 61 2.8% 52 2.9% 75 2.6%
No diagnosis 230 10.5% 225 12.4% 710 24.5%
Miscellaneous 281 12.8% 299 16.5% 433 14.9%
Total no. of admissions 2199 (2.9%) 1810 (2.6%) 2898 (3.6%) The percentage of individual diagnosis refers to the percentage under this disease category while that of the total no. of
admissions refers to the percentage of all admissions.
In most of the disease categories, the number of miscellaneous conditions increased
significantly over the past 5-10 years. This was especially in genital displacements and urinary
disorders in which the number increased by 7.7 times. In the current audit, data from the public
hospitals was extracted from the CMS system of the Hospital Authority which was mapped from
their own diagnosis and treatment clinical database. Those from the private hospitals were
produced by individual hospital and the data was input into a new database system developed by
the College. The possibility of wrong coding is likely. Another possibility was inadequacy in the
diagnosis coding which was less likely to be the main cause.
Miscellaneous Conditions in different disease categories
Disorders 2004 2009 2014
Vulva 171 9.2% 188 11.0% 268 13.5%
Vagina 55 11.5% 73 16.7% 90 14.9%
Cervix 171 3.3% 154 3.6% 551 9.3%
Uterus 89 0.8% 160 1.3% 271 2.0%
Fallopian Tube 68 3.9% 95 6.9% 51 3.1%
Ovary 114 1.5% 96 1.4% 191 3.1%
Broad Ligaments and Pelvic Peritoneum 136 14.5% 109 12.5% 95 16.6%
Genital Displacement and Urinary Disorder 26 1.7% 76 3.9% 200 8.6%
Menstruation 91 1.0% 255 3.2% 339 2.7%
Pregnancy and Reproduction 458 1.3% 875 2.7% 1667 4.6%
Gynaecological Conditions 134 5.3% 147 8.3% 180 11.0%
Non-Gynaecological Conditions 281 12.8% 299 16.5% 433 14.9%
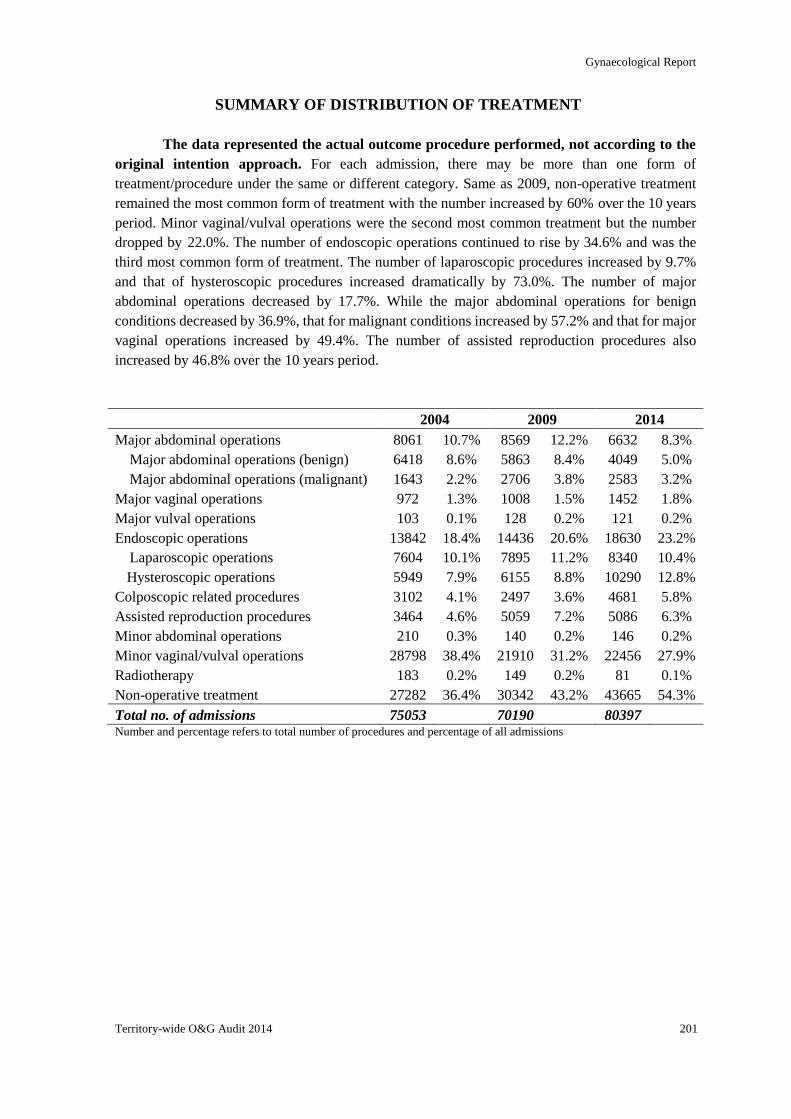
Gynaecological Report
Territory-wide O&G Audit 2014 201
SUMMARY OF DISTRIBUTION OF TREATMENT
The data represented the actual outcome procedure performed, not according to the
original intention approach. For each admission, there may be more than one form of
treatment/procedure under the same or different category. Same as 2009, non-operative treatment
remained the most common form of treatment with the number increased by 60% over the 10 years
period. Minor vaginal/vulval operations were the second most common treatment but the number
dropped by 22.0%. The number of endoscopic operations continued to rise by 34.6% and was the
third most common form of treatment. The number of laparoscopic procedures increased by 9.7%
and that of hysteroscopic procedures increased dramatically by 73.0%. The number of major
abdominal operations decreased by 17.7%. While the major abdominal operations for benign
conditions decreased by 36.9%, that for malignant conditions increased by 57.2% and that for major
vaginal operations increased by 49.4%. The number of assisted reproduction procedures also
increased by 46.8% over the 10 years period.
2004 2009 2014
Major abdominal operations 8061 10.7% 8569 12.2% 6632 8.3%
Major abdominal operations (benign) 6418 8.6% 5863 8.4% 4049 5.0%
Major abdominal operations (malignant) 1643 2.2% 2706 3.8% 2583 3.2%
Major vaginal operations 972 1.3% 1008 1.5% 1452 1.8%
Major vulval operations 103 0.1% 128 0.2% 121 0.2%
Endoscopic operations 13842 18.4% 14436 20.6% 18630 23.2%
Laparoscopic operations 7604 10.1% 7895 11.2% 8340 10.4%
Hysteroscopic operations 5949 7.9% 6155 8.8% 10290 12.8%
Colposcopic related procedures 3102 4.1% 2497 3.6% 4681 5.8%
Assisted reproduction procedures 3464 4.6% 5059 7.2% 5086 6.3%
Minor abdominal operations 210 0.3% 140 0.2% 146 0.2%
Minor vaginal/vulval operations 28798 38.4% 21910 31.2% 22456 27.9%
Radiotherapy 183 0.2% 149 0.2% 81 0.1%
Non-operative treatment 27282 36.4% 30342 43.2% 43665 54.3%
Total no. of admissions 75053 70190 80397 Number and percentage refers to total number of procedures and percentage of all admissions
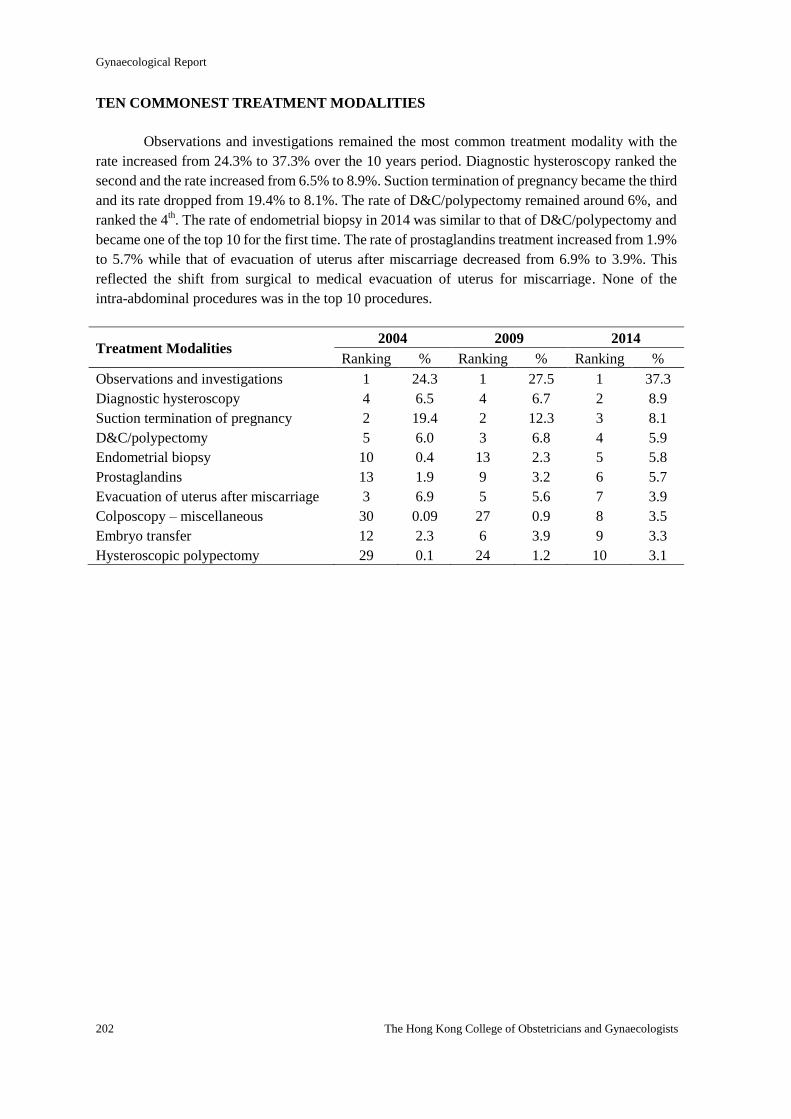
Gynaecological Report
202 The Hong Kong College of Obstetricians and Gynaecologists
TEN COMMONEST TREATMENT MODALITIES
Observations and investigations remained the most common treatment modality with the
rate increased from 24.3% to 37.3% over the 10 years period. Diagnostic hysteroscopy ranked the
second and the rate increased from 6.5% to 8.9%. Suction termination of pregnancy became the third
and its rate dropped from 19.4% to 8.1%. The rate of D&C/polypectomy remained around 6%, and
ranked the 4th. The rate of endometrial biopsy in 2014 was similar to that of D&C/polypectomy and
became one of the top 10 for the first time. The rate of prostaglandins treatment increased from 1.9%
to 5.7% while that of evacuation of uterus after miscarriage decreased from 6.9% to 3.9%. This
reflected the shift from surgical to medical evacuation of uterus for miscarriage. None of the
intra-abdominal procedures was in the top 10 procedures.
Treatment Modalities 2004 2009 2014
Ranking % Ranking % Ranking %
Observations and investigations 1 24.3 1 27.5 1 37.3
Diagnostic hysteroscopy 4 6.5 4 6.7 2 8.9
Suction termination of pregnancy 2 19.4 2 12.3 3 8.1
D&C/polypectomy 5 6.0 3 6.8 4 5.9
Endometrial biopsy 10 0.4 13 2.3 5 5.8
Prostaglandins 13 1.9 9 3.2 6 5.7
Evacuation of uterus after miscarriage 3 6.9 5 5.6 7 3.9
Colposcopy – miscellaneous 30 0.09 27 0.9 8 3.5
Embryo transfer 12 2.3 6 3.9 9 3.3
Hysteroscopic polypectomy 29 0.1 24 1.2 10 3.1
Gynaecological Report
Territory-wide O&G Audit 2014 203
DETAILED BREAKDOWN OF INDIVIDUAL TREATMENT
MAJOR ABDOMINAL OPERATIONS
In the current audit, coding for Major Abdominal Operations for "Benign and Pre-malignant
Conditions" and that for "Malignant Conditions" were combined, same as the laparoscopic
operations. The differentiation between benign and malignant conditions was based on the coding
for “Diagnosis”, coding under the section for “Oncology Cases” and the coding for pathology under
“Intra-abdominal Operation” which was an ad hoc audit in the 2014 exercise.
The number of admissions for this category of treatment decreased significantly from 7,111
in 2004 to 5,679 in 2009 and 3,593 in 2014. This represented an overall 49.5% decrease over the 10
years period. Most of the major abdominal procedures showed a reduction in numbers except for
pelvic and para-aortic lymphadenectomy which increased by 2 and 2.5 folds respectively.
Salpingo-oophorectomy was separated from total and subtotal hysterectomy as an individual
procedure in 2009, which resulted in a dramatic increase in the number of this procedure in that year
(from 580 to 2,048) and the number dropped to 1,666 in 2014. The number of abdominal
hysterectomies, myomectomies and ovarian cystectomies reduced by 50%. Abdominal operations
for stress incontinence and genital prolapse were uncommonly performed in 2014. These changes
reflected that minimal invasive surgery had replaced traditional laparotomy and became the standard
operative approach in most of the gynaecological pelvic procedures.
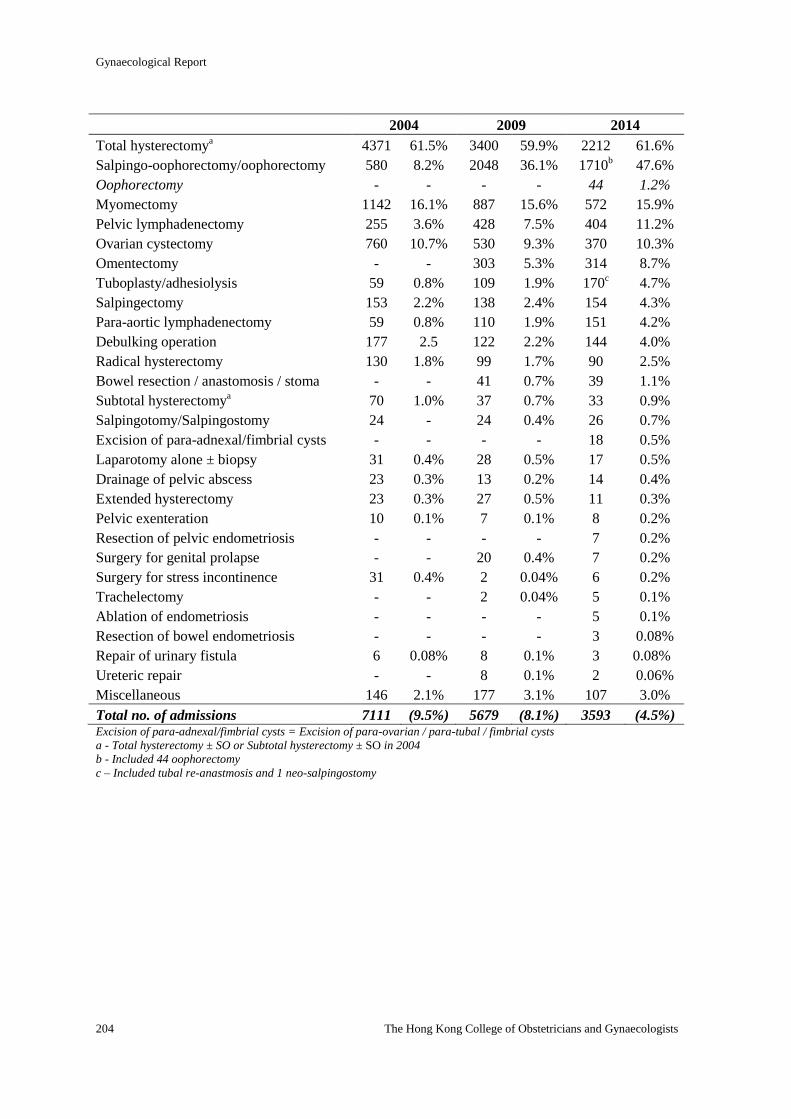
Gynaecological Report
204 The Hong Kong College of Obstetricians and Gynaecologists
2004 2009 2014
Total hysterectomya 4371 61.5% 3400 59.9% 2212 61.6%
Salpingo-oophorectomy/oophorectomy 580 8.2% 2048 36.1% 1710b 47.6%
Oophorectomy - - - - 44 1.2%
Myomectomy 1142 16.1% 887 15.6% 572 15.9%
Pelvic lymphadenectomy 255 3.6% 428 7.5% 404 11.2%
Ovarian cystectomy 760 10.7% 530 9.3% 370 10.3%
Omentectomy - - 303 5.3% 314 8.7%
Tuboplasty/adhesiolysis 59 0.8% 109 1.9% 170c 4.7%
Salpingectomy 153 2.2% 138 2.4% 154 4.3%
Para-aortic lymphadenectomy 59 0.8% 110 1.9% 151 4.2%
Debulking operation 177 2.5 122 2.2% 144 4.0%
Radical hysterectomy 130 1.8% 99 1.7% 90 2.5%
Bowel resection / anastomosis / stoma - - 41 0.7% 39 1.1%
Subtotal hysterectomya 70 1.0% 37 0.7% 33 0.9%
Salpingotomy/Salpingostomy 24 - 24 0.4% 26 0.7%
Excision of para-adnexal/fimbrial cysts - - - - 18 0.5%
Laparotomy alone ± biopsy 31 0.4% 28 0.5% 17 0.5%
Drainage of pelvic abscess 23 0.3% 13 0.2% 14 0.4%
Extended hysterectomy 23 0.3% 27 0.5% 11 0.3%
Pelvic exenteration 10 0.1% 7 0.1% 8 0.2%
Resection of pelvic endometriosis - - - - 7 0.2%
Surgery for genital prolapse - - 20 0.4% 7 0.2%
Surgery for stress incontinence 31 0.4% 2 0.04% 6 0.2%
Trachelectomy - - 2 0.04% 5 0.1%
Ablation of endometriosis - - - - 5 0.1%
Resection of bowel endometriosis - - - - 3 0.08%
Repair of urinary fistula 6 0.08% 8 0.1% 3 0.08%
Ureteric repair - - 8 0.1% 2 0.06%
Miscellaneous 146 2.1% 177 3.1% 107 3.0%
Total no. of admissions 7111 (9.5%) 5679 (8.1%) 3593 (4.5%) Excision of para-adnexal/fimbrial cysts = Excision of para-ovarian / para-tubal / fimbrial cysts
a - Total hysterectomy ± SO or Subtotal hysterectomy ± SO in 2004
b - Included 44 oophorectomy
c – Included tubal re-anastmosis and 1 neo-salpingostomy
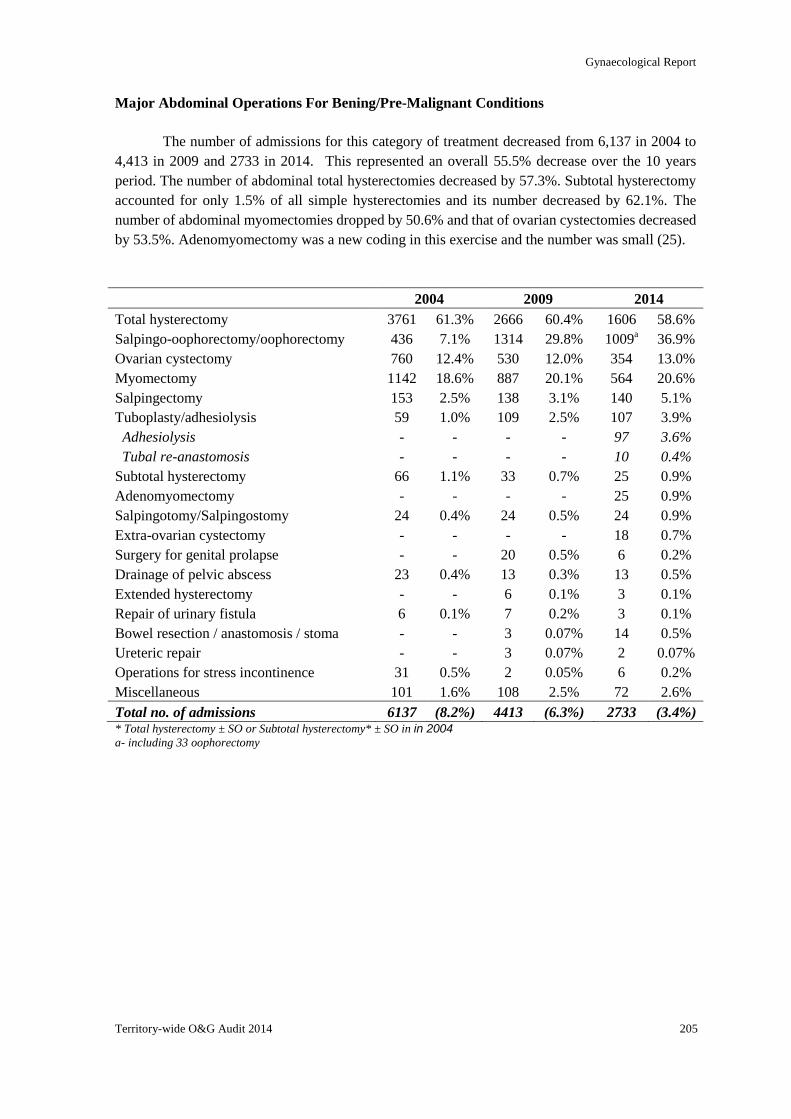
Gynaecological Report
Territory-wide O&G Audit 2014 205
Major Abdominal Operations For Bening/Pre-Malignant Conditions
The number of admissions for this category of treatment decreased from 6,137 in 2004 to
4,413 in 2009 and 2733 in 2014. This represented an overall 55.5% decrease over the 10 years
period. The number of abdominal total hysterectomies decreased by 57.3%. Subtotal hysterectomy
accounted for only 1.5% of all simple hysterectomies and its number decreased by 62.1%. The
number of abdominal myomectomies dropped by 50.6% and that of ovarian cystectomies decreased
by 53.5%. Adenomyomectomy was a new coding in this exercise and the number was small (25).
2004 2009 2014
Total hysterectomy 3761 61.3% 2666 60.4% 1606 58.6%
Salpingo-oophorectomy/oophorectomy 436 7.1% 1314 29.8% 1009a 36.9%
Ovarian cystectomy 760 12.4% 530 12.0% 354 13.0%
Myomectomy 1142 18.6% 887 20.1% 564 20.6%
Salpingectomy 153 2.5% 138 3.1% 140 5.1%
Tuboplasty/adhesiolysis 59 1.0% 109 2.5% 107 3.9%
Adhesiolysis - - - - 97 3.6%
Tubal re-anastomosis - - - - 10 0.4%
Subtotal hysterectomy 66 1.1% 33 0.7% 25 0.9%
Adenomyomectomy - - - - 25 0.9%
Salpingotomy/Salpingostomy 24 0.4% 24 0.5% 24 0.9%
Extra-ovarian cystectomy - - - - 18 0.7%
Surgery for genital prolapse - - 20 0.5% 6 0.2%
Drainage of pelvic abscess 23 0.4% 13 0.3% 13 0.5%
Extended hysterectomy - - 6 0.1% 3 0.1%
Repair of urinary fistula 6 0.1% 7 0.2% 3 0.1%
Bowel resection / anastomosis / stoma - - 3 0.07% 14 0.5%
Ureteric repair - - 3 0.07% 2 0.07%
Operations for stress incontinence 31 0.5% 2 0.05% 6 0.2%
Miscellaneous 101 1.6% 108 2.5% 72 2.6%
Total no. of admissions 6137 (8.2%) 4413 (6.3%) 2733 (3.4%) * Total hysterectomy ± SO or Subtotal hysterectomy* ± SO in in 2004 a- including 33 oophorectomy
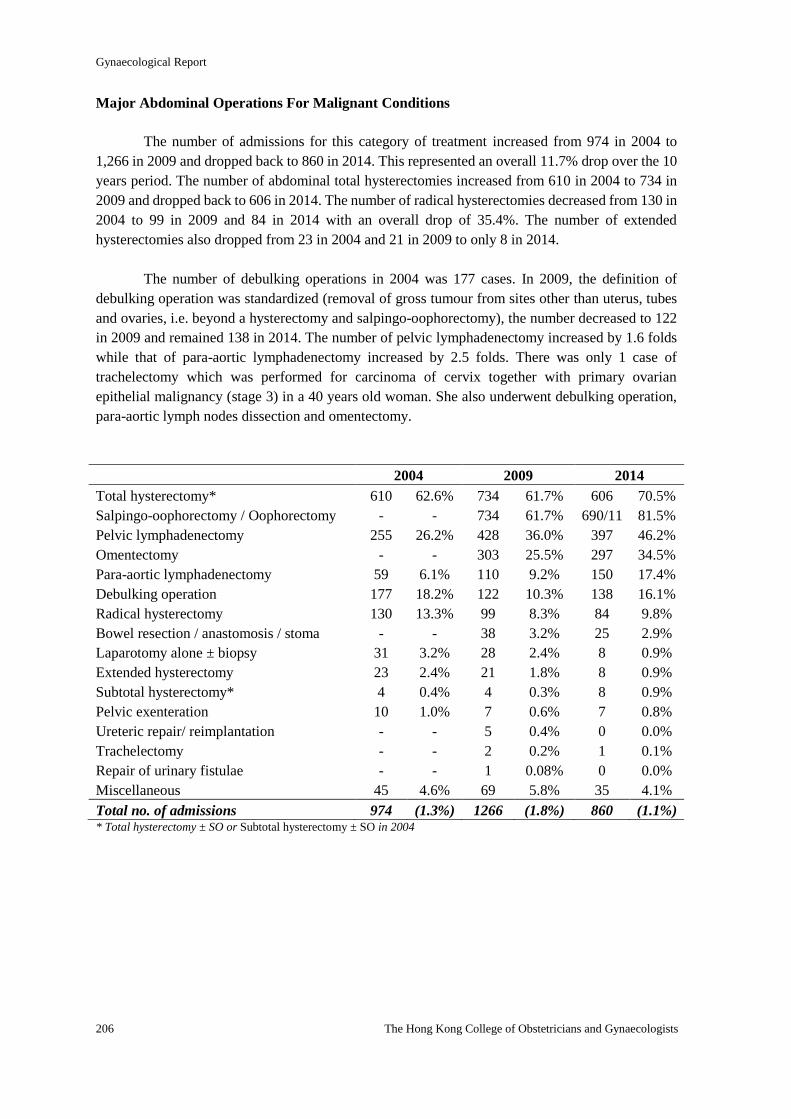
Gynaecological Report
206 The Hong Kong College of Obstetricians and Gynaecologists
Major Abdominal Operations For Malignant Conditions
The number of admissions for this category of treatment increased from 974 in 2004 to
1,266 in 2009 and dropped back to 860 in 2014. This represented an overall 11.7% drop over the 10
years period. The number of abdominal total hysterectomies increased from 610 in 2004 to 734 in
2009 and dropped back to 606 in 2014. The number of radical hysterectomies decreased from 130 in
2004 to 99 in 2009 and 84 in 2014 with an overall drop of 35.4%. The number of extended
hysterectomies also dropped from 23 in 2004 and 21 in 2009 to only 8 in 2014.
The number of debulking operations in 2004 was 177 cases. In 2009, the definition of
debulking operation was standardized (removal of gross tumour from sites other than uterus, tubes
and ovaries, i.e. beyond a hysterectomy and salpingo-oophorectomy), the number decreased to 122
in 2009 and remained 138 in 2014. The number of pelvic lymphadenectomy increased by 1.6 folds
while that of para-aortic lymphadenectomy increased by 2.5 folds. There was only 1 case of
trachelectomy which was performed for carcinoma of cervix together with primary ovarian
epithelial malignancy (stage 3) in a 40 years old woman. She also underwent debulking operation,
para-aortic lymph nodes dissection and omentectomy.
2004 2009 2014
Total hysterectomy* 610 62.6% 734 61.7% 606 70.5%
Salpingo-oophorectomy / Oophorectomy - - 734 61.7% 690/11 81.5%
Pelvic lymphadenectomy 255 26.2% 428 36.0% 397 46.2%
Omentectomy - - 303 25.5% 297 34.5%
Para-aortic lymphadenectomy 59 6.1% 110 9.2% 150 17.4%
Debulking operation 177 18.2% 122 10.3% 138 16.1%
Radical hysterectomy 130 13.3% 99 8.3% 84 9.8%
Bowel resection / anastomosis / stoma - - 38 3.2% 25 2.9%
Laparotomy alone ± biopsy 31 3.2% 28 2.4% 8 0.9%
Extended hysterectomy 23 2.4% 21 1.8% 8 0.9%
Subtotal hysterectomy* 4 0.4% 4 0.3% 8 0.9%
Pelvic exenteration 10 1.0% 7 0.6% 7 0.8%
Ureteric repair/ reimplantation - - 5 0.4% 0 0.0%
Trachelectomy - - 2 0.2% 1 0.1%
Repair of urinary fistulae - - 1 0.08% 0 0.0%
Miscellaneous 45 4.6% 69 5.8% 35 4.1%
Total no. of admissions 974 (1.3%) 1266 (1.8%) 860 (1.1%) * Total hysterectomy ± SO or Subtotal hysterectomy ± SO in 2004
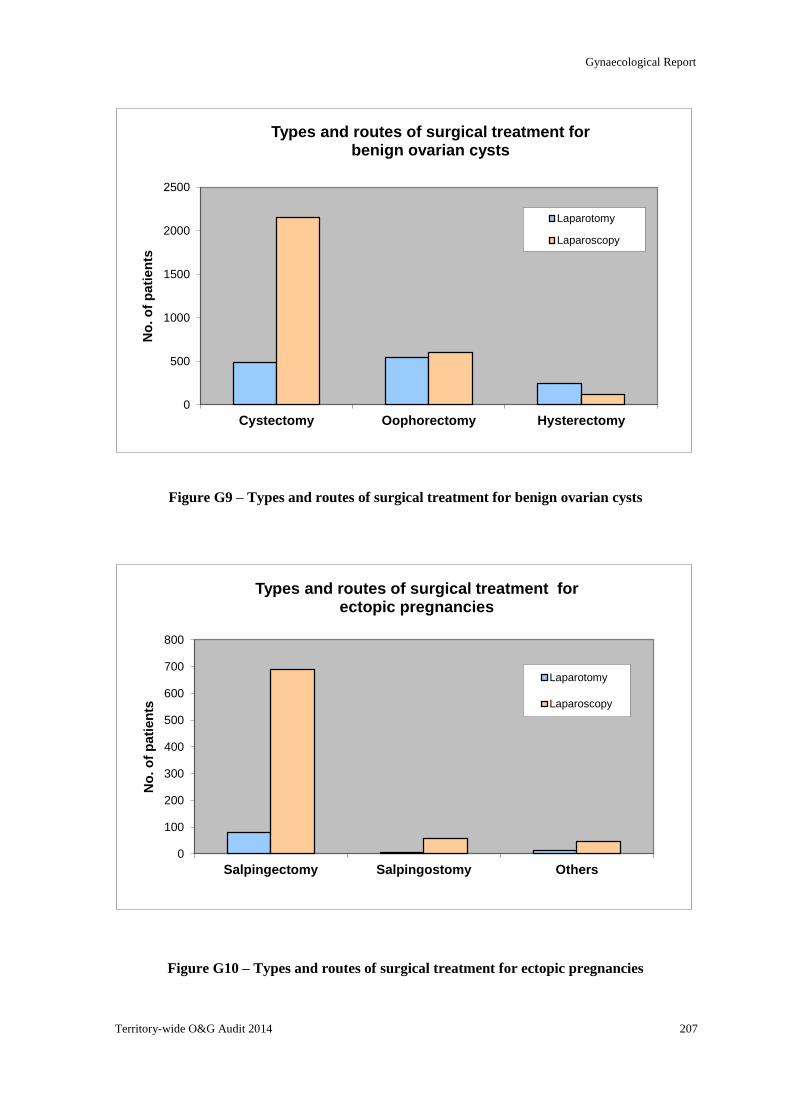
Gynaecological Report
Territory-wide O&G Audit 2014 207
0
500
1000
1500
2000
2500
Cystectomy Oophorectomy Hysterectomy
No
. o
f p
ati
en
ts
Types and routes of surgical treatment for benign ovarian cysts
Laparotomy
Laparoscopy
0
100
200
300
400
500
600
700
800
Salpingectomy Salpingostomy Others
No
. o
f p
ati
en
ts
Types and routes of surgical treatment for ectopic pregnancies
Laparotomy
Laparoscopy
Figure G9 – Types and routes of surgical treatment for benign ovarian cysts
Figure G10 – Types and routes of surgical treatment for ectopic pregnancies
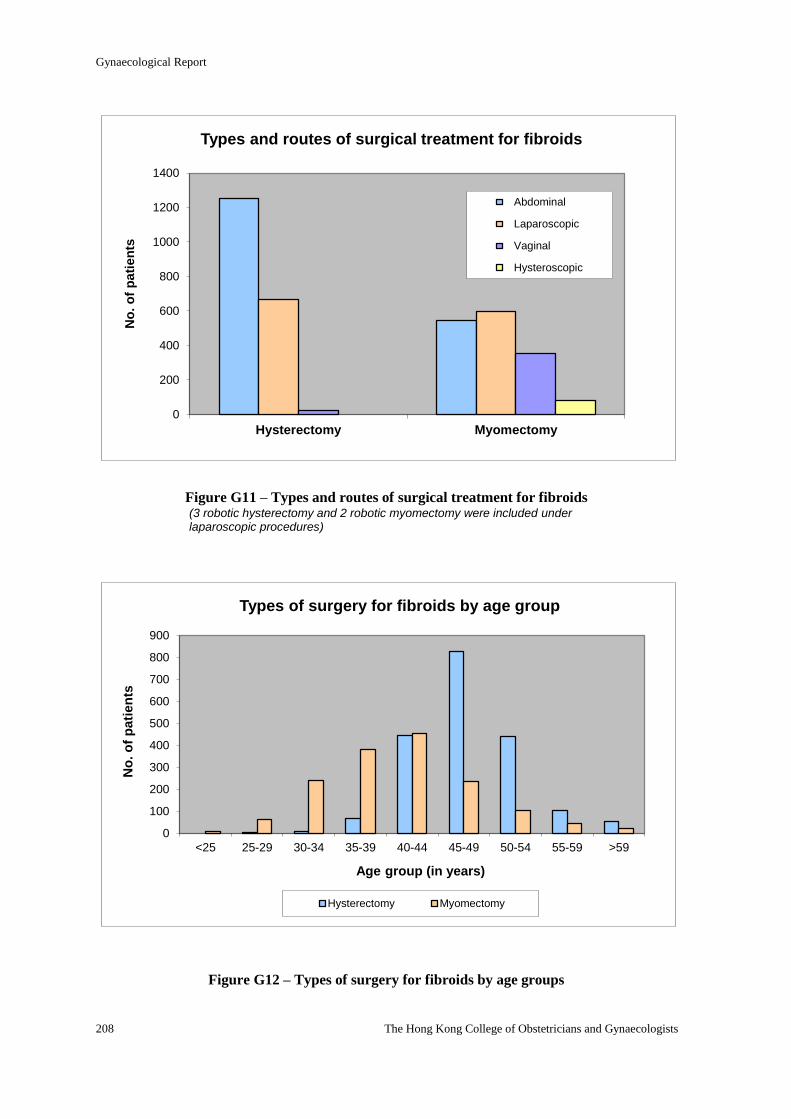
Gynaecological Report
208 The Hong Kong College of Obstetricians and Gynaecologists
0
200
400
600
800
1000
1200
1400
Hysterectomy Myomectomy
No
. o
f p
ati
en
ts
Types and routes of surgical treatment for fibroids
Abdominal
Laparoscopic
Vaginal
Hysteroscopic
Figure G11 – Types and routes of surgical treatment for fibroids (3 robotic hysterectomy and 2 robotic myomectomy were included under laparoscopic procedures)
Figure G12 – Types of surgery for fibroids by age groups
0
100
200
300
400
500
600
700
800
900
<25 25-29 30-34 35-39 40-44 45-49 50-54 55-59 >59
No
. o
f p
ati
en
ts
Age group (in years)
Types of surgery for fibroids by age group
Hysterectomy Myomectomy
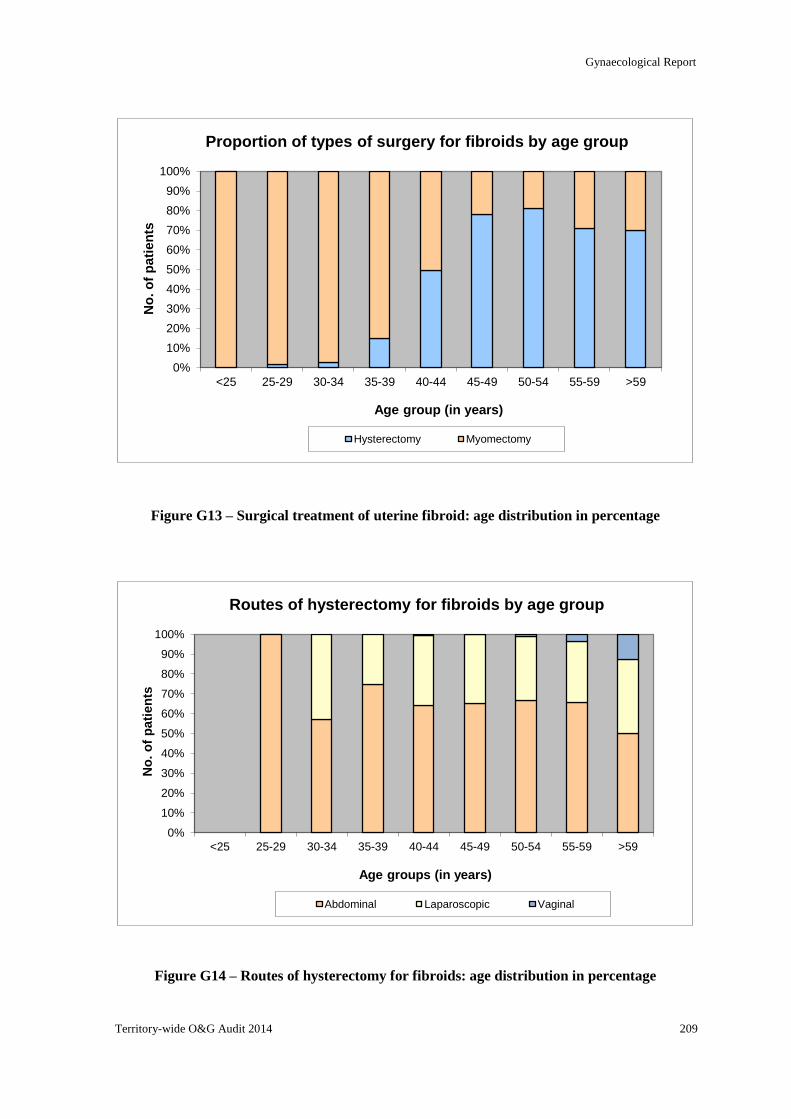
Gynaecological Report
Territory-wide O&G Audit 2014 209
Figure G13 – Surgical treatment of uterine fibroid: age distribution in percentage
Figure G14 – Routes of hysterectomy for fibroids: age distribution in percentage
0%
10%
20%
30%
40%
50%
60%
70%
80%
90%
100%
<25 25-29 30-34 35-39 40-44 45-49 50-54 55-59 >59
No
. o
f p
ati
en
ts
Age group (in years)
Proportion of types of surgery for fibroids by age group
Hysterectomy Myomectomy
0%
10%
20%
30%
40%
50%
60%
70%
80%
90%
100%
<25 25-29 30-34 35-39 40-44 45-49 50-54 55-59 >59
No
. o
f p
ati
en
ts
Age groups (in years)
Routes of hysterectomy for fibroids by age group
Abdominal Laparoscopic Vaginal
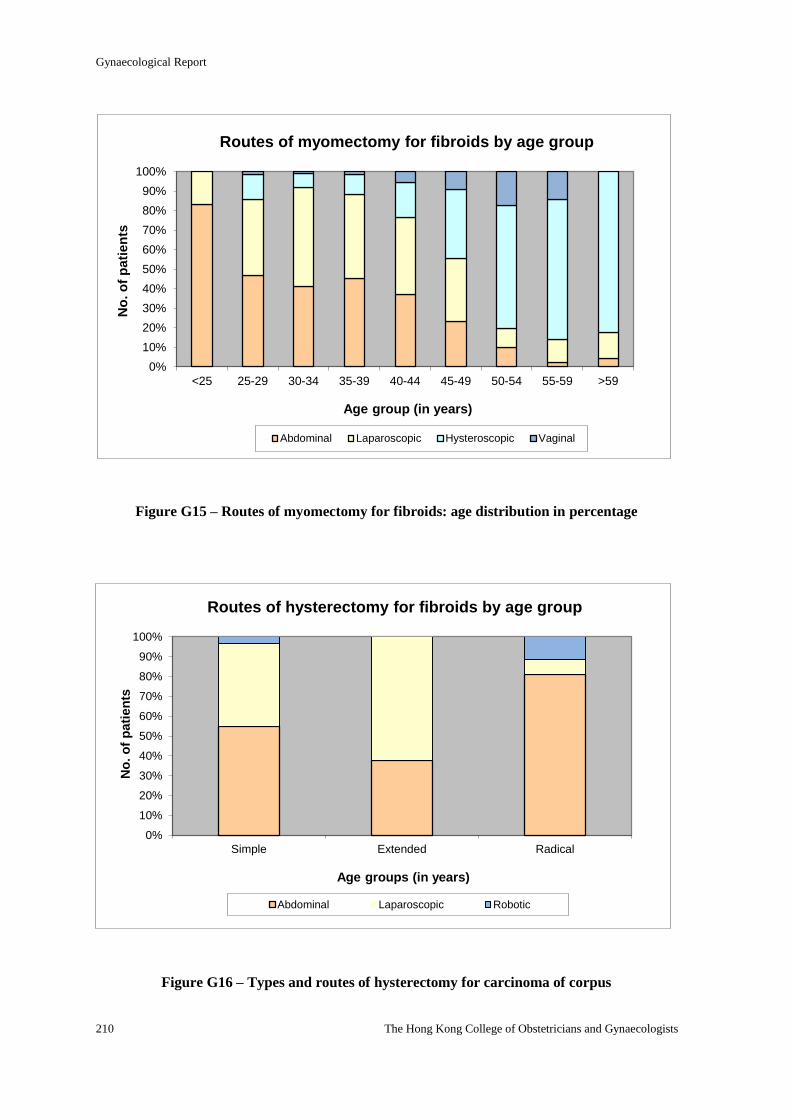
Gynaecological Report
210 The Hong Kong College of Obstetricians and Gynaecologists
0%
10%
20%
30%
40%
50%
60%
70%
80%
90%
100%
Simple Extended Radical
No
. o
f p
ati
en
ts
Age groups (in years)
Routes of hysterectomy for fibroids by age group
Abdominal Laparoscopic Robotic
Figure G15 – Routes of myomectomy for fibroids: age distribution in percentage
Figure G16 – Types and routes of hysterectomy for carcinoma of corpus
0%
10%
20%
30%
40%
50%
60%
70%
80%
90%
100%
<25 25-29 30-34 35-39 40-44 45-49 50-54 55-59 >59
No
. o
f p
ati
en
ts
Age group (in years)
Routes of myomectomy for fibroids by age group
Abdominal Laparoscopic Hysteroscopic Vaginal
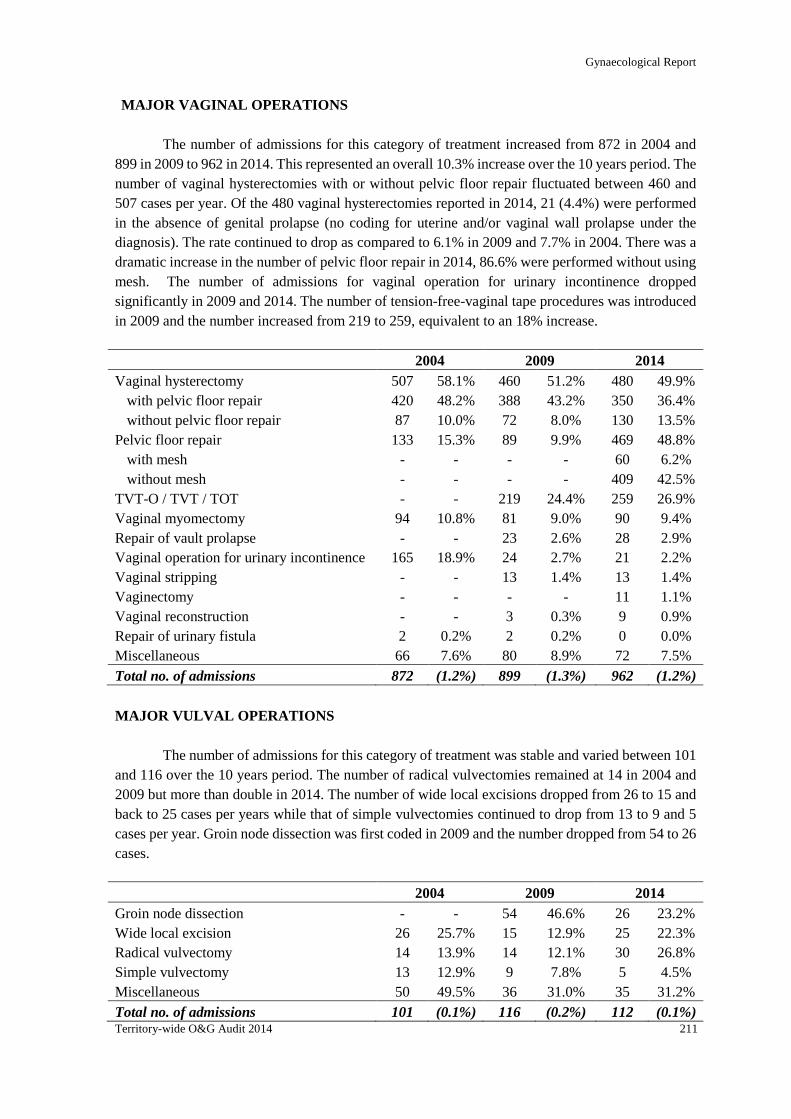
Gynaecological Report
Territory-wide O&G Audit 2014 211
MAJOR VAGINAL OPERATIONS
The number of admissions for this category of treatment increased from 872 in 2004 and
899 in 2009 to 962 in 2014. This represented an overall 10.3% increase over the 10 years period. The
number of vaginal hysterectomies with or without pelvic floor repair fluctuated between 460 and
507 cases per year. Of the 480 vaginal hysterectomies reported in 2014, 21 (4.4%) were performed
in the absence of genital prolapse (no coding for uterine and/or vaginal wall prolapse under the
diagnosis). The rate continued to drop as compared to 6.1% in 2009 and 7.7% in 2004. There was a
dramatic increase in the number of pelvic floor repair in 2014, 86.6% were performed without using
mesh. The number of admissions for vaginal operation for urinary incontinence dropped
significantly in 2009 and 2014. The number of tension-free-vaginal tape procedures was introduced
in 2009 and the number increased from 219 to 259, equivalent to an 18% increase.
2004 2009 2014
Vaginal hysterectomy
with pelvic floor repair
without pelvic floor repair
507
420
87
58.1%
48.2%
10.0%
460
388
72
51.2%
43.2%
8.0%
480
350
130
49.9%
36.4%
13.5%
Pelvic floor repair
with mesh
without mesh
133
-
-
15.3%
-
-
89
-
-
9.9%
-
-
469
60
409
48.8%
6.2%
42.5%
TVT-O / TVT / TOT - - 219 24.4% 259 26.9%
Vaginal myomectomy 94 10.8% 81 9.0% 90 9.4%
Repair of vault prolapse - - 23 2.6% 28 2.9%
Vaginal operation for urinary incontinence 165 18.9% 24 2.7% 21 2.2%
Vaginal stripping - - 13 1.4% 13 1.4%
Vaginectomy - - - - 11 1.1%
Vaginal reconstruction - - 3 0.3% 9 0.9%
Repair of urinary fistula 2 0.2% 2 0.2% 0 0.0%
Miscellaneous 66 7.6% 80 8.9% 72 7.5%
Total no. of admissions 872 (1.2%) 899 (1.3%) 962 (1.2%)
MAJOR VULVAL OPERATIONS
The number of admissions for this category of treatment was stable and varied between 101
and 116 over the 10 years period. The number of radical vulvectomies remained at 14 in 2004 and
2009 but more than double in 2014. The number of wide local excisions dropped from 26 to 15 and
back to 25 cases per years while that of simple vulvectomies continued to drop from 13 to 9 and 5
cases per year. Groin node dissection was first coded in 2009 and the number dropped from 54 to 26
cases.
2004 2009 2014
Groin node dissection - - 54 46.6% 26 23.2%
Wide local excision 26 25.7% 15 12.9% 25 22.3%
Radical vulvectomy 14 13.9% 14 12.1% 30 26.8%
Simple vulvectomy 13 12.9% 9 7.8% 5 4.5%
Miscellaneous 50 49.5% 36 31.0% 35 31.2%
Total no. of admissions 101 (0.1%) 116 (0.2%) 112 (0.1%)
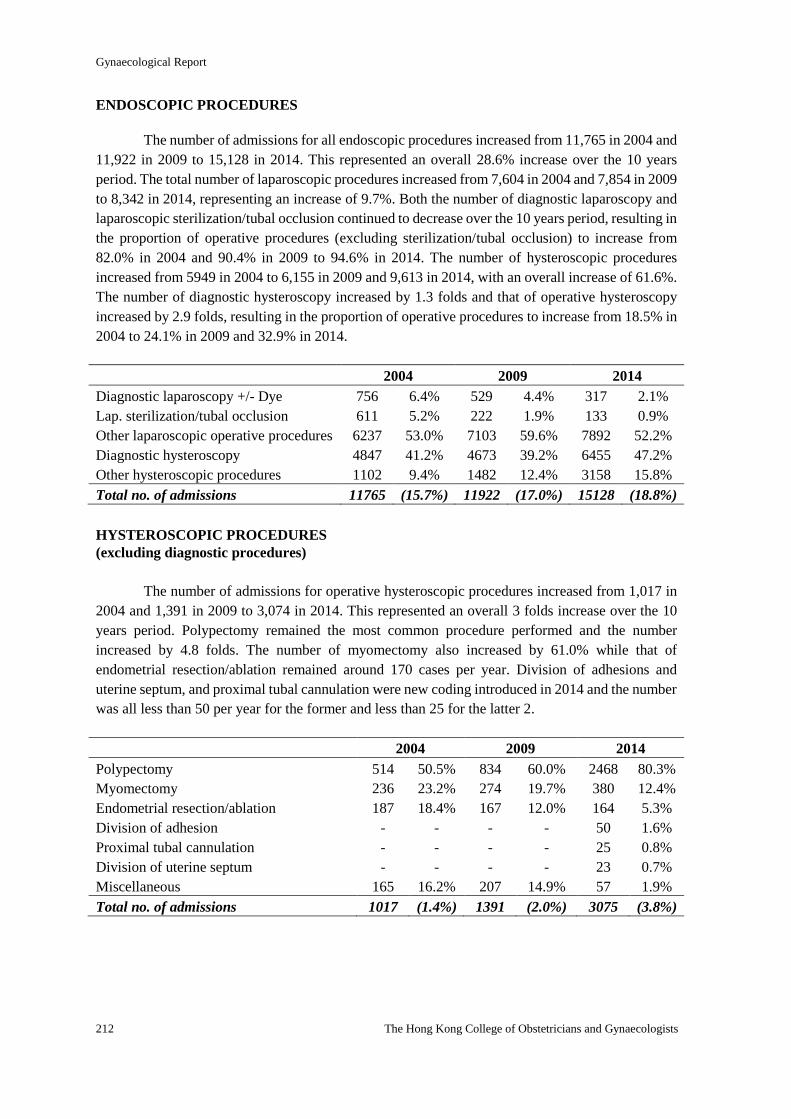
Gynaecological Report
212 The Hong Kong College of Obstetricians and Gynaecologists
ENDOSCOPIC PROCEDURES
The number of admissions for all endoscopic procedures increased from 11,765 in 2004 and
11,922 in 2009 to 15,128 in 2014. This represented an overall 28.6% increase over the 10 years
period. The total number of laparoscopic procedures increased from 7,604 in 2004 and 7,854 in 2009
to 8,342 in 2014, representing an increase of 9.7%. Both the number of diagnostic laparoscopy and
laparoscopic sterilization/tubal occlusion continued to decrease over the 10 years period, resulting in
the proportion of operative procedures (excluding sterilization/tubal occlusion) to increase from
82.0% in 2004 and 90.4% in 2009 to 94.6% in 2014. The number of hysteroscopic procedures
increased from 5949 in 2004 to 6,155 in 2009 and 9,613 in 2014, with an overall increase of 61.6%.
The number of diagnostic hysteroscopy increased by 1.3 folds and that of operative hysteroscopy
increased by 2.9 folds, resulting in the proportion of operative procedures to increase from 18.5% in
2004 to 24.1% in 2009 and 32.9% in 2014.
2004 2009 2014
Diagnostic laparoscopy +/- Dye 756 6.4% 529 4.4% 317 2.1%
Lap. sterilization/tubal occlusion 611 5.2% 222 1.9% 133 0.9%
Other laparoscopic operative procedures 6237 53.0% 7103 59.6% 7892 52.2%
Diagnostic hysteroscopy 4847 41.2% 4673 39.2% 6455 47.2%
Other hysteroscopic procedures 1102 9.4% 1482 12.4% 3158 15.8%
Total no. of admissions 11765 (15.7%) 11922 (17.0%) 15128 (18.8%)
HYSTEROSCOPIC PROCEDURES
(excluding diagnostic procedures)
The number of admissions for operative hysteroscopic procedures increased from 1,017 in
2004 and 1,391 in 2009 to 3,074 in 2014. This represented an overall 3 folds increase over the 10
years period. Polypectomy remained the most common procedure performed and the number
increased by 4.8 folds. The number of myomectomy also increased by 61.0% while that of
endometrial resection/ablation remained around 170 cases per year. Division of adhesions and
uterine septum, and proximal tubal cannulation were new coding introduced in 2014 and the number
was all less than 50 per year for the former and less than 25 for the latter 2.
2004 2009 2014
Polypectomy 514 50.5% 834 60.0% 2468 80.3%
Myomectomy 236 23.2% 274 19.7% 380 12.4%
Endometrial resection/ablation 187 18.4% 167 12.0% 164 5.3%
Division of adhesion - - - - 50 1.6%
Proximal tubal cannulation - - - - 25 0.8%
Division of uterine septum - - - - 23 0.7%
Miscellaneous 165 16.2% 207 14.9% 57 1.9%
Total no. of admissions 1017 (1.4%) 1391 (2.0%) 3075 (3.8%)
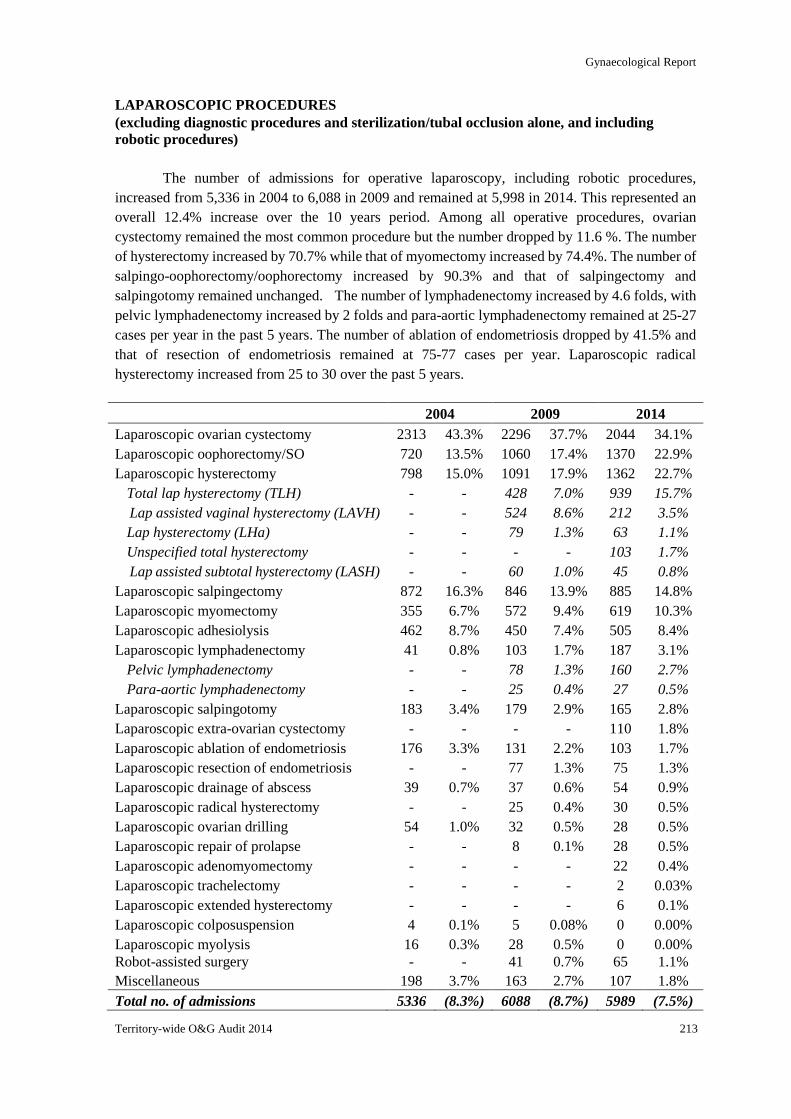
Gynaecological Report
Territory-wide O&G Audit 2014 213
LAPAROSCOPIC PROCEDURES
(excluding diagnostic procedures and sterilization/tubal occlusion alone, and including
robotic procedures)
The number of admissions for operative laparoscopy, including robotic procedures,
increased from 5,336 in 2004 to 6,088 in 2009 and remained at 5,998 in 2014. This represented an
overall 12.4% increase over the 10 years period. Among all operative procedures, ovarian
cystectomy remained the most common procedure but the number dropped by 11.6 %. The number
of hysterectomy increased by 70.7% while that of myomectomy increased by 74.4%. The number of
salpingo-oophorectomy/oophorectomy increased by 90.3% and that of salpingectomy and
salpingotomy remained unchanged. The number of lymphadenectomy increased by 4.6 folds, with
pelvic lymphadenectomy increased by 2 folds and para-aortic lymphadenectomy remained at 25-27
cases per year in the past 5 years. The number of ablation of endometriosis dropped by 41.5% and
that of resection of endometriosis remained at 75-77 cases per year. Laparoscopic radical
hysterectomy increased from 25 to 30 over the past 5 years.
2004 2009 2014
Laparoscopic ovarian cystectomy 2313 43.3% 2296 37.7% 2044 34.1%
Laparoscopic oophorectomy/SO 720 13.5% 1060 17.4% 1370 22.9%
Laparoscopic hysterectomy 798 15.0% 1091 17.9% 1362 22.7%
Total lap hysterectomy (TLH)
Lap assisted vaginal hysterectomy (LAVH)
Lap hysterectomy (LHa)
Unspecified total hysterectomy
Lap assisted subtotal hysterectomy (LASH)
-
-
-
-
-
-
-
-
-
-
428
524
79
-
60
7.0%
8.6%
1.3%
-
1.0%
939
212
63
103
45
15.7%
3.5%
1.1%
1.7%
0.8%
Laparoscopic salpingectomy 872 16.3% 846 13.9% 885 14.8%
Laparoscopic myomectomy 355 6.7% 572 9.4% 619 10.3%
Laparoscopic adhesiolysis 462 8.7% 450 7.4% 505 8.4%
Laparoscopic lymphadenectomy 41 0.8% 103 1.7% 187 3.1%
Pelvic lymphadenectomy
Para-aortic lymphadenectomy
-
-
-
-
78
25
1.3%
0.4%
160
27
2.7%
0.5%
Laparoscopic salpingotomy 183 3.4% 179 2.9% 165 2.8%
Laparoscopic extra-ovarian cystectomy - - - - 110 1.8%
Laparoscopic ablation of endometriosis 176 3.3% 131 2.2% 103 1.7%
Laparoscopic resection of endometriosis - - 77 1.3% 75 1.3%
Laparoscopic drainage of abscess 39 0.7% 37 0.6% 54 0.9%
Laparoscopic radical hysterectomy - - 25 0.4% 30 0.5%
Laparoscopic ovarian drilling 54 1.0% 32 0.5% 28 0.5%
Laparoscopic repair of prolapse - - 8 0.1% 28 0.5%
Laparoscopic adenomyomectomy - - - - 22 0.4%
Laparoscopic trachelectomy - - - - 2 0.03%
Laparoscopic extended hysterectomy - - - - 6 0.1%
Laparoscopic colposuspension 4 0.1% 5 0.08% 0 0.00%
Laparoscopic myolysis 16 0.3% 28 0.5% 0 0.00%
Robot-assisted surgery - - 41 0.7% 65 1.1%
Miscellaneous 198 3.7% 163 2.7% 107 1.8%
Total no. of admissions 5336 (8.3%) 6088 (8.7%) 5989 (7.5%)
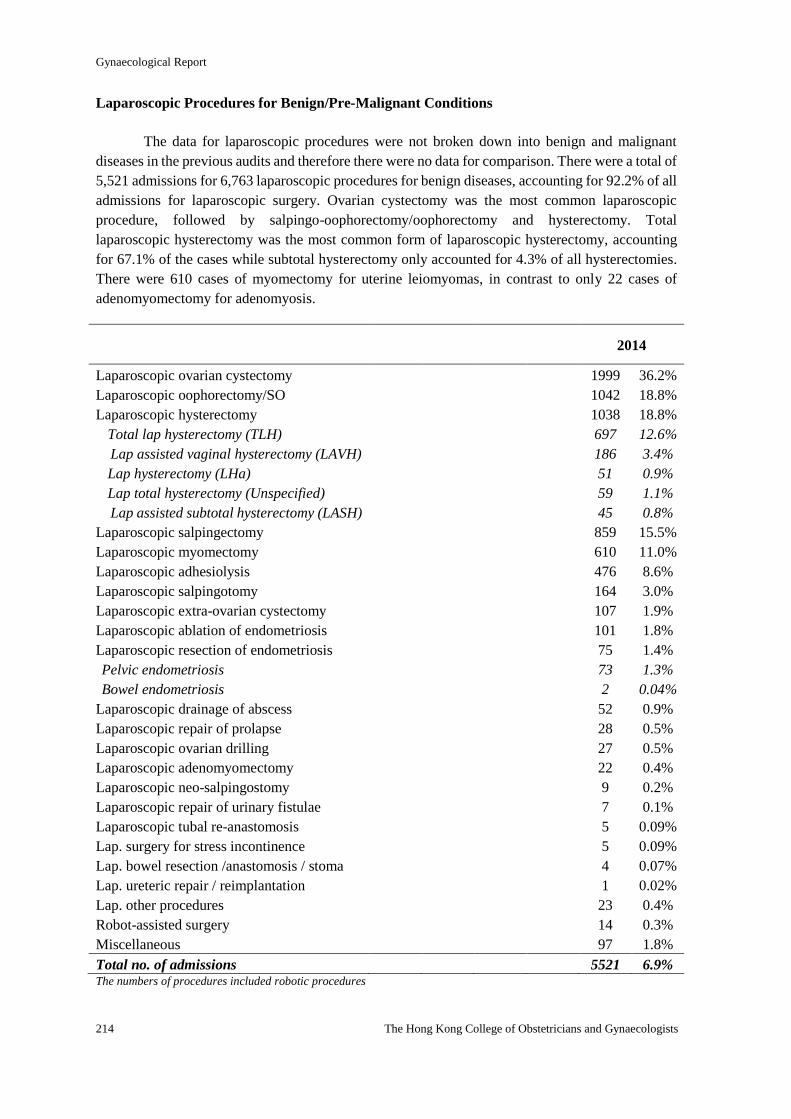
Gynaecological Report
214 The Hong Kong College of Obstetricians and Gynaecologists
Laparoscopic Procedures for Benign/Pre-Malignant Conditions
The data for laparoscopic procedures were not broken down into benign and malignant
diseases in the previous audits and therefore there were no data for comparison. There were a total of
5,521 admissions for 6,763 laparoscopic procedures for benign diseases, accounting for 92.2% of all
admissions for laparoscopic surgery. Ovarian cystectomy was the most common laparoscopic
procedure, followed by salpingo-oophorectomy/oophorectomy and hysterectomy. Total
laparoscopic hysterectomy was the most common form of laparoscopic hysterectomy, accounting
for 67.1% of the cases while subtotal hysterectomy only accounted for 4.3% of all hysterectomies.
There were 610 cases of myomectomy for uterine leiomyomas, in contrast to only 22 cases of
adenomyomectomy for adenomyosis.
2014
Laparoscopic ovarian cystectomy 1999 36.2%
Laparoscopic oophorectomy/SO 1042 18.8%
Laparoscopic hysterectomy 1038 18.8%
Total lap hysterectomy (TLH)
Lap assisted vaginal hysterectomy (LAVH)
Lap hysterectomy (LHa)
Lap total hysterectomy (Unspecified)
Lap assisted subtotal hysterectomy (LASH)
697
186
51
59
45
12.6%
3.4%
0.9%
1.1%
0.8%
Laparoscopic salpingectomy 859 15.5%
Laparoscopic myomectomy 610 11.0%
Laparoscopic adhesiolysis 476 8.6%
Laparoscopic salpingotomy 164 3.0%
Laparoscopic extra-ovarian cystectomy 107 1.9%
Laparoscopic ablation of endometriosis 101 1.8%
Laparoscopic resection of endometriosis 75 1.4%
Pelvic endometriosis
Bowel endometriosis
73
2
1.3%
0.04%
Laparoscopic drainage of abscess 52 0.9%
Laparoscopic repair of prolapse 28 0.5%
Laparoscopic ovarian drilling 27 0.5%
Laparoscopic adenomyomectomy 22 0.4%
Laparoscopic neo-salpingostomy 9 0.2%
Laparoscopic repair of urinary fistulae 7 0.1%
Laparoscopic tubal re-anastomosis 5 0.09%
Lap. surgery for stress incontinence 5 0.09%
Lap. bowel resection /anastomosis / stoma 4 0.07%
Lap. ureteric repair / reimplantation 1 0.02%
Lap. other procedures 23 0.4%
Robot-assisted surgery 14 0.3%
Miscellaneous 97 1.8%
Total no. of admissions 5521 6.9% The numbers of procedures included robotic procedures
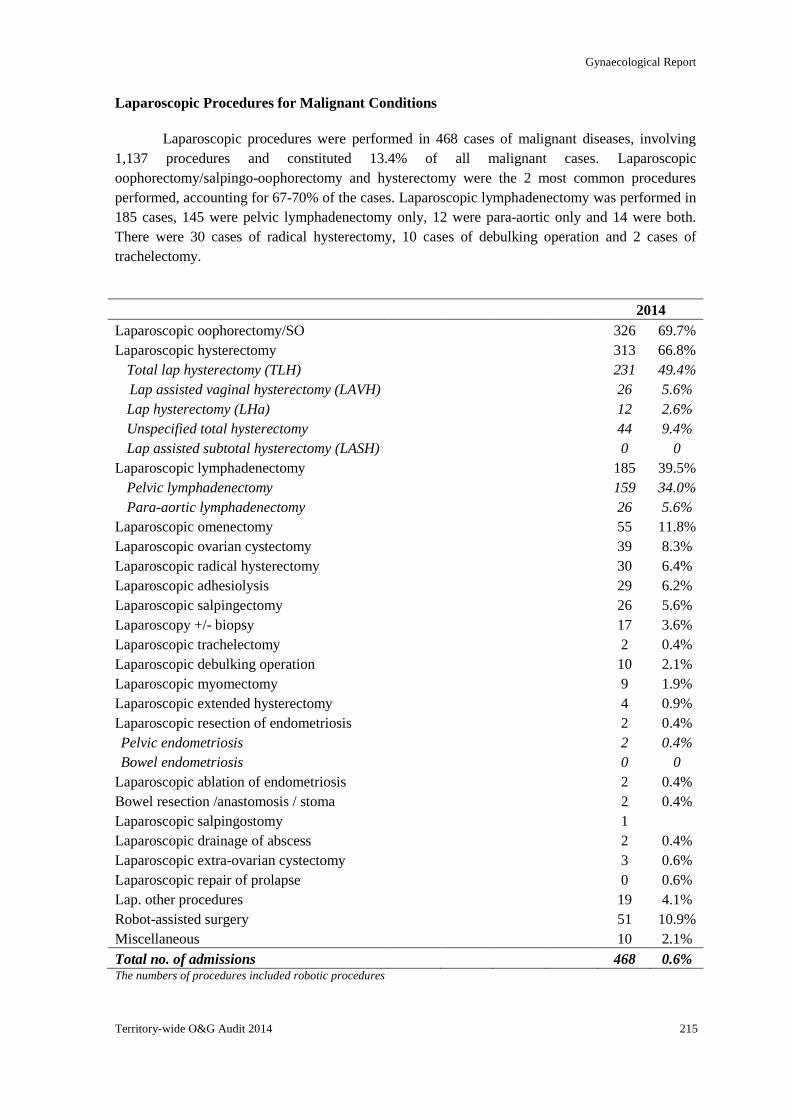
Gynaecological Report
Territory-wide O&G Audit 2014 215
Laparoscopic Procedures for Malignant Conditions
Laparoscopic procedures were performed in 468 cases of malignant diseases, involving
1,137 procedures and constituted 13.4% of all malignant cases. Laparoscopic
oophorectomy/salpingo-oophorectomy and hysterectomy were the 2 most common procedures
performed, accounting for 67-70% of the cases. Laparoscopic lymphadenectomy was performed in
185 cases, 145 were pelvic lymphadenectomy only, 12 were para-aortic only and 14 were both.
There were 30 cases of radical hysterectomy, 10 cases of debulking operation and 2 cases of
trachelectomy.
2014
Laparoscopic oophorectomy/SO 326 69.7%
Laparoscopic hysterectomy 313 66.8%
Total lap hysterectomy (TLH)
Lap assisted vaginal hysterectomy (LAVH)
Lap hysterectomy (LHa)
Unspecified total hysterectomy
Lap assisted subtotal hysterectomy (LASH)
231
26
12
44
0
49.4%
5.6%
2.6%
9.4%
0
Laparoscopic lymphadenectomy 185 39.5%
Pelvic lymphadenectomy
Para-aortic lymphadenectomy
159
26
34.0%
5.6%
Laparoscopic omenectomy 55 11.8%
Laparoscopic ovarian cystectomy 39 8.3%
Laparoscopic radical hysterectomy 30 6.4%
Laparoscopic adhesiolysis 29 6.2%
Laparoscopic salpingectomy 26 5.6%
Laparoscopy +/- biopsy 17 3.6%
Laparoscopic trachelectomy 2 0.4%
Laparoscopic debulking operation 10 2.1%
Laparoscopic myomectomy 9 1.9%
Laparoscopic extended hysterectomy 4 0.9%
Laparoscopic resection of endometriosis 2 0.4%
Pelvic endometriosis
Bowel endometriosis
2
0
0.4%
0
Laparoscopic ablation of endometriosis 2 0.4%
Bowel resection /anastomosis / stoma 2 0.4%
Laparoscopic salpingostomy 1
Laparoscopic drainage of abscess 2 0.4%
Laparoscopic extra-ovarian cystectomy 3 0.6%
Laparoscopic repair of prolapse 0 0.6%
Lap. other procedures 19 4.1%
Robot-assisted surgery 51 10.9%
Miscellaneous 10 2.1%
Total no. of admissions 468 0.6% The numbers of procedures included robotic procedures
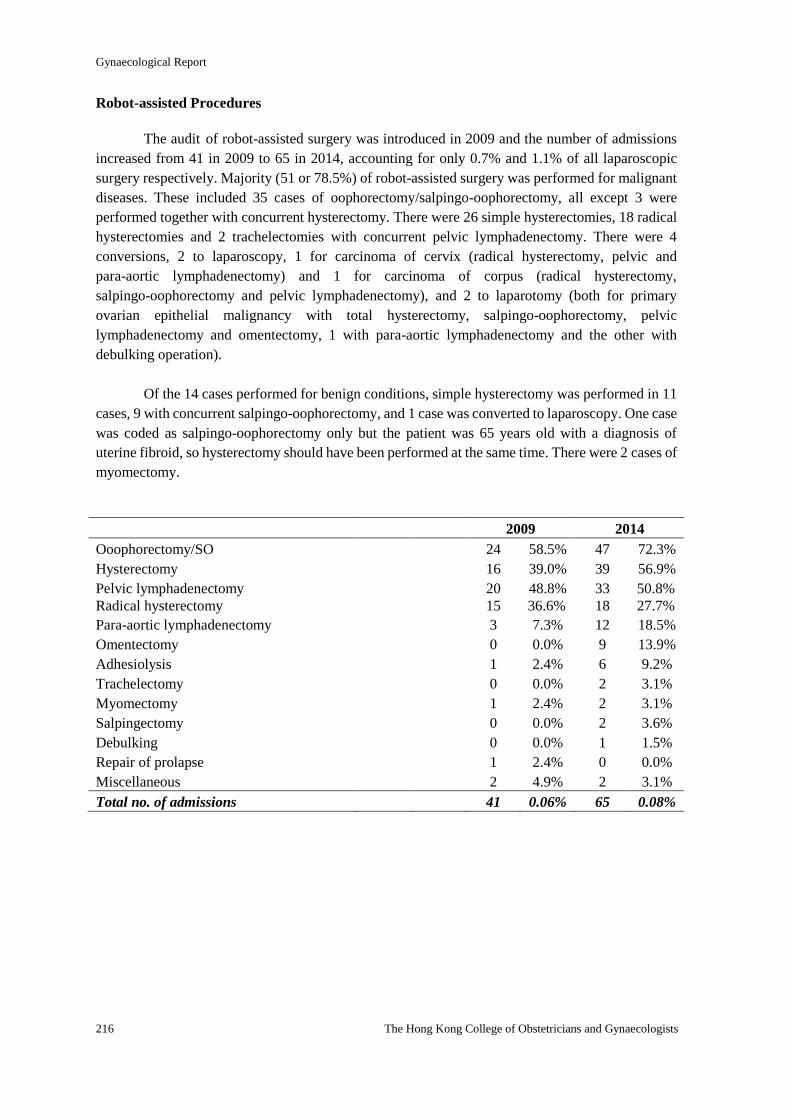
Gynaecological Report
216 The Hong Kong College of Obstetricians and Gynaecologists
Robot-assisted Procedures
The audit of robot-assisted surgery was introduced in 2009 and the number of admissions
increased from 41 in 2009 to 65 in 2014, accounting for only 0.7% and 1.1% of all laparoscopic
surgery respectively. Majority (51 or 78.5%) of robot-assisted surgery was performed for malignant
diseases. These included 35 cases of oophorectomy/salpingo-oophorectomy, all except 3 were
performed together with concurrent hysterectomy. There were 26 simple hysterectomies, 18 radical
hysterectomies and 2 trachelectomies with concurrent pelvic lymphadenectomy. There were 4
conversions, 2 to laparoscopy, 1 for carcinoma of cervix (radical hysterectomy, pelvic and
para-aortic lymphadenectomy) and 1 for carcinoma of corpus (radical hysterectomy,
salpingo-oophorectomy and pelvic lymphadenectomy), and 2 to laparotomy (both for primary
ovarian epithelial malignancy with total hysterectomy, salpingo-oophorectomy, pelvic
lymphadenectomy and omentectomy, 1 with para-aortic lymphadenectomy and the other with
debulking operation).
Of the 14 cases performed for benign conditions, simple hysterectomy was performed in 11
cases, 9 with concurrent salpingo-oophorectomy, and 1 case was converted to laparoscopy. One case
was coded as salpingo-oophorectomy only but the patient was 65 years old with a diagnosis of
uterine fibroid, so hysterectomy should have been performed at the same time. There were 2 cases of
myomectomy.
2009 2014
Ooophorectomy/SO 24 58.5% 47 72.3%
Hysterectomy 16 39.0% 39 56.9%
Pelvic lymphadenectomy 20 48.8% 33 50.8%
Radical hysterectomy 15 36.6% 18 27.7%
Para-aortic lymphadenectomy 3 7.3% 12 18.5%
Omentectomy 0 0.0% 9 13.9%
Adhesiolysis 1 2.4% 6 9.2%
Trachelectomy 0 0.0% 2 3.1%
Myomectomy 1 2.4% 2 3.1%
Salpingectomy 0 0.0% 2 3.6%
Debulking 0 0.0% 1 1.5%
Repair of prolapse 1 2.4% 0 0.0%
Miscellaneous 2 4.9% 2 3.1%
Total no. of admissions 41 0.06% 65 0.08%
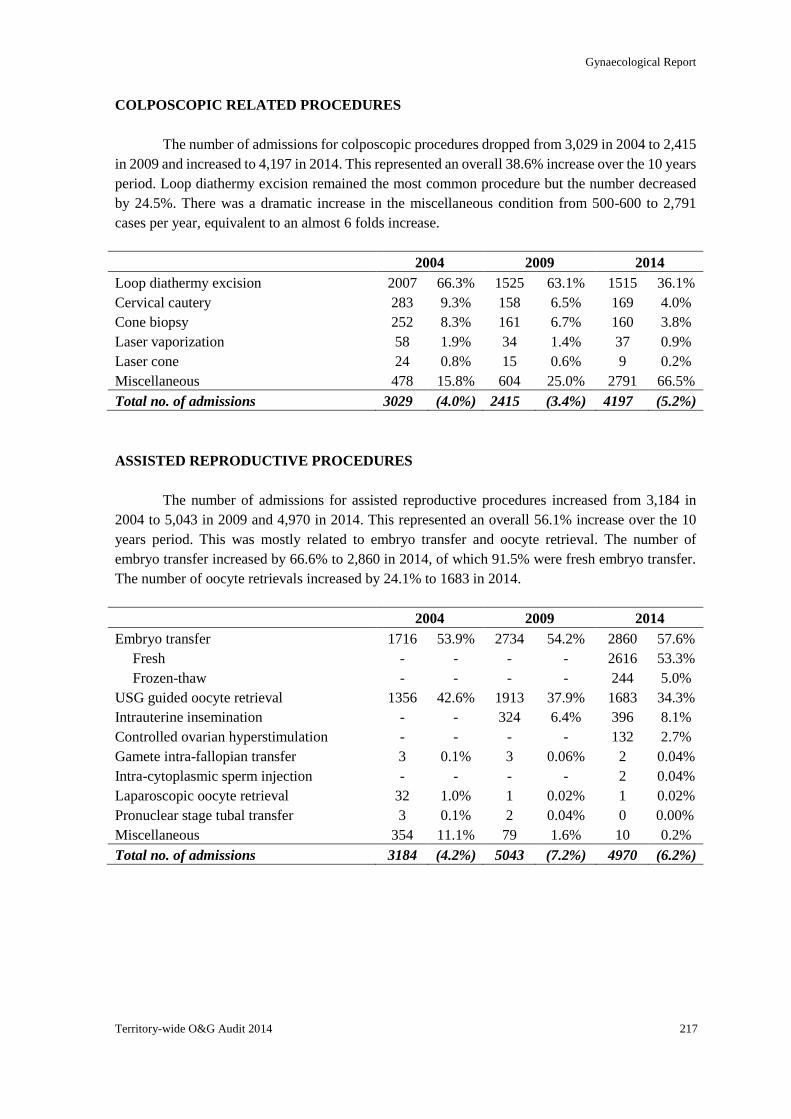
Gynaecological Report
Territory-wide O&G Audit 2014 217
COLPOSCOPIC RELATED PROCEDURES
The number of admissions for colposcopic procedures dropped from 3,029 in 2004 to 2,415
in 2009 and increased to 4,197 in 2014. This represented an overall 38.6% increase over the 10 years
period. Loop diathermy excision remained the most common procedure but the number decreased
by 24.5%. There was a dramatic increase in the miscellaneous condition from 500-600 to 2,791
cases per year, equivalent to an almost 6 folds increase.
2004 2009 2014
Loop diathermy excision 2007 66.3% 1525 63.1% 1515 36.1%
Cervical cautery 283 9.3% 158 6.5% 169 4.0%
Cone biopsy 252 8.3% 161 6.7% 160 3.8%
Laser vaporization 58 1.9% 34 1.4% 37 0.9%
Laser cone 24 0.8% 15 0.6% 9 0.2%
Miscellaneous 478 15.8% 604 25.0% 2791 66.5%
Total no. of admissions 3029 (4.0%) 2415 (3.4%) 4197 (5.2%)
ASSISTED REPRODUCTIVE PROCEDURES
The number of admissions for assisted reproductive procedures increased from 3,184 in
2004 to 5,043 in 2009 and 4,970 in 2014. This represented an overall 56.1% increase over the 10
years period. This was mostly related to embryo transfer and oocyte retrieval. The number of
embryo transfer increased by 66.6% to 2,860 in 2014, of which 91.5% were fresh embryo transfer.
The number of oocyte retrievals increased by 24.1% to 1683 in 2014.
2004 2009 2014
Embryo transfer 1716 53.9% 2734 54.2% 2860 57.6%
Fresh - - - - 2616 53.3%
Frozen-thaw - - - - 244 5.0%
USG guided oocyte retrieval 1356 42.6% 1913 37.9% 1683 34.3%
Intrauterine insemination - - 324 6.4% 396 8.1%
Controlled ovarian hyperstimulation - - - - 132 2.7%
Gamete intra-fallopian transfer 3 0.1% 3 0.06% 2 0.04%
Intra-cytoplasmic sperm injection - - - - 2 0.04%
Laparoscopic oocyte retrieval 32 1.0% 1 0.02% 1 0.02%
Pronuclear stage tubal transfer 3 0.1% 2 0.04% 0 0.00%
Miscellaneous 354 11.1% 79 1.6% 10 0.2%
Total no. of admissions 3184 (4.2%) 5043 (7.2%) 4970 (6.2%)
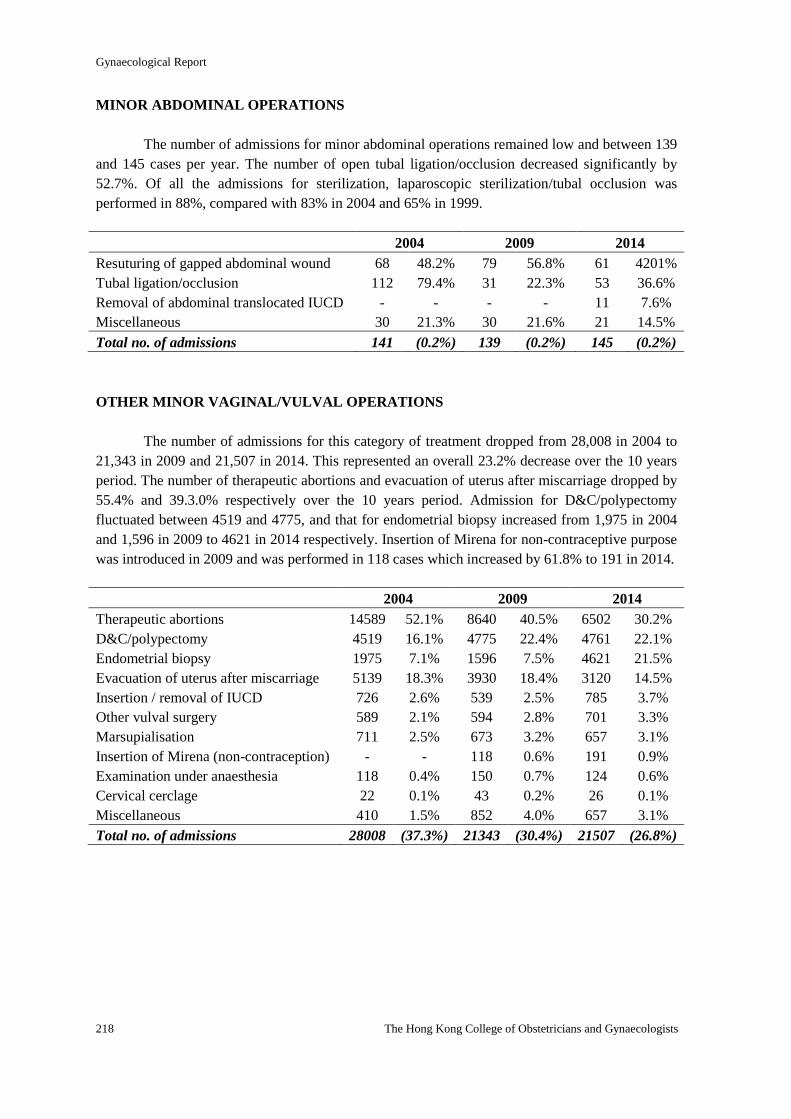
Gynaecological Report
218 The Hong Kong College of Obstetricians and Gynaecologists
MINOR ABDOMINAL OPERATIONS
The number of admissions for minor abdominal operations remained low and between 139
and 145 cases per year. The number of open tubal ligation/occlusion decreased significantly by
52.7%. Of all the admissions for sterilization, laparoscopic sterilization/tubal occlusion was
performed in 88%, compared with 83% in 2004 and 65% in 1999.
2004 2009 2014
Resuturing of gapped abdominal wound 68 48.2% 79 56.8% 61 4201%
Tubal ligation/occlusion 112 79.4% 31 22.3% 53 36.6%
Removal of abdominal translocated IUCD - - - - 11 7.6%
Miscellaneous 30 21.3% 30 21.6% 21 14.5%
Total no. of admissions 141 (0.2%) 139 (0.2%) 145 (0.2%)
OTHER MINOR VAGINAL/VULVAL OPERATIONS
The number of admissions for this category of treatment dropped from 28,008 in 2004 to
21,343 in 2009 and 21,507 in 2014. This represented an overall 23.2% decrease over the 10 years
period. The number of therapeutic abortions and evacuation of uterus after miscarriage dropped by
55.4% and 39.3.0% respectively over the 10 years period. Admission for D&C/polypectomy
fluctuated between 4519 and 4775, and that for endometrial biopsy increased from 1,975 in 2004
and 1,596 in 2009 to 4621 in 2014 respectively. Insertion of Mirena for non-contraceptive purpose
was introduced in 2009 and was performed in 118 cases which increased by 61.8% to 191 in 2014.
2004 2009 2014
Therapeutic abortions 14589 52.1% 8640 40.5% 6502 30.2%
D&C/polypectomy 4519 16.1% 4775 22.4% 4761 22.1%
Endometrial biopsy 1975 7.1% 1596 7.5% 4621 21.5%
Evacuation of uterus after miscarriage 5139 18.3% 3930 18.4% 3120 14.5%
Insertion / removal of IUCD 726 2.6% 539 2.5% 785 3.7%
Other vulval surgery 589 2.1% 594 2.8% 701 3.3%
Marsupialisation 711 2.5% 673 3.2% 657 3.1%
Insertion of Mirena (non-contraception) - - 118 0.6% 191 0.9%
Examination under anaesthesia 118 0.4% 150 0.7% 124 0.6%
Cervical cerclage 22 0.1% 43 0.2% 26 0.1%
Miscellaneous 410 1.5% 852 4.0% 657 3.1%
Total no. of admissions 28008 (37.3%) 21343 (30.4%) 21507 (26.8%)
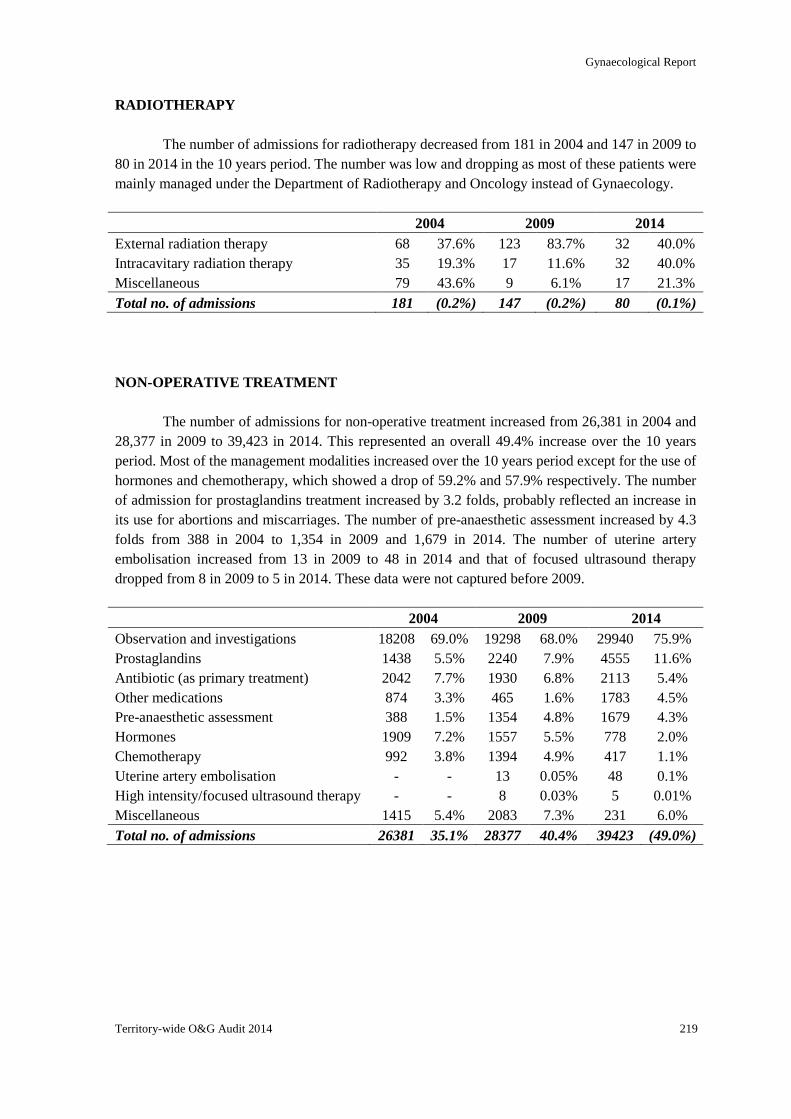
Gynaecological Report
Territory-wide O&G Audit 2014 219
RADIOTHERAPY
The number of admissions for radiotherapy decreased from 181 in 2004 and 147 in 2009 to
80 in 2014 in the 10 years period. The number was low and dropping as most of these patients were
mainly managed under the Department of Radiotherapy and Oncology instead of Gynaecology.
2004 2009 2014
External radiation therapy 68 37.6% 123 83.7% 32 40.0%
Intracavitary radiation therapy 35 19.3% 17 11.6% 32 40.0%
Miscellaneous 79 43.6% 9 6.1% 17 21.3%
Total no. of admissions 181 (0.2%) 147 (0.2%) 80 (0.1%)
NON-OPERATIVE TREATMENT
The number of admissions for non-operative treatment increased from 26,381 in 2004 and
28,377 in 2009 to 39,423 in 2014. This represented an overall 49.4% increase over the 10 years
period. Most of the management modalities increased over the 10 years period except for the use of
hormones and chemotherapy, which showed a drop of 59.2% and 57.9% respectively. The number
of admission for prostaglandins treatment increased by 3.2 folds, probably reflected an increase in
its use for abortions and miscarriages. The number of pre-anaesthetic assessment increased by 4.3
folds from 388 in 2004 to 1,354 in 2009 and 1,679 in 2014. The number of uterine artery
embolisation increased from 13 in 2009 to 48 in 2014 and that of focused ultrasound therapy
dropped from 8 in 2009 to 5 in 2014. These data were not captured before 2009.
2004 2009 2014
Observation and investigations 18208 69.0% 19298 68.0% 29940 75.9%
Prostaglandins 1438 5.5% 2240 7.9% 4555 11.6%
Antibiotic (as primary treatment) 2042 7.7% 1930 6.8% 2113 5.4%
Other medications 874 3.3% 465 1.6% 1783 4.5%
Pre-anaesthetic assessment 388 1.5% 1354 4.8% 1679 4.3%
Hormones 1909 7.2% 1557 5.5% 778 2.0%
Chemotherapy 992 3.8% 1394 4.9% 417 1.1%
Uterine artery embolisation - - 13 0.05% 48 0.1%
High intensity/focused ultrasound therapy - - 8 0.03% 5 0.01%
Miscellaneous 1415 5.4% 2083 7.3% 231 6.0%
Total no. of admissions 26381 35.1% 28377 40.4% 39423 (49.0%)
Gynaecological Report
220 The Hong Kong College of Obstetricians and Gynaecologists
COMPLICATIONS
Complications were counted according to the intention to treat, not the actual
procedure performed. Conversion from initially intended surgical approach to other approach was
counted as complication. There might be more than one complication for each admission, and there
might be more than one complication for each operative procedure performed. When the
complication was associated with multiple procedures, it was considered to have occurred with each
individual procedure.
A trend of reduction of the overall complication rate was observed over the 10 years period.
The overall complication rate was 0.79%, which was lower than the 1.00% in 2009 and 1.15% in
2004. In the current audit, complications were divided into intra-operative and post-operative
complications and the overall rate was 0.24% and 0.58% respectively.
The most common complication was re-admission within 28 days of surgery. This was
first reported in the current audit and the rate was 0.08%. Febrile morbidity, defined as fever >38oC
at least 4 hours apart 24 hours after operations with no identifiable cause, was the second most
common complication and the rate reduced from 0.30-0.35% to 0.08%. There was also a trend of
reduction in haemorrhage. The rate reduced from 0.23-0.25% to 0.14%. The reduction was mainly
due to reduction in intra-operative haemorrhage which reduced from 0.18-0.20% to 0.10% while
post-operative haemorrhage remained at 0.04-0.05%.
The incidence of inadvertent organ injury reduced from 0.13-0.16% to 0.09%. Bowel injury
was the most common visceral injury and the rate was 0.04%, of which 84.4% were diagnosed
during operation. Uterine injury (essentially perforation of uterus) was the second most common
organ injury and the rate was 0.03%. Bladder injury occurred in 0.02%, of which 85% were
diagnosed during operation. Ureteric injury occurred in 0.01% and only 50% were diagnosed during
operation. Vascular injury occurred in 0.007%, of which 83.3% were major vascular injury.
Thrombo-embolic complication included deep vein thrombosis (DVT) and pulmonary
embolism (PE), the latter was introduced in the current audit. The overall thrombo-embolic
complication rate was 0.01%. The incidence of DVT reduced by 10 folds from 0.03-0.04% to
0.004% while that of PE increased by 3 folds from 0.003% in 2009 to 0.009% in 2014.
Conversion to laparotomy occurred in 0.15% in 2014 which was much higher than the
0.09% in both 2004 and 2009. There were another 2 cases of conversion from robotic to
laparoscopic surgery and 1 case from vaginal to laparoscopic surgery.
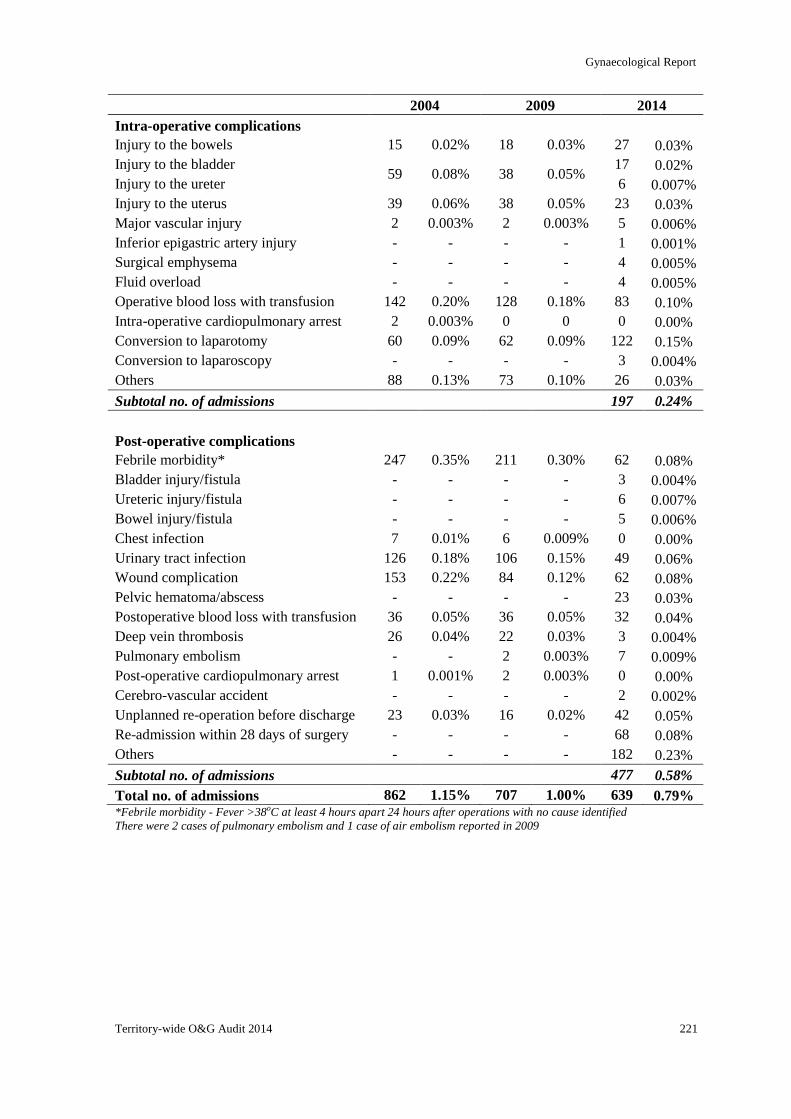
Gynaecological Report
Territory-wide O&G Audit 2014 221
2004 2009 2014
Intra-operative complications
Injury to the bowels 15 0.02% 18 0.03% 27 0.03%
Injury to the bladder 59 0.08% 38 0.05%
17 0.02%
Injury to the ureter 6 0.007%
Injury to the uterus 39 0.06% 38 0.05% 23 0.03%
Major vascular injury 2 0.003% 2 0.003% 5 0.006%
Inferior epigastric artery injury - - - - 1 0.001%
Surgical emphysema - - - - 4 0.005%
Fluid overload - - - - 4 0.005%
Operative blood loss with transfusion 142 0.20% 128 0.18% 83 0.10%
Intra-operative cardiopulmonary arrest 2 0.003% 0 0 0 0.00%
Conversion to laparotomy 60 0.09% 62 0.09% 122 0.15%
Conversion to laparoscopy - - - - 3 0.004%
Others 88 0.13% 73 0.10% 26 0.03%
Subtotal no. of admissions 197 0.24%
Post-operative complications
Febrile morbidity* 247 0.35% 211 0.30% 62 0.08%
Bladder injury/fistula - - - - 3 0.004%
Ureteric injury/fistula - - - - 6 0.007%
Bowel injury/fistula - - - - 5 0.006%
Chest infection 7 0.01% 6 0.009% 0 0.00%
Urinary tract infection 126 0.18% 106 0.15% 49 0.06%
Wound complication 153 0.22% 84 0.12% 62 0.08%
Pelvic hematoma/abscess - - - - 23 0.03%
Postoperative blood loss with transfusion 36 0.05% 36 0.05% 32 0.04%
Deep vein thrombosis 26 0.04% 22 0.03% 3 0.004%
Pulmonary embolism - - 2 0.003% 7 0.009%
Post-operative cardiopulmonary arrest 1 0.001% 2 0.003% 0 0.00%
Cerebro-vascular accident - - - - 2 0.002%
Unplanned re-operation before discharge 23 0.03% 16 0.02% 42 0.05%
Re-admission within 28 days of surgery - - - - 68 0.08%
Others - - - - 182 0.23%
Subtotal no. of admissions 477 0.58%
Total no. of admissions 862 1.15% 707 1.00% 639 0.79% *Febrile morbidity - Fever >38oC at least 4 hours apart 24 hours after operations with no cause identified
There were 2 cases of pulmonary embolism and 1 case of air embolism reported in 2009
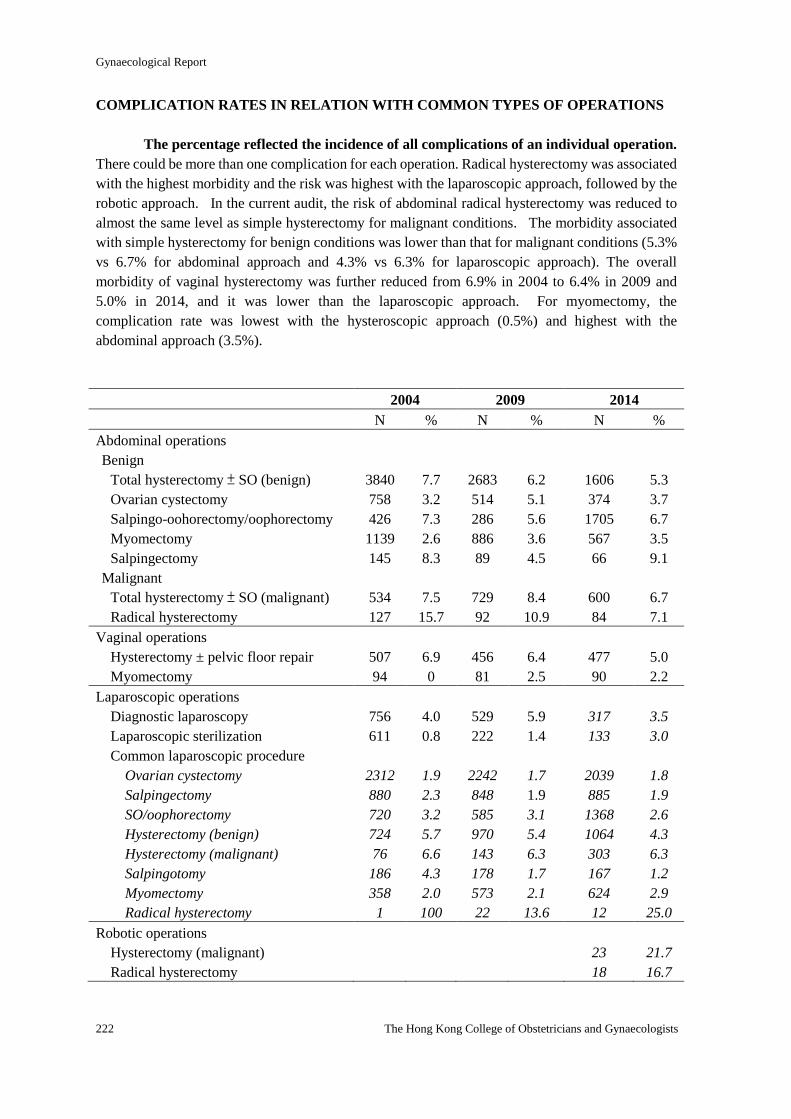
Gynaecological Report
222 The Hong Kong College of Obstetricians and Gynaecologists
COMPLICATION RATES IN RELATION WITH COMMON TYPES OF OPERATIONS
The percentage reflected the incidence of all complications of an individual operation.
There could be more than one complication for each operation. Radical hysterectomy was associated
with the highest morbidity and the risk was highest with the laparoscopic approach, followed by the
robotic approach. In the current audit, the risk of abdominal radical hysterectomy was reduced to
almost the same level as simple hysterectomy for malignant conditions. The morbidity associated
with simple hysterectomy for benign conditions was lower than that for malignant conditions (5.3%
vs 6.7% for abdominal approach and 4.3% vs 6.3% for laparoscopic approach). The overall
morbidity of vaginal hysterectomy was further reduced from 6.9% in 2004 to 6.4% in 2009 and
5.0% in 2014, and it was lower than the laparoscopic approach. For myomectomy, the
complication rate was lowest with the hysteroscopic approach (0.5%) and highest with the
abdominal approach (3.5%).
2004 2009 2014
N % N % N %
Abdominal operations
Benign
Total hysterectomy ± SO (benign)
Ovarian cystectomy
Salpingo-oohorectomy/oophorectomy
Myomectomy
Salpingectomy
Malignant
Total hysterectomy ± SO (malignant)
Radical hysterectomy
3840
758
426
1139
145
534
127
7.7
3.2
7.3
2.6
8.3
7.5
15.7
2683
514
286
886
89
729
92
6.2
5.1
5.6
3.6
4.5
8.4
10.9
1606
374
1705
567
66
600
84
5.3
3.7
6.7
3.5
9.1
6.7
7.1
Vaginal operations
Hysterectomy ± pelvic floor repair
Myomectomy
507
94
6.9
0
456
81
6.4
2.5
477
90
5.0
2.2
Laparoscopic operations
Diagnostic laparoscopy
Laparoscopic sterilization
Common laparoscopic procedure
Ovarian cystectomy
Salpingectomy
SO/oophorectomy
Hysterectomy (benign)
Hysterectomy (malignant)
Salpingotomy
Myomectomy
Radical hysterectomy
756
611
2312
880
720
724
76
186
358
1
4.0
0.8
1.9
2.3
3.2
5.7
6.6
4.3
2.0
100
529
222
2242
848
585
970
143
178
573
22
5.9
1.4
1.7
1.9
3.1
5.4
6.3
1.7
2.1
13.6
317
133
2039
885
1368
1064
303
167
624
12
3.5
3.0
1.8
1.9
2.6
4.3
6.3
1.2
2.9
25.0
Robotic operations
Hysterectomy (malignant)
Radical hysterectomy
23
18
21.7
16.7
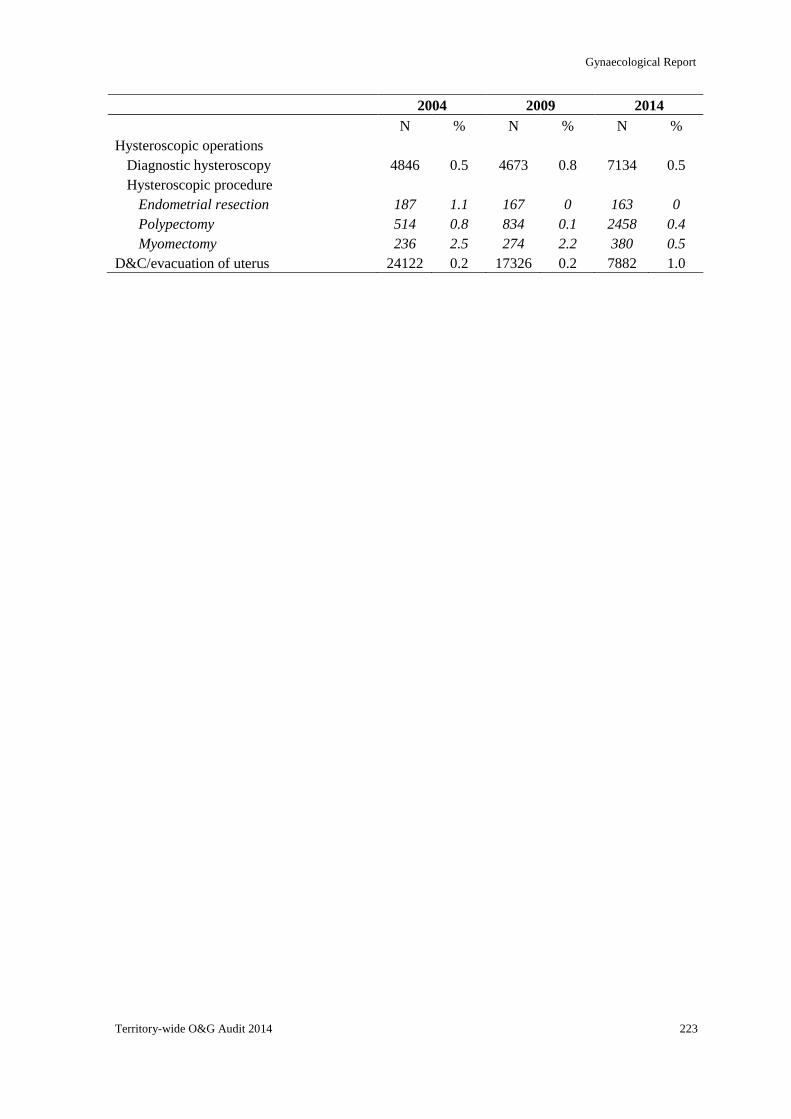
Gynaecological Report
Territory-wide O&G Audit 2014 223
2004 2009 2014
N % N % N %
Hysteroscopic operations
Diagnostic hysteroscopy
Hysteroscopic procedure
Endometrial resection
Polypectomy
Myomectomy
4846
187
514
236
0.5
1.1
0.8
2.5
4673
167
834
274
0.8
0
0.1
2.2
7134
163
2458
380
0.5
0
0.4
0.5
D&C/evacuation of uterus 24122 0.2 17326 0.2 7882 1.0
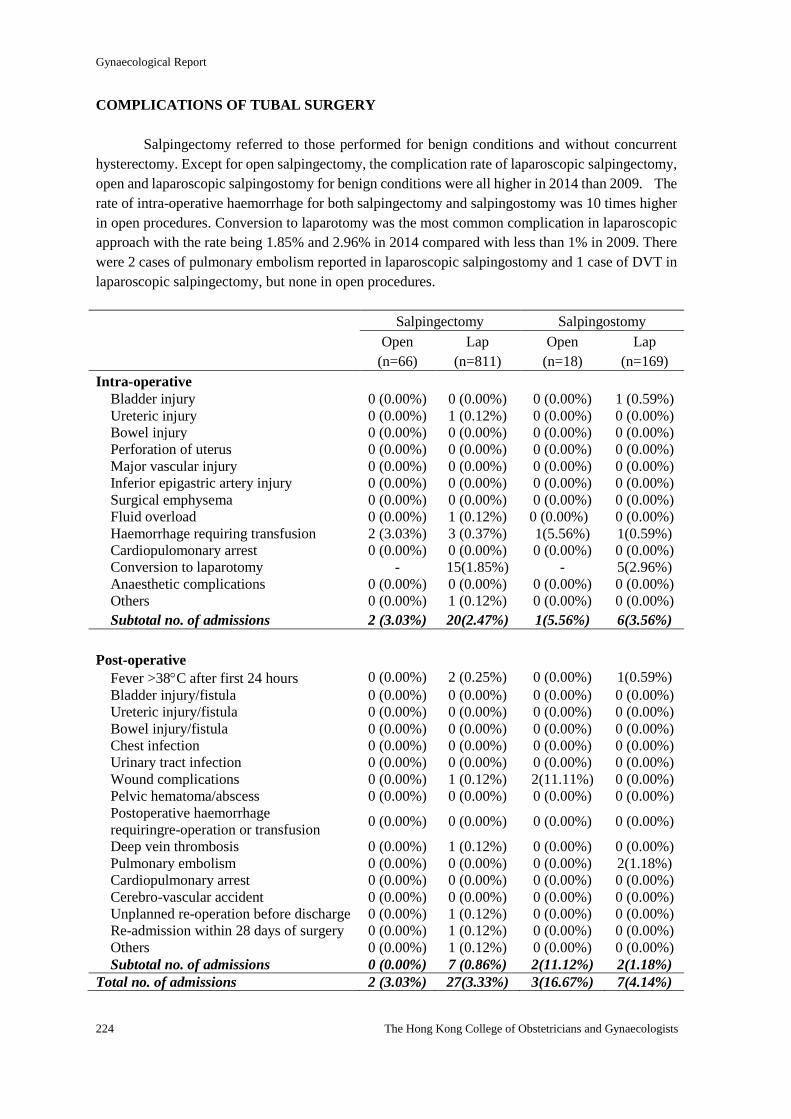
Gynaecological Report
224 The Hong Kong College of Obstetricians and Gynaecologists
COMPLICATIONS OF TUBAL SURGERY
Salpingectomy referred to those performed for benign conditions and without concurrent
hysterectomy. Except for open salpingectomy, the complication rate of laparoscopic salpingectomy,
open and laparoscopic salpingostomy for benign conditions were all higher in 2014 than 2009. The
rate of intra-operative haemorrhage for both salpingectomy and salpingostomy was 10 times higher
in open procedures. Conversion to laparotomy was the most common complication in laparoscopic
approach with the rate being 1.85% and 2.96% in 2014 compared with less than 1% in 2009. There
were 2 cases of pulmonary embolism reported in laparoscopic salpingostomy and 1 case of DVT in
laparoscopic salpingectomy, but none in open procedures.
Salpingectomy Salpingostomy
Open
(n=66)
Lap
(n=811)
Open
(n=18)
Lap
(n=169)
Intra-operative
Bladder injury 0 (0.00%) 0 (0.00%) 0 (0.00%) 1 (0.59%)
Ureteric injury 0 (0.00%) 1 (0.12%) 0 (0.00%) 0 (0.00%) Bowel injury 0 (0.00%) 0 (0.00%) 0 (0.00%) 0 (0.00%) Perforation of uterus 0 (0.00%) 0 (0.00%) 0 (0.00%) 0 (0.00%) Major vascular injury 0 (0.00%) 0 (0.00%) 0 (0.00%) 0 (0.00%) Inferior epigastric artery injury 0 (0.00%) 0 (0.00%) 0 (0.00%) 0 (0.00%) Surgical emphysema 0 (0.00%) 0 (0.00%) 0 (0.00%) 0 (0.00%) Fluid overload 0 (0.00%) 1 (0.12%) 0 (0.00%) 0 (0.00%) Haemorrhage requiring transfusion 2 (3.03%) 3 (0.37%) 1(5.56%) 1(0.59%)
Cardiopulomonary arrest 0 (0.00%) 0 (0.00%) 0 (0.00%) 0 (0.00%) Conversion to laparotomy - 15(1.85%) - 5(2.96%)
Anaesthetic complications 0 (0.00%) 0 (0.00%) 0 (0.00%) 0 (0.00%) Others 0 (0.00%) 1 (0.12%) 0 (0.00%) 0 (0.00%)
Subtotal no. of admissions 2 (3.03%) 20(2.47%) 1(5.56%) 6(3.56%)
Post-operative
Fever >38C after first 24 hours 0 (0.00%) 2 (0.25%) 0 (0.00%) 1(0.59%)
Bladder injury/fistula 0 (0.00%) 0 (0.00%) 0 (0.00%) 0 (0.00%) Ureteric injury/fistula 0 (0.00%) 0 (0.00%) 0 (0.00%) 0 (0.00%) Bowel injury/fistula 0 (0.00%) 0 (0.00%) 0 (0.00%) 0 (0.00%) Chest infection 0 (0.00%) 0 (0.00%) 0 (0.00%) 0 (0.00%) Urinary tract infection 0 (0.00%) 0 (0.00%) 0 (0.00%) 0 (0.00%) Wound complications 0 (0.00%) 1 (0.12%) 2(11.11%) 0 (0.00%) Pelvic hematoma/abscess 0 (0.00%) 0 (0.00%) 0 (0.00%) 0 (0.00%) Postoperative haemorrhage
requiringre-operation or transfusion 0 (0.00%) 0 (0.00%) 0 (0.00%) 0 (0.00%)
Deep vein thrombosis 0 (0.00%) 1 (0.12%) 0 (0.00%) 0 (0.00%) Pulmonary embolism 0 (0.00%) 0 (0.00%) 0 (0.00%) 2(1.18%)
Cardiopulmonary arrest 0 (0.00%) 0 (0.00%) 0 (0.00%) 0 (0.00%) Cerebro-vascular accident 0 (0.00%) 0 (0.00%) 0 (0.00%) 0 (0.00%) Unplanned re-operation before discharge 0 (0.00%) 1 (0.12%) 0 (0.00%) 0 (0.00%) Re-admission within 28 days of surgery 0 (0.00%) 1 (0.12%) 0 (0.00%) 0 (0.00%) Others 0 (0.00%) 1 (0.12%) 0 (0.00%) 0 (0.00%) Subtotal no. of admissions 0 (0.00%) 7 (0.86%) 2(11.12%) 2(1.18%)
Total no. of admissions 2 (3.03%) 27(3.33%) 3(16.67%) 7(4.14%)
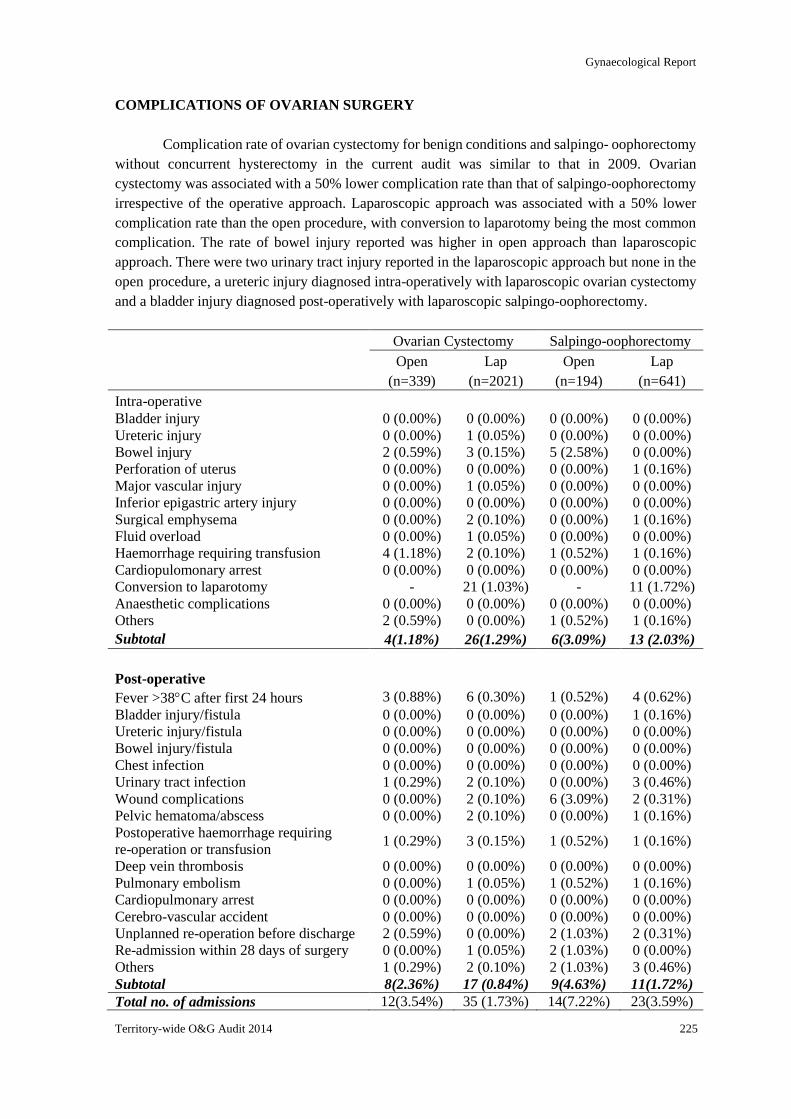
Gynaecological Report
Territory-wide O&G Audit 2014 225
COMPLICATIONS OF OVARIAN SURGERY
Complication rate of ovarian cystectomy for benign conditions and salpingo- oophorectomy
without concurrent hysterectomy in the current audit was similar to that in 2009. Ovarian
cystectomy was associated with a 50% lower complication rate than that of salpingo-oophorectomy
irrespective of the operative approach. Laparoscopic approach was associated with a 50% lower
complication rate than the open procedure, with conversion to laparotomy being the most common
complication. The rate of bowel injury reported was higher in open approach than laparoscopic
approach. There were two urinary tract injury reported in the laparoscopic approach but none in the
open procedure, a ureteric injury diagnosed intra-operatively with laparoscopic ovarian cystectomy
and a bladder injury diagnosed post-operatively with laparoscopic salpingo-oophorectomy.
Ovarian Cystectomy Salpingo-oophorectomy
Open
(n=339)
Lap
(n=2021)
Open
(n=194)
Lap
(n=641)
Intra-operative
Bladder injury 0 (0.00%) 0 (0.00%) 0 (0.00%) 0 (0.00%)
Ureteric injury 0 (0.00%) 1 (0.05%) 0 (0.00%) 0 (0.00%) Bowel injury 2 (0.59%) 3 (0.15%) 5 (2.58%) 0 (0.00%) Perforation of uterus 0 (0.00%) 0 (0.00%) 0 (0.00%) 1 (0.16%)
Major vascular injury 0 (0.00%) 1 (0.05%) 0 (0.00%) 0 (0.00%)
Inferior epigastric artery injury 0 (0.00%) 0 (0.00%) 0 (0.00%) 0 (0.00%)
Surgical emphysema 0 (0.00%) 2 (0.10%) 0 (0.00%) 1 (0.16%)
Fluid overload 0 (0.00%) 1 (0.05%) 0 (0.00%) 0 (0.00%)
Haemorrhage requiring transfusion 4 (1.18%) 2 (0.10%) 1 (0.52%) 1 (0.16%)
Cardiopulomonary arrest 0 (0.00%) 0 (0.00%) 0 (0.00%) 0 (0.00%)
Conversion to laparotomy - 21 (1.03%) - 11 (1.72%)
Anaesthetic complications 0 (0.00%) 0 (0.00%) 0 (0.00%) 0 (0.00%)
Others 2 (0.59%) 0 (0.00%) 1 (0.52%) 1 (0.16%)
Subtotal 4(1.18%) 26(1.29%) 6(3.09%) 13 (2.03%)
Post-operative
Fever >38C after first 24 hours 3 (0.88%) 6 (0.30%) 1 (0.52%) 4 (0.62%)
Bladder injury/fistula 0 (0.00%) 0 (0.00%) 0 (0.00%) 1 (0.16%)
Ureteric injury/fistula 0 (0.00%) 0 (0.00%) 0 (0.00%) 0 (0.00%)
Bowel injury/fistula 0 (0.00%) 0 (0.00%) 0 (0.00%) 0 (0.00%)
Chest infection 0 (0.00%) 0 (0.00%) 0 (0.00%) 0 (0.00%)
Urinary tract infection 1 (0.29%) 2 (0.10%) 0 (0.00%) 3 (0.46%)
Wound complications 0 (0.00%) 2 (0.10%) 6 (3.09%) 2 (0.31%)
Pelvic hematoma/abscess 0 (0.00%) 2 (0.10%) 0 (0.00%) 1 (0.16%)
Postoperative haemorrhage requiring
re-operation or transfusion 1 (0.29%) 3 (0.15%) 1 (0.52%) 1 (0.16%)
Deep vein thrombosis 0 (0.00%) 0 (0.00%) 0 (0.00%) 0 (0.00%)
Pulmonary embolism 0 (0.00%) 1 (0.05%) 1 (0.52%) 1 (0.16%)
Cardiopulmonary arrest 0 (0.00%) 0 (0.00%) 0 (0.00%) 0 (0.00%)
Cerebro-vascular accident 0 (0.00%) 0 (0.00%) 0 (0.00%) 0 (0.00%)
Unplanned re-operation before discharge 2 (0.59%) 0 (0.00%) 2 (1.03%) 2 (0.31%)
Re-admission within 28 days of surgery 0 (0.00%) 1 (0.05%) 2 (1.03%) 0 (0.00%)
Others 1 (0.29%) 2 (0.10%) 2 (1.03%) 3 (0.46%)
Subtotal 8(2.36%) 17 (0.84%) 9(4.63%) 11(1.72%)
Total no. of admissions 12(3.54%) 35 (1.73%) 14(7.22%) 23(3.59%)
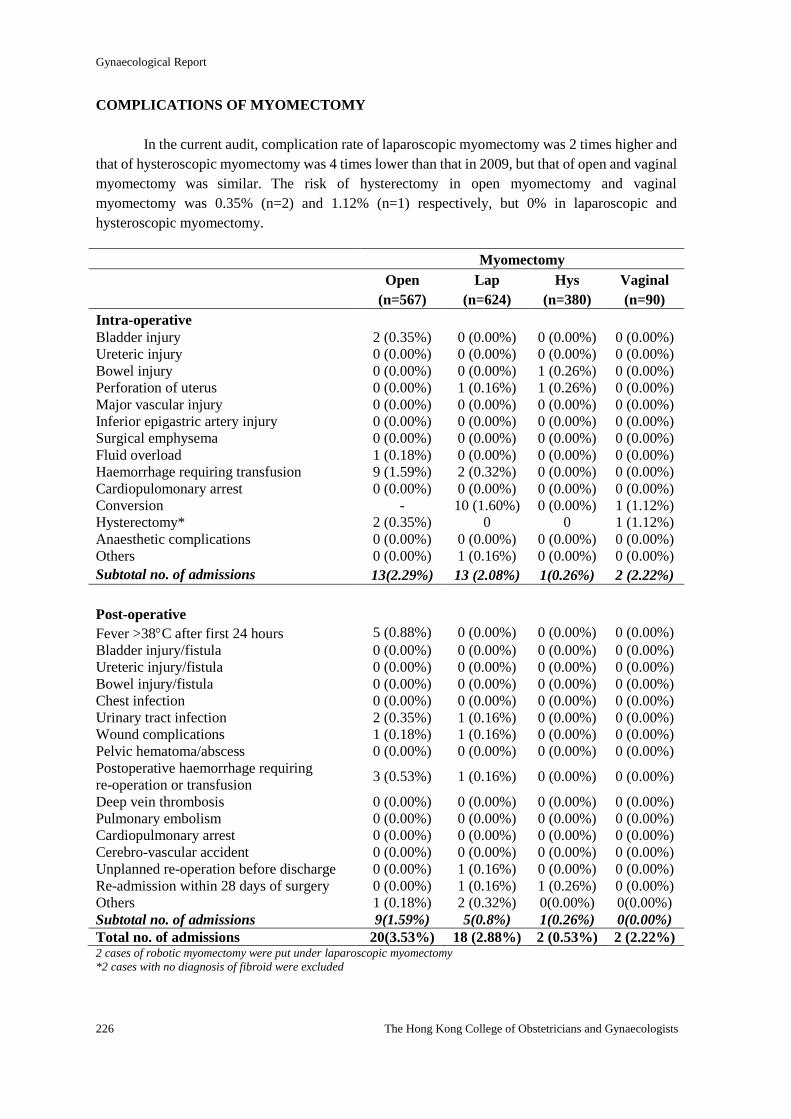
Gynaecological Report
226 The Hong Kong College of Obstetricians and Gynaecologists
COMPLICATIONS OF MYOMECTOMY
In the current audit, complication rate of laparoscopic myomectomy was 2 times higher and
that of hysteroscopic myomectomy was 4 times lower than that in 2009, but that of open and vaginal
myomectomy was similar. The risk of hysterectomy in open myomectomy and vaginal
myomectomy was 0.35% (n=2) and 1.12% (n=1) respectively, but 0% in laparoscopic and
hysteroscopic myomectomy.
Myomectomy
Open
(n=567)
Lap
(n=624)
Hys
(n=380)
Vaginal
(n=90)
Intra-operative
Bladder injury 2 (0.35%) 0 (0.00%) 0 (0.00%) 0 (0.00%) Ureteric injury 0 (0.00%) 0 (0.00%) 0 (0.00%) 0 (0.00%) Bowel injury 0 (0.00%) 0 (0.00%) 1 (0.26%) 0 (0.00%) Perforation of uterus 0 (0.00%) 1 (0.16%) 1 (0.26%) 0 (0.00%) Major vascular injury 0 (0.00%) 0 (0.00%) 0 (0.00%) 0 (0.00%) Inferior epigastric artery injury 0 (0.00%) 0 (0.00%) 0 (0.00%) 0 (0.00%) Surgical emphysema 0 (0.00%) 0 (0.00%) 0 (0.00%) 0 (0.00%) Fluid overload 1 (0.18%) 0 (0.00%) 0 (0.00%) 0 (0.00%) Haemorrhage requiring transfusion 9 (1.59%) 2 (0.32%) 0 (0.00%) 0 (0.00%) Cardiopulomonary arrest 0 (0.00%) 0 (0.00%) 0 (0.00%) 0 (0.00%) Conversion - 10 (1.60%) 0 (0.00%) 1 (1.12%) Hysterectomy* 2 (0.35%) 0 0 1 (1.12%)
Anaesthetic complications 0 (0.00%) 0 (0.00%) 0 (0.00%) 0 (0.00%) Others 0 (0.00%) 1 (0.16%) 0 (0.00%) 0 (0.00%)
Subtotal no. of admissions 13(2.29%) 13 (2.08%) 1(0.26%) 2 (2.22%)
Post-operative
Fever >38C after first 24 hours 5 (0.88%) 0 (0.00%) 0 (0.00%) 0 (0.00%)
Bladder injury/fistula 0 (0.00%) 0 (0.00%) 0 (0.00%) 0 (0.00%)
Ureteric injury/fistula 0 (0.00%) 0 (0.00%) 0 (0.00%) 0 (0.00%)
Bowel injury/fistula 0 (0.00%) 0 (0.00%) 0 (0.00%) 0 (0.00%)
Chest infection 0 (0.00%) 0 (0.00%) 0 (0.00%) 0 (0.00%)
Urinary tract infection 2 (0.35%) 1 (0.16%) 0 (0.00%) 0 (0.00%)
Wound complications 1 (0.18%) 1 (0.16%) 0 (0.00%) 0 (0.00%)
Pelvic hematoma/abscess 0 (0.00%) 0 (0.00%) 0 (0.00%) 0 (0.00%)
Postoperative haemorrhage requiring
re-operation or transfusion 3 (0.53%) 1 (0.16%) 0 (0.00%) 0 (0.00%)
Deep vein thrombosis 0 (0.00%) 0 (0.00%) 0 (0.00%) 0 (0.00%)
Pulmonary embolism 0 (0.00%) 0 (0.00%) 0 (0.00%) 0 (0.00%)
Cardiopulmonary arrest 0 (0.00%) 0 (0.00%) 0 (0.00%) 0 (0.00%)
Cerebro-vascular accident 0 (0.00%) 0 (0.00%) 0 (0.00%) 0 (0.00%)
Unplanned re-operation before discharge 0 (0.00%) 1 (0.16%) 0 (0.00%) 0 (0.00%)
Re-admission within 28 days of surgery 0 (0.00%) 1 (0.16%) 1 (0.26%) 0 (0.00%)
Others 1 (0.18%) 2 (0.32%) 0(0.00%) 0(0.00%)
Subtotal no. of admissions 9(1.59%) 5(0.8%) 1(0.26%) 0(0.00%)
Total no. of admissions 20(3.53%) 18 (2.88%) 2 (0.53%) 2 (2.22%) 2 cases of robotic myomectomy were put under laparoscopic myomectomy
*2 cases with no diagnosis of fibroid were excluded
Gynaecological Report
Territory-wide O&G Audit 2014 227
Open myomectomy was associated with the highest complication rate than the other
approaches and significant haemorrhage was the most common complication, occurring in 1.59%
(n=9) intra-operatively and 0.53% (n=3) post-operatively. Conversion to laparotomy was the most
common complication in laparoscopic myomectomy. There were 2 cases of bladder injury in open
myomectomy, and 1 case of bowel injury with another case of uterine perforation in the
hysteroscopic approach.
There were 5 cases of hysterectomy associated with myomectomy reported, of which 4
cases were abdominal hysterectomy associated with abdominal myomectomy. One with abdominal
myomectomy, hysterectomy, bilateral salpingo-oophorectomy, pelvic lymph node dissection and
omentectomy for primary ovarian malignancy but there was no diagnosis coding for uterine fibroid.
One with abdominal myomectomy, hysterectomy, salpingo-oophorectomy and debulking operation
for carcinoma of cervix and secondary ovarian malignancy but again there was no diagnosis coding
for fibroid. Two cases with abdominal myomectomy and hysterectomy, one for uterine fibroid
(uterine size 14-16 weeks with blood loss 500 ml) and another for fibroid with endometriosis
(uterine size 18-20 weeks with blood loss 1750 ml). There were 1 case of laparoscopic hysterectomy
and bilateral salpingo-oophorectomy associated with a vaginal myomectomy for submucosal fibroid
(uterine size 10-12 weeks). So there should only be 2 cases of abdominal myomectomy and 1 case of
vaginal myomectomy required hysterectomy.
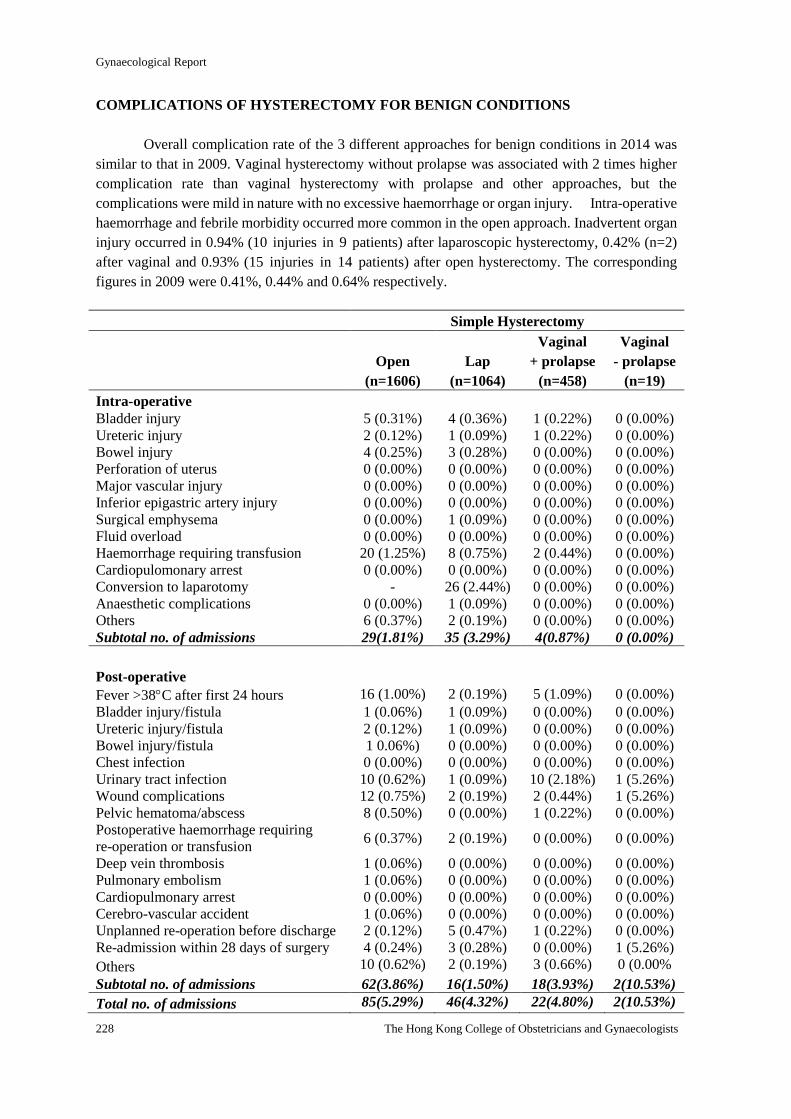
Gynaecological Report
228 The Hong Kong College of Obstetricians and Gynaecologists
COMPLICATIONS OF HYSTERECTOMY FOR BENIGN CONDITIONS
Overall complication rate of the 3 different approaches for benign conditions in 2014 was
similar to that in 2009. Vaginal hysterectomy without prolapse was associated with 2 times higher
complication rate than vaginal hysterectomy with prolapse and other approaches, but the
complications were mild in nature with no excessive haemorrhage or organ injury. Intra-operative
haemorrhage and febrile morbidity occurred more common in the open approach. Inadvertent organ
injury occurred in 0.94% (10 injuries in 9 patients) after laparoscopic hysterectomy, 0.42% (n=2)
after vaginal and 0.93% (15 injuries in 14 patients) after open hysterectomy. The corresponding
figures in 2009 were 0.41%, 0.44% and 0.64% respectively.
Simple Hysterectomy
Open
(n=1606)
Lap
(n=1064)
Vaginal
+ prolapse
(n=458)
Vaginal
- prolapse
(n=19)
Intra-operative
Bladder injury 5 (0.31%) 4 (0.36%) 1 (0.22%) 0 (0.00%) Ureteric injury 2 (0.12%) 1 (0.09%) 1 (0.22%) 0 (0.00%) Bowel injury 4 (0.25%) 3 (0.28%) 0 (0.00%) 0 (0.00%) Perforation of uterus 0 (0.00%) 0 (0.00%) 0 (0.00%) 0 (0.00%) Major vascular injury 0 (0.00%) 0 (0.00%) 0 (0.00%) 0 (0.00%) Inferior epigastric artery injury 0 (0.00%) 0 (0.00%) 0 (0.00%) 0 (0.00%) Surgical emphysema 0 (0.00%) 1 (0.09%) 0 (0.00%) 0 (0.00%) Fluid overload 0 (0.00%) 0 (0.00%) 0 (0.00%) 0 (0.00%) Haemorrhage requiring transfusion 20 (1.25%) 8 (0.75%) 2 (0.44%) 0 (0.00%) Cardiopulomonary arrest 0 (0.00%) 0 (0.00%) 0 (0.00%) 0 (0.00%) Conversion to laparotomy - 26 (2.44%) 0 (0.00%) 0 (0.00%) Anaesthetic complications 0 (0.00%) 1 (0.09%) 0 (0.00%) 0 (0.00%) Others 6 (0.37%) 2 (0.19%) 0 (0.00%) 0 (0.00%) Subtotal no. of admissions 29(1.81%) 35 (3.29%) 4(0.87%) 0 (0.00%)
Post-operative
Fever >38C after first 24 hours 16 (1.00%) 2 (0.19%) 5 (1.09%) 0 (0.00%)
Bladder injury/fistula 1 (0.06%) 1 (0.09%) 0 (0.00%) 0 (0.00%) Ureteric injury/fistula 2 (0.12%) 1 (0.09%) 0 (0.00%) 0 (0.00%) Bowel injury/fistula 1 0.06%) 0 (0.00%) 0 (0.00%) 0 (0.00%) Chest infection 0 (0.00%) 0 (0.00%) 0 (0.00%) 0 (0.00%) Urinary tract infection 10 (0.62%) 1 (0.09%) 10 (2.18%) 1 (5.26%)
Wound complications 12 (0.75%) 2 (0.19%) 2 (0.44%) 1 (5.26%)
Pelvic hematoma/abscess 8 (0.50%) 0 (0.00%) 1 (0.22%) 0 (0.00%)
Postoperative haemorrhage requiring
re-operation or transfusion 6 (0.37%) 2 (0.19%) 0 (0.00%) 0 (0.00%)
Deep vein thrombosis 1 (0.06%) 0 (0.00%) 0 (0.00%) 0 (0.00%) Pulmonary embolism 1 (0.06%) 0 (0.00%) 0 (0.00%) 0 (0.00%) Cardiopulmonary arrest 0 (0.00%) 0 (0.00%) 0 (0.00%) 0 (0.00%) Cerebro-vascular accident 1 (0.06%) 0 (0.00%) 0 (0.00%) 0 (0.00%) Unplanned re-operation before discharge 2 (0.12%) 5 (0.47%) 1 (0.22%) 0 (0.00%)
Re-admission within 28 days of surgery 4 (0.24%) 3 (0.28%) 0 (0.00%) 1 (5.26%)
Others 10 (0.62%) 2 (0.19%) 3 (0.66%) 0 (0.00%
Subtotal no. of admissions 62(3.86%) 16(1.50%) 18(3.93%) 2(10.53%)
Total no. of admissions 85(5.29%) 46(4.32%) 22(4.80%) 2(10.53%)
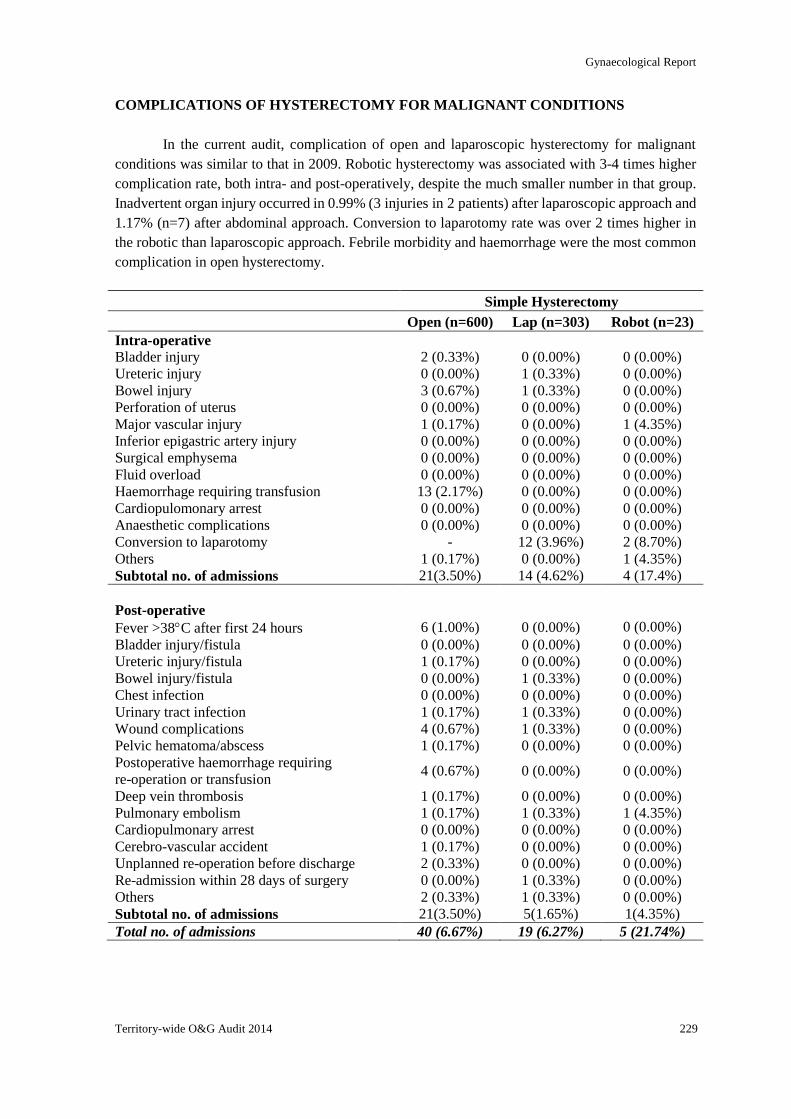
Gynaecological Report
Territory-wide O&G Audit 2014 229
COMPLICATIONS OF HYSTERECTOMY FOR MALIGNANT CONDITIONS
In the current audit, complication of open and laparoscopic hysterectomy for malignant
conditions was similar to that in 2009. Robotic hysterectomy was associated with 3-4 times higher
complication rate, both intra- and post-operatively, despite the much smaller number in that group.
Inadvertent organ injury occurred in 0.99% (3 injuries in 2 patients) after laparoscopic approach and
1.17% (n=7) after abdominal approach. Conversion to laparotomy rate was over 2 times higher in
the robotic than laparoscopic approach. Febrile morbidity and haemorrhage were the most common
complication in open hysterectomy.
Simple Hysterectomy
Open (n=600) Lap (n=303) Robot (n=23)
Intra-operative
Bladder injury 2 (0.33%) 0 (0.00%) 0 (0.00%)
Ureteric injury 0 (0.00%) 1 (0.33%) 0 (0.00%)
Bowel injury 3 (0.67%) 1 (0.33%) 0 (0.00%)
Perforation of uterus 0 (0.00%) 0 (0.00%) 0 (0.00%)
Major vascular injury 1 (0.17%) 0 (0.00%) 1 (4.35%)
Inferior epigastric artery injury 0 (0.00%) 0 (0.00%) 0 (0.00%)
Surgical emphysema 0 (0.00%) 0 (0.00%) 0 (0.00%)
Fluid overload 0 (0.00%) 0 (0.00%) 0 (0.00%)
Haemorrhage requiring transfusion 13 (2.17%) 0 (0.00%) 0 (0.00%)
Cardiopulomonary arrest 0 (0.00%) 0 (0.00%) 0 (0.00%)
Anaesthetic complications 0 (0.00%) 0 (0.00%) 0 (0.00%)
Conversion to laparotomy - 12 (3.96%) 2 (8.70%)
Others 1 (0.17%) 0 (0.00%) 1 (4.35%)
Subtotal no. of admissions 21(3.50%) 14 (4.62%) 4 (17.4%)
Post-operative
Fever >38C after first 24 hours 6 (1.00%) 0 (0.00%) 0 (0.00%)
Bladder injury/fistula 0 (0.00%) 0 (0.00%) 0 (0.00%)
Ureteric injury/fistula 1 (0.17%) 0 (0.00%) 0 (0.00%)
Bowel injury/fistula 0 (0.00%) 1 (0.33%) 0 (0.00%)
Chest infection 0 (0.00%) 0 (0.00%) 0 (0.00%)
Urinary tract infection 1 (0.17%) 1 (0.33%) 0 (0.00%)
Wound complications 4 (0.67%) 1 (0.33%) 0 (0.00%)
Pelvic hematoma/abscess 1 (0.17%) 0 (0.00%) 0 (0.00%)
Postoperative haemorrhage requiring
re-operation or transfusion 4 (0.67%) 0 (0.00%) 0 (0.00%)
Deep vein thrombosis 1 (0.17%) 0 (0.00%) 0 (0.00%)
Pulmonary embolism 1 (0.17%) 1 (0.33%) 1 (4.35%)
Cardiopulmonary arrest 0 (0.00%) 0 (0.00%) 0 (0.00%)
Cerebro-vascular accident 1 (0.17%) 0 (0.00%) 0 (0.00%)
Unplanned re-operation before discharge 2 (0.33%) 0 (0.00%) 0 (0.00%)
Re-admission within 28 days of surgery 0 (0.00%) 1 (0.33%) 0 (0.00%)
Others 2 (0.33%) 1 (0.33%) 0 (0.00%)
Subtotal no. of admissions 21(3.50%) 5(1.65%) 1(4.35%)
Total no. of admissions 40 (6.67%) 19 (6.27%) 5 (21.74%)
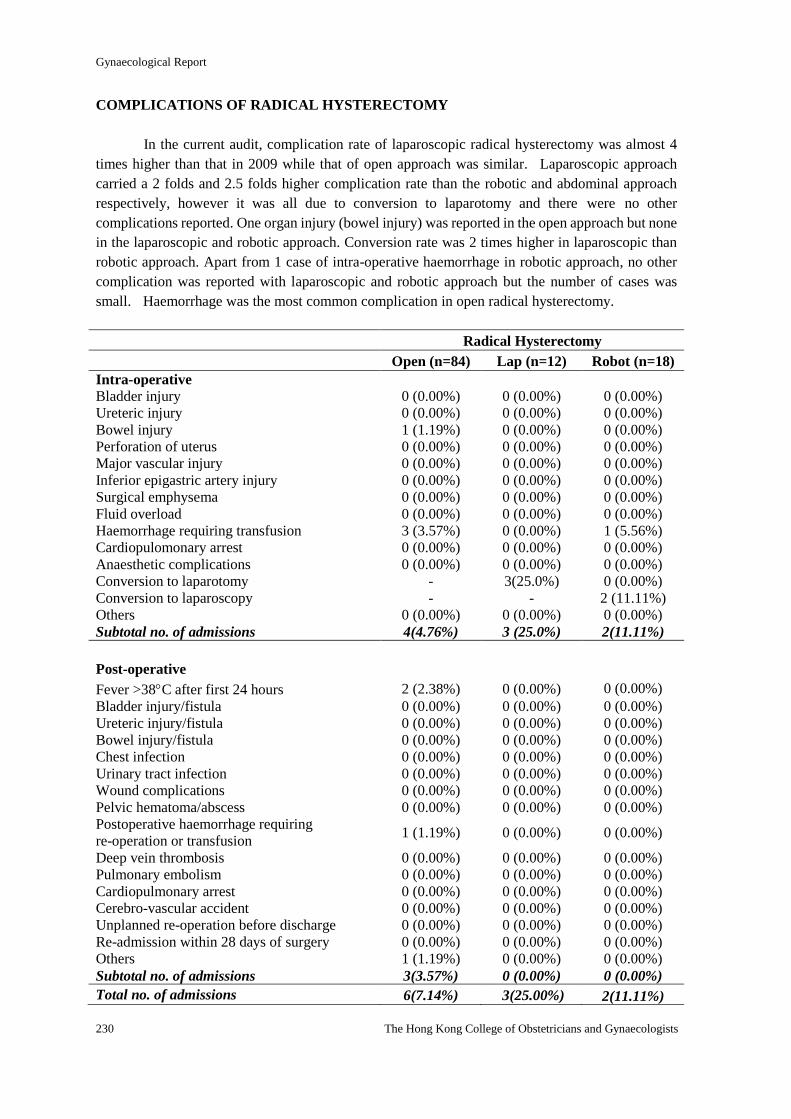
Gynaecological Report
230 The Hong Kong College of Obstetricians and Gynaecologists
COMPLICATIONS OF RADICAL HYSTERECTOMY
In the current audit, complication rate of laparoscopic radical hysterectomy was almost 4
times higher than that in 2009 while that of open approach was similar. Laparoscopic approach
carried a 2 folds and 2.5 folds higher complication rate than the robotic and abdominal approach
respectively, however it was all due to conversion to laparotomy and there were no other
complications reported. One organ injury (bowel injury) was reported in the open approach but none
in the laparoscopic and robotic approach. Conversion rate was 2 times higher in laparoscopic than
robotic approach. Apart from 1 case of intra-operative haemorrhage in robotic approach, no other
complication was reported with laparoscopic and robotic approach but the number of cases was
small. Haemorrhage was the most common complication in open radical hysterectomy.
Radical Hysterectomy
Open (n=84) Lap (n=12) Robot (n=18)
Intra-operative
Bladder injury 0 (0.00%) 0 (0.00%) 0 (0.00%)
Ureteric injury 0 (0.00%) 0 (0.00%) 0 (0.00%)
Bowel injury 1 (1.19%) 0 (0.00%) 0 (0.00%)
Perforation of uterus 0 (0.00%) 0 (0.00%) 0 (0.00%)
Major vascular injury 0 (0.00%) 0 (0.00%) 0 (0.00%)
Inferior epigastric artery injury 0 (0.00%) 0 (0.00%) 0 (0.00%)
Surgical emphysema 0 (0.00%) 0 (0.00%) 0 (0.00%)
Fluid overload 0 (0.00%) 0 (0.00%) 0 (0.00%)
Haemorrhage requiring transfusion 3 (3.57%) 0 (0.00%) 1 (5.56%)
Cardiopulomonary arrest 0 (0.00%) 0 (0.00%) 0 (0.00%)
Anaesthetic complications 0 (0.00%) 0 (0.00%) 0 (0.00%)
Conversion to laparotomy - 3(25.0%) 0 (0.00%)
Conversion to laparoscopy - - 2 (11.11%)
Others 0 (0.00%) 0 (0.00%) 0 (0.00%)
Subtotal no. of admissions 4(4.76%) 3 (25.0%) 2(11.11%)
Post-operative
Fever >38C after first 24 hours 2 (2.38%) 0 (0.00%) 0 (0.00%)
Bladder injury/fistula 0 (0.00%) 0 (0.00%) 0 (0.00%)
Ureteric injury/fistula 0 (0.00%) 0 (0.00%) 0 (0.00%)
Bowel injury/fistula 0 (0.00%) 0 (0.00%) 0 (0.00%)
Chest infection 0 (0.00%) 0 (0.00%) 0 (0.00%)
Urinary tract infection 0 (0.00%) 0 (0.00%) 0 (0.00%)
Wound complications 0 (0.00%) 0 (0.00%) 0 (0.00%)
Pelvic hematoma/abscess 0 (0.00%) 0 (0.00%) 0 (0.00%)
Postoperative haemorrhage requiring
re-operation or transfusion 1 (1.19%) 0 (0.00%) 0 (0.00%)
Deep vein thrombosis 0 (0.00%) 0 (0.00%) 0 (0.00%)
Pulmonary embolism 0 (0.00%) 0 (0.00%) 0 (0.00%)
Cardiopulmonary arrest 0 (0.00%) 0 (0.00%) 0 (0.00%)
Cerebro-vascular accident 0 (0.00%) 0 (0.00%) 0 (0.00%)
Unplanned re-operation before discharge 0 (0.00%) 0 (0.00%) 0 (0.00%)
Re-admission within 28 days of surgery 0 (0.00%) 0 (0.00%) 0 (0.00%)
Others 1 (1.19%) 0 (0.00%) 0 (0.00%)
Subtotal no. of admissions 3(3.57%) 0 (0.00%) 0 (0.00%)
Total no. of admissions 6(7.14%) 3(25.00%) 2(11.11%)
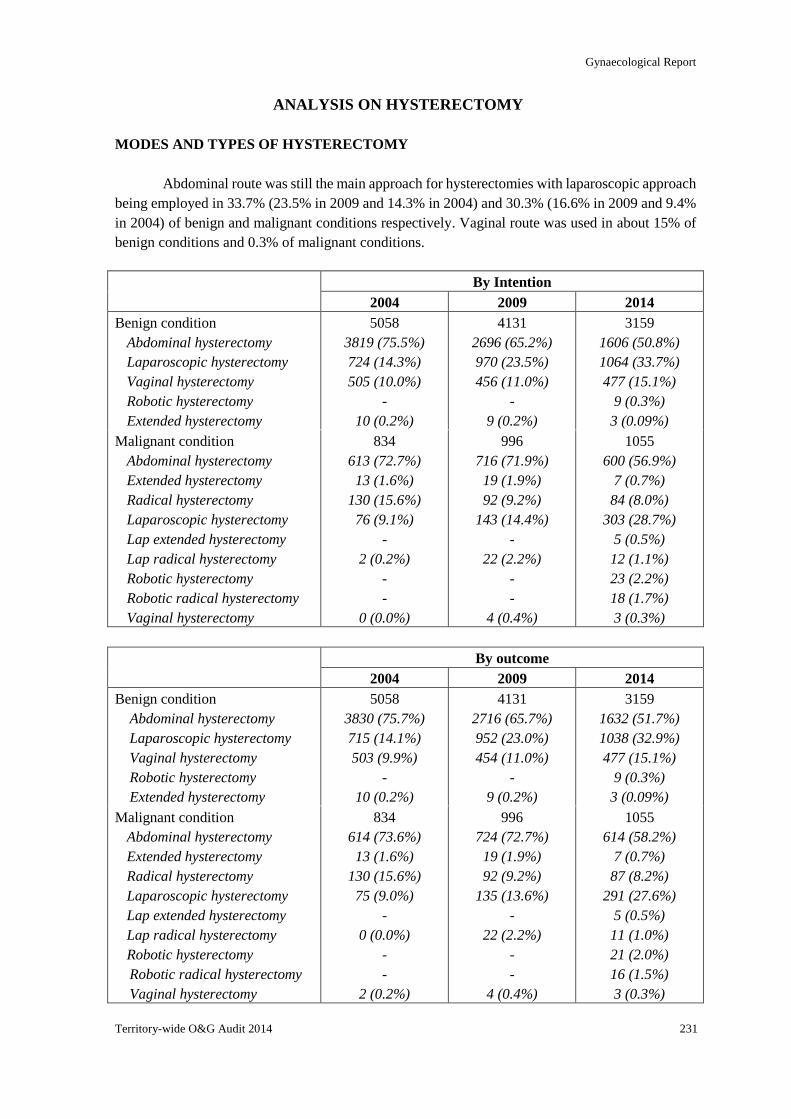
Gynaecological Report
Territory-wide O&G Audit 2014 231
ANALYSIS ON HYSTERECTOMY
MODES AND TYPES OF HYSTERECTOMY
Abdominal route was still the main approach for hysterectomies with laparoscopic approach
being employed in 33.7% (23.5% in 2009 and 14.3% in 2004) and 30.3% (16.6% in 2009 and 9.4%
in 2004) of benign and malignant conditions respectively. Vaginal route was used in about 15% of
benign conditions and 0.3% of malignant conditions.
By Intention
2004 2009 2014
Benign condition
Abdominal hysterectomy
Laparoscopic hysterectomy
Vaginal hysterectomy
Robotic hysterectomy
Extended hysterectomy
5058
3819 (75.5%)
724 (14.3%)
505 (10.0%)
-
10 (0.2%)
4131
2696 (65.2%)
970 (23.5%)
456 (11.0%)
-
9 (0.2%)
3159
1606 (50.8%)
1064 (33.7%)
477 (15.1%)
9 (0.3%)
3 (0.09%)
Malignant condition
Abdominal hysterectomy
Extended hysterectomy
Radical hysterectomy
Laparoscopic hysterectomy
Lap extended hysterectomy
Lap radical hysterectomy
Robotic hysterectomy
Robotic radical hysterectomy
Vaginal hysterectomy
834
613 (72.7%)
13 (1.6%)
130 (15.6%)
76 (9.1%)
-
2 (0.2%)
-
-
0 (0.0%)
996
716 (71.9%)
19 (1.9%)
92 (9.2%)
143 (14.4%)
-
22 (2.2%)
-
-
4 (0.4%)
1055
600 (56.9%)
7 (0.7%)
84 (8.0%)
303 (28.7%)
5 (0.5%)
12 (1.1%)
23 (2.2%)
18 (1.7%)
3 (0.3%)
By outcome
2004 2009 2014
Benign condition
Abdominal hysterectomy
Laparoscopic hysterectomy
Vaginal hysterectomy
Robotic hysterectomy
Extended hysterectomy
5058
3830 (75.7%)
715 (14.1%)
503 (9.9%)
-
10 (0.2%)
4131
2716 (65.7%)
952 (23.0%)
454 (11.0%)
-
9 (0.2%)
3159
1632 (51.7%)
1038 (32.9%)
477 (15.1%)
9 (0.3%)
3 (0.09%)
Malignant condition
Abdominal hysterectomy
Extended hysterectomy
Radical hysterectomy
Laparoscopic hysterectomy
Lap extended hysterectomy
Lap radical hysterectomy
Robotic hysterectomy
Robotic radical hysterectomy
Vaginal hysterectomy
834
614 (73.6%)
13 (1.6%)
130 (15.6%)
75 (9.0%)
-
0 (0.0%)
-
-
2 (0.2%)
996
724 (72.7%)
19 (1.9%)
92 (9.2%)
135 (13.6%)
-
22 (2.2%)
-
-
4 (0.4%)
1055
614 (58.2%)
7 (0.7%)
87 (8.2%)
291 (27.6%)
5 (0.5%)
11 (1.0%)
21 (2.0%)
16 (1.5%)
3 (0.3%)
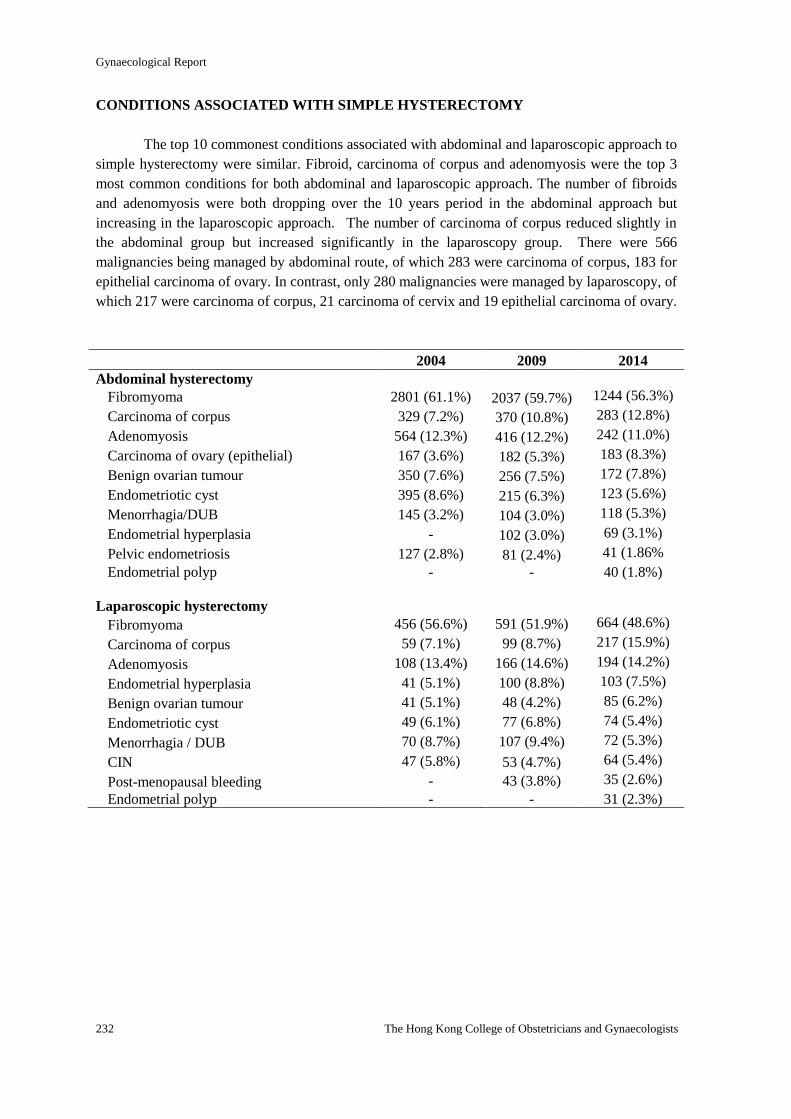
Gynaecological Report
232 The Hong Kong College of Obstetricians and Gynaecologists
CONDITIONS ASSOCIATED WITH SIMPLE HYSTERECTOMY
The top 10 commonest conditions associated with abdominal and laparoscopic approach to
simple hysterectomy were similar. Fibroid, carcinoma of corpus and adenomyosis were the top 3
most common conditions for both abdominal and laparoscopic approach. The number of fibroids
and adenomyosis were both dropping over the 10 years period in the abdominal approach but
increasing in the laparoscopic approach. The number of carcinoma of corpus reduced slightly in
the abdominal group but increased significantly in the laparoscopy group. There were 566
malignancies being managed by abdominal route, of which 283 were carcinoma of corpus, 183 for
epithelial carcinoma of ovary. In contrast, only 280 malignancies were managed by laparoscopy, of
which 217 were carcinoma of corpus, 21 carcinoma of cervix and 19 epithelial carcinoma of ovary.
2004 2009 2014
Abdominal hysterectomy
Fibromyoma 2801 (61.1%) 2037 (59.7%) 1244 (56.3%)
Carcinoma of corpus 329 (7.2%) 370 (10.8%) 283 (12.8%)
Adenomyosis 564 (12.3%) 416 (12.2%) 242 (11.0%)
Carcinoma of ovary (epithelial) 167 (3.6%) 182 (5.3%) 183 (8.3%)
Benign ovarian tumour 350 (7.6%) 256 (7.5%) 172 (7.8%)
Endometriotic cyst 395 (8.6%) 215 (6.3%) 123 (5.6%)
Menorrhagia/DUB 145 (3.2%) 104 (3.0%) 118 (5.3%)
Endometrial hyperplasia - 102 (3.0%) 69 (3.1%)
Pelvic endometriosis 127 (2.8%) 81 (2.4%) 41 (1.86%
Endometrial polyp - - 40 (1.8%)
Laparoscopic hysterectomy
Fibromyoma 456 (56.6%) 591 (51.9%) 664 (48.6%)
Carcinoma of corpus 59 (7.1%) 99 (8.7%) 217 (15.9%)
Adenomyosis 108 (13.4%) 166 (14.6%) 194 (14.2%)
Endometrial hyperplasia 41 (5.1%) 100 (8.8%) 103 (7.5%)
Benign ovarian tumour 41 (5.1%) 48 (4.2%) 85 (6.2%)
Endometriotic cyst 49 (6.1%) 77 (6.8%) 74 (5.4%)
Menorrhagia / DUB 70 (8.7%) 107 (9.4%) 72 (5.3%)
CIN 47 (5.8%) 53 (4.7%) 64 (5.4%)
Post-menopausal bleeding - 43 (3.8%) 35 (2.6%)
Endometrial polyp - - 31 (2.3%)
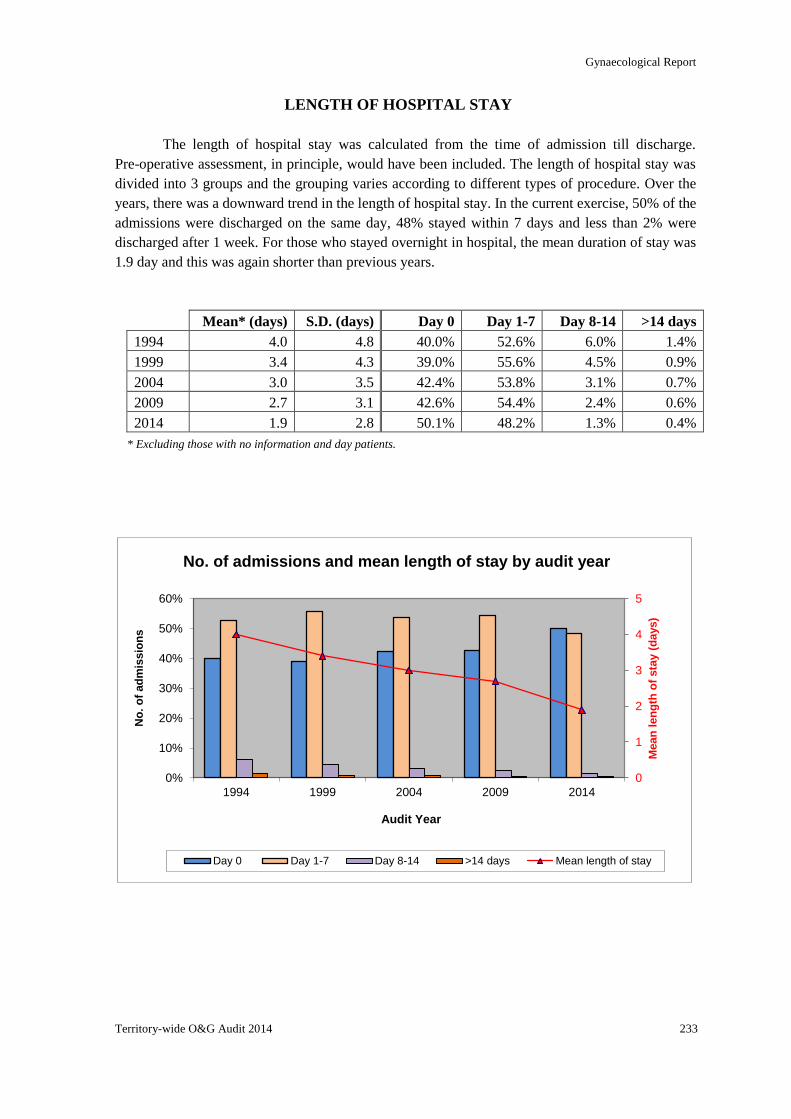
Gynaecological Report
Territory-wide O&G Audit 2014 233
0
1
2
3
4
5
0%
10%
20%
30%
40%
50%
60%
1994 1999 2004 2009 2014
Mean
len
gth
of
sta
y (
days)
No
. o
f ad
mis
sio
ns
Audit Year
No. of admissions and mean length of stay by audit year
Day 0 Day 1-7 Day 8-14 >14 days Mean length of stay
LENGTH OF HOSPITAL STAY
The length of hospital stay was calculated from the time of admission till discharge.
Pre-operative assessment, in principle, would have been included. The length of hospital stay was
divided into 3 groups and the grouping varies according to different types of procedure. Over the
years, there was a downward trend in the length of hospital stay. In the current exercise, 50% of the
admissions were discharged on the same day, 48% stayed within 7 days and less than 2% were
discharged after 1 week. For those who stayed overnight in hospital, the mean duration of stay was
1.9 day and this was again shorter than previous years.
Mean* (days) S.D. (days) Day 0 Day 1-7 Day 8-14 >14 days
1994 4.0 4.8 40.0% 52.6% 6.0% 1.4%
1999 3.4 4.3 39.0% 55.6% 4.5% 0.9%
2004 3.0 3.5 42.4% 53.8% 3.1% 0.7%
2009 2.7 3.1 42.6% 54.4% 2.4% 0.6%
2014 1.9 2.8 50.1% 48.2% 1.3% 0.4%
* Excluding those with no information and day patients.
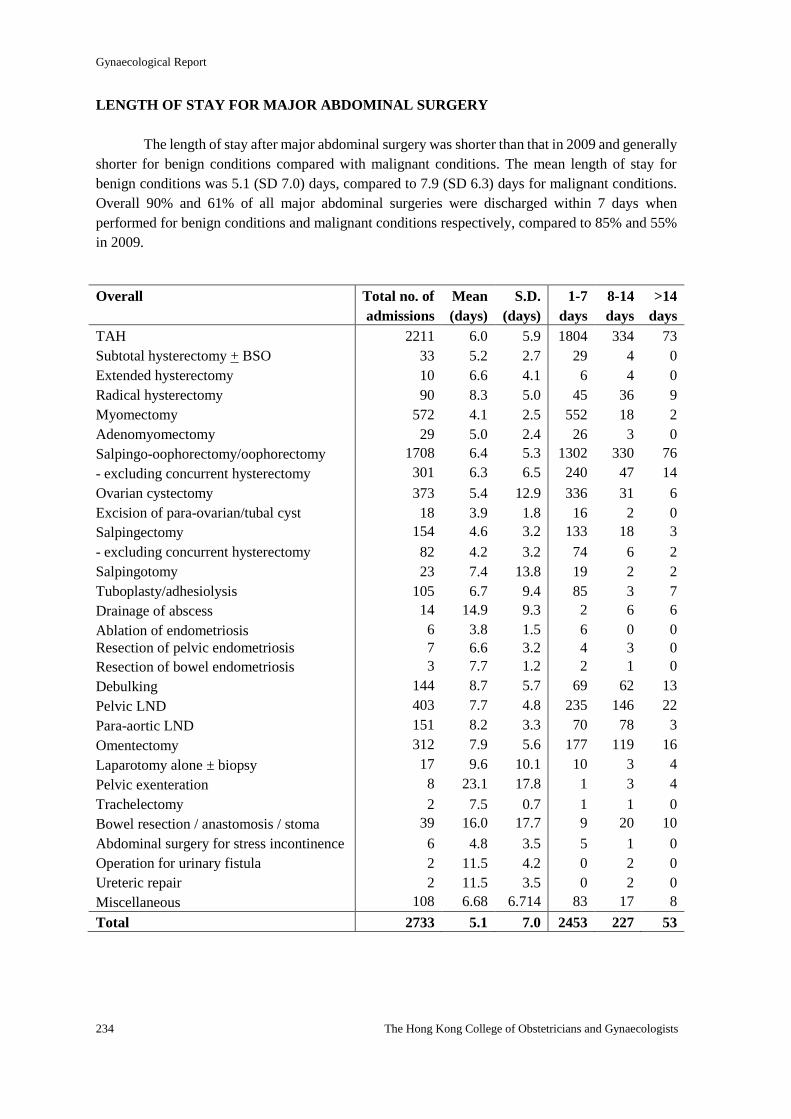
Gynaecological Report
234 The Hong Kong College of Obstetricians and Gynaecologists
LENGTH OF STAY FOR MAJOR ABDOMINAL SURGERY
The length of stay after major abdominal surgery was shorter than that in 2009 and generally
shorter for benign conditions compared with malignant conditions. The mean length of stay for
benign conditions was 5.1 (SD 7.0) days, compared to 7.9 (SD 6.3) days for malignant conditions.
Overall 90% and 61% of all major abdominal surgeries were discharged within 7 days when
performed for benign conditions and malignant conditions respectively, compared to 85% and 55%
in 2009.
Overall Total no. of
admissions
Mean
(days)
S.D.
(days)
1-7
days
8-14
days
>14
days
TAH 2211 6.0 5.9 1804 334 73
Subtotal hysterectomy + BSO 33 5.2 2.7 29 4 0
Extended hysterectomy 10 6.6 4.1 6 4 0
Radical hysterectomy 90 8.3 5.0 45 36 9
Myomectomy 572 4.1 2.5 552 18 2
Adenomyomectomy 29 5.0 2.4 26 3 0
Salpingo-oophorectomy/oophorectomy 1708 6.4 5.3 1302 330 76
- excluding concurrent hysterectomy 301 6.3 6.5 240 47 14
Ovarian cystectomy 373 5.4 12.9 336 31 6
Excision of para-ovarian/tubal cyst 18 3.9 1.8 16 2 0
Salpingectomy 154 4.6 3.2 133 18 3
- excluding concurrent hysterectomy 82 4.2 3.2 74 6 2
Salpingotomy 23 7.4 13.8 19 2 2
Tuboplasty/adhesiolysis 105 6.7 9.4 85 3 7
Drainage of abscess 14 14.9 9.3 2 6 6
Ablation of endometriosis 6 3.8 1.5 6 0 0
Resection of pelvic endometriosis 7 6.6 3.2 4 3 0
Resection of bowel endometriosis 3 7.7 1.2 2 1 0
Debulking 144 8.7 5.7 69 62 13
Pelvic LND 403 7.7 4.8 235 146 22
Para-aortic LND 151 8.2 3.3 70 78 3
Omentectomy 312 7.9 5.6 177 119 16
Laparotomy alone ± biopsy 17 9.6 10.1 10 3 4
Pelvic exenteration 8 23.1 17.8 1 3 4
Trachelectomy 2 7.5 0.7 1 1 0
Bowel resection / anastomosis / stoma 39 16.0 17.7 9 20 10
Abdominal surgery for stress incontinence 6 4.8 3.5 5 1 0
Operation for urinary fistula 2 11.5 4.2 0 2 0
Ureteric repair 2 11.5 3.5 0 2 0
Miscellaneous 108 6.68 6.714 83 17 8
Total 2733 5.1 7.0 2453 227 53
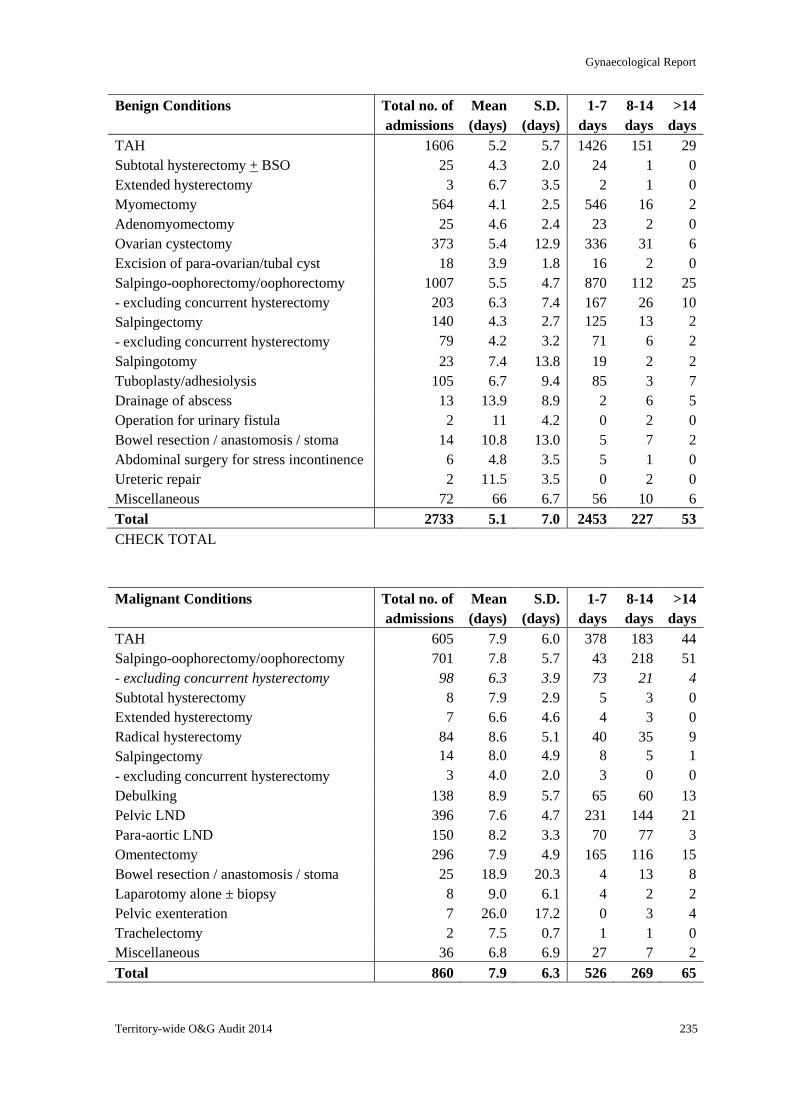
Gynaecological Report
Territory-wide O&G Audit 2014 235
Benign Conditions Total no. of
admissions
Mean
(days)
S.D.
(days)
1-7
days
8-14
days
>14
days
TAH 1606 5.2 5.7 1426 151 29
Subtotal hysterectomy + BSO 25 4.3 2.0 24 1 0
Extended hysterectomy 3 6.7 3.5 2 1 0
Myomectomy 564 4.1 2.5 546 16 2
Adenomyomectomy 25 4.6 2.4 23 2 0
Ovarian cystectomy 373 5.4 12.9 336 31 6
Excision of para-ovarian/tubal cyst 18 3.9 1.8 16 2 0
Salpingo-oophorectomy/oophorectomy 1007 5.5 4.7 870 112 25
- excluding concurrent hysterectomy 203 6.3 7.4 167 26 10
Salpingectomy 140 4.3 2.7 125 13 2
- excluding concurrent hysterectomy 79 4.2 3.2 71 6 2
Salpingotomy 23 7.4 13.8 19 2 2
Tuboplasty/adhesiolysis 105 6.7 9.4 85 3 7
Drainage of abscess 13 13.9 8.9 2 6 5
Operation for urinary fistula 2 11 4.2 0 2 0
Bowel resection / anastomosis / stoma 14 10.8 13.0 5 7 2
Abdominal surgery for stress incontinence 6 4.8 3.5 5 1 0
Ureteric repair 2 11.5 3.5 0 2 0
Miscellaneous 72 66 6.7 56 10 6
Total 2733 5.1 7.0 2453 227 53
CHECK TOTAL
Malignant Conditions Total no. of
admissions
Mean
(days)
S.D.
(days)
1-7
days
8-14
days
>14
days
TAH 605 7.9 6.0 378 183 44
Salpingo-oophorectomy/oophorectomy 701 7.8 5.7 43 218 51
- excluding concurrent hysterectomy 98 6.3 3.9 73 21 4
Subtotal hysterectomy 8 7.9 2.9 5 3 0
Extended hysterectomy 7 6.6 4.6 4 3 0
Radical hysterectomy 84 8.6 5.1 40 35 9
Salpingectomy 14 8.0 4.9 8 5 1
- excluding concurrent hysterectomy 3 4.0 2.0 3 0 0
Debulking 138 8.9 5.7 65 60 13
Pelvic LND 396 7.6 4.7 231 144 21
Para-aortic LND 150 8.2 3.3 70 77 3
Omentectomy 296 7.9 4.9 165 116 15
Bowel resection / anastomosis / stoma 25 18.9 20.3 4 13 8
Laparotomy alone ± biopsy 8 9.0 6.1 4 2 2
Pelvic exenteration 7 26.0 17.2 0 3 4
Trachelectomy 2 7.5 0.7 1 1 0
Miscellaneous 36 6.8 6.9 27 7 2
Total 860 7.9 6.3 526 269 65
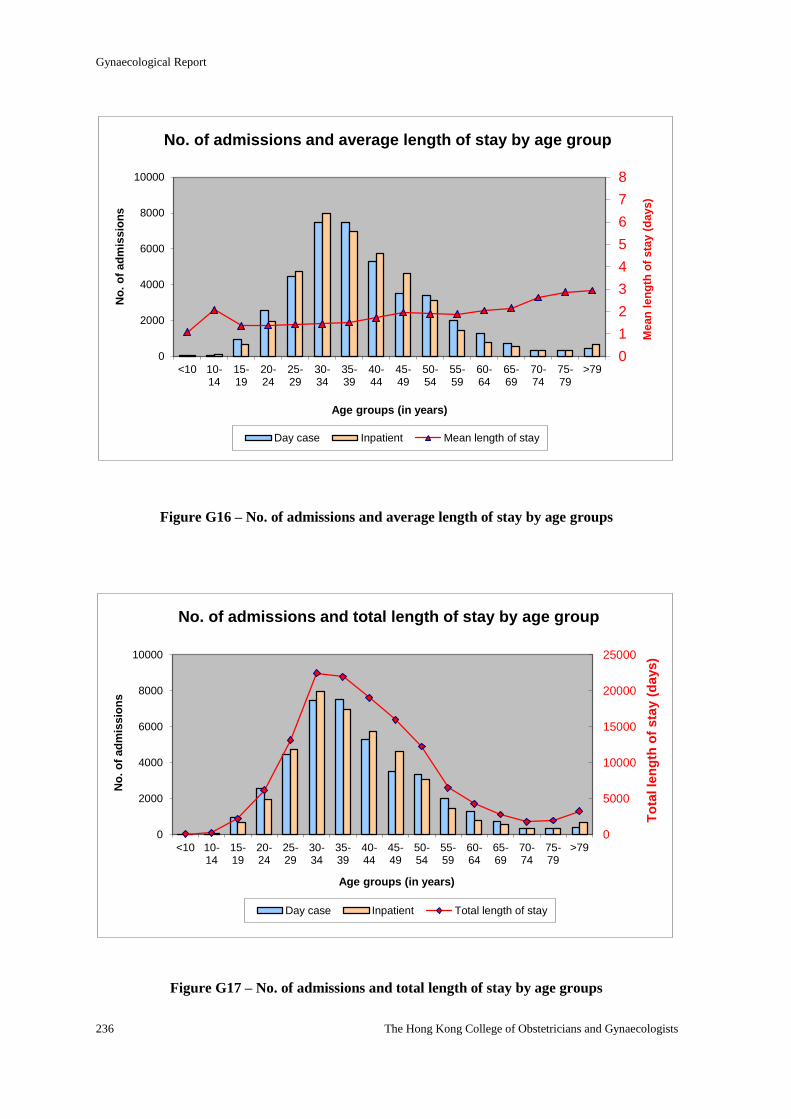
Gynaecological Report
236 The Hong Kong College of Obstetricians and Gynaecologists
0
1
2
3
4
5
6
7
8
0
2000
4000
6000
8000
10000
<10 10-14
15-19
20-24
25-29
30-34
35-39
40-44
45-49
50-54
55-59
60-64
65-69
70-74
75-79
>79
Mean
len
gth
of
sta
y (
days)
No
. o
f ad
mis
sio
ns
Age groups (in years)
No. of admissions and average length of stay by age group
Day case Inpatient Mean length of stay
0
5000
10000
15000
20000
25000
0
2000
4000
6000
8000
10000
<10 10-14
15-19
20-24
25-29
30-34
35-39
40-44
45-49
50-54
55-59
60-64
65-69
70-74
75-79
>79
To
tal le
ng
th o
f sta
y (
days)
No
. o
f ad
mis
sio
ns
Age groups (in years)
No. of admissions and total length of stay by age group
Day case Inpatient Total length of stay
Figure G16 – No. of admissions and average length of stay by age groups
Figure G17 – No. of admissions and total length of stay by age groups
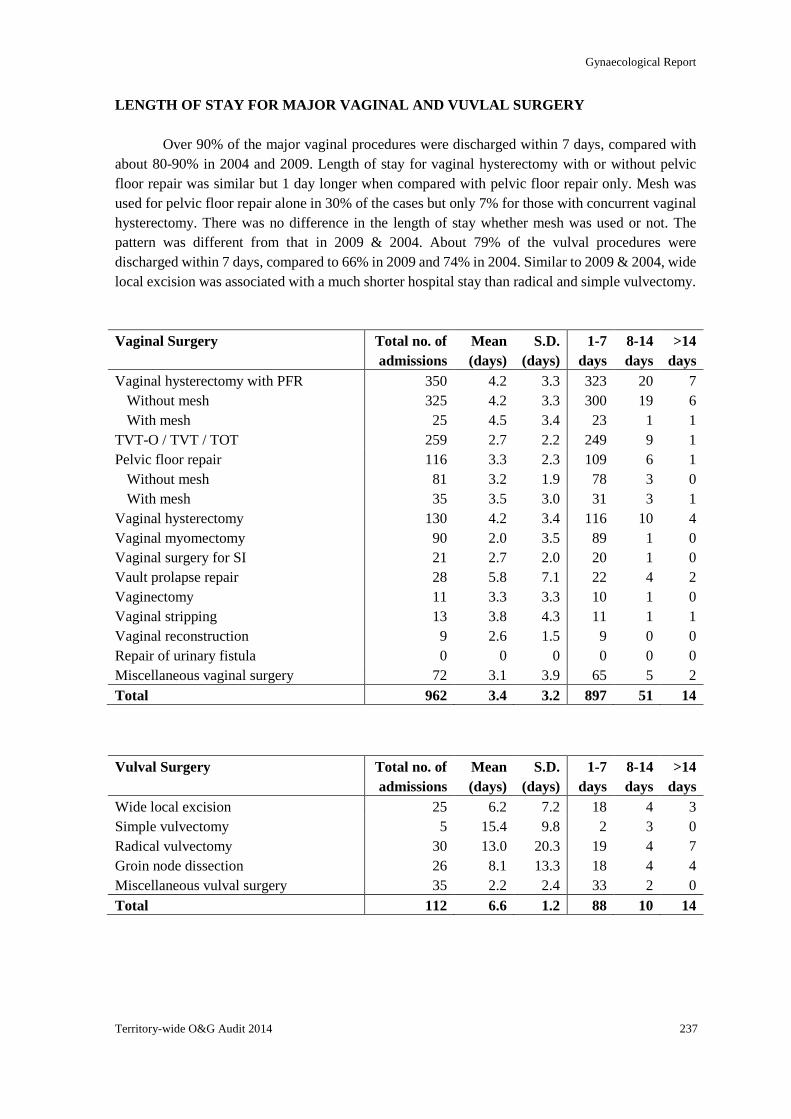
Gynaecological Report
Territory-wide O&G Audit 2014 237
LENGTH OF STAY FOR MAJOR VAGINAL AND VUVLAL SURGERY
Over 90% of the major vaginal procedures were discharged within 7 days, compared with
about 80-90% in 2004 and 2009. Length of stay for vaginal hysterectomy with or without pelvic
floor repair was similar but 1 day longer when compared with pelvic floor repair only. Mesh was
used for pelvic floor repair alone in 30% of the cases but only 7% for those with concurrent vaginal
hysterectomy. There was no difference in the length of stay whether mesh was used or not. The
pattern was different from that in 2009 & 2004. About 79% of the vulval procedures were
discharged within 7 days, compared to 66% in 2009 and 74% in 2004. Similar to 2009 & 2004, wide
local excision was associated with a much shorter hospital stay than radical and simple vulvectomy.
Vaginal Surgery Total no. of
admissions
Mean
(days)
S.D.
(days)
1-7
days
8-14
days
>14
days
Vaginal hysterectomy with PFR 350 4.2 3.3 323 20 7
Without mesh 325 4.2 3.3 300 19 6
With mesh 25 4.5 3.4 23 1 1
TVT-O / TVT / TOT 259 2.7 2.2 249 9 1
Pelvic floor repair 116 3.3 2.3 109 6 1
Without mesh 81 3.2 1.9 78 3 0
With mesh 35 3.5 3.0 31 3 1
Vaginal hysterectomy 130 4.2 3.4 116 10 4
Vaginal myomectomy 90 2.0 3.5 89 1 0
Vaginal surgery for SI 21 2.7 2.0 20 1 0
Vault prolapse repair 28 5.8 7.1 22 4 2
Vaginectomy 11 3.3 3.3 10 1 0
Vaginal stripping 13 3.8 4.3 11 1 1
Vaginal reconstruction 9 2.6 1.5 9 0 0
Repair of urinary fistula 0 0 0 0 0 0
Miscellaneous vaginal surgery 72 3.1 3.9 65 5 2
Total 962 3.4 3.2 897 51 14
Vulval Surgery
Total no. of
admissions
Mean
(days)
S.D.
(days)
1-7
days
8-14
days
>14
days
Wide local excision 25 6.2 7.2 18 4 3
Simple vulvectomy 5 15.4 9.8 2 3 0
Radical vulvectomy 30 13.0 20.3 19 4 7
Groin node dissection 26 8.1 13.3 18 4 4
Miscellaneous vulval surgery 35 2.2 2.4 33 2 0
Total 112 6.6 1.2 88 10 14
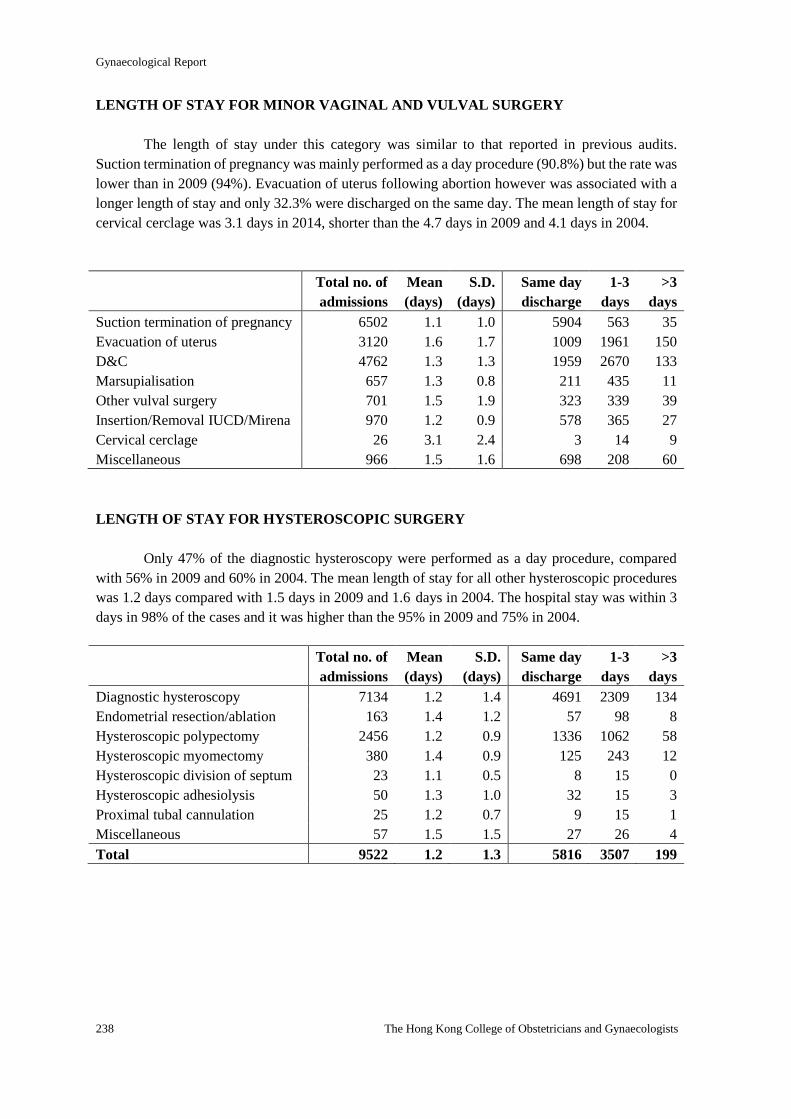
Gynaecological Report
238 The Hong Kong College of Obstetricians and Gynaecologists
LENGTH OF STAY FOR MINOR VAGINAL AND VULVAL SURGERY
The length of stay under this category was similar to that reported in previous audits.
Suction termination of pregnancy was mainly performed as a day procedure (90.8%) but the rate was
lower than in 2009 (94%). Evacuation of uterus following abortion however was associated with a
longer length of stay and only 32.3% were discharged on the same day. The mean length of stay for
cervical cerclage was 3.1 days in 2014, shorter than the 4.7 days in 2009 and 4.1 days in 2004.
Total no. of
admissions
Mean
(days)
S.D.
(days)
Same day
discharge
1-3
days
>3
days
Suction termination of pregnancy 6502 1.1 1.0 5904 563 35
Evacuation of uterus 3120 1.6 1.7 1009 1961 150
D&C 4762 1.3 1.3 1959 2670 133
Marsupialisation 657 1.3 0.8 211 435 11
Other vulval surgery 701 1.5 1.9 323 339 39
Insertion/Removal IUCD/Mirena 970 1.2 0.9 578 365 27
Cervical cerclage 26 3.1 2.4 3 14 9
Miscellaneous 966 1.5 1.6 698 208 60
LENGTH OF STAY FOR HYSTEROSCOPIC SURGERY
Only 47% of the diagnostic hysteroscopy were performed as a day procedure, compared
with 56% in 2009 and 60% in 2004. The mean length of stay for all other hysteroscopic procedures
was 1.2 days compared with 1.5 days in 2009 and 1.6 days in 2004. The hospital stay was within 3
days in 98% of the cases and it was higher than the 95% in 2009 and 75% in 2004.
Total no. of
admissions
Mean
(days)
S.D.
(days)
Same day
discharge
1-3
days
>3
days
Diagnostic hysteroscopy 7134 1.2 1.4 4691 2309 134
Endometrial resection/ablation 163 1.4 1.2 57 98 8
Hysteroscopic polypectomy 2456 1.2 0.9 1336 1062 58
Hysteroscopic myomectomy 380 1.4 0.9 125 243 12
Hysteroscopic division of septum 23 1.1 0.5 8 15 0
Hysteroscopic adhesiolysis 50 1.3 1.0 32 15 3
Proximal tubal cannulation 25 1.2 0.7 9 15 1
Miscellaneous 57 1.5 1.5 27 26 4
Total 9522 1.2 1.3 5816 3507 199
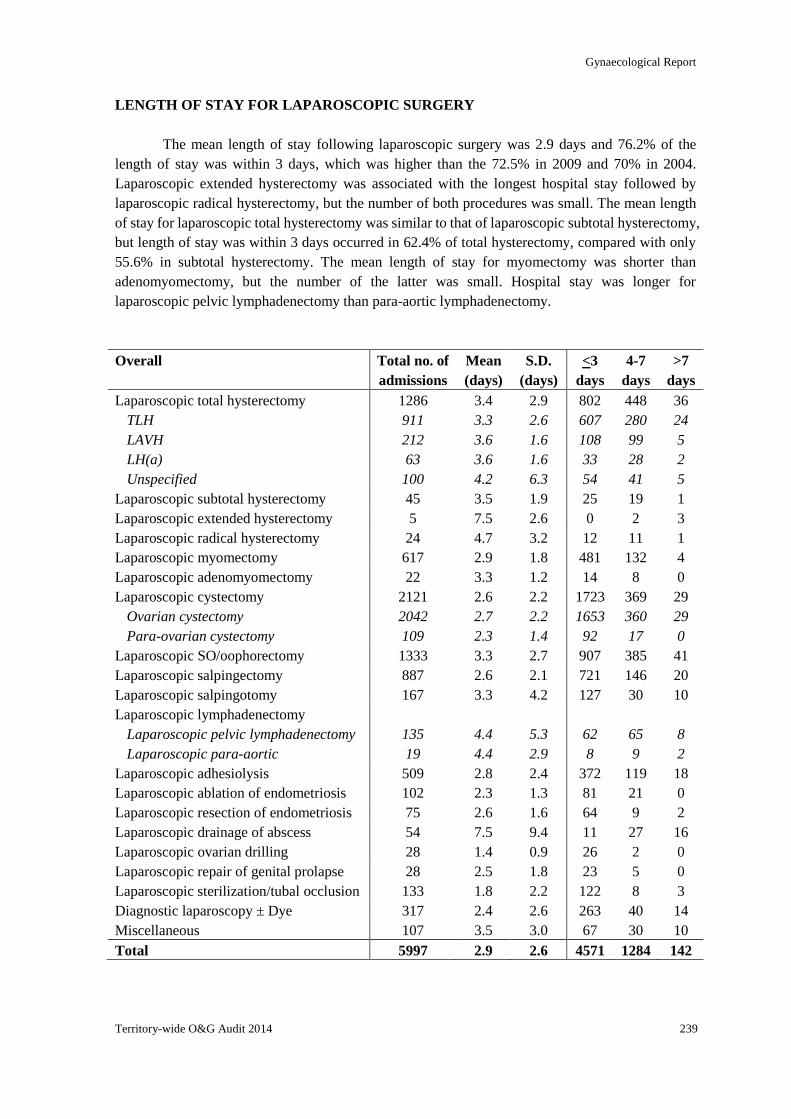
Gynaecological Report
Territory-wide O&G Audit 2014 239
LENGTH OF STAY FOR LAPAROSCOPIC SURGERY
The mean length of stay following laparoscopic surgery was 2.9 days and 76.2% of the
length of stay was within 3 days, which was higher than the 72.5% in 2009 and 70% in 2004.
Laparoscopic extended hysterectomy was associated with the longest hospital stay followed by
laparoscopic radical hysterectomy, but the number of both procedures was small. The mean length
of stay for laparoscopic total hysterectomy was similar to that of laparoscopic subtotal hysterectomy,
but length of stay was within 3 days occurred in 62.4% of total hysterectomy, compared with only
55.6% in subtotal hysterectomy. The mean length of stay for myomectomy was shorter than
adenomyomectomy, but the number of the latter was small. Hospital stay was longer for
laparoscopic pelvic lymphadenectomy than para-aortic lymphadenectomy.
Overall Total no. of
admissions
Mean
(days)
S.D.
(days)
<3
days
4-7
days
>7
days
Laparoscopic total hysterectomy
TLH
LAVH
LH(a)
Unspecified
1286
911
212
63
100
3.4
3.3
3.6
3.6
4.2
2.9
2.6
1.6
1.6
6.3
802
607
108
33
54
448
280
99
28
41
36
24
5
2
5
Laparoscopic subtotal hysterectomy 45 3.5 1.9 25 19 1
Laparoscopic extended hysterectomy 5 7.5 2.6 0 2 3
Laparoscopic radical hysterectomy 24 4.7 3.2 12 11 1
Laparoscopic myomectomy 617 2.9 1.8 481 132 4
Laparoscopic adenomyomectomy 22 3.3 1.2 14 8 0
Laparoscopic cystectomy
Ovarian cystectomy
Para-ovarian cystectomy
2121
2042
109
2.6
2.7
2.3
2.2
2.2
1.4
1723
1653
92
369
360
17
29
29
0
Laparoscopic SO/oophorectomy 1333 3.3 2.7 907 385 41
Laparoscopic salpingectomy 887 2.6 2.1 721 146 20
Laparoscopic salpingotomy 167 3.3 4.2 127 30 10
Laparoscopic lymphadenectomy
Laparoscopic pelvic lymphadenectomy
Laparoscopic para-aortic
135
19
4.4
4.4
5.3
2.9
62
8
65
9
8
2
Laparoscopic adhesiolysis 509 2.8 2.4 372 119 18
Laparoscopic ablation of endometriosis 102 2.3 1.3 81 21 0
Laparoscopic resection of endometriosis 75 2.6 1.6 64 9 2
Laparoscopic drainage of abscess 54 7.5 9.4 11 27 16
Laparoscopic ovarian drilling 28 1.4 0.9 26 2 0
Laparoscopic repair of genital prolapse 28 2.5 1.8 23 5 0
Laparoscopic sterilization/tubal occlusion 133 1.8 2.2 122 8 3
Diagnostic laparoscopy ± Dye 317 2.4 2.6 263 40 14
Miscellaneous 107 3.5 3.0 67 30 10
Total 5997 2.9 2.6 4571 1284 142
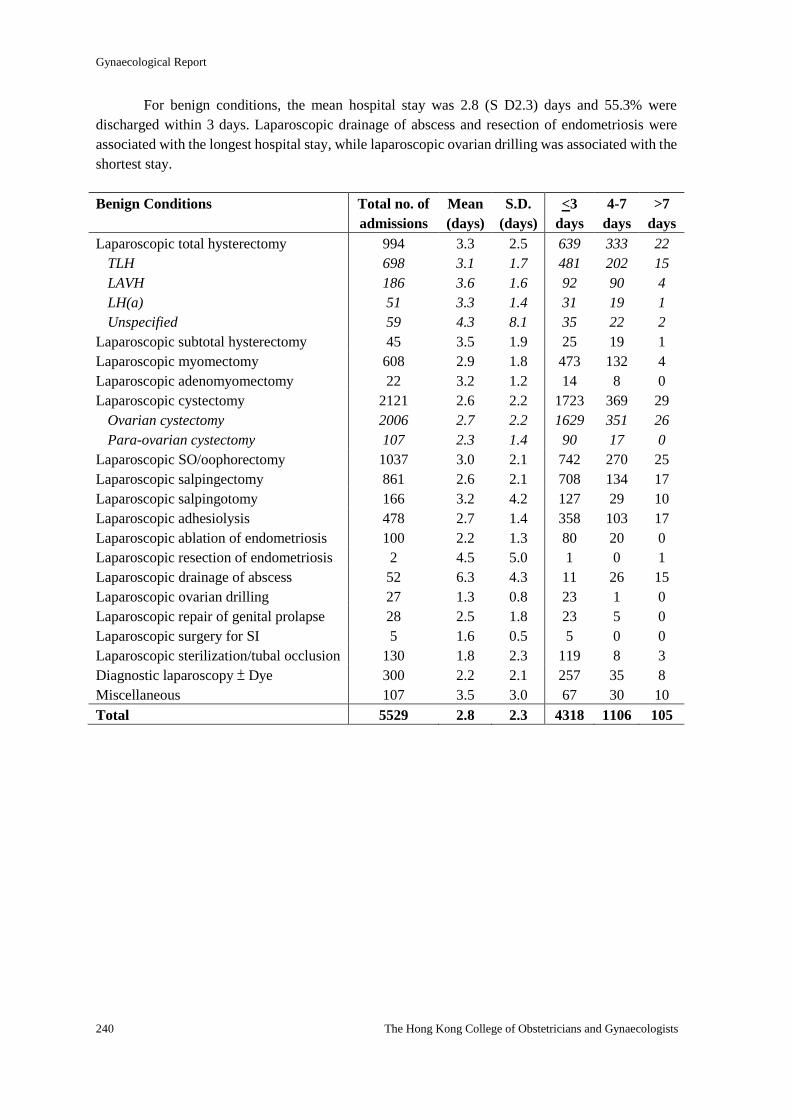
Gynaecological Report
240 The Hong Kong College of Obstetricians and Gynaecologists
For benign conditions, the mean hospital stay was 2.8 (S D2.3) days and 55.3% were
discharged within 3 days. Laparoscopic drainage of abscess and resection of endometriosis were
associated with the longest hospital stay, while laparoscopic ovarian drilling was associated with the
shortest stay.
Benign Conditions Total no. of
admissions
Mean
(days)
S.D.
(days)
<3
days
4-7
days
>7
days
Laparoscopic total hysterectomy
TLH
LAVH
LH(a)
Unspecified
994
698
186
51
59
3.3
3.1
3.6
3.3
4.3
2.5
1.7
1.6
1.4
8.1
639
481
92
31
35
333
202
90
19
22
22
15
4
1
2
Laparoscopic subtotal hysterectomy 45 3.5 1.9 25 19 1
Laparoscopic myomectomy 608 2.9 1.8 473 132 4
Laparoscopic adenomyomectomy 22 3.2 1.2 14 8 0
Laparoscopic cystectomy
Ovarian cystectomy
Para-ovarian cystectomy
2121
2006
107
2.6
2.7
2.3
2.2
2.2
1.4
1723
1629
90
369
351
17
29
26
0
Laparoscopic SO/oophorectomy 1037 3.0 2.1 742 270 25
Laparoscopic salpingectomy 861 2.6 2.1 708 134 17
Laparoscopic salpingotomy 166 3.2 4.2 127 29 10
Laparoscopic adhesiolysis 478 2.7 1.4 358 103 17
Laparoscopic ablation of endometriosis 100 2.2 1.3 80 20 0
Laparoscopic resection of endometriosis 2 4.5 5.0 1 0 1
Laparoscopic drainage of abscess 52 6.3 4.3 11 26 15
Laparoscopic ovarian drilling 27 1.3 0.8 23 1 0
Laparoscopic repair of genital prolapse 28 2.5 1.8 23 5 0
Laparoscopic surgery for SI 5 1.6 0.5 5 0 0
Laparoscopic sterilization/tubal occlusion 130 1.8 2.3 119 8 3
Diagnostic laparoscopy ± Dye 300 2.2 2.1 257 35 8
Miscellaneous 107 3.5 3.0 67 30 10
Total 5529 2.8 2.3 4318 1106 105
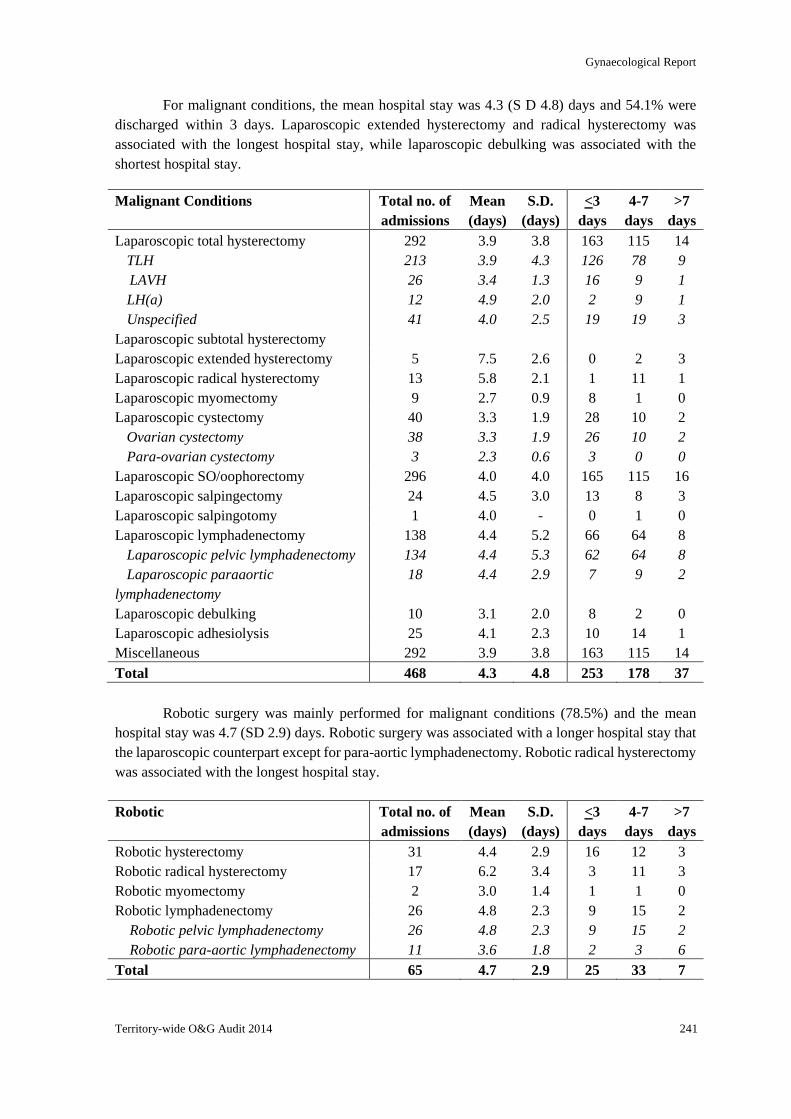
Gynaecological Report
Territory-wide O&G Audit 2014 241
For malignant conditions, the mean hospital stay was 4.3 (S D 4.8) days and 54.1% were
discharged within 3 days. Laparoscopic extended hysterectomy and radical hysterectomy was
associated with the longest hospital stay, while laparoscopic debulking was associated with the
shortest hospital stay.
Malignant Conditions Total no. of
admissions
Mean
(days)
S.D.
(days)
<3
days
4-7
days
>7
days
Laparoscopic total hysterectomy
TLH
LAVH
LH(a)
Unspecified
292
213
26
12
41
3.9
3.9
3.4
4.9
4.0
3.8
4.3
1.3
2.0
2.5
163
126
16
2
19
115
78
9
9
19
14
9
1
1
3
Laparoscopic subtotal hysterectomy
Laparoscopic extended hysterectomy 5 7.5 2.6 0 2 3
Laparoscopic radical hysterectomy 13 5.8 2.1 1 11 1
Laparoscopic myomectomy 9 2.7 0.9 8 1 0
Laparoscopic cystectomy
Ovarian cystectomy
Para-ovarian cystectomy
40
38
3
3.3
3.3
2.3
1.9
1.9
0.6
28
26
3
10
10
0
2
2
0
Laparoscopic SO/oophorectomy 296 4.0 4.0 165 115 16
Laparoscopic salpingectomy 24 4.5 3.0 13 8 3
Laparoscopic salpingotomy 1 4.0 - 0 1 0
Laparoscopic lymphadenectomy
Laparoscopic pelvic lymphadenectomy
Laparoscopic paraaortic
lymphadenectomy
138
134
18
4.4
4.4
4.4
5.2
5.3
2.9
66
62
7
64
64
9
8
8
2
Laparoscopic debulking 10 3.1 2.0 8 2 0
Laparoscopic adhesiolysis 25 4.1 2.3 10 14 1
Miscellaneous 292 3.9 3.8 163 115 14
Total 468 4.3 4.8 253 178 37
Robotic surgery was mainly performed for malignant conditions (78.5%) and the mean
hospital stay was 4.7 (SD 2.9) days. Robotic surgery was associated with a longer hospital stay that
the laparoscopic counterpart except for para-aortic lymphadenectomy. Robotic radical hysterectomy
was associated with the longest hospital stay.
Robotic Total no. of
admissions
Mean
(days)
S.D.
(days)
<3
days
4-7
days
>7
days
Robotic hysterectomy 31 4.4 2.9 16 12 3
Robotic radical hysterectomy 17 6.2 3.4 3 11 3
Robotic myomectomy 2 3.0 1.4 1 1 0
Robotic lymphadenectomy 26 4.8 2.3 9 15 2
Robotic pelvic lymphadenectomy 26 4.8 2.3 9 15 2
Robotic para-aortic lymphadenectomy 11 3.6 1.8 2 3 6
Total 65 4.7 2.9 25 33 7
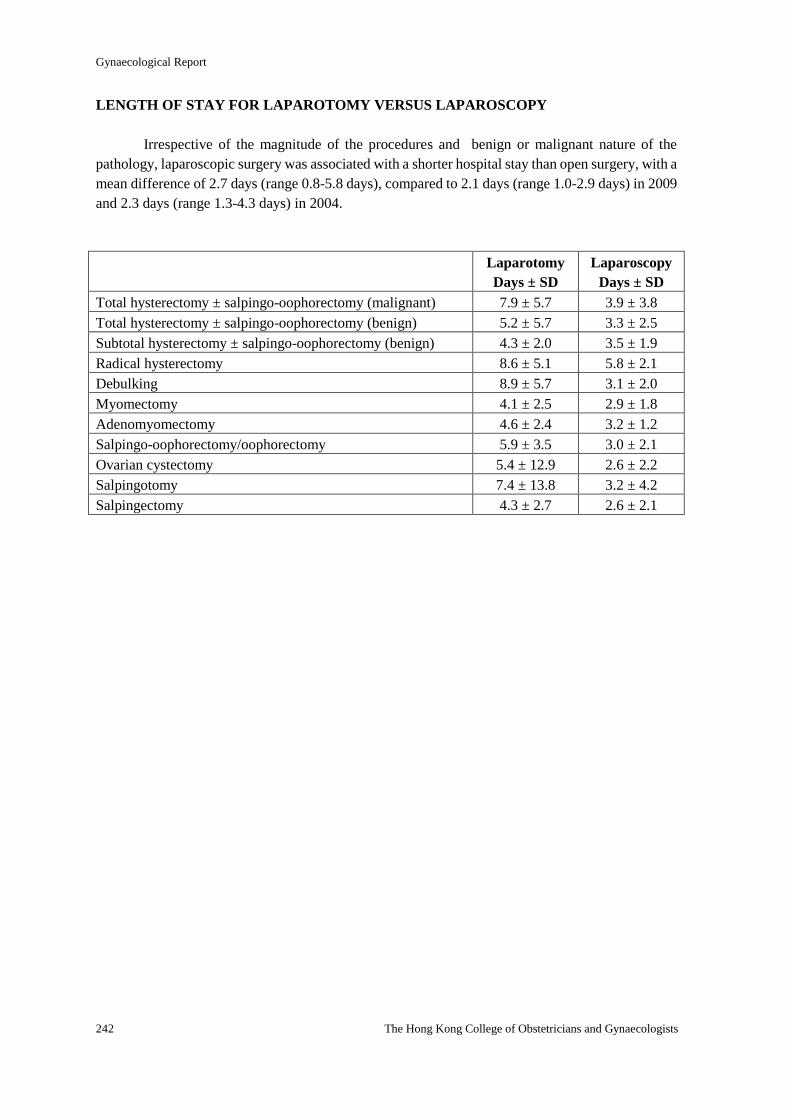
Gynaecological Report
242 The Hong Kong College of Obstetricians and Gynaecologists
LENGTH OF STAY FOR LAPAROTOMY VERSUS LAPAROSCOPY
Irrespective of the magnitude of the procedures and benign or malignant nature of the
pathology, laparoscopic surgery was associated with a shorter hospital stay than open surgery, with a
mean difference of 2.7 days (range 0.8-5.8 days), compared to 2.1 days (range 1.0-2.9 days) in 2009
and 2.3 days (range 1.3-4.3 days) in 2004.
Laparotomy
Days ± SD
Laparoscopy
Days ± SD
Total hysterectomy ± salpingo-oophorectomy (malignant) 7.9 ± 5.7 3.9 ± 3.8
Total hysterectomy ± salpingo-oophorectomy (benign) 5.2 ± 5.7 3.3 ± 2.5
Subtotal hysterectomy ± salpingo-oophorectomy (benign) 4.3 ± 2.0 3.5 ± 1.9
Radical hysterectomy 8.6 ± 5.1 5.8 ± 2.1
Debulking 8.9 ± 5.7 3.1 ± 2.0
Myomectomy 4.1 ± 2.5 2.9 ± 1.8
Adenomyomectomy 4.6 ± 2.4 3.2 ± 1.2
Salpingo-oophorectomy/oophorectomy 5.9 ± 3.5 3.0 ± 2.1
Ovarian cystectomy 5.4 ± 12.9 2.6 ± 2.2
Salpingotomy 7.4 ± 13.8 3.2 ± 4.2
Salpingectomy 4.3 ± 2.7 2.6 ± 2.1
The Special Audit Report
On
Intra-abdominal Gynaecological
Operations
2014

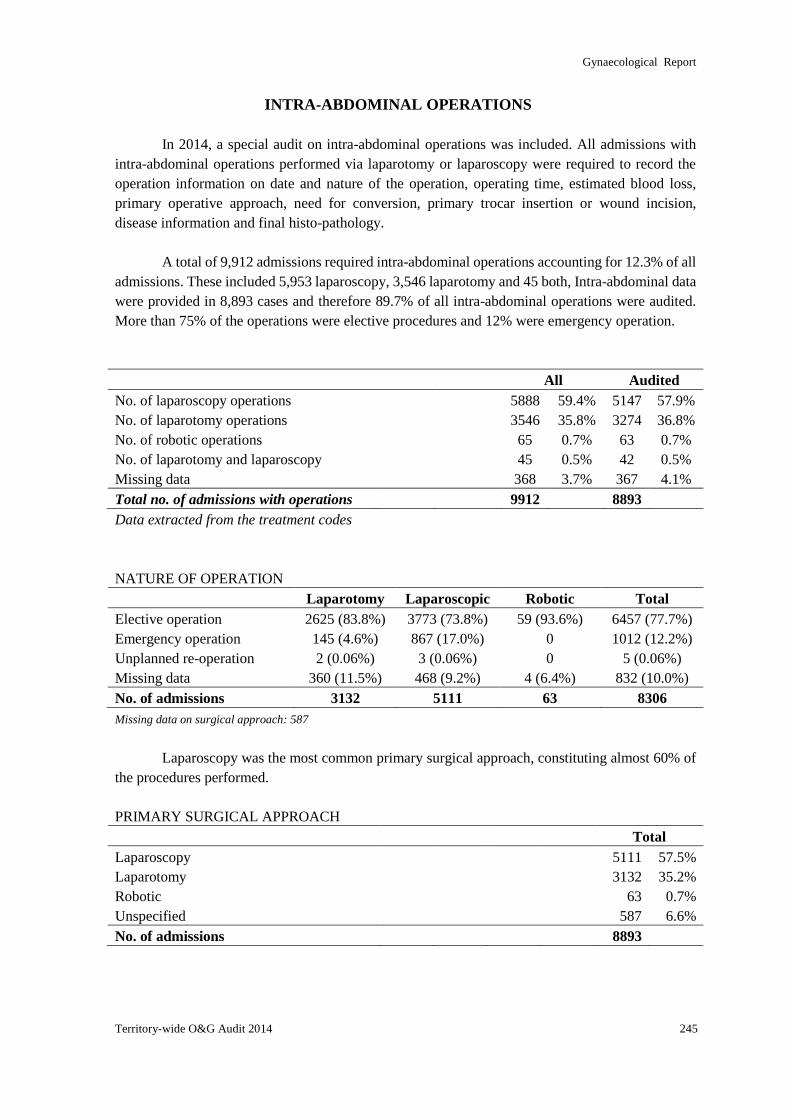
Gynaecological Report
Territory-wide O&G Audit 2014 245
INTRA-ABDOMINAL OPERATIONS
In 2014, a special audit on intra-abdominal operations was included. All admissions with
intra-abdominal operations performed via laparotomy or laparoscopy were required to record the
operation information on date and nature of the operation, operating time, estimated blood loss,
primary operative approach, need for conversion, primary trocar insertion or wound incision,
disease information and final histo-pathology.
A total of 9,912 admissions required intra-abdominal operations accounting for 12.3% of all
admissions. These included 5,953 laparoscopy, 3,546 laparotomy and 45 both, Intra-abdominal data
were provided in 8,893 cases and therefore 89.7% of all intra-abdominal operations were audited.
More than 75% of the operations were elective procedures and 12% were emergency operation.
All Audited
No. of laparoscopy operations 5888 59.4% 5147 57.9%
No. of laparotomy operations 3546 35.8% 3274 36.8%
No. of robotic operations 65 0.7% 63 0.7%
No. of laparotomy and laparoscopy 45 0.5% 42 0.5%
Missing data 368 3.7% 367 4.1%
Total no. of admissions with operations 9912 8893
Data extracted from the treatment codes
NATURE OF OPERATION
Laparotomy Laparoscopic Robotic Total
Elective operation 2625 (83.8%) 3773 (73.8%) 59 (93.6%) 6457 (77.7%)
Emergency operation 145 (4.6%) 867 (17.0%) 0 1012 (12.2%)
Unplanned re-operation 2 (0.06%) 3 (0.06%) 0 5 (0.06%)
Missing data 360 (11.5%) 468 (9.2%) 4 (6.4%) 832 (10.0%)
No. of admissions 3132 5111 63 8306
Missing data on surgical approach: 587
Laparoscopy was the most common primary surgical approach, constituting almost 60% of
the procedures performed.
PRIMARY SURGICAL APPROACH
Total
Laparoscopy 5111 57.5%
Laparotomy 3132 35.2%
Robotic 63 0.7%
Unspecified 587 6.6%
No. of admissions 8893
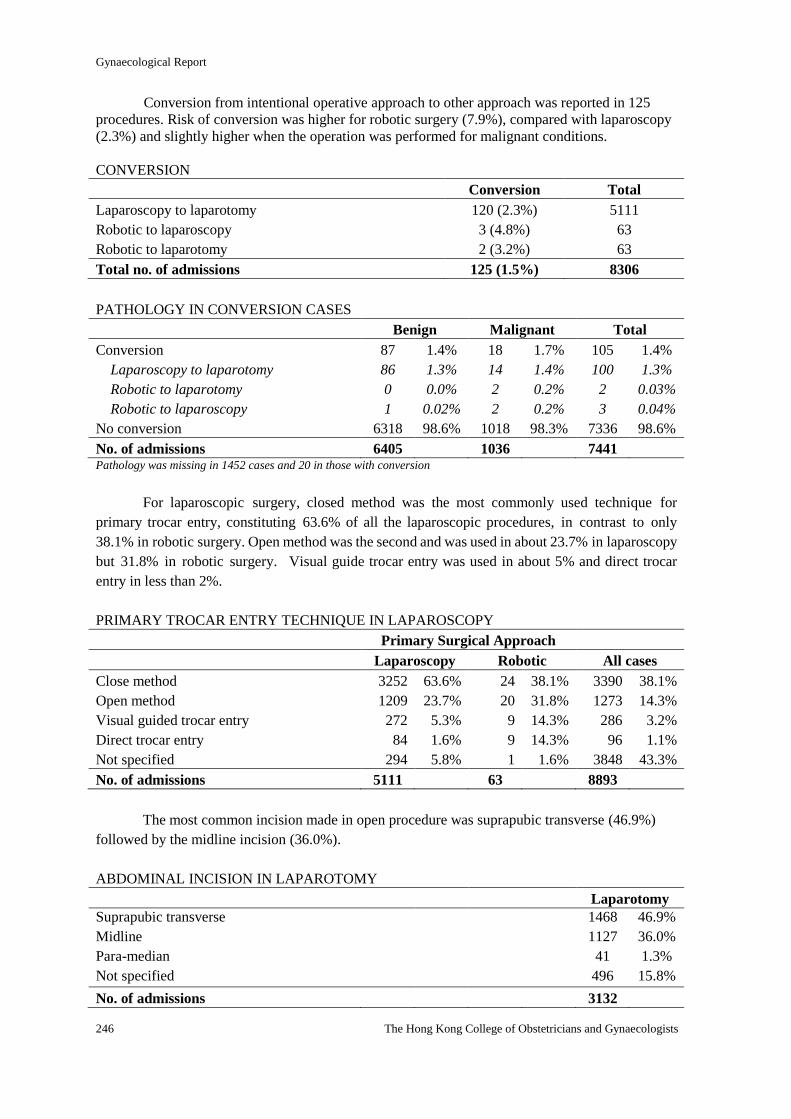
Gynaecological Report
246 The Hong Kong College of Obstetricians and Gynaecologists
Conversion from intentional operative approach to other approach was reported in 125
procedures. Risk of conversion was higher for robotic surgery (7.9%), compared with laparoscopy
(2.3%) and slightly higher when the operation was performed for malignant conditions.
CONVERSION
Conversion Total
Laparoscopy to laparotomy 120 (2.3%) 5111
Robotic to laparoscopy 3 (4.8%) 63
Robotic to laparotomy 2 (3.2%) 63
Total no. of admissions 125 (1.5%) 8306
PATHOLOGY IN CONVERSION CASES
Benign Malignant Total
Conversion 87 1.4% 18 1.7% 105 1.4%
Laparoscopy to laparotomy 86 1.3% 14 1.4% 100 1.3%
Robotic to laparotomy 0 0.0% 2 0.2% 2 0.03%
Robotic to laparoscopy 1 0.02% 2 0.2% 3 0.04%
No conversion 6318 98.6% 1018 98.3% 7336 98.6%
No. of admissions 6405 1036 7441 Pathology was missing in 1452 cases and 20 in those with conversion
For laparoscopic surgery, closed method was the most commonly used technique for
primary trocar entry, constituting 63.6% of all the laparoscopic procedures, in contrast to only
38.1% in robotic surgery. Open method was the second and was used in about 23.7% in laparoscopy
but 31.8% in robotic surgery. Visual guide trocar entry was used in about 5% and direct trocar
entry in less than 2%.
PRIMARY TROCAR ENTRY TECHNIQUE IN LAPAROSCOPY
Primary Surgical Approach
Laparoscopy Robotic All cases
Close method 3252 63.6% 24 38.1% 3390 38.1%
Open method 1209 23.7% 20 31.8% 1273 14.3%
Visual guided trocar entry 272 5.3% 9 14.3% 286 3.2%
Direct trocar entry 84 1.6% 9 14.3% 96 1.1%
Not specified 294 5.8% 1 1.6% 3848 43.3%
No. of admissions 5111 63 8893
The most common incision made in open procedure was suprapubic transverse (46.9%)
followed by the midline incision (36.0%).
ABDOMINAL INCISION IN LAPAROTOMY
Laparotomy
Suprapubic transverse 1468 46.9%
Midline 1127 36.0%
Para-median 41 1.3%
Not specified 496 15.8%
No. of admissions 3132
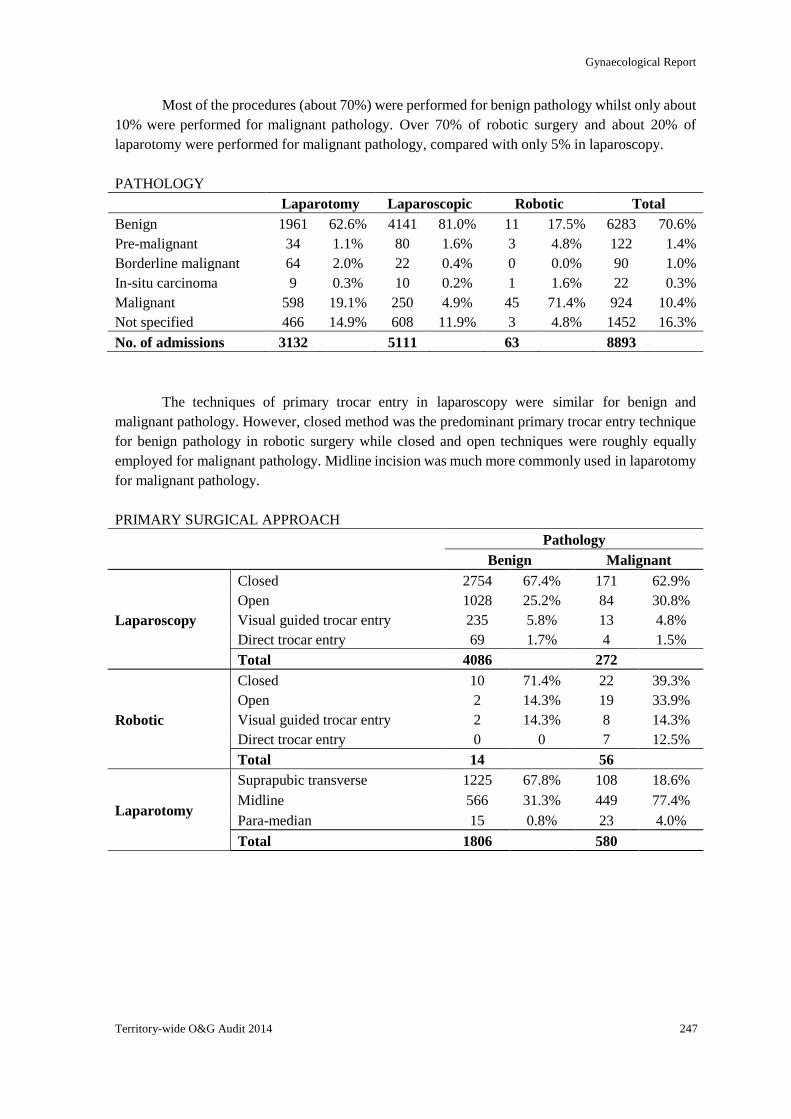
Gynaecological Report
Territory-wide O&G Audit 2014 247
Most of the procedures (about 70%) were performed for benign pathology whilst only about
10% were performed for malignant pathology. Over 70% of robotic surgery and about 20% of
laparotomy were performed for malignant pathology, compared with only 5% in laparoscopy.
PATHOLOGY
Laparotomy Laparoscopic Robotic Total
Benign 1961 62.6% 4141 81.0% 11 17.5% 6283 70.6%
Pre-malignant 34 1.1% 80 1.6% 3 4.8% 122 1.4%
Borderline malignant 64 2.0% 22 0.4% 0 0.0% 90 1.0%
In-situ carcinoma 9 0.3% 10 0.2% 1 1.6% 22 0.3%
Malignant 598 19.1% 250 4.9% 45 71.4% 924 10.4%
Not specified 466 14.9% 608 11.9% 3 4.8% 1452 16.3%
No. of admissions 3132 5111 63 8893
The techniques of primary trocar entry in laparoscopy were similar for benign and
malignant pathology. However, closed method was the predominant primary trocar entry technique
for benign pathology in robotic surgery while closed and open techniques were roughly equally
employed for malignant pathology. Midline incision was much more commonly used in laparotomy
for malignant pathology.
PRIMARY SURGICAL APPROACH
Pathology
Benign Malignant
Laparoscopy
Closed 2754 67.4% 171 62.9%
Open 1028 25.2% 84 30.8%
Visual guided trocar entry 235 5.8% 13 4.8%
Direct trocar entry 69 1.7% 4 1.5%
Total 4086 272
Robotic
Closed 10 71.4% 22 39.3%
Open 2 14.3% 19 33.9%
Visual guided trocar entry 2 14.3% 8 14.3%
Direct trocar entry 0 0 7 12.5%
Total 14 56
Laparotomy
Suprapubic transverse 1225 67.8% 108 18.6%
Midline 566 31.3% 449 77.4%
Para-median 15 0.8% 23 4.0%
Total 1806 580
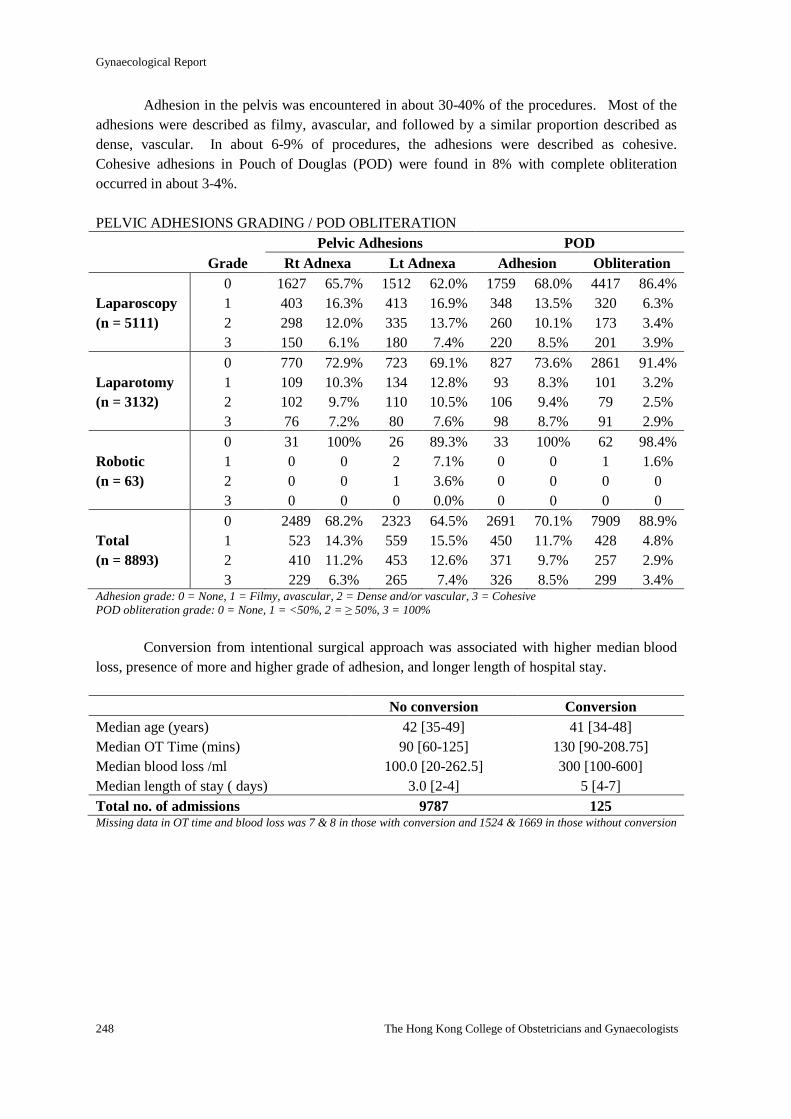
Gynaecological Report
248 The Hong Kong College of Obstetricians and Gynaecologists
Adhesion in the pelvis was encountered in about 30-40% of the procedures. Most of the
adhesions were described as filmy, avascular, and followed by a similar proportion described as
dense, vascular. In about 6-9% of procedures, the adhesions were described as cohesive.
Cohesive adhesions in Pouch of Douglas (POD) were found in 8% with complete obliteration
occurred in about 3-4%.
PELVIC ADHESIONS GRADING / POD OBLITERATION
Pelvic Adhesions POD
Grade Rt Adnexa Lt Adnexa Adhesion Obliteration
0 1627 65.7% 1512 62.0% 1759 68.0% 4417 86.4%
Laparoscopy 1 403 16.3% 413 16.9% 348 13.5% 320 6.3%
(n = 5111) 2 298 12.0% 335 13.7% 260 10.1% 173 3.4%
3 150 6.1% 180 7.4% 220 8.5% 201 3.9%
0 770 72.9% 723 69.1% 827 73.6% 2861 91.4%
Laparotomy 1 109 10.3% 134 12.8% 93 8.3% 101 3.2%
(n = 3132) 2 102 9.7% 110 10.5% 106 9.4% 79 2.5%
3 76 7.2% 80 7.6% 98 8.7% 91 2.9%
0 31 100% 26 89.3% 33 100% 62 98.4%
Robotic 1 0 0 2 7.1% 0 0 1 1.6%
(n = 63) 2 0 0 1 3.6% 0 0 0 0
3 0 0 0 0.0% 0 0 0 0
0 2489 68.2% 2323 64.5% 2691 70.1% 7909 88.9%
Total 1 523 14.3% 559 15.5% 450 11.7% 428 4.8%
(n = 8893) 2 410 11.2% 453 12.6% 371 9.7% 257 2.9%
3 229 6.3% 265 7.4% 326 8.5% 299 3.4% Adhesion grade: 0 = None, 1 = Filmy, avascular, 2 = Dense and/or vascular, 3 = Cohesive
POD obliteration grade: 0 = None, 1 = <50%, 2 = ≥ 50%, 3 = 100%
Conversion from intentional surgical approach was associated with higher median blood
loss, presence of more and higher grade of adhesion, and longer length of hospital stay.
No conversion Conversion
Median age (years) 42 [35-49] 41 [34-48]
Median OT Time (mins) 90 [60-125] 130 [90-208.75]
Median blood loss /ml 100.0 [20-262.5] 300 [100-600]
Median length of stay ( days) 3.0 [2-4] 5 [4-7]
Total no. of admissions 9787 125 Missing data in OT time and blood loss was 7 & 8 in those with conversion and 1524 & 1669 in those without conversion
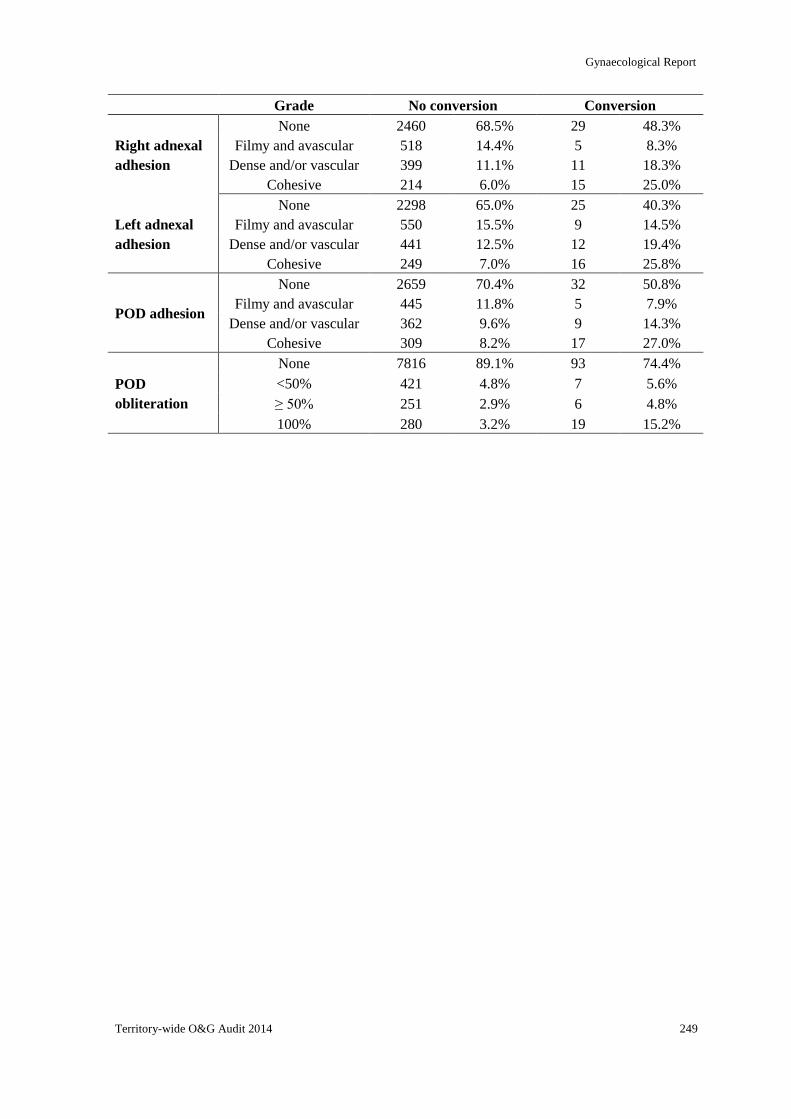
Gynaecological Report
Territory-wide O&G Audit 2014 249
Grade No conversion Conversion
Right adnexal
adhesion
None 2460 68.5% 29 48.3%
Filmy and avascular 518 14.4% 5 8.3%
Dense and/or vascular 399 11.1% 11 18.3%
Cohesive 214 6.0% 15 25.0%
Left adnexal
adhesion
None 2298 65.0% 25 40.3%
Filmy and avascular 550 15.5% 9 14.5%
Dense and/or vascular 441 12.5% 12 19.4%
Cohesive 249 7.0% 16 25.8%
POD adhesion
None 2659 70.4% 32 50.8%
Filmy and avascular 445 11.8% 5 7.9%
Dense and/or vascular 362 9.6% 9 14.3%
Cohesive 309 8.2% 17 27.0%
POD
obliteration
None 7816 89.1% 93 74.4%
<50% 421 4.8% 7 5.6%
≥ 50% 251 2.9% 6 4.8%
100% 280 3.2% 19 15.2%
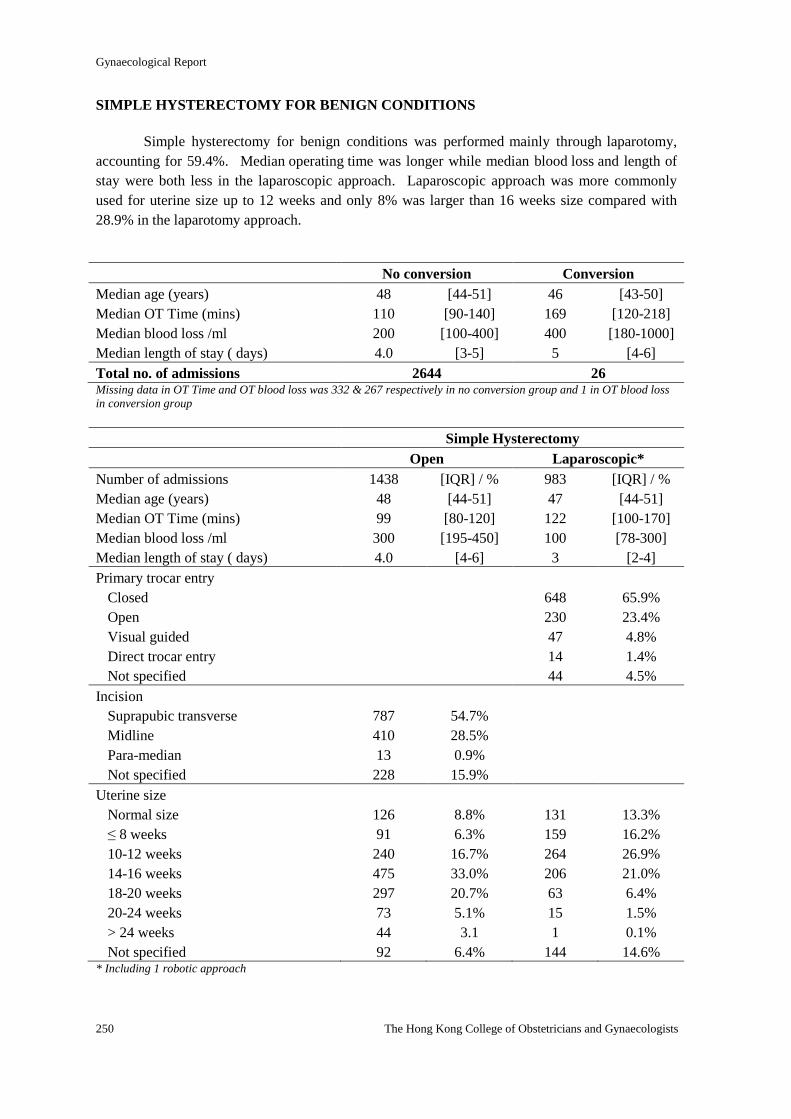
Gynaecological Report
250 The Hong Kong College of Obstetricians and Gynaecologists
SIMPLE HYSTERECTOMY FOR BENIGN CONDITIONS
Simple hysterectomy for benign conditions was performed mainly through laparotomy,
accounting for 59.4%. Median operating time was longer while median blood loss and length of
stay were both less in the laparoscopic approach. Laparoscopic approach was more commonly
used for uterine size up to 12 weeks and only 8% was larger than 16 weeks size compared with
28.9% in the laparotomy approach.
No conversion Conversion
Median age (years) 48 [44-51] 46 [43-50]
Median OT Time (mins) 110 [90-140] 169 [120-218]
Median blood loss /ml 200 [100-400] 400 [180-1000]
Median length of stay ( days) 4.0 [3-5] 5 [4-6]
Total no. of admissions 2644 26 Missing data in OT Time and OT blood loss was 332 & 267 respectively in no conversion group and 1 in OT blood loss
in conversion group
Simple Hysterectomy
Open Laparoscopic*
Number of admissions 1438 [IQR] / % 983 [IQR] / %
Median age (years) 48 [44-51] 47 [44-51]
Median OT Time (mins) 99 [80-120] 122 [100-170]
Median blood loss /ml 300 [195-450] 100 [78-300]
Median length of stay ( days) 4.0 [4-6] 3 [2-4]
Primary trocar entry
Closed 648 65.9%
Open 230 23.4%
Visual guided 47 4.8%
Direct trocar entry 14 1.4%
Not specified 44 4.5%
Incision
Suprapubic transverse 787 54.7%
Midline 410 28.5%
Para-median 13 0.9%
Not specified 228 15.9%
Uterine size
Normal size 126 8.8% 131 13.3%
≤ 8 weeks 91 6.3% 159 16.2%
10-12 weeks 240 16.7% 264 26.9%
14-16 weeks 475 33.0% 206 21.0%
18-20 weeks 297 20.7% 63 6.4%
20-24 weeks 73 5.1% 15 1.5%
> 24 weeks 44 3.1 1 0.1%
Not specified 92 6.4% 144 14.6% * Including 1 robotic approach
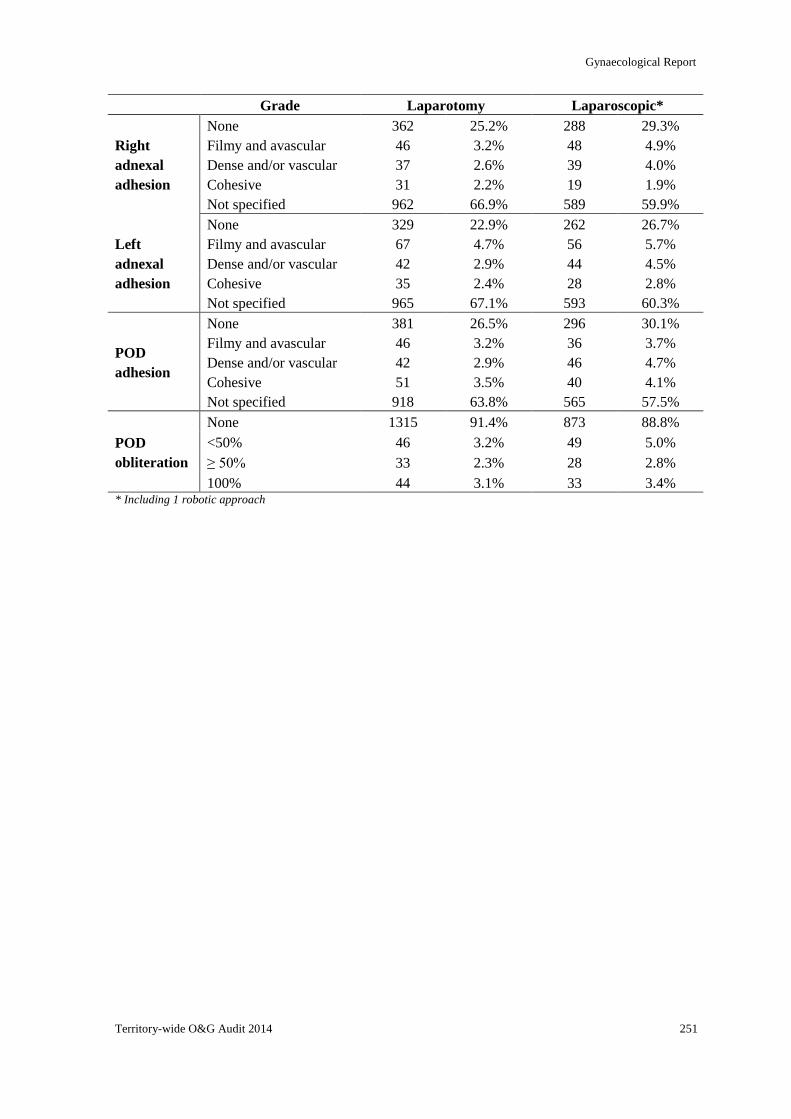
Gynaecological Report
Territory-wide O&G Audit 2014 251
Grade Laparotomy Laparoscopic*
Right
adnexal
adhesion
None 362 25.2% 288 29.3%
Filmy and avascular 46 3.2% 48 4.9%
Dense and/or vascular 37 2.6% 39 4.0%
Cohesive 31 2.2% 19 1.9%
Not specified 962 66.9% 589 59.9%
Left
adnexal
adhesion
None 329 22.9% 262 26.7%
Filmy and avascular 67 4.7% 56 5.7%
Dense and/or vascular 42 2.9% 44 4.5%
Cohesive 35 2.4% 28 2.8%
Not specified 965 67.1% 593 60.3%
POD
adhesion
None 381 26.5% 296 30.1%
Filmy and avascular 46 3.2% 36 3.7%
Dense and/or vascular 42 2.9% 46 4.7%
Cohesive 51 3.5% 40 4.1%
Not specified 918 63.8% 565 57.5%
POD
obliteration
None 1315 91.4% 873 88.8%
<50% 46 3.2% 49 5.0%
≥ 50% 33 2.3% 28 2.8%
100% 44 3.1% 33 3.4% * Including 1 robotic approach
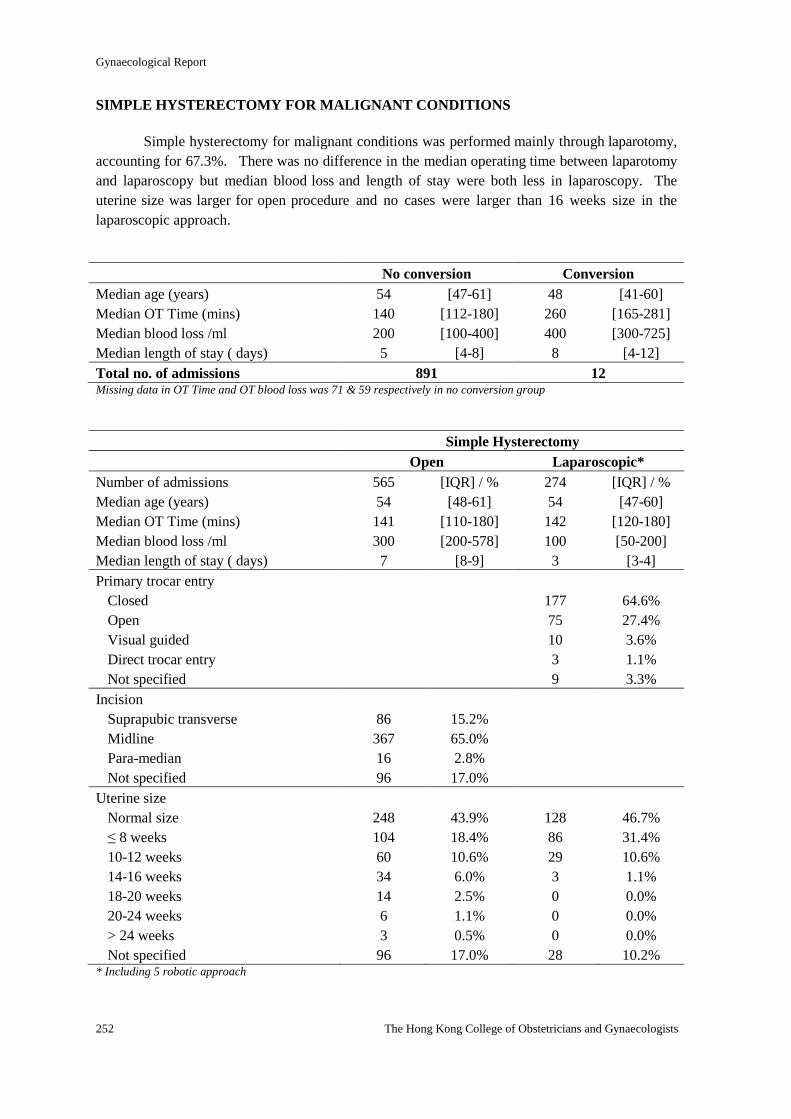
Gynaecological Report
252 The Hong Kong College of Obstetricians and Gynaecologists
SIMPLE HYSTERECTOMY FOR MALIGNANT CONDITIONS
Simple hysterectomy for malignant conditions was performed mainly through laparotomy,
accounting for 67.3%. There was no difference in the median operating time between laparotomy
and laparoscopy but median blood loss and length of stay were both less in laparoscopy. The
uterine size was larger for open procedure and no cases were larger than 16 weeks size in the
laparoscopic approach.
No conversion Conversion
Median age (years) 54 [47-61] 48 [41-60]
Median OT Time (mins) 140 [112-180] 260 [165-281]
Median blood loss /ml 200 [100-400] 400 [300-725]
Median length of stay ( days) 5 [4-8] 8 [4-12]
Total no. of admissions 891 12 Missing data in OT Time and OT blood loss was 71 & 59 respectively in no conversion group
Simple Hysterectomy
Open Laparoscopic*
Number of admissions 565 [IQR] / % 274 [IQR] / %
Median age (years) 54 [48-61] 54 [47-60]
Median OT Time (mins) 141 [110-180] 142 [120-180]
Median blood loss /ml 300 [200-578] 100 [50-200]
Median length of stay ( days) 7 [8-9] 3 [3-4]
Primary trocar entry
Closed 177 64.6%
Open 75 27.4%
Visual guided 10 3.6%
Direct trocar entry 3 1.1%
Not specified 9 3.3%
Incision
Suprapubic transverse 86 15.2%
Midline 367 65.0%
Para-median 16 2.8%
Not specified 96 17.0%
Uterine size
Normal size 248 43.9% 128 46.7%
≤ 8 weeks 104 18.4% 86 31.4%
10-12 weeks 60 10.6% 29 10.6%
14-16 weeks 34 6.0% 3 1.1%
18-20 weeks 14 2.5% 0 0.0%
20-24 weeks 6 1.1% 0 0.0%
> 24 weeks 3 0.5% 0 0.0%
Not specified 96 17.0% 28 10.2% * Including 5 robotic approach
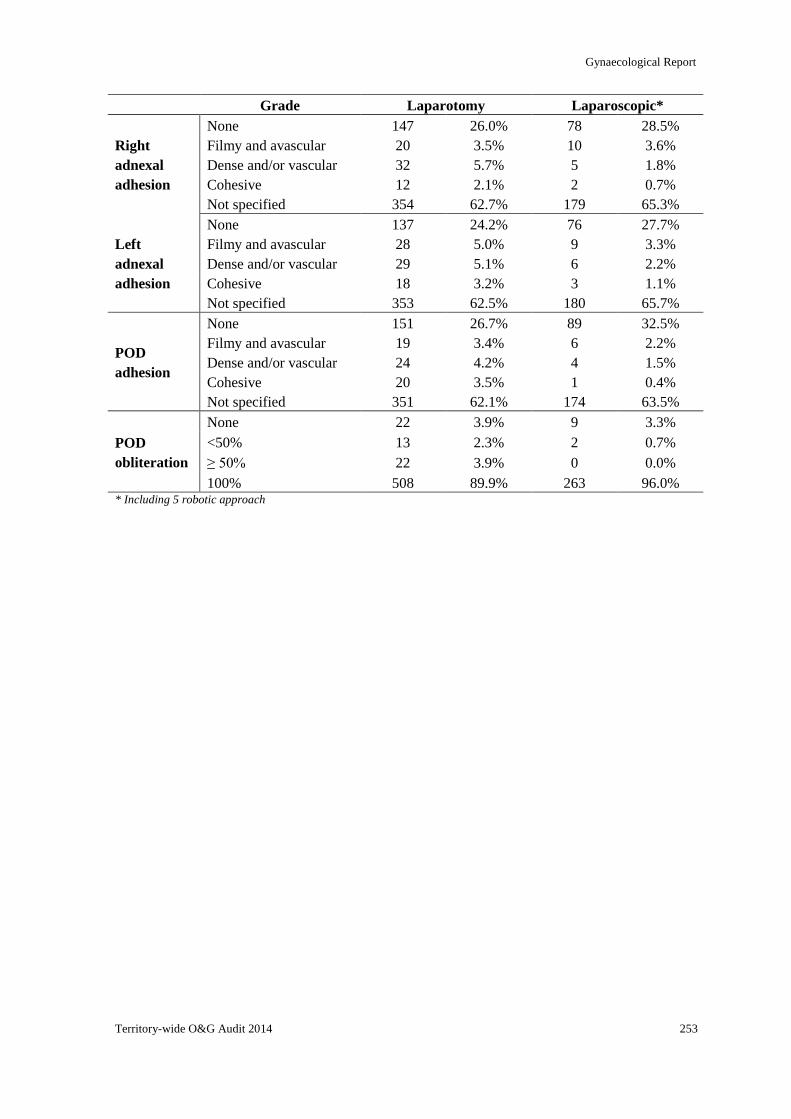
Gynaecological Report
Territory-wide O&G Audit 2014 253
Grade Laparotomy Laparoscopic*
Right
adnexal
adhesion
None 147 26.0% 78 28.5%
Filmy and avascular 20 3.5% 10 3.6%
Dense and/or vascular 32 5.7% 5 1.8%
Cohesive 12 2.1% 2 0.7%
Not specified 354 62.7% 179 65.3%
Left
adnexal
adhesion
None 137 24.2% 76 27.7%
Filmy and avascular 28 5.0% 9 3.3%
Dense and/or vascular 29 5.1% 6 2.2%
Cohesive 18 3.2% 3 1.1%
Not specified 353 62.5% 180 65.7%
POD
adhesion
None 151 26.7% 89 32.5%
Filmy and avascular 19 3.4% 6 2.2%
Dense and/or vascular 24 4.2% 4 1.5%
Cohesive 20 3.5% 1 0.4%
Not specified 351 62.1% 174 63.5%
POD
obliteration
None 22 3.9% 9 3.3%
<50% 13 2.3% 2 0.7%
≥ 50% 22 3.9% 0 0.0%
100% 508 89.9% 263 96.0% * Including 5 robotic approach
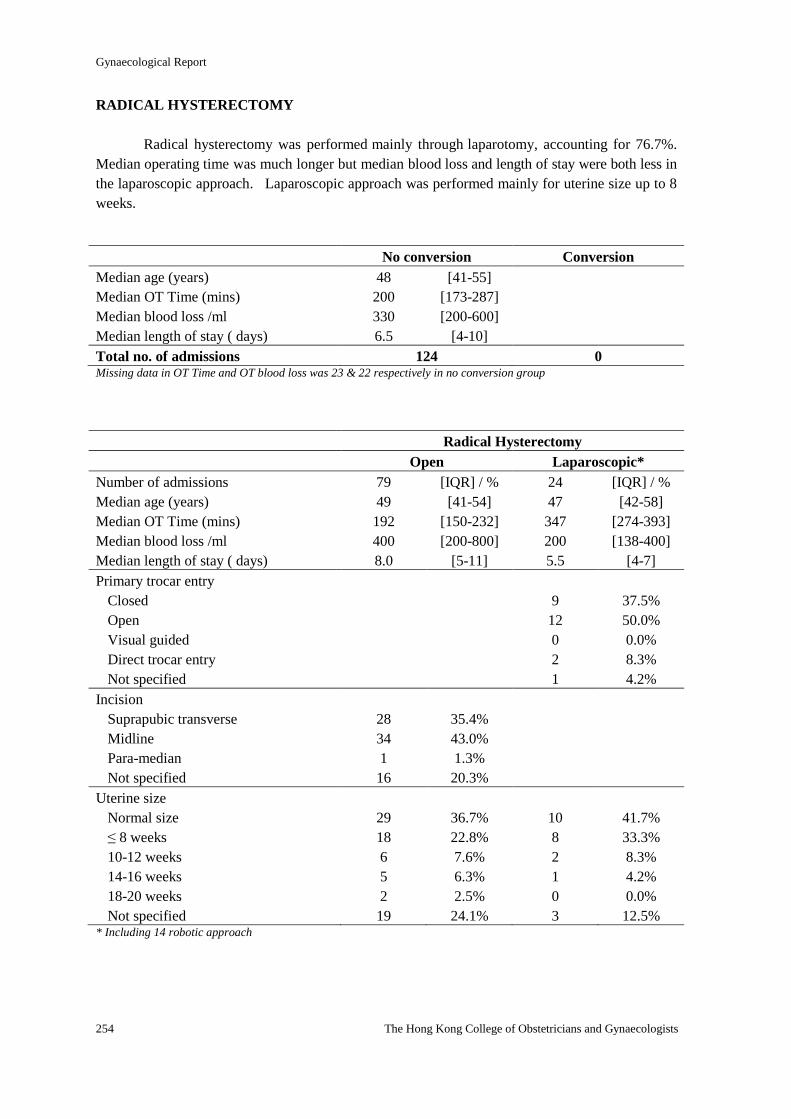
Gynaecological Report
254 The Hong Kong College of Obstetricians and Gynaecologists
RADICAL HYSTERECTOMY
Radical hysterectomy was performed mainly through laparotomy, accounting for 76.7%.
Median operating time was much longer but median blood loss and length of stay were both less in
the laparoscopic approach. Laparoscopic approach was performed mainly for uterine size up to 8
weeks.
No conversion Conversion
Median age (years) 48 [41-55]
Median OT Time (mins) 200 [173-287]
Median blood loss /ml 330 [200-600]
Median length of stay ( days) 6.5 [4-10]
Total no. of admissions 124 0 Missing data in OT Time and OT blood loss was 23 & 22 respectively in no conversion group
Radical Hysterectomy
Open Laparoscopic*
Number of admissions 79 [IQR] / % 24 [IQR] / %
Median age (years) 49 [41-54] 47 [42-58]
Median OT Time (mins) 192 [150-232] 347 [274-393]
Median blood loss /ml 400 [200-800] 200 [138-400]
Median length of stay ( days) 8.0 [5-11] 5.5 [4-7]
Primary trocar entry
Closed 9 37.5%
Open 12 50.0%
Visual guided 0 0.0%
Direct trocar entry 2 8.3%
Not specified 1 4.2%
Incision
Suprapubic transverse 28 35.4%
Midline 34 43.0%
Para-median 1 1.3%
Not specified 16 20.3%
Uterine size
Normal size 29 36.7% 10 41.7%
≤ 8 weeks 18 22.8% 8 33.3%
10-12 weeks 6 7.6% 2 8.3%
14-16 weeks 5 6.3% 1 4.2%
18-20 weeks 2 2.5% 0 0.0%
Not specified 19 24.1% 3 12.5% * Including 14 robotic approach
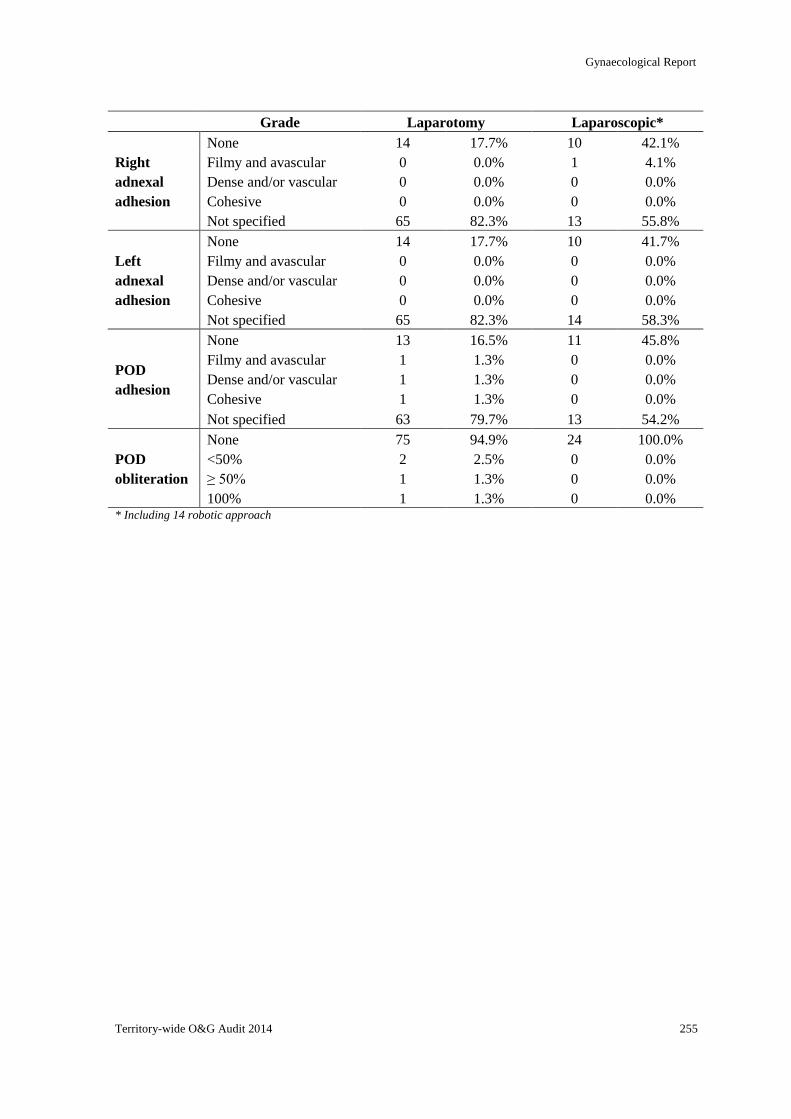
Gynaecological Report
Territory-wide O&G Audit 2014 255
Grade Laparotomy Laparoscopic*
Right
adnexal
adhesion
None 14 17.7% 10 42.1%
Filmy and avascular 0 0.0% 1 4.1%
Dense and/or vascular 0 0.0% 0 0.0%
Cohesive 0 0.0% 0 0.0%
Not specified 65 82.3% 13 55.8%
Left
adnexal
adhesion
None 14 17.7% 10 41.7%
Filmy and avascular 0 0.0% 0 0.0%
Dense and/or vascular 0 0.0% 0 0.0%
Cohesive 0 0.0% 0 0.0%
Not specified 65 82.3% 14 58.3%
POD
adhesion
None 13 16.5% 11 45.8%
Filmy and avascular 1 1.3% 0 0.0%
Dense and/or vascular 1 1.3% 0 0.0%
Cohesive 1 1.3% 0 0.0%
Not specified 63 79.7% 13 54.2%
POD
obliteration
None 75 94.9% 24 100.0%
<50% 2 2.5% 0 0.0%
≥ 50% 1 1.3% 0 0.0%
100% 1 1.3% 0 0.0% * Including 14 robotic approach
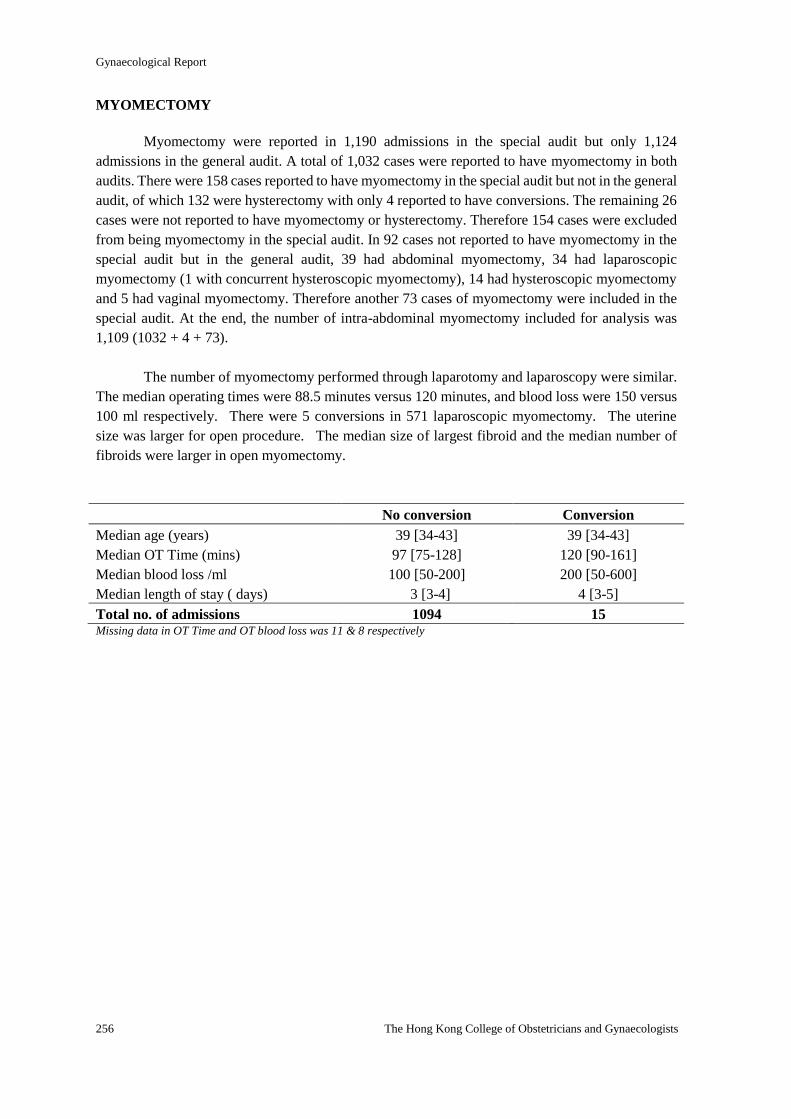
Gynaecological Report
256 The Hong Kong College of Obstetricians and Gynaecologists
MYOMECTOMY
Myomectomy were reported in 1,190 admissions in the special audit but only 1,124
admissions in the general audit. A total of 1,032 cases were reported to have myomectomy in both
audits. There were 158 cases reported to have myomectomy in the special audit but not in the general
audit, of which 132 were hysterectomy with only 4 reported to have conversions. The remaining 26
cases were not reported to have myomectomy or hysterectomy. Therefore 154 cases were excluded
from being myomectomy in the special audit. In 92 cases not reported to have myomectomy in the
special audit but in the general audit, 39 had abdominal myomectomy, 34 had laparoscopic
myomectomy (1 with concurrent hysteroscopic myomectomy), 14 had hysteroscopic myomectomy
and 5 had vaginal myomectomy. Therefore another 73 cases of myomectomy were included in the
special audit. At the end, the number of intra-abdominal myomectomy included for analysis was
1,109 (1032 + 4 + 73).
The number of myomectomy performed through laparotomy and laparoscopy were similar.
The median operating times were 88.5 minutes versus 120 minutes, and blood loss were 150 versus
100 ml respectively. There were 5 conversions in 571 laparoscopic myomectomy. The uterine
size was larger for open procedure. The median size of largest fibroid and the median number of
fibroids were larger in open myomectomy.
No conversion Conversion
Median age (years) 39 [34-43] 39 [34-43]
Median OT Time (mins) 97 [75-128] 120 [90-161]
Median blood loss /ml 100 [50-200] 200 [50-600]
Median length of stay ( days) 3 [3-4] 4 [3-5]
Total no. of admissions 1094 15 Missing data in OT Time and OT blood loss was 11 & 8 respectively
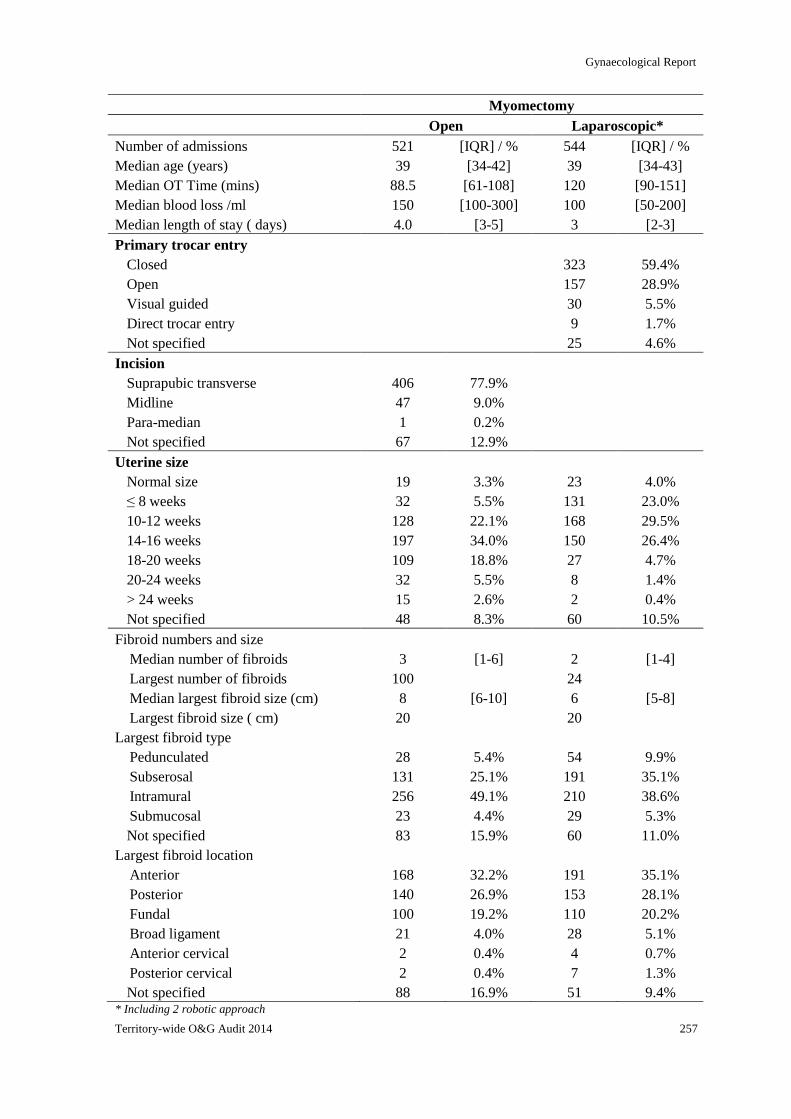
Gynaecological Report
Territory-wide O&G Audit 2014 257
Myomectomy
Open Laparoscopic*
Number of admissions 521 [IQR] / % 544 [IQR] / %
Median age (years) 39 [34-42] 39 [34-43]
Median OT Time (mins) 88.5 [61-108] 120 [90-151]
Median blood loss /ml 150 [100-300] 100 [50-200]
Median length of stay ( days) 4.0 [3-5] 3 [2-3]
Primary trocar entry
Closed 323 59.4%
Open 157 28.9%
Visual guided 30 5.5%
Direct trocar entry 9 1.7%
Not specified 25 4.6%
Incision
Suprapubic transverse 406 77.9%
Midline 47 9.0%
Para-median 1 0.2%
Not specified 67 12.9%
Uterine size
Normal size 19 3.3% 23 4.0%
≤ 8 weeks 32 5.5% 131 23.0%
10-12 weeks 128 22.1% 168 29.5%
14-16 weeks 197 34.0% 150 26.4%
18-20 weeks 109 18.8% 27 4.7%
20-24 weeks 32 5.5% 8 1.4%
> 24 weeks 15 2.6% 2 0.4%
Not specified 48 8.3% 60 10.5%
Fibroid numbers and size
Median number of fibroids 3 [1-6] 2 [1-4]
Largest number of fibroids 100 24
Median largest fibroid size (cm) 8 [6-10] 6 [5-8]
Largest fibroid size ( cm) 20 20
Largest fibroid type
Pedunculated 28 5.4% 54 9.9%
Subserosal 131 25.1% 191 35.1%
Intramural 256 49.1% 210 38.6%
Submucosal 23 4.4% 29 5.3%
Not specified 83 15.9% 60 11.0%
Largest fibroid location
Anterior 168 32.2% 191 35.1%
Posterior 140 26.9% 153 28.1%
Fundal 100 19.2% 110 20.2%
Broad ligament 21 4.0% 28 5.1%
Anterior cervical 2 0.4% 4 0.7%
Posterior cervical 2 0.4% 7 1.3%
Not specified 88 16.9% 51 9.4% * Including 2 robotic approach
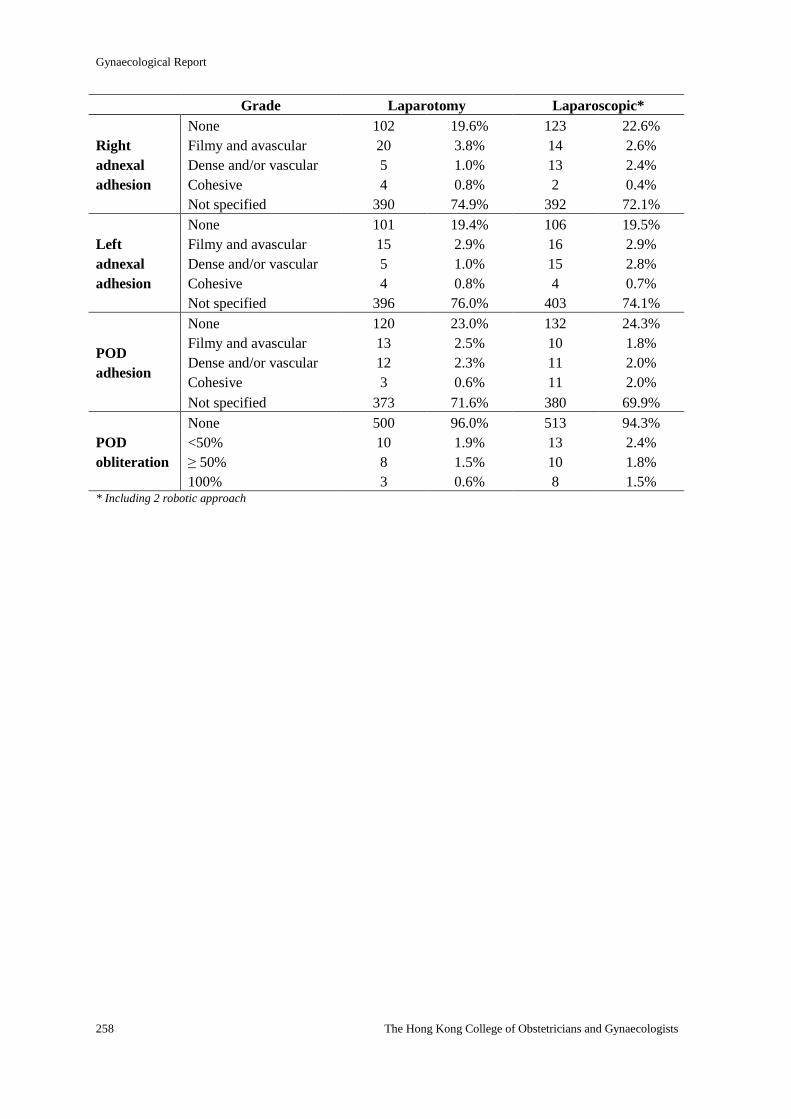
Gynaecological Report
258 The Hong Kong College of Obstetricians and Gynaecologists
Grade Laparotomy Laparoscopic*
Right
adnexal
adhesion
None 102 19.6% 123 22.6%
Filmy and avascular 20 3.8% 14 2.6%
Dense and/or vascular 5 1.0% 13 2.4%
Cohesive 4 0.8% 2 0.4%
Not specified 390 74.9% 392 72.1%
Left
adnexal
adhesion
None 101 19.4% 106 19.5%
Filmy and avascular 15 2.9% 16 2.9%
Dense and/or vascular 5 1.0% 15 2.8%
Cohesive 4 0.8% 4 0.7%
Not specified 396 76.0% 403 74.1%
POD
adhesion
None 120 23.0% 132 24.3%
Filmy and avascular 13 2.5% 10 1.8%
Dense and/or vascular 12 2.3% 11 2.0%
Cohesive 3 0.6% 11 2.0%
Not specified 373 71.6% 380 69.9%
POD
obliteration
None 500 96.0% 513 94.3%
<50% 10 1.9% 13 2.4%
≥ 50% 8 1.5% 10 1.8%
100% 3 0.6% 8 1.5% * Including 2 robotic approach
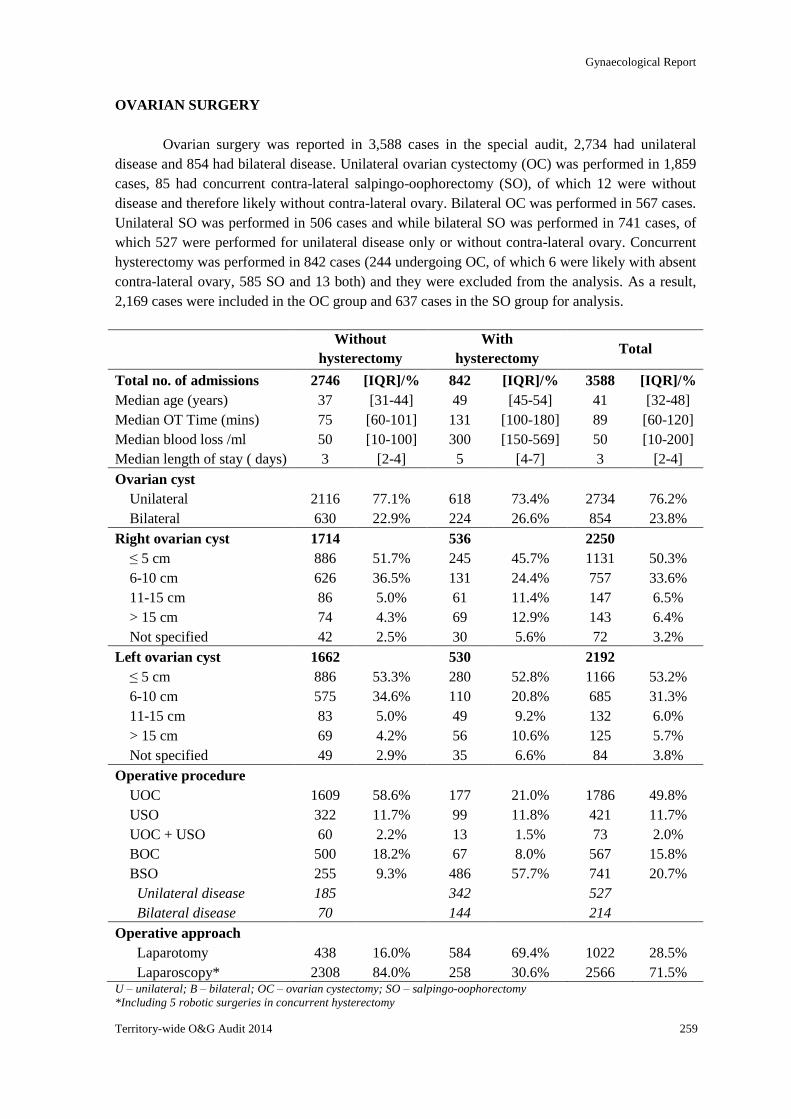
Gynaecological Report
Territory-wide O&G Audit 2014 259
OVARIAN SURGERY
Ovarian surgery was reported in 3,588 cases in the special audit, 2,734 had unilateral
disease and 854 had bilateral disease. Unilateral ovarian cystectomy (OC) was performed in 1,859
cases, 85 had concurrent contra-lateral salpingo-oophorectomy (SO), of which 12 were without
disease and therefore likely without contra-lateral ovary. Bilateral OC was performed in 567 cases.
Unilateral SO was performed in 506 cases and while bilateral SO was performed in 741 cases, of
which 527 were performed for unilateral disease only or without contra-lateral ovary. Concurrent
hysterectomy was performed in 842 cases (244 undergoing OC, of which 6 were likely with absent
contra-lateral ovary, 585 SO and 13 both) and they were excluded from the analysis. As a result,
2,169 cases were included in the OC group and 637 cases in the SO group for analysis.
Without
hysterectomy
With
hysterectomy Total
Total no. of admissions 2746 [IQR]/% 842 [IQR]/% 3588 [IQR]/%
Median age (years) 37 [31-44] 49 [45-54] 41 [32-48]
Median OT Time (mins) 75 [60-101] 131 [100-180] 89 [60-120]
Median blood loss /ml 50 [10-100] 300 [150-569] 50 [10-200]
Median length of stay ( days) 3 [2-4] 5 [4-7] 3 [2-4]
Ovarian cyst
Unilateral 2116 77.1% 618 73.4% 2734 76.2%
Bilateral 630 22.9% 224 26.6% 854 23.8%
Right ovarian cyst 1714 536 2250
≤ 5 cm 886 51.7% 245 45.7% 1131 50.3%
6-10 cm 626 36.5% 131 24.4% 757 33.6%
11-15 cm 86 5.0% 61 11.4% 147 6.5%
> 15 cm 74 4.3% 69 12.9% 143 6.4%
Not specified 42 2.5% 30 5.6% 72 3.2%
Left ovarian cyst 1662 530 2192
≤ 5 cm 886 53.3% 280 52.8% 1166 53.2%
6-10 cm 575 34.6% 110 20.8% 685 31.3%
11-15 cm 83 5.0% 49 9.2% 132 6.0%
> 15 cm 69 4.2% 56 10.6% 125 5.7%
Not specified 49 2.9% 35 6.6% 84 3.8%
Operative procedure
UOC 1609 58.6% 177 21.0% 1786 49.8%
USO 322 11.7% 99 11.8% 421 11.7%
UOC + USO 60 2.2% 13 1.5% 73 2.0%
BOC 500 18.2% 67 8.0% 567 15.8%
BSO 255 9.3% 486 57.7% 741 20.7%
Unilateral disease 185 342 527
Bilateral disease 70 144 214
Operative approach
Laparotomy 438 16.0% 584 69.4% 1022 28.5%
Laparoscopy* 2308 84.0% 258 30.6% 2566 71.5% U – unilateral; B – bilateral; OC – ovarian cystectomy; SO – salpingo-oophorectomy
*Including 5 robotic surgeries in concurrent hysterectomy
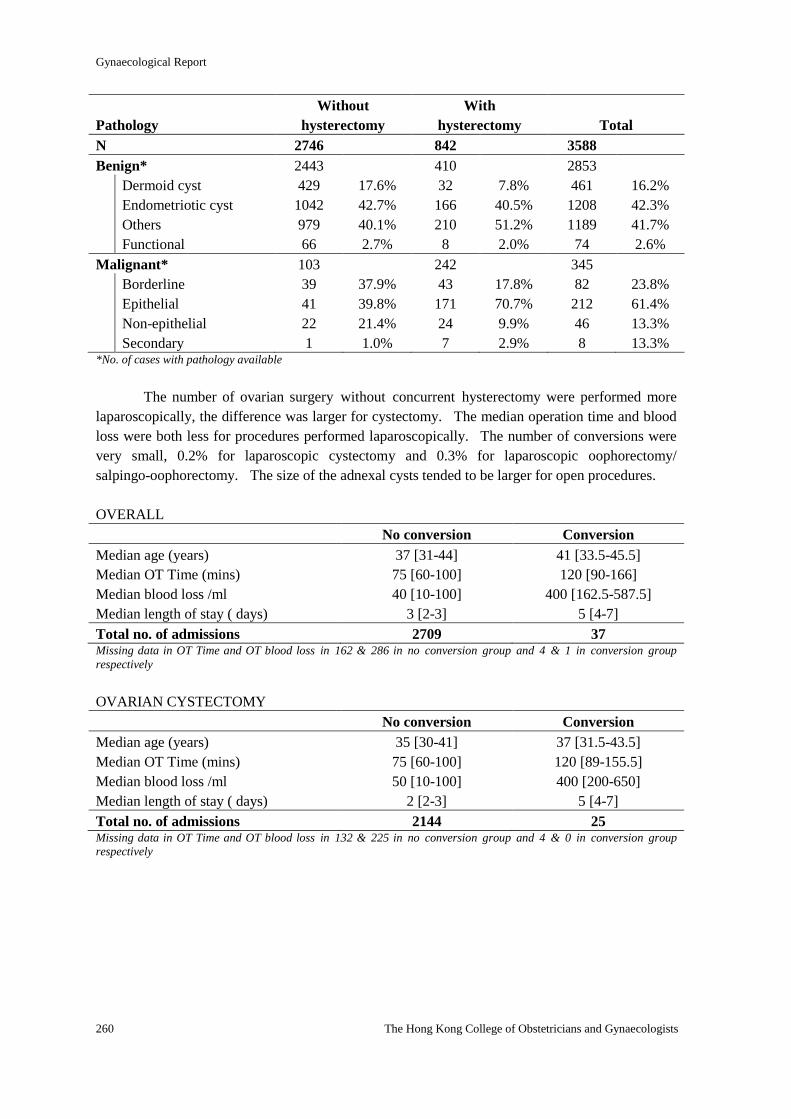
Gynaecological Report
260 The Hong Kong College of Obstetricians and Gynaecologists
Pathology
Without
hysterectomy
With
hysterectomy
Total
N 2746 842 3588
Benign* 2443 410 2853
Dermoid cyst 429 17.6% 32 7.8% 461 16.2%
Endometriotic cyst 1042 42.7% 166 40.5% 1208 42.3%
Others 979 40.1% 210 51.2% 1189 41.7%
Functional 66 2.7% 8 2.0% 74 2.6%
Malignant* 103 242 345
Borderline 39 37.9% 43 17.8% 82 23.8%
Epithelial 41 39.8% 171 70.7% 212 61.4%
Non-epithelial 22 21.4% 24 9.9% 46 13.3%
Secondary 1 1.0% 7 2.9% 8 13.3% *No. of cases with pathology available
The number of ovarian surgery without concurrent hysterectomy were performed more
laparoscopically, the difference was larger for cystectomy. The median operation time and blood
loss were both less for procedures performed laparoscopically. The number of conversions were
very small, 0.2% for laparoscopic cystectomy and 0.3% for laparoscopic oophorectomy/
salpingo-oophorectomy. The size of the adnexal cysts tended to be larger for open procedures.
OVERALL
No conversion Conversion
Median age (years) 37 [31-44] 41 [33.5-45.5]
Median OT Time (mins) 75 [60-100] 120 [90-166]
Median blood loss /ml 40 [10-100] 400 [162.5-587.5]
Median length of stay ( days) 3 [2-3] 5 [4-7]
Total no. of admissions 2709 37 Missing data in OT Time and OT blood loss in 162 & 286 in no conversion group and 4 & 1 in conversion group
respectively
OVARIAN CYSTECTOMY
No conversion Conversion
Median age (years) 35 [30-41] 37 [31.5-43.5]
Median OT Time (mins) 75 [60-100] 120 [89-155.5]
Median blood loss /ml 50 [10-100] 400 [200-650]
Median length of stay ( days) 2 [2-3] 5 [4-7]
Total no. of admissions 2144 25 Missing data in OT Time and OT blood loss in 132 & 225 in no conversion group and 4 & 0 in conversion group
respectively
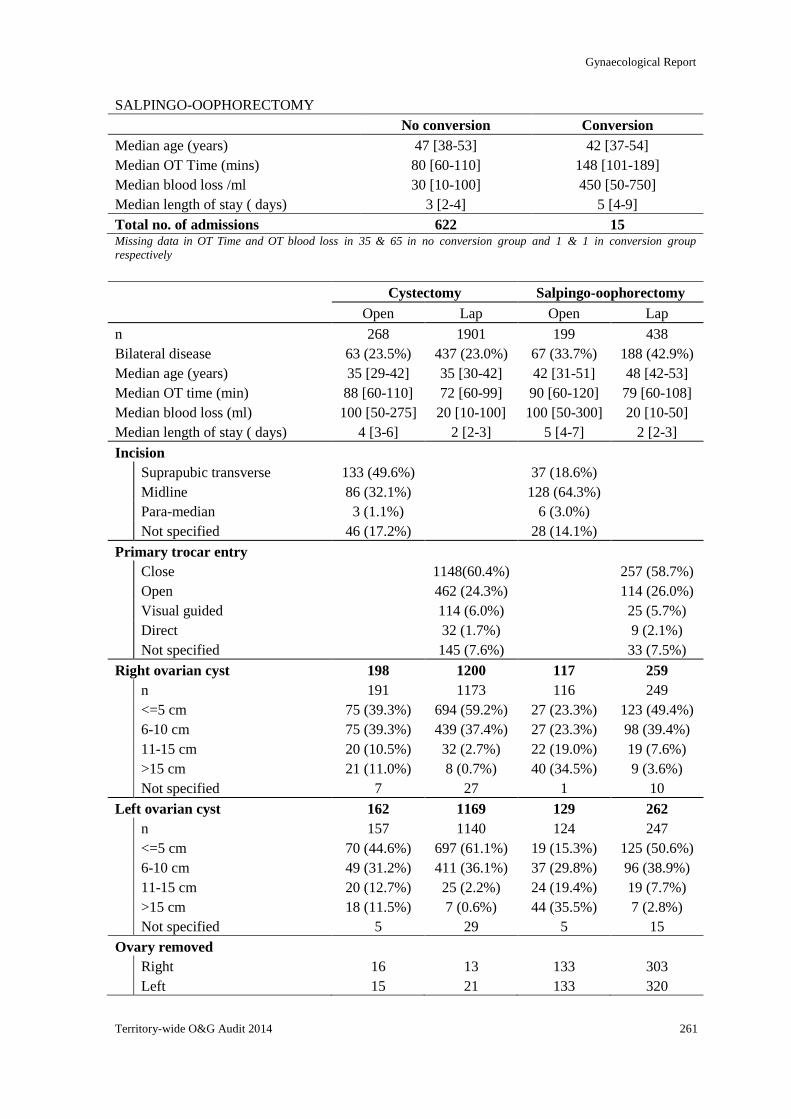
Gynaecological Report
Territory-wide O&G Audit 2014 261
SALPINGO-OOPHORECTOMY
No conversion Conversion
Median age (years) 47 [38-53] 42 [37-54]
Median OT Time (mins) 80 [60-110] 148 [101-189]
Median blood loss /ml 30 [10-100] 450 [50-750]
Median length of stay ( days) 3 [2-4] 5 [4-9]
Total no. of admissions 622 15 Missing data in OT Time and OT blood loss in 35 & 65 in no conversion group and 1 & 1 in conversion group
respectively
Cystectomy Salpingo-oophorectomy
Open Lap Open Lap
n 268 1901 199 438
Bilateral disease 63 (23.5%) 437 (23.0%) 67 (33.7%) 188 (42.9%)
Median age (years) 35 [29-42] 35 [30-42] 42 [31-51] 48 [42-53]
Median OT time (min) 88 [60-110] 72 [60-99] 90 [60-120] 79 [60-108]
Median blood loss (ml) 100 [50-275] 20 [10-100] 100 [50-300] 20 [10-50]
Median length of stay ( days) 4 [3-6] 2 [2-3] 5 [4-7] 2 [2-3]
Incision
Suprapubic transverse 133 (49.6%) 37 (18.6%)
Midline 86 (32.1%) 128 (64.3%)
Para-median 3 (1.1%) 6 (3.0%)
Not specified 46 (17.2%) 28 (14.1%)
Primary trocar entry
Close 1148(60.4%) 257 (58.7%)
Open 462 (24.3%) 114 (26.0%)
Visual guided 114 (6.0%) 25 (5.7%)
Direct 32 (1.7%) 9 (2.1%)
Not specified 145 (7.6%) 33 (7.5%)
Right ovarian cyst 198 1200 117 259
n 191 1173 116 249
<=5 cm 75 (39.3%) 694 (59.2%) 27 (23.3%) 123 (49.4%)
6-10 cm 75 (39.3%) 439 (37.4%) 27 (23.3%) 98 (39.4%)
11-15 cm 20 (10.5%) 32 (2.7%) 22 (19.0%) 19 (7.6%)
>15 cm 21 (11.0%) 8 (0.7%) 40 (34.5%) 9 (3.6%)
Not specified 7 27 1 10
Left ovarian cyst 162 1169 129 262
n 157 1140 124 247
<=5 cm 70 (44.6%) 697 (61.1%) 19 (15.3%) 125 (50.6%)
6-10 cm 49 (31.2%) 411 (36.1%) 37 (29.8%) 96 (38.9%)
11-15 cm 20 (12.7%) 25 (2.2%) 24 (19.4%) 19 (7.7%)
>15 cm 18 (11.5%) 7 (0.6%) 44 (35.5%) 7 (2.8%)
Not specified 5 29 5 15
Ovary removed
Right 16 13 133 303
Left 15 21 133 320
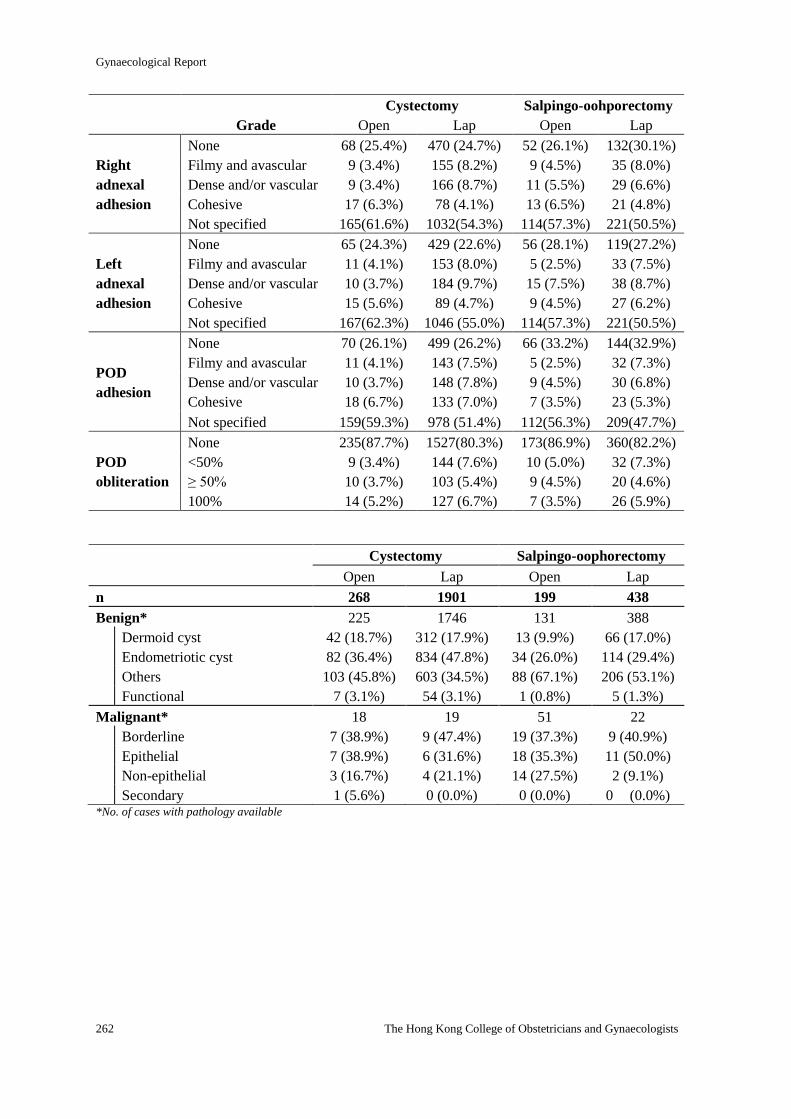
Gynaecological Report
262 The Hong Kong College of Obstetricians and Gynaecologists
Cystectomy Salpingo-oohporectomy
Grade Open Lap Open Lap
Right
adnexal
adhesion
None 68 (25.4%) 470 (24.7%) 52 (26.1%) 132(30.1%)
Filmy and avascular 9 (3.4%) 155 (8.2%) 9 (4.5%) 35 (8.0%)
Dense and/or vascular 9 (3.4%) 166 (8.7%) 11 (5.5%) 29 (6.6%)
Cohesive 17 (6.3%) 78 (4.1%) 13 (6.5%) 21 (4.8%)
Not specified 165(61.6%) 1032(54.3%) 114(57.3%) 221(50.5%)
Left
adnexal
adhesion
None 65 (24.3%) 429 (22.6%) 56 (28.1%) 119(27.2%)
Filmy and avascular 11 (4.1%) 153 (8.0%) 5 (2.5%) 33 (7.5%)
Dense and/or vascular 10 (3.7%) 184 (9.7%) 15 (7.5%) 38 (8.7%)
Cohesive 15 (5.6%) 89 (4.7%) 9 (4.5%) 27 (6.2%)
Not specified 167(62.3%) 1046 (55.0%) 114(57.3%) 221(50.5%)
POD
adhesion
None 70 (26.1%) 499 (26.2%) 66 (33.2%) 144(32.9%)
Filmy and avascular 11 (4.1%) 143 (7.5%) 5 (2.5%) 32 (7.3%)
Dense and/or vascular 10 (3.7%) 148 (7.8%) 9 (4.5%) 30 (6.8%)
Cohesive 18 (6.7%) 133 (7.0%) 7 (3.5%) 23 (5.3%)
Not specified 159(59.3%) 978 (51.4%) 112(56.3%) 209(47.7%)
POD
obliteration
None 235(87.7%) 1527(80.3%) 173(86.9%) 360(82.2%)
<50% 9 (3.4%) 144 (7.6%) 10 (5.0%) 32 (7.3%)
≥ 50% 10 (3.7%) 103 (5.4%) 9 (4.5%) 20 (4.6%)
100% 14 (5.2%) 127 (6.7%) 7 (3.5%) 26 (5.9%)
Cystectomy Salpingo-oophorectomy
Open Lap Open Lap
n 268 1901 199 438
Benign* 225 1746 131 388
Dermoid cyst 42 (18.7%) 312 (17.9%) 13 (9.9%) 66 (17.0%)
Endometriotic cyst 82 (36.4%) 834 (47.8%) 34 (26.0%) 114 (29.4%)
Others 103 (45.8%) 603 (34.5%) 88 (67.1%) 206 (53.1%)
Functional 7 (3.1%) 54 (3.1%) 1 (0.8%) 5 (1.3%)
Malignant* 18 19 51 22
Borderline 7 (38.9%) 9 (47.4%) 19 (37.3%) 9 (40.9%)
Epithelial 7 (38.9%) 6 (31.6%) 18 (35.3%) 11 (50.0%)
Non-epithelial 3 (16.7%) 4 (21.1%) 14 (27.5%) 2 (9.1%)
Secondary 1 (5.6%) 0 (0.0%) 0 (0.0%) 0 (0.0%) *No. of cases with pathology available
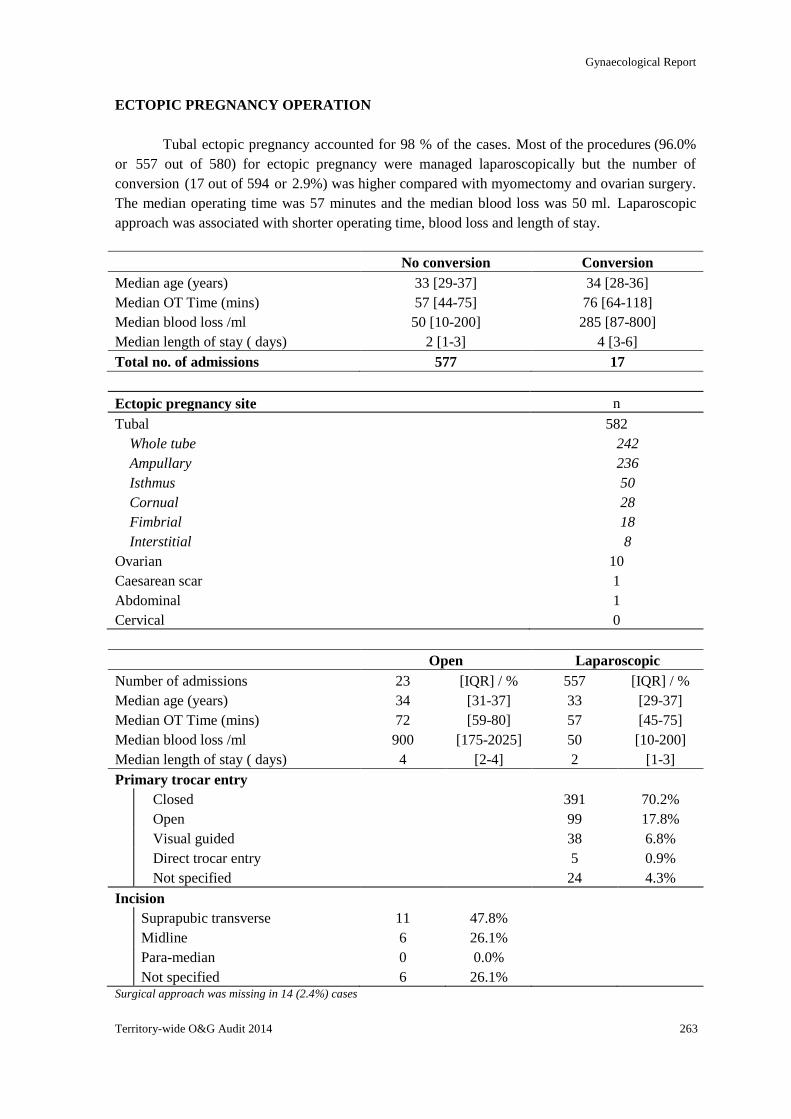
Gynaecological Report
Territory-wide O&G Audit 2014 263
ECTOPIC PREGNANCY OPERATION
Tubal ectopic pregnancy accounted for 98 % of the cases. Most of the procedures (96.0%
or 557 out of 580) for ectopic pregnancy were managed laparoscopically but the number of
conversion (17 out of 594 or 2.9%) was higher compared with myomectomy and ovarian surgery.
The median operating time was 57 minutes and the median blood loss was 50 ml. Laparoscopic
approach was associated with shorter operating time, blood loss and length of stay.
No conversion Conversion
Median age (years) 33 [29-37] 34 [28-36]
Median OT Time (mins) 57 [44-75] 76 [64-118]
Median blood loss /ml 50 [10-200] 285 [87-800]
Median length of stay ( days) 2 [1-3] 4 [3-6]
Total no. of admissions 577 17
Ectopic pregnancy site n
Tubal 582
Whole tube 242
Ampullary 236
Isthmus 50
Cornual 28
Fimbrial 18
Interstitial 8
Ovarian 10
Caesarean scar 1
Abdominal 1
Cervical 0
Open Laparoscopic
Number of admissions 23 [IQR] / % 557 [IQR] / %
Median age (years) 34 [31-37] 33 [29-37]
Median OT Time (mins) 72 [59-80] 57 [45-75]
Median blood loss /ml 900 [175-2025] 50 [10-200]
Median length of stay ( days) 4 [2-4] 2 [1-3]
Primary trocar entry
Closed 391 70.2%
Open 99 17.8%
Visual guided 38 6.8%
Direct trocar entry 5 0.9%
Not specified 24 4.3%
Incision
Suprapubic transverse 11 47.8%
Midline 6 26.1%
Para-median 0 0.0%
Not specified 6 26.1% Surgical approach was missing in 14 (2.4%) cases
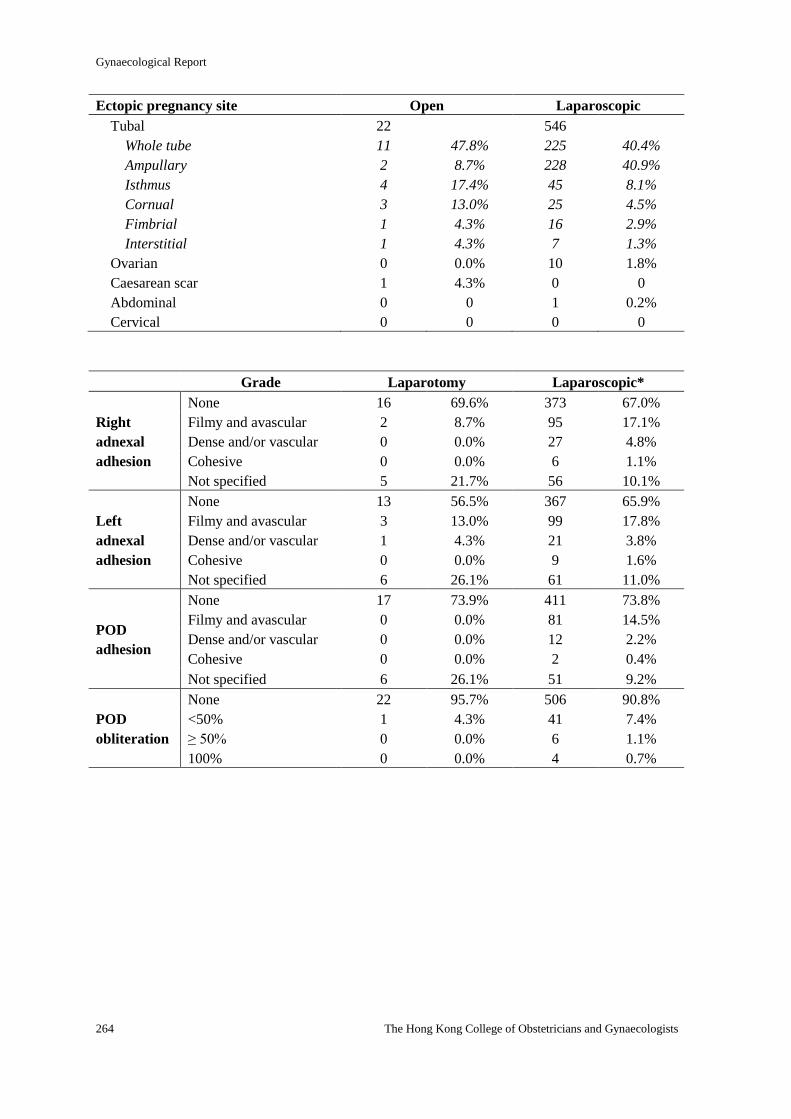
Gynaecological Report
264 The Hong Kong College of Obstetricians and Gynaecologists
Ectopic pregnancy site Open Laparoscopic
Tubal 22 546
Whole tube 11 47.8% 225 40.4%
Ampullary 2 8.7% 228 40.9%
Isthmus 4 17.4% 45 8.1%
Cornual 3 13.0% 25 4.5%
Fimbrial 1 4.3% 16 2.9%
Interstitial 1 4.3% 7 1.3%
Ovarian 0 0.0% 10 1.8%
Caesarean scar 1 4.3% 0 0
Abdominal 0 0 1 0.2%
Cervical 0 0 0 0
Grade Laparotomy Laparoscopic*
Right
adnexal
adhesion
None 16 69.6% 373 67.0%
Filmy and avascular 2 8.7% 95 17.1%
Dense and/or vascular 0 0.0% 27 4.8%
Cohesive 0 0.0% 6 1.1%
Not specified 5 21.7% 56 10.1%
Left
adnexal
adhesion
None 13 56.5% 367 65.9%
Filmy and avascular 3 13.0% 99 17.8%
Dense and/or vascular 1 4.3% 21 3.8%
Cohesive 0 0.0% 9 1.6%
Not specified 6 26.1% 61 11.0%
POD
adhesion
None 17 73.9% 411 73.8%
Filmy and avascular 0 0.0% 81 14.5%
Dense and/or vascular 0 0.0% 12 2.2%
Cohesive 0 0.0% 2 0.4%
Not specified 6 26.1% 51 9.2%
POD
obliteration
None 22 95.7% 506 90.8%
<50% 1 4.3% 41 7.4%
≥ 50% 0 0.0% 6 1.1%
100% 0 0.0% 4 0.7%
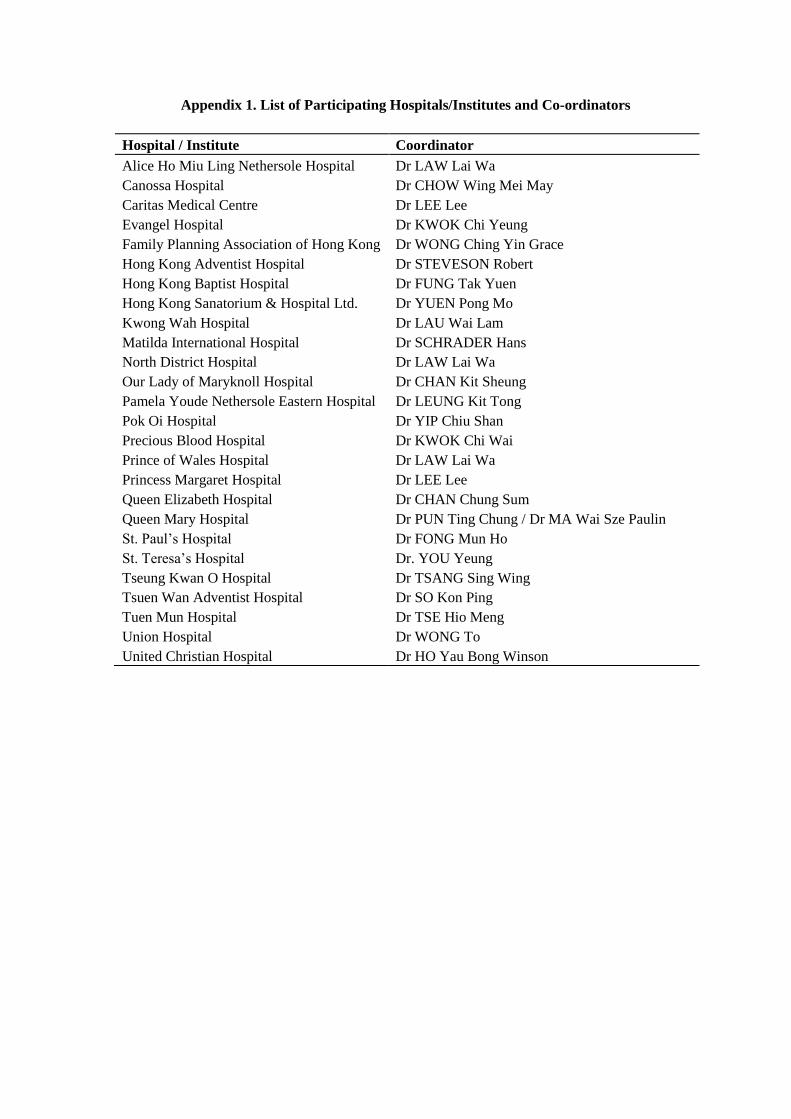
Appendix 1. List of Participating Hospitals/Institutes and Co-ordinators
Hospital / Institute Coordinator
Alice Ho Miu Ling Nethersole Hospital Dr LAW Lai Wa
Canossa Hospital Dr CHOW Wing Mei May
Caritas Medical Centre Dr LEE Lee
Evangel Hospital Dr KWOK Chi Yeung
Family Planning Association of Hong Kong Dr WONG Ching Yin Grace
Hong Kong Adventist Hospital Dr STEVESON Robert
Hong Kong Baptist Hospital Dr FUNG Tak Yuen
Hong Kong Sanatorium & Hospital Ltd. Dr YUEN Pong Mo
Kwong Wah Hospital Dr LAU Wai Lam
Matilda International Hospital Dr SCHRADER Hans
North District Hospital Dr LAW Lai Wa
Our Lady of Maryknoll Hospital Dr CHAN Kit Sheung
Pamela Youde Nethersole Eastern Hospital Dr LEUNG Kit Tong
Pok Oi Hospital Dr YIP Chiu Shan
Precious Blood Hospital Dr KWOK Chi Wai
Prince of Wales Hospital Dr LAW Lai Wa
Princess Margaret Hospital Dr LEE Lee
Queen Elizabeth Hospital Dr CHAN Chung Sum
Queen Mary Hospital Dr PUN Ting Chung / Dr MA Wai Sze Paulin
St. Paul’s Hospital Dr FONG Mun Ho
St. Teresa’s Hospital Dr. YOU Yeung
Tseung Kwan O Hospital Dr TSANG Sing Wing
Tsuen Wan Adventist Hospital Dr SO Kon Ping
Tuen Mun Hospital Dr TSE Hio Meng
Union Hospital Dr WONG To
United Christian Hospital Dr HO Yau Bong Winson
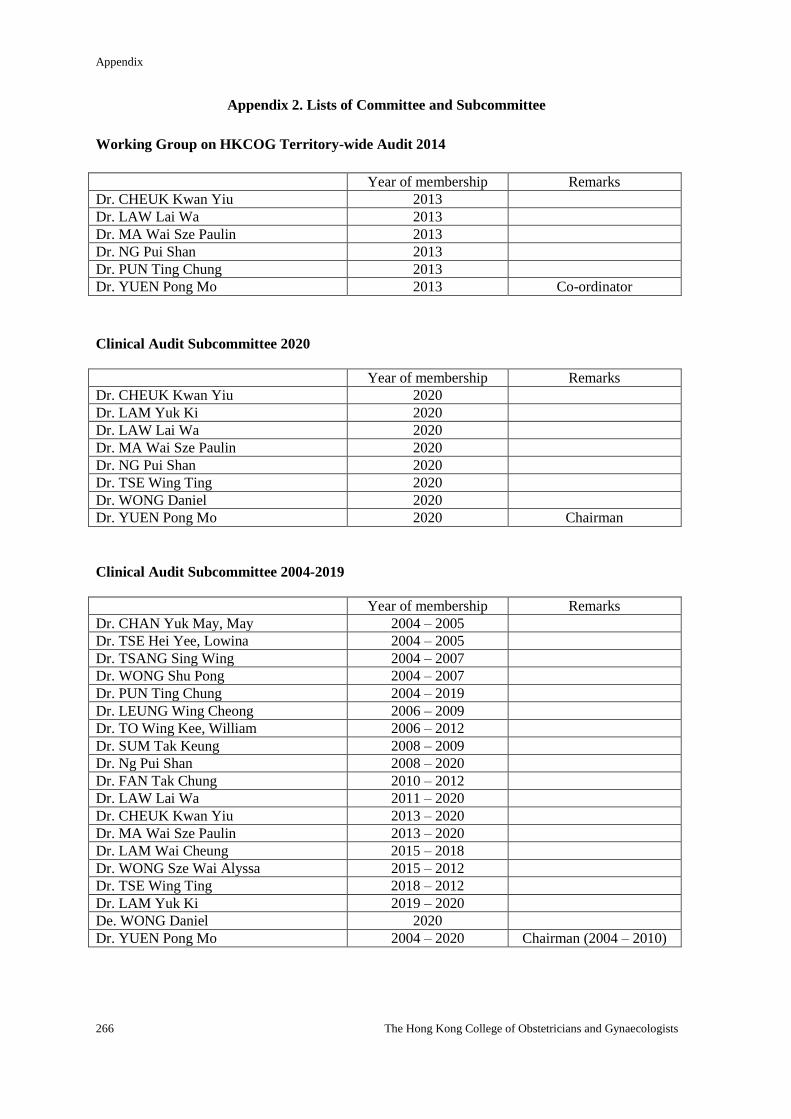
Appendix
266 The Hong Kong College of Obstetricians and Gynaecologists
Appendix 2. Lists of Committee and Subcommittee
Working Group on HKCOG Territory-wide Audit 2014
Year of membership Remarks
Dr. CHEUK Kwan Yiu 2013
Dr. LAW Lai Wa 2013
Dr. MA Wai Sze Paulin 2013
Dr. NG Pui Shan 2013
Dr. PUN Ting Chung 2013
Dr. YUEN Pong Mo 2013 Co-ordinator
Clinical Audit Subcommittee 2020
Year of membership Remarks
Dr. CHEUK Kwan Yiu 2020
Dr. LAM Yuk Ki 2020
Dr. LAW Lai Wa 2020
Dr. MA Wai Sze Paulin 2020
Dr. NG Pui Shan 2020
Dr. TSE Wing Ting 2020
Dr. WONG Daniel 2020
Dr. YUEN Pong Mo 2020 Chairman
Clinical Audit Subcommittee 2004-2019
Year of membership Remarks
Dr. CHAN Yuk May, May 2004 – 2005
Dr. TSE Hei Yee, Lowina 2004 – 2005
Dr. TSANG Sing Wing 2004 – 2007
Dr. WONG Shu Pong 2004 – 2007
Dr. PUN Ting Chung 2004 – 2019
Dr. LEUNG Wing Cheong 2006 – 2009
Dr. TO Wing Kee, William 2006 – 2012
Dr. SUM Tak Keung 2008 – 2009
Dr. Ng Pui Shan 2008 – 2020
Dr. FAN Tak Chung 2010 – 2012
Dr. LAW Lai Wa 2011 – 2020
Dr. CHEUK Kwan Yiu 2013 – 2020
Dr. MA Wai Sze Paulin 2013 – 2020
Dr. LAM Wai Cheung 2015 – 2018
Dr. WONG Sze Wai Alyssa 2015 – 2012
Dr. TSE Wing Ting 2018 – 2012
Dr. LAM Yuk Ki 2019 – 2020
De. WONG Daniel 2020
Dr. YUEN Pong Mo 2004 – 2020 Chairman (2004 – 2010)
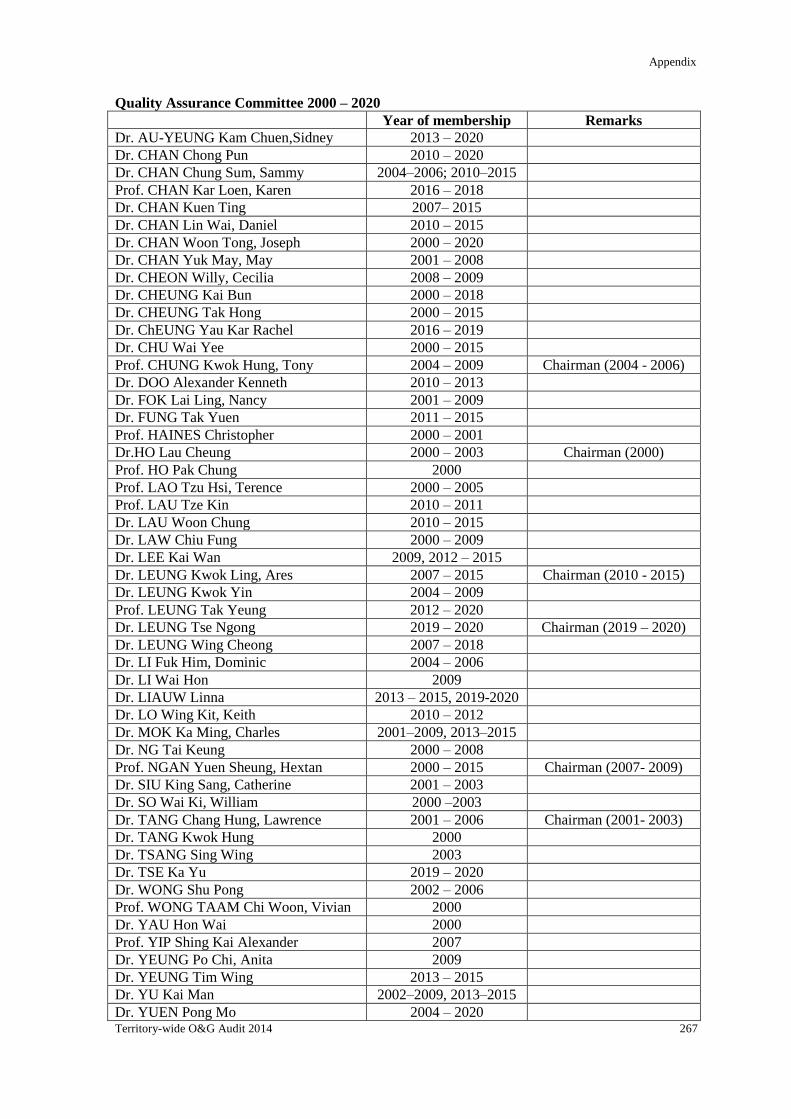
Appendix
Territory-wide O&G Audit 2014 267
Quality Assurance Committee 2000 – 2020
Year of membership Remarks
Dr. AU-YEUNG Kam Chuen,Sidney 2013 – 2020
Dr. CHAN Chong Pun 2010 – 2020
Dr. CHAN Chung Sum, Sammy 2004–2006; 2010–2015
Prof. CHAN Kar Loen, Karen 2016 – 2018
Dr. CHAN Kuen Ting 2007– 2015
Dr. CHAN Lin Wai, Daniel 2010 – 2015
Dr. CHAN Woon Tong, Joseph 2000 – 2020
Dr. CHAN Yuk May, May 2001 – 2008
Dr. CHEON Willy, Cecilia 2008 – 2009
Dr. CHEUNG Kai Bun 2000 – 2018
Dr. CHEUNG Tak Hong 2000 – 2015
Dr. ChEUNG Yau Kar Rachel 2016 – 2019
Dr. CHU Wai Yee 2000 – 2015
Prof. CHUNG Kwok Hung, Tony 2004 – 2009 Chairman (2004 - 2006)
Dr. DOO Alexander Kenneth 2010 – 2013
Dr. FOK Lai Ling, Nancy 2001 – 2009
Dr. FUNG Tak Yuen 2011 – 2015
Prof. HAINES Christopher 2000 – 2001
Dr.HO Lau Cheung 2000 – 2003 Chairman (2000)
Prof. HO Pak Chung 2000
Prof. LAO Tzu Hsi, Terence 2000 – 2005
Prof. LAU Tze Kin 2010 – 2011
Dr. LAU Woon Chung 2010 – 2015
Dr. LAW Chiu Fung 2000 – 2009
Dr. LEE Kai Wan 2009, 2012 – 2015
Dr. LEUNG Kwok Ling, Ares 2007 – 2015 Chairman (2010 - 2015)
Dr. LEUNG Kwok Yin 2004 – 2009
Prof. LEUNG Tak Yeung 2012 – 2020
Dr. LEUNG Tse Ngong 2019 – 2020 Chairman (2019 – 2020)
Dr. LEUNG Wing Cheong 2007 – 2018
Dr. LI Fuk Him, Dominic 2004 – 2006
Dr. LI Wai Hon 2009
Dr. LIAUW Linna 2013 – 2015, 2019-2020
Dr. LO Wing Kit, Keith 2010 – 2012
Dr. MOK Ka Ming, Charles 2001–2009, 2013–2015
Dr. NG Tai Keung 2000 – 2008
Prof. NGAN Yuen Sheung, Hextan 2000 – 2015 Chairman (2007- 2009)
Dr. SIU King Sang, Catherine 2001 – 2003
Dr. SO Wai Ki, William 2000 –2003
Dr. TANG Chang Hung, Lawrence 2001 – 2006 Chairman (2001- 2003)
Dr. TANG Kwok Hung 2000
Dr. TSANG Sing Wing 2003
Dr. TSE Ka Yu 2019 – 2020
Dr. WONG Shu Pong 2002 – 2006
Prof. WONG TAAM Chi Woon, Vivian 2000
Dr. YAU Hon Wai 2000
Prof. YIP Shing Kai Alexander 2007
Dr. YEUNG Po Chi, Anita 2009
Dr. YEUNG Tim Wing 2013 – 2015
Dr. YU Kai Man 2002–2009, 2013–2015
Dr. YUEN Pong Mo 2004 – 2020
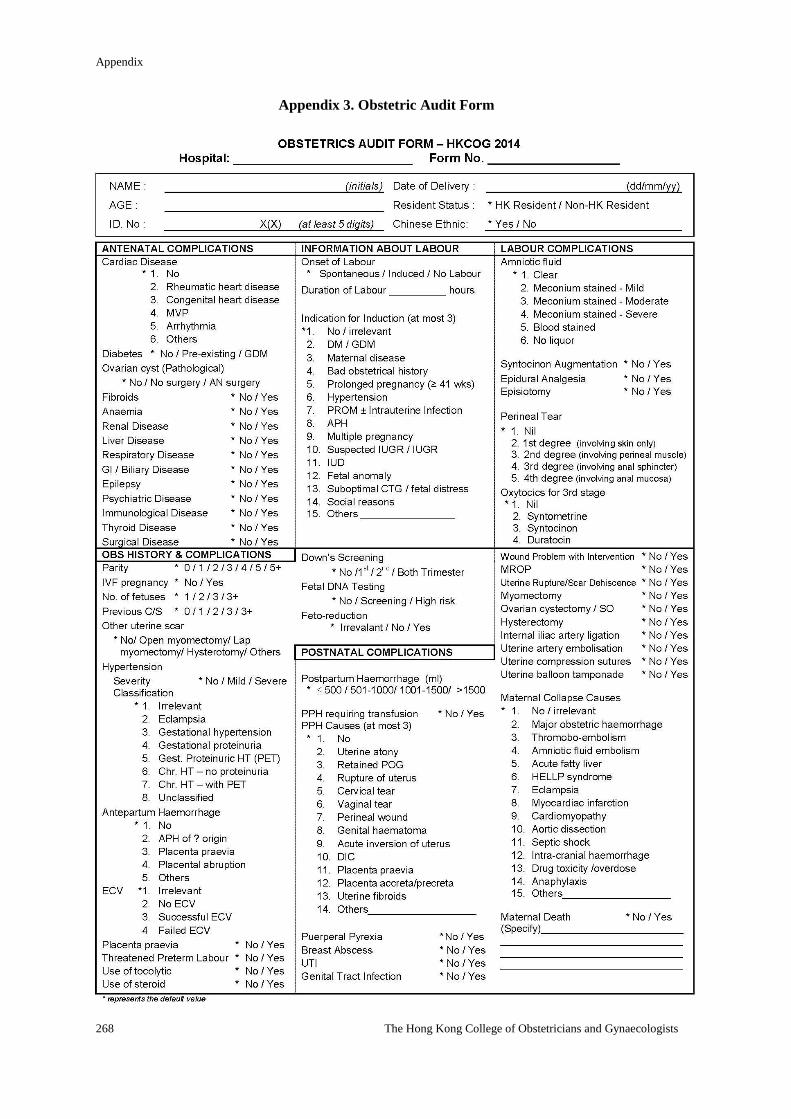
Appendix
268 The Hong Kong College of Obstetricians and Gynaecologists
Appendix 3. Obstetric Audit Form
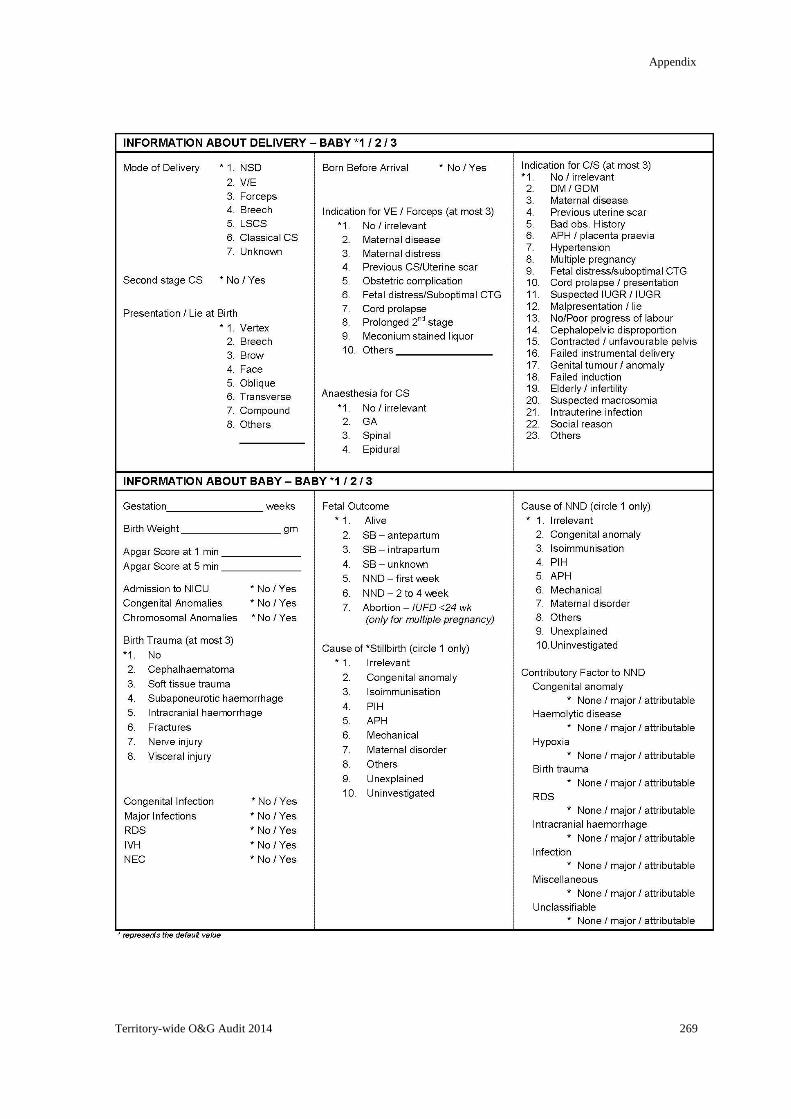
Appendix
Territory-wide O&G Audit 2014 269
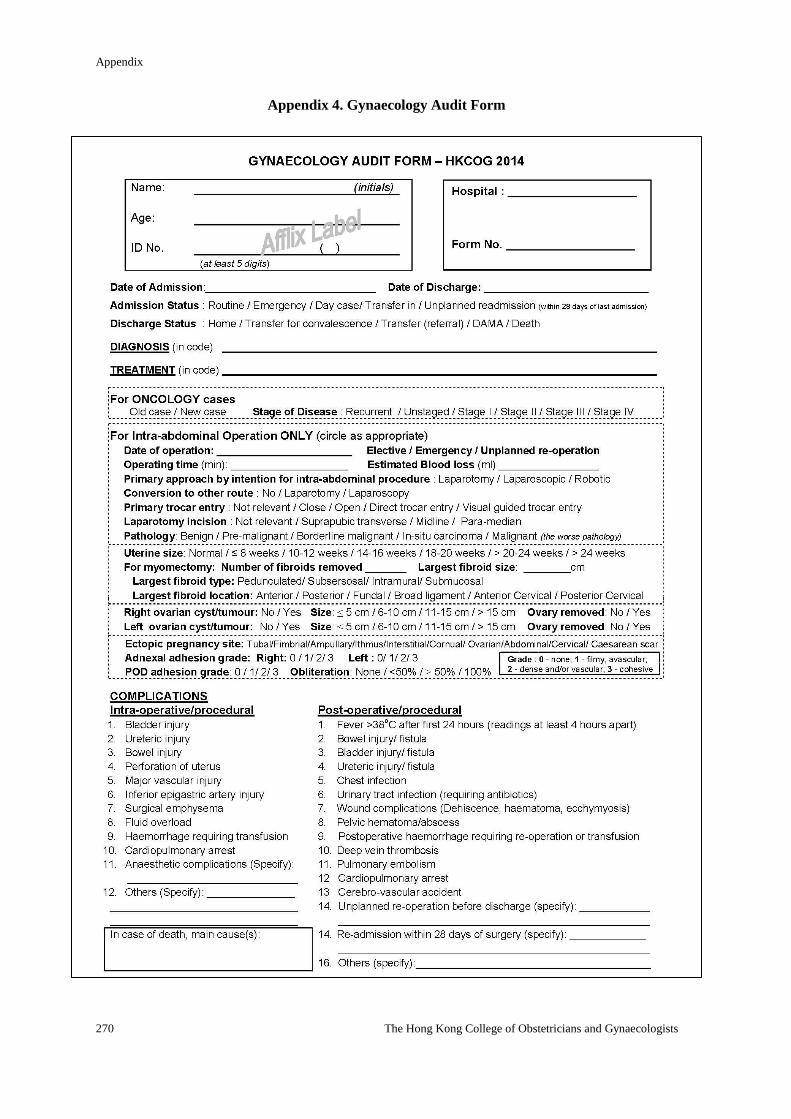
Appendix
270 The Hong Kong College of Obstetricians and Gynaecologists
Appendix 4. Gynaecology Audit Form
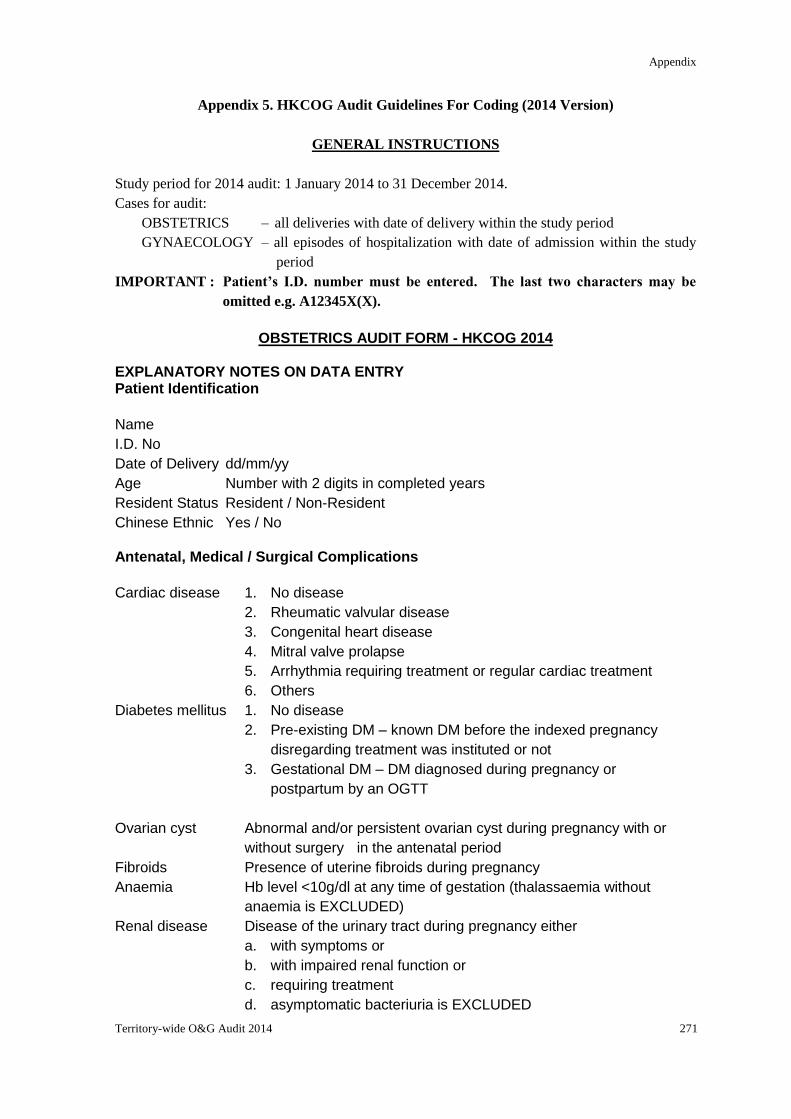
Appendix
Territory-wide O&G Audit 2014 271
Appendix 5. HKCOG Audit Guidelines For Coding (2014 Version)
GENERAL INSTRUCTIONS
Study period for 2014 audit: 1 January 2014 to 31 December 2014.
Cases for audit:
OBSTETRICS – all deliveries with date of delivery within the study period
GYNAECOLOGY – all episodes of hospitalization with date of admission within the study
period
IMPORTANT : Patient’s I.D. number must be entered. The last two characters may be
omitted e.g. A12345X(X).
OBSTETRICS AUDIT FORM - HKCOG 2014
EXPLANATORY NOTES ON DATA ENTRY Patient Identification
Name
I.D. No
Date of Delivery dd/mm/yy
Age Number with 2 digits in completed years
Resident Status Resident / Non-Resident
Chinese Ethnic Yes / No
Antenatal, Medical / Surgical Complications
Cardiac disease 1. No disease
2. Rheumatic valvular disease
3. Congenital heart disease
4. Mitral valve prolapse
5. Arrhythmia requiring treatment or regular cardiac treatment
6. Others
Diabetes mellitus 1. No disease
2. Pre-existing DM – known DM before the indexed pregnancy
disregarding treatment was instituted or not
3. Gestational DM – DM diagnosed during pregnancy or
postpartum by an OGTT
Ovarian cyst Abnormal and/or persistent ovarian cyst during pregnancy with or
without surgery in the antenatal period
Fibroids Presence of uterine fibroids during pregnancy
Anaemia Hb level <10g/dl at any time of gestation (thalassaemia without
anaemia is EXCLUDED)
Renal disease Disease of the urinary tract during pregnancy either
a. with symptoms or
b. with impaired renal function or
c. requiring treatment
d. asymptomatic bacteriuria is EXCLUDED
Appendix
272 The Hong Kong College of Obstetricians and Gynaecologists
Liver disease Liver diseases during pregnancy with impaired liver function
Respiratory
disease
Only those requiring treatment during pregnancy or with impaired
respiratory function
Upper respiratory tract infection is EXCLUDED
Gastrointestinal
biliary disease
Include only those requiring hospitalization and treatment
Epilepsy Only those requiring treatment during pregnancy
Psychiatric disease Only those requiring treatment during pregnancy
Immunological
disease
Only those requiring treatment during pregnancy
Thyroid disease Only those requiring treatment during pregnancy
Surgical disease Major surgical conditions / laparotomy or major operations that
require general anaesthesia during pregnancy or puerperium
(except PPS)
Obstetric History & Complications
Parity Including liveborns and stillbirths after 24 weeks or over 500gm
Conception Spontaneous or IVF pregnancy
Previous CS
Including lower segment and classical Caesarean section
Other Uterine
scar
Including open or laparoscopic myomectomy / hysterotomy /
plastic operation / perforation of uterus requiring repair
Hypertension /
eclampsia
Severity : 1. No
2. Mild-DBP < 110mmHg AND no proteinuria
3. Severe-DBP >= 110 mmHg AND / OR
proteinuria
Classification : 1. Irrelevant
2. Eclampsia
3. Gestational hypertension
- BP normal before 20 weeks and no previous
history of hypertension
- DBP >=110mmHg on any 1 occasion or
>=90mmHg on 2 or more occasions at 4
hours apart
Classification : 4. Gestational proteinuria (proteinuria >=300
mg/24 hours; or 2 MSU / CSU collected >=4
hours apart with 1 g/1; or 2+ or more on
reagent strips
5. Gestational proteinuric hypertension
6. Chronic hypertension with proteinuria
7. Chronic hypertension with superimposed
preeclampsia – proteinuria developing for the
first time during pregnancy
8. Unclassified – BP unknown before 20 weeks
Appendix
Territory-wide O&G Audit 2014 273
Antepartum
haemorrhage
Bleeding per vaginum from the 24th week to the time of delivery
1. No
2. APH of unknown origin – including those with “show” but not
going into labour within 72 hours
3. Placenta praevia with bleeding
4. Accidental haemorrhage – including those with no revealed
bleeding
5. Other causes
Placenta praevia Including those with or without bleeding
ECV Performance of external cephalic version
Threatened
preterm labour
Diagnosed or suspected to have labour before 37 weeks of
gestation which does not proceed to delivery either spontaneously
or after tocolytic therapy
Use of tocolytics Use of tocolytic agent(s) to suppress preterm labour
Use of steroid Use of antenatal steroid to enhance fetal lung maturity
Down's screening Down's screening in first timester (OSCAR) or second trimester
(Biochemical) or combined
Fetal DNA
screening
Non-invasive fetal DNA testing for trisomy
Fetal reduction Fetal reduction for high multiple pregnancy
Information About Labour
Onset of labour Definition - a retrospective diagnosis
- regular contractions with cervix at least 3cm dilated or
there is progressive cervical effacement or dilatation
over 4 hours
Induction of labour An obstetric procedure designed to pre-empt the natural process
of labour by initiating its onset artificially before this occurs
spontaneously
Indications :
1. Maternal diseases / conditions
(I) DM / GDM
(II) Maternal medical / surgical condition
2. Bad obstetric history
3. Antenatal / obstetric complications
(I) Prolonged pregnancy
(II) Hypertensive disease
(III) PROM / intrauterine infection
(IV) Antepartum haemorrhage
(V) Multiple pregnancy
4. Fetal and cord conditions
(I) Suspected IUGR / IUGR
(II) Intrauterine death
(III) Severe fetal abnormality
(IV) Suboptimal antepartum cardiotocography
Appendix
274 The Hong Kong College of Obstetricians and Gynaecologists
5. Others
Augmentation of
labour
The use of synthetic oxytocin to accelerate labour process after it
is already begun and that its quality of progress is unsatisfactory –
use of amniotomy is NOT counted as augmentation
Duration of labour Summation of first stage and second stage (if any) of labour to the
closest number of hours. Enter 1 if duration <1 hour
Postnatal Complications
PPH
(choose at
most 3)
Blood loss of > 500 ml following vaginal delivery
or > 1000 ml following Caesarean delivery
Causes
1. Uterine atony
2. Retained POG
3. Injuries to genital tract
- ruptured uterus
- cervical tear
- vaginal tear
- perineal wound
4. Genital haematoma
5. Uterine inversion
6. DIC
7. Placenta praevia/accreta/percreta
8. Others
Amniotic fluid Status of the amniotic fluid during labour 1. Clear 2 Meconium stained 3. Blood stained 4. No liquor seen
Perineal tear 1. 1st degree tear - where the fourchette and vaginal mucosa are damaged and the underlying muscles are exposed, but not torn
2. 2nd degree tear - the posterior vaginal walls and perineal muscles, but the anal sphincter is intact.
3. 3rd degree tear - extend to the anal sphincter that is torn, but the rectal mucosa is intact
4. 4th degree tear - where the anal canal is opened, and the tear may spread to the rectum
Uterine rupture /
scar dehiscence
Includes dehiscence of previous scar with no PPH
Hysterectomy Include those performed up to 6 weeks postpartum
Puerperal pyrexia Temperature >38 degree C within 14 days of delivery
Maternal collapse An acute event involving the cardiorespiratory systems and/or
brain, resulting in a reduced or absent conscious level (and
potentially death), at any stage in pregnancy and up to six weeks
after delivery.
Maternal death The death of a woman while pregnant or within 42 days of
termination of pregnancy, irrespective of the duration and site of
the pregnancy, from any cause related to or aggravated by the
Appendix
Territory-wide O&G Audit 2014 275
pregnancy or its management but not from accidental or incidental
causes.
Information About Delivery
Mode of delivery 1. Spontaneous vertex delivery
2. Ventouse extraction
3. Forceps delivery
4. Breech delivery
5. Lower segment Caesarean section
6. Classical Caesarean section
7. Unknown
Second stage CS
Caesarean section performed at second stage of labour
BBA Birth before arrival
Presentation / lie at
delivery
1. Vertex
2. Breech
3. Brow
4. Face
5. Oblique lie
6. Transverse lie
7. Compound presentation
8. Others
Indications for
instrumental
delivery (maximum
3 indications)
2. Maternal diseases / conditions
- maternal disease complicating pregnancy
- maternal distress
3. Past obstetrical history
- previous Caesarean section
4. Antenatal / obstetric complications e.g. hypertension
5. Fetal and cord conditions
- fetal distress (except cord prolapse)
- cord prolapse / presentation
6. Labour and delivery problems
- prolonged second stage
- after-coming head of breech is EXCLUDED
7. Others
Indications for
Caesarean section
(maximum 3
indications)
1. Maternal disease / conditions
- GDM / DM
- maternal disorders
2. Past obstetrical history
- previous sections / uterine scar
- bad obstetrical history
3. Antenatal / obstetric complications
- antepartum haemorrhage
- hypertensive disorders
- multiple pregnancy
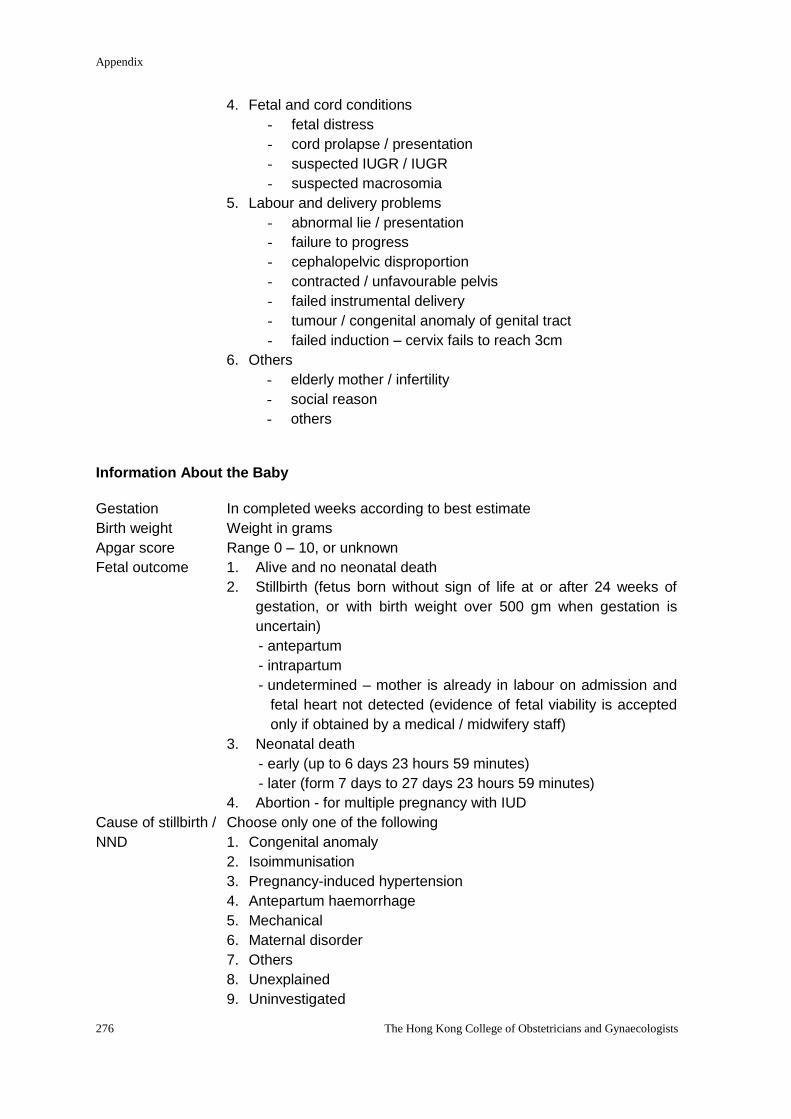
Appendix
276 The Hong Kong College of Obstetricians and Gynaecologists
4. Fetal and cord conditions
- fetal distress
- cord prolapse / presentation
- suspected IUGR / IUGR
- suspected macrosomia
5. Labour and delivery problems
- abnormal lie / presentation
- failure to progress
- cephalopelvic disproportion
- contracted / unfavourable pelvis
- failed instrumental delivery
- tumour / congenital anomaly of genital tract
- failed induction – cervix fails to reach 3cm
6. Others
- elderly mother / infertility
- social reason
- others
Information About the Baby
Gestation In completed weeks according to best estimate
Birth weight Weight in grams
Apgar score Range 0 – 10, or unknown
Fetal outcome 1. Alive and no neonatal death
2. Stillbirth (fetus born without sign of life at or after 24 weeks of
gestation, or with birth weight over 500 gm when gestation is
uncertain)
- antepartum
- intrapartum
- undetermined – mother is already in labour on admission and
fetal heart not detected (evidence of fetal viability is accepted
only if obtained by a medical / midwifery staff)
3. Neonatal death
- early (up to 6 days 23 hours 59 minutes)
- later (form 7 days to 27 days 23 hours 59 minutes)
4. Abortion - for multiple pregnancy with IUD
Cause of stillbirth /
NND
Choose only one of the following
1. Congenital anomaly
2. Isoimmunisation
3. Pregnancy-induced hypertension
4. Antepartum haemorrhage
5. Mechanical
6. Maternal disorder
7. Others
8. Unexplained
9. Uninvestigated
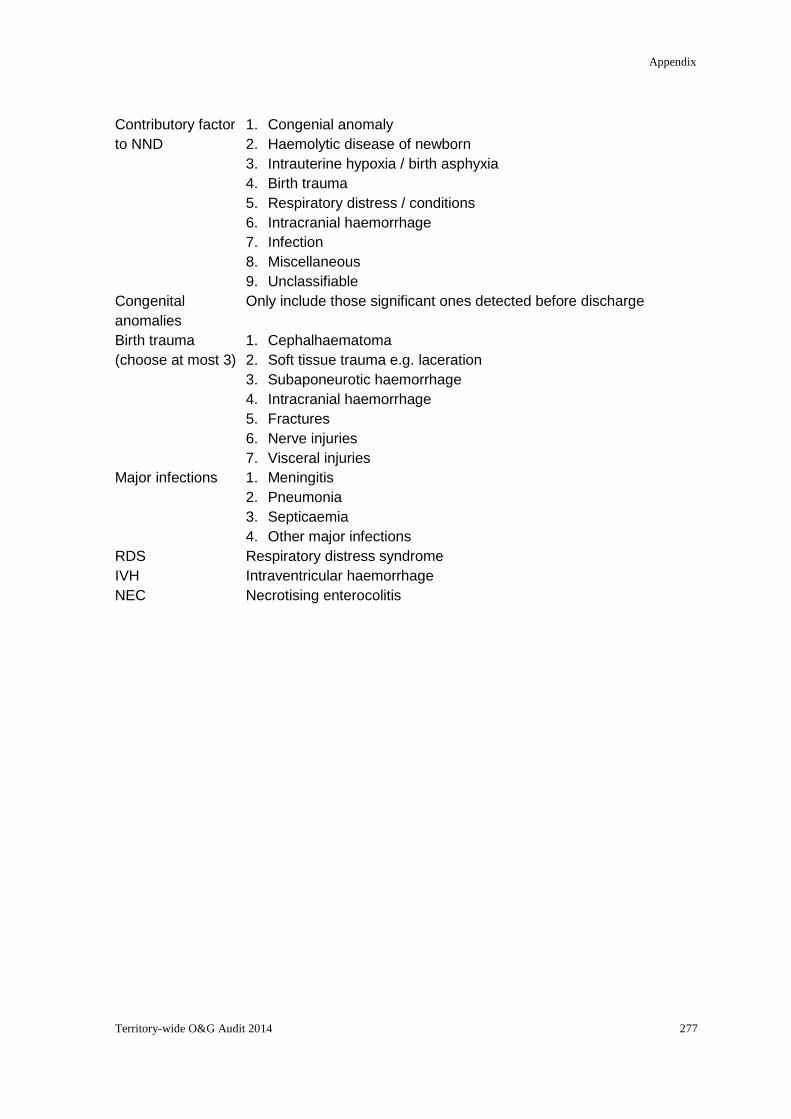
Appendix
Territory-wide O&G Audit 2014 277
Contributory factor
to NND
1. Congenial anomaly
2. Haemolytic disease of newborn
3. Intrauterine hypoxia / birth asphyxia
4. Birth trauma
5. Respiratory distress / conditions
6. Intracranial haemorrhage
7. Infection
8. Miscellaneous
9. Unclassifiable
Congenital
anomalies
Only include those significant ones detected before discharge
Birth trauma
(choose at most 3)
1. Cephalhaematoma
2. Soft tissue trauma e.g. laceration
3. Subaponeurotic haemorrhage
4. Intracranial haemorrhage
5. Fractures
6. Nerve injuries
7. Visceral injuries
Major infections 1. Meningitis
2. Pneumonia
3. Septicaemia
4. Other major infections
RDS Respiratory distress syndrome
IVH Intraventricular haemorrhage
NEC Necrotising enterocolitis
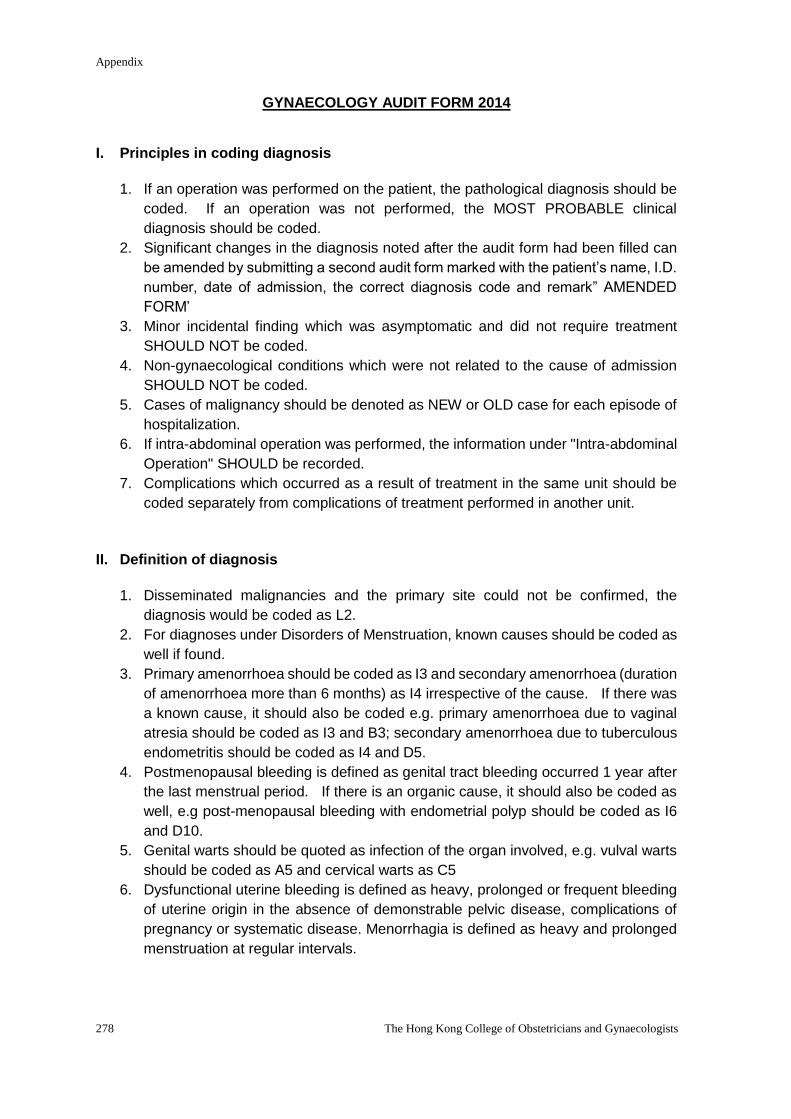
Appendix
278 The Hong Kong College of Obstetricians and Gynaecologists
GYNAECOLOGY AUDIT FORM 2014 I. Principles in coding diagnosis
1. If an operation was performed on the patient, the pathological diagnosis should be
coded. If an operation was not performed, the MOST PROBABLE clinical
diagnosis should be coded.
2. Significant changes in the diagnosis noted after the audit form had been filled can
be amended by submitting a second audit form marked with the patient’s name, I.D.
number, date of admission, the correct diagnosis code and remark” AMENDED
FORM’
3. Minor incidental finding which was asymptomatic and did not require treatment
SHOULD NOT be coded.
4. Non-gynaecological conditions which were not related to the cause of admission
SHOULD NOT be coded.
5. Cases of malignancy should be denoted as NEW or OLD case for each episode of
hospitalization.
6. If intra-abdominal operation was performed, the information under "Intra-abdominal
Operation" SHOULD be recorded.
7. Complications which occurred as a result of treatment in the same unit should be
coded separately from complications of treatment performed in another unit.
II. Definition of diagnosis
1. Disseminated malignancies and the primary site could not be confirmed, the
diagnosis would be coded as L2.
2. For diagnoses under Disorders of Menstruation, known causes should be coded as
well if found.
3. Primary amenorrhoea should be coded as I3 and secondary amenorrhoea (duration
of amenorrhoea more than 6 months) as I4 irrespective of the cause. If there was
a known cause, it should also be coded e.g. primary amenorrhoea due to vaginal
atresia should be coded as I3 and B3; secondary amenorrhoea due to tuberculous
endometritis should be coded as I4 and D5.
4. Postmenopausal bleeding is defined as genital tract bleeding occurred 1 year after
the last menstrual period. If there is an organic cause, it should also be coded as
well, e.g post-menopausal bleeding with endometrial polyp should be coded as I6
and D10.
5. Genital warts should be quoted as infection of the organ involved, e.g. vulval warts
should be coded as A5 and cervical warts as C5
6. Dysfunctional uterine bleeding is defined as heavy, prolonged or frequent bleeding
of uterine origin in the absence of demonstrable pelvic disease, complications of
pregnancy or systematic disease. Menorrhagia is defined as heavy and prolonged
menstruation at regular intervals.
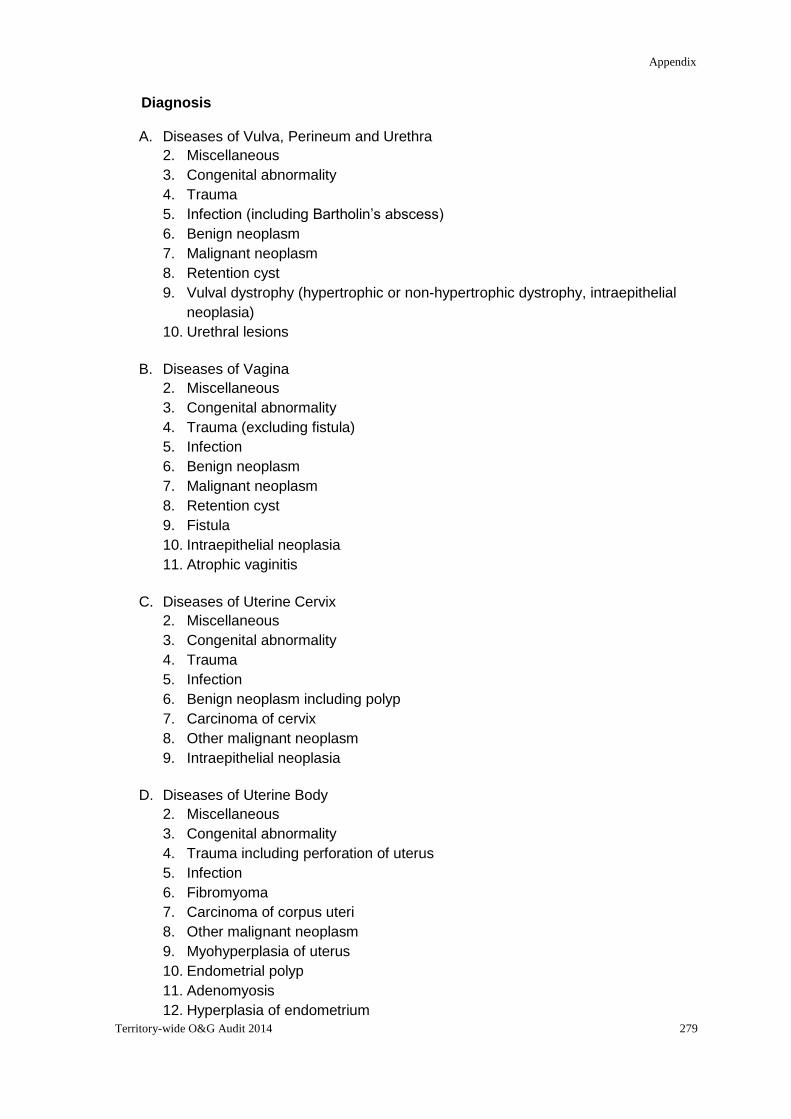
Appendix
Territory-wide O&G Audit 2014 279
Diagnosis A. Diseases of Vulva, Perineum and Urethra
2. Miscellaneous
3. Congenital abnormality
4. Trauma
5. Infection (including Bartholin’s abscess)
6. Benign neoplasm
7. Malignant neoplasm
8. Retention cyst
9. Vulval dystrophy (hypertrophic or non-hypertrophic dystrophy, intraepithelial
neoplasia)
10. Urethral lesions
B. Diseases of Vagina
2. Miscellaneous
3. Congenital abnormality
4. Trauma (excluding fistula)
5. Infection
6. Benign neoplasm
7. Malignant neoplasm
8. Retention cyst
9. Fistula
10. Intraepithelial neoplasia
11. Atrophic vaginitis
C. Diseases of Uterine Cervix
2. Miscellaneous
3. Congenital abnormality
4. Trauma
5. Infection
6. Benign neoplasm including polyp
7. Carcinoma of cervix
8. Other malignant neoplasm
9. Intraepithelial neoplasia
D. Diseases of Uterine Body
2. Miscellaneous
3. Congenital abnormality
4. Trauma including perforation of uterus
5. Infection
6. Fibromyoma
7. Carcinoma of corpus uteri
8. Other malignant neoplasm
9. Myohyperplasia of uterus
10. Endometrial polyp
11. Adenomyosis
12. Hyperplasia of endometrium
Appendix
280 The Hong Kong College of Obstetricians and Gynaecologists
13. Atrophic endometritis
E. Diseases of Fallopian Tubes
2. Miscellaneous
3. Acute pelvic inflammatory disease (acute salpingitis, acute salpingo-oophoritis,
pyosalpinx and tubo-ovarian abscess)
4. Chronic pelvic inflammatory disease (chronic salpingitis, chronic
salpingo-oophoritis, hydrosalpinx and tubo-ovarian cyst)
5. Tuberculous salpingitis
6. Benign neoplasm including para-tubal and fimbrial cysts
7. Malignant neoplasm
F. Diseases of Ovary
2. Miscellaneous
3. Retention cysts, follicular / corpus luteal cyst
4. Endometriotic cyst
5. Benign ovarian tumour / cyst
6. Primary malignant neoplasm – epithelial
7. Primary malignant neoplasm – non-epithelial
8. Secondary malignant neoplasm
9. Borderline malignant neoplasm
10. Dermoid cyst
11. Polycystic ovarian disease / syndrome
G. Diseases of Broad Ligaments and Pelvic Peritoneum
2. Miscellaneous
3. Pelvic endometriosis, including utero-sacral endometriosis
4. Paraovarian cyst
5. Peritoneal carcinoma
6. Recto-vaginal endometriosis
7. Bowel endometriosis
H. Genital displacement / Urinary Disorders
2. Miscellaneous
3. Prolapse of uterus
4. Anterior vaginal wall prolapse (Cystocoele, urethrocele, paravaginal defect)
5. Posterior vaginal wall prolapse (enterocoele, rectocoele perineal deficiency)
6. Vault prolapse
7. Genuine stress incontinence
8. Detrusor instability
9. Detrusor hyperreflexia 10. Sensory urgency 11. Voiding difficulty 12. Other urinary disorders
I. Disorders of Menstruation (Causes should be coded as well if found)
2. Miscellaneous
3. Primary amenorrhoea
Appendix
Territory-wide O&G Audit 2014 281
4. Secondary amenorrhoea
5. Dysfunctional uterine bleeding
6. Postmenopausal bleeding
7. Dysmenorrhoea
8. Menorrhagia
J. Disorders of Pregnancy & Reproduction
2. Miscellaneous
3. Subfertility
4. Vomiting in pregnancy
5. Threatened miscarriage
6. Spontaneous / Silent / Incomplete miscarriage
7. Complete hydatidiform mole
8. Partial hydatidiform mole
9. Residual trophoblastic disease
10. Metastatic malignant trophoblastic neoplasia, chorioepithelioma, placental site
trophoblastic tumour
11. Secondary postpartum haemorrthage
12. Other postpartum complications
13. Tubal ectopic pregnancy
14. Conditions leading to termination of pregnancy – 1st trimester (≤12 weeks)
15. Conditions leading to termination of pregnancy – 2nd trimester (>12 weeks)
16. Conditions leading to sterilization/tubal occlusion
17. Pregnancy after sterilization/tubal occlusion
18. Conditions leading to tubal reversal
19. Failed/Incomplete miscarriage after medical abortion/evacuation
20. Non-tubal ectopic pregnancy
21. Ovarian hyperstimulation syndrome
K. Disease Complications in Pregnancy
2. Benign neoplasm of genital tract
3. Malignant neoplasm of genital tract
4. Medical disease
5. Surgical disease
6. Non-specific abdominal pain complicating pregnancy
L. Miscellaneous Gynaecological Conditions
2. Miscellaneous
3. Retained IUCD
4. Abdominal or pelvic pain of unknown cause
5. Complication of previous treatment / procedure performed in the same unit
(outpatient or inpatient)
6. Complication of previous treatment / procedure performed outside the unit
7. Translocated IUCD
M. Miscellaneous Conditions
1. No disease identified
Appendix
282 The Hong Kong College of Obstetricians and Gynaecologists
2. Miscellaneous
3. Diseases of breasts
4. Diseases of urinary tract
5. Diseases of gastrointestinal tract
6. Diseases of cardiovascular system
7. Diseases of respiratory system
8. Diseases of central nervous system
9. Diseases of endocrine
10. Diseases of blood
11. Diseases of skin / musculoskeletal system
III. Coding for operations / treatment
1. Coding for Major Abdominal Operations for "Benign and Pre-malignant Conditions"
and that for "Malignant Conditions" are combined.
2. Laparscopic and hysteroscopic procedures are separately coded.
3. All operative procedures should be coded e.g. salpingectomy after diagnostic
laparoscopy should be coded as B33 and A13.
4. Medical treatment for ectopic pregnancy using methotrexate should be coded as
K7. If subsequent surgery (e.g. laparoscopic salpingectomy) is also required, the
exact procedure should also be quoted (K7 and B13).
5. Medical treatment for miscarriage using prostaglandins should be coded as K5. If
subsequent evacuation of uterus is also required, the treatment should be quoted
as K5 and I5.
6. Dilatation and Curettage (D&C) or obtaining endometrium with a curette should be
quoted as I3. Any other form of endometrial biopsy using special designed device
such as endometrial sampler or Vabra aspirator should be quoted as I10.
7. Salpingo-oophorectomy, oophorectomy or salpingectomy performed at the time of
hysterectomy should be quoted separately.
8. Debulking operation (A24) is defined as removal of gross tumour from sites other
than uterus, tubes and ovaries (i.e. beyond a hysterectomy and
salpingo-oophorectomy). Removal of tumour bulk in POD in addition to a TAHBSO
should be coded as A24, A3 & A12. Omentectomy (A27) for gross tumour in the
omentum however should be coded as both B7 & A27.
9. For laparoscopic surgery for endometriosis, if the disease, including ovarian cyst
wall, is cauterised with electrosurgery or vapourised with laser, it should be coded
as laparoscopic ablation of endometriosis (B20). If the disease is excised, it should
be coded as laparoscopic resection of endometriosis (B22) or laparoscopic ovarian
cystectomy in case of endometriotic cyst (E14).
10. For laparoscopic hysterectomy, TLH (B3a) (Total laparoscopic hysterectomy)
refers to entire operation performed laparoscopically, including suturing of the
vaginal vault. LAVH (B3b) (Laparoscopic-assisted vaginal hysterectomy) refers to
a combined laparoscopic and vaginal approach with division of uterine artery
performed vaginally. LHa (B3c) (Laparoscopic hysterectomy) refers to a combined
laparoscopic and vaginal approach with laparoscopic division of the uterine artery;
the remainder of the procedure is completed vaginally.
11. Robotic assisted surgery is considered as laparoscopic surgery and should be
Appendix
Territory-wide O&G Audit 2014 283
coded as B1 together with the exact procedure performed. For example, robotic
assisted radical hysterectomy and pelvic lymph node dissection should be coded
as B1, B6, B25.
12. If LNG-LUS is inserted for treatment of menorrhagia, adenomyosis or
endometriosis, i.e, for non-contraceptive purpose, it should be coded as I12.
However, if LNG-LUS is inserted for contraceptive purpose, it should be coded as
I11.
Treatment
A. Major Abdominal Operations (Laparotomy)
2. Miscellaneous
3. Total hysterectomy
4. Subtotal hysterectomy
5. Extended hysterectomy
6. Radical hysterectomy
7. Myomectomy
8. Adenomyomectomy
9. Trachelectomy
10. Ovarian cystectomy / excision of ovarian lesions
11. Oophorectomy
12. Salpingo-oophorectomy
13. Salpingectomy
14. Salpingotomy / Salpingostomy
15. Neo-salpingostomy
16. Tubal re-anastomosis
17. Excision of para-ovarian / paratubal / fimbrial cysts
18. Adhesiolysis
19. Drainage of pelvic abscess
20. Ablation of endometriosis
21. Resection of pelvic endometriosis
22. Resection of bowel endometriosis
23. Pelvic exenteration
24. Debulking operation
25. Pelvic lymphadenectomy / lymph node sampling
26. Para-aortic lymphadenectomy / lymph node sampling
27. Omentectomy
28. Surgery for genital prolapse
29. Surgery for stress incontinence
30. Repair of urinary fistulae
31. Ureteric repair / reimplantation
32. Bowel resection /anastomosis / stoma
33. Laparotomy alone +/- biopsy
B. Laparoscopic Operations (including Robotic assisted)
1. Robotic surgery (the exact procedures need to be coded as well)
2. Miscellaneous
Appendix
284 The Hong Kong College of Obstetricians and Gynaecologists
3. Total hysterectomy
a. TLH (Total laparoscopic hysterectmy)
b. LAVH (Laparoscopic-assisted vaginal hysterectomy)
c. LHa (Laparoscopic hysterectomy)
4. Subtotal hysterectomy
5. Extended hysterectomy
6. Radical hysterectomy
7. Myomectomy
8. Adenomyomectomy
9. Trachelectomy
10. Ovarian cystectomy / excision of ovarian lesions
11. Oophorectomy
12. Salpingo-oophorectomy
13. Salpingectomy
14. Salpingotomy / Salpingostomy
15. Neo-salpingostomy
16. Tubal re-anastomosis
17. Excision of para-ovarian / paratubal / fimbrial cysts
18. Adhesiolysis
19. Drainage of pelvic abscess
20. Ablation of endometriosis
21. Resection of pelvic endometriosis
22. Resection of bowel endometriosis
23. Pelvic exenteration
24. Debulking operation
25. Pelvic lymphadenectomy / lymph node sampling
26. Para-aortic lymphadenectomy / lymph node sampling
27. Omentectomy
28. Surgery for genital prolapse
29. Surgery for stress incontinence
30. Repair of urinary fistulae
31. Ureteric repair / reimplantation
32. Bowel resection /anastomosis / stoma
33. Diagnostic laparoscopy +/- biopsy +/- chromotubation
34. Laparosopic ovarian drilling
35. Laparoscopic myolysis
36. Laparoscopic tubal occlusion/sterilization
C. Major Vaginal Operations
2. Miscellaneous
3. Surgery for urinary incontinence
4. Vaginal hysterectomy
5. Repair of prolapse without using mesh
6. Repair of prolapse using mesh
7. Repair of vault prolapse
8. Vaginal myomectomy
9. Vaginectomy
Appendix
Territory-wide O&G Audit 2014 285
10. Vaginal stripping
11. Vaginal reconstruction
12. Repair of urinary fistulae
13. TVT-O/TVT/TOT
D. Major Vulval Operations
2. Miscellaneous
3. Radical vulvectomy
4. Simple vulvectomy
5. Wide local excision
6. Groin node dissection
E. Hysteroscopic Procedures
2. Miscellaneous
3. Diagnostic hysteroscopy
4. Proximal tubal cannulation
5. Endometrial resection / ablation
6. Hysteroscopic polypectomy
7. Hysteroscopic myomectomy
8. Hysteroscopic division of uterine septum
9. Hysteroscopic division of adhesion
F. Colposcopy Related Procedures
2. Miscellaneous (including cervical biopsy)
3. Cervical cautery / cryotherapy / cold coagulation
4. Laser vaporization of cervical / vaginal / vulval lesions
5. Laser cone
6. Loop electro-surgical excision procedure (LEEP)
7. Cone biopsy
G. Assisted Reproduction Procedures
2. Miscellaneous
3. Ultrasound guided oocyte retrieval
4. Laparoscopic oocyte retrieval
5. Gamete intrafallopian transfer
6. Pronuclear stage tubal transfer
7. Fresh embryo transfer
8. Frozen-thawed embryo transfer
9. Controlled ovarian hyperstimulation
10. Intrauterine insemination
11. Intra-cytoplasmic sperm injection
H. Minor Abdominal Operation
2. Miscellaneous
3. Tubal ligation /occlusion
4. Resuturing of abdominal wound
5. Removal of abdominal/pelvic translocated IUCD
Appendix
286 The Hong Kong College of Obstetricians and Gynaecologists
I. Other Minor Operations
2. Miscellaneous
3. Diagnostic curettage (including avulsion of polyp)
4. Therapeutic abortions (suction evacuation)
5. Evacuation of retained products of conception (including suction evacuation of
silent / incomplete miscarriage, post-medical evacuation)
6. Marsupialization
7. Cervical cerclage
8. Other minor vulval operations (including evacuation of vulval haematoma,
vulval biopsy)
9. E.U.A.
10. Endometrial biopsy
11. Insertion / Removal of IUCD
12. Insertion of LNG-IUS for non-contraceptive purpose
J. Radiotherapy
2. Miscellaneous
3. Intracavitary radium / cesium
4. External irradiation
K. Other Forms of Treatment
2. Miscellaneous
3. Observation and investigation
4. Antibiotic as primary treatment
5. Prostaglandins
6. Hormones (O.C. progestogens, danazol, GnRHa)
7. Chemotherapy
8. Other medication
9. Pre-anaesthetic assessment
10. Uterine artery embolization
11. High intensity / focused ultrasound therapy

Related Documents