Terapia dei tumori chirurgia Stadio I-II chemioterapia primaria chirurgia Stadio III chemioterapia della malattia metastatica radioterapia chirurgia Stadio IV guarigione guarigione prolungamento della sopravvivenza prolungamento della sopravvivenza palliazione

Welcome message from author
This document is posted to help you gain knowledge. Please leave a comment to let me know what you think about it! Share it to your friends and learn new things together.
Transcript

Terapia dei tumori
chirurgia
Stadio I-II
chemioterapia primaria
chirurgia
Stadio III
chemioterapia della malattia metastatica
radioterapia chirurgia
Stadio IV
guarigione
guarigione prolungamento
della sopravvivenza
prolungamento della sopravvivenza
palliazione

Obiettivi della chemioterapia antitumorale negli stadi avanzati (stadio IV)
Riduzione della massa tumorale
Aumento della sopravvivenza
Beneficio sui sintomi

Sviluppo storico della chemioterapia antineoplastica
1945
1950
1955
1960
1965
1970
Mecloretamina
Metotrexato 6-Mercaptopurina Busulfan
Clorambucil Ciclofosfamide
Vinblastina, vincristina Fluorouracile, actinomicina D Melfalan
Procarbazina, 6-tioguanina Citosina arabinoside Adriamicina
• Prima chemioterapia adiuvante con actinomicina D nel tumore di Wilms
da G. Bonadonna, 1999 (modificata)
Bleomicina, dacarbazina

Sviluppo storico della chemioterapia antineoplastica (II)
1975
1980
1985
1990
1995
CCNU, BCNU, cisplatino
Etoposide, mitoxantrone
Carboplatino Ifofosfamide + MESNA
Paclitaxel, docetaxel Topotecan, irinotecan Gemcitabina Oxaliplatino
• Trapianto autologo con GM-CSF • Espansione chemioterapia primaria
da G. Bonadonna, 1999 (modificata)
• CMF adiuvante nel ca. mammario • Terapia adiuvante nell’osteosarcoma • Trapianto di midollo osseo • PVB nei tumori del testicolo
• Inizio chemioterapia primaria in vari tumori solidi resecabili
2000
• Terapia antiemetica
Target therapy

Tossicità arigenerativa dei chemioterapici antitumorali
•Amenorrea, azoospermia GONADI
•Alopecia CUTE ED ANNESSI CUTANEI
•Stomatite
•Enterite arigenerativa
•Colite mucosa-membranosa
•Diarrea
MUCOSA GASTRO-INTESTINALE
•Leucopenia, immunodepressione,
•Piastrinopenia
•Anemia
MIDOLLO OSSEO EMATOPOIETICO
Farmaci NON target!

Adverse skin effects after anti EGFR treatment
A

Changing of the Guard
A Paradigm Shift in the Treatment of Cancer
• Conventional cytotoxic drugs interact with DNA to prevent cell replication but are not specific to cancer cells
• We are moving to targeted therapies which specifically target cancer cells
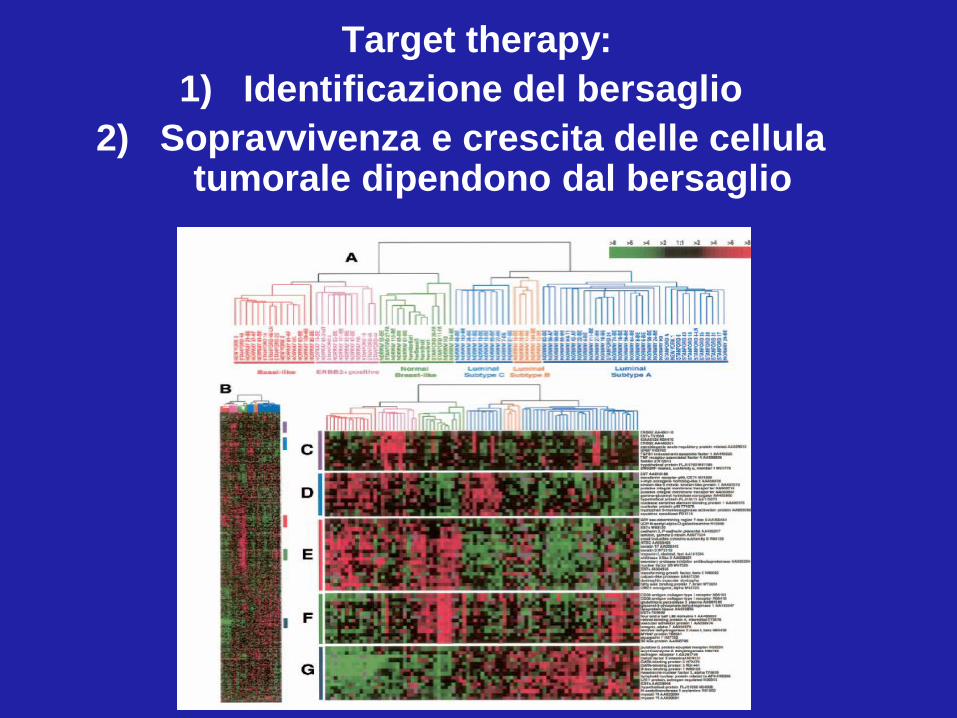
Target therapy:
1) Identificazione del bersaglio
2) Sopravvivenza e crescita delle cellula tumorale dipendono dal bersaglio
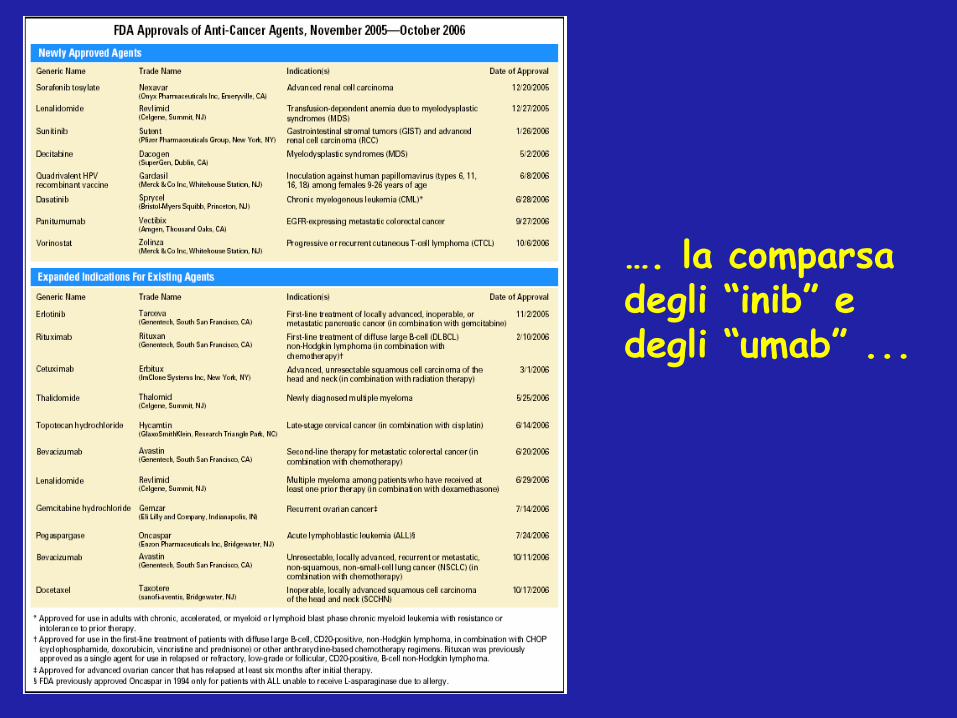
…. la comparsa degli “inib” e degli “umab” ...

Targeted Therapies
• Monoclonal antibodies: proteine che si legano a recettore o altra molecola di segnale extracellulare
• Tyrosine Kinase Inhibitors: molecola che lega e inibisce attività enzimatiche intracellulari
• Gli “umab
• Gli “inib”

Lo sviluppo degli “umab” e degli “inib” segue quello dei chemioterapici antitumorali
Acquisizione
Screening
Produzione e Formulazione
Studi clinici di fase I
Studi clinici di fase II
Studi clinici di fase III
Pratica clinica
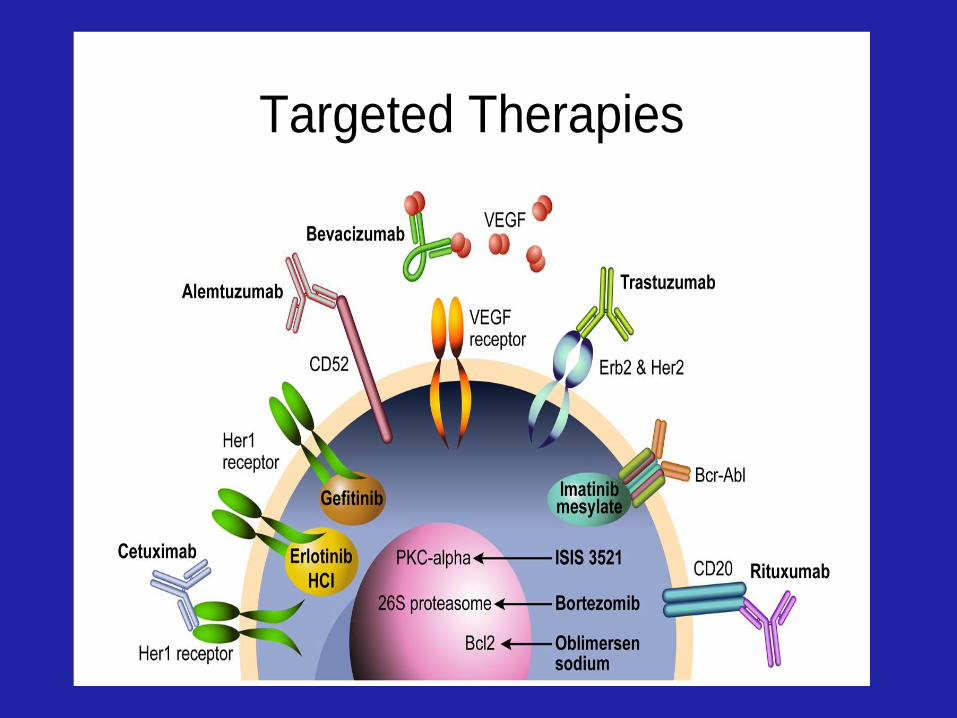
Targeted Therapies

Anticorpi monoclonali
….gli “umab”
Inibitori della trasduzione del segnale
…” gli “inib”
Rituximab (CD20) Imatinib mesilato ( bcr-abl -,
c-kit-, PDGF-TKs)
Trastuzumab (HER2) Gefitinib ( EGFR-TK)
Erlotinib ( EGFR-TK)
Cetuximab & Panitumumab (EGFR)
Bortezomib ( proteasoma)
Sorafenib, Sunitinib
Bevacizumab (VEGF)
Farmaci a Berasglio
Molecolare
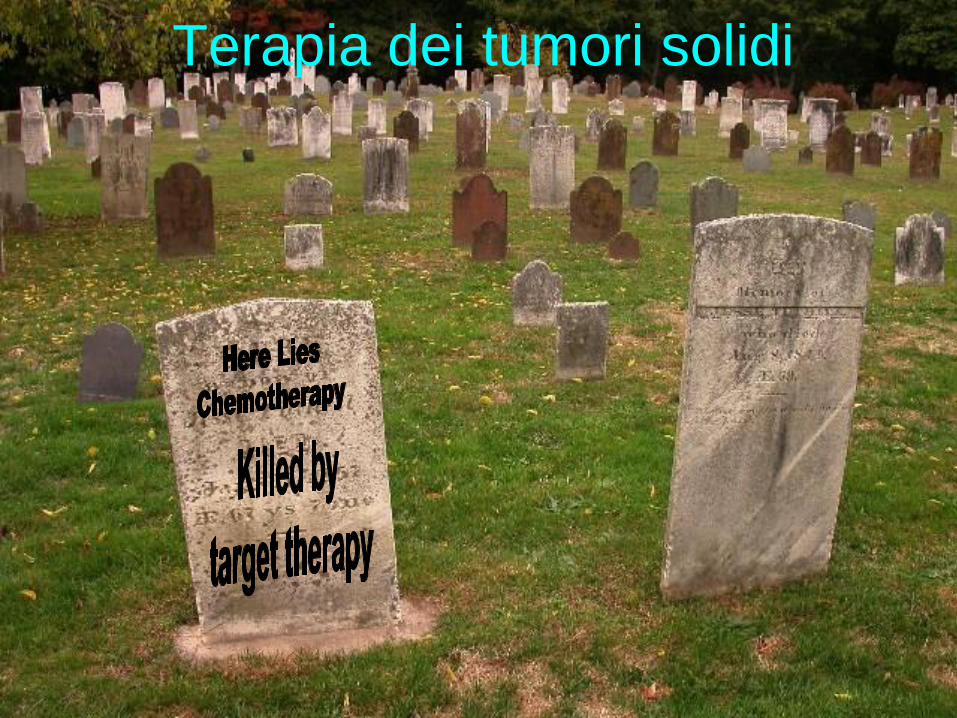
Terapia dei tumori solidi
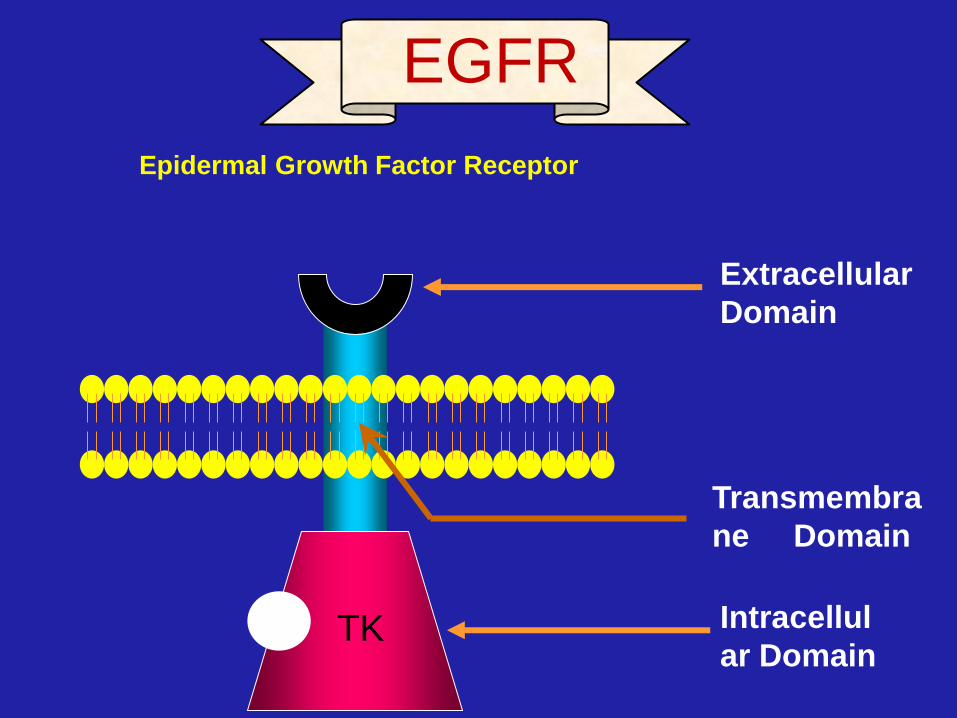
TK Intracellul
ar Domain
Transmembra
ne Domain
Extracellular
Domain
EGFR
Epidermal Growth Factor Receptor
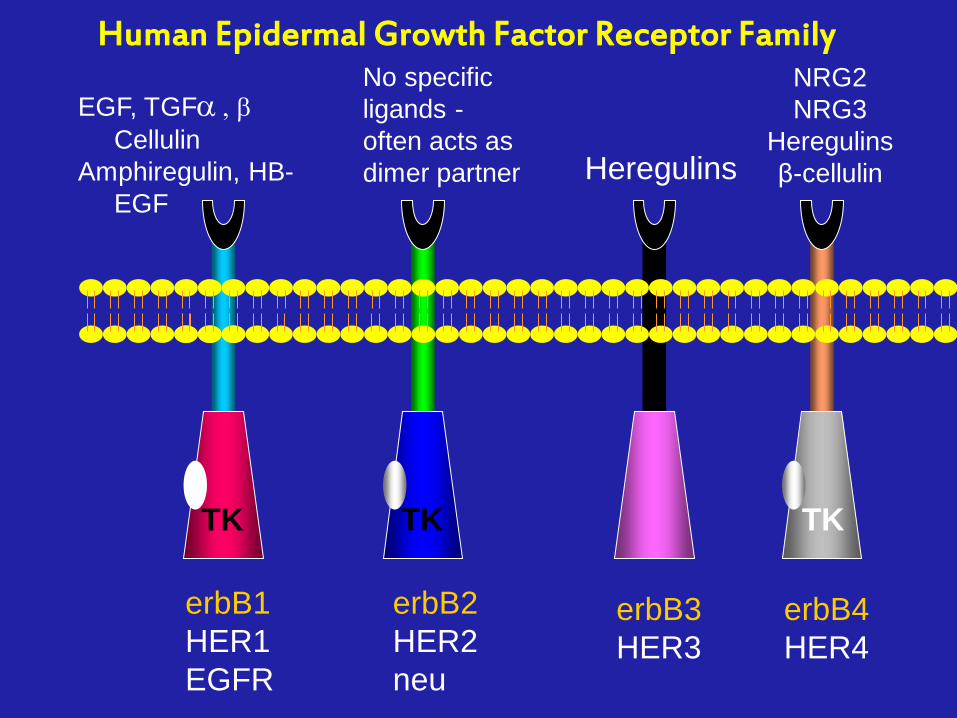
TK TK TK
erbB1
HER1
EGFR
erbB2
HER2
neu
erbB3
HER3
erbB4
HER4
No specific
ligands -
often acts as
dimer partner Heregulins
NRG2
NRG3
Heregulins
β-cellulin
EGF, TGFa , b
Cellulin
Amphiregulin, HB-
EGF
Human Epidermal Growth Factor Receptor Family

Normal Cell Cancer Cell
Epidermal Growth Factor Receptor

EGFR expression in solid tumors
Lung
(NSCLC)
Colorectal
Head & Neck
(SCC)
Colorectal cancer
(advanced) 75-82%
Lung cancer (NSCLC) 40-91%
Head & neck cancer
(SCCHN)
90-
100%
Gastric cancer 33-74%
Ovarian cancer 35-70%
EGFR is expressed in a variety
of solid tumors
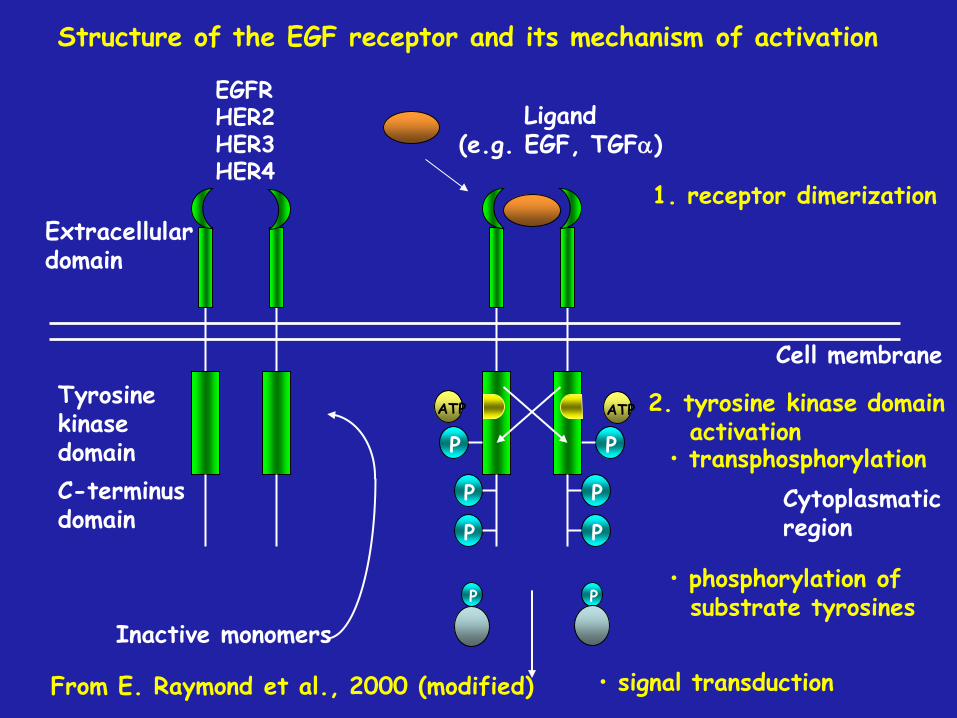
Extracellular domain
Tyrosine kinase domain
C-terminus domain
P
P
P
P
P
P
ATP ATP
Cell membrane
Ligand (e.g. EGF, TGFa)
1. receptor dimerization
2. tyrosine kinase domain activation
Cytoplasmatic region
• signal transduction
• transphosphorylation
• phosphorylation of substrate tyrosines
Inactive monomers
EGFR HER2 HER3 HER4
Structure of the EGF receptor and its mechanism of activation
From E. Raymond et al., 2000 (modified)
P P
TK TK
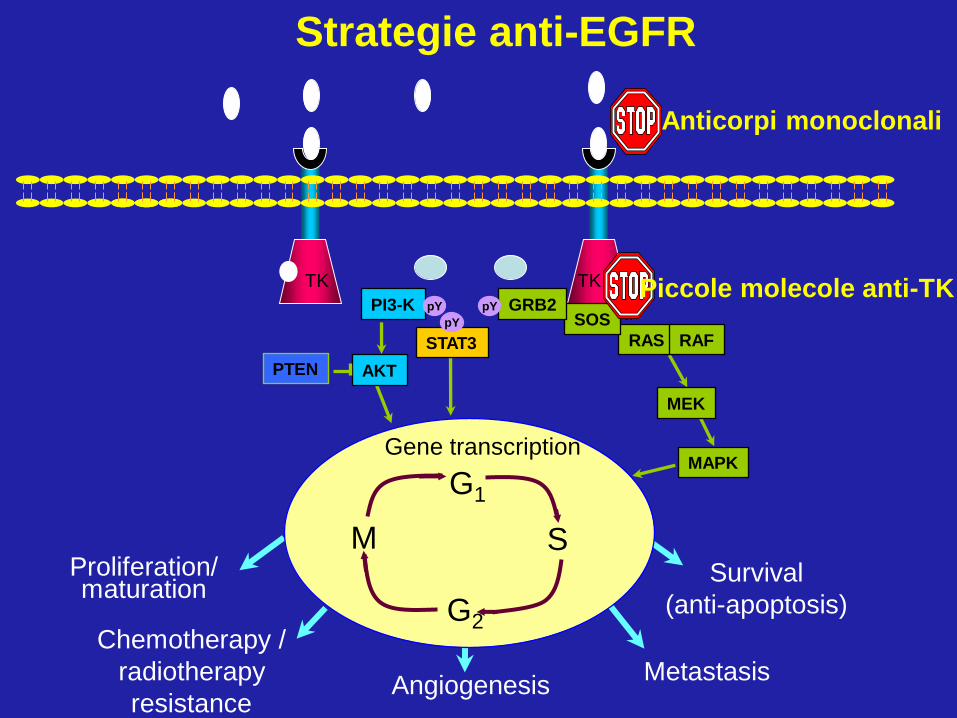
Survival
(anti-apoptosis)
PI3-K
STAT3
AKT PTEN
MEK
Gene transcription MAPK
Proliferation/ maturation
Chemotherapy /
radiotherapy
resistance Angiogenesis
Metastasis
pY
pY
RAS RAF
SOS GRB2 pY
G1
S M
G2
Anticorpi monoclonali
Piccole molecole anti-TK
Strategie anti-EGFR

Anti-EGFR
Cetuximab Panitumumab
cetuximab matuzumab panitumumab
100% Mouse 34% Mouse 10% Mouse 100% Human
Mouse Fully Human Humanized Chimeric
Anti EGFR antibody
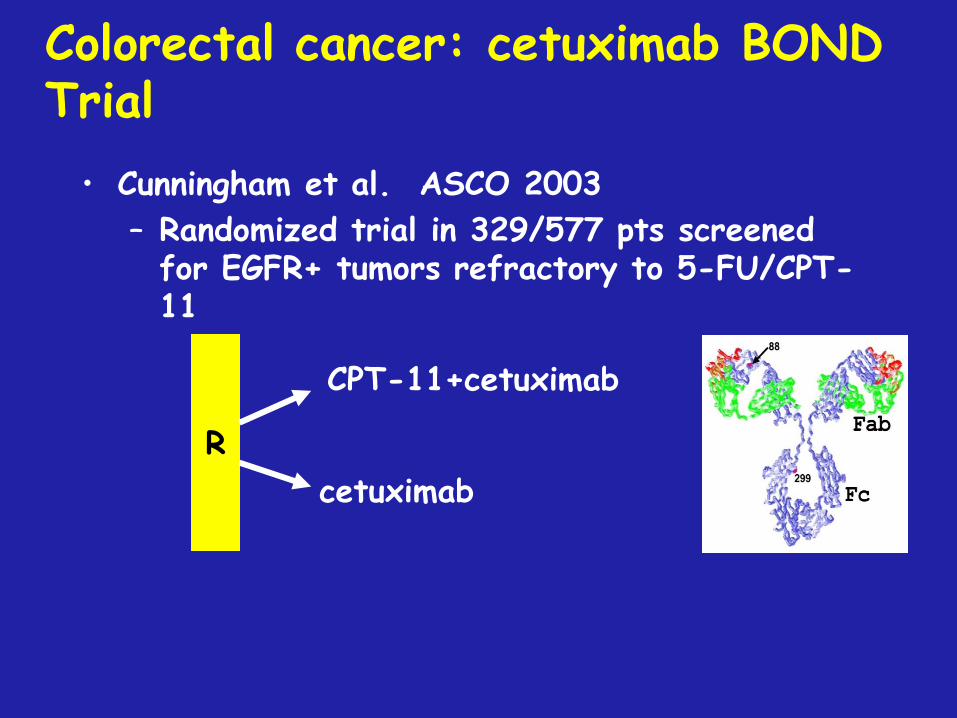
Colorectal cancer: cetuximab BOND Trial
• Cunningham et al. ASCO 2003
– Randomized trial in 329/577 pts screened for EGFR+ tumors refractory to 5-FU/CPT-11
CPT-11+cetuximab
cetuximab
R

0
0,2
0,4
0,6
0,8
1
0 2 4 6 8 10 12
MONTHS
PR
OP
OR
TIO
N
Mono Combo N 111 218 No. events 92 152 Median 1.5 4.1
HR (95% CI): 0.54 (0.42; 0.71) log rank p-value < 0.0001
0
0,2
0,4
0,6
0,8
1
0 2 4 6 8 10 12 14 16
MONTHS
PR
OP
OR
TIO
N
Mono Combo N 111 218 No. events 75 140 Median 6.9 8.6
HR (95% CI): 0.91 (0.68; 1.21) log rank p-value = 0.48
Cetuximab vs. CPT-11+Cetuximab in CPT-11 refractory CRC
Patient
s su
rviving
(%)
Patient
s fr
ee o
f pr
ogre
ssion
(%)
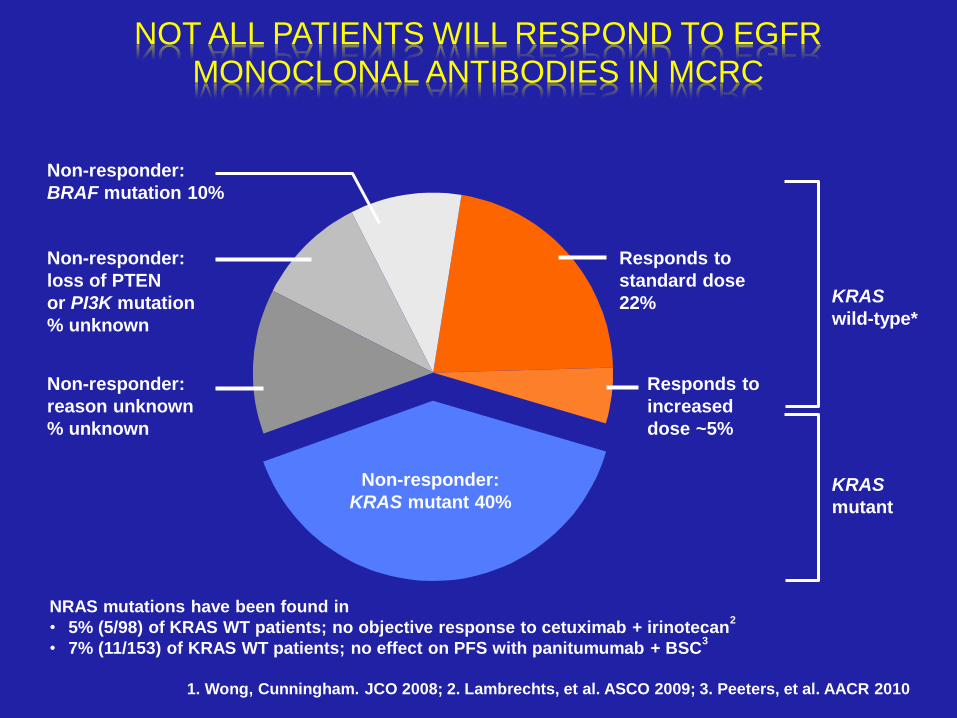
Responds to
standard dose
22%
Responds to
increased
dose ~5%
Non-responder:
KRAS mutant 40%
Non-responder:
BRAF mutation 10%
Non-responder:
loss of PTEN
or PI3K mutation
% unknown
Non-responder:
reason unknown
% unknown
KRAS
wild-type*
KRAS
mutant
NOT ALL PATIENTS WILL RESPOND TO EGFR
MONOCLONAL ANTIBODIES IN MCRC
1. Wong, Cunningham. JCO 2008; 2. Lambrechts, et al. ASCO 2009; 3. Peeters, et al. AACR 2010
NRAS mutations have been found in
• 5% (5/98) of KRAS WT patients; no objective response to cetuximab + irinotecan2
• 7% (11/153) of KRAS WT patients; no effect on PFS with panitumumab + BSC3
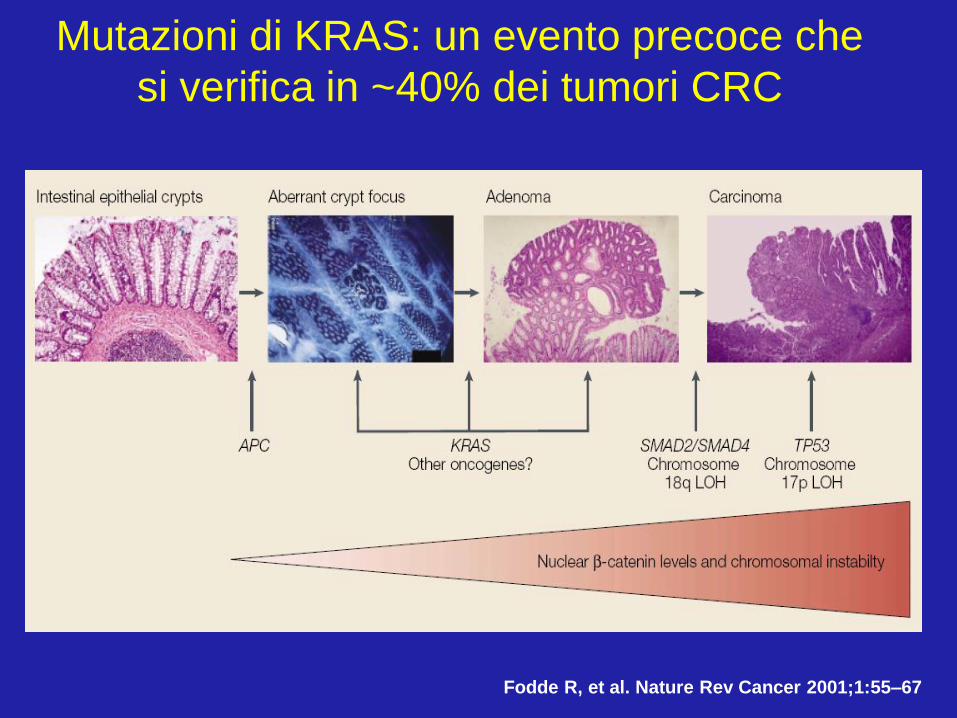
Fodde R, et al. Nature Rev Cancer 2001;1:55–67
Mutazioni di KRAS: un evento precoce che
si verifica in ~40% dei tumori CRC

Normanno Nat Rev Clin Oncol 2009
Frequenza delle mutazioni di KRAS nei pazienti
con CRC

KRAS wt è presente in circa il 60% dei pazienti con CRC metastatico
Van Cutsem E, et al. N Engl J Med 2009;360:1408–1417;
Van Cutsem E, et al. J Clin Oncol 2010;28(Suppl. 15):Abstract No. 3570
Come un biomarcatore predittivo può ottimizzare
l’outcome: KRAS
KRAS wt population
Ove
rall
su
rviv
al
es
tim
ate
0.0
0.2
0.4
0.6
0.8
1.0
18 0 6 12 24 54 30 36 42 48
Time (months)
ERBITUX + FOLFIRI (n=316)
FOLFIRI (n=350)
20 23.5
HR=0.80
Overall patient
population
19.9
18.6
0.0
0.2
0.4
0.6
0.8
1.0
18 0 6 12 24 30 36
Time (months)
Ove
rall
su
rviv
al
es
tim
ate
HR=0.93
ERBITUX + FOLFIRI (n=599)
FOLFIRI (n=599)
STUDIO CRYSTAL

CRYSTAL trial: Surgery with curative intent
2,5
1,5
6
4,3
0
1
2
3
4
5
6
7
Surgery with curative
intent
No residual tumor after
resection
Percen
tag
e (
%)
*CMH test n=599 / group n=599 / group
p=0.0034*
odds ratio 3.0
[95% CI: 1.4 - 6.5]
FOLFIRI alone Cetuximab + FOLFIRI
4.5
9.8
0
1
2
3
4
5
6
7
8
9
10
Pe
rce
nta
ge (%
)
n=134 / n=122
No residual tumor in patients
with liver metastases
ITT population
(pre-planned) Liver metastases only population
(exploratory)
Van Cutsem et al. ASCO 2007
This improvement obtained in the absence of superimposed post-operative complications

And Panitumumab…..
• Conferma efficacia dei farmaci anti-
EGFR in termini di aumento della
risposta rispetto alla sola chemioterapia
-> applicazione clinica in paziente K-ras
wt con meta epatiche potenzialmente
resecabili o in pazienti fortemente
sintomatici
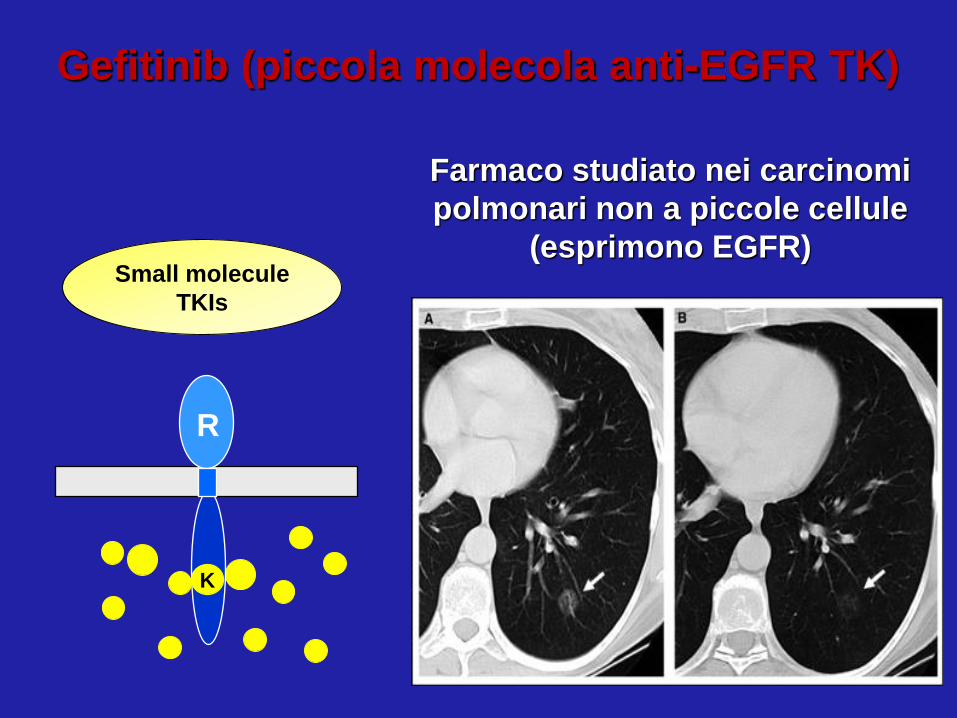
Gefitinib (piccola molecola anti-EGFR TK)
Farmaco studiato nei carcinomi
polmonari non a piccole cellule
(esprimono EGFR) Small molecule
TKIs
R
K

IRESSA
• è indicato nel trattamento di pazienti adulti con
• carcinoma polmonare non a piccole cellule (NSCLC)
• localmente avanzato o metastatico
• con mutazione attivante l’EGFR-TK
Approvazione EMEA 24 giugno 2009
indicazione include la prima linea di trattamento

Previously
untreated
NSCLC patients
(N = 1217)
Up to six
3-wk cycles
Gefitinib 250 mg/day PO
(n = 609)
Paclitaxel 200 mg/m2 IV on Day 1 +
Carboplatin AUC 5-6 mg/mL/min IV on Day 1
(n = 608)
Mok TS, et al. N Engl J Med. 2009;361:247-257.
IPASS Study Design

609
453 (74.4%)
608
497 (81.7%)
N
Events
HR (95% CI) = 0.741 (0.651, 0.845) p<0.0001
Gefitinib
Primary objective exceeded: Gefitinib
demonstrated superiority relative to carboplatin /
paclitaxel in terms of PFS
Carboplatin /
paclitaxel
Carboplatin /
paclitaxel
Gefitinib
Median PFS (months) 4 months progression-free 6 months progression-free 12 months progression-free
5.7 61% 48% 25%
5.8 74% 48% 7%
609 212 76 24 5 0
608 118 22 3 1 0
363
412
0 4 8 12 16 20 24 Months
0.0
0.2
0.4
0.6
0.8
1.0 Probability
of PFS
At risk :
Objective response rate 43% vs 32% p=0.0001
IPASS: PFS e ORR


Normal Cell Cancer Cell
Overexpression
+
mutation

85% circa
di queste mutazioni
delezioni multinucleotidiche
“in-frame” (ESONE 19) mutazioni
puntiformi
(ESONE 21)
MUTAZIONI DI EGFR
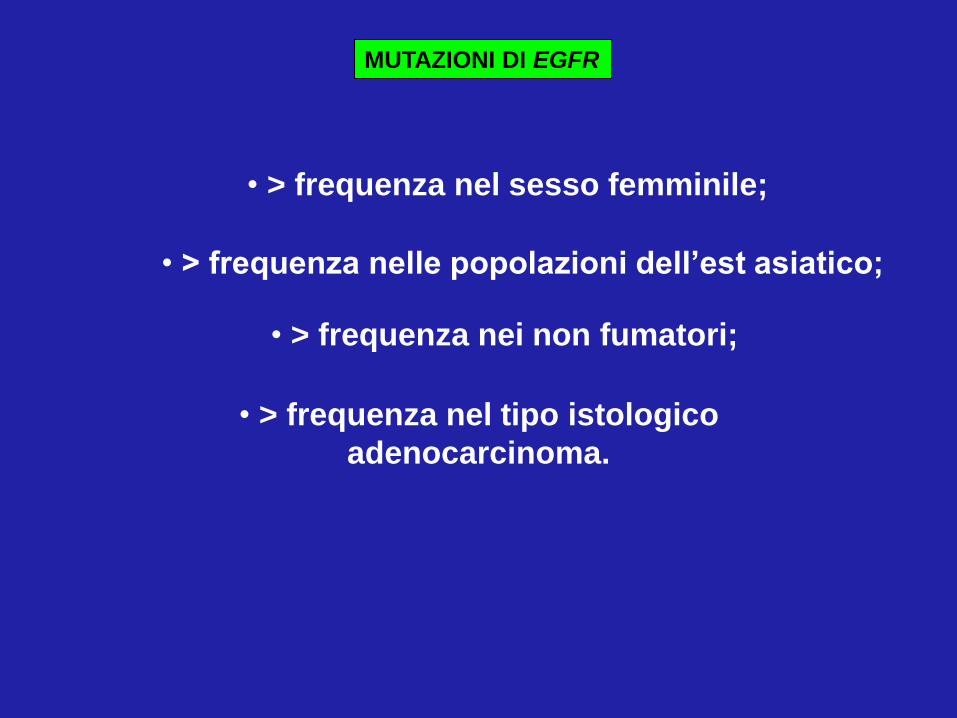
MUTAZIONI DI EGFR
• > frequenza nel sesso femminile;
• > frequenza nei non fumatori;
• > frequenza nel tipo istologico
adenocarcinoma.
• > frequenza nelle popolazioni dell’est asiatico;
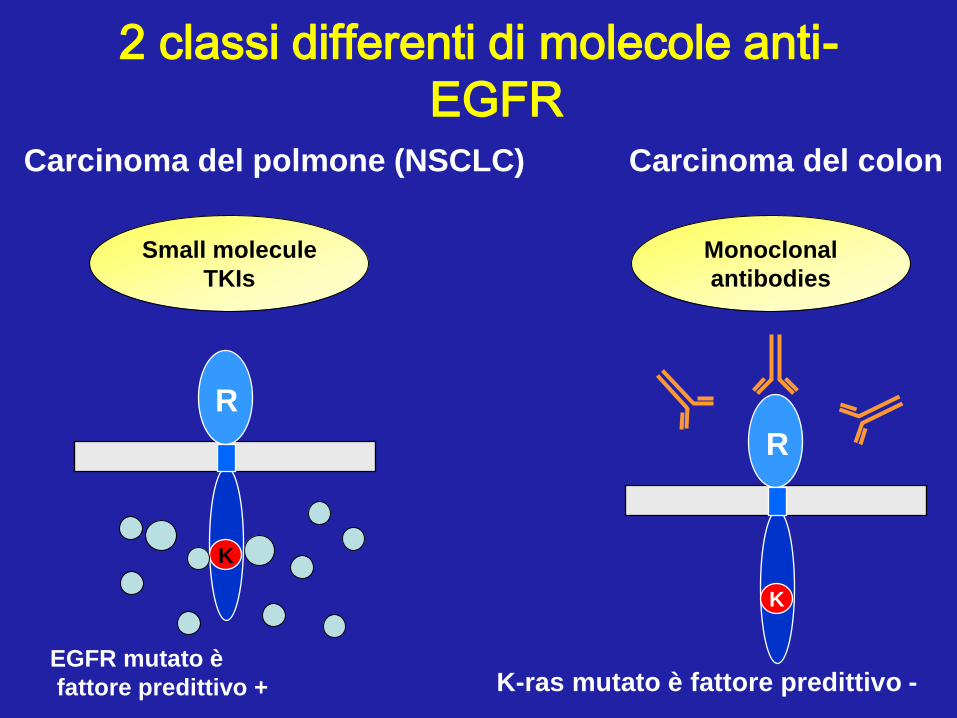
2 classi differenti di molecole anti-
EGFR
Small molecule
TKIs
Monoclonal
antibodies
R
K
R
K
K-ras mutato è fattore predittivo -
Carcinoma del colon Carcinoma del polmone (NSCLC)
EGFR mutato è
fattore predittivo +

Drug-related adverse events in >5% of patients: IDEAL 1 (250 mg/day)
0
10
20
30
40
50All grades
Grade 3
Patients (%)
No grade 4 drug-related adverse events were recorded
Fukuoka et al 2003a
Rash Diarrhoea Pruritus Dry skin Acne Nausea
Tossicità dei farmaci anti-EGFR

Normal tissue Tumor tissue
Jain: Science; 307: 58-62, 2005
Neo-angiogenesi tumorale

ANGIOGENESI:
formazione di nuovi vasi sanguigni
a partire da pre-esistenti
vasi capillari normali
aggressività della malattia
esito clinico sfavorevole
ridotta sopravvivenza globale
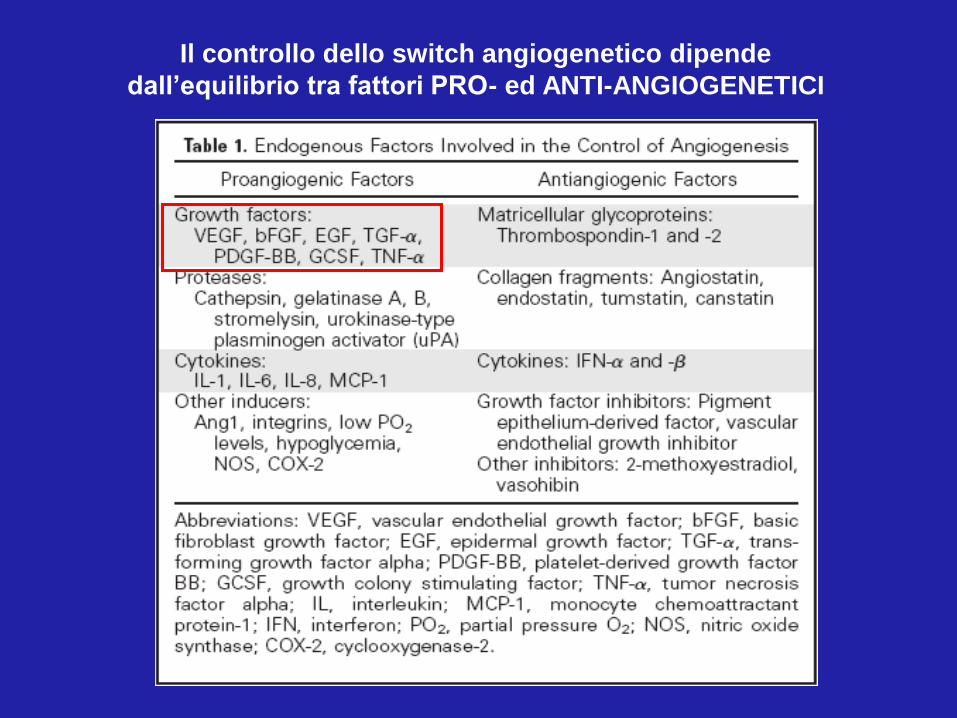
Il controllo dello switch angiogenetico dipende
dall’equilibrio tra fattori PRO- ed ANTI-ANGIOGENETICI
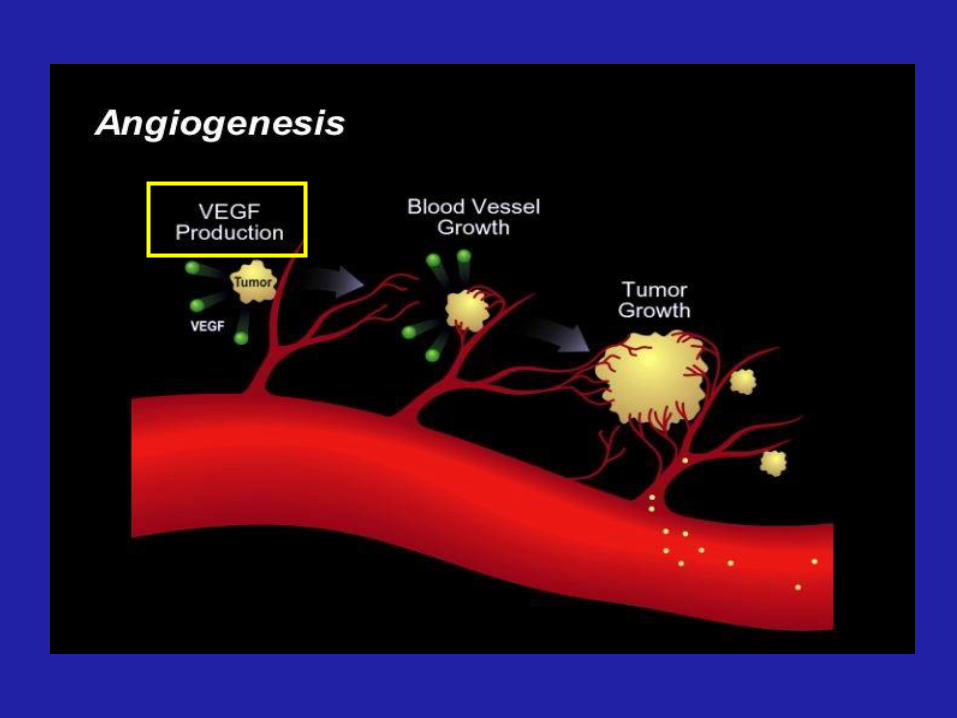

VEGF
• è il più potente e specifico fattore mitogeno
per le cellule endoteliali;
• è un fattore di sopravvivenza per le cellule
dei vasi neoformati;
• induce un aumento della permeabilità
vasale, facilitando l’immissione delle cellule
neoplastiche nel torrente circolatorio.

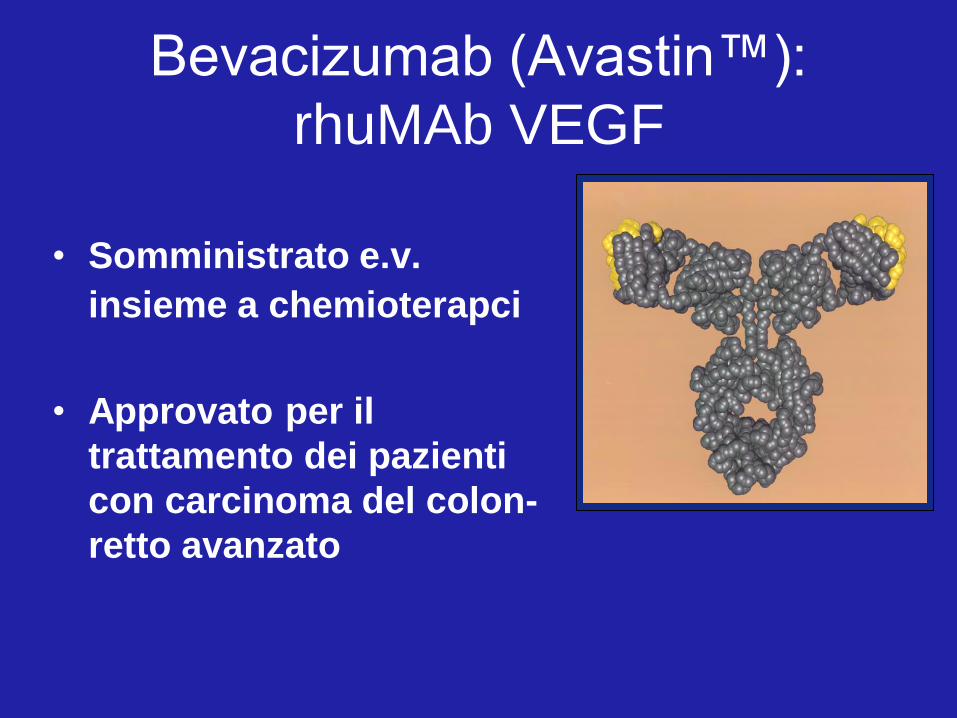
Bevacizumab (Avastin™):
rhuMAb VEGF
• Somministrato e.v.
insieme a chemioterapci
• Approvato per il
trattamento dei pazienti
con carcinoma del colon-
retto avanzato

Hurwitz, et al. NEJM 2004
6.2 10.6 15.6 20.3
Bevacizumab + Irinotecan* come terapia di
prima linea nel carcinoma del colon retto
0 10 20 30 40
Months
1.0
0.8
0.6
0.4
0.2
0
Months
0 10 20 30
1.0
0.8
0.6
0.4
0.2
0
Median OS
15.6 vs 20.3 months
HR=0.66 p<0.001
Median PFS
6.2 vs 10.6 months
HR=0.54 p<0.0001
IFL + Avastin (n=402)
IFL + placebo (n=411)
PF
S e
sti
mate
Su
rviv
al
esti
mate
IFL + Avastin (n=402)
IFL + placebo (n=411)
Aumento significativo
del tempo a progressione e della sopravvivenza
*Inibitore di topoisomeasi

932 deaths (reported as of the January 21, 2007 data cutoff)
Median follow-up time 19.6 months
No treatment
(n=253)
Avastin
post PD
(n=642)
Patients with previously untreated,
unresectable metastatic CRC (n=1,953)
1st-line Avastin + CTx
No Avastin
post PD
(n=531)
1st progression
(n=1,445)
Grothey, et al. ASCO 2007
Bevacizumab nei pazienti in progressione dopo
chemioterapia di prima linea con Bevacizumab

And post progression?
• Beva oltre la progressione: vantaggio in OS (ASCO 2012)
• Afflibercept in seconda linea: vantaggio in OS (Velour 2012)
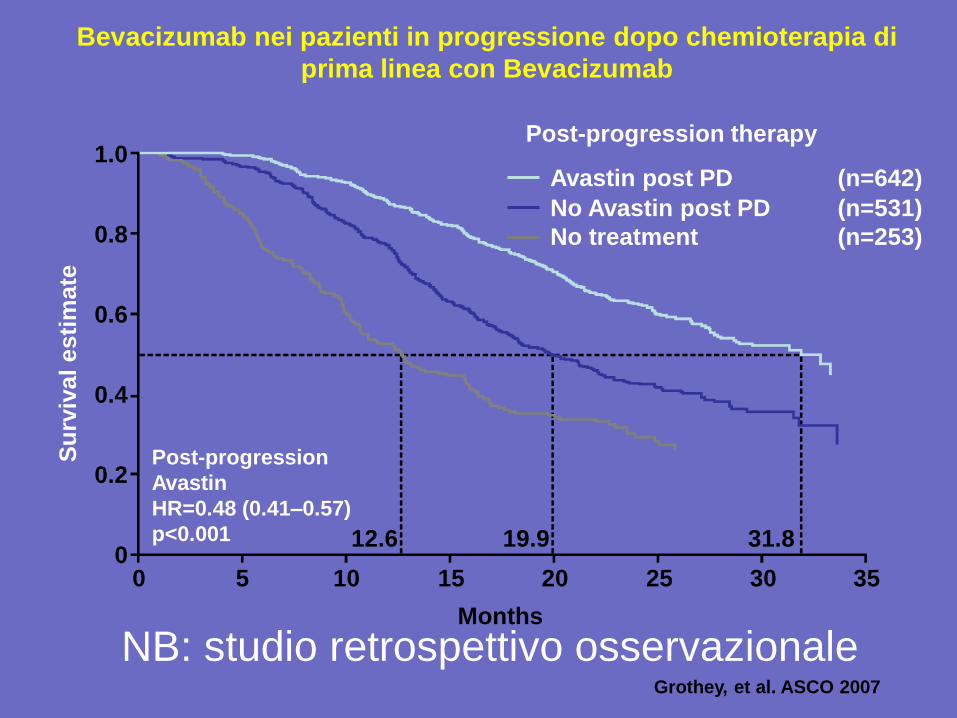
Bevacizumab nei pazienti in progressione dopo chemioterapia di
prima linea con Bevacizumab
Grothey, et al. ASCO 2007
1.0
0.8
0.6
0.4
0.2
0 0 5 10 15 20 25 30 35
Months
Su
rviv
al
es
tim
ate
Post-progression therapy
12.6 19.9 31.8
Post-progression
Avastin
HR=0.48 (0.41–0.57)
p<0.001
Avastin post PD (n=642)
No Avastin post PD (n=531)
No treatment (n=253)
NB: studio retrospettivo osservazionale

Bevacizumab nel carcinoma del polmone (PFS)
1.0
0.8
0.6
0.4
0.2
0
0 6 12 18 24 30
Time (months)
Pro
babili
ty
CP + Bevacizumab
CP
HR=0.66 (0.57–0.77) p<0.001
4.5 6.2
Sandler, et al. NEJM 2006
“En España pendiente de autorización de precio y condiciones de reembolso”

Tossicità di Bevacizumab in associazione alla chemioterapia
• Less frequently reported events:
– congestive heart failure (CHF)/cardiomyopathy
– arterial thromboembolism (ATE)
– venous thromboembolism (VTE)
– wound-healing complications
– gastrointestinal perforations
• Commonly reported events:
– hypertension
– proteinuria
– bleeding/haemorrhage

Ma …..
E la terapia adiuvante?
Bevacizumab associato a CT:
2 studi randomizzati negativi
Cetuximab associato a CT:
2 studi randomizzati negativi
E poi :
1 + 1 = 2
Anti-EGFR + Anti- VEGF:
effetto detrimentale!!!

GIST: Gastrointestinal Stromal Tumors
• GI sarcoma
• Highest incidence in the 40-60 year age group
• Expression of c-KIT (CD117) in ~95% of cases

ATP
Proliferation Survival
Adhesion
Invasion
Metastasis
Angiogenesis
ADP
+
P
Kit Receptor Phenotype

ATP
= imanitib contact point
Proliferation Survival
Adhesion
Invasion
Metastasis
Angiogenesis
Kit Receptor Phenotype
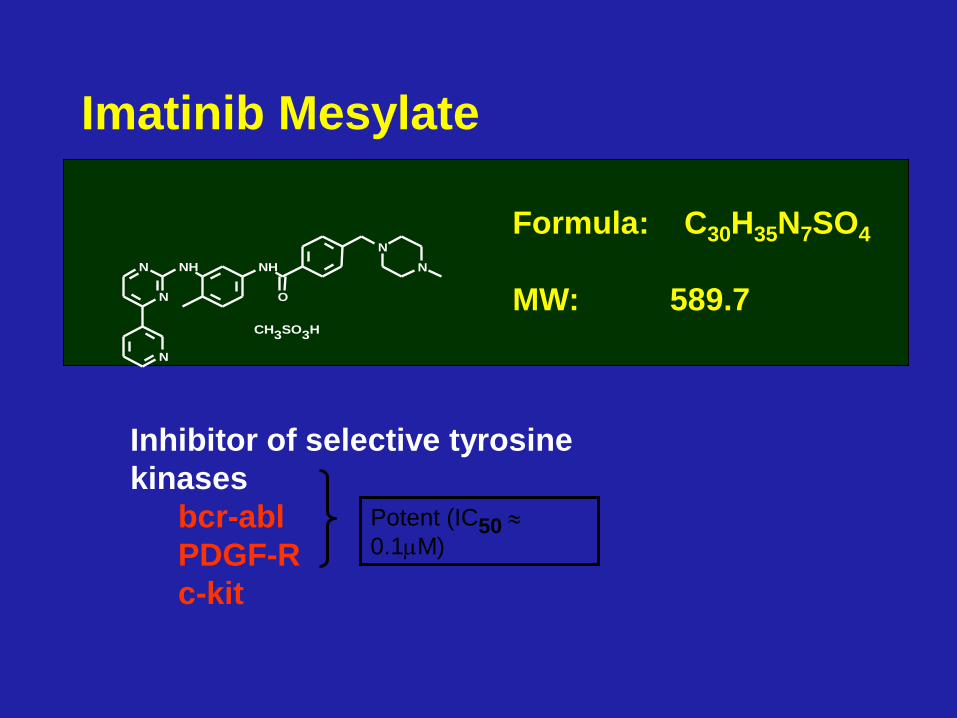
Formula: C30H35N7SO4
MW: 589.7
Imatinib Mesylate
CH3SO3H
N
N
N
NH NH
O
N
N
Inhibitor of selective tyrosine
kinases
bcr-abl
PDGF-R
c-kit
Potent (IC50
0.1M)

IMATINIB nei Tumori Stromali
GastroIntestinali (GIST)
• 2001: apoptosi in linee cellulari di GIST
• 2001: pubblicazione su NEJM del primo
pz. con GIST, trattato con Glivec
• 2001: NIH GIST Workshop
• Febbraio 2002: approvazione FDA di
Glivec per trattamento dei GIST
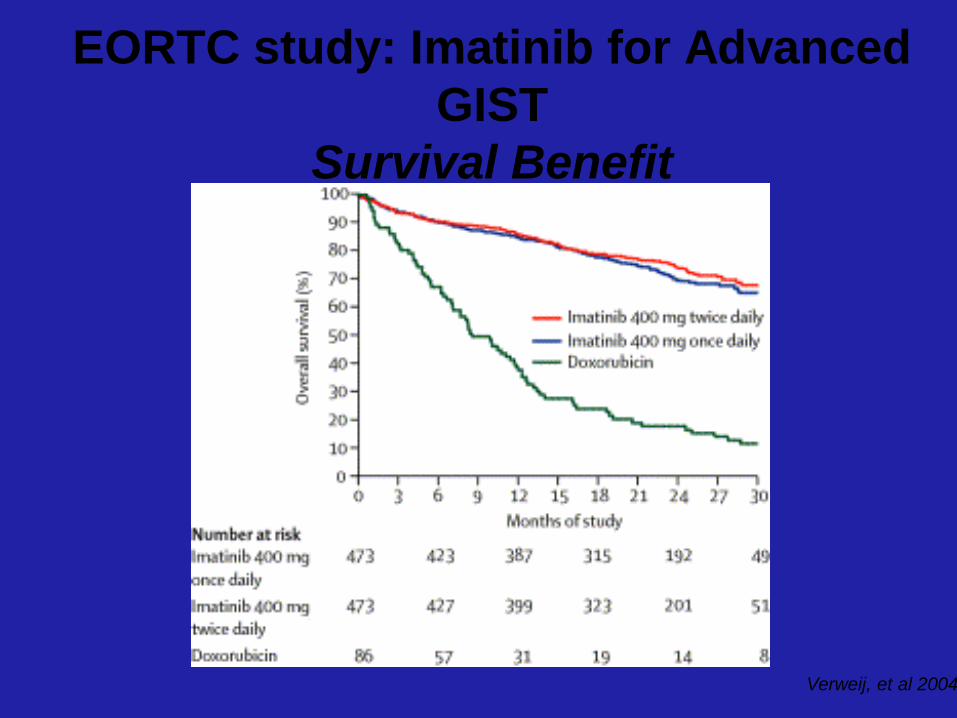
Verweij, et al 2004
EORTC study: Imatinib for Advanced
GIST
Survival Benefit

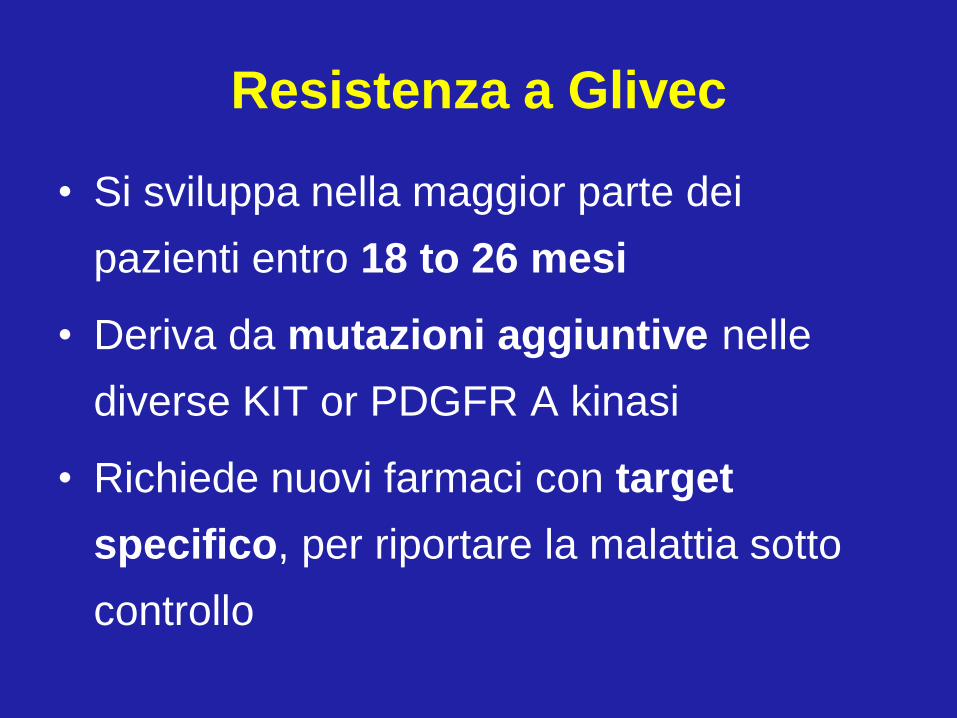
Resistenza a Glivec
• Si sviluppa nella maggior parte dei
pazienti entro 18 to 26 mesi
• Deriva da mutazioni aggiuntive nelle
diverse KIT or PDGFR A kinasi
• Richiede nuovi farmaci con target
specifico, per riportare la malattia sotto
controllo

Extracellular Domain (exon 9, 10.2%)
Juxtamembrane Domain (exon 11, 66.1%)
Tyrosine Kinase Domain I (exon 13/14, 1.2%)
Tyrosine Kinase Domain II (exon 17, 0.6%)
= common mutation site
ATP
c-Kit Receptor Structure

Overall Survival by Genotype
Exon 11
Exon 9
No Mutation
Median Survival
Exon 11 Not reached
Exon 9
1347 days
No mut 250 days
0 250 500 750 1000 1250 1500
0
10
20
30
40
50
60
70
80
90
100
Exon 9 23 22 18 14 11 11
No Mutation 9 5 3 3 3 3
Exon 11 86 82 81 73 64 53
P-value = 0.0012
Survival Number at Risk
Days 0 250 500 750 1000 1250
Days
Ove
rall S
urv
iva
l (%
)
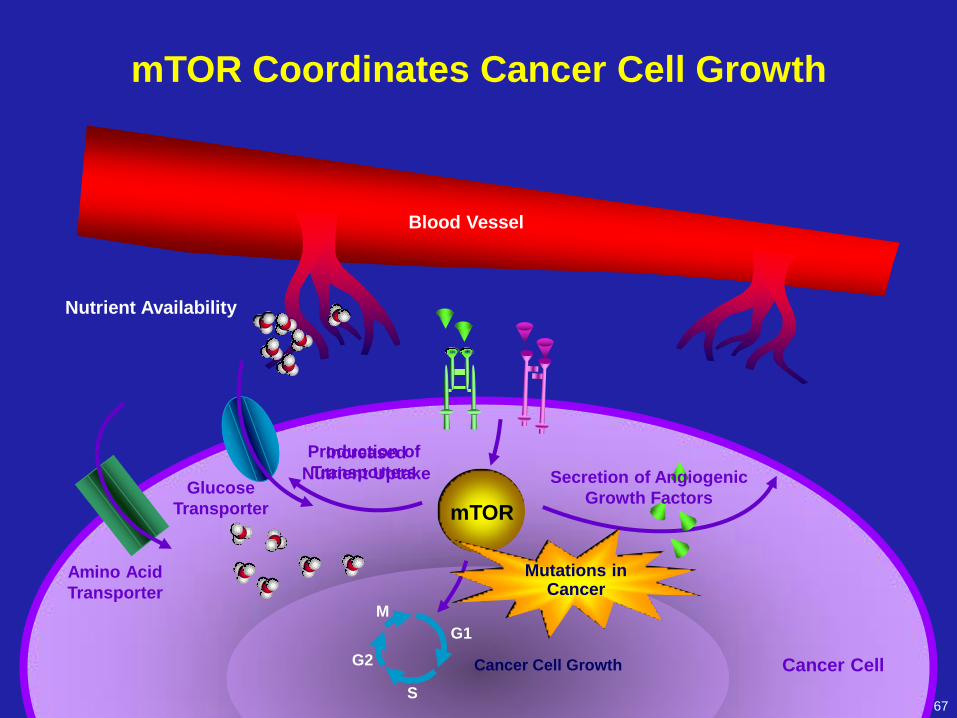
67
Production of
Transporters
mTOR
M
G1
G2
S
Cancer Cell Growth
mTOR Coordinates Cancer Cell Growth
Glucose
Transporter
Increased
Nutrient Uptake
Nutrient Availability
Secretion of Angiogenic
Growth Factors
Cancer Cell
Amino Acid
Transporter
Mutations in Cancer
Blood Vessel

TRASTUZUMAB
nel carcinoma mammario
(Herceptin)
• Anticorpo monoclonale
“umanizzato”
• Diretto contro HER2/neu
• Approvato dalla FDA nel 1998

Carcinoma della mammella:
Trastuzumab +Paclitaxel vs Paclitaxel
(HER+++) Trastuzumab +
Paclitaxel Paclitaxel P-value
Median TTP (mos.) 6.9 3.0 <0.001
OR (%) 38.0 16.0 <0.001
Median duration 10.5 4.5
<0.001
Median TTF (mos) 5.8 2.9
Median OS (mos) 22.1 18.4 <0.05
Slamon NEJM 2001

Carcinoma della mammella:
Trastuzumab + Docetaxel vs Docetaxel
TRASTUZ.+
DOCETAX.
DOCETAXEL
ALONE P
ORR 61 34 0.0002
CR 7 2
PR 54 32
SD 27 44
DR* med.
mos. 11.7 5.7 0.009
TTPmed. mos. 11.7 6.1 0.0001
OS med. mos. 31.2 22.7 0.0325
Marty M et al, JCO 2005 *Duration of response

Tassi di risposte obiettive nel carcinoma
della mammella
0
10
20
30
40
50
60
70
%
Pre-
Antracyclines
Antracyclines
Taxanes
Herceptin
Mean values fron pooled studies
1970 1980 1990 2000

1703 1127 140
1698 930 114
HR: 0.63 (95% CI: 0.53-0.75; P<0.0001)
3-year DFS: 80.6% vs 74.0%
Disease-Free Survival (Censored)
Pati
en
ts (
%)
100
80
60
40
20
0 12 36 0 18 6 24 30
Observation
1 year trastuzumab
Months From Randomization P
ati
en
ts A
live (
%)
1703 1190 146
1698 1042 126
100
80
60
40
20
0 12 36 0 18 6 24 30
Overall Survival (Censored)
Observation
1 year trastuzumab
Months From Randomization
HR: 0.63 (95% CI: 0.45-0.87; P<0.0051)
3-year OS: 92.4% vs 89.2%
I. Smith. ASCO, 2006.
HERA: Trastuzumab in HER2+
Early Breast Cancer (cont’d)
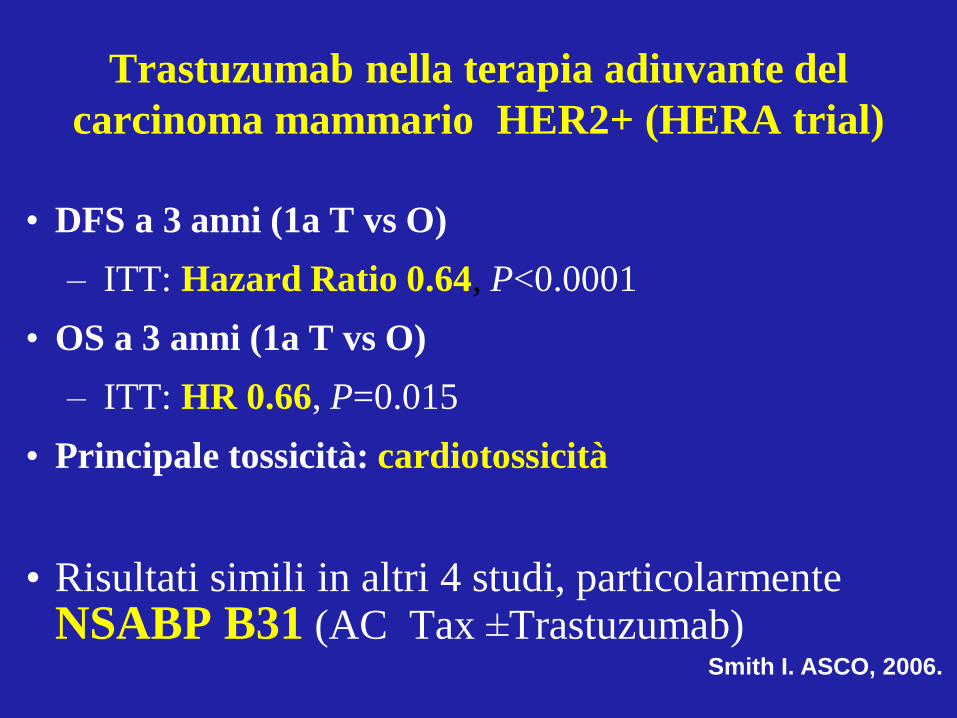
• DFS a 3 anni (1a T vs O)
– ITT: Hazard Ratio 0.64, P<0.0001
• OS a 3 anni (1a T vs O)
– ITT: HR 0.66, P=0.015
• Principale tossicità: cardiotossicità
• Risultati simili in altri 4 studi, particolarmente NSABP B31 (AC Tax ±Trastuzumab)
Trastuzumab nella terapia adiuvante del
carcinoma mammario HER2+ (HERA trial)
Smith I. ASCO, 2006.

Trastuzumab: conclusioni
Trastuzumab rappresenta attualmente la
terapia standard, sia in fase avanzata che
adiuvante, per il trattamento della pazienti
con carcinoma della mammella con
iperespressione di HER2+ determinata con
Immunoistochimica (3+) o con positività di
fluorescence in situ hybridization (FISH).

Survival in patients with advanced gastric cancer:
conventional regimens
Best supportive care
5-FU monotherapy
FAM
FAMTX, PELF
ECF , CF, TCF , EOX
3–4 months
4–5 months
4–5 months
6–8 months
8–11 months
Median OS
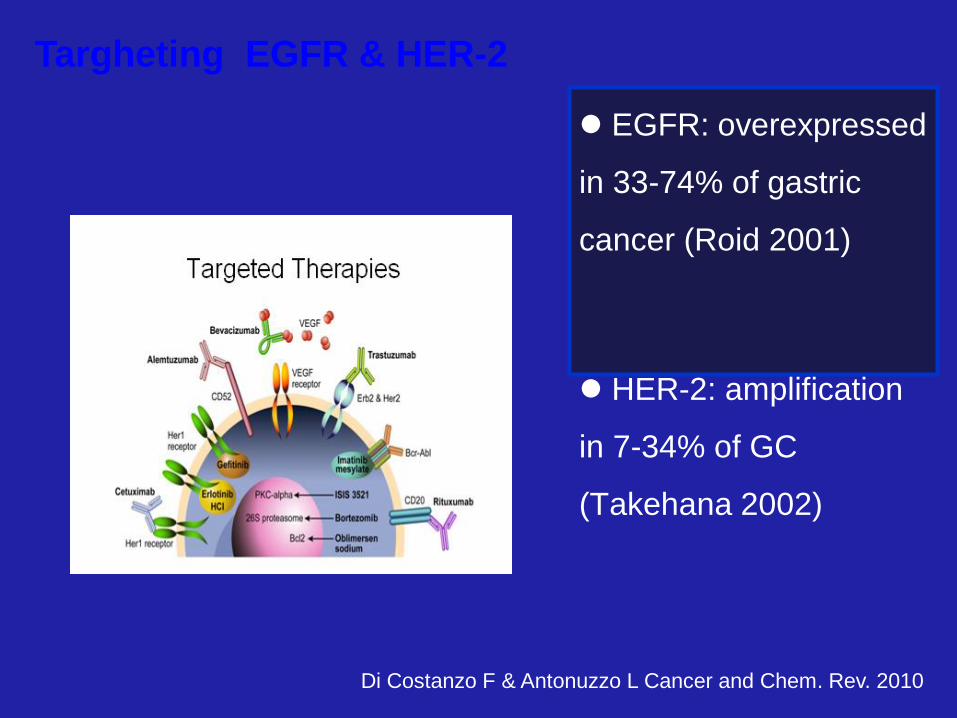
EGFR: overexpressed
in 33-74% of gastric
cancer (Roid 2001)
HER-2: amplification
in 7-34% of GC
(Takehana 2002)
Targheting EGFR & HER-2
Di Costanzo F & Antonuzzo L Cancer and Chem. Rev. 2010
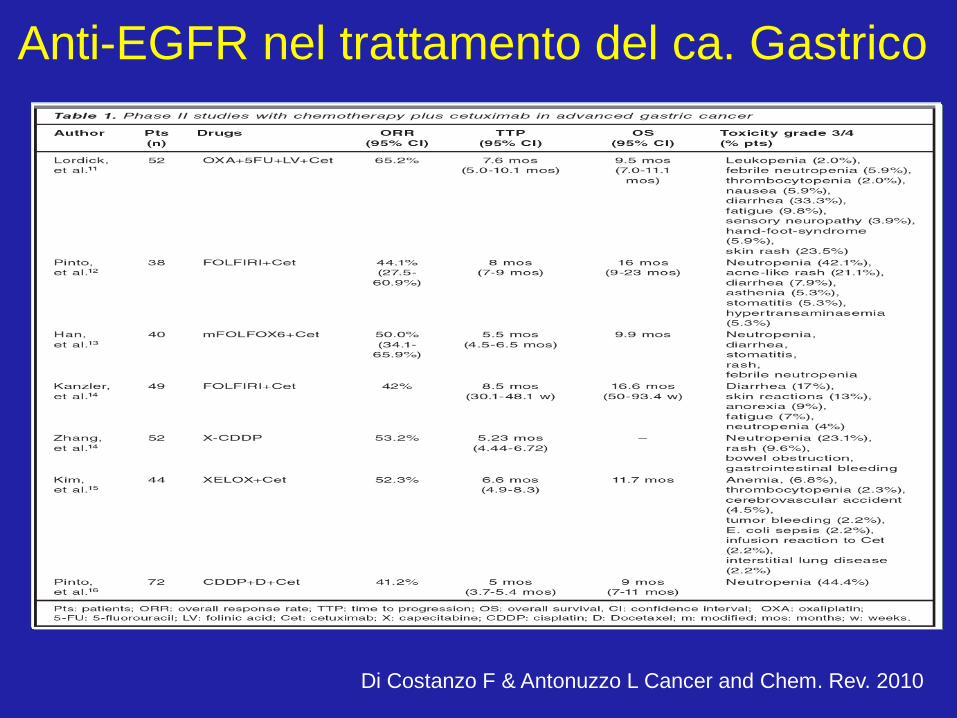
Anti-EGFR nel trattamento del ca. Gastrico
Di Costanzo F & Antonuzzo L Cancer and Chem. Rev. 2010

Primary end point: OS
Time (months)
294 290
277 266
246 223
209 185
173 143
147 117
113 90
90 64
71 47
56 32
43 24
30 16
21 14
13 7
12 6
6 5
4 0
1 0
0 0
No. at risk
11.1 13.8
0.0
0.1
0.2
0.3
0.4
0.5
0.6
0.7
0.8
0.9
1.0
0 2 4 6 8 10 12 14 16 18 20 22 24 26 28 30 32 34 36
Event
FC + T
FC
Events
167 182
HR
0.74
95% CI
0.60, 0.91
p value
0.0046
Median OS
13.8 11.1
T, trastuzumab
Bang Y-J et al Lancet 2010
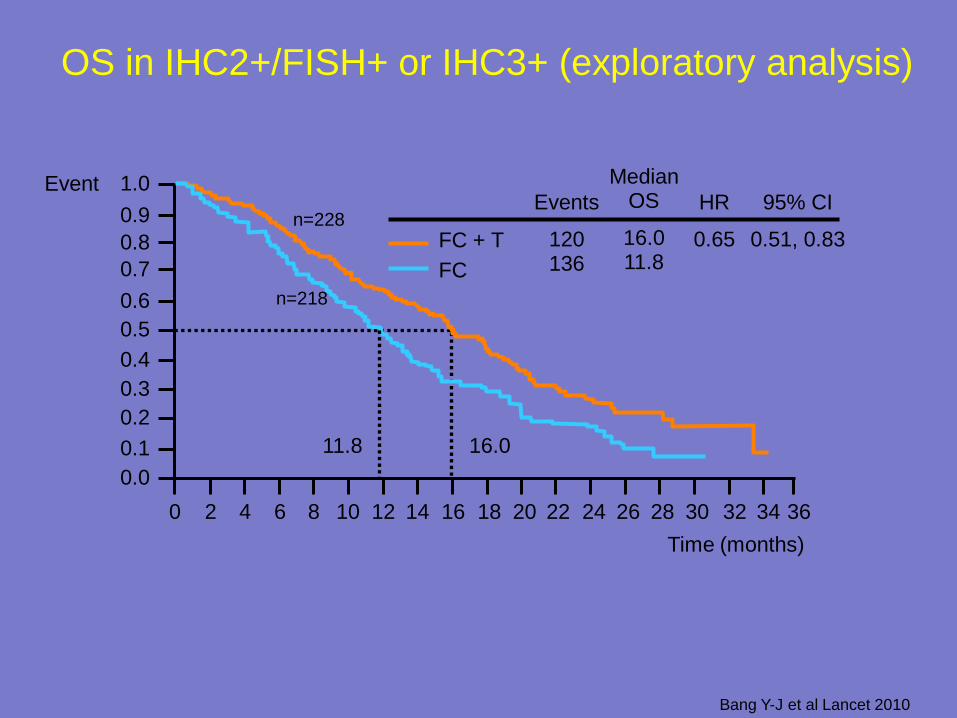
OS in IHC2+/FISH+ or IHC3+ (exploratory analysis)
1.0
0.8
0.6
0.4
0.2
0.0
36 34 32 30 28 26 24 22 20 18 16 14 12 10 8 6 4 2 0
Time (months)
11.8 16.0
FC + T
FC
Events
120 136
HR
0.65
95% CI
0.51, 0.83
Median OS
16.0 11.8
Event
0.1
0.3
0.5
0.7
0.9 n=228
n=218
Bang Y-J et al Lancet 2010
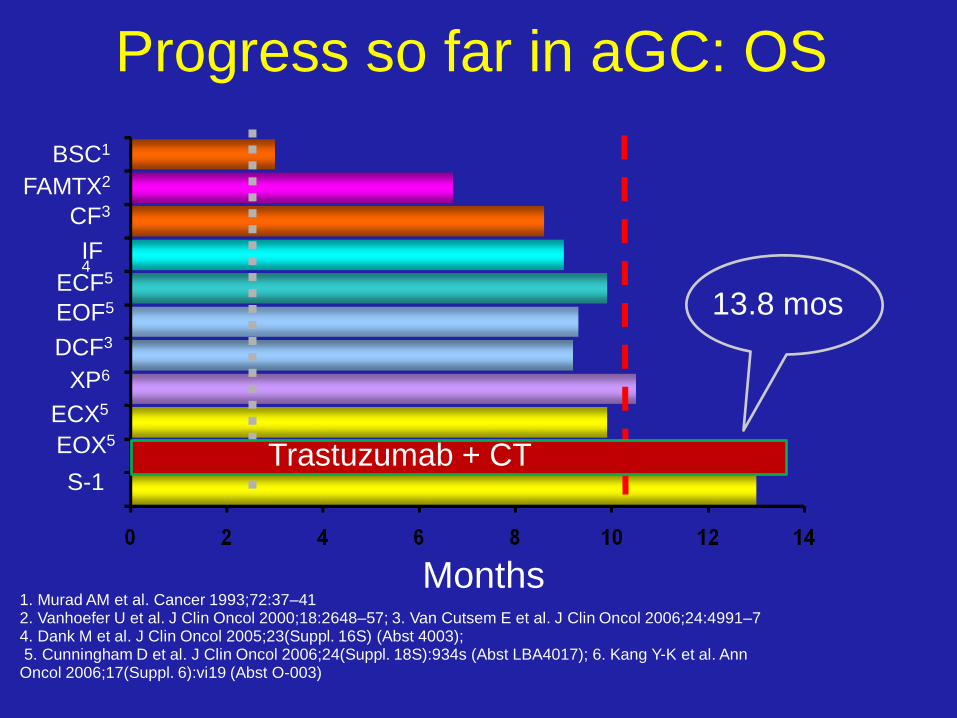
Progress so far in aGC: OS
1. Murad AM et al. Cancer 1993;72:37–41 2. Vanhoefer U et al. J Clin Oncol 2000;18:2648–57; 3. Van Cutsem E et al. J Clin Oncol 2006;24:4991–7 4. Dank M et al. J Clin Oncol 2005;23(Suppl. 16S) (Abst 4003); 5. Cunningham D et al. J Clin Oncol 2006;24(Suppl. 18S):934s (Abst LBA4017); 6. Kang Y-K et al. Ann Oncol 2006;17(Suppl. 6):vi19 (Abst O-003)
Months
BSC1
FAMTX2
CF3
IF4
EOF5
DCF3
ECF5
XP6
ECX5
EOX5
S-1 Trastuzumab + CT
13.8 mos
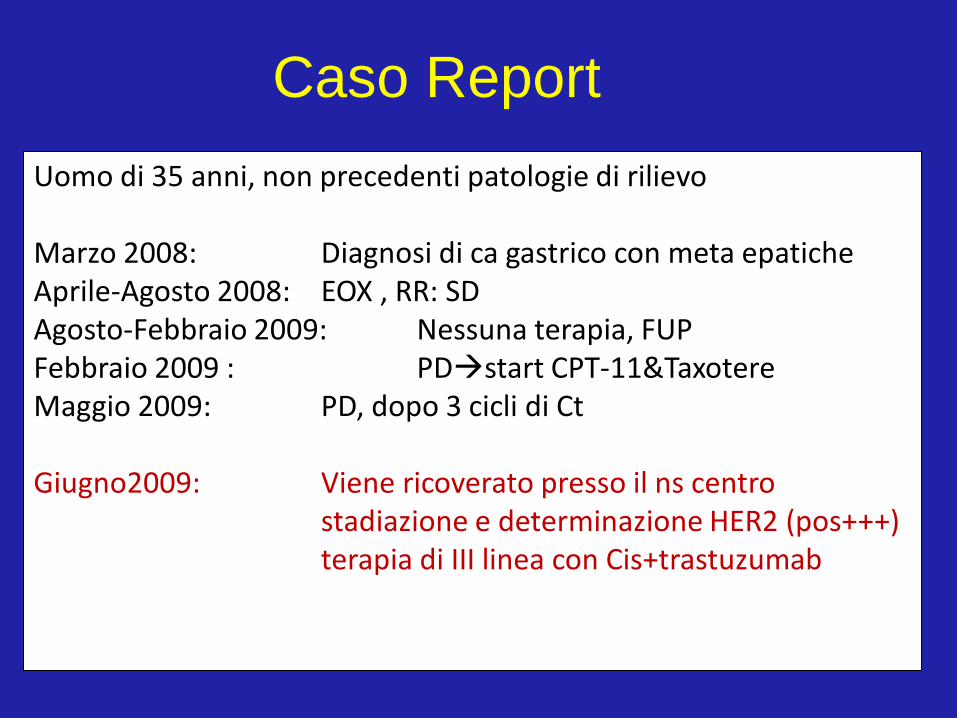
Caso Report
Uomo di 35 anni, non precedenti patologie di rilievo Marzo 2008: Diagnosi di ca gastrico con meta epatiche Aprile-Agosto 2008: EOX , RR: SD Agosto-Febbraio 2009: Nessuna terapia, FUP Febbraio 2009 : PDstart CPT-11&Taxotere Maggio 2009: PD, dopo 3 cicli di Ct Giugno2009: Viene ricoverato presso il ns centro stadiazione e determinazione HER2 (pos+++) terapia di III linea con Cis+trastuzumab

Valutazione TAC dopo 3 mesi di CT + trastuzumab

K
R
K
R
K
Tumor response
metastasis invasion
proliferation
Inibition of apoptosis
angiogenesis
The concept
targeted therapy for a broad range of common solid tumors
Clinical trials
proof of concept
well tolerated therapy
tumor responses in several tumor types
The promise
improved outcomes in the treatment of common solid tumors
Small mol.
T cell Mb.
EGFR signaling in tumor development
EGFR
EGF

A randomized placebo-controlled trial of erlotinib
in patients with advanced NSCLC
Stratified by:
Centre
PS, 0/1 vs 2/3
Response to prior Rx
(CR/PR:SD:PD)
Prior regimens,
(1 vs 2)
Prior platinum,
/Yes vs no)
731 stage IIIB-IV
NSCLC
Nov/01 – Feb/03
R
A
N
D
O
M
ERLOTINIB *
150 mg daily
Placebo
“150 mg” daily
* 2:1Randomization 1° endpoint: Survival
2° endpoints: PFS, RR, Tox., Q.o.L.
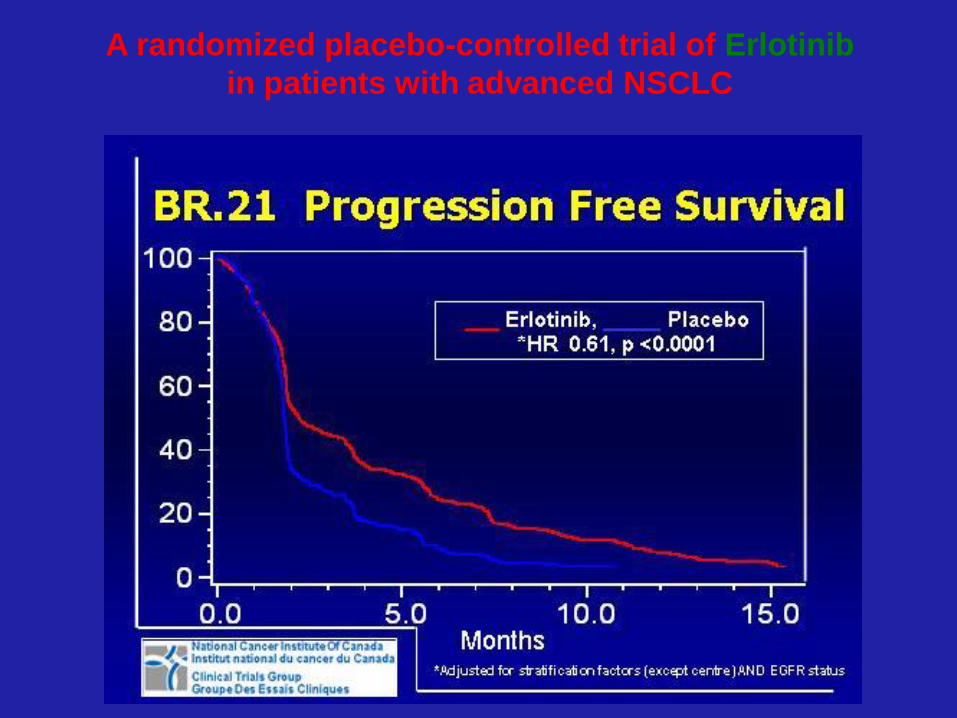
A randomized placebo-controlled trial of Erlotinib
in patients with advanced NSCLC
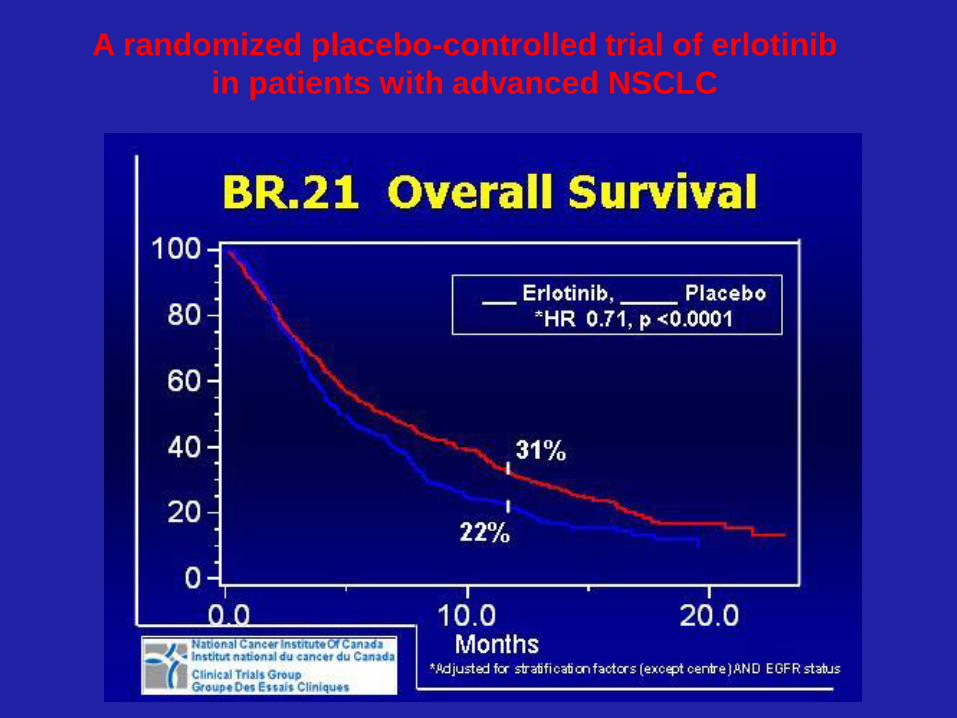
A randomized placebo-controlled trial of erlotinib
in patients with advanced NSCLC
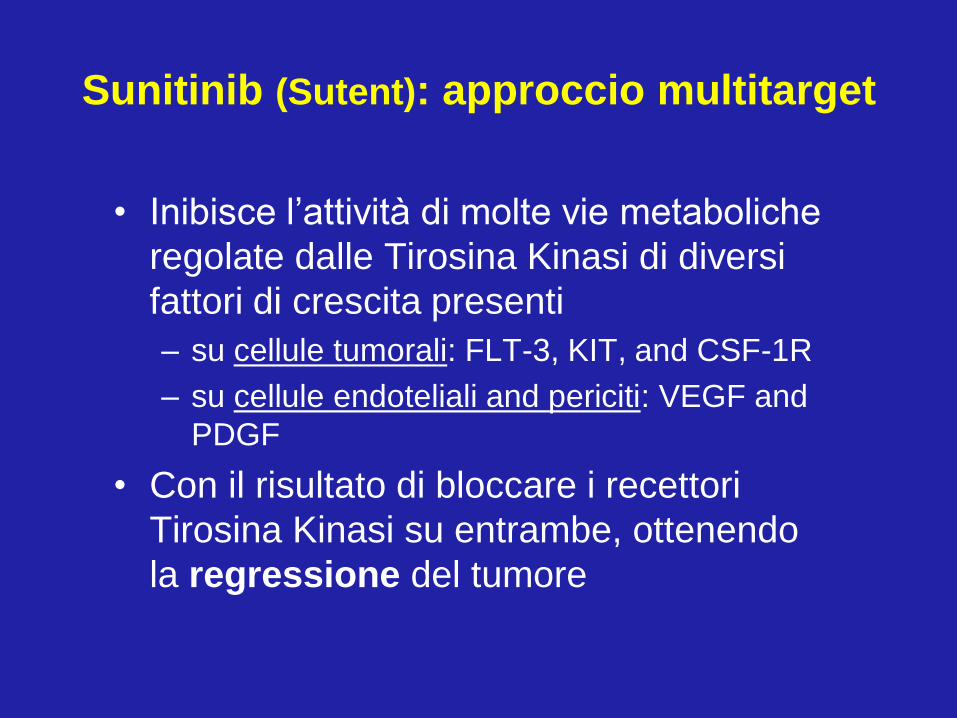
Sunitinib (Sutent): approccio multitarget
• Inibisce l’attività di molte vie metaboliche
regolate dalle Tirosina Kinasi di diversi
fattori di crescita presenti
– su cellule tumorali: FLT-3, KIT, and CSF-1R
– su cellule endoteliali and periciti: VEGF and
PDGF
• Con il risultato di bloccare i recettori
Tirosina Kinasi su entrambe, ottenendo
la regressione del tumore

Sunitinib nei
GIST resistenti
a Imatinib

• Attività dimostrata in:
– GIST
– Carcinoma del rene
– Tumori Neuroendocrini
• Rappresenta un vero approccio multitarget
nella terapia dei tumori
Sunitinib:
approccio multitarget

Sunitinib nel carcinoma del rene
Investigator Assessment
Independent Central
Review
Sunitinib
(n=374)
IFN-a
(n=373)
Sunitinib
(n=365)
IFN-a
(n=346)
Response (RECIST) %
Objective response* 46 12 39% 8%
Complete
response 1 1 0 0
Partial response 45 11 39 8
Stable disease 41 55 40% 48%
PD or Not evaluable 13 33 21 44
*Sunitinib vs IFN-a: P<0.000001. Motzer R. ASCO 2007
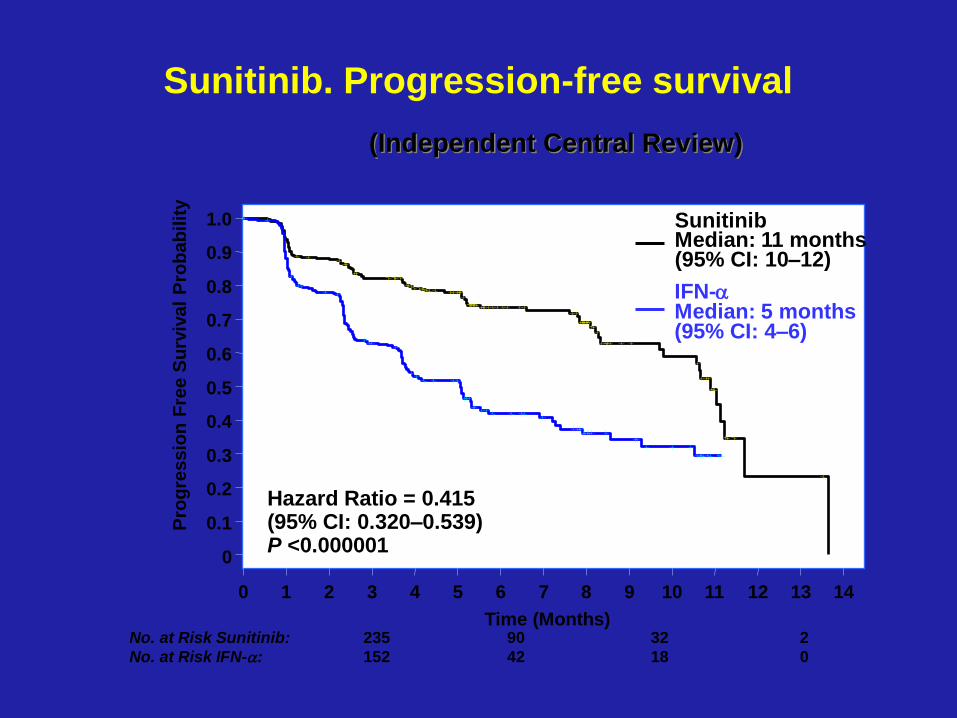
Sunitinib. Progression-free survival
No. at Risk Sunitinib: 235 90 32 2
No. at Risk IFN-a: 152 42 18 0
0 1 2 3 4 5 6 7 8 9 10 11 12 13 14
Time (Months)
0
0.1
0.2
0.3
0.4
0.5
0.6
0.7
0.8
0.9
1.0
Pro
gre
ssio
n F
ree S
urv
ival
Pro
bab
ilit
y
Sunitinib Median: 11 months (95% CI: 10–12)
IFN-a Median: 5 months (95% CI: 4–6)
Hazard Ratio = 0.415 (95% CI: 0.320–0.539) P <0.000001
(Independent Central Review)
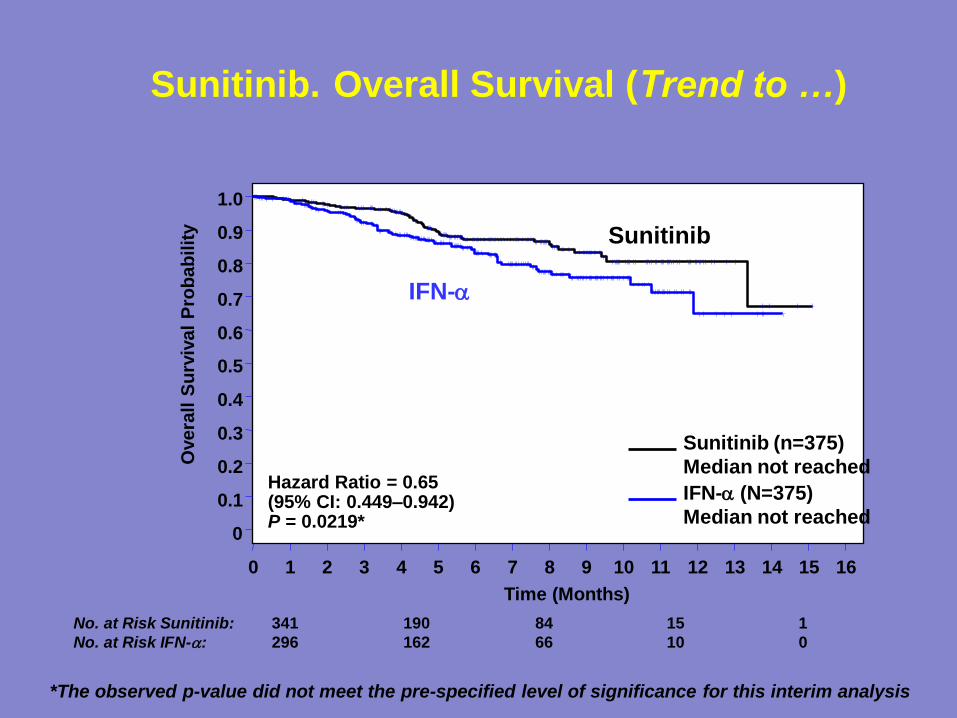
Sunitinib. Overall Survival (Trend to …)
No. at Risk Sunitinib: 341 190 84 15 1
No. at Risk IFN-a: 296 162 66 10 0
0 1 2 3 4 5 6 7 8 9 10 11 12 13 14 15 16
Time (Months)
0
0.1
0.2
0.3
0.4
0.5
0.6
0.7
0.8
0.9
1.0 O
vera
ll S
urv
ival
Pro
bab
ilit
y
Sunitinib (n=375)
Median not reached
IFN-a (N=375)
Median not reached
Hazard Ratio = 0.65 (95% CI: 0.449–0.942) P = 0.0219*
*The observed p-value did not meet the pre-specified level of significance for this interim analysis
IFN-a
Sunitinib
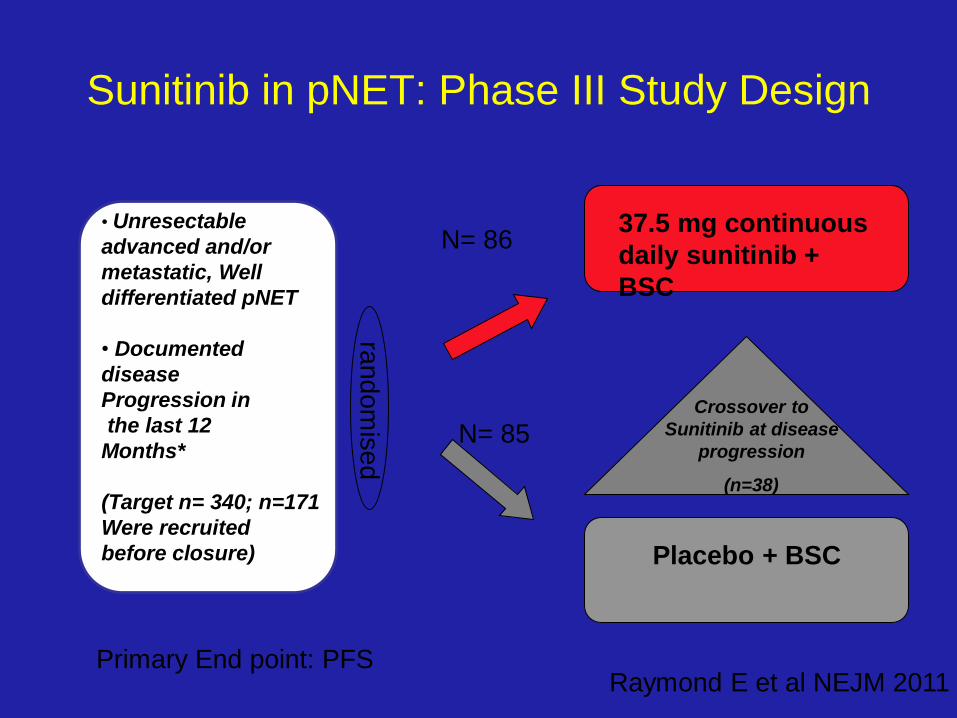
Sunitinib in pNET: Phase III Study Design
• Unresectable
advanced and/or
metastatic, Well
differentiated pNET
• Documented
disease
Progression in
the last 12
Months*
(Target n= 340; n=171
Were recruited
before closure)
Placebo + BSC
ra
ndom
ised
N= 86
N= 85
37.5 mg continuous
daily sunitinib +
BSC
Crossover to
Sunitinib at disease
progression
(n=38)
Raymond E et al NEJM 2011 Primary End point: PFS

Raymond E et al NEJM 2011
Sunitinib: PFS & OS
Raymond E et al ASCO 2011
PFS 11.4 vs 5.5 mos

Sunitinib: Safaty profile
Raymond E et al NEJM 2011
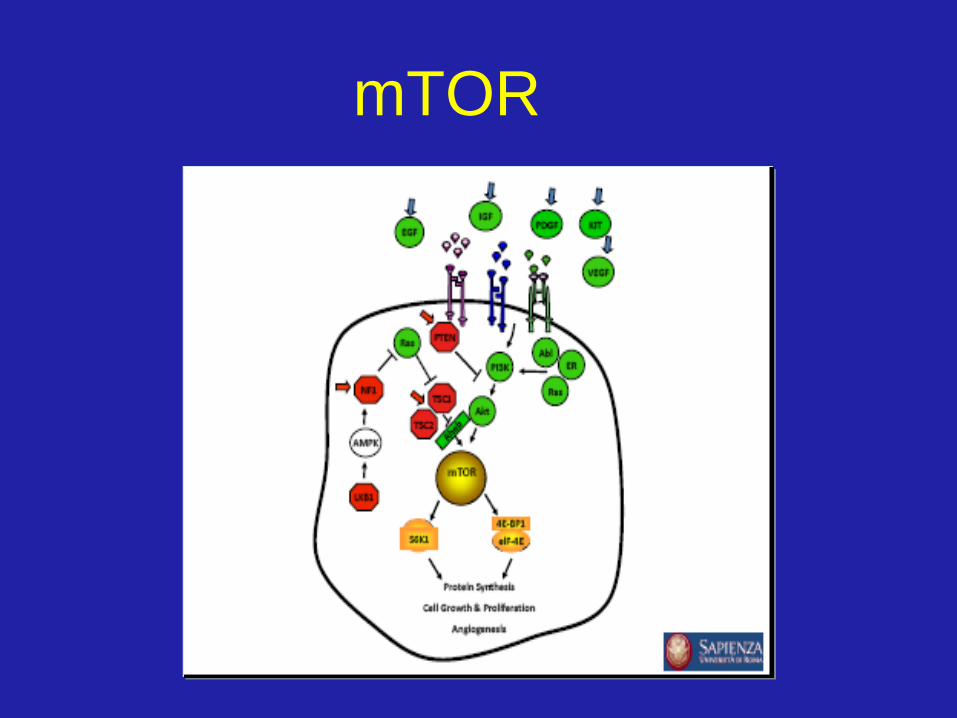
mTOR

Yao et al NEJM 2011
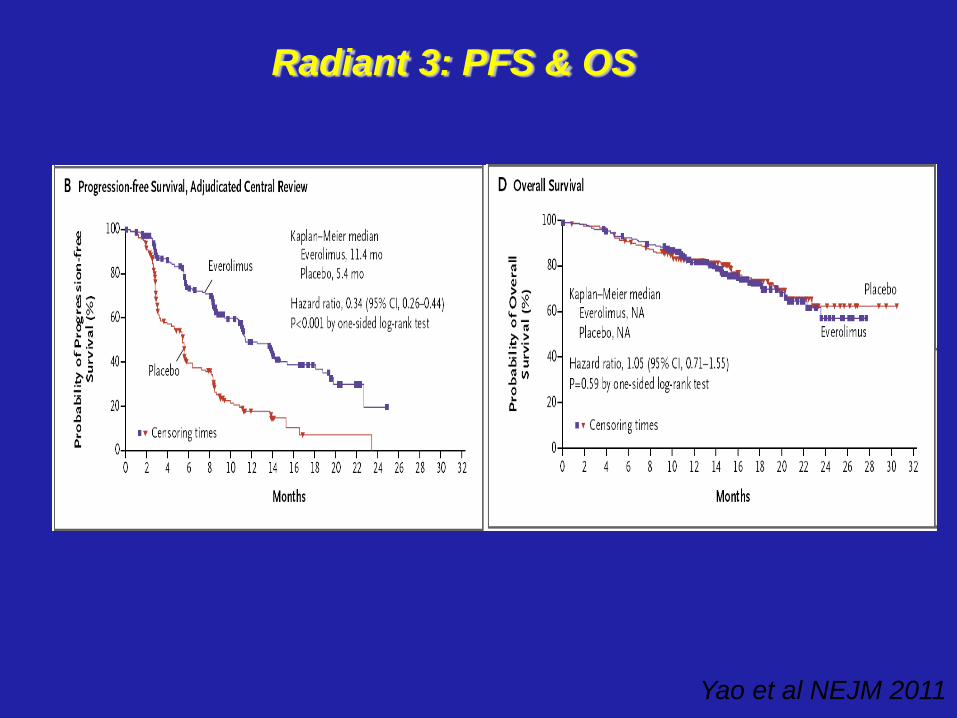
Yao et al NEJM 2011
Radiant 3: PFS & OS

Radiant 3: Safaty profile
Yao et al NEJM 2011
• Riduzione dose 59%
pz
• Interruzione per
tossicità 17% pz
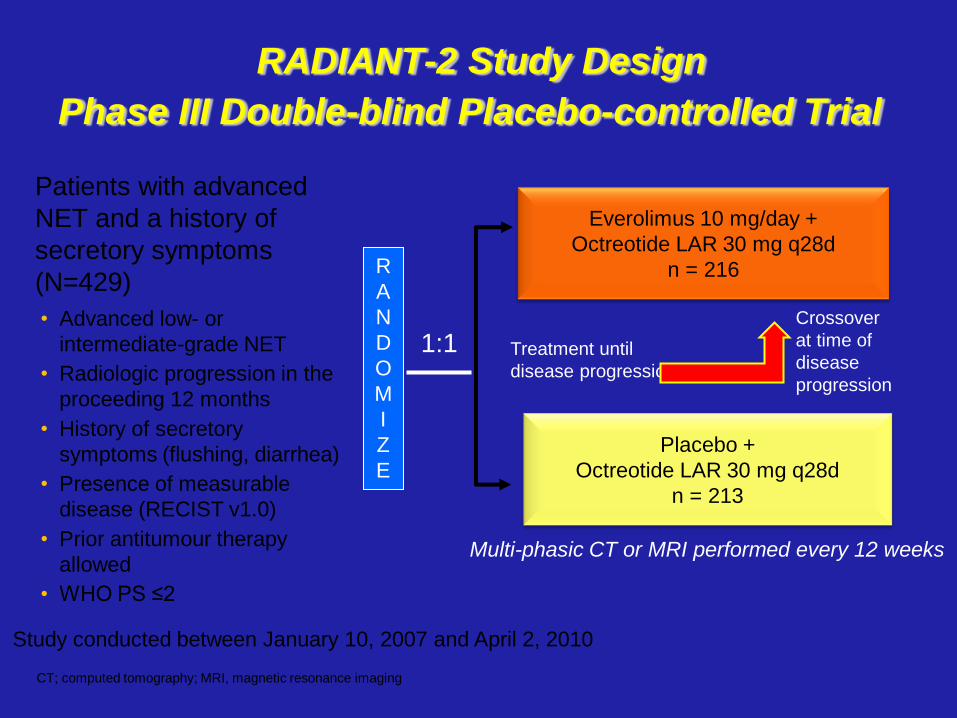
RADIANT-2 Study Design
Everolimus 10 mg/day +
Octreotide LAR 30 mg q28d
n = 216
Placebo +
Octreotide LAR 30 mg q28d
n = 213
Treatment until
disease progression
R
A
N
D
O
M
I
Z
E
1:1
Multi-phasic CT or MRI performed every 12 weeks
Crossover
at time of
disease
progression
Study conducted between January 10, 2007 and April 2, 2010
Phase III Double-blind Placebo-controlled Trial
CT; computed tomography; MRI, magnetic resonance imaging
Patients with advanced
NET and a history of
secretory symptoms
(N=429)
• Advanced low- or
intermediate-grade NET
• Radiologic progression in the
proceeding 12 months
• History of secretory
symptoms (flushing, diarrhea)
• Presence of measurable
disease (RECIST v1.0)
• Prior antitumour therapy
allowed
• WHO PS ≤2

PFS by Local Investigator Review
• P-value is obtained from the one-sided log rank test
• Hazard ratio is obtained from unadjusted Cox model
No. of patients still at risk E + O
P + O
216
213
199
201
167
159
129
121
119
114
100
92
81
75
74
72
68
64
62
56
51
50
40
41
32
27
24
21
18
11
11
10
4
4
2
1
1
0
0
0
E + O = Everolimus + Octreotide LAR
P + O = Placebo + Octreotide LAR
Pe
rce
nta
ge
eve
nt-
fre
e
0
20
40
60
80
100
0 2 4 6 8 10 12 14 16 18 20 22 24 26 28 30 32 34 36 38
Time (months)
Kaplan-Meier median PFS
Everolimus + Octreotide LAR: 12.0 months
Placebo + Octreotide LAR: 8.6 months
Hazard ratio = 0.78; 95% CI [0.62-0.98]
P-value = 0.018
Total events = 284
Censoring times
E + O (n/N = 128/216)
P + O (n/N = 156/213)
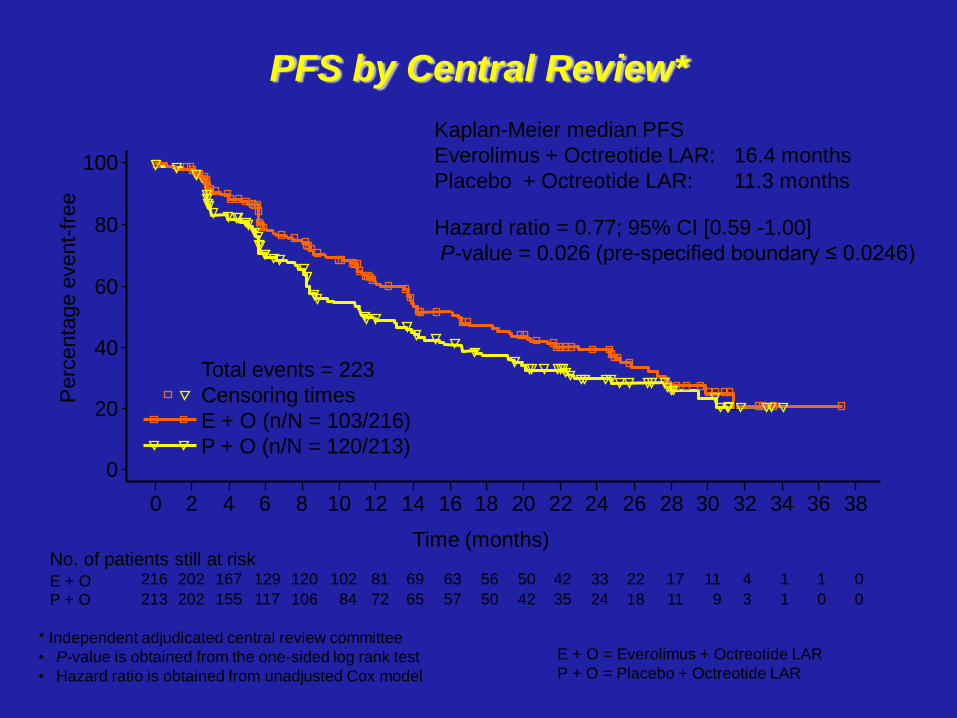
PFS by Central Review*
Time (months) No. of patients still at risk E + O P + O
216
213
202
202
167
155
129
117
120
106
102
84
81
72
69
65
63
57
56
50
50
42
42
35
33
24
22
18
17
11
11
9
4
3
1
1
1
0
0
0
* Independent adjudicated central review committee
• P-value is obtained from the one-sided log rank test
• Hazard ratio is obtained from unadjusted Cox model
E + O = Everolimus + Octreotide LAR
P + O = Placebo + Octreotide LAR
0
20
40
60
80
100
0 2 4 6 8 10 12 14 16 18 20 22 24 26 28 30 32 34 36 38
Perc
enta
ge e
vent-
free
Kaplan-Meier median PFS
Everolimus + Octreotide LAR: 16.4 months
Placebo + Octreotide LAR: 11.3 months
Hazard ratio = 0.77; 95% CI [0.59 -1.00]
P-value = 0.026 (pre-specified boundary ≤ 0.0246)
Total events = 223
Censoring times
E + O (n/N = 103/216)
P + O (n/N = 120/213)
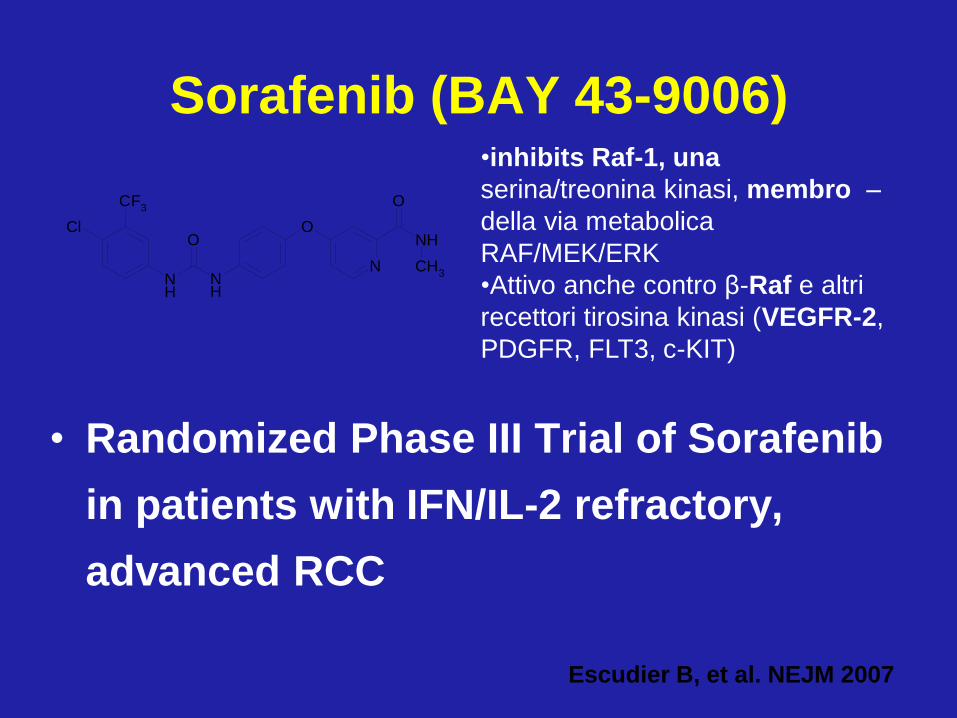
Sorafenib (BAY 43-9006)
• Randomized Phase III Trial of Sorafenib
in patients with IFN/IL-2 refractory,
advanced RCC
•inhibits Raf-1, una
serina/treonina kinasi, membro –
della via metabolica
RAF/MEK/ERK
•Attivo anche contro β-Raf e altri
recettori tirosina kinasi (VEGFR-2,
PDGFR, FLT3, c-KIT)
N
CF3
Cl
NH
NH
OO
NH
O
CH3
Escudier B, et al. NEJM 2007

Maximum percent reduction in Tumor Measurement*
*Independently assessed measurements available for 574
patients -100
-80
-60
-40
-20
0
20
40
60
80
100
Patient number
Ch
an
ge
in
tu
mo
r m
ea
su
rem
en
t (%
)
50 100 150 200 250
-100
-80
-60
-40
-20
0
20
40
60
80
100
Patient number
Ch
an
ge
in
tu
mo
r m
ea
su
rem
en
t (%
)50 100 150 200 250
Placebo Sorafenib
Ma
xim
um
Pe
rce
nt R
ed
uctio
n in
Tu
mo
r M
ea
su
rem
en
t
-100
-80
-60
-40
-20
0
20
40
60
80
100
Patient number
Ch
an
ge
in
tu
mo
r m
ea
su
rem
en
t (%
)
50 100 150 200 250
-100
-80
-60
-40
-20
0
20
40
60
80
100
Patient number
Ch
an
ge
in
tu
mo
r m
ea
su
rem
en
t (%
)
50 100 150 200 250
PR 7 ( 2%) 0 ( 0%) SD 261 (78%) 186 (55%) PD 29 ( 9%) 102 (30%) Missing 38 (11%) 49 (15%)
Best RR
(RECIST)
Sorafenib (n=335)* Placebo
(n=337)*
Objective
Response by
independent
review 80%

SHARP Phase III Trial: OS
Sorafenib (n=299) = 10.7 months
Placebo (n=303) = 7.9 months
Time from randomisation (months)
HR = 0.69 (95% CI: 0.55–0.87)
p<0.001
Llovet JM, et al. N Engl J Med 2008
Median OS: 10.7 mos vs 7.9 mos
HR= 0.69

Cheng AL et al. Lancet Oncol 2009
Asia-Pacific Phase III Trial: OS
Median OS: 6.5 mos vs 4.2 mos
HR= 0.68

Inibitori Tirosina Chinasi:
tossicità
• Di solito modesta
• Prevalentemente a carico delle
strutture epiteliali di rivestimento
(rash cutaneo) o intestinali
(diarrea)
• Possibili ma poco frequenti, astenia,
problemi cardiocircolatori
(ipertensione/ipotensione) o
metabolici

Benefici delle terapie target
• Elevati tassi di risposta in combinazione con chemio
• Aumento significativo della sopravvivenza libera da progressione
• Aumento della sopravvivenza (alcuni).
Atkins MB et al, Clin Cancer Res. 2007 Jan 15;13, 667s-670s,
Sosman JA et al,Clin Cancer Res. 2007 Jan 15;13:764s-769s

–Risposte complete rare o assenti
–Necessaria una somministrazione a
lungo termine: rapida progressione
con l’interruzione del trattamento
–Tutti i pazienti alla fine sviluppano
resistenza (entro 6-12 mesi)
Atkins MB et al, Clin Cancer Res. 2007 Jan 15;13, 667s-670s,
Sosman JA et al,Clin Cancer Res. 2007 Jan 15;13:764s-769s
Limiti delle terapie target
–Costi estremamente elevati:
–Necessità di più precisa
identificazione dei pazienti responsivi
Limiti delle terapie target
Related Documents