Tensile creep and shrinkage of PVA-ECC ISI 2006-3 WP Boshoff Institute of Structural Engineering Jan 2006

Welcome message from author
This document is posted to help you gain knowledge. Please leave a comment to let me know what you think about it! Share it to your friends and learn new things together.
Transcript
Tensile creep and shrinkage of PVA-ECC ISI 2006-3
WP Boshoff Institute of Structural Engineering
Jan 2006
1 Introduction
High performance fibre reinforced cement-based composites (HPFRCC), also known as
ECC (Engineered cement-based composites), has become an appealing possibility in the field of
construction [Li et al, 2001]. It does not only offer improved durability, but also the ability to
absorb orders of magnitude more energy before failing, than normal concrete, or even more than
standard fibre reinforced concrete/cements (FRC). HPFRCC was engineered using micro-
mechanical laws [Li 1992]. If the variables of the mix, e.g. the fibre volume, fibre aspect ration
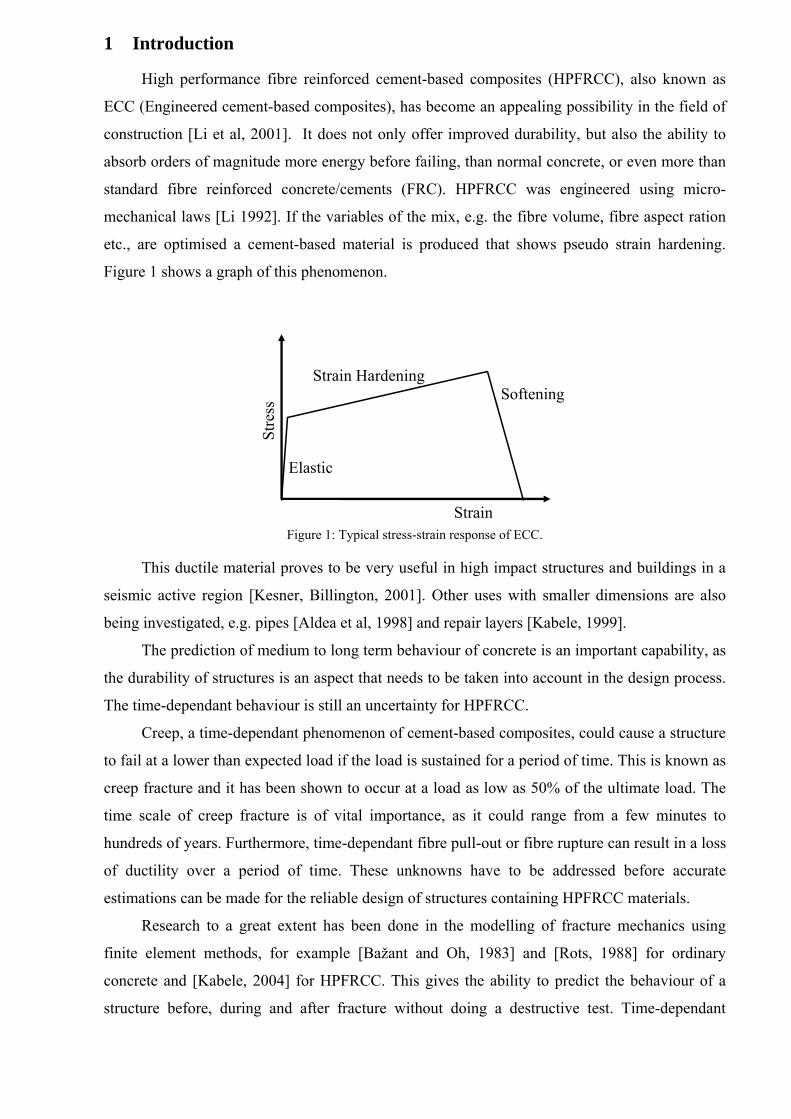
etc., are optimised a cement-based material is produced that shows pseudo strain hardening.
Figure 1 shows a graph of this phenomenon.
Softening
Strain
Stre
ss
Strain Hardening
Elastic
Figure 1: Typical stress-strain response of ECC.
This ductile material proves to be very useful in high impact structures and buildings in a
seismic active region [Kesner, Billington, 2001]. Other uses with smaller dimensions are also
being investigated, e.g. pipes [Aldea et al, 1998] and repair layers [Kabele, 1999].
The prediction of medium to long term behaviour of concrete is an important capability, as
the durability of structures is an aspect that needs to be taken into account in the design process.
The time-dependant behaviour is still an uncertainty for HPFRCC.
Creep, a time-dependant phenomenon of cement-based composites, could cause a structure
to fail at a lower than expected load if the load is sustained for a period of time. This is known as
creep fracture and it has been shown to occur at a load as low as 50% of the ultimate load. The
time scale of creep fracture is of vital importance, as it could range from a few minutes to
hundreds of years. Furthermore, time-dependant fibre pull-out or fibre rupture can result in a loss
of ductility over a period of time. These unknowns have to be addressed before accurate
estimations can be made for the reliable design of structures containing HPFRCC materials.
Research to a great extent has been done in the modelling of fracture mechanics using
finite element methods, for example [Bažant and Oh, 1983] and [Rots, 1988] for ordinary
concrete and [Kabele, 2004] for HPFRCC. This gives the ability to predict the behaviour of a
structure before, during and after fracture without doing a destructive test. Time-dependant
behaviour is normally neglected and static analyses are done when modelling a cement-based
material. This method of modelling is ignoring an important property of concrete, namely creep
and shrinkage. Time-dependant analyses for concrete and masonry fracture have been done [Van
Zijl, 2001], but are still missing for HPFRCC.
Time-dependant behaviour of a cement-based material is mostly caused by shrinkage in the
short term and creep in the medium to long term. For the investigation of creep fracture it is
believed that creep is the most dominant failing mechanism, therefore the main focus of this
research program is on creep.
Creep is a complex phenomenon of a cement-based composite. It plays an even more
important role for HPFRC, as normally the binder content of a typical HPFRCC mix is more
than 60% [Li et al, 2001], which is predominantly prone to creep and shrinkage, as shown by
[Billington and Rousse, 2003]. This accentuates the importance of a study on the time-dependant
behaviour of HPFRCC.
Where creep fracture analyses have been attempted with a cement-based material, creep
has been incorporated as a visco-elastic phenomenon [Van Zijl et al, 2001]. This was found to be
inadequate to predict the correct time scale of fracture and a calibration factor was introduced,
namely the crack mouth opening rate (CMOR). One particular deficiency is the indirect
characterisation of the CMOR parameters. This has motivated the current further study of creep
on a macro-level. A physically more appealing approach is followed, by separating irreversible
viscous flow associated with micro-cracking from the description of macro-cracking. Thereby, it
is attempted to incorporate all rate effects in the creep description. In the process, the
determination of the creep fracture modelling parameters is rationalised.
2 Time-dependant behaviour of HPFRCC
Creep can be defined as the increase of strain of a structure under a constant load or stress
over a period of time. Many theories have seen the light in the past century to describe the
mechanisms of creep. The theories have been narrowed down by scholars to a combination of
three mechanisms.
Firstly, creep is caused by the migration of the ever present water in the micro-pores in the
matrix. This movement is provoked if stress is applied to the material. The second is breaking
and re-establishing of bonds on the micro-level. This is believed to act in combination with the
first mechanism. Lastly, the formation of micro cracks in the matrix in relative high stress
conditions is known to cause the non-linearity of creep [Neville, 1970].
A typical strain-time graph of creep is shown in Figure 2. In the figure the load is kept
constant for a period of time and then removed. As seen on the graph, the creep strain increases
rapidly in the early days after loading and then flattens to an asymptote called the creep limit of
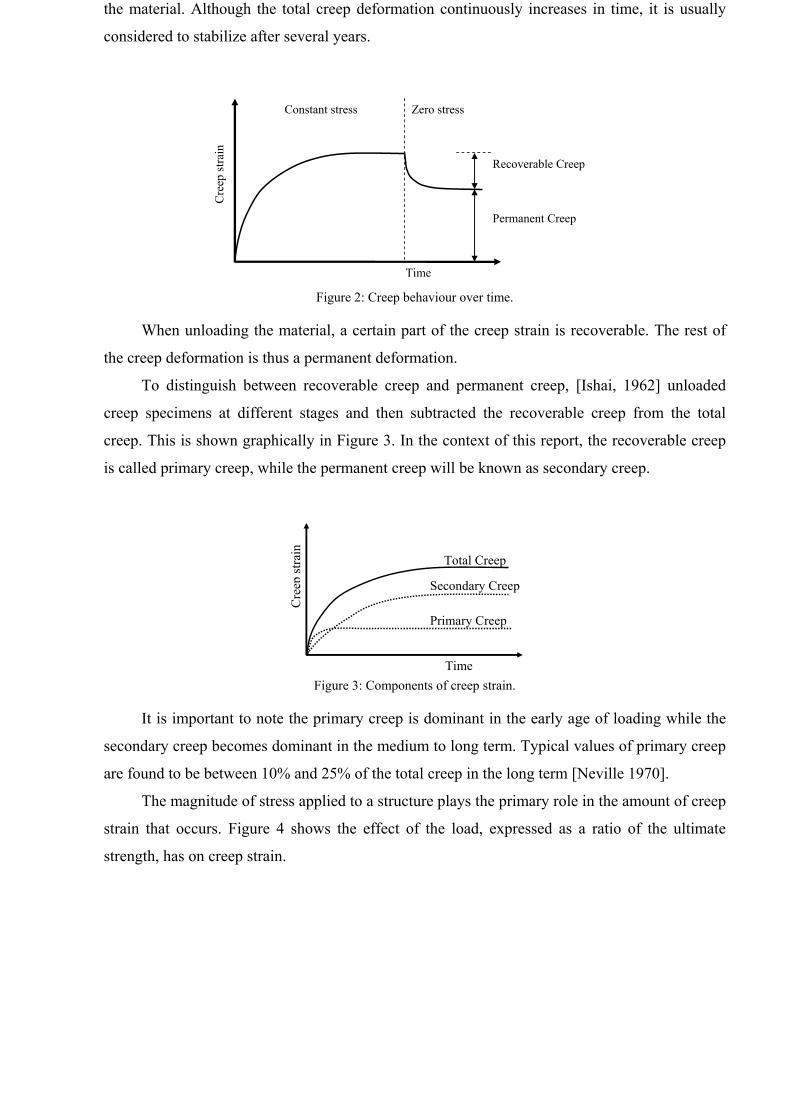
the material. Although the total creep deformation continuously increases in time, it is usually
considered to stabilize after several years.
Zero stress
Time
Cre
ep st
rain
Constant stress
Recoverable Creep
Permanent Creep
Figure 2: Creep behaviour over time.
When unloading the material, a certain part of the creep strain is recoverable. The rest of
the creep deformation is thus a permanent deformation.
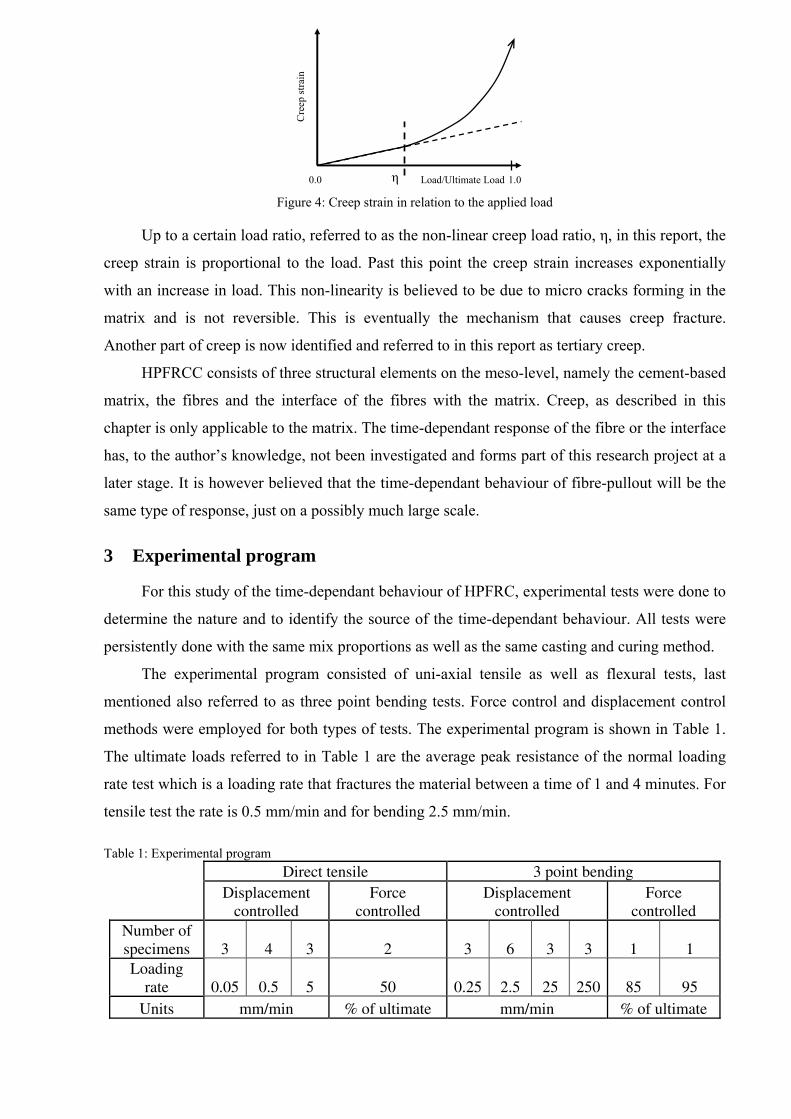
To distinguish between recoverable creep and permanent creep, [Ishai, 1962] unloaded
creep specimens at different stages and then subtracted the recoverable creep from the total
creep. This is shown graphically in Figure 3. In the context of this report, the recoverable creep
is called primary creep, while the permanent creep will be known as secondary creep.
Primary Creep
Time
Cre
ep st
rain
Total Creep
Secondary Creep
Figure 3: Components of creep strain.
It is important to note the primary creep is dominant in the early age of loading while the
secondary creep becomes dominant in the medium to long term. Typical values of primary creep
are found to be between 10% and 25% of the total creep in the long term [Neville 1970].
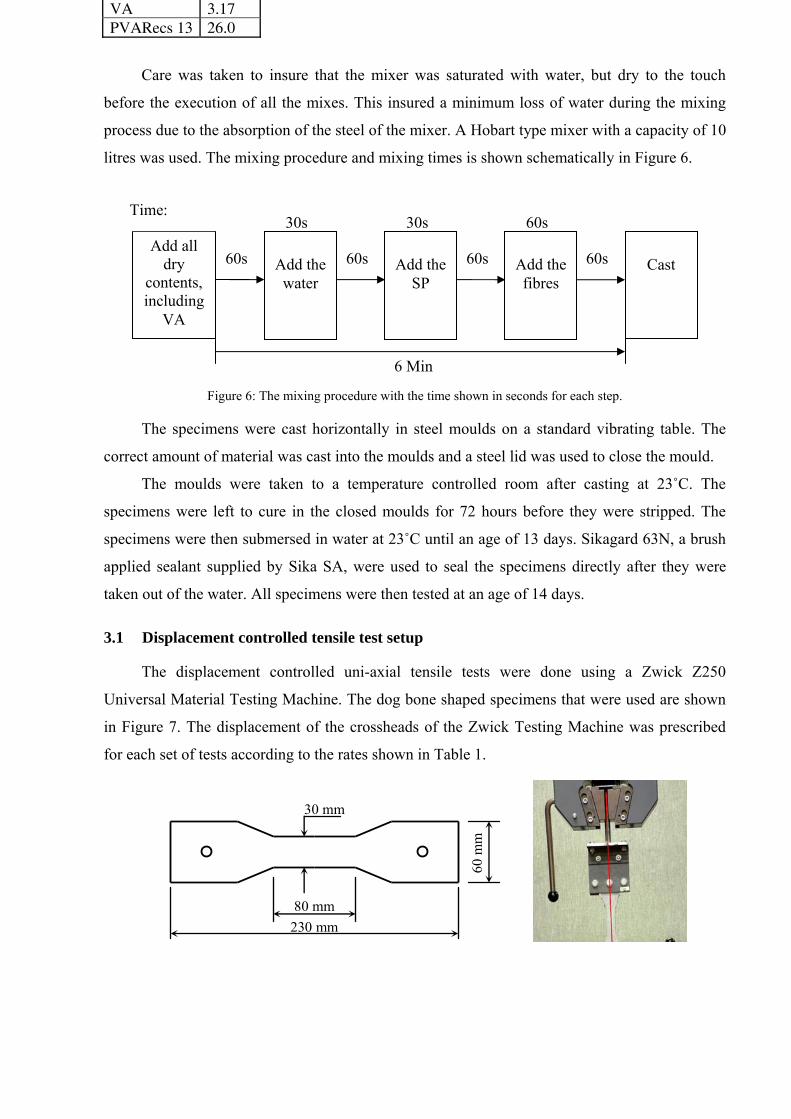
The magnitude of stress applied to a structure plays the primary role in the amount of creep
strain that occurs. Figure 4 shows the effect of the load, expressed as a ratio of the ultimate
strength, has on creep strain.
Load/Ultimate Load
Cre
ep st
rain
1.0 0.0 η
Figure 4: Creep strain in relation to the applied load
Up to a certain load ratio, referred to as the non-linear creep load ratio, η, in this report, the
creep strain is proportional to the load. Past this point the creep strain increases exponentially
with an increase in load. This non-linearity is believed to be due to micro cracks forming in the
matrix and is not reversible. This is eventually the mechanism that causes creep fracture.
Another part of creep is now identified and referred to in this report as tertiary creep.
HPFRCC consists of three structural elements on the meso-level, namely the cement-based
matrix, the fibres and the interface of the fibres with the matrix. Creep, as described in this
chapter is only applicable to the matrix. The time-dependant response of the fibre or the interface
has, to the author’s knowledge, not been investigated and forms part of this research project at a
later stage. It is however believed that the time-dependant behaviour of fibre-pullout will be the
same type of response, just on a possibly much large scale.
3 Experimental program
For this study of the time-dependant behaviour of HPFRC, experimental tests were done to
determine the nature and to identify the source of the time-dependant behaviour. All tests were
persistently done with the same mix proportions as well as the same casting and curing method.
The experimental program consisted of uni-axial tensile as well as flexural tests, last
mentioned also referred to as three point bending tests. Force control and displacement control
methods were employed for both types of tests. The experimental program is shown in Table 1.
The ultimate loads referred to in Table 1 are the average peak resistance of the normal loading
rate test which is a loading rate that fractures the material between a time of 1 and 4 minutes. For
tensile test the rate is 0.5 mm/min and for bending 2.5 mm/min.
Table 1: Experimental program Direct tensile 3 point bending
Displacement
controlled Force
controlled Displacement
controlled Force
controlled Number of specimens 3 4 3 2 3 6 3 3 1 1 Loading
rate 0.05 0.5 5 50 0.25 2.5 25 250 85 95 Units mm/min % of ultimate mm/min % of ultimate

load load
The mix proportions are shown in Table 2. This is calculated using the following ratios:
Water/Binder ratio of 0.4, Aggregate/binder ratio of 0.5. The binder consisted of CEM I cement,
a fly ash filler marketed as PozzFill by Ash Resources and Corex Slag of origin of the Saldanha
Steel Refinery in the Western Cape Province used in the ratio of 40:50:10. Please note that even
though not all the fly ash reacts as binder due to its high content with relation to the cement, all
the fly ash is assumed as part of the binder for the mix calculation purposes.
Fine sand was used as the aggregate and its grading is shown in Figure 5. Please note for
particle sizes above 150 um, locally available dune sand, marketed as Phillipe sand was used and
for the smaller particles, finely crushed Malmesbury Shale easily available in the Cape
Peninsula, Western Cape Province, was used.
0
10
20
30
40
50
60
70
80
90
100
Pan 75 105 150 210 300Sieve size in um
Tota
l % o
n si
eve
Phillipe SandChrushed Sand
Figure 5: The grading of the aggregate used for the HPFRCC mix.
Super plasticizer was added to 1% of the binder by mass, and the viscous agent was 0.3%
of the binder, also by mass. PVA fibres were added at 2% by volume. The super plasticizer used
was Premia 100, and the viscous agent is marketed as Aqua Beton. Both are products of Chryso
SA.
Table 2: Mix proportions for the chosen HPFRCC mix. Mass kg/m3 Water 423 CEM I 423 FA 528 Slag 106 Fine Sand 528 SP 10.6
VA 3.17 PVARecs 13 26.0
Care was taken to insure that the mixer was saturated with water, but dry to the touch
before the execution of all the mixes. This insured a minimum loss of water during the mixing
process due to the absorption of the steel of the mixer. A Hobart type mixer with a capacity of 10
litres was used. The mixing procedure and mixing times is shown schematically in Figure 6.
Add all dry
contents, including
VA
Time:
Add the water
Add the
SP
Add the fibres
Cast 60s
30s
60s
30s
60s
60s
60s
6 Min
Figure 6: The mixing procedure with the time shown in seconds for each step.
The specimens were cast horizontally in steel moulds on a standard vibrating table. The
correct amount of material was cast into the moulds and a steel lid was used to close the mould.
The moulds were taken to a temperature controlled room after casting at 23˚C. The
specimens were left to cure in the closed moulds for 72 hours before they were stripped. The
specimens were then submersed in water at 23˚C until an age of 13 days. Sikagard 63N, a brush
applied sealant supplied by Sika SA, were used to seal the specimens directly after they were
taken out of the water. All specimens were then tested at an age of 14 days.
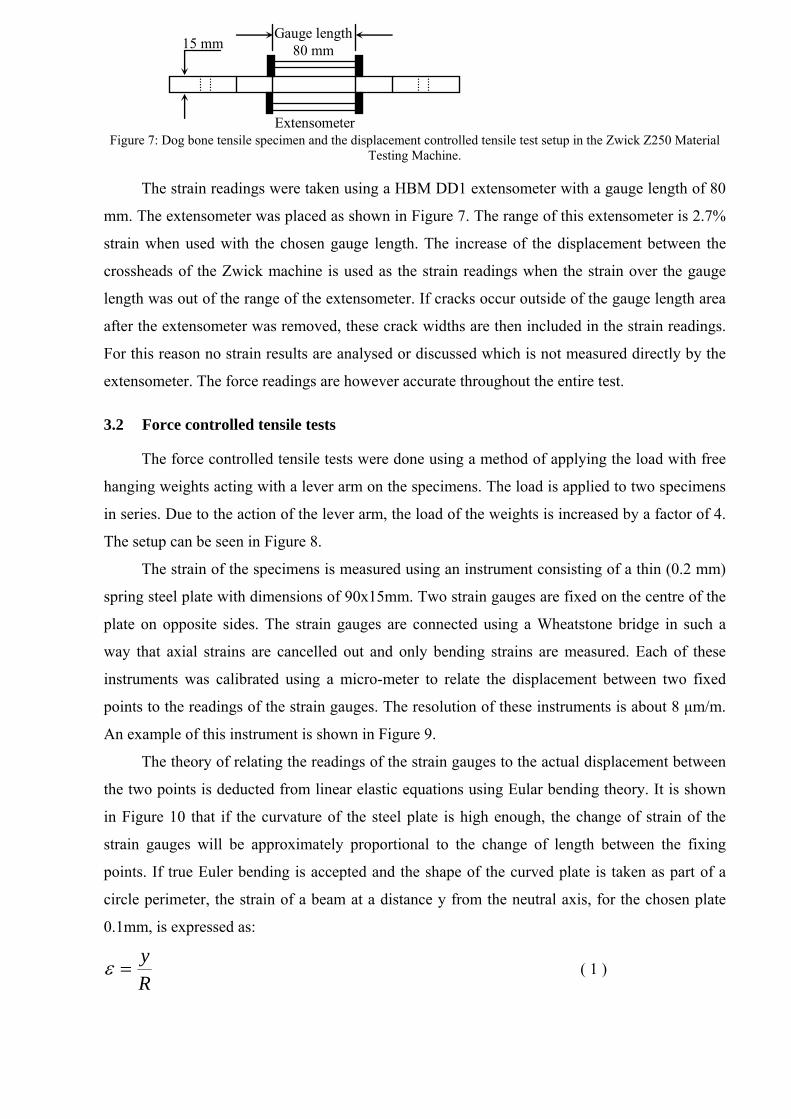
3.1 Displacement controlled tensile test setup
The displacement controlled uni-axial tensile tests were done using a Zwick Z250
Universal Material Testing Machine. The dog bone shaped specimens that were used are shown
in Figure 7. The displacement of the crossheads of the Zwick Testing Machine was prescribed
for each set of tests according to the rates shown in Table 1.
80 mm230 mm
60 m
m
30 mm
Gauge length 80 mm 15 mm
Extensometer Figure 7: Dog bone tensile specimen and the displacement controlled tensile test setup in the Zwick Z250 Material
Testing Machine.
The strain readings were taken using a HBM DD1 extensometer with a gauge length of 80
mm. The extensometer was placed as shown in Figure 7. The range of this extensometer is 2.7%
strain when used with the chosen gauge length. The increase of the displacement between the
crossheads of the Zwick machine is used as the strain readings when the strain over the gauge
length was out of the range of the extensometer. If cracks occur outside of the gauge length area
after the extensometer was removed, these crack widths are then included in the strain readings.
For this reason no strain results are analysed or discussed which is not measured directly by the
extensometer. The force readings are however accurate throughout the entire test.
3.2 Force controlled tensile tests
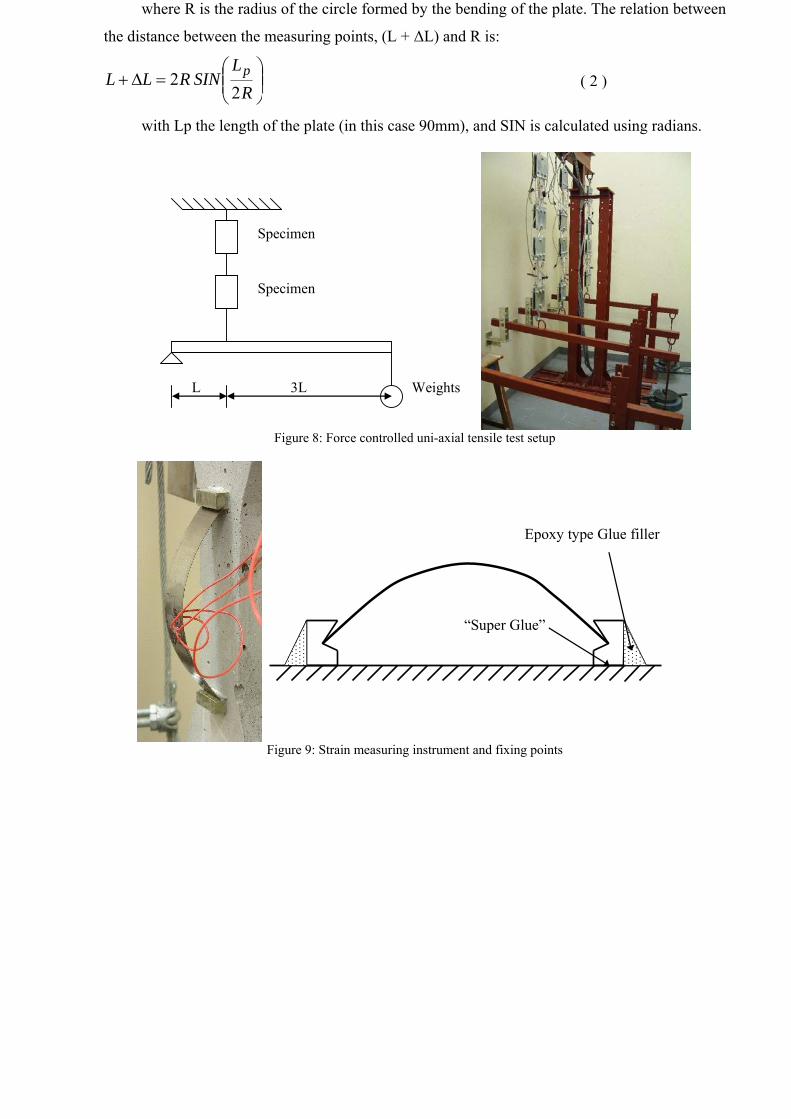
The force controlled tensile tests were done using a method of applying the load with free
hanging weights acting with a lever arm on the specimens. The load is applied to two specimens
in series. Due to the action of the lever arm, the load of the weights is increased by a factor of 4.
The setup can be seen in Figure 8.
The strain of the specimens is measured using an instrument consisting of a thin (0.2 mm)
spring steel plate with dimensions of 90x15mm. Two strain gauges are fixed on the centre of the
plate on opposite sides. The strain gauges are connected using a Wheatstone bridge in such a
way that axial strains are cancelled out and only bending strains are measured. Each of these
instruments was calibrated using a micro-meter to relate the displacement between two fixed
points to the readings of the strain gauges. The resolution of these instruments is about 8 μm/m.
An example of this instrument is shown in Figure 9.
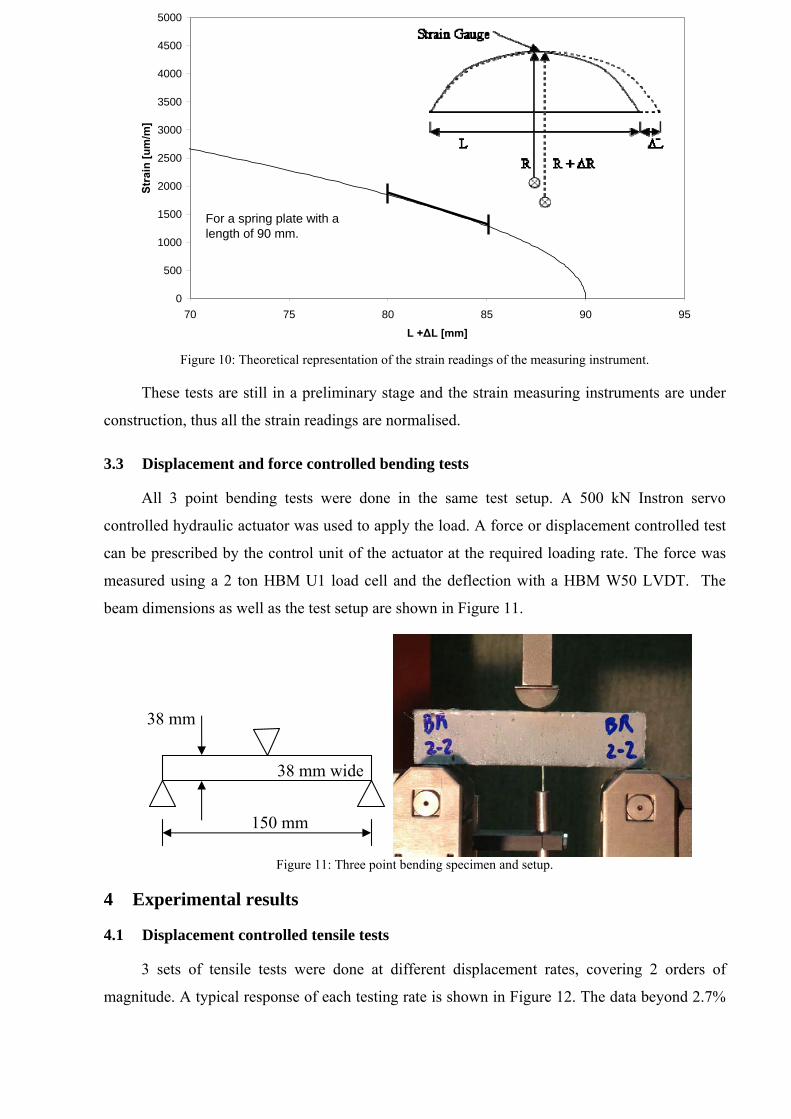
The theory of relating the readings of the strain gauges to the actual displacement between
the two points is deducted from linear elastic equations using Eular bending theory. It is shown
in Figure 10 that if the curvature of the steel plate is high enough, the change of strain of the
strain gauges will be approximately proportional to the change of length between the fixing
points. If true Euler bending is accepted and the shape of the curved plate is taken as part of a
circle perimeter, the strain of a beam at a distance y from the neutral axis, for the chosen plate
0.1mm, is expressed as:
Ry
=ε
( 1 )
where R is the radius of the circle formed by the bending of the plate. The relation between
the distance between the measuring points, (L + ΔL) and R is:
⎟⎟⎠
⎞⎜⎜⎝
⎛=Δ+
RL
SINRLL p
22
( 2 )
with Lp the length of the plate (in this case 90mm), and SIN is calculated using radians.
Weights
Specimen
Specimen
L 3L
Figure 8: Force controlled uni-axial tensile test setup
“Super Glue”
Epoxy type Glue filler
Figure 9: Strain measuring instrument and fixing points
0
500
1000
1500
2000
2500
3000
3500
4000
4500
5000
70 75 80 85 90 95
L +ΔL [mm]
Stra
in [u
m/m
]
For a spring plate with a length of 90 mm.
Figure 10: Theoretical representation of the strain readings of the measuring instrument.
These tests are still in a preliminary stage and the strain measuring instruments are under
construction, thus all the strain readings are normalised.
3.3 Displacement and force controlled bending tests
All 3 point bending tests were done in the same test setup. A 500 kN Instron servo
controlled hydraulic actuator was used to apply the load. A force or displacement controlled test
can be prescribed by the control unit of the actuator at the required loading rate. The force was
measured using a 2 ton HBM U1 load cell and the deflection with a HBM W50 LVDT. The
beam dimensions as well as the test setup are shown in Figure 11.
38 mm
38 mm wide
150 mm
Figure 11: Three point bending specimen and setup.
4 Experimental results
4.1 Displacement controlled tensile tests
3 sets of tensile tests were done at different displacement rates, covering 2 orders of
magnitude. A typical response of each testing rate is shown in Figure 12. The data beyond 2.7%
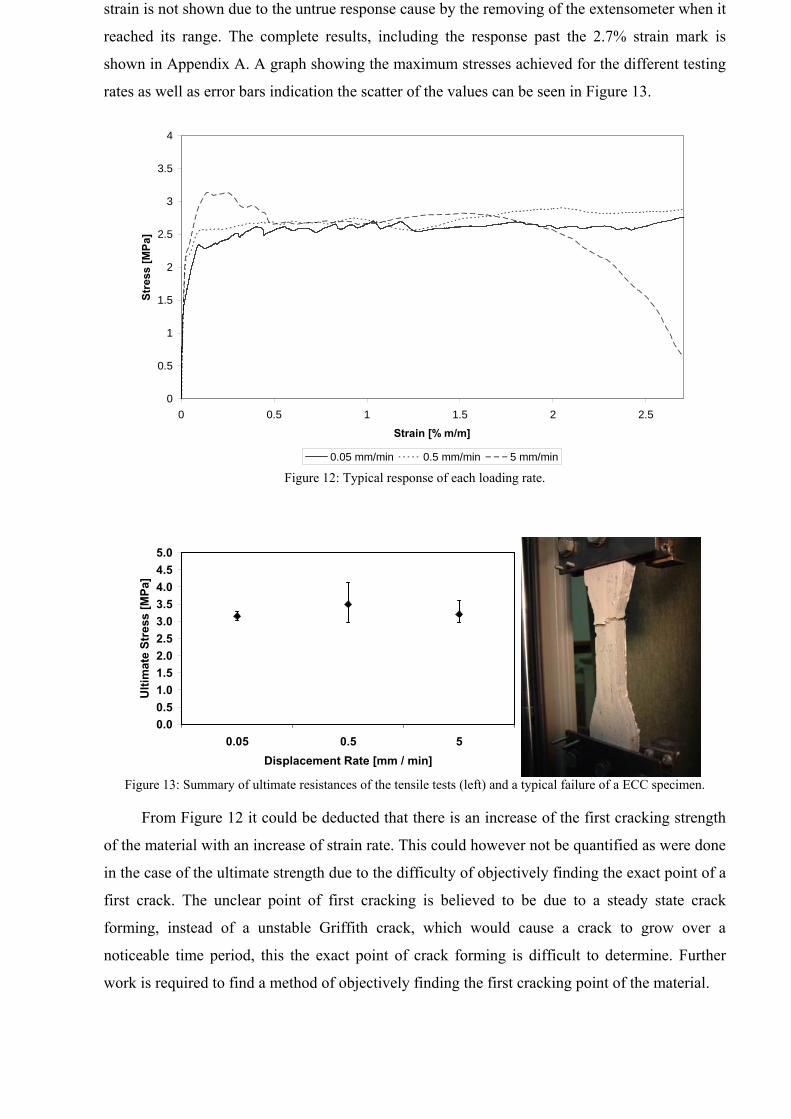
strain is not shown due to the untrue response cause by the removing of the extensometer when it
reached its range. The complete results, including the response past the 2.7% strain mark is
shown in Appendix A. A graph showing the maximum stresses achieved for the different testing
rates as well as error bars indication the scatter of the values can be seen in Figure 13.
0
0.5
1
1.5
2
2.5
3
3.5
4
0 0.5 1 1.5 2 2.5
Strain [% m/m]
Stre
ss [M
Pa]
0.05 mm/min 0.5 mm/min 5 mm/min Figure 12: Typical response of each loading rate.
0.00.51.01.52.02.53.03.54.04.55.0
0.05 0.5 5Displacement Rate [mm / min]
Ulti
mat
e St
ress
[MPa
]
Figure 13: Summary of ultimate resistances of the tensile tests (left) and a typical failure of a ECC specimen.
From Figure 12 it could be deducted that there is an increase of the first cracking strength
of the material with an increase of strain rate. This could however not be quantified as were done
in the case of the ultimate strength due to the difficulty of objectively finding the exact point of a
first crack. The unclear point of first cracking is believed to be due to a steady state crack
forming, instead of a unstable Griffith crack, which would cause a crack to grow over a
noticeable time period, this the exact point of crack forming is difficult to determine. Further
work is required to find a method of objectively finding the first cracking point of the material.

It is apparent from Figure 12 that a typical HPFRCC strain hardening response was
obtained for all specimens in direct tension. Moreover, reasonable repeatability was found,
indicated by for instance a coefficient of variance of less than 15% in ultimate tensile strength.
In contrast with the direct tensile strength rate dependence observed for concrete [Van Zijl
et. al., 2001b] and HPFRCC [Maalej et. al., 2004], no significant rate enhancement of ultimate
tensile strength was found for this material within the loading rate range investigated. It is
proposed that a larger range of strain rates are investigated to establish a trend. Furthermore, to
improve the objectivity of the rate dependence characterisation, more specimens need to be
tested and the strain rate over the gauge length of the specimens will be prescribed in future
experimentation, as opposed to the current control of the cross head velocity.
An important characterisation which is especially important for computational modelling is
the localising crack opening response. This is not easily deducted from the response over the
gauge length, as only one of the multiply cracks localises and the rest of the cracks close due to
the decrease in the load. A possible solution is to measure the opening displacement of the
localising crack, but this is difficult as the position of the localising crack is not known
beforehand. Another pragmatic option is to investigate the unloading behaviour of this material
and then calculate the localisation behaviour using the response over the gauge length and
assume the unloading behaviour to act on the material in gauge length. Thus, the correct
localisation response of the material is achieved. This is however only possible if the strain is
measured over the gauge length for the full duration of the test.
4.2 Force controlled tensile tests
At the time of the compilation of this report, the difficulties found with the strain
measuring instruments used to measure the strain increase due to uni-axial creep has not yet been
solved. The results shown include an uncertain amount of increase of strain which is the results
of the creep of the strain gauges used in the manufacturing of the instrument and not the
specimen itself. There is however trends found in the results which are worth noting.
Two tensile specimens were subjected to a constant load of 50% of the ultimate load. The
definition for the ultimate load for force control tests was described earlier in this report. The
results of the strain against the time are shown in Figure 14. Note that after about 4 minutes
subsequent to the load application, the one specimen cracked and this caused a sudden increase
of strain.

0
0.1
0.2
0.3
0.4
0.5
0.6
0.7
0.8
0.9
1
0 20 40 60 80 100 120 140 160 180 200
Time [Minutes]
Nor
mal
ised
Str
ain
4 min
Creep of Cracked Section
Creep of Uncracked Section
Figure 14: Prelimary results of tensile creep responses. The specimens were loaded at 50% of their ultimate load.
Preliminary trends observed in the direct tensile creep tests, of which only two have been
performed up to the date of this report, are that a large increase in time dependent deformation
accompanies matrix cracking. In Figure 14, which shows the tensile creep responses of two
identical specimens, both loaded to 50% of the average peak tensile resistance, a significantly
larger creep strain can be seen for the specimen which cracked, compared with the specimen
which did not crack. This increased deformation is attributed to time-dependent fibre pull-out in
the cracked specimen. The difference in total strain between cracked and uncracked specimens,
in this case at the same load level, is of critical importance for the serviceability limit state
conditions of structures or members fabricated of such materials. This time-dependant fibre pull-
out could also cause a complete failure to occur.
4.3 Displacement controlled bending tests
Flexural tests were done over a range of 3 orders of magnitude of the deflection rate. A
typical response of each testing rate is shown in Figure 15. The complete set of results can be
found in Appendix B.

0.0
0.5
1.0
1.5
2.0
2.5
3.0
3.5
4.0
4.5
0 1 2 3 4 5 6 7 8 9 10
Deflection [mm]
Forc
e [k
N]
0.25 mm/min 2.5 mm/min 25 mm/min 250 mm/min Figure 15: A typical response of each loading rate of the 3 point bending tests.
The results are summarized in Figure 16 with regards to the first cracking strength,
deflection at the first crack, the ultimate resistance and the deflection of the ultimate resistance.
Unlike the tensile responses, the point of the first matrix crack is objectively determinable in
these tests. Note that the definition of a first crack used is the point where the increased
displacement causes a sudden change of slope of the load response. The stiffness of the beam
before the first cracking point, which is a good indication of the change stiffness of the material,
is shown in Figure 17.
0.00.10.20.30.40.50.60.70.80.91.0
0.25 2.5 25 250Deflection Rate [mm/min]
Def
lect
ion
[mm
]
0.00
0.50
1.00
1.50
2.00
2.50
3.00
Forc
e [k
N]
Deflection
Force
0.01.02.03.04.05.06.07.08.09.0
10.0
0.25 2.5 25 250Deflection Rate [mm/min]
Def
lect
ion
[mm
]
0.000.501.001.502.002.503.003.504.004.505.00
Forc
e [k
N]
Deflection
Force
Figure 16: The force and displacement averages with the minimum and maximum values shown of the first cracking
point (left) and the ultimate force point (right).
0
2
4
6
8
10
12
0.25 2.5 25 250Deflection Rate [mm/min]
Stiff
ness
[kN
/mm
]
Figure 17: The stiffness of the beam until the first cracking point (left) and a typical localising crack in bending
(right).
As opposed to the direct tensile response measured in this research project up to now, clear
trends are observed for bending rate dependence of this HPFRC, as was also reported for
concrete [Bažant and Gettu, 1992], [Zhou, 1992]. An increased first cracking strength (by
approximately 70%), ultimate strength (25%), as well as increased stiffness (40%) are observed
in Figure 17 with 3 orders of magnitude increase in deflection rate. On the other hand, a reduced
ductility is seen in Figure 16 with increased deflection rate.
The results show clear trends, but the slowest testing rate resulted in a test of only about 30
minutes. A remarkable slower test is practically possible and will give a better representation of
the creep limit. It is proposed that a test is done at a deflection rate of 0.025 mm/min, which
would take approximately 5 hours.
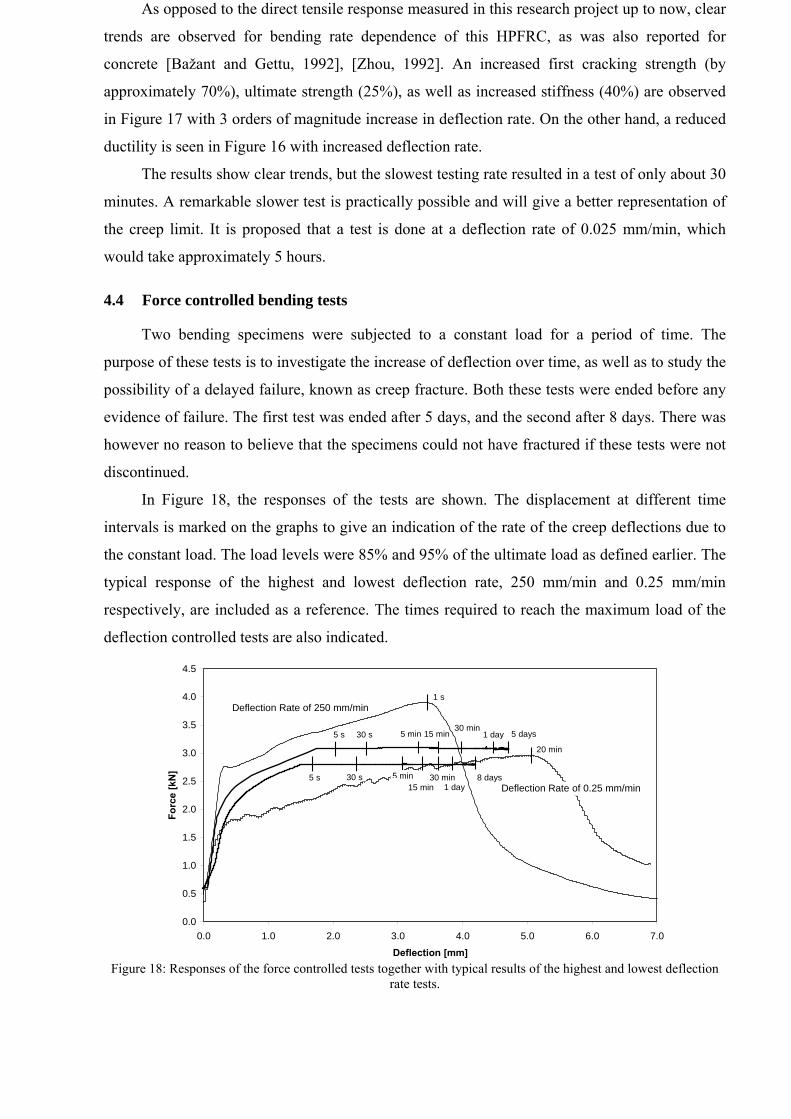
4.4 Force controlled bending tests
Two bending specimens were subjected to a constant load for a period of time. The
purpose of these tests is to investigate the increase of deflection over time, as well as to study the
possibility of a delayed failure, known as creep fracture. Both these tests were ended before any
evidence of failure. The first test was ended after 5 days, and the second after 8 days. There was
however no reason to believe that the specimens could not have fractured if these tests were not
discontinued.
In Figure 18, the responses of the tests are shown. The displacement at different time
intervals is marked on the graphs to give an indication of the rate of the creep deflections due to
the constant load. The load levels were 85% and 95% of the ultimate load as defined earlier. The
typical response of the highest and lowest deflection rate, 250 mm/min and 0.25 mm/min
respectively, are included as a reference. The times required to reach the maximum load of the
deflection controlled tests are also indicated.
0.0
0.5
1.0
1.5
2.0
2.5
3.0
3.5
4.0
4.5
0.0 1.0 2.0 3.0 4.0 5.0 6.0 7.0
Deflection [mm]
Forc
e [k
N]
5 s
5 s 30 s
30 s
5 min
5 min
15 min
15 min
30 min
30 min1 day
1 day 5 days
8 days
Deflection Rate of 250 mm/min
Deflection Rate of 0.25 mm/min
1 s
20 min
Figure 18: Responses of the force controlled tests together with typical results of the highest and lowest deflection
rate tests.
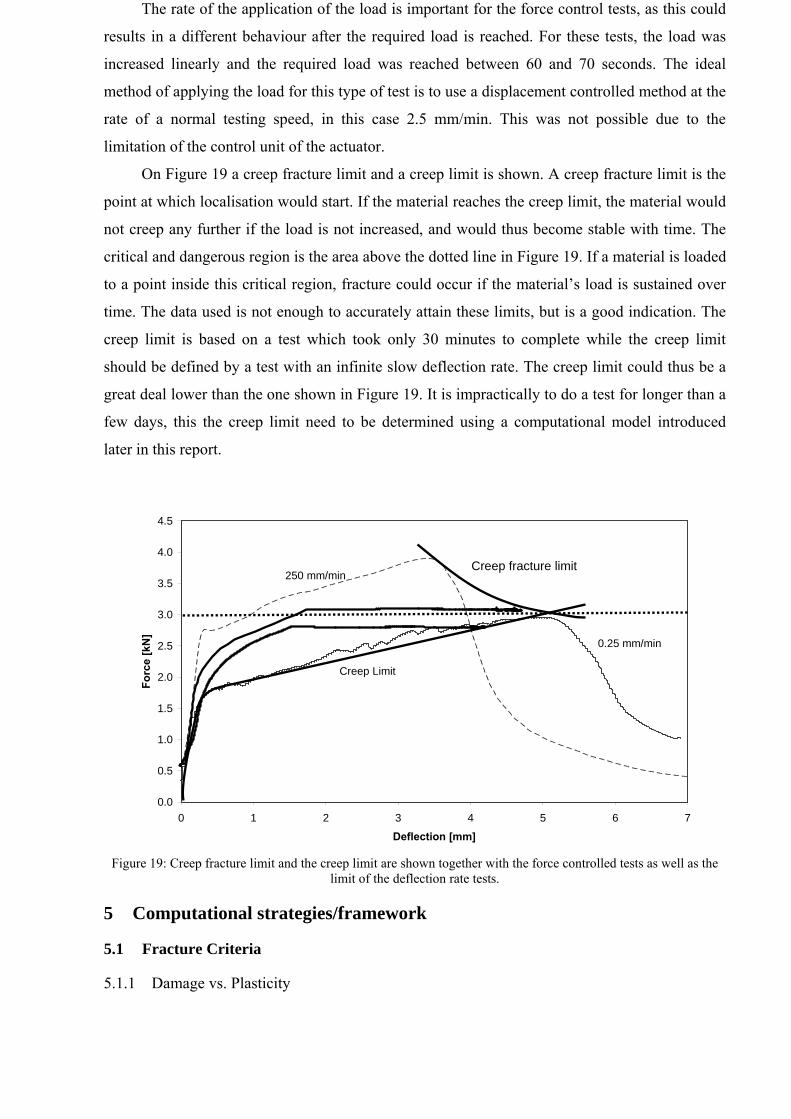
The rate of the application of the load is important for the force control tests, as this could
results in a different behaviour after the required load is reached. For these tests, the load was
increased linearly and the required load was reached between 60 and 70 seconds. The ideal
method of applying the load for this type of test is to use a displacement controlled method at the
rate of a normal testing speed, in this case 2.5 mm/min. This was not possible due to the
limitation of the control unit of the actuator.
On Figure 19 a creep fracture limit and a creep limit is shown. A creep fracture limit is the
point at which localisation would start. If the material reaches the creep limit, the material would
not creep any further if the load is not increased, and would thus become stable with time. The
critical and dangerous region is the area above the dotted line in Figure 19. If a material is loaded
to a point inside this critical region, fracture could occur if the material’s load is sustained over
time. The data used is not enough to accurately attain these limits, but is a good indication. The
creep limit is based on a test which took only 30 minutes to complete while the creep limit
should be defined by a test with an infinite slow deflection rate. The creep limit could thus be a
great deal lower than the one shown in Figure 19. It is impractically to do a test for longer than a
few days, this the creep limit need to be determined using a computational model introduced
later in this report.
0.0
0.5
1.0
1.5
2.0
2.5
3.0
3.5
4.0
4.5
0 1 2 3 4 5 6 7
Deflection [mm]
Forc
e [k
N]
Creep fracture limit
Creep Limit
250 mm/min
0.25 mm/min
Figure 19: Creep fracture limit and the creep limit are shown together with the force controlled tests as well as the
limit of the deflection rate tests.
5 Computational strategies/framework
5.1 Fracture Criteria
5.1.1 Damage vs. Plasticity
The two most widely used and accepted approaches for numerical modelling the fracture
of concrete as a continuum material is a continuum damage mechanics approach and a
computational associative elasto-plasticity model. Both can be implemented as a smeared
cracking approach, i.e. the strains caused by the crack openings are added to the total strain of a
material point compared to a discrete crack modelling where specific interface elements are
placed strategically to act as crack openings. The discrete cracking approach is not suitable for
ductile materials as HPFRCC because the crack position and path is not known beforehand as is
required by a discrete modelling approach. Other smeared cracking numerical models has also
been defined and used, e.g. total strain model by Peter Feenstra which is especially useful for
modelling cycled loading of concrete and other cement-based materials.
Even though these models give similar results, their mathematical formulations differ
significantly. The basic relation used in an elastic computational model is shown in Equation ( 3
).
εσe
D= ( 3 )
The stress vector, σ, is related to the strain vector, ε, via the elastic stiffness matrix, De. The
damage approach is based on the reduction of the stiffness matrix of the material when yielding
occurs using a damage indicator scalar, ω, which ranges from 1, no damage, to 0, total damage,
shown in Equation ( 4 ).
( ) εωσe
D−= 1 ( 4 )
Plasticity on the other hand, does not alter the elastic stiffness of the material, but uses the
same stiffness matrix. There is however an added plastic strain to represent the crack opening.
This is shown in ( 5 ).
plasticelastictotal εεε +=
( )plastictotale
D εεσ −= ( 5 )
The calculation of ω and εplastic is shown later in this report.
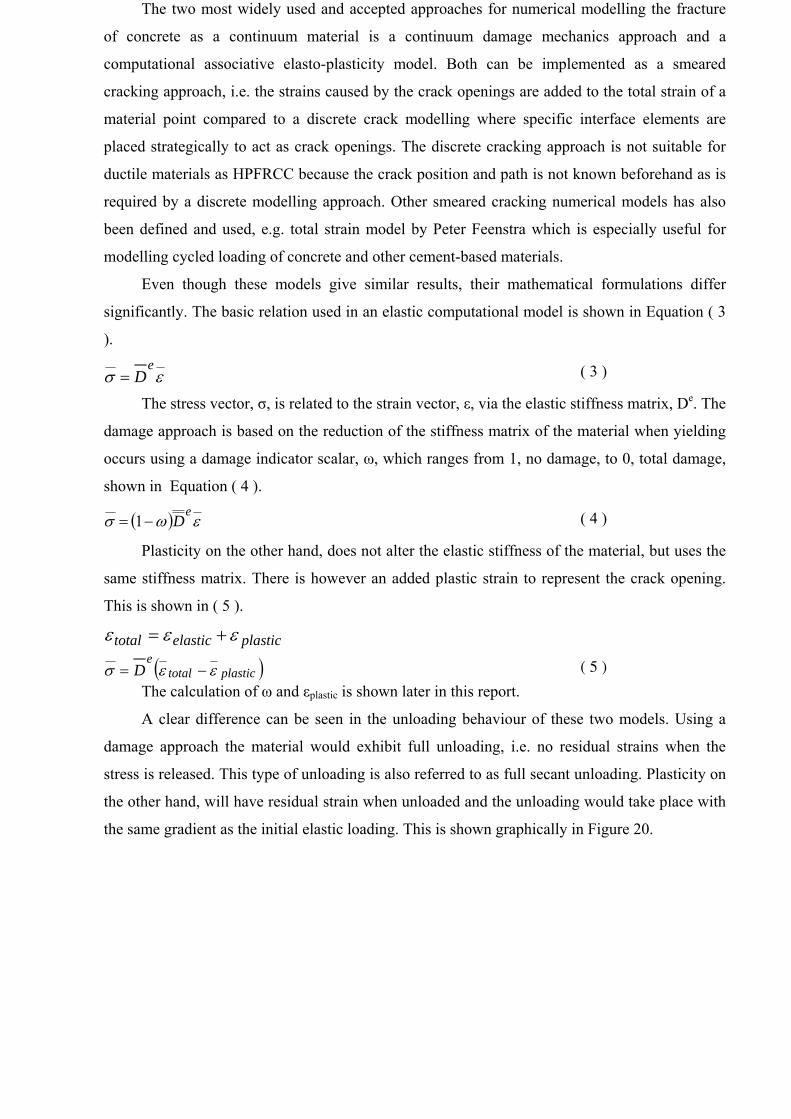
A clear difference can be seen in the unloading behaviour of these two models. Using a
damage approach the material would exhibit full unloading, i.e. no residual strains when the
stress is released. This type of unloading is also referred to as full secant unloading. Plasticity on
the other hand, will have residual strain when unloaded and the unloading would take place with
the same gradient as the initial elastic loading. This is shown graphically in Figure 20.
Stre
ss
Strain
Loading
Unloading Stre
ss
Strain
Loading
Unloading
Figure 20: The unloading behaviour of a damage formulation (left) and a plasticity implementation (right).
Another important difference between the two models is the fracture or yielding criterion.
Plasticity based constitutive models use a stress based yielding criterion. This implies that the
non-linear behaviour is prescribed using a formulation that is based on the current stress. A
formulation for the compression behaviour and tensile behaviour are combined to produce a two
dimensional fracture criterion.
A damage approach in contrast uses a strain controlled fracture criterion. The formulation
used to determine the state of damage (ω) is calculated using the current strain condition.
Generally, only the tensile behaviour is prescribed, thus the compression yielding is seldom
included in a damage formulation.
Compression failure does still occur indirectly in a damage mechanics implementation due
to the poison effect on the induced strains. The tensile strains in the orthogonal direction are
increased if the material is loaded in uni-axial compression, thus failure can occur in the
orthogonal direction even if no stress is induced in that direction. Failure in compression will
thus occur due to splitting and is controlled by the poison ratio for the material, e.g. if the
ultimate tensile strain in a material is prescribed as 300 um/m and the poison ratio at 0.2, the
material will yield in tension if the compression strain reaches 1500 um/m. A numerical example
of this is scheduled for later in this research project.
The physical interpretation of these models is more intuitive. Using a damage approach
would mean that all the crack openings in the material will close completely when the material is
unloaded. With plasticity however, no cracks will close during unloading as the strain caused by
the cracking is permanent. Not one of these two models is believed to be true to the actual
response of a cement-based material, as the correct representation would however be a
combination of the two models. This will hopefully be proved by the unloading tests of
HPFRCC scheduled for later in this research program. However, for the purpose of this research
project, the damage approach is chosen for fracture. The plasticity approach would however be
introduced to incorporate the time-dependant creep behaviour.
5.1.2 Tensile response
The basis behind an isotropic continuum damage approach has already been introduced in
Equation ( 4 ). Using an isotropic damage mechanics implementation as done in this report, a
rotating crack approach is entailed. This implies that the direction of the crack is always
orthogonal to the direction of the largest principal tensile strain and an increase of strain in any
direction would add to the crack width included in the total strain. This type of modelling would
be a concern if there are significant changes in the direction of the principal strains during an
analysis. For the type of analyses planned in this research project this would however not be a
concern.
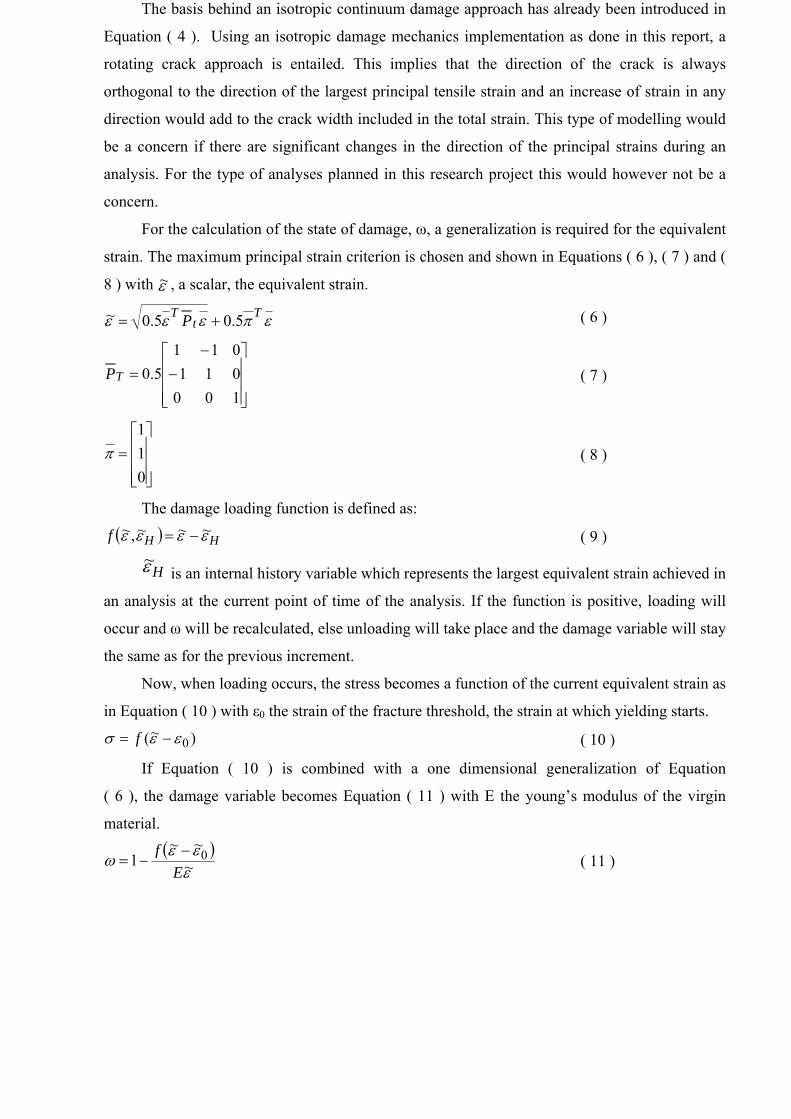
For the calculation of the state of damage, ω, a generalization is required for the equivalent
strain. The maximum principal strain criterion is chosen and shown in Equations ( 6 ), ( 7 ) and (
8 ) with ε~, a scalar, the equivalent strain.
επεεε Tt
T P 5.05.0~ += ( 6 )
⎥⎥⎥
⎦
⎤
⎢⎢⎢
⎣
⎡−
−=
100011011
5.0TP
( 7 )
⎥⎥⎥
⎦
⎤
⎢⎢⎢
⎣
⎡=
011
π
( 8 )
The damage loading function is defined as:
( ) HHf εεεε ~~~,~ −= ( 9 )
Hε~ is an internal history variable which represents the largest equivalent strain achieved in
an analysis at the current point of time of the analysis. If the function is positive, loading will
occur and ω will be recalculated, else unloading will take place and the damage variable will stay
the same as for the previous increment.
Now, when loading occurs, the stress becomes a function of the current equivalent strain as
in Equation ( 10 ) with ε0 the strain of the fracture threshold, the strain at which yielding starts.
)~( 0εεσ −= f ( 10 )
If Equation ( 10 ) is combined with a one dimensional generalization of Equation
( 6 ), the damage variable becomes Equation ( 11 ) with E the young’s modulus of the virgin
material.
( )εεεω ~~~
1 0E
f −−=
( 11 )
ε~
σ
ε0 εsh
εtu
fty
ftu
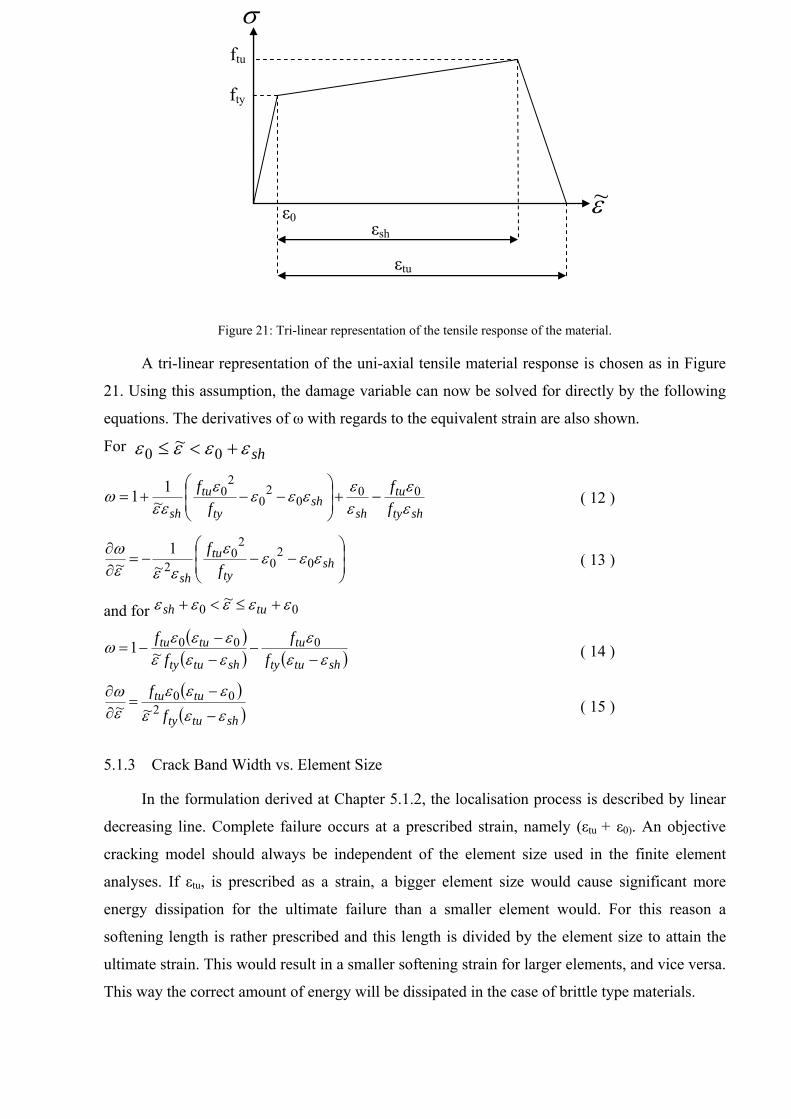
Figure 21: Tri-linear representation of the tensile response of the material.
A tri-linear representation of the uni-axial tensile material response is chosen as in Figure
21. Using this assumption, the damage variable can now be solved for directly by the following
equations. The derivatives of ω with regards to the equivalent strain are also shown.
For shεεεε +<≤ 00~
shty
tu
shsh
ty
tu
sh ff
ff
εε
εεεεεε
εεω 00
02
0
20
~11 −+⎟
⎟⎠
⎞⎜⎜⎝
⎛−−+=
( 12 )
⎟⎟⎠
⎞⎜⎜⎝
⎛−−−=
∂∂
shty
tu
sh ff εεεε
εεεω
02
0
20
2~1
~
( 13 )
and for 00~ εεεεε +≤<+ tush
( )( ) ( )shtuty
tu
shtuty
tutuf
ff
fεε
εεεεεεεω
−−
−−
−= 000~1
( 14 )
( )( )shtuty
tutu
ff
εεεεεε
εω
−
−=
∂∂
200
~~
( 15 )
5.1.3 Crack Band Width vs. Element Size
In the formulation derived at Chapter 5.1.2, the localisation process is described by linear
decreasing line. Complete failure occurs at a prescribed strain, namely (εtu + ε0). An objective
cracking model should always be independent of the element size used in the finite element
analyses. If εtu, is prescribed as a strain, a bigger element size would cause significant more
energy dissipation for the ultimate failure than a smaller element would. For this reason a
softening length is rather prescribed and this length is divided by the element size to attain the
ultimate strain. This would result in a smaller softening strain for larger elements, and vice versa.
This way the correct amount of energy will be dissipated in the case of brittle type materials.

For materials as ductile as HPFRC, it is often found that the localising crack is spread over
a region at the start of localisation and only at a later stage the crack would form at one position,
using one row of elements and not a band of elements. During the time that the localisation is
spread over multiple elements, using the element size calculation for the softening strain would
cause more energy to be dissipated the finer the mesh used.
A pragmatic solution would however be to find a combination of the two approaches that
would give the best representation of the true behaviour and be mesh independent. Analyses is
planned for later in the research program to find the optimal relation.
Another problem with modelling the softening of the material is to correctly attain the
softening response from experimental tests. To implement true softening response, the softening
response of a single crack has to be found. This is difficult as the other cracks over the gauge
length which is not softening at the point of localisation, is closing due to the reduction of the
stress level. It is also not so easy to directly measure the opening displacement of the localising
crack, as its position is known before hand.
5.2 Geometric non-linearity.
Normally in analyses the geometric non-linearity are neglected. This simplifies the
solution. The assumption is based on the reasoning that the displacements of the model are very
small with regards to the deflection on the structural level.
This assumption need to be proven is part of the ongoing research project.
5.3 Time-dependant strategies – non-linear creep and implementation
5.3.1 Mathematical description of non-linear creep
As described in Chapter 2, creep is believed to consist of 3 components, namely primary
creep, secondary creep and tertiary creep. At this stage of the research project, the effect of
recoverable creep is ignored and the focused lies on the secondary and tertiary creep for
simplification of the proposed model.
A mathematical model is required to calculate the total creep strain of a material point at
every finite point of time during an analysis. Even though the concept of superposition is
accepted for creep, the formulation still needs to take into account the load history. A
formulation has to be derived that represents the complete stress history over time without
having to add a variable for each history point.
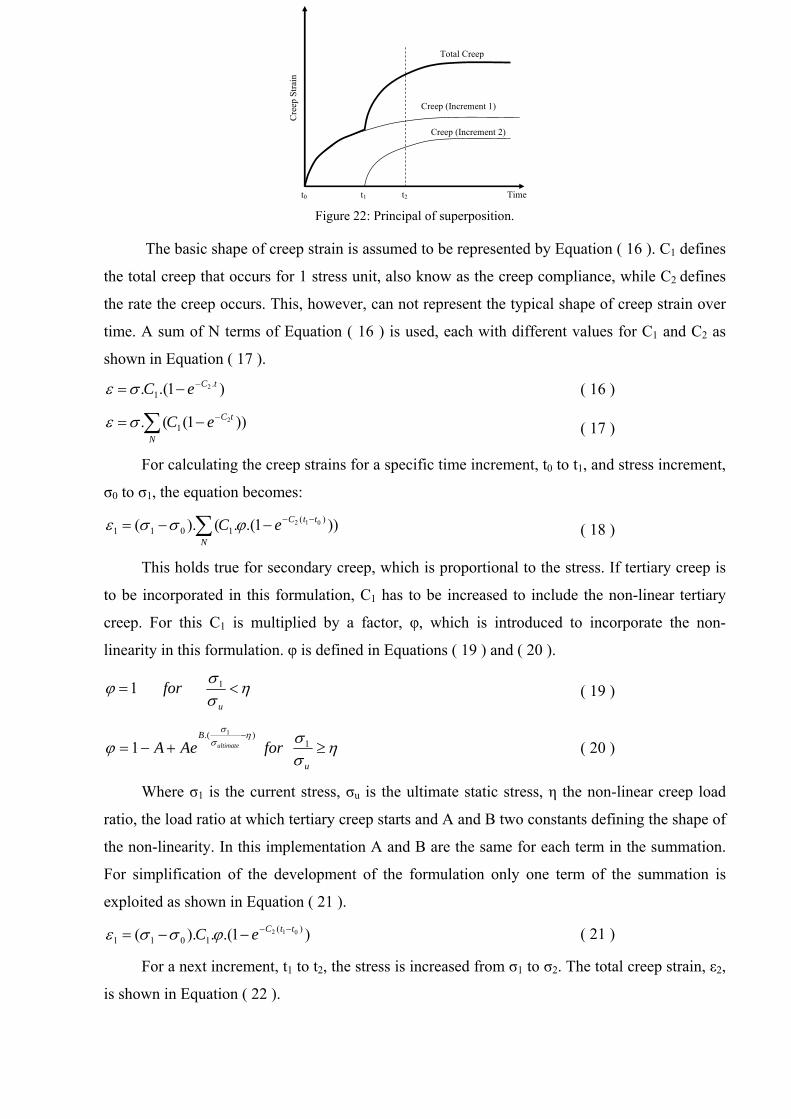
The assumption of super position implies that the total creep strain can be calculated by
taking the sum of the creep strains caused by each stress and time increment separately. This is
explained graphically for two increments in Figure 22.
Total Creep
Creep (Increment 1)
Creep (Increment 2)
Time
Cre
ep S
train
t0 t1 t2 Figure 22: Principal of superposition.
The basic shape of creep strain is assumed to be represented by Equation ( 16 ). C1 defines
the total creep that occurs for 1 stress unit, also know as the creep compliance, while C2 defines
the rate the creep occurs. This, however, can not represent the typical shape of creep strain over
time. A sum of N terms of Equation ( 16 ) is used, each with different values for C1 and C2 as
shown in Equation ( 17 ).
)1.(. .1
2 tCeC −−=σε ( 16 )
))1((. 21
tC
NeC −−= ∑σε
( 17 )
For calculating the creep strains for a specific time increment, t0 to t1, and stress increment,
σ0 to σ1, the equation becomes:
))1.(.().( )(1011
012 ttC
NeC −−−−= ∑ ϕσσε
( 18 )
This holds true for secondary creep, which is proportional to the stress. If tertiary creep is
to be incorporated in this formulation, C1 has to be increased to include the non-linear tertiary
creep. For this C1 is multiplied by a factor, φ, which is introduced to incorporate the non-
linearity in this formulation. φ is defined in Equations ( 19 ) and ( 20 ).
ησσϕ <=
u
for 11
( 19 )
ησσϕ
ησσ
≥+−=−
u
BforAeA ultimate 1
).( 1
1
( 20 )
Where σ1 is the current stress, σu is the ultimate static stress, η the non-linear creep load
ratio, the load ratio at which tertiary creep starts and A and B two constants defining the shape of
the non-linearity. In this implementation A and B are the same for each term in the summation.
For simplification of the development of the formulation only one term of the summation is
exploited as shown in Equation ( 21 ).
)1.(.).( )(1011
012 ttCeC −−−−= ϕσσε ( 21 )
For a next increment, t1 to t2, the stress is increased from σ1 to σ2. The total creep strain, ε2,
is shown in Equation ( 22 ).
)1.(.).( )(11012
022 ttCeC −−−−= ϕσσε )1.(.).( )(2112
122 ttCeC −−−−+ ϕσσ ( 22 )
This simplifies to:
( )[ +−= − 0222 ... 11102tCtC eCe ϕσσε ( ) ]+− 12... 2121
tCeC ϕσσ
( ) ( )[ ]21121101 .... ϕσσϕσσ CC −+− ( 23 )
At a given increment the stress and time at the start and end of the increment is known.
The variables of the first term between each square bracket is known at the end of the first
increment, while the parameters of second term in each square bracket is known at the end of the
second increment, without needing any information about the previous increments. If another
increment is added, a third term would arise with the same property, that it is all the parameters
of that term is known at the end of that term without needing any information about the previous
increments. The equation is simplified to produce Equation ( 24 ) .
( )[ ] ( )[ ]21122212112 ..... 1222 ϕσσϕσσε CHeCHe tCtC −++−+= − ( 24 )
Two new variables are found in Equation ( 24 ), namely H1 and H2. These are two history
variables, which encapsulate the stress history. The update of the history variables after the
second increment is as follow: 12..).( 212111tC
New eCHH ϕσσ −+= ( 25 )
211222 .).( ϕσσ CHH New −+= ( 26 )
Thus, a formulation is derived where secondary and tertiary creep can be modelled in a
continuum where the applied stress can change with time. This formulation uses only two
variables per summation term to represent the stress history. The complete formulation is shown
in Equation ( 27 ).
( )[ ][ ( )[ ]]21122212112 ..... 1222 ϕσσϕσσε CHeCHeN
tCtC −++−+= ∑ −
( 27 )
Elasto-plasticity, as introduced in Chapter 5.1.1 is chosen for modelling creep. As
explained in the previous chapter this modelling strategy has the results that all creep strains are
permanent.
Associative isotropic plasticity has the feature of an activation stress and it has been shown
that creep occurs even at relative small stresses (Neville, 1970). Therefore, it can be deduced that
creep does not have an activation stress level. The activation stress level is thus chosen as zero at
the start of loading, but changes due to changes in the load, the time and the stress history (H).
),,( HtfCreep σε = ( 28 )
The creep strain after an increment in a numerical analysis is a function of the stress, time
and the stress history, see Equation ( 28 ).
This formulation can be used for calculating the yielding criteria for a plastic constitutive
implementation for a plane stress element. The yielding stress for plastic flow is found by
solving equation 15 for σ2, the stress at the end of the increment, which becomes the yield stress,
σft and σfc for tensile and compression respectively. ε2, the total creep strain at the end of the
increment becomes κ, the plastic strain. The result is shown in Equation ( 29 ) together with the
derivative with regards to in κ in Equation ( 30 ).
( )( )∑
∑
−
−−
−
−++−=
N
tCtCN
tCtCtC
eCC
CHeCHe
221211
1122212
11112
2ϕϕ
ϕσϕσκσ
( 29 )
( )∑ −−=
∂∂
N
tCtCeCC 122211
2 1ϕϕκ
σ
( 30 )
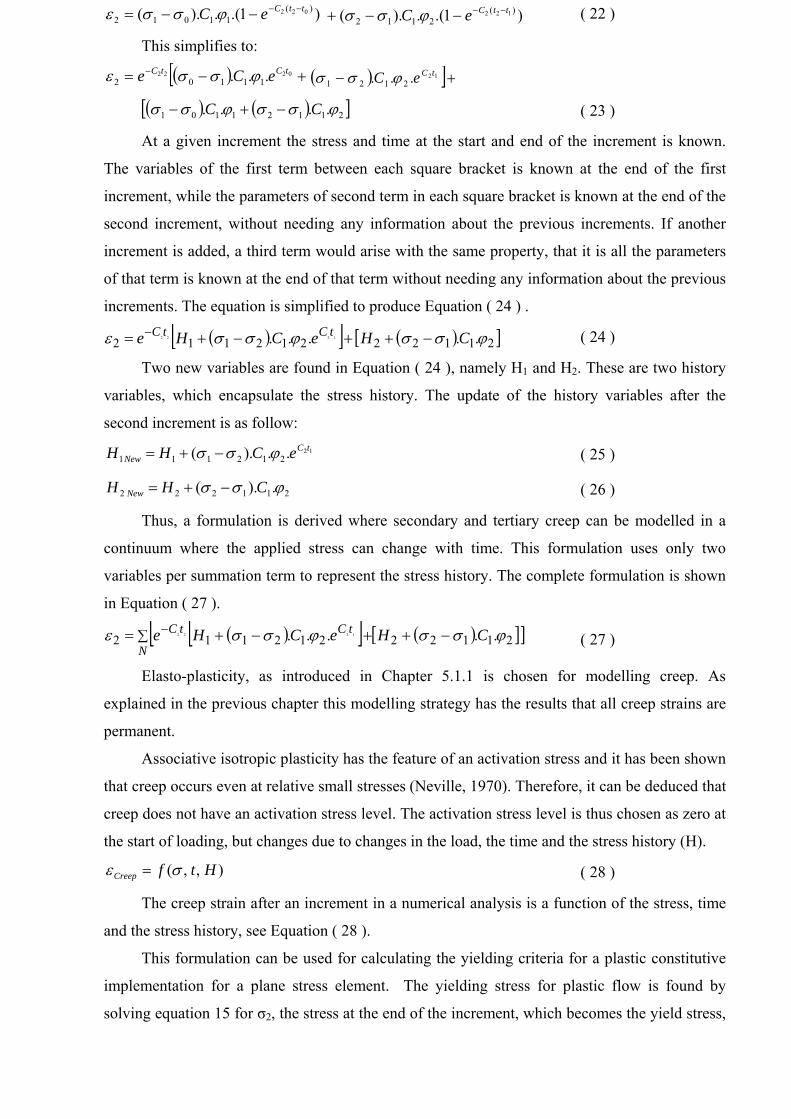
A Rankine yield surface, also known as the maximum principal stress yield criteria is used
for the compression and tension zones. The yielding function, f, and the potential flow function,
g, which are the same in associative plasticity are shown in equation ( 31 ) and equation ( 32 ) for
tension and compression respectively. The derivatives with regards to κ are shown in equations (
36 ) and ( 37 ).
ytT
tT Pgf σσπσσ −−== 5.05.0 ( 31 )
ycT
tT Pgf σσπσσ −+== 5.05.0 ( 32 )
επεεε Tt
T P 5.05.0~ += ( 33 )
⎥⎥⎥
⎦
⎤
⎢⎢⎢
⎣
⎡−
−=
400011011
5.0TP
( 34 )
⎥⎥⎥
⎦
⎤
⎢⎢⎢
⎣
⎡=
011
π
( 35 )
κσ
κ ∂
∂−=
∂∂ ytg
( 36 )
κσ
κ ∂
∂−=
∂∂ ycg
( 37 )
σ1
σ2
τ
ft
ft
fc
fc
Figure 23: Rankine yield surface used for constitutive plasticity.

The yielding surface is shown in Figure 23 with σ1, σ2 and τ the components of the stress
vector in a plane stress environment.
To simplify the implementation, the assumption of isotropic creep is made. It is, however,
possible to distinguish between compressive and tensile creep.
Creep can thus occur in compression and tension independently.
5.4 Incorporating time-dependant creep of fibre slippage in model
It was shown in Chapter 4.2 that a significant increase was found when the material is
cracked. This is believed to be due to the time-dependant pull-out of the fibres which contribute
to the creep of the material. This time-dependant phenomenon is only found if the material is in
the strain-hardening or softening region.
This behaviour is added to the current representation by adding a variable to Equation ( 16
) that increases the creep compliance with regards to the current straining position. This will be
done at a later stage in the research project.
6 References
Li, V.C., Wang, S., Wu, C. 2001. Tensile strain-hardening behaviour of polyvinyl alcohol
engineered cemetitious composite (PVA-ECC). ACI Materials Journal : 483-492.
Li V.C. 1992. Performance driven design of Engineered Cementitious Composites. Fibre
Reinforced Cement and Concrete. RILEM, London.
Kesner, K. E., and Billington, S. L., 2001, “Investigation of Ductile Cement Based Composites
for Seismic Strengthening and Retrofit,” Fracture Mechanics of Concrete Structures,
R. de Borst, J. Mazars, G. Pijaudier-Cabot, and J. van Mier, eds., Proceedings of the
Fourth International Conference on Fracture Mechanics of Concrete and Concrete
Structures, Cachan, France, May-June, pp. 65-72.
Aldea, C., Marikunte, S. and Shah, S.P. 1998. Extruded fiber reinforced cement pressure pipe.
Advanced Cement-based Materials, 8, pp. 47-55.
Kabele, P. 1999. Performance of engineered cementitious composites in repair and retrofit:
analytical estimates. Reinhardt, H.W. and Naaman, A. (eds), High Performance Fiber
Reinforced Composites, Rilem: 617-627.
Bažant, Z.P. and Oh, B.H. 1983. Crack band theory for fracture of concrete, Mat. and Struct.,
16(93), 155-77.
Rots, J.G. 1988. Computational modelling of concrete fracture. Dissertation, Delft Univ. of
Techn., Delft, The Netherlands.
Kabele, P. 2004. Linking scales in modeling of fracture in high prerformance fibre reinforced
cementitious composites. Fracture Mechanics of Concrete Structures, Li et al (eds).
Van Zijl GPAG, de Borst R and Rots JG, 2001a. A numerical model for the time-dependent
cracking of cementitious materials. Int. J. Numerical Methods in Engineering, 52(7),
637-654.
Billington, S.L. and Rouse, J.M. 2003. Time-Dependent Response of Highly Ductile Fiber-
Reinforced Cement-Based Composites. Proceedings of 7th Int’l Symp. on Brittle
Matrix Composites, Poland.
Neville, A.M. 1970. Creep of Concrete: Plain, reinforced ans prestressed. North Holland
publishing company. Amsterdam.
Ishai, O. 1962. Influence of sand concentration on deformation of mortar beams under low
stresses. ACI Journal Proc 58, pp..611-622
Van Zijl, G.P.A.G. De Borst, R. and Rots, J.G. 2001b. The role of crack rate dependence in the
long-term behaviour of cementitious materials. International Journal of Solids and
Structures, 38 (30-31) 5063-5079.
Maalej, M., Zhang, J., Quek, S.T. and Lee, S.C. 2004. High velocity impact resistance of hybrid-
fiber engineered cementitious composites’, Fracture Mechanics of Concrete
Structures, (eds. Li et al.), La Fra
Bažant, Z.P. and Gettu, R. 1992. Rate effects and load relaxation in static fracture of concrete,
ACI Materials Journal, 89 (5) (1992) 456-468.
Zhou, F.P. 1992. Time-dependent Crack Growth and Fracture in Concrete, PhD thesis,
(University of Lund, Sweden, 1992).
Related Documents