TR0003 (REV 10/98) TECHNICAL REPORT DOCUMENTATION PAGE STATE OF CALIFORNIA • DEPARTMENT OF TRANSPORTATION Reproduction of completed page authorized. 1. REPORT NUMBER CA16-2342 2. GOVERNMENT ASSOCIATION NUMBER 3. RECIPIENT'S CATALOG NUMBER 4. TITLE AND SUBTITLE Effects of Superstructure Creep and Shrinkage on Column Design in Posttensioned Concrete Box-Girder Bridges 5. REPORT DATE February 2017 6. PERFORMING ORGANIZATION CODE 7. AUTHOR Ebadollah Honarvar, Sri Sritharan, and Matt Rouse 8. PERFORMING ORGANIZATION REPORT NO. 9. PERFORMING ORGANIZATION NAME AND ADDRESS Department of Civil, Construction and Environmental Engineering Iowa State University 10. WORK UNIT NUMBER 11. CONTRACT OR GRANT NUMBER 65A0463 12. SPONSORING AGENCY AND ADDRESS California Department of Transportation Division of Engineering Services 1801 30th Street, MS #9-2/5i Sacramento, CA 95816 13. TYPE OF REPORT AND PERIOD COVERED Final Report June, 2012 – January, 2015 14. SPONSORING AGENCY CODE 913 15. SUPPLEMENTARY NOTES Prepared in cooperation with the State of California Department of Transportation 16. ABSTRACT During and after construction, cast-in-place posttensioned concrete box-girder bridges (CIP/PS Box) experience continuous movement primarily due to time-dependent shortening of the superstructure caused by creep and shrinkage. As a result, displacement-induced forces are developed in columns. These forces must be accurately estimated in order to ensure satisfactory performance of the bridge as well as to produce cost-effective design. When computer models are not used, California Department of Transportation (Caltrans) has adopted a simplified method (SM) to estimate the displacement-induced column forces, which has not been validated. This report systematically investigates the displacement-induced column forces using eight representative CIP/PS Box bridges using a combination of an experimental program and finite element analyses. It was found that Caltrans SM has deficiencies due to the estimation of strain rate and accurately accounting for concrete relaxation. Recommendations are presented to improve the Caltrans SM, thereby increasing the accuracy of calculated column design forces with due consideration to strain rate, concrete relaxation, and effects of column flexural cracking. 17. KEY WORDS Creep, Relaxation, Shrinkage, Posttensioned concrete, box-girder, bridge, Finite element, Displacement-induced, column, forces 18. DISTRIBUTION STATEMENT No restriction. This document is available to the public through the National Technical Information Service, Springfield, Virginia 22161 19. SECURITY CLASSIFICATION (of this report) Unclassified 20. NUMBER OF PAGES 159 21. COST OF REPORT CHARGED For individuals with sensory disabilities, this document is available in alternate formats. For information call (916) 654-6410 or TDD (916) 654-3880 or write Records and Forms Management, 1120 N Street, MS-89, Sacramento, CA 95814. ADA Notice

Welcome message from author
This document is posted to help you gain knowledge. Please leave a comment to let me know what you think about it! Share it to your friends and learn new things together.
Transcript

TR0003 (REV 10/98)TECHNICAL REPORT DOCUMENTATION PAGESTATE OF CALIFORNIA • DEPARTMENT OF TRANSPORTATION
Reproduction of completed page authorized.
1. REPORT NUMBER
CA16-2342
2. GOVERNMENT ASSOCIATION NUMBER 3. RECIPIENT'S CATALOG NUMBER
4. TITLE AND SUBTITLE
Effects of Superstructure Creep and Shrinkage on Column Design in Posttensioned Concrete Box-Girder Bridges
5. REPORT DATE
February 20176. PERFORMING ORGANIZATION CODE
7. AUTHOR
Ebadollah Honarvar, Sri Sritharan, and Matt Rouse
8. PERFORMING ORGANIZATION REPORT NO.
9. PERFORMING ORGANIZATION NAME AND ADDRESS
Department of Civil, Construction and Environmental Engineering Iowa State University
10. WORK UNIT NUMBER
11. CONTRACT OR GRANT NUMBER
65A046312. SPONSORING AGENCY AND ADDRESS
California Department of Transportation Division of Engineering Services 1801 30th Street, MS #9-2/5i Sacramento, CA 95816
13. TYPE OF REPORT AND PERIOD COVERED
Final Report June, 2012 – January, 201514. SPONSORING AGENCY CODE
91315. SUPPLEMENTARY NOTES
Prepared in cooperation with the State of California Department of Transportation
16. ABSTRACT
During and after construction, cast-in-place posttensioned concrete box-girder bridges (CIP/PS Box) experience continuous movement primarily due to time-dependent shortening of the superstructure caused by creep and shrinkage. As a result, displacement-induced forces are developed in columns. These forces must be accurately estimated in order to ensure satisfactory performance of the bridge as well as to produce cost-effective design. When computer models are not used, California Department of Transportation (Caltrans) has adopted a simplified method (SM) to estimate the displacement-induced column forces, which has not been validated. This report systematically investigates the displacement-induced column forces using eight representative CIP/PS Box bridges using a combination of an experimental program and finite element analyses. It was found that Caltrans SM has deficiencies due to the estimation of strain rate and accurately accounting for concrete relaxation. Recommendations are presented to improve the Caltrans SM, thereby increasing the accuracy of calculated column design forces with due consideration to strain rate, concrete relaxation, and effects of column flexural cracking.
17. KEY WORDS
Creep, Relaxation, Shrinkage, Posttensioned concrete, box-girder, bridge, Finite element, Displacement-induced, column, forces
18. DISTRIBUTION STATEMENT
No restriction. This document is available to the public through the National Technical Information Service, Springfield, Virginia 22161
19. SECURITY CLASSIFICATION (of this report)
Unclassified
20. NUMBER OF PAGES
159
21. COST OF REPORT CHARGED
For individuals with sensory disabilities, this document is available in alternate formats. For information call (916) 654-6410 or TDD (916) 654-3880 or write Records and Forms Management, 1120 N Street, MS-89, Sacramento, CA 95814.
ADA Notice

1
E. Honarvar, S. Sritharan, M. Rouse
Effects of Superstructure Creep and Shrinkage on Column Design in Posttensioned Concrete Box-Girder Bridges
Submitted to the
California Department of Transportation Caltrans Project Contract: 65A0463
FEBRUARY 2017
Final
REPORT
IOWA STATE UNIVERSITY O F S C I E N C E A N D T E C H N O L O G Y
Department of Civil, Construction and Environmental Engineering
Effects of Superstructure Creep and Shrinkage on Column Design in Posttensioned Concrete Box-Girder Bridges
by
Ebadollah Honarvar Structural/Bridge Engineer, Jacobs Engineering
Sri Sritharan Wilson Engineering Professor, Iowa State University
Matt Rouse Senior Lecturer, Iowa State University
Caltrans Project Contract: 65A0463
A Final Report to the California Department of Transportation
Department of Civil, Construction and Environmental Engineering Iowa State University
Ames, IA 50011
February 2017
iii
DISCLAIMER
This document is disseminated in the interest of information exchange. The contents
of this report reflect the views of the authors who are responsible for the facts and accuracy of
the data presented herein. The contents do not necessarily reflect the official views or policies
of the State of California or the Federal Highway Administration. This publication does not
constitute a standard, specification or regulation. This report does not constitute an
endorsement by the Department of any product described herein.
For individuals with sensory disabilities, this document is available in Braille, large
print, audiocassette, or compact disk. To obtain a copy of this document in one of these
alternate formats, please contact: Division of Research and Innovation, MS-83, California
Department of Transportation, P.O. Box 942873, Sacramento, CA 94273-0001.
iv
ACKNOWLEDGMENTS
The authors would like to thank the California Department of Transportation for
sponsoring this research project and Dr. Charles Sikorsky for serving as the project manager.
Thanks are also due to the following individuals for serving on the technical advisory committee
of this project: Marc Friedheim, Ahmed Ibrahim, Richard Schendel, Gudmund Setberg, Rodney
Simmons, Foued Zayati, and Toorak Zokaie. Their guidance and feedback during the course of
the project are also greatly appreciated.
The help and guidance provided by Doug Wood, the manager of the structural
engineering laboratories at Iowa State University, in performing the concrete relaxation tests on a
tight schedule are much appreciated.
v
ABSTRACT
Creep and shrinkage of cast-in-place post-tensioned concrete box-girder bridges (CIP /
PS Box) designed with longitudinal prestressing introduce significant lateral displacement
demands to the supporting columns within each continuous multi-span frame. Consequently, the
columns are subjected to lateral forces and flexural stresses as a function of time following the
construction of the superstructure. These forces must be accurately estimated in order to ensure
satisfactory performance of the bridge as well as to produce cost-effective design.
Although computer models are routinely used for estimating the column forces,
California Department of Transportation (Caltrans) has adopted a simplified method (SM) to
estimate displacement-induced column forces using the strain rates established for joints and
bearing design. The Caltrans SM has never been validated, raising the following two concerns:
1) the shortening strain rate of the superstructure in CIP/ PS Box may not be appropriate for
estimating the displacement-induced column forces because it was originally established for
joints and bearing design; and (2) it may not accurately capture the beneficial effects of concrete
relaxation on the displacement-induced forces. Using a combination of an experimental program
and analytical models, this report investigates the displacement-induced column forces in CIP/
PS Box and presents recommendations to address the aforementioned concerns, thereby
improving the calculation of column design forces.
After demonstrating the beneficial effects of concrete relaxation on displacement-induced
forces through an experimental investigation, the corresponding effects were studied on eight
CIP/ PS Box frames of various configurations and lengths. Using the finite-element models
(FEM), the shortening strain rate of the superstructure and the variation of the column lateral
displacement were calculated, including the effects of concrete relaxation in the columns. For the
vi
eight analyzed CIP/ PS Box frames, the shrinkage of the superstructure had a significantly larger
contribution to the shortening strain rate of the superstructure, the column top lateral
displacement and the corresponding base shear force compared to the corresponding effects due
to dead load, prestress, and creep. The contribution of the dead load was the smallest compared
to the corresponding effect due to prestress, creep, and shrinkage.
Using the FEM results for the strain rates, four simplified approaches were developed to
more accurately calculate the displacement-induced column forces in CIP / PS Box frames,
without conducing detailed computer modeling. Similar to the Caltrans SM, Approaches 1a and
1b use the FEM creep and shrinkage strains for each frame type (i.e., short-, medium-, and long-
span), and average of the eight frames, respectively, to calculate forces. Whereas, columns forces
are calculated based on Approaches 2a and 2b using the FEM total strains for each frame type,
and average of the eight frames, respectively.
These approaches and the Caltrans SM were compared to the FEM results to determine
the most appropriate simplified approach. When displacements were evaluated, Approach 1a
resulted in the best agreement with the FEM results. A better correlation was found between the
Caltrans SM and the FEM results when the total strains were used rather than the creep and
shrinkage stains. For shear force calculation using simplified analysis, Approaches 2a and 2b
resulted in the best agreement with the FEM results, while the Caltrans SM resulted in the
poorest agreement with the FEM results. Although Approach 2b was found to be the most
appropriate simplified approach, Approach 1b has an advantage of using creep and shrinkage
strains, like the Caltrans SM and account for the prestress strains as part of the structural
analysis. Therefore, Approach 1b is recommended by this study to calculate the displacement-
induced column forces in CIP / PS Box frames.
vii
TABLE OF CONETENTS
DISCLAIMER .............................................................................................................................. III
ACKNOWLEDGMENTS ............................................................................................................ IV
ABSTRACT ................................................................................................................................... V
TABLE OF CONETENTS .......................................................................................................... VII
LIST OF FIGURES ...................................................................................................................... IX
LIST OF TABLES ..................................................................................................................... XIII
CHAPTER 1: INTRODUCTION .............................................................................................. 1
Overview ......................................................................................................................... 1 Problem Statement .......................................................................................................... 3 Design Practice ............................................................................................................... 4 Scope of Research ........................................................................................................... 6 Report Layout ................................................................................................................. 7
CHAPTER 2: LITERATURE REVIEW ................................................................................... 9
Overview ......................................................................................................................... 9 Posttensioned Concrete Box-Girder Bridges ................................................................ 10 Time-Dependent Material Properties ............................................................................ 11
2.3.1 Compressive Strength of Concrete ........................................................................... 12 2.3.2 Modulus of Elasticity of Concrete ............................................................................ 13 2.3.3 Concrete Creep.......................................................................................................... 15 2.3.4 Concrete Relaxation .................................................................................................. 26 2.3.5 Concrete Shrinkage ................................................................................................... 29 2.3.6 Relaxation of Prestressing Steel................................................................................ 36 Prestress Losses ............................................................................................................ 37
2.4.1 Prediction of Short-Term Losses .............................................................................. 38 2.4.2 Prediction of Long-Term Losses .............................................................................. 39 Analysis of Prestressed Concrete Bridges .................................................................... 42
2.5.1 Time-Step Method .................................................................................................... 43 2.5.2 Finite-Element Analysis............................................................................................ 46
CHAPTER 3: CHARACTERIZATION OF CONCRETE RELAXATION ........................... 48
Introduction ................................................................................................................... 48 Experimental Investigation ........................................................................................... 50
3.2.1 Specimens ................................................................................................................. 50 3.2.2 Instrumentation ......................................................................................................... 51 3.2.3 Testing Apparatus and Methodology ........................................................................ 54 3.2.4 Loading ..................................................................................................................... 55 Observed Behavior........................................................................................................ 56
3.3.1 Summary of Relaxation Tests ................................................................................... 64 Relaxation Functions .................................................................................................... 64 Summary and Conclusions ........................................................................................... 67
I. I 1.2 1.3 1.4 1.5
2. 1 2.2 2.3
2.4
2.5
3.1 3.2
3.3
3.4 3.5
viii
CHAPTER 4: DETAILS OF SELECTED CIP/ PS BOX FRAMES ...................................... 69
Introduction ................................................................................................................... 69 Elevation Views and Box-Girder Cross Sections ......................................................... 70 Bent Details ................................................................................................................... 77 Prestressing Details ....................................................................................................... 82 Material Properties ........................................................................................................ 83
CHAPTER 5: DETAILS OF ANALYTICAL MODELS........................................................ 84
Introduction ................................................................................................................... 84 Analytical Model .......................................................................................................... 85
5.2.1 Model Assumptions .................................................................................................. 85 5.2.2 Construction Stages .................................................................................................. 86 5.2.3 Material Properties .................................................................................................... 89 5.2.4 Boundary Conditions ................................................................................................ 90 5.2.5 Loading ..................................................................................................................... 90 5.2.6 Column Effective Stiffness ....................................................................................... 91 Analysis Results ............................................................................................................ 92
5.3.1 Shortening Strain Rate of the Superstructure ............................................................ 94 5.3.2 Column Top Lateral Displacement ........................................................................... 95 5.3.3 Column Base Shear Force ......................................................................................... 97 5.3.4 Effects of Loading Age on Displacement-Induced Forces ..................................... 100 5.3.5 Effects of Creep and Shrinkage on Displacement-Induced Forces ........................ 103 Summary and Conclusions ......................................................................................... 106
CHAPTER 6: ANALYSIS OF TIME-DEPENDENT EFFECTS OF EIGHT CIP / PS BOX FRAMES 108
Introduction ................................................................................................................. 108 Creep and Shrinkage Models ...................................................................................... 108 Finite-Element Models................................................................................................ 109 Finite Element Analysis Results ................................................................................. 110
6.4.1 Shortening Strain Rate of the Superstructure .......................................................... 112 6.4.2 Column Top Lateral Displacement ......................................................................... 114 6.4.3 Column Base Shear Force ....................................................................................... 114 6.4.4 Maximum Displacements and Forces ..................................................................... 118 Simplified Analysis ..................................................................................................... 120
6.5.1 Prediction of Shortening Strain Rate of the Superstructure .................................... 121 6.5.2 Prediction of Column Top Lateral Displacement ................................................... 124 6.5.3 Estimation of Column Base Shear Force ................................................................ 128 6.5.4 Recommended Design Approach ........................................................................... 132 Summary and Conclusions ......................................................................................... 136
CHAPTER 7: SUMMARY, CONCLUSIONS, AND FUTURE WORK ............................. 138
Summary ..................................................................................................................... 138 Conclusions ................................................................................................................. 139 Future Work ................................................................................................................ 140
REFERENCES ........................................................................................................................... 142
4.1 4.2 4.3 4.4 4.5
5.1 5.2
5.3
5.4
6.1 6.2 6.3 6.4
6.5
6.6
7. 1 7.2 7.3
ix
LIST OF FIGURES
Figure 1.1: Continuous prestressed concrete bridge frame deformations due to axial force, creep and shrinkage .......................................................................................................................... 4
Figure 1.2: Shortening of prestressed concrete bridges due to prestressing, creep, and shrinkage as a function of time (Caltrans 1994- Attachment 4) .............................................................. 6
Figure 2.1: A typical cross sectional view of a CIP / PS Box used for bridge construction ........ 11
Figure 2.2: Concrete stress-strain curve ........................................................................................ 17
Figure 2.3: Concrete creep under the effect of sustained stress .................................................... 17
Figure 2.4: Creep deformation summed over increasing stress history ........................................ 47
Figure 3.1: Concrete column specimens used for relaxatoin tests under uniaxial compression strains .................................................................................................................................... 53
Figure 3.2: The RC beam specimen under four-point bending and the location of gauges ......... 53
Figure 3.3: Loading under force-control mode ............................................................................. 54
Figure 3.4: Loading under displacement-control mode ................................................................ 55
Figure 3.5: Measured strains, stresses and displacement from Test 1 .......................................... 58
Figure 3.6: Measured strains, stresses and displacement from Test 2 .......................................... 59
Figure 3.7: Measured strains, stresses and displacement from Test 3 .......................................... 59
Figure 3.8: Measured strains, stresses and displacement from Test 4 .......................................... 60
Figure 3.9: Measured strains, stresses and displacement from Test 5 .......................................... 60
Figure 3.10: Measured strains, stresses and displacement from Test 6 ........................................ 61
Figure 3.11: Measured strains, stresses and displacement from Test 7 ........................................ 62
Figure 3.12: Thermal and shrinkage strains .................................................................................. 63
Figure 3.13: Variations of steel longitudinal tensile strain and load with the time at the end of Test 7 and prior to failing of the beam .................................................................................. 63
Figure 3.14: Concrete strain and stress variations with time ........................................................ 64
Figure 3.15: Relaxation functions established for the column specimens .................................... 66
Figure 3.16: Relaxation functions obtained for the RC beam ...................................................... 67
x
Figure 4.1: Elevation views of the short-span CIP / PS Box frames (all dimensions are in meter; 1 m = 3.28 ft) ........................................................................................................................ 71
Figure 4.2: Elevation views of the medium-span CIP / PS Box frames (all dimensions are in meter; 1 m = 3.28 ft) ............................................................................................................. 72
Figure 4.3: Elevation views of the long-span CIP / PS Box frames (all dimensions are in meter; 1 m = 3.28 ft) ........................................................................................................................... 73
Figure 4.4: Typical mid-span cross sectional views of the short-span CIP / PS Box frames (all dimensions are in mm; 1 mm = 0.039 in.) ............................................................................ 74
Figure 4.5: Typical mid-span cross sectional views of the medium-span CIP / PS Box frames (all dimensions are in mm; 1 mm = 0.039 in.) ............................................................................ 75
Figure 4.6: Typical mid-span cross sectional views of the long-span CIP / PS Box frames (all dimensions are in mm; 1 mm = 0.039 in.) ............................................................................ 76
Figure 4.7: Bent details for the short-span CIP / PS Box frames (all dimensions are in mm; 1 mm = 0.039 in.) ............................................................................................................................ 79
Figure 4.8: Bent details for the medium-span CIP / PS Box frames (all dimensions are in mm; 1 mm = 0.039 in.) ..................................................................................................................... 80
Figure 4.9: Bent details of the long-span CIP / PS Box frames (all dimensions are in mm; 1 mm = 0.039 in.) ............................................................................................................................ 81
Figure 5.1: Timeline used for construction of B4 ......................................................................... 87
Figure 5.2: Tendons along the length of the box-girder as modeled in the FEM ......................... 87
Figure 5.3: Construction stages of B4 as used in the FEM ........................................................... 88
Figure 5.4: Moment curvature analysis of columns in B4 ............................................................ 92
Figure 5.5: Deformed shape of B4 (in meters) predicted by the FEA due to presterssing, creep, and shrinkage after 2000 days from completion of pier construction .................................. 93
Figure 5.6: Shortening strain rate of the superstructure calculated using the FEM with concrete relaxation in the columns (single line) and without concrete relaxation (double line) ......... 95
Figure 5.7: Variation of column top lateral displacements calculated using the FEM with concrete relaxation (single line) and without concrete relaxation (double line) in columns 96
Figure 5.8: Variation of column base shear force calculated using the FEM with concrete relaxation (single line) and without concrete relaxation (double line) in columns............... 98
Figure 5.9: Comparison between the column moment calculated using the FEM and the critical column moments determined from the moment-curvature analyses .................................... 99
xi
Figure 5.10: The AASHTO LRFD 2010 recommended creep coefficients for the different loading ages of concrete...................................................................................................... 101
Figure 5.11: Variation of reduction in base shear force with time due to relaxation using different loading ages for columns .................................................................................................... 102
Figure 5.12: Reduction in base shear force after 2000 days due to relaxation as a function of column age .......................................................................................................................... 103
Figure 5.13: Determination of column base shear force using the different creep and shrinkage models in FEM of B4 (solid lines show the effcets of concrete relaxation in columns and dashed lines ignore the effects of concrete relaxation) ....................................................... 105
Figure 6.1: Calculated creep coefficients and shrinkage strains for the eight CIP / PS Box using AASHTO recommendations (2010) ................................................................................... 109
Figure 6.2: The FEM results (in meters) for the longitudinal displacement of CIP / PS Box frames due to time-dependent effects ................................................................................. 111
Figure 6.3: The FEM results for shortening strain rate of the superstructure ............................. 113
Figure 6.4: Variation of the FEM predicted column top lateral displacements and the corresponding base shear forces with time for the short-span CIP / PS Box frames.......... 115
Figure 6.5: Variation of the FEM predicted column top lateral displacements and the corresponding base shear forces with time for the medium-span CIP / PS Box frames .... 116
Figure 6.6: Variation of the FEM predicted column top lateral displacements and the corresponding base shear forces with time for the long-span CIP / PS Box frames .......... 117
Figure 6.7: The FEM results for the maximum column top lateral displacements at the age of 2000 days ............................................................................................................................ 119
Figure 6.8: The FEM results for the maximum base shear forces at the age of 2000 days ........ 120
Figure 6.9: A comparison between the strains predicted by the four proposed methods and strains based on a deck expansion joint design memorandum (Caltrans 1994- Attachment 4) ..... 122
Figure 6.10: A comparison between the maximum displacements calculated by the FEM and those obtained by the Caltrans SM and the simplified analysis based on Approach 1a strains............................................................................................................................................. 125
Figure 6.11: A comparison between the maximum displacements calculated by the FEMs and maximum displacements obtained using Approach 2a and the Caltrans ............................ 126
Figure 6.12: A comparison between the maximum displacements calculated by the FEM and those obtained by Caltrans SM and the simplified analysis based on Approach 2a strains 127
Figure 6.13: A comparison between the maximum displacements calculated by the FEMs and
xii
maximum displacements obtained using Approach 2b and the Caltrans ........................... 128
Figure 6.14: A comparison between the maximum base shear force calculated by the FEMs and maximum displacements obtained using Approach 1b and the Caltrans ........................... 129
Figure 6.15: A comparison between the maximum base shear force calculated by the FEM and those obtained by Caltrans SM and the simplified analysis based on Approach 1a strains 130
Figure 6.16: A comparison between the maximum base shear force calculated by the FEM and those obtained by Caltrans SM and the simplified analysis based on Approach 2a strains 131
Figure 6.17: A comparison between the maximum base shear force calculated by the FEMs and maximum displacements obtained using Approach 2b and the Caltrans ........................... 132
Figure 6.18: Ratio of column displacements predicted by the simplified approaches to the FEM............................................................................................................................................. 134
Figure 6.19: Ratio of base shear forces predicted by the simplified approaches to the FEM .... 135
xiii
LIST OF TABLES
Table 3.1: Descriptions of the specimens used for the relaxation tests ........................................ 51
Table 3.2: Details of the seven relaxation tests ............................................................................. 56
Table 3.3: Results of the seven relaxation tests ............................................................................ 58
Table 4.1: Classification and details of the selected CIP / PS Box frames ................................... 70
Table 4.2: Nomenclatures used for the CIP / PS Box frames and their columns ......................... 70
Table 4.3: The height and flexural stiffness of the columns in the eight CIP / PS Box frames ... 78
Table 4.4: Details used for prestressing of the box-girders .......................................................... 82
Table 4.5: Details of material properties used in the CIP / PS Boxs ............................................ 83
Table 5.1: Prediction models used in the FEM to account for the time-dependent properties ..... 89
Table 5.2: Terminology used in the FEMs for the primary and secondary effects in continuous CIP / PS Box frames ............................................................................................................. 94
Table 6.1: The predicted maximum strains (με) based on the different simplified approaches at the age of 2000 days ........................................................................................................... 123
Table 6.2: The mean and standard deviation of the ratio of the column top lateral displacement calculated by the simplified analyses to the FEM .............................................................. 136
Table 6.3: The mean and standard deviation of the ratio of the base shear force calculated by the simplified analyses to the FEM........................................................................................... 136
1
CHAPTER 1: INTRODUCTION
Overview
In a prestressed concrete bridge, stresses and strains continuously change as a function of
time due to characteristics of time-dependent behavior of materials. Although not studied herein,
changes in bridge temperature due to varying environmental conditions will also cause thermal
stresses and strains with time. Concrete undergoes creep and shrinkage behavior while steel
experiences relaxation, producing time-dependent movements. In structurally indeterminate
bridges, these movements are restrained, which, in turn, cause changes to reactions and internal
forces as a function of time. When these bridges are built on site, the time dependent effects are
expected to take place during and after construction. Hence, the time-dependent analysis used for
estimating the corresponding stresses and deformations require information related to the time-
dependent properties of concrete and prestressing steel. Steel relaxation is mainly dependent on
the magnitude of the applied stress and can be determined fairly accurately. However, estimation
of creep and shrinkage is more involved since concrete is a versatile composite material. Both
creep and shrinkage are influenced by intrinsic and extrinsic factors. Intrinsic factors typically
include proportion and the properties of mixtures, while size of concrete, age of concrete, curing
conditions, ambient temperature, and relative humidity are considered as extrinsic factors.
Prediction of stresses and strains within a partially completed structure at a particular
stage of construction may impact the subsequent stages, and consequently the long-term state of
stresses and strains of a bridge. Quantities characterizing structural behavior such as
deformations and stresses continue to change during and after the construction. The changes are
due to varying time dependent properties such as creep, shrinkage, modulus of elasticity, and
steel relaxation. Furthermore, since the structural configuration continuously changes with
2
different loading and/or support locations, and each construction stage affects the subsequent
stages, the design of certain structural components may be governed during construction.
Therefore, the time dependent construction stage analysis is required to examine the changes in
stresses and strains in each stage of the construction. If such analyses are ignored, the post-
construction analyses of bridges may be meaningless because members have already developed
significant stresses and strains. These developed strains and stresses may also be accounted for
when assessing bridges based on health monitoring data or calculating their strength and
displacement corresponding to yield and ultimate conditions.
Among different types of prestressed concrete bridge superstructures, the cast-in-place
post-tensioned concrete box-girder (CIP / PS Box) bridge has become the choice of many
jurisdictions for long spans structures. In addition, the inherently high torsional stiffness of the
box-girder cross section helps to effectively resist the high torsional forces induced in the curved
bridges. However, concerns have been expressed with respect to the long-term behavior and
durability of CIP / PS Box because of the effects of concrete creep and shrinkage (Lark et al.
2004). Excessive long-term mid-span deflections of such bridges have been observed in the past
(Vitek 1995 and Bazant et al. 2012).
The superstructure of CIP / PS Box experiences continuous movements due to shortening
of the structure length, resulting from creep caused primarily by prestressing and shrinkage as
well as a temperature. Unless provisions are made in design, these movements can, in the long
run, cause significant internal stresses and strains, resulting in undesirable consequences to
critical bridge members. Typically, deck expansion joints, bearing systems, and/or restraining
devices have been used to minimize the internal forces resulting from thermal and shortening
movements. Because addition of these elements increases the maintenance and repair costs, there
3
is an increasing inclination to design bridges with less number of frames, minimizing the number
of expansion joints. When bridges are designed with a minimum number of expansion joints, the
continuous movements of the bridge can cause significant internal stresses in the integral column
bents. Since the movement of CIP / PS Box due to thermal effects is adequately addressed in
current design guidelines, this study only focuses on the shortening of the superstructure due to
creep and shrinkage and the corresponding effects on column forces. Accurately estimating
column forces are critical for the design of the columns and their performance under extreme
loads such as those due to earthquakes. When they are underestimated, yielding of the columns
may occur prematurely as they are subjected to external lateral loads. When forces are
overestimated, columns will become unnecessarily large, which in turn can attract more forces
and amplify the problem.
Problem Statement
During and after construction, time-dependent shortening of superstructures of CIP / PS
Box bridges due to creep and shrinkage produces significant lateral movements in the cast-in-
place superstructures. When they are monolithically connected to the concrete piers, they
continue to shorten because of their high axial stiffness compared to the lateral stiffness of the
columns. As a result, displacement-induced forces are produced in columns (see Figure 1.1),
which are significant in magnitude, but are not systematically addressed in the current design
guidelines. Two specific design issues associated with this problem are: (1) unrealistic estimate
for the shortening strain rate of the superstructure; and (2) not accurately accounting for the
beneficial effects of concrete relaxation in columns on the displacement-induced column forces.
Due to these issues, the displacement-induced column forces are suspected to be overestimated.
When these forces are combined with the effects of other loads such as live loads and seismic
4
loads, the result, as previously noted, is a larger column cross section, inefficient design of
columns and foundation, increase in the adverse effects of time-dependent issues, and thus
increased construction costs.
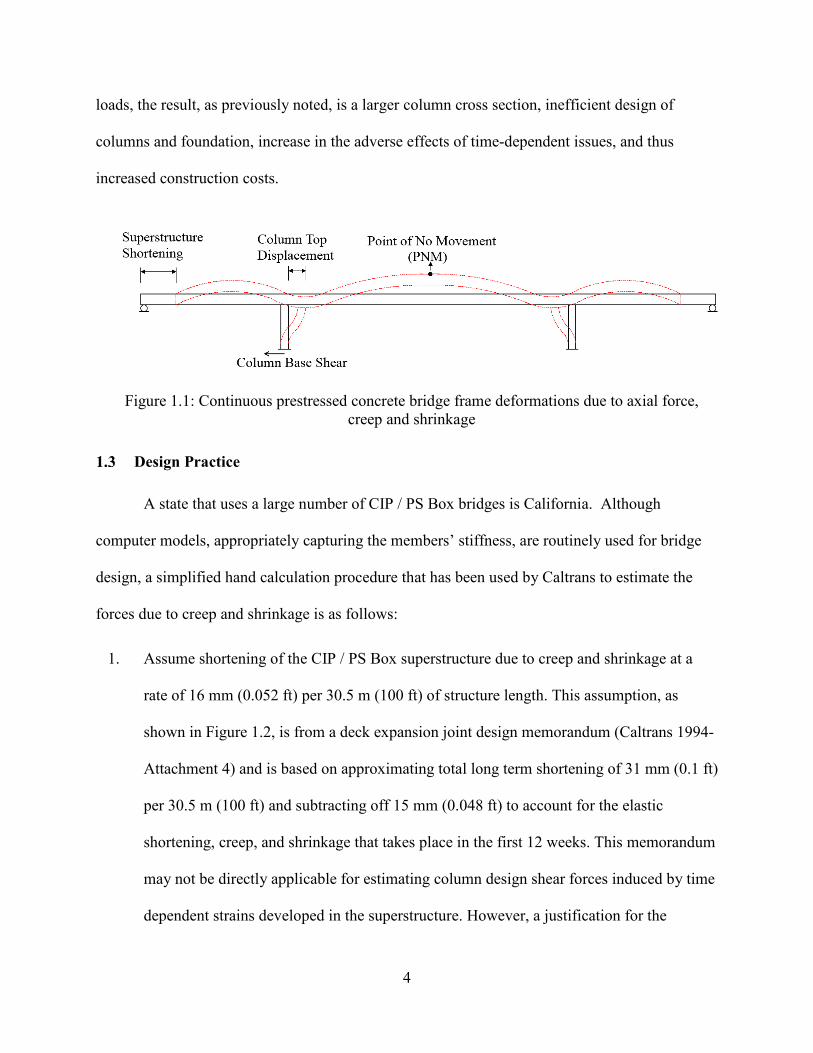
Figure 1.1: Continuous prestressed concrete bridge frame deformations due to axial force, creep and shrinkage
Design Practice
A state that uses a large number of CIP / PS Box bridges is California. Although
computer models, appropriately capturing the members’ stiffness, are routinely used for bridge
design, a simplified hand calculation procedure that has been used by Caltrans to estimate the
forces due to creep and shrinkage is as follows:
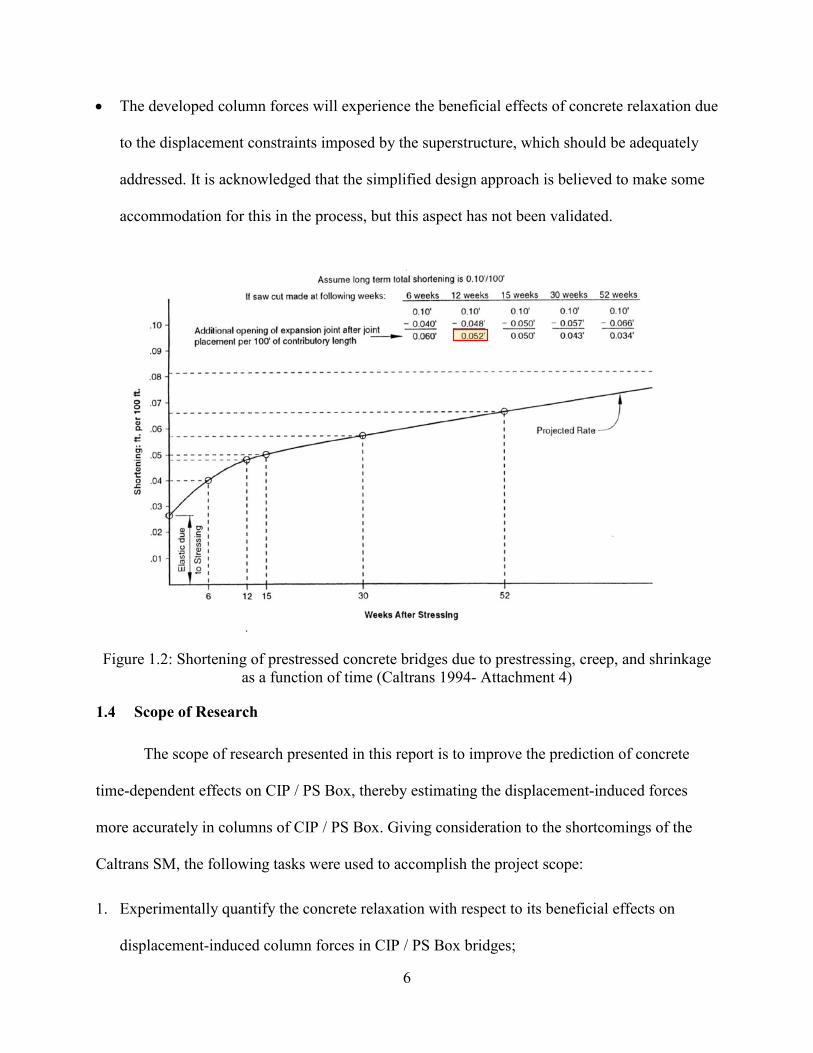
1. Assume shortening of the CIP / PS Box superstructure due to creep and shrinkage at a
rate of 16 mm (0.052 ft) per 30.5 m (100 ft) of structure length. This assumption, as
shown in Figure 1.2, is from a deck expansion joint design memorandum (Caltrans 1994-
Attachment 4) and is based on approximating total long term shortening of 31 mm (0.1 ft)
per 30.5 m (100 ft) and subtracting off 15 mm (0.048 ft) to account for the elastic
shortening, creep, and shrinkage that takes place in the first 12 weeks. This memorandum
may not be directly applicable for estimating column design shear forces induced by time
dependent strains developed in the superstructure. However, a justification for the
5
approach described above is that use of a strain rate of 16 mm (0.052 ft) per 30.5 m (100
ft) for CIP / PS Box superstructures would adequately capture the expected forces in the
columns.
2. Determine the location of point of no movement (PNM), where the longitudinal
displacement of the CIP / PS Box superstructure frame due to the time-dependent effects
can be assumed to be zero.
3. Multiply the strain rate by the distance of the column to the PNM to calculate the column
top lateral displacement.
4. Calculate the column base shear force as the product of column displacement and
stiffness based on the theory of elasticity with consideration to the column potentially
experiencing flexural cracking (Caltrans 2015). The cracked column stiffness is typically
approximated to 50% of gross stiffness.
The design guidelines described above, identified herein as the Caltrans Simplified
Method (or Caltrans SM), have not been validated and the following concerns have been
identified as part of the current research:
• The shortening strain rate of superstructures assumed for the column design force may not be
appropriate. The deck joint and seal memorandum assumes a total shortening of 31 mm (0.1
ft) per 30.5 m (100 ft), which may be appropriate for deck joints (Caltrans 1994). However,
the assumed shortening strain rate of 16 mm (0.63 in.) per 30.5 m (100 ft) for estimating the
column forces due to CR and SH may not be accurate;
• The columns in a CIP / PS Box will undergo different degrees of lateral movements
depending on the locations to PNM and thus assuming cracked section properties for all
columns may not be appropriate; and
6
• The developed column forces will experience the beneficial effects of concrete relaxation due
to the displacement constraints imposed by the superstructure, which should be adequately
addressed. It is acknowledged that the simplified design approach is believed to make some
accommodation for this in the process, but this aspect has not been validated.
Figure 1.2: Shortening of prestressed concrete bridges due to prestressing, creep, and shrinkage as a function of time (Caltrans 1994- Attachment 4)
Scope of Research
The scope of research presented in this report is to improve the prediction of concrete
time-dependent effects on CIP / PS Box, thereby estimating the displacement-induced forces
more accurately in columns of CIP / PS Box. Giving consideration to the shortcomings of the
Caltrans SM, the following tasks were used to accomplish the project scope:
1. Experimentally quantify the concrete relaxation with respect to its beneficial effects on
displacement-induced column forces in CIP / PS Box bridges;
7
2. Examine the beneficial effects of concrete relaxation on the displacement-induced forces in
the columns of a prototype CIP / PS Box using a detailed finite element model (FEM);
3. Select eight different CIP / PS Box bridges of various lengths and configurations for the
study such that the analyses would include representative short-, medium-, and long-span
California bridge frames, multiple and single column bents, pinned and fixed base columns,
and varying amount of prestress;
4. Investigate the time-dependent effects on eight different CIP / PS Box frames using FEMs
selected from the above task;
5. Systematically evaluate the range of expected shortening strain rate of the superstructure due
to dead load, prestress, creep, and shrinkage imposed on California bridge columns and
compare these ranges with the assumptions used in the current practice;
6. Assess the effects of time-dependent deformations on the behavior of columns in various
California CIP / PS Box frame configurations; and
7. Develop rational design recommendations that may be used by engineers and consultants to
account for these effects in routine bridge design.
Report Layout
Completed research presented in this report consists of seven chapters. Following the
introductory chapter, an extensive literature review of time-dependent material properties, time-
dependent analysis methods, and available prediction models for the time-dependent material
properties are presented in Chapter 2. Chapter 3 describes the experimental program conducted
at the Iowa State University structural laboratory to quantify concrete relaxation with respect to
its beneficial effects on the displacement-induced column forces in CIP / PS Box frames. In
Chapter 4, the details of the eight CIP / PS Box frames and the selected frames for the analytical

8
investigation are presented, which shows the variation in span lengths, cross section of the
superstructure, elevation views, and foundation type across the eight frames. The details of the
FEM and the methodology used to examine the time-dependent effects are described for one of
the eight box-girder frames in detail in Chapter 5. In this chapter, model assumptions, material
models, beneficial effects of concrete relaxation, moment curvature analysis of columns, details
of construction stages, and loading ages for creep and relaxation are discussed. In line with
findings presented in Chapter 5, design recommendations are provided in Chapter 6 to
incorporate the time-dependent effects in the design of frame columns by examining eight
different CIP / PS Box frames. Finally, Chapter 7 provides a summary of research and the
corresponding conclusions as well as recommendations for future work to validate the analytical
findings of this study.
9
CHAPTER 2: LITERATURE REVIEW
Overview
Over the years, prestressed concrete has established itself as a preferred choice for bridge
design because it satisfies engineering, economic, and aesthetic criteria. Prestressing in bridges is
utilized to counteract high internal tensile forces and stresses due to dead and live loads by
developing axial compression, which also minimizes the deflection as well of restressed
members.
Prestressed concrete offers many advantages over conventional reinforced concrete. For
example, prestressed concrete allows for the use of stronger materials, such as high-strength steel
(with yield strengths of 270 ksi) and high-strength concrete (with compressive strengths in
excess of 5 ksi). These materials cannot be used effectively with conventional reinforced
concrete since their properties lead to cost effective design solutions. The higher strength
concrete and steel allow for smaller and lighter sections, than those used for conventional
reinforced concrete members with the same load carrying capacity. Cracking, deflections, and
service load stresses can be controlled easily using these high-strength materials used in
prestressed concrete. In general, except for chemical prestressing, the methods of applying
prestress can be ramified into two major groups: pretensioning and posttensioning.
Concrete and steel strands are considered the main constituents of each prestressing
method. High-strength steel with low relaxation characteristic is generally used to accommodate
high elongations. High-strength concrete is primarily used to sustain the high compressive
stresses and exhibit lower volume changes. In recent years, the Federal Highway Administration
(FWHA) has stimulated the development and implementation of high performance concrete
(HPC) as well as ultra-high performance concrete (UHPC). The use of HPC in bridge design
10
offers a way to utilize higher compressive strength while ensuring long-term durability in these
already popular bridges. Increased span lengths and fewer structural components resulting from
use of UHPC lead to cost savings during construction, while the bridges’ longer service life (e.g.,
increased bridge deck longevity) reduces their lower life-cycle cost (Honarvar et al. 2016).
Posttensioned Concrete Box-Girder Bridges
In posttensioning, the prestressing tendons are stressed and anchored at the ends of the
concrete member after the concrete has been cast and attained sufficient strength to securely
withstand the prestressing force. The tendons used in posttensioning can be either bonded or
unbonded to the concrete. Posttensioning is more suitable in cast-in-place construction where
bridge girders are too large to be transported, even though it can be used in precast prestressed
operations. Posttensioning is widely used in CIP / PS Box bridges to resist high internal forces
and stresses.
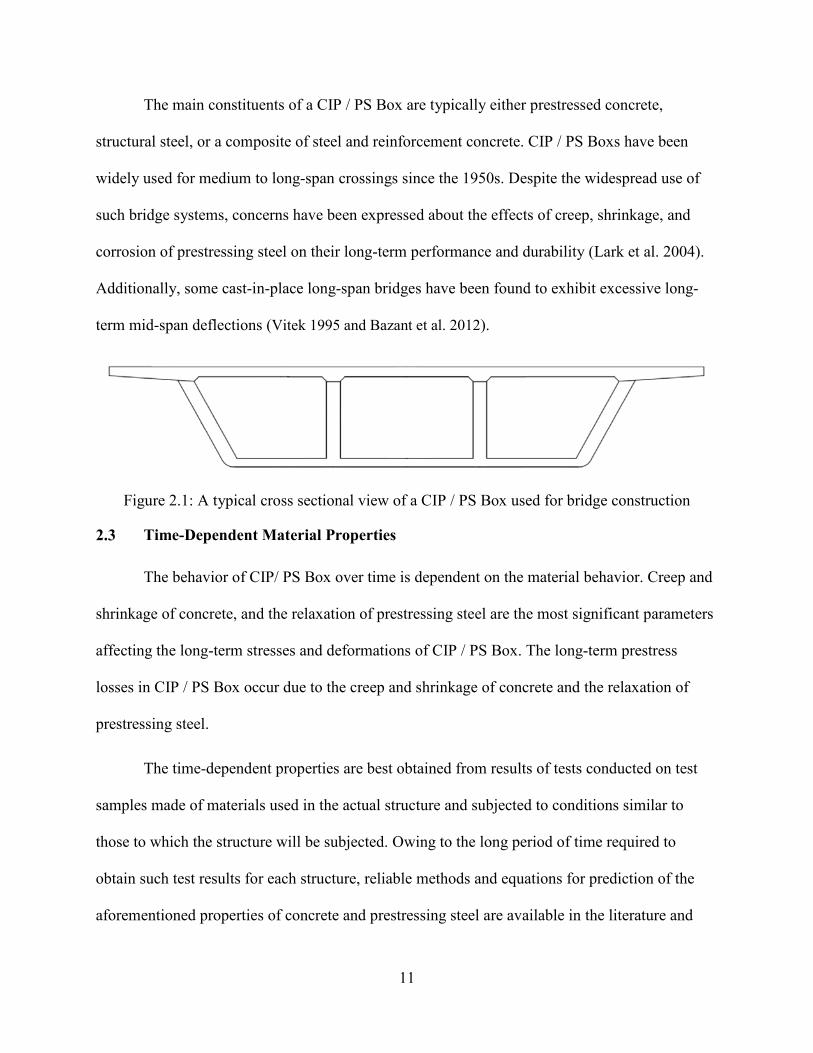
A box-girder bridge is comprised of the main girders in the shape of a hollow box with
generally a rectangular or trapezoidal cross section, as shown in Figure 2.1. Due to cast-in-place
construction of box-girder bridges, any desired alignment in plan including straight, skew and
curved bridges of various shapes can be accommodated. A box-girder bridge is specifically
suited to bridges with significant curvature because of high torsional resistance. Typically, box-
girders can be categorized using three definitions as follows:
1. Based on geometry: monocellular, monocellular with ribs or struts, and multicellular
2. Based on material: concrete, steel, and composite
3. Based on reinforcement: reinforced concrete, pretensioned concrete, and posttensioned
concrete
11
The main constituents of a CIP / PS Box are typically either prestressed concrete,
structural steel, or a composite of steel and reinforcement concrete. CIP / PS Boxs have been
widely used for medium to long-span crossings since the 1950s. Despite the widespread use of
such bridge systems, concerns have been expressed about the effects of creep, shrinkage, and
corrosion of prestressing steel on their long-term performance and durability (Lark et al. 2004).
Additionally, some cast-in-place long-span bridges have been found to exhibit excessive long-
term mid-span deflections (Vitek 1995 and Bazant et al. 2012).
Figure 2.1: A typical cross sectional view of a CIP / PS Box used for bridge construction
Time-Dependent Material Properties
The behavior of CIP/ PS Box over time is dependent on the material behavior. Creep and
shrinkage of concrete, and the relaxation of prestressing steel are the most significant parameters
affecting the long-term stresses and deformations of CIP / PS Box. The long-term prestress
losses in CIP / PS Box occur due to the creep and shrinkage of concrete and the relaxation of
prestressing steel.
The time-dependent properties are best obtained from results of tests conducted on test
samples made of materials used in the actual structure and subjected to conditions similar to
those to which the structure will be subjected. Owing to the long period of time required to
obtain such test results for each structure, reliable methods and equations for prediction of the
aforementioned properties of concrete and prestressing steel are available in the literature and
12
they are suitable for incorporation in computer programs for the required analysis. The most
commonly used sources for prediction of these properties are AASHTO LRFD Bridge Design
Specifications (2010), the CEB-FIP Mode1 Code (1990), and the ACI Committee 209 (1992).
2.3.1 Compressive Strength of Concrete
Compressive strength is the most common performance indicator of concrete, which is
calculated from the failure load divided by the cross-sectional area of a concrete specimen. The
compressive strength of concrete is affected by several factors, including the water-to-
cementitious (w/c) ratio, mix proportion, and curing conditions. Typically, the compressive
strength of concrete decreases when the w/c ratio increases. The compressive strength of
concrete also depends on the strength of the aggregate itself and the relative ratio between the
aggregate and cement paste. The higher the strength of the aggregate, the higher the compressive
strength of concrete becomes. The cement type also plays an important role in the compressive
strength of concrete. Because Portland Type III cement hydrates more rapidly than Type I, Type
III cement would result in a higher early strength than Type I. In HPC, supplementary materials
such as slag and fly ash are frequently added to increase the early strength of the concrete.
Prediction of Compressive Strength
The empirical Equation (2-1) recommended by ACI 209R may be used to calculate the
compressive strength of concrete at different ages.
fc′(t)= t
α+βtfc
′(28) (2-1)
where 𝛼𝛼 and 𝛽𝛽 are the constants and depend on the type of cement and the type of curing; 𝑓𝑓𝑐𝑐′(28)
is the 28-day compressive strength; and t is the age of concrete in days.
13
2.3.2 Modulus of Elasticity of Concrete
The modulus of elasticity is an important property of hardened concrete. Concrete is a
composite material that includes aggregate and cement paste. The modulus of elasticity of
concrete highly depends on the properties and proportions of the mixture materials. ASTM
Standard C469 provides the method to measure the static modulus of elasticity of concrete in
compression. The elastic modulus of concrete has a significant effect on the behavior of CIP / PS
Box, including deflections and stresses. In Section 2.3.2.1, four prediction models to calculate
the modulus of elasticity are presented.
Prediction of Modulus of Elasticity
Typically, the relation between the modulus of elasticity of concrete and the
corresponding compressive strength is provided. This relation in not due to a direct relation
between elastic moduli and compressive strength, but because the measurement of compressive
strength is readily available. The following four models are commonly used for the prediction of
the modulus of elasticity when the actual measurements are not available.
AASHTO LRFD (2010)
In the absence of measured data, the modulus of elasticity, Ec, for concretes with unit
densities between 90 and 155 pcf and specified compressive strengths up to 15.0 ksi may be
calculated using Equation (2-2).
Ec=33 K1wc1.5�fc
' (2-2)
where Ec is the elastic modulus of elasticity of concrete (psi); K1 is the correction factor for a
source of an aggregate to be taken as 1.0 unless determined by a physical test and approved by
14
the authority of jurisdiction; 𝑤𝑤𝑐𝑐 is the unit density for concrete (lb/ft3); and fc' is the compressive
strength of concrete (psi).
ACI 318-05 (1992)
The modulus of elasticity of concrete may be predicted using Equation (2-3)
recommended by ACI 318-05.
Ec=33 wc1.5�fc
' (2-3)
CEB-FIP (1990)
Values of the modulus of elasticity for normal weight concrete can be estimated from the
specified characteristic strength by using Equation (2-4).
Eci= Eco[ fck+∆ffcm0
]13 (2-4)
where Eci is the modulus of elasticity (MPa) at a concrete age of 28 days; Eco is 2.15 × 10⁴
MPa; fck is the characteristic strength (MPa) mentioned at Table 2.1.1 in CEB-FIP 1990; ∆f is 8
MPa; and fcmo is 10 MPa.
When the actual compressive strength of concrete at an age of 28 days fcm is known, Eci
may be estimated using Equation (2-5).
Eci= Eco fcm fcmo
13 �� (2-5)
When only an elastic analysis of a concrete structure is carried out, a reduced Ec can be
calculated in order to account for an initial plastic strain using Equation (2-6).
Ec= 0.85 Eci (2-6)
15
Tadros (2003)
The modulus of elasticity of high performance concrete can be calculated using Equation
(2-7).
Ec= 33,000 K1 K2(0.140 + fc′
1000)1.5 fc
′� ( Ec and 𝑓𝑓𝑐𝑐′ are in ksi) (2-7)
where K1 is the correction factor for local material variability, and K1 is 1.0 for the average of
all data obtained by the author; K2 is the correction factor based on the 90th percentile upper-
bound and the 10th percentile lower-bound for all data, and for the average of all data K2 is 0.777
(10th percentile) and K2 is 1.224 (90th percentile).
2.3.3 Concrete Creep
Creep of any material in general is defined as the increase of strain with time under
constant sustained stress. Concrete creep comprises of two components: basic creep and drying
creep. Basic creep occurs under a condition of no moisture movement to or from the
environment whereas drying creep which is the additional creep that occurs during drying of
concrete. Both components affect prestress losses. The amount of creep observed in stressed
concrete over time is a function of many variables. They include mixture proportions, level of
applied stress, relative humidity, maturity of concrete when load is applied, and duration of load.
Mixture proportions greatly affect concrete’s ability to resist creep, including type and amount of
cement, aggregate properties, and water-to-cement ratio. Different types of cement experience
different amounts of creep, and the inclusion of supplemental cementitious materials yields even
more variability in creep of concrete. Creep effects are primarily a result of stress redistribution
away from the paste and towards aggregate in the concrete. Stiffer aggregates resist more load
and reduce creep. Also, aggregate with a rougher surface reduces creep because the load is better
16
transferred along the paste-aggregate interface. Finally, the water-to-cementitious material ratio
is significant as mixes with less free water lead to smaller volume changes due to creep.
As applied stress increases, greater creep can be expected. Creep is proportional to the
stress level of the concrete up to a point of 40 to 60% of the concrete compressive strength.
Relative humidity affects drying creep and hence the total creep. In regions with lower relative
humidity, more creep can be expected. Concrete that is more mature when loaded will
experience less total creep.
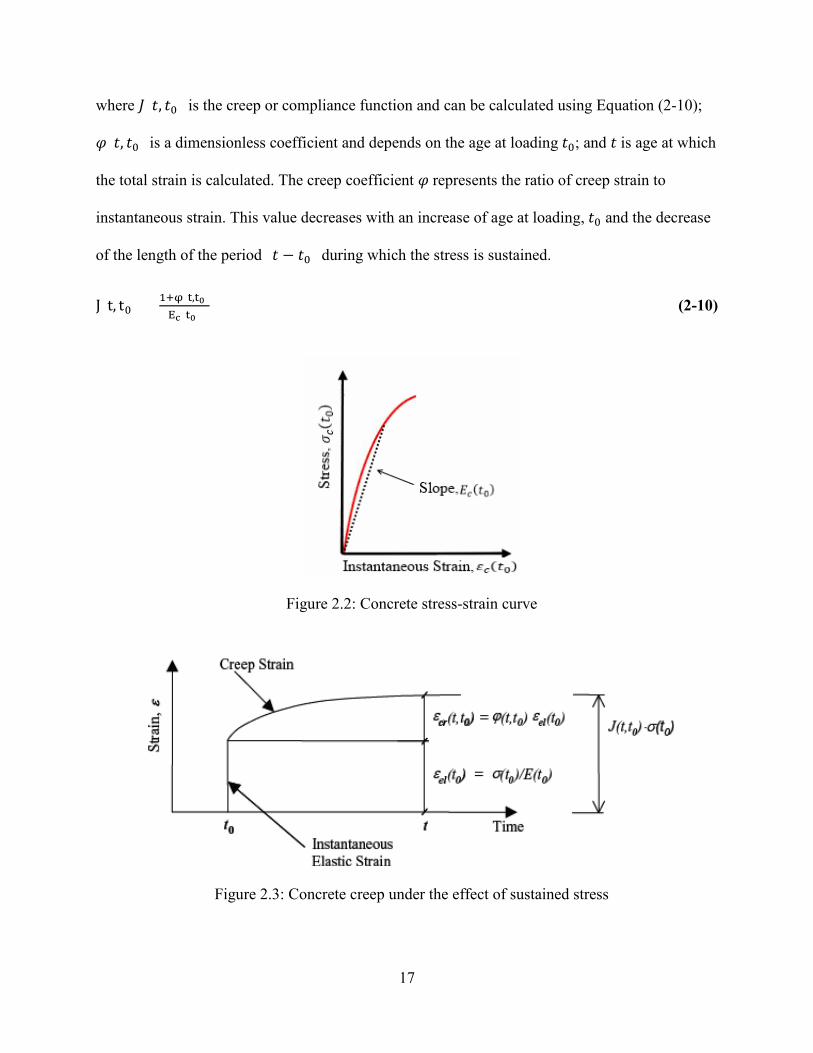
A typical stress-strain curve for concrete compressive behavior is shown in Figure 2.2. It
is common practice to assume that the stress in concrete is linearly proportional to the strain in
the service conditions. The strain occurring during the application of load, or immediately after
the application of load, is referred to as the instantaneous strain and is defined by Equation (2-8).
εc(t0) = σc(t0)Ec(t0) (2-8)
where 𝜎𝜎𝑐𝑐(𝑡𝑡0) is the concrete stress; 𝐸𝐸𝑐𝑐(𝑡𝑡0) is the modulus of elasticity of concrete at age 𝑡𝑡0; and
𝑡𝑡0 is the time of application of the stress. The value of 𝐸𝐸𝑐𝑐, the secant modulus defined in Figure
2.2 depends on the magnitude of the stress, but this dependence is ignored in the practical
applications. The value of 𝐸𝐸𝑐𝑐 is typically proportional to the square root of concrete compressive
strength, which is highly affected by the age of concrete at loading. Under sustained stress, the
strain increases with time due to creep as shown in Figure 2.3, and the total stress-dependent
strain (i.e., instantaneous plus creep strain) can be expressed using Equation (2-9) (Ghali et al.
2002).
εc(t) = σc(t0)Ec(t0)
[1 + φ(t, t0)] = J(t, t0)σc(t0) (2-9)
17
where 𝐽𝐽(𝑡𝑡, 𝑡𝑡0) is the creep or compliance function and can be calculated using Equation (2-10);
𝜑𝜑(𝑡𝑡, 𝑡𝑡0) is a dimensionless coefficient and depends on the age at loading 𝑡𝑡0; and 𝑡𝑡 is age at which
the total strain is calculated. The creep coefficient 𝜑𝜑 represents the ratio of creep strain to
instantaneous strain. This value decreases with an increase of age at loading, 𝑡𝑡0 and the decrease
of the length of the period (𝑡𝑡 − 𝑡𝑡0) during which the stress is sustained.
J(t, t0) = 1+φ(t,t0)Ec(t0) (2-10)
Figure 2.2: Concrete stress-strain curve
Figure 2.3: Concrete creep under the effect of sustained stress
18
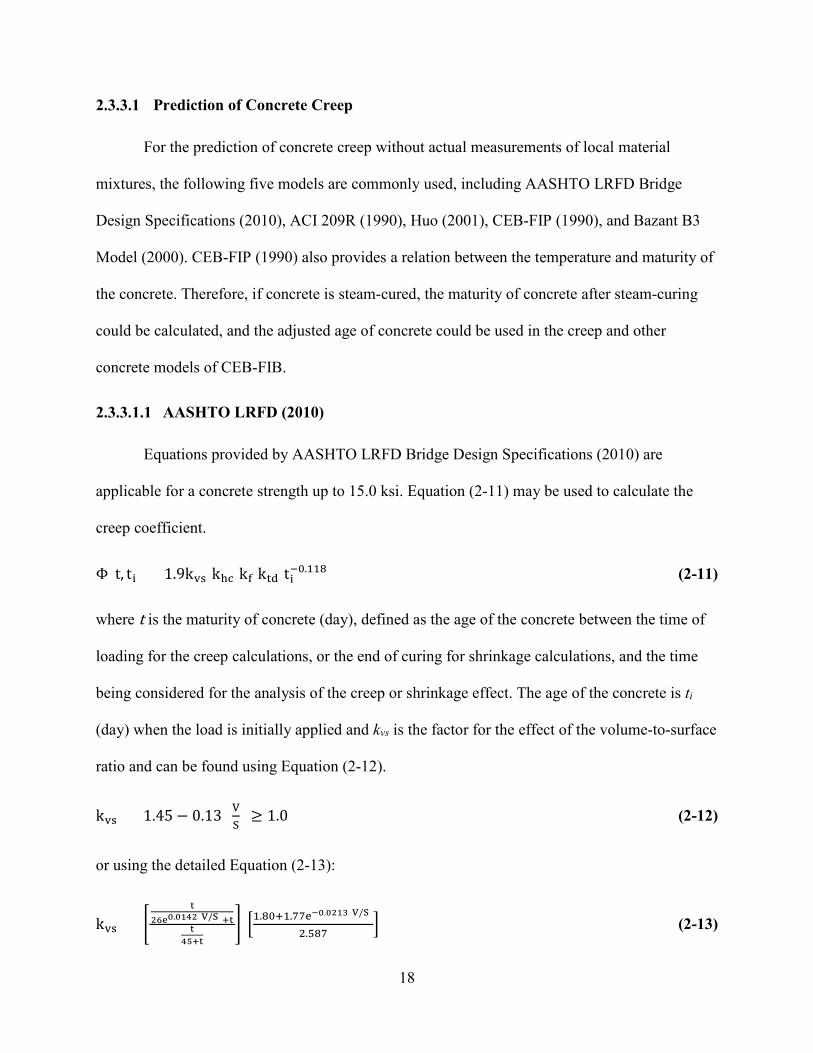
Prediction of Concrete Creep
For the prediction of concrete creep without actual measurements of local material
mixtures, the following five models are commonly used, including AASHTO LRFD Bridge
Design Specifications (2010), ACI 209R (1990), Huo (2001), CEB-FIP (1990), and Bazant B3
Model (2000). CEB-FIP (1990) also provides a relation between the temperature and maturity of
the concrete. Therefore, if concrete is steam-cured, the maturity of concrete after steam-curing
could be calculated, and the adjusted age of concrete could be used in the creep and other
concrete models of CEB-FIB.
AASHTO LRFD (2010)
Equations provided by AASHTO LRFD Bridge Design Specifications (2010) are
applicable for a concrete strength up to 15.0 ksi. Equation (2-11) may be used to calculate the
creep coefficient.
Φ(t, ti) = 1.9kvs khc kf ktd ti−0.118 (2-11)
where t is the maturity of concrete (day), defined as the age of the concrete between the time of
loading for the creep calculations, or the end of curing for shrinkage calculations, and the time
being considered for the analysis of the creep or shrinkage effect. The age of the concrete is ti
(day) when the load is initially applied and kvs is the factor for the effect of the volume-to-surface
ratio and can be found using Equation (2-12).
kvs = 1.45 − 0.13 (VS
) ≥ 1.0 (2-12)
or using the detailed Equation (2-13):
kvs = �t
26e0.0142(V/S)+tt
45+t� � �1.80+1.77e−0.0213(V/S)
2.587 (2-13)
19
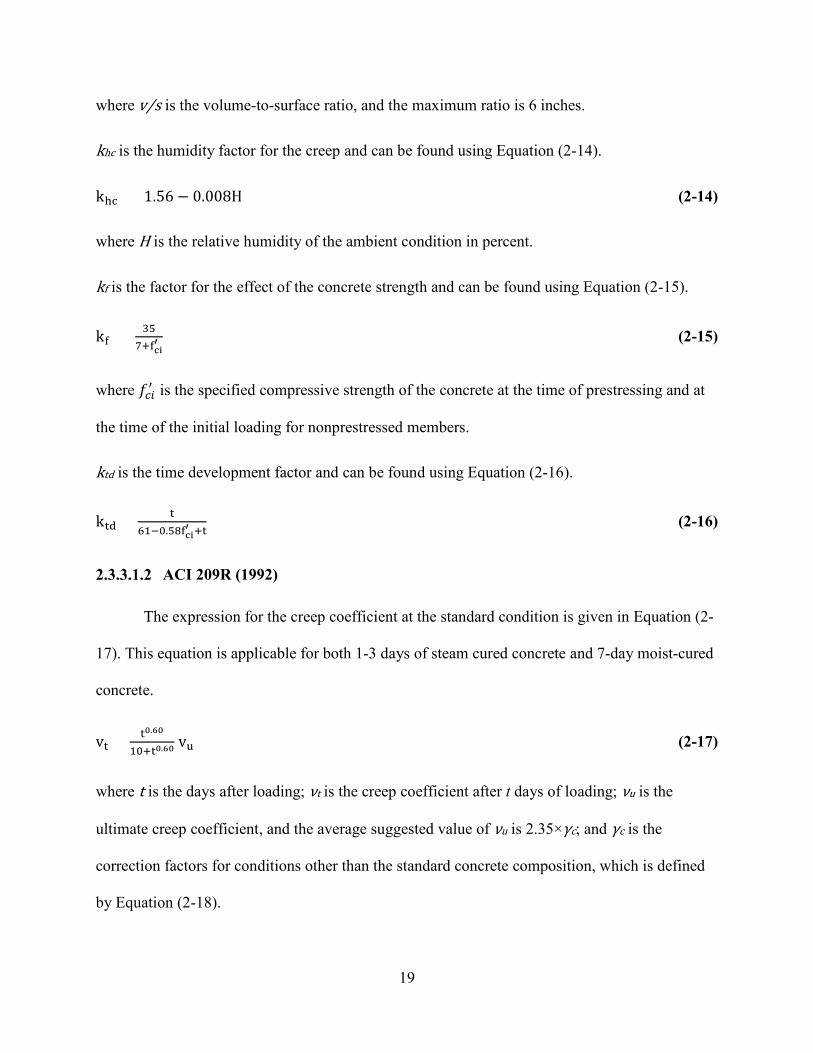
where v/s is the volume-to-surface ratio, and the maximum ratio is 6 inches.
khc is the humidity factor for the creep and can be found using Equation (2-14).
khc = 1.56 − 0.008H (2-14)
where H is the relative humidity of the ambient condition in percent.
kf is the factor for the effect of the concrete strength and can be found using Equation (2-15).
kf = 357+fci
′ (2-15)
where 𝑓𝑓𝑐𝑐𝑐𝑐′ is the specified compressive strength of the concrete at the time of prestressing and at
the time of the initial loading for nonprestressed members.
ktd is the time development factor and can be found using Equation (2-16).
ktd = t61−0.58fci
′ +t (2-16)
ACI 209R (1992)
The expression for the creep coefficient at the standard condition is given in Equation (2-
17). This equation is applicable for both 1-3 days of steam cured concrete and 7-day moist-cured
concrete.
vt = t0.60
10+t0.60 vu (2-17)
where t is the days after loading; νt is the creep coefficient after t days of loading; νu is the
ultimate creep coefficient, and the average suggested value of νu is 2.35×γc; and γc is the
correction factors for conditions other than the standard concrete composition, which is defined
by Equation (2-18).
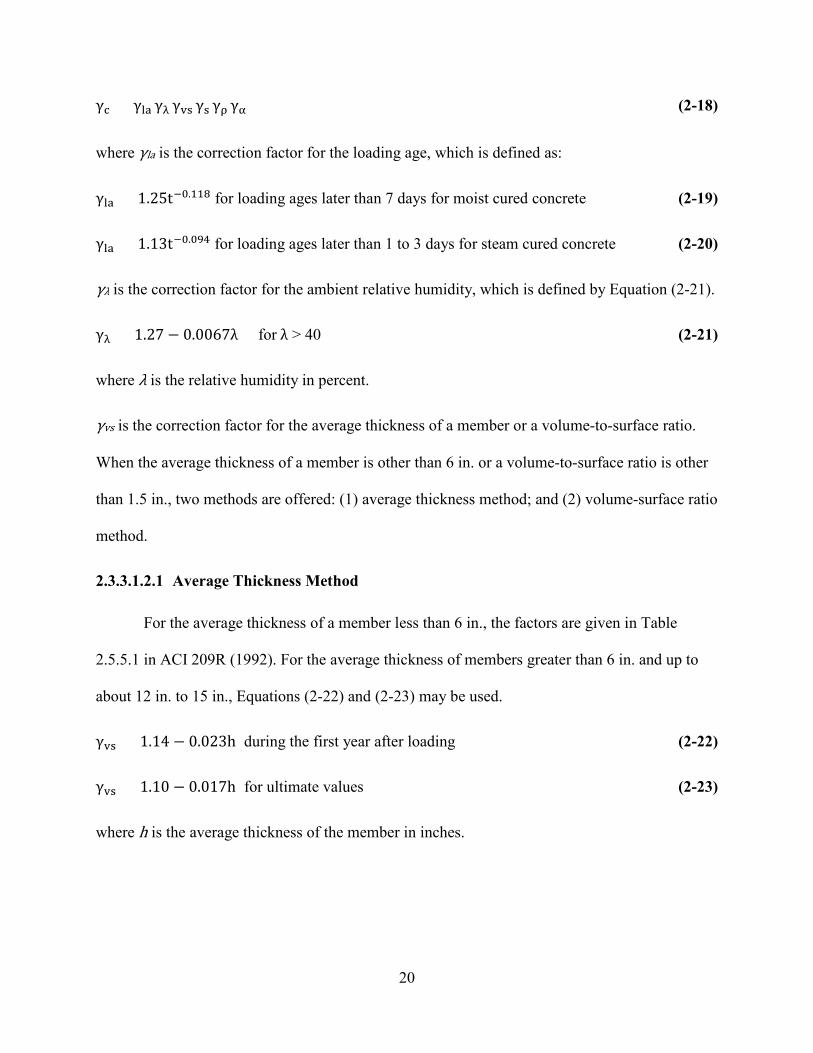
20
γc = γla γλ γvs γs γρ γα (2-18)
where γla is the correction factor for the loading age, which is defined as:
γla = 1.25t−0.118 for loading ages later than 7 days for moist cured concrete (2-19)
γla = 1.13t−0.094 for loading ages later than 1 to 3 days for steam cured concrete (2-20)
γλ is the correction factor for the ambient relative humidity, which is defined by Equation (2-21).
γλ = 1.27 − 0.0067λ for λ > 40 (2-21)
where λ is the relative humidity in percent.
γvs is the correction factor for the average thickness of a member or a volume-to-surface ratio.
When the average thickness of a member is other than 6 in. or a volume-to-surface ratio is other
than 1.5 in., two methods are offered: (1) average thickness method; and (2) volume-surface ratio
method.
2.3.3.1.2.1 Average Thickness Method
For the average thickness of a member less than 6 in., the factors are given in Table
2.5.5.1 in ACI 209R (1992). For the average thickness of members greater than 6 in. and up to
about 12 in. to 15 in., Equations (2-22) and (2-23) may be used.
γvs = 1.14 − 0.023h during the first year after loading (2-22)
γvs = 1.10 − 0.017h for ultimate values (2-23)
where h is the average thickness of the member in inches.
21
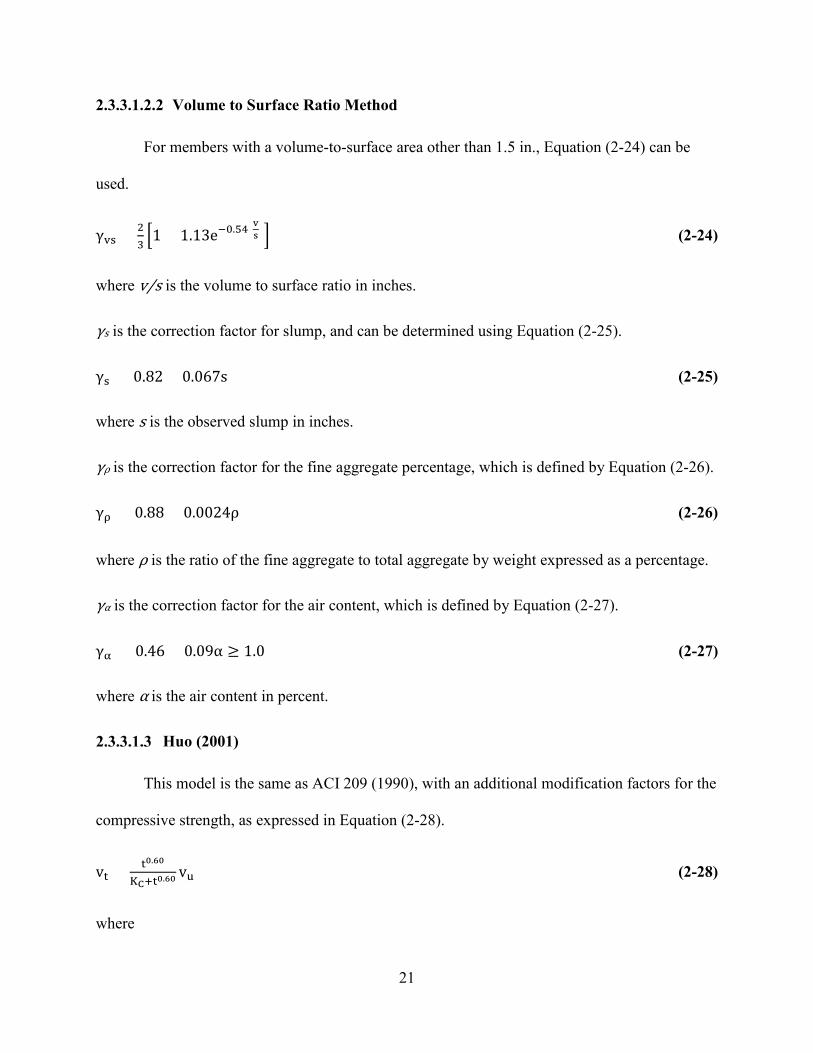
2.3.3.1.2.2 Volume to Surface Ratio Method
For members with a volume-to-surface area other than 1.5 in., Equation (2-24) can be
used.
γvs = 23
� �1 + 1.13e−0.54(vs) (2-24)
where v/s is the volume to surface ratio in inches.
γs is the correction factor for slump, and can be determined using Equation (2-25).
γs = 0.82 + 0.067s (2-25)
where s is the observed slump in inches.
γρ is the correction factor for the fine aggregate percentage, which is defined by Equation (2-26).
γρ = 0.88 + 0.0024ρ (2-26)
where ρ is the ratio of the fine aggregate to total aggregate by weight expressed as a percentage.
γα is the correction factor for the air content, which is defined by Equation (2-27).
γα = 0.46 + 0.09α ≥ 1.0 (2-27)
where α is the air content in percent.
Huo (2001)
This model is the same as ACI 209 (1990), with an additional modification factors for the
compressive strength, as expressed in Equation (2-28).
vt = t0.60
KC+t0.60 vu (2-28)
where
22
KC = 12 − 0.5fc′ (2-29)
γst,c is the correction factor, which is additionally introduced in Equation (2-18) to
account for the compressive strength of concrete and can be found using Equation (2-30).
γst,c = 1.18 − 0.045𝑓𝑓𝑐𝑐′ (2-30)
where 𝑓𝑓𝑐𝑐′ is the 28-day compressive strength in ksi.
CEB-FIP (1990)
Equation (2-31) is recommended by CEB-FIP (1990) to calculate creep coefficient.
φ(t, t0) = φ0βc(t − t0) (2-31)
where t is the age of concrete (days) at which creep coefficient is calculated; t0 is the age of
concrete at the time of loading (days); φ0 is the notional creep coefficient and is calculated using
Equation (2-32); and βc is the coefficient to describe the development of the creep with time after
the loading.
φ0 = φRH β(fcm)β(t0) (2-32)
where φRH is the coefficient for the relative humidity and the dimension of member, and is
calculated using Equation (2-33).
φRH = 1 + 1−RH/RH00.46·(h/h0)1/3 (2-33)
where RH is the relative humidity of the ambient environment in percent (%), RH0 is 100%; and
h is the notational size of the member (mm), and is defined as 2Ac/u, where Ac is the area of a
cross section, and u is the perimeter of the member in contact with the atmosphere; and h0 is 100
mm.
23
β(fcm) = 5.3(fcm /fcmo)0.5 (2-34)
where 𝑓𝑓𝑐𝑐𝑐𝑐 is the mean compressive strength of the concrete at the age of 28 days (MPa); and
𝑓𝑓𝑐𝑐𝑐𝑐𝑐𝑐 is 10 MPa.
β(t0) = 10.1+ (t0/t1)0.2 (2-35)
where t1 is taken as 1 day.
The expression for the development of the creep with time is given by Equation (2-36).
βc(t − t0) = [ (t−t0)/t1βH+(t− t0)/t1
]0.3 (2-36)
where:
βH = 150 �1 + 1.2( RHRH0
�)18 hh0
+ 250 ≤ 1500· (2-37)
where t1 is 1 day; RH0 is 100%; and ℎ0 is 100 mm.
If concrete undergoes elevated or reduced temperature, the maturity of the concrete could
be calculated using Equation (2-38).
tT = ∑ ∆ti e�13.65− 4000
273+T(∆ti)/T0� n
i=1 (2-38)
where tT is the maturity of the concrete, which can be used in the creep and shrinkage models;
∆𝑡𝑡𝑐𝑐 is the number of days where a temperature T prevails; 𝑇𝑇(∆𝑡𝑡𝑐𝑐) is the temperature (°C) during
the time of period ∆𝑡𝑡𝑐𝑐; and T0 is 1 °C.
Bazant B3 (2000)
The compliance function for loaded specimens is expressed by Equation (2-39).
24
J(t, t′) = q1 + C0(t, t′) + Cd(t, t′, t0) (2-39)
where q1 is the instantaneous strain due to the unit stress and can be found using Equation (2-
39).
q1 = 106
Eci or 6×10⁶
Ec28 (2-40)
in which
Eci = 57000�fci′ (fci
′ is the compressive strength at the age of loading, psi) (2-41)
Ec28 = 57000�fc28′ (fc28
′ is the 28-day compressive strength, psi) (2-42)
C0(t, t’) is the compliance function for the basic creep (in/in/psi) and can be found using Equation
(2-43).
C0(t, t′) = q2Q(t, t′) + q3 ln[1 + (t − t′)n] + q4 ln(tt′� ) (2-43)
where t is the age of the concrete after casting (days); t’ is age of the concrete at the loading
(days); and t0 is the age of the concrete at the beginning of the shrinkage (days).
q2 = 451.4 c0.5 fc28′ 0.9 (c is the cement content in pcf) (2-44)
Q(t, t′) = Qf(t′) �1 + Qf(t’)Z(t,t’)
��ϒ(t′)
1ϒ(t′)
(2-45)
Qf(t′) = �0.056(t′)29� + 1.21(t′)4
9� �−1
(2-46)
Z(t, t′) = t′−m ln[1 + (t − t′)n] (m = 0.5, n = 0.1) (2-47)
ϒ(t′) = 1.7(t’)0.12 + 8 (2-48)
25
𝐶𝐶𝑑𝑑(𝑡𝑡, 𝑡𝑡′, 𝑡𝑡0) is the additional compliance function due to the simultaneous drying
(in/in/psi) and can be found using Equation (2-49).
Cd(t, t′, t0) = q5�e−8H(t) − e−8H(t′)�1
2� (2-49)
q5 = 7.57 × 10⁵(fc28′ )−1|(εsh∞)−0.6| (2-50)
εsh∞ = 𝛼𝛼1𝛼𝛼2[26𝑤𝑤2.1(fc28′ )−0.28 + 270] (ω is the water content in pcf) (2-51)
with:
𝛼𝛼1 = �1.0 for type I cement
0.85 for type II cement1.1 for type III cement
(2-52)
and
𝛼𝛼2 = �0.75 for steam − curing
1.2 for sealed or normal curing in air with inital protection against drying1.0 for curing in water or at 100% relative humidity
(2-53)
H(t) = 1 − (1 − h)S(t) (2-54)
where h is the relative humidity.
S(t) = tanh �t−t0τsh
12 �
�(2-55)
τsh = kt(ksD)2 (2-56)
D = 2v/s (2-57)
kt = 190.8(t0)−0.08(fc28′ )−0.25 (2-58)
ks = 1 for infinite slab
= 1.15 for infinite cylinder
26
= 1.25 for infinite square prism
= 1.30 for sphere
= 1.55 for cube
= 1.00 for undefined member
H(t′) = 1 − (1 − h)S(t′) (2-59)
S(t′) = tanh �t′−t0τsh
�1
2� (2-60)
The creep strain should be calculated using Equation (2-61).
ϵcr = [C0(t, t′) + Cd(t, t′, t0) ]σ (2-61)
where σ is the applied stress in psi.
The creep coefficient should be expressed by Equation (2-62).
φ(t, t′) = ϵcrq1σ
(2-62)
The total strain may be expressed by Equation (2-63).
ϵtotal = J(t, t′)σ + ϵsh (2-63)
where 𝜀𝜀𝑠𝑠ℎis the shrinkage strain and can be estimated using the equations presented in Section
2.3.5.1.5.
2.3.4 Concrete Relaxation
Relaxation is the loss of stress under a state of constant strain for viscoelastic materials
such as steel, concrete, and aluminum. Creep and relaxation are two alternative descriptions of
the same phenomenon but different manifestation of the same fundamental viscoelastic
27
properties. If a structural concrete member can freely deform under a permanent constant stress,
its deformation increases due to creep. If free development of creep deformation is prevented,
then the original stress is reduced over time, i.e., relaxation takes place.
When a concrete member is subjected to an imposed axial stress at time 𝑡𝑡0, which varies
with time, the stress-dependent strain as a function of time may be written as shown in Equation
(2-64).
εc(t) = σc(t0)Ec(t0)
[1 + φ(t, t0)] + ∫ 1+φ(t,τ)Ec(τ)
τ0 dσc(τ) = σc(t0) × J(t, t0) + ∫ J(t, τ)τ
0 dσc(τ) (2-64)
where 𝐸𝐸𝑐𝑐(𝑡𝑡0) is the modulus of elasticity of concrete at age 𝑡𝑡0; 𝜏𝜏 is an indeterminate age between
𝑡𝑡0 and 𝑡𝑡; 𝜎𝜎𝑐𝑐(𝑡𝑡0) is the initial stress applied at age 𝑡𝑡0; 𝑑𝑑𝜎𝜎𝑐𝑐(𝜏𝜏) is an elemental stress applied at age
𝜏𝜏; 𝐸𝐸𝑐𝑐(𝜏𝜏) is the modulus of elasticity of concrete at age 𝜏𝜏; 𝜑𝜑(𝑡𝑡, 𝜏𝜏) is the creep coefficient at time 𝑡𝑡
for loading at age 𝜏𝜏; and 𝐽𝐽(𝑡𝑡, 𝑡𝑡0) and 𝐽𝐽(𝑡𝑡, 𝜏𝜏) are the creep functions at time t for loading at age 𝑡𝑡0
and 𝜏𝜏, respectively.
If the length of the member is subsequently maintained constant, the strain 𝜀𝜀𝑐𝑐 will not
change, but the stress will gradually decrease because of creep. The value of stress at any time
𝑡𝑡 > 𝑡𝑡0 may be defined by Equation (2-65) (Ghali et al. 2002).
σc(t) = εc R(t, t0) (2-65)
where 𝑅𝑅(𝑡𝑡, 𝑡𝑡0) is the relaxation function and can be mathematically determined using the time-
step method, provided the concrete creep behavior. 𝑅𝑅(𝑡𝑡, 𝑡𝑡0) is defined as the stress at age t due to
a unit strain introduced at age t0 and sustained constant during the period (𝑡𝑡 − 𝑡𝑡0).
Using a unit step function for the history of stress-dependent strain, the history of stress is
consequently represented by the relaxation function as expressed by Equation (2-65).
28
σc(t) = R(t, t0) (2-66)
Subsequently, combining Equations (2-66) and (2-64) yields Equation (2-67).
R(t, t0) × J(t, t0) + ∫ J(t, τ)τ0 dσc(τ) = EC(t0) × J(t, t0) + ∫ J(t, τ)τ
0 dσc(τ) = 1 (2-67)
Subdividing time t by discrete times t0, t1,…ti…tk into sub intervals Δti= ti- ti-1 (with
Δt1=t1-t0=0 and as a result Δεc(t1)=1), Equation (2-67) may be expressed by Equation (2-68).
∑ 12
[J(𝑡𝑡k, 𝑡𝑡i) + J(𝑡𝑡k, 𝑡𝑡i−1)]∆𝑅𝑅(𝑡𝑡i) = 1ki=1 (2-68)
For t=tk-1 (k>1), Equation (2-68) can be rewritten as shown in Equation (2-69).
∑ 12
[J(𝑡𝑡k−1, 𝑡𝑡i) + J(𝑡𝑡k−1, 𝑡𝑡i−1)]∆𝑅𝑅(𝑡𝑡i) = 1ki=1 (2-69)
By subtracting Equation (2-68) from Equation (2-67), the relaxation function may be
calculated using Equations (2-70) and (2-71).
∆R(ti) = − ∑ [J(tk,ti)+J(tk,ti−1)−J(tk−1,ti)−J(tk−1,ti−1)]∆R(ti)ki=1
J(tk,tk)+J(tk,tk−1) when k > 1 (2-70)
∆R(ti) = 1J(t1,t1) = 1
J(t0,t0) = EC(t0) when k = 1 (2-71)
However, Bazant (1979) showed that the exact solution presented in Equation (2-70) may
be approximated by Equation (2-72) with 2% error between the exact and approximate solution.
R(t, t0) = 1−Δ0J(t,t0) − 0.115
J(t,t−1) J(t0+ξ,t0)J(t,t−ξ)� �− 1 (2-72)
where 𝛥𝛥0 is the coefficient for age-independent correction and can be neglected except for (t −
t0) < 1 𝑑𝑑𝑑𝑑𝑑𝑑, where Δ0 ≈ 0.008; and the optimum value of 𝜉𝜉 can be found using Equation (2-
73).
ξ = 12
(t − t0) (2-73)
29
Additionally, if the stress remains constant over time the relaxation function can be
calculated directly from Equation (2-64), which yields to Equation (2-74).
R(t, t0) = 1J(t,t0) (2-74)
2.3.5 Concrete Shrinkage
Shrinkage of concrete is the decrease in its volume under zero stress due to loss of
moisture. Shrinkage of concrete occurs at several stages during the life of a prestressed member
and is caused by different mechanisms. However, not all types of shrinkage lead to loss of
prestress. First, plastic shrinkage refers to a volume loss due to moisture evaporation in fresh
concrete, generally at exposed surfaces (Mindess et al. 2002). This shrinkage occurs before
prestressing force is applied and does not affect the long-term prestressing forces. Drying
shrinkage is the strain due to loss of water in hardened concrete (Mindess et al. 2002). Since
drying shrinkage occurs in hardened concrete, it affects the time-dependent behavior and loss of
prestress. Drying shrinkage occurs almost entirely in the paste of the concrete matrix, with
aggregate providing some restraint against volume changes. Since drying shrinkage involves
moisture loss, it is largely affected by the ambient relative humidity. Drying shrinkage is also
affected by the specimen’s shape and size if there is a large surface area to volume ratio that can
cause more moisture to escape from concrete. Additionally, drying shrinkage is affected by the
concrete porosity, which is a function of mixture proportions and curing conditions. Two special
cases of drying shrinkage in hardened concrete are autogeneous and carbonation shrinkage.
Since both occur after the concrete is hardened, they can contribute to the time-dependent
behavior of concrete. Autogeneous shrinkage occurs as cement paste hydrates, because the
volume of hydrated cement paste is less than the total solid volume of unhydrated cement and
water. Carbonation shrinkage results from the carbonation of the calcium-silicate-hydrate
30
molecules in concrete, which causes a decrease in volume (Mindess et al. 2002). Due to the
complex and uncertain nature of shrinkage, most predictive models are empirical fits to
experimental data. In most cases the models asymptotically approach an ultimate shrinkage value
that was determined from the test data and can be further adjusted by a series of factors which
account for differences between the test conditions and the in-situ conditions.
Stresses develop when the change in volume by shrinkage is restrained, which may be
caused by the presence of reinforcing steel, by the supports, and/or by the difference in volume
change of various parts of the structure. These stresses due to shrinkage are generally alleviated
by the effect of concrete creep. Hence, in the stress analysis, the effects of these two
simultaneous phenomena should be taken into account. At time 𝑡𝑡0, when moist curing
terminates, shrinkage starts to develop. The strain that develops due to free shrinkage between 𝑡𝑡𝑠𝑠
and a later time 𝑡𝑡 may be expressed by Equation (2-75) (Ghali et al. 2002).
εcs(t, ts) = εcs0βs(t − ts) (2-75)
where 𝜀𝜀𝑐𝑐𝑠𝑠0 is the total shrinkage that occurs after concrete hardening up to the infinity. The
values of 𝜀𝜀𝑐𝑐𝑠𝑠0 depends on the quality of concrete and the ambient air humidity. The function
𝛽𝛽𝑠𝑠(𝑡𝑡 − 𝑡𝑡𝑠𝑠) depends on the size and shape of the element considered.
Prediction of Shrinkage of Concrete
For the prediction of the shrinkage of concrete, several models are typically used,
including AASHTO LRFD Bridge Design Specifications (2010), ACI 209R (1990), Huo (2001),
CEB-FIP (1990), and Bazant B3 Model (2000). They are considered to be appropriate in the
absence of measured data.
31
AASHTO LRFD (2010)
The expression for the shrinkage strain is given by Equation (2-76), for which the
ultimate shrinkage strain is taken as 0.00048 in./in.
εsh = kvskhskfktd0.48 × 10−3 (2-76)
where
kvs = 1.45 − 0.13(vs) ≥ 1.0 (2-77)
or is obtained from a detailed expression given in Equation (2-78).
kvs = �
t
26·e0.0142(vs)+t
t45+t
� � �1064−3.7(v
s )
923(maximum v/s is 6 in.) (2-78)
khs is the humidity factor and can be found using Equation (2-79).
khs = 2.00 − 0.014H (2-79)
ACI 209R (1992)
The expression for the shrinkage strain at the standard condition is given by Equations (2-
80) and (2-81).
εsh = t35+t
(εsh)u shrinkage after 7 days for moist cured concrete (2-80)
εsh = t55+t
(εsh)u shrinkage after 1-3 days for steam cured concrete (2-81)
where t is days after the end of the initial wet curing;(εsh)t is shrinkage strain after t days; and
(εsh)u is the ultimate shrinkage strain, and the suggested average value can be found using
Equation (2-82).
32
(εsh)u = 780γsh × 10−3 𝑐𝑐𝑖𝑖.𝑐𝑐𝑖𝑖.
(2-82)
where γsh is the correction factors for conditions other than the standard concrete composition,
which is defined by Equation (2-83).
γsh = γλγvsγsγργcγα (2-83)
where γλ is correction factor for the ambient relative humidity and can be determined using
Equations (2-84) and (2-85).
γλ = 1.40 − 0.0102λ for 40 ≤ λ ≤ 80, where λ is the relative humidity in percent (2-84)
γλ = 3.00 − 0.030λ for 80 < λ ≤ 100, where λ is the relative humidity in percent (2-85)
γvs is the correction factor for the average thickness of a member or volume-to-surface ratio.
When the average thickness of a member is other than 6 in. or the volume-to-surface ratio is
other than 1.5 in., two methods are proposed: (1) average thickness method; and (2) volume-
surface ratio method.
2.3.5.1.2.1 Average Thickness Method
For the average thickness of members less than 6 in. (150 mm), the factors are given in
Table 2.5.5.1 which is found in ACI 209R (1992). For the average thickness of members greater
than 6 in. and up to 12 to 15 in., Equations (2-86) and (2-87) are given.
γvs = 1.23 − 0.038h during the first year after loading (2-86)
γvs = 1.17 − 0.029h for ultimate values (2-87)
where h is the average thickness of the member in inches.
33
2.3.5.1.2.2 Volume to Surface Ratio Method
For members with a volume-to-surface area other than 1.5 in., the following equations are
given:
γvs = 1.2e−012(vs) (2-88)
where v/s is the volume-surface ratio in inches.
γs is the correction factor for slump, and can be found using Equation (2-89).
γs = 0.89 + 0.041s (2-89)
where s is the observed slump in inches.
γρ is the correction factor for the fine aggregate percentage, which is defined by Equations (2-90)
and (2-91).
γp = 0.30 + 0.014ρ, when ρ ≤ 50 percent (2-90)
γp = 0.90 + 0.002ρ, when ρ > 50 percent (2-91)
where ρ is the ratio of the fine aggregate to the total aggregate by weight expressed as a
percentage.
γc is the correction factor for the cement content, which is defined by Equation (2-92).
γc = 0.75 + 0.00036c (2-92)
where c is the cement content in lb/yd3.
γα is the correction factor for the air content, which is defined by Equation (2-93).
γα = 0.95 + 0.008α (2-93)
where α is the air content in percent.
34
Huo (2001)
This model is the same as ACI 209 (1990), with an additional modification factors for the
compressive strength, as shown in Equation (2-94).
εsh = tKs+t
(εsh)u (2-94)
where
Ks = 45 − 2.5fc′ (2-95)
γst,s is the correction factor, which is additionally introduced in Equation (2-83) to account for
the compressive strength of concrete and can be found using Equation (2-96).
γst,s = 1.20 − 0.05fc′ (2-96)
where 𝑓𝑓𝑐𝑐′ is the 28-day compressive strength in ksi.
CEB-FIP (1990)
Equation (2-97) is given by CEB-FIP (1990) to calculate shrinkage strain.
εcs(t, ts) = εcs0βs(t − ts) (2-97)
where 𝜀𝜀𝑐𝑐𝑠𝑠0 is the notional shrinkage coefficient; βs is the coefficient to describe the development
of shrinkage with time; t is the age of concrete (days); and ts is the age of concrete (days) at the
beginning of the shrinkage.
The notional shrinkage coefficient is given by Equation (2-98).
εcs0 = εs(fcm)βRH (2-98)
and,
εs(fcm) = 160 + 10βsc(9 − fcmfcm0
) × 10−6 �� (2-99)
35
where 𝑓𝑓𝑐𝑐𝑐𝑐 is the mean compressive strength of concrete at the age of 28 days (MPa); 𝑓𝑓𝑐𝑐𝑐𝑐0 is 10
MPa; βsc is the coefficient which depends on the type of cement: βsc is 4 for slowly hardening
cements SL, βsc is 5 for normal or rapid hardening cements N and R, and βsc is 8 for the rapid
hardening high strength cements RS.
βRH = −1.55βsRH 𝑓𝑓𝑓𝑓𝑓𝑓 40% ≤ RH ≤ 99% (2-100)
βRH = +0.25 for RH > 99% (2-101)
where
βsRH = 1 − ( RHRH0
)3 (2-102)
where RH is the relative humidity of the ambient atmosphere (%) and RH0 is 100%.
The development of the shrinkage with time is given by Equation (2-103).
βs(t − ts) = (t − ts)/t1350·(h/h0)2+(t− ts)/t1
��0.5
(2-103)
where h is the notational size of member (mm), and is defined as 2Ac/u, where Ac is the area of
cross section, and u is the perimeter of the member in constant with the atmosphere. Also, h0
is100 mm, and t1 is one day.
Bazant B3 Model (2000)
In this model, the shrinkage strain is expressed using Equation (2-104).
εsh(t, t′) = εsh∞KhS(t) (2-104)
where 𝜀𝜀𝑠𝑠ℎ∞ could be calculated using Equation (2-51); S(t) could be calculated by using
Equation (2-55); and 𝐾𝐾ℎ could be calculated using Equation (2-105).
36
�Kh =1 − h3 for h < 0.98
−0.2 for h = 1use linear interpolation for 0.98 < h < 1
(2-105)
2.3.6 Relaxation of Prestressing Steel
Steel relaxation is a loss of stress in the prestressing steel when held at a constant strain
(i.e., intrinsic relaxation). The strands typically used in practice today are called low-relaxation
strands. They undergo a strain tempering process during production that heats them to about
660°F and then cools while under tension. This process reduces relaxation losses to
approximately 25% of that for stress-relieved strand. Equation (2-106) is widely used to calculate
the intrinsic relaxation of prestressing steel at any time 𝜏𝜏 (Ghali et al. 2002).
∆σpr
σp0��= log(τ−t0)
10σp0
fpy− 0.5 (2-106)
where 𝑓𝑓𝑝𝑝𝑝𝑝 is the yield strength, defined as the stress at a strain rate of 0.01. The ratio of 𝑓𝑓𝑝𝑝𝑝𝑝 to the
characteristic tensile stress, 𝑓𝑓𝑝𝑝𝑝𝑝𝑝𝑝 varies between 0.8 and 0.9, with lower value for prestressing
bars and the higher value for low-relaxation strands; 𝜎𝜎𝑝𝑝0 in the initial stress; and (𝜏𝜏 − 𝑡𝑡0) is the
period of time in hours for which the tendon is stretched.
Reduced Relaxation
In case of a prestressed concrete member, the prestressing strand is not held at constant
strain because the actions of elastic shortening, shrinkage and creep of the concrete continuously
reduce the tension strain in the steel. Therefore, the relaxation is expected to be smaller than the
intrinsic value. The intrinsic relaxation of the steel resulting from maintaining constant strain
must be considered in developing a procedure to estimate prestress loss. Thus, Equation (2-107)
can be used to calculate the reduced relaxation value in prestressed concrete members (Ghali et
al. 2002).
37
∆σ�pr = χr∆σpr (2-107)
where ∆𝜎𝜎𝑝𝑝𝑝𝑝 is the intrinsic relaxation that would occur in a constant length relaxation test and
can be calculated using Equation (2-105); and 𝜒𝜒𝑝𝑝 is a dimensionless coefficient smaller than
unity.
Prestress Losses
The prestressing force in tendons of a CIP/ PS Box continuously decreases with time, and
asymptotically levels off after a long time. The losses in prestressing force comprised of two
major time components: (1) short-term losses, which occur immediately after the transfer of
prestressing force; (2) long-term losses, which occur due to time-dependent material properties.
Total loss of pretressing force in a CIP/ PS Box is the summation of short-term losses and long-
term losses, which is typically attributed to the cumulative contribution of the following sources
(Naaman 2004):
• Elastic shortening: Elastic shortening occurs when there is a reduction in strain in the
prestressing strands at the transfer of prestress due to the concrete member shortening.
• Friction: The friction between the posttensioned tendons and the concrete during the
tensioning process results in losses in the presressing force.
• Seating: Seating is the movement of prestressing steel when it is allowed to rest in the
anchorage, which leads to a loss of stress in the tendon.
• Relaxation of prestressing steel: Relaxation occurs due to the loss in tension in a prestressing
strand with respect to time when it is held at a constant length or strain.
• Concrete creep: The compressive stress caused by the concrete creep induces a shortening
strain in the concrete which leads to loss of prestressing force in tendons.
38
• Concrete shrinkage: The free water is gradually lost from the concrete as a result of concrete
shrinkage, which creates a shortening in the concrete producing losses in the presressing
force.
For a CIP/ PS Box, the total prestress losses, ∆PT, can be defined by Equation (2-108).
∆PT = ∆PST + ∆PLT (2-108)
where ∆PST is the total short-term losses and ∆PLT is the total long-term losses.
The calculation of the short-term losses is a more straightforward task than the
calculation of long-term losses due to complexity of time-dependent material behavior, and the
interaction among the different long-term losses.
2.4.1 Prediction of Short-Term Losses
Assuming tendons are posttensioned simultaneously which eliminates the elastic
shortening losses, short-term losses primarily occurs due to seating and friction between the
prestress tendons and sheathing. Thus, the short-term losses can be calculated using Equation (2-
109).
∆PST= ∆PF+∆PS (2-109)
where ∆PF is the prestress loss due to friction, and ∆PS is the prestress loss due to seating, which
can be estimated using the equations presented in Sections 2.4.1.1 and 2.4.1.2, respectively.
Prestress Loss Due to Friction
In a posttensioned concrete member, friction loss is due to a combination of linear and
curvature effects. The linear effect, also known as the wobble effect, pertains to the fact that a
theoretically linear duct, is never exactly linear after placing it in the concrete beam. The
39
curvature effect reflects the friction losses due to the intended curvature of tendons. Hence,
Equation (2-110) can be used to estimate the tendon force after the occurrence of friction losses.
Px = P0e−(µα+kx) (2-110)
where 𝑃𝑃𝑥𝑥 is the tendon force at a distance 𝑥𝑥 away from the end with the angular change, 𝛼𝛼,
representing curvature effect; 𝜇𝜇 is the coefficient of angular friction; and 𝑘𝑘 is the wobble
coefficient, per unit length.
Prestress Loss Due to Seating
In a wedge-type anchorage system, upon transfer of pretressing force to the anchorage,
the wedges get seated into the anchor head, thus causing the tendon to slacken slightly. This
movement causes prestress losses which is known as the seating losses. This loss is sometimes
referred as the anchorage slip losses, which can be computed using Equation (2-111).
ΔP = 2P0ηlset (2-111)
where 𝑃𝑃0 is the prestress force at the jacking end; 𝜂𝜂 denotes the effect of reverse friction; and 𝑙𝑙𝑠𝑠𝑠𝑠𝑝𝑝
is the setting length which can be computed using Equation (2-112).
lset = �ΔsApEp
P0η (2-112)
where 𝐴𝐴𝑝𝑝 is the tendon area; 𝐸𝐸𝑝𝑝is the modulus of elasticity of the steel tendon; and 𝛥𝛥𝑠𝑠 is the
amount of seating or the anchorage slip.
2.4.2 Prediction of Long-Term Losses
To accurately estimate the long-term prestress losses, sufficient knowledge of time-
dependent material properties in addition to the interaction between creep, shrinkage of concrete
and the relaxation of steel is required. However, in the absence of such information, several
40
prediction methods have been developed to estimate the long-term prestress losses. These
prediction methods are typically classified based on their analytical approach in the calculation
of losses, as listed below:
1. Lump-sum methods
2. Refined methods
3. Time-step methods
In the lump-sum methods, the prestress losses are determined using the results from
various parametric study conducted on prestressed beams under average conditions. The current
AASHTO LRFD (2010) approximate method was developed according to the lump-sum method.
To increase the accuracy of prediction of losses, the refined method was developed. In this
method, the contribution of each component including creep, shrinkage, and steel relaxation are
determined separately. Subsequently, the individual losses are summed up to obtain the total loss
(AASHTO LRFD 2010), which is discussed in Section 2.4.2.1.
By using a step-by-step numerical analysis implemented in computer programs, the time-
step method offers higher prediction accuracy compared to the previous two methods. In
particular, this method is greatly appreciated in the estimation of prestress losses for multi-stage
bridge constructions. Typically, the time-step method is developed by dividing time into
intervals to account for the continuous interaction between the creep and shrinkage of concrete
and relaxation of strands over time. The duration of each time interval can be continuously
increased as concrete ages. The stress in the strands at the end of each time interval is determined
by subtracting the calculated prestress losses during the interval from the initial condition at the
beginning of that time interval. The strand stress and the deformation at the beginning of each
time interval correspond to those at the end of the preceding interval. Using this method, the
41
prestress level can be approximated at any critical time during the life of the prestressed member.
More information about this method can be found in the studies carried out by Tadros et al
(1977), Abdel-Karim (1993), the PCI-BDM (1997), and Hinkle (2006).
AASHTO LRFD Refined Method (2010)
Total long-term losses, ∆PLT can be calculated using Equation (2-113) based on the
AASHTO LRFD (2010) refined estimates of the time-dependent losses method.
∆PLT = ∆PSH + ∆PCR + ∆PR (2-113)
where ∆PR is the prestress loss due to the relaxation of prestressing strands between the time of
transfer and the deck placement; ∆PCR is the prestress loss due to creep of the girder between the
transfer and deck placement; and ∆PSH is the prestress loss due to the shrinkage of the girder
between the transfer and deck placement.
Prestress Loss Due to Shrinkage
Based on AASHTO LRFD (2010), the prestress loss due to the shrinkage between the transfer
and deck placement can be determined using Equation (2-114).
∆PSH = EpεbidKid (2-114)
where εbid is the specified shrinkage strain (10-6 in/in).
Prestress Loss Due to Creep
Based on AASHTO LRFD (2010), the prestress loss due to creep between the transfer
and deck placement can be determined using Equation (2-115).
∆PCR = ∆fpESΦbidKid (2-115)
where
42
Kid = 1
1+ EpEci
ApsA (1+
Aepg2
I )[1+0.7Φbif] (2-116)
In Equation (2-115), Φbid is the specified creep coefficient of concrete; 𝛷𝛷𝑏𝑏𝑐𝑐𝑏𝑏 is the ultimate creep
coefficient of concrete; 𝐴𝐴𝑝𝑝𝑠𝑠 is the total area of prestressing strands (in.2); A is the area of cross
section (in.2); I is the moment of inertia of cross section (in.4); and epg is the eccentricity of
strand with respect to the centroid of the girder (in.).
Prestress Loss Due to Relaxation
Based on AASHTO LRFD (2010), ∆PR between the transfer and deck placement can be
determined using Equation (2-117).
∆PR = fpt
KL(fpt
fpy− 0.55) (2-117)
where 𝑓𝑓𝑝𝑝𝑝𝑝 is the stress in prestressing strands immediately after transfer; KL is a factor accounting
for the type of steel, which is taken as 30 for low relaxation strands and is 7 for other prestressing
steel; and fpy is the yield strength of prestressing steel.
Also, ∆PR may be assumed equal to 1.2 ksi for low relaxation strands according to
AASHTO LRFD (2010). Moreover, according to the study by Tadros (2003), the relaxation loss
after the transfer is between 1.8 to 3.0 ksi, and comprises relatively a small part of the total
prestressing losses.
Analysis of Prestressed Concrete Bridges
Time dependent estimation of stresses and deformations in prestressed concrete bridges
can be approached with a different level of sophistication depending on the method of analysis.
The critical mechanical properties needed for the analysis are typically concrete creep and
43
shrinkage, steel relaxation, and concrete and steel moduli of elasticity. The accuracy of these
mechanical properties directly affects the accuracy of strain and stress analyses, regardless of the
method used. A number of numerical techniques and computer programs are available in the
literature for the time-dependent analysis of prestressed concrete structures. One of the most
accurate technique used to calculate long-term prestress losses, and subsequently stresses and
deformations is the time-step method.
2.5.1 Time-Step Method
The time-step method can be developed by dividing time into a number of equal or
unequal time intervals to account for the continuous interaction between creep and shrinkage of
concrete and relaxation of strands with time. This allows for the computation of modulus of
elasticity, creep, shrinkage, and relaxation at each considered time interval. Typically, initial
curvature due to the initial prestressing force and beam self-weight is calculated, including the
effects of instantaneous losses. Increase or decrease in section curvature along the member
length due to long-term prestress losses is calculated at each time interval, which allows stresses
and deformations to be determined. The stress in strands at the end of each time interval can be
determined by subtracting the calculated prestress losses during the interval from the initial
condition at the beginning of that time interval. The strands stress and deformation at the
beginning of each time interval correspond to those at the end of the preceding interval. Using
this method, the prestress level can be approximated at any critical time during the life of the
prestressed member. Although several time-step methods have been recommended by Nilson
(1987), Collins and Mitchell (1997), and Hinkle (2006), each is dependent on the accurate
calculation of time-dependent material properties.
44
The total strain of a prestressed concrete member at age, t, is typically comprised of:
elastic strain, creep strain, free shrinkage strain, and thermal strain, which can be expressed by
Equation (2-118) (Ghali et al. 2002).
εc(t) = σc(t0)Ec(t0)
[1 + φ(t, t0)] + ∫ 1+φ(t,τ)Ec(τ)
∆σ0(t)0 dσc(τ) + εsh(t, t0) + εth (2-118)
where 𝑡𝑡0 and 𝑡𝑡 is the age of concrete when the initial stress is applied and when the strain is
calculated, respectively; 𝜏𝜏 is an indeterminate age between 𝑡𝑡0 and 𝑡𝑡; 𝜎𝜎𝑐𝑐(𝑡𝑡0) is an initial stress
applied at age 𝑡𝑡0; 𝑑𝑑𝜎𝜎𝑐𝑐(𝜏𝜏) is an elemental stress applied at age 𝜏𝜏; 𝐸𝐸𝑐𝑐(𝜏𝜏) is the modulus of
elasticity of concrete at age 𝜏𝜏; 𝜑𝜑(𝑡𝑡, 𝜏𝜏) is the creep coefficient at time 𝑡𝑡 for loading at age 𝜏𝜏;
𝜀𝜀𝑠𝑠ℎ(𝑡𝑡, 𝑡𝑡0) is the free shrinkage occurring between the ages 𝑡𝑡0 and t, and 𝜀𝜀𝑝𝑝ℎ is the thermal strain
which can be calculated using Equation (2-119).
εth = αt∆T (2-119)
where 𝛼𝛼𝑝𝑝 is the coefficient of thermal expansion; and ∆𝑇𝑇 is the temperature difference. It should
be noted that the second term in Equation. (2-117) pertains to the effects of creep when the
magnitude of the applied stress changes with time.
Not only does the creep in posttensioned bridges translate into the increase in
deformations, but it also affects the prestressing in the tendons, thereby affecting the structural
behavior. In order to accurately account for the time dependent variables, a time history of
stresses in a member and creep coefficients for numerous loading ages are required. Calculating
the creep in such a manner demands a considerable amount of calculations and data space. Creep
is a non-mechanical deformation, and as such only deformations can occur without
accompanying stresses unless constraints are imposed.
45
One of the general methods used in practice to account for creep in concrete structures
uses a predetermined creep coefficient for each element at each stage to determine the
accumulated element stresses. Another commonly used method relies on specific functions for
creep and these functions are integrated in determining stresses as a function of time. The first
method requires creep coefficients for each element for every stage. The second method
calculates the creep by integrating the stress time history using the creep coefficients specified in
the built-in standards within the program.
If the creep coefficients for individual elements are calculated, the results may vary
substantially depending on the coefficient values. For accurate results, the creep coefficients
must be obtained from adequate data with suitable stress time history and loading times. If the
creep coefficients at various stages are known from experience and experiments, directly using
these values can be effective. The creep load group is defined and activated with creep
coefficients assigned to elements. The creep loadings are calculated by applying the creep
coefficients and the element stresses accumulated to the present. The user directly enters the
creep coefficients and explicitly understands the magnitudes of forces in this method, which is
also easy to use. However, it entails the burden of calculating the creep coefficients.
The principle of superposition was first introduced by McHenry (1943). It implies that
the total strain induced by a number of stress increments applied at different ages is equal to the
sum of the strains due to each stress increment considered separately. Using the principle of
superposition, total creep strain at any time t is obtained as the sum of independent creep strains
produced by stress changes at different ages with different duration of time up to t. Thus, creep
strain at time t can be calculated using Equation (2-120).
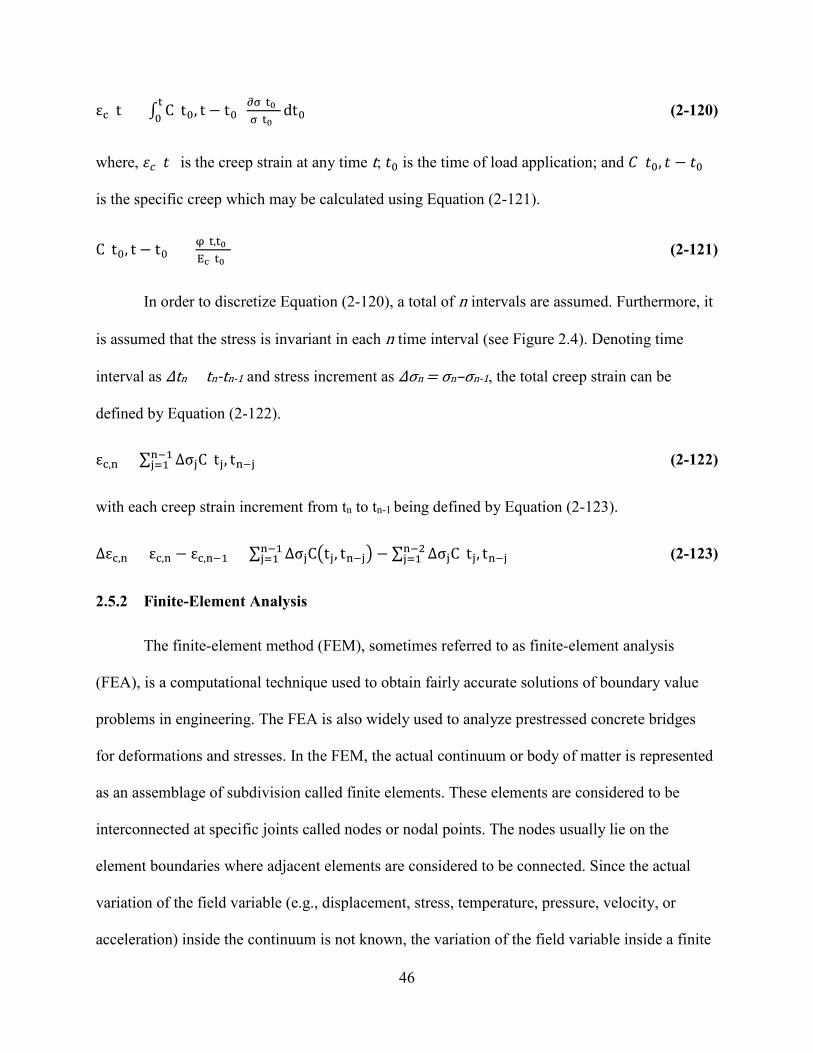
46
εc(t) = ∫ C(t0, t − t0) ∂σ(t0)σ(t0)
t0 dt0 (2-120)
where, 𝜀𝜀𝑐𝑐(𝑡𝑡) is the creep strain at any time t; 𝑡𝑡0 is the time of load application; and 𝐶𝐶(𝑡𝑡0, 𝑡𝑡 − 𝑡𝑡0)
is the specific creep which may be calculated using Equation (2-121).
C(t0, t − t0) = φ(t,t0)Ec(t0) (2-121)
In order to discretize Equation (2-120), a total of n intervals are assumed. Furthermore, it
is assumed that the stress is invariant in each n time interval (see Figure 2.4). Denoting time
interval as Δtn = tn-tn-1 and stress increment as Δσn = σn–σn-1, the total creep strain can be
defined by Equation (2-122).
εc,n = ∑ ∆σjC(tj, tn−j)n−1j=1 (2-122)
with each creep strain increment from tn to tn-1 being defined by Equation (2-123).
∆εc,n = εc,n − εc,n−1 = ∑ ∆σjC�tj, tn−j� − ∑ ∆σjC(tj, tn−j)n−2j=1
n−1j=1 (2-123)
2.5.2 Finite-Element Analysis
The finite-element method (FEM), sometimes referred to as finite-element analysis
(FEA), is a computational technique used to obtain fairly accurate solutions of boundary value
problems in engineering. The FEA is also widely used to analyze prestressed concrete bridges
for deformations and stresses. In the FEM, the actual continuum or body of matter is represented
as an assemblage of subdivision called finite elements. These elements are considered to be
interconnected at specific joints called nodes or nodal points. The nodes usually lie on the
element boundaries where adjacent elements are considered to be connected. Since the actual
variation of the field variable (e.g., displacement, stress, temperature, pressure, velocity, or
acceleration) inside the continuum is not known, the variation of the field variable inside a finite
47
element can be presumably estimated by a simple function. These approximating functions, also
known as interpolation functions, are defined in terms of the values of the field variables at the
nodes. When field equations, like equilibrium or compatibility equations, for the whole
continuum are written, the new unknowns will be the nodal values of the field variable. By
solving the field equations, which are generally in the form of matrix equations, the nodal values
of the field variable will be known. Once these are known, the approximating functions
determine the field variable throughout the assemblage of elements.
(a) Stress history
(b) Specific creep
(c) Total strain
Figure 2.4: Creep deformation summed over increasing stress history
48
CHAPTER 3: CHARACTERIZATION OF CONCRETE RELAXATION
Introduction
As described in Section 1.2, time-dependent displacement-induced forces are developed
during and after construction especially in columns supporting CIP / PS Box. These forces are
primarily induced due to shortening of the superstructure and their magnitudes are highly
influenced by the time-dependent behavior of the superstructure (e.g., shortening and prestress
losses) as well as the effects of concrete relaxation in the columns. Although these forces are
suspected to be reduced over time due to concrete relaxation, they are not systematically
accounted for in routine design of columns supporting a CIP / PS Box, resulting in
overestimation of lateral forces.
Concrete is a structural material with time-dependent behavior, such as shrinkage as well
as creep and its associated stress relaxation, which significantly affect the structural behavior of
CIP / PS Box. Creep and shrinkage are generally viewed unfavorably when they cause prestress
losses and increase in deflections, which may impair serviceability of a bridge structure.
However, creep and its associated stress relaxation can be beneficial if it contributes toward
redistribution and/or reduction of stresses. Since creep and relaxation of concrete are different
manifestations of the same viscoelastic material property, they have been used interchangeably
in the literature. However, in this report, the relaxation term is referred to the loss of stress under
a state of a constant strain and the creep term is used to identify the increase in strain under a
constant sustained stress.
The effects of concrete relaxation may be beneficial at two stages: (1) at early ages
during hardening of concrete; and (2) long-term after maturity of concrete. The main beneficial
effect of concrete relaxation at early ages is that it reduces the restraint stresses induced by
49
thermal dilation and autogenous shrinkage, thereby reducing the risk of cracking during
hardening. In many cases, a reduction in restraint stress of as much as 30-40% due to stress
relaxation has been reported during hardening of concrete (Bosnjak 2001, Atrushi 2003, Schutter
2004). After the concrete matures, the test data on a set of continuous reinforced concrete beams
(Ghali et al. 1969) and continuous prestressed concrete beams (Digler et al. 1970) subjected to a
fixed displacement (representing a settlement) verified the beneficial effects of relaxation by
reducing the reaction forces with time. Moreover, Choudhury et al. (1988) showed that when
designing reinforced concrete bridge columns subjected to imposed deformation, economical
solutions can be achieved by including the beneficial effects of column creep resulting from axial
loads. However, the beneficial role of concrete relaxation in reducing the deformation-induced
forces in the columns of CIP/ PS Box caused by time-dependent shortening of the superstructure
was not examined.
Upon review of the current literature, it was discovered that limited data exist on the
effects of concrete relaxation, which may be due to the difficulties associated with maintaining a
state of constant strain during a relaxation test. Hence, information available on creep is typically
used in lieu of relaxation data for most of the theoretical studies involving relaxation. Though not
useful for long-term studies, a few investigations have examined the characterization of concrete
relaxation only at early ages. The relaxation of early age concrete under axial tension was studied
by Rostásy (1993) and Gutsch (2001). They noted that relaxation increased as the loading age
decreased, and relaxation and creep were accelerated at a temperature higher than 68 °F under
loading. Moreover, they validated the assumption of using linear viscoelasticity behavior to
model the concrete creep and relaxation.
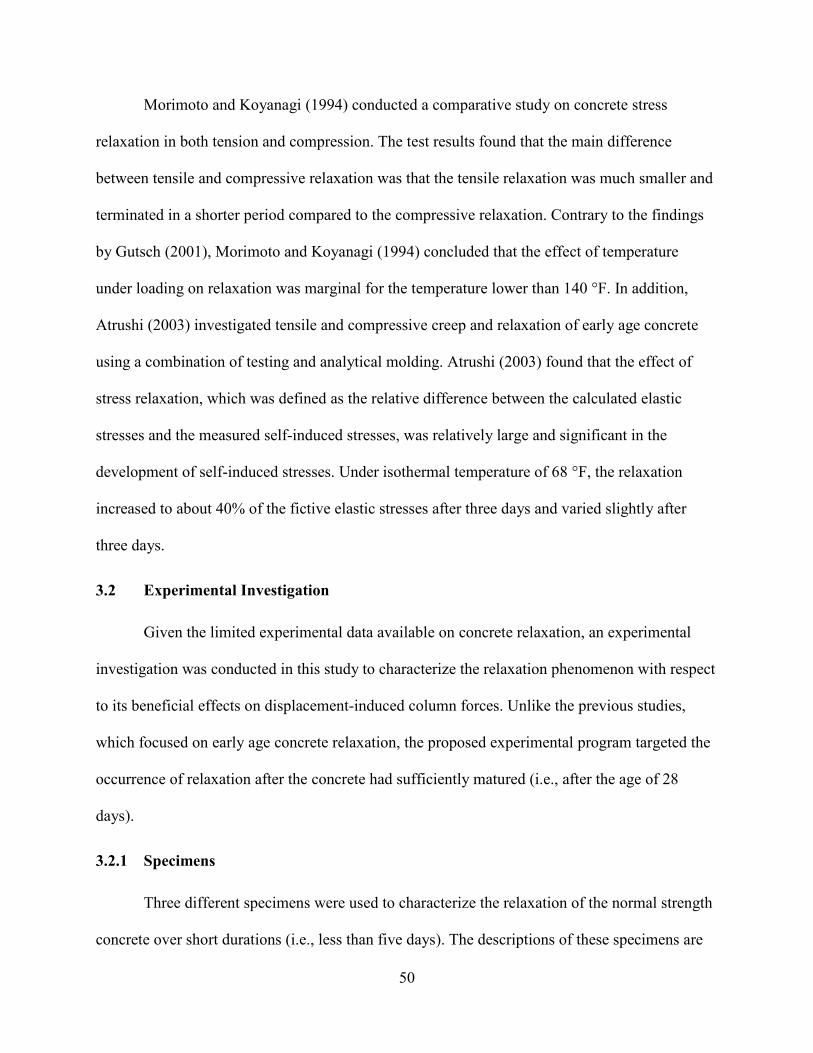
50
Morimoto and Koyanagi (1994) conducted a comparative study on concrete stress
relaxation in both tension and compression. The test results found that the main difference
between tensile and compressive relaxation was that the tensile relaxation was much smaller and
terminated in a shorter period compared to the compressive relaxation. Contrary to the findings
by Gutsch (2001), Morimoto and Koyanagi (1994) concluded that the effect of temperature
under loading on relaxation was marginal for the temperature lower than 140 °F. In addition,
Atrushi (2003) investigated tensile and compressive creep and relaxation of early age concrete
using a combination of testing and analytical molding. Atrushi (2003) found that the effect of
stress relaxation, which was defined as the relative difference between the calculated elastic
stresses and the measured self-induced stresses, was relatively large and significant in the
development of self-induced stresses. Under isothermal temperature of 68 °F, the relaxation
increased to about 40% of the fictive elastic stresses after three days and varied slightly after
three days.
Experimental Investigation
Given the limited experimental data available on concrete relaxation, an experimental
investigation was conducted in this study to characterize the relaxation phenomenon with respect
to its beneficial effects on displacement-induced column forces. Unlike the previous studies,
which focused on early age concrete relaxation, the proposed experimental program targeted the
occurrence of relaxation after the concrete had sufficiently matured (i.e., after the age of 28
days).
3.2.1 Specimens
Three different specimens were used to characterize the relaxation of the normal strength
concrete over short durations (i.e., less than five days). The descriptions of these specimens are
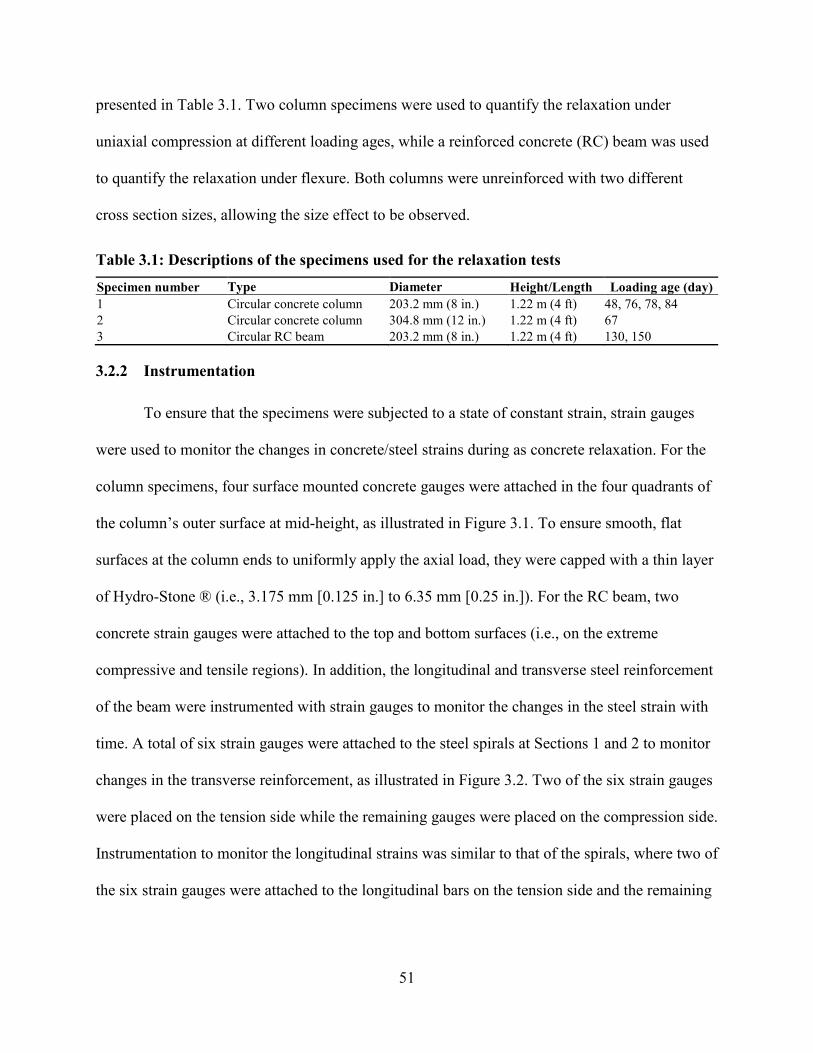
51
presented in Table 3.1. Two column specimens were used to quantify the relaxation under
uniaxial compression at different loading ages, while a reinforced concrete (RC) beam was used
to quantify the relaxation under flexure. Both columns were unreinforced with two different
cross section sizes, allowing the size effect to be observed.
Table 3.1: Descriptions of the specimens used for the relaxation tests
Specimen number Type Diameter Height/Length Loading age (day) 1 Circular concrete column 203.2 mm (8 in.) 1.22 m (4 ft) 48, 76, 78, 84 2 Circular concrete column 304.8 mm (12 in.) 1.22 m (4 ft) 67 3 Circular RC beam 203.2 mm (8 in.) 1.22 m (4 ft) 130, 150
3.2.2 Instrumentation
To ensure that the specimens were subjected to a state of constant strain, strain gauges
were used to monitor the changes in concrete/steel strains during as concrete relaxation. For the
column specimens, four surface mounted concrete gauges were attached in the four quadrants of
the column’s outer surface at mid-height, as illustrated in Figure 3.1. To ensure smooth, flat
surfaces at the column ends to uniformly apply the axial load, they were capped with a thin layer
of Hydro-Stone ® (i.e., 3.175 mm [0.125 in.] to 6.35 mm [0.25 in.]). For the RC beam, two
concrete strain gauges were attached to the top and bottom surfaces (i.e., on the extreme
compressive and tensile regions). In addition, the longitudinal and transverse steel reinforcement
of the beam were instrumented with strain gauges to monitor the changes in the steel strain with
time. A total of six strain gauges were attached to the steel spirals at Sections 1 and 2 to monitor
changes in the transverse reinforcement, as illustrated in Figure 3.2. Two of the six strain gauges
were placed on the tension side while the remaining gauges were placed on the compression side.
Instrumentation to monitor the longitudinal strains was similar to that of the spirals, where two of
the six strain gauges were attached to the longitudinal bars on the tension side and the remaining
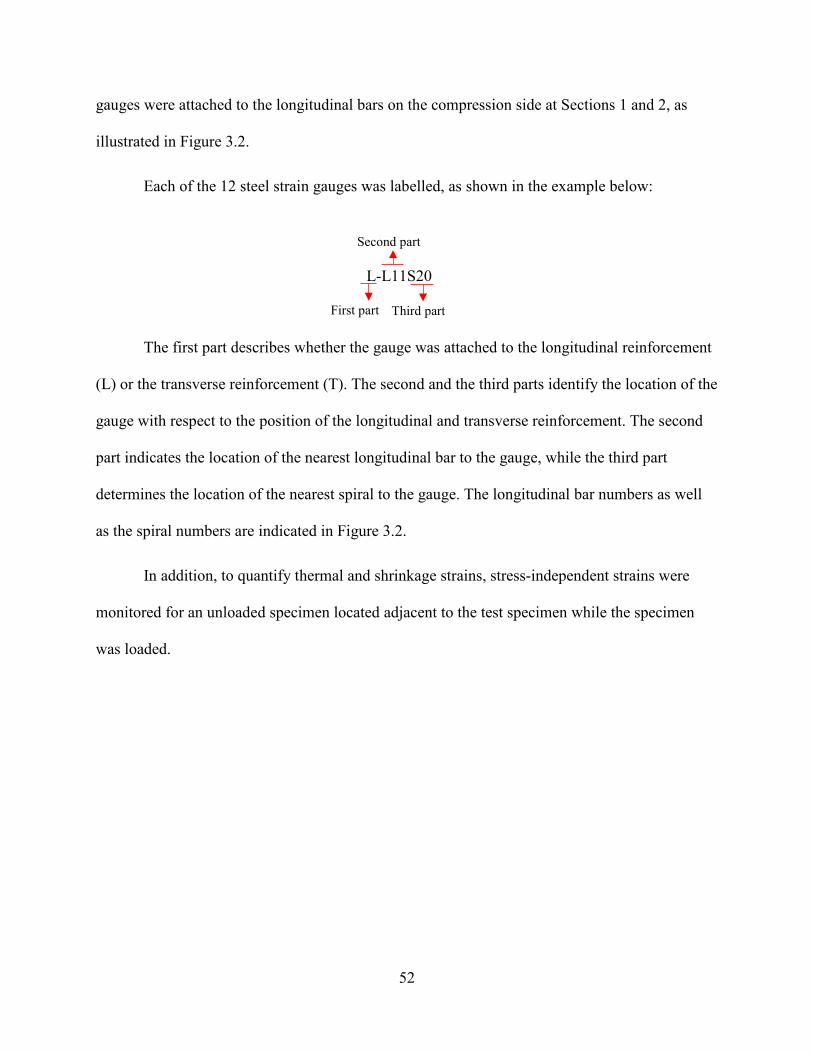
52
gauges were attached to the longitudinal bars on the compression side at Sections 1 and 2, as
illustrated in Figure 3.2.
Each of the 12 steel strain gauges was labelled, as shown in the example below:
The first part describes whether the gauge was attached to the longitudinal reinforcement
(L) or the transverse reinforcement (T). The second and the third parts identify the location of the
gauge with respect to the position of the longitudinal and transverse reinforcement. The second
part indicates the location of the nearest longitudinal bar to the gauge, while the third part
determines the location of the nearest spiral to the gauge. The longitudinal bar numbers as well
as the spiral numbers are indicated in Figure 3.2.
In addition, to quantify thermal and shrinkage strains, stress-independent strains were
monitored for an unloaded specimen located adjacent to the test specimen while the specimen
was loaded.
Second part
Third part First part
L-L11S20
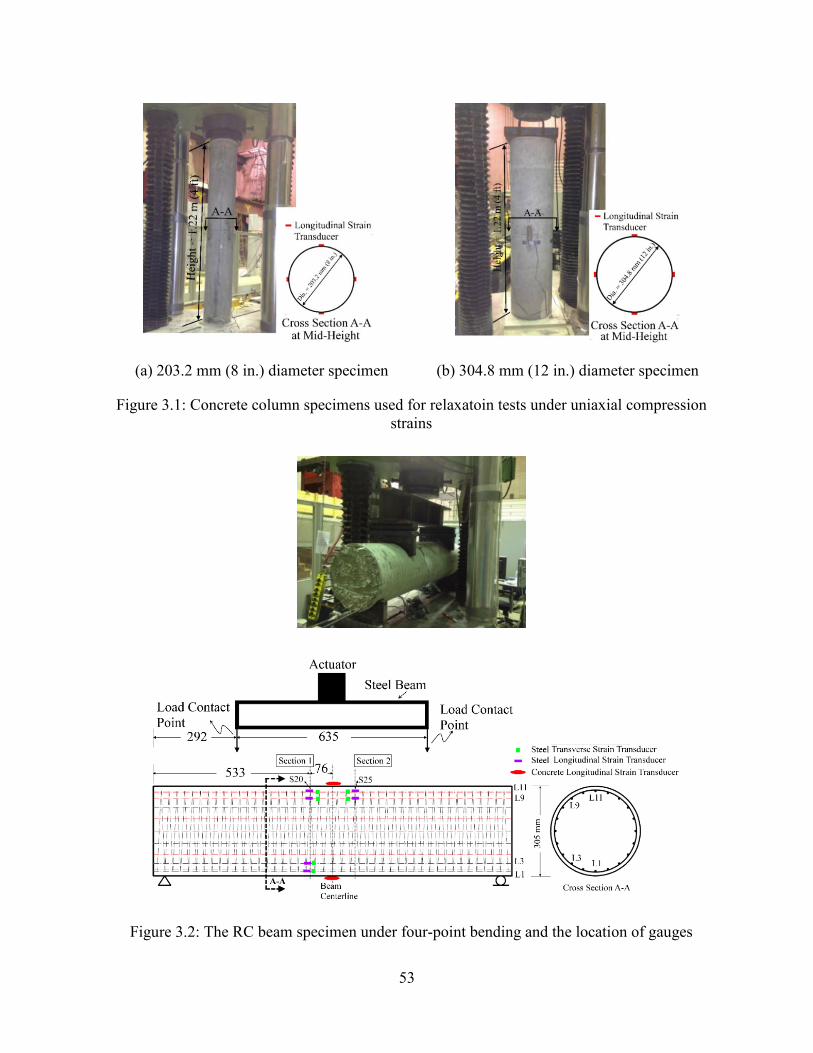
53
(a) 203.2 mm (8 in.) diameter specimen (b) 304.8 mm (12 in.) diameter specimen
Figure 3.1: Concrete column specimens used for relaxatoin tests under uniaxial compression strains
Figure 3.2: The RC beam specimen under four-point bending and the location of gauges
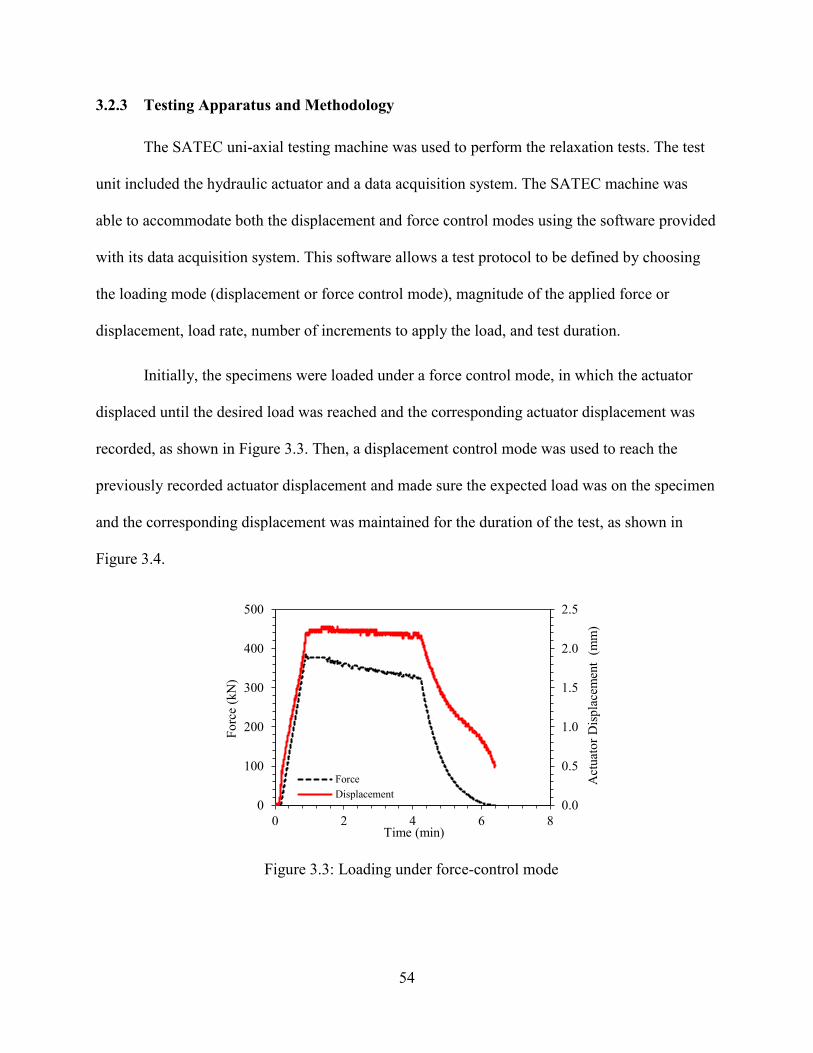
54
3.2.3 Testing Apparatus and Methodology
The SATEC uni-axial testing machine was used to perform the relaxation tests. The test
unit included the hydraulic actuator and a data acquisition system. The SATEC machine was
able to accommodate both the displacement and force control modes using the software provided
with its data acquisition system. This software allows a test protocol to be defined by choosing
the loading mode (displacement or force control mode), magnitude of the applied force or
displacement, load rate, number of increments to apply the load, and test duration.
Initially, the specimens were loaded under a force control mode, in which the actuator
displaced until the desired load was reached and the corresponding actuator displacement was
recorded, as shown in Figure 3.3. Then, a displacement control mode was used to reach the
previously recorded actuator displacement and made sure the expected load was on the specimen
and the corresponding displacement was maintained for the duration of the test, as shown in
Figure 3.4.
Figure 3.3: Loading under force-control mode
0.0
0.5
1.0
1.5
2.0
2.5
0
100
200
300
400
500
0 2 4 6 8Time (min)
Act
uato
r Dis
plac
emen
t (m
m)
Forc
e (k
N)
ForceDisplacement
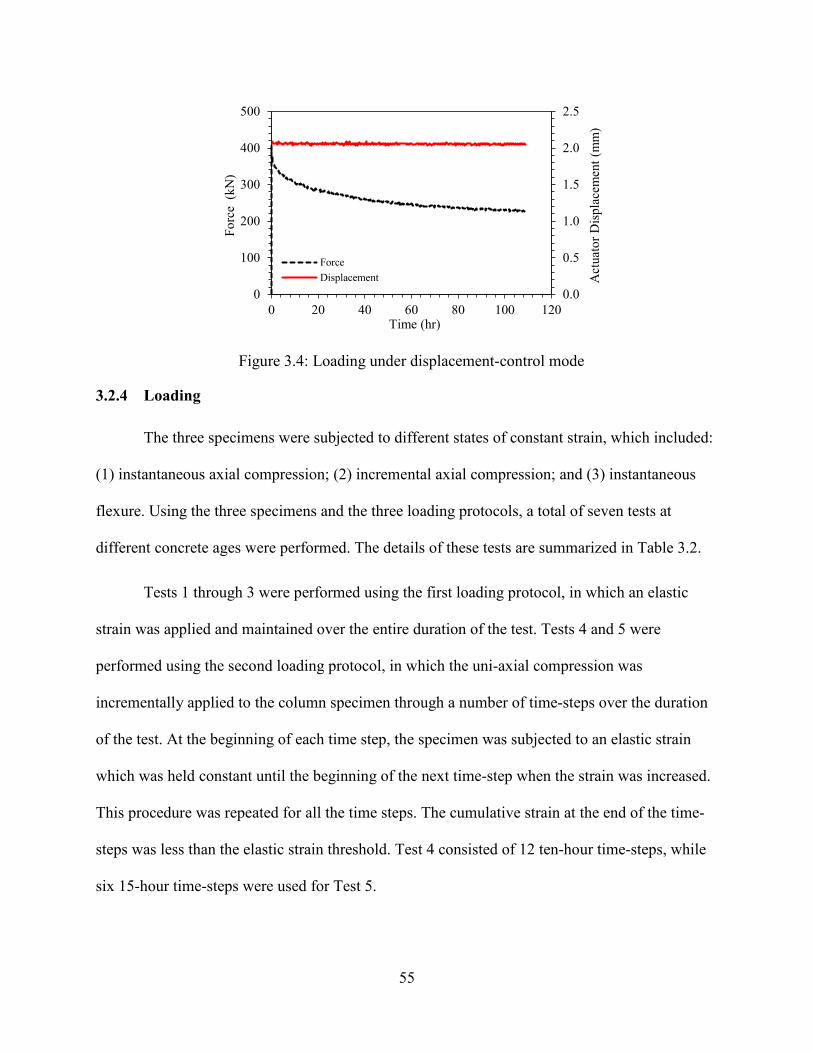
55
Figure 3.4: Loading under displacement-control mode
3.2.4 Loading
The three specimens were subjected to different states of constant strain, which included:
(1) instantaneous axial compression; (2) incremental axial compression; and (3) instantaneous
flexure. Using the three specimens and the three loading protocols, a total of seven tests at
different concrete ages were performed. The details of these tests are summarized in Table 3.2.
Tests 1 through 3 were performed using the first loading protocol, in which an elastic
strain was applied and maintained over the entire duration of the test. Tests 4 and 5 were
performed using the second loading protocol, in which the uni-axial compression was
incrementally applied to the column specimen through a number of time-steps over the duration
of the test. At the beginning of each time step, the specimen was subjected to an elastic strain
which was held constant until the beginning of the next time-step when the strain was increased.
This procedure was repeated for all the time steps. The cumulative strain at the end of the time-
steps was less than the elastic strain threshold. Test 4 consisted of 12 ten-hour time-steps, while
six 15-hour time-steps were used for Test 5.
0.0
0.5
1.0
1.5
2.0
2.5
0
100
200
300
400
500
0 20 40 60 80 100 120
Act
uato
r Dis
plac
emen
t (m
m)
Forc
e (k
N)
Time (hr)
ForceDisplacement
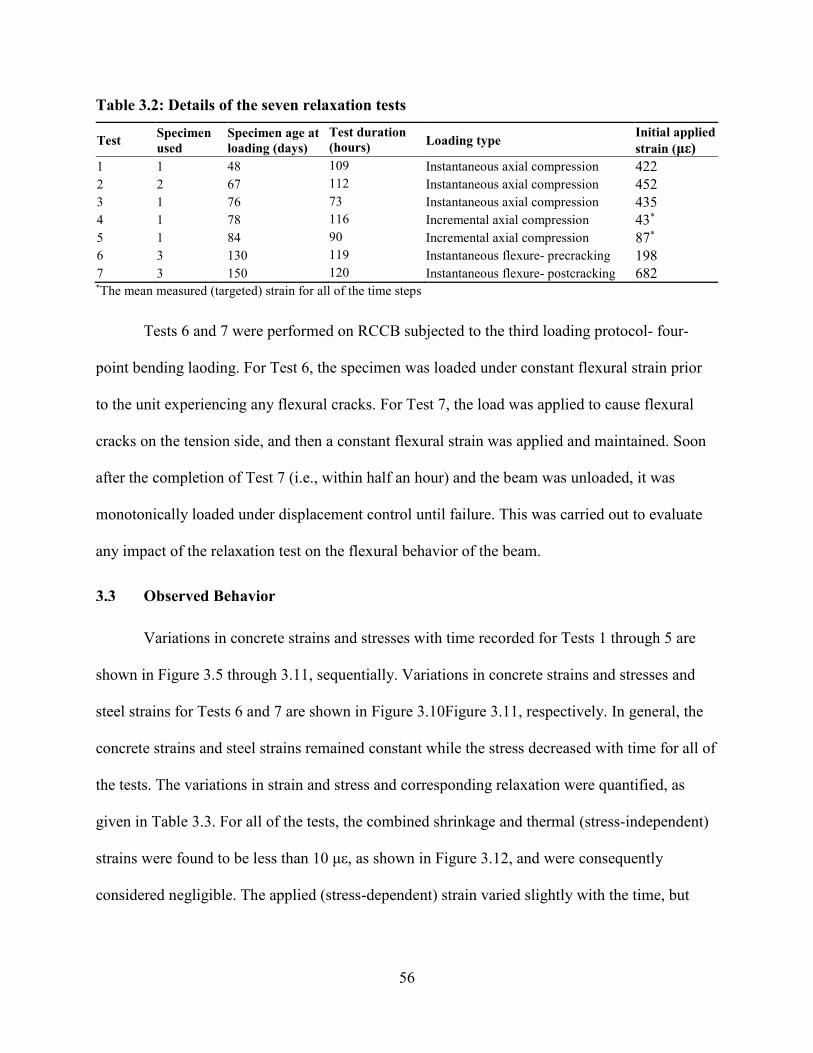
56
Table 3.2: Details of the seven relaxation tests
Test Specimen used
Specimen age at loading (days)
Test duration (hours) Loading type Initial applied
strain (με) 1 1 48 109 Instantaneous axial compression 422 2 2 67 112 Instantaneous axial compression 452 3 1 76 73 Instantaneous axial compression 435 4 1 78 116 Incremental axial compression 43* 5 1 84 90 Incremental axial compression 87* 6 3 130 119 Instantaneous flexure- precracking 198 7 3 150 120 Instantaneous flexure- postcracking 682 *The mean measured (targeted) strain for all of the time steps
Tests 6 and 7 were performed on RCCB subjected to the third loading protocol- four-
point bending laoding. For Test 6, the specimen was loaded under constant flexural strain prior
to the unit experiencing any flexural cracks. For Test 7, the load was applied to cause flexural
cracks on the tension side, and then a constant flexural strain was applied and maintained. Soon
after the completion of Test 7 (i.e., within half an hour) and the beam was unloaded, it was
monotonically loaded under displacement control until failure. This was carried out to evaluate
any impact of the relaxation test on the flexural behavior of the beam.
Observed Behavior
Variations in concrete strains and stresses with time recorded for Tests 1 through 5 are
shown in Figure 3.5 through 3.11, sequentially. Variations in concrete strains and stresses and
steel strains for Tests 6 and 7 are shown in Figure 3.10Figure 3.11, respectively. In general, the
concrete strains and steel strains remained constant while the stress decreased with time for all of
the tests. The variations in strain and stress and corresponding relaxation were quantified, as
given in Table 3.3. For all of the tests, the combined shrinkage and thermal (stress-independent)
strains were found to be less than 10 με, as shown in Figure 3.12, and were consequently
considered negligible. The applied (stress-dependent) strain varied slightly with the time, but
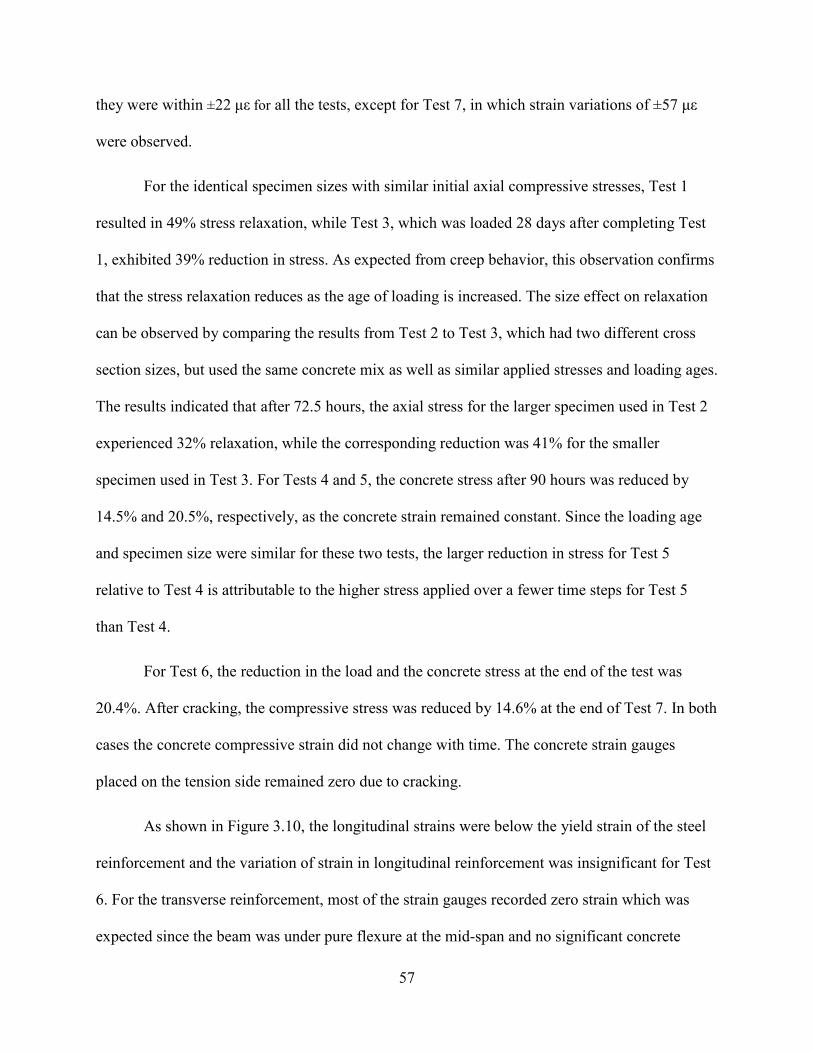
57
they were within ±22 με for all the tests, except for Test 7, in which strain variations of ±57 με
were observed.
For the identical specimen sizes with similar initial axial compressive stresses, Test 1
resulted in 49% stress relaxation, while Test 3, which was loaded 28 days after completing Test
1, exhibited 39% reduction in stress. As expected from creep behavior, this observation confirms
that the stress relaxation reduces as the age of loading is increased. The size effect on relaxation
can be observed by comparing the results from Test 2 to Test 3, which had two different cross
section sizes, but used the same concrete mix as well as similar applied stresses and loading ages.
The results indicated that after 72.5 hours, the axial stress for the larger specimen used in Test 2
experienced 32% relaxation, while the corresponding reduction was 41% for the smaller
specimen used in Test 3. For Tests 4 and 5, the concrete stress after 90 hours was reduced by
14.5% and 20.5%, respectively, as the concrete strain remained constant. Since the loading age
and specimen size were similar for these two tests, the larger reduction in stress for Test 5
relative to Test 4 is attributable to the higher stress applied over a fewer time steps for Test 5
than Test 4.
For Test 6, the reduction in the load and the concrete stress at the end of the test was
20.4%. After cracking, the compressive stress was reduced by 14.6% at the end of Test 7. In both
cases the concrete compressive strain did not change with time. The concrete strain gauges
placed on the tension side remained zero due to cracking.
As shown in Figure 3.10, the longitudinal strains were below the yield strain of the steel
reinforcement and the variation of strain in longitudinal reinforcement was insignificant for Test
6. For the transverse reinforcement, most of the strain gauges recorded zero strain which was
expected since the beam was under pure flexure at the mid-span and no significant concrete
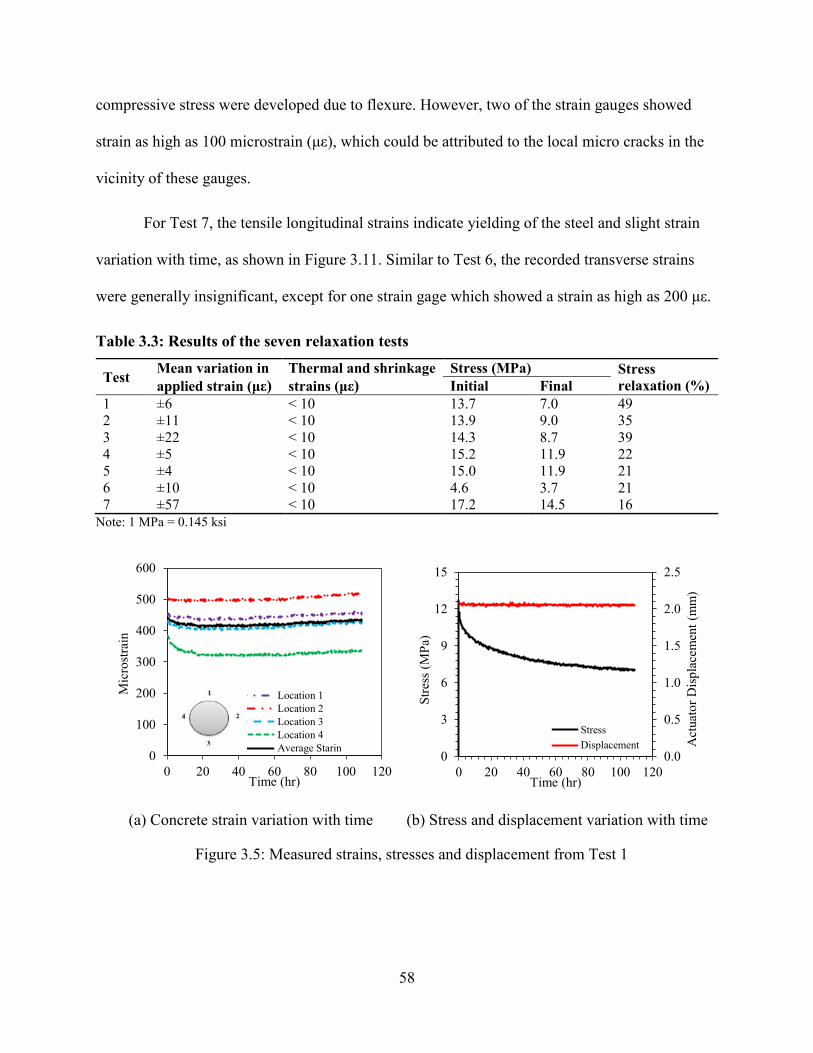
58
compressive stress were developed due to flexure. However, two of the strain gauges showed
strain as high as 100 microstrain (με), which could be attributed to the local micro cracks in the
vicinity of these gauges.
For Test 7, the tensile longitudinal strains indicate yielding of the steel and slight strain
variation with time, as shown in Figure 3.11. Similar to Test 6, the recorded transverse strains
were generally insignificant, except for one strain gage which showed a strain as high as 200 με.
Table 3.3: Results of the seven relaxation tests
Test Mean variation in applied strain (με)
Thermal and shrinkage strains (με)
Stress (MPa) Stress relaxation (%) Initial Final
1 ±6 < 10 13.7 7.0 49 2 ±11 < 10 13.9 9.0 35 3 ±22 < 10 14.3 8.7 39 4 ±5 < 10 15.2 11.9 22 5 ±4 < 10 15.0 11.9 21 6 ±10 < 10 4.6 3.7 21 7 ±57 < 10 17.2 14.5 16
Note: 1 MPa = 0.145 ksi
(a) Concrete strain variation with time (b) Stress and displacement variation with time
Figure 3.5: Measured strains, stresses and displacement from Test 1
0
100
200
300
400
500
600
0 20 40 60 80 100 120
Mic
rostr
ain
Time (hr)
Location 1Location 2Location 3Location 4Average Starin
0.0
0.5
1.0
1.5
2.0
2.5
0
3
6
9
12
15
0 20 40 60 80 100 120
Act
uato
r Dis
plac
emen
t (m
m)
Stre
ss (M
Pa)
Time (hr)
StressDisplacement
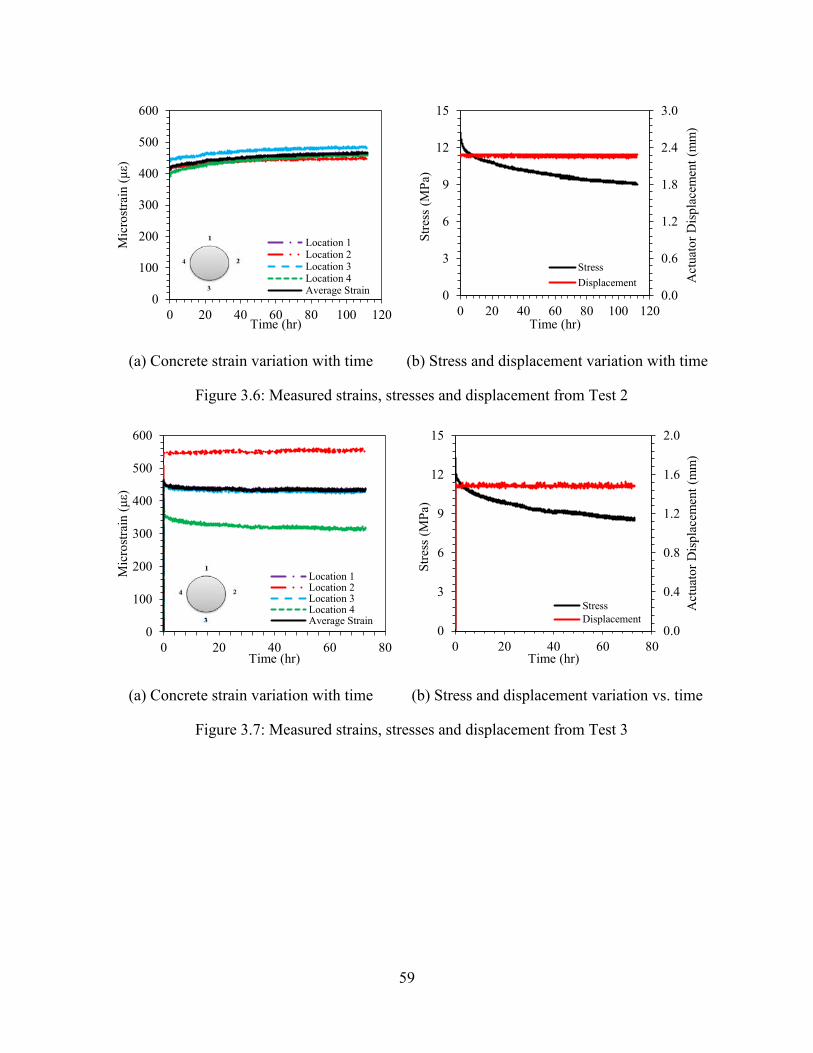
59
(a) Concrete strain variation with time (b) Stress and displacement variation with time
Figure 3.6: Measured strains, stresses and displacement from Test 2
(a) Concrete strain variation with time (b) Stress and displacement variation vs. time
Figure 3.7: Measured strains, stresses and displacement from Test 3
0
100
200
300
400
500
600
0 20 40 60 80 100 120
Mic
rost
rain
(με)
Time (hr)
Location 1Location 2Location 3Location 4Average Strain 0.0
0.6
1.2
1.8
2.4
3.0
0
3
6
9
12
15
0 20 40 60 80 100 120
Act
uato
r Dis
plac
emen
t (m
m)
Stre
ss (M
Pa)
Time (hr)
StressDisplacement
0
100
200
300
400
500
600
0 20 40 60 80
Mic
rost
rain
(με)
Time (hr)
Location 1Location 2Location 3Location 4Average Strain
0.0
0.4
0.8
1.2
1.6
2.0
0
3
6
9
12
15
0 20 40 60 80
Act
uato
r Dis
plac
emen
t (m
m)
Stre
ss (M
Pa)
Time (hr)
StressDisplacement
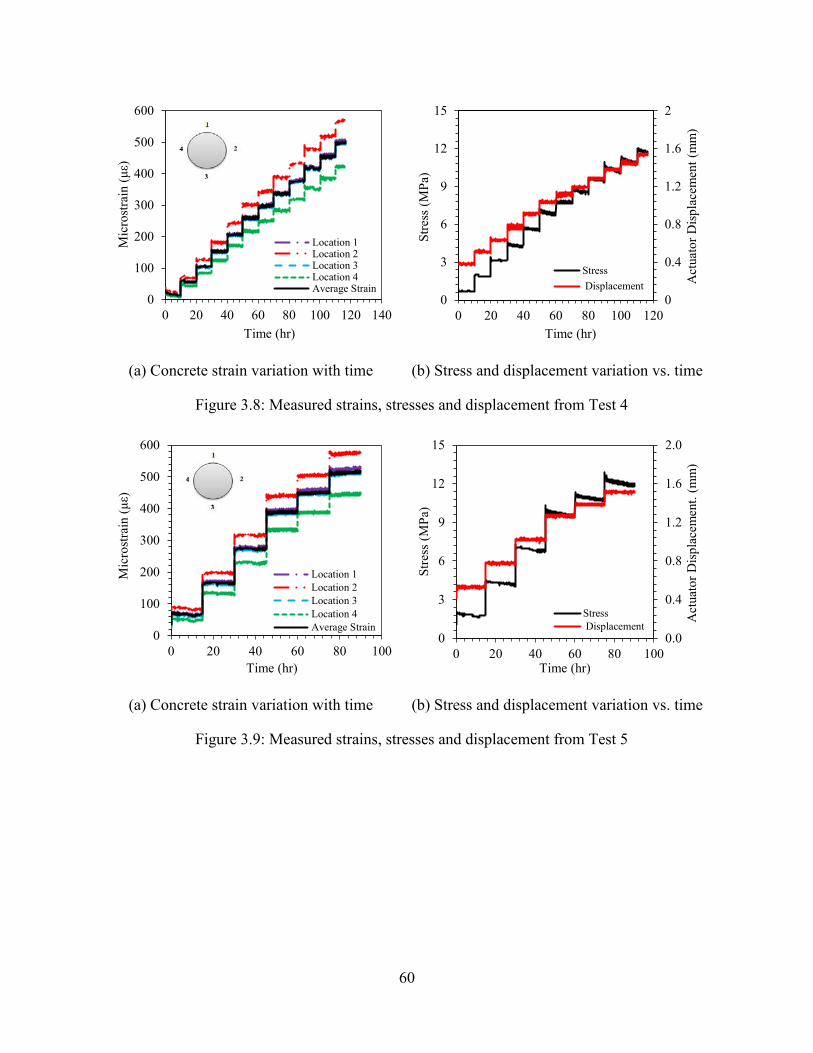
60
(a) Concrete strain variation with time (b) Stress and displacement variation vs. time
Figure 3.8: Measured strains, stresses and displacement from Test 4
(a) Concrete strain variation with time (b) Stress and displacement variation vs. time
Figure 3.9: Measured strains, stresses and displacement from Test 5
0
100
200
300
400
500
600
0 20 40 60 80 100 120 140
Mic
rost
rain
(με)
Time (hr)
Location 1Location 2Location 3Location 4Average Strain
0
0.4
0.8
1.2
1.6
2
0
3
6
9
12
15
0 20 40 60 80 100 120
Act
uato
r Dis
plac
emen
t (m
m)
Stre
ss (M
Pa)
Time (hr)
Stress Displacement
0
100
200
300
400
500
600
0 20 40 60 80 100
Mic
rost
rain
(με)
Time (hr)
Location 1Location 2Location 3Location 4Average Strain
0.0
0.4
0.8
1.2
1.6
2.0
0
3
6
9
12
15
0 20 40 60 80 100
Act
uato
r Dis
plac
emen
t. (m
m)
Stre
ss (M
Pa)
Time (hr)
Stress Displacement
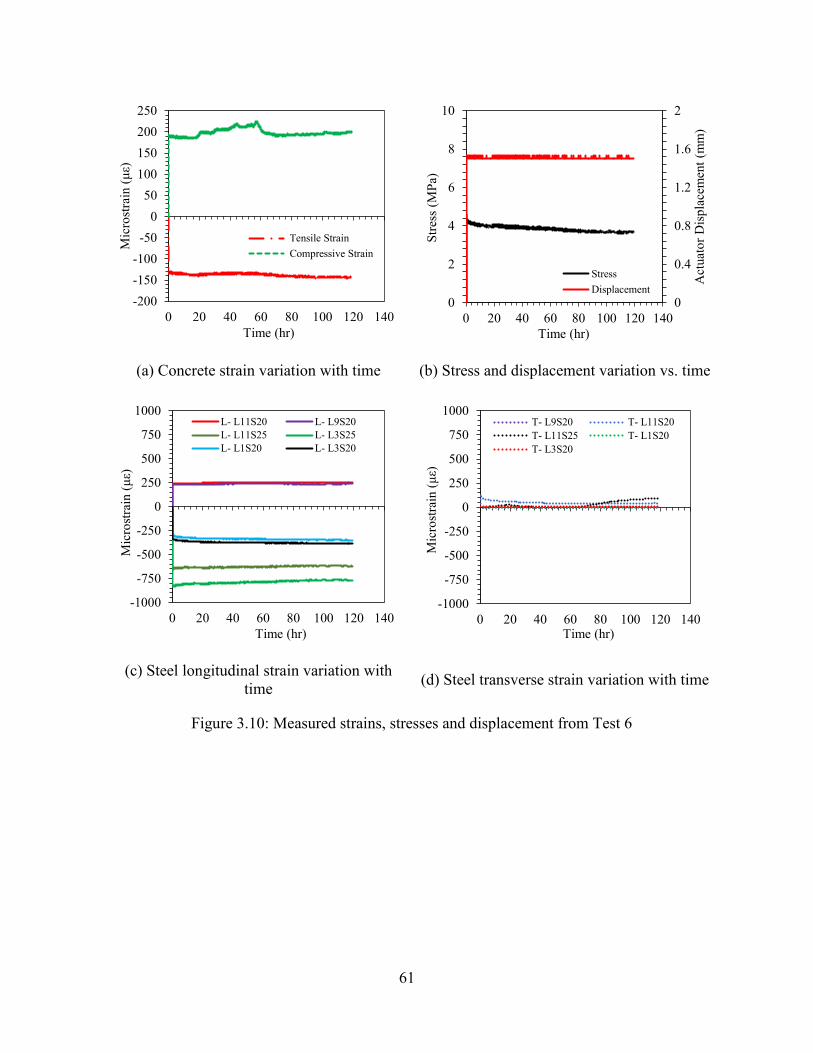
61
(a) Concrete strain variation with time (b) Stress and displacement variation vs. time
(c) Steel longitudinal strain variation with time (d) Steel transverse strain variation with time
Figure 3.10: Measured strains, stresses and displacement from Test 6
-200-150-100
-500
50100150200250
0 20 40 60 80 100 120 140
Mic
rost
rain
(με)
Time (hr)
Tensile Strain Compressive Strain
0
0.4
0.8
1.2
1.6
2
0
2
4
6
8
10
0 20 40 60 80 100 120 140
Act
uato
r Dis
plac
emen
t (m
m)
Stre
ss (M
Pa)
Time (hr)
StressDisplacement
-1000
-750
-500
-250
0
250
500
750
1000
0 20 40 60 80 100 120 140
Mic
rost
rain
(με)
Time (hr)
L- L11S20 L- L9S20L- L11S25 L- L3S25L- L1S20 L- L3S20
-1000
-750
-500
-250
0
250
500
750
1000
0 20 40 60 80 100 120 140
Mic
rost
rain
(με)
Time (hr)
T- L9S20 T- L11S20T- L11S25 T- L1S20T- L3S20
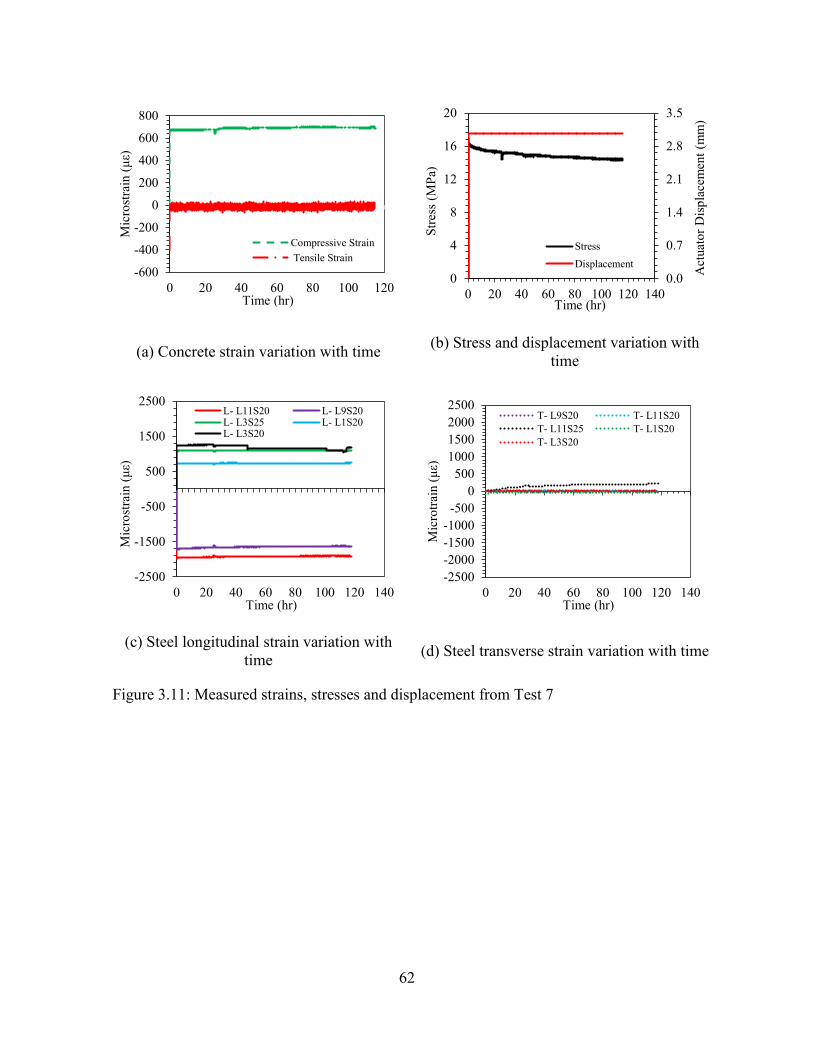
62
(a) Concrete strain variation with time (b) Stress and displacement variation with time
(c) Steel longitudinal strain variation with time (d) Steel transverse strain variation with time
Figure 3.11: Measured strains, stresses and displacement from Test 7
-600
-400
-200
0
200
400
600
800
0 20 40 60 80 100 120
Mic
rost
rain
(με)
Time (hr)
Compressive Strain Tensile Strain
0.0
0.7
1.4
2.1
2.8
3.5
0
4
8
12
16
20
0 20 40 60 80 100 120 140
Act
uato
r Dis
plac
emen
t (m
m)
Stre
ss (M
Pa)
Time (hr)
StressDisplacement
-2500
-1500
-500
500
1500
2500
0 20 40 60 80 100 120 140
Mic
rost
rain
(με)
Time (hr)
L- L11S20 L- L9S20L- L3S25 L- L1S20L- L3S20
-2500-2000-1500-1000
-5000
5001000150020002500
0 20 40 60 80 100 120 140
Mic
rotra
in (μ
ε)
Time (hr)
T- L9S20 T- L11S20T- L11S25 T- L1S20T- L3S20
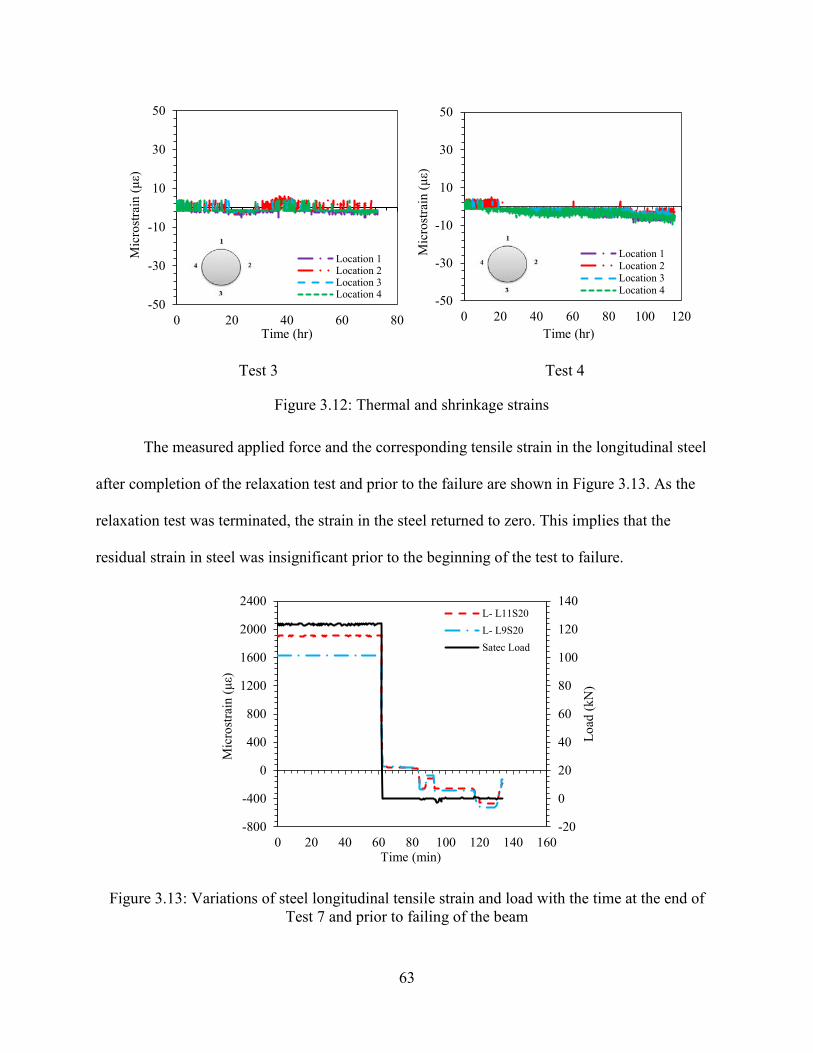
63
Test 3 Test 4
Figure 3.12: Thermal and shrinkage strains
The measured applied force and the corresponding tensile strain in the longitudinal steel
after completion of the relaxation test and prior to the failure are shown in Figure 3.13. As the
relaxation test was terminated, the strain in the steel returned to zero. This implies that the
residual strain in steel was insignificant prior to the beginning of the test to failure.
Figure 3.13: Variations of steel longitudinal tensile strain and load with the time at the end of Test 7 and prior to failing of the beam
-50
-30
-10
10
30
50
0 20 40 60 80
Mic
rost
rain
(με)
Time (hr)
Location 1Location 2Location 3Location 4 -50
-30
-10
10
30
50
0 20 40 60 80 100 120
Mic
rost
rain
(με)
Time (hr)
Location 1Location 2Location 3Location 4
-20
0
20
40
60
80
100
120
140
-800
-400
0
400
800
1200
1600
2000
2400
0 20 40 60 80 100 120 140 160
Load
(kN
)
Mic
rost
rain
(με)
Time (min)
L- L11S20L- L9S20Satec Load
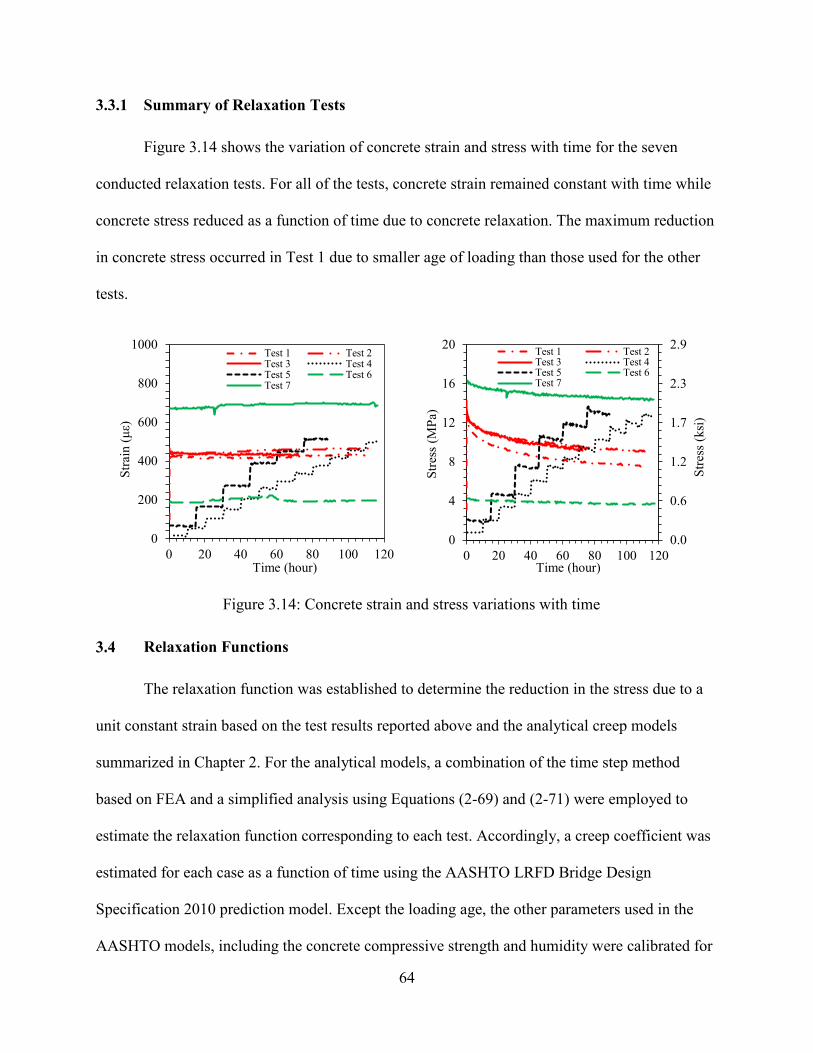
64
3.3.1 Summary of Relaxation Tests
Figure 3.14 shows the variation of concrete strain and stress with time for the seven
conducted relaxation tests. For all of the tests, concrete strain remained constant with time while
concrete stress reduced as a function of time due to concrete relaxation. The maximum reduction
in concrete stress occurred in Test 1 due to smaller age of loading than those used for the other
tests.
Figure 3.14: Concrete strain and stress variations with time
Relaxation Functions
The relaxation function was established to determine the reduction in the stress due to a
unit constant strain based on the test results reported above and the analytical creep models
summarized in Chapter 2. For the analytical models, a combination of the time step method
based on FEA and a simplified analysis using Equations (2-69) and (2-71) were employed to
estimate the relaxation function corresponding to each test. Accordingly, a creep coefficient was
estimated for each case as a function of time using the AASHTO LRFD Bridge Design
Specification 2010 prediction model. Except the loading age, the other parameters used in the
AASHTO models, including the concrete compressive strength and humidity were calibrated for
0
200
400
600
800
1000
0 20 40 60 80 100 120
Stra
in (μ
ε)
Time (hour)
Test 1 Test 2Test 3 Test 4Test 5 Test 6Test 7
0.0
0.6
1.2
1.7
2.3
2.9
0
4
8
12
16
20
0 20 40 60 80 100 120
Stre
ss (k
si)
Stre
ss (M
Pa)
Time (hour)
Test 1 Test 2Test 3 Test 4Test 5 Test 6Test 7
65
the first test such that the best agreement was found between the estimated and measured
relaxation functions.
Using the midas Civil software (2013), a FEM of the tests were developed with due
consideration to specimen geometry, creep, and loading protocol. A constant strain was applied
to the FEM such that the corresponding initial stress was the same as the measured initial stress
for the test. This was achieved by adjusting the concrete modulus of elasticity. The same
calibrated values for concrete compressive strength and humidity were used to estimate creep in
the analytical models developed for the remaining tests.
Figure 3.15 and Figure 3.16 show the comparison between the calculated relaxation
functions based on the test results and the different analytical models for the concrete columns
and RC beam, respectively. In general, a good agreement is found between the test results and
the FEM results for the different tests. The simplified analysis and the Bazant’s method (1979)
resulted in identical approximation of the relaxation functions for the different tests due to the
short duration of the tests (i.e., less than 5 days). The relaxation functions estimated by the
simplified analysis and Bazant’s method (1979) did not correlate well with the test results for the
first 48 hours of Tests 1 through 5. After 48 hours, it is observed that the simplified analysis and
Bazant’s method (1979) resulted in the overestimation of the relaxation functions for Tests 1 and
2, while underestimated the relaxation functions for Tests 4 and 5.
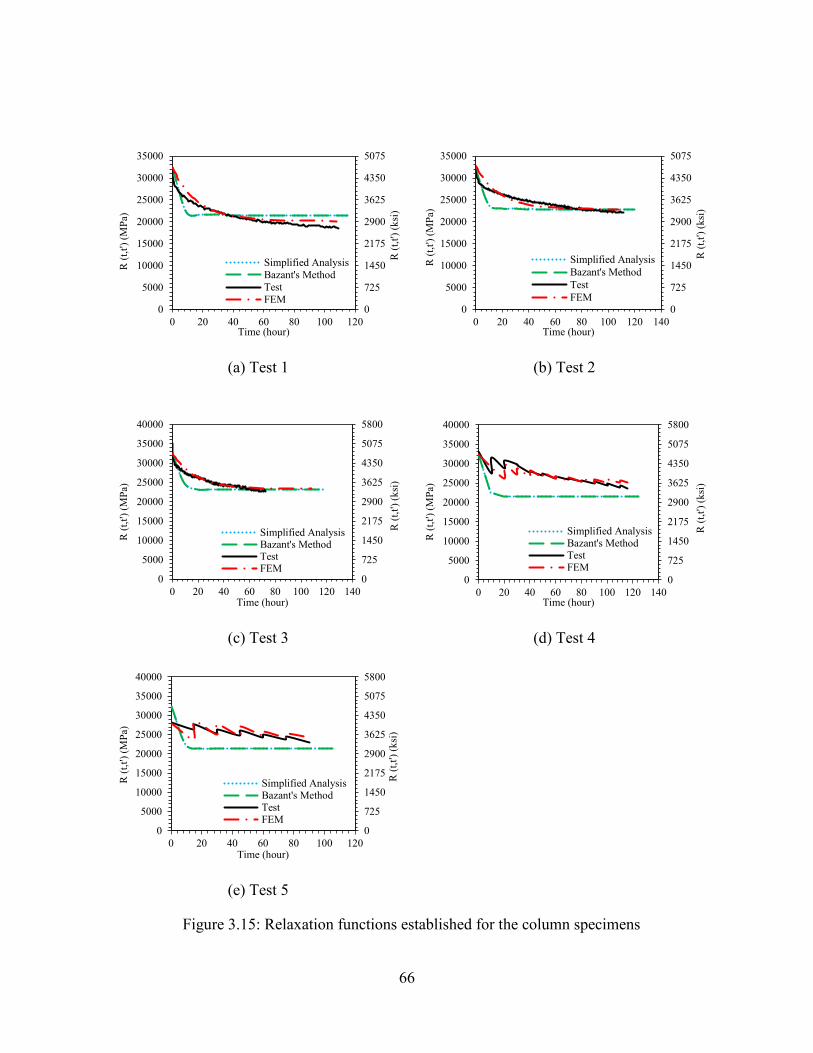
66
(a) Test 1 (b) Test 2
(c) Test 3 (d) Test 4
(e) Test 5 Figure 3.15: Relaxation functions established for the column specimens
0
725
1450
2175
2900
3625
4350
5075
0
5000
10000
15000
20000
25000
30000
35000
0 20 40 60 80 100 120
R (t
,t') (
ksi)
R (t
,t') (
MPa
)
Time (hour)
Simplified AnalysisBazant's MethodTestFEM
0
725
1450
2175
2900
3625
4350
5075
0
5000
10000
15000
20000
25000
30000
35000
0 20 40 60 80 100 120 140
R (t
,t') (
ksi)
R (t
,t') (
MPa
)
Time (hour)
Simplified AnalysisBazant's MethodTestFEM
0
725
1450
2175
2900
3625
4350
5075
5800
0
5000
10000
15000
20000
25000
30000
35000
40000
0 20 40 60 80 100 120 140
R (t
,t') (
ksi)
R (t
,t') (
MPa
)
Time (hour)
Simplified AnalysisBazant's MethodTestFEM
0
725
1450
2175
2900
3625
4350
5075
5800
0
5000
10000
15000
20000
25000
30000
35000
40000
0 20 40 60 80 100 120 140
R (t
,t') (
ksi)
R (t
,t') (
MPa
)
Time (hour)
Simplified AnalysisBazant's MethodTestFEM
0
725
1450
2175
2900
3625
4350
5075
5800
0
5000
10000
15000
20000
25000
30000
35000
40000
0 20 40 60 80 100 120
R (t
,t') (
ksi)
R (t
,t') (
MPa
)
Time (hour)
Simplified AnalysisBazant's MethodTestFEM
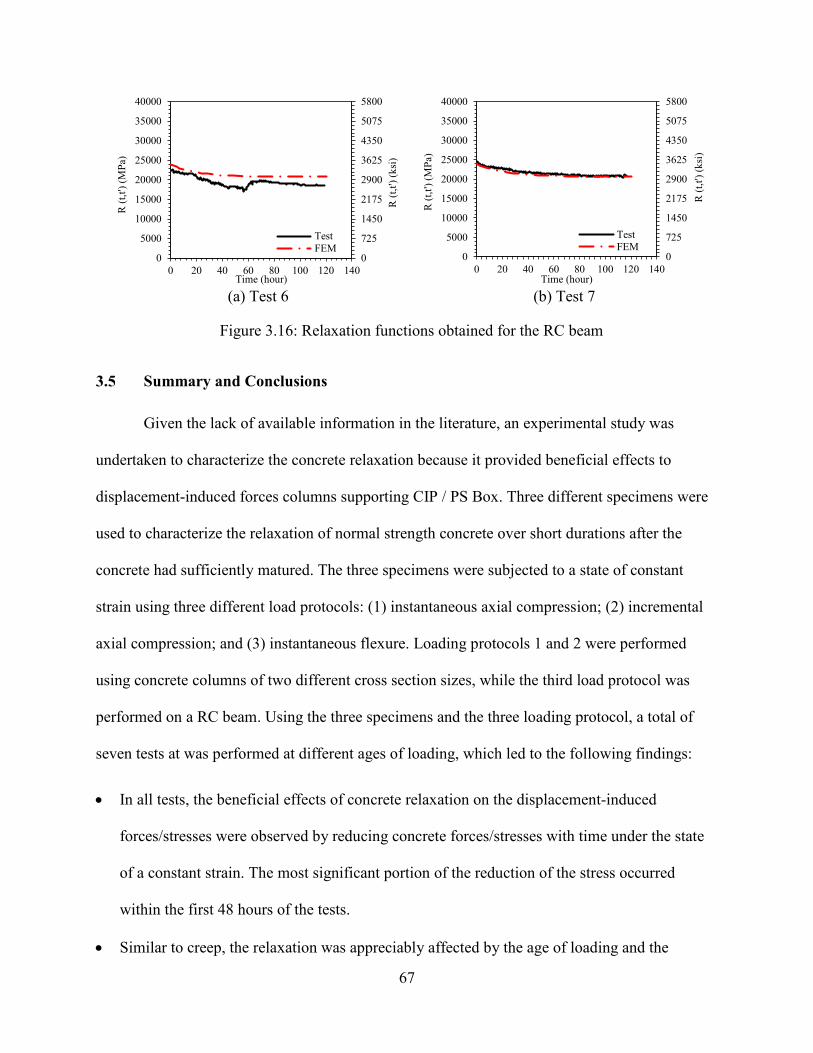
67
(a) Test 6 (b) Test 7
Figure 3.16: Relaxation functions obtained for the RC beam
Summary and Conclusions
Given the lack of available information in the literature, an experimental study was
undertaken to characterize the concrete relaxation because it provided beneficial effects to
displacement-induced forces columns supporting CIP / PS Box. Three different specimens were
used to characterize the relaxation of normal strength concrete over short durations after the
concrete had sufficiently matured. The three specimens were subjected to a state of constant
strain using three different load protocols: (1) instantaneous axial compression; (2) incremental
axial compression; and (3) instantaneous flexure. Loading protocols 1 and 2 were performed
using concrete columns of two different cross section sizes, while the third load protocol was
performed on a RC beam. Using the three specimens and the three loading protocol, a total of
seven tests at was performed at different ages of loading, which led to the following findings:
• In all tests, the beneficial effects of concrete relaxation on the displacement-induced
forces/stresses were observed by reducing concrete forces/stresses with time under the state
of a constant strain. The most significant portion of the reduction of the stress occurred
within the first 48 hours of the tests.
• Similar to creep, the relaxation was appreciably affected by the age of loading and the
0
725
1450
2175
2900
3625
4350
5075
5800
0
5000
10000
15000
20000
25000
30000
35000
40000
0 20 40 60 80 100 120 140
R (t
,t') (
ksi)
R (t
,t') (
MPa
)
Time (hour)
TestFEM
0
725
1450
2175
2900
3625
4350
5075
5800
0
5000
10000
15000
20000
25000
30000
35000
40000
0 20 40 60 80 100 120 140
R (t
,t') (
ksi)
R (t
,t') (
MPa
)
Time (hour)
TestFEM
68
magnitude of the initial applied load. Hence, Test 1 with the smallest loading age resulted in
the largest relaxation (i.e., 49% reduction in stress after 109 hours) among the seven tests.
• By incrementally applying the constant displacement in Tests 4 and 5, a more realistic
loading expected on columns supporting the CIP / PS Box was simulated, for which the
beneficial effects of relaxation were still significant in reducing the stresses.
• Conducting the relaxation tests on the RC beam indicated that the relaxation was not affected
by the cracking of the specimen except that the magnitude of stresses and strains in concrete
and steel increased due to cracking.
• The relaxation function calculated by the FEM led to a better agreement with the test results
compared to the approximate method proposed by Bazant (1979) and the simplified analysis.
By applying these functions with the FEM of CIP / PS Box, column forces can be accurately
calculated with due consideration to the effects of concrete relaxation.
69
CHAPTER 4: DETAILS OF SELECTED CIP/ PS BOX FRAMES
Introduction
To conduct detailed analyses on CIP / PS Box frames to quantify the time dependent
effects of concrete and prestressing steel, several California CIP / PS Box frames were chosen
with input from Caltrans engineers. Key variables that were used in selecting different frames
encompassed pier type (e.g., multiple vs. single column bents), foundation type, lengths, and
connection details. Accordingly, eight CIP / PS Box frames were chosen for detailed analyses.
Based on the total frame length, they were categorized as short-, medium-, and long-span frames,
as outlined in Table 4.1. For these CIP / PS Box frames, the number of spans varies between
three and eight, and they were characterized as short, medium and long span bridge frames.
When the longest span length from all bridges are compared, the largest value is 91.4 m (300 ft)
in the S405-E22 CIP / PS Box and the smallest value is 50 m (164 ft) in Frame 8 of the
Floodway Viaduct CIP / PS Box. The Trabuco Creek CIP / PS Box has the longest bridge frame
with a total length of 426.7 m (1400 ft), while the WB SR60 HOV Connector CIP / PS Box has
the shortest bridge frame with a total length of 131 m (430 ft).
Each CIP / PS Box frame was identified with a label comprised of a numeral which
increases as the total length of the bridge increases (see Table 4.2). The column of each bent
within the selected CIP / PS Box frame was then assigned a twofold label, for which the first part
refers to the bridge name and the second part corresponded to the bent number in accordance
with the details presented in Section 4.2. For instance, B4-C4 designates the column at Bent 4 in
Frame 6 of the Floodway Viaduct CIP / PS Box. A summary of this nomenclature, as used in the
remainder of this report, is presented in Table 4.2.
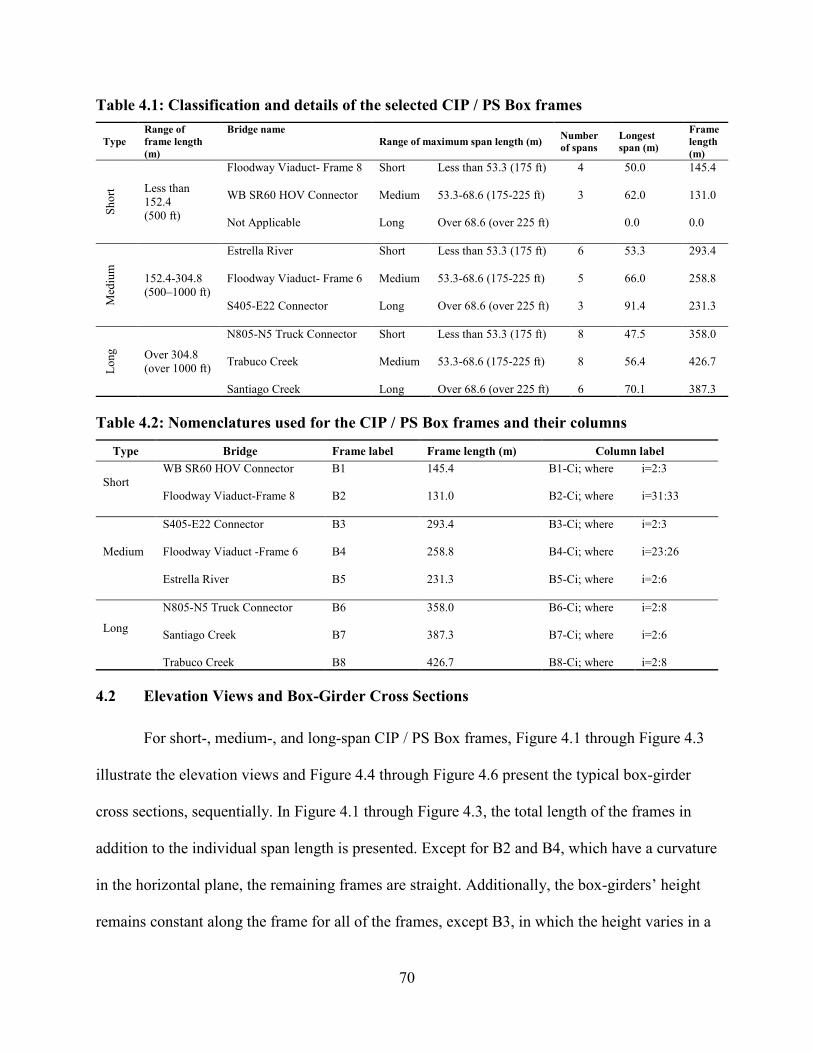
70
Table 4.1: Classification and details of the selected CIP / PS Box frames
Type Range of frame length (m)
Bridge name Range of maximum span length (m) Number
of spans Longest span (m)
Frame length (m)
Shor
t Less than 152.4 (500 ft)
Floodway Viaduct- Frame 8 Short Less than 53.3 (175 ft) 4 50.0 145.4
WB SR60 HOV Connector Medium 53.3-68.6 (175-225 ft) 3 62.0 131.0
Not Applicable Long Over 68.6 (over 225 ft) 0.0 0.0
Med
ium
152.4-304.8 (500–1000 ft)
Estrella River Short Less than 53.3 (175 ft) 6 53.3 293.4
Floodway Viaduct- Frame 6 Medium 53.3-68.6 (175-225 ft) 5 66.0 258.8
S405-E22 Connector Long Over 68.6 (over 225 ft) 3 91.4 231.3
Long
Over 304.8 (over 1000 ft)
N805-N5 Truck Connector Short Less than 53.3 (175 ft) 8 47.5 358.0
Trabuco Creek Medium 53.3-68.6 (175-225 ft) 8 56.4 426.7
Santiago Creek Long Over 68.6 (over 225 ft) 6 70.1 387.3
Table 4.2: Nomenclatures used for the CIP / PS Box frames and their columns
Type Bridge Frame label Frame length (m) Column label
Short WB SR60 HOV Connector B1 145.4 B1-Ci; where i=2:3
Floodway Viaduct-Frame 8 B2 131.0 B2-Ci; where i=31:33
Medium
S405-E22 Connector B3 293.4 B3-Ci; where i=2:3
Floodway Viaduct -Frame 6 B4 258.8 B4-Ci; where i=23:26
Estrella River B5 231.3 B5-Ci; where i=2:6
Long
N805-N5 Truck Connector B6 358.0 B6-Ci; where i=2:8
Santiago Creek B7 387.3 B7-Ci; where i=2:6
Trabuco Creek B8 426.7 B8-Ci; where i=2:8
Elevation Views and Box-Girder Cross Sections
For short-, medium-, and long-span CIP / PS Box frames, Figure 4.1 through Figure 4.3
illustrate the elevation views and Figure 4.4 through Figure 4.6 present the typical box-girder
cross sections, sequentially. In Figure 4.1 through Figure 4.3, the total length of the frames in
addition to the individual span length is presented. Except for B2 and B4, which have a curvature
in the horizontal plane, the remaining frames are straight. Additionally, the box-girders’ height
remains constant along the frame for all of the frames, except B3, in which the height varies in a
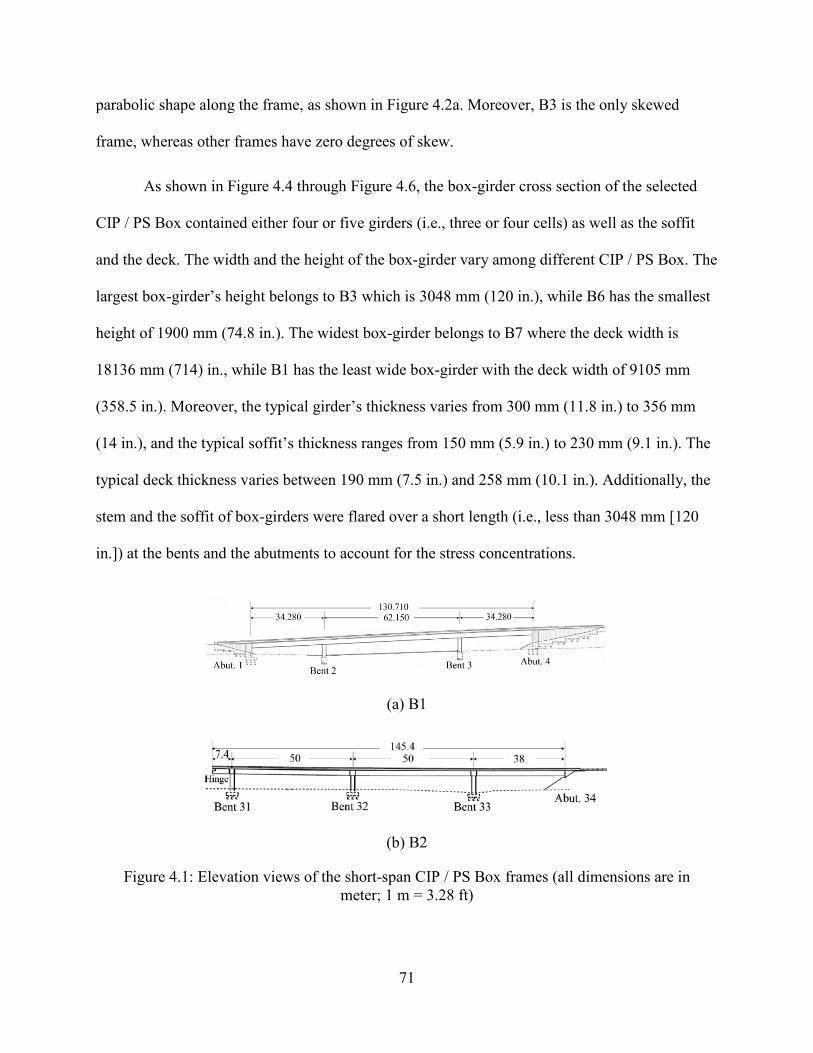
71
parabolic shape along the frame, as shown in Figure 4.2a. Moreover, B3 is the only skewed
frame, whereas other frames have zero degrees of skew.
As shown in Figure 4.4 through Figure 4.6, the box-girder cross section of the selected
CIP / PS Box contained either four or five girders (i.e., three or four cells) as well as the soffit
and the deck. The width and the height of the box-girder vary among different CIP / PS Box. The
largest box-girder’s height belongs to B3 which is 3048 mm (120 in.), while B6 has the smallest
height of 1900 mm (74.8 in.). The widest box-girder belongs to B7 where the deck width is
18136 mm (714) in., while B1 has the least wide box-girder with the deck width of 9105 mm
(358.5 in.). Moreover, the typical girder’s thickness varies from 300 mm (11.8 in.) to 356 mm
(14 in.), and the typical soffit’s thickness ranges from 150 mm (5.9 in.) to 230 mm (9.1 in.). The
typical deck thickness varies between 190 mm (7.5 in.) and 258 mm (10.1 in.). Additionally, the
stem and the soffit of box-girders were flared over a short length (i.e., less than 3048 mm [120
in.]) at the bents and the abutments to account for the stress concentrations.
(a) B1
(b) B2
Figure 4.1: Elevation views of the short-span CIP / PS Box frames (all dimensions are in meter; 1 m = 3.28 ft)
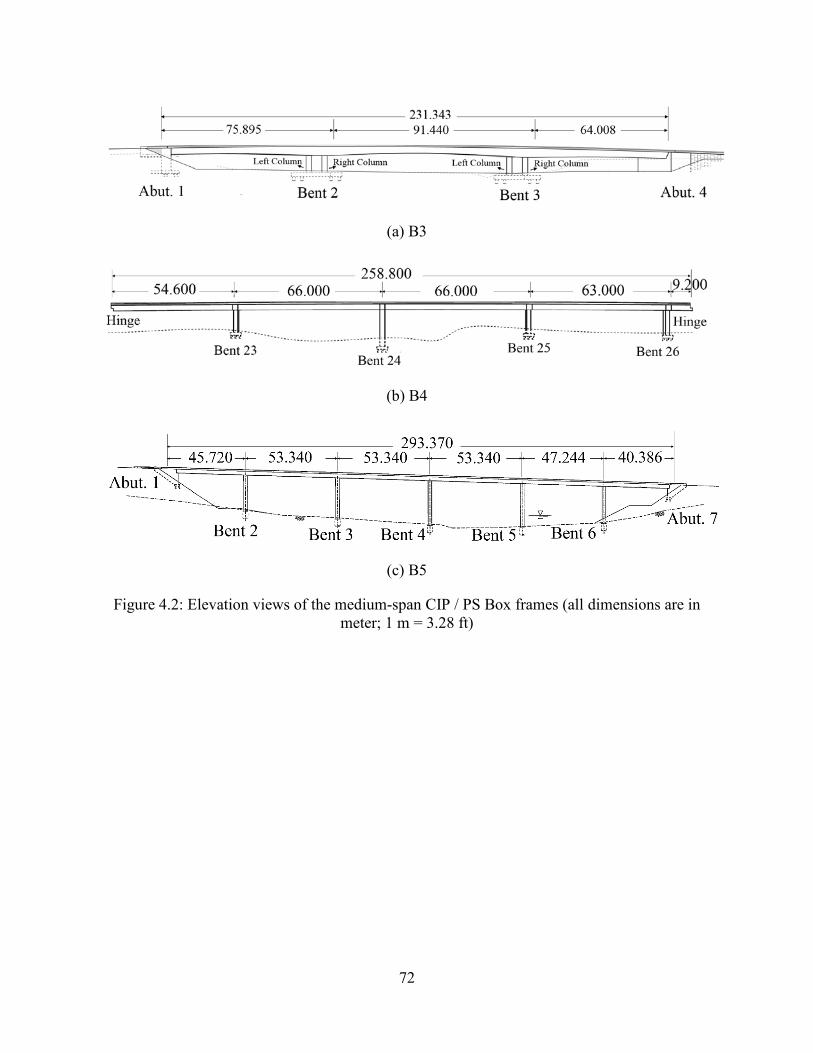
72
(a) B3
(b) B4
(c) B5
Figure 4.2: Elevation views of the medium-span CIP / PS Box frames (all dimensions are in meter; 1 m = 3.28 ft)
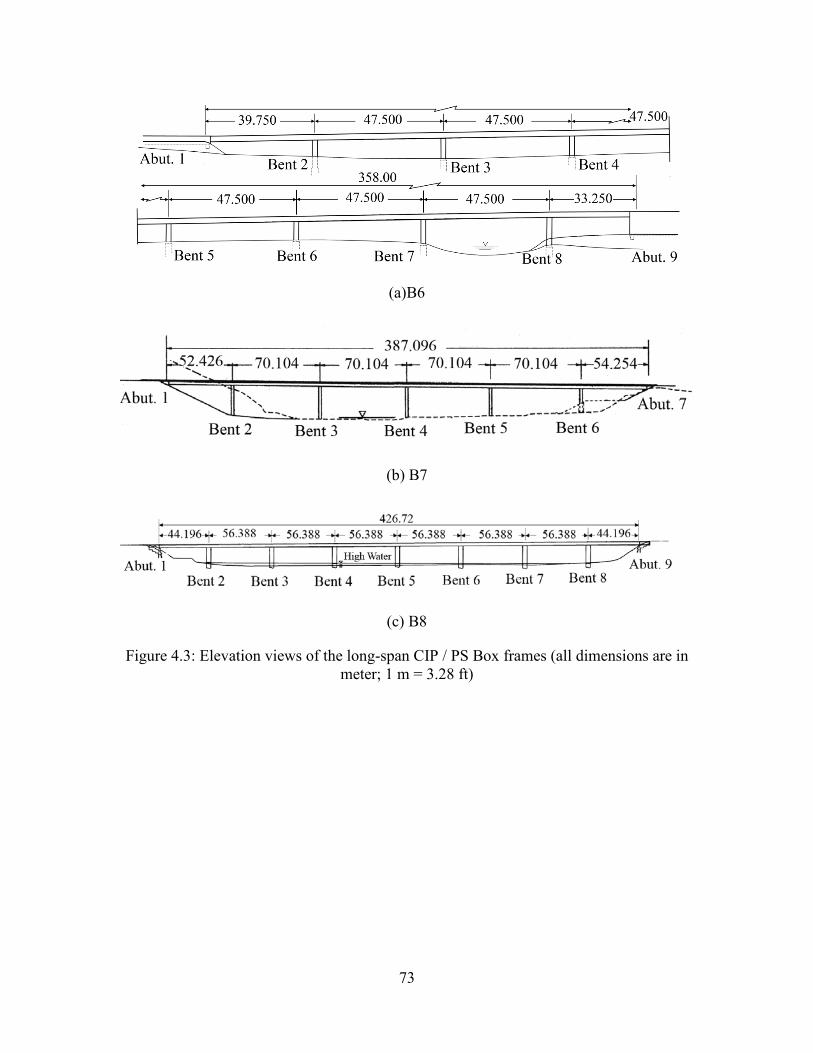
73
(a)B6
(b) B7
(c) B8
Figure 4.3: Elevation views of the long-span CIP / PS Box frames (all dimensions are in meter; 1 m = 3.28 ft)
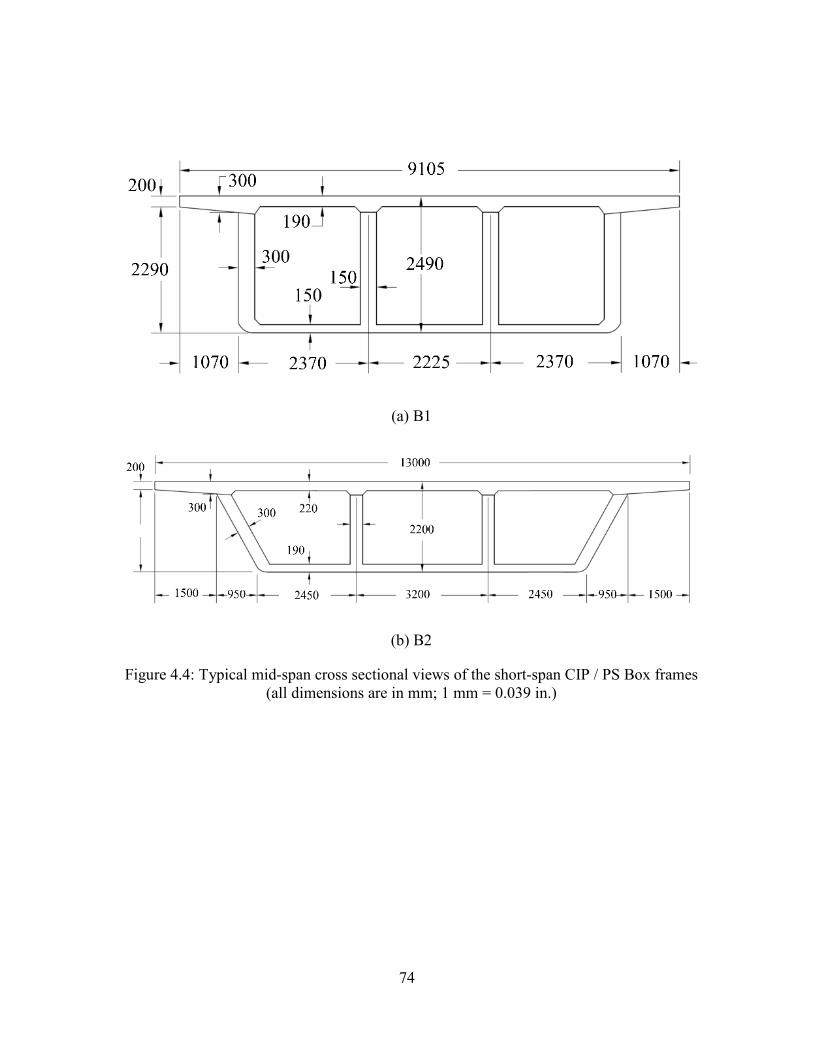
74
(a) B1
(b) B2
Figure 4.4: Typical mid-span cross sectional views of the short-span CIP / PS Box frames (all dimensions are in mm; 1 mm = 0.039 in.)
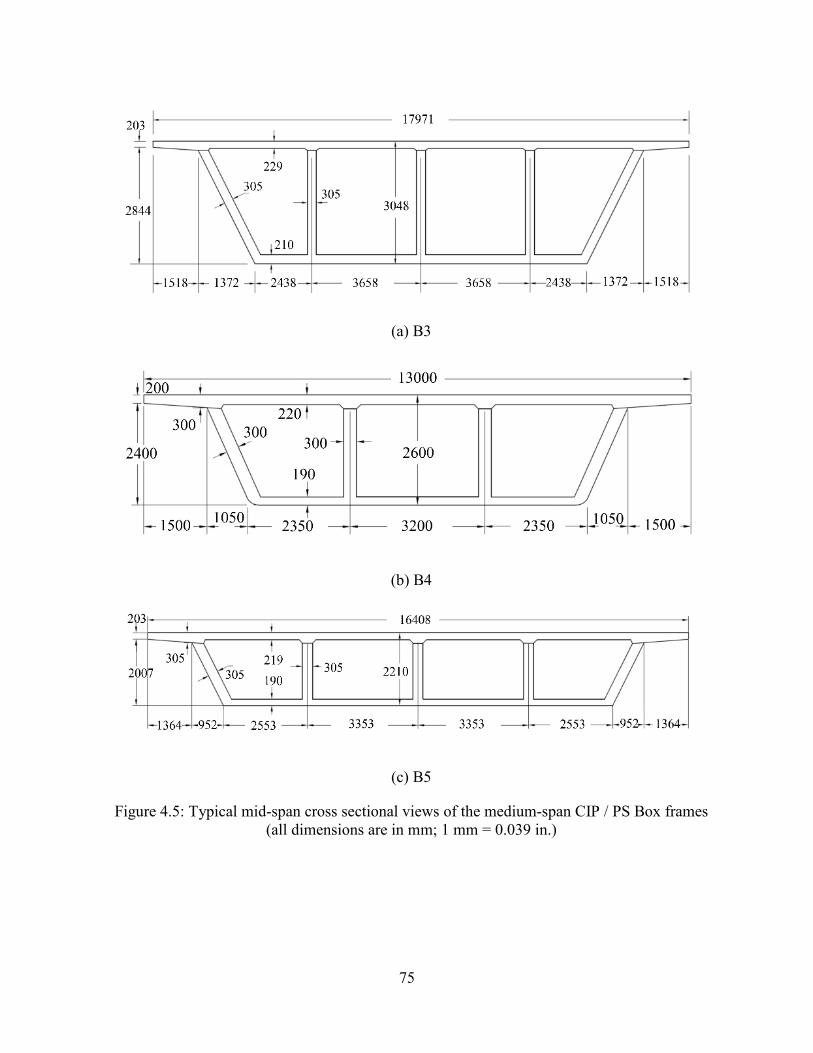
75
(a) B3
(b) B4
(c) B5
Figure 4.5: Typical mid-span cross sectional views of the medium-span CIP / PS Box frames (all dimensions are in mm; 1 mm = 0.039 in.)
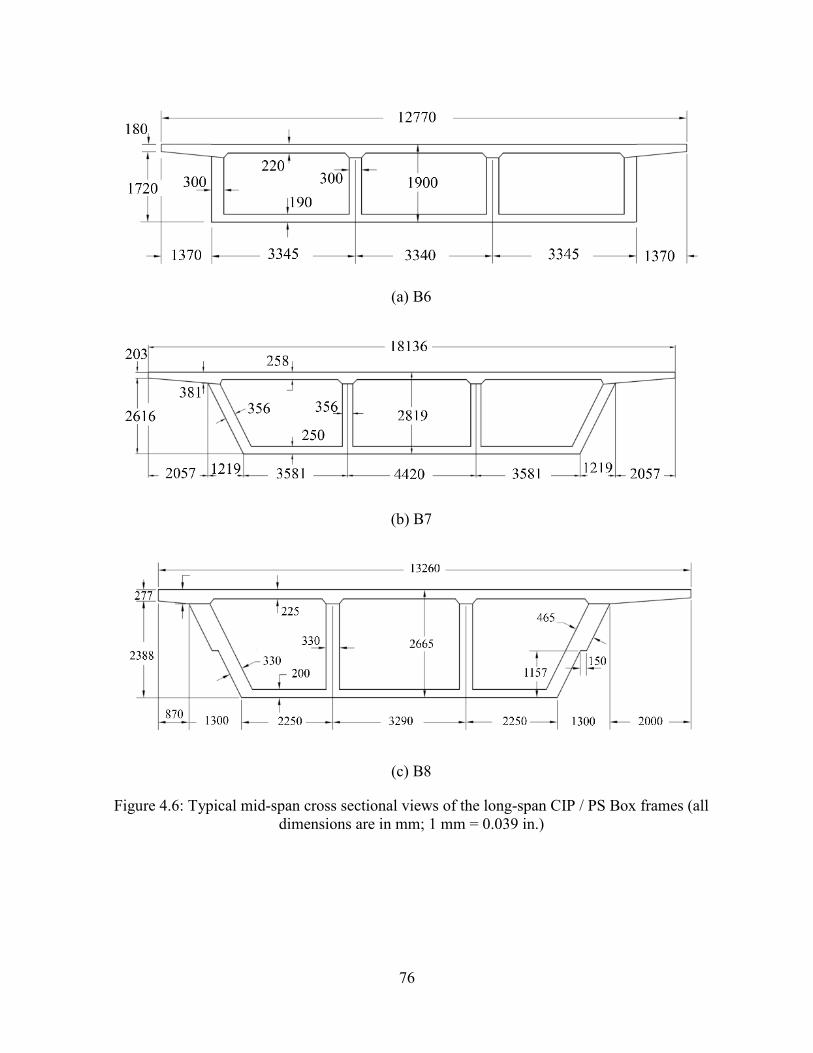
76
(a) B6
(b) B7
(c) B8
Figure 4.6: Typical mid-span cross sectional views of the long-span CIP / PS Box frames (all dimensions are in mm; 1 mm = 0.039 in.)
77
Bent Details
The details of each bent, including the connection of columns to the box-girder and the
foundation, type of foundation, and column cross section are demonstrated in Figure 4.7 through
Figure 4.9 for the short-, medium-, and long-span frames, sequentially. It is worth noting that the
configuration of all the bents in Frames 6 and 8 of B4 are similar, except for Bent 24 which
differs from the rest of the bents.
The columns are rigidly connected to the box-girder for all the frames, except for B3,
where a hinge connection is used between the column top and the box-girder. The foundation
type is either pipe piles or cast-in-place drilled hole (CIDH) shafts, where the former was mostly
used for short- and medium-span frame and the latter was mostly used in the long-span frames.
For the frames with the CIDH shafts, the column is integrated with the drilled shafts through the
extension of column longitudinal reinforcement into the shaft, replicating a fixed connection at
the bottom of the column. However, when the pipe pile foundation is used, the column is either
connected to the foundation using a hinge (i.e., B2 and B4) or the column is rigidly connected to
the foundation (i.e., B3). The bents are either a single- or a two-column bent. In B2, B4, and B5,
the column cross section varies along the height for aesthetics purposes, whereas a uniform cross
section was used for the columns in other CIP / PS Box frames. Furthermore, the height (H), the
gross stiffness (kg), and the effective flexural stiffness (keff) of the columns of the eight CIP / PS
Box investigated in this study are presented in Table 4.3.
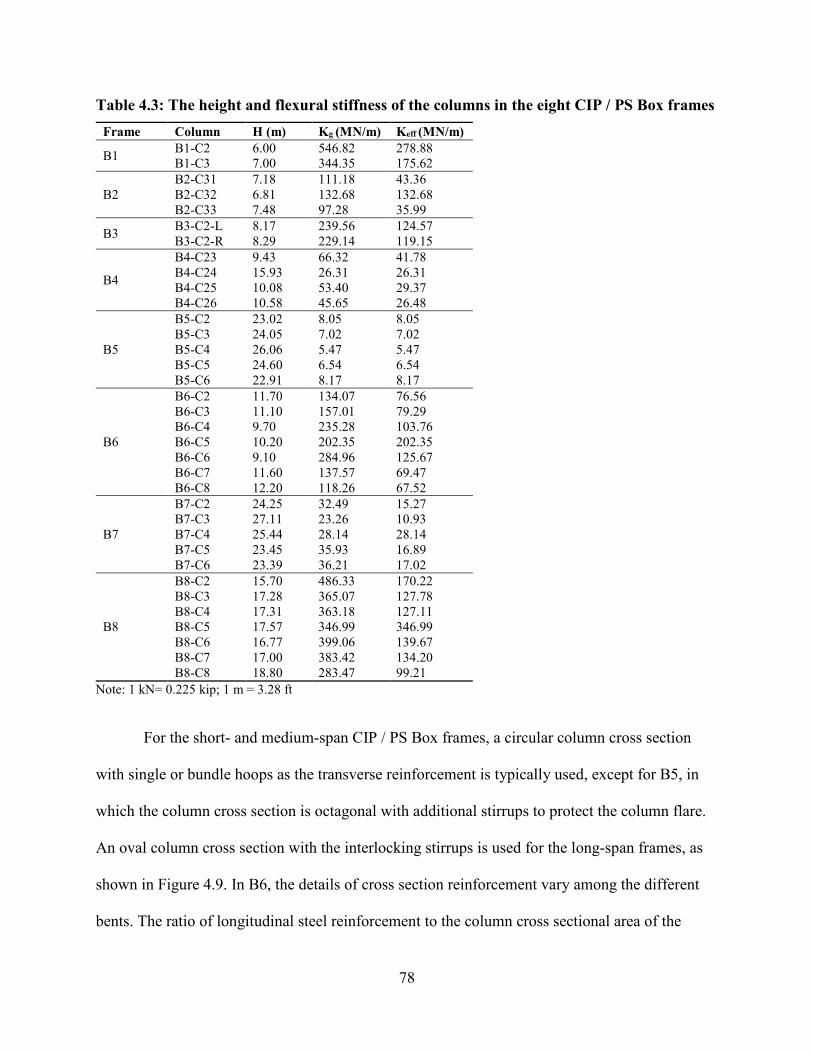
78
Table 4.3: The height and flexural stiffness of the columns in the eight CIP / PS Box frames Frame Column H (m) Kg (MN/m) Keff (MN/m)
B1 B1-C2 6.00 546.82 278.88 B1-C3 7.00 344.35 175.62
B2 B2-C31 7.18 111.18 43.36 B2-C32 6.81 132.68 132.68 B2-C33 7.48 97.28 35.99
B3 B3-C2-L 8.17 239.56 124.57 B3-C2-R 8.29 229.14 119.15
B4
B4-C23 9.43 66.32 41.78 B4-C24 15.93 26.31 26.31 B4-C25 10.08 53.40 29.37 B4-C26 10.58 45.65 26.48
B5
B5-C2 23.02 8.05 8.05 B5-C3 24.05 7.02 7.02 B5-C4 26.06 5.47 5.47 B5-C5 24.60 6.54 6.54 B5-C6 22.91 8.17 8.17
B6
B6-C2 11.70 134.07 76.56 B6-C3 11.10 157.01 79.29 B6-C4 9.70 235.28 103.76 B6-C5 10.20 202.35 202.35 B6-C6 9.10 284.96 125.67 B6-C7 11.60 137.57 69.47 B6-C8 12.20 118.26 67.52
B7
B7-C2 24.25 32.49 15.27 B7-C3 27.11 23.26 10.93 B7-C4 25.44 28.14 28.14 B7-C5 23.45 35.93 16.89 B7-C6 23.39 36.21 17.02
B8
B8-C2 15.70 486.33 170.22 B8-C3 17.28 365.07 127.78 B8-C4 17.31 363.18 127.11 B8-C5 17.57 346.99 346.99 B8-C6 16.77 399.06 139.67 B8-C7 17.00 383.42 134.20 B8-C8 18.80 283.47 99.21
Note: 1 kN= 0.225 kip; 1 m = 3.28 ft
For the short- and medium-span CIP / PS Box frames, a circular column cross section
with single or bundle hoops as the transverse reinforcement is typically used, except for B5, in
which the column cross section is octagonal with additional stirrups to protect the column flare.
An oval column cross section with the interlocking stirrups is used for the long-span frames, as
shown in Figure 4.9. In B6, the details of cross section reinforcement vary among the different
bents. The ratio of longitudinal steel reinforcement to the column cross sectional area of the
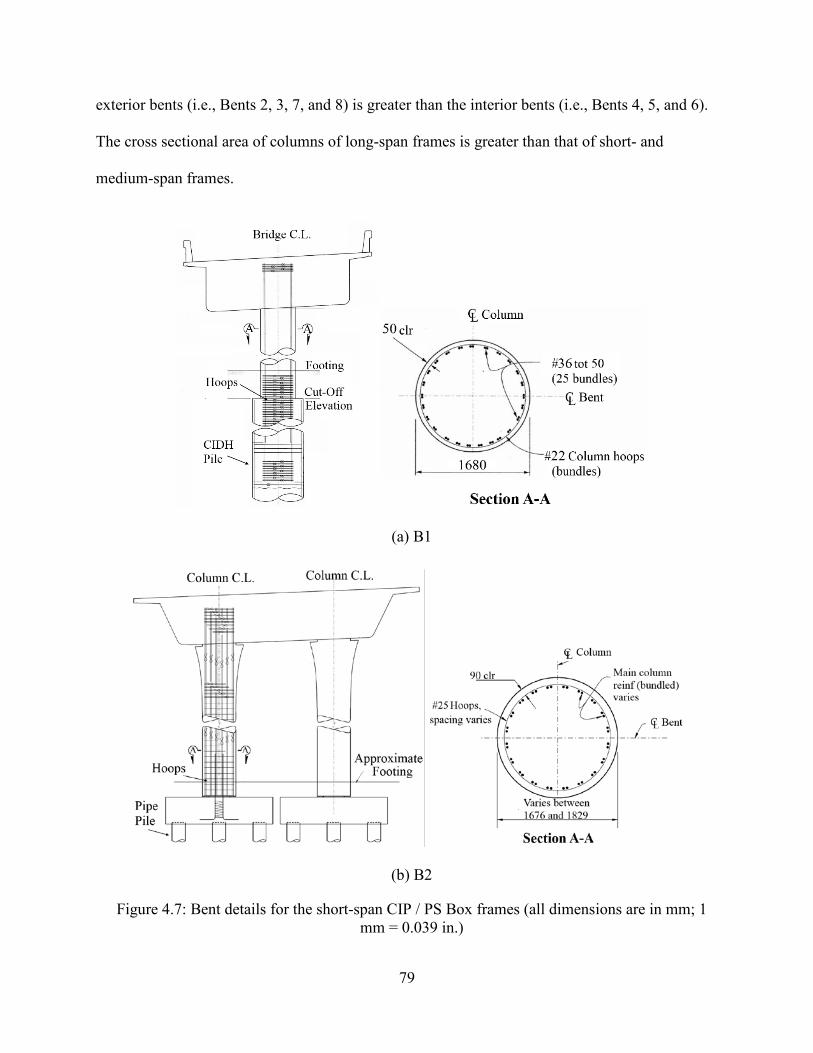
79
exterior bents (i.e., Bents 2, 3, 7, and 8) is greater than the interior bents (i.e., Bents 4, 5, and 6).
The cross sectional area of columns of long-span frames is greater than that of short- and
medium-span frames.
(a) B1
(b) B2
Figure 4.7: Bent details for the short-span CIP / PS Box frames (all dimensions are in mm; 1 mm = 0.039 in.)
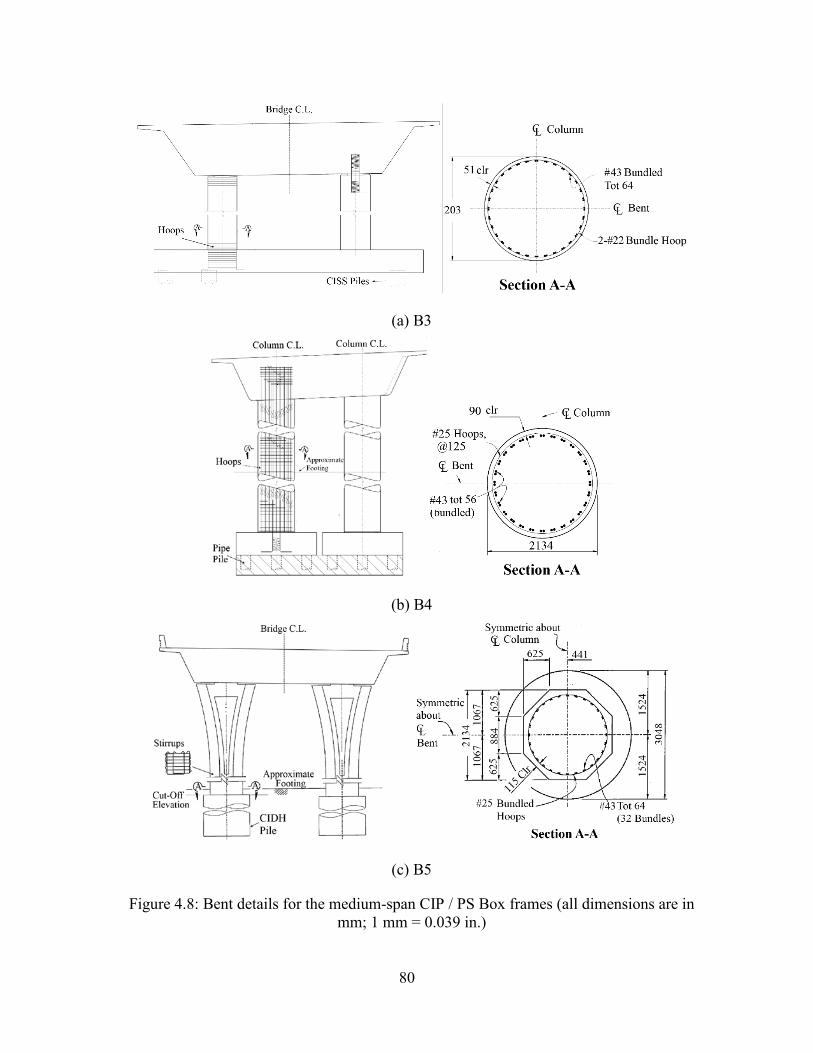
80
(a) B3
(b) B4
(c) B5
Figure 4.8: Bent details for the medium-span CIP / PS Box frames (all dimensions are in mm; 1 mm = 0.039 in.)
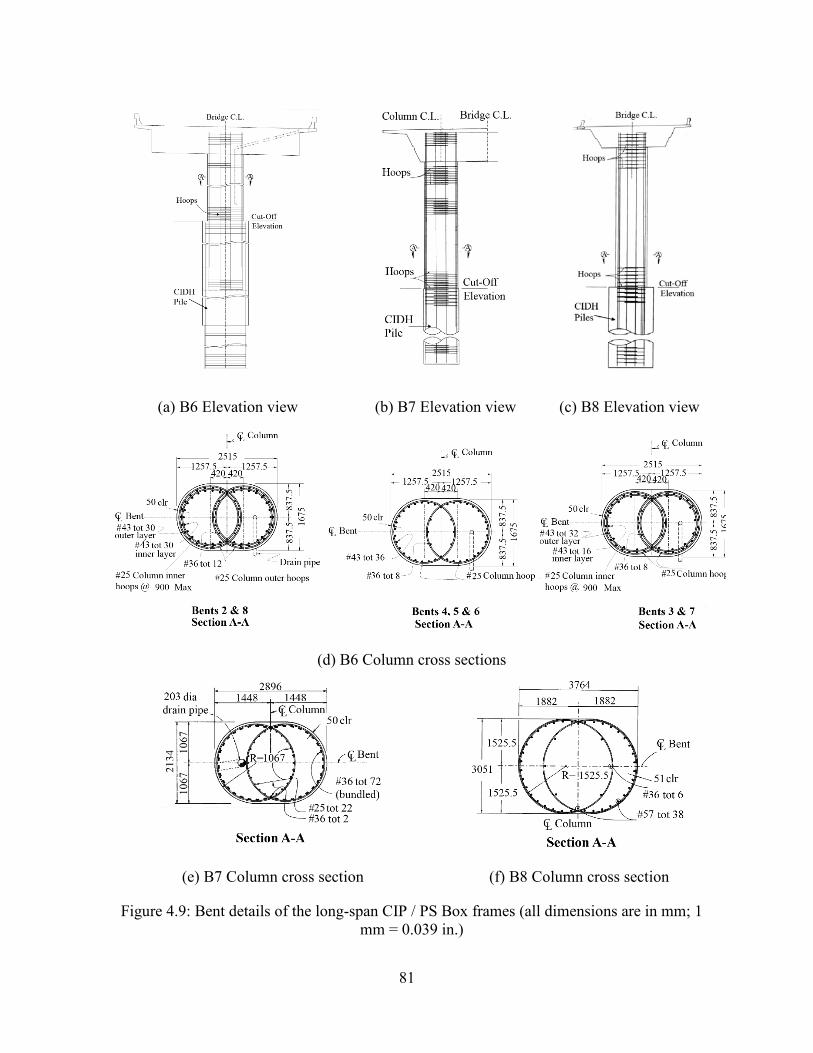
81
(a) B6 Elevation view (b) B7 Elevation view (c) B8 Elevation view
(d) B6 Column cross sections
(e) B7 Column cross section (f) B8 Column cross section
Figure 4.9: Bent details of the long-span CIP / PS Box frames (all dimensions are in mm; 1 mm = 0.039 in.)
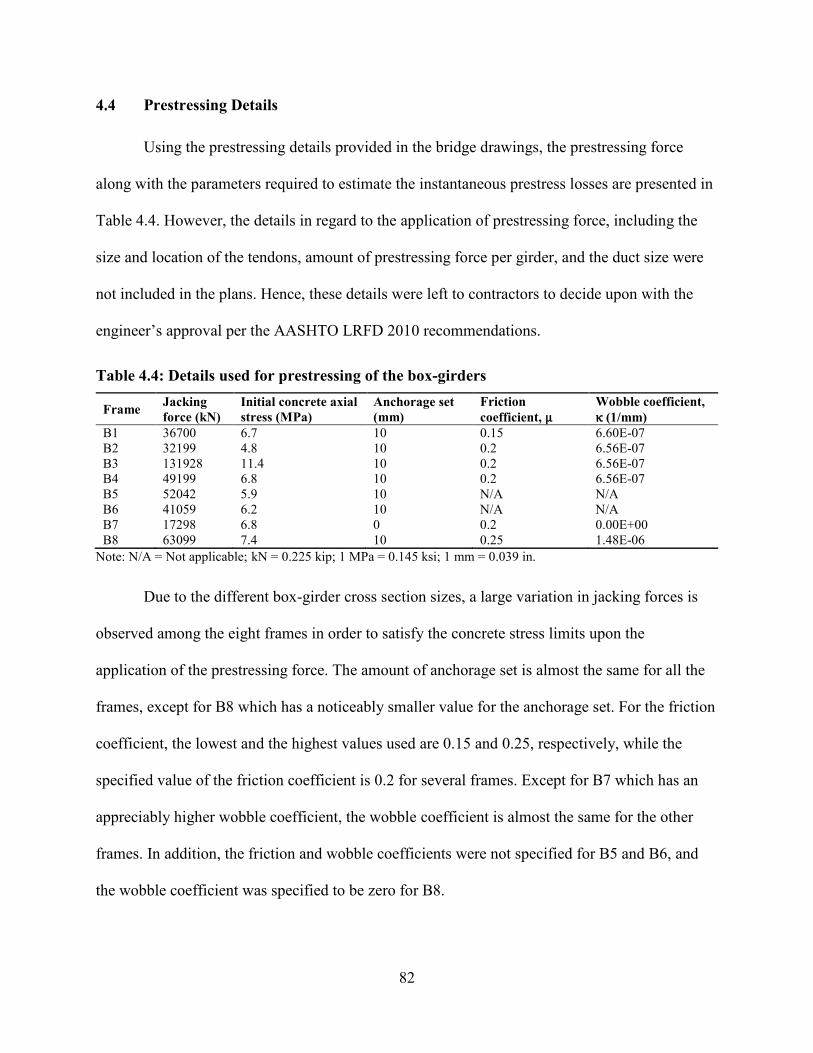
82
Prestressing Details
Using the prestressing details provided in the bridge drawings, the prestressing force
along with the parameters required to estimate the instantaneous prestress losses are presented in
Table 4.4. However, the details in regard to the application of prestressing force, including the
size and location of the tendons, amount of prestressing force per girder, and the duct size were
not included in the plans. Hence, these details were left to contractors to decide upon with the
engineer’s approval per the AASHTO LRFD 2010 recommendations.
Table 4.4: Details used for prestressing of the box-girders
Frame Jacking force (kN)
Initial concrete axial stress (MPa)
Anchorage set (mm)
Friction coefficient, μ
Wobble coefficient, κ (1/mm)
B1 36700 6.7 10 0.15 6.60E-07 B2 32199 4.8 10 0.2 6.56E-07 B3 131928 11.4 10 0.2 6.56E-07 B4 49199 6.8 10 0.2 6.56E-07 B5 52042 5.9 10 N/A N/A B6 41059 6.2 10 N/A N/A B7 17298 6.8 0 0.2 0.00E+00 B8 63099 7.4 10 0.25 1.48E-06
Note: N/A = Not applicable; kN = 0.225 kip; 1 MPa = 0.145 ksi; 1 mm = 0.039 in.
Due to the different box-girder cross section sizes, a large variation in jacking forces is
observed among the eight frames in order to satisfy the concrete stress limits upon the
application of the prestressing force. The amount of anchorage set is almost the same for all the
frames, except for B8 which has a noticeably smaller value for the anchorage set. For the friction
coefficient, the lowest and the highest values used are 0.15 and 0.25, respectively, while the
specified value of the friction coefficient is 0.2 for several frames. Except for B7 which has an
appreciably higher wobble coefficient, the wobble coefficient is almost the same for the other
frames. In addition, the friction and wobble coefficients were not specified for B5 and B6, and
the wobble coefficient was specified to be zero for B8.
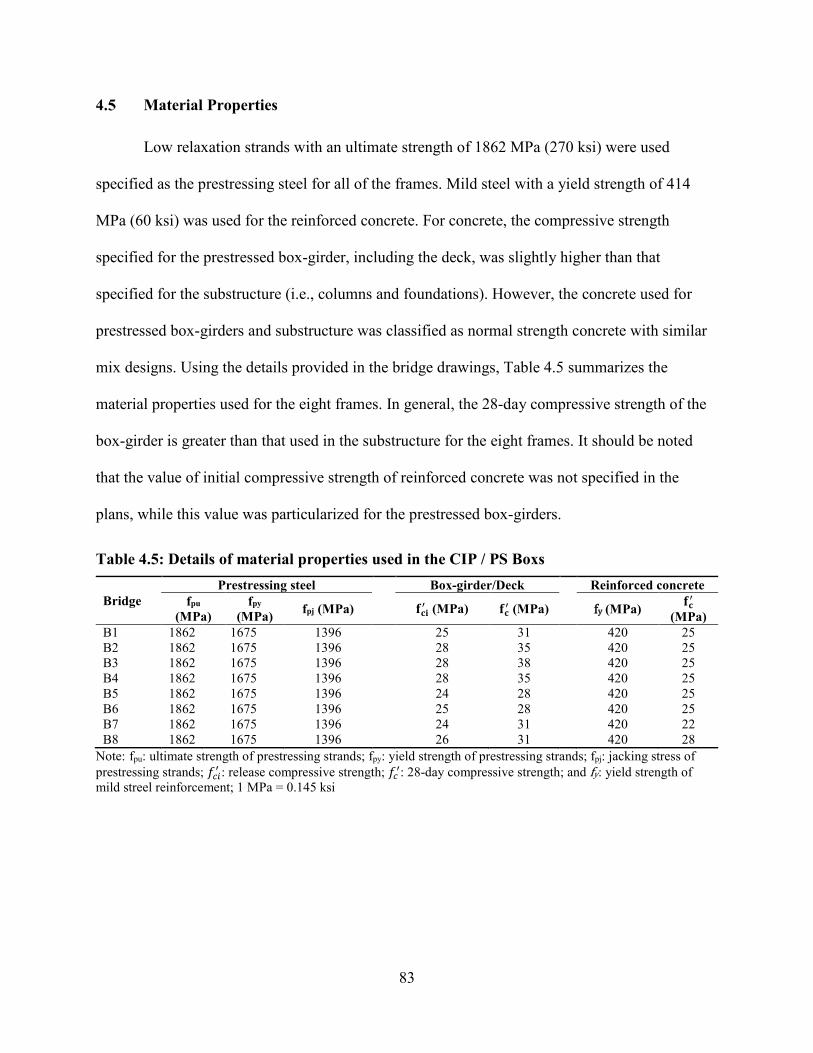
83
Material Properties
Low relaxation strands with an ultimate strength of 1862 MPa (270 ksi) were used
specified as the prestressing steel for all of the frames. Mild steel with a yield strength of 414
MPa (60 ksi) was used for the reinforced concrete. For concrete, the compressive strength
specified for the prestressed box-girder, including the deck, was slightly higher than that
specified for the substructure (i.e., columns and foundations). However, the concrete used for
prestressed box-girders and substructure was classified as normal strength concrete with similar
mix designs. Using the details provided in the bridge drawings, Table 4.5 summarizes the
material properties used for the eight frames. In general, the 28-day compressive strength of the
box-girder is greater than that used in the substructure for the eight frames. It should be noted
that the value of initial compressive strength of reinforced concrete was not specified in the
plans, while this value was particularized for the prestressed box-girders.
Table 4.5: Details of material properties used in the CIP / PS Boxs
Bridge Prestressing steel Box-girder/Deck Reinforced concrete
fpu (MPa)
fpy (MPa) fpj (MPa) 𝐟𝐟𝐜𝐜𝐜𝐜
′ (MPa) 𝐟𝐟𝐜𝐜′ (MPa) fy (MPa) 𝐟𝐟𝐜𝐜
′ (MPa)
B1 1862 1675 1396 25 31 420 25 B2 1862 1675 1396 28 35 420 25 B3 1862 1675 1396 28 38 420 25 B4 1862 1675 1396 28 35 420 25 B5 1862 1675 1396 24 28 420 25 B6 1862 1675 1396 25 28 420 25 B7 1862 1675 1396 24 31 420 22 B8 1862 1675 1396 26 31 420 28
Note: fpu: ultimate strength of prestressing strands; fpy: yield strength of prestressing strands; fpj: jacking stress of prestressing strands; 𝑓𝑓𝑐𝑐𝑐𝑐
′ : release compressive strength; 𝑓𝑓𝑐𝑐′: 28-day compressive strength; and fy: yield strength of
mild streel reinforcement; 1 MPa = 0.145 ksi
84
CHAPTER 5: DETAILS OF ANALYTICAL MODELS
Introduction
Time-dependent effects on the behavior of a prestressed bridge differ from one structural
system to another. In a statically indeterminate structure, creep and shrinkage result in
redistribution of strains and stresses within individual sections meaning a decrease in the
compression in concrete and in the tension in steel. The compression stresses induced in concrete
by prestressing lead to a reduction of the prestressing force under the influence of concrete creep.
Additionally, the initial prestressing force is reduced by shortening due to shrinkage in
combination with the relaxation of the prestressing steel. By virtue of concrete creep and
shrinkage, the reduction of internal stresses caused by prestressing, naturally is dependent on the
prestressing force. In statically indeterminate structures, additional changes in stresses and in the
reactions (i.e. secondary effects) will develop, producing continuous variation of internal forces
along the bridge with time. In these structures, creep and shrinkage experienced by one member
therefore induce forces and stresses in other members, facilitating redistribution of forces and
stresses.
Given the interrelated and interdependent nature of time-dependent material properties,
one needs a sophisticated analysis to accurately predict the time-dependent stresses and strains,
especially in statically indeterminate prestressed bridges. Therefore, in this study, the time-
dependent analysis of prestressed concrete bridges was carried out using the midas Civil
software. This commercial software enables systematic analyses of FEMs with due
considerations to creep and shrinkage effects using the time-step method, as detailed in Section
2.5, thereby producing time-dependent stresses and deformations in members of prestressed
concrete bridges. Each selected bridge, identified in Chapter 4, was simulated in midas Civil
85
following the details provided in the bridge plans and the selected assumptions and
approximations. Using bridge frame B4, this chapter demonstrates the methodology including
the assumptions and approximations employed in this study to investigate time-dependent effects
on CIP / PS Box frames. The methodology was repeated for the analysis of the other seven CIP /
PS Box frames and the analysis results are presented in Chapter 6.
Analytical Model
The FEM of B4 was first developed in midas Civil software (2013), accounting for the
construction stages and an appropriate timeline. Beam elements were employed to model the
box-girder and columns. The significant parameters affecting time-dependent behavior of
prestressed concrete bridges, as outlined in Section 2.3, such as concrete creep (and relaxation)
and shrinkage, changes in prestressing force, support conditions, and construction sequence were
taken into account in the analytical models.
5.2.1 Model Assumptions
The following assumptions were used in the FEM of B4 and all other frames to so that
the analysis results can be compared and appropriate recommendations can be formulated:
• The bridge was modeled with zero curvature in the horizontal plane.
• The box-girder remained elastic and uncracked when the time-dependent deformations were
imposed;
• The restraining effects of box-girder nonprestressed reinforcement on shrinkage were
disregarded;
• The loads acting on the bridge frame were dead load and prestressing force;
• Linear elastic behavior was used for columns, although the stiffness was modified to account
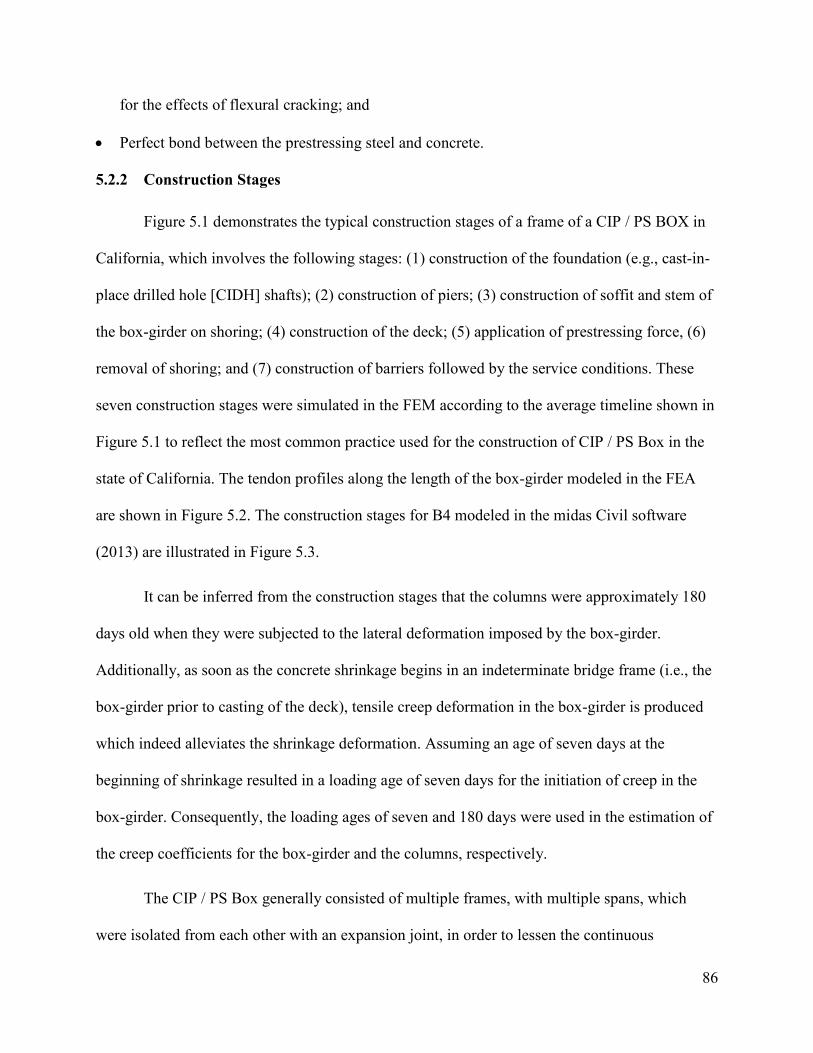
86
for the effects of flexural cracking; and
• Perfect bond between the prestressing steel and concrete.
5.2.2 Construction Stages
Figure 5.1 demonstrates the typical construction stages of a frame of a CIP / PS BOX in
California, which involves the following stages: (1) construction of the foundation (e.g., cast-in-
place drilled hole [CIDH] shafts); (2) construction of piers; (3) construction of soffit and stem of
the box-girder on shoring; (4) construction of the deck; (5) application of prestressing force, (6)
removal of shoring; and (7) construction of barriers followed by the service conditions. These
seven construction stages were simulated in the FEM according to the average timeline shown in
Figure 5.1 to reflect the most common practice used for the construction of CIP / PS Box in the
state of California. The tendon profiles along the length of the box-girder modeled in the FEA
are shown in Figure 5.2. The construction stages for B4 modeled in the midas Civil software
(2013) are illustrated in Figure 5.3.
It can be inferred from the construction stages that the columns were approximately 180
days old when they were subjected to the lateral deformation imposed by the box-girder.
Additionally, as soon as the concrete shrinkage begins in an indeterminate bridge frame (i.e., the
box-girder prior to casting of the deck), tensile creep deformation in the box-girder is produced
which indeed alleviates the shrinkage deformation. Assuming an age of seven days at the
beginning of shrinkage resulted in a loading age of seven days for the initiation of creep in the
box-girder. Consequently, the loading ages of seven and 180 days were used in the estimation of
the creep coefficients for the box-girder and the columns, respectively.
The CIP / PS Box generally consisted of multiple frames, with multiple spans, which
were isolated from each other with an expansion joint, in order to lessen the continuous
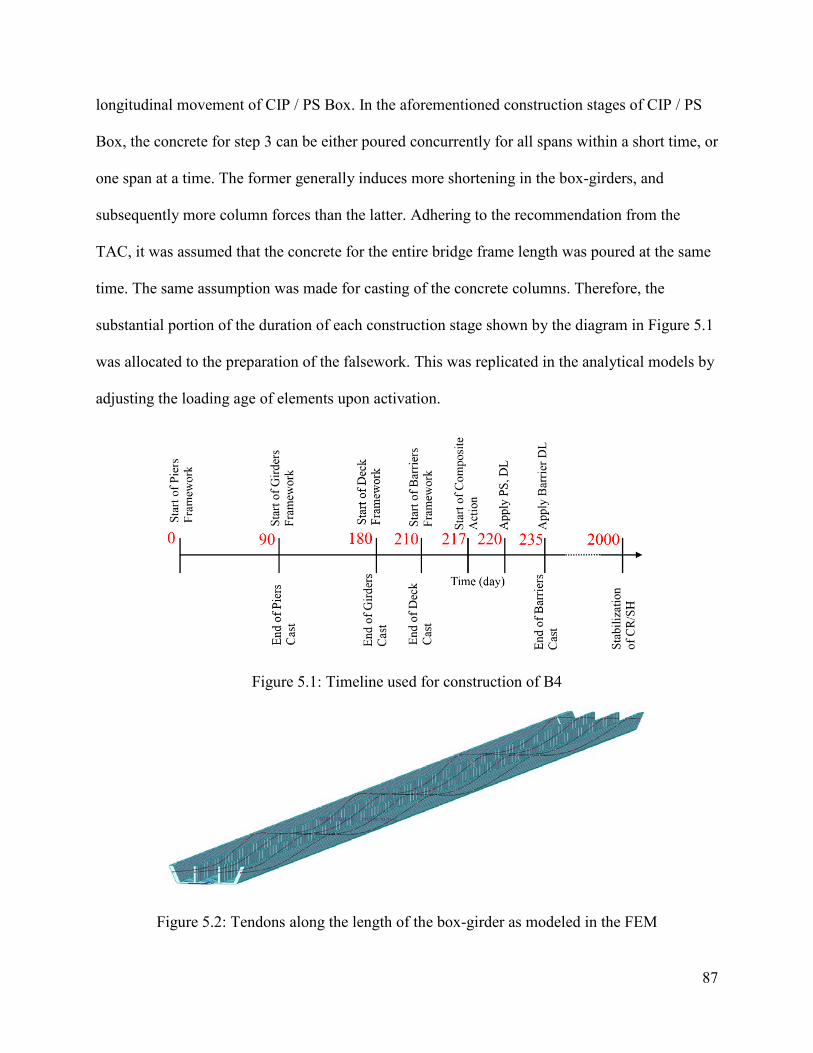
87
longitudinal movement of CIP / PS Box. In the aforementioned construction stages of CIP / PS
Box, the concrete for step 3 can be either poured concurrently for all spans within a short time, or
one span at a time. The former generally induces more shortening in the box-girders, and
subsequently more column forces than the latter. Adhering to the recommendation from the
TAC, it was assumed that the concrete for the entire bridge frame length was poured at the same
time. The same assumption was made for casting of the concrete columns. Therefore, the
substantial portion of the duration of each construction stage shown by the diagram in Figure 5.1
was allocated to the preparation of the falsework. This was replicated in the analytical models by
adjusting the loading age of elements upon activation.
Figure 5.1: Timeline used for construction of B4
Figure 5.2: Tendons along the length of the box-girder as modeled in the FEM
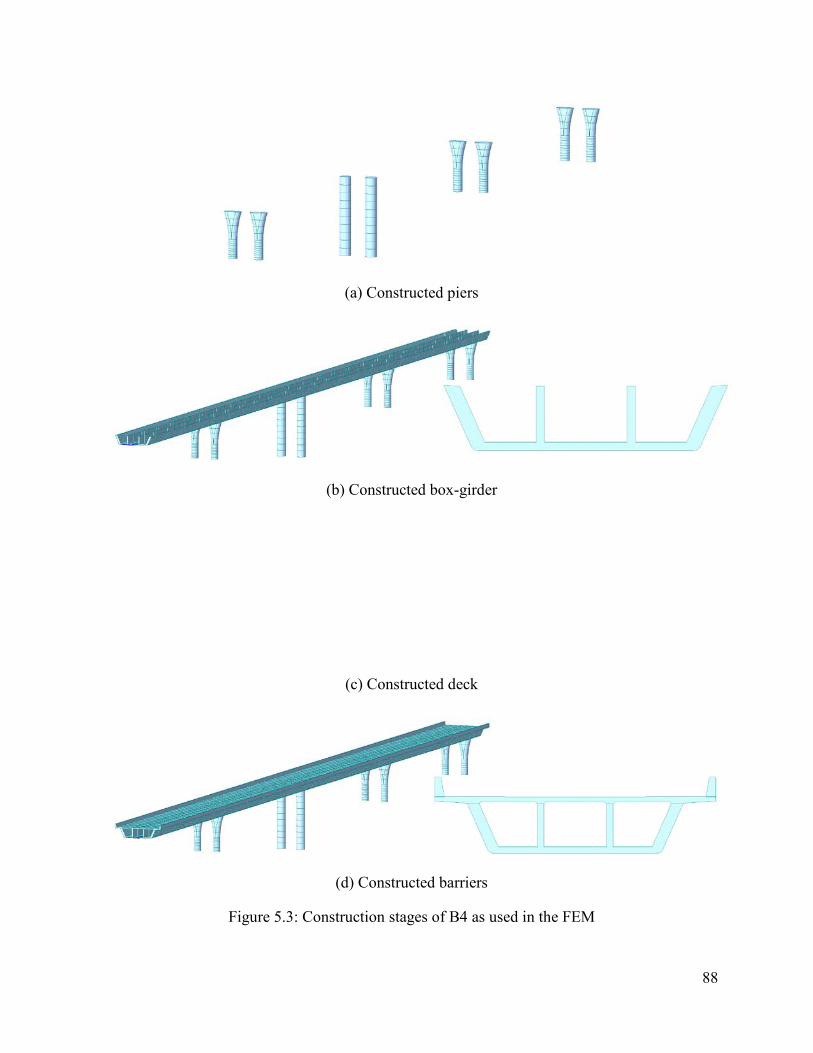
88
(a) Constructed piers
(b) Constructed box-girder
(c) Constructed deck
(d) Constructed barriers
Figure 5.3: Construction stages of B4 as used in the FEM
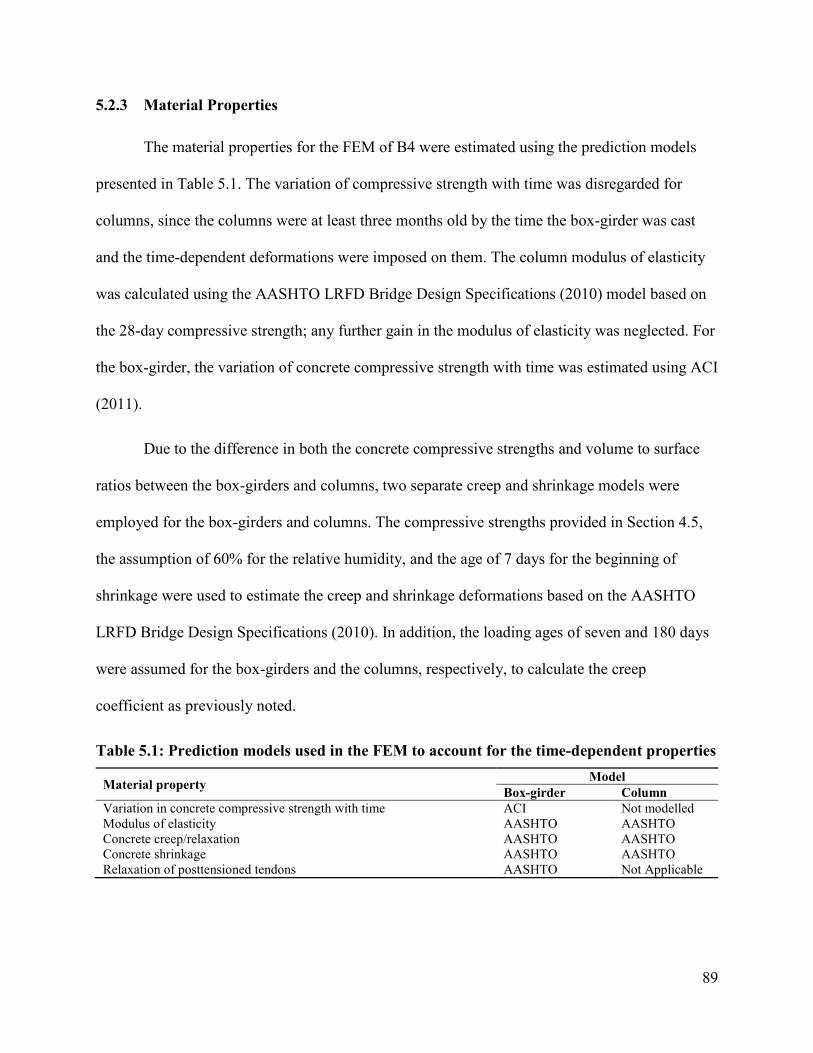
89
5.2.3 Material Properties
The material properties for the FEM of B4 were estimated using the prediction models
presented in Table 5.1. The variation of compressive strength with time was disregarded for
columns, since the columns were at least three months old by the time the box-girder was cast
and the time-dependent deformations were imposed on them. The column modulus of elasticity
was calculated using the AASHTO LRFD Bridge Design Specifications (2010) model based on
the 28-day compressive strength; any further gain in the modulus of elasticity was neglected. For
the box-girder, the variation of concrete compressive strength with time was estimated using ACI
(2011).
Due to the difference in both the concrete compressive strengths and volume to surface
ratios between the box-girders and columns, two separate creep and shrinkage models were
employed for the box-girders and columns. The compressive strengths provided in Section 4.5,
the assumption of 60% for the relative humidity, and the age of 7 days for the beginning of
shrinkage were used to estimate the creep and shrinkage deformations based on the AASHTO
LRFD Bridge Design Specifications (2010). In addition, the loading ages of seven and 180 days
were assumed for the box-girders and the columns, respectively, to calculate the creep
coefficient as previously noted.
Table 5.1: Prediction models used in the FEM to account for the time-dependent properties
Material property Model Box-girder Column
Variation in concrete compressive strength with time ACI Not modelled Modulus of elasticity AASHTO AASHTO Concrete creep/relaxation AASHTO AASHTO Concrete shrinkage AASHTO AASHTO Relaxation of posttensioned tendons AASHTO Not Applicable
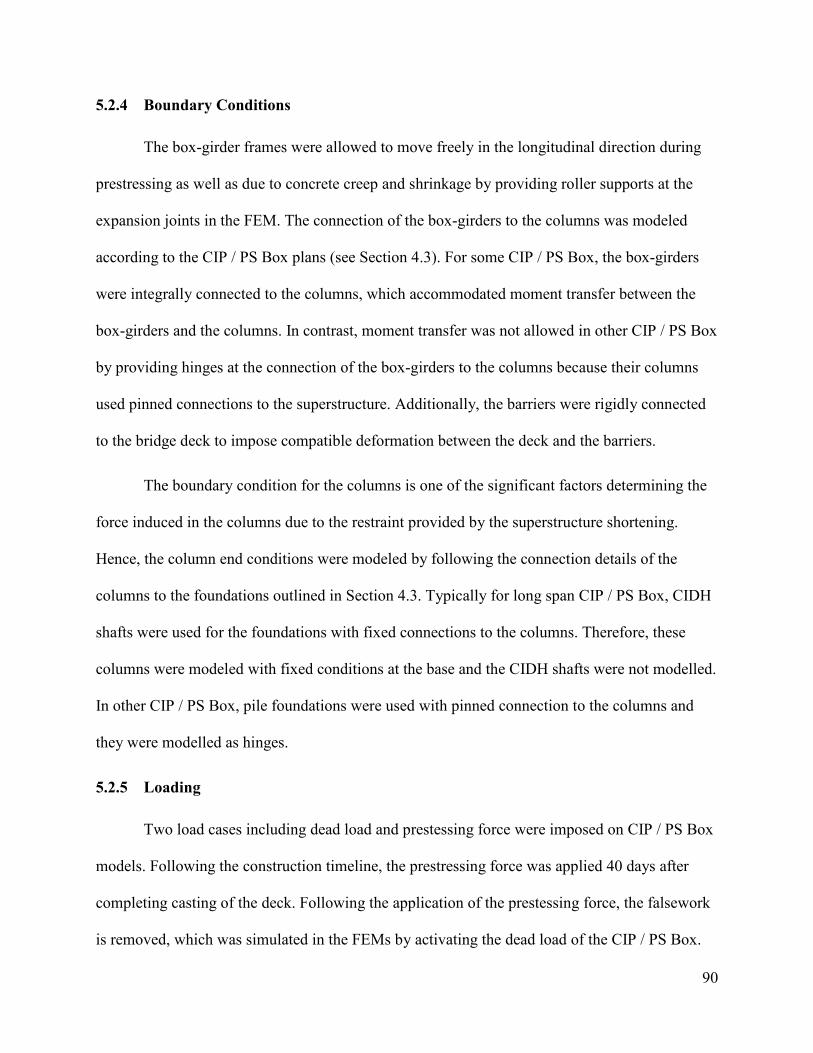
90
5.2.4 Boundary Conditions
The box-girder frames were allowed to move freely in the longitudinal direction during
prestressing as well as due to concrete creep and shrinkage by providing roller supports at the
expansion joints in the FEM. The connection of the box-girders to the columns was modeled
according to the CIP / PS Box plans (see Section 4.3). For some CIP / PS Box, the box-girders
were integrally connected to the columns, which accommodated moment transfer between the
box-girders and the columns. In contrast, moment transfer was not allowed in other CIP / PS Box
by providing hinges at the connection of the box-girders to the columns because their columns
used pinned connections to the superstructure. Additionally, the barriers were rigidly connected
to the bridge deck to impose compatible deformation between the deck and the barriers.
The boundary condition for the columns is one of the significant factors determining the
force induced in the columns due to the restraint provided by the superstructure shortening.
Hence, the column end conditions were modeled by following the connection details of the
columns to the foundations outlined in Section 4.3. Typically for long span CIP / PS Box, CIDH
shafts were used for the foundations with fixed connections to the columns. Therefore, these
columns were modeled with fixed conditions at the base and the CIDH shafts were not modelled.
In other CIP / PS Box, pile foundations were used with pinned connection to the columns and
they were modelled as hinges.
5.2.5 Loading
Two load cases including dead load and prestessing force were imposed on CIP / PS Box
models. Following the construction timeline, the prestressing force was applied 40 days after
completing casting of the deck. Following the application of the prestessing force, the falsework
is removed, which was simulated in the FEMs by activating the dead load of the CIP / PS Box.

91
The total prestessing force was equally distributed to all stems and was applied to each stem by
placing a tendon in the plane through the middle of the girder thickness. The size of each tendon
was chosen such that the geometry constraints were satisfied and the stress in each tendon was
below the yield strength of the tendons as specified in the drawings. Based on the diameter of the
tendons, the appropriate duct size was included in the FEM. In addition, the tendons were
modeled as bonded tendons with perfect bonding to the surrounding concrete. Thus, the box-
girder section properties used in the analyses reflected the transformed section properties.
5.2.6 Column Effective Stiffness
Moment-curvature analyses of columns were performed using the XSection software
(ref) to determine when they would experience flexural cracking due to the displacement-
induced forces. The required axial force for the moment-curvature analysis was estimated using
the FEM of the CIP / PS Box when the bridge was subjected only to the dead load. The moment-
curvature analysis results of the four bents of B4 are presented in Figure 5.4.
The time-dependent analysis was initially completed assuming columns remained
uncracked (i.e., using the gross section properties) and then the resulting column moments were
compared to the column cracking moments calculated using the XSection software. When a
column was identified to be cracked, the effective stiffness calculated by the moment-curvature
analysis was used to replace the corresponding gross stiffness value to account for cracking and
the FEM analysis was repeated. This step was accomplished in the analyses by decreasing the
column gross moment of inertia in the FEM using a reduction factor. The reduction factor
represented the ratio between the effective to gross stiffness. Subsequently, the column moments
were reevaluated and compared to the cracking moment to ensure use of appropriate column
stiffness values.
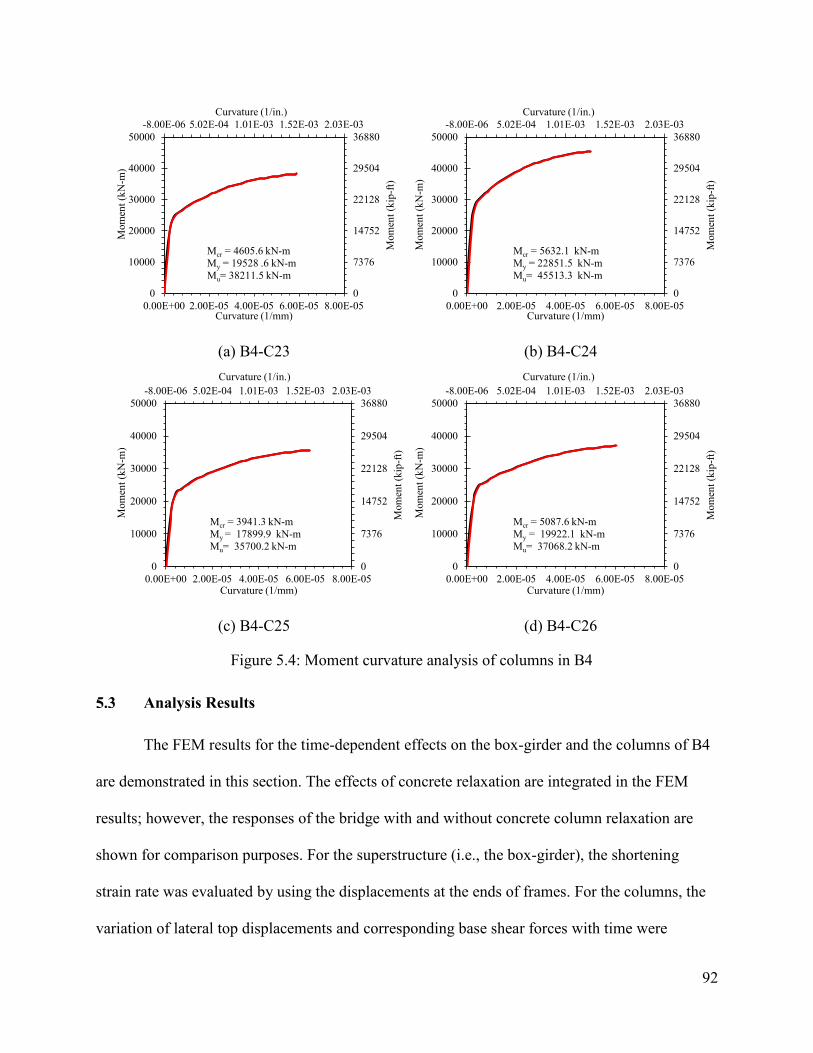
92
(a) B4-C23 (b) B4-C24
(c) B4-C25 (d) B4-C26
Figure 5.4: Moment curvature analysis of columns in B4
Analysis Results
The FEM results for the time-dependent effects on the box-girder and the columns of B4
are demonstrated in this section. The effects of concrete relaxation are integrated in the FEM
results; however, the responses of the bridge with and without concrete column relaxation are
shown for comparison purposes. For the superstructure (i.e., the box-girder), the shortening
strain rate was evaluated by using the displacements at the ends of frames. For the columns, the
variation of lateral top displacements and corresponding base shear forces with time were
-8.00E-06 5.02E-04 1.01E-03 1.52E-03 2.03E-03
0
7376
14752
22128
29504
36880
0
10000
20000
30000
40000
50000
0.00E+00 2.00E-05 4.00E-05 6.00E-05 8.00E-05
Curvature (1/in.)
Mom
ent (
kip-
ft)
Mom
ent (
kN-m
)
Curvature (1/mm)
Mcr = 4605.6 kN-mMy = 19528 .6 kN-mMu= 38211.5 kN-m
-8.00E-06 5.02E-04 1.01E-03 1.52E-03 2.03E-03
0
7376
14752
22128
29504
36880
0
10000
20000
30000
40000
50000
0.00E+00 2.00E-05 4.00E-05 6.00E-05 8.00E-05
Curvature (1/in.)
Mom
ent (
kip-
ft)
Mom
ent (
kN-m
)
Curvature (1/mm)
Mcr = 5632.1 kN-mMy = 22851.5 kN-mMu= 45513.3 kN-m
-8.00E-06 5.02E-04 1.01E-03 1.52E-03 2.03E-03
0
7376
14752
22128
29504
36880
0
10000
20000
30000
40000
50000
0.00E+00 2.00E-05 4.00E-05 6.00E-05 8.00E-05
Curvature (1/in.)
Mom
ent (
kip-
ft)
Mom
ent (
kN-m
)
Curvature (1/mm)
Mcr = 3941.3 kN-mMy = 17899.9 kN-mMu= 35700.2 kN-m
-8.00E-06 5.02E-04 1.01E-03 1.52E-03 2.03E-03
0
7376
14752
22128
29504
36880
0
10000
20000
30000
40000
50000
0.00E+00 2.00E-05 4.00E-05 6.00E-05 8.00E-05
Curvature (1/in.)
Mom
ent (
kip-
ft)
Mom
ent (
kN-m
)
Curvature (1/mm)
Mcr = 5087.6 kN-mMy = 19922.1 kN-mMu= 37068.2 kN-m
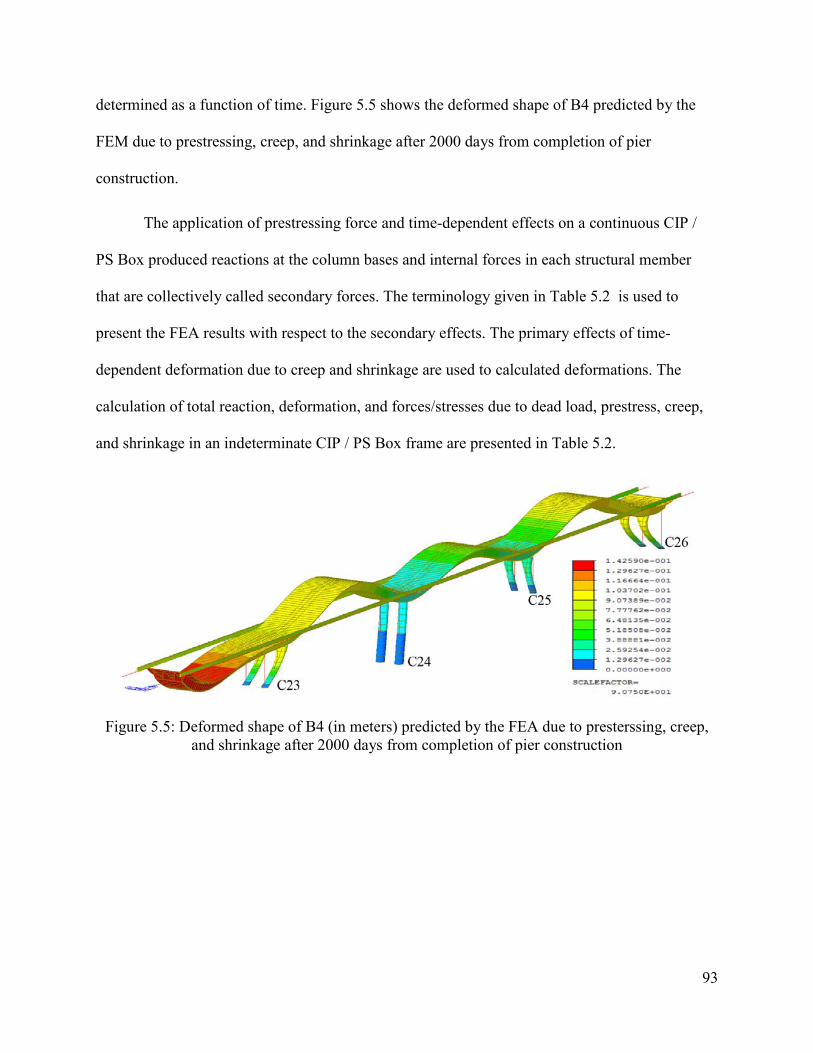
93
determined as a function of time. Figure 5.5 shows the deformed shape of B4 predicted by the
FEM due to prestressing, creep, and shrinkage after 2000 days from completion of pier
construction.
The application of prestressing force and time-dependent effects on a continuous CIP /
PS Box produced reactions at the column bases and internal forces in each structural member
that are collectively called secondary forces. The terminology given in Table 5.2 is used to
present the FEA results with respect to the secondary effects. The primary effects of time-
dependent deformation due to creep and shrinkage are used to calculated deformations. The
calculation of total reaction, deformation, and forces/stresses due to dead load, prestress, creep,
and shrinkage in an indeterminate CIP / PS Box frame are presented in Table 5.2.
Figure 5.5: Deformed shape of B4 (in meters) predicted by the FEA due to presterssing, creep, and shrinkage after 2000 days from completion of pier construction
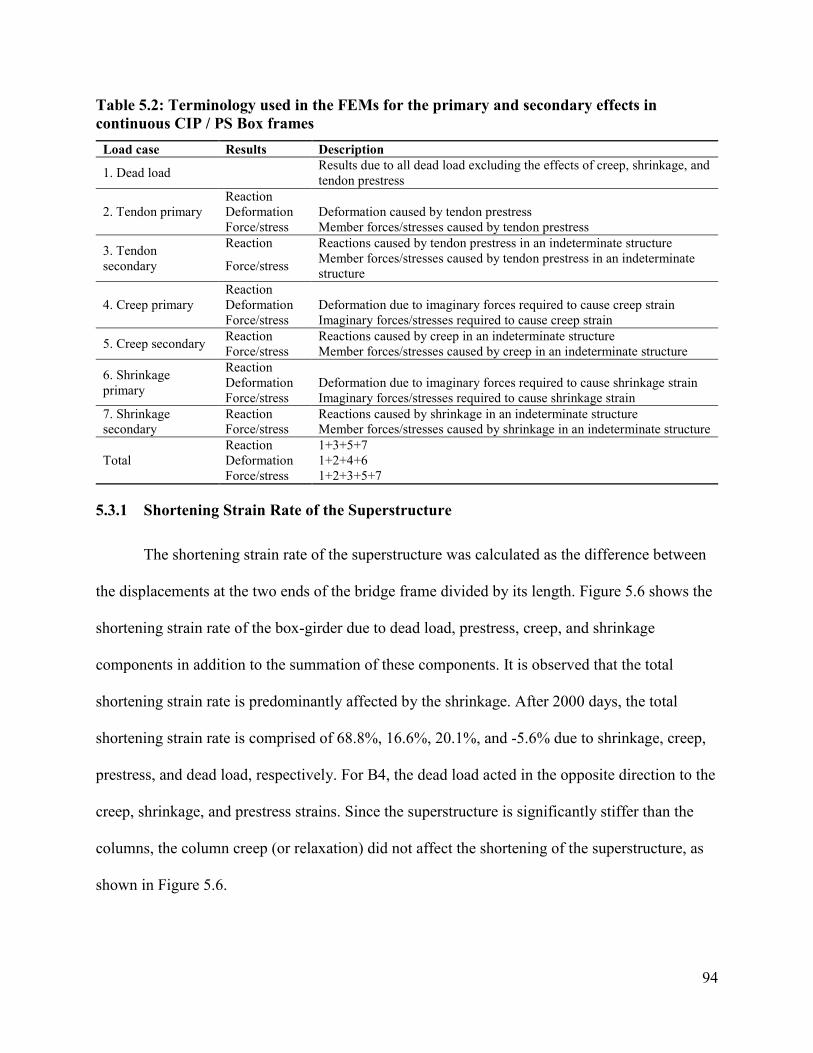
94
Table 5.2: Terminology used in the FEMs for the primary and secondary effects in continuous CIP / PS Box frames
Load case Results Description
1. Dead load Results due to all dead load excluding the effects of creep, shrinkage, and tendon prestress
2. Tendon primary Reaction Deformation Deformation caused by tendon prestress Force/stress Member forces/stresses caused by tendon prestress
3. Tendon secondary
Reaction Reactions caused by tendon prestress in an indeterminate structure
Force/stress Member forces/stresses caused by tendon prestress in an indeterminate structure
4. Creep primary Reaction Deformation Deformation due to imaginary forces required to cause creep strain Force/stress Imaginary forces/stresses required to cause creep strain
5. Creep secondary Reaction Reactions caused by creep in an indeterminate structure Force/stress Member forces/stresses caused by creep in an indeterminate structure
6. Shrinkage primary
Reaction Deformation Deformation due to imaginary forces required to cause shrinkage strain Force/stress Imaginary forces/stresses required to cause shrinkage strain
7. Shrinkage secondary
Reaction Reactions caused by shrinkage in an indeterminate structure Force/stress Member forces/stresses caused by shrinkage in an indeterminate structure
Total Reaction 1+3+5+7 Deformation 1+2+4+6 Force/stress 1+2+3+5+7
5.3.1 Shortening Strain Rate of the Superstructure
The shortening strain rate of the superstructure was calculated as the difference between
the displacements at the two ends of the bridge frame divided by its length. Figure 5.6 shows the
shortening strain rate of the box-girder due to dead load, prestress, creep, and shrinkage
components in addition to the summation of these components. It is observed that the total
shortening strain rate is predominantly affected by the shrinkage. After 2000 days, the total
shortening strain rate is comprised of 68.8%, 16.6%, 20.1%, and -5.6% due to shrinkage, creep,
prestress, and dead load, respectively. For B4, the dead load acted in the opposite direction to the
creep, shrinkage, and prestress strains. Since the superstructure is significantly stiffer than the
columns, the column creep (or relaxation) did not affect the shortening of the superstructure, as
shown in Figure 5.6.
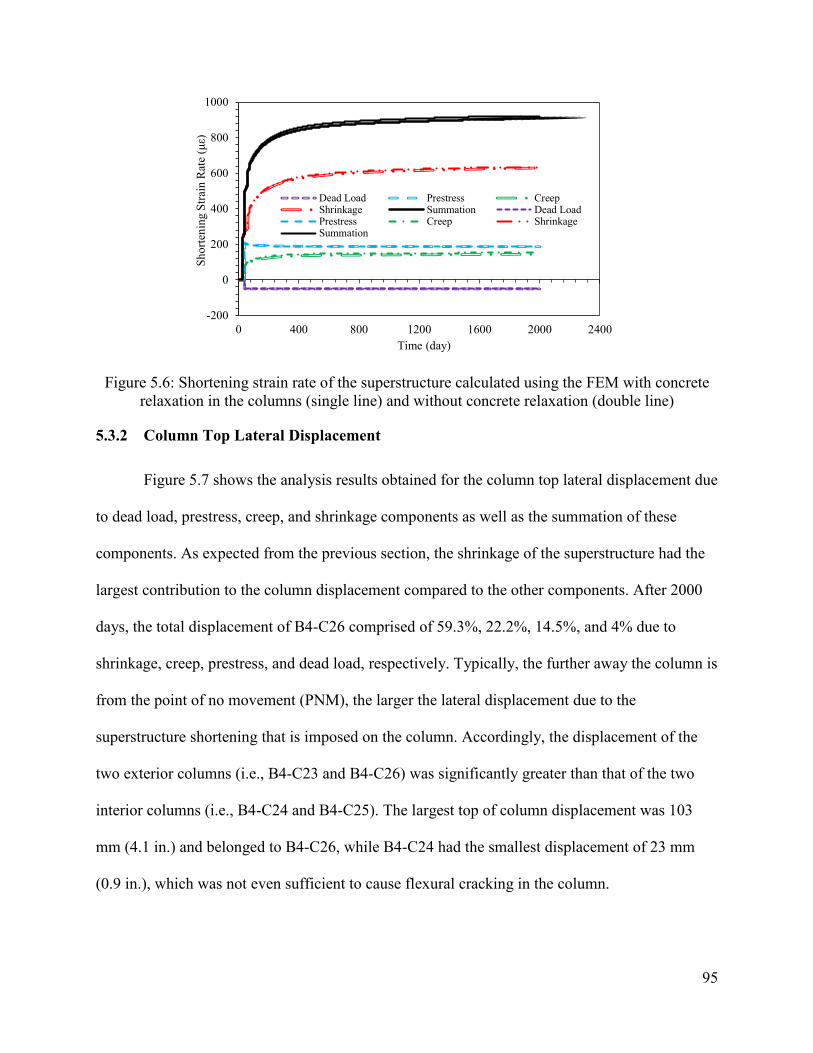
95
Figure 5.6: Shortening strain rate of the superstructure calculated using the FEM with concrete relaxation in the columns (single line) and without concrete relaxation (double line)
5.3.2 Column Top Lateral Displacement
Figure 5.7 shows the analysis results obtained for the column top lateral displacement due
to dead load, prestress, creep, and shrinkage components as well as the summation of these
components. As expected from the previous section, the shrinkage of the superstructure had the
largest contribution to the column displacement compared to the other components. After 2000
days, the total displacement of B4-C26 comprised of 59.3%, 22.2%, 14.5%, and 4% due to
shrinkage, creep, prestress, and dead load, respectively. Typically, the further away the column is
from the point of no movement (PNM), the larger the lateral displacement due to the
superstructure shortening that is imposed on the column. Accordingly, the displacement of the
two exterior columns (i.e., B4-C23 and B4-C26) was significantly greater than that of the two
interior columns (i.e., B4-C24 and B4-C25). The largest top of column displacement was 103
mm (4.1 in.) and belonged to B4-C26, while B4-C24 had the smallest displacement of 23 mm
(0.9 in.), which was not even sufficient to cause flexural cracking in the column.
-200
0
200
400
600
800
1000
0 400 800 1200 1600 2000 2400
Shor
teni
ng S
train
Rat
e (μ
ε)
Time (day)
Dead Load Prestress CreepShrinkage Summation Dead LoadPrestress Creep ShrinkageSummation
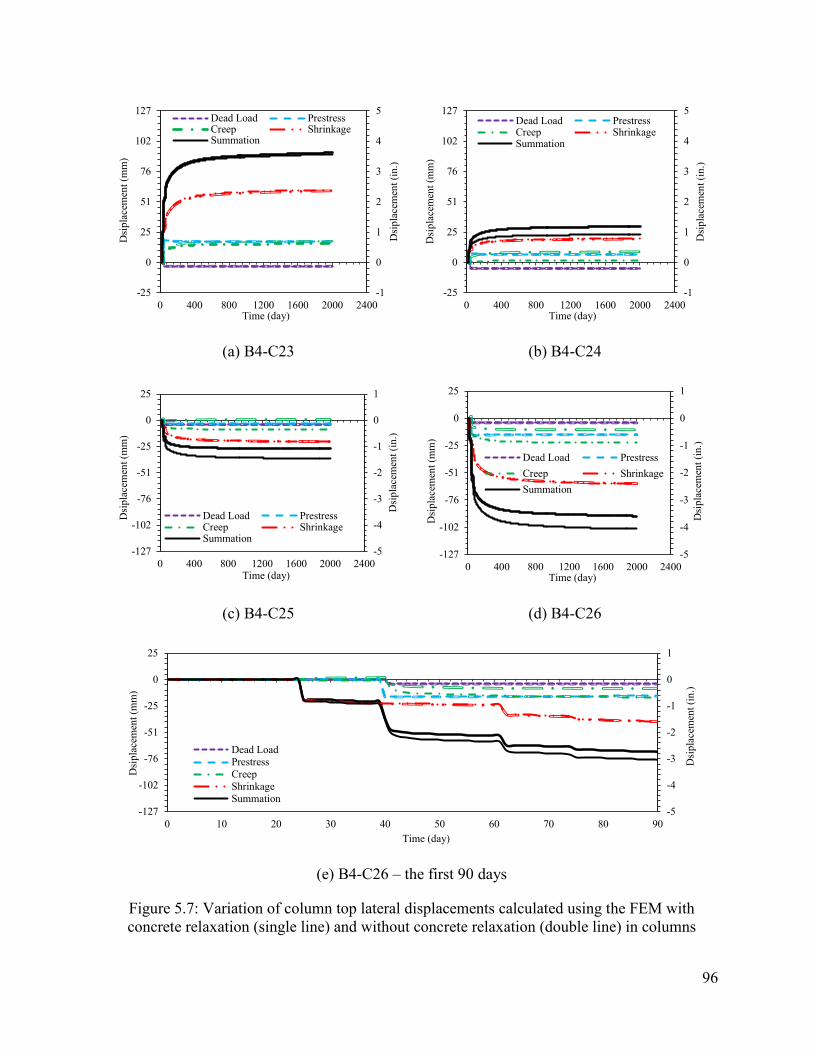
96
(a) B4-C23 (b) B4-C24
(c) B4-C25 (d) B4-C26
(e) B4-C26 – the first 90 days
Figure 5.7: Variation of column top lateral displacements calculated using the FEM with concrete relaxation (single line) and without concrete relaxation (double line) in columns
-1
0
1
2
3
4
5
-25
0
25
51
76
102
127
0 400 800 1200 1600 2000 2400
Dsi
plac
emen
t (in
.)
Dsi
plac
emen
t (m
m)
Time (day)
Dead Load PrestressCreep ShrinkageSummation
-1
0
1
2
3
4
5
-25
0
25
51
76
102
127
0 400 800 1200 1600 2000 2400
Dsi
plac
emen
t (in
.)
Dsi
plac
emen
t (m
m)
Time (day)
Dead Load PrestressCreep ShrinkageSummation
-5
-4
-3
-2
-1
0
1
-127
-102
-76
-51
-25
0
25
0 400 800 1200 1600 2000 2400
Dsi
plac
emen
t (in
.)
Dsi
plac
emen
t (m
m)
Time (day)
Dead Load PrestressCreep ShrinkageSummation
-5
-4
-3
-2
-1
0
1
-127
-102
-76
-51
-25
0
25
0 400 800 1200 1600 2000 2400
Dsi
plac
emen
t (in
.)
Dsi
plac
emen
t (m
m)
Time (day)
Dead Load PrestressCreep ShrinkageSummation
-5
-4
-3
-2
-1
0
1
-127
-102
-76
-51
-25
0
25
0 10 20 30 40 50 60 70 80 90
Dsi
plac
emen
t (in
.)
Dsi
plac
emen
t (m
m)
Time (day)
Dead LoadPrestressCreepShrinkageSummation
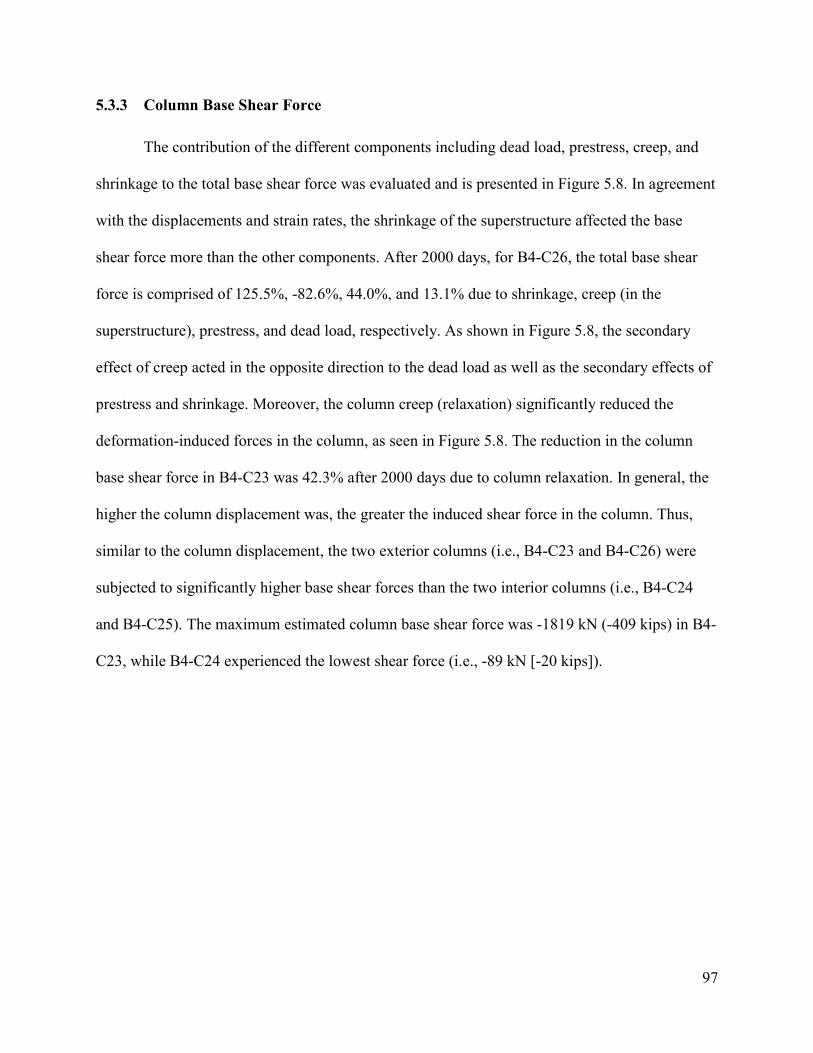
97
5.3.3 Column Base Shear Force
The contribution of the different components including dead load, prestress, creep, and
shrinkage to the total base shear force was evaluated and is presented in Figure 5.8. In agreement
with the displacements and strain rates, the shrinkage of the superstructure affected the base
shear force more than the other components. After 2000 days, for B4-C26, the total base shear
force is comprised of 125.5%, -82.6%, 44.0%, and 13.1% due to shrinkage, creep (in the
superstructure), prestress, and dead load, respectively. As shown in Figure 5.8, the secondary
effect of creep acted in the opposite direction to the dead load as well as the secondary effects of
prestress and shrinkage. Moreover, the column creep (relaxation) significantly reduced the
deformation-induced forces in the column, as seen in Figure 5.8. The reduction in the column
base shear force in B4-C23 was 42.3% after 2000 days due to column relaxation. In general, the
higher the column displacement was, the greater the induced shear force in the column. Thus,
similar to the column displacement, the two exterior columns (i.e., B4-C23 and B4-C26) were
subjected to significantly higher base shear forces than the two interior columns (i.e., B4-C24
and B4-C25). The maximum estimated column base shear force was -1819 kN (-409 kips) in B4-
C23, while B4-C24 experienced the lowest shear force (i.e., -89 kN [-20 kips]).
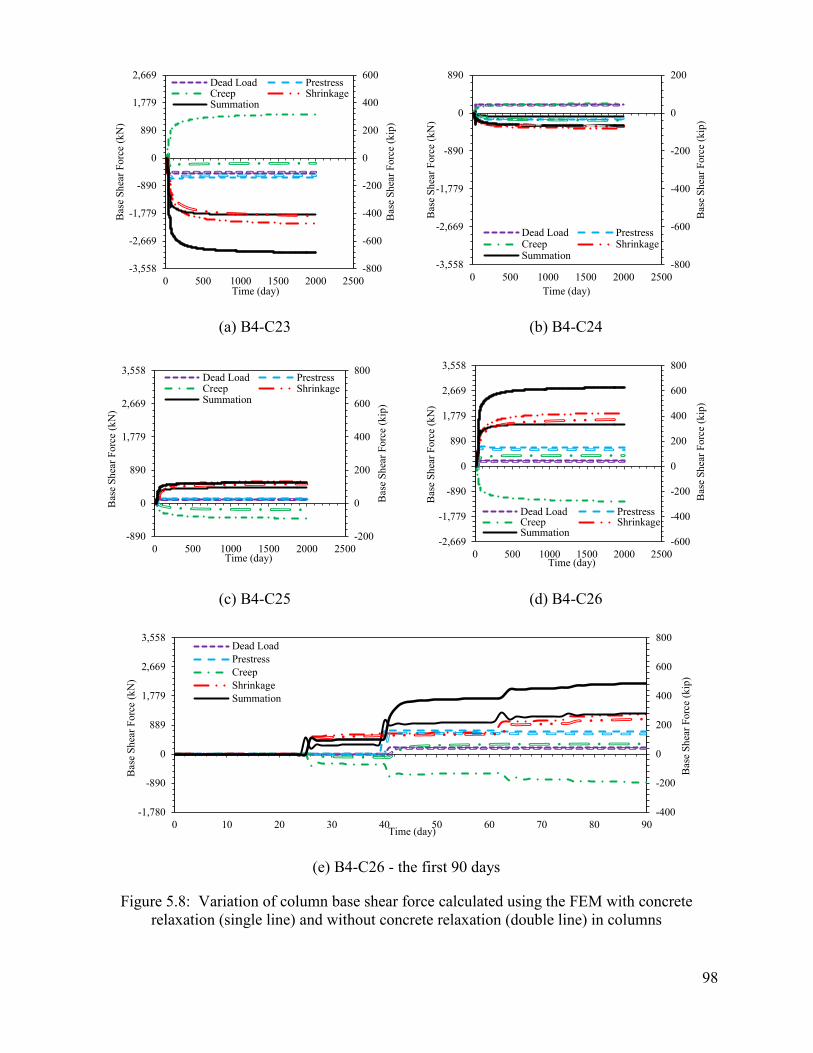
98
(a) B4-C23 (b) B4-C24
(c) B4-C25 (d) B4-C26
(e) B4-C26 - the first 90 days
Figure 5.8: Variation of column base shear force calculated using the FEM with concrete relaxation (single line) and without concrete relaxation (double line) in columns
-800
-600
-400
-200
0
200
400
600
-3,558
-2,669
-1,779
-890
0
890
1,779
2,669
0 500 1000 1500 2000 2500
Bas
e Sh
ear F
orce
(kip
)
Bas
e Sh
ear F
orce
(kN
)
Time (day)
Dead Load PrestressCreep ShrinkageSummation
-800
-600
-400
-200
0
200
-3,558
-2,669
-1,779
-890
0
890
0 500 1000 1500 2000 2500
Bas
e Sh
ear F
orce
(kip
)
Bas
e Sh
ear F
orce
(kN
)
Time (day)
Dead Load PrestressCreep ShrinkageSummation
-200
0
200
400
600
800
-890
0
890
1,779
2,669
3,558
0 500 1000 1500 2000 2500
Bas
e Sh
ear F
orce
(kip
)
Bas
e Sh
ear F
orce
(kN
)
Time (day)
Dead Load PrestressCreep ShrinkageSummation
-600
-400
-200
0
200
400
600
800
-2,669
-1,779
-890
0
890
1,779
2,669
3,558
0 500 1000 1500 2000 2500
Bas
e Sh
ear F
orce
(kip
)
Bas
e Sh
ear F
orce
(kN
)
Time (day)
Dead Load PrestressCreep ShrinkageSummation
-400
-200
0
200
400
600
800
-1,780
-890
0
889
1,779
2,669
3,558
0 10 20 30 40 50 60 70 80 90
Bas
e Sh
ear F
orce
(kip
)
Bas
e Sh
ear F
orce
(kN
)
Time (day)
Dead LoadPrestressCreepShrinkageSummation
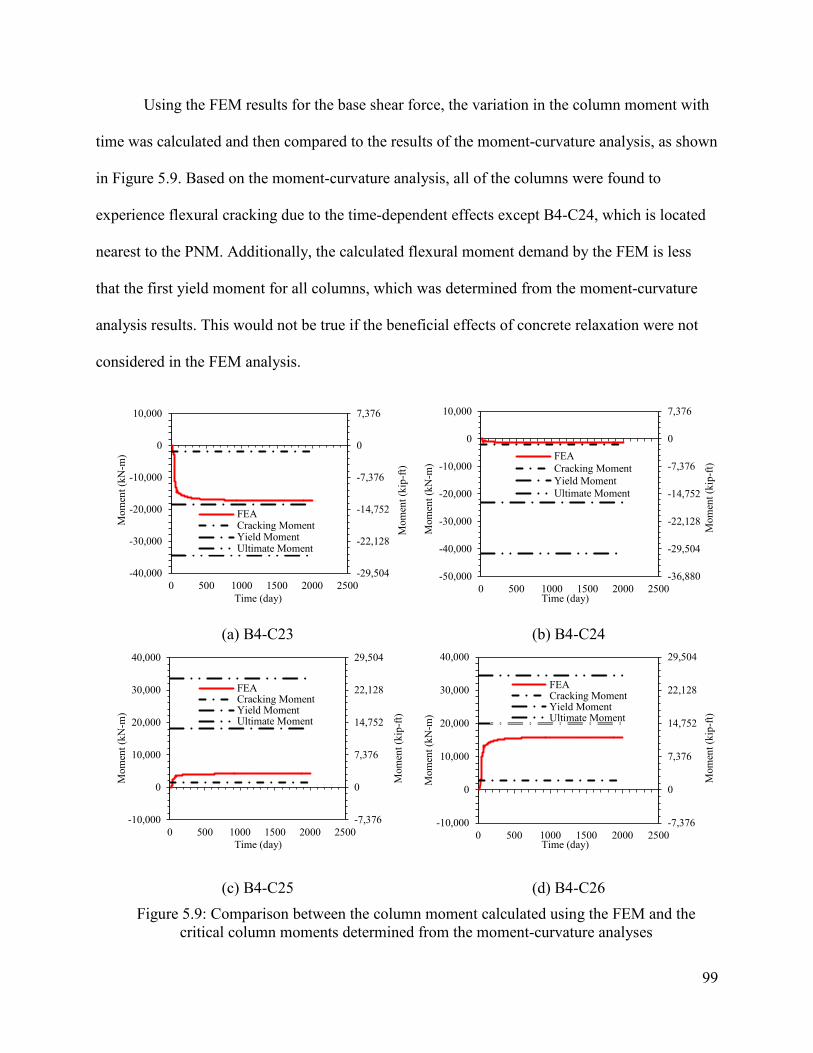
99
Using the FEM results for the base shear force, the variation in the column moment with
time was calculated and then compared to the results of the moment-curvature analysis, as shown
in Figure 5.9. Based on the moment-curvature analysis, all of the columns were found to
experience flexural cracking due to the time-dependent effects except B4-C24, which is located
nearest to the PNM. Additionally, the calculated flexural moment demand by the FEM is less
that the first yield moment for all columns, which was determined from the moment-curvature
analysis results. This would not be true if the beneficial effects of concrete relaxation were not
considered in the FEM analysis.
(a) B4-C23 (b) B4-C24
(c) B4-C25 (d) B4-C26 Figure 5.9: Comparison between the column moment calculated using the FEM and the
critical column moments determined from the moment-curvature analyses
-29,504
-22,128
-14,752
-7,376
0
7,376
-40,000
-30,000
-20,000
-10,000
0
10,000
0 500 1000 1500 2000 2500
Mom
ent (
kip-
ft)
Mom
ent (
kN-m
)
Time (day)
FEACracking MomentYield MomentUltimate Moment
-36,880
-29,504
-22,128
-14,752
-7,376
0
7,376
-50,000
-40,000
-30,000
-20,000
-10,000
0
10,000
0 500 1000 1500 2000 2500
Mom
ent (
kip-
ft)
Mom
ent (
kN-m
)
Time (day)
FEACracking MomentYield MomentUltimate Moment
-7,376
0
7,376
14,752
22,128
29,504
-10,000
0
10,000
20,000
30,000
40,000
0 500 1000 1500 2000 2500
Mom
ent (
kip-
ft)
Mom
ent (
kN-m
)
Time (day)
FEACracking MomentYield MomentUltimate Moment
-7,376
0
7,376
14,752
22,128
29,504
-10,000
0
10,000
20,000
30,000
40,000
0 500 1000 1500 2000 2500
Mom
ent (
kip-
ft)
Mom
ent (
kN-m
)
Time (day)
FEACracking MomentYield MomentUltimate Moment
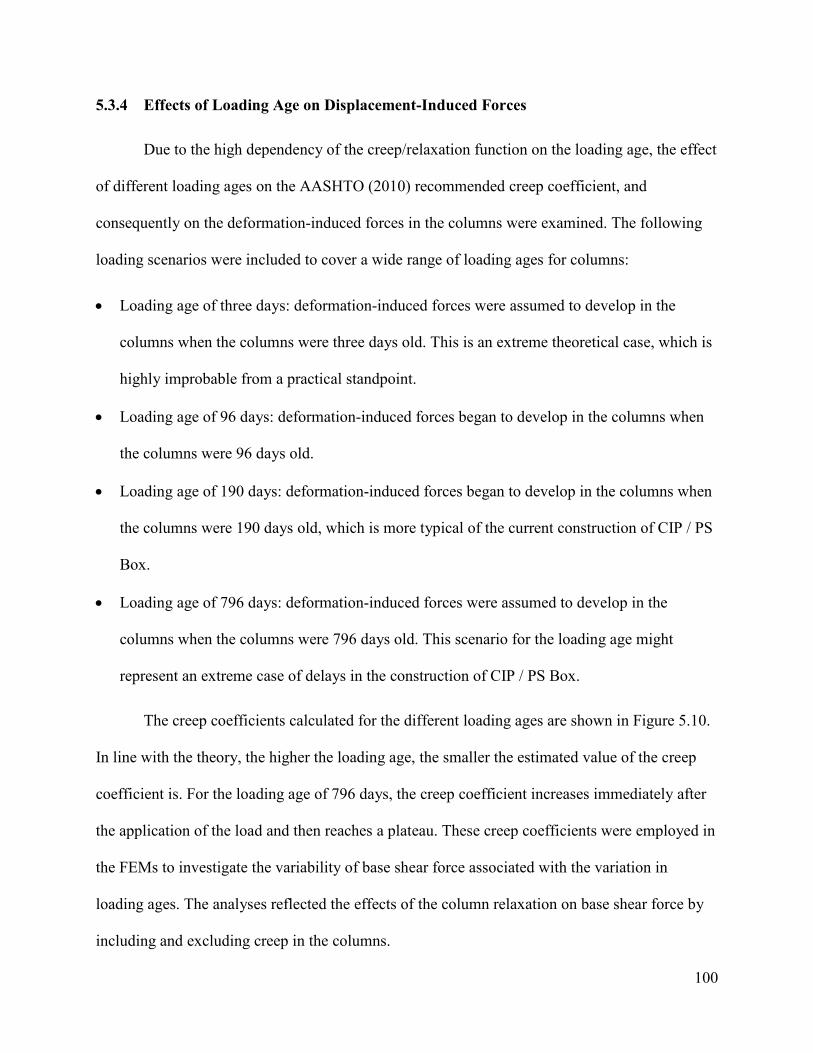
100
5.3.4 Effects of Loading Age on Displacement-Induced Forces
Due to the high dependency of the creep/relaxation function on the loading age, the effect
of different loading ages on the AASHTO (2010) recommended creep coefficient, and
consequently on the deformation-induced forces in the columns were examined. The following
loading scenarios were included to cover a wide range of loading ages for columns:
• Loading age of three days: deformation-induced forces were assumed to develop in the
columns when the columns were three days old. This is an extreme theoretical case, which is
highly improbable from a practical standpoint.
• Loading age of 96 days: deformation-induced forces began to develop in the columns when
the columns were 96 days old.
• Loading age of 190 days: deformation-induced forces began to develop in the columns when
the columns were 190 days old, which is more typical of the current construction of CIP / PS
Box.
• Loading age of 796 days: deformation-induced forces were assumed to develop in the
columns when the columns were 796 days old. This scenario for the loading age might
represent an extreme case of delays in the construction of CIP / PS Box.
The creep coefficients calculated for the different loading ages are shown in Figure 5.10.
In line with the theory, the higher the loading age, the smaller the estimated value of the creep
coefficient is. For the loading age of 796 days, the creep coefficient increases immediately after
the application of the load and then reaches a plateau. These creep coefficients were employed in
the FEMs to investigate the variability of base shear force associated with the variation in
loading ages. The analyses reflected the effects of the column relaxation on base shear force by
including and excluding creep in the columns.
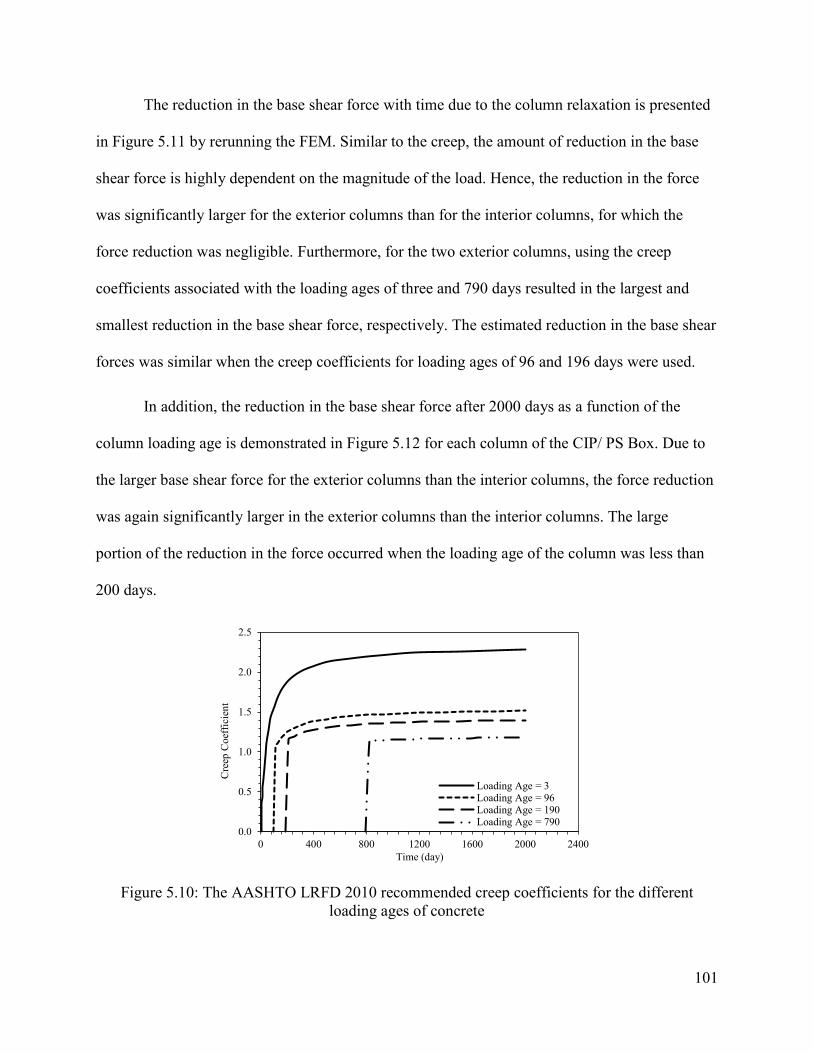
101
The reduction in the base shear force with time due to the column relaxation is presented
in Figure 5.11 by rerunning the FEM. Similar to the creep, the amount of reduction in the base
shear force is highly dependent on the magnitude of the load. Hence, the reduction in the force
was significantly larger for the exterior columns than for the interior columns, for which the
force reduction was negligible. Furthermore, for the two exterior columns, using the creep
coefficients associated with the loading ages of three and 790 days resulted in the largest and
smallest reduction in the base shear force, respectively. The estimated reduction in the base shear
forces was similar when the creep coefficients for loading ages of 96 and 196 days were used.
In addition, the reduction in the base shear force after 2000 days as a function of the
column loading age is demonstrated in Figure 5.12 for each column of the CIP/ PS Box. Due to
the larger base shear force for the exterior columns than the interior columns, the force reduction
was again significantly larger in the exterior columns than the interior columns. The large
portion of the reduction in the force occurred when the loading age of the column was less than
200 days.
Figure 5.10: The AASHTO LRFD 2010 recommended creep coefficients for the different loading ages of concrete
0.0
0.5
1.0
1.5
2.0
2.5
0 400 800 1200 1600 2000 2400
Cre
ep C
oeffi
cien
t
Time (day)
Loading Age = 3Loading Age = 96Loading Age = 190Loading Age = 790
102
(a) B4-C23 (b) B4-C24
(c) B4-C25 (d) B4-C26
Figure 5.11: Variation of reduction in base shear force with time due to relaxation using different loading ages for columns
0
112
225
337
450
0
500
1000
1500
2000
0 500 1000 1500 2000 2500
Bas
e Sh
ear R
educ
tion
(kip
)
Bas
e Sh
ear R
educ
tion
(kN
)
Time (day)
Loading at 3 daysLoading at 96 daysLoading at 190 daysLoading at 790 days
0
112
225
337
450
0
500
1000
1500
2000
0 500 1000 1500 2000 2500
Bas
e Sh
ear R
educ
tion
(kip
)
Bas
e Sh
ear R
educ
tion
(kN
)
Time (day)
Loading at 3 daysLoading at 96 daysLoading at 190 daysLoading at 790 days
0
112
225
337
450
0
500
1000
1500
2000
0 500 1000 1500 2000 2500
Bas
e Sh
ear R
educ
tion
(kip
)
Bas
e Sh
ear R
educ
tion
(kN
)
Time (day)
Loading at 3 daysLoading at 96 daysLoading at 190 daysLoading at 790 days
0
112
225
337
450
0
500
1000
1500
2000
0 500 1000 1500 2000 2500
Bas
e Sh
ear R
educ
tion
(kip
)
Bas
e Sh
ear R
educ
tion
(kN
)
Time (day)
Loading at 3 daysLoading at 96 daysLoading at 190 daysLoading at 790 days
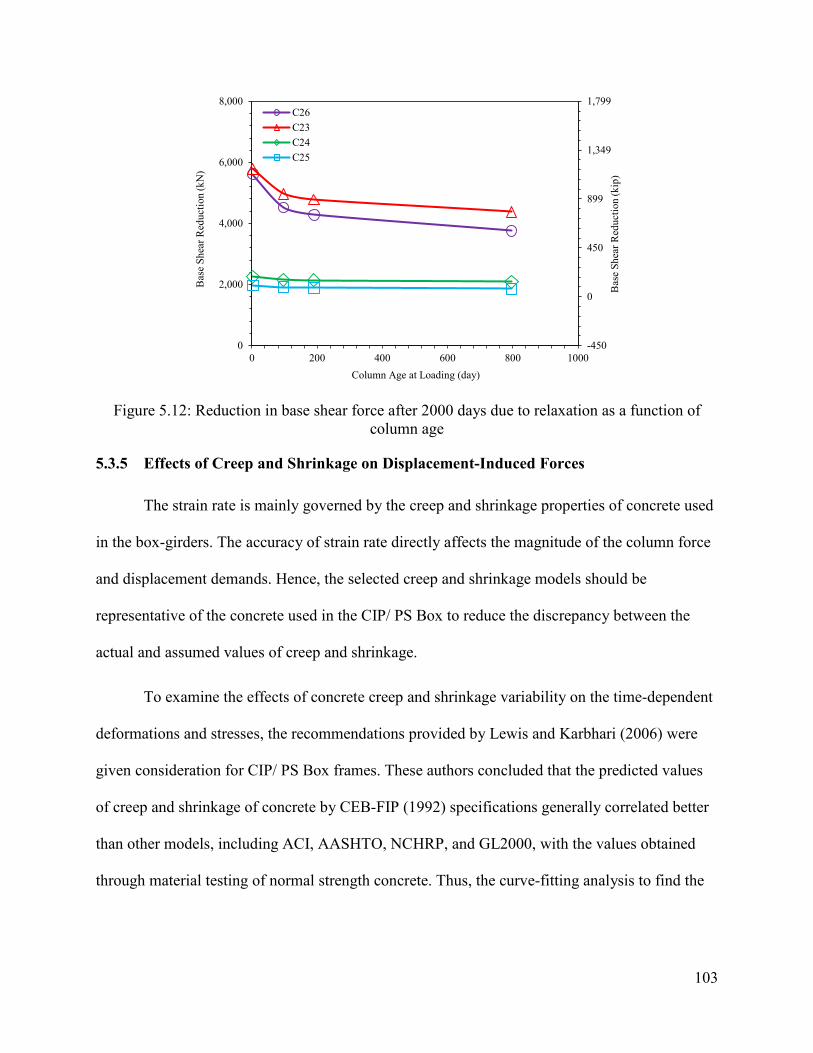
103
Figure 5.12: Reduction in base shear force after 2000 days due to relaxation as a function of column age
5.3.5 Effects of Creep and Shrinkage on Displacement-Induced Forces
The strain rate is mainly governed by the creep and shrinkage properties of concrete used
in the box-girders. The accuracy of strain rate directly affects the magnitude of the column force
and displacement demands. Hence, the selected creep and shrinkage models should be
representative of the concrete used in the CIP/ PS Box to reduce the discrepancy between the
actual and assumed values of creep and shrinkage.
To examine the effects of concrete creep and shrinkage variability on the time-dependent
deformations and stresses, the recommendations provided by Lewis and Karbhari (2006) were
given consideration for CIP/ PS Box frames. These authors concluded that the predicted values
of creep and shrinkage of concrete by CEB-FIP (1992) specifications generally correlated better
than other models, including ACI, AASHTO, NCHRP, and GL2000, with the values obtained
through material testing of normal strength concrete. Thus, the curve-fitting analysis to find the
-450
0
450
899
1,349
1,799
0
2,000
4,000
6,000
8,000
0 200 400 600 800 1000
Bas
e Sh
ear R
educ
tion
(kip
)
Bas
e Sh
ear R
educ
tion
(kN
)
Column Age at Loading (day)
C26C23C24C25
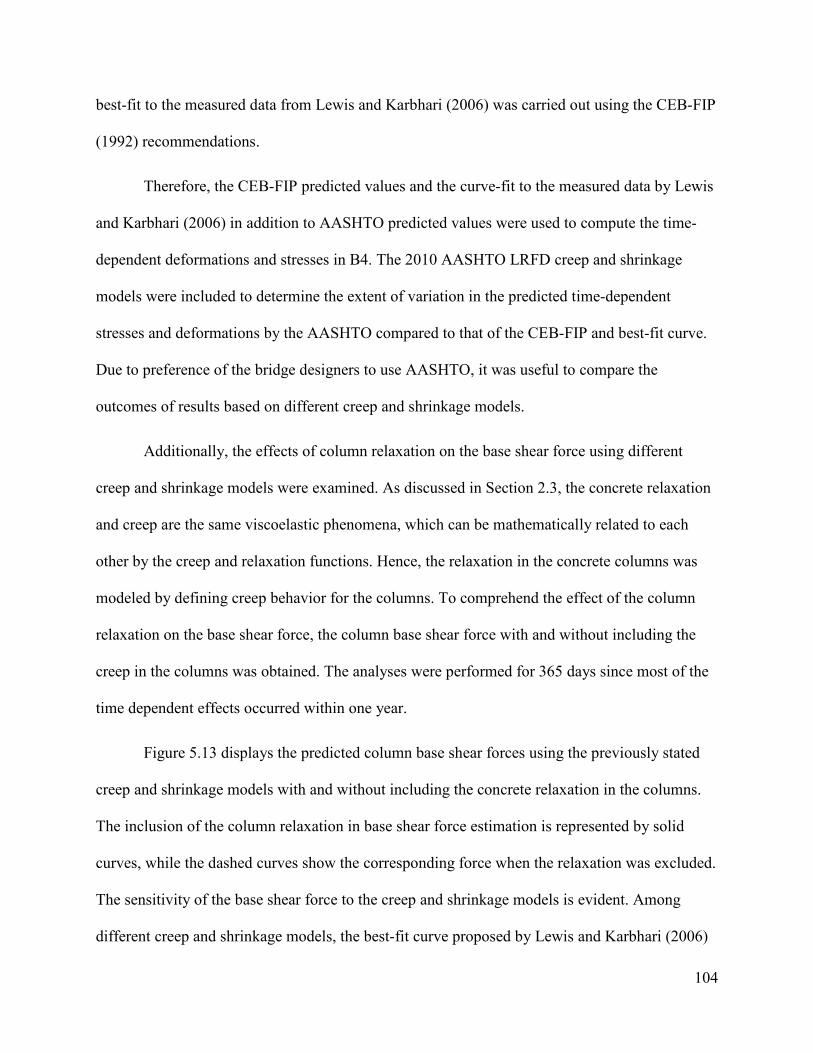
104
best-fit to the measured data from Lewis and Karbhari (2006) was carried out using the CEB-FIP
(1992) recommendations.
Therefore, the CEB-FIP predicted values and the curve-fit to the measured data by Lewis
and Karbhari (2006) in addition to AASHTO predicted values were used to compute the time-
dependent deformations and stresses in B4. The 2010 AASHTO LRFD creep and shrinkage
models were included to determine the extent of variation in the predicted time-dependent
stresses and deformations by the AASHTO compared to that of the CEB-FIP and best-fit curve.
Due to preference of the bridge designers to use AASHTO, it was useful to compare the
outcomes of results based on different creep and shrinkage models.
Additionally, the effects of column relaxation on the base shear force using different
creep and shrinkage models were examined. As discussed in Section 2.3, the concrete relaxation
and creep are the same viscoelastic phenomena, which can be mathematically related to each
other by the creep and relaxation functions. Hence, the relaxation in the concrete columns was
modeled by defining creep behavior for the columns. To comprehend the effect of the column
relaxation on the base shear force, the column base shear force with and without including the
creep in the columns was obtained. The analyses were performed for 365 days since most of the
time dependent effects occurred within one year.
Figure 5.13 displays the predicted column base shear forces using the previously stated
creep and shrinkage models with and without including the concrete relaxation in the columns.
The inclusion of the column relaxation in base shear force estimation is represented by solid
curves, while the dashed curves show the corresponding force when the relaxation was excluded.
The sensitivity of the base shear force to the creep and shrinkage models is evident. Among
different creep and shrinkage models, the best-fit curve proposed by Lewis and Karbhari (2006)
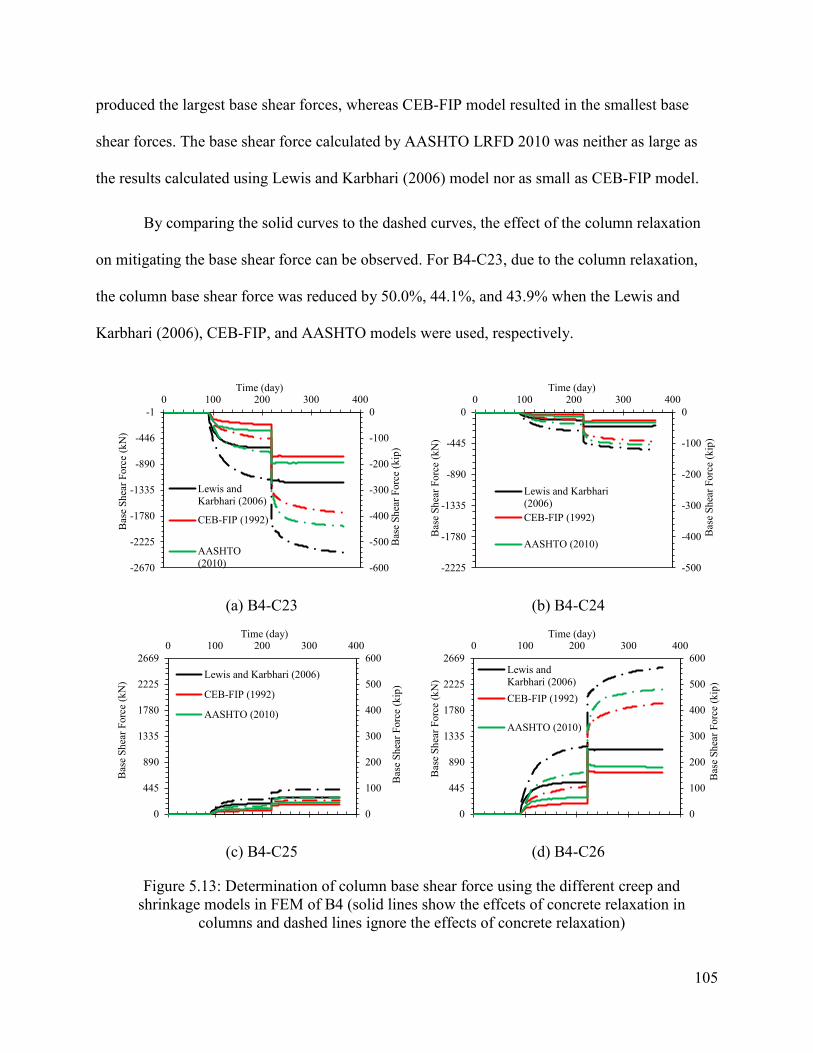
105
produced the largest base shear forces, whereas CEB-FIP model resulted in the smallest base
shear forces. The base shear force calculated by AASHTO LRFD 2010 was neither as large as
the results calculated using Lewis and Karbhari (2006) model nor as small as CEB-FIP model.
By comparing the solid curves to the dashed curves, the effect of the column relaxation
on mitigating the base shear force can be observed. For B4-C23, due to the column relaxation,
the column base shear force was reduced by 50.0%, 44.1%, and 43.9% when the Lewis and
Karbhari (2006), CEB-FIP, and AASHTO models were used, respectively.
(a) B4-C23 (b) B4-C24
(c) B4-C25 (d) B4-C26
Figure 5.13: Determination of column base shear force using the different creep and shrinkage models in FEM of B4 (solid lines show the effcets of concrete relaxation in
columns and dashed lines ignore the effects of concrete relaxation)
-600
-500
-400
-300
-200
-100
0
-2670
-2225
-1780
-1335
-890
-446
-10 100 200 300 400
Bas
e Sh
ear F
orce
(kip
)
Bas
e Sh
ear F
orce
(kN
)
Time (day)
Lewis andKarbhari (2006)
CEB-FIP (1992)
AASHTO(2010) -500
-400
-300
-200
-100
0
-2225
-1780
-1335
-890
-445
00 100 200 300 400
Bas
e Sh
ear F
orce
(kip
)
Bas
e Sh
ear F
orce
(kN
)
Time (day)
Lewis and Karbhari(2006)CEB-FIP (1992)
AASHTO (2010)
0
100
200
300
400
500
600
0
445
890
1335
1780
2225
26690 100 200 300 400
Bas
e Sh
ear F
orce
(kip
)
Bas
e Sh
ear F
orce
(kN
)
Time (day)
Lewis and Karbhari (2006)
CEB-FIP (1992)
AASHTO (2010)
0
100
200
300
400
500
600
0
445
890
1335
1780
2225
26690 100 200 300 400
Bas
e Sh
ear F
orce
(kip
)
Bas
e Sh
ear F
orce
(kN
)
Time (day)
Lewis andKarbhari (2006)CEB-FIP (1992)
AASHTO (2010)
106
Summary and Conclusions
The methodology and the assumptions used to analyze the CIP / PS Box were
demonstrated through detailed analyses of a bridge frame (i.e., B4) in this chapter. An FEM of
the selected CIP / PS Box was developed using the midas Civil software (2013) to calculate the
stresses and deformations over several hundred time-steps from the time of construction to the
completion of the CIP / PS Box. The significant parameters affecting time-dependent behavior of
CIP / PS BOX, including concrete creep/relaxation and shrinkage, prestress losses, support
locations, column effective stiffness, and construction stages were taken into account in the
FEM. The beneficial effects of concrete relaxation were demonstrated by comparing the results
when the CIP / PS Box was analyzed by including and ignoring the relaxation functions for the
columns. Based on the findings of the FEM analyses, the following conclusions have been
drawn:
• The shrinkage of the CIP / PS Box superstructure had the largest contribution to the
shortening strain rate of the superstructure, column top lateral displacement, and the column
base shear force compared to the corresponding effects of dead load, prestress, and creep.
• In general, the further away the column was from the location of the PNM, the larger the
column top lateral displacement and consequently the base shear force were. Thus, the
exterior columns experienced higher lateral displacements and base shear forces than the
interior columns.
• Based on the moment-curvature analysis, the exterior columns would crack due to
displacement-induced forces, while the column adjacent to the PNM might not experience
flexural cracking.
• The reduction in bending moment due to concrete relaxation prevented any columns

107
experiencing yielding, which would not be the case if the concrete relaxation was not
included in the analyses.
• Due to the column relaxation, the ultimate base shear force was reduced by as much as 53%
for the exterior column (i.e., B4-C26).
• The sensitivity analysis on the effects of the column loading age on the relaxation of
displacement-induced forces indicated that a 51.8% reduction in creep coefficient between
the loading ages of three and 790 days, which translated to a 32.8% increase in the column
base shear force for C23 at 2000 days.
• The sensitivity analysis indicated that the variation in the predicted creep and shrinkage
values resulting from different creep and shrinkage models resulted in significantly different
column base shear forces. The AASHTO models were found to give results that are not too
conservative or less conservative.
• The base shear force was not as sensitive as the AASHTO creep coefficient was to the
column loading age. After 2000 days, a 51.8% reduction in creep coefficient between loading
ages of three and 790 days was found, which translated to 32.8% increase in the column base
shear force for B4-C23.
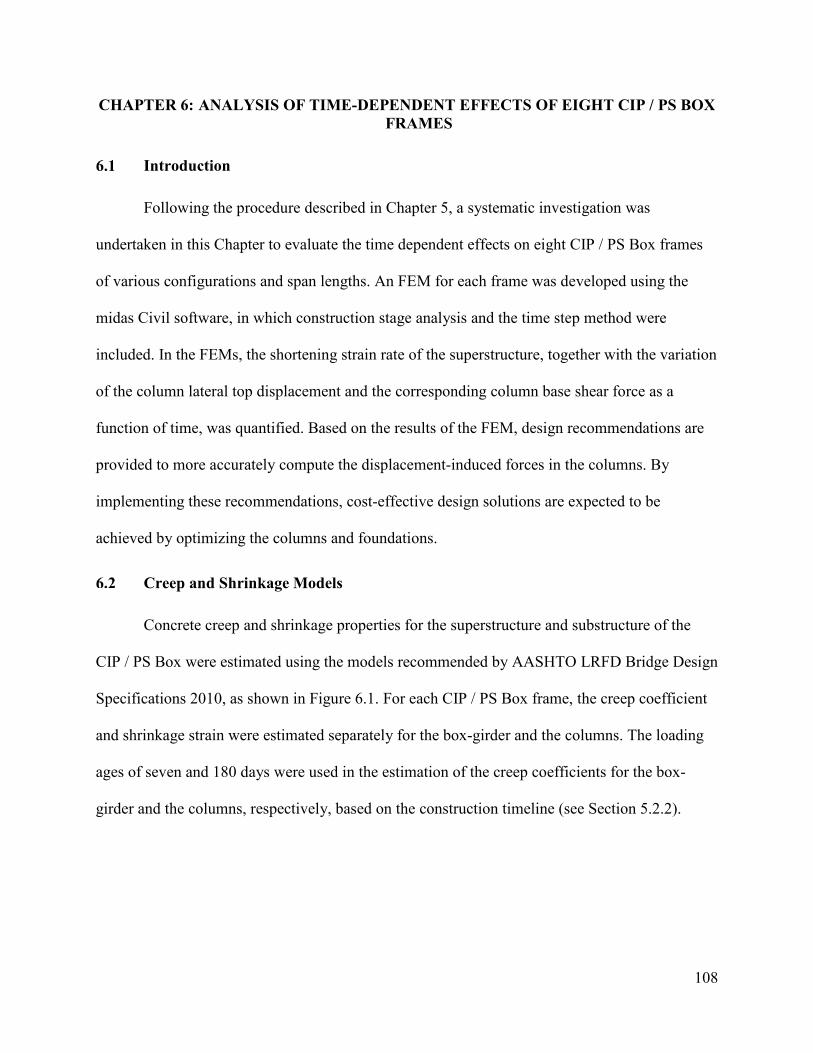
108
CHAPTER 6: ANALYSIS OF TIME-DEPENDENT EFFECTS OF EIGHT CIP / PS BOX FRAMES
Introduction
Following the procedure described in Chapter 5, a systematic investigation was
undertaken in this Chapter to evaluate the time dependent effects on eight CIP / PS Box frames
of various configurations and span lengths. An FEM for each frame was developed using the
midas Civil software, in which construction stage analysis and the time step method were
included. In the FEMs, the shortening strain rate of the superstructure, together with the variation
of the column lateral top displacement and the corresponding column base shear force as a
function of time, was quantified. Based on the results of the FEM, design recommendations are
provided to more accurately compute the displacement-induced forces in the columns. By
implementing these recommendations, cost-effective design solutions are expected to be
achieved by optimizing the columns and foundations.
Creep and Shrinkage Models
Concrete creep and shrinkage properties for the superstructure and substructure of the
CIP / PS Box were estimated using the models recommended by AASHTO LRFD Bridge Design
Specifications 2010, as shown in Figure 6.1. For each CIP / PS Box frame, the creep coefficient
and shrinkage strain were estimated separately for the box-girder and the columns. The loading
ages of seven and 180 days were used in the estimation of the creep coefficients for the box-
girder and the columns, respectively, based on the construction timeline (see Section 5.2.2).
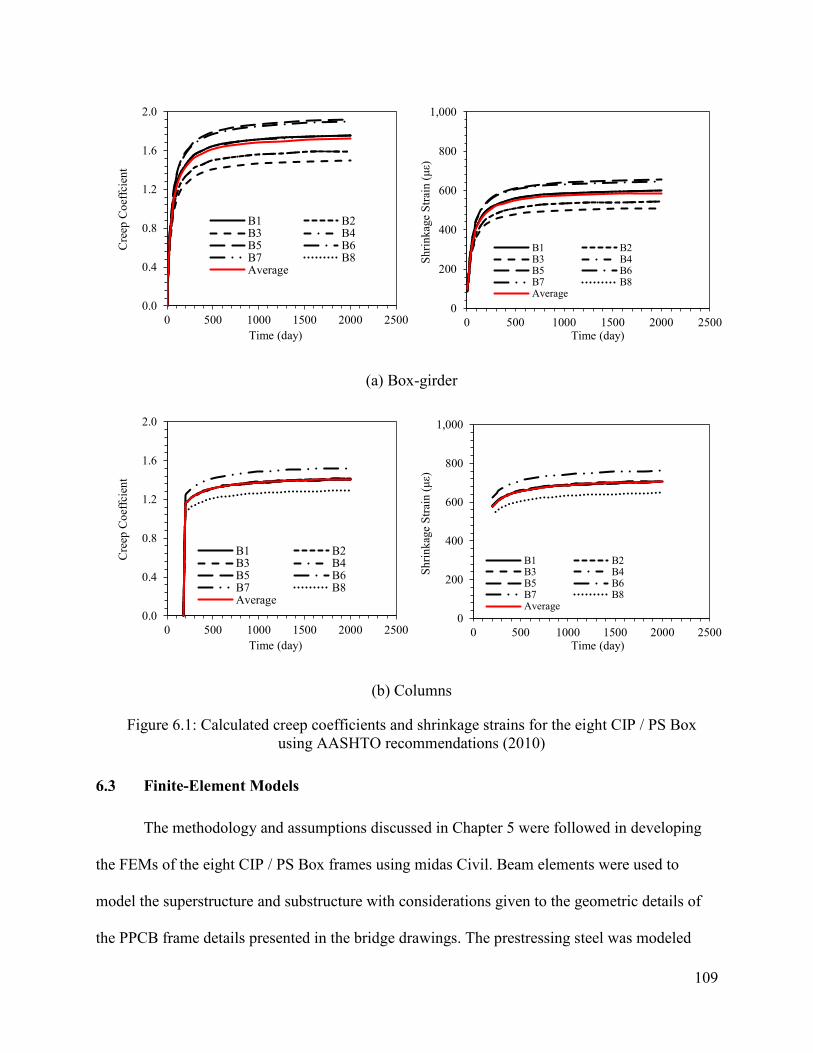
109
(a) Box-girder
(b) Columns
Figure 6.1: Calculated creep coefficients and shrinkage strains for the eight CIP / PS Box using AASHTO recommendations (2010)
Finite-Element Models
The methodology and assumptions discussed in Chapter 5 were followed in developing
the FEMs of the eight CIP / PS Box frames using midas Civil. Beam elements were used to
model the superstructure and substructure with considerations given to the geometric details of
the PPCB frame details presented in the bridge drawings. The prestressing steel was modeled
0.0
0.4
0.8
1.2
1.6
2.0
0 500 1000 1500 2000 2500
Cre
ep C
oeffc
ient
Time (day)
B1 B2B3 B4B5 B6B7 B8Average
0
200
400
600
800
1,000
0 500 1000 1500 2000 2500
Shrin
kage
Stra
in (μ
ε)
Time (day)
B1 B2B3 B4B5 B6B7 B8Average
0.0
0.4
0.8
1.2
1.6
2.0
0 500 1000 1500 2000 2500
Cre
ep C
oeffc
ient
Time (day)
B1 B2B3 B4B5 B6B7 B8Average
0
200
400
600
800
1,000
0 500 1000 1500 2000 2500
Shrin
kage
Stra
in (μ
ε)
Time (day)
B1 B2B3 B4B5 B6B7 B8Average
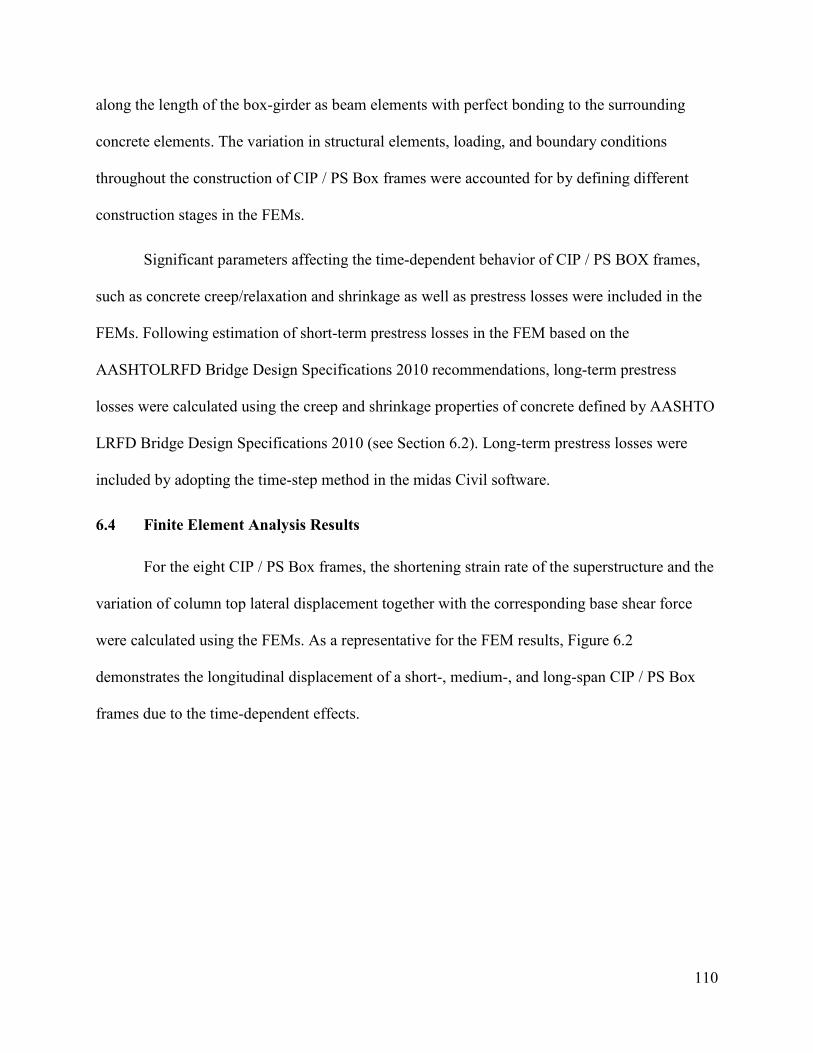
110
along the length of the box-girder as beam elements with perfect bonding to the surrounding
concrete elements. The variation in structural elements, loading, and boundary conditions
throughout the construction of CIP / PS Box frames were accounted for by defining different
construction stages in the FEMs.
Significant parameters affecting the time-dependent behavior of CIP / PS BOX frames,
such as concrete creep/relaxation and shrinkage as well as prestress losses were included in the
FEMs. Following estimation of short-term prestress losses in the FEM based on the
AASHTOLRFD Bridge Design Specifications 2010 recommendations, long-term prestress
losses were calculated using the creep and shrinkage properties of concrete defined by AASHTO
LRFD Bridge Design Specifications 2010 (see Section 6.2). Long-term prestress losses were
included by adopting the time-step method in the midas Civil software.
Finite Element Analysis Results
For the eight CIP / PS Box frames, the shortening strain rate of the superstructure and the
variation of column top lateral displacement together with the corresponding base shear force
were calculated using the FEMs. As a representative for the FEM results, Figure 6.2
demonstrates the longitudinal displacement of a short-, medium-, and long-span CIP / PS Box
frames due to the time-dependent effects.
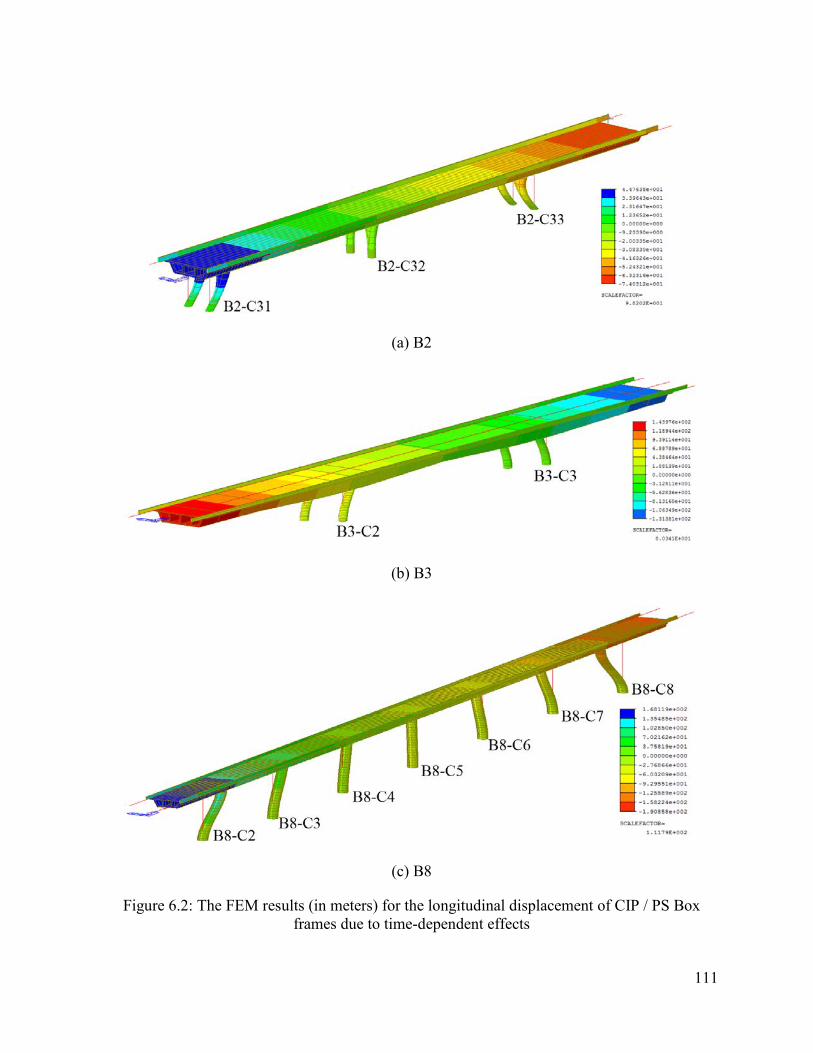
111
(a) B2
(b) B3
(c) B8
Figure 6.2: The FEM results (in meters) for the longitudinal displacement of CIP / PS Box frames due to time-dependent effects
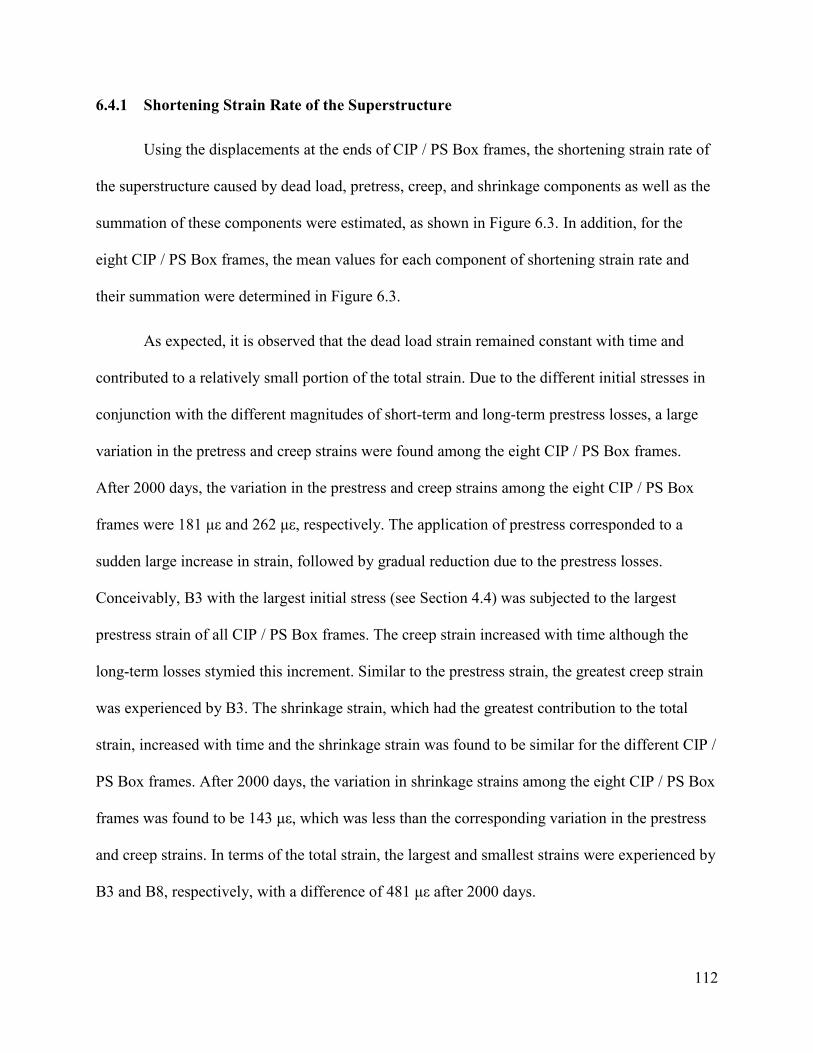
112
6.4.1 Shortening Strain Rate of the Superstructure
Using the displacements at the ends of CIP / PS Box frames, the shortening strain rate of
the superstructure caused by dead load, pretress, creep, and shrinkage components as well as the
summation of these components were estimated, as shown in Figure 6.3. In addition, for the
eight CIP / PS Box frames, the mean values for each component of shortening strain rate and
their summation were determined in Figure 6.3.
As expected, it is observed that the dead load strain remained constant with time and
contributed to a relatively small portion of the total strain. Due to the different initial stresses in
conjunction with the different magnitudes of short-term and long-term prestress losses, a large
variation in the pretress and creep strains were found among the eight CIP / PS Box frames.
After 2000 days, the variation in the prestress and creep strains among the eight CIP / PS Box
frames were 181 με and 262 με, respectively. The application of prestress corresponded to a
sudden large increase in strain, followed by gradual reduction due to the prestress losses.
Conceivably, B3 with the largest initial stress (see Section 4.4) was subjected to the largest
prestress strain of all CIP / PS Box frames. The creep strain increased with time although the
long-term losses stymied this increment. Similar to the prestress strain, the greatest creep strain
was experienced by B3. The shrinkage strain, which had the greatest contribution to the total
strain, increased with time and the shrinkage strain was found to be similar for the different CIP /
PS Box frames. After 2000 days, the variation in shrinkage strains among the eight CIP / PS Box
frames was found to be 143 με, which was less than the corresponding variation in the prestress
and creep strains. In terms of the total strain, the largest and smallest strains were experienced by
B3 and B8, respectively, with a difference of 481 με after 2000 days.
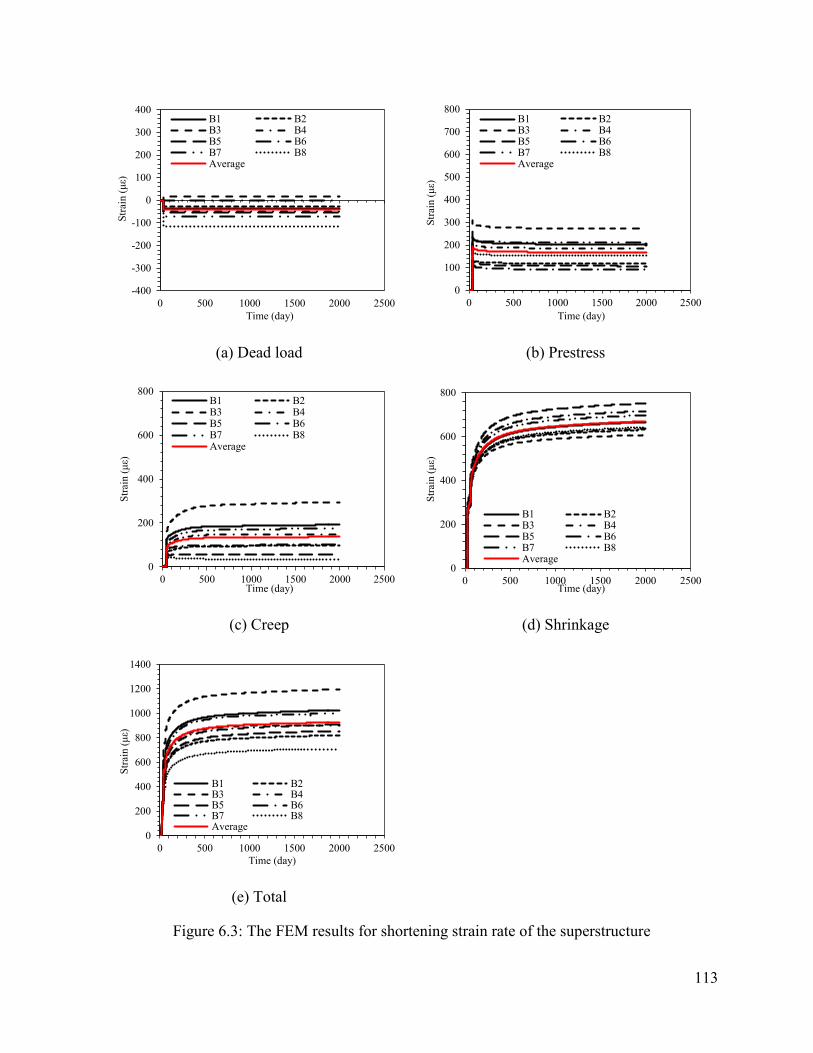
113
(a) Dead load (b) Prestress
(c) Creep (d) Shrinkage
(e) Total Figure 6.3: The FEM results for shortening strain rate of the superstructure
-400
-300
-200
-100
0
100
200
300
400
0 500 1000 1500 2000 2500
Stra
in (μ
ε)
Time (day)
B1 B2B3 B4B5 B6B7 B8Average
0
100
200
300
400
500
600
700
800
0 500 1000 1500 2000 2500
Stra
in (μ
ε)
Time (day)
B1 B2B3 B4B5 B6B7 B8Average
0
200
400
600
800
0 500 1000 1500 2000 2500
Stra
in (μ
ε)
Time (day)
B1 B2B3 B4B5 B6B7 B8Average
0
200
400
600
800
0 500 1000 1500 2000 2500
Stra
in (μ
ε)
Time (day)
B1 B2B3 B4B5 B6B7 B8Average
0
200
400
600
800
1000
1200
1400
0 500 1000 1500 2000 2500
Stra
in (μ
ε)
Time (day)
B1 B2B3 B4B5 B6B7 B8Average
114
6.4.2 Column Top Lateral Displacement
The left sides of Figure 6.4 through Figure 6.6 exhibit the results for the total top lateral
displacement of columns in short-, medium-, and long-span CIP / PS Box frames, sequentially.
In each figure, the results for the two exterior columns are shown using a solid curve and a
dotted curve. Simlarly for all CIP / PS Box frames, the extreior columns were subjected to the
laregst displcaments due to their relative distance to the PNM, while the interior columns, which
were the nearest to the PNM, had the smallest lateral displcements. Typically, the displcament of
the extreior columns increased as the CIP / PS Box length increased, where B1-C2 and B7-C2
had the smallest and largest diplacments of 23 mm (0.9 in.) and 173 mm (6.8 in.), respectively.
6.4.3 Column Base Shear Force
The estimated total column base shear force caused by a combination of dead load,
prestress, creep, and shrinkage for short-, medium-, and long-span CIP / PS Box frames are
presented in the right sides of Figure 6.4 through Figure 6.6. In each figure, the two exterior
columns are designated by a solid curve and a dotted curve. Similar to the displcaments, the
largest base shear force was induced in the exterior columns, while the interior columns adjacent
to the PNM experineced siginificantly smaller displacement-induced base shear forces. As a
result, the exterior columns were found to experience cracking due to deformation-induced
forces, while the columns adjacent to the PNM remained uncracked.
Since the estimated base shear force is predominatly affected by a combination of column
displacment and the slenderness ratio, the columns in the long-span CIP / PS Box frames with
higher column displacment do not necessarily have larger base shear forces compared to the
columns in short-span CIP / PS Box frames. For instance, the column base shear forces in B5 are
significantly less than the corresponding values in B1 even though the column displacements in
115
B5 weare significantly larger than those of B1. This can be attributed to the slender columns of
B5, while the columns in B1 are reletively short and stiff. The smallest and largest base shear
force among the exterior columns of the eight CIP / PS Box after 2000 days was found to be 297
kN (66.8 kips) and -11610 kN (2610 kips) for B5-C6 and B8-C2, respectively.
(a) B1
(b) B2
Figure 6.4: Variation of the FEM predicted column top lateral displacements and the corresponding base shear forces with time for the short-span CIP / PS Box frames
-2
-1
0
1
2
-51
-25
0
25
51
0 500 1000 1500 2000 2500
Dis
plac
emen
t (in
.)
Dis
plac
emen
t (m
m)
Time (day)
B1-C2B1-C3
-1000
-500
0
500
1000
-4448
-2224
0
2224
4448
0 500 1000 1500 2000 2500
Bas
e Sh
ear F
orce
(kip
)
Bas
e Sh
ear F
orce
(kN
)
Time (day)
B1-C2B1-C3
-2
-1
0
1
2
-51
-25
0
25
51
0 500 1000 1500 2000 2500
Dis
plac
emen
t (in
.)
Dis
plac
emen
t (m
m)
Time (day)
B2-C31B2-C32B2-C33
-300
-150
0
150
300
-1,334
-667
0
667
1,334
0 500 1000 1500 2000 2500
Bas
e Sh
ear F
orce
(kip
)
Bas
e Sh
ear F
orce
(kN
)
Time (day)
B2-C33B2-C32B2-C31
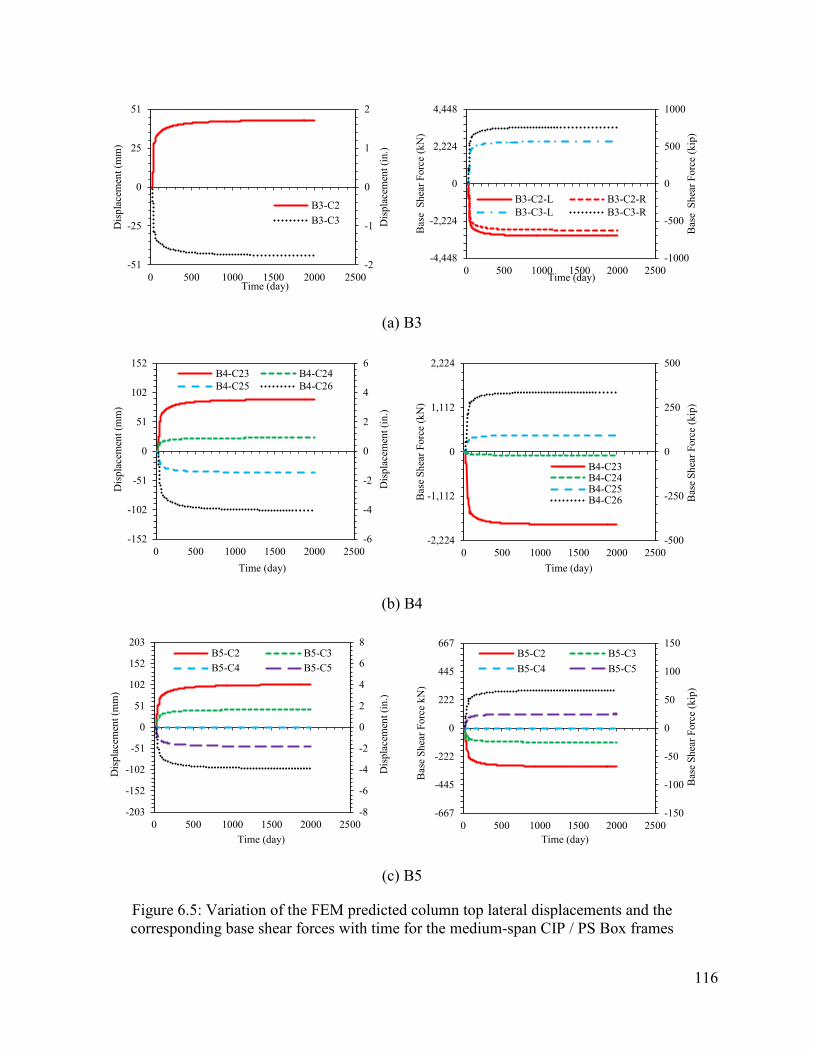
116
(a) B3
(b) B4
(c) B5
Figure 6.5: Variation of the FEM predicted column top lateral displacements and the corresponding base shear forces with time for the medium-span CIP / PS Box frames
-2
-1
0
1
2
-51
-25
0
25
51
0 500 1000 1500 2000 2500
Dis
plac
emen
t (in
.)
Dis
plac
emen
t (m
m)
Time (day)
B3-C2B3-C3
-1000
-500
0
500
1000
-4,448
-2,224
0
2,224
4,448
0 500 1000 1500 2000 2500
Bas
e S
hear
For
ce (k
ip)
Bas
e S
hear
For
ce (k
N)
Time (day)
B3-C2-L B3-C2-RB3-C3-L B3-C3-R
-6
-4
-2
0
2
4
6
-152
-102
-51
0
51
102
152
0 500 1000 1500 2000 2500
Dis
plac
emen
t (in
.)
Dis
plac
emen
t (m
m)
Time (day)
B4-C23 B4-C24B4-C25 B4-C26
-500
-250
0
250
500
-2,224
-1,112
0
1,112
2,224
0 500 1000 1500 2000 2500
Bas
e Sh
ear F
orce
(kip
)
Bas
e Sh
ear F
orce
(kN
)
Time (day)
B4-C23B4-C24B4-C25B4-C26
-8
-6
-4
-2
0
2
4
6
8
-203
-152
-102
-51
0
51
102
152
203
0 500 1000 1500 2000 2500
Dis
plac
emen
t (in
.)
Dis
plac
emen
t (m
m)
Time (day)
B5-C2 B5-C3B5-C4 B5-C5
-150
-100
-50
0
50
100
150
-667
-445
-222
0
222
445
667
0 500 1000 1500 2000 2500
Bas
e Sh
ear F
orce
(kip
)
Bas
e Sh
ear F
orce
kN
)
Time (day)
B5-C2 B5-C3B5-C4 B5-C5
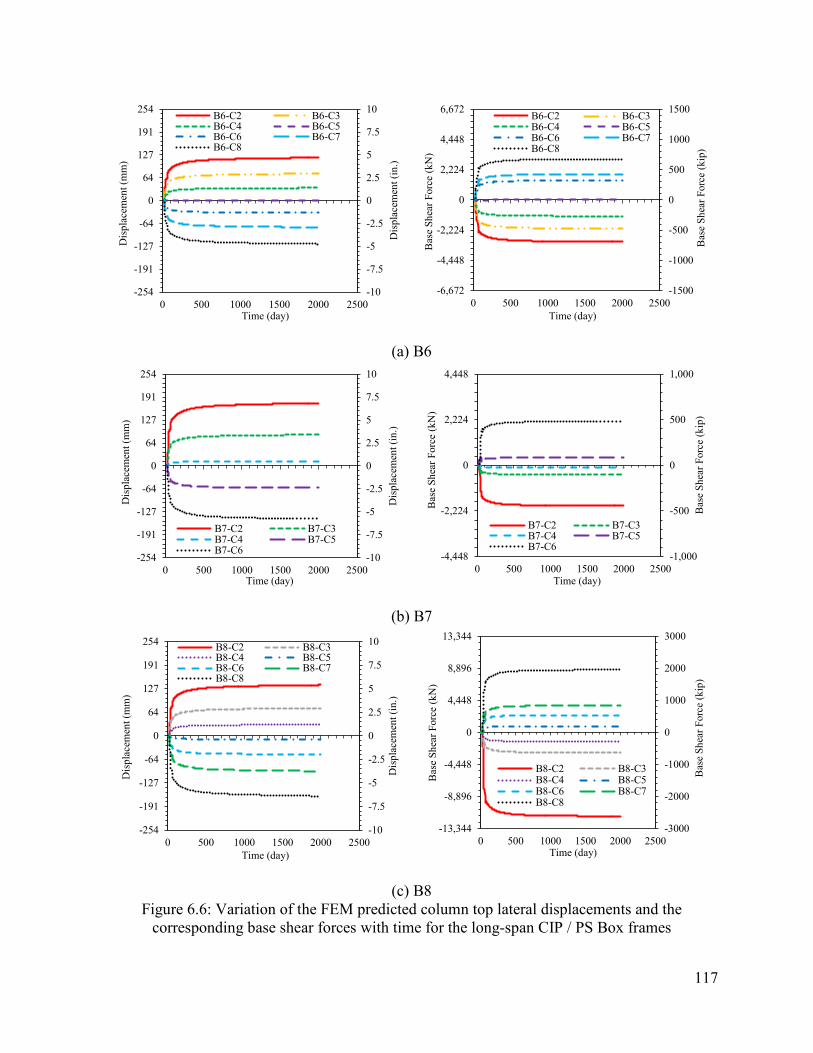
117
(a) B6
(b) B7
(c) B8 Figure 6.6: Variation of the FEM predicted column top lateral displacements and the
corresponding base shear forces with time for the long-span CIP / PS Box frames
-10
-7.5
-5
-2.5
0
2.5
5
7.5
10
-254
-191
-127
-64
0
64
127
191
254
0 500 1000 1500 2000 2500
Dis
plac
emen
t (in
.)
Dis
plac
emen
t (m
m)
Time (day)
B6-C2 B6-C3B6-C4 B6-C5B6-C6 B6-C7B6-C8
-1500
-1000
-500
0
500
1000
1500
-6,672
-4,448
-2,224
0
2,224
4,448
6,672
0 500 1000 1500 2000 2500
Bas
e Sh
ear F
orce
(kip
)
Bas
e Sh
ear F
orce
(kN
)
Time (day)
B6-C2 B6-C3B6-C4 B6-C5B6-C6 B6-C7B6-C8
-10
-7.5
-5
-2.5
0
2.5
5
7.5
10
-254
-191
-127
-64
0
64
127
191
254
0 500 1000 1500 2000 2500
Dis
plac
emen
t (in
.)
Dis
plac
emen
t (m
m)
Time (day)
B7-C2 B7-C3B7-C4 B7-C5B7-C6 -1,000
-500
0
500
1,000
-4,448
-2,224
0
2,224
4,448
0 500 1000 1500 2000 2500
Bas
e Sh
ear F
orce
(kip
)
Bas
e Sh
ear F
orce
(kN
)
Time (day)
B7-C2 B7-C3B7-C4 B7-C5B7-C6
-10
-7.5
-5
-2.5
0
2.5
5
7.5
10
-254
-191
-127
-64
0
64
127
191
254
0 500 1000 1500 2000 2500
Dis
plac
emen
t (in
.)
Dis
plac
emen
t (m
m)
Time (day)
B8-C2 B8-C3B8-C4 B8-C5B8-C6 B8-C7B8-C8
-3000
-2000
-1000
0
1000
2000
3000
-13,344
-8,896
-4,448
0
4,448
8,896
13,344
0 500 1000 1500 2000 2500
Bas
e Sh
ear F
orce
(kip
)
Bas
e Sh
ear F
orce
(kN
)
Time (day)
B8-C2 B8-C3B8-C4 B8-C5B8-C6 B8-C7B8-C8
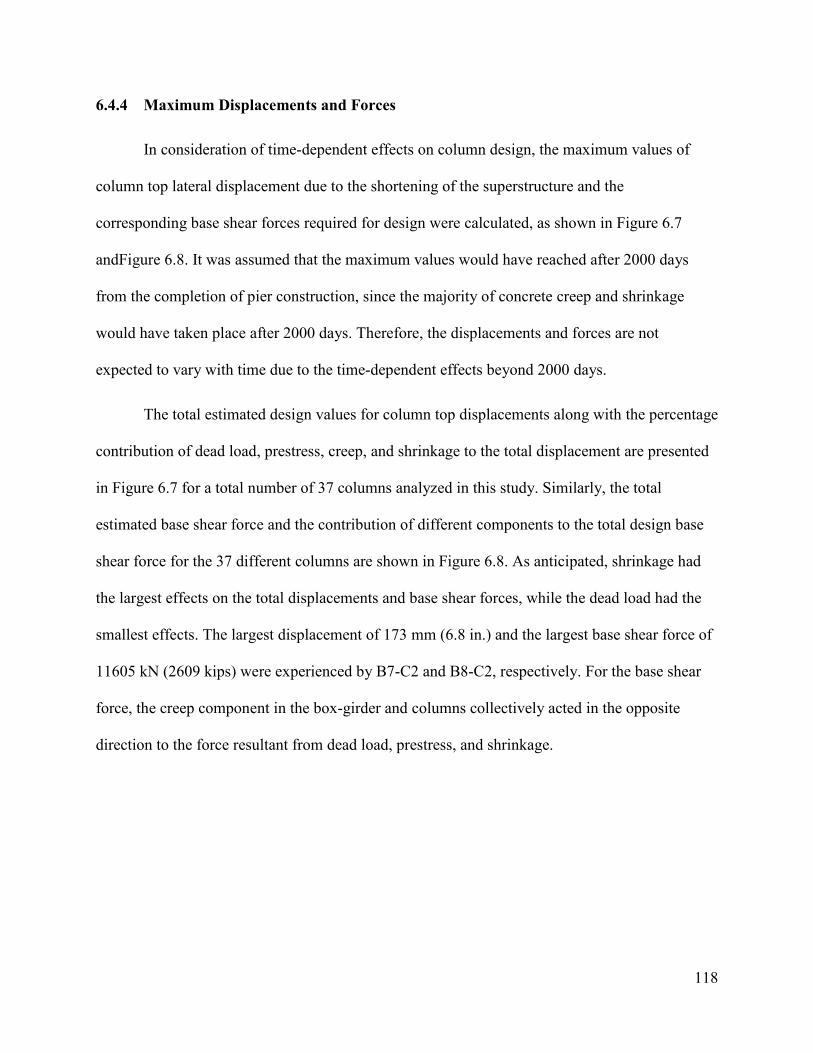
118
6.4.4 Maximum Displacements and Forces
In consideration of time-dependent effects on column design, the maximum values of
column top lateral displacement due to the shortening of the superstructure and the
corresponding base shear forces required for design were calculated, as shown in Figure 6.7
andFigure 6.8. It was assumed that the maximum values would have reached after 2000 days
from the completion of pier construction, since the majority of concrete creep and shrinkage
would have taken place after 2000 days. Therefore, the displacements and forces are not
expected to vary with time due to the time-dependent effects beyond 2000 days.
The total estimated design values for column top displacements along with the percentage
contribution of dead load, prestress, creep, and shrinkage to the total displacement are presented
in Figure 6.7 for a total number of 37 columns analyzed in this study. Similarly, the total
estimated base shear force and the contribution of different components to the total design base
shear force for the 37 different columns are shown in Figure 6.8. As anticipated, shrinkage had
the largest effects on the total displacements and base shear forces, while the dead load had the
smallest effects. The largest displacement of 173 mm (6.8 in.) and the largest base shear force of
11605 kN (2609 kips) were experienced by B7-C2 and B8-C2, respectively. For the base shear
force, the creep component in the box-girder and columns collectively acted in the opposite
direction to the force resultant from dead load, prestress, and shrinkage.
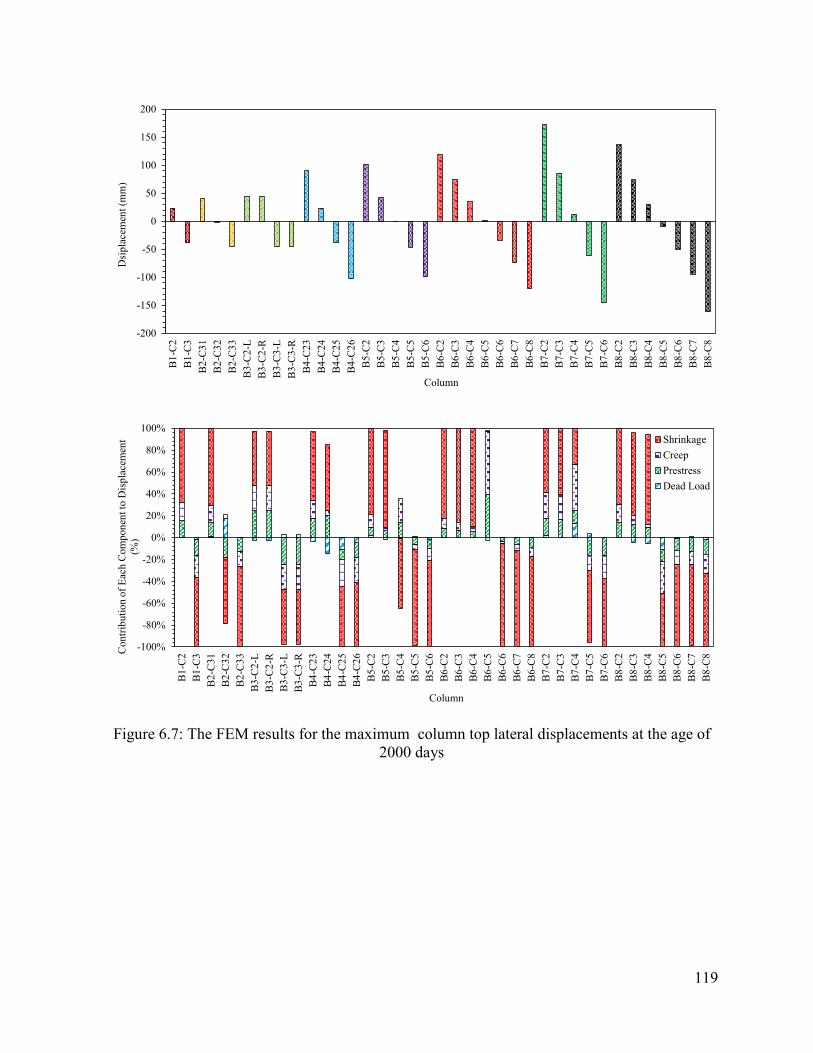
119
Figure 6.7: The FEM results for the maximum column top lateral displacements at the age of 2000 days
-200
-150
-100
-50
0
50
100
150
200
B1-C
2B1
-C3
B2-C
31B2
-C32
B2-C
33B3
-C2-
LB3
-C2-
RB3
-C3-
LB3
-C3-
RB4
-C23
B4-C
24B4
-C25
B4-C
26B5
-C2
B5-C
3B5
-C4
B5-C
5B5
-C6
B6-C
2B6
-C3
B6-C
4B6
-C5
B6-C
6B6
-C7
B6-C
8B7
-C2
B7-C
3B7
-C4
B7-C
5B7
-C6
B8-C
2B8
-C3
B8-C
4B8
-C5
B8-C
6B8
-C7
B8-C
8
Dsi
plac
emen
t (m
m)
Column
-100%
-80%
-60%
-40%
-20%
0%
20%
40%
60%
80%
100%
B1-C
2B1
-C3
B2-C
31B2
-C32
B2-C
33B3
-C2-
LB3
-C2-
RB3
-C3-
LB3
-C3-
RB4
-C23
B4-C
24B4
-C25
B4-C
26B5
-C2
B5-C
3B5
-C4
B5-C
5B5
-C6
B6-C
2B6
-C3
B6-C
4B6
-C5
B6-C
6B6
-C7
B6-C
8B7
-C2
B7-C
3B7
-C4
B7-C
5B7
-C6
B8-C
2B8
-C3
B8-C
4B8
-C5
B8-C
6B8
-C7
B8-C
8Con
tribu
tion
of E
ach
Com
pone
nt to
Dis
plac
emen
t (%
)
Column
ShrinkageCreepPrestressDead Load
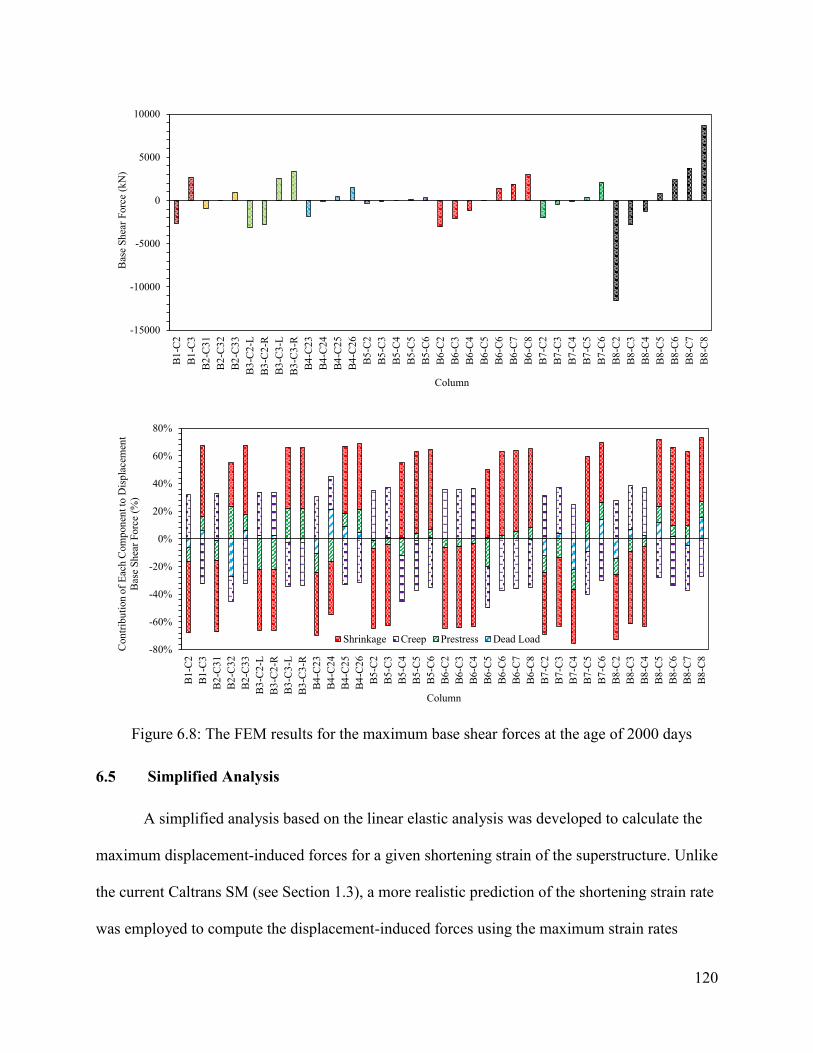
120
Figure 6.8: The FEM results for the maximum base shear forces at the age of 2000 days
Simplified Analysis
A simplified analysis based on the linear elastic analysis was developed to calculate the
maximum displacement-induced forces for a given shortening strain of the superstructure. Unlike
the current Caltrans SM (see Section 1.3), a more realistic prediction of the shortening strain rate
was employed to compute the displacement-induced forces using the maximum strain rates
-15000
-10000
-5000
0
5000
10000
B1-C
2B1
-C3
B2-C
31B2
-C32
B2-C
33B3
-C2-
LB3
-C2-
RB3
-C3-
LB3
-C3-
RB4
-C23
B4-C
24B4
-C25
B4-C
26B5
-C2
B5-C
3B5
-C4
B5-C
5B5
-C6
B6-C
2B6
-C3
B6-C
4B6
-C5
B6-C
6B6
-C7
B6-C
8B7
-C2
B7-C
3B7
-C4
B7-C
5B7
-C6
B8-C
2B8
-C3
B8-C
4B8
-C5
B8-C
6B8
-C7
B8-C
8
Bas
e Sh
ear F
orce
(kN
)
Column
-80%
-60%
-40%
-20%
0%
20%
40%
60%
80%
B1-C
2B1
-C3
B2-C
31B2
-C32
B2-C
33B3
-C2-
LB3
-C2-
RB3
-C3-
LB3
-C3-
RB4
-C23
B4-C
24B4
-C25
B4-C
26B5
-C2
B5-C
3B5
-C4
B5-C
5B5
-C6
B6-C
2B6
-C3
B6-C
4B6
-C5
B6-C
6B6
-C7
B6-C
8B7
-C2
B7-C
3B7
-C4
B7-C
5B7
-C6
B8-C
2B8
-C3
B8-C
4B8
-C5
B8-C
6B8
-C7
B8-C
8
Con
tribu
tion
of E
ach
Com
pone
nt to
Dis
plac
emen
t B
ase
Shea
r For
ce (%
)
Column
Shrinkage Creep Prestress Dead Load
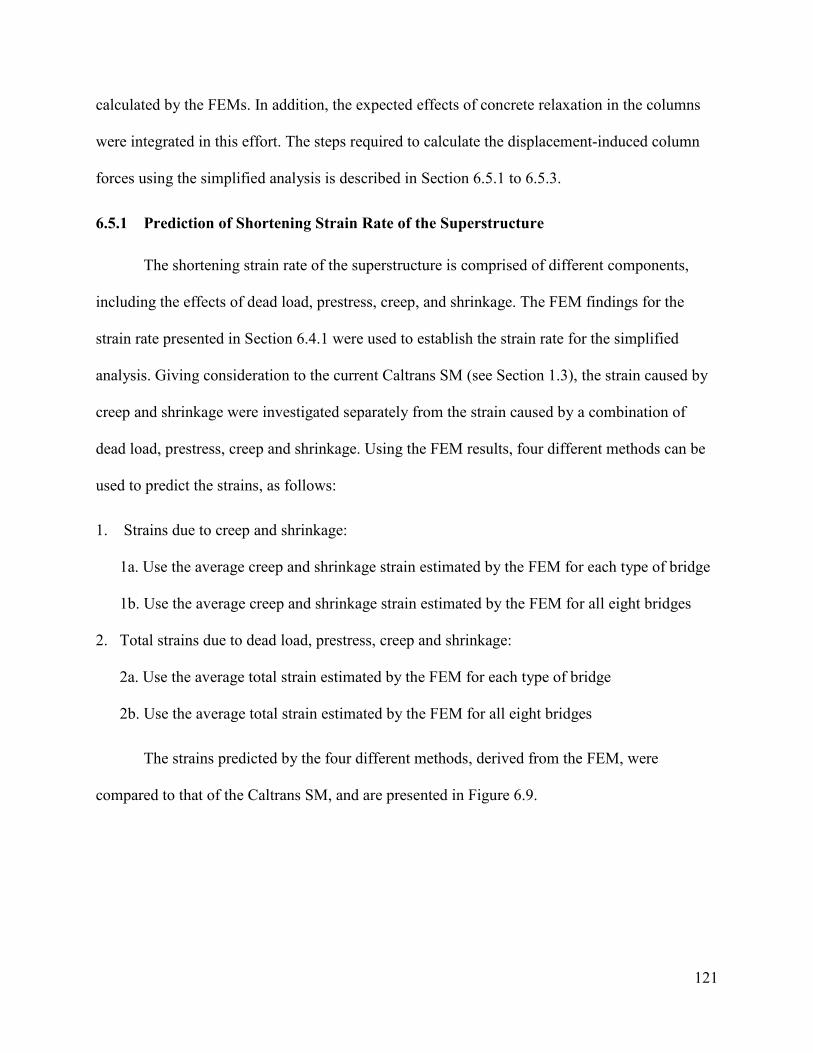
121
calculated by the FEMs. In addition, the expected effects of concrete relaxation in the columns
were integrated in this effort. The steps required to calculate the displacement-induced column
forces using the simplified analysis is described in Section 6.5.1 to 6.5.3.
6.5.1 Prediction of Shortening Strain Rate of the Superstructure
The shortening strain rate of the superstructure is comprised of different components,
including the effects of dead load, prestress, creep, and shrinkage. The FEM findings for the
strain rate presented in Section 6.4.1 were used to establish the strain rate for the simplified
analysis. Giving consideration to the current Caltrans SM (see Section 1.3), the strain caused by
creep and shrinkage were investigated separately from the strain caused by a combination of
dead load, prestress, creep and shrinkage. Using the FEM results, four different methods can be
used to predict the strains, as follows:
1. Strains due to creep and shrinkage:
1a. Use the average creep and shrinkage strain estimated by the FEM for each type of bridge
1b. Use the average creep and shrinkage strain estimated by the FEM for all eight bridges
2. Total strains due to dead load, prestress, creep and shrinkage:
2a. Use the average total strain estimated by the FEM for each type of bridge
2b. Use the average total strain estimated by the FEM for all eight bridges
The strains predicted by the four different methods, derived from the FEM, were
compared to that of the Caltrans SM, and are presented in Figure 6.9.
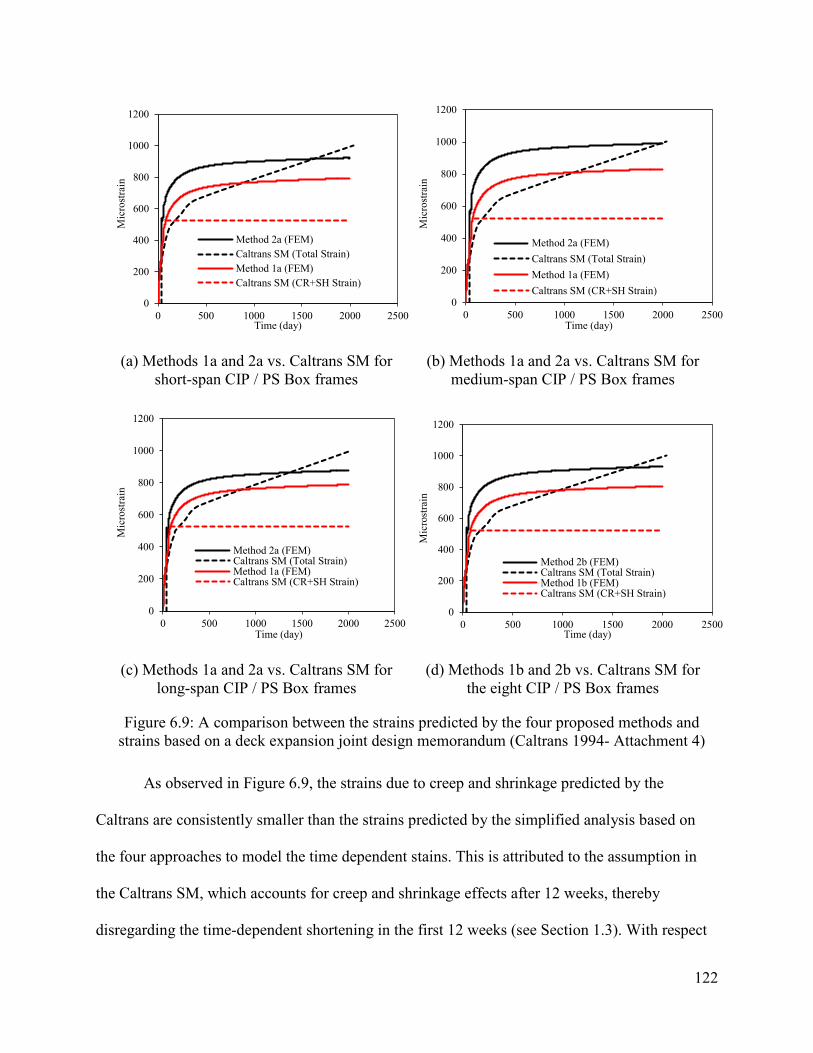
122
(a) Methods 1a and 2a vs. Caltrans SM for short-span CIP / PS Box frames
(b) Methods 1a and 2a vs. Caltrans SM for medium-span CIP / PS Box frames
(c) Methods 1a and 2a vs. Caltrans SM for long-span CIP / PS Box frames
(d) Methods 1b and 2b vs. Caltrans SM for the eight CIP / PS Box frames
Figure 6.9: A comparison between the strains predicted by the four proposed methods and strains based on a deck expansion joint design memorandum (Caltrans 1994- Attachment 4)
As observed in Figure 6.9, the strains due to creep and shrinkage predicted by the
Caltrans are consistently smaller than the strains predicted by the simplified analysis based on
the four approaches to model the time dependent stains. This is attributed to the assumption in
the Caltrans SM, which accounts for creep and shrinkage effects after 12 weeks, thereby
disregarding the time-dependent shortening in the first 12 weeks (see Section 1.3). With respect
0
200
400
600
800
1000
1200
0 500 1000 1500 2000 2500
Mic
rost
rain
Time (day)
Method 2a (FEM)Caltrans SM (Total Strain)Method 1a (FEM)Caltrans SM (CR+SH Strain)
0
200
400
600
800
1000
1200
0 500 1000 1500 2000 2500
Mic
rost
rain
Time (day)
Method 2a (FEM)Caltrans SM (Total Strain)Method 1a (FEM)Caltrans SM (CR+SH Strain)
0
200
400
600
800
1000
1200
0 500 1000 1500 2000 2500
Mic
rost
rain
Time (day)
Method 2a (FEM)Caltrans SM (Total Strain)Method 1a (FEM)Caltrans SM (CR+SH Strain)
0
200
400
600
800
1000
1200
0 500 1000 1500 2000 2500
Mic
rost
rain
Time (day)
Method 2b (FEM)Caltrans SM (Total Strain)Method 1b (FEM)Caltrans SM (CR+SH Strain)
123
to the total strain, the Caltrans and simplified approaches yield to comparable maximum strains
at the age of about 1800 days, although the Caltrans resulted in smaller total strains compared to
the recommended approaches in the early stages (i.e., less than 1500 days).
The maximum total strains due to the dead load, prestress, creep, and shrinkage in
addition to maximum strains due to creep and shrinkage predicted by the different proposed
methods and Caltrans are summarized in Table 6.1. It is observed that the current Caltrans SM
results in noticeably smaller creep and shrinkage strains compared to the strains predicted by the
four recommended approaches. By including the creep and shrinkage strain of the first 12 weeks
in the Caltrans SM, the Caltrans results would be more comparable to the predicted values by the
simplified approaches.
A better correlation was found between the maximum total strains incorporated into the
simplified method and the maximum total strains estimated by the Caltrans SM. The largest
difference of 323 µε was found between the total strains predicted by the Caltrans and Approach
2a for long-span CIP / PS Box frames. The predicted total strains by the Caltrans had the best
agreement with Approach 2a for medium-span bridges.
Table 6.1: The predicted maximum strains (με) based on the different simplified approaches at the age of 2000 days
PPCB Frames
Creep and shrinkage strain Total strain
Caltrans SM Approach 1a Approach 1b Caltrans SM Approach 2a Approach 2b
Short-span 525 794 806 1200 926 932
Medium-span 525 831 806 1200 990 932
Long-span 525 788 806 1200 877 932
All Eight 525 Not applicable 806 1200 Not applicable 932
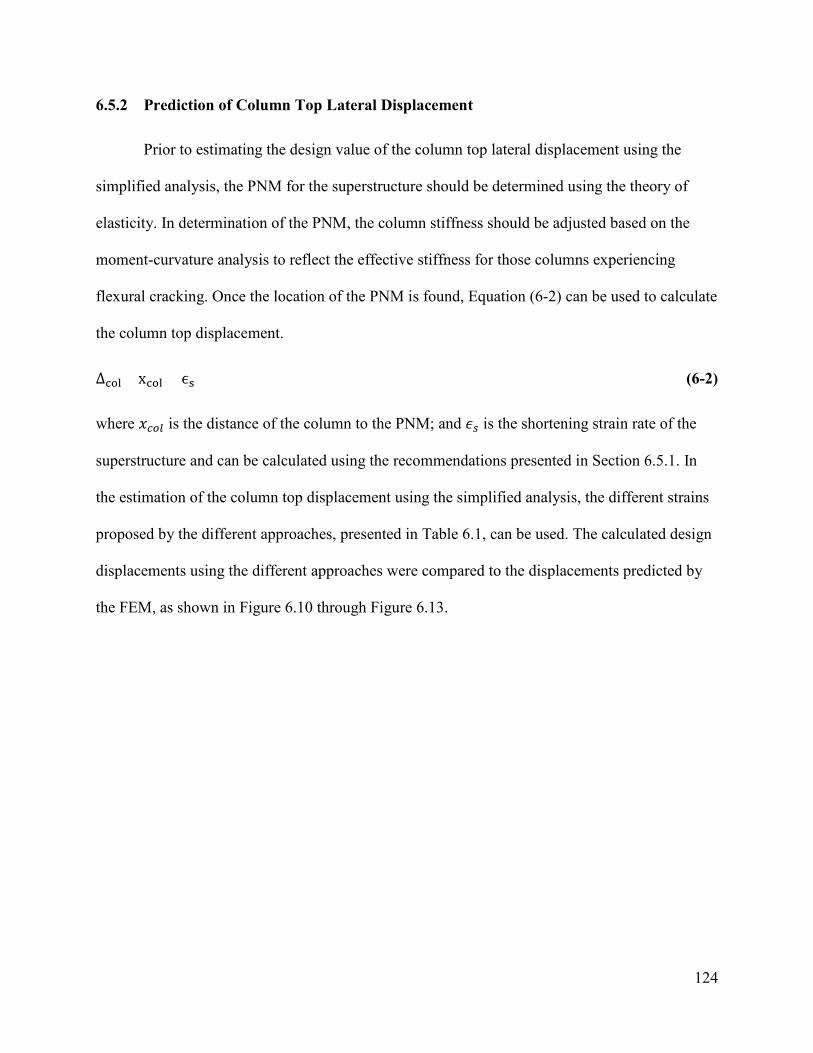
124
6.5.2 Prediction of Column Top Lateral Displacement
Prior to estimating the design value of the column top lateral displacement using the
simplified analysis, the PNM for the superstructure should be determined using the theory of
elasticity. In determination of the PNM, the column stiffness should be adjusted based on the
moment-curvature analysis to reflect the effective stiffness for those columns experiencing
flexural cracking. Once the location of the PNM is found, Equation (6-2) can be used to calculate
the column top displacement.
∆col= xcol × ϵs (6-2)
where 𝑥𝑥𝑐𝑐𝑐𝑐𝑐𝑐 is the distance of the column to the PNM; and 𝜖𝜖𝑠𝑠 is the shortening strain rate of the
superstructure and can be calculated using the recommendations presented in Section 6.5.1. In
the estimation of the column top displacement using the simplified analysis, the different strains
proposed by the different approaches, presented in Table 6.1, can be used. The calculated design
displacements using the different approaches were compared to the displacements predicted by
the FEM, as shown in Figure 6.10 through Figure 6.13.
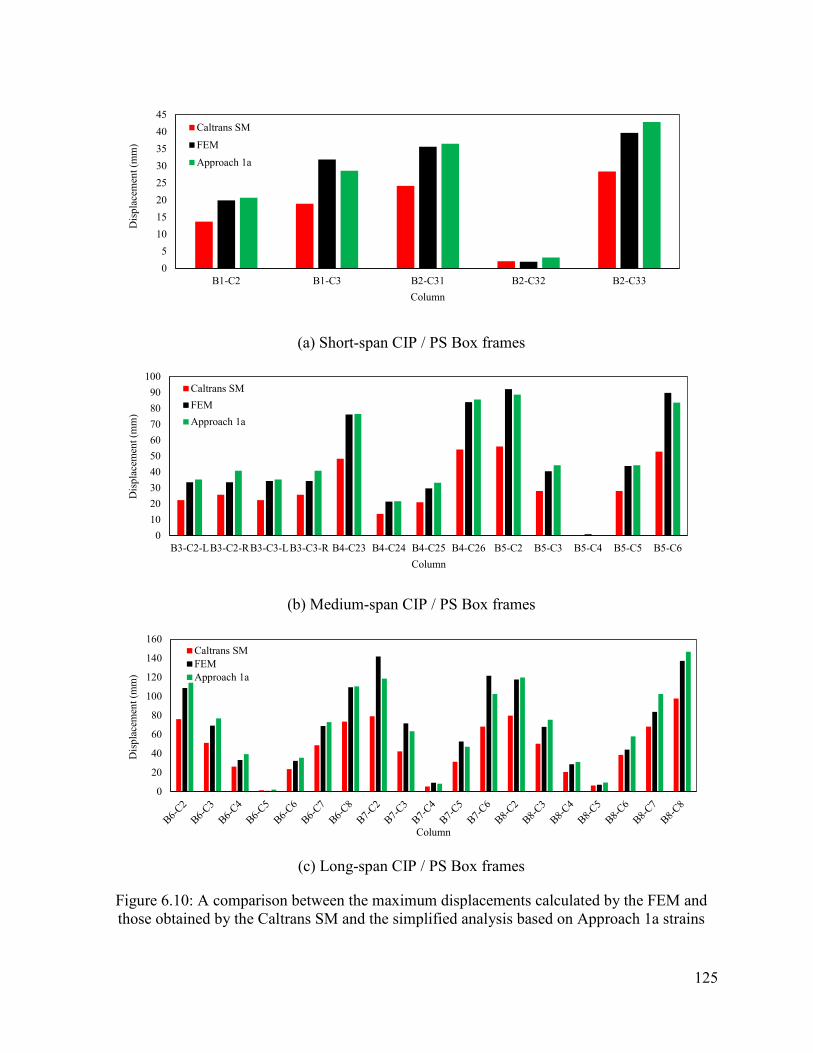
125
(a) Short-span CIP / PS Box frames
(b) Medium-span CIP / PS Box frames
(c) Long-span CIP / PS Box frames
Figure 6.10: A comparison between the maximum displacements calculated by the FEM and those obtained by the Caltrans SM and the simplified analysis based on Approach 1a strains
05
1015202530354045
B1-C2 B1-C3 B2-C31 B2-C32 B2-C33
Dis
plac
emen
t (m
m)
Column
Caltrans SMFEMApproach 1a
0102030405060708090
100
B3-C2-LB3-C2-RB3-C3-LB3-C3-R B4-C23 B4-C24 B4-C25 B4-C26 B5-C2 B5-C3 B5-C4 B5-C5 B5-C6
Dis
plac
emen
t (m
m)
Column
Caltrans SMFEMApproach 1a
0
20
40
60
80
100
120
140
160
Dis
plac
emen
t (m
m)
Column
Caltrans SMFEMApproach 1a
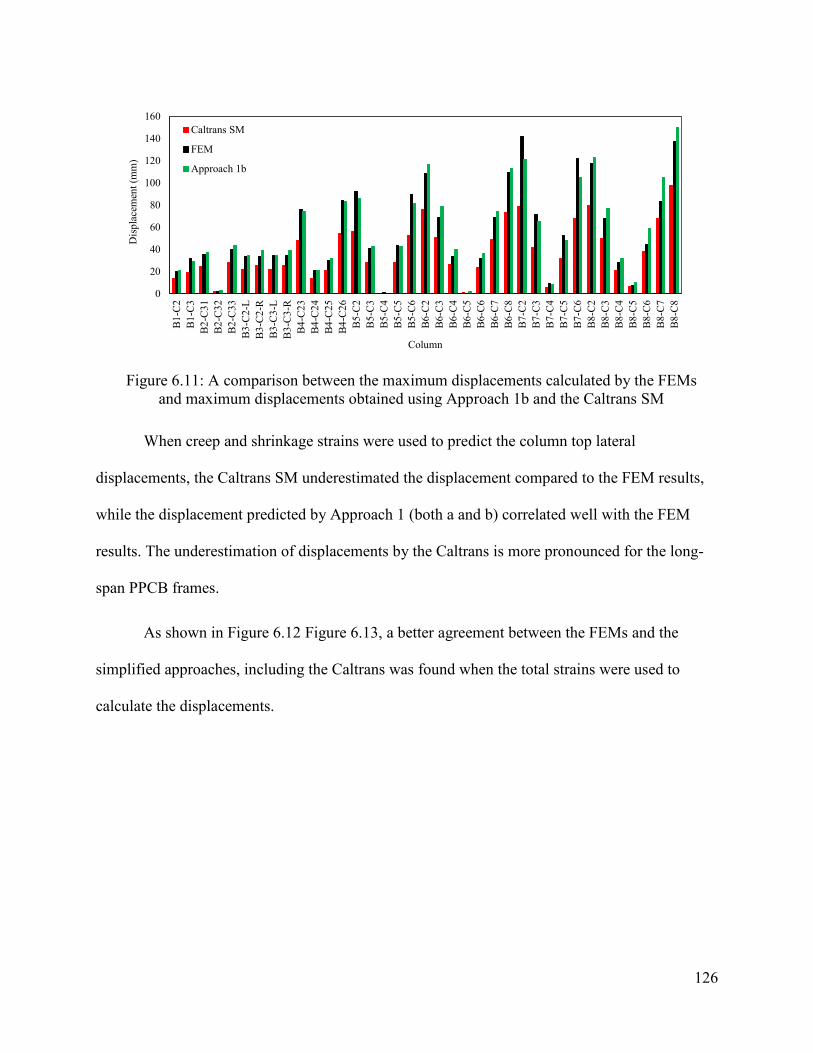
126
Figure 6.11: A comparison between the maximum displacements calculated by the FEMs and maximum displacements obtained using Approach 1b and the Caltrans SM
When creep and shrinkage strains were used to predict the column top lateral
displacements, the Caltrans SM underestimated the displacement compared to the FEM results,
while the displacement predicted by Approach 1 (both a and b) correlated well with the FEM
results. The underestimation of displacements by the Caltrans is more pronounced for the long-
span PPCB frames.
As shown in Figure 6.12 Figure 6.13, a better agreement between the FEMs and the
simplified approaches, including the Caltrans was found when the total strains were used to
calculate the displacements.
0
20
40
60
80
100
120
140
160
B1-C
2B1
-C3
B2-C
31B2
-C32
B2-C
33B3
-C2-
LB3
-C2-
RB3
-C3-
LB3
-C3-
RB4
-C23
B4-C
24B4
-C25
B4-C
26B5
-C2
B5-C
3B5
-C4
B5-C
5B5
-C6
B6-C
2B6
-C3
B6-C
4B6
-C5
B6-C
6B6
-C7
B6-C
8B7
-C2
B7-C
3B7
-C4
B7-C
5B7
-C6
B8-C
2B8
-C3
B8-C
4B8
-C5
B8-C
6B8
-C7
B8-C
8
Dis
plac
emen
t (m
m)
Column
Caltrans SM
FEM
Approach 1b
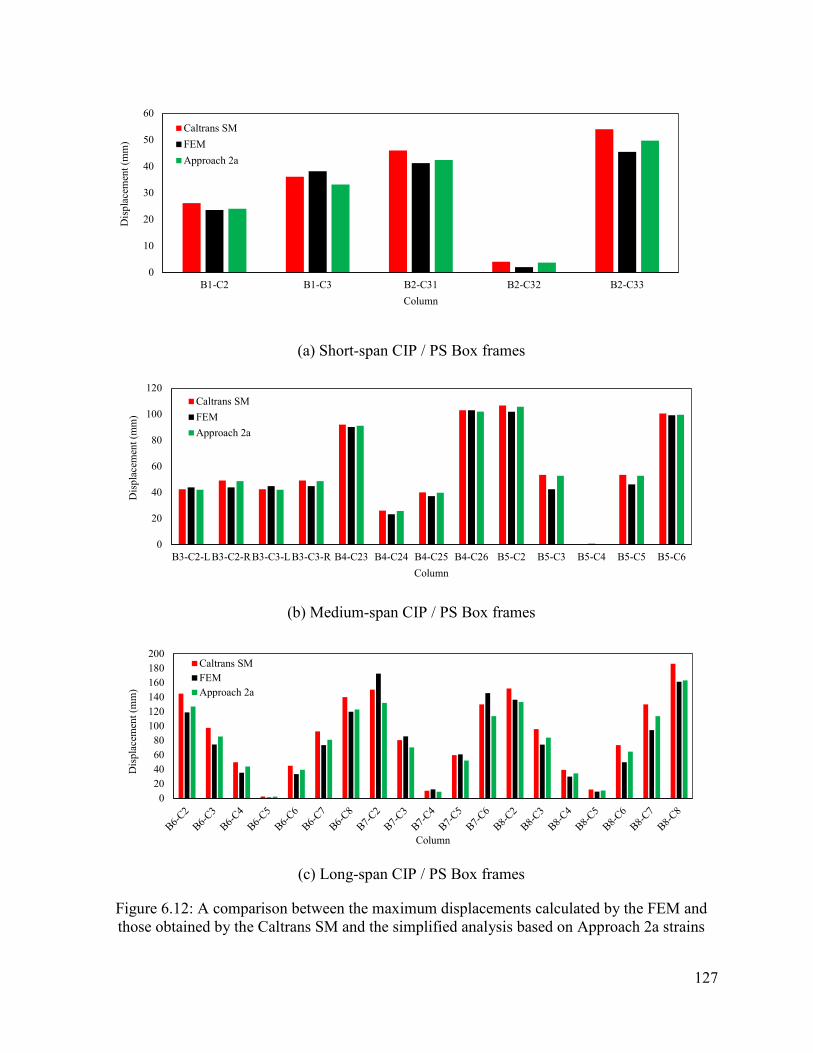
127
(a) Short-span CIP / PS Box frames
(b) Medium-span CIP / PS Box frames
(c) Long-span CIP / PS Box frames
Figure 6.12: A comparison between the maximum displacements calculated by the FEM and those obtained by the Caltrans SM and the simplified analysis based on Approach 2a strains
0
10
20
30
40
50
60
B1-C2 B1-C3 B2-C31 B2-C32 B2-C33
Dis
plac
emen
t (m
m)
Column
Caltrans SMFEMApproach 2a
0
20
40
60
80
100
120
B3-C2-LB3-C2-RB3-C3-LB3-C3-R B4-C23 B4-C24 B4-C25 B4-C26 B5-C2 B5-C3 B5-C4 B5-C5 B5-C6
Dis
plac
emen
t (m
m)
Column
Caltrans SMFEMApproach 2a
020406080
100120140160180200
Dis
plac
emen
t (m
m)
Column
Caltrans SMFEMApproach 2a
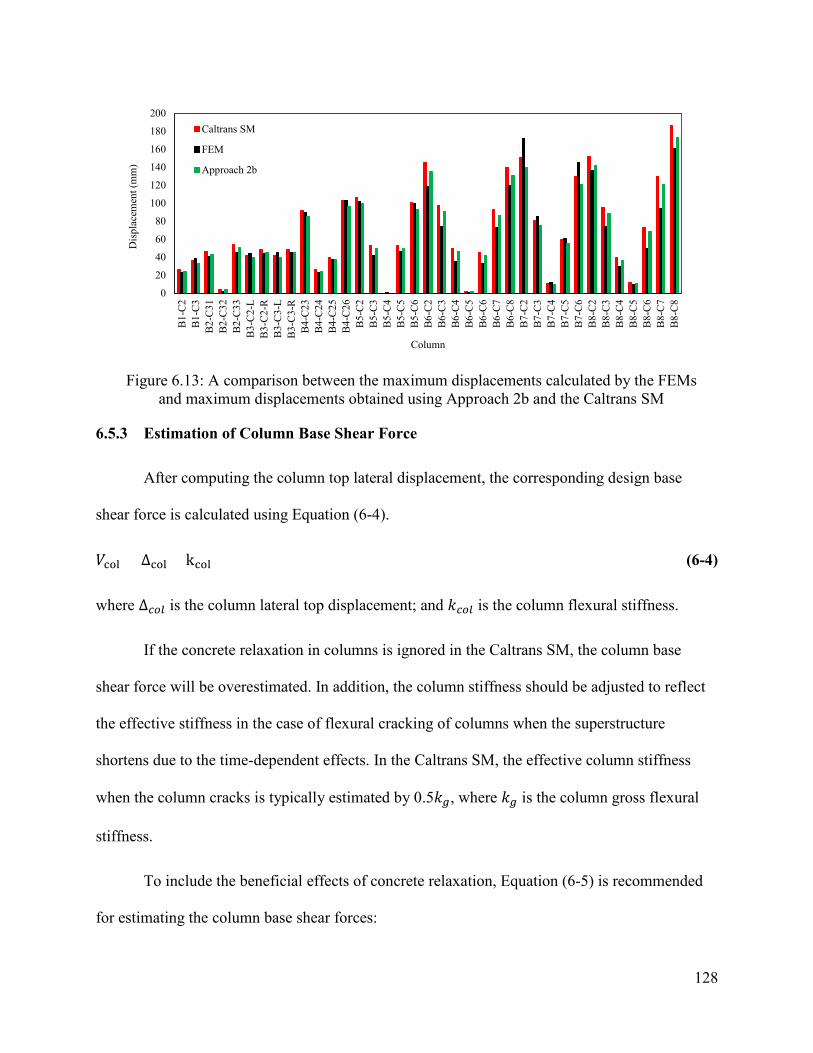
128
Figure 6.13: A comparison between the maximum displacements calculated by the FEMs and maximum displacements obtained using Approach 2b and the Caltrans SM
6.5.3 Estimation of Column Base Shear Force
After computing the column top lateral displacement, the corresponding design base
shear force is calculated using Equation (6-4).
𝑉𝑉col = ∆col × kcol (6-4)
where ∆𝑐𝑐𝑐𝑐𝑐𝑐 is the column lateral top displacement; and 𝑘𝑘𝑐𝑐𝑐𝑐𝑐𝑐 is the column flexural stiffness.
If the concrete relaxation in columns is ignored in the Caltrans SM, the column base
shear force will be overestimated. In addition, the column stiffness should be adjusted to reflect
the effective stiffness in the case of flexural cracking of columns when the superstructure
shortens due to the time-dependent effects. In the Caltrans SM, the effective column stiffness
when the column cracks is typically estimated by 0.5𝑘𝑘𝑔𝑔, where 𝑘𝑘𝑔𝑔 is the column gross flexural
stiffness.
To include the beneficial effects of concrete relaxation, Equation (6-5) is recommended
for estimating the column base shear forces:
0
20
40
60
80
100
120
140
160
180
200
B1-C
2B1
-C3
B2-C
31B2
-C32
B2-C
33B3
-C2-
LB3
-C2-
RB3
-C3-
LB3
-C3-
RB4
-C23
B4-C
24B4
-C25
B4-C
26B5
-C2
B5-C
3B5
-C4
B5-C
5B5
-C6
B6-C
2B6
-C3
B6-C
4B6
-C5
B6-C
6B6
-C7
B6-C
8B7
-C2
B7-C
3B7
-C4
B7-C
5B7
-C6
B8-C
2B8
-C3
B8-C
4B8
-C5
B8-C
6B8
-C7
B8-C
8
Dis
plac
emen
t (m
m)
Column
Caltrans SM
FEM
Approach 2b
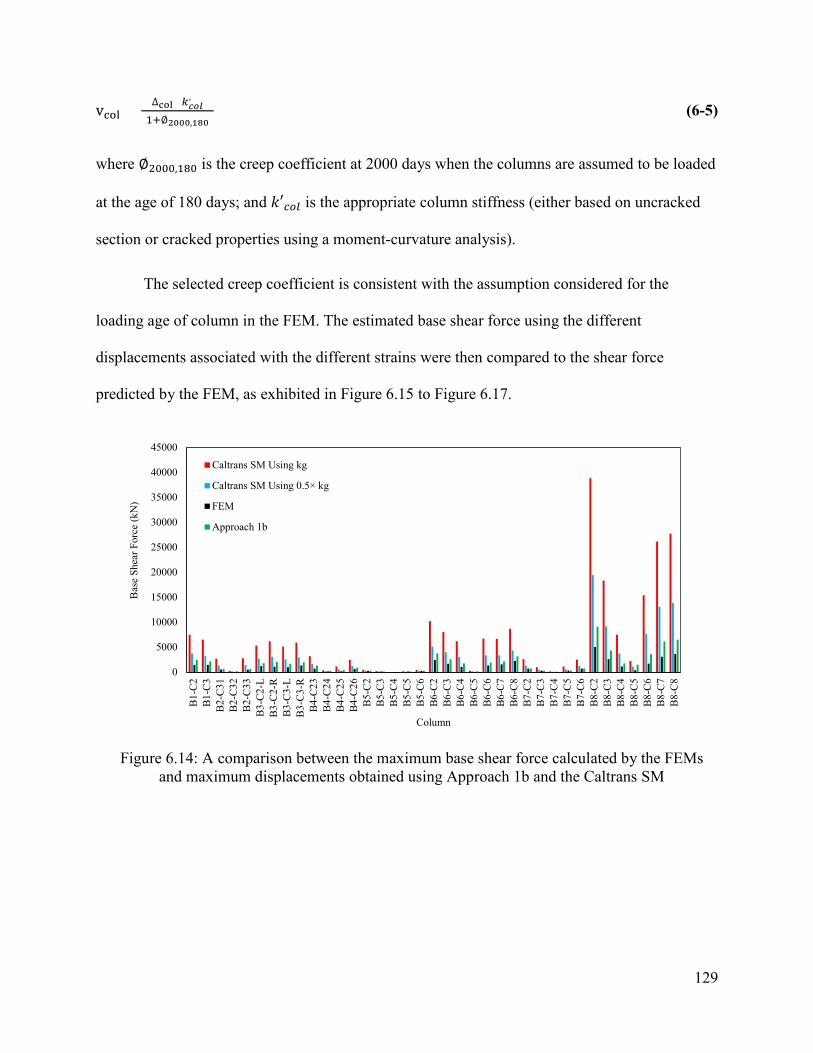
129
vcol = ∆col×𝑝𝑝𝑐𝑐𝑐𝑐𝑐𝑐,
(1+∅2000,180) (6-5)
where ∅2000,180 is the creep coefficient at 2000 days when the columns are assumed to be loaded
at the age of 180 days; and 𝑘𝑘′𝑐𝑐𝑐𝑐𝑐𝑐 is the appropriate column stiffness (either based on uncracked
section or cracked properties using a moment-curvature analysis).
The selected creep coefficient is consistent with the assumption considered for the
loading age of column in the FEM. The estimated base shear force using the different
displacements associated with the different strains were then compared to the shear force
predicted by the FEM, as exhibited in Figure 6.15 to Figure 6.17.
Figure 6.14: A comparison between the maximum base shear force calculated by the FEMs and maximum displacements obtained using Approach 1b and the Caltrans SM
0
5000
10000
15000
20000
25000
30000
35000
40000
45000
B1-C
2B1
-C3
B2-C
31B2
-C32
B2-C
33B3
-C2-
LB3
-C2-
RB3
-C3-
LB3
-C3-
RB4
-C23
B4-C
24B4
-C25
B4-C
26B5
-C2
B5-C
3B5
-C4
B5-C
5B5
-C6
B6-C
2B6
-C3
B6-C
4B6
-C5
B6-C
6B6
-C7
B6-C
8B7
-C2
B7-C
3B7
-C4
B7-C
5B7
-C6
B8-C
2B8
-C3
B8-C
4B8
-C5
B8-C
6B8
-C7
B8-C
8
Bas
e Sh
ear F
orce
(kN
)
Column
Caltrans SM Using kg
Caltrans SM Using 0.5× kg
FEM
Approach 1b
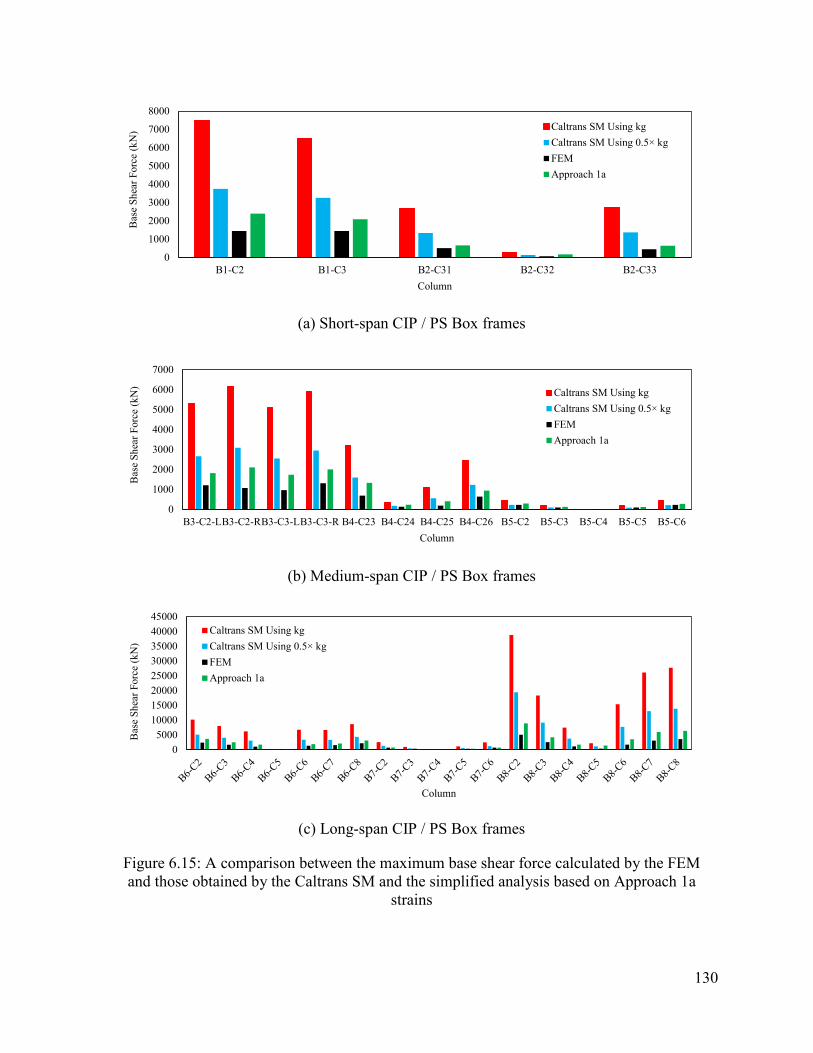
130
(a) Short-span CIP / PS Box frames
(b) Medium-span CIP / PS Box frames
(c) Long-span CIP / PS Box frames
Figure 6.15: A comparison between the maximum base shear force calculated by the FEM and those obtained by the Caltrans SM and the simplified analysis based on Approach 1a
strains
0
1000
2000
3000
4000
5000
6000
7000
8000
B1-C2 B1-C3 B2-C31 B2-C32 B2-C33
Bas
e Sh
ear F
orce
(kN
)
Column
Caltrans SM Using kgCaltrans SM Using 0.5× kgFEMApproach 1a
0
1000
2000
3000
4000
5000
6000
7000
B3-C2-LB3-C2-RB3-C3-LB3-C3-R B4-C23 B4-C24 B4-C25 B4-C26 B5-C2 B5-C3 B5-C4 B5-C5 B5-C6
Bas
e Sh
ear F
orce
(kN
)
Column
Caltrans SM Using kgCaltrans SM Using 0.5× kgFEMApproach 1a
05000
1000015000200002500030000350004000045000
Bas
e Sh
ear F
orce
(kN
)
Column
Caltrans SM Using kgCaltrans SM Using 0.5× kgFEMApproach 1a
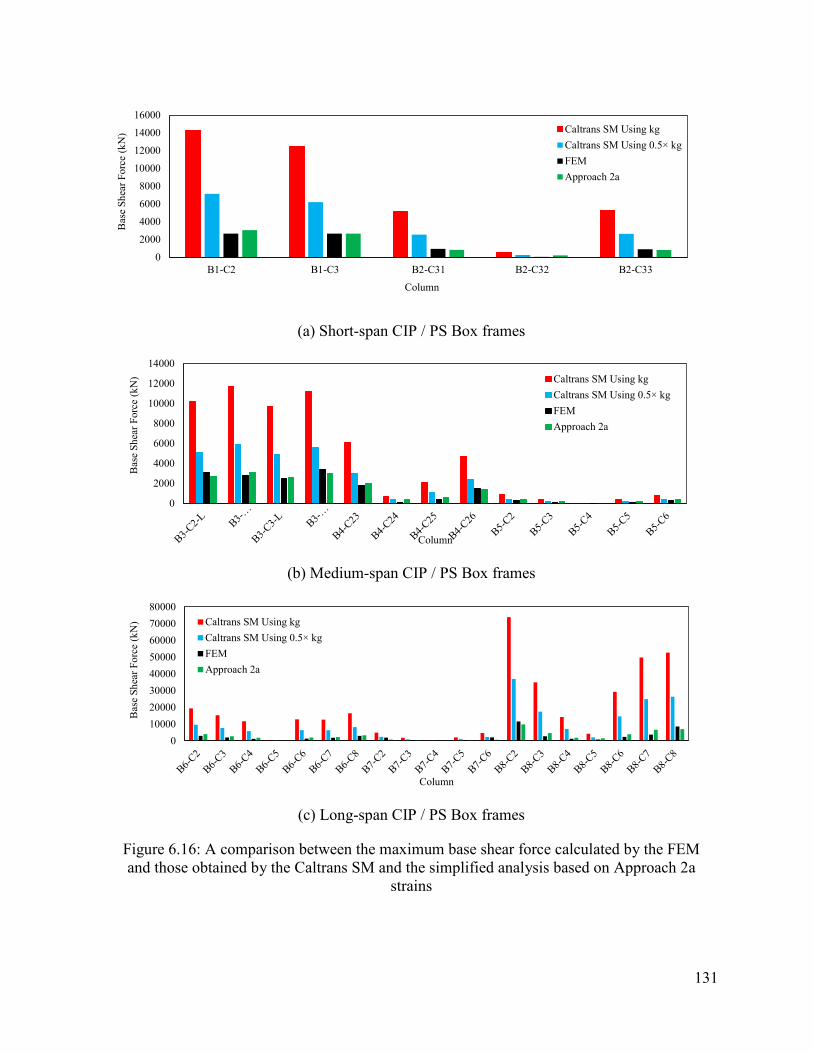
131
(a) Short-span CIP / PS Box frames
(b) Medium-span CIP / PS Box frames
(c) Long-span CIP / PS Box frames
Figure 6.16: A comparison between the maximum base shear force calculated by the FEM and those obtained by the Caltrans SM and the simplified analysis based on Approach 2a
strains
0
2000
4000
6000
8000
10000
12000
14000
16000
B1-C2 B1-C3 B2-C31 B2-C32 B2-C33
Bas
e Sh
ear F
orce
(kN
)
Column
Caltrans SM Using kgCaltrans SM Using 0.5× kgFEMApproach 2a
0
2000
4000
6000
8000
10000
12000
14000
Bas
e Sh
ear F
orce
(kN
)
Column
Caltrans SM Using kgCaltrans SM Using 0.5× kgFEMApproach 2a
01000020000300004000050000600007000080000
Bas
e Sh
ear F
orce
(kN
)
Column
Caltrans SM Using kgCaltrans SM Using 0.5× kgFEMApproach 2a
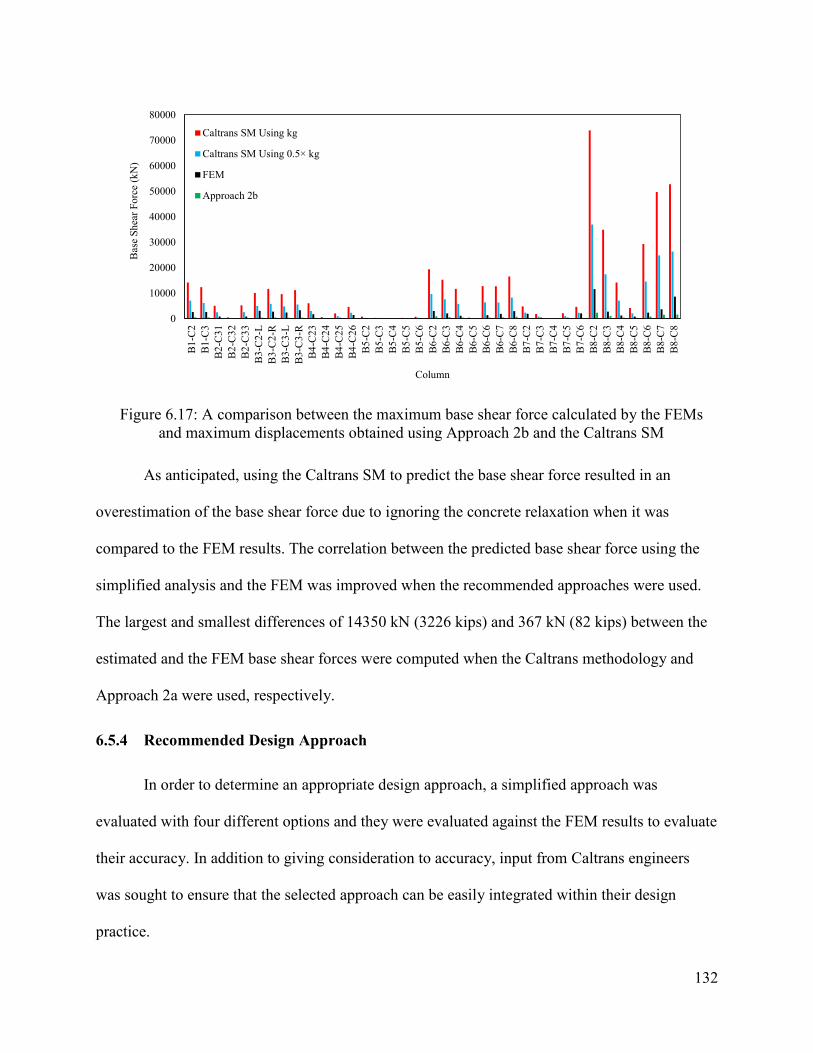
132
Figure 6.17: A comparison between the maximum base shear force calculated by the FEMs and maximum displacements obtained using Approach 2b and the Caltrans SM
As anticipated, using the Caltrans SM to predict the base shear force resulted in an
overestimation of the base shear force due to ignoring the concrete relaxation when it was
compared to the FEM results. The correlation between the predicted base shear force using the
simplified analysis and the FEM was improved when the recommended approaches were used.
The largest and smallest differences of 14350 kN (3226 kips) and 367 kN (82 kips) between the
estimated and the FEM base shear forces were computed when the Caltrans methodology and
Approach 2a were used, respectively.
6.5.4 Recommended Design Approach
In order to determine an appropriate design approach, a simplified approach was
evaluated with four different options and they were evaluated against the FEM results to evaluate
their accuracy. In addition to giving consideration to accuracy, input from Caltrans engineers
was sought to ensure that the selected approach can be easily integrated within their design
practice.
0
10000
20000
30000
40000
50000
60000
70000
80000
B1-C
2B1
-C3
B2-C
31B2
-C32
B2-C
33B3
-C2-
LB3
-C2-
RB3
-C3-
LB3
-C3-
RB4
-C23
B4-C
24B4
-C25
B4-C
26B5
-C2
B5-C
3B5
-C4
B5-C
5B5
-C6
B6-C
2B6
-C3
B6-C
4B6
-C5
B6-C
6B6
-C7
B6-C
8B7
-C2
B7-C
3B7
-C4
B7-C
5B7
-C6
B8-C
2B8
-C3
B8-C
4B8
-C5
B8-C
6B8
-C7
B8-C
8
Bas
e Sh
ear F
orce
(kN
)
Column
Caltrans SM Using kg
Caltrans SM Using 0.5× kg
FEM
Approach 2b

133
Figure 6.18 and Figure 6.19 show the ratio of column top lateral displacements and the
corresponding forces estimated by the simplified approaches and the Caltrans method to those
obtained from the FEMs. Additionally, the mean and standard deviation for these ratios were
calculated and are presented in Table 6.2 and Table 6.3, respectively.
The Caltrans SM and the simplified approach resulted in accurate estimates of the
column lateral displacements when compared to the FEM results for the displacements.
However, the poorest agreement was found between the Caltrans and the FEM for the base shear
forces. Approach 2b resulted in the best correlation for base shear forces with the FEM results
and the corresponding mean and standard deviation were 1.09 and 0.40, respectively. Approach
1b produced better results compared to the Caltrans SM with the mean and standard deviation of
1.49 and 0.30, respectively. Although Approach 2b is the most appropriate simplified approach,
Approach 1b has advantages in that it uses creep and shrinkage strains, similar to the Caltrans
SM and account for the prestress strains as part of the structural analysis. Therefore, Approach
1b may be used for calculating the displacement-induced column forces. The resulting forces
could be reduced by 1.2 (i.e., mean - standard deviation), which will still reduce the base shear
forces by 50% the Caltrans bridge design procedures.
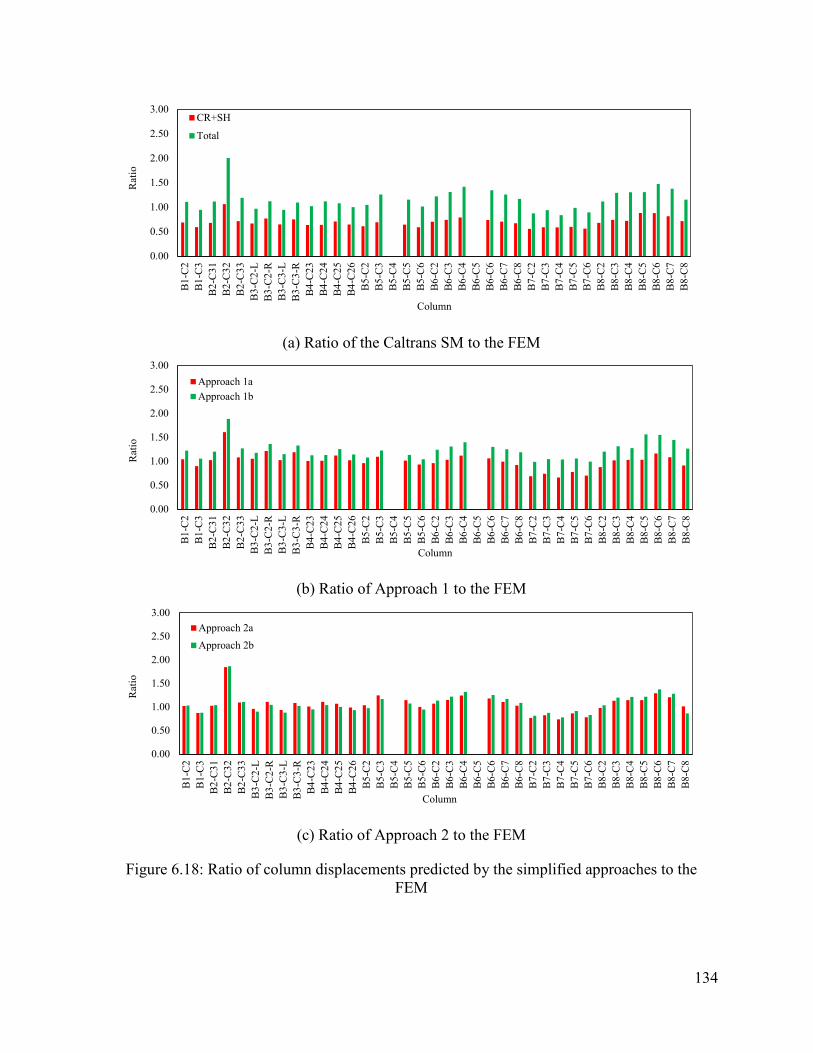
134
(a) Ratio of the Caltrans SM to the FEM
(b) Ratio of Approach 1 to the FEM
(c) Ratio of Approach 2 to the FEM
Figure 6.18: Ratio of column displacements predicted by the simplified approaches to the FEM
0.00
0.50
1.00
1.50
2.00
2.50
3.00
B1-C
2B1
-C3
B2-C
31B2
-C32
B2-C
33B3
-C2-
LB3
-C2-
RB3
-C3-
LB3
-C3-
RB4
-C23
B4-C
24B4
-C25
B4-C
26B5
-C2
B5-C
3B5
-C4
B5-C
5B5
-C6
B6-C
2B6
-C3
B6-C
4B6
-C5
B6-C
6B6
-C7
B6-C
8B7
-C2
B7-C
3B7
-C4
B7-C
5B7
-C6
B8-C
2B8
-C3
B8-C
4B8
-C5
B8-C
6B8
-C7
B8-C
8
Rat
io
Column
CR+SH
Total
0.00
0.50
1.00
1.50
2.00
2.50
3.00
B1-C
2B1
-C3
B2-C
31B2
-C32
B2-C
33B3
-C2-
LB3
-C2-
RB3
-C3-
LB3
-C3-
RB4
-C23
B4-C
24B4
-C25
B4-C
26B5
-C2
B5-C
3B5
-C4
B5-C
5B5
-C6
B6-C
2B6
-C3
B6-C
4B6
-C5
B6-C
6B6
-C7
B6-C
8B7
-C2
B7-C
3B7
-C4
B7-C
5B7
-C6
B8-C
2B8
-C3
B8-C
4B8
-C5
B8-C
6B8
-C7
B8-C
8
Rat
io
Column
Approach 1aApproach 1b
0.00
0.50
1.00
1.50
2.00
2.50
3.00
B1-C
2B1
-C3
B2-C
31B2
-C32
B2-C
33B3
-C2-
LB3
-C2-
RB3
-C3-
LB3
-C3-
RB4
-C23
B4-C
24B4
-C25
B4-C
26B5
-C2
B5-C
3B5
-C4
B5-C
5B5
-C6
B6-C
2B6
-C3
B6-C
4B6
-C5
B6-C
6B6
-C7
B6-C
8B7
-C2
B7-C
3B7
-C4
B7-C
5B7
-C6
B8-C
2B8
-C3
B8-C
4B8
-C5
B8-C
6B8
-C7
B8-C
8
Rat
io
Column
Approach 2aApproach 2b
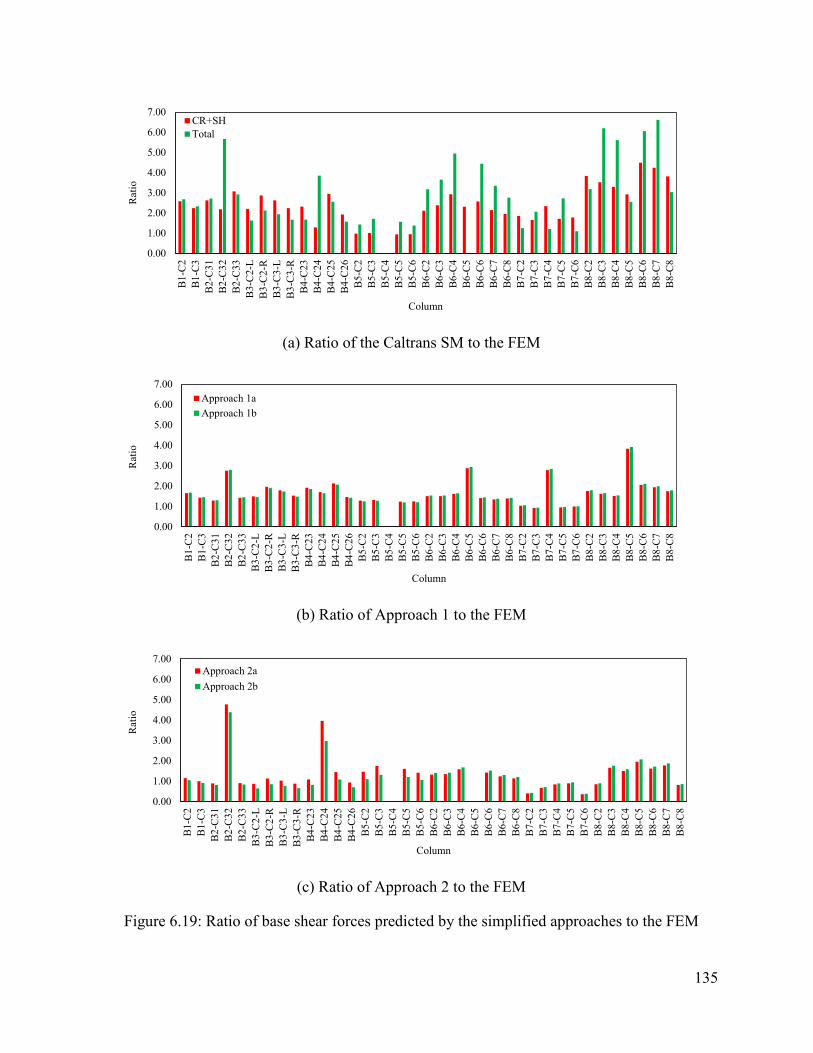
135
(a) Ratio of the Caltrans SM to the FEM
(b) Ratio of Approach 1 to the FEM
(c) Ratio of Approach 2 to the FEM
Figure 6.19: Ratio of base shear forces predicted by the simplified approaches to the FEM
0.00
1.00
2.00
3.00
4.00
5.00
6.00
7.00
B1-C
2B1
-C3
B2-C
31B2
-C32
B2-C
33B3
-C2-
LB3
-C2-
RB3
-C3-
LB3
-C3-
RB4
-C23
B4-C
24B4
-C25
B4-C
26B5
-C2
B5-C
3B5
-C4
B5-C
5B5
-C6
B6-C
2B6
-C3
B6-C
4B6
-C5
B6-C
6B6
-C7
B6-C
8B7
-C2
B7-C
3B7
-C4
B7-C
5B7
-C6
B8-C
2B8
-C3
B8-C
4B8
-C5
B8-C
6B8
-C7
B8-C
8
Rat
io
Column
CR+SHTotal
0.00
1.00
2.00
3.00
4.00
5.00
6.00
7.00
B1-C
2B1
-C3
B2-C
31B2
-C32
B2-C
33B3
-C2-
LB3
-C2-
RB3
-C3-
LB3
-C3-
RB4
-C23
B4-C
24B4
-C25
B4-C
26B5
-C2
B5-C
3B5
-C4
B5-C
5B5
-C6
B6-C
2B6
-C3
B6-C
4B6
-C5
B6-C
6B6
-C7
B6-C
8B7
-C2
B7-C
3B7
-C4
B7-C
5B7
-C6
B8-C
2B8
-C3
B8-C
4B8
-C5
B8-C
6B8
-C7
B8-C
8
Rat
io
Column
Approach 1aApproach 1b
0.00
1.00
2.00
3.00
4.00
5.00
6.00
7.00
B1-C
2B1
-C3
B2-C
31B2
-C32
B2-C
33B3
-C2-
LB3
-C2-
RB3
-C3-
LB3
-C3-
RB4
-C23
B4-C
24B4
-C25
B4-C
26B5
-C2
B5-C
3B5
-C4
B5-C
5B5
-C6
B6-C
2B6
-C3
B6-C
4B6
-C5
B6-C
6B6
-C7
B6-C
8B7
-C2
B7-C
3B7
-C4
B7-C
5B7
-C6
B8-C
2B8
-C3
B8-C
4B8
-C5
B8-C
6B8
-C7
B8-C
8
Rat
io
Column
Approach 2aApproach 2b
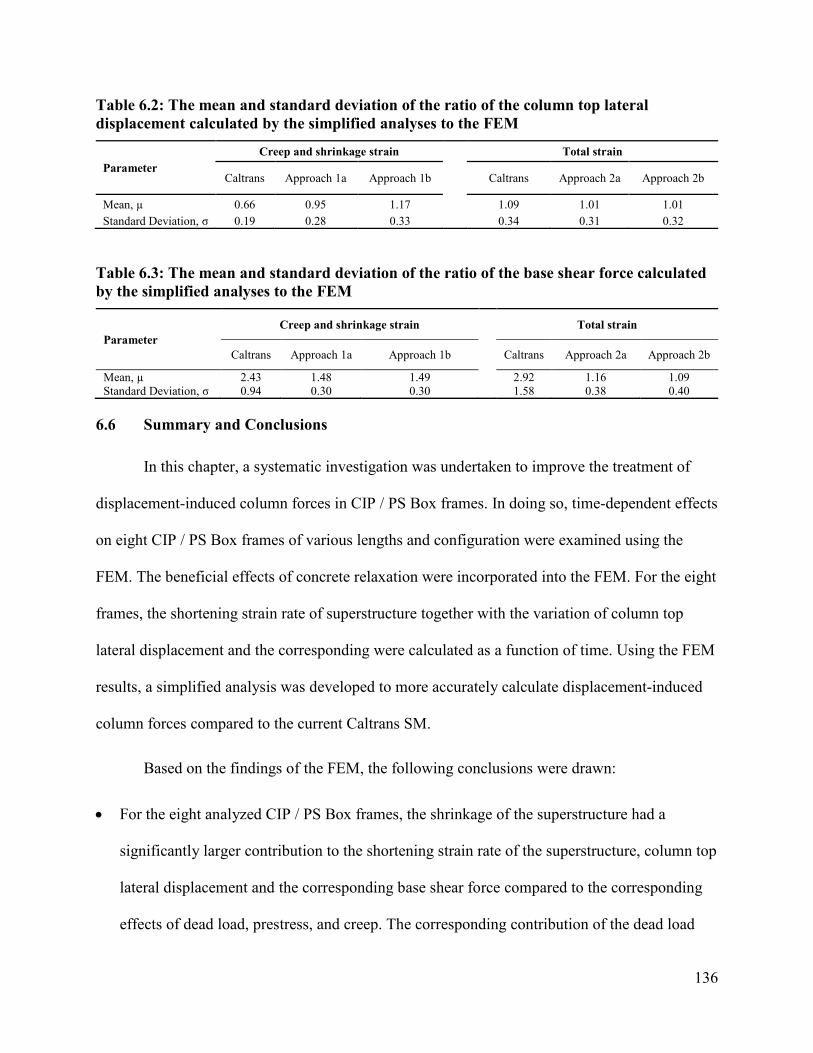
136
Table 6.2: The mean and standard deviation of the ratio of the column top lateral displacement calculated by the simplified analyses to the FEM
Parameter Creep and shrinkage strain Total strain
Caltrans Approach 1a Approach 1b Caltrans Approach 2a Approach 2b
Mean, µ 0.66 0.95 1.17 1.09 1.01 1.01 Standard Deviation, σ 0.19 0.28 0.33 0.34 0.31 0.32
Table 6.3: The mean and standard deviation of the ratio of the base shear force calculated by the simplified analyses to the FEM
Parameter Creep and shrinkage strain Total strain
Caltrans Approach 1a Approach 1b Caltrans Approach 2a Approach 2b
Mean, µ 2.43 1.48 1.49 2.92 1.16 1.09 Standard Deviation, σ 0.94 0.30 0.30 1.58 0.38 0.40
Summary and Conclusions
In this chapter, a systematic investigation was undertaken to improve the treatment of
displacement-induced column forces in CIP / PS Box frames. In doing so, time-dependent effects
on eight CIP / PS Box frames of various lengths and configuration were examined using the
FEM. The beneficial effects of concrete relaxation were incorporated into the FEM. For the eight
frames, the shortening strain rate of superstructure together with the variation of column top
lateral displacement and the corresponding were calculated as a function of time. Using the FEM
results, a simplified analysis was developed to more accurately calculate displacement-induced
column forces compared to the current Caltrans SM.
Based on the findings of the FEM, the following conclusions were drawn:
• For the eight analyzed CIP / PS Box frames, the shrinkage of the superstructure had a
significantly larger contribution to the shortening strain rate of the superstructure, column top
lateral displacement and the corresponding base shear force compared to the corresponding
effects of dead load, prestress, and creep. The corresponding contribution of the dead load
137
was the smallest compared to the prestress, creep, and shrinkage.
• The FEM predicted similar shrinkage strains for the eight CIP / PS Box, where the difference
between the largest and smallest maximum shrinkage strain was estimated to be 143 με
which was less than the corresponding differences for the prestress and creep.
• Typically, the longer the CIP / PS Box was, the larger the total displacement was imposed on
the exterior columns.
• The column base shear force was affected by a combination of the column top displacement
and the column stiffness. The large column displacement did not necessarily result in a large
base shear force as it was observed for the slender columns in B5 due to low stiffness.
• For displacement calculation using simplified analysis, Approach 1a resulted in the best
agreement with the FEM results. A better correlation was found between the Caltrans SM
and the FEM results when the total strains were used rather than the creep and shrinkage
stains.
• For shear calculation using simplified analysis, Approaches 2a and 2b resulted in the best
agreement with the FEM results, while the Caltrans SM resulted in the poorest agreement
with the FEM results.
138
CHAPTER 7: SUMMARY, CONCLUSIONS, AND FUTURE WORK
Summary
The superstructure of a CIP / PS Box frame experiences continuous movements due to
shortening of the structure length resulting from shrinkage as well as prestressing and creep
caused primarily by prestressing. As a result of these movements, columns within each
continuous multi-span frame are subjected to lateral displacements and forces as a function of
time following the construction of the superstructure. Accurately estimating displacement-
induced column forces is critical for the design of the columns and their foundations. When these
forces are underestimated, yielding of the columns can occur prematurely when they are
subjected to external loads. This can cause the bridge to produce unexpected performance when
it is subjected to event such as seismic excitation. When displacement-induced forces are
overestimated, columns will become unnecessarily large, which in turn can attract more forces
and amplify the problem.
In the absence of detailed computer modeling, the Caltrans SM calculates the
displacement-induced column forces using the strain rates established for joints and bearing
design. Two concerns are raised with this simplified method: (1) the selected shortening strain
rate for the superstructure may not be appropriate; and (2) the beneficial effects of concrete
relaxation on the displacement-induced column forces may not be accurately accounted for.
Using a combination of an experimental program and analytical models, this report has
investigated the displacement-induced column forces and presented recommendations to address
the aforementioned concerns, thereby improving the calculation of column design forces.
Given the limited experimental data available on concrete relaxation, an experimental
study was undertaken to characterize the concrete relaxation since it provides beneficial effects
139
to displacement-induced column forces. Using three specimens and three loading protocols,
seven relaxation tests were performed at different ages of loading. In all tests, the beneficial
effects of concrete relaxation on the displacement-induced forces were observed. The induced
forces in the test columns were reduced with time under the state of constant strains.
After demonstrating the beneficial effects of concrete relaxation on the displacement-
induced forces through the experimental program, corresponding effects on eight CIP / PS Box
frames of various lengths and configurations were evaluated using FEMs representing these
frames. The shortening strain rate of superstructure together with the variation of column top
lateral displacement and the corresponding force with time were calculated. Using the FEM
results for strains rates, simplified approaches were formulated to take advantage of concrete
relaxation and thus more accurately to calculate the displacement-induced column forces.
Conclusions
The detailed conclusions for the study presented in this report can be found at the end of
Chapters 3, 5, and 6. In addition, the following general conclusions have been drawn:
• The beneficial effects of concrete relaxation on the displacement-induced forces were
verified by the laboratory tests in addition to the FEA of a demonstrative CIP / PS Box
frame. These effects cause reduction to the concrete forces/stresses with time under the state
of a constant displacement/strain. The FEM of the CIP / PS Box frame showed that the
displacement-induced column force (i.e., design base shear force) was reduced by as much as
53% for an exterior column due to the relaxation of the column concrete even though the
column was 180 days old when it was first subjected to superstructure induced lateral
displacement.
• For the eight CIP / PS Box analyzed with consideration to the effects of concrete relaxation
140
in the columns, the shrinkage of the superstructure had the largest contribution to the
shortening strain rate of the superstructure, column top lateral displacement and the
corresponding base shear force compared to the corresponding effects due to dead load,
prestress, and creep.
• Among four simplified approaches and the Caltrans SM, column forces calculated by
Approach 2b resulted in the best agreement with the corresponding FEM results. However,
Approach 1b is recommended by this study since it has an advantage of using creep and
shrinkage strains, like the Caltrans SM and account for the prestress strains separately as part
of the structural analysis.
Future Work
The recent findings from analysis of bridge frames designed with concrete box-girders
was that they undergo significant shortening due to creep and shrinkage effects, which imposed
gradual lateral displacements to the columns following the construction phase. The expected
shortening of long-span bridges can make the columns to experience displacements closer to
their yield value. Impact of these columns under earthquake load is currently unknown.
A column that experiences gradual lateral displacement due to superstructure shortening
does not build up any significant stresses as typically assumed in practice. This is because they
experience stress relaxation, which has been confirmed in this project. This phenomenon is new
in design calculations and opens up several questions. The answers to these questions are
important to understand the true seismic behavior of bridges with columns experiencing
displacement-induced forces. When columns undergo gradual lateral displacements, they may
experience flexural cracking. This in turn will induce strains on the tension reinforcement. While

141
the induced stresses are partly reduced in concrete, the strains in concrete and longitudinal
reinforcement may remain the same. If the columns experience large strains, they could yield
even under a small earthquake load. What needs to be understood is that as the concrete stresses
are relaxed, if any changes in steel strains occur as steel can also experience relaxation. Once the
long-term effects are matured, it is important to understand the true seismic performance of
columns and their impact to the bridge response. This issue is not currently considered. A
systematic experimental and analytical study needs to look at the column relaxation with and
without flexural cracking with appropriate gravity load effects, and its impact on seismic
behavior of individual columns and the entire bridge frame. Understanding the impact of long-
term effects of superstructure on bridge columns and their expected seismic behavior, and a
procedure to account for this phenomenon in routine design of long span bridges are considered
to be the useful next steps.
142
REFERENCES
American Association of State Highway and Transportation Officials (AASHTO) (2010).
AASHTO LRFD Bridge Design Specifications, 5th edition. Washington, DC.
Abdel Karim, A. and Tadros, M.K. (1993) "Computer analysis of spliced girder bridges," ACI
Structural Journal, 90(1), 21-31.
ACI (1992). Building Code Requirements for Reinforced Concrete (ACI 318-89) and
Commentary-ACI 318R-89. Detroit, MI.
ACI 209R (2008) "Guide for Modeling and Calculating Shrinkage and Creep in Hardened
Concrete."
Atrushi, D. S., (2003). “Tensile and compressive creep of early age concrete: testing and
modelling.” doctoral thesis, The Norwegian University of Science and Technology,
Trondheim, Norway.
Bazant, Z.P., and Kim, S. (1979). “Approximate relaxation function for concrete.” Journal of the
Structural Division, 105 (12), 2695-2705.
Bazant, Z. P. (2000) "Creep and shrinkage prediction model for analysis and design of concrete
structures: Model B3." Adam Neville Symposium: Creep and Shrinkage - Structural
Design Effects ACI SP-194, 1-83, Farmington, MI.
Bazant, Z.P., Yu, Q., and Li, H.G. (2012). “Excessive long-time deflections of prestressed box-
girders. II: numerical analysis and lessons learned.” ASCE Journal of Structural
Engineering, 138 (6), 687-696.
Bosnjak, D. (2001). "Self-induced cracking problems in hardening concrete structure." PhD
dissertation, Department of Structural Engineering, NTNU, Trondheim, Norway.
California Department of Transportation. Caltrans. (2015). Bridge Design Practice. Concrete
Columns.
California Department of Transportation. Caltrans. (1994). Memorandum to designers. Bridge
deck joints and deck joint seals. Attachment 4.
143
CEB-FIP (1990). Evaluation of Time Dependent Behavior of Concrete, Comite Euro-
International du Beton, Bulletin d'information, No. 199, Paris, France.
Choudhury, D., Mari, A.R., and Scordelis, A.C. (1988). "Design of reinforced concrete bridge
columns subjected to imposed deformations." ACI, 85 (5): 521-529.
Collins, M. P., and Mitchell, D. (1997). “Prestressed concrete structures.” Response Publications,
Ontario, Canada.
Digler, W., Ghali, A., and Kountouris, C (1970). "Time-dependent forces induced by settlement
in continuous prestressed concrete structures." ACI, 80 (12), 507-515.
Ghali, A., Digler, W., and Neville, A.M. (1969). "Time-dependent forces induced by settlement
of supports in continuous reinforced concrete beams." ACI, 66 (11): 907-915.
Ghali, A., Favre, R., and Elbadry, M., (2002) “Concrete structures- stresses and deformation.”
Spon Press.
Gutsch, A. (2001). “Properties of early age concrete - experiments and modelling”. RILIM
International Conference on ‘Early Age Cracking in Cementitious Systems’ (EAC'01),
Haifa, pp. 11-18.
Hinkle, S. D. (2006). “Investigation of time-dependent deflection in long span, high strength,
prestressed concrete bridge beams.” MS thesis, Virginia Polytechnic Institute and State
Univ., Blacksburg, Va.
Honarvar, E., Sritharan, S., Rouse, J., and Aaleti, S. (2016). “Bridge decks with precast UHPC
waffle panels: a field evaluation and design optimization,” ASCE Journal of Bridge
Engineering, 21 (1): 1-13.
Huo, X. S., Al-Omaishi, N. and Tadros, M. K. (2001) "Creep, shrinkage, and modulus of
elasticity of high-performance concrete." ACI Materials Journal, 98(6), 440-449.
Lark, J.R., Howells, W.R., and Barr, I.B. (2004). “Behavior of post-tensioned concrete box-
girders.” Proceedings of the Institution of Civil Engineers, Issue BE2, Paper 13564, 71-81.
Lewis, M., and Karbhari, M.V. (2006). “Experimental verification of the influence of time-
dependent material properties on long-term bridge characteristics.” FHWA/CA/ES-
144
2006/24, California Department of Transportation Division of Engineering Services,
Sacramento, CA.
McHenry, D. (1943). “A new aspect of creep in concrete and its application to design”. Proc.
ASTM., 43, 1069-84.
MIDAS Civil Software (2013). Analysis reference.
Mindess, S., Young, J. F., and Darwin, D. (2002). “Concrete.” Second Edition, Prentice Hall.
Morimoto H., Koyangi W. (1994). “Estimation of stress relaxation in concrete at early ages”,
Proceeding of the RILEM International Symposium on ‘Thermal Cracking in Concrete at
Early Ages’, edited by R. Springenschmid E & FN Spon, London, 95-120.
Naaman, A. E. (2004). “Prestressed concrete analysis and design: fundamentals.” Techno Press
3000, Ann Arbor, MI.
Nilson, A. H. (1987). “Design of prestressed concrete.” 2nd Ed., Wiley, NY.
Precast/Prestressed Concrete Institute (PCI) (1997). Bridge Design Manual, Chicago, IL.
Rostásy, F. S., Gutsch, A. and Laube, M. (1993). “Creep and relaxation of concrete at early ages:
experiments and mathematical modelling”, in ‘Creep and shrinkage of concrete’, Z.
Bazant and C. Carol, E&FN Spon, London, pp. 453-458.
Schutter, G.D. (2004). "Applicability of degree of hydration and maturity method for thermo-
viso-elastic behavior of early age concrete." Cement & Concrete Composites, 26 (5): 437-
443.
Tadros, M.K., Ghali, A. and Dilger, W.H. (1977) "Time- Dependent analysis of composite
frames." ASCE Journal of Structural Engineering, 871-884.
Tadros, M. K., Ghali, A., and Meyer, A. W. (1985). “Prestress loss and deflection of precast
concrete members.” PCI Journal, 301, 114–141.
Tadros, M. K. and Al-Omaishi, N. (2003). “Prestressed losses in pretensioned high-strength
concrete bridge girders.” Washington D. C.: Transportation Research Board, 2003.
Vitek J. L. (1995). “Long-term deflections of large prestressed concrete bridges.” CEB Bulletin
d’Information, No. 235 Serviceability Models, Paris, France.

145
Related Documents


