Temporal Variation of Aerosol Optical Properties at Ma ˘ gurele, Romania LAURA MIHAI Faculty of Physics, Department of Earth and Atmospheric Physics, University of Bucharest, and National Institute for Laser, Plasma and Radiation Physics, Bucharest, Romania SABINA STEFAN Faculty of Physics, Department of Earth and Atmospheric Physics, University of Bucharest, Bucharest, Romania (Manuscript received 6 October 2010, in final form 29 April 2011) ABSTRACT Even though much research has been conducted regarding the study of atmospheric aerosols, significant uncertainties still exist in this direction. The uncertainties are related to different physical and microphysical properties of these fine particles, but they are also related to the complex processes of interactions between aerosols and other atmospheric components, such as water droplets in the clouds or gaseous molecules. Therefore, it is mandatory to understand aerosol physics with maximum precision in real time all over the world. In this paper, the results of the statistical analysis of atmospheric aerosol optical properties as the total scattering and the backscattering coefficients, the A ˚ ngstro ¨ m parameter, and the aerosol optical depth from Ma˘ gurele (Ilfov, Romania) are presented. The analysis covers the period between 1 June 2008 and 31 December 2009. The results showed significant differences in temporal variations of the optical parameters for the winter of 2008 and 2009. From spring 2009 to the winter of this year, a decreasing tendency of the total scattering coefficient and an increasing trend for the A ˚ ngstro ¨ m exponent were observed. The size-increase tendency, over 1 mm, appears during the spring of 2008 and the summers of 2008 and 2009, coinciding with the local pollution or Saharan dust intrusion episodes. From the seasonal analysis, a certain monthly variation of the optical parameters was noticed. The results of the diurnal optical properties variations for the Ma˘ gurele area showed visible differences between the maximal and minimal values for the spring and summer seasons. 1. Introduction The aerosols are atmospheric components with a very important role in establishing the earth’s radiative bal- ance. They act both in a direct way, through the solar radiation scattering and absorption phenomena, and in- directly, through influencing the microphysical and radi- ative properties of clouds (Lyamani et al. 2010). At the global scale, the main aerosol types originate from nat- ural processes such as dust storms, agricultural activities, biomass burning, and volcano eruptions (Solomon et al. 2007). The anthropogenic aerosol, which is mainly de- rived from various combustion processes (urban traffic and industrial activity), dominates in densely populated areas, very industrialized zones, and areas where intense biomass burning takes place (Houghton et al. 2001). Ex- amples of aerosol types that strongly scatter and absorb the solar radiation are organic particles, water-soluble inorganic particles (sulfates and nitrates) from biomass/ fuel burnings, ammonium from fertilizers, sea salt, dust, etc. (Dubovik et al. 2002; Houghton et al. 2001). To date, significant uncertainties persist in our under- standing of the aerosol effects on climate (Houghton et al. 2001; Solomon et al. 2007). This is a consequence of the complexity of the interaction processes between aerosols and water vapors (Vardavas and Taylor 2007). The high space–time variability and the heterogeneity associated to the short lifetime both contribute to the persistence of those uncertainties (Vardavas and Taylor 2007). It is therefore very important to understand the aerosols ef- fects in the radiative transfer phenomena and to obtain their optical properties with maximum accuracy, both in real time and over the largest possible area of the earth. The optical properties that offer a thorough picture of the aerosol size distribution and mass are the aerosol optical Corresponding author address: Laura Mihai, 409 Atomistilor St., Laser Metrology and Standardization Laboratory, National Institute for Laser, Plasma and Radiation Physics, Ma˘ gurele 077125, Romania. E-mail: laura.mihai@inflpr.ro OCTOBER 2011 MIHAI AND STEFAN 1307 DOI: 10.1175/2011JTECHA1532.1 Ó 2011 American Meteorological Society

Welcome message from author
This document is posted to help you gain knowledge. Please leave a comment to let me know what you think about it! Share it to your friends and learn new things together.
Transcript
Temporal Variation of Aerosol Optical Properties at Magurele, Romania
LAURA MIHAI
Faculty of Physics, Department of Earth and Atmospheric Physics, University of Bucharest, and National
Institute for Laser, Plasma and Radiation Physics, Bucharest, Romania
SABINA STEFAN
Faculty of Physics, Department of Earth and Atmospheric Physics, University of Bucharest, Bucharest, Romania
(Manuscript received 6 October 2010, in final form 29 April 2011)
ABSTRACT
Even though much research has been conducted regarding the study of atmospheric aerosols, significant
uncertainties still exist in this direction. The uncertainties are related to different physical and microphysical
properties of these fine particles, but they are also related to the complex processes of interactions between
aerosols and other atmospheric components, such as water droplets in the clouds or gaseous molecules.
Therefore, it is mandatory to understand aerosol physics with maximum precision in real time all over
the world. In this paper, the results of the statistical analysis of atmospheric aerosol optical properties as the
total scattering and the backscattering coefficients, the Angstrom parameter, and the aerosol optical depth
from Magurele (Ilfov, Romania) are presented. The analysis covers the period between 1 June 2008 and
31 December 2009. The results showed significant differences in temporal variations of the optical parameters
for the winter of 2008 and 2009. From spring 2009 to the winter of this year, a decreasing tendency of the total
scattering coefficient and an increasing trend for the Angstrom exponent were observed. The size-increase
tendency, over 1 mm, appears during the spring of 2008 and the summers of 2008 and 2009, coinciding with the
local pollution or Saharan dust intrusion episodes. From the seasonal analysis, a certain monthly variation of
the optical parameters was noticed. The results of the diurnal optical properties variations for the Magurele
area showed visible differences between the maximal and minimal values for the spring and summer seasons.
1. Introduction
The aerosols are atmospheric components with a very
important role in establishing the earth’s radiative bal-
ance. They act both in a direct way, through the solar
radiation scattering and absorption phenomena, and in-
directly, through influencing the microphysical and radi-
ative properties of clouds (Lyamani et al. 2010). At the
global scale, the main aerosol types originate from nat-
ural processes such as dust storms, agricultural activities,
biomass burning, and volcano eruptions (Solomon et al.
2007). The anthropogenic aerosol, which is mainly de-
rived from various combustion processes (urban traffic
and industrial activity), dominates in densely populated
areas, very industrialized zones, and areas where intense
biomass burning takes place (Houghton et al. 2001). Ex-
amples of aerosol types that strongly scatter and absorb
the solar radiation are organic particles, water-soluble
inorganic particles (sulfates and nitrates) from biomass/
fuel burnings, ammonium from fertilizers, sea salt, dust,
etc. (Dubovik et al. 2002; Houghton et al. 2001).
To date, significant uncertainties persist in our under-
standing of the aerosol effects on climate (Houghton et al.
2001; Solomon et al. 2007). This is a consequence of the
complexity of the interaction processes between aerosols
and water vapors (Vardavas and Taylor 2007). The high
space–time variability and the heterogeneity associated
to the short lifetime both contribute to the persistence
of those uncertainties (Vardavas and Taylor 2007). It is
therefore very important to understand the aerosols ef-
fects in the radiative transfer phenomena and to obtain
their optical properties with maximum accuracy, both in
real time and over the largest possible area of the earth.
The optical properties that offer a thorough picture of the
aerosol size distribution and mass are the aerosol optical
Corresponding author address: Laura Mihai, 409 Atomistilor St.,
Laser Metrology and Standardization Laboratory, National Institute
for Laser, Plasma and Radiation Physics, Magurele 077125, Romania.
E-mail: [email protected]
OCTOBER 2011 M I H A I A N D S T E F A N 1307
DOI: 10.1175/2011JTECHA1532.1
� 2011 American Meteorological Society
depth (AOD), the Angstrom exponent, and the fraction
of fine-mode aerosol.
In this paper, the results of the statistical analysis of
certain representative optical properties of the atmo-
spheric aerosol from Magurele (Ilfov, Romania) are
presented. The analysis covers the period between 1 June
2008 and 31 December 2009. The nature of the various
aerosol sources in Magurele, which is a suburban area of
Bucharest, the capital of Romania, underlines the im-
portance of studying the aerosol properties in this area.
The various sources of atmospheric aerosol in the area
originate in agricultural parcels, in the primary sources
of dust from biomass burning, in concrete mixing units,
and in forest vegetation. The placement of the mea-
surement sites is discussed in section 2.
A TSI 3653 integrated nephelometer has been used to
measure the aerosol scattering coefficients for three
wavelengths (Charlson 2005). The obtained data have been
compared to the results provided by a sun photometer
placed in the same area. The following optical parameters
have been obtained from these measurements: the total
scattering and backscattering coefficients, the Angstrom
parameter, and the AOD. Details of the instruments and
the methods used for the measurements are presented in
section 3. The temporal, seasonal, and diurnal evolution
of the aerosol optical parameters during the considered
period is described in section 4. The related conclusions
are summarized in the final section of the paper.
2. Obtaining and processing numerical data
a. The aerosol sources in the studied area
The measurements have been performed in a suburban
area of Bucharest, in the town of Magurele, positioned at
448219N latitude and 26829E longitude. The character-
ization of aerosol properties in Magurele is important
because this region lies adjacent to both the agriculture
region, which is a large dust source, and the southern part
of Bucharest, which is the location of power plants that
are sources of aerosols and trace gas emissions. In addi-
tion, a substantial amount of smoke and pollution are
generated locally from the rapid growth of economic ac-
tivity, with associated increases in fossil fuel combustion.
It was found (Solomon et al. 2007) that up to 50% of
the total amount of atmospheric aerosols comes from
land processing. The aerosols produced by these sources
have diameters within 2–4 mm (Solomon et al. 2007). The
forest surrounding the research facilities from the central
city of Magurele is a source of biogenic aerosol. This type
of aerosol, which consists of vegetation residue and mi-
crobial particles (e.g., pollen, spores, bacteria, fungi, etc.),
absorbs the solar radiation mainly in the ultraviolet B
(UVB) range of the solar spectrum (Havers et al. 1998).
The sizes of biogenic aerosols are usually between 3 and
150 mm (Solomon et al. 2007). In the industrial area on
the northeastern part of the town there are other aerosol
sources: the waste pit (with particles produced from the
biomass and chemical burning) and the concrete mixing
unit, which is placed 1 km away from the measurement
spot (with particles produced from cement processing
activity). Moreover, one should consider the mechanical
disintegration and the gas–particle conversion processes
(which dominate in the industrial northeastern part of
the town) that produce aerosols with diameters larger
than 0.1 mm. The gaseous pollution is generated locally
due to the rapid development of economic activity, which
is associated with the increase in the combustion of fossil
fuel (in urban transportation as well as in traffic on the
nearby belt road of Bucharest city).
The climate in Magurele is temperate–continental
characterized by the clear differentiation between the
four seasons, especially between summer and winter.
b. Description of the instruments used in themeasurements
The main equipment used in acquiring data between
June 2008 and December 2009 was a TSI 3653 integrated
nephelometer. The instrument is placed in the Laboratory
of Atmospheric Physics of the Faculty of Physics of the
University of Bucharest. The nephelometer inlet is lo-
cated about 15 m above the ground. The air sample is
absorbed through a smooth Teflon tube of 7-m length
and approximately 10-cm diameter. We used Teflon as
the material for the inlet tube in order to minimize the
aerosols losses; Teflon is a material that prohibits an
electrostatic charge. The tube’s vent is protected from
rain and insect intrusion. The instrument’s extracting-type
exhausting turbine absorbs an aerosol sample through the
high-pitched duct into the measuring room. The sample is
then illuminated with a halogen lamp under incident an-
gles of between 78 and 1708. The dichroic filters placed in
the nephelometer cavity select three wavelengths of visi-
ble light (450, 550, and 700 nm, each with a bandwidth of
50 nm) from the entire radiation scattered by aerosols.
Three total scattering coefficients are thus obtained, cor-
responding to these exploring wavelengths. The back-
scattering disk of the instrument serves to integrate the
radiation scattered backward in both the 908–1708 and 78–
1708 range. In this way, three hemispherical backscat-
tering coefficients are obtained. An automatic internal
valve is acting to diversify the aerosol sample with a high-
efficiency filter [high-efficiency particulate air (HEPA)].
Thus, the six optical parameters corresponding to the
three different wavelengths (viz., the total scattering co-
efficients and the backscattering coefficients) are contin-
uously mediated, acquired, and saved in the computer.
1308 J O U R N A L O F A T M O S P H E R I C A N D O C E A N I C T E C H N O L O G Y VOLUME 28
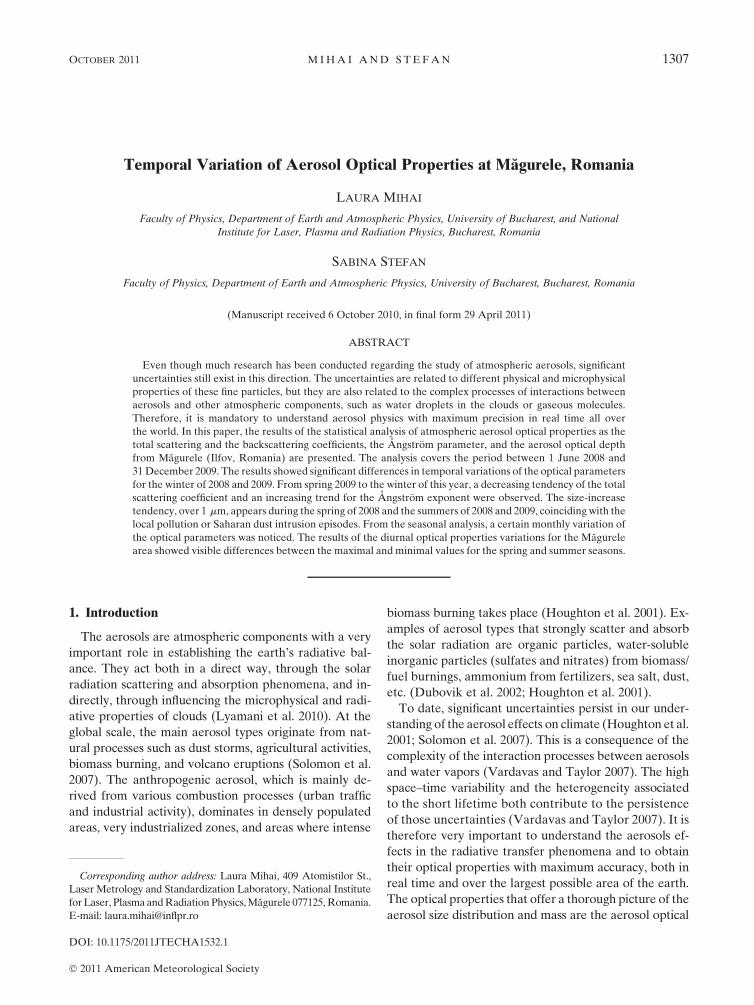
For scattering coefficients measurement we set up the
averaging time to be 1 min and the zero background
measure to be 1 h. The pressure and the temperature
inside the nephelometer were recorded and monitored
continuously. In Fig. 1 we represented the dependence
of the backscattering coefficients with relative humidity.
As can be noted in Fig. 1, the humidity inside the neph-
elometer was lower than 50% and there were no major
variations of backscattering coefficients with humidity.
Targino et al. (2005) wrote that if the relative humidity
inside the instrument is lower than 50%, then the air sam-
pling can be considered dry. Anderson and Ogren (1998)
also wrote that the scattering properties of aerosols are
affected by humidity only if it is larger than 50%.
In conclusion, the measurements were performed with
no aerosol heating and no aerosol size cutoff. Also, in order
to track the performance of the nephelometer, we per-
formed periodical span gas checks and calibrations using
CO2 as the high span gas and filtered air as the low span gas
(Anderson and Ogren 1998). The nephelometer calibra-
tion results showed the very good behavior of the equip-
ment, with typical values for K2 for all three wavelengths in
the range from 2 3 1023 to 8 3 1023 (Sheridan and Ogren
2006). The K2 constant is responsive for the quantity of
light detected during the nephelometer calibration for each
chopper cycle, by the three PMTs. Depending on the
chopper shutter optical defects, the values of K2 can vary
more or less. The K4 constant, which is related to the
fraction of the scattering volume illuminated during the
backscatter measurement, had typical values around 0.5.
The columnar AOD was obtained from two CIMEL
CE-318 sun photometers placed in Magurele National
Institute of Research and Development for Optoelec-
tronics (INOE) (used from June to December 2008) and
Baneasa (used from March to December 2009). This
type of instrument has a full-view angle of 1.28 and is
equipped with eight interferential filters and a tempera-
ture sensor for the temperature correction of the signal
for temperature-dependent channels. Both sun photom-
eters are part of the Aerosol Robotic Network (AER-
ONET; Holben et al. 2001) and measure direct sun and
diffuse sky radiances in eight spectral channels at 340,
380, 440, 523, 675, 870, 940, and 1020 nm. All of the
channels are used to obtain the AOD, minus the spectral
channel corresponding to 940 nm, which is used to
compute total precipitable water (Lyamani et al. 2006).
The particulate matter (PM)10 mass concentrations
were measured using a gravimetric system; the samples
were collected for a 24-h period on a glass fiber filter
(daily measurements). For filters weighing an analytical
balance (with 0.000 01 g precision) was used.
To see the aerosol source regions responsible for the
most important aerosol episodes in the study area for the
period of June 2008–December 2009, a backward tra-
jectory was calculated using the Hybrid Single-Particle
Lagrangian Integrated Trajectory (HYSPLIT) model
(Draxler and Hess 1998).
We used the Goddard Earth Sciences (GES) Data and
Information Services Center (DISC) Interactive Online
Visualization and Analysis Infrastructure (GIOVANNI)
application to visualize parameters, such as the aerosol
optical depth at 550 nm and the Angstrom parameter
from satellite measurements for our area of interest.
GIOVANNI is a Web-based application developed by
the GES DISC (Acker and Leptoukh 2007).
3. The obtained aerosol optical parameters
The Angstrom exponent for three wavelengths ranges,
namely, 450–550, 550–700, and 450–700 nm, have been
obtained in this study. This parameter’s definition origi-
nates in the Angstrom’s power-law approximation of the
spectral dependence of the AOD,
tl5 bl2a. (1)
Aerosol optical thickness (AOT; also called the AOD)
is another important parameter that characterizes the
atmospheric aerosol on a vertical column. AOT is defined
as the measure of radiation extinction resulting from the
interaction of radiation with aerosols in the atmosphere,
primarily resulting from the processes of scattering and
absorption.
By writing Eq. (1) for two different wavelengths, one
can easily eliminate the turbidity factor b and can write
the Angstrom exponent as
FIG. 1. The backscattering coefficient dependency on relative
humidity for Jun 2008–Dec 2009. Diurnal values of backscattering
coefficient and relative humidity were used.
OCTOBER 2011 M I H A I A N D S T E F A N 1309
a 5 (lntl1/t
l2)/(ln l2/l1), (2)
where the AOD can be expressed with the scattering
coefficient ss as tl
5ÐL
0 ss dl. Because the optical path
in the horizontal direction is considered to be position
independent, the Angstrom exponent of Eq. (2) can be
put under the following form:
a 5 (lnssl1/ssl2)/(lnl2/l1), (3)
where ssl1 and ssl2 are the scattering coefficients for
the two considered wavelengths. In this paper, those
coefficients have been obtained directly from the data
provided by the integrated nephelometer. The Ang-
strom exponent is used to characterize the physical and
radiative properties of the atmospheric aerosol. It is
known that, for aerosols of diameter less than 0.1 mm,
the Angstrom exponent is greater than 1.8 and the fine-
mode aerosol dominates quantitatively. When particles
with diameters greater than 1 mm (e.g., dust) prevail in
the atmosphere, the Angstrom exponent takes values
smaller than 0.7. The particles with diameters between
0.1 and 1 mm constitute the so-called accumulation
mode for which the Angstrom exponent takes values
between 0.7 and 1.8 (Kaufman 1994). Using the inte-
grated nephelometer, one can obtain directly, through
angular integration of the scattering per unit volume of
the air sample, three backscattering coefficients corre-
sponding to the three measuring wavelengths of the
equipment: 450, 550, and 700 nm.
4. Results and discussions
a. Seasonal variations of the daily averages of theoptical scattering parameters of the aerosols
In a first stage, the seasonal evolution of the daily av-
erages of the aerosol parameters in 2008 and 2009, in the
FIG. 2. (a) Total scattering and (b) the Angstrom parameter statistics for the years 2008 and 2009. The statistical data are represented through
the box–whiskers method; the upper and the lower sides of the box represent the maximal and minimal values, respectively. The horizontal line
of each box is the median. The extended lines from each end of the box represent the confidence percentages of 5% and 95%, respectively.
1310 J O U R N A L O F A T M O S P H E R I C A N D O C E A N I C T E C H N O L O G Y VOLUME 28
Magurele area, has been analyzed. The averaging time set
for the nephelometer was of 5 min and the dark signal has
been measured once every hour. The statistics of the daily
averages of the aerosol optical properties during the 2-yr
period is presented in Fig. 2. The values of the total
scattering coefficients (Fig. 2a) ss for the three wave-
lengths of the instrument have varied overall with two
orders of magnitude. For ss (at 550 nm), during 2009,
the range was (5.45; 173.29) 3 1026 m21, with an av-
erage value (ss 6 std) of (58.42 6 32.18) 3 1026 m21.
The variations are explained by the annual average,
which is influenced by the seasonal cycles. The values
of the standard deviations exceed, on average, 50%
from the corresponding coefficients figures, thus un-
derlying the great seasonal variability of the scattering
processes. One may observe in Fig. 2a the different
statistical behavior of the total scattering coefficient in
2008 as compared to 2009. The explanation is revealed
in the difference between the time intervals used for the
two averages: for 2008 the averaging period was June–
December and for 2009 the average was taken between
March and December. Consequently, the difference was
made by the spring of 2009 when, in general, air cir-
culation is faster during the springtime, and thus the
meteorological conditions change frequently. Also, in
the past it was proved that Romanian air masses are
influenced by Saharan intrusion and biomass burning
(Papayannis et al. 2005; Nicolae et al. 2008). These factors
could explain the very high values of the total scattering
coefficient in the winter of 2008. Consequently, we used
HYSPLIT_4 model to check the airmass provenience for
the period when the maximum values of total scattering
coefficients were present. The GIOVANNI application
was used in parallel to visualize the atmospheric aerosol
loading characterized by aerosol optical depth for 500 nm.
Thus, as we can see, the maximum values in the winter
of 2008 (Figs. 2–4) correspond to some Saharan intrusion
events. In April 2009, the air masses carried biomass
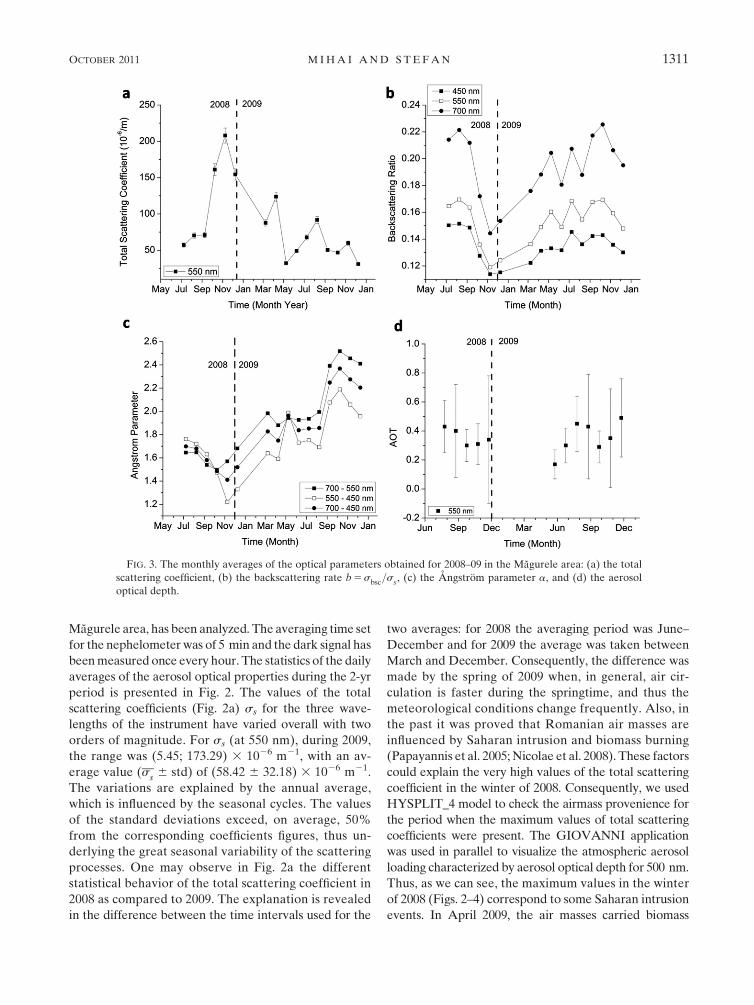
FIG. 3. The monthly averages of the optical parameters obtained for 2008–09 in the Magurele area: (a) the total
scattering coefficient, (b) the backscattering rate b 5 sbsc=s
s, (c) the Angstrom parameter a, and (d) the aerosol
optical depth.
OCTOBER 2011 M I H A I A N D S T E F A N 1311
burning aerosol above Romania from Ukraine and
Belarus (Ulevicius et al. 2010). The reduced values from
the winter of 2009 are explained by the strong suppression
of the local sources of aerosol and by the advection of an
Arctic and polar mass of air, which is generally very clean.
In the spectral range of 450–550 nm, the Angstrom
parameter mean values for each season were 1.69 6 0.18
in spring, 1.74 6 0.12 in summer, 1.69 6 0.4 in autumn,
and 1.39 6 0.37 in winter (Fig. 2b). During the June–
December 2008 interval, when the Angstrom parameter
was under 1.5, the coarse-mode aerosol is dominant
while between March and December 2009 the fine-mode
aerosol prevails (Seinfeld and Pandis 1998). The size-
increase tendency, over 1 mm, appears during spring and
summer, coinciding with the Saharan dust intrusion and
biomass burning episodes (Fig. 7). The rather high
aerosol concentrations in the winter of 2008 cannot be
found again in the winter of 2009 (Fig. 2a). The domi-
nance of the coarse-mode particles during the autumn and
winter of 2008 underline the very different characteristics
of the two seasons in the consecutive years (Fig. 2b). The
highest values for the total backscattering were observed
in spring for the wavelength of 450 nm (122.17 6 51.27) 3
1026 m21, followed by that for the wavelength of 550 nm
(88.45 6 39.00) 3 1026 m21 (not shown). The smallest
value of the total scattering coefficient was obtained
during winter at the same wavelength of 450 nm (45.65 6
28.97) 3 1026 m21 (Fig. 2a).
The monthly evolution of the aerosol optical parame-
ters during 2008–09 can be observed in Fig. 3. However,
one can get more insight from the analysis of monthly
(Fig. 3) averages, which allow conclusions on the aerosol
load in the atmosphere. A decreasing tendency of the
total scattering coefficient (Fig. 3a) from spring to the
next winter was observed and, as expected, the trend for
the Angstrom exponent increases from spring to the next
winter (Fig. 3c). One can also notice a certain periodicity
in the monthly evolution of both the total scattering co-
efficient (Fig. 3a) and the Angstrom parameter (Fig. 3c).
The period in the variation of the ratio between the
backscattering and the total scattering coefficients—
the backscattering ratio—is about 1 month, except for the
last 3 months of the year (Fig. 3b). Because this ratio gives
the fraction of the backscattered energy, it is very useful in
radiative transfer computations (Heintzenberg and
Charlson 1996), when an account is taken of the angular
distribution of the scattered radiation. The backscattering
ratio showed very low seasonal variability. The obtained
values for spring were 0.14 6 0.013, for summer were 0.15
6 0.02, for autumn were 0.15 6 0.02, and for winter were
0.13 6 0.02. It can be seen that the dominant size of the
aerosol during all of the months was in the range of the fine
mode. This can be also seen from Fig. 4b because particles
larger than the wavelength are mainly forward scattered.
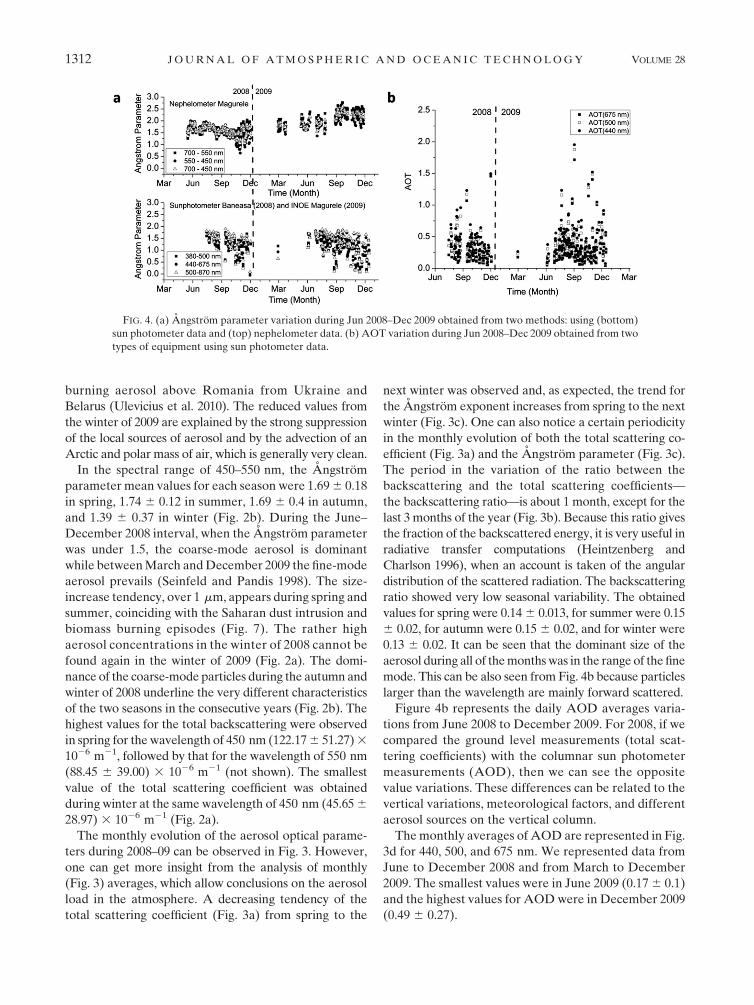
Figure 4b represents the daily AOD averages varia-
tions from June 2008 to December 2009. For 2008, if we
compared the ground level measurements (total scat-
tering coefficients) with the columnar sun photometer
measurements (AOD), then we can see the opposite
value variations. These differences can be related to the
vertical variations, meteorological factors, and different
aerosol sources on the vertical column.
The monthly averages of AOD are represented in Fig.
3d for 440, 500, and 675 nm. We represented data from
June to December 2008 and from March to December
2009. The smallest values were in June 2009 (0.17 6 0.1)
and the highest values for AOD were in December 2009
(0.49 6 0.27).
FIG. 4. (a) Angstrom parameter variation during Jun 2008–Dec 2009 obtained from two methods: using (bottom)
sun photometer data and (top) nephelometer data. (b) AOT variation during Jun 2008–Dec 2009 obtained from two
types of equipment using sun photometer data.
1312 J O U R N A L O F A T M O S P H E R I C A N D O C E A N I C T E C H N O L O G Y VOLUME 28
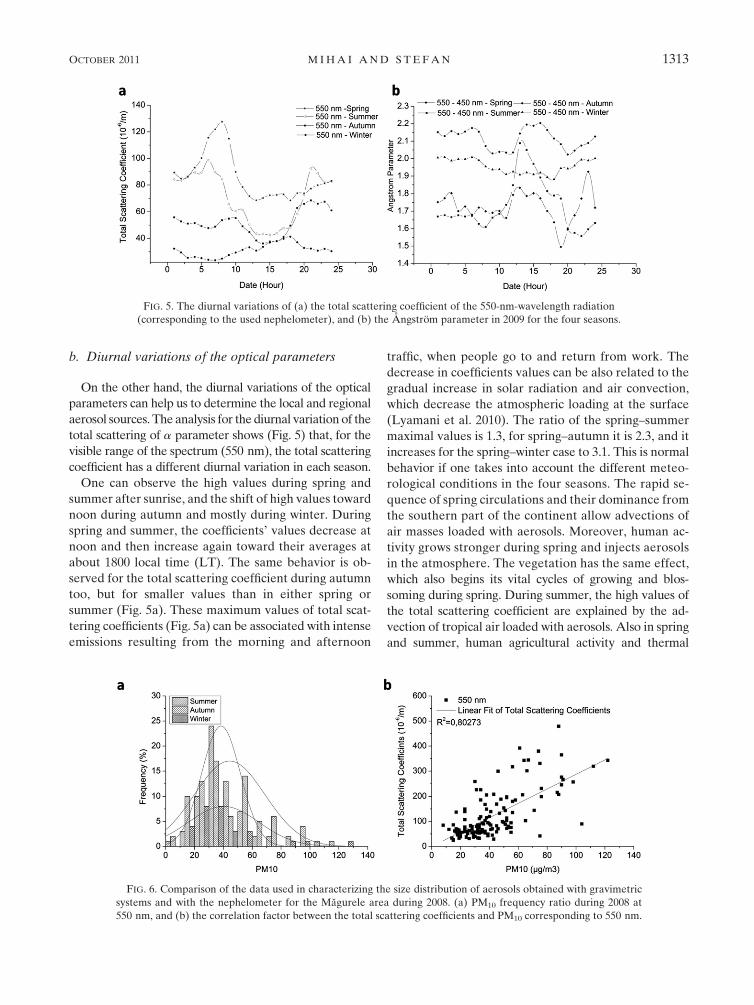
b. Diurnal variations of the optical parameters
On the other hand, the diurnal variations of the optical
parameters can help us to determine the local and regional
aerosol sources. The analysis for the diurnal variation of the
total scattering of a parameter shows (Fig. 5) that, for the
visible range of the spectrum (550 nm), the total scattering
coefficient has a different diurnal variation in each season.
One can observe the high values during spring and
summer after sunrise, and the shift of high values toward
noon during autumn and mostly during winter. During
spring and summer, the coefficients’ values decrease at
noon and then increase again toward their averages at
about 1800 local time (LT). The same behavior is ob-
served for the total scattering coefficient during autumn
too, but for smaller values than in either spring or
summer (Fig. 5a). These maximum values of total scat-
tering coefficients (Fig. 5a) can be associated with intense
emissions resulting from the morning and afternoon
traffic, when people go to and return from work. The
decrease in coefficients values can be also related to the
gradual increase in solar radiation and air convection,
which decrease the atmospheric loading at the surface
(Lyamani et al. 2010). The ratio of the spring–summer
maximal values is 1.3, for spring–autumn it is 2.3, and it
increases for the spring–winter case to 3.1. This is normal
behavior if one takes into account the different meteo-
rological conditions in the four seasons. The rapid se-
quence of spring circulations and their dominance from
the southern part of the continent allow advections of
air masses loaded with aerosols. Moreover, human ac-
tivity grows stronger during spring and injects aerosols
in the atmosphere. The vegetation has the same effect,
which also begins its vital cycles of growing and blos-
soming during spring. During summer, the high values of
the total scattering coefficient are explained by the ad-
vection of tropical air loaded with aerosols. Also in spring
and summer, human agricultural activity and thermal
FIG. 5. The diurnal variations of (a) the total scattering coefficient of the 550-nm-wavelength radiation
(corresponding to the used nephelometer), and (b) the Angstrom parameter in 2009 for the four seasons.
FIG. 6. Comparison of the data used in characterizing the size distribution of aerosols obtained with gravimetric
systems and with the nephelometer for the Magurele area during 2008. (a) PM10 frequency ratio during 2008 at
550 nm, and (b) the correlation factor between the total scattering coefficients and PM10 corresponding to 550 nm.
OCTOBER 2011 M I H A I A N D S T E F A N 1313
convection during the afternoons (resulting from intense
sunlight) both lift aerosols from the ground up to quite
high levels. In wintertime, the masses of cold air brought
from the northern part of the continent are cleaner and
the local pollution is much reduced. Moreover, winter
precipitation effectively scrubs the atmosphere of its
pollutants. These assertions are sustained by observing the
diurnal variation of the seasons (Fig. 5).
Regarding the diurnal variation of the Angstrom ex-
ponent, it may be observed that for the spectral range of
700–550 nm in autumn and winter 2009 the aerosols are
from the fine, submicrometer mode, and in spring and
summer the coarse-mode (over 1 mm but not extending
beyond 10–15 mm) particles dominate (Fig. 5b). During
winter 2009, domestic heating using fossil fuel contributes
to the increase of the fine-mode aerosols. Independent
FIG. 7. Aerosol optical depth at 550 nm from (left) Moderate Resolution Imaging Spectroradiometer (MODIS) satellite data and (right)
back trajectories at 100, 1000, and 3500 m on (a) 31 Oct 2008 and (b) 9 Apr 2009 at the Magurele site.
1314 J O U R N A L O F A T M O S P H E R I C A N D O C E A N I C T E C H N O L O G Y VOLUME 28
measurements of the size distribution of sub-10-mm
aerosols, performed by the Bucharest Environmental
Agency at its Magurele station, have confirmed the
increase of the concentration of fine-mode particles (see
Figs. 6a,b for the situation in 2008). The PM10 mass
concentrations are lower in autumn and winter than in
summer (Fig. 6a). The total scattering coefficient has
similar behavior (Fig. 5a). The good correlation (R2 5
0.803) between the total scattering coefficient deter-
mined using the nephelometer and the PM10 mass
concentrations can be observed in Fig. 6b.
5. Summary and conclusions
In this article a temporal analysis of the daily averages
of aerosol optical parameters in the Magurele area
during 2008 and 2009 is reported. Significant differences
between the results obtained during these 2 yr were
observed for the autumn–winter period. For 2009, the
daily averages of the optical parameters were computed
and variations of two orders of magnitude over the
whole year were observed. The maximal values of the
total scattering coefficient suggest the abundance of
coarse-mode particles larger than 1 mm during the
spring–summer period of 2009. Air circulations nor-
mally carry the Saharan dust and biomass burning
aerosols over the studied area (see Fig. 7). Human ac-
tivities and the vegetation cycles, which are intensified
during those two seasons, contribute to the episodes of
atmosphere’s loading with aerosols. The minimal
values of the scattering coefficients were obtained
during the cold seasons (autumn–winter 2009) and
were associated with northern airmass advections. The
average values of the Angstrom exponent showed an
increasing tendency from spring to winter.
From the seasonal analysis, a certain monthly peri-
odicity of the optical parameters was noticed. The
wavelength dependence of the scattering coefficients
suggested the presence of dry aerosols and the domi-
nance of fine-mode aerosols extended over the whole
year.
The results of the diurnal analysis for Magurele area
showed visible differences between the maximal and the
minimal values for the spring–summer seasons. The
maximum values occurred between 0600 and 0900 and
between 1800 and 2300 LT, while the minima showed up
between 1300 and 1600 LT. For colder seasons, these
variations were much smaller, with maxima appearing
after 0800 LT in winter, between 0800 and 1100 and
between 1700 and 2400 LT.
Acknowledgments. The author Laura Mihai gratefully
acknowledges the support of the POSDRU Program of
University of Bucharest. The work of Sabina Stefan was
supported by the RADO Project, Contract STVES
2008/115266 from Norway’s INNOVATION program.
Airmass backtrajectories were produced with the Hy-
brid Single-Particle Lagrangian Integrated Trajectory
(HYSPLIT-4.6) model (NOAA). Analyses and visu-
alizations used in this paper were produced with the
GIOVANNI online data system, which is developed
and maintained by the NASA GES DISC. We also
acknowledge the MODIS mission scientists and associ-
ated NASA personnel for the production of the data used
in this research effort.
REFERENCES
Acker, J. G., and Leptoukh, G., 2007: Online analysis enhances use
of NASA Earth science data. Eos, Trans. Amer. Geophys.
Union, 88, 14, doi:10.1029/2007EO020003.
Anderson, T. L., and J. A. Ogren, 1998: Determining aerosol ra-
diative properties using the TSI 3563 integrating nephelome-
ter. Aerosol Sci. Technol., 29, 57–69.
Charlson, R., 2005: Model 3563 integrating nephelometer: Oper-
ation and service manual. TSI P/N 1933563 Revision F, 219 pp.
[Available online at http://www.tsi.com/documents/1933563f-
3563.pdf.]
Draxler, R. R., and G. D. Hess, 1998: An overview of the
HYSPLIT_4 modeling system for trajectories, dispersion, and
deposition. Aust. Meteor. Mag., 47, 295–308.
Dubovik, O., B. Holben, T. F. Eck, A. Smirnov, Y. J. Kaufman,
M. D. King, D. Tanre, and I. Slutsker, 2002: Variability of ab-
sorption and optical properties of key aerosol types observed in
worldwide locations. J. Atmos. Sci., 59, 590–608.
Havers, N., P. Burba, J. Lambert, and D. Klockow, 1998: Spec-
troscopic characterization of humic-like substances in air-
borne particulate matter. J. Atmos. Chem., 29, 45–54.
Heintzenberg, J., and R. J. Charlson, 1996: Design and applications
of the integrating nephelometer: A review. J. Atmos. Oceanic
Technol., 13, 987–1000.
Holben, B. N., D. Tanre, A. Smirnov, T. F. Eck, and I. Slutsker,
2001: An emerging ground-based aerosol climatology: Aero-
sol optical depth from AERONET. J. Geophys. Res., 106,
12 067–12 097.
Houghton, J. T., Y. Ding, D. J. Griggs, M. Noguer, P. J. van der
Linden, X. Dai, K. Maskell, and C. A. Johnson, Eds., 2001:
Climate Change 2001: The Scientific Basis. Cambridge Uni-
versity Press, 881 pp.
Kaufman, Y. J., 1994: Remote sensing of the direct and indirect
aerosol forcing. Aerosol Forcing of Climate, R. J. Charlson and
J. Heintzenberg, Eds., Wiley, 297–334.
Lyamani, H., F. J. Olmo, A. Alcantara, and L. Alados-Arboledas,
2006: Atmospheric aerosols during the 2003 heat wave in
southeastern Spain I: Spectral optical depth. Atmos. Environ.,
40, 6453–6464.
——, ——, and L. Alados-Arboledas, 2010: Physical and optical
properties of aerosols over an urban location in Spain:
Seasonal and diurnal variability. Atmos. Chem. Phys., 10,
239–254.
Nicolae, D., C. Talianu, R. Mamouri, E. Carstea, A. Papayannis,
G. Tsaknakis, 2008: Air mass modification processes over the
Balkans area detected by aerosol lidar techniques. J. Opto-
electron. Adv. Mater., 2, 405–412.
OCTOBER 2011 M I H A I A N D S T E F A N 1315
Papayannis, A., and Coauthors, 2005: Measurements of Saharan
dust aerosols over the Eastern Mediterranean using elastic
backscatter-Raman lidar, spectrophotometric and satellite
observations in the frame of the EARLINET project. Atmos.
Chem. Phys., 5, 2065–2079.
Seinfeld, J. H., and S. N. Pandis, 1998: Atmospheric Chemistry and
Physics: From Air Pollution to Climate Change. John Wiley,
1326 pp.
Sheridan, P. J., and J. A. Ogren, 2006: TSI Model 3563 integrating
nephelometer operations reference manual. TSI, 15 pp.
Solomon, S., D. Qin, M. Manning, Z. Chen, M. Marquis, K. B.
Averyt, M. Tignor, and H. L. Miller, Eds., 2007: Climate
Change 2007: The Physical Science Basis. Cambridge Uni-
versity Press, 996 pp.
Targino, A. C., K. J. Noone, and E. Ostrom, 2005: Airborne in situ
characterization of dry aerosol optical properties in a multi-
source influenced marine region. Tellus, 57B, 247–260.
Ulevicius, V., S. Bycenkien _e, V. Remeikis, A. Garbaras, S. Kecorius,
J. Andriejauskien_e, D. Jasinevicien _e, and G. Mocnik, 2010: Char-
acterization of pollution events in the East Baltic regions affected
by regional biomass fire emissions. Atmos. Res., 98, 190–200.
Vardavas, I. M., and F. W. Taylor, 2007: Radiation and Climate.
International Series of Monographs on Physics, Vol. 138, Oxford
University Press, 512 pp.
1316 J O U R N A L O F A T M O S P H E R I C A N D O C E A N I C T E C H N O L O G Y VOLUME 28
Related Documents