Welcome message from author
This document is posted to help you gain knowledge. Please leave a comment to let me know what you think about it! Share it to your friends and learn new things together.
Transcript
1
stressinamerica.org
STRESS IN AMERICA™ 2017: Technology and Social Media
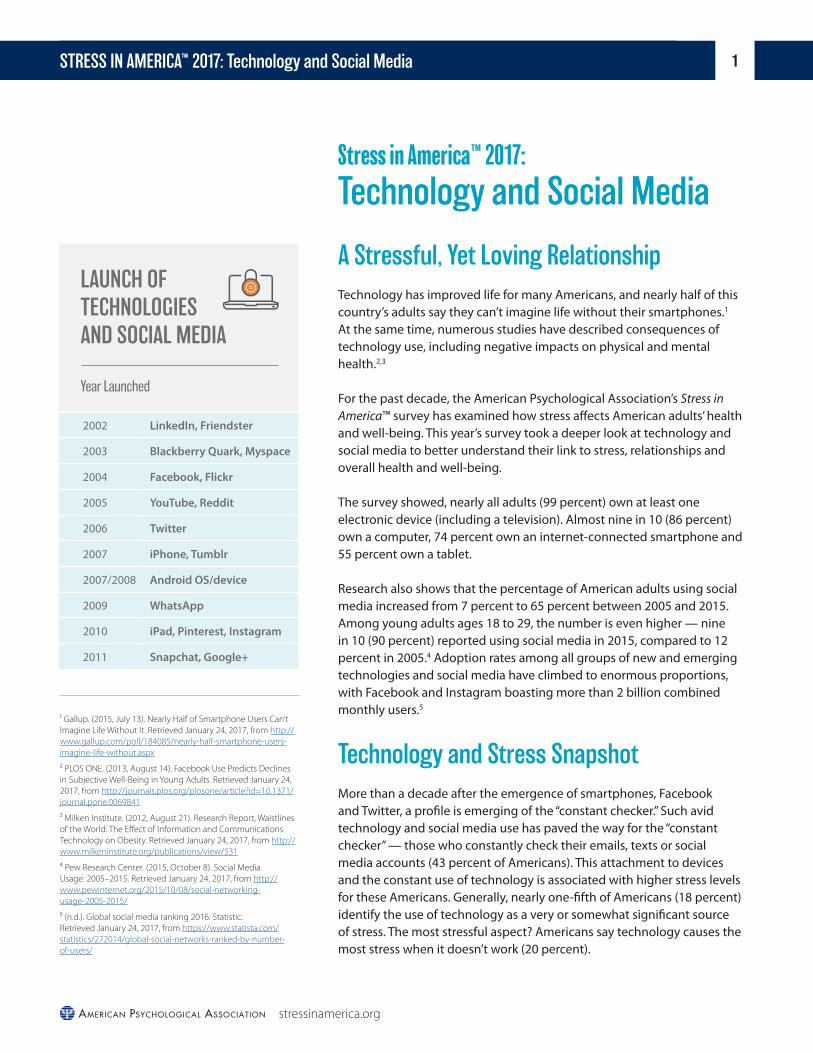
A Stressful, Yet Loving Relationship Technology has improved life for many Americans, and nearly half of this country’s adults say they can’t imagine life without their smartphones.1 At the same time, numerous studies have described consequences of technology use, including negative impacts on physical and mental health.2,3
For the past decade, the American Psychological Association’s Stress in America™ survey has examined how stress affects American adults’ health and well-being. This year’s survey took a deeper look at technology and social media to better understand their link to stress, relationships and overall health and well-being.
The survey showed, nearly all adults (99 percent) own at least one electronic device (including a television). Almost nine in 10 (86 percent) own a computer, 74 percent own an internet-connected smartphone and 55 percent own a tablet. Research also shows that the percentage of American adults using social media increased from 7 percent to 65 percent between 2005 and 2015. Among young adults ages 18 to 29, the number is even higher — nine in 10 (90 percent) reported using social media in 2015, compared to 12 percent in 2005.4 Adoption rates among all groups of new and emerging technologies and social media have climbed to enormous proportions, with Facebook and Instagram boasting more than 2 billion combined monthly users.5
Technology and Stress SnapshotMore than a decade after the emergence of smartphones, Facebook and Twitter, a profile is emerging of the “constant checker.” Such avid technology and social media use has paved the way for the “constant checker” — those who constantly check their emails, texts or social media accounts (43 percent of Americans). This attachment to devices and the constant use of technology is associated with higher stress levels for these Americans. Generally, nearly one-fifth of Americans (18 percent) identify the use of technology as a very or somewhat significant source of stress. The most stressful aspect? Americans say technology causes the most stress when it doesn’t work (20 percent).
Stress in America™ 2017:
Technology and Social Media
2002 LinkedIn, Friendster
2003 Blackberry Quark, Myspace
2004 Facebook, Flickr
2005 YouTube, Reddit
2006 Twitter
2007 iPhone, Tumblr
2007/2008 Android OS/device
2009 WhatsApp
2010 iPad, Pinterest, Instagram
2011 Snapchat, Google+
LAUNCH OF TECHNOLOGIES AND SOCIAL MEDIA
Year Launched
¹ Gallup. (2015, July 13). Nearly Half of Smartphone Users Can’t Imagine Life Without It. Retrieved January 24, 2017, from http://www.gallup.com/poll/184085/nearly-half-smartphone-users-imagine-life-without.aspx
² PLOS ONE. (2013, August 14). Facebook Use Predicts Declines in Subjective Well-Being in Young Adults. Retrieved January 24, 2017, from http://journals.plos.org/plosone/article?id=10.1371/journal.pone.0069841
³ Milken Institute. (2012, August 21). Research Report, Waistlines of the World: The Effect of Information and Communications Technology on Obesity. Retrieved January 24, 2017, from http://www.milkeninstitute.org/publications/view/531
⁴ Pew Research Center. (2015, October 8). Social Media Usage: 2005–2015. Retrieved January 24, 2017, from http://www.pewinternet.org/2015/10/08/social-networking-usage-2005-2015/
⁵ (n.d.). Global social media ranking 2016. Statistic. Retrieved January 24, 2017, from https://www.statista.com/statistics/272014/global-social-networks-ranked-by-number-of-users/
2
stressinamerica.org
STRESS IN AMERICA™ 2017: Technology and Social Media
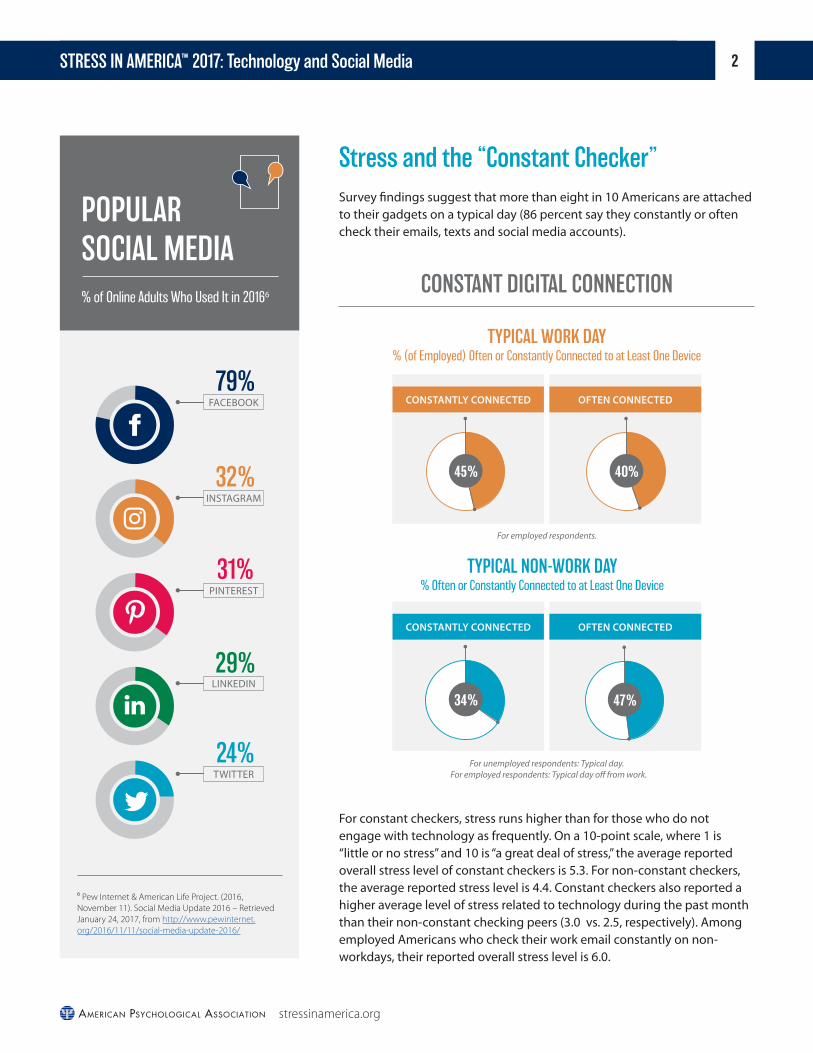
Stress and the “Constant Checker”Survey findings suggest that more than eight in 10 Americans are attached to their gadgets on a typical day (86 percent say they constantly or often check their emails, texts and social media accounts).
⁶ Pew Internet & American Life Project. (2016, November 11). Social Media Update 2016 – Retrieved January 24, 2017, from http://www.pewinternet.org/2016/11/11/social-media-update-2016/
POPULAR SOCIAL MEDIA% of Online Adults Who Used It in 20166
For constant checkers, stress runs higher than for those who do not engage with technology as frequently. On a 10-point scale, where 1 is “little or no stress” and 10 is “a great deal of stress,” the average reported overall stress level of constant checkers is 5.3. For non-constant checkers, the average reported stress level is 4.4. Constant checkers also reported a higher average level of stress related to technology during the past month than their non-constant checking peers (3.0 vs. 2.5, respectively). Among employed Americans who check their work email constantly on non-workdays, their reported overall stress level is 6.0.
32%
24%
29%
31%
79%
TYPICAL WORK DAY % (of Employed) Often or Constantly Connected to at Least One Device
CONSTANT DIGITAL CONNECTION
CONSTANTLY CONNECTED OFTEN CONNECTED
45% 40%
TYPICAL NON-WORK DAY % Often or Constantly Connected to at Least One Device
CONSTANTLY CONNECTED OFTEN CONNECTED
47%34%
For employed respondents.
For unemployed respondents: Typical day. For employed respondents: Typical day off from work.

3
stressinamerica.org
STRESS IN AMERICA™ 2017: Technology and Social Media
TECHNOLOGY MORE LIKELY TO BE A SOURCE OF STRESS FOR CONSTANT CHECKERS
Technology Use Is a Somewhat or Significant Source of Stress
23% 14%
CONSTANT CHECKERS NON-CONSTANT CHECKERS
On a typical day (or day off from work for those who are employed), 65 percent of American adults say they often or constantly check personal email, 52 percent and 44 percent say the same about texts and social media, respectively, and 28 percent (of those employed) report the same about their work email. For some, constant checking itself can be a stressful act. Constant checkers are more likely to say that constantly checking devices is a stressful aspect of technology, compared to non-constant checkers (29 percent vs. 24 percent, respectively). For employed Americans who check their work email constantly on non-work days, this jumps to 41 percent.
Constant Checkers and Non-Constant Checkers: The Social Media and Technology Divide Social media also negatively affects a greater proportion of constant checkers than non-constant checkers. More than two in five constant checkers (42 percent) say that political and cultural discussions on social media cause them stress, compared to 33 percent of non-constant checkers. Additionally, 42 percent say they worry about negative effects of social media on their physical and mental health (compared to 27 percent of non-constant checkers). Constant checkers express feeling disconnected from their family, even when they are together, as a result of technology (44 percent of constant checkers versus 25 percent of non-constant checkers). In addition to feeling disconnected, more than one-third (35 percent) of constant checkers report being less likely to meet with family and friends in person because of social media. In comparison, half as many (15 percent) non-constant checkers report the same.
Many Americans Looking to Unplug and Manage Tech UseMany Americans (65 percent) somewhat or strongly agree that periodically “unplugging” or taking a “digital detox” is important for their mental health. However, only 28 percent of those agree about the important of a detox actually report doing so.
Other commonly reported strategies used by Americans to manage their technology usage include not allowing cell phones at the dinner table (28 percent) and turning off notifications for social media apps (19 percent).
Don’t allow devices during time with friends
Don’t allow devices during family time
“Unplug” or take a “digital detox” periodically
Don’t allow cell phones at the dinner table
Turn off notifications for social media apps
Limit time spent watchingTV each day
19%
19%
19%
21%
21%
28%
COMMON TECHNOLOGY USAGE MANAGEMENT STRATEGIES
% of Americans Using These Strategies
4
stressinamerica.org
STRESS IN AMERICA™ 2017: Technology and Social Media
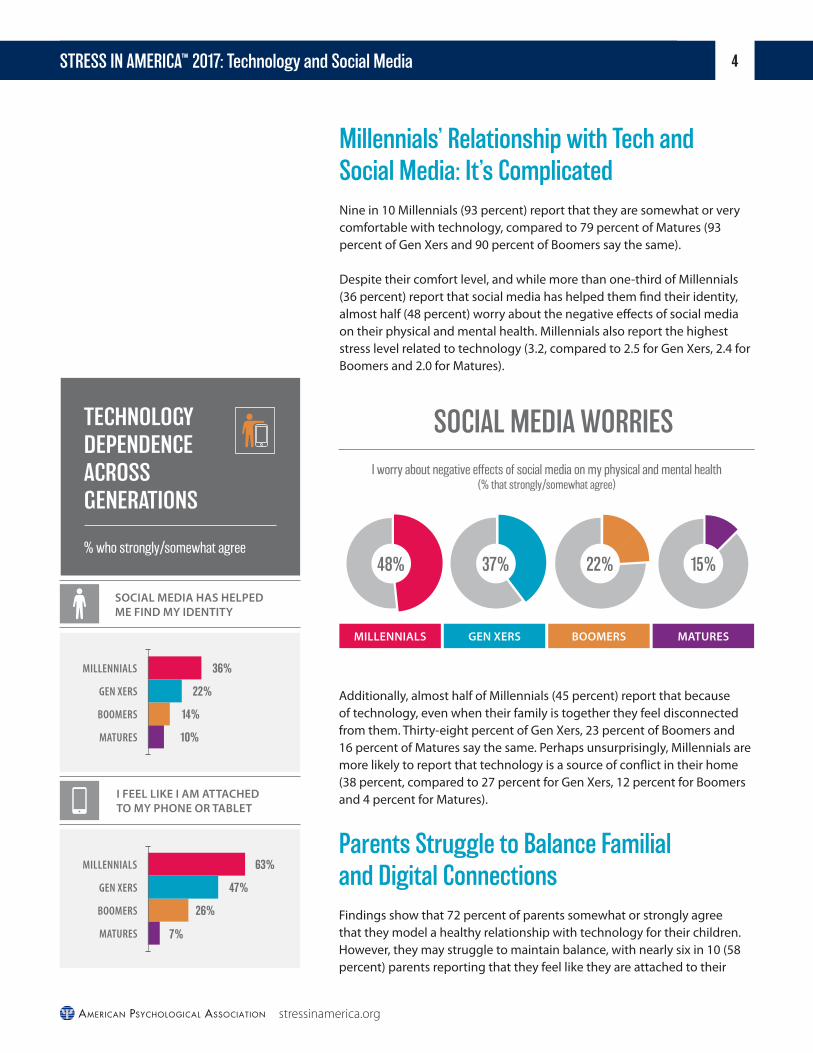
Millennials’ Relationship with Tech and Social Media: It’s ComplicatedNine in 10 Millennials (93 percent) report that they are somewhat or very comfortable with technology, compared to 79 percent of Matures (93 percent of Gen Xers and 90 percent of Boomers say the same). Despite their comfort level, and while more than one-third of Millennials (36 percent) report that social media has helped them find their identity, almost half (48 percent) worry about the negative effects of social media on their physical and mental health. Millennials also report the highest stress level related to technology (3.2, compared to 2.5 for Gen Xers, 2.4 for Boomers and 2.0 for Matures).
SOCIAL MEDIA WORRIES
I worry about negative effects of social media on my physical and mental health (% that strongly/somewhat agree)
MILLENNIALS GEN XERS BOOMERS MATURES
15%22%37%48%
Additionally, almost half of Millennials (45 percent) report that because of technology, even when their family is together they feel disconnected from them. Thirty-eight percent of Gen Xers, 23 percent of Boomers and 16 percent of Matures say the same. Perhaps unsurprisingly, Millennials are more likely to report that technology is a source of conflict in their home (38 percent, compared to 27 percent for Gen Xers, 12 percent for Boomers and 4 percent for Matures).
Parents Struggle to Balance Familial and Digital ConnectionsFindings show that 72 percent of parents somewhat or strongly agree that they model a healthy relationship with technology for their children. However, they may struggle to maintain balance, with nearly six in 10 (58 percent) parents reporting that they feel like they are attached to their
SOCIAL MEDIA HAS HELPED ME FIND MY IDENTITY
I FEEL LIKE I AM ATTACHEDTO MY PHONE OR TABLET
36%
22%
14%
10%
MILLENNIALS
GEN XERS
BOOMERS
MATURES
MILLENNIALS
GEN XERS
BOOMERS
MATURES
63%
47%
26%
7%
TECHNOLOGY DEPENDENCE ACROSS GENERATIONS
% who strongly/somewhat agree

5
stressinamerica.org
STRESS IN AMERICA™ 2017: Technology and Social Media
stressinamerica.org
phone or tablet. More than one-third of employed parents (35 percent) say they check work email often or constantly on non-work days. On days off, the vast majority of parents also often or constantly check personal email (67 percent), text messages (69 percent) and social media (57 percent).
The struggle with technology usage extends to their children as well. While 94 percent of parents say that they take at least one action to manage their child’s technology usage during the school year, such as not allowing cell phones at the dinner table (32 percent) or limiting screen time before bed (32 percent), almost half (48 percent) say that regulating their child’s screen time is a constant battle, and more than half of parents (58 percent) report feeling like their child is attached to their phone or tablet.
Additionally, almost half of parents (45 percent) also say that they feel disconnected from their families even when they are together, because of technology. More than half of parents (58 percent) say that they worry about the influence of social media on their child’s physical and mental health.
Teen Girls’ Parents Disproportionately Concerned
The teen years are taxing for almost everyone, but perhaps especially for teen girls. According to a recent study in Pediatrics7, in the U.S. more teen girls than boys may be experiencing major depressive episodes. Research also shows teen girls were more likely to use social media to communicate8, which could expose them to the negative effects of this medium. A Youth Risk Behavior Surveillance from the CDC9 found that white teens and teen girls were more likely to say they were bullied both on school property and online. Almost eight in 10 (79 percent) parents say their teens (ages 13-17) use social media. However, parents of teen girls are significantly more likely to report that they worry about the influence of social media on their child’s physical and mental health (69 percent, compared to 39 percent of parents of teen boys).
7 Pediatrics. (2016, November). National Trends in the Prevalence and Treatment of Depression in Adolescents and Young Adults. Retrieved February 17, 2017, from http://pediatrics.aappublications.org/content/early/2016/11/10/peds.2016-18788 Pew Research Center. (2015, April 9). Teens, Social Media & Technology Overview 2015. Retrieved February 17, 2017, from http://www.pewinternet.org/2015/04/09/teens-social-media-technology-2015/9 CDC (2014, June 13). Morbidity and Mortality Weekly Report. Retrieved February 17, 2017, from https://www.cdc.gov/mmwr/pdf/ss/ss6304.pdf

2016 STRESS IN AMERICA SURVEY METHODS

7
stressinamerica.org
STRESS IN AMERICA™ 2017: Technology and Social Media
Stress in America™ 2017:
Survey MethodsThe 2016, Stress in America™ survey was conducted online within the United States by Harris Poll on behalf of the American Psychological Association (APA) between August 5 and 31, 2016, among 3,511 adults ages 18+ who reside in the U.S. Interviews were conducted in English (n=3255) and Spanish (n=256).
APA commissioned Harris Poll to conduct an additional survey in January 2017 specifically about the results of the 2016 presidential election. The follow-up survey was conducted online within the United States by Harris Poll on behalf of APA between January 5 and 19, 2017, among 1,019 adults ages 18+ who reside in the U.S. Interviews were conducted in English (n=957) and Spanish (n=62).
Respondents for these surveys were selected from among those who have agreed to participate in Harris Poll surveys. Data are weighted to reflect their proportions in the population. Weighting variables included age, gender, race/ethnicity, education, region and household income. Propensity score weighting also was used to adjust for respondents’ propensity to be online. In addition to the demographic variables listed, data from Hispanic respondents were weighted for acculturation, taking into account respondents’ household language as well as their ability to read and speak in English and Spanish.
All sample surveys and polls, whether or not they use probability sampling, are subject to multiple sources of error, which most often are not possible to fully estimate and control, including sampling error, coverage error, error associated with nonresponse, error associated with question wording and response options, and post-survey weighting and adjustments. Therefore, Harris Poll avoids the words “margin of error” as they are misleading. All that can be calculated are different possible sampling errors with different probabilities for unweighted, random samples with 100 percent response rates. These are only theoretical because no published polls — whether conducted by telephone or online — come close to the ideal probability sample given the sources of error previously noted. Because the sample is based on those who were invited and agreed to participate in an online research panel, no estimates of theoretical sampling error can be calculated.
Sample Size and Key Sample Definition
Sample Size
Throughout this report different segments of adults are discussed. Demographic sub-groups of adults are defined below:
2016 Main Survey (n=3511 total)
• Generation: Millennials (18-37 years old) n=1306; Gen Xers (38-51 years old) n=746; Baby Boomers (52-70 years old) n=1194; Matures (age 71 or older) n=265
• Parents: Parents (n=1120); No children (n=2391); Parents of teens (13-17) (n=303); Parents of teen girls (n=149); Parents of teen boys (n=154)
• Digital Connection: Constant checker (n=1807); Non-constant checker (n=1704); Constant checker of work email on a non-work day (n=283)

8
stressinamerica.org
STRESS IN AMERICA™ 2017: Technology and Social Media
Digital Connection Definition
Digital Connection was defined using the two questions below. Constant checkers were defined as those who indicated they constantly check their email, texts and social media accounts on a typical day (either typical work day or typical day off from work for those who are employed). Those who indicated they do not constantly check their email, texts and social media accounts on a typical day (either work day or day off from work for those who are employed) were defined as non-constant checkers.
BASE: ALL EMPLOYED RESPONDENTS
Q9035A On a typical work day, how often do you check the following?
1. Never2. Rarely3. Sometimes 4. Often5. Constantly6. Not applicable
[RANDOMIZE]
1. Personal email 2. Work email 3. Social media (e.g., Facebook, Twitter, Instagram, Snapchat, etc.) 4. Text messages
BASE: ALL QUALIFIED RESPONDENTS
Q9035B On a typical day [FOR EMPLOYED: SHOW ‘off from work’], how often do you check the following?
1. Never2. Rarely3. Sometimes 4. Often5. Constantly6. Not applicable
[RANDOMIZE]
1. Personal email 2. Work email [ONLY SHOW FOR EMPLOYED]3. Social media (e.g., Facebook, Twitter, Instagram, Snapchat, etc.) 4. Text messages
Stress in America™: Coping with Change was developed, reviewed and produced by the following team of experts: AMERICAN PSYCHOLOGICAL ASSOCIATION
Cynthia D. Belar, PhD, ABPP, APA Interim CEO, January 2016 to March 2017Katherine C. Nordal, PhD, Executive Director for Professional Practice, Practice DirectorateDavid W. Ballard, PsyD, MBA, Assistant Executive Director for Organizational ExcellenceLynn F. Bufka, PhD, Associate Executive Director, Practice Research and Policy, Practice DirectorateJaime Diaz-Granados, PhD, Executive Director for EducationLula Beatty, Senior Director, Health Disparities Initiative, Public Interest DirectorateC. Vaile Wright, PhD, Director, Practice Research and Policy, Practice DirectorateLuana Bossolo, Associate Executive Director, Public Relations, Practice DirectorateSophie Bethune, Director, Public Relations and Special Projects, Practice DirectorateElizabeth Lewan, Program Coordinator, Practice Directorate HARRIS POLL
Aimee Vella Ripley, Manager, Research ManagerAllyssa Birth, Senior Research AnalystGabriel Rozenwasser, Research Analyst VANGUARD COMMUNICATIONS
Brenda K. Foster, MPA, Senior Vice PresidentScott Rieder, Senior Account ExecutiveKiran Bammarito, MA, WriterSangeetha Sarma, Senior Account Manager TO CITE THIS REPORT:American Psychological Association (2017). Stress in America: Coping with Change. Stress in America™ Survey.
stressinamerica.org
Related Documents