Technical Feasibility and Economic Analysis of Proposed Sethusamudram Channel (Executive Summary) Sponsor : Tuticorin Port Trust, Tuticorin National Environmental Engineering Research Institute Nehru Marg, Nagpur- 440 020

Welcome message from author
This document is posted to help you gain knowledge. Please leave a comment to let me know what you think about it! Share it to your friends and learn new things together.
Transcript
Technical Feasibility and Economic Analysis of Proposed Sethusamudram Channel
(Executive Summary)
Sponsor :
Tuticorin Port Trust, Tuticorin
National Environmental Engineering Research Institute Nehru Marg, Nagpur- 440 020

5.1-1
July 2004
5.1-2
Technical Feasibility and Economic Analysis of Proposed Sethusamudram Channel
Sponsor :
Tuticorin Port Trust, Tuticorin
National Environmental Engineering Research Institute Nehru Marg, Nagpur- 440 020
5.1-3
July 2004
Contents Index No. Title Page No. List of Figures (iv) List of Tables (v) List of Annexures (vi) Executive Summary i-xxi 1.0 Introduction 1.1-
1.5 1.1 General 1.1 1.2 Economy of Sea Transport 1.2 1.3 Pre-Independence Proposals 1.3 1.4 Post Independence Proposal 1.3 1.5 Present Proposal 1.3
2.0 Earlier Proposals 2.1-2.18
2.1 General 2.1 2.2 Pre Independence Proposals 2.1
2.2.1 History of Earlier Proposals 2.2
2.2.2.1 Proposal-1 2.2 2.2.2.2 Proposal-2 2.3 2.2.2.3 Proposal-3 2.3 2.2.2.4 Proposal-4 2.3 2.2.2.5 Proposal-5 2.3 2.2.2.6 Proposal-6 2.3 2.2.2.7 Proposal-7 2.4 2.2.2.8 Proposal-8 2.4 2.2.2.9 Proposal-9 2.4
2.3 Post Independence Proposals 2.7 2.4 Traffic Projections 2.9 2.5 Canal Alignment 2.9 2.6 Economic Evaluation 2.11 2.7 Cost Benefit 2.11 2.8 Indirect Benefits
2.11
5.1-4
Figure 2.1-2.2 2.13-2.14
Tables 2.1-2.4 2.15-2.18
3.0 Traffic Analysis 3.1-3.16
3.1 Design Draft for Sethusamudram Ship Channel Project 3.1 3.2 Past Traffic Surveys 3.2 3.3 Traffic Projections by Shipping Corporation of India (SCI) 3.2 3.4 Traffic Projections for the Present Study 3.4 3.5 Conclusion 3.5
Annexure 3.1 3.6
5.1-5
Index No. Title Page No. 4.0 Channel Alignment and Characteristics 4.1-
4.9 4.1 General 4.1 4.2 Channel Alignment 4.1
4.2.1 Alignment in the Adam's Bridge Area 4.2 4.2.2 Alignment in Palk Bay and Palk Strait 4.2
4.3 Design Vessel Dimensions for the Sethusamudram Ship Channel Project 4.3 4.4 Channel Width 4.4 4.5 Channel Depth 4.6 4.6 Conclusions 4.7
Figures 4.1-4.2 4.8-4.9
Charts 4.1-4.12 Vol. II
5.0 Cost Estimates 5.1-
5.31 5.1 General 5.1
5.1.1 Dredging 5.1
5.1.1.1 Methodology of Dredging 5.1
5.1.2 Rate Analysis for Dredging 5.4 5.1.3 Navigational Aids 5.9 5.1.4 Other Items
5.11
5.2 Capital Cost 5.12 5.3 Phasing of Capital Expenditure 5.12 5.4 Source of Funds 5.12 5.5 Operation and Maintenance Cost
5.12
Table 5.1-5.2 5.14-5.17
Annexure 5.1 5.18-5.31 Charts 5.1-5.2 Vol. II
5.1-6
6.0 Cost Benefits 6.1-6.3
6.1 General 6.1 6.2 Benefits from Sethusamudram Ship Channel 6.1
6.2.1 Direct Benefits 6.2 6.2.2 Indirect Benefits 6.2
7.0 Economic Viability 7.1-
7.8 7.1 Economic Evaluation 7.1 7.2 Methods of Evaluation 7.1
7.2.1 Net Present Value (NPV) 7.1 7.2.2 Internal Rate of Return (IRR) 7.2 7.2.3 Benefit / Cost Ratio (B/C Ratio) 7.2 7.2.4 Average Rate of Return 7.2 7.2.5 Pay Back Period 7.2 7.2.6 Selection of the Method 7.2
5.1-7
Index No. Title Page No. 7.3 Cost Estimates 7.2
7.3.1 Capital Costs 7.2 7.3.2 Operation and Maintenance Costs 7.3
7.4 Cost Benefits 7.3
7.4.1 Traffic Projections 7.3 7.4.2 Fixation of Channel Dues 7.3
7.5 Results of Economic Analysis 7.4
Annexures 7.1-7.4 7.5-7.8
8.0 Conclusion 8.1-
8.2
Annexure I Report on Sea State for Sethusamudram Ship Channel Project I.1-I.83
Annexure II Report on Tidal Information II.1-
II.65 Annexure III Literature Review III.1-
III.18
5.1-8
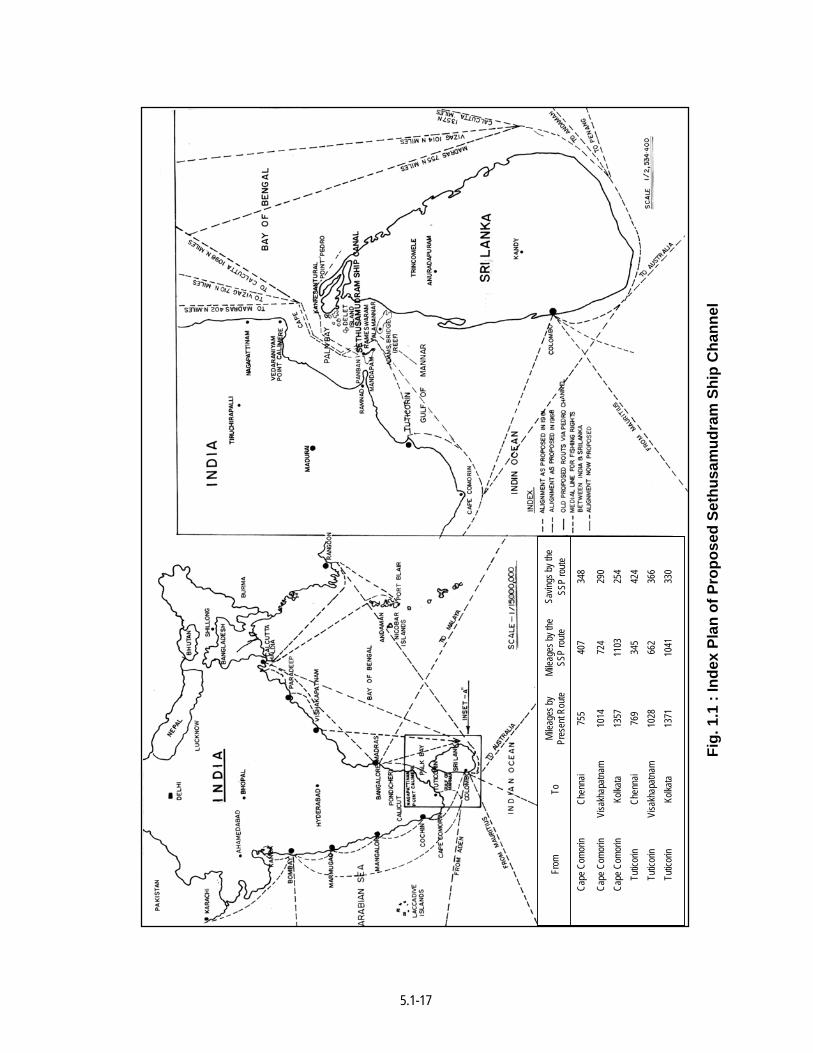
List of Figures Figure No. Title Page No. 1.1 Index Plan of Proposed Sethusamudram Ship Channel 1.5
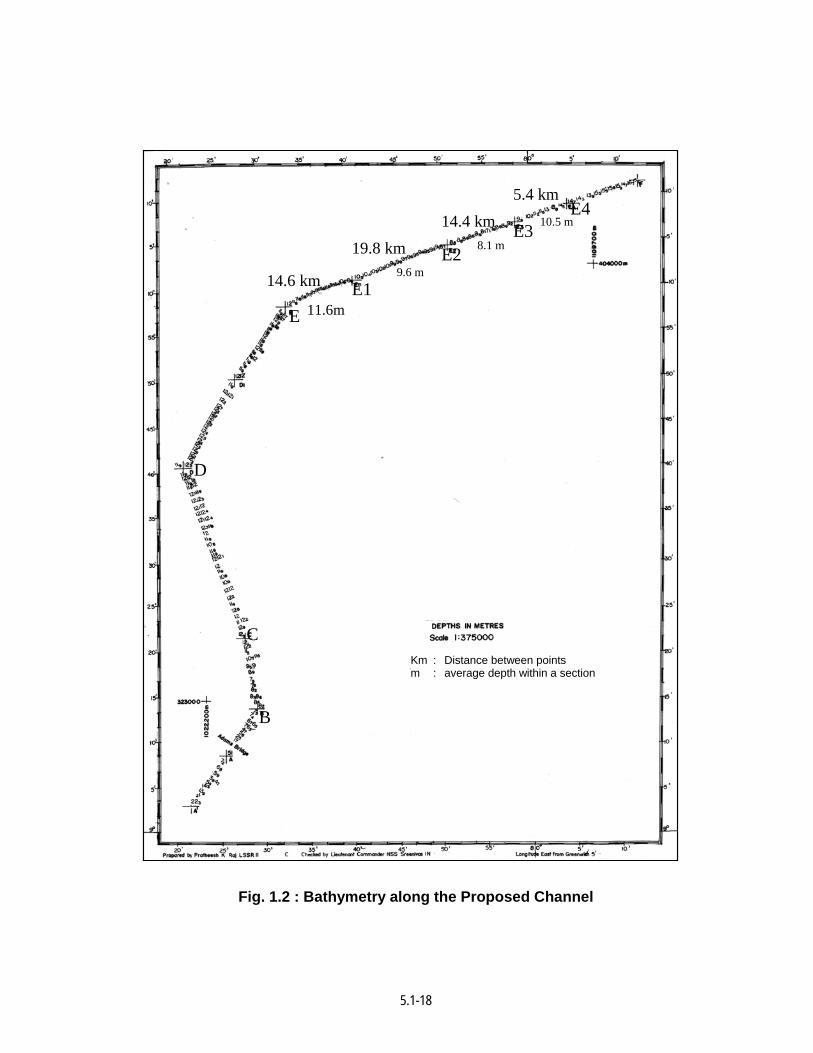
1.2 Bathymetry along the Proposed Channel 1.6
2.1 Alignment of Sethusamudram Ship Canal (Earlier Proposal) 2.13
2.2 Various Alignments of Sethusamudram Ship Channel Project Including the Proposed Alignment 2.14
4.1 The Alignment of the Proposed Channel 4.8
4.2 Cross Section of Proposed Channel 4.9
5.1-9
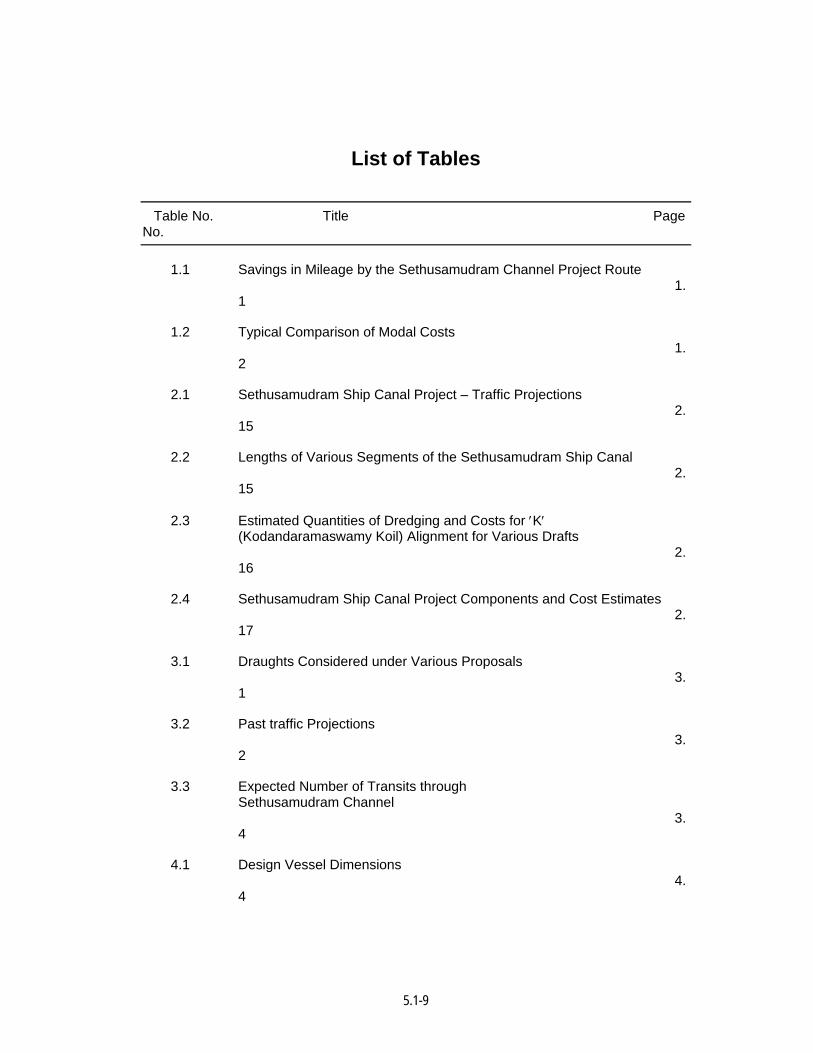
List of Tables Table No. Title Page No. 1.1 Savings in Mileage by the Sethusamudram Channel Project Route
1.1
1.2 Typical Comparison of Modal Costs 1.2
2.1 Sethusamudram Ship Canal Project – Traffic Projections 2.15
2.2 Lengths of Various Segments of the Sethusamudram Ship Canal 2.15
2.3 Estimated Quantities of Dredging and Costs for ′K′ (Kodandaramaswamy Koil) Alignment for Various Drafts 2.16
2.4 Sethusamudram Ship Canal Project Components and Cost Estimates 2.17
3.1 Draughts Considered under Various Proposals 3.1
3.2 Past traffic Projections 3.2
3.3 Expected Number of Transits through Sethusamudram Channel 3.4
4.1 Design Vessel Dimensions 4.4
5.1-10
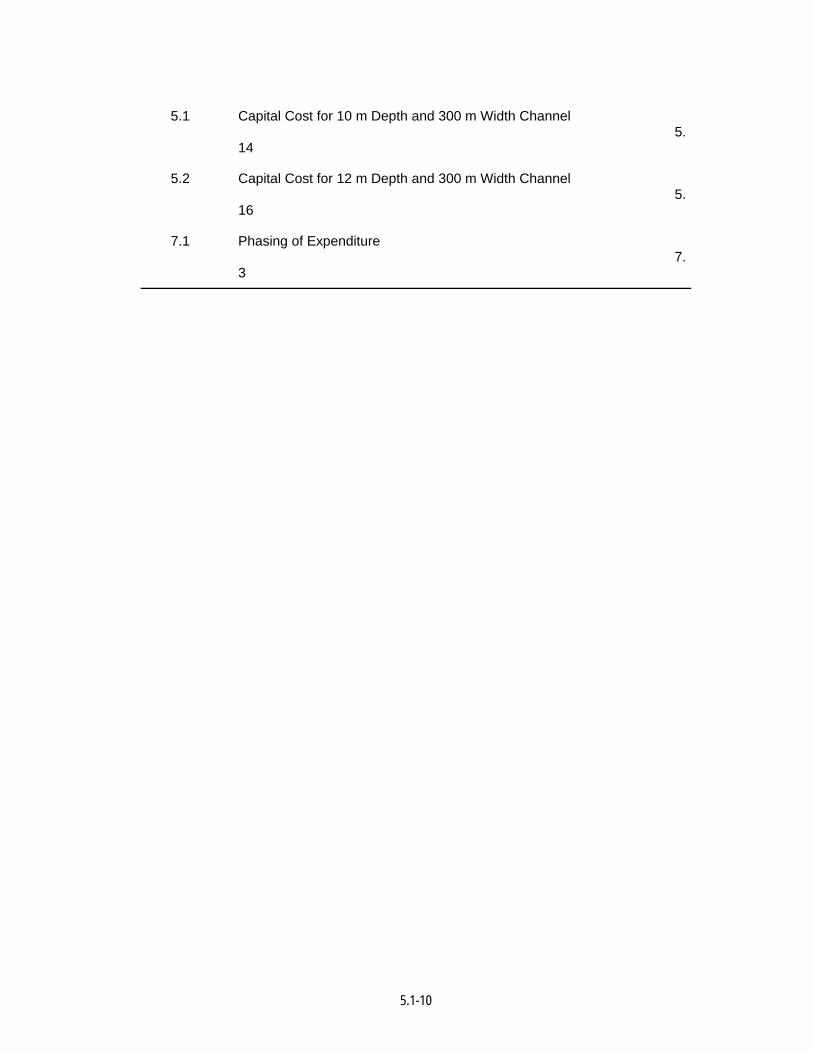
5.1 Capital Cost for 10 m Depth and 300 m Width Channel 5.14
5.2 Capital Cost for 12 m Depth and 300 m Width Channel 5.16
7.1 Phasing of Expenditure 7.3
5.1-11
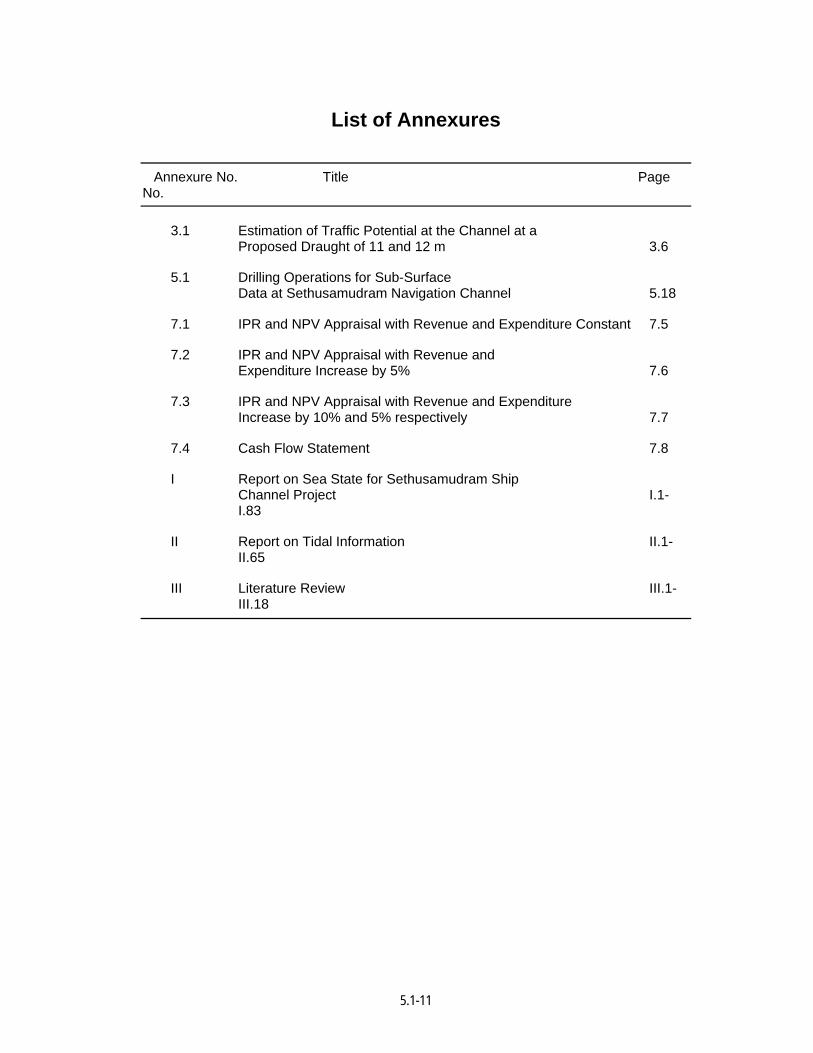
List of Annexures Annexure No. Title Page No. 3.1 Estimation of Traffic Potential at the Channel at a
Proposed Draught of 11 and 12 m 3.6
5.1 Drilling Operations for Sub-Surface Data at Sethusamudram Navigation Channel 5.18
7.1 IPR and NPV Appraisal with Revenue and Expenditure Constant 7.5
7.2 IPR and NPV Appraisal with Revenue and Expenditure Increase by 5% 7.6
7.3 IPR and NPV Appraisal with Revenue and Expenditure Increase by 10% and 5% respectively 7.7
7.4 Cash Flow Statement 7.8
I Report on Sea State for Sethusamudram Ship Channel Project I.1-I.83
II Report on Tidal Information II.1-II.65
III Literature Review III.1-III.18
5.1-12
1. Introduction
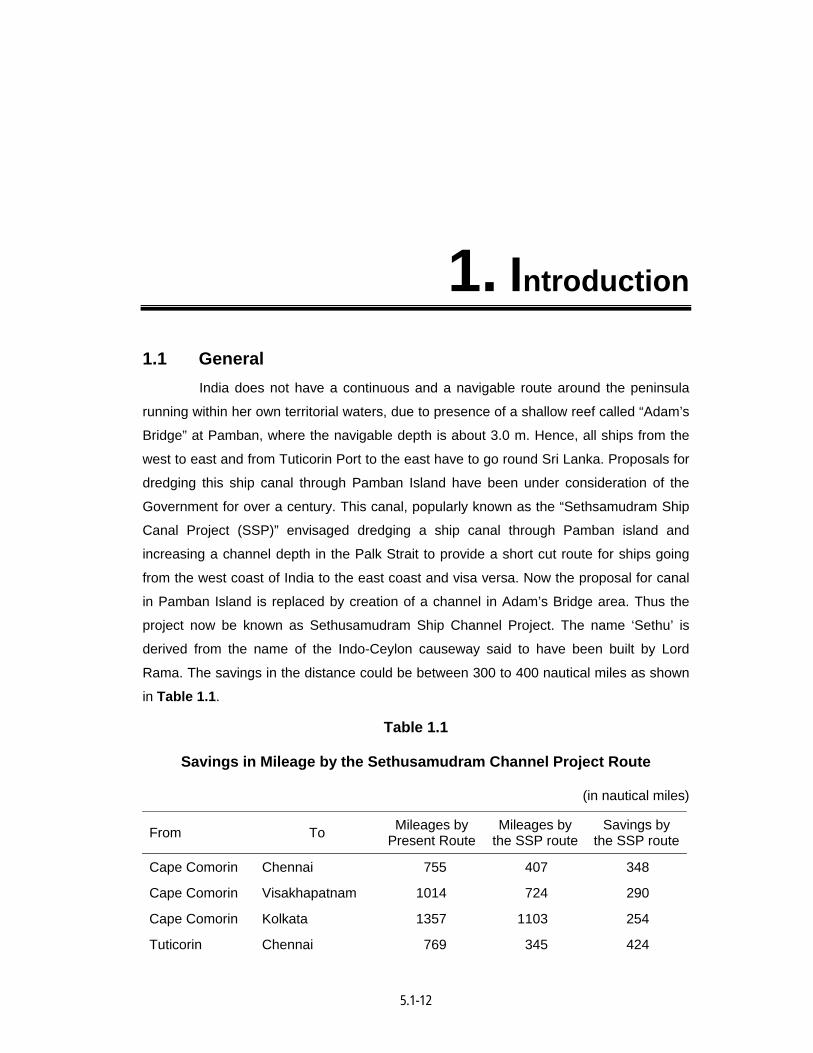
1.1 General India does not have a continuous and a navigable route around the peninsula
running within her own territorial waters, due to presence of a shallow reef called “Adam’s
Bridge” at Pamban, where the navigable depth is about 3.0 m. Hence, all ships from the
west to east and from Tuticorin Port to the east have to go round Sri Lanka. Proposals for
dredging this ship canal through Pamban Island have been under consideration of the
Government for over a century. This canal, popularly known as the “Sethsamudram Ship
Canal Project (SSP)” envisaged dredging a ship canal through Pamban island and
increasing a channel depth in the Palk Strait to provide a short cut route for ships going
from the west coast of India to the east coast and visa versa. Now the proposal for canal
in Pamban Island is replaced by creation of a channel in Adam’s Bridge area. Thus the
project now be known as Sethusamudram Ship Channel Project. The name ‘Sethu’ is
derived from the name of the Indo-Ceylon causeway said to have been built by Lord
Rama. The savings in the distance could be between 300 to 400 nautical miles as shown
in Table 1.1.
Table 1.1
Savings in Mileage by the Sethusamudram Channel Project Route
(in nautical miles)
From To Mileages by Present Route
Mileages by the SSP route
Savings by the SSP route
Cape Comorin Chennai 755 407 348
Cape Comorin Visakhapatnam 1014 724 290
Cape Comorin Kolkata 1357 1103 254
Tuticorin Chennai 769 345 424
5.1-13
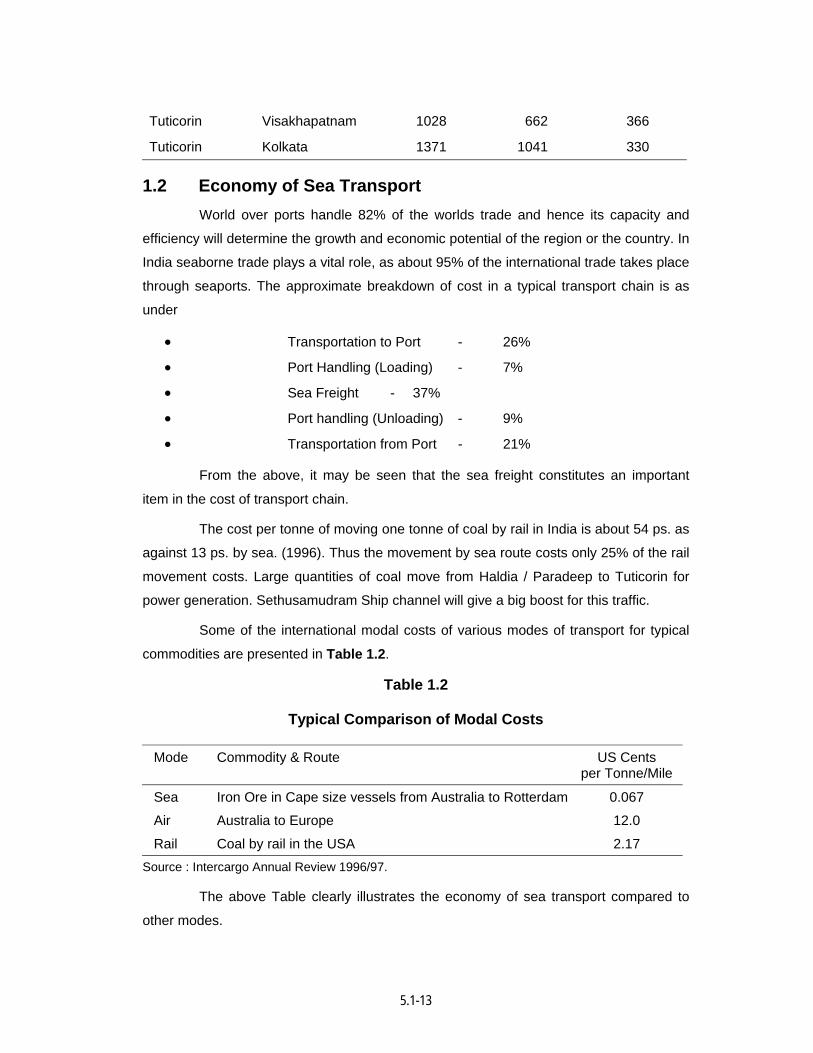
Tuticorin Visakhapatnam 1028 662 366
Tuticorin Kolkata 1371 1041 330
1.2 Economy of Sea Transport World over ports handle 82% of the worlds trade and hence its capacity and
efficiency will determine the growth and economic potential of the region or the country. In
India seaborne trade plays a vital role, as about 95% of the international trade takes place
through seaports. The approximate breakdown of cost in a typical transport chain is as
under
• Transportation to Port - 26%
• Port Handling (Loading) - 7%
• Sea Freight - 37%
• Port handling (Unloading) - 9%
• Transportation from Port - 21%
From the above, it may be seen that the sea freight constitutes an important
item in the cost of transport chain.
The cost per tonne of moving one tonne of coal by rail in India is about 54 ps. as
against 13 ps. by sea. (1996). Thus the movement by sea route costs only 25% of the rail
movement costs. Large quantities of coal move from Haldia / Paradeep to Tuticorin for
power generation. Sethusamudram Ship channel will give a big boost for this traffic.
Some of the international modal costs of various modes of transport for typical
commodities are presented in Table 1.2.
Table 1.2
Typical Comparison of Modal Costs
Mode Commodity & Route US Cents per Tonne/Mile
Sea Iron Ore in Cape size vessels from Australia to Rotterdam 0.067
Air Australia to Europe 12.0
Rail Coal by rail in the USA 2.17 Source : Intercargo Annual Review 1996/97.
The above Table clearly illustrates the economy of sea transport compared to
other modes.
5.1-14
The proposed ship channel in Gulf of Mannar and Palk Bay area will save
about 20-25 hours of time which is around 20% of the average time for a ship movement
between Tuticorin and Haldia and will improve number of transits for transport of coal to
Tuticorin from Haldia Port. Thus already economic mode of transport can be further
economized due to this ship channel project.
The Sethusamudram ship channel will reduce the haulage distance by 424 nm
miles between Tuticorin and Chennai and about 366 nm between Tuticorin and
Visakhapatnam.
This channel system
• will also establish National waterway within territorial waters
• Reduce shipping distances
• Reduce voyage time
• Reduce operating costs and pave way for regional economic
developments.
1.3 Pre-Independence Proposals Between 1890 and 1922 as many as nine proposals were formulated for
dredging a canal across the narrow strip of land mostly through the Rameshwaram Island
and the Gulf of Mannar with Palk Bay. However, the concerned authorities did not evince
much interest for the development of this project.
1.4 Post Independence Proposal Between 1956 and 1996, five proposals were drawn up for the development of
the Sethusamudram Canal Project. The various proposals were
• Sethusamudram Project Committee (1956)
• Government of Madras (1960) which was revised in 1963
• Dr. Nagendra Singh Committee (1967)
• Shri H.R. Laxminarayan Committee (1983) (Fig. 1.1)
• M/s. Pallavan Transport Consultancy Services Ltd. (1996)
• NEERI report shifting canal alignment to Adams Bridge (1998)
1.5 Present Proposal The Ministry of Shipping has identified Tuticorin Port Trust as the nodal agency
for the implementation of the Sethusamudram Ship Canal Project. In pursuance of its
5.1-15
decision to incorporate environmental considerations in the design phase of the project,
retained National Environmental Engineering Research Institute (NEERI), Nagpur to
conduct the Environmental Impact Assessment study for the project.
This report incorporates technical feasibility and economic analysis of proposed
Sethusamudram Ship Channel Project.
The present proposal envisages creation of a ship navigation channel to suit
different draughts viz. 9.15m, 10.7m and 12.8 m requiring dredging depths of 10 m, 12 m
and 14 m respectively. The width of the channel for 9.15 m and 10.7 m draught will be
300 m whereas for 12.8 m draught width will be 500 m. Based on the bathymetry survey
done by National Hydrographic Office (Fig. 1.2), it is observed that navigation depths in
Palk Bay area between Adams Bridge and Palk Strait are restricted to about 12 m only.
The total length from Adams Bridge to Palk Strait is about 145 km. In the event of
proposal for 12.8 m draught requiring 14 m depth, dredging will require to be carried out
in entire Palk Bay incurring heavy expenditure and additional dredge spoil generation of
about 170-180 million m3. Dredging in Palk Bay all along the channel length will be
detrimental to ecological sensitivity of Palk Bay. It would also entail incurrance of huge
additional expenditure for dredging & disposal of dredge spoil. Thus keeping in view
Environmental sensitivity and economic viability the proposal for 14 m depth (12.8 m
draught) is not evaluated.
The proposals are therefore evaluated only for 9.15 m and 10.7 m draught
requiring 10 and 12 m depth respectively.
Thus the proposed Sethusamudram Ship Channel Project is considered with
two dredged depth viz. of -10 mCD, -12 mCD to cater to vessels drawing a draught of
9.15 and 10.7 m respectively. The channel will have a bed width of 300 m providing a two
way channel for vessels drawing a draught of 9.15 and 10.7 m. The dredging of the
channel will be in
• Adam’s Bridge
• Parts of Palk Bay and
• Palk Strait
The navigation route will originate from Tuticorin Port in the Gulf of Mannar
utilizing the available depths which are about -20 mCD upto south east of Pambam
island, pass through a channel to be dredged to a depth of 10.0 m or -12 mCD in the
Adam’s Bridge within the international boundary and proceed parallel to the International
Medial Line in the Palk Bay, pass through a channel to be dredged to - 10 mCD or
5.1-16
-12 mCD in the Palk Strait and adjoining parts of Palk Bay and terminate in the Bay of
Bengal.
The basic difference between Sri. H.R. Laxminarayan Committee’s Report
(1983) and the present Report is that the creation of canal as a land locked body with a
Canal Lock which was proposed in the 1983 Report has been dispensed and creation of
channel in Gulf of Mannar and Palk Bay is proposed in the present report after a detailed
review.
5.1-17
Fig.
1.1
: In
dex
Plan
of P
ropo
sed
Seth
usam
udra
m S
hip
Cha
nnel
Savin
gs by
the
SSP
route
348
290
254
424
366
330
Milea
ges b
y the
SS
P ro
ute
407
724
1103
34
5 66
2 10
41
Milea
ges b
y Pr
esen
t Rou
te
755
1014
13
57
769
1028
13
71
To
Chen
nai
Visa
khap
atnam
Ko
lkata
Chen
nai
Visa
khap
atnam
Ko
lkata
From
Cape
Com
orin
Cape
Com
orin
Cape
Com
orin
Tutic
orin
Tutic
orin
Tutic
orin
5.1-18
Fig. 1.2 : Bathymetry along the Proposed Channel
10.5 m
8.1 m
9.6 m
11.6m
10.5 m
8.1 m
9.6 m
11.6m
B
D
E
C
E1
E2E3
E4
14.6 km
19.8 km14.4 km
5.4 km
Km : Distance between points m : average depth within a section
5.1-19
2. Earlier Proposals
2.1 General All the earlier project proposals were for creation of canal popularly known as
Sethusamudram Ship Canal Project and had been under the demand by the public,
statesmen, administrators and navigators for over a century. The phenomenal increase
in the traffic on land, steep hikes in the prices of the petroleum products had enhanced
the advantages and the economics of waterborne traffic.
2.2 Pre Independence Proposals Between 1860 and 1922 as many as nine proposals were formulated for cutting
a canal across the narrow strip of land mostly through the Rameshwaram Island to
connect the Gulf of Mannar with Palk Bay with the object of providing a short cut for oean
going ships plying between the west and east coasts of India. The various proposals
were :
i. 1860 - Commander Taylor’s Proposal
ii. 1861 - Mr. Town Shed’s Proposal
iii. 1862 - Parliamentary Committee’s Proposal
iv. 1863 - His Excellency Sir William Dennison’s (Governor of Madras)
Proposal
v. 1871 - Mr. Stoddart’s Proposal
vi. 1872 - Mr. Robertson’s (Harbour Engineer to the Govt. of India) Proposal
vii. 1884 - Sir John Code’s Proposal
viii. 1903 - S.I Railway Engineers Proposal
ix. 1922 - Sir Robert Bristo’s (Harbour Engineer to the Govt. of India)
Proposal
5.1-20
A brief review of these proposals extracted from Shri C.V. Venkateshwaran’s
report.
2.2.1 History of Earlier Proposals
Between 1860 and 1922, as many as nine proposals were made for cutting a
Ship Channel across the narrow strip of land to connect the Gulf of Mannar and the Palk
Bay with the object of providing a short-cut for ocean-going ships plying between the
West Coast of India and the East Coast. These were :
1. 1860 Commander Taylor’s Proposal 2. 1861 Mr. Townshend’s Proposal 3. 1862 Parliamentary Committee’s Proposal 4. 1863 His Excellency Sir William dennison’s R.E. (Governor of Madras)
Proposal 5. 1871 Mr. Stoddart’s Proposal 6. 1872 Mr. Robertson’s (Harbour Engineer for India) Proposal 7. 1884 Sir John Code’s Proposal for South India Ship Canal, Port & Coaling
Station, Limited 8. 1903 S.I. Railway Engineer’s Proposal based on their Survey 9. 1922 Sir Robert Bristow’s (Harbour Engineer to the Government of Madras)
Proposal These proposals are shown in Drawing No. 3
A brief survey of these various proposals extracted from Sir Bristow’s Report is
given hereunder :
2.2.1.1 Proposal-1
The earliest proposal for cutting a link canal was made in 1860 by Commander
Taylor of the Indian Marine. In his paper, he advocated cutting a canal across the
Tonitorai Peninsula at a place about 12 miles west of the Pamban Pass. He stated “The
southern end would start from ‘Port Lorne’, a natural harbour, a few miles down the coast
from Mandapam, about seven miles in length and four-and-a-half miles in breadth, the
grater part of which had a depth of 24 feet, and for some considerable extent up to 30
feet, the deepest parts being 36 feet. It was well sheltered by the Musal and Muli Islands
and reefs. Its entrance had only a depth of less than 15 feet, but if this were depend, it
would make the harbour a safe one for the anchorage of all vessels during the South-
West Monsoon”.
5.1-21
The Scheme involved the excavation of a deep cutting nearly three miles in
length through the dry land and deepening to five fathoms for at least three miles on each
side to connect it with the harbour on the south, and the deep water on the north. It would
also involve cutting a channel across the reef barrier at the southern entrance to the
harbour. It was at first stated to cost only about £ 90,000, but further inquiries brought the
estimate up to £ 1,500,000. The Northern approach would be exposed to the North-East
monsoon and would require special protective works. Owing to the great expense
involved and the extra work to be done in comparison with a canal across the Island of
Rameswaram (please see proposals 3 to 9), the Scheme was not seriously considered.
2.2.1.2 Proposal-2
The next proposal was by Mr. Townshend. He proposed siting the canal through
the Pamban Pass. His proposal was to deepen the existing tortuous Pamban Channel to
enable the passage of large vessels. However, the objections to its adoption, with a
curved channel, and subject to the strong currents through the Pamban Pass were so
obvious that it put the Scheme outside the pale of practical consideration.
2.2.1.3 Proposal-3
In 1862, a Parliamentary Committee of Her Majesty’s Government was
appointed to report on the site for a canal across the Island of Rameswaram, and they
recommended an alignment situated about two miles East of Pamban, crossing the Island
in a straight Northerly direction.
2.2.1.4 Proposal-4
In 1863, His Excellency Sir William Dennison, R.E., Acting Governor of Madras,
visited Pamban and selected a site which he considered the most advantageous. This
was about a mile further East from that recommended by the Parliamentary Committee.
Probably he visited the Island during the North-East monsoon, as he chose the best
position for a sheltered Northern approach at a time when the Northern seas were rough
and the Southern seas were calm. In the South-West monsoon, the Southern side will be
rough and the Northern side calm. This alignment was unsuitable, as its Southern
entrance would be very much exposed during the South-West monsoon.
2.2.1.5 Proposal-5
Subsequently in 1871, Mr. Stoddart recommended a site about one mile West of
Dennison’s alignment and parallel to it. This was practically the same as the one
suggested by the Parliamentary Committee. This alignment was protected by the reefs
5.1-22
and small islands on the Southern side from the South-West monsoon; its Northern
approach was, however, exposed to the North-East monsoon.
2.2.1.6 Proposal-6
In March, 1872, Sir Elphinstone, M.P., wrote to the Under Secretary of State for
India, requesting that “Mr. Robertson, Harbour Engineer for India, should be directed to
proceed to Pamban and examine the locality closely and minutely and give his opinion as
to the best mode of proceeding in the matter, which is every month becoming of greater
importance to the commerce and trade of the East”.
Mr. Robertson accordingly visited Pamban and selected a new site about a mile
from Pamban with its Southern entrance well within the protection of Kurisadi and Shingle
Islands leaving the Northern entrance quite unprotected from the North-East Monsoon as
he was of the opinion “that the point of paramount importance was the protection of the
Southern entrance from the swell of the South-West monsoon”. He did not evidently
make a close examination of the channel leading to the Southern entrance which would
be narrow and would require an enormous amount of dredging to fit it for the passage of
vessels.
2.2.1.7 Proposal-7
After a lapse of 12 years in the year 1884, “The South India Ship Canal Port and
Coaling Station, Limited,” U.K., considered the project for the construction of a canal
across the Rameswaram Island and instructed Sir John Code, Consulting Engineer, to
prepare a report and estimate. His report discussed the previous schemes and decided
on the best alignment for the canal. The southern entrance was just near that
recommended by Mr. Stoddart in 1871, but the placed his line of canal obliquely on land
so that the northern entrance would “derive considerable shelter from the northerly stretch
of the coast immediately to the eastward”. He states “there will be a further advantage
than the improved sheltering of the entrances, viz., the bringing of the course of vessels
passing through it more directly in the line of the winds both in the North-East and South-
West Monsoons. This I regard as a material consideration seeing that vessels of the
largest class which have their sides so high above the water will be much less liable to be
deflected from their true course while passing through the canal, owing to the wind being
almost invariably either ahead or astern, whichever monsoon might be blowing”.
The Secretary of State for India granted the South India Ship Canal Port and
Coaling Station, Limited, a perpetual concession, reserving the right to purchase the
canal under certain conditions. Correspondence between the Home and the Indian
5.1-23
Governments was carried on for some years. The Madras Government in their
proceeding, dated the 14th October 1890, however, advised the Government of India to
reject the scheme on the ground that the shoals at the Palk Straits between Pt. Calimere
and Pt. Pedro would prevent the projected canal being made use of by vessels of a deep-
sea draft. Apparently, the Madras Government Adviser had not studied the Ceylon
Government chart of the channel north of Ceylon, which showed ample waterway. The
present Drawing No. 2, in which soundings taken from the Admiralty Chart Nos. 68-A and
2197 are plotted would also show that there is a minimum depth of 33 to 34 feet by the
route via the Pedro Channel. In this drawing, this channel route is also marked for easy
reference.
Another point worth mentioning here is that in those days dredging and
deepening a channel in the open sea conditions in the Palk Straits where they may get
fiver or six feet waves in fair weather, could not be thought of, as dredgers could work
only in two or three feet waves. Now Dredger design has advanced considerably and
swell-compensating arrangements are provided in Trailer Suction Dredgers, so that it is
possible to dredge in 7 ft. or 8 ft. waves without any difficulty. In this connection, mention
may be made of the new estuarian dredger “Mohana” acquired for Calcutta Port to
dredge in the estuary in the exposed open sea conditions.
2.2.1.8 Proposal-8
In 1902, the South Indian Railway Company carried out a fresh survey by their
Engineers and decided upon an alignment in Rameswaram about which they stated as
follows :
″The final alignment of the canal has been determined after a careful survey
was made of the seas on each side, and due consideration was given to its protection at
both ends during the monsoons. A glance at the maps which accompany the project
report will show that the minimum amount of dredging at the approaches will be required
to enable a depth of 30 ft. to be dredged. The southern entrance is well under the
protection of the Kallaru reef with the Shingle Islets and also of the Kurisadi, Pulli-Vausel
and Pulli Islands and their surrounding reefs which form a natural breakwater during the
South-West monsoon″.
″The line of canal is oblique (and in the direction of the prevailing winds) and
has the same advantage as advocated by Sir John Code in his alignment, which has
already been referred to″.
5.1-24
″No other alignment can be made for a canal which would offer the same
advantages having reference to the eligibility of the approaches and shelter which the
present one affords″.
2.2.1.9 Proposal-9
After another two decades, Sir Robert Bristow, Harbour Engineer to the
Government of Madras, made a thorough study of all the previous proposals and carried
out detailed investigations and put up his proposal for an alignment somewhat similar to
the previous one adopted by the S.I. Railway across the Rameswaram Island, as being
the best line for the canal crossing. He, however, shifted the southern extremity of the
land canal by about 500 yards west in order to get still better protection for the southern
approach.
Sir Robert Bristow in his report has stated that the reason for reopening the
matter at this date (1922) was that ″One of the reasons which was acting adversely to the
development of the ports of the South-East India was the fact that there was no deep-sea
passage northward of Cape Comorin and that nearly all traffic had to pass round the
Island of Ceylon. The question was, therefore, raised as to the advisability of cutting a
canal through the Island of Rameswaram, in order to remove this disability. A good deal
of discussion was aroused by this proposal, especially among the people of Tuticorin,
who, whilst in entire agreement with the idea of making a canal ‘qual canal’, were
apprehensive that, as it would cross the main line of railway from Dhanushkodi to
Madras, a port might grow up there, which would attract the trade from Tuticorin to
Rameswaram.
Again to quote from the Report of the Tuticorin Ad hoc Committee which
considered the Canal Scheme drawn up by Sir Robert Bristow :
″There has been very little of divergence of opinion during the discussions as to
the advantage of the canal in the abstract. Indeed, its obvious usefulness and the
desirability in the constructing it, if only on the broad ground of reducing ocean distances,
has made anything like serious discussion impossible. For example, it reduces the
distance from off Cape Comorin (a common point for all traffic from the West) to Madras,
Calcutta and Rangoon by 333, 240 and 109 miles, respectively and from Trincomalee to
Cape Comorin by 125 miles″.
″Further the actual saving in mileage and money is enhanced by the less
tangible, but, perhaps, more important savings consequent upon avoiding the stormy
journey round the Island of Ceylon particularly in monsoon weather. The increased wear
5.1-25
on all parts of the ship, and the anxiety and risk which are thus eliminated in the case of
all vessels render the construction of the canal a very desirable object on the general
grounds″.
This proposal, however, was not pursued then, apparently because of dearth of
finance.
2.3 Post Independence Proposals The proposals considered after independence are as under :-
i) Sethusamudram Project Committee (1956)
The committee was headed by Sir A. Ramaswamy Mudaliyar and the committee
contemplated a 26 feet draft land canal crossing the main land at Mandapam
estimated to cost Rs.1.8 crores. Capt. H.R. Davis carried out further survey in
the year 1959 and suggested certain modifications, regarding alternative
alignment across the main land maintaining the same draft.
ii) The Government of Madras under the guidance of State Port Officer
explored the possibility of increasing the draft from 26 feet to 36 feet in the year
1963 at an estimated cost of Rs.21 crores.
iii) Government of India constituted a committee under the Chairmanship of
Dr. Nagendra Singh, Secretary Ministry of Shipping and Transport in the year
1964. Shri C.V. Venkateshwaran, Retd. Development Advisor, (Ports) was
appointed as the Chief Engineer to take up the investigation work. Shri R.
Natarajan was appointed as the Project Officer to collect the statistics of
shipping and to determine the economic viability of the project. The committee
completed its report in 1967 and the draft contemplated was 30 feet at an
estimated cost of Rs.37.46 crores. The committee examined both the
alignments suggested earlier and due to the presence of layers of sand stone in
the Madapam alignment, suggested an alternative alignment in the
Rameshwaram Island Crossing called the DE alignment near Thankachimadam.
The main components of the project involved were
- Excavation and dredging of the canal
- Construction of a lock
- Construction of a bridge
5.1-26
- Construction of breakwaters
- Procurement of a dredger and
- Land acquisition and procurement of harbour crafts, construction of
buildings, model studies etc.
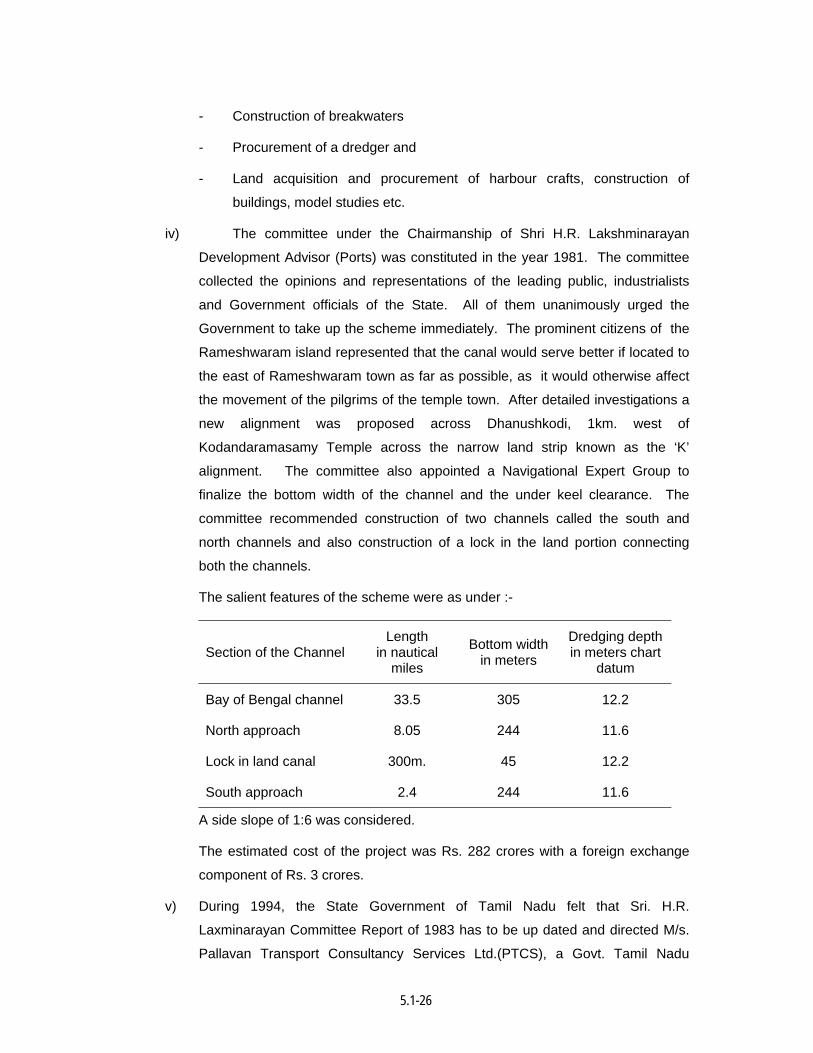
iv) The committee under the Chairmanship of Shri H.R. Lakshminarayan
Development Advisor (Ports) was constituted in the year 1981. The committee
collected the opinions and representations of the leading public, industrialists
and Government officials of the State. All of them unanimously urged the
Government to take up the scheme immediately. The prominent citizens of the
Rameshwaram island represented that the canal would serve better if located to
the east of Rameshwaram town as far as possible, as it would otherwise affect
the movement of the pilgrims of the temple town. After detailed investigations a
new alignment was proposed across Dhanushkodi, 1km. west of
Kodandaramasamy Temple across the narrow land strip known as the ‘K’
alignment. The committee also appointed a Navigational Expert Group to
finalize the bottom width of the channel and the under keel clearance. The
committee recommended construction of two channels called the south and
north channels and also construction of a lock in the land portion connecting
both the channels.
The salient features of the scheme were as under :-
Section of the Channel Length
in nautical miles
Bottom widthin meters
Dredging depth in meters chart
datum
Bay of Bengal channel 33.5 305 12.2
North approach 8.05 244 11.6
Lock in land canal 300m. 45 12.2
South approach 2.4 244 11.6
A side slope of 1:6 was considered.
The estimated cost of the project was Rs. 282 crores with a foreign exchange
component of Rs. 3 crores.
v) During 1994, the State Government of Tamil Nadu felt that Sri. H.R.
Laxminarayan Committee Report of 1983 has to be up dated and directed M/s.
Pallavan Transport Consultancy Services Ltd.(PTCS), a Govt. Tamil Nadu
5.1-27
undertaking, to reappraise and revalidate the 1983 report. Fresh particulars of
cost and traffic were collected and incorporated in the report.
PTCS Report Considered Following Project Components :
Apart from the construction of the proposed canal, which constitutes the major
component of the project, a number of infrastructural facilities as listed below are
envisaged to be created under the project :
• Construction of a ″lock″
• Construction of rubble mound type breakwaters on either side of the land canal
• Navigational aids
- Lighted beacons/buoys - Racons - Satellite based differential global system - Improvements to Pamban light house
• Flotilla
- Harbour tugs - Pilot, mooring, survey-cum-lighting launches - Despatch vessels
• Shore facilities
- Two service jetties - Slipways - Buoy yard - Repair workshop
• Staff and administration buildings
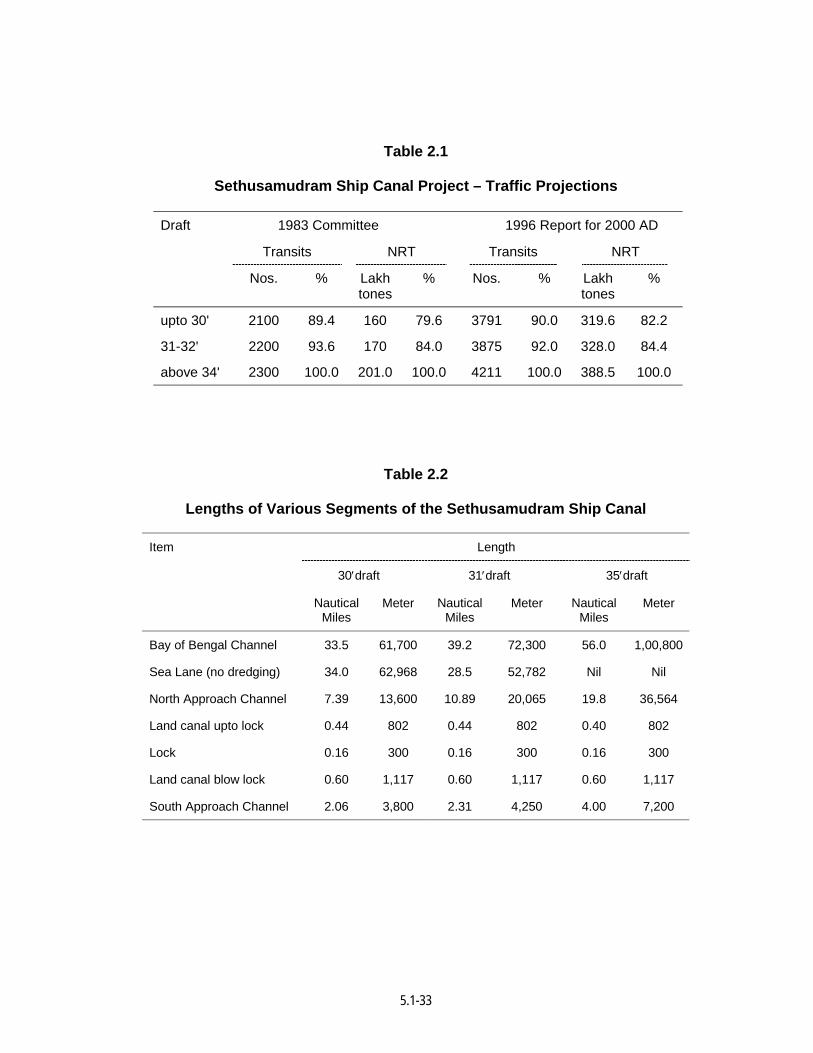
2.4 Traffic Projections The Lakshminarayan Committee in 1983 had made traffic projections for 30′
draft in the first stage by which time the harbours at Mangalore, Tuticorin, Vizag and
Paradeep had come into existence. Following a detailed analysis of traffic through other
Indian ports, projections have been made for the year 2000 AD (Table 2.1) while
updating the report by the PTCS Ltd. The minimum depth available in Chennai,
Vishakhapatnam and Paradeep in inner harbour is 18.6, 10.7 and 12.8 m respectively
whereas depth available in outer harbour is 19.2 and 17.5 m at Chennai and
Vishakhapatnam respectively.
2.5 Canal Alignment
5.1-28
The canal proposed earlier (Fig. 2.1) had two legs, one near the Point Calimere
which is called the Bay of Bengal Channel and another across the narrow Danushkody
Peninsula near Kodandaramasamy Temple. The lengths of various segments of the canal
for the different drafts are shown in Table 2.2. The Bay of Bengal Channel traverses the
Palk Bay wherein the sea-bed is mostly soft to hard clayey-sand in nature. Bore holes
drilled into the sea-bed upto 15 m depth met with only clay and not corals or rock. The
canal is 19.3 km away from Point Calimere and Kanakesan Thurai where the coast
consists of only clayey-sand. The second leg of the canal 802 m long crosses the narrow
Danushkody Peninsula through the land portion. The entire coast of Danushkody
Peninsula on the North and the South is all sandy. Drillings done at 16 places here have
shown only sandy strata upto 12 depth. In the North Approach Channel, soft sand-stone
was met with below 12 m depth and cutting this sand-stone is not necessary even in the
ultimate stage of the canal. The canal will, however, cut the road connecting
Rameswaram and Danushkody. This road is being used by the Rameswaram fisherman
to go to Danushkody for daily fishing as there is no habitation at Danushkody. The project
envisages a high-level or a swinging bridge at the crossing point to enable the traffic to go
through.
Tracer studies at two places along the 'K' alignment conducted jointly by the
Atomic Energy Establishment and the Central Water and Power Research Station in two
monsoon seasons established that the pattern of movement of sea-bed silt would almost
be in the same direction as that of the proposed channel, and that the chances of siltation
would be very minimal.
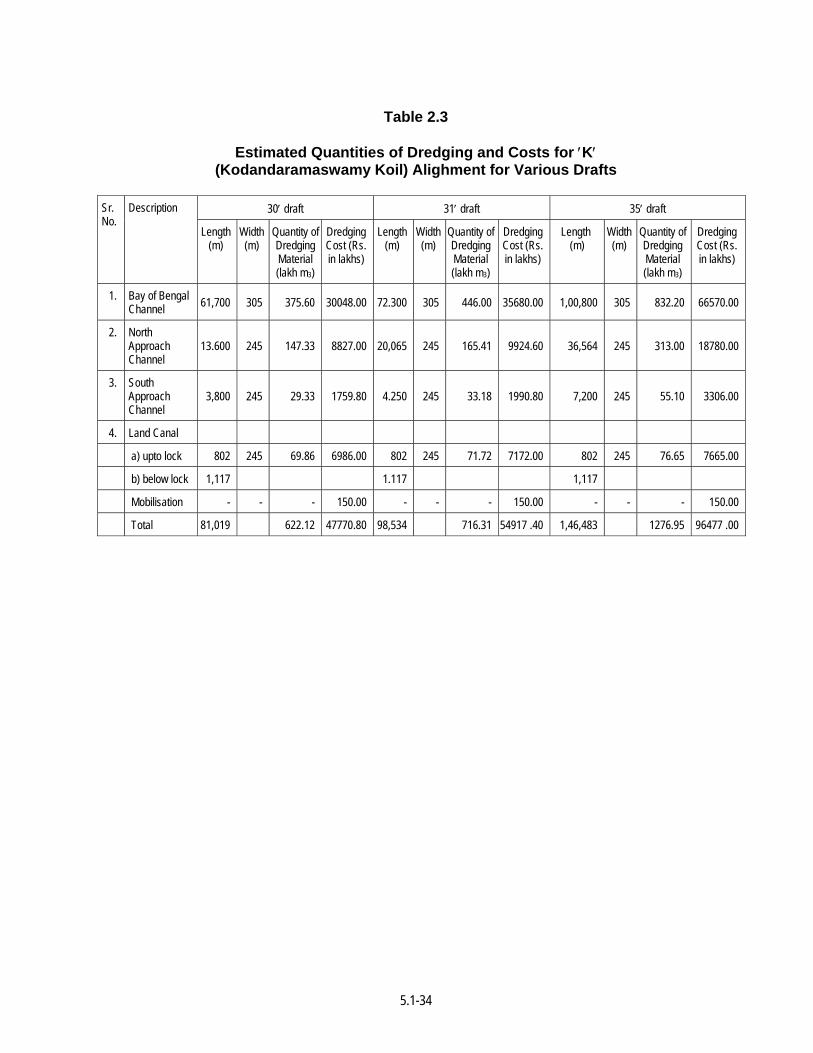
Cost Estimates
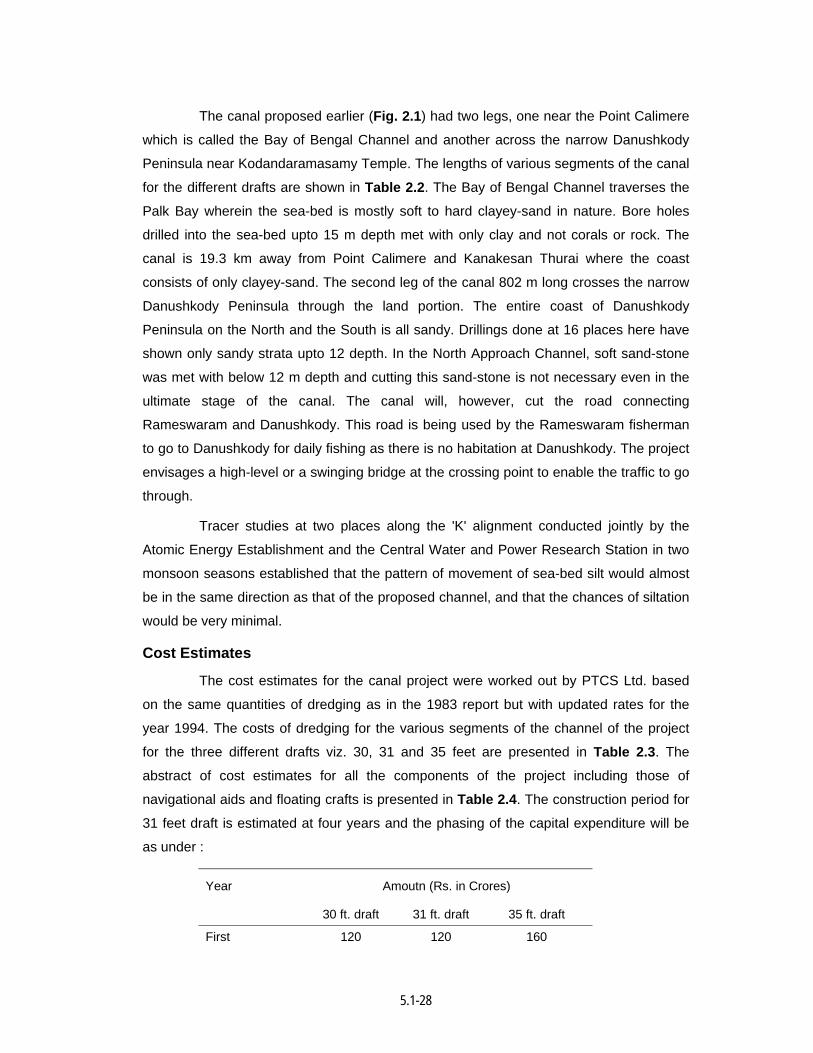
The cost estimates for the canal project were worked out by PTCS Ltd. based
on the same quantities of dredging as in the 1983 report but with updated rates for the
year 1994. The costs of dredging for the various segments of the channel of the project
for the three different drafts viz. 30, 31 and 35 feet are presented in Table 2.3. The
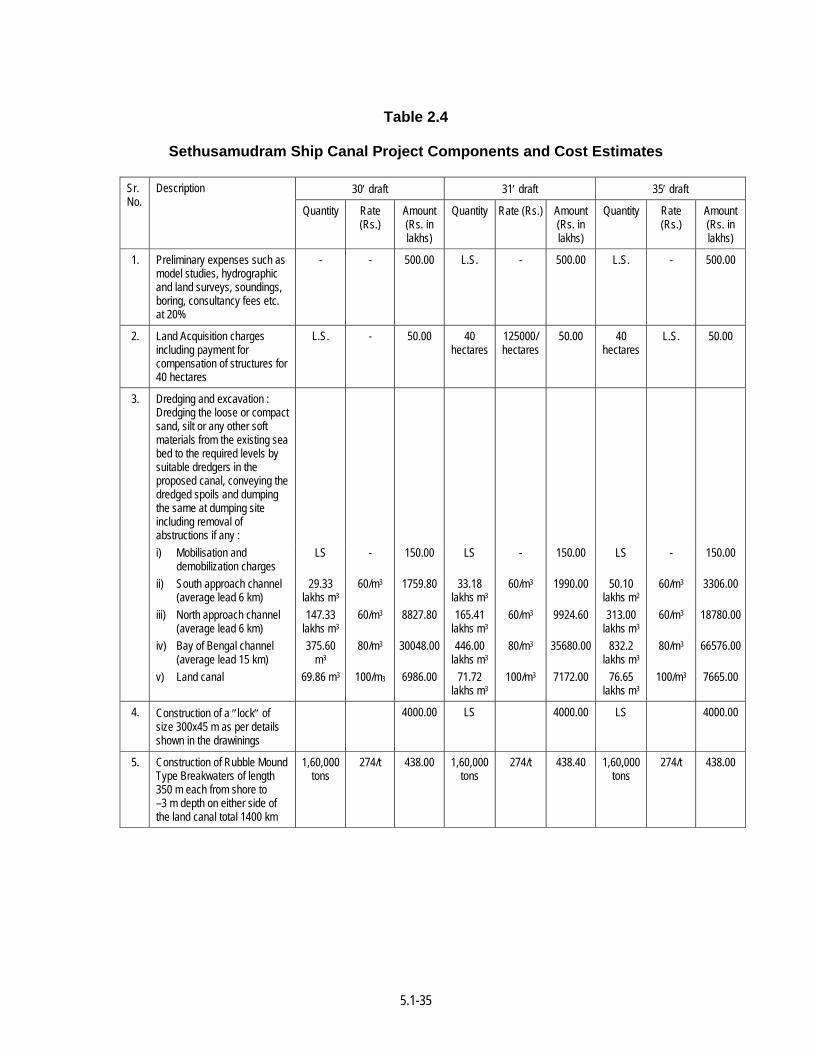
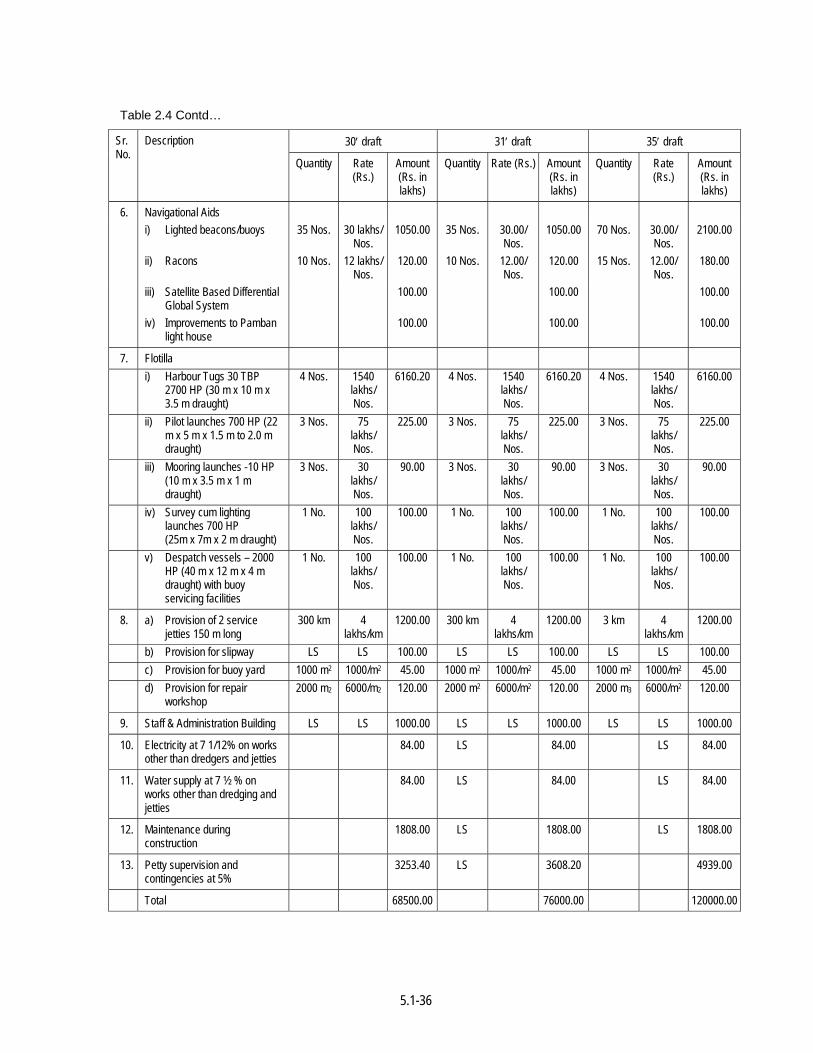
abstract of cost estimates for all the components of the project including those of
navigational aids and floating crafts is presented in Table 2.4. The construction period for
31 feet draft is estimated at four years and the phasing of the capital expenditure will be
as under :
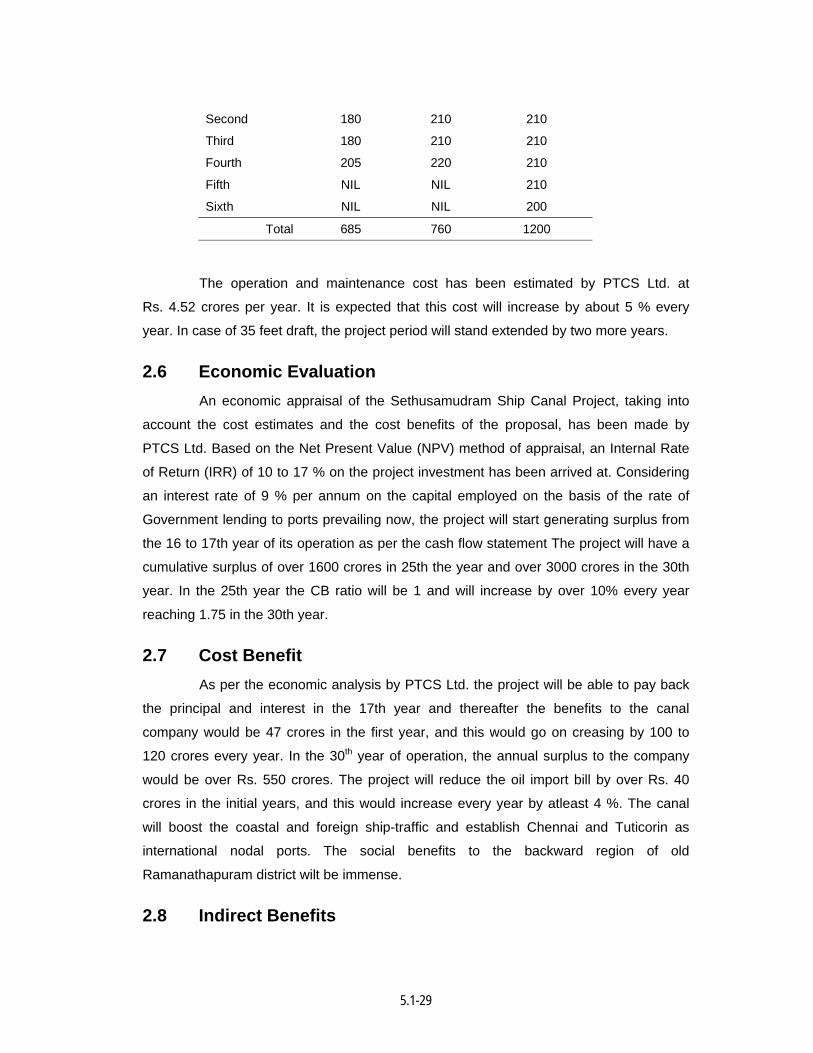
Year Amoutn (Rs. in Crores)
30 ft. draft 31 ft. draft 35 ft. draft
First 120 120 160
5.1-29
Second 180 210 210
Third 180 210 210
Fourth 205 220 210
Fifth NIL NIL 210
Sixth NIL NIL 200
Total 685 760 1200
The operation and maintenance cost has been estimated by PTCS Ltd. at
Rs. 4.52 crores per year. It is expected that this cost will increase by about 5 % every
year. In case of 35 feet draft, the project period will stand extended by two more years.
2.6 Economic Evaluation An economic appraisal of the Sethusamudram Ship Canal Project, taking into
account the cost estimates and the cost benefits of the proposal, has been made by
PTCS Ltd. Based on the Net Present Value (NPV) method of appraisal, an Internal Rate
of Return (IRR) of 10 to 17 % on the project investment has been arrived at. Considering
an interest rate of 9 % per annum on the capital employed on the basis of the rate of
Government lending to ports prevailing now, the project will start generating surplus from
the 16 to 17th year of its operation as per the cash flow statement The project will have a
cumulative surplus of over 1600 crores in 25th the year and over 3000 crores in the 30th
year. In the 25th year the CB ratio will be 1 and will increase by over 10% every year
reaching 1.75 in the 30th year.
2.7 Cost Benefit As per the economic analysis by PTCS Ltd. the project will be able to pay back
the principal and interest in the 17th year and thereafter the benefits to the canal
company would be 47 crores in the first year, and this would go on creasing by 100 to
120 crores every year. In the 30th year of operation, the annual surplus to the company
would be over Rs. 550 crores. The project will reduce the oil import bill by over Rs. 40
crores in the initial years, and this would increase every year by atleast 4 %. The canal
will boost the coastal and foreign ship-traffic and establish Chennai and Tuticorin as
international nodal ports. The social benefits to the backward region of old
Ramanathapuram district wilt be immense.
2.8 Indirect Benefits
5.1-30
Presently, the Tamil Nadu Electricity Board which moves coal from mines in
North India by road and brings it to the port for onward shipment to Tuticorin, spends
54 paise per tonne kilometre on road and 13 paise per tonne kilometre by sea. For want
of a sea canal, many commodities like salt, fish, and caustic soda are now transported by
rail causing congestion and incurring high cost. Once the canal comes into being, aIl this
and more can take the sea-route. Further, the canal system will establish a national
waterway within the territorial waters of India, reduce distances, and voyage time.
Likewise, all coastal ships plying between the East and the West coasts can make
considerable profits on extra turn-arounds. The canal will be a great asset from national
defence and security points of view and also the coast guards who now have to go
around Sri Lanka. Benefit of shorter distance will encourage small entrepreneurs to
launch new ventures of coastal sea-traffic between ports on trade and commerce. There
are rich resources of fish and shrimps in the area and this can be exported to Japan and
U.S.A. through Rameswaram Port which will get strengthened once the canal comes into
being. This will relieve the distress of Ramanathapuram district which is one of the worst
drought-prone areas in the country, and save the Governments from taking annual
special alleviation measures. On the whole, the canal will come as a boon to the industrial
development of the Ramanathapuram, Sivagangai, Tuticorin and Virudhunagar districts of
Tamil Nadu, and the nation in general.
Thus the revised cost as worked out by M/s Pallavan Transport for 35′ draught
was Rs. 1200 Crores.
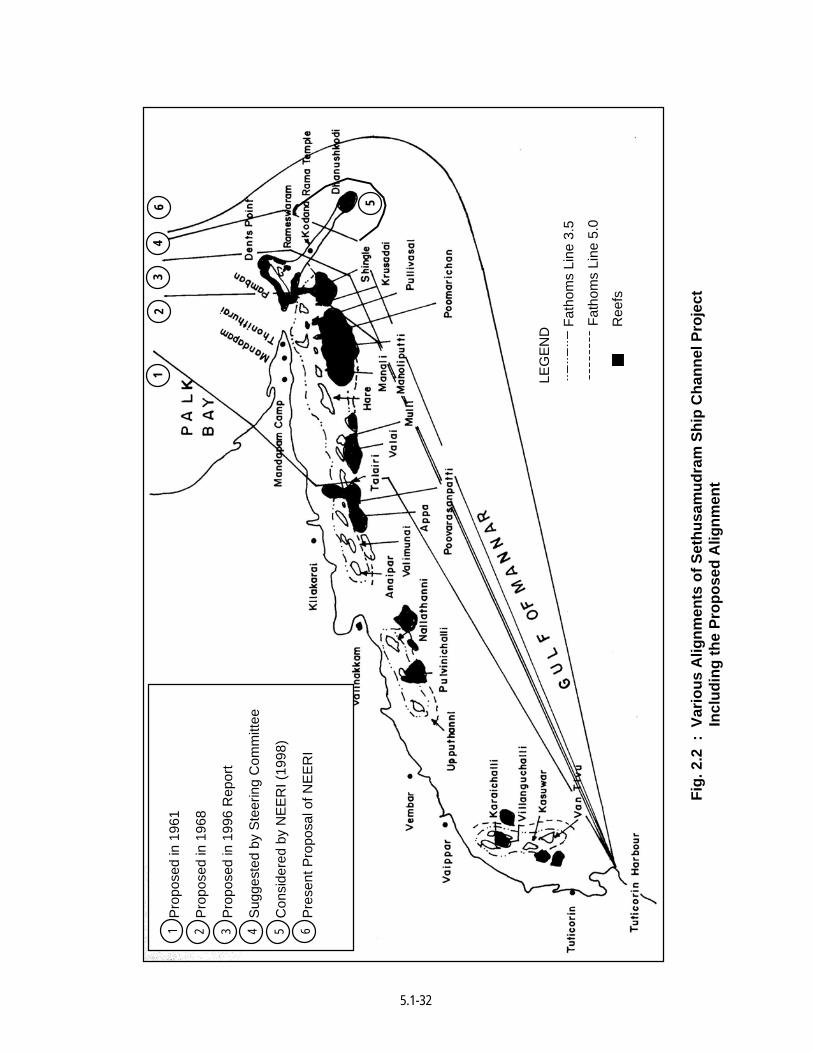
Various alignments of Sethusamudram Ship Channel Project proposed earlier
till NEERI's report of 1998 as also now proposed alignment is shown in Fig. 2.2.

5.1-31
Fig.
2.1
: A
lignm
ent o
f Set
husa
mud
ram
Shi
p C
anal
(Ear
lier P
ropo
sal)
5.1-32
Fig.
2.2
: V
ario
us A
lignm
ents
of S
ethu
sam
udra
m S
hip
Cha
nnel
Pro
ject
Incl
udin
g th
e Pr
opos
ed A
lignm
ent
Pro
pose
d in
196
1
Pro
pose
d in
196
8
Pro
pose
d in
199
6 R
epor
t
Sug
gest
ed b
y St
eerin
g C
omm
ittee
Con
side
red
by N
EE
RI (
1998
)
Pre
sent
Pro
posa
l of N
EE
RI
1 2 3 4 5
1 2
3 4
6 5
6
LEG
EN
D
Fath
oms
Line
3.5
Fa
thom
s Li
ne 5
.0
Ree
fs
5.1-33
Table 2.1
Sethusamudram Ship Canal Project – Traffic Projections
Draft 1983 Committee 1996 Report for 2000 AD
Transits NRT Transits NRT
Nos. % Lakh tones
% Nos. % Lakh tones
%
upto 30' 2100 89.4 160 79.6 3791 90.0 319.6 82.2
31-32' 2200 93.6 170 84.0 3875 92.0 328.0 84.4
above 34' 2300 100.0 201.0 100.0 4211 100.0 388.5 100.0
Table 2.2
Lengths of Various Segments of the Sethusamudram Ship Canal
Length
30′draft 31′draft 35′draft
Item
Nautical Miles
Meter Nautical Miles
Meter Nautical Miles
Meter
Bay of Bengal Channel 33.5 61,700 39.2 72,300 56.0 1,00,800
Sea Lane (no dredging) 34.0 62,968 28.5 52,782 Nil Nil
North Approach Channel 7.39 13,600 10.89 20,065 19.8 36,564
Land canal upto lock 0.44 802 0.44 802 0.40 802
Lock 0.16 300 0.16 300 0.16 300
Land canal blow lock 0.60 1,117 0.60 1,117 0.60 1,117
South Approach Channel 2.06 3,800 2.31 4,250 4.00 7,200
5.1-34
Table 2.3
Estimated Quantities of Dredging and Costs for ′K′ (Kodandaramaswamy Koil) Alighment for Various Drafts
30′ draft 31′ draft 35′ draft Sr.
No. Description
Length (m)
Width (m)
Quantity of Dredging Material (lakh m3)
Dredging Cost (Rs. in lakhs)
Length (m)
Width (m)
Quantity of Dredging Material (lakh m3)
Dredging Cost (Rs. in lakhs)
Length (m)
Width (m)
Quantity of Dredging Material (lakh m3)
Dredging Cost (Rs. in lakhs)
1. Bay of Bengal Channel 61,700 305 375.60 30048.00 72.300 305 446.00 35680.00 1,00,800 305 832.20 66570.00
2. North Approach Channel
13.600 245 147.33 8827.00 20,065 245 165.41 9924.60 36,564 245 313.00 18780.00
3. South Approach Channel
3,800 245 29.33 1759.80 4.250 245 33.18 1990.80 7,200 245 55.10 3306.00
4. Land Canal
a) upto lock 802 245 69.86 6986.00 802 245 71.72 7172.00 802 245 76.65 7665.00
b) below lock 1,117 1.117 1,117
Mobilisation - - - 150.00 - - - 150.00 - - - 150.00
Total 81,019 622.12 47770.80 98,534 716.31 54917 .40 1,46,483 1276.95 96477 .00
5.1-35
Table 2.4
Sethusamudram Ship Canal Project Components and Cost Estimates
30′ draft 31′ draft 35′ draft Sr. No.
Description
Quantity Rate (Rs.)
Amount (Rs. in lakhs)
Quantity Rate (Rs.) Amount (Rs. in lakhs)
Quantity Rate (Rs.)
Amount (Rs. in lakhs)
1. Preliminary expenses such as model studies, hydrographic and land surveys, soundings, boring, consultancy fees etc. at 20%
- - 500.00 L.S. - 500.00 L.S. - 500.00
2. Land Acquisition charges including payment for compensation of structures for 40 hectares
L.S. - 50.00 40 hectares
125000/ hectares
50.00 40 hectares
L.S. 50.00
3. Dredging and excavation : Dredging the loose or compact sand, silt or any other soft materials from the existing sea bed to the required levels by suitable dredgers in the proposed canal, conveying the dredged spoils and dumping the same at dumping site including removal of abstructions if any :
i) Mobilisation and demobilization charges
LS - 150.00 LS - 150.00 LS - 150.00
ii) South approach channel (average lead 6 km)
29.33 lakhs m3
60/m3 1759.80 33.18 lakhs m3
60/m3 1990.00 50.10 lakhs m2
60/m3 3306.00
iii) North approach channel (average lead 6 km)
147.33 lakhs m3
60/m3 8827.80 165.41 lakhs m3
60/m3 9924.60 313.00 lakhs m3
60/m3 18780.00
iv) Bay of Bengal channel (average lead 15 km)
375.60 m3
80/m3 30048.00 446.00 lakhs m3
80/m3 35680.00 832.2 lakhs m3
80/m3 66576.00
v) Land canal 69.86 m3 100/m3 6986.00 71.72 lakhs m3
100/m3 7172.00 76.65 lakhs m3
100/m3 7665.00
4. Construction of a ″lock″ of size 300x45 m as per details shown in the drawinings
4000.00 LS 4000.00 LS 4000.00
5. Construction of Rubble Mound Type Breakwaters of length 350 m each from shore to –3 m depth on either side of the land canal total 1400 km
1,60,000 tons
274/t 438.00 1,60,000 tons
274/t 438.40 1,60,000 tons
274/t 438.00
5.1-36
Table 2.4 Contd…
30′ draft 31′ draft 35′ draft Sr. No.
Description
Quantity Rate (Rs.)
Amount (Rs. in lakhs)
Quantity Rate (Rs.) Amount (Rs. in lakhs)
Quantity Rate (Rs.)
Amount (Rs. in lakhs)
6. Navigational Aids i) Lighted beacons/buoys 35 Nos. 30 lakhs/
Nos. 1050.00 35 Nos. 30.00/
Nos. 1050.00 70 Nos. 30.00/
Nos. 2100.00
ii) Racons 10 Nos. 12 lakhs/ Nos.
120.00 10 Nos. 12.00/ Nos.
120.00 15 Nos. 12.00/ Nos.
180.00
iii) Satellite Based Differential Global System
100.00 100.00 100.00
iv) Improvements to Pamban light house
100.00 100.00 100.00
7. Flotilla i) Harbour Tugs 30 TBP
2700 HP (30 m x 10 m x 3.5 m draught)
4 Nos. 1540 lakhs/ Nos.
6160.20 4 Nos. 1540 lakhs/ Nos.
6160.20 4 Nos. 1540 lakhs/ Nos.
6160.00
ii) Pilot launches 700 HP (22 m x 5 m x 1.5 m to 2.0 m draught)
3 Nos. 75 lakhs/ Nos.
225.00 3 Nos. 75 lakhs/ Nos.
225.00 3 Nos. 75 lakhs/ Nos.
225.00
iii) Mooring launches -10 HP (10 m x 3.5 m x 1 m draught)
3 Nos. 30 lakhs/ Nos.
90.00 3 Nos. 30 lakhs/ Nos.
90.00 3 Nos. 30 lakhs/ Nos.
90.00
iv) Survey cum lighting launches 700 HP (25m x 7m x 2 m draught)
1 No. 100 lakhs/ Nos.
100.00 1 No. 100 lakhs/ Nos.
100.00 1 No. 100 lakhs/ Nos.
100.00
v) Despatch vessels – 2000 HP (40 m x 12 m x 4 m draught) with buoy servicing facilities
1 No. 100 lakhs/ Nos.
100.00 1 No. 100 lakhs/ Nos.
100.00 1 No. 100 lakhs/ Nos.
100.00
8. a) Provision of 2 service jetties 150 m long
300 km 4 lakhs/km
1200.00 300 km 4 lakhs/km
1200.00 3 km 4 lakhs/km
1200.00
b) Provision for slipway LS LS 100.00 LS LS 100.00 LS LS 100.00 c) Provision for buoy yard 1000 m2 1000/m2 45.00 1000 m2 1000/m2 45.00 1000 m2 1000/m2 45.00 d) Provision for repair
workshop 2000 m2 6000/m2 120.00 2000 m2 6000/m2 120.00 2000 m3 6000/m2 120.00
9. Staff & Administration Building LS LS 1000.00 LS LS 1000.00 LS LS 1000.00
10. Electricity at 7 1/12% on works other than dredgers and jetties
84.00 LS 84.00 LS 84.00
11. Water supply at 7 ½ % on works other than dredging and jetties
84.00 LS 84.00 LS 84.00
12. Maintenance during construction
1808.00 LS 1808.00 LS 1808.00
13. Petty supervision and contingencies at 5%
3253.40 LS 3608.20 4939.00
Total 68500.00 76000.00 120000.00
5.1-37
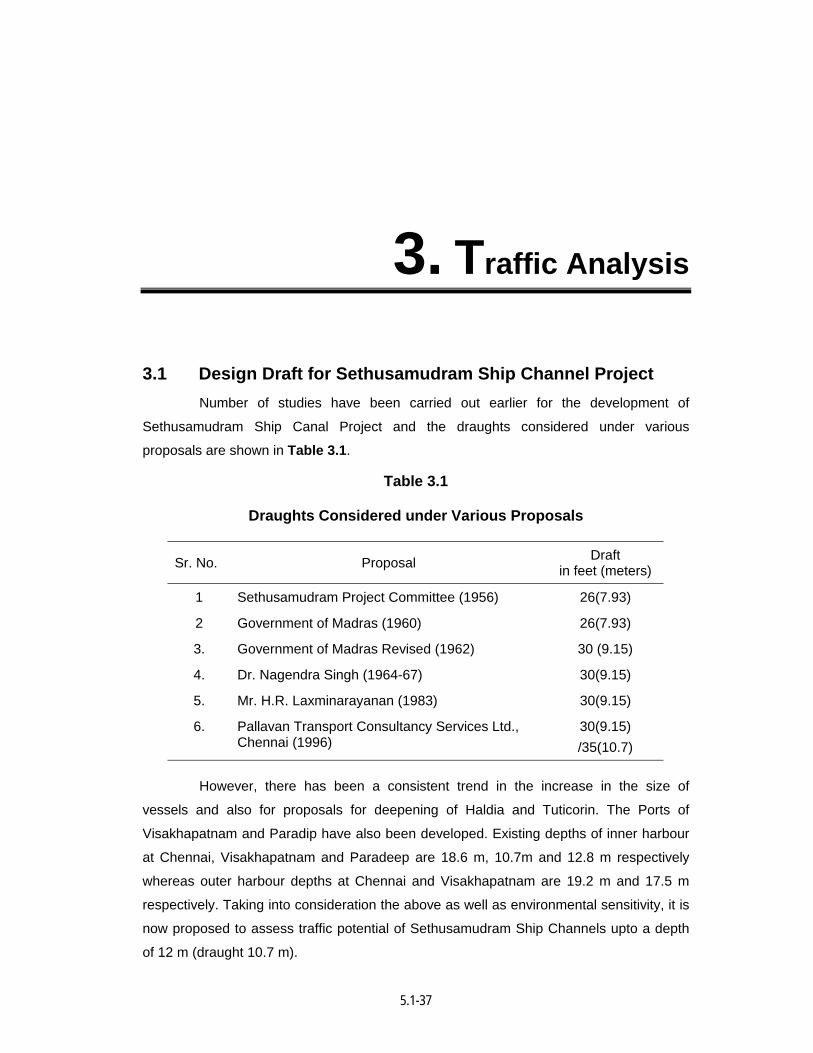
3. Traffic Analysis
3.1 Design Draft for Sethusamudram Ship Channel Project Number of studies have been carried out earlier for the development of
Sethusamudram Ship Canal Project and the draughts considered under various
proposals are shown in Table 3.1.
Table 3.1
Draughts Considered under Various Proposals
Sr. No. Proposal Draft in feet (meters)
1 Sethusamudram Project Committee (1956) 26(7.93)
2 Government of Madras (1960) 26(7.93)
3. Government of Madras Revised (1962) 30 (9.15)
4. Dr. Nagendra Singh (1964-67) 30(9.15)
5. Mr. H.R. Laxminarayanan (1983) 30(9.15)
6. Pallavan Transport Consultancy Services Ltd., Chennai (1996)
30(9.15) /35(10.7)
However, there has been a consistent trend in the increase in the size of
vessels and also for proposals for deepening of Haldia and Tuticorin. The Ports of
Visakhapatnam and Paradip have also been developed. Existing depths of inner harbour
at Chennai, Visakhapatnam and Paradeep are 18.6 m, 10.7m and 12.8 m respectively
whereas outer harbour depths at Chennai and Visakhapatnam are 19.2 m and 17.5 m
respectively. Taking into consideration the above as well as environmental sensitivity, it is
now proposed to assess traffic potential of Sethusamudram Ship Channels upto a depth
of 12 m (draught 10.7 m).
5.1-38
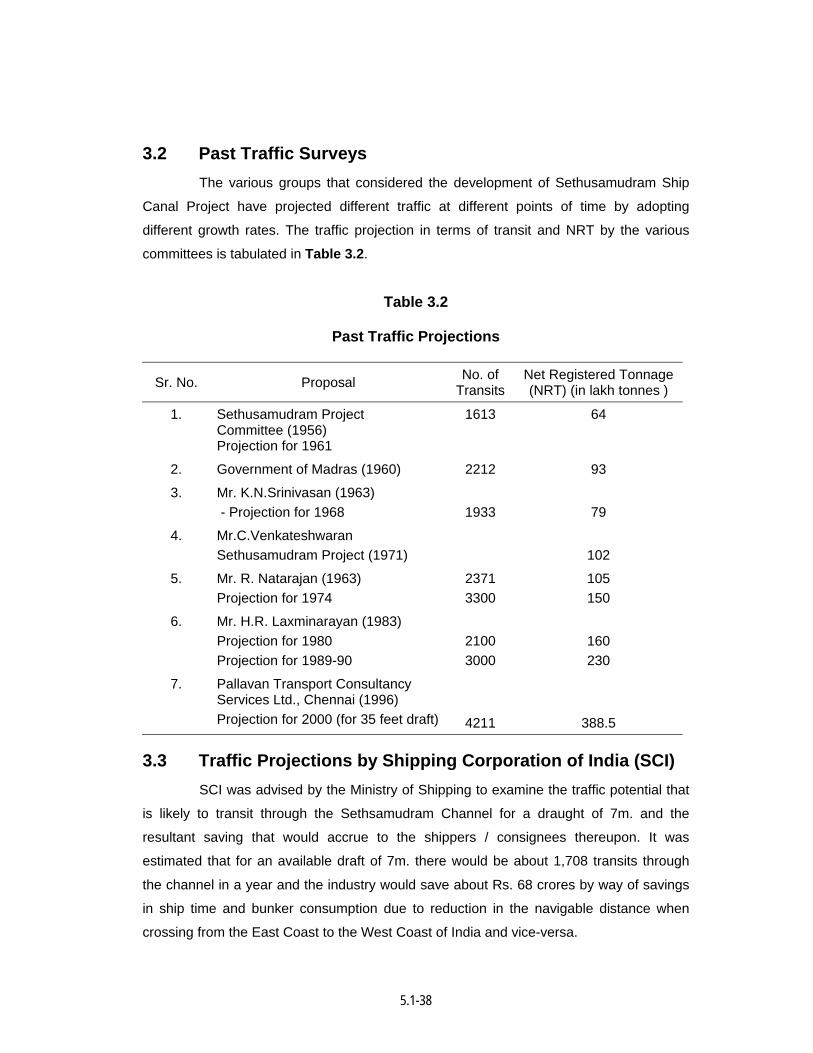
3.2 Past Traffic Surveys The various groups that considered the development of Sethusamudram Ship
Canal Project have projected different traffic at different points of time by adopting
different growth rates. The traffic projection in terms of transit and NRT by the various
committees is tabulated in Table 3.2.
Table 3.2
Past Traffic Projections
Sr. No. Proposal No. of Transits
Net Registered Tonnage (NRT) (in lakh tonnes )
1. Sethusamudram Project Committee (1956) Projection for 1961
1613 64
2. Government of Madras (1960) 2212 93
3. Mr. K.N.Srinivasan (1963) - Projection for 1968
1933
79
4. Mr.C.Venkateshwaran Sethusamudram Project (1971)
102
5. Mr. R. Natarajan (1963) Projection for 1974
2371 3300
105 150
6. Mr. H.R. Laxminarayan (1983) Projection for 1980 Projection for 1989-90
2100 3000
160 230
7. Pallavan Transport Consultancy Services Ltd., Chennai (1996) Projection for 2000 (for 35 feet draft)
4211
388.5
3.3 Traffic Projections by Shipping Corporation of India (SCI) SCI was advised by the Ministry of Shipping to examine the traffic potential that
is likely to transit through the Sethsamudram Channel for a draught of 7m. and the
resultant saving that would accrue to the shippers / consignees thereupon. It was
estimated that for an available draft of 7m. there would be about 1,708 transits through
the channel in a year and the industry would save about Rs. 68 crores by way of savings
in ship time and bunker consumption due to reduction in the navigable distance when
crossing from the East Coast to the West Coast of India and vice-versa.
5.1-39
In a meeting chaired by the Hon’ble Minister of State for Shipping, it was
presented by the National Environmental Research Institute (NEERI) that Indian Navy are
keen in using the facilities of the proposed channel. However, it was indicated that the
minimum draught required by them was 9 m. Accordingly, M/s. SCI were advised to
estimate the likely increase in the number of transits through the proposed channel if the
draught is increased from 7 to 9 m. The study revealed that the number of transits
expected for the 9 m draught channel would be 1,792 and the estimated savings would
be Rs. 80.71 crores. The above transits and the savings accrued was only for merchant
ships. If naval ships are also taken into account, additional savings would be accrued due
to the construction of the channel. It was noticed that both for 7 and 9 m draft, a large
number of ships estimated to transit the channel would be during the ballast voyage only.
Further, the whole of liquid and dray bulk cargo vessels projected to transit the channel
with 7 and 9 m draught would not be able to transit the channel during their loaded
voyages due to the limitations in the draught offered by the channel. Many of these
vessels had a loaded draught of about 11 m. However, since these vessels have a
draught of about 6 to 9 m in ballast, these vessels may navigate through the channel
during the ballast voyages. Thus, these ships would have to use different routes for
loaded passage vis-à-vis ballast passage, even when shuttling between the ports of India.
Further, there have been apprehensions in some circles that, ship operators may not be
comfortable with the idea of plying on two different routes between the same ports
depending upon the loaded / ballast condition of the vessel. It is also likely that the
operators may refrain from using the channel from ballast voyages only.
Accordingly, M/s. SCI was advised to estimate the likely increase in the number
of transits through the proposed channel if the draught offered at the channel would be
increased from 9 to 11/12 m. Hence, in addition to estimation of traffic at the channel at
11 m, the committee also analyzed the likely increase in traffic if the channel were to offer
12 m draught. The estimation was based on the same assumptions as made in the earlier
reports.
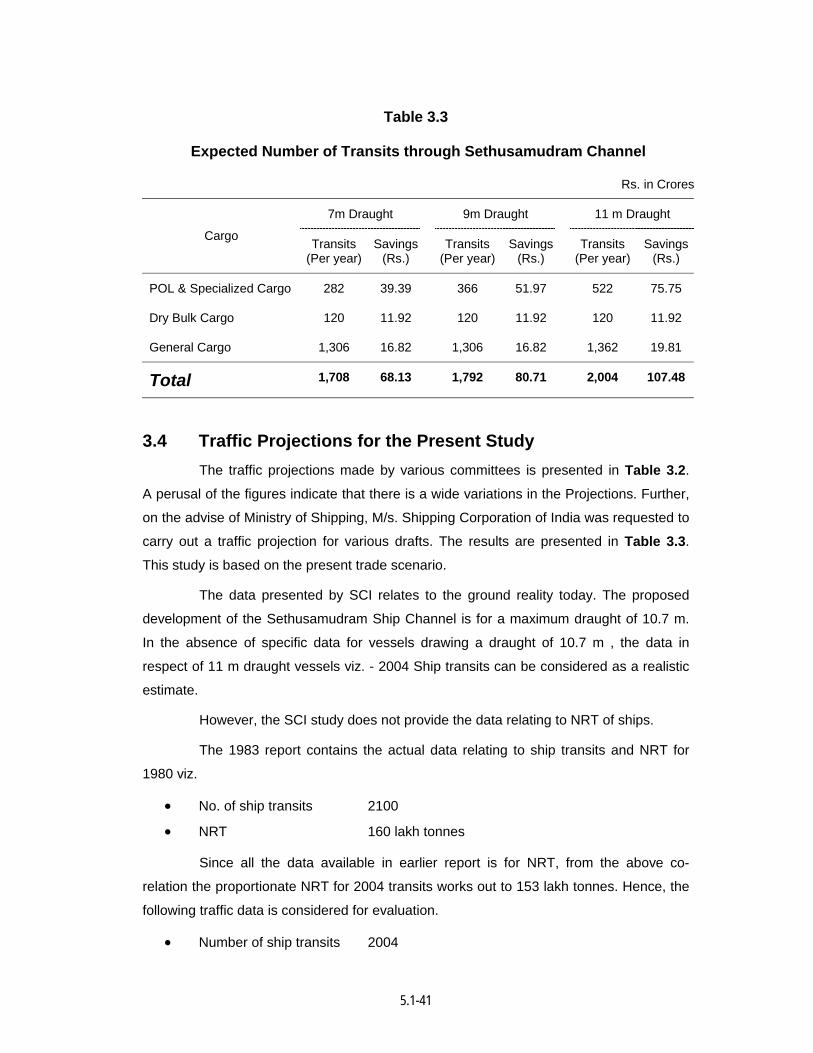
Based on the present day scenario, the expected number of crossings through
the proposed Sethusamudram channel at various drafts and the resultant benefits
accruing to the trade there from are summarized in Table 3.3.
The proposed development of the Sethusamudram channel is for a draught of
10.7 m. In the absence of specific data for vessels drawing a draught of 10.7 m , the data
in respect of 11 m draught vessels are adopted for evaluation.
5.1-40
A report prepared by Shipping Corporation of India on Traffic Potential for 11
and 12 m draughts is appended as Annexure 3.1.
5.1-41
Table 3.3
Expected Number of Transits through Sethusamudram Channel
Rs. in Crores
7m Draught 9m Draught 11 m Draught
Cargo Transits (Per year)
Savings (Rs.)
Transits (Per year)
Savings (Rs.)
Transits (Per year)
Savings (Rs.)
POL & Specialized Cargo 282 39.39 366 51.97 522 75.75
Dry Bulk Cargo 120 11.92 120 11.92 120 11.92
General Cargo 1,306 16.82 1,306 16.82 1,362 19.81
Total 1,708 68.13 1,792 80.71 2,004 107.48
3.4 Traffic Projections for the Present Study The traffic projections made by various committees is presented in Table 3.2.
A perusal of the figures indicate that there is a wide variations in the Projections. Further,
on the advise of Ministry of Shipping, M/s. Shipping Corporation of India was requested to
carry out a traffic projection for various drafts. The results are presented in Table 3.3.
This study is based on the present trade scenario.
The data presented by SCI relates to the ground reality today. The proposed
development of the Sethusamudram Ship Channel is for a maximum draught of 10.7 m.
In the absence of specific data for vessels drawing a draught of 10.7 m , the data in
respect of 11 m draught vessels viz. - 2004 Ship transits can be considered as a realistic
estimate.
However, the SCI study does not provide the data relating to NRT of ships.
The 1983 report contains the actual data relating to ship transits and NRT for
1980 viz.
• No. of ship transits 2100
• NRT 160 lakh tonnes
Since all the data available in earlier report is for NRT, from the above co-
relation the proportionate NRT for 2004 transits works out to 153 lakh tonnes. Hence, the
following traffic data is considered for evaluation.
• Number of ship transits 2004
5.1-42
• NRT 153 lakh tonnes
3.5 Conclusion In view of large variations in the past traffic projections and the study now
carried out by SCI, it is proposed to consider the number of transits as per the SCI Study
which is based on the present trade scenario for the purpose of evaluation. However, the
SCI Study do not contain the NRT data. Hence, the co-relation between transits and NRT
as per the 1983 report has been considered.
Thus, the number of transits and the NRT considered for evaluation are
• Number of ship transits - 2004
• NRT - 153 lakh tons
5.1-43
Annexure 3.1
Sethusamudram Ship Channel
Supplementary Report – II
Estimation of Traffic Potential at the Channel at a Proposed Draught of 11 and 12 m
(Report Prepared by Shipping Corporation of India, January 2003)
In respect of the proposed Sethusamudram Ship Canal Project, the SCI has
done an estimation on the traffic that is likely to transit through the proposed canal at a
draught of 7 metres as also 9 metres, and the resultant savings that would accrue to the
shippers/consignees thereupon due to reduction in the navigable distance when crossing
from the East Coast to the West Coast of India and vice-versa. It has been estimated
that, at a navigable draught of 7 metres at the canal, there would be about 1,708 transits
through the canal per annum and the industry would save about Rs. 68 crores by way of
savings in shiptime and bunker consumption. Similarly, if the canal were to offer 9 metres
navigable draught, the total number of transits would be about 1,792 and the savings
would be about Rs.80 crores. The savings estimated are exclusive of any user charges,
which the vessels would have to pay for using the facilities that would be provided by the
canal.
The number of transits shown above and the savings accruing due to reduction
in the navigable distance for ships-crossing from the East Coast to the West Coast of
India and vice-versa, are for merchant ships only. There can be additional transits by
Naval ships, which would mean additional savings from the canal.
It has been noticed that, at 7 as also at 9 meters navigable draught, a large
number of ships' estimated to transit the canal would be during their ballast voyage only.
Almost the whole of liquid and dry bulk cargo vessels projected to transit the canal with 7-
9 metres draught, would not be able to transit the canal during their loaded voyages due
to limitations in draught offered by the canal. Many of these vessels have a draught of
about 11 metres in loaded condition, and would continue to ply along the existing route
thereby encircling around Sri Lanka, during loaded voyages from the East coast to West
Coast of India and vice-versa. However, since these vessels have a draught of about 6-9
metres in ballast these vessels may navigate through the canal during ballast voyages.
5.1-44
Thus, these ships would have to use different routes for loaded passage vis-a-vis ballast
passage, even when shuttling between the same ports in India.
There has been apprehension in some circles that, ship operators may not be
comfortable with the idea of plying on two different routes between the same ports,
depending upon the loaded/ballast condition of the vessel. The operators may refrain
from using the canal for ballast voyage only and may continue to use only one trade route
for their ships i.e. encircling around Srilanka, irrespective of the loaded/ballast condition of
the vessel. Thus, if the canal has to attract these vessels to use its facilities, it should
offer navigating facilities to these vessels in loaded condition also. By this, the operators
may find the idea of using the canal attractive and the canal may thus witness transit by
these vessels in both the legs i.e. loaded as also ballast passage.
The SCI has, therefore, been advised to estimate the likely increase in the
number of transits through the proposed canal, if the draught offered at the canal would
be increased from 9 metres to 11 metres. This aspect has been studied by the committee
of SCI officials that has studied the Project, and its observations are presented in the
subsequent paragraphs. The Committee is of the opinion that, since the majority of the oil
tankers and dry bulk carriers that are expected to transit the canal in ballast, have a
loaded draught of about 11 metres, in order to attract these vessels to use the canal, the
authorities have to consider offering a navigable draught of 12 metres. Hence, in addition
to estimation of traffic at the canal at 11 metres, the Committee has also analysed the
likely increase in traffic if the canal were to offer 12 metres draught. The estimation has
been based on the same assumptions as made in the earlier reports.
These observations are the views of the committee of SCI officials that has
studied the proposal and should not be perceived as the commitments of either. The
Shipping Corporation of India Ltd., or The Indian National Shipowners' Association, or.
The Indian Coastal Conference, as in the previous reports on the subject.
Petroleum Oil and Lube Crude Oil
As stated in the earlier reports, while larger sized vessels like VLCCs and LR-II
tanker (Aframax/Suezmax) transport crude oil imports to India, the coastal movement of
crude oil is mostly on LR-I and MR sized tankers. Out of the various sizes of tankers
deployed, the largest ones i.e. VLCCs have a ballast draught in excess of 12 metres,
hence an increase in draught at the canal even upto 12 metres would not be of any
benefit to these tankers.
5.1-45
The next size i.e. Suezmax tankers have a loaded draught of about 15 metres
and a ballast draught of around 9 metres. Considering the size and safety of these
vessels, it was earlier presumed that these vessels may not transit the canal, if the canal
were to provide a navigable draught 9 metres. However. If the canal would offer a
navigable draught of 11/12 metres, these vessels may transit the canal when crossing
from the East Coast of India to the Western water front in ballast.
As stated in the Supplementary Report I, on an average, atleast one Suezmax
tanker sails in ballast to Persian Gulf after discharging crude oil at Sandheads and
another from Visakhapatnam, every month. These vessels can navigate through the
canal when moving in ballast from the East Coast of India to the Persian Gulf, if the canal
offers a draught of 11 metres. Thus as per the present trade pattern, about 24 transits in
a year by Suezmax tankers can be considered at the proposed canal. This would lead to
savings of about 36 days of shiptime and about 1,800 tons of bunkers (at a consumption
rate of 50 tonnes per day). At an average charter hire rate of US$ 18000 per day for
Suezmax tankers, savings in shiptime would be to the tune of US$ 0.65 million. Similarly,
at a bunker cost of US$ 165 per tonne, annual savings of bunkers would be about US$
0.3 million. Thus, there would be an annual saving of about US$ 0.95 million or Rs.4.65
crores (US$ 1 = Rs.49) for Suezmax tankers from the canal.
Next, the LR-II size tankers (CSL built tankers, SCI's World Bank tankers), have
a loaded draught of about 14 metres and these would not be able to transit the canal in
loaded condition even if the navigable draught at the canal were increased upto
12 metres. Transits by these tankers in ballast have already been considered during the
traffic estimation at 9 metres draught at the canal. Hence, an increase in draught to
11/12 metres at the canal would not be of any further benefit to this category of tankers.
The LR-I size tankers transporting coastal crude oil, cross from West Coast to
East Coast of India when transporting Mumbai High crude. These vessels have already
been considered to transit through the proposed canal during their ballast passage from
East Coast to the West Coast of India. For loaded voyage, the loading port for these
vessels i.e. Mumbai provides a draught of about 37 feet and these tankers load the
maximum upto this limit i.e. about 11.1 metres draught. Thus, with a draught limitation of
11 metres at the canal, these tankers may not be able to transit the canal in majority of
the cases. However, if the proposed canal is dredged to offer a navigable draught of 12
metres, these vessels would be able to transit the canal in loaded condition. Thus, an
increase in draught at the canal from 9 metres to 12 metres will enable LR-I tankers to
transit the canal both in ballast as also loaded voyages, i.e. while crossing from East
5.1-46
Coast to West Coast of India and vice-versa. The number of transits by LR-f tankers and
the resultant savings therefrom would, therefore, double from that expected at 9 metres
draught, when transits by these vessels was considered in ballast condition only. Thus,
about 36 additional transits by these tankers can be expected every year, which would
result in a saving of about Rs.5.19 crores.
The next size range of crude oil tankers Le. MR tankers generally undertake
short haul voyages only and as per past experience, generally these vessels do not cross
over from one coast in India to the other. This has already been stated in the earlier
reports and no transits by tankers of these size can be expected at the canal.
Thus, an increase in draught at the canal from 9 metres to 11 metres may lead
to about 24 additional transits by crude oil tankers per annum, which may lead to a saving
of about Rs. 4.65 crores. Additionally, an increase in draught from 11 metres to 12 metres
may witness about 36 additional transits, which may lead to a saving of about Rs.5.19
crores per annum to the ship operators.
Oil Products
In the earlier report, about 150 transits. of Product tankers have been
anticipated at a navigable draught of 7 metres at the proposed Sethusamudram canal. All
these transits would be during the ballast leg of the voyage, with vessels moving to
loadports on the West Coast after discharge on the East Coast of India. Majority of the
tankers currently deployed in this trade have loaded draughts ranging from about 10.5
metres to 12 metres. In normal practise, these vessels load upto 90-95 percent capacity
depending upon the cargo loaded, and tile draught ranges from about 10 to 11.5 metres
in majority of the cases. An assumption on the number of times the tankers would move
with less than 11 metres draught would be difficult to estimate. Thus, for the purpose of
this study we have presumed that these tankers would be able to transit the canal when
the navigable draught available at the canal is 12 metres.
Thus, it is presumed that, while there would be no additional transits at the canal
if its draught were to be increased from 7 metres to 11 metres, the number of transits
would double if the draught at the canal is increased to 12 metres. There can thus be
about 150 additional transits in a year, which would result to a saving of Rs.20.26 crores
at 12 metres draught at the canal.
5.1-47
Speclised Cargoes Phosphoric Acid
As stated in the earlier reports, there are about 10-12 acid carriers deployed for
transporting Phosphoric acid from Morocco to India. These vessels usually discharge at
2/3 ports amongst Sikka, Kandla, Nhava Sheva, Marmugao, New Mangalore and Cochin
on the West Coast and Tuticorin, Kakinada, Paradip and Haldia on the East Coast. Since
the sequence of discharge ports is not fixed, based on the past experience, we had
presumed that each vessel deployed in this trade would cross from the West Coast to the
East Coast of India atleast 5 times in a year.
These vessels have a draught of about 9-10 metres in loaded condition and in
ballast their draught is less than 7 metres. For the purpose of estimation of traffic at 7
metres navigable draught at the canal, we had considered 60 transits per annum by these
vessels, when these would move in ballast to Morocco after discharge on the East Coast
of India. If the draught at the canal would be increased to 11 metres, these vessels can
transit through the canal when crossing from the West Coast of India to the East in
loaded condition as well. Thus, at 11 metres draught at the canal, the number of transits
and the benefits accruing to this trade would double from the estimates at 7 metres
draught. The incremental transits for this trade would thus be about 60 transits per
annum, which would lead to a saving of about RS.7.55 crores.
Liquified Petroleum Gas
For the purpose of estimation of traffic at the proposed canal at 7 metres
draught, based on the current LPG transportation scenario in India, it was anticipated that
each of the 6 Indian flag LPG carriers may cross over from the East Coast to the West
Coast of India in ballast, atleast once every month. Thus, a total of 72 transits per annum
has been anticipated through the canal at 7 metres draught, which would result in savings
of about RS.11.58 crores.
As already stated in the earlier reports, while these vessels have a draught of
less than 7 metres in ballast, in loaded condition their draught is in the range of about 8-
11 metres. While the largest vessel operating in this trade may have a draught 'marginally
exceeding 11 metres in full load condition, it is understood that in normal practise the
vessel moves with a draught of less than 11 metres in majority of the cases.
Thus, if the proposed canal would offer a navigable draught of 11 metres, all the
Indian flag LPG carriers operating in the Indian trade can be expected to transit through
the canal during loaded voyages also. The number of transits would, therefore, be twice
5.1-48
the number of transits expected when the canal were to offer 7 metres navigable draught,
when these vessels were expected to transit the canal only in ballast. Thus, the
incremental traffic at the canal would be about 72 transits per annum, which would lead to
a saving of about RS.11.58 crores.
Dry Bulk Cargo As has already been stated in the earlier reports, one major beneficiary from the
canal would be the thermal coal movement from Haldia, Paradip and Visakapatnam to
Tuticorin on behalf of Tamil Nadu Electricity Board. This cargo moves in handysize and
handymax size bulk carriers, which have a loaded draught of around 10-12 metres and a
ballast draught of less than 7 metres. Since these vessels move to the load port in ballast
after discharge at Tuticorin, it was earlier estimated that these vessels may transit
through the canal during the ballast passage, when the navigable draught offered by the
canal would be 7 metres.
As the loaded draught of these vessels varies from 10 metres to 12 metres
depending upon the vessel's dimensions, the exact number of times when the draught
would be less than 11 metres, would be difficult to quantify. Thus, a fair estimation of
number of transits through the canal at 11 metre draught would not be realistic. However,
if the navigable draught at the canal were 12 metres, all the vessels operating in this
trade would be able to transit the canal even in loaded condition. The number of transits
through the canal would, therefore, double if the draught at the canal is increased from 7
metres to 12 metres. Thus, about 120 additional transits per annum are anticipated at the
canal by these vessels, which may lead to a saving of about RS.11.92 crores. As regards
other dry bulk cargo, as already stated in the earlier reports, although there is ' substantial
seaborne transportation of Iron are, Coking Coal and Fertiliser in India, there is no fixed
deployment pattern of bulk carriers operating in this trade which would indicate these
vessels may transit the canal. These vessels operate in the tramp market and an
estimation on the fixed pattern of movement of those through the proposed canal would
not be possible. Thus, there cannot be a fair estimation of the benefits this trade would
derive from increasing the draught at the canal to 11/12 metres. Hence, for the purpose of
this study, no additional benefits are presumed to accrue to this trade by increasing the
draught at the proposed canal.
5.1-49
General Cargo Containers
Most of the mainline container vessels calling at Indian ports have less than 12
metres draughts and if the proposed canal were to offer 12 metres navigable draught,
these vessels can transit the canal whenever required. However, as per the present trade
pattern, there are hardly any mainline, vessels which call on both the East Coast and
West Coast ports of India. A container service with ports of call on both the coasts would
not be economical, and operators prefer to call on one of the coasts only and feeder the
cargo originating/destined from/to the port on the other coast. Thus, if container shipping
in India were to continue following the same pattern as of now, there may not be any
additional transits at the canal by these vessels.
However, container shipping in India is set to witness drastic changes in future
as the Government is developing one hub port each on the East Coast and the West
Coast of India i.e. at Chennai and Vallarpadam respectively. Development of these ports
may change the face of container shipping in India as studies have projected that
operation by these ports may lead to majority of feedering of Indian cargo at these ports,
and not at Singapore, Colombo or Dubai as is done at present. This would thus lead to
some of the mainline vessels to call at these ports.
Thus, a scenario can be that the mainline vessel includes both Vallarpadam and
Chennai in its itinerary. In such a case, the vessel can transit the proposed canal
whenever moving from one port to the other, thereby avoiding the need to encircle around
Sri Lanka and thus save on valuable shiptime and bunker consumption. However, such
scenarios may arise only after the Indian ports are developed as major hubs and are able
to attract mainline vessels to call at these ports instead of Colombo. This would require
the Indian ports to offer international level port operation services and other ancillary
services which are offered at other major hubs.
Thus, as of now, any estimation on the transits by tnese vessels through the
proposed canal would be difficult to assess. Although the increase in draught at the
proposed canal would be beneficial to container shipping in India, estimation of such
benefit at this moment would not be realistic. Hence, for the purpose of this study, no
additional benefit to the container trade be considered due to increase in draught at the
proposed canal.
5.1-50
Beak-Bulk
An increase in the navigable draught at the proposed canal upto 11 metres
would enable almost all break-bulk vessels operating in the Indian trade to transit
through the canal when crossing from the East Coat of India to the West, and vice-versa.
Almost all the break-bulk vessels in the Indian trade have less than 11 metres loaded
draught, hence these vessels can safely navigate through the canal whenever required.
Benefits accruing to the major sectors would be the following:
India - UK Continent Service : Currently, SCI in a consortium with Rickmers
Line provides the sole fixed breakbulk service between India and the UK Continent. There
is one sailing every month from India with both partners offering their vessels every
alternate month. The vessels deployed are in the range of 10-15,000 DWT, which have a
loaded draught of about 10 metres. Amongst the Indian ports, the vessels normally call at
Mumbai and Cochin on the West Coast, and Chennai, Visakhapatnam and Kolkata on the
East Coast. Since 'these vessels have to cross from the West Coast of India to the East
during the inward leg and East Coast to the West in the outward leg, these vessels can
transit through the proposed canal providing a navigable draught of 11 metres. Thus,
about 12 transits during the inward leg, and 12 during the outward leg are estimated by
the vessels plying in the India-UK Continent breakbulk liner service. This would lead to
annual saving of about 36 days seatime and about 720 tonnes of bunker (at a
consumption rate of 20 tonnes per day). At prevailing charter hire rate of US$ 4,000 per
day, total savings from sea time would be about US$ 0.14 million. Similarly, savings from
bunker consumption would be about US$ 0.12 million. Thus, total savings from the canal
to the India-UK breakbulk liner trade would be about US$ 0.26 million or RS.1.27 crores.
Black Sea - India Service : SCI used to provide regular liner service between
India and Black Sea ports in the past. However, currently there is no fixed service and
whenever there is sufficient cargo available, SCI books space on breakbulk ships plying
on this region. Major cargo transported on this sector is Machinery goods to India and the
vessels plying in this trade are normally in the range of about 10-15,000 DWT, which
have loaded draughts of around 10 metres. Thus, these vessels can safely transit through
the proposed canal providing a navigable draught of 11 metres. Based on the present
pattern of trade, about transits from the West Coast to KoIkata and 6 on the return leg,
can be expected by these vessels in a year. This would lead to annual saving of about
18 days seatime and about 360 tonnes of bunker (at a consumption rate of 20 tonnes per
day). At prevailing charter hire rate of US$ 4,000 per day, total savings from sea time
would be about US$ 0.07 million. Similarly, savings from bunker consumption would be
5.1-51
about US$ 0.06 million. Thus, total savings from the canal to the India-Black Sea
breakbulk liner trade would be about US$ 0.13 million or RS.0.64 crores.
Granite Trade : India exports substantial quantity of Granite to the European
and the Far-East Asian countries. The major load ports for Granite are Visakhapatnam,
Chennai and Tuticorin and in addition to transportation on regular liner vessels, often
vessels are chartered in for this trade. The vessels are primarily in the range of about 10-
15,000 DWT, which have around 10 metres loaded draught. The presence of the
Sethusamudram canal with a navigable draught of 11 metres would enable ships loading
Europe bound cargo from the East Coast of India, to transit through the canal. Based on
the present trade pattern, atleast one vessel loads Europe bound cargo from the East
Coast ports every month. These vessels are chartered for specific voyages and it would
not be realistic to assume as to from which part of the world would these vessels be
positioned on the Indian port. Thus, while the vessel may transit the canal when moving
from the West to the East Coast India, she need not transit the canal if she has to
repositiofa from East Asia. Thus to have a realistic study, only outbound voyages from
East Coast of India to Europe have been considered. The proposed canal would,
therefore, have about 12 transits per annum by vessels transporting Granite. This would
lead to annual saving of about 18 days seatime and about 360 tonnes of bunker (at a
consumption rate of 20, tonnes per day). At charter hire rate of US$ 4,000 per (by, 101:11
savings from seatime would be about US$ 0.07 million. Similarly, saving from bunker
consumption would be about US$ 0.06 million. Thus, total savings to this trade from the
canal would be about US$ 0.13 million or RS.0.64 crores.
Steel Trade : Steel Plants located in Eastern region of India export steel (mainly
Hot Rolled Coils) to various destinations in the western world, primarily the USA and UK.
On an average, each of SAIL and TISCO transport about one shipment in every
2/3 months. These parcels are transported on about 10-15,000 DWT size vessels which
have loaded draughts of about 10 metres. These vessels can, therefore, transit through
the proposed canal whenever required. Thus, based on the present trade pattern, about 8
transits per annum can be expected at the canal by vessels transporting steel. This would
lead to a saving of about 12 days of shiptime and about 240 lons of hunker (at a
consumption rate of 20 tons per day). At charter hire rate of US$ 4,000 per day, total
savings from seatime would be about US$ 0.05 million. Similarly, savings from bunker
consumption would be about US$ 0.04 million. Thus, 1010/ savings to this trade from the
canal would be about US$ 0.09 mil/ion or RS.0.44 crores.
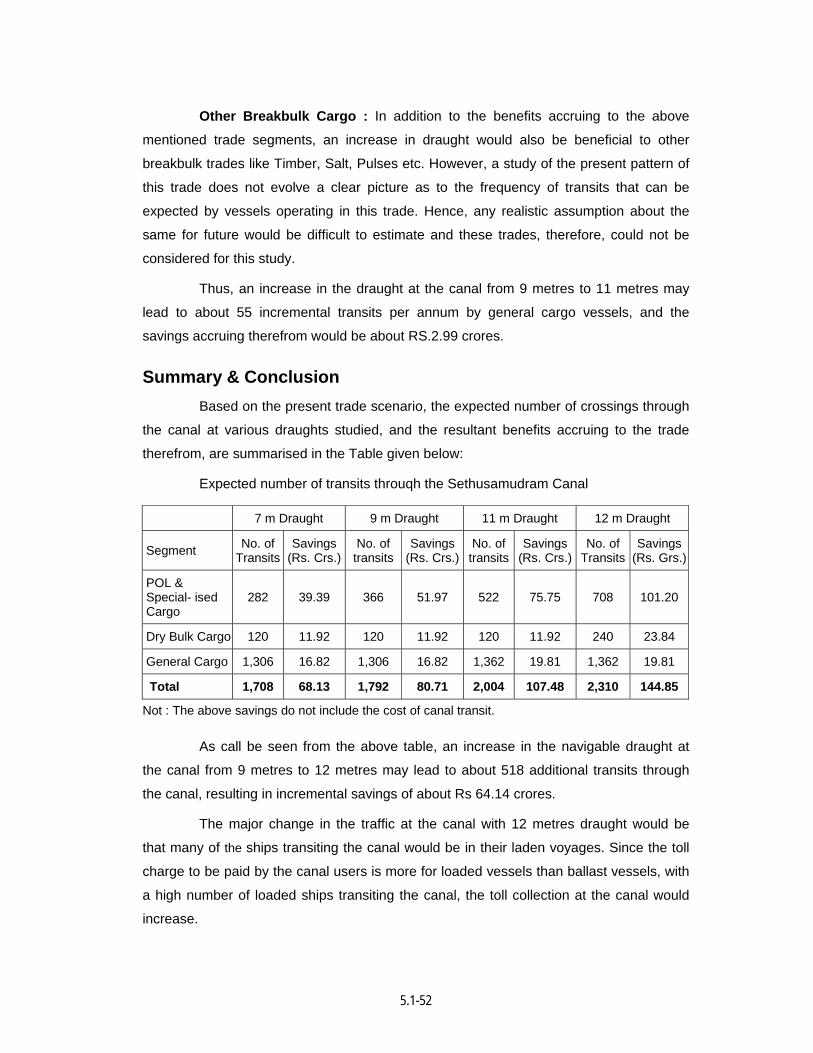
5.1-52
Other Breakbulk Cargo : In addition to the benefits accruing to the above
mentioned trade segments, an increase in draught would also be beneficial to other
breakbulk trades like Timber, Salt, Pulses etc. However, a study of the present pattern of
this trade does not evolve a clear picture as to the frequency of transits that can be
expected by vessels operating in this trade. Hence, any realistic assumption about the
same for future would be difficult to estimate and these trades, therefore, could not be
considered for this study.
Thus, an increase in the draught at the canal from 9 metres to 11 metres may
lead to about 55 incremental transits per annum by general cargo vessels, and the
savings accruing therefrom would be about RS.2.99 crores.
Summary & Conclusion Based on the present trade scenario, the expected number of crossings through
the canal at various draughts studied, and the resultant benefits accruing to the trade
therefrom, are summarised in the Table given below:
Expected number of transits throuqh the Sethusamudram Canal
7 m Draught 9 m Draught 11 m Draught 12 m Draught
Segment No. of Transits
Savings(Rs. Crs.)
No. oftransits
Savings(Rs. Crs.)
No. oftransits
Savings(Rs. Crs.)
No. of Transits
Savings(Rs. Grs.)
POL & Special- ised Cargo
282 39.39 366 51.97 522 75.75 708 101.20
Dry Bulk Cargo 120 11.92 120 11.92 120 11.92 240 23.84
General Cargo 1,306 16.82 1,306 16.82 1,362 19.81 1,362 19.81
Total 1,708 68.13 1,792 80.71 2,004 107.48 2,310 144.85
Not : The above savings do not include the cost of canal transit.
As call be seen from the above table, an increase in the navigable draught at
the canal from 9 metres to 12 metres may lead to about 518 additional transits through
the canal, resulting in incremental savings of about Rs 64.14 crores.
The major change in the traffic at the canal with 12 metres draught would be
that many of the ships transiting the canal would be in their laden voyages. Since the toll
charge to be paid by the canal users is more for loaded vessels than ballast vessels, with
a high number of loaded ships transiting the canal, the toll collection at the canal would
increase.
5.1-53
As has already been stated earlier, the estimates shown above are primarily
based on the present trade pattern in India, and the number of transits and the benefits
accruing from the canal may increase with the increase in the future trade. The operation
of the proposed canal with 12 metres navigable draught may open up new frontiers in
shipping and the benefits accruing may be much more than those anticipated now. This
will also depend upon the ability of the canal ta attract operators to utilise the facilities
offered by the canal and the savings that would accrue to the trade.
It is, however, understood that for a canal with 12 metres navigable draught, in
addition to the increase in depth the length of the channel to be dredged would also
increase. The waterfront adjoining the Adam's Bridge currently has draught ranging from
7 to 12 metres, and if the canal has to offer a navigable draught of 12 metres, the area of
sea bed to be dredged would increase. Thus, the investment requirement for building the
canal would accordingly rise substantially. Therefore, based on the savings projected to
accrue vis-à-vis the investments required, an appropriate decision on the navigable
draught at the canal may be taken.
4. Channel Alignment and Characteristics
4.1 General The alignment and characteristics of any navigation channel are closely related
to marine environmental and meteorological conditions. The alignment has to be oriented
keeping in view the following factors :
• The channel should be so oriented so as to avoid cross winds and currents
5.1-54
• The channel should be straight as far as possible
• The channel has to be so oriented as to have the shortest distance in order to
optimise the capital and maintenance dredging.
In addition, in areas sensitive to environmental effects, as in the case of
Sethusamudram Ship channel Project, the channel has to be so aligned as to have
minimum environmental impact on the surroundings.
4.2 Channel Alignment The proposed Sethusamudram Ship Channel is to be constructed in the Palk
Bay and the Gulf of Mannar cover an area of 10,500 km2 is biologically rich and rated
among the highly productive seas of the world. Its diversity is considered globally
significant. In Gulf of Mannar, between the coastline and proposed alignment there are
twenty one islands which has been declared as National Marine Park by the Tamil Nadu
Forest Department and the MoEF, Government of India. In view of the above the channel
had to be aligned to minimize environmental impacts on the surroundings, in addition to
the technical and the hydrological requirements.
4.2.1 Alignment in the Adam’s Bridge Area
Keeping in view the above, the alignment of the channel in the Adam’s Bridge
has been so selected considering the proximity to the International Medial line for fishing
as well as National Park boundary. The selected alignment is approximately 6-8 km away
from Arimunai tip and about 20 km away from Sringle Island which is a part of National
Park. Five bathymetric lines were run in the Adam’s Bridge area and the Line No. 2 was
considered as the most desirable alignment as dredging requirement is the minimum. The
bathymetry and shallow seismic data collected along these lines are given in Charts 4.1
to 4.10. The bathymetry of 4 km x 4 km area in Adam’s Bridge area is given Chart 4.11.
The alignment of the channel south of the Adam’s Bridge is marked as ‘A-B’ and North of
Adam’s Bridge has been marked as ‘B-C’ (Fig. 4.1). The total dredged spoil generation in
this area will be about 38 million m3 including allowance for slope and tolerance. This
quantity would reduce to about 24.5 million m3 if channel depth is restricted to 10 m in
Adam’s Bridge area as against 38 million m3 required to attain 12 m depth.
4.2.2 Alignment in Palk Bay and Palk Strait
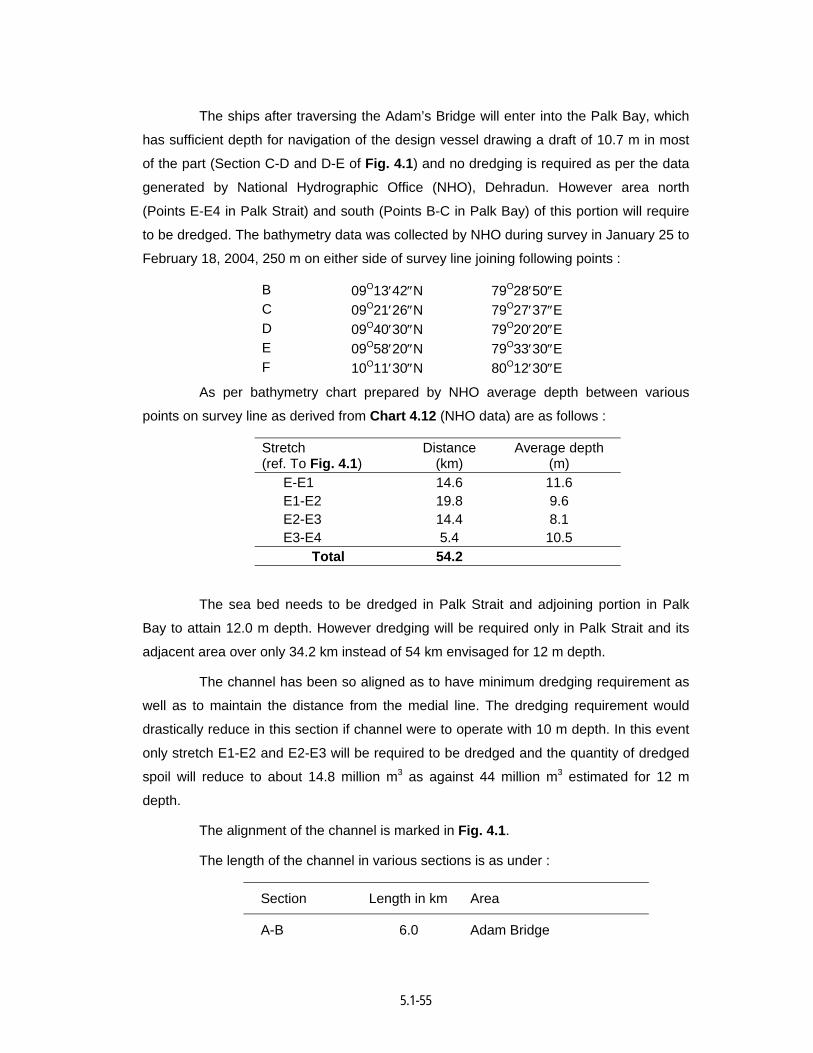
5.1-55
The ships after traversing the Adam’s Bridge will enter into the Palk Bay, which
has sufficient depth for navigation of the design vessel drawing a draft of 10.7 m in most
of the part (Section C-D and D-E of Fig. 4.1) and no dredging is required as per the data
generated by National Hydrographic Office (NHO), Dehradun. However area north
(Points E-E4 in Palk Strait) and south (Points B-C in Palk Bay) of this portion will require
to be dredged. The bathymetry data was collected by NHO during survey in January 25 to
February 18, 2004, 250 m on either side of survey line joining following points :
B 09O13′42″N 79O28′50″E C 09O21′26″N 79O27′37″E D 09O40′30″N 79O20′20″E E 09O58′20″N 79O33′30″E F 10O11′30″N 80O12′30″E
As per bathymetry chart prepared by NHO average depth between various
points on survey line as derived from Chart 4.12 (NHO data) are as follows :
Stretch (ref. To Fig. 4.1)
Distance (km)
Average depth (m)
E-E1 14.6 11.6 E1-E2 19.8 9.6 E2-E3 14.4 8.1 E3-E4 5.4 10.5
Total 54.2
The sea bed needs to be dredged in Palk Strait and adjoining portion in Palk
Bay to attain 12.0 m depth. However dredging will be required only in Palk Strait and its
adjacent area over only 34.2 km instead of 54 km envisaged for 12 m depth.
The channel has been so aligned as to have minimum dredging requirement as
well as to maintain the distance from the medial line. The dredging requirement would
drastically reduce in this section if channel were to operate with 10 m depth. In this event
only stretch E1-E2 and E2-E3 will be required to be dredged and the quantity of dredged
spoil will reduce to about 14.8 million m3 as against 44 million m3 estimated for 12 m
depth.
The alignment of the channel is marked in Fig. 4.1.
The length of the channel in various sections is as under :
Section Length in km Area
A-B 6.0 Adam Bridge
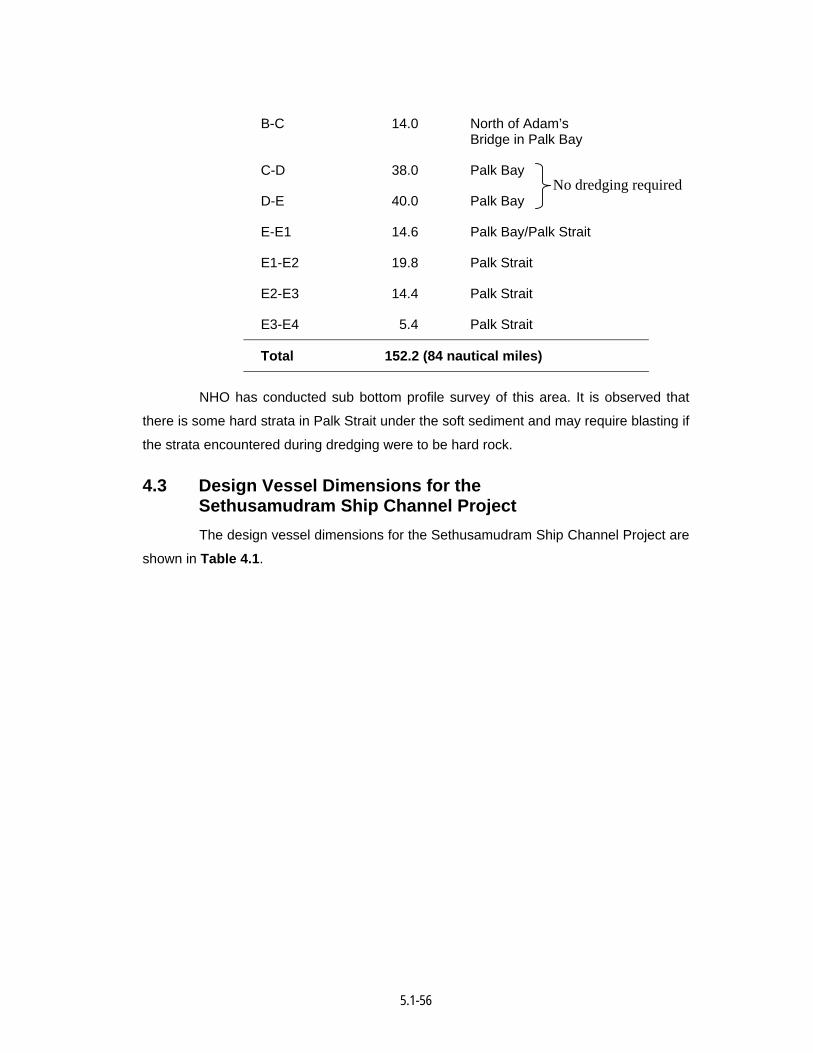
5.1-56
B-C 14.0 North of Adam’s Bridge in Palk Bay
C-D 38.0 Palk Bay
D-E 40.0 Palk Bay
E-E1 14.6 Palk Bay/Palk Strait
E1-E2 19.8 Palk Strait
E2-E3 14.4 Palk Strait
E3-E4 5.4 Palk Strait
Total 152.2 (84 nautical miles)
NHO has conducted sub bottom profile survey of this area. It is observed that
there is some hard strata in Palk Strait under the soft sediment and may require blasting if
the strata encountered during dredging were to be hard rock.
4.3 Design Vessel Dimensions for the Sethusamudram Ship Channel Project
The design vessel dimensions for the Sethusamudram Ship Channel Project are
shown in Table 4.1.
No dredging required
5.1-57
Table 4.1
Design Vessel Dimensions
LOA Beam Actual Draught
Restricted Draught Type of Vessel
(in meters)
POL Product Tankers 188 28 10.8 10.7
LPG Tanker 188 28 10.8 10.7
Chemical and Other Tankers 174 24.5 9.8 9.8
Break Bulk Cargo 199 26.1 11.0 10.7
Dry Bulk Cargo 220 33.5 12.8 10.7
Container Vessels 237 32.2 11.7 10.7
The actual draught are shown in column four, however taking into consideration
the vessels presently being handled at Tuticorin and Haldia the restricted design draught
to be used for the Sethusamudram Channel Project is shown in column five.
4.4 Channel Width The width of the channel depends upon
• Size of the vessel
• Maneuverability characteristics of the vessel
• Type of channel sides
• Effect of wind, waves and cross currents
• Cross current gradients
• Visibility
• Information regarding the ships position in the channel and
• Effect of other vessels moving if any in the channel
The required channel width consists of three lanes as under :
• Maneuvering lane
• Ship clearing lane and
• Bank clearance lane
However, additional channel width has to be provided depending upon
• Vessel speed
5.1-58
• Environmental conditions such as wind, current, wave etc.
• Navigational aids
• Type of sub soil
• Depth of waterway
• Type of cargo and
• Traffic Density
The methods used for determining the width and layout of the channel are as
under :
• Expert judgment
• Guidelines
• Fast time mathematical navigation simulation models
• Real time navigation simulation
• Hydraulic scale models
• Traffic flow simulation models
Of the above, Guidelines can be utilized at the feasibility stage. However, it
would be advisable to compare the results with a Fast Time Simulation Model. At the
detailed engineering stage, depending on the importance of the projects Real Time
Simulation Models assisted by hydraulic scale models have to be used. However, for the
feasibility study the width of the channel is proposed based on the recommended
Guidelines.
The width of the channel is normally a multiple of the Beam(B) of the design
vessel. The recommended width of channel for a single lane traffic, taking into
considerations the environmental factors as prevailing in Sethusamudram Ship Channel
Project Site is evaluated as under :
Multiple of Beam Basic Maneuvering lane - 1.5 Provision for wind - 0.5 Provision for cross current - 0.7 Wave action - 1.0 Aids to navigation system - 0.2 Bank clearance - 1.0 Bottom surface - 0.2 Depth of waterway - 0.2 Cargo hazard - 0.5
5.1-59
Total 5.8 B
Research and experience has confirmed that the average value for the
conditions prevailing at site should be of the order of 3 to 6 B. Actual single way canal
widths in the existing ports vary between 2.5 to 6 B. For two way traffic, the channel width
has to be increased relative to the one way canal by about 2 B.
Channel subject to large tidal ranges are often given a width which is equivalent
to the length of the biggest ship expected to call at the port. This is to provide a
contingency for any ship running aground on the canal bank when it may turn on the tide.
From the Table 4.1, it may be seen that the maximum width of the vessel is
33.5m. and draft of 10.7 m. Considering the width of the channel to be 5.8 times the
Beam for one way channel, the width required will be 194.3 m. and for a two way channel
the width of the channel required will be 7.8 times the beam and this works out to
261.3 m.
As already brought out earlier, the width of the channel is also governed by the
maneuverability characteristics of the vessel and environmental factors such as wind
waves, currents etc. Though the major portion of the Sethusamudram channel is well
protected from waves and currents, the area is highly prone for strong winds which are
likely to affect the width required for the safe navigation of the vessel. Taking into
consideration this factor, the width of the channel for a two lane traffic has been fixed as
300 m.
4.5 Channel Depth The channel depth is estimated from x. At – Rest –draft of design ship xi. Tidal variation xii. Trim / tilt due to loading xiii. Ship motion induced due to waves such as pitch, roll and heave xiv. Squat allowance xv. A margin depending upon the characteristics of the sea bottom xvi. Water density and its effect on draft
The general recommendation regarding the keel clearances as a percentage of
the maximum draft of ships, as per the Permanent International Association of Navigation
Congress(PIANC)-International Committee for the Reception of Large Vessels
(ICORELS) – Group IV (1980) are as under:-
xvii. Open sea areas - 20%
5.1-60
xviii. Waiting areas - 15% xix. Exposed canal - 15% xx. Less exposed canal - 10% xxi. Exposed maneuvering and berthing areas - 10 to 15% xxii. Protected maneuvering and berthing areas - 7%
However, the joint working group of PIANC and IAPH in their report “Approach
Canals - A Guide for Design – PTC II -30(1997) have recommended that the depth /
draught ratio should be
xxiii. 1.10 in sheltered waters xxiv. 1.3 in waves upto 1m. in height and xxv. 1.5 in higher waves with unfavourable periods and directions.
In the case of Sethusamudram channel, taking into account environmental
factors a keel clearance of 10% the maximum loaded draught of the ship is
recommended for adoption, which is consistent with the provisions of the Indian and other
International codes.
From Table 4.1, it may be seen that the maximum draught of the vessel likely to
cross the Sethusamudram Ship Channel is 10.7 m. Hence, the depth of the channel
required will be 1.1 times the draught namely 11.8 m. Accordingly the maximum depth of
the channel has been fixed as 12 mCD. However for vessels having draught 9.15 m, the
depth of channel will be 10 m only. Cross section of proposed channel is shown in
Fig. 4.2.
4.6 Conclusions The largest length, beam and draught of the vessels considered in planning the
Sethusamudram Ship Channel Project as extracted from Table 4.1 are as under :
xxvi. Length - 237 m. xxvii. Beam - 33.5 m. xxviii. Restricted Draught - 10.7 m.
To cater to the above requirements, the recommended dimensions of the canal
are as under :
xxix. Width of channel (two way channel) - 300 m. xxx. Depth of channel - -12.0 mCD xxxi. Side slope - 1 in 3
5.1-61
Fig.
4.1
: Th
e A
lignm
ent o
f the
Pro
pose
d C
hann
el
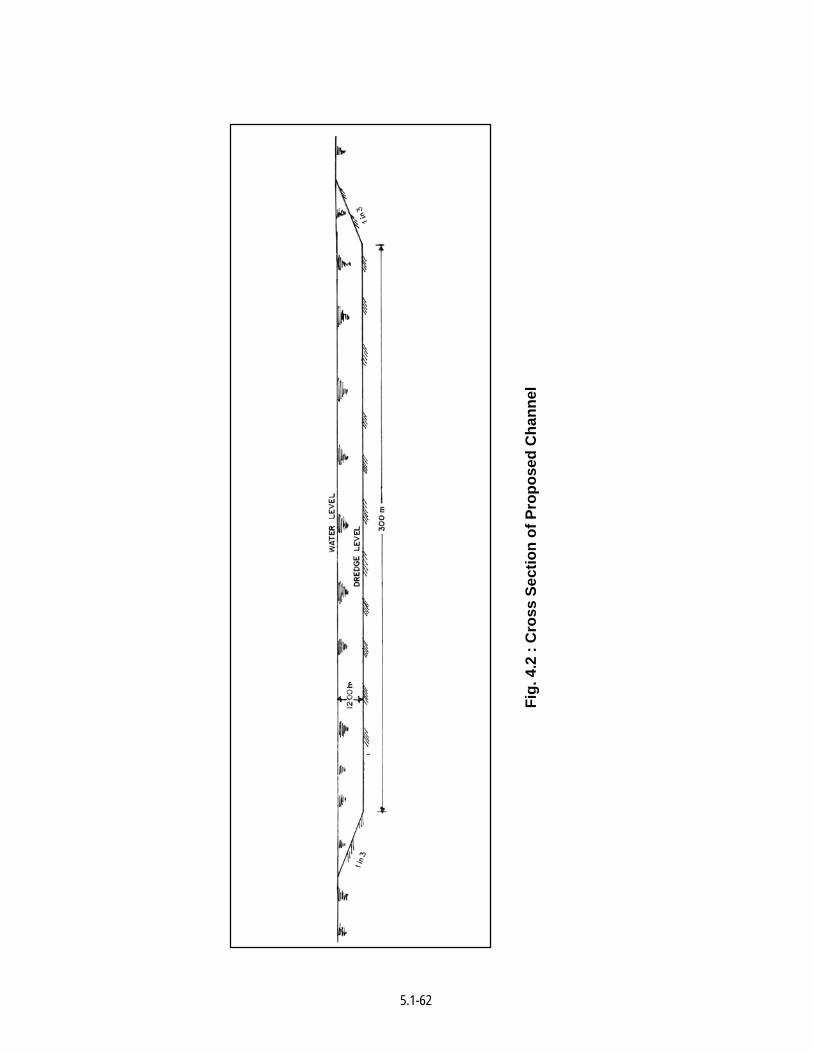
5.1-62
Fig.
4.2
: C
ross
Sec
tion
of P
ropo
sed
Cha
nnel
5.1-63
5. Cost Estimates
5.1 General The estimate is based generally on the same assumptions made in the 1983
and 1996 proposal reports.
5.1.1 Dredging
5.1.1.1 Methodology of Dredging
The route of the proposed Sethusamudram Ship Channel is shown in Fig. 4.1.
The channel is in different sections as under :
Section Length in km
A-B 6.0
B-C 14.0
*C-D 38.0
*D-E 40.0
E-E1 14.6
E1-E2 19.8
E2-E3 14.4
E3-E4 5.4
Total 152.2 * Dredging in these sections not required for 12 m depth channel
• The proposed Sethusamudram Ship Channel Project will have a dredged depth
of maximum -12 mCD to cater to vessels drawing a draught of 10.7 m. The
channel will have a bed width of 300 m providing a two way channel for vessels
drawing a draught of 10.7 m. A side slope of 1in 3 has been assumed.
5.1-64
• The navigation route will originate from Tuticorin Port in the Gulf of Mannar
utilizing the available depths which are about -20 mCD upto south east of
Pambam island, pass through a channel to be dredged maximum up to
-12 mCD in the Adam’s Bridge within the international boundary and proceed
parallel to the International Medial Line in the Palk Bay, further pass through a
channel to be dredged to -12 mCD in the Palk Strait and adjoining parts of Palk
Bay (as in the case of Adam’s Bridge) and terminate in the Bay of Bengal.
• Out of the above, the channel has mainly two legs to be dredged viz.,
- Adam’s Bridge Section and - Palk Strait Section
Dredging in Adam’s Bridge Section and its Disposal
The minimum depth of water in the Adam’s Bridge section is about +0.20 mCD.
The bed material based on the shallow seismic survey has been identified consisting of a
top layer of thickness of about 0.30 m comprising of soft sediments. The layer below this
varying in thickness from 0.50 to 1.50 m consists of very dense sand followed by another
layer of 1 to 2.5 m thickness also consisting of very high density sands. This is followed
by a further layer of thickness varying from 0.50 to 2 m consisting of low density loose
sand. Three bore holes have also been taken in this area which confirm only sand and no
hard coral material is envisaged. However, ‘N’ value of these sandy layers are not
available. In the absence of data, it is assumed that soil is dredgeable by a normal cutter
suction dredger. (Bore whole data is presented in Annexure 5.1)
As there is no sufficient depth for a Trailer Suction Hopper Dredger (TSHD) to
navigate in this area, the initial dredging upto a depth of about 7 to 8 m will have to be
carried out by a Cutter Suction Dredger (CSD). The Environmental Impact Assessment
Study carried out has suggested that the top material of 2 m thickness can be disposed
off in the degraded land in Pamban Island which is a long stretch between
Kodandaramasamy Temple and Dhanushkody. However, the full depth upto a level of 7
to 8 m will have to be dredged by a CSD as TSHD requires its own draft for floatation and
this material can be used for reclamation. Reclamation bunds with necessary overflow
weirs may have to be provided to contain the dredged material. The type of bunds and its
construction maerial can be detailed in Detailed Project Report (DPR). The distance to
the disposal area is about 7 to 8 km and is beyond the reach of normal cutter suction
dredgers. Hence, the dredged material can be disposed off in the final reclamation areas
by the use of booster stations. In the alternative, the material dredged by the CSD can be
5.1-65
discharged into hopper barges and the hopper barges can be taken to a barge handling
system where the material in the hopper barge can be emptied and pumped to the
disposal areas.
The EIA study has also suggested that the balance dredged material upto the
design depth in the Adam’s Bridge area to be disposed off in depths of 25 to 40 m in Gulf
of Mannar area which is available at a distance of 25 to 30 km away from Adam’s Bridge.
Dredging in the Palk Strait Section and its Disposal
The existing depths available in this leg of the channel is 8.1 to 10 m and can be
dredged by a TSHD. No bore hole logs in this area are available. However, the sub-
bottom profile survey carried by NHO has indicated that the sea bed of the complete area
comprises of sand and mud with few broken shells. They have also stated that the Capital
Dredging would not be a difficult proposition though the sub-bottom profiler indicates that
there are some hard strata under the soft sediments. As in the case of Adam’s Bridge ‘N’
values of the material to be dredged is not available. Bore hole data available from C.V.
Venkteswaran’s report (Chart No. 5.1) shows that in Palk Strait area it is mostly sand and
clay upto 12 m depth however this needs to be reconfirmed. Pending confirmed soil data
it is presumed that this material can be dredged by a TSHD. Here also, the Environmental
Impact Assessment study has suggested that the dredged material should be disposed
off in the Bay of Bengal, where depth of more than 25-40 m is available. In the alternative
also, they have suggested that depending upon the quality of the dredged material, land
disposal in the proximity of the dredging area can also be considered. Taking into account
the quantity to be dredged particularly for 12 m depth, the sea disposal is a better
preferred option. Dumping in Palk Bay as envisaged in earlier study report (1968) is not
recommended in EIA study. It is observed from data available of Venkateshwarn’s report
that current direction in Palk Strait is mostly parallel to channel i.e. NE and SW (Chart No. 5.2) and dumping in Palk Bay will result in siltation in Palk Bay area and may hamper
the channel itselt. In the event of hard strata comprising rock is encountered, the
dimension of dredging costs will drastically change as blasting might be required.
Radio Active Tracer Studies
It is very necessary to carry out a Radio Active Tracer Study to optimize the
dredge disposal areas as 80% of the cost of the project is on dredging and disposal of
dredged spoil. These studies will required to be done at minimum 25 m depth in Bay of
Bengal.
Sub-Soil Investigations
5.1-66
The investigation of soil and sub-soil straita in Adam’s bridge area is based as
sub-bottom seismic survey and three borings carried out by NSDRC, Vishakhapatnam.
In Palk Strait area, National Hydrographic office Dehradun has collected bathymetry data
and also carried out sub-bottom seismic survey. The data in Palk Bay carried out
recently through drilling (bore hole) is not available. However bore hole data and sub-
bottom profile upto 40 feet (12 m) in Venkateshwarn’s report of 1968 indicate that it will
be mostly sand and clay upto 12m. NHO has also indicated that presence of sand and
clay in sub-bottom profile bulky data but possibility of hard strata is also indicated. In
view of this it is essential that detailed sub-soil investigation must be carried out and the
soils are classified as per “Classification of Soils and Rocks to be dredged – Report of
Working Group of the PTC-II – Supplement to Bulletin No. 47 (1984) so as to avoid any
contractual complications at a later date. Any short cut will be a disaster for the project. It
is also necessary that reference is made to ‘BS 6349 British Standard Code of Practice
for Marine Structures – Part 5 (1991) Code of Practice for Dredging and Land
Reclamation’, as there is no Indian Standard for Dredging and Reclamation Works.
5.1.2 Rate Analysis for Dredging
The dredging rates adopted for estimation in the 1983 and 1996 proposal
reports were based on the budgetary quotations obtained from the Dredging Corporation
of India (DCI). In view of short time available, the budgetary quotations could not be
obtained and an attempt has been made to work out the rates based on first principles.
However dredging rates are basically market driven and hence it is necessary to obtain
budgetary quotations to estimate the costs accurately. This will be done during DPR
stage. For the present, the rates derived from first principles is detailed below :
A. Capital Dredging
The dredging to be carried out in Adam’s Bridge is from the existing level which
varies from +0.2 mCD to -12 mCD. The Trailer Suction Hopper Dredger (TSHD) requires
her own draft for carrying out dredging, which is in the region of 7 to 8 m. However the
Cutter Suction Dredger (CSD) can create her own floatation. Hence for carrying out the
dredging in the Adam’s Bridge up to a depth of about 7 to 8 m. a Cutter Suction Dredger
will have to be deployed. The material dredged is proposed to be discharged into a
hopper barge. An unloading system will be installed near the reclamation area which will
empty the hopper barge and pump to the reclamation areas. In the alternative, a booster
pump can be incorporated in the system. A reclamation bund will have to constructed all
round the area proposed for reclamation so as to contain the material. However
discharge weirs will be provided for draining the excess water. The material not required
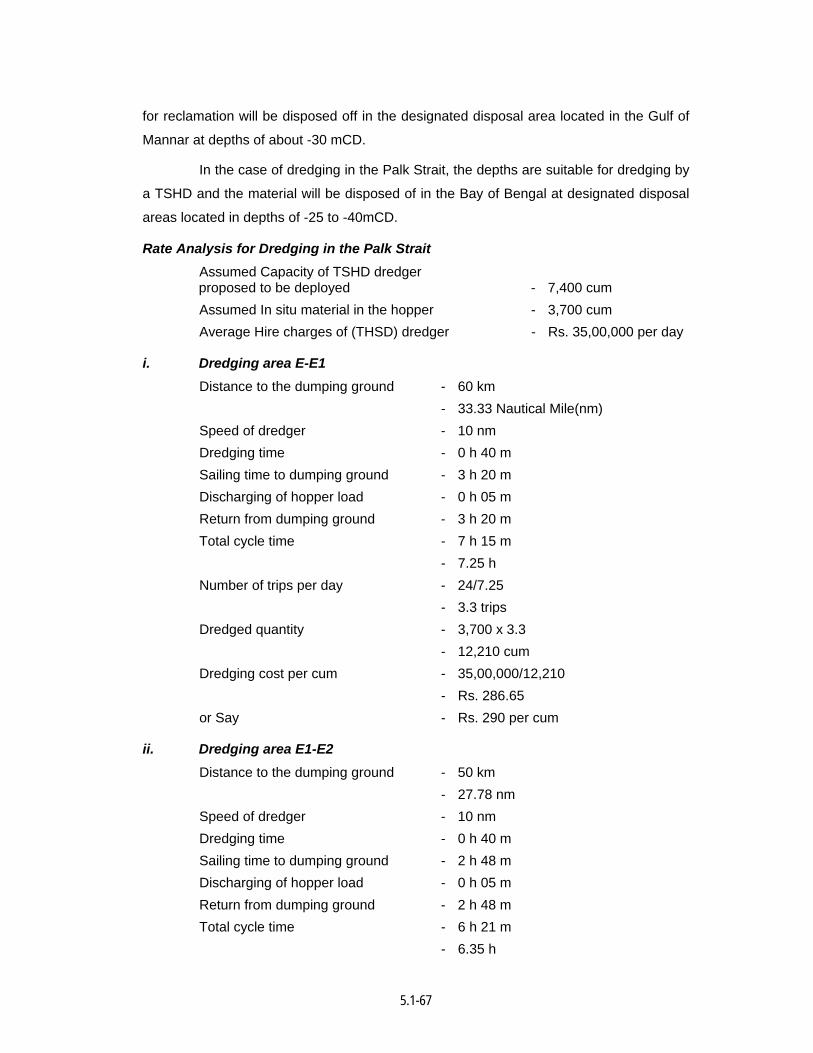
5.1-67
for reclamation will be disposed off in the designated disposal area located in the Gulf of
Mannar at depths of about -30 mCD.
In the case of dredging in the Palk Strait, the depths are suitable for dredging by
a TSHD and the material will be disposed of in the Bay of Bengal at designated disposal
areas located in depths of -25 to -40mCD.
Rate Analysis for Dredging in the Palk Strait Assumed Capacity of TSHD dredger
proposed to be deployed - 7,400 cum Assumed In situ material in the hopper - 3,700 cum Average Hire charges of (THSD) dredger - Rs. 35,00,000 per day
i. Dredging area E-E1 Distance to the dumping ground - 60 km - 33.33 Nautical Mile(nm) Speed of dredger - 10 nm Dredging time - 0 h 40 m Sailing time to dumping ground - 3 h 20 m Discharging of hopper load - 0 h 05 m Return from dumping ground - 3 h 20 m Total cycle time - 7 h 15 m - 7.25 h Number of trips per day - 24/7.25 - 3.3 trips Dredged quantity - 3,700 x 3.3 - 12,210 cum Dredging cost per cum - 35,00,000/12,210 - Rs. 286.65 or Say - Rs. 290 per cum
ii. Dredging area E1-E2 Distance to the dumping ground - 50 km - 27.78 nm Speed of dredger - 10 nm Dredging time - 0 h 40 m Sailing time to dumping ground - 2 h 48 m Discharging of hopper load - 0 h 05 m Return from dumping ground - 2 h 48 m Total cycle time - 6 h 21 m - 6.35 h
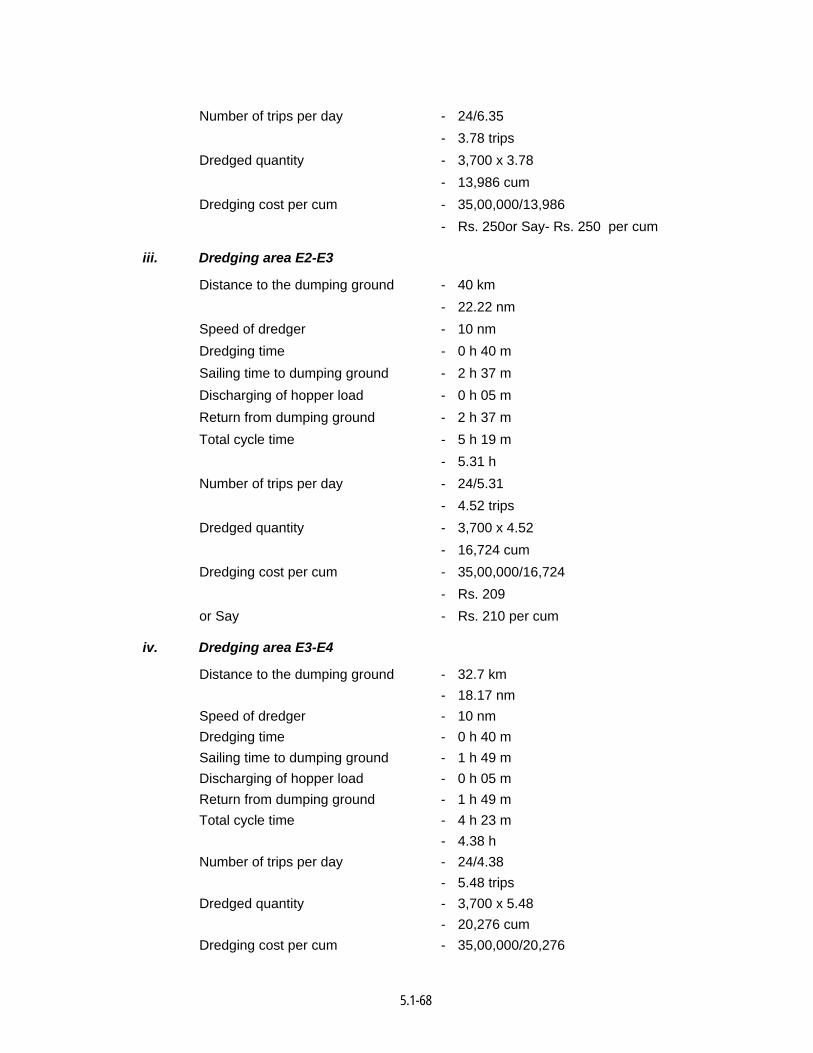
5.1-68
Number of trips per day - 24/6.35 - 3.78 trips Dredged quantity - 3,700 x 3.78 - 13,986 cum Dredging cost per cum - 35,00,000/13,986 - Rs. 250or Say- Rs. 250 per cum
iii. Dredging area E2-E3
Distance to the dumping ground - 40 km - 22.22 nm Speed of dredger - 10 nm Dredging time - 0 h 40 m Sailing time to dumping ground - 2 h 37 m Discharging of hopper load - 0 h 05 m Return from dumping ground - 2 h 37 m Total cycle time - 5 h 19 m - 5.31 h Number of trips per day - 24/5.31 - 4.52 trips Dredged quantity - 3,700 x 4.52 - 16,724 cum Dredging cost per cum - 35,00,000/16,724 - Rs. 209 or Say - Rs. 210 per cum
iv. Dredging area E3-E4
Distance to the dumping ground - 32.7 km - 18.17 nm Speed of dredger - 10 nm Dredging time - 0 h 40 m Sailing time to dumping ground - 1 h 49 m Discharging of hopper load - 0 h 05 m Return from dumping ground - 1 h 49 m Total cycle time - 4 h 23 m - 4.38 h Number of trips per day - 24/4.38 - 5.48 trips Dredged quantity - 3,700 x 5.48 - 20,276 cum Dredging cost per cum - 35,00,000/20,276
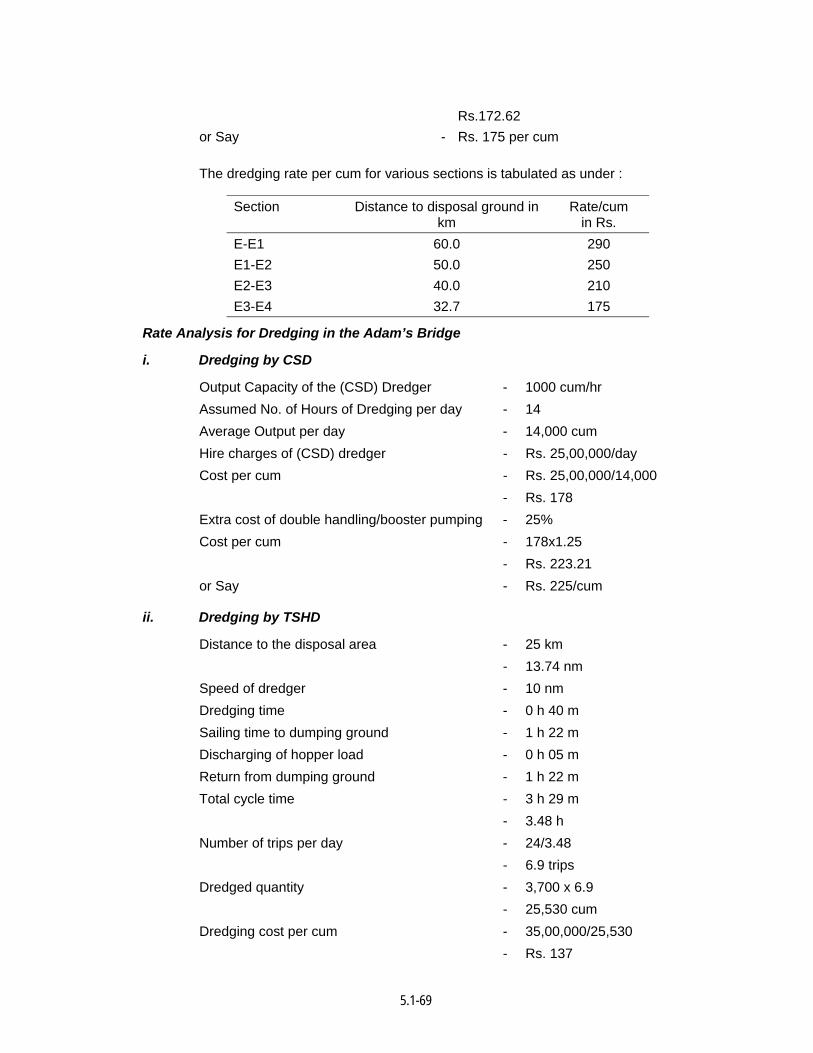
5.1-69
Rs.172.62 or Say - Rs. 175 per cum
The dredging rate per cum for various sections is tabulated as under :
Section Distance to disposal ground in km
Rate/cum in Rs.
E-E1 60.0 290 E1-E2 50.0 250 E2-E3 40.0 210 E3-E4 32.7 175
Rate Analysis for Dredging in the Adam’s Bridge
i. Dredging by CSD
Output Capacity of the (CSD) Dredger - 1000 cum/hr Assumed No. of Hours of Dredging per day - 14 Average Output per day - 14,000 cum Hire charges of (CSD) dredger - Rs. 25,00,000/day Cost per cum - Rs. 25,00,000/14,000 - Rs. 178 Extra cost of double handling/booster pumping - 25% Cost per cum - 178x1.25 - Rs. 223.21 or Say - Rs. 225/cum
ii. Dredging by TSHD
Distance to the disposal area - 25 km - 13.74 nm Speed of dredger - 10 nm Dredging time - 0 h 40 m Sailing time to dumping ground - 1 h 22 m Discharging of hopper load - 0 h 05 m Return from dumping ground - 1 h 22 m Total cycle time - 3 h 29 m - 3.48 h Number of trips per day - 24/3.48 - 6.9 trips Dredged quantity - 3,700 x 6.9 - 25,530 cum Dredging cost per cum - 35,00,000/25,530 - Rs. 137
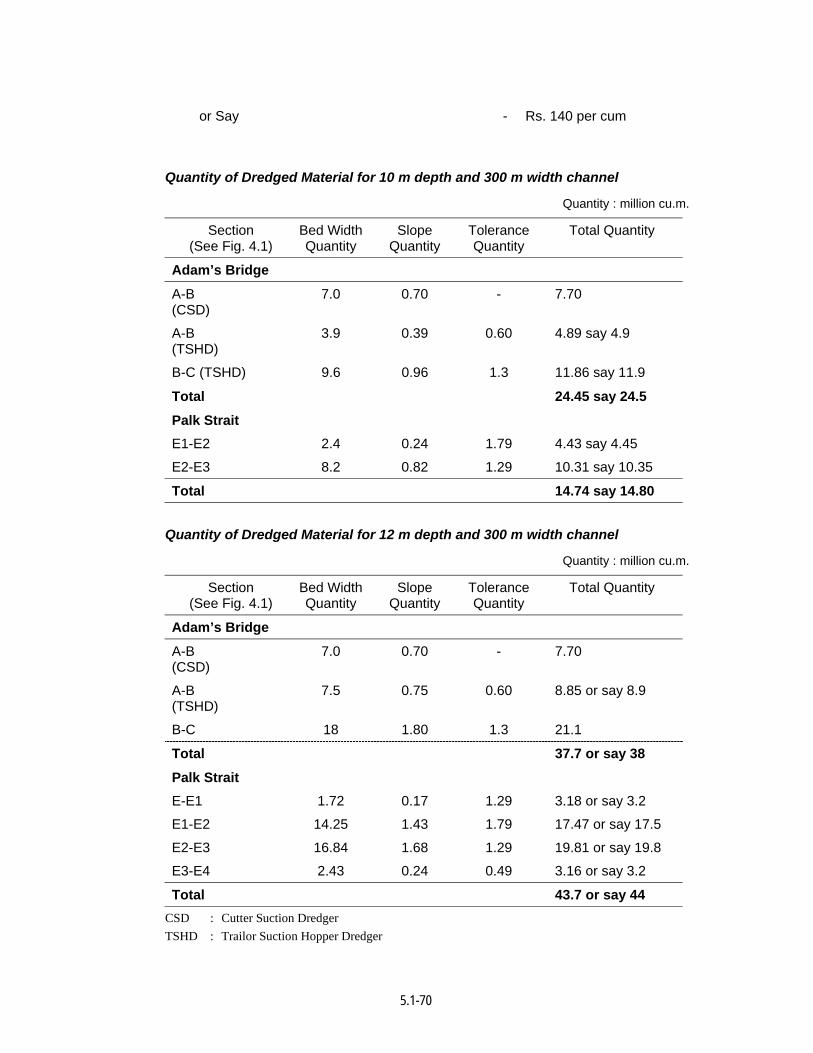
5.1-70
or Say - Rs. 140 per cum
Quantity of Dredged Material for 10 m depth and 300 m width channel
Quantity : million cu.m.
Section (See Fig. 4.1)
Bed Width Quantity
Slope Quantity
Tolerance Quantity
Total Quantity
Adam’s Bridge
A-B (CSD)
7.0 0.70 - 7.70
A-B (TSHD)
3.9 0.39 0.60 4.89 say 4.9
B-C (TSHD) 9.6 0.96 1.3 11.86 say 11.9
Total 24.45 say 24.5
Palk Strait
E1-E2 2.4 0.24 1.79 4.43 say 4.45
E2-E3 8.2 0.82 1.29 10.31 say 10.35
Total 14.74 say 14.80
Quantity of Dredged Material for 12 m depth and 300 m width channel
Quantity : million cu.m.
Section (See Fig. 4.1)
Bed Width Quantity
Slope Quantity
Tolerance Quantity
Total Quantity
Adam’s Bridge
A-B (CSD)
7.0 0.70 - 7.70
A-B (TSHD)
7.5 0.75 0.60 8.85 or say 8.9
B-C 18 1.80 1.3 21.1
Total 37.7 or say 38
Palk Strait
E-E1 1.72 0.17 1.29 3.18 or say 3.2
E1-E2 14.25 1.43 1.79 17.47 or say 17.5
E2-E3 16.84 1.68 1.29 19.81 or say 19.8
E3-E4 2.43 0.24 0.49 3.16 or say 3.2
Total 43.7 or say 44 CSD : Cutter Suction Dredger TSHD : Trailor Suction Hopper Dredger
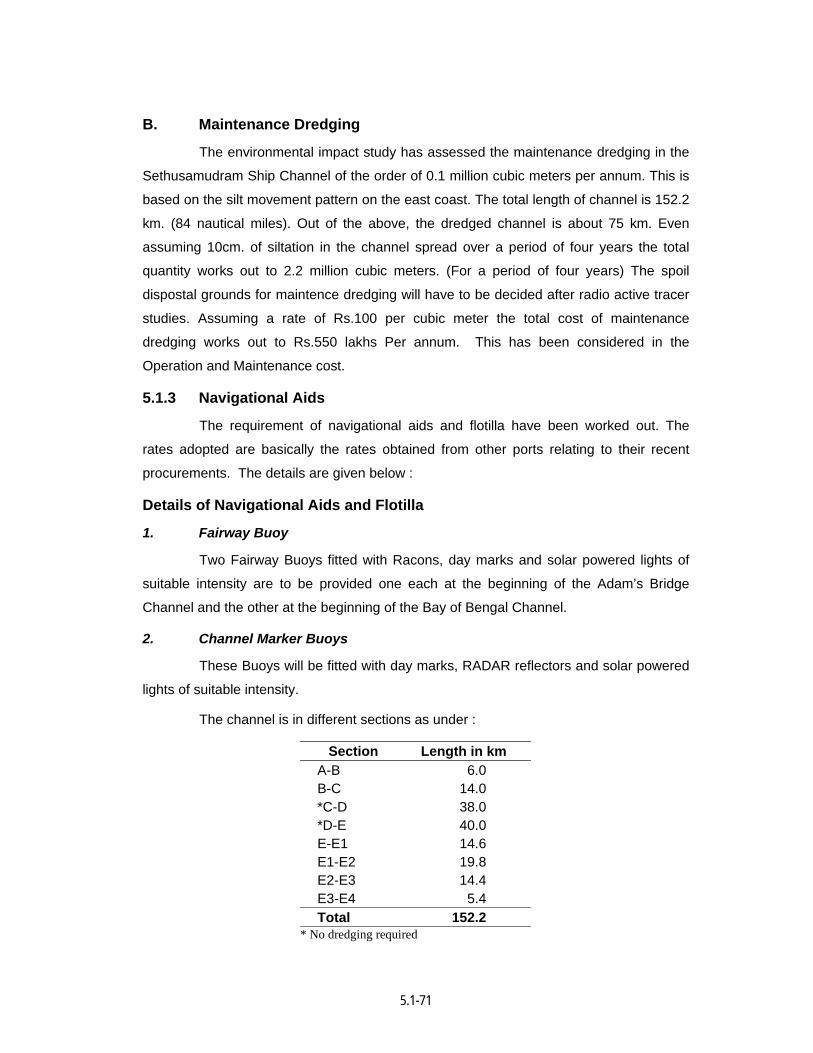
5.1-71
B. Maintenance Dredging
The environmental impact study has assessed the maintenance dredging in the
Sethusamudram Ship Channel of the order of 0.1 million cubic meters per annum. This is
based on the silt movement pattern on the east coast. The total length of channel is 152.2
km. (84 nautical miles). Out of the above, the dredged channel is about 75 km. Even
assuming 10cm. of siltation in the channel spread over a period of four years the total
quantity works out to 2.2 million cubic meters. (For a period of four years) The spoil
dispostal grounds for maintence dredging will have to be decided after radio active tracer
studies. Assuming a rate of Rs.100 per cubic meter the total cost of maintenance
dredging works out to Rs.550 lakhs Per annum. This has been considered in the
Operation and Maintenance cost.
5.1.3 Navigational Aids
The requirement of navigational aids and flotilla have been worked out. The
rates adopted are basically the rates obtained from other ports relating to their recent
procurements. The details are given below :
Details of Navigational Aids and Flotilla 1. Fairway Buoy
Two Fairway Buoys fitted with Racons, day marks and solar powered lights of
suitable intensity are to be provided one each at the beginning of the Adam’s Bridge
Channel and the other at the beginning of the Bay of Bengal Channel.
2. Channel Marker Buoys
These Buoys will be fitted with day marks, RADAR reflectors and solar powered
lights of suitable intensity.
The channel is in different sections as under :
Section Length in km A-B 6.0 B-C 14.0 *C-D 38.0 *D-E 40.0 E-E1 14.6 E1-E2 19.8 E2-E3 14.4 E3-E4 5.4 Total 152.2
* No dredging required
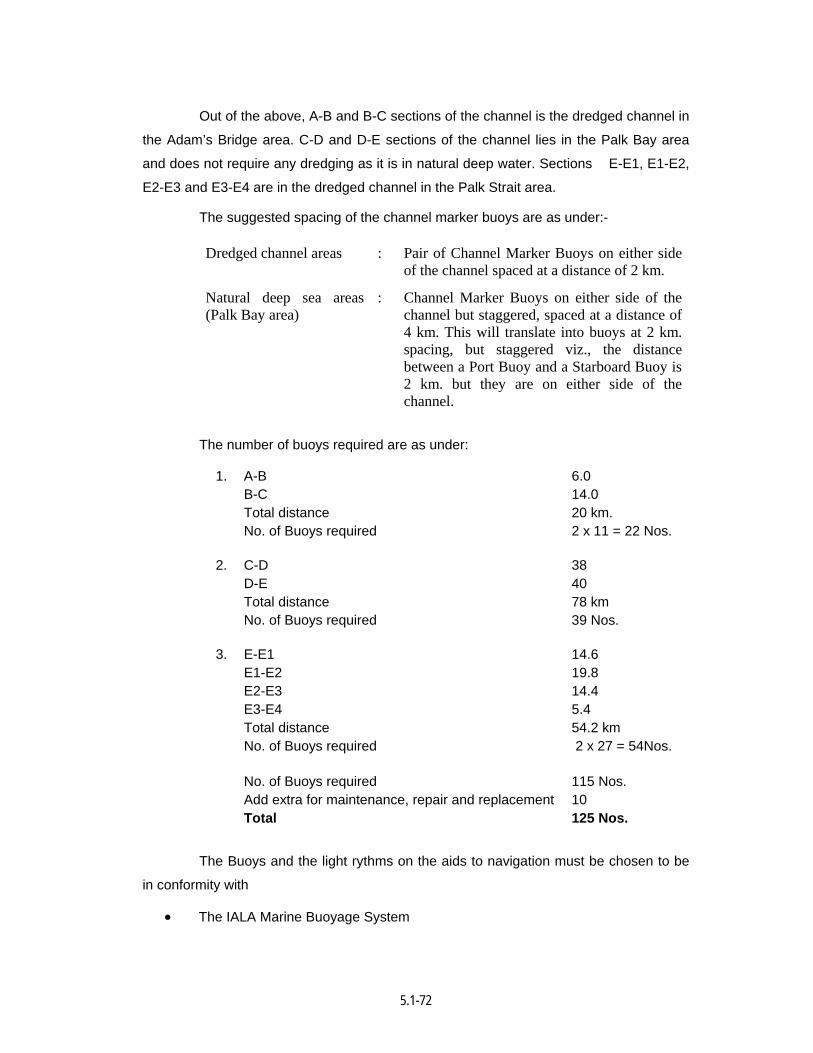
5.1-72
Out of the above, A-B and B-C sections of the channel is the dredged channel in
the Adam’s Bridge area. C-D and D-E sections of the channel lies in the Palk Bay area
and does not require any dredging as it is in natural deep water. Sections E-E1, E1-E2,
E2-E3 and E3-E4 are in the dredged channel in the Palk Strait area.
The suggested spacing of the channel marker buoys are as under:-
Dredged channel areas : Pair of Channel Marker Buoys on either side of the channel spaced at a distance of 2 km.
Natural deep sea areas (Palk Bay area)
: Channel Marker Buoys on either side of the channel but staggered, spaced at a distance of 4 km. This will translate into buoys at 2 km. spacing, but staggered viz., the distance between a Port Buoy and a Starboard Buoy is 2 km. but they are on either side of the channel.
The number of buoys required are as under:
1. A-B 6.0 B-C 14.0 Total distance 20 km. No. of Buoys required 2 x 11 = 22 Nos.
2. C-D 38 D-E 40 Total distance 78 km No. of Buoys required 39 Nos.
3. E-E1 14.6 E1-E2 19.8 E2-E3 14.4 E3-E4 5.4 Total distance 54.2 km No. of Buoys required 2 x 27 = 54Nos.
No. of Buoys required 115 Nos. Add extra for maintenance, repair and replacement 10 Total 125 Nos.
The Buoys and the light rythms on the aids to navigation must be chosen to be
in conformity with
• The IALA Marine Buoyage System
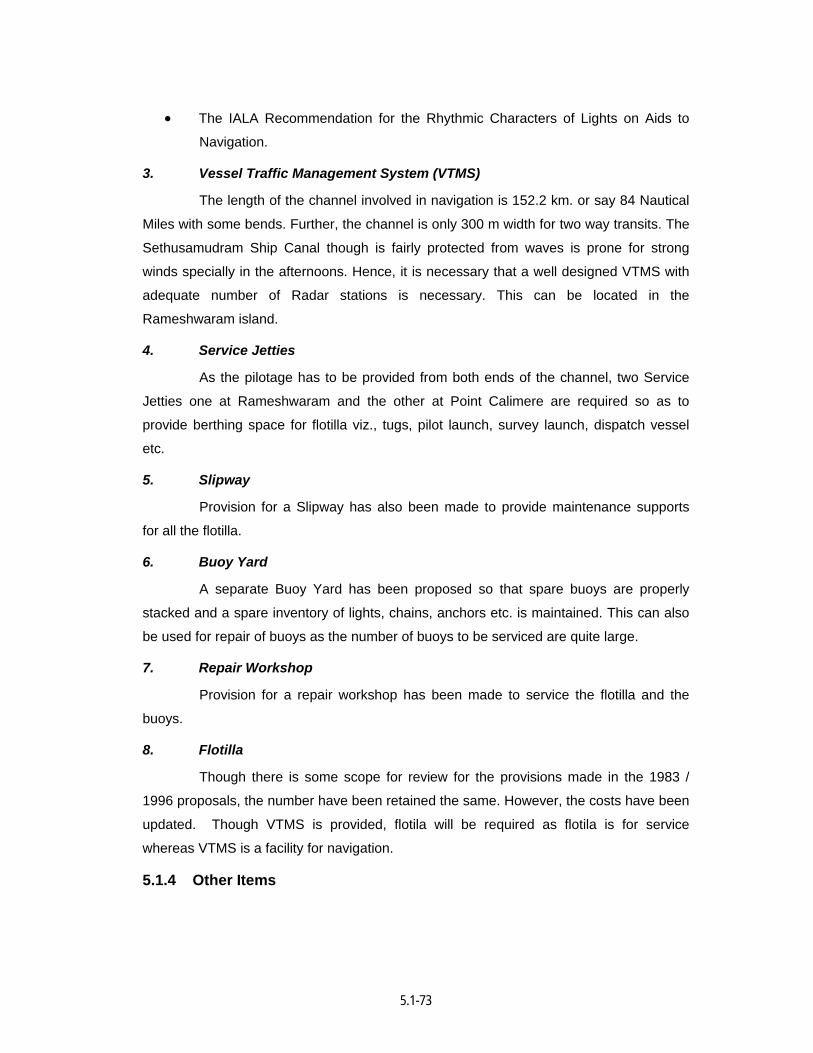
5.1-73
• The IALA Recommendation for the Rhythmic Characters of Lights on Aids to
Navigation.
3. Vessel Traffic Management System (VTMS)
The length of the channel involved in navigation is 152.2 km. or say 84 Nautical
Miles with some bends. Further, the channel is only 300 m width for two way transits. The
Sethusamudram Ship Canal though is fairly protected from waves is prone for strong
winds specially in the afternoons. Hence, it is necessary that a well designed VTMS with
adequate number of Radar stations is necessary. This can be located in the
Rameshwaram island.
4. Service Jetties
As the pilotage has to be provided from both ends of the channel, two Service
Jetties one at Rameshwaram and the other at Point Calimere are required so as to
provide berthing space for flotilla viz., tugs, pilot launch, survey launch, dispatch vessel
etc.
5. Slipway
Provision for a Slipway has also been made to provide maintenance supports
for all the flotilla.
6. Buoy Yard
A separate Buoy Yard has been proposed so that spare buoys are properly
stacked and a spare inventory of lights, chains, anchors etc. is maintained. This can also
be used for repair of buoys as the number of buoys to be serviced are quite large.
7. Repair Workshop
Provision for a repair workshop has been made to service the flotilla and the
buoys.
8. Flotilla
Though there is some scope for review for the provisions made in the 1983 /
1996 proposals, the number have been retained the same. However, the costs have been
updated. Though VTMS is provided, flotila will be required as flotila is for service
whereas VTMS is a facility for navigation.
5.1.4 Other Items
5.1-74
The provisions of other items is retained as per the 1983 and 1996 proposals.
However, the cost of floating craft, building etc. are based on cost of similar items
provided / prevalent in other ports.
5.2 Capital Cost The capital cost of construction of Sethusamudram Ship Channel Project
amounts to Rs. 1050 crores for 10 m depth and Rs. 2000 crores for 12 m depth channel.
The capital costs worked for 10 m and 12 m depth are given in Tables 5.1 and 5.2 respectively.
5.3 Phasing of Capital Expenditure From the data on traffic potential provided by Shipping Corporation of India it is
obvious that minimum draught requirement will be 10.7 m (12 m depth) for improving
traffic and trade therefore further analysis has been carried out for option of 12.0 m depth.
The project will be implemented in four years and the phasing of the expenditure would
as under :
1st Year Rs. 300 Crores
2nd Year Rs. 600 Crores
3rd Year Rs. 600 Crores
4th Year Rs. 500 Crores
Total Rs. 2000 Crores
The phasing of cost is based on initial slow activity in first year reaching the
peak in 2nd and 3rd year followed by tapering in fourth year.
5.4 Source of Funds The Government of India has now privatized many of the port facilities on BOT
basis. The Sethusamudram Ship Channel Project also can be privatized on BOT basis for
a period of 30 years. At the end of the 30 years the channel will be handed over back to
the Government. Outsourcing for funding can be done for Flotilla (Rs. 8870 lakhs),
Service Jetties (Rs. 1500 lakhs) Sllipways (Rs. 200 lakhs), Buoy Yard (Rs. 100 lakh) and
Repair Workshop (Rs. 200 lakhs). If expenditure for staff and Administrative Building
(Rs. 2000 lakhs) building also can be out sourced, the total capital expenditure will reduce
by approximately Rs. 128.70 crores.
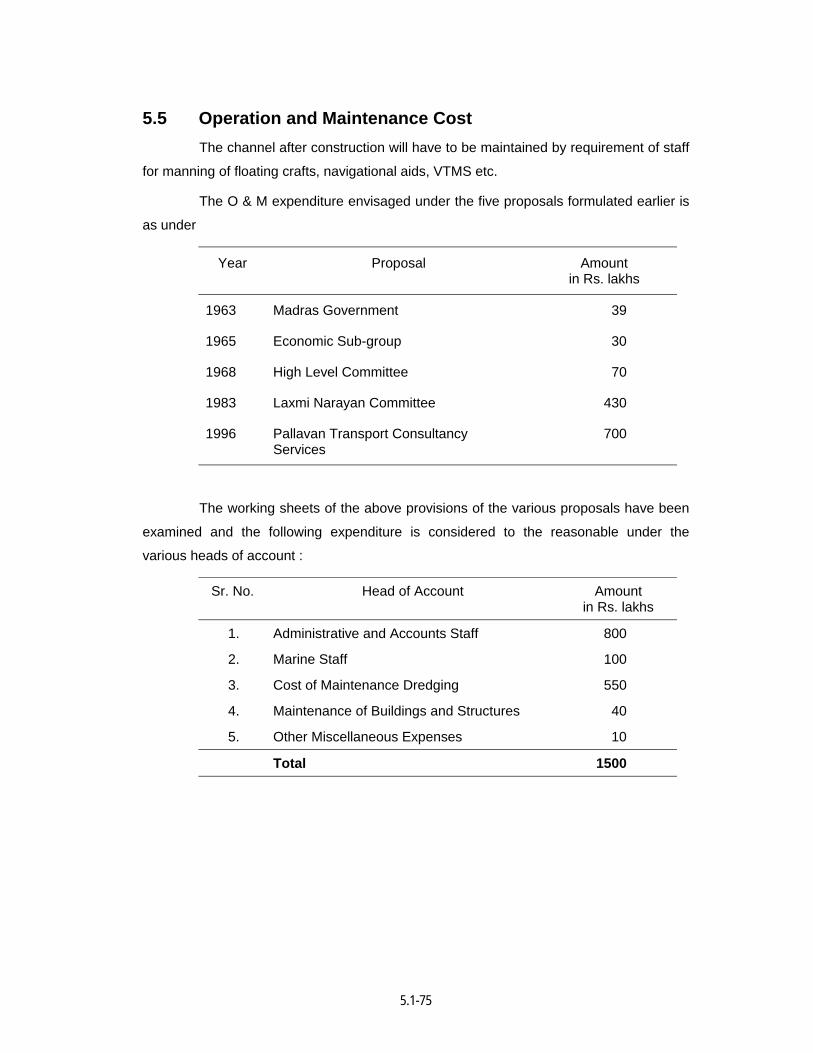
5.1-75
5.5 Operation and Maintenance Cost The channel after construction will have to be maintained by requirement of staff
for manning of floating crafts, navigational aids, VTMS etc.
The O & M expenditure envisaged under the five proposals formulated earlier is
as under
Year Proposal Amount in Rs. lakhs
1963 Madras Government 39
1965 Economic Sub-group 30
1968 High Level Committee 70
1983 Laxmi Narayan Committee 430
1996 Pallavan Transport Consultancy Services
700
The working sheets of the above provisions of the various proposals have been
examined and the following expenditure is considered to the reasonable under the
various heads of account :
Sr. No. Head of Account Amount in Rs. lakhs
1. Administrative and Accounts Staff 800
2. Marine Staff 100
3. Cost of Maintenance Dredging 550
4. Maintenance of Buildings and Structures 40
5. Other Miscellaneous Expenses 10
Total 1500
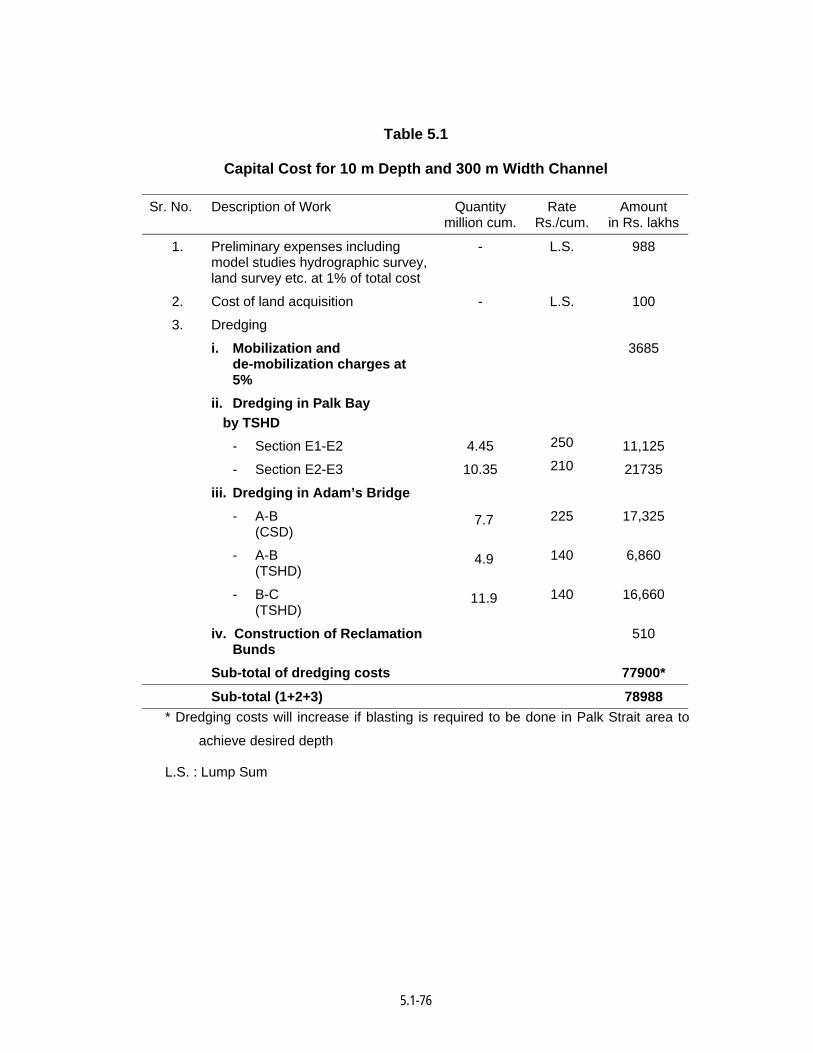
5.1-76
Table 5.1
Capital Cost for 10 m Depth and 300 m Width Channel
Sr. No. Description of Work Quantity
million cum. Rate
Rs./cum. Amount
in Rs. lakhs
1. Preliminary expenses including model studies hydrographic survey, land survey etc. at 1% of total cost
- L.S. 988
2. Cost of land acquisition - L.S. 100
3. Dredging
i. Mobilization and de-mobilization charges at 5%
3685
ii. Dredging in Palk Bay by TSHD
- Section E1-E2 4.45 250 11,125
- Section E2-E3 10.35 210 21735
iii. Dredging in Adam’s Bridge - A-B
(CSD) 7.7 225 17,325
- A-B (TSHD)
4.9 140 6,860
- B-C (TSHD)
11.9 140 16,660
iv. Construction of Reclamation Bunds
510
Sub-total of dredging costs 77900*
Sub-total (1+2+3) 78988 * Dredging costs will increase if blasting is required to be done in Palk Strait area to
achieve desired depth
L.S. : Lump Sum

5.1-77
Table 5.1 Contd…
Sr. No. Description of Work Quantity (Nos.)
Rate/Unit in Rs.
Amount in Rs. lakhs
4. Navigational Aids
i. Fairway buoy 2 15 lakhs 30
ii. Channel marker buoys 115 10 lakhs 1150
iii. Racons 2 10 lakhs 20
iv. Vessel Traffic Management System
1 L.S. 1000
5. Flotilla
i. Harbour Tugs - 30 t bollard pull 4
2000 lakhs
8000
ii. Pilot Launches – 30 m 3 100 lakhs 300
iii. Mooring Launches – 10 m 3 40 lakhs 120
iv. Survey cum lighting launch - 30 m
1 150 lakhs 150
v. Dispatch vessels with buoy laying arrangement
1 300 lakhs 300
6. Service Jetties 2 750 lakhs 1500
7. Slipway 1 L.S. 200
8. Buoy Yard - L.S. 100
9. Repair Workshop - L.S. 200
10. Staff and Administrative Building - L.S. 2000
11. Electricity - L.S. 500
12. Water Supply - L.S. 200
Sub-total 94758 13. Consultancy - L.S. 5,000
14. Contingency and Supervision at 5 %
- L.S. 5242
Total 105,000*
* Upward revision in total cost is envisaged if there is change in dredging costs L.S. : Lump Sum

5.1-78
Table 5.2
Capital Cost for 12 m depth and 300 m Width Channel
Sr. No. Description of Work Quantity million cum.
Rate Rs./cum.
Amount in Rs. lakhs
1. Preliminary expenses including model studies hydrographic survey, land survey etc. at 1% of total cost
- L.S. 1,839
2. Cost of land acquisition - L.S. 100
3. Dredging
i. Mobilization and de-mobilization charges at 5%
7,976
ii. Dredging in Palk Bay by TSHD
- Section E-E1 3.2 290 9,280
- Section E1-E2 17.5 250 43,750
- Section E2-E3 19.8 210 41,580
- Section E3-E4 3.2 175 5,600
iii. Dredging in Adam’s Bridge - A-B
(CSD) 7.7
225 17,325
- A-B (TSHD)
8.9
140 12,460
- B-C (TSHD)
21.1
140 29,540
iv. Construction of Reclamation Bunds
489
Sub-total of dredging costs 168000*
Sub-total (1+2+3) 169939 * Dredging costs will increase if blasting is required to be done in Palk Strait area to
achieve desired depth
L.S. : Lump Sum
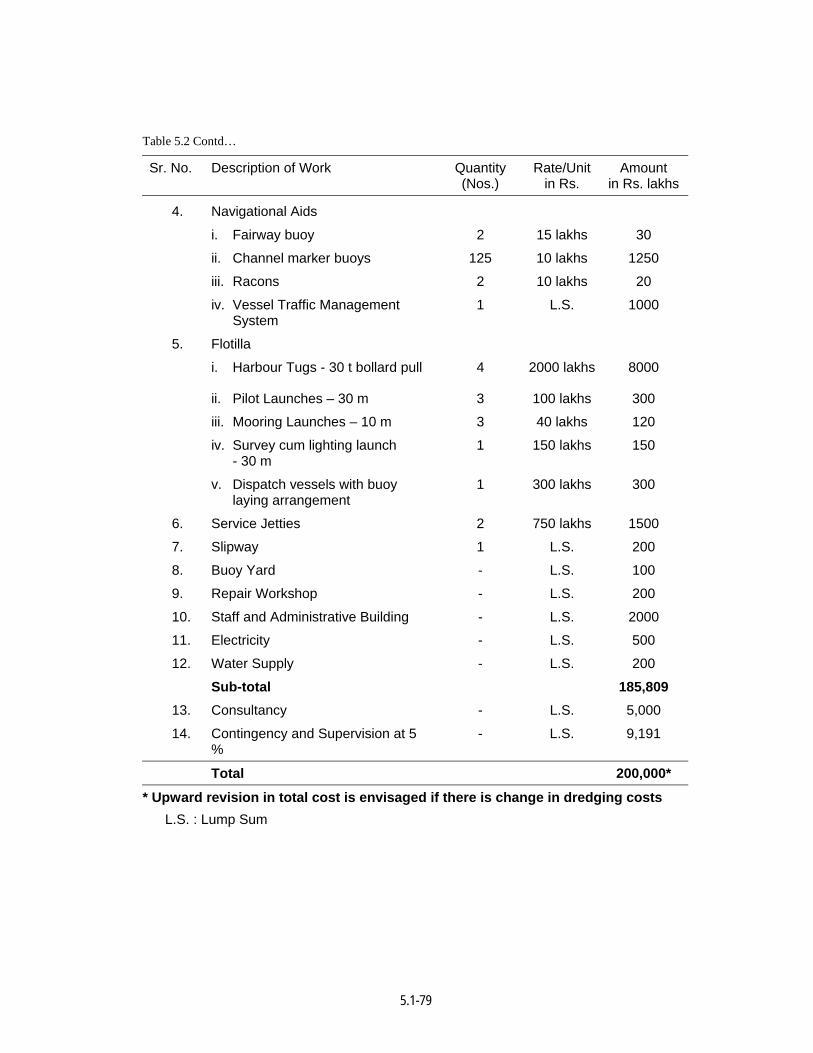
5.1-79
Table 5.2 Contd…
Sr. No. Description of Work Quantity (Nos.)
Rate/Unit in Rs.
Amount in Rs. lakhs
4. Navigational Aids
i. Fairway buoy 2 15 lakhs 30
ii. Channel marker buoys 125 10 lakhs 1250
iii. Racons 2 10 lakhs 20
iv. Vessel Traffic Management System
1 L.S. 1000
5. Flotilla
i. Harbour Tugs - 30 t bollard pull 4 2000 lakhs 8000
ii. Pilot Launches – 30 m 3 100 lakhs 300
iii. Mooring Launches – 10 m 3 40 lakhs 120
iv. Survey cum lighting launch - 30 m
1 150 lakhs 150
v. Dispatch vessels with buoy laying arrangement
1 300 lakhs 300
6. Service Jetties 2 750 lakhs 1500
7. Slipway 1 L.S. 200
8. Buoy Yard - L.S. 100
9. Repair Workshop - L.S. 200
10. Staff and Administrative Building - L.S. 2000
11. Electricity - L.S. 500
12. Water Supply - L.S. 200
Sub-total 185,809 13. Consultancy - L.S. 5,000
14. Contingency and Supervision at 5 %
- L.S. 9,191
Total 200,000*
* Upward revision in total cost is envisaged if there is change in dredging costs L.S. : Lump Sum
5.1-80
6. Cost Benefits
6.1 General The appraisal of the Sethusamudram Ship Channel Project requires the
evaluation of the streams of cost and benefits extending into the future. Measuring of the
benefits of such a major investment present certain conceptual and practical problems.
This arises because, the benefits are not circumscribed within the channel authority but
are passed on various other sectors and public interest.
6.2 Benefits from Sethusamudram Ship Channel Movement of Goods
The cost of movement of goods by sea is still cheaper than by road or by rail.
The cost for moving one tonne of coal by rail is about 54 paise as against 13 paise by
sea. The movement by sea-route costs only 25% of the rail-movement cost. Large
quantities of cargoes like fish, cement, salt and bye – products like caustic soda and
fertilizers are now moving from Tuticorin area by rail. This is because the movement by
ship involves longer haulage by over 400 miles around Sri Lanka and consequent higher
cost. With the availability of Sethusamudram Channel the movements would by made by
sea route. Similarly the marine products which are abundant in the Palk Bay and Gulf of
Mannar and Bay of Bengal are now being transported by lorries to Kochi and Chennai
Ports for export. If the channel were there, these could have been directly loaded and
dispatched from minor ports likely to be developed at Rameshwaram.
This channel system will also establish national waterway within the territorial
waters, reduce shipping distances, voyage-time, reduce operating costs and pave way for
the regional economic development. The benefits likely to come from the channel can be
classified as direct and indirect which are dealt below.
5.1-81
6.2.1 Direct Benefits
These are (a) benefits to the channel authority and (b) benefits to the Shipping
companies. The channel will give sheltered water route from the western ports to the
eastern ports touching Tuticorin Port and/or Chennai Port on the way and reduction in
distances and voyage – time and operating costs. The average time saved per voyage is
25 hours (average 300 nm saving with 12 knot speed). Average amount saved per
voyage is Rs. 5.36 lakhs (2003).
6.2.2 Indirect Benefits
The channel would save 25 hours of voyage and the amount saved per voyage
due to lower consumption of crude and diesel oil at the current rates would be Rs. 5.36
lakhs. Total savings which would work out to Rs. 107.48 crores for 12 m depth (2003)
and savings per NRT will be Rs. 70.25. Today the country is importing crude oil and
spending more than Rs. 18000 crores every year and the savings on account of the canal
would be a sizable savings in foreign exchange.
Ships transporting coal between Tuticorin and Haldia take 4 days to make one
trip. The channel will save 25 hours or 20% of the voyage time and at this rate ships may
make 20% more trips, turning around one extra trip in every four months and save price
of one voyage in every 2 months saving substantial amount on charges of chartering. In
a similar manner all coastal ships plying between East and West coasts can save
considerable indirect charges on the extra turn-arounds. By generating this free-coastal-
passage the Indian Peninsula can have free length of about 3550 nautical miles inside
Indian territorial waters.
The channel will be a great asset from National defence and security point of
view, enabling easier and quicker access. The channel will facilitate the free movement
of ships of coast guards and check the flow of illicit transport of commodities between
India and Sri Lanka.
The benefit of shorter distances and cheaper rates of sea transport will definitely
divert the present movements of fish and salt to Kolkata and Assam from rail to sea route
and contribute to the overall economy of the nation.
Benefit of shorter distance will definitely encourage small enterpreneurs to
launch upon new ventures of coastal sea – traffic between Eastern and Western ports of
India by purchasing vessels of smaller capacity upto 20000 DWT and promote marine
trade as envisaged under the on-going liberalization of trade and commerce.
5.1-82
There are rich resources of fish and shrimps in Palk Bay, Gulf of Manner and
Indian Ocean and at present the catches are being sent by means of refrigerated lorries
to Kochi and Chennai for onward export to Japan and United States. Instead of this, the
fishing – harbour at Rameswaram can be upgraded into a port where the catches can be
directly exported to Kolkata and foreign countries. This will promote maritime trade
among the residents of island and ameliorate their present backwardness and conditions
of distress of which Governments of State and Centre often invest special grants for
removal of such distresses. This will be an indirect benefit to national exchequer.
Due to spurt in movement of coastal traffic, bunkering facilities can develop at
Tuticorin and Rameswaram ad this is likely to boost the income to the nation.
The summary of benefits is given below :
Direct Benefits
The direct benefits are
• to the channel authority
• to the shipping company
• the channel will give sheltered water route from the western ports to the eastern
ports.
• Average time saved per voyage is 25 hours.
• Average amount saved per voyage is Rs. 5.36 lakhs (2003)
Indirect Benefits
Some of the Indirect benefits are:
• The channel would save about 25 hours of voyage and due to the lower
consumption of fuel, there will be considerable savings of foreign exchange.
• The ships transporting coal between Tuticorin and Haldia normally take 4 days
and the saving of 25 hours per voyage translates into 20% of the voyage time
and in turn can make 20% more trips.
• The channel will be of very great importance from national defense and security
point of view. The revenue from naval and coastal traffic will go up adding to
indirect benefit.

5.1-83
7. Economic Viability
7.1 Economic Evaluation An attempt has been made for the economic appraisal of Sethusamudram Ship
Channel Project taking into account the cost estimates and the cost benefits. This
appraisal takes into account the estimates for operating expenditure and income. The
inflow and outflow of cash have been taken into account in the shape of earnings from
channel dues and the maintenance and operational costs and loan repayments
respectively. These time streams of cash flows of costs and benefits have been evaluated
on consistent basis.
7.2 Methods of Evaluation The following methods are normally used for the economical evaluation of
Projects.
- Net Present Value (NPV) - Internal Rate of Return (IRR) - Benefit / Cost Ratio (B/C Ratio) - Average Rate of Return - Pay Back Period
The principal features and relative merits of each methods are as under
7.2.1 Net Present Value (NPV)
5.1-84
The NPV is the sum of all economic benefits discounted to a base year less all
economic costs discounted to the same time. The value is dependent upon the chosen
discount rate. The project is worthwhile if the NPV is positive.
5.1-85
7.2.2 Internal Rate of Return (IRR)
The IRR is the value of discount rate which would give an NPV of Zero. This is
compared with the chosen discount rate to see whether a project is feasible or not. A
project is worthwhile if the IRR exceeds the discount rates.
7.2.3 Benefit / Cost Ratio (B/C Ratio)
The B/C Ratio is the ratio of present value of benefits to present value of costs
both calculated using the discount rate. A value greater than 1, implies that the project is
worthwhile. This method is less commonly used than the first two.
7.2.4 Average Rate of Return
This is an accounting devise and is normally not appropriate for evaluation of
cost benefit analysis. It is normally calculated as the average annual benefit divided by
the fixed investment in the project. Since the time value of money is not considered, this
method is normally not adopted.
7.2.5 Pay Back Period
The pay back period is the length of time after commitment to a project until net
benefits exceed net costs. This method is normally used only for small scale investments.
7.2.6 Selection of the Method
Of the above, the NPV Method and IRR method which take into account the
time value of money, involve discounting. Both the methods are inter related and gives
similar answers with respect to the acceptance or rejection, of an investment proposal.
Selection of discount rate is important and crucial for the use of NPV method. Generally,
Government set the social discount rate to be adopted. In the absence of information on
social discount rate, it is preferably to adopt IRR Method and see whether the resultant
IRR exceeds the interest rate charges by the Government on the capital loans. Hence
the IRR method is used in the economic appraisal of the project.
7.3 Cost Estimates 7.3.1 Capital Costs
The Sethusamudram Ship Channel Project has to be implemented in four
years. The phasing of expenditure is as given a Table 7.1.
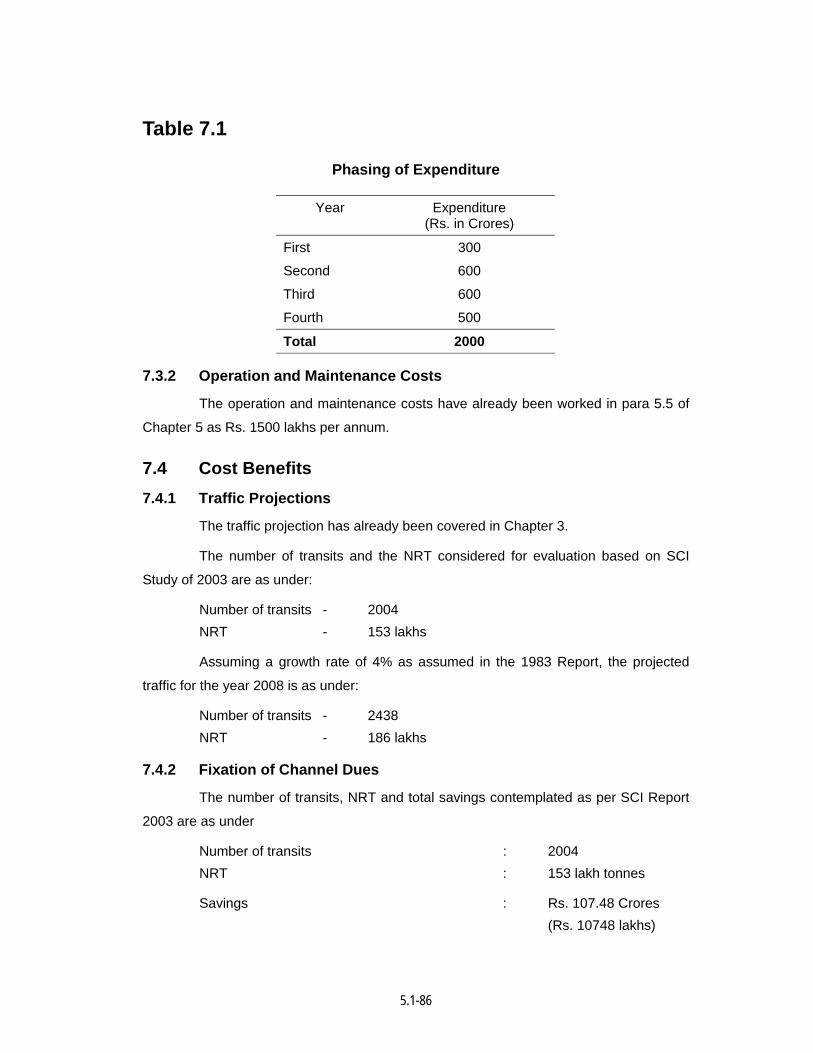
5.1-86
Table 7.1
Phasing of Expenditure
Year Expenditure (Rs. in Crores)
First 300
Second 600
Third 600
Fourth 500
Total 2000
7.3.2 Operation and Maintenance Costs
The operation and maintenance costs have already been worked in para 5.5 of
Chapter 5 as Rs. 1500 lakhs per annum.
7.4 Cost Benefits 7.4.1 Traffic Projections
The traffic projection has already been covered in Chapter 3.
The number of transits and the NRT considered for evaluation based on SCI
Study of 2003 are as under:
Number of transits - 2004 NRT - 153 lakhs
Assuming a growth rate of 4% as assumed in the 1983 Report, the projected
traffic for the year 2008 is as under:
Number of transits - 2438 NRT - 186 lakhs
7.4.2 Fixation of Channel Dues
The number of transits, NRT and total savings contemplated as per SCI Report
2003 are as under
Number of transits : 2004 NRT : 153 lakh tonnes
Savings : Rs. 107.48 Crores (Rs. 10748 lakhs)
5.1-87
Hence, the savings per NRT for use of
Sethusamudram Channel Project : 10748/153 = Rs. 70.25
Out of this, it is proposed to charge 2/3rd as channel levy viz., Rs. 47.00 and
pass on the benefit of 1/3rd savings viz., Rs. 23.25 to the ship owners. In this connection,
the channel levy recommended by the previous reports are reproduced for comparison.
1964 : Rs. 1.50 1983 : Rs. 6.00 1996 : Rs. 17.00
The increase in the proposed channel levy of Rs.47/- per NRT as derived
above, is mainly due to present day prices of fuel and is reasonable.
The Revenue to the Channel Authority is 186X47=Rs.8742 lakhs.
It is expected that the annual increase in the revenue will be in the order of 10%
on account of growth of traffic as well as increase in tariff.
7.5 Results of Economic Analysis Based on the NPV method of appraisal, the following internal rate of return are
obtained.
- With revenue and expenditure constant - Negative - With revenue and expenditure increasing 5% annually - +5% - With Revenue increasing by 10% and expenditure increasing 5 % - +10%
The IRR Calculations in respect of the above three criteria are enclosed in
Annexures 7.1, 7.2 and 7.3 respectively.
Taking into account an interest rate of 9% per annum on the capital employed
on the basis of the rate of government lending to ports, the project starts having surplus
from 19th year of its operation as per the Cash Flow statement(Annexure 7.4). The
Project will have a cumulative surplus of Rs.3,138 crores at the end of 25th year after
commissioning.
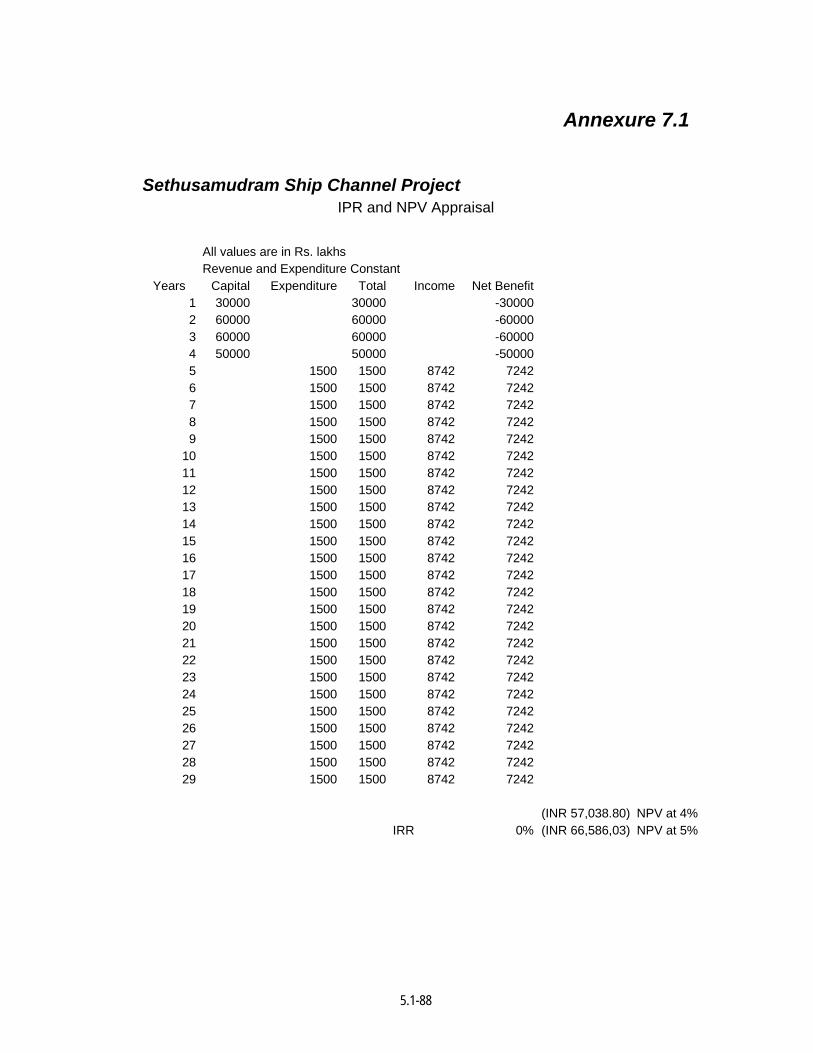
5.1-88
Annexure 7.1
Sethusamudram Ship Channel Project IPR and NPV Appraisal
All values are in Rs. lakhs Revenue and Expenditure Constant
Years Capital Expenditure Total Income Net Benefit 1 30000 30000 -30000 2 60000 60000 -60000 3 60000 60000 -60000 4 50000 50000 -50000 5 1500 1500 8742 7242 6 1500 1500 8742 7242 7 1500 1500 8742 7242 8 1500 1500 8742 7242 9 1500 1500 8742 7242
10 1500 1500 8742 7242 11 1500 1500 8742 7242 12 1500 1500 8742 7242 13 1500 1500 8742 7242 14 1500 1500 8742 7242 15 1500 1500 8742 7242 16 1500 1500 8742 7242 17 1500 1500 8742 7242 18 1500 1500 8742 7242 19 1500 1500 8742 7242 20 1500 1500 8742 7242 21 1500 1500 8742 7242 22 1500 1500 8742 7242 23 1500 1500 8742 7242 24 1500 1500 8742 7242 25 1500 1500 8742 7242 26 1500 1500 8742 7242 27 1500 1500 8742 7242 28 1500 1500 8742 7242 29 1500 1500 8742 7242
(INR 57,038.80) NPV at 4% IRR 0% (INR 66,586,03) NPV at 5%
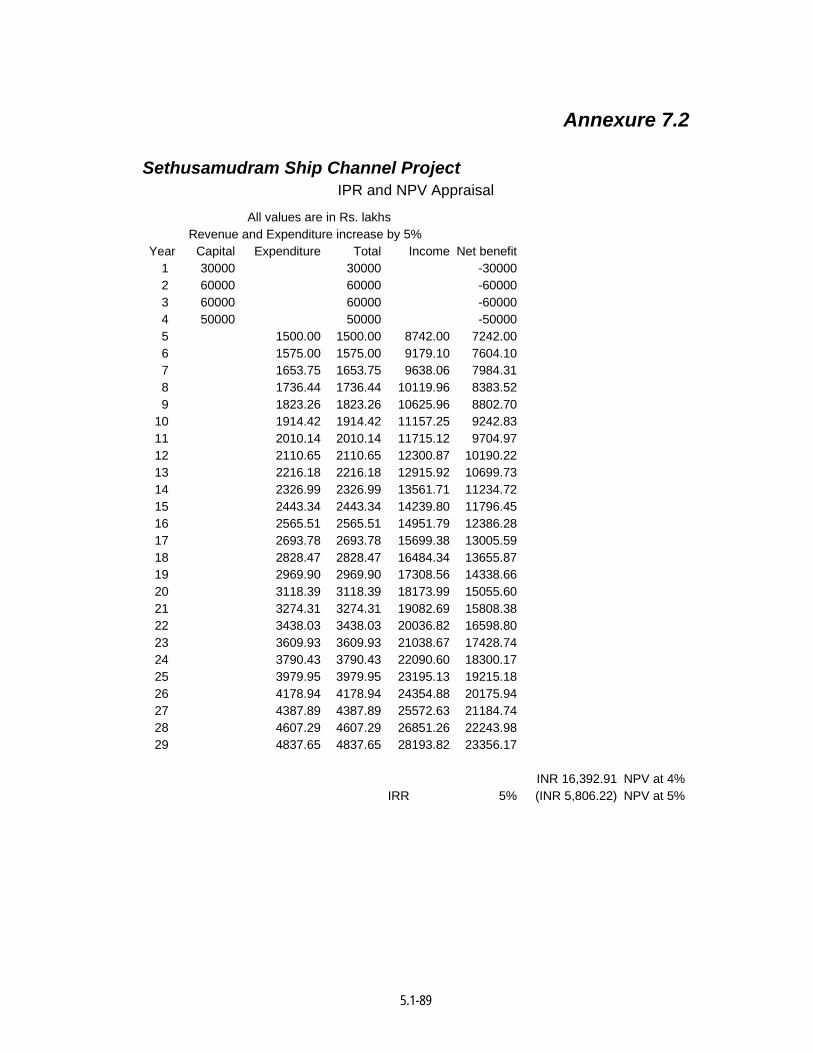
5.1-89
Annexure 7.2
Sethusamudram Ship Channel Project IPR and NPV Appraisal
All values are in Rs. lakhs Revenue and Expenditure increase by 5% Year Capital Expenditure Total Income Net benefit
1 30000 30000 -30000 2 60000 60000 -60000 3 60000 60000 -60000 4 50000 50000 -50000 5 1500.00 1500.00 8742.00 7242.00 6 1575.00 1575.00 9179.10 7604.10 7 1653.75 1653.75 9638.06 7984.31 8 1736.44 1736.44 10119.96 8383.52 9 1823.26 1823.26 10625.96 8802.70
10 1914.42 1914.42 11157.25 9242.83 11 2010.14 2010.14 11715.12 9704.97 12 2110.65 2110.65 12300.87 10190.22 13 2216.18 2216.18 12915.92 10699.73 14 2326.99 2326.99 13561.71 11234.72 15 2443.34 2443.34 14239.80 11796.45 16 2565.51 2565.51 14951.79 12386.28 17 2693.78 2693.78 15699.38 13005.59 18 2828.47 2828.47 16484.34 13655.87 19 2969.90 2969.90 17308.56 14338.66 20 3118.39 3118.39 18173.99 15055.60 21 3274.31 3274.31 19082.69 15808.38 22 3438.03 3438.03 20036.82 16598.80 23 3609.93 3609.93 21038.67 17428.74 24 3790.43 3790.43 22090.60 18300.17 25 3979.95 3979.95 23195.13 19215.18 26 4178.94 4178.94 24354.88 20175.94 27 4387.89 4387.89 25572.63 21184.74 28 4607.29 4607.29 26851.26 22243.98 29 4837.65 4837.65 28193.82 23356.17
INR 16,392.91 NPV at 4% IRR 5% (INR 5,806.22) NPV at 5%
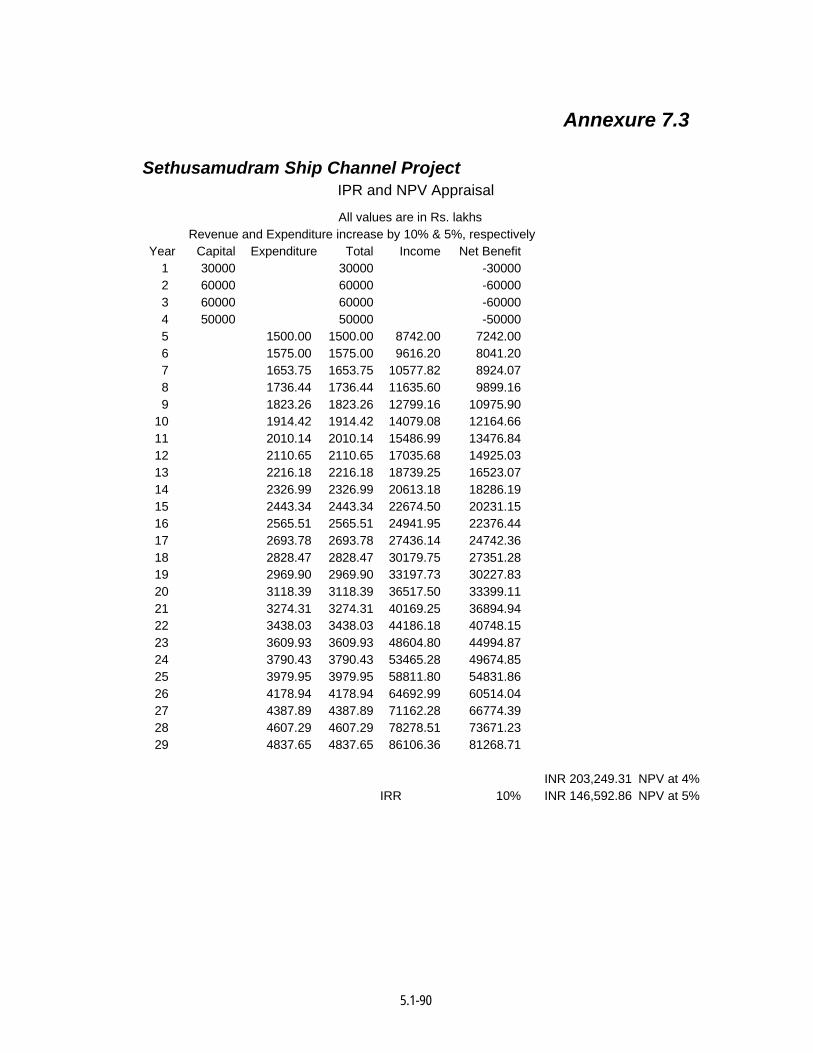
5.1-90
Annexure 7.3
Sethusamudram Ship Channel Project IPR and NPV Appraisal
All values are in Rs. lakhs Revenue and Expenditure increase by 10% & 5%, respectively Year Capital Expenditure Total Income Net Benefit
1 30000 30000 -30000 2 60000 60000 -60000 3 60000 60000 -60000 4 50000 50000 -50000 5 1500.00 1500.00 8742.00 7242.00 6 1575.00 1575.00 9616.20 8041.20 7 1653.75 1653.75 10577.82 8924.07 8 1736.44 1736.44 11635.60 9899.16 9 1823.26 1823.26 12799.16 10975.90
10 1914.42 1914.42 14079.08 12164.66 11 2010.14 2010.14 15486.99 13476.84 12 2110.65 2110.65 17035.68 14925.03 13 2216.18 2216.18 18739.25 16523.07 14 2326.99 2326.99 20613.18 18286.19 15 2443.34 2443.34 22674.50 20231.15 16 2565.51 2565.51 24941.95 22376.44 17 2693.78 2693.78 27436.14 24742.36 18 2828.47 2828.47 30179.75 27351.28 19 2969.90 2969.90 33197.73 30227.83 20 3118.39 3118.39 36517.50 33399.11 21 3274.31 3274.31 40169.25 36894.94 22 3438.03 3438.03 44186.18 40748.15 23 3609.93 3609.93 48604.80 44994.87 24 3790.43 3790.43 53465.28 49674.85 25 3979.95 3979.95 58811.80 54831.86 26 4178.94 4178.94 64692.99 60514.04 27 4387.89 4387.89 71162.28 66774.39 28 4607.29 4607.29 78278.51 73671.23 29 4837.65 4837.65 86106.36 81268.71
INR 203,249.31 NPV at 4% IRR 10% INR 146,592.86 NPV at 5%
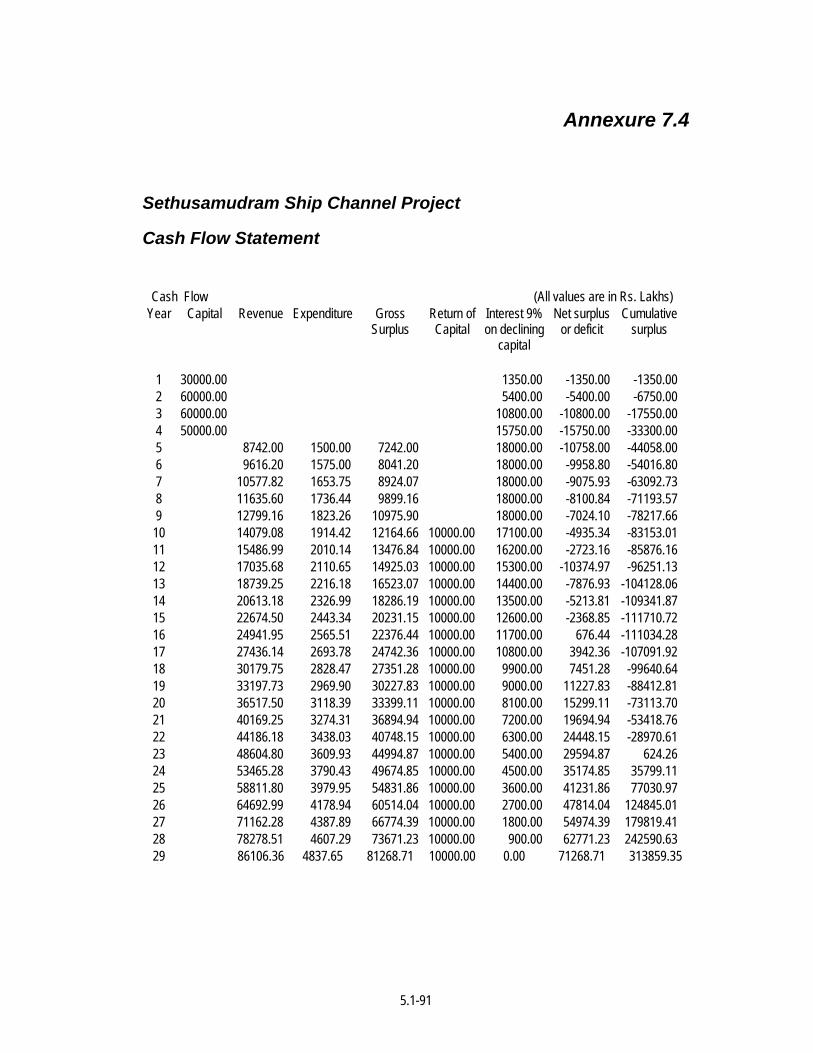
5.1-91
Annexure 7.4
Sethusamudram Ship Channel Project
Cash Flow Statement
Cash Flow (All values are in Rs. Lakhs) Year Capital Revenue Expenditure Gross
Surplus Return of Capital
Interest 9% on declining
capital
Net surplus or deficit
Cumulative surplus
1 30000.00 1350.00 -1350.00 -1350.00 2 60000.00 5400.00 -5400.00 -6750.00 3 60000.00 10800.00 -10800.00 -17550.00 4 50000.00 15750.00 -15750.00 -33300.00 5 8742.00 1500.00 7242.00 18000.00 -10758.00 -44058.00 6 9616.20 1575.00 8041.20 18000.00 -9958.80 -54016.80 7 10577.82 1653.75 8924.07 18000.00 -9075.93 -63092.73 8 11635.60 1736.44 9899.16 18000.00 -8100.84 -71193.57 9 12799.16 1823.26 10975.90 18000.00 -7024.10 -78217.66 10 14079.08 1914.42 12164.66 10000.00 17100.00 -4935.34 -83153.01 11 15486.99 2010.14 13476.84 10000.00 16200.00 -2723.16 -85876.16 12 17035.68 2110.65 14925.03 10000.00 15300.00 -10374.97 -96251.13 13 18739.25 2216.18 16523.07 10000.00 14400.00 -7876.93 -104128.06 14 20613.18 2326.99 18286.19 10000.00 13500.00 -5213.81 -109341.87 15 22674.50 2443.34 20231.15 10000.00 12600.00 -2368.85 -111710.72 16 24941.95 2565.51 22376.44 10000.00 11700.00 676.44 -111034.28 17 27436.14 2693.78 24742.36 10000.00 10800.00 3942.36 -107091.92 18 30179.75 2828.47 27351.28 10000.00 9900.00 7451.28 -99640.64 19 33197.73 2969.90 30227.83 10000.00 9000.00 11227.83 -88412.81 20 36517.50 3118.39 33399.11 10000.00 8100.00 15299.11 -73113.70 21 40169.25 3274.31 36894.94 10000.00 7200.00 19694.94 -53418.76 22 44186.18 3438.03 40748.15 10000.00 6300.00 24448.15 -28970.61 23 48604.80 3609.93 44994.87 10000.00 5400.00 29594.87 624.26 24 53465.28 3790.43 49674.85 10000.00 4500.00 35174.85 35799.11 25 58811.80 3979.95 54831.86 10000.00 3600.00 41231.86 77030.97 26 64692.99 4178.94 60514.04 10000.00 2700.00 47814.04 124845.01 27 71162.28 4387.89 66774.39 10000.00 1800.00 54974.39 179819.41 28 78278.51 4607.29 73671.23 10000.00 900.00 62771.23 242590.63 29 86106.36 4837.65 81268.71 10000.00 0.00 71268.71 313859.35
5.1-92
8. Conclusion
8.1 The cost of the Sethusamudram Ship Channel Project estimated at different
times are as under:
1968 - Rs.37.5 crores (30 feet/10 m draught)
1983 - Rs.282 crores (30 feet/10 m draught)
1996 - Rs.685 crores (30 feet/10 m draught)
- Rs.1200 crores (35 feet/10.5 m draught)
2004 - Rs.2000 crores (35.6 feet/10.7 m draught)
The increase in the cost has been mainly due to escalation and certain changes in
channel parameters. However, the project has been found to be technically
feasible in all the proposals.
8.2 Economic Viability is the basic criteria for evaluation and approval of any
developmental project. As far as Sethusamudram Ship Channel is concerned,
this is rather difficult to quantify in an exact manner, as certain factors contributing
to the economic assessment of the project are based on a number of probabilities.
The results of the economic analysis has revealed that the IRR for the various
scenarios is as under:
- With revenue and expenditure constant - Negative - With revenue and expenditure increasing 5% annually - +5% - With Revenue increasing by 10% and expenditure increasing 5 % - 10%
Though this may not compare favourably, with the return normally adopted for a
development project there are certain direct and indirect benefits as brought out in
Chapter 6 which are summarized as under:
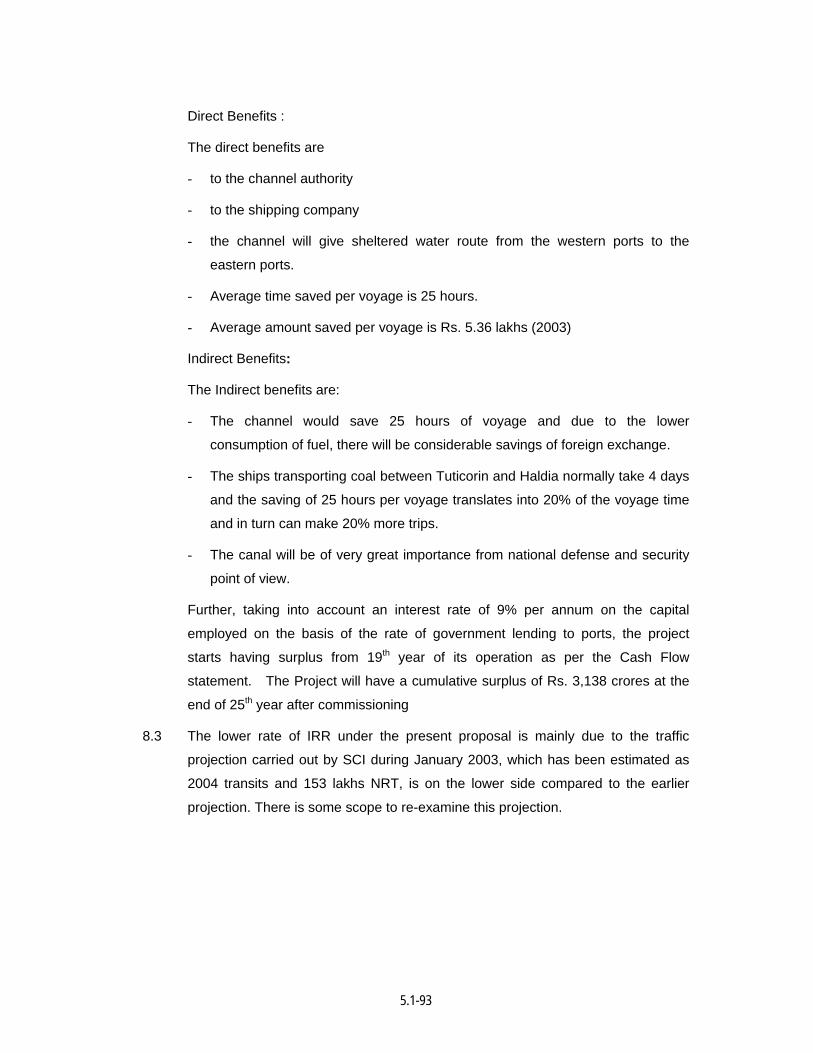
5.1-93
Direct Benefits :
The direct benefits are
- to the channel authority
- to the shipping company
- the channel will give sheltered water route from the western ports to the
eastern ports.
- Average time saved per voyage is 25 hours.
- Average amount saved per voyage is Rs. 5.36 lakhs (2003)
Indirect Benefits:
The Indirect benefits are:
- The channel would save 25 hours of voyage and due to the lower
consumption of fuel, there will be considerable savings of foreign exchange.
- The ships transporting coal between Tuticorin and Haldia normally take 4 days
and the saving of 25 hours per voyage translates into 20% of the voyage time
and in turn can make 20% more trips.
- The canal will be of very great importance from national defense and security
point of view.
Further, taking into account an interest rate of 9% per annum on the capital
employed on the basis of the rate of government lending to ports, the project
starts having surplus from 19th year of its operation as per the Cash Flow
statement. The Project will have a cumulative surplus of Rs. 3,138 crores at the
end of 25th year after commissioning
8.3 The lower rate of IRR under the present proposal is mainly due to the traffic
projection carried out by SCI during January 2003, which has been estimated as
2004 transits and 153 lakhs NRT, is on the lower side compared to the earlier
projection. There is some scope to re-examine this projection.
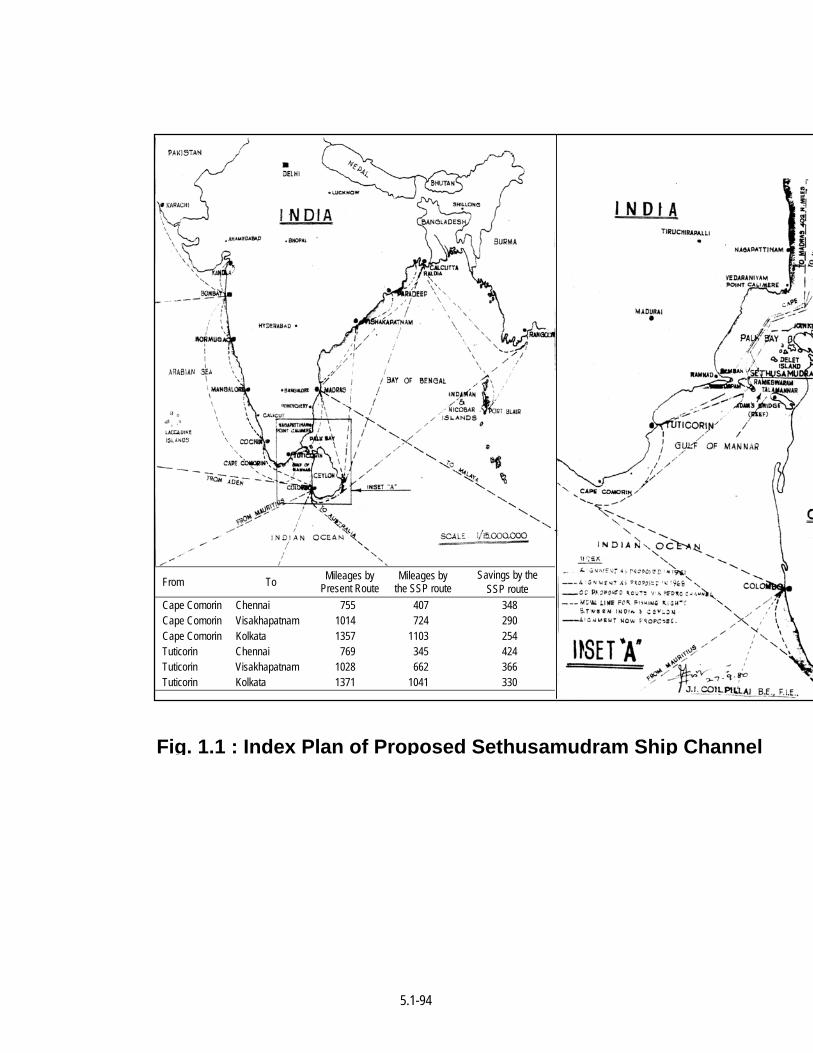
5.1-94
From To Mileages by Present Route
Mileages by the SSP route
Savings by the SSP route
Cape Comorin Chennai 755 407 348 Cape Comorin Visakhapatnam 1014 724 290 Cape Comorin Kolkata 1357 1103 254 Tuticorin Chennai 769 345 424 Tuticorin Visakhapatnam 1028 662 366 Tuticorin Kolkata 1371 1041 330
Fig. 1.1 : Index Plan of Proposed Sethusamudram Ship Channel
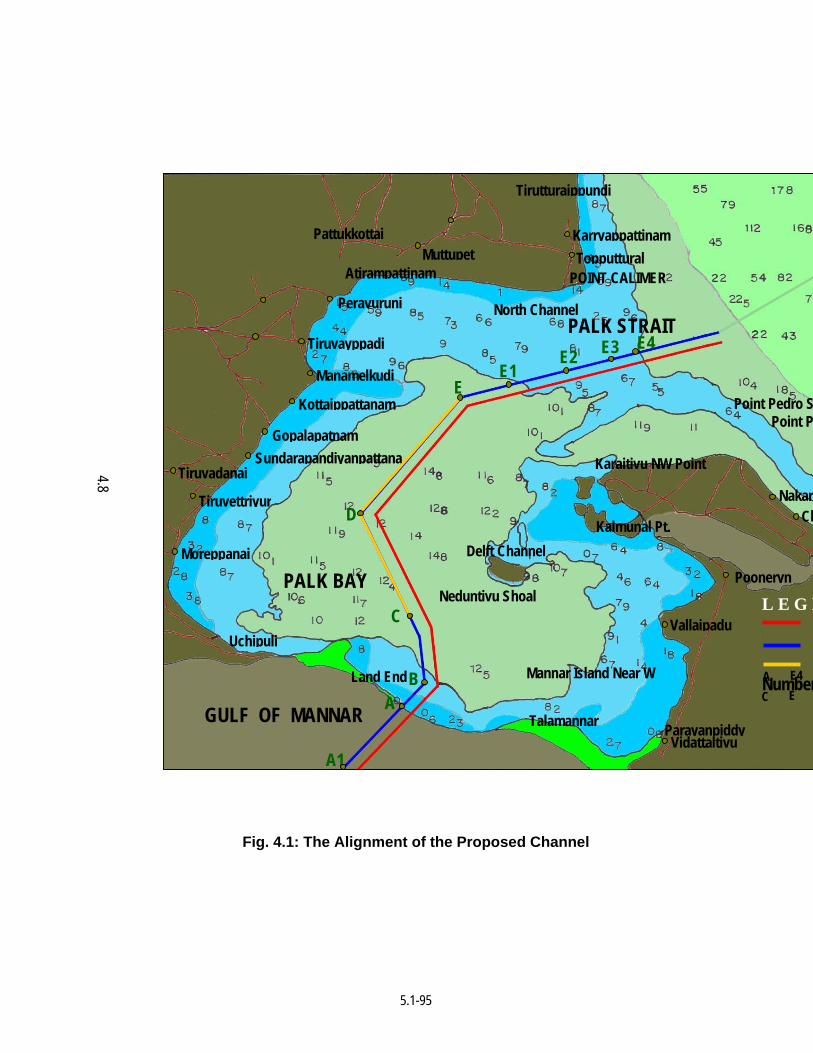
5.1-95
Fig. 4.1: The Alignment of the Proposed Channel
4.8
L E G E
Number
A1
A B
C
D
E E1
E2 E3 E4
Tirutturaippundi
Karryappattinam Topputtural
POINT CALIMER
North Channel
Muttupet Pattukkottai
Atirampattinam
Peravuruni
Tiruvayppadi
Manamelkudi
Kottaippattanam
Gopalapatnam Sundarapandiyanpattana
Tiruvadanai
Tiruvettriyur
Moreppanai
Uchipuli
Neduntivu Shoal
Delft Channel
Land End Mannar Island Near W
Talamannar
Vallaipadu
Vidattaltivu Parayanpiddy
Pooneryn
ChNakark
Point PPoint Pedro S
Kalmunal Pt.
Karaitivu NW Point
PALK STRAIT
PALK BAY
GULF OF MANNAR
A E4 C E
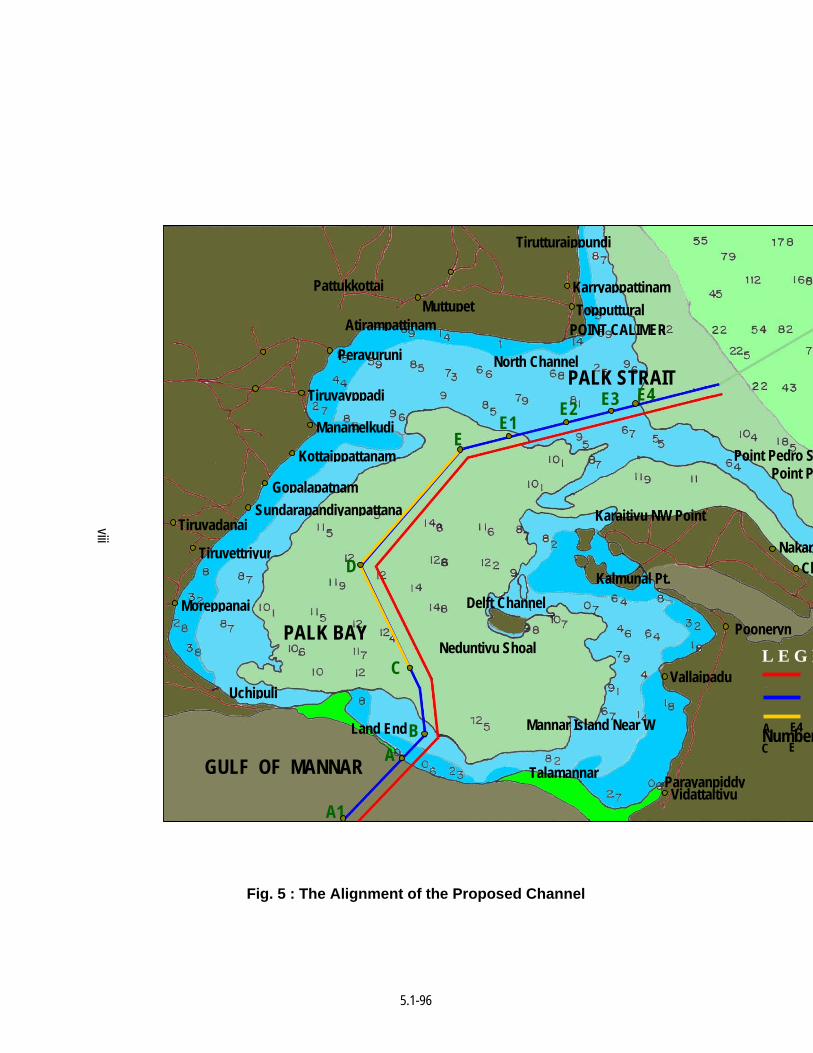
5.1-96
Fig. 5 : The Alignment of the Proposed Channel
viii
L E G E
Number
A1
A B
C
D
E E1
E2 E3 E4
Tirutturaippundi
Karryappattinam Topputtural
POINT CALIMER
North Channel
Muttupet Pattukkottai
Atirampattinam
Peravuruni
Tiruvayppadi
Manamelkudi
Kottaippattanam
Gopalapatnam Sundarapandiyanpattana
Tiruvadanai
Tiruvettriyur
Moreppanai
Uchipuli
Neduntivu Shoal
Delft Channel
Land End Mannar Island Near W
Talamannar
Vallaipadu
Vidattaltivu Parayanpiddy
Pooneryn
ChNakark
Point PPoint Pedro S
Kalmunal Pt.
Karaitivu NW Point
PALK STRAIT
PALK BAY
GULF OF MANNAR
A E4 C E
5.1-97
Executive Summary
1.0 Introduction India does not have a continuous navigable route around the peninsula running
within her own territorial waters due to presence of a shallow reef called “Adam’s Bridge”
at Pamban where the navigable depth is only about 3m. Hence all the ships from west to
east and from Tuticorin Port to the east have to go round Sri Lanka entailing an additional
distance of more than 254-424 nautical miles and 21-36 hours of sailing time.
The proposal for providing a navigable route has been drawing the attention of
the Government of India for a long time. The first proposal was mooted during 1890 and
nine proposals were formulated between 1890 and 1922 for dredging a canal across the
narrow strip of land mostly through the Rameshwaram island to connect the Gulf of
Mannar with Palk Bay. However, after 1922 the proposal was dormant for a long time till
the country attained independence.
After independence, five proposals were drawn up for the development of
Sethusamudram Ship Canal Project during different times. The recent one being by M/s.
Pallavan Transport Consultancy Services Ltd., Chennai during 1996. The index plan is
shown in Fig. 1.
The Ministry of Shipping, Government of India has now identified the Tuticorin
Port Trust as the nodal agency for the implementation of the Sethusamudram Ship Canal
Project. The Tuticorin Port Trust has retained National Environmental Engineering
Research Institute (NEERI), Nagpur to conduct the Environmental Impact Assessment
study for the project. The institute in its EIA study dispensed with idea of a canal through
Pamban island and suggested a channel linking Palkbay and Gulf of Mannar through
5.1-98
Adams bridge. It also recommended creation of additional depth in Palk Bay/Strait to
create channel connecting Palk Strait with Bay of Bengal. This report addresses technical
feasibility and economic analysis of proposed Sethusamudram Ship Channel Project.
2.0 Present Proposal All the earlier proposals selected the route, particularly in the Gulf of Mannar
area passing through Mandapam / Rameshwaram etc. involving the dredging of a canal
mainly through the land portion. These alignments were so selected as to optimize
the cost of dredging. An analysis of the earlier proposals reveal that with each
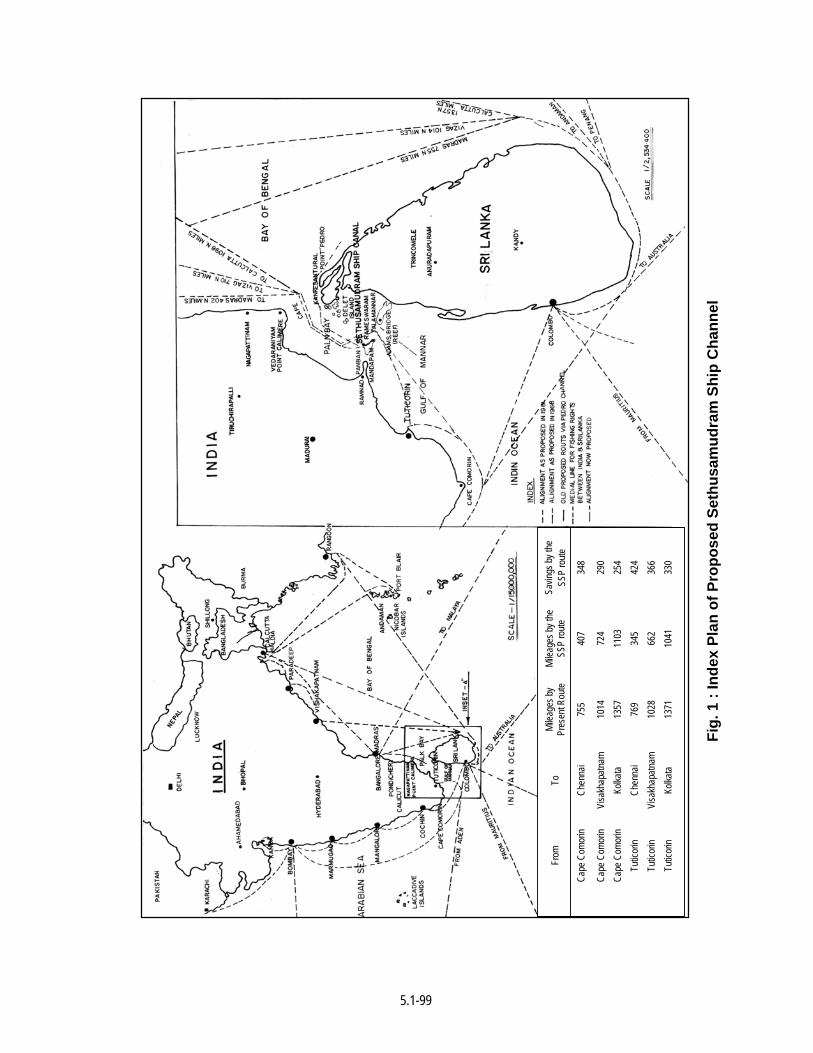
5.1-99
Fig.
1 :
Inde
x Pl
an o
f Pro
pose
d Se
thus
amud
ram
Shi
p C
hann
el
Savin
gs by
the
SSP
route
348
290
254
424
366
330
Milea
ges b
y the
SS
P ro
ute
407
724
1103
34
5 66
2 10
41
Milea
ges b
y Pr
esen
t Rou
te
755
1014
13
57
769
1028
13
71
To
Chen
nai
Visa
khap
atnam
Ko
lkata
Chen
nai
Visa
khap
atnam
Ko
lkata
From
Cape
Com
orin
Cape
Com
orin
Cape
Com
orin
Tutic
orin
Tutic
orin
Tutic
orin
5.1-100
proposal, the canal was shifted eastwards mainly due to the apprehensions of the local
population. The report prepared by NEERI in 1998 had considered modification in route
proposed by steering committee. However due to apprehension that route around
Dhanushkodi might require to cut through Coral reef, the route suggested by steering
committee was considered the best choice.
The Environmental Impact Assessment Study carried out by NEERI has
revealed that, in view of the sensitivity along the coastal stretch of Gulf of Mannar
harbouring Marine National Park, a navigation route keeping a minimum distance of 6 to
8 km from Van Tiu near Tuticorin and more than 20 km from Shingle Island in Adam’s
Bridge approach area is the most suitable one. The alignment of the proposed channel is
shown in Fig. 2 which also shows earlier selected routes. The recent hydrography/
hydrogeology study in Adam’s Bridge area indicated that sub-bottom profiles comprise
soft and hard sand and not the coral reef as envisaged earlier. The bore hole data is
shown in Fig. 3.
The proposed Sethusamudram Ship Channel will have following two legs :
• one near Point Calimere called the Bay of Bengal channel and
• the other across the Adam’s Bridge
The Bay of Bengal channel traverses the Pak Bay wherein the sea bed is
reported to be mostly soft to hard clayey - sand in nature. However presence of hard
strata below the soft sediment is envisaged in data collected by National Hydrographic
Office (NHO), Dehradun. The present proposal envisaged creation of navigation channel
to suit different draught requirement viz. 9.15, 10.7 and 12.8 m requiring dredging depths
of 10 m, 12 m and 14 m respectively. For 12.8 m draught channel width will be 500 m
whereas for 9.15 and 10.7 m draughts, channel width will be 300 m. Based
on hydrography data collected by NHO (Fig. 4) it is observed that navigation depths in
Palk Bay are restricted to about 12 m only. The total length from Adam’s Bridge to
Palk Strait is about 145 km. In the event of proposal for 12.8 m draught requiring 14 m
depth, dredging will require to be carried out in entire Palk Bay area to create a channel
of 500 m width generating huge additional dredge spoil of about 170-180 million m3.
Dredging all along the length of the channel in Palk Bay will be detrimental to
ecologically sensitive area of this region. It would also involve heavy additional
expenditure on dredging and disposal of dredge spoil. Thus keeping in view
environmental sensitivity and economic viability the proposal for 14 m depth
(12.8 m draught) is not evaluated. Thus channel depth of only 10 m and 12 m are

5.1-101
Fig.
2 :
Var
ious
Alig
nmen
ts o
f Set
husa
mud
ram
Shi
p C
hann
el P
roje
ct
In
clud
ing
the
Prop
osed
Alig
nmen
t
Pro
pose
d in
196
1
Pro
pose
d in
196
8
Pro
pose
d in
199
6 R
epor
t
Sug
gest
ed b
y S
teer
ing
Com
mitt
ee
Con
side
red
by N
EER
I (19
98)
Pre
sent
Pro
posa
l of N
EE
RI
1 2 3 4 5
1 2
3 4
6 5
6
LEG
EN
D
Fath
oms
Line
3.5
Fa
thom
s Li
ne 5
.0
Ree
fs
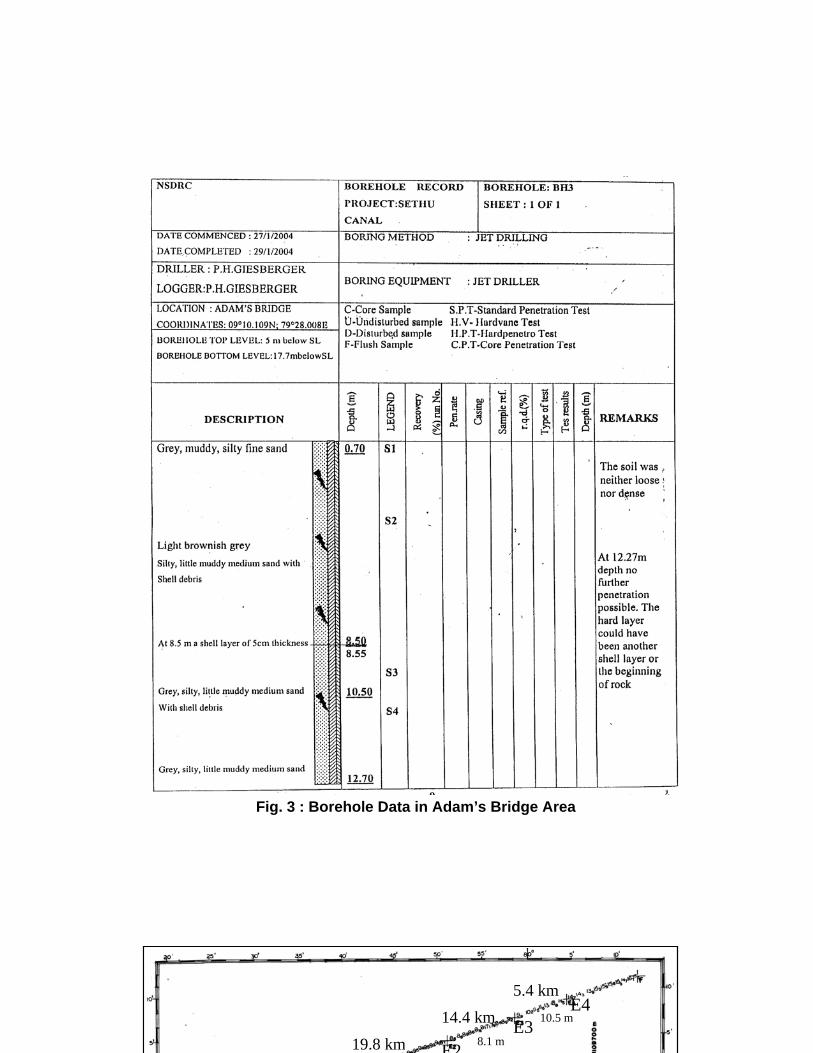
5.1-102
Fig. 3 : Borehole Data in Adam’s Bridge Area
10.5 m
8.1 m
10.5 m
8.1 mE2E3
E4
19.8 km14.4 km
5.4 km
5.1-103
Fig. 4 : Bathymetry along the Proposed Channel
Km : Distance between points m : average depth within a section
5.1-104
considered for economic evaluation. The channel will be dredged with a bottom width of
300m to a depth of -10mCD or -12mCD in Palk Strait and adjoining parts of Palk Bay to
achieve the required depth over a stretch of 36 and 18km respectively. In the Gulf of
Mannar, navigational depths (more than 12 m) will be used from Tuticorin Port to Adam’s
Bridge Area. A 20 km long channel with a bed width of 300 m. will be dredged to a depth
of -10mCD or -12 mCD catering to vessels drawing a draught of 9.15 or 10.7m
respectively. Proposed alignment of channel is shown in Fig. 5. Stretch requiring
dredging is given in Table 1 and actual dredging requirements are calculated in Table 2.
3.0 Provisions in the Present Proposal Though option for both 9.15 m and 10.7 m draught were evaluated, study
carried out by shipping corporation of India for estimating traffic potential at 7, 9 and 11
draught recommended that a minimum draught of 10.7 m be kept to make channel viable.
The savings based on expected number of transits through proposed channel for various
considered draught is given in Table 3.
The proposed channel will have a bed width of 300m which will provide a safe
width for navigation of two way channel. The channel will have side slopes of 1:3. A cross
section of channel is shown in Fig. 6.
A Control Station equipped with VTMS is proposed to be located at
Rameshwaram Island between Dhanushkodi and Koil Nagar villages with an additional
Control Station near Point Calimere.
Provision has been made for necessary navigational aids which include lighted
Fairway Buoys, Channel Marker Buoys, Racons etc. to assist navigation round the clock.
Provision has also been made for necessary flotilla to assist navigation
consisting of tugs, pilot launches, survey launches, buoy laying tender etc.
4.0 Estimated Cost The cost estimates have been worked out for both 9.15 and 10.7 m draught.
It was observed that estimated cost of project for 9.15 m draught (10 m depth) is
Rs. 1050 crores with dredging costs of about Rs.779 crores. However estimated costs for
12 m deep channel is Rs. 2000 crores with dredging costs of around Rs. 1680 crores.
The capital investment is to be done in 4 years. The cost estimates are given in Tables 4 and 5 for 10 m and 12 m depth channel respectively.
5.1-105
Fig.
5 :
The
Alig
nmen
t of t
he P
ropo
sed
Cha
nnel
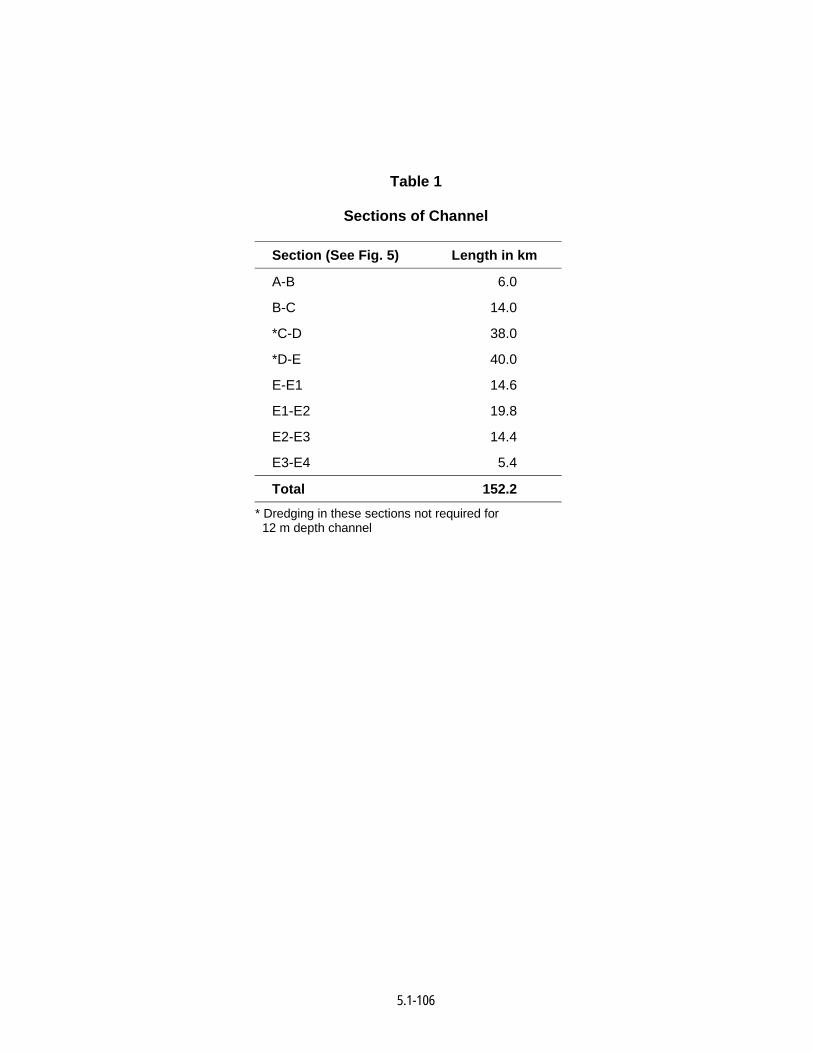
5.1-106
Table 1
Sections of Channel
Section (See Fig. 5) Length in km
A-B 6.0
B-C 14.0
*C-D 38.0
*D-E 40.0
E-E1 14.6
E1-E2 19.8
E2-E3 14.4
E3-E4 5.4
Total 152.2
* Dredging in these sections not required for 12 m depth channel
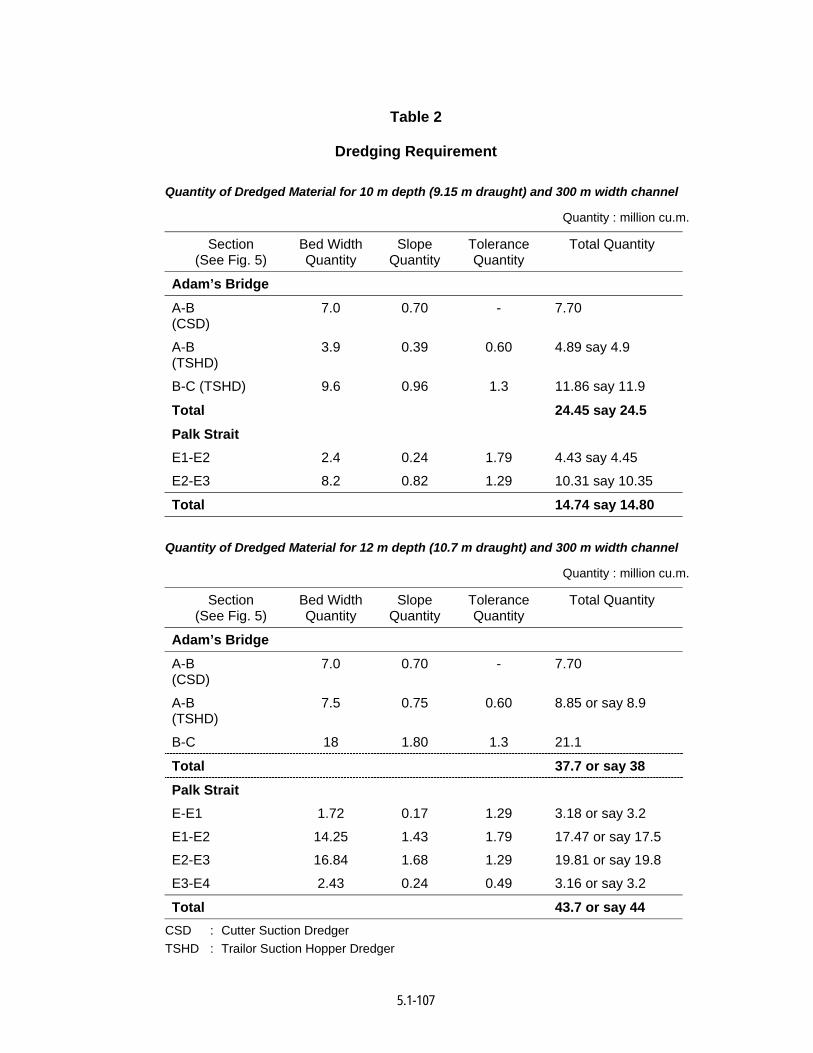
5.1-107
Table 2
Dredging Requirement
Quantity of Dredged Material for 10 m depth (9.15 m draught) and 300 m width channel
Quantity : million cu.m.
Section (See Fig. 5)
Bed Width Quantity
Slope Quantity
Tolerance Quantity
Total Quantity
Adam’s Bridge
A-B (CSD)
7.0 0.70 - 7.70
A-B (TSHD)
3.9 0.39 0.60 4.89 say 4.9
B-C (TSHD) 9.6 0.96 1.3 11.86 say 11.9
Total 24.45 say 24.5
Palk Strait
E1-E2 2.4 0.24 1.79 4.43 say 4.45
E2-E3 8.2 0.82 1.29 10.31 say 10.35
Total 14.74 say 14.80
Quantity of Dredged Material for 12 m depth (10.7 m draught) and 300 m width channel
Quantity : million cu.m.
Section (See Fig. 5)
Bed Width Quantity
Slope Quantity
Tolerance Quantity
Total Quantity
Adam’s Bridge
A-B (CSD)
7.0 0.70 - 7.70
A-B (TSHD)
7.5 0.75 0.60 8.85 or say 8.9
B-C 18 1.80 1.3 21.1
Total 37.7 or say 38
Palk Strait
E-E1 1.72 0.17 1.29 3.18 or say 3.2
E1-E2 14.25 1.43 1.79 17.47 or say 17.5
E2-E3 16.84 1.68 1.29 19.81 or say 19.8
E3-E4 2.43 0.24 0.49 3.16 or say 3.2
Total 43.7 or say 44 CSD : Cutter Suction Dredger TSHD : Trailor Suction Hopper Dredger
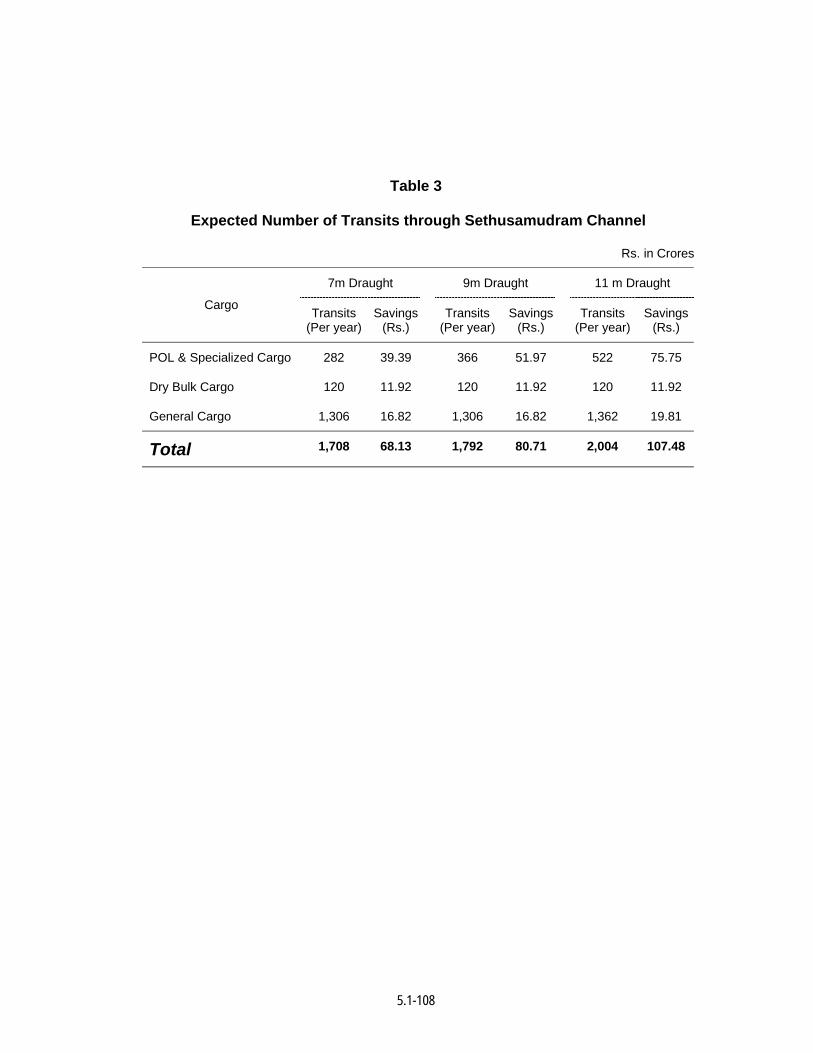
5.1-108
Table 3
Expected Number of Transits through Sethusamudram Channel
Rs. in Crores
7m Draught 9m Draught 11 m Draught
Cargo Transits (Per year)
Savings (Rs.)
Transits (Per year)
Savings (Rs.)
Transits (Per year)
Savings (Rs.)
POL & Specialized Cargo 282 39.39 366 51.97 522 75.75
Dry Bulk Cargo 120 11.92 120 11.92 120 11.92
General Cargo 1,306 16.82 1,306 16.82 1,362 19.81
Total 1,708 68.13 1,792 80.71 2,004 107.48
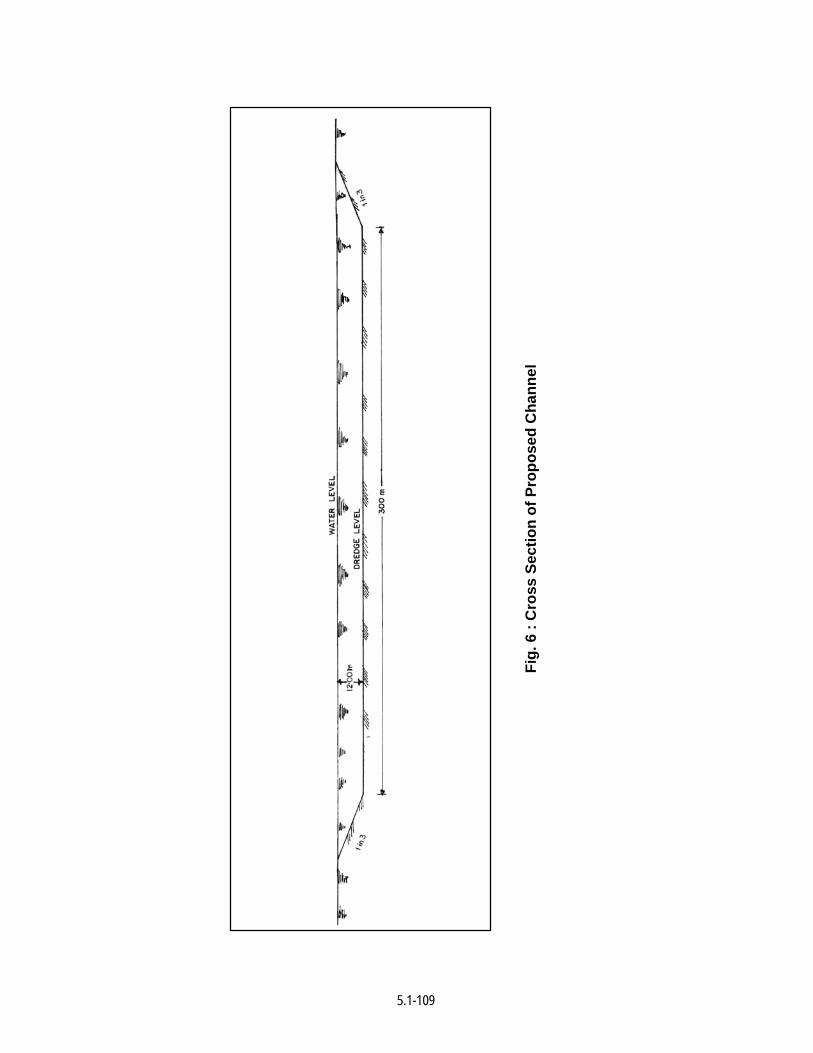
5.1-109
Fig.
6 :
Cro
ss S
ectio
n of
Pro
pose
d C
hann
el
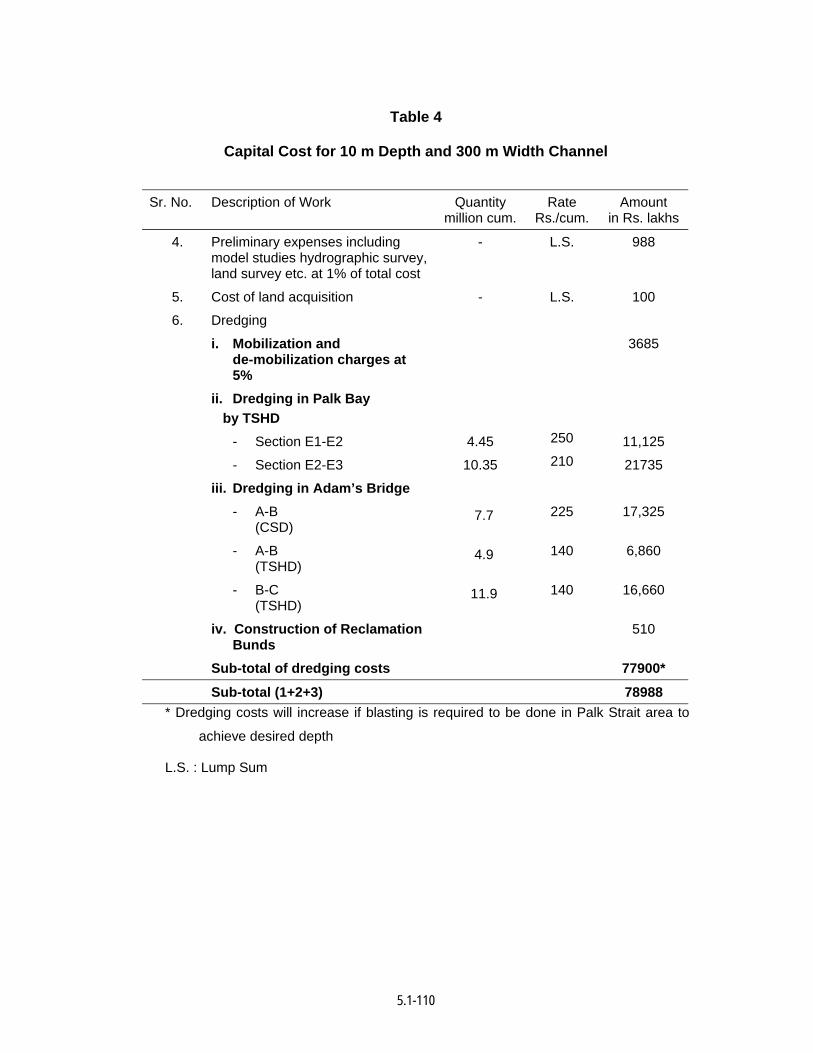
5.1-110
Table 4
Capital Cost for 10 m Depth and 300 m Width Channel
Sr. No. Description of Work Quantity million cum.
Rate Rs./cum.
Amount in Rs. lakhs
4. Preliminary expenses including model studies hydrographic survey, land survey etc. at 1% of total cost
- L.S. 988
5. Cost of land acquisition - L.S. 100
6. Dredging
i. Mobilization and de-mobilization charges at 5%
3685
ii. Dredging in Palk Bay by TSHD
- Section E1-E2 4.45 250 11,125
- Section E2-E3 10.35 210 21735
iii. Dredging in Adam’s Bridge - A-B
(CSD) 7.7 225 17,325
- A-B (TSHD)
4.9 140 6,860
- B-C (TSHD)
11.9 140 16,660
iv. Construction of Reclamation Bunds
510
Sub-total of dredging costs 77900*
Sub-total (1+2+3) 78988 * Dredging costs will increase if blasting is required to be done in Palk Strait area to
achieve desired depth
L.S. : Lump Sum
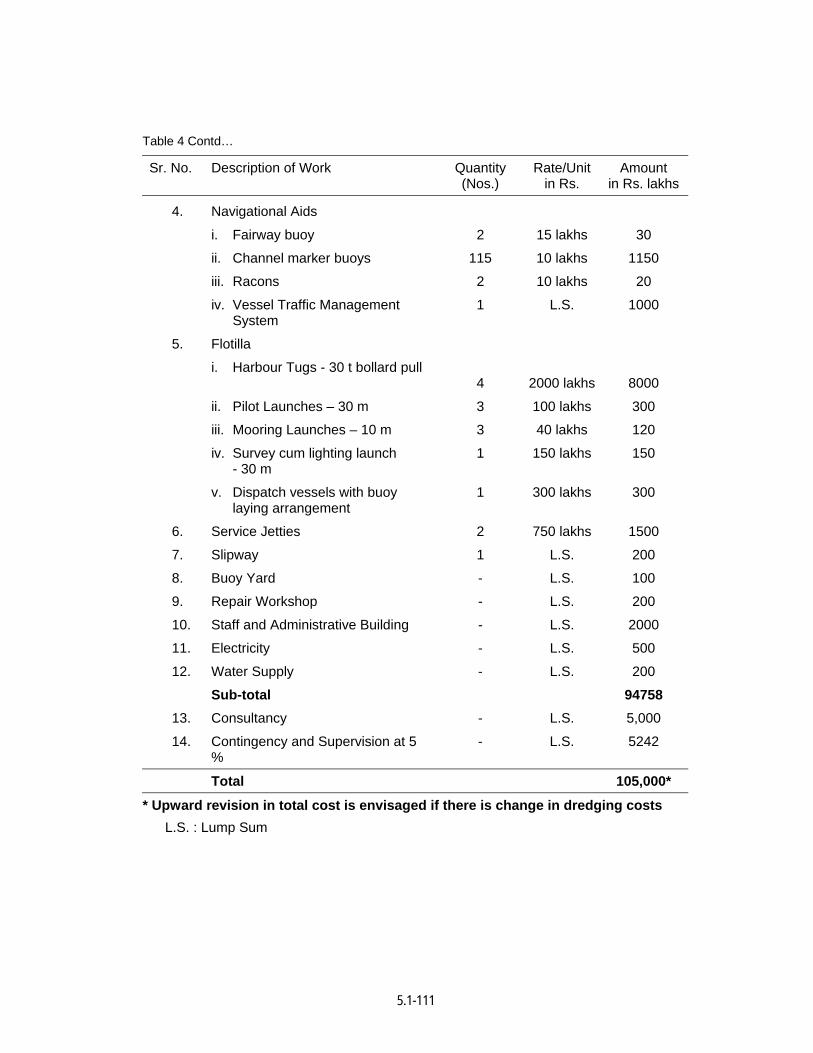
5.1-111
Table 4 Contd…
Sr. No. Description of Work Quantity (Nos.)
Rate/Unit in Rs.
Amount in Rs. lakhs
4. Navigational Aids
i. Fairway buoy 2 15 lakhs 30
ii. Channel marker buoys 115 10 lakhs 1150
iii. Racons 2 10 lakhs 20
iv. Vessel Traffic Management System
1 L.S. 1000
5. Flotilla
i. Harbour Tugs - 30 t bollard pull 4
2000 lakhs
8000
ii. Pilot Launches – 30 m 3 100 lakhs 300
iii. Mooring Launches – 10 m 3 40 lakhs 120
iv. Survey cum lighting launch - 30 m
1 150 lakhs 150
v. Dispatch vessels with buoy laying arrangement
1 300 lakhs 300
6. Service Jetties 2 750 lakhs 1500
7. Slipway 1 L.S. 200
8. Buoy Yard - L.S. 100
9. Repair Workshop - L.S. 200
10. Staff and Administrative Building - L.S. 2000
11. Electricity - L.S. 500
12. Water Supply - L.S. 200
Sub-total 94758 13. Consultancy - L.S. 5,000
14. Contingency and Supervision at 5 %
- L.S. 5242
Total 105,000*
* Upward revision in total cost is envisaged if there is change in dredging costs L.S. : Lump Sum
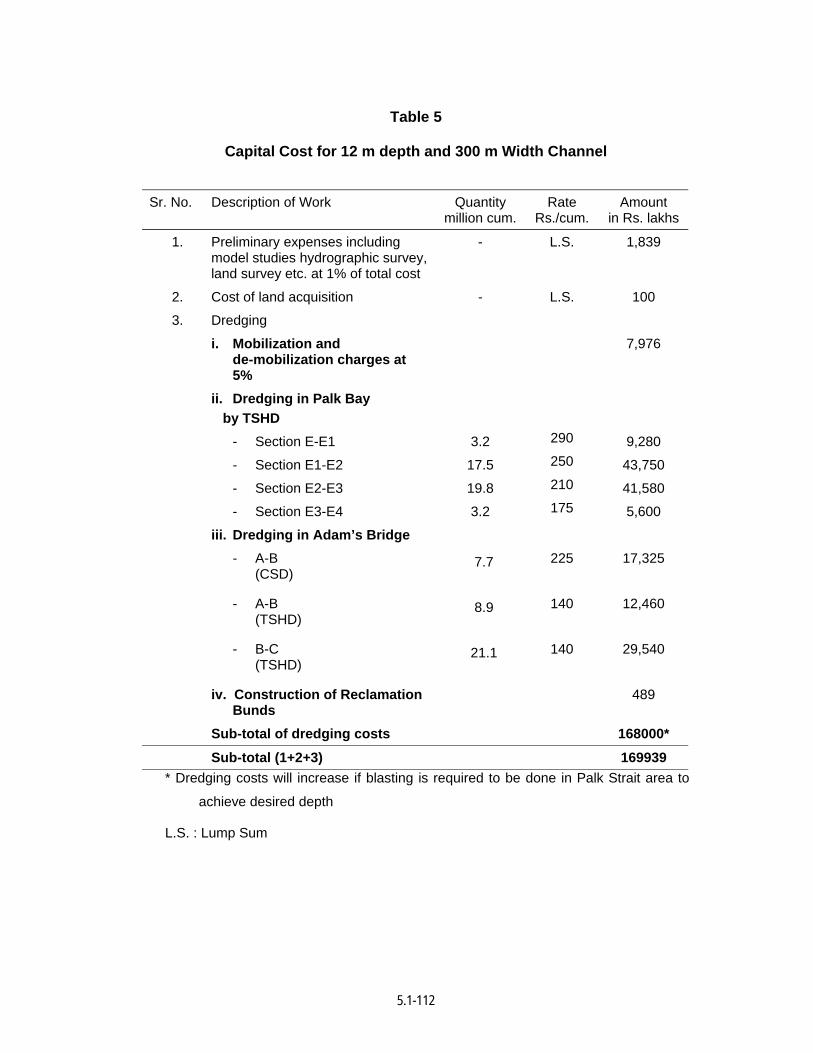
5.1-112
Table 5
Capital Cost for 12 m depth and 300 m Width Channel
Sr. No. Description of Work Quantity million cum.
Rate Rs./cum.
Amount in Rs. lakhs
1. Preliminary expenses including model studies hydrographic survey, land survey etc. at 1% of total cost
- L.S. 1,839
2. Cost of land acquisition - L.S. 100
3. Dredging
i. Mobilization and de-mobilization charges at 5%
7,976
ii. Dredging in Palk Bay by TSHD
- Section E-E1 3.2 290 9,280
- Section E1-E2 17.5 250 43,750
- Section E2-E3 19.8 210 41,580
- Section E3-E4 3.2 175 5,600
iii. Dredging in Adam’s Bridge - A-B
(CSD) 7.7
225 17,325
- A-B (TSHD)
8.9
140 12,460
- B-C (TSHD)
21.1
140 29,540
iv. Construction of Reclamation Bunds
489
Sub-total of dredging costs 168000*
Sub-total (1+2+3) 169939 * Dredging costs will increase if blasting is required to be done in Palk Strait area to
achieve desired depth
L.S. : Lump Sum

5.1-113
Table 5 Contd…
Sr. No. Description of Work Quantity (Nos.)
Rate/Unit in Rs.
Amount in Rs. lakhs
4. Navigational Aids
i. Fairway buoy 2 15 lakhs 30
ii. Channel marker buoys 125 10 lakhs 1250
iii. Racons 2 10 lakhs 20
iv. Vessel Traffic Management System
1 L.S. 1000
5. Flotilla
i. Harbour Tugs - 30 t bollard pull 4 2000 lakhs 8000
ii. Pilot Launches – 30 m 3 100 lakhs 300
iii. Mooring Launches – 10 m 3 40 lakhs 120
iv. Survey cum lighting launch - 30 m
1 150 lakhs 150
v. Dispatch vessels with buoy laying arrangement
1 300 lakhs 300
6. Service Jetties 2 750 lakhs 1500
7. Slipway 1 L.S. 200
8. Buoy Yard - L.S. 100
9. Repair Workshop - L.S. 200
10. Staff and Administrative Building - L.S. 2000
11. Electricity - L.S. 500
12. Water Supply - L.S. 200
Sub-total 185,809 13. Consultancy - L.S. 5,000
14. Contingency and Supervision at 5 %
- L.S. 9,191
Total 200,000*
* Upward revision in total cost is envisaged if there is change in dredging costs L.S. : Lump Sum
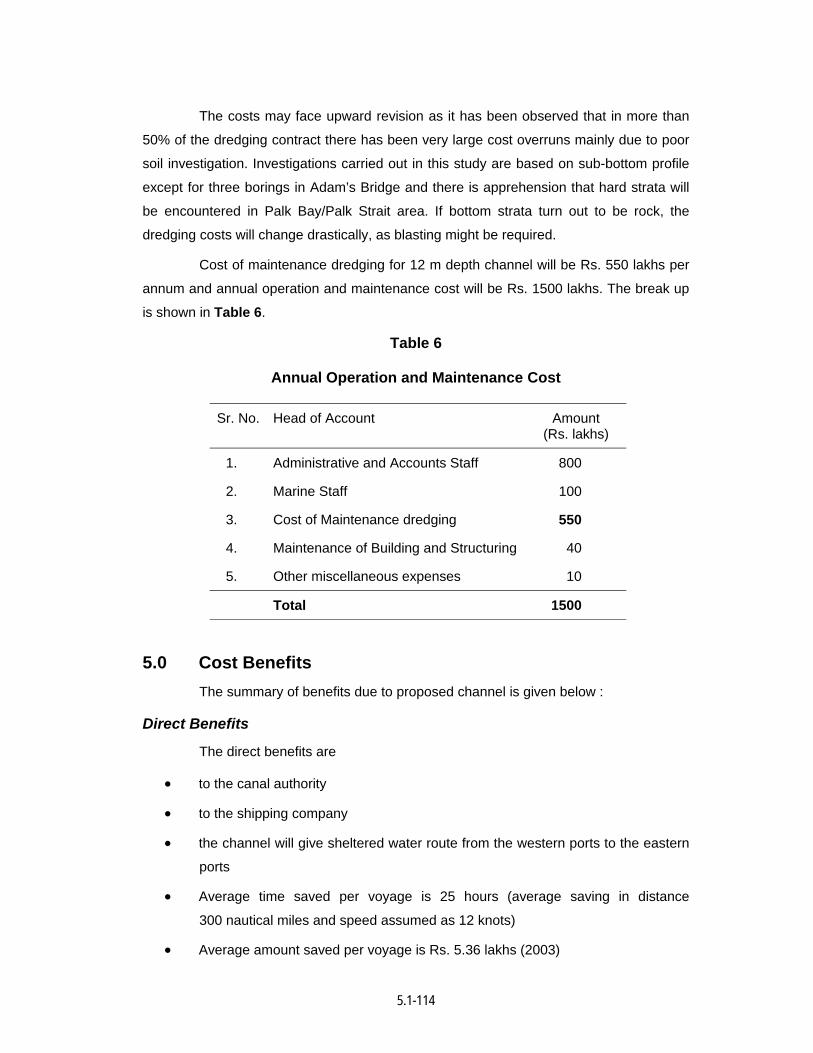
5.1-114
The costs may face upward revision as it has been observed that in more than
50% of the dredging contract there has been very large cost overruns mainly due to poor
soil investigation. Investigations carried out in this study are based on sub-bottom profile
except for three borings in Adam’s Bridge and there is apprehension that hard strata will
be encountered in Palk Bay/Palk Strait area. If bottom strata turn out to be rock, the
dredging costs will change drastically, as blasting might be required.
Cost of maintenance dredging for 12 m depth channel will be Rs. 550 lakhs per
annum and annual operation and maintenance cost will be Rs. 1500 lakhs. The break up
is shown in Table 6.
Table 6
Annual Operation and Maintenance Cost
Sr. No. Head of Account Amount (Rs. lakhs)
1. Administrative and Accounts Staff 800
2. Marine Staff 100
3. Cost of Maintenance dredging 550
4. Maintenance of Building and Structuring 40
5. Other miscellaneous expenses 10
Total 1500
5.0 Cost Benefits The summary of benefits due to proposed channel is given below :
Direct Benefits
The direct benefits are
• to the canal authority
• to the shipping company
• the channel will give sheltered water route from the western ports to the eastern
ports
• Average time saved per voyage is 25 hours (average saving in distance
300 nautical miles and speed assumed as 12 knots)
• Average amount saved per voyage is Rs. 5.36 lakhs (2003)
5.1-115
Indirect Benefits
Some of the Indirect benefits are:
• The channel would save 25 hours of voyage and due to the lower consumption
of fuel, there will be considerable savings of foreign exchange.
• The ships transporting coal between Tuticorin and Haldia normally take 4 days
and the saving of 25 hours per voyage translates into 20% of the voyage time
and in turn can make 20% more trips.
• The channel will be of very great importance from national defense and security
point of view. The revenue from naval and coastal traffic will go up adding to
indirect benefit
6.0 Economic Viability Based on the NPV method of appraisal, the following internal rate of return are
obtained.
• With revenue and expenditure constant : Negative
• With revenue and expenditure increasing 5% annually : +5%
• With Revenue increasing by 10% and expenditure increasing 5 % : +10%
Taking into account an interest rate of 9% per annum on the capital employed
on the basis of the rate of government lending to ports, the project starts having surplus
from 19th year of its operation as per the Cash Flow statement. The Project will have a
cumulative surplus of Rs. 3,138 crores at the end of 25th year after commissioning of 12
m deep channel as shown in Table 7.
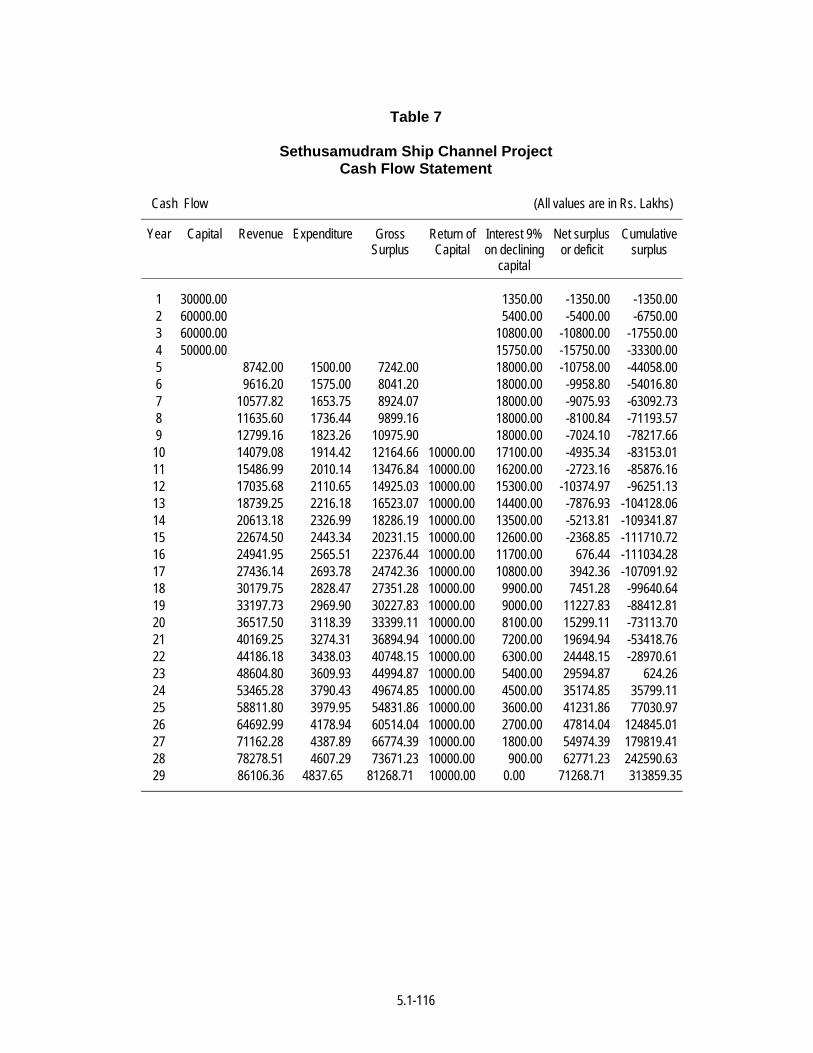
5.1-116
Table 7
Sethusamudram Ship Channel Project Cash Flow Statement
Cash Flow (All values are in Rs. Lakhs)
Year Capital Revenue Expenditure Gross Surplus
Return of Capital
Interest 9% on declining
capital
Net surplus or deficit
Cumulative surplus
1 30000.00 1350.00 -1350.00 -1350.00 2 60000.00 5400.00 -5400.00 -6750.00 3 60000.00 10800.00 -10800.00 -17550.00 4 50000.00 15750.00 -15750.00 -33300.00 5 8742.00 1500.00 7242.00 18000.00 -10758.00 -44058.00 6 9616.20 1575.00 8041.20 18000.00 -9958.80 -54016.80 7 10577.82 1653.75 8924.07 18000.00 -9075.93 -63092.73 8 11635.60 1736.44 9899.16 18000.00 -8100.84 -71193.57 9 12799.16 1823.26 10975.90 18000.00 -7024.10 -78217.66 10 14079.08 1914.42 12164.66 10000.00 17100.00 -4935.34 -83153.01 11 15486.99 2010.14 13476.84 10000.00 16200.00 -2723.16 -85876.16 12 17035.68 2110.65 14925.03 10000.00 15300.00 -10374.97 -96251.13 13 18739.25 2216.18 16523.07 10000.00 14400.00 -7876.93 -104128.06 14 20613.18 2326.99 18286.19 10000.00 13500.00 -5213.81 -109341.87 15 22674.50 2443.34 20231.15 10000.00 12600.00 -2368.85 -111710.72 16 24941.95 2565.51 22376.44 10000.00 11700.00 676.44 -111034.28 17 27436.14 2693.78 24742.36 10000.00 10800.00 3942.36 -107091.92 18 30179.75 2828.47 27351.28 10000.00 9900.00 7451.28 -99640.64 19 33197.73 2969.90 30227.83 10000.00 9000.00 11227.83 -88412.81 20 36517.50 3118.39 33399.11 10000.00 8100.00 15299.11 -73113.70 21 40169.25 3274.31 36894.94 10000.00 7200.00 19694.94 -53418.76 22 44186.18 3438.03 40748.15 10000.00 6300.00 24448.15 -28970.61 23 48604.80 3609.93 44994.87 10000.00 5400.00 29594.87 624.26 24 53465.28 3790.43 49674.85 10000.00 4500.00 35174.85 35799.11 25 58811.80 3979.95 54831.86 10000.00 3600.00 41231.86 77030.97 26 64692.99 4178.94 60514.04 10000.00 2700.00 47814.04 124845.01 27 71162.28 4387.89 66774.39 10000.00 1800.00 54974.39 179819.41 28 78278.51 4607.29 73671.23 10000.00 900.00 62771.23 242590.63 29 86106.36 4837.65 81268.71 10000.00 0.00 71268.71 313859.35
5.1-117
7.0 Conclusion 7.1 The cost of the Sethusamudram Ship Channel Project estimated at different times are as under:
1968 - Rs.37.5 crores (30 feet/10 m draught)
1983 - Rs.282 crores (30 feet/10 m draught)
1996 - Rs.685 crores (30 feet/10 m draught)
- Rs.1200 crores (35 feet/10.5 m draught)
2004 - Rs.2000 crores (35.6 feet/10.7 m draught)
The increase in the cost has been mainly due to escalation and certain changes
in channel parameters. However, the project has been found to be technically
feasible in all the proposals.
7.2 Economic Viability is the basic criteria for evaluation and approval of any
developmental project. As far as Sethusamudram Ship Channel is concerned,
this is rather difficult to quantify in an exact manner, as certain factors
contributing to the economic assessment of the project are based on a number
of probabilities. The results of the economic analysis has revealed that the IRR
for the various scenarios is as under:
- With revenue and expenditure constant - Negative - With revenue and expenditure increasing 5% annually - +5% - With Revenue increasing by 10% and expenditure increasing 5 % - 10%
Though this may not compare favourably, with the return normally adopted for a
development project there are certain direct and indirect benefits are
summarized as under :
Direct Benefits
The direct benefits are
- to the channel authority
- to the shipping company
- the channel will give sheltered water route from the western ports to the
eastern -ports.
- Average time saved per voyage is 25 hours.
- Average amount saved per voyage is Rs. 5.36 lakhs (2003)
5.1-118
Indirect Benefits
The Indirect benefits are:
- The channel would save 25 hours of voyage and due to the lower
consumption of fuel, there will be considerable savings of foreign
exchange.
- The ships transporting coal between Tuticorin and Haldia normally take 4
days and the saving of 25 hours per voyage translates into 20% of the
voyage time and in turn can make 20% more trips.
- The channel will be of very great importance from national defence and
security point of view.
Further, taking into account an interest rate of 9% per annum on the capital
employed on the basis of the rate of government lending to ports, the project
starts having surplus from 19th year of its operation as per the Cash Flow
statement. The Project will have a cumulative surplus of Rs. 3,138 crores at the
end of 25th year after commissioning
7.3 The lower rate of IRR under the present proposal is mainly due to the traffic projection carried out by SCI during January 2003, which has been estimated as 2004 transits and 153 lakhs NRT, is on the lower side compared to the earlier projection. There is some scope to re-examine this projection.
3.7 Longshore Sediment Transport The longshore sediment rate varies with season for different locations in the
study region. The details are given below :
3.7.1 Sippikulam
South West Monsoon (June-September)
North East Monsoon (October-January)
Fair Weather (February-May)
Annual Gross Transport Rate
Annual Net Transport
0.06-0.84 x 10³m3/month
0.05-2.14 x 10³m3/month
0.03-0.09 x 10³m3/month
5.0 x 10³m3/year
1.4 x 10³m3/year towards south
3.7.2 Vember
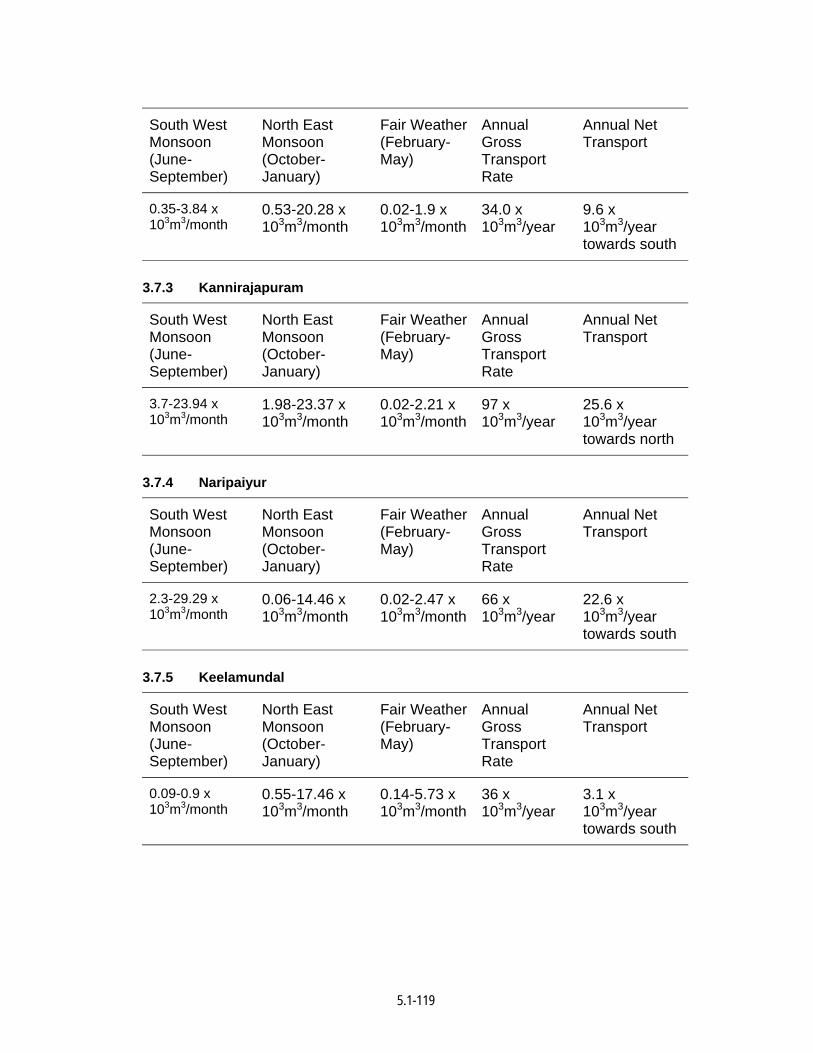
5.1-119
South West Monsoon (June-September)
North East Monsoon (October-January)
Fair Weather (February-May)
Annual Gross Transport Rate
Annual Net Transport
0.35-3.84 x 10³m3/month
0.53-20.28 x 10³m3/month
0.02-1.9 x 10³m3/month
34.0 x 10³m3/year
9.6 x 10³m3/year towards south
3.7.3 Kannirajapuram
South West Monsoon (June-September)
North East Monsoon (October-January)
Fair Weather (February-May)
Annual Gross Transport Rate
Annual Net Transport
3.7-23.94 x 10³m3/month
1.98-23.37 x 10³m3/month
0.02-2.21 x 10³m3/month
97 x 103m3/year
25.6 x 10³m3/year towards north
3.7.4 Naripaiyur
South West Monsoon (June-September)
North East Monsoon (October-January)
Fair Weather (February-May)
Annual Gross Transport Rate
Annual Net Transport
2.3-29.29 x 10³m3/month
0.06-14.46 x 10³m3/month
0.02-2.47 x 10³m3/month
66 x 103m3/year
22.6 x 10³m3/year towards south
3.7.5 Keelamundal
South West Monsoon (June-September)
North East Monsoon (October-January)
Fair Weather (February-May)
Annual Gross Transport Rate
Annual Net Transport
0.09-0.9 x 10³m3/month
0.55-17.46 x 10³m3/month
0.14-5.73 x 10³m3/month
36 x 103m3/year
3.1 x 10³m3/year towards south
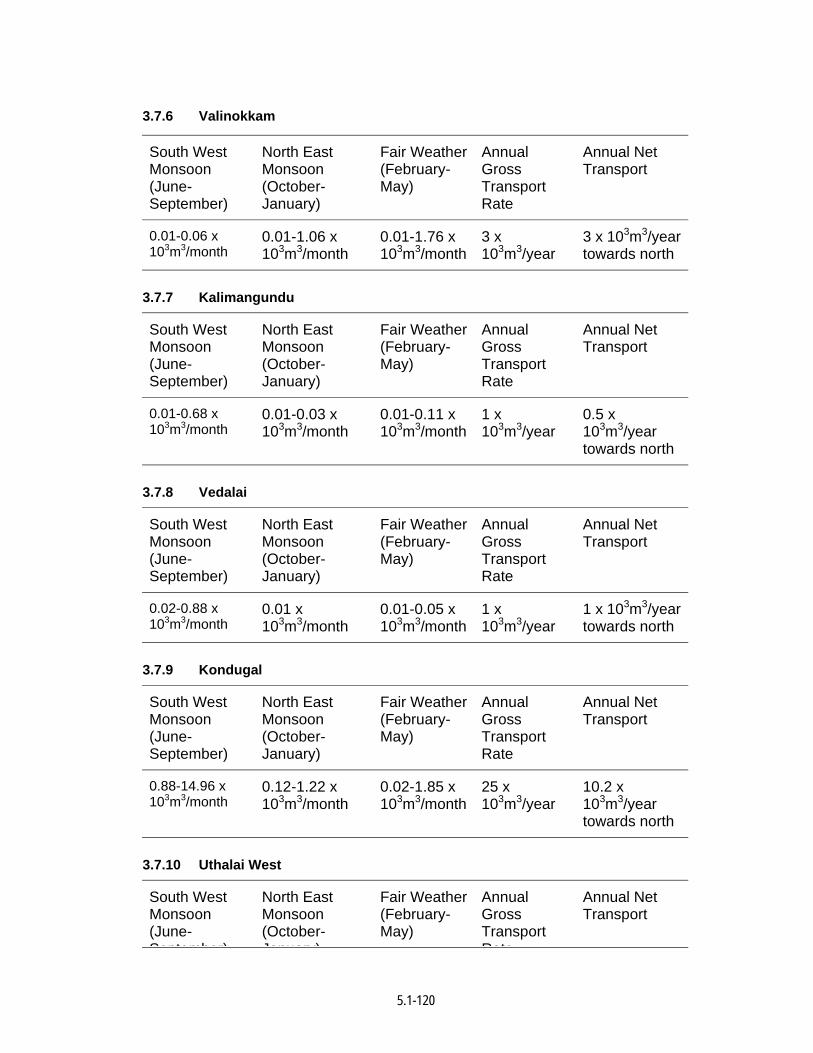
5.1-120
3.7.6 Valinokkam
South West Monsoon (June-September)
North East Monsoon (October-January)
Fair Weather (February-May)
Annual Gross Transport Rate
Annual Net Transport
0.01-0.06 x 10³m3/month
0.01-1.06 x 10³m3/month
0.01-1.76 x 10³m3/month
3 x 10³m3/year
3 x 10³m3/year towards north
3.7.7 Kalimangundu
South West Monsoon (June-September)
North East Monsoon (October-January)
Fair Weather (February-May)
Annual Gross Transport Rate
Annual Net Transport
0.01-0.68 x 10³m3/month
0.01-0.03 x 10³m3/month
0.01-0.11 x 10³m3/month
1 x 10³m3/year
0.5 x 10³m3/year towards north
3.7.8 Vedalai
South West Monsoon (June-September)
North East Monsoon (October-January)
Fair Weather (February-May)
Annual Gross Transport Rate
Annual Net Transport
0.02-0.88 x 10³m3/month
0.01 x 10³m3/month
0.01-0.05 x 10³m3/month
1 x 10³m3/year
1 x 10³m3/year towards north
3.7.9 Kondugal
South West Monsoon (June-September)
North East Monsoon (October-January)
Fair Weather (February-May)
Annual Gross Transport Rate
Annual Net Transport
0.88-14.96 x 10³m3/month
0.12-1.22 x 10³m3/month
0.02-1.85 x 10³m3/month
25 x 103m3/year
10.2 x 10³m3/year towards north
3.7.10 Uthalai West
South West Monsoon (June-September)
North East Monsoon (October-January)
Fair Weather (February-May)
Annual Gross Transport Rate
Annual Net Transport
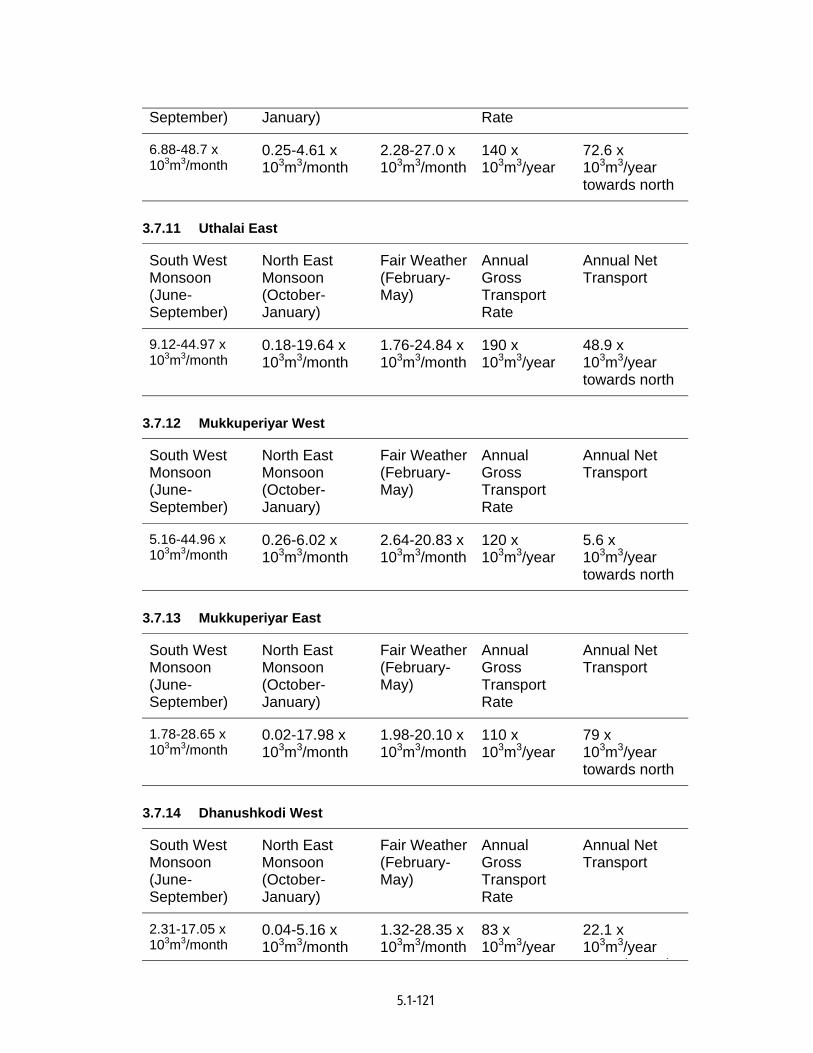
5.1-121
September) January) Rate
6.88-48.7 x 10³m3/month
0.25-4.61 x 10³m3/month
2.28-27.0 x 10³m3/month
140 x 103m3/year
72.6 x 10³m3/year towards north
3.7.11 Uthalai East
South West Monsoon (June-September)
North East Monsoon (October-January)
Fair Weather (February-May)
Annual Gross Transport Rate
Annual Net Transport
9.12-44.97 x 10³m3/month
0.18-19.64 x 10³m3/month
1.76-24.84 x 10³m3/month
190 x 103m3/year
48.9 x 10³m3/year towards north
3.7.12 Mukkuperiyar West
South West Monsoon (June-September)
North East Monsoon (October-January)
Fair Weather (February-May)
Annual Gross Transport Rate
Annual Net Transport
5.16-44.96 x 10³m3/month
0.26-6.02 x 10³m3/month
2.64-20.83 x 10³m3/month
120 x 103m3/year
5.6 x 10³m3/year towards north
3.7.13 Mukkuperiyar East
South West Monsoon (June-September)
North East Monsoon (October-January)
Fair Weather (February-May)
Annual Gross Transport Rate
Annual Net Transport
1.78-28.65 x 10³m3/month
0.02-17.98 x 10³m3/month
1.98-20.10 x 10³m3/month
110 x 103m3/year
79 x 103m3/year towards north
3.7.14 Dhanushkodi West
South West Monsoon (June-September)
North East Monsoon (October-January)
Fair Weather (February-May)
Annual Gross Transport Rate
Annual Net Transport
2.31-17.05 x 10³m3/month
0.04-5.16 x 10³m3/month
1.32-28.35 x 10³m3/month
83 x 103m3/year
22.1 x 10³m3/year t d th
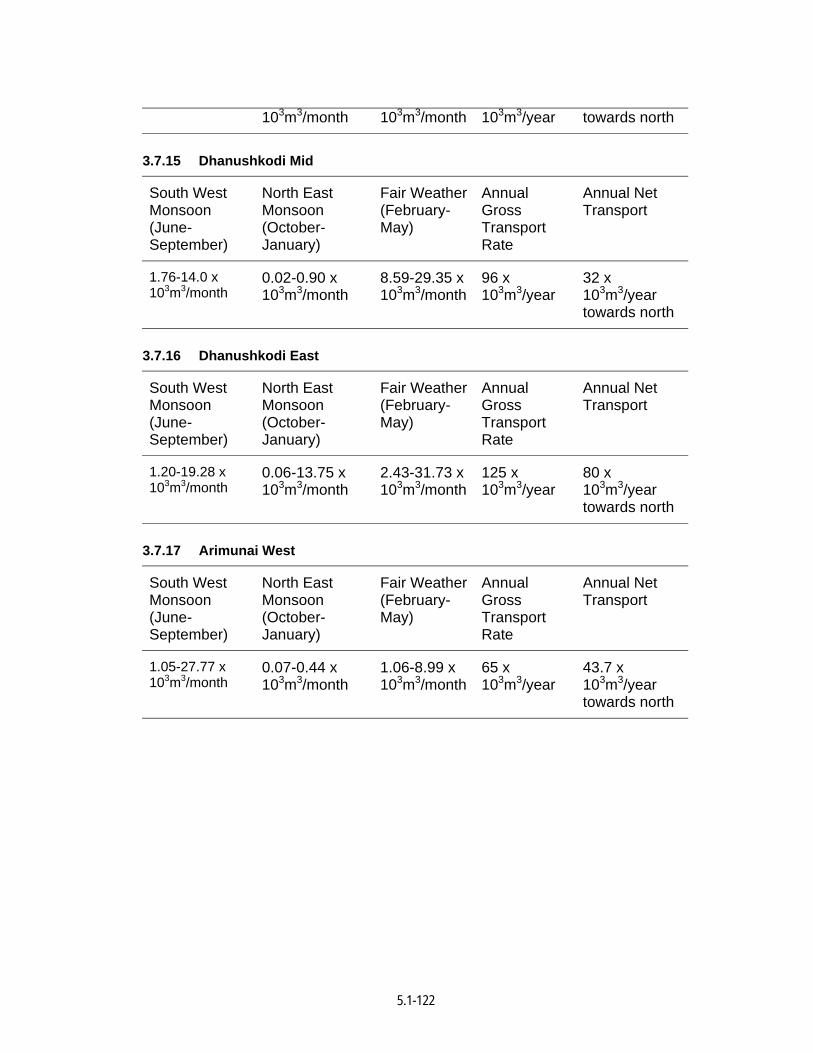
5.1-122
103m3/month 103m3/month 103m3/year towards north
3.7.15 Dhanushkodi Mid
South West Monsoon (June-September)
North East Monsoon (October-January)
Fair Weather (February-May)
Annual Gross Transport Rate
Annual Net Transport
1.76-14.0 x 10³m3/month
0.02-0.90 x 10³m3/month
8.59-29.35 x 10³m3/month
96 x 103m3/year
32 x 103m3/year towards north
3.7.16 Dhanushkodi East
South West Monsoon (June-September)
North East Monsoon (October-January)
Fair Weather (February-May)
Annual Gross Transport Rate
Annual Net Transport
1.20-19.28 x 10³m3/month
0.06-13.75 x 10³m3/month
2.43-31.73 x 10³m3/month
125 x 103m3/year
80 x 103m3/year towards north
3.7.17 Arimunai West
South West Monsoon (June-September)
North East Monsoon (October-January)
Fair Weather (February-May)
Annual Gross Transport Rate
Annual Net Transport
1.05-27.77 x 10³m3/month
0.07-0.44 x 10³m3/month
1.06-8.99 x 10³m3/month
65 x 103m3/year
43.7 x 10³m3/year towards north
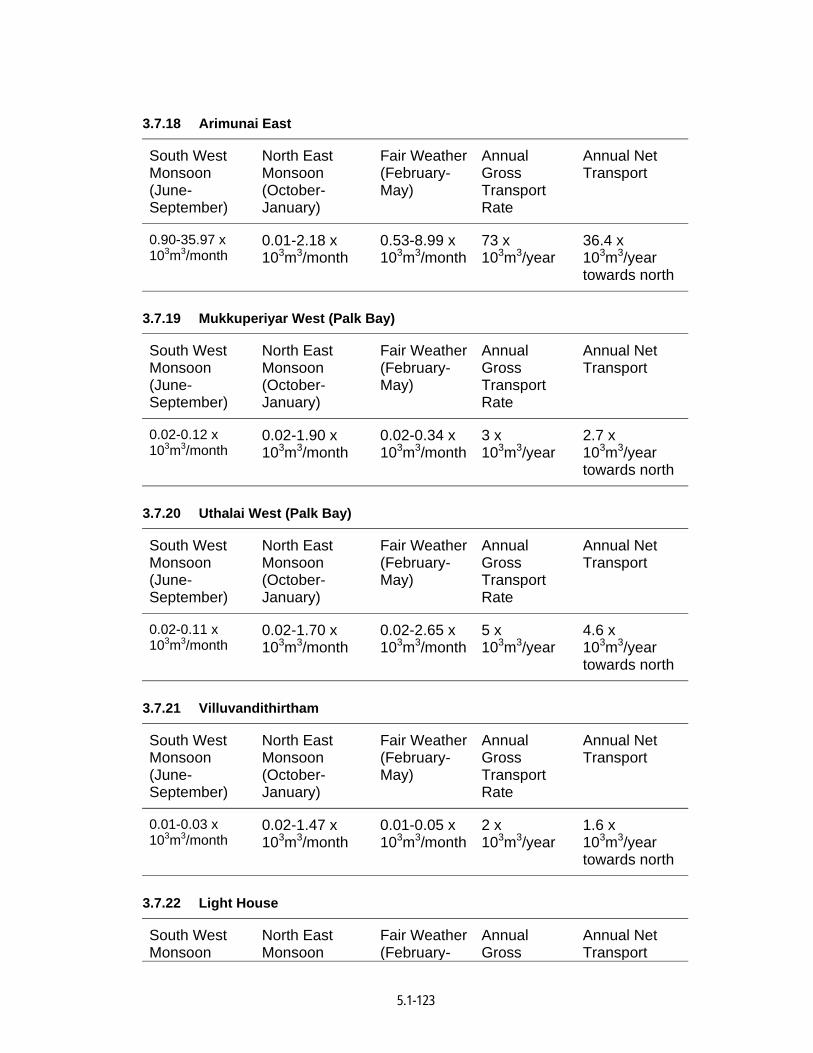
5.1-123
3.7.18 Arimunai East
South West Monsoon (June-September)
North East Monsoon (October-January)
Fair Weather (February-May)
Annual Gross Transport Rate
Annual Net Transport
0.90-35.97 x 10³m3/month
0.01-2.18 x 10³m3/month
0.53-8.99 x 10³m3/month
73 x 103m3/year
36.4 x 10³m3/year towards north
3.7.19 Mukkuperiyar West (Palk Bay)
South West Monsoon (June-September)
North East Monsoon (October-January)
Fair Weather (February-May)
Annual Gross Transport Rate
Annual Net Transport
0.02-0.12 x 10³m3/month
0.02-1.90 x 10³m3/month
0.02-0.34 x 10³m3/month
3 x 10³m3/year
2.7 x 10³m3/year towards north
3.7.20 Uthalai West (Palk Bay)
South West Monsoon (June-September)
North East Monsoon (October-January)
Fair Weather (February-May)
Annual Gross Transport Rate
Annual Net Transport
0.02-0.11 x 10³m3/month
0.02-1.70 x 10³m3/month
0.02-2.65 x 10³m3/month
5 x 10³m3/year
4.6 x 10³m3/year towards north
3.7.21 Villuvandithirtham
South West Monsoon (June-September)
North East Monsoon (October-January)
Fair Weather (February-May)
Annual Gross Transport Rate
Annual Net Transport
0.01-0.03 x 10³m3/month
0.02-1.47 x 10³m3/month
0.01-0.05 x 10³m3/month
2 x 10³m3/year
1.6 x 10³m3/year towards north
3.7.22 Light House
South West Monsoon
North East Monsoon
Fair Weather (February-
Annual Gross
Annual Net Transport
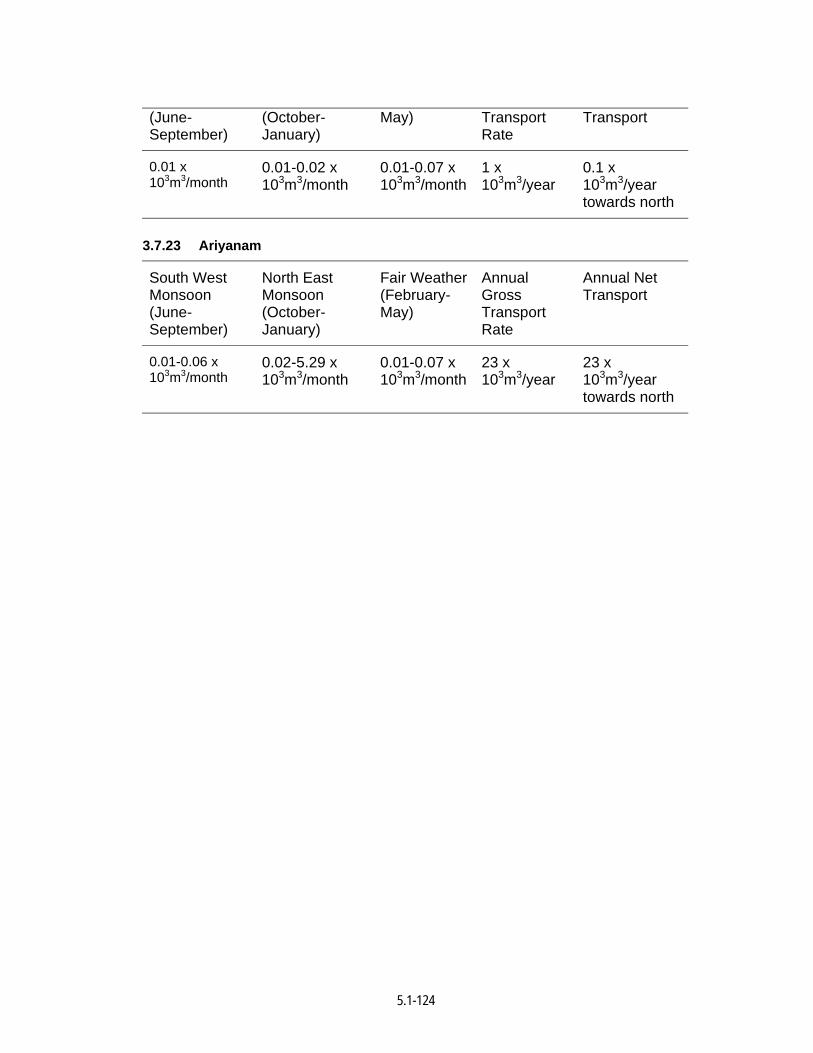
5.1-124
(June-September)
(October-January)
May) Transport Rate
Transport
0.01 x 10³m3/month
0.01-0.02 x 10³m3/month
0.01-0.07 x 10³m3/month
1 x 10³m3/year
0.1 x 10³m3/year towards north
3.7.23 Ariyanam
South West Monsoon (June-September)
North East Monsoon (October-January)
Fair Weather (February-May)
Annual Gross Transport Rate
Annual Net Transport
0.01-0.06 x 10³m3/month
0.02-5.29 x 10³m3/month
0.01-0.07 x 10³m3/month
23 x 103m3/year
23 x 103m3/year towards north
5.1-125
During southwest monsoon, the longshore sediment transport was considerable
(>10x103m3/month) along the spit facing Gulf of Mannar and negligible on Palk Bay side.
Very close to the tip i.e., near Arimunai the longshore transport direction dominate in
easterly direction indicating the movement from Gulf of Mannar to Palk Bay through
Adam’s Bridge.
In northeast monsoon the values of longshore transport rate was relatively low
along the spit facing Gulf of Mannar and negligible in Palk Bay. It is noticed that the long
shore sediment transport rate was considerable (>10x103m3/month) in January between
Uthalai and Mukkuperiyar. The sediment transport direction was consistently towards
west in Gulf of Mannar and east in Palk Bay.
In fair weather period the longshore sediment transport was low along the spit
facing Gulf of Mannar and also Palk Bay. The transport direction was observed to be
westerly near the tip facing Gulf of Mannar. It shows that in February, April and May the
sediment drifts from Palk Bay to Gulf of Mannar and the net quantity is found to be
8000m3, 6000 m3, 20000 m3 respectively. Consequently, in March, March, June, July,
August and September, it drifts from Gulf of Mannar towards Palk Bay and the quantity is
8000 m3, 35000 m3, 10000 m3, 4000 m3 and 1000 m3 respectively. There was no
significant movement of sediment observed during October to January. It infers that
during southwest monsoon, the sediments move from Gulf of Mannar to Palk Bay and
during fair weather period from Palk Bay to Gulf of Mannar. No noticeable exchange due
to wave induced longshore transport takes place in northeast monsoon. It is noticed that
over a period of one year, a net volume of 24000 m3 sediments as a wave induced
longshore transport move from Gulf of Mannar to Palk Bay around Adam’s Bridge.
The study indicates that in general the entire study region between Tuticorin and
Ariyaman including the Rameswaram Island experiences very low sediment transport rate
compared to the rest of Indian east coast. The east coast between Chennai and
Paradeep experiences a gross transport rate of more than 1x10⁶m3/year. On the
otherhand, along the study region, it remained always less than 0.1x10⁶m3/year, which
shows only 10 percent of the rest of the Indian east coast.
The sediment transport rate is practically negligible throughout the year,
particularly between Valinokkam and Kondugal in Gulf of Mannar, and between Arimunai
and Ariyaman in Palk Bay. The geomorphological formation of inner part of Gulf of
Mannar and the presence of many offshore islands are the main reasons for wave
attenuation and reduction in sediment transport.
5.1-126
The coastal segment between Tuticorin and Valinokkam experienced relatively
higher sediment transport rate during northeast monsoon, but remained calm during the
rest of the year. However, the small stretch between Vember and Naripaiyur experienced
relatively higher sediment transport rate also during southwest monsoon. The only
coastline between Uthalai and Arimunai experienced relatively higher sediment transport
rate both during southwest monsoon and fair weather period, with relatively low sediment
transport during northeast monsoon.
The direction of sediment transport during southwest monsoon remained
easterly between Tuticorin and Arimunai except near Kondugal and Dhanushkodi, where
it was opposite towards west. Due to the reversal of sediment transport direction near
Kondugal, the easterly transport gets deposited in the vicinity of Pamban Pass, Kursadi
Tivu, Kovi Tivu and Shingle Tivu. Once again the easterly transport along Vedalai
terminates near Dhanushkodi which would cause the formation of shoals in the vicinity off
Arimunai. Such formation of submerged shoals was observed south of Arimunai during
the study period. The prevalence of easterly transport at Arimunai might cause part of the
sediments deposited as shoals to migrate towards Adam’s Bridge and enter into Palk
Bay. This process migration of sediments were noticed close to Adam’s Bridge. Hence a
small proportion of littoral drift deposited during southwest monsoon close to Pamban
Pass and Arimunai has the tendency to enter Palk Bay.
During the northeast monsoon, the sediment transport rate was very low
moving in southerly direction between Tuticorin and Valinokkam and it was negligible
between Valinokkam and Mandapam. Between Kondugal and Arimunai, the transport
was relatively low in westerly direction. It implies that there will be a deposition of littoral
drift in the vicinity of Pamban Pass. Due to low littoral drift taking place during northeast
monsoon, the quantity of sediments entering Gulf of Mannar from Palk Bay will be much
lower than the quantity moving from Gulf of Mannar to Palk Bay during southwest
monsoon.
During fair weather monsoon, the sediment transport rate along the entire study
region except between Uthalai and Arimunai remains negligible. The sediment transport
between Uthalai and Arimunai exists relatively low in westerly direction for which the
source of sediment is expected from Palk Bay though Adam’s Bridge.
Due to low sediment transport rate prevailing in the study region, which
comprises of about 10 percent compared to the rest of Indian east coast, the volume of
sediment exchange is expected to be low. During southwest monsoon, the sizeable
portion of littoral drift from west coast passing around Kanyakumari is seen getting
5.1-127
deposited before reaching Tuticorin. This deposited sediment is supplied back for the
westerly transport during northeast monsoon. Such deposition is evidenced from the
occurrence of large beach deposition is evidenced from the occurrence of large beach
deposits and elevated dunes along Tiruchendur – Manapad region. Similarly, the
southerly transport along the east coast during northeast monsoon gets deposited
between Vedaranyam and Manmelkudi in Palk Bay, which is supplied back to the littoral
drift cycle during southwest monsoon.
Thus the study indicates that there is a break in the chain of littoral drift at
Tuticorin on the south and Vedaranyam is relatively low and there exits limited quantity of
exchange through Pamban Pass and Adam’s Bridge.
It signifies that the region around Adam’s Bridge forms as significant sink for the
littoral drift. The prolonged accumulation may lead to the emergence of new islands. In
case of occurrence of cyclones in Gulf of Mannar, such prolonged deposition of
sediments move north and enter in Palk Bay through Pamban Pass and Adam’s Bridge.
Once the sediments enter in Palk Bay, the environment favours immediate deposition.
Hence the occurrence of cyclones in Gulf of Mannar and the associated high northerly
waves might exchange more sediments from the southern part of Peninsular India to
northern part of east coast. Similarly any cyclones moving in Palk Bay, would generate
large southerly waves and transport sizeable amount of deposited sediments into Gulf of
Mannar. In the event of absence of cyclones, the deposition will increase causing the
enlargement of sand spit and shoaling across Adam’s Bridge, but the order of sediment
exchange will be limited.
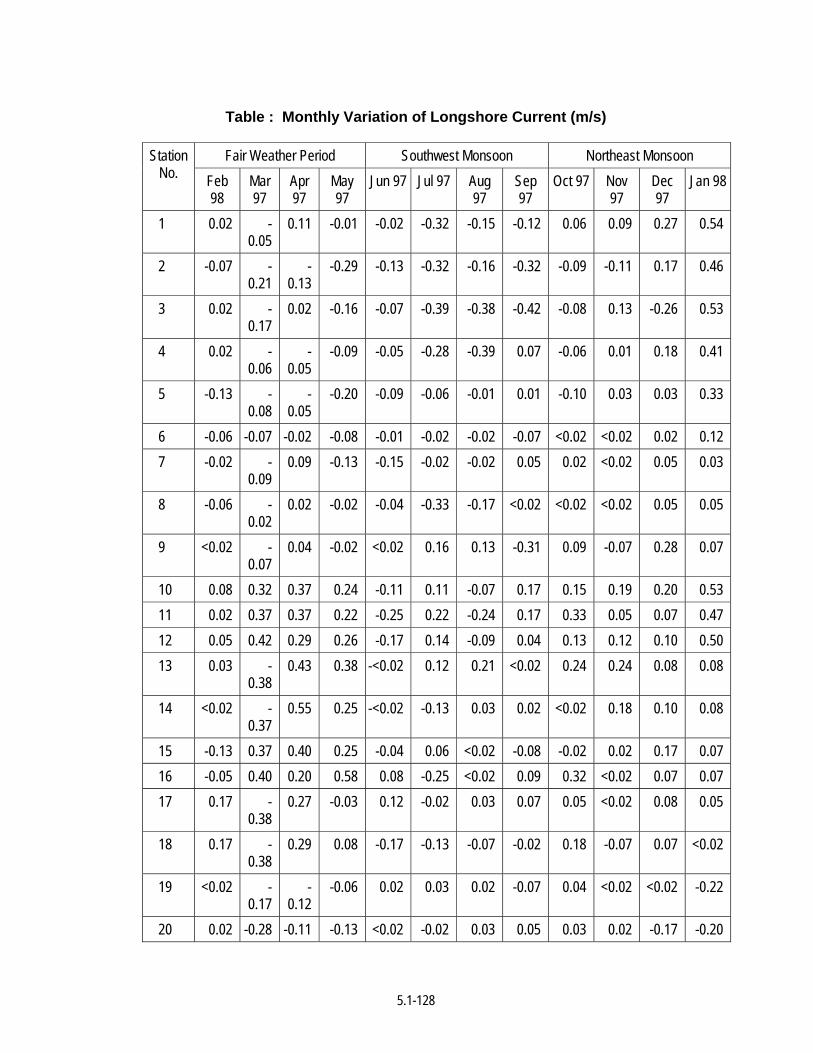
5.1-128
Table : Monthly Variation of Longshore Current (m/s)
Fair Weather Period Southwest Monsoon Northeast Monsoon Station No. Feb
98 Mar 97
Apr 97
May 97
Jun 97 Jul 97 Aug 97
Sep 97
Oct 97 Nov 97
Dec 97
Jan 98
1 0.02 -0.05
0.11 -0.01 -0.02 -0.32 -0.15 -0.12 0.06 0.09 0.27 0.54
2 -0.07 -0.21
-0.13
-0.29 -0.13 -0.32 -0.16 -0.32 -0.09 -0.11 0.17 0.46
3 0.02 -0.17
0.02 -0.16 -0.07 -0.39 -0.38 -0.42 -0.08 0.13 -0.26 0.53
4 0.02 -0.06
-0.05
-0.09 -0.05 -0.28 -0.39 0.07 -0.06 0.01 0.18 0.41
5 -0.13 -0.08
-0.05
-0.20 -0.09 -0.06 -0.01 0.01 -0.10 0.03 0.03 0.33
6 -0.06 -0.07 -0.02 -0.08 -0.01 -0.02 -0.02 -0.07 <0.02 <0.02 0.02 0.12 7 -0.02 -
0.09 0.09 -0.13 -0.15 -0.02 -0.02 0.05 0.02 <0.02 0.05 0.03
8 -0.06 -0.02
0.02 -0.02 -0.04 -0.33 -0.17 <0.02 <0.02 <0.02 0.05 0.05
9 <0.02 -0.07
0.04 -0.02 <0.02 0.16 0.13 -0.31 0.09 -0.07 0.28 0.07
10 0.08 0.32 0.37 0.24 -0.11 0.11 -0.07 0.17 0.15 0.19 0.20 0.53 11 0.02 0.37 0.37 0.22 -0.25 0.22 -0.24 0.17 0.33 0.05 0.07 0.47 12 0.05 0.42 0.29 0.26 -0.17 0.14 -0.09 0.04 0.13 0.12 0.10 0.50 13 0.03 -
0.38 0.43 0.38 -<0.02 0.12 0.21 <0.02 0.24 0.24 0.08 0.08
14 <0.02 -0.37
0.55 0.25 -<0.02 -0.13 0.03 0.02 <0.02 0.18 0.10 0.08
15 -0.13 0.37 0.40 0.25 -0.04 0.06 <0.02 -0.08 -0.02 0.02 0.17 0.07 16 -0.05 0.40 0.20 0.58 0.08 -0.25 <0.02 0.09 0.32 <0.02 0.07 0.07 17 0.17 -
0.38 0.27 -0.03 0.12 -0.02 0.03 0.07 0.05 <0.02 0.08 0.05
18 0.17 -0.38
0.29 0.08 -0.17 -0.13 -0.07 -0.02 0.18 -0.07 0.07 <0.02
19 <0.02 -0.17
-0.12
-0.06 0.02 0.03 0.02 -0.07 0.04 <0.02 <0.02 -0.22
20 0.02 -0.28 -0.11 -0.13 <0.02 -0.02 0.03 0.05 0.03 0.02 -0.17 -0.20
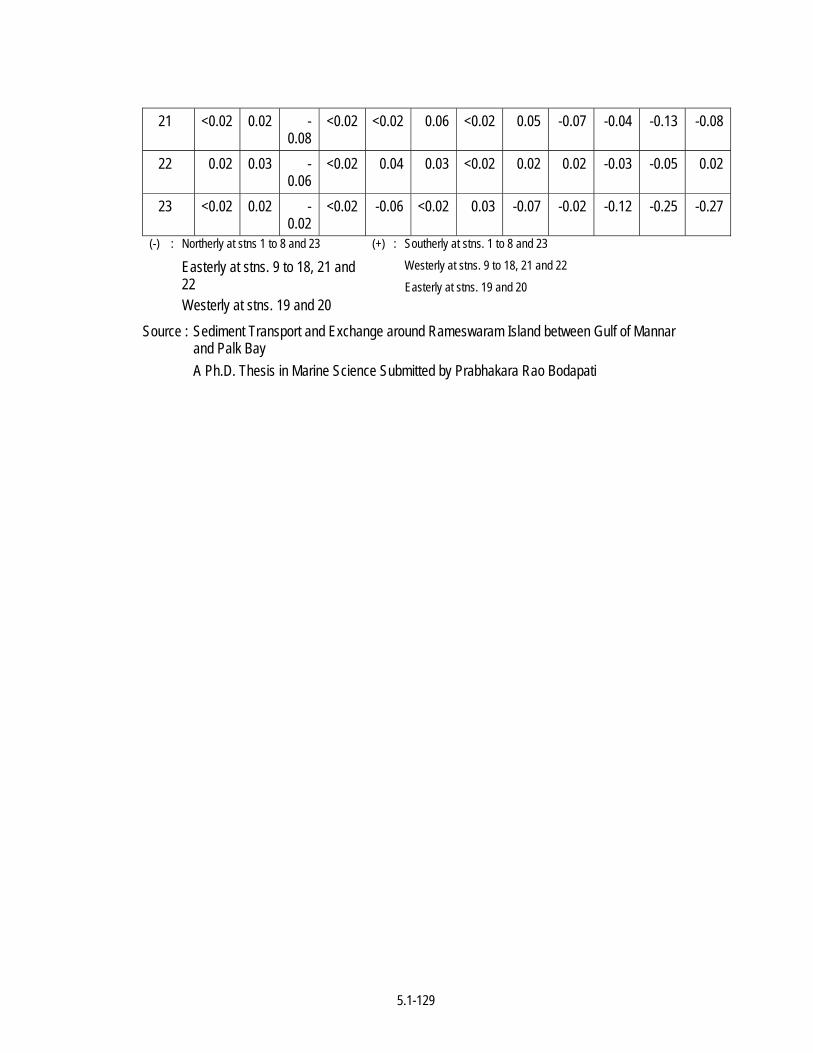
5.1-129
21 <0.02 0.02 -0.08
<0.02 <0.02 0.06 <0.02 0.05 -0.07 -0.04 -0.13 -0.08
22 0.02 0.03 -0.06
<0.02 0.04 0.03 <0.02 0.02 0.02 -0.03 -0.05 0.02
23 <0.02 0.02 -0.02
<0.02 -0.06 <0.02 0.03 -0.07 -0.02 -0.12 -0.25 -0.27
(-) : Northerly at stns 1 to 8 and 23
Easterly at stns. 9 to 18, 21 and 22
Westerly at stns. 19 and 20
(+) : Southerly at stns. 1 to 8 and 23 Westerly at stns. 9 to 18, 21 and 22
Easterly at stns. 19 and 20
Source : Sediment Transport and Exchange around Rameswaram Island between Gulf of Mannar and Palk Bay
A Ph.D. Thesis in Marine Science Submitted by Prabhakara Rao Bodapati
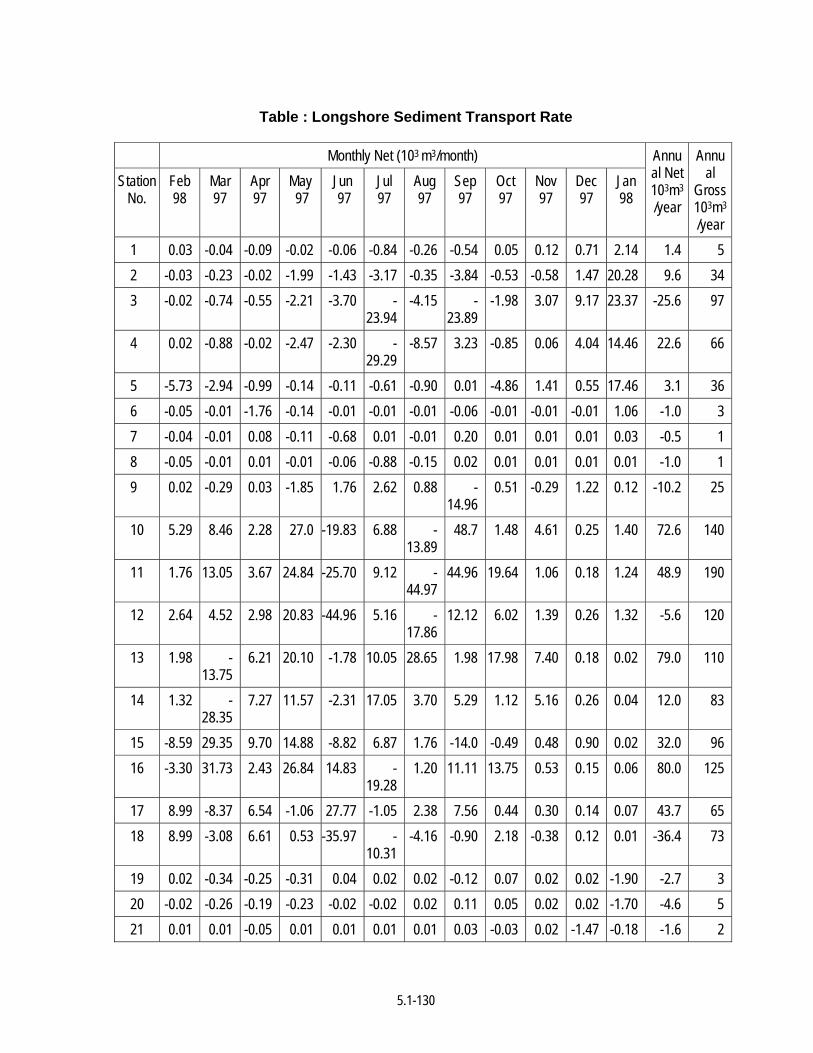
5.1-130
Table : Longshore Sediment Transport Rate
Monthly Net (103 m3/month) Station
No. Feb 98
Mar 97
Apr 97
May 97
Jun 97
Jul 97
Aug 97
Sep 97
Oct 97
Nov 97
Dec 97
Jan 98
Annual Net 103m3
/year
Annual
Gross 103m3
/year 1 0.03 -0.04 -0.09 -0.02 -0.06 -0.84 -0.26 -0.54 0.05 0.12 0.71 2.14 1.4 5 2 -0.03 -0.23 -0.02 -1.99 -1.43 -3.17 -0.35 -3.84 -0.53 -0.58 1.47 20.28 9.6 34 3 -0.02 -0.74 -0.55 -2.21 -3.70 -
23.94 -4.15 -
23.89 -1.98 3.07 9.17 23.37 -25.6 97
4 0.02 -0.88 -0.02 -2.47 -2.30 -29.29
-8.57 3.23 -0.85 0.06 4.04 14.46 22.6 66
5 -5.73 -2.94 -0.99 -0.14 -0.11 -0.61 -0.90 0.01 -4.86 1.41 0.55 17.46 3.1 36 6 -0.05 -0.01 -1.76 -0.14 -0.01 -0.01 -0.01 -0.06 -0.01 -0.01 -0.01 1.06 -1.0 3 7 -0.04 -0.01 0.08 -0.11 -0.68 0.01 -0.01 0.20 0.01 0.01 0.01 0.03 -0.5 1 8 -0.05 -0.01 0.01 -0.01 -0.06 -0.88 -0.15 0.02 0.01 0.01 0.01 0.01 -1.0 1 9 0.02 -0.29 0.03 -1.85 1.76 2.62 0.88 -
14.96 0.51 -0.29 1.22 0.12 -10.2 25
10 5.29 8.46 2.28 27.0 -19.83 6.88 -13.89
48.7 1.48 4.61 0.25 1.40 72.6 140
11 1.76 13.05 3.67 24.84 -25.70 9.12 -44.97
44.96 19.64 1.06 0.18 1.24 48.9 190
12 2.64 4.52 2.98 20.83 -44.96 5.16 -17.86
12.12 6.02 1.39 0.26 1.32 -5.6 120
13 1.98 -13.75
6.21 20.10 -1.78 10.05 28.65 1.98 17.98 7.40 0.18 0.02 79.0 110
14 1.32 -28.35
7.27 11.57 -2.31 17.05 3.70 5.29 1.12 5.16 0.26 0.04 12.0 83
15 -8.59 29.35 9.70 14.88 -8.82 6.87 1.76 -14.0 -0.49 0.48 0.90 0.02 32.0 96 16 -3.30 31.73 2.43 26.84 14.83 -
19.28 1.20 11.11 13.75 0.53 0.15 0.06 80.0 125
17 8.99 -8.37 6.54 -1.06 27.77 -1.05 2.38 7.56 0.44 0.30 0.14 0.07 43.7 65 18 8.99 -3.08 6.61 0.53 -35.97 -
10.31 -4.16 -0.90 2.18 -0.38 0.12 0.01 -36.4 73
19 0.02 -0.34 -0.25 -0.31 0.04 0.02 0.02 -0.12 0.07 0.02 0.02 -1.90 -2.7 3 20 -0.02 -0.26 -0.19 -0.23 -0.02 -0.02 0.02 0.11 0.05 0.02 0.02 -1.70 -4.6 5 21 0.01 0.01 -0.05 0.01 0.01 0.01 0.01 0.03 -0.03 0.02 -1.47 -0.18 -1.6 2
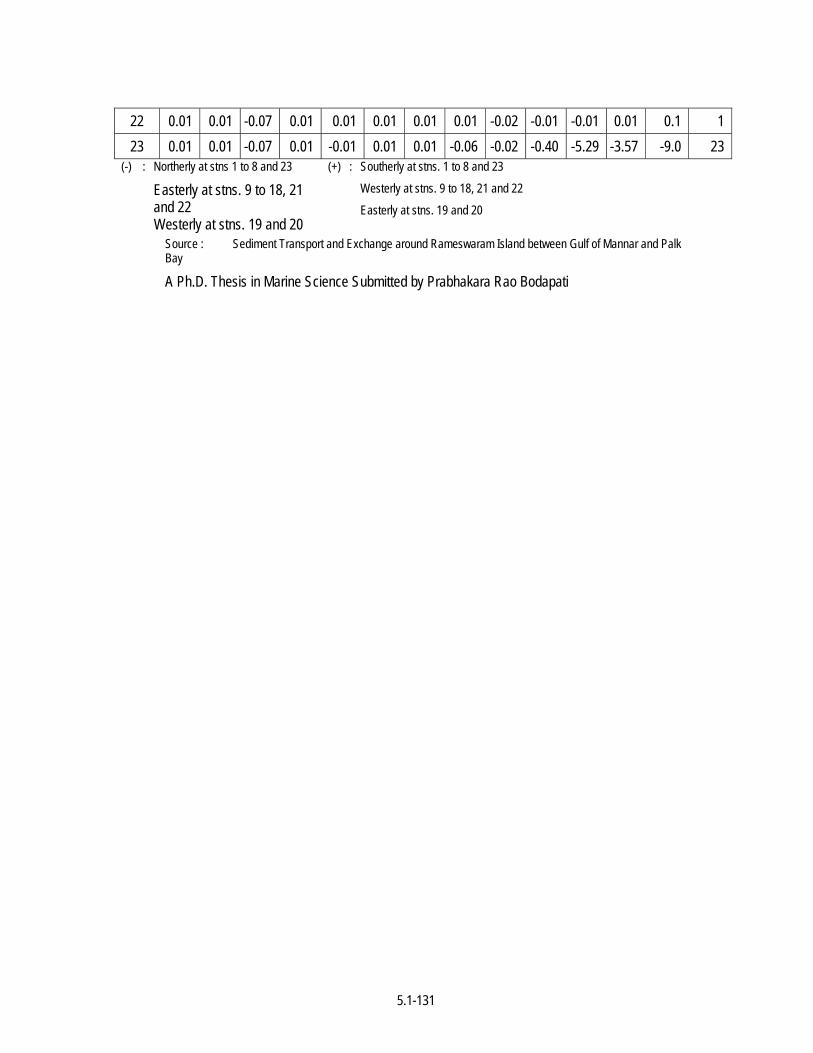
5.1-131
22 0.01 0.01 -0.07 0.01 0.01 0.01 0.01 0.01 -0.02 -0.01 -0.01 0.01 0.1 1 23 0.01 0.01 -0.07 0.01 -0.01 0.01 0.01 -0.06 -0.02 -0.40 -5.29 -3.57 -9.0 23
(-) : Northerly at stns 1 to 8 and 23
Easterly at stns. 9 to 18, 21 and 22
Westerly at stns. 19 and 20
(+) : Southerly at stns. 1 to 8 and 23
Westerly at stns. 9 to 18, 21 and 22
Easterly at stns. 19 and 20
Source : Sediment Transport and Exchange around Rameswaram Island between Gulf of Mannar and Palk Bay
A Ph.D. Thesis in Marine Science Submitted by Prabhakara Rao Bodapati
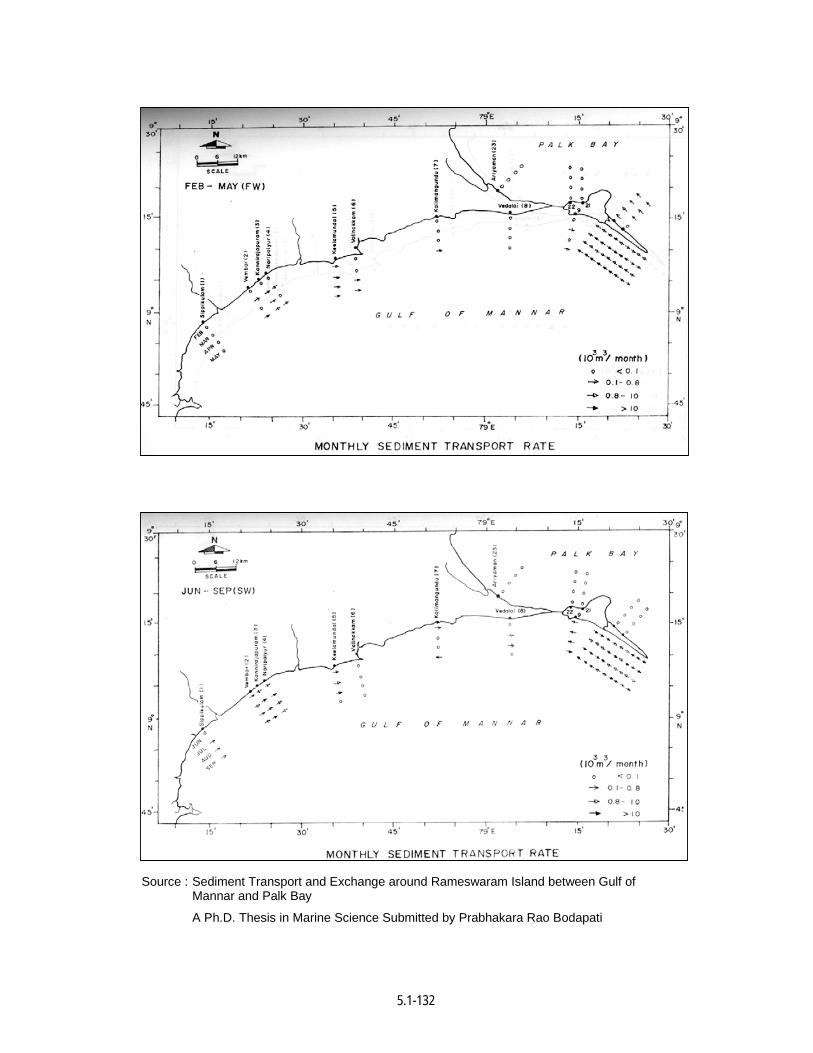
5.1-132
Source : Sediment Transport and Exchange around Rameswaram Island between Gulf of Mannar and Palk Bay
A Ph.D. Thesis in Marine Science Submitted by Prabhakara Rao Bodapati
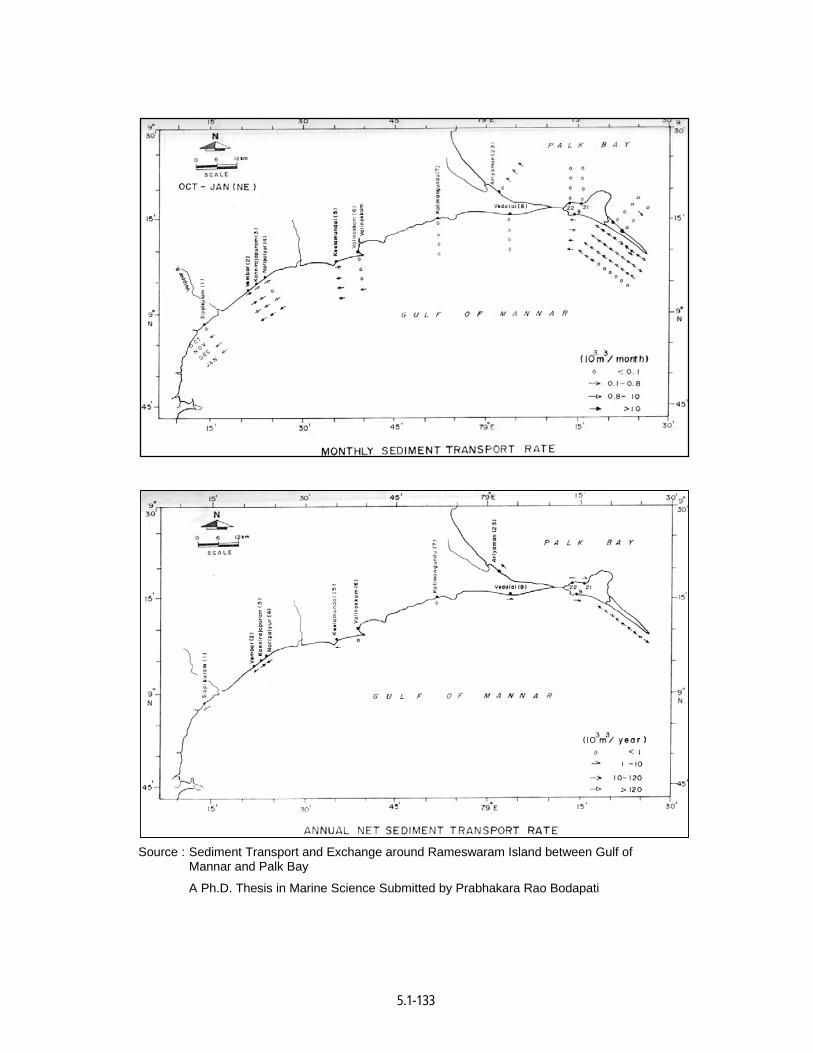
5.1-133
Source : Sediment Transport and Exchange around Rameswaram Island between Gulf of Mannar and Palk Bay
A Ph.D. Thesis in Marine Science Submitted by Prabhakara Rao Bodapati
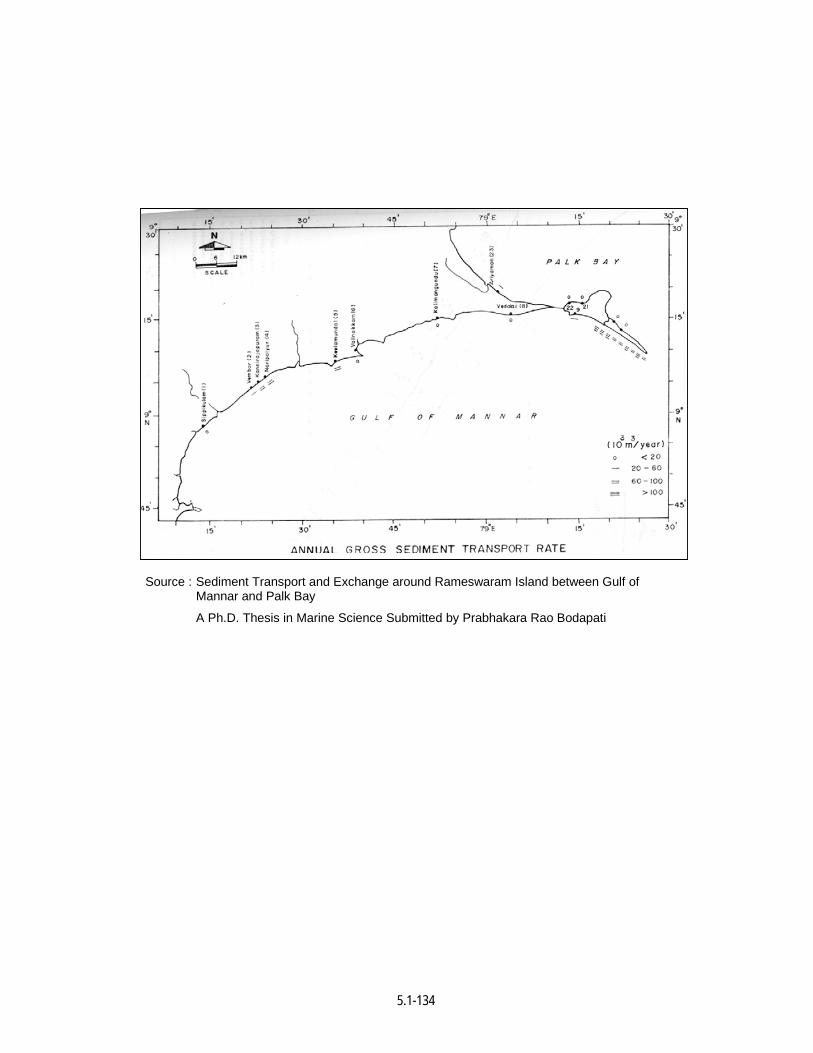
5.1-134
Source : Sediment Transport and Exchange around Rameswaram Island between Gulf of Mannar and Palk Bay
A Ph.D. Thesis in Marine Science Submitted by Prabhakara Rao Bodapati
5.1-135
3.8 Current Studies :
Stn. No. Location Description
C1 Adams Bridge Influence by GM and PB
C2 Uthalai Influence by GM
C3 Pamban Pass Influence by GM and PB
C4 Tharuvai Influence by PB
GM : Gulf of Mannar PB : Palk Bay
Continuous measurements on tidal current speed and direction were carried out
for three seasons at 4 locations viz., i) stn. C1 - off Arimunai-Adam’s Bridge, ii) stn. C2 -
off Uthalai (Gulf of Mannar), iii) stn. C3 - Pamban Pass, and iv) stn. C4 - off Tharuvai
(Palk Bay). The measured currents were resolved into parallel and perpendicular
components with respect to the coastline. The variation of current speed and direction
and the resolved components are presented in Figs. 4.32 to 4.50.
3.8.1 Southwest monsoon (June to September)
Near Arimunai (stn. C1) the average current speed occurred around 0.2 m/s
with the maximum and minimum speed of 0.3 m/s and 0.05 m/s respectively both at
surface and bottom (Fig. 4.32). The variation of current direction had not followed the
tidal phase. It showed consistent northwesterly flow over one tidal cycle and changed to
southeasterly flow for the subsequent tidal cycle. It indicates that current shifted its flow
direction for alternate tidal cycles rather than flood and ebb tidal phases. The shore
parallel component of currents indicates that for larger tidal range, the flow was in
westerly direction and for small range in easterly direction (Fig. 4.33). The shore
perpendicular component of currents indicates that the flow consistently existed from Gulf
of Mannar into Palk Bay. The northwesterly and southeasterly currents over different tidal
cycles were found to be equally predominant.
At Uthalai (stn. C2) in Gulf of Mannar, the average current prevailed around 0.1
m/s with the maximum and minimum of 0.2 m/s and 0.05 m/s respectively (Fig. 4.34).
Similar to stn. C1, the bottom current was seen responding to tides flowing east over one
tidal cycle and west during the subsequent tidal cycle. The direction of flow was
predominant in southeasterly direction for larger tidal range and northwesterly direction
for small tidal range. The shore parallel component of currents indicates that the flow
shifted in southeast and northwest both at surface and bottom (Fig. 4.35). The shore
5.1-136
perpendicular component of currents indicates that the flow shifts towards northeast and
southwest both at surface and remains consistently northeast at bottom.
The variation of currents at surface measured near Pamban Pass (stn. C3) is
shown in Fig. 4.36. The current speed was found to be strong showing an average of 0.5
m/s, with the maximum of 1 m/s and minimum of 0.1 m/s. Current direction remained
consistently northeast flowing from Gulf of Mannar into Palk Bay. Variation of current
speed shows that the magnitude of the current speed was more during flood and less
during ebb tide indicating the influence of tides over the seasonal unidirectional flow. The
shore parallel component of currents indicates that the flow is into Palk Bay with high
speed during flood tide and low speed during ebb tide (Fig. 4.36). The shore
perpendicular component of currents indicates that the flow is across the Pamban Pass
towards Rameswaram Island.
At Tharuvai (stn. C4), the average current speed of 0.2 m/s with the maximum of
0.3 m/s and minimum of 0.1 m/s were observed both at surface and bottom (Fig. 4.37).
The flow was unidirectional towards southeast but the current speed varied with tidal
phase. Current speed was high during flood tide and low during ebb tide indicating the
strong influence of seasonal circulation current towards northeast during southwest
monsoon period. The shore parallel component of currents indicates that the flow was
towards southeast at surface and bottom (Fig. 4.38). The shore perpendicular component
of currents indicates the flow was towards northeast both at surface and bottom.
The measurement shows that during southwest monsoon when the tidal range
is large, the opposite direction of flow prevail between Adam’s Bridge (stn. C1) and
Uthalai (stn. C2) would cause the water mass to flow from Gulf of Mannar to Palk Bay.
This flow would transport sediments into Palk Bay from Gulf of Mannar. On the other
hand, when the range is small, the divergence of flow occurring near Adams’s Bridge
(stn. C1) and Uthalai (stn. C2) would initiate a flow from Palk Bay into Gulf of Mannar
through Adam’s Bridge. Thus the sediment exchange taken place into Palk Bay during
large tidal range day would return back to Gulf of Mannar.
3.8.2 Northeast Monsoon (October to January)
Near Arimunai (stn. C1), current was generally weak showing an average of 0.1
m/s, with the maximum of 0.2 m/s and minimum of 0.05 m/s (Fig. 4.39). The flow direction
remained unidirectional towards west both at surface and bottom. The current speed
increased during flood tide and reduced during ebb tide. The shore parallel component of
currents indicates that the flow was consistently towards northwest at surface and bottom
5.1-137
(Fig. 4.40). The shore perpendicular component of currents indicates the flow prevailed
northeast at surface and southwest at bottom.
The variation of currents at Uthalai (stn. C2), showed an average current speed
of 0.08 m/s, with the maximum of 0.15 m/s and a minimum of 0.04 m/s (Fig. 4.41). The
bottom flow was nearly unidirectional towards southeast. The shore parallel component of
currents indicates that the flow was oscillating in southeast and northwest at surface and
remaining consistently southeast at bottom (Fig. 4.42). The shore perpendicular
component of currents indicates that the flow was towards northeast both at surface and
bottom.
The currents at Pamban Pass (stn. C3) prevailed strong with the average of
1 m/s, maximum of 1.4 m/s and minimum of 0.5 m/s (Fig. 4.43). Currents remained
consistently unidirectional around 2250. The change in tidal phase caused the variation in
current speed showing stronger currents during ebb tide and reduction in current speed
during flood tide. It indicates that the flood tide propagates from Gulf of Mannar to Palk
Bay and vice versa. The shore parallel component (Fig. 4.43) indicates that the flow was
consistently from Palk Bay into Gulf of Mannar during ebb tide and flood tide. The shore
perpendicular component of currents indicates the flow was across the Pamban Pass
from Rameswaram to Mandapam.
The current was found to be weak off Tharuvai at Palk Bay (stn. C4) showing
with the average speed of 0.1 m/s, maximum of 0.13 m/s and minimum of 0.04 m/s
(Fig. 4.44). Similar to stn. C3, the current flow was unidirectional towards 250°, but the
speed was high during ebb tide and low during flood tide. The shore parallel component
of currents indicates that the flow was towards northwest both at surface and bottom
(Fig. 4.45). The shore perpendicular component of currents indicates that the flow was
towards southwest both at surface and bottom.
The observation during northeast monsoon indicates that the current flow was
more influenced by seasonal flow than tides. Stronger currents were observed during ebb
tides flowing from Palk Bay into Gulf of Mannar through Pamban Pass. The currents were
generally weak in Gulf of Mannar and Palk Bay (stns. C2 and C4). Significant flow from
Palk Bay to Gulf of Mannar was observed also through Adam’s Bridge. Such current
pattern during northeast monsoon can transport and exchange the sediments from Palk
Bay into Gulf of Mannar.
3.8.3 Fair weather (February to May)
5.1-138
The variation of currents near Arimunai (stn. C1) at surface and bottom are
shown in Fig. 4.46. The current was generally weak showing average of 0.1 m/s, with the
maximum of 0.2 m/s and minimum of 0.05 m/s. The current flow was found to be
unidirectional towards northwest both at surface and bottom. The shore parallel
component of currents (Fig. 4.47) indicates that the flow was towards northwest both at
surface and at bottom. The shore perpendicular component of currents indicates the flow
was changed its direction in northeast and southwest both at surface and bottom.
At Gulf of Mannar (stn. C2), the current was weak with average of 0.1 m/s,
maximum of 0.2 m/s and minimum of 0.04 m/s (Fig. 4.48). The flow remained
unidirectional consistently towards 3050, but the current speed varied in random between
0.04 and 0.12 m/s. the shore parallel component of currents indicates that the flow was
towards northwest both at surface and bottom (Fig. 4.49). The shore perpendicular
component of currents indicates the flow changed the direction in northeast and
southwest both at surface bottom.
The flow through the Pamban Pass (stn. C3) was quite distinct, showing the
average speed of 0.3 m/s, maximum of 0.6 m/s and minimum of 0.04 m/s. Current flow
was noticed towards 45°, i.e., into Palk Bay during flood tide and towards 225°, i.e., into
Gulf of Mannar during ebb tide. The shore parallel component of currents indicates that
the flow was into Palk Bay during flood tide and into Gulf of Mannar during ebb tide
(Fig. 4.50). The shore perpendicular component of currents (Fig. 4.50) indicates the flow
was changing its direction across the Pamban Pass between Mandapam and
Rameswaram.
During the period of study, only during fair weather period, the change in
current direction was observed over the tidal phases at Pamban Pass. The study shows
that the current flows mostly parallel to the coast. The general circulation of current in
northwesterly direction dominates the tide induced current. This would help the
sediments to move by tide induced currents from Gulf of Mannar to Palk Bay prevailing
through Pamban Pass and to some extent through Adam’s Bridge.
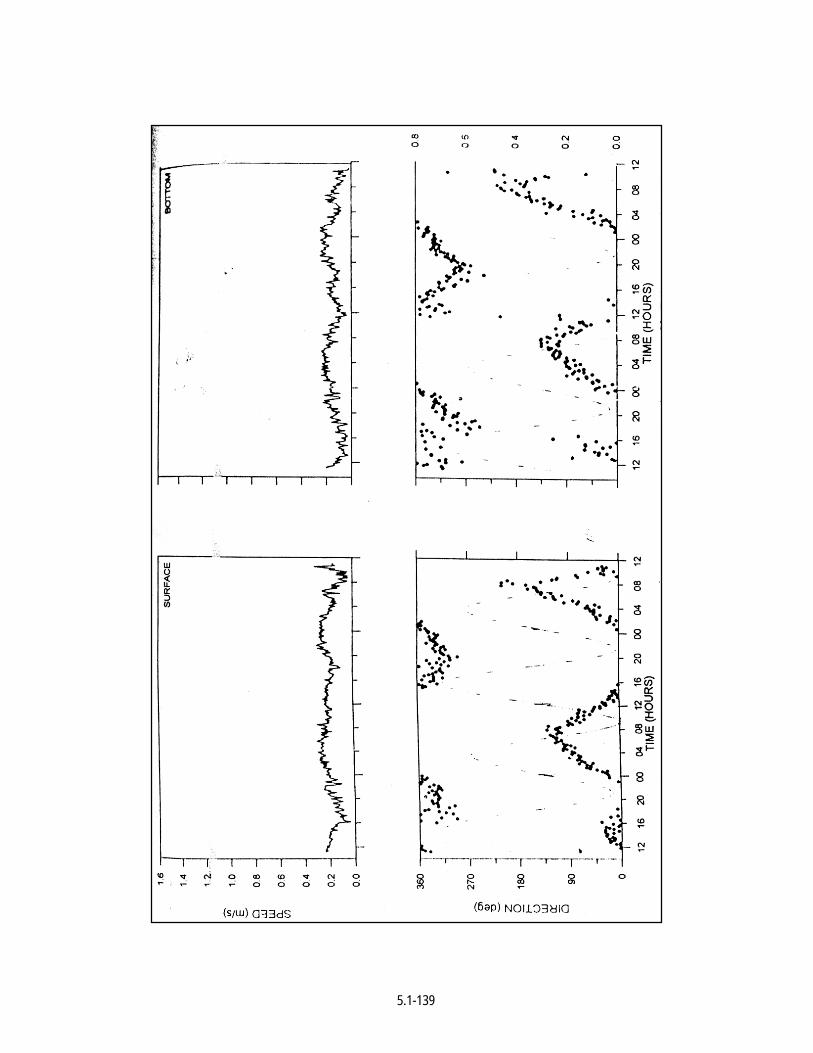
5.1-139
5.1-140
Fig. 4.32 : Variation of Currents Off Arimunai in SW Monsoon
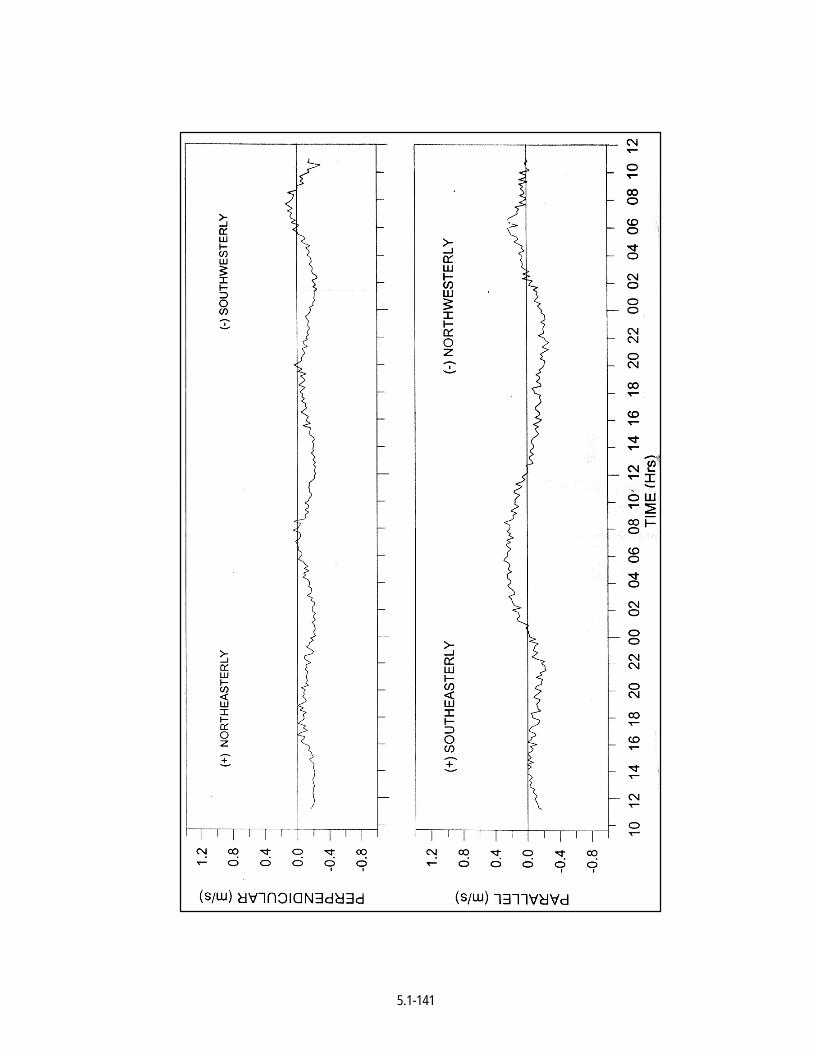
5.1-141
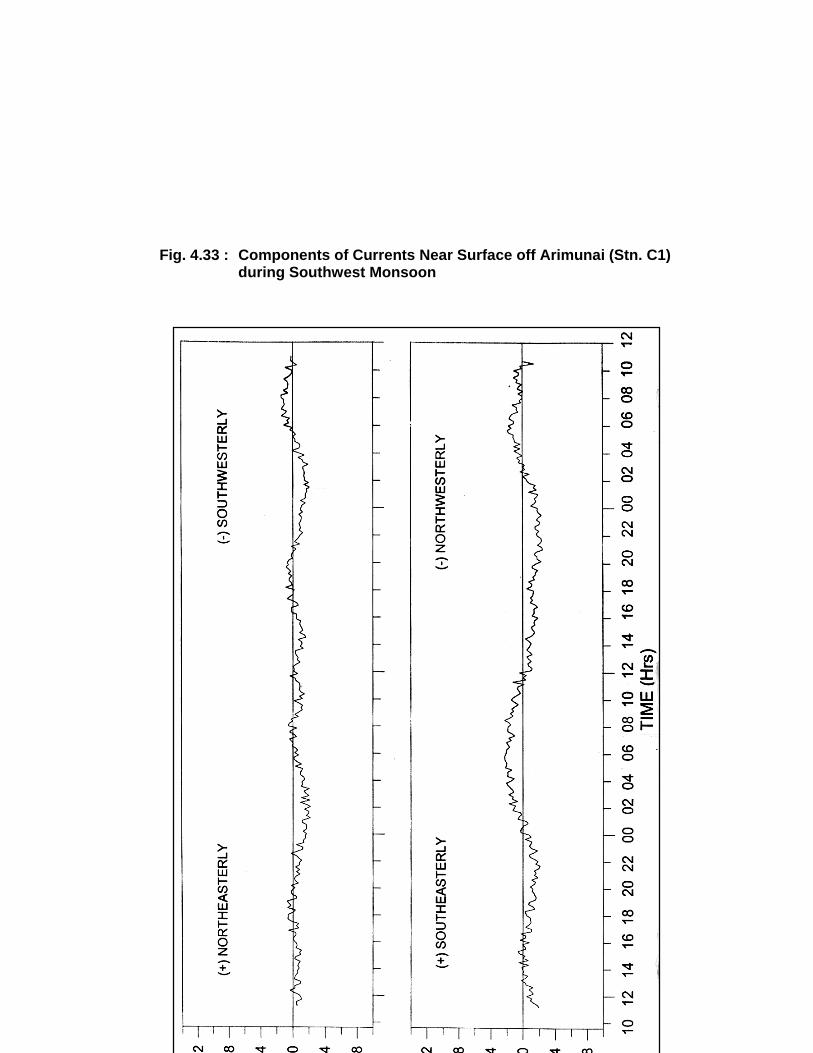
5.1-142
Fig. 4.33 : Components of Currents Near Surface off Arimunai (Stn. C1) during Southwest Monsoon
5.1-143
Fig. 4.34 : Components of Currents near Bottom Off Arimunai (Stn. C1) during Southwest Monsoon
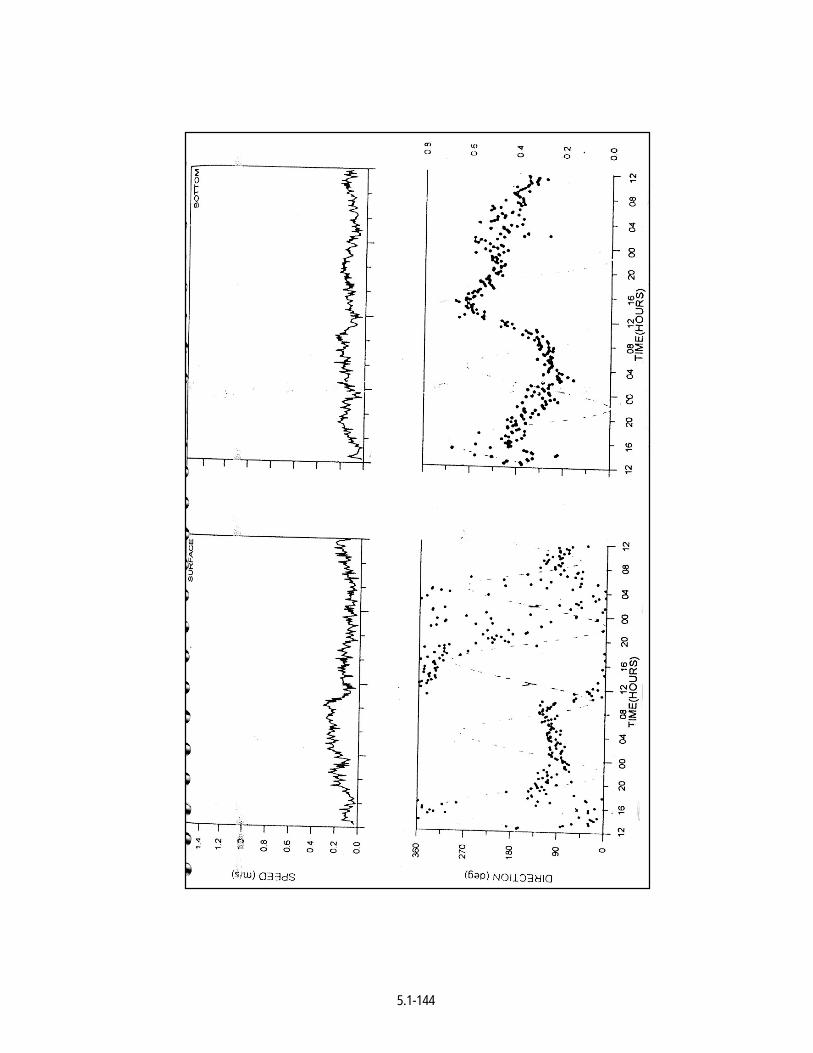
5.1-144
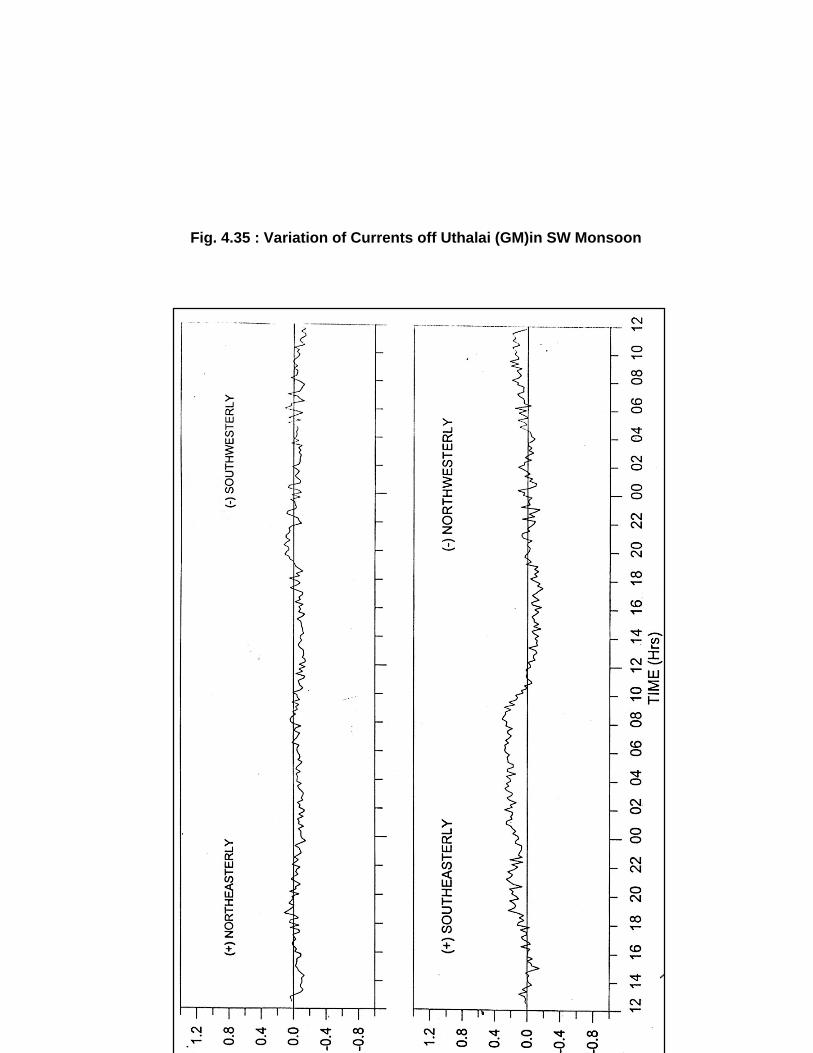
5.1-145
Fig. 4.35 : Variation of Currents off Uthalai (GM)in SW Monsoon

5.1-146
Fig. 4.36 : Components of Currents near Surface off Rameswaram Island South (Stn. C2) (GM) during Southwest Monsoon
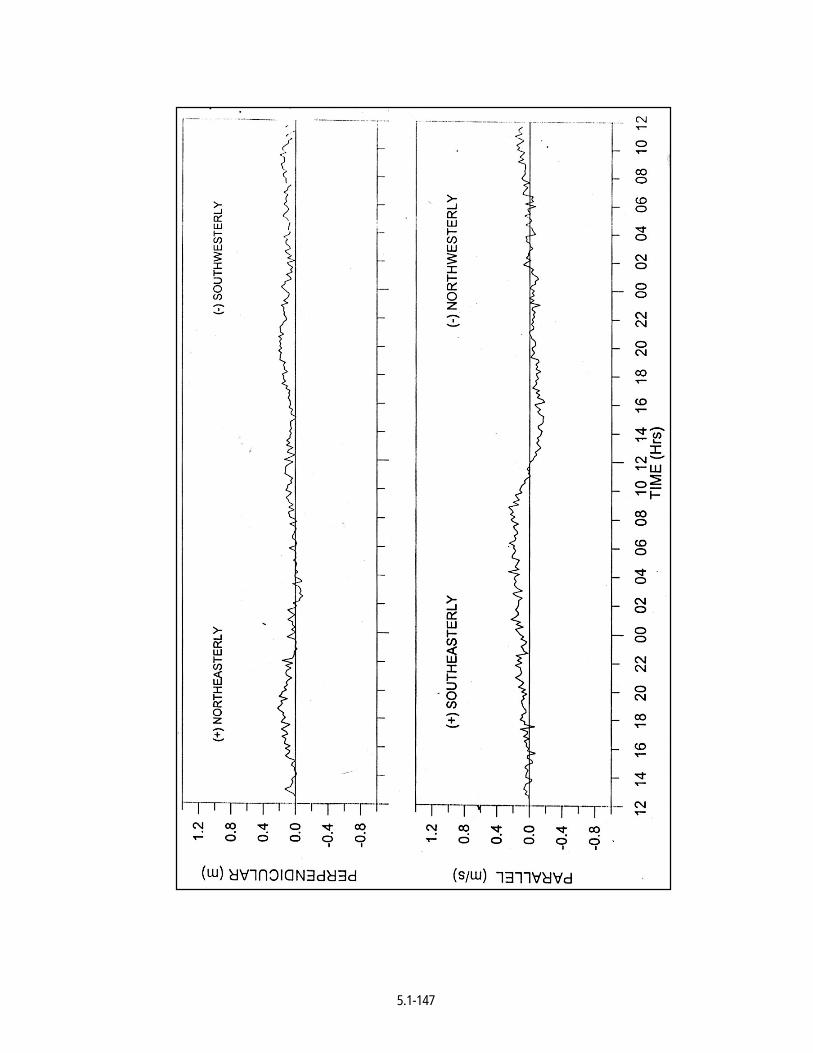
5.1-147
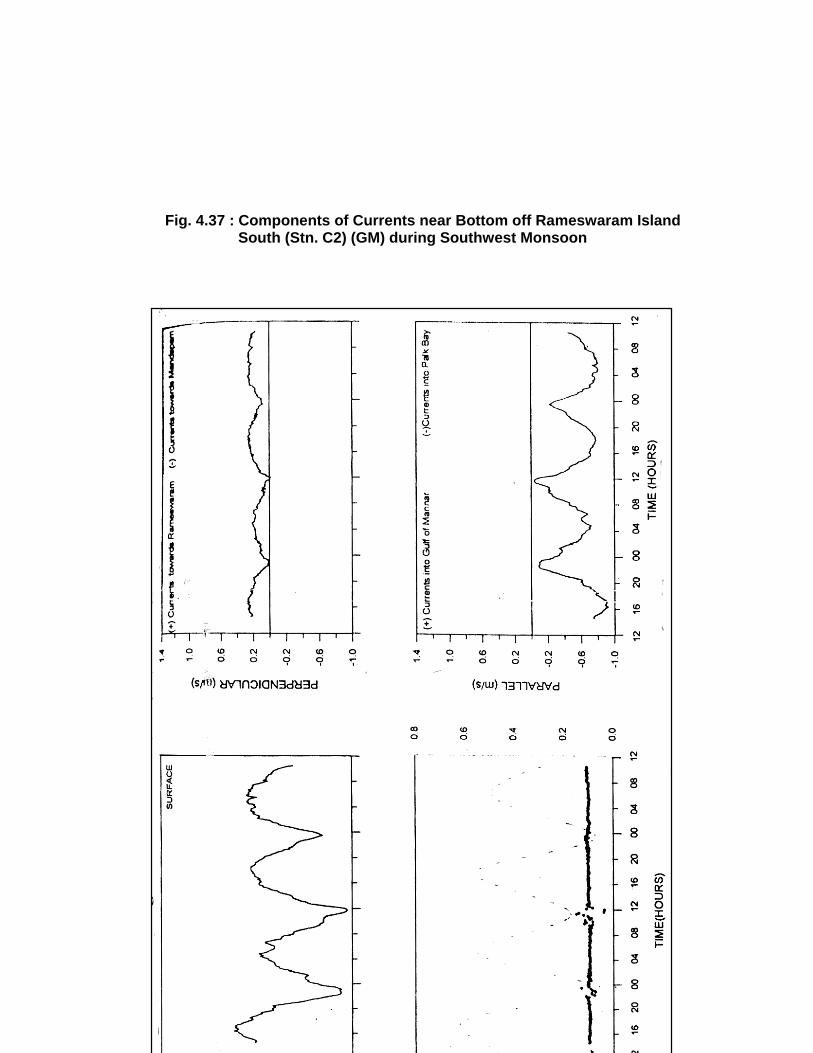
5.1-148
Fig. 4.37 : Components of Currents near Bottom off Rameswaram Island South (Stn. C2) (GM) during Southwest Monsoon
5.1-149
Fig. 4.38 : Variation of Currents off Pamban Pass in SW Monsoon
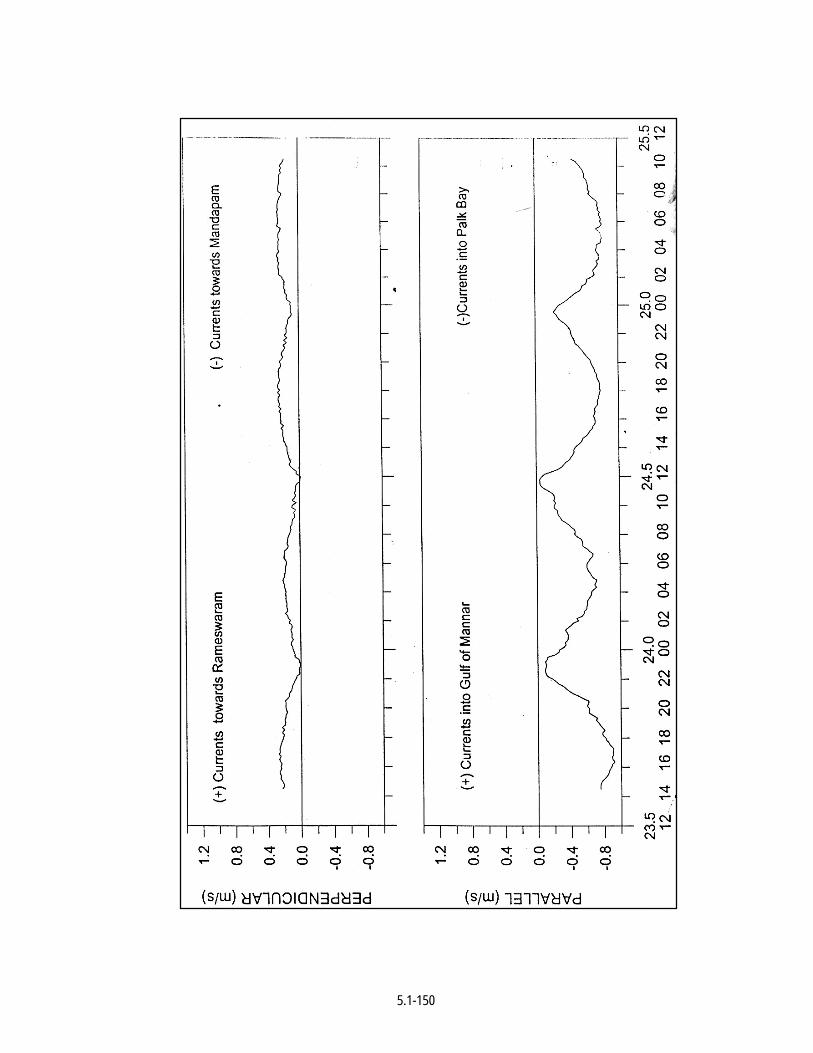
5.1-150
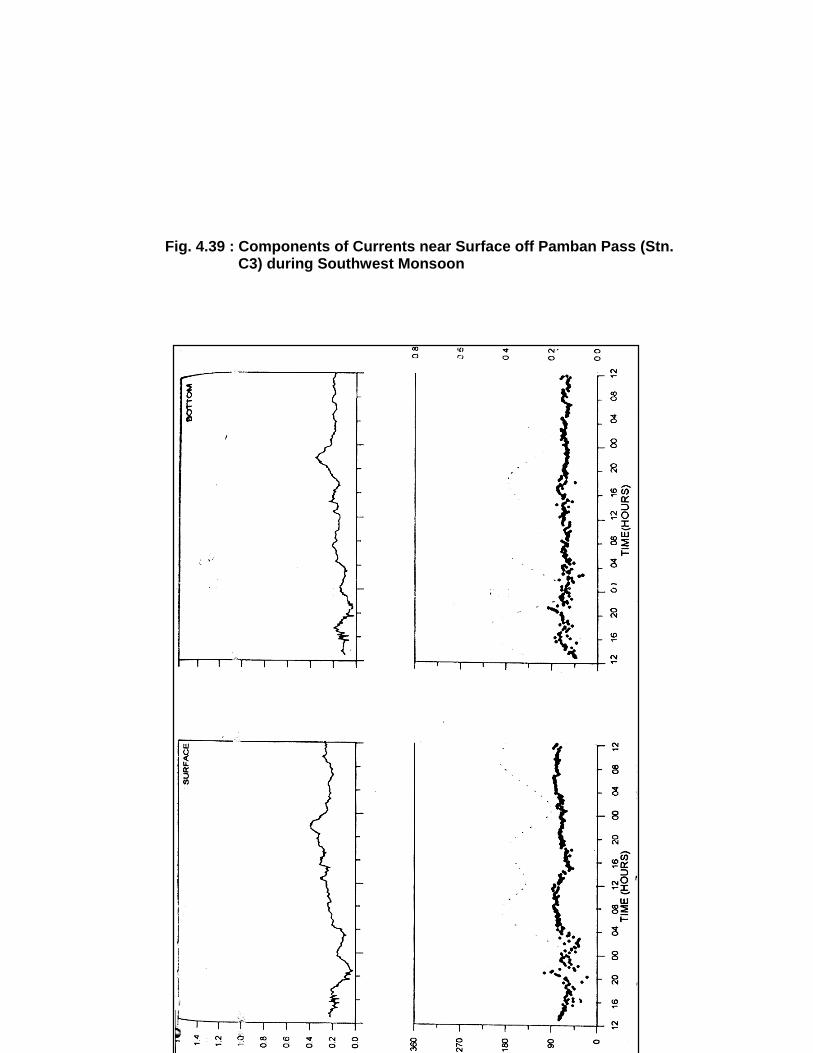
5.1-151
Fig. 4.39 : Components of Currents near Surface off Pamban Pass (Stn. C3) during Southwest Monsoon
5.1-152
Fig. 4.40 : Variation of Currents off Tharuvai in SW Monsoon
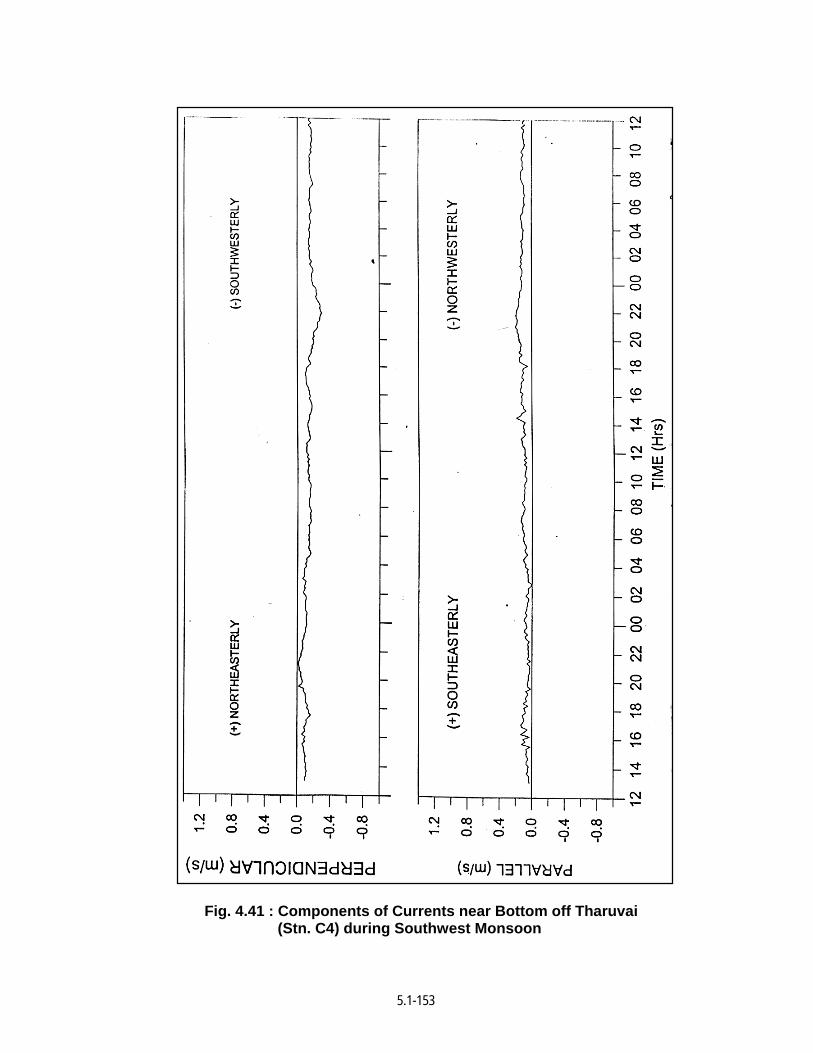
5.1-153
Fig. 4.41 : Components of Currents near Bottom off Tharuvai (Stn. C4) during Southwest Monsoon

5.1-154

5.1-155
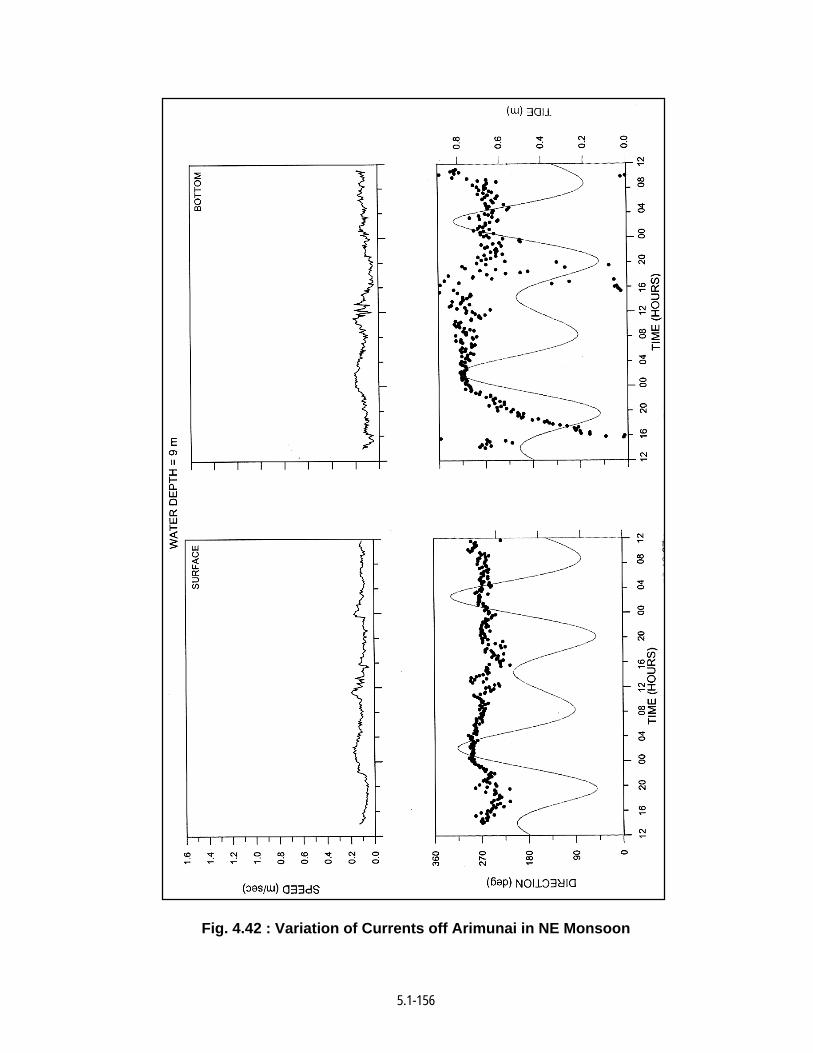
5.1-156
Fig. 4.42 : Variation of Currents off Arimunai in NE Monsoon
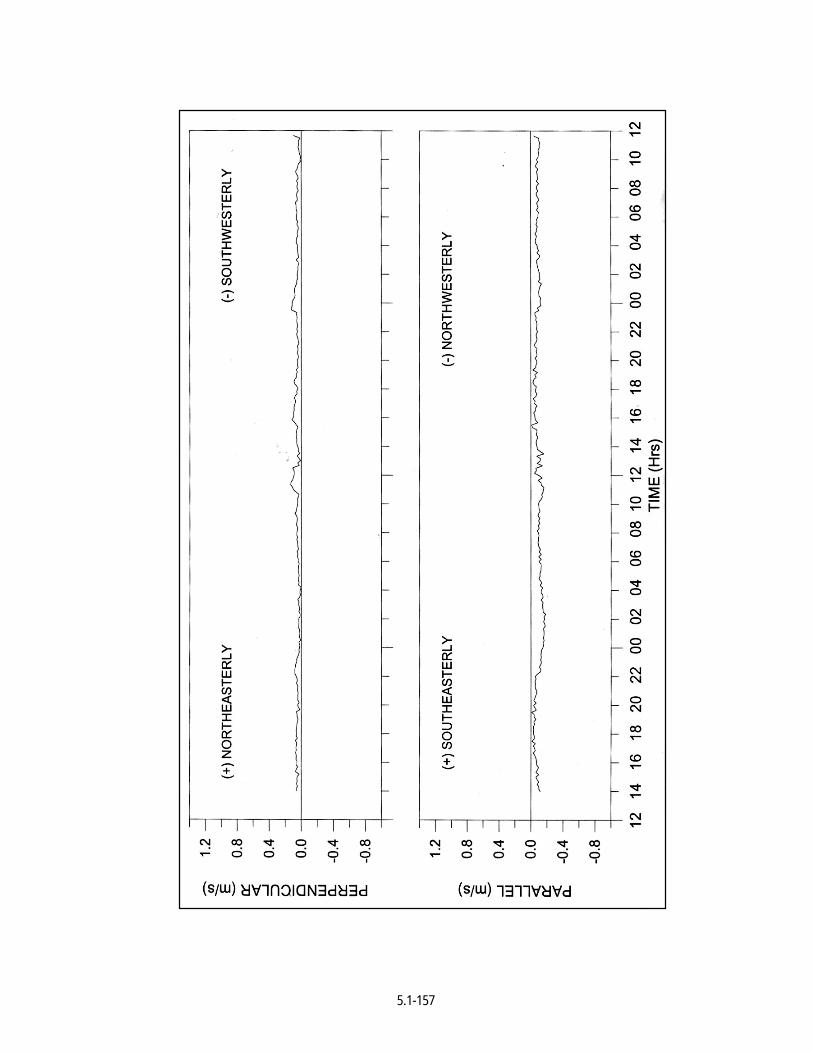
5.1-157
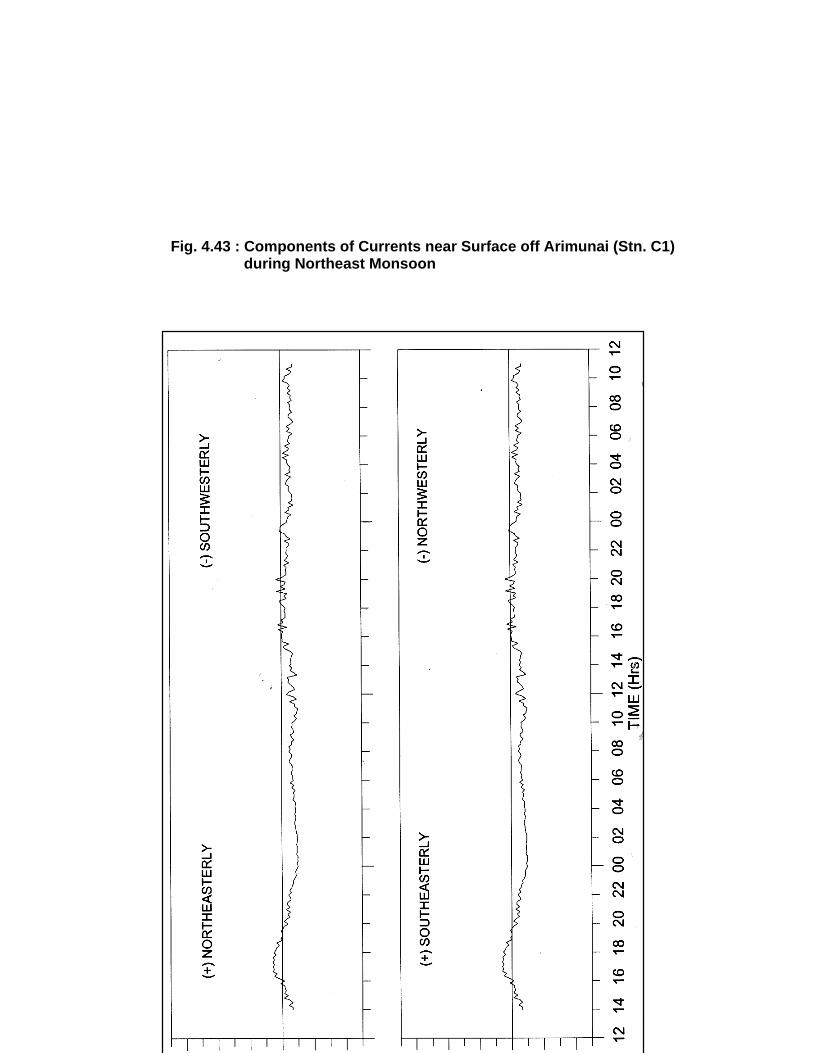
5.1-158
Fig. 4.43 : Components of Currents near Surface off Arimunai (Stn. C1) during Northeast Monsoon
5.1-159
Fig. 4.44 : Components of Currents near Bottom off Arimunai (Stn. C1) during Northeast Monsoon
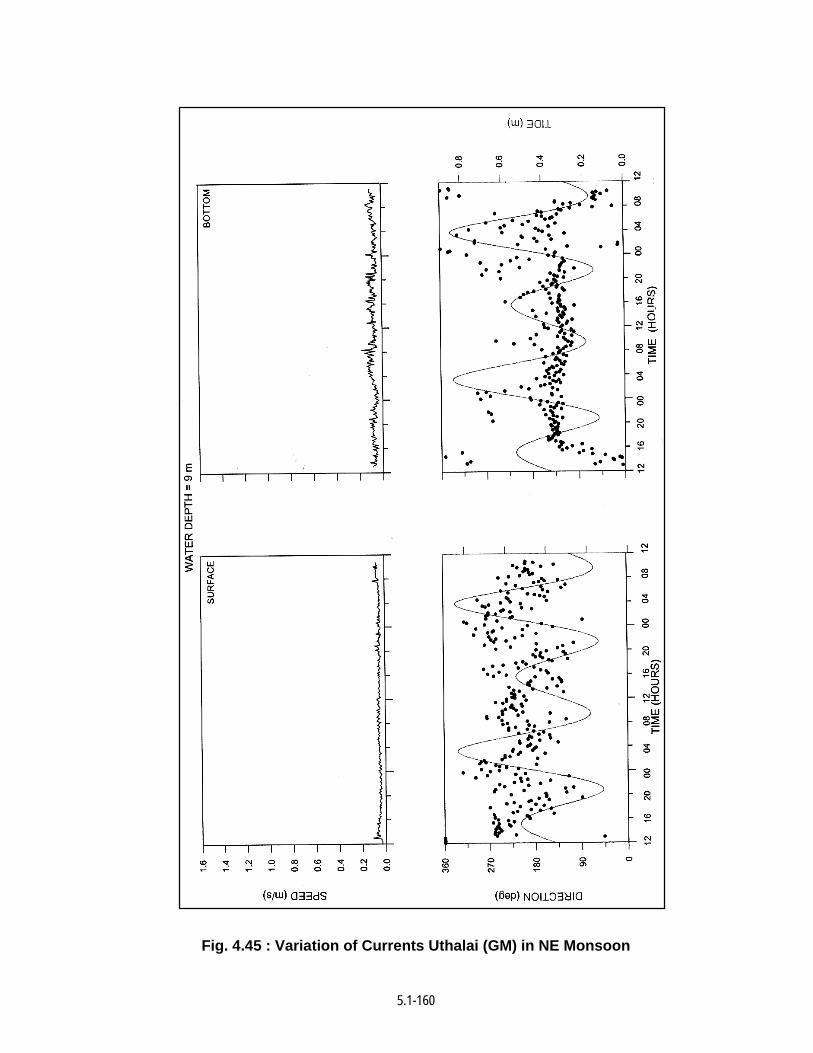
5.1-160
Fig. 4.45 : Variation of Currents Uthalai (GM) in NE Monsoon

5.1-161
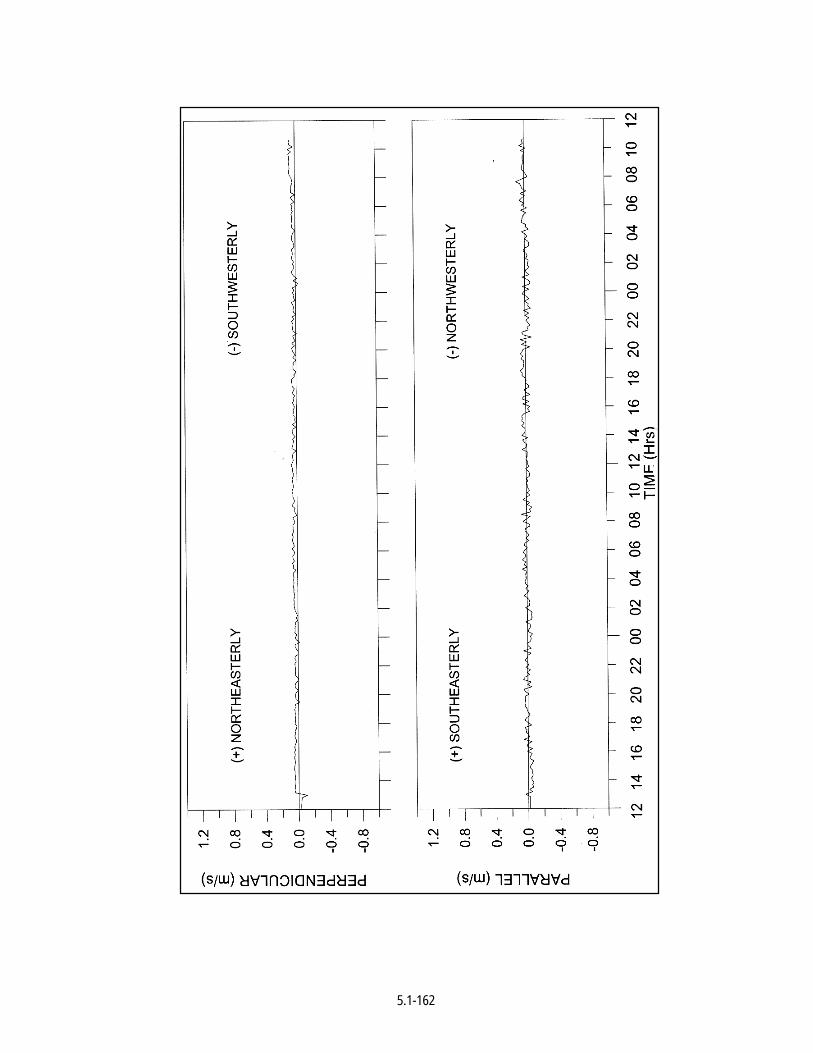
5.1-162
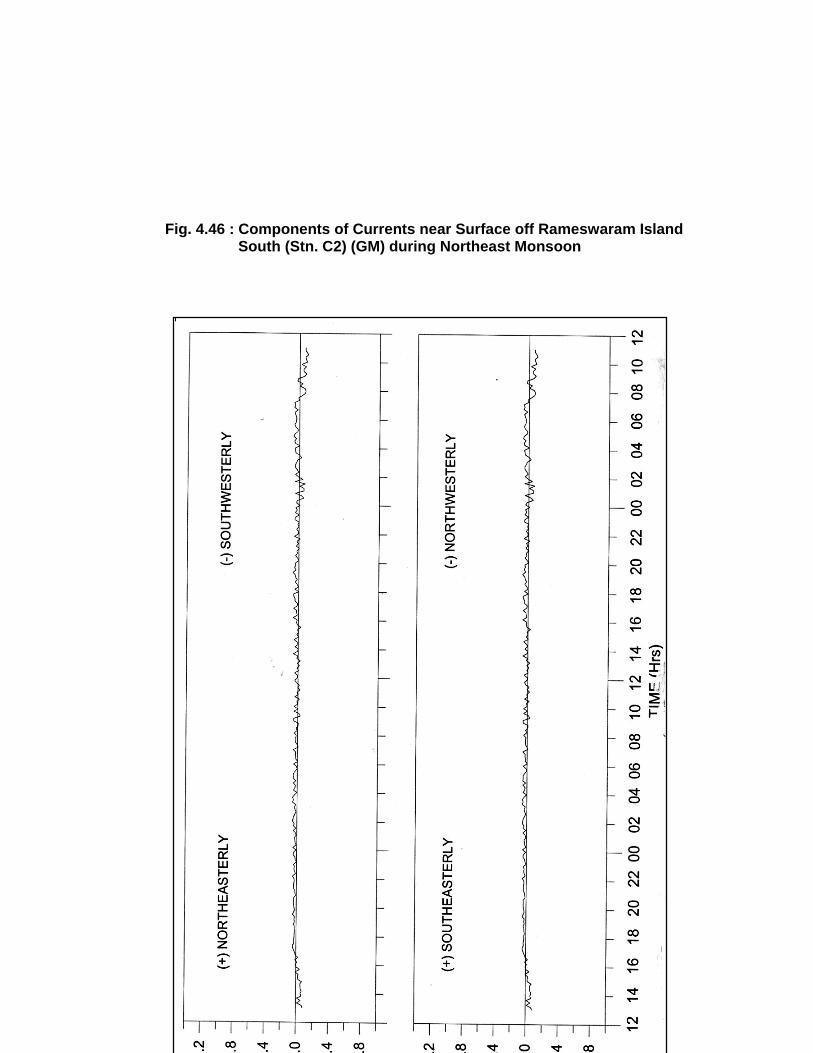
5.1-163
Fig. 4.46 : Components of Currents near Surface off Rameswaram Island South (Stn. C2) (GM) during Northeast Monsoon
5.1-164
Fig. 4,47 : Components of Currents near Bottom off Rameswaram Island South (Stn. C2) (GM) during Northeast Monsoon
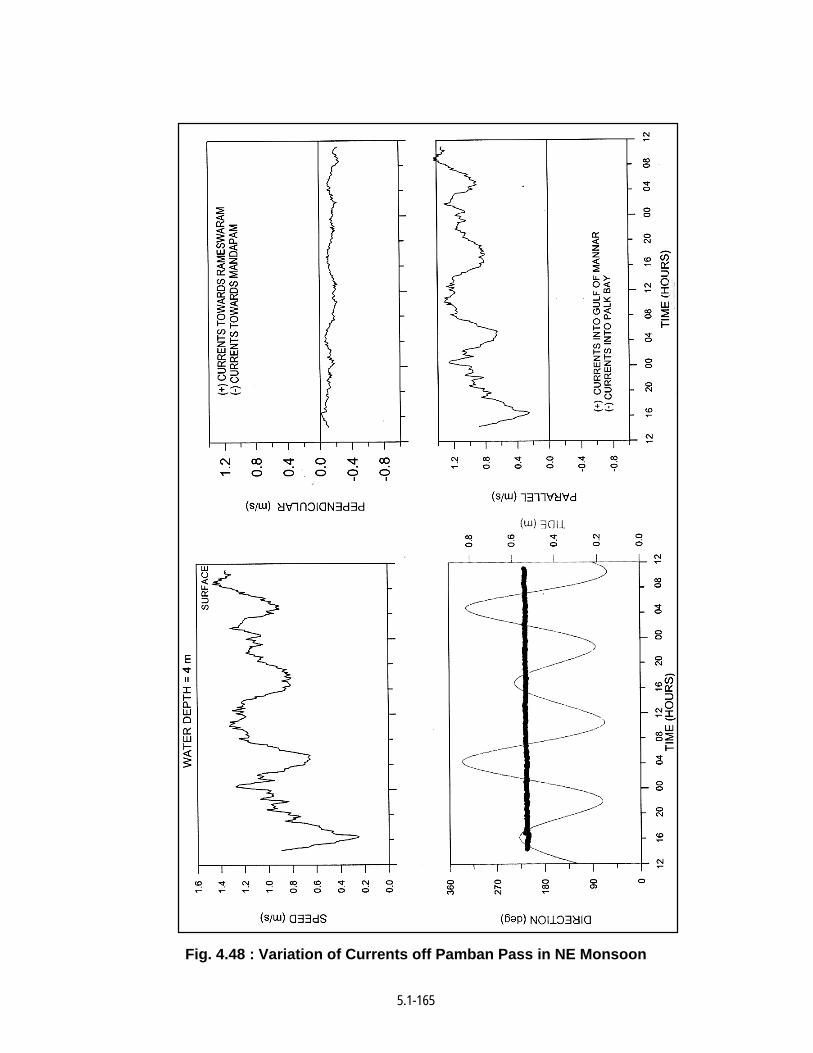
5.1-165
Fig. 4.48 : Variation of Currents off Pamban Pass in NE Monsoon
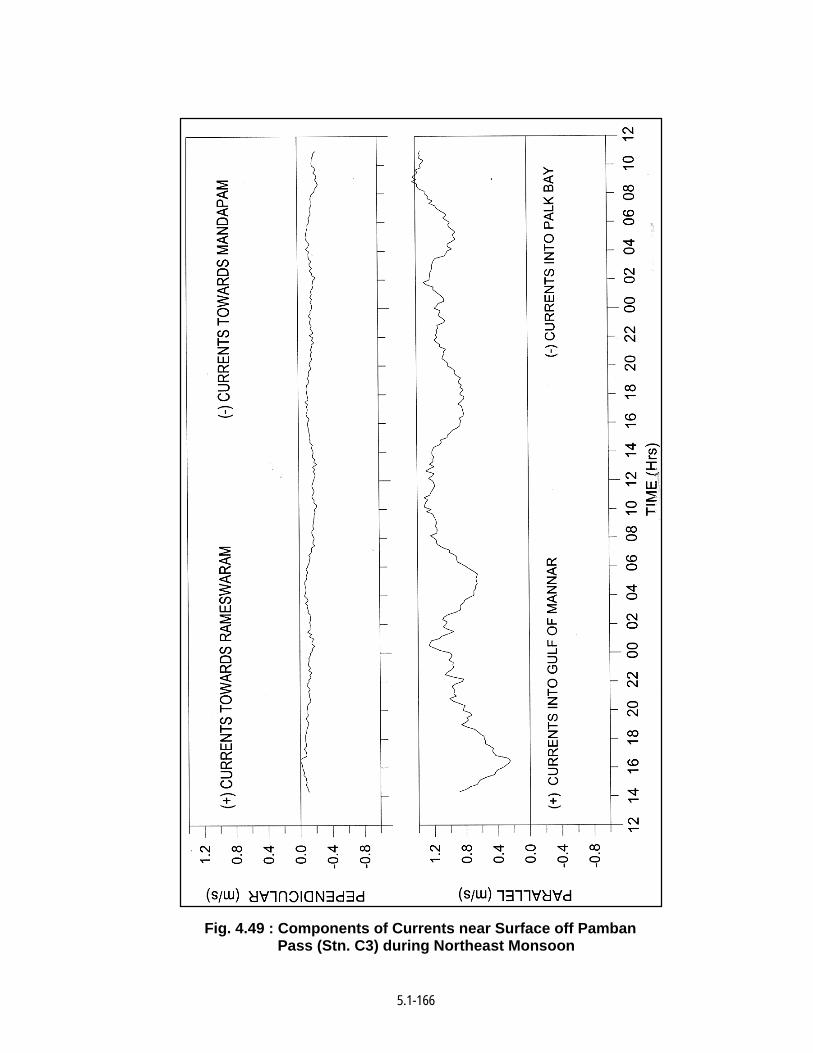
5.1-166
Fig. 4.49 : Components of Currents near Surface off Pamban Pass (Stn. C3) during Northeast Monsoon
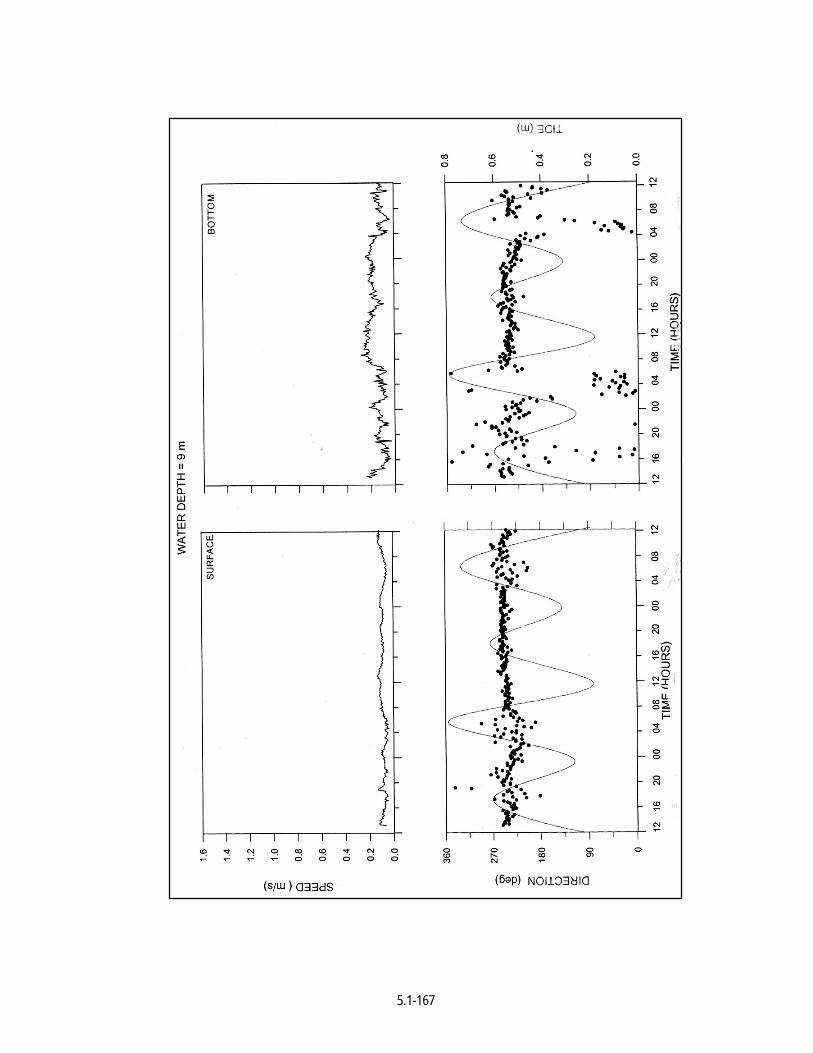
5.1-167
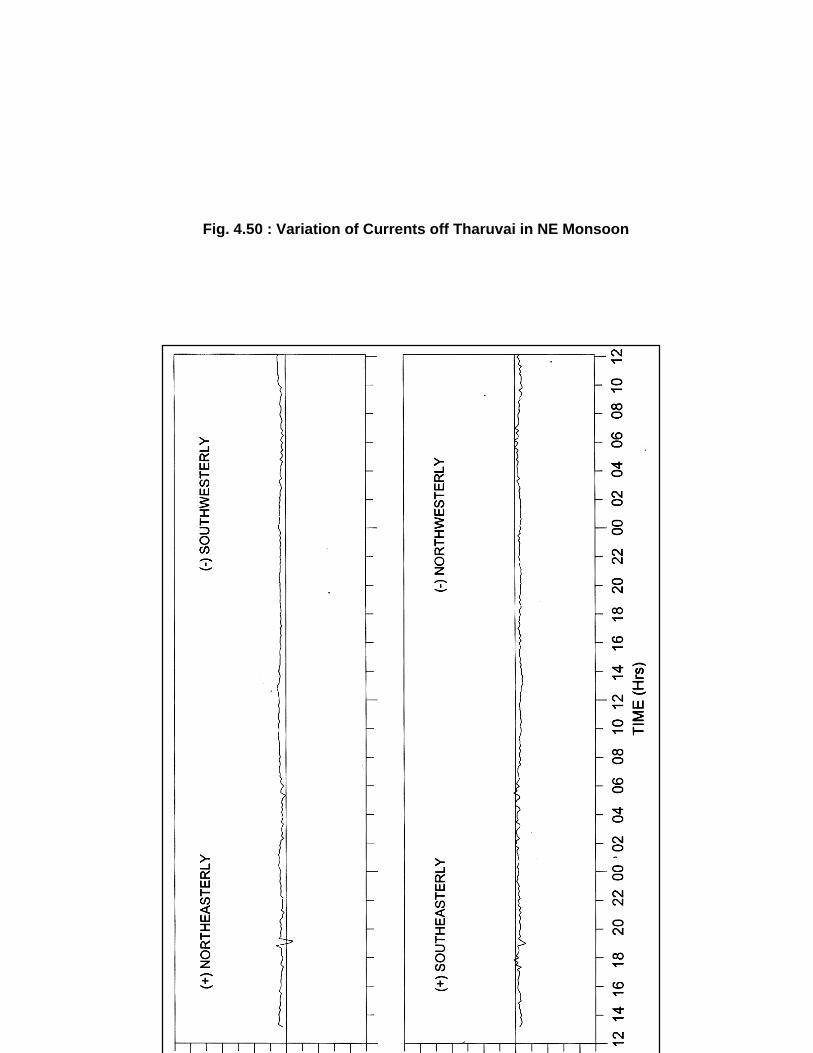
5.1-168
Fig. 4.50 : Variation of Currents off Tharuvai in NE Monsoon

5.1-169
Fig. 4.51 : Components of Currents near Surface off Tharuvai (Stn. C4) during Northeast Monsoon
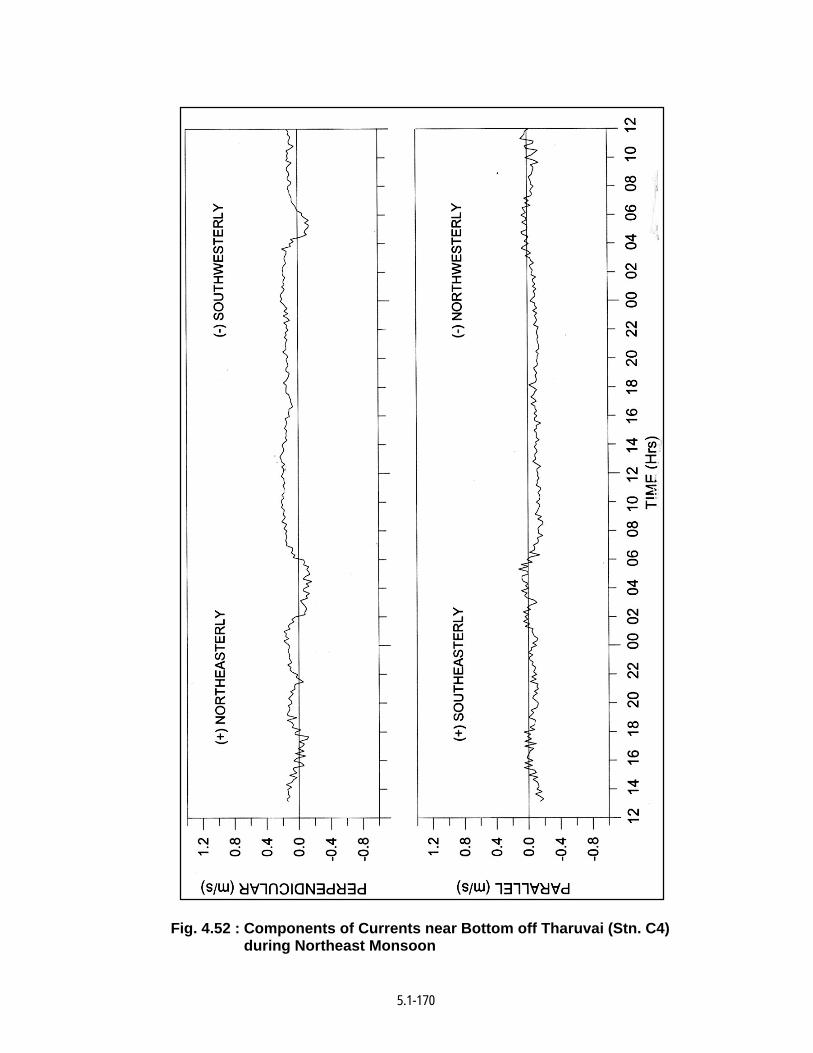
5.1-170
Fig. 4.52 : Components of Currents near Bottom off Tharuvai (Stn. C4)
during Northeast Monsoon
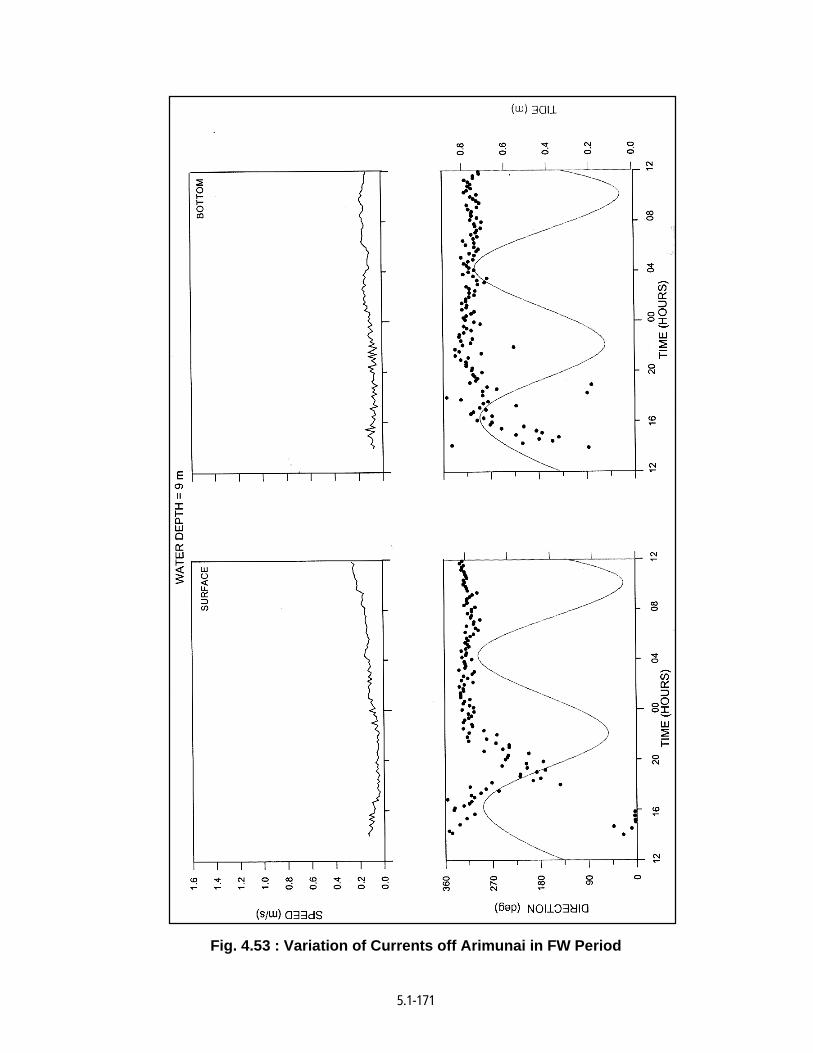
5.1-171
Fig. 4.53 : Variation of Currents off Arimunai in FW Period

5.1-172
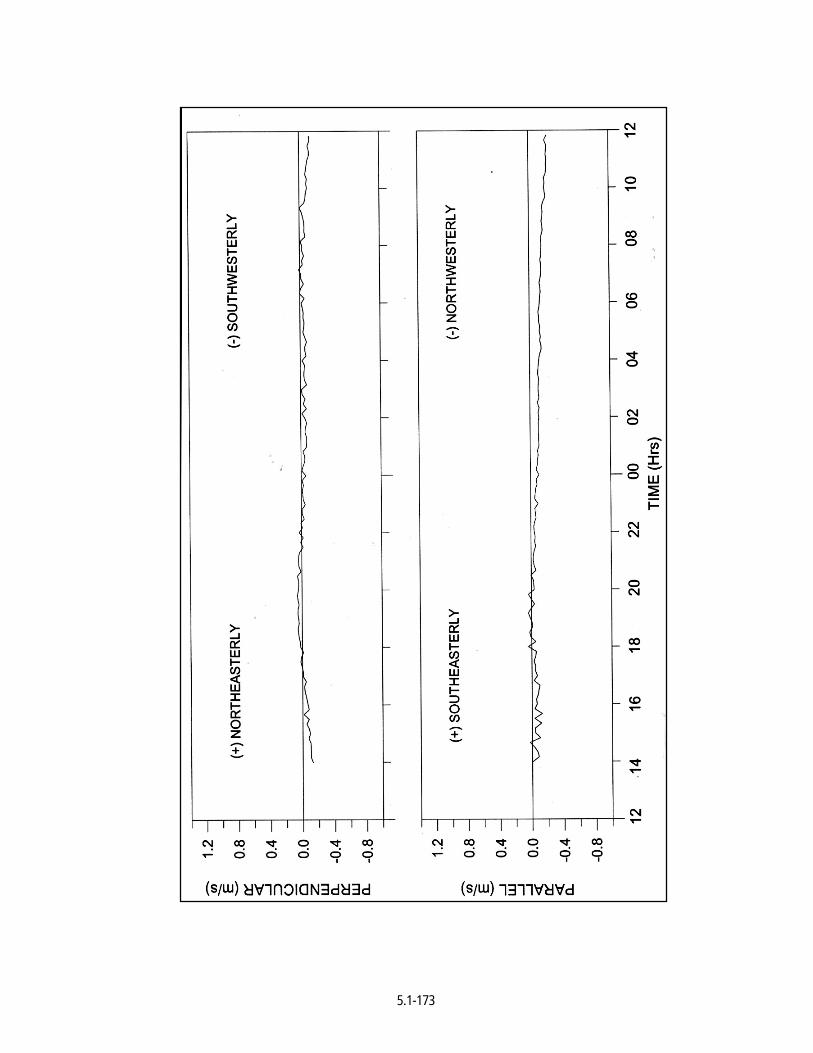
5.1-173
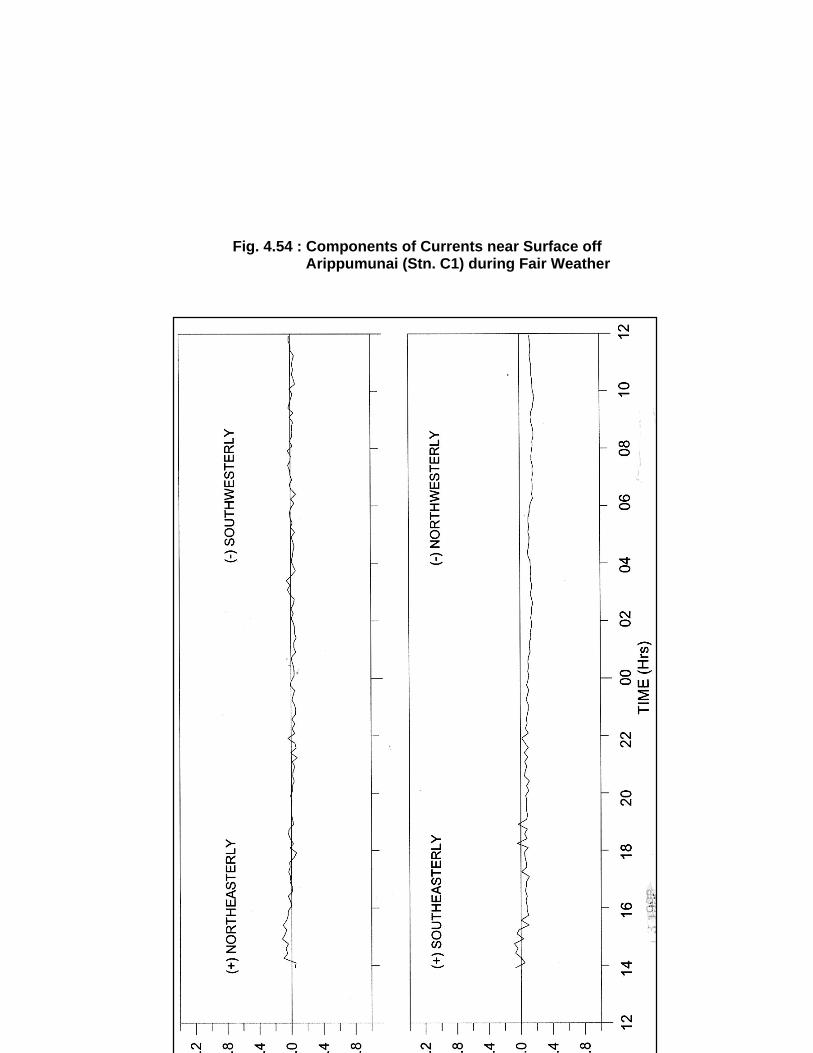
5.1-174
Fig. 4.54 : Components of Currents near Surface off Arippumunai (Stn. C1) during Fair Weather
5.1-175
Fig. 4.55: Components of Currents near Bottom off
Arrippumunai (Stn. C1) during Fair Weather
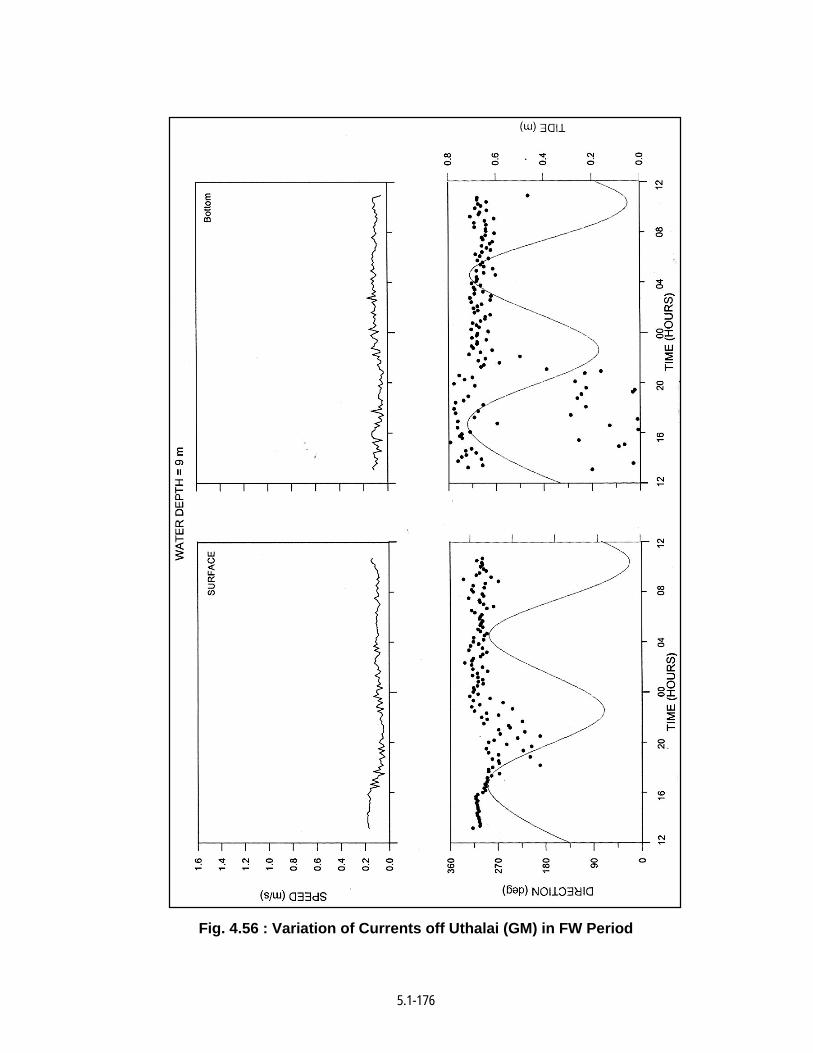
5.1-176
Fig. 4.56 : Variation of Currents off Uthalai (GM) in FW Period
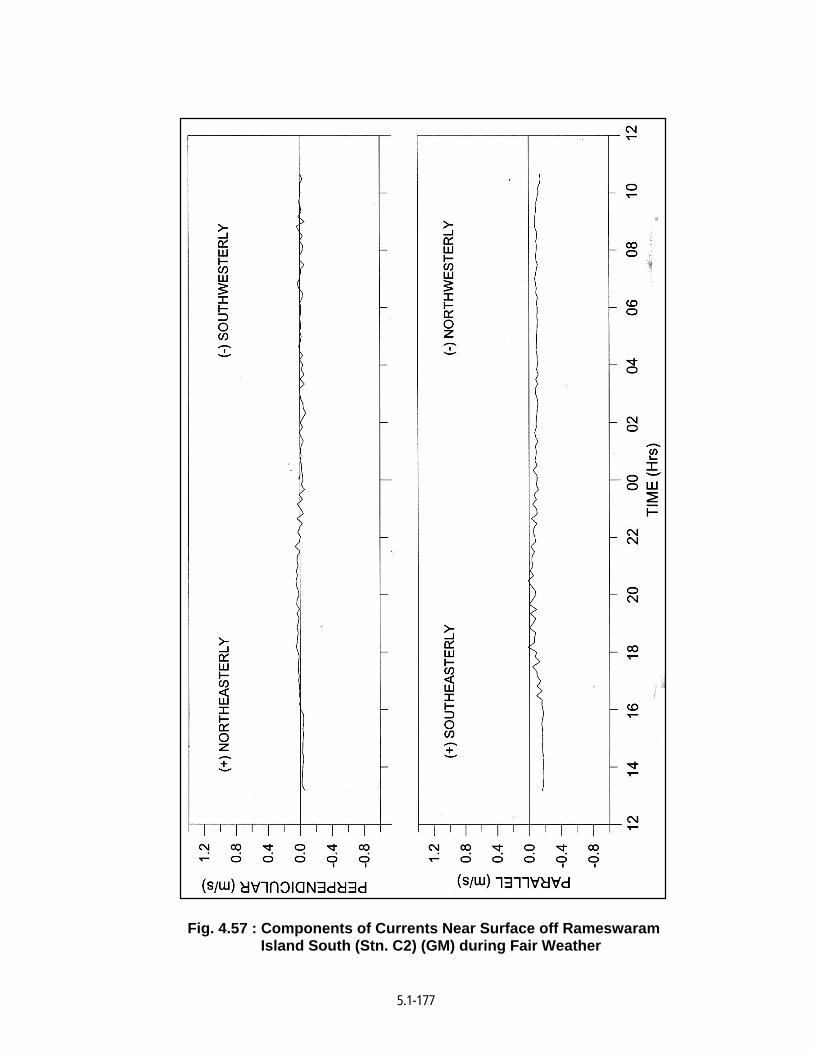
5.1-177
Fig. 4.57 : Components of Currents Near Surface off Rameswaram Island South (Stn. C2) (GM) during Fair Weather

5.1-178
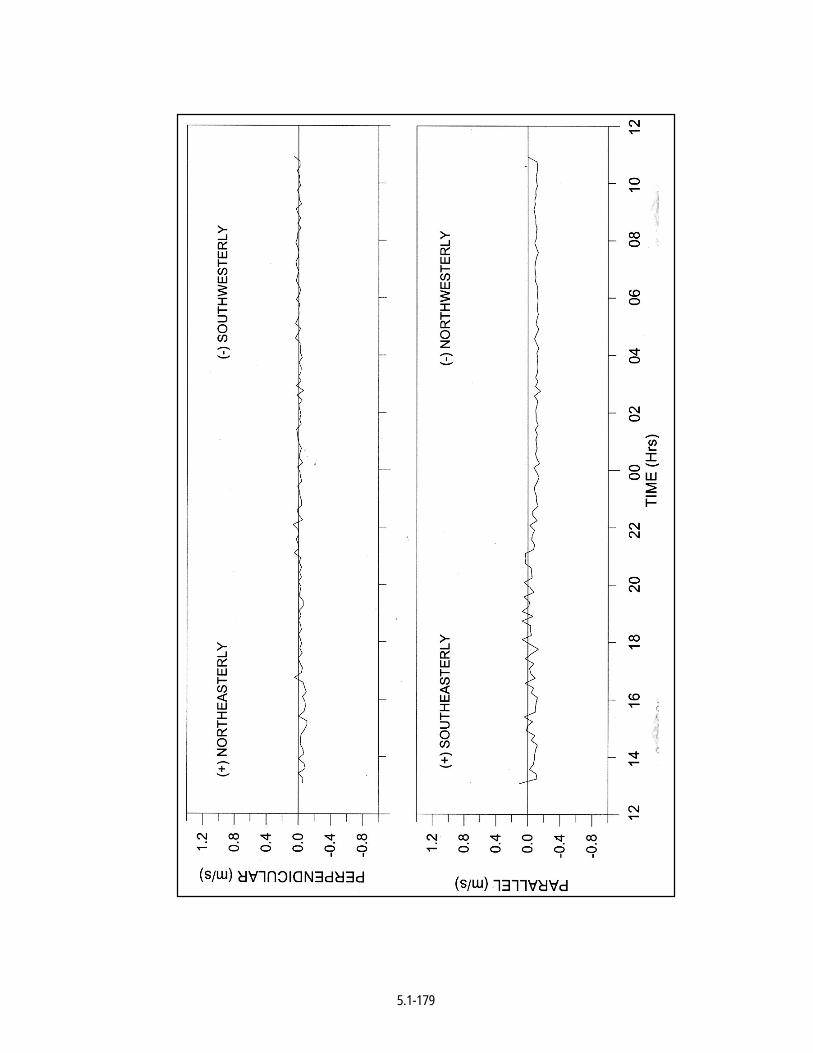
5.1-179
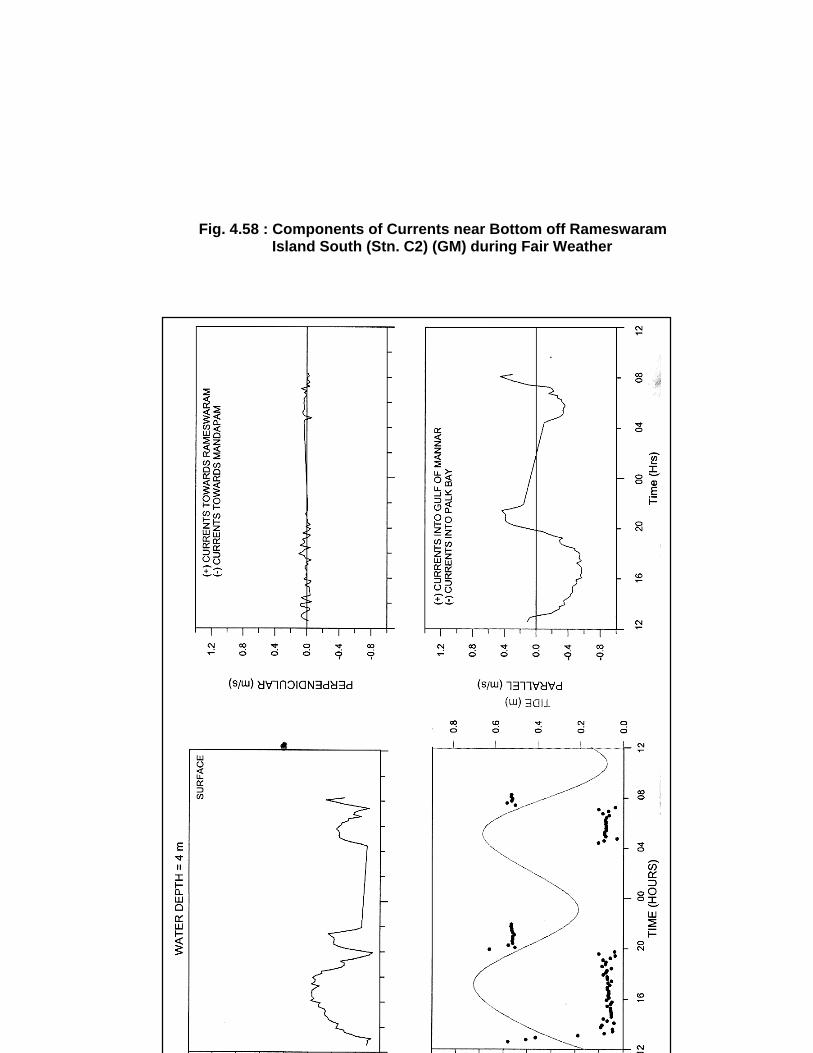
5.1-180
Fig. 4.58 : Components of Currents near Bottom off Rameswaram Island South (Stn. C2) (GM) during Fair Weather
5.1-181
Fig. 4.59 : Variation of Currents off Pamban Pass in FW Period
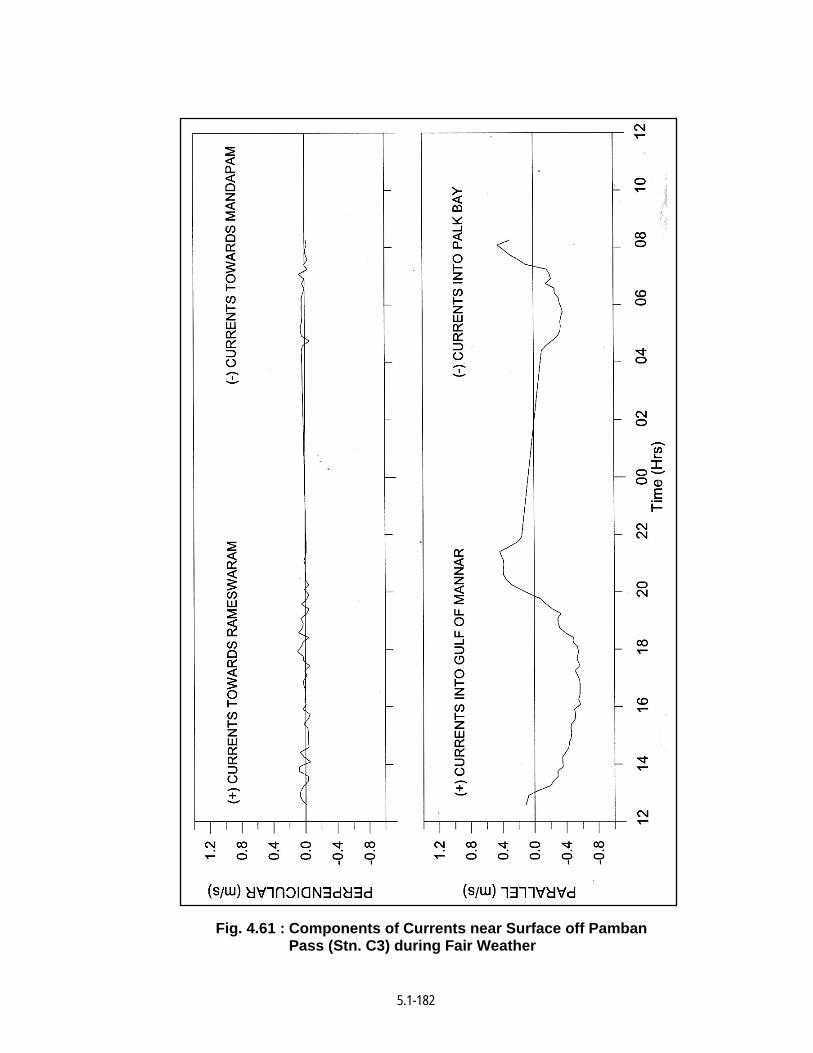
5.1-182
Fig. 4.61 : Components of Currents near Surface off Pamban Pass (Stn. C3) during Fair Weather

5.1-183
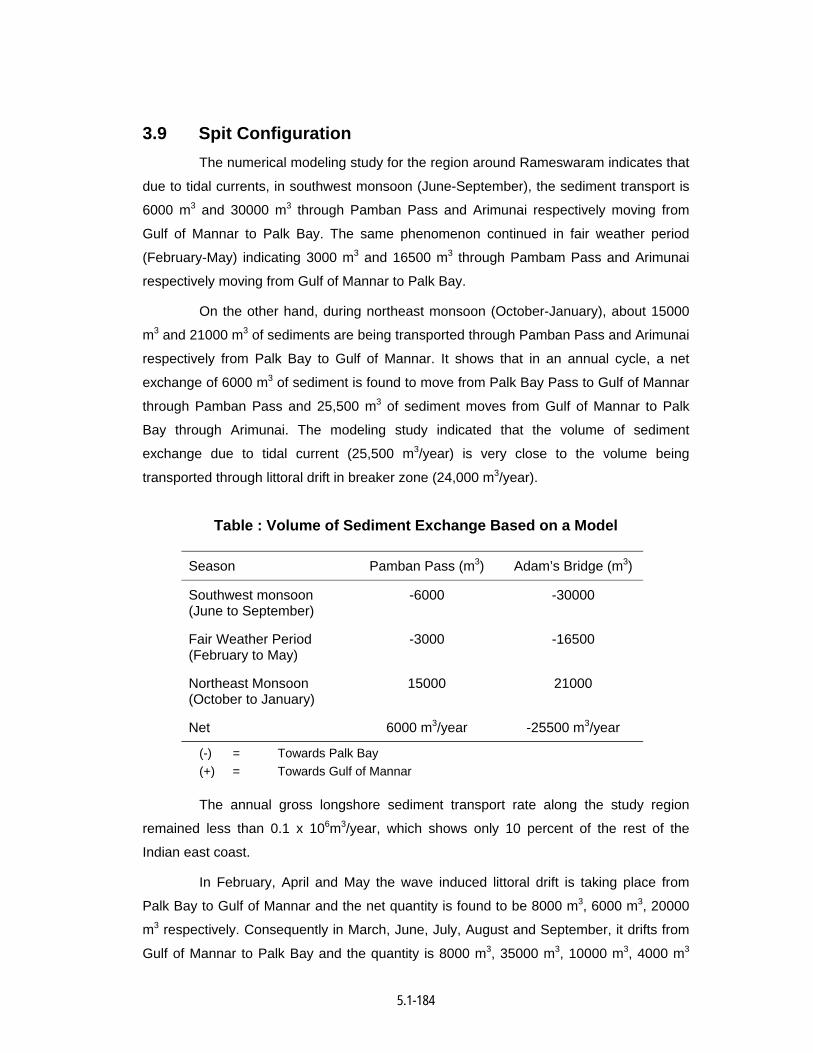
5.1-184
3.9 Spit Configuration The numerical modeling study for the region around Rameswaram indicates that
due to tidal currents, in southwest monsoon (June-September), the sediment transport is
6000 m3 and 30000 m3 through Pamban Pass and Arimunai respectively moving from
Gulf of Mannar to Palk Bay. The same phenomenon continued in fair weather period
(February-May) indicating 3000 m3 and 16500 m3 through Pambam Pass and Arimunai
respectively moving from Gulf of Mannar to Palk Bay.
On the other hand, during northeast monsoon (October-January), about 15000
m3 and 21000 m3 of sediments are being transported through Pamban Pass and Arimunai
respectively from Palk Bay to Gulf of Mannar. It shows that in an annual cycle, a net
exchange of 6000 m3 of sediment is found to move from Palk Bay Pass to Gulf of Mannar
through Pamban Pass and 25,500 m3 of sediment moves from Gulf of Mannar to Palk
Bay through Arimunai. The modeling study indicated that the volume of sediment
exchange due to tidal current (25,500 m3/year) is very close to the volume being
transported through littoral drift in breaker zone (24,000 m3/year).
Table : Volume of Sediment Exchange Based on a Model
Season Pamban Pass (m3) Adam’s Bridge (m3)
Southwest monsoon (June to September)
-6000 -30000
Fair Weather Period (February to May)
-3000 -16500
Northeast Monsoon (October to January)
15000 21000
Net 6000 m3/year -25500 m3/year
(-) = Towards Palk Bay (+) = Towards Gulf of Mannar The annual gross longshore sediment transport rate along the study region
remained less than 0.1 x 10⁶m3/year, which shows only 10 percent of the rest of the
Indian east coast.
In February, April and May the wave induced littoral drift is taking place from
Palk Bay to Gulf of Mannar and the net quantity is found to be 8000 m3, 6000 m3, 20000
m3 respectively. Consequently in March, June, July, August and September, it drifts from
Gulf of Mannar to Palk Bay and the quantity is 8000 m3, 35000 m3, 10000 m3, 4000 m3
5.1-185
and 1000 m3 respectively. There was no significant movement of sediment between
October and January. Over a period of one year, a net volume of 24000 m3/year
sediments moves from Gulf of Mannar to Palk Bay. Adam’s Bridge forms as noticeable
sink for the littoral drift. The prolonged accumulation leads to the emergence of new
islands.
The modeling study indicates that over an annual cycle, the net volume of
sediment exchange due to tidal current is 6000 m3 from Palk Bay to Gulf of Mannar
through Pamban Pass and 25000 m3 from Gulf of Mannar to Palk Bay through Arimunai.
The satellite imageries show that the spit gets deflected towards Palk Bay
during southwest monsoon indicating erosion in Gulf of Mannar side and deposition on
Palk Bay side. During northeast monsoon, the spit gets deposited on Gulf of Mannar side
and eroded in Palk Bay side, but the over all length increased by 150 m towards Adam’s
Bridge.
The sand spit extended 455 m in seven years indicating an average growth of
65 m in a year. The width increased 200 m at 1 km distance from the tip.
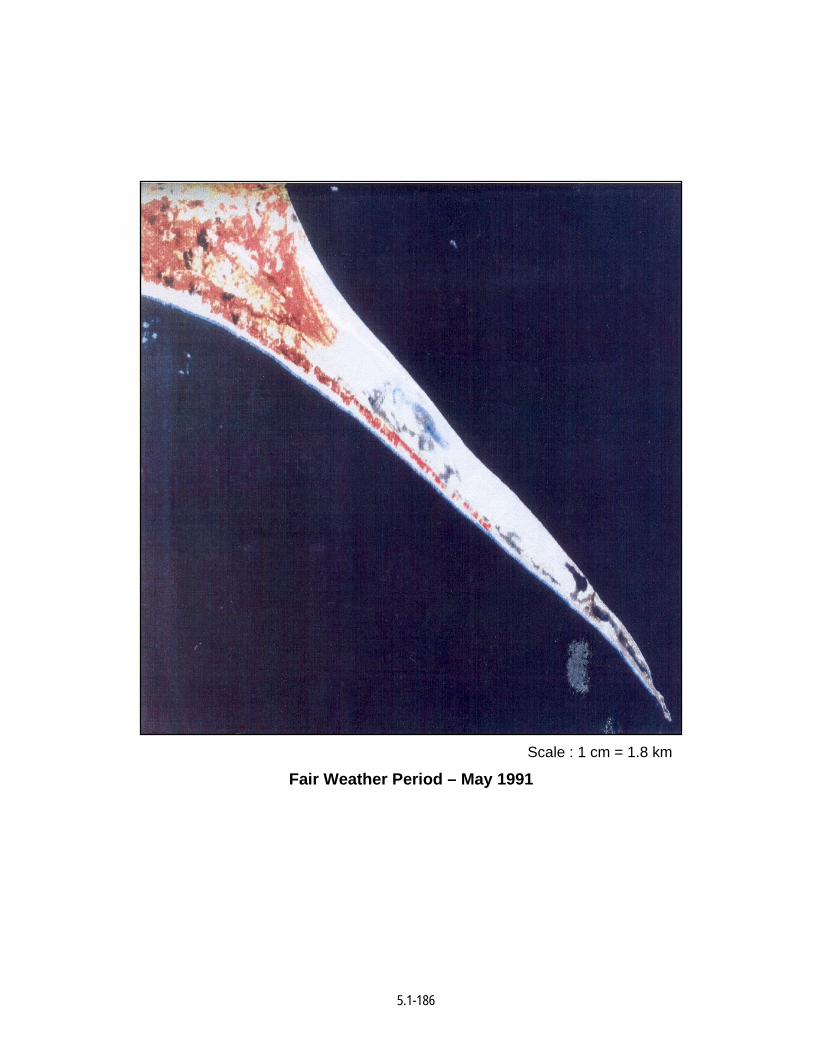
5.1-186
Scale : 1 cm = 1.8 km
Fair Weather Period – May 1991
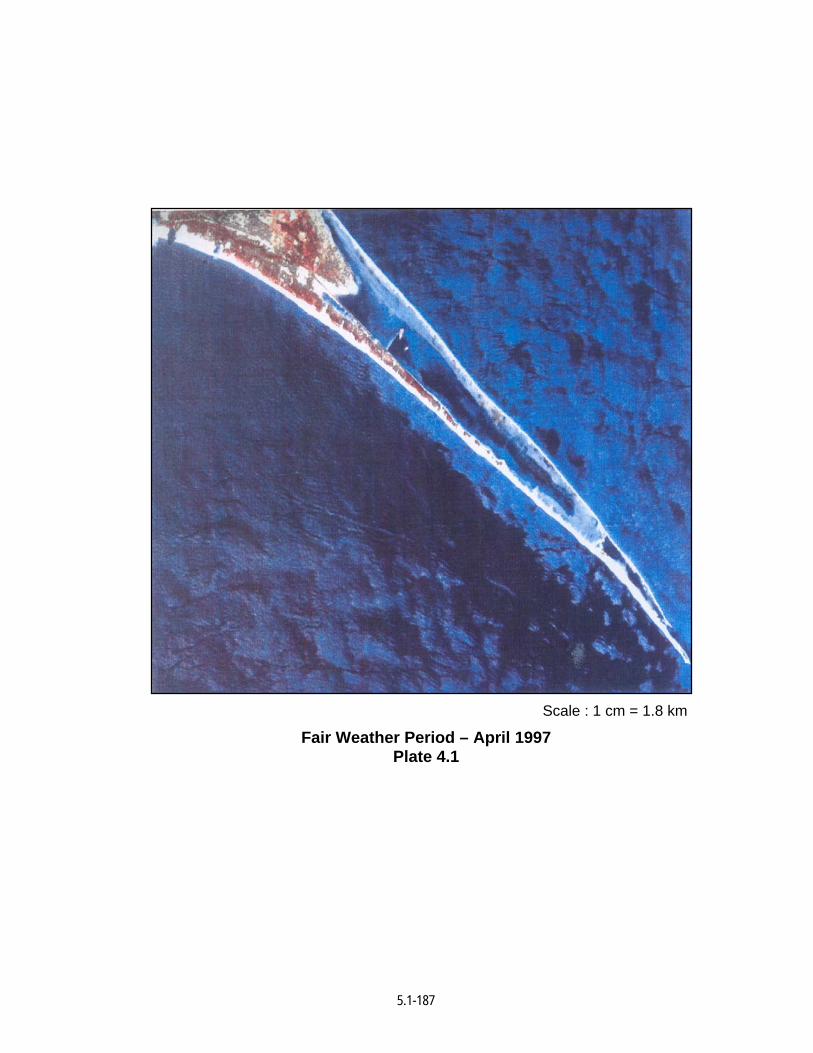
5.1-187
Scale : 1 cm = 1.8 km
Fair Weather Period – April 1997 Plate 4.1
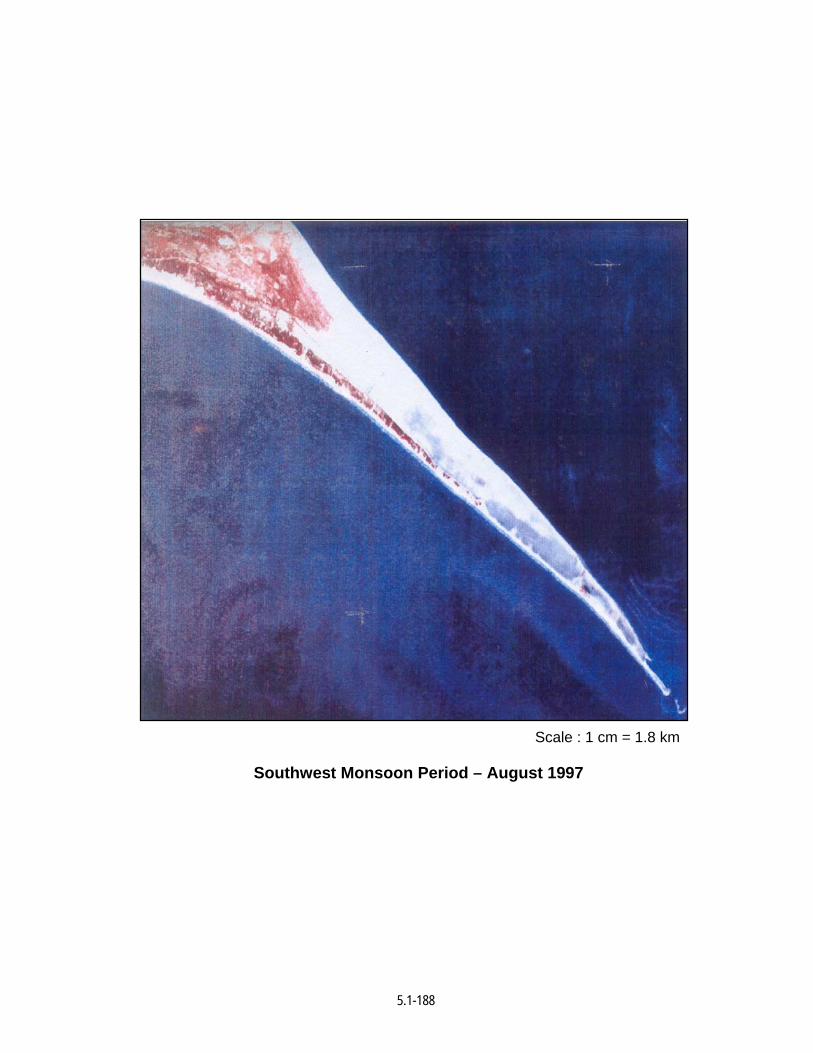
5.1-188
Scale : 1 cm = 1.8 km
Southwest Monsoon Period – August 1997
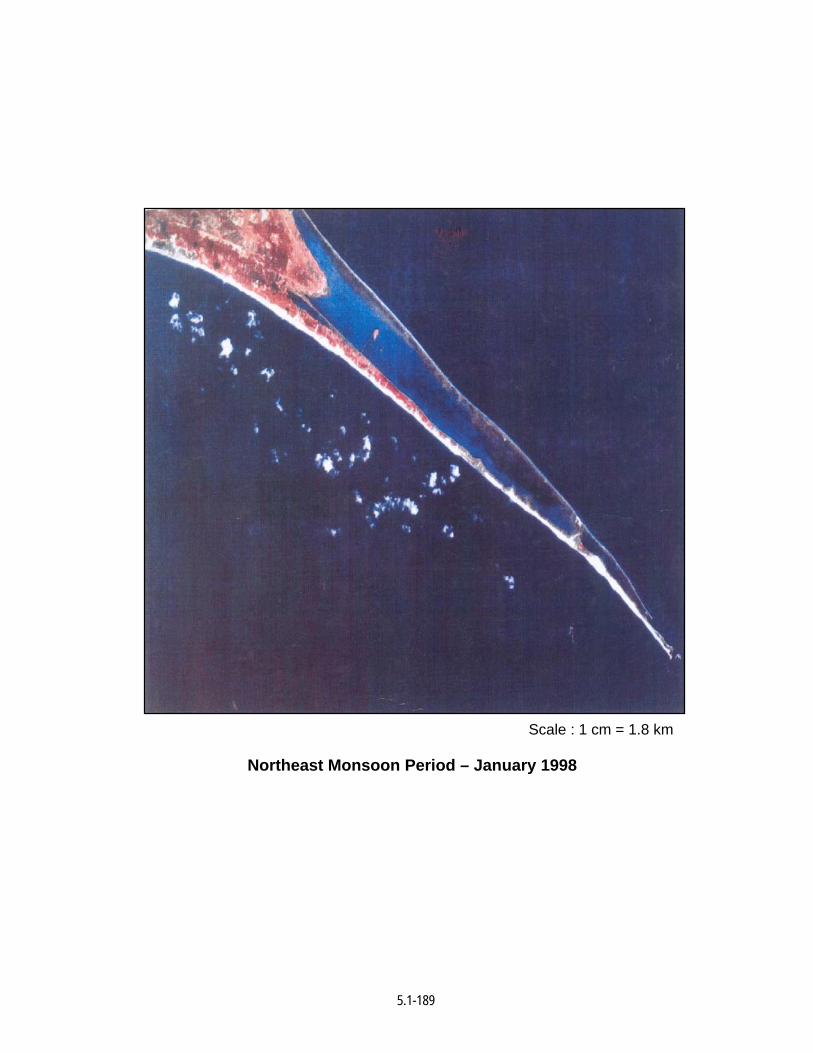
5.1-189
Scale : 1 cm = 1.8 km
Northeast Monsoon Period – January 1998
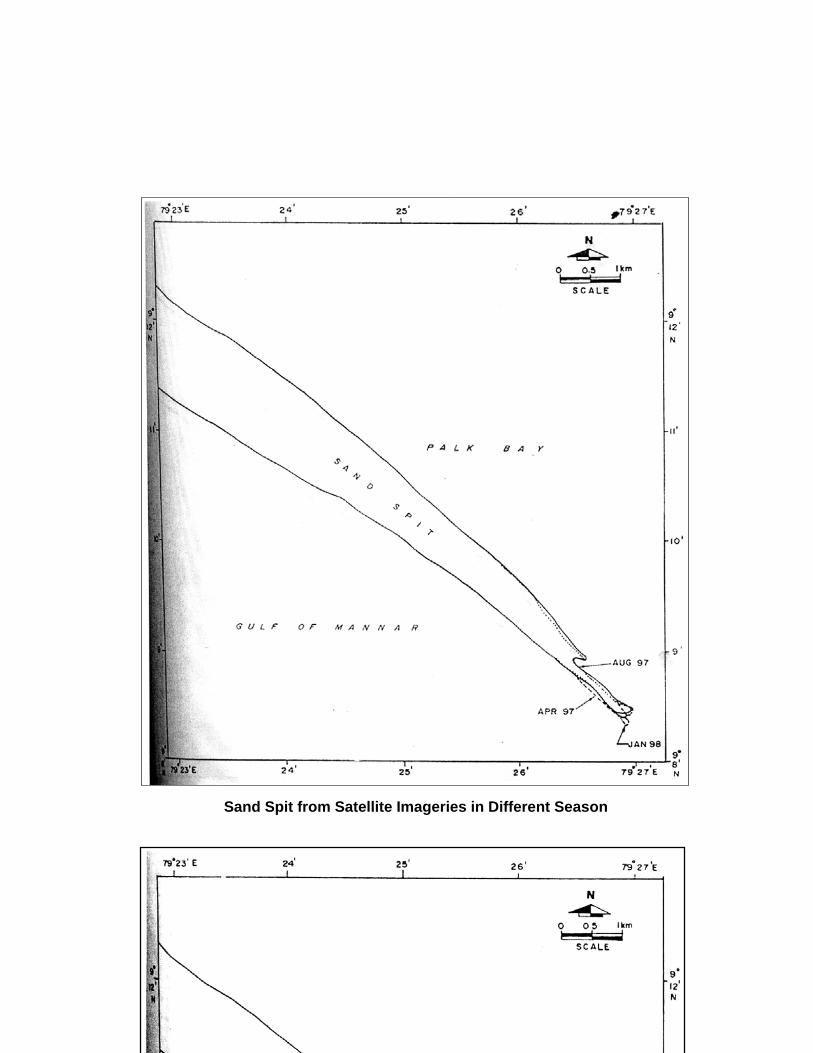
5.1-190
Sand Spit from Satellite Imageries in Different Season
5.1-191
Sand Spit from Satellite Imageries (May 91 - April 97)
1.0 Introduction India has an extensive coastline of about 7500 km long and a vast Exclusive
Economic Zone (EEZ) of more than 2.1 million km2, which includes the Andaman,
Nicobar and Lakshadweep islands. The EEZ of India embraces 12 major ports, 16
intermediate ports, 78 minor ports, and more than 200 fishing harbours. The coastal zone
is subjected to multiple uses like construction of ports and harbours, transportation,
extraction of living and non-living resources, land reclamation for commercial and
5.1-192
industrial development, agriculture, human habitation, military defense, aesthetic
appreciation, tourism and waste disposal. The stability of this coastal zone is influenced
by number of environmental factors, primarily due to geological, biological, meteorological
and oceanographically parameters, which distinctly vary from one sector of the coast to
another. The most influencing factors in coastal waters are the tides, waves and currents,
and they interact each other to produce an energy input, which shapes and modifies the
shore. Any attempt to study the coastal problems require a thorough understanding of the
factors and processes involved in the coastal geo-morphological system: the pattern of
sediment transport in the littoral zone, the volume of exchange of littoral drift from one
region to another, the monthly and seasonal variation, and the intermittent
oceanographical factors acting on the system.
The physical regime of the Indian shoreline is characterized by vivid forms like
headlands, promontories, rocky shores, sandy spits, barrier beaches, open beaches,
emabayments, estuaries, inlets, bays, marshy land and offshore islands. The littoral drift
system along the Indian shore is quite complex with the presence of major sedimentary
sources like Indus, Mahe, Sabarmati, Narmada, Tapi, Pennar, Cauvery, Krishna,
Godavari, Subarnarekha, Brahmani, Mahanadi, Ganga, Brahmaputra and Hugli rivers,
and sinks like Gulf of Khambhat, Gulf of Kachchh, Gulf of Mannar, Palk Bay, sandy Head
and various other inlets. The Indian mainland consists of nearly 2500 km long sandy
beaches browsed along Orissa, Andhra Pradesh, Tamilnadu, Kerala, Karnataka and part
of Goa; 670 km long rocky coasts with cliffs in Maharastra, part of Gujarat, northern part
of Rann of Kachchh, Kanyakumari and Visakhapatnam; 2100 km long mud flats in
Gujarat, and parts of Andhra Pradesh, West Bengal, Tamilnadu and Maharastra; and 600
km long marshy coast in parts of Gujarat and West Bengal. Steeper and cliffed rocky
shores, bays, islands, estuaries, barrier beaches, headlands, and pocket beaches are
widely noticed on the West Coast. Consequently sand spit, inlets, river mouths, estuaries,
and beaches are found to be more extensive along the East Coast.
The geographical formation of Tamilnadu coast plays a vial role on maintaining
the stability of the Indian shoreline. It determines the extent of sources and sinks for the
littoral drift moving around the Indian peninsular tip across the east and west coasts of
India. Based on the characteristics of the sediment processes and the various influencing
parameters, the Tamilnadu coastline can be classified into 6 segment viz., i) open coast
in Bay of Bengal – Pulicat to Pondicherry, ii) partly protected coast in Bay of Bengal –
Pondicherry to Vedaraniyam, iii) protected coast in Palk Bay – Vedaraniyam to
Dhanushkodi, iv) protected coast in Gulf of Mannar – Dhanushkodi to Tuticorin, v) partly
5.1-193
protected coast in Indian Ocean – Tuticorin to Ovari and vi) open coast in Indian Ocean –
Ovari to Thengaipattinam. The typical formation of Tamilnadu coast comprises of long
sandy beaches on the northern part. The stretch between Pondicherry and Vedaraniyam
has been experiencing a recession of coastline since historical period. The coastlines
between Vedaraniyam and Rameswaram in Palk Bay and between Rameswaram and
Tuticorin in Gulf of Mannar are substantially protected from monsoon waves due to the
proximity of Srilanka Island. Palk Bay is very shallow and is largely occupied by
sandbanks and submerged shoals. Abundant growth of corals, Oysters, Sponges and
other sea bottom communities flourish in the relatively calm waters of Gulf of Mannar. No
significant supply of sediment appears to exist from Gulf of Mannar towards Kanyakumari
and the littoral sediments are found to be confined within the Gulf of Mannar region. The
large volume of southerly littoral drift along the east coast enters into Palk Bay and is
seen getting deposited as spits and shoals.
Rameswaram Island, the geological formation of coral atoll with huge sand
cover between India and Srilanka plays a vital role on the process of exchange of littoral
drift between east coast and west coast. It separates the sea in the north by Palk Bay and
south by Gulf of Mannar. The wave sheltering effect due to Sri Lanka Island, the large
siltation in Palk Bay, the presence of numerous offshore islands in Gulf of Mannar, the
growing sand spit along Dhanushkodi and the shallow reef (Adam’s Bridge) between
Arimunai (India) and Thalaimannar (Sri Lanka) largely modify the sediment movement. It
is strongly evident that the coastal processes taking place around the Rameswaram
Island and the exchange of the littoral drift between Gulf of Mannar and Palk Bay
significantly determine the supply of sediments to the rest of the east coast and in turn the
stability of the region.
2.0 Geomorphology of the Study Region 2.1 General
In Indian coast, various investigations pertaining to different fields of
oceanography were carried out by a number of research workers. Sediment transport
along the east coast of India was initiated by Lafond and Prasada Rao (1954) and
subsequently by many investigators.
There are number of coral banks and islands present in Gulf of Mannar
(Krishnamurhty, 1991). The coastline near Tuticorin is extensively used due to the
presence of a major port. Beaches are very flat and narrow between Tuticorin and
Sippikulam. Offshore islands viz; Pandyan Tivu, Van Tivu, Kasuvari Tivu, Vilangu Shuli
5.1-194
Tivu and Kariya Shuli Tivu are present within 5 km distance from the coast line along this
segment and offer protection from wave action. The backshore of this coastal segment
largely consists of salt pans. The Viappar river joins the Gulf of Mannar near Sippikulam
where an extensive coastal low land is seen between Sippikulam and Vembar (Loveson,
1994).
The coastal segment between Sippikulam and Naripaiyur is open without any
offshore islands or submerged coral banks and is exposed to direct action of waves both
during southwest monsoon and northeast monsoon. The coastline near Kannirajapuram
is primarily composed with a large extent of beach rocks with pear luster (Loveson, 1994).
Wide and flat sandy beach with numerous small dunes are seen between Naripaiyur and
Mukkaiyur.
The formation of sand islands off Tuticorin region indicates this region acts as a
sediment sink with progressive accumulation of sand. The large beach storage of sand
between Manppad and Tiruchendur, Vembar and Valinokkam and Rameswaram Island
indicates the depositional features of littoral sediments.
Gundar river joins the sea near Mukkaiyur. The presence of offshore islands is
once again observed from Mukkaiyur till Mandapam. There are 16 such islands along this
segment viz., Uppu Tanni Tivu, Shalli Tivu, Nalla Tanni Tivu, Anaipar Tivu, Palliyarmunai
Tivu, Puvarasanpatti Tivu, Appa Tivu, Talairi Tivu, Valai Tivu, Muli Tivu, Musal Tivu,
Manali Tivu, Pumorichan Tivu, Kursadi Tivu, Kovi Tivu, and Shingle Tivu. The beaches
between Mukkaiyur and Valinokkam are very wide with elevated dunes. An extensively
developed beach is seen at Kilamundal. Flat rocky shorelines are noticed near
Valinokkam is contoured by an extensive spread of rocky shore with hard sand stone
platform (Loveson, 1994). There is a Bay formation in the immediate northern side of
Valinokkam.
A narrow beach near Kilakarai disappears high tide. A narrow and flat beach is
noticed near Sethukarai with the abundance of algae along the coastline. Loveson and
Rajamanickam (1987,1989) have identified a spit growth near Pariyapattinam. They
described a well-developed hooked natural spit extending southeast and connecting the
main land in southwest direction. The formation of this spit indicates seaward
progradation of the coast between Tuticorn and Mandapam.
Wave cut cliffs are seen at places like Valinokkam, Sethukarai and Mandapam.
Very low and narrow sandy beach exist between Kalimangundu and Vedalai (Loveson,
1994) where the sea is exceptionally calm. A wave cut platform is once again noticed
along the coast of Vedalai and a rocky patch is observed along the coast between
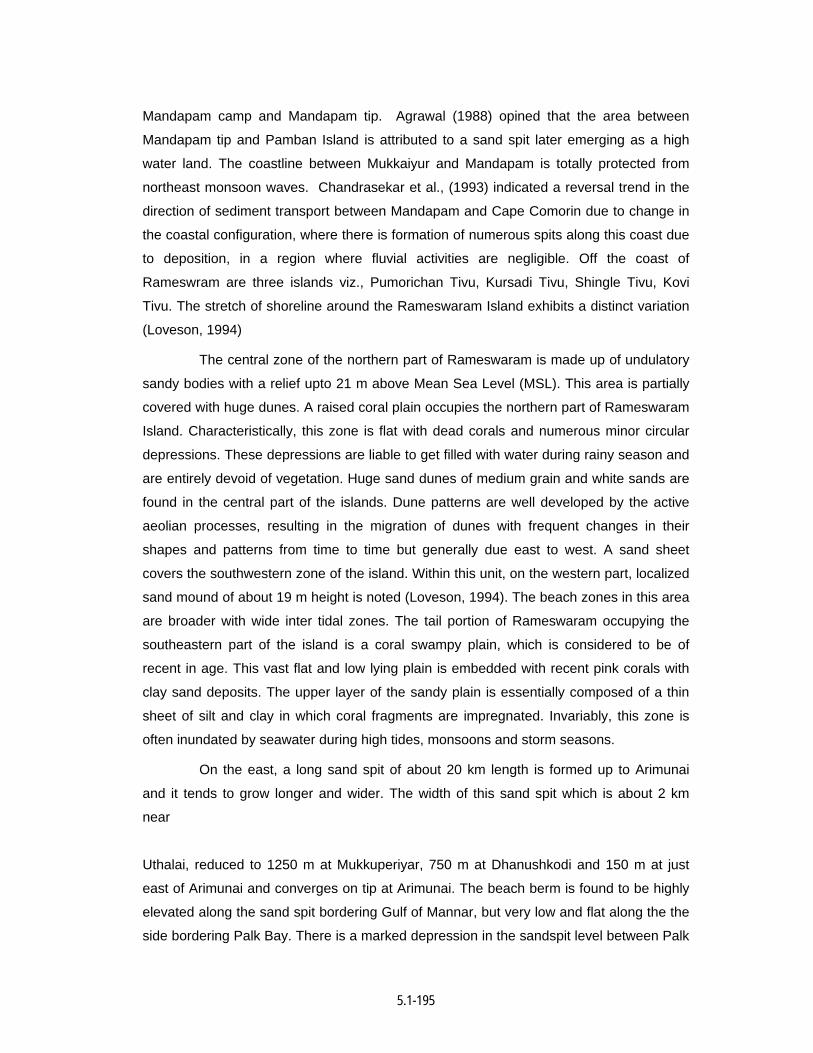
5.1-195
Mandapam camp and Mandapam tip. Agrawal (1988) opined that the area between
Mandapam tip and Pamban Island is attributed to a sand spit later emerging as a high
water land. The coastline between Mukkaiyur and Mandapam is totally protected from
northeast monsoon waves. Chandrasekar et al., (1993) indicated a reversal trend in the
direction of sediment transport between Mandapam and Cape Comorin due to change in
the coastal configuration, where there is formation of numerous spits along this coast due
to deposition, in a region where fluvial activities are negligible. Off the coast of
Rameswram are three islands viz., Pumorichan Tivu, Kursadi Tivu, Shingle Tivu, Kovi
Tivu. The stretch of shoreline around the Rameswaram Island exhibits a distinct variation
(Loveson, 1994)
The central zone of the northern part of Rameswaram is made up of undulatory
sandy bodies with a relief upto 21 m above Mean Sea Level (MSL). This area is partially
covered with huge dunes. A raised coral plain occupies the northern part of Rameswaram
Island. Characteristically, this zone is flat with dead corals and numerous minor circular
depressions. These depressions are liable to get filled with water during rainy season and
are entirely devoid of vegetation. Huge sand dunes of medium grain and white sands are
found in the central part of the islands. Dune patterns are well developed by the active
aeolian processes, resulting in the migration of dunes with frequent changes in their
shapes and patterns from time to time but generally due east to west. A sand sheet
covers the southwestern zone of the island. Within this unit, on the western part, localized
sand mound of about 19 m height is noted (Loveson, 1994). The beach zones in this area
are broader with wide inter tidal zones. The tail portion of Rameswaram occupying the
southeastern part of the island is a coral swampy plain, which is considered to be of
recent in age. This vast flat and low lying plain is embedded with recent pink corals with
clay sand deposits. The upper layer of the sandy plain is essentially composed of a thin
sheet of silt and clay in which coral fragments are impregnated. Invariably, this zone is
often inundated by seawater during high tides, monsoons and storm seasons.
On the east, a long sand spit of about 20 km length is formed up to Arimunai
and it tends to grow longer and wider. The width of this sand spit which is about 2 km
near
Uthalai, reduced to 1250 m at Mukkuperiyar, 750 m at Dhanushkodi and 150 m at just
east of Arimunai and converges on tip at Arimunai. The beach berm is found to be highly
elevated along the sand spit bordering Gulf of Mannar, but very low and flat along the the
side bordering Palk Bay. There is a marked depression in the sandspit level between Palk
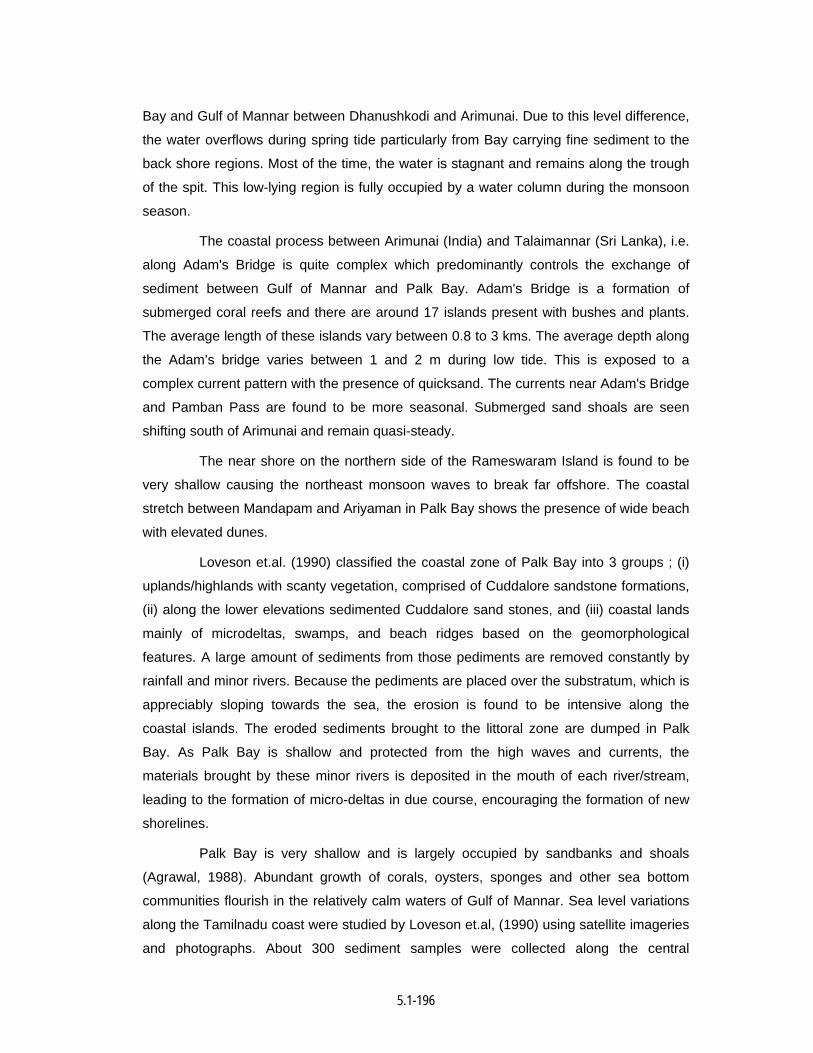
5.1-196
Bay and Gulf of Mannar between Dhanushkodi and Arimunai. Due to this level difference,
the water overflows during spring tide particularly from Bay carrying fine sediment to the
back shore regions. Most of the time, the water is stagnant and remains along the trough
of the spit. This low-lying region is fully occupied by a water column during the monsoon
season.
The coastal process between Arimunai (India) and Talaimannar (Sri Lanka), i.e.
along Adam's Bridge is quite complex which predominantly controls the exchange of
sediment between Gulf of Mannar and Palk Bay. Adam's Bridge is a formation of
submerged coral reefs and there are around 17 islands present with bushes and plants.
The average length of these islands vary between 0.8 to 3 kms. The average depth along
the Adam’s bridge varies between 1 and 2 m during low tide. This is exposed to a
complex current pattern with the presence of quicksand. The currents near Adam's Bridge
and Pamban Pass are found to be more seasonal. Submerged sand shoals are seen
shifting south of Arimunai and remain quasi-steady.
The near shore on the northern side of the Rameswaram Island is found to be
very shallow causing the northeast monsoon waves to break far offshore. The coastal
stretch between Mandapam and Ariyaman in Palk Bay shows the presence of wide beach
with elevated dunes.
Loveson et.al. (1990) classified the coastal zone of Palk Bay into 3 groups ; (i)
uplands/highlands with scanty vegetation, comprised of Cuddalore sandstone formations,
(ii) along the lower elevations sedimented Cuddalore sand stones, and (iii) coastal lands
mainly of microdeltas, swamps, and beach ridges based on the geomorphological
features. A large amount of sediments from those pediments are removed constantly by
rainfall and minor rivers. Because the pediments are placed over the substratum, which is
appreciably sloping towards the sea, the erosion is found to be intensive along the
coastal islands. The eroded sediments brought to the littoral zone are dumped in Palk
Bay. As Palk Bay is shallow and protected from the high waves and currents, the
materials brought by these minor rivers is deposited in the mouth of each river/stream,
leading to the formation of micro-deltas in due course, encouraging the formation of new
shorelines.
Palk Bay is very shallow and is largely occupied by sandbanks and shoals
(Agrawal, 1988). Abundant growth of corals, oysters, sponges and other sea bottom
communities flourish in the relatively calm waters of Gulf of Mannar. Sea level variations
along the Tamilnadu coast were studied by Loveson et.al, (1990) using satellite imageries
and photographs. About 300 sediment samples were collected along the central
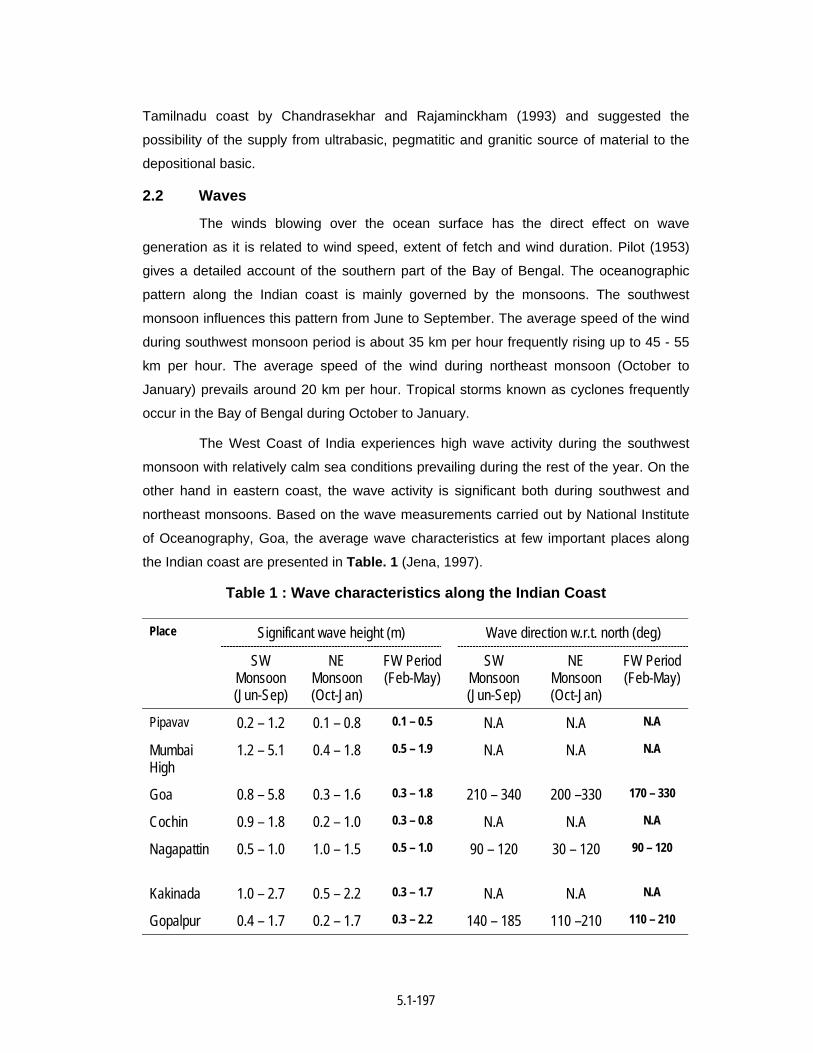
5.1-197
Tamilnadu coast by Chandrasekhar and Rajaminckham (1993) and suggested the
possibility of the supply from ultrabasic, pegmatitic and granitic source of material to the
depositional basic.
2.2 Waves
The winds blowing over the ocean surface has the direct effect on wave
generation as it is related to wind speed, extent of fetch and wind duration. Pilot (1953)
gives a detailed account of the southern part of the Bay of Bengal. The oceanographic
pattern along the Indian coast is mainly governed by the monsoons. The southwest
monsoon influences this pattern from June to September. The average speed of the wind
during southwest monsoon period is about 35 km per hour frequently rising up to 45 - 55
km per hour. The average speed of the wind during northeast monsoon (October to
January) prevails around 20 km per hour. Tropical storms known as cyclones frequently
occur in the Bay of Bengal during October to January.
The West Coast of India experiences high wave activity during the southwest
monsoon with relatively calm sea conditions prevailing during the rest of the year. On the
other hand in eastern coast, the wave activity is significant both during southwest and
northeast monsoons. Based on the wave measurements carried out by National Institute
of Oceanography, Goa, the average wave characteristics at few important places along
the Indian coast are presented in Table. 1 (Jena, 1997).
Table 1 : Wave characteristics along the Indian Coast
Significant wave height (m) Wave direction w.r.t. north (deg) Place
SW Monsoon (Jun-Sep)
NE Monsoon (Oct-Jan)
FW Period (Feb-May)
SW Monsoon (Jun-Sep)
NE Monsoon (Oct-Jan)
FW Period (Feb-May)
Pipavav 0.2 – 1.2 0.1 – 0.8 0.1 – 0.5 N.A N.A N.A
Mumbai High
1.2 – 5.1 0.4 – 1.8 0.5 – 1.9 N.A N.A N.A
Goa 0.8 – 5.8 0.3 – 1.6 0.3 – 1.8 210 – 340 200 –330 170 – 330
Cochin 0.9 – 1.8 0.2 – 1.0 0.3 – 0.8 N.A N.A N.A
Nagapattin 0.5 – 1.0 1.0 – 1.5 0.5 – 1.0 90 – 120 30 – 120 90 – 120
Kakinada 1.0 – 2.7 0.5 – 2.2 0.3 – 1.7 N.A N.A N.A
Gopalpur 0.4 – 1.7 0.2 – 1.7 0.3 – 2.2 140 – 185 110 –210 110 – 210
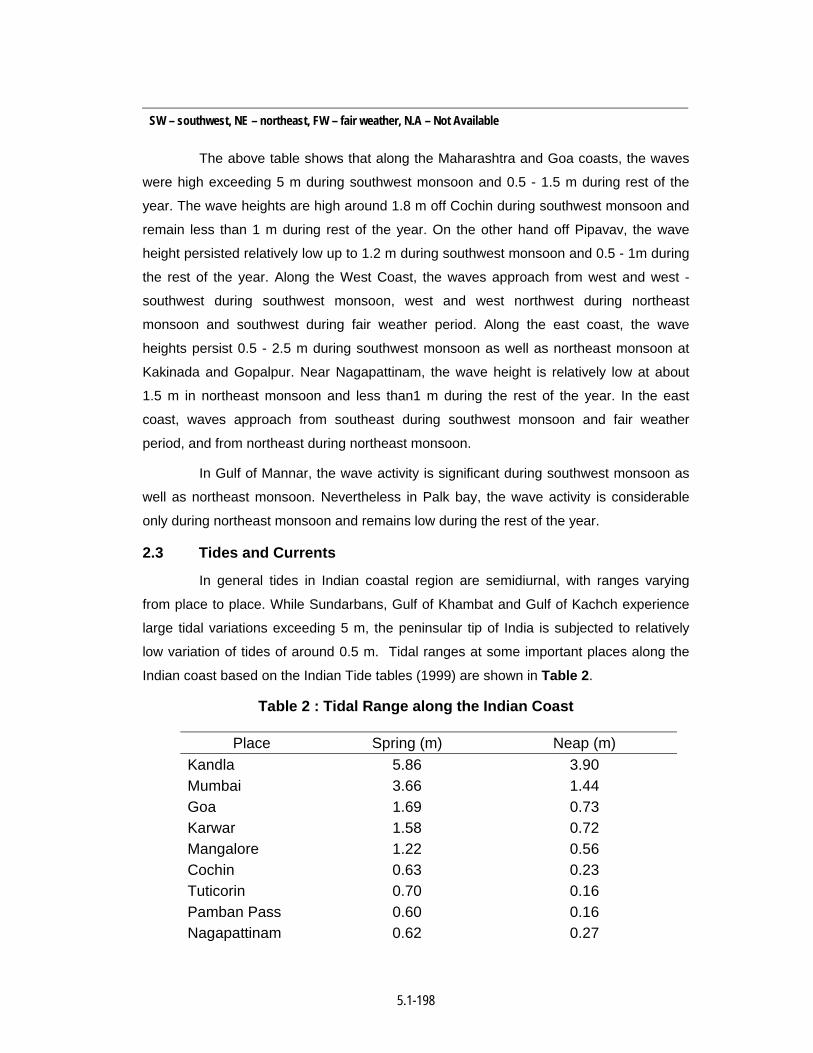
5.1-198
SW – southwest, NE – northeast, FW – fair weather, N.A – Not Available
The above table shows that along the Maharashtra and Goa coasts, the waves
were high exceeding 5 m during southwest monsoon and 0.5 - 1.5 m during rest of the
year. The wave heights are high around 1.8 m off Cochin during southwest monsoon and
remain less than 1 m during rest of the year. On the other hand off Pipavav, the wave
height persisted relatively low up to 1.2 m during southwest monsoon and 0.5 - 1m during
the rest of the year. Along the West Coast, the waves approach from west and west -
southwest during southwest monsoon, west and west northwest during northeast
monsoon and southwest during fair weather period. Along the east coast, the wave
heights persist 0.5 - 2.5 m during southwest monsoon as well as northeast monsoon at
Kakinada and Gopalpur. Near Nagapattinam, the wave height is relatively low at about
1.5 m in northeast monsoon and less than1 m during the rest of the year. In the east
coast, waves approach from southeast during southwest monsoon and fair weather
period, and from northeast during northeast monsoon.
In Gulf of Mannar, the wave activity is significant during southwest monsoon as
well as northeast monsoon. Nevertheless in Palk bay, the wave activity is considerable
only during northeast monsoon and remains low during the rest of the year.
2.3 Tides and Currents
In general tides in Indian coastal region are semidiurnal, with ranges varying
from place to place. While Sundarbans, Gulf of Khambat and Gulf of Kachch experience
large tidal variations exceeding 5 m, the peninsular tip of India is subjected to relatively
low variation of tides of around 0.5 m. Tidal ranges at some important places along the
Indian coast based on the Indian Tide tables (1999) are shown in Table 2.
Table 2 : Tidal Range along the Indian Coast
Place Spring (m) Neap (m) Kandla 5.86 3.90 Mumbai 3.66 1.44 Goa 1.69 0.73 Karwar 1.58 0.72 Mangalore 1.22 0.56 Cochin 0.63 0.23 Tuticorin 0.70 0.16 Pamban Pass 0.60 0.16 Nagapattinam 0.62 0.27
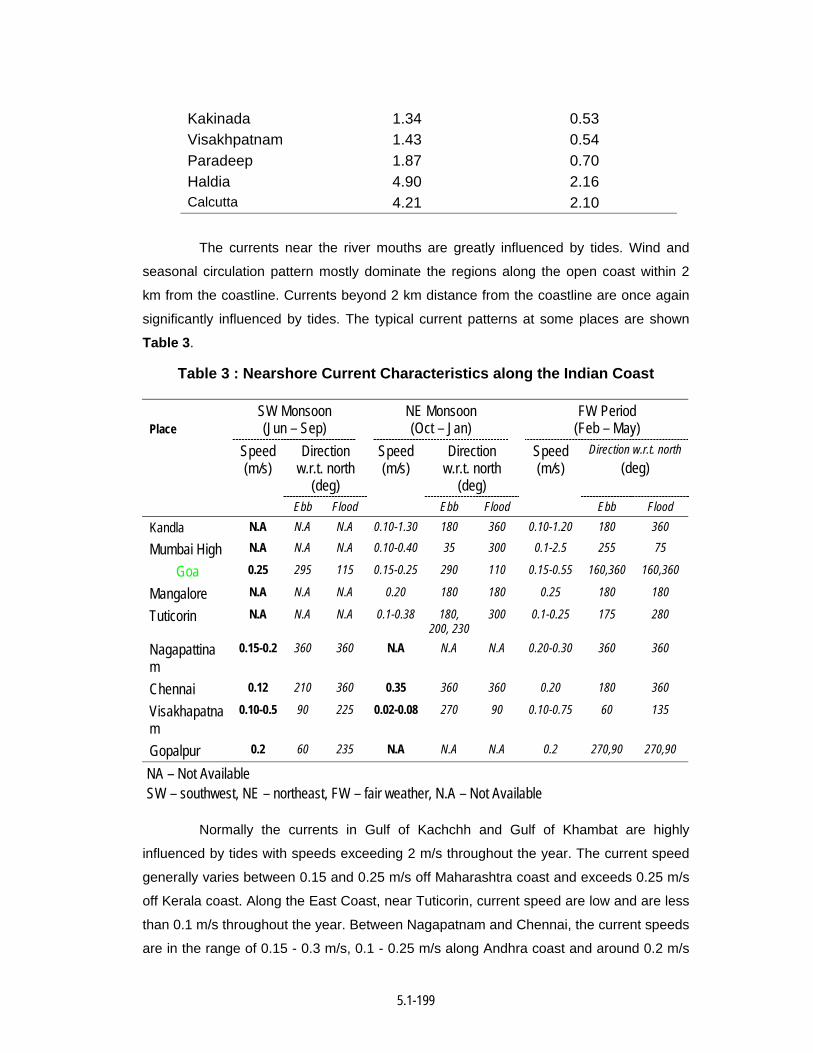
5.1-199
Kakinada 1.34 0.53 Visakhpatnam 1.43 0.54 Paradeep 1.87 0.70 Haldia 4.90 2.16 Calcutta 4.21 2.10
The currents near the river mouths are greatly influenced by tides. Wind and
seasonal circulation pattern mostly dominate the regions along the open coast within 2
km from the coastline. Currents beyond 2 km distance from the coastline are once again
significantly influenced by tides. The typical current patterns at some places are shown
Table 3.
Table 3 : Nearshore Current Characteristics along the Indian Coast
SW Monsoon (Jun – Sep)
NE Monsoon (Oct – Jan)
FW Period (Feb – May)
Direction w.r.t. north
(deg)
Direction w.r.t. north
(deg)
Direction w.r.t. north (deg)
Place Speed
(m/s)
Ebb Flood
Speed (m/s)
Ebb Flood
Speed (m/s)
Ebb Flood
Kandla N.A N.A N.A 0.10-1.30 180 360 0.10-1.20 180 360
Mumbai High N.A N.A N.A 0.10-0.40 35 300 0.1-2.5 255 75
Goa 0.25 295 115 0.15-0.25 290 110 0.15-0.55 160,360 160,360
Mangalore N.A N.A N.A 0.20 180 180 0.25 180 180
Tuticorin N.A N.A N.A 0.1-0.38 180, 200, 230
300 0.1-0.25 175 280
Nagapattinam
0.15-0.2 360 360 N.A N.A N.A 0.20-0.30 360 360
Chennai 0.12 210 360 0.35 360 360 0.20 180 360
Visakhapatnam
0.10-0.5 90 225 0.02-0.08 270 90 0.10-0.75 60 135
Gopalpur 0.2 60 235 N.A N.A N.A 0.2 270,90 270,90
NA – Not Available SW – southwest, NE – northeast, FW – fair weather, N.A – Not Available
Normally the currents in Gulf of Kachchh and Gulf of Khambat are highly
influenced by tides with speeds exceeding 2 m/s throughout the year. The current speed
generally varies between 0.15 and 0.25 m/s off Maharashtra coast and exceeds 0.25 m/s
off Kerala coast. Along the East Coast, near Tuticorin, current speed are low and are less
than 0.1 m/s throughout the year. Between Nagapatnam and Chennai, the current speeds
are in the range of 0.15 - 0.3 m/s, 0.1 - 0.25 m/s along Andhra coast and around 0.2 m/s
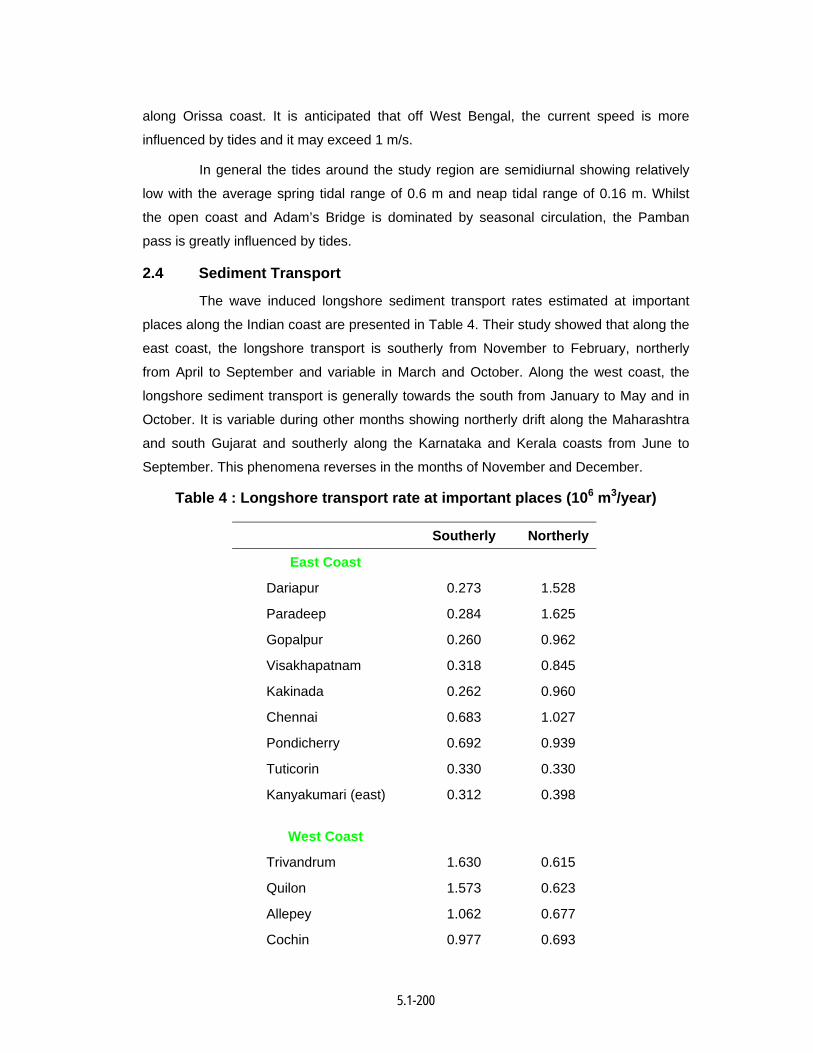
5.1-200
along Orissa coast. It is anticipated that off West Bengal, the current speed is more
influenced by tides and it may exceed 1 m/s.
In general the tides around the study region are semidiurnal showing relatively
low with the average spring tidal range of 0.6 m and neap tidal range of 0.16 m. Whilst
the open coast and Adam’s Bridge is dominated by seasonal circulation, the Pamban
pass is greatly influenced by tides.
2.4 Sediment Transport
The wave induced longshore sediment transport rates estimated at important
places along the Indian coast are presented in Table 4. Their study showed that along the
east coast, the longshore transport is southerly from November to February, northerly
from April to September and variable in March and October. Along the west coast, the
longshore sediment transport is generally towards the south from January to May and in
October. It is variable during other months showing northerly drift along the Maharashtra
and south Gujarat and southerly along the Karnataka and Kerala coasts from June to
September. This phenomena reverses in the months of November and December.
Table 4 : Longshore transport rate at important places (106 m3/year)
Southerly Northerly
East Coast
Dariapur 0.273 1.528
Paradeep 0.284 1.625
Gopalpur 0.260 0.962
Visakhapatnam 0.318 0.845
Kakinada 0.262 0.960
Chennai 0.683 1.027
Pondicherry 0.692 0.939
Tuticorin 0.330 0.330
Kanyakumari (east) 0.312 0.398
West Coast
Trivandrum 1.630 0.615
Quilon 1.573 0.623
Allepey 1.062 0.677
Cochin 0.977 0.693
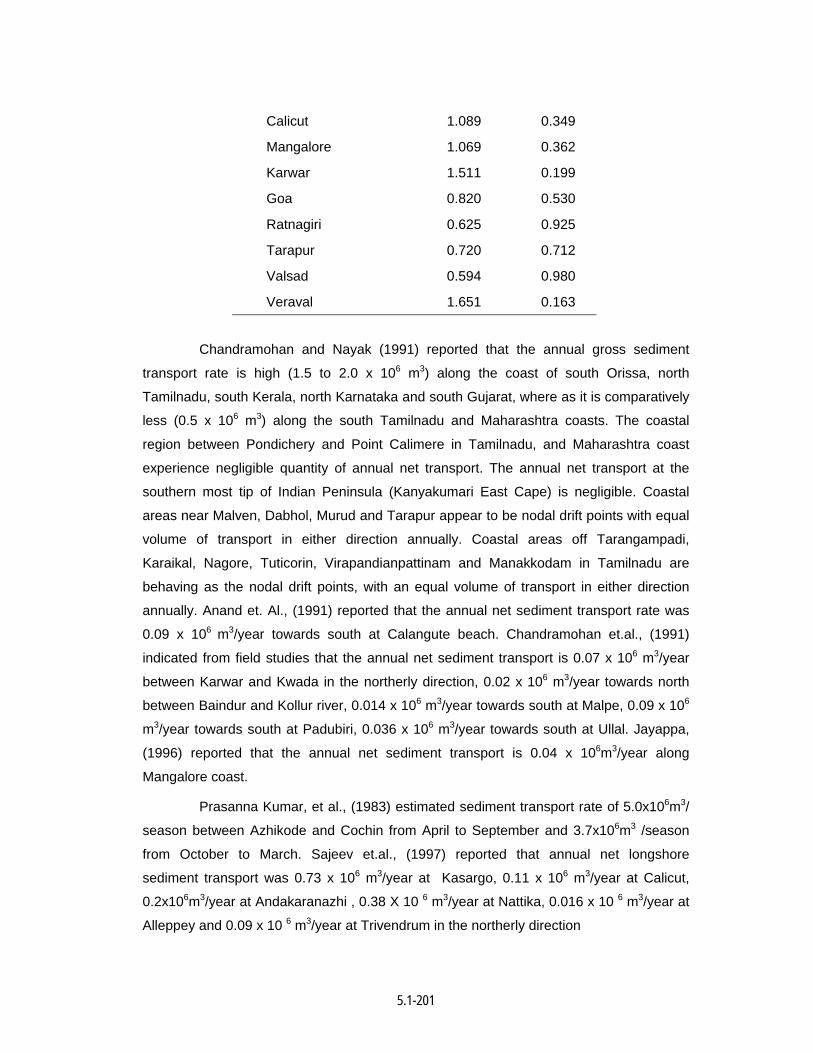
5.1-201
Calicut 1.089 0.349
Mangalore 1.069 0.362
Karwar 1.511 0.199
Goa 0.820 0.530
Ratnagiri 0.625 0.925
Tarapur 0.720 0.712
Valsad 0.594 0.980
Veraval 1.651 0.163
Chandramohan and Nayak (1991) reported that the annual gross sediment
transport rate is high (1.5 to 2.0 x 10⁶ m3) along the coast of south Orissa, north
Tamilnadu, south Kerala, north Karnataka and south Gujarat, where as it is comparatively
less (0.5 x 10⁶ m3) along the south Tamilnadu and Maharashtra coasts. The coastal
region between Pondichery and Point Calimere in Tamilnadu, and Maharashtra coast
experience negligible quantity of annual net transport. The annual net transport at the
southern most tip of Indian Peninsula (Kanyakumari East Cape) is negligible. Coastal
areas near Malven, Dabhol, Murud and Tarapur appear to be nodal drift points with equal
volume of transport in either direction annually. Coastal areas off Tarangampadi,
Karaikal, Nagore, Tuticorin, Virapandianpattinam and Manakkodam in Tamilnadu are
behaving as the nodal drift points, with an equal volume of transport in either direction
annually. Anand et. Al., (1991) reported that the annual net sediment transport rate was
0.09 x 10⁶ m3/year towards south at Calangute beach. Chandramohan et.al., (1991)
indicated from field studies that the annual net sediment transport is 0.07 x 10⁶ m3/year
between Karwar and Kwada in the northerly direction, 0.02 x 10⁶ m3/year towards north
between Baindur and Kollur river, 0.014 x 10⁶ m3/year towards south at Malpe, 0.09 x 10⁶
m3/year towards south at Padubiri, 0.036 x 10⁶ m3/year towards south at Ullal. Jayappa,
(1996) reported that the annual net sediment transport is 0.04 x 10⁶m3/year along
Mangalore coast.
Prasanna Kumar, et al., (1983) estimated sediment transport rate of 5.0x10⁶m3/
season between Azhikode and Cochin from April to September and 3.7x10⁶m3 /season
from October to March. Sajeev et.al., (1997) reported that annual net longshore
sediment transport was 0.73 x 10⁶ m3/year at Kasargo, 0.11 x 10⁶ m3/year at Calicut,
0.2x10⁶m3/year at Andakaranazhi , 0.38 X 10 6 m3/year at Nattika, 0.016 x 10 6 m3/year at
Alleppey and 0.09 x 10 6 m3/year at Trivendrum in the northerly direction
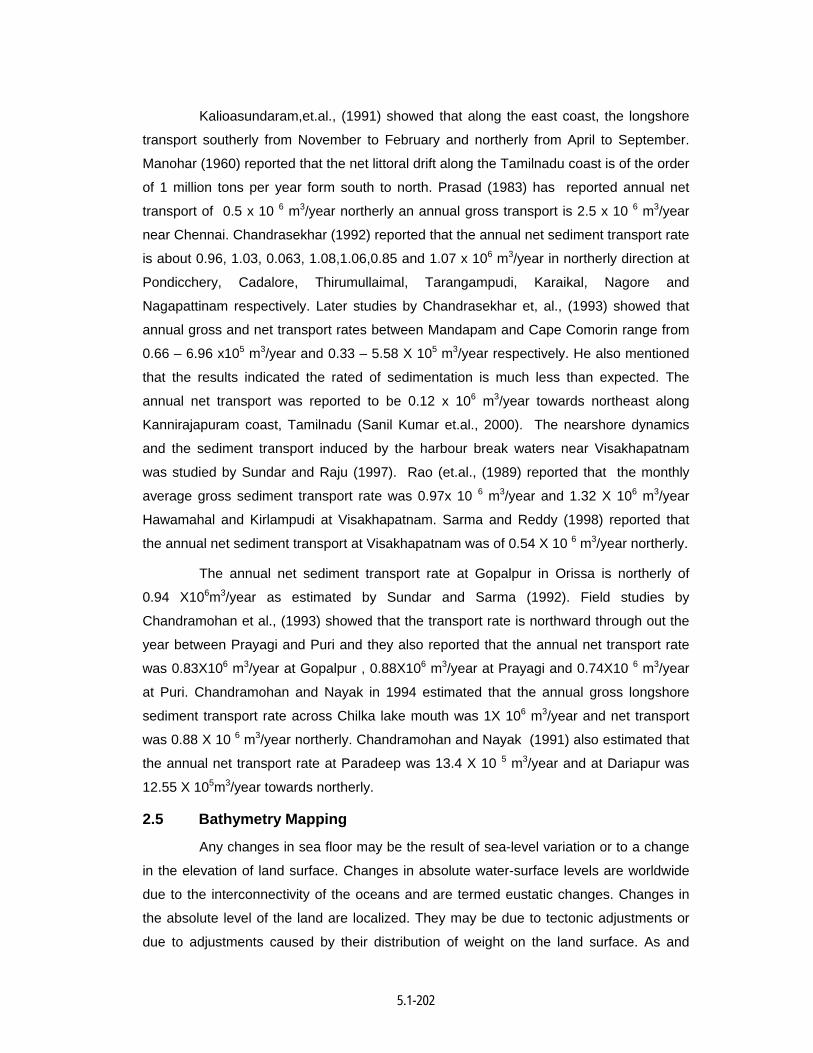
5.1-202
Kalioasundaram,et.al., (1991) showed that along the east coast, the longshore
transport southerly from November to February and northerly from April to September.
Manohar (1960) reported that the net littoral drift along the Tamilnadu coast is of the order
of 1 million tons per year form south to north. Prasad (1983) has reported annual net
transport of 0.5 x 10 6 m3/year northerly an annual gross transport is 2.5 x 10 6 m3/year
near Chennai. Chandrasekhar (1992) reported that the annual net sediment transport rate
is about 0.96, 1.03, 0.063, 1.08,1.06,0.85 and 1.07 x 10⁶ m3/year in northerly direction at
Pondicchery, Cadalore, Thirumullaimal, Tarangampudi, Karaikal, Nagore and
Nagapattinam respectively. Later studies by Chandrasekhar et, al., (1993) showed that
annual gross and net transport rates between Mandapam and Cape Comorin range from
0.66 – 6.96 x10⁵ m3/year and 0.33 – 5.58 X 10⁵ m3/year respectively. He also mentioned
that the results indicated the rated of sedimentation is much less than expected. The
annual net transport was reported to be 0.12 x 10⁶ m3/year towards northeast along
Kannirajapuram coast, Tamilnadu (Sanil Kumar et.al., 2000). The nearshore dynamics
and the sediment transport induced by the harbour break waters near Visakhapatnam
was studied by Sundar and Raju (1997). Rao (et.al., (1989) reported that the monthly
average gross sediment transport rate was 0.97x 10 6 m3/year and 1.32 X 10⁶ m3/year
Hawamahal and Kirlampudi at Visakhapatnam. Sarma and Reddy (1998) reported that
the annual net sediment transport at Visakhapatnam was of 0.54 X 10 6 m3/year northerly.
The annual net sediment transport rate at Gopalpur in Orissa is northerly of
0.94 X10⁶m3/year as estimated by Sundar and Sarma (1992). Field studies by
Chandramohan et al., (1993) showed that the transport rate is northward through out the
year between Prayagi and Puri and they also reported that the annual net transport rate
was 0.83X10⁶ m3/year at Gopalpur , 0.88X10⁶ m3/year at Prayagi and 0.74X10 6 m3/year
at Puri. Chandramohan and Nayak in 1994 estimated that the annual gross longshore
sediment transport rate across Chilka lake mouth was 1X 10⁶ m3/year and net transport
was 0.88 X 10 6 m3/year northerly. Chandramohan and Nayak (1991) also estimated that
the annual net transport rate at Paradeep was 13.4 X 10 5 m3/year and at Dariapur was
12.55 X 10⁵m3/year towards northerly.
2.5 Bathymetry Mapping
Any changes in sea floor may be the result of sea-level variation or to a change
in the elevation of land surface. Changes in absolute water-surface levels are worldwide
due to the interconnectivity of the oceans and are termed eustatic changes. Changes in
the absolute level of the land are localized. They may be due to tectonic adjustments or
due to adjustments caused by their distribution of weight on the land surface. As and
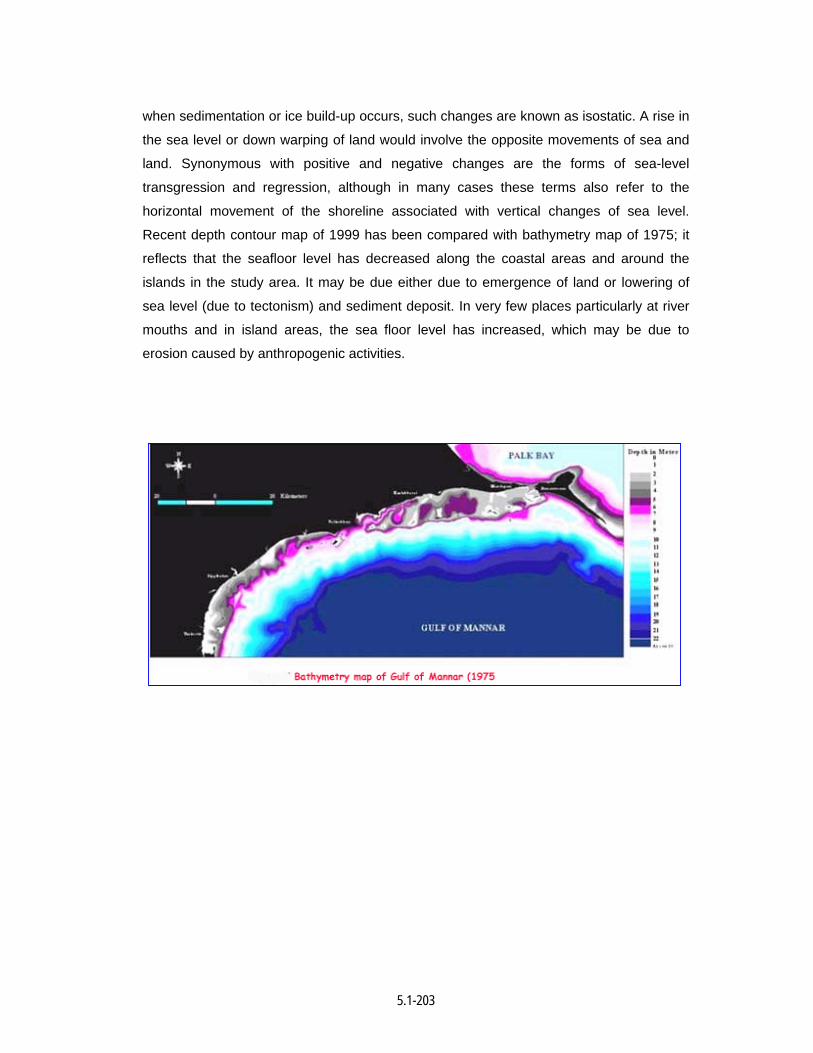
5.1-203
when sedimentation or ice build-up occurs, such changes are known as isostatic. A rise in
the sea level or down warping of land would involve the opposite movements of sea and
land. Synonymous with positive and negative changes are the forms of sea-level
transgression and regression, although in many cases these terms also refer to the
horizontal movement of the shoreline associated with vertical changes of sea level.
Recent depth contour map of 1999 has been compared with bathymetry map of 1975; it
reflects that the seafloor level has decreased along the coastal areas and around the
islands in the study area. It may be due either due to emergence of land or lowering of
sea level (due to tectonism) and sediment deposit. In very few places particularly at river
mouths and in island areas, the sea floor level has increased, which may be due to
erosion caused by anthropogenic activities.
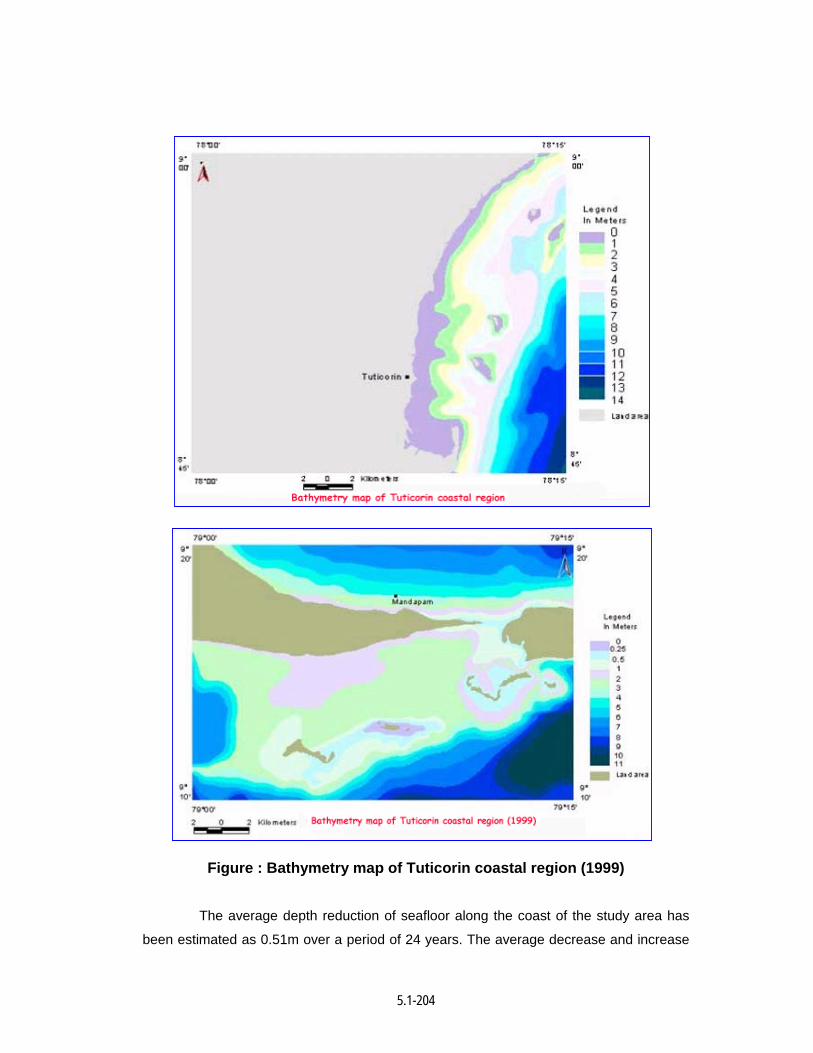
5.1-204
Figure : Bathymetry map of Tuticorin coastal region (1999)
The average depth reduction of seafloor along the coast of the study area has
been estimated as 0.51m over a period of 24 years. The average decrease and increase
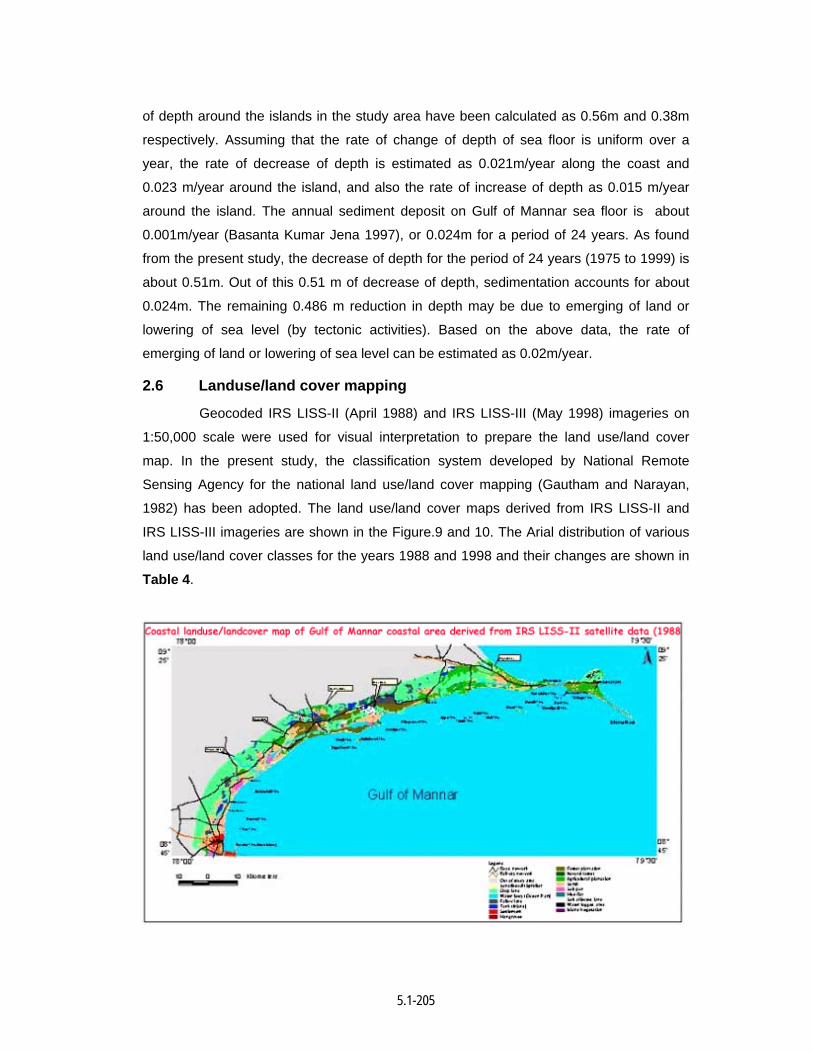
5.1-205
of depth around the islands in the study area have been calculated as 0.56m and 0.38m
respectively. Assuming that the rate of change of depth of sea floor is uniform over a
year, the rate of decrease of depth is estimated as 0.021m/year along the coast and
0.023 m/year around the island, and also the rate of increase of depth as 0.015 m/year
around the island. The annual sediment deposit on Gulf of Mannar sea floor is about
0.001m/year (Basanta Kumar Jena 1997), or 0.024m for a period of 24 years. As found
from the present study, the decrease of depth for the period of 24 years (1975 to 1999) is
about 0.51m. Out of this 0.51 m of decrease of depth, sedimentation accounts for about
0.024m. The remaining 0.486 m reduction in depth may be due to emerging of land or
lowering of sea level (by tectonic activities). Based on the above data, the rate of
emerging of land or lowering of sea level can be estimated as 0.02m/year.
2.6 Landuse/land cover mapping
Geocoded IRS LISS-II (April 1988) and IRS LISS-III (May 1998) imageries on
1:50,000 scale were used for visual interpretation to prepare the land use/land cover
map. In the present study, the classification system developed by National Remote
Sensing Agency for the national land use/land cover mapping (Gautham and Narayan,
1982) has been adopted. The land use/land cover maps derived from IRS LISS-II and
IRS LISS-III imageries are shown in the Figure.9 and 10. The Arial distribution of various
land use/land cover classes for the years 1988 and 1998 and their changes are shown in
Table 4.

5.1-206
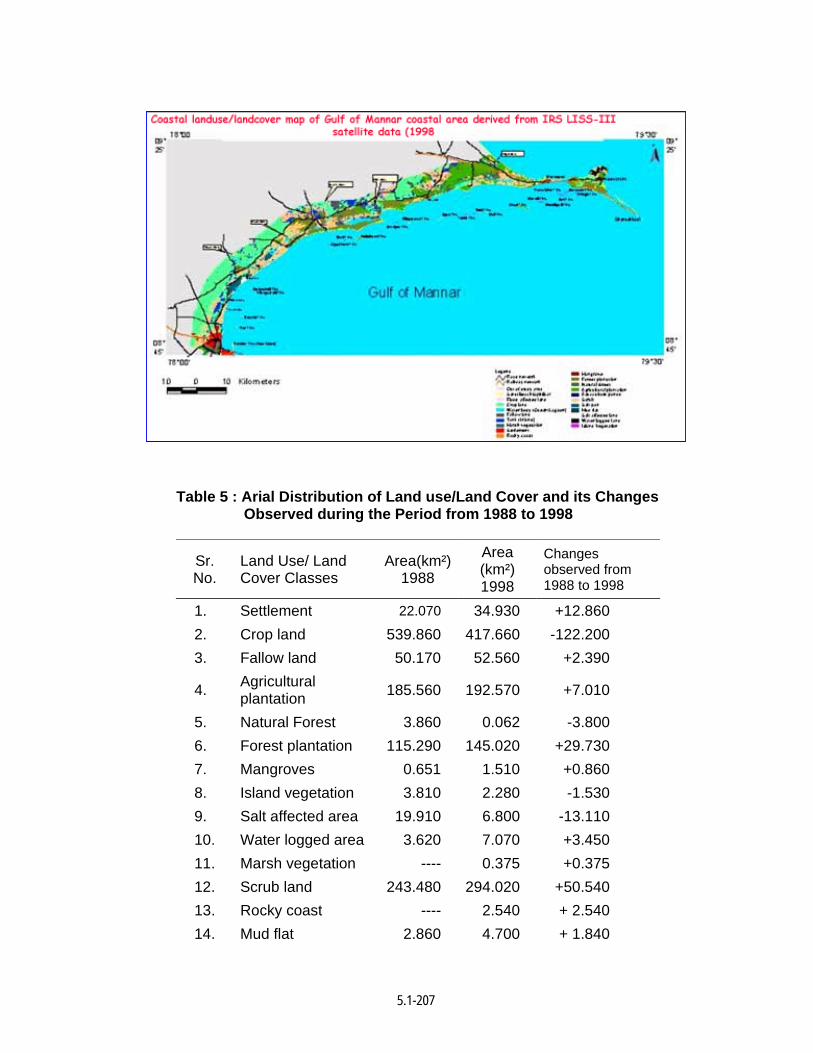
5.1-207
Table 5 : Arial Distribution of Land use/Land Cover and its Changes Observed during the Period from 1988 to 1998
Sr. No.
Land Use/ Land Cover Classes
Area(km²) 1988
Area (km²) 1998
Changes observed from 1988 to 1998
1. Settlement 22.070 34.930 +12.860 2. Crop land 539.860 417.660 -122.200 3. Fallow land 50.170 52.560 +2.390
4. Agricultural plantation 185.560 192.570 +7.010
5. Natural Forest 3.860 0.062 -3.800 6. Forest plantation 115.290 145.020 +29.730 7. Mangroves 0.651 1.510 +0.860 8. Island vegetation 3.810 2.280 -1.530 9. Salt affected area 19.910 6.800 -13.110 10. Water logged area 3.620 7.070 +3.450 11. Marsh vegetation ---- 0.375 +0.375 12. Scrub land 243.480 294.020 +50.540 13. Rocky coast ---- 2.540 + 2.540 14. Mud flat 2.860 4.700 + 1.840
5.1-208
15. Sandy area 39.280 36.800 -2.480 16. Tanks 70.840 74.850 + 4.010 17. Salt pan 27.730 48.930 +21.200 18. Aquaculture ponds ---- 3.170 +3.170 19. Flood affected area ---- 0.800 +0.800
2.7 Land use/Land Cover Changes
Multi temporal satellite data used in the present study enabled observing the
land use and land cover changes in the study area from 1988 to 1998. Over the past 10
years, areas of some land use classes have increased, areas of some classes have
decreased and some categories have changed in to another category in the study area.
These changes are taken place due to the increase in population in towns and villages
along the coast and various kinds of economic activities.
The major land use/land cover changes has occurred in the following classes:
a. Cropland area has reduced from 539.86 km² to 417.66 km² b. Fallow land increased has from 50.17 km² to 52.56 km² c. Agricultural plantation has increased from 185.56 km² to 192.57 km² d. Forest plantation has increased from 115.29 km² to 145.02 km², e. Scrub lands has increase from 243.48 km² to 294.02 km², f. Sandy area has reduced to 36.80 km² and g. Area of tanks has increased from 70.84 km² to 74.85 km².
2.8 Associated Problems
Problems associated with excessive sediment deposition and siltation have
been noticed at all harbour channels and various river mouths particularly in Andhra
Pradesh and Tamilnadu. There is significant deposition of littoral materials in Gulf of
Kachchh and Gulf of Khambat along the west coast, and Gulf of Mannar, Palk Bay and
Sandhead along the east coast. The sand spits in the estuarine mouths of the Tapi,
Narmada, Dhadar, Mahe, Sabarmati, Kim,Purna and Ambica indicate further the features
of sediments deposition. The growth of long sand spits at Chilka Lake, Kakinada and
Pulicat lake indicates the enormous movement of littoral sediment and subsequent
deposition.
Indian coast, in general, experiences seasonal erosion during southwest
monsoon (June to September), except along the south Tamilnadu which undergoes
erosion during northeast monsoon (October to January). Most of the beaches regain their
5.1-209
original profiles by March/April in summer. The segments which do not regain their
original shape over the annual cycle undergo net erosion.
Nayak (1980) reported shoreline erosion in Gujarat: at Ghoga, Bhagwa, Dumas,
Kaniar, Kolak and Umbergoan, in Maharashtra: at Versova, Revdanda, Rajapuri, Vashi
and Malvan, in Goa: at Miramar and Calangute, in Karnataka: at Belekeri, Ankola,
Bhatkal, Maravanthe, Malpe, Mulur and Mangalore, in Keral most of the coast covering a
length of 330 km out of the total 530 km length og the shoreline, in Tamilnadu: at
Kanyakumari, Rameswaram, Cuddalore, Mahabalipuram, Covelon and Ennore, in
Andhra Pradesh; at Kakinada, Visakhapatnam and Bhimunipatnam, in Orissa: Gopalpur,
Paradeep and Satbhaya and in West Bengal: at Digha, Bankiput and Gangasagar. Reddy
and Hariharan, (1979) reported that the erosion at Versova and near fishing port in
Mumbai. Deshpande, (1977) reported that erosion and submergence of land near Ankola,
Bhatkal, Malpe, Mulur, Mangalore, Honnavar, Maravante and Gokarn in Karnataka. In
Kerala about 360 km long coastline is exposed to severe erosion near Trivandrum,
Quilon, Kannamaly, Chellanam, and entire northern coast (Samsuddin and Suchindan,
1987, Purandara and Dora, 1989 and Samuddin et al., 1991). In Tamilnadu.,
Kaliasundaram, et al ., (1991) reported that the coastline at Pulicat, Royapuram, Elliot,
Kovalam, Pondichery, Poompuhar, Taragampadi, Nagapattinam, Madapam, Manapadu,
Kanyakumari, Colachal and Eramanthurai are exposed to erosion and at Ennore,
Mahabalipuram, Kilakarai, Rameswaram, Tiruchendur, Manakudi and at Muttom are
exposed to accretion.
Palk Bay is shallow and is largely occupied by sandbanks and shoals (Agrawal,
1988). The sediments brought by Vaigai, Vaishali and Valiyar rivers and the littoral drift
from the north Tamilnadu coast are the major sources of sediments entering the Palk Bay
(Mallik, 1983). Jena (1997) indicated that 0.02 X 10¹⁰ m3 sediment get deposited over a
period of 75 years in Gulf of Mannar causing the reduction of water depth to 0.72 m i.e.
0.001 m per year. Jena (1997) estimated that 0.3 X 10¹⁰ m3 sediment get deposited over
a period of 52 years in Palk Bay causing the reduction in the water depth of about 0.32 m
i.e., 0.006 m per year. Not much information is available in study region on the process of
littoral to sediment transport.
Usha and Subramanian (1993) stated that the accretion pattern was observed in
the Palk Bay at Mandapam and Rameswaram and the accretion pattern for sites located
in the Palk Bay, Viz., Ammapattinam, Mandapam and Rameswaram was observed.
There is no serious problem of erosion reported in the study region. However this region
is prone sediment deposition and occurrence of offshore islands and sand spits/shoals.
5.1-210
The Hindu (29.10.1999) reported that extremely exciting possibilities of the Point
Calimere, nose of Vedaraniyam, welding itself with the Jaffna Peninsula, and
Dhanushkodi becoming a single landmass with Talaimannar in Jaffna, within about 500
years. It is very essential to take up inter-disciplinary and inter-institutional research
project to know more about these phenomena. The dating of beach ridges taken up on
Tamilanadu coast, had indicated that the sea had withdrawn to the extent of about 4 km
in about 4000 years in Chennai coast, 50 km in 5000 years in Vedaraniyam – Point
Calimere coast, and about 65 km in about 7000 to 8000 years in Ramanadhapuram coast
according Dr. S.M. Ramaswamy (Hindu 29.10.1999).
3.0 Geomorphology, Hydrography and Sediment Transport of the Study Area 3.1 Waves
The Wave measurement observations are showing that, significant wave height
varied from 0.46 to 1.12 m in March, 0.33 to 1.18 m in April, 0.46 to 1.74 m in May, 0.71
to 1.78 m in June, 0.68 to 1.6 m in July, 0.68 to 1.49 in August, 0.64 to 1.76 m in
September, 0.54 to 1.35 m in October, 0.40 to 1.13 m in November, 0.40 to 1.12 m in
December, 0.35 to 1.03 m in January and 0.35 to 1.23 m in February.
The maximum wave height varied from 0.67 to 1.78 m in March, 0.44 to 1.73 m
in April, 0.66 to 2.81 m in May, 0.98 to 2.72 m in June, 0.91 to 2.45 m in July, 0.89 to 2.48
m in August, 0.89 to 2.96 m in September, 0.66 to 2.94 m in October, 0.59 to 1.60m in
November, 0.48 to 1.73 m in December, 0.47 to 1.68 m in January and 0.45 to 1.79 m in
Febraury. Wave heights are relatively higher during southwest monsoon.
The wave direction (with respect to north) mostly prevailed 140O to 230O in
southwest monsoon (June to September), 85O to 150O during northeast monsoon
(October to January), and 90O – 200O during fair weather period (February to May). The
wave direction is highly variable in January and May. The zero crossing wave period
predominantly varied 3-8 s in December to April, 4-10 s in May and 4-9 s during rest of
the year.
In west coast the wave heights of Bombay are in between 2.0 – 6.0 m in
southwest monsoon, 2.0 –3.0 in north east monsoon, and 1.0 – 2.5 m in fair weather
period. Off Goa the wave heights are between 0.8 –5.1 m in southwest monsoon. Off
Mangalore wave heights are around 3.2 m in southwest monsoon and 0.8 min fair
weather period. Off Trivandrum the wave heights are 2 – 4.3 m in southwest monsoon
and 1 –2.0 m in fair weather period. Off Cochin the wave heights are between 0.9 – 2.0 in
5.1-211
southwest monsoon. In east coast off Chennai the wave heights are 2.5 m in southwest
monsoon and 1 m in northeast monsoon. Off Visakhapatnam coast these heights are
between 0.8 - 3.9 m in southwest monsoon 0.6 –2.9 m in northeast monsoon and
0.5 –3.8 m in fair weather period. Off Orissa the wave heights are between 1.0 –2.5 m in
southwest monsoon and 0.8 –2.5 m in northeast monsoon, and around 1 –2.2 m in fair
weather period.
The wave climate reported in the literature indicates that the wave activity in the
study region remains relatively low compared to the rest of Indian coast.
3.2 Wave Refraction
3.2.1 Tuticorin to Arimunai
Wave refraction during the southwest monsoon shows appreciable divergence
of wave orthogonal near Adams Bridge, Arimunai, and south of Sippikulam. Wave activity
was found to be extremely reduced between Mandapam and north of Valinokkam due to
the presence of offshore islands, which causes waves to break offshore. Wave energy
concentration was observed at Mukkuperiyar, Valinokkam, Mukkaiyur and Vember. The
region between Sippikulam and Tuticorin is again protected from southwestern waves
due to the presence of islands. The presence of offshore islands is observed to protect
the coastal stretch from Mandapam to Valinokkam, and Veppalodai to Tuticorin from
northeasterly waves.
3.2.2 Arimunai to Vedarnyam:
This segment of the coastline lies in Palk Bay and waves propagating from
south
(during southwest monsoon and fair weather period) do not enter in this region. Studies
are indicating that even during the northeast monsoon, waves are found not entering the
bay and get attenuated across the shoals of middle banks and south banks between
Vedaranyam (India) and Matakal (Sri Lanka). Part of wave energy with less magnitude
enters the bay through Pedro Channel and reach the coast between Puduvalasai and
Gopalpatnam.
3.5 Wave Period
During southwest monsoon, the wave period predominantly persisted 9 –10 s
between Vembar and Keelamunadal, and 6 – 8 s between Uthalai and Dhanushkodi.
During the northeast monsoon, it predominantly persisted 5 –10 s between Vembar and
Keelamundal, and 5 –8 s between Uthalai and Dhanushkodi east. In fair weather period,
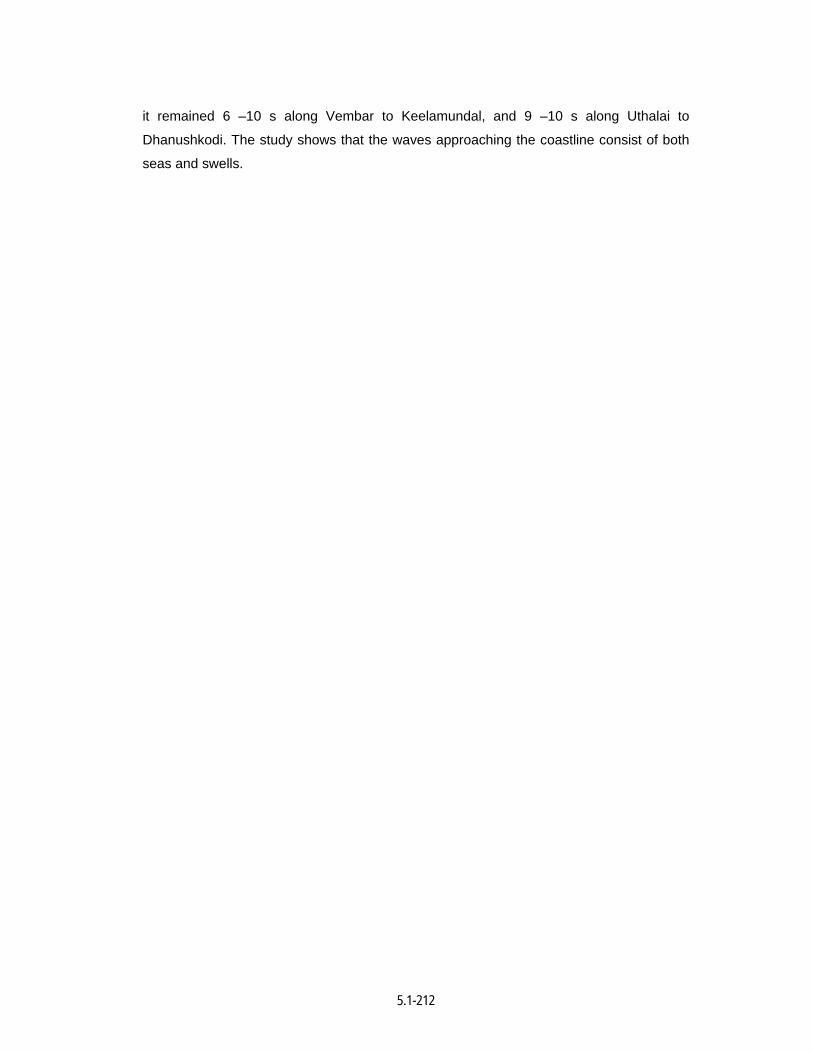
5.1-212
it remained 6 –10 s along Vembar to Keelamundal, and 9 –10 s along Uthalai to
Dhanushkodi. The study shows that the waves approaching the coastline consist of both
seas and swells.
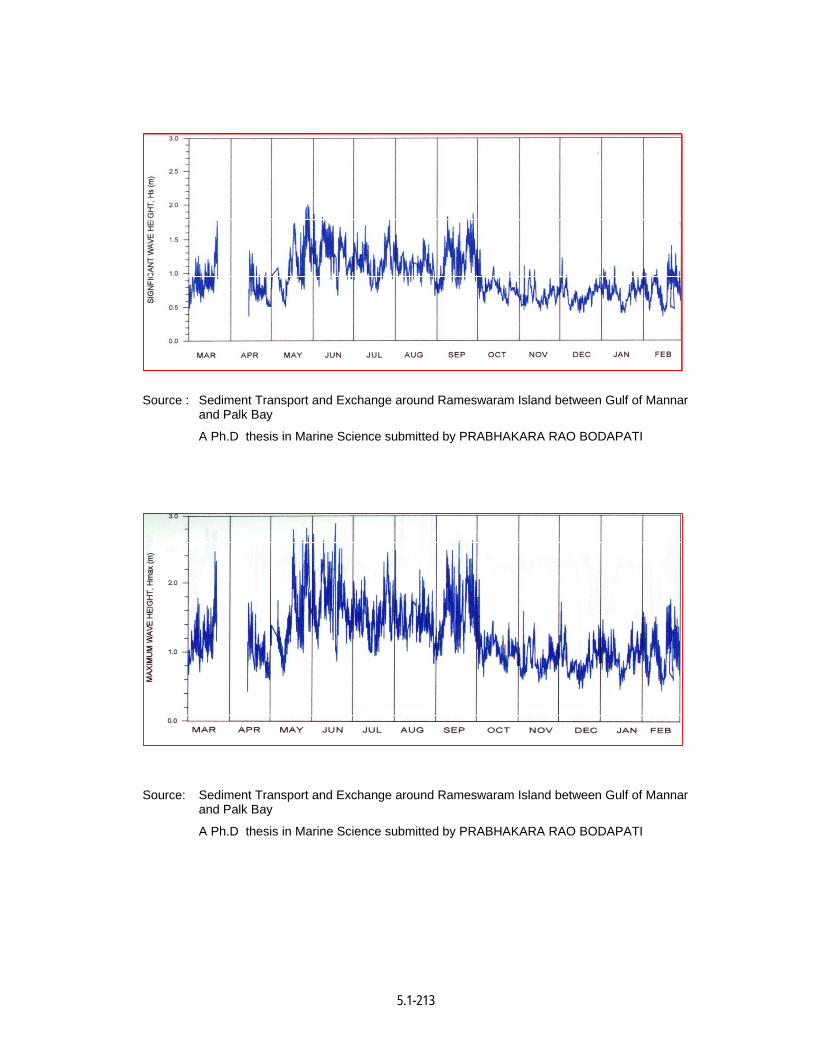
5.1-213
Source : Sediment Transport and Exchange around Rameswaram Island between Gulf of Mannar
and Palk Bay
A Ph.D thesis in Marine Science submitted by PRABHAKARA RAO BODAPATI
Source: Sediment Transport and Exchange around Rameswaram Island between Gulf of Mannar
and Palk Bay
A Ph.D thesis in Marine Science submitted by PRABHAKARA RAO BODAPATI
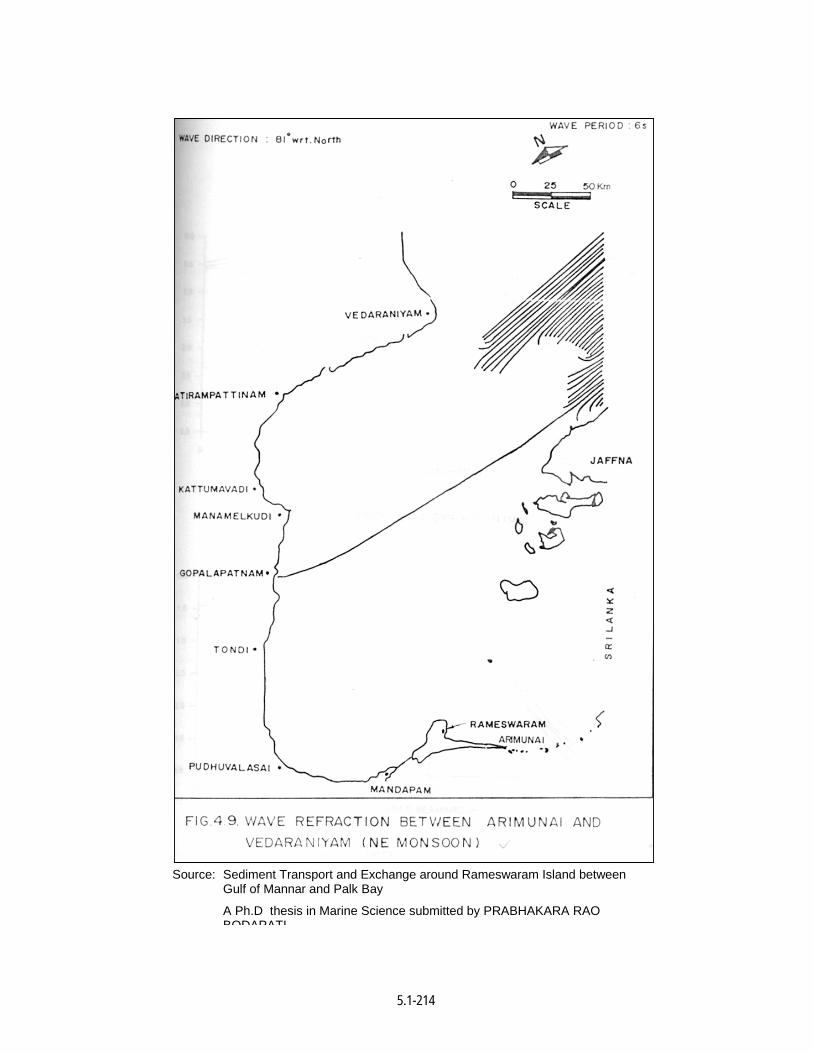
5.1-214
Source: Sediment Transport and Exchange around Rameswaram Island between Gulf of Mannar and Palk Bay
A Ph.D thesis in Marine Science submitted by PRABHAKARA RAO BODAPATI
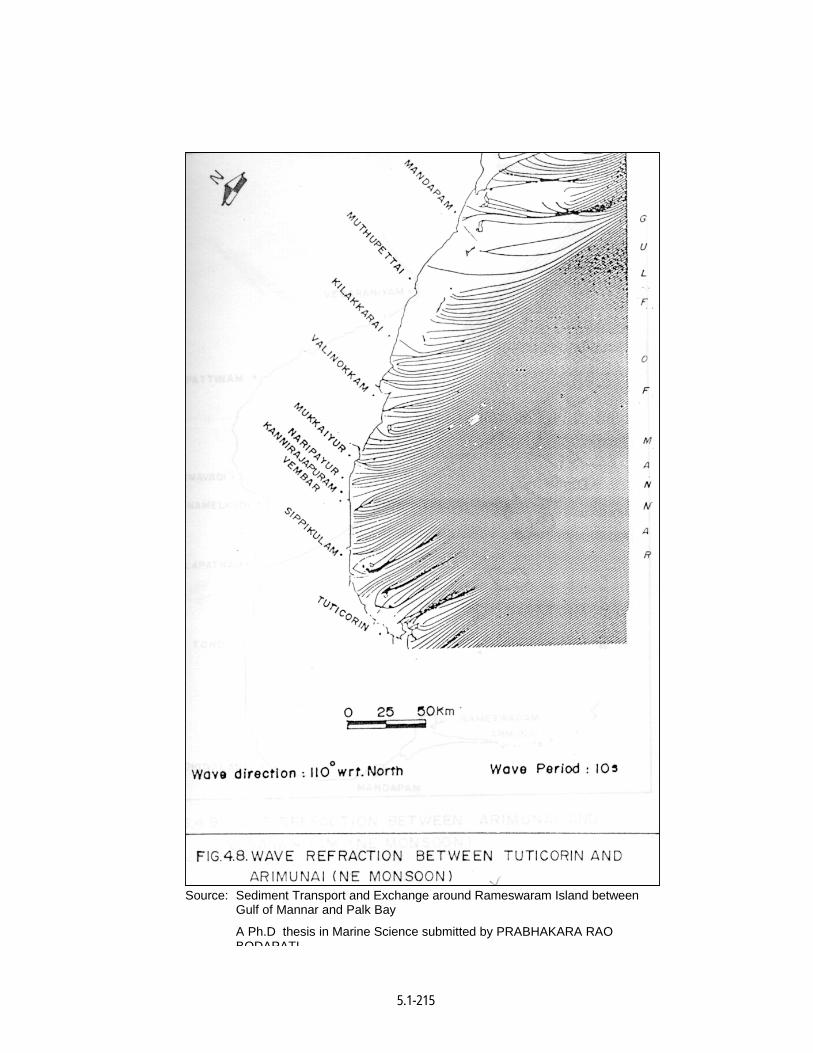
5.1-215
Source: Sediment Transport and Exchange around Rameswaram Island between Gulf of Mannar and Palk Bay
A Ph.D thesis in Marine Science submitted by PRABHAKARA RAO BODAPATI
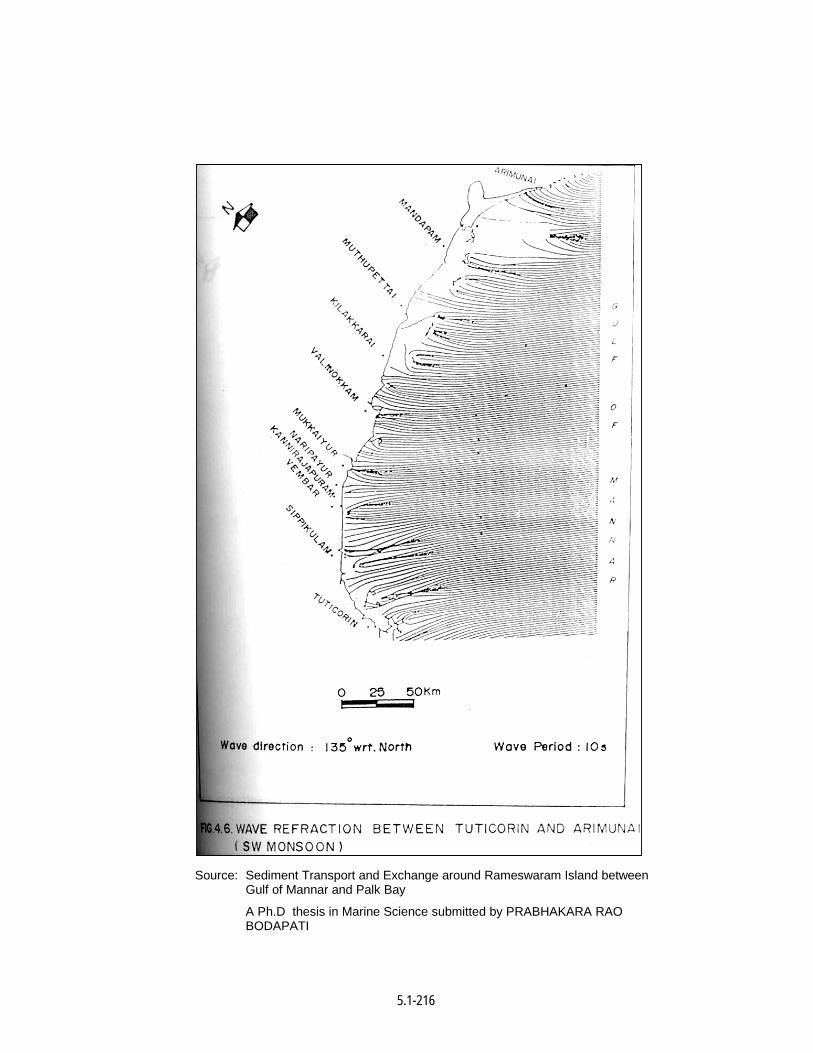
5.1-216
Source: Sediment Transport and Exchange around Rameswaram Island between Gulf of Mannar and Palk Bay
A Ph.D thesis in Marine Science submitted by PRABHAKARA RAO BODAPATI
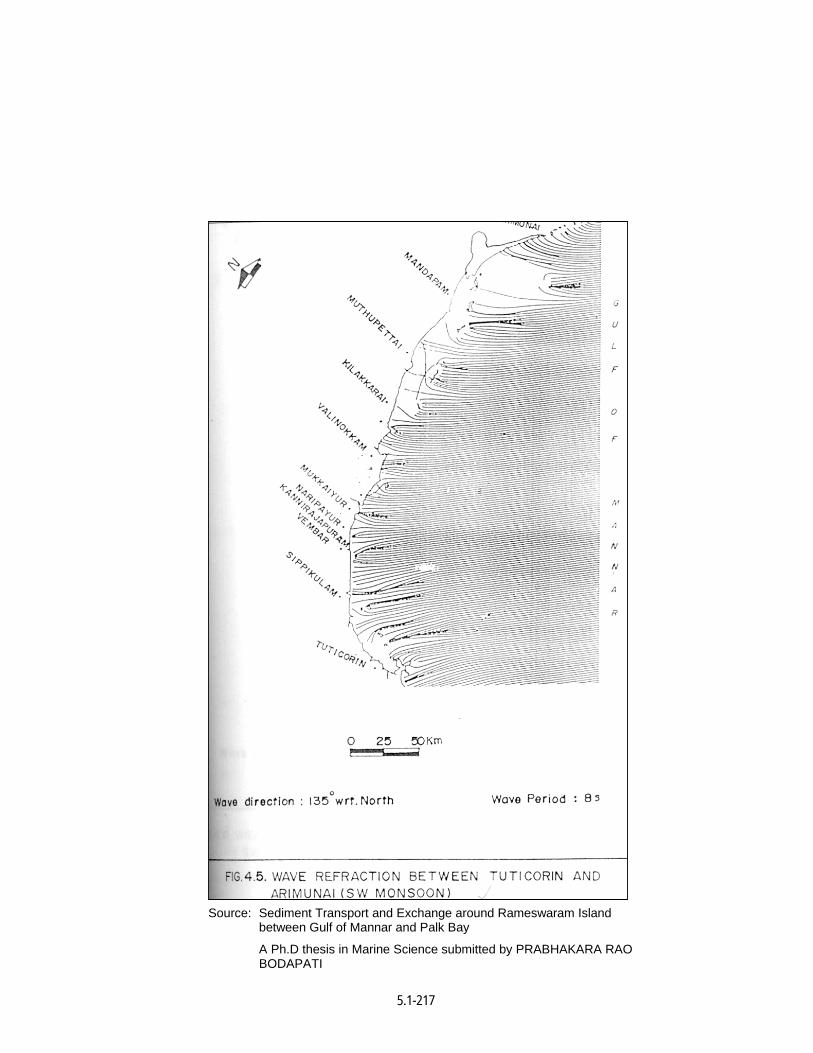
5.1-217
Source: Sediment Transport and Exchange around Rameswaram Island between Gulf of Mannar and Palk Bay
A Ph.D thesis in Marine Science submitted by PRABHAKARA RAO BODAPATI
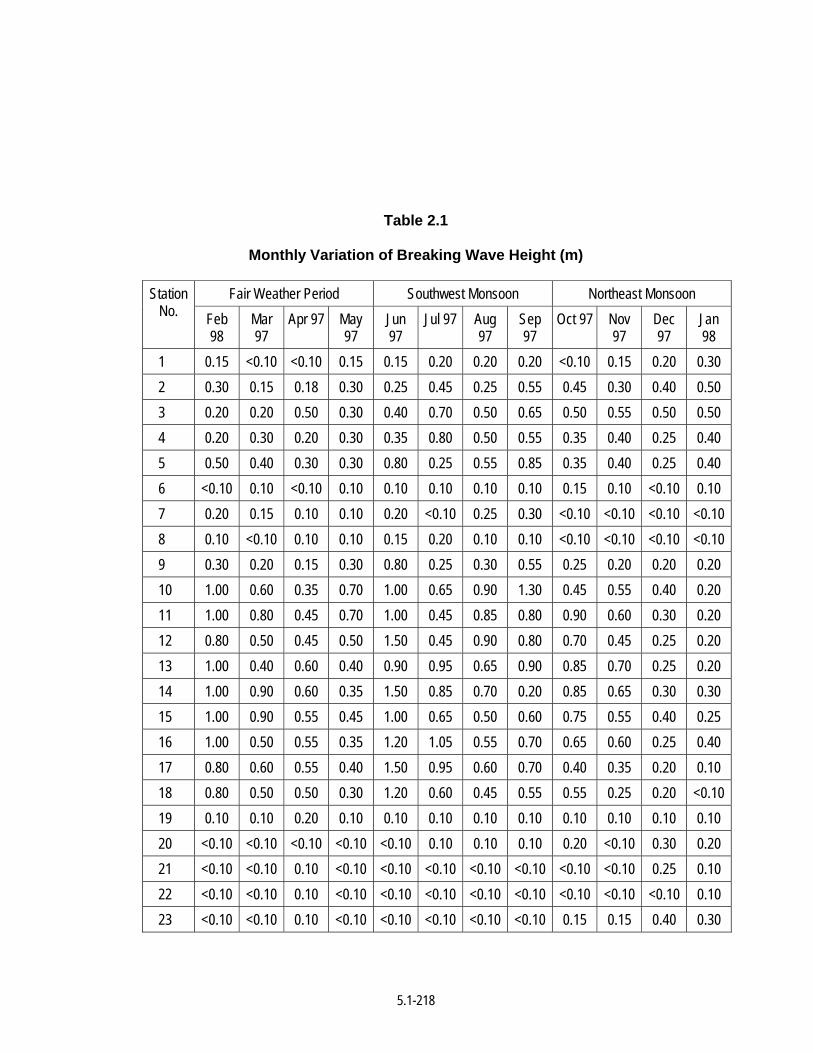
5.1-218
Table 2.1
Monthly Variation of Breaking Wave Height (m)
Fair Weather Period Southwest Monsoon Northeast Monsoon Station No. Feb
98 Mar 97
Apr 97 May 97
Jun 97
Jul 97 Aug 97
Sep 97
Oct 97 Nov 97
Dec 97
Jan 98
1 0.15 <0.10 <0.10 0.15 0.15 0.20 0.20 0.20 <0.10 0.15 0.20 0.30 2 0.30 0.15 0.18 0.30 0.25 0.45 0.25 0.55 0.45 0.30 0.40 0.50 3 0.20 0.20 0.50 0.30 0.40 0.70 0.50 0.65 0.50 0.55 0.50 0.50 4 0.20 0.30 0.20 0.30 0.35 0.80 0.50 0.55 0.35 0.40 0.25 0.40 5 0.50 0.40 0.30 0.30 0.80 0.25 0.55 0.85 0.35 0.40 0.25 0.40 6 <0.10 0.10 <0.10 0.10 0.10 0.10 0.10 0.10 0.15 0.10 <0.10 0.10 7 0.20 0.15 0.10 0.10 0.20 <0.10 0.25 0.30 <0.10 <0.10 <0.10 <0.10 8 0.10 <0.10 0.10 0.10 0.15 0.20 0.10 0.10 <0.10 <0.10 <0.10 <0.10 9 0.30 0.20 0.15 0.30 0.80 0.25 0.30 0.55 0.25 0.20 0.20 0.20 10 1.00 0.60 0.35 0.70 1.00 0.65 0.90 1.30 0.45 0.55 0.40 0.20 11 1.00 0.80 0.45 0.70 1.00 0.45 0.85 0.80 0.90 0.60 0.30 0.20 12 0.80 0.50 0.45 0.50 1.50 0.45 0.90 0.80 0.70 0.45 0.25 0.20 13 1.00 0.40 0.60 0.40 0.90 0.95 0.65 0.90 0.85 0.70 0.25 0.20 14 1.00 0.90 0.60 0.35 1.50 0.85 0.70 0.20 0.85 0.65 0.30 0.30 15 1.00 0.90 0.55 0.45 1.00 0.65 0.50 0.60 0.75 0.55 0.40 0.25 16 1.00 0.50 0.55 0.35 1.20 1.05 0.55 0.70 0.65 0.60 0.25 0.40 17 0.80 0.60 0.55 0.40 1.50 0.95 0.60 0.70 0.40 0.35 0.20 0.10 18 0.80 0.50 0.50 0.30 1.20 0.60 0.45 0.55 0.55 0.25 0.20 <0.10 19 0.10 0.10 0.20 0.10 0.10 0.10 0.10 0.10 0.10 0.10 0.10 0.10 20 <0.10 <0.10 <0.10 <0.10 <0.10 0.10 0.10 0.10 0.20 <0.10 0.30 0.20 21 <0.10 <0.10 0.10 <0.10 <0.10 <0.10 <0.10 <0.10 <0.10 <0.10 0.25 0.10 22 <0.10 <0.10 0.10 <0.10 <0.10 <0.10 <0.10 <0.10 <0.10 <0.10 <0.10 0.10 23 <0.10 <0.10 0.10 <0.10 <0.10 <0.10 <0.10 <0.10 0.15 0.15 0.40 0.30
5.1-219
Source : Sediment Transport and Exchange around Rameswaram Island between Gulf of Mannar and Palk Bay
A Ph.D. Thesis in Marine Science Submitted by Prabhakara Rao Bodapati
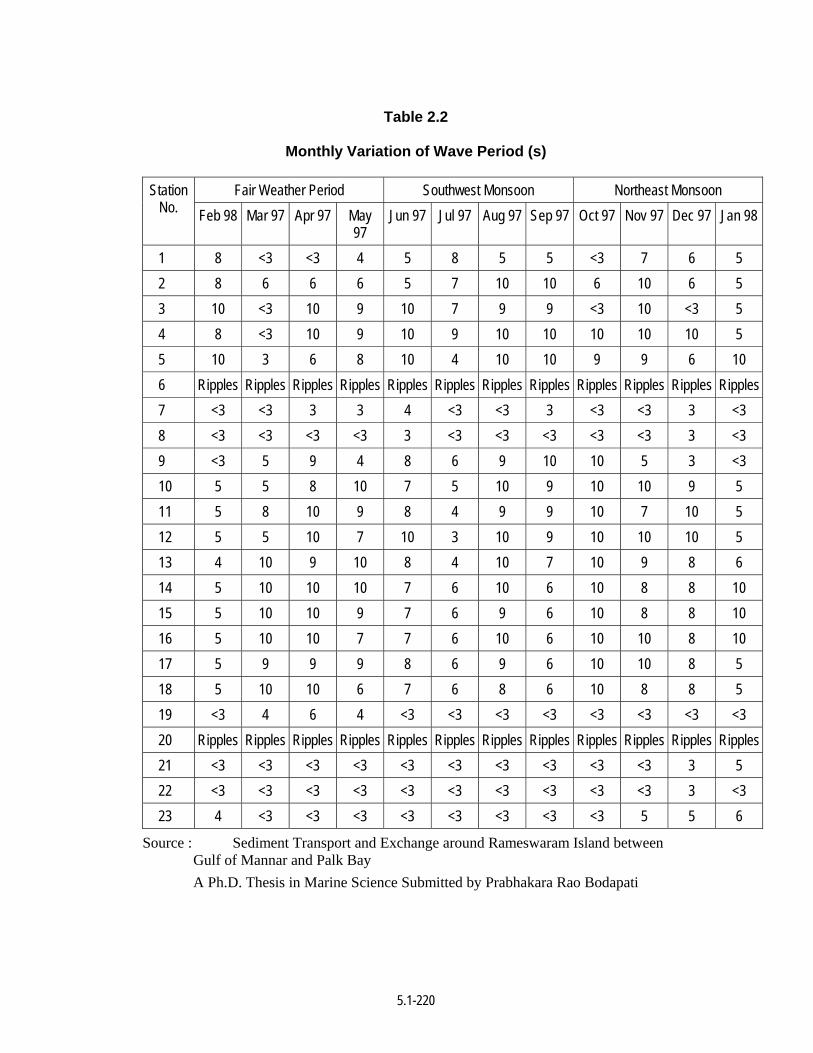
5.1-220
Table 2.2
Monthly Variation of Wave Period (s)
Fair Weather Period Southwest Monsoon Northeast Monsoon Station No. Feb 98 Mar 97 Apr 97 May
97 Jun 97 Jul 97 Aug 97 Sep 97 Oct 97 Nov 97 Dec 97 Jan 98
1 8 <3 <3 4 5 8 5 5 <3 7 6 5 2 8 6 6 6 5 7 10 10 6 10 6 5 3 10 <3 10 9 10 7 9 9 <3 10 <3 5 4 8 <3 10 9 10 9 10 10 10 10 10 5 5 10 3 6 8 10 4 10 10 9 9 6 10 6 Ripples Ripples Ripples Ripples Ripples Ripples Ripples Ripples Ripples Ripples Ripples Ripples 7 <3 <3 3 3 4 <3 <3 3 <3 <3 3 <3 8 <3 <3 <3 <3 3 <3 <3 <3 <3 <3 3 <3 9 <3 5 9 4 8 6 9 10 10 5 3 <3 10 5 5 8 10 7 5 10 9 10 10 9 5 11 5 8 10 9 8 4 9 9 10 7 10 5 12 5 5 10 7 10 3 10 9 10 10 10 5 13 4 10 9 10 8 4 10 7 10 9 8 6 14 5 10 10 10 7 6 10 6 10 8 8 10 15 5 10 10 9 7 6 9 6 10 8 8 10 16 5 10 10 7 7 6 10 6 10 10 8 10 17 5 9 9 9 8 6 9 6 10 10 8 5 18 5 10 10 6 7 6 8 6 10 8 8 5 19 <3 4 6 4 <3 <3 <3 <3 <3 <3 <3 <3 20 Ripples Ripples Ripples Ripples Ripples Ripples Ripples Ripples Ripples Ripples Ripples Ripples 21 <3 <3 <3 <3 <3 <3 <3 <3 <3 <3 3 5 22 <3 <3 <3 <3 <3 <3 <3 <3 <3 <3 3 <3 23 4 <3 <3 <3 <3 <3 <3 <3 <3 5 5 6
Source : Sediment Transport and Exchange around Rameswaram Island between Gulf of Mannar and Palk Bay
A Ph.D. Thesis in Marine Science Submitted by Prabhakara Rao Bodapati
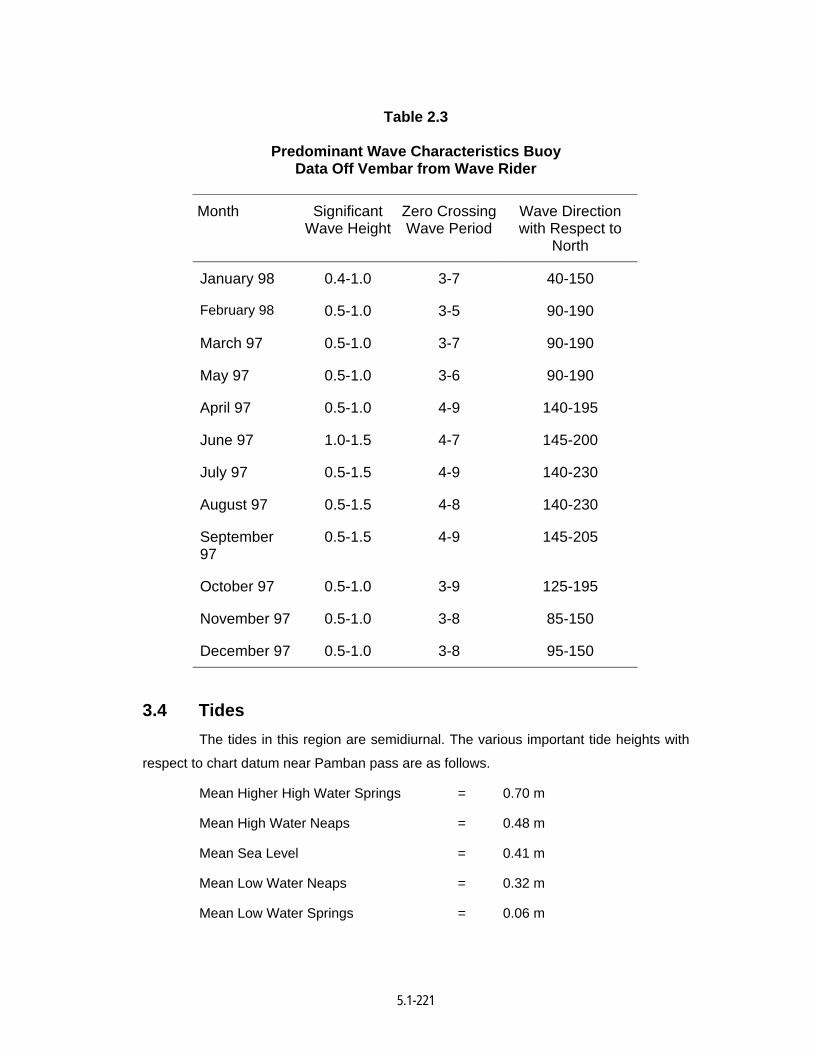
5.1-221
Table 2.3
Predominant Wave Characteristics Buoy Data Off Vembar from Wave Rider
Month Significant
Wave HeightZero Crossing Wave Period
Wave Direction with Respect to
North
January 98 0.4-1.0 3-7 40-150
February 98 0.5-1.0 3-5 90-190
March 97 0.5-1.0 3-7 90-190
May 97 0.5-1.0 3-6 90-190
April 97 0.5-1.0 4-9 140-195
June 97 1.0-1.5 4-7 145-200
July 97 0.5-1.5 4-9 140-230
August 97 0.5-1.5 4-8 140-230
September 97
0.5-1.5 4-9 145-205
October 97 0.5-1.0 3-9 125-195
November 97 0.5-1.0 3-8 85-150
December 97 0.5-1.0 3-8 95-150
3.4 Tides The tides in this region are semidiurnal. The various important tide heights with
respect to chart datum near Pamban pass are as follows.
Mean Higher High Water Springs = 0.70 m
Mean High Water Neaps = 0.48 m
Mean Sea Level = 0.41 m
Mean Low Water Neaps = 0.32 m
Mean Low Water Springs = 0.06 m
5.1-222
It shows that the average spring tidal range is about 0.64 m and the neap tidal
range is about 0.16 m. The tidal range is relatively low compared to the northern part of
the Indian coast, which inturn would restrict the influence of tidal currents
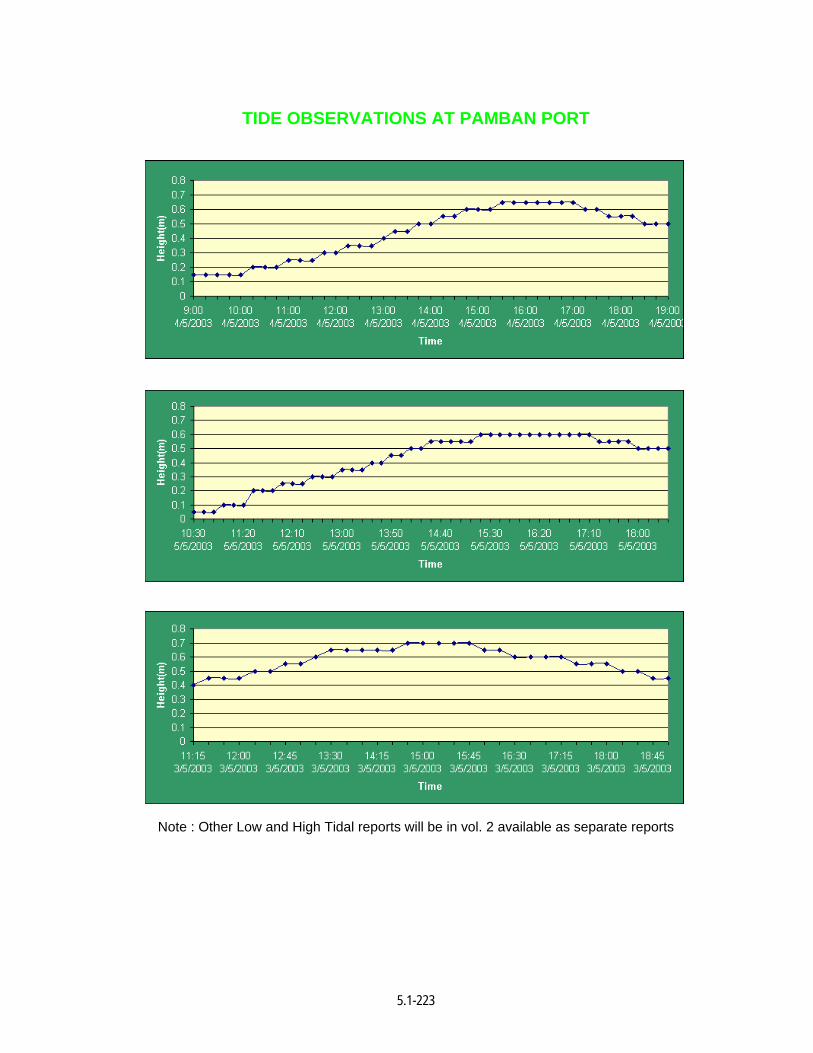
5.1-223
TIDE OBSERVATIONS AT PAMBAN PORT
Note : Other Low and High Tidal reports will be in vol. 2 available as separate reports
5.1-224
3.6 Longshore Currents The longshore current speed remained weak (<0.1 m/s) throughout the year
between Keelamundal and Vedalai and along the northern coast of Rameswaram from
Arimunai to Ariyaman. Consequently, it was relatively moderate (>0.1 m/s) throughout the
year between Sippikulam and Naripaiyur and along the southern coast of Rameswaram
i.e. from Uthalai to Mukkuperiyar.
The spit between Dhanuskodi and Arimunai in Gulf of Mannar experienced
relatively stronger currents during fair weather period (March to May) and remained weak
during southwest monsoon and northeast monsoon periods (June to February). It
indicates that the stronger currents prevailing in the adjacent coasts during
southwest/northeast monsoons becoming weaker between Dhanushkodi and Arimunai.
This phenomenon of sudden weakening of littoral currents causes the littoral drift to
deposit and form series of sand shoals near Arimunai. Such prolonged deposition of
littoral drift over many years can be attributed to formation of numerous islands and
shallow shoals across the strait between Arimunai (India) and Talaimannar (Sri Lanka)
called Adam’s Bridge.
The Uthalai coast facing Gulf of Mannar experienced stronger longshore
currents (0.2 – 0.5 m/s) throughout the year, followed by a segment of the coast between
Vembar and Naripayur (0.2 – 0.4 m/s) with exposure to relatively high wave energy
environment.
The prevalence of weak longshore currents between Keelamundal and Vedalai
is causing deposition of littoral drift on either side, as evidenced by the occurrence of
many offshore islands and submerged shoals.
Although the Pamban Pass, connecting Palk Bay and Gulf of Mannar break the
continuity of longshore current between the mainland and Rameswaram Island, the
magnitude of the current on either side of Pamban Pass is found to be very weak. This
reduces the volume of littoral sediments approaching the Pamban Pass which inturn
reduces the quantity of sediment passing through Pamban Pass from Gulf of Mannar to
Palk Bay.
The longshore current direction prevailed northerly during southwest monsoon
and fair weather period, and southerly during northeast monsoon between Sippikulam
and Uthallai. The entire coast of Rameswaram facing Gulf of Mannar, experienced the
current in westerly direction throughout the year, except in June and July. This
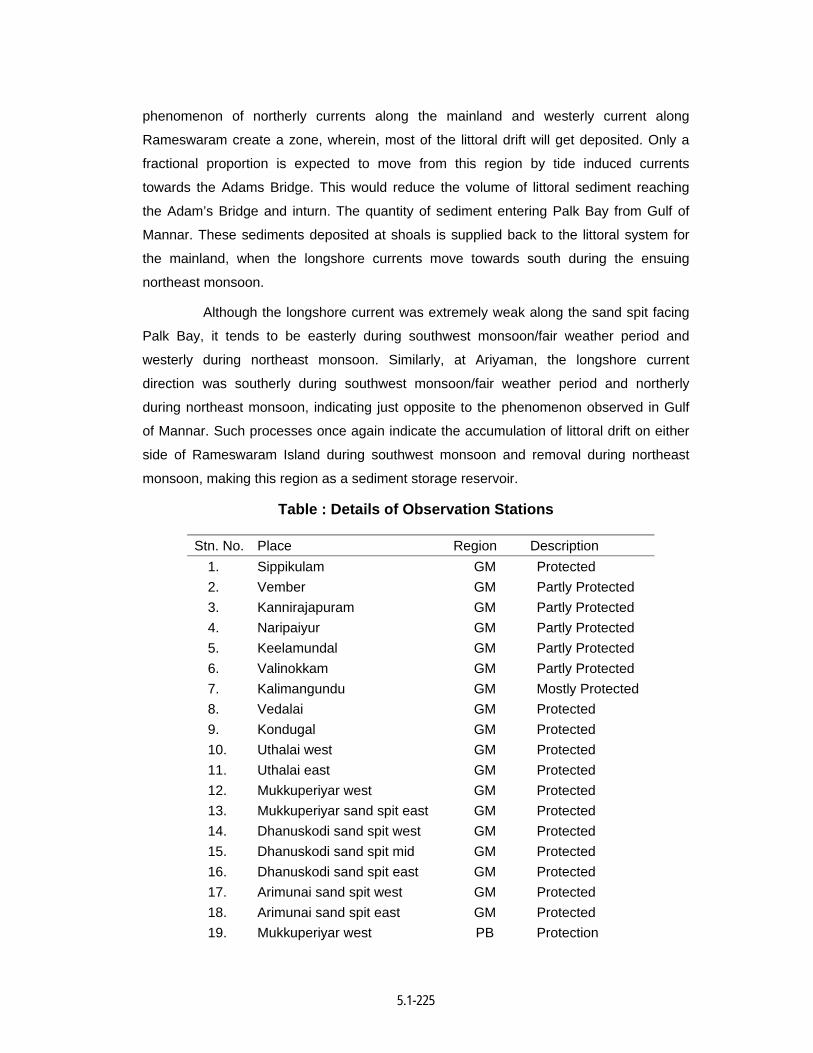
5.1-225
phenomenon of northerly currents along the mainland and westerly current along
Rameswaram create a zone, wherein, most of the littoral drift will get deposited. Only a
fractional proportion is expected to move from this region by tide induced currents
towards the Adams Bridge. This would reduce the volume of littoral sediment reaching
the Adam’s Bridge and inturn. The quantity of sediment entering Palk Bay from Gulf of
Mannar. These sediments deposited at shoals is supplied back to the littoral system for
the mainland, when the longshore currents move towards south during the ensuing
northeast monsoon.
Although the longshore current was extremely weak along the sand spit facing
Palk Bay, it tends to be easterly during southwest monsoon/fair weather period and
westerly during northeast monsoon. Similarly, at Ariyaman, the longshore current
direction was southerly during southwest monsoon/fair weather period and northerly
during northeast monsoon, indicating just opposite to the phenomenon observed in Gulf
of Mannar. Such processes once again indicate the accumulation of littoral drift on either
side of Rameswaram Island during southwest monsoon and removal during northeast
monsoon, making this region as a sediment storage reservoir.
Table : Details of Observation Stations
Stn. No. Place Region Description 1. Sippikulam GM Protected 2. Vember GM Partly Protected 3. Kannirajapuram GM Partly Protected 4. Naripaiyur GM Partly Protected 5. Keelamundal GM Partly Protected 6. Valinokkam GM Partly Protected 7. Kalimangundu GM Mostly Protected 8. Vedalai GM Protected 9. Kondugal GM Protected 10. Uthalai west GM Protected 11. Uthalai east GM Protected 12. Mukkuperiyar west GM Protected 13. Mukkuperiyar sand spit east GM Protected 14. Dhanuskodi sand spit west GM Protected 15. Dhanuskodi sand spit mid GM Protected 16. Dhanuskodi sand spit east GM Protected 17. Arimunai sand spit west GM Protected 18. Arimunai sand spit east GM Protected 19. Mukkuperiyar west PB Protection
5.1-226
20. Uthalai west PB Protection 21. Villuvandi Thirtham PB Protection 22. Light House PB Protection 23. Ariyaman PB Protection
GM : Gulf of Mannar PB : Palk Bay
TIDAL CHARTS FOR YEAR 2002
Times and Heights of High and Low Waters
Tuticorin – India, East Coast-India
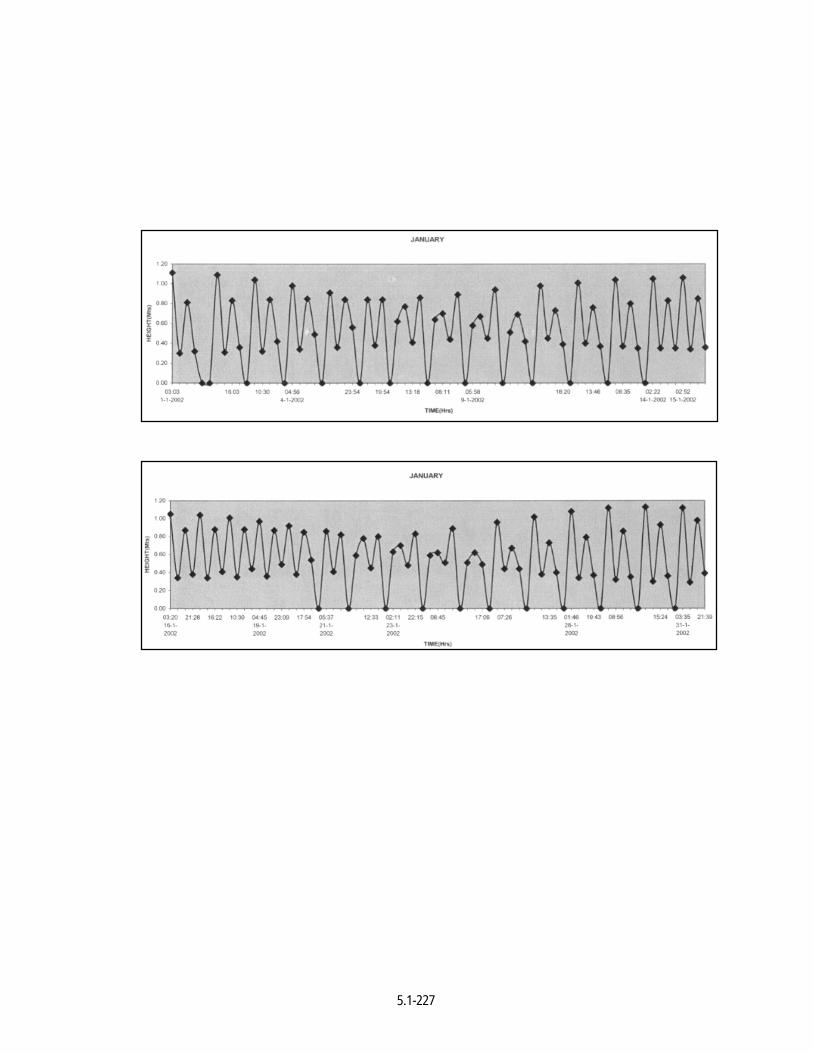
5.1-227

5.1-228
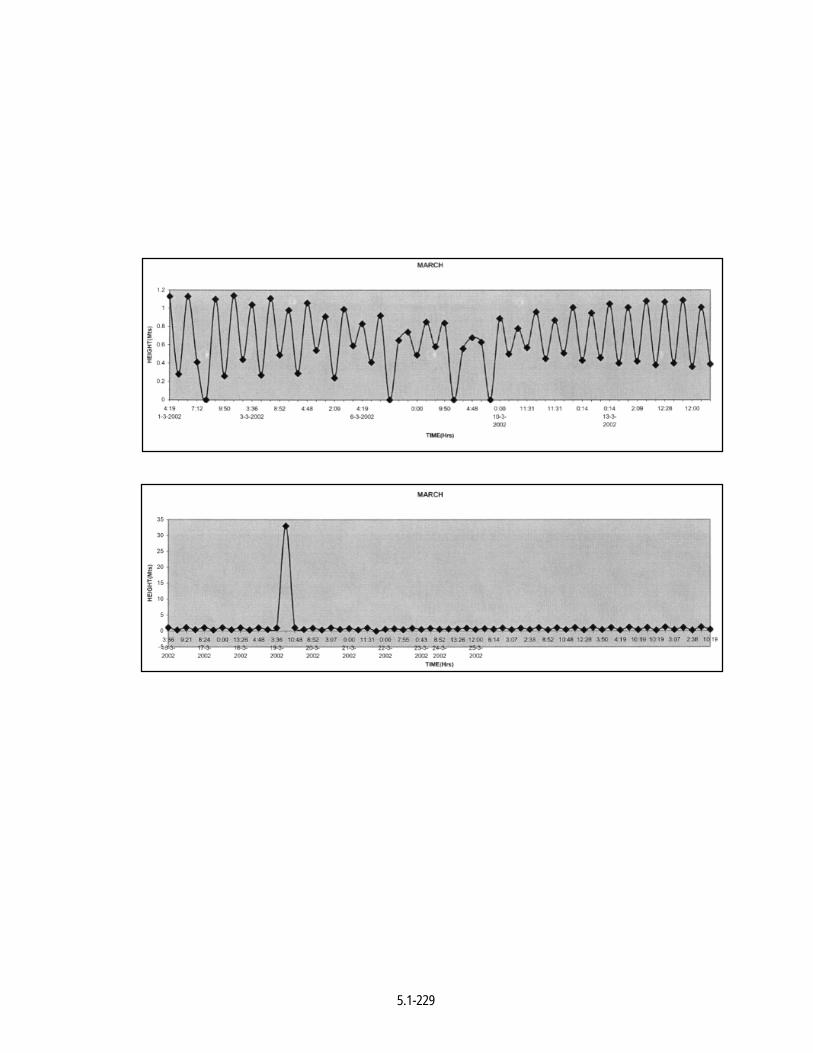
5.1-229
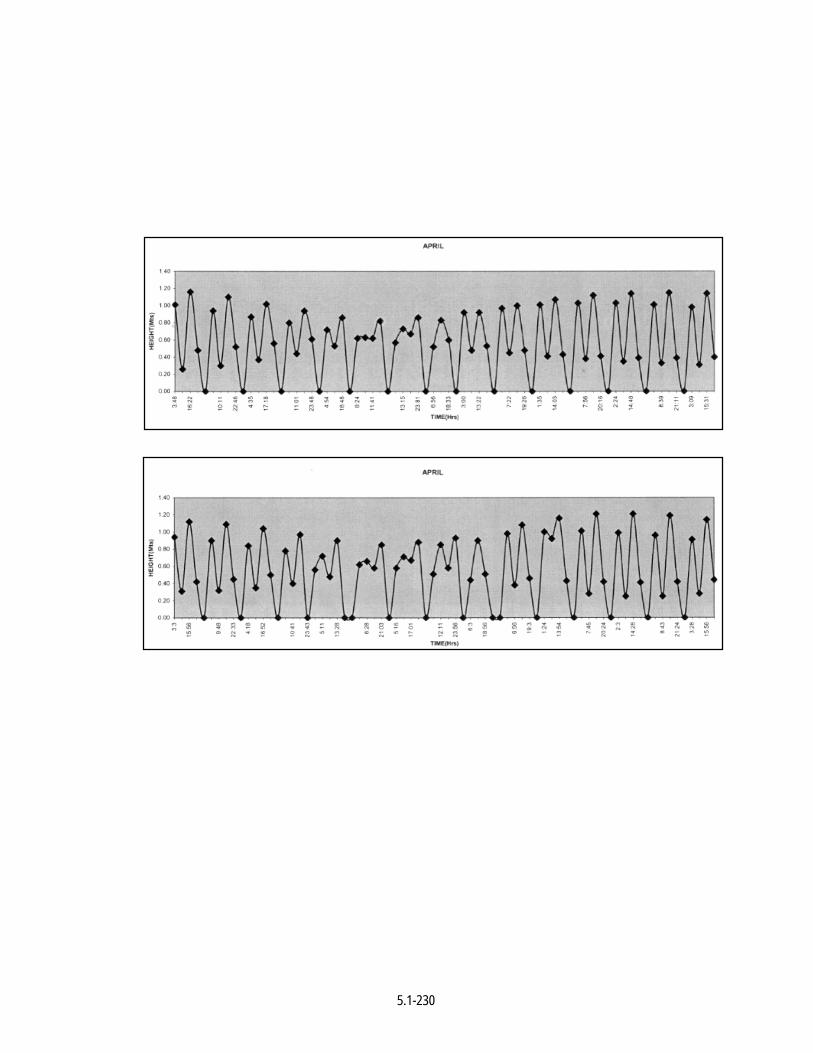
5.1-230
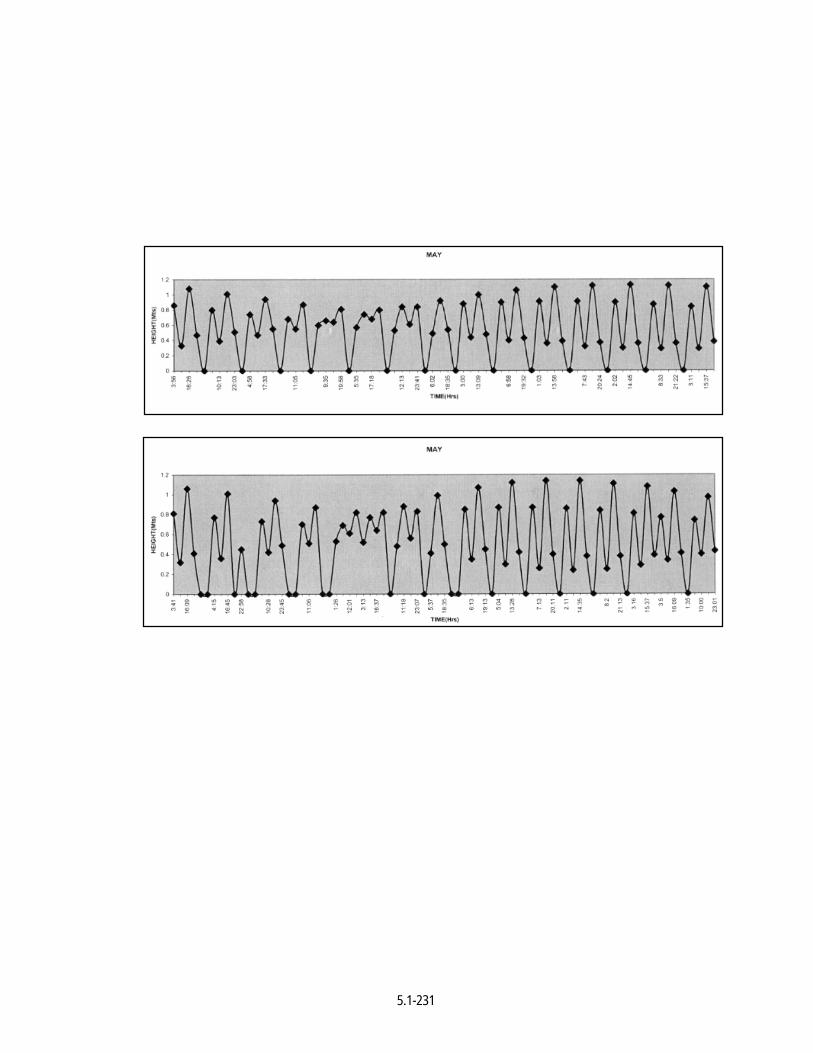
5.1-231

5.1-232
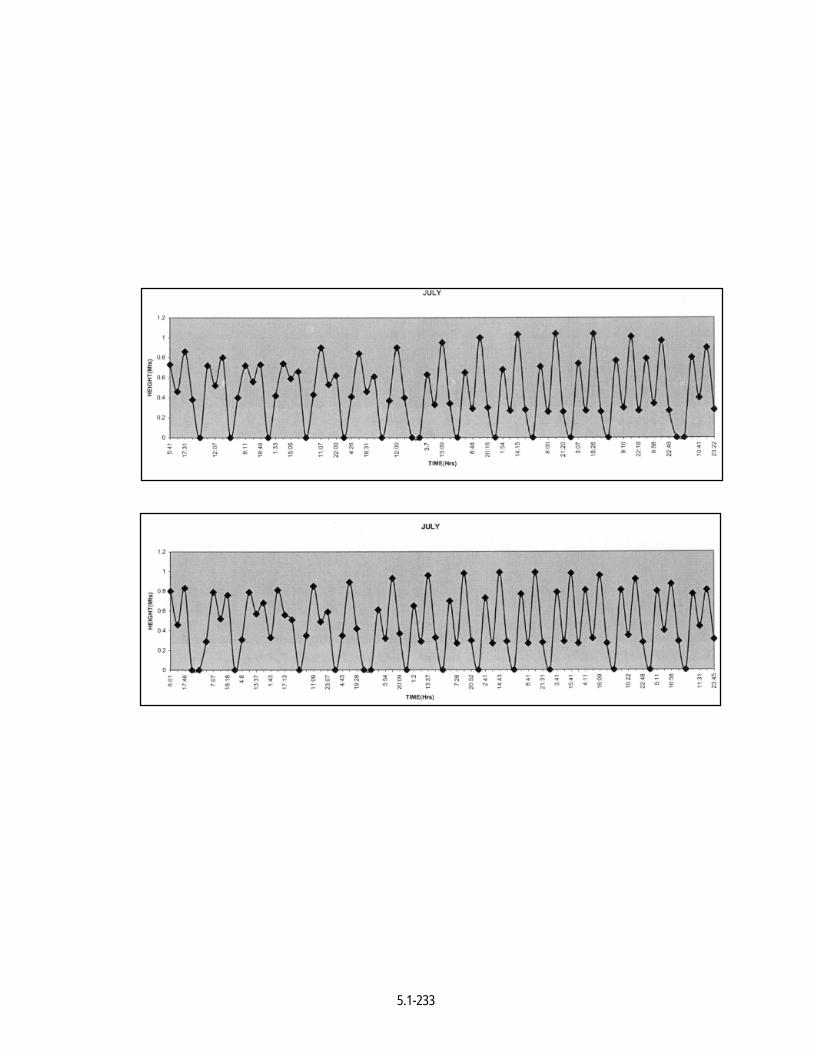
5.1-233

5.1-234
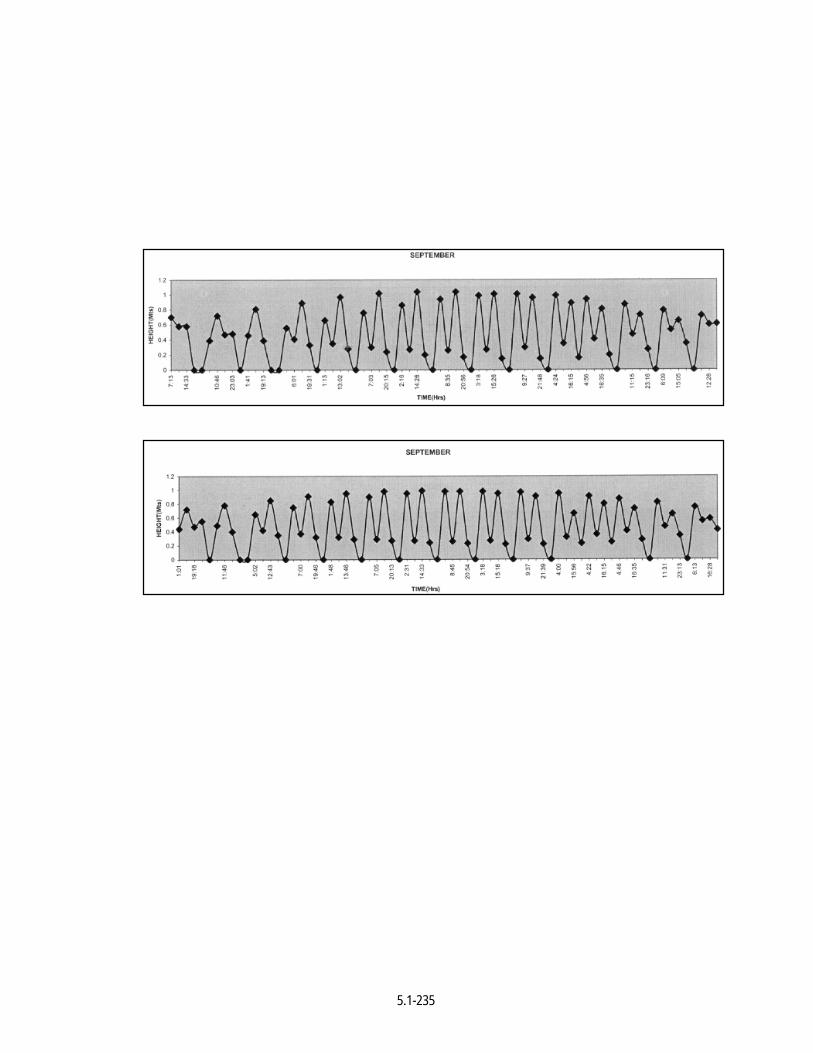
5.1-235
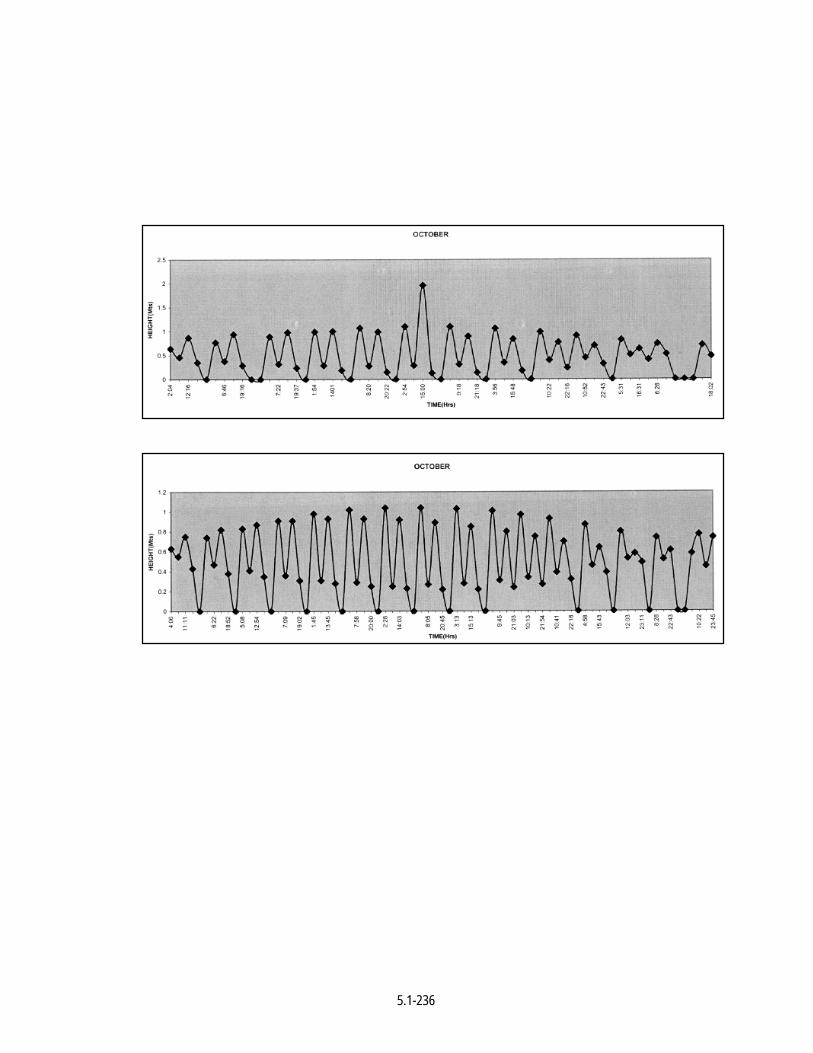
5.1-236
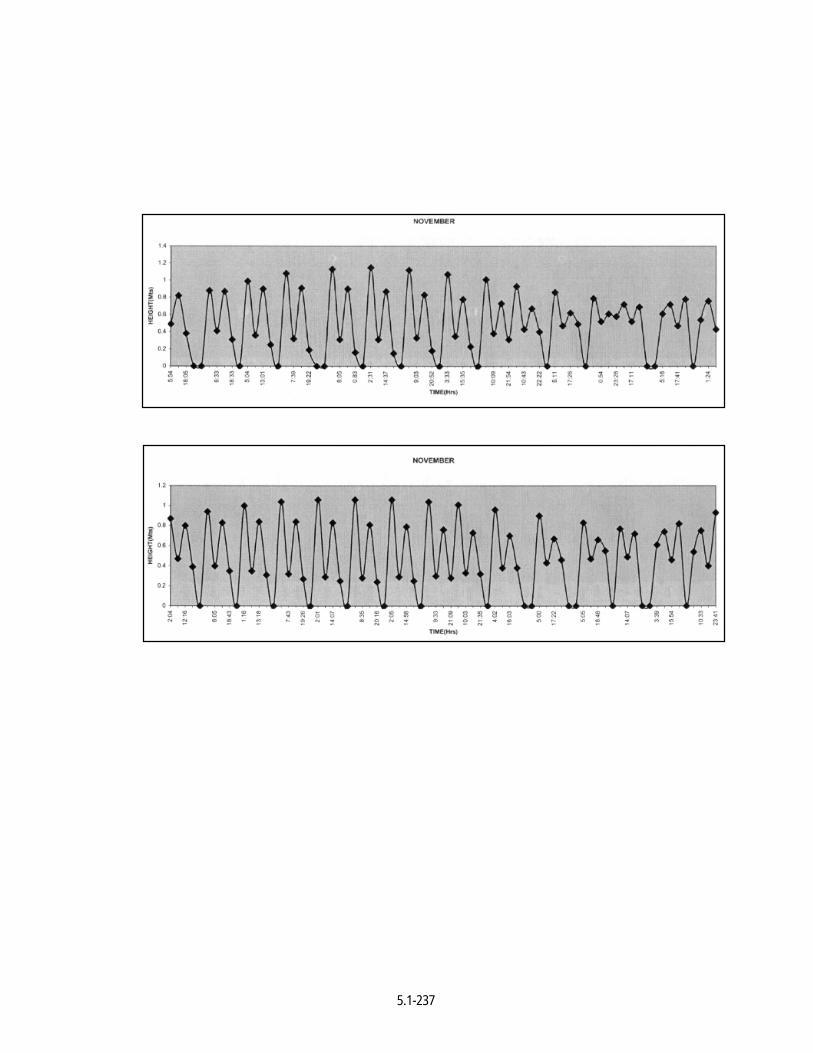
5.1-237

5.1-238
5.1-239
TIDAL CHARTS FOR YEAR 2002
Times and Heights of High and Low Waters
Pamban Island (Rameswaram) – India, East Coast-India
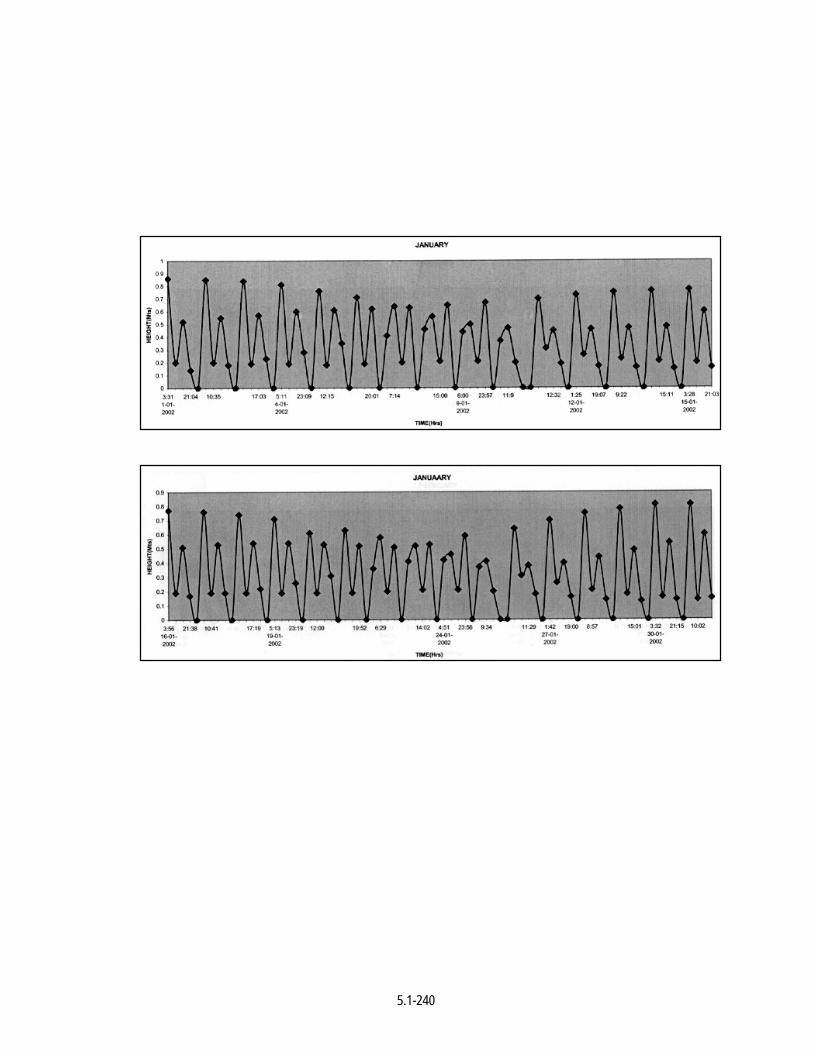
5.1-240
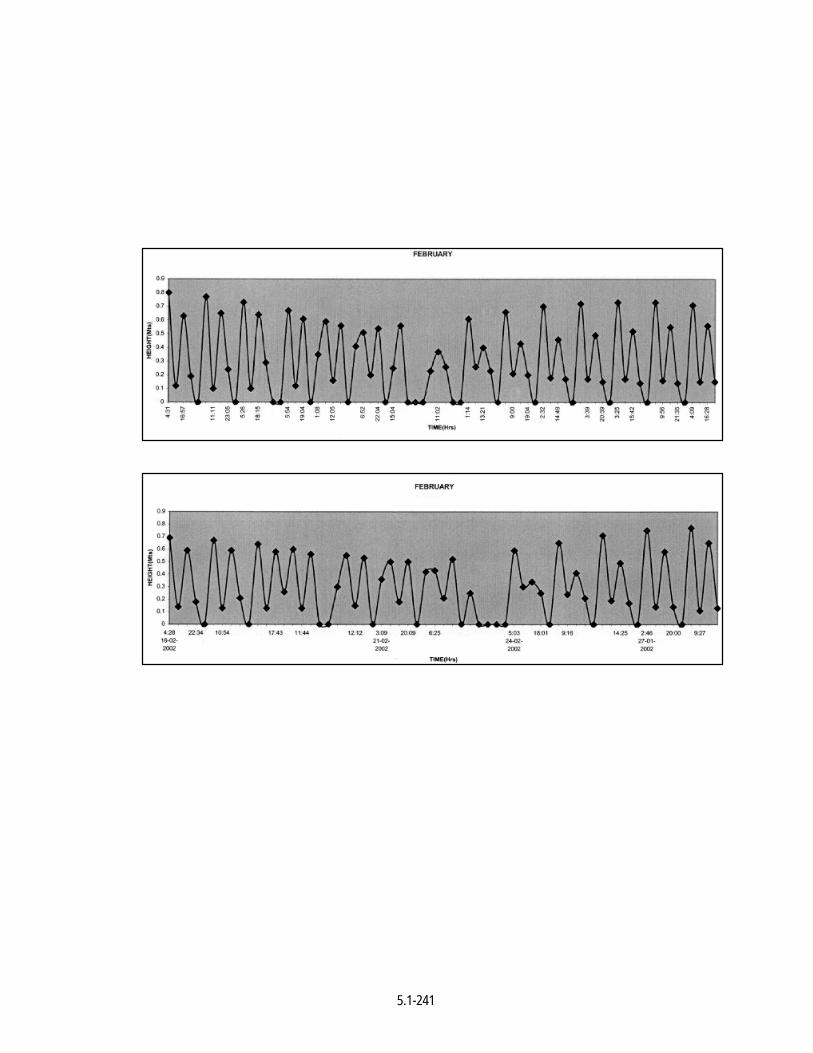
5.1-241
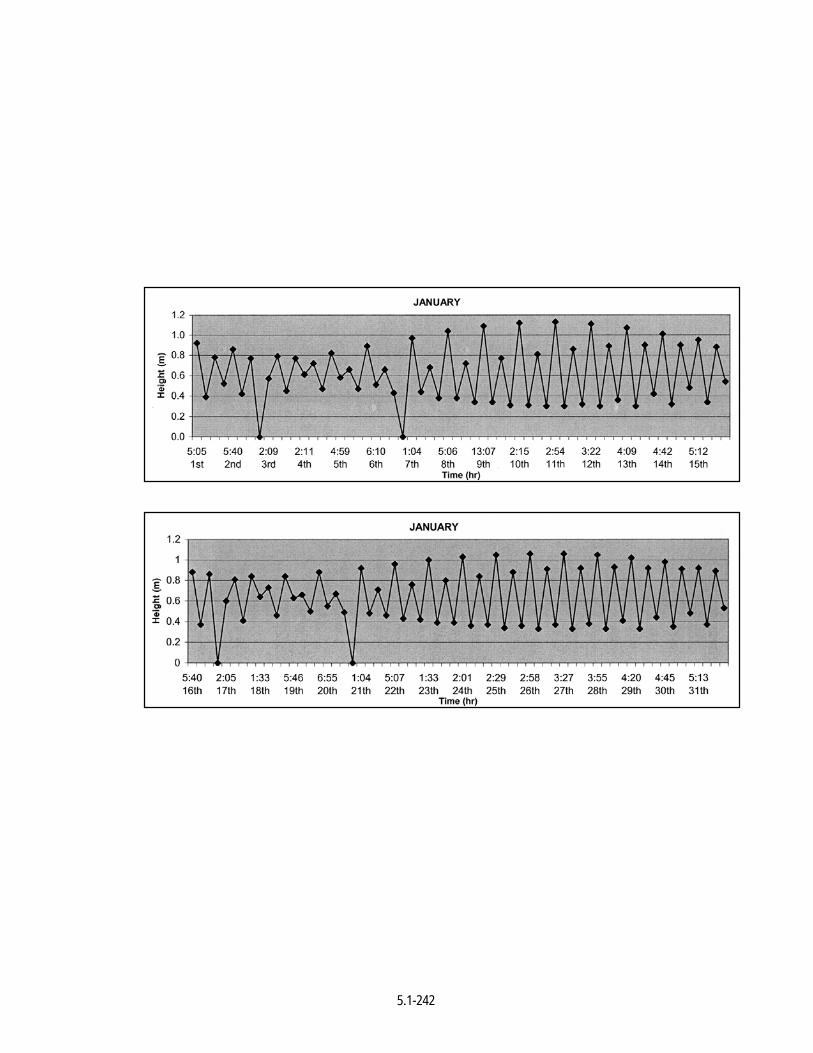
5.1-242

5.1-243

5.1-244

5.1-245
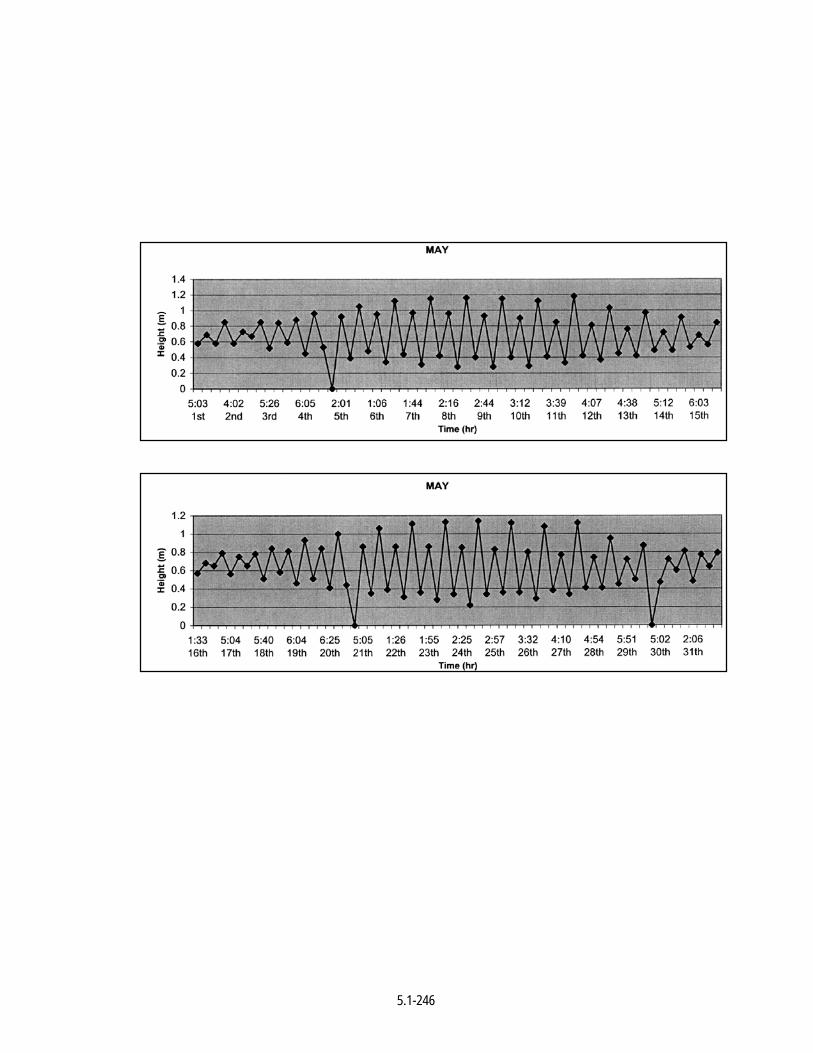
5.1-246
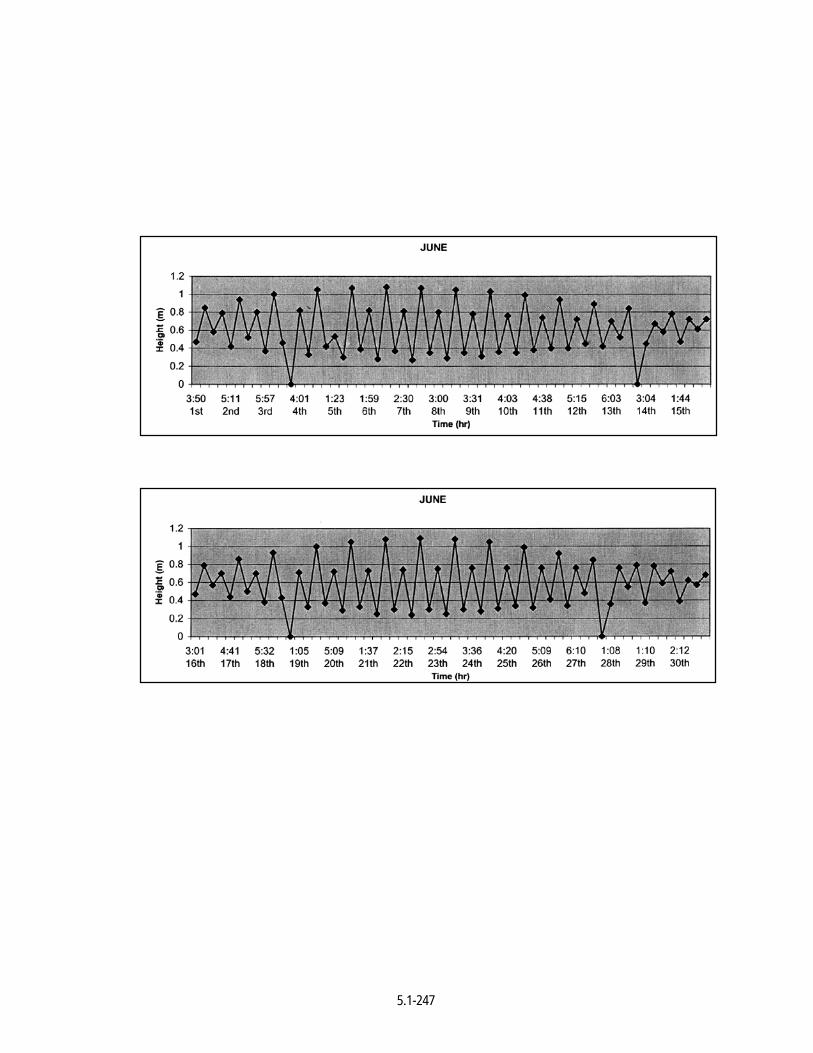
5.1-247

5.1-248
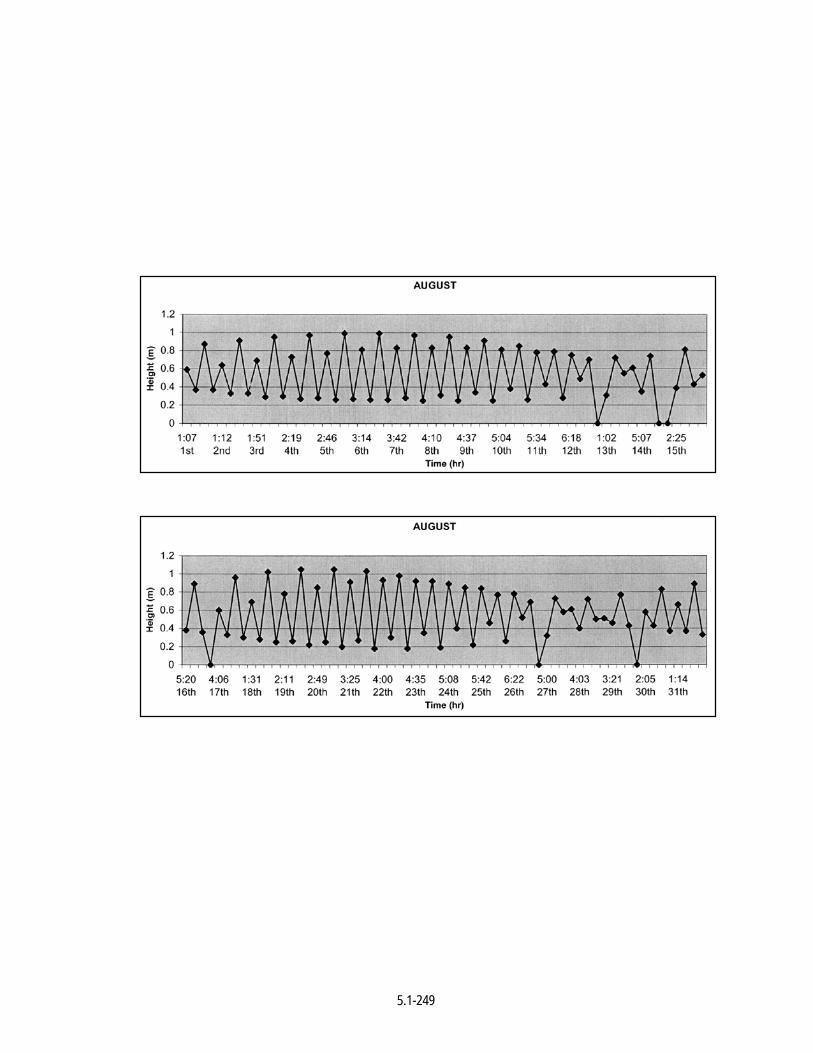
5.1-249
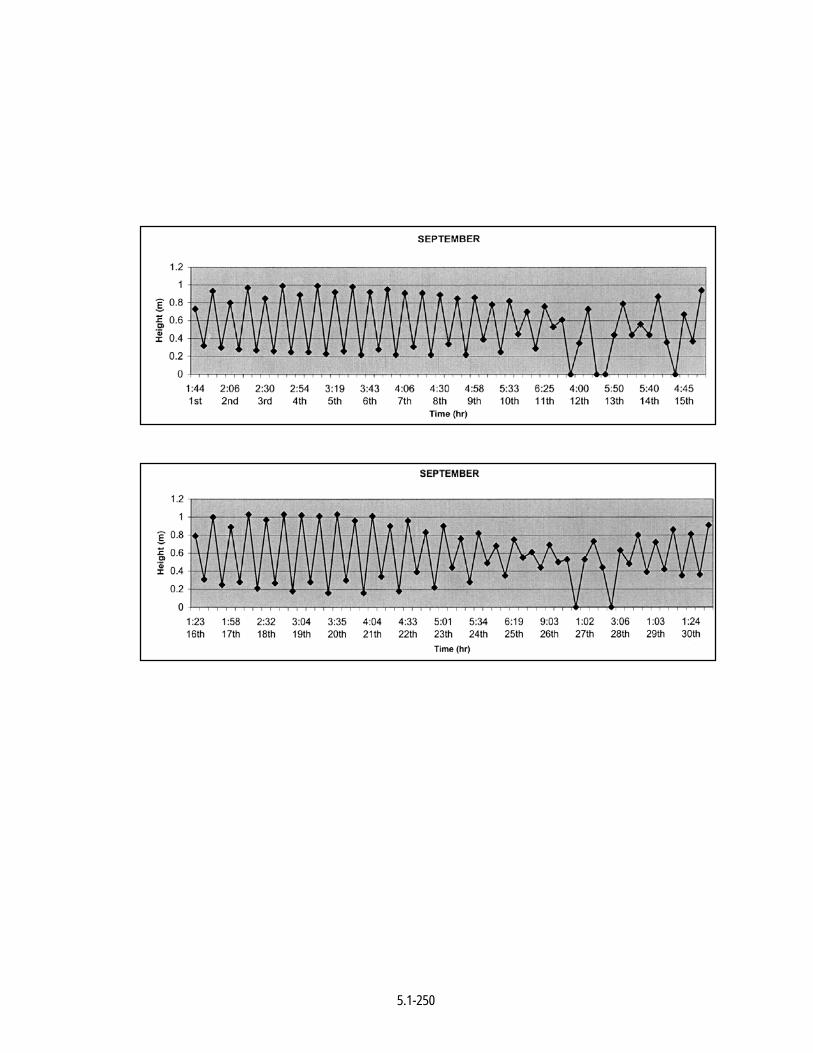
5.1-250

5.1-251
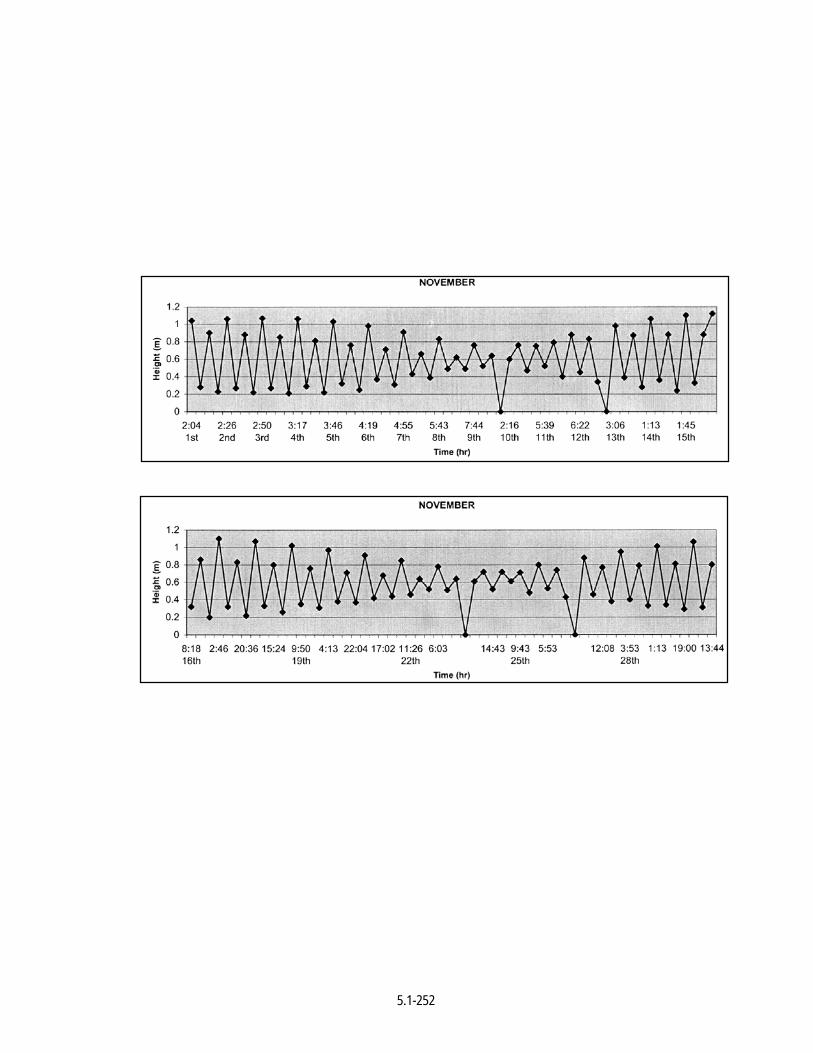
5.1-252
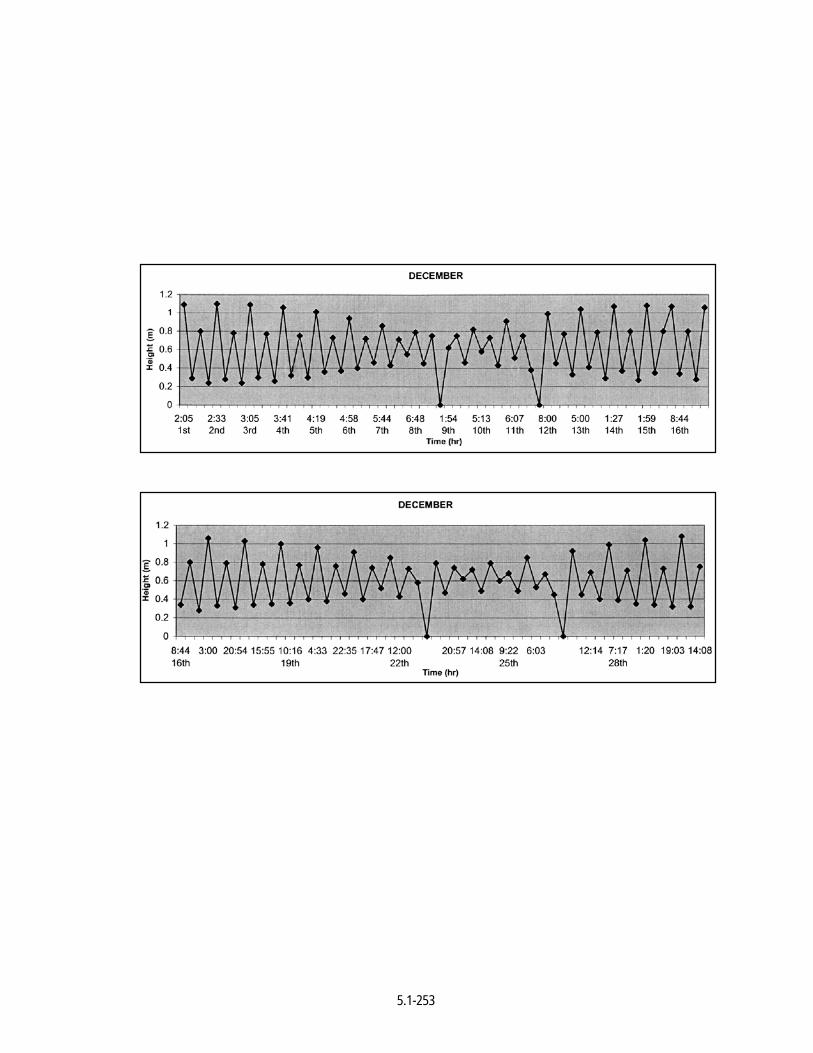
5.1-253
5.1-254
TIDAL CHARTS FOR YEAR 2001
Times and Heights of High and Low Waters
Pamban Pass (Rameswaram Island) – India, East Coast-India
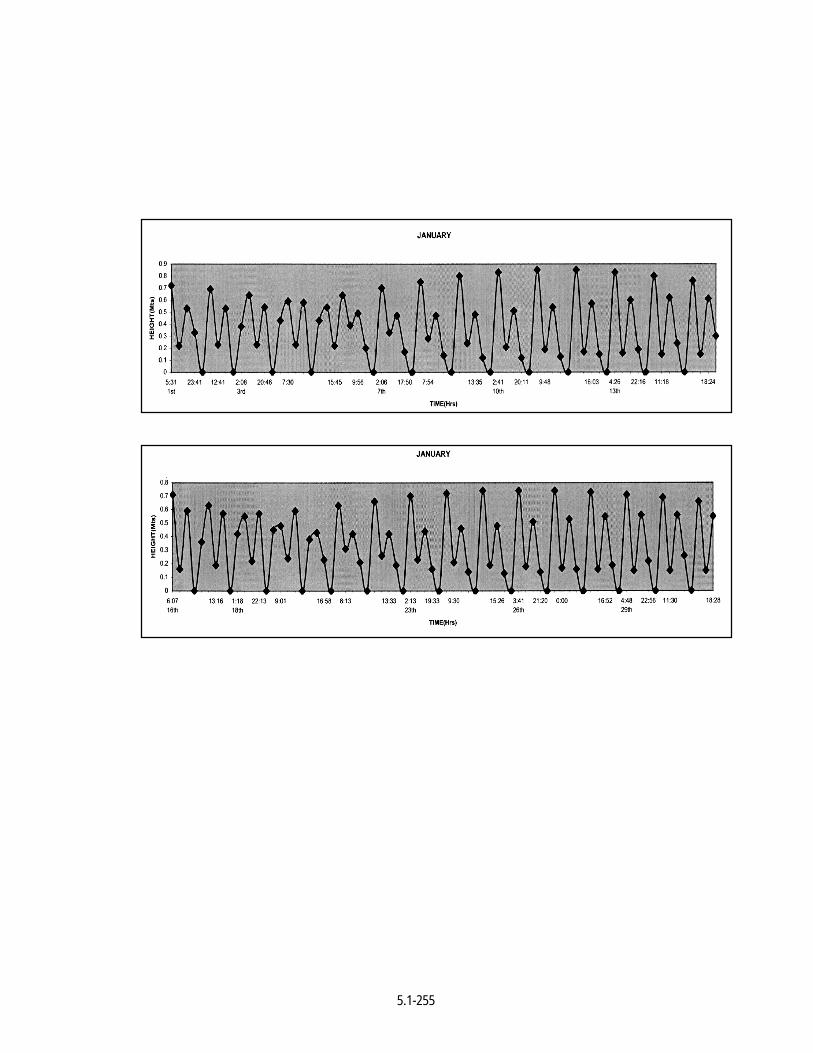
5.1-255
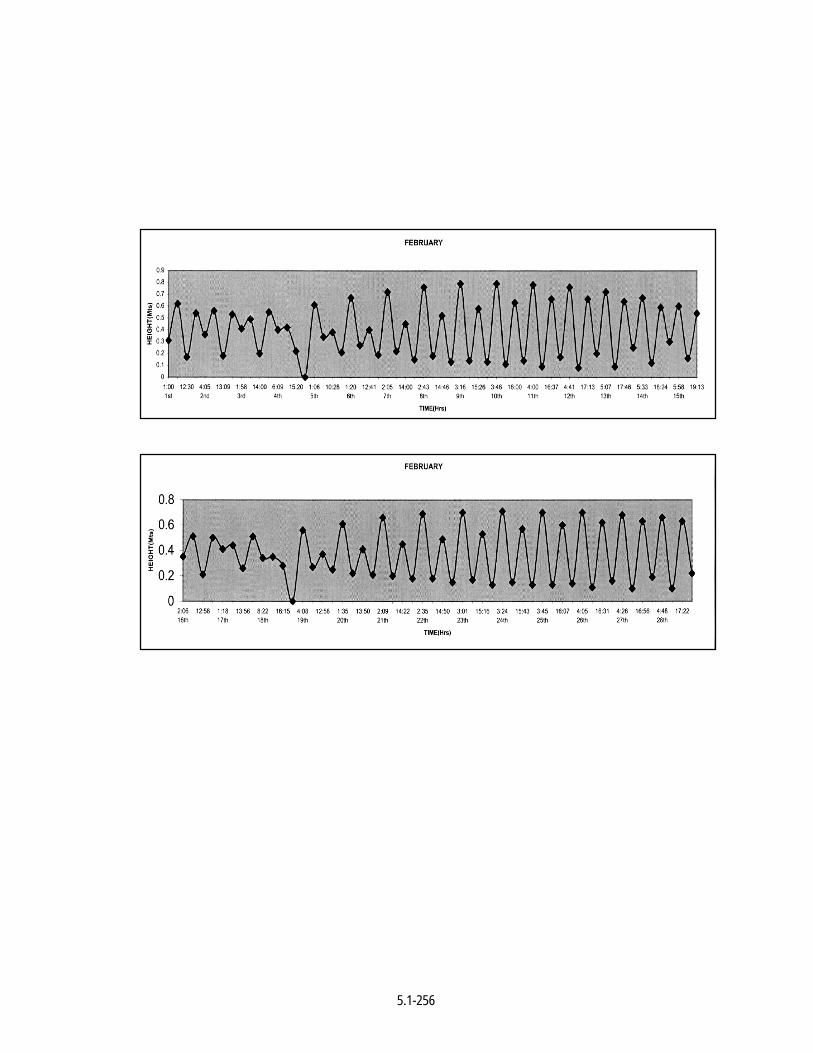
5.1-256
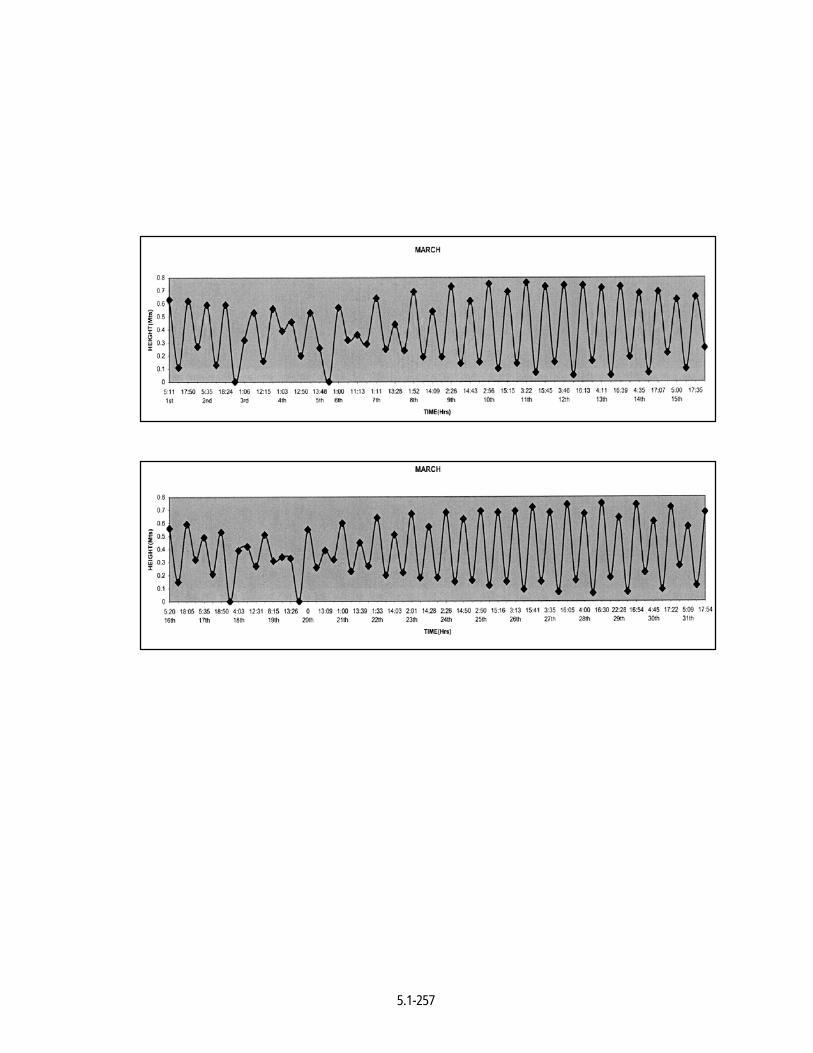
5.1-257
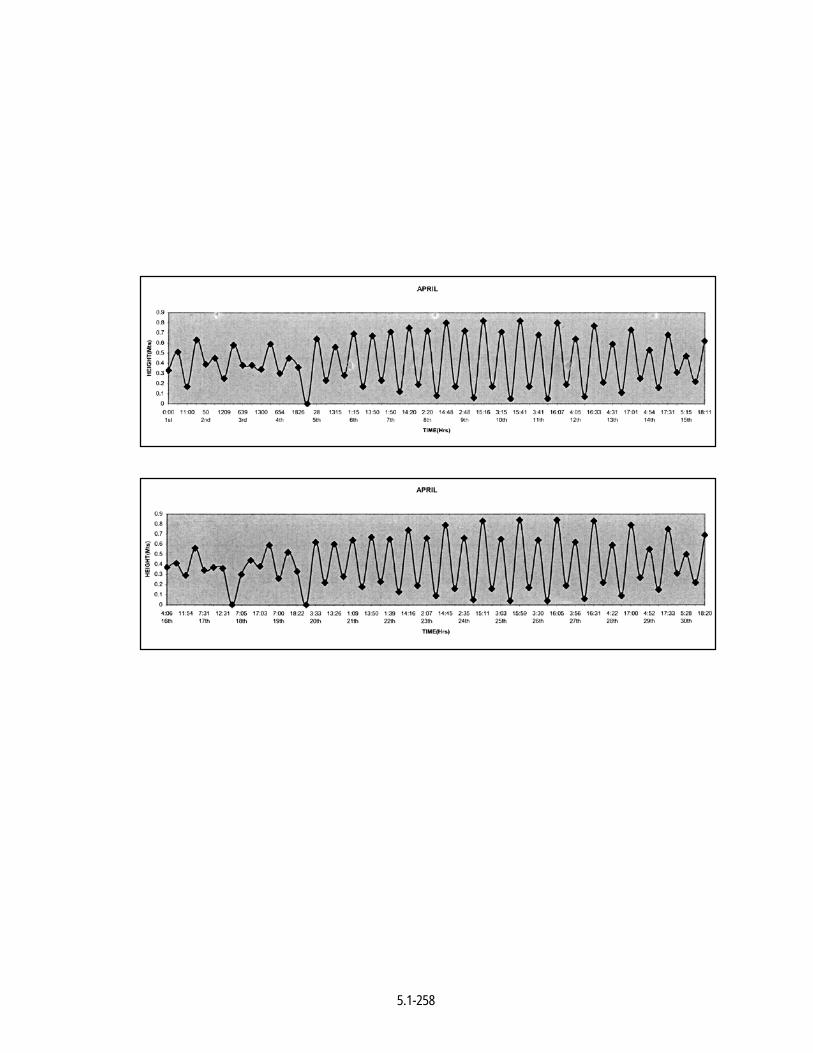
5.1-258
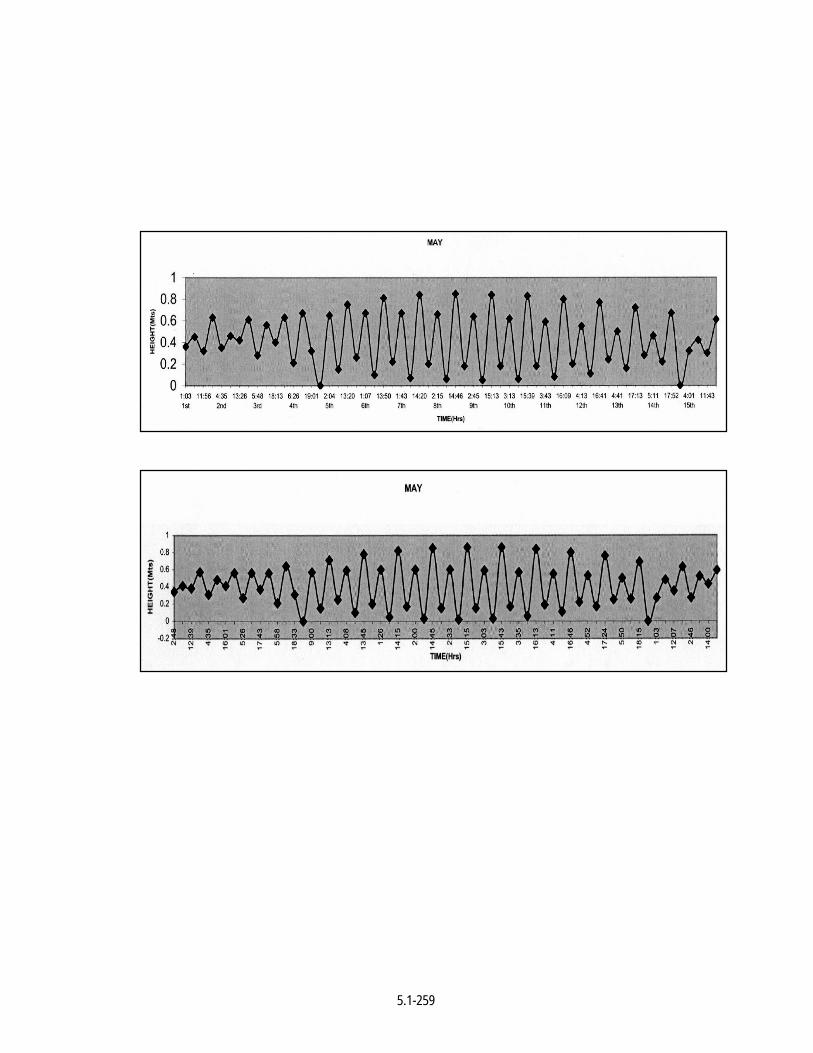
5.1-259
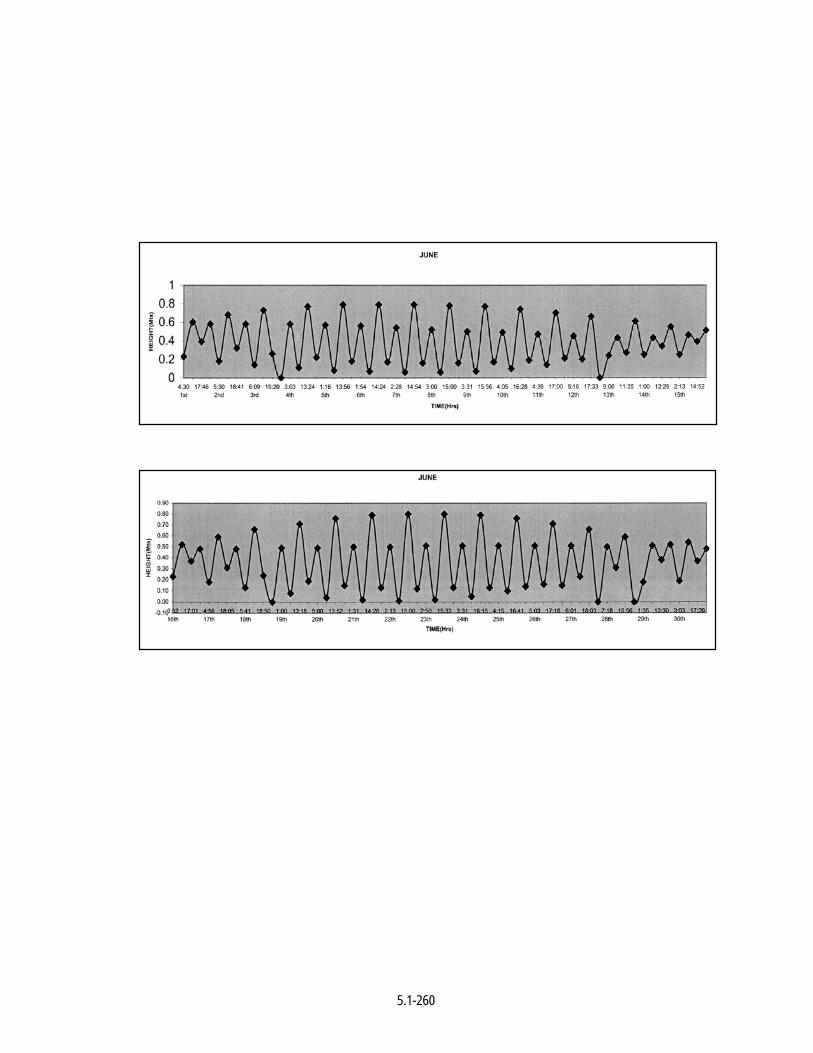
5.1-260
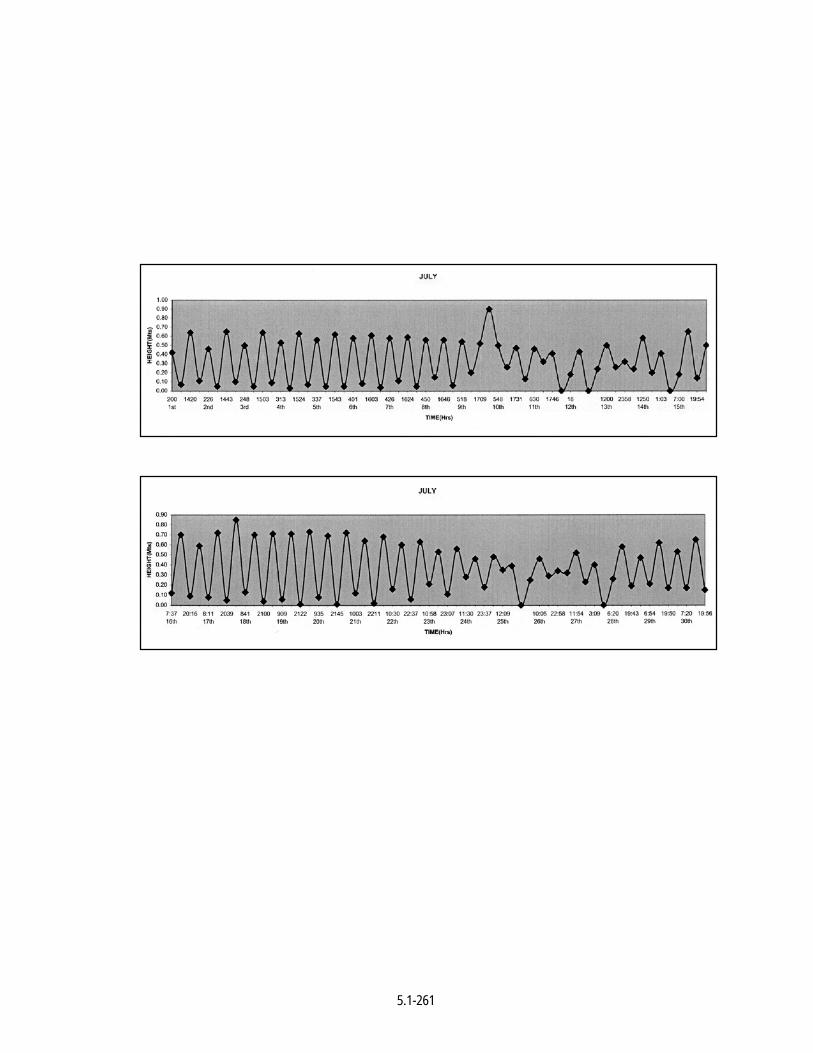
5.1-261
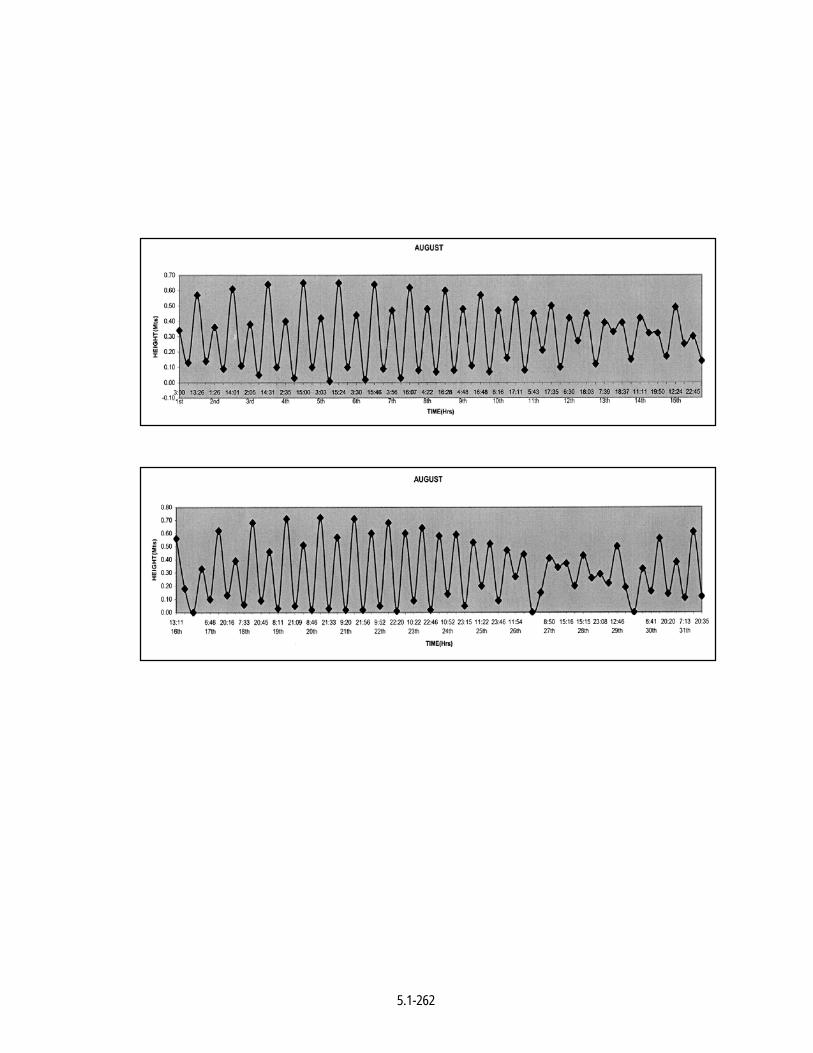
5.1-262
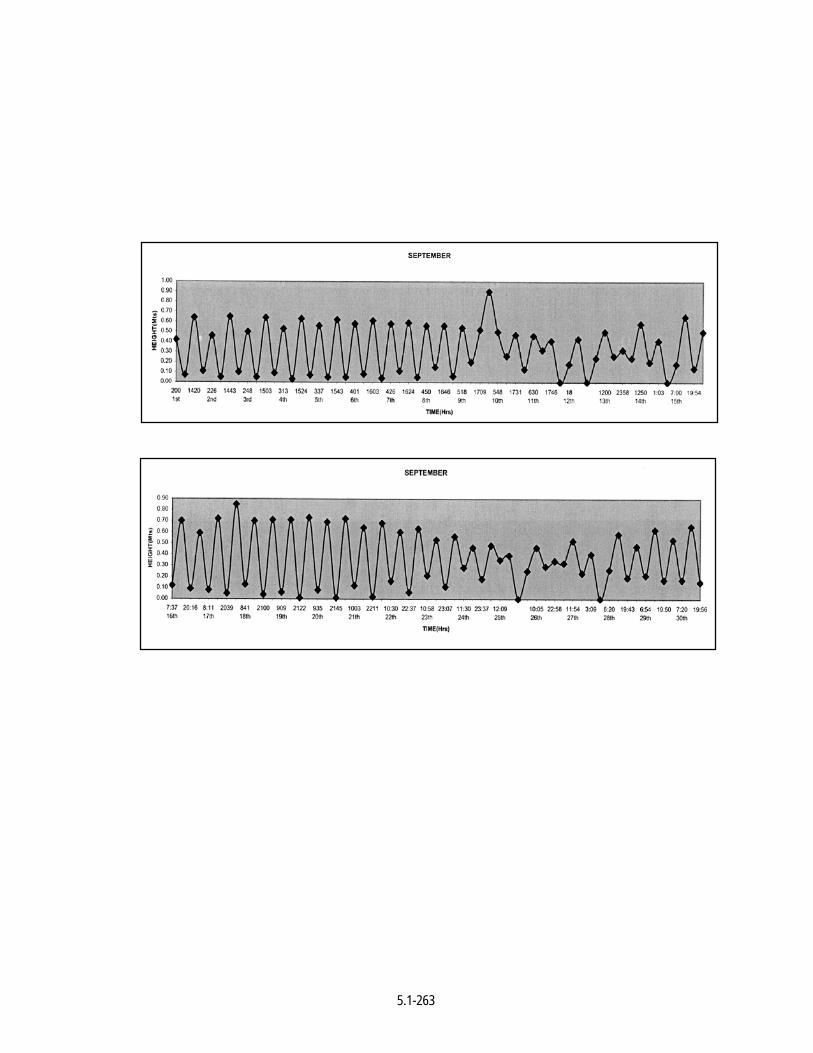
5.1-263
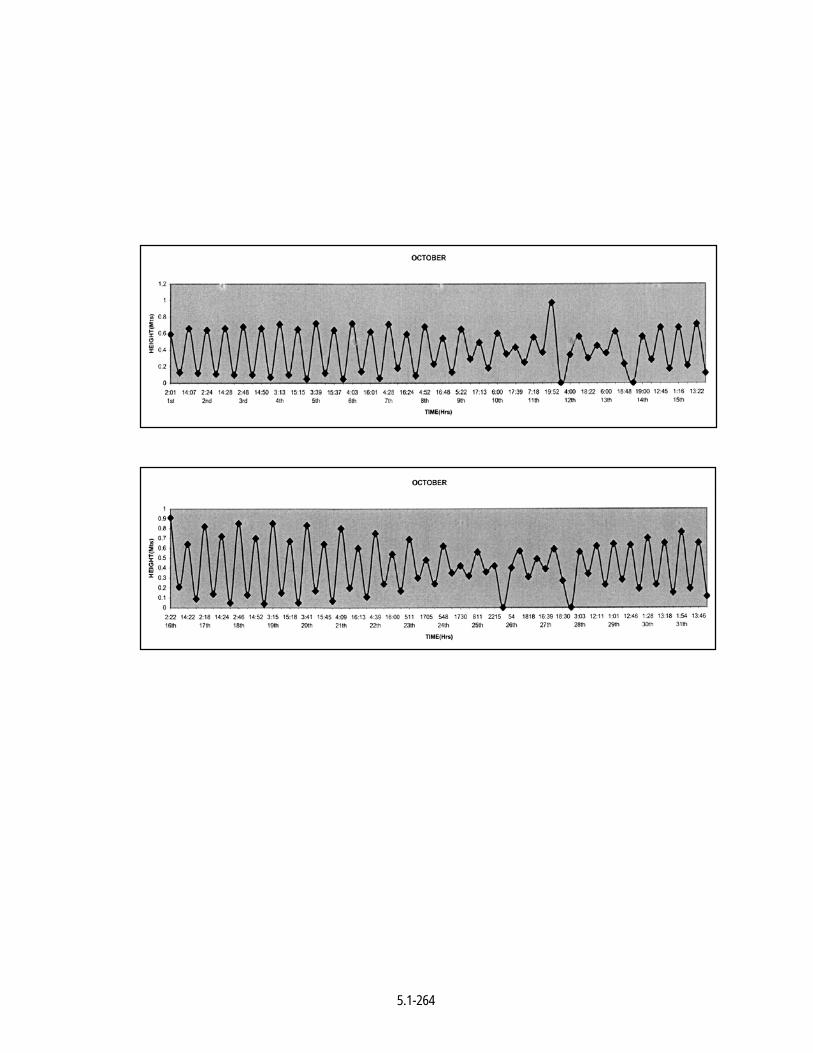
5.1-264
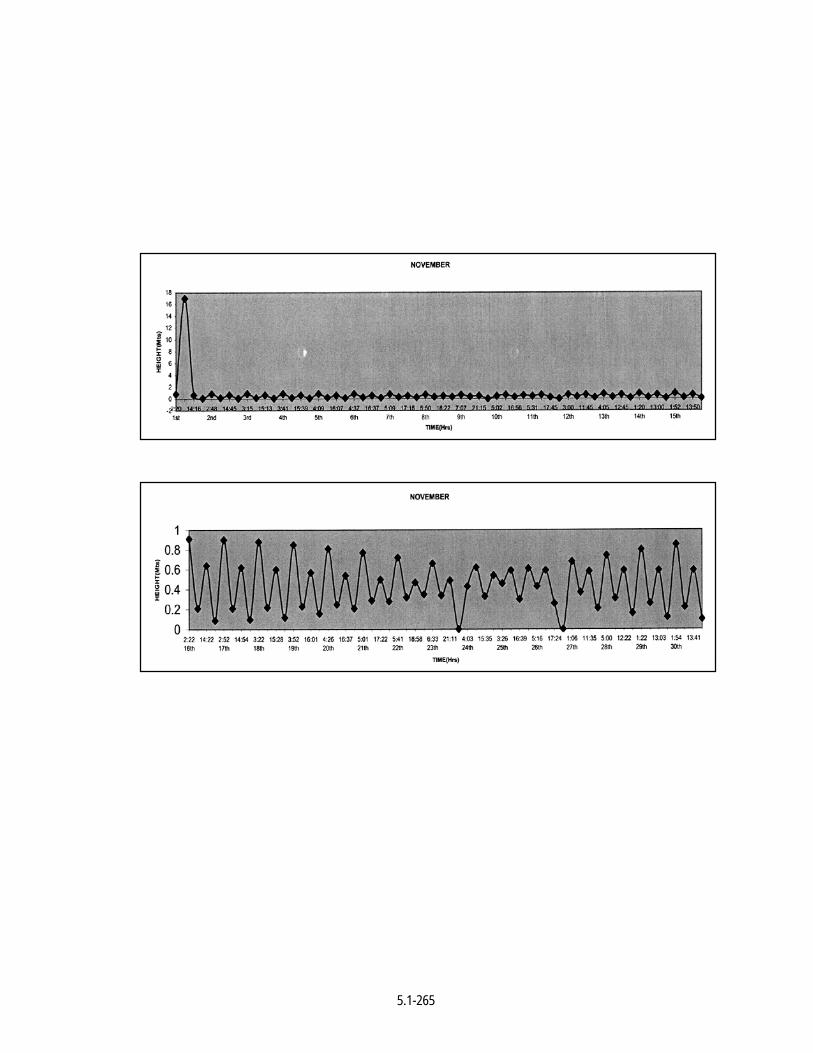
5.1-265
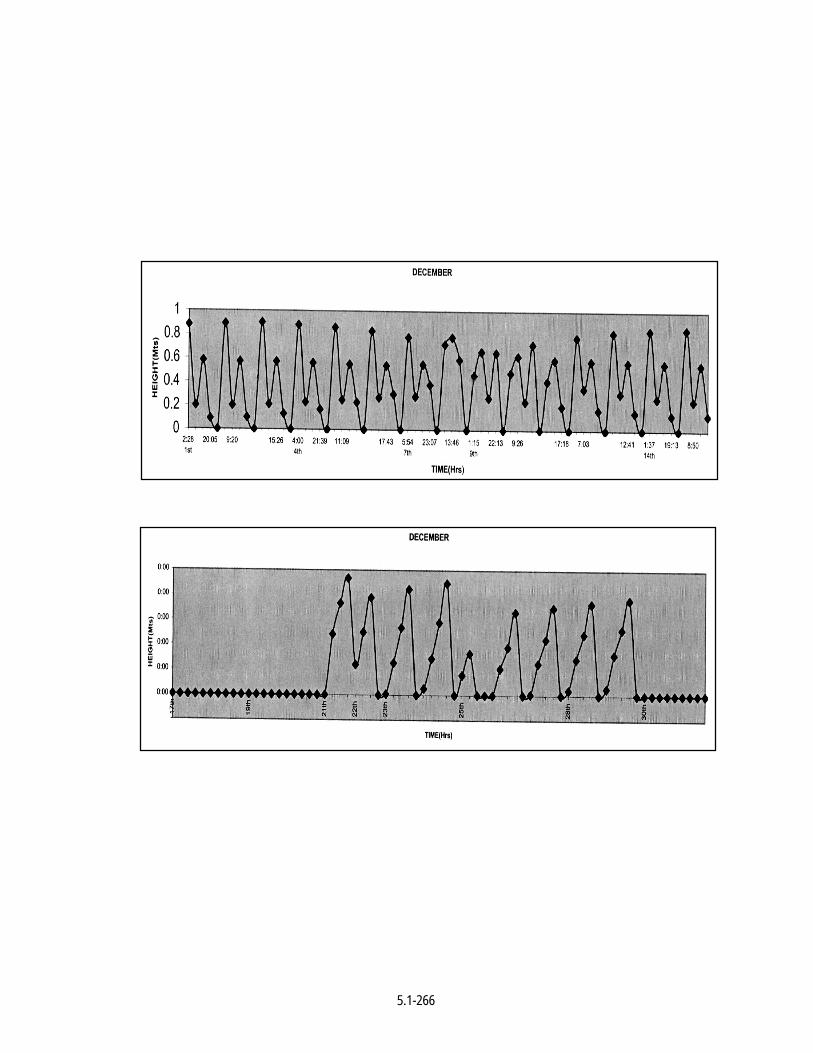
5.1-266
5.1-267
TIDAL CHARTS FOR YEAR 2002
Times and Heights of High and Low Waters
Tuticorin – East Coast-India
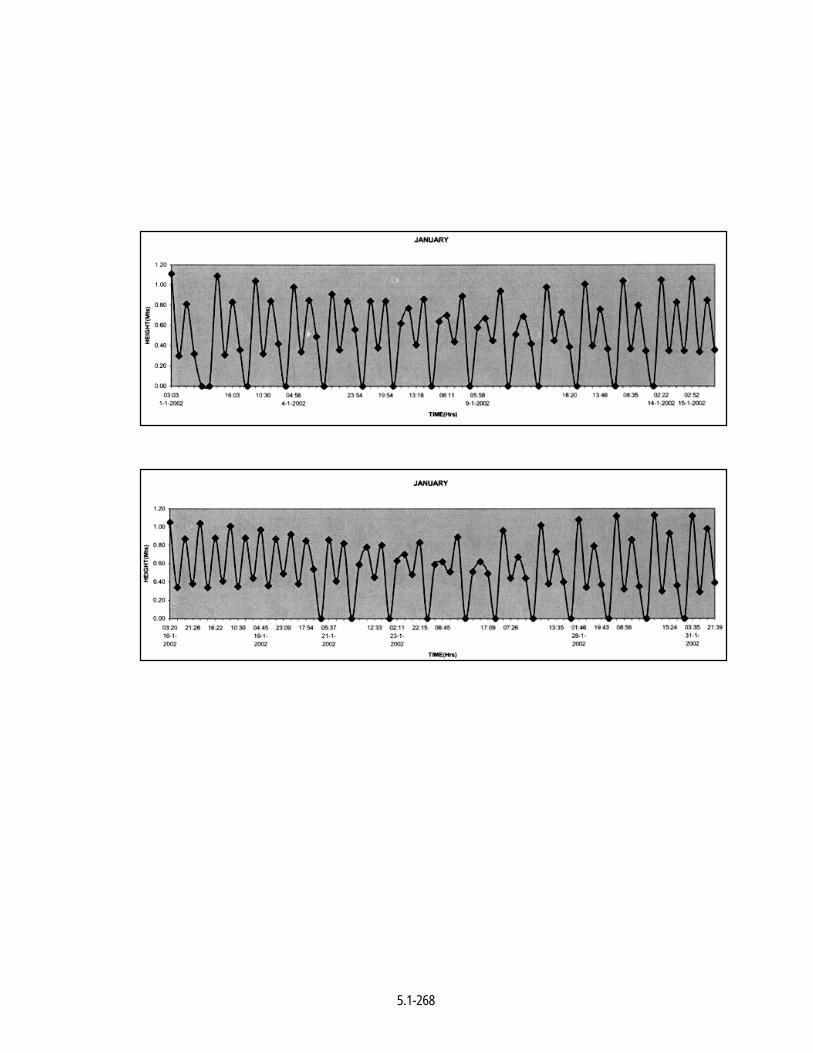
5.1-268
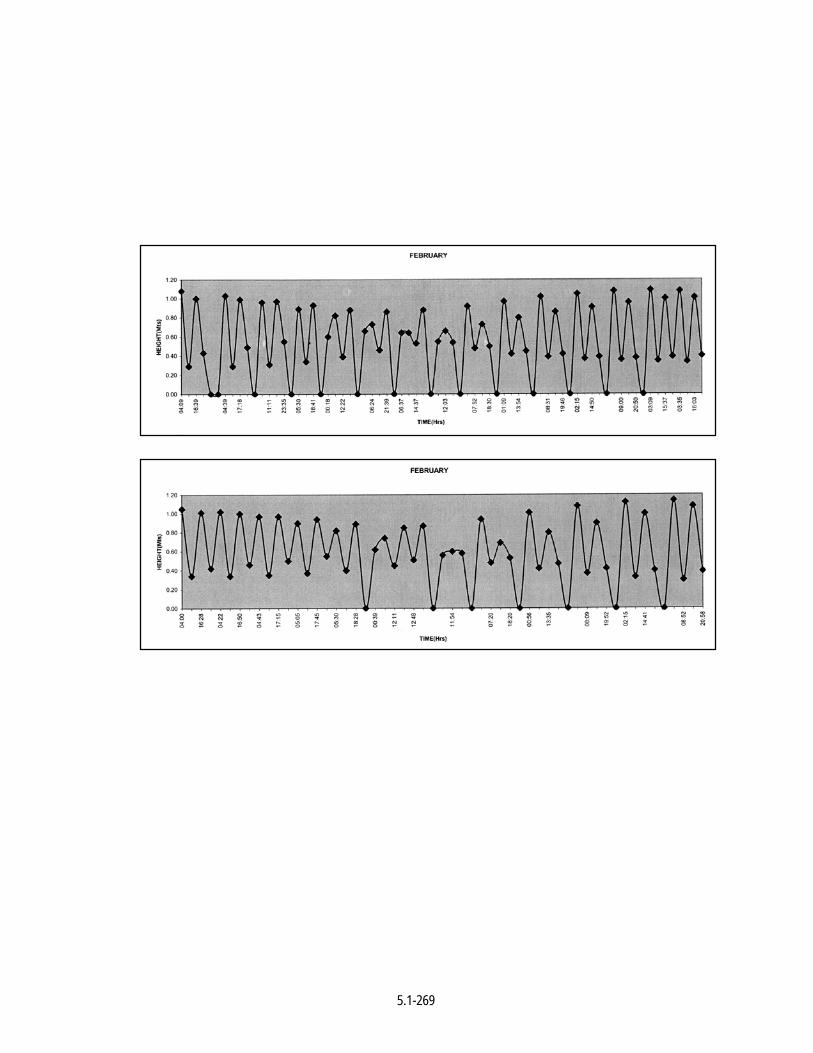
5.1-269
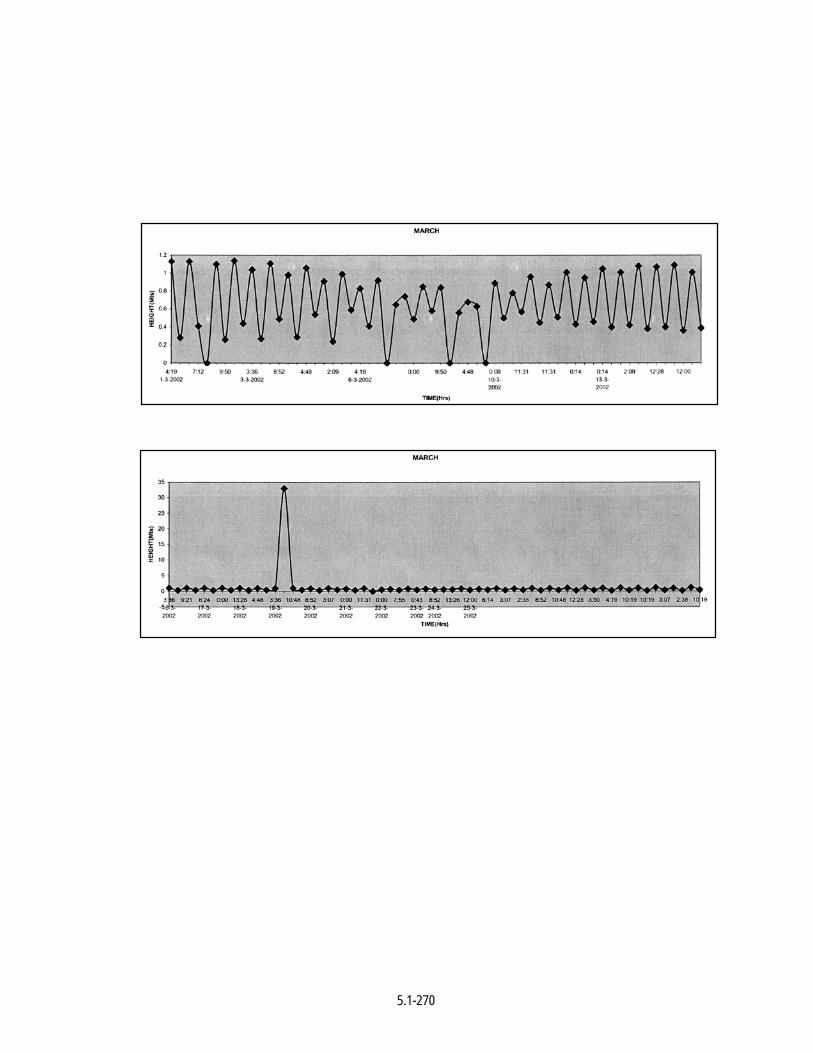
5.1-270
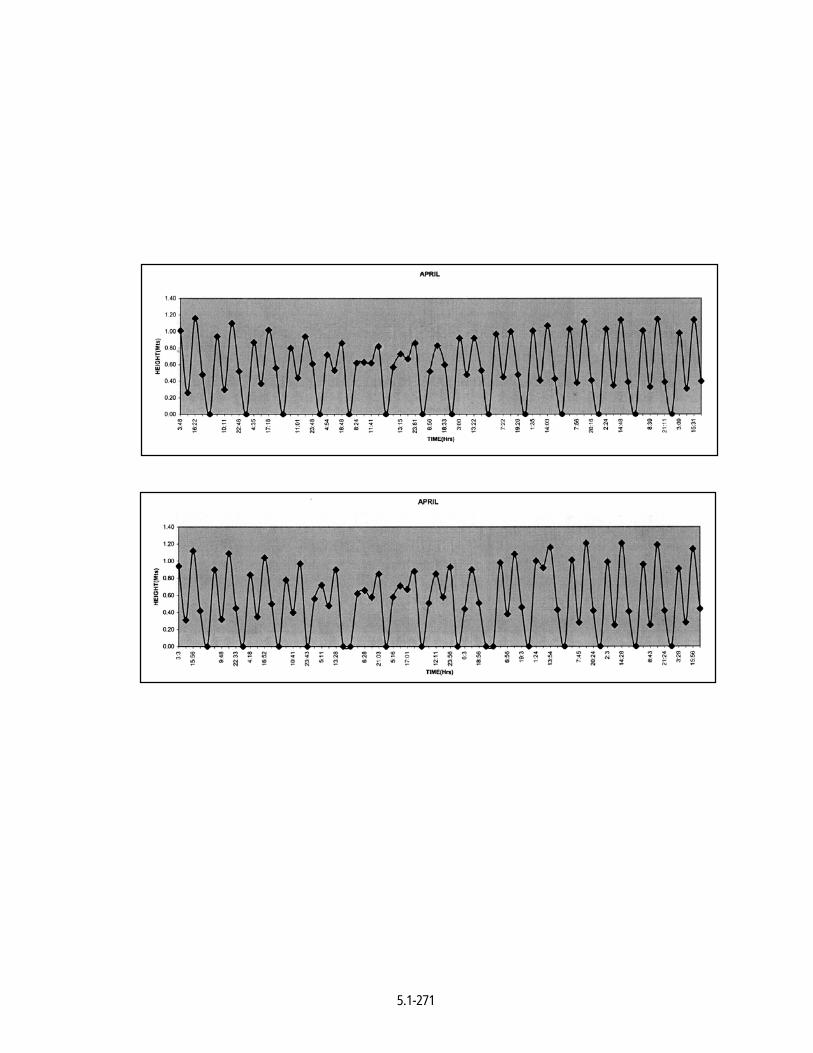
5.1-271
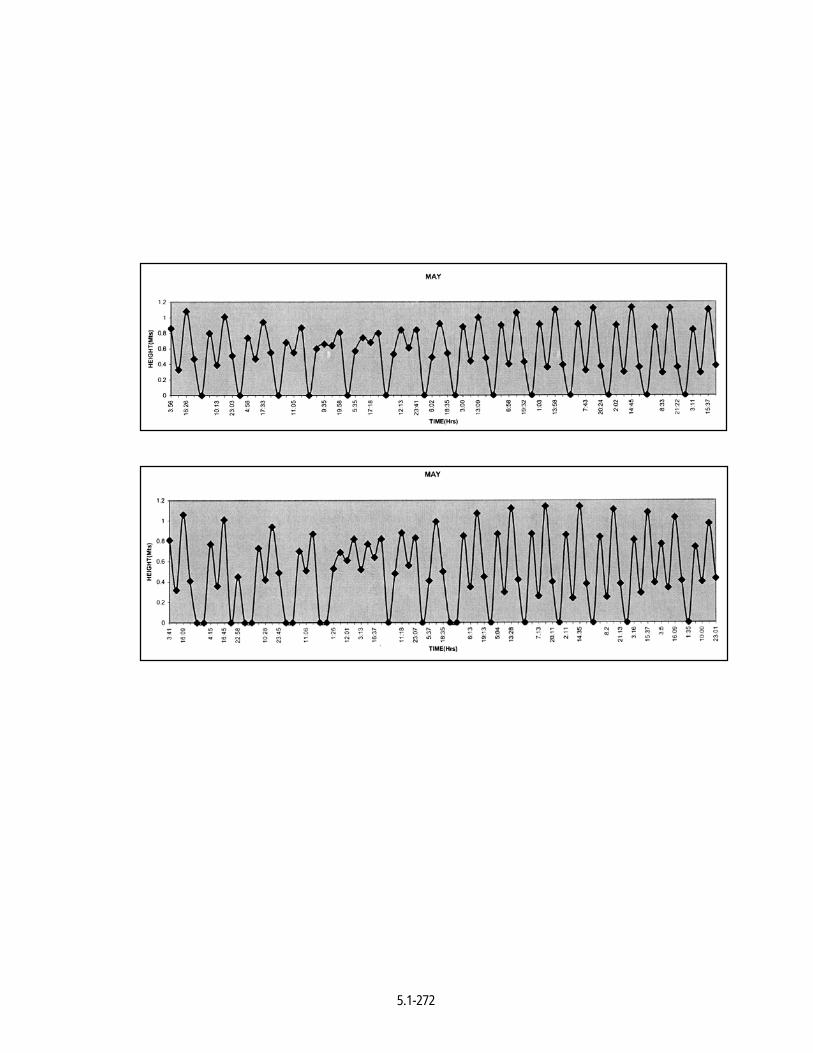
5.1-272
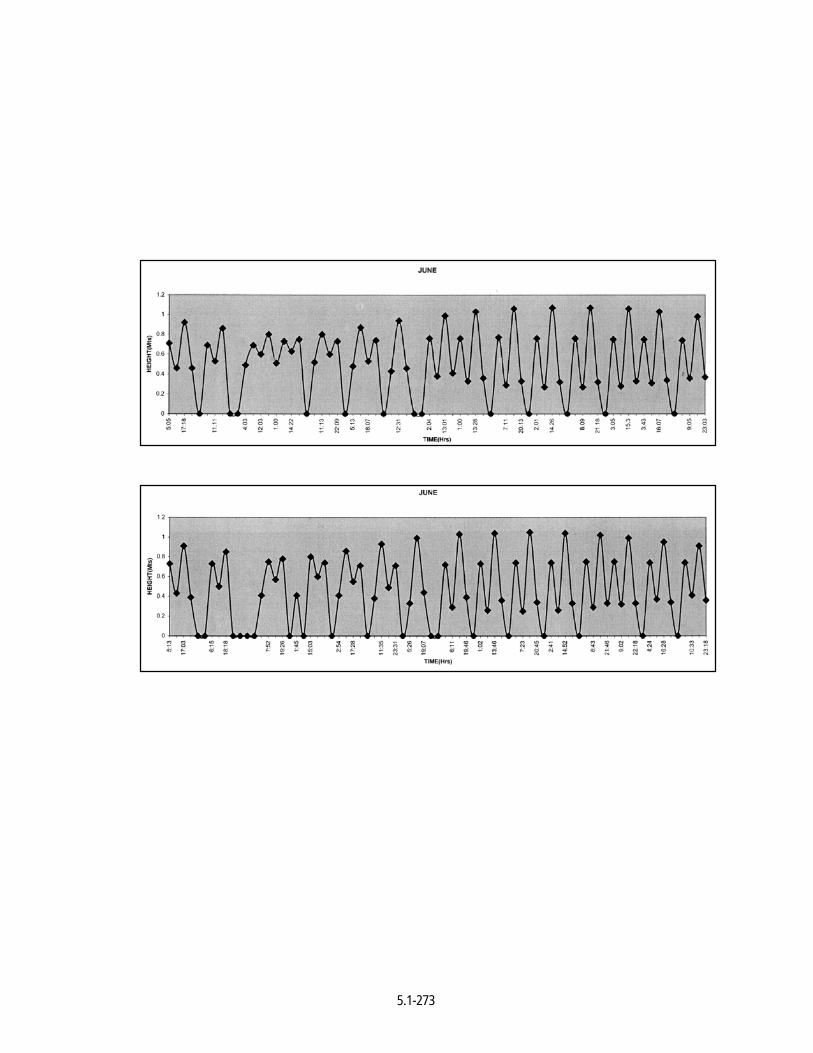
5.1-273
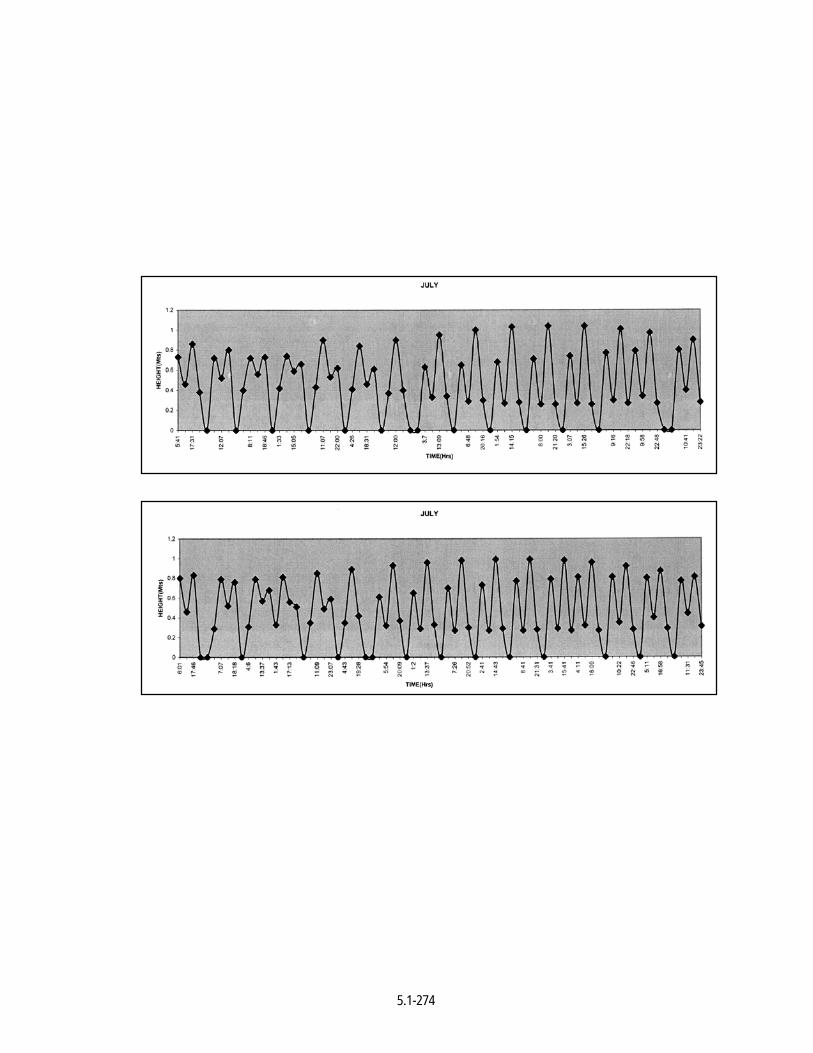
5.1-274

5.1-275
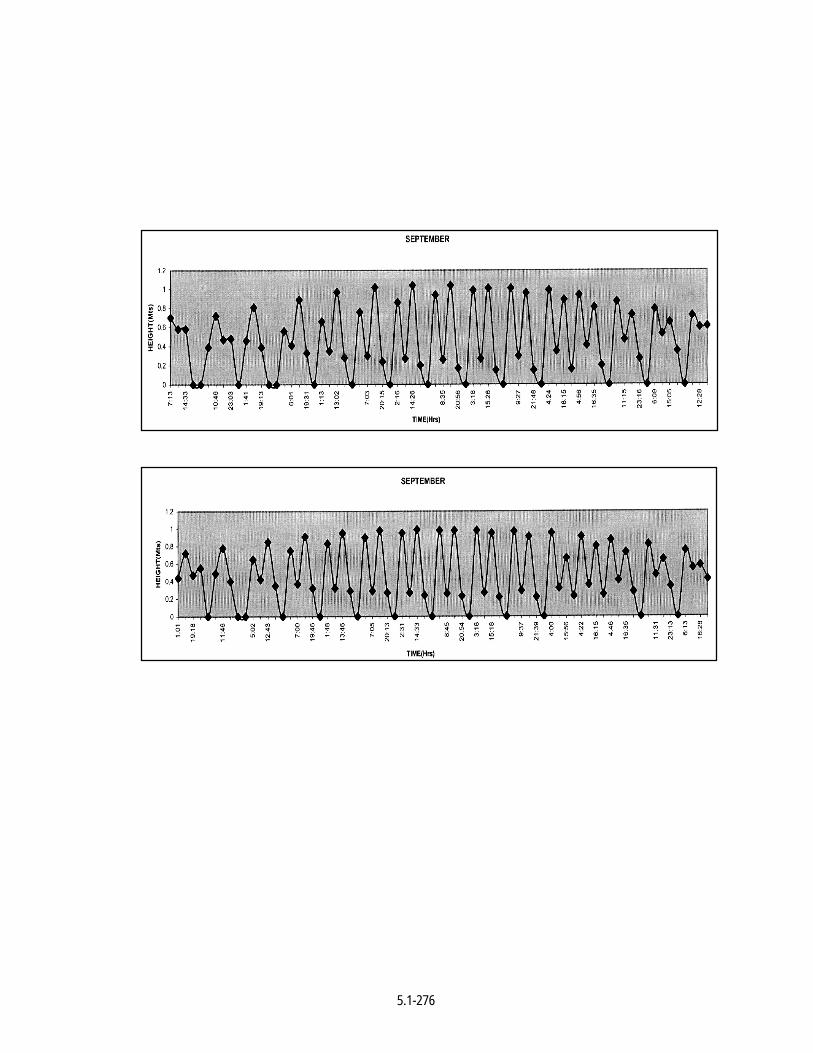
5.1-276
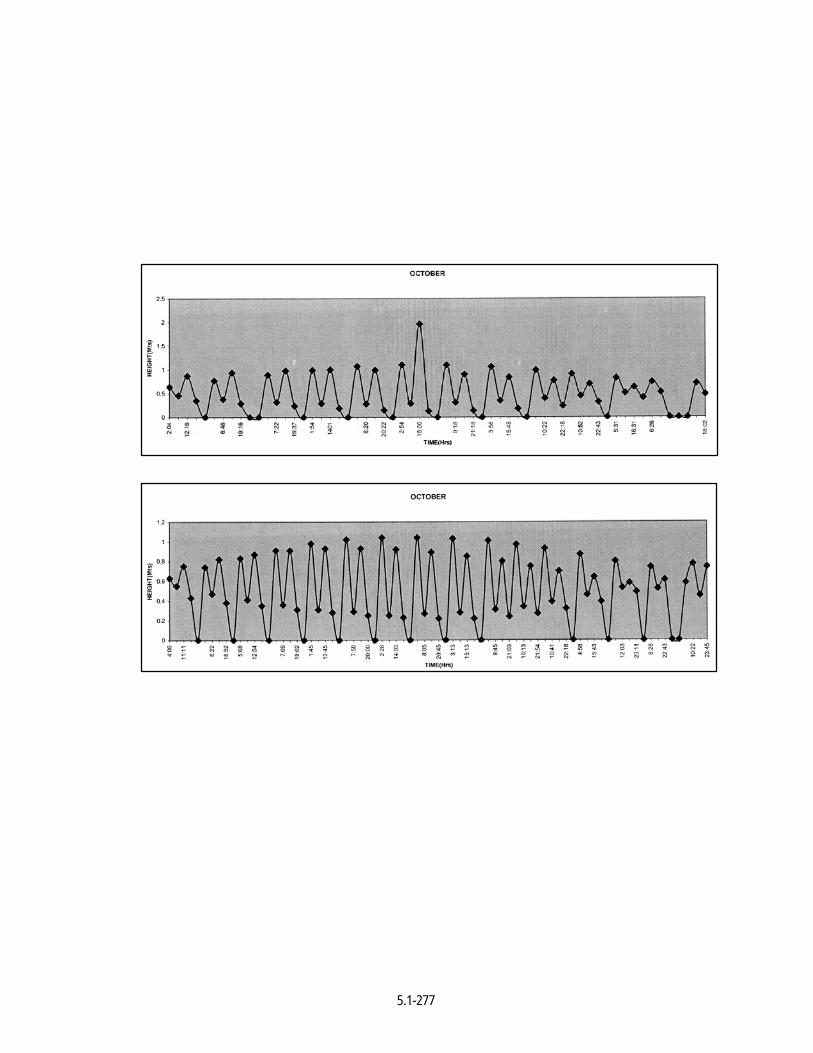
5.1-277
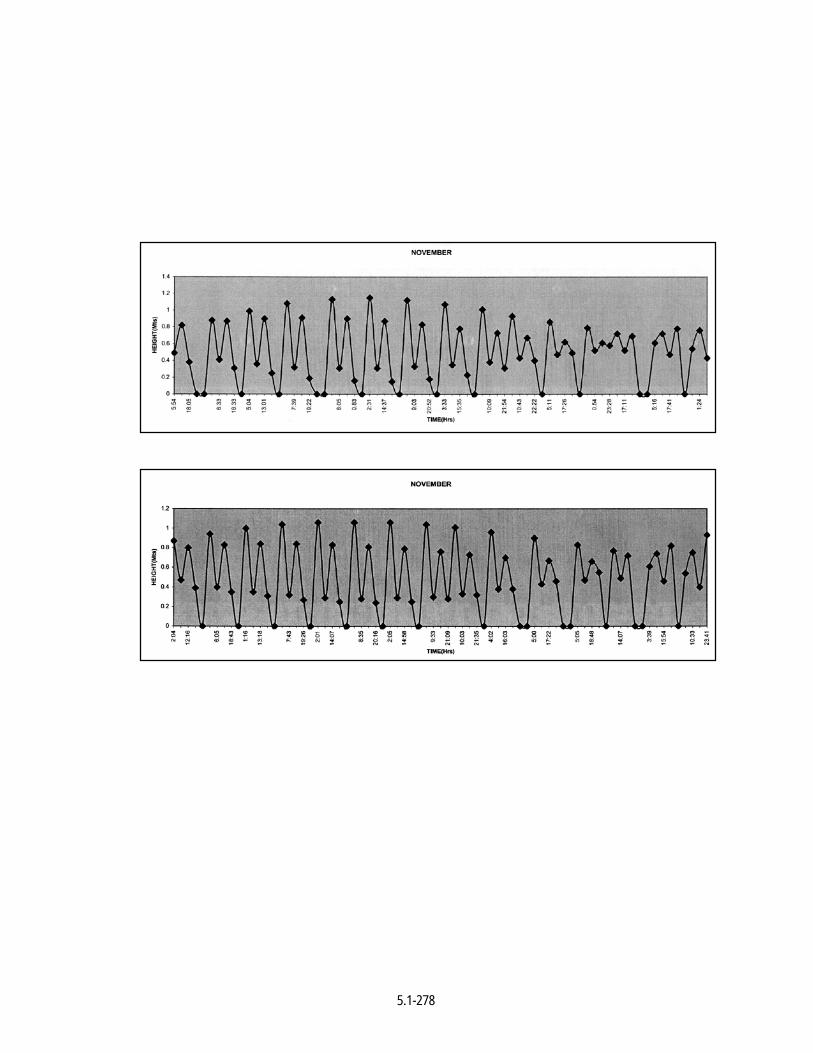
5.1-278
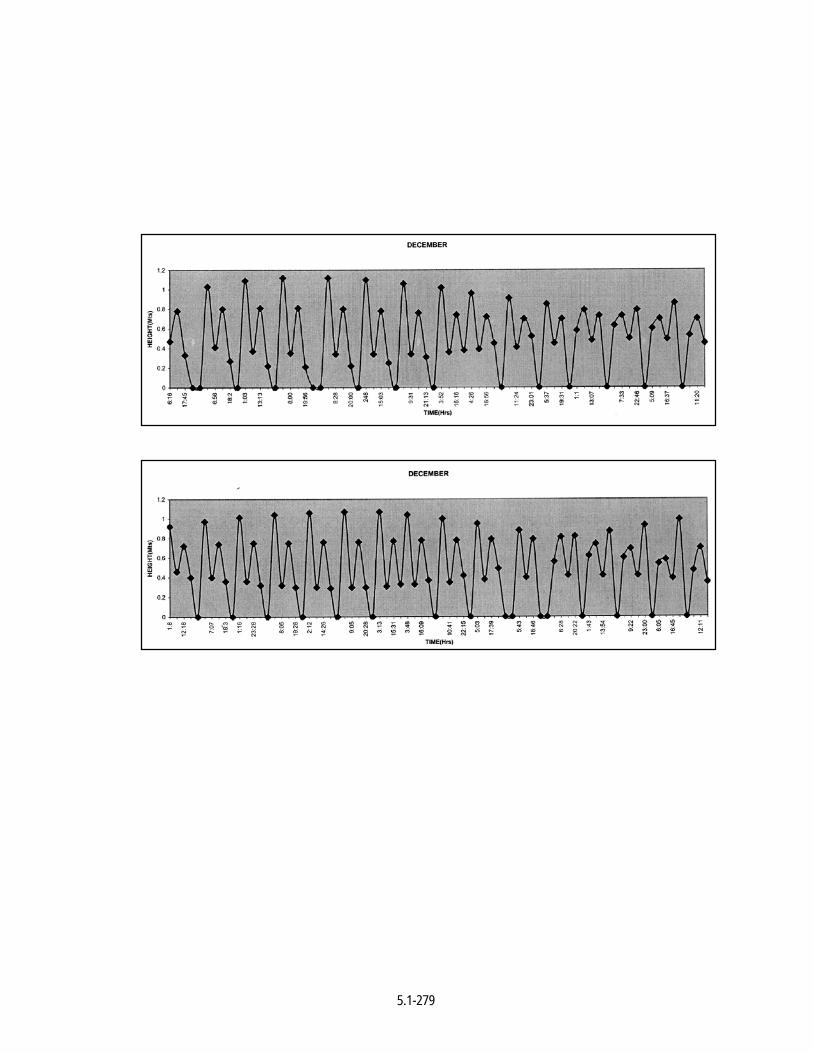
5.1-279

5.1-280
TIDAL CHARTS FOR YEAR 2002
Times and Heights of High and Low Waters
Pamban Island (Rameswaram) – India, East Coast – India
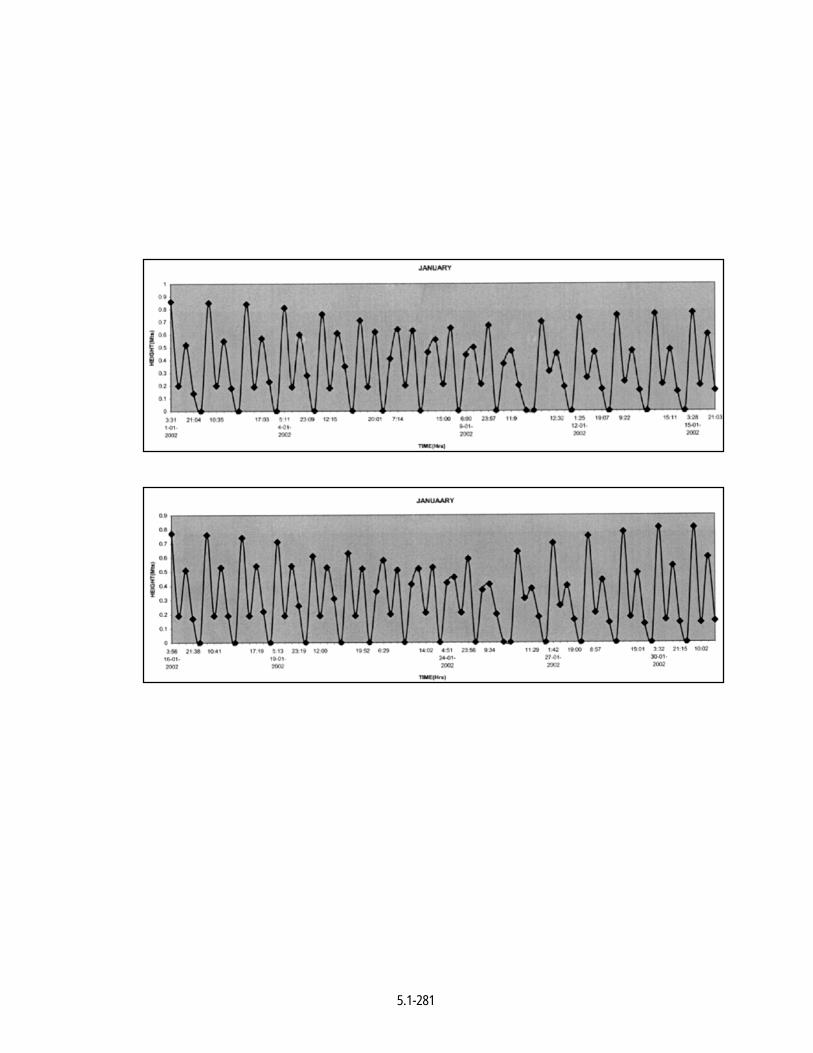
5.1-281
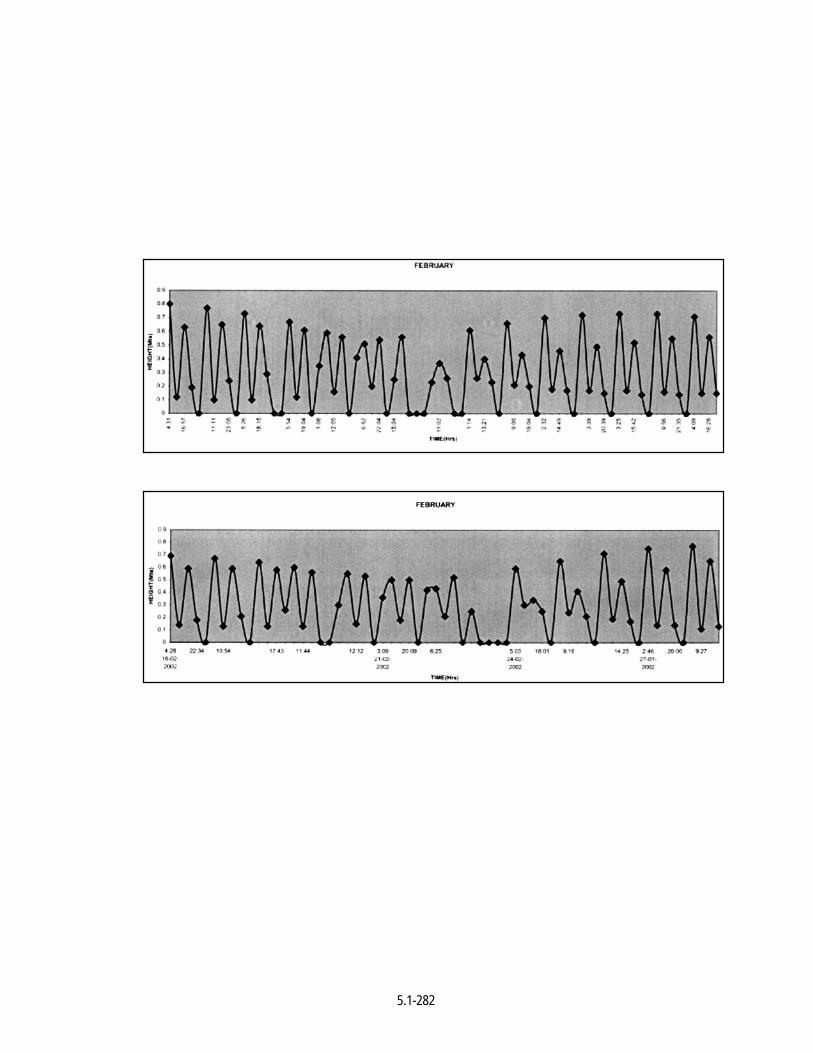
5.1-282
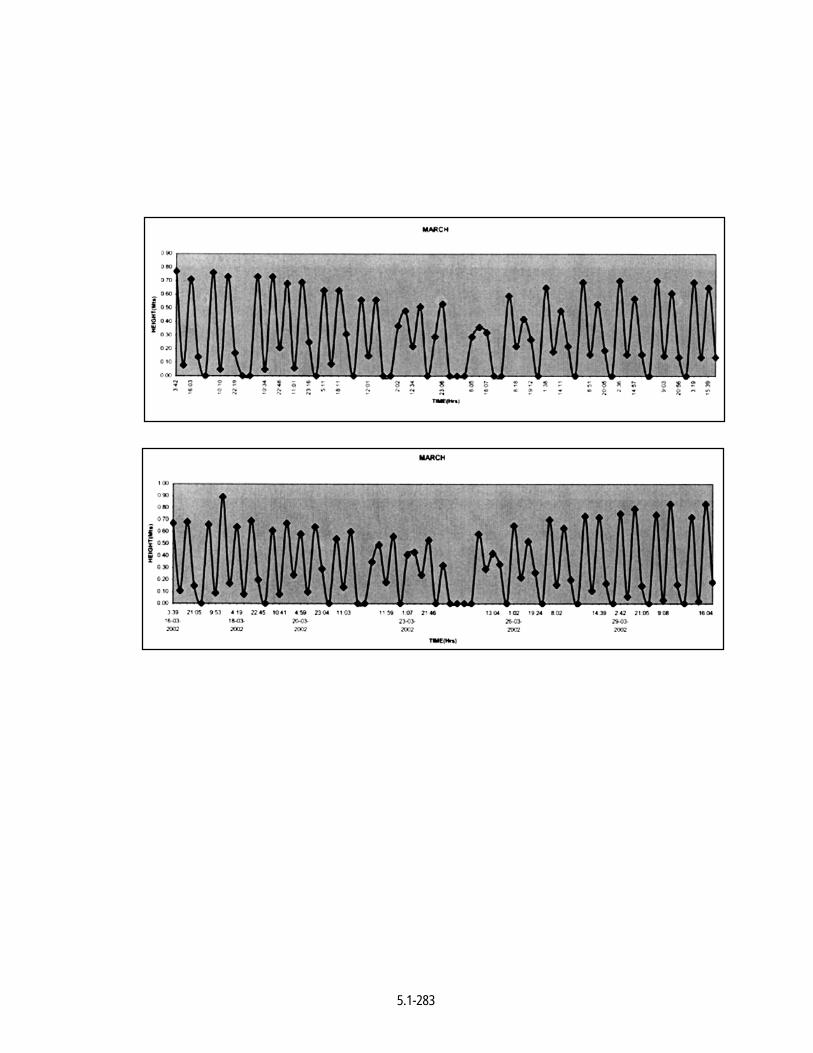
5.1-283
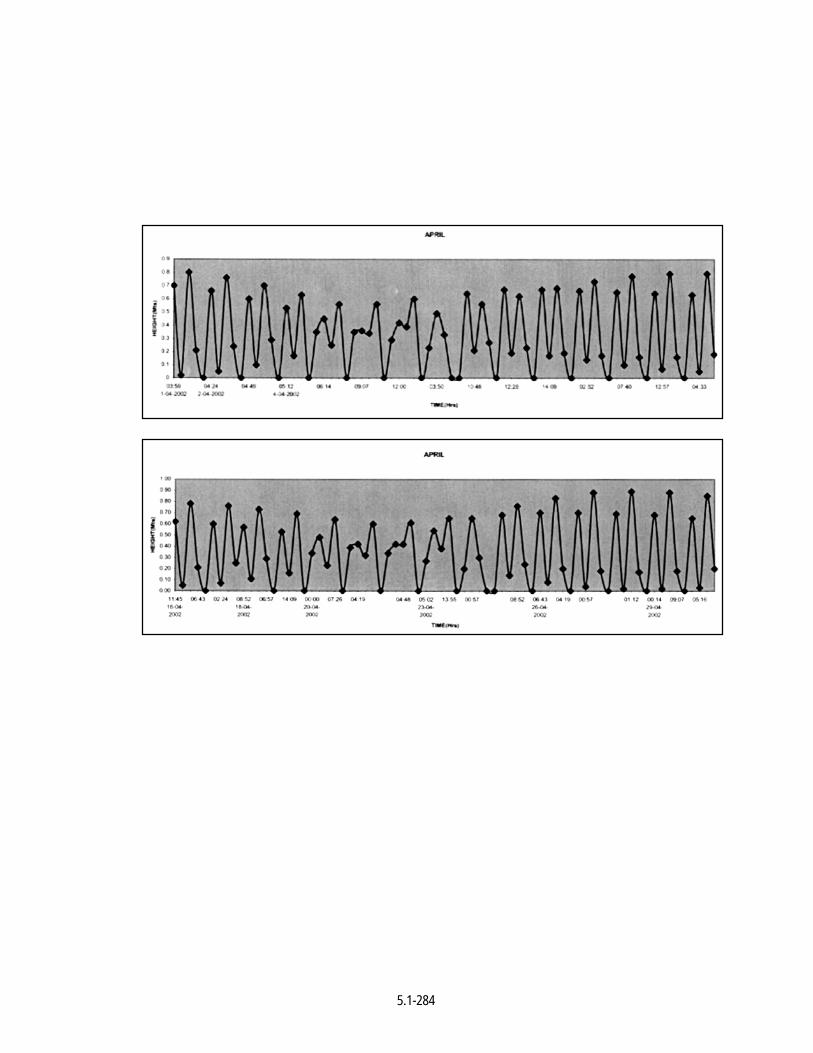
5.1-284
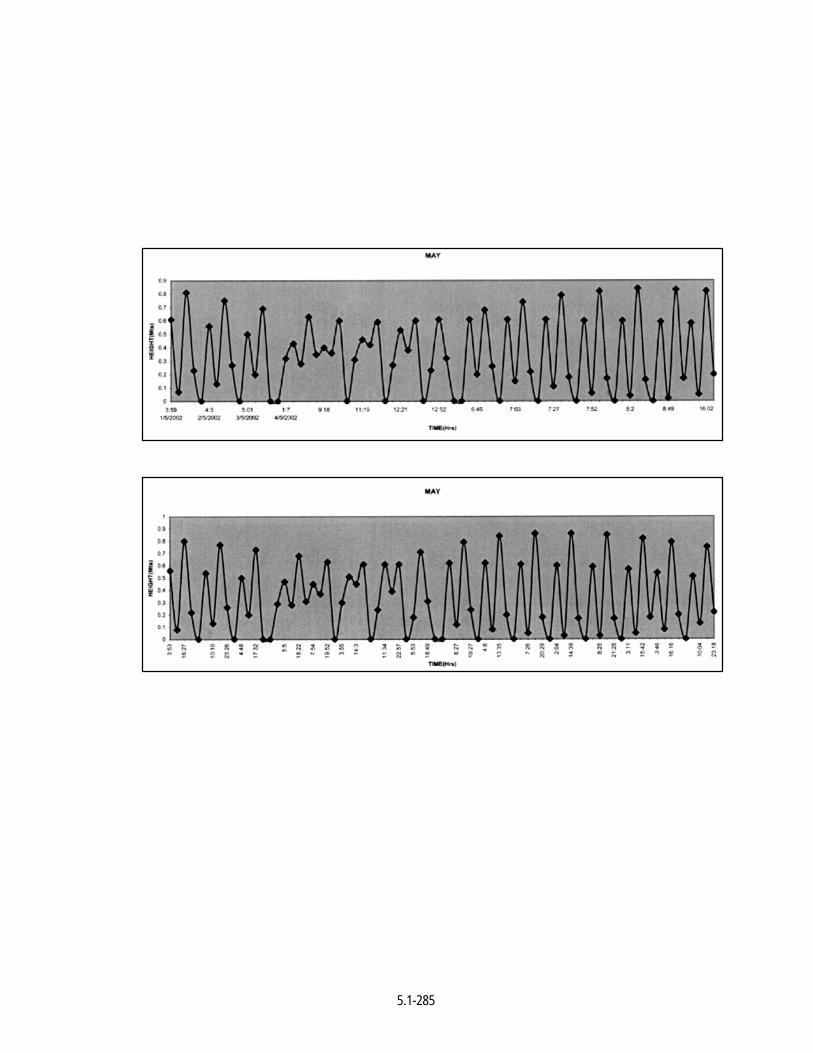
5.1-285
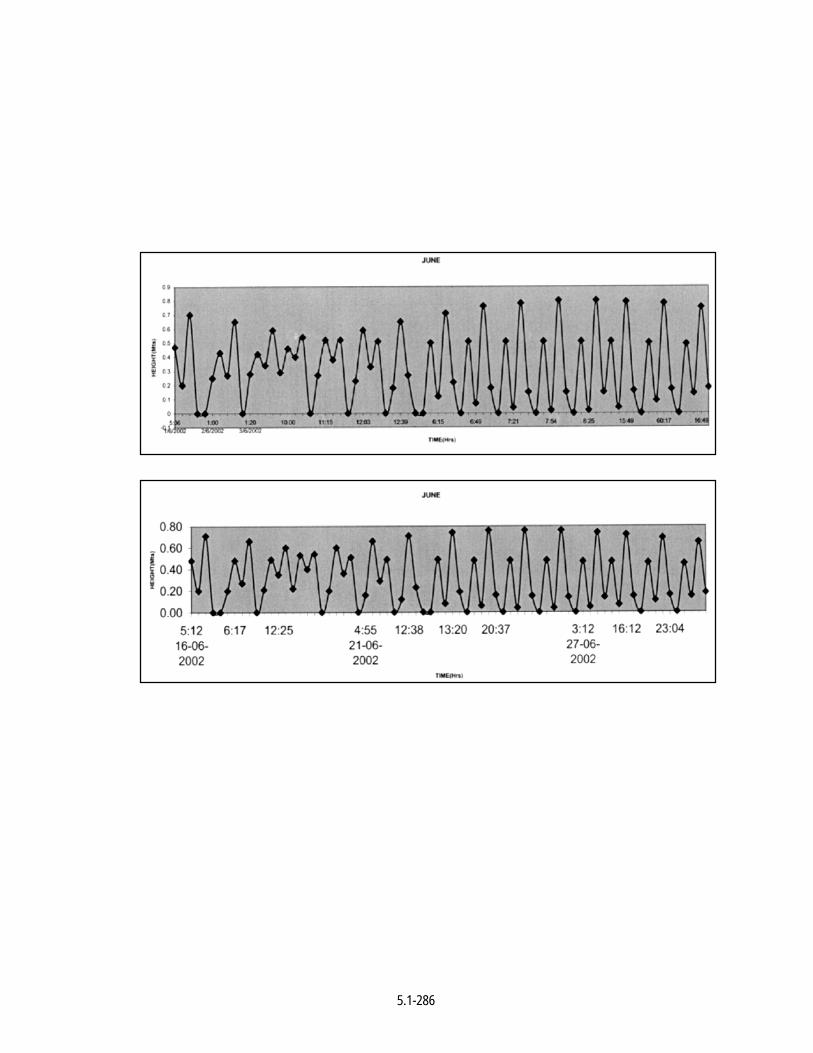
5.1-286
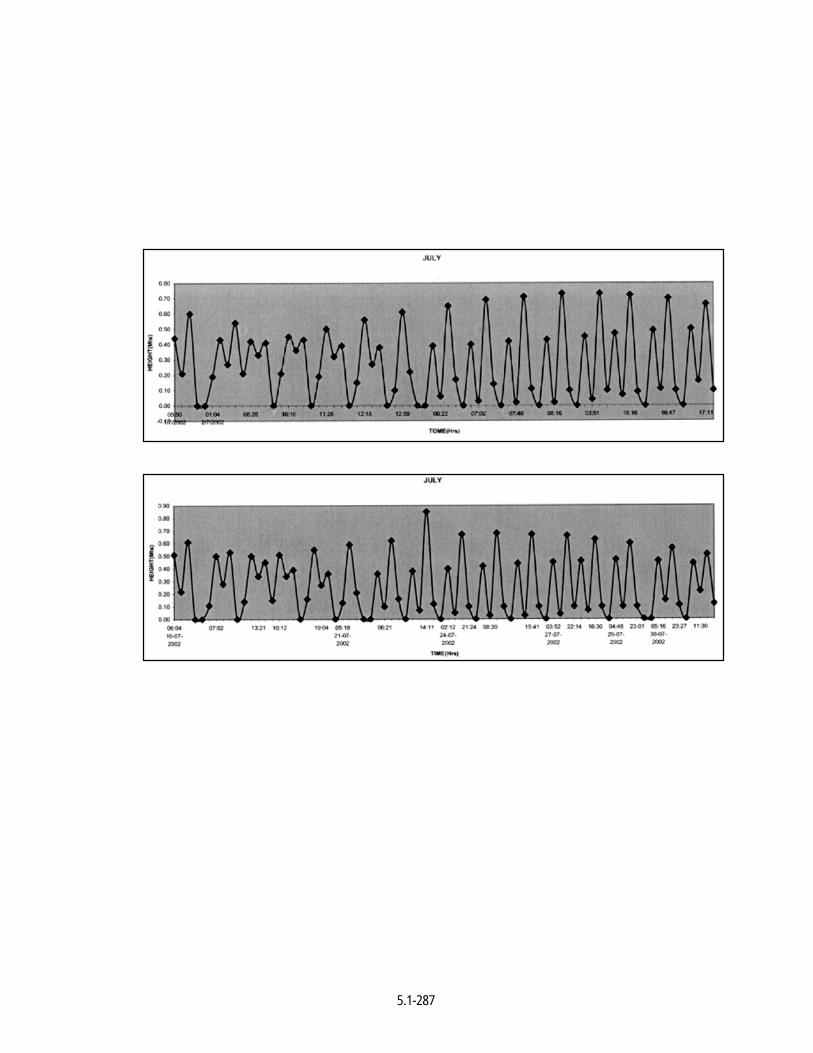
5.1-287

5.1-288
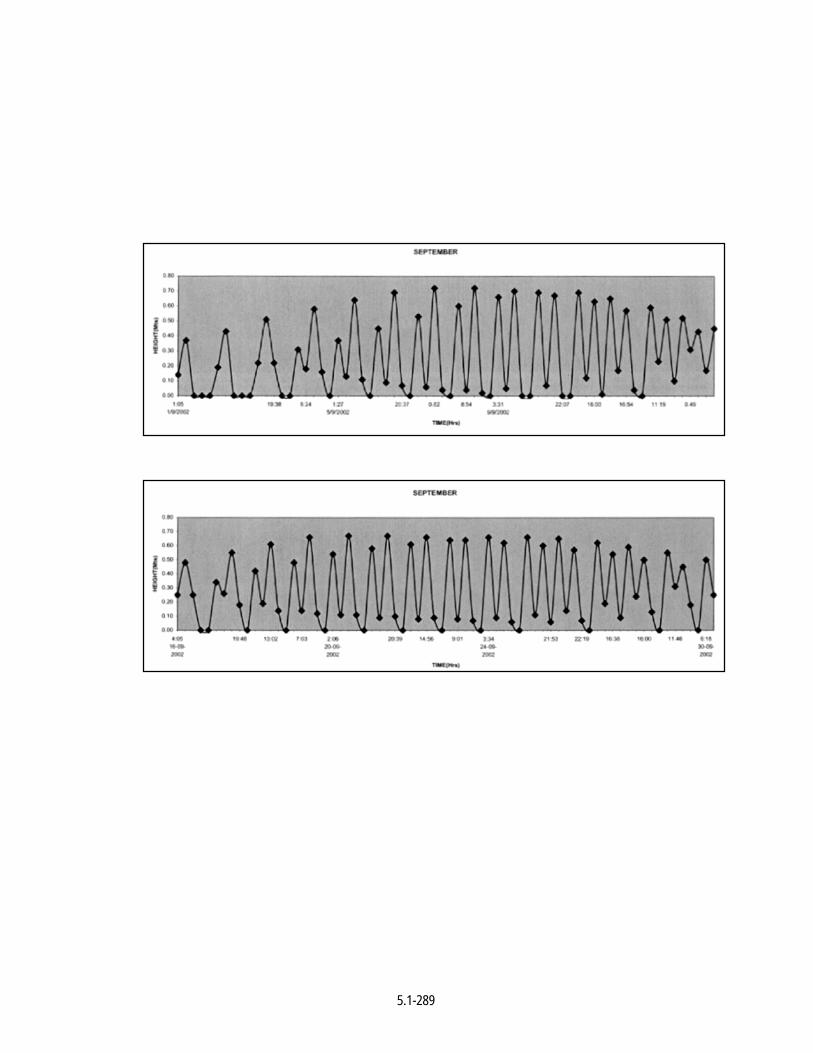
5.1-289
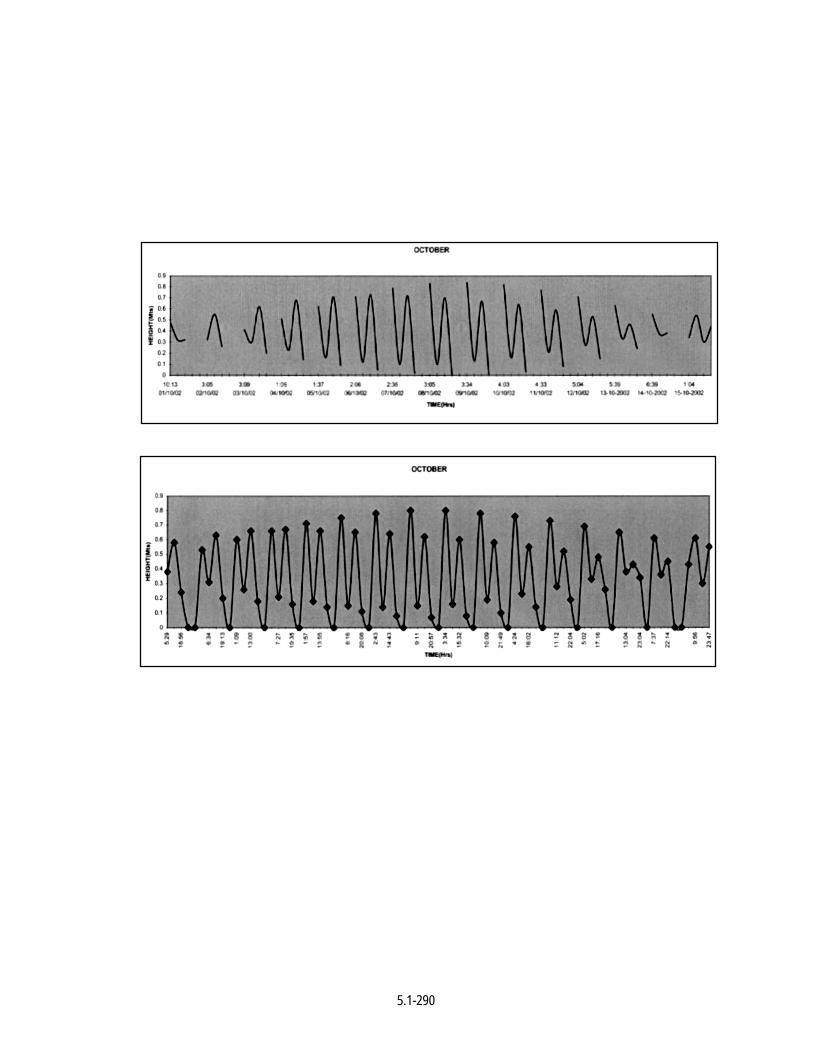
5.1-290
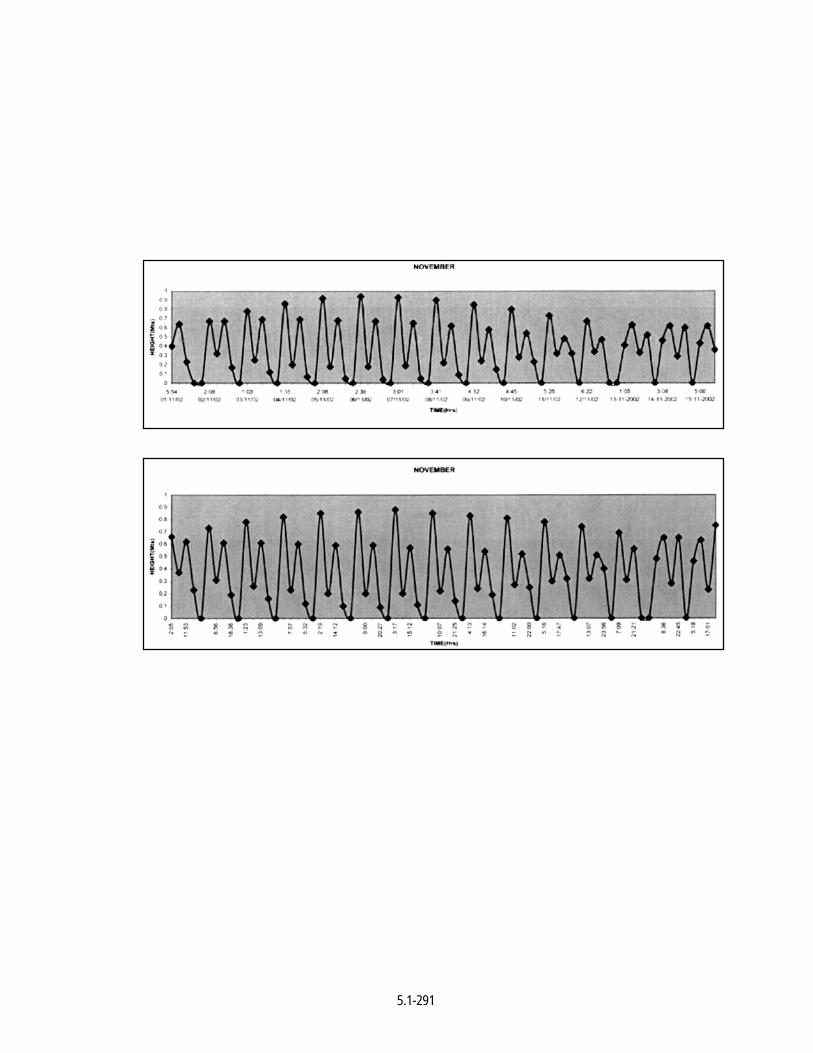
5.1-291
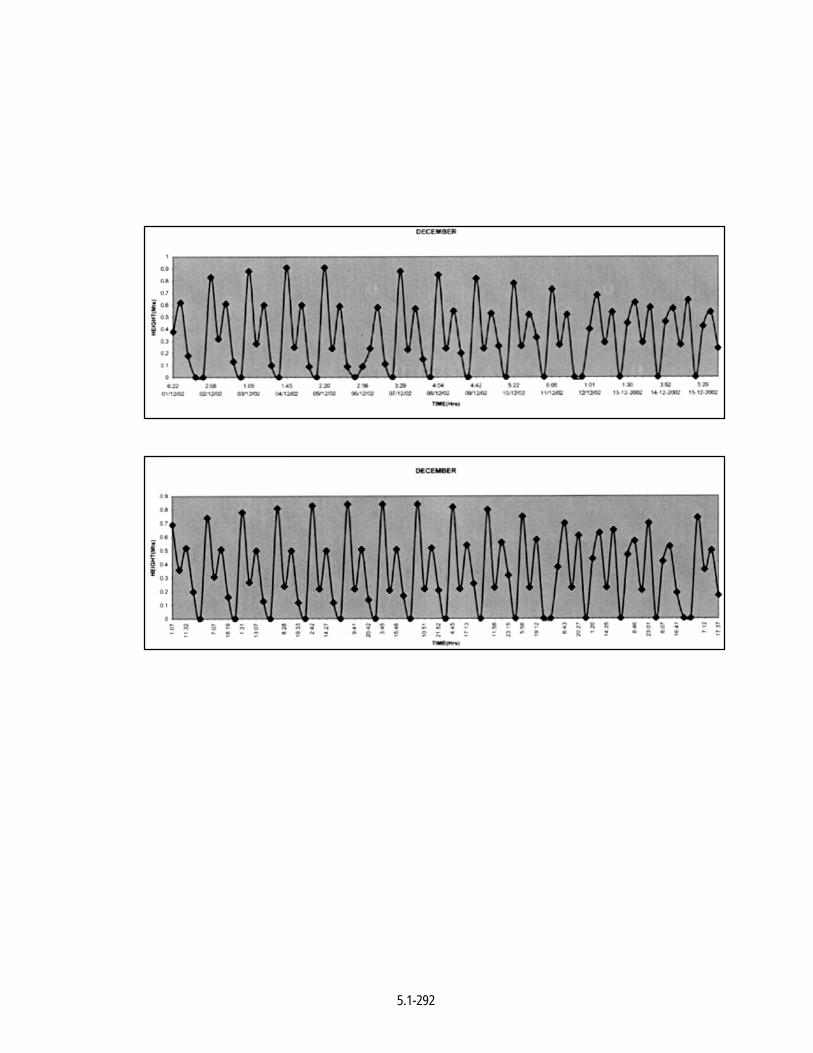
5.1-292
5.1-293
TIDAL CHARTS FOR YEAR 2003
Times and Heights of High and Low Waters
Pamban Pass (Rameswaram Island) – India, East Coast-India
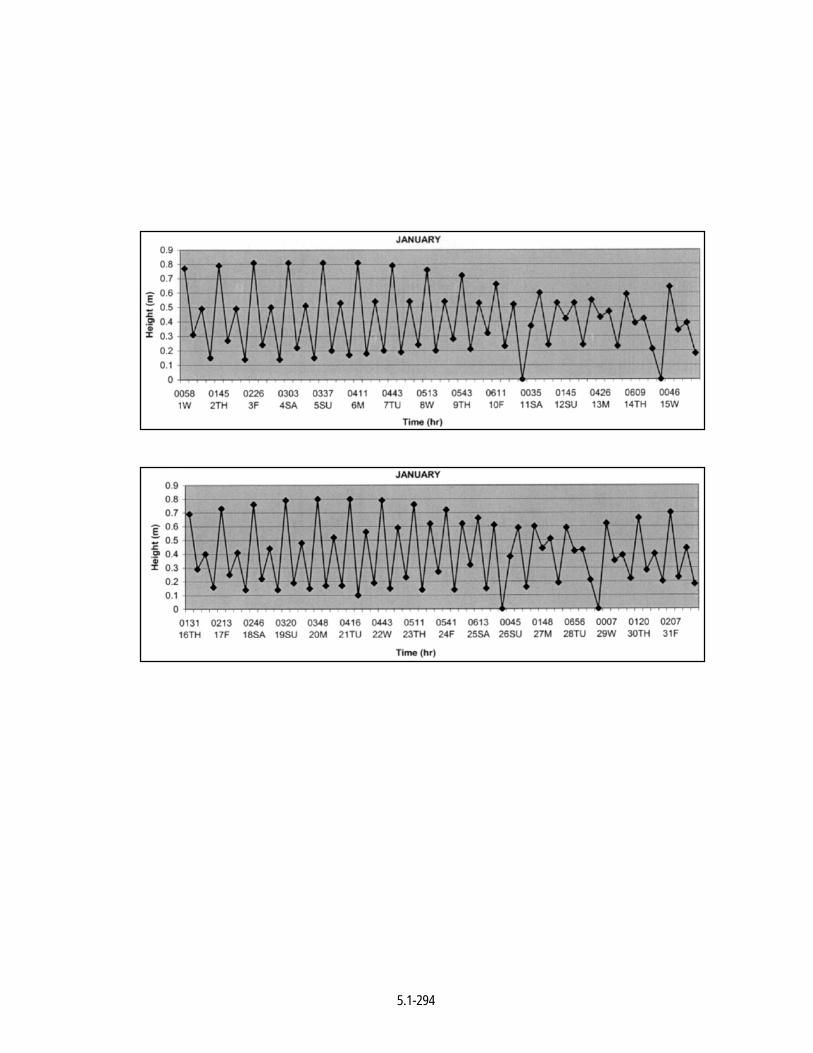
5.1-294
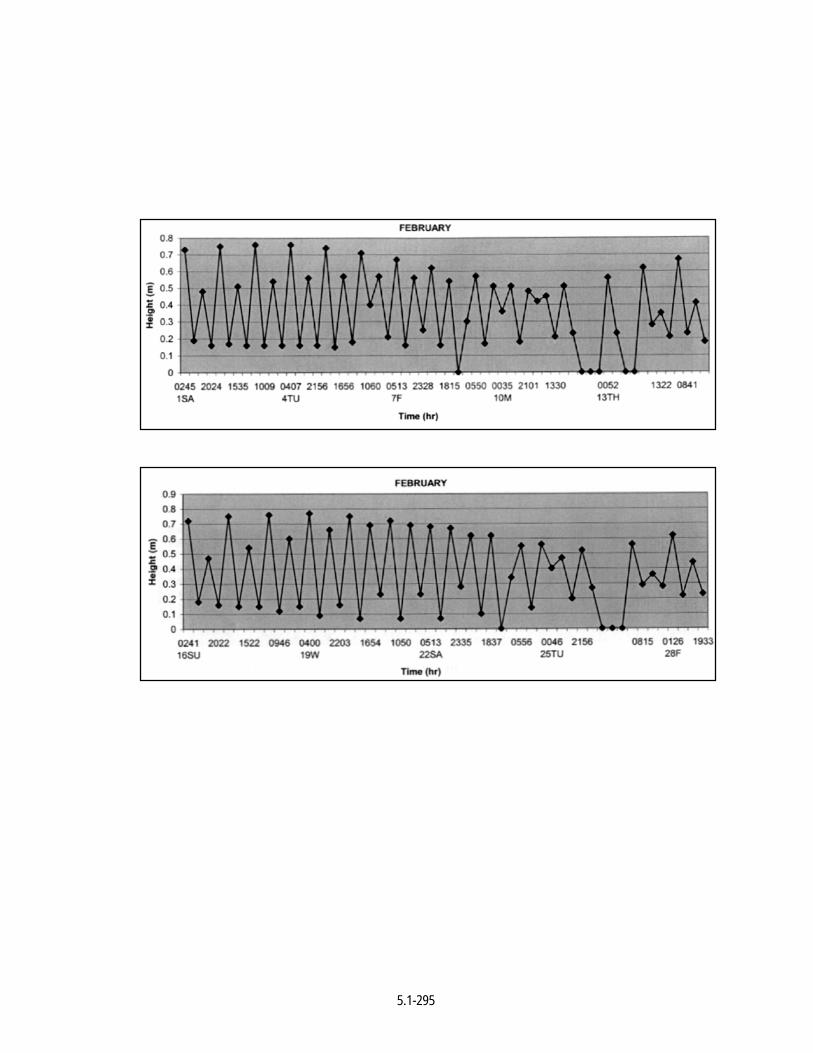
5.1-295
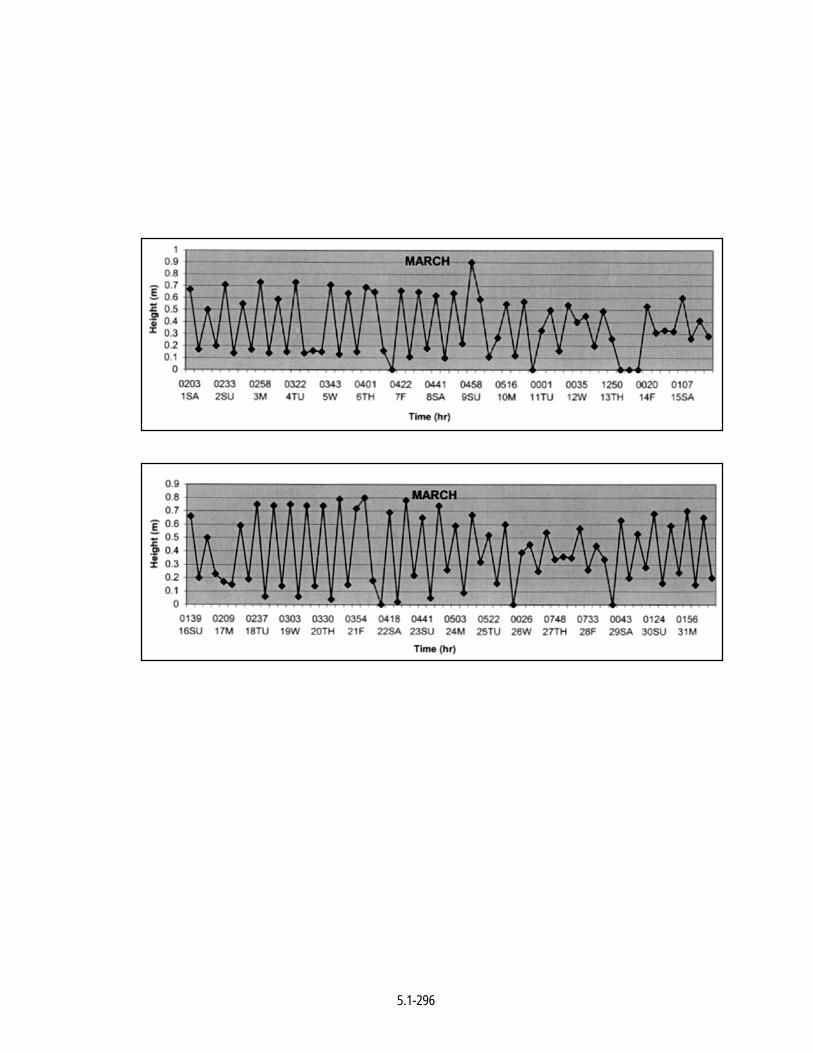
5.1-296
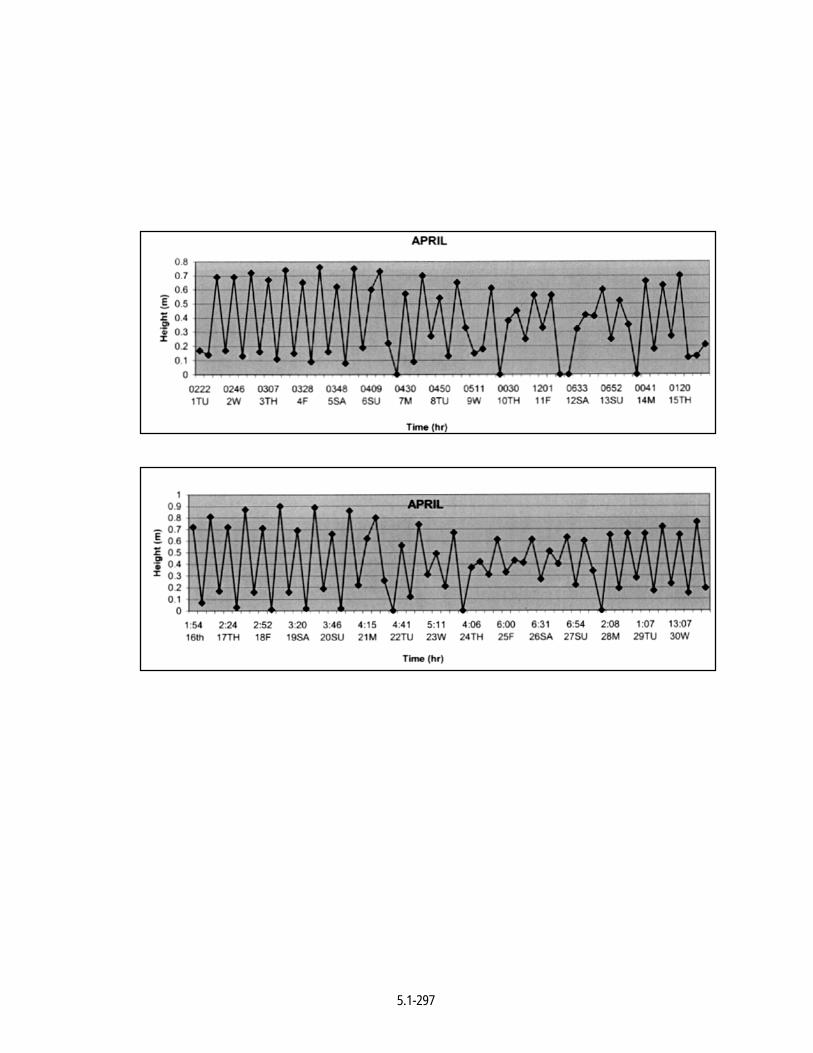
5.1-297
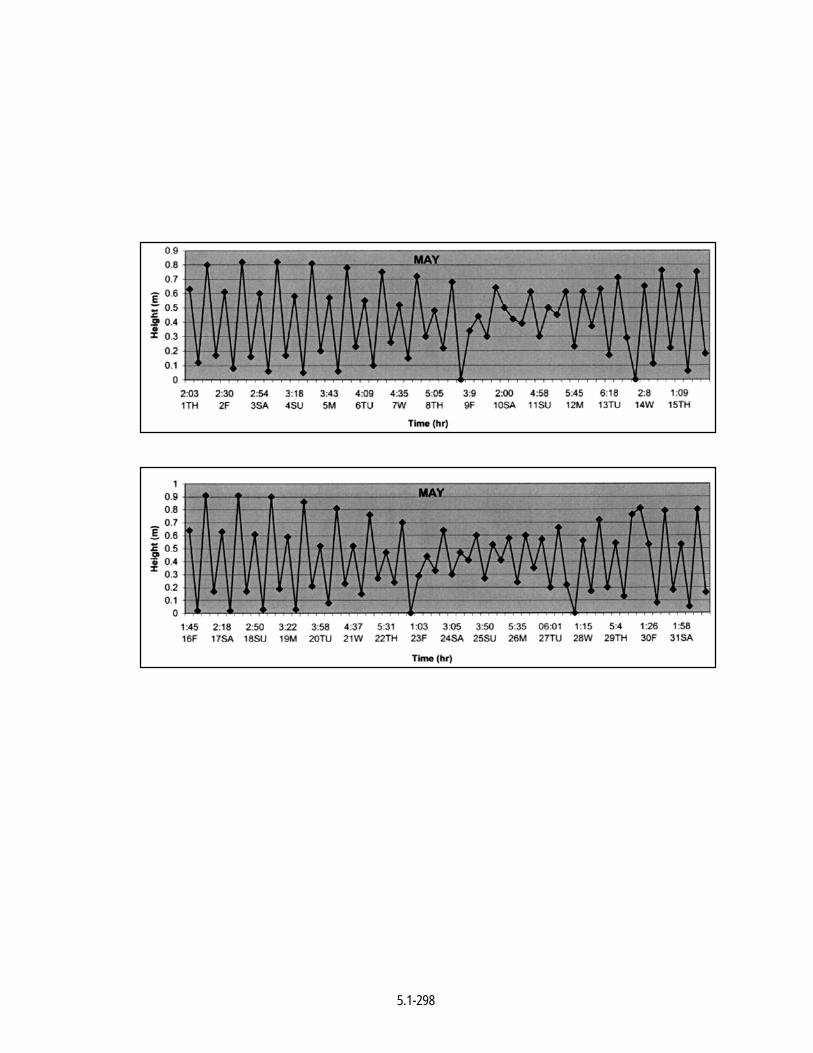
5.1-298
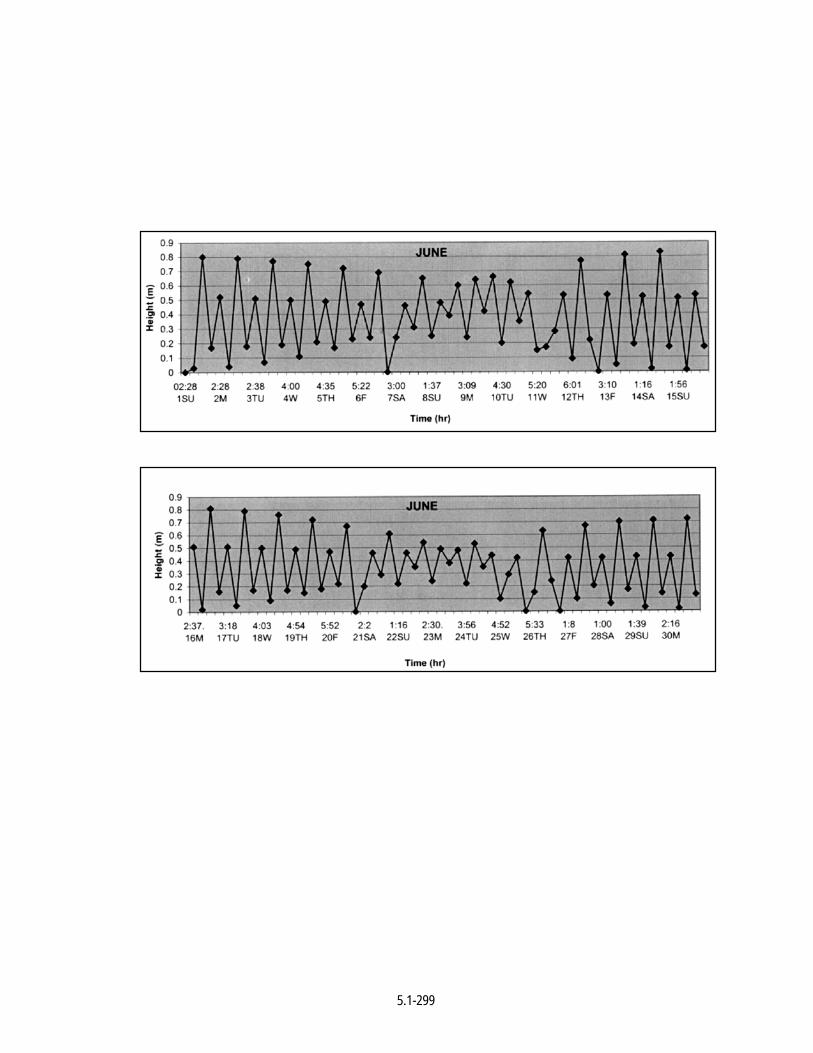
5.1-299
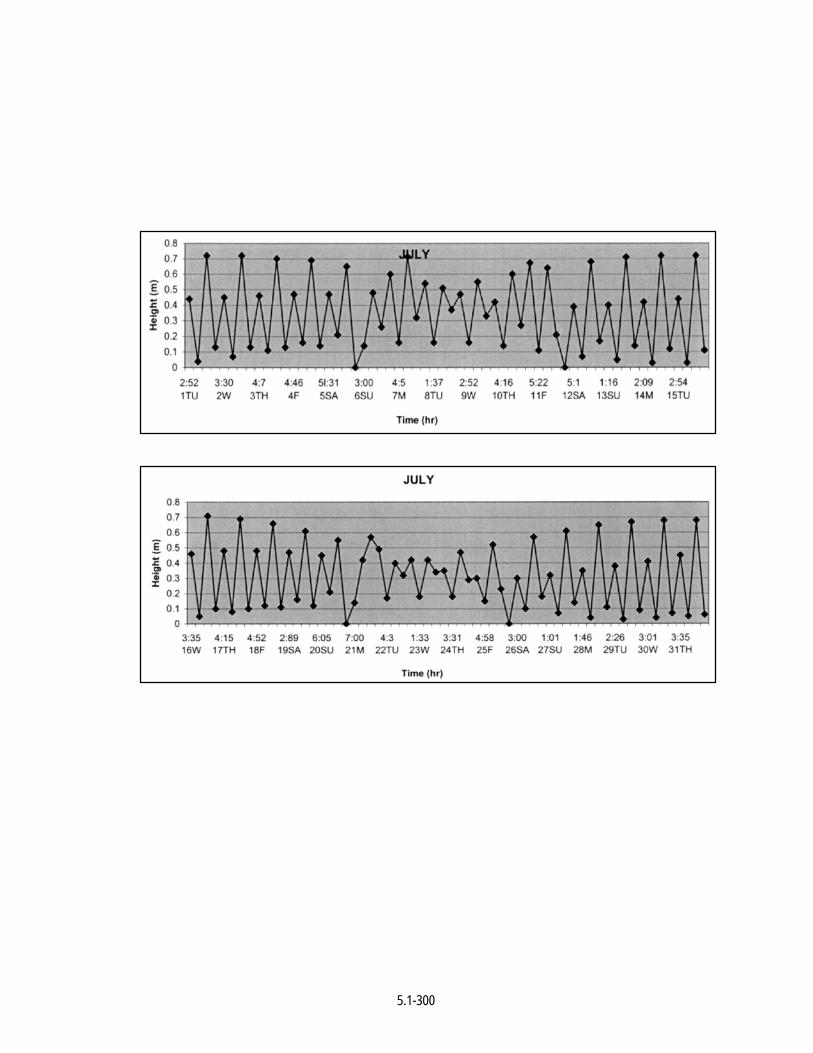
5.1-300

5.1-301

5.1-302
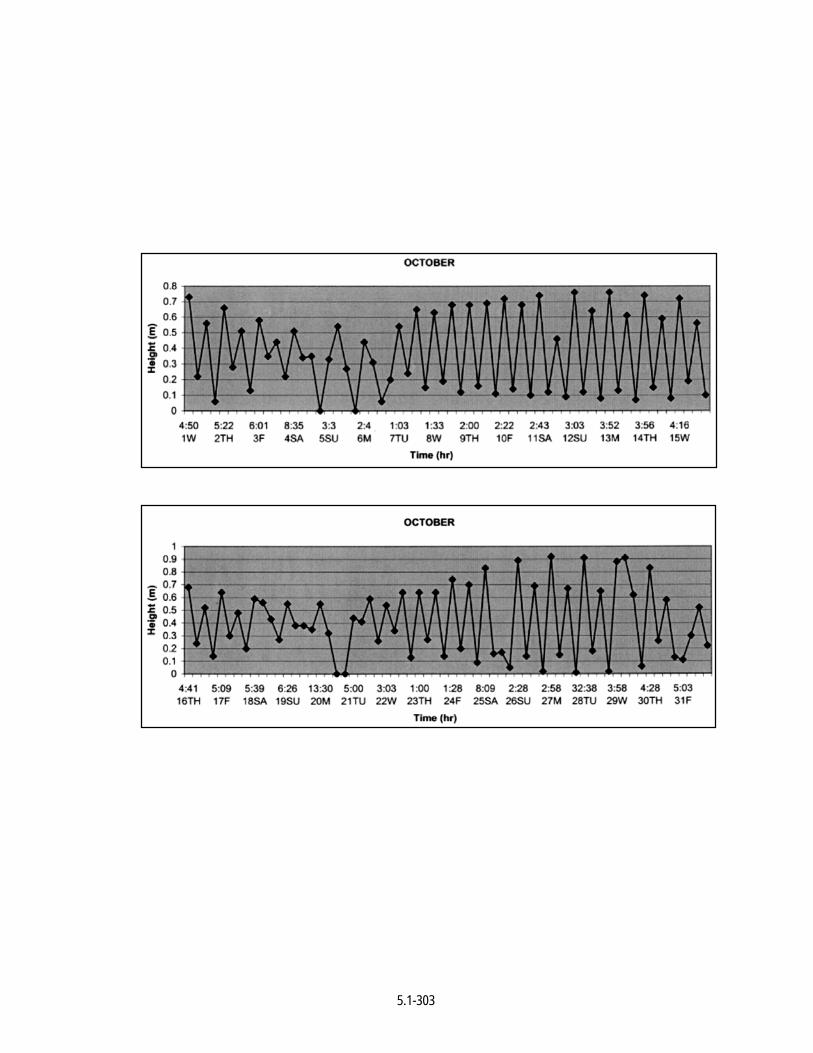
5.1-303
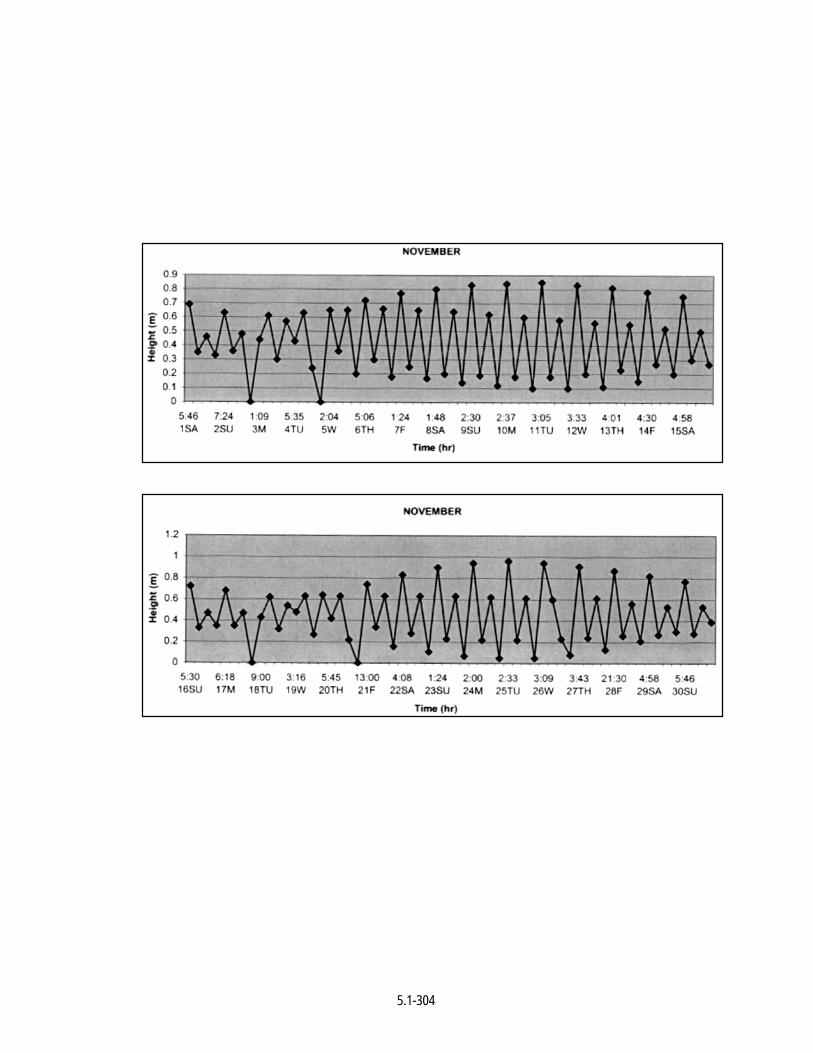
5.1-304
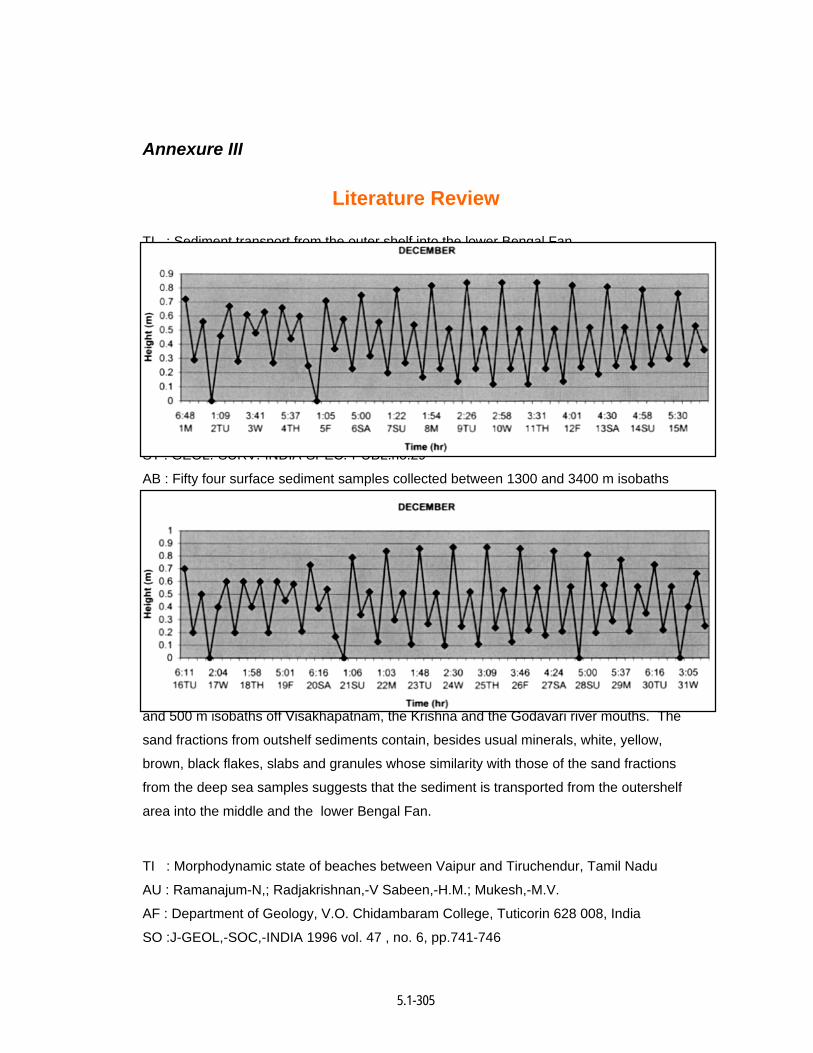
5.1-305
Annexure III
Literature Review
TI : Sediment transport from the outer shelf into the lower Bengal Fan
AU : Sastry, A.V.R ; Suresh, K.V.; Ramesh, M.V.; Kamalakaram; S.
AF : Geol. Dep ., Andhra Univ ., Visakhapatnam, India
CO : Seminar on Geoscientific Studies in the Bay of Bengal and the Andaman Sea,
Calcutta, West Bengal (India) , 9-11 Oct 1990
SO : RECENT-GEOSCIENTIFIC-STUDIES-IN-THE-BAY-OF-BENGAL-AND-THE –
ANDAMAN-SEA-PAPERS-PRESENTED-IN-THE-SEMINAR-HELD-ON-OCTOBER-9-11-
1990-AT-CALCUTTA. Geological Surv. – of – India, - Calcutta – India Calcutta.- India
GSI 1992 no. 29 pp. 189-195
ST : GEOL.-SURV.-INDIA-SPEC.-PUBL.no.29
AB : Fifty four surface sediment samples collected between 1300 and 3400 m isobaths
covering the lower Bengal Fan area bounded by latitudes 13 degree 30’N and 15 degree
30’N and longitudes 81 degree E and 84 degree E are analysed for grain size distribution
and for their Total Foraminiferal Number (TFN) with the objectives of delineating the
sediment transport. Sand is concentrated wherever the sea floor slope changes and
attains maximum of 35%. The occurences of benthonic foraminifera of exclusive shelf
habitat and the sand in the deep-sea samples are the unequivocal evidences of sediment
transport from the adjacent shelf and shelf slope into the northwestern part of the lower
Bengal Fan. To identify the origin of the transported sediments, mineralogical and
sedimentological analysis were carried out on 124 grab samples collected between 20
and 500 m isobaths off Visakhapatnam, the Krishna and the Godavari river mouths. The
sand fractions from outshelf sediments contain, besides usual minerals, white, yellow,
brown, black flakes, slabs and granules whose similarity with those of the sand fractions
from the deep sea samples suggests that the sediment is transported from the outershelf
area into the middle and the lower Bengal Fan.
TI : Morphodynamic state of beaches between Vaipur and Tiruchendur, Tamil Nadu
AU : Ramanajum-N,; Radjakrishnan,-V Sabeen,-H.M.; Mukesh,-M.V.
AF : Department of Geology, V.O. Chidambaram College, Tuticorin 628 008, India
SO :J-GEOL,-SOC,-INDIA 1996 vol. 47 , no. 6, pp.741-746
5.1-306
AB : The relationship between the surf zone processes and the morphodynamic state of
beaches between Vaipar and Tiruchendur along the southeastern coast of Tamil Nadu
(India) was studied through 46 beach profile measurements and other morphological
features across and along the shoreline. The energy variations in the beach along with
the morphological and sedimentological properties are distinguished by the surf-scale
parameter. The dissipative beaches with higher wave heights and low beach gradients
yield the higher amount of surf-scale parameter (22.0 to 154.3) whereas at the other
extreme, the reflective beaches with steep beach gradients and lower wave height
conditions resulted with low surf-scale value (0.5711 to 2.500). Intermediate beach states
possessing dissipative and reflective elements with four transitional stages are
recognized.
TI : Dynamics of the East India Coastal Current. 2. Numerical solutions
AU: McCreary, - J.P.; Han,-W,; Shankar,-D,; Shetye, - S.R.
AF: Oceanographic Cent, Nove Southeastern Univ., Dania, FL 33004, USA
SO: J- GEOPHYS, - RES,-C-OCEANS 1996 vol.101, no. C6, pp. 13993-14010
AB: A linear, continuously stratified model is used to investigate the East India Coastal
Current (EICC). Solutions are found numerically in a basin that resembles the Indian
Ocean basin north of 290S, and they are forced by Hellerman and Rosenstein (1983)
winds. Effects due to the following four forcing mechanisms are isolated; local
alongshore winds adjacent to the east coasts of India and Sri Lanka, remote alongshore
winds adjacent to the northern and eastern boundaries of the Bay, remotely forced
signals propagating from the equator, and interior Ekman pumping. Each process
contributes significantly to the EICC surface flow at some locations and at some times
during the year. Along the Indian coast, there is southwestward flow extending to depths
greater than 1000 m from May to July that is driven primarily by equatorial forcing. From
July to September the southwestward flow forms a shallow subsurface counter flow (a
Coastal Undercurrent); its cause is primarily equatorial forcing and interior Ekman
pumping, not the local alongshore winds, as might be expected.
TI : Dynamicas of the East Indian Coastal Current, 1. Analytic solutions forced by interior
Ekman pumping and local alongshore winds
AU : Shankar,-D,; McCreary,-J.P.; Han,-W,;Shetye,-S.R.
AF : Natl, inst. Oceanogr., Dona Paula, Goa, India
SO : J,-GEOPHYS,-RES,-C-OCEANS 1996 vol. 101 , no.C6, pp. 13975-13992
5.1-307
AB : A linear, continuously stratified model is used to investigate how forcing by interior
Ekman pumping and local alongshore winds affects the East India Coastal Current
(EICC). Solutions are found analytically to an approximate version of the equations of the
motion. Consistent with the observed surface current, themodel EICC flows northward
along the Indian coast from March to September and equatorward along the Indian and
Sri Lankan coasts from October to January. In contrast to the observations, however, the
onset of northward flow along the Indian coast occurs 1-2 months late, the Sri Lankan
coastal current does not reverse to flow southward during the summer, and the maximum
northward transport of the model EICC is 5 Sv in May, only about half the transport
estimated from hydrographic data. We conclude that, although interior Ekman pumping
and local alongshore winds have a significant impact on the EICC, other driving
mechanisms must be taken into account in order to simulate the observed variability
adequately.
TI: Morphology of dunes of the Coromandel coast of Tamil Nadu; A satellite databased
approach for coastal landuse planning
AU : Sanjeevi,-S.
AF : Dep. Geol., Anna Univ., Madras 600 025, India
CO : International Conference on the Science and Management of Coastal Dunes, Port
Elizabeth and Stellenbosch (South Africa), 6-11 Jan 1994
SO :LANDSCAPE-URBAN-PLANN 1996 vol. 34, no.3-4, pp, 189-195
AB: The 1000 km long coast of the Tamil Nadu state of India forms part of the
Coromandel coast. The dunes which consist of Quaternary to Recent sediments are a
major part of the various coastal landforms such as lagoons, estuaries, bays, beaches,
spits, bars, deltas, marshes, tidal flats, mud flats, etc. The dunes occupy a large part of
the Coromandel coast and have a key role in the morphology and landuse planning of the
coastal zone. These dunes are an important source of ground water, heavy minerals,
silica (glass) sands and are also potential avenues for social forestry, mixed forests,
plantations and recreational resorts. As a first step in coastal zone management,
mapping of these dunes and study of their relation to landuse is to be carried out. Their
large extent and widespread habit make conventional mapping tecniques difficult to use.
Hence, the Indian Remote Sensing Satellite (IRS-1A) imagery has been used to map
them. This paper gives an account of mapping these coastal dunes using IRS-1A
imagery, a study of their morphology, the related landuse/land cover details, and also
suggestions for optimal landuse management techniques.
5.1-308
TI : T-S variability and volume transport in the central Bay of Bengal during southwest
monsoon
AU : GopalaKrishna,-V.V.; Pednekar,-S.M.; Murty,-V.S.N.
AF : Physical Oceanography Division, NIO, Dona Paula, Goa 403 004
SO : INDIAN-J.-MAR.-SCI.1996 vol. 25, no. 1, pp. 50-55
AB : The variability of temperature and salinity along 11 degree N and 12 degree N
sections in the Bay of Bengal during southwest monsoon months (July-September) was
found to be large in the upper 200 m West of 83 degree E and East of 90 degree E, and
upto upper 400 m in the central parts between 84 degree and 89 degree E. Coastal
upwelling of Madras appears to be intense during August with a strong (40 cm sec
super(-1)) northward flow close to the coast. The associated northward transport in the
upper 100 m (between 81 degree and 82 degree E) increased by 2.5 x 10 super(6) m
super (3), delta sub(s.t) = 400 cl/t) doming of isolines of t, S and sigma sub(t) (sigma-t)
towards sea surface was noticed between 86 degree and 89 degree E only during
August. The flow in this region was directed towards north with a volume transport of 5.5
x 10 super(6) m super (3) sec super(-1) in the upper 100 m.
TI : Seasonal shoreline oscillation of Tamil Nadu coast
AU : Natesan,-U,; Subramanian,-S.P.
AF : Indira Gandhi Inst. Dev. Res. Goregaon (East), Bombay 400 065, India
SO : CURR.-SCI. 1993 vol. 65, no. 9, pp. 667-668
AB : Berm crest data, was collected from > 22 locations along the Tamil Nadu coast,
India, from 1979 to 1988, to understand the coastal processes. The period and sites of
erosion and accretion, and their patterns have been reported.
TI : Sediment transport from the outer shelf into the lower Bengal Fan
AU : Sastry, - A.V.R.; Suresh,-K.V. Ramesh, - M.V.; Kamalakaram,-S.
AF : Geol, Dep., Andhra Univ., Visakhapatnam, India
CO : Seminar on Geoscientific Studies in the Bay of Bengal and the Andaman Sea,
Calcutta, West Bengal (India), 9-11 Oct, 1990.
SO : RECENT-GEOSCIENTIFIC-STUDIES-IN-THE-BAY-OF-BENGAL-AND-THE-
ANDAMAN-SEA.-PAPERS-PRESENTED-IN-THE-SEMINAR-HELD-ON-OCTOBER-9-11,
1990-AT-CALCUTTA. Geological-Surv-of-India, -Calcutta India Calcutta-India GSI 1992
NO. 29 PP. 189-195
5.1-309
ST : GEOL.-SURV.-INDIA-SPEC.-PUBL. No.29
AB: Fifty four surface sediment samples collected between 1300 to 3400 m isobaths
covering the lower Bengal Fan area bounded by latitudes 13 degree 30’N and 15 N and
longitudes 81 degree E and 84 degree E are analysed for grain size distribution and for
their Total Foraminiferal Number (TFN) with the objectives of delineating the sediment
transport. Sand is concentrated wherever the sea floor slope changes and attains a
mximum of 35%. The occurence of benthonic foraminifera of exclusive shelf habitat and
the sand in the deep sea samples are the unequivocal evidences of sediment transport
from the adjacent shelf and shelf slope into the northwestern part of the lower Bengal
Fan. To identify the origin of the transported sediments, mineralogical and
sedimentological analysis were carried out on 124 grab samples collected between 20
and 500 m isobaths off Visakhapatnam, the Krishna and the Godavari River mouths. The
sand fractions from outshelf sediments contain, besides usual mineral, white, yellow,
brown, black flakes, slabs and granules whose similarity with those of the sand fractions
from the deep sea samples suggests that the sediment is transported from the outershelf
area into the middle and the lower Bengal Fan.
T1: Morpghology and sedimentation of continental slope, rise and abyssal plain of
western part of Bay of Bengal
AU: Rao,-L.H.J.; Rao,-T.S.; Reddy,-D.R.S.; Biswas,-N.R.; Mohapatra,-G.P.; Murty,-P.S.N.
AF: Mar, Wing, Geol. Surv. India, Visakhapatnam, India
CO: Seminar on Geoscientific studies in the Bay of Bengal and the Andaman Sea,
Calcutta, West Bengal (India), 9-11 Oct 1990
SO : RECENT-GEOSCIENTIFIC-STUDIES-IN-THE-BAY-OF-BENGAL-AND-THE-
ANDAMAN-SEA-PAPERS-PRESENTED-IN-THE-SEMINAR-HELD-ON-OCTOBER-9-
11,-1990-AT-CALCUTTA. Geological-Surv,-0f-India,-Calcutta-India Calcutta-India GSI
1992 no. 29 pp. 209-217
ST: GEOL,-SURV-INDIA-SPEC.-PUBL. No. 29
AB: The physiographic domains consisting of continental shelf, slope, rise and abyssai
plain over an area of about 350,000 sq km, off the east coast of India, from Puri to
Pondicherry have been investigated by echosounding (3.5 kHz) and sediment sampling.
Off the deltaic areas the slope is smooth and gentle (40 m/km), whereas off the
nondeltaic areas it is incised by several valleys. The base of slope drops down from 1600
5.1-310
m isobath in the north to 300 m isobath in the south. The continental rise is easily
discernible all along except off major rivers where the slope smoothly passes over
through the rise into the abyssal plain. The abyssal plain is covered by Bengal Fan
sediments. It is flat from west to east and exhibits a slight gradient (1 m/km) from north to
south. Numerous fan valleys which are either “V” or “U” shaped cut through the abyssal
plain. They have thick levee systems with growth faults developed in the mid fan area
and thin and sprawling levee systems in the lower fan area. A southerly sloping broad
depression occurs to the east of the continental rise and marks the morphological
boundary between the peninsular river sediments and the Bengal Fan sediments. The
study of the onland lineament fabric Pari passu with the offshore morpghology suggests
that the onland lineament fabric extends into the offshore and is responsible for
sculpturing the continental slope.
TI : A longshore sediment transport estimation for the Indian coast
AU : Nayak,-B.U.; Chandramoghan,-P .
AF : NIO, Dona Paula, Goa 403 004, India
CO : 1. Conv. Of the Indian Society for Physical Sciences of the Ocean, NIO, Goa (India),
13-15 Dec 1989
SO : PHYSICAL-PROCESSES-IN-THE-INDIAN-SEAS. Swamy,-G.N.;Das,-V.K.Antony,-
M.K.-eds, DONA-PAULA,-GOA-INDIA INDIAN-SOC,-FOR-PHYS,-SCI,-OCEAN 1992 pp,
111-116
AB: An empirical sediment transport model has been developed based on longshore
enefgy flux equation. Study indicates that annual gross sediment transport rate is high
(1.5x10 super(6) m super(3) to 2.0x10 super(6) m super(3) along the coasts of south
Orissa, North Tamil Nadu, South Kerala, North Karnataka and South Gujarat, whereas it
is comparatively lesds (0.5x10 super(6) m super(3) to 1.0x10 super(6) m super(3)) along
the South Tamil Nadu Coast between Pondicherry and Point Calimere in Tamil Nadu, and
the Maharashtra coast experience negligible annual net transport. The direction of
annual net transport along the east coast is towards north and along the west coast
towards south except at South Gujarat Coast.
T1: Determination of net shore drift direction of central west coast of India using remote
sensing data.
AU: Kunte,-P.D.; Wagle,-B.G.
5.1-311
AF: Nati. Inst. Oceanogr., Dona Paula, Goa 403 004, India
SO: J,-COAST,-RES. 1993. Vol.9. no. 3 pp. 811-822
AB: Landsite images along with aerial photographs of the central west coast of India were
studied to mark drift cells and determine shore drift of the area. For this purpose, coastal
landform indicators like stream mouth diversion, spit growth, recesdsion of cliffs, beach
width, mid-day bar and tombolos and man-made structures interrupting shore drift cells,
drift direction is due north though net shore drift direction of the area is towards the south.
As a result, shore drift is eroding sediments from the cliffy coast of the nothern sector and
is depositing them in the southern sector causing recession and accretion of the
respective coastal sectors. It is concluded that geomorphic landform indicators studied
using remotely sensed data provide a quick, reliable and accurate solution for
determining the net shore drift direction.
T1: Study of modern sediments from Kerala, continental shelf. Lakshadweep coral atolls,
and Arabian deep sea bed (sedimentary petrology and paleoenvironment analysis)
AU: Hardas,-M.G.; Rastogi,;-R.K.; Gupta,-J.K.; Narendra,-P,; Ganeshan,-G.
SO: DEHRADUN-INDIA OIL-AND-NAT. GAS-COMM. 1988. Vp
AB: Areas of modern sedimentation, around Lakshadweep, Arabian deep sea, and Keral
offshore, have been selected for various types of sedimentological studies. The samples
from three distinct depositional environments, i.e. non-clastic (Lakshadweep_, deep
marine-clastic (Arabian deep sea) and a shallow marine clastic (Kerala offshore) have
been studied for the sediment properties, provenance, and dynamic processesd
responsible for sediment transport and deposition. The report presents the results of
lithological, granulometric, heavy mineral, X-ray diffraction, and geochemical studies,
establishing relationship between different sedimentological parameters in three
depositional environments. In the Lakshadweep area, beach and lagoon environments
could be established by sedimentological studies. Similarly at the Kerala offshore area,
the grain size parameters of modern sediments identified 3 depth zones corroborating the
prevailing environments, except at the outer shelf where sediments are relict in nature.
T1: Pattern recognition of shoreline trend of south east coast of India.
AU: Natesan,-U.; Subramanian,-S.P/
5.1-312
AF: IIT, Madras 600 036 India
CO: 4. Indian Conf. On Ocean Engineering (INCODE ’91), Dona Paula, Goa (India), 4-6
Sep 1991
SO: FOURTH-INDIAN-CONFERENCE-ON-OCEAN-ENGINEERING.-PROCEEDINGS.
National-inst-of-Oceanography-Dona-Paula-India DONA-PAULA-GOA-INDIA NIO no.
1991, pp. 417-418
AB: Distance of the beams from the reference pillars were measured by the Public Works
Department., Madras, India for a decade from 1978 to 1988. Poompuhar and
Tharangamabadi stations located near Nagapatnam, Tamil Nadu Coast are selected for
the analysis. To find any specific relationship existing in the pattern of shoreline
movements during full moon period, these two sites are subjected to seasonal and annual
pattern analysis. In the seasonal analysis, deviation for each month from January was
calculated to note erosion and accretion. Accretion up to the month of April, followed by
erosion till December except accretion in September. In the annual analysis, deviation
from the year 1978 was calculated for demarcating annual erosion and accretion. The
result proves that there exists a typical trend in both seasonal and annual shoreline
oscillation of these sites and the gravitional effect of Sun and Moon also play a role in the
shoreline oscillations.
5.1-313
T1: Longshore sediment transport model for the Indian west coast.
AU: Chandramohan,-P.; Nayak,-B.U.
AF: Ocean Eng. Div., Natl. Inst. Oceanogr., Dona Paula, Goa 403 004, India
SO: J.-COAT.-RES. 1992. Vol. 8, no. 4, pp. 775-787
AB: Longshore sediment transport rates for the Indian west coast from Cochin to
Porbandar are estimated from ship observed wave data (1968 to 1986). The sediment
transport rate is relatively high during the southwest monsoon period from June to
September. Annual gross sediment transport rate is high (4.5-2 x 10 super(6) m
super(3)) along north Kerala, north Karnataka and south Gujarat coast. Maharashtra
coast shows relatively low annual net transport (0.1 x 10 super(6) m super (3)). The
annual net transport is south along north Kerala and Karnataka coasts. Coasts near
Malavan, Dabhol, Marud and Tarapur appear to be nodal drift points with equal volume
transport in either direction annually.
T1: Shelf sediments and mineral distribution patterns off Mandapam, Palk Bay
AU: Mallik,-T.K.
AF: Offshore Miner.Explor.and Mar.Geol.Div.GSI, Calcutta, India
SO:INDIAN – J.-Mar.-SCI.1983.vol.12.no.4, pp.203-208
AB:Grain size variation and heavy minerals of offshore and beach samples, Palk Bay ,
India, were studied.Offshore sediments consist of sand, silt, clay and their admixtures,
corals and algae.Most of the samples have three major types. Fluctuating energy
condition is reflected by sorting differences. Probable sediment transport direction is
towards the south and west . Offshore sediments have a primary mode around 1.5-2.0
beach samples with good concentration of black sands are polymodal and India cate
mixing from multiple sediment sources. Heavy mineral assemblage suggests
contribution from high and low rank metamorphic rocks and igneous rocks of the adjacent
area. The area can be divided into 4 mineralogic provinces depending on the mineral
assemblage.
T1: Wave measurement in severe ocean currents.
AU: Diwan,-S.G,; Suryavanshi,-A.K.; Nayak,-B.U.
5.1-314
AF: NIO, Dona Paula, Goa 403 004, India
SO: J.-INST.-ENG.-INDIA-CIV.-ENG., 1991. Vol. 7.1, no. 5, pp. 148-152
AB: Wave data and understanding of wave phenomena are essential to ocean
engineering coastal engineering and to many marine operations. The National Institute of
Oceanography, Goa, India has undertaken a wave measurement programme using
Datawell waverider buoys at four locations in the northern part of the west coast of India
and at one location in the mouth of the River Godavari in the east coast where high
current speeds varying from 2 to 5 knots are observed. As a consequence of prevailing
high currents, significant forces have been experienced by the buoys and their mooring
system causing occasional submergence. The paper highlights some of the mooring
systems and the components adopted in an attempt to reduce the drag forces. A
successful technique adopted for replacing waverider buoys using the original mooring
system for attaching buoys in the high flow area of the Gulf of Cambay is discussed.
T1: Longshore sediment transport along the Indian coast.
AU: Chandramohan,-P.; Nayak,-B.U
AF: NIO, Dona Paula, Goa 403 004, India
SO:INDIAN-j.-MAR.-SCI. 1991. Vol. 20, pp. 110-114
AB: An empirical sediment transport model has been developed based on longshore
energy flux equation. Ship reported waves, published in indian Daily Weather Reports,
are compiled for 19 years and used for estimation of sediment transport. Annual gross
sediment transport rate is high (15-20 x 10 super (5) m super(3)) along the coasts of
South Orissa. North Tamil Nadu, South Kerala, North Karnataka and South Gujarat,
while it is comparatively less (5-10 x 10 super(5) m super(3)) along the South Tamil Nadu
coast. The Maharashtra coast and the part between Pondicherry and Point Calimere in
Tamilnadu show negligible order of annual net transport. Annual net transport along the
east coast is northwards and along the west coast is southwards except for the South
Gujarat coast.
T1: Coastal geomorphology of Tamil Nadu – based on Landsite imagery (without field
checks)
AU: Srinivasan,-R,; Srinivasan,-V
5.1-315
SO: SEA-LEVEL-VARIATION-AND-ITS-IMPACT-ON-COASTAL-ENVIRONMENT,
Rajamanickam,-G.V.-ed. 1990. Pp. 303-312
AB: Landset gives a synoptic view of portion of the earth and therefore exhibits regional
geomorphological, geological and structural features. The coast of Tamil Nadu consists
of sedimentary formations of upper Gondwanas, Cretaceous, Pilocene and Miocene
formations, overlain by alluvium and laterite of Recent and Pleistocend age. The
geomorphic features are sandy beaches, coastal plain without sand, swampy region and
mangrove forests, raised beaches, beaches with sand dunes and “teri” sands and salt
pans, indicating sedimentation and erosional processes. More detailed study and field
checks in this coastal tract of Tamil Nadu are necessary to explain the presence of these
geomorphic features.
T1: Some aspects of morphology and Quaternary sea level changes in Coromandel coast
of Tamil Nadu and Andhra Pradesh.
AU: Rao,-M.S.
SO: SEA-LEVEL-VARIATION-AND-ITS-IMPACT-ON-COASTAL-ENVIRONMENT.
Rajamanickam,-G.V.,ed. 1990 pp. 279-295
AB: The Coromandel Coast, located in Tamil Nadu and Andhra Pradesh, India, and
extending for approximately equals 1,000 km, was studied with the help of Landsite and
selected aerial photographs to delineate landforms formed within the coastal region.
Field checks were carried out to identify the various landforms recognised and field
measurements were made to study altitudinal variations. The various landforms are
identified. From the study of beach ridges 3 strandlines were identified. The coral
formations in and around Rameswaram indicate local emergence and are presumed to
be formed around 4,000 years B.P. The marine terraces identified indicate local uplift
and regression of sea. Based on the disporition of coastal landforms, the Quaternary sea
level changes in the Coromandel coast were studied.
T1 :Remote sensing application in the study of sea level variation along the Tamilnadu
coast,India.
AU: Loveson,-V.J ,Raja manickam,G.V:Anbarasu,_k
SO: SEA-LEVEL-VARIATION-AND-ITS-IMPACT-ON-COASTAL-ENVIRONMENT.
Rajamanickam,-G.V.-ed. 1990. Pp. 179-196
5.1-316
AB: Sea level variations along Tamil Nadu, India coast were studied using satellite
imageries and other photographs. In Tamil Nadu coast the beach ridges are prominent
with complementary swales. Each ridge denotes one ancient sea level stand and about 4
or 5 prominent major beach ridges are recognised. Each coastal area is significant in
view of the nature of its beach ridges. Beach ridges display different types in different
places when considering their morphology pattern and extent. Most of the coastal lakes
and backwater zones are occupying the swales of the ladt stages of the shore line
changes of Holocene period. An attempt is made to clarify the effect of sea level
variations with reference to the different kinds of beach ridges, and the nature of
backwaters and coastal lakes observed along the coast of Tamil Nadu.
T1: Environmental impact of micro-details and swamps along the coast of Palk Bay, Tamil
Nadu, India
AU: Loveson,-V.J.; Rajamanickam,-G.V.; Chandrasekar,-N
SO: SEA-LEVEL-VARIATION-AND-ITS-IMPACT-ON-COASTAL-ENVIRONMENT.
Rajamanickam,-G.V.-ed. 1990.pp. 159-178
AB: Geomorphologically, the coastal zone of Palk Bay in Tamil Nadu, India can be
broadly classified into 3 groups (1) uplands/highlands with scanty vegetations,comprised
of Cuddalore sandstones ; and (3) coastal lands mainly of microdeltas, swamps, and
beach ridges. A large amount of sediments from those pediments are removed constantly
by rainfall and minor rivers. Because the pediments are placed over the substratum which
is appreciably sloping towards the sea, the erosion is found to be intensive along the
coastal islands. The eroded sediments brought to the littoral zone are dumped in Palk
Bay. As Palk Bay is shallow and protected from the high waves and currents, the
material brought by these minor rivers is deposited in the mouth of each river/stream,
leading to the formation of micro-deltas in due course, encouraging the formation of new
shorelines.
T1: Analysis of waves and beach behaviour of Kanyakumari coast.
AU: Usha,-K.; Subramanian,-S.P
AF: IIT, Ocean Eng. Cent., Madras 600 036, India
CA: Karnataka Reg. Engineering Coll, Suraktal (India)
5.1-317
CO: 3 Natl. Conf. On Dock and Harbour Engineering, Suratkal (India), 6-9 Dec 1989
SO: THIRD-NATIONAL-CONFERENCE-ON-DOCK-AND-HARBOUR-ENGINEERING, -6-
9-DECEMBER-1989-PROCEEDINGS. 1989. Pp. 561-568
AB: From the visually observed wave data, wave characteristics of a coast such as wave
height and wave period can be obtained with some limitations. A stretch of coast near
Kanyakumari, India, was selected for analysis. The sea bed of the coast consists of
calcareous sand, beach sediment is dominantly sandy in nature and clay fraction is
present only in traces. Data from 1979-88 were taken for the study. The probability
density function and cumulative probability density function for wave height and wave
period were obtained. From the two dimensional diagrams, most frequency occuring
wave height and wave period ranges were derived. Berm oscillation and the mean rate of
change of berm oscillation over the decade was also obtained.
T1: Computer model for longshore velocity and sediment transport.
AU: Ghosh,-L.K.; Singh,- C.B.
AF: CWPRS, Khadakwasla, Pune 411 024, India
CA: Karnataka Reg. Engineering Coll, Suraktal(India)
CO: 3 Nati. Conf. On Dock and Harbour Engineering, Suratkal (India), 6-9 Dec 1989
SO: THIRD-NATIONAL-CONFERENCE-ON-DOCK-AND-HARBOUR-ENGINEERING,-6-
9-DECEMBER-1989-PROCEEDINGS, 1989. Pp. 751-757
AB: The total longshore sediment transport was calculated by integrating the local
sediment transport across the surf zone width. In addition, total transport was computed
CERC (1977) formula. The estimate of littoral drift obtained by two different methods
were compared. The general computer model was applied to a major port along the
east coast of India. Inputs for the model were obtained from field investigation as well as
analysis of deep sea wave data. The model is efficiently working and can be applied for
the computation of littoral process along the Indian coast.
T1: Estimation of littoral drift along west coast of India
AU: Dixit,-J.G.; Dange,-A.P.; Nagendra,-T
AF: CWPRS, Khadakvasla, Pune 411 024, India
5.1-318
CA: Karnataka Reg. Engineering Coll, Suratkal (India)
CO: 3 Nati. Conf. on Dock and Harbour Engineering, Suratkal(India)
CO: 3. Natl. Conf. on Dock and Harbour Engineering, Suratkal (India), 6-9 Dec 1989
SO: THIRD-NATIONAL-CONFERENCE-ON-DOCK-AND-HARBOUR-ENGINEERING, 6-
9. DECEMBER-1989-PROCEEDINGS. 1989 pp. 509-515
AB: SPM method and other available methods were found to overestimate littoral drift
when applied at locations along the west coast of India. The main reason may be the flat
bed slope along the west coast with wide breaker zone. The method by Longuet-Higgins
to compute longshore current distribution across breaker zone and use of sediment
transport formulae were found to describe the coastal processes at three locations along
the west coast. The limitation of the available methods are discussed and the results of
the application of the proposed method at three locations are presented.
T1: Distribution of longshore sediment transport along the Indian coast based on
empirical model
AU: Chandramohan,-P.
AF: NIO, Dona Paula, Goa 403 004, India
CA: Karnataka Reg. Engineering Coll., Suratkal (India)
CO: 3, Natil Conf. on Dock and Harbour Engineering, Suratkal (India) 6-9 Dec 1989
SO: THIRD-NATIONAL-CONFERENCE-ON DOCK-AND-HARBOUR-ENGINEERING, -6-
9- DECEMBER-1989-PROCEEDINGS. 1989.pp. 501-508
AB: An empirical sediment transport model was developed based on longshore energy
flux equation. Annual gross sediment transport rate is high (1.5 x 10 super(6) cubic
meters to 2.0 x 10 super(6) cubic meters) along the coasts of south Orissa, North
Tamilnadu, south Kerala, north Karnataka and south Gujarat, whereas it is comparatively
lesds (0.5 x 10 super(6) cubic meters to 1.0 x 10 super(6) cubic meters along the south
Tamilnadu coast. Coast between Pondicherry and Point Calimere in Tamilnadu, and
Maharashtra coast experience negligible quality of annual net transport. The direction of
annual net transport along the east coast is in the north and along the west coast in the
south Gujarat coast.
5.1-319
TI: Sediment transport from the outer shelf into the lower Bengal fan
AU: Sastry-AVR,; Suresh KV,Ramesh M.V.;Kamalakaram-S.
AF: Geol.Dep., Andhra University, Visakhapatanam, India.
CO: Seminar on Geo scientific Studies in the Bay of Bengal and the Andaman Sea,
Calcutta, West Bengal (India), 9 - 11 Oct 1990
AB: Fifty four surface sediment samples collected between 1300 and 3400 m isobaths
covering the lower Bengal fan area bounded by latitudes 13O30′ N and 15O30′N and
longitudes 81OE and 84OE are analysed for grain size distribution and for their total
foraminiferal Number (TFN) with the objectives of delineating the sediment transport.
Sand is concentrated wherever the sea floor slope changes and attains a maximum of
35%. The occurrence of benthonic foraminifera of exclusive shelf habitat and the sand in
the deep sea samples are the unequivocal evidences of sediment transport from the
adjacent shelf and shelf slope into the northwestern part of the lower Bengal Fan. To
identify the origin of the transported sediments, mineralogical and sedimentological
analysis were carried out on 124 grab samples collected between 20 and 500 m isobaths
off Visakhapatnam, the Krishna and the Godavari river mouths. The sand fractions from
outshelf sediments contain, besides usual minerals, white, yellow, brown, black flakes,
slabs and granules whose similarity with those of the sand fractions from the deep sea
samples suggests that the sediment is transported from the outershelf area into the
middle and the lower Bengal fan.
TI: Shelf sediments and mineral distribution patterns off Mandapam, Palk Bay.
AU: Mallik, -T.K.
SO: IJMS, 1983, Vol.12, No.4, pp.203-208
AB: Grain size variation and heavy minerals of offshore and beach samples from Palk
Bay, India were studied. Offshore sediments consist of sand, silt clay and their
admixtures, corals and algae. Most of the samples have 3 major types. Fluctuating
energy condition is reflected by sorting differences. Probable sediment transport direction
is towards the south and south-west. Offshore sediment have a primary mode around 1.5
to 2.0 beach samples with good concentration of black sands are polymodal and indicate
mixing from multiple sediment sources. Heavy mineral assemblage suggests contribution
from high and low rank metamorphic rocks and igneous rocks provinces depending on
the mineral assemblage.
TI: remote sensing application in the study of sea level variation along the Tamil Nadu
coast, India.
5.1-320
AU: Loveson, VJ, Rajamanickam, GV, Anbarasu,K.
SO: Sea level variation and its impact on coastal environment.1990
AB: Sea level variations along Tamil Nadu, India coast were studied using satellite
imageries and other photographs. In Tamil Nadu coast the beach ridges are prominent
with complementary swales. Each ridge denotes one ancient sea level stand and about 4
or 5 prominent major beach ridges are recognized. Each coastal area is significant in
view of the nature of its beach ridges. Beach ridges display different types in different
places when considering their morphology pattern and extent. Most of the coastal lakes
and back water zones are occupying the swales of the last stages of the shore line
changes of Holocene period. An attempt is made to clarify the effect of sea level
variations with reference to the different kinds of beach ridges, and the nature of
backwaters and coastal lakes observed along the coast of Tamil Nadu.
TI: Environmental impact of micro-deltas and swamps along the coast of Palk Bay, Tamil
Nadu, India.
AU: Loveson, VJ, Rajamanickam, GV
SO: Sea level variation and its impact on coastal environment.1990
AB: Geomorphologically, the coastal zone of Palk Bay in Tamil Nadu, India can be
broadly classified into 3 groups (1) uplands/high lands with scanty vegetations, comprised
of Cuddalore sandstone formations: (2) along the lower elevations pedimented Cuddalore
sand stones; and (3) coastal lands mainly of microdeltas, swamps, and beach ridges. A
large amount of sediments from those pediments are removed constantly by rainfall and
minor rivers. Because the pediments are placed over the substratum which is appreciably
sloping towards the sea, the erosion is found to be intensive along the coastal islands.
The eroded sediments brought to the littoral zone are dumped in Palk Bay. As Palk Bay is
shallow and protected from the high waves and currents, the material brought by these
minor rivers is deposited in the mouth of each river/stream, leading to the formation of
micro-deltas in due course, encouraging the formation of new shorelines.
TI: Long shore transport model for south Indian and Sri Lankan coasts.
AU: Chandramohan,-P; Nayak,_B.U
SO: J-Waterway-Port-Coast-Ocean-Eng. 1990. Vol 116, No.4 pp 408-424
AB: Long shore sediment transport rates for the south Indian coast from Allur to Cochin
and for Sri Lanka are estimated from Ship - reported wave data (1968 - 86). Annual gross
sediment transport rate is high (1.5 to 2.0 x 10 super (6)m super (3)) along the coasts of
north Tamil Nadu and south Kerala and is less (0.5 to 1.0 x 10 super (6) m super (3))
5.1-321
along the south Tamil Nadu and Sri Lankan coasts. The annual net transport is southerly
along the west coast of India and predominantly northerly along the east coast except
near Durgarajupatnam in Andhra Pradesh coasts near Tharangampadi, Karaikal, Nagore,
Tuticorin, Virapandianpatinam, and Manakkodam in India and Kuchchaveli, Betticola,
Pottuvil, Chilaw and Negombo in Sri Lanka appear to be nodal drift points, with and equal
volume of transport in either direction annually.
TI: Studies on littoral sediment transport along the southern coast of Tamil Nadu
AU: Chandrasekhar,_N; Sudheer,_A.S;Rajamanickam, GV.; Loveson,V.J.
AB: Active sediment movement is ascribed to the formation of various coastal landforms
and the changes in configuration of beaches. More than a million tonnes per annum of
sand movement is presumed to be along this coast. Here strong cyclonic winds are also
catalysing the wave energy. Inspite of such active sediment movement, the quantum of
sediment transport mainly by the wave induced currents has not been computed so far.
So, an attempt to visualise the different rate of sediment movement on the basis of wave
approaching the shore from directions varying from 10 degree to 180 degree with periods
varying from 5 to 1 sec for different months, along the shore line between Mandapam and
Cape Comorin has been computed. It is estimated that annual gross and net transport
rates ranging from 0.66 x 10 super (5) m super (3) y super (1) to 6.96 x 10 super (5) m
super (3) y super (1) and 0.33 x 10 super (5) m super 93) y super (1) to 5.58 x 10 super
95) m super (3) y super (1). The results indicate that the rate of sedimentation is much
less to the expectations. The areas of erosion and deposition are also earmarked. The
reversal trend in the direction of sediment transport, due to change in the direction of
sediment transport, due to change in the coastal configuration such as scattered elevated
terraces in the south and sequence of barrier islands in the north, is observed in the
region of barrier islands showing prograding conditions and their sediment movement is
controlled by sheltered waves. It is also reflected in the formation of numerous spits along
this coast that too, in a region where fluvial activities are negligible. Such spit growth has
also attested the strong role of littoral drift from the south.
5.1-322
TI: The distribution and nature of heavy minerals along the beaches of Southern Tamil
Nadu
AU: Angusamy, _N; Rajamanickam, _G.V. (1993)
AB: The southern coast of Tamil Nadu from Kanyakumari to Mandapam (India) is known
for the occurrence of enriched beach placers. About 150 sediment samples, collected
from tidal and berm regions of this area, were studied for its heavy mineral content. The
result shows the predominant distribution of opaque, followed by zircon, garnet, chlorite,
biotite, muscovite and monazite, whereas the accessory minerals like rutile, kyanite,
hypersthene, hornblends, andalusite, apatite, topaz, silimanite, constitute the heavy
mineral assemblages. The abundance of dominant minerals is noticed to be changing
from place to place. Based on the observed predominance of heavy minerals, the area is
divided into five mineralogical provinces (1) Kanyakumari Province (2) Manappad
Province (3) Tuticorn Province (4) Valinokkam Province (5) Mandapam Province. From
the nature of heavy minerals and their etched surface markings, it is inferred that the
heavy minerals are derived from basic igneous srocks, acid charnockites and medium to
high grade metamorphic rocks and their distribution is controlled by geomorphology,
tectonic regime and littoral processes.
TI: Gulf of Mannar
AU: Menon,_N.G.
SO: J.Mar.Biol.Assoc.India,1979.Vol 21
AB: Henneguya tachysuri sp.nov. was found in the subcutaneous muscles of the marine
catfish Tachysurus thalassinus caught of Gulf of Mannar at Tuticorin. The parasite causes
bleeding ulcers in the body of T. Thalassinus. The occurrence of the parasite and its
possible damage to the host is of economic interest as T. Thalassinus is an important
commercial fish.
TI: Foraminifera collected off Mandapam (Gulf of Manar)
AU: Ammer - Hamsa, - K.M.S.; Gandhi. - V.
SO: J.Mar. Biol.Assoc.India. 1978. Vol 20. No. 1-2.
AB: This note deals with the recent formanifera from the mud samples collected 200 m off
Mandapam (Gulf of Mannar). Fourteen species belonging to 11 genera and 8 families are
described and illustrated of which 4 species are new from the Indian region are (1)
Bulimina elegans d' orbigny var. Exilis H.B. Brady, (2) Bolivina subtenuis Cushman, (3)
Bolivina subreticulata Parr and (4) Streblus catesbyanus (d'Orbigny0.
5.1-323
TI: Impact of the cyclone of November 1978 on fishing activities at Rameswaram
AU: Shanmuchavelu,C.R.; Sathiadas, R.; Nejeemudeen, S.H.
AB: A major cyclone hit the island on 24.11.78. A brief account of the cyclone and its
impact is presented.
TI : Marine magnetic studies over a lost wellhead in Palk Bay, Cauvery Basin, India
AU: Ramana-M.V., Subrahmanyam,-V; Sarma -K.V.L.N.S.
AB: Close grid marine magnetic surveys in the vicinity of a drill well site pH 9-1 in Palk
Bay revealed that the area is characterized by smooth magnetic field except for a local
anomaly caused by a lost wellhead. The smooth magnetic field is attributed to the deep
burial of Precambrain granitic basement devoid of any charnockite intrusions. The
seismic reflection records of the study area show > 3200 m thick sediment over the
basement.
TI : Distribution of Clay minerals in modern sediments of Palk Bay.
AU: Vasudevan, -V.; Seetaramaswamy,-A
SO: IJMS, 1983, Vol 12
AB: X-ray diffraction studies on clay minerals from the surface sediments of the Palk Bay,
Tamil Nadu, India indicate the presence of montimorillonite, illite and kalonite. These
montimorillonite increasing from the shore towards the deep bay and illite showing a
reverse trend.
TI: Shelf sediments and mineral distribution patterns off Mandapam, Palk Bay.
AU: Mallik, - T.K.
SO: IJMS, 1983, Vol.12.
AB: Grain size variation and heavy minerals of offshore and beach samples from Palk
Bay, India were studied. Offshore sediments consist of sand, silt clay and their
admixtures, coral and algae. Most of the samples have 3 major types. Fluctuating energy
condition is reflected by sorting differences. Probable sediment transport direction is
towards the south and south - west. Offshore sediments have a primary mode around 1.5
to 2.0 beach samples with good concentration of black sands are polymodel and indicate
mixing from multiple sediment sources. Heavy mineral assemblage suggests contribution
from high and low rank metamorphic rocks and igneous rocks of the adjacent area. The
area can be divided into 4 mineralogical provinces depending on the mineral assemblage.
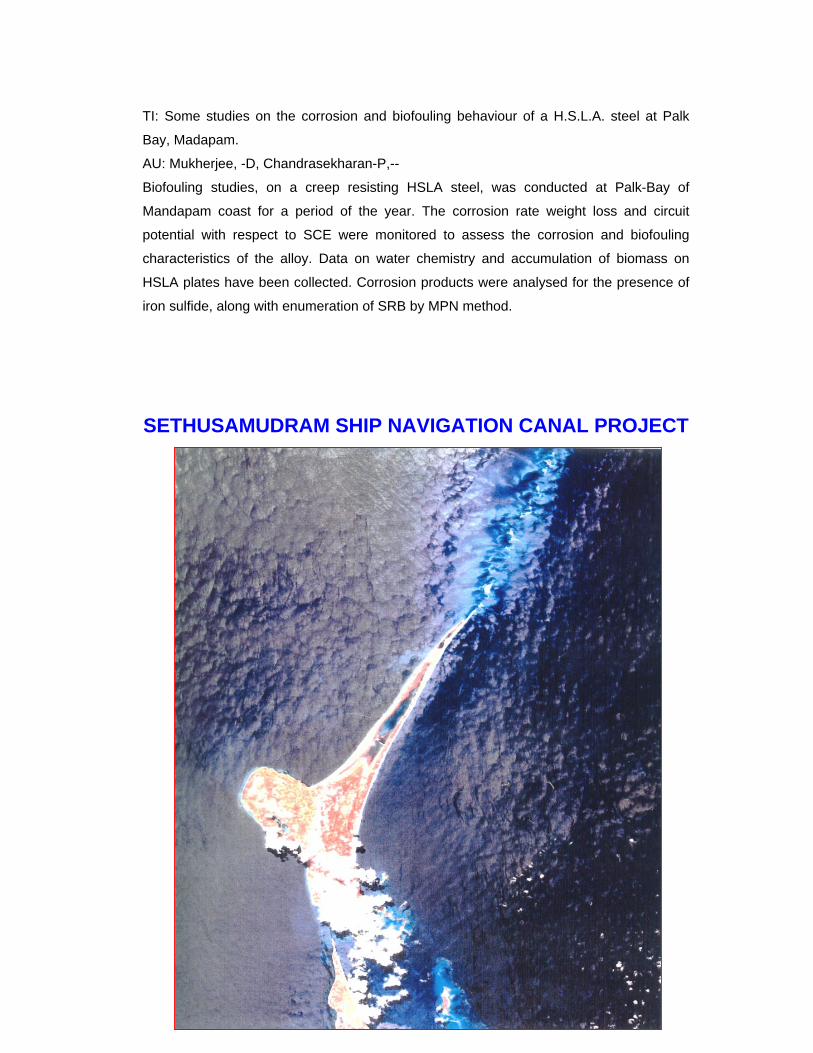
5.1-324
TI: Some studies on the corrosion and biofouling behaviour of a H.S.L.A. steel at Palk
Bay, Madapam.
AU: Mukherjee, -D, Chandrasekharan-P,--
Biofouling studies, on a creep resisting HSLA steel, was conducted at Palk-Bay of
Mandapam coast for a period of the year. The corrosion rate weight loss and circuit
potential with respect to SCE were monitored to assess the corrosion and biofouling
characteristics of the alloy. Data on water chemistry and accumulation of biomass on
HSLA plates have been collected. Corrosion products were analysed for the presence of
iron sulfide, along with enumeration of SRB by MPN method.
SETHUSAMUDRAM SHIP NAVIGATION CANAL PROJECT
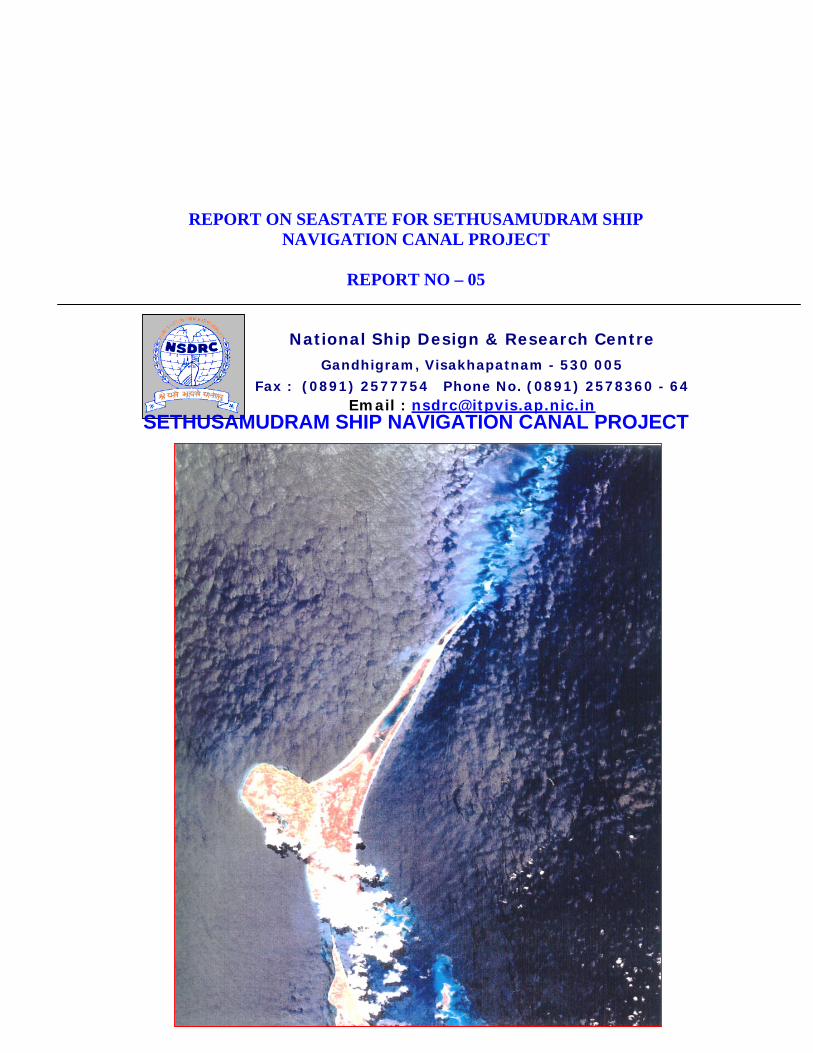
5.1-325
REPORT ON SEASTATE FOR SETHUSAMUDRAM SHIP NAVIGATION CANAL PROJECT
REPORT NO – 05
SETHUSAMUDRAM SHIP NAVIGATION CANAL PROJECT
National Ship Design & Research Centre
Gandhigram, Visakhapatnam - 530 005
Fax : (0891) 2577754 Phone No. (0891) 2578360 - 64 Email : [email protected]
5.1-326
REPORT ON SEASTATE FOR SETHUSAMUDRAM SHIP NAVIGATION CANAL PROJECT
REPORT NO – 06
SETHUSAMUDRAM SHIP NAVIGATION CANAL PROJECT
National Ship Design & Research Centre
Gandhigram, Visakhapatnam - 530 005
Fax : (0891) 2577754 Phone No. (0891) 2578360 - 64 Email : [email protected]
5.1-327
REPORT ON SEASTATE FOR SETHUSAMUDRAM SHIP NAVIGATION CANAL PROJECT
REPORT NO – 07
Drilling Operations for Sub-Surface Data at Sethusamudram Navigation Channel
For National Environmental Engineering Research Institute (NEERI)
Nagpur
March 2004
Report No. 1 : Drilling Operations Project No. : 9422
National Ship Design & Research Centre
Gandhigram, Visakhapatnam - 530 005
Fax : (0891) 2577754 Phone No. (0891) 2578360 - 64 Email : [email protected]
Annexure 5.1
5.1-328
National Ship Design & Research Centre Govt. of India
Visakhapatnam 530 005
1. Introduction National Ship Design and Research Centre (NSDRC), a premier Ship Design
and Research Centre under the Ministry of Shipping, Government of India, has taken up
part of the oceanographic investigations for the feasibility and the Environmental
Assessment Studies undertaken by National Environmental Engineering Research
Institute (NEERI), CSIR, Nagpur, for Sethu Samudram ship navigational canal.
NSDRC with the help of M/s Indomer Coastal Hydraulics Pvt. Ltd, has taken up
jet probe drilling operations on the sea floor to identify the type of geological strata along
the navigational canal.
The results are presented in this report.
2. Scope i) to carry out wash boring at 3 locations at 2m , 3m and 5m water depths along
the proposed navigational route,
ii) to carryout drilling upto 12 m penetration into the sea floor or till reaching the
hard strata whichever is minimum,
iii) to collect wash boring sediment samples, and
iv) to analyze the soil classifications of the collected sediment samples.
5.1-329
3. Methodology Drilling jet probe was constructed on board a vessel with 5 HP pumps driven by
diesel generator. The outlet of 75 mm diameter pipe was connected to 30 m long hose.
To the other end of the hose, a drilling jet, having a tapered mechanism varying from 75
mm to 40 mm diameter was attached. During the operation of pump at full capacity, the
jet velocity remained about 10 m/s. The jet was capable of penetrating into sea floor up to
a depth of 12 m in case of sandy bed. The jet drilling was carried out at 3 points in each
location to confirm the type of strata. During the last attempt of jet drilling, sediment
samples were collected by divers. These sediment samples were analyzed for grain size
distribution using sieve shaker with sieves of different mesh sizes.
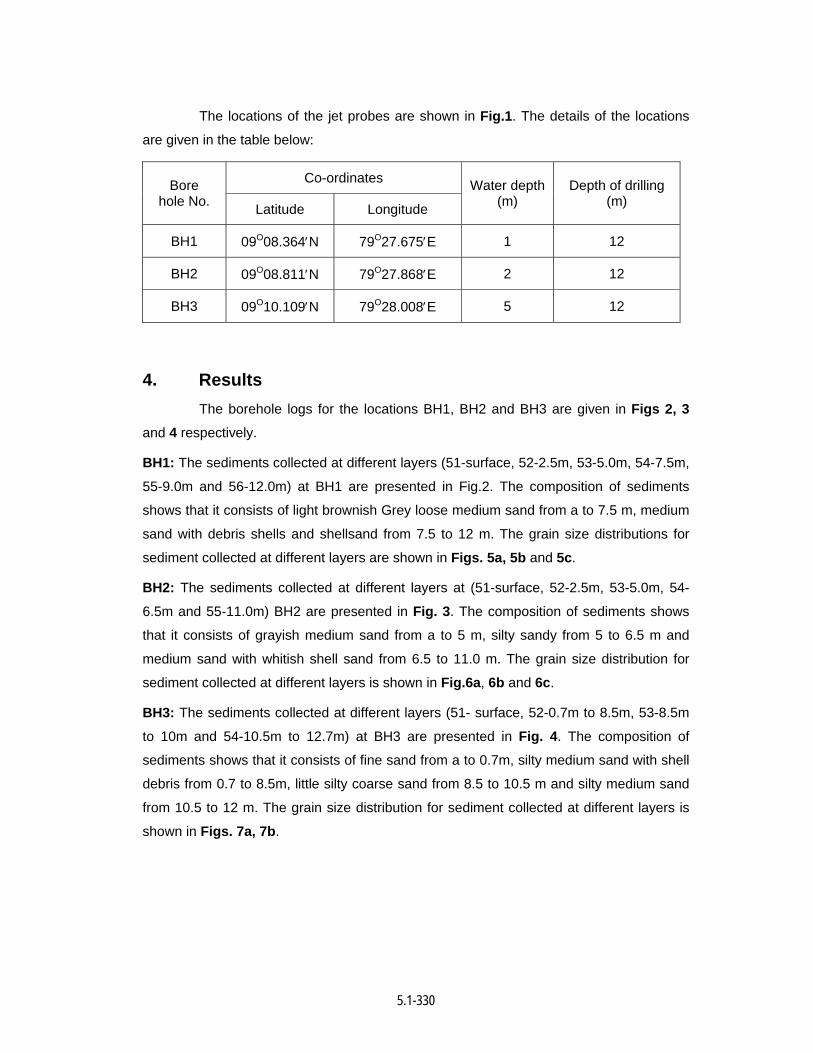
5.1-330
The locations of the jet probes are shown in Fig.1. The details of the locations
are given in the table below:
Co-ordinates Bore hole No. Latitude Longitude
Water depth (m)
Depth of drilling (m)
BH1 09O08.364′N 79O27.675′E 1 12
BH2 09O08.811′N 79O27.868′E 2 12
BH3 09O10.109′N 79O28.008′E 5 12
4. Results The borehole logs for the locations BH1, BH2 and BH3 are given in Figs 2, 3
and 4 respectively.
BH1: The sediments collected at different layers (51-surface, 52-2.5m, 53-5.0m, 54-7.5m,
55-9.0m and 56-12.0m) at BH1 are presented in Fig.2. The composition of sediments
shows that it consists of light brownish Grey loose medium sand from a to 7.5 m, medium
sand with debris shells and shellsand from 7.5 to 12 m. The grain size distributions for
sediment collected at different layers are shown in Figs. 5a, 5b and 5c.
BH2: The sediments collected at different layers at (51-surface, 52-2.5m, 53-5.0m, 54-
6.5m and 55-11.0m) BH2 are presented in Fig. 3. The composition of sediments shows
that it consists of grayish medium sand from a to 5 m, silty sandy from 5 to 6.5 m and
medium sand with whitish shell sand from 6.5 to 11.0 m. The grain size distribution for
sediment collected at different layers is shown in Fig.6a, 6b and 6c.
BH3: The sediments collected at different layers (51- surface, 52-0.7m to 8.5m, 53-8.5m
to 10m and 54-10.5m to 12.7m) at BH3 are presented in Fig. 4. The composition of
sediments shows that it consists of fine sand from a to 0.7m, silty medium sand with shell
debris from 0.7 to 8.5m, little silty coarse sand from 8.5 to 10.5 m and silty medium sand
from 10.5 to 12 m. The grain size distribution for sediment collected at different layers is
shown in Figs. 7a, 7b.

Related Documents