Master of Science Thesis KTH School of Industrial Engineering and Management Energy Technology EGI-2012-SEE SE-100 44 STOCKHOLM Techno-Economic Assessment of Solar PV/Thermal System for Power and Cooling Generation in Antalya, Turkey Serdar KUMBASAR

Welcome message from author
This document is posted to help you gain knowledge. Please leave a comment to let me know what you think about it! Share it to your friends and learn new things together.
Transcript

Master of Science Thesis
KTH School of Industrial Engineering and Management
Energy Technology EGI-2012-SEE
SE-100 44 STOCKHOLM
Techno-Economic Assessment of
Solar PV/Thermal System for Power
and Cooling Generation in Antalya,
Turkey
Serdar KUMBASAR

1
Master of Science Thesis EGI 2012:Applied
Thermodynamics
“Techno-Economic Assessment of Solar
PV/Thermal System for Power and Cooling
Generation in Antalya, Turkey”
Serdar KUMBASAR
Approved
Examiner
Prof. Björn PALM
Supervisor
Dr. Nabil KASSEM
Commissioner
Contact person
Abstract
In this study a roof-top PVT/absorption chiller system is modeled for a hotel building in Antalya, Turkey to cover the cooling demand of the hotel, to produce electricity and domestic hot water. PVT modules, an absorption chiller, a hot storage tank and a natural gas fired auxiliary heater are the main components of the system. Elecetrical power produced by the system is 94.2 MWh, the cooling power is 185.5 MWh and the amount of domestic hot water produced in the system is 65135 m3 at 45 0C annually. Even though the systems is capable of meeting the demands of the hotel building, because of the high investment costs of PVT modules and high interest rates in Turkey, it is not economically favorable. Using cheaper solar collectors, integrating a cold storage unit in the system or having an improved conrol strategy are the options to increase the system efficiency and to make the system economically competitive.
Key words: solar cooling, photovoltaic/thermal collectors, absorption chiller, techno-economic assessment

2
Table of Contents
ABSTRACT ....................................................................................................................................... 1
LIST OF FIGURES .......................................................................................................................... 3
LIST OF TABLES ............................................................................................................................ 4
1 INTRODUCTION ................................................................................................................... 5 1.1 PROBLEM DEFINITION AND OBJECTIVE ............................................................................................... 5 1.2 METHODOLOGY ......................................................................................................................................... 5 1.3 LOCATION .................................................................................................................................................... 6 1.4 SOLAR ENERGY........................................................................................................................................... 8
1.4.1 Photovoltaic/Thermal Collertors ............................................................................................................. 8 1.5 A REVIEW OF COOLING TECHNOLOGIES ...........................................................................................10
1.5.1 Vapor-Compression Cooling Cycle ........................................................................................................10 1.5.2 Desiccant Cooling Cycle ........................................................................................................................11 1.5.3 Absorption Cooling Cycle .....................................................................................................................12 1.5.4 Adsorption Cooling Cycle .....................................................................................................................13
2 HOTEL DESCRIPTION AND COOLING LOAD ESTIMATION .................................... 15 2.1 HOTEL DESCRĐPTION ..............................................................................................................................15 2.2 COOLING LOAD ESTIMATION ...............................................................................................................15
3 SYSTEM DESCRIPTION ...................................................................................................... 19 3.1 PVT COLLECTOR ......................................................................................................................................20 3.2 ABSORPTION CHILLER.............................................................................................................................20 3.3 DESCRIPTION OF THE SYSTEM MODEL ...............................................................................................21 3.4 CONTROL STRATEGY ...............................................................................................................................22
4 RESULTS AND ANALYSIS ................................................................................................... 24
5 ECONOMIC ASSESSMENT ................................................................................................. 36 5.1 CASE 1 .........................................................................................................................................................40 5.2 CASE 2 .........................................................................................................................................................41 5.3 CASE 3 .........................................................................................................................................................41 5.4 CASE 4 .........................................................................................................................................................42
6 CONCLUSION ....................................................................................................................... 44
REFERENCES ............................................................................................................................... 46
APPENDIX ..................................................................................................................................... 48

3
List of Figures
Figure 1: Global Solar Radiation in Antalya (YEGM, 2012) .................................................................................. 6 Figure 2: Average Daily Hours of Sunshine in Antalya (YEGM, 2012) .............................................................. 7 Figure 3: Global Radiation in Antalya (YEGM, 2012) ............................................................................................ 7 Figure 4: A Simple Vapor-Compression Cycle .......................................................................................................10 Figure 5: Basic Desiccant Cooling Cycle (ESTIF, 2006) ......................................................................................11 Figure 6: Basic Absorption Cooling Cycle (Chpcentermw.org) ..........................................................................13 Figure 7: Basic Adsorption Cooling Cycle ..............................................................................................................14 Figure 8: Sketch of a Typical Floor in the Hotel Building ....................................................................................15 Figure 9: Graphical Representation of the Hourly Cooling Load of the Hotel Building ................................18 Figure 10: PVT/Absorption Chiller System Model Developed in TRNSYS ....................................................19 Figure 11: Control Strategy of the PVT/Absorption Chiller System .................................................................22 Figure 12: Indoor Air Temperature Profile of the 7th Floor Rooms (Set-on value: 0 kW) ...........................24 Figure 13: Indoor Air Temperature Profile of the 7th Floor Rooms (Set-on value: 2.78 kW) ......................25 Figure 14: Indoor Air Temperature Profile of the 7th Floor Rooms (Set-on value: 15 kW) ..........................25 Figure 15: Total Cooling Load and Cooling Generations for Each Case ..........................................................26 Figure 16: Comparison of System Outputs and Inputs for Different Set-on Values ......................................26 Figure 17: Monthly Thermal Energy Input to the System in GJ .........................................................................29 Figure 18: Monthly Thermal Energy Consumption in the System in GJ ...........................................................30 Figure 19: Monthly and Total Annual Electricity Consumption of the System in kWh .................................31 Figure 20: Annual Payment Trends for the Two Systems Over 20 Years - I ....................................................40 Figure 21: Annual Payment Trends for the Two Systems Over 20 Years - II ..................................................41 Figure 22: Annual Payment Trends for the Two Systems Over 20 Years - III ................................................42 Figure 23: Annual Payment Trends for the Two Systems Over 20 Years - IV.................................................42

4
List of Tables
Table 1: Monthly Average and High Temperature Values in Antalya (DMI, 2012) .......................................... 7 Table 2: Recommendation of the Collector Type Based on the Type of Demand (Arif Hasan and Sumathy, 2010)............................................................................................................................................................... 9 Table 3: Recommended Maximum U-values for Building Materials in Antalya Region .................................16 Table 4: Wall Construction Materials .......................................................................................................................16 Table 5: Monthly Average and High Temperature Values in Antalya (DMI, 2012) ........................................17 Table 6: Monthly Cooling Loads ..............................................................................................................................17 Table 7: Thermal Characteristics of the PVT Collectors ......................................................................................20 Table 8: Comparison of System Outputs and Inputs for Different Set-on Values ..........................................26 Table 9: Comparison of Collector Tilt Angles........................................................................................................27 Table 10: Monthly and Total Annual Outputs of the System ..............................................................................28 Table 11: Monthly and Total Annual Thermal Energy Input to the System in GJ ..........................................28 Table 12: Monthly and Total Annual Natural Gas Consumption .......................................................................29 Table 13: Monthly and Total Annual Thermal Energy Consumption in the System in GJ ............................30 Table 14: Monthly and Total Annual Electricity Consumption of the System in kWh ...................................31 Table 15: Hours of ON Signal and The Ratio of ON Signals to Total Number of Hours – Controller 1 ..32 Table 16: Hours of ON Signal and The Ratio of ON Signals to Total Number of Hours – Controller 2 ..32 Table 17: Energy Inputs and Outputs of the Chiller and Average COP Values ..............................................32 Table 18: Annual Values of Some Key Inputs and Outputs and Their Abbreviations ...................................33 Table 19: Summary of the Efficiencies for the PVT/Absorption Chiller System ............................................34 Table 20: Basic Formulas and Data Used in the Calculations .............................................................................37 Table 21: Equipment Costs .......................................................................................................................................38 Table 22: Cost Summary ............................................................................................................................................40 Table 23: Cash Flow Table I ......................................................................................................................................48 Table 24: Cash Flow Table II ....................................................................................................................................49 Table 25: Cash Flow Table III ..................................................................................................................................50 Table 26: Cash Flow Table IV...................................................................................................................................51

5
1 Introduction According to International Energy Agency’s report “World Energy Outlook 2011”, world primary energy demand is expected to increase by one third from 2010 to 2035 and energy related carbon dioxide emissions are expected to increase by 20% within the same period. Average global temperature is also expected to rise by 3.5 oC according to the same scenario (IEA, 2011). Trying to cover the most of the increasing energy demand by conventional sources would put the world into a bigger trouble. Therefore, renewable energy sources and energy efficiency improvements are the inevitable actors in the solution. Considering the worldwide economic growth and rising temperatures due to global warming, cooling and air conditioning energy demands are also increasing both for commercial and residential sectors. Therefore, it is also a smart move to use more efficient and less polluting cooling technologies.
1.1 Problem Definition and Objective
Turkey is a developing country and as a natural consequence it has an increasing energy demand. According to the statistical data given by the Turkish Electricity Transmission Company, the demand for electricity was 118484 GWH in 1999 and it has increased to 210434 GWH in 2010 which corresponds to a 77.6% growth of demand within the given period. The same statistical data also indicates that in 2010, 73.6% of the total electricity generation in Turkey was by thermal power generation from fossil-fuels, 24.5% was from hydropower, 1.7% was by wind power and 0.2% was from other renewable energy sources (TEIAS, 2010). The statistical data on the gross electricity generation by share of primary energy resources shows that the electricity mix in Turkey is still dominated by fossil-fuels.
During summer season, one of the major components of the Turkey’s electricity demand is due to the air conditioning devices. Most of the cooling production for both residential and commercial sectors is provided by electrically-driven air conditioning units. This situation has two major disadvantages. Considering the fossil-fuel dominated electricity mix in Turkey, air conditioning turns out to have a significant contribution to the GHG emissions. Another disadvantage is the large air conditioning loads on the electricity networks. Especially in the south coast of the country which has long and hot summers, large air conditioning loads on the electricity network cause electricity shortages and blackouts during the summer season. Antalya, as a city on the south coast of Turkey, suffers from the same problem. As a city with a long, hot and sunny summer season, Antalya is a highly suitable location to utilize solar energy technologies. Considering the unreliable electricity grid, high cooling demands and tourism as the major business of the city, in this study, a roof-top PVT/absorption chiller system is designed for a hotel building in Antalya, Turkey to cover the cooling demand of the hotel, to produce electricity and domestic hot water. The seasonal performance of the system is investigated and an economic assessment of the system is carried out. Considering the solar availability and high cooling loads in Antalya, the proposed PVT/absorption chiller system seems to be a good option for the city. Within the study, some background information about the solar energy and cooling technologies is presented, cooling load estimation of the hotel building and the simulation of the system is carried out in TRNSYS and in the final part, an economic assessment of the system is carried out considering the unit energy prices and capital costs of the components used in the system.
1.2 Methodology
The main objective of the study is to design a roof-top PVT/Absorption chiller in system for a hotel building in Antalya, Turkey to cover the cooling demand of the hotel building, to generate electricity and to produce domestic hot water. The seasonal performance of the system is investigated and an economic assessment of the system is carried out. As the first part of the study, background information on the location, solar energy, PVT arrays, cooling technology and solar cooling technologies is provided. After the literature survey, a hypothetical hotel building is defined with basic assumptions about the size, the structure and the orientation. The hotel is assumed to have a separate residential building which accommodates only the guest rooms and the system is designed for that specific residential building only.

6
Other facilities, such as reception, restaurants, spa and etc. are assumed to be in other buildings. The type of construction materials, size of the rooms and the building itself, structure and the orientation of the building are described in chapter 2 of this report. Before building up the system model and simulate it, a cooling load for the hotel building is generated in TRNSYS. An electricity load for the hotel building is not generated due to lack of data but the system to be designed is grid-connected. The main method of attack in terms of electrical part of the system is to generate as much electricity as possible within the physical limitations such as the roof area, the efficiency of the collectors, solar availability, etc. and sell it to the grid in times of excess generation and buy it from the grid if the demand is not met by the generation. The system also produces domestic hot water to be used in the hotel building and in the other facilities of the hotel. The main assumption about domestic hot water production is that there is a demand for domestic hot water from 06:00 a.m. in the morning to 01:00 a.m. at night either in guest rooms or in other facilities such as kitchens, bars and house holding facilities. Therefore, demand for domestic hot water is not generated neither and assumed to be always larger than the amount supplied by the system. Then, the control strategy, components to be used in the system and their sizes, layout of the system model and the system parameters are determined with the help of existing literature on solar cooling technologies. After having all the parameters determined about the system, the simulation is carried out in TRNSYS. The cooling load generation and the system simulation is carried out for a six-month period because it is the period when the hotel building has cooling demand and the tourism season is on. In other words, it is assumed that the hotel is in operation for a six-month period and the system is designed and simulated for this specific period which is between the 1st of May and the 31st of October. In chapter 3, the system modeled in TRNSYS and some of the key results obtained from the simulation are presented. After obtaining the results from simulation, an economic assessment of the system is carried out considering the unit energy prices and capital costs of the components used in the system.
1.3 Location
Antalya is a coastal city in the south of Turkey. The city is located at 360 54’ N and 300 41’ E. As a typical Mediterranean city, Antalya has hot and dry summers and mild and rainy winters. Around 300 days of the year the days are sunny with no precipitation which makes this city a suitable place for utilizing solar energy technologies. Below figures give a hint about the solar availability in Antalya.
kWh/m2-year
Figure 1: Global Solar Radiation in Antalya (YEGM, 2012)

7
Figure 2: Average Daily Hours of Sunshine in Antalya (YEGM, 2012)
Figure 3: Global Radiation in Antalya (YEGM, 2012)
The major business of the city is tourism and there are hundreds of hotels located within the borders of the city. The tourism season lasts around 8 months every year, starting from April 1st to October 31st. During the season, the minimum amount of solar radiation is around 4 kWh/m2 per day as seen in Figure 3 and the minimum number of sunshine hours is around 7 hours per day. In the table below, average and peak temperature values for each month in Antalya are presented.
Table 1: Monthly Average and High Temperature Values in Antalya (DMI, 2012)
Month Jan Feb Mar Apr May Jun Jul Aug Sep Oct Nov Dec
Record high (°C) 22.1 23.4 28.8 33.2 37.6 44.8 45 43.3 42.1 37.7 33 25.4
Average high (°C) 15 15.4 18.1 21.5 26.1 31.4 34.6 34.4 31.4 26.9 21 16.4
Average ( oC) 9.7 10.2 12.6 16.0 20.5 25.4 28.4 28.1 24.6 19.8 14.6 11.1
0.00
2.00
4.00
6.00
8.00
10.00
12.00
14.00
Hours of sunshine
Hours of sunshine
0.00
1.00
2.00
3.00
4.00
5.00
6.00
7.00
8.00
Global radiation (kWh/m2-day)
Global radiation (kWh/m2-day)
8
The population of Antalya differs depending on the number of visitors coming to the city. Off-season population of the city is around 1 million (TUIK, 2012). The number of visitors to Antalya from foreign countries and other cities of Turkey was more than 9 million in 2010 (TMCT, 2010). During the season, the population of the city varies between 2 million and 2.5 millions. The significant increase in the population also increases the electricity consumption, and also, since most of the cooling load is covered by electrically-driven air conditioners, rising temperature causes extra increase in the electricity consumption in the city. Depending on the number of visitors and the weather temperature, grid cannot afford all of the electricity demand of the city and this sometimes leads to planned or unplanned power cuts in the city. Considering all the facts about climate, tourism and the strength of the grid, distributed power generation, utilizing solar energy for power generation and cooling production seem to be a good solution for Antalya.
1.4 Solar Energy
Solar energy originates from the solar radiation reaching to the Earth. Besides being the indirect source of almost every type of energy used today, it can also be directly converted into other forms of energy such as heat and electricity. Basically, there are two ways of capturing solar energy; either by photovoltaic cells which directly convert the radiation into electricity or by solar thermal collectors which captures the thermal energy of the radiation. There are three types of collectors; flat-plate collectors, focusing collectors and passive collectors (Brown, 1988). Once the solar thermal energy is captured, it can either be used to produce electricity by different types of generators or it can be used for heating tap water, for space heating or for many other applications.
In this study, a solar co-generation system will be designed with photovoltaic/thermal collectors. Therefore, among all types of solar collectors, some background information about PV/T collectors will be presented under the next subtitle.
1.4.1 Photovoltaic/Thermal Collertors
Photovoltaic modules operate more efficiently when they are cooled down. Normally, power generated by typical photovoltaic modules increases with 0.2-0.5% per each 0C decrease in the temperature of the module (Bosanac et al., 2003). Therefore, it is favorable to take away the excess heat generated in the module.
PV/T technology consists of solar thermal collectors and PV cells which mean that the system generates both electrical and thermal energy. In PV/T modules, the excess heat generated in the photovoltaic cells is not only removed but it is also used for some other applications which require thermal energy, such as solar cooling, water heating, etc. This way, the efficiency of the PV cells is improved and thermal energy is produced at the same time. Naturally these features of PVT systems make them attractive in hot and warm climates.
Besides being efficient and having dual purpose which is producing electricity and heat output at the same time, having a wide application area, being cheap and practical are also some other advantages of PVT systems. The heat output from the PVT modules can be used for various applications such as water heating, space heating, cooling, etc. Modules can be easily integrated to buildings and replacing the roofing material with PVT modules can reduce the payback period (Arif Hasan and Sumathy, 2010).
Photovoltaic/thermal collectors can be divided into two categories; Water PV/T collectors and Air PV/T collectors. As it is understood from the names, heat transfer fluids are different for each type of collector.
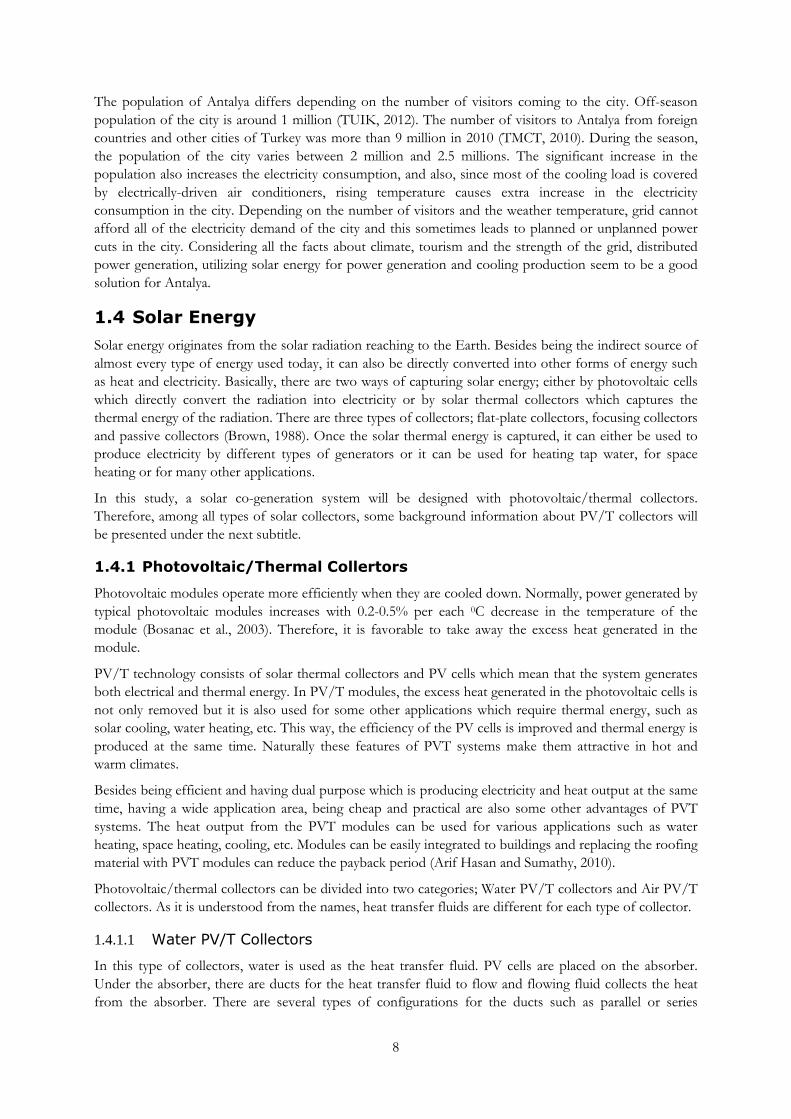
1.4.1.1 Water PV/T Collectors
In this type of collectors, water is used as the heat transfer fluid. PV cells are placed on the absorber. Under the absorber, there are ducts for the heat transfer fluid to flow and flowing fluid collects the heat from the absorber. There are several types of configurations for the ducts such as parallel or series
9
configuration, and different configurations affect the efficiency of the system. Depending on the system design, the heat transfer fluid can be circulated actively by a pump or passively by gravitational forces (Bosanac et al., 2003).
1.4.1.2 Air PV/T Collectors
In this type of collectors, air is used as the heat transfer fluid. Air can be circulated behind the PV cells either through forced flow or natural flow. Due to better convective and conductive heat transfer, forced circulation is more efficient than the natural circulation. However, electricity needed to run the fan for forced circulation may decrease net electricity gain from the system (Chow, 2009). Air PV/T collectors are mostly preferred if there is demand for hot air, space heat, dry agricultural products or preheating of ventilation air (Arif Hasan and Sumathy, 2010).
Since water has higher heat conductivity and heat capacity compared to air, water PV/T collectors are more efficient than air PV/T collectors. However, using air as the heat transfer fluid is the easier mode of operation compared to water PVT systems for producing heat output since water is a corrosive substance and there is the requirement for the systems using water as heat transfer fluid to have water-tight and corrosion-free construction (Arif Hasan and Sumathy, 2010).
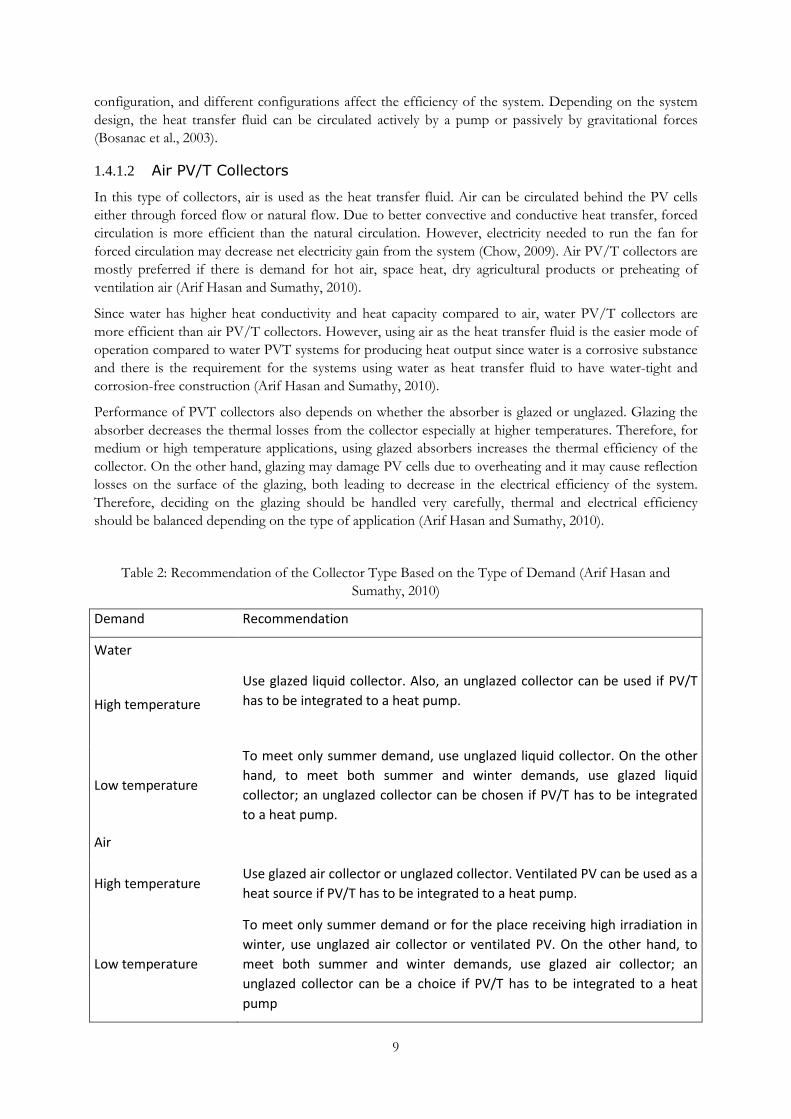
Performance of PVT collectors also depends on whether the absorber is glazed or unglazed. Glazing the absorber decreases the thermal losses from the collector especially at higher temperatures. Therefore, for medium or high temperature applications, using glazed absorbers increases the thermal efficiency of the collector. On the other hand, glazing may damage PV cells due to overheating and it may cause reflection losses on the surface of the glazing, both leading to decrease in the electrical efficiency of the system. Therefore, deciding on the glazing should be handled very carefully, thermal and electrical efficiency should be balanced depending on the type of application (Arif Hasan and Sumathy, 2010).
Table 2: Recommendation of the Collector Type Based on the Type of Demand (Arif Hasan and Sumathy, 2010)
Demand Recommendation
Water
High temperature
Use glazed liquid collector. Also, an unglazed collector can be used if PV/T
has to be integrated to a heat pump.
Low temperature
To meet only summer demand, use unglazed liquid collector. On the other
hand, to meet both summer and winter demands, use glazed liquid
collector; an unglazed collector can be chosen if PV/T has to be integrated
to a heat pump.
Air
High temperature Use glazed air collector or unglazed collector. Ventilated PV can be used as a
heat source if PV/T has to be integrated to a heat pump.
Low temperature
To meet only summer demand or for the place receiving high irradiation in
winter, use unglazed air collector or ventilated PV. On the other hand, to
meet both summer and winter demands, use glazed air collector; an
unglazed collector can be a choice if PV/T has to be integrated to a heat
pump

10
PVT collectors can be classified into water PVT and air PVT collectors in terms of thermal performance. However, electrical performance of the system depends exclusively on the type of PV cells used. There are basically three types of PV cells; crystalline-silicon, polycrystalline-silicon and thin-film cells. Thin-film cells have also several different types such as amorphous silicon thin-film, cadmium telluride thin-film, etc. Among those different types, crystalline-silicon cells have the highest efficiency but they are also the most expensive ones. Cadmium-telluride or amorphous-silicon thin-film cells are the cheapest ones but efficiencies are also low. Therefore, choosing the type of PV cells is important in the sense of electrical performance but it depends on the expectations and the preference of the designers.
1.5 A Review of Cooling Technologies
Although there are several cooling technologies available for space conditioning in buildings, in this part of the study, some basic background information about the four major cooling cycles which are vapor-compression, absorption, adsorption and desiccant cooling cycles is provided. All four of the mentioned cooling cycles can be coupled with solar energy to produce cooling power.
1.5.1 Vapor-Compression Cooling Cycle
Vapor-compression cycle is the most commonly used method for air-conditioning purposes in buildings and it is also used in domestic or commercial refrigerators. A liquid refrigerant is circulated in the system to absorb the heat from the cold reservoir which is the space to be cooled and to reject the heat to the hot reservoir which is the surroundings. A simple vapor-compression cycle consists of the following components: mechanically-driven compressor, condenser, expansion valve and evaporator (Moran and Shapiro, 2006).
Figure 4: A Simple Vapor-Compression Cycle (www-old.me.gatech.edu)
Above figure represents the arrangement in a simple vapor-compression cycle and shows the four processes take place in an ideal vapor-compression cycle. Circulating refrigerant enters the compressor in a saturated vapor phase and undergoes an adiabatic compression which results in higher pressure and thereby a higher temperature. This process requires a work input to the mechanically-driven compressor (1�2 in the figure). Then the refrigerant which is at superheated vapor state is cooled and condensed in an isobaric condensation process. The heat is transferred from the refrigerant to the hot reservoir (2�3 in

11
the figure). The refrigerant which is at saturated liquid phase is then passed through an expansion valve where it is throttled down to a low pressure. This process lowers the temperature of the liquid-vapor mixture of the refrigerant where it is colder than the cold reservoir which is the space to be cooled (3�4 in the figure). The refrigerant which is at liquid-vapor mixture phase is then fed to the evaporator where the heat transfer from the cold reservoir to the refrigerant occurs (4�1 in the figure). The cycle gets completed with this final process and then it starts again with the refrigerant entering to the compressor (Moran and Shapiro, 2006).
The main disadvantages of the vapor-compression cycles are that they use conventional refrigerants, such as chlorofluorocarbon (CFC), hydro chlorofluorocarbon (HCFC) and hydro fluorocarbon (HFC), which are considered to be one of the reasons for ozone depletion and greenhouse effect and they consume electricity to run the mechanically-driven compressors. Considering that the vapor-compression cycle is the most widely used cycle for air conditioning and refrigeration purposes, they have a large impact on power consumption.
1.5.2 Desiccant Cooling Cycle
Desiccant cooling cycle is another thermally-driven cooling technology. It is an open cycle system that combines evaporative cooling and air dehumidification by a desiccant. Since it is an open cycle, which means that the refrigerant is in contact with the atmosphere, water is the only option to be used as a refrigerant in the system. Using other types of refrigerants which are ozone depleting is extremely harmful to the environment (ESTIF, 2006).
Figure 5: Basic Desiccant Cooling Cycle (ESTIF, 2006)
In desiccant cooling cycle, desiccants are used to absorb the moisture in the outdoor air. Warm moist outdoor air is passed through a desiccant wheel (dehumidifier in the figure above) to remove the moisture in it. Then the dry hot air is passed through a thermal wheel (heat recovery in the figure) where it is cooled by the air coming out of the building. Next, the cooled dry air is passed through a humidifier and it is evaporatively cooled down. The process of evaporative cooling takes place by passing the cooled dry air through a wet panel which causes some evaporation and consequently drop in the air temperature. Thus the air enters the building cold and slightly humid.
On the other hand, air flowing out of the building is first passed through a humidifier where it is humidified and cooled down. Then it is fed to the thermal wheel (heat recovery in the figure) to cool down the incoming air. While cooling down the incoming air, it is heated up at the same time. Next it passes through a heater and heated up by an external heat source. Finally it passes through the desiccant

12
wheel (dehumidifier in the figure) to regenerate the desiccant by removing the water that is absorbed by the desiccant (Project Solar LTD, 2010).
The advantages of desiccant cooling cycle are that it requires low temperature energy source to operate, it does not have any GHG emissions and it improves the indoor air quality through ventilation. On the other hand, the drawback of desiccant cooling cycle is that it does not operate efficiently if the outdoor air is too humid.
1.5.3 Absorption Cooling Cycle
In absorption cooling, instead of electricity which is the driving energy source for vapor compression cycles, heat input is used to produce cooling. Heat input can be supplied to the cycle in different ways and one of the classification methods of absorption chillers is based on this difference in the heat inputs. In this sense, absorption chillers can basically be classified into three (CIBSE, 2012):
1. Direct-fired absorption chillers 2. Indirect-fired absorption chiller which utilize steam or hot water. 3. Absorption chillers which are fired by exhaust gases.
Another way of classifying absorption chillers is based on the number of condensers and generators used in the device. According to this classification, there are three types of absorption chillers (Sustainable-buildings.org):
1. Single-effect: This is the basic absorption cooling cycle with one condenser and one generator. 2. Double-effect: There are two condensers and two generators in the device to make the heat
transfer more efficient and to increase the COP of the device. 3. Triple-effect: This type is still in development and is designed to have better heat transfer and
higher COP.
A final method of classifying absorption chillers is based on the working fluids that are utilized in the devices. There are two commercially available types of absorption chillers in this classification (Rafferty, 1998):
1. Lithium bromide/water cycles where LiBr is used as absorbent and water as the refrigerant. 2. Ammonia/water cycle where ammonia is used as the refrigerant and water as the absorbent.
Both vapor compression and absorption cooling cycles have the same ways of removing heat, which is realized by evaporation of refrigerant at low pressure, and rejecting heat which is through condensation of the refrigerant at higher pressure. However, in absorption cooling cycle, unlike vapor compression cycle, a mechanically driven compressor is not needed to increase the pressure of the refrigerant and this significantly reduces the amount of work needed (Rafferty, 1998).
The figure and the explanation below represent how a simple single-effect absorption cycle works.

13
Figure 6: Basic Absorption Cooling Cycle (Chpcentermw.org)
In the absorption cycle, the low pressure refrigerant in the vapor form is absorbed into the absorbent in the absorber. The heat released during this process is removed by the cooling water coming from a cooling tower. Then the liquid solution of absorbent and refrigerant is pumped to the generator in higher pressure. In the generator, the solution is heated above its boiling point by the heat coming from an external source and the refrigerant is vaporized. The weak solution is returned to the absorber and the vapor refrigerant is passed to the condenser where it is condensed to a high-pressure liquid. The heat rejected in the condenser is also removed by the cooling water coming from a cooling tower. The liquid is then passed through an expansion valve to reduce its pressure and fed to the evaporator. In the evaporator, the liquid refrigerant evaporates by absorbing heat and producing chilled water. Then the cycle is completed by feeding low pressure vapor refrigerant to absorber to make up a new solution with the returned absorbent (Chpcentermw.org).
The only work input in the process explained above is the work required to run the pump and compared to work needed for compressor in the vapor compression cycle, it is considerable low. This is one of the advantages of absorption cooling and the other advantages may be listed as elimination of ozone depleting refrigerants, high reliability and low maintenance. On the other hand, high capital cost, relatively low thermal efficiency and requirement for a cooling tower are the downsides of absorption cooling.
1.5.4 Adsorption Cooling Cycle
Adsorption cooling is similar to absorption cooling in terms of using heat input as the driving energy source. However, in adsorption cooling, there is not any requirement for work input to the system. The evaporation and condensation processes take place due to the natural pressure difference occurring in the system. This pressure difference is caused by adsorption phenomena. A simple adsorption cycle is basically composed of 4 stages.

Figure 7: Basic
In the first stage, adsorbent in the adsorption chamber is heated, the temperature and the pressure of the absorbent increase. In the second stage, the adsorbent continues to be heated and the valve between adsorbent chamber and condenser is opened. The desorbed refrigerant in vapor form flows to the condenser and liquefies in the condenser. The heat released is taken away by the cooling water. Then in the third stage, the valve between adsorption chamber andthe adsorption chamber by cooling water passing through the chamber. As a consequence, adsorbent temperature and pressure decreases. In the final stage, the valve between evaporator and the adsorption chamber is opened. The adsorbent continues to be cooled causing refrigerant to be adsorbed. The heat required for this adsorption process is supplied by the chilled water stream, causing chilled water stream to be cooled down and creating cooling production.
The main advantages of adsorption chillers are that they have robust construction and easy installation. They do not contain any harmful fluids either as refrigerant or adsorbent and thereby they have no possibilities of corrosion, hazardous leakage. They have consumption and maintenance requirements and they have a long life span.
14
: Basic Adsorption Cooling Cycle (foodmanufacturing.com)
In the first stage, adsorbent in the adsorption chamber is heated, the temperature and the pressure of the absorbent increase. In the second stage, the adsorbent continues to be heated and the valve between adsorbent chamber and condenser is opened. The desorbed refrigerant in vapor form flows to the condenser and liquefies in the condenser. The heat released is taken away by the cooling water. Then in the third stage, the valve between adsorption chamber and condenser is closed. Heat is taken away from the adsorption chamber by cooling water passing through the chamber. As a consequence, adsorbent temperature and pressure decreases. In the final stage, the valve between evaporator and the adsorption
s opened. The adsorbent continues to be cooled causing refrigerant to be adsorbed. The heat required for this adsorption process is supplied by the chilled water stream, causing chilled water stream to be cooled down and creating cooling production.
ain advantages of adsorption chillers are that they have robust construction and easy installation. They do not contain any harmful fluids either as refrigerant or adsorbent and thereby they have no possibilities of corrosion, hazardous leakage. They have low operation costs, minimal electricity consumption and maintenance requirements and they have a long life span.
(foodmanufacturing.com)
In the first stage, adsorbent in the adsorption chamber is heated, the temperature and the pressure of the absorbent increase. In the second stage, the adsorbent continues to be heated and the valve between adsorbent chamber and condenser is opened. The desorbed refrigerant in vapor form flows to the condenser and liquefies in the condenser. The heat released is taken away by the cooling water. Then in
condenser is closed. Heat is taken away from the adsorption chamber by cooling water passing through the chamber. As a consequence, adsorbent temperature and pressure decreases. In the final stage, the valve between evaporator and the adsorption
s opened. The adsorbent continues to be cooled causing refrigerant to be adsorbed. The heat required for this adsorption process is supplied by the chilled water stream, causing chilled water stream to
ain advantages of adsorption chillers are that they have robust construction and easy installation. They do not contain any harmful fluids either as refrigerant or adsorbent and thereby they have no
low operation costs, minimal electricity

15
2 Hotel Description and Cooling Load Estimation
2.1 Hotel Description
The system is designed for a hypothetical hotel building in Antalya to evaluate the technical and economic feasibility of the system in a realistic application. The hotel is assumed to have a separate residential building which accommodates only the guest rooms. Other facilities, such as reception, restaurants, spa and etc., are in other buildings. The system is designed for the residential building only. PVT arrays, absorption chiller and all the other components are assumed to be placed on the roof of this residential building. The hotel building is assumed to have 7 floors and 30 identical rooms on each floor, with basic furniture and 30 m2 of room area. The central air-conditioning system is assumed to cool the guest rooms and the corridors. Below is a simple sketch of the floor plan of the building.
Figure 8: Sketch of a Typical Floor in the Hotel Building
As seen in the figure above, on each floor, 15 of the rooms are facing south and 15 of them are facing north. Each room is identical in shape with 5x6 m size and each room has window area of 3x2.5 m. Each floor is divided into three thermal zones: North zone which is composed of the 15 rooms that are facing north, south zone which is composed of the 15 rooms that are facing south and corridor zone.
2.2 Cooling Load Estimation
In cooling load estimation, along with the size, orientation and plan of the building, construction materials are also required parameters. Selection of construction materials depends on many criteria such as availability of the materials, insulation standards, cost, etc. Since the building is a hypothetical building, average values are assigned to each type of construction material. In order to determine the average u-values for the construction materials, Turkish Standard TS 825 (Thermal insulation requirements for buildings) is used as the guideline.
According to the Turkish Standard TS 825, recommended maximum u-values of the building materials for external facade in Antalya region are shown in the table below.

16
Table 3: Recommended Maximum U-values for Building Materials in Antalya Region
Uwall (W/m2K) Uceiling (W/m
2K) Ufloor (W/m
2K) Uwindow (W/m
2K)*
0.7 0.45 0.70 2.8
* The recommended value for windows is 1.4
In TS 825, it is also noted that values lower than those given in the standard are recommended to use for efficiency measures. The u-values of construction materials for the hypothetical hotel building are selected considering the given values and recommendations in TS 825.
Wall types, details of the layers and u-values that are used in this project are given in the table below.
Table 4: Wall Construction Materials
Wall Type Layers Thickness (m) Total u-value
(W/m2K)
Fibreglass 0.06
External Wall Plaster 0.04 0.491
Brick 0.3
Floor 0.005
Stone 0.06
Ground Floor Silence 0.04 0.313
Concrete 0.24
Insulation 0.08
Floor 0.005
Interfloor Stone 0.06 0.834
Silence 0.04
Concrete 0.24
Gypsum 0.012
Interwall Plasterboard 0.03 1.228
Silence 0.02
Roof wall Concrete 0.24 0.233
Insulation 0.16
U-values of the windows are set to 1.4 W/m2K which is the exact value recommended in TS 825.
The tourism season in Antalya starts in the beginning of April and ends at the end of October each year. This is the period when the hotel is in use. On the other hand, according to the monthly average temperatures given in the table below, cooling requirement for the hotel starts in May and ends at the end

17
of October. Therefore, cooling load estimation and PVT/absorption chiller system simulation are carried out for the period that starts with May 1st and ends with October 31st.
Table 5: Monthly Average and High Temperature Values in Antalya (DMI, 2012)
Month Jan Feb Mar Apr May Jun Jul Aug Sep Oct Nov Dec
Record high (°C) 22.1 23.4 28.8 33.2 37.6 44.8 45 43.3 42.1 37.7 33 25.4
Average high (°C) 15 15.4 18.1 21.5 26.1 31.4 34.6 34.4 31.4 26.9 21 16.4
Average ( oC) 9.7 10.2 12.6 16.0 20.5 25.4 28.4 28.1 24.6 19.8 14.6 11.1
Having all the physical parameters determined, the last step for the cooling load estimation is to set the indoor design temperature. According to Turkish Standards, the indoor temperature set value for the hotel rooms should be 20 oC. Therefore, in this project, indoor design set temperature for hotel guest rooms are selected as 20 oC and 25 oC for the corridors.
A TRNSYS simulation is carried out to calculate the cooling load with the above mentioned parameters. The table below shows the cooling loads for each month and the sum of the whole season when the indoor design set temperatures for rooms and corridors are taken 20 oC and 25 oC, respectively. As seen in the table, the system should produce 150.8 MWh of cooling power annually.
Table 6: Monthly Cooling Loads
Month Cooling Load (kWh)
May 7931
June 26430
July 43440
August 42340
September 24890
October 5751
Total 150782
Below is the graphical representation of the results obtained from TRNSYS simulation for cooling load calculations. As expected, maximum cooling load corresponds to July and August; May and October are the months with the least cooling power requirements. The blue line represents the rated capacity of the absorption chiller used in this project. As seen in the figure, cooling power requirement exceeds the rated capacity of the absorption chiller only for several hours throughout the whole season. The peak load is 117 kW and there are only 12 hours that the cooling load is between 110kW and 117 kW, and 18 hours that the cooling load is between 105 kW and 110 kW. In the rest of the whole season, which corresponds to approximately 4400 hours, cooling load is below the rated capacity of the absorption chiller.

18
Figure 9: Graphical Representation of the Hourly Cooling Load of the Hotel Building

19
3 System Description
PVT/absorption chiller system model is developed in TRNSYS and system scheme is given in the figure below. In this section, components used in the model are explained first, and then the working principles of the model and control strategy are explained.
Figure 10: PVT/Absorption Chiller System Model Developed in TRNSYS
Type 109 – Data Reader and Radiation Processor is the unit with “weather data” label on it in the system scheme above. It simply reads the weather data at regular time intervals from a data file for a specific location and converts it to a desired system of units. It also processes the solar radiation data and converts it to required formation for different kinds of surfaces with variable tilt angles and etc.
Type 50 – PV-Thermal Collector is the unit with “PVT Array” label on it. This unit is used to model a combined PV and flat-plate collector with constant loss coefficient (UL) and transmission coefficient (to).
Type 107 – Hot Water-Fired Single-Effect Absorption Chiller is the unit with “Absorption chiller” label on it. It is used to model a single effect absorption chiller with how water stream as the energy input to the machine’s generator. This unit calls an external file that includes the machine’s real performance map in normalized form. Therefore, in order to use this unit, the user should have the performance data for the absorption chiller and convert it into the required form.
Type 4 – Storage Tank (Variable Inlets, Uniform Losses) is the unit with “Hot Storage Tank” label on it. This unit is used to model a fluid-filled, constant volume cylindrical tank with vertical configuration. The user can have N (N<=100) fully-mixed equal volume segments in the tank. The degree of thermal stratification depends on N. The greater the number of nodes, better the thermal stratification is.
Type 6 – Auxiliary Heater is the unit with “Natural Gas Heater” label on it and is used to elevate the temperature of a flow stream to a pre-defined set temperature by using a control mechanism. The control mechanism can be either internal, external or a combination of both.

20
Type 3 – Pump is the units with “Pump 1” and “Pump 2” labels. This unit computes a mass flow rate using a variable control function and a fixed (user specified) maximum flow rate. The control function must have a value between 0 and 1, where 0 stands for “off” signal and “1” for full capacity. The values in between stand for the fractions of the maximum flow rate.
Type 91 – Heat Exchanger is the units with “Heat Exchanger 1” and “Heat Exchanger 2” labels in the system scheme above. This unit is modeled as a constant effectiveness device and effectiveness is input as a parameter.
Type 2 – On/Off Differential Controller is the units with “Controller 1” and “Controller 2” labels and it generates a control function which can have a value between 0 and 1.
Type 9 – Data Reader for Generic Data Files is the unit with “Cooling Load Data Reader” label on it. This unit reads the data at regular time intervals from an external data file and converts it to desired system of units, making it available to other TRNSYS components.
Parameters for the two of the major components in the system are PVT collector and absorption chiller are given below and all the parameters for the rest of the components used in the system are presented in the appendix.
3.1 PVT Collector
Electrical characteristics of the PVT collectors are obtained from “Wiosun PVT185”. The PVT modules that are produced by the German Company Wiosun GmbH have 185 Wp nominal power. The modules have a surface area of 1.33 m2 and consist of 48 (6x8) polycrystalline cells which are each 125mmx125mm in size. Each module has a 3.2 mm “solarglass” as a front covering glass and the efficiency of the cells used in the module are 15.83%.
The thermal characteristics of the PVT collectors are obtained from a study by Bergene and Martin (Bergene, T., Martin, O., 1995). Below table presents the parameters used in the TRNSYS component for PVT collector.
Table 7: Thermal Characteristics of the PVT Collectors
Parameter Value
Ratio of aperture to absorber area 1
Collector plate absorptance 0.9
Collector fin efficiency factor 0.9
Collector back loss coefficient 1
Cover transmittance 0.9
The sitting area for PVT collectors and the rest of the components is the roof of the building. The available area on the roof is 1080 m2. Since the objective is to utilize as much solar energy as possible, 1000 m2 of the available area is assigned to the PVT collectors while allocating 80 m2 for remaining components and maintenance purposes. 750 PVT modules are used in 1000 m2 area.
3.2 Absorption Chiller
A hot water fired single effect absorption chiller is used in this project. “Yazaki WFC-SC30” is a LiBr- water absorption chiller with 105.6 kW rated capacity. The absorption cycle is energized by hot water

21
which is between 75 oC and 95 oC. The chiller uses a solution of lithium bromide and water as the working fluid. Water poses as refrigerant and lithium bromide which is a non-toxic salt as the absorbent.
The rated capacity of the chiller is 105.6 kW and the rated COP is 0.7. The electricity consumption of the chiller is 0.31 kW. The flow rate of the chilled water circuit is 16.5 m3/h and at rated capacity, chilled water leaving temperature is 7.0 oC and entering temperature is 12.5 oC. Again at rated capacity, the flow rates and the leaving and entering temperatures are 25.9 m3/h, 83 oC and 88 oC, respectively for hot water circuit, 55.1 m3/h, 35 oC and 31 oC, respectively for cooling water circuit. The chiller allows 75 oC as the minimum inlet hot water temperature and 95 oC as the maximum. The control strategy of the chiller is partly based on this hot water inlet temperature range. When the system needs to run at part-load, the hot water inlet temperature is manipulated as the control parameter and lowered.
3.3 Description of the System Model
The PVT/absorption chiller system in this project can be divided in two major subsystems; Heat-supply circuit and Cold-supply circuit.
Heat-supply circuit is composed PVT array, hot storage tank, pump 1, heat exchanger 1 and controller 1. If the signal coming from controller 1 is on, pump 1 drives the water from the bottom of the hot storage tank, where the water has the minimum temperature level within the tank, to the heat exchanger 1. If the water coming from the tank has temperature above 55 0C, it is cooled down to a temperature between 50-55 0C and then sent to the PVT array. If the water coming from the tank is below 55 0C, it is directly sent to the PVT array without being cooled down. The actual reason of cooling down the water to a temperature below 55 0C is to keep the PVT array temperature at a considerable level for PV cells efficiency. If the water fed to the PVT array is too hot, electrical efficiency of the PVT array drops down. The thermal energy obtained in the heat exchanger 1, while cooling down the water, is used to produce domestic hot water at 45 0C. The water that is fed to the PVT array is heated up, then sent to the hot storage tank and thereby heat-supply circuit is completed.
Cold-supply circuit is composed of hot storage tank, natural gas heater, absorption chiller, pump 2, heat exchanger 2, controller 2 and cooling load data reader. Building cooling load data is read by the cooling load data reader. If the cooling load is above a certain value, the controller sends an “ON” signal to absorption chiller, pump 2 and natural gas heater to make them work. When the pump 2 receives on signal from the controller, it starts to drive the cold-supply circuit by circulating the water flow in the circuit. Hot water from the top of the hot storage tank, where the water has the maximum temperature level within the tank, is send to natural gas heater. Depending on the temperature of the coming water from the tank and the building’s cooling requirement, natural gas heater heats the water up to a certain temperature. Then the water is sent to the absorption chiller, providing thermal energy for driving the chiller. Since some amount of the thermal energy in the water stream is used up by the absorption chiller, temperature of the hot water stream exiting the absorption chiller is reduced down to a certain degree. Exiting water stream is then driven to the heat exchanger 2 by the pump 2. Water is cooled down to a temperature between 50-55 0C, then sent back to the tank. And thereby, the cold-supply circuit is completed. Heat taken away from the water stream in heat exchanger 2 is used to produce domestic hot water at 45 0C again. The reason of cooling down the water before entering the hot water storage tank is to produce domestic hot water and to keep the temperature level of the tank at a certain degree to utilize the solar thermal enery as much as possible.
Below is a summary of some important characteristics of the system model.
• PVT Collector Orientation: South
• PVT Collector Tilt Angle: 20o
• PVT Collector Area: 1000 m2 (750 modules)

22
• Type of PVT modules: 185 Wp with 1.33 m2 surface area, 48 (6x8) polycrystalline cells and 15.83% cell efficiency.
• Hot Circuit Flow Rate: 26 m3 / h
• Cold Circuit Flow Rate : 25.9 m3 / h
• Type of Absorption Chiller: How water fired single effect LiBr-Water
• Size of the Absorption Chiller: 105.6 kW
• Size of the Hot Storage Tank: 20 m3
• Size of the Natural Gas Aux. Heater: 1163 kW
• Average Temperature of Domestic Hot Water Production: 45 oC
3.4 Control Strategy
There are two different ON/OFF controllers in the system and each controlling a separate circuit. Below is the schematic representation of the control mechanism of the system. Green lines represent the inputs to the controllers and blue lines represent the outputs from the controllers.
Figure 11: Control Strategy of the PVT/Absorption Chiller System
Controller 1 receives input from PVT array and hot storage tank, and sends a signal to pump 1 to control the mass flow rate of the hot-supply circuit. The controller compares the PVT array outlet temperature and the temperature of the top of the hot storage tank. If the PVT array outlet temperature is higher than the temperature of the top of the hot storage tank, the controller sends ON signal to the pump 1 to drive the flow. If the temperatures are equal or PVT array outlet temperature is less than the temperature of the top of the tank, the controller stops the pump 1.
Controller 2 receives input from the cooling load data reader, and sends a signal to pump 2, natural gas heater and absorption chiller to control the cold-supply circuit. The controller checks the building cooling load, if it is less than a certain base value; it stops pump 2, natural gas heater and absorption chiller. If the building cooling load is above a certain base value, it sends an ON signal to those components to drive the cold-supply circuit.
Beside the ON/OFF controller, there is another control strategy for the absorption chiller based on the machine’s part-load performance data provided by the manufacturer. Since the building cooling load is varying depending on the atmospheric conditions, it is unnecessary to run the absorption chiller at full capacity at all times. When the cooling load is less than the full capacity of the absorption chiller, it is possible to run the device at part load by decreasing the inlet hot water temperature. 105 kW Yazaki WFC-SC30 is the absorption chiller model that is used in the system and it allows inlet hot water

23
temperature to be between 75 0C and 88 0C. According to the performance map that is provided by the manufacturer, 88 0C is the temperature for full capacity and it is possible to run the device at part load with inlet hot water temperatures below 88 0C down to 75 0C. 75 0C is the minimum temperature that is allowed by the device. Considering this fact, another control mechanism is created for the absorption chiller by changing the inlet hot water temperature. In the system scheme, EQUA 2 works as a controller; it receives an input from cooling load data reader and depending on the value of the building cooling load, it sends a signal to the natural gas heater to adjust the temperature of the water stream that is to be fed to the absorption chiller. If the building cooling load is below 48 kW, outlet temperature of the natural gas heater is set to 75 0C because according to the performance map that is provided by the manufacturer, absorption chiller produces 48 kW of cooling power when it is driven by 75 0C inlet hot water. If the building cooling load is between 48 kW and 74 kW, natural gas heater is set to 80 0C because according to the performance map, absorption chiller produces 74 kW of cooling power when it is driven by 80 0C inlet hot water. If the building cooling load is between 74 kW and 96 kW, outlet temperature of the natural gas heater is set to 85 0C because absorption chiller produces 96 kW of cooling power when it is driven by 85 0C inlet hot water. If the building cooling load is above 96 kW, natural gas heater is set to 88 0C to run the absorption chiller at full capacity. This control mechanism enables the system to avoid unnecessary cooling production, leading to decrease in the natural gas consumption and increase in the solar fraction used in the cooling generation.

24
4 Results and Analysis Several TRNSYS simulations are carried out for the system model described in the previous sections on hourly basis for the time period from 1st of May to 31st of October to analyse the effects of some system parameters on the system outputs.
The cooling load of the building varies between 0 and 117 kW throughout the whole season. The absorption chiller used in this project which is “Yazaki WFC-SC30 (105.6 kW)” has a minimum part-load capacity of 48 kW. Cooling load of the building is less than 48 kW for the half of the season and is less than 15kW for the 37% of the whole season. This means that even if the absorption chiller is on at its minimum capacity whenever there is cooling load, there is a considerable amount of excess cooling power production. Therefore, as described in the previous section, the absorption chiller is run when the cooling load is above a certain degree to reduce the amount of excess cooling production. The minimum cooling load value (which is going to be called “set-on value” from now on) at which the chiller starts running is determined in such a way that the temperature of the hotel rooms and corridors does not exceed the indoor design set temperature by 1 oC at any time.
The effect of set-on values on the room temperatures is analysed with three different simulations. In the first case the absorption chiller works whenever there is a positive cooling load. The second case is that the absorption chiller works when the cooling load is above 2.78 kW (10000 kj/h) and in the third case the absorption chiller works when the cooling load is above 15 kW (54000 kj/h). Since the top floor always has the highest temperature values throughout the season, temperature values of the top floor rooms are compared in the graphs below.
Figure 12: Indoor Air Temperature Profile of the 7th Floor Rooms (Set-on value: 0 kW)

25
Figure 13: Indoor Air Temperature Profile of the 7th Floor Rooms (Set-on value: 2.78 kW)
Figure 14: Indoor Air Temperature Profile of the 7th Floor Rooms (Set-on value: 15 kW)
In case 1 where the set-on value is 0 kW, the absorption chiller works whenever there is a positive cooling load. Therefore, the temperature of the rooms and corridors never exceeds the indoor design set temperatures. This is also the case which has the highest amount of excess cooling power produced due to high minimum part load capacity of the chiller. In case 2, the absorption chiller works when the cooling load is above 2.78 kW. Temperature of the rooms never reaches 21 0C and most of the time the temperature is either at the indoor design set temperature or below. In case 3, the absorption chiller works when the cooling load is above 15 kW. Temperature of the rooms never reaches 210C. There are only 118 hours where the indoor temperature exceeds 20.5 0C throughout the whole season and almost all of them are in the very early mornings when the cooling load is low, between 5 a.m. and 8 a.m. Therefore, choosing 15 kW as the set-on value for the absorption chiller has stronger effects on the indoor air temperatures compared to case 2 where the set-on value is 2.78 kW, but not significant enough to disturb the comfort conditions in the building. Choosing 15 kW as set-on value reduces the excess cooling power production without disturbing the indoor comfort conditions in the building.
The figure below shows the cooling demand of the building and the cooling production for each case.

26
Figure 15: Total Cooling Load and Cooling Generations for Each Case
Having different set-on values has effect on system outputs other than cooling generation and system inputs as well. Table and figure below compares the two other system outputs which are electricity generation and domestic hot water production and two system inputs which are PVT energy gain and natural gas consumption for each case.
Table 8: Comparison of System Outputs and Inputs for Different Set-on Values
Case 1 Case 2 Case 3
PVT Energy Gain (MWh) 680.6 663.1 635.2
Electricity Generation (MWh) 95.1 94.8 94.2
Natural Gas Consumption (m3) 160500 148115 130736
Domestic Hot Water Production (m3) 74623 70800 65135
Figure 16: Comparison of System Outputs and Inputs for Different Set-on Values
0
50
100
150
200
250
Cooling Load (150.8 MWh)
Cooling Generation Case 1 (224.2 MWh)
Cooling Generation Case 2 (208.3 MWh)
Cooling Generation Case 3 (185.5 MWh)
0.00
100.00
200.00
300.00
400.00
500.00
600.00
700.00
800.00
PVT Energy Gain (kWh)
Electricity Generation (kWh)
Natural Gas Consumption (m3)
Domestic Hot Water Production
(m3)
Thousands
Case 1
Case 2
Case 3

27
As seen in the table and figures above, when the set-on value is 15 kW, PVT energy gain, electricity generation and DHW production are the lowest among the three different cases. When the set-on value is 15 kW, the absorption chiller and thereby the cold-supply circuit do not operate if the cooling load of the building is lower than 15 kW. Consequently, the number of hours that the absorption chiller and the cold-supply circuit is running is lower compared to the other cases. The decrease in the number of hours that the cold-supply circuit is running cause to a reduction in the DHW production because heat exchanger 2 does not work if the cold-supply circuit is not working. It also conduces to a higher average storage tank temperature which leads to a decrease in the operational hours of the hot-supply circuit. Since the control mechanism for the hot-supply circuit is basicly comparing the PVT array outlet temperature and the temperature of the top of the hot storage tank, if the average temperature of the hot storage tank increases, the number of hours that the hot-supply circuit is running deacreases. Therefore, in total, less cooling water is passing through the PVT array causing the PVT energy gain and the electricity generation to decrease. When the set-on value is 15 kW, electricity consumption of the system also decreases considering that the number of hours that the absorption chiller, cooling tower and the pumps are running decreases. Even though the electricity generation decreases slightly compared to the other two cases when the set-on value is 15 kW, the decrease in the elecetricity consumption of the system offsets the difference in the net electricity gain from the system. After all, the significant reduction in the excess cooling generation and the natural gas consumption decreases the operational cost of the system when the set-on value is 15 kW. Therefore, 15 kW is chosen as the set-on value used in this project.
Another parameter which has an effect on the system performance is the collector tilt angle. Collector tilt angle should be adjusted to achieve the maximum amount of solar energy. Since the solar position changes both during the day and the year, in theory, the collector tilt angle should also be adjusted continuously. However, since the tracking mechanisms are expensive and need serious maintenance and since the amount of solar energy obtained by using an annual average for the tilt angle is only 6% less than the amount of solar energy obtained by adjusting the tilt angle continuously by a tracking mechanism (Hartley et al., 1999), non-tracking PVT collectors are used in this project. According to most of the solar energy books and common knowledge, the rule of thumb is that the optimum tilt angle, for northern hemisphere, is equal to the latitude of the location for the systems used throughout the whole year, latitude minus 15 degrees for the systems used during summer and latitude plus 15 degrees for the systems used during winter. Since the system is design for a hotel building that is in operation during the period between May 1st and October 31st, it is assumed that the system is in operation during summer. Considering that Antalya is located at 360 54’ N, the optimum tilt angle for the system is chosen to be 20 degrees. However, in order to check the validity of this assumption, another simulation with 36 degrees of tilt angle is carried out as if the system is in operation throughout the whole year. Below table presents the comparison of some of the key performance criteria of the system for two different collector tilt angles.
Table 9: Comparison of Collector Tilt Angles
Tilt Angle= 360 Tilt Angle= 200
PVT Energy Gain (MWh) 613.6 635.2
Electricity Generation (MWh) 91.8 94.2
Natural Gas Consumption (m3) 133110 130736
Domestic Hot Water Production (m3) 65126 65135
As seen in the table above, PVT energy gain and electricity generation are higher and natural gas consumed for the operation is lower when the tilt angle is 200. Since most of the operational period of the system corresponds to summer, it is a valid assumption to fix the collector tilt angle to 20 degrees.

28
The main simulation for the system with parameters given in the chapter 5.3 of this report is run with 15 kW set-on value. Below table presents the monthly and total annual values of the three main outputs of the system, which are cooling production, electricity generation and domestic hot water production.
Table 10: Monthly and Total Annual Outputs of the System
May June July August Sept. Oct. Annual
Cooling Production (MWh) 10.0 33.6 51.8 50.8 31.6 7.6 185.5
Electricity Generation (MWh) 15.3 16.9 17.9 17.2 14.9 12.0 94.2
DHW Production at 45 oC (m
3) 5100 12131 16517 16271 11256 3858 65135
Although the cooling load of the building is annually 150.8 MWh, cooling produced by the system is more than the required amount due to natural supply-demand mismatch of the solar/solar-assisted cooling systems. This is the case with the minimum amount of excess cooling production within the current set-up of the system model as explained in the previous sections.
Since the electrical system is grid-connected, there is not any specific electrical load for the system. The main assumption with the electrical power generation is that if there is excess electricity, it is given to the grid and if the generation is short for the hotel demand, electricity is supplied from the grid.
The average temperature of the domestic hot water produced by the PVT/absorption chiller system is 45 oC. Depending on the weather conditions or system performance, the temperature of the DHW varies between 43 oC and 50 oC.
There are two sources of thermal energy input to the PVT/absorption chiller system which are solar thermal energy via PVT collectors and thermal energy from natural gas via auxiliary heater. Below table and the figure present the monthly and total annual thermal energy inputs to the systems.
Table 11: Monthly and Total Annual Thermal Energy Input to the System in GJ
May June July Aug Sept Oct Annual
PVT Input 284.7 439.6 494.5 480.8 381.8 205.4 2286.7
Aux. Heater Input 266.8 856.9 1257.4 1247.9 819.9 211.6 4660.4
Total 551.4 1296.4 1751.9 1728.7 1201.7 417.0 6947.1

29
Figure 17: Monthly Thermal Energy Input to the System in GJ
In May and October, when there is less cooling demand, thermal energy supplied by auxiliary heater and PVT collector are almost equal. However, when the cooling demand rises in summer months, even though the available solar energy is higher compared to May and October, thermal energy supplied by auxiliary heater dominates the thermal energy input from PVT collector. The figure above is a picture of the low solar fraction of the designed PVT/absorption chiller system. Dependency of the system on natural gas is high and this high level of natural gas consumption increases the operational costs of the system.
The efficiency of the natural gas fired auxiliary heater is 0.93 (Demirdokum.com) and heating value of the natural gas supplied from the grid is 38330.15 kJ/m3 (BOTAS, 2012).
������ �� . �. = ����� ��������� �� ��� ������
�� .!�"��� ##�$���$�×
&
!�"���� '"��� �# (.). Eq. 1
Monthly and total annual natural gas consumptions of the PVT/absorption system are calculated by the above given equation and values and presented in the table below.
Table 12: Monthly and Total Annual Natural Gas Consumption
May June July Aug Sept Oct Annual
N. Gas Consumption (m3) 7483 24037 35272 35006 23001 5934 130736
130736 m3 of natural gas is consumed throughout the operation period of the system. This high amount of natural gas consumption does not only decrease the solar thermal efficiency of the system but also brings a significant economical burden as operational cost. In order to make it more efficient and economically more competitive, some improvements on the system are essential.
One of the reasons that cause low solar fraction and high natural gas consumption is low outlet temperature from the solar collectors. The highest outlet temperature achieved by the PVT array in this project is 76.5 0C which is not always enough to run the absorption chiller. This induces the system to use natural gas to make up the deficiency. The absorption chiller runs with 75 C0 hot water inlet temperature when the cooling demand is lower than 48 kWh. Whenever the cooling demand of the building exceeds 48 kWh, temperature requirement for the hot inlet water to the absorption chiller increases and natural gas
0
200
400
600
800
1000
1200
1400
1600
1800
2000
May June July Aug Sept Oct
PVT Input
Aux. Heater Input
30
fired auxiliary heater steps in causing high natural gas consumption. As a consequence, in summer months, the thermal energy input from the auxiliary heater almost triples the thermal energy input from the PVT collector to the system because of the high hourly cooling demand of the building. Therefore, using solar collectors which can provide higher outlet temperature would increase the solar fraction and lower the dependency of the system on natural gas. This would increase the system efficiency and the economic competitiveness.
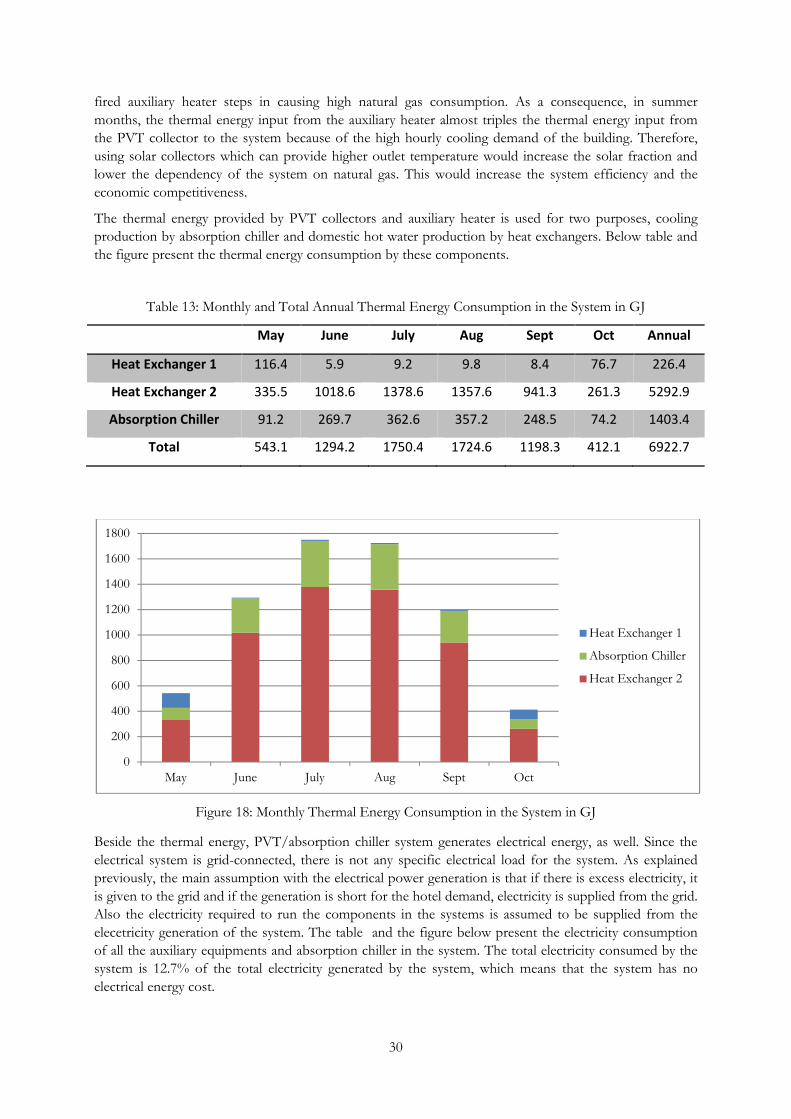
The thermal energy provided by PVT collectors and auxiliary heater is used for two purposes, cooling production by absorption chiller and domestic hot water production by heat exchangers. Below table and the figure present the thermal energy consumption by these components.
Table 13: Monthly and Total Annual Thermal Energy Consumption in the System in GJ
May June July Aug Sept Oct Annual
Heat Exchanger 1 116.4 5.9 9.2 9.8 8.4 76.7 226.4
Heat Exchanger 2 335.5 1018.6 1378.6 1357.6 941.3 261.3 5292.9
Absorption Chiller 91.2 269.7 362.6 357.2 248.5 74.2 1403.4
Total 543.1 1294.2 1750.4 1724.6 1198.3 412.1 6922.7
Figure 18: Monthly Thermal Energy Consumption in the System in GJ
Beside the thermal energy, PVT/absorption chiller system generates electrical energy, as well. Since the electrical system is grid-connected, there is not any specific electrical load for the system. As explained previously, the main assumption with the electrical power generation is that if there is excess electricity, it is given to the grid and if the generation is short for the hotel demand, electricity is supplied from the grid. Also the electricity required to run the components in the systems is assumed to be supplied from the elecetricity generation of the system. The table and the figure below present the electricity consumption of all the auxiliary equipments and absorption chiller in the system. The total electricity consumed by the system is 12.7% of the total electricity generated by the system, which means that the system has no electrical energy cost.
0
200
400
600
800
1000
1200
1400
1600
1800
May June July Aug Sept Oct
Heat Exchanger 1
Absorption Chiller
Heat Exchanger 2

31
Table 14: Monthly and Total Annual Electricity Consumption of the System in kWh
May June July August Sept. Oct. Annual
Pump 1 Cons. 155 219 246 229 192 126 1166
Pump 2 Cons. 122 359 479 472 330 98 1860
Chiller Cons. 56 167 223 219 153 46 864
Cooling Tower Cons. 400 1184 1580 1555 1087 323 6129
Cooling Tower Pump Cons. 129 382 510 502 351 104 1978
Total Consumption 862 2310 3037 2977 2112 697 11996
Figure 19: Monthly and Total Annual Electricity Consumption of the System in kWh
The highest electrical energy consuming component in the system is cooling tower, then come the pumps to drive the water flow and the least electrical energy consuming component is absorption chiller. Higher electrical consumption in the system indicates higher working load of the system which can be investigated by analysing the behaviors of the controllers used in the system.
Controllers play a vital role in the operation of the PVT/absorption chiller system. As mentioned before, there are two ON/OFF controllers in the system. Controller 1 is responsible with the hot-supply circuit. If the PVT outlet temperature is higher than the temperature of the top of the hot storage tank, it drives the water flow in the hot-supply circuit. Controller 2 is responsible with the cold-supply circuit. If the building cooling load is higher than 15 kW which is the “set-on” value for the chiller, it drives the water flow in the cold-supply circuit. Therefore, the activity of the controllers tells a lot about the operational characteristics of the system. Below tables present the hours in which the controllers send ON signal and the ratio of those hours to total number of hours in each month and within the whole season.
0
500
1000
1500
2000
2500
3000
3500
May June July August Sept. Oct.
Cool. Tower Pump
Cool. Tower
Abs. Chiller
Pump 2
Pump 1

32
Table 15: Hours of ON Signal and The Ratio of ON Signals to Total Number of Hours – Controller 1
Controller 1 May June July Aug Sept Oct Annual
Total Hours 744 720 744 744 720 744 4416
On Hours 232 328 368 343 287 188 1746
Ratio 0.31 0.46 0.49 0.46 0.40 0.25 0.40
Table 16: Hours of ON Signal and The Ratio of ON Signals to Total Number of Hours – Controller 2
Controller 2 May June July Aug Sept Oct Annual
Total Hours 744 720 744 744 720 744 4416
On Hours 182 538 718 707 494 147 2786
Ratio 0.24 0.75 0.97 0.95 0.69 0.20 0.63
In the case of controller 1, a high ratio means having high utilization of solar energy and high PVT outlet temperatures. As expected, the ratio is highest in July, other summer months August and June share the second place, in September the ratio is still close to those in summer months and in October it has the lowest value.
In the case of controller 2, a high ratio means high cooling demand and high operational hours of cold-supply circuit and absorption chiller. As in the controller 1 case, July has the highest ratio for controller 2 as well. August is very close to July again, but this time the difference between June and other two summer months is significant, meaning that June has a lower cooling demand even though it has a high solar irradiation. October and May are the two months with lowest cooling demands.
Controller 2 in the system has a working ratio of 0.63, in other words, it sends “ON” signal to absorption chiller for 2786 hours out of 4416 hours in the season. However, the number of hours that the absorption chiller is running at rated capacity is much less than 2786 hours, which means that the chiller is oftenly running at part-load capacity, leading to a decrease in the average COP of the absorption chiller. The rated COP of the absorption chiller used in the system is 0.7. When the chiller runs at part-load capacity, COP of the device drops down. Therefore the chiller has an average COP of below 0.7 throughout the whole season. Below table presents the energy input and output of the chiller and average COP values for each month and annually.
Table 17: Energy Inputs and Outputs of the Chiller and Average COP Values
May June July Aug Sept Oct Annual
Energy Input (GJ) 91.2 269.7 362.6 357.2 248.5 74.2 1403.4
Energy Output (GJ) 36.1 121.1 186.5 182.7 113.8 27.4 667.6
COP 0.40 0.45 0.51 0.51 0.46 0.37 0.48
In order to have a better understanding of the system performance, a few basic efficiency measures are defined below. In the rest of this section, these efficiencies along with values of some key inputs and outputs are presented.

33
Table 18: Annual Values of Some Key Inputs and Outputs and Their Abbreviations
Description Abbrevation Value (MWh)
Global horizontal irradiation times the collector area GHI 1205.0
Energy from natural gas EN.G 1392.0
PVT thermal energy gain Pthermal 635.2
PVT electricity generation PVTelec 94.2
Cooling power generation Pcool 185.5
Domestic hot water energy EDHW 1533.1
Electrical energy consumption Pelec 12.0
Solar Thermal Efficiency is defined as;
*�+,- �ℎ/-�,+ /��010/�12 =3456789:
)!; Eq. 2
It is a measure of how much of the total irradiation is captured and converted into thermal energy by the PVT collector. For the PVT/absorption chiller system;
*�+,- �ℎ/-�,+ /��010/�12 =635.2
1205= B. CDEF
Overall Solar Efficiency is defined as;
GH/-,++ I�+,- /��010/�12 =3456789:J3'K6:6L
)!; Eq. 3
It is a measure of how much of the total irradiation is captured and converted into thermal and electrical energy by PVT collector. For the PVT/absorption chiller system;
GH/-,++ I�+,- /��010/�12 =635.2 + 94.2
1205= B. PBCQ
Overall Cooling Efficiency is defined as;
GH/-,++ 1��+0�R /��010/�12 =3LSS:
)!;J T.UJ36:6L Eq. 4
It is a measure of how much of the total energy input to the system is converted into cooling power. For the PVT/absorption chiller system;
GH/-,++ 1��+0�R /��010/�12 =185.5
1205 + 1392 + 12= B. BEF

34
Overall Thermal Efficiency is defined as;
GH/-,++ �ℎ/-�,+ /��010/�12 = WXYJ3LSS:
)!;J T.U Eq. 5
It is a measure of how much of the total thermal energy is converted into useful thermal energy by the system. For the PVT/absorption chiller system;
GH/-,++ �ℎ/-�,+ /��010/�12 =1533.1 + 185.5
1205 + 1392= B. PPFE
Overall System Efficiency is defined as;
GH/-,++ I2I�/� /��010/�12 = WXYJ3LSS:Z3'K6:6L
)!;J T.UJ36:6L Eq. 6
It is a measure of how much of the total energy input to the system is converted to useful energy by the system. For the PVT/absorption chiller system;
GH/-,++ I2I�/� /��010/�12 =1533.1 + 185.5 + 94.2
1205 + 1392 + 12= B. P[C
Below table is the summary of the efficiency measures described above.
Table 19: Summary of the Efficiencies for the PVT/Absorption Chiller System
Definition Efficiency Value
Solar Thermal Efficiency \�����"�
�]^ 0.5271
Overall Solar Efficiency \�����"� + \_ �̀��$
�]^ 0.6053
Overall Cooling Efficiency \$���
�]^ + a(.) + \���$
0.071
Overall Thermal Efficiency a�!b + \$���
�]^ + a(.)
0.6617
Overall System Efficiency a�!b + \$���J\_ �̀��$
�]^ + a(.) + \���$
0.695
Capturing the available solar energy with a good efficiency does not indicate that the collector produces outlet water at high temperature. Even though the solar thermal efficiency of the system is fairly good, meaning that more than half of the available solar energy is captured and converted into useful thermal energy, overall cooling efficiency is very low. The reason behind this fact is not only the low COP of the

35
absorption chiller but mainly the low outlet water temperature from the PVT collector. Having low outlet water temperature from PVT collector call for the contribution of natural gas fired auxiliary heater and high amount of natural gas consumption reduces the cooling efficiency dramatically. High hot water inlet temperature requirement of the absorption chiller brings along the excess thermal energy input to the system. At this point, domestic hot water production is really important for the system to utilize this excess thermal energy input. Low temperature thermal energy is used to produce domestic hot water, leading to higher system efficiency and economical competitiveness.
Beside the low outlet temperature from the solar collector as a natural consequence of using PVT collectors, inefficient control strategy and deficincies in the system set-up are the other factors leading to low system performance. In order to achieve high system performance and economical competitiveness, some improvements on the system, which are going to be mentioned further in the conclusion part, are essential.

36
5 Economic Assessment
Solar energy projects are generally considered to have high investment costs and low operational costs. The costs in solar energy economics can be divided into three categories: capital cost which includes the costs of the purchased products, engineering and installation costs, operational cost which is mostly the cost of energy input to the system, and maintenance costs. In order to calculate the mentioned costs for the aforesaid project, some assumptions, which are mostly based on relevant literature on the subject, are made. Before starting the economic assessment of the project, these assumptions along with the data collected from Turkish Authorities are presented below.
First assumption is made on the lifespan of the equipments used in the system and the salvage value for them. The equipments have different lifespan ranging between 10 years and 30 years. In the project, all of the equipments are assumed to have 20 years of lifespan and have no salvage value at the end.
Most of the equipment costs are supplied from manufacturers’ price lists. Pricing of the equipments with no price data on the specific size of the equipment is done by interpolating or extrapolating of the known price data.
Exact annual maintenance costs for the equipments are not provided by the manufacturers. Therefore the maintenance costs are taken as 2% of the investment costs, as it is taken so in some standards like VDI (The Association of German Engineers) (Eicker and Pietruschka, 2009).
Due to lack of reliable information about installation and system integration costs for the solar systems, some assumptions are made in this cost component as well. The total installation and system integration cost for both thermal and electrical components of the system is assumed to be 20% of the equipment costs (Eicker and Pietruschka, 2009).
Operational costs are assumed to be the costs of energy input to the system only.
Inflation rate and interest rate announced by the Turkish Central Bank are 8.28% and 17% respectively. Since there is no specific information announced by Turkish authorities on the energy inflation rate, it is first assumed to be the same as the inflation rate given above. Later, another assessment is made with a different energy inflation rate of 16% which is almost double the core inflation rate and close to U.S. energy inflation rate.
The unit price for natural gas announced by Botas (National natural gas Company) is taken as the current price in June 2012 which is 0.650460 TL/m3 (BOTAS, 2012). The unit price for electricity announced by Tedas (National electricity distribution company) is taken as 0.26459 TL/kWh which is the most current price announced by the company in May 2012 (TEDAS, 2012). The unit prices given for both electricity and natural gas are excluding taxes and they are subject to 18% tax which are accounted in the calculations.
All the costs such as equipment costs or energy costs are in different currencies and they are converted to Turkish Lira in the calculations. The exchange rates are assumed to be fixed and avarage values are used. The averaged exchange rates used in the calculations are as follows:
• 1 Euro is equal to 2.3 TL (Turkish Lira)
• 1 US dollar is equal to 1.85 TL
Government support mechanisms are also important for solar energy systems. In most of the countries, solar energy technologies are supported by some certain mechanisms developed by the governments. Turkish law on the use of renewable energies was out dated until 2011. However, in the beginning of 2011, the renewable energy law which was introduced in 2005 was amended by Law no: 6094. Although the amendments were meant to improve the law with the up-to-date support mechanisms, the competence of the current law is still being questioned by different parties. Since it is unnecessary to review the whole renewable energy law, the points relevant to the project are presented below (TBMM, 2012):

37
• There is no specific support mechanism mentioned about solar cooling.
• Feed-in tariffs for electricity produced based on solar power. The price determined by the law is 13.3 US Dollar cents per kWh of electricity. This price may go up depending on the use of solar system components which are manufactured in Turkey. However, in the aforesaid project, most of the main components are from different countries.
• Power transmission line permits, system integration fees and all other permits relevant to the generation facility are discounted by 85%. (In the economic assessment calculations, these costs will be neglected due to this support mechanism)
Since no data is created for the exact electricity consumption or domestic hot water consumption of the hotel building, some assumptions are made. All the domestic hot water and electricity produced by the system is assumed to be used in the hotel building and the whole demand for electricity and domestic hot water is assumed to be covered by the system. Since the system is grid-connected, the net electricity trade between the system and the grid is assumed to be zero during a day, which means that the amount produced by the system is sufficient enough to cover the demand. Being grid-connected enables the system to be independent of the solar hours.
The data presented and the assumptions mentioned above are used in the economic assessment of the PVT/absorption chiller system. The economic method utilized in the assessment is Equivalent Uniform Annual Cost (EUAC) method by which the annual cost of building the system over a specific time is calculated. The total investment cost of the PVT/absorption chiller system is annualized uniformly over 10 and 20 years in two different cases for the two different energy inflation rate values. In other words, four different cases are created for the economic assessment of the system with two different payment periods for the investment costs and two different energy inflation rates. The operational costs are calculated annually considering the effect of the inflation on the fuel prices and then a cash flow chart is prepared with the calculated results for 20 years for each case.
The formulas and data that are used in the calculations and equipment costs are given in the tables below:
Table 20: Basic Formulas and Data Used in the Calculations
Basic Formulas and Data
Lifespan of the system (N) = 20 years
Energy inflation rate (i) = 0.0828 and 0.16
Interest rate (d) = 0.17
Unit electricity price (including VAT) (UEP) = 0.3122162 TL / kWh
Unit natural gas price (including VAT) (UNGP) = 0.7675428 TL / m3
Equipment cost (EC) = Sum of the VAT included prices of all equipments
Installation and system integration cost (ISIC) = 20% of the equipment cost
Operational cost (OC) = Fuel costs to run the system
Investment cost (IC) = EC + ISIC = EC + 0.2 x EC
Maintenance cost (MC) = 0.02 x IC
In the Equivalent Uniform Annual Cost (EUAC) method, the cost is annualized uniformly over a specific time by using a factor called Capital Recovery Factor (CRF). CRF converts a present value into a series of equal annual payments over a specified time.

38
cde =�×(&J�)4
(&J�)Th& Eq. 7
CRF values for 10 and 20 years are calculated using the Eq. 7 as below:
cde (10) =0.17 × (1 + 0.17)&j
(1 + 0.17)&j − 1= 0.2146565967
cde (20) =0.17 × (1 + 0.17)lj
(1 + 0.17)lj − 1= 0.1776903593
The total cost of the system is broken down to three main cost categories which are investment costs, maintenance costs and operational costs. Their annualized forms are calculated by using the below formulas:
• ����,+0m/n ^�H/I��/�� c�I�(�^c) = ^c × cde Eq. 8
• ����,+0m/n o,0��/�,�1/ c�I�(�oc) = 0.02 × ^c Eq. 9
• ����,+0m/n Gp/-,�0��,+ c�I�(�Gc) = Gc × (1 + 0)� Eq.10
Table 21: Equipment Costs
Equipment Name Unit Price Quantitiy Cost (TL)
PVT module 610 € 750 1052250
Central Inverter 22000 € 1 50600
Hot water storage tank 26000 $ 1 48100
Auxilary gas heater 14500 TL 1 14500
Absorption chiller 36750 € 1 84525
Cooling tower 8000 $ 1 14800
Pump 1 630 TL 1 630
Pump 2 675 TL 1 675
Pump (cooling tower) 775 TL 1 775
Heat Exchanger 1 3790 $ 1 7011.5
Heat Exchanger 2 4932 $ 1 9124.2
Total
1282990

39
The annual cost of the PVT/absorption chiller system is compared with only the operational costs of the existing system in the hotel because there is no investment cost for the existing system and the maintenance costs are assumed to be zero. In order to be able to make the comparison some assumptions about the existing system should also be made. The two necessary assumptions are that the domestic hot water production is carried out by natural gas fired boilers and electrically-driven air conditioners are used to cover the cooling demand of the hotel. Natural gas fired boilers are assumed to have 93% efficiency and the demand for hot water is assumed to be equal to the hot water production by the new system. The existing air conditioners used in the hotel are assumed to be low efficiency A class air conditioners with 3.20 (W/W) EER (Energy Efficiency Ratio) rating. Another assumption for this case is that the whole electricity produced by the PVT/absorption chiller system is used in the hotel and none is sold out to the grid.
Below are the costs associated with PVT/absorption chiller system:
^c = ac + ^*^c = 1282990 + 0.2 × 1282990 = 1539589 `q
The only energy input to the PVT/absorption chiller system is natural gas for the auxiliary heater. The electricity needed for the pumps and the chiller is assumed to be covered by the production. The amount of natural gas needed is 130736.5 m3. Therefore the operational cost of the system for the first year is as below:
Gc = 130736.5 × 0.7675428 = 100346 TL
Annual maintenance cost for the PVT/absorption chiller system is:
�oc = ^c × 0.02 = 1539589 × 0.02 = 30792 `q
In order to calculate the costs associated with the existing system, some assumptions are made. The existing system is assumed to have operational costs only. Natural gas needed for the domestic hot water production, electricity needed for cooling and the electricity used in the hotel for non-cooling purposes are the components of the operational costs of the existing system.
The assumption is that the elecetricity consumption in the existing system for non-cooling purposes is equal to the amount produced by the PVT/absorption chiller system. Annual amount of electricity generated by the PVT/absorption chiller system is 94.2 MWh and the annual electricity consumption of the system is 12.0 MWh. The net electricity output from the system becomes 82.2 MWh/a. This is also the amount of electricity consumed in the hotel with the existing system for non-cooling purposes.
A similar assumption is also made for domestic hot water production. Hot water demand is equal to the amount produced by the new system and natural gas fired boiler is used to produce domestic hot water in the existing system. Annually 65135 m3 of domestic hot water at 45 0C is produced by the PVT/absorption chiller system. In order to produce the same amount with a 93% efficient natural gas boiler, the amount of natural gas needed is 152757 m3.
Annual cooling load of the hotel building is 150.8 MWh. In order to provide this amount of cooling by air conditioners with 3.20 (W/W) EER rating, the amount of electricity needed annually is 47.1 MWh.
Operational cost of the existing system for the first year is calculated by using the data above in kWh and costs in TL/kWh:

40
Gc = (82165.4 + 47120.287) × 0.3122162 + 152757 × 0.7675428 = 157612 TL
Below table is a summary of the costs associated with both the existing system and the PVT/absorption chiller system.
Table 22: Cost Summary
Existing System PVT/absorption Chiller System
Investment Costs - 1539589 `q
Annual Operational Costs 157612 TL 100346 TL
Annual Maintenance Costs - 30792 `q
As mentioned earlier, four different cases are created for the economic assessment of the system with two different payment periods for the investment costs (10 and 20 years) and two different energy inflation rates (8.28% and 16%). The operational costs are calculated annually considering the effect of the inflation on the fuel prices and then a cash flow chart is prepared with the calculated results for the lifespan of the system which is 20 years, for each case.
5.1 Case 1
In this case, investment costs are uniformly annualized over 10 years with 8.28% energy inflation rate. Annualized investment, maintenance and operational costs are calculated by using Eq. 8, Eq. 9 and Eq. 10, respectively. Cash flow table is present in the appendix. As seen in the figure below, in the first 10 years, the difference between the total annual cost of the PVT/absorption chiller system and the operational cost of the existing system is significantly large. After 10 years, in other words, when all the investment cost is paid off, since the new system consumes less energy, it starts to be more economical. However, considering the whole life span of the system, the existing system seems to be more economical. The total net present value of the new system is 4698707 TL and the net present value of the operational costs of the existing system is 3152246 TL, meaning that it is not economically feasible to install the PVT/absorption chiller system in these conditions. Below table presents the annual payment trands for the two systems.
Figure 20: Annual Payment Trends for the Two Systems Over 20 Years - I
0
100
200
300
400
500
600
700
800
1 2 3 4 5 6 7 8 9 10 11 12 13 14 15 16 17 18 19 20
Thousands
Annual Cost (New System) (TL)
Annual Cost (Existing System) (TL)

41
5.2 Case 2
In this case, investment costs are uniformly annualized over 20 years with 8.28% energy inflation rate. Annualized investment, maintenance and operational costs are calculated by using Eq. 8, Eq. 9 and Eq. 10, respectively. Cash flow table is present in the appendix. As seen in the figure below, total annual costs for the PVT/absorption chiller system are always higher than the costs for the existing system. Therefore, in this case, the existing system seems to be more economical as well. The total net present value of the new system is 5176292 TL and the net present value of the operational costs of the existing system is 3152246 TL, meaning that it is not economically feasible to install the PVT/absorption chiller system in these conditions, either. Below table presents the annual payment trands for the two systems.
Figure 21: Annual Payment Trends for the Two Systems Over 20 Years - II
As it is seen in the first two cases, when the energy inflation rate is assumed to be 8.28% which is the core inflation rate in Turkey, the PVT/absorption chiller system never gets even close to being economically feasible. However, using the core inflation rate value as the energy inflation rate is not a realistic approach. Core inflation excludes certain items with volatile price movements such as food and energy. Since energy price is the major concern in the annual operational cost calculations, it is more preferable and realistic to use energy inflation rate in this project. . In most of the countries, energy inflation rate is announced yearly as well as the core inflation rate and energy inflation rate turns out to be higher. However, there is no data announced by Turkish Authorities about the energy inflation rate. Furthermore, it is a well-known fact that the rate of increase of energy prices is higher than the rate of increase of consumer goods’ prices in Turkey as well. For instance, natural gas unit price went up to 0.65 TL/m3 in 2012 from 0.54 TL/m3 in 2011, which is a 20% increase over a year. Another example showing that the energy inflation rate is normally higher than the core inflation rate is the U.S. case. In U.S., energy inflation rate was 15.48%, which was a little higher than the normal trend, whilst core inflation rate was 2.93% in 2011(Forecast-chart.com). Therefore, assuming 16% as energy inflation rate in the economic assessment is a more realistic case. In the following two cases, 16% energy inflation rate used in the calculations.
5.3 Case 3
In this case, investment costs are uniformly annualized over 10 years with 16% energy inflation rate. Annualized investment, maintenance and operational costs are calculated by using Eq. 8, Eq. 9 and Eq. 10, respectively. Cash flow table is present in the appendix. As seen in the figure below, in the first 10 years, the difference between the total annual cost of the PVT/absorption chiller system and the operational cost of the existing system is significantly large. After 10 years, as in the first case, the PVT/absorption Chiller System starts to be more economical. The total net present value of the new system is 6864233 TL
0
100
200
300
400
500
600
700
800
1 2 3 4 5 6 7 8 9 10 11 12 13 14 15 16 17 18 19 20
Thousands
Annual Cost (New System) (TL)
Annual Cost (Existing System) (TL)

42
and the net present value of the operational costs of the existing system is 6553618 TL. Below table presents the annual payment trands for the two systems.
Figure 22: Annual Payment Trends for the Two Systems Over 20 Years - III
5.4 Case 4
In this case, investment costs are uniformly annualized over 20 years with 16% energy inflation rate. Annualized investment, maintenance and operational costs are calculated by using Eq. 8, Eq. 9 and Eq. 10, respectively. Cash flow table is present in the appendix. As seen in the figure below, in the first 12 years, the total annual costs of the PVT/absorption chiller system are higher than the annual operational costs of the existing system. After that, the new system starts to be more economical. The total net present value of the new system is 7341818 TL and the net present value of the operational costs of the existing system is 6553618 TL. Below table presents the annual payment trands for the two systems.
Figure 23: Annual Payment Trends for the Two Systems Over 20 Years - IV
Among 3rd and 4th cases where the energy inflation rate is assumed to be 16%, the third case with 10 years of investment cost pay-off period seems to be more economical. Considering the high interest rates in Turkey, it is an expected outcome that the case with a shorter payment period option has the advantage over the ones with longer payment period option. However, even in the third case, the PVT/absorption chiller system is not economically feasible; in other words, the existing system still seems to be cheaper in the 20-year period. Having an even shorter payment period option for the investment costs for the
0
500
1000
1500
2000
2500
3000
1 2 3 4 5 6 7 8 9 10 11 12 13 14 15 16 17 18 19 20
Thousands
Annual Cost (New System) (TL)
Annual Cost (Existing System) (TL)
0
500
1000
1500
2000
2500
3000
1 2 3 4 5 6 7 8 9 10 11 12 13 14 15 16 17 18 19 20
Thousands
Annual Cost (New System) (TL)
Annual Cost (Existing System) (TL)

43
PVT/absorption chiller system, or a down payment in the beginning of the project or including the investment, maintenance and replacement costs for the existing system in the calculations may turn the PVT/absorption chiller system to be an economically feasible project.
The main disadventage of the PVT/absorption chiller system is the high investment cost. Capital cost of PVT modules constitutes 82% of the total equipment cost and this cost component is the main reason for the new system not to be economically feasible. However, PVT is an advancing technology and cost reducing technological advancements are quite likely.

44
6 Conclusion The results show that it is really challenging to achieve high efficiency in solar/solar assisted absorption cooling applications by using flat plate photovoltaic/thermal collectors. The outlet temperature of the PVT collectors is not high enough for absorption chiller. Therefore, the system depends on natural gas and loses its economic competitiveness. It is better to use a cooling technology which requires lower hot water inlet temperature if PVT collectors are used or it is better to use solar collectors that can provide higher outlet temperature if absorption cooling is selected as the cooling technology. If PVT collectors are to be used for solar/solar-assisted cooling technologies, desiccant cooling technology may be a better choice for producing cooling. Hot water used to drive the desiccant cooling systems may have a temprature range of 45 0C – 95 0C. If absorption chillers are to be used for solar/solar-assisted cooling technologies, concentrating solar collectors may be a better choice. Since there are no commercially available hybrid PV and thermal concentrating collectors which can produce high temperature outlet water and elecetricity at the same time, electricity production has to be left out. Concentrated photovoltaic/thermal collectors which are claimed to have outlet temperature up to 100 0C are still in development phase. This new technology would be a good option for improving the efficiency, increasing the solar fraction of the system and thereby increasing the economic competitiveness.
In technological perspective, the system designed in this project is competent to cover the cooling load of the hotel building, to produce sufficient electricity and domestic hot water. However, it is still open for further improvements in terms of control strategies, set-up of the system or choice of components. For instance, utilization of a cold storage unit would increase the solar fraction of the system and descrease natural gas consumption. Lack of a cold storage unit in the system causes the absorption chiller to work for longer periods. Controller 2 in the system has a working ratio of 0.631, in other words, it sends “ON” signal to absorption chiller for 2786 hours out of 4416 hours in the season. Utilization of a cold storage unit in the system can decrease the number of hours that the absorption chiller is working by providing the necessary cooling without running the chiller. As a consequence, demand for inlet hot water to the chiller decreases, which in return reduces the natural gas consumption. The cooling production by the system is 185.5 MWh and the cooling load of the hotel building is 150.8 MWh. Utilization of a cold storage unit would also offset this excess cooling production.
Control strategy used in the system is also a prominent issue in terms of efficiency and system characteristics. In this project, a simple approach as explained previously is used as the control strategy. However, more complicated control strategies would increase the solar fraction of the system. Since solar /solar assisted cooling systems are highly dependent on the weather conditions, more improved charge and discharge control strategies on hot water storage tank or cold storage unit would have a significant influence on the system efficiency. Additionally, instead of having only the hot water inlet temperature as the controlled variable for absorption chiller as it is in this project, manipulating the cooling water inlet temperature is another control strategy that can be utilized for absorption chiller. Having both as controlled variables in an improved control strategy for absorption chiller would certainly increase the efficiency of the chiller and decrease the dependency of the system on natural gas.
On the other hand, in economical perspective, due to the high investment costs and dependency on natural gas, it is not a feasible project. In countries where the interest rate is lower, the project may be economically better off but in Turkey, due to high interest rate, amortization of the investment costs creates a significant financial burden, which makes the project infeasible. Introduction of effective and targeted financial support mechanisms by the government and technological improvements that would decrease the system’s dependency on natural gas can make the project economically feasible in Turkey. In the current law, the only support is given in terms of feed-inn tariffs and licensing. However, introduction of mechanisms such as tax reduction for the equipments purchased, lowered interest rates, subsidies for the utilization of renewable energy sources or financial support mechanisms rewarding emission reducing technology utilizations may bring the PVT/absorption chiller system to a more competitive level against the existing system.

45
As mentioned earlier in the report, Turkey has a fossil-fuel dominated electricity mix and south coast of Turkey experiences electricity shortages and blackouts during summer season. Therefore, even though the project seems to be not economically feasible, considering the invisible costs of using electricity for cooling, depending on an unreliable electricity grid and contributing to GHG emissions by using electricity from a grid with high emission intensity electricity mix, it stands as a worth considering alternative for the existing system.

46
References
Bergene, T., Martin, O., 1995. Model calculations on a flat-plate solar heat collector with integrated solar
Cells. Solar Energy, Volume 55, Issue 6, December 1995, Pages 453-462
Forecast-chart.com. U.S. Energy Inflation Rate. [Online] Available at: < http://www.forecast-chart.com/inflation-usa-energy.html >
Hartley, L.E., Martinez-Lozano, J.A., Utrillas, M.P., Tena, F. & Pedros, R., 1999. The optimization of the angle of inclination of a solar collector to maximize the incident solar radiation. Renewable Energy, Volume 17, Issue 3, 1 July 1999, Pages 291-309
Demirdokum.com, Efficiency of Auxiliary Heater. [Online] Available at: < http://www.demirdokum.com/?urun=ck-500 >
BOTAS, Petroleum Pipilne Corporation, 2012. Unit price of Natural Gas. [Online] Available at: < http://www.botas.gov.tr/icerik/tur/dogalgaz/boruhatti/dg_tarifeGosterMS.asp?yil=2012&ay=6 > (June 2012)
IAE, World Energy Outlook 2011, 2011. How will global energy markets evolve to 2035? [Online] Available at: < http://www.iea.org/weo/docs/weo2011/factsheets.pdf >
TEIAS, Turkish Electricity Transmissin Company, 2010. Electricity Generation & Transmission Statistics of
Turkey. [Online] Available at: < http://www.teias.gov.tr/istatistik2010/%C4%B0statistik%202010.htm >
Moran, M. J., and Shapiro, H. N., Fundamentals of Engineering Thermodynamics, Fifth Ed., Wiley, 2006
ESTIF, European Solar Thermal Industry Federation, 2006. Key Issues for Reneable Heat in Europe, Solar
Assisted Cooling. [Online] Available at: < http://www.estif.org/fileadmin/estif/content/policies/downloads/D23-solar-assisted-cooling.pdf >
Project Solar LTD, Performance Analysis of Renewable Energy Systems, 2010. Solar Cooling – A review of
Technology, and Feasibility Study for Ager Sectur Winery, Blenhein, New Zeland. [Online] Available at: < http://www.solarthermalworld.org/files/innovation-fund-solar-cooling-report-2010.pdf?download >
YEGM, General Directorate of Renewable Energy, 2012. [Online] Available at: < http://www.yegm.gov.tr/english/index-e.html >
DMI, Turkish State Meteorological Service, 2012. [Online] Available at: < http://www.dmi.gov.tr/index.aspx#sfU >
TUIK, Turkish Statistical Institute, 2012. Population Statistics. [Online] Available at: < http://www.turkstat.gov.tr/Start.do >
TMCT, Republic of Turkey Ministry of Culture and Tourism, 2010. Quantitative Statistics about the Visitors in
Antalya. [Online] Available at < http://www.antalyakulturturizm.gov.tr/belge/1-85021/yabanci-ziyaretci-sayilari-ve-milliyet-dagilimi-2010-yi-.html >
Brown, E.W., Northeastern University, 1988. An Introduction to Solar Energy. [Online] Available at: < http://www.ccs.neu.edu/home/feneric/solar.html >
Bosanac M., Sørensen B., Katic I., Sørensen H., Nielsen B., Badran J., 2003. Photovoltaic/Thermal Solar Collectors and Their Potential in Denmark. Final Report EFP project 1713/00-0014. Danish Technological Institute, Solar Energy Centre.
Arif Hasan M., Sumathy K., 2010. Photovoltaic Thermal Module Concepts and Performance Analysis: A Review.
Renewable and Sustainable Energy Reviews, Volume 14, Issue 7, September 2010, Pages 1845–1859
Chow, T.T., 2009. A Review on Photovoltaic/Thermal Hybrid Solar Technology. Applied Energy, Volume 87, Issue 2, February 2010, Pages 365–379

47
CIBSE, Chartered Institution of Building Services Engineers, 2012. Absorption Cooling. [Online] Available at: < http://www.cibse.org/content/documents/Groups/CHP/Datasheet%207%20-%20Absorption%20Cooling.pdf >
Sustainable-buildings.org, Absorption Chillers. [Online] Available at: < http://www.sustainable-buildings.org/wiki/index.php/Absorption_Chillers >
Rafferty, K. D., 1998. Absorption refrigeration. The Geo-Heat Center Quarterly Bulletin, Vol. 19, No. 1., March 1998
Chpcentermw.org, U.S. Department of Energy, Midwest Clean Energy Application center. Technical Professionals -Technology Status - Thermally-Activated Machines - Refrigeration Cycle Descriptions [Online] Available at: < http://www.chpcentermw.org/08-01141_tech.html >
www-old.me.gatech.edu, Georgia Institute of Technology, School of Mechanical Engineering. Design Analysis of the Einstein Refrigeration Cycle [Online] Available at: < http://www-old.me.gatech.edu/energy/andy_phd/one.htm#I >
Foodmanufacturing.com, Energy Recycling with Adsorption Chillers. [Online] Available at: < http://www.foodmanufacturing.com/articles/2009/09/energy-recycling-adsorption-chillers >
Eicker, U., Pietruschka, D., 2009. Design and Performance of Solar Powered Absorption Cooling Systems in Office
Buildings. Energy and Buildings, Volume 41, Issue 1, January 2009, Pages 81-91
TEDAS, Turkish Electricity Distribution Corporation, 2012. Electricity Price rates. [Online] Available at: < http://www.tedas.gov.tr/274,2012_Tarifeler.html >
TBMM, The Grand National Assembly of Turkey, 2012. Renewable Energy Law. [Online] Available at: < http://www.tbmm.gov.tr/kanunlar/k6094.html >

48
Appendix
Below tables are the cash flow tables for cases 1, 2, 3 and 4, respectively, in the economical assessment chapter.
Table 23: Cash Flow Table I
Year PVT-Absorption Chiller System Existing System
N AIC* AMC* AOC * Total Annual Cost* AOC*
1 330482.90 30791.78 100345.86 461620.54 157612.31
2 330482.90 30791.78 108654.50 469929.18 170662.61
3 330482.90 30791.78 117651.09 478925.77 184793.47
4 330482.90 30791.78 127392.60 488667.28 200094.37
5 330482.90 30791.78 137940.71 499215.39 216662.19
6 330482.90 30791.78 149362.20 510636.88 234601.82
7 330482.90 30791.78 161729.39 523004.07 254026.85
8 330482.90 30791.78 175120.58 536395.26 275060.27
9 330482.90 30791.78 189620.56 550895.24 297835.26
10 330482.90 30791.78 205321.15 566595.83 322496.02
11 0.00 30791.78 222321.74 253113.52 349198.69
12 0.00 30791.78 240729.98 271521.76 378112.34
13 0.00 30791.78 260662.42 291454.20 409420.04
14 0.00 30791.78 282245.27 313037.05 443320.02
15 0.00 30791.78 305615.18 336406.96 480026.92
16 0.00 30791.78 330920.11 361711.89 519773.15
17 0.00 30791.78 358320.30 389112.08 562810.37
18 0.00 30791.78 387989.22 418781.00 609411.06
19 0.00 30791.78 420114.73 450906.51 659870.30
20 0.00 30791.78 454900.23 485692.01 714507.56
* All the costs are in Turkish Liras

49
Table 24: Cash Flow Table II
Year PVT-Absorption Chiller System Existing System
N AIC* AMC* AOC * Total Annual Cost* AOC*
1 273570.09 30791.78 100345.86 404707.73 157612.31
2 273570.09 30791.78 108654.50 413016.37 170662.61
3 273570.09 30791.78 117651.09 422012.96 184793.47
4 273570.09 30791.78 127392.60 431754.47 200094.37
5 273570.09 30791.78 137940.71 442302.58 216662.19
6 273570.09 30791.78 149362.20 453724.07 234601.82
7 273570.09 30791.78 161729.39 466091.26 254026.85
8 273570.09 30791.78 175120.58 479482.45 275060.27
9 273570.09 30791.78 189620.56 493982.43 297835.26
10 273570.09 30791.78 205321.15 509683.02 322496.02
11 273570.09 30791.78 222321.74 526683.61 349198.69
12 273570.09 30791.78 240729.98 545091.85 378112.34
13 273570.09 30791.78 260662.42 565024.29 409420.04
14 273570.09 30791.78 282245.27 586607.14 443320.02
15 273570.09 30791.78 305615.18 609977.05 480026.92
16 273570.09 30791.78 330920.11 635281.98 519773.15
17 273570.09 30791.78 358320.30 662682.17 562810.37
18 273570.09 30791.78 387989.22 692351.09 609411.06
19 273570.09 30791.78 420114.73 724476.60 659870.30
20 273570.09 30791.78 454900.23 759262.10 714507.56
* All the costs are in Turkish Liras

50
Table 25: Cash Flow Table III
Year PVT-Absorption Chiller System Existing System
N AIC* AMC* AOC * Total Annual Cost* AOC*
1 330482.90 30791.78 100345.86 461620.54 157612.31
2 330482.90 30791.78 116401.20 477675.88 182830.28
3 330482.90 30791.78 135025.39 496300.07 212083.12
4 330482.90 30791.78 156629.45 517904.13 246016.42
5 330482.90 30791.78 181690.16 542964.84 285379.05
6 330482.90 30791.78 210760.59 572035.27 331039.70
7 330482.90 30791.78 244482.28 605756.96 384006.05
8 330482.90 30791.78 283599.45 644874.13 445447.02
9 330482.90 30791.78 328975.36 690250.04 516718.54
10 330482.90 30791.78 381611.42 742886.10 599393.51
11 0.00 30791.78 442669.25 473461.03 695296.47
12 0.00 30791.78 513496.33 544288.11 806543.91
13 0.00 30791.78 595655.74 626447.52 935590.93
14 0.00 30791.78 690960.66 721752.44 1085285.48
15 0.00 30791.78 801514.36 832306.14 1258931.16
16 0.00 30791.78 929756.66 960548.44 1460360.15
17 0.00 30791.78 1078517.73 1109309.51 1694017.77
18 0.00 30791.78 1251080.56 1281872.34 1965060.61
19 0.00 30791.78 1451253.45 1482045.23 2279470.31
20 0.00 30791.78 1683454.00 1714245.78 2644185.56
* All the costs are in Turkish Liras

51
Table 26: Cash Flow Table IV
Year PVT-Absorption Chiller System Existing System
N AIC* AMC* AOC * Total Annual Cost* AOC*
1 273570.09 30791.78 100345.86 404707.73 157612.31
2 273570.09 30791.78 116401.20 420763.07 182830.28
3 273570.09 30791.78 135025.39 439387.26 212083.12
4 273570.09 30791.78 156629.45 460991.32 246016.42
5 273570.09 30791.78 181690.16 486052.03 285379.05
6 273570.09 30791.78 210760.59 515122.46 331039.70
7 273570.09 30791.78 244482.28 548844.15 384006.05
8 273570.09 30791.78 283599.45 587961.32 445447.02
9 273570.09 30791.78 328975.36 633337.23 516718.54
10 273570.09 30791.78 381611.42 685973.29 599393.51
11 273570.09 30791.78 442669.25 747031.12 695296.47
12 273570.09 30791.78 513496.33 817858.20 806543.91
13 273570.09 30791.78 595655.74 900017.61 935590.93
14 273570.09 30791.78 690960.66 995322.53 1085285.48
15 273570.09 30791.78 801514.36 1105876.23 1258931.16
16 273570.09 30791.78 929756.66 1234118.53 1460360.15
17 273570.09 30791.78 1078517.73 1382879.60 1694017.77
18 273570.09 30791.78 1251080.56 1555442.43 1965060.61
19 273570.09 30791.78 1451253.45 1755615.32 2279470.31
20 273570.09 30791.78 1683454.00 1987815.87 2644185.56
* All the costs are in Turkish Liras
Related Documents