Contents lists available at ScienceDirect Solar Energy journal homepage: www.elsevier.com/locate/solener Techno-economic analysis of solar thermal power plants using liquid sodium as heat transfer fluid Andreas Fritsch ⁎ , Cathy Frantz, Ralf Uhlig German Aerospace Center (DLR), Institute for Solar Research, Pfaffenwaldring 38-40, 70569 Stuttgart, Germany ARTICLE INFO Keywords: Concentrated solar power Central receiver system LCOE calculation Molten salt Liquid metals Sodium 2010 MSC: 00-01 99-00 ABSTRACT Solar thermal power plants with central receiver and thermal storage are expected to be one key technology in future electricity generation, because they are renewable and due to the thermal storage independent of the current solar radiation. State-of-the-art solar power plants often use molten nitrate salts as heat transfer fluid. The use of liquid sodium instead leads to lower electricity generation costs. Sodium has a high thermal con- ductivity and thus large heat transfer rates are possible. Hence, a smaller absorber surface is sufficient for the same thermal power. As a result, the sodium receiver achieves a higher efficiency at lower investment cost. Additionally, the aiming strategy, which reduces the peak heat flux on molten salt receivers isn’t necessary for sodium. Even at high heat flux densities, the absorber tubes will be cooled sufficiently due to the high heat transfer coefficients. Therefore, the sodium receiver in this analysis is designed for one single aim point, resulting in a heat flux density of q 1.06 MW/m mean 2 = and q 2.99 MW/m peak 2 = . The state-of-the-art system with molten salt considers q 0.51 MW/m mean 2 = and q 1.0 MW/m peak 2 = . The presented techno-economic analysis of two so- dium based concepts compared to a reference system with molten salt results in up to 16% lower electricity generation costs. 1. Introduction Concentrating solar power (CSP) is a renewable energy option that uses concentrate sunlight to produce high temperature heat, which ca be used in a power block to generate electricity. The basic concept is illustrated in Fig. 1. Computer controlled mirrors (heliostats) follow the movement of the sun and reflect the sunlight to the receiver. Usually, the heliostat field surround the tower. In the receiver, the concentrated solar radiation is converted to heat and transferred to a heat transfer fluid (HTF). The energy in the fluid can be stored in tanks and trans- ferred to water/steam by a steam generator to generate electricity in the turbine generator. Because CSP uses thermal energy, it can also in- corporate thermal energy storage (TES) for higher levels of stability, dispatchability and increased duration of energy output. In June 2011, the Gemasolar plant already achieved 24 h uninterrupted electricity production (Burgaleta et al., 2011). Due to the low cost of molten salts this technology is on the advance. More than 70% of the plants under construction will use solar salt as HTF. However, the use of solar salt entails some disadvantages like the limited temperature range, corro- sion and the operating behavior. The Sunshot Initiative (Sunshot, 2014) of 2014 aims to reduce the levelized cost of electricity (LCOE) of such power plants to 0.06 $/kWh. In order to meet this goal further cost reduction is necessary. Basically, there are two options to reduce the LCOE: • Higher overall efficiency (higher annual yield) • Lower investment cost (direct cost reduction) The use of liquid sodium as HTF in the solar receiver acts on both options to reduce the LCOE. 2. Advantages of sodium The first advantage of sodium as HTF in solar power plants is its high temperature range in the liquid state (see Table 1). The low melting point of 98 °C leads to less trace heating compared to solar salt and therefore lower parasitic losses. On the other hand, sodium is sui- table for high temperature high efficient energy conversion systems due to its high boiling point above 800 °C. Sodium is chemically stable and can even be operated at higher temperatures in the vapor state (e.g. Dish-Stirling engines Laing and Palsson, 2002 or AMTEC-cells de los Ríos Ramos et al., 2015). Binary salt mixtures like Solar Salt aren’t chemically stable at higher temperatures. They can withstand tem- peratures around 600 °C, but the salt has to be replaced from time to https://doi.org/10.1016/j.solener.2018.10.005 Received 4 July 2017; Received in revised form 28 September 2018; Accepted 2 October 2018 ⁎ Corresponding author. E-mail address: [email protected] (A. Fritsch). Solar Energy 177 (2019) 155–162 Available online 14 November 2018 0038-092X/ © 2018 Published by Elsevier Ltd. T

Welcome message from author
This document is posted to help you gain knowledge. Please leave a comment to let me know what you think about it! Share it to your friends and learn new things together.
Transcript
Contents lists available at ScienceDirect
Solar Energy
journal homepage: www.elsevier.com/locate/solener
Techno-economic analysis of solar thermal power plants using liquid sodiumas heat transfer fluidAndreas Fritsch⁎, Cathy Frantz, Ralf UhligGerman Aerospace Center (DLR), Institute for Solar Research, Pfaffenwaldring 38-40, 70569 Stuttgart, Germany
A R T I C L E I N F O
Keywords:Concentrated solar powerCentral receiver systemLCOE calculationMolten saltLiquid metalsSodium
2010 MSC:00-0199-00
A B S T R A C T
Solar thermal power plants with central receiver and thermal storage are expected to be one key technology infuture electricity generation, because they are renewable and due to the thermal storage independent of thecurrent solar radiation. State-of-the-art solar power plants often use molten nitrate salts as heat transfer fluid.The use of liquid sodium instead leads to lower electricity generation costs. Sodium has a high thermal con-ductivity and thus large heat transfer rates are possible. Hence, a smaller absorber surface is sufficient for thesame thermal power. As a result, the sodium receiver achieves a higher efficiency at lower investment cost.Additionally, the aiming strategy, which reduces the peak heat flux on molten salt receivers isn’t necessary forsodium. Even at high heat flux densities, the absorber tubes will be cooled sufficiently due to the high heattransfer coefficients. Therefore, the sodium receiver in this analysis is designed for one single aim point, resultingin a heat flux density of q 1.06 MW/mmean
2= and q 2.99 MW/mpeak2= . The state-of-the-art system with molten
salt considers q 0.51 MW/mmean2= and q 1.0 MW/mpeak
2= . The presented techno-economic analysis of two so-dium based concepts compared to a reference system with molten salt results in up to 16% lower electricitygeneration costs.
1. Introduction
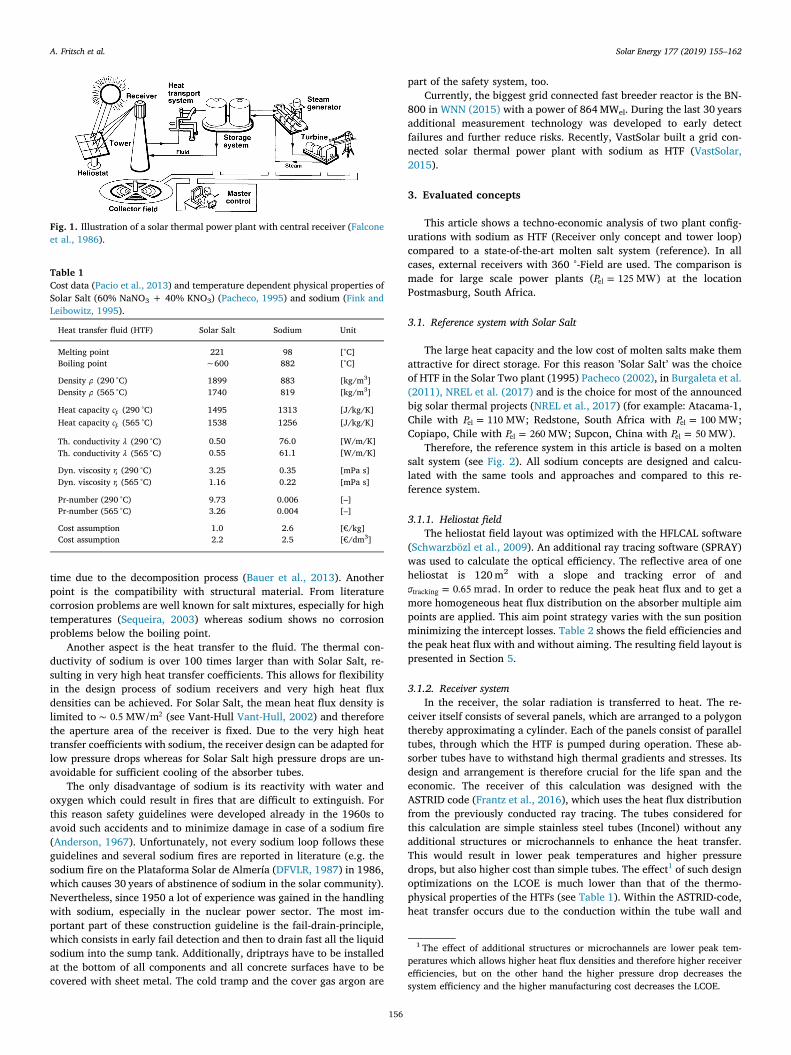
Concentrating solar power (CSP) is a renewable energy option thatuses concentrate sunlight to produce high temperature heat, which cabe used in a power block to generate electricity. The basic concept isillustrated in Fig. 1. Computer controlled mirrors (heliostats) follow themovement of the sun and reflect the sunlight to the receiver. Usually,the heliostat field surround the tower. In the receiver, the concentratedsolar radiation is converted to heat and transferred to a heat transferfluid (HTF). The energy in the fluid can be stored in tanks and trans-ferred to water/steam by a steam generator to generate electricity in theturbine generator. Because CSP uses thermal energy, it can also in-corporate thermal energy storage (TES) for higher levels of stability,dispatchability and increased duration of energy output. In June 2011,the Gemasolar plant already achieved 24 h uninterrupted electricityproduction (Burgaleta et al., 2011). Due to the low cost of molten saltsthis technology is on the advance. More than 70% of the plants underconstruction will use solar salt as HTF. However, the use of solar saltentails some disadvantages like the limited temperature range, corro-sion and the operating behavior.
The Sunshot Initiative (Sunshot, 2014) of 2014 aims to reduce thelevelized cost of electricity (LCOE) of such power plants to 0.06 $/kWh.
In order to meet this goal further cost reduction is necessary. Basically,there are two options to reduce the LCOE:
• Higher overall efficiency (higher annual yield)• Lower investment cost (direct cost reduction)
The use of liquid sodium as HTF in the solar receiver acts on bothoptions to reduce the LCOE.
2. Advantages of sodium
The first advantage of sodium as HTF in solar power plants is itshigh temperature range in the liquid state (see Table 1). The lowmelting point of 98 °C leads to less trace heating compared to solar saltand therefore lower parasitic losses. On the other hand, sodium is sui-table for high temperature high efficient energy conversion systems dueto its high boiling point above 800 °C. Sodium is chemically stable andcan even be operated at higher temperatures in the vapor state (e.g.Dish-Stirling engines Laing and Palsson, 2002 or AMTEC-cells de losRíos Ramos et al., 2015). Binary salt mixtures like Solar Salt aren’tchemically stable at higher temperatures. They can withstand tem-peratures around 600 °C, but the salt has to be replaced from time to
https://doi.org/10.1016/j.solener.2018.10.005Received 4 July 2017; Received in revised form 28 September 2018; Accepted 2 October 2018
⁎ Corresponding author.E-mail address: [email protected] (A. Fritsch).
Solar Energy 177 (2019) 155–162
Available online 14 November 20180038-092X/ © 2018 Published by Elsevier Ltd.
T
time due to the decomposition process (Bauer et al., 2013). Anotherpoint is the compatibility with structural material. From literaturecorrosion problems are well known for salt mixtures, especially for hightemperatures (Sequeira, 2003) whereas sodium shows no corrosionproblems below the boiling point.
Another aspect is the heat transfer to the fluid. The thermal con-ductivity of sodium is over 100 times larger than with Solar Salt, re-sulting in very high heat transfer coefficients. This allows for flexibilityin the design process of sodium receivers and very high heat fluxdensities can be achieved. For Solar Salt, the mean heat flux density islimited to 0.5 MW/m2 (see Vant-Hull Vant-Hull, 2002) and thereforethe aperture area of the receiver is fixed. Due to the very high heattransfer coefficients with sodium, the receiver design can be adapted forlow pressure drops whereas for Solar Salt high pressure drops are un-avoidable for sufficient cooling of the absorber tubes.
The only disadvantage of sodium is its reactivity with water andoxygen which could result in fires that are difficult to extinguish. Forthis reason safety guidelines were developed already in the 1960s toavoid such accidents and to minimize damage in case of a sodium fire(Anderson, 1967). Unfortunately, not every sodium loop follows theseguidelines and several sodium fires are reported in literature (e.g. thesodium fire on the Plataforma Solar de Almería (DFVLR, 1987) in 1986,which causes 30 years of abstinence of sodium in the solar community).Nevertheless, since 1950 a lot of experience was gained in the handlingwith sodium, especially in the nuclear power sector. The most im-portant part of these construction guideline is the fail-drain-principle,which consists in early fail detection and then to drain fast all the liquidsodium into the sump tank. Additionally, driptrays have to be installedat the bottom of all components and all concrete surfaces have to becovered with sheet metal. The cold tramp and the cover gas argon are
part of the safety system, too.Currently, the biggest grid connected fast breeder reactor is the BN-
800 in WNN (2015) with a power of 864 MWel. During the last 30 yearsadditional measurement technology was developed to early detectfailures and further reduce risks. Recently, VastSolar built a grid con-nected solar thermal power plant with sodium as HTF (VastSolar,2015).
3. Evaluated concepts
This article shows a techno-economic analysis of two plant config-urations with sodium as HTF (Receiver only concept and tower loop)compared to a state-of-the-art molten salt system (reference). In allcases, external receivers with 360 °-Field are used. The comparison ismade for large scale power plants (P 125 MWel = ) at the locationPostmasburg, South Africa.
3.1. Reference system with Solar Salt
The large heat capacity and the low cost of molten salts make themattractive for direct storage. For this reason ’Solar Salt’ was the choiceof HTF in the Solar Two plant (1995) Pacheco (2002), in Burgaleta et al.(2011), NREL et al. (2017) and is the choice for most of the announcedbig solar thermal projects (NREL et al., 2017) (for example: Atacama-1,Chile with P 110 MWel = ; Redstone, South Africa with P 100 MWel = ;Copiapo, Chile with P 260 MWel = ; Supcon, China with P 50 MWel = ).
Therefore, the reference system in this article is based on a moltensalt system (see Fig. 2). All sodium concepts are designed and calcu-lated with the same tools and approaches and compared to this re-ference system.
3.1.1. Heliostat fieldThe heliostat field layout was optimized with the HFLCAL software
(Schwarzbözl et al., 2009). An additional ray tracing software (SPRAY)was used to calculate the optical efficiency. The reflective area of oneheliostat is 120 m2 with a slope and tracking error of and
0.65 mradtracking = . In order to reduce the peak heat flux and to get amore homogeneous heat flux distribution on the absorber multiple aimpoints are applied. This aim point strategy varies with the sun positionminimizing the intercept losses. Table 2 shows the field efficiencies andthe peak heat flux with and without aiming. The resulting field layout ispresented in Section 5.
3.1.2. Receiver systemIn the receiver, the solar radiation is transferred to heat. The re-
ceiver itself consists of several panels, which are arranged to a polygonthereby approximating a cylinder. Each of the panels consist of paralleltubes, through which the HTF is pumped during operation. These ab-sorber tubes have to withstand high thermal gradients and stresses. Itsdesign and arrangement is therefore crucial for the life span and theeconomic. The receiver of this calculation was designed with theASTRID code (Frantz et al., 2016), which uses the heat flux distributionfrom the previously conducted ray tracing. The tubes considered forthis calculation are simple stainless steel tubes (Inconel) without anyadditional structures or microchannels to enhance the heat transfer.This would result in lower peak temperatures and higher pressuredrops, but also higher cost than simple tubes. The effect1 of such designoptimizations on the LCOE is much lower than that of the thermo-physical properties of the HTFs (see Table 1). Within the ASTRID-code,heat transfer occurs due to the conduction within the tube wall and
Fig. 1. Illustration of a solar thermal power plant with central receiver (Falconeet al., 1986).
Table 1Cost data (Pacio et al., 2013) and temperature dependent physical properties ofSolar Salt (60% NaNO3 + 40% KNO3) (Pacheco, 1995) and sodium (Fink andLeibowitz, 1995).
Heat transfer fluid (HTF) Solar Salt Sodium Unit
Melting point 221 98 [°C]Boiling point ∼600 882 [°C]
Density (290 °C) 1899 883 [kg/m3]Density (565 °C) 1740 819 [kg/m3]
Heat capacity cp (290 °C) 1495 1313 [J/kg/K]Heat capacity cp (565 °C) 1538 1256 [J/kg/K]
Th. conductivity (290 °C) 0.50 76.0 [W/m/K]Th. conductivity (565 °C) 0.55 61.1 [W/m/K]
Dyn. viscosity (290 °C) 3.25 0.35 [mPa s]Dyn. viscosity (565 °C) 1.16 0.22 [mPa s]
Pr-number (290 °C) 9.73 0.006 [–]Pr-number (565 °C) 3.26 0.004 [–]
Cost assumption 1.0 2.6 [€/kg]Cost assumption 2.2 2.5 [€/dm3]
1 The effect of additional structures or microchannels are lower peak tem-peratures which allows higher heat flux densities and therefore higher receiverefficiencies, but on the other hand the higher pressure drop decreases thesystem efficiency and the higher manufacturing cost decreases the LCOE.
A. Fritsch et al. Solar Energy 177 (2019) 155–162
156

conduction and convection within the HTF. The heat transfer coeffi-cients are calculated with Nusselt number correlations. Radiation ex-change between surfaces as well as natural and forced convection dueto wind is also considered in the model. During the optimization pro-cess with FEM, the aperture size as well as the panel and tube numberwas varied. The resulting receiver geometry of this thermo-hydraulicoptimization is presented in Section 5. During the design process, amaximum film temperature of 565 °C was considered for the Solar Saltreceiver. For the sodium system, no temperature limit was set. Theresulting tube temperatures are shown in Table 5. The panel arrange-ment is the same as in the Solar Two receiver with two flow paths and across section at half way through the receiver (Reilly and Kolb, 2001).The thermal energy storage operates at atmospheric pressure, thus thesalt circulates in an open loop. The high tower height leads to a highhead of the mechanical pumps, which represent a large proportion ofthe parasitic losses. This issue was considered within the field optimi-zation.
3.1.3. Thermal energy storage (TES)Despite the result, that one tank thermocline storage systems in-
dicate lower cost (Pacheco et al., 2002), all commercial molten saltplants (see Section 3.1) are using 2-tank storage systems up to now.Therefore, all presented concepts consider a 2-tank storage system withSolar Salt. The storage size is optimized for each concept to minimizethe LCOE.
3.1.4. Power blockDue to the temperature limitation of Solar Salt to 565 °C, a rankine
cycle with steam turbine (125 MWel with intermediate superheating to552 °C at 155 bar) and dry cooling is used in this analysis. In the annual
yield calculation, the turbine efficiency is calculated for each hour ofthe year depending on load and ambient temperature.
3.2. Receiver-only concept with sodium
The receiver-only concept is based on the reference system withSolar Salt. All components are identical except the receiver system,which is replaced by a sodium receiver and an additional heat ex-changer to Solar Salt (see Fig. 3). In order to get the same temperatureranges in the thermal storage, the temperature of the sodium loop hasto be increased by the temperature gradient between the two fluids. Inthe presented study, 10 K was supposed, resulting in a temperaturerange of 300–575 °C for the sodium loop.
As already discussed in Section 2, the use of sodium as HTF offersmore flexibility in the receiver design. The aiming strategy isn’t ne-cessary anymore. Even at high heat flux densities, the absorber tubeswill be cooled sufficiently due to the very high heat transfer coefficientsof sodium. Therefore, one single aim point is applied in the middle ofthe sodium receiver. As a result, the aperture area of the absorber canbe decreased without significantly reducing the field efficiency.Nevertheless, the tracking accuracy of the heliostats becomes moreimportant with smaller receiver apertures.
Additionally, the sodium receiver can be designed for a lowerpressure drop than the molten salt receiver. This low pressure dropallows the application of a EM pump which works without moving partsincreasing the safety of the sodium loop. The efficiency characteristic ofthe EM pump used in the presented analysis was taken from (Ota et al.,2004).
3.3. Tower loop concept with sodium
A major part of the parasitic losses in the reference system and thereceiver-only concept is due to the high head of the salt pump whichworks in an open loop, because the 2-tank storage is at atmosphericpressure. Typically, the salt is pumped up the tower and then throttledat the tower base before it enters the hot storage tank. The sodiumreceiver and the intermediate heat exchanger could be designed as aclose loop system in which the work required to circulate the liquidmetal is only due to the wall friction of the piping. In this case however,the intermediate heat exchanger has to be placed at the ground andriser and downcomer are filled with sodium. The ’tower loop’ concept is
Fig. 2. Reference concept with Solar Salt as HTF and storage material. Powerblock with steam turbine and dry cooling.
Table 2Optical efficiency and heat flux density on receiver surface (Reference systemwith Solar Salt, 700 MWth receiver on 21 March)
Time Azimut in [°] Elevation in [°] field (without aiming) field (with aiming)6h30 86.43 6.60 0.2755 0.27567h00 82.76 13.17 0.4331 0.42678h00 74.70 26.12 0.5818 0.56409h00 64.64 38.51 0.6292 0.606712h00 0 61.71 0.6760 0.6474
Peak heat flux density at 12h00: 2.23 MW/m2 0.93 MW/m2
Fig. 3. Receiver-only concept with sodium as HTF in the receiver and heatexchanger to Salt as storage material. Power block with steam turbine and drycooling.
A. Fritsch et al. Solar Energy 177 (2019) 155–162
157

designed in this way (see Fig. 4), resulting in further pumping reduc-tion. As with the receiver-only and the reference concept, power blockand thermal storage system stays unchanged.
4. Evaluation methodology
Fig. 5 shows the methodology for the concept assessment. As al-ready mentioned, the field design is strongly dependent on the receiverdesign. The optimal receiver size depends on tracking accuracy, power,parasitics and cost. Reducing the absorber area results in higher re-ceiver efficiency and lower receiver cost. But at the same time, thisleads to higher spillage losses and therefore to a lower optical efficiencyof the heliostat field, which increases the required number of heliostatsand therefore the cost. In order to find the optimal trade-off betweenreceiver size and optical efficiency a receiver aperture size study wasconducted. For each receiver size, several iterations are necessary to getthe optimal field layout and tower height.
4.1. Annual yield calculation
The annual energy yield is calculated by the sum of the hourly netelectricity output of the power block during one year. The power blockefficiency depends on the load and ambient temperature and pressure.The algorithm ignores the electricity demand from the grid and alwaystries full load operation (from storage or directly from receiver). Thestart-up energy for the receiver system and the power block is con-sidered as well as parasitic losses (Pumps, trace heating, heliostattracking). For each hour, the heat from the receiver is calculated by theDNI (time dependent), the reflective area of the heliostats (const.), thefield efficiency (azimut, elevation) and the receiver efficiency (load,wind speed).
The capacity of the TES is optimized within the annual yield cal-culation to get the minimal LCOE (best ratio between storage size andenergy dumping = defocus of heliostats).
4.2. Cost functions
The cost of the heliostat field ranges between 98 €/m2 to 170 €/m2
reflective area (Kolb et al., 2011). In the present analysis, the meanvalue of this range is used:
C 130 /m mirror surface 3 /m LandField2 2= + (1)
The tower height has a significant influence to the field efficiencybut also to the parasitic losses due to pumping in the open salt loop.Commercial plants have tower heights between 100 and 200 m. Thiswork uses the following tower height dependent cost function (Singer,2014):
C H250, 000 14.77· [ ]tower tower2.392= + (2)
The receiver system includes the panels with insulation, buffer andcollection tank, the structural support as well as the equipment (pumps,valves, piping, compressor, trace heating, instrumentation and con-trols). Babcock (1984) estimates a cost break down for a four zonecavity. It turns out, that the biggest cost fraction is the erection with44% of the total receiver cost. After transferring these cost data to aexternal molten salt receiver by introducing absorber area and powerdependent cost functions as well as constant cost parameters, the fol-lowing cost function for the receiver system was developed:
Cq
46, 438 21.899 /kWrec = +(3)
The mean heat flux density q in [kW/m2] is calculated by the quotientof thermal receiver power and the cylindrical surface of the receiveraperture. Fig. 6 shows this cost function.
The cost of the salt receiver of the reference system is therefore 115€/kW, a value which is in the range of molten salt receiver cost datafound in literature: Kolb et al. (2011): 96–154 €/kW, IRENA (IRENA,2012): 116 €/kW.
The presented optimized sodium receiver results in a mean heat flux
Fig. 4. Tower loop concept with sodium as HTF in the receiver. Riser anddowncomer with sodium as well. Heat exchanger to Salt as storage material.Power block with steam turbine and dry cooling. Sump tank with capacity of allsodium in the loop. In case of leakage or maintenance all sodium will bedrained to this sump tank.
Fig. 5. Evaluation methodology and parameters used for the component designand annual yield and LCOE calculation.
Fig. 6. Specific receiver cost function of external receivers with mean heat fluxdensity q (quotient of thermal receiver power and the cylindrical surface of thereceiver aperture).
A. Fritsch et al. Solar Energy 177 (2019) 155–162
158

of q 1.06 MW/m2= and therefore 66 €/kW receiver cost.The liquid/liquid heat exchanger for sodium/Solar Salt is a safety-
relevant component. In order to avoid the direct contact of sodium andSolar Salt, a double-tube safety heat exchanger is used in the analysis.The cost is estimated (Personal, 2015) to:
C 10.7140 [ /kW]HX = (4)
The cost of the 2-tank thermal storage system is developed in ac-cordance to Fritsch et al. (2015) with ETES as the storage capacity inMWhth:
C E155.6· 10.55 [ /kWh ]TES TES0.3549
th= + (5)
Based on the study by Black & Veatch for NREL (BV, 2012), the costof the power block can be estimated to:
K 950 /kWPB el= (6)
Additional assumptions for financing, operation and maintenanceused in the LCOE calculation are presented in Table 3.
5. Results
5.1. Heliostat field
Fig. 7 shows the field layout of the reference system with Solar Saltin comparison to the sodium system with the optical efficiency (colormap) of each heliostat on 21.3 at 12 h. The field layout is stronglydependent on the receiver aperture size. The spillage increases with thedistance between heliostat and receiver as well as with decreasing re-ceiver sizes. The atmospheric attenuation also increases with the size ofthe heliostat field. From this point of view, the heliostats have to beplaced as near as possible around the tower. However, blocking andshading of solar radiation increases, the narrower the heliostats are puttogether. The field optimization algorithm calculates the best compro-mise based on annual heat production cost. This means for the sodiumsystem, that spillage dominates, resulting in a nearly circular field andheliostats are located very close to each other, accepting higher lossesdue to blocking and shading (see Fig. 7). Table 4 shows the opticalefficiency of both heliostat fields.
5.2. Receiver comparison
The receiver can’t be designed independently from the heliostatfield, because there is a strong sensitivity between receiver, heliostatfield and tower. Therefore, each plant has to be designed and optimizedfor the specific location and a detailed analysis with several iterations offield layout, ray tracing and receiver arrangement based on annualsystem performance is necessary. The receiver of the reference systemwith Solar Salt results in a mean heat flux density of q 0.51 MW/m2=with aiming strategy to limit the peak flux to approx.q 1.0 MW/mpeak
2= . These values are in the range of all commercialmolten salt power plants (e.g. Lata et al., 2008: q 0.48 MW/m2= ,SolarReserve, 2017: q 0.52 MW/m2= ). For liquid metal receivers no
aim point strategy is necessary, resulting in a mean heat flux density ofq 1.06 MW/m2= and a peak value of q 2.99 MW/mpeak
2= . Table 5shows the comparison of both receivers in detail. Although the re-ceivers have the same thermal power, they differ significantly in size,weight and efficiency. The weight of the salt receiver absorber tubes isabout 2.75 times higher than that of the sodium receiver. Despite thehigher tube temperatures of the sodium receiver, the heat losses arelower because of the reduced absorber area. Additionally, the sodiumreceiver achieves very high Reynolds-numbers ( 10 times higher thanfor the salt receiver). In part load situations, the Reynolds-number de-creases nearly linearly with the solar radiation. Therefore, the criticalReynolds-number (laminar flow) would be reached at lower radiationwith the sodium receiver, increasing the operating time and the energyyield.
Another interesting aspect of the operating behavior is the retentiontime of the HTF in the receiver. The annual yield calculation of thepresented analysis however ignores the dynamic behavior of the re-ceiver. Instead, the calculation is based on the assumption that it’s al-ways possible to control the receiver outlet temperature to exactly565 °C for Solar Salt and 575 °C for sodium. Additionally, a fixed startup energy is considered.
The receiver design indicates a significantly lower retention time inthe sodium receiver of only 16 s towards 55 s for the Solar Salt receiverleads to advantages for the automatic control of the receiver. If gra-dients in the solar radiation occur (e.g. passage of clouds), the outlettemperature can be adjusted faster, especially in part load, where theinertia of the loop is still higher. Due to the imprecise forecast of cloudmovement and the resulting heat flux distribution on the absorbertubes, receivers with Solar Salt operate in the so called cloud standbyduring cloudy sky to avoid overheating of the salt mixture. In this case,the mass flow is adjusted to achieve an outlet temperature of 510 °Cunder theoretical clear sky conditions (Zavoico, 2001). This safetymode reduces the energy yield. Sodium can be operated in the tem-perature range of 100–800 °C. For the operation between 290 and565 °C neither freezing nor overheating precaution have to be im-plemented which increases the energy yield. The detailed analysis ofdynamic receiver behavior and it’s influence on the LCOE will be part offuture work.
5.3. LCOE comparison
In all presented power plant concepts the same power block andstorage system are applied. Due to this fact, the error of a relative LCOEcomparison is minimized, because the cost assumptions of these com-ponents cancel each other out.
Table 6 summarizes the main plant parameters:It turns out, that both sodium systems result in lower LCOE than the
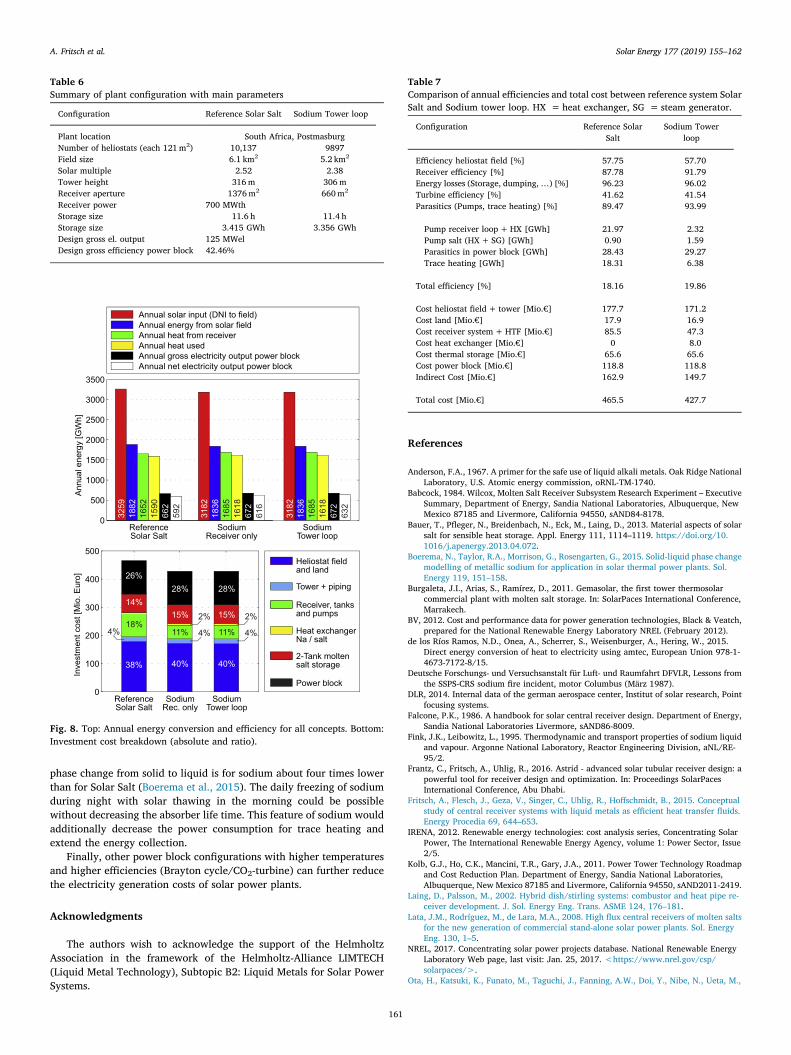
reference system with Solar Salt. The receiver-only concept results in upto 13% lower LCOE, whereas with the tower loop concept an LCOEreduction of 16% is achievable. Fig. 8 shows the comparison betweenthe analyzed systems in terms of efficiency and investment cost. Table 7summarizes additionally the detailed parasitic losses of the referencesystem and the sodium tower loop concept.
The higher annual energy yield of the sodium system is based ontwo features. Firstly the higher receiver efficiency and secondly thelower parasitic losses in the system (pumping and heat tracing). In therelative comparison of both systems, the gross efficiency of the sodiumtower loop concept is 4% higher. Considering the parasitic losses, thesodium system results in a 9% higher net efficiency. The total systemefficiency of the sodium system is therefore about 1.7%-points higherthan that of the reference system.
The lower cost of the sodium system is to a small share due to thelower cost of the heliostat field (which is in fact a result of the highersystem efficiency). The decisive cost reduction however is attained bythe cost-effective sodium receiver. In total, the sodium system results in8% lower investment cost.
Table 3Cost parameters for financing, operation and maintenance (DLR)
Labor costs per employee 48,000 €/yearNumber of persons (excl. field maintenance) 25 Pers.Number of persons for field maintenance 0.03 Pers./1000 m2
Water cost 200,000 €/yearO&M of equipment 3% of investmentInsurance cost 0.7% of EPCLife time of plant 25 yearsDept interest rate ir 8%Fixed charge rate FCR 0.0937Surcharges (engineering, risk, management) 35% of investmentElectricity consumption tracking heliostats 55 Wel per heliostatElectricity from grid for offline parasitics 0.074 /kWth
A. Fritsch et al. Solar Energy 177 (2019) 155–162
159

The tracking accuracy of the heliostat field is essential for the pre-sented results. Changes in slope and tracking errors of the heliostatsmay result in other results. For this reason, a sensitivity analysis wasconducted. The slope and tracking error was increased by 50%, re-presenting a heliostat field with low accuracy and subsequently de-creased by 25% for high precision heliostats.
The high precision heliostat field results obviously in smaller re-ceiver apertures and lower LCOE. But even with low precision heliostats( 1.95 mradslope = and 0.975 mradtracking = ), the optimized receiveraperture size is still 25% lower than the reference case and the LCOEreduction with the sodium tower loop is about 12%.
6. Conclusions and outlook
The paper discusses two different sodium based solar tower con-cepts in comparison with a state-of-the-art molten salt system. Theconducted techno-economic analysis turns out in significant lowerelectricity generation costs for both sodium systems. Up to 16% lowerLCOE are achievable with the sodium tower loop concept. This resultmust be confirmed by the construction of real power plants.
The design of sodium receivers differ significantly from molten saltreceivers. Further optimization is still possible. One research path is the
panel arrangement and their conjunction. The presented sodium re-ceiver design is similar to a molten salt receiver. Other arrangementswith double-sided irradiated tubes and/or mass flow controlled panelswith the total temperature difference (290–565 °C) within each panelare promising concepts for high flux and high efficient receivers.Another research path is the dynamic behavior of the receiver system,including the temperature control during fluctuating irradiation and thestart up and shut down process as well. The volume change during
Fig. 7. Resulting field layout with optical efficiency on 21.3 at 12 h at Postmasburg in South Africa. The aperture size of one heliostat is 120 m2. Left: Referencesystem with Solar Salt, thermal receiver power: 700 MWth, Receiver size: 1376 m2, number of heliostats: 10,137, tower height: 298 m. Right: Sodium system(receiver-only/tower loop), receiver power: 700 MWth, Receiver size: 660 m2, number of heliostats: 9897, tower height: 294 m.
Table 4Results of field design (21.3. at 12 h): Comparison of field layout for two dif-ferent receiver sizes with the same thermal power. Calculation made with raytracing program SPRAY.
Configuration Reference Solar Salt Sodium system
Thermal power 700 MWth 700 MWth
Receiver size (aperture) 1376 m2 660 m2
Tower height 298 m 294 mNumber of heliostats 10,137 9897Reflectivity of mirrors 89.3% 89.3%
Field efficiency 21.3./12 h 21.3./12 hCosine efficiency 86.6% 85.7%Blocking & shading 96.8% 96.1%Extinction 90.4% 90.1%Intercept 95.6% 97.5%
Total field efficiency 64.8% 64.7%Peak heat flux 0.93 MW/m2 2.99 MW/m2
Table 5Receiver comparison between Reference system with Solar Salt and Sodiumsystem (Receiver-only and Tower loop)
Configuration Reference SolarSalt
Sodium system
Absorber surface (cylinder) [m2] 1376 660Number of panels [–] 2 × 5 2 × 3Pressure drop in receiverb [bar] 13.16 1.87Number of tubesa per panel [–] 142 131Inner tube diameter [mm] 32.8 50Tube wall thickness [mm] 1.4 1.4Total weight of empty tubes [t] 65 24.1Total weight of HTF in receiver [t] 82.3 29.4Min./Max. flow velocityb [m/s] 3.8/4.2 4.4/4.6Min. Reynolds numberb [–] 68000 569 000Min./Max. heat trans.coeff.b [kW/m2/K] 7.9/12.7 29.2/32Retention time of HTF in receiverb [s] 55 16Receiver inlet temperature [°C] 290 300Receiver outlet temperature [°C] 565 575Max. tube wall temperaturec [°C] 628 689Max. heat flux densityb [MW/m2] 0.93 2.99Absolute absorptivitybe [%] 94.8 94.7Absorbed heat by tubesb [MWth] 721.4 711.7Heat transferred to fluidb [MWth] 699.7 699.9Total heat lossesb [MWth] 42.5 27.4Receiver efficiencybd [%] 91.9 93.1Diameter riser/downcomer [m] 0.6 0.6Max. static pressure in riser [bar] 59.1 26.4Pressure drop in riser/downcomerb [bar] 0.56 1.09
a Tube material: INCONEL alloy 617.b On 21 March at 12 h.c On 21 March at 9 h.d Absorbed by sodium/Incident on tubes.e Absorptivity of tube material (coating): 0.93.
A. Fritsch et al. Solar Energy 177 (2019) 155–162
160
phase change from solid to liquid is for sodium about four times lowerthan for Solar Salt (Boerema et al., 2015). The daily freezing of sodiumduring night with solar thawing in the morning could be possiblewithout decreasing the absorber life time. This feature of sodium wouldadditionally decrease the power consumption for trace heating andextend the energy collection.
Finally, other power block configurations with higher temperaturesand higher efficiencies (Brayton cycle/CO2-turbine) can further reducethe electricity generation costs of solar power plants.
Acknowledgments
The authors wish to acknowledge the support of the HelmholtzAssociation in the framework of the Helmholtz-Alliance LIMTECH(Liquid Metal Technology), Subtopic B2: Liquid Metals for Solar PowerSystems.
References
Anderson, F.A., 1967. A primer for the safe use of liquid alkali metals. Oak Ridge NationalLaboratory, U.S. Atomic energy commission, oRNL-TM-1740.
Babcock, 1984. Wilcox, Molten Salt Receiver Subsystem Research Experiment – ExecutiveSummary, Department of Energy, Sandia National Laboratories, Albuquerque, NewMexico 87185 and Livermore, California 94550, sAND84-8178.
Bauer, T., Pfleger, N., Breidenbach, N., Eck, M., Laing, D., 2013. Material aspects of solarsalt for sensible heat storage. Appl. Energy 111, 1114–1119. https://doi.org/10.1016/j.apenergy.2013.04.072.
Boerema, N., Taylor, R.A., Morrison, G., Rosengarten, G., 2015. Solid-liquid phase changemodelling of metallic sodium for application in solar thermal power plants. Sol.Energy 119, 151–158.
Burgaleta, J.I., Arias, S., Ramírez, D., 2011. Gemasolar, the first tower thermosolarcommercial plant with molten salt storage. In: SolarPaces International Conference,Marrakech.
BV, 2012. Cost and performance data for power generation technologies, Black & Veatch,prepared for the National Renewable Energy Laboratory NREL (February 2012).
de los Ríos Ramos, N.D., Onea, A., Scherrer, S., Weisenburger, A., Hering, W., 2015.Direct energy conversion of heat to electricity using amtec, European Union 978-1-4673-7172-8/15.
Deutsche Forschungs- und Versuchsanstalt für Luft- und Raumfahrt DFVLR, Lessons fromthe SSPS-CRS sodium fire incident, motor Columbus (März 1987).
DLR, 2014. Internal data of the german aerospace center, Institut of solar research, Pointfocusing systems.
Falcone, P.K., 1986. A handbook for solar central receiver design. Department of Energy,Sandia National Laboratories Livermore, sAND86-8009.
Fink, J.K., Leibowitz, L., 1995. Thermodynamic and transport properties of sodium liquidand vapour. Argonne National Laboratory, Reactor Engineering Division, aNL/RE-95/2.
Frantz, C., Fritsch, A., Uhlig, R., 2016. Astrid - advanced solar tubular receiver design: apowerful tool for receiver design and optimization. In: Proceedings SolarPacesInternational Conference, Abu Dhabi.
Fritsch, A., Flesch, J., Geza, V., Singer, C., Uhlig, R., Hoffschmidt, B., 2015. Conceptualstudy of central receiver systems with liquid metals as efficient heat transfer fluids.Energy Procedia 69, 644–653.
IRENA, 2012. Renewable energy technologies: cost analysis series, Concentrating SolarPower, The International Renewable Energy Agency, volume 1: Power Sector, Issue2/5.
Kolb, G.J., Ho, C.K., Mancini, T.R., Gary, J.A., 2011. Power Tower Technology Roadmapand Cost Reduction Plan. Department of Energy, Sandia National Laboratories,Albuquerque, New Mexico 87185 and Livermore, California 94550, sAND2011-2419.
Laing, D., Palsson, M., 2002. Hybrid dish/stirling systems: combustor and heat pipe re-ceiver development. J. Sol. Energy Eng. Trans. ASME 124, 176–181.
Lata, J.M., Rodríguez, M., de Lara, M.A., 2008. High flux central receivers of molten saltsfor the new generation of commercial stand-alone solar power plants. Sol. EnergyEng. 130, 1–5.
NREL, 2017. Concentrating solar power projects database. National Renewable EnergyLaboratory Web page, last visit: Jan. 25, 2017. <https://www.nrel.gov/csp/solarpaces/>.
Ota, H., Katsuki, K., Funato, M., Taguchi, J., Fanning, A.W., Doi, Y., Nibe, N., Ueta, M.,
Table 6Summary of plant configuration with main parameters
Configuration Reference Solar Salt Sodium Tower loop
Plant location South Africa, PostmasburgNumber of heliostats (each 121 m2) 10,137 9897Field size 6.1 km2 5.2 km2
Solar multiple 2.52 2.38Tower height 316 m 306 mReceiver aperture 1376 m2 660 m2
Receiver power 700 MWthStorage size 11.6 h 11.4 hStorage size 3.415 GWh 3.356 GWhDesign gross el. output 125 MWelDesign gross efficiency power block 42.46%
Fig. 8. Top: Annual energy conversion and efficiency for all concepts. Bottom:Investment cost breakdown (absolute and ratio).
Table 7Comparison of annual efficiencies and total cost between reference system SolarSalt and Sodium tower loop. HX = heat exchanger, SG = steam generator.
Configuration Reference SolarSalt
Sodium Towerloop
Efficiency heliostat field [%] 57.75 57.70Receiver efficiency [%] 87.78 91.79Energy losses (Storage, dumping, …) [%] 96.23 96.02Turbine efficiency [%] 41.62 41.54Parasitics (Pumps, trace heating) [%] 89.47 93.99
Pump receiver loop + HX [GWh] 21.97 2.32Pump salt (HX + SG) [GWh] 0.90 1.59Parasitics in power block [GWh] 28.43 29.27Trace heating [GWh] 18.31 6.38
Total efficiency [%] 18.16 19.86
Cost heliostat field + tower [Mio.€] 177.7 171.2Cost land [Mio.€] 17.9 16.9Cost receiver system + HTF [Mio.€] 85.5 47.3Cost heat exchanger [Mio.€] 0 8.0Cost thermal storage [Mio.€] 65.6 65.6Cost power block [Mio.€] 118.8 118.8Indirect Cost [Mio.€] 162.9 149.7
Total cost [Mio.€] 465.5 427.7
A. Fritsch et al. Solar Energy 177 (2019) 155–162
161
Inagaki, T., 2004. Development of 160m3/min large capacity sodium-immersedselfcooled electromagnetic pump. Nucl. Sci. Technol. 41, 511–523.
Pacheco, J.E., 1995. Results of Molten Salt Panel and Component Experiments for SolarCentral Receivers, Department of Energy, Sandia National Laboratories,Albuquerque, New Mexico 87185 and Livermore, California 94550, sAND1994-2525.
Pacheco, J.E., 2002. Final Test and Evaluation Results from the Solar Two Project,Department of Energy, Sandia National Laboratories, Albuquerque, New Mexico87185 and Livermore, California 94550, sAND2002-0120.
Pacheco, J.E., Showalter, S.K., Kolb, W.J., 2002. Development of a molten-salt thermo-cline thermal storage system for parabolic trough plants. J. Sol. Energy Eng. 124,153–159.
Pacio, J., Singer, C., Wetzel, T., Uhlig, R., 2013. Thermodynamic evaluation of liquidmetals as heat transfer fluids in concentrated solar power plants. Appl. Therm. Eng.60 (1–2), 295–302. https://doi.org/10.1016/j.applthermaleng.2013.07.010.
Personal conversation with Deller GmbH and cost estimation of a double-tube safety heatexchanger for sodium/Solar Salt, Wilhelm Deller heat exchangers, Siegen, summer2015.
Reilly, H.E., Kolb, G.J., 2001. An Evaluation of Molten-Salt Power Towers IncludingResults of the Solar Two Project, Department of Energy, Sandia NationalLaboratories, Albuquerque, New Mexico 87185 and Livermore, California 94550,sAND2001-3674.
Schwarzbözl, P., Pitz-Paal, R., Schmitz, M., 2009. Visual hflcal - a software tool for layout
and optimisation of heliostat fields. In: Proceedings SolarPaces InternationalConference, Berlin.
Sequeira, C., 2003. Fundamentals of molten salt corrosion, Molten Salt Forum, Trans TechPublication, Switzerland, vol. 7, pp. 3–40.
Singer, C., 2014. Assessment of improved molten salt solar tower plants, SolarPaces 2013.Energy Procedia 49, 1553–1562.
SolarReserve, 2017. Crescent dunes solar energy project, SolarReserve Web page, lastvisit: May 2017. <http://www.solarreserve.com/en/technology/molten-salt-tower-receiver>.
Sunshot, 2014. Tackling challenges in solar: 2014 portfolio. Tech. Rep. DOE/EE-1081, U.S. Department of Energy: Sunshot Initiative, Solar Energy Technologies Office.
Vant-Hull, L.L., 2002. The role of allowable flux density in the design and operation ofmolten-salt solar central receivers. J. Sol. Energy Eng. 124, 165–169. https://doi.org/10.1115/1.1464124.
VastSolar, 2015. Commercially sustainable csp scalable, high efficiency, low cost. In:ASTRI Symposium (11. Februar 2015).
WNN, 2015. Russia connects bn-800 fast reactor to grid, World Nuclear News Web page,last visit: 11. Dezember 2015. <http://www.world-nuclear-news.org/NN-Russia-connects-BN800-fast-reactor-to-grid-11121501.html>.
Zavoico, A.B., 2001. Solar Power Tower Design Basis Document, Department of Energy,Sandia National Laboratories, Albuquerque, New Mexico 87185 and Livermore,California 94550, sAND2001-2100.
A. Fritsch et al. Solar Energy 177 (2019) 155–162
162
Related Documents