1 Technical Report Documentation Page 1. Report No MPM-10 2. Government Accession No. 3. Recipient’s Catalog No. 4. Title and Subtitle Effects of Aggregate Angularity on Mix Design Characteristics and Pavement Performance 5. Report Date December 02, 2009 6. Performing Organization Code 7. Author/s Leonardo, T. Souza and Yongrak Kim 8. Performing Organization Report No. MPM-10 9. Performing Organization Name and Address University of Nebraska-Lincoln (Department of Civil Engineering) 10. Work Unit No. (TRAIS) W351 NH, PO Box 880531, Lincoln, NE 68588 11. Contract or Grant No. 26-1107-0107-001 12. Sponsoring Organization Name and Address Nebraska Department of Roads (NDOR) 1400 Highway 2, PO Box 94759, Lincoln, NE 68509 13. Type of Report and Period Covered 14. Sponsoring Agency Code 15. Supplementary Notes 16. Abstract This research targets two primary purposes: to estimate current aggregate angularity test methods and to evaluate current aggregate angularity requirements in the Nebraska asphalt mixture/pavement specification. To meet the first research objective, various aggregate angularity tests are estimated with the same sets of aggregates and are compared by investigating their characteristics on testing repeatability, cost, testing time, workability, and sensitivity of test results. For the second objective, the effect of aggregate angularity on mixture performance is investigated by conducting laboratory performance tests (the uniaxial static creep test and the indirect tensile fracture energy test) of five mixes designed with different combinations of coarse and fine aggregate angularity and statistical analyses of five-year asphalt pavement analyzer test results of field mixtures. Results from the indirect tensile fracture energy test are then incorporated with finite element simulations of virtual specimens, which attempt to explore the detailed mechanisms of cracking related to the aggregate angularity. Results from the estimation of various angularity test methods imply that for the coarse aggregate angularity measurement, the AASHTO T326 method looks better than the current Superpave method, ASTM D5821, in that it is more objective and is very simple to perform with much less testing time. For the fine aggregate angularity measurement, the current Superpave testing method, AASHTO T304, is considered reasonable in a practical sense. Rutting performance test results indicate that higher angularity in the mixture improves rut resistance due to better aggregate interlocking. The overall effect of angularity on the mixtures’ resistance to fatigue damage is positive because aggregate blends with higher angularity require more binder to meet mix design criteria, which mitigates cracking due to increased viscoelastic energy dissipation from the binder, while angular particles produce a higher stress concentration that results in potential cracks. Finite element simulations of virtual specimens support findings from experimental tests. Outcomes from this research are expected to potentially improve current Nebraska asphalt specifications, particularly for aggregate angularity requirements and test methods to characterize local aggregate angularity. 17. Key Words Aggregate Angularity, Asphalt Mixture, Pavement, Performance, Finite Element Modeling 18. Distribution Statement 19. Security Classification (of this report) Unclassified 20. Security Classification (of this page) Unclassified 21. No. of Pages 88 22. Price Form DOT F 1700.7 (8-72) Reproduction of form and completed page is authorized

Welcome message from author
This document is posted to help you gain knowledge. Please leave a comment to let me know what you think about it! Share it to your friends and learn new things together.
Transcript

1
Technical Report Documentation Page 1. Report No
MPM-10 2. Government Accession No. 3. Recipient’s Catalog No.
4. Title and Subtitle
Effects of Aggregate Angularity on Mix Design Characteristics and Pavement Performance
5. Report Date
December 02, 2009
6. Performing Organization Code
7. Author/s
Leonardo, T. Souza and Yongrak Kim 8. Performing Organization Report No.
MPM-10 9. Performing Organization Name and Address University of Nebraska-Lincoln (Department of Civil Engineering)
10. Work Unit No. (TRAIS)
W351 NH, PO Box 880531, Lincoln, NE 68588 11. Contract or Grant No.
26-1107-0107-001 12. Sponsoring Organization Name and Address Nebraska Department of Roads (NDOR) 1400 Highway 2, PO Box 94759, Lincoln, NE 68509
13. Type of Report and Period Covered
14. Sponsoring Agency Code
15. Supplementary Notes
16. Abstract This research targets two primary purposes: to estimate current aggregate angularity test methods and to evaluate current aggregate angularity requirements in the Nebraska asphalt mixture/pavement specification. To meet the first research objective, various aggregate angularity tests are estimated with the same sets of aggregates and are compared by investigating their characteristics on testing repeatability, cost, testing time, workability, and sensitivity of test results. For the second objective, the effect of aggregate angularity on mixture performance is investigated by conducting laboratory performance tests (the uniaxial static creep test and the indirect tensile fracture energy test) of five mixes designed with different combinations of coarse and fine aggregate angularity and statistical analyses of five-year asphalt pavement analyzer test results of field mixtures. Results from the indirect tensile fracture energy test are then incorporated with finite element simulations of virtual specimens, which attempt to explore the detailed mechanisms of cracking related to the aggregate angularity. Results from the estimation of various angularity test methods imply that for the coarse aggregate angularity measurement, the AASHTO T326 method looks better than the current Superpave method, ASTM D5821, in that it is more objective and is very simple to perform with much less testing time. For the fine aggregate angularity measurement, the current Superpave testing method, AASHTO T304, is considered reasonable in a practical sense. Rutting performance test results indicate that higher angularity in the mixture improves rut resistance due to better aggregate interlocking. The overall effect of angularity on the mixtures’ resistance to fatigue damage is positive because aggregate blends with higher angularity require more binder to meet mix design criteria, which mitigates cracking due to increased viscoelastic energy dissipation from the binder, while angular particles produce a higher stress concentration that results in potential cracks. Finite element simulations of virtual specimens support findings from experimental tests. Outcomes from this research are expected to potentially improve current Nebraska asphalt specifications, particularly for aggregate angularity requirements and test methods to characterize local aggregate angularity. 17. Key Words Aggregate Angularity, Asphalt Mixture, Pavement, Performance, Finite Element Modeling
18. Distribution Statement
19. Security Classification (of this report)
Unclassified 20. Security Classification (of this page)
Unclassified 21. No. of Pages
88 22. Price
Form DOT F 1700.7 (8-72) Reproduction of form and completed page is authorized

2
DISCLAIMER
This report was funded in part through grant[s] from the Federal Highway Administration
[and Federal Transit Administration], U.S. Department of Transportation. The views and
opinions of the authors [or agency] expressed herein do not necessarily state or reflect
those of the U. S. Department of Transportation.

3
TABLE OF CONTENTS
Page
CHAPTER
I INTRODUCTION....................................................................................... 7 Research Objectives ............................................................................... 9 Research Scope....................................................................................... 9 Organization of the Report ..................................................................... 10
II BACKGROUND......................................................................................... 11
Test Methods to Estimate Aggregate Angularity ................................... 13 Effect of Aggregate Angularity on HMA Performance ......................... 19
III RESEARCH METHODOLOGY ................................................................ 26 Materials Selection ................................................................................. 26 Mix Design Method................................................................................ 29 Aggregate Angularity Tests Performed.................................................. 32 Performance Tests of Mixtures .............................................................. 43 Finite Element Modeling of IDT Fracture Testing................................. 52
IV RESULTS AND DISCUSSION.................................................................. 59 Mix Design Results ................................................................................ 59 Laboratory Performance Test Results .................................................... 60 Finite Element Model Simulation Results.............................................. 65 Angularity Test Results and Discussion................................................. 70
V SUMMARY AND CONCLUSIONS.......................................................... 77 Conclusions ............................................................................................ 77 NDOR Implementation Plan .................................................................. 79 REFERENCES .......................................................................................................... 80 ACKNOWLEDGMENTS ......................................................................................... 88

4
LIST OF FIGURES
FIGURE Page
2.1. Aggregate Shape Characteristics (Sukhwani et al. 2006)........................ 11
3.1. A Target Gradation Curve of Aggregate Blends ..................................... 30
3.2. Gradation Curves of the Asphalt Mixtures and the FAM Mixtures ........ 31
3.3. Internal Microstructure of (a) FAM Mixture; (b) Asphalt Concrete Mixture..................................................................................................... 32 3.4. Definition of Fractured Face (ASTM D5821) ......................................... 33 3.5. Aggregates with Different Angularity Characteristics ............................ 34 3.6. Correlation between Aggregate Angularity and Voids............................ 35
3.7. Apparatus of the AASHTO T326 Test .................................................... 35 3.8. AIMS Device ........................................................................................... 36
3.9. AIMS Interface for Coarse Aggregates ................................................... 37
3.10. AIMS Gradient Method to Quantify Angularity ..................................... 38 3.11. Steps of the Two-Dimensional Digital Image Processing ....................... 39
3.12. AASHTO T304 Testing Apparatus ......................................................... 41
3.13. AIMS Interface for Fine Aggregates ....................................................... 43 3.14. A Specimen Cored and Sawed from the Gyratory Compacted Sample .. 44 3.15. A Device Used to Place the Mounting Studs for LVDTs........................ 44
3.16. A Specimen with LVDTs Mounted in the UTM-25kN........................... 45
3.17. Typical Test Results of the Uniaxial Static Creep Test ........................... 46 3.18. Asphalt Pavement Analyzer (APA) ......................................................... 47 3.19. Relationship between Field Fatigue Performance and IDT Fracture Energy (Kim et al. 2002) ......................................................................... 48

5
FIGURE Page
3.20. Testing Specimens after Coring-Sawing Process .................................... 49
3.21. Gauge-Point Mounting Device ................................................................ 49 3.22. An IDT Specimen Installed in the UTM-25kN ....................................... 50 3.23. Typical Stress-Strain Plot of the IDT Fracture Test ................................ 52 3.24. Several Internal Microstructures Virtually Generated............................. 54
3.25. Finite Element Mesh of the Virtual Specimen......................................... 55 3.26. Schematic Representation of the Cohesive Zone Concept ...................... 57 4.1. Uniaxial Static Creep Test Results .......................................................... 60
4.2. APA Test Results of SP2 Mixtures.......................................................... 61 4.3. APA Test Results of SP4 Mixtures.......................................................... 62 4.4. APA Test Results of SP4S Mixtures........................................................ 62 4.5. APA Test Results of SP5 Mixtures.......................................................... 63
4.6. IDT Fracture Energy Test Results from Asphalt Concrete Specimens ... 64 4.7. IDT Fracture Energy Test Results from Fine Aggregate Matrix Specimens ................................................................................................ 65
4.8. Virtual IDT Specimens Produced for the FE Simulations....................... 66
4.9. Finite Element Simulation Results of the IDT Fracture Energy Test ...... 68 4.10. Deformation and Crack Growth of the Specimen (Shown in Figure 4.8(b)) at Two Different Loading Stages (at the Peak Force and Near Failure).. 69 4.11. Comparison of Elemental Stress Contour Plots....................................... 70

6
LIST OF TABLES
TABLE Page
2.1. Advantages and Disadvantages of the Testing Methods Used to Measure Aggregate Characteristics (reproduced from Masad et al. 2007) ............ 16
2.2. Features of Test Methods for Experimental Evaluation (reproduced from
Masad et al. 2007)……………………………………..………………... 18
3.1. Fundamental Properties of Aggregates.................................................... 27 3.2. Asphalt Binder Properties of PG 64-28 ................................................... 28 3.3. Physical Properties of Hydrated Lime ..................................................... 28 3.4. Chemical Properties of Hydrated Lime ................................................... 29 3.5. Five Mixtures Designed for This Study................................................... 30 3.6. Sample Size of AIMS for Fine Aggregates ............................................. 42 3.7. Parameters in Equation [3.5].................................................................... 51 4.1. Volumetric Mix Properties ...................................................................... 59 4.2. Linear Elastic and Linear Viscoelastic Material Properties..................... 66 4.3. Cohesive Zone Properties Assumed for This Study ................................ 67 4.4. Summary of Coarse Aggregate Angularity Tests .................................... 71 4.5. Summary of Fine Aggregate Angularity Tests ........................................ 72 4.6. Repeatability Analysis Results ................................................................ 73 4.7. Estimated Price of Each Test Method...................................................... 73 4.8. Testing Time Spent to Perform Each Angularity Test............................. 74 4.9. Testing Sensitivity of Each Angularity Test ............................................ 75 4.10. Ranking of Coarse Aggregate Angularity Tests for Each Category........ 76 4.11. Ranking of Fine Aggregate Angularity Tests for Each Category............ 76

7
CHAPTER 1
INTRODUCTION
Since aggregates make up between 80% and 90% of the total volume or 94% to 95% of
the mass of hot-mix asphalt (HMA), the quality of the aggregate significantly influences
pavement performance. Aggregate geometry consists of three independent characteristics,
form, angularity (or roundness), and surface texture. Aggregate angularity, which can be
defined as the measurement of the sharpness of the corners of a particle, has been
recognized as a critical property of bituminous mixtures and is one of the primary
aggregate properties described in the Superpave specifications. Moreover, angularity is
often mentioned as having the potential to influence aggregate and mixture performance
through significant interactions with other mixture and material properties. Therefore, the
effects of aggregate angularity on mix design characteristics and mixture performance
should be appropriately established based on scientific rigor.
Of the various tests for measuring aggregate angularity, the current Superpave mix design
method uses the standard “number of fractured faces” testing method (ASTM D5821) for
coarse aggregates and the “uncompacted void content” method for fine aggregates
(AASHTO T304). Recently, the National Cooperative Highway Research Program
(NCHRP) Research Report No. 557 (2006) indicated that current Superpave testing to
assess coarse aggregate angularity is empirical and has not been directly related to
pavement performance. Based on extensive literature reviews and various testing results,
the report found that the uncompacted void content in aggregates reasonably predicts the
rutting performance of HMA mixtures better than the current Superpave angularity
testing method (i.e., ASTM D5821). In addition, it was specified that an attempt should
be made to suggest appropriate testing methods that are more objective, scientific, and
reliable to quantify aggregate angularity. For example, numerous state highway agencies
and researchers have investigated the Aggregate Imaging System (AIMS). Based on the
analysis of two-dimensional images of aggregates, AIMS characterizes angularity by
monitoring the difference in the gradient vector measured at various edge points of the

8
aggregate’s image. Interesting correlations have been found between aggregate
angularity quantified by AIMS and mixture performance (Masad 2004).
Thus far, a number of studies have been conducted to analyze the effect of aggregate
angularity on bituminous mixtures and pavement performance. In their study on the
effect of crushed gravel in dense mixtures, Wedding and Gaynor (1961) showed that the
use of crushed gravel increased the stability of the asphalt mixture when compared with
asphalt mixtures containing uncrushed gravel. Moreover, several studies have indicated
that the effect of fine aggregate angularity (FAA) is more significant than that of coarse
aggregate angularity (CAA). Foster (1970) studied the resistance of dense-graded hot-
mix asphalt mixtures by comparing mixes containing different degrees of crushed and
uncrushed coarse aggregates. Although pavement test sections showed similar
performance results obtained by the mixes with crushed coarse aggregate and those with
uncrushed aggregate, the effect of using fine aggregate was more significant. Cross and
Purcell (2001) used mixtures containing natural sand and limestone, and showed that
increased FAA results in improved rutting performance. Stiady et al. (2001) evaluated the
effect of FAA using the Purdue Laboratory Wheel Track Device (PURWheel) and
showed, based on the evaluation of 21 mixtures, that FAA correlated fairly well with
performance, although mixtures produced with an FAA higher than 48% did not
necessarily perform better than those with an FAA equal to 45%.
Most of the relevant literature has focused on the effect of aggregate angularity on the
resistance to permanent deformation and skid resistance (Mahmoud 2005); however, few
studies have examined the role of aggregate angularity related to mixture volumetric
characteristics and fatigue performance. Compared to the relatively clear benefit of
angular particles in rut resistance, mechanical characteristics and related mechanisms on
cracking, such as fatigue damage, are not yet fully understood. Furthermore, conflicting
results have been reported regarding the effect of the properties of aggregates on the
fatigue life of flexible pavement. For example, Huang et al. (1972) reported that the
geometric characteristics of coarse aggregates were not significant in the fatigue behavior
of asphalt mixtures. By contrast, Maupin (1970) performed a constant strain mode fatigue

9
test and showed that mixtures containing uncrushed gravel yield better fatigue resistance
than mixtures containing crushed limestone or slate.
Therefore, a better and more scientific understanding of the effects of aggregate
angularity is necessary, given that the minimum angularity requirements for bituminous
mix design significantly affect both mix production costs and long-term pavement
performance. Thus, the refinement of aggregate angularity criteria is crucial for state
highway agencies and pavement/materials contractors.
1.1. RESEARCH OBJECTIVES
The primary goal of this research is to provide guidelines that potentially help improve
current Nebraska asphalt specifications, particularly for aggregate angularity
requirements and testing methods based on scientific investigations and experiments.
Research outcomes from this study can also be incorporated with research findings from
the previous NDOR project (P-556 “Restricted-Zone Requirements for Superpave Mixes
Made with Local Aggregate Sources”), which will result in a more comprehensive
understanding of the effects of aggregate morphology (gradation and angularity) on the
performance of asphalt mixtures and pavements in Nebraska.
1.2. RESEARCH SCOPE
To accomplish the objective, this research is divided into four phases. Phase one consists
of a literature review, material selection, and volumetric mixture design of target
mixtures. The second phase is defined as the evaluation of various aggregate angularity
tests, which includes four types of coarse aggregate angularity tests and two fine
aggregate angularity tests. The focus of the third phase is the fabrication of asphalt
concrete specimens and their mechanical tests to estimate the effects of aggregate
angularity on mixture performance characteristics. The static creep test (often referred to
as the flow time test) and the asphalt pavement analyzer (APA) test were considered to
assess the rutting potential of the mixtures with different angularities, and the indirect

10
tensile (IDT) test was performed to evaluate fatigue damage characteristics of mixtures
with different angularities. The fourth phase of this research is the numerical modeling
of the IDT test with finite element simulations of virtual specimens, which attempted to
explore the detailed mechanisms of cracking related to the aggregate angularity.
Simulation results were then compared with laboratory test results. Based on the
experimental test results and numerical simulations, pros and cons of each different
angularity testing method are summarized, and the mechanical effects of aggregate
angularity on mixture-pavement performance are identified.
1.3. ORGANIZATION OF THE REPORT
This report is composed of five chapters. Following this introduction (Chapter 1),
Chapter 2 presents background information found from open literature associated with
aggregate angularity, its currently available test methods to assess, and the effect of
angularity on mixture-pavement performance. Chapter 3 presents detailed descriptions of
material selection and research methodology employed for this study. Chapter 4 shows
laboratory test results, such as volumetric mix design results of all mixes, various
angularity test results, and mixture performance test results from the APA, static creep,
and IDT. Chapter 4 also presents numerical simulation results that model the IDT test to
explore the detailed mechanisms of cracking related to the aggregate angularity. Finally,
Chapter 5 provides a summary of findings and conclusions of this study. Implementation
plans for the Nebraska Department of Roads (NDOR) are also presented in the final
chapter.

11
CHAPTER 2
BACKGROUND
The aggregates’ geometry presents three independent characteristics: form, angularity (or
roundness), and surface texture. Aggregate angularity can be defined as the measurement
of the sharpness of the corners of a particle. Thus, a rounded particle can be classified as
a particle with low angularity and a non-rounded particle can be classified as a particle
with high angularity. Aggregate form is defined as the variation of the particles’
proportion, and the aggregate surface texture is defined based on the irregularities
observed from the surface of the particles (Masad 2004). Figure 2.1 (Sukhwani et al.
2006) illustrates geometric characteristics of an aggregate particle to help understand the
angularity and other shape features.
Figure 2.1. Aggregate Shape Characteristics (Sukhwani et al. 2006)
Form
Angularity

12
Particle form is quantified by the summation of the incremental changes in a particle
radius in all directions. Radius is defined as the length of the line that connects the
particle center to points on the boundary. Equation [2.1] gives the form index (FI):
�=
=
+ −=
355
0
5θ
θ θ
θθ
R
RRFI [2.1]
where R = radius of the particle in different directions; and
θ = angle in different directions.
Angularity is analyzed using both the radius and gradient methods. The radius method
quantifies angularity by the difference between a particle radius in a certain direction and
that of an equivalent ellipse (Figure 2.1). The equivalent ellipse has the same major and
minor axes as the particle, but has no angularity. Normalizing the measurements to the
radius of an equivalent ellipse minimizes the effect of form on this angularity index. The
angularity index using the radius method (AIR) is expressed as:
�=
=
−=
355
0
θ
θ θ
θθ
EE
EER R
RRAI [2.2]
where θR = radius of the particle at a directional angle θ; and
θEER = radius of an equivalent ellipse at a directional angle θ.
The gradient method is based on the concept of gradient vectors. The direction of the
gradient vector is used to calculate the measure of angularity of aggregate particles. In
the gradient method, the direction of the gradient vector for adjacent points changes
rapidly at the edge if the corners are sharp. On the other hand, the direction of the
gradient vector changes slowly for adjacent points on the edge of the particle for rounded
particles. Thus the change in the angle of the gradient vector for a rounded object is much
less compared to the change in the angle of gradient vector for an angular object.
Angularity values for all the boundary points are calculated and their sum accumulated
around the edge to finally form the angularity index of the aggregate particle. The
angularity index based on the gradient method (AIG) is defined as:

13
�−
=+−=
3
13
n
iiiGAI θθ [2.3]
where θ = angle of the gradient vector with the horizontal axis of the image;
i = denotes the ith point on the edge of the particle; and
n = the total number of points on the edge of the particle.
2.1. TEST METHODS TO ESTIMATE AGGREGATE ANGULARITY
Several different types of tests are used to measure aggregate angularity. Currently, the
Superpave mix design method requires two standard methods, ASTM D5821
(“Determining Percent of Fractured Particles in Coarse Aggregate) and AASHTO T304
(“Uncompacted Void Content of Fine Aggregate”), to measure coarse and fine aggregate
angularities, respectively.
ASTM D5821 is a subjective test that requires the testing operator to evaluate whether
the aggregate has fractured faces. The test method cannot distinguish between the
angularity of aggregates with 100% two or more fractured faces (most quarried
aggregates). As such, NCHRP Project 4-19 (published as NCHRP Report 405: Aggregate
Tests Related to Asphalt Concrete Performance in Pavements) (Kandhal et al. 1998)
recommended AASHTO TP56 (currently T326), “Uncompacted Voids in Coarse
Aggregate,” as a replacement. AASHTO T326 combines the effects of aggregate form,
angularity, and texture. To date, ASTM D5821, or a similar procedure, is still used by a
majority of state agencies.
As mentioned, the Superpave method specifies AASHTO T304 to represent angularity of
fine aggregate. The test is to ensure that there is sufficient internal friction—resulting
from particle shape, angularity, and texture—to provide rut-resistance in the mixture. The
uncompacted voids test is an indirect measure of aggregate shape, angularity, and texture,
and works under the assumption that particles that are more flat and elongated, are more

14
angular, have more texture, or are a combination thereof will not pack as tightly and
therefore will have a higher uncompacted void content.
The next group of tests to estimate fine aggregate angularity is to use a compacted
specimen subjected to pressure or shear forces. Tests such as a direct shear test, the
Florida bearing ratio test, and a compacted aggregate resistance (CAR) test are examples
that use compacted specimens. Of these methods, the CAR test is a relatively new test
and has not received enough evaluation. Chowdhury and Button (2001) concluded that
the CAR test method offers much more sensitivity than the direct shear test. This method
also has more advantages than the Florida bearing ratio and direct shear tests.
For the past decade, test methods based on imaging system and analysis have been
actively attempted by many researchers for the characterization of aggregate morphology,
since the imaging technique can identify aggregates’ individual geometric characteristics
(i.e., form, angularity, texture, etc.) better and more scientifically than other groups of test
methods. Traditional developments include the VDG-40 Videograder, Computer Particle
Analyzer, Micromeritics OptiSizer PSDA, Video Imaging System (VIS), and Buffalo
Wire Works PSSDA. The VDG-40 Videograder is capable of analyzing every particle in
the sample, and it has shown good correlation with manual measurements of flat and
elongated particles (Weingart and Prowell 1999; Tutumluer et al. 2000). The PSSDA
method is capable of analyzing particles with a wide range of sizes (from passing sieve
#200 to 1.5 inches).
The Camsizer system uses two cameras to capture images at different resolutions; it
evaluates a large number of particles in the sample as they fall in front of a backlight.
Using two cameras improves the accuracy of measuring the characteristics of both coarse
and fine aggregates. The system has the capability of automatically producing the
distribution of particles’ size, shape, angularity, and texture.
The WipShape system uses two cameras to capture images of aggregates passing on a
mini-conveyor or on a rotating circular lighting table. This system was selected because it

15
can analyze large quantities of particles in a short time and has the potential to measure
and report various shape factors, including sphericity, roundness, and angularity (Maerz
and Lusher 2001; Maerz and Zhou 2001).
The University of Illinois Aggregate Image Analyzer (UIAIA) uses three cameras to
capture images from three orthogonal directions and build a 3-D shape of each particle; it
automatically determines flat and elongated particles, coarse aggregate angularity, coarse
aggregate texture, and gradation. The use of three images for each particle allows an
accurate computation of the volume of each aggregate particle and provides information
about the actual 3-D characteristics of the aggregate.
Aggregate Imaging System (AIMS) uses one video camera and a microscope to capture
different types of images based on the type of aggregate and the property to be measured.
The system measures the three dimensions of the aggregate particles. Images can be
captured using different resolutions based on the particle size detected by the system. The
system is reported to analyze the characteristics of fine and coarse aggregates and provide
a detailed analysis of texture for coarse aggregates.
The advantages and disadvantages of various test methods to characterize aggregate
angularity are summarized in Table 2.1 (Masad et al. 2007). Each angularity test method
can then be categorized into two groups depending on its analysis concept. The first
group contains tests that apply a direct approach of angularity measurement, quantifying
the angularity through direct measurement of individual particles, and the second group
consists of tests that apply an indirect approach of measurement that represent the
angularity based on measurements of bulk properties (Masad et al. 2007). Table 2.2
presents the angularity testing methods classified as direct or indirect.

16
Table 2.1. Advantages and Disadvantages of the Testing Methods Used to Measure Aggregate Characteristics (reproduced from Masad et al. 2007)
Test Method
Measured Aggregate Characteristics
Advantages Disadvantages
AASHTO T304 (ASTM C1252) Uncompacted
Void Content of Fine Aggregate
A combination of angularity, texture, and shape
1. Simple 2. Inexpensive 3. Used in the current Superpave system
1. The test does not consistently identify angular and cubical aggregates. 2. The results are influenced by shape, angularity, texture, and bulk specific gravity.
AASHTO T326 Uncompacted
Void Content of Coarse Aggregate
A combination of angularity, texture, and shape
1. Simple 2. Inexpensive
1. The results are influenced by shape, angularity, texture, and bulk specific gravity.
ASTM D3398 Standard Test
Method for Index of Aggregate
Particle Shape and Texture
A combination of angularity, texture, and shape
1. Simple 2. Inexpensive
1. The method does not provide good correlation with concrete performance. 2. Results are influenced by bulk properties, shape, angularity, and texture.
Compacted Aggregate
Resistance (CAR) Test
A combination of angularity, texture, and shape
1. Simple 2. Inexpensive 3. More sensitive to changes in aggregate characteristics than FAA and direct shear methods.
1. The results are influenced by shape, angularity, texture, and bulk properties.
Florida Bearing Value of Fine
Aggregate
A combination of angularity, texture, and shape
1. Simple 1. The results are influenced by shape, angularity, texture, and bulk properties. 2. Less practical and involves more steps than the FAA. 3. Operates based on the same concept as the CAR test but requires more equipment and time.
AASHTO T236 (ASTM D3080)
Direct Shear Test
A combination of angularity, texture, and shape
1. Simple 2. Test method has good correlation with HMA performance.
1. Expensive 2. The results are influenced by shape, angularity, texture, mineralogy, and particle size distribution. 3. Nonuniform stress distribution causes discrepancies in the measured internal friction.
ASTM D5821 Determining the Percentages of
Fractured Particles in
Coarse Aggregate
Angularity 1. Simple 2. Inexpensive 3. Used in the current Superpave system
1. Labor intensive and time consuming 2. Depends on the operator’s judgment. 3. Provides low prediction, precision, and medium practicality.
Flat and Elongated Coarse
Aggregates (ASTM D4791)
Shape 1. Used in the current Superpave system 2. Able to identify large portions of flat and elongated particles 3. Gives accurate measurements of particle dimension ratio.
1. Tedious, labor intensive, time consuming to be used on a daily basis. 2. Limited to test only one particle at a time. 3. Unable to identify spherical, rounded, or smooth particles. 4. Does not directly predict performance.

17
Table 2.1. Continued
Test Method
Measured Aggregate Characteristics
Advantages Disadvantages
VDG-40 Videograder
Shape 1. Measures the shape of large aggregate quantity. 2. Good correlation with manual measurements of flat-elongated particles
1. Expensive 2. Does not address angularity or texture. 3. Assumes idealized particle shape (ellipsoid). 4. Uses one camera magnification to capture images of all sizes.
Computer Particle Analyzer (CPA)
Shape 1. Measures the shape of large aggregate quantity.
1. Expensive 2. Does not address angularity or texture. 3. Assumes idealized particle shape (ellipsoid). 4. Uses one camera magnification to capture images of all sizes.
Micrometrics OptiSizer PSDA
Shape 1. Measures the shape of large aggregate quantity.
1. Expensive 2. Does not address angularity or texture. 3. Assumes idealized particle shape (ellipsoid). 4. Uses one camera magnification to capture images of all sizes.
Video Imaging System (VIS)
Shape 1. Measures the shape of large aggregate quantity.
1. Expensive 2. Does not address angularity or texture. 3. Assumes idealized particle shape (ellipsoid). 4. Uses one camera magnification to capture images of all sizes.
Camsizer Shape and Angularity 1. Measures the shape of large aggregate quantity. 2. Uses two cameras to capture images at different magnifications based on aggregate size.
1. Expensive 2. Assumes idealized particle shape (ellipsoid).
WipShape Shape and Angularity 1. Measures the shape of large aggregate quantity. 2. Measures the three dimensions of aggregates.
1. Expensive 2. Does not address texture. 3. Uses same camera magnification to capture images of all sizes.
University of Illinois Aggregate Image Analyzer
(UIAIA)
Shape, Angularity, and Texture 1. Measures the shape of large aggregate quantity. 2. Measures the three dimensions of aggregates.
1. Expensive 2. Uses same camera magnification to capture images of all sizes.
Aggregate Imaging System
(AIMS)
Shape, Angularity, and Texture 1. Measures the three dimensions of aggregates. 2. Uses a mechanism for capturing images at different resolutions based on particle size. 3. Gives detailed analysis of texture.
1. Expensive
Laser-Based Aggregate
Analysis System
Shape, Angularity, and Texture 1. Measures the three dimensions of aggregates.
1. Expensive 2. Use the same scan to analyze aggregates with different sizes.

18
Table 2.2. Features of Test Methods for Experimental Evaluation (reproduced from Masad et al. 2007)
Test Method Direct (D) or Indirect (I)
Method
Features of Analysis Concept
AASHTO T304 (ASTM C1252) Uncompacted Void Content of Fine Aggregate
I
AASHTO T326 Uncompacted Void Content of Coarse Aggregate
I
Packing of aggregate that flows through a given sized orifice
ASTM D3398 Standard Test Method for Index of Aggregate Particle Shape and Texture
I
Packing of aggregate in a mold using two levels of compactions
Compacted Aggregate Resistance (CAR) Test I
Florida Bearing Value of Fine Aggregate I
AASHTO T236 (ASTM D3080) Direct Shear Test
I
Exposing a compacted specimen to pressure or shear forces
ASTM D5821 Determining the Percentages of Fractured Particles in Coarse Aggregate
D
Visual inspection of particles
Flat and Elongated Coarse Aggregates (ASTM D4791)
D Measuring particle dimension using caliper
VDG-40 Videograder D Computer Particle Analyzer (CPA) D
Micrometrics OptiSizer PSDA D
Video Imaging System (VIS) D
Using one camera to image and evaluate particles in the sample as they fall in front of a back light
Camsizer D Uses two cameras to image and evaluate particles in the sample as they fall in front of a back light
WipShape D Uses two cameras to capture image of aggregates passing on a mini conveyor system
University of Illinois Aggregate Image Analyzer (UIAIA)
D Uses three cameras to capture three projections of a particle moving on a conveyor belt
Aggregate Imaging System (AIMS) D Uses one camera and autofocus microscope to measure
the characteristics of coarse and fine aggregates Laser-Based Aggregate Analysis System D Uses a laser scan

19
2.2. EFFECT OF AGGREGATE ANGULARITY ON HMA PERFORMANCE
Cross and Brown (1992) studied the effects of aggregate angularity on the rutting
potential based on testing conducted on 42 pavements in 14 states; 30 of the 42
pavements had experienced premature rutting. Rut-depth measurements and cores were
taken at each site. The cores were tested for their aggregate characteristics, such as the
percent with two crushed faces and the uncompacted void content. Data analysis
indicated that there is a relationship between the percent with two crushed faces in the
coarse aggregate and the rutting rate when in-place air voids were greater than 2.5%,
while none of the aggregate properties were related to the rutting rate when air voids
were less than 2.5%.
Kandhal and Parker (1998) evaluated the properties of nine coarse aggregate sources by
performing nine tests to evaluate coarse aggregate shape, angularity, and texture. Rut
testing was also performed on the mixtures using the Superpave Shear Tester (SST) and
Georgia Loaded Wheel Tester (GLWT). The uncompacted voids in the coarse aggregate
test (AASHTO T326) produced the best relationships with the rutting parameters from all
nine mixtures. The results from AASHTO T326 and ASTM D3398 (“Index of Aggregate
Particle Shape and Texture”) were highly correlated.
Hand et al. (2000) conducted round-robin testing to determine the precision of ASTM
D5821. The study was initiated because of concerns that insufficient fractured faces in
the original crushed gravel source used at WesTrack may have contributed to the
premature failure of the coarse-graded sections. The materials were collected from cold
feed samples taken during the construction and reconstruction of WesTrack. Four
materials were included in the study. By monitoring the percentage of fractured faces of
the mixtures considered, the study concluded that coarse aggregate angularity did not
have an effect on the rutting performance of Superpave mixtures at WesTrack.
A Canadian study (2002) was conducted in Saskatchewan to investigate the effect of the
percentage of fractured coarse aggregate particles on rutting performance with 10

20
pavements ranging in age from two to nine years. Rut depths were measured and cores
were recovered within and between the wheel paths. Cores were tested for density, voids
filled, asphalt content, coarse aggregate fractured face count, and uncompacted void
content in fine aggregate. A stepwise regression was performed to identify the factors
most related to the in-place rut depth. Regression analysis between the reported fractured
face counts and rutting rate indicated no clear relationship.
Ahlrich (1996) investigated 11 aggregate blends. The blends were produced by
combining different percentages of crushed limestone, crushed gravel, uncrushed gravel,
and natural sand. The blends were combined to produce 0%, 30%, 50%, 70%, and 100%
crushed coarse aggregate particle counts. The resulting mixtures were tested for rutting
resistance using a confined repeated-load permanent deformation test. Coarse aggregate
shape, angularity, and texture were evaluated using the test for fractured face count,
ASTM D3398, and the uncompacted voids in coarse aggregate test (AASHTO T326).
Testing indicated a strong correlation between the individual tests and parameters from
the confined repeated-load permanent deformation test. The combined (coarse and fine
aggregate) particle index value from ASTM D3398 appears to provide the best overall
correlation with the rutting performance results.
Full-scale rutting tests were performed at the Indiana Department of Transportation
(DOT) accelerated pavement testing (APT) facility in West Lafayette, Indiana
(Rismantojo 2002). Five mixes were tested in the APT facility. The rounded gravel mix
produced 29.5 mm of rutting after 5,000 passes, at which time testing was terminated.
The other four sections containing quarried 18 stone were tested to 20,000 passes. A
strong relationship was identified between the uncompacted voids and the total rut depth
at 5,000 passes. This relationship is strongly influenced by the uncrushed gravel mixture.
When the gravel mix is excluded and only the four mixes that were tested to 20,000
passes are analyzed, the uncompacted voids in the coarse aggregate performed on the
plant stockpile material produces the best correlation.

21
As introduced, numerous studies have indicated improved rut resistance with increased
coarse aggregate angularity. Furthermore, several other studies have evaluated the
relationship between both the particle index value (ASTM D3398) and the coarse
aggregate uncompacted voids test (AASHTO T326) and rutting performance. Trends
indicate that higher particle index values or uncompacted void contents produce more rut-
resistant pavements.
Stuart and Mogawer (1994) conducted a study to evaluate different methods of measuring
fine aggregate shape and texture. Twelve materials were evaluated in the study—five
natural sands with a poor performance history, four natural sands with a good
performance history, and three manufactured (crushed) sands with a good performance
history—by performing five different laboratory tests, including the uncompacted voids
test, ASTM D3398, and a flow time test to characterize mixture rutting potential. The 12
sands were ranked by each of the test methods based on the average test value. The best
method of differentiation was the flow time test. ASTM D3398 correctly differentiated
all of the poor-quality sands from the good-quality sands. The weighted particle index
that divided good- and poor-performing materials was between 11.7 and 13.9. Later,
Mogawer and Stuart (1992) concluded that 44.7% uncompacted voids would divide
good- and poor-performing sands for high traffic levels.
Huber et al. (1998) conducted a study to assess the contribution of fine aggregate
angularity and particle shape to the rutting performance of a Superpave-designed asphalt
mixture. Four fine aggregates were selected for the study: Georgia granite, Alabama
limestone, Indiana crushed sand, and Indiana natural sand. The uncompacted void
contents (AASHTO T304) of the four aggregates were measured as 48, 46, 42, and 38,
respectively. A reference mixture was prepared with the Georgia granite (coarse and fine
aggregate) and a PG 67-22 binder. The other three aggregates were sieved into size
fractions and substituted for the granite fine aggregate to produce four mixtures, keeping
the gradation constant. All four blends were mixed at the optimum asphalt content
determined for the granite blend. The resulting mixtures were tested in the Couch Wheel
Tracker (a modified Hamburg Wheel Tracker), the Asphalt Pavement Analyzer (APA),

22
and the SST using the frequency sweep test. The rutting tests did not appear to
differentiate between the blends in a consistent manner—or at all, in some cases. The
authors concluded that the choice of coarse aggregate might have masked the effect of the
fine aggregate. There was not a clear correlation between any of the tests and the
uncompacted void contents.
NCHRP Project 4-19, “Aggregate Tests Related to Asphalt Concrete Performance in
Pavements,” (Kandhal and Parker 1998) evaluated fine aggregate tests related to rutting
performance. Three tests were used in the study: ASTM D3398, AASHTO T304, and
particle shape from image analysis (the University of Arkansas method). Used in this
study were nine fine aggregate sources with a range in uncompacted void contents of
40.3% to 47.5%. Three of the materials were natural sands. The fine aggregates were
mixed with an uncrushed gravel coarse aggregate. All of the mixes were produced using
the same gradation, above the maximum density line. The coarse aggregate and
gradation were chosen to emphasize the response of the fine aggregate. The resulting
mixtures were tested using the GLWT and the SST. Poor correlation coefficients were
observed between all three fine aggregate tests and the SST results. The index of
aggregate shape and particle texture from ASTM D3398 produced the best correlation
with the GLWT rut depths. The uncompacted void contents produced a slightly lower
correlation. The authors recommended AASHTO T304 to quantify fine aggregate
particle shape, angularity, and surface texture due to its simplicity and high correlation
with the aggregate index.
Lee et al. (1999) conducted a study on the effect of fine aggregate angularity on asphalt
mixture performance for the Indiana DOT. The study included six fine aggregate sources,
which were used to produce different gradations and blends. The angularity of the fine
aggregates were evaluated, which resulted in the uncompacted void content of the fine
aggregate ranging from 38.7 to 49.0. Volumetric mix designs were conducted, and rut
testing was also performed on the mixtures using the PurWheel Laboratory Tracking
Device and the SST. Correlation analysis between the fine aggregate tests and rutting
performance based on both repeated shear at constant height and the PurWheel rut depths

23
indicated that the uncompacted void content was highly correlated with rutting
performance. The authors however concluded that uncompacted voids alone may not be
sufficient to evaluate the fine aggregate contribution to mixture rutting performance. It
was observed that a mixture having an uncompacted void content of 43 performed as well
as a mixture with an uncompacted void content of 48. The authors noted that this may be
due to the confounding effects of gradation and compactability.
National Pooled Fund Study No. 176 (Haddock et al. 1999), “Validation of SHRP
Asphalt Mixture Specifications Using Accelerated Testing,” was conducted to examine
the effect of fine aggregate angularity on the rutting performance of Superpave mixtures.
Two coarse aggregates (a limestone and granite) and three fine aggregates (a natural sand,
limestone sand, and granite sand) were used in the study. The fine aggregates had
uncompacted void contents of 39%, 44%, and 50%, respectively. The rutting
propensities of the mixes were tested with the PurWheel, the SST, and Triaxial Tests and
in the APT facility. In Phase II of the project, an additional six mixtures were tested in
the APT facility for a total of 10 mixtures. Stiady et al. (2001) discussed the findings
obtained from the project relative to aggregate. The rounded natural sand (uncompacted
void content of 39%) produced the worst rutting performance; however, the limestone
fine aggregate (uncompacted void content of 44%) performed as well or better than the
granite fine aggregate (uncompacted void content of 50%). Analysis of variance
(ANOVA) performed on the triaxial shear strength test results indicated that the
uncompacted void contents for the fine aggregates in the mixtures were a significant
factor (Hand et al. 2001).
Chowdhury et al. (2001) conducted a study to evaluate various measures of fine
aggregate angularity and texture and their relationship to rutting performance. The study
evaluated 23 fine aggregates using seven different procedures: uncompacted void content
(AASHTO T304), ASTM D3080, CAR test, three different methods of digital image
analysis, and visual inspection. A laboratory rutting study was conducted with four of the
fine aggregates: three crushed materials and one natural sand. Cylindrical samples at 4
± 1% air voids were tested in the APA at 64°C. Regression analysis indicated a fair to

24
poor relationship between uncompacted voids and APA rut depth. The mix with 100%
natural sand fines (uncompacted void content of 39%) had the highest rut depth, followed
closely by the mix with the crushed river gravel fines (uncompacted void content of
44.3%). The mix with the granite fines (uncompacted void content of 48%) had the least
amount of rutting, followed closely by the mix with the limestone fines (uncompacted
void content of 43.5%). Laboratory results imply that it is possible to design mixes using
fine aggregate that fails the uncompacted voids criteria but produces acceptable rutting
performance.
Roque et al. (2002) conducted a study on fine aggregate angularity for the Florida DOT.
A total of nine fine aggregates were included in the study: six limestone sources, two
granite sources, and a gravel source. The fine aggregates were evaluated visually and
using AASHTO T304 and ASTM D3080. A poor correlation was observed between the
uncompacted void content and direct shear strength. The trend indicates decreasing shear
strength with increasing uncompacted void content. This may be due to the packing
characteristics of the fine aggregates with higher uncompacted void contents. The authors
concluded that “although fine aggregate angularity had some influence on the shear
strength, aggregate toughness and gradation appeared to overwhelm its effects,
confirming that fine aggregate angularity alone was not a good predictor of fine
aggregate shear strength.” Rutting tests were also performed with the APA. The trend
between uncompacted voids and APA rut depths indicated decreased rutting with
increasing uncompacted voids.
Stackston et al. (2002) conducted a study to evaluate the effect of fine aggregate
angularity on compaction effort and rutting resistance. Three aggregate sources were used
in the study. Twenty-four Superpave mix designs were developed using blends of the
three materials and two gradation shapes: fine and s-shaped. The response of the mixtures
was evaluated using Superpave volumetric properties and the gyratory load plate
assembly. The gyratory load plate assembly measures the force on the sample at three
points. Testing indicated that the density at Ninitial decreases with increasing uncompacted
void content. This indicates that mixes with higher uncompacted void contents would be
25
less likely to be tender mixes. Data from the gyratory load plate assembly indicated that
mixes with higher uncompacted void contents are harder to compact. The authors
reported that the effect of uncompacted void content was not consistent in terms of
rutting resistance as measured by the gyratory load plate assembly.
NCHRP Project 4-19 (Kandhal and Parker 1998) examined the relationship between
uncompacted void tests and rutting through accelerated testing using the Indiana
prototype APT facility. Six fine aggregates were initially selected for the fine aggregate
characterization portion of the study: crushed gravel, granite, dolomite, traprock sands,
and two natural sands. The uncompacted void contents for these sands ranged from
40.3% to 49.1% (Rismantojo 2002). The six mixtures with passing Superpave volumetric
properties were tested in the full-scale Indiana APT facility. The results indicate that
uncompacted voids were significantly related to the total rut depth after 1,000 passes. The
author noted that the decrease in rut depth with increasing uncompacted voids occurs to a
lesser extent above 45% voids. Rismantojo (2002) concluded that the results of the study
are similar to those reported by Kandhal and Parker (1998), including that fine-graded
mixtures with uncompacted void contents between 42% and 46% demonstrate similar
levels of rutting resistance.
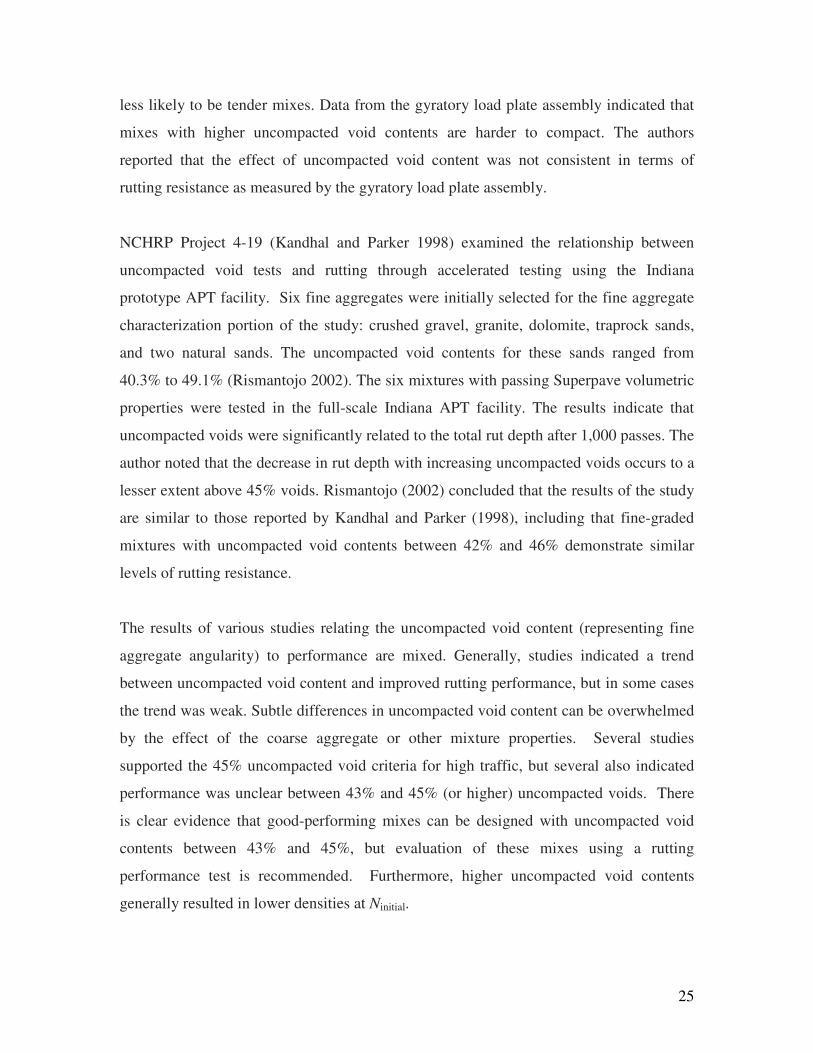
The results of various studies relating the uncompacted void content (representing fine
aggregate angularity) to performance are mixed. Generally, studies indicated a trend
between uncompacted void content and improved rutting performance, but in some cases
the trend was weak. Subtle differences in uncompacted void content can be overwhelmed
by the effect of the coarse aggregate or other mixture properties. Several studies
supported the 45% uncompacted void criteria for high traffic, but several also indicated
performance was unclear between 43% and 45% (or higher) uncompacted voids. There
is clear evidence that good-performing mixes can be designed with uncompacted void
contents between 43% and 45%, but evaluation of these mixes using a rutting
performance test is recommended. Furthermore, higher uncompacted void contents
generally resulted in lower densities at Ninitial.

26
CHAPTER 3
RESEARCH METHODOLOGY
This chapter describes materials used in this research (aggregates, asphalt binder, and an
anti-stripping additive, hydrated lime). It also illustrates mix design methods to obtain
five Superpave mixes with different combinations of coarse aggregate angularity (CAA)
and fine aggregate angularity (FAA) values. Then, a brief description of laboratory tests
included in this study is presented. Several different test methods to estimate CAA and
FAA were conducted in this study. Characteristics and concepts of each angularity test
method are briefly introduced in this chapter. Then, three laboratory performance tests
(i.e., the uniaxial static creep test, the asphalt pavement analyzer (APA) test, and the
indirect tensile fracture energy test) involved in this research to investigate mixtures’
rutting and fatigue-cracking resistance are described. The indirect tensile fracture energy
test employed two different asphalt mixtures: the asphalt concrete mixture to evaluate
both CAA and FAA effects, and the fine aggregate asphalt matrix mixture for particularly
evaluating the effect of FAA. Results from the indirect tensile fracture energy test were
then incorporated with finite element simulations of virtual specimens that were
attempted to explore the detailed mechanisms of cracking related to the aggregate
angularity.
3.1. MATERIALS SELECTION
To accomplish a more realistic simulation of asphalt mixtures paved in Nebraska, the
most widely used local paving materials (aggregates and asphalt binder) were selected for
fabricating laboratory samples. In addition, an anti-stripping agent, hydrated lime was
used in this project, since hydrated lime has been used as an active anti-stripping agent
for pavements constructed in Nebraska due to its unique chemical and mechanical
characteristics.

27
3.1.1 Aggregates
A total of seven types of local aggregates (5/8-inch limestone, 1/4-inch limestone,
screenings, 2A, 3ACR-LA, 3ACR-HA, and 47B) were used in this study. These
aggregates were selected because they are the most widely used by Nebraska pavement
contractors. Table 3.1 illustrates laboratory-measured physical properties, such as bulk
specific gravity (Gsb) and absorption capacity of each aggregate. In addition, important
Superpave aggregate consensus properties, coarse aggregate angularity (CAA), fine
aggregate angularity (FAA), and sand equivalency (SE) are also presented in the table.
As can be seen, each aggregate demonstrates very different characteristics; therefore, a
wide range of aggregate blends meeting target specific gravity and angularity can be
obtained via appropriate aggregate mixing. For this study, aggregates were blended in
order to obtain mixes with desired values of CAA (75%, 90%, and 97%) and FAA
(43.5% and 45.5%).
Table 3.1. Fundamental Properties of Aggregates
Aggregate Property Fine Aggregate Coarse Aggregate
Material Gsb Absorption
Capacity (%)
FAA (%)
Sand Equivalency
(%) Gsb
Absorption Capacity
(%)
CAA (%)
5/8" LS - - - - 2.624 1.25 100.0 1/4" LS - - - - 2.607 1.54 100.0
Screening 2.478 3.66 46.7 26.0 - - - 2A 2.580 0.76 37.6 100.0 2.589 0.68 28.0
3ACR-LA 2.556 1.13 43.7 84.0 2.588 0.75 91.0 3ACR-HA 2.576 1.13 45.7 84.0 - - -
47B 2.605 0.49 37.3 98.0 2.594 0.65 35.0
3.1.2. Asphalt binder
The asphalt binder used in this project is a Superpave performance-graded binder PG 64-
28 provided from Flint Hills, located in Omaha, Nebraska. This type of binder has been
mostly used for low-traffic-volume roads in Nebraska. Table 3.2 present fundamental
properties of the binder by performing dynamic shear rheometer (DSR) tests and bending
beam rheometer (BBR) tests, which have been designated in the Superpave binder
specification to identify performance grade and viscoelastic properties of asphalt binder.

28
Table 3.2. Asphalt Binder Properties of PG 64-28
Test Temperature (oC) Test Result Required Value
Unaged DSR, |G*|/sin� (kPa) 64 1.494 min. 1.00 Unaged phase angle (degree) 64 74.76 -
RTFO - elastic recovery 25 74 - RTFO, Aged DSR |G*|/sin� (kPa) 64 3.445 min. 2.20 PAV - Aged DSR, |G*|sin� (kPa) 22 3,245 max. 5,000 PAV - Aged BBR, stiffness (Mpa) -18 240 max. 300
PAV - Aged BBR, m-value -18 0.306 min. 0.30
3.1.3. Hydrated lime
The use of hydrated lime has been recommended in Nebraska, where asphalt pavements
are susceptible to moisture-related stripping. Hydrated lime has been known to be an
effective material to reduce moisture damage of pavements due to its unique physical-
chemical-mechanical characteristics. Hydrated lime was obtained from Mississippi Lime
Company, located in Sainte Genevieve, Missouri. Tables 3.3 and 3.4 illustrate the basic
physical and chemical properties of hydrated lime used for this study.
Table 3.3. Physical Properties of Hydrated Lime
Physical Properties Specific Gravity 2.343
Dry Brightness, G.E. 92.0 Median Particle Size - Sedigraph 2 micron
pH 12.4 BET Surface Area 22 m2/g
-100 Mesh (150 �m) 100.0% -200 Mesh (150 �m) 99.0% -350 Mesh (150 �m) 94.0%
Apparent Dry Bulk Density – Loose 22lbs./ft3 Apparent Dry Bulk Density –
Packed 35lbs./ft3

29
Table 3.4. Chemical Properties of Hydrated Lime
Chemical Properties CA(OH)2 – Total 98.00%
CA(OH)2 – Available 96.80% CO2 0.50% H2O 0.70%
CaSO4 0.10% Sulfur – Equivalent 0.024%
Crystaline Silica <0.1% SiO2 0.50% Al2O3 0.20% Fe2O3 0.06% MgO 0.40% P2O5 0.010% MnO 0.0025%
3.2. MIX DESIGN METHOD
Five Superpave mixtures were designed to conduct the indirect tensile fracture energy
and the uniaxial static creep tests. In order to evaluate the effect of aggregate angularity
on the asphalt mixture performance, three CAA values (75%, 90%, and 97%) and two
FAA values (43.5% and 45.5%) were selected to produce five combinations as presented
in Table 3.5. The selection of angularity values was based on the analysis of field asphalt
pavement projects carried out over the last decade in Nebraska. The chosen values were
the most common angularity values used in the field. Each mixture was designed to find
its optimum asphalt content until all volumetric parameters of the mixtures met the
required Nebraska Superpave specifications. All five mixes, designed in the Geomaterials
Laboratory at the University of Nebraska–Lincoln (UNL), were submitted to NDOR
asphalt/aggregate laboratories for validation of aggregate properties (i.e., Superpave
consensus properties of aggregates) and volumetric mix design parameters. Figure 3.1
presents a gradation of aggregate blends targeted to form each mix. As shown in the
figure, the mix is located below the restricted zone and contains 3.5% of mineral filler—
aggregates passing the No. 200 sieve (0.075-mm mesh size).

30
Table 3.5. Five Mixtures Designed for This Study
Mixtures Angularity Characteristics Mix 1 CAA = 97%, FAA 45.5% Mix 2 CAA = 90%, FAA 45.5% Mix 3 CAA = 75%, FAA 45.5% Mix 4 CAA = 90%, FAA 43.5% Mix 5 CAA = 75%, FAA 43.5%
The five asphalt concrete mixtures were produced in order to achieve the 4% ± 1% air
voids requirement of Superpave methodology, and for that reason, different percentages
of binder content were necessary for each mixture. This indicates that two variables,
aggregate angularity and binder content, are involved in the analysis of asphalt concrete
performance test results, which may be misleading the understanding of the pure effect of
aggregate angularity on mixture performance. Thus, to obtain mixtures where the same
binder content is maintained but different angularity values are applied, two fine
0
10
20
30
40
50
60
70
80
90
100
0.0 0.5 1.0 1.5 2.0 2.5 3.0 3.5 4.0
Sieve size (mm)^0.45
% P
assi
ng
RZ_upper
RZ_lower
control point_upper
control point_lower
maximum density
Mix Gradation Curve
Figure 3.1. A Target Gradation Curve of Aggregate Blends

31
aggregate matrix (FAM) mixtures targeting different FAA values (43.5 and 45.5) were
also produced. The FAM mixture is defined herein as the combination of asphalt binder
and aggregates passing through sieve No. 16 (mesh size of 1.18 mm). As illustrated in
Figure 3.2, the FAM mixture gradation was obtained from the original mixture gradation
shown in Figure 3.1, excluding the aggregates larger than 1.18 mm (i.e., retained on sieve
No. 8). Since the FAM mixtures contain only fine aggregates, volumetric characteristics
such as air voids between two mixtures were not significantly different, even if the same
amount of asphalt binder (6.0% in this study) was used. This implies that the effect of
FAA on mixture performance can be observed in a much more efficient way than using
asphalt concrete mixture results. The amount of binder, 6.0%, was determined as an
appropriate value that guarantees complete coating of aggregates with no bleeding on the
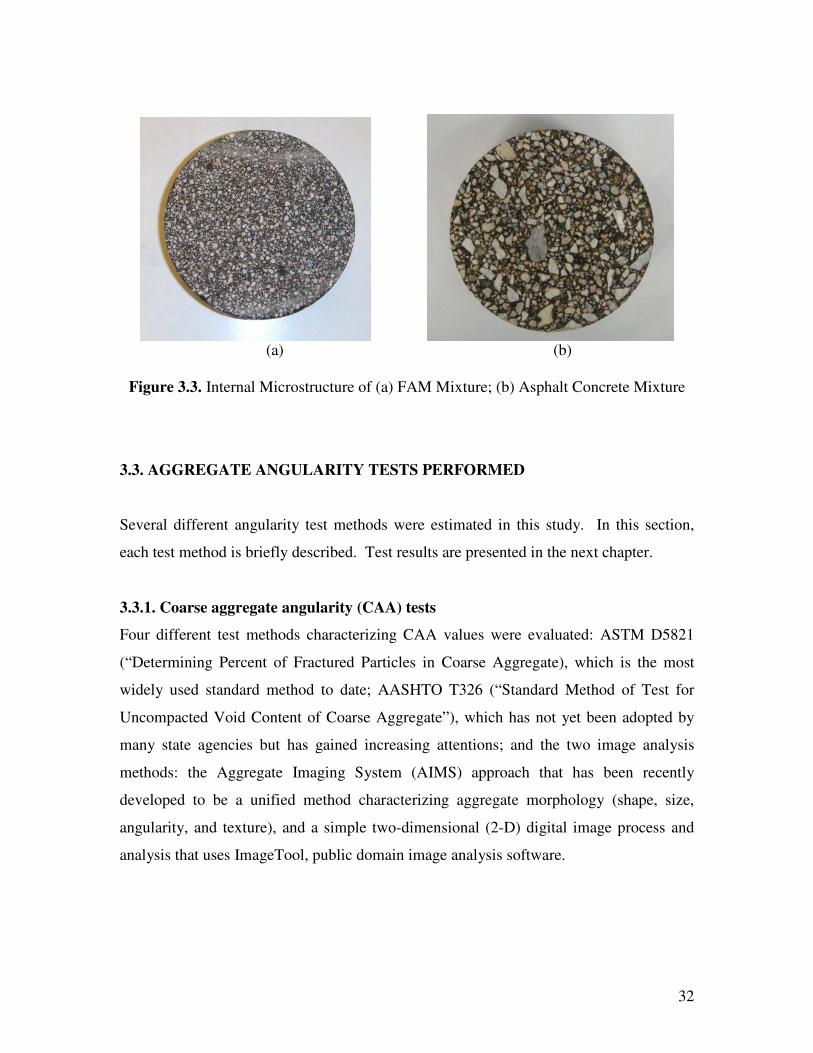
completion of mixture compaction. Figure 3.3 compares the internal microstructure of
the FAM mixture and the asphalt concrete mixture, respectively.
0
10
20
30
40
50
60
70
80
90
100
0.0 0.5 1.0 1.5 2.0 2.5 3.0 3.5 4.0
Sieve Size (mm)^0.45
% P
assi
ng
Gradation Curve_Asphalt Mixture
Gradation Curve_FAM Mixture
Figure 3.2. Gradation Curves of the Asphalt Mixtures and the FAM Mixtures
32
(a) (b)
Figure 3.3. Internal Microstructure of (a) FAM Mixture; (b) Asphalt Concrete Mixture
3.3. AGGREGATE ANGULARITY TESTS PERFORMED
Several different angularity test methods were estimated in this study. In this section,
each test method is briefly described. Test results are presented in the next chapter.
3.3.1. Coarse aggregate angularity (CAA) tests
Four different test methods characterizing CAA values were evaluated: ASTM D5821
(“Determining Percent of Fractured Particles in Coarse Aggregate), which is the most
widely used standard method to date; AASHTO T326 (“Standard Method of Test for
Uncompacted Void Content of Coarse Aggregate”), which has not yet been adopted by
many state agencies but has gained increasing attentions; and the two image analysis
methods: the Aggregate Imaging System (AIMS) approach that has been recently
developed to be a unified method characterizing aggregate morphology (shape, size,
angularity, and texture), and a simple two-dimensional (2-D) digital image process and
analysis that uses ImageTool, public domain image analysis software.

33
3.3.1.1. ASTM D5821 Method
ASTM D5821 was based on the Pennsylvania test method and was later adopted as the
method for measuring coarse aggregate angularity within the Superpave mix design
method. The fractured face count of a representative sample of coarse aggregate is
determined by visual inspection. ASTM D5821 (2002) defines a fractured face as “an
angular, rough, or broken surface of an aggregate particle created by crushing, by other
artificial means, or by nature.” A face is considered fractured only if it has the projected
area of fractured face (Af) greater than 25% of the maximum particle cross-sectional area
(Xmax), as illustrated in Figure 3.4. A fractured particle is “a particle of aggregate having
at least the minimum number of fractured faces specified (usually one or two)” (ASTM
D5821 2002).
Figure 3.4. Definition of Fractured Face (ASTM D5821 2002)

34
To run the test, a representative sample is washed over the 4.75-mm sieve and dried to a
constant mass. The size of the sample is dependent on the nominal maximum aggregate
size (NMAS) of the aggregate. The aggregate particles are visually inspected and divided
into piles of particles with no fractured faces and one or more fractured faces. After all of
the particles are sorted, the mass of each pile is determined. The percentage of fractured
particles is expressed as the mass of particles having a given number of fractured faces
divided by the total mass of the samples (result expressed as a percentage), as
mathematically expressed in Equation [3.1].
100*(%)NF
FP
+= [3.1]
where P = percentage of particles with the specified number of fractured faces;
F = mass or count of fractured particles with at least the specified number of
fractured face; and
N = mass or count of particles in the nonfractured category not meeting the
fractured face criterion.
For Superpave specifications, after the percentage of particles with one or more fractured
faces is determined, the aggregates are reexamined for two or more fractured faces.
Figure 3.5 illustrates two distinct groups of aggregates: aggregates classified as
nonfractured face and classified as fractured face aggregates.
(a) non-fractured face (b) fractured face
Figure 3.5. Aggregates with Different Angularity Characteristics

35
3.3.1.2. AASHTO T326 Method
Ahlrich (1996) developed the uncompacted voids in coarse aggregate test based on
ASTM C1252, “Uncompacted Void Content in Fine Aggregate.” Both AASHTO T326
and ASTM C1252 use the same concept to quantify the aggregate angularity; the higher
the percentage of voids, the higher the angularity of the aggregate, as illustrated in Figure
3.6. AASHTO T326 is preferable to ASTM D5821 because it requires much less testing
time to perform; however, the effects of particle shape, angularity, and texture cannot be
purely separated, since the uncompacted void content of coarse aggregates is directly or
indirectly related to all three aggregate characteristics: shape, angularity, and texture.
The apparatus used to perform this test is presented in Figure 3.7.
(a) low angularity (b) high angularity
Figure 3.6. Correlation between Aggregate Angularity and Voids
Figure 3.7. Apparatus of the AASHTO T326 Test

36
3.3.1.3. Aggregate Imaging System (AIMS)
The AIMS method was developed by researchers at Texas A&M University. The AIMS
contains both a fine aggregate and a coarse aggregate module (Masad 2003). These two
modules allow the system to capture measurements of shape (form), angularity, and
texture altogether. The system (Figure 3.8) consists of a video microscope, video camera,
data acquisition system, lighting system, automated carriage, and associated software.
The aggregate particles are randomly spread on a disk tray. A video microscope is
coupled with a black-and-white video camera to acquire images. The images are then
analyzed to identify aggregates’ angularity, form, and surface texture characteristics. The
most recent AIMS device manufactured by Pine provides software (shown in Figure 3.9)
that produces image analysis results in spreadsheet (such as Microsoft Excel) files so that
users can easily manipulate test data.
(a) Exterior View (b) Inside of the Chamber
Figure 3.8. AIMS Device

37
Figure 3.9. AIMS Interface for Coarse Aggregates
Evaluation of aggregate angularity is based on the analysis of two-dimensional (2-D)
image of aggregates by monitoring differences of the gradient vectors at different edge
points of the aggregate image. The gradient vector is obtained at the edge of the particle
image, and its direction is determined based on the changing of colors from white
(aggregate) to black (background), as shown in Figure 3.9. Simply, the concept is that at
smooth corners of the image, the gradient vector changes slowly, while at sharp corners it
changes rapidly (Bathina 2005). Figure 3.10 exemplifies the concept with two cases: a
rounded particle and an angular particle. Clearly, the change in the gradient vectors in
the angular particle is much more rapid than the change from the rounded particle. The
angularity index (AIG) can then be calculated from the accumulated sum of the difference
of consecutive gradient vectors for all edge points (Masad 2004) as presented in Equation
[2.3] in the previous chapter.

38
Figure 3.10. AIMS Gradient Method to Quantify Angularity
3.3.1.4. Two-dimensional Digital Image Process and Analysis
The two-dimensional (2-D) digital image analysis was also evaluated in this study as a
potential approach to estimate coarse aggregate angularity since it is very simple, fast,
and economical to perform. For the testing, digital image creation and processing of
aggregate particles are performed following a set of steps, and then the processed image
is analyzed by using public domain software (ImageTool) that was developed by the
University of Texas Health and Science Center. As illustrated in Figure 3.11, the digital
image processing is typically composed of four steps: digital image formation, image
enhancement, segmentation, and identification of the objects.
Digital image formation is the first step in any digital image processing application. From
this step, the aggregates are simply digitalized using a conventional scanner. Then, image
enhancement techniques are applied to highlight certain characteristics of interest in the
image. Enhancement is a simple but very subjective area of image processing, because
enhancement is based on human subjective preferences depending on what features of the
image is important to the analysis (Gonzalez and Woods 2008). Figure 3.11(b) shows the
image of aggregates transformed in black and white. This step can be executed using a
commercial image editor such as CorelDraw or Photoshop. Next step is segmentation,

39
which is the detection of object boundaries, as presented in Figure 3.11(c). This step is
performed by using edge- and line-detection techniques. Segmentation is considered one
of the most critical tasks in digital image processing (Gonzalez and Woods 2008),
because this step involves recognizing and separating the object of interests from the
background. The segmentation was executed by using the ImageTool software. After
the detection of object boundaries through the segmentation process, the next step is the
identification of the objects. This stage provides specific geometric characteristics, such
as perimeter, area, and roundness, of each identified object. Figure 3.11(d) illustrates the
process performed by the ImageTool software.
(a) image formation (b) image enhancement
(c) image segmentation (d) identification of objects
Figure 3.11. Steps of the Two-Dimensional Digital Image Processing

40
The roundness parameter resulting from the digital image analysis is used as an
angularity measurement. The roundness is between 0 and 1, where the greater the value,
the rounder the object. The roundness can be calculated as follows:
2
**4P
Aroundness
π= [3.2]
where A = area of the particle image; and
P = perimeter of the particle image.
3.3.2. Fine aggregate angularity (FAA) tests
Among several different testing methods to evaluate fine aggregate angularity, two tests
were analyzed in this study: AASHTO T304 (“Uncompacted Void Content of Fine
Aggregate”), which is the most widely used method designated in the current Superpave
specification; and the AIMS approach, which is a method that has been receiving
increasing attention from the asphalt pavement community due to its more scientific
characteristics.
3.3.2.1. AASHTO T304 Method
AASHTO T304 is commonly referred to as the FAA test. The Superpave method
specifies AASHTO T304 to ensure that the blend of fine aggregates in an asphalt mixture
has sufficient internal friction to provide rut-resistance in the mixture (McGennis et al.
1994), since higher internal friction is typically associated with increased rutting
resistance. The amount of friction depends on the aggregate particle shape and texture.
AASHTO T304 test is an indirect measure of particle shape, angularity, and texture, since
it is based on an empirical observation indicating that more angular particles or particles
with more surface texture are not packed together as tightly as rounded or smooth
particles would be.
As presented in Figure 3.12, a 190-g sample of fine aggregate of a prescribed gradation is
allowed to flow through the orifice of a funnel and fill a 100-cm3 calibrated cylinder.
Excess material is struck off, and the cylinder with aggregate is weighed. The

41
uncompacted void content of the sample is then computed using the loosely compacted
weight of the aggregate, the bulk dry specific gravity of the aggregate, and the calibrated
volume of the receiving cylinder. Equation [3.3] presents a mathematical formula to
calculate the uncompacted void content in fine aggregates. The FAA value is defined as
the percentage of air voids in a loosely compacted sample of fine aggregate.
100*(%)V
GF
VU
��
���
�−= [3.3]
where U = uncompacted void content (in percentage);
V = known volume of the cylinder;
F = net mass (in gram) of fine aggregates; and
G = bulk specific gravity of fine aggregate sample.
Figure 3.12. AASHTO T304 Testing Apparatus
There are three methods for running AASHTO T304: Methods A, B, and C. The mass of
the sample for all three methods is fixed at 190 g. Method A specifies a known gradation
ranging from material passing the 2.36-mm sieve to material retained on the 0.15-mm

42
sieve. Method B specifies that the test be run on three individual size fractions: 2.36 to
1.18 mm, 1.18 to 0.60 mm, and 0.60 to 0.30 mm. The reported void content for Method
B is the average of the results from the three individual size fractions. In Method C, the
test is run on the as-received gradation. The Superpave researchers chose Method A to
limit the effect of gradation, particularly material passing the 0.075-mm sieve on the test
result.
3.3.2.2. Aggregate Imaging System (AIMS)
This test uses the same device shown in Figure 4.5. Measurement concept is also based
on the changes of the gradient vector on the edges of the particle image, as described in
section 3.3.1.3. The only difference between the test procedure for fine aggregates and
the one for coarse aggregates is the amount of particles for each sieve size. Table 3.6
presents the suggested number of particles presented in the operator’s manual.
Table 3.6. Sample Size of AIMS for Fine Aggregates
Sieve Size Suggested Number of Particles Coarse Aggregate
12.5 mm (1/2”) 50 9.5 mm (3/8”) 50 4.75 mm (#4) 50
Fine Aggregate 2.36 mm (#8) 150
1.18 mm (#16) 150 0.6 mm (#30) 150 0.3 mm (#50) 150
0.15 mm (#100) 150 0.075 mm (#200) 150
Similar to the coarse aggregate case, the image of individual fine aggregate particle is
analyzed to identify its angularity and form characteristics. The most recent AIMS
system manufactured by Pine provides a user-friendly interface (shown in Figure 3.13),
and test results are summarized in Excel spreadsheets for further graphing and data
analyses.
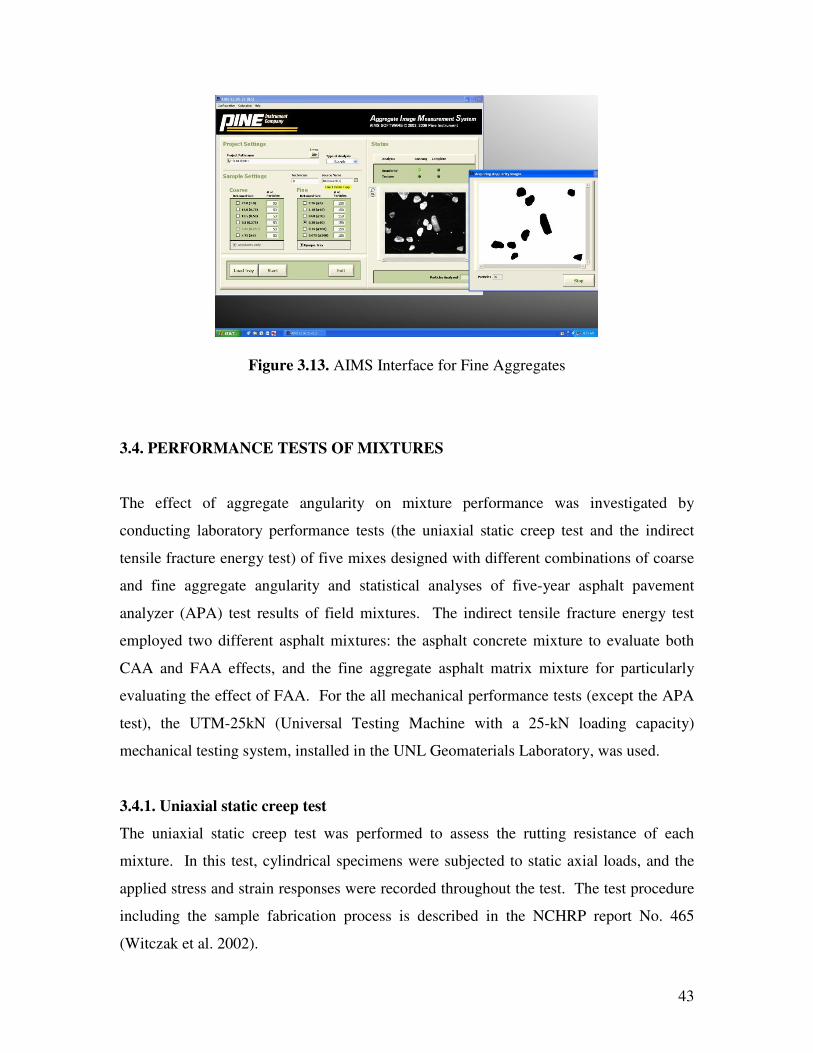
43
Figure 3.13. AIMS Interface for Fine Aggregates
3.4. PERFORMANCE TESTS OF MIXTURES
The effect of aggregate angularity on mixture performance was investigated by
conducting laboratory performance tests (the uniaxial static creep test and the indirect
tensile fracture energy test) of five mixes designed with different combinations of coarse
and fine aggregate angularity and statistical analyses of five-year asphalt pavement
analyzer (APA) test results of field mixtures. The indirect tensile fracture energy test
employed two different asphalt mixtures: the asphalt concrete mixture to evaluate both
CAA and FAA effects, and the fine aggregate asphalt matrix mixture for particularly
evaluating the effect of FAA. For the all mechanical performance tests (except the APA
test), the UTM-25kN (Universal Testing Machine with a 25-kN loading capacity)
mechanical testing system, installed in the UNL Geomaterials Laboratory, was used.
3.4.1. Uniaxial static creep test
The uniaxial static creep test was performed to assess the rutting resistance of each
mixture. In this test, cylindrical specimens were subjected to static axial loads, and the
applied stress and strain responses were recorded throughout the test. The test procedure
including the sample fabrication process is described in the NCHRP report No. 465
(Witczak et al. 2002).

44
A Superpave gyratory compactor was used to produce the cylindrical samples with a
diameter of 150 mm and an approximate height of 170 mm. Then, the samples were
cored and sawed to produce testing specimens with a 100-mm diameter and 150-mm
height. Figure 3.14 presents a specimen after the compaction and coring-sawing process.
Figure 3.14. A Specimen Cored and Sawed from the Gyratory Compacted Sample
To measure the axial displacement of the specimen under the constant compressive force,
mounting studs were fixed to the surface of the specimen with epoxy glue so that the
three linear variable differential transformers (LVDTs) could be attached onto the surface
of the specimen at 120o radial intervals with a 100-mm gauge length, as illustrated in
Figure 3.15. Then, the specimen was mounted in the UTM-25kN testing station for the
testing (Figure 3.16).
Figure 3.15. A Device Used to Place the Mounting Studs for LVDTs
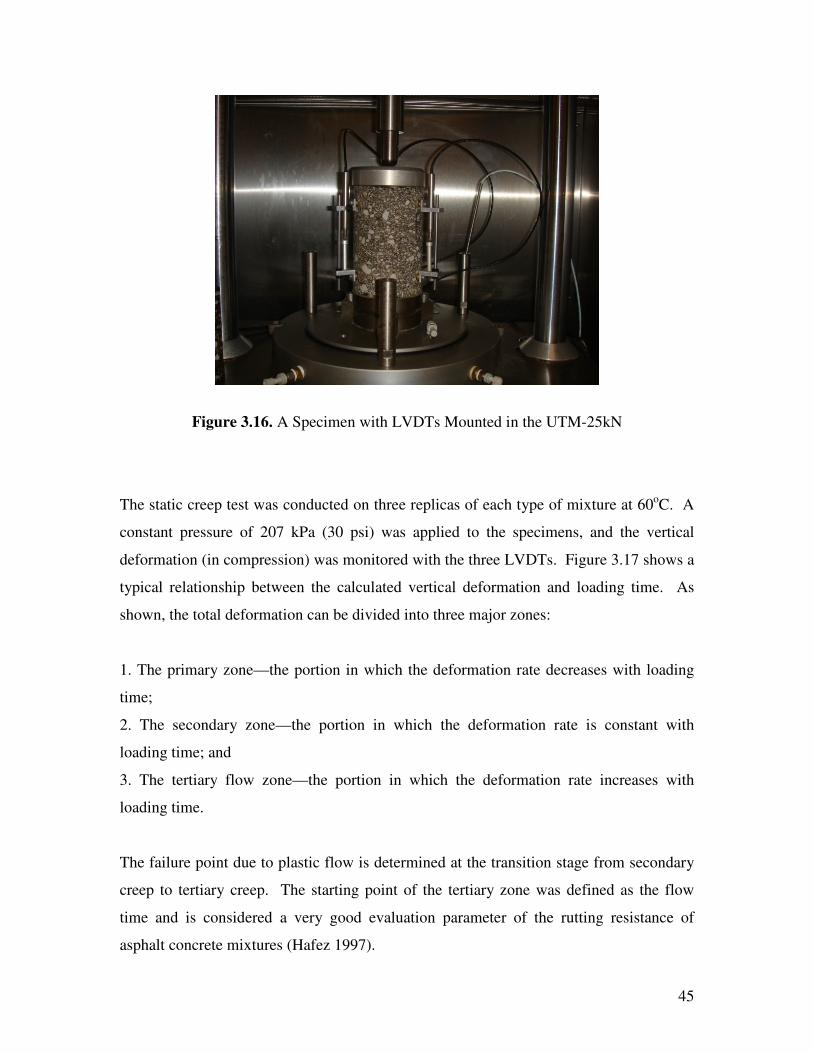
45
Figure 3.16. A Specimen with LVDTs Mounted in the UTM-25kN
The static creep test was conducted on three replicas of each type of mixture at 60oC. A
constant pressure of 207 kPa (30 psi) was applied to the specimens, and the vertical
deformation (in compression) was monitored with the three LVDTs. Figure 3.17 shows a
typical relationship between the calculated vertical deformation and loading time. As
shown, the total deformation can be divided into three major zones:
1. The primary zone—the portion in which the deformation rate decreases with loading
time;
2. The secondary zone—the portion in which the deformation rate is constant with
loading time; and
3. The tertiary flow zone—the portion in which the deformation rate increases with
loading time.
The failure point due to plastic flow is determined at the transition stage from secondary
creep to tertiary creep. The starting point of the tertiary zone was defined as the flow
time and is considered a very good evaluation parameter of the rutting resistance of
asphalt concrete mixtures (Hafez 1997).

46
3.4.2. Asphalt pavement analyzer (APA) test
Rutting susceptibility of asphalt concrete samples can be practically evaluated using the
APA testing equipment shown in Figure 3.18. The APA is an automated, new generation
of the Georgia Load Wheel Tester (GLWT) used to evaluate rutting, fatigue, and
moisture resistance of asphalt concrete mixtures. During the APA test, the rutting
susceptibility of compacted specimens is tested by applying repetitive linear loads
through three pressurized hoses via wheels to simulate trafficking. Even though it has
been reported that APA testing results are not very well correlated with actual field
performance, APA testing is relatively simple to perform and produces a ranking of
mixtures’ rutting potential by simply measuring sample rut depth.
0.0
0.3
0.6
0.9
1.2
1.5
0 100 200 300 400 500 600
Loading Time (sec)
Dis
pla
cem
ent (
mm
) Primary Zone
Secondary Zone
Tertiary Zone
Figure 3.17. Typical Test Results of the Uniaxial Static Creep Test

47
(a) APA with Beam and Cylindrical Samples (b) Front View of APA
Figure 3.18. Asphalt Pavement Analyzer (APA)
In addition to the uniaxial static creep test, the APA test was considered to assess the
effect of aggregate angularity on a mixture’s rutting potential. Instead of performing the
APA test for the five mixtures shown in Table 3.5, APA test data accumulated in the
NDOR laboratory were obtained and used for this study. This approach might be
somewhat limited to provide a direct relationship between the aggregate angularity and
the mixture’s rutting potential, because many other variables are involved in the process;
however, a simple statistical analysis of the test results obtained from various types of
Nebraska asphalt mixes (i.e., SP-2, SP-4, SP-4S, and SP-5) is expected to produce at least
some useful insights into the role of aggregate angularities to the mixtures’ rutting
performance.
The number of APA specimens considered was 11, 90, 24, and 21 for SP-2, SP-4, SP-4S,
and SP-5, respectively. Asphalt field mixtures were compacted in the laboratory to
produce testing specimens, 150 mm in diameter and 50 mm high. For all specimens, the
hose pressure and wheel load were 690 kPa and 445 N (100 psi and 100 lb), respectively.
All tests were performed at 64oC.

48
3.4.3. Indirect Tensile Fracture Energy Test
To evaluate the effects of aggregate angularity on fatigue damage resistance, the indirect
tensile (IDT) test was performed on laboratory mixed, laboratory compacted specimens.
As in several studies (Kim et al. 2002; Wen and Kim 2002; Kim and Wen 2002)
conducted at North Carolina State University, the fracture energy obtained from the IDT
test can be a good indicator for field performance. In the studies, the ranking of the
mixtures with respect to this parameter agreed with that of the mixtures in the field, with
respect to the percentage of fatigue cracking, as illustrated in Figure 3.19 (Kim et al.
2002). They validated the use of fracture energy by testing actual pavement cores; that is,
the field mixed–field compacted specimens and fracture energy was able to distinguish
between the performance of mixtures with different gradations, asphalt contents, and air
void contents.
Figure 3.19. Relationship between Field Fatigue Performance and IDT Fracture Energy (Kim et al. 2002)
In addition, the IDT test is easy to perform and can significantly reduce testing efforts
compared to typical mixture fatigue tests. Typical fatigue tests require long testing times,
and test results are usually not repeatable.

49
Following the procedures described in Kim et al. (2002), Superpave gyratory compacted
samples of 150-mm diameter and approximately 115-mm tall were produced and then
cored to produce specimens with a diameter of 100 mm. Each cored specimen was then
cut to produce two IDT specimens 38-mm tall, as shown in Figure 3.20. Then, gauge
points were glued over a 50-mm gauge length in the center of the specimen on both faces
to measure horizontal and vertical displacements during the IDT fracture test. The gauge
points were placed as accurately as possible on the desired locations of the specimen to
alleviate positioning errors. Toward the end, a gauge-point mounting and gluing device,
as shown in Figure 3.21, was developed and used. Lateral metallic bars were also used to
avoid rotation and translation at the top and bottom plates while gluing the gauge points.
Figure 3.20. Testing Specimens after Coring-Sawing Process
Figure 3.21. Gauge-Point Mounting Device

50
Then, the specimen was mounted in the UTM-25kN testing station (as shown in Figure
3.22). A constant crosshead rate loading (0.833 mm/s) was applied to the specimen at
20oC. Horizontal and vertical displacements were measured from the cross LVDTs on
both faces.
Figure 3.22. An IDT Specimen Installed in the UTM-25kN
Using the horizontal displacements measured, the strain is calculated at the center of the
specimen using the following equation.
43
210 )()(
νγγνγγε
++
== tUtx [3.5]
where )(0 tx=ε = strain at the center;
)(tU = horizontal displacement (m);
4321 ,,, γγγγ = parameters; and
ν = Poisson’s ratio (0.35).
The parameters γ1, γ2, γ3, and γ4 are related to specimen diameter and gauge length used.
Table 3.7 shows the values of these parameters for specimens with different diameters

51
and gauge lengths (Kim et al. 2002). Since the IDT specimens for this study used 100-
mm diameter and 50.8-mm gauge length, the parameters γ1, γ2, γ3, and γ4 are 12.4, 37.7,
0.471, and 1.57, respectively.
Table 3.7. Parameters in Equation [3.5]
Specimen Diameter (mm)
Gauge Length (mm) �1 �2 �3 �4
100 25.4 12.4 37.7 0.291 0.908 100 50.8 12.4 37.7 0.471 1.57 150 25.4 8.48 27.6 0.207 0.634 150 50.8 8.48 27.6 0.378 1.18 100 76.2 8.48 27.6 0.478 1.59
The stress at the center of the specimen can also be calculated based on the equation
developed by Hondros (1959), which is written as follows:
tdtP
tx πσ )(2
)(0 == [3.6]
where )(0 tx=σ = strain at the center;
)(tP = force applied;
t = thickness of the specimen (38 mm in this study); and
d = diameter of the specimen (100 mm in this study).
Using Equations [3.5] and [3.6], test results can then be plotted in a stress-strain curve, as
illustrated in Figure 3.23. The area under the stress-strain curve until peak stress is
defined as the fracture energy (Kim et al. 2002).

52
0
200000
400000
600000
800000
1000000
1200000
0 0.03 0.06 0.09 0.12 0.15Strain
Str
ess
(Pa)
Area under the Curve: Fracture Energy
Figure 3.23. Typical Stress-Strain Plot of the IDT Fracture Test
3.5. FINITE ELEMENT MODELING OF IDT FRACTURE TESTING
The objective of this effort is to further investigate the effect of aggregate angularity
through a numerical modeling approach. Some visible findings and related inferences
can be obtained from the results of the indirect tensile test; however, the global behavior
observed from the laboratory test is not often sufficient to address the detailed local
events occurring in the specimens. Angularity, a material-level (aggregate) design
variable, is one of critical properties of bituminous mixtures and is regarded as having the
potential to influence mixture performance through a significant level of interactions with
other materials such as binders. Thus, the effects of aggregate angularity on mixture
performance would be better identified by certain approaches that can provide insights
into detailed local behavior and interactions among materials.
Recently, a micromechanics-based computational modeling approach has been actively
pursued to account for the effects of individual mixture constituents (e.g., aggregates and
asphalt binder) on overall mixture performance. Some studies (Masad et al. 2001;

53
Papagiannakis et al. 2002; Dai and You 2007) have proposed finite element (FE) method-
based models to characterize the damage performance of asphaltic composites. The
discrete element method (DEM), an explicit numerical technique, has also been
employed by several researchers (Abbas and Shenoy 2005; You and Buttlar 2006; You et
al. 2008). These computational approaches allow engineers to better understand the
mechanical effects of small-scale design variables (such as asphalt mastic film thickness,
air voids in the mix, size/shape/distribution of aggregates, mineral additives in the
mixture, volume fraction of asphalt mastics, etc.) on overall damage-associated responses
and the lifetimes of mixtures.
To this end, the micromechanical FE simulation was implemented in this study to
investigate in greater detail the effect of angularity on asphalt mixture fatigue
performance. Modeling and simulations were carried out using a UNL in-house code that
has been developed and employed to model various composite materials and structures
(Kim et al. 2006a, 2006b, 2007). The code is based on the FE method and incorporates
elasticity, viscoelasticity, and nonlinear fracture. Since asphalt mixtures consist of elastic
aggregates and viscoelastic asphalt, and typically present nonlinear viscoelastic fracture,
all of these features are essentially necessary for the modeling of asphalt mixtures. The
indirect tensile fracture energy test was simulated using this code. The same loading
condition (a constant displacement rate of 0.833 mm/s) was applied to all modeled
specimens.
3.5.1. Finite element mesh
In order to accomplish micromechanical FE modeling, it is necessary to construct and
mesh the internal microstructure of the specimen. For this study, the inner microstructure
of the specimens was artificially generated by a newly developed virtual microstructure
generator (Souza 2009). The virtual microstructure generator allows the experimental
effort to be considerably reduced due to its virtual mixture fabrication and laboratory
testing. The current working (beta) version of the virtual microstructure generator can
produce the microstructure of mixtures with known basic geometric properties of
aggregates (i.e., gradation, angularity, elongation, and orientation) and mixture

54
volumetric parameters (such as volume fraction of each phase). In particular, the
angularity characteristic is controlled by its input aggregate imaging system (AIMS)
values of aggregate particles. Figure 3.24 exemplifies several internal microstructures
virtually generated.
(a) (b) (c)
Figure 3.24. Several Internal Microstructures Virtually Generated
With the virtually generated microstructure, triangular elements were used for the FE
meshing, as presented in Figure 3.25, which is the FE mesh of Figure 3.24(c). It can be
noted that a higher degree of refinement was intended around the aggregates in order to
capture more accurately any detailed mechanical behavior related to angularity. In
addition, studies of mesh and time step convergence were performed to minimize
numerical errors. Analysis results indicate that a time step of 0.01 second and a mesh
with 15,000 elements were adequate to guarantee a reasonable degree of accuracy.

55
Figure 3.25. Finite Element Mesh of the Virtual Specimen
3.5.2. Modeling methodology
Figure 3.25 also presents the constitutive relation of each phase for the FE modeling. As
shown in the figure, aggregates and metal blocks (loading strips) were modeled as linear
elastic materials. The linear elastic constitutive relationship can be expressed as:
),(),( , txCtx mklEijklmij εσ = [3.7]
where ),( txmijσ = stress as a function of space and time;
),( txmklε = strain as a function of space and time;
EijklC , = elastic modulus, which is not time-dependent;
mx = spatial coordinates; and
t = time of interest.
The time-independent elastic modulus consists of elastic material properties. If the
individual particle of aggregates and the metal loading strips are assumed to follow
Linear Elastic
Linear Viscoelastic
Nonlinear Viscoelastic Cohesive Zone

56
simply isotropic linear elastic behavior, only two independent material constants among
Young’s modulus (E), shear modulus (G), and Poisson’s ratio (ν) are required.
The constitutive behavior of the asphalt phase surrounding aggregates can often be
represented by the following linear viscoelastic convolution integral:
� ∂∂
−=t
mklVEijklmij d
xtCtx
0,
),()(),( τ
ττετσ [3.8]
where )(, tC VEijkl = linear viscoelastic time-dependent stress relaxation modulus; and
τ = time-history integration variable.
The linear viscoelastic relaxation modulus of the asphalt phase is often represented by a
mathematical form such as a Prony series based on the generalized Maxwell model. The
linear viscoelastic stress relaxation modulus by a Prony series can be expressed as:
�=
∞ ��
�
�
��
�
�−+=
M
p pijklpijklijklVEijkl
tCCtC
1 ,,,, exp)(
ρ [3.9]
where ∞,ijklC and pijklC , = spring constants in the generalized Maxwell model;
pijkl ,ρ = relaxation times in the generalized Maxwell model; and
M = the number of dashpots in the generalized Maxwell model.
To simulate cracking and fracture failure, the cohesive zone concept was implemented in
the modeling. Fracture behavior can be modeled in many different ways, and one of the
well-known approaches is to use the cohesive zone. Cohesive zone approaches regard
fracture as a gradual phenomenon in which separation takes place across an extended
crack tip, or cohesive zone (fracture process zone), and where the fracture is resisted by
cohesive tractions. As shown in Figure 3.26, cohesive zones are placed between
continuum elements to represent the progressive separation of a material. The cohesive
zone effectively describes the material resistance when material elements are being
displaced.

57
DiscreteCrack
TractionBoundary Condition
DisplacementBoundary Condition
1x
2x
3x
crack tip
cohesivezone tip
cohesive zone
δ
A GeneralObject nT maxT
Figure 3.26. Schematic Representation of the Cohesive Zone Concept
Cohesive zone models are well-established tools in classic fracture mechanics developed
to remove stress singularities ahead of crack tips. Recently, the cohesive zone concept
has been employed in several studies, most of which attempted to simulate crack-
associated fracture damage of asphalt concrete mixtures (Song et al. 2006; Kim et al.
2007. Among the various cohesive zone models available, this study used a cohesive
zone model developed by Allen and Searcy (2001), because the model can reflect
nonlinear viscoelastic damage growth in the asphalt mixtures. Furthermore, the model
can predict damage evolution, microcracking, corresponding post-peak material
softening, and eventual fracture failure of highly inelastic asphalt mixtures. The general
traction-displacement relationship for the nonlinear viscoelastic cohesive zone model is
as follows (Allen and Searcy 2001):

58
[ ]
��
�
∂∂−+⋅−= �
tcf
ii
ii dtEt
tut
tT0
)()()(1
)()(
1)( τ
ττλτσα
δλ [3.10]
where iT = cohesive zone traction;
iu = cohesive zone displacement;
iδ = cohesive zone material length parameter;
)(tλ = Euclidean norm of cohesive zone displacements;
)(tα = microscale damage evolution function;
fiσ = requisite stress level to initiate cohesive zone;
)(tE c = stress relaxation modulus of the cohesive zone; and
i = n (opening) or s (shearing).
As presented in Equation [3.10], the cohesive zone damage evolution is characterized by
the internal state variable, α(t). It can be noted from Equation [3.10] that when α(t)
reaches the value of unity, the crack face traction decays to zero, thus resulting in crack
extension. The damage evolution law can be determined by performing fracture tests to
represent locally averaged cross-sectional area of damaged material in a cohesive zone.
Alternatively, a phenomenological form of the damage evolution can also be employed to
represent rate-dependent fracture. In this study, the following simple phenomenological
form has been selected, since it is sufficient to evaluate mixtures designed with different
aggregate angularities. Parameters A and m are microscale phenomenological material
constants that govern damage evolution behavior.
[ ]mtA )(λα =•
, when 0>•λ and 1<α [3.11]
0=•
α , when 0≤•λ or 1=α [3.12]
Cohesive zone elements were embedded within asphalt phase elements and along
boundaries between aggregates and asphalt. No cracking was allowed inside the
aggregates.

59
CHAPTER 4
RESULTS AND DISCUSSION
Superpave mix designs of all five mixes were accomplished at UNL. Mix design results
are presented in this chapter. Laboratory performance testing results from the uniaxial
static creep test, the APA test, and the IDT fracture energy test are then presented and
discussed in this chapter. The finite element simulation results of the IDT fracture test
are also presented and further discussed in this chapter. Finally, angularity test results
estimated from the four coarse aggregate angularity methods and the two fine aggregate
angularity testing methods are presented and are further discussed regarding their
characteristics to the testing repeatability, cost, testing time, workability, and sensitivity
of test results.
4.1. MIX DESIGN RESULTS
Volumetric parameters of each mix are shown in Table 4.1. All mixes were designed at
UNL, and representative batches of each mix were sent to NDOR laboratories for
validation. As can be seen in the table, no huge discrepancy between NDOR results and
UNL results was observed. Mix volumetric properties obtained from UNL laboratory
generally satisfied NDOR mix specifications.
Table 4.1. Volumetric Mix Properties
Va VMA VFA Pb (%) D/B NDOR Specification 4 ± 1 > 14 65 - 75 - 0.7-1.7
UNL volumetric results 3.8 14.5 73.3 6.0 0.9 CAA = 97 FAA = 45.5 NDOR volumetric results 3.6 14.7 75.3 6.0 -
UNL volumetric results 4.8 14.7 67.6 5.7 1.02 CAA = 90 FAA = 45.5 NDOR volumetric results 3.7 14.1 74.1 5.7 -
UNL volumetric results 5.9 14.3 65 5.4 1.04 CAA = 75 FAA = 45.5 NDOR volumetric results 4.5 14.2 68.3 5.4 -
UNL volumetric results 4.2 14.0 69.8 5.0 0.99 CAA = 90 FAA = 43.5 NDOR volumetric results 4.0 13.9 71.3 5.0 -
UNL volumetric results 4.8 13.9 65.4 4.7 1.05 CAA = 75 FAA = 43.5 NDOR volumetric results 4.1 13.7 70.1 4.7 -

60
4.2. LABORATORY PERFORMANCE TEST RESULTS
4.2.1. Uniaxial static creep test results
Figure 4.1 shows the average flow times obtained from three specimens of each mixture
and its standard deviation in the form of an error bar. As shown in the figure, there was
an increasing trend in the resistance to rutting as increasingly angular aggregates were
placed in the mixtures. This was an expected phenomenon since higher angularity
produces better aggregate interlocking. This improved interlocking can increase the
rutting resistance of the asphalt mixtures, as has been indicated in other studies (Wedding
and Gaynor 1961; Pan et al. 2005; Huang et al. 2009). The contribution of angular
aggregates to rutting resistance becomes even more obvious when the binder content of
each mixture is considered. As shown in Figure 4.1 by the percentage inside each bar,
mixtures with higher binder content were more resistant to rutting, which contradicts a
typical observation, namely, that the increase of binder content decreases the rutting
resistance. Thus, the effect of angular particles is clearly a factor in the resistance of
rutting.
450517
2,400
3,700
4,700
0
1000
2000
3000
4000
5000
6000
7000
CAA = 97 FAA = 45.5
CAA = 90 FAA = 45.5
CAA = 75 FAA = 45.5
CAA = 90 FAA = 43.5
CAA = 75 FAA = 43.5
Mixtures
Tim
e (s
)
6.0%
5.7%
5.4%
5.0% 4.7%
Figure 4.1. Uniaxial Static Creep Test Results

61
4.2.2. APA test results
Figures 4.2 to 4.5 plot analysis results of APA specimens tested at the NDOR laboratories
for the past several years. Instead of using the APA rut depth, a different quantity, rut
ratio, was used for the analysis. The rut ratio serves as a replacement for the rut depth
and is simply calculated by dividing the total rut depth by the corresponding number of
loading cycles and multiplying the obtained value by 100. Rut ratio was employed
because the APA test stopped automatically when the wheel loading reached 8,000 cycles
before a 12-mm rut depth had been reached or when the total rut depth exceeded 12 mm
before 8,000 cycles had passed. Therefore, rut ratio was calculated to provide an
equivalent measure of a mixture’s rut potential for any case. As can be observed in the
figures, APA test results generally present a high testing variability. However, for all
mixtures, the simple linear regression implies that the increase of coarse aggregate
angularity, which is represented by higher percentage of the number of fractured faces,
improved the rutting performance, which supports the results from the static creep test.
0.0
0.4
0.8
1.2
1.6
2.0
80 85 90 95 100 105
Number of Fractured Face (%)
Ru
t Rat
io
Figure 4.2. APA Test Results of SP2 Mixtures

62
0.0
0.4
0.8
1.2
1.6
2.0
80 85 90 95 100 105
Number of Fractured Faces (%)
Ru
t Rat
io
Figure 4.3. APA Test Results of SP4 Mixtures
0.0
0.4
0.8
1.2
1.6
2.0
80 85 90 95 100 105
Number of Fractured Faces (%)
Rut
Rat
io
Figure 4.4. APA Test Results of SP4S Mixtures

63
0.0
0.4
0.8
1.2
1.6
2.0
80 85 90 95 100 105
Number of Fractured Faces (%)
Rut
Rat
io
Figure 4.5. APA Test Results of SP5 Mixtures
4.2.3. IDT fracture energy test results
Figure 4.6 presents test results with average fracture energy and its standard deviation
obtained from three specimens of each mixture with the optimum binder content for each
mixture shown within each bar. As can be seen in Figure 4.6, mixtures with a higher
CAA value produced greater fracture energy, which corresponds to their better resistance
to fatigue cracking. In addition, mixtures with different FAA values but the same CAA
value showed similar values of fracture energy. As two variables (binder content and
aggregate angularity) are involved in the test, both can affect test results. It is generally
known that an increase in the binder content of a mixture increases the mixture’s fatigue
life (Epps 1998) because the binder helps dissipate viscoelastic energy, which results in
the stress relaxation of the mixture. On the other hand, the presence of angular particles
in the mixture produces a higher stress concentration, which results in the development of
more cracks. Thus, from the results of the IDT test for the mixtures with different CAA
values but identical FAA values, it can be inferred that the role of the binder might be
more significant than the effect of the CAA. This inference agrees with a study by
Huang and Grisham (1972) who found that the geometric characteristics of coarse
aggregates were not significant in the fatigue behavior of asphalt mixtures. As for FAA,

64
an examination of the mixtures with identical CAA values but different FAA values in
Figure 4.6 shows that the effect of FAA was equivalent but opposite to that of the binder
content, which resulted in similar fracture energy between the mixtures.
0
2000
4000
6000
8000
10000
12000
CAA = 97 FAA = 45.5
CAA = 90 FAA = 45.5
CAA = 75 FAA = 45.5
CAA = 90 FAA = 43.5
CAA = 75 FAA = 43.5
Mixtures
Fra
ctu
re E
ner
gy (P
a)
8,829
7,938
5,909
7,547
5,895
6.0%5.7%
5.4%
5.0%4.7%
Figure 4.6. IDT Fracture Energy Test Results from Asphalt Concrete Specimens
In order to further investigate the aforementioned inference, the IDT test was performed
with fine aggregate matrix mixture specimens to analyze only the effect of angularity.
The fine aggregate matrix was produced by mixing aggregate particles of less than 2.36
mm. Two matrix mixtures with different FAA values (43.5% and 45.5%) but with the
same amount of binder content were produced for comparison. Since the matrix mixtures
were very dense, varying the angularity did not significantly alter the internal volumetric
characteristics (such as air voids), even when the same amount of binder (6.0%) was
used. Three specimens of each mixture were tested, and test results are presented in
Figure 4. Although no dramatic difference between two mixes was observed in the
figure, the inference can be supported to a certain extent, as higher angularity increases
potential cracking due to stress concentration around the particles.

65
0
5000
10000
15000
20000
25000
FAA = 43.5 FAA = 45.5Mixtures
Fra
ctur
e E
ner
gy (P
a)
21,47619,288
6.0%
6.0%
Figure 4.7. IDT Fracture Energy Test Results from Fine Aggregate Matrix Specimens
4.3. FINITE ELEMENT MODEL SIMULATION RESULTS
In an attempt to incorporate the FE simulations with laboratory test results more closely,
four virtual IDT specimens were generated, as presented in Figure 4.8. The first specimen
(Figure 4.8(a)) was generated with the angularity value of 2,633 (in AIMS), while the
second specimen had a target of a higher angularity (2,935). Aside from angularity, all
other variables were maintained the same, so that simulation comparisons between two
specimens would purely produce the effect of aggregate angularity on cracking behavior.
To evaluate the effect of binder content, the third (Figure 4.8(c)) and fourth (Figure
4.8(d)) specimens were generated by varying their aggregate volume fraction with 20%
and 15%, respectively, but keeping the angularity constant (2,935 in AIMS) of the second
specimen.

66
(a) 2,633 and 25% (b) 2,935 and 25% (c) 2,935 and 20% (d) 2,935 and 15%
Figure 4.8. Virtual IDT Specimens Produced for the FE Simulations
For the simulation, the material properties of each phase (aggregates, loading strips,
asphalt phase, and cohesive zone) are necessary. As mentioned earlier, aggregates and
metal blocks (loading strips) were modeled as linear elastic materials, and the asphalt
phase was modeled as a linear viscoelastic material. To simulate cracking and fracture
failure, the nonlinear viscoelastic cohesive zone model was used. Material properties of
each phase have been reasonably assumed by referring to other studies (Kim et al. 2006a,
2006b, 2007), since the purpose of the simulation for this study was only to capture the
qualitative effects of the angularity and volume fraction of the aggregate. Table 4.2
presents linear elastic and linear viscoelastic material properties used for the FE
modeling.
Table 4.2. Linear Elastic and Linear Viscoelastic Material Properties
Linear Elastic Material Properties E (GPa) � Metal Block
200 0.29 E (GPa) � Aggregate
55.2 0.15 Linear Viscoelastic Material Properties
Modulus, Ei (MPa) Relaxation time, ρi (sec) 1.23E+03 0.00003 2.11E+03 0.0003 2.00E+03 0.003 1.26E+03 0.03 3.45E+02 0.3 1.13E+02 3 3.91E+01 30 1.73E+01 300
Prony Series Parameters for Asphalt Phase
3.51E+01 �

67
Several cohesive zone properties are necessary as model inputs to simulate fracture and
failure in the IDT testing. The finite element code used herein adaptively inserts cohesive
zone elements based on the value of σif (requisite stress level to initiate cohesive zone).
Once the cohesive zone element is included in the object, damage evolution of the
cohesive zone is governed by the two material parameters, A and m, in the damage
evolution function, α(t). Cohesive zone failure is then associated with the material length
parameter, �i which is incorporated with the damage evolution function. Table 4.3
presents cohesive zone model parameters used for this study. Instead of performing any
direct fracture tests to obtain parameters, they were reasonably assumed for this study
simply to rank-order cracking potential of the four mixtures (shown in Figure 4.8) where
their angularity and volume fraction of aggregates varied.
Table 4.3. Cohesive Zone Properties Assumed for This Study
Parameter Normal Component (n) Shear Component (s) σ��(MPa) 2.0 15.0 � (m) 0.01 0.01
A 5.0E+05 5.0E+05 m 2.0 2.0
Simulation results are presented in Figure 4.9 in the form of a bar chart representing
fracture energy. The fracture energy of each specimen was calculated from stress-strain
curves predicted by the model. As shown in the figure, fracture energy increased as the
angularity of the mixture decreased and the asphalt content increased. This is consistent
with the IDT test results, as asphalt content positively affects a mixture’s fatigue
resistance, while angularity lowers resistance to cracking due to sharp corners that cause
higher stress concentration.

68
0
4000
8000
12000
16000
20000
24000
VF=15%,AIMS=2935
VF=20%,AIMS=2935
VF=25%,AIMS=2935
VF=25%,AIMS=2633
Mixtures
Frac
ture
Ene
rgy
(Pa)
17,285
11,038
8,233
11,482
Figure 4.9. Finite Element Simulation Results of the IDT Fracture Energy Test
Figure 4.10 shows the deformation of the specimen (Figure 4.8(b)) and crack growth at
two different loading stages (at the peak force and near failure) selected from the force-
time curve. Clearly, the deformation of the specimen is increasing due to the accumulated
viscoelastic elemental deformation and material cracking. Some cracks develop within
the asphalt phase, and others are located at the boundaries between the aggregate and
asphalt phases. Further loading after the occurrence of peak force illustrates the
development of numerous macrocracks in the specimen, which can be observed by the
large decrease in load-bearing capacity.
Along with the result shown in Figure 4.10, the elemental stress contour plots in Figure
4.11 confirm the inferences made from the laboratory IDT test, namely that the sharper
corners of the higher angularity aggregates tend to concentrate stresses, thus yielding
crack formation and propagation at earlier stages. Figure 4.11 gives a comparison of the
stress contour plots between two specimens (Figure 4.8(a) and Figure 4.8(b)) at the same
loading level. As can be observed, the specimen with higher angularity presents a higher
intensity of stress concentration, which results in lower fracture energy (see Figure 4.9).
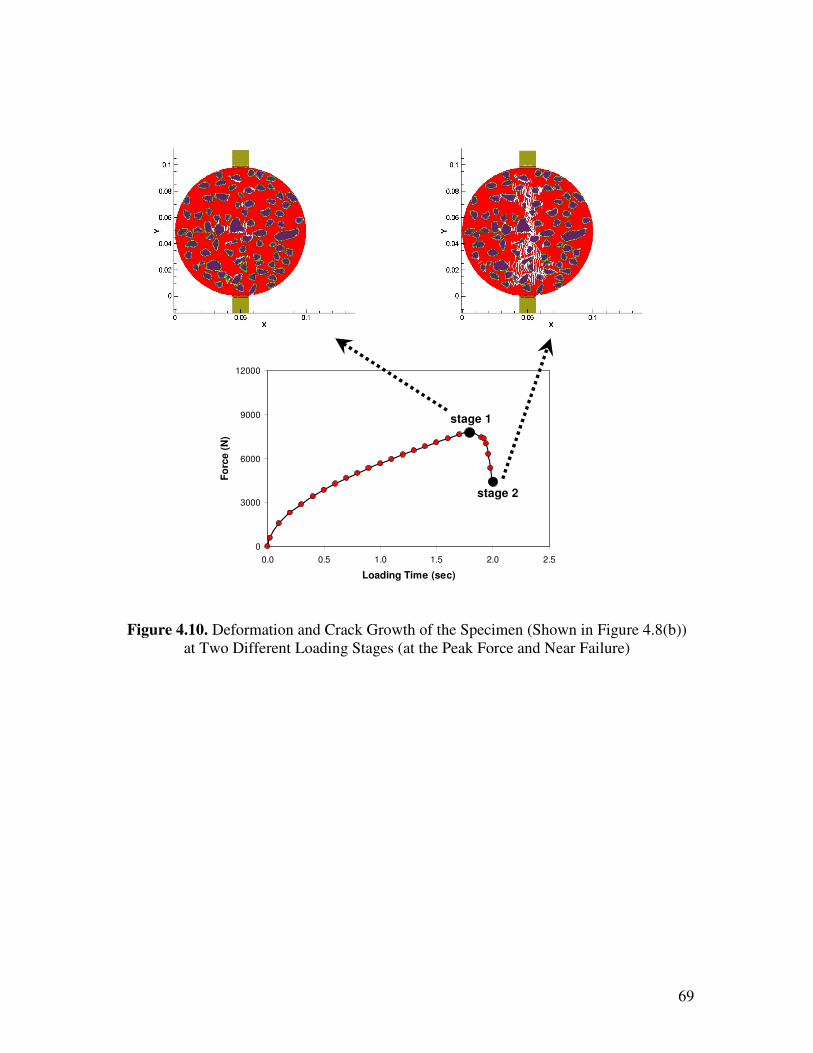
69
0
3000
6000
9000
12000
0.0 0.5 1.0 1.5 2.0 2.5
Loading Time (sec)
Forc
e (N
)
stage 1
stage 2
Figure 4.10. Deformation and Crack Growth of the Specimen (Shown in Figure 4.8(b)) at Two Different Loading Stages (at the Peak Force and Near Failure)

70
(a) Specimen Shown in Figure 4.8(a)
(b) Specimen Shown in Figure 4.8(b)
Figure 4.11. Comparison of Elemental Stress Contour Plots
4.4. ANGULARITY TEST RESULTS AND DISCUSSION
Results from the four different coarse aggregate angularity tests are summarized in Table
4.4. The test results presented for each coarse aggregate (Limestone, 2A, 3ACR-LA,
3ACR-HA, and 47B) are the mean and its standard deviation of three replicates. In order

71
to achieve more consistent and efficient comparison, the same material was evaluated by
the same operator for each different angularity test method. As can be observed in the
table, all tests demonstrated an identical trend of angularity values of aggregates:
limestone presented the highest angularity value, followed by 3ACR-HA, 3ACR-LA,
47B, and 2A with the lowest value of angularity.
Table 4.4. Summary of Coarse Aggregate Angularity Tests
Angularity Tests Aggregate Type Mean Standard Deviation Limestone 100 0.000
2A 25.61 1.265 3ACR LA 90.04 5.000 3ACR HA 92.85 1.064
ASTM D5821
47B 34.98 2.916 Limestone 50.23 0.123
2A 41.98 0.232 3ACR LA 43.39 0.314 3ACR HA 46.37 0.521
AASHTO T326
47B 42.69 0.113 Limestone 2971 27.719
2A 2051 18.364 3ACR LA 2240 15.885 3ACR HA 2484 33.554
AIMS
47B 2027 107.968 Limestone 0.637 0.009
2A 0.745 0.012 3ACR LA 0.727 0.001 3ACR HA 0.707 0.025
2-D Digital Image Process and Analysis
47B 0.731 0.001
Two fine aggregate angularity tests (AASHTO T304 and the AIMS) were performed, and
test results are presented in Table 4.5. The test results presented for each fine aggregate
are the mean value and its standard deviation of three replicates. Similar to the coarse
aggregate angularity analysis, for a better consistency and comparison, the same material
was evaluated by the same operator for the two different angularity test methods.
As can be seen in Table 4.5, the two test methods presented a different angularity ranking
of aggregates. From the AASHTO T304 method, Screenings presented the highest value
(uncompacted void content), followed by 3ACR-HA, 3ACR-LA, 47B, and 2A with the
lowest value, whereas, looking at the AIMS test results, 3ACR-HA was the most angular,
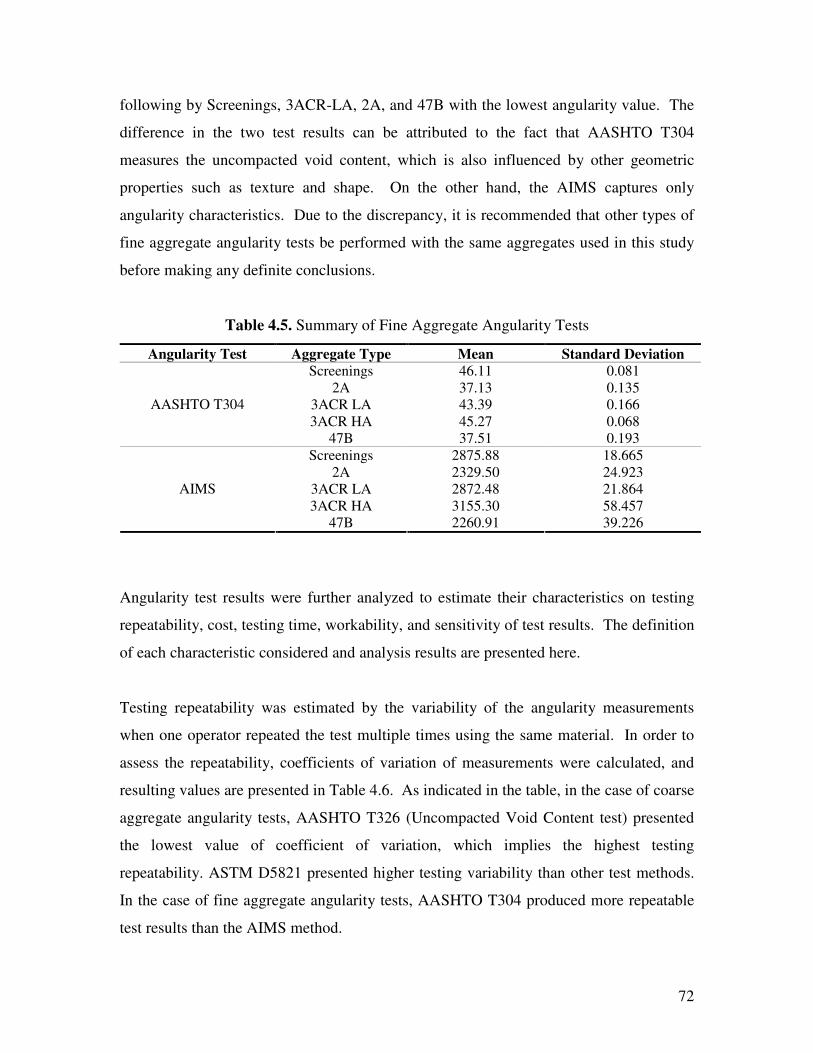
72
following by Screenings, 3ACR-LA, 2A, and 47B with the lowest angularity value. The
difference in the two test results can be attributed to the fact that AASHTO T304
measures the uncompacted void content, which is also influenced by other geometric
properties such as texture and shape. On the other hand, the AIMS captures only
angularity characteristics. Due to the discrepancy, it is recommended that other types of
fine aggregate angularity tests be performed with the same aggregates used in this study
before making any definite conclusions.
Table 4.5. Summary of Fine Aggregate Angularity Tests
Angularity Test Aggregate Type Mean Standard Deviation Screenings 46.11 0.081
2A 37.13 0.135 3ACR LA 43.39 0.166 3ACR HA 45.27 0.068
AASHTO T304
47B 37.51 0.193 Screenings 2875.88 18.665
2A 2329.50 24.923 3ACR LA 2872.48 21.864 3ACR HA 3155.30 58.457
AIMS
47B 2260.91 39.226
Angularity test results were further analyzed to estimate their characteristics on testing
repeatability, cost, testing time, workability, and sensitivity of test results. The definition
of each characteristic considered and analysis results are presented here.
Testing repeatability was estimated by the variability of the angularity measurements
when one operator repeated the test multiple times using the same material. In order to
assess the repeatability, coefficients of variation of measurements were calculated, and
resulting values are presented in Table 4.6. As indicated in the table, in the case of coarse
aggregate angularity tests, AASHTO T326 (Uncompacted Void Content test) presented
the lowest value of coefficient of variation, which implies the highest testing
repeatability. ASTM D5821 presented higher testing variability than other test methods.
In the case of fine aggregate angularity tests, AASHTO T304 produced more repeatable
test results than the AIMS method.

73
Table 4.6. Repeatability Analysis Results
Aggregate Type Angularity Test Standard
Deviation Data
Range Coefficient of
Variation ASTM D5821 2.049 0-100 3.995
AASHTO T326 0.261 0-100 0.582 2-D Image Analysis 0.009 0-1 1.348
Coarse Aggregates
AIMS 40.698 0-10000 1.843 AASHTO T304 0.129 0-100 0.318 Fine
Aggregates AIMS 32.627 0-10000 1.214
The next category investigated is cost. The cost is defined herein as an estimated price of
apparatus and/or testing device required to perform each test. Table 4.7 presents the
estimated cost. The cost necessary to perform ASTM D5821 is almost zero, since it
simply counts the fractured surfaces of aggregates. To perform AASHTO T326 or T304,
a relatively cheap apparatus, which is approximately $500 to $700, is necessary to
measure the uncompacted void content in aggregates. For the 2-D digital image process
and analysis, a high-resolution scanner and a computer including the image analysis
software (ImageTool) are necessary. Compared to other test methods, the AIMS method
is the most expensive, because it requires the testing equipment (i.e., AIMS), which is
approximately $30,000 to $40,000 in the current market.
Table 4.7. Estimated Price of Each Test Method
Aggregate Type Angularity Test Estimated Price ($) ASTM D5821 0
AASHTO T326 500 – 700 2-D Image Analysis 700 – 1000 Coarse Aggregates
AIMS 30,000 – 40,000 Fine Aggregates AASHTO T304 500 – 700
AIMS 30,000 – 40,000
Testing time was then investigated as a parameter to estimate each angularity test.
Testing time herein is defined as the approximate time spent to perform the test when the
sample is ready. The time spent for the sample preparation was not included in the
analysis. Table 4.8 summarizes the time measured for each angularity test. As presented

74
in the table, the uncompacted void content tests (AASHTO T326 and T304) can be
executed much faster than other tests such as ASTM D5821 and the 2-D digital image
process-analysis method. The AIMS is also considered a rapid test.
Table 4.8. Testing Time Spent to Perform Each Angularity Test
Aggregate Type Angularity Test Approximate Time (min) ASTM D5821 40
AASHTO T326 6 2-D Image Analysis 60 Coarse Aggregates
AIMS 12 AASHTO T304 6 Fine Aggregates AIMS 20
The next category investigated is testing workability. Workability is defined herein as
the degree of ease with which a test can be performed, including the handling of the
material used, the way the test is performed, and if any special experience is needed to
perform the test. Since the testing workability is hard to quantify as a number, narrative
descriptions based on the operator’s experience are provided here.
In performing the coarse aggregate angularity tests, the ASTM D5821 method is very
simple, but must be performed by an operator with experience, otherwise the results are
likely very nonrepeatable. The AASHTO T326 test method can be considered easy to
perform by any operator, but it requires a large amount of coarse aggregates to perform;
also, during the test, it is necessary to strike off excess heaped aggregates from the
cylinder by a single pass of the spatula, which may cause different results with different
operators. The 2-D digital image process-analysis method is a test that requires an
operator with experience in image treatment. Without appropriate experience in image
treatment, the enhancement of the image might be performed incorrectly, which will lead
to a different result from the original aggregate images. The AIMS approach is the easiest
among all test considered, since it is an automated process and is controlled by the
software. Therefore, test results are fairly repeatable and are less dependent on testing
operators than other methods. In performing the fine aggregate angularity tests, both tests
are considered easy to perform, rapid, and generally repeatable. However, similar to the

75
coarse aggregate case, AASHTO T304 should be performed carefully during the process
of striking off excess heaped fine aggregates from the cylinder with the single pass of the
spatula.
The last characteristic considered for estimating angularity test methods was sensitivity
of testing results. The sensitivity is assessed herein by the ratio of the difference between
the angularity values of the most angular and the most rounded materials tested to the
whole scale range of each angularity test, as mathematically expressed by the following
equation.
RAA
ySensitivit LH −= [4.1]
where HA = the highest angularity value;
LA = the lowest angularity value; and
R = scale range of each angularity test.
Table 4.9 presents the sensitivity of each test method. It can be clearly observed that,
except for ASTM D5821, testing sensitivity of all methods was very similar, with a value
of around 0.1.
Table 4.9. Testing Sensitivity of Each Angularity Test
Aggregate Type Angularity Test Angularity
Difference Test Range Sensitivity
ASTM D5821 74.39 0-100 0.7439 AASHTO T326 8.25 0-100 0.0825
2-D Image Analysis 0.108 0-1 0.1080 Coarse
Aggregates AIMS 920 0-10000 0.0920
AASHTO T304 8.98 0-100 0.0898 Fine Aggregates AIMS 894.39 0-10000 0.0894
Based on the analysis results estimating angularity testing characteristics on each
category (i.e., repeatability, cost, time, workability, and sensitivity), the ranking of test
methods for each category was made and is presented in Tables 4.10 and 4.11.

76
Table 4.10. Ranking of Coarse Aggregate Angularity Tests for Each Category
Category ASTM D5821 AASHTO T326 2-D Image Analysis AIMS Repeatability 4 1 3 2
Cost 1 2 3 4 Time 4 1 3 2
Workability 4 2 3 1 Sensitivity 1 2 4 3
Table 4.11. Ranking of Fine Aggregate Angularity Tests for Each Category
Category AASHTO T304 AIMS Repeatability 1 2
Cost 1 2 Time 1 2
Workability 2 1 Sensitivity 1 1
As summarized in Table 4.10, the AASHTO T326 method is generally ranked higher
than other test methods over the several estimation categories considered in this study. In
particular, AASHTO T326 seems to perform better than the current Superpave CAA
method (i.e., ASTM D5821) in that it is more objective and is very simple to perform
with much less testing time. Testing apparatus is not expensive, and the testing quality is
not highly influenced by operator’s experience. The AIMS approach is also very
attractive as a new method that can provide more scientific information of various
individual aggregate geometric characteristics separately; however, its relatively high
price might be an obstacle for practical implementation. In the case of fine aggregate angularity test methods, each method demonstrated pros and
cons. As shown in Table 4.11, AIMS provides better workability than AASHTO T304,
while it requires longer testing time and a much more expensive testing device. The
current Superpave FAA testing method, AASHTO T304, seems reasonable in a practical
sense, even if the testing result (i.e., uncompacted voids) is not solely the angularity
characteristic, but a combined effect of angularity, texture, and form.

77
CHAPTER 5
SUMMARY AND CONCLUSIONS
A better and more scientific understanding of the effects of aggregate angularity on
performance of asphalt mixtures is crucial, given that the angularity requirements for
asphalt mix design significantly affect both mix production costs and long-term pavement
performance. Thus, this study was conducted to provide guidelines that potentially help
improve current Nebraska asphalt specifications, particularly for aggregate angularity
requirements and test methods to characterize aggregate angularities based on scientific
investigations and experiments. To meet the research objectives, various aggregate
angularity tests (four coarse aggregate angularity tests and two fine aggregate angularity
tests) were assessed and compared by investigating their characteristics on testing
repeatability, cost, testing time, workability, and sensitivity of test results. Then, three
laboratory performance tests—the uniaxial static creep test, the APA test, and the indirect
tensile fracture energy test—were considered to investigate mixtures’ rutting and fatigue
cracking resistance from various Superpave mixes designed with different combinations
of CAA and FAA values. Results from the indirect tensile fracture energy test were then
incorporated with finite element simulations of virtual specimens, which were attempted
to explore the detailed mechanisms of cracking related to the aggregate angularity.
Simulation results were compared with laboratory test results. Based on the experimental
results and numerical simulations, the following conclusions can be drawn:
5.1. CONCLUSIONS
• The AASHTO T326 method generally ranked higher than other CAA test methods
considered. In particular, it seems to perform better than the current Superpave CAA
method (i.e., ASTM D5821) in that it is more objective and is very simple to perform
with much less testing time.

78
• The current Superpave FAA testing method, AASHTO T304, seems reasonable in a
practical sense, although the testing result is not purely angularity characteristic, but a
combined effect of angularity, texture, and form.
• The AIMS approach looks very attractive in the sense that it can provide more
scientific information of various individual aggregate geometric characteristics
separately, but its cost might be an obstacle for practical implementation.
• The analysis of rutting performance showed the same trend in the static creep test and
the APA test. That is, increased CAA and FAA in a mixture improved the mixture’s
resistance to rutting.
• Test results and analyses of fatigue performance data allowed the inference that CAA
produces a less significant effect than binder content, while FAA produces an almost
equivalent but opposite effect to that of binder content.
• The effect of angularity on fatigue performance could further be evaluated with the
test results using fine aggregate matrix mixtures. The increase in FAA was observed
to decrease the mixture’s resistance to cracking.
• Experimental results were supported by micromechanical finite element simulations.
The use of the virtual specimens produced by varying angularities and volumetrics
demonstrated clear effects of mixture components and interactions among
components on the overall fracture-related mixture performance.
• Model simulations and experimental results indicate that the asphalt binder content
positively affects mixture fatigue resistance, while angularity lowers resistance to
cracking due to sharp corners, which cause a higher stress concentration.
• Although angular particles develop a higher stress concentration, which can result in
cracks, the overall effect of angularity on the mixtures’ resistance to fatigue damage

79
is positive, because aggregate blends with higher angularity typically require more
binder to meet mix design criteria. Thicker binder films in the mixture mitigate
cracking due to increased viscoelastic energy dissipation from the binder.
5.2. NDOR IMPLEMENTATION PLAN
This research study affirms the necessary balance in design of angularity and binder
contents while measuring the effectiveness of current available testing methods. The
NDOR will continue to use AASHTO T304 for Fine Aggregate Angularity and ASTM
D5821 for Coarse Aggregate Angularity, although AASHTO T326 showed improved
CAA test repeatability, the equipment size and sample size is quite cumbersome, and has
potential for increased multiple operator variability, due to the requirement to strike off
heaping coarse aggregate in a single pass.
The research also confirms that while high angularity is desirable for both FAA and CAA,
and higher binder contents help resist fatigue and crack resistance, there is a limit to the
improvement that increased FAA’s improve the mix and, in research, shows that it will
decrease the crack resistance due to stress concentrations at the sharp points of the
crushed particles. The research supports the continued direction that the NDOR has been
on, and in the past year has been utilizing more designs with FAA’s of 43+ and CAA’s of
83+, which were first utilized approximately 12 years ago and are exhibiting excellent
field performance in various applications. The research also supports and reinforces the
NDOR’s implementation in the last year of a minimum binder content specification for
the current mixes. Equally important in the research were the findings that the modeling
and model predictions appear to be quite accurate.

80
REFERENCES
AASHTO T326, (2005). “Standard Method of Test for Uncompacted Void Content of
Coarse Aggregate (As Influenced by Particle Shape, Surface Texture, and Grading)”.
AASHTO T304, (2008). “Standard Method of Test for Uncompacted Void Content of
Fine Aggregate”.
Abbas, A. M. and Shenoy, A. (2005). “Modeling asphalt mastic stiffness using discrete
element analysis and micromechanics-based modes.” International Jounal of Pavement
Engineering, 6(2), pp. 137-146.
Ahlrich, R.C. (1996). “Influence of aggregate properties on performance of heavy-duty
hot-mix asphalt pavement.” Transportation Research Record 1547, TRB, National
Research Council, Washington, DC, pp. 7–14.
Allen, D. H. and Searcy, C. R. (2001). “A micromechanical model for a viscoelastic
cohesive zone.” International Journal of Fracture, 107, pp. 159-176.
ASTM C1252, (2006). “Standard Test Methods for Uncompacted Void Content of Fine
Aggregate (as Influenced by Particle Shape, Surface Texture, and Grading)”.
ASTM D3080, (2004). “Standard Test Method for Direct Shear Test of Soils Under
Consolidated Drained Conditions”.
ASTM D5821, (2006). “Standard Test Method for Determining the Percentage of
Fractured Particles in Coarse Aggregate”.
Bathina, M., (2005). “Quality analysis of the aggregate imaging system (AIMS)
measurements.” M.S. Thesis, Texas A&M University, College Station, Texas.

81
Carlberg, M., C.F. Berthelot, and N. Richardson. (2002). “In-service rut performance of
Saskatchewan highways and transportation asphalt concrete mixes.” Canadian Technical
Asphalt Proceedings, Calgary, Alberta.
Chowdhury, A., and Button, J. W., (2001). “Fine aggregate angularity: conventional and
unconventional approach, aggregate contribution to hot-mix asphalt (HMA)
performance”. American Society for Testing and Materials (ASTM) Special Technical
Publication, No. 1412, 144–159.
Chowdhury, A., J. Button, V. Kohale, and D. Jahn. (2001). “Evaluation of Superpave fine
aggregate angularity specification.” ICAR Research Report No. 201-1, College Station,
TX.
Cross, S.A., and E.R. Brown. (1992). “Selection of aggregate properties to minimize
rutting of heavy duty pavements.” ASTM STP 1147. American Society for Testing and
Materials, Philadelphia, PA, 1992.
Cross, S. A., and Purcell, E. M. (2001). “Effects of fine aggregate angularity on VMA
and rutting of Kansas HMA mixtures.” ASTM STP 1412, West Conshohocken, PA.
Dai, Q. and You, Z. (2007). “Micromechanical finite element framework for predicting
viscoelastic properties of asphalt mixtures.” Materials and Structures , 41, pp. 1025-1037.
Epps, J. (1998). “Performance of HMA test sections at WesTrack.” Association of the
Asphalt Paving Technologists, 67, pp. 738-782.
Foster, C.R. (1970). “Dominant effect of fine aggregate on strength of dense-graded
asphalt mixes.” Highway Research Board Special Report 109.
Gonzalez, R. C., and Woods, R. E., (2008). “Digital image processing.” 3rd Edition, New
York, Prentice Hall.

82
Haddock, J., T.D. White, C. Pan, A. Feng, and K. Galal. (1999). “Validation of SHRP
asphalt mixture specifications using accelerated testing.” Interim Report, National Pooled
Fund Study No. 176, West Lafayette, IN.
Hafez, I. (1997). “Development of a simplified asphalt mix stability procedure for use in
Superpave volumetric mix design.” Ph.D. Dissertation, University of Maryland, College
Park, MD.
Hand, A.J., J.A. Epps, and P.E. Sebaaly. (2000). “Precision of ASTM D5821 sandard test
method for determining the percentage of fractured particles in coarse aggregate.” Journal
of Testing and Evaluation, ASTM, Vol. 28, No. 2, pp. 67–75.
Hand, A.J., J.L. Stiady, T.D. White, A.S. Noureldin, and K. Galal. (2001). “Gradation
effects on HMA performance.” Transportation Research Record 1767, TRB, National
Research Council, Washington, DC, pp. 152–157.
Hondros, G. (1959). “The evaluation of Poisson`s ratio and the modulus of materials of a
low tensile resistence by Brasilian (indirect tensile) test with particular 67 reference to
concrete.” Australian J. Appl. Sci., 10(3).
Huang, B., Chen, X., Shu, X., Masad, E., and Mahmoud, E. (2009). “Effects of coarse
aggregate angularity and asphalt binder on laboratory-measured permanent deformation
properties of HMA.” International Journal of Pavement Engineering, 10(1), pp. 19-28.
Huang, E. Y. and Grisham, D. A. (1972). “Effect of geometric characteristics of
aggregates on the fatigue response of bituminous paving mixtures.” ASTM STP 508,
West Conshohocken, PA.
Huber, G.A., J.C. Jones, P.E. Messersmith, and N.M. Jackson. (1998). “Contribution of
fine aggregate angularity and particle shape to Superpave mixture performance.”

83
Transportation Research Record 1609, TRB, National Research Council, Washington,
DC, pp. 28–35.
Kandhal, P.S., and F. Parker, Jr. (1998). “Aggregate tests related to asphalt concrete
performance in pavements.”, NCHRP Report 405, Transportation Research Board,
National Research Council, Washington, DC, 1998.
Kim, Y.R., J. Daniel, and Wen, H. (2002). “Fatigue performance evaluation of WesTrack
asphalt mixtures using viscoelastic continuum damage approach.” Final Report No.
FHWA/NC/2002-004.
Kim, Y. R. and Wen, H. (2002). “Fracture energy from indirect tension testing.” Journal
of the Association of the Asphalt Paving Technologists, 71, pp. 779-793.
Kim, Y. R., Allen, D. H., and Seidel, G. D. (2006a). “Damage-induced modeling of
elastic-viscoelastic randomly oriented particulate composites.” Journal of Engineering
Materials and Technology, pp. 18-27.
Kim, Y. R., Allen, D. H., and Little, D. N. (2006b). “Computational model to predict
fatigue damage behavior of asphalt mixtures under cyclic loading.” Transportation
Research Record TRB, 1970, pp. 196-206.
Kim, Y. R., D. H. Allen, and D. N. Little. (2007). “Computational constitutive model for
predicting nonlinear viscoelastic damage and fracture failure of asphalt concrete
mixtures.” International Journal of Geomechanics, pp. 102-110.
Lee, C.J., T.D. White, and T.R. West. (1999). “Effect of fine aggregate angularity on
asphalt mixture performance.” Final Report, FHWA/INDOT/JTRP-98/20, Purdue
University, West Lafayette, IN.

84
Maerz, N. H., and Lusher, M. (2001). “Measurement of flat and elongation of coarse
aggregate using digital image processing.” Transportation Research Board Proceedings,
80th Annual Meeting, Washington D.C., Paper No. 01-0177.
Maerz, N. H., and Zhou, W. (2001). “Flat and elongated: advances using digital image
analysis.” Proceedings of the 9th Annual Symposium of the International Center for
Aggregates Research (ICAR), Austin, TX.
Mahmoud, E. M. (2005). “Development of experimental methods for the evaluation of
aggregate resistance to polishing, abrasion, and breakage.” M.S. Thesis, Texas A&M
University, College Station, TX.
Masad, E. A. (2004). “Aggregate imaging system (AIMS): basics and applications.” TTI
Report 5-1707-01-1, Texas Transportation Institute, College Station, TX.
Masad, E. (2003). “The development of a computer controlled image analysis system for
measuring aggregate shape properties.” NCHRP-IDEA Program Project Final Report,
NCHRP-IDEA Project 77, National Research Council, Washington, DC.
Masad, E., Niranjanan, S., Bahia, H., and Kose, S. (2001). “Modeling and experimental
measurements of localized strain distribution in asphalt mixes.” Journal of Transportation
Engineering, 127(6), pp. 477-485.
Masad, E., Al-Rousan, T., Button, J., Little, D., and Tutumluer, E. (2007). “Test methods
for characterizing aggregate shape, texture, and angularity.” NCHRP Report 555,
Transportation Research Board, National Research Council, Washington, D.C.
Maupin, G.W. (1970). “Effect of particle shape and surface texture on the fatigue
behavior of asphalt concrete.” Highway Research Record 313.

85
McGennis, R.B., R.M. Anderson, T.W. Kennedy, and M. Solaimanian. (1994).
Background of Superpave asphalt mixture design and analysis. Research Report SA-95-
003. FHWA, U.S. DOT.
Mogawer, W.S., and K.D. Stuart. (1992). “Evaluation of test methods used to quantify
sand shape and texture.” Transportation Research Record 1362, TRB, National Research
Council, Washington, DC, pp. 28–37.
Pan, T., Tutumluer, E., and Carpenter, S. H. (2005). “Effect of coarse aggregate
morphology on the resilient modulus of hot-mix asphalt.” Transportation Research
Record, 1929, TRB, pp. 1-9.
Papagiannakis, A. T., Abbas, A., and Masad, E. (2002). “Micromechanical analysis of
viscoelastic properties of asphalt concretes.” Transportation Research Record, 1789,
TRB, pp. 113-120.
Rismantojo, E. (2002). “Permanent deformation and moisture susceptibility related
aggregate tests for use in hot-mix asphalt pavements.” Doctoral Dissertation, Purdue
University, West Lafayette, IN.
Roque, R., B. Birgisson, M. Tia, L. Casanova, and E. Kestory. (2002). “Evaluation of
Superpave criteria for VMA and fine aggregate angularity, Final Report, Volume 2: Fine
Aggregate Angularity,” University of Florida, Gainesville, FL.
Song, S. H., Paulino, G. H., and Buttlar, W. G. (2006). “Simulation of crack propagation
in asphalt concrete using an intrinsic cohesive zone model.” Journal of Engineering
Mechanics, pp. 1215-1223.
Souza, L. T. (2009). “Investigation of aggregate angularity effects on asphalt concrete
mixture performance using experimental and virtual asphalt samples.” M.S. Thesis,
University of Nebraska, Lincoln, NE.

86
Stakston, A.D., J.J. Bushek, and H.U. Bahia. (2002). “Effect of fine aggregate angularity
on compaction and shearing resistance of asphalt mixtures.” Transportation Research
Record 1789, TRB, National Research Council, Washington, DC, pp. 14–24.
Stiady, J., Hand, A., and White, T. (2001). “Quantifying contribution of aggregate
characteristics to HMA performance using PURWheel laboratory tracking device.”
ASTM STP 1412, West Conshohocken, PA.
Stiady, J., K. Galal, S. Noureldin, A. Hand, and T. White. (2001). “Identification of
aggregate role in performance of Superpave mixtures employing accelerated testing
facility.” ASTM STP 1412, ASTM, West Conshohocken, PA.
Stuart, K.D. and W.S. Mogawer. (1994). “Evaluation of natural sands used in asphalt
mixtures.” Transportation Research Record 1436, TRB, National Research Council,
Washington, DC, pp. 115–123.
Sukhwani, R., Little, D. N., and Masad, E. (2006). “Sensitivity of HMA performance to
aggregate shape measured using conventional and image analysis methods.” TTI Report
0-1707-5, Texas Transportation Institute, College Station, TX.
Tutumluer, E., Rao, C., and Stefanski, J. (2000). “Video image analysis of aggregates.”
Final Project Report, FHWA-IL-UI-278,Civil Engineering Studies UILU-ENG-2000-
2015, University of Illinois Urbana-Champaign, Urbana, IL.
Wedding, P.A. and Gaynor, R.D. (1961). “The effects of using crushed gravel as the
coarse and fine aggregate in dense graded bituminous mixtures.” Association of the
Asphalt Paving Technologists, 30.
Weingart, R. L., and Prowell, B. D. (1999). “Specification development using the VDG-
40 videograder for shape classification of aggregates.” Proceedings of the 7th Annual
87
Symposium of the International Center for Aggregate Research (ICAR), University of
Texas, Austin, TX.
Wen, H. and Kim, Y. R. (2002). “Simple performance test for fatigue cracking and
validation with WesTrack mixtures.” Transportation Research Record, 1789, pp. 66-72.
White, T. D., Haddock, J. E., and Rismantojo, E. (2006). “Aggregate tests for hot-mix
asphalt mixtures used in pavements.” NCHRP Report 557, National Cooperative
Highway Research Program. National Research Council, Washington, D.C.
Witczak, M. W., Kaloush, K., Pellinen, T., Basyouny, M. E., and Quintus, H. V. (2002).
“Simple performance test for Superpave mix design.” NCHRP Report 465,
Transportation Research Board, National Research Council, Washington, D.C.
You, Z. and Buttlar, W. G. (2006). “Micromechanical modeling approach to predict
compressive dynamic moduli of asphalt mixture using the distinct element method.”
Transportation Research Record, 1970, TRB, pp. 73-83.
You, Z., Adhikari, S., and Kutay, M. E. (2008). “Dynamic modulus simulation of the
asphalt concrete using the X-ray computed tomography images.” Materials and
Structures, 42, pp. 617-630.

88
ACKNOWLEDGMENTS
The authors thank the Nebraska Department of Roads (NDOR) for the financial support
needed to complete this study. In particular, the authors thank NDOR Technical Advisory
Committee (TAC), Moe Jamshidi, Bob Rea, Mick Syslo, Amy Starr, Brandon Varilek,
Matt Beran, Lieska Halsey, and Jodi Gibson for their technical support and invaluable
discussions/comments. Special thanks go to Dr. Flavio Souza. His wonderful suggestions
and critical comments on the finite element model simulations were greatly helpful.
Related Documents