Technical Report Documentation Page 1. Report No. FHWA/TX-04/0-4523-1 2. Government Accession No. 3. Recipient's Catalog No. 4. Title and Subtitle RECOMMENDATIONS FOR MINIMIZING POOR QUALITY COARSE AGGREGATE IN ASPHALT PAVEMENTS 5. Report Date March 2004 6. Performing Organization Code 7. Author(s) John P. Harris and Arif Chowdhury 8. Performing Organization Report No. Report 0-4523-1 10. Work Unit No. (TRAIS) 9. Performing Organization Name and Address Texas Transportation Institute The Texas A&M University System College Station, Texas 77843-3135 11. Contract or Grant No. Project No. 0-4523 13. Type of Report and Period Covered Research: September 2002-August 2003 12. Sponsoring Agency Name and Address Texas Department of Transportation Research and Technology Implementation Office P. O. Box 5080 Austin, Texas 78763-5080 14. Sponsoring Agency Code 15. Supplementary Notes Research performed in cooperation with the Texas Department of Transportation and the U.S. Department of Transportation, Federal Highway Administration. Research Project Title: Controlling Mineralogical Segregation in Bituminous Mixes 16. Abstract The Texas Department of Transportation has experienced problems with inconsistent performance of the coarse aggregate fraction of hotmix asphalt pavements. This project was initiated to address problems associated with variations in hotmix coarse aggregate quality. More specifically, the researchers wanted to identify simple tests that can be performed at the aggregate quarries to assess the durability of aggregates and determine what percentage of an aggregate is poor quality. The researchers surveyed civil engineering and geological literature to identify simple tests that can identify poor performing aggregates and can be performed in the field with a minimal amount of skill. Following the identification of potential tests, the researchers visited several quarries in Texas and used these techniques to differentiate good and poor quality coarse aggregates. The researchers identified several simple tests that inspectors can perform in the field to identify poor quality aggregates, including: aggregate angularity (more rounded = poorer quality), water absorption (more absorbed = poorer quality), hardness (soft = poorer quality), and fines content (more fines = poorer quality). Things that can be done at the aggregate quarries include: constructing smaller stockpiles, selective quarrying of good rock, and utilizing a wash system to remove some of the poorer quality aggregates. The preceeding tests and quarry recommendations can be utilized by inspectors to regulate the quality of coarse aggregate used in hotmix applications. 17. Key Words Asphalt, coarse aggregate, quarries, stockpiles, crushed limestone, aggregate quality tests. 18. Distribution Statement No restrictions. This document is available to the public through NTIS: National Technical Information Service 5285 Port Royal Road Springfield, Virginia 22161 19. Security Classif.(of this report) Unclassified 20. Security Classif.(of this page) Unclassified 21. No. of Pages 62 22. Price Form DOT F 1700.7 (8-72) Reproduction of completed page authorized

Welcome message from author
This document is posted to help you gain knowledge. Please leave a comment to let me know what you think about it! Share it to your friends and learn new things together.
Transcript

Technical Report Documentation Page 1. Report No. FHWA/TX-04/0-4523-1
2. Government Accession No.
3. Recipient's Catalog No.
4. Title and Subtitle RECOMMENDATIONS FOR MINIMIZING POOR QUALITY COARSE AGGREGATE IN ASPHALT PAVEMENTS
5. Report Date March 2004
6. Performing Organization Code
7. Author(s) John P. Harris and Arif Chowdhury
8. Performing Organization Report No. Report 0-4523-1 10. Work Unit No. (TRAIS)
9. Performing Organization Name and Address Texas Transportation Institute The Texas A&M University System College Station, Texas 77843-3135
11. Contract or Grant No. Project No. 0-4523 13. Type of Report and Period Covered Research: September 2002-August 2003
12. Sponsoring Agency Name and Address Texas Department of Transportation Research and Technology Implementation Office P. O. Box 5080 Austin, Texas 78763-5080
14. Sponsoring Agency Code
15. Supplementary Notes Research performed in cooperation with the Texas Department of Transportation and the U.S. Department of Transportation, Federal Highway Administration. Research Project Title: Controlling Mineralogical Segregation in Bituminous Mixes 16. Abstract The Texas Department of Transportation has experienced problems with inconsistent performance of the coarse aggregate fraction of hotmix asphalt pavements. This project was initiated to address problems associated with variations in hotmix coarse aggregate quality. More specifically, the researchers wanted to identify simple tests that can be performed at the aggregate quarries to assess the durability of aggregates and determine what percentage of an aggregate is poor quality. The researchers surveyed civil engineering and geological literature to identify simple tests that can identify poor performing aggregates and can be performed in the field with a minimal amount of skill. Following the identification of potential tests, the researchers visited several quarries in Texas and used these techniques to differentiate good and poor quality coarse aggregates. The researchers identified several simple tests that inspectors can perform in the field to identify poor quality aggregates, including: aggregate angularity (more rounded = poorer quality), water absorption (more absorbed = poorer quality), hardness (soft = poorer quality), and fines content (more fines = poorer quality). Things that can be done at the aggregate quarries include: constructing smaller stockpiles, selective quarrying of good rock, and utilizing a wash system to remove some of the poorer quality aggregates. The preceeding tests and quarry recommendations can be utilized by inspectors to regulate the quality of coarse aggregate used in hotmix applications. 17. Key Words Asphalt, coarse aggregate, quarries, stockpiles, crushed limestone, aggregate quality tests.
18. Distribution Statement No restrictions. This document is available to the public through NTIS: National Technical Information Service 5285 Port Royal Road Springfield, Virginia 22161
19. Security Classif.(of this report) Unclassified
20. Security Classif.(of this page) Unclassified
21. No. of Pages 62
22. Price
Form DOT F 1700.7 (8-72) Reproduction of completed page authorized
RECOMMENDATIONS FOR MINIMIZING POOR QUALITY COARSE AGGREGATE IN ASPHALT PAVEMENTS
by
John P. Harris, P.G. Associate Research Scientist
Texas Transportation Institute
and
Arif Chowdhury, P.E. Associate Transportation Researcher
Texas Transportation Institute
Report 0-4523-1 Project Number 0-4523
Research Project Title: Controlling Mineralogical Segregation in Bituminous Mixes
Sponsored by the Texas Department of Transportation
In Cooperation with the U.S. Department of Transportation Federal Highway Administration
March 2004
TEXAS TRANSPORTATION INSTITUTE The Texas A&M University System College Station, Texas 77843-3135
v
DISCLAIMER
The contents of this report reflect the views of the authors, who are responsible for the
facts and the accuracy of the data presented herein. The contents do not necessarily reflect the
official view or policies of the Texas Department of Transportation (TxDOT) or the Federal
Highway Administration (FHWA). This report does not constitute a standard, specification, or
regulation.
There is no invention or discovery conceived or first actually reduced to practice in the
course of or under this contract, including any art, method, process, machine, manufacture,
design, or composition of matter, or any new useful improvement thereof, or any variety of plant,
which is or may be patentable under the patent laws of the United States of America or any
foreign country.

vi
ACKNOWLEDGMENTS
This project was made possible by the Texas Department of Transportation in
cooperation with the Federal Highway Administration. The authors thank the many personnel
who contributed to the coordination and accomplishment of the work presented herein. Special
thanks are extended to Caroline Herrera, P.E., and John Rantz, P.E., for serving as the project
director and project coordinator, respectively. Other individuals that contributed to the success
of this project include: Ed Morgan, James Bates, K.C. Evans, and Geraldine Anderson, all from
TxDOT, Vartan Babakhanian and Leslie Hassell from Hanson Aggregates, Ron Kelley and Tye
Bradshaw from Vulcan Materials, and Ted Swiderski from CSA Materials.
vii
TABLE OF CONTENTS
Page List of Figures .............................................................................................................................. viii
List of Tables ...................................................................................................................................x
Chapter 1. Coarse Aggregate Tests for Bituminous Mixes ...........................................................1
Introduction..........................................................................................................................1
Role of Coarse Aggregate in HMAC...................................................................................2
Methods..............................................................................................................................14
Results ...............................................................................................................................22
Discussion..........................................................................................................................27
Recommendations for Sampling Aggregates and Field Tests at the Quarry and
Stockpile ............................................................................................................................35
Quarry Recommendations for Better Quality Aggregates.................................................36
Miscellaneous ....................................................................................................................36
Chapter 2. Binder Evaluation for Field Cores from Abilene and Lubbock Districts ..................37
Introduction........................................................................................................................37
Experimental Methodology ...............................................................................................38
References......................................................................................................................................49

viii
LIST OF FIGURES
Figure Page 1. Working Face at the Baird Quarry Shows a Thin (2 ft) Resistant Unit at Top..................10
2. The Semi-horizontal Tan Lines in the Top One-Third of the Image are Stylolites
from the Black Quarry .......................................................................................................14
3. Drilling Cores from US-84 ................................................................................................17
4. TTI Overlay Tester ............................................................................................................19
5. Typical Output of the TTI Overlay Tester.........................................................................20
6. Grade 3 Stockpile at the Baird Quarry in the Abilene District ..........................................21
7. Sample from US-84 in Tyler County Showing Aggregates with a Lot of
Absorbed Asphalt ..............................................................................................................22
8. Aggregates from the Same Stockpile Showing Variations in Porosity,
Angularity, and Mineralogy...............................................................................................26
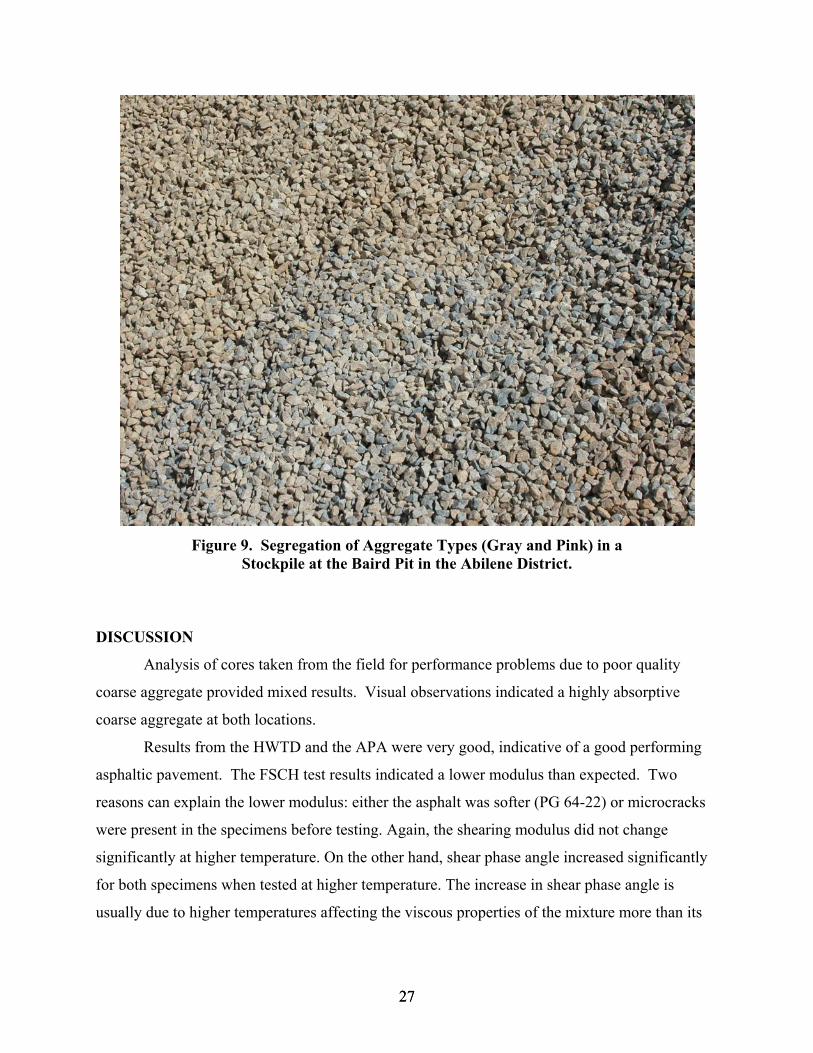
9. Segregation of Aggregate Types (Gray and Pink) in a Stockpile at the Baird Pit in the
Abilene District ..................................................................................................................27
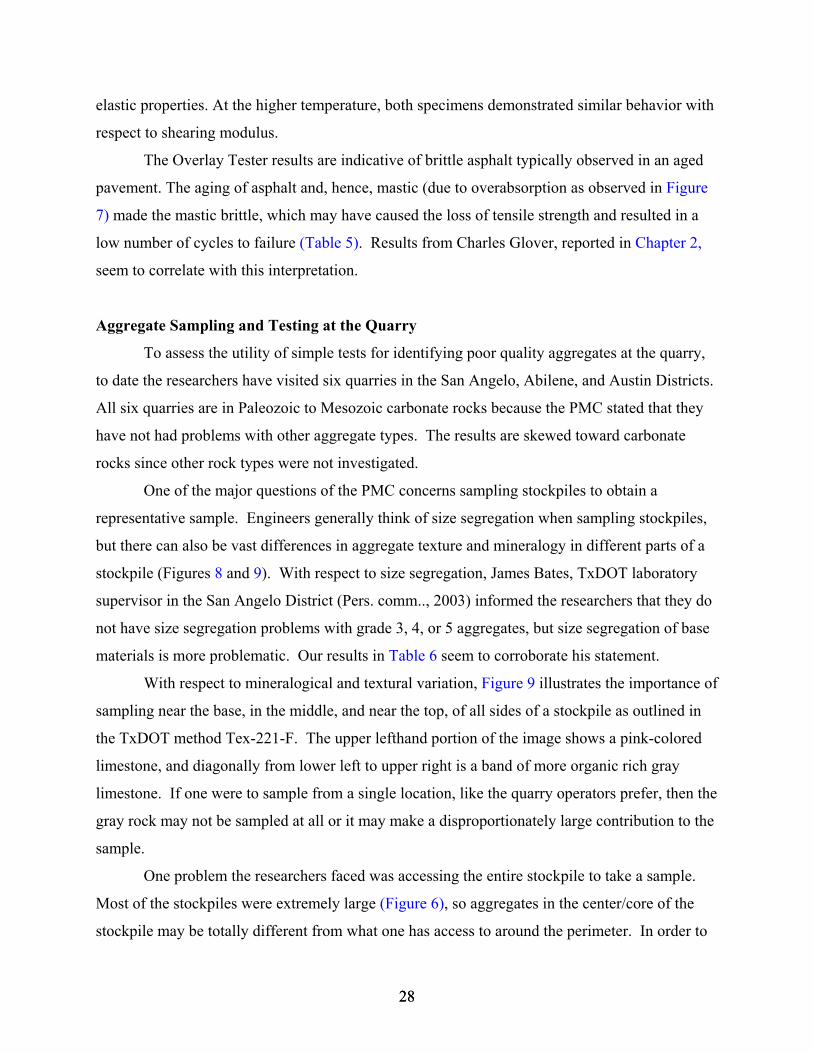
10. Vertical Fracture at the Price Clements Pit Showing Grayish
Orange-Pink Clay Attached to a Pale Yellowish Brown Limestone Block.......................30
11. (Top) Thin-Section Photomicrograph of a Limestone Aggregate from the Vulcan
Black Pit Showing No Pores. (Bottom) Macroscopic Image of the Same
Limestone Aggregate (Note Angularity) ...........................................................................32
12. (Top) Thin-Section Photomicrograph Showing Moldic Pores (Blue) in a
Limestone Aggregate from the Centex Yearwood Pit. (Bottom) Macroscopic
Image of the Same Limestone Aggregate (Note Pits in Surface) ......................................33
13. (Top) Thin-Section Photomicrograph Showing Intergranular Pores (Blue) in a
Limestone Aggregate from the Centex Yearwood Pit. (Bottom) Macroscopic
Image of the Same Limestone Aggregate (Note Roundness)............................................34
14. Extraction/Recovery Flow Diagram of (a) 1st Method and (b) 2nd Method.......................39
15. Refractive Index (RI) Response from Size Exclusion Chromatography of
(a) 84-S9, (b) 84-S2, and (c) 84-6......................................................................................42
16. Zeroth Viscosity (ηo*, poise) of Recovered Asphalt Binder .............................................44

ix
17. Carbonyl Area of Recovered Asphalt Binder ....................................................................44
18. DSR Map of Calculated Ductility of (a) 84-S9 and 84-S2 and (b) 84-6 and 84-S6..........45
19. Hardening Susceptibility of US-84 Cores..........................................................................46
20. Comparison of RI Response between 84-S Series and 84 Series ......................................47
x
LIST OF TABLES Table Page 1. Coarse Aggregate Quality Requirements.............................................................................6
2. Core Description for Northbound Outside Lane of US-84 in Taylor County ..................15
3 Core Description for Northbound Outside Lane of US-84 in Scully County....................16
4. FSCH Test Results.............................................................................................................23
5. Overlay Tester Results.......................................................................................................24
6. Gradations for Samples Collected by the TxDOT Method and the Quarry
Method for the CSA Turner Pit ........................................................................................25
1 1
CHAPTER 1
COARSE AGGREGATE TESTS FOR BITUMINOUS MIXES
INTRODUCTION
Hotmix asphalt concrete (HMAC) contains about 94 percent (by weight) coarse and fine
aggregate (Kandhal and Parker, 1998); the quality of that aggregate has a profound impact on the
performance of the asphalt pavement. The Texas Department of Transportation (TxDOT) has
experienced problems obtaining consistent performance from the coarse aggregate fraction.
Studies performed at the Geotechnical, Soils, and Aggregates Branch of the TxDOT
Construction Division indicate that many of these aggregate sources contain as many as eight
distinctive rock types. The quantity of each of these rock types present at any point in time can
vary significantly. Some of these heterogeneities can be addressed at the quarry, but current
specifications and test procedures do not adequately address this problem. For example, an
aggregate stockpile run in a five-cycle Magnesium Sulfate Soundness (MSS) Test (Tex-411-A)
can have as much as 30 percent loss and still be considered acceptable. Asphalt produced one
day may have a MSS loss of 30 percent coarse aggregate and the next day may only have a MSS
loss of 5 percent coarse aggregate. Asphalt quality and performance will be different for each
day.
This project was initiated to address problems associated with variations in hotmix coarse
aggregate quality. More specifically, the researchers wanted to identify tests that can be
performed at the aggregate quarries to control variations in aggregate quality that result from
multiple layers of durable and non-durable strata within a quarry. The tests should monitor
aggregate variation with a frequency necessary to take corrective action before large quantities of
poor quality aggregate are produced. Second, the researchers wanted to define the term
“mineralogical segregation” coined by TxDOT.
According to Fookes et al. (1988), durability is a rock material’s ability to resist
degradation during its working life and is dependent on a number of parameters. The original
stage of weathering of the rock mass; the degree of imposed stressing during winning,
production, placing, and service; the climate; and topographical and hydrological environments
in service are the parameters that Fookes et al. (1988) list as affecting durability.
2 2
ROLE OF COARSE AGGREGATE IN HMAC
Properties of the coarse aggregate fraction, related to mineralogy, that influence the
performance of HMAC and seal coat are briefly described. Coarse aggregate is defined as
material larger than 2.38 mm (#8 U.S. standard sieve) in accordance with TxDOT specifications.
Shape and Surface Texture
Angular shape and rough surface texture are among the most desirable aggregate
properties for resistance to rutting and fatigue fracture (Chowdhury et al., 2000). Cubic and
angular aggregate shapes provide increased internal friction and improved resistance to rutting
(Kandhal et al., 1990). Rough surface texture is also important in the frictional resistance of a
mixture. Rough surface texture yields better bonding between the aggregate surface and asphalt
binder, which is desirable for minimizing stripping problems. Excessively flat and/or elongated
aggregates are undesirable because there is a chance of those aggregates breaking under traffic
loading, making the mixture more moisture susceptible. There are numerous research studies
showing the importance of shape and surface texture for aggregate. The shape of aggregate
depends mainly on the rock mineralogy, reduction ratio, and crushing methods, whereas surface
texture is mostly dependent on the mineralogy of the rock.
Toughness and Abrasion Resistance
Toughness and abrasion resistance are associated with degradation of aggregate occurring
during construction and under traffic loading. Aggregate must be tough and resistant to abrasion,
to resist crushing, degradation, and disintegration when stockpiled, fed through the HMAC plant,
compacted with a paving roller, and subjected to heavy traffic loading. These properties are more
critical for open-graded and gap-graded mixtures than dense-graded mixtures (Kandhal and
Parker, 1998). Excessive degradation of aggregate during mixture compaction and trafficking is
a severe problem as; aggregate faces are exposed and uncoated, resulting in stripping and less
durability (Amirkhanian et al., 1991). The Los Angeles Abrasion Test is widely used to measure
this property.

3 3
Durability and Soundness
Soundness and durability are related to the degradation of aggregate upon exposure to
environmental factors. Aggregate must be resistant to breakdown or disintegration when
subjected to wetting and drying and/or freezing and thawing cycles during its service life. If the
asphalt coating remains intact, these weathering cycles do not significantly affect the HMA
mixture. However, water can penetrate the aggregate particles if some degradation of the HMA
mixture occurs during construction. Soft, weak particles that break down during compaction
provide convenient access for water. Water can also penetrate if the HMA mixture has
experienced stripping. Raveling, stripping, and, in some cases, rutting of HMA pavement can
result from the use of unsound aggregate. Kandhal and Parker (1998) mentioned that aggregate
durability and soundness are closely related to aggregate toughness and abrasion resistance.
Polish and Frictional Characteristics
Asphalt concrete and seal coat are primarily used as the topmost layer in a flexible
pavement and, therefore, the layer in contact with vehicle tires. As a result, the frictional
characteristics of an aggregate are as important as its structural characteristics. Frictional
characteristics of a layer are provided by macrotexture (aggregate gradation control) and
microtexture (mineralogy of the aggregate). There has been considerable effort to correlate
coarse aggregate polish and frictional properties with frictional resistance of pavement.
Pavement frictional resistance is most often measured with a locked-wheel skid trailer.
Porosity and Absorption
Mineral aggregate used in HMA and seal coat are somewhat porous and as such tend to
absorb some asphalt and water. Sometimes this absorption of asphalt may be beneficial to the
mixture properties (Kandhal and Parker, 1998). If this asphalt absorption is time dependent and
the aggregate continues to absorb asphalt, the portion of the binder that is asphalt is no longer
available as binder (Kandhal and Koehler, 1985). Excessive absorption of asphalt binder in
mineral aggregate may lead to incorrect computation of void of mineral aggregate (VMA) and
void filled with asphalt (VFA); lack of enough effective binder may lead to raveling and
cracking or stripping, possible premature hardening, and low-temperature cracking.
4 4
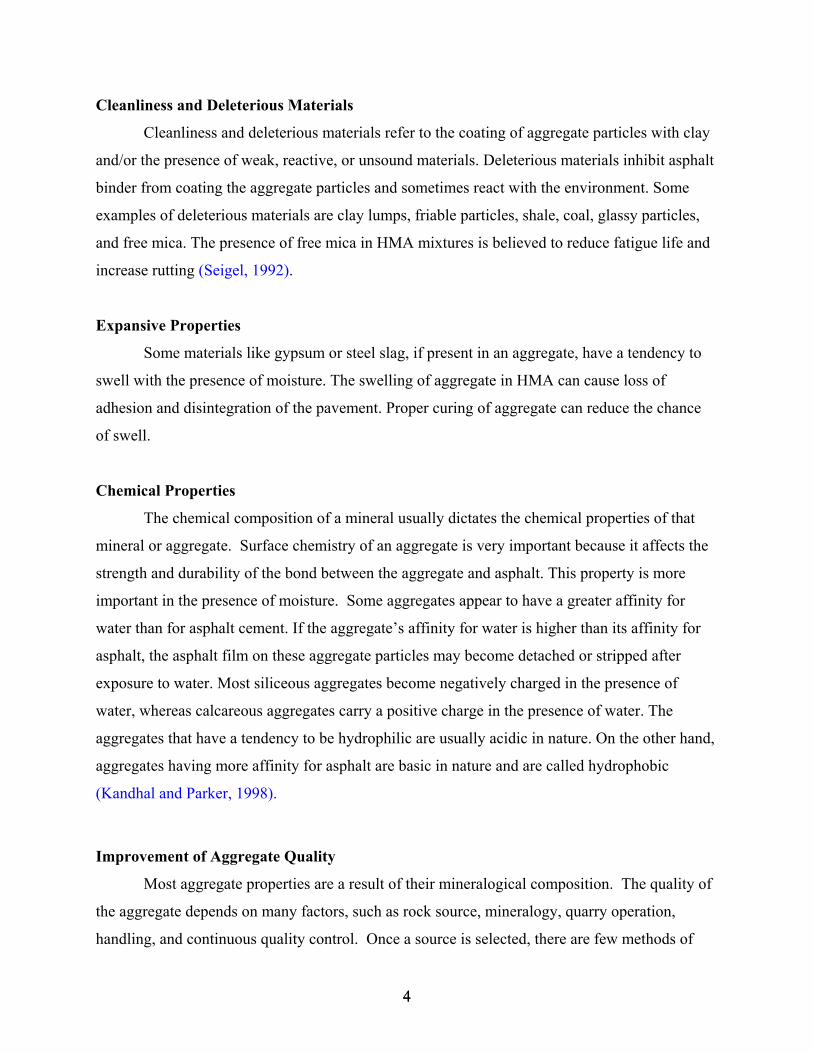
Cleanliness and Deleterious Materials
Cleanliness and deleterious materials refer to the coating of aggregate particles with clay
and/or the presence of weak, reactive, or unsound materials. Deleterious materials inhibit asphalt
binder from coating the aggregate particles and sometimes react with the environment. Some
examples of deleterious materials are clay lumps, friable particles, shale, coal, glassy particles,
and free mica. The presence of free mica in HMA mixtures is believed to reduce fatigue life and
increase rutting (Seigel, 1992).
Expansive Properties
Some materials like gypsum or steel slag, if present in an aggregate, have a tendency to
swell with the presence of moisture. The swelling of aggregate in HMA can cause loss of
adhesion and disintegration of the pavement. Proper curing of aggregate can reduce the chance
of swell.
Chemical Properties
The chemical composition of a mineral usually dictates the chemical properties of that
mineral or aggregate. Surface chemistry of an aggregate is very important because it affects the
strength and durability of the bond between the aggregate and asphalt. This property is more
important in the presence of moisture. Some aggregates appear to have a greater affinity for
water than for asphalt cement. If the aggregate’s affinity for water is higher than its affinity for
asphalt, the asphalt film on these aggregate particles may become detached or stripped after
exposure to water. Most siliceous aggregates become negatively charged in the presence of
water, whereas calcareous aggregates carry a positive charge in the presence of water. The
aggregates that have a tendency to be hydrophilic are usually acidic in nature. On the other hand,
aggregates having more affinity for asphalt are basic in nature and are called hydrophobic
(Kandhal and Parker, 1998).
Improvement of Aggregate Quality
Most aggregate properties are a result of their mineralogical composition. The quality of
the aggregate depends on many factors, such as rock source, mineralogy, quarry operation,
handling, and continuous quality control. Once a source is selected, there are few methods of
5 5
improving aggregate quality; however, some aggregate properties can be improved in an
economical manner. A few of the common techniques employed for improving aggregate
quality used in HMAC are described below.
Rock Quality Monitoring
One way to improve aggregate quality to identify the location of poor quality rocks in a
quarry and to exclude them from the quarry operation. This can be done using a rock quality
monitoring process where a geologist maps the rock types present in the quarry (Barksdale,
2001).
Blending
The most widely used method of improving aggregate quality is blending a marginal
aggregate with superior aggregate/s. Aggregates may also be blended to meet the gradation
criterion. The aggregate supplier adopts this technique to meet the agency criterion. However,
this method does not always work. The properties of the blend do not always represent the
weighted average of the constituent aggregates. For instance, mixing uncrushed smooth
aggregate with a crushed rough one does not significantly improve the quality of the blend. To
achieve good interlocking, all the particles in the mixture should be angular and rough.
Proper Crushing
Shape and surface texture of aggregate used in HMAC are by far the most important
properties. Angular shape and rough surface texture are two of the most desirable aggregate
properties for resistance to rutting and fatigue fracture. Cubic and angular aggregates provide
increased internal friction and improved resistance to rutting. These properties of the aggregate
are mainly affected by the mineralogy of the rock. Another factor influencing the shape and
surface texture is the crushing technique. Rock is crushed when a force is applied with sufficient
energy to disrupt atomic bonds within minerals or along planes of weakness that exist within the
rock. There are many types of crushers used by aggregate producers. One common technique
involves a series of more than one crusher. A primary crusher reduces the large rock generated
from blasting, and a secondary crusher further reduces the size and shape of aggregates passed
6 6
through the primary crusher. The primary crusher is usually a jaw or gyratory crusher. The
secondary crusher is commonly an impact crusher, which applies a high-speed impact force to
the feed rock. The primary factor determining the shape of the crushed product is the reduction
ratio (i.e., size ratio between the feed rock and the broken aggregate) (Barksdale, 2001). Impact-
type crushers are thought to be the best type for producing angular and cubical aggregate, so they
make good secondary crushers.
Washing
Most coarse aggregates and some fine aggregates can be rinsed over a vibrating inclined
screen with a pressure spray nozzle (Barksdale, 2001). Washing the aggregate reduces the clay-
sized particles (excessive dust) and other deleterious materials (Roberts et al., 1996). Prewetting
the aggregate further enhances the removal of clay particles during washing over the screen.
TxDOT Aggregate Test Methods
The Texas Department of Transportation currently runs four tests for quality control of
coarse aggregate in HMAC pavements. These tests are generally time-consuming and must be
performed in a laboratory environment.
Tests used to determine coarse aggregate quality for bituminous materials are outlined in
TxDOT’s Standard Specifications for Construction and Maintenance of Highways, Streets, and
Bridges (Table 1). The Polish Value Test (Tex-438-A) is also performed on aggregate from
rated sources (Ed Morgan, TxDOT geologist, pers. Comm., 2003).
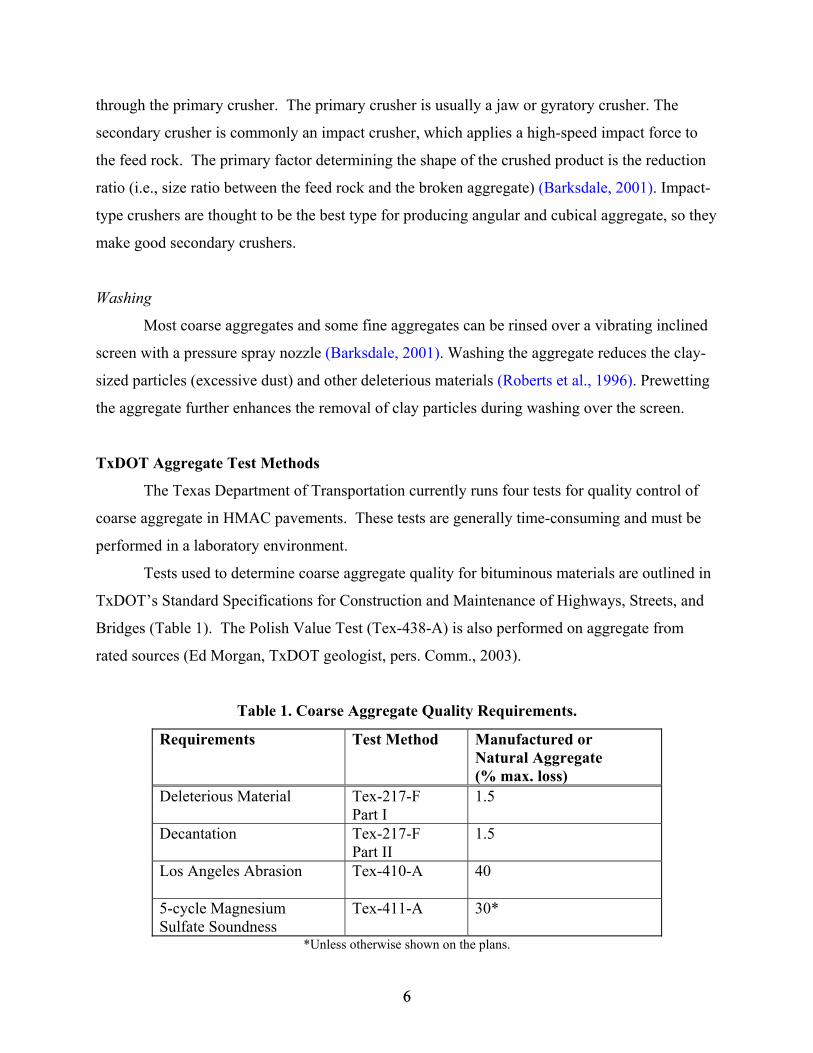
Table 1. Coarse Aggregate Quality Requirements.
Requirements Test Method Manufactured or Natural Aggregate (% max. loss)
Deleterious Material Tex-217-F Part I
1.5
Decantation Tex-217-F Part II
1.5
Los Angeles Abrasion Tex-410-A 40
5-cycle Magnesium Sulfate Soundness
Tex-411-A 30*
*Unless otherwise shown on the plans.
7 7
There is a need for tests that can be performed in the field at the aggregate quarry and that
require a minimum amount of skill. The geologic literature contains numerous tests (requiring
different levels of skill) that can be performed rapidly in the field for identification of mineral
constituents, textural parameters, and engineering properties. We will review some of these
techniques later in the report.
Other States’ Aggregate Practices
As part of this project the researchers documented how other states with problematic
carbonate aggregates detect poorly performing materials. Two states that use carbonate
aggregates almost exclusively are Iowa and Florida. Iowa uses predominantly Paleozoic Era
carbonates typical of rocks found in central Texas (Brownwood District), while Florida uses
predominantly Cenozoic Era carbonates typical of many parts of west-central Texas (Abilene
and San Angelo Districts).
Robert Dawson of the Iowa DOT (pers. comm., 2003) informed the researchers that most
of their aggregates are quarried carbonate rocks. Iowa DOT geologists spend a good deal of time
making detailed maps of all of the rocks that are quarried in Iowa. From the mapping, they
determine what rocks pose potential problems. The Iowa DOT can then focus attention on
certain aggregate sources. However, they still perform a detailed chemical analysis of all
aggregate sources.
The Iowa DOT performs X-ray diffraction (XRD), X-ray fluorescence (XRF), and the
Iowa Pore Index Test to predict the performance of an aggregate. Their experience has shown
that aggregates with extensive capillary pore systems and a high clay mineral content are subject
to durability problems. Iowa uses a combination of XRD and XRF to identify deleterious clay
minerals and Al2O3 content, respectively. The Pore Index Test gives an indication of the extent
of the capillary pore system
The Iowa DOT coarse aggregate tests (limits) for HMAC are freeze and thaw (10), Los
Angeles (LA) Abrasion (45 percent), absorption (6.0 percent), clay lumps (0.5 percent), Al2O3
content (0.7 percent), and gradation. They run the Magnesium Sulfate Soundness Test only for
Portland cement concrete (PCC) aggregates.
8 8
Gale Page, Flexible Pavement Materials Engineer for the Florida DOT (pers. comm.,
2003) discussed problems they have with limestone aggregates. All of the limestone aggregates
in Florida are soft and porous. Florida has only one specification for asphalt coarse aggregate,
they use the LA Abrasion test, and allow a maximum loss of 45 percent for limestone aggregates.
Florida used to have a sodium sulfate loss requirement, but too many good performing
aggregates were failing, so the test was discontinued. They do not have any criteria for specific
gravity or water absorption. Water absorption values are typically around 3% for limestone
aggregates. Mr. Page informed the researchers that the keys to quality hotmix are having the
hotmix association on your side and having large penalties for violations of specifications (i.e.,
like taking contractors off the bid list). The penalties will help keep the contractors honest.
Soft Aggregates
Aggregate breakdown is a problem that the Florida DOT anticipates; there is a change in
gradation due to asphalt plant processing. Most soft limestones do not show a change on coarse
sieves but generate a lot of dust in the finer sieve fractions; the Florida DOT is accustomed to
managing dust. They design for a change in gradation from the beginning. They determine or
anticipate from experience with certain aggregates the amount of fines that will be generated in
the asphalt processing plant and then design the mix based on that gradation. For example,
Florida commonly uses a mix of Georgia granite and Florida limestone for the coarse aggregate
in a hotmix. When they fabricate samples the limestone generates a lot of dust, so only
limestone dust is added in the mix design and granite dust is not added. To stabilize the dust
generation, the asphalt mixing plant must change the production rates slowly to maintain a
consistent dust content. The mixing plants anticipate how much dust is generated from startup to
shutdown, so they change production rates slowly.
Porous Aggregates
Florida limestone aggregates commonly have about 3 percent absorbed moisture, so the
Florida DOT does not allow asphalt plants to run at maximum capacity; production rates are cut
in half because of the absorbed moisture. They allow the asphalt plants to run at only half the
maximum to allow time for the aggregates to dry out. If an asphalt truck arrives at a job site with
water in it, then the inspector shuts the plant down until the water problem is taken care of. If a
9 9
plant can run 400 tons of hotmix a day, then the Florida DOT will recommend they only run 200
tons a day to allow time for the porous aggregates to dry out.
Literature Review
The literature review is split into aggregate quarrying, sampling, and testing techniques
sections. Kandhal and Parker (1998) performed an extensive literature review on asphalt
aggregate test methods currently in use. We see no need to repeat their thorough literature
review, so we refer interested readers to their work.
Aggregate Quarrying
The quality of aggregate changes throughout the quarry. Two important controls on
aggregate quality are (1) what geologic environment the rock originally formed in and (2) what
happened to the rock after it was formed. For example, basalt is an extrusive igneous rock that is
extremely hard and makes excellent railroad ballast when not heavily altered. If the basalt is
exposed to humid, tropical conditions for an extended period of time, the minerals will be altered
by a process called weathering. The ferromagnesian minerals and glass in the basalt alter to
hydrous clay minerals. Day (1962) reported problems with basalt aggregates in Idaho that were
a result of severe alteration of the basalt to clay minerals by physical and chemical weathering.
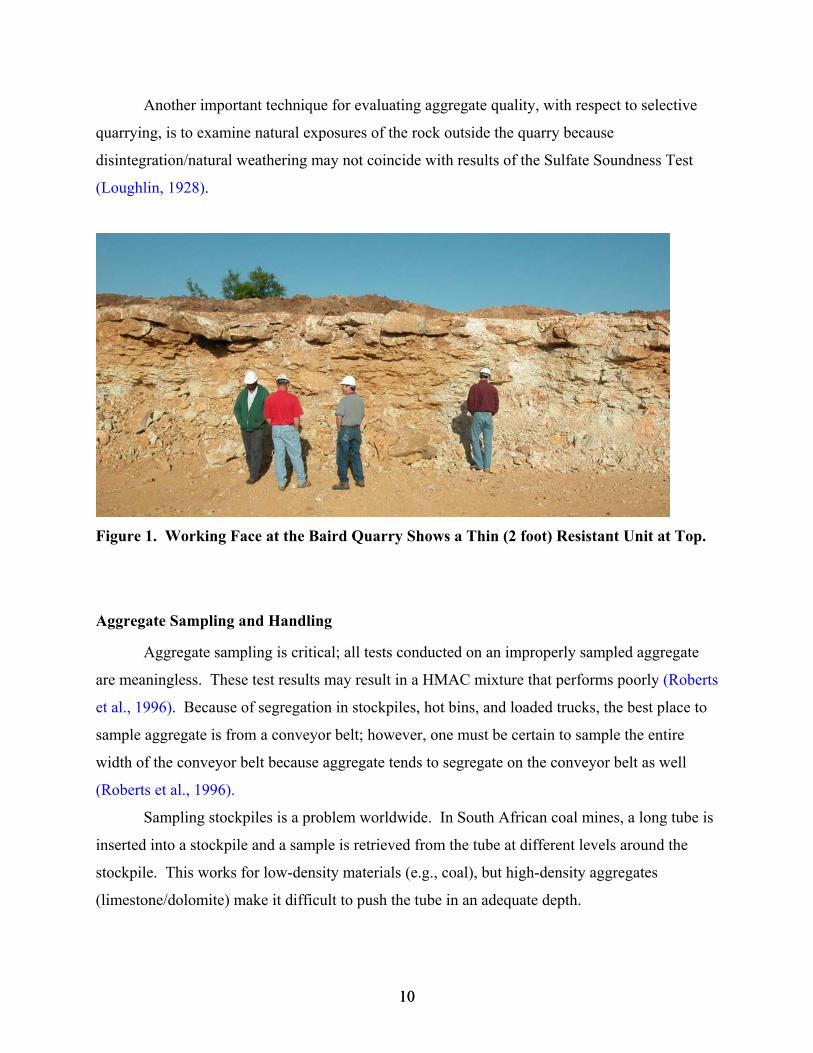
A quarrying technique available to operators to combat heterogeneous aggregates is
termed selective quarrying. For example, Hanson Aggregates commonly performs aggregate
tests on cores to classify the rocks in a quarry based on engineering properties (Vartan
Babakhanian, pers. comm., 2003). Using this technique, Hanson Aggregates may identify a soft
limestone down to a depth of 20 feet that is only good for base material and a hard limestone
suitable for concrete aggregate from 20 to 35 feet. They will quarry the top 20 feet and stockpile
the material for base courses. The next 15 feet will then be quarried and stockpiled for concrete
aggregate. This technique works well in areas with laterally continuous rock units 10 to 15 feet
thick, but the economics of selective quarrying become a factor in regions where the rock is thin-
bedded (units 2-3 feet thick) and less continuous (Figure 1). For example, the working face at
the Baird Quarry (Abilene District) is only 10 feet high and contains thin (1-2 foot)
discontinuous limestone beds intercalated with fissile shale and thin sand stringers. Selectively
quarrying this material would be extremely difficult and cost prohibitive.
10 10
Another important technique for evaluating aggregate quality, with respect to selective
quarrying, is to examine natural exposures of the rock outside the quarry because
disintegration/natural weathering may not coincide with results of the Sulfate Soundness Test
(Loughlin, 1928).
Figure 1. Working Face at the Baird Quarry Shows a Thin (2 foot) Resistant Unit at Top.
Aggregate Sampling and Handling
Aggregate sampling is critical; all tests conducted on an improperly sampled aggregate
are meaningless. These test results may result in a HMAC mixture that performs poorly (Roberts
et al., 1996). Because of segregation in stockpiles, hot bins, and loaded trucks, the best place to
sample aggregate is from a conveyor belt; however, one must be certain to sample the entire
width of the conveyor belt because aggregate tends to segregate on the conveyor belt as well
(Roberts et al., 1996).
Sampling stockpiles is a problem worldwide. In South African coal mines, a long tube is
inserted into a stockpile and a sample is retrieved from the tube at different levels around the
stockpile. This works for low-density materials (e.g., coal), but high-density aggregates
(limestone/dolomite) make it difficult to push the tube in an adequate depth.

11 11
To try to alleviate some of the sampling problems with large stockpiles, the Ohio DOT
specifies that the stockpile should not be larger than 2000 tons until the material has been
sampled and tested (80 to 100 lb). Then a stockpile may be enlarged, but the enlarged portion
must be sampled and tested in the same manner (Jessberger, 2002). The Kansas DOT specifies
that aggregates that have been accepted must be stockpiled in layers 1.0 to 1.5 m thick, each
layer is bermed so aggregates do not “cone” down into lower layers (Clowers, 1999). The
Kansas DOT also specifies that aggregates from different sources, with different gradings, or
with a significantly different specific gravity be stockpiled separately (Clowers, 1999).
The type of stockpile constructed makes a significant contribution to size segregation. In
1965 a National Cooperative Highway Research Project (NCHRP) study evaluated size
segregation in three different types of stockpiles. The study determined that the type of stockpile
had a profound impact on segregation. The cast-and-spread technique produced the least amount
of segregation, and stockpiles constructed using the cone technique were by far the most
segregated.
Handling aggregates generates fines. The amount of fines generated varies for different
aggregates; how the aggregate is handled before being placed also contributes to the fines
content. Many aggregate suppliers can give gradations and standard deviations on the belt,
stockpile, and truck samples.
Aggregate Laboratory Testing
Many studies have concluded that aggregate performance cannot be linked to a single
mechanical or chemical test, but a combination of tests (Fookes et al., 1988; Kandhal and Parker
1998; Little et al., 2001).
Kandhal and Parker (1998) performed an extensive literature review and laboratory
evaluation of aggregate tests related to asphalt concrete performance. They concluded that
permanent deformation, raveling, popouts, potholing, fatigue cracking, and frictional resistance
are all affected by the properties of the aggregates. They identified nine aggregate tests that can
be related to HMAC performance; four of the tests are for the fine aggregate only. The five tests
they recommend for the coarse aggregate include: sieve analysis (permanent deformation and
fatigue cracking), uncompacted void content (permanent deformation and fatigue cracking), flat
or elongated particles (2:1 ratio) in coarse aggregate (permanent deformation and fatigue
12 12
cracking), Micro-Deval (MD) Test (raveling, popouts, or potholing), and Magnesium Sulfate
Soundness Test (raveling, popouts, or potholing).
There have been some questions about the utility of the Sulfate Soundness Test. Many
researchers and DOT personnel report repeatability problems with the Sulfate Soundness Test
(Ed Morgan, TxDOT geologist, pers. comm., 2003). Soundness was defined as an aggregate’s
resistance to weathering in ASTM-C-88. Forster (1994) points out the pitfalls, resulting in low
precision, of the Sulfate Soundness Test when the results are not used in concert with other
aggregate test methods and preferably including a prior service record. He concludes that a low
soundness loss will “usually” indicate a durable aggregate, but collaborative evidence from other
tests should be used.
Researchers at Texas Tech University compared the Micro-Deval to the Magnesium
Sulfate Soundness Test (Phillips et al., 2000). They determined that absorption has a significant
effect on MSS and MD test results; at a 95 percent confidence interval an aggregate with less
than 1.7 percent absorption shows less than 20 percent MSS loss if MD loss is less than 18
percent, and an aggregate with less than 2.1 percent absorption shows less than 30 percent MSS
loss if MD loss is less than 25 percent. Phillips et al. (2000) stated that specific gravity did not
correlate with performance. They concluded that MD was more repeatable and reproducible
than the MSS test.
A research consortium of three different institutions in Texas is collaborating on research
dealing with bituminous coarse aggregates. The Texas Transportation Institute (TTI) is the lead
agency in this research effort. To date, they have reevaluated many of the tests outlined by
Kandhal and Parker (1998) and have concluded that the aggregate tests currently used are not
closely related and that the tests monitor independent properties. Therefore, all of these tests
may be needed to evaluate aggregate quality, confirming the conclusions of Fookes et al. (1988).
Aggregate Field Testing
The first year of this project focused on identifying and performing simple tests that can
be used in the field to identify poor performing aggregate. Two physical properties that indicate
poor aggregate performance are (1) extensive capillary pore systems, as reported by the Iowa
DOT, and (2) soft aggregate. Most of the engineering tests in the literature require time-
13 13
consuming laboratory procedures; however, this literature review lists a few simple field tests
that may distinguish the poor quality aggregate from the good.
Mielenz (1994) recommends making observations regarding nine properties of aggregate
in the field that can be related to aggregate performance. The properties include: (1) friability or
pulverulence in the fingers; (2) resonance when struck; (3) ease of fracturing; (4) nature of the
fracture surface and fracture fillings; (5) odor on fresh fracture; (6) color and its variation; (7)
internal structure, such as porosity, granularity, seams, and veinlets; (8) reaction to water, such as
absorption of droplets on fresh fracture, evolution of air on immersion, capillary suction against
the tongue, slaking, softening, or swelling; and (9) differential attack by acids or other media.
The Schmidt Hammer, originally developed for nondestructive testing of concrete, has
been used to estimate rock strength, mainly at the quarry working face (Katz et al., 2000). Katz
et al. (2000) report numerous studies showing good correlation between rebound readings with
the Schmidt Hammer and laboratory measured values of Young’s modulus, uniaxial compressive
strength, and density of the rock. Two drawbacks to this technique are that large blocks are
required and that a smooth interface between the tool and rock is required for best results.
Therefore, samples in a stockpile cannot be tested with this device.
As stated previously, an important physical property of an aggregate is the ability to
absorb moisture. Poor quality aggregates typically absorb more moisture, whereas good quality
aggregates absorb very little moisture. Absorption may be regarded as an aggregate property that
is a function of aggregate porosity and pore size (Landgren, 1994). Absorption is a simple test
that can be performed rapidly in the field.
Because the different physical and chemical properties of calcite (CaCO3) and dolomite
[CaMg(CO3)2] (dolomite is harder and has a higher density), it is desirable to distinguish
between these two minerals in a quarry. A simple test is to add several small chips of aggregate
to a porcelain spot plate and add a drop of 0.1 percent Alizarin-S solution dissolved in saturated
tartaric acid. Calcite causes the solution to turn a purple-red, but dolomite does not react
(Jungries, 1985).
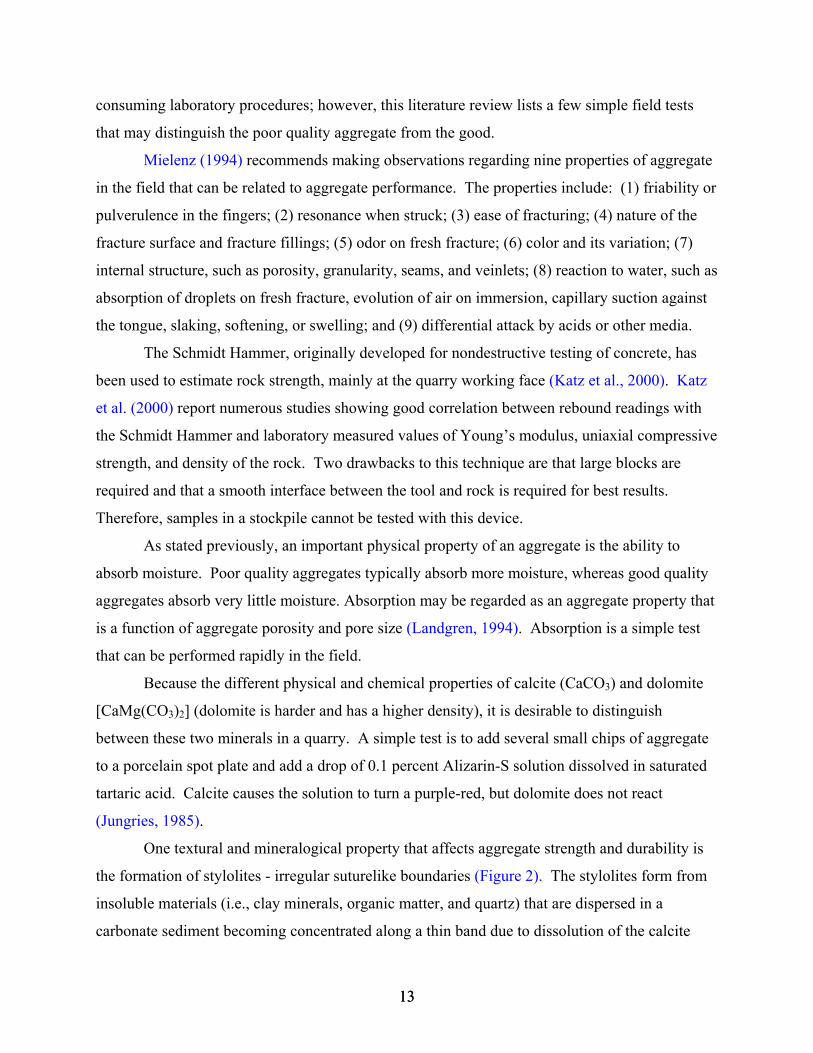
One textural and mineralogical property that affects aggregate strength and durability is
the formation of stylolites - irregular suturelike boundaries (Figure 2). The stylolites form from
insoluble materials (i.e., clay minerals, organic matter, and quartz) that are dispersed in a
carbonate sediment becoming concentrated along a thin band due to dissolution of the calcite
14 14
from increased pressures generated by burial. The stylolites form perpendicular to the principal
stress and are generally horizontal in flat-lying limestones. Verhoef and van de Wall (1998)
report durability problems with limestone blocks containing stylolites composed of expansive
clay minerals (smectite).
Figure 2. The Semihorizontal Tan Lines in the Top One-Third of the Image are Stylolites
from the Black Quarry.
METHODS
To accomplish the goals of this research project, the researchers employed the following
techniques to answer fundamental questions about coarse aggregate field performance.
Initially, an extensive literature search was conducted to identify any new field tests that
may be used for the identification of poor quality aggregates. Following the literature review,
the Project Management Committee (PMC) met with the researchers and identified several
districts that may have problems with coarse aggregates in HMAC.

15 15
The researchers contacted key personnel in the following districts: Abilene, Atlanta,
Bryan, Lubbock, Odessa, Pharr, and San Angelo. Only two districts, Abilene and Lubbock,
reported problems related to poor quality aggregates. The Lubbock District sent core samples to
the researchers from roads suspected of having performance problems due to low-quality coarse
aggregate.
The researchers visited the Abilene District in March 2002 to obtain core samples. The
district personnel identified three sections of US-84 in Tyler and Scully Counties that may have
problems due to poor quality coarse aggregates. The coarse aggregate quality was questioned
because of the presence of fatigue cracking on these highway sections. The researchers also
noticed popouts and surface aggregate degradation. Six-inch diameter cores were collected from
US-84 in each of the two counties (Tables 2 and 3). The quarry that produced the aggregate used
in both sections closed a few years ago. As a result, it was not possible to collect aggregate
samples from the quarry to test in the laboratory.
Table 2. Core Description for Northbound Outside Lane of US-84 in Taylor County.
Core No. Location of Core Distress
84-1 Center of the lane Lot of alligator cracks, no rutting
84-2 Center of the lane Same as above
84-3 Right wheel path (RWP) Same as above
84-4 Left wheel path (LWP) Same as above
84-5 Center of the lane Same as above
84-6 RWP Same as above
84-7 Left side of the RWP Some raveling
84-8 Center of the lane Cracks in the vicinity
84-9 LWP Lot of alligator cracking
84-10 Center of the lane No distress
84-11 LWP Lot of alligator cracks, no rutting
84-12 Center of the lane Lot of alligator cracks, no rutting
84-13 Left side of RWP Some alligator cracks
84-14 Center of the lane Good spot

16 16
Table 3. Core Description for Northbound Outside Lane of US-84 in Scully County.
Core No. Location of Core Distress
84-S1 Right side of LWP Low alligator crack around the spot
84-S2 Center of the lane Very low crack
84-S3 Left side of LWP Low crack
84-S4 Right side of LWP Low crack
84-S5 Center of the lane Popouts
84-S6 Center of the lane No apparent distress
84-S7 Right side of LWP Close to huge alligator crack
84-S8 Center of LWP Close to huge alligator crack
84-S9 Center of the lane No apparent distress
84-S10 Center of LWP Low cracks
Sample Locations
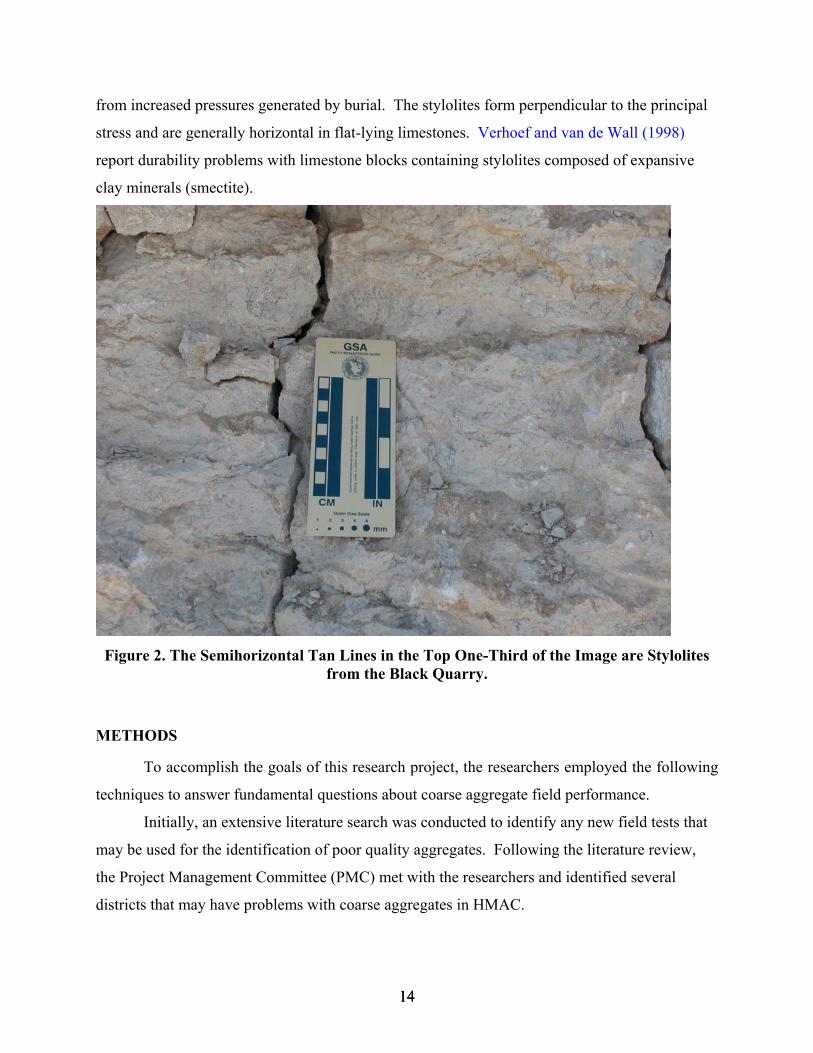
The researchers focused on the surface course, but full-depth cores were collected from
different locations in the roadway. Cores were collected using TxDOT’s mobile coring drill
from the northbound outside lane in both counties (Figure 3). Cores were collected from all
positions of a lane (e.g., center, left wheelpath, and right wheelpath) and from both damaged and
undamaged parts of the lane.
17 17
Figure 3. Drilling Cores from US-84.
Once the cores were delivered to the TTI laboratory, they were cut to separate the top
layer from the remainder of the core for laboratory testing. Visual inspections were performed
before and after sawing.
Mixture Design Data
In 1997, Asphalt Materials, Inc., overlayed a section on US-84 in Tyler County. A type
D mixture with PG 64-22 asphalt and limestone from the Parmally Quarry in Abilene was used.
The design asphalt content was 5.2 percent. Design data do not show the use of antistripping
agent or field sand.
Price Construction constructed the segment of US-84 in Scully County in 1998. A type D
mixture with limestone from the Jordan Quarry and PG 70-22 asphalt from Fina was used for the
overlay. This mixture also used 7 percent field sand from South Anderson and 2 percent hydrated
lime. The design asphalt content was 6.1 percent.

18 18
Tests Conducted on the Core Samples
There were five tests performed on the cores retrieved from Abilene. First, each core was
visually examined for absorptive aggregates, popouts, cracks, etc. Second, cores were subjected
to testing in the Asphalt Pavement Analyzer (APA). The third step was to run a Frequency
Sweep at Constant Height (FSCH) on selected cores. The Hamburg Wheel Tracking Device
(HWTD) was fourth in the testing sequence. Finally, the Overlay Tester was used to test
selected samples. The paragraphs below present brief descriptions of the conditions of each test.
One pair of specimens from each of the two roadway sections was tested with the APA
machine. The test was conducted at 147 °F, 100 psi wheel pressure, and 100 lb wheel load. The
top 3 inches of selected 6-inch diameter cores was used for this test.
Frequency sweep is a strain-controlled repeated test that measures the viscoelastic
behavior of asphalt mixtures. A small magnitude of sinusoidal shearing strain is applied to the
specimen at 10 different frequencies, and the stress response is measured. Due to the
viscoelastic behavior of an HMA mixture, the specimen’s stress response is not in the same
phase as the applied strain. The stress always lags behind the applied strain. The ratio between
the stress response and the applied strain is used to compute the complex shear modulus, G*.
The measured time delay between the strain and stress response is used to compute shear phase
angle, *. Higher complex modulus indicates a stiffer mix that is more resistant to rutting, and
lower shear phase angle indicates more elastic behavior that is more resistant to rutting
(Chowdhury and Button, 2002).
The HWTD is an accelerated wheel tester that has been used as a specification
requirement to evaluate rutting and stripping for some of the most traveled roadways in
Germany. Use of this device in the U.S. began during the 1990s. Several agencies undertook
research efforts to evaluate the performance of the HWTD. Since the adoption of the original
HWTD, significant changes have been made to this equipment. A U.S. manufacturer now builds
a slightly different device. The basic idea is to operate a steel wheel on a submerged, compacted
HMA slab or cylindrical specimen. Recent TxDOT HMAC specifications require that all
mixtures pass certain HWTD specifications based on the asphalt grade used in the mixture.
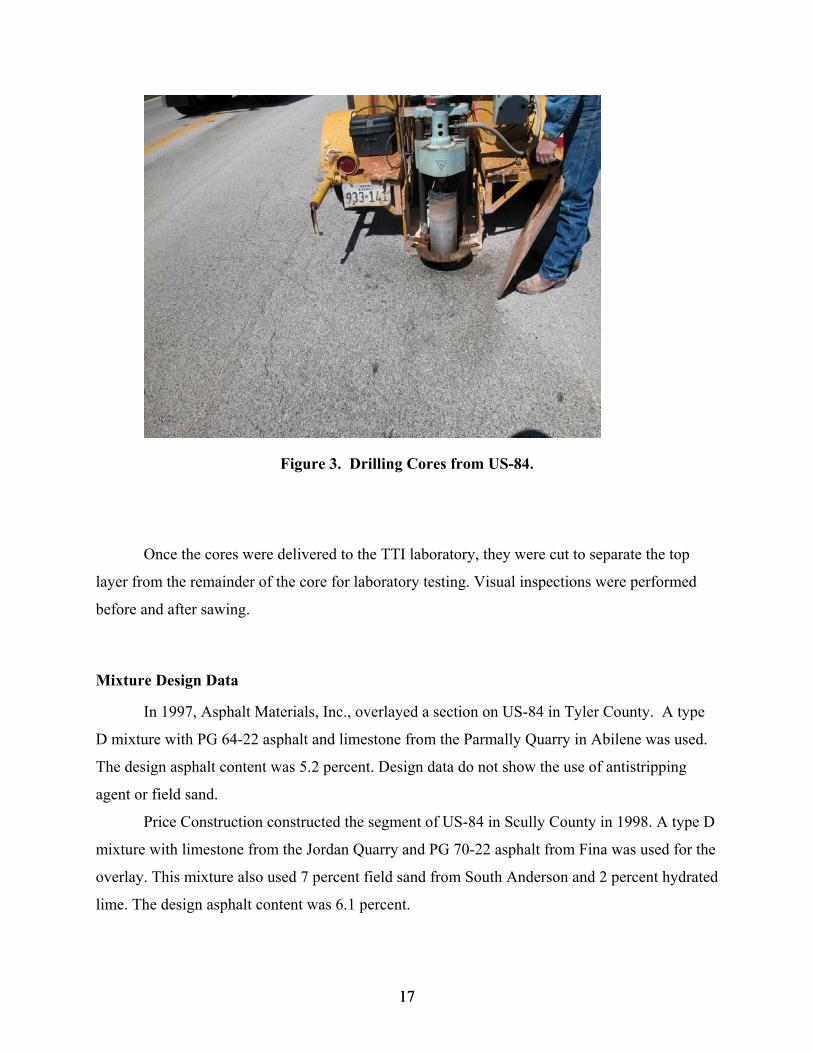
The TTI overlay tester was designed by Germann and Lytton in the late 1970s to simulate
the opening and closing of joints or cracks, which are the main driving force inducing reflection
crack initiation and propagation (Germann and Lytton, 1979). The key part of the apparatus, as
19 19
shown in Figure 4, consists of two steel plates, one fixed and the other movable in a horizontal
direction, to simulate the opening and closing of joints or cracks in the old pavements beneath an
overlay. There are two overlay testing machines at TTI: one is a small overlay tester for a
specimen size of 375 mm (15 inch) long by 75 mm (3 inch) wide with variable height; the other
is a large overlay tester for a larger size specimen of 500 mm (20 inch) long by 150 mm (6 inch)
wide with variable height. Both overlay testers have been successfully used to evaluate the
effectiveness of geosynthetic materials on retarding reflection cracking. These applications
indicate that the overlay testers have the potential to characterize the reflection cracking
resistance of asphalt mixtures.
The overlay tester data include the time, displacement, and load corresponding to a
certain number of loading cycles. In addition, the crack length can be manually measured. The
overlay tester provides two types of information: one is the reflection cracking life of an asphalt
mixture under certain test conditions; the other is fracture parameters of an asphalt mixture.
These are discussed below (Zhou and Scullion, 2003).
Three prismatic specimens ( 6-inch X 3-inch X 2.5 inch) sawed from cores were tested
with the TTI overlay tester at 77 °F. The test was performed following the protocol suggested by
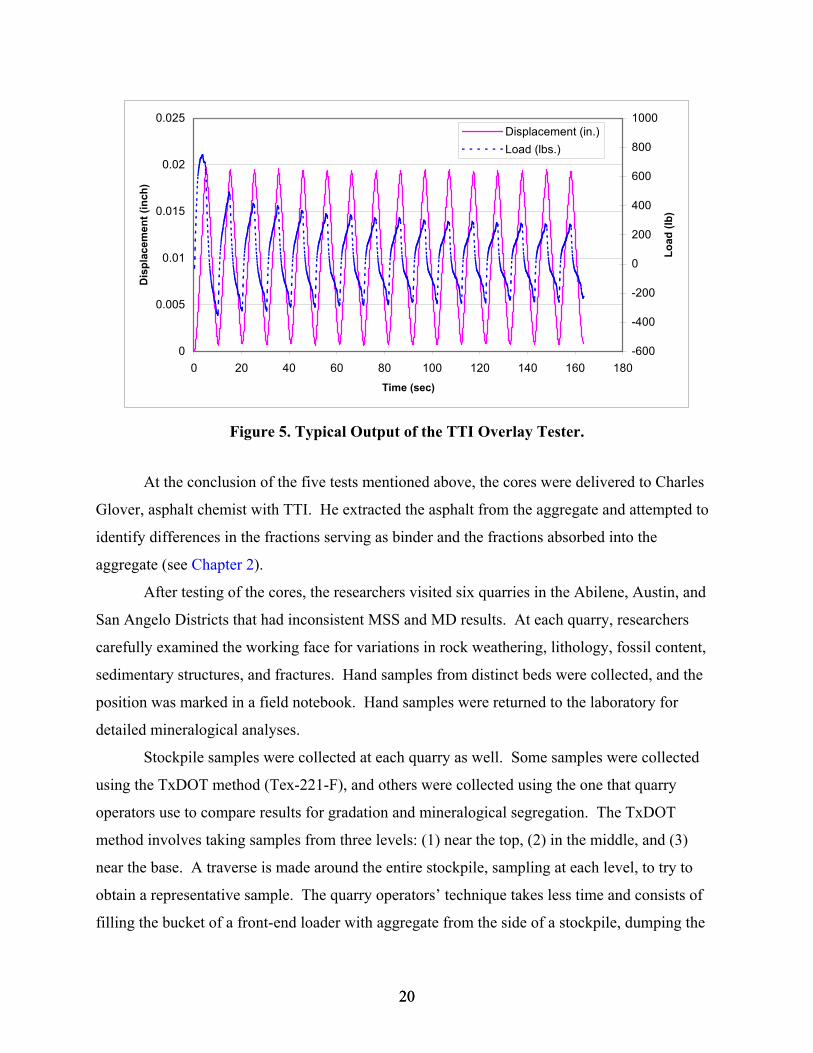
Zhou and Scullion (2003). Figure 5 shows data typical of the TTI overlay tester.
Figure 4. TTI Overlay Tester.
20 20
0
0.005
0.01
0.015
0.02
0.025
0 20 40 60 80 100 120 140 160 180Time (sec)
Dis
plac
emen
t (in
ch)
-600
-400
-200
0
200
400
600
800
1000
Load
(lb)
Displacement (in.)Load (lbs.)
Figure 5. Typical Output of the TTI Overlay Tester.
At the conclusion of the five tests mentioned above, the cores were delivered to Charles
Glover, asphalt chemist with TTI. He extracted the asphalt from the aggregate and attempted to
identify differences in the fractions serving as binder and the fractions absorbed into the
aggregate (see Chapter 2).
After testing of the cores, the researchers visited six quarries in the Abilene, Austin, and
San Angelo Districts that had inconsistent MSS and MD results. At each quarry, researchers
carefully examined the working face for variations in rock weathering, lithology, fossil content,
sedimentary structures, and fractures. Hand samples from distinct beds were collected, and the
position was marked in a field notebook. Hand samples were returned to the laboratory for
detailed mineralogical analyses.
Stockpile samples were collected at each quarry as well. Some samples were collected
using the TxDOT method (Tex-221-F), and others were collected using the one that quarry
operators use to compare results for gradation and mineralogical segregation. The TxDOT
method involves taking samples from three levels: (1) near the top, (2) in the middle, and (3)
near the base. A traverse is made around the entire stockpile, sampling at each level, to try to
obtain a representative sample. The quarry operators’ technique takes less time and consists of
filling the bucket of a front-end loader with aggregate from the side of a stockpile, dumping the

21 21
material on the ground, and flattening the top of the pile generated by the bucket (Figure 6).
Sample bags are then filled with aggregate removed from a trench dug across the top of the
flattened pile.
The researchers also talked to quarry operators about techniques used for quarrying/selective
quarrying, crushing, and handling (washing and stockpiling) the aggregates. Some operators
expressed economic concerns about selective quarrying. The type of crusher selected is also
very important. Some crushers work better on soft rocks, for instance, impactors generate nice
cubical aggregates in carbonate rocks with less than 5 percent silica. Increased silica results in
more wear and higher maintenance costs.
Four simple field tests (visual inspection of rounding, color, and porosity; water absorption;
fines content; and hardness/friability in the fingers) were identified and employed at the
stockpiles. These tests are simple to perform and give a good indication of properties related to
aggregate performance, as outlined in the literature review.
Figure 6. Grade 3 Stockpile at the Baird Quarry in the Abilene District.
22 22
RESULTS
Of the seven districts contacted about HMAC problems due to poor quality aggregates,
only two districts, Abilene and Lubbock, identified roads that were failing possibly due to coarse
aggregate problems. Multiple 6-inch cores were collected from poor performing roads in these
two districts and returned to the laboratory for analysis.
Visual Observation
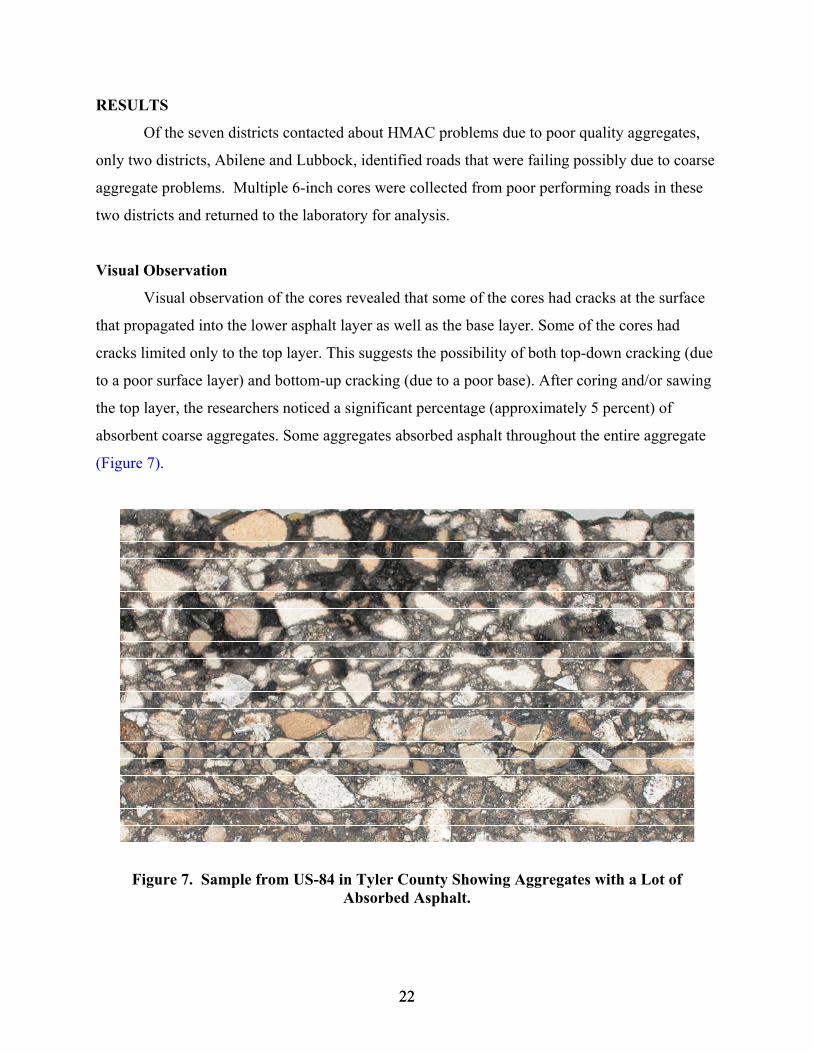
Visual observation of the cores revealed that some of the cores had cracks at the surface
that propagated into the lower asphalt layer as well as the base layer. Some of the cores had
cracks limited only to the top layer. This suggests the possibility of both top-down cracking (due
to a poor surface layer) and bottom-up cracking (due to a poor base). After coring and/or sawing
the top layer, the researchers noticed a significant percentage (approximately 5 percent) of
absorbent coarse aggregates. Some aggregates absorbed asphalt throughout the entire aggregate
(Figure 7).
Figure 7. Sample from US-84 in Tyler County Showing Aggregates with a Lot of Absorbed Asphalt.

23 23
APA Test
In the field, the researchers noticed alligator cracking on the roadway. Specimens 84-9
and 84-4 (Tyler County) and 84S-9 and 84S-10 (Scully County) were tested together. The
maximum rut depths at the end of 8000 APA load cycles were measured as 0.09 inch and 0.07
inch for the Tyler and Scully County roadway sections, respectively. These rut depths are very
low and match field observations. In the field, the researchers found very little rutting.
Frequency Sweep at Constant Height
Researchers tested one sample from each roadway section at two temperatures (68 °F and
104 °F) and 10 frequencies (10 Hz to 0.01 Hz). The Association of American State Highway
and Transportation Officials (AASHTO) TP07-01 test standard was followed to conduct this test.
Table 4 summarizes the FSCH test results. The specimens from Tyler County exhibit a low
shearing modulus at 68 °F.
Table 4. FSCH Test Results.
Test at 68 °F Test at 104 °F Specimen No.
Frequency, Hz G* psi *, degree G* psi *, degree
10.0 86,924 19.6 67,078 33.9 5.0 79,668 16.5 55,206 32.3 2.0 71,819 16.0 42,041 32.1 1.0 66,286 14.9 36,656 31.9 0.5 60,929 16.1 30,980 32.7 0.2 54,217 16.8 25,498 32.3 0.1 49,734 18.6 21,264 33.7 0.05 45,154 19.9 18,475 33.3 0.02 39,345 21.8 15,135 32.1
84-3 Tyler
0.01 34,948 24.3 13,117 33.6 10.0 177,512 18.4 66,135 31.9 5.0 160,549 14.6 53,944 32.0 2.0 142,442 15.3 41,559 32.3 1.0 124,146 17.1 34,899 34.1 0.5 107,949 18.7 28,579 35.8 0.2 88,049 21.4 21,898 35.1 0.1 75,177 22.3 17,987 36.7 0.05 64,416 24.4 14,086 36.9 0.02 51,565 27.5 10,986 37.5
84S-4 Scully
0.01 42,920 30.1 9,055 39.8

24 24
Hamburg Wheel Tracking Device
Hamburg testing was conducted with 6-inch diameter and 2.5-inch high samples sawed
from the top layer of the cores. One pair of specimens was tested from each of the two roadway
sections at 122 °F. The cores used for testing were specimens 84-1 and 84-5 together and 84-S2
and 84-S6 together. The final rut depths of the specimens at the end of 20,000 loading cycles
were 0.18 inch and 0.13 inch for the Tyler and Scully County specimens, respectively. The
relative rut depths are very small and match the results from the APA test. There was no sign of
stripping.
Overlay Tester
None of the samples failed by aggregate fracture. All of the samples failed either along
the mastic (around the aggregate) or along the interface between the specimen and the horizontal
plate. All of the samples failed after very few cycles (Table 5). The tensile force is relatively
small, so it is unlikely that the aggregate will break.
Table 5. Overlay Tester Results.
NUMBER OF CYCLES TO FAILURE SPECIMEN NO. Opening=0.020 inch Opening=0.040 inch
84-6 (Tyler) 19 13 84-10 (Tyler) 25 - 84-S1 (Scully) 19 - 84-S2 (Scully) 6 -
Aggregate Sampling at Quarries
Sieve analyses of stockpile samples collected using the TxDOT and the quarry operators’
methods show virtually identical gradations (Table 6). This consistency indicates that both
techniques yield a similar sample with respect to size variation, but texturally and
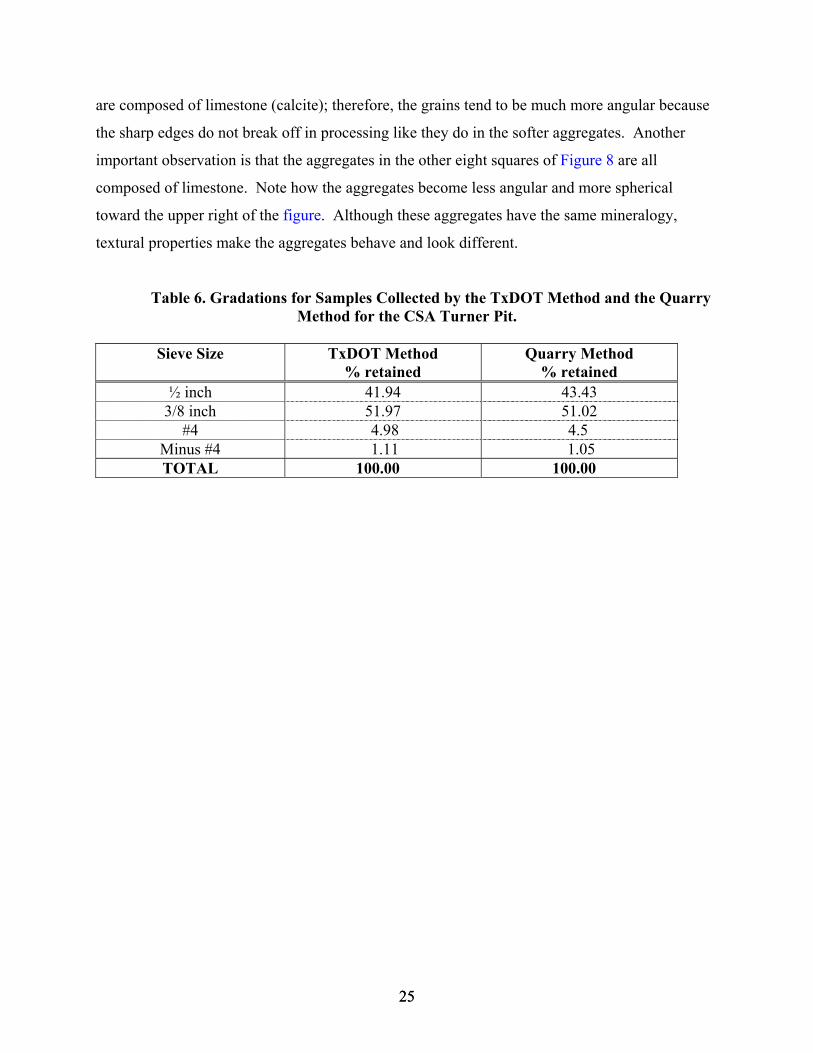
compositionally, the samples can be very different, as illustrated in Figures 8 and 9. Figure 8
shows examples of the different aggregate types found in a single stockpile. The orange
gridlines are one inch on a side. Note the differences in angularity of the aggregate grains. The
three grains in the lower left corner are chert (microcrystalline quartz) and exhibit conchoidal
fracture typical of chert. The chert is also much harder than the other aggregate grains, which
25 25
are composed of limestone (calcite); therefore, the grains tend to be much more angular because
the sharp edges do not break off in processing like they do in the softer aggregates. Another
important observation is that the aggregates in the other eight squares of Figure 8 are all
composed of limestone. Note how the aggregates become less angular and more spherical
toward the upper right of the figure. Although these aggregates have the same mineralogy,
textural properties make the aggregates behave and look different.
Table 6. Gradations for Samples Collected by the TxDOT Method and the Quarry Method for the CSA Turner Pit.
Sieve Size TxDOT Method
% retained Quarry Method
% retained ½ inch 41.94 43.43
3/8 inch 51.97 51.02 #4 4.98 4.5
Minus #4 1.11 1.05 TOTAL 100.00 100.00
26 26
Figure 8. Aggregates from the Same Stockpile Showing Variations in
Porosity, Angularity, and Mineralogy.
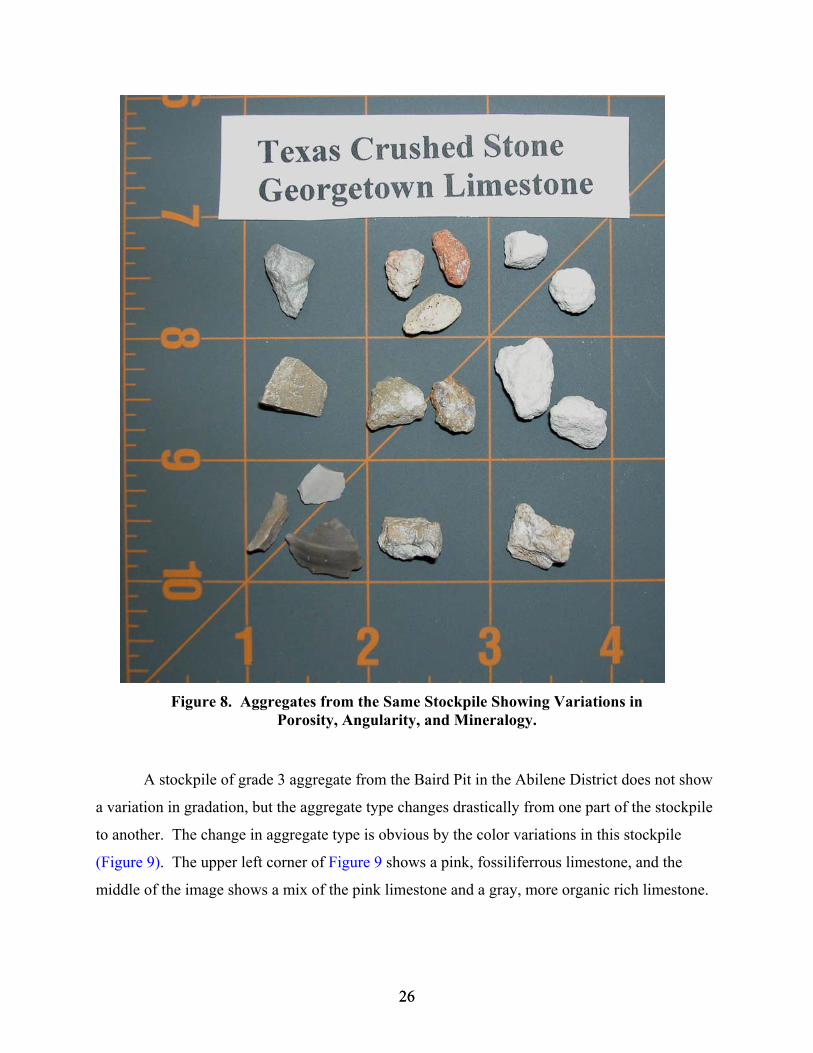
A stockpile of grade 3 aggregate from the Baird Pit in the Abilene District does not show
a variation in gradation, but the aggregate type changes drastically from one part of the stockpile
to another. The change in aggregate type is obvious by the color variations in this stockpile
(Figure 9). The upper left corner of Figure 9 shows a pink, fossiliferrous limestone, and the
middle of the image shows a mix of the pink limestone and a gray, more organic rich limestone.
27 27
Figure 9. Segregation of Aggregate Types (Gray and Pink) in a
Stockpile at the Baird Pit in the Abilene District.
DISCUSSION
Analysis of cores taken from the field for performance problems due to poor quality
coarse aggregate provided mixed results. Visual observations indicated a highly absorptive
coarse aggregate at both locations.
Results from the HWTD and the APA were very good, indicative of a good performing
asphaltic pavement. The FSCH test results indicated a lower modulus than expected. Two
reasons can explain the lower modulus: either the asphalt was softer (PG 64-22) or microcracks
were present in the specimens before testing. Again, the shearing modulus did not change
significantly at higher temperature. On the other hand, shear phase angle increased significantly
for both specimens when tested at higher temperature. The increase in shear phase angle is
usually due to higher temperatures affecting the viscous properties of the mixture more than its
28 28
elastic properties. At the higher temperature, both specimens demonstrated similar behavior with
respect to shearing modulus.
The Overlay Tester results are indicative of brittle asphalt typically observed in an aged
pavement. The aging of asphalt and, hence, mastic (due to overabsorption as observed in Figure
7) made the mastic brittle, which may have caused the loss of tensile strength and resulted in a
low number of cycles to failure (Table 5). Results from Charles Glover, reported in Chapter 2,
seem to correlate with this interpretation.
Aggregate Sampling and Testing at the Quarry
To assess the utility of simple tests for identifying poor quality aggregates at the quarry,
to date the researchers have visited six quarries in the San Angelo, Abilene, and Austin Districts.
All six quarries are in Paleozoic to Mesozoic carbonate rocks because the PMC stated that they
have not had problems with other aggregate types. The results are skewed toward carbonate
rocks since other rock types were not investigated.
One of the major questions of the PMC concerns sampling stockpiles to obtain a
representative sample. Engineers generally think of size segregation when sampling stockpiles,
but there can also be vast differences in aggregate texture and mineralogy in different parts of a
stockpile (Figures 8 and 9). With respect to size segregation, James Bates, TxDOT laboratory
supervisor in the San Angelo District (Pers. comm.., 2003) informed the researchers that they do
not have size segregation problems with grade 3, 4, or 5 aggregates, but size segregation of base
materials is more problematic. Our results in Table 6 seem to corroborate his statement.
With respect to mineralogical and textural variation, Figure 9 illustrates the importance of
sampling near the base, in the middle, and near the top, of all sides of a stockpile as outlined in
the TxDOT method Tex-221-F. The upper lefthand portion of the image shows a pink-colored
limestone, and diagonally from lower left to upper right is a band of more organic rich gray
limestone. If one were to sample from a single location, like the quarry operators prefer, then the
gray rock may not be sampled at all or it may make a disproportionately large contribution to the
sample.
One problem the researchers faced was accessing the entire stockpile to take a sample.
Most of the stockpiles were extremely large (Figure 6), so aggregates in the center/core of the
stockpile may be totally different from what one has access to around the perimeter. In order to

29 29
get a representative sample, there are a couple of techniques employed by other state DOTs that
the researchers prefer. If one must sample from a stockpile, then a compromise would be to limit
the size of a stockpile to 2000 tons or less like the Ohio DOT. Another technique recommended
by Shergold (1963) for sampling from a stockpile is to sample a stockpile at intervals as it is
being constructed to establish any fluctuations in the product.
The best technique for obtaining a representative sample is sampling from the conveyor
belt. Shergold (1963) stated that crushed rock aggregate should be sampled while in motion
(e.g., from conveyor belts or at a discharge from bins). He recommends a minimum of eight
increments over a period of one day with the weight depending on the size of the material. The
increments are then mixed to form a composite and reduced by riffling.
The identification of poor quality aggregates can be accomplished using a few simple
tests in the field. The most important of these tests is visual observation. The difficulty is in
collecting a representative sample.
Other researchers have identified properties that make a limestone aggregate undesirable.
Chief among these properties are microporosity and clay mineral content. Simple field tests that
give a good indication of microporosity are water absorption, low density (lightweight), and lack
of angularity.
Clay mineral content is more difficult to identify in the field. The easiest identification is
made at the working face of the quarry by looking for stylolites (Figure 2) and less resistant
units. One simple test for individual aggregates is to place the aggregate into a glass of water to
soak. If the aggregate breaks apart or slakes, then there is a potential problem with clay
minerals.
Another way to identify clay minerals is to look for highly weathered rocks. Clays often
concentrate in these weathered zones. The vertical fracture/joint in Figure 10 is a good example
of differential weathering. Along the face of the fracture, there are more fines/clays (grayish
orange-pink) that are a product of weathering of the preexisting strata. The pale yellowish brown
limestone is the fresh rock. Rock quarried along the fractures will have more deleterious clay
minerals and yield a poorer quality aggregate. Soaking the aggregate and use of a washer will
help to remove some of the poorer quality material associated with the fractures.
30 30
Figure 10. Vertical Fracture at the Price Clements Pit Showing Grayish Orange-Pink Clay
Attached to a Pale Yellowish Brown Limestone Block.
The next three figures illustrate good, moderate, and poor quality aggregates,
respectively, which are all composed of a single mineral (calcite). The difference in quality is
related to the texture. Figure 11 shows textural properties of a good quality aggregate. The top
image is a thin-section photomicrograph of a limestone (CaCO3) aggregate from the Vulcan
Black Pit: it does not have any visible pores, as evidenced by the lack of blue-dyed epoxy. The
fossil fragments (light colored) in this limestone are still preserved. The darker areas are micrite
(lime mud) that bind the fossil fragments together. This rock makes a strong, angular,
nonabsorptive aggregate as evidenced in the bottom image.
The aggregate represented by the images in Figure 12 is from the Centex Yearwood Pit.
It is not as strong as the aggregate in Figure 11 because it has numerous large pores (blue-dyed
epoxy) that were generated by the dissolution of fossil fragments. This is called moldic porosity.
These pores are not well connected and they are large so there is not a lot of water absorption.
The bottom image shows the aggregate. It has more rounded edges than the aggregate in Figure
11 and it also has little pits all over the surface. The pits are the moldic pores observed in the

31 31
thin-section image above. This rock makes a moderately strong, subangular to subrounded,
nonabsorptive aggregate.
The images in Figure 13 are of another aggregate from the Centex Yearwood Pit. This
aggregate is also a limestone, composed of the mineral calcite (CaCO3), but the texture is
different. The top image shows a limestone with intergranular porosity (pores between the
grains) that will absorb a large amount of water or asphalt. This pore network also makes the
aggregate very weak. The bottom image shows how the aggregate particle has become well
rounded after being crushed and transported. Ed Morgan, TxDOT construction geologist (pers.
comm., 2003), concluded that poorer quality aggregates tend to be more rounded based on
observations of aggregates from quarries around Texas.
From looking at Figures 11-13, one can easily see how important textural variations are
in affecting aggregate quality. Two ways to easily distinguish these three aggregate types are
visual observation of aggregate angularity (as observed by Ed Morgan) and absorption of water.

32 32
Figure 11. (Top) Thin-Section Photomicrograph of a Limestone Aggregate from the
Vulcan Black Pit Showing No Pores. (Bottom) Macroscopic Image of the Same Limestone Aggregate (Note Angularity).

33 33
Figure 12. (Top) Thin-Section Photomicrograph Showing Moldic Pores (Blue) in a
Limestone Aggregate from the Centex Yearwood Pit. (Bottom) Macroscopic Image of the Same Limestone Aggregate (Note Pits in Surface).

34 34
Figure 13. (Top) Thin-Section Photomicrograph Showing Intergranular Pores (Blue) in a Limestone Aggregate from the Centex Yearwood Pit. (Bottom) Macroscopic Image of the
Same Limestone Aggregate (Note Roundness).

35 35
Definition of Mineralogical Segregation
Mineralogical (adj.) for mineralogy is defined as the scientific study of minerals, their
characteristics, and their classification. Mineral is defined as naturally occurring, inorganic,
possessing a definite internal structure, and a definite chemical composition. Segregation is
defined in the American Heritage Desk Dictionary as the act or process of segregating.
Segregating is defined to become separated from a main body or mass, separated, isolated.
Mineralogical segregation would therefore be defined as separation of different minerals in a
stockpile. None of the quarries visited as part of this project revealed mineralogical segregation
in any of the stockpiles. There was variation in the quality of the aggregate in different parts of
stockpiles, but the variation in quality was primarily due to textural differences (i.e., grain shape
and grain rounding; Figures 8, 11-13), induration (amount of cementation; Figures 11-13), and
degree of weathering in limestone quarries (Figure 10). It is this researcher’s opinion that
mineralogical segregation would more appropriately be termed textural segregation for this
particular study. Textural (adj.), for texture, is defined as the general physical appearance or
character of a rock, including the geometric aspects of, and the mutual relations among, its
component particles or crystals (e.g., the size, shape, and arrangement of the constituent elements
of a sedimentary rock) in the American Geological Institute (AGI) Glossary of Geology. There
is a certain amount of bias in this study because it focused predominantly on monomineralic
(calcite/limestone) quarries. Perhaps visits to quarries with more diverse mineralogies would
yield different results and merit the use of the term mineralogical segregation.
RECOMMENDATIONS FOR SAMPLING AGGREGATES AND FIELD TESTS AT
THE QUARRY AND STOCKPILE
• Have a geologist perform a detailed investigation of the aggregate quarry and
surrounding area. This may include selecting fresh and weathered samples for thin-
section analysis.
• Recommend selecting samples from the conveyor belt to identify different minerals and
obtain a better indication of the composition of the stockpile.
• Recommend smaller stockpiles if one has to sample from a stockpile. Ohio specifies a
stockpile no larger than 2000 tons.
36 36
• Visually inspect how well rounded or angular the aggregates are (more rounded = lower
quality).
• Observe reaction to water by absorption on a fresh fracture, evolution of air on
immersion, capillary suction against the tongue, slaking, softening, or swelling.
• Determine hardness - friability between fingers. If an aggregate breaks in the hand, then
the aggregate is too soft.
• Visually inspect fines content to identify soft aggregates.
• Visually inspect porosity. Big, isolated pores are not a problem, but small,
interconnected pores absorb moisture through capillary action and are generally less
resistant.
QUARRY RECOMMENDATIONS FOR BETTER QUALITY AGGREGATES
• Selectively quarry the rocks and place in numerous stockpiles for variations in the quality
of the materials.
• Utilize water to wash aggregate using a log washer or barrel washer to remove clays and
other deleterious materials.
• Have Micro-Deval testing equipment at quarries with inconsistent aggregate quality.
• Use density separation to remove light, porous aggregates from more dense, better quality
aggregates.
MISCELLANEOUS
• Design the mix based on the gradation of the mix as it is placed. For example, there is
always material loss/generation of fines as an aggregate is crushed, stockpiled, moved to
the hotmix plant, mixed with the asphalt, and placed on the roadway. Aggregates from
different sources lose different amounts of fines, so one needs to determine what the final
gradation will be based upon handling and design the mix based on what the final
gradation will be.
• To get more quantitative numbers on aggregate quality, try the new aggregate imaging
device made by the French (mlpc VDG 40). It can be attached to a conveyor belt and
measures aggregate shape as the aggregate travels over the end of the conveyor belt.
37 37
CHAPTER 2
BINDER EVALUATION FOR FIELD CORES FROM ABILENE
AND LUBBOCK DISTRICTS
INTRODUCTION
Pavement cracking is a major problem of many asphalt concrete pavements later in their
service lives. Such cracking is frequently termed fatigue cracking, implying physical damage to
the binder. However, oxidative stiffening of the binder, the result of chemical changes to the
binder due to oxidation during the hot summer months, certainly is a significant contributor as
well. Other mechanisms of binder stiffening may be possible and prompted this study of binders
in pavement cores.
The asphalt concrete in US-84 was in service for approximately 5 years when significant
cracking problems were observed. As this is a very short time for age-related cracking failure,
further investigation of the binder was conducted to determine the root cause of this cracking.
Several cores were obtained from two sections of US-84. One section was from Scurry
County, northwest of Abilene, and the other from Taylor County, the Abilene home county. The
Scurry County cores were designated series 84-Sx, while those from Taylor County were labeled
series 84-x, where “x” is a number that denotes replicates for each group of cores. From a
mixture design perspective, the US-84-Sx cores were 6.1 percent by weight of a Fina PG 70-22
binder, whereas the US-84-x cores were 5.2 percent of a Fina PG 64-22 binder.
From physical observations of the pavement cross-sections, visible in the recovered
cores, it was clear that asphalt binder had penetrated past the surface of the aggregate. The
researchers suspected that such penetration may have resulted in fractionation of the binder, if,
for example, the lighter, more mobile binder components were absorbed preferentially, leaving
behind the less mobile and stiffer binder components. It was hypothesized that such
fractionation could create a binder that was more susceptible to cracking than was the original
design material. This hypothesized, residual binder, we term the “inter-binder.”

38 38
Objectives
The objectives of this work were threefold:
1. to recover inter-binder and penetrated binder materials and compare their properties,
2. to assess the possibility of binder penetration from the results obtained from objective
1, and
3. to analyze the likelihood of pavement cracking being caused by binder penetration
into the aggregate.
EXPERIMENTAL METHODOLOGY
Binder Extraction and Recovery
Extraction
Two methods of binder extraction were used in this study. In each method, a solution of
15 percent by volume of ethanol (ETOH) in toluene was used to extract the asphalt binder from
each core. Before extraction, each core was broken into small pieces to increase contact surface
with the solvent. After the crushed core was washed with the solvent mixture for 20 minutes, the
asphalt solution was separated from aggregate using filtration and centrifugation. This step was
repeated until there was practically no asphalt remaining in the aggregate.
For method 1, the asphalt solutions from each wash were combined into one solution, and
then passed to recovery process. This method produced a single recovered binder product. This
method is called the 1st Method.
For comparison purposes, another extraction method, the 2nd Method, was identical to the
1st Method except that the individual wash solutions were recovered separately to give three
recovered binder products.
Normally, three washes were required to remove asphalt binder from the aggregate, so
the 1st Method required one recovery step whereas the 2nd Method required three separate
recoveries.
Recovery
In the recovery process, a Brinkman rotovap apparatus was used to evaporate all solvent
from the asphalt. Asphalt solution was evaporated for about 80 minutes under vacuum and with

39 39
a nitrogen purge to assist solvent removal. The recovered asphalt binder was then subjected to
further chemical and physical analyses.
Extraction/Recovery flow diagrams for both the 1st Method and the 2nd Method are
shown in Figure 14.
Size-Exclusion Chromatography
After each recovery process, it is essential to confirm the removal of all solvent from the
asphalt binder. Solvent in recovered binder can dramatically distort the rheological properties of
1-1CrushedCore1st Wash
CrushedCore1st Wash
1-2
1-3
Toluene/EtOH
Toluene/EtOH
Toluene/EtOH
Waste
LeftOver
2nd Wash LeftOver
2nd Wash
LeftOver3rd Wash LeftOver3rd Wash
1st Method
2-1CrushedCore1st Wash
2-2
2-3
Toluene/ EtOH
Toluene/ EtOH
Toluene/ EtOH
Extraction RecoveryWaste
LeftOver2nd Wash
LeftOver
3rd Wash
2nd Method, 1 st Wash
2-4Toluene/ EtOHLeft
Over
2nd Method, 2 nd Wash
2nd Method, 3 rd Wash
a)
b)
Figure 14. Extraction/Recovery Flow Diagram of (a) 1st Method and (b) 2nd Method.

40 40
the asphalt, making it appear to be much softer than it is, in fact. Using tetrahydrofuran (THF) as
a carrier fluid in gel permeation chromatography (GPC), also known as size exclusion
chromatography (SEC), a toluene-based solvent can be detected. Also, any other unexpected
components in the recovered binder may be observed. SEC conveniently gives a broad
perspective of a binder’s composition. Components that can be detected and identified from
SEC, for example, are the asphaltene-rich fraction of a binder, the maltene-rich fraction, toluene,
polymers, and water. Once recovered and binders are found to be free from the extracting
solvent, properties of the binder can be confidently measured. The shape and relative size of the
asphaltene and maltene peaks can also be used as “fingerprinting,” along with other methods, to
establish that different binders have been used in different pavement sections or to establish that
two binders are likely the same.
Dynamic Shear Rheometer
Two types of rheological property data were obtained from dynamic shear rheometry
(DSR) measurements: the viscosity master curve at 60 oC and an estimated ductility of the
asphalt binder. A 2.5 cm diameter parallel-plate geometry with a 500 µm gap was used for the
measurements. To acquire the viscosity master curve at 60 oC reference temperature, complex
viscosity measurements were obtained in a controlled-stress mode by performing two frequency
sweeps at 60 oC and 90 oC over a frequency range of 100 to 0.1 rad/s. Then, a shift factor was
used to adjust frequency range, moduli, and viscosities at 90 oC to match with the 60 oC
reference data. As a result, a single master curve with a wider range of frequency at 60 oC can be
constructed. After this procedure, also called a time-temperature superposition, a viscosity
master curve at 60 oC should have a frequency range of 100 to 0.001 rad/s. At the lower end of
the frequency range, the viscosity approaches a low shear rate limiting viscosity (also termed the
“zero-shear” viscosity), a useful characteristic of the binder. An estimate of the binder’s
ductility at 15 oC and 1 cm/min extension rate can be calculated from DSR G' and G" at 44.7 oC
and 10 rad/s (Ruan et al., 2003). The DSR function relationship is shown below:
δω
η tan*'
''
' G
G
GFunctionDSR =
=
41 41
)()/(
tan'""'
degreeAnglePhasesradFrequencyAngular
GGandGwhere
==
==
δω
δω
η
Then, G' vs. (η'/G') can be plotted on the map with a constant ductility curve to identify
calculated ductility of each asphalt binder.
Fourier Transform-Infrared Spectrometer
The Fourier Transform Infrared (FT-IR) spectrometer used in this study is a Mattson
5020 Galaxy spectrometer. The infrared spectrum of asphalt binder coated on a zinc selenide
prism was collected and analyzed over wavenumbers of 1800 to 700 cm-1. From the data, we
define the band from 1820 to 1650 cm-1 as the carbonyl area of asphalt binder, which is used to
indicate the level of oxidation that a binder has reached. Differences between inter-binder and
penetrated binder oxidation were evaluated using this method.
Hardening Susceptibility
Each asphalt has a unique linear relationship between logarithm of viscosity (low-shear
rate viscosity at 60 oC), ln(�), and carbonyl area. The slope of such a relationship is defined as
the hardening susceptibility, and it has been found to be independent of oxidation temperature
but is a function of oxidation pressure. This parameter was used to assess whether binders from
each wash were likely of different composition on the basis that if different they would yield
different values of the hardening susceptibility.
Results and Discussion
In this study, four cores of asphalt mixture were analyzed which included specimens 84-
S9, 84-S2, 84-6, and 84-S6. Each core was extracted/recovered and then the measurement
methods, as described above, were performed. The material from 1st Method represents the
weighted average of all three washes from the 2nd Method, which separates the different parts of
asphalt binder. Although every core was washed with solvent three times during the 2nd Method,
the 84-S9 core was washed only twice because of limited material. Hence, specimen 84-S9 has
only two washed data points.

42 42
From the 2nd Method, the 1st wash represents the majority of the inter-binder of the
asphalt pavement. The 2nd wash is a transition mixture between the inter-binder and penetrated
binder, and the 3rd wash is mostly remaining penetrated binder on the aggregate surface. From
this point, the 1stand 3rd washes will be referred to as inter-binder and penetrated binder,
respectively, for ease of understanding.
First, SEC was used to detect any solvent left behind in the asphalt binder from the
extraction/recovery process. Figure 15 shows that all asphalt binders were free from solvent. If
there was any solvent present in the binder, a solvent peak appeared at 38 minutes retention time.
With these results, accurate property measurements can be assured.
According to the DSR measurements each wash from each core has different zeroth
viscosities, as shown in Figure 16. However, every core from the 2nd Method illustrates the same
tendency of decreasing viscosity, from the 1st wash to the 3rd wash. This phenomenon indicates
-0.2
-0.1
0
0.1
0.2
0.3
0.4
0.5
0.6
15 20 25 30 35 40 45
84-S91st Method2nd Method, 1st Wash2nd Method, 2nd Wash
Time (min)
RI R
espo
nse
(mV)
-0.2
-0.1
0
0.1
0.2
0.3
0.4
0.5
0.6
15 20 25 30 35 40 45
84-S21st Method2nd Method, 1st Wash2nd Method, 2nd Wash2nd Method, 3rd Wash
Time (min)
RI R
espo
nse
(mV)
-0.2
-0.1
0
0.1
0.2
0.3
0.4
0.5
0.6
15 20 25 30 35 40 45
84-61st Method2nd Method, 1st Wash2nd Method, 2nd Wash2nd Method, 3rd Wash
Time (min)
RI R
espo
nse
(mV)
Figure 15. Refractive Index (RI) Response from Size Exclusion Chromatography of (a) 84-S9 (b) 84-S2 (c) 84-6.
a) b)
c)
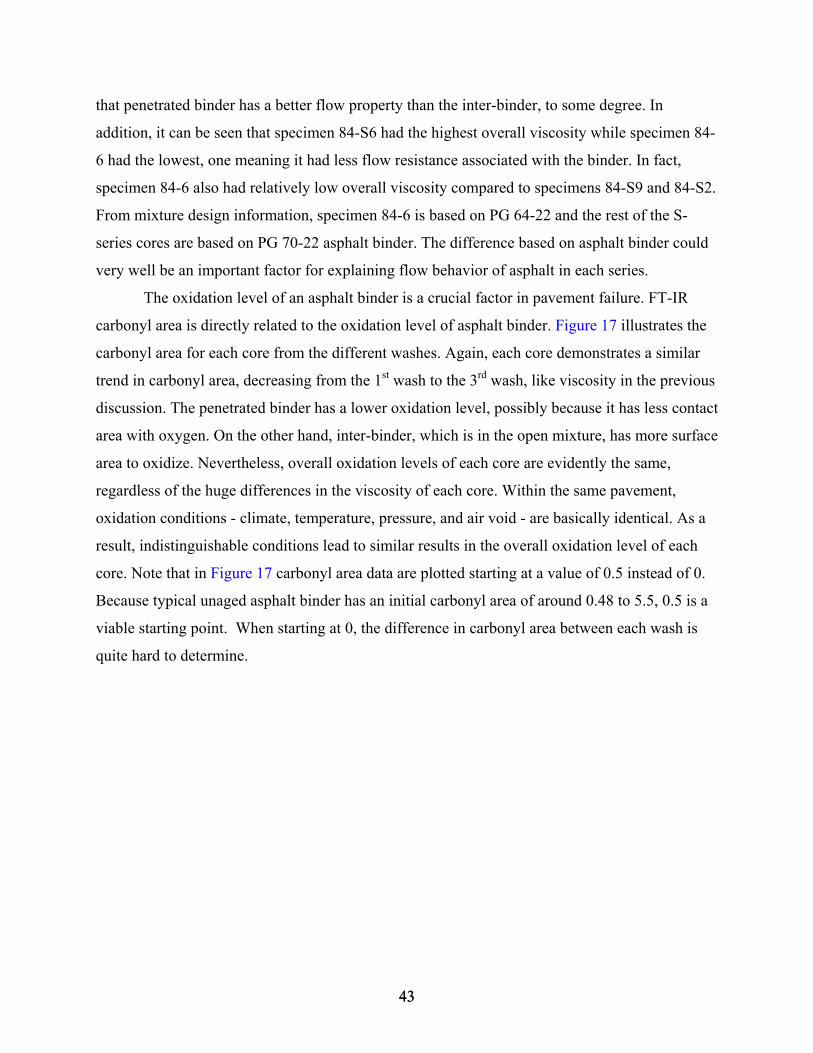
43 43
that penetrated binder has a better flow property than the inter-binder, to some degree. In
addition, it can be seen that specimen 84-S6 had the highest overall viscosity while specimen 84-
6 had the lowest, one meaning it had less flow resistance associated with the binder. In fact,
specimen 84-6 also had relatively low overall viscosity compared to specimens 84-S9 and 84-S2.
From mixture design information, specimen 84-6 is based on PG 64-22 and the rest of the S-
series cores are based on PG 70-22 asphalt binder. The difference based on asphalt binder could
very well be an important factor for explaining flow behavior of asphalt in each series.
The oxidation level of an asphalt binder is a crucial factor in pavement failure. FT-IR
carbonyl area is directly related to the oxidation level of asphalt binder. Figure 17 illustrates the
carbonyl area for each core from the different washes. Again, each core demonstrates a similar
trend in carbonyl area, decreasing from the 1st wash to the 3rd wash, like viscosity in the previous
discussion. The penetrated binder has a lower oxidation level, possibly because it has less contact
area with oxygen. On the other hand, inter-binder, which is in the open mixture, has more surface
area to oxidize. Nevertheless, overall oxidation levels of each core are evidently the same,
regardless of the huge differences in the viscosity of each core. Within the same pavement,
oxidation conditions - climate, temperature, pressure, and air void - are basically identical. As a
result, indistinguishable conditions lead to similar results in the overall oxidation level of each
core. Note that in Figure 17 carbonyl area data are plotted starting at a value of 0.5 instead of 0.
Because typical unaged asphalt binder has an initial carbonyl area of around 0.48 to 5.5, 0.5 is a
viable starting point. When starting at 0, the difference in carbonyl area between each wash is
quite hard to determine.
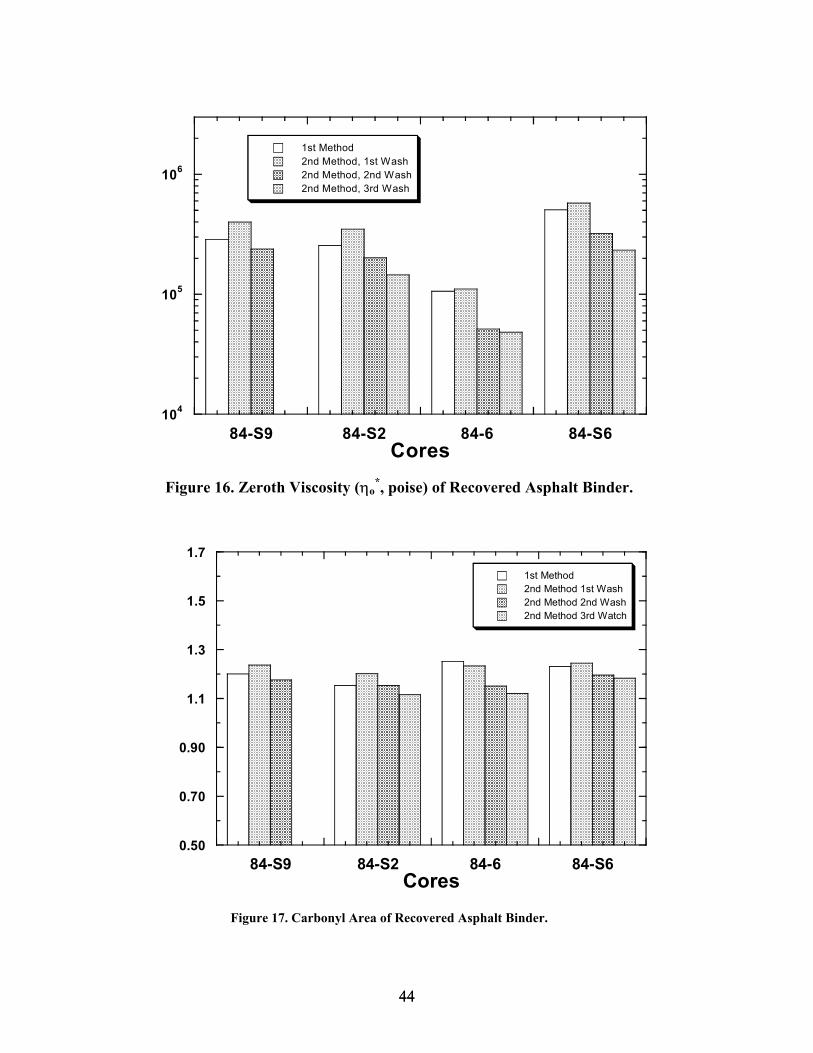
44 44
Figure 17. Carbonyl Area of Recovered Asphalt Binder.
0.50
0.70
0.90
1.1
1.3
1.5
1.7
84-S9 84-S2 84-6 84-S6
1st Method2nd Method 1st Wash2nd Method 2nd Wash2nd Method 3rd Watch
Cores
Figure 16. Zeroth Viscosity (ηo*, poise) of Recovered Asphalt Binder.
104
105
106
84-S9 84-S2 84-6 84-S6
1st Method2nd Method, 1st Wash2nd Method, 2nd Wash2nd Method, 3rd Wash
Cores
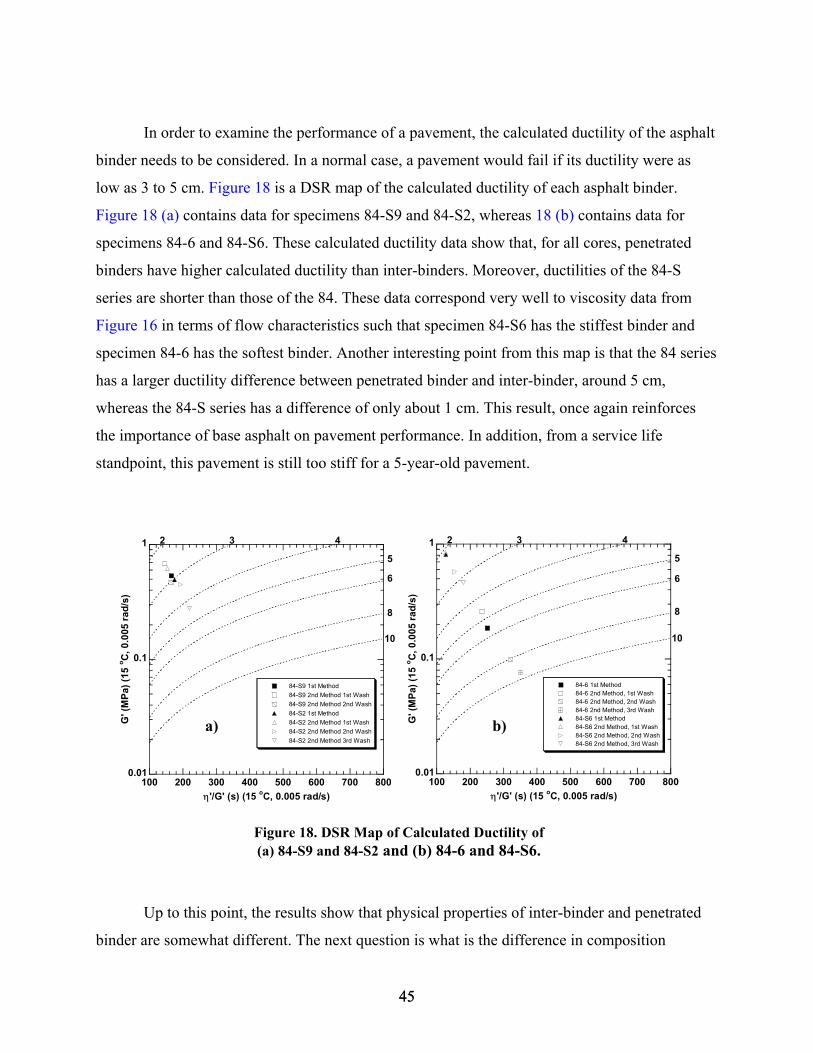
45 45
In order to examine the performance of a pavement, the calculated ductility of the asphalt
binder needs to be considered. In a normal case, a pavement would fail if its ductility were as
low as 3 to 5 cm. Figure 18 is a DSR map of the calculated ductility of each asphalt binder.
Figure 18 (a) contains data for specimens 84-S9 and 84-S2, whereas 18 (b) contains data for
specimens 84-6 and 84-S6. These calculated ductility data show that, for all cores, penetrated
binders have higher calculated ductility than inter-binders. Moreover, ductilities of the 84-S
series are shorter than those of the 84. These data correspond very well to viscosity data from
Figure 16 in terms of flow characteristics such that specimen 84-S6 has the stiffest binder and
specimen 84-6 has the softest binder. Another interesting point from this map is that the 84 series
has a larger ductility difference between penetrated binder and inter-binder, around 5 cm,
whereas the 84-S series has a difference of only about 1 cm. This result, once again reinforces
the importance of base asphalt on pavement performance. In addition, from a service life
standpoint, this pavement is still too stiff for a 5-year-old pavement.
Up to this point, the results show that physical properties of inter-binder and penetrated
binder are somewhat different. The next question is what is the difference in composition
0.01
0.1
1
100 200 300 400 500 600 700 800
84-S9 1st Method84-S9 2nd Method 1st Wash84-S9 2nd Method 2nd Wash84-S2 1st Method84-S2 2nd Method 1st Wash84-S2 2nd Method 2nd Wash84-S2 2nd Method 3rd Wash
G' (
MPa
) (15
o C, 0
.005
rad/
s)
η'/G' (s) (15 oC, 0.005 rad/s)
2 3 4
5
6
8
10
0.01
0.1
1
100 200 300 400 500 600 700 800
84-6 1st Method84-6 2nd Method, 1st Wash84-6 2nd Method, 2nd Wash84-6 2nd Method, 3rd Wash84-S6 1st Method84-S6 2nd Method, 1st Wash84-S6 2nd Method, 2nd Wash84-S6 2nd Method, 3rd Wash
G' (
MPa
) (15
o C, 0
.005
rad/
s)
η'/G' (s) (15 oC, 0.005 rad/s)
2 3 4
5
6
8
10
Figure 18. DSR Map of Calculated Ductility of(a) 84-S9 and 84-S2 and (b) 84-6 and 84-S6.
a) b)

46 46
between those two binders. To answer this question, the concept of hardening susceptibility was
used to verify differences in composition of each binder. Since each binder has a unique linear
relationship between logarithm of viscosity (ln η) and carbonyl area, a plot of carbonyl area
versus ln η should highlight inconsistencies, if any, between the asphalt binders. Figure 19 was
constructed to ascertain whether there is a linear relationship for asphalt binders from each core.
From the hardening susceptibility perspective, no matter at what temperature and how long
asphalt binder is aged, a linear relationship should still hold. As can be seen from Figure 19, data
from each core form an acceptable linear relationship, as indicated by R-value. With this
information, the overall composition of penetrated binder and inter-binder are not significantly
different from each other.
Other evidence that can confirm composition differences between inter-binder and
penetrated binder is refractive index response from SEC. Figure 14, shows the refractive index
response of each wash for the same core is consistent in terms of curve shape. Any inconsistency
would cause the curve to be different in shape, as illustrated in Figure 20. Because the 84-S
series and the 84 series were designed based on different asphalt binders, refractive index
responses for these two series are quite distinguishable. The refractive index response of the 84
series is shifted slightly to the left of that of the 84-S
104
105
106
1.1 1.12 1.14 1.16 1.18 1.2 1.22 1.24 1.26
84-S984-S284-684-S6
y = 9.1429 * e^(8.6329x) R= 0.99946
y = 1.9814 * e^(10.068x) R= 0.96278
y = 20.783 * e^(6.8693x) R= 0.96689
y = 0.012936 * e^(14.17x) R= 0.99236
η∗
(poi
se) @
60o C
, 0.0
01 ra
d/s
Carbonyl Area
84-S6
84-S2
84-6
84-S9
Figure 19. Hardening Susceptibility of US-84 Cores.
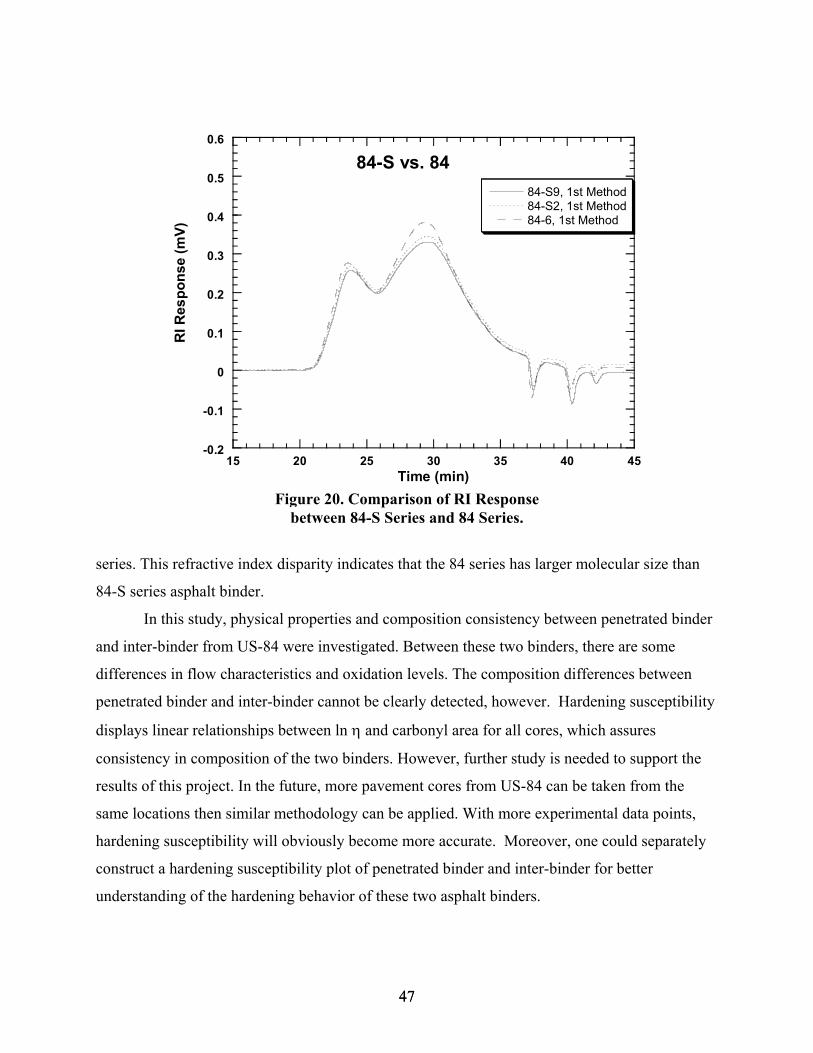
47 47
series. This refractive index disparity indicates that the 84 series has larger molecular size than
84-S series asphalt binder.
In this study, physical properties and composition consistency between penetrated binder
and inter-binder from US-84 were investigated. Between these two binders, there are some
differences in flow characteristics and oxidation levels. The composition differences between
penetrated binder and inter-binder cannot be clearly detected, however. Hardening susceptibility
displays linear relationships between ln η and carbonyl area for all cores, which assures
consistency in composition of the two binders. However, further study is needed to support the
results of this project. In the future, more pavement cores from US-84 can be taken from the
same locations then similar methodology can be applied. With more experimental data points,
hardening susceptibility will obviously become more accurate. Moreover, one could separately
construct a hardening susceptibility plot of penetrated binder and inter-binder for better
understanding of the hardening behavior of these two asphalt binders.
-0.2
-0.1
0
0.1
0.2
0.3
0.4
0.5
0.6
15 20 25 30 35 40 45
84-S vs. 8484-S9, 1st Method84-S2, 1st Method84-6, 1st Method
Time (min)
RI R
espo
nse
(mV)
Figure 20. Comparison of RI Response between 84-S Series and 84 Series.
49 49
REFERENCES
Amirkhanian, S. N., Kaczmarek, D., and Burati, J. L. (1991). Effects of Los Angeles
Abrasion Test Values on Strengths of Laboratory-Prepared Marshall Specimens. In
Transportation Research Record 1301, Transportation Research Board, National
Research Council, Washington, D.C. pp. 77-86.
Barksdale, R. D. (2001). The Aggregate Handbook. National Stone, Sand, and Gravel
Association, Arlington, Virginia, pp. 3-74.
Chowdhury, A., and Button, J. W. (2002). Evaluation of Superpave Shear Test Protocol.
Research Report No. FHWA/TX-02/1819-1. Texas Transportation Institute, Texas A&M
University, College Station, Texas.
Chowdhury, A., Grau, J. D. C., Button, J. W., and Little, D. N. (2000). Effect of
Superpave Restricted Zone on Permanent Deformation. 8th Annual Symposium
Proceedings, International Center for Aggregates Research, Denver, Colorado April
2000.
Clowers, K. A. (1999). Seventy-Five Years of Aggregate Research in Kansas. Kansas FHWA-
KS-99/1. Department of Transportation, Materials and Research Center, Topeka,
Kansas.
Day, H. L. (1962). A Progress Report on Studies of Degrading Basalt Aggregate Bases. In
Highway Research Board Bulletin 344, Washington D.C., pp. 8-16.
Fookes, P. G., Gourley, C. S., and Ohikere, C. (1988). Rock Weathering in Engineering
Time. In Quarterly Journal of Engineering Geology, vol. 21, pp. 33-57.
Forster, S. W. (1994). Soundness, Deleterious Substances, and Coatings. In Significance
of Tests and Properties of Concrete and Concrete-Making Materials. Klieger, P., and
Lamond, J.F. (eds.) ASTM STP 169C, 411-420.
Germann, F. P., and Lytton, R. L. (1979) Methodology for Predicting the Reflection
Cracking Life of Asphalt Concrete Overlays. Research Report FHWA/TX-79/09+207-5.
Texas Transportation Institute, Texas A&M University, College Station, Texas.
Jessberger, B. (2002). Specification Update: Ohio Department of Transportation
http://www.dot.state.oh.us/construction/oca/specs. Accessed
September 11, 2003.

50 50
Jungries, E. (1985). Spot Test Analysis, Clinical, Environmental, Forensic, and
Geochemical Applications. In Chemical Analysis, Vol. 75, John Wiley & Sons, New
York, 315 p.
Kandhal, P. S., and Parker, Jr., F. (1998). Aggregate Tests Related to Asphalt Concrete
Performance in Pavements. NCHRP Report 405. National Center for Asphalt
Technology, Auburn University, Auburn Alabama.
Kandhal, P. S., Cross, S. A., and Brown, E. R. (1990). Evaluation of Bituminous pavement
for High Pressure Truck Tires. Report No. FHWA-PA-90-008-87-01. Federal Highway
Administration, Washington D.C.
Kandhal, P. S., and Koehler, W. C. (1985). Marshall Mix Design Methods: Current
Practices. In Journal of the Association of Asphalt Paving Technologists, Vol. 54, pp.
284-303.
Katz, O., Reches, Z., and Roegiers, J. C. (2000). Evaluation of Mechanical Rock
Properties Using a Schmidt Hammer. In International Journal of Rock Mechanics and
Mining Science, Vol. 37, pp. 723-728.
Landgren, R. (1994). Unit Weight, Specific Gravity, Absorption, and Surface Moisture.
In Significance of Tests and Properties of Concrete and Concrete-Making Materials.
Klieger, P., and Lamond, J.F. (eds.) ASTM STP 169C, 421-428.
Little, D., Button, J., Jayawickrama, P.W., Solaimanian, M., and Hudson, B. (2001)
Development of Statistical Wet Weather Model to Evaluate Frictional Properties at the
Pavement-Tire Interface on Hot-Mix Asphalt Concrete. Research Report 1707-3. Texas
Transportation Institute, Texas A&M University, College Station, Texas.
Loughlin, G. F. (1928). Usefulness of Petrology in the Selection of Limestone. In Rock
Products, vol. 31, p. 50.
Mielenz, R. C. (1994). Petrographic Evaluation of Concrete Aggregates. In Significance
of Tests and Properties of Concrete and Concrete-Making Materials. Klieger, P., and
Lamond, J.F. (eds.) ASTM STP 169C, 341-364.
Phillips, F., Jayawickrama, P. W., Hossain, M. S., and Lehman, T. M. (2000). Comparative
Analysis of the Micro-Deval and Magnesium Sulfate Soundness Tests. Research Report 0-
1771. Center for Multidisciplinary Research in Transportation, Texas Tech University,
Lubbock, Texas.
51 51
Roberts, F. L., Kandhal, P. S., Brown, E. R., Lee, D. -Y., and Kennedy, T. W. (1996). Hot
Mix Asphalt Materials, Mixture Design, and Construction. (second ed.), NAPA Research
and Education Foundation, Lanham, Maryland, 585 p.
Siegel, T. C. (1992). Correlation of Mix Characteristics with Rutting in Bituminous
Mixes, M. S. Thesis, School of Civil Engineering, Georgia Institute of Technology,
Atlanta, Georgia.
Shergold, F. A. (1963). A Study of the Variability of Roadstones in Relation to Sampling
Procedures. In Quarry Managers Journal, Vol. 47, pp. 3-8.
Verhoef, P. N. W., and van de Wall, A. R. G. (1998). Application of Petrography in
Durability Assessment of Rock Construction Materials. In Aggregate Resources: A
Global Perspective. Bobrowsky, P.T. (ed.) A.A. Balkema, Rotterdam, The Netherlands,
pp. 307-330.
Zhou, F., and Scullion, T. (2003). Upgraded Overlay Tester and Its Application to Characterize
Reflection Cracking Resistance of Asphalt Mixtures. Research Report No FHWA/TX-
04/4467-1. Texas Transportation Institute, Texas A&M University, College Station,
Texas.
Related Documents