Technical Report: Electrical Engineering Student Information Full Initials & Surname: R. Bester Student Number: 206015259 Mailing Address for Reports: Cape Town Campus Mr. L Khetla Department of Co-operative Education CPUT – Cape Town Campus P O Box 652 Cape Town 8000 Project Information: Report No: P1 Ti tl e of Proje ct: Th e Assembl y and Te st ing of a 3kW Ax ia l Fl ux Ai r-co re Wind Generator Fi el d o f Wor k: De si gn, Man uf ac turi ng , Assembl y, El ectr ical Te st in g a nd Fa ul t Finding Company Information Company Name: Electrical Machines Laboratory Department of Electrical Engineering Stellenbosch University Postal Address: University of Stellenbosch Private Bag X1 Matieland 7602 Street Address: Room E166 Electrical Machines Research Dept of Electrical Engineering Engineering Building Complex University of Stellenbosch Banghoek Road Stellenbosch 7600 Telephone No: 021 808 3890 Fax No: 021 808 3951 Email Address: [email protected] Name of Mentor: Pr of M.J. Kamper (M. Ing S tel l PhD(In g) St el l SMIEEE MSAIEE Pr Eng Tel No of Mentor: 021 808 4323 1

Welcome message from author
This document is posted to help you gain knowledge. Please leave a comment to let me know what you think about it! Share it to your friends and learn new things together.
Transcript

8/6/2019 Technical Repor1 3kw Wind Generator 2003
http://slidepdf.com/reader/full/technical-repor1-3kw-wind-generator-2003 1/22
Technical Report: Electrical Engineering
Student Information
Full Initials & Surname: R. Bester
Student Number: 206015259
Mailing Address for Reports: Cape Town Campus
Mr. L Khetla
Department of Co-operative Education
CPUT – Cape Town Campus
P O Box 652
Cape Town
8000
Project Information:
Report No: P1
Title of Project: The Assembly and Testing of a 3kW Axial Flux Air-core Wind
Generator
Field of Work: Design, Manufacturing, Assembly, Electrical Testing and Fault
Finding
Company Information
Company Name: Electrical Machines Laboratory
Department of Electrical Engineering
Stellenbosch University
Postal Address: University of Stellenbosch
Private Bag X1
Matieland
7602
Street Address: Room E166
Electrical Machines Research Dept of Electrical Engineering
Engineering Building Complex
University of StellenboschBanghoek Road
Stellenbosch
7600
Telephone No: 021 808 3890
Fax No: 021 808 3951
Email Address: [email protected]
Name of Mentor: Prof M.J. Kamper (M.Ing Stell PhD(Ing) Stell SMIEEE
MSAIEE Pr Eng
Tel No of Mentor: 021 808 4323
1

8/6/2019 Technical Repor1 3kw Wind Generator 2003
http://slidepdf.com/reader/full/technical-repor1-3kw-wind-generator-2003 2/22
Table of Contents
Table of Contents ........................................................................................................... 2
Introduction .................................................................................................................... 3
Theoretical investigation ................................................................................................ 3
Practical Considerations .................................................................................................5
Manufacturing of the generator ................................................................................. 5
Testing ........................................................................................................................ 6
Control Circuit ............................................................................................................6
Erecting the generator onto the tower ........................................................................ 7
Fault finding ............................................................................................................... 7
Conclusions .................................................................................................................... 8
References ...................................................................................................................... 8
Tables ............................................................................................................................. 9
Figures ..........................................................................................................................10
......................................................................................................................................11
......................................................................................................................................18
2

8/6/2019 Technical Repor1 3kw Wind Generator 2003
http://slidepdf.com/reader/full/technical-repor1-3kw-wind-generator-2003 3/22
Introduction
I am an Electrical Engineering student from CPUT Cape Town doing my in-service
experimental training at the Electrical Machines Research Laboratory in the Electrical
Engineering Department at Stellenbosch University as a technical assistant.
This is my first Projects report.
I work in a post graduate research laboratory with post graduate students doing
research for their post graduate education. The students I am working with are
students busy with their MsC Eng degree or PHD Eng degree.
One of our main focuses is renewable energy in the form of environmentally friendly
electrical generation and we also spend a great amount of time in research and the
construction of electrical vehicles.
This project report is going to focus the assembly, erecting and testing a 3kW Axial
Flux Air Core Wind generator which powers a motor which drives a centrifugal
pump. This pump is going to pump water from a lower tank to an upper tank which is
situated in the lab and the amount of water pumped is going to be compared to the
wind speed at that specific time and the efficiency of the system is going to be
determined with this data.
In this report I am going to focus on the Wind generator driven pump system and
what my contribution to the project was and all of the areas that I was personally
involved in.
The system was designed by Edward Lenner who finished with his Msc Eng degree in
Electrical Engineering in 2008. Edward and I work under our mentor Prof. M.J.
Kamper.
Edward is currently employed at a mine in Gauteng and I was put in charge to
complete his pump system and retrieve valuable data from the various sensors for
research purposes.We communicate via email en telephone.
Theoretical investigation
The whole project is based on the simple fact that the standard 50Hz 3 phase
induction motors which is commonly used today can operate at variable speeds by
varying the supply voltage and frequency as long as a constant Voltage to Hertz ratiois used.
3

8/6/2019 Technical Repor1 3kw Wind Generator 2003
http://slidepdf.com/reader/full/technical-repor1-3kw-wind-generator-2003 4/22
This system is intended to replace the traditional wind pump system commonly found
in the agricultural sector. This system consists of a mechanical piston type of pump
driven with galvanized steel blades. This system is highly inefficient because of its
rugged construction.
This project replaces that system and consists of a turbine generator which generates a
varying voltage and frequency supply at variable wind speeds, induction motor which
drives the pump and a pump which pump the water.
Before designing the generator for the system we need to look at the behavior of the
other components or parts of the system as well. At first we look at the specific pump
performance curves (see fig. 1) to see where the working points for this specific pump
is. The working points on the graph are where the system curve intercepts the various
pump performance curves at certain speeds. The system curve is the total pressure
losses made up of the distance the fluid must travel which include friction and fittings
used in the pipeline. Now that we have the working points we can calculate themechanical- and input power of the pump by using the following formulas:
Mechanical power:
Ph = ρgQH
Where ρ = density of fluid
g = gravitational constant
Q = low capacity
H = head.
Input power:
Pin = Ph/л
Where л = efficiency.
The pump power must be matched to points where the turbine delivers optimum
power.
Fig. 2 is a graph that shows the characteristics of a 3kW, 3-blade turbine at certain
wind speeds. Optimum power points are indicated on the graph where the turbine is
most efficient. The input power of the pump is plotted on the graph and is known asthe load line. We want our system to operate as close to the optimum points as
possible at certain wind speeds. In other words we are trying to get the load line as
close as possible to the optimum points. The load line is shifted by playing with the
ratio of the poles between the motor and generator. The system will never operate at
the optimum power points because of the power losses in the motor and generator.
After calculating the input power of the pump the generator and induction motor can
be analyzed which deliver the mechanical power of the wind turbine shaft to the shaft
of the pump. The generator and motor must be sized according to the maximum
operating conditions of the turbine. The maximum wind speed on the graph in fig. 2 is11m/s. The maximum wind speed we are designing for is 10m/s which equals to a
4

8/6/2019 Technical Repor1 3kw Wind Generator 2003
http://slidepdf.com/reader/full/technical-repor1-3kw-wind-generator-2003 5/22
generator speed of 250 r.p.m therefore the generators power rating is going to be
2,2kW according to the graph because that is the maximum power the turbine can
deliver at 10m/s.
The motor used for the system is a 2,2kW induction motor with 2-poles because it
operates at lower frequencies. High frequencies cause unnecessary iron losses.
The power losses in the generator and motor must be known because the total input
power must be equal to the power required by the pump and the losses in the
generator and motor. This will help to choose the pole ratio between the motor and
generator.
The losses are calculated as follow:
R fe = 3E p² / Pfe
Where E p = volt drop over stator iron lossesPfe = Stator iron power loss.
After the calculations we find that 1:10 ratio causes the pump to operate closest to the
optimum operation points. This translates that the generator must have 20-poles. The
induced emf per phase of the generator follows a constant V/Hz ratio and is given by
the following equation:
Eƒ = 4.44NK wΦƒ
Where N = amount of turns
K w = winding factor
Φ = magnetic flux per pole and ƒ = operating frequency.
The maximum open circuit induced emf is calculated to be 400VL-L. That is for a
maximum speed of 250 r.p.m.
The system as whole is laid out in fig 3
Practical Considerations
Manufacturing of the generator
The coil width, coil height and the amount of turns of each coil were specifically
designed for this machine. All of these parameters influence the output voltage of the
generator.
The first step was to turn the windings on the winder using a Tufnell former on which
the copper enameled wires was turned on. This is shown in fig 4 and 5The specifications for the coils is as follows
5

8/6/2019 Technical Repor1 3kw Wind Generator 2003
http://slidepdf.com/reader/full/technical-repor1-3kw-wind-generator-2003 6/22
18 coils needed
200 turns per coil
0.8 mm diameter copper enameled grade 1 wire is used
After all 18 coils were wound; they were packed into a previously used mould in a
circle. 6 Coils was connected in series to with Farrell’s to form a phase. The 3 phaseswas then connected in a star configuration. This connection diagram is shown in fig 6
The next step was to reinforce the epoxy with weaving fiber-glass cloth. The mould
was closed up. The epoxy was mixed according to specific specifications and was
poured into the mould. After 24 hours the mould is set and is ready to be baked in a
oven. The dried stator is baked still in the mould at 100 degrees Celsius for 4 hours
and after that the heat is increased up to 110 degrees Celsius for 1 hour. The mould is
left to dry overnight. The next day the stator is taken out of the mould and inspected.
Part of the inspection process is to do a few measurements to check if everything is
correct. I used a multimeter and measured the resistance of each phase and I used a
LC meter to measure the inductance of each phase. Measurements were taken line toline and from line to neutral. The results are situated in table 1.
The phases are also connected to a megger to ensure that there are no short circuits or
leakage current between the phases. The completed stator is shown in fig 7
After the stator passed the inspection process, the generator assembly is started.
The permanent magnet rotor and is situated on both sides of the stator. A 1 mm air
gap is left between both sides of the stator and the rotor. The rotor and stator needs to
be lined up so that a 1mm air gap is present across both sides of the stator and is
uniform all around. This is done by inserting 1mm aluminum spacers between the
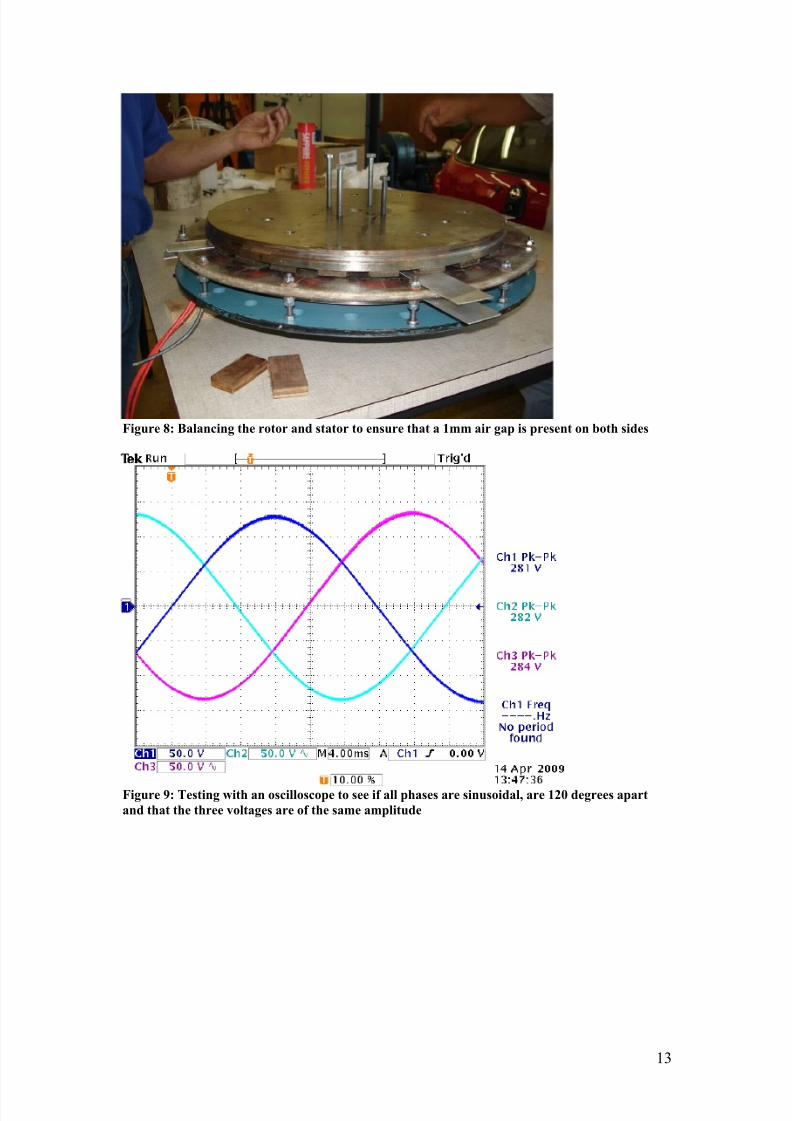
rotor and the stator and aligning them up. This part of the assembly is shown in fig 8.
Testing
After everything is aligned, the assembly is completed and more tests are done to
ensure that the generator gives out the correct voltage and that all 3 phases give a
sinusoidal wave which is 120 degrees apart from each other. This test is done by
connecting an oscilloscope to the phases and measuring the output voltage when the
generator is turned by hand. The results of the oscilloscope are shown in fig 9. After
the generator passed this test, I designed a control circuit which senses the output
voltage and frequency of the generator and uses these values along with contactor to
regulate the system and engage the load at the correct voltage range. If the voltageexceeds or drops below this voltage range, the load is disengaged. The system also
picks up the speed by sensing the frequency and breaks the system with resistive
braking if the generator were to spin out of control, bringing the speed down to the
regulated voltage.
Control Circuit
The load is engaged when the generator produces 170V.
The load is regulated between 140V and 280V. If the generator exceeds or falls below
this range, the load disengages. The frequency is monitored and kept between 20Hz
and 48Hz. If the frequency exceeds 51Hz or above, a contactor engages the resistive
braking which brings the overall speed down to a safe and manageable amount.
6

8/6/2019 Technical Repor1 3kw Wind Generator 2003
http://slidepdf.com/reader/full/technical-repor1-3kw-wind-generator-2003 7/22
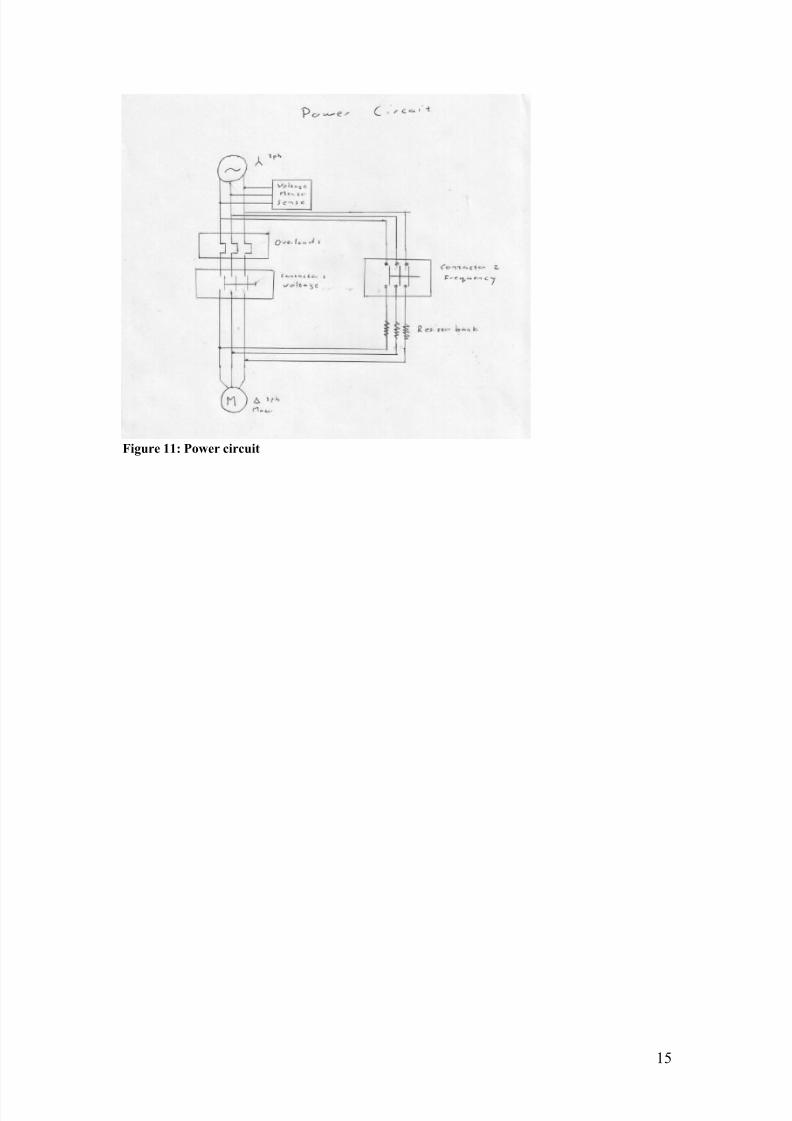
The control circuit and the power circuit are shown in fig 10 and fig 11.
I designed the cover using a program called Autodesk Inventor. The drawing was then
sent fabrinox in Paarl to be manufactured. This drawing is shown in fig 12 and 13.
Erecting the generator onto the tower
After the control circuit is in place, the generator ready to be put on its tower. The
tower consists of a head on which the generator is mounted, a tail which keeps the
generator pointing into the wind. Attached to the generator are 3 fiberglass 1.8m
blades. These blades weigh only 6 kg each and are light enough to pick up speed with
the smallest of breeze.
The tower is designed to fold in the middle so that the generator can be assembled on
the ground and pulled up using a winch and rope.
This is shown in fig 14, fig 15, fig 16, fig 17, fig 18 and fig 19.
After the assembly is completed, the generator is connected to the control circuit. The
2.2kw load (3ph induction motor) is also connected to the load. Test was done earlier
in order to test the performance of this system and is show in table 2.
This setup is shown in fig 20.
A weather station is also mounted on the pole which senses and records wind speed
every minute and saves the data. A flow sensor is attached to the system and will
show how much cubic meter of water is pumped up to date. These data is going to beused over the next 6 months and we are going to establish the efficiency of this
system by comparing the amount of water pumped at which wind speed and
conclusions will be made after that
Fault finding
After some testing we ran into problems when the wind generator stopped. I was sent
to investigate and to find the fault in the system. I used a DC constant current supply
and I connected it between two phases. With this I measured the voltage and I
measured the current. With these two values I determined the resistance of all three
coils with the formula R = V/I
I discovered that there was a short circuit in two of the phases and that is the reason
why the blades do not turn, because a short circuit brakes the system electrically.
The reason I used a Constant current DC supply is because if you use a multimeter or
a megger, the readings is unstable and difficult to read due to the fact that the
generator rotates slightly and generates a voltage. The DC supply brakes the generator
and makes it stable enough to make accurate measurements.
We took the generator down from the pole and tested the generator and found the
there are no faults on the generator. Then I measured the cable coming from the
generator head and found that there is a short circuit between the blue and yellow
conductor.
7

8/6/2019 Technical Repor1 3kw Wind Generator 2003
http://slidepdf.com/reader/full/technical-repor1-3kw-wind-generator-2003 8/22
When we inspected the wire inside of the pole, we discovered that the cable got
damaged and was squashed at the point where the pole hinges. It pressed so hard on
the cable that a short occurred through the insulation.
We fixed that with insulation tape and giving the cable more slack by loosening the
glands a bit. After we fixed the cable, we assembled the generator back on the pole.And everything worked as it was intended to do
Conclusions
The generator was assembled successfully in time. A common problem is that a short
circuit can occurred due to vibration. The vibration sends the pole into oscillation and
if it reaches resonant frequency, the vibrations will cause the rotor to make contact
with the stator and cause a flashover and creates a short circuit. These vibrations canalso lead to mechanical failure of the system.
There are still quite a bit of vibration on the pole, but we will see how this will affect
the generator. And this can only be tested if the system runs for some time. The only
way we will know if the project is successful, is to let the system run for a couple of
months and compare the amount of flow to the amount of wind speed.
If this project is successful, it will attract the general public, government and the
private sector to invest in these types of technologies and this will create more
opportunities for further studies into this field of education.
I learned with this experience that theoretical concepts are not always successful in
practice. It takes trial and error to perfect a product up the point where it is reliable
enough to use in industry. I gained a huge amount of experience in taking
measurements and using equipment to solve problems. Skills that I will definitely use
in the future
References
Kamper, P. M. (2009, March 20). Wind generator principles. (R. Bester, Interviewer)
Lenner, E. C. (2008). Wind-Electric Pump System Design. Stellenbosch: Electrical
Machines Research Laboratory, Electrical Engineering Department, Stellenbosch
University.
8

8/6/2019 Technical Repor1 3kw Wind Generator 2003
http://slidepdf.com/reader/full/technical-repor1-3kw-wind-generator-2003 9/22
Technical crew
Pietro Petzer
Technical Officer
Andre Swart
Technical Officer
Marius Jumat
Technical Assistant
Ruan Bester
Technical Assistant
Tables
Resistance Inductance
Red – Yellow Line-to-line 17Ω 30.74mH
Yellow - Blue Line-to-line 17 Ω 30.87mH
Blue - Red Line-to-line 17 Ω 30.73mH
Red - Neutral 8.6 Ω 14.45mH
Blue – Neutral 8.7 Ω 14.34mHYellow - Neural 8.6 Ω 14.45mHTable 1: Measurements of the generator
Generator
Speed
(r.p.m)
Generator V
(V)
Generator I
(A)
Torque
Generator
Input (N.m)
Torque
Motor
Output(N.m)
Motor r.p.m
100 135 1.5 24 0.9 1175
110 150 1.6 25 1.2 1290
120 160 1.7 30 1.5 1400
130 170 1.8 36 1.78 1500
140 180 1.9 40 2 1610
150 195 2 45 2.33 1720
160 200 2.2 50 2.65 1830
170 215 2.42 54 3 1930
180 225 2.65 60 3.35 2040
190 230 2.9 67 3.65 2140
200 240 3.1 73 4 2240
210 250 3.4 80 4.3 2335
220 260 3.8 89 4.75 2430
230 265 4.15 98 5.15 2520
240 272 4.5 108 5.5 2600250 280 5 117 6 2700
9

8/6/2019 Technical Repor1 3kw Wind Generator 2003
http://slidepdf.com/reader/full/technical-repor1-3kw-wind-generator-2003 10/22
Wind Turbine
Permanent MagnetGenerator
3-PhaseInduction Motor Centrifugal
Pump
Table 2: Performance measurements of the motor and generator
Figures
Figure 1: Pump performance curve
Figure 2: Power speed characteristics of a 3-blade, 3kW wind turbine
10
Figure 3: System layout

8/6/2019 Technical Repor1 3kw Wind Generator 2003
http://slidepdf.com/reader/full/technical-repor1-3kw-wind-generator-2003 11/22
Figure 4: Turning a winding onto a former with a machine called "the winder"
Figure 5: Finished winding
11

8/6/2019 Technical Repor1 3kw Wind Generator 2003
http://slidepdf.com/reader/full/technical-repor1-3kw-wind-generator-2003 12/22
Figure 6: Connection diagram of the windings
Figure 7: Completed Stator
12
8/6/2019 Technical Repor1 3kw Wind Generator 2003
http://slidepdf.com/reader/full/technical-repor1-3kw-wind-generator-2003 13/22
Figure 8: Balancing the rotor and stator to ensure that a 1mm air gap is present on both sides
Figure 9: Testing with an oscilloscope to see if all phases are sinusoidal, are 120 degrees apart
and that the three voltages are of the same amplitude
13

8/6/2019 Technical Repor1 3kw Wind Generator 2003
http://slidepdf.com/reader/full/technical-repor1-3kw-wind-generator-2003 14/22
Figure 10: Control circuit
14
8/6/2019 Technical Repor1 3kw Wind Generator 2003
http://slidepdf.com/reader/full/technical-repor1-3kw-wind-generator-2003 15/22
Figure 11: Power circuit
15

8/6/2019 Technical Repor1 3kw Wind Generator 2003
http://slidepdf.com/reader/full/technical-repor1-3kw-wind-generator-2003 16/22
Figure 12: Base of the box which houses the control circuit
16

8/6/2019 Technical Repor1 3kw Wind Generator 2003
http://slidepdf.com/reader/full/technical-repor1-3kw-wind-generator-2003 17/22
Figure 13: Cover of box which houses the control circuit
17

8/6/2019 Technical Repor1 3kw Wind Generator 2003
http://slidepdf.com/reader/full/technical-repor1-3kw-wind-generator-2003 18/22
Figure 14: Completed generator
Figure 15: After the three 1.8 meter blades are put on, it is all held together with 6 brackets and
bolts
18

8/6/2019 Technical Repor1 3kw Wind Generator 2003
http://slidepdf.com/reader/full/technical-repor1-3kw-wind-generator-2003 19/22
Figure 16: The protective cover protects the generator from rain and improves aerodynamics
Figure 17: The pole hinges in the middle and can be hoisted up with a winch and by manpower
19

8/6/2019 Technical Repor1 3kw Wind Generator 2003
http://slidepdf.com/reader/full/technical-repor1-3kw-wind-generator-2003 20/22
Figure 18: The generator is lifted up very slowly
20

8/6/2019 Technical Repor1 3kw Wind Generator 2003
http://slidepdf.com/reader/full/technical-repor1-3kw-wind-generator-2003 21/22
Figure 19: The wind generator is in its final position
21

8/6/2019 Technical Repor1 3kw Wind Generator 2003
http://slidepdf.com/reader/full/technical-repor1-3kw-wind-generator-2003 22/22
Figure 20: A 2.2 kW 3ph motor is connected to a centrifugal pump which pumps water from a
lower tank to an upper tank
Related Documents