Page 1 Technical Note: Road Condition and Maintenance data Contents 1. Introduction ............................................................................................................... 2 2. Reporting of road condition ....................................................................................... 4 3. Measuring surface condition using automated visual methods .................................. 6 4. Measuring surface condition using manual visual surveys ....................................... 22 5. Measuring skid resistance ....................................................................................... 29 6. Measuring road structural condition ......................................................................... 32 7. Glossary of technical terms ..................................................................................... 35 Published by: Network Condition & Geography Statistics Branch, Department for Transport Zone 3/28 Great Minister House 33 Horseferry Road London. SW1P 4DR Email: [email protected] Tel: 020 7944 3095 Website: https://www.gov.uk/government/organisations/department-for-transport/series/road- conditions-statistics Version: 1.4 Publish date: 31/01/2019

Welcome message from author
This document is posted to help you gain knowledge. Please leave a comment to let me know what you think about it! Share it to your friends and learn new things together.
Transcript

Page 1
Technical Note:
Road Condition and Maintenance data
Contents 1. Introduction ............................................................................................................... 2 2. Reporting of road condition ....................................................................................... 4 3. Measuring surface condition using automated visual methods .................................. 6 4. Measuring surface condition using manual visual surveys ....................................... 22 5. Measuring skid resistance ....................................................................................... 29 6. Measuring road structural condition ......................................................................... 32 7. Glossary of technical terms ..................................................................................... 35
Published by: Network Condition & Geography Statistics Branch, Department for Transport Zone 3/28 Great Minister House 33 Horseferry Road London. SW1P 4DR Email: [email protected] Tel: 020 7944 3095 Website: https://www.gov.uk/government/organisations/department-for-transport/series/road-
conditions-statistics Version: 1.4 Publish date: 31/01/2019

Page 2
1. Introduction In England there is around 300,000 km of public road. The road network is maintained by three main types of body –Highways England (HE), Transport for London (TfL) and Local Authorities. They are each responsible for the following on their respective networks:
Routine maintenance - such as clearing hazardous defects, clearing debris and litter, treating ice and snow, clearing drains, and cleaning and replacing signs
Roads renewals - including new road surfaces, and other road works such as footways, cycle tracks, safety fences and drains
Structures renewals - for example the repair and rebuilding of bridges and underpasses, tunnels and gantries
Construction of new roads where required
Highways England (formerly the Highways Agency) The Highways Agency was an Executive Agency of the Department for Transport (DfT), and was responsible for operating, maintaining and improving the Strategic Road Network (SRN) in England on behalf of the Secretary of State for Transport. The Highways Agency (HA) was replaced by Highways England (HE) in April 2015, changing from a government agency to a government-owned company. The last year of reporting by the HA was in 2014/15.
As the SRN is of a different nature to ‘local’ roads, HE have additional responsibilities, including:
Technology renewals - including repair of variable message signs, cameras, emergency telephones and equipment in control centres
Highways England Traffic Officer Service - these are staff that help to keep the SRN running by dealing with drivers and vehicles on the roads, accidents, traffic management, and keeping the carriageways clear of debris. They do not carry out the same work as police officers relating to crime or accidents, but work alongside them where necessary
Transport for London TfL maintains the Transport for London Road Network (TLRN) which consists of some of London's busiest roads. In addition to the ordinary tasks of running a road network as mentioned above, TfL also runs the Congestion Charge system in London.
Local Authorities Each local authority is responsible for maintaining the roads within its boundaries. These roads account for about 98% of all publically owned roads in England. Highways matters are dealt with by the upper tier local authorities (County

Page 3
Councils) as well as the unitary authorities, metropolitan borough councils and London boroughs.
Data for rest of the UK This publication only covers the English road network. Wales, Scotland and Northern Ireland are all responsible for their maintaining their own roads. Links to their web publications and where to go for more information can be found below.
Scottish Road Condition Surveys –
http://transport-scotland-old.clients.civiccomputing.com/road/maintenance/prioritising-and-maintaining/road-condition-survey%20
Welsh Road Condition –
http://gov.wales/statistics-and-research/road-lengths-conditions/?lang=en

Page 4
2. Reporting of road condition The statistical bulletin Road Conditions in England reports on a number of methodologies for assessing road condition. Most of these are covered in more detail later in this technical note.
The report is based on the measures that are now most widely used as network level tools (SCANNER, TRACS, Visual condition, SCRIM), and these are described in detail later. Another tool that is often used, but not so widely as a routine device, is the Deflectograph, which has been included in the technical note because it still has relevance to highway assessment.
The SCANNER, TRACS (see section 3 for further details on these survey systems) and skidding data (see section 5) provided in the bulletin are all measures of surface condition, and in most cases are primarily used by highways authorities for operational purposes.
Both SCANNER and TRACS data are also used for reporting road condition. The former National Indicators (NI) 168 and 169 now listed on the Single Data list as 130-01 and 130-02 respectively both use SCANNER results from UKPMS to report on the proportion of roads that might be in need of maintenance. Data from TRACS are used by Highways England (formerly the Highways Agency) to report its Key Performance Indicator (KPI).
130-01 and 130-02 report the proportion of the network where maintenance should be considered (i.e. where the Road Conditions Indicator is over 100). 130-01 and 130-02 draw on surveys from multiple years, if necessary, to cover as large a proportion of the network as possible. The statistics for surface condition on trunk roads are provided by Highways England for 2017/18, as produced from TRACS. As the UK government is now providing Highways England with greater decision-making powers and increased, longer-term funding to manage the Strategic Road Network, it requires independent assurance about the levels of performance and efficiency that Highways England is delivering. The Office of Rail and Road (ORR) has taken the position of being the monitor of Highways England and its management of the Strategic Road Network in England. Further information can be found at the following link below: http://orr.gov.uk/highways-monitor/about-the-highways-monitor
As part of their role as Highways Monitor, ORR monitor HE’s management and reporting of road condition information with the latest report from April 2017 – March 2018 and earlier reports can be found at the following link: http://orr.gov.uk/publications/reports
Comparability to data from earlier years Prior to 2006/07, the condition of local authority roads, footways, kerbs and verges was assessed through the National Road Maintenance Condition Survey (NRMCS). This was a sample survey of around 12 thousand locations a year and consisted of visual inspections of the carriageway, footway, verge and kerb.
Defects to the highway and footway at each site were recorded and this information was used to produce the Defects Index.

Page 5
Data collected by the visual surveys carried out for the NMRCS is not directly comparable with the data collected by SCANNER and TRACS. Therefore it is not possible to compare the results from the visual surveys to the results from the automated surveys.
More detail on the differences between automated and visual surveys is provided in sections 3 and 4.
Survey Response Rate Local authorities are required to provide the Department with figures relating to data collections specified on the Ministry for Housing, Communities and Local Government (MHCLG) Single Data List, as per the Local Government Act 1972.This includes: - 130-01: principal roads where maintenance should be considered. - 130-02: non-principal classified roads where maintenance should be considered. - 130-03: skidding resistance data. - 130-04: carriageway work done data. The latest collection took place in 2018 and sought data for 2017/18 as well as any provide local authorities to make revisions to the 2016/17 data (excluding 130-04).. The small number of changes for 2016/17 are marked in the latest tables, and there is no impact to the national level figures. Response rates to the surveys are high. However, a small number of authorities are unable to provide this. For these authorities, where data is published at local authority level, there will be no 2017/18 data displayed in the table. Links to other relevant data or websites Road traffic, road lengths and congestion:
https://www.gov.uk/government/collections/road-traffic-statistics https://www.gov.uk/government/collections/road-network-size-and-condition https://www.gov.uk/government/collections/road-congestion-and-reliability-statistics
Highways England (formerly the Highways Agency): www.highways.gov.uk/
Single Data List (Former National Indicators and Best Value Performance Indicators): https://www.gov.uk/government/publications/single-data-list
Previous road conditions publications:
https://www.gov.uk/government/collections/road-network-size-and-condition

Page 6
3. Measuring surface condition using automated visual methods
3.1. TRACS
TRACS (TRAffic-speed Condition Surveys) were developed to provide a consistent method of measuring the surface condition of trunk roads using an automated survey machine that would not be disruptive to traffic. TRACS surveys have been carried out for the Highways Agency/Highways England on the trunk road network since 2000. The surveys are commissioned centrally by the Highways England (formerly the Highways Agency) and carried out by a single independent contractor using a survey vehicle specifically constructed for the purpose of undertaking the surveys, shown in Figure 1. The TRACS survey employs laser based methods to measure the shape and texture of the road surface at traffic-speed. Downward facing digital video equipment is used to collect pavement images which are used to measure cracking. Forward facing video is also collected. The survey employs inertially assisted differential GPS combined with distance measurement equipment, to provide accurate location referencing.
Figure 1: The TRACS survey vehicle (RST27, used since 2006)
TRACS surveys of the trunk road network are undertaken as follows:
Every six months on lane one
Annually on lane two
Annually on lane three of four lane roads
The slip roads are covered over a two year period
Roundabouts are not surveyed TRACS surveys are subject to a detailed quality assurance regime, which is supervised by an independent auditor. The TRACS survey vehicle is subject to accreditation testing before being given a certificate to commence surveys. The system is then re-accredited every three months. Regular contractor’s repeat surveys are carried out, where repeat surveys are undertaken by the contractor

Page 7
and checked for consistency. Contractors also provide data from randomly selected sites for comparison with the results of surveys undertaken by an independent survey vehicle. Following processing of the raw data, TRACS data is delivered to the Highways England in the form of Base Condition Data, a bespoke format that has been developed to enable the data to be loaded into the Highways England’s Pavement Management System, HAPMS). The TRACS data is used in a range of applications, including:
Identification of lengths in need of further investigation
Support for SCRIM site investigations
Value management (scheme prioritisation)
Scheme design
Calculation of Highways England’s Key Performance Measure (KPM) Guidance on the use of TRACS data is provided in Section 3 of Volume 7 of the Design Manual for Roads and Bridges (see below). 3.2. SCANNER The SCANNER (Surface Condition Assessment for the National Network of Roads) survey was initially introduced as a traffic-speed survey of the principal road network under the name TTS (TRACS-Type Survey). As the name suggests, TTS was based on the Trunk Road TRACS survey, to provide a consistent method of measuring the surface condition of road carriageways, using automated road condition survey machines, throughout the United Kingdom. TTS became the recommended survey method for Local Authorities to use for the calculation of the BV96 indicator on ‘A’ class roads in England in 2003/4. The TTS survey later became known as SCANNER and its application expanded from ‘A’ roads to all classified roads. SCANNER surveys are now mandatory for the assessment of the classified road network. In England the SCANNER Road Condition Indicator (RCI) is the only method used for the calculation of performance indicators for the reporting of condition of the classified road network, initially as BV223 and BV224a, and (from 2008/9) as National Indicators NI168 (‘A’ roads) and NI169 (other classified roads). As of 2011 the National Indicator set was abolished and replaced by the Single Data List where the former National Indicators 168 and 169 are listed as 130-01 and 130-02 respectively. SCANNER surveys in England are commissioned by Local Authorities either individually or through consortia. There are currently two survey contractors operating SCANNER accredited survey vehicles, of which typical examples are shown in Figure 2. The measurement equipment installed on SCANNER survey vehicles is fundamentally similar to TRACS (described above), but there are technical differences, as a result of the requirement for different reported parameters, described in sections 3.4 and 3.5.

Page 8
Figure 2: Typical SCANNER survey vehicles
The DfT specifies that SCANNER surveys of the local road network should be undertaken as follows:
Annually, covering on average at least 45% of the ‘A’ road network in both directions
Annually, covering on average at least 42.5% of the ‘B’ road network in both directions
Annually, covering on average at least 40% of the ‘C’ road network in one direction
Whilst roundabouts and slip roads may be covered by the survey vehicle during the process of driving over the network, the data from these lengths are not required as part of the survey and are not included in calculations of RCI or coverage
All of these figures are minimum averages for the most recent two years of scanning. For example, an ‘A’ road figure reported for 2014 will use data gathered between April 2012 and March 2014 covering 90% of the ‘A’ road network in both directions. However, some Local Authorities undertake surveys to cover a greater proportion of the network each year, either covering more than the minimum length on classified roads (in effect increasing the frequency of survey) or including some unclassified roads (particularly those carrying more traffic, where the carriageway may be in a higher category in the maintenance hierarchy). SCANNER surveys are subject to a detailed quality assurance regime, which is supervised by an independent auditor. Each SCANNER survey vehicle is subject to accreditation testing before being given a certificate to commence surveys. The system is then re-accredited annually. Regular contractor’s repeat surveys are carried out, where repeat surveys are undertaken by the contractor and checked for consistency. Contractors also provide data from randomly selected sites for comparison with the results of surveys undertaken by an independent survey vehicle. Following processing of the raw data, SCANNER survey data are delivered as an HMDIF file, the defined standard format for loading survey data into a UKPMS

Page 9
compliant pavement management system. A key use of UKPMS with SCANNER data is in the processing to produce the SCANNER Road Condition Indicator (RCI). The SCANNER data and the RCI are used in a range of applications, including:
Identification of schemes
Prioritisation of maintenance
Support for SCRIM site investigations
Calculation of Single Data List items 130-01 and 130-02 The SCANNER Specification defines the technical requirements for SCANNER survey parameters, accreditation testing, and quality assurance.
3.3. Consistency of SCANNER data SCANNER surveys are automated surveys carried out using accredited
SCANNER survey vehicles. Local authorities commission them to assess the surface condition of their classified ‘A’, ‘B’ and ‘C’ road network - further detail can found in section 3.6. Fleet consistency (cracking) – Road Conditions in England 2015
Following the validation process carried out by the Department for the Road Conditions in England publication 2015, further investigations were undertaken on the SCANNER survey data. This was completed with the assistance of TRL. TRL are quality auditors for automated condition measurement under the UK SCANNER survey, for the whole of the UK classified road network.
It was found that a particular survey vehicle (ARAN26, which ceased undertaking SCANNER surveys at the end of 2014/15 survey year) that was used by certain authorities in different years, reported relatively higher levels of cracking (a definition of cracking can be found within section 3.3) when compared against the fleet of accredited SCANNER vehicles, leading to a higher RCI score.
This meant that although the vehicle satisfied all the relevant acceptance process tests to meet the specification required, its tendency to detect a higher proportion of cracks present on the road surface in comparison with other vehicles in the fleet, may have led to a degree of bias being introduced into the assessment of cracking. This in turn could affect the reporting for the authorities where this vehicle was used. All the figures that could have been affected have been marked in the table accordingly. Fleet consistency (cracking) – Road Conditions in England 2016
Following the validation process carried out by the Department for the Road Conditions in England publication 2016 further investigations were undertaken on the SCANNER survey data. This again was completed with the assistance of TRL as the quality auditors for automated condition measurement under the UK SCANNER survey.
TRL confirmed that, for the 14/15 survey, the measurement of cracking reported by the ARAN1 and ARAN2 survey vehicles lay slightly outside the

Page 10
other vehicles in the SCANNER survey fleet. This meant that, although these vehicles satisfied all the relevant acceptance tests to meet the specification requirements, they had a tendency to report moderately higher levels of cracking in comparison to the levels reported in 13/14 and in 15/16, and hence moderately higher levels than other SCANNER vehicles.
This change was small, and not as significant as seen with ARAN26. However, Authorities for whom surveys were undertaken in 2014/15 using ARAN1 or ARAN2 could see a small drop in the RCI where a different survey vehicle was used in the following year (2015/16). Fleet consistency (texture) – Road Conditions in England 2016
Until 2016 TRL required that a calibration correction be applied to the texture (SMTD) data provided by the Tempest vehicles, to fully meet the specification requirements and optimise the consistency of the SCANNER survey fleet for the measurement of Texture. As a result of ongoing improvements to Tempest, the need for this correction was removed from the start of the 2016/17 survey.
As part of the ongoing QA checks that are applied throughout the survey, TRL identified some datasets where the calibration had not been applied in the 2015/16 survey. This was tracked to a processing issue, and the data was re-processed (by the SCANNER contractor) and corrected data delivered to all of the authorities identified.
However, there is a possibility that this problem may have affected a small number of authorities in the previous year’s (2014/15) survey. As a result the SCANNER data from these authorities could exhibit a small increase in the RCI. It has not been possible to identify, in the table, the individual local authorities that were affected.
Fleet consistency (cracking) – Road Conditions in England to March 2018
As a result of ongoing improvements a new crack detection system was installed on the Tempest3 device during 2017. The device was tested against the requirements for SCANNER surveys. Although the device satisfied the relevant acceptance tests, it was found that the device had a tendency to report higher levels of cracking in comparison to other SCANNER vehicles. With the objective of optimising the consistency of the SCANNER fleet, an attempt was made to correct for this. This delivered improved consistency, whilst still satisfying the relevant acceptance tests. However, as a result of this work, the levels of cracking associated with this vehicle are now moderately lower in comparison to other SCANNER vehicles. Therefore, the SCANNER data from these authorities could exhibit a small decrease in the RCI. It has not been possible to identify all of the individual local authorities that are affected.
Research was commissioned in 2016 to investigate fleet consistency problems with the measurement of cracking. The research proposed methods for testing consistency during the accreditation programme, including better identification of outliers and tightening of the range of measurements reported by the SCANNER fleet. These assisted in managing, and minimising, the consistency issues

Page 11
identified with one vehicle in 2017, and work is ongoing to determine how further consistency improvements could be achieved.
Further information on this issue can be provided by the SCANNER Auditor (TRL), who may be contacted at [email protected].
3.4. Defects measured by both TRACS and SCANNER, and used within condition indices and indicators – the core parameters
The TRACS and SCANNER surveys provide several parameters describing the condition of the pavement surface. Currently, some of these could be considered the “core” parameters that are used in condition indices such as the SCANNER RCI. There are further measures, some of which have been developed more recently, that can be used by highway engineers to assist in targeting lengths for further investigation. As more experience is gained with these measures they may be included within condition indices in the future.
Transverse profile – Rut Depth TRACS rut depths are determined from Transverse Profile data, recorded at 100mm intervals over a width of 3.2m. The general principle of the rut depth calculation is to replicate the use of a 2m straight edge with one end positioned close to the left edge of the transverse profile for the nearside rut, and close to the right edge of the transverse profile for the offside rut, as shown in the diagram below. Rut depths are measured perpendicular to the straight edge (Figure 3).
The rut depth is reported as nearside rut depth and offside rut depth averaged over 10m lengths. A value of maximum rut depth is also calculated, which is the maximum of the nearside or offside rut depths within the reporting length.

Page 12
Figure 3: Calculating rutting from transverse profile
Longitudinal profile – Moving Average Longitudinal Profile Variance (MALPV) and Enhanced Longitudinal Profile Variance (ELPV) Longitudinal Profile Variance (LPV) is a measure of the ride quality of individual lengths of the road that can be used to assist in the assessment of the likely user opinion of that length of road. SCANNER reports two measures of profile variance – Moving Average (MALPV) and Enhanced (ELPV). TRACS only reports ELPV. Each is reported as the average over each 10m length.
The basis of profile variance is the identification of differences between the measured longitudinal profile and a smoothed version of this profile. This smooth profile is obtained by applying a filter to the measured raw profile over three different lengths: 3m, 10m and 30m to obtain the three measures of profile variance. Both Moving Average LPV and Enhanced LPV apply a similar approach. However, the filters used in ELPV differ from those used in MALPV, so that ELPV is less affected by external influences such as extremes of gradient. ELPV was introduced initially in TRACS as a replacement for MALPV. However, in order to provide continuity in the transfer from one measure to the other, SCANNER currently reports both measures, and the SCANNER RCI is based on MALPV.
Research has shown that Longitudinal Profile Variance can be related to the user’s opinion of ride quality. 3m Longitudinal Profile Variance provides a relatively simple yet effective method of highlighting lengths of the network which users consider to have poor ride quality. 10m Longitudinal Profile Variance also shows reasonable agreement with users, particularly on high speed roads, and this measure is more likely to reflect the opinions of users of longer vehicles such as buses and trucks. Although 30m Longitudinal Profile Variance is not well related to user opinion, it can be used to show the presence of long undulations associated with defects such as subsidence, and is still reported by TRACS on trunk roads, although it is no longer required by the SCANNER specification on local roads.
Texture in a single line (SMTD) The surface Texture Depth measured by TRACS and SCANNER accredited survey vehicles is the coarser element of macrotexture and the finer element of mega texture formed by aggregate particles in the asphalt surfacing or by the brushing or grooving of concrete surfaces. Texture Depth contributes to skidding resistance, primarily at medium and high speeds, in two ways. Firstly, it provides drainage paths to allow water to be

Page 13
removed rapidly from the tyre/road interface. Secondly, the projections, which contribute to hysteresis losses in the tyre, are an important factor in the braking process.
In TRACS and SCANNER the texture is measured in the nearside wheel-track using a laser sensor that reports at approximately 1mm longitudinal intervals. The parameter reported as the average SMTD (Sensor Measured Texture Depth) within each 10m length, which is effectively the RMS height of the texture profile after the removal of wavelengths longer than approximately 300mm.
Cracking - Area of Cracking SCANNER and TRACS survey vehicles use downward facing cameras to continuously collect images of the road surface. The video images are processed through automatic crack detection software. The cracking is reported as a “crack map” which describes the transverse and longitudinal position of each crack, the length of each crack and the angle of the crack relative to the direction of travel.
The measurement of cracking typically covers a survey width of 3.2m, although this can vary with the survey vehicle (the minimum requirement is 2.9m). The area of cracking is obtained by overlaying the crack map with a 200mm grid covering the whole survey width, and counting the number of grid squares containing cracks. The area of cracking over each 10m length is reported as a percentage measure.
The automatic detection of cracking is a demanding task for computer processing systems, and the software employed is subject to a process of continuous improvement to help improve confidence in the cracking data. However, the measurement of cracking is still subject to a degree of variability.
Figure 4: Cracking
3.5. Further defects measured by TRACS and SCANNER Transverse profile – Cleaned Rut Depth (SCANNER only) SCANNER reports an additional measurement called Cleaned Rut Depths, in each 10m length. Sometimes the measurement of rut depth can be affected by features at the edge of narrower roads such as verges that result in erroneously high rut depths. For Cleaned

Page 14
Rut Depths an algorithm is applied to identify the road edge, hence removing edge features from the rut calculation. The Cleaned Rut Depth method is still being evaluated in practice to confirm its reliability and robustness. In order to provide continuity in the transfer from one measure to the other, SCANNER currently reports both measures, and the SCANNER RCI is based on the original rut depth measure. Transverse profile – Transverse unevenness (SCANNER only) Transverse profile unevenness assesses how much the slope of the transverse profile changes from point to point across the carriageway (Figure 5), calculated as the absolute deviation of the first derivative of the transverse profile and reported each 10m. An even surface would have a low value of unevenness. This measure may be of use when assessing a narrow road where the transverse profile is uneven, but there are no distinct ruts.
Figure 5.Transverse unevenness
Edge Deterioration (SCANNER only) SCANNER measurements of edge condition are derived from the measured transverse profile. Algorithms are applied to identify the edge region at the nearside of the traffic lane (Figure 6). Once identified, further algorithms are applied to determine the severity of any stepping at the road edge, and the roughness of the road in the regions close to the road edge. These are reported every 10m. The edge deterioration parameters are not included in the core parameters or the current SCANNER indicator (RCI). However, an edge condition indicator has been included within UKPMS systems to provide an overall report of SCANNER edge condition (see Watson & Wright, 2006).

Page 15
Figure 6: Identifying the edge region for the assessment of edge deterioration
Longitudinal profile – Bump (TRACS and SCANNER) User trials have found that users are sensitive to short length “bump” features that cause jolt-like sensations within the vehicle but these are not effectively identified using LPV. The “Bump Measure” has been designed to identify lengths of pavement containing short defects (“bumps”), such as sunken ironwork, potholes, and poor joints (see Figure 7). Such defects can cause jolting discomfort to the road user.
Figure 7: Example of “bump” feature The Bump Measure is calculated from the Longitudinal Profile, and reported over 10m lengths. It reports a simple “Yes” or “No”, with a “Yes” indicating that the length contains one or more bumps. The bump data is intended to complement other measures, for example to assist engineers in prioritising lengths for maintenance.
Texture – in multiple lines (SCANNER only) Research has shown that reporting texture along multiple measurement lines (across the traffic lane) could be of assistance in identifying lengths of surface deterioration because the variability of texture depth along and across road surfaces can be associated with road surface wear (an “as new” road would be expected to have quite an even texture) - Figure 8. The SCANNER survey therefore reports texture in multiple measurement lines over a minimum of 3 (maximum 40) lines. The measure is reported as the RMST (Root Mean Square Texture), which is the RMS height of the texture profile after the removal of wavelengths longer than approximately 100mm. Various RMST parameters are reported

Page 16
every 10m, covering the regions over, and between, the wheel paths. The texture variability is quite a new measure in SCANNER that aims to assist engineers in identifying lengths of surface deterioration, in particular on lower classes of road.
Figure 8 Variation in average texture depth across the road surface
Texture – Fretting (TRACS only) The TRACS texture profile data is used to calculate an estimation of the intensity of fretting present on Hot Rolled Asphalt surfaces every 10m. Because the measure applies only to Hot Rolled Asphalt surfaces, the surface type must be known. Furthermore, texture profile data is only measured along a single line in the nearside wheelpath; this measure only estimates the presence of fretting that extends into the wheelpath. Work is ongoing by Highways England to further develop the capability of TRACS in the automated measurement of fretting.
Noise (TRACS only) The TRACS noise measure applies an algorithm to the texture profile to estimate the level of noise that would be reported at the tyre-road interface within each 10m, which is the noise typically, measured using a close proximity noise measurement system. Whilst the TRACS noise measure can be used to aid the investigation of noise levels, the predicted noise value does not relate directly with the roadside noise level, which is influenced by the volume, type and speed of traffic, and surrounding geometry; nor does it indicate the noise experienced at nearby properties, which is influenced by their distance from the road and the presence of natural or man-made barriers. However, the measure can be used to aid investigation of the noise levels generated by the road/tyre interaction on the pavement. For example, it can be used to provide an indication of the potential benefit of providing lower noise surfacing for sites where noise levels have been identified as an issue.
Cracking – Wheeltrack cracking (both TRACS and SCANNER) In addition to reporting the area of cracking present over the whole traffic lane, SCANNER and TRACS estimate the extent of cracking present within the region covered by the wheel paths. The approach taken by each system differs. SCANNER reports the total
Page 17
length of the wheeltrack affected by wheel track cracking (as a percentage of each 10m length). TRACS reports the total area of wheeltrack cracking present in each 10m length (as a percentage of the total area of the wheeltrack). Because the measure of wheeltrack cracking is effectively a sub-set of the total area of cracking present, wheeltrack cracking is not currently included in the SCANNER RCI.
Geometry (both TRACS and SCANNER) Three measures of road geometry are delivered every 10m, as Gradient, Crossfall, and Radius of Curvature. Gradient and Crossfall are reported as percentage values, whilst Radius of Curvature is reported in metres.
Retro-reflectivity (TRACS only) The TRACS survey employs a separate survey vehicle to measure the retro-reflectivity of longitudinal road markings. A device fitted to the vehicle directs light at the road markings and reports the amount of light reflected, which provides an indication of the night-time visibility of the marking every 10m. The data is used to support the assessment of the condition of road markings and the identification of lengths for investigation.
3.6. Assessing road condition using TRACS and SCANNER data TRACS The condition of trunk roads is assessed by comparing the values measured by TRACS for each length (100m) against thresholds defined in section HD29/08 of the Design Manual for Roads and Bridges. Four condition categories are used in the interpretation of TRACS condition data. The categories are used to grade pavement condition starting at Category 1, which indicates no visible deterioration, up to Category 4, which indicates severe deterioration. When using TRACS data highways engineers are advised that any length for which the defect value falls above Category 3 contains moderate deterioration, and is at a warning level of condition where the need for maintenance must be investigated. If the level is at Category 4 detailed investigations should be carried out on the deteriorated lengths at the earliest opportunity.
Surface Condition of Trunk Roads The data on the surface condition of trunk roads provided in the publication describes the percentage of the trunk road network that may be in need of maintenance. It is calculated using both TRACS data, and skid resistance data provided by SCRIM surveys (see section 5 for further information on the measurement skid resistance).
The data on the surface condition of trunk roads is obtained using a similar approach to that described above, where the condition is assessed by comparing the values measured for each length (100m) against thresholds. To estimate the percentage of the trunk road network that may be in need of maintenance it is assumed that not all lengths with condition exceeding the Category 3 thresholds defined in the DMRB will be in need of maintenance. However, all lengths exceeding the Category 4 thresholds should be considered to be in need of maintenance. Therefore, an intermediate set of thresholds was established in 2004 for the assessment of TRACS data to indicate the levels of condition more likely to require maintenance in the short term, as shown in Figure 9.

Page 18
Defect Threshold Rutting 15.5mm Texture 0.6mm Enhanced Longitudinal Profile Variance (LPV) – 3m Motorways and Rural Dual Carriageways Urban Dual Carriageways Rural Single Carriageway Roads Urban Single Carriageway Roads
3.3mm2
3.85mm2
3.85mm2
6.55mm2 Enhanced Longitudinal Profile Variance (LPV) – 10m Motorways and Rural Dual Carriageways Urban Dual Carriageways Rural Single Carriageway Roads Urban Single Carriageway Roads
10.6mm2
15.7mm2
15.7mm2
27.45mm2 Enhanced Longitudinal Profile Variance (LPV) – 30m Motorways and Rural Dual Carriageways Urban Dual Carriageways Rural Single Carriageway Roads Urban Single Carriageway Roads
88.0mm2
98.0mm2
98.0mm2
145.0mm2 Figure 9: TRACS surface condition thresholds
For the assessment of SCRIM data an equivalent Category 3a value was determined based on advice given in section HD28/04 of the Design Manual for Roads and Bridges. The Category 3a threshold is generally equal to the (Investigatory Level – 0.05), see section 5.
In the calculation, if one or more of the condition parameters exceeds any of the thresholds, the length is flagged (Note that for texture the length is flagged if the texture parameter falls below the threshold, because a decrease in texture represents a deterioration in condition). The value reported in the publication has been calculated by summing the length of pavement that triggers any of the specified threshold levels and expressing the sum as a percentage of the network length.
SCANNER Individual SCANNER parameters can be used to identify lengths containing particular types of defect. However, the SCANNER RCI (Road Condition Index) was developed through the SCANNER research programme to combine SCANNER defects into a single value to assist in the assessment of road condition. The approach used to combine the SCANNER defects was developed by Cartwright & Pickett (2004). This was used with an initial set of thresholds and weightings to calculate the ‘original RCI’ for 2006 and 2007. Further research (McRobbie, Walter, Read, Viner & Wright, 2007) led to new thresholds giving a ‘revised RCI’ which has been used since 2008 and is described herein.
The revised SCANNER RCI is calculated using a sub-set of the parameters measured by SCANNER (these are referred to as the core parameters in section 3.4). In summary, these are:
Maximum rut depth
3m Moving Average Longitudinal Profile Variance
10m Moving Average Longitudinal Profile Variance
Page 19
Whole carriageway cracking
Texture depth
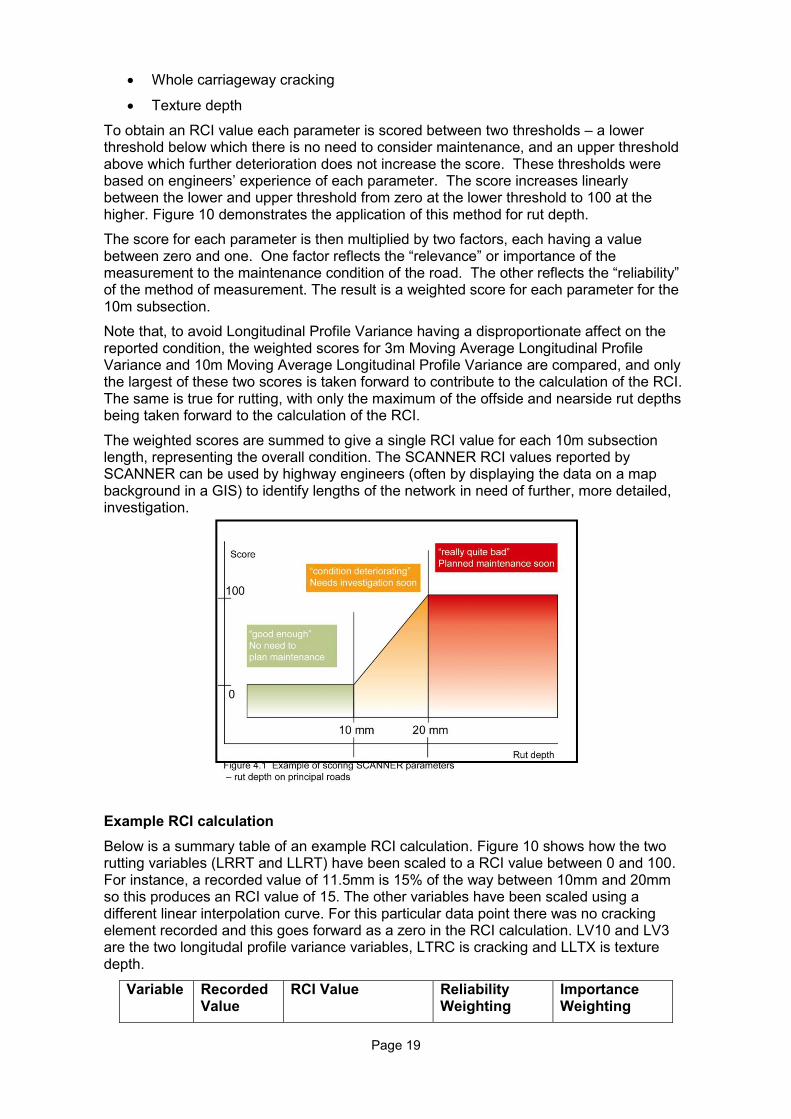
To obtain an RCI value each parameter is scored between two thresholds – a lower threshold below which there is no need to consider maintenance, and an upper threshold above which further deterioration does not increase the score. These thresholds were based on engineers’ experience of each parameter. The score increases linearly between the lower and upper threshold from zero at the lower threshold to 100 at the higher. Figure 10 demonstrates the application of this method for rut depth.
The score for each parameter is then multiplied by two factors, each having a value between zero and one. One factor reflects the “relevance” or importance of the measurement to the maintenance condition of the road. The other reflects the “reliability” of the method of measurement. The result is a weighted score for each parameter for the 10m subsection.
Note that, to avoid Longitudinal Profile Variance having a disproportionate affect on the reported condition, the weighted scores for 3m Moving Average Longitudinal Profile Variance and 10m Moving Average Longitudinal Profile Variance are compared, and only the largest of these two scores is taken forward to contribute to the calculation of the RCI. The same is true for rutting, with only the maximum of the offside and nearside rut depths being taken forward to the calculation of the RCI.
The weighted scores are summed to give a single RCI value for each 10m subsection length, representing the overall condition. The SCANNER RCI values reported by SCANNER can be used by highway engineers (often by displaying the data on a map background in a GIS) to identify lengths of the network in need of further, more detailed, investigation.
Figure 10: Scoring rutting for the SCANNER RCI
Example RCI calculation Below is a summary table of an example RCI calculation. Figure 10 shows how the two rutting variables (LRRT and LLRT) have been scaled to a RCI value between 0 and 100. For instance, a recorded value of 11.5mm is 15% of the way between 10mm and 20mm so this produces an RCI value of 15. The other variables have been scaled using a different linear interpolation curve. For this particular data point there was no cracking element recorded and this goes forward as a zero in the RCI calculation. LV10 and LV3 are the two longitudal profile variance variables, LTRC is cracking and LLTX is texture depth.
Variable Recorded Value
RCI Value Reliability Weighting
Importance Weighting

Page 20
LRRT 11.5 15 1 1
LLRT 13.4 34 1 1
LLTX 0.29 100 (the actual figure 102.5, but this is scaled back to a maximum 100)
1 0.75
LV10 41.52 58.63 1 0.6
LV3 4.79 13.17 1 0.8
LTRC Null - 0.6 1
The RCI is calculated by summing the weighted individual RCI values, taking the maximum of the weighted LRRT or LLRT and the maximum of the weighted LV10 or LV3 variables forward as demonstrated below:
RCI = max((LRRT * 1* 1) , (LLRT * 1 * 1)) + (LLTX * 1 * 0.75) + max((LV10 * 1 * 0.6) , (LV3 * 1 * 0.8)) + (LTRC * 0.6 * 1)
In this case, this becomes:
RCI = (34 * 1 * 1) + (100 * 1 * 0.75) + (58.63 * 1 * 0.6) + (0 * 0.6 * 1)
= 34 + 75 + 35.18 + 0
= 144.18
A large RCI score such as this indicates this section of the road is in ‘poor’ condition and is likely to require maintenance soon.
SCANNER National Indicators for local roads The RCI values for each 10m length can be summed to determine the overall percentage of the 10m lengths within the network falling into three categories:
"GREEN" - lengths where the carriageway is generally in a good state of repair (low RCI values). Green lengths have an RCI score below 40.
"AMBER" - lengths where some deterioration is apparent which should be investigated to determine the optimum time for planned maintenance treatment (mid-range RCI values). Amber lengths have an RCI score over 40 and below 100.
"RED" - lengths in poor overall condition which are likely to require planned maintenance soon (i.e. within a year or so) on a "worst first" basis (high RCI values). Red lengths have an RCI score of 100 or over.
In England Local authorities can use UKPMS to obtain the proportion of the network in the "red" category, which is reported as the Single Data List items 130-01 (‘A’ class roads) and 130-02 (other classified roads) for their network. These were formerly National Indicators 168 and 169 respectively.
The parameters, thresholds and weightings that define the calculation of the RCI are published on the DfT website as a “Weighting Set” (see below).
3.7. Further information on TRACS and SCANNER The above paragraphs provides summary information on the TRACS and SCANNER surveys and how the data is processed. Further information can be obtained from:

Page 21
TRACS Design Manual for Roads and Bridges (DMRB) –HD 29/08, Volume 7, Section 3, Part 2, “Traffic speed condition surveys”. (Highways England), www.standardsforhighways.co.uk/dmrb/vol7/.
SCANNER SCANNER user guide and specification, Volume 1, Introduction to SCANNER surveys. (Roads Board). www.pcis.org.uk
SCANNER user guide and specification, volume 2, Procuring SCANNER Surveys. (Roads Board). www.pcis.org.uk
SCANNER user guide and specification, volume 3, Using SCANNER Survey Results. (Roads Board). www.pcis.org.uk
SCANNER user guide and specification, volume 4, Technical Requirements for SCANNER Survey Data and Quality Assurance. (Roads Board). www.pcis.org.uk
SCANNER user guide and specification, volume 5, Technical Requirements for SCANNER Survey Parameters and Accreditation. (Roads Board). www.pcis.org.uk.
E. Benbow, K. Nesnas & A.Wright (2006), Shape (surface form) of local roads. TRL published project report PPR131.
Reporting condition and indicators Cartwright, R. A., & Pickett, A. (2004). TTS Defects Index Preliminary Analysis – Final Report version 2. (Chris Britton Consultancy). http://ukroadsboard.org/en/UKRLG-and-boards/uk-roads-board/scanner/scanner-research/tts-defects-index-preliminary-analysis.cfm
Watson, P., & Wright, A. a. (2006). Edge deterioration on Local Roads. TRL Published Project Report PPR084. (TRL Limited). http://ukroadsboard.org/en/UKRLG-and-boards/uk-roads-board/scanner/scanner-research/initial-study-of-edge-deterioration.cfm
McRobbie, S., Walter, L., Read, C., Viner, H., & and Wright, A. (2007). Developing SCANNER Road Condition Indicator parameter thresholds and weightings. . TRL Published Project Report PPR199. (TRL Limited, Wokingham)
Design Manual for Roads and Bridges (DMRB) –HD 28/04, Volume 7, Section 3, Part 1, “Skid Resistance”. (Highways England), www.standardsforhighways.co.uk/dmrb/vol7/
UKPMS Technical Note 36 and 37 – Calculation of RCI values for BVPI and National Indicators www.ukpms.com/tech_docs/techdocsdynamic.asp?techdocsID=4 UKPMS Weight Sets and RCI Description www.ukpms.com/tech_docs/techdocsdynamic.asp?techdocsID=37 UKPMS Document No 078 (2005), SCANNER Road Condition Indicator, Description of Processing aimed at Users, www.pcis.org.uk
UKPMS Document No 070 (2006), SCANNER Road Condition Indicator, Implementation Guidelines, www.pcis.org.uk

Page 22
4. Measuring surface condition using manual visual surveys 4.1. CHART CHART was developed in the 1970s at TRL to provide a system of assessing the structural maintenance need of highways, and was routinely used by the Highways Agency on the trunk road network until 1999. The CHART system of recording defects was adopted for the NRMCS visual survey when it was established in 1977 and was also used for the Road Conditions in England report in 2007.
The CHART system used manual visual condition surveys to assess the condition of the network, with the sample survey used to measure trends in the visual road condition in England by comparing changes in a ‘defects index’ for the following types of road:
• All purpose trunk roads - until 2002.
• Principal ‘A’ roads and motorways - until 2006.
• Other classified roads - until 2006.
• Unclassified roads
From 2007 the assessment of visual condition was limited to unclassified roads, and it was decided that the condition information on classified roads should be based on that provided by the SCANNER survey for future editions of the publication. Because SCANNER assesses condition using a method very different from CHART, the data provided within Road Conditions in England 2009, which is based on SCANNER surveys, cannot be directly compared with the information provided in Road Conditions in England 2007 and previous versions of the NRMCS bulletin.
Since 2008 the assessment of condition of unclassified roads has been provided by the Coarse Visual Inspection (CVI) surveys, described in the following section. Because CVI assesses visual condition using an index calculated using a different approach to that employed in CHART, it is not possible to reliably compare the results of the condition of unclassified roads obtained using CHART in RCE 2008 with the results obtained using CVI in RCE 2009
4.2. Coarse Visual Inspection (CVI) The Coarse Visual Inspection survey (CVI) is a coarse, rapid survey, usually carried out from a slow-moving vehicle, that allows a large part of a highways authority’s road network to be assessed each year. Footways and cycle ways adjacent to the carriageway may also be inspected at the same time as the carriageway itself, or can be assessed separately.
The CVI was adopted as one method of reporting best value performance indicators (BVPI) in England on principal roads in 2000 (BV96), and as the only method on other classified roads in 2001 (BV97 and then BV97(a)), and on unclassified roads in 2002 (BV97b). It was replaced by TTS on principal roads in 2004, and on all classified roads by SCANNER in 2005 (BV223 and BV224a, subsequently replaced by National Indicators in 2008, in turn replaced by Single Data List items 130-01 and 130-02 in 2011). The BVPI for the condition of unclassified roads from CVI surveys was renamed BV224b in 2005, and not required as a National Indicator in 2008. The method of calculating the BVPI changed over the period and there is more detailed information about the changes in Cartwright and Pickett (2004).
CVI survey data are delivered as an HMDIF file, the defined standard format for loading survey data into a UKPMS compliant pavement management system.
Because CVI is no longer required for the calculation of indicators, there is no centrally defined requirement for Local Authorities in England to carry out CVI surveys on their

Page 23
road networks. Nevertheless, many authorities continue to use the surveys as a routine inspection method on unclassified roads (which are not routinely surveyed by SCANNER), to obtain condition data for maintenance planning.
The UK Roads Board recommends that anyone who undertakes a CVI survey should be accredited to the current nationally accepted standard. A new Visual Survey Inspector accreditation scheme was introduced in April 2007. To be accredited inspectors must have passed through this scheme.
4.3. Detailed Visual Inspection (DVI) The Detailed Visual Inspection survey (DVI) is a more comprehensive survey than CVI, with defects identified by a larger number of more detailed classifications. The DVI is a walked survey that provides much more detailed information than the CVI, and is typically targeted at lengths already identified as defective and potentially in need of treatment either by the CVI, or from other sources of information such as SCANNER.
DVI is not required for the calculation of indicators and there is no centrally defined requirement for Local Authorities to undertake DVI surveys on their road networks. However, some authorities use the DVI survey as the main inspection method on urban roads, particularly where footway condition is important, (as these are not surveyed by SCANNER), and some as a scheme level survey to obtain more detailed condition data for maintenance planning.
DVI survey data are delivered as an HMDIF file, the defined standard format for loading survey data into a UKPMS compliant pavement management system.
Because some authorities prefer to carry out DVI surveys, rather than CVI, as routine surveys (for example in urban areas) local authorities can opt to undertake DVI surveys as an alternative to CVI and then convert the results to a "CVI-equivalent" survey, using UKPMS Conversion Software. However this is not a straightforward conversion, and can lead to subtle changes in the results.
As with CVI surveys The UK Roads Board recommends that anyone who undertakes DVI surveys should be accredited to the current nationally accepted standard (see section 4.2).
4.4. Carriageway defects measured by CVI and DVI Both CVI and DVI surveys record a wide range of defects, However, CVI and DVI surveys often take a different approach to recording the presence and extent of a particular defect. Typically, because DVI is a walked survey, it is able to record a greater number of defects and to a higher level of detail. Because the (driven) CVI survey is only able to make a broad estimate of the width of the carriageway affected, the results of CVI surveys are processed to express the defects as “local”, “partial” and “general” for loading into UKPMS.
The following briefly describes the defects that appear on bituminous carriageways (which represent the vast majority of roads in England). Further information on these defects, and those found on concrete carriageways, can be found in the UKPMS user manuals (Volume 2 – Visual data collection for UKPMS). The descriptions are also restricted to defects identified on the road surface and not on the adjacent footway. Both CVI and DVI surveys can be used to assess footway condition, but these defects are not included in the calculation of carriageway condition indices such as those used in the publication to report the condition of unclassified roads.

Page 24
Wheel track cracking Most vehicles follow a similar path on a road, resulting in the formation of identifiable wheel tracks. The significance of the wheel tracks is that damage to the road structure, as well as the surface, is most serious there. In particular, cracking in the area of the wheel tracks (Figure 11) may indicate structural damage, especially if associated with the presence of a rut along the wheel track. In both CVI and DVI surveys the length of cracking present is recorded by noting the start and end points of the defect as the survey progresses (as noted above, in the CVI survey the defect is post-processed to “local”, “partial” and “general” for loading into UKPMS).
Transverse/reflection cracking Distinct single or multiple transverse cracks can often be related to the presence of a defect beneath the surface, such as a crack in the concrete layer of a composite pavement (Figure 12 - this defect is only recorded when the carriageway is of composite or covered concrete construction). These cracks are therefore reported as a specific type of cracking in both CVI and DVI surveys, reported as the number present within each reporting length. In DVI the defect is separated into two severities, severity 1 and severity 2 as judged by the inspector.
Figure 11: Wheel track cracking (left) and wheel track rutting (right) Whole carriageway cracking Only DVI surveys record this defect, which is observed as single or multiple cracking present over any part of the road surface. The defect is reported as the area affected and in two severities, minor (where the cracking is fine) and major (where the cracking is wide - Figure 12).
Note that, although this defect is only recorded separately in a DVI survey, the presence of this type of cracking would be recorded as Wearing Course Deterioration in a CVI survey.

Page 25
Figure 12: Transverse/reflection cracking (left) and whole carriageway cracking (right)
Wheel track rutting Wheel track rutting (Figure 11) does not necessarily indicate structural damage if there is no cracking, but it is undesirable because the ruts can hold water which can cause skidding, especially in winter when the roads can become icy. On urban roads, in particular, pedestrians may get splashed and there is a hazard to cyclists and motorcyclists, while on roads with higher speeds there is the risk of vehicles aquaplaning. Because it is a driven survey, the CVI is only able to broadly assess the rutting, which is done by recording the lengths of the network where the inspector judges the rutting to be greater than 13mm. In a DVI survey the depth of the rutting in the nearside wheelpath is measured at intervals (e.g. every 20m) using an appropriate device (such as a straight edge and wedge).
Deterioration of the wearing course Both CVI and DVI surveys collect information on deterioration of the wearing course, again at different levels of detail.
CVI defects in the wearing course are reported as wearing course deterioration or surface deterioration, both of which are reported in terms of the area of the carriageway affected (as “local”, “partial” and “general” deterioration). Whereas wearing course deterioration reports the loss of material from the surface other than surface applied chippings (a defect often referred to as “fretting”, which can in the extreme lead to potholing), surface deterioration assesses the loss of surface applied chippings (such as surface dressing), and reports where bituminous binder is appearing in the surface course (Figure 13) to an extent that the friction material is flush or covered, a defect often referred to as “fatting up”.
In DVI these wearing course defects are reported separately as chip loss (loss of surface applied chippings), fretting (loss of material that has not been surface applied) and fatting, which are classified by the inspector into minor and major defects, depending on their severity. Again, the defects are reported in terms of the area of the carriageway affected
Figure 13: Wearing coarse deterioration (left) and surface deterioration (right)
Settlement and subsidence Both CVI and DVI record the presence and area of local settlement or subsidence. This will include patches or public utility reinstatements (and areas where the carriageway has

Page 26
heaved, for example due to tree roots. In CVI this is reported (as “local”, “partial” and “general” deterioration) only where it produces a difference in level to the surroundings of greater than 30mm. In DVI settlement to such an extent is reported as severe, with settlement between 13mm and 30mm reported as moderate.
Figure 14: Settlement and subsidence (left) and edge deterioration (right)
Edge Deterioration Deterioration of the road edge can present a hazard to users and also lead to more extensive deterioration of the remainder of the carriageway as the edge support becomes eroded. Both CVI and DVI surveys record this defect, as the length of deterioration present. In the same approach as the defects described above, the CVI survey reports this defect as “local”, “partial” and “general” deterioration, in a DVI survey the defect is separated into two severities, severity 1 and severity 2, as judged by the inspector.
4.5. Calculation of road condition using DVI and CVI data Processing of CVI and DVI data is carried out in UKPMS to analyse the condition of the network and generate condition indices. UKPMS will also suggest treatments and an indicative budget for the work required. UKPMS processing splits the network up into defect lengths, and then reports the condition, treatment and ranking for each of these defect lengths. There are four key steps which together create the defect lengths and enable the calculation of the condition indices.
Chopping to form Rating Lengths The condition data collected within each section of the network is analysed to identify lengths within the section where the reported level of defects are relatively constant. This is used to chop up each section into subsections of consistent defectiveness. These subsection lengths are referred to as Rating Lengths.
Calculating Defect Ratings Each rating length is re-analysed to determine the value or score for each defect within the length, this value is referred to as a defect rating. The defect ratings are obtained from predefined look up tables or curves, with a different rating for each defect. For example, CVI local surface deterioration will have a rating of 10. So if the chopping process identified an 80m long length with consistent local surface deterioration, this 80m length would be given a defect rating of 10.

Page 27
Calculating Condition Indices A condition index (CI) is a measure of the condition of a particular aspect of the defect length. In UKPMS there are several condition indices. The Edge CI provides information about the condition of the edge of the carriageway, and is calculated from defects which measure the deterioration of the edge. Other UKPMS carriageway condition indices include Structural CI, Wearing Course CI, Surface Properties CI and the Overall CI.
A value for each of the condition indices is calculated for each rating length. For some indices this may require combining together the defect ratings for that index. The process is governed by the rules which determine which defects contribute to which condition index, and the precise way in which they are combined together.
Merging to form Defect Lengths The final stage in the calculation of condition indices is to merge the rating lengths to form defect lengths. This process is controlled by the parameters contained within UKPMS, and can be carried out to generate fixed lengths (e.g. 100m), pre-defined lengths, or variable lengths (where the system identifies lengths with generally consistent values of condition index). The result is a set of sub-sections (now referred to as defect lengths) each having associated with it a value for the condition index.
Obtaining National Indicators (Best Value Performance Indicators) As noted above, CVI was adopted as a method of reporting best value performance indicators (BVPI) in England, initially on principal roads in 2000 and later for other classified roads and unclassified roads in 2002. Although the CVI BVPIs have been replaced by SCANNER Single Data List items on classified roads, many authorities undertake CVI surveys on unclassified roads, and the methodology previously used to calculate the unclassified road BVPI (BV224b) is available in current versions of UKPMS. In the Road Conditions publication this has been used as the basis for the reporting of the condition of the unclassified road network. BV224b uses the defect lengths calculated above to determine the proportion of the (surveyed) length of the unclassified carriageway for which at least one of the Condition Index thresholds shown in the following table has been equalled or exceeded. The value is reported as the total length exceeding the thresholds divided by the total length of unclassified carriageway network surveyed, expressed as a percentage.
UKPMS RP6.01 Condition Index Threshold Value
Structural CI 85
Edge CI 50
Wearing Course CI 60
Figure 15: threshold values for calculation of BV224b 4.6. Further information on CHART, CVI, DVI and the use of data The above paragraphs provide summary information on the CHART, CVI and DVI surveys and how the data is processed in UKPMS to obtain condition indices. Further information can be obtained from:
CHART. (1988). A System for Assessing the structural maintenance needs of Highways (HECB/R/16-CHART). Department of Transport, Highways Engineering Computing Branch.

Page 28
UKPMS User Manual. (2007). The UKPMS User Manual. http://www.pcis.org.uk/
UKPMS Technical Note 3 (2009): UKPMS File Structures and Content http://www.pcis.org.uk
UKPMS Technical Note 38 (2007): Production of Best Value Performance Indicator report BV224b – Condition of non-principal classified roads, http://www.pcis.org.uk
Page 29
5. Measuring skid resistance
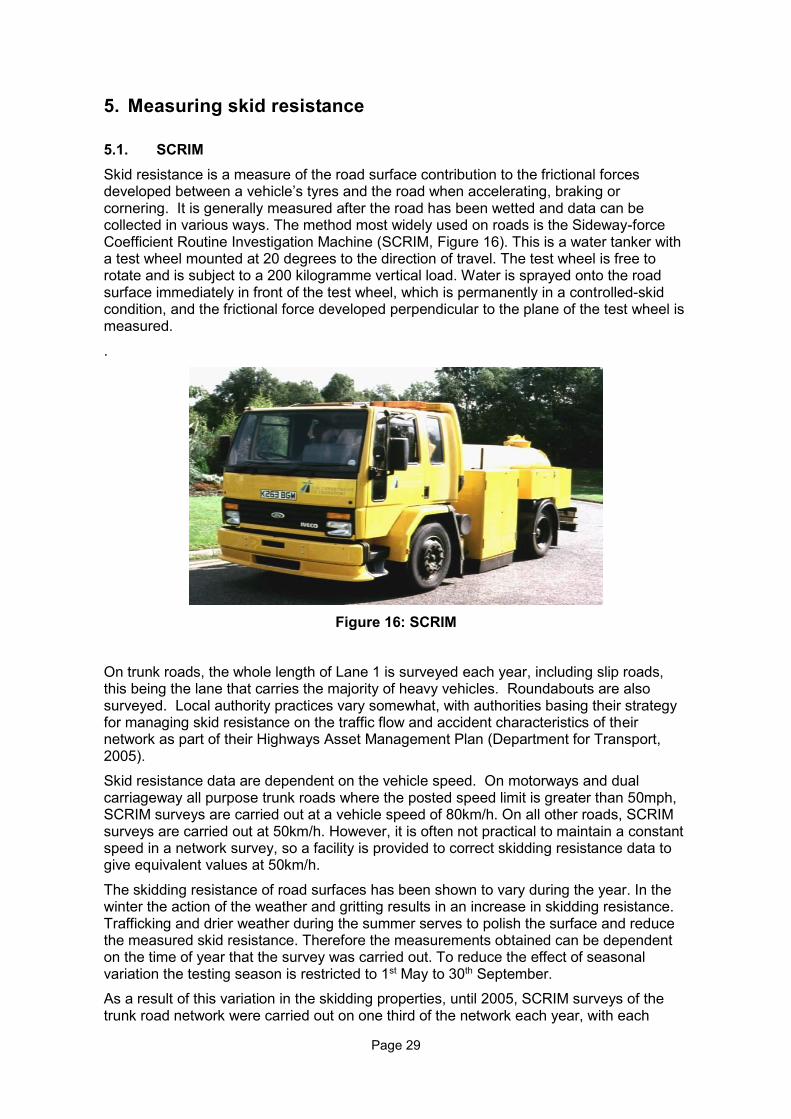
5.1. SCRIM Skid resistance is a measure of the road surface contribution to the frictional forces developed between a vehicle’s tyres and the road when accelerating, braking or cornering. It is generally measured after the road has been wetted and data can be collected in various ways. The method most widely used on roads is the Sideway-force Coefficient Routine Investigation Machine (SCRIM, Figure 16). This is a water tanker with a test wheel mounted at 20 degrees to the direction of travel. The test wheel is free to rotate and is subject to a 200 kilogramme vertical load. Water is sprayed onto the road surface immediately in front of the test wheel, which is permanently in a controlled-skid condition, and the frictional force developed perpendicular to the plane of the test wheel is measured.
.
Figure 16: SCRIM
On trunk roads, the whole length of Lane 1 is surveyed each year, including slip roads, this being the lane that carries the majority of heavy vehicles. Roundabouts are also surveyed. Local authority practices vary somewhat, with authorities basing their strategy for managing skid resistance on the traffic flow and accident characteristics of their network as part of their Highways Asset Management Plan (Department for Transport, 2005).
Skid resistance data are dependent on the vehicle speed. On motorways and dual carriageway all purpose trunk roads where the posted speed limit is greater than 50mph, SCRIM surveys are carried out at a vehicle speed of 80km/h. On all other roads, SCRIM surveys are carried out at 50km/h. However, it is often not practical to maintain a constant speed in a network survey, so a facility is provided to correct skidding resistance data to give equivalent values at 50km/h.
The skidding resistance of road surfaces has been shown to vary during the year. In the winter the action of the weather and gritting results in an increase in skidding resistance. Trafficking and drier weather during the summer serves to polish the surface and reduce the measured skid resistance. Therefore the measurements obtained can be dependent on the time of year that the survey was carried out. To reduce the effect of seasonal variation the testing season is restricted to 1st May to 30th September.
As a result of this variation in the skidding properties, until 2005, SCRIM surveys of the trunk road network were carried out on one third of the network each year, with each

Page 30
length surveyed three times in the year (at the start, middle and end of the SCRIM survey season).
However, there was a change in approach to the surveying of trunk roads from 2005, such that skidding resistance measurements are now undertaken each year under a single annual survey regime. The surveys are scheduled such that, over a three year period, the network is surveyed early, middle and late in the test season in successive years, i.e. a length that was surveyed early in the first year will be surveyed in the middle of the season in the second year and then late in the season in the third year.
Highways England (formerly the Highways Agency) has implemented an annual correlation trial for SCRIM survey vehicles, which are currently carried out by TRL. All SCRIM vehicles undertaking surveys on trunk roads are required to pass the trial in order to undertake surveys on the trunk road network. Other SCRIM survey operators are also able to attend the trials, although it is not compulsory. However, local authorities commissioning SCRIM surveys typically expect that the SCRIM vehicles used on their network will have passed the trials, and therefore in practice it has been found that all SCRIM vehicles operating in the UK attend the trials. In the trials the SCRIM vehicles are required to undertake surveys on a number of sites having different levels of skid resistance and the data is compared to identify outliers. The trials therefore aim to ensure consistency across the fleet of vehicles operating in the UK.
5.2. Reporting SCRIM skid resistance data SCRIM skidding resistance data are recorded continuously and stored as an average. Typically the SCRIM values are reported as SCRIM Coefficients over 10m lengths.
The SCRIM Coefficients are processed to correct for temperature and speed (to obtain corrected SCRIM Coefficients) and then these are further processed to obtain Characteristic SCRIM Coefficient values (CSC), in which some allowance has been made for seasonal effects on the skid resistance.
Where the survey procedure has been to carry out surveys of one third of the network each year, with each length surveyed three times in the year, the characteristic value is calculated as the average value of the corrected SCRIM Coefficients over the three surveys - the Mean Summer SCRIM coefficient.
Under the single annual survey regime, the network surveyed is broken up into regions, or localities, that have similar climatic conditions. The average corrected SCRIM Coefficient in the preceding three years is calculated for each locality, along with the average corrected SCRIM Coefficient for the current year. The ratio of these values defines a factor that is used to scale each of the corrected SCRIM Coefficients obtained in the particular locality in the current year.
Typically, the 10m CSC data are averaged into longer, 100m lengths, for further analysis.
The calculation and application of a coefficient that is based on skidding resistance data from the previous three years means that the skidding resistance value provided by Highways England for a given year is influenced by the values from other recent years. These can cause the measured value for the most recent year to be adjusted upwards or downwards. This process is designed to smooth out fluctuations in the measured values to give a more reliable long term trend.
5.3. Using SCRIM skid resistance data The degree of skidding resistance required at a given site on the road network depends on the site category (e.g. junction approach, bend). An investigatory level is established by the highway authority for each site category. If the skidding resistance at a site is found to be at or below the investigatory level, the highway authority policy is normally to carry

Page 31
out a site investigation to determine whether the existing level of skidding resistance is likely to cause an accident problem. Note that if a road is below the investigatory level, it does not necessarily mean that the road is unsafe, it indicates a need for further investigation to determine the need for maintenance.
For Trunk Roads the investigatory levels for each site category are specified in the Design Manual for Roads and Bridges, HD 28/04. Local highway authorities may either apply these levels, or develop a local policy. Often local policies will be based on HD28/04, but adapted according to local practice.
As noted in section 3, SCRIM data is used when reporting the surface condition of trunk roads in the report. The data used in the report (from 2004) is obtained by determining whether any sub-section has a CSC which fall 0.05 or more below the Investigatory Level. If so this length will be counted within the total length reported to be in need of maintenance.
5.4. GripTester The GripTester offers an alternative to the use of SCRIM for the measurement of friction on certain roads, and is included here for information. The GripTester is a three-wheeled trailer, the third wheel being braked to produce a drag (skid) and both drag and load are continuously monitored. The friction coefficient (i.e. load/drag) is calculated and transmitted to a data collection computer held in the cab of the towing vehicle.
Due to its smaller size, the GripTester has a wider range of application, including horizontal signs, footways and pedestrian precincts as well as highway surfacing (BS 7941 Part 2). Because of the different measurement method of the device it is not possible to directly compare GripTester results with the data provided by SCRIM. However, research work is being undertaken to determine whether robust conversion factors could be developed.
There is currently no formal process of accreditation or correlation for GripTester devices.
5.5. Further information on the SCRIM The above paragraphs provide summary information on SCRIM and GripTester, and the data they provide. Further information can be obtained in the following references:
Design Manual for Roads and Bridges (DMRB) –HD 28/04, Volume 7, Section 3, Part 1, “Skid Resistance”. (Highways England), www.standardsforhighways.co.uk/dmrb/vol7/.
BS7941 Part 1, “Methods for measuring the skid resistance of pavement surfaces. Sideways Force Coefficient Routine Investigation Machine”, BSI
BS7941 Part 2, “Surface friction of pavements – test method for measurement of the surface skid resistance using the GripTester braked wheel fixed slip device”, BSI
Department for Transport (2005). “Well maintained highways. Code of practice for highway maintenance management”. The Stationery Office, London.

Page 32
6. Measuring road structural condition 6.1. Deflectograph It is considered useful to complement information on the visual condition of major roads with information about their structural condition. Many highway authorities obtain information about the structural condition of parts of their major road networks by carrying out Deflectograph surveys.
The Deflectograph is a machine for assessing the structural condition of flexible pavements. The survey vehicle employs a beam, which is laid onto the surface of the pavement. The survey vehicle drives over the beam and the amount the beam tip deflects under the load of the vehicle is measured. The survey vehicle then draws the beam along the road to the next measurement point. As a result of this survey method, the Deflectograph survey is carried out at slow speed (2.5 km/h).
Figure 17: Deflectograph Until 2000 routine Deflectograph surveys were carried out on the trunk road network at a rate of approximately 25% of Lane 1 in each year. However, because of the increasing traffic delays caused by traffic management, and with the introduction of routine TRACS surveys, routine Deflectograph surveys were discontinued and the device is now used for scheme level assessment only, covering around 10% of Highways England’s (formerly the Highways Agency) strategic Lane 1 road network each year.
On local roads there has also been a reduction in the use of Deflectograph as a routine tool, following the introduction of SCANNER surveys. Again the technique is still used for scheme level assessment. However, some local authorities still undertake routine assessments of certain lengths of their road networks with this device.
As a result of the discontinuing of the Deflectograph as routine assessments tool on trunk roads it is not possible to collate representative national statistics for this device for trunk roads. The significant decline in its use on English local loads, and the lack of nationally collated data, also makes it impossible to collate representative national statistics for this device for local roads. However, summary information has been provided in this technical note because of the widespread use of the method as a scheme level tool.
Because of its use for scheme level assessment, Highways England continues to implement an annual correlation trial for Deflectograph survey vehicles, which is currently

Page 33
carried out by TRL. All Deflectograph vehicles undertaking surveys on trunk road network are required to pass this. Other Deflectograph survey operators are also able to attend the trials, although it is not compulsory. However, as local authorities commissioning these surveys expect that the Deflectograph vehicles used will have passed the trials, it has been found that the entire UK Deflectograph fleet attend the trials. In the trials the Deflectographs are required to undertake comparative surveys on a number of sites having different levels of structural strength. The trials therefore aim to ensure consistency across the Deflectograph fleet in the UK.
6.2. Deflectograph data Deflectograph data are recorded as point values describing the deflection of the measurement beam in each wheel path, reported at intervals of approximately 4m.
Because the deflection measurement is affected by temperature, the survey procedures require that the pavement temperature is also reported at regular intervals, and that surveys are not carried out outside a certain temperature range (this range is dependent on the type of pavement being surveyed). The measured deflection data is then corrected to a standard temperature of 20C.
Other data required to enable the further processing of Deflectograph data includes the pavement construction (type and age of materials and their thicknesses). This information is often missing or of poor quality for many parts of the network. Therefore Deflectograph surveys are frequently accompanied by coring and Ground Penetrating Radar measurements to assist in determining the pavement construction.
The analysis also requires information on the past traffic (in terms of standard axles) since the original construction of the road section under assessment, or since the last structural maintenance.
6.3. Assessing structural condition using Deflectograph data Methods have been developed to allow the structural condition of the road to be derived from the measured deflections, given the past traffic loading and the construction of the road pavement.
It has been shown that there are two main phases of ‘structural behaviour’ during the life of a flexible road. In the first phase there is a very slow increase in deflection until the onset of ‘investigatory’ conditions when the road pavement begins to deteriorate more rapidly and unpredictably. This increase in deflection is related both to the traffic loading since the date on which the road was built or last strengthened and the actual level of deflection.
In the second phase of ‘structural behaviour’ it is increasingly difficult to predict how the pavement will deteriorate This second phase ends when the pavement finally reaches a failed condition when reconstruction is likely to be needed. The “residual life” of the pavement is defined as the life of a pavement (in traffic or years) until the onset of ‘investigatory’ conditions, i.e. until the end of the first phase. This is the point at which more intensive monitoring of structural condition should start as the residual life falls below zero.
Relationships have been developed between deflection, cumulative traffic and the onset of ‘investigatory’ conditions for both flexible and flexible composite pavements. These relationships take into account both the type and thickness of the road structure. Essentially for a given pavement type the higher the initial level of deflection the shorter the residual life in terms of cumulative traffic (until the onset of ‘investigatory’ conditions). By knowing the projected traffic levels on the length under assessment it is possible to convert the predicted residual life, in terms of cumulative traffic, to years. The above analyses are provided in computer programmes such as HAPMS and PANDEF.
More recent research has shown that the deflection deterioration relationships described above do not apply to thick, well constructed pavements with asphalt bases on strong foundations. These pavements do not suffer from structural deterioration, but rather from

Page 34
environmental factors that cause cracking to occur at the surface of the road. Therefore the terminology “determinate” and “indeterminate” (or “long”) life has been introduced to describe pavements that typically would be expected to follow the behaviour assumed in the deflection models (determinate life) and those where the measurement of deflection cannot be used directly (using traditional methods) to determinate the life of the pavement (indeterminate life or “long life”).
6.4. Further information on deflection data The above paragraphs provide summary information on the Deflectograph and the data provided. Further information can be obtained in the following references:
DMRB Chapter 4. (2008). Design Manual for Roads and Bridges (DMRB) –Volume 7, Section 3, Part 2 HD 29/08, Chapter 4 and Annexe 4, “Deflectograph Testing”. (Highways England) www.standardsforhighways.co.uk/dmrb/vol7/.
HAPMS Document 104 (2001). Processing of Deflection Data. Version 01.05. (Highways England).
DMRB Chapter 5. (2008). Design Manual for Roads and Bridges (DMRB) –, Volume 7, Section 3, Part 3 HD 30/08 Chapter 2 “Pavement Deterioration Mechanisms” and Chapter 6 “Interpretation”. (Highways England). www.standardsforhighways.co.uk/dmrb/vol7/

Page 35
7. Glossary of technical terms All purpose trunk roads
Centrally owned and maintained ‘A’ roads.
BCD Base Condition Data. A bespoke data file format for input of data to HAPMS
BVPI Best Value Performance Indicator – BVPIs show the relative performance of English local authorities for different aspects of performance. Replaced by National Indicators. In turn replaced by the Single Data List in 2011.
Carriageway The paved area of the highway carrying vehicular traffic and including any hard shoulders and marginal strips.
CHART The Computerised Highway Assessment of Ratings and Treatments. Developed in the 1970s to provide a system of assessing the structural maintenance needs of highways
Classified roads Local authority owned and maintained roads with ‘A’, ‘B’ or ‘C’ classification.
CSC Characteristic SCRIM Coefficient. An estimate of the underlying skid resistance once the seasonal variation has been taken into account.
CVI Coarse Visual Inspection – a method of inspecting road condition at network level developed as part of the UK Pavement Management System.
DBFO Design, build, finance and operate. Defects index Representation of the carriageway defects that will show the trends
in condition (1977 value = 100) DVI Detailed Visual Inspection – a method of inspecting road condition
developed as part of the UK Pavement Management System (see below).
Flexible pavement A pavement with the base (Road base) and all layers above the base of bituminous material.
Flexible composite A pavement with a cement-bound base and bituminous upper pavement layers.
Footway Any area alongside a road intended for use by pedestrians. (Colloquially a footway will be described either as a ‘pavement’ or as a footpath alongside a road.)
HAPMS A generic term to cover the computer systems and related engineering and business processes that comprise the Highways Agency Pavement Management System.
HMDIF Highways Maintenance Data Interchange Format. A standard file format for the exchange of Highways-related data in UKPMS.
Investigatory level The level of condition at which consideration is given of the need for maintenance. At this juncture, all available evidence (e.g. accident rates) would be taken into account.
Local roads Local authority maintained ‘A’, ‘B’, ‘C’ and unclassified roads. These are also known as non-trunk roads.
Long life pavements
A flexible pavement that is thicker than traditional pavement and has a low deflection. Residual life (see below) is not used for long

Page 36
life pavements. Macrotexture The texture of road pavements results from the size and distribution
of the aggregates within it. Texture ranges across a broad wavelength spectrum from the micrometer to the decimetre range. The term macrotexture is used to describe texture with wavelengths between to 0.5 and 50mm.
Mean Summer SCRIM coefficient
Mean of 3 or more SCRIM Coefficients measured for a length of road at well spaced intervals between May and September in a year.
Megatexture The texture of road pavements results from the size and distribution of the aggregates within it. Texture ranges across a broad wavelength spectrum from the micrometer to the decimetre range. The term megatexture is used to describe texture with wavelengths between to 50 and 500mm.
Microtexture The texture of road pavements results from the size and distribution of the aggregates within it. Texture ranges across a broad wavelength spectrum from the micrometer to the decimetre range. The term microtexture is used to describe texture with wavelengths up to 0.5 mm.
Motorway A particular type of road with restricted use carrying predominantly long distance traffic. Most motorways are the responsibility of Highways England (formerly the Highways Agency) but there are some short lengths of local authority motorways.
NI National Indicator. Show the relative performance of English local authorities for different aspects of performance. Replaced in 2011 by the Single Data List.
Non-trunk roads Local authority maintained ‘A’, ‘B’, ‘C’ and unclassified roads. These are also known as local roads.
Non-principal roads Local authority maintained ‘B’, ‘C’ and unclassified roads Overlay Material placed on top of the existing pavement in a layer (or
layers) of regular thickness. This is a more substantial treatment that surface dressing.
Pavement Technical term for the carriageway of a road. Note this is not a footway (see definition above).
Principal roads Local authority maintained 'A' roads and motorways. In general they carry less traffic than all purpose trunk roads which are 'A' roads and motorways owned and maintained by central government.
Reconstruction The removal of some or all of the structural layers of a road pavement and their replacement with new material, including a new surfacing. This is a more substantial treatment than overlay.
Residual life The expected period before the structure of a flexible or flexible composite pavement reaches an ‘investigatory condition’. At this point further deterioration is no longer predictable, so that even though the road may still be serviceable it is not possible to predict how long it will remain so. Residual life is therefore a similar concept to the supermarket ‘shelf life’.
Resurfacing The removal and replacement of the existing surface, in order to restore the running surface and improve surface characteristics.
Rigid composite pavement
A pavement in which the structural layer is cement based concrete and the surface layers are bituminous material

Page 37
Rigid pavement A pavement in which the structural layers and the surface are cement-based concrete.
SCANNER Surface Condition Assessment of the National Network of Roads. Vehicle-mounted automated pavement surface condition surveys for local authority roads based on the TRACS surveys used on the trunk road network. Like TRACS, the specification covers the requirements for both the machinery used and the survey process.
SCRIM Sideway-force Coefficient Routine Investigation Machine – a lorry-based machine that when driven over a pavement surface, measures the resistance to skidding of the wet pavement surface.
Single annual SCRIM survey
All of lane 1 of the network is surveyed once during the SCRIM testing season in each year. In successive years each road length is tested in the early, middle and late parts of the season.
Surface dressing
A single/double/triple layer of aggregate combined with one or more layers of binder (e.g. bitumen) to form a running surface. This may be laid over the existing surface.
Thin surfacing Thin surfacing systems are machine-laid proprietary mixes of asphalt that have the capability to regulate and smooth the surface profile of a road pavement, restoring surface texture and skid resistance.
TRACS Traffic Speed Condition Survey – a label to describe a methodology for machine-based surveys of surface condition, including cracking and rutting, of the trunk road network in England. The TRACS specification covers the requirements for both the machinery used and the survey process.
Trunk roads Motorways and all purpose trunk roads owned by central government and for which Highways England (formerly the Highways Agency) and Welsh Assembly Government (in Wales) have responsibility for maintenance and operation. These are strategic roads with a high proportion of long distance traffic although some trunk roads may also have lengths, with the same number, designated as an ‘A’ principal road, where traffic is predominantly local in nature.
TTS TRACS type surveys. Now known as SCANNER surveys. UKPMS United Kingdom Pavement Management System – this is a
standard logical design for software used by local highway authorities for the management of the maintenance of their road networks. The development of UKPMS is currently funded by DfT. A number of companies market software that meets the UKPMS requirements. Associated with UKPMS are standard survey types (CVI and DVI, see above) and standard ‘rules and parameters’ to be used when processing survey data for ‘national’ purposes e.g. for Best Value Performance Indicators.
Unclassified roads Minor roads which are not designated as classified roads and which are owned and maintained by a local highway authority.
Related Documents