Full Terms & Conditions of access and use can be found at https://www.tandfonline.com/action/journalInformation?journalCode=vece20 The Journal of Economic Education ISSN: 0022-0485 (Print) 2152-4068 (Online) Journal homepage: https://www.tandfonline.com/loi/vece20 Teaching modules for estimating climate change impacts in economics courses using computational guided inquiry Lea Fortmann, Justin Beaudoin, Isha Rajbhandari, Aedin Wright, Steven Neshyba & Penny Rowe To cite this article: Lea Fortmann, Justin Beaudoin, Isha Rajbhandari, Aedin Wright, Steven Neshyba & Penny Rowe (2020) Teaching modules for estimating climate change impacts in economics courses using computational guided inquiry, The Journal of Economic Education, 51:2, 143-158, DOI: 10.1080/00220485.2020.1731383 To link to this article: https://doi.org/10.1080/00220485.2020.1731383 Published online: 26 Feb 2020. Submit your article to this journal Article views: 13 View related articles View Crossmark data

Welcome message from author
This document is posted to help you gain knowledge. Please leave a comment to let me know what you think about it! Share it to your friends and learn new things together.
Transcript

Full Terms & Conditions of access and use can be found athttps://www.tandfonline.com/action/journalInformation?journalCode=vece20
The Journal of Economic Education
ISSN: 0022-0485 (Print) 2152-4068 (Online) Journal homepage: https://www.tandfonline.com/loi/vece20
Teaching modules for estimating climatechange impacts in economics courses usingcomputational guided inquiry
Lea Fortmann, Justin Beaudoin, Isha Rajbhandari, Aedin Wright, StevenNeshyba & Penny Rowe
To cite this article: Lea Fortmann, Justin Beaudoin, Isha Rajbhandari, Aedin Wright, StevenNeshyba & Penny Rowe (2020) Teaching modules for estimating climate change impacts ineconomics courses using computational guided inquiry, The Journal of Economic Education, 51:2,143-158, DOI: 10.1080/00220485.2020.1731383
To link to this article: https://doi.org/10.1080/00220485.2020.1731383
Published online: 26 Feb 2020.
Submit your article to this journal
Article views: 13
View related articles
View Crossmark data

ECONOMIC INSTRUCTION
Teaching modules for estimating climate change impacts ineconomics courses using computational guided inquiry
Lea Fortmanna, Justin Beaudoinb, Isha Rajbhandaria, Aedin Wrighta, Steven Neshybaa,and Penny Rowec
aEconomics Department, University of Puget Sound, Tacoma, WA, USA; bEconomics Department, AcadiaUniversity, Wolfville, NS, Canada; cNorthWest Research Associates, Redmond, WA, USA
ABSTRACTThe authors of this article introduce two teaching modules that aim toincrease climate literacy and active learning in undergraduate economicscourses through the incorporation of real-world data and modeling. Thesemodules are based on the concept of computational guided inquiry (CGI),which combines a guided inquiry approach within a computational frame-work, such as Excel. In one module, students estimate and graph expectedmarginal damages due to regional sea level rise for various polar ice meltscenarios. In the second module, students partially replicate a journalarticle estimating the total economic value of ecosystem services in theArctic. These modules have been used in urban, environmental, andclimate change economics courses, and are ready to be implemented withminimal upfront cost to instructors.
KEYWORDSactive learning; climatechange; economicmodeling; environmentaleconomics; guided inquiry;Microsoft Excel; real-worlddata; urban andregional economics
JEL CODEA2
There has been a growing recognition in the field of economic education that the theoreticalmodels that make up the majority of the content in economic principles courses do not readilyalign with real-world applications and do not do a sufficient job at promoting economic literacy(Hansen, Salemi, and Siegfried 2002; Ormerod 2003; Becker 2004; Salemi 2005). Furthermore,studies have found that students who have taken economics courses retain very little of theknowledge gained during the course and often have a poor understanding of basic economicconcepts (Walstad and Allgood 1999; Hansen, Salemi, and Siegfried 2002). To address theseissues, Hansen, Salemi, and Siegfried (2002) recommend that courses move away from traditionallecture-based formats to allow for more active-learning opportunities in the classroom, along withan increased focus on real-world issues and problems and how they can be explained by basiceconomic principles. Active-learning strategies, such as group projects or cooperative learning,have also been found to improve student retention of material (Kvam 2000). We introduce aseries of computational teaching modules that incorporate these recommendations by connectingeconomic concepts and models to a pressing issue with real-world implications.
Climate change threatens the economic, social, and ecological well-being of our society andhas been called the “defining problem of our age”1 (Moon 2007, online). However, in a 2016 sur-vey of registered voters in the United States, only half of those surveyed thought that globalwarming “should be a ‘high’ or ‘very high’ priority for the president and Congress” (Leiserowitzet al. 2016). Another survey of Americans found that only 57 percent of adults agreed that “globalwarming is caused mostly by human activities” (Marlon et al. 2018, online). In recognition of the
CONTACT Lea Fortmann [email protected] Assistant Professor, Economics Department, University of PugetSound, 1500 North Warner Street, Tacoma, WA 98416, USA.� 2020 Taylor & Francis Group, LLC
THE JOURNAL OF ECONOMIC EDUCATION2020, VOL. 51, NO. 2, 143–158https://doi.org/10.1080/00220485.2020.1731383

importance of a climate-literate society, the National Oceanic and Atmospheric Administration(NOAA) has developed a set of climate literacy standards, stating in its mission that, “Americans’health, security, and economic well-being are linked closely to climate and weather” (NationalOceanic and Atmospheric Administration [NOAA] n.d., online). With this in mind, increasingclimate literacy in undergraduate curricula should be an important component of developing thenext generation of consumers, voters, and decision-makers.
The teaching modules presented in this article have the dual goals of improving climate liter-acy in undergraduate education through polar research and enhancing student learning of eco-nomic concepts through active-learning methods. The modules are the outcome of a NationalScience Foundation grant awarded by the Office of Polar Programs and the Division ofUndergraduate Education. The modules were conceptualized by a curriculum development teamcomposed of an educational specialist, polar researchers, and undergraduate instructors from arange of disciplines. The outcome of the project was the creation and implementation of sevendifferent teaching modules that have been used in a variety of courses, including thermodynam-ics, quantum mechanics, computer science, physics, and economics. These modules are based onthe concept of computational guided inquiry (CGI), which incorporates active-learning strategiesand guided inquiry within a computational platform, such as Microsoft Excel spreadsheets,Python Jupyter Notebooks, or R Studio Notebooks.
We describe two Excel-based CGI modules that can be used in a variety of undergraduateeconomics courses. The learning objectives of the modules are three-fold: to increase students’knowledge of climate change impacts and polar regions, to enhance student learning by applyingeconomic concepts to real-world data, and to strengthen students’ analytical and computationalskills through working in Excel. The content of the modules was developed using a backwarddesign approach that starts with the identification of the desired learning objectives of the moduleand the “enduring” understandings we wanted the students to come away with (Wiggins andMcTighe 1998). Given the central role of models in economics, the enduring understandings forboth modules focus on the students applying real-world data to an economic model or frame-work, identifying the key assumptions driving the results, and discussing the associated limita-tions of the model’s outcomes. In addition to the goal of using polar research to improve climateliteracy, course-specific learning objectives of the modules cover topics in standard microeconom-ics, environmental, urban, or cost-benefits analysis courses, including the total economic valuationframework, nonmarket valuation techniques, and principles of marginal analysis applied to mar-ginal cost and marginal damage curves. Each module takes approximately 50 to 80minutes tocomplete and can be implemented in a single class period or over multiple days. The first modulefocuses on estimating and graphing the expected marginal damages from regional sea level risedue to polar ice melt using data from Climate Central’s Surging Seas Risk Finder Web site.2 Themodule presented here specifically focuses on Tacoma, Washington, but it can be easily modifiedfor other coastal cities. The primary prerequisite knowledge needed for students to complete thismodule is the concept of marginal analysis and familiarity with marginal cost and marginal dam-age curves. The second module is based on a partial replication of a paper from the peer-reviewed journal, Ecosystem Services, that estimates the total economic value of ecosystem servicesin the Arctic. In the module, the students’ first task is to gather the relevant data from severalprimary sources. Then, they are guided through converting the data in Excel to get the final esti-mated value following the same methods used by the author of the original paper (O’Garra2017). This module assumes students have some prior knowledge of the total economic valuationframework and would ideally follow the introduction of the topic in a course.
An assessment was conducted based on pre- and post-module surveys completed by the stu-dents to evaluate the efficacy of the CGI modules regarding climate literacy and student learningoutcomes. The results in this article are based on student survey data from four different eco-nomics courses taught by three instructors who implemented the modules during the 2017–18
144 L. FORTMANN ET AL.
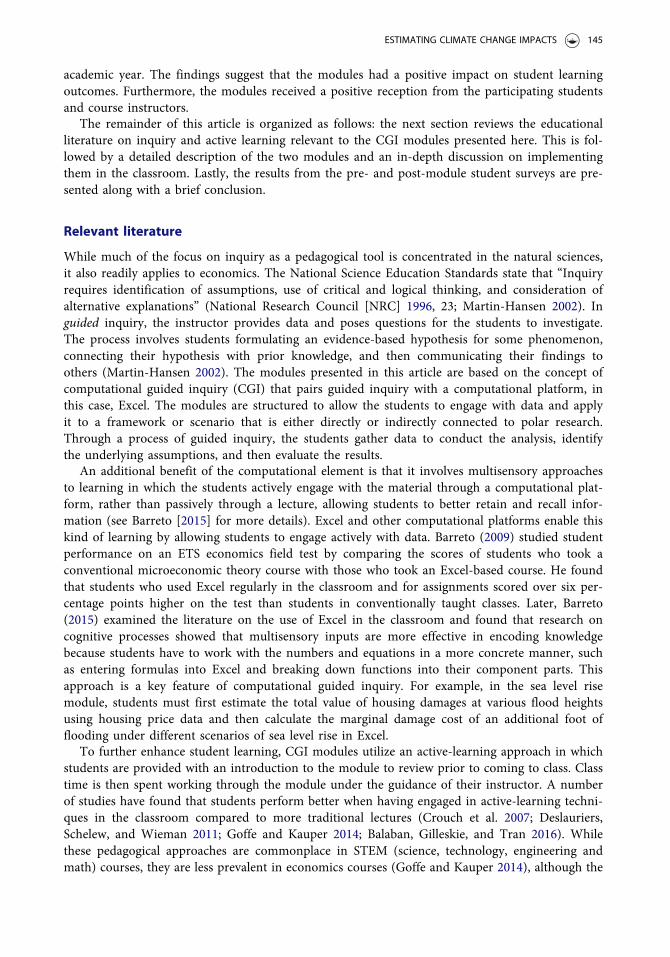
academic year. The findings suggest that the modules had a positive impact on student learningoutcomes. Furthermore, the modules received a positive reception from the participating studentsand course instructors.
The remainder of this article is organized as follows: the next section reviews the educationalliterature on inquiry and active learning relevant to the CGI modules presented here. This is fol-lowed by a detailed description of the two modules and an in-depth discussion on implementingthem in the classroom. Lastly, the results from the pre- and post-module student surveys are pre-sented along with a brief conclusion.
Relevant literature
While much of the focus on inquiry as a pedagogical tool is concentrated in the natural sciences,it also readily applies to economics. The National Science Education Standards state that “Inquiryrequires identification of assumptions, use of critical and logical thinking, and consideration ofalternative explanations” (National Research Council [NRC] 1996, 23; Martin-Hansen 2002). Inguided inquiry, the instructor provides data and poses questions for the students to investigate.The process involves students formulating an evidence-based hypothesis for some phenomenon,connecting their hypothesis with prior knowledge, and then communicating their findings toothers (Martin-Hansen 2002). The modules presented in this article are based on the concept ofcomputational guided inquiry (CGI) that pairs guided inquiry with a computational platform, inthis case, Excel. The modules are structured to allow the students to engage with data and applyit to a framework or scenario that is either directly or indirectly connected to polar research.Through a process of guided inquiry, the students gather data to conduct the analysis, identifythe underlying assumptions, and then evaluate the results.
An additional benefit of the computational element is that it involves multisensory approachesto learning in which the students actively engage with the material through a computational plat-form, rather than passively through a lecture, allowing students to better retain and recall infor-mation (see Barreto [2015] for more details). Excel and other computational platforms enable thiskind of learning by allowing students to engage actively with data. Barreto (2009) studied studentperformance on an ETS economics field test by comparing the scores of students who took aconventional microeconomic theory course with those who took an Excel-based course. He foundthat students who used Excel regularly in the classroom and for assignments scored over six per-centage points higher on the test than students in conventionally taught classes. Later, Barreto(2015) examined the literature on the use of Excel in the classroom and found that research oncognitive processes showed that multisensory inputs are more effective in encoding knowledgebecause students have to work with the numbers and equations in a more concrete manner, suchas entering formulas into Excel and breaking down functions into their component parts. Thisapproach is a key feature of computational guided inquiry. For example, in the sea level risemodule, students must first estimate the total value of housing damages at various flood heightsusing housing price data and then calculate the marginal damage cost of an additional foot offlooding under different scenarios of sea level rise in Excel.
To further enhance student learning, CGI modules utilize an active-learning approach in whichstudents are provided with an introduction to the module to review prior to coming to class. Classtime is then spent working through the module under the guidance of their instructor. A numberof studies have found that students perform better when having engaged in active-learning techni-ques in the classroom compared to more traditional lectures (Crouch et al. 2007; Deslauriers,Schelew, and Wieman 2011; Goffe and Kauper 2014; Balaban, Gilleskie, and Tran 2016). Whilethese pedagogical approaches are commonplace in STEM (science, technology, engineering andmath) courses, they are less prevalent in economics courses (Goffe and Kauper 2014), although the
ESTIMATING CLIMATE CHANGE IMPACTS 145
literature in this area is growing (Lage, Platt, and Treglia 2000; Simkins and Maier 2004; Emersonand Taylor 2004; Yamarik 2007).
In one study by Lage, Platt, and Treglia (2000), students in economics principles coursesreviewed the course material prior to coming to class via videotaped lectures, voice-recordedPowerPoint slides, and/or course readings. Then, in the classroom, the instructor led the studentsthrough a hands-on activity or a lab related to the material covered for that day. Additionally,the students completed worksheets and review questions in class. At the end of the course, themajority of students reported learning more economics with the inverted classroom format thatallowed for active learning and expressed a preference for it over traditional lecture formats.Similarly, Balaban, Gilleskie, and Tran (2016) found that students who engaged in hands-onproblem-solving activities in a flipped classroom setting outperformed students in a moretraditional lecture format across a range of measures, including knowledge, comprehension,application, and analysis.
Despite these positive findings, in a survey of economics instructors, Goffe and Kauper (2014)found that many instructors remain reluctant to incorporate active-learning techniques in theclassroom, citing reasons such as large upfront costs and beliefs that “students learn best fromlectures” (364). The CGI modules presented in this article aim to alleviate the first barrier by pro-viding an off-the-shelf teaching module that can be implemented with a minimal upfront cost,and the Excel-based format provides a hands-on, active-learning experience in the classroom.While this particular project focuses on climate literacy with an emphasis on polar research, themore general approach to active learning through the use of computational guided inquiry canalso be applied to a wider variety of topics and learning objectives in courses such as economet-rics or macroeconomics.
Implementation and description of modules
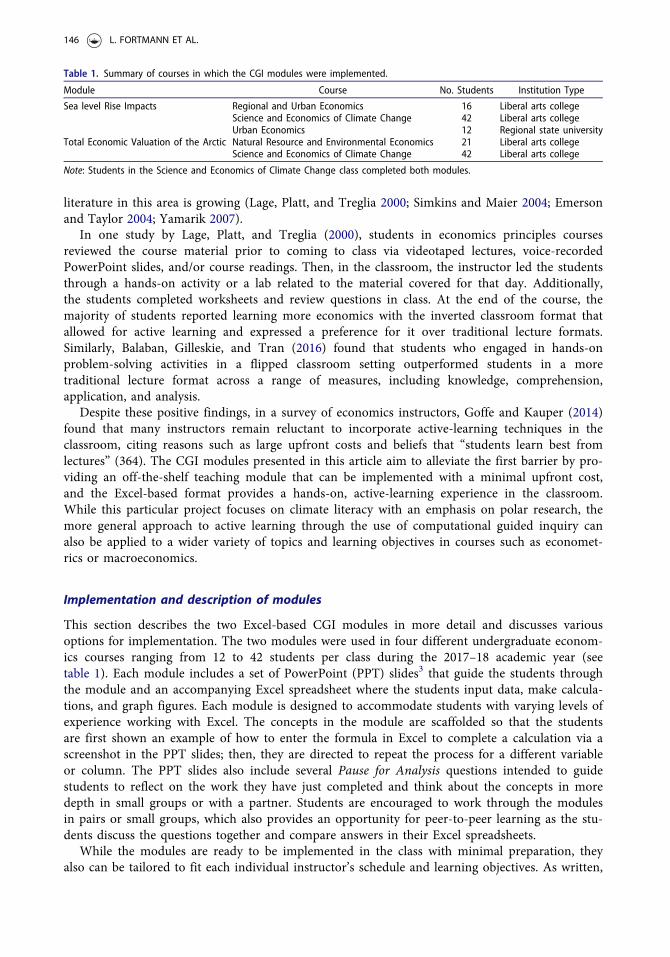
This section describes the two Excel-based CGI modules in more detail and discusses variousoptions for implementation. The two modules were used in four different undergraduate econom-ics courses ranging from 12 to 42 students per class during the 2017–18 academic year (seetable 1). Each module includes a set of PowerPoint (PPT) slides3 that guide the students throughthe module and an accompanying Excel spreadsheet where the students input data, make calcula-tions, and graph figures. Each module is designed to accommodate students with varying levels ofexperience working with Excel. The concepts in the module are scaffolded so that the studentsare first shown an example of how to enter the formula in Excel to complete a calculation via ascreenshot in the PPT slides; then, they are directed to repeat the process for a different variableor column. The PPT slides also include several Pause for Analysis questions intended to guidestudents to reflect on the work they have just completed and think about the concepts in moredepth in small groups or with a partner. Students are encouraged to work through the modulesin pairs or small groups, which also provides an opportunity for peer-to-peer learning as the stu-dents discuss the questions together and compare answers in their Excel spreadsheets.
While the modules are ready to be implemented in the class with minimal preparation, theyalso can be tailored to fit each individual instructor’s schedule and learning objectives. As written,
Table 1. Summary of courses in which the CGI modules were implemented.
Module Course No. Students Institution Type
Sea level Rise Impacts Regional and Urban Economics 16 Liberal arts collegeScience and Economics of Climate Change 42 Liberal arts collegeUrban Economics 12 Regional state university
Total Economic Valuation of the Arctic Natural Resource and Environmental Economics 21 Liberal arts collegeScience and Economics of Climate Change 42 Liberal arts college
Note: Students in the Science and Economics of Climate Change class completed both modules.
146 L. FORTMANN ET AL.
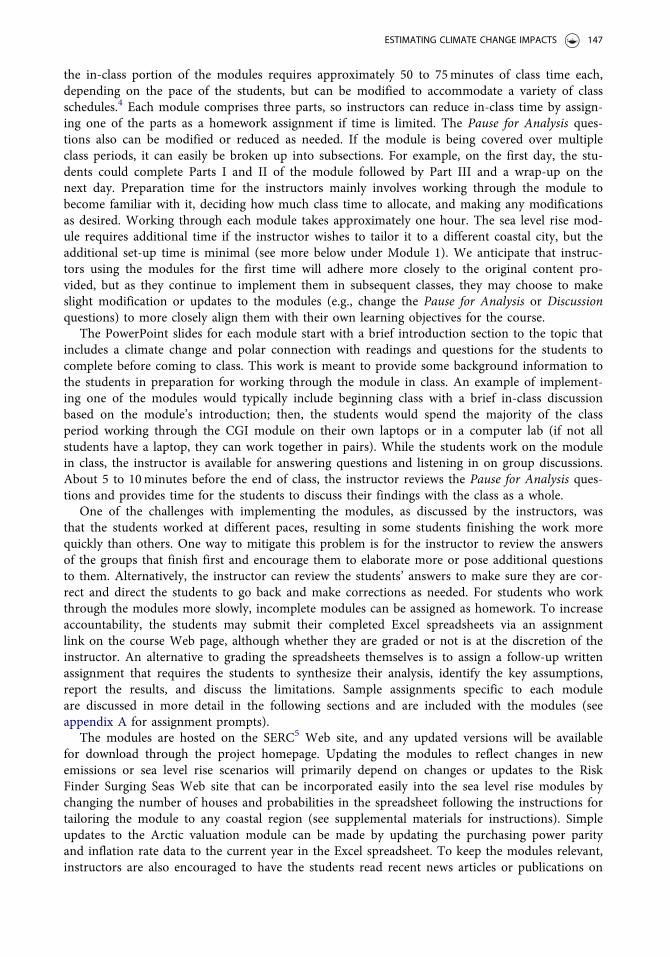
the in-class portion of the modules requires approximately 50 to 75minutes of class time each,depending on the pace of the students, but can be modified to accommodate a variety of classschedules.4 Each module comprises three parts, so instructors can reduce in-class time by assign-ing one of the parts as a homework assignment if time is limited. The Pause for Analysis ques-tions also can be modified or reduced as needed. If the module is being covered over multipleclass periods, it can easily be broken up into subsections. For example, on the first day, the stu-dents could complete Parts I and II of the module followed by Part III and a wrap-up on thenext day. Preparation time for the instructors mainly involves working through the module tobecome familiar with it, deciding how much class time to allocate, and making any modificationsas desired. Working through each module takes approximately one hour. The sea level rise mod-ule requires additional time if the instructor wishes to tailor it to a different coastal city, but theadditional set-up time is minimal (see more below under Module 1). We anticipate that instruc-tors using the modules for the first time will adhere more closely to the original content pro-vided, but as they continue to implement them in subsequent classes, they may choose to makeslight modification or updates to the modules (e.g., change the Pause for Analysis or Discussionquestions) to more closely align them with their own learning objectives for the course.
The PowerPoint slides for each module start with a brief introduction section to the topic thatincludes a climate change and polar connection with readings and questions for the students tocomplete before coming to class. This work is meant to provide some background information tothe students in preparation for working through the module in class. An example of implement-ing one of the modules would typically include beginning class with a brief in-class discussionbased on the module’s introduction; then, the students would spend the majority of the classperiod working through the CGI module on their own laptops or in a computer lab (if not allstudents have a laptop, they can work together in pairs). While the students work on the modulein class, the instructor is available for answering questions and listening in on group discussions.About 5 to 10minutes before the end of class, the instructor reviews the Pause for Analysis ques-tions and provides time for the students to discuss their findings with the class as a whole.
One of the challenges with implementing the modules, as discussed by the instructors, wasthat the students worked at different paces, resulting in some students finishing the work morequickly than others. One way to mitigate this problem is for the instructor to review the answersof the groups that finish first and encourage them to elaborate more or pose additional questionsto them. Alternatively, the instructor can review the students’ answers to make sure they are cor-rect and direct the students to go back and make corrections as needed. For students who workthrough the modules more slowly, incomplete modules can be assigned as homework. To increaseaccountability, the students may submit their completed Excel spreadsheets via an assignmentlink on the course Web page, although whether they are graded or not is at the discretion of theinstructor. An alternative to grading the spreadsheets themselves is to assign a follow-up writtenassignment that requires the students to synthesize their analysis, identify the key assumptions,report the results, and discuss the limitations. Sample assignments specific to each moduleare discussed in more detail in the following sections and are included with the modules (seeappendix A for assignment prompts).
The modules are hosted on the SERC5 Web site, and any updated versions will be availablefor download through the project homepage. Updating the modules to reflect changes in newemissions or sea level rise scenarios will primarily depend on changes or updates to the RiskFinder Surging Seas Web site that can be incorporated easily into the sea level rise modules bychanging the number of houses and probabilities in the spreadsheet following the instructions fortailoring the module to any coastal region (see supplemental materials for instructions). Simpleupdates to the Arctic valuation module can be made by updating the purchasing power parityand inflation rate data to the current year in the Excel spreadsheet. To keep the modules relevant,instructors are also encouraged to have the students read recent news articles or publications on
ESTIMATING CLIMATE CHANGE IMPACTS 147

sea level rise or Arctic ice melt to increase student interest and connect broader climate changeimpacts to local issues.6
Module 1: Regional sea level rise impactsThis module is framed from the perspective of a city planner trying to determine how much tospend on local climate change adaptation given different scenarios of sea level rise and theassociated storm surge and higher flood levels that come with it. It has been used within econom-ics departments in two lower-level courses on urban and regional economics, as well as in anupper-level elective course on climate change. Outside of economics, the module was used in aninterdisciplinary upper-level course on the science and economics of climate change with noeconomics prerequisite. For the urban classes, the module was implemented later in the semesterfollowing a unit on pollution, but it also could be incorporated into sections of the course focus-ing on future issues facing urban centers or the impact of climate change on growth and land-usemanagement decisions. Alternatively, it could even be used in a microeconomics class to reinforcebasic concepts of marginal analysis, given the comment of one instructor who implemented themodule and reported that after completing the module, “one of the main learning outcomes Isaw was that students really showed an improvement in thinking at the margin.” The moduledoes assume that students have had some exposure to basic economic concepts, such as marginalcost and marginal benefit curves, but as described above, it could be used to help reinforce theseconcepts if learning them in a class for the first time. Other concepts, such as calculating expecteddamages based on risk probabilities, are covered in the module.
The main calculations in the module are based on housing data provided to the students,which are used to estimate the avoided damages associated with regional flooding due to stormsurge and sea level rise. It incorporates different probabilities of flooding based on four differentsea level rise scenarios. While the module described here is specific to Tacoma, Washington, thedata come from Climate Central’s Risk Finder Web site that produces similar data for a varietyof coastal cities, allowing the module to be easily tailored to different locales. The learning objec-tives of the module are to:
1. Increase climate literacy by connecting sea level rise due to ice melt in the polar regionsto the local impacts of higher flood levels.
2. Learn tools to apply to decision-making given uncertainty in sea level rise and flooding.3. Gain computational skills through calculating and graphing marginal damage curves
in Excel.
In the introduction of the module, students become familiar with the connection of sea levelrise to melting polar ice by watching a video and reading an article on the topic. Then, they aredirected to the Risk Finder Web site and asked some basic questions to gain familiarity with thedata they will be using in the module to conduct the analysis. During the in-class portion ofthe module, the instructor is provided with a brief PowerPoint presentation highlighting thedifferent sea level rise scenarios and how they are related to polar ice melt. The students thenspend the rest of the class working through the first part of the CGI module, which requiresthem to calculate the expected marginal damages given different probabilities of flooding in theirregion using median house price data7 in Excel. As discussed above, the computational part isscaffolded to accommodate different levels of Excel experience among the students.
In the next section, the students use their results to graph the expected marginal damagecurves for various levels of flooding for the years 2050 and 2100. This section gives them experi-ence with creating graphs in Excel, including adding titles and labels for the axes. In the Pausefor Analysis question that follows, the students are asked to analyze the figures and discuss what
148 L. FORTMANN ET AL.
assumptions have been made so far and how they could contribute to the shape of the marginaldamage curves.
The final section requires the students to calculate the expected damages given different proba-bilities of sea level rise under low, medium, fast, and extreme rise scenarios. They also graph themarginal cost curve of a proposed sea wall relative to the marginal expected damages of flooding.In this final graph, students are confronted with the familiar graph of a marginal cost curve anda marginal avoided damage (or marginal benefit) curve. Using this graph, the students can makea recommendation about what the “optimal” (or efficient) seawall height would be given theexpected marginal damages from flooding.
While the analysis is very basic with many simplifications, one of the enduring goals of theexercise is for students to understand the importance of making assumptions in economic model-ing. Thus, the final set of Pause for Analysis questions focuses on the assumptions and limitationsof the analysis (e.g., only using housing values to estimate damage costs or assuming that thetotal value of the house is lost with one foot of flooding) and encourages the students to thinkabout how changing these assumptions would impact their results. Through this exercise, stu-dents begin to comprehend the broader role of models in economics, along with their limitationsand the implications of the underlying assumptions. Furthermore, students working in Excel areable to quickly calculate marginal costs from total costs, and then graph the curves to see howthe theory applies to real-world empirical data. For example, the economics of pollution is oftentaught with an upward-sloping, monotonic marginal damage curve, suggesting that as pollutionemissions increase, marginal damage costs also increase. However, when this model is applied tomarginal flood damages in Tacoma, Washington, the students find that the marginal damagecurves do not follow the expected upward trajectories. Therefore, the students are forced to revertback to the data and the underlying assumptions of the model to understand why this may bethe case.
Finally, instead of grading each Excel spreadsheet, an optional follow-up assignment is to havethe students write a memo to the city planning department that summarizes the analysis andresults, identifies the main limitations, and provides a policy recommendation (the assignmentprompt is included in the module). This assignment requires the students to synthesize and con-dense the multiple tables and graphs they compiled throughout the module into a single sum-mary document that highlights the key features of the analysis and requires the students toconvey economic concepts to a nontechnical audience in writing.
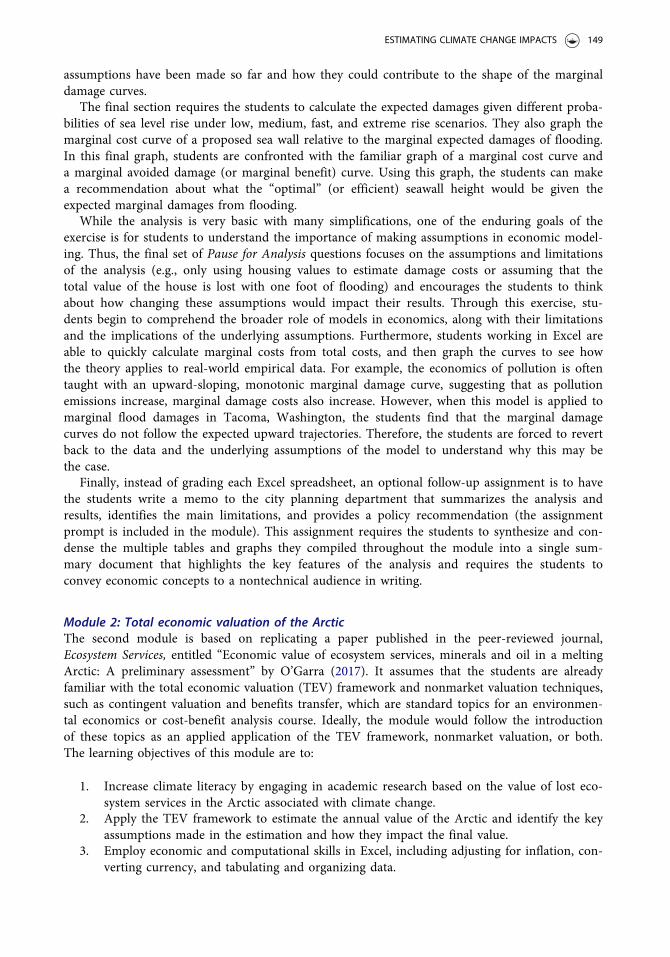
Module 2: Total economic valuation of the ArcticThe second module is based on replicating a paper published in the peer-reviewed journal,Ecosystem Services, entitled “Economic value of ecosystem services, minerals and oil in a meltingArctic: A preliminary assessment” by O’Garra (2017). It assumes that the students are alreadyfamiliar with the total economic valuation (TEV) framework and nonmarket valuation techniques,such as contingent valuation and benefits transfer, which are standard topics for an environmen-tal economics or cost-benefit analysis course. Ideally, the module would follow the introductionof these topics as an applied application of the TEV framework, nonmarket valuation, or both.The learning objectives of this module are to:
1. Increase climate literacy by engaging in academic research based on the value of lost eco-system services in the Arctic associated with climate change.
2. Apply the TEV framework to estimate the annual value of the Arctic and identify the keyassumptions made in the estimation and how they impact the final value.
3. Employ economic and computational skills in Excel, including adjusting for inflation, con-verting currency, and tabulating and organizing data.
ESTIMATING CLIMATE CHANGE IMPACTS 149
The pre-class assignment includes reading the paper that will be replicated (6 pages) and com-pleting the Introduction section of the module, which briefly introduces the Arctic region and thepredicted changes in temperature and precipitation given different climate scenarios. In class, thestudents start with the first part of the module that identifies four papers and reports used inO’Garra (2017) and guides the students through extracting and recording the relevant data fromeach source in Excel.
After the key data have been collected (e.g., replacement costs of subsistence hunting in theArctic, household willingness-to-pay for polar bear conservation, etc.), the next part requires thestudents to convert the values to get the annual total economic value for each component. Forexample, they have to use the household stated preference value for polar bear conservation fromOlar et al. (2011) to estimate the per capita value for Canada, and ultimately the total annualvalue for the Arctic. Similar to the previous module, the calculations are scaffolded in Excel toaccommodate different levels of experience. Once all of the values have been estimated, in thefinal part of the module, the students convert the Canadian currency to U.S. dollars based onpurchasing power parity and adjust for inflation. In this section, they use the appropriate conver-sion rates to get a final estimate of the annual value of ecosystem services in the Arctic updatedto 2018 USD.
In addition to exposing the students to empirical research that employs nonmarket valuationtechniques, another key feature of the module is that it requires the students to apply the sameassumptions that O’Garra used in her analysis (e.g., households have 1.5 people). This require-ment enables the students to assess the validity of these assumptions and analyze how theyimpact the final estimated value, which is a focus of the Pause for Analysis and Discussion ques-tions. The final discussion questions aim to get the students to focus on other potential limita-tions to the analysis and the challenges associated with this type of environmental valuation.Follow-up assignments for this module could include having the students write a memo summa-rizing their analysis to a local policymaker. Alternatively, a more advanced assignment would behaving the students identify a potential missing value not accounted for in the O’Garra (2017)paper (e.g., existence values for other Arctic wildlife or the value of carbon sequestration in theArctic tundra) and then finding an academic source to get an estimate of the missing value andincorporating it into an update of the total economic value of the Arctic, written up as an adden-dum to the original paper (an optional prompt for this assignment is included in the module).
CGI module evaluation and assessment
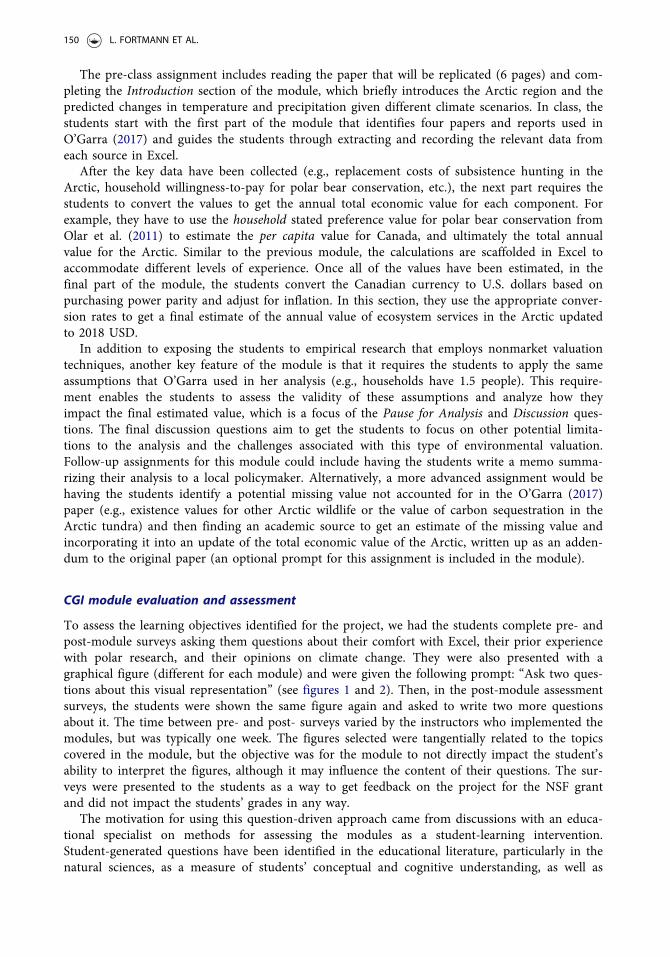
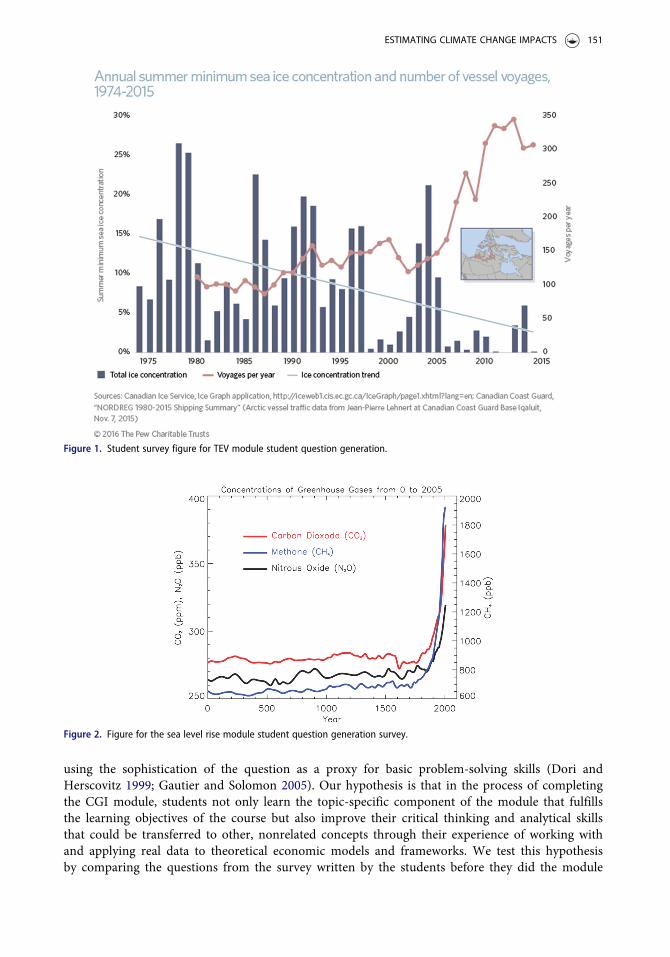
To assess the learning objectives identified for the project, we had the students complete pre- andpost-module surveys asking them questions about their comfort with Excel, their prior experiencewith polar research, and their opinions on climate change. They were also presented with agraphical figure (different for each module) and were given the following prompt: “Ask two ques-tions about this visual representation” (see figures 1 and 2). Then, in the post-module assessmentsurveys, the students were shown the same figure again and asked to write two more questionsabout it. The time between pre- and post- surveys varied by the instructors who implemented themodules, but was typically one week. The figures selected were tangentially related to the topicscovered in the module, but the objective was for the module to not directly impact the student’sability to interpret the figures, although it may influence the content of their questions. The sur-veys were presented to the students as a way to get feedback on the project for the NSF grantand did not impact the students’ grades in any way.
The motivation for using this question-driven approach came from discussions with an educa-tional specialist on methods for assessing the modules as a student-learning intervention.Student-generated questions have been identified in the educational literature, particularly in thenatural sciences, as a measure of students’ conceptual and cognitive understanding, as well as
150 L. FORTMANN ET AL.
using the sophistication of the question as a proxy for basic problem-solving skills (Dori andHerscovitz 1999; Gautier and Solomon 2005). Our hypothesis is that in the process of completingthe CGI module, students not only learn the topic-specific component of the module that fulfillsthe learning objectives of the course but also improve their critical thinking and analytical skillsthat could be transferred to other, nonrelated concepts through their experience of working withand applying real data to theoretical economic models and frameworks. We test this hypothesisby comparing the questions from the survey written by the students before they did the module
Figure 1. Student survey figure for TEV module student question generation.
Figure 2. Figure for the sea level rise module student question generation survey.
ESTIMATING CLIMATE CHANGE IMPACTS 151

with the questions they wrote after they completed it, with both the pre- and post- questionsreferring to the same graph (figures 1 and 2). We use two different approaches for the analysis.The first is a top-down approach, in which a rubric is used to score the students’ questions basedon their level of testability (see table 2), and the results are analyzed using OLS regression ana-lysis. For the second approach, we followed the methods of Ryken and Hamel (2016), using aprocess based on grounded theory to analyze the questions from a more qualitative, bottom-upperspective. This approach involved a team of three people analyzing sets of questions that werewritten by the same student from their pre- and post-module surveys. The team looked for shiftsthat emerged from the pre- to the post-survey questions that exhibited some form of positivegrowth or change by the student.
We recognize that the relatively short engagement that students have with the modules (typicallyone week or less) and the brief time elapsed between the pre- and post- surveys may not allow forappreciable gains in student learning. However, the results from the assessments presented here arepositive and suggest that the students did experience some measurable growth based on the evalua-tions of their questions. The regression results indicate that the CGI module improved students’ability to generate “testable” questions, and the grounded theory approach suggests that the level ofquestions written by the students progressed from more basic or one-dimensional questions writtenin the pre-assessment survey to more detailed and multi-dimensional questions in the post-assessment survey.
Regression results from top-down analysisAs part of the pre- and post-module surveys, students were asked to generate a total of four ques-tions (two pre- and two post-) based on the figure presented to them that differed for each mod-ule. Using a top-down approach, the questions were then ranked on a scale of 1 to 3, based on arubric defining various levels of “testability” (see table 2). To test the robustness of the rubric, arandom sample of 20 percent of the questions was double-coded and achieved a 76 percent agree-ment.8 The selection of the testability criterion was based on a preliminary assessment of thequestions generated by students who completed a CGI module from a different course.9 Students
Table 2. Rubric for ranking questions on testability.
Score Criteria and Sample Questions
1 Not relevant to testabilitya. No reference to physical world (about the visual meaning of colors, etc.).b. Question is too unclear to be testable.c. Not answerable with the scientific method because too unclear about what variables could be tested.
Sample questions� What am I looking at?� How was this data gathered?� Why are voyages per year increasing so much?
2 Question references physical world but is not testable with the scientific method.a. Not answerable, perhaps because it is unspecific, shows an incorrect understanding of the figure, or is too unclear.b. Answerable, but scientific method is not needed.c. The figure already answers the question.d. Possibly a specific question referring to the figure but too broad to answer with the scientific method.
Sample questions� What is the trend in Artic sea ice volume change?� What caused the spike in ice cover around 2004?� What is the average of summer minimal sea ice concentration?
3 Question is testable with the scientific method.a. Empirical question about the physical world.b. Specific references to the visual.
Sample questions� What causes the cyclical nature of the ice concentration to decline?� What environmental factors allow a year to have below average ice in one season but above average ice in another?� Is the Ice concentration trend directly correlated to the number of voyages per year?
152 L. FORTMANN ET AL.

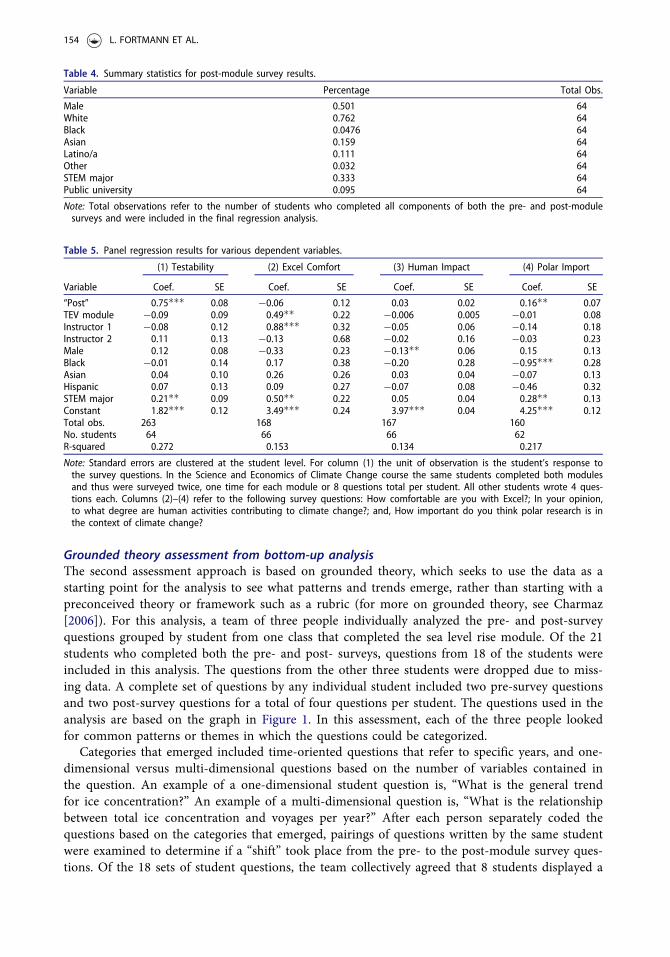
were also asked questions regarding their comfort level with Excel and opinions on climatechange and polar research to evaluate the other project goals regarding climate literacy, familiaritywith polar data, and improved computational skills (see table 3). The survey results, together withthe testability scores, were compiled into a panel dataset of pre- and post-module responses,along with socio-demographic data on the students (see table 4). Out of the 91 total studentsregistered in the four classes in which modules were implemented, 90 percent of the studentscompleted some portion of the pre- or post- survey. However, in the final analysis, a number ofobservations were dropped due to incomplete data. For example, some students filled out thepre-module survey but did not complete the post- survey. Other students started the survey butdid not complete all the questions in one or both of the surveys. If students did not provide fourquestions across both surveys, they were not given a testability score by the evaluators. The finalsample size used in the regression analysis includes 64 students or 70 percent of all studentsregistered in the four courses.
To analyze the results, we use OLS regression analysis to compare the students’ questions andsurvey responses before and after they completed the CGI module. The answers to the surveyquestions, along with the testability scores, serve as the dependent variables in the regressionmodels, and the main independent variable of interest is the dummy variable, post, which is anindicator for survey responses from the post-module survey. The regression results are displayedin table 5. The results indicate that completing the CGI module improved the students’ abilityto ask more “testable” questions, as defined by the rubric. The coefficient of the post variableindicates that after the module, testability increased by almost one unit after controlling forinstructor, module type (TEV or SLR), race, gender, and whether the student is a STEM major.While the coefficient value for post is not directly interpretable, the results are statistically signifi-cant and suggest that the students improved their ability to ask more advanced questions aftercompleting the CGI module.
Other results indicate that working through the module did not increase students’ level ofcomfort with Excel spreadsheets. The lack of perceived improvement in Excel skills is somewhatsurprising. Some students initially responded being “somewhat comfortable” using Excel in thepre-module survey response, but changed their post-module survey response to “neutral” oreven “somewhat uncomfortable,” suggesting that the module may have exposed some weak-nesses in their Excel skills, which is reflected in these results. For the survey question that asksstudents to rank the degree to which they think humans are contributing to climate change, thepost-module coefficient is not statistically significant. However, in the pre-module survey, 95percent of the students indicate that they think human activities are “significantly” contributingto climate change, so there is little room for movement. Not surprisingly, upon completion ofthe module, students felt that polar research was more important in the context of climatechange based on the positive and statistically significant coefficient for post in column (4) oftable 5.
Table 3. Questions in pre- and post-assessment survey and associated value scale.
Survey Questions
ScaleHow comfortable are you
with Excel?
In your opinion, to whatdegree are human activities
contributing toclimate change?
How important do you thinkpolar research is in the
context of climate change?
1 Very uncomfortable Not at all Not important at all2 Somewhat uncomfortable Slightly Slightly important3 Neutral Moderately Moderately important4 Somewhat comfortable Significantly Very important5 Very comfortable – Extremely important
ESTIMATING CLIMATE CHANGE IMPACTS 153
Grounded theory assessment from bottom-up analysisThe second assessment approach is based on grounded theory, which seeks to use the data as astarting point for the analysis to see what patterns and trends emerge, rather than starting with apreconceived theory or framework such as a rubric (for more on grounded theory, see Charmaz[2006]). For this analysis, a team of three people individually analyzed the pre- and post-surveyquestions grouped by student from one class that completed the sea level rise module. Of the 21students who completed both the pre- and post- surveys, questions from 18 of the students wereincluded in this analysis. The questions from the other three students were dropped due to miss-ing data. A complete set of questions by any individual student included two pre-survey questionsand two post-survey questions for a total of four questions per student. The questions used in theanalysis are based on the graph in Figure 1. In this assessment, each of the three people lookedfor common patterns or themes in which the questions could be categorized.
Categories that emerged included time-oriented questions that refer to specific years, and one-dimensional versus multi-dimensional questions based on the number of variables contained inthe question. An example of a one-dimensional student question is, “What is the general trendfor ice concentration?” An example of a multi-dimensional question is, “What is the relationshipbetween total ice concentration and voyages per year?” After each person separately coded thequestions based on the categories that emerged, pairings of questions written by the same studentwere examined to determine if a “shift” took place from the pre- to the post-module survey ques-tions. Of the 18 sets of student questions, the team collectively agreed that 8 students displayed a
Table 4. Summary statistics for post-module survey results.
Variable Percentage Total Obs.
Male 0.501 64White 0.762 64Black 0.0476 64Asian 0.159 64Latino/a 0.111 64Other 0.032 64STEM major 0.333 64Public university 0.095 64
Note: Total observations refer to the number of students who completed all components of both the pre- and post-modulesurveys and were included in the final regression analysis.
Table 5. Panel regression results for various dependent variables.
(1) Testability (2) Excel Comfort (3) Human Impact (4) Polar Import
Variable Coef. SE Coef. SE Coef. SE Coef. SE
“Post” 0.75��� 0.08 �0.06 0.12 0.03 0.02 0.16�� 0.07TEV module �0.09 0.09 0.49�� 0.22 �0.006 0.005 �0.01 0.08Instructor 1 �0.08 0.12 0.88��� 0.32 �0.05 0.06 �0.14 0.18Instructor 2 0.11 0.13 �0.13 0.68 �0.02 0.16 �0.03 0.23Male 0.12 0.08 �0.33 0.23 �0.13�� 0.06 0.15 0.13Black �0.01 0.14 0.17 0.38 �0.20 0.28 �0.95��� 0.28Asian 0.04 0.10 0.26 0.26 0.03 0.04 �0.07 0.13Hispanic 0.07 0.13 0.09 0.27 �0.07 0.08 �0.46 0.32STEM major 0.21�� 0.09 0.50�� 0.22 0.05 0.04 0.28�� 0.13Constant 1.82��� 0.12 3.49��� 0.24 3.97��� 0.04 4.25��� 0.12Total obs. 263 168 167 160No. students 64 66 66 62R-squared 0.272 0.153 0.134 0.217
Note: Standard errors are clustered at the student level. For column (1) the unit of observation is the student’s response tothe survey questions. In the Science and Economics of Climate Change course the same students completed both modulesand thus were surveyed twice, one time for each module or 8 questions total per student. All other students wrote 4 ques-tions each. Columns (2)–(4) refer to the following survey questions: How comfortable are you with Excel?; In your opinion,to what degree are human activities contributing to climate change?; and, How important do you think polar research is inthe context of climate change?
154 L. FORTMANN ET AL.

positive shift, indicating that their questions in the post-assessment survey could be consideredmore advanced or evolved.
Table 6 shows three examples of student questions from the pre- and post- surveys. Twoexamples were identified by the team as representing a positive shift in question generation, andone example displays no change in the level or complexity of questions asked by the student. Inthe first two examples, the students’ questions shift from being one-dimensional in the pre- sur-vey, focusing solely on the figure, to multi-dimensional questions in the post- survey that engagedexternal factors such as the ecosystem or other factors affecting voyages. In the third example,there is no discernable difference between the questions in the pre- and post- surveys. Among 18sets of questions analyzed in this manner, 8 sets (or 44%) displayed a shift to a more complex orhigher-order question, which we believe is a positive outcome given the relatively short durationthe students engaged with the module. These findings also support the empirical results from theregression analysis that students asked more “testable” questions after completing the module.
Conclusion
The objective of the CGI modules introduced in this article is to walk students through exercisesthat apply polar research and related data to economic models with the ultimate goal of increas-ing climate literacy. Additionally, the modules highlight the important role that assumptions playin economic modeling and provide insight into both the limitations of the models, as well as theirusefulness in a policy setting. The CGI framework presented here aims to provide students withpractical skills such as data manipulating and analysis, while at the same time allowing instructorsto achieve learning objectives specific to their course and enhancing the student learning experi-ence by incorporating more active learning in the classroom.
Notes
1. United Nations Secretary General Ban-Ki Moon made this statement in his speech at the United NationsConference on Climate Change in Bali in 2007.
2. Climate Central is a nonprofit organization that conducts research on climate change impacts due to sealevel rise and flooding in coastal cities. Web site: https://riskfinder.climatecentral.org/
Table 6. Sample pre- and post-module survey questions from grounded theory analysis.
No. Survey Questions Analysis
1 Pre Why does voyages per year rise sharply after2005?How would this information look differentif presented seasonally?
The post- questions display a shift tomore open questions, makingconnections to outside factors.
Post What other factors converged in 1990 thatled to voyages overtaking melting seaice?How does factors [sic] further hinder seatraffic as the ice melts?
2 Pre Why are voyages per year significant?Why is sea ice significant?
The post- questions make connectionsto outside circumstances while thepre- questions are focused onorienting to the figure.
Post When is summer sea ice expected to be 0?How have ecosystems changed with thedecrease in sea ice?
3 Pre Why is there a sharp increase in the numberof vessel voyages?Why does the total ice concentration varyso much between certain years?
There seems to be no difference inthe quality or complexity ofquestions from the pre- topost- survey.
Post Why does voyages per year increase as iceconcentration falls? Why is there a sharpdecline in ice concentration after 2004?
ESTIMATING CLIMATE CHANGE IMPACTS 155

3. The format of the original CGI modules the students completed in this study was in Microsoft Word withan accompanying Excel spreadsheet. They have since been reformatted to PowerPoint slides to improve theuser interface. The main content and text of the modules remain the same.
4. Among the three instructors who implemented the sea level rise module, one completed it over two 50-minute class periods, another did it in one full 80-minute class, and the third completed it during one 2-hour class.
5. SERC refers to the Science Education Resource Center at Carleton College, and is home to a largecollection of educational resources. Web site: https://serc.carleton.edu/penguin/
6. Articles on sea level rise and its impacts are becoming more and more common in the news. For example,a quick news search on “sea level rise” finds a number of articles, including “$50 billion worth of Bay Areahomes at risk of rising seas by 2050, says report” from The Mercury News on July 31, 2019, and “RecordHeat Threatens Greenland’s Ice Sheet” from the Pacific Standard on July 30, 2019.
7. House price data comes from ESRI’s ArcGIS interactive Web site with 2012 data for USA medianhome values. Web site: https://www.arcgis.com/home/webmap/viewer.html?useExisting=1&layers=8abd47c2988d497a8f24ad89180980c8
8. The “testability” assessment was conducted for all modules developed for the NSF project. The totalsample size of student questions from all modules implemented in both science and economics coursesis 666.
9. The students completed a CGI module on rovibrational waves that was part of a course in atmosphericchemistry. Among the various criteria considered for evaluating the questions from this module, includingsophistication, clarity, engagement, and synthesis, testability was the only one that showed a statisticallysignificant difference between pre- and post-question scores after a subset of the questions was ranked bythree different evaluators.
Acknowledgment
The authors thank Amy Ryken for her guidance and assistance with the grounded theory analysis.
Funding
This work was supported by the National Science Foundation under Grant 271033.
References
Balaban, R. A., D. B. Gilleskie, and U. Tran. 2016. A quantitative evaluation of the flipped classroom in a large lec-ture principles of economics course. Journal of Economic Education 47 (4): 269–87. doi: 10.1080/00220485.2016.1213679.
Barreto, H. 2009. Intermediate microeconomics with Microsoft Excel. New York: Cambridge University Press.——— 2015. Why Excel? Journal of Economic Education 46 (3): 300–9.Becker, W. E. 2004. Economics for a higher education. International Review of Economics Education 3 (1): 52–62.
doi: 10.1016/S1477-3880(15)30145-6.Charmaz, K. 2006. Constructing grounded theory: A practical guide through qualitative analysis. Thousand Oaks,
CA: Sage Publications.Crouch, C. H., J. Watkins, A. P. Fagen, and E. Mazur. 2007. Peer instruction: Engaging students one-on-one, all at
once. In Research-based reform of university physics, ed. E. F. Redish and P. J. Cooney. Reviews in PhysicsEducation Research 1 (1). College Park, MD: American Association of Physics Teachers.
Deslauriers, L., E. Schelew, and C. Wieman. 2011. Improved learning in a large-enrollment physics class. Science332 (6031): 862–64. doi: 10.1126/science.1201783.
Dori, Y. J., and O. Herscovitz. 1999. Question-posing capability as an alternative evaluation method: Analysis of anenvironmental case study. Journal of Research in Science Teaching 36 (4): 411–30. doi: 10.1002/(SICI)1098-2736(199904)36:4<411::AID-TEA2>3.0.CO;2-E.
Emerson, T. L. N., and B. Taylor. 2004. Comparing student achievement across experimental and lecture-orientedsections of a principles of microeconomics course. Southern Economic Journal 70 (3): 672–93. doi: 10.2307/4135338.
Gautier, C., and R. Solomon. 2005. A preliminary study of students’ asking quantitative scientific questions forinquiry-based climate model experiments. Journal of Geoscience Education 53 (4): 432–43. doi: 10.5408/1089-9995-53.4.432.
156 L. FORTMANN ET AL.
https://www.arcgis.com/home/webmap/viewer.html?useExisting=1&layers=8abd47c2988d497a8f24ad89180980c8
Goffe, W. L., and D. Kauper. 2014. A survey of principles instructors: Why lecture prevails. Journal of EconomicEducation 45 (4): 360–75. doi: 10.1080/00220485.2014.946547.
Hansen, W. L., M. K. Salemi, and J. J. Siegfried. 2002. Use it or lose it: Teaching literacy in the economics princi-ples course. American Economic Review 92 (2): 463–72. doi: 10.1257/000282802320191813.
Kvam, P. 2000. The effect of active learning methods on student retention in engineering statistics. The AmericanStatistician 54 (2): 136–40. doi: 10.2307/2686032.
Lage, M. J., G. J. Platt, and M. Treglia. 2000. Inverting the classroom: A gateway to creating an inclusive learningenvironment. Journal of Economic Education 31 (1): 30–43. doi: 10.1080/00220480009596759.
Leiserowitz, A., E. Maibach, C. Roser-Renouf, S. Rosenthal, and M. Cutler. 2016. Politics & global warming. YaleUniversity and George Mason University. New Haven, CT: Yale Program on Climate Change Communication.
Marlon, J., P. Howe, M. Mildenberger, A. Leiserowitz, and X. Wang. 2018. Yale climate opinions maps 2018. NewHaven, CT: Yale Program on Climate Change Communication. https://climatecommunication.yale.edu/visualiza-tions-data/ycom-us-2018/?est=human&type=value&geo=national. (accessed September 2, 2019).
Martin-Hansen, L. 2002. Defining inquiry: Exploring the many types of inquiry in the science classroom. TheScience Teacher 69 (2): 34–37.
Moon, B.-K. 2007. United Nations Climate change conference. Speech, Bali, Indonesia, December 12. TheGuardian. https://www.theguardian.com/environment/2007/dec/12/bali.climatechange1. (accessed September 2,2019).
National Oceanic and Atmospheric Administration (NOAA). n.d. About NOAA climate.gov: Mission. NOAAClimate.gov. https://www.climate.gov/about. (accessed July 9, 2019).
National Research Council (NRC). 1996. National science education standards. Washington, DC: NationalAcademies Press.
O’Garra, T. 2017. Economic value of ecosystem services, minerals and oil in a melting Arctic: A preliminary assessment.Ecosystem Services 24 (April): 180–86. doi: 10.1016/j.ecoser.2017.02.024.
Olar, M., J. Louvel, M. Hernandez, C. Sauve, S. Zussy, and J. Messier. 2011. Evidence of the socio-economic importanceof polar bears for Canada. Ottawa, Canada: Government of Canada.
Ormerod, P. 2003. Turning the tide: Bringing economics teaching into the twenty first century. InternationalReview of Economics Education 1 (1): 71–79. doi: 10.1016/S1477-3880(15)30212-7.
Ryken, A. E., and F. L. Hamel. 2016. Looking again at “surface-level” reflections. Teacher Education Quarterly 43(4): 31–54.
Salemi, M. K. 2005. Teaching economic literacy: Why, what and how. International Review of Economics Education4 (2): 46–57. doi: 10.1016/S1477-3880(15)30132-8.
Simkins, S., and M. Maier. 2004. Using just-in-time teaching techniques in the principles of economics course.Social Science Computer Review 22 (4): 444–56. doi: 10.1177/0894439304268643.
Walstad, W., and S. Allgood. 1999. What do college seniors know about economics?. American Economic Review89 (2): 350–54. doi: 10.1257/aer.89.2.350.
Wiggins, G., and J. McTighe. 1998. What is backward design. In Understanding by Design, G. Wiggins 13–34.Alexandria, VA: Association for Supervision and Curriculum Development.
Yamarik, S. 2007. Does cooperative learning improve student learning outcomes? Journal of Economic Education38 (3): 259–77. doi: 10.3200/JECE.38.3.259-277.
Appendix A
Assignment prompts
Sea level rise module memo assignmentSuppose that you were hired by the City of Tacoma to conduct an analysis of the impacts and potential damagesof impending sea level rise in Tacoma. For this assignment, you now need to synthesize the information and datayou have analyzed while working through the module into a 2- to 3-page memo (including figures) to the directorof the City of Tacoma’s Office of Environmental Policy and Sustainability. You can check out the mission of thedepartment at their Web site, https://www.cityoftacoma.org/cms/one.aspx?objectId=18996.
The memo should briefly outline the problem, describe how you conducted the analysis, your results, limita-tions of the results, and a recommendation for action. For direction on the format of a memo, check out this Website, https://owl.purdue.edu/owl/purdue_owl.html, for detailed guidelines.
Total economic valuation module paper addendum assignmentAn addendum is an item of additional material added at the end of a book or other publication. For this assign-ment, you will write an addendum to the O’Garra (2017) paper for the journal Ecosystem Services that will include
ESTIMATING CLIMATE CHANGE IMPACTS 157
a revised estimate of the TEV of the Arctic based on your research that includes an additional component in thevaluation calculation. For example, you could include the existence value of penguins, or another species nativeto the Arctic, the value of research conducted in the Arctic, or other missing values you’ve identified in the currentpaper.
To conduct your revised calculation, you must find a research article that provides an estimate of the missingvalue you intend to include, and then you will convert the values found in that paper to the Arctic as a whole,similarly to what you have done in this module.
The addendum should include the following components:
� An Introduction explaining why the current estimated value in the paper is not sufficient and how youpropose to update the calculation.
� A description of the added primary data source (research paper, journal article, etc.) used in yourupdated valuation.
� A description of the process by which you converted the data from the primary source to fit in with theestimate for the annual total economic value, including a table of your conversions and relevant sources asappropriate.� This description should include a discussion of any assumptions you made in the calculation of your
added value and the potential limitations of these assumptions.� Results and discussion where you report to revised annual TEV of the Arctic and why this estimate is
important from a policy perspective.
158 L. FORTMANN ET AL.
Related Documents