Travis Central Appraisal District Fiscal Year 2017 Proposed Budget Travis County, Texas Finance Department July 26, 2016

Welcome message from author
This document is posted to help you gain knowledge. Please leave a comment to let me know what you think about it! Share it to your friends and learn new things together.
Transcript

Travis Central
Appraisal District Fiscal Year 2017 Proposed Budget
Travis County, Texas
Finance Department
July 26, 2016

Tra
vis
Cen
tra
l A
pp
rais
al
Dis
tric
t F
Y 2
01
7
Strategic Goals
1. Develop appraisals that
reflect market value and
ensure fairness and
uniformity
2. Be efficient in business
processes and ensure
that mission critical
tasks are completed in a
timely manner with a
high level of accuracy
3. Collect, analyze and
maintain accurate data
4. Ensure that the district
maintains a highly
educated, motivated and
skilled workforce
5. Provide customer
service that is
courteous, professional
and accurate
Travis Central
Appraisal DistrictThe activities of the Travis Central Appraisal District are
governed by the legislature, and the administrative rules
adopted by the Comptroller’s Property Tax Assistance
Division.
Our Mission
The mission of the Travis Central Appraisal District, in
accordance with the Texas Constitution and the laws of the state,
is to provide accurate appraisal of all property in Travis County
at one hundred percent market value, equally and uniformly, in a
professional, ethical, economical and courteous manner, working
to ensure that each taxpayer pays only their fair share of the
property tax burden.
Our Vision
The Travis Central Appraisal District will act in accordance with
the highest principals of professional conduct, ethics,
accountability, efficiency, openness, skill and integrity. We
approach our activities with a deep sense of purpose and
responsibility to ensure fairness and equity for all taxpayers of
Travis County while striving to be the premier appraisal district
in the state by being an innovative and knowledgeable workforce.
Our Values
Appraise- fairly, uniformly, efficiently, and effectively, balancing
the needs of both taxpayers and the taxing units by adhering to the
Texas Property Tax Code, USPAP, and generally accepted
appraisal standards.
Educate- taxpayers of their rights, remedies and responsibilities.
Communicate- collaboratively with and encourage communication
among the taxing units, taxpayer public, and the agency.
Service- provide exceptional customer service that is accessible,
accurate, responsible and transparent.
Performance- demand integrity, accountability and high standards
from all staff and strive continuously for excellence and efficiency.

Tra
vis
Cen
tra
l A
pp
rais
al
Dis
tric
t F
Y 2
01
7
Travis Central Appraisal District FY 2017 Proposed Budget
Board of Directors
Mr. Richard Lavine, Chair
Austin ISD
Mr. Ed Keller, Secretary
Austin ISD
Ms. Shelda D. Grant
Travis County
Ms. Eleanor Powell
City of Austin
Ms. Blanca Zamora-Garcia
City of Austin
Mr. Kristoffer S. Lands, Vice Chair
City of Austin/Austin ISD
Mr. Tom Buckle
West Travis County
Mr. Bruce Grube
Travis County
Mr. Rico Reyes
East Travis County
Mr. Bruce Elfant
Travis County Tax Assessor/Collector
Ms. Marya Crigler
Chief Appraiser
Prepared by the TCAD Finance Department

Tra
vis
Cen
tra
l A
pp
rais
al
Dis
tric
t F
Y 2
01
7
TABLE OF CONTENTS INTRODUCTORY SECTION:
Budget Transmittal Letter …………………………………………………………………. Organizational Chart ………………………………………………………………………. Key District Personnel …………………………………………………………………….. Distinguished Budget Presentation Award ………………………. ……………………..
BUDGET OVERVIEW ............................................................................................................
DISTRICT BUDGET:
Budget Comparison ………………………………………………………….................... District Budget by Department ……………………………………………………………. Revenue Budget …………………………………………………………………………… 2017 Estimated Jurisdiction Liabilities …………………………………………………… Capital Improvement Program ……………………………………………………………. Debt Administration ………………………………………………………………………...
DEPARTMENT BUDGETS:
Administration ………………………………………………………………………………. Information Technology …………………………………………………………………… Customer Service ………………………………………………………………………….. Appraisal Support ………………………………………………………………………….. Appeals ……………………………………………………………………………………… Commercial & Personal Property Appraisal …………………………………………….. Residential Appraisal ……………………………………………………………………… Appraisal Review Board (ARB) …………………………………………………………...
STATISTICAL INFORMATION ………..…………………………………………………………….
APPENDIX ………………………………………………………………………………………….
GLOSSARY ………………………………………………………………………………………...
i x xi xii
1
27 30 35 38 43 53
55 69 81 89 95 103 111 117
121
153
157

Tra
vis
Cen
tra
l A
pp
rais
al
Dis
tric
t F
Y 2
01
7
lmann
Stamp

Intr
od
uct
ory
Sec
tio
n
Introductory Section

Intr
od
uct
ory
Sec
tio
n
i
TRAVIS CENTRAL APPRAISAL DISTRICT BOARD OFFICERS RICHARD LAVINE
CHAIRPERSON
KRISTOFFER S. LANDS
VICE CHAIRPERSON
ED KELLER
SECRETARY/TREASURER
MARYA CRIGLER
CHIEF APPRAISER
BOARD MEMBERS TOM BUCKLE
SHELLDA D. GRANT
DENNY HAMILL
BRUCE ELFANT
ELEANOR POWELL
RICO REYES
BLANCA ZAMORA-GARCIA
July 26, 2016
Travis County Taxpayers, Travis CAD Board of Directors, Presiding Officers of all Taxing Entities, and Ms. Marya Crigler, Chief Appraiser, Travis Central Appraisal District:
I am pleased to present the proposed budget of the Travis Central Appraisal District (the District) for fiscal year 2017. The proposed budget for 2017 totals $18,103,517, which represents a modest 3.49% increase over the 2016 budget. The proposed and five previous years’ budget history compare as follows:
Year Budget Amount Percentage Increase
2012 $ 12,914,797 1.77%
2013 $ 13,375,023 3.56%
2014 $ 14,246,848 6.52%
2015 $ 17,149,799 20.38%
2016 $ 17,492,994 2.00%
2017 $ 18,103,517 3.49%
The Austin region continues to thrive as it enters its seventh year of positive trends in its real estate and overall economy. The decade ending in 2010 saw a 37% increase in population and, in the summer of 2015, the Austin metro population surpassed 2 million. As of October 2015, the population was 2,020,452 and the Urban Institute predicts it could grow up to 3.2 million by 2030. With a 3% population increase, Austin-Round Rock was the fastest growing metro area in the state and the seventh fastest in the nation. The area added 57,395 new residents- about 157 people per day. The Austin-San Antonio region, especially along the I-35 corridor, is posed to becoming the next Dallas-Fort Worth metroplex in terms of population growth.
FACTORS AFFECTING FINANCIAL CONDITION

Intr
od
uct
ory
Sec
tio
n
ii
Population Growth 2004-2014
Source: US Bureau of the Census, Population Estimates
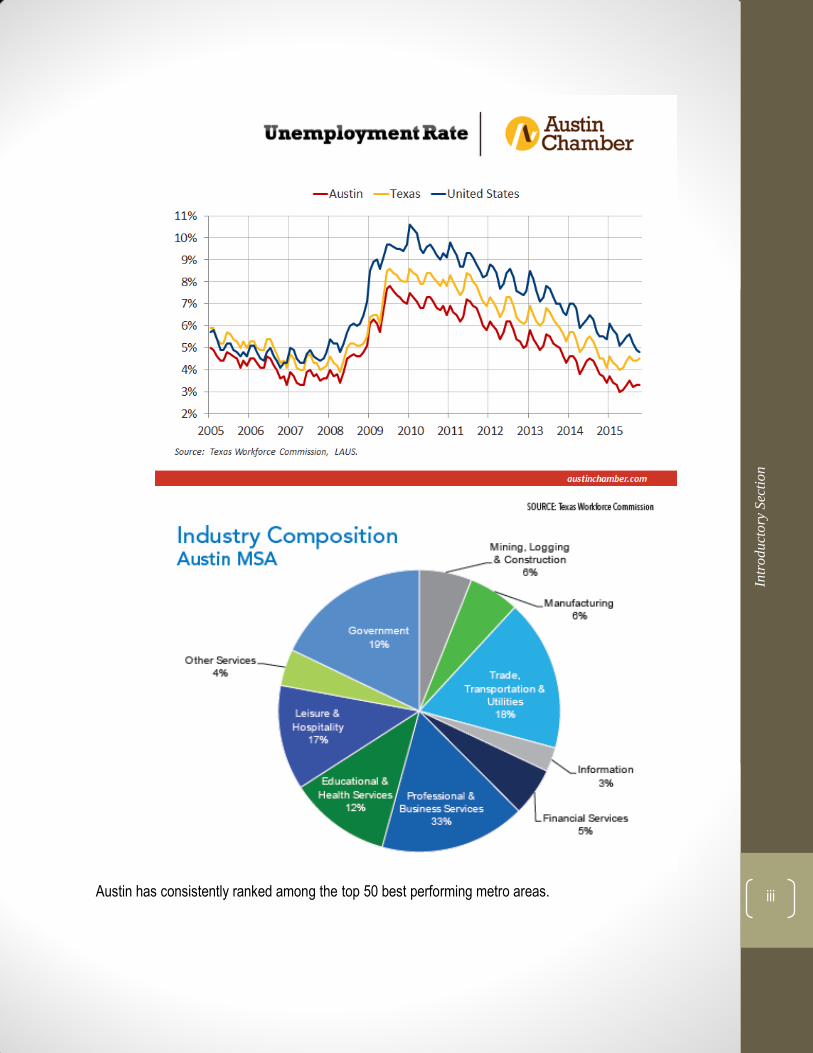
According to revised data released by the Texas Workforce Commission in March 2016, the Austin metro added 44,500 jobs in 2015, a 4.7% increase. Central Texas payrolls expanded faster in 2015 than in the prior two years. The Federal Reserve Bank of Dallas put Austin’s seasonally adjusted jobless rate in December 2015 at 3.3% compared to the statewide December average of 4.6% and national average of 5.0%. With several large firms hiring, like Apple, or getting ready for large expansions, like Oracle, Austin’s employment numbers are expected to remain strong and stay insulated from the state’s depressed energy sector.
Intr
od
uct
ory
Sec
tio
n
iii Austin has consistently ranked among the top 50 best performing metro areas.

Intr
od
uct
ory
Sec
tio
n
iv

Intr
od
uct
ory
Sec
tio
n
v
Across all commercial portfolios, we continue to see declining vacancy rates and increasing rent rates.

Intr
od
uct
ory
Sec
tio
n
vi
Intr
od
uct
ory
Sec
tio
n
vii
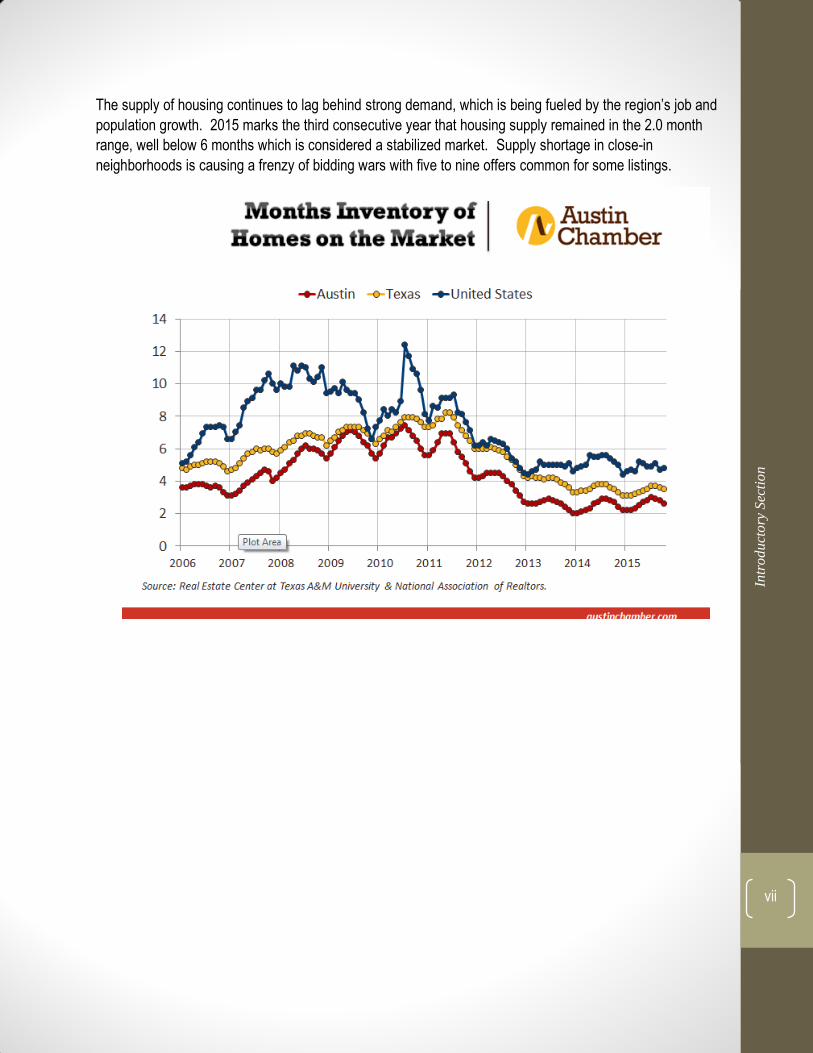
The supply of housing continues to lag behind strong demand, which is being fueled by the region’s job and
population growth. 2015 marks the third consecutive year that housing supply remained in the 2.0 month
range, well below 6 months which is considered a stabilized market. Supply shortage in close-in
neighborhoods is causing a frenzy of bidding wars with five to nine offers common for some listings.

Intr
od
uct
ory
Sec
tio
n
viii
According to the Austin Board of Realtors, 2015 set all-time highs for Austin-area home sales volume and
prices. The total dollar volume increased 13% to $9.7 billion.

Intr
od
uct
ory
Sec
tio
n
ix
Should you have any questions about the District’s 2017 proposed budget or the budgeting process, please
contact Leana H. Mann, the District’s Finance & Facilities Director, at (512) 834-9317 Ext. 405 or by e-mail at
Respectfully submitted,
Leana H. Mann Finance & Facilities Director Travis Central Appraisal District

Intr
od
uct
ory
Sec
tio
n
x
TRAVIS CENTRAL APPRAISAL DISTRICT
Organizational ChartFiscal Year 2017
Sharon Baxter
Sr. Litigation Attorney
Paul Snyder
Deputy Chief of Appraisal
Open
Customer Service Director
Marya Crigler
Chief Appraiser
Paula Fugate
Human Resource Director
Carlos Ortiz
Information Systems
Director
Leana Hengst Mann
Finance and Facilities
Director
Board of Directors
Michael Kasper
Director Residential
Adrienne Albers
Appraisal Support
Lonnie Hendry
Director Commercial
Martin Wilbanks
Taxpayer Liaison

Intr
od
uct
ory
Sec
tio
n
xi
TRAVIS CENTRAL APPRAISAL DISTRICT
Key District Personnel Fiscal Year 2017
Chief Appraiser Marya Crigler Deputy Chief of Appraisal Paul Snyder
Director of Residential Appraisal Michael Kasper Director of Commercial & Personal Property Appraisal Lonnie Hendry, Jr.
Director of Customer Service Director of Appraisal Support
Vacant Adrienne Albers
Director of Information Technology (IT) Carlos Ortiz
Human Resources Director Paula Fugate Finance & Facilities Director Leana H. Mann
Senior Litigation Attorney Sharon Baxter

Intr
od
uct
ory
Sec
tio
n
xii
Distinguished Budget Presentation Award
Certificate of Achievement for Excellence in Financial Reporting The Government Finance Officers Association of the United States and Canada (GFOA) presented a Distinguished Budget Presentation Award to the Travis Central Appraisal District, Texas for its annual budget for the fiscal year beginning January 1, 2016. In order to receive this award, a governmental unit must publish a budget document that meets program criteria as a policy document, as an operations guide, as a financial plan, and as a communications device.
This award is valid for a period of one year only. We believe that our fiscal year 2017 budget continues to
conform to program requirements, and we are submitting it to GFOA to determine its eligibility for another
award.

Budget Overview

Bu
dg
et O
verv
iew
1
TRAVIS CENTRAL APPRAISAL DISTRICT
Budget Overview
There are three main parts to the property tax system in Texas: An appraisal district in each county sets the value of property each year. A chief appraiser is the
chief administrator and operates the appraisal office. A citizen board, called the Appraisal Review Board (ARB), hears any disagreements between a
property owner and the appraisal district about a property’s value. Local taxing units—city, county, school and special districts—decide how much money they will
spend by adopting a budget. Next, the taxing units set tax rates that will raise the revenuenecessary to fund their budgets. The adopted budgets and the tax rates set to fund the budgetsdetermine the total amount of taxes that a person will pay.
The property tax year has four stages: appraising taxable property, protesting the appraised values, adopting the tax rates and collecting the taxes. The following represents a summary of the process.
1. A large part of each appraisal district's job is to estimate what your property is worth on January 1.What a property is used for on January 1, market conditions at that time and who owns the propertyon that date determine whether the property is taxed, its value and who is responsible for paying thetax. The appraisal district also processes applications for tax exemptions, agricultural appraisals andother tax relief.
2. Around May 15, the appraisal review board begins hearing protests from property owners whobelieve their property values are incorrect or who did not get correct exemptions or agriculturalappraisals. When the ARB finishes its work, the appraisal district gives each taxing unit a list oftaxable property.
3. In August or September, the elected officials of each taxing unit adopt tax rates for their operationsand debt payments. Several taxing units tax each property. Every property is taxed by the countyand the local school district. You also may pay taxes to a city and to special districts such ashospital, junior college, water, fire and others.
4. Tax collection starts around October 1 as tax bills go out. Taxpayers have until January 31 of thefollowing year to pay their taxes. On February 1, penalty and interest charges begin accumulatingon most unpaid tax bills. Tax collectors may start legal action to collect unpaid taxes on February 1.
HOW DOES THE PROPERTY TAX SYSTEM WORK?

Bu
dg
et O
verv
iew
2
January 1 Appraisal districts are required to appraise property at its value on this date. A lien attaches to each taxable property to ensure property tax payment.
January 1 – April 30 Appraisal districts complete appraisals and process applications for exemptions.
January 31 Taxes due to local taxing units (or county tax assessor, if acting on their behalf)
February 1 Local taxing units begin charging penalty and interest for unpaid tax bills.
April – May Appraisal districts send notices of appraised value.
May 1 Appraisal review boards begin hearing protests from property owners.
July 25 Appraisal districts certify current appraised values to taxing units.
August – September Local taxing units adopt tax rates.
October 1 Local taxing units begin sending tax bills to property owners.
The Travis Central Appraisal District was created under the 66th Texas State Legislature in 1979 under the provisions of Senate Bill 621 known as the Property Tax Code. The District is responsible for the appraisal of property subject to ad valorem taxation in Travis County, Texas. The District is governed by a board of nine directors serving two year terms, plus a tenth statutorily designated non-voting member who is the County Tax Assessor-Collector. Travis County appoints two board members, Austin ISD appoints two board members, City of Austin appoints two board members, and Austin ISD and City of Austin appoint one board member together. The remaining two board members are appointed by a vote of the eastern and western taxing entities within Travis County.
The District was formed in 1981 and formally began operations in 1982, pursuing its mission to provide accurate appraisal of all property in Travis County at one hundred percent of market value, equally and uniformly, in a professional, ethical, economical and courteous manner, working to ensure that each
TRAVIS CENTRAL APPRAISAL DISTRICT
THE PROPERTY TAX CALENDAR

Bu
dg
et O
verv
iew
3
taxpayer pays only their fair share of the property tax burden. As stipulated under the Texas Property Tax Code, the District serves the citizens and taxpayers of Travis County and the taxing entities which lie within Travis County.
Travis County is located in south central Texas astride the Balcones Fault, the boundary between the Edwards Plateau to the west and the Blackland Prairies to the east. Its county seat, Austin, is the capital of Texas. Travis County’s population, as of the 2010 census was 1,033,553 and continues to grow rapidly every year. Since the previous census in 2000, the population of Travis County has grown 26.1%.
Each Texas county is served by an appraisal district that determines the value of all of the county’s taxable property. Generally, a local government that collects property taxes, such as a county, city and school district, is a member of the appraisal district. A board of directors appointed by the member governments presides over the appraisal district.
The appraisal district is considered a political subdivision and must follow applicable laws such as Open Meetings and Public Information Acts. Meetings are generally open to the public and information generated by the appraisal district is, in most cases, also available to the public.
The appraisal district board of directors hires a chief appraiser, approves contracts and sets policies. The chief appraiser is the chief administrator of the appraisal district. The chief appraiser may employ and compensate professional, clerical and other personnel as provided by the appraisal district budget. The chief appraiser’s primary duty is to discover, list, review and appraise all taxable property in the appraisal district using generally accepted appraisal techniques.
Accounting Basis
The District reports its financial activities as a special-purpose government. Special-purpose governments are governmental entities which engage in a single government program. Like most governments, special-purpose governments present two types of financial statements: (1) government-wide financial statements and (2) fund financial statements.
The government-wide financial statements report information on all of the activities of the District. Governmental activities generally are financed through charges for services and intergovernmental revenues. The statement of activities reflects the revenues and expenses of the District. The government-wide statements are reported using the economic resources measurement focus and the accrual basis of accounting. The economic resources measurement focus means all assets and liabilities (whether current or non-current) are included on the statement of net position and the operating statements present increases
THE ROLE OF THE APPRAISAL DISTRICT
ACCOUNTING BASIS AND CONTROLS

Bu
dg
et O
verv
iew
4
(revenues) and decreases (expenses) in total net position. Under the accrual basis of accounting, revenues are recognized when earned and expenses are recognized at the time the liability is incurred.
The fund financial statements provide information about the District’s governmental funds. The emphas is of fund financial statements is directed to specific activities of the District. The District reports the general fund as its only major governmental fund. It is the District’s primary operating fund. This fund is used to account for the acquisition and use of the District’s expendable financial resources and the related liabilities. The measurement focus is based on the determination of changes in financial position rather than upon net income determination. Governmental fund financial statements are reported using the current financial resources measurement focus and are accounted for using the modified accrual basis of accounting. Under the modified accrual basis of accounting, revenues are recognized when susceptible to accrual; i.e., when they become both measurable and available and expenditures are recorded when the related fund liability is incurred.
Internal Controls
To provide a reasonable basis for making its representations, the District’s management team has established a comprehensive internal control framework. This framework is designed to provide reasonable assurance that assets are safeguarded against loss from unauthorized use or disposition, and that accounting transactions are executed in accordance with management’s authorization and properly recorded so that the financial statements can be prepared in conformity with generally accepted accounting principles (GAAP). The objective of the internal control framework is to provide reasonable, rather than absolute, assurance that the financial statements are free of any material misstatements. The concept of reasonable assurance recognizes that: (1) the cost of a control should not exceed the benefits likely to be derived; and (2) the evaluation of costs and benefits requires estimates and judgments by management. The design and operation of internal controls also ensures that all funds are expended in compliance with applicable laws and regulations.
All internal control evaluations occur within the above framework. During the fiscal year ended December 31, 2015, the District reviewed its internal controls. I believe that the District’s internal controls adequately safeguard assets and provide reasonable assurance of proper recording of financial transactions.
The Travis Central Appraisal District (the District) financial policies compiled below encompass the basic framework for the overall financial management of the District. These policies assist the Board of Directors and management with decision-making and provide guidelines for evaluating both the current and long-range financial activities. They are reviewed annually in conjunction with the budgetary process to verify continued applicability and benefit to the District.
The primary objectives of the policies are to provide accountability for cost-effective stewardship of taxpayers’ funds through fairly presented financial statements supported by full disclosures.
FINANCIAL POLICIES & PROCEDURES

Bu
dg
et O
verv
iew
5
Revenue Policy
Revenue Recognition- Revenues shall be recorded on the modified accrual basis of accounting. Under the modified accrual basis of accounting, revenues are recognized when susceptible to accrual; i.e., when they become both measurable and available.
1. Daily Deposits- In accordance with the District’s finance policy, the District shall require weeklydeposits of receipts only when the cash on hand amounts to at least $1,000. Any funds notimmediately deposited shall be appropriately safeguarded in a locked file cabinet in the FinanceDirector’s office.
2. Monitoring Revenue- District finance staff shall monitor revenues as billed and collected andshall report to the Board of Directors no less than quarterly on any past due or uncollectibleamounts.
3. Authority- The Finance & Facilities Director shall be responsible for designing, implementing,monitoring, and amending as necessary, accounting procedures, including internal controls, forthe billing, recording, and reporting of all revenues of the District in compliance with GenerallyAccepted Accounting Principles (GAAP) and applicable state laws. Any changes to revenueprocedures shall be reported to the Board of Directors at their next regularly scheduled meeting.
Cash Disbursement Policy
1. Centralized Purchasing- The District will operate under a centralized purchasing concept.
2. Payments- Local governments and state agencies are required to pay all bills owed within 30calendar days. The District adheres to this requirement. Any deviations from this requirementare reported to the Chief Appraiser.
3. Monitoring- District finance staff shall monitor cash disbursements and report to the Board ofDirectors at each regularly scheduled meeting all capital asset purchases and any purchasesover $50,000.
4. Authority- The Finance & Facilities Director shall be responsible for designing, implementing,monitoring, and amending (as necessary), accounting procedures including internal controls,for the requisition, purchase and cash disbursement functions of the district in compliance withGenerally Accepted Accounting Principles (GAAP) and applicable state laws. Any change tocash disbursement procedures shall be reported to the Board of Directors at their nextregularly scheduled meeting.
Operating Budget Policy
1. Planning: The District will prepare a five-year operating budget projection annually, which willinclude projections of expenditures for the next five years.
2. Performance Measures: The District will integrate performance measures and productivityindicators into its budgetary process whenever feasible.

Bu
dg
et O
verv
iew
6
3. Periodic Reporting: The Finance and Facilities Director shall present budget to actualfinancial reports to the Board of directors monthly (or at each board meeting) and bi-weekly tothe Chief Appraiser.
4. Balanced Budget: The District shall submit a balanced budget wherein budgetedexpenditures shall not exceed budgeted revenues.
Asset Management and Capital Improvement Policy
1. Planning for Operational and Maintenance Costs: The District shall utilize an equipmentreplacement schedule to plan major operational maintenance and asset acquisitions on asystematic, comprehensive, and entity-wide basis.
2. Asset Condition: The District will maintain all assets at a level adequate to comply with allregulatory requirements and to minimize future replacement and maintenance costs.
3. Planning: The District will annually update a ten-year capital improvement program, identifyingand describing each capital project along with the estimated cost.
4. Capitalization: The District will capitalize all asset cost which are $1,000 or more and whoseuseful life is more than one year.
5. Reporting: The District will provide reports of expenditures by project to the Board of Directorsno less than quarterly.
Cash Management and Investment Policy
1. Written Policy: The District’s investment policy must be written and in compliance with allapplicable state and local laws. The policy must be reviewed on an annual basis by the Boardof Directors and approved through a resolution.
2. Objectives: The primary objectives of investment activities, in priority order, shall bepreservation of principal, liquidity, and yield.
3. Periodic Reporting: The District shall provide monthly investment reports to the Board ofDirectors.
4. Treasury Services: The District shall prepare a Request for Proposal (RFP) for bankingservices every 2 years, with the option to renew the contract for an additional 2 years.
Accounting Policy
1. Authority for Accounting Procedures: The District will establish and maintain the accountingsystem according to Generally Accepted Accounting Principles (GAAP) and all applicable stateand local laws.
2. Annual Audit: An annual audit will be performed by an independent public accounting firm,which will issue an official opinion on the annual financial statements, and a management letterindicating any suggestions for improvement or areas of concern.
3. Transparency: Full disclosure will be provided in the financial statements.4. Financial Report: The District shall prepare a comprehensive annual financial report (CAFR)
upon completion of the financial audit, which will be submitted to the Government Finance

Bu
dg
et O
verv
iew
7
Officers’ Association (GFOA) for the Certificate of Achievement for Excellence in Financial Reporting award.
Debt Policy
1. Capital Financing: All financing of capital projects must be included in the current year’sproposed budget and approved by the Board of Directors. The District statutorily cannot issuedebt to fund capital projects. All financing of capital projects must be done through the budgetprocess.
2. Unfunded Liabilities: The District’s policy extends beyond capital financing and includes notknowingly entering into any contracts creating significant unfunded liabilities
The District is provided very strict guidelines on the budgeting process in the Texas Property Tax Code. This information can be found in Chapter 6.06 of the Texas Property Tax Code and in the appendix of this report. A brief overview of the budgeting process is provided below.
The District begins its annual budgeting process in February. Discussions are held with the Chief Appraiser, the Finance Director and the department directors to discuss what the department’s budget needs are for the upcoming fiscal year. Once this information is gathered, the Finance Director prepares the proposed budget based on the Chief Appraiser’s directives. In May, the District holds a budget workshop with the Board of Directors, the Chief Appraiser and the Finance Director where the budget is looked at in-depth. The District must send the proposed budget to the presiding officer of each taxing unit no later than 10 days before the board of director’s meeting where the proposed budget will be presented. This allows any taxing unit to dispute all or part of the budget at that meeting. The proposed budget must be presented no later than June 15th.
During this meeting, the board of directors makes suggestions along with any taxing units that come to the meeting to discuss the proposed budget. The District then takes the budget and revises it to include the changes made at the meeting. The District must again send a copy of the budget to the presiding officer of each taxing unit no later than 10 days before the board of director’s meeting where the budget will be adopted. The board of directors must hold a public hearing to adopt the annual budget. The secretary of the board must also post the notice of the public hearing in the county newspaper. The District posts this information in the Austin American Statesman. The budget must be adopted no later than September 15 th. Once the budget is adopted, the taxing units have 30 days to file a resolution with the board of director’s secretary to disapprove the budget. If governing bodies of a majority of the taxing units entitled to vote on the appointment of board members adopt resolutions disapproving the budget and file them with the secretary of the board within 30 days after its adoption, the budget does not take effect, and the board shall adopt a new budget within 30 days of the disapproval.
BUDGET PROCESS & PROCEDURES

Bu
dg
et O
verv
iew
8
All budget amendments must be presented to the taxing units 30 days prior to the meeting where the board is set to approve the amendment. A budget amendment changes the final amount due from the taxing unit. The District can make line item transfers without notifying the taxing units. The Chief Appraiser has the authority to approve or disapprove any line item transfers. All line item transfers are then presented to the board for approval. Budget line item transfers do not change the final amount of the budget, but simply move budgeted funds from one function or program to another. Budget line item transfers do not require any additional funds from the taxing units and they do not change the amount of any surplus credited to the jurisdictions at year end.
JAN 2016
S M T W T F S
1 2
3 4 5 6 7 8 9
10 11 12 13 14 15 16
17 18 19 20 21 22 23
24 25 26 27 28 29 30
31
DATE SUBJECT FEB 2016 2/8/2016 Budget discussion with Chief Appraiser on 2017 Budget
2/15/2016 Meet with division directors
S M T W T F S
1 2 3 4 5 6
7 8 9 10 11 12 13
14 15 16 17 18 19 20
21 22 23 24 25 26 27
28 29
MAR 2016 DATE SUBJECT
3/7/2016 2017 Budget requests due from department directors
3/31/2016 First draft of budget to Chief Appraiser
S M T W T F S
1 2 3 4 5
6 7 8 9 10 11 12
13 14 15 16 17 18 19
20 21 22 23 24 25 26
27 28 29 30 31
BUDGET CALENDAR

Bu
dg
et O
verv
iew
9
APR 2016 DATE SUBJECT
4/11/2016 First quarter line item transfers approved at Board of Director's meeting
4/18/2016 Second draft of budget to Chief Appraiser
S M T W T F S 4/27/2016 Final draft of budget to Chief Appraiser 1 2 4/29/2016 Mail budget to taxing jurisdictions
3 4 5 6 7 8 9
10 11 12 13 14 15 16
17 18 19 20 21 22 23
24 25 26 27 28 29 30
DATE SUBJECT MAY 2016 5/9/2016 Present proposed budget to board of directors
S M T W T F S
1 2 3 4 5 6 7
8 9 10 11 12 13 14
15 16 17 18 19 20 21
22 23 24 25 26 27 28
29 30 31
JUN 2016 DATE SUBJECT
6/15/2016 Last day to present proposed budget
S M T W T F S 6/30/2016 First draft of adopted budget to Chief Appraiser 1 2 3 4
5 6 7 8 9 10 11
12 13 14 15 16 17 18
19 20 21 22 23 24 25
26 27 28 29 30
JUL 2016 DATE SUBJECT
7/11/2016 2nd quarter line item transfers approved at Board of Director's meeting
7/18/2016 Second draft of adopted budget to Chief Appraiser S M T W T F S
7/25/2016 Final draft of adopted budget to Chief Appraiser 1 2
7/29/2016 Post public notice of budget in local newspaper 3 4 5 6 7 8 9
10 11 12 13 14 15 16
17 18 19 20 21 22 23
24 25 26 27 28 29 30
31
AUG 2016 DATE SUBJECT
8/1/2016 Mail out final budget to taxing entities
S M T W T F S 8/8/2016 Public budget hearing and adoption of 2017 budget 1 2 3 4 5 6
7 8 9 10 11 12 13
14 15 16 17 18 19 20
21 22 23 24 25 26 27
28 29 30 31

Bu
dg
et O
verv
iew
10
SEPT 2016 DATE SUBJECT 9/15/2016 Final day to adopt 2017 budget
9/30/2016 Tax rates are set by all taxing entities
S M T W T F S
1 2 3
4 5 6 7 8 9 10
11 12 13 14 15 16 17
18 19 20 21 22 23 24
25 26 27 28 29 30
DATE SUBJECT OCT 2016 10/10/2016 Mail out final calculation of jurisdiction liability
10/24/2016 Mail out end of year budget amendment to all taxing entities
10/31/2016 Submit budget to GFOA for Distinguished Budget Award S M T W T F S
1
2 3 4 5 6 7 8
9 10 11 12 13 14 15
16 17 18 19 20 21 22
23 24 25 26 27 28 29
30 31
NOV 2016 DATE SUBJECT 11/7/2016 Board of Directors meeting to approve final budget amendment
11/7/2016 Final line item transfers approved at Board of Director's meeting
S M T W T F S
1 2 3 4 5
6 7 8 9 10 11 12
13 14 15 16 17 18 19
20 21 22 23 24 25 26
27 28 29 30
DATE SUBJECT DEC 2016 12/31/2016 Fiscal year-end
1/1/2017 2017 Budget takes affect
S M T W T F S
1 2 3
4 5 6 7 8 9 10
11 12 13 14 15 16 17
18 19 20 21 22 23 24
25 26 27 28 29 30 31
The Travis Central Appraisal District (TCAD) established a Strategic Plan, referred to as a Three Year Plan, to outline the activities and operations of the TCAD from year to year in anticipation of future projects, funds and resources, technology, legislative changes, and capital improvements.
This Strategic Plan will be reviewed each year to monitor the completion of the tasks outline and to add another year to the ongoing plan. This will help the TCAD to prepare for the future in an effort to anticipate changes within
STRATEGIC PLANNING

Bu
dg
et O
verv
iew
11
the appraisal environment. Management staff personnel will be responsible for the development of this plan and will ensure its viability in the tasks the TCAD is charged.
The Strategic Plan will address five major issues: 1) Future Projects2) Funds and Resources3) Technology4) Legislative Changes5) Capital Improvements
The Strategic Plan will become a tool for the final development of the TCAD Annual Management Plan.
This strategic plan addresses the following key strengths, weaknesses, threats and opportunities for the Travis Central Appraisal District.
The SWOT analysis began by conducting an inventory of internal strengths and weaknesses within the appraisal district. The strategic team noted the external opportunities and threats that may affect the organization, based on the economic market and the overall environment. The primary purpose of the SWOT analysis is to identify and assign each significant factor, positive and negative, to one of the four categories, allowing the strategic team to take an objective look at the appraisal district operations. The SWOT analysis is a useful tool in developing and confirming goals, objectives, strategy.
Strengths:
Strong management team
Strong support from sixty-one taxing entities served by the TCAD
Strong base for recruitment of qualified staff
Very focused management/staff
Experienced and proven management and supportive Board of Directors
Weaknesses:
Uncertain economic conditions affecting property valuations
Economic climate of the cities, school districts, county, and special districts
Retention of qualified staff personnel
Opportunities:
Technology advancement can streamline business operations
Increased efficiencies will result in stronger credibility and support
Threats:
New technology advancements may become too costly
Economic slowdown could reduce proper funding
Economic situation could upturn and resources could be limited

Bu
dg
et O
verv
iew
12
Strategic Goal
Planning Goal Objective Outcome Measure Strategy Output Measure Efficiency Measure
Dev
elo
p a
pp
rais
als
that
ref
lect
mar
ket
valu
e an
d e
nsu
re f
airn
ess
and
un
ifo
rmit
y.
Make better utilization of ratio studies when developing market appraisals.
Analyze ratio study statistics by neighborhood and school district weekly during valuation and equalization phases in 2013/2014, and guarantee that sales ratio median levels and weighted mean are between 97 and 102 and COD are between 5 and 15.
Median sales ratio Maintain an ongoing program of audit and verification activities in support of improved appraisal levels
Number of sales qualified Number of property protests
Weighted mean sales ratio
Number of neighborhood profiles created
Number of value reductions
COD Number of school districts reviewed
Improve accuracy and reduce value changes to 5% or less.
Create evidence packets to be used at both information and formal level that support District values and require a higher standard of evidence for informal changes. Train staff to make clear and concise arguments at the ARB to defend the District's values.
Reduction in value changes at informal and formal by 50% from 11% average to 5% or less.
Staff training on defending appraisal values and standards of evidence
Percent value change Number of property protests
Number of value reductions
Improve quality and consistency of land values of lakefront property
Correctly identify all lake front property to include lake cove and lake views and consistently apply appropriate land unit prices and modifiers.
Reduction in value formal challenges of land equity on lake front property.
In conjunction with field inspections, utilize aerial photography to identify lake front, lake cove and lake view properties. Utilize GIS mapping and analysis to ensure consistent land values.
Uniformity in COD measures of specific ratio studies
Number of land values updated
Number of property protests based on equity
Update cost tables of main area and details.
Create a program to regularly update cost tables based on nationally recognized publications adjusted for local economic conditions.
Timely and accurate cost tables
Staff training on use of national publications used to develop cost approach appraisals. Create benchmark properties and test developed cost schedules against researched local cost information. Test land value assignments through allocation by abstraction against researched land values. Create specific procedure manual to document steps taken to update and test cost tables.
Accuracy of cost approach appraisals compared to researched local development costs.
Number of cost tables updated
Lower market segment adjustments
Number of benchmark properties tested
Software enhancements
Work cooperatively with software vendor True Automation and other PACS metro appraisal district clients to enhance the software to provide greater appraisal and analysis capabilities.
Increased functionality in the PACS software modules
Create a coalition of PACS metro appraisal district clients to leverage the group dynamics to push for focus on Texas clients from True Automation. Schedule and hold quarterly meetings with the metro clients and True Automation decision makers to focus on the common needs of the metro appraisal districts, and enhancements required to complete appraisal tasks and meet legislative requirements.
Co-development commitments from metro clients and True Automation and group consensus on enhancement priorities
Number of co-development projects approved
Number of software requirement documents written and approved
Number of enhancements included in each software release

Bu
dg
et O
verv
iew
13
Strategic Goal
Planning Goal
Objective Outcome Measure Strategy Output Measure Efficiency Measure
Be
effi
cien
t in
bu
sin
ess
pro
cess
es a
nd
en
sure
th
at m
issi
on
cri
tica
l tas
ks a
re c
om
ple
ted
in a
tim
ely
man
ner
wit
h a
hig
h le
vel o
f ac
cura
cy.
Complete the top three mission critical tasks ahead of schedule.
Ensure that mission critical tasks of notices, certification and PTAD studies are completed at minimum one to two weeks prior to statutory deadline.
Percent of accounts noticed at each run date
Improve Compliance by establishing formal plans, timelines, benchmarks, and monitoring programs to ensure that deadlines are met. Increase individual accountability
Completion date of mission critical tasks
Number of notices mailed at each run date
Certification level of 90% as of July 18.
Number of protests completed
Local Value Findings or Exceeds Standards finding
Complete protest as soon as possible after certification.
Ensure that all protests are completed as soon as possible after certification to shift the annual calendar of events and provide more time to appraisal staff to perform discovery and valuation tasks. Increased time to perform discovery and valuation should result in higher accuracy in the appraisal roll and fewer property protests.
Earlier start to discovery and valuation cycles
Select a target date of completion and communicate the date and objective with staff, ARB and agents. Maintain consistency in scheduling of protests hearings to ensure that protests are completed by the target date
Date of completion and percent of open protest
Number of informal hearings held per day
Number formal hearings per day
Complete fieldwork and eliminate field work overlap with valuation cycle
Ensure that all field inspections have been completed and that the data entry of the field cards has been completed by February 1
Timely start to valuation cycle
Develop a documented work plan to identify the scope of field work to be completed, evaluate field inspection productivity tasks times and develop a field work plan that recognizes the man hours available for the project. Work plan should include refresher training for appraisers to ensure that work in completed in an accurate manner as well as communicating to the appraisers work productivity expectations. Completion benchmarks should be established to evaluate progress. Regular meetings to ensure progress. Accountability consequences for failing to meet expectations and deadlines. Explore technological solutions such as Austin Energy data and field devices to increase efficiency in the field
Timely start to valuation cycle
Number of field inspections per day
Number of field cards processed per day
Complete valuation cycle and reduce the number of properties in NOAV runs after April 1st
Ensure that properties are valued and notices are sent in the first NOAV run to be completed between April 1 and April 15
Fewer than 5% of properties noticed in subsequent NOAV runs
Develop a documented work plan of valuation tasks to be completed. Work plan should include research and confirmation of sales data, review of neighborhood designations, assign senior staff to lead valuation teams and include refresher training for appraisers to ensure that work in completed in an accurate manner as well as communicating to the appraisers work productivity expectations. Completion benchmarks should be established to evaluate progress. Regular meetings to ensure progress. Accountability consequences for failing to meet expectations and deadlines.
Percent of properties noticed with each NOAV run
Number of neighborhood profiles completed each week
Complete homestead exemption processing within 30 days of receipt of application
Lack of taxpayer compliance with new homestead documentation requirements has become an obstacle to timely processing of the exemptions. Provide more information and alerts to taxpayers to ensure that the appropriate documents are include with the application when first submitted so that staff may process applications upon receipt
Fewer than 5% of exemptions processed after 30 days of receipt
Create additional insert to be included with homestead application reminding taxpayers of the new documentation requirements. Custom print return envelopes with a reminder on back of envelope to include additional documentation. Add additional information on website FAQ reminding taxpayers of additional requirements and create online video detailing requirements.
Percent of exemption applications processed on first receipt
Number of additional documentation letters mailed to taxpayers
Number of exemption applications processed

Bu
dg
et O
verv
iew
14
Strategic Goal
Planning Goal Objective Outcome Measure Strategy Output Measure Efficiency Measure
Co
llect
, cre
ate
and
mai
nta
in a
ccu
rate
dat
a.
Field work quality control
Ensure that consistent procedures are followed by all staff and that careful review and consideration is given to each tax parcel appraised
Percent of field card returned for corrections
Improve quality of data collection by updating procedure manuals’ and training staff in procedures, performing quality assurance checks on returned field work, using GIS and other tools for data validation and holding staff accountable for errors discovered
Number of field cards processed
Average time to process field work
Percent of accounts requesting 25.25(c) or (d) corrections
Number of errors identified
Accuracy of sales ratio studies
Neighborhood cleanup
Ensure that neighborhoods are appropriately defined and identified and address population and sample size issues caused by over stratification
Reduction in the number of neighborhoods and increased performance in sales ratio studies
Develop procedures for the definition of neighborhoods and ensure consistent application of the procedures. Procedures should identify characteristics to be considered in the creation of neighborhoods and establish population minimums. Existing neighborhoods of insufficient population size should be combined where practicable. Procedures should also define a plan for annual review of neighborhoods
Number of neighborhoods with insufficient population and sample size
Number of neighborhoods reviewed
Property classification
Ensure that property classifications are uniform and consistent, and that procedures are followed by all staff and that careful review and consideration is given to each tax parcel appraised
Percent of field card returned for corrections
Review existing property classification guides to determine applicability in current mass appraisal models and modify classification guide as necessary in context with model and cost tables developed. Create detailed standards manuals for the classification of property. Conduct annual training with appraisers and utilize aerial photography and GIS for data validation and to ensure consistent application of standards and procedures. Develop work plan for quality assurance of property classifications which includes manager review of appraiser classification determinations
Percentage of properties incorrectly classified
Number of properties classified
Percent of accounts requesting 25.25(c) or (d) corrections
Number of properties classifications corrected by manager
Accuracy of sales ratio studies
Sketch Verification
Ensure that improvement size based on property sketches matched actual building footprint
Increased accuracy and consistency in property sketches and area calculations
Utilize aerial photography and GIS to overlay existing improvement sketches on top of current orthophotography to identify improvements where the sketch dimensions are incorrect or where property additions have been missed
Percentage of properties with size corrections
Number of sketches pinned to map
Number of changes or inspections identified

Bu
dg
et O
verv
iew
15
Strategic Goal
Planning Goal
Objective Outcome Measure
Strategy Output Measure
Efficiency Measure
En
sure
th
at t
he
Dis
tric
t m
ain
tain
s a
hig
hly
ed
uca
ted
, mo
tiva
ted
an
d s
kille
d w
ork
forc
e.
Increase training opportunities
Ensure that district staff receives sufficient training in their mission critical duty skills to include customer service, exemption administration, programming and technology, record maintenance, mapping, and basic and advance training in appraisal theory and practice. In addition to attaining Registered Professional Appraiser certification appraisal staff should be encouraged to attain IAAO and Appraisal Institute certifications
Increased number of appraisal staff with RPA, IAAO, AI certifications
Increase training budget for external courses and provide more internal training opportunities
Percentage of employees attaining certifications
Number of classes attended
Number of internal training sessions offered
Number of certifications awarded
Management training
Provide management training program to increase effectiveness and efficiency of managers
Increased ability of managers to create functional teams, manage projects, meet deadlines, and handle employee relations
Provide internal training on the following topics: Systems thinking, project management, delegating, teamwork, motivating staff, effective feedback, documenting discipline, and dealing with conflict
Number of internal training sessions offered
Number of projects completed
Number of employee coachings
Cross departmental training
Create a knowledgeable workforce that can assist each other and taxpayers without “governmental shuffle” by providing cross departmental training so that staff may answer basic questions and, if not able to answer, will be able to re-direct questions to the appropriate resource
Increased knowledge and understanding by staff of all phases of appraisal cycle, responsibilities, and district procedures and policies
Provide opportunities for related departments to cross train staff to create a greater understanding amongst staff of the full requirements of the appraisal district and how each division plays a role. Newly hired staff should spend at minimum one week on Customer Service and GIS divisions. Clerical staff should go out in the field with appraisers to understand the field inspection process and appraisers should train on data entry to understand the importance of accurate and complete field card notes
Decreased the number of tasks and taxpayers transferred between departments
Employee retention
Ensure that the district is able to retain long term employees that have developed a lot of institutional knowledge and skills
Increased average length of employments and increase percentage of skilled workers retiring from the district
Review employee salaries and benefit packages to ensure that the district can remain competitive in the market. Benefits would include retirement packages, health insurance, and sick and vacation time. Review employee reward and recognition programs such as service awards and district sponsored morale events. Explore non-monetary rewards such as flexible work schedule and telecommuting
Tenure of employees leaving district service
Succession planning
The population of the senior management is aging and several division directors in key positions are currently, or soon will be, eligible for retirement. Efforts first must be made to retain these employees as long as possible; however, the decision to retire is a personal choice and should be respected and treated with dignity. Regardless of retirement status institutional knowledge from key employees needs to be documented and transferred to the next generation of leaders
A well informed and trained staff ready to assume leadership responsibilities
Directors and managers should document annual work plans which include tasks and deadlines that may not be included in departments general procedure manuals. Directors should identify staff with leadership potential and offer mentoring and training opportunities that will allow theses staff members to become prepared to assume leadership responsibilities in the future
Documented work plans
Technology and facilities
Provide employees an appropriate work environment with adequate equipment and space to work efficiently
Create an equipment replacement schedule to ensure employees are given current technology and are able to work efficiently as possible. This schedule includes servers, SAN, network equipment, workstation, and peripheral equipment and software replacement. Employee workstations and office productivity software are scheduled to be replaced in 2013 and servers are scheduled for replacement in 2014. District facilities were remodeled in 2009-2011 to provide ergonomic cubicle furniture; however, there is limited space for additional employee growth. The district should research potential growth solutions such as additions to the existing building, satellite offices, or relocation to new facilities and develop recommendations based on growth projections
Documented work plans
Number of PCs replaced

Bu
dg
et O
verv
iew
16
Strategic Goal
Planning Goal
Objective Outcome Measure
Strategy Output Measure Efficiency Measure
Pro
vid
e cu
sto
mer
ser
vice
th
at is
co
urt
eou
s,
pro
fess
ion
al a
nd
acc
ura
te.
Emphasize customer service
Providing excellent customer service should be a recognized goal of every employee in the district
Percentage of surveyed customers expressing overall satisfaction with services received
Improve services delivered to our internal and external clients through employee training. Annual and mandatory training for all staff in customer service shall be conducted. Employees will be informed of expectations and phone calls, meetings and protest hearings will be audited by managers to ensure the highest level of customer service is attained
Number of customer complaints and compliments received
Number of customers assisted
Measure customer service feedback
Attain highest rating possible from those we serve as evidence by feedback provided through interviews, surveys, cards, letters or any other measuring device used in the agency
Percentage of surveyed customers expressing overall satisfaction with services received
Customer service cards will be placed at the reception desk in each department and customers will be encouraged to complete the surveys. The cards will be designed to measure the type of assistance (phone, online, at office), who the customer interacted with (customer service representative, appraiser…) and the level of satisfaction with the staff members courtesy, professionalism, knowledge, communication, resolution of the issue and overall satisfaction
Number of customers surveyed
Number of customers served
Provide additional online resources to taxpayers
Provide information and resources to taxpayers that will be educational and convenient
Percentage of surveyed customers expressing overall satisfaction with services received
Improve services delivered to our internal and external clients through the districts website, to include; better mapping and property search functionality, ability to file renditions, homesteads and fiduciary online, providing notices of appraised value, improved online protests including rescheduling capabilities, and a series of informational videos covering topics such as homestead applications, mass appraisal procedures, field inspections, and property protests
Percentage of customers getting information from website rather than phone call of office visit
The revenue budget for fiscal year 2017 is $18,213,517. Since the District uses a balance budget policy,
budgeted assessments to the taxing units must equal budgeted expenditures. Budgeted assessments to
the taxing units and budgeted expenditures both total $18,103,517. The additional $110,000 in the revenue
budget is for miscellaneous income. This is income that the District is allowed to keep from year to year for
charges for services, investment income, and other miscellaneous income items.
If the District has a surplus of revenues over expenditures from the preceding year’s budget, the District
must reduce the current budget allocation to each taxing unit proportionately for the year that the surplus is
from. This is shown as a refund of appraisal assessments and is a contra revenue account, which
consequently reduces budgeted revenues required by the taxing units for that fiscal year. For fiscal year
2017, the District does not have any surplus funds being credited back to the taxing units.
The table and graph below show the total budgeted revenues by source for the fiscal year 2017 budget and
the previous five years budget history.
OVERVIEW OF SIGNIFICANT BUDGET ITEMS

Bu
dg
et O
verv
iew
17
On a high level view, expenditures are broken down by function. The District uses four categories or
functions of expenditures for budgeting purposes: (1) payroll related expenditures, (2) operating
expenditures, (3) service expenditures and (4) capital equipment and debt expenditures. The chart and
graph below outline the budgeted expenditures by functions for fiscal year 2017 and the previous five year’s
budget histories.
$-
$2,000,000
$4,000,000
$6,000,000
$8,000,000
$10,000,000
$12,000,000
$14,000,000
$16,000,000
$18,000,000
$20,000,000
Budgeted Revenues

Bu
dg
et O
verv
iew
18
Three general ledger accounts combine to make the capital expenditures function: (1) capital equipment, (2)
debt service- principal, and (3) debt service- interest. Capital equipment is any fixed asset whose cost is
over the capitalization threshold and has a useful life greater than one year. The District has established a
capitalization threshold of $1,000 or more. Under the modified accrual basis of accounting, capital
equipment is expensed in the period in which it is purchased. When preparing government-wide financial
statements, adjusting entries are made to account for the depreciation of capital equipment, since the
government-wide statements use the full accrual basis of accounting.
Debt service principal and interest are treated similar to the capital equipment account. Under the modified
accrual basis of accounting, all debts should be expensed in the period that they are incurred. However,
debt is typically a long-term liability and must be adjusted when converting to the government-wide
statements, which use the full-accrual basis of accounting.
The table and graph below outline the capital expenditures & debt function for the fiscal year 2017 and the
previous five fiscal years budget histories.
$-
$2,000,000
$4,000,000
$6,000,000
$8,000,000
$10,000,000
$12,000,000
$14,000,000
2012 2013 2014 2015 2016 2017
Expenditures by Function
Payroll Replated Expenditures Operating Supplies Expenditures
Service Expenditures Capital Equip. & Debt

Bu
dg
et O
verv
iew
19
The following table provides a broad overview of the major revenue sources and major expenditure
functions by fiscal year for fiscal year 2017 and the previous five fiscal years budget histories.
The fiscal year 2017 proposed budget for the District’s one and only fund, the general fund, is $18,103,517,
a 3.49% increase from the fiscal year 2016 budget.
$0
$100,000
$200,000
$300,000
$400,000
$500,000
$600,000
$700,000
2012 2013 2014 2015 2016 2017
Capital Expenditures Function
Capital Equipment Debt Service- Principal
Debt Service- Interest
DETAILED BUDGETARY ITEMS

Bu
dg
et O
verv
iew
20
FY 2016 Adopted Budget
FY 2017 Proposed
Budget $ Change % Change
General Fund $17,492,994 $ 18,103,517 $610,523 3.49%
Information on significant budgetary increases and decreases are provided below.
(The ARB expenditures have been removed from the totals and shown as a department total to compare
fiscal year 2016 with fiscal year 2017.)
Budget Category 2017 Budget
2016 Budget
$ Change 16-17
% Change 16-17
2015 Final Budget
2015 Actual
Overtime 159,342 81,342 78,000 95.89% 56,700 95,257
Deferred Compensation 573,053 - 573,053 100.00%
Postage & Freight- In House 146,343 111,200 35,143 31.60% 103,500 143,050
Travel, Meals & Lodging 42,990 22,830 20,160 88.30% 19,630 9,671
Training & Education 183,965 152,665 31,300 20.50% 168,740 83,012
Telephone 45,000 33,084 11,916 36.02% 28,800 39,755
Professional Services 174,893 98,459 76,434 77.63% 345,250 181,753
Software Maintenance 904,306 663,934 240,372 36.20% 665,174 617,689
Security Services 129,500 101,460 28,040 27.64% 22,900 64,272
Bank Fees 9,000 1,800 7,200 400.00% 1,800 2,876
Overtime: The Department of Labor has changed the rules for exempt vs non-exempt employees. For
fiscal year 2017, all residential and personal property appraisers will become non-exempt employees
because they do not meet the weekly threshold to be exempt employees. Because of this change, the
District has increased the overtime budget by $78,000 for FY 2017.
Deferred Compensation: Because the District’s employees do not participate in social security, the District
has set up a 401(a) retirement plan to allow employees to save additional funds for retirement. With the
401(a) plan, the District will contribute 5% of the employee’s annual salary to the retirement fund. The
employee then has the option to contribute an additional 5% in which the District will match 100% on the first
3% and 50% on the next 2% of contributions made by the employee. The funds are contributed on a 5 year
rolling vest scale.
Postage & Freight- In House: The cost of general postage was increased to the 2015 actual expenditures.
During 2015, the District sent more mail to taxpayers because of the increase in home sales. When the
number of sales increases, the pieces of mail we are required to send increases, which increases our
postage budget.
Travel, Meals & Lodging: The District is hoping to receive the IAAO award for excellence at the national
IAAO conference in 2017. We are also planning to present numerous topics at the conference. Therefore,
the travel budget was increased for the 2017 budget to cover travel costs of the employees attending the
conference.
Bu
dg
et O
verv
iew
21
Training & Education: The IT training budget was increased $34,500 for fiscal year 2017. The District has
budgeted for the IT staff to attend trainings on Sequel Server, VMWare, Cisco and CommVault. The District
also budgeted $25,000 for the GIS mapping department to attend training on ArcServer and ESRI in 2017.
Telephone: Due to the increased call volume during 2015, the District added an additional trunk to the
phone system with AT&T. This will prevent calls from being dropped during peak call volume times.
Professional Services: The District plans to participate in an aerial drone photography analysis project
during FY 2017. The estimated cost of this project is $75,000.
Software Maintenance: The District plans to continue to fund efficiency projects with our CAMA software
vendor, Harris Computer Systems. The increased budget for co-development projects will gain the District
much needed efficiencies.
Security Services: The District has increased the number of Travis County Sheriff’s Deputies that will be at
the District during the protest seasons from 1 to 2.
Bank Fees: During 2015, The District switched banking depositories from J.P. Morgan Chase to Wells
Fargo Bank, N.A. The monthly transaction fees with Wells Fargo are higher; however, the District also
earns a higher interest rate on the accounts. This increased cost is countered by the increase in investment
interest revenue.
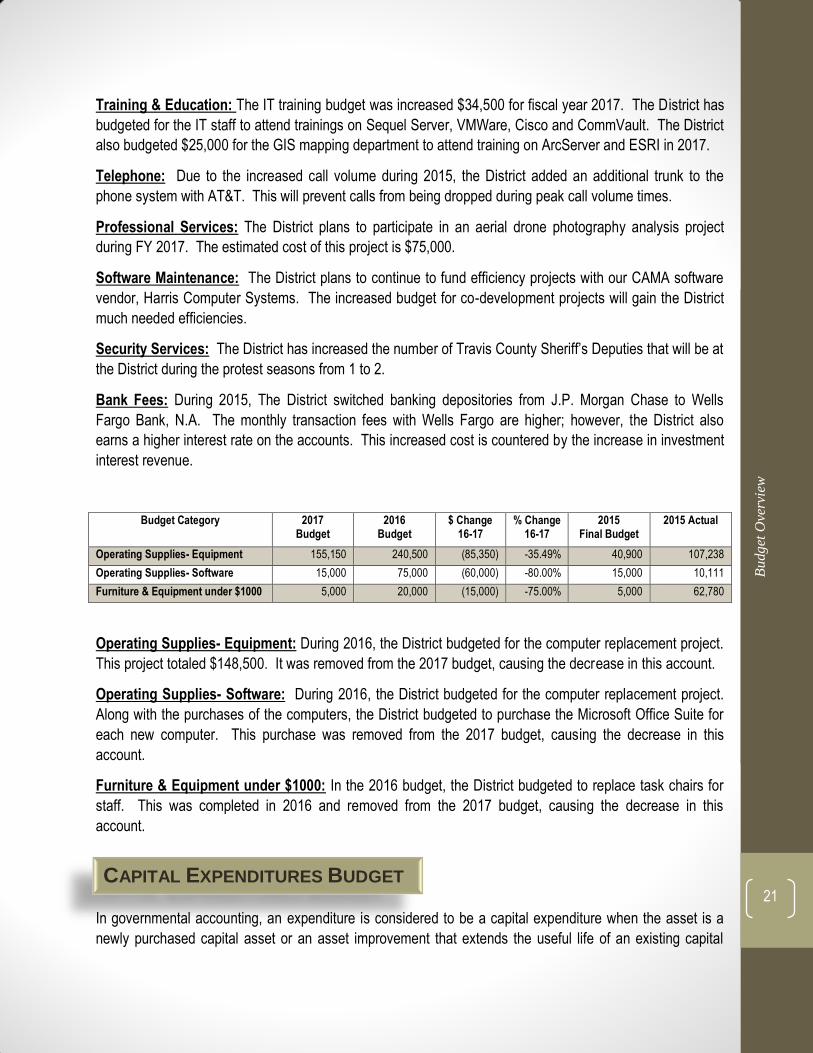
Budget Category 2017 Budget
2016 Budget
$ Change 16-17
% Change 16-17
2015 Final Budget
2015 Actual
Operating Supplies- Equipment 155,150 240,500 (85,350) -35.49% 40,900 107,238
Operating Supplies- Software 15,000 75,000 (60,000) -80.00% 15,000 10,111
Furniture & Equipment under $1000 5,000 20,000 (15,000) -75.00% 5,000 62,780
Operating Supplies- Equipment: During 2016, the District budgeted for the computer replacement project.
This project totaled $148,500. It was removed from the 2017 budget, causing the decrease in this account.
Operating Supplies- Software: During 2016, the District budgeted for the computer replacement project.
Along with the purchases of the computers, the District budgeted to purchase the Microsoft Office Suite for
each new computer. This purchase was removed from the 2017 budget, causing the decrease in this
account.
Furniture & Equipment under $1000: In the 2016 budget, the District budgeted to replace task chairs for
staff. This was completed in 2016 and removed from the 2017 budget, causing the decrease in this
account.
In governmental accounting, an expenditure is considered to be a capital expenditure when the asset is a
newly purchased capital asset or an asset improvement that extends the useful life of an existing capital
CAPITAL EXPENDITURES BUDGET

Bu
dg
et O
verv
iew
22
asset. The Governmental Accounting Standards Board (GASB) provides the following authoritative
definition of a capital asset for state and local governments:
The term capital asset includes land, improvements to land, easements, buildings, building
improvements, vehicles, machinery, equipment, works of art and historical treasures, infrastructure,
and all other tangible or intangible assets that are used in operations and that have initial useful
lives extending beyond a single reporting period.
Per the District’s capitalization policy, if an asset’s cost is $1,000 or greater and the useful life of the asset is
more than one year, the asset is a capital asset and should be capitalized; this requires the District to spread
the cost of the expenditure over the useful life of the asset. If, however, the expenditure is one that
maintains the asset at its current condition, the cost is expensed fully in the year of the purchase.
The table on the following page outlines the capital expenditures in the 2017 proposed budget. The total
dollar amount of the budgeted capital expenditures for FY 2017 is $394,900. More in depth information on
major capital projects can be found in the Capital Improvement Program section of this document on pages
43-52.
Department Capital Asset to be Purchased Budgeted Cost
Administration (10) A/C Replacements $ 15,000 Transfer to Reserves- Building Repair or Replacement 100,000
IT (20) Servers 10,000 Online Protest Expansion Storage 6,000 Virtual Server Replacement- VM4 17,000 Cisco 2500 Series Wireless Controller 5,500 Phone System Replacement 75,000 Virtual Server Host Replacement 18,500 Windows Server Datacenter Software Purchase 9,000 Microsoft Exchange 2016 Software Purchase 8,000
Windows Server STD 2014 Software Purchase 30,900
Transfer to Reserves- Computer Equipment Replacement 50,000 Transfer to Reserves- Network Equipment Replacement 50,000
Total Capital Expenditures $ 394,900
During fiscal year 2016, the District has focused on hiring and maintaining qualified, skilled employees. Due
to the high turnover rate that the District was facing in clerical positions, the District has implemented a
policy of hiring temporary employees for a six month period prior to those individuals being hired as an
employee of the District. The graph below shows the budgeted number of employees versus the actual
number of employees. The variance for fiscal year 2015 and 2016 is due to the temporary employees within
their six month trial period are not included in the head count of actual employees.
STAFFING

Bu
dg
et O
verv
iew
23
Year 2006 2007 2008 2009 2010 2011 2012 2013 2014 2015 2016
# of Budgeted Personnel 107 112 113 119 128 129 130 128 127.5 132 131
Actual Personnel 110 103 111 119 120 123 117 116 114 107 108
Variance -3 9 2 0 8 6 13 12 13.5 25 23
Budgeted employees by function/program:
Function/Program 2007 2008 2009 2010 2011 2012 2013 2014 2015 2016 2017
Appraisal 64 65 69 78 78 79 80 81 89 87 89
Information Systems 37 37 38 37 36 35 33 32 29 29 29
Administration/General Operations 11 11 12 13 15 16 15 14.5 14 15 14
Total 112 113 119 128 129 130 128 127.5 132 131 132
0
20
40
60
80
100
120
140
2006 2007 2008 2009 2010 2011 2012 2013 2014 2015 2016
Personnel Comparison
# of Budgeted Personnel Actual Personnel

Bu
dg
et O
verv
iew
24
The Government Finance Officers Association (GFOA) describes fund balance as “The net position of a
governmental fund (difference between assets, liabilities, deferred outflows of resources, and deferred
inflows of resources).” There are five different components of fund balance (nonspendable, restricted,
committed, assigned, and unassigned) designed to indicate both:
Constraints on how resources of the fund can be spent, and
The sources of those constraints.
For fiscal year ending December 31, 2015, the District had a total fund balance of $6,141,693 with
$1,243,778 being nonspendable fund balance for prepaid items, $3,419,849 being committed fund balance
for reserves for future expenditures, and $1,478,066 being unassigned. The District anticipates having an
excess of revenues over expenditures for fiscal year ending December 31, 2016 of approximately $500,000,
which the District will request from the jurisdictions through a budget amendment to append this amount to
the 2017 budget or place the surplus into reserves.
During fiscal year 2016, the District requested from the taxing jurisdictions to purchase the adjacent lot that
became available. The purchase of this lot will directly reduce the reserves for future building repair or
replacement. The estimated cost of the lot including closing costs is $270,000.
The District’s fund balance is also increased by miscellaneous revenue that appraisal districts are allowed to
exempt from the credit of surplus funds back to the jurisdictions. Miscellaneous revenue includes revenue
0
10
20
30
40
50
60
70
80
90
100
2007 2008 2009 2010 2011 2012 2013 2014 2015 2016 2017
Budgeted Positions by Function/Program
Appraisal Information Systems Administration/General Operations
PROJECTED CHANGES IN FUND BALANCE

Bu
dg
et O
verv
iew
25
from the sale of data produced by the District as well as any late payment rendition revenue that is split
between the District and the county tax assessor-collector. The District expects for the FY ending
December 31, 2015 to have approximately $83,000 in miscellaneous revenue that will increase the
unassigned fund balance accordingly.
Fund Balance, December 31, 2015 $ 611,693
Estimated Increases in Fund balance:
Excess of Revenues over Expenditures for FY 2016 $ 500,000
Miscellaneous revenue from fiscal year 2016 $ 110,000
Estimated Decreases in Fund Balance:
Purchase of Adjacent Lot $ (270,000)
Estimated Fund Balance, December 31, 2016 $ 951,693
The District is currently focusing on two major long-term financial plans: IT replacements that need to be
done every 5 to 7 years and the need for a larger building in the near future.
Every five to seven years the District’s needs to purchase new computer equipment as well as new
networking equipment that could cost upwards of $800,000. This a large expense to include in the budget
for one year. The cost increases the budget significantly and increases the amount due from the taxing units
significantly. This makes the expenditures of the District unpredictable for the taxing units and difficult for
them to budget for. During 2014, an attorney general opinion was issued that allowed appraisal districts to
set up reserve accounts. The District began implementing this practice in 2014. The District has set up
reserve accounts and budgets for a portion of the total cost to be put in the reserve account each year. For
FY 2017, the District allocated $100,000 in the administration budget for reserves for capital expenditures
and $100,000 in the information technology budget for reserves for computer and network expenditures.
The District continues to grow at a rapidly increasing rate. In the next three to five years, the District expects
that we will outgrow the building that we are currently in. The District began making a plan on how to solve
this problem (i.e. whether to purchase a new building, set up a satellite office, etc.), but no conclusion has
been reached.
CONTACT INFORMATION
Should you have any questions about the District’s FY 2017 budget or the budgeting process, please
contact Leana H. Mann, Finance & Facilities Director for the Travis Central Appraisal District at (512)834-
9317 Ext. 405 or by e-mail at [email protected].
LONG-TERM FINANCIAL PLANS

Bu
dg
et O
verv
iew
26
lmann
Stamp

District Budget

Dis
tric
t B
ud
get
27
TRAVIS CENTRAL APPRAISAL DISTRICT
Budget Comparison 2017 2016 $ Change % Change 2015
Budget Category Budget Budget 16-17 16-17 Final Budget 2015 Actual
NO. OF EMPLOYEES 132 131 1 0.76%
REVENUES:
Assessments 18,103,517 17,492,994 610,525 3.49% 17,149,799 17,149,799
Refund of appraisal assessments - - - 0.00% - (26,908)
Investment earnings 5,000 3,000 2,000 66.67% 3,000 4,993
Charges for services 30,000 20,000 10,000 50.00% 20,000 31,707
Miscellaneous Revenue 75,000 60,000 15,000 25.00% 60,000 89,267
Total Revenue 18,213,517 17,575,994 637,525 3.63% 17,232,799 17,248,858
EXPENDITURES:
Payroll Expenditures
Salaries 7,247,635 7,234,307 13,328 0.18% 7,344,622 6,158,749
Auto Allowance 435,000 426,602 8,398 1.97% 423,750 350,514
Overtime 159,342 81,342 78,000 95.89% 56,700 95,257
Seasonal & Temporary 145,000 145,000 - 0.00% 32,000 315,526
Medicare Tax 115,883 111,268 4,615 4.15% 110,806 91,650
Retirement Contribution 1,438,555 1,381,260 57,295 4.15% 1,375,522 2,194,581
Deferred Compensation 573,053 - 573,053 100.00%
Health Insurance 1,622,680 1,868,944 (246,264) -13.18% 1,896,123 927,958
Dental Insurance 46,014 44,124 1,890 4.28% 33,499 28,336
Life Insurance 26,231 22,071 4,160 18.85% 22,406 17,646
Disability Insurance 39,352 38,676 676 1.75% 38,514 29,212
Long Term Care 49,564 49,565 (1) 0.00% 50,321 25,952
Employee Assistance Program 3,390 3,390 - 0.00% 3,390 3,390
Workers Compensation 35,000 32,500 2,500 7.69% 32,500 28,429
Unemployment Insurance 30,000 29,999 1 0.00% 30,693 10,312
Total Payroll Expenditures 11,966,700 11,469,048 497,652 4.34% 11,450,846 10,277,514
Operating Expenditures
Printing 117,735 118,485 (750) -0.63% 111,560 106,962
Paper 14,700 13,300 1,400 10.53% 14,400 13,394
Postage & Freight- In House 146,343 111,200 35,143 31.60% 103,500 143,050
Postage & Freight- Special Services 162,000 167,000 (5,000) -2.99% 154,500 157,120
Operating Supplies 74,980 73,530 1,450 1.97% 70,286 70,732
Operating Supplies- Equipment 155,150 240,500 (85,350) -35.49% 40,900 107,238
Operating Supplies- Software 15,000 75,000 (60,000) -80.00% 15,000 10,111
Furniture & Equipment under $1000 5,000 20,000 (15,000) -75.00% 5,000 62,780
Books, Publications, Subscriptions & Databases 134,938 129,285 5,653 4.37% 130,673 107,153
Microfilm - 1,000 (1,000) -100.00% 1,000 -
Records Management 7,000 4,000 3,000 75.00% 2,440 16,415
Total Operating Expenditures 832,846 953,300 (120,454) -12.64% 649,259 794,955

Dis
tric
t B
ud
get
28
2017 2016 $ Change % Change 2015
Budget Category Budget Budget 16-17 16-17 Final Budget 2015 Actual
Service Expenditures
Dues & Memberships 16,365 14,800 1,565 10.57% 14,115 13,444
Travel, Meals & Lodging 42,990 22,830 20,160 88.30% 19,630 9,671
Training & Education 183,965 152,665 31,300 20.50% 168,740 83,012
Advertising & Legal Notices 26,500 23,000 3,500 15.22% 34,000 23,864
Employee Recognition 25,000 22,500 2,500 11.11% 17,300 12,661
Board of Directors 43,500 57,040 (13,540) -23.74% 26,950 66,223
Utilities 94,060 97,140 (3,080) -3.17% 102,960 83,787
Telephone 45,000 33,084 11,916 36.02% 28,800 39,755
Internet Services 75,200 68,000 7,200 10.59% 63,200 65,439
Legal & Attorney 1,435,000 1,535,000 (100,000) -6.51% 1,285,000 272,885
Legal & Attorney- Personnel 35,000 35,000 - 0.00% 41,000 14,290
SOAH 1,500 1,500 - 0.00% 1,500 -
Arbitration Refunds 28,125 28,125 - 0.00% 28,125 3,600
Legal Fees- Expert Witness 250,000 250,000 - 0.00% 250,000 144,338
Accounting & Audit 17,290 16,725 565 3.38% 15,745 16,290
Appraisal Services 462,820 462,820 - 0.00% 582,820 313,320
Professional Services 174,893 98,459 76,434 77.63% 345,250 181,753
Professional Services- Payroll 32,000 30,000 2,000 6.67% 32,000 29,520
Rental- Office Machines 43,800 39,600 4,200 10.61% 47,200 42,990
Rental- Storage Space 17,510 17,330 180 1.04% 20,450 16,682
Repair & Maintenance- Equipment 111,341 117,901 (6,560) -5.56% 77,800 69,134
Building Maintenance 62,000 62,120 (120) -0.19% 62,700 45,306
Building Cleaning Service 43,120 42,120 1,000 2.37% 41,700 37,876
Software Maintenance 904,306 663,934 240,372 36.20% 665,174 617,689
Property Insurance 7,500 7,500 - 0.00% 7,500 4,513
Liability Insurance 32,000 32,000 - 0.00% 32,000 23,412
Security Services 129,500 101,460 28,040 27.64% 22,900 64,272
Aerial Photography 215,226 215,226 - 0.00% 78,240 185,837
Deed Copies 2,500 2,000 500 25.00% 4,000 2,200
Vehicle Fuel 1,800 1,800 - 0.00% 1,800 932
Vehicle Maintenance 600 600 - 0.00% 600 287
Bank Fees 9,000 1,800 7,200 400.00% 1,800 2,876
Prompt Pay Discount - - - 0.00% - (24)
Appraisal Review Board 339,660 322,695 16,965 5.26% 322,695 475,896
Total Service Expenditures $ 4,909,071 $ 4,576,774 $ 332,297 7.26% $ 4,443,694 $ 2,963,728

Dis
tric
t B
ud
get
29
Capital Equipment and Debt:
Capital Equipment 394,900 493,872 (98,972) -20.04% 606,000 569,720
Total Capital & Debt $ 394,900 $ 493,872 $ (98,972) -20.04% $ 606,000 $ 569,720
Total Expenditures $ 18,103,517 $ 17,492,994 $ 610,523 3.49% $ 17,149,799 $ 14,605,917
2016 Total Budget 17,492,994
2017 Total Budget 18,103,517
$ Change in Total Budget 610,523
% Change in Total Budget 3.49%
lmann
Line

Dis
tric
t B
ud
get
30
TRAVIS CENTRAL APPRAISAL DISTRICT
District Budget by Department 10 20 30 35 50 60 90 01
Budget Admin Information Customer Tech Appeals Comm & BPP Residential ARB Total
Category Technology Service Support Appraisal Appraisal Budget
# Personnel 10 12 17 19 4 23 47 NA 132
Salaries 824,677 771,202 608,326 722,984 381,718 1,424,760 2,513,969 312,700 7,560,336
Auto Allowance 6,600 9,600 132,000 286,800 435,000
Overtime 12,000 17,500 17,500 26,842 1,500 84,000 159,342 Seasonal & Temporary 5,000 90,000 50,000 145,000
Medicare Tax 12,228 11,436 10,379 11,597 5,696 22,718 41,829 115,883 Retirement Contribution 151,790 141,966 128,848 143,969 70,707 282,017 519,258 1,438,555 Deferred Compensation 59,754 58,725 45,885 58,851 33,185 109,170 207,483 573,053
Health Insurance 178,385 142,062 201,254 224,931 47,354 272,285 556,409 1,622,680
Dental Insurance 3,486 4,183 5,926 6,623 1,394 8,018 16,384 46,014
Life Insurance 2,973 2,907 2,443 2,701 1,387 5,170 8,650 26,231 Disability Insurance 4,381 4,284 3,600 3,980 2,044 7,619 13,444 39,352
Long Term Care 3,755 4,506 6,383 7,134 1,502 8,636 17,648 49,564 Employee Assistance Program 3,390 3,390 Workers Compensation 35,000 35,000 Unemployment Insurance 30,000 - - - - - - 30,000
Total Payroll Costs 1,333,419 1,158,771 1,120,544 1,259,612 556,087 2,272,393 4,265,874 312,700 12,279,400
Printing 1,335 114,300 50 50 50 750 1,200 117,735
Paper 11,200 3,500 14,700 Postage & Freight- In House 146,343 146,343 Postage & Freight- Special Services 162,000 162,000
Operating Supplies 18,900 42,500 3,000 2,500 1,080 2,000 5,000 1,020 76,000 Operating Supplies- Equipment 155,150 155,150 Operating Supplies- Software 15,000 15,000 Furniture & Equipment under $1000 5,000 5,000 Books, Publications, Subscriptions & Databases 35,055 790 15,948 4,665 76,755 1,725 134,938 Records Management 7,000 7,000
Total Operating Supplies 224,833 493,240 18,998 2,550 5,795 79,505 7,925 1,020 833,866

Dis
tric
t B
ud
get
31
TRAVIS CENTRAL APPRAISAL DISTRICT
District Budget by Department
10 20 30 35 50 60 90 01
Budget Admin Information Customer Tech Appeals Comm &
BPP Residential ARB Total
Category Technology Service Support Appraisal Appraisal Budget
Dues & Memberships 10,135 90
90 2,900 1,035 2,115
16,365
Travel, Meals & Lodging 41,990
1,000
42,990
Training & Education 111,715 50,000 250 2,500 1,500 8,000 10,000 13,190 197,155
Advertising & Legal Notices 24,500
2,000
26,500
Employee Recognition 25,000
25,000
Board of Directors 43,500
43,500
Utilities 94,060
94,060
Telephone 45,000
45,000
Internet Services 42,900 32,300
75,200
Legal & Attorney
1,435,000
12,750 1,447,750
Legal & Attorney- Personnel 35,000
35,000
SOAH
1,500
1,500
Arbitration Refunds
28,125
28,125
Legal Fees- Expert Witness
250,000
250,000
Accounting & Audit 17,290
17,290
Appraisal Services 462,820
462,820
Professional Services 103,893 71,000
174,893
Professional Services- Payroll 32,000
32,000
Rental- Office Machines 43,800
43,800
Rental- Storage Space 7,910 9,600
17,510 Repair & Maintenance- Equipment 6,600 103,225 1,516
111,341
Building Maintenance 62,000
62,000
Building Cleaning Service 43,120
43,120
Software Maintenance 904,306
904,306
Property Insurance 7,500
7,500
Liability Insurance 32,000
32,000
Security Services 129,500
129,500
Aerial Photography 215,226
215,226
Deed Copies
2,500
2,500
Vehicle Fuel 1,800
1,800
Vehicle Maintenance 600
600
Bank Fees 9,000
9,000
Total Services 1,433,633 1,385,747 4,266 2,590 1,722,025 9,035 12,115 25,940 4,595,351

Dis
tric
t B
ud
get
32
TRAVIS CENTRAL APPRAISAL DISTRICT
District Budget by Department
10 20 30 35 50 60 90 01
Budget Admin Information Customer Tech Appeals Comm &
BPP Residential ARB Total
Category Technology Service Support Appraisal Appraisal Budget
Capital Equipment 115,000 279,900
394,900
Debt Service-Principal
-
Debt Service-Interest -
Total Capital & Debt 115,000 279,900 - - - - - - 394,900
Total Expenditure 3,106,885 3,317,658 1,143,808 1,264,752 2,283,907 2,360,933 4,285,914 339,660 18,103,517
Total 2017 Budget $18,103,517

Dis
tric
t B
udget
33
TRAVIS CENTRAL APPRAISAL DISTRICT Departmental Budget Recap
Department Number of Employees 2017 Budget
% of TCAD Budget
Administration 10 $3,106,885 17.16%
Information Technology 12 $3,317,658 18.33%
Customer Service 17 $1,143,808 6.32%
Appraisal Support 19 $1,264,752 6.99%
Appeals 4 $2,283,907 12.62%
Commercial & Personal Property Appraisal 23 $2,360,933 13.04%
Residential Appraisal 47 $4,285,914 23.67%
Appraisal Review Board* $339,660 1.88%
Total Appraisal District 132 18,103,517 100.00%
The ARB, while included in the District budget, is managed separately from the appraisal district.

Dis
tric
t B
udget
34
Administration 17.16%
Information Technology
18.33%
Customer Service 6.32%
Appraisal Support 6.99%
Appeals 12.62%
Commercial & Personal Property
Appraisal 13.04%
Residential Appraisal 23.67%
Appraisal Review Board* 1.88%
% of Total Budget by Department
$
$1,000,000
$2,000,000
$3,000,000
$4,000,000
$5,000,000
Total Expenditures by Department

Revenue Budget

Rev
enu
e B
udg
et
35
TRAVIS CENTRAL APPRAISAL DISTRICT
Revenue Budget
The revenue budget for fiscal year 2017 is $18,213,517. Since the District uses a balanced budget policy,
budgeted assessments to the taxing units must equal budgeted expenditures. Budgeted assessments to
the taxing units and budgeted expenditures both total $18,103,517. The additional $110,000 in the revenue
budget is for miscellaneous income. This is income that the District is allowed to keep from year to year for
charges for services, investment income and other miscellaneous income items.
Assessments to the taxing entities: Most of the District’s revenue comes from the taxing entities of Travis
County. The District serves the 119 local government agencies including 21 cities, 14 emergency districts,
the county, the hospital district, the junior college, 48 municipal utility districts, 1 road districts, 15 school
districts, and 17 water control improvement districts. Each taxing entity is allocated a portion of the budget
equal to the proportion that the total dollar amount of property taxes imposed in the District by the unit for the
tax year in which the budget proposal is prepared bears the sum of the total dollar amount of property taxes
imposed in the District by each participating unit for that year. The budget liability is then divided into four
equal installments paid at the beginning of each quarter. If a taxing unit decides not to impose taxes for any
tax year, the unit is not liable for any costs of operating the District for that year, and those costs are then
allocated amongst the other taxing entities. The revenue budget for assessments from the taxing entities
totals $18,103,517 for the 2017 fiscal year. A chart showing each taxing unit and their proportionate share
along with the information used to calculate their budget liability to the District is provided on pages 38-41.
If the District has a surplus of revenues over expenditures from the preceding year’s budget, the District
must reduce the current budget allocation to each taxing unit proportionately for the year that the surplus is
from. This is shown as a refund of appraisal assessments and is a contra revenue account, which
consequently reduces budgeted revenues required by the taxing units for that fiscal year. For fiscal year
2017, the District does not have any surplus funds being credited back to the taxing units.
Assessments to the taxing entities 99.40%
Micellaneous Revenue
0.41%
Charges for Services 0.16%
Investment Income 0.03%
Other Income 0.60%
Where the Money Comes From...
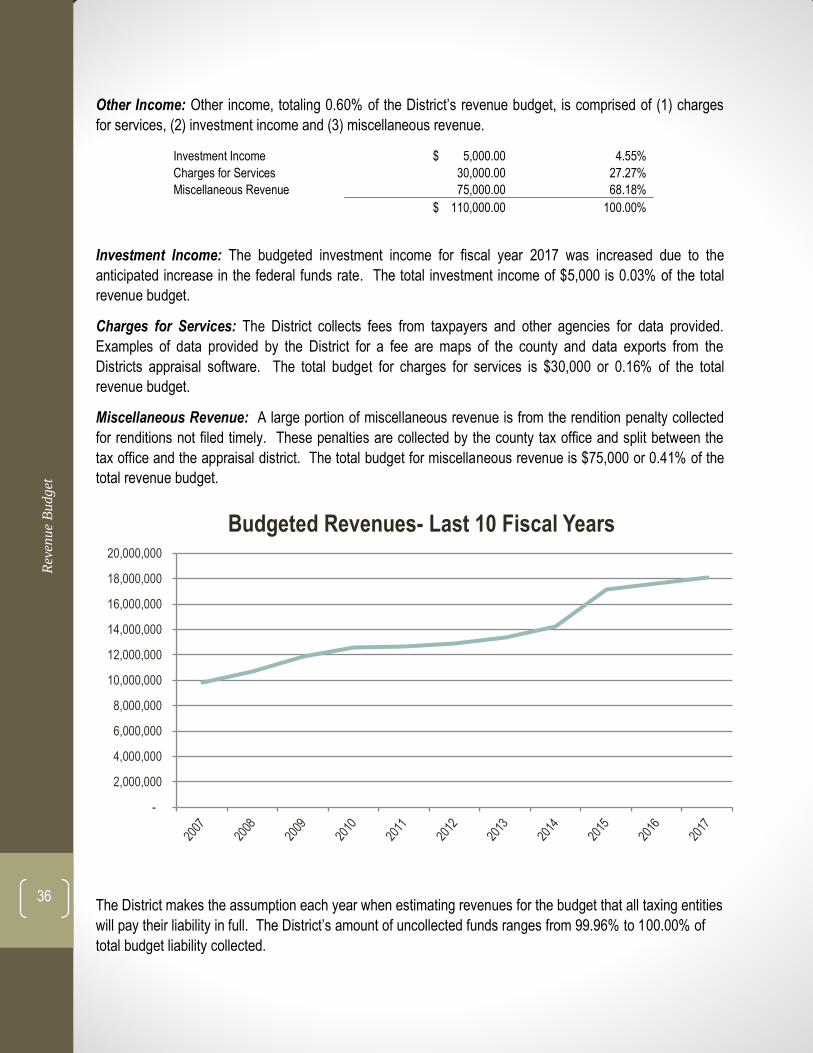
Rev
enu
e B
udg
et
36
Other Income: Other income, totaling 0.60% of the District’s revenue budget, is comprised of (1) charges
for services, (2) investment income and (3) miscellaneous revenue.
Investment Income $ 5,000.00 4.55%
Charges for Services 30,000.00 27.27%
Miscellaneous Revenue 75,000.00 68.18%
$ 110,000.00 100.00%
Investment Income: The budgeted investment income for fiscal year 2017 was increased due to the
anticipated increase in the federal funds rate. The total investment income of $5,000 is 0.03% of the total
revenue budget.
Charges for Services: The District collects fees from taxpayers and other agencies for data provided.
Examples of data provided by the District for a fee are maps of the county and data exports from the
Districts appraisal software. The total budget for charges for services is $30,000 or 0.16% of the total
revenue budget.
Miscellaneous Revenue: A large portion of miscellaneous revenue is from the rendition penalty collected
for renditions not filed timely. These penalties are collected by the county tax office and split between the
tax office and the appraisal district. The total budget for miscellaneous revenue is $75,000 or 0.41% of the
total revenue budget.
The District makes the assumption each year when estimating revenues for the budget that all taxing entities
will pay their liability in full. The District’s amount of uncollected funds ranges from 99.96% to 100.00% of
total budget liability collected.
-
2,000,000
4,000,000
6,000,000
8,000,000
10,000,000
12,000,000
14,000,000
16,000,000
18,000,000
20,000,000
Budgeted Revenues- Last 10 Fiscal Years

Rev
enu
e B
udg
et
37
Fiscal Year Ended Dec. 31
Total Assessments to Taxing Entities
Amount Collected Surplus Credit/Refund- Reduction of
Liability
Amount Not Collected
Percent of Assessment
2006 8,325,763 8,325,763 - 100.0000%
2007 9,829,300 8,927,273 902,018 9 99.9999%
2008 10,674,750 10,674,750 - 100.0000%
2009 11,856,540 11,856,540 - 100.0000%
2010 12,595,720 11,801,483 789,802 4,435 99.9648%
2011 12,689,610 12,076,873 612,738 (1) 100.0000%
2012 12,914,797 11,655,130 1,259,667 - 100.0000%
2013 13,375,023 13,375,023 - - 100.0000%
2014 14,246,848 14,157,414 89,434 - 100.0000%
2015 17,149,799 17,122,872 26,927 - 100.0000%

Rev
enu
e B
udg
et
38
TRAVIS CENTRAL APPRAISAL DISTRICT
Revenue Budget
Entity Cd
Name Tax Rate Levy Amount Pct Budget Liability
Quarterly Payments
01 AUSTIN ISD $1.202000 $1,034,132,608.67 31.4038% $5,685,194.09 $1,421,298.52
02 CITY OF AUSTIN $0.458900 $481,399,288.05 14.6188% $2,646,515.89 $661,628.97
03 TRAVIS COUNTY $0.416900 $570,645,769.08 17.3290% $3,137,152.75 $784,288.19
05 CITY OF MANOR $0.711800 $2,804,138.73 0.0852% $15,415.89 $3,853.97
06 DEL VALLE ISD $1.530000 $60,434,839.57 1.8352% $332,243.46 $83,060.86
07 LAKE TRAVIS ISD $1.407500 $122,286,103.60 3.7135% $672,273.78 $168,068.44
08 EANES ISD $1.212500 $148,710,313.72 4.5159% $817,542.15 $204,385.54
09 CITY OF WEST LAKE HILLS $0.057200 $956,938.77 0.0291% $5,260.82 $1,315.20
1A HAYS CONSOLIDATED ISD $1.537700 $122,146.44 0.0037% $671.51 $167.88
1C TRAVIS CO ESD NO 3 $0.090000 $2,365,345.51 0.0718% $13,003.60 $3,250.90
1D TRAVIS CO MUD NO 5 $0.742800 $1,053,480.56 0.0320% $5,791.56 $1,447.89
1F TANGLEWD FOREST LTD DIST $0.178800 $546,166.69 0.0166% $3,002.58 $750.64
1H COTTONWD CREEK MUD NO 1 $0.917000 $573,416.59 0.0174% $3,152.39 $788.10
1J CYPRESS RANCH WCID NO 1 $0.900000 $1,022,551.65 0.0311% $5,621.53 $1,405.38
10 TRAVIS CO WCID NO 10 $0.029400 $979,385.06 0.0297% $5,384.22 $1,346.05
11 CITY OF ROLLINGWOOD $0.202100 $1,360,721.70 0.0413% $7,480.63 $1,870.16
12 VILLAGE OF SAN LEANNA $0.249800 $131,345.54 0.0040% $722.08 $180.52
16 LAGO VISTA ISD $1.320000 $16,579,893.49 0.5035% $91,148.77 $22,787.19
17 TRAVIS CO WCID NO 17 $0.058500 $2,972,060.28 0.0903% $16,339.05 $4,084.76
18 TRAVIS CO WCID NO 18 $0.095200 $533,386.23 0.0162% $2,932.32 $733.08
19 PFLUGERVILLE ISD $1.540000 $147,767,194.68 4.4873% $812,357.31 $203,089.33
2A ELGIN ISD $1.540000 $3,031,751.89 0.0921% $16,667.20 $4,166.80
2D TRAVIS CO MUD NO 6 $0.460000 $782,458.59 0.0238% $4,301.60 $1,075.40
2F CITY OF ROUND ROCK $0.414650 $1,400,346.58 0.0425% $7,698.47 $1,924.62
2G WMSN CO WSID DIST 3 $0.730600 $417,770.32 0.0127% $2,296.71 $574.18
2H NE TRAVIS CO UTILITY DIST $0.861000 $1,970,092.60 0.0598% $10,830.68 $2,707.67
2J TRAVIS COUNTY HEALTHCARE DISTRICT $0.117781 $161,309,184.18 4.8985% $886,805.05 $221,701.26
20 CITY OF PFLUGERVILLE $0.540500 $20,875,417.54 0.6339% $114,763.62 $28,690.90
21 CITY OF LAKEWAY $0.170000 $5,933,816.04 0.1802% $32,621.44 $8,155.36
22 COUPLAND ISD $1.040050 $38,202.58 0.0012% $210.02 $52.51

Rev
enu
e B
udg
et
39
Entity Cd
Name Tax Rate Levy Amount Pct Budget Liability
Quarterly Payments
23 TRAVIS CO WCID POINT VENTURE $0.625300 $1,055,988.29 0.0321% $5,805.35 $1,451.34
25 HURST CREEK MUD $0.363200 $1,609,260.35 0.0489% $8,846.99 $2,211.75
26 LAKEWAY MUD $0.153600 $1,699,634.76 0.0516% $9,343.82 $2,335.96
27 LOST CREEK LIMITED DISTRICT $0.076000 $654,350.25 0.0199% $3,597.32 $899.33
3A MARBLE FALLS ISD $1.280000 $6,152,190.00 0.1868% $33,821.96 $8,455.49
3C TRAVIS CO WCID 17 STEINER RANCH (DA) $0.375100 $7,799,916.74 0.2369% $42,880.42 $10,720.10
3D TRAVIS CO MUD NO 7 $0.908900 $45,346.98 0.0014% $249.30 $62.32
3F CITY OF CEDAR PARK $0.479500 $4,116,426.89 0.1250% $22,630.26 $5,657.56
3G TRAVIS CO MUD NO 14 $0.905000 $755,351.86 0.0229% $4,152.58 $1,038.15
32 WELLS BRANCH MUD $0.390000 $3,745,236.84 0.1137% $20,589.62 $5,147.41
33 SHADY HOLLOW MUD $0.048900 $144,695.83 0.0044% $795.47 $198.87
34 MANOR ISD $1.515000 $58,955,605.10 1.7903% $324,111.29 $81,027.82
35 TRAVIS CO WCID NO 19 $0.240000 $475,389.00 0.0144% $2,613.47 $653.37
37 TRAVIS CO WCID NO 20 $0.207200 $784,701.74 0.0238% $4,313.94 $1,078.48
38 DRIPPING SPRINGS ISD $1.520000 $157,943.92 0.0048% $868.30 $217.08
39 TRAVIS CO ESD NO 9 $0.074160 $4,946,907.04 0.1502% $27,195.86 $6,798.97
4A JOHNSON CITY ISD $1.145800 $113,527.41 0.0034% $624.12 $156.03
4D TRAVIS CO MUD NO 8 $0.714500 $550,646.31 0.0167% $3,027.20 $756.80
4F TRAVIS CO MUD NO 10 $0.780000 $795,312.85 0.0242% $4,372.27 $1,093.07
4H TRAVIS CO WCID 17 FLINTROCK (DA) $0.450500 $1,267,909.37 0.0385% $6,970.39 $1,742.60
40 CITY OF CREEDMOOR $0.380000 $171,357.70 0.0052% $942.05 $235.51
41 TRAVIS CO ESD NO 1 $0.100000 $2,279,822.55 0.0692% $12,533.43 $3,133.36
49 CITY OF LAGO VISTA $0.650000 $4,426,188.44 0.1344% $24,333.19 $6,083.30
5A ROUND ROCK ISD $1.332500 $88,104,955.99 2.6755% $484,361.26 $121,090.32
5D TRAVIS CO MUD NO 9 $0.859500 $29,618.53 0.0009% $162.83 $40.71
5E SENNA HILLS MUD $0.541100 $1,499,161.73 0.0455% $8,241.71 $2,060.43
5F CITY OF ELGIN $0.656916 $345,426.04 0.0105% $1,899.00 $474.75
5G VILLAGE OF VOLENTE $0.100000 $178,813.71 0.0054% $983.04 $245.76
5H VILLAGE OF WEBBERVILLE $0.305100 $59,299.94 0.0018% $326.00 $81.50
50 CITY OF JONESTOWN $0.565600 $2,228,160.61 0.0677% $12,249.42 $3,062.36
51 TRAVIS CO ESD NO 11 $0.100000 $848,519.26 0.0258% $4,664.78 $1,166.19
52 TRAVIS CO ESD NO 6 $0.100000 $12,418,743.08 0.3771% $68,272.64 $17,068.16
55 VILLAGE OF BRIARCLIFF $0.160500 $396,351.68 0.0120% $2,178.96 $544.74
56 TRAVIS CO ESD NO 5 $0.091800 $948,994.82 0.0288% $5,217.14 $1,304.29

Rev
enu
e B
udg
et
40
Entity Cd
Name Tax Rate Levy Amount Pct Budget Liability
Quarterly Payments
57 TRAVIS CO ESD NO 4 $0.091400 $1,565,470.04 0.0475% $8,606.25 $2,151.56
58 TRAVIS CO ESD NO 10 $0.100000 $1,639,120.32 0.0498% $9,011.14 $2,252.79
59 RIVER PLACE MUD $0.231300 $1,243,871.88 0.0378% $6,838.25 $1,709.56
6E WEST TRAVIS CO MUD NO 3 $0.282000 $588,098.12 0.0179% $3,233.10 $808.27
6F CITY OF LEANDER $0.632920 $3,770,825.42 0.1145% $20,730.30 $5,182.57
6G TRAVIS CO MUD NO 15 $0.332500 $1,162,980.31 0.0353% $6,393.54 $1,598.39
6H WEST TRAVIS CO MUD NO 6 $0.450000 $1,728,117.57 0.0525% $9,500.41 $2,375.10
6J WEST TRAVIS CO MUD NO 8 $0.611000 $863,093.75 0.0262% $4,744.90 $1,186.22
61 CITY OF MUSTANG RIDGE $0.495000 $262,137.88 0.0080% $1,441.12 $360.28
68 AUSTIN COMM COLL DIST $0.100500 $121,593,077.48 3.6925% $668,463.83 $167,115.96
69 LEANDER ISD $1.511870 $115,934,230.34 3.5206% $637,354.04 $159,338.51
7A MOORES CROSSING MUD $0.932400 $919,023.22 0.0279% $5,052.37 $1,263.09
7D WEST TRAVIS CO MUD NO 5 $0.260000 $604,236.07 0.0183% $3,321.82 $830.45
7E VILLAGE OF THE HILLS $0.060000 $239,688.90 0.0073% $1,317.70 $329.43
7F VILLAGE OF POINT VENTURE $0.109500 $188,254.88 0.0057% $1,034.94 $258.74
7G WILBARGER CRK MUD NO 1 $0.908000 $247,364.17 0.0075% $1,359.90 $339.97
7H WILBARGER CRK MUD NO 2 $0.950000 $60,189.92 0.0018% $330.90 $82.72
70 TRAVIS CO MUD NO 2 $0.958500 $1,404,384.94 0.0426% $7,720.67 $1,930.17
71 TRAVIS CO ESD NO 14 $0.100000 $425,869.66 0.0129% $2,341.24 $585.31
72 TRAVIS CO ESD NO 12 $0.100000 $1,404,653.62 0.0427% $7,722.15 $1,930.54
77 TRAVIS CO ESD NO 8 $0.099800 $1,704,717.17 0.0518% $9,371.77 $2,342.94
8C TRAVIS CO MUD NO 3 $0.482500 $2,823,652.37 0.0857% $15,523.17 $3,880.79
8E RNCH @ CYPRSS CRK MUD 1 $0.365000 $311,598.17 0.0095% $1,713.03 $428.26
83 CITY OF BEE CAVE $0.020000 $305,865.88 0.0093% $1,681.51 $420.38
84 NORTHTOWN MUD $0.722000 $4,181,038.20 0.1270% $22,985.46 $5,746.36
9B TRAVIS CO ESD NO 2 $0.095800 $7,855,985.93 0.2386% $43,188.66 $10,797.17
9C TRAVIS CO MUD NO 4 $0.729600 $844,692.73 0.0257% $4,643.74 $1,160.93
9D LAKESIDE WCID NO 1 $0.800000 $1,077,784.45 0.0327% $5,925.17 $1,481.29
9G LAKESIDE MUD NO 2A $0.970000 $13,806.01 0.0004% $75.90 $18.97
9H LAKESIDE WCID NO 2B $0.970000 $977,508.30 0.0297% $5,373.90 $1,343.47
9I LAKESIDE WCID NO 2C $0.970000 $1,038,881.34 0.0315% $5,711.30 $1,427.83
9J LAKESIDE WCID NO 2D $0.970000 $1,232,737.28 0.0374% $6,777.03 $1,694.26
4J TRAVIS CO MUD NO 11 $0.737500 $1,826,897.74 0.0555% $10,043.46 $2,510.86
4K TRAVIS CO MUD NO 12 $0.772500 $621,981.62 0.0189% $3,419.37 $854.84
4L TRAVIS CO MUD NO 13 $0.772500 $499,015.04 0.0152% $2,743.36 $685.84

Rev
enu
e B
udg
et
41
Entity Cd
Name Tax Rate Levy Amount Pct Budget Liability Quarterly Payments
5J KELLY LANE WCID NO 1 $0.950000 $1,002,272.75 0.0304% $5,510.04 $1,377.51
5K KELLY LANE WCID NO 2 $0.950000 $231,813.35 0.0070% $1,274.41 $318.60
1K BELVEDERE MUD $0.425000 $664,767.41 0.0202% $3,654.59 $913.65
2K PRESIDENTIAL GLEN MUD $0.501900 $196,238.65 0.0060% $1,078.83 $269.71
7J LAKESIDE MUD NO 3 $0.847000 $1,006,879.30 0.0306% $5,535.37 $1,383.84
8K TRAVIS CO ESD NO 13 $0.100000 $56,580.59 0.0017% $311.05 $77.76
1L BASTROP-TRAVIS COUNTIES ESD NO 1 $0.093300 $126,550.12 0.0038% $695.72 $173.93
7K SUNFIELD MUD NO 1 $0.900000 $2,111.44 0.0001% $11.61 $2.90
8L TRAVIS CO BEE CAVE ROAD DIST NO 1 $0.321500 $1,113,076.76 0.0338% $6,119.19 $1,529.80
2N NORTH AUSTIN MUD NO 1 $0.317000 $286,493.99 0.0087% $1,575.01 $393.75
2L TRAVIS CO MUD NO 16 $0.950000 $1,298,887.82 0.0394% $7,140.70 $1,785.17
5M LAZY NINE MUD NO 1B $1.010000 $1,423,077.17 0.0432% $7,823.44 $1,955.86
3M WILLIAMSON/TRAVIS MUD NO 1 $0.510000 $532,447.19 0.0162% $2,927.15 $731.79
8N ANDERSON MILL LIMITED DISTRICT $0.126000 $11,346.72 0.0003% $62.38 $15.59
9L TRAVIS CO WCID 17 SERENE HILLS (DA) $0.650000 $370,902.95 0.0113% $2,039.06 $509.76
9M SOUTHEAST TRAVIS COUNTY MUD NO 1 $0.980000 $237.12 0.0000% $1.30 $0.33
6M TRAVIS CO MUD NO 21 $0.312500 $105,818.04 0.0032% $581.74 $145.43
6L TRAVIS CO MUD NO 17 $0.950000 $192,935.60 0.0059% $1,060.67 $265.17
3N TRAVIS CO MUD NO 18 $0.750000 $270,091.00 0.0082% $1,484.84 $371.21
4M PILOT KNOB MUD NO 3 $0.950000 $65,111.94 0.0020% $357.96 $89.49
$3,293,016,381.17 100% $18,103,517.00 $4,525,879.25
Amount due from Jurisdictions $18,103,517
Refund 2015 Surplus Funds $ -
Total Revenue to TCAD $18,103,517
Cost of Service to Jurisdictions
0.55%
Note: The liabilities shown above have been calculated based on the 2015 tax rate and the 2015 levy. When the 2016 tax rates and levies are set, the numbers will be recalculated. This will change individual liabilities depending upon the tax rates set, levy of each jurisdiction, and the taxable values established for each jurisdiction for 2016

Rev
enu
e B
udg
et
42
lmann
Stamp

Capital Improvement
Plan

Ca
pit
al
Imp
rove
men
t P
lan
43
TRAVIS CENTRAL APPRAISAL DISTRICT
Capital Improvement Plan
Capital Improvement Plan Overview
The Capital Improvement Plan (CIP) is a multi-year plan to address capital projects necessary to maintain
infrastructure and replace aging equipment. The plan is updated annually to reflect the latest priorities,
updated cost estimates, and available funding information.
A capital asset, by definition, includes land, improvements to land, easements, buildings, building
improvements, vehicles, machinery, equipment, works of art and historical treasures, infrastructure, and all
other tangible or intangible assets that are used in operations and that have initial useful lives extending
beyond a single reporting period. The District’s capitalization threshold is $1,000 and a useful life of more
than one year. The District’s finance department is responsible for the establishment, maintenance and
safeguarding of all fixed assets. The District’s capital assets are depreciated using the straight-line method
over their estimated useful lives outlined below based on the following asset classes:
Asset Class Useful Life
Land Inexhaustible
Building 50 years
Building Improvements 5-10 years
Computer Equipment 3-5 years
Furniture & Equipment 5-10 years
Vehicles 5-10 years

Ca
pit
al
Imp
rove
men
t P
lan
44
2017 Capital Improvement Plan
For fiscal year 2017, the District has budgeted for a total of $394,900 for capital asset expenditures. The
chart below shows the breakdown by department.
Department Capital Asset to be Purchased Budgeted Cost
Administration (10) A/C Replacements $ 15,000
Transfer to Reserves- Building Repair or Replacement 100,000
IT (20) Servers 10,000
Online Protest Expansion Storage 6,000
Virtual Server Replacement- VM4 17,000 Cisco 2500 Series Wireless Controller 5,500 Phone System Replacement 75,000 Virtual Server Host Replacement 18,500 Windows Server Datacenter Software Purchase 9,000 Microsoft Exchange 2016 Software Purchase 8,000
Windows Server STD 2014 Software Purchase 30,900
Transfer to Reserves- Computer Equipment Replacement 50,000 Transfer to Reserves- Network Equipment Replacement 50,000
Total Capital Expenditures $ 394,900
Administration 29.1%
Information Technology
70.9%
Capital Asset Purchases by Department

Ca
pit
al
Imp
rove
men
t P
lan
45
Capital Asset to be Purchased Total Cost Routine Non-Routine
A/C Replacements $15,000 $15,000
Transfer to Reserves- Building Repair or Replacement 100,000 100,000
Servers 10,000 10,000
Online Protest Expansion Storage 6,000 6,000
Virtual Server Replacement- VM4 17,000 17,000
Cisco 2500 Series Wireless Controller 5,500 5,500
Phone System Replacement 75,000 75,000
Virtual Server Host Replacement 18,500 18,500
Windows Server Datacenter Software Purchase 9,000 9,000
Microsoft Exchange 2016 Software Purchase 8,000 8,000
Windows Server STD 2014 Software Purchase 30,900 30,900
Transfer to Reserves- Computer Equipment Replacement 50,000 50,000
Transfer to Reserves- Network Equipment Replacement 50,000 50,000
2017 Routine Capital Projects AC Replacements
The District budgets $15,000 per year for A/C unit replacements. The District has approximately 30 rooftop units at
various stages in their useful life. Approximately two units are replaced each year, as needed.
Emergency Server Replacement
The District budgets $10,000 for emergency server replacements. The District’s CAMA software is critical to the property tax system for Travis County. The District’s IT department tries to replace all equipment before the estimated useful life is up; however, occasionally, there may be a server that needs to be replaced that is critical to the operations of the District.
Online Protest Expansion Storage
The District has been advertising the online appeals process for the past 2015 and 2016 tax years. As more
taxpayers take advantage of the online options, more storage may be necessary to complete the appeals process.
Transfer to Reserves- Building Repair or Replacement
The District budgets $100,000 to be put into the reserve fund for the building repair or replacement each year. The
District estimates that by 2019, we will outgrow the current building. As the population of Travis County continues to
grow exponentially, more staff will be necessary to complete the mission critical tasks outlined in the Texas Property
Tax Code.
Transfer to Reserves- Computer Equipment Replacement
The District budgets $50,000 to be transferred to the reserve fund for computer equipment replacement each year.
The District estimates that computer equipment will need to be replaced every 5 years.
Transfer to Reserves- Network Equipment Replacement
The District budgets $50,000 to be transferred to the reserve fund for network equipment replacement each year. The
District estimates that critical network equipment will need to be replaced every 7 years.

Ca
pit
al
Imp
rove
men
t P
lan
46
2017 Significant and Nonroutine Capital Projects

Ca
pit
al
Imp
rove
men
t P
lan
47

Ca
pit
al
Imp
rove
men
t P
lan
48

Ca
pit
al
Imp
rove
men
t P
lan
49

Ca
pit
al
Imp
rove
men
t P
lan
50

Ca
pit
al
Imp
rove
men
t P
lan
51
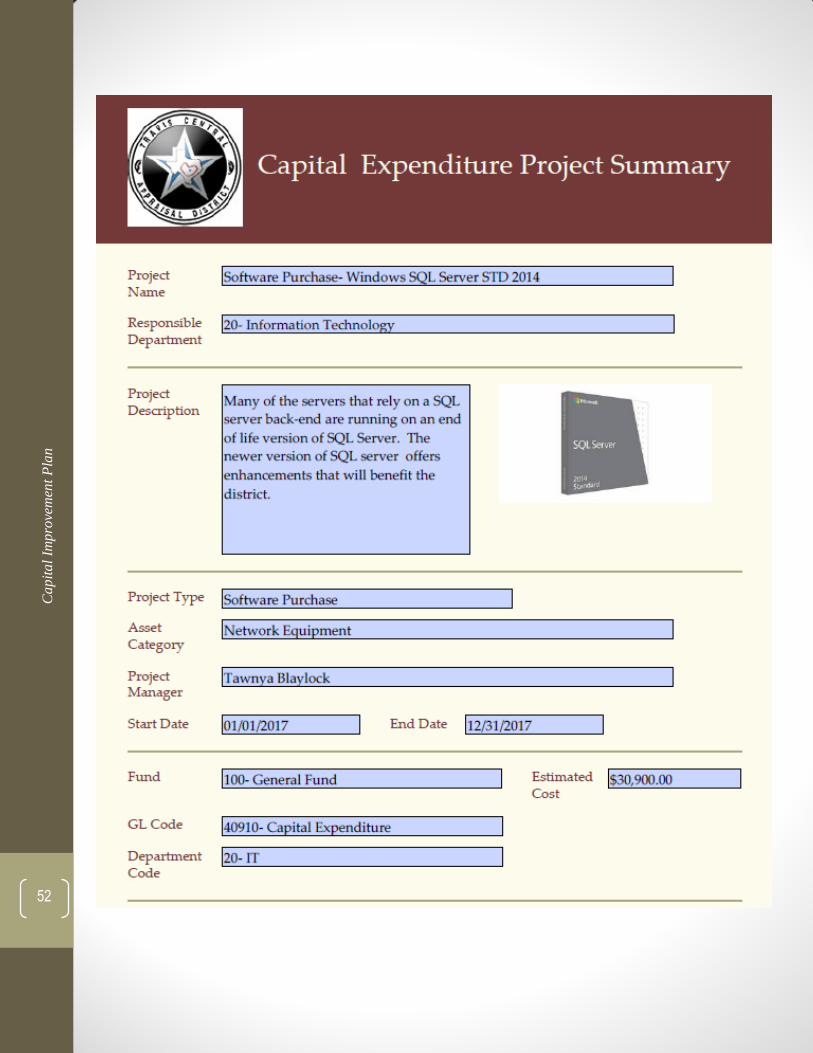
Ca
pit
al
Imp
rove
men
t P
lan
52

Debt Administration

Deb
t A
dm
inis
tra
tio
n
53
TRAVIS CENTRAL APPRAISAL DISTRICT
Capital Improvement Program
All financing of capital projects must be included in the current year’s proposed budget and approved by the board of directors. Appraisal Districts are not authorized to levy ad valorem taxes or issue bonded indebtedness or other debt instruments. Therefore, any capital asset acquisition requiring the use of financing must be done through the budget process. For fiscal year 2017, the District does not anticipate the need to enter into any financing agreements for the purchase of capital equipment.

Deb
t A
dm
inis
tra
tio
n
54
lmann
Stamp

Department Budgets

Dep
art
men
t B
ud
get
s
55
Admin Clerk.
(1)
Records Coordinator
(1)
Chief Appraiser
(1)
Human Resource Director
(1)
Finance & Facilities
Director
(1)
Mail Clerk Messenger
(1)
Maint./Janitor
(1)
Deputy Chief of Appraisal
(1)
Executive Asst.
(1)
Communication Specialist
(1)
Employee Position
Number of
Positions Position Grade Hourly Range
Auto Allowance
Total Employee Benefit
Chief Appraiser 1 Exempt $88.27 - $88.27 $ - $63,868 - $63,868 Deputy Chief of Appraisal 1 20 $49.91 - $69.87 $ 6,600 $41,884 - $53,323 Human Resource Director 1 15 $37.39 - $52.35 $ - $34,708 - $43,282 Finance & Facilities Director 1 15 $37.39 - $52.35 $ - $34,708 - $43,282 Communications Specialist 1 12 $33.04 - $46.25 $ - $32,215 - $39,786 Executive Assistant 1 5 $20.20 - $28.33 $ - $24,856 - $29,516 Mail Clerk/Messenger 1 3 $17.71 - $24.81 $ - $23,429 - $27,498 Records Coordinator 1 5 $20.20 - $28.33 $ - $24,856 - $29,516 Admin Clerk 1 5 $20.20 - $28.33 $ - $24,856 - $29,516
Maintenance/Janitor 1 2 $14.75 - $20.65 $ - $21,733 - $25,114
Total employee benefit is comprised of health, dental, life, disability and long-term care insurance, retirement, and the employee assistance program that are all provided by the District as terms of employment.

Dep
art
men
t B
ud
get
s
56
Administration Department
Mission Statement
The mission of the Administration department, which includes human resources, finance, facilities’
maintenance, records management and the offices of the Chief Appraiser and the Deputy Chief of Appraisal
is to provide timely, useful, and accurate information to all internal and external customers including but not
limited to staff, division directors, the Board of Directors, the taxing jurisdictions of Travis County, and all
taxpayers of Travis County, and to assure prudent control of the District’s cash and investments. It is also
the mission of the Administration department to oversee all mission critical tasks of the appraisal district to
ensure completion and to meet all legislative requirements.
Key Responsibilities
The Administration Department’s function is to plan, organize, direct and control the business support
functions related to human resources, budget, finance, purchasing, payroll, facilities maintenance, records
management and mail services.
Key Tasks & Deadlines
Tasks Deadline Key Players
Performance Reviews/ Merit Increases January 15 HR, Divisions Directors & Managers
Year End Processing & W2’s January 1 HR, Finance
Budget Planning Meetings March 1 Finance, Chief Appraiser, Division Directors
Certified Estimates April 30 Chief Appraiser
Financial Audit June 15 Finance
Presentation Preliminary Budget June 15 Chief Appraiser, Finance
Appraisal Roll Certification July 25 Chief Appraiser
Director’s Retreat August 10 Chief Appraiser, Division Directors & Managers
Reappraisal Plan September 15 Chief Appraiser
Budget Adoption September 15 Chief Appraiser, Finance
Strategic Plan October 15 Chief Appraiser, Division Directors & Managers
Annual Report November 1 Chief Appraiser
Open Enrollment November 1 HR

Dep
art
men
t B
ud
get
s
57
Department Goals
Department 2017 Goals Output Measure Efficiency Measure
Ad
min
istr
atio
n
Improve standing as an industry leader and enhance Travis CAD's reputation and networking capabilities (Deputy Chief)
Achieve IAAO Designation of CAE (Certified Assessment Evaluator)
Inspire other CAD employees to seek additional training and education
Improve planning, procedures, appraisal accuracy and defense of values
Produce measurable results with respect to current over stratification of real property accounts (Deputy Chief)
Reduce total number of residential neighborhoods from 2,282 to 2,000
Ability to profile greater percentage of neighborhoods
Larger neighborhoods have more sales to analyze and calibrate appraisal models
Prepare and administer the District's annual operating budget by maximizing the accuracy of budgeted revenue and expenditure estimates, and effectively meeting the short and long-term needs of the District (Finance)
Adoption of the 2018 budget by the statutory deadline of September 15, 2017.
Award by GFOA for Distinguished Budget Presentation
Number of budget variance reports with a variance of less than 10%
Department budget variance percentage of less than 5%
Manage the annual financial audit and prepare the Comprehensive annual financial report in which the report is user friendly and understandable to the taxpayers and jurisdictions of Travis County (Finance)
Create a PAFR (Popular Annual Financial Report) that meets the GFOA requirements
Award by GFOA for Excellence in Financial Reporting
Number and type of financial information available on the TCAD website
Award for Popular Annual Financial Report (PAFR) by GFOA
CAFR & Budget documents available on TCAD website
Training - New Appraisal Staff training with emphasis on completing the 5 year RPA Level IV in 3 years
Number of appraisers completing RPA Level IV early
Improved quality and efficiency
Complete and Implement Email Policy for Retention
Completion of Policy Reduced storage space. Improved capacity for Ability to recoup costs for high volume requestors.
Continue to work with clerical supervisors to establish productivity/accuracy goals
Quality of product, meeting time constrained goals.
Increased accuracy and productivity and ultimately customer satisfaction.
Training - Work with managers and directors to produce training videos
Consistent employee directed training.
Reduced duplicative effort, improved consistency in training, reduced learning curve.

Dep
art
men
t B
ud
get
s
58
Department Accomplishments
1 Deputy Chief assisted with personnel changes to key positions to enhance accuracy and fairness of commercial and residential values. The selection and mentoring of these two appraisal division Directors, both new employees at Travis CAD, has enhanced and accelerated their positive impact on the performance of the district. Commercial values increased 30% in 2015 and 30% again for 2016 alleviating concerns of level of appraisal of Commercial properties relative to Residential properties. The Residential Division has processed a record number of protests before May 31st, giving the department a great head start on protest season.
2 Receipt of Government Finance Officers Association Distinguished Budget Presentation Award 3 Receipt of Government Finance Officers Association Award for Excellence in Financial Report 4 Finance Director became a Certified Government Finance Office (CGFO) through the Government
Finance Officers Association of Texas 5 Changed health care providers reducing cost 6 Added an auxiliary long-term disability plan 7 Implemented an off-site call center to address spikes in call volume; improved response time and
number of dropped calls

Dep
art
men
t B
ud
get
s
59
Administration
2017
Budget Detail Description
Salaries
824,677
Personnel Salaries
Auto Allowance
6,600
Overtime
12,000
Seasonal & Temporary
5,000
Medicare Tax
12,228
District pays a matching 1.45% of gross wages
Retirement
151,790
18% Contribution rate
Deferred Compensation
59,754
The District contributes 5% of the annual salary on a 5 year sliding vest; the District also matches at 100% on the first 3% contributed, and 50% on the next 2% contributed.
Health Insurance
178,385
118,385 Employer paid health insurance at $941.69 per employee per month
60,000 Direct pay funding
Dental Insurance
3,486
Employer paid dental insurance at $29.05 per employee per month
Life Insurance
2,973
Employer paid life insurance at 31.35% of base salary
Disability Insurance
4,381
Employer paid long-term disability insurance at 0.554% of base salary
Long Term Care (LTC)
3,755
Employer paid long-term care coverage at an average of $375.49 per employee
Employee Assistance Program
3,390
District pays $282.50 per employee per month for Employee Assistance Program
Workers Compensation
35,000
Unemployment Insurance
30,000
Total Payroll Costs 1,333,419

Dep
art
men
t B
ud
get
s
60
Administration
2017
Budget Detail Description
Printing
1,335
500 A/P checks
275 ARB payroll checks
210 ARB direct deposit vouchers
100 Business Cards, ID Badges & Name Plates
250 Miscellaneous print jobs
Paper
11,200
Copy paper
Postage & Freight- In House
146,343
140,000 General mail postage
1,343 PO box rental
5,000 Shipping charges
Operating Supplies
18,900
7,500 Office supplies
3,250 First aid supplies
500 Postage meter supplies
150 End of year tax forms
7,500 TCAD shirt order
Furniture and Equipment under $1,000
5,000
5,000 Misc. furniture under $1000
Books/Publ/Subs/Data Bases
35,055
18,000 Metro Study
450 Austin American Statesman
105 Austin Business Journal
250 GASB Subscription
250 Survey monkey
500 Miscellaneous publications
1,200 Online test for applicants
3,500 Legislative Tracking Subscription
500 USPAP Books
300 Angelou Economics Monthly Updates
10,000 Additional Market Research Publications
Records Management
7,000
3,500 Biweekly shredding
3,500 Microfilm- appraisal roll & permanent records
Total Supplies 224,833

Dep
art
men
t B
ud
get
s
61
Administration
2017
Budget Detail Description
Dues & Memberships
10,135
2,800 Walnut Creek Improvement Association
200 Metro CAD
175 ARMA
90 TDLR
35 TX Soc. Sec. Program (ERS)
360 GFOA
75 GTOT
4,000 TAAD
100 Comptroller's Coop Membership
350 IAAO
350 SHRM
100 TAAO
1,500 Other
Travel/Meals/Lodging
41,990
3,000 TAAD Conference
25,000 IAAO Conference
5,040 GIS/CAMA Conference-
1,100 Ad Valorem Taxation Seminar
750 TAAO Conference
2,000 ESRI User Conference
1,500 ESRI User Conference
1,600 TA Conference
2,000 Other
Training & Education
111,715
500 Chief Appraiser
500 Deputy Chief of Appraisal
250 HR Director
750 Finance & Facilities Officer
250 Records Coordinator
250 TAAD Courses
1,500 Angelou Economic Forecast Forum
2,500 Annual Legal Seminar
2,550 GIS/CAMA Conference
14,300 IAAO Conference
30,000 IAAO In-house Training Classes
30,000 Appraisal Institute Courses
750 IREM Economic Forecast Forum

Dep
art
men
t B
ud
get
s
62
Administration
2017
Budget Detail Description
Training & Education (Cont.)
600 Legislative Update
10,000 Management Training
645 Open Government Conference
975 Property Tax Institute
675 TA Conference
1,875 TAAD Conference
1,140 TAAO Conference
705 TCDRS Conference
3,000 ESRI User Conference
3,000 Tuition Reimbursement for TCAD Employees
5,000 Miscellaneous Training
Advertising/Legal Notices
24,500
14,750 Property Tax Benefits
3,500 ARB Notice Accepting Application
2,500 Notice of Budget
1,000 RFP/RFQ Postings
2,750 Employment Ads
Employee Recognition
25,000
10,000 Employee recognition
10,000 IAAO Designation Reward
5,000 Fee Appraiser License Reward
Board of Directors
43,500
18,000 Taxpayer Liaison Officer
20,000 BOD General Counsel
1,500 Annual TAAD Conference
1,500 Travel Expenses for BOD Members
2,500 Other costs associated with the BOD
Utilities
94,060
85,000 Electricity & Water
4,200 Trash Pickup
1,020 Recycling
3,840 Cable
Telephone & Communication
45,000
Local/Long Distance Telephone
Internet Services
42,900
36,000 iPad Data Plan
6,900 AT&T Mobility wireless data cards
Legal & Attorney- Personnel
35,000
Human resources legal costs

Dep
art
men
t B
ud
get
s
63
Administration
2017
Budget Detail Description
Accounting & Audit
17,290
16,500 Annual Audit Cost
715 CAFR & Budget Submission to GFOA
75 Investment Policy Certification
Appraisal Services
462,820
101,820 BPP Appraisal Services
11,000 Circuit of the America Appraisal
350,000 Fee Appraisals for Commercial & High End Residential Properties
Professional Services
103,893
7,213 Direct Pay Administrative Fee
4,080 Flex System Administrative Fee
1,250 Interpreter
1,350 Laminating Services
75,000 Aerial drone project
15,000 Miscellaneous
Professional Services- Payroll
32,000
25,000 Payroll Processing Fees
7,000 Time Clocks
Rental Office Machines
43,800
800 Postage Security Devise Rental
43,000 Copier Leases
Rental Storage Space
7,910
3,660 Off-site warehouse & storage
4,250 Parking Lot Lease
Repair & Maintenance- Equipment
6,600
4,000 Pitney Bowes Mail Equipment
400 Fire Alarm Test & Inspect
500 Elevator Maintenance
200 Security System
500 AED Machines
1,000 Other Equipment
Building Repair/Maintenance
62,000
11,400 Grounds Maintenance
48,000 Building Maintenance
800 Liebert Maintenance
1,200 Quarterly Filter Changes
600 Quarterly Pest Control
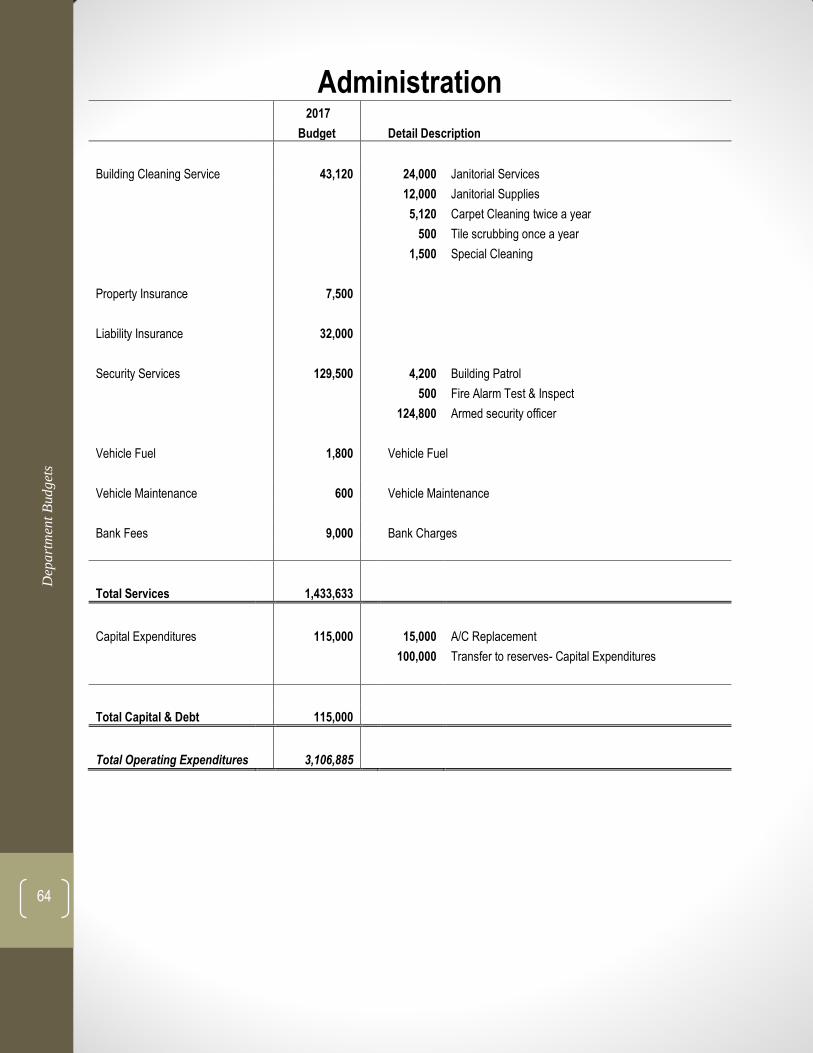
Dep
art
men
t B
ud
get
s
64
Administration
2017
Budget Detail Description
Building Cleaning Service
43,120
24,000 Janitorial Services
12,000 Janitorial Supplies
5,120 Carpet Cleaning twice a year
500 Tile scrubbing once a year
1,500 Special Cleaning
Property Insurance
7,500
Liability Insurance
32,000
Security Services
129,500
4,200 Building Patrol
500 Fire Alarm Test & Inspect
124,800 Armed security officer
Vehicle Fuel
1,800
Vehicle Fuel
Vehicle Maintenance
600
Vehicle Maintenance
Bank Fees
9,000
Bank Charges
Total Services 1,433,633
Capital Expenditures
115,000
15,000 A/C Replacement
100,000 Transfer to reserves- Capital Expenditures
Total Capital & Debt 115,000
Total Operating Expenditures 3,106,885

Dep
art
men
t B
ud
get
s
65
Administration
2017 2016 2015 2015 $ %
Budget Budget Budget Actual Inc (Dec) Inc (Dec)
Salaries 824,677 921,851 796,449 642,193 (97,174) -10.54%
Auto Allowance 6,600 6,600 13,050 6,304 - 0.00%
Overtime 12,000 11,500 4,000 10,776 500 4.35%
Seasonal & Temporary 5,000 5,000 5,000 13,350 - 0.00%
Medicare Tax 12,228 10,843 9,328 9,485 1,385 12.77%
Retirement 151,790 134,598 115,799 1,134,438 17,192 12.77%
Health Insurance 178,385 211,462 211,463 98,932 (33,077) -15.64%
Deferred Compensation 59,754 - - - 59,754 100.00%
Dental Insurance 3,486 3,031 2,267 2,001 455 15.01%
Life Insurance 2,973 1,516 1,516 1,582 1,457 96.09%
Disability Insurance 4,381 3,769 3,242 2,599 612 16.23%
Long Term Care (LTC) 3,755 3,405 3,405 2,077 350 10.28%
Employee Assistance Program 3,390 3,390 3,390 3,390 - 0.00%
Workers Compensation 35,000 32,500 32,500 28,429 2,500 7.69%
Unemployment Insurance 30,000 2,061 2,077 - 27,939 1355.60%
Total Payroll Costs 1,333,419 1,351,526 1,203,486 1,955,556 (18,108) -1.34%
Printing 1,335 1,485 1,600 1,280 (150) -10.10%
Paper 11,200 9,800 8,400 10,327 1,400 14.29%
Postage & Freight- In House 146,343 111,200 103,500 143,050 35,143 31.60%
Operating Supplies 18,900 18,630 18,260 19,790 270 1.45% Furniture and Equipment under $1,000 5,000 20,000 5,000 62,780
(15,000) -75.00%
Books/Publ/Subs/Data Bases 35,055 41,485 46,806 26,280 (6,430) -15.50%
Microfilm - 1,000 1,000 - (1,000) -100.00%
Records Management 7,000 4,000 2,440 16,415 3,000 75.00%
Total Supplies 224,833 207,600 187,006 279,922 17,233 8.30%
Dues & Memberships 10,135 8,830 8,000 7,449 1,305 14.78%
Training & Education 111,715 121,665 124,930 55,555
(9,950) -8.18%
Travel/Meals/Lodging 41,990 21,830 18,130 8,675 20,160 92.35%
Advertising/Legal Notices 24,500 21,500 31,500 22,156 3,000 13.95%
Employee Recognition 25,000 22,500 17,300 12,661 2,500 11.11%
Board of Directors 43,500 57,040 26,950 66,223 (13,540) -23.74%
Utilities 94,060 97,140 102,960 83,787 (3,080) -3.17%
Telephone & Communication 45,000 33,084 28,800 39,755 11,916 36.02%

Dep
art
men
t B
ud
get
s
66
Administration
2017 2016 2015 2015 $ %
Budget Budget Budget Actual Inc (Dec) Inc (Dec)
Internet Services 42,900 38,100 33,300 35,885 4,800 12.60%
Legal & Attorney- Personnel 35,000 35,000 41,000 14,290 - 0.00%
Accounting & Audit 17,290 16,725 15,745 16,290 565 3.38%
Appraisal Services 462,820 462,820 582,820 313,320 - 0.00%
Rental Office Machines 43,800 39,600 47,200 42,990 4,200 10.61%
Professional Services 103,893 23,459 268,250 126,749 80,434 342.87%
Professional Services- Payroll 32,000 30,000 32,000 29,520 2,000 6.67%
Rental Storage Space 7,910 7,730 8,450 7,245 180 2.33% Repair & Maintenance- Equipment 6,600 8,800 8,700 4,544 (2,200) -25.00%
Building Repair/Maintenance 62,000 62,120 62,700 45,306 (120) -0.19%
Building Cleaning Service 43,120 42,120 41,700 37,876 1,000 2.37%
Property Insurance 7,500 7,500 7,500 4,513 - 0.00%
Liability Insurance 32,000 32,000 32,000 23,412 - 0.00%
Security Services 129,500 101,460 22,900 64,272 28,040 27.64%
Vehicle Fuel 1,800 1,800 1,800 932 - 0.00%
Vehicle Maintenance 600 600 600 287 - 0.00%
Bank Fees 9,000 1,800 1,800 2,876 7,200 400.00%
Prompt Payment Discount - - - (24) - 0.00%
Total Services 1,433,633 1,295,223 1,567,035 1,066,543 138,410 10.69%
Capital Expenditures 115,000 140,000 215,000 120,009 (25,000) -17.86%
Total Capital & Debt 115,000 140,000 215,000 120,009 (25,000) -17.86%
Total Operating Expenditures 3,106,885 2,994,349 3,172,527 3,422,030 112,535 3.76%
Admin Department Net Change 16-17
Increase (Decrease) $ 112,535 3.76%

Dep
art
men
t B
ud
get
s
67
2017 Budget 2016 Budget $ Inc (Dec) % Inc (Dec) 2015 Budget 2015 Actual
# of Personnel 10 9 1 11.11%
Payroll Expenditures 1,333,419 1,351,526 (18,107) -1.34% 1,955,556 1,955,556
Supplies Expenditures 224,833 207,600 17,233 8.30% 279,922 279,922
Service Expenditures 1,433,633 1,295,223 138,410 10.69% 1,066,543 1,066,543
Capital & Debt Expenditures 115,000 140,000 (25,000) -17.86% 120,009 120,009
Total Expenditures $ 3,106,885 $ 2,994,349 $ 112,536 3.76% $ 3,422,030 $ 3,422,030
42.92%
7.24%
46.14%
3.70%
2017Administration Expenditures
Payroll Expenditures
Supplies Expenditures
Service Expenditures
Capital & Debt Expenditures
-
200,000
400,000
600,000
800,000
1,000,000
1,200,000
1,400,000
1,600,000
PayrollExpenditures
SuppliesExpenditures
ServiceExpenditures
Capital & DebtExpenditures
Administration Expenditures
2017 Budget
2016 Budget
2015 Budget

Dep
art
men
t B
ud
get
s
68
lmann
Stamp

Dep
art
men
t B
ud
get
s
69
Number of
Positions Position Grade Hourly Range
Auto Allowance Total Employee Benefit
Director Information Technology 1 19 $ 47.37 - $ 66.32 $ - $ 40,428 - $ 51,288 GIS Manager 1 12 $ 33.04 - $ 46.25 $ - $ 32,215 - $ 39,786 Network Support Manager 1 13 $ 34.76 - $ 48.69 $ - $ 33,201 - $ 41,184 Data Base Analyst 1 19 $ 47.37 - $ 66.32 $ - $ 40,428 - $ 51,288 Software Analyst 1 10 $ 29.55 - $ 41.37 $ - $ 30,215 - $ 36,989 Help Desk- Application Support 1 6 $ 22.84 - $ 32.00 $ - $ 26,369 - $ 31,619 Network Technician 1 6 $ 22.84 - $ 32.00 $ - $ 26,369 - $ 31,619 Help Desk Technician 2 4 $ 18.43 - $ 25.81 $ - $ 23,842 - $ 28,071
GIS/PACS Technician 3 4 $ 18.43 - $ 25.81 $ - $ 23,842 - $ 28,071
Total employee benefit is comprised of health, dental, life, disability and long-term care insurance, retirement, and the
employee assistance program that are all provided by the District as terms of employment.
Database Analyst
(1)
Network Support Manager
(1)
Help Desk - Appl. Sup
(1)
Network Technician
(1)
Software Analyst
(1)
Help Desk Technician
(2)
GIS Manager
(1)
GIS/PACS Tech
(3)
Director Information Technology
(1)

Dep
art
men
t B
ud
get
s
70
Information Technology Department
Mission Statement
The mission of the Information Technology department is to provide, develop, and maintain a highly
effective, reliable, secure and innovative technology infrastructure which supports all facets of the district
staff, division directors, Board of Directors, taxing jurisdictions of Travis County, and all taxpayers of Travis
County in the most cost effective manner.
Key Responsibilities
The Information Technology department’s function is to manage the activities of the information technology
environment including the network, security, database, and CAMA software administration. This department
is highly technical in all areas for troubleshooting, evaluating, and recommending changes to current and
future network requirements to meet the District’s needs. The IT department works closely with
management and the District’s software vendor to help design and implement new software features and
programming changes, including changes required by legislative mandate. This department coordinates
supplement processing with entities and district staff, works with various departments of the taxing units to
electronically exchange information and provide data/information for all taxing units as requested. The IT
department also processes record requests requiring computer generated information.
Key Tasks/Deadlines
Tasks Deadline Key Players
Annual Development Schedule January 6 IT Director
PTAD Sales Submission January 31 IT Director, Operations Manager
Application Mailing February 1 Operations Manager
Equipment replacement & upgrades March 31 IT Director, Network Manager
Notice of Appraised Value Mailing April 16 Operations Manager
Certification Processing July 19 IT Director, Operation Manager
PTAD EARS Submission September 1 IT Director, Operations Manger
Division Priority Planning September 15 IT Director
NCOA/CASS Updates Quarterly Operations Manager
Supplement Processing Monthly Operations Manager
Subdivisions Plats March 31 GIS Technicians
Condominiums Declarations March 31 GIS Technicians
Annexations, De-annexations March 31 GIS Technicians
Entity Records July 10 GIS Director
Division Priority Planning September 15 GIS Director
Splits/Merges Year Round GIS Technicians
Future Year Layer Updates Year Round GIS Technicians

Dep
art
men
t B
ud
get
s
71
Department Goals
Department 2017 Goals Output Measure Efficiency Measure In
form
atio
n T
ech
no
log
y PBX Replacement Successful deployment of
equipment Better connectivity
Less noise
More features
VM4 Host Replacement Successful deployment of equipment and configuration of system
Additional processing power
Increase flexibility minimizing downtime
Field Device (iPad) Replacement Successful deployment of equipment and configuration
Less time by support staff for problems related to older hardware
New functionality to increase field productivity
Wireless Controller Successful deployment of equipment and configuration
Less downtime
Better coverage
Replace end of list software SQL Server
Successful deployment and migration of data
Increased performance of databases
Better tools for use in the appraisal process
Develop and deploy GIS/ Appraisal tools
Successful deployment of GIS and Appraisal tools for staff
Increased accuracy in records and the appraisal roll in general
Better tools for use in the appeals and evidence packets
Department Accomplishments
1. Replaced end of life VM hosts, upgraded management tools
2. Replaced and upgraded aging equipment at the co-location
3. Deployed new Taxpayer Portal (Upgraded e-file and new Homestead Portal)
4. Deployed new HTML5 webmap on TCAD website
5. Further automated and streamlined evidence packet creating process
6. Modified agent check-in app with QR-code reading from the already deployed iPad
7. Deployed commercial income tools for use in analysis

Dep
art
men
t B
ud
get
s
72
Information Technology
2017
Budget Detail Description
Salaries
771,202
Overtime
17,500
Medicare Tax
11,436
District pays a matching 1.45% of gross wages
Retirement
141,966
18% Contribution rate
Deferred Compensation
58,725
The District contributes 5% of the annual salary on a 5 year sliding vest; the District also matches at 100% on the first 3% contributed, and 50% on the next 2% contributed.
Health Insurance
142,062
Employer paid health insurance at $941.69 per employee per month
Dental Insurance
4,183
Employer paid dental insurance at $29.05 per employee per month
Life Insurance
2,907
Employer paid life insurance at 31.35% of base salary
Disability Insurance
4,284
Employer paid long-term disability insurance at 0.554% of base salary
Long Term Care (LTC)
4,506
Employer paid long-term care coverage at an average of $375.49 per employee
Total Payroll Costs 1,158,771
Printing
114,300
8,250 Protest season printing
13,000 Renditions
65,000 Notice of Appraised Value Printing
18,000 TCAD Envelopes
50 Business Cards/ID Badges
10,000 Homestead Applications for Audit
Paper
3,500
3,500.00 IT Paper
Postage & Freight- Special Services
162,000
135,000 Notice of Appraised Values Postage
15,000 Renditions Postage
12,000 Homestead Applications Postage

Dep
art
men
t B
ud
get
s
73
Information Technology
2017
Budget Detail Description
Operating Supplies
42,500
30,000 Printing Supplies
12,500 Office & PC Supplies
Operating Supplies- Equipment
155,150
See Operating Supplies- Equipment Details
Operating Supplies- Software
15,000
See Operating Supplies-Software Details
Books/Publ/Subs/Data Bases
790
500 NCOA/CASS
290 Training Manuals
Total Supplies 493,240
Dues & Memberships
90
TDLR Registration
Training & Education
50,000
500 TAAD Courses
4,500 Stormwind Training Portal
20,000 IT Training
25,000 GIS Training
Internet Services
32,300
See telephone & communications details
Professional Services
71,000
65,000 Services provided by Subvenion
3,500 Miscellaneous Contract Services
2,500 Voice Work for Phone System
Rental Storage Space
9,600
Off-site storage for backups & perm records
Hardware/Equipment Maintenance
103,225
See hardware maintenance details
Software Maintenance
904,306
See software maintenance details
Aerial Photography
215,226
125,079 County-wide aerial photography
90,147 Pictometry Change Finder
Total Services 1,385,747

Dep
art
men
t B
ud
get
s
74
Information Technology
2017
Budget Detail Description
Capital Expenditures
279,900
See Hardware/Software Capital Expenditure details
($1,000 or more)
Total Capital Equipment 279,900
Total Operating Expenditures 3,317,658

Dep
art
men
t B
ud
get
s
75
Operating Supplies- Equipment 2017
(Less than $1,000) Budget
Hardware:
Emergency Hard Drives 3,000
Miscellaneous Parts & Supplies 18,000
Backup Tapes/other equipment 5,000
UPS Battery Replacements 26,400
Microphone Repairs in Panel Rooms 2,500
Monitors 30,000
Scanners 18,000
iPads 42,500
Printers 2,500
Projectors 1,500
Laptops 4,500
Wireless Access Points 1,250
Total Operating Supplies- Equipment 155,150
Operating Supplies- Software 2017
(Less than $1,000) Budget
Software:
iPad Software/Applications 10,000
Miscellaneous Software Purchases 5,000
Total Operating Supplies- Software 15,000
Hardware Maintenance 2017
Budget
CISCO Maintenance Contract 37,000
APC Maintenance 4,300
Printer Maintenance 6,000
Other Equipment & PC Maintenance 7,500
Pitney Bowes Inserter 2,000
Dell Gold Support for Servers 25,000
VMware Support/Maintenance 21,425
Total Hardware Maintenance 103,225

Dep
art
men
t B
ud
get
s
76
Software Maintenance 2017
Budget
PACS Co-Development Programming:
PACS Appraisal Maintenance 257,048
Pacs Field Device- Device Maint. 26,460
Pacs Field Device- Server Maint. 5,512
Cloud Hosting Fee 15,112
PACS Co-Development Programming 510,000
Commvault 30,000
ESRI
31,395
Barracuda 5,000
Antivirus Software 5,000
Sage Fund Accounting Annual Maintenance 8,235
Phone System Software/Support Maintenance 5,124
CD/DVD Publisher 2,920
AirWatch LLC 2,500
Total Software Maintenance 904,306
Telephone & Communication 2017
(Internet, Telephone & Data) Budget
Prismnet Co-Location Services 7,200
Prismnet Fiber Optic ISP Services 24,000
Domain Registration/Certificates 1,100
Total Internet & Data Services 32,300

Dep
art
men
t B
ud
get
s
77
Hardware/Software Capital Expenditures 2017
($1,000 or more) Budget
Hardware:
Servers 10,000
Online Protest Expansion Storage 6,000
VM4 Replacement 17,000
Cisco Wireless Controller 5,500
Phone System Replacement 75,000
VM Host- w/ ESXi license 18,500
Software:
Windows Server Datacenter 9,000
Microsoft Exchange 2016 VLA 8,000
Windows Server STD 2014 VLA 30,900
Transfer to reserves- Computer Equipment Replacement 50,000
Transfer to reserves- Network Equipment Replacement 50,000
Total Hardware/Software Capital Expenditures 279,900

Dep
art
men
t B
ud
get
s
78
Information Technology
2017 2016 2015 2015 $ %
Budget Budget Budget Actual Inc (Dec) Inc (Dec)
Salaries 771,202 774,279 784,183 695,586 (3,077) -0.40%
Overtime 17,500 17,500 8,200 4,254 - 0.00%
Medicare Tax 11,436 11,481 11,580 9,953 (45) -0.39%
Retirement 141,966 142,520 143,749 124,619 (554) -0.39%
Health Insurance 142,062 163,031 163,032 90,637 (20,969) -12.86%
Deferred Compensation 58,725 - - - 58,725 100.00%
Dental Insurance 4,183 4,042 3,022 2,909 141 3.49%
Life Insurance 2,907 2,022 2,022 1,945 885 43.77%
Disability Insurance 4,284 3,991 4,025 3,201 293 7.34%
Long Term Care (LTC) 4,506 4,540 4,540 1,671 (34) -0.75%
Unemployment Insurance - 2,748 2,769 2,926 (2,748) -100.00%
Total Payroll Costs 1,158,771 1,126,154 1,127,122 937,700 32,617 2.90%
Printing 114,300 114,800 108,610 103,782 (500) -0.44%
Paper 3,500 3,500 6,000 3,067 - 0.00%
Postage & Freight- Special Services 162,000 167,000 154,500 157,120 (5,000) -2.99%
Operating Supplies 42,500 37,500 35,336 41,671 5,000 13.33%
Operating Supplies- Equipment 155,150 240,500 40,900 107,238 (85,350) -35.49%
Operating Supplies- Software 15,000 75,000 15,000 10,111 (60,000) -80.00%
Books/Publ/Subs/Data Bases 790 2,240 3,920 386 (1,450) -64.73%
Total Supplies 493,240 640,540 364,266 423,374 (147,300) -23.00%
Dues & Memberships 90 135 90 90 (45) -33.33%
Training & Education 50,000 15,500 8,310 6,704 34,500 222.58%
Internet Services 32,300 29,900 29,900 29,554 2,400 8.03%
Professional Services 71,000 75,000 77,000 55,004 (4,000) -5.33%
Rental Storage Space 9,600 9,600 12,000 9,437 - 0.00%
Hardware/Equipment Maintenance 103,225 107,585 67,300 63,414 (4,360) -4.05%
Software Maintenance 904,306 663,934 665,174 617,689 240,372 36.20%
Aerial Photography 215,226 215,226 78,240 185,837 (0) 0.00%
Total Services 1,385,747 1,116,880 938,014 967,729 268,867 24.07%

Dep
art
men
t B
ud
get
s
79
Information Technology
2017 2016 2015 2015 $ %
Budget Budget Budget Actual Inc (Dec) Inc
(Dec)
Capital Expenditures 279,900 353,872 391,000 449,711 (73,972) -20.90%
($1,000 or more)
Total Capital Equipment 279,900 353,872 391,000 449,711 (73,972) -20.90%
Total Operating Expenditures 3,317,658 3,237,446 2,820,402 2,778,514 80,212 2.48%
IT Department Net Change 16-17 80,212 2.48%
Increase (Decrease)

Dep
art
men
t B
ud
get
s
80
2017 Budget 2016 Budget $ Inc (Dec) % Inc (Dec) 2015 Budget 2015 Actual
# of Personnel 12 12 - 0.00%
Payroll Expenditures 1,158,771 1,126,154 32,617 2.90% 1,127,122 937,701 Supplies Expenditures 493,240 640,540 -147,300 -23.00% 364,266 423,375 Service Expenditures 1,385,747 1,116,880 268,867 24.07% 938,014 967,729 Capital & Debt Expenditures 279,900 353,872 -73,972 -20.90% 391,000 449,711
Total Expenditures $ 3,317,658 $ 3,237,446 $ 80,212 2.48% $ 2,820,402 $ 2,778,516
34.93%
14.87%
41.77%
8.44%
2017 IT Expenditures
Payroll Expenditures
Supplies Expenditures
Service Expenditures
Capital & Debt Expenditures
-
200,000
400,000
600,000
800,000
1,000,000
1,200,000
1,400,000
PayrollExpenditures
SuppliesExpenditures
ServiceExpenditures
Capital & DebtExpenditures
IT Expenditures
2017 Budget
2016 Budget
2015 Budget

Dep
art
men
t B
ud
get
s
81
Employee Position Number of Positions
Position Grade Hourly Range
Auto Allowance Total Employee Benefit
Customer Service Director 1 15 $ 37.39 - $ 52.35 $ - $ 34,708 - $ 43,282
Customer Service Mgr. 1 8 $ 26.34 - $ 36.87 $ - $ 28,375 - $ 34,410
Customer Service Rep. 14 2 $ 14.75 - $ 20.65 $ - $ 21,733 - $ 25,114
Receptionist 1 2 $ 14.75 - $ 20.65 $ - $ 21,733 - $ 25,114
Total employee benefit is comprised of health, dental, life, disability and long-term care insurance, retirement, and the employee assistance program that are all provided by the District as terms of employment.
Director Customer Service
(1)
Customer Service
Representatives
(14)
Manager
Customer Service
(1)
Receptionist
(1)

Dep
art
men
t B
ud
get
s
82
Customer Service Department
Mission Statement
The mission of the customer service department is to provide assistance to the public in a professional and
courteous manner in addition to ensuring that exemptions are fairly and consistently granted.
Key Responsibilities
The customer service department is responsible for representing the District in frequent contact with the
public. This department assists property owners, property tax professionals, attorneys and the general
public with any request. The customer service department administers homestead, disable veteran and
over-65 exemptions, as well as answering general questions received primarily from walk-in and telephone
inquiries. This department is responsible for ensuring that exemptions are fairly and consistently granted
per the Texas Property Tax Code.
Key Tasks & Deadlines
Tasks Deadline Key Players
Homestead Reset January 31 Customer Service Director, IT
Director
Homestead Processing February - April Customer Service
Representatives
Exemption Audits December – February Customer Service
Representatives
Division Priority Planning September 15 Customer Service Director
Deed Processing Year Round Deed Clerks
Mailing Address Corrections Year Round Deed Clerks
Customer Contact (phone calls, walk-ins) Year Round Customer Service
Representatives

Dep
art
men
t B
ud
get
s
83
Department Goals
Department 2017 Goals Output Measure Efficiency Measure
Cu
sto
mer
Ser
vice
Improve online portal for processing
Find ways to ensure taxpayers are aware of the Texas driver’s license or ID address requirement
Stay up to date on portal submissions
Train staff on all facets of homestead exemptions
Reduce processing time for homestead applications
Retain proficient staff
Train staff on scanning homestead applications
Scan in homestead applications for walk-in customers
Reduce taxpayer wait time
Department Accomplishments
1 Cross trained deed processing staff to handle walk-in customers at the front counter
2 Cross trained on phone procedures and processing homestead exemptions
3 All prior year absolute exemptions were processed

Dep
art
men
t B
ud
get
s
84
Customer Service
2017
Budget Detail Description
Salaries
608,326
Overtime
17,500
Seasonal & Temporary
90,000
Medicare Tax
10,379
District pays a matching 1.45% of gross wages
Retirement
128,848
18% Contribution rate
Deferred Compensation
45,885
The District contributes 5% of the annual salary on a 5 year sliding vest; the District also matches at 100% on the first 3% contributed, and 50% on the next 2% contributed.
Health Insurance
201,254
Employer paid health insurance at $941.69 per employee per month
Dental Insurance
5,926
Employer paid dental insurance at $29.05 per employee per month
Life Insurance
2,443
Employer paid life insurance at 31.35% of base salary
Disability Insurance
3,600
Employer paid long-term disability insurance at 0.554% of base salary
Long Term Care (LTC)
6,383
Employer paid long-term care coverage at an average of $375.49 per employee
Total Payroll Costs 1,120,544
Printing
50
Business cards & ID badges
Operating Supplies
3,000
Office Supplies
Books/Publ/Subs/Data Bases
15,948
15,648 CLEAR Investigator Subscription
300 Death Data File
Total Supplies 18,998
Training & Education
250
Miscellaneous Training

Dep
art
men
t B
ud
get
s
85
Customer Service
2017
Budget Detail Description
Repair & Maint. Contracts
1,516
KIPP 7100 Printer Maintenance
Deed Copies
2,500
Deed Copies
Total Services 4,266
Total Operating Expenditures 1,143,808

Dep
art
men
t B
ud
get
s
86
Customer Service
2017 2016 2015 2015 $ %
Budget Budget Budget Actual Inc (Dec) Inc (Dec)
Salaries 608,326 578,028 704,164 508,556 30,298 5.24%
Overtime 17,500 17,500 10,000 45,698 - 0.00%
Temporary/Contract 90,000 90,000 - 147,770 - 0.00%
Medicare Tax 10,379 9,905 10,171 6,796 474 4.79%
Retirement 128,848 122,960 126,267 99,392 5,888 4.79%
Health Insurance 201,254 230,961 230,961 115,179 (29,707) -12.86%
Deferred Compensation 45,885 - - - 45,885 100.00%
Dental Insurance 5,926 5,726 4,282 3,270 200 3.49%
Life Insurance 2,443 2,864 2,864 1,389 (421) -14.69%
Disability Insurance 3,600 3,443 3,535 2,378 157 4.57%
Long Term Care (LTC) 6,383 6,432 6,432 3,744 (49) -0.76%
Unemployment Insurance - 3,893 3,923 2,902 (3,893) -
100.00%
Total Payroll Costs 1,120,544 1,071,712 1,102,599 937,074 48,832 4.56%
Printing 50 200 100 39 (150) -75.00%
Operating Supplies 3,000 6,500 5,734 2,622 (3,500) -53.85%
Books/Publ/Subs/Data Bases 15,948 14,833 12,115 16,072 1,115 7.52%
Total Supplies 18,998 21,533 17,949 18,733 (2,535) -11.77%
Dues & Memberships - - 45 - - 0.00%
Training & Education 250 250 250 - - 0.00%
Travel, Meals & Lodging - - - - - 0.00%
Repair & Maint. Contracts 1,516 1,516 1,800 1,176 - 0.00%
Deed Copies 2,500 2,000 4,000 2,200 500 25.00%
Total Services 4,266 3,766 6,095 3,376 500 13.28%
Capital Equipment - - - 3,162 - 0.00%
Total Capital Equipment - - - 3,162 - 0.00%
Total Operating Expenditures 1,143,808 1,097,011 1,126,643 962,345 46,797 4.27%
Customer Service Department Net Change 16-17 $ 46,797 4.27%
Increase (Decrease)

Dep
art
men
t B
ud
get
s
87
2017 budget 2016 Budget $ Inc (Dec) % Inc (Dec) 2015 Budget 2015 Actual
# of Personnel 17 17 0.00%
Payroll Expenditures 1,120,544 1,071,712 48,832 4.56% 1,102,599 937,074
Supplies Expenditures 18,998 21,533 (2,535) -11.77% 17,949 18,733
Service Expenditures 4,266 3,766 500 13.28% 6,095 3,376
Capital & Debt Expenditures - - - 0.00% - 3,162
Total Expenditures $ 1,143,808 $ 1,097,011 $ 46,797 4.27% $ 1,126,643 $ 962,345
97.97%
1.66%
0.37% 0.00%
2017 Customer Service Expenditures
Payroll Expenditures
Supplies Expenditures
Service Expenditures
Capital & Debt Expenditures
-
200,000
400,000
600,000
800,000
1,000,000
1,200,000
PayrollExpenditures
SuppliesExpenditures
ServiceExpenditures
Capital & DebtExpenditures
Customer Service Expenditures
2017 Budget
2016 Budget
2015 Budget

Dep
art
men
t B
ud
get
s
88
lmann
Stamp

Dep
art
men
t B
ud
get
s
89
Employee Position
Number of
Positions Position Grade Hourly Range
Auto Allowance
Total Employee Benefit
Appraisal Support Director 1 15 $37.39 - $52.35 $ - $34,708 - $43,282 Appraisal Support Manager 1 8 $26.34 - $36.87 $ - $28,375 - $34,410 Appraisal Support QC Specialist 1 3 $17.71 - $24.81 $ - $23,426 - $27,498 ARB Administrative Assistant 1 3 $17.71 - $24.81 $ - $23,426 - $27,498
Appraisal Support Specialist 15 2 $14.75 - $20.65 $ - $21,733 - $25,114
Total employee benefit is comprised of health, dental, life, disability and long-term care insurance, retirement, and the employee assistance program that are all provided by the District as terms of employment.
Appraisal Support Director
(1)
Appraisal Support
QC Specialist
(1)
Appraisal Support
Manager
(1)
Appraisal Support
Specialist (15)
ARB
Admin. Asst. (1)
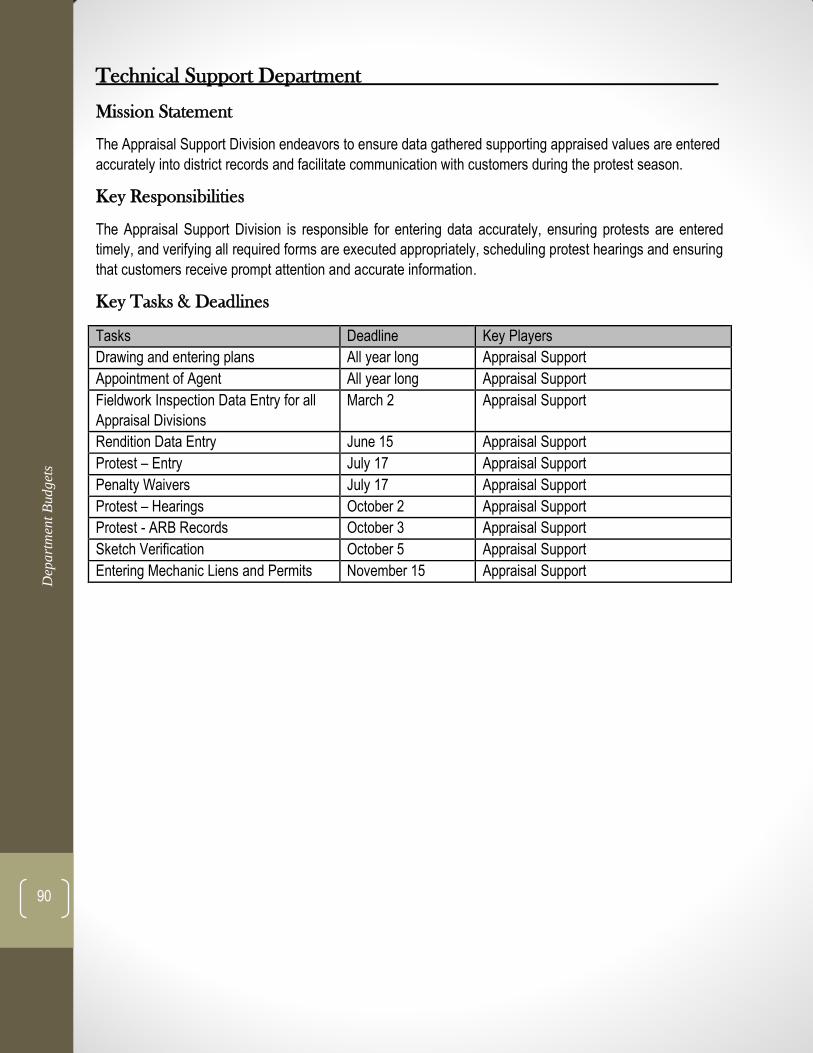
Dep
art
men
t B
ud
get
s
90
Technical Support Department
Mission Statement
The Appraisal Support Division endeavors to ensure data gathered supporting appraised values are entered
accurately into district records and facilitate communication with customers during the protest season.
Key Responsibilities
The Appraisal Support Division is responsible for entering data accurately, ensuring protests are entered
timely, and verifying all required forms are executed appropriately, scheduling protest hearings and ensuring
that customers receive prompt attention and accurate information.
Key Tasks & Deadlines
Tasks Deadline Key Players
Drawing and entering plans All year long Appraisal Support
Appointment of Agent All year long Appraisal Support
Fieldwork Inspection Data Entry for all
Appraisal Divisions
March 2 Appraisal Support
Rendition Data Entry June 15 Appraisal Support
Protest – Entry July 17 Appraisal Support
Penalty Waivers July 17 Appraisal Support
Protest – Hearings October 2 Appraisal Support
Protest - ARB Records October 3 Appraisal Support
Sketch Verification October 5 Appraisal Support
Entering Mechanic Liens and Permits November 15 Appraisal Support

Dep
art
men
t B
ud
get
s
91
Department Goals
Department 2017 Goals Output Measure Efficiency Measure
App
rais
al S
uppo
rt
Draw all plans on system before Appraisers go to the field
1/hr. New Error rate below 1.5% to meet
3/hr. Remodel standards
6/hr. Copy
Research and enter building permits and mechanic liens
28/hr. Building Permits Error rate below 1.5% to meet
10/hr. Mechanic Liens standards
Complete BPP field work 8/hr. New Error rate below 1.5% to meet
30/hr. Changes standards
Complete BPP Renditions 10/hr. Entry Error rate below 1.5% to meet
33/hr. Scan standards
50/hr. Extension Request
20/hr. Waiver Request
Enter Appointment of Agent forms
40/hr. Individual 40/hr. Revocations
Error rate below 1.5% to meet standards
Complete Appeals Season 22/hr. Manual protest entry 400/hr. Mass protest entry
Error rate below 1.5% to meet standards
12/hr. Affidavit processing
8/hr. ARB hearing data entry
95/hr. Certified ORD letters
Department Accomplishments
1. Completed 3900 plans, 2650 copy plans, 215 master plans and reviewed 17,000 using sketch verification.
2. Researched and entered 6000 building permits and mechanic liens.
3. Entered 3600 BPP new setups and 39,000 BPP changes.
4. Completed entry on all BPP Renditions, scanned 24,000 renditions and entered 3900 extension requests.
5. Entered 46,000 Appointment of Agent forms.
6. Entered, scheduled and processed hearing data for 104,000 protests. Rescheduled 1300 hearings.
lmann
Rectangle
lmann
Rectangle

Dep
art
men
t B
ud
get
s
92
Appraisal Support
2017
Budget Detail Description
Salaries 722,984
Overtime 26,842
Temporary/Contract 50,000
Medicare Tax 11,597
District pays a matching 1.45% of gross wages
Retirement 143,969
18% Contribution rate
Deferred Compensation 58,851
The District contributes 5% of the annual salary on a 5 year sliding vest; the District also matches at 100% on the first 3% contributed, and 50% on the next 2% contributed.
Health Insurance 224,931
Employer paid health insurance at $941.69 per employee per month
Dental Insurance 6,623
Employer paid dental insurance at $29.05 per employee per month
Life Insurance 2,701
Employer paid life insurance at 31.35% of base salary
Disability Insurance 3,980
Employer paid long-term disability insurance at 0.554% of base salary
Long Term Care (LTC) 7,134
Employer paid long-term care coverage at an average of $375.49 per employee
Total Payroll Costs 1,259,612
Printing 50
Business cards, name plates & ID badges
Operating Supplies 2,500
Office Supplies
Total Supplies 2,550
Dues & Memberships 90
TDLR (2 @ $45 each)
Training 2,500
Miscellaneous Training
Total Services 2,590
Total Operating Expenditures 1,264,752

Dep
art
men
t B
ud
get
s
93
Technical Support
2017 2016 2015 2015 $ %
Budget Budget Budget Actual Inc (Dec) Inc (Dec)
Salaries 722,984 677,794 834,112 542,816 45,190 6.67%
Overtime 26,842 26,842 25,000 26,446 0 0.00%
Temporary/Contract 50,000 50,000 27,000 142,919 - 0.00%
Medicare Tax 11,597 10,919 12,554 7,866 678 6.21%
Retirement 143,969 135,544 155,840 101,365 8,425 6.22%
Deferred Compensation 58,851 - - - 58,851 100.00%
Health Insurance 224,931 258,132 285,305 103,862 (33,201) -12.86%
Dental Insurance 6,623 6,400 5,289 3,250 223 3.49%
Life Insurance 2,701 3,201 3,538 1,555 (500) -15.63%
Disability Insurance 3,980 3,795 4,364 2,686 185 4.87%
Long Term Care (LTC) 7,134 7,189 7,946 2,923 (55) -0.76%
Unemployment Insurance - 4,351 4,846 - (4,351) -100.00%
Total Payroll Costs 1,259,612 1,184,167 1,365,794 935,688 75,445 6.37%
Printing 50 100 100 38 (50) -50.00%
Operating Supplies 2,500 2,850 3,024 1,108 (350) -12.28%
Books/Publ/Subs/Databases - 420 - 80 (420) -100.00%
Total Supplies 2,550 3,370 3,124 1,226 (820) -24.33%
Dues & Memberships 90 90 90 90 - 0.00%
Training 2,500 2,750 2,750 1,610 (250) -9.09%
Travel, Meals & Lodging - - - 333 - 0.00%
Total Services 2,590 2,840 2,840 2,033 (250) -8.80%
Total Operating Expenditures 1,264,752 1,190,377 1,371,758 938,947 74,375 6.25%
Appraisal Support Department Net Change 16-17
Increase (Decrease) $ 74,375 6.25%

Dep
art
men
t B
ud
get
s
94
2017 Budget 2016 Budget $ Inc (Dec) % Inc (Dec) 2015 Budget 2015 Actual
# of Personnel 19 19 0.00%
Payroll Expenditures 1,259,612 1,184,167 75,445 6.37% 1,365,794 935,688
Supplies Expenditures 2,550 3,370 (820) -24.33% 3,124 1,226
Service Expenditures 2,590 2,840 (250) -8.80% 2,840 2,033
Capital & Debt Expenditures - - - 0.00% - -
Total Expenditures $ 1,264,752 $ 1,190,377 $ 74,375 6.25% $ 1,371,758 $ 938,947
-
200,000
400,000
600,000
800,000
1,000,000
1,200,000
1,400,000
PayrollExpenditures
SuppliesExpenditures
ServiceExpenditures
Capital & DebtExpenditures
Appraisal Support Expenditures
2017 Budget
2016 Budget
2015 Budget
99.59%
0.20%
0.20% 0.00%
2017 Appraisal Support Expenditures
Payroll Expenditures
Supplies Expenditures
Service Expenditures
Capital & Debt Expenditures

Dep
art
men
t B
ud
get
s
95
Employee Position
Number of
Positions Position Grade Hourly Range
Auto Allowance Total Employee Benefit
Sr. Litigation Attorney 1 19 $ 47.37 - $ 66.32 $ 2,400 $ 40,428 - $ 51,288 Sr. Litigation Appraiser 1 14 $ 36.51 - $ 51.12 $ 4,800 $ 34,204 - $ 42,577 Litigation Attorney 1 13 $ 34.76 - $ 48.69 $ 2,400 $ 33,201 - $ 41,184
Paralegal 1 5 $ 20.20 - $ 28.33 $ - $ 24,856 - $ 25,960
Total employee benefit is comprised of health, dental, life, disability and long-term care insurance, retirement, and the employee assistance program that are all provided by the District as terms of employment.
Sr. Litigation Attorney
(1)
Sr. Litigation Appraiser
(1)
Chief Appraiser
Litigation Attorney
(1)Paralegal
(1)

Dep
art
men
t B
ud
get
s
96
Appeals Department
Mission Statement
In furtherance of the mission of the Travis Central Appraisal District, the Appeals division through its
attorneys, paralegals and litigation appraisers, seek to provide legal analysis and property valuations for the
District during informal and formal hearings, settlement conferences, mediations, arbitrations, SOAH
hearings, and lawsuits filed in Travis County in accordance with the Texas Property Tax Code and appraisal
practices and standards, and to carry out the duties in a professional, friendly, courteous and ethical
manner.
Key Responsibilities
Key responsibilities of the legal staff include, but are not limited to: managing lawsuits, arbitrations, SOAH
hearings, mediations and settlement conferences (internally and those of outside counsel); preparation and
review of expert reports; filing and answering lawsuits; preparing and answering discovery, motions, and
judgments; and providing legal advice on day-to-day issues arising out of issues involving the Texas
Property Tax Code, exemption application, contracts, open meetings, and public information requests.
Additional responsibilities include conducting staff training/CLE, legislative bill tracking and analysis, as well
as notarizing and translating forms and documents. The litigation appraisers handle all the arbitrations and
coordinate valuation efforts for use in SOAH hearings, mediations and settlement conferences involving real
property.
Key Tasks & Deadlines
Tasks Deadline Key Players
Case Transfers Year Round Paralegal
Arbitrations Year Round Arbitration Appraiser
Mediations Year Round Attorney, Division Appraiser
Settlement Conference Year Round Attorney, Division Appraiser
Lawsuit Preparation Year Round Attorney, Division Appraiser

Dep
art
men
t B
ud
get
s
97
Department Goals
Dept. 2017 Goals Output Measure Efficiency Measure
Ap
pea
ls
Lawsuit management and resolution of commercial and residential lawsuits through the use of set policy and procedures, to include, pretrial motions, monthly settlement conferences, mediation and trial.
Standard and Metrics measured by reduction and closure of residential and commercial lawsuits (by property type), of all prior year lawsuit, reduction in litigation cost, cost of expert witnesses, and percent loss.
Quality control check, measured by the accuracy, efficiency and consistency across residential and commercial portfolios, reduction in the number of pending lawsuits and years in suit, to not exceed lawsuit pendency of over 24 months (Exception: complex litigation with scheduling orders in place, consistent with the court calendar)
Resolution of lawsuits, through pretrial motions, mediation and trial.
Standard and Metrics measured by the elimination of lawsuits involving three tax years or greater in suit. (Exception: complex litigation with scheduling orders in place, consistent with the court calendar)
Quality control check: decreased backlog of prior year suits, all pending litigation either scheduled for pretrial motions, settlement conference, mediation, or trial.
Manage Appeals budget involving lawsuit expenses, outside counsel and expert witnesses and reports, through set policy and processes, to include: jurisdictional motions to be filed within ten days of filed lawsuit, lawsuit review by commercial and residential within 10 days of lawsuit being imputed in PAC’S; settlement conferences being scheduled within 30 days of lawsuit being imputed in PACS; monthly settlement conferences,; monthly lawsuit meetings across divisions; selection of expert witness; mediation; and trial..
Standard and Metrics measured by set policy and procedures for lawsuit management and review of and management of status and event codes, cost to defend, expert cost, outside counsel firm cost and fees, progression of the lawsuit, and length of time on the docket not to exceed 24 months. (Exception: complex litigation with scheduling orders in place, consistent with the court calendar)
Quality control check measured by initial jurisdictional motions, settlement conference results, adherence to lawsuit policy and procedures, duration of lawsuit, not to exceed 24 months (Exception: complex litigation with scheduling orders in place, consistent with the court calendar)
Develop effective management of market and equity arbitration, utilizing skills and expertise of TCAD mass appraisers and MAI appraisers.
Standard and Metrics measured by implementation of train and quality control of report writing, assignments through residential and commercial staff, as directed by department directors.
Quality control check measured by Initial assessment of arbitration, potential for negotiations, determination of arbitrator (within 10 days of receipt), and arbitration results.
Implement 85th Legislative Changes to the Property Tax Code, anticipating and preparing for future changes impacting CADS
Standard and Metrics measured by review and analysis of all relevant legislative bills impacting TCAD, and the implementation of legislative changes impacting the District.
Quality control measured by the training and Implementation of legislative changes impacting ad valorem tax law through review of policy and staff training.
Department Accomplishments
1 Resolution of over 70 commercial lawsuits utilizing mass appraisal settlement conference model
2 Four Season Hotel - Plaintiff Non-suit based on Senior Litigation Appraiser's Review Report
3 Resolution of Mueller lawsuit(s) and protest
4 Resolution of AMD lawsuit and 2016 protest through the use of data retrieval and negotiation
5 Resolution of Dunn v. TCAD Motion Granted case dismissed
6 Reviewed and updated PACS status and event codes for utilization in 2016 lawsuits
7 Utilization of PACS to create documents
8 Updated Lawsuit policy and procedures for commercial litigation
9 Utilization of settlement conferences in conjunction with motions to the court to reduce prior year lawsuits

Dep
art
men
t B
ud
get
s
98
Appeals
2017
Budget Detail Description
Salaries
381,718
Auto Allowances
9,600
Overtime
1,500
Medicare Tax
5,696
District pays a matching 1.45% of gross wages
Retirement 70,707
18% Contribution rate
Deferred Compensation
33,185
The District contributes 5% of the annual salary on a 5 year sliding vest; the District also matches at 100% on the first 3% contributed, and 50% on the next 2% contributed.
Health Insurance
47,354
Employer paid health insurance at $941.69 per employee per month
Dental Insurance
1,394
Employer paid dental insurance at $29.05 per employee per month
Life Insurance
1,387
Employer paid life insurance at 31.35% of base salary
Disability Insurance
2,044
Employer paid long-term disability insurance at 0.554% of base salary
Long Term Care (LTC)
1,502
Employer paid long-term care coverage at an average of $375.49 per employee
Total Payroll Costs 556,087
Printing
50
Business cards, Name Plates and ID Badges
Operating Supplies
1,080
$15 per employee per month - office supplies
Books/Publ/Subs/Data Bases
4,665
3,300 West Payment Center Information Charges
405 Texas Rules of Civil Trials
110 Texas Pretrial Deadline Calculator
125 Texas Civil Forms
225 Texas Rules of Court
500 Other Miscellaneous Publications
Total Supplies 5,795
Dues & Memberships
2,900
1,330 Appraisal Institute
90 TDLR License Renewal
405 Paralegal Division Annual Membership
475 State Bar Dues
600 TX Brokers License Renewal

Dep
art
men
t B
ud
get
s
99
Appeals
2017
Budget Detail Description
Travel/Meals/Lodging
1,000
For use in conjunction with appraisal courses & meetings
Training & Education
1,500
Advertising & Legal Notices
2,000
Online E-filing Charges
Attorney & Court Costs
1,435,000
1,120,000 Outside Legal Council
250,000 Transfer to Reserve for Litigation
5,000 Mediation Fees
10,000 Other Legal Costs
50,000 Legal Settlements
SOAH
1,500
Estimated 1 per year at $1500 each
Arbitration Refunds
28,125
Estimated 125 per year at $225 each
Expert Witness Costs
250,000
Expert Witness Costs
Total Services 1,722,025
Total Operating Expenditures 2,283,907

Dep
art
men
t B
ud
get
s
100
Appeals
2017 2016 2015 2015 $ %
Budget Budget Budget Actual Inc (Dec) Inc (Dec)
Salaries 381,718 514,321 507,057 407,139 (132,603) -25.78%
Auto Allowances 9,600 14,400 13,500 9,240 (4,800) -33.33%
Overtime 1,500 2,000 2,000 3,024 (500) -25.00%
Medicare Tax 5,696 7,631 7,530 5,997 (1,935) -25.36% Retirement 70,707 94,735 93,470 74,866 (24,028) -25.36%
Health Insurance 47,354 81,516 81,516 38,419 (34,162) -41.91%
Deferred Compensation 33,185 - - - 33,185 100.00%
Dental Insurance 1,394 2,021 1,511 1,319 (627) -31.01%
Life Insurance 1,387 1,011 1,011 1,161 376 37.20%
Disability Insurance 2,044 2,653 2,617 2,090 (609) -22.95%
Long Term Care (LTC) 1,502 2,270 2,270 1,440 (768) -33.83%
Unemployment Insurance - 1,374 1,385 4,185 (1,374) -100.00%
Total Payroll Costs 556,087 723,932 713,867 548,880 (167,845) -23.19%
Printing 50 50 50 - - 0.00%
Operating Supplies 1,080 1,080 1,440 426 - 0.00%
Books/Publ/Subs/Data Bases 4,665 5,355 5,735 3,587 (690) -12.89%
Total Supplies 5,795 6,485 7,225 4,013 (690) -10.64%
Dues & Memberships 2,900 2,640 3,030 2,790 260 9.85%
Travel/Meals/Lodging 1,000 1,000 1,500 664 - 0.00%
Training & Education 1,500 1,500 2,000 1,744 - 0.00%
Advertising & Legal Notices 2,000 1,500 2,500 1,707 500 33.33%
Attorney & Court Costs 1,435,000 1,535,000 1,285,000 272,885 (100,000) -6.51%
SOAH 1,500 1,500 1,500 - - 0.00%
Arbitration Refunds 28,125 28,125 28,125 3,600 - 0.00%
Expert Witness Costs 250,000 250,000 250,000 144,338 - 0.00%
Total Services 1,722,025 1,821,265 1,573,655 427,728 (99,240) -5.45%
Total Operating Expenditures 2,283,907 2,551,682 2,294,747 980,621 (267,775) -10.49%
Appeals Department Net Change 16-17
Increase (Decrease) (267,775) -10.49%

Dep
art
men
t B
ud
get
s
101
2017 Budget 2016 Budget $ Inc (Dec) % Inc (Dec) 2015 Budget 2015 Actual
# of Personnel 4 6 -2 -33.33%
Payroll Expenditures 556,087 723,932 (167,845) -23.19% 713,867 548,880
Supplies Expenditures 5,795 6,485 (1,190) -18.35% 7,225 4,013
Service Expenditures 1,822,025 1,821,265 760 0.04% 1,573,655 427,728
Capital & Debt Expenditures - - - 0.00% - -
Total Expenditures $ 2,283,907 $ 2,551,682 $ (267,775) -10.49% $ 2,294,747 $ 980,621
-
200,000
400,000
600,000
800,000
1,000,000
1,200,000
1,400,000
1,600,000
1,800,000
2,000,000
PayrollExpenditures
SuppliesExpenditures
ServiceExpenditures
Capital & DebtExpenditures
Appeals Expenditures
2017 Budget
2016 Budget
2015 Budget
24.35%
0.25%
75.40%
2017 Appeals Expenditures
Payroll Expenditures
Supplies Expenditures
Service Expenditures
Capital & Debt Expenditures

Dep
art
men
t B
ud
get
s
102
lmann
Stamp

Dep
art
men
t B
ud
get
s
103
Employee Position Number of Positions
Position Grade Hourly Range
Auto Allowance Total Employee Benefit
Director Commercial & Business Personal Property 1 18 $ 44.83 - $ 62.81 $ 6,600 $ 34,708 - $ 43,282
Commercial Manager 1 10 $ 29.55 - $ 41.37 $ 6,600 $ 30,215 - $ 36,989
Personal Property Manager 1 10 $ 29.55 - $ 41.37 $ 6,600 $ 30,215 - $ 36,989
Commercial Research Specialist 2 9 $ 28.17 - $ 39.45 $ 6,600 $ 29,424 - $ 35,889
Sr. Personal Property Appraiser 2 6 $ 22.84 - $ 32.00 $ 6,600 $ 26,369 - $ 31,619
Commercial Appraiser 7 6 $ 22.84 - $ 32.00 $ 6,600 $ 26,369 - $ 31,619 Commercial Appraisal Support Specialist 1 6 $ 22.84 - $ 32.00 $ - $ 26,369 - $ 31,619
Personal Property Appraiser 7 5 $ 20.20 - $ 28.33 $ 6,600 $ 24,856 - $ 29,516
Administrative Assistant 1 3 $ 17.71 - $ 24.81 $ - $ 23,429 - $ 27,498
Total employee benefit is comprised of health, dental, life, disability and long-term care insurance, retirement, and the employee assistance program that are all provided by the District as terms of employment.

Dep
art
men
t B
ud
get
s
104
Commercial and Personal Property Appraisal Department
Mission Statement
The mission of the Commercial Appraisal department of the Travis Central Appraisal District is to provide accurate appraisals of all commercial properties in Travis County at one hundred percent of market value, equally and uniformly, in a professional and ethical manner, according to the Texas Property Tax Code, USPAP, and generally adhered to IAAO standards but for jurisdictional exceptions. The mission of the Business Personal Property Appraisal department is to discover, value and resolve disputes of all business personal property within Travis County following Uniform Standards of Professional Appraisal Practice (USPAP) Standard 6 for mass appraisal; To treat all businesses fairly and uniformly as they relate to others in their industry; To comply with the Texas Comptrollers’ guidelines and work in unison with all other departments to convey an accurate and fair representation of market value for the local taxing jurisdictions.
Key Responsibilities
The Commercial Appraisal department is responsible for appraising all commercial properties within Travis County, including all multi-family properties of five units and larger, retail, office, industrial and lodging properties. This department must gather data pertaining to quality, classification and value of complex commercial properties. They are responsible for scheduling that allows for the systematic processing of commercial protests in a timely manner that will allow the District to certify timely as well as perform appraisals, data collection, sales analysis and estimates for construction costs for various types of commercial properties. The Business and Personal Property (BPP) Appraisal department is responsible for the fair and equitable appraisal of all business and personal property in Travis County. This department is responsible for valuing all personal property accounts, including equipment, inventory, furniture, fixtures and vehicles; they are also responsible for administering abatements, special inventory and Freeport exemptions. Additionally, they oversee contract appraisals for utilities, transportation and minerals.
Key Tasks & Deadlines
Tasks Deadline Key Players
Fieldwork Inspections February 1 Commercial Appraisers
Sales Verification March 1 Commercial Appraisers
Valuation – Schedule building April 11 Commercial Director & Managers
Valuation – Calibration April 11 Commercial Appraisers
Property Value Study Prep April 31 Commercial Director
Protest – Evidence Preparation May 15 Commercial Appraisers
Protest – Hearings July 19 Commercial Appraisers
Division Priority Planning September 15 Commercial Director
Dealer Inventory & Aircraft February 1 VIT Appraiser
Field Inspections March 15 BPP Appraisers
Depreciation & Schedule Building March 15 BPP Director
Rendition Processing June 1 BPP Appraisers
Property Value Study Prep April 31 BPP Director
Protest – Evidence Preparation May 15 BPP Appraisers
Protest – Hearings July 19 BPP Appraisers
Division Priority Planning September 15, 2016 BPP Director

Dep
art
men
t B
ud
get
s
105
Department Goals
Dept. 2017 Goals Output Measure Efficiency Measure
Co
mm
erci
al &
Per
son
al P
rop
erty
Ap
pra
isal
Review the current Industrial Property
Classification. Refine and possible
redefine classifications based on market
data and trends.
Comparison of 2016 Industrial
Classifications compared to new 2017
Industrial Classifications.
Produce Industrial valuations that more
accurately reflect the current market trends.
Review all land submarkets based on
2016 certified values to determine areas
that need additional delineation and
refinement for 2017.
New submarkets or redrawn submarket
boundaries.
Data mining TCAD’s own data to more
accurately reflect the current land
submarkets and values within them.
Continue to integrate the iPad field
devices into our daily workflows during
the 2017 field cycle.
Having the ability to track and query
commercial field work data.
More expedient field cycle allowing more
time for the valuation phase of the appraisal
calendar.
Review the rapidly changing East Austin
area to fully understand the current
“revitalization” impacts on commercial
values.
More detailed breakdown of interim use
properties identified and calibrated into the
valuation models.
More efficient valuation and cooperation
between the commercial and residential
appraisal divisions in this area of rapid
revitalization.
Foster continued cross training of
Commercial and BPP staffs.
Number of appraisers qualified to perform
cross-departmental functions.
Reduces the organizational exposure if
some personnel leave the district by having
qualified employees to step in and
immediately produce.
Complete the commercial protest season
on June 23rd, 2017.
All improved property commercial protests
completed.
This will allow for an earlier start to the 2017
litigation season and allow for more time
during the field season and valuation
seasons for the commercial staff.
Get an early start on 2017 field work. Field work start date Earlier field work start date will allow for
more time dedicated to valuation and
review.
Learn and support the commercial
department with informal and other
appraisal tasks
Number of appraisers qualified to perform
cross-departmental functions.
Reduces the organizational exposure if
some personnel leave the district by having
qualified employees to step in and
immediately produce.
Continue development of an online
rendition portal for use in 2017.
Online rendition access portal Online renditions will streamline the
rendition process
Improve TCAD rendition form for easier
use, entry, and processing.
New rendition form Revamped rendition forms will expedite the
rendition entry process.
Conduct personal interior site visits on
each account that hasn't been rendered
in the last three years.
Performing site visits Will give a more accurate valuation of
properties that have failed to render their
Business Personal Property.

Dep
art
men
t B
ud
get
s
106
Department Accomplishments
1. Mailed all Commercial Notices of Appraised Value the first week of April. This was also the earliest completion date in the history of TCAD.
2. Completed all Commercial Improved Property protests by July 1st, 2016. This was the earliest completion date in the history of TCAD.
3. Continued to implement data mining techniques to acquire more market data and create a more accurate appraisal roll.
4. Built on the positive departmental culture that was established in 2015. Pushed to promotes collaboration between appraisal departments/divisions while concurrently achieving organizational results.
5. Continued to cross train the BPP staff to assist with Commercial protests. This year TCAD had three BPP appraisers assist with Commercial protests.
6. Hosted multiple data mining training classes to train other appraisal districts on how and why we collect the type of data we collect and how it relates to more accurate appraisals.
7. Current personal property appraisers completed all field work and associated responsibilities with one less appraiser position than in the past and without a BPP Manager for several months of the year.

Dep
art
men
t B
ud
get
s
107
Commercial & Personal Property Appraisal
2017
Budget Detail Description
Salaries
1,424,760
Auto Allowances
132,000
Medicare Tax
22,718
District pays a matching 1.45% of gross wages
Retirement
282,017
18% Contribution rate
Deferred Compensation
109,170
The District contributes 5% of the annual salary on a 5 year sliding vest; the District also matches at 100% on the first 3% contributed, and 50% on the next 2% contributed.
Health Insurance
272,285
Employer paid health insurance at $941.69 per employee per month
Dental Insurance
8,018
Employer paid dental insurance at $29.05 per employee per month
Life Insurance
5,170
Employer paid life insurance at 31.35% of base salary
Disability Insurance
7,619
Employer paid long-term disability insurance at 0.554% of base salary
Long Term Care (LTC)
8,636
Employer paid long-term care coverage at an average of $375.49 per employee
Total Payroll Costs 2,272,393
Printing
750
Business cards, name plates & ID badges
Operating Supplies
2,000
Office Supplies
Books/Publ/Subs/Data Bases
76,755
500 Austin Area Apartment Survey
500 Austin Office Market Survey
500 Austin Area Multi-tenant Retail Survey
500 Austin Area Retail Survey
32,000 CoStar Sales Subscription
2,500 Austin Investors Interest
130 Austin Business Journal
700 Annual Trends PKF Consulting
1,200 M&S Commercial Cost Estimator 7 (1 seat)
650 Valuation Services Book
325 Robert G. Watts- Realtyrates.com
400 Real Estate Research Corp.
1,200 Smith Travel Research Publication
500 Apartment Association Income/Expense Survey
8,350 Axiometrics Apartment & Student Housing Subscription
12,420 Real Capital Analytics Subscription

Dep
art
men
t B
ud
get
s
108
Commercial & Personal Property Appraisal
2017
Budget Detail Description
Books/Publ/Subs/Data Bases
150 Aircraft Bluebook
(cont.)
2,000 Guide for Construction Equipment
105 Used Car Guide
75 Older Used Car Guide
8,550 Tax Guide- Infonation, Inc.
500 Vehicle Inquiries
500 VREF Online Subscription
2,500 Other miscellaneous subscriptions
Total Supplies 79,505
Dues & Memberships
1,035
TDLR Registration Appraisal Licenses @ $45 each
Training & Education
8,000
Miscellaneous Training
Total Services 9,035
Total Operating Expenditures 2,360,933

Dep
art
men
t B
ud
get
s
109
Commercial & Personal Property Appraisal
2017 2016 2015 2015 $ %
Budget Budget Budget Actual Inc (Dec) Inc (Dec)
Salaries 1,424,760 1,328,900 1,303,248 1,199,009 95,860 7.21%
Overtime - - 2,500 319 - 0.00%
Auto Allowances 132,000 125,402 123,600 100,444 6,598 5.26%
Medicare Tax 22,718 21,049 20,671 18,136 1,669 7.93%
Retirement 282,017 261,302 256,604 231,416 20,715 7.93%
Deferred Compensation 109,170 - - - 109,170 100.00%
Health Insurance 272,285 298,890 298,891 166,140 (26,605) -8.90%
Dental Insurance 8,018 7,410 5,541 5,057 608 8.20%
Life Insurance 5,170 3,707 3,706 3,330 1,463 39.46%
Disability Insurance 7,619 7,316 7,185 5,498 303 4.14%
Long Term Care (LTC) 8,636 8,324 8,324 5,101 312 3.75%
Unemployment Insurance - 5,038 5,077 - (5,038) -
100.00%
Total Payroll Costs 2,272,393 2,067,338 2,035,347 1,734,450 205,055 9.92%
Printing 750 450 350 701 300 66.67%
Operating Supplies 2,000 1,970 1,392 1,487 30 1.52%
Books/Publ/Subs/Data Bases 76,755 62,252 57,532 58,600 14,503 23.30%
Total Supplies 79,505 64,672 59,274 60,788 14,833 22.94%
Dues & Memberships 1,035 1,035 1,195 975 - 0.00%
Training & Education 8,000 6,000 11,000 7,654 2,000 33.33%
Total Services 9,035 7,035 12,195 8,629 2,000 28.43%
Total Operating Expenditures 2,360,933 2,139,045 2,106,816 1,803,867 221,888 10.37%
Commercial Appraisal Department Net Change 16-17
Increase (Decrease) $ 221,888 10.37%

Dep
art
men
t B
ud
get
s
110
2017 Budget 2016 Budget $ Inc (Dec) % Inc (Dec) 2015 Budget 2015 Actual
# of Personnel 23 22 1 4.55%
Payroll Expenditures 2,272,393 2,067,338 205,055 9.92% 2,035,347 1,734,450
Supplies Expenditures 79,505 64,672 14,833 22.94% 59,274 60,788
Service Expenditures 9,035 7,035 2,000 28.43% 12,195 8,629
Capital & Debt Expenditures - - - 0.00% - -
Total Expenditures $ 2,360,933 $ 2,139,045 $ 221,888 10.37% $ 2,106,816 $ 1,803,867
-
500,000
1,000,000
1,500,000
2,000,000
2,500,000
PayrollExpenditures
SuppliesExpenditures
ServiceExpenditures
Capital & DebtExpenditures
Commercial Appraisal Expenditures
2017 Budget
2016 Budget
2015 Budget
96.25%
3.37%
0.38% 0.00%
2017 Commercial Appraisal Expenditures
Payroll Expenditures
Supplies Expenditures
Service Expenditures
Capital & Debt Expenditures

Dep
art
men
t B
ud
get
s
111
Employee Position Number of Positions
Position Grade Hourly Range
Auto Allowance
Total Employee Benefit
Director Residential Appraisal 1 18 $44.83 - $62.81 $ 6,600 $34,708 - $43,282
Residential Appraisal Manager 2 10 $29.55 - $41.37 $ 6,600 $30,215 - $36,989
Agriculture & Residential Manager 1 10 $29.55 - $41.37 $ 6,600 $30,215 - $36,989
Residential Specialist 1 10 $29.55 - $41.37 $ 6,600 $30,215 - $36,989
Residential Appraisal Team Lead 5 6 $22.84 - $32.00 $ 6,600 $26,369 - $31,619
Sr. Residential Appraiser 1 5 $20.20 - $28.33 $ 6,600 $24,856 - $29,516
Residential Appraiser 33 5 $20.20 - $28.33 $ 6,600 $24,856 - $29,516
Administrative Assistant 1 4 $18.43 - $25.81 $ - $23,842 - $28,071
Ag Administrator 1 3 $17.71 - $24.81 $ - $23,429 - $27,498
Support Specialist 1 2 $14.75 - $20.65 $ - $21,733 - $25,114
Total employee benefit is comprised of health, dental, life, disability and long-term care insurance, retirement, and the employee assistance program that are all provided by the District as terms of employment.
Director Residential
Appraisal
(1)
Residential Appraisal
Manager
(1)
Residential Apprsiser
(11)
Residential Specialist
(1)
Residential Apprsiser
(11)
Sr. Residential Apprsiser
(1)
Residential Appraisal
Manager
(1)
Residential Apprsiser
(11)
Agriculture & Residential
Appraisal Manager
(1)
Ag Administrator
(1)
Admin Asst.
(1)
Team Lead
(1)
Team Lead
(1)
Team Lead
(1)
Team Lead
(2)
Support Specialist
(1)

Dep
art
men
t B
ud
get
s
112
Residential Appraisal Department
Mission Statement
The mission of the Residential Appraisal department of the Travis Central Appraisal District is to incorporate
best practices to provide accurate appraisals of all residential properties in Travis County at market value,
equally and uniformly in a professional and ethical manner within the framework of the Texas Property Tax
Code and USPAP, subject to jurisdictional exceptions, and within the guidelines and standards of IAAO. The
residential department is also responsible for the appraisals of all taxable land parcels and determining if the
property is qualified for open space valuation in Travis County.
Key Responsibilities
The Residential Appraisal department is responsible for the fair and equitable appraisal of all residential
property in Travis County, including houses, mobile homes, duplexes, triplexes, fourplexes and residential
condominiums. This department is responsible for applying the generally accepted appraisal methods to
estimate the value of all residential property in Travis County and producing an accurate residential
appraisal roll. This department is also responsible for the scheduling that allows for the systematic
processing of residential protests in a timely manner that will allow the District to certify timely. This
department values all land, builder’s inventory and places productivity (usually call Ag) values on properties.
Key Tasks and Deadlines
Tasks Deadline Key Players
Fieldwork Inspections February 1 Residential Appraisers
Agricultural Applications February 1 Land-Residential Manager, Ag
Administrator
Sales Verification March 1 Residential Appraisers
Fieldwork Inspections- Agricultural March 31 Residential Appraisers
Valuation – Schedule building April 11 Residential Director & Managers
Valuation – Calibration April 11 Residential Appraisers
Valuation- Schedule Building April 11 Residential Appraisers
Property Value Study Prep April 31 Residential Director
Protest – Evidence Preparation May 15 Residential Appraisers
Protest – Hearings July 19 Residential Appraisers
Division Priority Planning September 15 Residential Director

Dep
art
men
t B
ud
get
s
113
Department Goals
Department 2017 Goals Output Measure Efficiency Measure
Res
iden
tial
Ap
pra
isal
Use Marshall & Swift, and other cost resources, to analyze and adjust cost tables for "8-,8,8+" sub classed homes
More even distribution of adjustments between "7" and "8" subclasses homes in Sales and Equity grids
High-end "replacement cost new" and ratio studies will more closely match permit cost and sales data.
Analyze, quantify, and accurately adjust for the contributory value of secondary improvements (e.g. garage apartments, "granny" flats, detached living quarters, etc.…)
Paired sales analysis, and ratio studies, will indicate uniform accuracy of valuation with sale comparables containing, and not containing, secondary improvements
Valuation of ever-increasing population of Austin homes with secondary improvements will be more accurate
To enable wide scale implementation for 2018; all images needed for the "Class Calculator" will be obtained in the urban core
Every home in Alpha sections K, L, Y will have "main" images in PACs
"Class Calculator" output will be easily indicated by images already on PACs by the 2017 appeals season
Partner with Harris govern and internal I.T. for uniform Residential evidence packets to publish to online portal for home owner viewing
1 version of Residential evidence packet, containing the same format of files, auto-generates and publishes to online portal
Manual Residential evidence packet generation, and delivery, will be essentially obsolete, resulting in improved efficiency and owner experience
Calibrate and value Alpha section "Y" according to the "Class Calculator" through stored "Feature" level characteristics in PACs
Homes with identical relevant characteristics (# of corners, uniqueness, roof pitch, etc.…) will be classed identically, regardless of appraiser
Uniform and equitable classing of homes will result in more accurate contributory values and mass market adjustments
Identify and reasonably adjust properties within new FEMA 100-year flood map
All Residential parcels located within the new 100-year flood plain will be labeled with a "Flood" land adjustment equal to the local market effect
Values will reflect changes to, and local market impact of, new FEMA 100-year floodplain
Consolidate urban condo neighborhoods according to local market factors; reduce quantity of condo neighborhoods in K,L,X,Y by 50%
Increased sample size in condo sales profiles
More uniform urban condo value increases once consolidated into larger contributing market segments
Department Accomplishments
1 Implemented standardized classroom training modules, and codified process workflows, for all 3 phases of property tax calendar: field, valuation, appeals.
2 Completed valuation and "dropped" Notices of Appraised Values by April 4th, 2016
3 Implemented more accurate "dual-axis depreciation" matrix that linked maximum home depreciation to subclass of home
4 Utilized new Condition categories: Average + and Good + to more accurately capture the contributory cost value of updates and remodels
5 Completed informal appeal hearings (agents and owners) by August 12, 2016

Dep
art
men
t B
ud
get
s
114
Residential Appraisal
2017
Budget Detail Description
Salaries
2,513,969
Auto Allowances
286,800
Overtime
84,000
Medicare Tax
41,829
District pays a matching 1.45% of gross wages
Retirement
519,258
18% Contribution rate
Deferred Compensation
207,483
The District contributes 5% of the annual salary on a 5 year sliding vest; the District also matches at 100% on the first 3% contributed, and 50% on the next 2% contributed.
Health Insurance
556,409
Employer paid health insurance at $941.69 per employee per month
Dental Insurance
16,384
Employer paid dental insurance at $29.05 per employee per month
Life Insurance
8,650
Employer paid life insurance at 31.35% of base salary
Disability Insurance
13,444
Employer paid long-term disability insurance at 0.554% of base salary
Long Term Care (LTC)
17,648
Employer paid long-term care coverage at an average of $375.49 per employee
Total Payroll Costs 4,265,874
Printing
1,200
Business cards, name plates & ID badges
Operating Supplies
5,000
Operating Supplies
Books/Publ/Subs/Data Bases
1,725
125 Austin Business Journal Subscription
750 Manufactured Housing Guide
350 Residential Cost Handbook
500 Miscellaneous Publications
Total Supplies 7,925
Dues & Memberships
2,115
TDLR Registration Appraisal Licenses @ $45 each
Training & Education
10,000
Miscellaneous Training including TAAD Courses
Total Services 12,115
Total Operating Expenditures 4,285,914

Dep
art
men
t B
ud
get
s
115
Residential Appraisal
2017 2016 2015 2015 $ %
Budget Budget Budget Actual Inc (Dec) Inc (Dec)
Salaries 2,513,969 2,439,134 2,415,409 2,163,451 74,835 3.07%
Auto Allowances 286,800 280,200 273,600 234,527 6,600 2.36%
Overtime 84,000 6,000 5,000 4,740 78,000 1300.00
%
Temporary/Seasonal Work - - - 11,487 - 0.00%
Medicare Tax 41,829 39,440 38,972 33,417 2,389 6.06%
Retirement 519,258 489,601 483,793 428,485 29,657 6.06%
Deferred Compensation 207,483 - - - 207,483 100.00%
Health Insurance 556,409 624,952 624,955 314,790 (68,543) -10.97%
Dental Insurance 16,384 15,494 11,586 10,529 890 5.74%
Life Insurance 8,650 7,750 7,749 6,684 900 11.62%
Disability Insurance 13,444 13,709 13,546 10,760 (265) -1.93%
Long Term Care (LTC) 17,648 17,405 17,405 8,996 243 1.40%
Unemployment Insurance - 10,534 10,616 299 (10,534) -100.00%
Total Payroll Costs 4,265,874 3,944,219 3,902,631 3,228,165 321,655 8.16%
Printing 1,200 1,400 750 1,123 (200) -14.29%
Operating Supplies 5,000 5,000 5,100 3,628 - 0.00%
Books/Publ/Subs/Data Bases 1,725 3,120 4,565 2,148 (1,395) -44.71%
Total Supplies 7,925 9,520 10,415 6,899 (1,595) -16.75%
Dues & Memberships 2,115 2,070 1,665 2,380 45 2.17%
Training & Education 10,000 5,000 19,500 9,415 5,000 100.00%
Total Services 12,115 7,070 21,165 11,795 5,045 71.36%
Capital Equipment - - - - - 0.00%
Total Capital & Debt - - - - - 0.00%
Total Operating Expenditures 4,285,914 3,960,809 3,934,211 3,246,859 325,105 8.21%
Residential Appraisal Department Net Change 16-17
Increase (Decrease) $ 325,105 8.21%

Dep
art
men
t B
ud
get
s
116
2017 Budget 2016 Budget $ Inc (Dec) % Inc (Dec) 2015 Budget 2015 Budget
# of Personnel 47 46 1 2.17%
Payroll Expenditures 4,265,874 3,944,219 321,655 8.16% 3,902,631 3,228,165
Supplies Expenditures 7,925 9,520 (1,595) -16.75% 10,415 6,899
Service Expenditures 12,115 7,070 5,045 71.36% 21,165 11,795
Capital & Debt Expenditures - - - 0.00% - -
Total Expenditures $ 4,285,914 $ 3,960,809 $ 325,105 8.21% $ 3,934,211 $ 3,246,859
-
500,000
1,000,000
1,500,000
2,000,000
2,500,000
3,000,000
3,500,000
4,000,000
4,500,000
PayrollExpenditures
SuppliesExpenditures
ServiceExpenditures
Capital & DebtExpenditures
Residential Appraisal Expenditures
2017 Budget
2016 Budget
2015 Budget
99.53%
0.18%
0.28% 0.00%
2017 Residential Appraisal Expenditures
Payroll Expenditures
Supplies Expenditures
Service Expenditures
Capital & Debt Expenditures
Dep
art
men
t B
ud
get
s
117

Dep
art
men
t B
ud
get
s
118
Appraisal Review Board 2017
Budget Detail Description
Personnel 312,700 300,000 Hearing Cost
1,200 Committee Work
11,500 Pay during training
Operating Supplies 1,020 Office Supplies
Training/Education 13,190 1,190 Comptroller Training
12,000 In-house Training
Attorney/Legal Costs 12,750 Outside attorneys' fees
Total ARB Budget 339,660
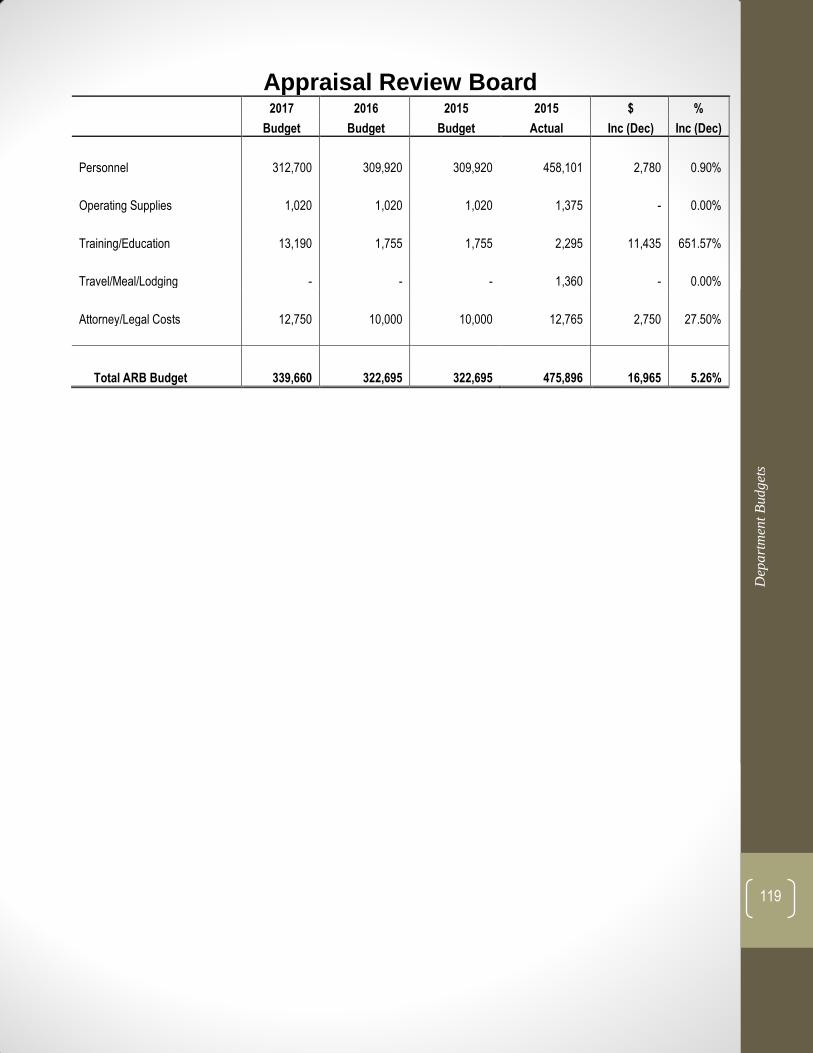
Dep
art
men
t B
ud
get
s
119
Appraisal Review Board 2017 2016 2015 2015 $ %
Budget Budget Budget Actual Inc (Dec) Inc (Dec)
Personnel 312,700 309,920 309,920 458,101 2,780 0.90%
Operating Supplies 1,020 1,020 1,020 1,375 - 0.00%
Training/Education 13,190 1,755 1,755 2,295 11,435 651.57%
Travel/Meal/Lodging - - - 1,360 - 0.00%
Attorney/Legal Costs 12,750 10,000 10,000 12,765 2,750 27.50%
Total ARB Budget 339,660 322,695 322,695 475,896 16,965 5.26%

Dep
art
men
t B
ud
get
s
120
2017 Budget 2016 Budget $ Inc (Dec) % Inc (Dec) 2015 Budget 2015 Actual
# of Personnel 36 36 - 0.00%
Payroll Expenditures 312,700 309,920 2,780 0.90% 309,920 458,101
Supplies Expenditures 1,020 1,020 - 0.00% 1,020 1,375
Service Expenditures 25,940 11,755 14,185 120.67% 11,755 16,420
Capital & Debt Expenditures - - - 0.00% - -
Total Expenditures $ 339,660 $ 322,695 $ 16,965 5.26% $ 322,695 $ 475,896
92.06%
0.30%
7.64% 0.00%
2017 Appraisal Review Board Expenditures
Payroll Expenditures
Supplies Expenditures
Service Expenditures
Capital & Debt Expenditures
-
50,000
100,000
150,000
200,000
250,000
300,000
350,000
PayrollExpenditures
SuppliesExpenditures
ServiceExpenditures
Capital & DebtExpenditures
Appraisal Review Board Expenditures
2017 Budget
2016 Budget
2015 Budget
Statistical Information

Sta
tist
ica
l In
form
ati
on
121
Demographic & Economic Statistics FY 2006-2015
Fiscal Year
Travis County
Population (1)
Travis County Personal
Income (In Thousands)
(2)
Travis County Per
Capita Personal Income
Single Family Home
Sales in the Austin Area
(3)
Average Home
Price in the
Austin Area
(3)
Travis County Un- employment
Rate (4)
2006 920,544 38,816,257 42,167 29,806 226,614 3.9%
2007 948,160 40,467,372 42,680 29,263 243,112 3.7%
2008 978,976 44,894,416 45,859 23,973 245,068 4.5%
2009 1,008,345 43,115,804 42,759 19,511 237,314 7.2%
2010 1,024,266 45,752,271 44,668 20,837 244,131 6.6%
2011 1,049,873 50,576,367 48,174 20,644 252,575 6.6%
2012 1,076,119 57,362,564 53,305 24,295 262,436 5.2%
2013 1,108,403 58,670,035 52,932 29,841 283,523 5.0%
2014 1,141,655 62,329,270 54,596 30,429 300,934 4.0%
2015 1,173,051 INA INA 32,055 321,616 3.2%
SOURCES: (1) City Of Austin demographer
(2) Bureau of Economic Analysis, Department of Commerce
(3) Texas A&M University, Real Estate Research Center
(4) Texas Workforce Commission
NOTES: INA= Information Not Available
Prior years may have been updated by the source

Sta
tist
ica
l In
form
ati
on
122
Top Ten Travis County Ad Valorem Taxpayers
Top Ten 2015 Ad Valorem Taxpayers in Travis County
Taxpayer Name* Taxable Value % of Total County Taxable Value
1 Samsung Austin Semiconductor $ 2,477,907,165 1.37%
2 Columbia/St Davids Healthcare $ 517,113,089 0.29%
3 PKY-San Jacinto Center LLC $ 307,829,941 0.17%
4 Circuit of the Americas $ 293,155,450 0.16%
5 Apple Inc $ 264,264,140 0.15%
6 HEB Grocery Company $ 257,045,142 0.14%
7 IMT Capital II Riata LP $ 256,260,021 0.14%
8 I B M Corporation $ 253,816,041 0.14%
9 CSHV-401 Congress LLC $ 251,256,450 0.14%
10 Finley Company $ 242,301,917 0.13%
Total $ 5,120,949,356 2.83%
* Sum of all properties/accounts for the principal taxpayer

Sta
tist
ica
l In
form
ati
on
123
Top Ten Travis County Employers
Employer Employees
Percentage of Total
County Employment
State of Texas 58,263 8.49%
The University of Texas/Austin 25,893 3.78%
HEB Grocery Co. 18,729 2.73%
Dell, Inc. 13,000 1.90%
Austin Independent School District 12,395 1.81%
Federal Government 11,218 1.63%
Seton Family of Hospitals 10,945 1.60%
City of Austin 8,858 1.29%
St. David’s Healthcare 8,369 1.22%
IBM Corporation 6,000 0.87%
Travis County Principal Employers
State of Texas 34%
The University of Texas/Austin
15% HEB Grocery Co. 11%
Dell, Inc. 8%
Austin Independent School District
7%
Federal Government 6%
Seton Family of Hospitals
6%
City of Austin 5%
St. David’s Healthcare 5% IBM Corporation
3%

Sta
tist
ica
l In
form
ati
on
124
Travis County Demographics
Travis County is located in south central Texas astride the Balcones Fault, the boundary between the Edwards
Plateau to the west and the Blackland Prairies to the east. Its County seat, Austin, is also the capital of Texas.
Entity ID Entity
Cd Entity Name M&O Tax
Rate I&S Tax
Rate Total Tax
Rate
1003 03 TRAVIS COUNTY 0.34860 0.06830 0.41690
Travis County Demographics
Established: January 25, 1840
County Seat: Austin
2011 Population: 1,063,130
Square Miles: 1,023
Jurisdictions: 15 Schools
22 Cities
80 Special Districts

Sta
tist
ica
l In
form
ati
on
125
Travis County School Districts
Travis County has 6 school districts wholly contained within its boundaries and 9 school districts which are
shared across county lines. Austin ISD is the largest school district in Travis County and the third largest
school district in the State.
Entity ID
Entity Cd Entity Name
M&O Tax Rate
I&S Tax Rate
Total Tax Rate
1001 01 AUSTIN ISD 1.07900 0.12300 1.20200
1005 06 DEL VALLE ISD 1.04000 0.49000 1.53000
1006 07 LAKE TRAVIS ISD 1.04000 0.36750 1.40750
1007 08 EANES ISD 1.04000 0.17250 1.21250
1009 1A HAYS CONSOLIDATED ISD* 1.04000 0.49770 1.53770
1023 16 LAGO VISTA ISD 1.06000 0.26000 1.32000
1026 19 PFLUGERVILLE ISD* 1.04000 0.50000 1.54000
1027 2A ELGIN ISD* 1.17000 0.37000 1.54000
1037 22 COUPLAND ISD* 1.04005 0.00000 1.04005
1042 3A MARBLE FALLS ISD* 1.05330 0.22670 1.28000
1053 34 MANOR ISD 1.04000 0.47500 1.51500
1057 38 DRIPPING SPRINGS ISD* 1.04000 0.48000 1.52000
1059 4A JOHNSON CITY ISD* 1.04000 0.10580 1.14580
1072 5A ROUND ROCK ISD* 1.04000 0.29250 1.33250
1098 69 LEANDER ISD* 1.04000 0.47187 1.51187
*Split boundary districts

Sta
tist
ica
l In
form
ati
on
126

Sta
tist
ica
l In
form
ati
on
127
Travis County Cities
Travis County has 22 cities within its boundaries including the State capital Austin. Austin is the fourth largest
city in the state and the 34th
largest metropolitan statistical area in the United States. Residents of the area
represent a diverse mixture of government employees, college students and staff, musicians, high-tech workers
and business people.
Entity ID
Entity Cd Entity Name
M&O Tax Rate
I&S Tax Rate
Total Tax Rate
1002 02 CITY OF AUSTIN 0.35270 0.10620 0.45890
1004 05 CITY OF MANOR 0.43810 0.27370 0.71180
1008 09 CITY OF WEST LAKE HILLS 0.05720 0.00000 0.05720
1018 11 CITY OF ROLLINGWOOD 0.11380 0.08830 0.20210
1019 12 VILLAGE OF SAN LEANNA 0.24980 0.00000 0.24980
1020 13 CITY OF SUNSET VALLEY 0.00000 0.00000 0.00000
1031 2F CITY OF ROUND ROCK 0.25446 0.16019 0.41465
1035 20 CITY OF PFLUGERVILLE 0.36650 0.17400 0.54050
1036 21 CITY OF LAKEWAY 0.14110 0.02890 0.17000
1046 3F CITY OF CEDAR PARK 0.23675 0.24275 0.47950
1065 40 CITY OF CREEDMOOR 0.38000 0.00000 0.38000
1069 44 CITY OF AUSTIN/WMSN CO 0.00000 0.00000 0.00000
1071 49 CITY OF LAGO VISTA 0.39230 0.25770 0.65000
1075 5F CITY OF ELGIN 0.34935 0.30757 0.65692
1076 5G VILLAGE OF VOLENTE 0.10000 0.00000 0.10000
1077 5H VILLAGE OF WEBBERVILLE 0.24730 0.05780 0.30510
1078 50 CITY OF JONESTOWN 0.52230 0.04330 0.56560
1083 55 VILLAGE OF BRIARCLIFF 0.05050 0.11000 0.16050
1090 6F CITY OF LEANDER 0.40364 0.22928 0.63292
1096 61 CITY OF MUSTANG RIDGE 0.43910 0.05590 0.49500
1102 7E VILLAGE OF THE HILLS 0.06000 0.00000 0.06000
1103 7F VILLAGE OF POINT VENTURE 0.10950 0.00000 0.10950
1122 83 CITY OF BEE CAVE 0.00000 0.02000 0.02000

Sta
tist
ica
l In
form
ati
on
128

Sta
tist
ica
l In
form
ati
on
129
Property Taxes at Work
Property taxes are local taxes that are assessed locally, collected locally, and used locally. You pay your property taxes to
the local tax collector. The tax collector distributes the funds to schools, cities and other local governments. Local
governments spend the funds on schools, roads, hospitals, police departments, fire departments and other programs.
In Travis County property taxes support 119 local government agencies including 21 cities, 14 emergency districts, the
county, the hospital district, the junior college, 48 municipal utility districts, 1 road districts, 15 school districts, and 17 water
control improvement districts. For 2015 the projected tax levy for all taxing units in Travis County is $3,015,093,033.
DISTRIBUTION OF PROPERTY TAXES
City 16.14%
Emergency District 1.17%
County 17.33%
Hospital District 4.90%
Junior College 3.69%
Municipal Utility 1.29%
Road District 0.03%
School District 54.74%
Water Control Improvement
0.70%
Budget by Taxing Unit Type

Sta
tist
ica
l In
form
ati
on
130
20 Year History of Appraisal Roll Values
2015 was the fifth consecutive year of appraisal roll growth. All sectors experienced growth.
Year Total Appraisal Roll Appraisal Roll in
Billions Change from Prior Year Percent Change
1995 $ 31,846,455,059 $ 32 $ 3,361,500,060 11.80%
1996 $ 40,692,869,477 $ 41 $ 8,846,414,418 27.78%
1997 $ 43,211,067,501 $ 43 $ 2,518,198,024 6.19%
1998 $ 48,341,540,251 $ 48 $ 5,130,472,750 11.87%
1999 $ 53,722,795,667 $ 54 $ 5,381,255,416 11.13%
2000 $ 64,972,943,609 $ 65 $ 11,250,147,942 20.94%
2001 $ 76,239,445,881 $ 76 $ 11,266,502,272 17.34%
2002 $ 79,728,445,991 $ 80 $ 3,489,000,110 4.58%
2003 $ 76,469,139,131 $ 76 $ (3,259,306,860) -4.09%
2004 $ 77,781,583,339 $ 78 $ 1,312,444,208 1.72%
2005 $ 82,375,357,378 $ 82 $ 4,593,774,039 5.91%
2006 $ 95,936,148,525 $ 96 $ 13,560,791,147 16.46%
2007 $ 108,842,809,351 $ 109 $ 12,906,660,826 13.45%
2008 $ 121,867,062,483 $ 122 $ 13,024,253,132 11.97%
2009 $ 125,928,596,303 $ 126 $ 4,061,533,820 3.33%
2010 $ 120,257,672,985 $ 120 $ (5,670,923,318) -4.50%
2011 $ 123,199,899,915 $ 123 $ 2,942,226,930 2.45%
2012 $ 128,204,974,265 $ 128 $ 5,005,074,350 4.06%
2013 $ 136,845,095,996 $ 137 $ 8,640,121,731 6.74%
2014 $ 154,932,296,956 $ 155 $ 18,087,200,960 13.22%
2015 $ 180,899,915,175 $ 181 $ 25,967,618,219 16.76%
$-
$20
$40
$60
$80
$100
$120
$140
$160
$180
$200
199519961997199819992000200120022003200420052006200720082009201020112012201320142015
Val
ue
in B
illio
ns

Sta
tist
ica
l In
form
ati
on
131
Value Distributions
General Property Type Count Market
Residential 300,679 $ 102,780,034,362
Commercial 15,598 $ 50,458,213,803
Land 57,186 $ 14,793,521,369
Business Personal Property 43,072 $ 12,868,145,641
Total Appraisal Roll 416,535 $ 180,899,915,175
72%
4%
14%
10%
57% 28%
8% 7%
Distribution by General Property Type
Residential Commercial Land Business Personal Property
Outer Ring = Distribution by Market Value
Inner Ring = Distribution by Number of Parcels
25%
24% 22%
24%
5%
41%
11%
27%
16%
5%
Commercial Distribution by Property Type
Apartments Industrial Office Retail Other Commercial
Outer Ring = Distribution by Market Value
Inner Ring = Distribution by Number of Parcels

Sta
tist
ica
l In
form
ati
on
132
2015 State Property Categories
State Code Description Count Market
A SINGLE FAMILY RESIDENCE 282,950 $ 91,638,915,001
B MULTIFAMILY RESIDENCE 13,389 $ 18,924,936,270
C VACANT LOT 29,732 $ 2,442,014,906
D1 QUALIFIED AG LAND 5,183 $ 2,907,861,394
D2 NON-QUALIFIED LAND 445 $ 38,192,455
E FARM OR RANCH IMPROVEMENT 5,834 $ 1,080,700,959
F1 COMMERCIAL REAL PROPERTY 13,825 $ 32,744,021,187
F2 INDUSTRIAL REAL PROPERTY 45 $ 634,373,924
G1 OIL AND GAS 5 $ 222,622
J1 WATER SYSTEMS 32 $ 23,083,666
J2 GAS DISTRIBUTION SYSTEM 10 $ 109,879,069
J3 ELECTRIC COMPANY (INCLUDING CO-OP) 38 $ 159,665,720
J4 TELEPHONE COMPANY (INCLUDING CO-OP) 1,265 $ 423,198,453
J5 RAILROAD 10 $ 23,779,834
J6 PIPELINE COMPANY 116 $ 28,604,569
J7 CABLE TELEVISION COMPANY 45 $ 174,628,572
J8 OTHER TYPE OF UTILITY 2 $ 55,000,000
L1 COMMERCIAL PERSONAL PROPERTY 37,291 $ 6,634,438,686
L2 INDUSTRIAL PERSONAL PROPERTY 971 $ 4,935,661,066
M1 TANGIBLE OTHER PERSONAL, MOBILE HOMES 8,774 $ 179,472,922
N INTANGIBLE PROPERTY AND/OR UNCERTIFIED 2 $ 3,136,075
O RESIDENTIAL INVENTORY 7,632 $ 531,669,576
S SPECIAL INVENTORY TAX 474 $ 281,250,104
X TOTALLY EXEMPT PROPERTY 11,713 $ 16,925,183,695
419,783 $ 180,899,890,725

Sta
tist
ica
l In
form
ati
on
133
$- $40,000,000,000 $80,000,000,000
SINGLE FAMILY RESIDENCE
MULTIFAMILY RESIDENCE
VACANT LOT
QUALIFIED AG LAND
NON-QUALIFIED LAND
FARM OR RANCH IMPROVEMENT
COMMERCIAL REAL PROPERTY
INDUSTRIAL REAL PROPERTY
OIL AND GAS
WATER SYSTEMS
GAS DISTRIBUTION SYSTEM
ELECTRIC COMPANY (INCLUDING CO-OP)
TELEPHONE COMPANY (INCLUDING CO-OP)
RAILROAD
PIPELINE COMPANY
CABLE TELEVISION COMPANY
OTHER TYPE OF UTILITY
COMMERCIAL PERSONAL PROPERTY
INDUSTRIAL PERSONAL PROPERTY
TANGIBLE OTHER PERSONAL, MOBILE HOMES
INTANGIBLE PROPERTY AND/OR UNCERTIFIED…
RESIDENTIAL INVENTORY
SPECIAL INVENTORY TAX
$91,638,915,001
$18,924,936,270
$2,442,014,906
$2,907,861,394
$38,192,455
$1,080,700,959
$32,744,021,187
$634,373,924
$222,622
$23,083,666
$109,879,069
$159,665,720
$423,198,453
$23,779,834
$28,604,569
$174,628,572
$55,000,000
$6,634,438,686
$4,935,661,066
$179,472,922
$3,136,075
$531,669,576
$281,250,104
Value Distribution by Property Category

Sta
tist
ica
l In
form
ati
on
134
2014 Appraisal Workload
2013 2014 2015
Permits 21,135 23,985 24,274
New Subdivision 225 273 306
New Lots 2,536 4,297 6,470
New Condos 424 444 603
New Units 1,198 980 2,664
New Construction 5,197 6,110 7,503
Field Inspections 75,753 89,905 100,980
Deed Transactions 31,833 30,885 32,125
Sales Transactions 15,281 16,082 16,575
Exemptions Processed 14,154 19,611 19,548
Phone Calls 60,036 95,499 58,619
Walk In Visitors 9,995 14,999 9,427
Renditions Processed 26,615 25,651 26,889
Notices of Appraised Value Mailed 391,497 395,956 404,922

Sta
tist
ica
l In
form
ati
on
135
Exemptions
The general homestead exemption is for owner occupied residential properties. The exemption removes a portion of your value from taxation providing a lower tax amount for the homestead property.
If you qualify for the Over 65 exemption there is a property tax “Ceiling” that automatically limits School taxes to the amount you paid in the year that you first qualified for the Over 65 exemption.
100% Disabled veterans are eligible for 100% exemptions for their residence homestead. Documentation from the Department of Veterans Affairs must be submitted indicating 1) 100 percent disability compensation due to a service connected disability; and 2) a rating of 100 percent disabled or a determination of individual unemployability from the VA.
Entity Name
State Mandated
Homestead
Local Option
Homestead
State Mandated
Over 65
Local Option
Over 65
State Mandated Disability
Local Option
Disability
ACC DIST - WMSN CO 1.00 $ 75,000 $ 75,000
ANDERSON MILL LIMITED DISTRICT 20.00 $ 10,000 $ 10,000
AUSTIN COMM COLL DIST 1.00 $ 135,000 $ 135,000
AUSTIN ISD $ 25,000 $ 10,000 $ 25,000 $ 10,000 $ 15,000
CITY OF AUSTIN 6.00 $ 80,000 $ 80,000
CITY OF AUSTIN/HAYS CO $ 51,000 $ 51,000
CITY OF AUSTIN/WMSN CO $ 51,000 $ 51,000
CITY OF BEE CAVE 20.00 $ 65,000 $ 65,000
CITY OF CEDAR PARK $ 30,000 $ 20,000
CITY OF ELGIN $ 15,000 $ 15,000
CITY OF JONESTOWN 10.00 $ 8,000 $ 8,000
CITY OF LAGO VISTA 20.00
CITY OF LAKEWAY $ 5,000
CITY OF LEANDER $ 10,000 $ 10,000
CITY OF MANOR $ 10,000
CITY OF MUSTANG RIDGE $ 5,000
CITY OF PFLUGERVILLE $ 35,000 $ 35,000
CITY OF ROLLINGWOOD $ 3,000
CITY OF ROUND ROCK $ 22,000 $ 3,000
CITY OF SUNSET VALLEY 10.00 $ 3,000 $ 3,000
CITY OF WEST LAKE HILLS $ 4,000
COTTONWD CREEK MUD NO 1 $ 5,000 $ 5,000
COUPLAND ISD $ 25,000 $ 10,000 $ 10,000
DEL VALLE ISD $ 25,000 $ 10,000 $ 10,000
DOWNTOWN PUB IMP DIST $ 70,000 $ 70,000
DRIPPING SPRINGS ISD $ 25,000 $ 10,000 $ 10,000
E SIXTH ST PUB IMP DIST $ 70,000 $ 70,000
EANES ISD $ 25,000 $ 10,000 $ 20,000 $ 10,000 $ 20,000
ELGIN ISD $ 25,000 $ 10,000 $ 10,000
HAYS CONSOLIDATED ISD $ 25,000 $ 10,000 $ 10,000
HURST CREEK MUD 20.00 $ 10,000 $ 10,000
HUTTO ISD $ 25,000 $ 10,000 $ 10,000
JOHNSON CITY ISD $ 25,000 $ 10,000 $ 10,000

Sta
tist
ica
l In
form
ati
on
136
LAGO VISTA ISD $ 25,000 20.00 $ 10,000 $ 10,000
LAKE TRAVIS ISD $ 25,000 20.00 $ 10,000 $ 10,000
LAKEWAY MUD $ 5,000
LEANDER ISD $ 25,000 $ 10,000 $ 10,000
LOST CREEK LIMITED DISTRICT $ 4,000
MANOR ISD $ 25,000 $ 10,000 $ 25,000 $ 10,000 $ 15,000
MARBLE FALLS ISD $ 25,000 $ 10,000 $ 3,000 $ 10,000
NORTH AUSTIN MUD NO 1 $ 10,000 $ 10,000
PFLUGERVILLE ISD $ 25,000 $ 10,000 $ 9,100 $ 10,000
RIVER PLACE MUD 10.00 $ 25,000
RNCH @ CYPRSS CRK MUD 1 $ 15,000 $ 15,000
ROUND ROCK ISD $ 25,000 $ 10,000 $ 10,000 $ 3,000
SOUTHEAST TRAVIS COUNTY MUD NO 1
SOUTHEAST TRAVIS COUNTY MUD NO 2
TANGLEWD FOREST LTD DIST 10.00 $ 50,000 $ 15,000
TRAVIS CO BCCP 20.00 $ 65,000 $ 65,000
TRAVIS CO ESD NO 9 $ 4,000
TRAVIS CO MUD NO 10 10.00 $ 10,000 $ 10,000
TRAVIS CO MUD NO 15 $ 10,000 $ 10,000
TRAVIS CO MUD NO 2 $ 5,000 $ 5,000
TRAVIS CO RFP DIST NO 6 $ 3,000 $ 3,000
TRAVIS CO WCID NO 10 $ 4,000
TRAVIS CO WCID NO 15 30.00 $ 15,000
TRAVIS CO WCID NO 17 10.00 $ 15,000 $ 15,000
TRAVIS CO WCID NO 18 $ 30,000
TRAVIS COUNTY 20.00 $ 75,000 $ 75,000
TRAVIS COUNTY HEALTHCARE DISTRICT 20.00 $ 75,000 $ 75,000
VILLAGE OF SAN LEANNA $ 25,000
VILLAGE OF THE HILLS 20.00 $ 10,000 $ 10,000
VILLAGE OF VOLENTE $ 45,000 $ 45,000
VILLAGE OF WEBBERVILLE 5.00
WELLS BRANCH MUD 20.00
WMSN-TR CO WCID NO 1F $ 15,000 $ 15,000
WMSN-TR CO WCID NO 1G $ 15,000 $ 15,000
Non-profit organizations that are eligible for property tax exemptions include but are not limited to: certain charitable
organizations, youth development organizations, religious organizations, non-profit private schools, charitable hospitals,
cemeteries and veterans’ organizations.
Property owners with mineral property or business personal property worth less than $500 are exempt from property taxes.
No exemption application is required.

Sta
tist
ica
l In
form
ati
on
137
Appraisal District Appeals
Taxpayers have the right to
appeal their property’s
valuation. The Appraisal
Review Board considers
all evidence presented by
the property owner and the
Appraisal District Office at
formal hearings. They then
rule on the value of the
property in question. -
20,000
40,000
60,000
80,000
100,000
120,000
10 Year History of Property Appeals
5%
52%
4%
39%
Distribution of 2015 Appeals
by Market Value
Business PersonalProperty
Commercial
Land
Residential
8% 16%
6% 70%
Distribution of 2015 Appeals
By Number of Appeals Filed
Business PersonalProperty
Commercial
Land
Residential

Sta
tist
ica
l In
form
ati
on
138
Taxpayers that file an appeal are first given an opportunity to meet “Informally” with an appraiser. The majority
of protests filed are resolved at an informal level. If the property owner is unable to reach a value agreement
with the appraiser they are then able to carry their protest to the Appraisal Review Board for a “Formal”
hearing.
Taxpayers dissatisfied with the Appraisal Review Board “Formal” hearing determination may appeal the
decision to: Arbitration, SOAH, or District Court.
67%
12%
10% 9%
2%
Informal
Withdrawn
No Show/Dismissed
Formal
Other
0
200
400
600
800
1000
1200
10 Year History of Property Lawsuits

Sta
tist
ica
l In
form
ati
on
139
Comptroller PTAD Studies
Annually the Comptroller’s Property Tax Assistance Division performs either a Property Value Study (PVS) or
Methods and Assistance Program (MAP) review of each appraisal district.
Travis CAD received its most recent PVS review in 2014. The purpose of the PVS is to determine the median
level of appraisal for the appraisal district; and, determine the taxable value for each ISD for school funding
purposes.
2014 Property Value Study
Category
Number
of Ratios
**
2014 CAD Rept
Appraised Value
Median
Level of
Appr
Coefficient
of
Dispersion
% Ratios
w/in (+/-)
10% of
Median
% Ratios
w/in (+/-)
25% of
Median
Price-
Related
Differential
A. Single-Family
Residences 4,278 81,613,899,419 .97 7.33 78.40 96.30 1.01
B. Multi-Family
Residences 178 15,782,902,804 .96 10.93 67.97 87.07 1.00
C1. Vacant Lots 245 2,461,892,228 * * * * *
C2. Colonia lots 0 0 * * * * *
D2. Farm/Ranch
Imp 0 44,979,235 * * * * *
E. Rural non-
qualified 29 958,615,801 * * * * *
F1. Commercial
Real 243 26,916,178,183 .97 13.24 54.32 87.24 .99
F2. Industrial Real 0 604,359,046 * * * * *
G. Oil, Gas,
Minerals 0 54,502 * * * * *
J. Utilities 7 982,159,907 * * * * *
L1. Commercial
Personal 179 6,306,349,071 1.02 9.27 68.71 90.50 1.02
L2. Industrial
Personal 0 4,974,326,062 * * * * *
M. Other Personal 0 164,243,898 * * * * *
O. Residential
Inventory 0 341,521,702 * * * * *
S. Special
Inventory 0 256,885,841 * * * * *
Overall 5,159 141,408,367,699 .97 8.46 74.78 93.93 .99
Travis CAD received its most recent MAP review in 2015. The review is designed to determine whether
appraisal districts are meeting minimum requirements for appraisal duties and reviews specifically for
governance, taxpayer assistance, operating procedures, and appraisal standards and methodology. Travis CAD
passed all mandatory requirements and received exceeds rating in all areas of review.

Sta
tist
ica
l In
form
ati
on
140
2015 Methods and Assistance Program Review

Sta
tist
ica
l In
form
ati
on
141
Appraisal District Finances
Local taxing units pay CAD expenses according to their share of the total property tax levy of all the taxing
units in the CAD. Each taxing unit participating in the CAD is allocated a portion of the amount of the budget
equal to the proportion that the total dollar amount of property taxes imposed in the CAD by the unit for the tax
year in which the budget proposal is prepared bears to the sum of the total dollar amount of property taxes
imposed in the CAD by each participating unit for that year.
The District’s financial statements are audited annually by a CPA in accordance with generally accepted
auditing standards. The results of the audit are presented to the Board.
The appraisal district budget is prepared and presented to the Board of Directors and all taxing units in
preliminary form no later than June 15th
of the preceding budget year. After a public hearing is held, the Board
formally adopts the district budget no later than September 15th
. The budget outlines goals, objectives and
programs to be accomplished; operating and maintenance expenditures, personnel breakdown with staffing
levels and salary ranges; and capitalized equipment to purchased.
City 16.14% Emergency
District 1.17%
County 17.33%
Hospital District 4.90%
Junior College 3.69%
Municipal Utility 1.29%
Road District 0.03%
School District 54.74%
Water Control Improvement
0.70%
Budget by Taxing Unit
35%
19% 16%
5%
5%
5% 4%
4% 4% 3%
Top 10 Contributing Taxing Units AUSTIN ISD
TRAVIS COUNTY
CITY OF AUSTIN
TRAVIS COUNTY HEALTHCARE DISTRICT
EANES ISD
PFLUGERVILLE ISD
LAKE TRAVIS ISD
AUSTIN COMM COLL DIST
LEANDER ISD
ROUND ROCK ISD

Sta
tist
ica
l In
form
ati
on
142
Below is summary of the major revenue sources and major expenditure categories by fiscal years for FY 2015
and the previous five years budget histories.
A useful statistic is comparing the CAD budget to the total taxes levied by the taxing entities. It reflects how
much it costs to generate a dollar of property tax revenue which, in turn, indicates appraisal and operating
efficiencies.
CAD 2014 Tax Levy 2015 Budget % of Levy
Dallas CAD $4,940,649,726 $ 23,677,340 0.48%
Travis CAD $3,300,883,208 $ 17,149,799 0.52%
Bexar CAD $2,876,754,296 $ 15,870,698 0.55%
Tarrant CAD $3,609,900,717 $ 21,507,531 0.60%
Harris CAD $8,524,596,828 $ 76,577,504 0.90%
El Paso CAD $991,364,185 $ 12,662,248 1.28%

Sta
tist
ica
l In
form
ati
on
143
lmann
Stamp

Sta
tist
ica
l In
form
ati
on
144
TRAVIS CENTRAL APPRAISAL DISTRICT
Net Position by Component
Last Ten Fiscal Years
(Accrual Basis of Accounting- Unaudited)
2006
2007
2008
2009
Governmental Activities
Net investment in capital
assets
$3,190,120
$2,646,972
$3,164,662
$3,688,647
Unrestricted
357,061
755,021
889,886
1,611,684
Total Governmental Activities
Net Position
3,547,181
3,401,993
4,054,548
5,300,331
Total Primary Government
Net Position
$3,547,181
$3,401,993
$4,054,548
$5,300,331
SOURCE: Audited Financial Statements 2006-2010
Comprehensive Annual Financial Report (CAFR) 2011-2015

Sta
tist
ica
l In
form
ati
on
145
TRAVIS CENTRAL APPRAISAL DISTRICT TABLE 1
Net Position by Component
Last Ten Fiscal Years
(Accrual Basis of Accounting- Unaudited)
2010
2011
2012
2013
2014
2015
$3,749,926
$4,423,085
$4,094,873
$5,290,153
$3,863,065
$ 3,890,995
1,895,825
1,640,950
1,431,888
2,005,592
5,685,923
6,940,385
5,645,751
6,064,035
5,526,761
7,295,745
9,548,988
10,831,380
$5,645,751
$6,064,035
$5,526,761
$7,295,745
$9,548,988
$ 10,831,380

Sta
tist
ica
l In
form
ati
on
146
TRAVIS CENTRAL APPRAISAL DISTRICT
Change in Net Position
Last Ten Fiscal Years
(Accrual Basis of Accounting- Unaudited)
2006
2007
2008
2009
Expenses
Governmental Activities
Appraisal services
$ 8,625,489
$ 9,237,366
$ 10,136,925
$ 10,688,920
Interest on long-term debt
20,883
12,687
4,064
-
Total Governmental
Activities Expenses
8,646,372
9,250,053
10,140,989
10,688,920
Total Primary
Government Expenses
8,646,372
9,250,053
10,140,989
10,688,920
Program Revenues
Governmental Activities
Fees, fines, and charges for services
8,412,252
9,008,393
10,744,086
11,932,726
Total Governmental Activities
Program Revenues
8,412,252
9,008,393
10,744,086
11,932,726
Total Primary Government
Program Revenues
8,412,252
9,008,393
10,744,086
11,932,726
Net Revenue (Expense)
(234,120)
(241,660)
603,097
1,243,806
Interest income
95,488
96,472
49,458
1,977
Change in net position
(138,632)
(145,188)
652,555
1,245,783
Net position- beginning of year
3,685,813
3,547,181
3,401,993
4,054,548
Net position restatement
-
-
-
-
Adjusted net position, beginning of year
3,685,813
3,547,181
3,401,993
Net position- end of year
$ 3,547,181
$ 3,401,993
$ 4,054,548
$ 5,300,331
SOURCE: Audited Financial Statements 2006-2010
Comprehensive Annual Financial Report (CAFR) 2011-2015

Sta
tist
ica
l In
form
ati
on
147
TRAVIS CENTRAL APPRAISAL DISTRICT TABLE 2
Change in Net Position
Last Ten Fiscal Years
(Accrual Basis of Accounting- Unaudited)
2010
2011
2012
2013
2014
2015
$ 11,527,480
$ 11,702,337
$ 12,278,520
$ 11,693,736
$ 12,032,932
$ 13,048,016
-
35,233
-
11,116
-
-
11,527,480
11,737,570
12,278,520
11,704,852
12,032,932
13,048,016
11,527,480
11,737,570
12,278,520
11,704,852
12,032,932
13,048,016
11,872,153
12,151,322
11,735,080
13,468,605
14,283,508
17,243,865
11,872,153
12,151,322
11,735,080
13,468,605
14,283,508
17,243,865
11,872,153
12,151,322
11,735,080
13,468,605
14,283,508
17,243,865
344,673
413,752
(543,440)
1,763,753
2,250,577
4,195,849
747
4,532
6,166
5,231
2,667
4,993
345,420
418,284
(537,274)
1,768,984
2,253,243
4,200,842
5,300,331
5,645,751
6,064,035
5,526,761
7,295,745
9,548,988
-
-
-
-
-
(2,920,450)
5,300,331
5,645,751
6,064,035
5,526,761
7,295,745
6,628,538
$ 5,645,751
$ 6,064,035
$ 5,526,761
$ 7,295,745
$ 9,548,988
$ 10,831,380

Sta
tist
ica
l In
form
ati
on
148
TRAVIS CENTRAL APPRAISAL DISTRICT
Fund Balance- Governmental Fund
Last Ten Fiscal Years
(Modified Accrual Basis of Accounting- Unaudited)
2006
2007
2008
2009
General Fund
Reserved
$ 68,657
$ 186,390
$ 120,040
$ 145,062
Unreserved
800,120
601,017
1,197,759
1,971,252
Nonspendable
-
-
-
-
Restricted
-
-
-
-
Committed
-
-
-
-
Assigned
-
-
-
-
Unassigned
-
-
-
-
Total General Fund
$ 868,777
$ 787,407
$ 1,317,799
$ 2,116,314
SOURCE: Audited Financial Statements 2006-2010
Comprehensive Annual Financial Report (CAFR) 2011-2015
NOTE: The District implemented GASB Statement No. 54 during the fiscal year ended December 31, 2011.
This statement eliminated the previous fund balance categories (reserved and unreserved), and replaced
them with the five new categories (nonspendable, restricted, committed, assigned and unassigned).
Fund balance amounts for fiscal year ended December 31, 2011 and thereafter reflect the new
categories; however, all previous fiscal years are presented using the old categories.

Sta
tist
ica
l In
form
ati
on
149
TRAVIS CENTRAL APPRAISAL DISTRICT TABLE 3
Change in Net Position
Last Ten Fiscal Years
(Accrual Basis of Accounting- Unaudited)
2010
2011
2012
2013
2014
2015
$ 82,376
$ -
$ -
$ -
$ -
$ -
2,340,265
-
-
-
-
-
-
101,849
174,147
377,866
311,360
1,243,778
-
-
-
-
-
-
-
-
-
-
1,250,000
3,419,849
-
-
-
-
-
-
-
2,135,141
1,933,761
2,302,068
1,935,393
1,478,066
$ 2,422,641
$ 2,236,990
$ 2,107,908
$ 2,679,934
$ 3,496,753
$ 6,141,693

Sta
tist
ica
l In
form
ati
on
150
TRAVIS CENTRAL APPRAISAL DISTRICT
Change in Fund Balance- Governmental Fund
Last Ten Fiscal Years
(Modified Accrual Basis of Accounting- Unaudited)
2006
2007
2008
2009
Revenues
Assessments
$ 8,325,763
$ 9,829,291
$ 10,674,750
$ 11,856,540
Less: Refunds
-
(902,018)
-
-
8,325,763
8,927,273
10,674,750
11,856,540
Investment earnings
95,488
96,472
49,458
1,977
Charges for services
29,740
23,436
21,325
17,998
Miscellaneous income
56,749
57,684
48,011
58,188
Total Revenue
8,507,740
9,104,865
10,793,544
11,934,703
Expenditures
Appraisal Services
Payroll and related expenses
6,220,542
7,390,215
7,918,880
8,182,739
Data processing
160,035
126,682
137,141
165,309
Transportation
207,456
8,640
10,641
13,872
Operating supplies
-
-
-
-
Rentals
55,987
43,804
47,536
46,032
Legal & professional
525,704
377,307
558,867
568,315
Utilities and telephone
137,470
121,473
133,819
143,229
Building and equipment
maintenance
-
119,560
197,766
286,939
Other services
869,148
646,216
668,060
771,590
Debt Service
Principal
270,540
278,409
263,134
-
Interest
20,883
12,687
4,064
-
Capital outlay
223,296
61,242
323,244
958,163
Total Expenditures
8,691,061
9,186,235
10,263,152
11,136,188
Excess (Deficiency) of Revenues
Over (Under) Expenditures
(183,321)
(81,370)
530,392
798,515
Other Financing Sources (Uses)
-
-
-
-
Net Change in Fund Balance
$ (183,321)
$ (81,370)
$ 530,392
$ 798,515
Ratio of Debt Service Expenditures
to total noncapital expenditures
3.44%
3.19%
2.69%
0.00%
SOURCE: Audited Financial Statements 2005-2010
Comprehensive Annual Financial Report (CAFR) 2011-2014

Sta
tist
ica
l In
form
ati
on
151
TABLE 4
Change in Net Position
cal Years
(Accruaed) 2010
2011
2012
2013
2014
2015
$ 12,591,285
$ 12,689,611
$ 12,914,797
$ 13,375,023
$ 14,246,848
$ 17,149,799
(789,802)
(612,738)
(1,259,667)
-
(89,434)
(26,908)
11,801,483
12,076,873
11,655,130
13,375,023
14,157,414
17,122,891
747
4,532
6,166
5,231
2,667
4,993
19,171
19,474
20,424
23,673
24,444
31,707
51,499
54,975
59,526
69,909
101,650
89,267
11,872,900
12,155,854
11,741,246
13,473,836
14,286,175
17,248,858
9,148,307
9,120,313
9,053,018
10,553,042
10,283,671
10,735,612
187,233
106,912
440,591
354,679
552,623
617,689
12,663
7,296
20,074
11,843
17,566
11,031
-
-
371,123
180,563
90,473
189,457
40,234
34,433
39,291
44,724
57,161
59,672
406,230
684,615
759,231
363,566
895,228
988,761
150,150
138,279
143,741
174,140
178,163
188,981
211,398
117,758
127,552
98,024
159,497
152,316
916,974
916,028
658,387
716,010
857,625
1,092,679
-
743,612
-
23,588
-
-
-
35,233
-
11,116
-
-
1,236,996
437,026
257,319
370,516
377,349
569,720
12,310,185
12,341,505
11,870,327
12,901,811
13,469,356
14,605,918
(437,285)
(185,651)
(129,081)
572,025
816,819
2,642,940
-
-
-
-
-
2,000
$ (437,285)
$ (185,651)
$ (129,081)
$ 572,025
$ 816,819
$ 2,644,940
0.00%
6.54%
0.00%
0.28%
0.00%
0.00%

Sta
tist
ica
l In
form
ati
on
152
Visit or Contact Us
Office Location: Travis Central Appraisal District 8314 Cross Park Drive Austin, TX 78754
Mailing Address: P.0. Box 149012 Austin, TX 78714-9012
Customer Inquiries and Assistance: Phone: (512) 834-9138 Fax: (512) 835-5371 Email: [email protected] Website: www.traviscad.org
Business Hours: Monday - Friday 7:45am-4:45pm
Directions:
From North Austin: From north Austin go south on IH 35 and take the 183 Lockhart/Lampasas exit which will be exit number 240A - 239. Turn left at the light onto highway 183 South staying on frontage road approximately 3/4 miles. Turn left onto Cameron Rd. Continue for approximately one mile and turn right at the second stop light onto Cross Park Drive. Proceed 3/4 mile and our office at 8314 Cross Park will be on the right. If you have reached the post office on the left you have gone too far.
From South Austin: From south Austin go north on IH 35 take the 183 Lockhart/Lampasas exit which will be exit number 240A - 239. At the second stop light turn right on Hwy 183 staying on frontage road approximately 3/4 miles. Turn left onto Cameron Rd. Continue for approximately one mile and turn right at the second stop light onto Cross Park Drive. Proceed 3/4 mile and our office at 8314 Cross Park will be on the right. If you have reached the post office on the left you have gone too far.
From East Austin: From east Austin, heading west on Hwy 183 take the Cameron Road Exit, turn right onto Cameron Rd. Continue for approximately one mile and turn right at the second stop light onto Cross Park Drive. Proceed 3/4 mile and our office at 8314 Cross Park will be on the right. If you have reached the post office on the left you have gone too far.
From West Austin: From west Austin, heading east on Hwy 183 take the Cameron Road exit. Turn left onto Cameron Rd. Continue for approximately one mile and turn right at the second stop light onto Cross Park Drive. Proceed 3/4 mile and our office at 8314 Cross Park will be on the right. If you have reached the post office on the left you have gone too far.

Appendix: Texas Property Tax
Code Section 6.06 Appraisal
District Budget & Financing

Ap
pen
dix
: T
exa
s P
rop
erty
Ta
x C
od
e S
ecti
on
6.0
6 A
pp
rais
al
Dis
tric
t B
ud
get
& F
inan
cin
g
153
SECTION 6.06 PROPERTY TAX CODE, APPRAISAL DISTRICT BUDGET AND FINANCING
(a) Each year the Chief Appraiser shall prepare a proposed budget for the operations of the district for the following
tax year and shall submit copies to each of the taxing units participating in the district and to the district board of
directors before June 15th. He shall include in the budget a list showing each proposed position, the proposed salary
for the position, all benefits proposed for the position, each proposed capital expenditure, and an estimate of the
amount of the budget that will be allocated to each taxing unit. Each taxing unit entitled to vote on the appointment of
board members shall maintain a copy of the proposed budget for public inspection at its principal administrative office.
(b) The board of directors shall hold a public hearing to consider the budget. The secretary of the board shall deliver
to the presiding officer of the governing body of each taxing unit participating in the district not later than the 10 th day
before the hearing. The board shall complete its hearings, make any amendments to the proposed budget it desires,
and finally approve a budget before September 15. If governing bodies of a majority of the taxing units entitled to vote
on the appointment of board members adopt resolutions disapproving a budget and file them with the secretary of the
board within 30 days after its adoption, the budget does not take effect, and the board shall adopt a new budget within
30 days of the disapproval.
(c) The board may amend the approved budget at any time, but the secretary of the board must deliver a written copy
of the proposed amendment to the presiding officer of the governing body of each taxing unit participating in the
district not later than the 30th day before the date the board acts on it.
(d) Each taxing unit participating in the district is allocated a portion of the amount of the budget equal to the
proportion that the total dollar amount of property taxes imposed in the district by the unit for the tax year in which the
budget proposal is prepared bears to the sum of the total dollar amount of property taxes imposed in the district by
each participating unit for that year. If a taxing unit participates in two or more districts, only the taxes imposed in a
district are used to calculate the unit’s cost allocations in the district. If the number of real property parcels in the
district and the taxing unit imposes in excess of 25 percent of the total amount of the property taxes imposed in the
district by all of the participating taxing units for a year, the unit’s allocation may not exceed a percentage of the
appraisal district’s budget equal to three times the unit’s percentage of the total number of real property parcels
appraised by the district.
(e) Unless the governing body of a unit and the chief appraiser agree to a different method of payment, each taxing
unit shall pay its allocation in four equal payments to be made at the end of each calendar quarter, and the first
payment shall be made before January 1 of the year in which the budget takes effect. A payment is delinquent if not
paid on the date it is due. A delinquent payment incurs a penalty of 5 percent of the amount of the payment and
accrues interest at an annual rate of 10 percent. If the budget is amended, any change in the amount of a unit’s
allocation is apportioned among the payments remaining.
(f) Payments shall be made to a depository designed by the district board of directors. The district’s funds may be
disbursed only by a written check, draft, or order signed by the chairman and secretary of the board or, if authorized
by resolution of the board, by the chief appraiser.
(g) If a taxing unit decides not to impose taxes for any tax year, the unit is not liable for any of the costs of operating
the district in that year, and those costs are allocated among the other taxing units as if that unit had not imposed
taxes in the year used to calculate allocation. However, if that unit has made any payments, it is not entitled to a
refund.

Ap
pen
dix
: T
exa
s P
rop
erty
Ta
x C
od
e S
ecti
on
6.0
6 A
pp
rais
al
Dis
tric
t B
ud
get
&
Fin
an
cin
g
154
(h) If a newly formed taxing unit or a taxing unit that did not impose taxes in the preceding year imposes taxes in any
tax year, that unit is allocated a portion of the amount budgeted to operate the district as if it had imposed taxes in the
preceding year, except that the amount of taxes the unit imposes in the current year is used to calculate its allocation.
Before the amount of taxes to be imposed for the current year is known, the allocation may be based on an estimate
to which the district board of directors and the governing body of the unit agree, and the payments made after that
amount is know shall be adjusted to reflect the amount imposed. The payments of a newly formed taxing unit that has
no source of funds are postponed until the unit has received adequate tax or other revenues.
(i) The fiscal year of an appraisal district is the calendar year unless the governing bodies of three-fourths of the taxing
units entitled to vote on the appointment of board members adopt resolutions proposing a different fiscal year and file
them with the secretary of the board not more than 12 and not less than eight months before the first day of the fiscal
year proposed by the resolutions. If the fiscal year of an appraisal district is changed under this subsection, the chief
appraiser shall prepare a proposed budget for the fiscal year as provided by Subsection (a) of this section before the
15th day of the seventh month preceding the first day of the fiscal year established by the change, and the board of
directors shall adopt a budget for the fiscal year as provided by Subsection (b) of this section before the 15th day of the
fourth month preceding the first day of the fiscal year established by the change. Unless the appraisal district adopts a
different method of allocation under Section 6.061 of this code, the allocation of the budget to each taxing unit shall be
calculated as provided by Subsection (d) of this section using the amount of property taxes imposed by each
participating taxing unit in the most recent tax year preceding the fiscal year established by the change for which the
necessary information is available. Each taxing unit shall pay its allocation as provided by Subsection (e) of the
section, except that the first payment shall be made before the first day of the fiscal year established by the change
and subsequent payments shall be made quarterly. In the year in which a change in the fiscal year occurs, the budget
that takes effect on January 1 of that year may be amended as necessary as provided by Subsection (c) of this
section in order to accomplish the change in fiscal years.
(j) If the total amount of the payments made or due to be made by the taxing units participating in an appraisal district
exceeds the amount actually spent or obligated to be spent during the fiscal year for which the payments were made,
the chief appraiser shall credit the excess amount against each taxing unit’s allocation payments for the following year
in proportion to the amount of each unit’s budget allocation for the fiscal year for which the payments were made. If a
taxing unit that paid its allocated amount is not allocated a portion of the district’s budget for the following fiscal year,
the chief appraiser shall refund to the taxing unit its proportionate share of the excess funds not later than the 150 th
day after the end of the fiscal year for which the payments were made.
SECTION 6.062 PROPERTY TAX CODE, PUBLICATION OF BUDGET
(a) Not later than the 10th day before the date of the public hearing at which the board of directors considers the
appraisal district budget, the chief appraiser shall give notice of the public hearing by publishing the notice in a
newspaper having general circulation in the county for which the appraisal district is established. The notice may not
be smaller than one-quarter page of a standard-size or tabloid-size newspaper and may not be published in the part of
the paper in which legal notices and classified advertisements appear.
(b) The notice must set out the time, date, and place of the public hearing and must set out a summary of the
proposed budget. The summary must set out as separate items:
(1) The total amount of the proposed budget;

Ap
pen
dix
: T
exa
s P
rop
erty
Ta
x C
od
e S
ecti
on
6.0
6 A
pp
rais
al
Dis
tric
t B
ud
get
& F
inan
cin
g
155
(2) The amount of increases proposed from the budget adopted for the current year; and
(3) The number of employees to be compensated under the current budget and the number of employees to
be compensated under the proposed budget.
(c) The notice must state that the appraisal district is supported solely by payments form the local taxing units served
by the appraisal district. The notice must also contain the following statement: “If approved by the appraisal district
board of directors at the public hearing, this proposed budget will take effect automatically unless disapproved by the
governing bodies of the county, school districts, cities, and towns served by the appraisal district. A copy of the
proposed budget is available for public inspection in the office of each of those governing bodies.”

Ap
pen
dix
: T
exa
s P
rop
erty
Ta
x C
od
e S
ecti
on
6.0
6 A
pp
rais
al
Dis
tric
t B
ud
get
&
Fin
an
cin
g
156
lmann
Stamp

Glossary

Glo
ssa
ry
157
GLOSSARY
Accrual Basis of Accounting- Method of accounting that recognizes the financial effect or transactions, events, and
interfund activity when they occur, regardless of the timing of related cash flows.
Ad Valorem- According to value
Ad Valorem Taxation- A tax levied in proportion to the value of the ting(s) being taxed. Exclusive of exemptions, use-
value assessment provisions, and the like, the property tax is an ad valorem tax.
Ad-hoc Reports- A report generated dynamically at the information consumer’s request. These reports are created
due to unplanned information requests in which information is gathered to support a non-routine decision.
Appropriation- a sum of money or total of assets devoted to a special purpose.
Arbitration- the use of an unbiased third-party arbitrator to settle a dispute.
ArcGIS- A geographic information system (GIS) by ESRI for working with maps and geographic information. It is used
for: creating and using maps; compiling geographic data; analyzing mapped information; sharing and discovering
geographic information; using maps and geographic information in a range of applications; and managing geographic
information in a database.
Assigned Fund Balance- The portion of the net position of a government fund that represents resources set aside
(“earmarked”) by the government for a particular purpose.
Balanced Budget Policy- The District’s policy that requires the total sum of money a government will collect in a
fiscal year equal the amount it spends on goods, services, and capital expenditures.
Basic Financial Statements- Minimum combination of financial statements and not disclosure required for fair
presentation in conformity with Generally Accepted Accounting Principles (GAAP).
Basis of Accounting- Timing of recognition for financial reporting purposes (when the effects of transaction or events
should be recognized in financial statements)
Basis of Budgeting- Method used to determine when revenues and expenditures are recognized for budgetary
purposes.
Budget Amendment- A proposal to change the dollar amount of an activity or project or to add an activity of project
after the budget has already been adopted. A budget amendment changes the final dollar amount of the budget,
requiring the jurisdictions to contribute more money to the District.
Capital Asset- Land, improvement to land, easements, buildings, building improvements, vehicles, machinery,
equipment, works of art and historical treasures, infrastructure, and all other tangible or intangible assets that are used
in operations and that have initial useful lives extending beyond a single reporting period.

Glo
ssa
ry
158
Capital Equipment- Equipment that you use to manufacture a product, provide a service or use to sell, store and
deliver merchandise. Such equipment will not be sold in the normal course of business, but will be used and worn out
or consumed in the normal course of business.
Capital Equipment Policy (Capitalization Threshold)- Dollar value at which a government elects to capitalize
tangible or intangible assets that are used in operations and that have initial useful lives extending beyond a single
reporting period. Generally, capitalization thresholds are applied to individual items rather than groups of items unless
the result would be to exclude items that in the aggregate would clearly be material to the financial statements.
Capital Expenditure- Funds used by a company to acquire or upgrade physical assets such as property, building, or
equipment. This type of outlay is made by companies to maintain or increase the scope of their operations and falls
within their capitalization threshold. These expenditures can include everything from repairing a roof to building a
brand new building.
Cash Management Controls- Controls which promote positive cash management. Cash management is the
financial management technique used by treasurers to accelerate the collection of receivables, control payments to
vendors/creditors, and efficiently manage cash.
Certification of Achievement for Excellence in Financial Reporting- Program sponsored by the GFOA to
encourage and assist state and local governments to prepare high-quality CAFRs. The program has been in
continuous operation since 1946. The program originally was known as the certificate of Conformance Program.
Committed Fund Balance- The portion of the net position of a governmental fund that represents resources whose
use is subject to a legally binding constraint that is imposed by the government itself at its highest level of decision-
making authority and that remains legally binding unless removed in the same manner.
Comprehensive Annual Financial Report (CAFR) - Financial report that contains, at a minimum, three sections: 1)
introductory, 2) financial, and 3) statistical, and whose financial sections provide information on each individual fund
and component unit.
Contra Revenue Account- A revenue account that is expected to carry a debit balance instead of the usual credit
balance. A contra revenue account reduces the amounts reported in a company’s revenue accounts.
Current Financial Resources Measurement Focus- Measurement focus where the aim of a set of financial
statements is to report the near-term (current) inflows, outflows, and balances of expendable financial resources. The
current financial resources measurement focus is unique to accounting and financial reporting for state and local
governments and is used solely for reporting the financial position and results of operations of governmental funds.
Debt Service- The cash that is required for a particular time period to cover the repayment of interest and principal on
a debt.
Deposition- A verbal or written testimony of a party or witness in a civil or criminal proceeding taken before trial,
usually in an attorney’s office.
Depreciate- A reduction in the value of an asset with the passage of time, due in particular to wear and tear.

Glo
ssa
ry
159
Discovery- A category of procedural devices employed by a party to a civil or criminal action, prior to trial, to require
the adverse party to disclose information that is essential for the preparation of the requesting party’s case and that
the other party alone knows or possesses.
Economic Development Abatement- A tax abatement is a local agreement between a taxpayer and a taxing unit
that exempts all or part of the increase in value of the real property and/or tangible personal property from taxation for
a period not to exceed 10 years. These tax abatements are an economic development tool available to cities,
counties and special districts to attract new industries and to encourage the retention and development of existing
businesses through property tax exemptions or reductions.
Economic Resources Measurement Focus- Measurement focus where the aim of a set of financial statements is to
report all inflows, outflows, and balances affecting or reflecting an entity’s net position. The economic resources
measurement focus is used for proprietary and trust funds, as well as for government-wide financial reporting. It also
is used by business enterprise and nonprofit organizations in the private sector.
Elected Contribution Rate- The board of directors may take a vote to increase the percentage of gross payroll paid
to the Texas Counties and District Retirement System (TCDRS) above that of the required rate.
Employer Contributions- A term used in the context of pension benefits and OPEB to describe actual payments
made by the employer as compared to the employer’s annual required contribution. Only amounts paid to trustees
and outside parties qualify as contributions.
Exemption- The District grants exemptions to certain organizations, persons, or property that may provide complete
relief from tax, tax at a reduced rate or tax on only a portion of the items subject to tax. Examples include the
homestead exemption and the over 65 exemption.
Expenditure- Under the current financial resources measurement focus, decreases in net financial resources not
properly classified as other financing uses.
Formal Hearing- When a taxpayer protests their property value, a formal hearing before the Appraisal Review Board
(ARB) is the final step before the appeals process. The formal hearing is conducted with a panel of three ARB
members (unless special circumstances exist).
Fund- Fiscal and accounting entity with a self-balancing set of accounts recording cash and other financial resources,
together with all related liabilities and residual equities or balances, and changes therein, that are segregated for the
purpose of carrying on specific activities or attaining certain objectives in accordance with special regulations,
restrictions, or limitations.
Fund Balance- Net position of a governmental fund (difference between assets, liabilities, deferred outflows of
resources, and deferred inflows of resources).
Fund Financial Statements- Basic financial statements presented for funds, in contrast to government-wide financial
statements.
General Fund- Main operating account for a nonprofit entity, such as a government or government agency.

Glo
ssa
ry
160
Governmental Fund- a broad category of funds used by state and local governments. Governmental funds include
the general fund, special revenue funds, capital projects funds, debt service funds and permanent funds.
Governmental Financial Reporting Model- Minimum combination of financial statements, notes, and required
supplementary information prescribed for state and local governments by the GASB.
Government-wide Financial Statements- Financial statements that incorporate all of a government’s governmental
and business-type activities, as well as its nonfiduciary component units. There are two basic government-wide
financial statements: the statement of net position and the statement of activities.
Homestead- A building occupied by the owner of the freehold and his or her family, with the primary intention of
making it their home, together with the parcel of land on which it stands and the other improvements attached to it.
Improvement- Building, other structures, and attachments or annexations to land that are intended to remain so
attached or annexed, such as sidewalks, trees, drives, tunnels, drains, and sewers.
Internal Control Framework- Integrated set of policies and procedures designed to assist management to achieve its
goals and objectives. To be truly comprehensive, a government’s internal control framework must 1) provide a
favorable control environment, 2) provide for the continuing assessment of risk, 3) provide for the design,
implementation, and maintenance of effective control-related policies and procedures, 4) provide for the effective
communication of information, and 5) provide for the ongoing monitoring of the effectiveness of control-related
policies.
Jurisdiction (Taxing Entity) - The right and power to interpret and apply the law; also, the power to tax and the
power to govern. The territorial range of authority of control.
Line Item Transfer- A proposal to change the dollar amount of an activity or project or to add an activity of project
after the budget has already been adopted. A budget line item transfer does not change the final dollar amount of the
budget, and does not require the jurisdictions to contribute more money to the District.
Major Fund- funds whose revenues, expenditures/expenses, assets or liabilities are at least 10 percent of the total of
their fund category (governmental or enterprise) and 5 percent of the aggregate of all governmental and enterprise
funds in total.
Mediation- A negotiation to resolve differences that is conducted by some impartial third party.
Modified Accrual Basis of Accounting- Basis of accounting used in conjunction with the current financial resources
measurement focus that modifies the accrual basis of accounting in two important ways: 1) revenues are not
recognized until they are measurable and available and 2) expenditures are recognized in the period in which
governments in general normally liquidate the related liability rather than when that liability is first incurred (if earlier)..
Net Position- The residual of all other financial statement elements presented in a statement of financial position.
Nonspendable Fund Balance- The portion of the net position of a governmental fund that cannot be spent either
because the underlying resources are not in spendable form or because the government is legally or contractually
required to maintain the resources intact.

Glo
ssa
ry
161
Oblique Photography- A photograph acquired with the camera axis intentionally directed between the horizontal and
vertical orientations.
Open Meetings Act- Rules that guarantee access to data held by the state or local government. This act establishes
a “right-to-know” legal process by which requests may be made for government-held information, to be received freely
or at minimal cost, barring standard exceptions.
Orthophotography- An aerial photograph in which the displacement of images have been removed and may also
form the base map for many GIS programs.
Parcel- A contiguous area of land described in a single legal description or as one of a number of lots on a plat;
separately owned, either publicly or privately; and capable of being separately conveyed.
Personal Property- Moveable property; belongings exclusive of land and buildings.
Real Property- Consists of the interests, benefits, and rights inherent in the ownership of land plus anything
permanently attached to the land or legally defined as immovable; also called “realty”.
Rendition- A form that provides information about property that one owns. The appraisal district uses the information
the taxpayer provides to appraise that property for taxation.
Request for Proposal- Referred to as an RFP, is an early state in a procurement process, issuing an invitation for
suppliers, often through the bidding process, to submit a proposal on a specific commodity or service. The RFP
process brings structure to the procurement decision and is meant to allow the risks and benefits to be identified
clearly upfront.
Request for Qualification- A document distributed by a customer seeking delineation of credentials for suppliers of
specific types of services. Also known as an RFQ.
Required Contribution Rate- The amount (typically express as a percentage of the contribution base) that is required
to be paid into the pension fund.
Restricted Fund Balance- The portion of the net position of a governmental fund that represents resources subject to
externally enforceable constraints.
Retention Policy- A set of guidelines that a company follows to determine how long it should keep certain records.
The policy is important for many reasons, including legal requirements that apply to some documents.
Shapefile- A popular geospatial vector data format for geographic information systems software. It is developed and
regulated by ESRI as a (mostly) open specification for data interoperability among ESRI and other software products.
SOAH- State Office of Administrative Hearings
Special Purpose Government- Governments that are not general-purpose governments and have a more limited
range of purposes. This often includes townships, park districts, sanitation district, and appraisal districts.

Glo
ssa
ry
162
Statement of Activities- A government-wide financial statement that reports the financial activity of the organization
by function over a period of time. Also known as the income statement or profit and loss statement in the for-profit
world.
Statement of Net Assets- A government-wide financial statement that reports the difference between assets and
liabilities as net assets, not fund balances or equity. Assets are reported in order of liquidity, or how readily they are
expected to be converted to cash and whether restrictions limit the government’s ability to use the resources.
Liabilities are reported based on their maturity, or when cash is expected to be used to liquidate them. Net assets are
displayed in three components- invested in capital assets, net of related debt; restricted; and unrestricted.
TCDRS- Texas Counties and Districts Retirement System; TCAD’s retirement plan.
Unassigned Fund Balance- The difference between the total fund balance in a governmental fund and its
nonspendable, restricted, committed, and assigned components.
ABBREVIATIONS:PTAD- Property Tax Assistance Division- a department of the Texas Comptroller's office who oversees appraisal Districts in Texas.EARS- Electronic Appraisal Roll Submission- a submission of an appraisal roll to PTAD for reviewCASS- Coding Accuracy Support System- A process used to eliminate incorrect addresses
Related Documents


