TB and poverty agenda in WPR WHO/WPRO Stop TB

TB and poverty agenda in WPR WHO/WPRO Stop TB. World Health Organization Percentage of population living below US$1 a day.
Dec 14, 2015
Welcome message from author
This document is posted to help you gain knowledge. Please leave a comment to let me know what you think about it! Share it to your friends and learn new things together.
Transcript
TB and poverty agenda in WPR
WHO/WPRO
Stop TB
World Health Organization
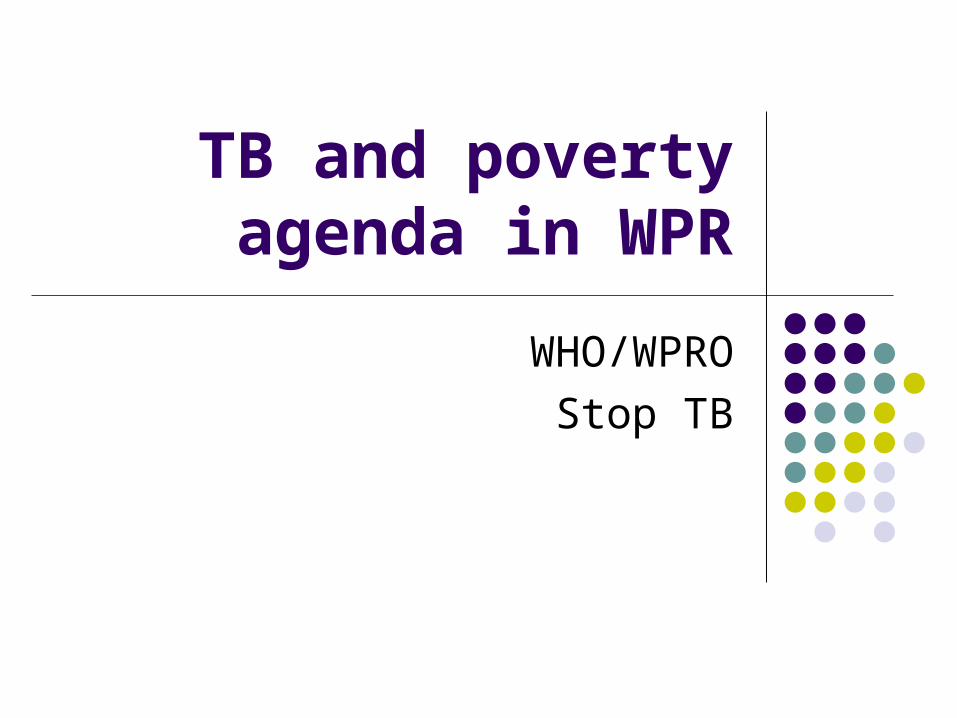
Percentage of population living below US$1 a day
0
5
10
15
20
25
30
China Lao PDR Viet Nam Malaysia Mongolia Philippines
Per
cent
age
of P
opul
atio
n
World Health Organization
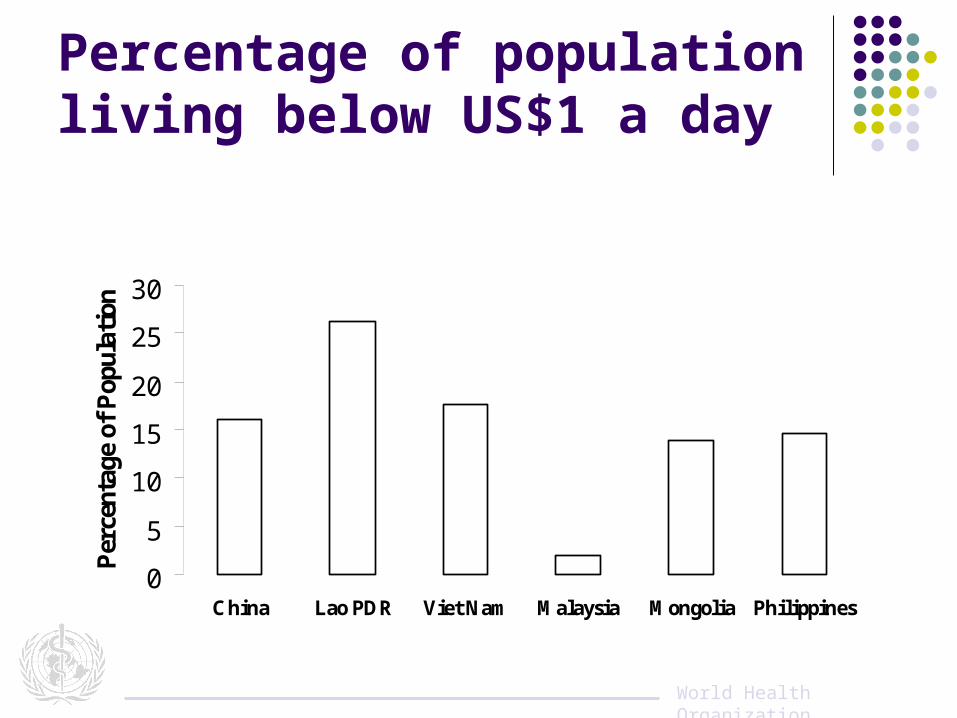
TB and poverty
98% of 1.8 million TB deaths per year in developing countries.
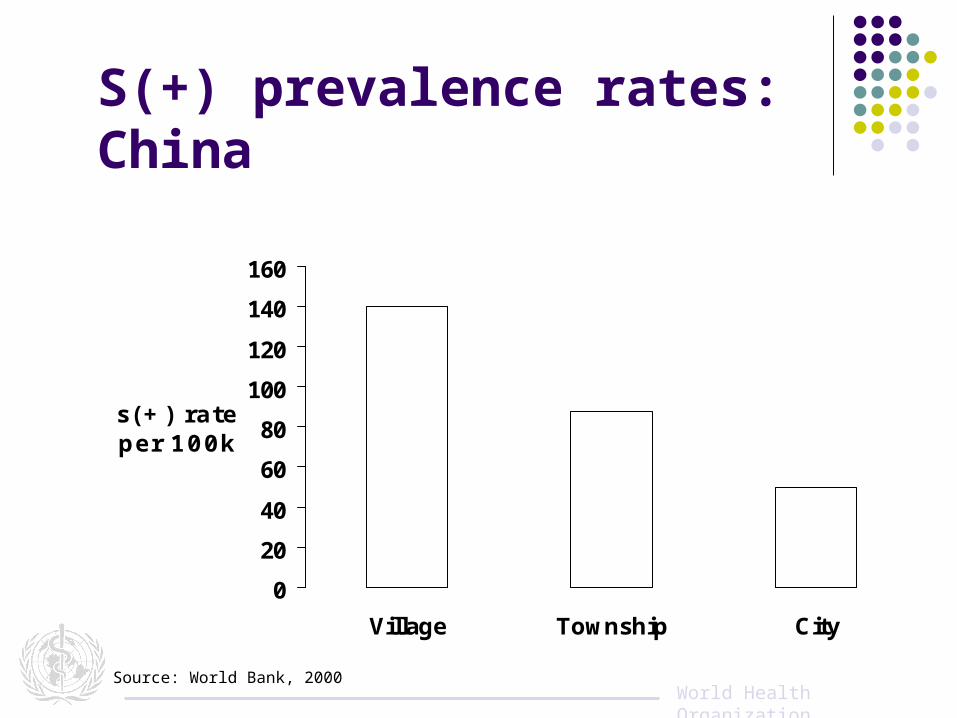
TB mortality rate 3 X higher in rural poor China than in more developed urban areas.
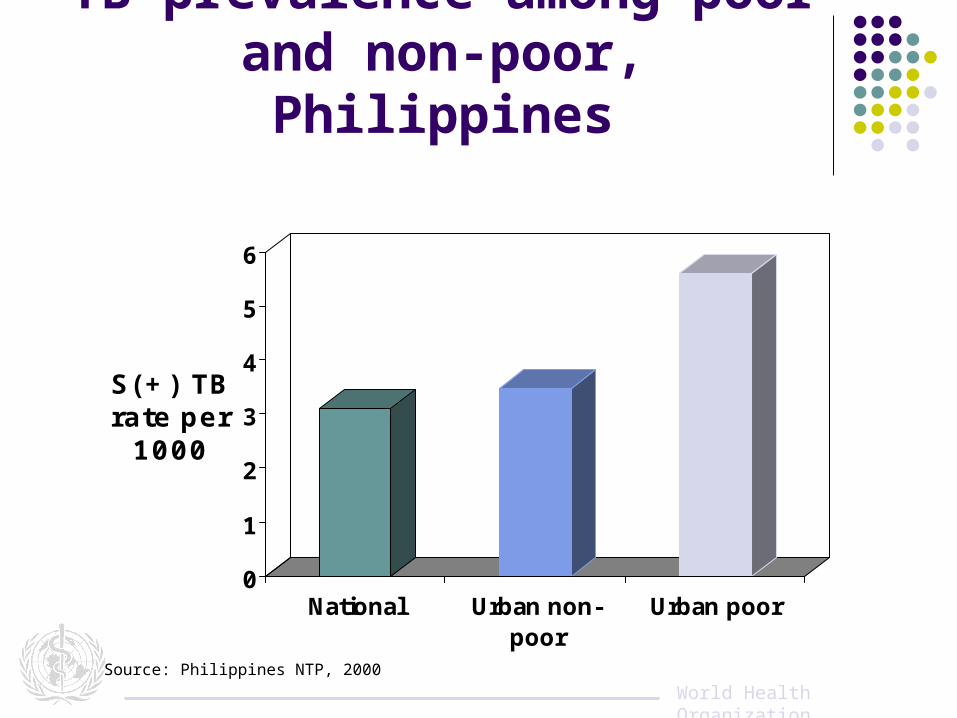
ARI in the Philippines 2.5 times higher among urban poor than urban non-poor.
Mexico and South Africa: no difference in socio-economic status between TB patients and non TB patients living in the same community
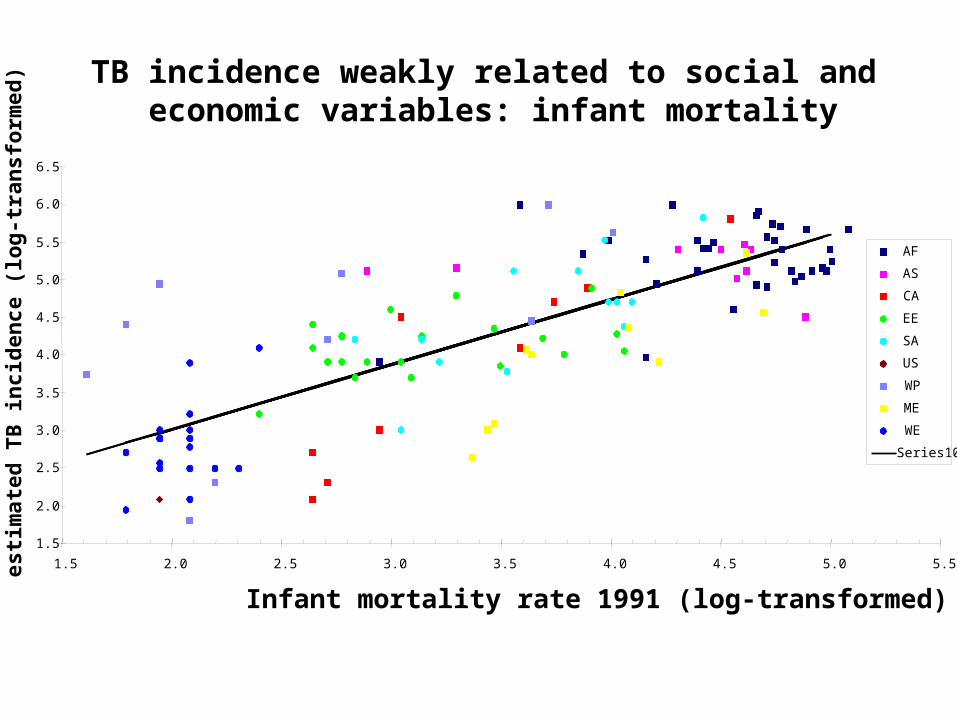
TB incidence weakly related to social and economic variables: infant mortality
1.5
2.0
2.5
3.0
3.5
4.0
4.5
5.0
5.5
6.0
6.5
1.5 2.0 2.5 3.0 3.5 4.0 4.5 5.0 5.5
Infant mortality rate 1991 (log-transformed)
esti
mat
ed T
B in
cid
ence
(lo
g-t
ran
sfo
rmed
)
AF
AS
CA
EE
SA
US
WP
ME
WE
Series10
World Health Organization
TB prevalence among poor and non-poor, Philippines
0
1
2
3
4
5
6
S(+) TB rate per
1000
National Urban non-poor
Urban poor
Source: Philippines NTP, 2000
World Health Organization
S(+) prevalence rates: China
0
20
40
60
80
100
120
140
160
Village Township City
s(+) rate per 100k
Source: World Bank, 2000
World Health Organization
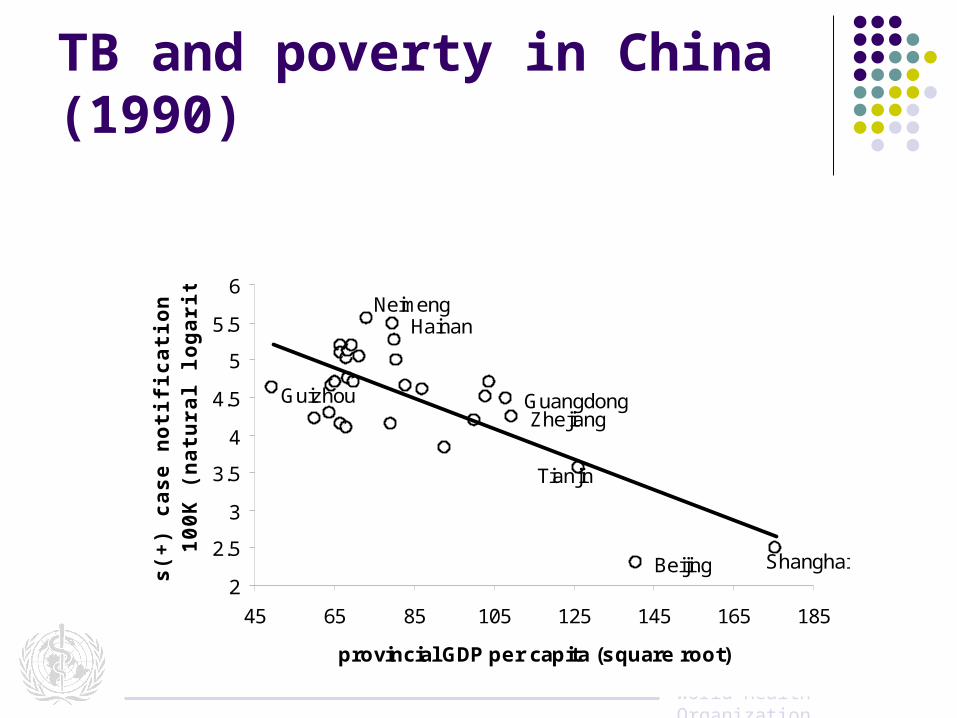
TB and poverty in China (1990)
ShanghaiBeijing
Tianjin
Guizhou
HainanNeimeng
ZhejiangGuangdong
2
2.5
3
3.5
4
4.5
5
5.5
6
45 65 85 105 125 145 165 185
provincial GDP per capita (square root)
s(+)
cas
e n
oti
fica
tio
n r
ate
per
10
0K (
nat
ura
l lo
gar
ith
m)
World Health Organization
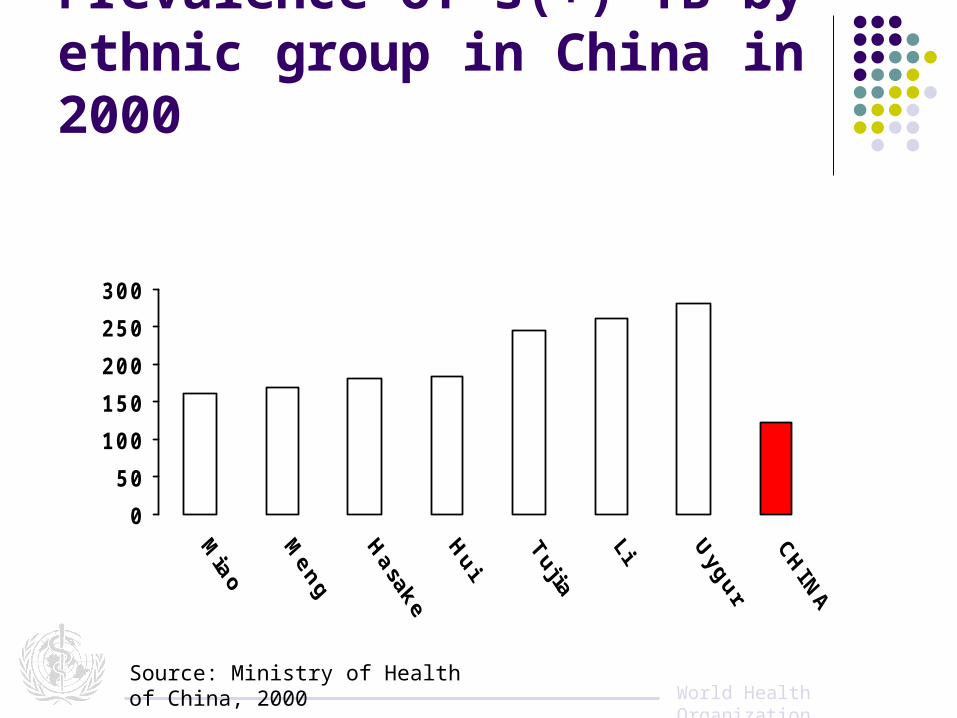
Prevalence of s(+) TB by ethnic group in China in 2000
0
50
100
150
200
250
300
Source: Ministry of Health of China, 2000
World Health Organization
Poverty and TB
Vulnerability to severe disease and death from TB Delaying access to care Inhibiting treatment adherence
Overcrowding associated with infection and outbreaks of TB
TB burden higher where poverty is higher
World Health Organization
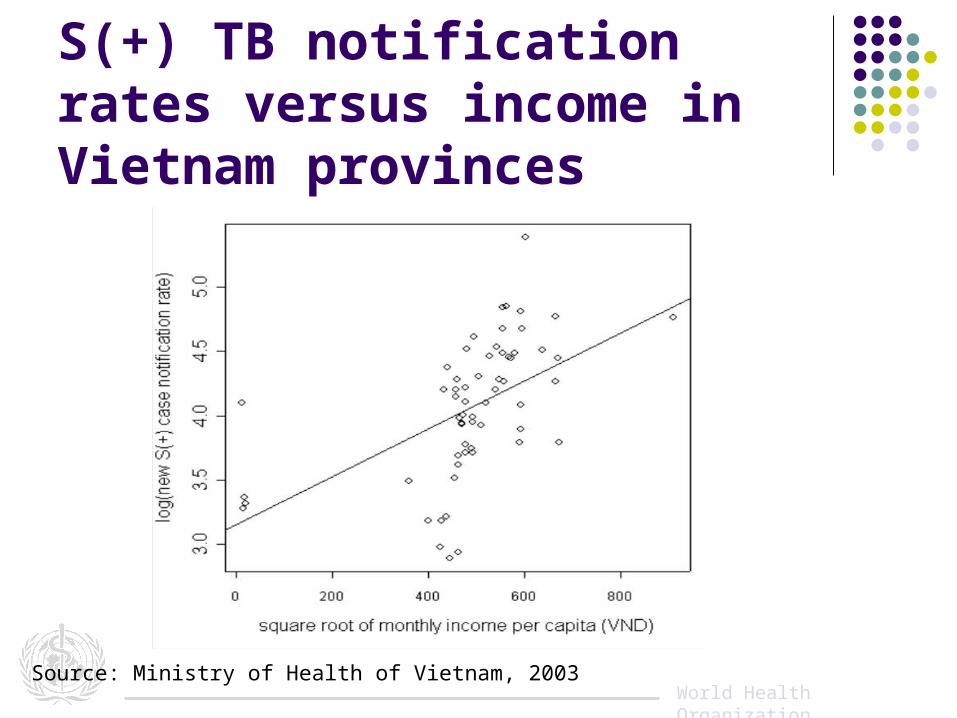
S(+) TB notification rates versus income in Vietnam provinces
Source: Ministry of Health of Vietnam, 2003
World Health Organization
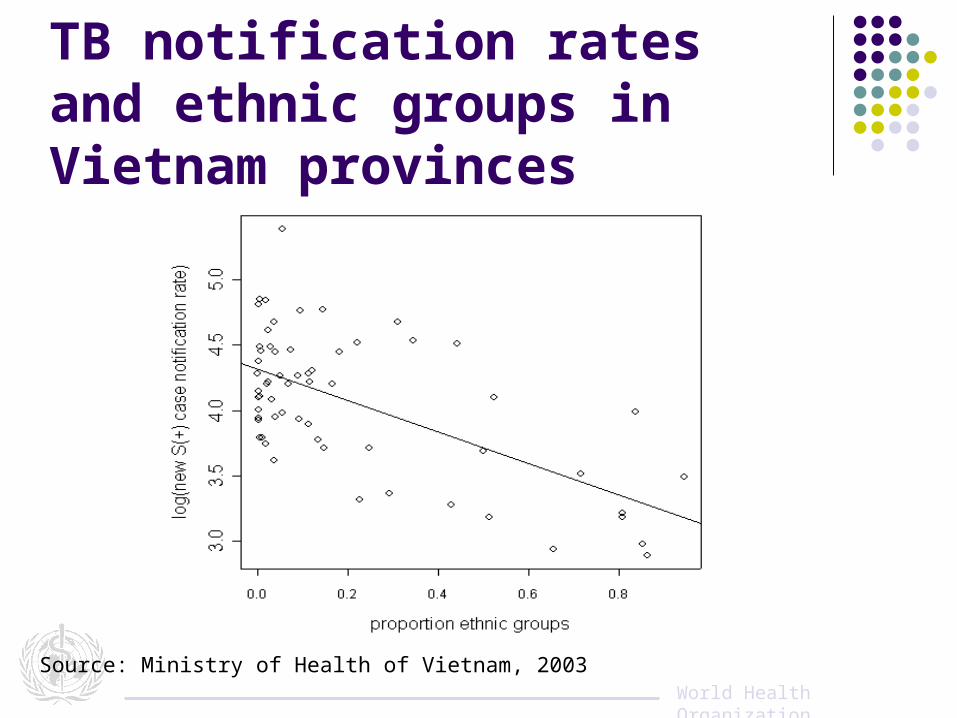
TB notification rates and ethnic groups in Vietnam provinces
Source: Ministry of Health of Vietnam, 2003
World Health Organization
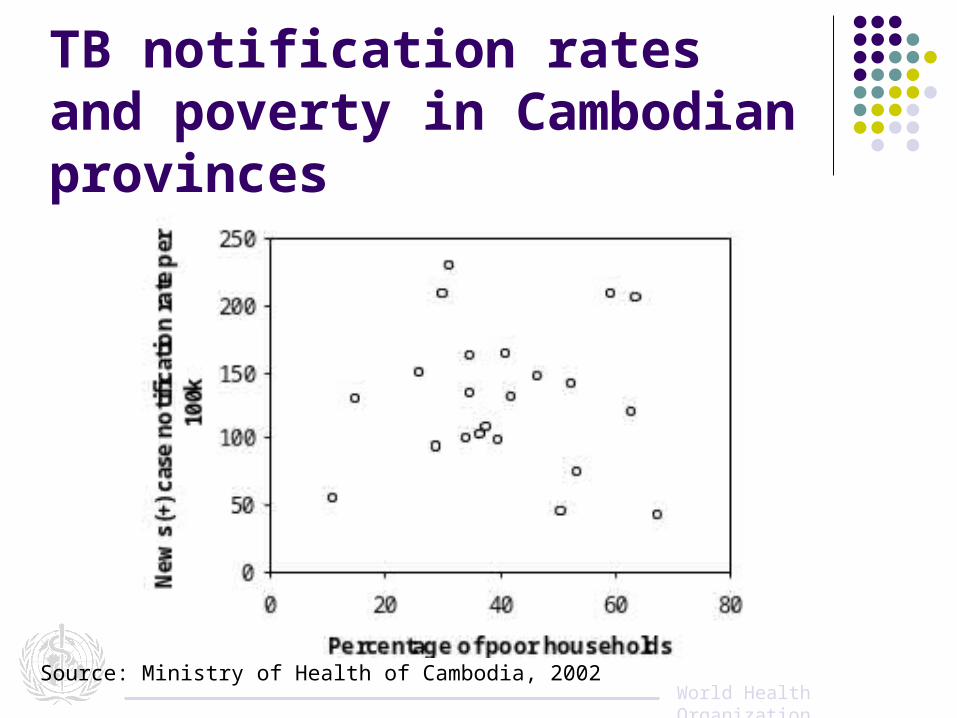
TB notification rates and poverty in Cambodian provinces
Source: Ministry of Health of Cambodia, 2002
World Health Organization
TB notification and poverty
TB notification is lower where poverty is higher in Vietnam
TB notification is at a similar level between poorer and less poor areas in Cambodia
World Health Organization
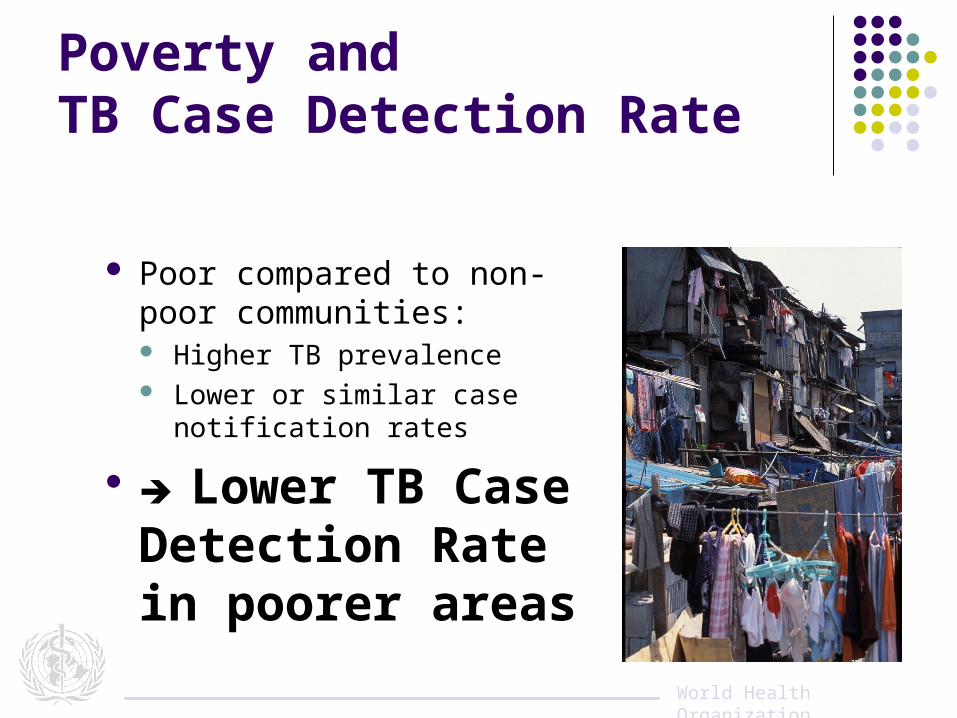
Poverty and TB Case Detection Rate
Poor compared to non-poor communities: Higher TB prevalence Lower or similar case
notification rates
Lower TB Case Detection Rate in poorer areas
World Health Organization
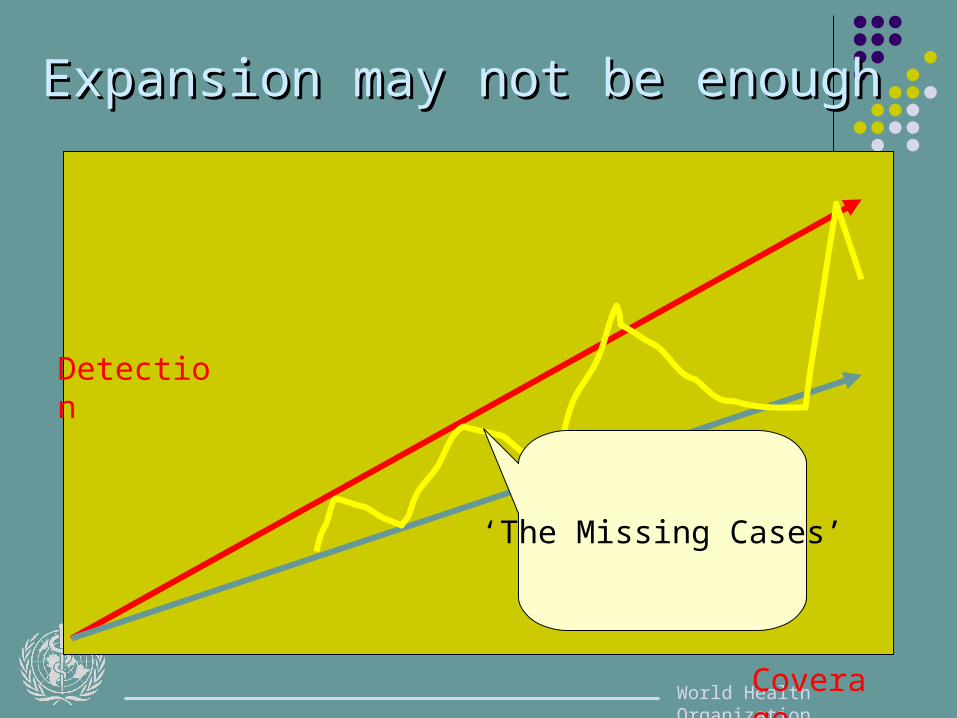
Expansion may not be enoughExpansion may not be enough
‘The Missing Cases’
Detection
Coverage
World Health Organization
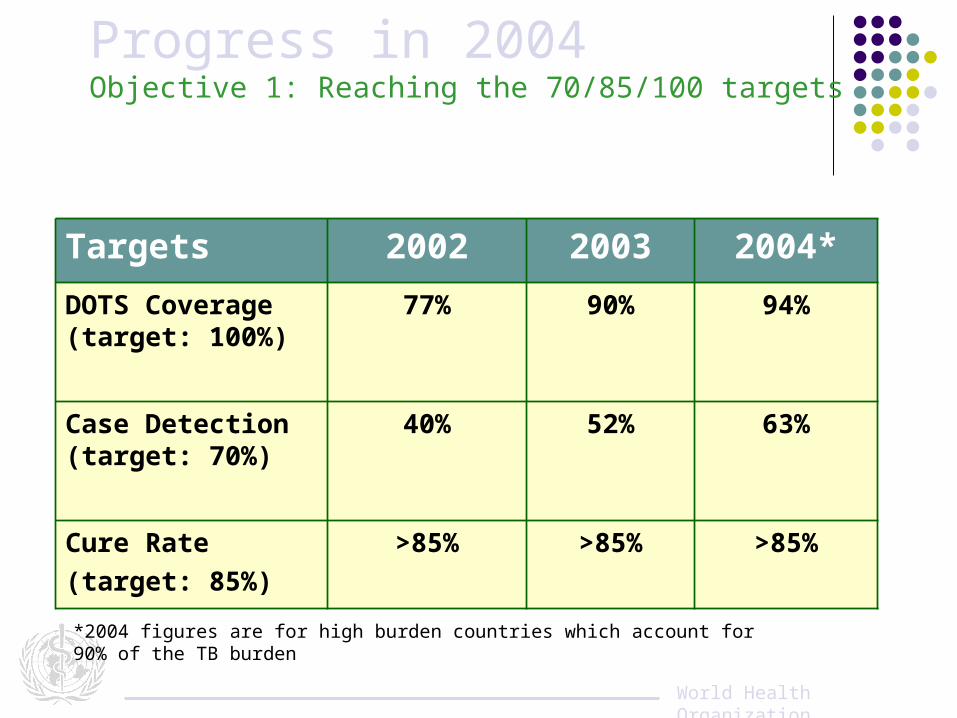
Progress in 2004Objective 1: Reaching the 70/85/100 targets
Targets 2002 2003 2004*
DOTS Coverage (target: 100%)
77% 90% 94%
Case Detection (target: 70%)
40% 52% 63%
Cure Rate (target: 85%)
>85% >85% >85%
*2004 figures are for high burden countries which account for 90% of the TB burden
World Health Organization
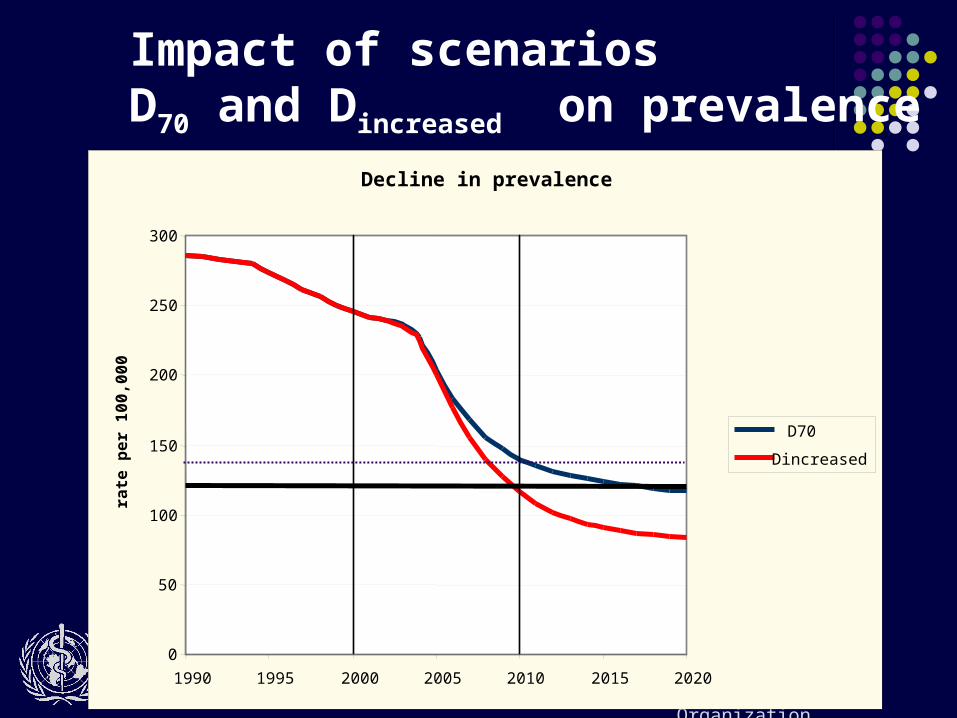
Impact of scenariosD70 and Dincreased on prevalence
Decline in prevalence
0
50
100
150
200
250
300
1990 1995 2000 2005 2010 2015 2020
rate
pe
r 1
00
,00
0
D70
Dincreased
World Health Organization
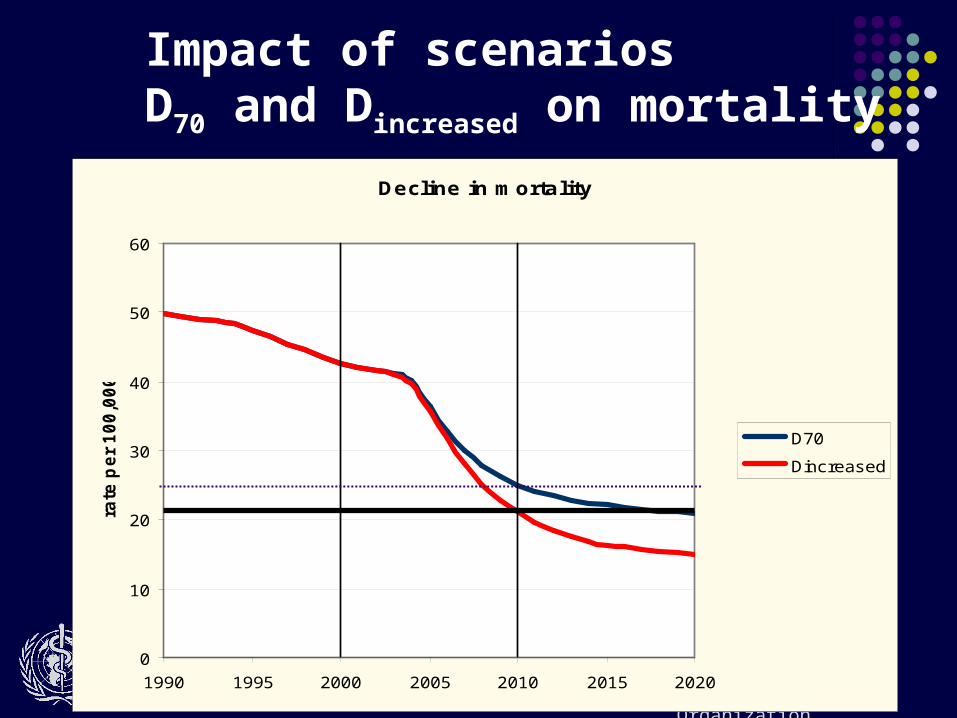
Impact of scenariosD70 and Dincreased on mortality
Decline in mortality
0
10
20
30
40
50
60
1990 1995 2000 2005 2010 2015 2020
rate
pe
r 1
00
,00
0
D70
Dincreased

World Health Organization
Thank you!
Related Documents