
Welcome message from author
This document is posted to help you gain knowledge. Please leave a comment to let me know what you think about it! Share it to your friends and learn new things together.
Transcript

TuberculosisControl
in the Western Pacific Region
TuberculosisControl
in the Western Pacific Region
2010 Report
Prepared by
Masaki Ota, Research Institute of Tuberculosis, Tokyo, was the lead author of this report. The following WHO staff from the regional and country offices contributed to the report: Catharina van Weezenbeek, Pieter van Maaren, Daniel Sagebiel, Katsunori Osuga, Nobuyuki Nishikiori, Catherine Lijinsky, Rajendra Yadav, Cornelia Hennig, Fabio Scano, Liu Yuhong, Nguyen Nhat Linh, Jacques Sebert, Yamuna Mundade, Woo-Jin Lew and Giampaolo Mezzabotta.
Correspondence: [email protected]
Acknowledgements
We would like to thank the national TB Control Programme (NTP) managers and statisticians from all countries and areas of the Western Pacific Region for providing data for this publication and to the Stop TB team in the TB Monitoring and Evaluation unit at WHO Headquarters responsible for the Global TB Report. Also, we would like to express our gratitude to the US Agency for International Development (USAID) and Japan Voluntary Contribution (JVC), which kindly provided funds to support this report.
WHO Library Cataloguing in Publication Data
Tuberculosis control in the Western Pacif ic Region: 2010 Report
1. Tuberculosis – epidemiology. 2. Tuberculosis – prevention and control. 3. Tuberculosis – drug therapy. 4. Directly
observed therapy – utilization. 5. Tuberculosis, Multidrug-resistant. 6. Western Pacif ic.
ISBN 978 92 9061 522 4 (NLM Classification: WF 200)
© World Health Organization 2011
All rights reserved.
Publications of the World Health Organization can be obtained from WHO Press, World Health Organization, 20 Avenue Appia,
1211 Geneva 27, Switzerland (tel.: +41 22 791 3264; fax: +41 22 791 4857; e-mail: [email protected]). Requests for permission to
reproduce or translate WHO publications – whether for sale or for noncommercial distribution – should be addressed to WHO
Press, at the above address (fax: +41 22 791 4806; e-mail: [email protected]). For WHO Western Pacific Regional Publications,
request for permission to reproduce should be addressed to the Publications Office, World Health Organization, Regional Office
for the Western Pacific, P.O. Box 2932, 1000, Manila, Philippines, (fax: +632 521 1036, e-mail: [email protected]).
The designations employed and the presentation of the material in this publication do not imply the expression of any opinion
whatsoever on the part of the World Health Organization concerning the legal status of any country, territory, city or area or
of its authorities, or concerning the delimitation of its frontiers or boundaries. Dotted lines on maps represent approximate
border lines for which there may not yet be full agreement.
The mention of specific companies or of certain manufacturers’ products does not imply that they are endorsed or
recommended by the World Health Organization in preference to others of a similar nature that are not mentioned. Errors and
omissions excepted, the names of proprietary products are distinguished by initial capital letters.
All reasonable precautions have been taken by the World Health Organization to verify the information contained in this
publication. However, the published material is being distributed without warranty of any kind, either expressed or implied.
The responsibility for the interpretation and use of the material lies with the reader. In no event shall the World Health
Organization be liable for damages arising from its use.
Layout and design by Alexander Pascual, www.alexdesigns.ph
Tuberculosis: 2010 Report iii
ContentsList of figures . . . . . . . . . . . . . . . . . . . . . . . . . . . . . . . . . . . . . . . . . . . . . . . . . . . . . . . . . . . . . . . . . . . . . . . . . . . . . . . . . . . . . . . . . . . . . . . . . . .iv
List of tables . . . . . . . . . . . . . . . . . . . . . . . . . . . . . . . . . . . . . . . . . . . . . . . . . . . . . . . . . . . . . . . . . . . . . . . . . . . . . . . . . . . . . . . . . . . . . . . . . . . .vi
List of abbreviations . . . . . . . . . . . . . . . . . . . . . . . . . . . . . . . . . . . . . . . . . . . . . . . . . . . . . . . . . . . . . . . . . . . . . . . . . . . . . . . . . . . . . . . . . . vii
Executive summary . . . . . . . . . . . . . . . . . . . . . . . . . . . . . . . . . . . . . . . . . . . . . . . . . . . . . . . . . . . . . . . . . . . . . . . . . . . . . . . . . . . . . . . . . . . .ix
Summary Table . . . . . . . . . . . . . . . . . . . . . . . . . . . . . . . . . . . . . . . . . . . . . . . . . . . . . . . . . . . . . . . . . . . . . . . . . . . . . . . . . . . . . . . . . . . . . . . . xii
1 Introduction . . . . . . . . . . . . . . . . . . . . . . . . . . . . . . . . . . . . . . . . . . . . . . . . . . . . . . . . . . . . . . . . . . . . . . . . . . . . . . . . . . . . . . . . . . . . . . . . . 1
2 Epidemiology . . . . . . . . . . . . . . . . . . . . . . . . . . . . . . . . . . . . . . . . . . . . . . . . . . . . . . . . . . . . . . . . . . . . . . . . . . . . . . . . . . . . . . . . . . . . . . . . 3
2.1 Estimated burden . . . . . . . . . . . . . . . . . . . . . . . . . . . . . . . . . . . . . . . . . . . . . . . . . . . . . . . . . . . . . . . . . . . . . . . . . . . . . . . . . . . . . . . . 3
2.2 Trend of prevalence and TB mortality rates in countries with a high burden of TB . . . . . . . . . . . . . . . . . . . . . . . . . . . 4
2.3 Case notification and trends . . . . . . . . . . . . . . . . . . . . . . . . . . . . . . . . . . . . . . . . . . . . . . . . . . . . . . . . . . . . . . . . . . . . . . . . . . . . . . 4
2.4 TB prevalence surveys . . . . . . . . . . . . . . . . . . . . . . . . . . . . . . . . . . . . . . . . . . . . . . . . . . . . . . . . . . . . . . . . . . . . . . . . . . . . . . . . . . . . 8
2.5 Drug resistance . . . . . . . . . . . . . . . . . . . . . . . . . . . . . . . . . . . . . . . . . . . . . . . . . . . . . . . . . . . . . . . . . . . . . . . . . . . . . . . . . . . . . . . . . . 9
2.6 TB-HIV . . . . . . . . . . . . . . . . . . . . . . . . . . . . . . . . . . . . . . . . . . . . . . . . . . . . . . . . . . . . . . . . . . . . . . . . . . . . . . . . . . . . . . . . . . . . . . . . . . 14
2.6.1 Surveillance data on HIV in TB cases . . . . . . . . . . . . . . . . . . . . . . . . . . . . . . . . . . . . . . . . . . . . . . . . . . . . . . . . . . . . . . . . . . . 14
2.6.2 Estimated prevalence of HIV among the general population and new TB cases . . . . . . . . . . . . . . . . . . . . . . . . . . . . . . 16
3 TB Control . . . . . . . . . . . . . . . . . . . . . . . . . . . . . . . . . . . . . . . . . . . . . . . . . . . . . . . . . . . . . . . . . . . . . . . . . . . . . . . . . . . . . . . . . . . . . . . . . 19
3.1 Case detection and trend . . . . . . . . . . . . . . . . . . . . . . . . . . . . . . . . . . . . . . . . . . . . . . . . . . . . . . . . . . . . . . . . . . . . . . . . . . . . . . . . 19
3.2 Treatment outcomes . . . . . . . . . . . . . . . . . . . . . . . . . . . . . . . . . . . . . . . . . . . . . . . . . . . . . . . . . . . . . . . . . . . . . . . . . . . . . . . . . . . . 19
3.3 Laboratory capacity . . . . . . . . . . . . . . . . . . . . . . . . . . . . . . . . . . . . . . . . . . . . . . . . . . . . . . . . . . . . . . . . . . . . . . . . . . . . . . . . . . . . . 20
4 Profiles of countries with a high burden of TB in the Region . . . . . . . . . . . . . . . . . . . . . . . . . . . . . . . . . . . . . . . . 23
4.1 Cambodia . . . . . . . . . . . . . . . . . . . . . . . . . . . . . . . . . . . . . . . . . . . . . . . . . . . . . . . . . . . . . . . . . . . . . . . . . . . . . . . . . . . . . . . . . . . . . . 23
4.2 China . . . . . . . . . . . . . . . . . . . . . . . . . . . . . . . . . . . . . . . . . . . . . . . . . . . . . . . . . . . . . . . . . . . . . . . . . . . . . . . . . . . . . . . . . . . . . . . . . . 27
4.3 Lao People's Democratic Republic . . . . . . . . . . . . . . . . . . . . . . . . . . . . . . . . . . . . . . . . . . . . . . . . . . . . . . . . . . . . . . . . . . . . . . . . 31
4.4 Mongolia . . . . . . . . . . . . . . . . . . . . . . . . . . . . . . . . . . . . . . . . . . . . . . . . . . . . . . . . . . . . . . . . . . . . . . . . . . . . . . . . . . . . . . . . . . . . . . 35
4.5 Papua New Guinea . . . . . . . . . . . . . . . . . . . . . . . . . . . . . . . . . . . . . . . . . . . . . . . . . . . . . . . . . . . . . . . . . . . . . . . . . . . . . . . . . . . . . . 39
4.6 The Philippines . . . . . . . . . . . . . . . . . . . . . . . . . . . . . . . . . . . . . . . . . . . . . . . . . . . . . . . . . . . . . . . . . . . . . . . . . . . . . . . . . . . . . . . . . 43
4.7 Viet Nam . . . . . . . . . . . . . . . . . . . . . . . . . . . . . . . . . . . . . . . . . . . . . . . . . . . . . . . . . . . . . . . . . . . . . . . . . . . . . . . . . . . . . . . . . . . . . . 47
5 Summary of the TB burden and epidemiologic indicators of Pacif ic island countries and areas in the Region . . . . . . . . . . . . . . . . . . . . . . . . . . . . . . . . . . . . . . . . . . . . . . . . . . . 51
Annexes . . . . . . . . . . . . . . . . . . . . . . . . . . . . . . . . . . . . . . . . . . . . . . . . . . . . . . . . . . . . . . . . . . . . . . . . . . . . . . . . . . . . . . . . . . . . . . . . . . . . . . . . 55
Annex 1: Estimation of prevalence and TB mortality rates . . . . . . . . . . . . . . . . . . . . . . . . . . . . . . . . . . . . . . . . . . . . . . . . . . . . . . . . . . 55
Annex 2: Estimation of MDR-TB prevalence . . . . . . . . . . . . . . . . . . . . . . . . . . . . . . . . . . . . . . . . . . . . . . . . . . . . . . . . . . . . . . . . . . . . . . 55
Annex 3: Definitions . . . . . . . . . . . . . . . . . . . . . . . . . . . . . . . . . . . . . . . . . . . . . . . . . . . . . . . . . . . . . . . . . . . . . . . . . . . . . . . . . . . . . . . . . . 551. Definitions of tuberculosis cases . . . . . . . . . . . . . . . . . . . . . . . . . . . . . . . . . . . . . . . . . . . . . . . . . . . . . . . . . . . . . . . . . . . . . . . . 552. Definitions of treatment outcome . . . . . . . . . . . . . . . . . . . . . . . . . . . . . . . . . . . . . . . . . . . . . . . . . . . . . . . . . . . . . . . . . . . . . . . 563. Indicators to assess treatment outcome . . . . . . . . . . . . . . . . . . . . . . . . . . . . . . . . . . . . . . . . . . . . . . . . . . . . . . . . . . . . . . . . . . 564. Case detection rate and DOTS detection rate . . . . . . . . . . . . . . . . . . . . . . . . . . . . . . . . . . . . . . . . . . . . . . . . . . . . . . . . . . . . . . 565. Definitions of MDR-TB and XDR-TB . . . . . . . . . . . . . . . . . . . . . . . . . . . . . . . . . . . . . . . . . . . . . . . . . . . . . . . . . . . . . . . . . . . . . . . 57
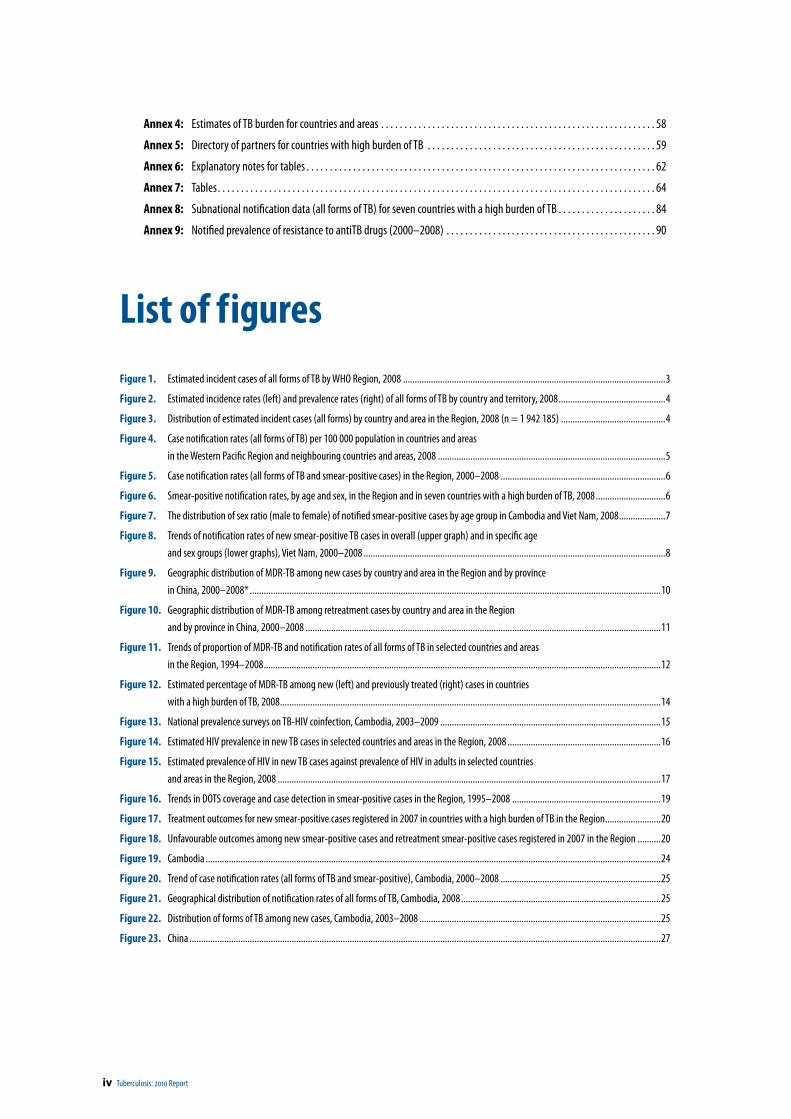
iv Tuberculosis: 2010 Report
List of f iguresFigure 1. Estimated incident cases of all forms of TB by WHO Region, 2008 .................................................................................................................3
Figure 2. Estimated incidence rates (left) and prevalence rates (right) of all forms of TB by country and territory, 2008 ..............................................4
Figure 3. Distribution of estimated incident cases (all forms) by country and area in the Region, 2008 (n = 1 942 185) .............................................4
Figure 4. Case notification rates (all forms of TB) per 100 000 population in countries and areas in the Western Pacific Region and neighbouring countries and areas, 2008 ..................................................................................................5
Figure 5. Case notification rates (all forms of TB and smear-positive cases) in the Region, 2000–2008 .......................................................................6
Figure 6. Smear-positive notification rates, by age and sex, in the Region and in seven countries with a high burden of TB, 2008 ..............................6
Figure 7. The distribution of sex ratio (male to female) of notified smear-positive cases by age group in Cambodia and Viet Nam, 2008 ....................7
Figure 8. Trends of notification rates of new smear-positive TB cases in overall (upper graph) and in specific age and sex groups (lower graphs), Viet Nam, 2000–2008 ..................................................................................................................................8
Figure 9. Geographic distribution of MDR-TB among new cases by country and area in the Region and by province in China, 2000–2008* .................................................................................................................................................................................10
Figure 10. Geographic distribution of MDR-TB among retreatment cases by country and area in the Region and by province in China, 2000–2008 .........................................................................................................................................................11
Figure 11. Trends of proportion of MDR-TB and notification rates of all forms of TB in selected countries and areas in the Region, 1994–2008 ...........................................................................................................................................................................12
Figure 12. Estimated percentage of MDR-TB among new (left) and previously treated (right) cases in countries with a high burden of TB, 2008 ....................................................................................................................................................................14
Figure 13. National prevalence surveys on TB-HIV coinfection, Cambodia, 2003–2009 ...............................................................................................15
Figure 14. Estimated HIV prevalence in new TB cases in selected countries and areas in the Region, 2008 ..................................................................16
Figure 15. Estimated prevalence of HIV in new TB cases against prevalence of HIV in adults in selected countries and areas in the Region, 2008 .....................................................................................................................................................................17
Figure 16. Trends in DOTS coverage and case detection in smear-positive cases in the Region, 1995–2008 ................................................................19
Figure 17. Treatment outcomes for new smear-positive cases registered in 2007 in countries with a high burden of TB in the Region ........................20
Figure 18. Unfavourable outcomes among new smear-positive cases and retreatment smear-positive cases registered in 2007 in the Region ..........20
Figure 19. Cambodia ....................................................................................................................................................................................................24
Figure 20. Trend of case notification rates (all forms of TB and smear-positive), Cambodia, 2000–2008 .....................................................................25
Figure 21. Geographical distribution of notification rates of all forms of TB, Cambodia, 2008 ......................................................................................25
Figure 22. Distribution of forms of TB among new cases, Cambodia, 2003–2008 ........................................................................................................25
Figure 23. China ...........................................................................................................................................................................................................27
Annex 4: Estimates of TB burden for countries and areas . . . . . . . . . . . . . . . . . . . . . . . . . . . . . . . . . . . . . . . . . . . . . . . . . . . . . . . . . . . 58
Annex 5: Directory of partners for countries with high burden of TB . . . . . . . . . . . . . . . . . . . . . . . . . . . . . . . . . . . . . . . . . . . . . . . . . 59
Annex 6: Explanatory notes for tables . . . . . . . . . . . . . . . . . . . . . . . . . . . . . . . . . . . . . . . . . . . . . . . . . . . . . . . . . . . . . . . . . . . . . . . . . . . 62
Annex 7: Tables . . . . . . . . . . . . . . . . . . . . . . . . . . . . . . . . . . . . . . . . . . . . . . . . . . . . . . . . . . . . . . . . . . . . . . . . . . . . . . . . . . . . . . . . . . . . . . 64
Annex 8: Subnational notification data (all forms of TB) for seven countries with a high burden of TB . . . . . . . . . . . . . . . . . . . . . 84
Annex 9: Notified prevalence of resistance to antiTB drugs (2000–2008) . . . . . . . . . . . . . . . . . . . . . . . . . . . . . . . . . . . . . . . . . . . . . 90
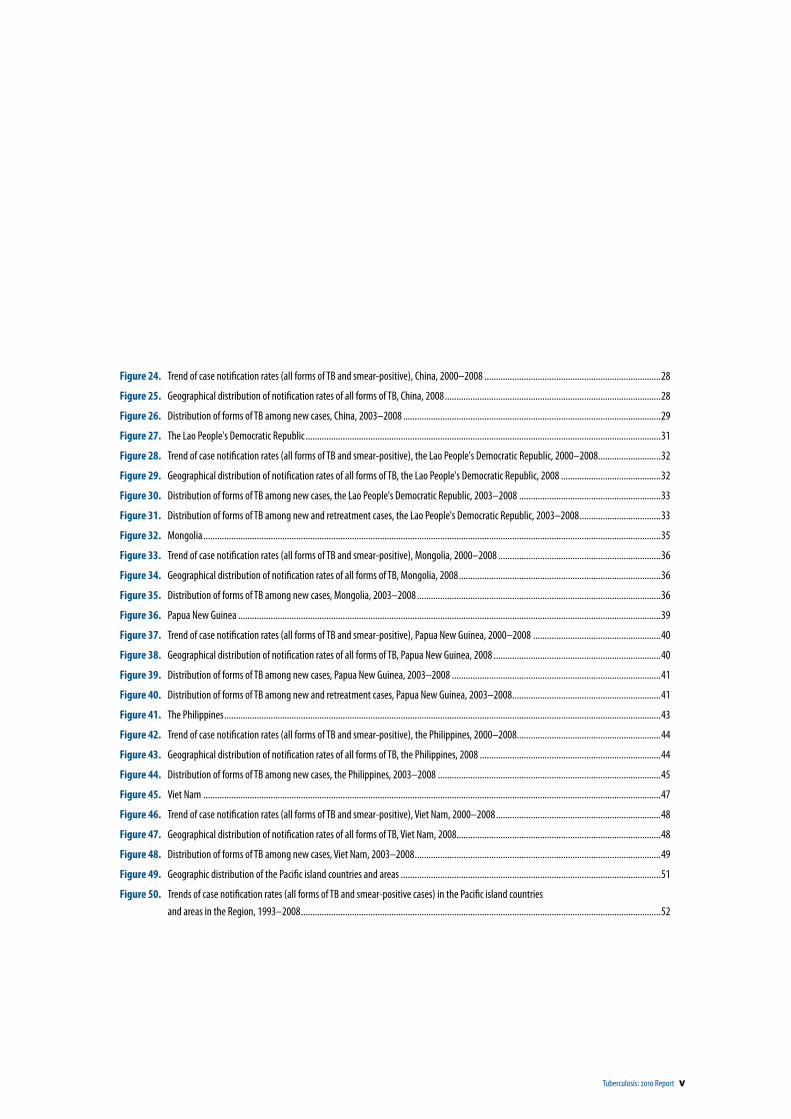
Tuberculosis: 2010 Report v
Figure 24. Trend of case notification rates (all forms of TB and smear-positive), China, 2000–2008 ............................................................................28
Figure 25. Geographical distribution of notification rates of all forms of TB, China, 2008 .............................................................................................28
Figure 26. Distribution of forms of TB among new cases, China, 2003–2008 ...............................................................................................................29
Figure 27. The Lao People's Democratic Republic .........................................................................................................................................................31
Figure 28. Trend of case notification rates (all forms of TB and smear-positive), the Lao People's Democratic Republic, 2000–2008 ...........................32
Figure 29. Geographical distribution of notification rates of all forms of TB, the Lao People's Democratic Republic, 2008 ...........................................32
Figure 30. Distribution of forms of TB among new cases, the Lao People's Democratic Republic, 2003–2008 .............................................................33
Figure 31. Distribution of forms of TB among new and retreatment cases, the Lao People's Democratic Republic, 2003–2008 ...................................33
Figure 32. Mongolia .....................................................................................................................................................................................................35
Figure 33. Trend of case notification rates (all forms of TB and smear-positive), Mongolia, 2000–2008 ......................................................................36
Figure 34. Geographical distribution of notification rates of all forms of TB, Mongolia, 2008 .......................................................................................36
Figure 35. Distribution of forms of TB among new cases, Mongolia, 2003–2008 .........................................................................................................36
Figure 36. Papua New Guinea ......................................................................................................................................................................................39
Figure 37. Trend of case notification rates (all forms of TB and smear-positive), Papua New Guinea, 2000–2008 .......................................................40
Figure 38. Geographical distribution of notification rates of all forms of TB, Papua New Guinea, 2008 ........................................................................40
Figure 39. Distribution of forms of TB among new cases, Papua New Guinea, 2003–2008 ..........................................................................................41
Figure 40. Distribution of forms of TB among new and retreatment cases, Papua New Guinea, 2003–2008 ................................................................41
Figure 41. The Philippines ............................................................................................................................................................................................43
Figure 42. Trend of case notification rates (all forms of TB and smear-positive), the Philippines, 2000–2008 ..............................................................44
Figure 43. Geographical distribution of notification rates of all forms of TB, the Philippines, 2008 ..............................................................................44
Figure 44. Distribution of forms of TB among new cases, the Philippines, 2003–2008 ................................................................................................45
Figure 45. Viet Nam .....................................................................................................................................................................................................47
Figure 46. Trend of case notification rates (all forms of TB and smear-positive), Viet Nam, 2000–2008 .......................................................................48
Figure 47. Geographical distribution of notification rates of all forms of TB, Viet Nam, 2008........................................................................................48
Figure 48. Distribution of forms of TB among new cases, Viet Nam, 2003–2008 ..........................................................................................................49
Figure 49. Geographic distribution of the Pacific island countries and areas ................................................................................................................51
Figure 50. Trends of case notification rates (all forms of TB and smear-positive cases) in the Pacific island countries and areas in the Region, 1993–2008 ...........................................................................................................................................................52
vi Tuberculosis: 2010 Report
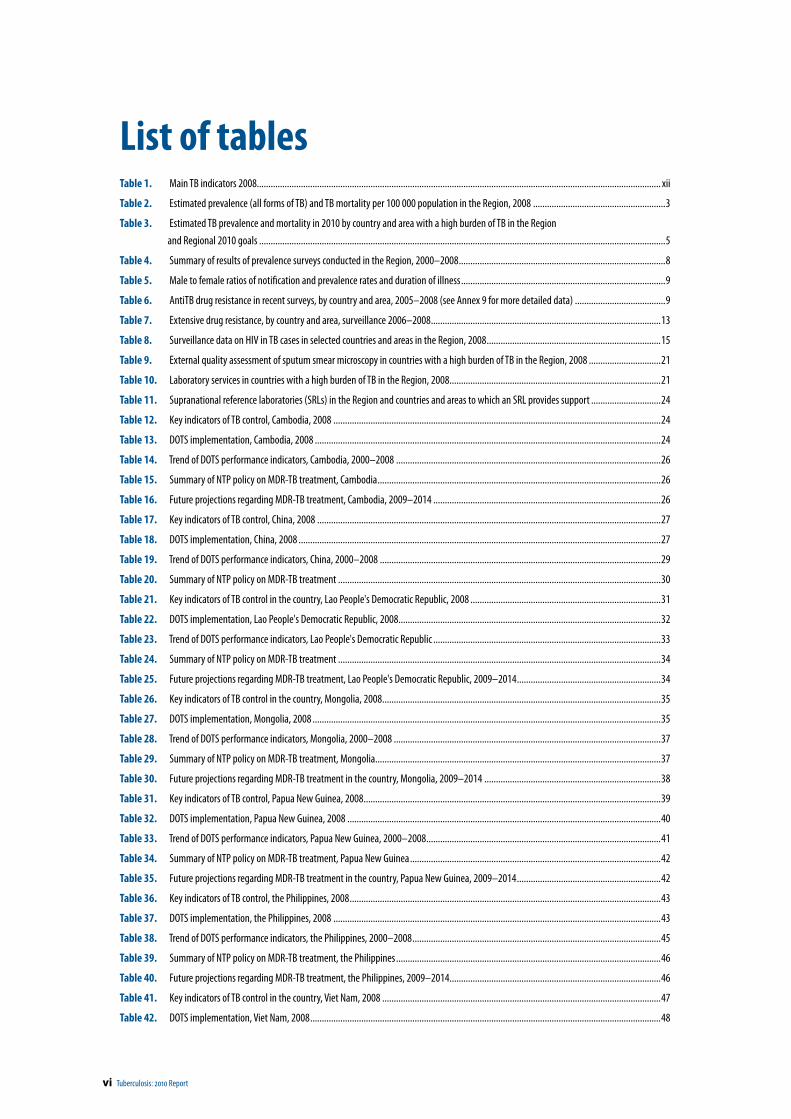
List of tablesTable 1. Main TB indicators 2008.............................................................................................................................................................................. xii
Table 2. Estimated prevalence (all forms of TB) and TB mortality per 100 000 population in the Region, 2008 .........................................................3
Table 3. Estimated TB prevalence and mortality in 2010 by country and area with a high burden of TB in the Region and Regional 2010 goals ...............................................................................................................................................................................5
Table 4. Summary of results of prevalence surveys conducted in the Region, 2000–2008 .........................................................................................8
Table 5. Male to female ratios of notification and prevalence rates and duration of illness ........................................................................................9
Table 6. AntiTB drug resistance in recent surveys, by country and area, 2005–2008 (see Annex 9 for more detailed data) .......................................9
Table 7. Extensive drug resistance, by country and area, surveillance 2006–2008 ...................................................................................................13
Table 8. Surveillance data on HIV in TB cases in selected countries and areas in the Region, 2008 ...........................................................................15
Table 9. External quality assessment of sputum smear microscopy in countries with a high burden of TB in the Region, 2008 ...............................21
Table 10. Laboratory services in countries with a high burden of TB in the Region, 2008 ...........................................................................................21
Table 11. Supranational reference laboratories (SRLs) in the Region and countries and areas to which an SRL provides support ..............................24
Table 12. Key indicators of TB control, Cambodia, 2008 .............................................................................................................................................24
Table 13. DOTS implementation, Cambodia, 2008 .....................................................................................................................................................24
Table 14. Trend of DOTS performance indicators, Cambodia, 2000–2008 ..................................................................................................................26
Table 15. Summary of NTP policy on MDR-TB treatment, Cambodia ..........................................................................................................................26
Table 16. Future projections regarding MDR-TB treatment, Cambodia, 2009–2014 ..................................................................................................26
Table 17. Key indicators of TB control, China, 2008 ....................................................................................................................................................27
Table 18. DOTS implementation, China, 2008 ............................................................................................................................................................27
Table 19. Trend of DOTS performance indicators, China, 2000–2008 .........................................................................................................................29
Table 20. Summary of NTP policy on MDR-TB treatment ...........................................................................................................................................30
Table 21. Key indicators of TB control in the country, Lao People's Democratic Republic, 2008 ..................................................................................31
Table 22. DOTS implementation, Lao People's Democratic Republic, 2008 .................................................................................................................32
Table 23. Trend of DOTS performance indicators, Lao People's Democratic Republic ..................................................................................................33
Table 24. Summary of NTP policy on MDR-TB treatment ...........................................................................................................................................34
Table 25. Future projections regarding MDR-TB treatment, Lao People's Democratic Republic, 2009–2014 ..............................................................34
Table 26. Key indicators of TB control in the country, Mongolia, 2008 ........................................................................................................................35
Table 27. DOTS implementation, Mongolia, 2008 ......................................................................................................................................................35
Table 28. Trend of DOTS performance indicators, Mongolia, 2000–2008 ...................................................................................................................37
Table 29. Summary of NTP policy on MDR-TB treatment, Mongolia ...........................................................................................................................37
Table 30. Future projections regarding MDR-TB treatment in the country, Mongolia, 2009–2014 ............................................................................38
Table 31. Key indicators of TB control, Papua New Guinea, 2008 ................................................................................................................................39
Table 32. DOTS implementation, Papua New Guinea, 2008 .......................................................................................................................................40
Table 33. Trend of DOTS performance indicators, Papua New Guinea, 2000–2008 .....................................................................................................41
Table 34. Summary of NTP policy on MDR-TB treatment, Papua New Guinea ............................................................................................................42
Table 35. Future projections regarding MDR-TB treatment in the country, Papua New Guinea, 2009–2014 ..............................................................42
Table 36. Key indicators of TB control, the Philippines, 2008 ......................................................................................................................................43
Table 37. DOTS implementation, the Philippines, 2008 .............................................................................................................................................43
Table 38. Trend of DOTS performance indicators, the Philippines, 2000–2008 ...........................................................................................................45
Table 39. Summary of NTP policy on MDR-TB treatment, the Philippines ..................................................................................................................46
Table 40. Future projections regarding MDR-TB treatment, the Philippines, 2009–2014 ...........................................................................................46
Table 41. Key indicators of TB control in the country, Viet Nam, 2008 ........................................................................................................................47
Table 42. DOTS implementation, Viet Nam, 2008 .......................................................................................................................................................48
Tuberculosis: 2010 Report vii
List of abbreviationsART antiretroviral therapyCI confidence intervalCPT cotrimoxazole preventive therapyDOTS directly observed treatment, short-courseDRS drug resistance surveillanceDST drug susceptibility testingEQA external quality assessmentGLC Green Light CommitteeHIV human immunodeficiency virusIDU injecting drug usersIPT isoniazid preventive therapyMDR-TB multidrug-resistant tuberculosisNAP National AIDS Control ProgrammeNTP National Tuberculosis Control ProgrammePICs Pacific island countries and areasPMDT Programmatic management of drug resistant TBpop. population ss+ or ss- sputum smear-positive or sputum smear-negativeSRLN supranational laboratory networkTB tuberculosisWHO World Health Organization
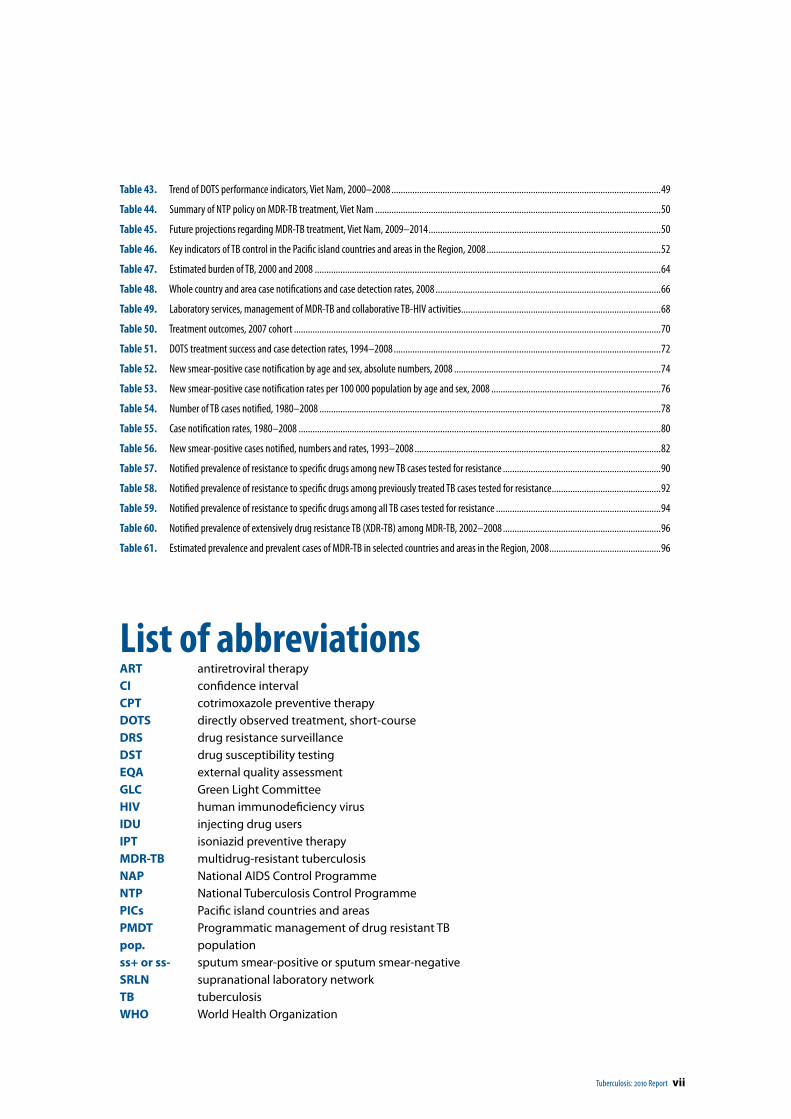
Table 43. Trend of DOTS performance indicators, Viet Nam, 2000–2008 ....................................................................................................................49
Table 44. Summary of NTP policy on MDR-TB treatment, Viet Nam ...........................................................................................................................50
Table 45. Future projections regarding MDR-TB treatment, Viet Nam, 2009–2014 ....................................................................................................50
Table 46. Key indicators of TB control in the Pacific island countries and areas in the Region, 2008 ...........................................................................52
Table 47. Estimated burden of TB, 2000 and 2008 .....................................................................................................................................................64
Table 48. Whole country and area case notifications and case detection rates, 2008 .................................................................................................66
Table 49. Laboratory services, management of MDR-TB and collaborative TB-HIV activities ......................................................................................68
Table 50. Treatment outcomes, 2007 cohort ..............................................................................................................................................................70
Table 51. DOTS treatment success and case detection rates, 1994–2008 ...................................................................................................................72
Table 52. New smear-positive case notification by age and sex, absolute numbers, 2008 .........................................................................................74
Table 53. New smear-positive case notification rates per 100 000 population by age and sex, 2008 .........................................................................76
Table 54. Number of TB cases notified, 1980–2008 ...................................................................................................................................................78
Table 55. Case notification rates, 1980–2008 ............................................................................................................................................................80
Table 56. New smear-positive cases notified, numbers and rates, 1993–2008 ..........................................................................................................82
Table 57. Notified prevalence of resistance to specific drugs among new TB cases tested for resistance ....................................................................90
Table 58. Notified prevalence of resistance to specific drugs among previously treated TB cases tested for resistance ...............................................92
Table 59. Notified prevalence of resistance to specific drugs among all TB cases tested for resistance .......................................................................94
Table 60. Notified prevalence of extensively drug resistance TB (XDR-TB) among MDR-TB, 2002–2008 ....................................................................96
Table 61. Estimated prevalence and prevalent cases of MDR-TB in selected countries and areas in the Region, 2008 ................................................96

5
Tuberculosis: 2010 Report ix
Executive summary
The 2010 report on tuberculosis (TB) control in the WHO Western Pacific Region presents data on disease burden, case notification in 2008 and treatment outcomes for patients registered in 2007. The report also includes information on drug resistant-TB, TB-HIV coinfection, laboratory services, profiles of the seven countries with a high burden of TB in the Region—Cambodia, China, Lao People's Democratic Republic, Mongolia, Papua New Guinea, the Philippines, and Viet Nam—and a summary of the epidemiological indicators and treatment outcomes in the Pacific island countries and areas. The report seeks to provide an update on the current epidemiological situation of TB and to show progress in TB control in the Region.
The report highlights the following:
TB burdenThere were an estimated 2.1 million prevalent TB cases (120 per 100 000 population) in the Region in 2008, of which 1.9 million were incident cases (109 per 100 000 population), including 0.9 million new smear-positive cases (53 per 100 000 population). The estimated number of incident cases accounted for 21% of the global burden of TB. In absolute numbers, China, the Philippines, Viet Nam and Cambodia ranked first to fourth, respectively. These four countries accounted for 93% of the total estimated incident cases in the Region. Cambodia had the highest incidence rate (490 per 100 000 population). Death from TB occurred in about 0.3 million cases (15 per 100 000 population). The mortality rate was the highest in Cambodia (79 per 100 000 population).
Case notification and trendsThe Region accounted for about 1.4 million cases of all forms of TB notified in 2008 (76 per 100 000 population), corresponding to 24% of the total cases notified globally. There were about 0.7 million new sputum smear-positive cases (37 per 100 000 population) notified, corresponding to 25% of the global smear-positive cases notified. The largest number of smear-positive cases were notified from China (463 000), followed by the Philippines (85 000) and Viet Nam (53 000). Since 2005, the notification rates for all forms of TB and new sputum smear-positive TB have remained stable in the Region.
Progress towards 2010 regional goalThe 2010 Regional goal was to halve the TB prevalence and mortality rates from those of the year 2000. Between 2000 and 2008, the TB prevalence rate is estimated to have declined by 46% at a rate of -7.5% per year and the mortality rate by 42% at a rate of -6.6% per year. At the current rates of decline, the prevalence will drop from 224 to 103 per 100 000 population by 2010 and the mortality from 26 to 13 per 100 000 population.
Treatment outcomesOf the 0.7 million new pulmonary smear-positive cases registered for treatment in 2007, the overall treatment success rate was 92% in the Region. Treatment success rates were above the 85% target in six of seven countries with a high burden of TB: Cambodia, China, Lao People's Democratic Republic, Mongolia, the Philippines and Viet Nam. Only Papua New Guinea did not reach the target, with 39% treatment success (for most cases, no treatment outcome available).
x Tuberculosis: 2010 Report
Multidrug-resistant TB
The estimated number of incident MDR-TB cases among all forms of TB (new and relapse) in the Region was about 120 000 (6.2%), of which cases from China, the Philippines and Viet Nam accounted for 97% of the overall total MDR-TB cases. Prevalence of MDR-TB reported between 2000 and 2008 varied from country to country and also by treatment history of the patient. In five countries with a high burden of TB for which data from surveys were available—Cambodia, China, Mongolia, the Philippines and Viet Nam—MDR-TB prevalence in new cases ranged from 0% in Cambodia to 5.7% in China and in retreatment cases from 3.1% in Cambodia to 27.5% in Mongolia (preliminary data for 2008).
TB-HIV coinfectionAmong the countries and areas that reported the TB-HIV data, about 150 000 patients of 1.4 million notified cases of all forms of TB were tested for HIV in 2008. The proportion of TB cases tested for HIV increased from 9.3% in 2007 to 11% in 2008. Of 150 000 tested, about 11 000 (6.9%) were found to be HIV-positive. In the Region, the overall estimated prevalence of HIV in new TB cases was 2.3%.
Laboratory servicesIn 2008, there were 6981 TB laboratories that performed acid-fast bacilli (AFB) smear microscopy in the seven countries with a high burden of TB in the Region, of which 6460 (93%) participated in external quality assessment (EQA) programmes. In five of the seven countries with a high burden of TB—Cambodia, China, Lao People's Democratic Republic, Mongolia and Viet Nam—over 95% of sputum smear microscopy centres participated in EQA activities.
In the seven countries with a high burden of TB in the Region, there were a total of 666 laboratories capable for TB culture in 2008. In six of the seven high burden countries—Cambodia, China, Mongolia, Papua New Guinea, the Philippines and Viet Nam—some 666 AFB culture facilities have been established, of which 117 are capable of performing DST for the first-line anti-TB drugs. The Lao People’s Democratic Republic just started culture and DST after completion of the National Reference Laboratory in August 2009. However, the number of laboratories in the Region capable of performing culture and DST is insufficient, given the threat of MDR-TB and TB-HIV coinfection.

xii Tuberculosis: 2010 Report
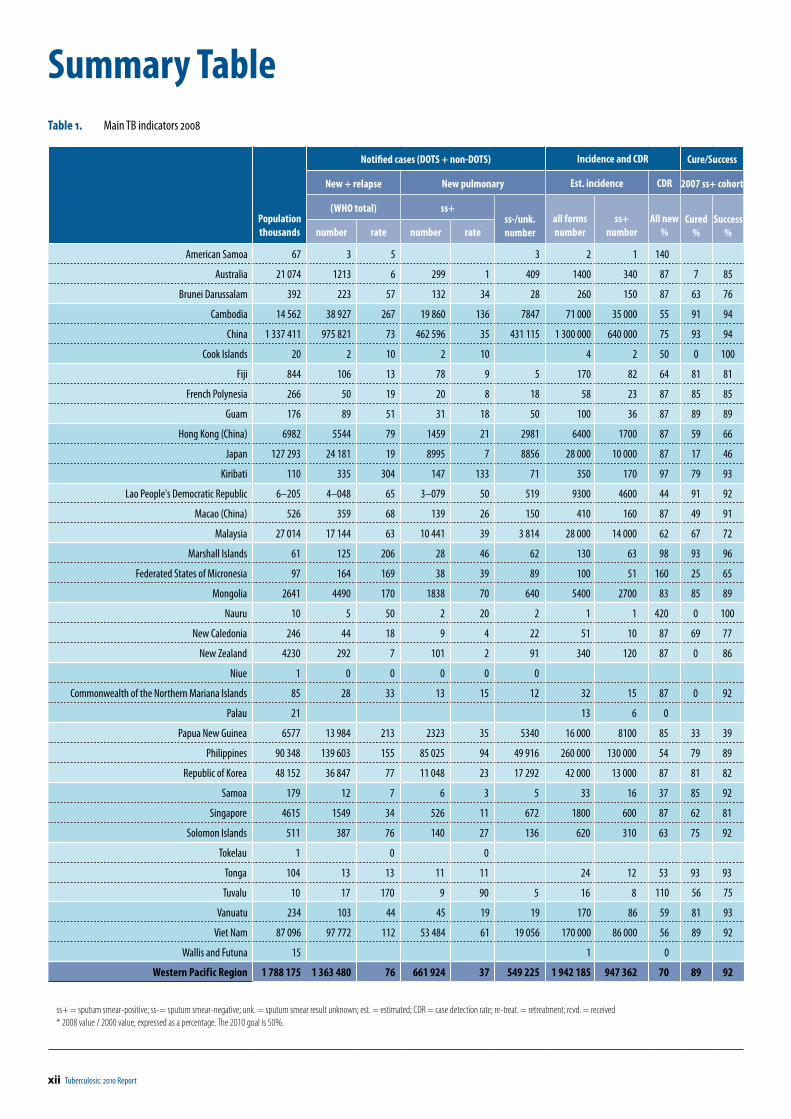
Table 1. Main TB indicators 2008
Populationthousands
Notified cases (DOTS + non-DOTS) Incidence and CDR Cure/Success
New + relapse New pulmonary Est. incidence CDR 2007 ss+ cohort
(WHO total) ss+ss-/unk.number
all formsnumber
ss+number
All new%
Cured%
Success%number rate number rate
American Samoa 67 3 5 3 2 1 140
Australia 21 074 1213 6 299 1 409 1400 340 87 7 85
Brunei Darussalam 392 223 57 132 34 28 260 150 87 63 76
Cambodia 14 562 38 927 267 19 860 136 7847 71 000 35 000 55 91 94
China 1 337 411 975 821 73 462 596 35 431 115 1 300 000 640 000 75 93 94
Cook Islands 20 2 10 2 10 4 2 50 0 100
Fiji 844 106 13 78 9 5 170 82 64 81 81
French Polynesia 266 50 19 20 8 18 58 23 87 85 85
Guam 176 89 51 31 18 50 100 36 87 89 89
Hong Kong (China) 6982 5544 79 1459 21 2981 6400 1700 87 59 66
Japan 127 293 24 181 19 8995 7 8856 28 000 10 000 87 17 46
Kiribati 110 335 304 147 133 71 350 170 97 79 93
Lao People's Democratic Republic 6–205 4–048 65 3–079 50 519 9300 4600 44 91 92
Macao (China) 526 359 68 139 26 150 410 160 87 49 91
Malaysia 27 014 17 144 63 10 441 39 3 814 28 000 14 000 62 67 72
Marshall Islands 61 125 206 28 46 62 130 63 98 93 96
Federated States of Micronesia 97 164 169 38 39 89 100 51 160 25 65
Mongolia 2641 4490 170 1838 70 640 5400 2700 83 85 89
Nauru 10 5 50 2 20 2 1 1 420 0 100
New Caledonia 246 44 18 9 4 22 51 10 87 69 77
New Zealand 4230 292 7 101 2 91 340 120 87 0 86
Niue 1 0 0 0 0 0
Commonwealth of the Northern Mariana Islands 85 28 33 13 15 12 32 15 87 0 92
Palau 21 13 6 0
Papua New Guinea 6577 13 984 213 2323 35 5340 16 000 8100 85 33 39
Philippines 90 348 139 603 155 85 025 94 49 916 260 000 130 000 54 79 89
Republic of Korea 48 152 36 847 77 11 048 23 17 292 42 000 13 000 87 81 82
Samoa 179 12 7 6 3 5 33 16 37 85 92
Singapore 4615 1549 34 526 11 672 1800 600 87 62 81
Solomon Islands 511 387 76 140 27 136 620 310 63 75 92
Tokelau 1 0 0
Tonga 104 13 13 11 11 24 12 53 93 93
Tuvalu 10 17 170 9 90 5 16 8 110 56 75
Vanuatu 234 103 44 45 19 19 170 86 59 81 93
Viet Nam 87 096 97 772 112 53 484 61 19 056 170 000 86 000 56 89 92
Wallis and Futuna 15 1 0
Western Pacif ic Region 1 788 175 1 363 480 76 661 924 37 549 225 1 942 185 947 362 70 89 92
ss+ = sputum smear-positive; ss-= sputum smear-negative; unk. = sputum smear result unknown; est. = estimated; CDR = case detection rate; re-treat. = retreatment; rcvd. = received* 2008 value / 2000 value, expressed as a percentage. The 2010 goal is 50%.
Summary Table
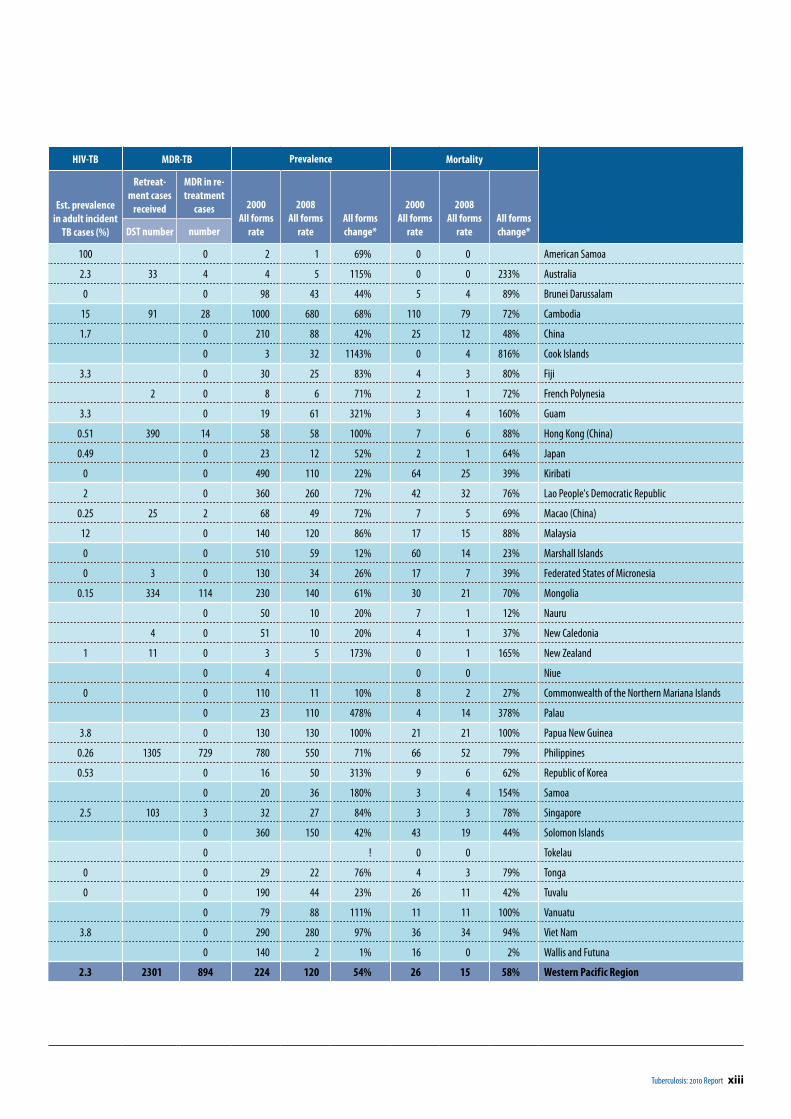
Tuberculosis: 2010 Report xiii
HIV-TB MDR-TB Prevalence Mortality
Est. prevalencein adult incident
TB cases (%)
Retreat-ment cases
received
MDR in re-treatment
cases 2000All forms
rate
2008All forms
rateAll forms change*
2000All forms
rate
2008All forms
rateAll forms change*DST number number
100 0 2 1 69% 0 0 American Samoa
2.3 33 4 4 5 115% 0 0 233% Australia
0 0 98 43 44% 5 4 89% Brunei Darussalam
15 91 28 1000 680 68% 110 79 72% Cambodia
1.7 0 210 88 42% 25 12 48% China
0 3 32 1143% 0 4 816% Cook Islands
3.3 0 30 25 83% 4 3 80% Fiji
2 0 8 6 71% 2 1 72% French Polynesia
3.3 0 19 61 321% 3 4 160% Guam
0.51 390 14 58 58 100% 7 6 88% Hong Kong (China)
0.49 0 23 12 52% 2 1 64% Japan
0 0 490 110 22% 64 25 39% Kiribati
2 0 360 260 72% 42 32 76% Lao People's Democratic Republic
0.25 25 2 68 49 72% 7 5 69% Macao (China)
12 0 140 120 86% 17 15 88% Malaysia
0 0 510 59 12% 60 14 23% Marshall Islands
0 3 0 130 34 26% 17 7 39% Federated States of Micronesia
0.15 334 114 230 140 61% 30 21 70% Mongolia
0 50 10 20% 7 1 12% Nauru
4 0 51 10 20% 4 1 37% New Caledonia
1 11 0 3 5 173% 0 1 165% New Zealand
0 4 0 0 Niue
0 0 110 11 10% 8 2 27% Commonwealth of the Northern Mariana Islands
0 23 110 478% 4 14 378% Palau
3.8 0 130 130 100% 21 21 100% Papua New Guinea
0.26 1305 729 780 550 71% 66 52 79% Philippines
0.53 0 16 50 313% 9 6 62% Republic of Korea
0 20 36 180% 3 4 154% Samoa
2.5 103 3 32 27 84% 3 3 78% Singapore
0 360 150 42% 43 19 44% Solomon Islands
0 ! 0 0 Tokelau
0 0 29 22 76% 4 3 79% Tonga
0 0 190 44 23% 26 11 42% Tuvalu
0 79 88 111% 11 11 100% Vanuatu
3.8 0 290 280 97% 36 34 94% Viet Nam
0 140 2 1% 16 0 2% Wallis and Futuna
2.3 2301 894 224 120 54% 26 15 58% Western Pacif ic Region

Tuberculosis: 2010 Report 1
1 Introduction
This is the annual report on tuberculosis (TB) control published by WHO’s Regional Office for the Western Pacific. Geographically and economically, the Western Pacific Region—which covers East Asia and the Pacific—has a great diversity of natural and human resources, economic dynamism, technological expertise and agricultural productivity. The Region has a total population of 1788 million, representing about 27% of the world’s population. In 2008, the Region accounted for 21% of the estimated global TB incidence and 19% of the prevalence, respectively.
Each year 36 countries and areas 1 in the Region report data to WHO using a standardized collection form for reporting surveillance data. Using data on disease burden and case notifications in 2008 and treatment outcomes of patients registered for treatment in 2007, this report presents an assessment of TB epidemiology, burden, estimation and progress towards the Regional goal to halve the prevalence and mortality rates of 2000 by 2010 2 and to achieve at least 85% successful treatment for new smear-positive cases and a case detection rate of 70%. This report includes data on drug resistance, TB-HIV surveillance, laboratory services and TB prevalence surveys conducted between 2000 and 2008 within the Region.
In addition, the report provides country- and area-specific data, which include epidemiologic indicators and detailed estimations of prevalence and mortality towards the 2010 goal for seven countries and areas with a high burden of TB. The epidemiological indicators and treatment outcomes of TB for the Pacific island countries are also summarized. There are nine annexes.
The first four describe methods for estimating prevalence and mortality for past, current and future years and the burden of multidrug-resistant TB 3 (MDR-TB) and provide definitions. In Annex 5, the names and contact information of the partners in countries with a high burden of TB in the Region are listed. Annex 6 provides explanatory notes for the tables listed in Annex 7. Subnational data on all forms of TB are in Annex 8. Notified prevalence of resistance to antiTB drugs and estimated numbers of MDR-TB cases that had occurred in 2008 are in Annex 9.
1 See Table 1 for countries and areas in the Region.2 The regional goal differs from the Millennium Development Goals.3 Isolates that are resistant to at least isoniazid and rifampicin.
The case detection rate (CDR) has been a much-used indicator of national progress in TB control since the mid-1990s. This report only presents estimates of the CDR for all new cases using the methodology of “Global Tuberculosis Control–a short update to the 2009 report” (WHO/HTM/TB/2009.426). Concerning the most recent development of moving away from estimates of the case detection rate for sputum smear-positive pulmonary TB please refer to chapter 4.3 and Box 6 of “Global Tuberculosis Control 2010” (WHO/HTM/TB/2010.7).

Tuberculosis: 2010 Report 3
2 Epidemiology
2.1 Estimated burden
Figure 1. Estimated incident cases of all forms of TB by WHO Region, 2008
In 2008, there were an estimated 2.1 million prevalent TB cases (120 per 100 000 population) in the Region. Over 1.9 million were incident cases (109 per 100 000 population), including 0.9 million new smear-positive cases (53 per 100 000 population). The estimated number of incident cases accounts for 21% of the global burden of TB (Figure 1). Figure 2 shows the estimated incidence rates of TB by country and area.
The incidence rate was the highest in Cambodia (490 per 100 000 population). Cases from Cambodia, China, the Philippines and Viet Nam together accounted for 93% of all incidence cases in the Region. Prevalence of all forms of TB declined at an estimated rate of 7.5% annually since 2000 (Table 2). Death from TB was estimated to occur in about 260 000 cases in 2008 (15 per 100 000 population). The mortality rate was highest in Cambodia (79 per 100 000 population) and lowest in American Samoa, Australia, Niue and Tokelau (0 per 100 000 population). Deaths from TB in Cambodia, China, the Philippines and Viet Nam accounted for 95% of all TB mortality in the Region. The regional TB mortality rate declined at an estimated rate of 6.6% annually since 2000 (Table 2).
Table 2. Estimated prevalence (all forms of TB) and TB mortality per 100 000 population in the Region, 2008
YearOverall decline
2000–2008Annual decline
2000–20082000 2008
Estimated Prevalence 224 [150–332] 120 [61 -196] 46% 7.5%
Estimated Mortality 26 [10 -49] 15 [6 -30] 42% 6.6%
*The ranges around the best estimates in this table show the highest and lowest estimates.
4 Tuberculosis: 2010 Report
2 | EPIDEMIOLOGY
Figure 2. Estimated incidence rates (left) and prevalence rates (right) of all forms of TB by country and territory, 2008
WPR = Western Pacific Region*The bars show the boundaries within which the actual rates lie, based on the best available information .
Figure 3. Distribution of estimated incident cases (all forms) by country and area in the Region, 2008 (n = 1 942 185 )
2.2 Trend of prevalence and TB mortality rates in countries with a high burden of TB
Regionally, prevalence and mortality had declined at rates of 7.5% per year and 6.6% per year, respectively, since 2000. At the current rate of decline, in 2010 the prevalence would be 103 and the mortality 13 per 100 000 population (see estimation method in Annex 1) (Table 3). Thus, according to the latest WHO estimates, the regional goal of halving prevalence and mortality by 2010 relative to 2000 levels is likely to be achieved whereas it would most likely not have been met with the previous method of estimation. However, the latest WHO estimates have large confidence intervals and thus should be interpreted with care.
Tuberculosis: 2010 Report 5
2 | EPIDEMIOLOGY
Table 3. Estimated TB prevalence and mortality in 2010 by country and area with a high burden of TB in the Region and Regional 2010 goals
Country and area
Prevalence rate Mortality rate
Overall change 2000–2008 (%)
Annual rate of decline a (%)
Estimate in 2010*
2010 goal†
Overall change 2000–2008 (%)
Annual rate of decline a (%)
Estimate in 2010*
2010 goal†
Cambodia 32 4.7 617 500 28 4.1 73 55
China 58 10.3 71 105 52 8.8 10 13
Lao People's Democratic Republic
28 4.0 240 180 24 3.3 30 21
Mongolia 39 6.0 124 115 30 4.4 19 15
Papua New Guinea 0 0.0 130 65 0 0.0 21 11
Philippines 29 4.3 504 390 21 2.9 49 33
Viet Nam 3 0.4 278 145 6 0.7 34 18
Western Pacif ic Region 46 7.5 103 112 42 6.6 13 13
a Average from 2000 through 2008* Per 100 000 population, assuming current rate of change† Assuming current annual rate of change
2.3 Case notification and trendsAbout 1.4 million cases of all forms of TB were notified in 2008 (76 per 100 000 population), corresponding to 24% of the total cases notified globally. There were 0.7 million new smear-positive cases notified in 2008 (37 per 100 000 population), corresponding to 25% of the total smear-positive cases notified globally. The largest number of smear-positive cases was reported from China (463 000), followed by the Philippines (85 000) and Viet Nam (53 000). Together with Cambodia, cases from these four countries accounted for 94% of all new smear-positive cases notified in the Region. Two countries with a high burden of TB in the Region, Cambodia and Papua New Guinea, had case notification rates of ≥200 per 100 000 population. Figure 4 shows case notification rates for all forms of TB in countries and areas in the Western Pacific Region and neighbouring countries and areas in 2008.
Figure 4. Case notification rates (all forms of TB) per 100 000 population in countries and areas in the Western Pacific Region and neighbouring countries and areas, 2008
TThe boundaries shown and the designations used on this map do not imply the expression of any opinion whatsoever on the part of WHO concerning the legal status of any country, territory, city or area or of its authorities, or concerning the delimitation of its frontiers or boundaries. White lines on maps represent approximate border lines for which there may not yet be full agreement. © WHO 2010. All rights reserved
6 Tuberculosis: 2010 Report
2 | EPIDEMIOLOGY
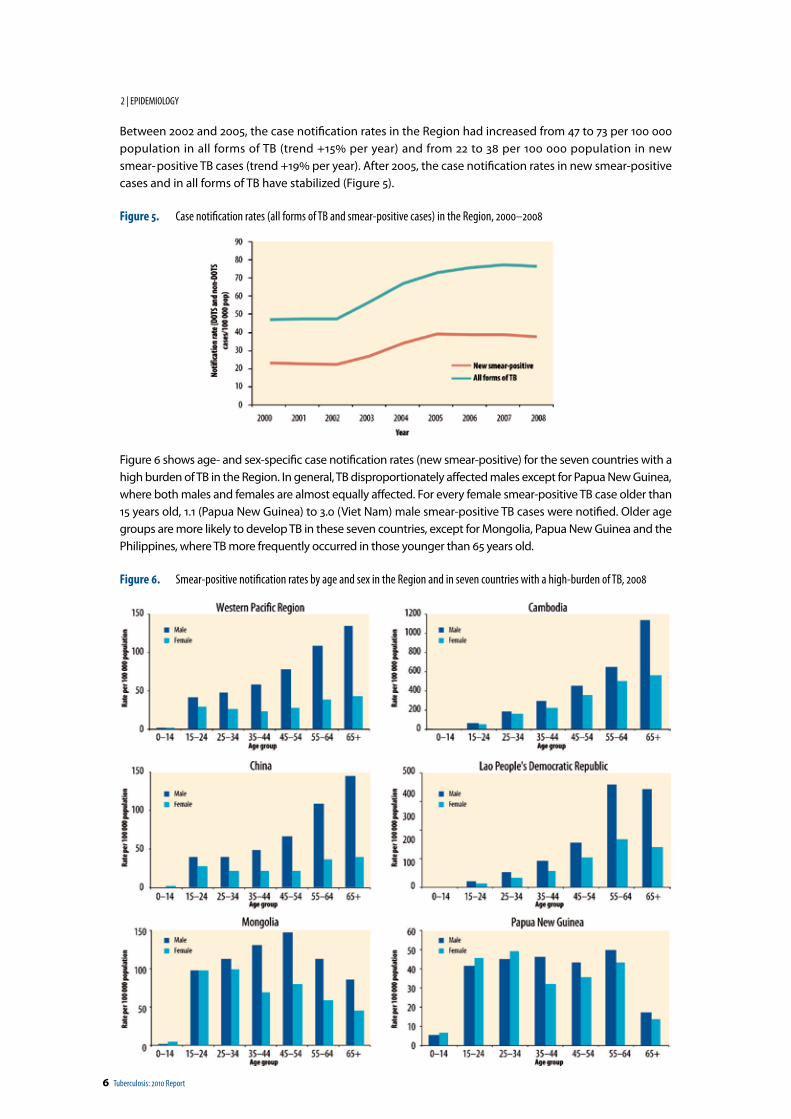
Between 2002 and 2005, the case notification rates in the Region had increased from 47 to 73 per 100 000 population in all forms of TB (trend +15% per year) and from 22 to 38 per 100 000 population in new smear- positive TB cases (trend +19% per year). After 2005, the case notification rates in new smear-positive cases and in all forms of TB have stabilized (Figure 5).
Figure 5. Case notification rates (all forms of TB and smear-positive cases) in the Region, 2000–2008
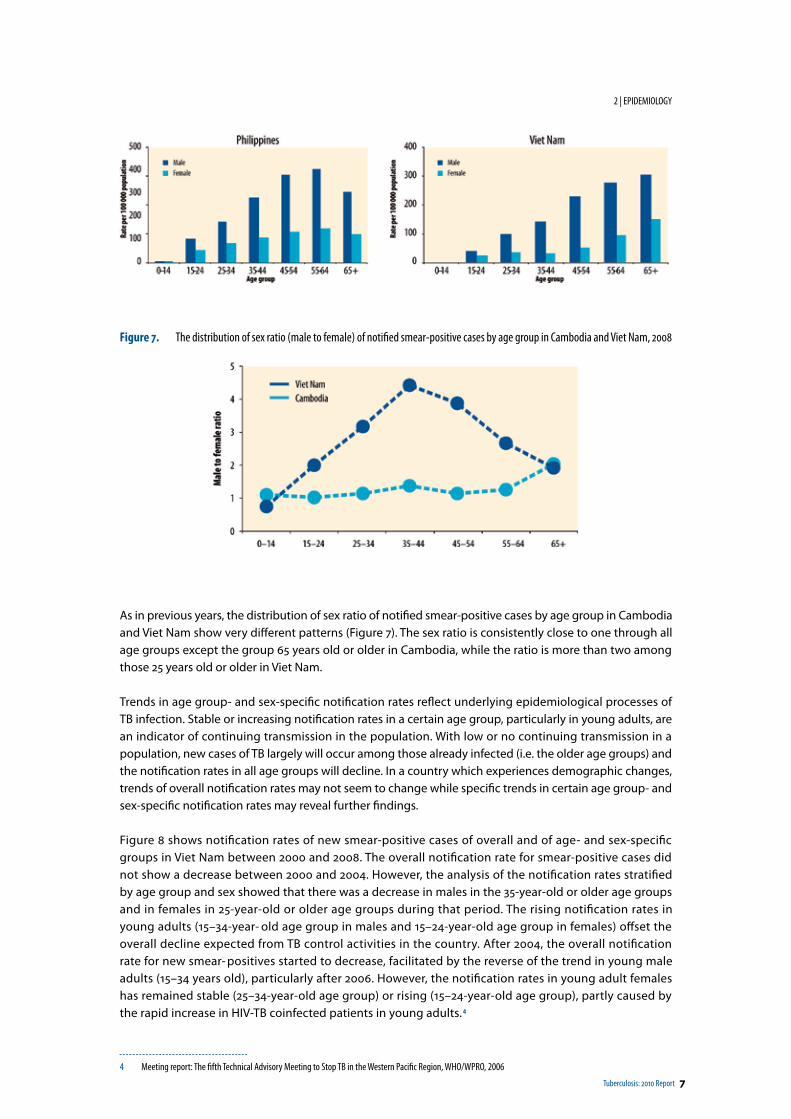
Figure 6 shows age- and sex-specific case notification rates (new smear-positive) for the seven countries with a high burden of TB in the Region. In general, TB disproportionately affected males except for Papua New Guinea, where both males and females are almost equally affected. For every female smear-positive TB case older than 15 years old, 1.1 (Papua New Guinea) to 3.0 (Viet Nam) male smear-positive TB cases were notified. Older age groups are more likely to develop TB in these seven countries, except for Mongolia, Papua New Guinea and the Philippines, where TB more frequently occurred in those younger than 65 years old.
Figure 6. Smear-positive notification rates by age and sex in the Region and in seven countries with a high-burden of TB, 2008
Tuberculosis: 2010 Report 7
2 | EPIDEMIOLOGY
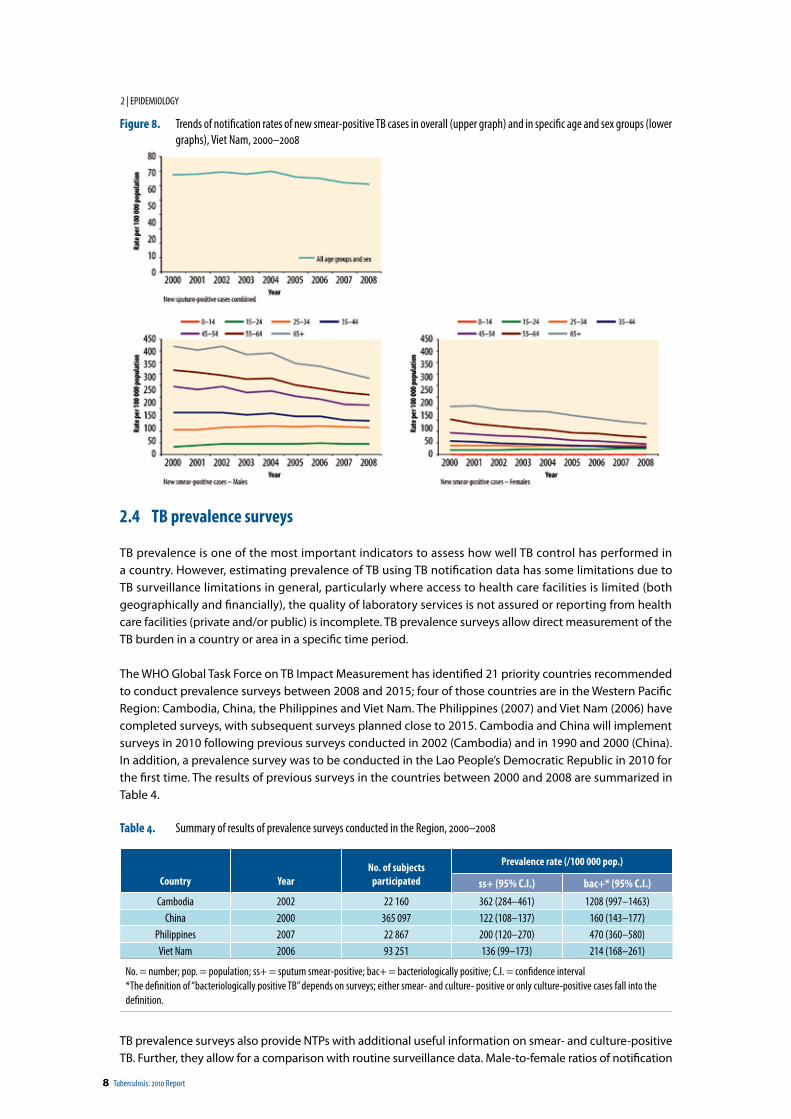
Figure 7. The distribution of sex ratio (male to female) of notified smear-positive cases by age group in Cambodia and Viet Nam, 2008
As in previous years, the distribution of sex ratio of notified smear-positive cases by age group in Cambodia and Viet Nam show very different patterns (Figure 7). The sex ratio is consistently close to one through all age groups except the group 65 years old or older in Cambodia, while the ratio is more than two among those 25 years old or older in Viet Nam.
Trends in age group- and sex-specific notification rates reflect underlying epidemiological processes of TB infection. Stable or increasing notification rates in a certain age group, particularly in young adults, are an indicator of continuing transmission in the population. With low or no continuing transmission in a population, new cases of TB largely will occur among those already infected (i.e. the older age groups) and the notification rates in all age groups will decline. In a country which experiences demographic changes, trends of overall notification rates may not seem to change while specific trends in certain age group- and sex-specific notification rates may reveal further findings.
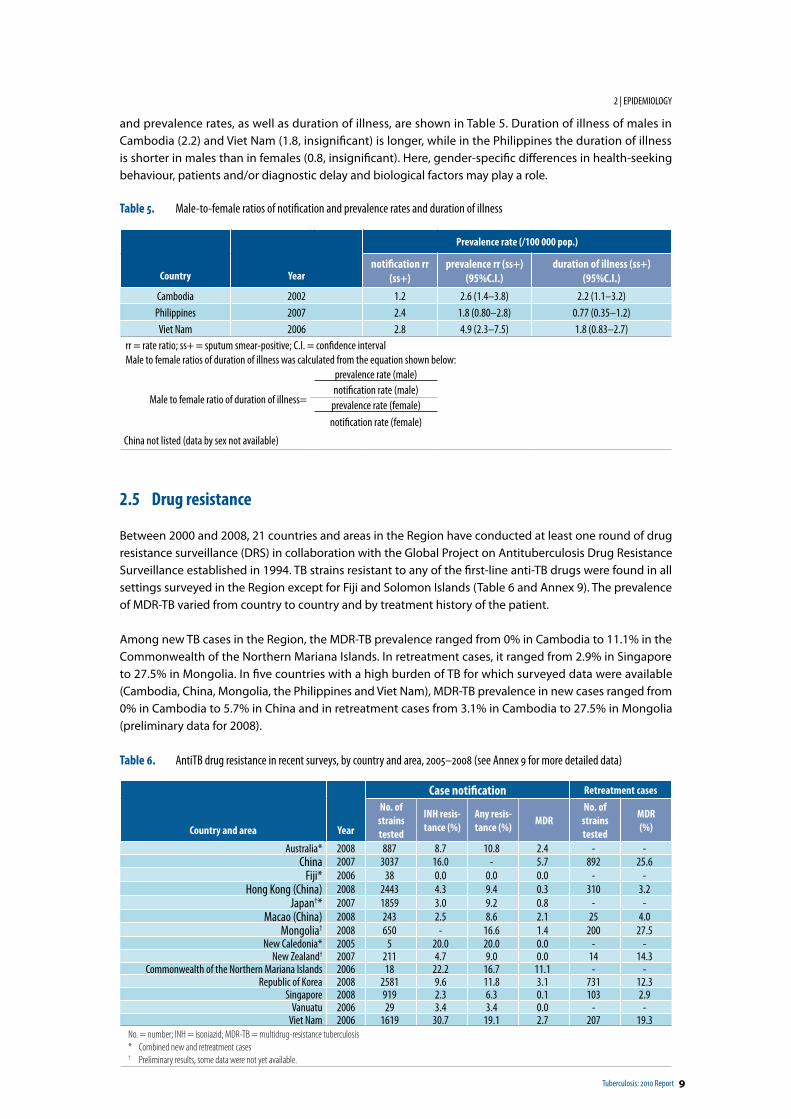
Figure 8 shows notification rates of new smear-positive cases of overall and of age- and sex-specific groups in Viet Nam between 2000 and 2008. The overall notification rate for smear-positive cases did not show a decrease between 2000 and 2004. However, the analysis of the notification rates stratified by age group and sex showed that there was a decrease in males in the 35-year-old or older age groups and in females in 25-year-old or older age groups during that period. The rising notification rates in young adults (15–34-year- old age group in males and 15–24-year-old age group in females) offset the overall decline expected from TB control activities in the country. After 2004, the overall notification rate for new smear- positives started to decrease, facilitated by the reverse of the trend in young male adults (15–34 years old), particularly after 2006. However, the notification rates in young adult females has remained stable (25–34-year-old age group) or rising (15–24-year-old age group), partly caused by the rapid increase in HIV-TB coinfected patients in young adults. 4
4 Meeting report: The fifth Technical Advisory Meeting to Stop TB in the Western Pacific Region, WHO/WPRO, 2006
8 Tuberculosis: 2010 Report
2 | EPIDEMIOLOGY
Figure 8. Trends of notification rates of new smear-positive TB cases in overall (upper graph) and in specific age and sex groups (lower graphs), Viet Nam, 2000–2008
2.4 TB prevalence surveys
TB prevalence is one of the most important indicators to assess how well TB control has performed in a country. However, estimating prevalence of TB using TB notification data has some limitations due to TB surveillance limitations in general, particularly where access to health care facilities is limited (both geographically and financially), the quality of laboratory services is not assured or reporting from health care facilities (private and/or public) is incomplete. TB prevalence surveys allow direct measurement of the TB burden in a country or area in a specific time period.
The WHO Global Task Force on TB Impact Measurement has identified 21 priority countries recommended to conduct prevalence surveys between 2008 and 2015; four of those countries are in the Western Pacific Region: Cambodia, China, the Philippines and Viet Nam. The Philippines (2007) and Viet Nam (2006) have completed surveys, with subsequent surveys planned close to 2015. Cambodia and China will implement surveys in 2010 following previous surveys conducted in 2002 (Cambodia) and in 1990 and 2000 (China). In addition, a prevalence survey was to be conducted in the Lao People’s Democratic Republic in 2010 for the first time. The results of previous surveys in the countries between 2000 and 2008 are summarized in Table 4.
Table 4. Summary of results of prevalence surveys conducted in the Region, 2000–2008
Country YearNo. of subjects
participated
Prevalence rate (/100 000 pop.)
ss+ (95% C.I.) bac+* (95% C.I.)Cambodia 2002 22 160 362 (284–461) 1208 (997–1463)
China 2000 365 097 122 (108–137) 160 (143–177)Philippines 2007 22 867 200 (120–270) 470 (360–580)Viet Nam 2006 93 251 136 (99–173) 214 (168–261)
No. = number; pop. = population; ss+ = sputum smear-positive; bac+ = bacteriologically positive; C.I. = confidence interval*The definition of “bacteriologically positive TB” depends on surveys; either smear- and culture- positive or only culture-positive cases fall into the definition.
TB prevalence surveys also provide NTPs with additional useful information on smear- and culture-positive TB. Further, they allow for a comparison with routine surveillance data. Male-to-female ratios of notification
Tuberculosis: 2010 Report 9
2 | EPIDEMIOLOGY
and prevalence rates, as well as duration of illness, are shown in Table 5. Duration of illness of males in Cambodia (2.2) and Viet Nam (1.8, insignificant) is longer, while in the Philippines the duration of illness is shorter in males than in females (0.8, insignificant). Here, gender-specific differences in health-seeking behaviour, patients and/or diagnostic delay and biological factors may play a role.
Table 5. Male-to-female ratios of notification and prevalence rates and duration of illness
Country Year
Prevalence rate (/100 000 pop.)
notification rr (ss+)
prevalence rr (ss+)(95%C.I.)
duration of illness (ss+)(95%C.I.)
Cambodia 2002 1.2 2.6 (1.4–3.8) 2.2 (1.1–3.2)Philippines 2007 2.4 1.8 (0.80–2.8) 0.77 (0.35–1.2)Viet Nam 2006 2.8 4.9 (2.3–7.5) 1.8 (0.83–2.7)
rr = rate ratio; ss+ = sputum smear-positive; C.I. = confidence intervalMale to female ratios of duration of illness was calculated from the equation shown below:
Male to female ratio of duration of illness=
prevalence rate (male)notification rate (male)
prevalence rate (female)notification rate (female)
China not listed (data by sex not available)
2.5 Drug resistance
Between 2000 and 2008, 21 countries and areas in the Region have conducted at least one round of drug resistance surveillance (DRS) in collaboration with the Global Project on Antituberculosis Drug Resistance Surveillance established in 1994. TB strains resistant to any of the first-line anti-TB drugs were found in all settings surveyed in the Region except for Fiji and Solomon Islands (Table 6 and Annex 9). The prevalence of MDR-TB varied from country to country and by treatment history of the patient.
Among new TB cases in the Region, the MDR-TB prevalence ranged from 0% in Cambodia to 11.1% in the Commonwealth of the Northern Mariana Islands. In retreatment cases, it ranged from 2.9% in Singapore to 27.5% in Mongolia. In five countries with a high burden of TB for which surveyed data were available (Cambodia, China, Mongolia, the Philippines and Viet Nam), MDR-TB prevalence in new cases ranged from 0% in Cambodia to 5.7% in China and in retreatment cases from 3.1% in Cambodia to 27.5% in Mongolia (preliminary data for 2008).
Table 6. AntiTB drug resistance in recent surveys, by country and area, 2005–2008 (see Annex 9 for more detailed data)
Country and area Year
Case notification Retreatment casesNo. of
strains tested
INH resis-tance (%)
Any resis-tance (%) MDR
No. of strains tested
MDR(%)
Australia* 2008 887 8.7 10.8 2.4 - -China 2007 3037 16.0 - 5.7 892 25.6
Fiji* 2006 38 0.0 0.0 0.0 - -Hong Kong (China) 2008 2443 4.3 9.4 0.3 310 3.2
Japan†* 2007 1859 3.0 9.2 0.8 - -Macao (China) 2008 243 2.5 8.6 2.1 25 4.0
Mongolia† 2008 650 - 16.6 1.4 200 27.5New Caledonia* 2005 5 20.0 20.0 0.0 - -
New Zealand† 2007 211 4.7 9.0 0.0 14 14.3Commonwealth of the Northern Mariana Islands 2006 18 22.2 16.7 11.1 - -
Republic of Korea 2008 2581 9.6 11.8 3.1 731 12.3Singapore 2008 919 2.3 6.3 0.1 103 2.9
Vanuatu 2006 29 3.4 3.4 0.0 - -Viet Nam 2006 1619 30.7 19.1 2.7 207 19.3
No. = number; INH = isoniazid; MDR-TB = multidrug-resistance tuberculosis* Combined new and retreatment cases† Preliminary results, some data were not yet available.
10 Tuberculosis: 2010 Report
2 | EPIDEMIOLOGY
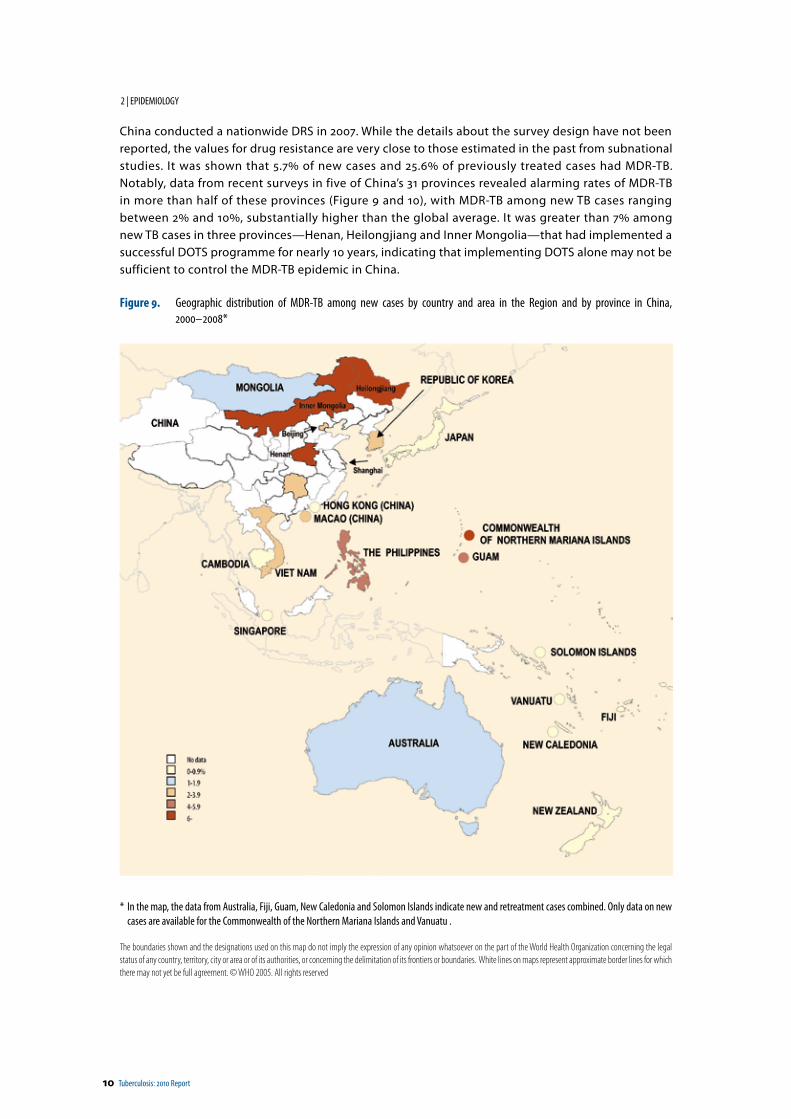
China conducted a nationwide DRS in 2007. While the details about the survey design have not been reported, the values for drug resistance are very close to those estimated in the past from subnational studies. It was shown that 5.7% of new cases and 25.6% of previously treated cases had MDR-TB. Notably, data from recent surveys in five of China’s 31 provinces revealed alarming rates of MDR-TB in more than half of these provinces (Figure 9 and 10), with MDR-TB among new TB cases ranging between 2% and 10%, substantially higher than the global average. It was greater than 7% among new TB cases in three provinces—Henan, Heilongjiang and Inner Mongolia—that had implemented a successful DOTS programme for nearly 10 years, indicating that implementing DOTS alone may not be sufficient to control the MDR-TB epidemic in China.
Figure 9. Geographic distribution of MDR-TB among new cases by country and area in the Region and by province in China, 2000– 2008*
* In the map, the data from Australia, Fiji, Guam, New Caledonia and Solomon Islands indicate new and retreatment cases combined. Only data on new cases are available for the Commonwealth of the Northern Mariana Islands and Vanuatu .
The boundaries shown and the designations used on this map do not imply the expression of any opinion whatsoever on the part of the World Health Organization concerning the legal status of any country, territory, city or area or of its authorities, or concerning the delimitation of its frontiers or boundaries. White lines on maps represent approximate border lines for which there may not yet be full agreement. © WHO 2005. All rights reserved
Tuberculosis: 2010 Report 11
2 | EPIDEMIOLOGY
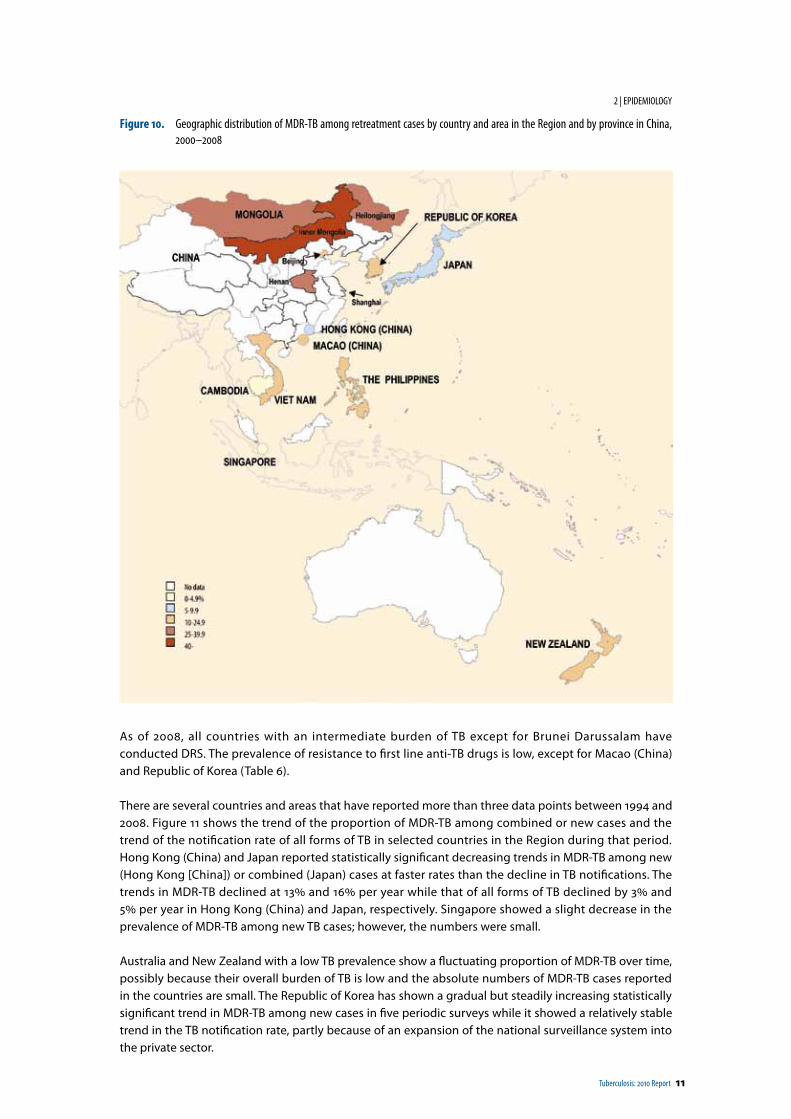
Figure 10. Geographic distribution of MDR-TB among retreatment cases by country and area in the Region and by province in China, 2000–2008
As of 2008, all countries with an intermediate burden of TB except for Brunei Darussalam have conducted DRS. The prevalence of resistance to first line anti-TB drugs is low, except for Macao (China) and Republic of Korea (Table 6).
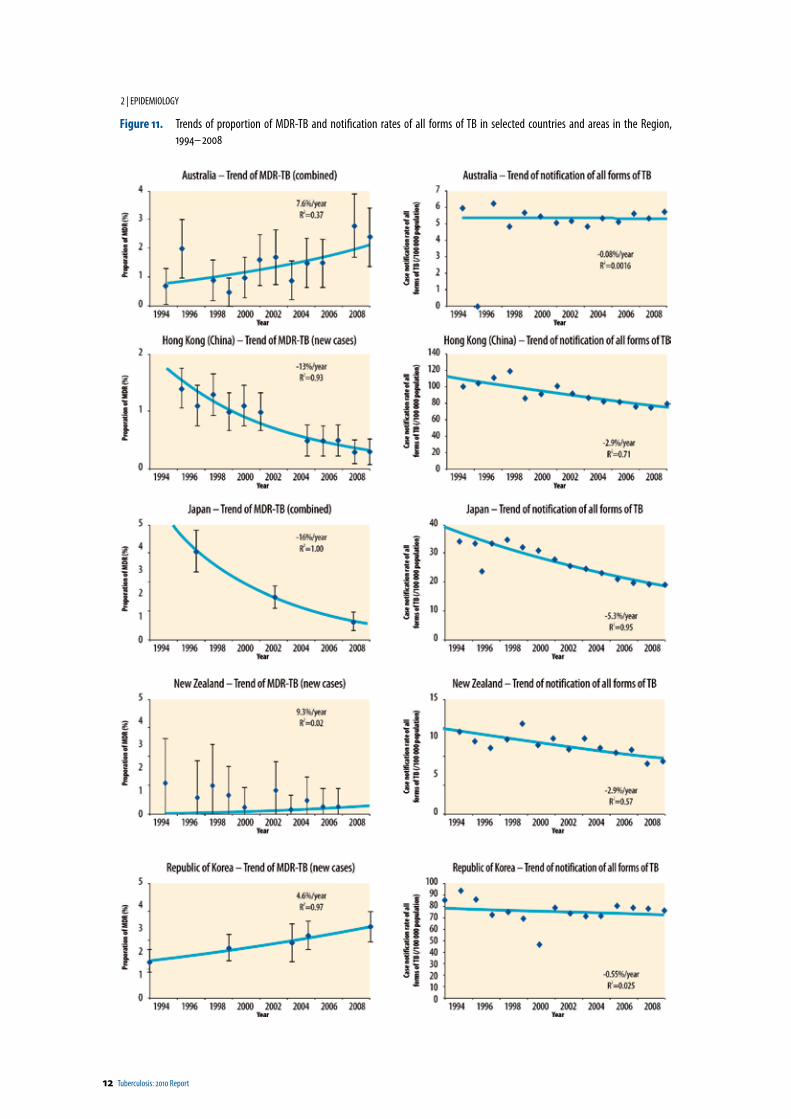
There are several countries and areas that have reported more than three data points between 1994 and 2008. Figure 11 shows the trend of the proportion of MDR-TB among combined or new cases and the trend of the notification rate of all forms of TB in selected countries in the Region during that period. Hong Kong (China) and Japan reported statistically significant decreasing trends in MDR-TB among new (Hong Kong [China]) or combined (Japan) cases at faster rates than the decline in TB notifications. The trends in MDR-TB declined at 13% and 16% per year while that of all forms of TB declined by 3% and 5% per year in Hong Kong (China) and Japan, respectively. Singapore showed a slight decrease in the prevalence of MDR-TB among new TB cases; however, the numbers were small.
Australia and New Zealand with a low TB prevalence show a fluctuating proportion of MDR-TB over time, possibly because their overall burden of TB is low and the absolute numbers of MDR-TB cases reported in the countries are small. The Republic of Korea has shown a gradual but steadily increasing statistically significant trend in MDR-TB among new cases in five periodic surveys while it showed a relatively stable trend in the TB notification rate, partly because of an expansion of the national surveillance system into the private sector.
12 Tuberculosis: 2010 Report
2 | EPIDEMIOLOGY
Figure 11. Trends of proportion of MDR-TB and notification rates of all forms of TB in selected countries and areas in the Region, 1994– 2008
Tuberculosis: 2010 Report 13
2 | EPIDEMIOLOGY
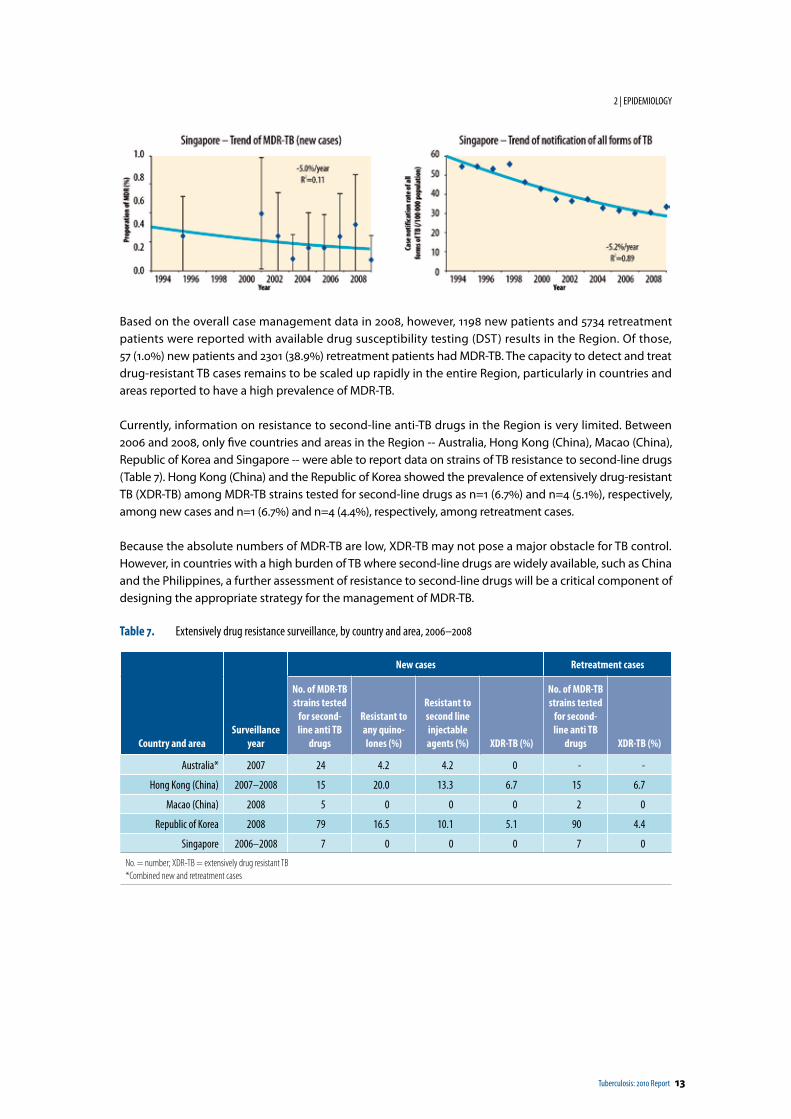
Based on the overall case management data in 2008, however, 1198 new patients and 5734 retreatment patients were reported with available drug susceptibility testing (DST) results in the Region. Of those, 57 (1.0%) new patients and 2301 (38.9%) retreatment patients had MDR-TB. The capacity to detect and treat drug-resistant TB cases remains to be scaled up rapidly in the entire Region, particularly in countries and areas reported to have a high prevalence of MDR-TB.
Currently, information on resistance to second-line anti-TB drugs in the Region is very limited. Between 2006 and 2008, only five countries and areas in the Region -- Australia, Hong Kong (China), Macao (China), Republic of Korea and Singapore -- were able to report data on strains of TB resistance to second-line drugs (Table 7). Hong Kong (China) and the Republic of Korea showed the prevalence of extensively drug-resistant TB (XDR-TB) among MDR-TB strains tested for second-line drugs as n=1 (6.7%) and n=4 (5.1%), respectively, among new cases and n=1 (6.7%) and n=4 (4.4%), respectively, among retreatment cases.
Because the absolute numbers of MDR-TB are low, XDR-TB may not pose a major obstacle for TB control. However, in countries with a high burden of TB where second-line drugs are widely available, such as China and the Philippines, a further assessment of resistance to second-line drugs will be a critical component of designing the appropriate strategy for the management of MDR-TB.
Table 7. Extensively drug resistance surveillance, by country and area, 2006–2008
Country and areaSurveillance
year
New cases Retreatment cases
No. of MDR-TB strains tested
for second-line anti TB
drugs
Resistant to any quino-lones (%)
Resistant to second line injectable agents (%) XDR-TB (%)
No. of MDR-TB strains tested
for second-line anti TB
drugs XDR-TB (%)
Australia* 2007 24 4.2 4.2 0 - -
Hong Kong (China) 2007–2008 15 20.0 13.3 6.7 15 6.7
Macao (China) 2008 5 0 0 0 2 0
Republic of Korea 2008 79 16.5 10.1 5.1 90 4.4
Singapore 2006–2008 7 0 0 0 7 0
No. = number; XDR-TB = extensively drug resistant TB*Combined new and retreatment cases
14 Tuberculosis: 2010 Report
2 | EPIDEMIOLOGY
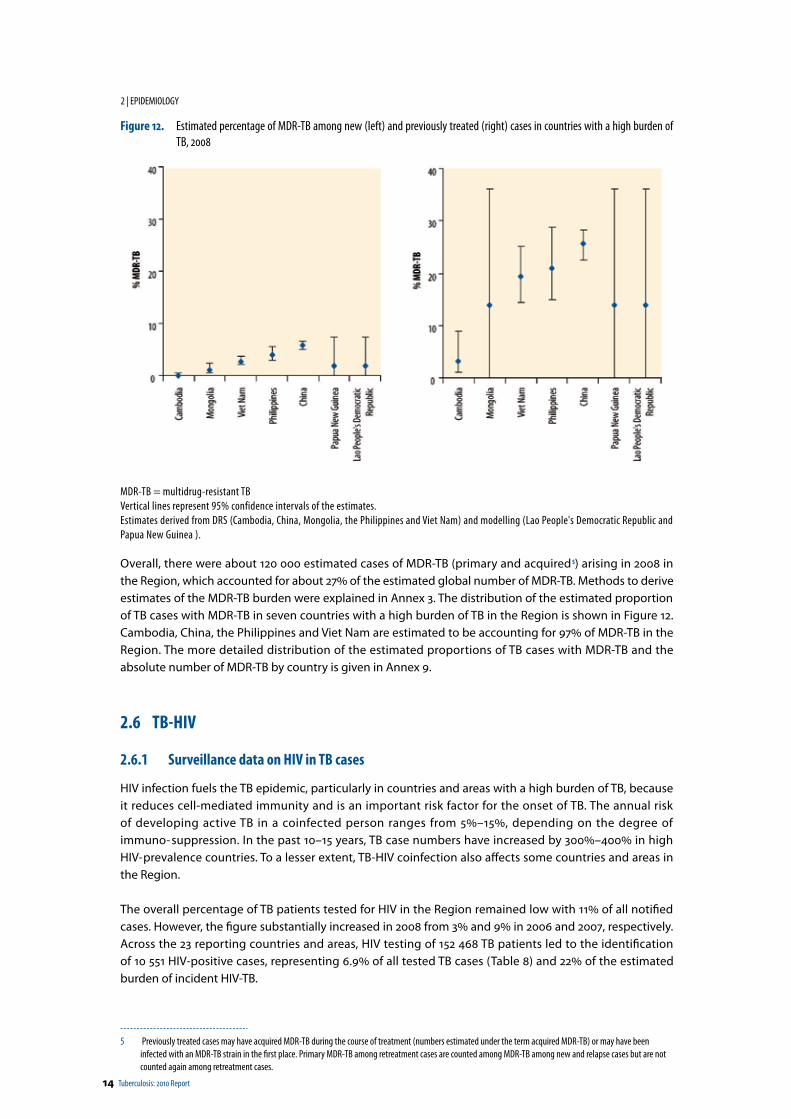
Figure 12. Estimated percentage of MDR-TB among new (left) and previously treated (right) cases in countries with a high burden of TB, 2008
MDR-TB = multidrug-resistant TBVertical lines represent 95% confidence intervals of the estimates.Estimates derived from DRS (Cambodia, China, Mongolia, the Philippines and Viet Nam) and modelling (Lao People's Democratic Republic and Papua New Guinea ).
Overall, there were about 120 000 estimated cases of MDR-TB (primary and acquired 5) arising in 2008 in the Region, which accounted for about 27% of the estimated global number of MDR-TB. Methods to derive estimates of the MDR-TB burden were explained in Annex 3. The distribution of the estimated proportion of TB cases with MDR-TB in seven countries with a high burden of TB in the Region is shown in Figure 12. Cambodia, China, the Philippines and Viet Nam are estimated to be accounting for 97% of MDR-TB in the Region. The more detailed distribution of the estimated proportions of TB cases with MDR-TB and the absolute number of MDR-TB by country is given in Annex 9.
2.6 TB-HIV
2.6.1 Surveillance data on HIV in TB cases
HIV infection fuels the TB epidemic, particularly in countries and areas with a high burden of TB, because it reduces cell-mediated immunity and is an important risk factor for the onset of TB. The annual risk of developing active TB in a coinfected person ranges from 5%–15%, depending on the degree of immuno- suppression. In the past 10–15 years, TB case numbers have increased by 300%–400% in high HIV- prevalence countries. To a lesser extent, TB-HIV coinfection also affects some countries and areas in the Region.
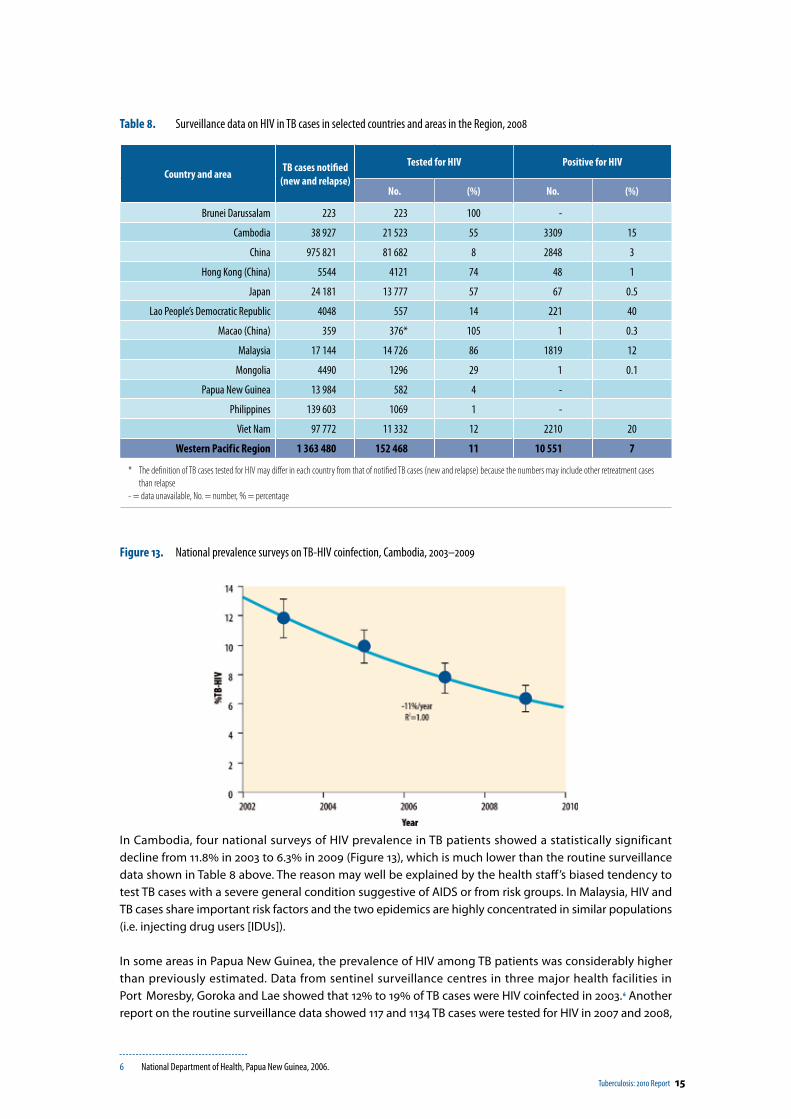
The overall percentage of TB patients tested for HIV in the Region remained low with 11% of all notified cases. However, the figure substantially increased in 2008 from 3% and 9% in 2006 and 2007, respectively. Across the 23 reporting countries and areas, HIV testing of 152 468 TB patients led to the identification of 10 551 HIV-positive cases, representing 6.9% of all tested TB cases (Table 8) and 22% of the estimated burden of incident HIV-TB.
5 Previously treated cases may have acquired MDR-TB during the course of treatment (numbers estimated under the term acquired MDR-TB) or may have been infected with an MDR-TB strain in the first place. Primary MDR-TB among retreatment cases are counted among MDR-TB among new and relapse cases but are not counted again among retreatment cases.
Tuberculosis: 2010 Report 15
Table 8. Surveillance data on HIV in TB cases in selected countries and areas in the Region, 2008
Country and area TB cases notified (new and relapse)
Tested for HIV Positive for HIV
No. (%) No. (%)
Brunei Darussalam 223 223 100 -
Cambodia 38 927 21 523 55 3309 15
China 975 821 81 682 8 2848 3
Hong Kong (China) 5544 4121 74 48 1
Japan 24 181 13 777 57 67 0.5
Lao People’s Democratic Republic 4048 557 14 221 40
Macao (China) 359 376* 105 1 0.3
Malaysia 17 144 14 726 86 1819 12
Mongolia 4490 1296 29 1 0.1
Papua New Guinea 13 984 582 4 -
Philippines 139 603 1069 1 -
Viet Nam 97 772 11 332 12 2210 20
Western Pacif ic Region 1 363 480 152 468 11 10 551 7
* The definition of TB cases tested for HIV may differ in each country from that of notified TB cases (new and relapse) because the numbers may include other retreatment cases than relapse
- = data unavailable, No. = number, % = percentage
Figure 13. National prevalence surveys on TB-HIV coinfection, Cambodia, 2003–2009
In Cambodia, four national surveys of HIV prevalence in TB patients showed a statistically significant decline from 11.8% in 2003 to 6.3% in 2009 (Figure 13), which is much lower than the routine surveillance data shown in Table 8 above. The reason may well be explained by the health staff’s biased tendency to test TB cases with a severe general condition suggestive of AIDS or from risk groups. In Malaysia, HIV and TB cases share important risk factors and the two epidemics are highly concentrated in similar populations (i.e. injecting drug users [IDUs]).
In some areas in Papua New Guinea, the prevalence of HIV among TB patients was considerably higher than previously estimated. Data from sentinel surveillance centres in three major health facilities in Port Moresby, Goroka and Lae showed that 12% to 19% of TB cases were HIV coinfected in 2003. 6 Another report on the routine surveillance data showed 117 and 1134 TB cases were tested for HIV in 2007 and 2008,
6 National Department of Health, Papua New Guinea, 2006.
16 Tuberculosis: 2010 Report
2 | EPIDEMIOLOGY
respectively, of which 17 (15%) and 116 (10%), respectively, were HIV-positive. 7 Sentinel surveillance in 2008 also showed a 19% TB-HIV coinfection rate. 8 In Ho Chi Minh City, Viet Nam, the prevalence had significantly increased from 1.5% between 1997 and 1998 to 9.0% between 2001 and 2002. 9 The prevalence remains high at 7.7% in selected districts of Ho Chi Minh City between 2006 and 2007. 10
2.6.2 Estimated prevalence of HIV among the general population and new TB cases
Papua New Guinea has a generalized HIV epidemic (HIV prevalence >1% of the national population) with an estimated 1.5% (low–high estimate: 1.4–1.6) of the adult population (15–49 years old) infected with HIV in 2007. 11 Cambodia used to have a generalized HIV epidemic. However, the prevalence is estimated to have decreased from a peak of 2.0% in 1998 down to below 0.8% (low–high estimate: 0.7–0.9) in adults (15–49 years old) in 2007. In other countries and areas in the Western Pacific Region, the prevalence of HIV in adults has remained stable or slightly has increased between 2001 and 2007.
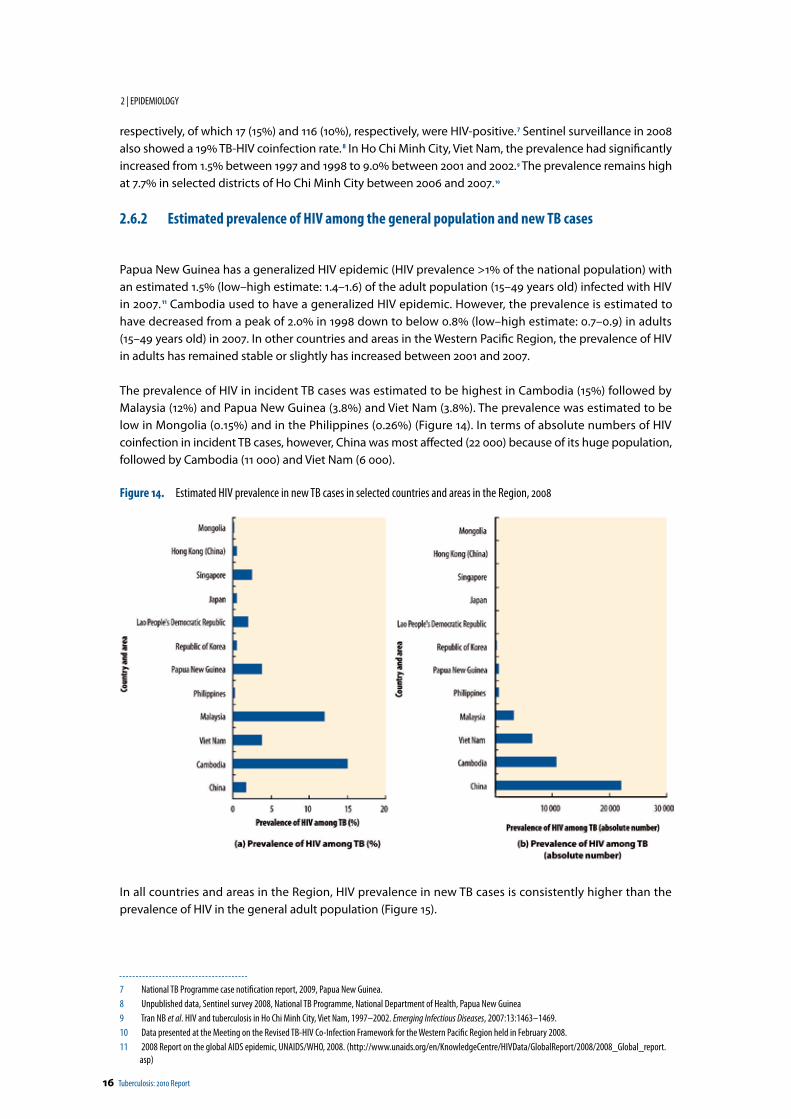
The prevalence of HIV in incident TB cases was estimated to be highest in Cambodia (15%) followed by Malaysia (12%) and Papua New Guinea (3.8%) and Viet Nam (3.8%). The prevalence was estimated to be low in Mongolia (0.15%) and in the Philippines (0.26%) (Figure 14). In terms of absolute numbers of HIV coinfection in incident TB cases, however, China was most affected (22 000) because of its huge population, followed by Cambodia (11 000) and Viet Nam (6 000).
Figure 14. Estimated HIV prevalence in new TB cases in selected countries and areas in the Region, 2008
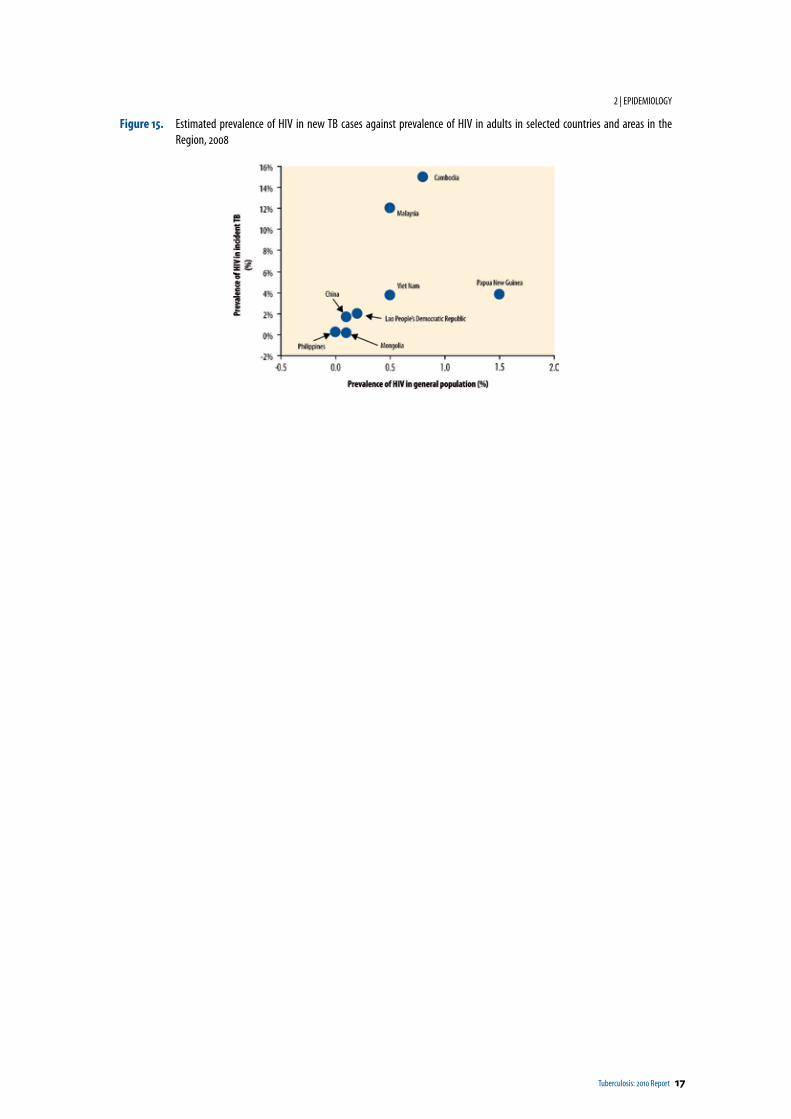
In all countries and areas in the Region, HIV prevalence in new TB cases is consistently higher than the prevalence of HIV in the general adult population (Figure 15).
7 National TB Programme case notification report, 2009, Papua New Guinea.8 Unpublished data, Sentinel survey 2008, National TB Programme, National Department of Health, Papua New Guinea9 Tran NB et al. HIV and tuberculosis in Ho Chi Minh City, Viet Nam, 1997–2002. Emerging Infectious Diseases, 2007:13:1463–1469.10 Data presented at the Meeting on the Revised TB-HIV Co-Infection Framework for the Western Pacific Region held in February 2008.11 2008 Report on the global AIDS epidemic, UNAIDS/WHO, 2008. (http://www.unaids.org/en/KnowledgeCentre/HIVData/GlobalReport/2008/2008_Global_report.
asp)
Tuberculosis: 2010 Report 17
2 | EPIDEMIOLOGY
Figure 15. Estimated prevalence of HIV in new TB cases against prevalence of HIV in adults in selected countries and areas in the Region, 2008

Tuberculosis: 2010 Report 19
3 TB Control
3.1 Case detection and trend
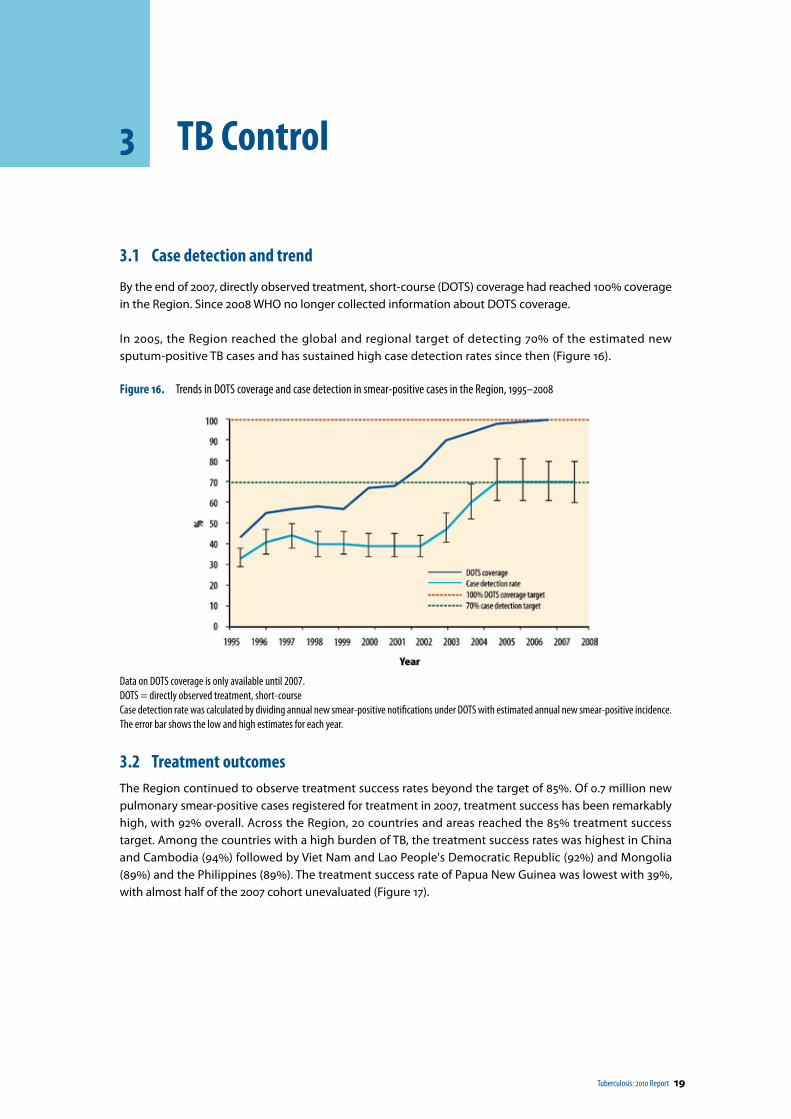
By the end of 2007, directly observed treatment, short-course (DOTS) coverage had reached 100% coverage in the Region. Since 2008 WHO no longer collected information about DOTS coverage.
In 2005, the Region reached the global and regional target of detecting 70% of the estimated new sputum-positive TB cases and has sustained high case detection rates since then (Figure 16).
Figure 16. Trends in DOTS coverage and case detection in smear-positive cases in the Region, 1995–2008
Data on DOTS coverage is only available until 2007.DOTS = directly observed treatment, short-course Case detection rate was calculated by dividing annual new smear-positive notifications under DOTS with estimated annual new smear-positive incidence.The error bar shows the low and high estimates for each year.
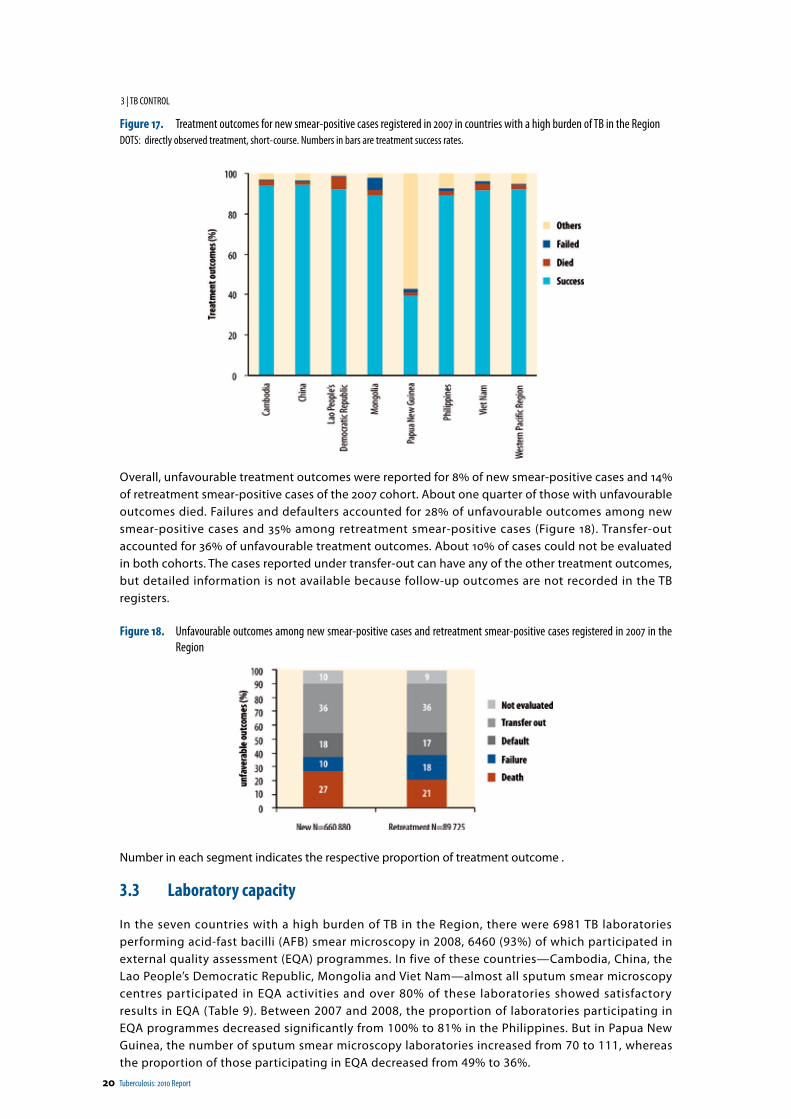
3.2 Treatment outcomesThe Region continued to observe treatment success rates beyond the target of 85%. Of 0.7 million new pulmonary smear-positive cases registered for treatment in 2007, treatment success has been remarkably high, with 92% overall. Across the Region, 20 countries and areas reached the 85% treatment success target. Among the countries with a high burden of TB, the treatment success rates was highest in China and Cambodia (94%) followed by Viet Nam and Lao People's Democratic Republic (92%) and Mongolia (89%) and the Philippines (89%). The treatment success rate of Papua New Guinea was lowest with 39%, with almost half of the 2007 cohort unevaluated (Figure 17).
20 Tuberculosis: 2010 Report
3 | TB CONTROL
Figure 17. Treatment outcomes for new smear-positive cases registered in 2007 in countries with a high burden of TB in the Region DOTS: directly observed treatment, short-course. Numbers in bars are treatment success rates.
Overall, unfavourable treatment outcomes were reported for 8% of new smear-positive cases and 14% of retreatment smear-positive cases of the 2007 cohort. About one quarter of those with unfavourable outcomes died. Failures and defaulters accounted for 28% of unfavourable outcomes among new smear-positive cases and 35% among retreatment smear-positive cases (Figure 18). Transfer-out accounted for 36% of unfavourable treatment outcomes. About 10% of cases could not be evaluated in both cohorts. The cases reported under transfer-out can have any of the other treatment outcomes, but detailed information is not available because follow-up outcomes are not recorded in the TB registers.
Figure 18. Unfavourable outcomes among new smear-positive cases and retreatment smear-positive cases registered in 2007 in the Region
Number in each segment indicates the respective proportion of treatment outcome .
3.3 Laboratory capacity
In the seven countries with a high burden of TB in the Region, there were 6981 TB laboratories performing acid-fast bacilli (AFB) smear microscopy in 2008, 6460 (93%) of which participated in external quality assessment (EQA) programmes. In five of these countries—Cambodia, China, the Lao People’s Democratic Republic, Mongolia and Viet Nam—almost all sputum smear microscopy centres participated in EQA activities and over 80% of these laboratories showed satisfactory results in EQA (Table 9). Between 2007 and 2008, the proportion of laboratories participating in EQA programmes decreased significantly from 100% to 81% in the Philippines. But in Papua New Guinea, the number of sputum smear microscopy laboratories increased from 70 to 111, whereas the proportion of those participating in EQA decreased from 49% to 36%.
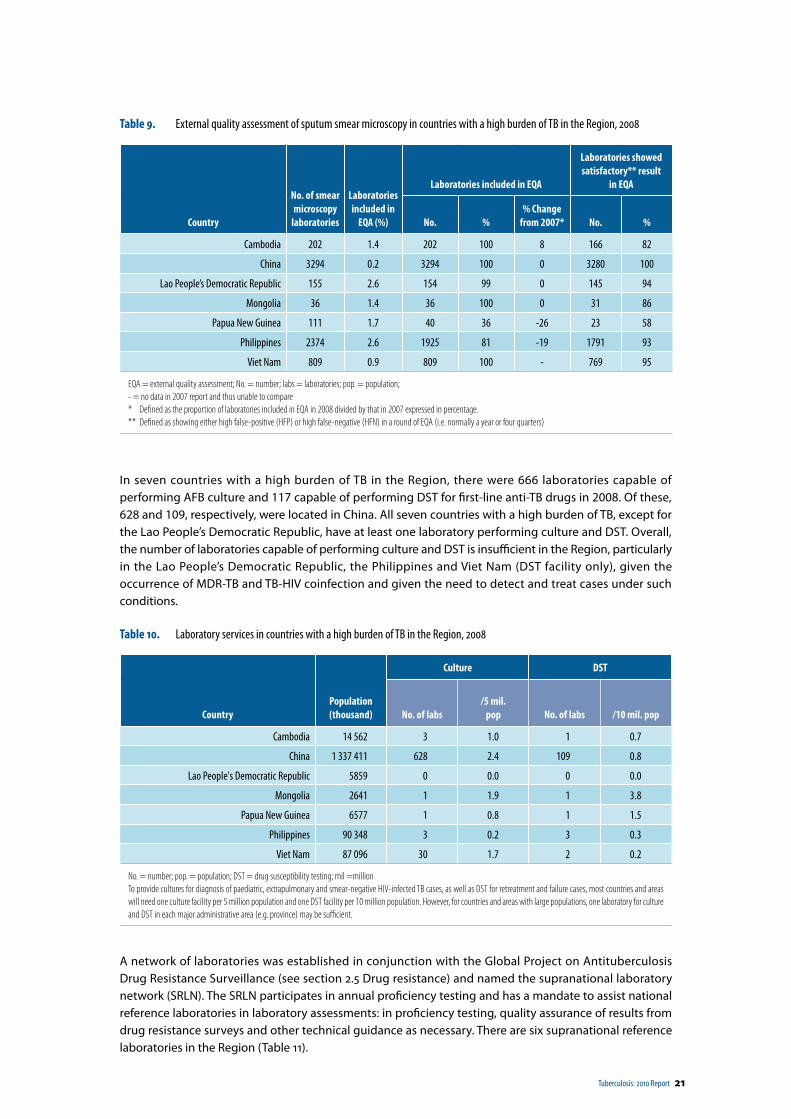
Tuberculosis: 2010 Report 21
Table 9. External quality assessment of sputum smear microscopy in countries with a high burden of TB in the Region, 2008
Country
No. of smear microscopy
laboratories
Laboratories included in
EQA (%)
Laboratories included in EQA
Laboratories showed satisfactory** result
in EQA
No. %% Change
from 2007* No. %
Cambodia 202 1.4 202 100 8 166 82
China 3294 0.2 3294 100 0 3280 100
Lao People’s Democratic Republic 155 2.6 154 99 0 145 94
Mongolia 36 1.4 36 100 0 31 86
Papua New Guinea 111 1.7 40 36 -26 23 58
Philippines 2374 2.6 1925 81 -19 1791 93
Viet Nam 809 0.9 809 100 - 769 95
EQA = external quality assessment; No. = number; labs = laboratories; pop. = population;- = no data in 2007 report and thus unable to compare* Defined as the proportion of laboratories included in EQA in 2008 divided by that in 2007 expressed in percentage.** Defined as showing either high false-positive (HFP) or high false-negative (HFN) in a round of EQA (i.e. normally a year or four quarters)
In seven countries with a high burden of TB in the Region, there were 666 laboratories capable of performing AFB culture and 117 capable of performing DST for first-line anti-TB drugs in 2008. Of these, 628 and 109, respectively, were located in China. All seven countries with a high burden of TB, except for the Lao People’s Democratic Republic, have at least one laboratory performing culture and DST. Overall, the number of laboratories capable of performing culture and DST is insufficient in the Region, particularly in the Lao People’s Democratic Republic, the Philippines and Viet Nam (DST facility only), given the occurrence of MDR-TB and TB-HIV coinfection and given the need to detect and treat cases under such conditions.
Table 10. Laboratory services in countries with a high burden of TB in the Region, 2008
CountryPopulation(thousand)
Culture DST
No. of labs/5 mil.
pop No. of labs /10 mil. pop
Cambodia 14 562 3 1.0 1 0.7
China 1 337 411 628 2.4 109 0.8
Lao People's Democratic Republic 5859 0 0.0 0 0.0
Mongolia 2641 1 1.9 1 3.8
Papua New Guinea 6577 1 0.8 1 1.5
Philippines 90 348 3 0.2 3 0.3
Viet Nam 87 096 30 1.7 2 0.2
No. = number; pop. = population; DST = drug susceptibility testing; mil =millionTo provide cultures for diagnosis of paediatric, extrapulmonary and smear-negative HIV-infected TB cases, as well as DST for retreatment and failure cases, most countries and areas will need one culture facility per 5 million population and one DST facility per 10 million population. However, for countries and areas with large populations, one laboratory for culture and DST in each major administrative area (e.g. province) may be sufficient.
A network of laboratories was established in conjunction with the Global Project on Antituberculosis Drug Resistance Surveillance (see section 2.5 Drug resistance) and named the supranational laboratory network (SRLN). The SRLN participates in annual proficiency testing and has a mandate to assist national reference laboratories in laboratory assessments: in proficiency testing, quality assurance of results from drug resistance surveys and other technical guidance as necessary. There are six supranational reference laboratories in the Region (Table 11).
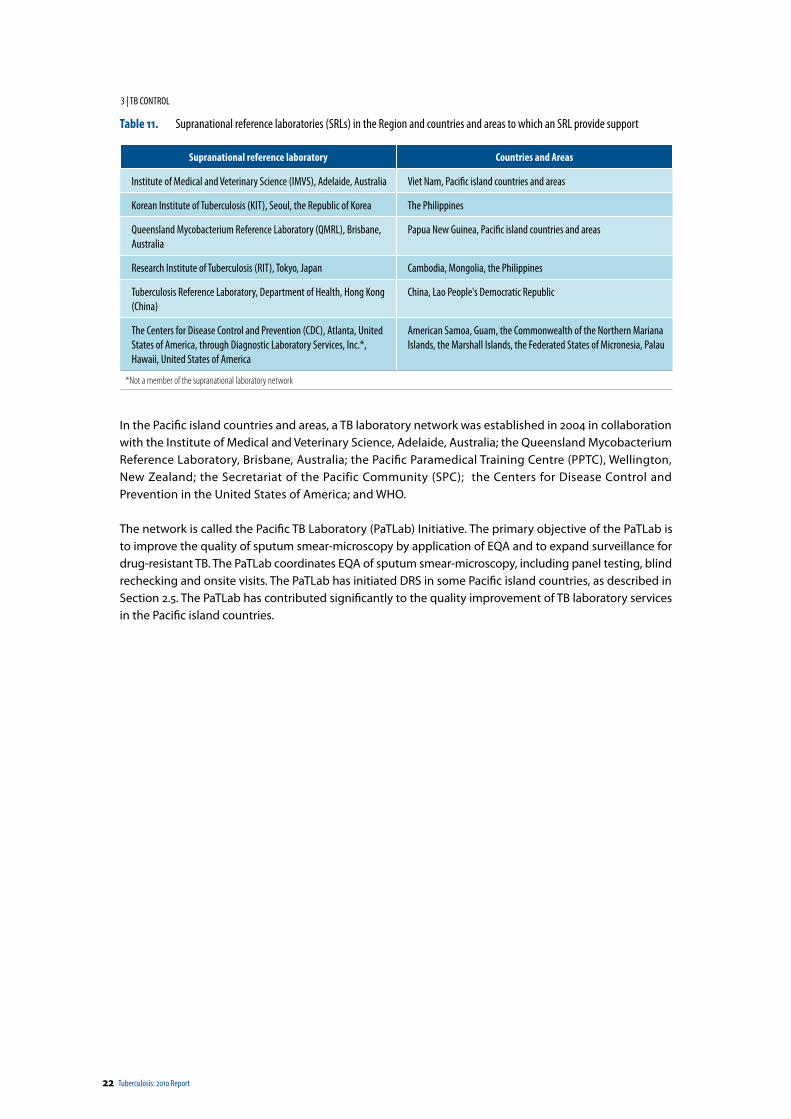
22 Tuberculosis: 2010 Report
3 | TB CONTROL
Table 11. Supranational reference laboratories (SRLs) in the Region and countries and areas to which an SRL provide support
Supranational reference laboratory Countries and Areas
Institute of Medical and Veterinary Science (IMVS), Adelaide, Australia Viet Nam, Pacific island countries and areas
Korean Institute of Tuberculosis (KIT), Seoul, the Republic of Korea The Philippines
Queensland Mycobacterium Reference Laboratory (QMRL), Brisbane, Australia
Papua New Guinea, Pacific island countries and areas
Research Institute of Tuberculosis (RIT), Tokyo, Japan Cambodia, Mongolia, the Philippines
Tuberculosis Reference Laboratory, Department of Health, Hong Kong (China)
China, Lao People's Democratic Republic
The Centers for Disease Control and Prevention (CDC), Atlanta, United States of America, through Diagnostic Laboratory Services, Inc.*, Hawaii, United States of America
American Samoa, Guam, the Commonwealth of the Northern Mariana Islands, the Marshall Islands, the Federated States of Micronesia, Palau
*Not a member of the supranational laboratory network
In the Pacific island countries and areas, a TB laboratory network was established in 2004 in collaboration with the Institute of Medical and Veterinary Science, Adelaide, Australia; the Queensland Mycobacterium Reference Laboratory, Brisbane, Australia; the Pacific Paramedical Training Centre (PPTC), Wellington, New Zealand; the Secretariat of the Pacific Community (SPC); the Centers for Disease Control and Prevention in the United States of America; and WHO.
The network is called the Pacific TB Laboratory (PaTLab) Initiative. The primary objective of the PaTLab is to improve the quality of sputum smear-microscopy by application of EQA and to expand surveillance for drug-resistant TB. The PaTLab coordinates EQA of sputum smear-microscopy, including panel testing, blind rechecking and onsite visits. The PaTLab has initiated DRS in some Pacific island countries, as described in Section 2.5. The PaTLab has contributed significantly to the quality improvement of TB laboratory services in the Pacific island countries.
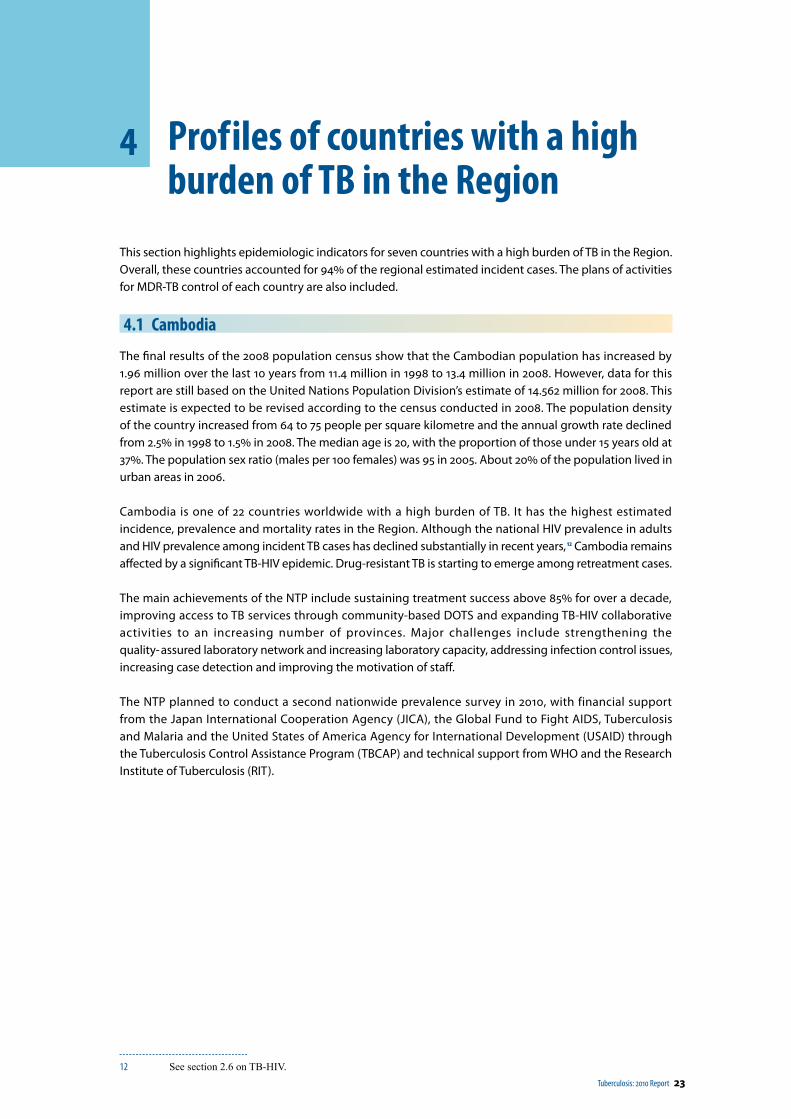
Tuberculosis: 2010 Report 23
4 Prof iles of countries with a high burden of TB in the Region
This section highlights epidemiologic indicators for seven countries with a high burden of TB in the Region. Overall, these countries accounted for 94% of the regional estimated incident cases. The plans of activities for MDR-TB control of each country are also included.
4.1 Cambodia
The final results of the 2008 population census show that the Cambodian population has increased by 1.96 million over the last 10 years from 11.4 million in 1998 to 13.4 million in 2008. However, data for this report are still based on the United Nations Population Division’s estimate of 14.562 million for 2008. This estimate is expected to be revised according to the census conducted in 2008. The population density of the country increased from 64 to 75 people per square kilometre and the annual growth rate declined from 2.5% in 1998 to 1.5% in 2008. The median age is 20, with the proportion of those under 15 years old at 37%. The population sex ratio (males per 100 females) was 95 in 2005. About 20% of the population lived in urban areas in 2006.
Cambodia is one of 22 countries worldwide with a high burden of TB. It has the highest estimated incidence, prevalence and mortality rates in the Region. Although the national HIV prevalence in adults and HIV prevalence among incident TB cases has declined substantially in recent years, 12 Cambodia remains affected by a significant TB-HIV epidemic. Drug-resistant TB is starting to emerge among retreatment cases.
The main achievements of the NTP include sustaining treatment success above 85% for over a decade, improving access to TB services through community-based DOTS and expanding TB-HIV collaborative activities to an increasing number of provinces. Major challenges include strengthening the quality- assured laboratory network and increasing laboratory capacity, addressing infection control issues, increasing case detection and improving the motivation of staff.
The NTP planned to conduct a second nationwide prevalence survey in 2010, with financial support from the Japan International Cooperation Agency (JICA), the Global Fund to Fight AIDS, Tuberculosis and Malaria and the United States of America Agency for International Development (USAID) through the Tuberculosis Control Assistance Program (TBCAP) and technical support from WHO and the Research Institute of Tuberculosis (RIT).
12 See section 2.6 on TB-HIV.
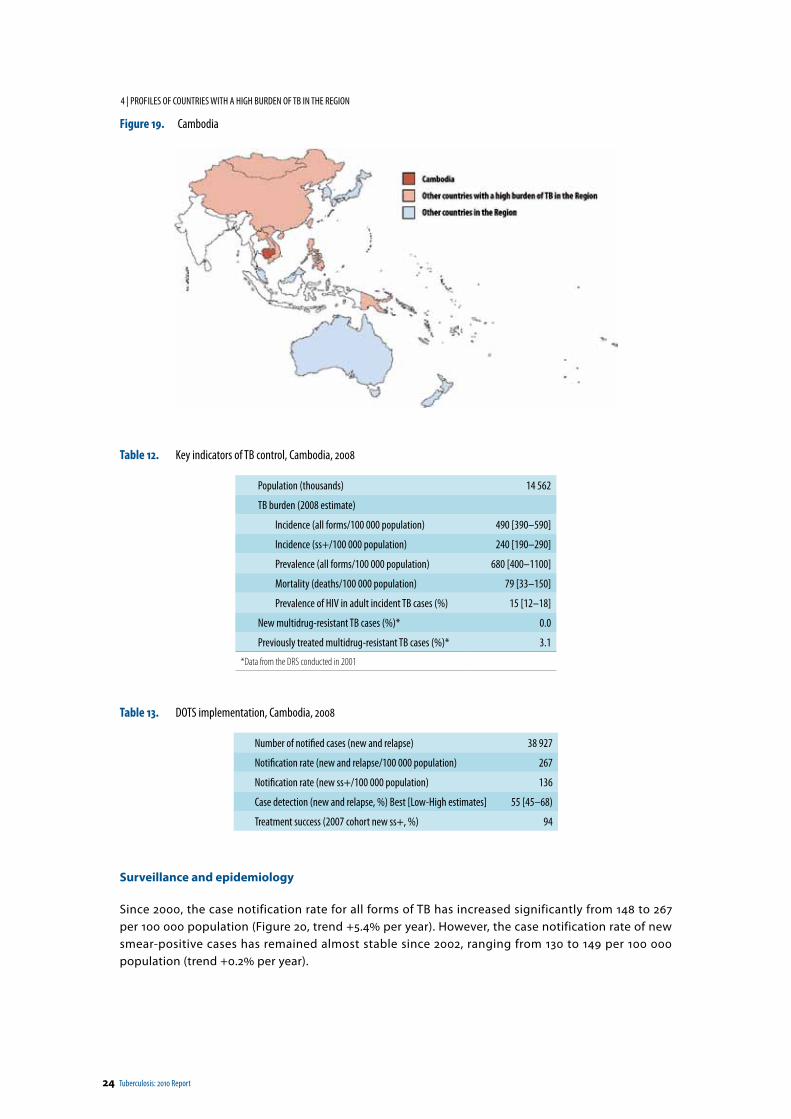
24 Tuberculosis: 2010 Report
4 | PROF ILES OF COUNTRIES WITH A HIGH BURDEN OF TB IN THE REGION
Figure 19. Cambodia
Table 12. Key indicators of TB control, Cambodia, 2008
Population (thousands) 14 562
TB burden (2008 estimate)
Incidence (all forms/100 000 population) 490 [390–590]
Incidence (ss+/100 000 population) 240 [190–290]
Prevalence (all forms/100 000 population) 680 [400–1100]
Mortality (deaths/100 000 population) 79 [33–150]
Prevalence of HIV in adult incident TB cases (%) 15 [12–18]
New multidrug-resistant TB cases (%)* 0.0
Previously treated multidrug-resistant TB cases (%)* 3.1
*Data from the DRS conducted in 2001
Table 13. DOTS implementation, Cambodia, 2008
Number of notified cases (new and relapse) 38 927
Notification rate (new and relapse/100 000 population) 267
Notification rate (new ss+/100 000 population) 136
Case detection (new and relapse, %) Best [Low-High estimates] 55 [45–68)
Treatment success (2007 cohort new ss+, %) 94
Surveillance and epidemiology
Since 2000, the case notification rate for all forms of TB has increased significantly from 148 to 267 per 100 000 population (Figure 20, trend +5.4% per year). However, the case notification rate of new smear-positive cases has remained almost stable since 2002, ranging from 130 to 149 per 100 000 population (trend +0.2% per year).
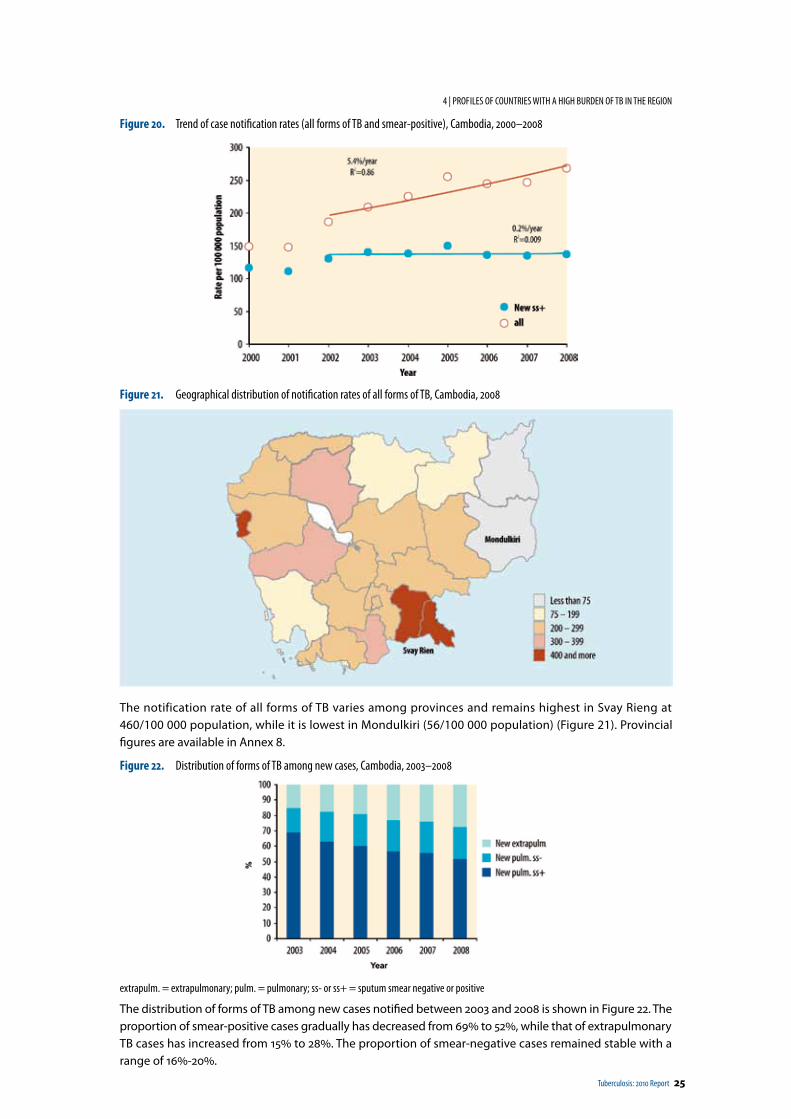
Tuberculosis: 2010 Report 25
4 | PROF ILES OF COUNTRIES WITH A HIGH BURDEN OF TB IN THE REGION
Figure 20. Trend of case notification rates (all forms of TB and smear-positive), Cambodia, 2000–2008
Figure 21. Geographical distribution of notification rates of all forms of TB, Cambodia, 2008
The notification rate of all forms of TB varies among provinces and remains highest in Svay Rieng at 460/100 000 population, while it is lowest in Mondulkiri (56/100 000 population) (Figure 21). Provincial figures are available in Annex 8.
Figure 22. Distribution of forms of TB among new cases, Cambodia, 2003–2008
extrapulm. = extrapulmonary; pulm. = pulmonary; ss- or ss+ = sputum smear negative or positive
The distribution of forms of TB among new cases notified between 2003 and 2008 is shown in Figure 22. The proportion of smear-positive cases gradually has decreased from 69% to 52%, while that of extrapulmonary TB cases has increased from 15% to 28%. The proportion of smear-negative cases remained stable with a range of 16%-20%.
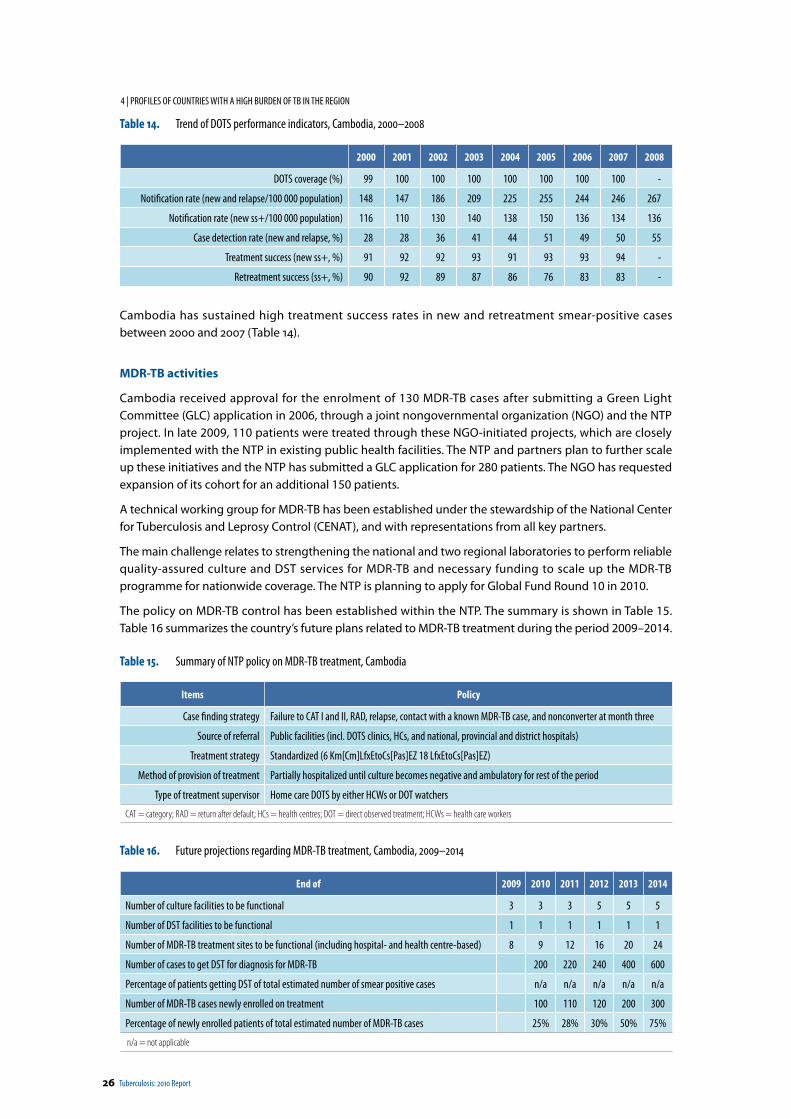
26 Tuberculosis: 2010 Report
4 | PROF ILES OF COUNTRIES WITH A HIGH BURDEN OF TB IN THE REGION
Table 14. Trend of DOTS performance indicators, Cambodia, 2000–2008
2000 2001 2002 2003 2004 2005 2006 2007 2008
DOTS coverage (%) 99 100 100 100 100 100 100 100 -
Notification rate (new and relapse/100 000 population) 148 147 186 209 225 255 244 246 267
Notification rate (new ss+/100 000 population) 116 110 130 140 138 150 136 134 136
Case detection rate (new and relapse, %) 28 28 36 41 44 51 49 50 55
Treatment success (new ss+, %) 91 92 92 93 91 93 93 94 -
Retreatment success (ss+, %) 90 92 89 87 86 76 83 83 -
Cambodia has sustained high treatment success rates in new and retreatment smear-positive cases between 2000 and 2007 (Table 14).
MDR-TB activities
Cambodia received approval for the enrolment of 130 MDR-TB cases after submitting a Green Light Committee (GLC) application in 2006, through a joint nongovernmental organization (NGO) and the NTP project. In late 2009, 110 patients were treated through these NGO-initiated projects, which are closely implemented with the NTP in existing public health facilities. The NTP and partners plan to further scale up these initiatives and the NTP has submitted a GLC application for 280 patients. The NGO has requested expansion of its cohort for an additional 150 patients.
A technical working group for MDR-TB has been established under the stewardship of the National Center for Tuberculosis and Leprosy Control (CENAT), and with representations from all key partners.
The main challenge relates to strengthening the national and two regional laboratories to perform reliable quality-assured culture and DST services for MDR-TB and necessary funding to scale up the MDR-TB programme for nationwide coverage. The NTP is planning to apply for Global Fund Round 10 in 2010.
The policy on MDR-TB control has been established within the NTP. The summary is shown in Table 15. Table 16 summarizes the country’s future plans related to MDR-TB treatment during the period 2009–2014.
Table 15. Summary of NTP policy on MDR-TB treatment, Cambodia
Items Policy
Case finding strategy Failure to CAT I and II, RAD, relapse, contact with a known MDR-TB case, and nonconverter at month three
Source of referral Public facilities (incl. DOTS clinics, HCs, and national, provincial and district hospitals)
Treatment strategy Standardized (6 Km[Cm]LfxEtoCs[Pas]EZ 18 LfxEtoCs[Pas]EZ)
Method of provision of treatment Partially hospitalized until culture becomes negative and ambulatory for rest of the period
Type of treatment supervisor Home care DOTS by either HCWs or DOT watchers
CAT = category; RAD = return after default; HCs = health centres; DOT = direct observed treatment; HCWs = health care workers
Table 16. Future projections regarding MDR-TB treatment, Cambodia, 2009–2014
End of 2009 2010 2011 2012 2013 2014
Number of culture facilities to be functional 3 3 3 5 5 5
Number of DST facilities to be functional 1 1 1 1 1 1
Number of MDR-TB treatment sites to be functional (including hospital- and health centre-based) 8 9 12 16 20 24
Number of cases to get DST for diagnosis for MDR-TB 200 220 240 400 600
Percentage of patients getting DST of total estimated number of smear positive cases n/a n/a n/a n/a n/a
Number of MDR-TB cases newly enrolled on treatment 100 110 120 200 300
Percentage of newly enrolled patients of total estimated number of MDR-TB cases 25% 28% 30% 50% 75%
n/a = not applicable
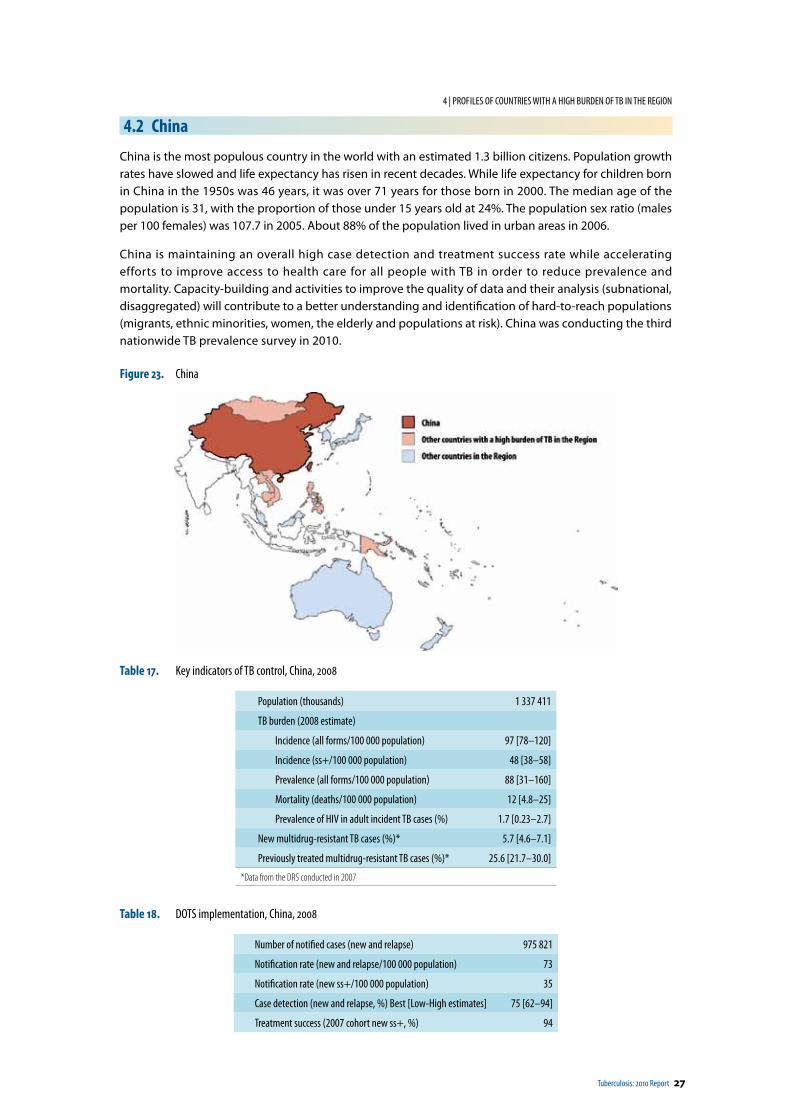
Tuberculosis: 2010 Report 27
4 | PROF ILES OF COUNTRIES WITH A HIGH BURDEN OF TB IN THE REGION
4.2 China
China is the most populous country in the world with an estimated 1.3 billion citizens. Population growth rates have slowed and life expectancy has risen in recent decades. While life expectancy for children born in China in the 1950s was 46 years, it was over 71 years for those born in 2000. The median age of the population is 31, with the proportion of those under 15 years old at 24%. The population sex ratio (males per 100 females) was 107.7 in 2005. About 88% of the population lived in urban areas in 2006.
China is maintaining an overall high case detection and treatment success rate while accelerating efforts to improve access to health care for all people with TB in order to reduce prevalence and mortality. Capacity-building and activities to improve the quality of data and their analysis (subnational, disaggregated) will contribute to a better understanding and identification of hard-to-reach populations (migrants, ethnic minorities, women, the elderly and populations at risk). China was conducting the third nationwide TB prevalence survey in 2010.
Figure 23. China
Table 17. Key indicators of TB control, China, 2008
Population (thousands) 1 337 411
TB burden (2008 estimate)
Incidence (all forms/100 000 population) 97 [78–120]
Incidence (ss+/100 000 population) 48 [38–58]
Prevalence (all forms/100 000 population) 88 [31–160]
Mortality (deaths/100 000 population) 12 [4.8–25]
Prevalence of HIV in adult incident TB cases (%) 1.7 [0.23–2.7]
New multidrug-resistant TB cases (%)* 5.7 [4.6–7.1]
Previously treated multidrug-resistant TB cases (%)* 25.6 [21.7–30.0]
*Data from the DRS conducted in 2007
Table 18. DOTS implementation, China, 2008
Number of notified cases (new and relapse) 975 821
Notification rate (new and relapse/100 000 population) 73
Notification rate (new ss+/100 000 population) 35
Case detection (new and relapse, %) Best [Low-High estimates] 75 [62–94]
Treatment success (2007 cohort new ss+, %) 94
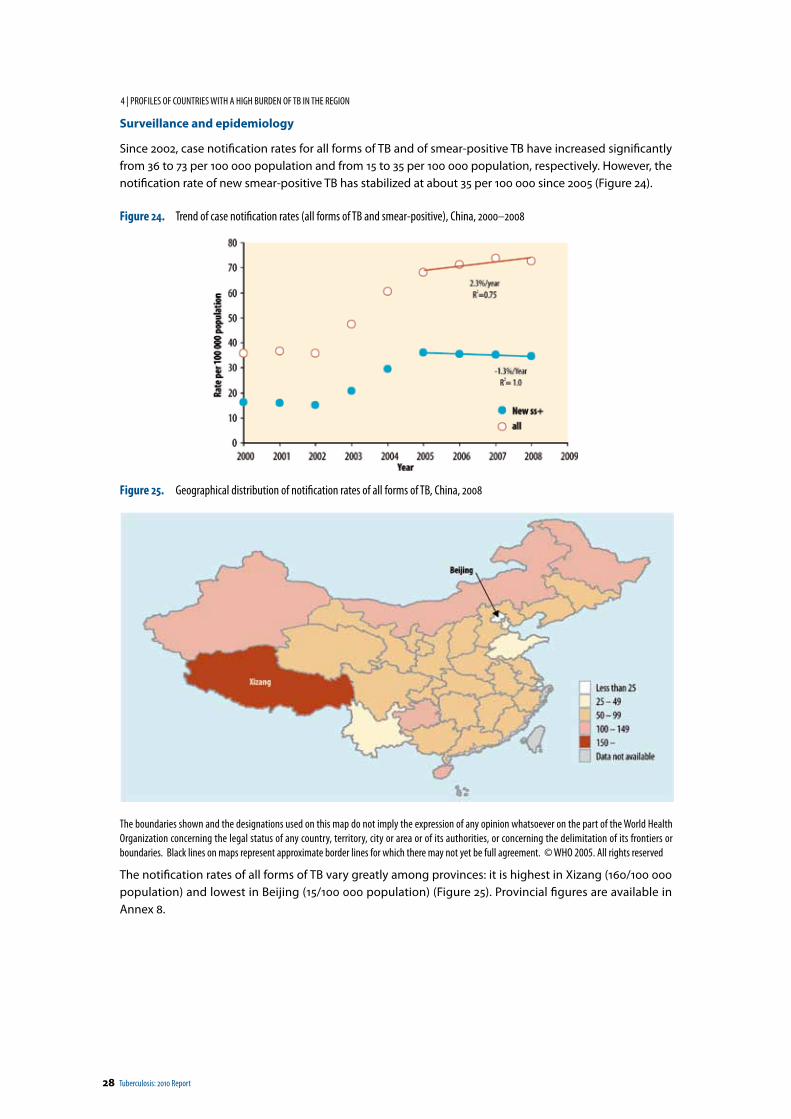
28 Tuberculosis: 2010 Report
4 | PROF ILES OF COUNTRIES WITH A HIGH BURDEN OF TB IN THE REGION
Surveillance and epidemiology
Since 2002, case notification rates for all forms of TB and of smear-positive TB have increased significantly from 36 to 73 per 100 000 population and from 15 to 35 per 100 000 population, respectively. However, the notification rate of new smear-positive TB has stabilized at about 35 per 100 000 since 2005 (Figure 24).
Figure 24. Trend of case notification rates (all forms of TB and smear-positive), China, 2000–2008
Figure 25. Geographical distribution of notification rates of all forms of TB, China, 2008
The boundaries shown and the designations used on this map do not imply the expression of any opinion whatsoever on the part of the World Health Organization concerning the legal status of any country, territory, city or area or of its authorities, or concerning the delimitation of its frontiers or boundaries. Black lines on maps represent approximate border lines for which there may not yet be full agreement. © WHO 2005. All rights reserved
The notification rates of all forms of TB vary greatly among provinces: it is highest in Xizang (160/100 000 population) and lowest in Beijing (15/100 000 population) (Figure 25). Provincial figures are available in Annex 8.
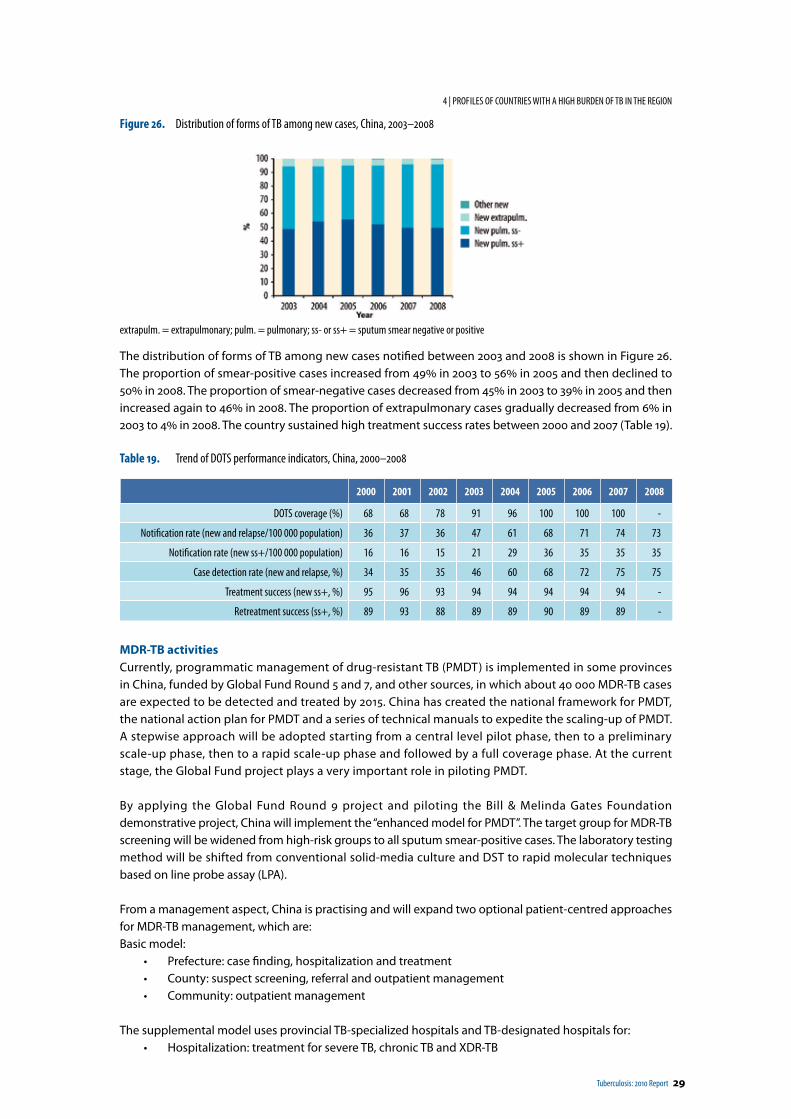
Tuberculosis: 2010 Report 29
4 | PROF ILES OF COUNTRIES WITH A HIGH BURDEN OF TB IN THE REGION
Figure 26. Distribution of forms of TB among new cases, China, 2003–2008
extrapulm. = extrapulmonary; pulm. = pulmonary; ss- or ss+ = sputum smear negative or positive
The distribution of forms of TB among new cases notified between 2003 and 2008 is shown in Figure 26. The proportion of smear-positive cases increased from 49% in 2003 to 56% in 2005 and then declined to 50% in 2008. The proportion of smear-negative cases decreased from 45% in 2003 to 39% in 2005 and then increased again to 46% in 2008. The proportion of extrapulmonary cases gradually decreased from 6% in 2003 to 4% in 2008. The country sustained high treatment success rates between 2000 and 2007 (Table 19).
Table 19. Trend of DOTS performance indicators, China, 2000–2008
2000 2001 2002 2003 2004 2005 2006 2007 2008
DOTS coverage (%) 68 68 78 91 96 100 100 100 -
Notification rate (new and relapse/100 000 population) 36 37 36 47 61 68 71 74 73
Notification rate (new ss+/100 000 population) 16 16 15 21 29 36 35 35 35
Case detection rate (new and relapse, %) 34 35 35 46 60 68 72 75 75
Treatment success (new ss+, %) 95 96 93 94 94 94 94 94 -
Retreatment success (ss+, %) 89 93 88 89 89 90 89 89 -
MDR-TB activitiesCurrently, programmatic management of drug-resistant TB (PMDT) is implemented in some provinces in China, funded by Global Fund Round 5 and 7, and other sources, in which about 40 000 MDR-TB cases are expected to be detected and treated by 2015. China has created the national framework for PMDT, the national action plan for PMDT and a series of technical manuals to expedite the scaling-up of PMDT. A stepwise approach will be adopted starting from a central level pilot phase, then to a preliminary scale-up phase, then to a rapid scale-up phase and followed by a full coverage phase. At the current stage, the Global Fund project plays a very important role in piloting PMDT.
By applying the Global Fund Round 9 project and piloting the Bill & Melinda Gates Foundation demonstrative project, China will implement the “enhanced model for PMDT”. The target group for MDR-TB screening will be widened from high-risk groups to all sputum smear-positive cases. The laboratory testing method will be shifted from conventional solid-media culture and DST to rapid molecular techniques based on line probe assay (LPA).
From a management aspect, China is practising and will expand two optional patient-centred approaches for MDR-TB management, which are:Basic model:
• Prefecture: case finding, hospitalization and treatment• County: suspect screening, referral and outpatient management• Community: outpatient management
The supplemental model uses provincial TB-specialized hospitals and TB-designated hospitals for: • Hospitalization: treatment for severe TB, chronic TB and XDR-TB
30 Tuberculosis: 2010 Report
4 | PROF ILES OF COUNTRIES WITH A HIGH BURDEN OF TB IN THE REGION
TB hospitals serve as clinical centres to provide clinical training, laboratory support and technical assistance.
With support from partners, the next steps for finalizing the plan for PMDT are:• To implement current projects and gain knowledge• To further consult and revise the current tentative plan• To fully integrate the plan into the next 10-year NTP plan• For the State Council to authorize the plan.
The policy on MDR-TB control has been established within the NTP. The summary is shown in Table 20.
Table 20. Summary of NTP policy on MDR-TB treatment
Items Policy
Case finding strategy Failure to Cat I and II, RAD, Relapse, Other retreatment, Contact with a known MDR-TB case, and nonconverter of smear after 2–3 months of start of treatment
Source of referral Public facilities (incl.: DOTS clinics, HCs, and hospitals at national, provincial and district levels)
Treatment strategy Both standardized (6ZKmLfxPasPto - 18ZLfxPASPto) and individualized
Method of provision of treatment Partially hospitalized (two months ) and ambulatory DOT
Type of treatment supervisor Home care DOT conducted by HCWs
Cat = category; RAD = return after default; HCs = health centres; DOT = direct observed treatment; HCWs = health care workers; incl. = including; Z = pyrazinamid; Km = kanamicin; Lfx = levofloxacin; Pas = para-aminosalicylic acid; Pto = protionamide
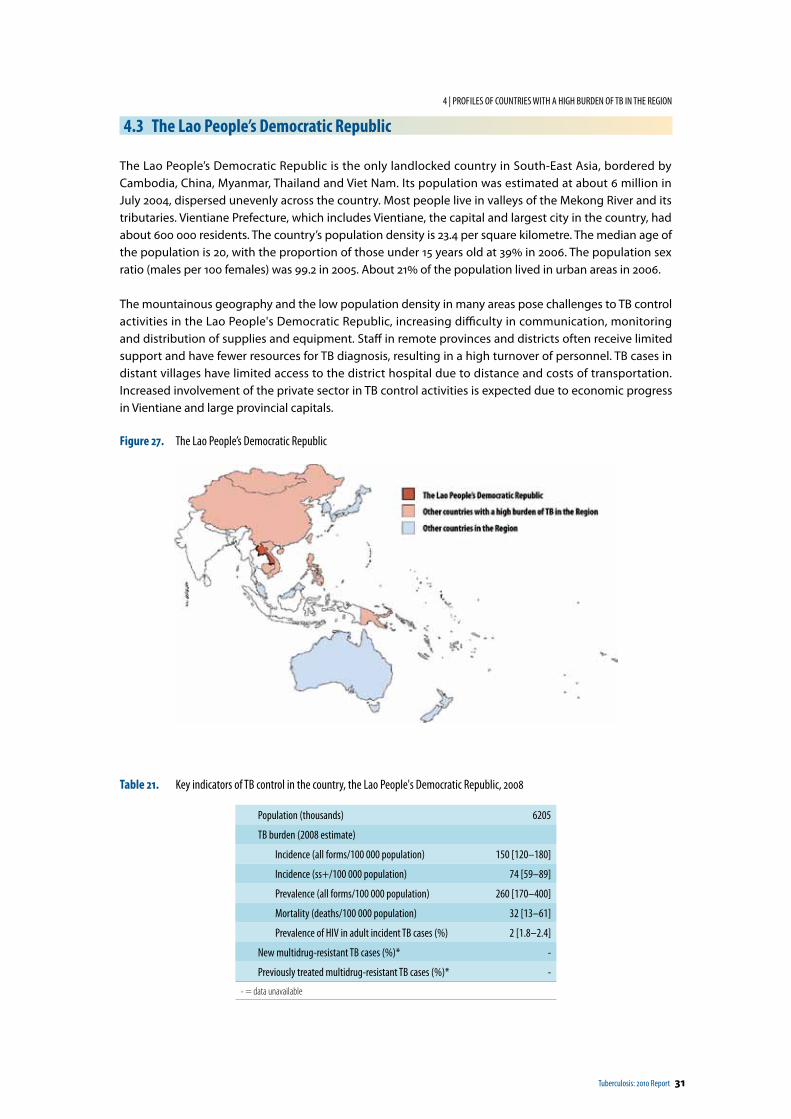
Tuberculosis: 2010 Report 31
4 | PROF ILES OF COUNTRIES WITH A HIGH BURDEN OF TB IN THE REGION
4.3 The Lao People’s Democratic Republic
The Lao People’s Democratic Republic is the only landlocked country in South-East Asia, bordered by Cambodia, China, Myanmar, Thailand and Viet Nam. Its population was estimated at about 6 million in July 2004, dispersed unevenly across the country. Most people live in valleys of the Mekong River and its tributaries. Vientiane Prefecture, which includes Vientiane, the capital and largest city in the country, had about 600 000 residents. The country’s population density is 23.4 per square kilometre. The median age of the population is 20, with the proportion of those under 15 years old at 39% in 2006. The population sex ratio (males per 100 females) was 99.2 in 2005. About 21% of the population lived in urban areas in 2006.
The mountainous geography and the low population density in many areas pose challenges to TB control activities in the Lao People's Democratic Republic, increasing difficulty in communication, monitoring and distribution of supplies and equipment. Staff in remote provinces and districts often receive limited support and have fewer resources for TB diagnosis, resulting in a high turnover of personnel. TB cases in distant villages have limited access to the district hospital due to distance and costs of transportation. Increased involvement of the private sector in TB control activities is expected due to economic progress in Vientiane and large provincial capitals.
Figure 27. The Lao People’s Democratic Republic
Table 21. Key indicators of TB control in the country, the Lao People's Democratic Republic, 2008
Population (thousands) 6205
TB burden (2008 estimate)
Incidence (all forms/100 000 population) 150 [120–180]
Incidence (ss+/100 000 population) 74 [59–89]
Prevalence (all forms/100 000 population) 260 [170–400]
Mortality (deaths/100 000 population) 32 [13–61]
Prevalence of HIV in adult incident TB cases (%) 2 [1.8–2.4]
New multidrug-resistant TB cases (%)* -
Previously treated multidrug-resistant TB cases (%)* -
- = data unavailable
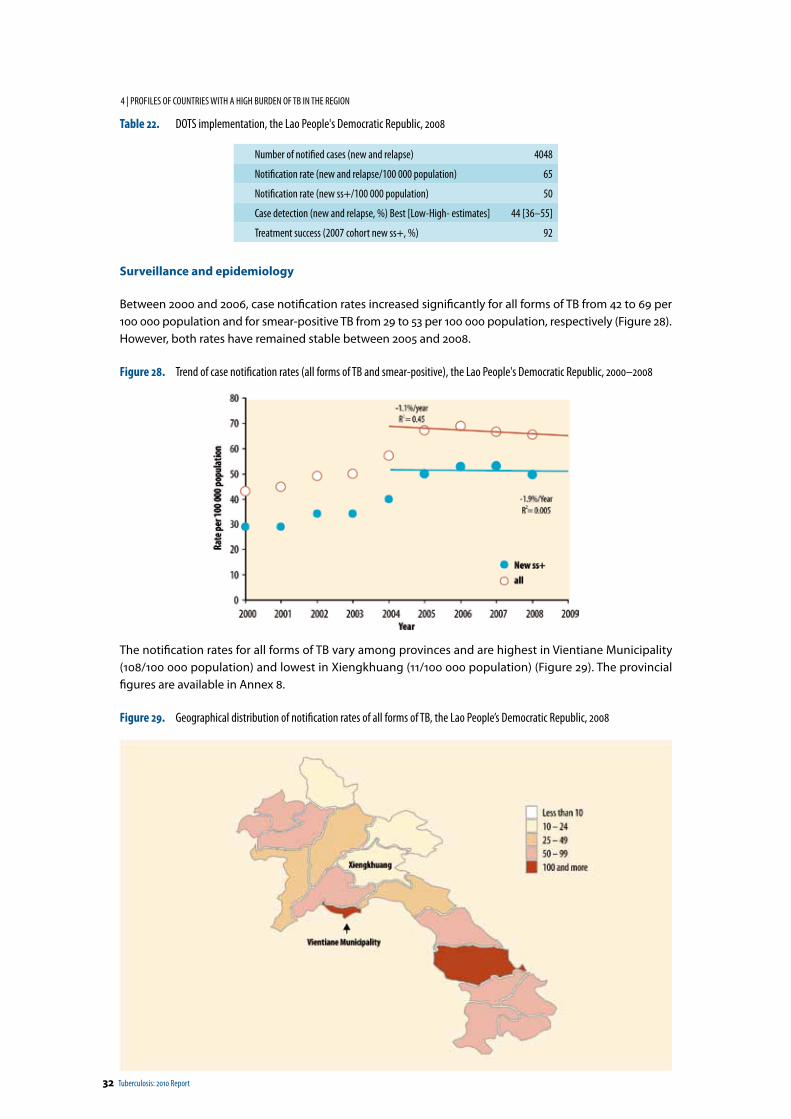
32 Tuberculosis: 2010 Report
4 | PROF ILES OF COUNTRIES WITH A HIGH BURDEN OF TB IN THE REGION
Table 22. DOTS implementation, the Lao People's Democratic Republic, 2008
Number of notified cases (new and relapse) 4048
Notification rate (new and relapse/100 000 population) 65
Notification rate (new ss+/100 000 population) 50
Case detection (new and relapse, %) Best [Low-High- estimates] 44 [36–55]
Treatment success (2007 cohort new ss+, %) 92
Surveillance and epidemiology
Between 2000 and 2006, case notification rates increased significantly for all forms of TB from 42 to 69 per 100 000 population and for smear-positive TB from 29 to 53 per 100 000 population, respectively (Figure 28). However, both rates have remained stable between 2005 and 2008.
Figure 28. Trend of case notification rates (all forms of TB and smear-positive), the Lao People's Democratic Republic, 2000–2008
The notification rates for all forms of TB vary among provinces and are highest in Vientiane Municipality (108/100 000 population) and lowest in Xiengkhuang (11/100 000 population) (Figure 29). The provincial figures are available in Annex 8.
Figure 29. Geographical distribution of notification rates of all forms of TB, the Lao People’s Democratic Republic, 2008
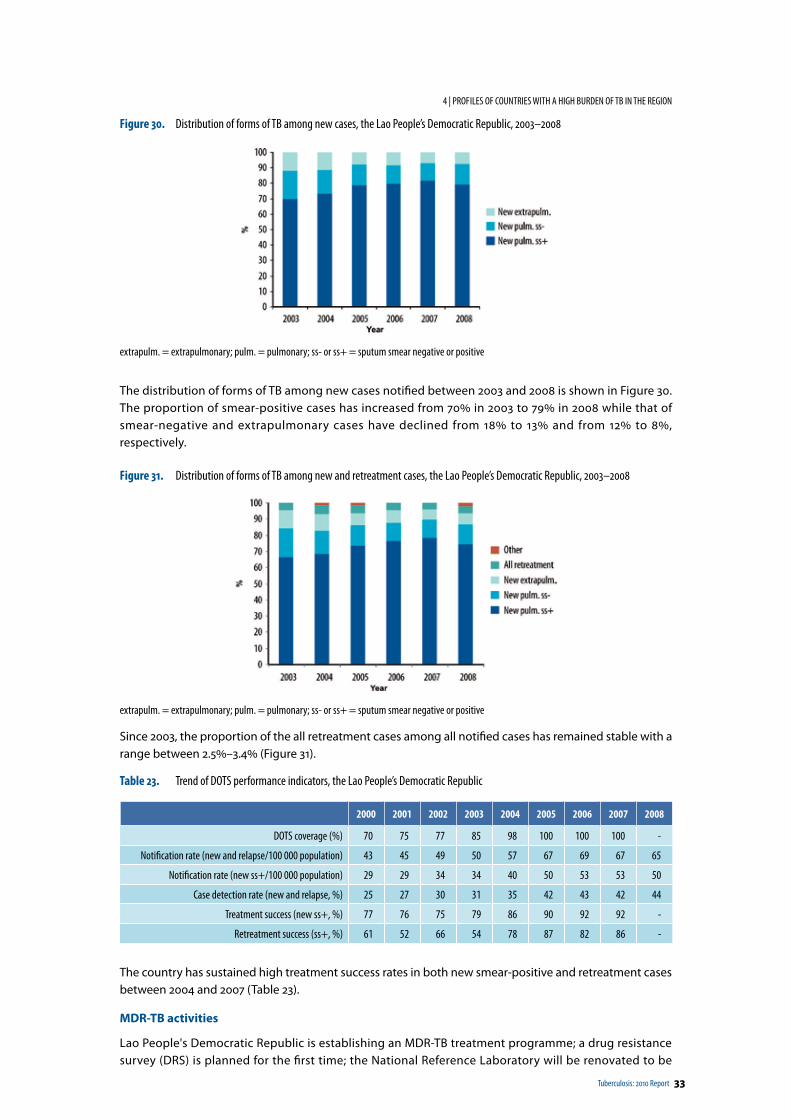
Tuberculosis: 2010 Report 33
4 | PROF ILES OF COUNTRIES WITH A HIGH BURDEN OF TB IN THE REGION
Figure 30. Distribution of forms of TB among new cases, the Lao People’s Democratic Republic, 2003–2008
extrapulm. = extrapulmonary; pulm. = pulmonary; ss- or ss+ = sputum smear negative or positive
The distribution of forms of TB among new cases notified between 2003 and 2008 is shown in Figure 30. The proportion of smear-positive cases has increased from 70% in 2003 to 79% in 2008 while that of smear-negative and extrapulmonary cases have declined from 18% to 13% and from 12% to 8%, respectively.
Figure 31. Distribution of forms of TB among new and retreatment cases, the Lao People’s Democratic Republic, 2003–2008
extrapulm. = extrapulmonary; pulm. = pulmonary; ss- or ss+ = sputum smear negative or positive
Since 2003, the proportion of the all retreatment cases among all notified cases has remained stable with a range between 2.5%–3.4% (Figure 31).
Table 23. Trend of DOTS performance indicators, the Lao People’s Democratic Republic
2000 2001 2002 2003 2004 2005 2006 2007 2008
DOTS coverage (%) 70 75 77 85 98 100 100 100 -
Notification rate (new and relapse/100 000 population) 43 45 49 50 57 67 69 67 65
Notification rate (new ss+/100 000 population) 29 29 34 34 40 50 53 53 50
Case detection rate (new and relapse, %) 25 27 30 31 35 42 43 42 44
Treatment success (new ss+, %) 77 76 75 79 86 90 92 92 -
Retreatment success (ss+, %) 61 52 66 54 78 87 82 86 -
The country has sustained high treatment success rates in both new smear-positive and retreatment cases between 2004 and 2007 (Table 23).
MDR-TB activities
Lao People's Democratic Republic is establishing an MDR-TB treatment programme; a drug resistance survey (DRS) is planned for the first time; the National Reference Laboratory will be renovated to be
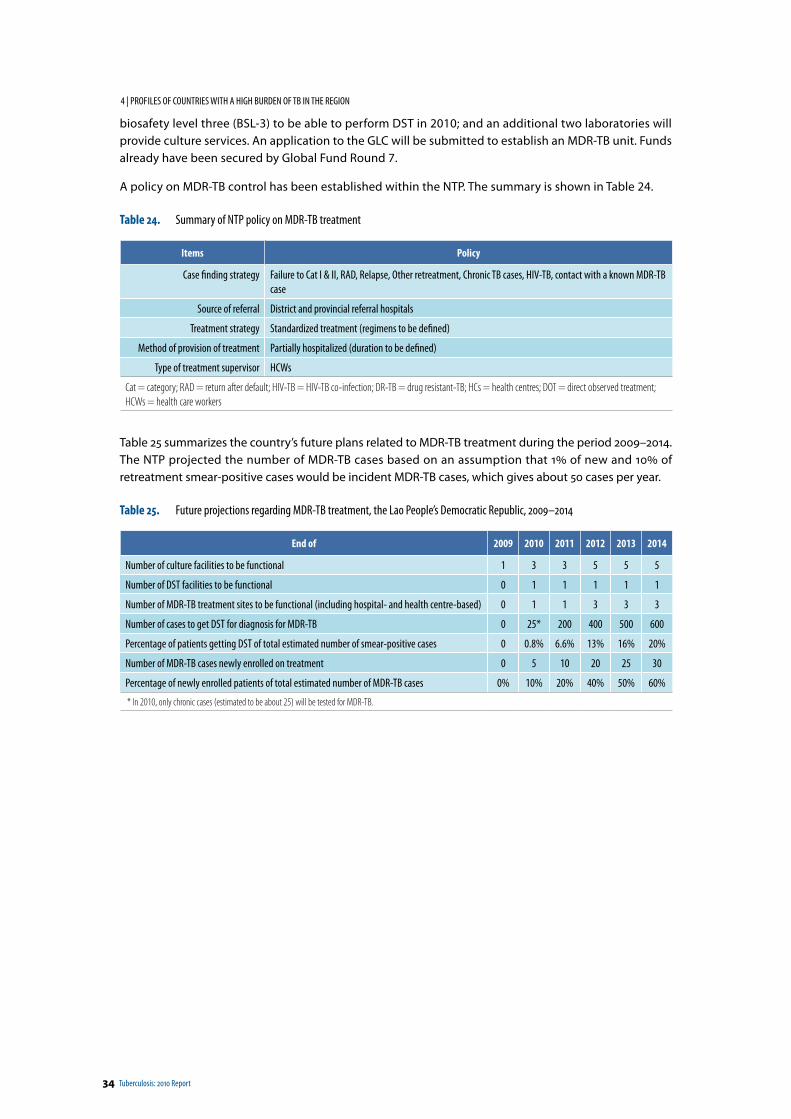
34 Tuberculosis: 2010 Report
4 | PROF ILES OF COUNTRIES WITH A HIGH BURDEN OF TB IN THE REGION
biosafety level three (BSL-3) to be able to perform DST in 2010; and an additional two laboratories will provide culture services. An application to the GLC will be submitted to establish an MDR-TB unit. Funds already have been secured by Global Fund Round 7.
A policy on MDR-TB control has been established within the NTP. The summary is shown in Table 24.
Table 24. Summary of NTP policy on MDR-TB treatment
Items Policy
Case finding strategy Failure to Cat I & II, RAD, Relapse, Other retreatment, Chronic TB cases, HIV-TB, contact with a known MDR-TB case
Source of referral District and provincial referral hospitals
Treatment strategy Standardized treatment (regimens to be defined)
Method of provision of treatment Partially hospitalized (duration to be defined)
Type of treatment supervisor HCWs
Cat = category; RAD = return after default; HIV-TB = HIV-TB co-infection; DR-TB = drug resistant-TB; HCs = health centres; DOT = direct observed treatment; HCWs = health care workers
Table 25 summarizes the country’s future plans related to MDR-TB treatment during the period 2009–2014. The NTP projected the number of MDR-TB cases based on an assumption that 1% of new and 10% of retreatment smear-positive cases would be incident MDR-TB cases, which gives about 50 cases per year.
Table 25. Future projections regarding MDR-TB treatment, the Lao People’s Democratic Republic, 2009–2014
End of 2009 2010 2011 2012 2013 2014
Number of culture facilities to be functional 1 3 3 5 5 5
Number of DST facilities to be functional 0 1 1 1 1 1
Number of MDR-TB treatment sites to be functional (including hospital- and health centre-based) 0 1 1 3 3 3
Number of cases to get DST for diagnosis for MDR-TB 0 25* 200 400 500 600
Percentage of patients getting DST of total estimated number of smear-positive cases 0 0.8% 6.6% 13% 16% 20%
Number of MDR-TB cases newly enrolled on treatment 0 5 10 20 25 30
Percentage of newly enrolled patients of total estimated number of MDR-TB cases 0% 10% 20% 40% 50% 60%
* In 2010, only chronic cases (estimated to be about 25) will be tested for MDR-TB.
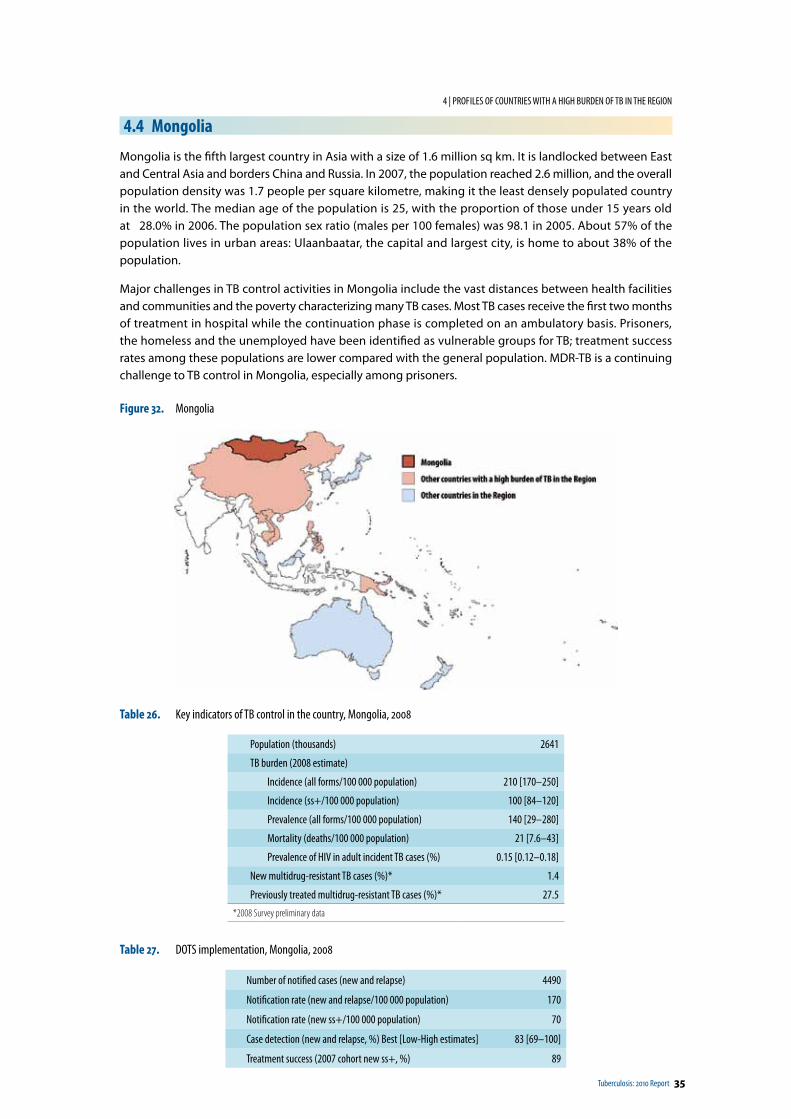
Tuberculosis: 2010 Report 35
4 | PROF ILES OF COUNTRIES WITH A HIGH BURDEN OF TB IN THE REGION
4.4 Mongolia
Mongolia is the fifth largest country in Asia with a size of 1.6 million sq km. It is landlocked between East and Central Asia and borders China and Russia. In 2007, the population reached 2.6 million, and the overall population density was 1.7 people per square kilometre, making it the least densely populated country in the world. The median age of the population is 25, with the proportion of those under 15 years old at 28.0% in 2006. The population sex ratio (males per 100 females) was 98.1 in 2005. About 57% of the population lives in urban areas: Ulaanbaatar, the capital and largest city, is home to about 38% of the population.
Major challenges in TB control activities in Mongolia include the vast distances between health facilities and communities and the poverty characterizing many TB cases. Most TB cases receive the first two months of treatment in hospital while the continuation phase is completed on an ambulatory basis. Prisoners, the homeless and the unemployed have been identified as vulnerable groups for TB; treatment success rates among these populations are lower compared with the general population. MDR-TB is a continuing challenge to TB control in Mongolia, especially among prisoners.
Figure 32. Mongolia
Table 26. Key indicators of TB control in the country, Mongolia, 2008
Population (thousands) 2641
TB burden (2008 estimate)
Incidence (all forms/100 000 population) 210 [170–250]
Incidence (ss+/100 000 population) 100 [84–120]
Prevalence (all forms/100 000 population) 140 [29–280]
Mortality (deaths/100 000 population) 21 [7.6–43]
Prevalence of HIV in adult incident TB cases (%) 0.15 [0.12–0.18]
New multidrug-resistant TB cases (%)* 1.4
Previously treated multidrug-resistant TB cases (%)* 27.5
*2008 Survey preliminary data
Table 27. DOTS implementation, Mongolia, 2008
Number of notified cases (new and relapse) 4490
Notification rate (new and relapse/100 000 population) 170
Notification rate (new ss+/100 000 population) 70
Case detection (new and relapse, %) Best [Low-High estimates] 83 [69–100]
Treatment success (2007 cohort new ss+, %) 89
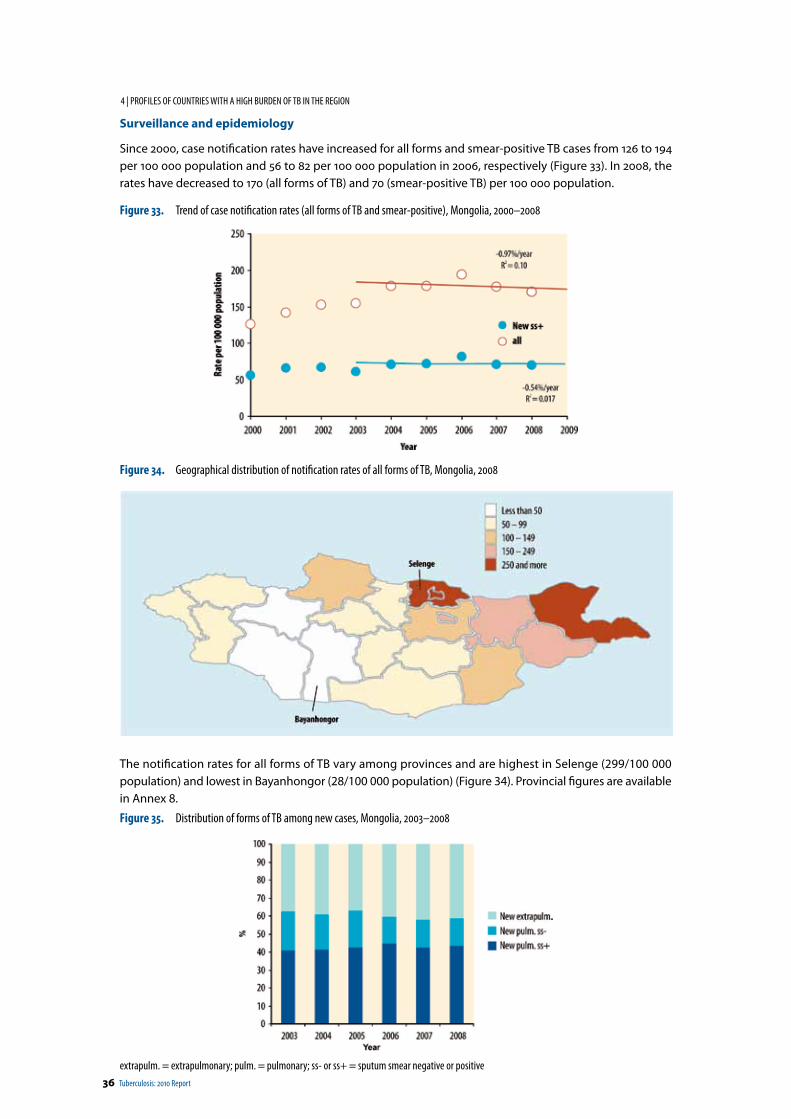
36 Tuberculosis: 2010 Report
4 | PROF ILES OF COUNTRIES WITH A HIGH BURDEN OF TB IN THE REGION
Surveillance and epidemiology
Since 2000, case notification rates have increased for all forms and smear-positive TB cases from 126 to 194 per 100 000 population and 56 to 82 per 100 000 population in 2006, respectively (Figure 33). In 2008, the rates have decreased to 170 (all forms of TB) and 70 (smear-positive TB) per 100 000 population.
Figure 33. Trend of case notification rates (all forms of TB and smear-positive), Mongolia, 2000–2008
Figure 34. Geographical distribution of notification rates of all forms of TB, Mongolia, 2008
The notification rates for all forms of TB vary among provinces and are highest in Selenge (299/100 000 population) and lowest in Bayanhongor (28/100 000 population) (Figure 34). Provincial figures are available in Annex 8.
Figure 35. Distribution of forms of TB among new cases, Mongolia, 2003–2008
extrapulm. = extrapulmonary; pulm. = pulmonary; ss- or ss+ = sputum smear negative or positive
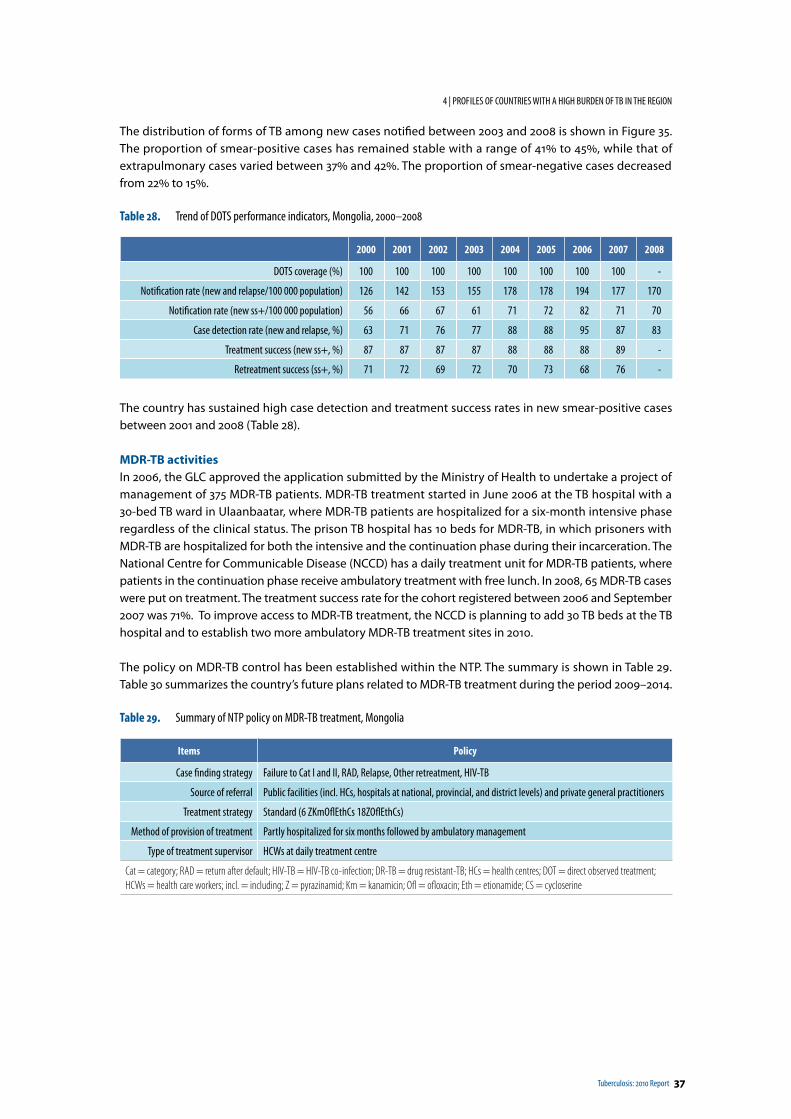
Tuberculosis: 2010 Report 37
4 | PROF ILES OF COUNTRIES WITH A HIGH BURDEN OF TB IN THE REGION
The distribution of forms of TB among new cases notified between 2003 and 2008 is shown in Figure 35. The proportion of smear-positive cases has remained stable with a range of 41% to 45%, while that of extrapulmonary cases varied between 37% and 42%. The proportion of smear-negative cases decreased from 22% to 15%.
Table 28. Trend of DOTS performance indicators, Mongolia, 2000–2008
2000 2001 2002 2003 2004 2005 2006 2007 2008
DOTS coverage (%) 100 100 100 100 100 100 100 100 -
Notification rate (new and relapse/100 000 population) 126 142 153 155 178 178 194 177 170
Notification rate (new ss+/100 000 population) 56 66 67 61 71 72 82 71 70
Case detection rate (new and relapse, %) 63 71 76 77 88 88 95 87 83
Treatment success (new ss+, %) 87 87 87 87 88 88 88 89 -
Retreatment success (ss+, %) 71 72 69 72 70 73 68 76 -
The country has sustained high case detection and treatment success rates in new smear-positive cases between 2001 and 2008 (Table 28).
MDR-TB activitiesIn 2006, the GLC approved the application submitted by the Ministry of Health to undertake a project of management of 375 MDR-TB patients. MDR-TB treatment started in June 2006 at the TB hospital with a 30-bed TB ward in Ulaanbaatar, where MDR-TB patients are hospitalized for a six-month intensive phase regardless of the clinical status. The prison TB hospital has 10 beds for MDR-TB, in which prisoners with MDR-TB are hospitalized for both the intensive and the continuation phase during their incarceration. The National Centre for Communicable Disease (NCCD) has a daily treatment unit for MDR-TB patients, where patients in the continuation phase receive ambulatory treatment with free lunch. In 2008, 65 MDR-TB cases were put on treatment. The treatment success rate for the cohort registered between 2006 and September 2007 was 71%. To improve access to MDR-TB treatment, the NCCD is planning to add 30 TB beds at the TB hospital and to establish two more ambulatory MDR-TB treatment sites in 2010.
The policy on MDR-TB control has been established within the NTP. The summary is shown in Table 29. Table 30 summarizes the country’s future plans related to MDR-TB treatment during the period 2009–2014.
Table 29. Summary of NTP policy on MDR-TB treatment, Mongolia
Items Policy
Case finding strategy Failure to Cat I and II, RAD, Relapse, Other retreatment, HIV-TB
Source of referral Public facilities (incl. HCs, hospitals at national, provincial, and district levels) and private general practitioners
Treatment strategy Standard (6 ZKmOflEthCs 18ZOflEthCs)
Method of provision of treatment Partly hospitalized for six months followed by ambulatory management
Type of treatment supervisor HCWs at daily treatment centre
Cat = category; RAD = return after default; HIV-TB = HIV-TB co-infection; DR-TB = drug resistant-TB; HCs = health centres; DOT = direct observed treatment; HCWs = health care workers; incl. = including; Z = pyrazinamid; Km = kanamicin; Ofl = ofloxacin; Eth = etionamide; CS = cycloserine
38 Tuberculosis: 2010 Report
4 | PROF ILES OF COUNTRIES WITH A HIGH BURDEN OF TB IN THE REGION
Table 30. Future projections regarding MDR-TB treatment in the country, Mongolia, 2009–2014
End of 2009 2010 2011 2012 2013 2014
Number of culture facilities to be functional 1 2 3 3 3 3
Number of DST facilities to be functional 1 1 1 1 1 1
Number of MDR-TB treatment sites to be functional (including hospital- and health centre-based) 5 7 14 14 14 14
Number of cases to get DST for diagnosis for MDR-TB 396 406 416 427 432 437
Percentage of patients getting DST of total estimated number of smear-positive cases 80 80 80 80 80 80
Number of MDR-TB cases newly enrolled on treatment 108 167 170 170 170 170
Percentage of newly enrolled patients of total estimated number of MDR-TB cases 86 100 100 100 100 100
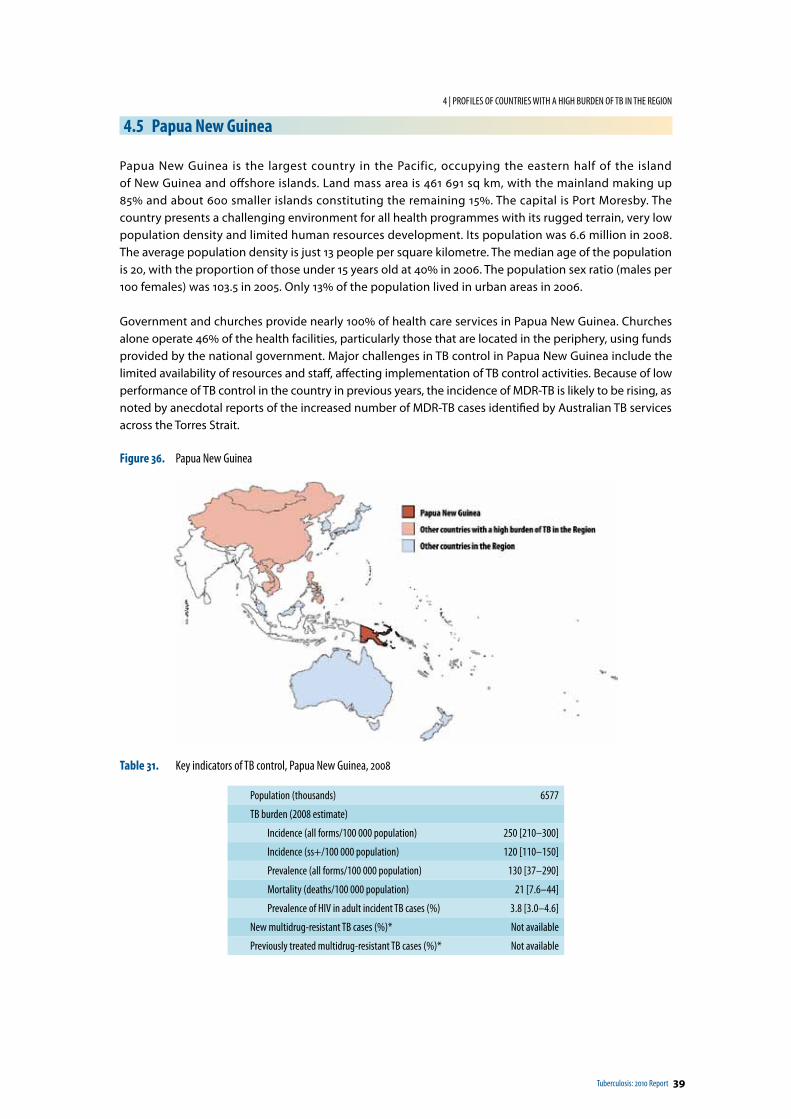
Tuberculosis: 2010 Report 39
4 | PROF ILES OF COUNTRIES WITH A HIGH BURDEN OF TB IN THE REGION
4.5 Papua New Guinea
Papua New Guinea is the largest country in the Pacific, occupying the eastern half of the island of New Guinea and offshore islands. Land mass area is 461 691 sq km, with the mainland making up 85% and about 600 smaller islands constituting the remaining 15%. The capital is Port Moresby. The country presents a challenging environment for all health programmes with its rugged terrain, very low population density and limited human resources development. Its population was 6.6 million in 2008. The average population density is just 13 people per square kilometre. The median age of the population is 20, with the proportion of those under 15 years old at 40% in 2006. The population sex ratio (males per 100 females) was 103.5 in 2005. Only 13% of the population lived in urban areas in 2006.
Government and churches provide nearly 100% of health care services in Papua New Guinea. Churches alone operate 46% of the health facilities, particularly those that are located in the periphery, using funds provided by the national government. Major challenges in TB control in Papua New Guinea include the limited availability of resources and staff, affecting implementation of TB control activities. Because of low performance of TB control in the country in previous years, the incidence of MDR-TB is likely to be rising, as noted by anecdotal reports of the increased number of MDR-TB cases identified by Australian TB services across the Torres Strait.
Figure 36. Papua New Guinea
Table 31. Key indicators of TB control, Papua New Guinea, 2008
Population (thousands) 6577
TB burden (2008 estimate)
Incidence (all forms/100 000 population) 250 [210–300]
Incidence (ss+/100 000 population) 120 [110–150]
Prevalence (all forms/100 000 population) 130 [37–290]
Mortality (deaths/100 000 population) 21 [7.6–44]
Prevalence of HIV in adult incident TB cases (%) 3.8 [3.0–4.6]
New multidrug-resistant TB cases (%)* Not available
Previously treated multidrug-resistant TB cases (%)* Not available
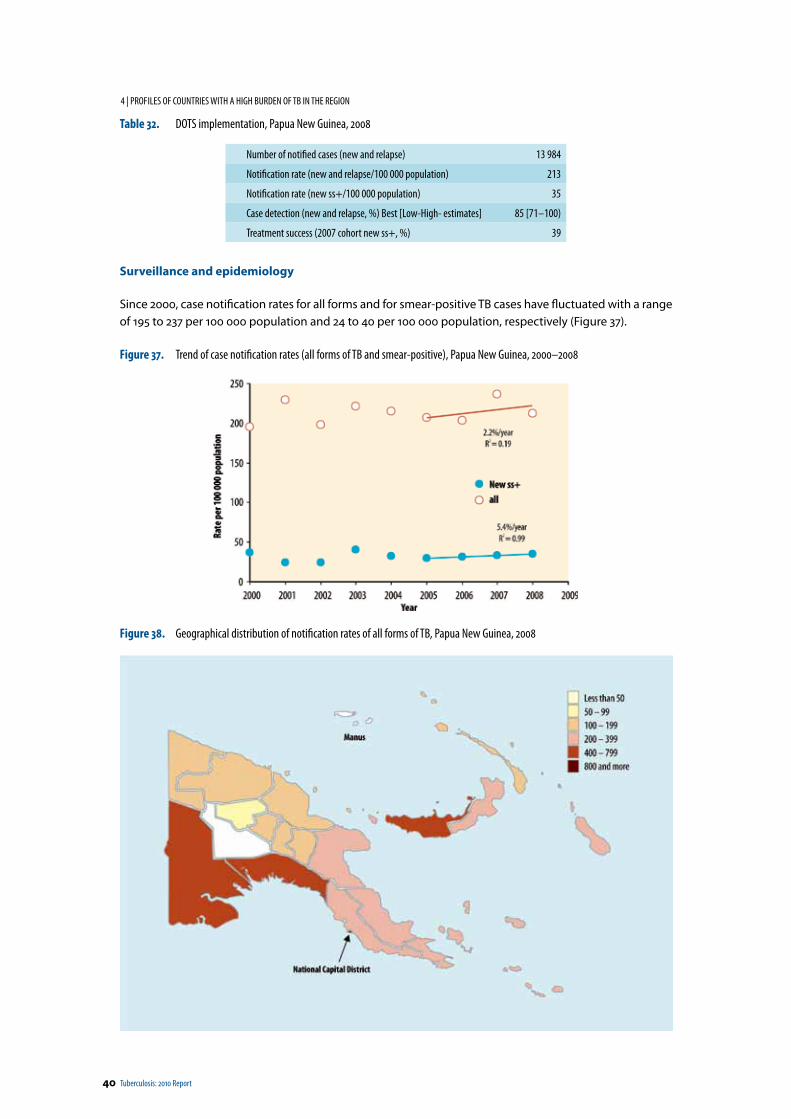
40 Tuberculosis: 2010 Report
4 | PROF ILES OF COUNTRIES WITH A HIGH BURDEN OF TB IN THE REGION
Table 32. DOTS implementation, Papua New Guinea, 2008
Number of notified cases (new and relapse) 13 984
Notification rate (new and relapse/100 000 population) 213
Notification rate (new ss+/100 000 population) 35
Case detection (new and relapse, %) Best [Low-High- estimates] 85 [71–100)
Treatment success (2007 cohort new ss+, %) 39
Surveillance and epidemiology
Since 2000, case notification rates for all forms and for smear-positive TB cases have fluctuated with a range of 195 to 237 per 100 000 population and 24 to 40 per 100 000 population, respectively (Figure 37).
Figure 37. Trend of case notification rates (all forms of TB and smear-positive), Papua New Guinea, 2000–2008
Figure 38. Geographical distribution of notification rates of all forms of TB, Papua New Guinea, 2008
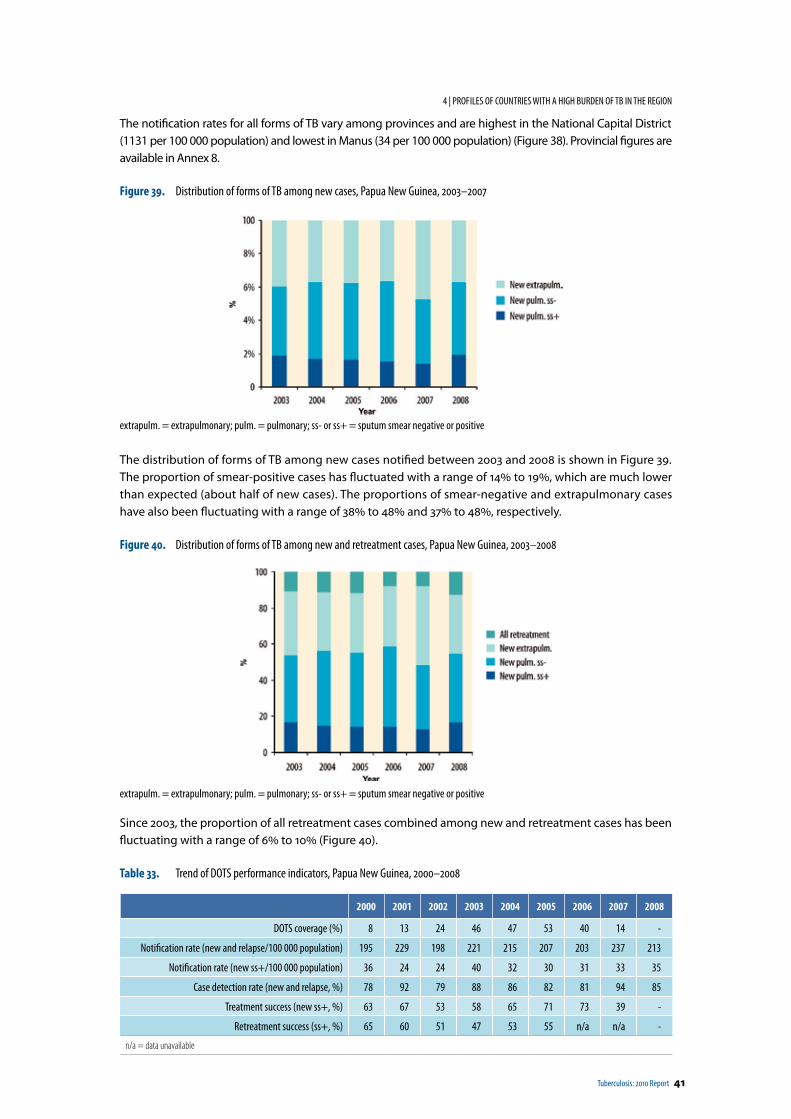
Tuberculosis: 2010 Report 41
4 | PROF ILES OF COUNTRIES WITH A HIGH BURDEN OF TB IN THE REGION
The notification rates for all forms of TB vary among provinces and are highest in the National Capital District (1131 per 100 000 population) and lowest in Manus (34 per 100 000 population) (Figure 38). Provincial figures are available in Annex 8.
Figure 39. Distribution of forms of TB among new cases, Papua New Guinea, 2003–2007
extrapulm. = extrapulmonary; pulm. = pulmonary; ss- or ss+ = sputum smear negative or positive
The distribution of forms of TB among new cases notified between 2003 and 2008 is shown in Figure 39. The proportion of smear-positive cases has fluctuated with a range of 14% to 19%, which are much lower than expected (about half of new cases). The proportions of smear-negative and extrapulmonary cases have also been fluctuating with a range of 38% to 48% and 37% to 48%, respectively.
Figure 40. Distribution of forms of TB among new and retreatment cases, Papua New Guinea, 2003–2008
extrapulm. = extrapulmonary; pulm. = pulmonary; ss- or ss+ = sputum smear negative or positive
Since 2003, the proportion of all retreatment cases combined among new and retreatment cases has been fluctuating with a range of 6% to 10% (Figure 40).
Table 33. Trend of DOTS performance indicators, Papua New Guinea, 2000–2008
2000 2001 2002 2003 2004 2005 2006 2007 2008
DOTS coverage (%) 8 13 24 46 47 53 40 14 -
Notification rate (new and relapse/100 000 population) 195 229 198 221 215 207 203 237 213
Notification rate (new ss+/100 000 population) 36 24 24 40 32 30 31 33 35
Case detection rate (new and relapse, %) 78 92 79 88 86 82 81 94 85
Treatment success (new ss+, %) 63 67 53 58 65 71 73 39 -
Retreatment success (ss+, %) 65 60 51 47 53 55 n/a n/a -
n/a = data unavailable
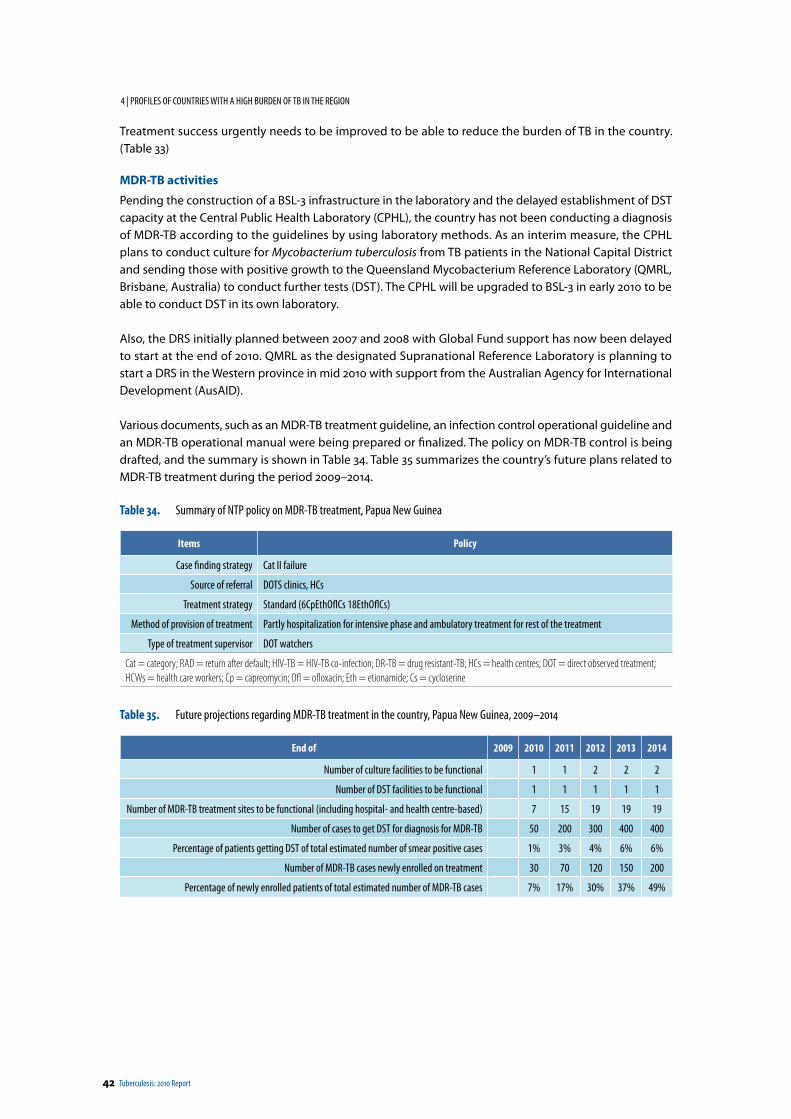
42 Tuberculosis: 2010 Report
4 | PROF ILES OF COUNTRIES WITH A HIGH BURDEN OF TB IN THE REGION
Treatment success urgently needs to be improved to be able to reduce the burden of TB in the country. (Table 33)
MDR-TB activities
Pending the construction of a BSL-3 infrastructure in the laboratory and the delayed establishment of DST capacity at the Central Public Health Laboratory (CPHL), the country has not been conducting a diagnosis of MDR-TB according to the guidelines by using laboratory methods. As an interim measure, the CPHL plans to conduct culture for Mycobacterium tuberculosis from TB patients in the National Capital District and sending those with positive growth to the Queensland Mycobacterium Reference Laboratory (QMRL, Brisbane, Australia) to conduct further tests (DST). The CPHL will be upgraded to BSL-3 in early 2010 to be able to conduct DST in its own laboratory.
Also, the DRS initially planned between 2007 and 2008 with Global Fund support has now been delayed to start at the end of 2010. QMRL as the designated Supranational Reference Laboratory is planning to start a DRS in the Western province in mid 2010 with support from the Australian Agency for International Development (AusAID).
Various documents, such as an MDR-TB treatment guideline, an infection control operational guideline and an MDR-TB operational manual were being prepared or finalized. The policy on MDR-TB control is being drafted, and the summary is shown in Table 34. Table 35 summarizes the country’s future plans related to MDR-TB treatment during the period 2009–2014.
Table 34. Summary of NTP policy on MDR-TB treatment, Papua New Guinea
Items Policy
Case finding strategy Cat II failure
Source of referral DOTS clinics, HCs
Treatment strategy Standard (6CpEthOflCs 18EthOflCs)
Method of provision of treatment Partly hospitalization for intensive phase and ambulatory treatment for rest of the treatment
Type of treatment supervisor DOT watchers
Cat = category; RAD = return after default; HIV-TB = HIV-TB co-infection; DR-TB = drug resistant-TB; HCs = health centres; DOT = direct observed treatment; HCWs = health care workers; Cp = capreomycin; Ofl = ofloxacin; Eth = etionamide; Cs = cycloserine
Table 35. Future projections regarding MDR-TB treatment in the country, Papua New Guinea, 2009–2014
End of 2009 2010 2011 2012 2013 2014
Number of culture facilities to be functional 1 1 2 2 2
Number of DST facilities to be functional 1 1 1 1 1
Number of MDR-TB treatment sites to be functional (including hospital- and health centre-based) 7 15 19 19 19
Number of cases to get DST for diagnosis for MDR-TB 50 200 300 400 400
Percentage of patients getting DST of total estimated number of smear positive cases 1% 3% 4% 6% 6%
Number of MDR-TB cases newly enrolled on treatment 30 70 120 150 200
Percentage of newly enrolled patients of total estimated number of MDR-TB cases 7% 17% 30% 37% 49%
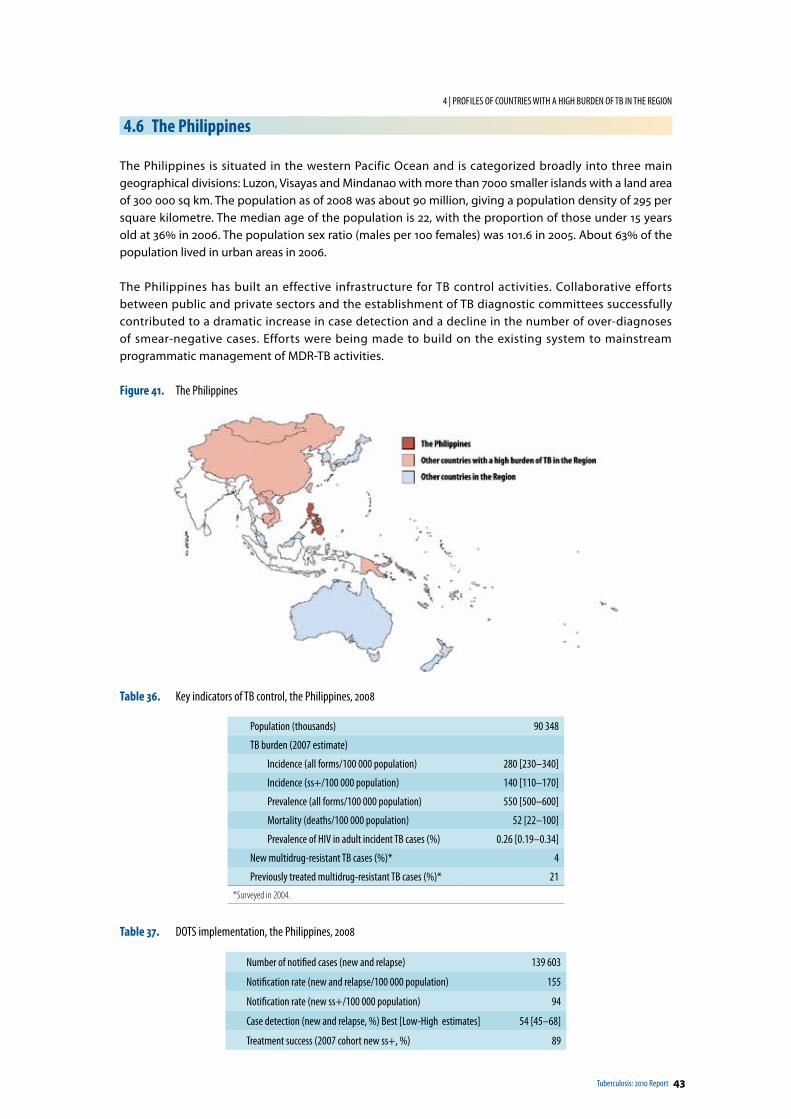
Tuberculosis: 2010 Report 43
4 | PROF ILES OF COUNTRIES WITH A HIGH BURDEN OF TB IN THE REGION
4.6 The Philippines
The Philippines is situated in the western Pacific Ocean and is categorized broadly into three main geographical divisions: Luzon, Visayas and Mindanao with more than 7000 smaller islands with a land area of 300 000 sq km. The population as of 2008 was about 90 million, giving a population density of 295 per square kilometre. The median age of the population is 22, with the proportion of those under 15 years old at 36% in 2006. The population sex ratio (males per 100 females) was 101.6 in 2005. About 63% of the population lived in urban areas in 2006.
The Philippines has built an effective infrastructure for TB control activities. Collaborative efforts between public and private sectors and the establishment of TB diagnostic committees successfully contributed to a dramatic increase in case detection and a decline in the number of over-diagnoses of smear-negative cases. Efforts were being made to build on the existing system to mainstream programmatic management of MDR-TB activities.
Figure 41. The Philippines
Table 36. Key indicators of TB control, the Philippines, 2008
Population (thousands) 90 348
TB burden (2007 estimate)
Incidence (all forms/100 000 population) 280 [230–340]
Incidence (ss+/100 000 population) 140 [110–170]
Prevalence (all forms/100 000 population) 550 [500–600]
Mortality (deaths/100 000 population) 52 [22–100]
Prevalence of HIV in adult incident TB cases (%) 0.26 [0.19–0.34]
New multidrug-resistant TB cases (%)* 4
Previously treated multidrug-resistant TB cases (%)* 21
*Surveyed in 2004.
Table 37. DOTS implementation, the Philippines, 2008
Number of notified cases (new and relapse) 139 603
Notification rate (new and relapse/100 000 population) 155
Notification rate (new ss+/100 000 population) 94
Case detection (new and relapse, %) Best [Low-High estimates] 54 [45–68]
Treatment success (2007 cohort new ss+, %) 89
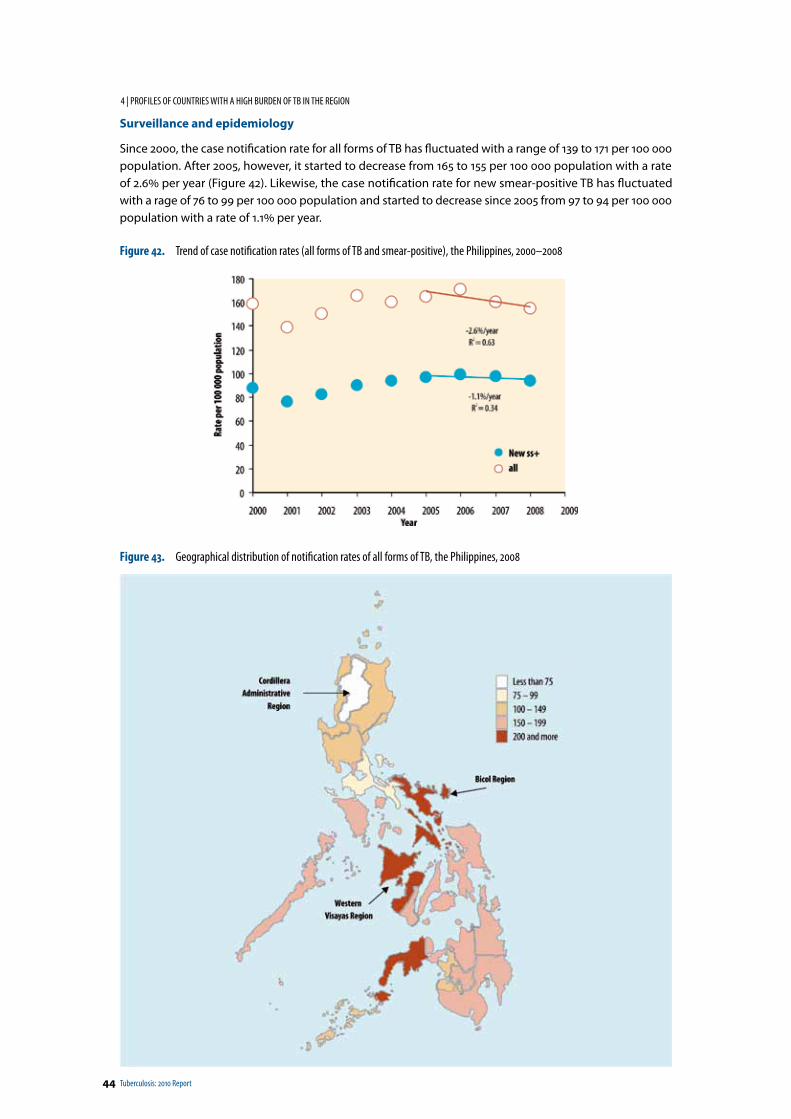
44 Tuberculosis: 2010 Report
4 | PROF ILES OF COUNTRIES WITH A HIGH BURDEN OF TB IN THE REGION
Surveillance and epidemiology
Since 2000, the case notification rate for all forms of TB has fluctuated with a range of 139 to 171 per 100 000 population. After 2005, however, it started to decrease from 165 to 155 per 100 000 population with a rate of 2.6% per year (Figure 42). Likewise, the case notification rate for new smear-positive TB has fluctuated with a rage of 76 to 99 per 100 000 population and started to decrease since 2005 from 97 to 94 per 100 000 population with a rate of 1.1% per year.
Figure 42. Trend of case notification rates (all forms of TB and smear-positive), the Philippines, 2000–2008
Figure 43. Geographical distribution of notification rates of all forms of TB, the Philippines, 2008
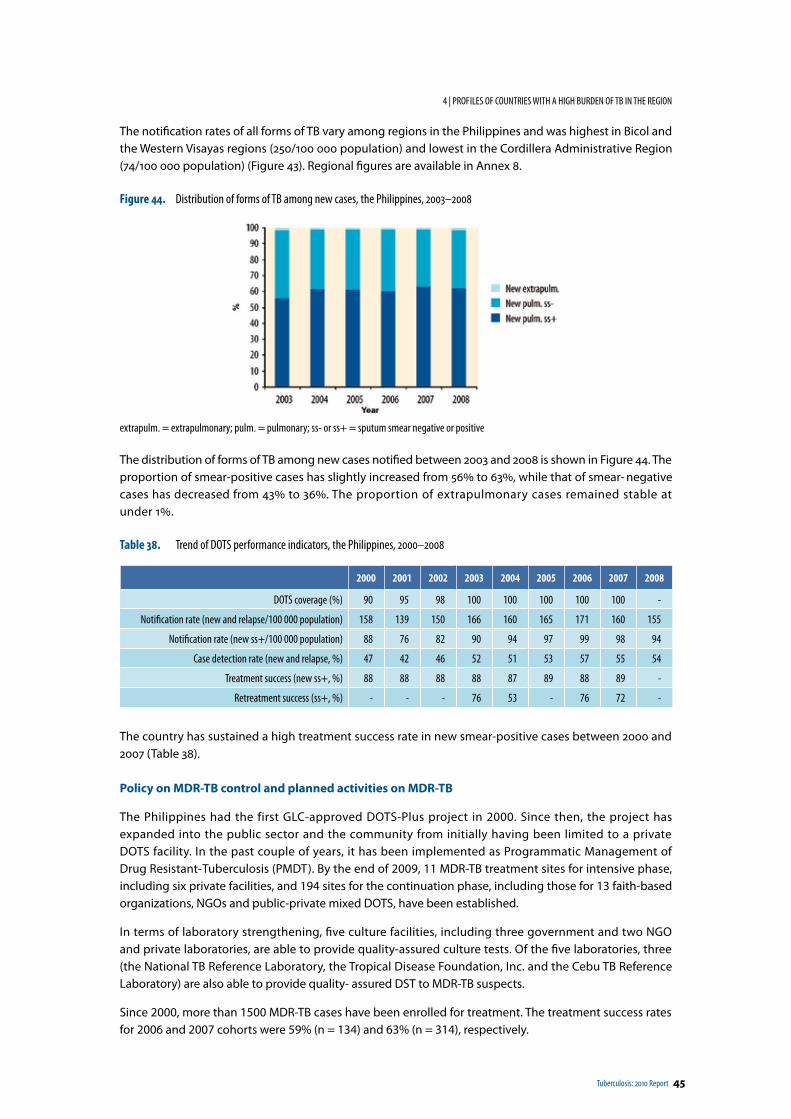
Tuberculosis: 2010 Report 45
4 | PROF ILES OF COUNTRIES WITH A HIGH BURDEN OF TB IN THE REGION
The notification rates of all forms of TB vary among regions in the Philippines and was highest in Bicol and the Western Visayas regions (250/100 000 population) and lowest in the Cordillera Administrative Region (74/100 000 population) (Figure 43). Regional figures are available in Annex 8.
Figure 44. Distribution of forms of TB among new cases, the Philippines, 2003–2008
extrapulm. = extrapulmonary; pulm. = pulmonary; ss- or ss+ = sputum smear negative or positive
The distribution of forms of TB among new cases notified between 2003 and 2008 is shown in Figure 44. The proportion of smear-positive cases has slightly increased from 56% to 63%, while that of smear- negative cases has decreased from 43% to 36%. The proportion of extrapulmonary cases remained stable at under 1%.
Table 38. Trend of DOTS performance indicators, the Philippines, 2000–2008
2000 2001 2002 2003 2004 2005 2006 2007 2008
DOTS coverage (%) 90 95 98 100 100 100 100 100 -
Notification rate (new and relapse/100 000 population) 158 139 150 166 160 165 171 160 155
Notification rate (new ss+/100 000 population) 88 76 82 90 94 97 99 98 94
Case detection rate (new and relapse, %) 47 42 46 52 51 53 57 55 54
Treatment success (new ss+, %) 88 88 88 88 87 89 88 89 -
Retreatment success (ss+, %) - - - 76 53 - 76 72 -
The country has sustained a high treatment success rate in new smear-positive cases between 2000 and 2007 (Table 38).
Policy on MDR-TB control and planned activities on MDR-TB
The Philippines had the first GLC-approved DOTS-Plus project in 2000. Since then, the project has expanded into the public sector and the community from initially having been limited to a private DOTS facility. In the past couple of years, it has been implemented as Programmatic Management of Drug Resistant- Tuberculosis (PMDT). By the end of 2009, 11 MDR-TB treatment sites for intensive phase, including six private facilities, and 194 sites for the continuation phase, including those for 13 faith-based organizations, NGOs and public-private mixed DOTS, have been established.
In terms of laboratory strengthening, five culture facilities, including three government and two NGO and private laboratories, are able to provide quality-assured culture tests. Of the five laboratories, three (the National TB Reference Laboratory, the Tropical Disease Foundation, Inc. and the Cebu TB Reference Laboratory) are also able to provide quality- assured DST to MDR-TB suspects.
Since 2000, more than 1500 MDR-TB cases have been enrolled for treatment. The treatment success rates for 2006 and 2007 cohorts were 59% (n = 134) and 63% (n = 314), respectively.
46 Tuberculosis: 2010 Report
4 | PROF ILES OF COUNTRIES WITH A HIGH BURDEN OF TB IN THE REGION
The NTP, in collaboration with its partners and local government units, plans to expand the PMDT nationwide with the goal of attaining 80% coverage of estimated MDR-TB cases and the target of detecting at least 15 000 MDR-TB patients and providing them with quality-assured MDR-TB treatment.
The policy on MDR-TB control has been established within NTP. The summary is shown in Table 39.
Table 39. Summary of NTP policy on MDR-TB treatment, the Philippines
Items Policy
Case finding strategy Failure to Cat I and II, RAD, relapse, other, HIV-TB, non-converter of Cat II, contact of a DR-TB
Source of referral Public facilities (inc. HCs, hospitals) and private facilities, and jails.
Treatment strategy Individualized treatment based on DST results
Method of provision of treatment Fully ambulatory DOT
Type of treatment supervisor HCWs and volunteers at DOTS facilities
Cat = category; RAD = return after default; HIV-TB = HIV-TB co-infection; DR-TB = drug resistant-TB; HCs = health centres; DOT = direct observed treatment; HCWs = health care workers
Table 40 summarizes the country's future plans related to MDR-TB treatment during the period 2009–2014.
Table 40. Future projections regarding MDR-TB treatment, the Philippines, 2009–2014
End of 2009 2010 2011 2012 2013 2014
Number of culture facilities to be functional 5 29 41 45 45 45
Number of DST facilities to be functional 3 5 5 5 5 5
Number of MDR-TB treatment sites to be functional (including hospital- and health centre-based) 11 32 42 42 42 42
Number of cases to get DST for diagnosis for MDR-TB 1728 2348 4474 4474 4474 4474
Percentage of patients getting DST of total estimated number of smear positive cases n/a n/a n/a n/a n/a n/a
Number of MDR-TB cases newly enrolled on treatment 864 1174 2237 2237 2237 2237
Percentage of newly enrolled patients of total estimated number of MDR-TB cases 21 45 61 65 80 75
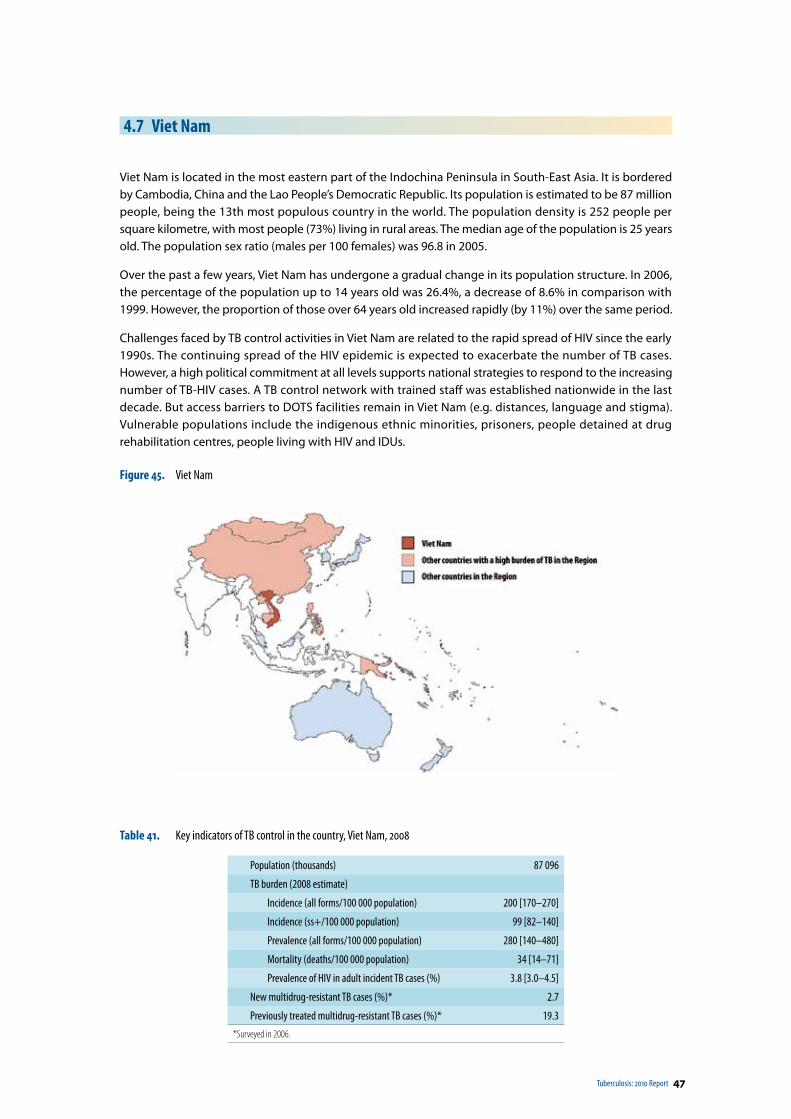
Tuberculosis: 2010 Report 47
4.7 Viet Nam
Viet Nam is located in the most eastern part of the Indochina Peninsula in South-East Asia. It is bordered by Cambodia, China and the Lao People’s Democratic Republic. Its population is estimated to be 87 million people, being the 13th most populous country in the world. The population density is 252 people per square kilometre, with most people (73%) living in rural areas. The median age of the population is 25 years old. The population sex ratio (males per 100 females) was 96.8 in 2005.
Over the past a few years, Viet Nam has undergone a gradual change in its population structure. In 2006, the percentage of the population up to 14 years old was 26.4%, a decrease of 8.6% in comparison with 1999. However, the proportion of those over 64 years old increased rapidly (by 11%) over the same period.
Challenges faced by TB control activities in Viet Nam are related to the rapid spread of HIV since the early 1990s. The continuing spread of the HIV epidemic is expected to exacerbate the number of TB cases. However, a high political commitment at all levels supports national strategies to respond to the increasing number of TB-HIV cases. A TB control network with trained staff was established nationwide in the last decade. But access barriers to DOTS facilities remain in Viet Nam (e.g. distances, language and stigma). Vulnerable populations include the indigenous ethnic minorities, prisoners, people detained at drug rehabilitation centres, people living with HIV and IDUs.
Figure 45. Viet Nam
Table 41. Key indicators of TB control in the country, Viet Nam, 2008
Population (thousands) 87 096
TB burden (2008 estimate)
Incidence (all forms/100 000 population) 200 [170–270]
Incidence (ss+/100 000 population) 99 [82–140]
Prevalence (all forms/100 000 population) 280 [140–480]
Mortality (deaths/100 000 population) 34 [14–71]
Prevalence of HIV in adult incident TB cases (%) 3.8 [3.0–4.5]
New multidrug-resistant TB cases (%)* 2.7
Previously treated multidrug-resistant TB cases (%)* 19.3
*Surveyed in 2006.
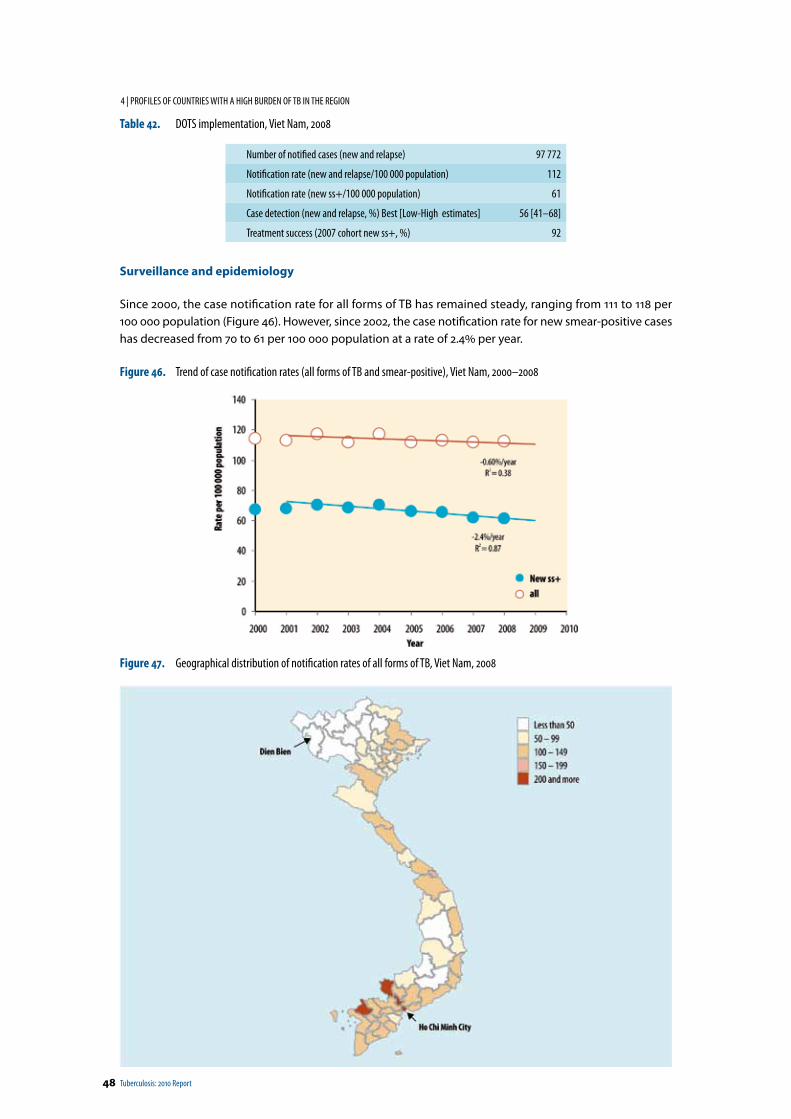
48 Tuberculosis: 2010 Report
4 | PROF ILES OF COUNTRIES WITH A HIGH BURDEN OF TB IN THE REGION
Table 42. DOTS implementation, Viet Nam, 2008
Number of notified cases (new and relapse) 97 772
Notification rate (new and relapse/100 000 population) 112
Notification rate (new ss+/100 000 population) 61
Case detection (new and relapse, %) Best [Low-High estimates] 56 [41–68]
Treatment success (2007 cohort new ss+, %) 92
Surveillance and epidemiology
Since 2000, the case notification rate for all forms of TB has remained steady, ranging from 111 to 118 per 100 000 population (Figure 46). However, since 2002, the case notification rate for new smear-positive cases has decreased from 70 to 61 per 100 000 population at a rate of 2.4% per year.
Figure 46. Trend of case notification rates (all forms of TB and smear-positive), Viet Nam, 2000–2008
Figure 47. Geographical distribution of notification rates of all forms of TB, Viet Nam, 2008
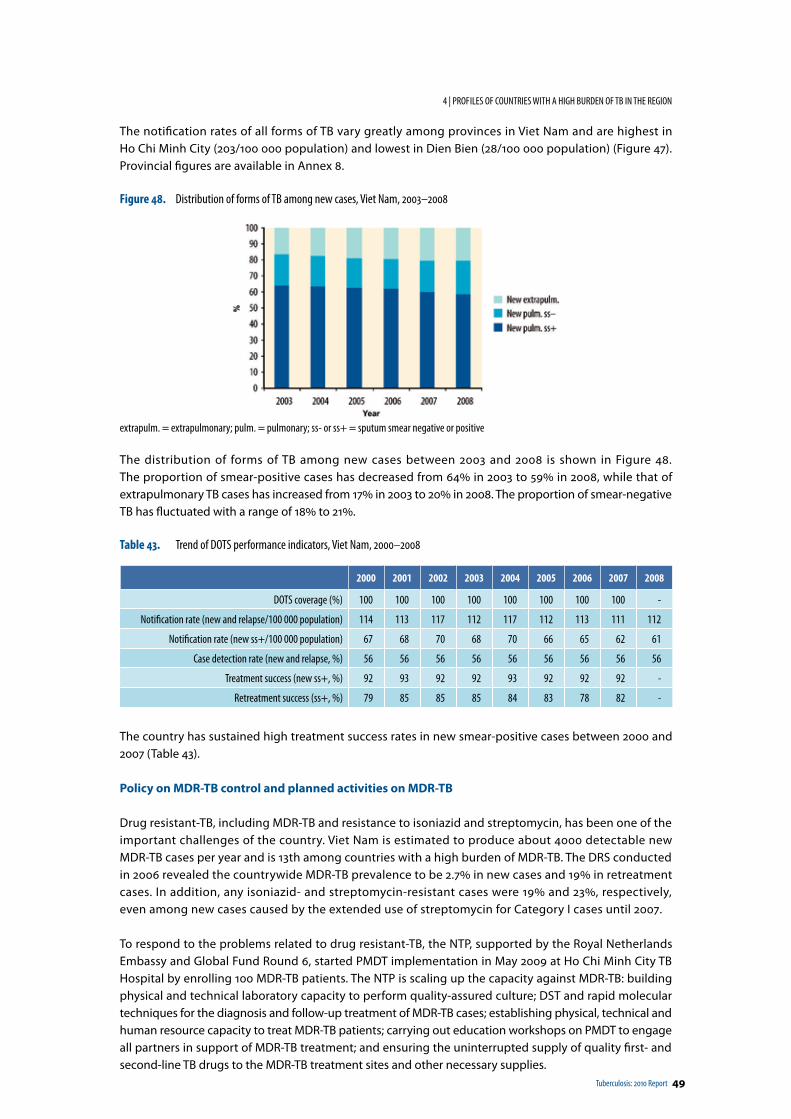
Tuberculosis: 2010 Report 49
4 | PROF ILES OF COUNTRIES WITH A HIGH BURDEN OF TB IN THE REGION
The notification rates of all forms of TB vary greatly among provinces in Viet Nam and are highest in Ho Chi Minh City (203/100 000 population) and lowest in Dien Bien (28/100 000 population) (Figure 47). Provincial figures are available in Annex 8.
Figure 48. Distribution of forms of TB among new cases, Viet Nam, 2003–2008
extrapulm. = extrapulmonary; pulm. = pulmonary; ss- or ss+ = sputum smear negative or positive
The distribution of forms of TB among new cases between 2003 and 2008 is shown in Figure 48. The proportion of smear-positive cases has decreased from 64% in 2003 to 59% in 2008, while that of extrapulmonary TB cases has increased from 17% in 2003 to 20% in 2008. The proportion of smear-negative TB has fluctuated with a range of 18% to 21%.
Table 43. Trend of DOTS performance indicators, Viet Nam, 2000–2008
2000 2001 2002 2003 2004 2005 2006 2007 2008
DOTS coverage (%) 100 100 100 100 100 100 100 100 -
Notification rate (new and relapse/100 000 population) 114 113 117 112 117 112 113 111 112
Notification rate (new ss+/100 000 population) 67 68 70 68 70 66 65 62 61
Case detection rate (new and relapse, %) 56 56 56 56 56 56 56 56 56
Treatment success (new ss+, %) 92 93 92 92 93 92 92 92 -
Retreatment success (ss+, %) 79 85 85 85 84 83 78 82 -
The country has sustained high treatment success rates in new smear-positive cases between 2000 and 2007 (Table 43).
Policy on MDR-TB control and planned activities on MDR-TB
Drug resistant-TB, including MDR-TB and resistance to isoniazid and streptomycin, has been one of the important challenges of the country. Viet Nam is estimated to produce about 4000 detectable new MDR-TB cases per year and is 13th among countries with a high burden of MDR-TB. The DRS conducted in 2006 revealed the countrywide MDR-TB prevalence to be 2.7% in new cases and 19% in retreatment cases. In addition, any isoniazid- and streptomycin-resistant cases were 19% and 23%, respectively, even among new cases caused by the extended use of streptomycin for Category I cases until 2007.
To respond to the problems related to drug resistant-TB, the NTP, supported by the Royal Netherlands Embassy and Global Fund Round 6, started PMDT implementation in May 2009 at Ho Chi Minh City TB Hospital by enrolling 100 MDR-TB patients. The NTP is scaling up the capacity against MDR-TB: building physical and technical laboratory capacity to perform quality-assured culture; DST and rapid molecular techniques for the diagnosis and follow-up treatment of MDR-TB cases; establishing physical, technical and human resource capacity to treat MDR-TB patients; carrying out education workshops on PMDT to engage all partners in support of MDR-TB treatment; and ensuring the uninterrupted supply of quality first- and second-line TB drugs to the MDR-TB treatment sites and other necessary supplies.
50 Tuberculosis: 2010 Report
4 | PROF ILES OF COUNTRIES WITH A HIGH BURDEN OF TB IN THE REGION
The NTP aims at treating up to 1500 (76% of estimated incidence cases) MDR-TB patients annually by 2015 and subsequently reducing the estimated incidence of smear-positive MDR-TB cases by 25% by 2015 compared with the estimated 2011 baseline. To assess the impact of MDR-TB control on prevalence, the NTP is planning to conduct another DRS in 2015.
The policy on MDR-TB control has been established within the NTP. The summary is shown in Table 44. Table 45 summarizes the country’s future plans related to MDR-TB treatment during the period 2009–2014.
Table 44. Summary of NTP policy on MDR-TB treatment, Viet Nam
Items Policy
Case finding strategy Failure to Cat I and II, RAD, relapse, other, contact of a MDR-TB
Source of referral Provincial hospitals
Treatment strategy Standardized treatment (6ZEKmLfxPtoCs[PAS], 12ZELfxPto Cs[PAS])
Method of provision of treatment Partly hospitalization for 1–2 months followed by ambulatory DOT
Type of treatment supervisor HCWs and DOT watchers at home
Cat = category; RAD = return after default; Z = pyrazinamide; E = ethambutol; Km = kanamycin; Lfx = levofloxacin; Pto = protianamid; Cs = cycloserine; PAS = para-aminosalicylic acid; DOT = direct observed treatment; HCWs = health care workers
Table 45. Future projections regarding MDR-TB treatment, Viet Nam, 2009–2014
End of 2009 2010 2011 2012 2013 2014
Number of culture facilities to be functional 2 17 17 17 20 25
No. of DST facilities to be functional 2 2 2 2 4 4
Number of MDR-TB treatment sites to be functional (including hospital- and health centre-based) 1 7 7 10 10 10
Number of cases to get DST for diagnosis for MDR-TB 300 1500 2730 2700 3300 3900
Percentage of patients getting DST of total estimated number of smear positive cases 0.5 2.2 3.9 3.6 4.2 4.8
Number of MDR-TB cases newly enrolled on treatment 100 500 910 900 1100 1300
Percentage of newly enrolled patients of total estimated number of MDR-TB cases 3.3 18 35 37 48 61
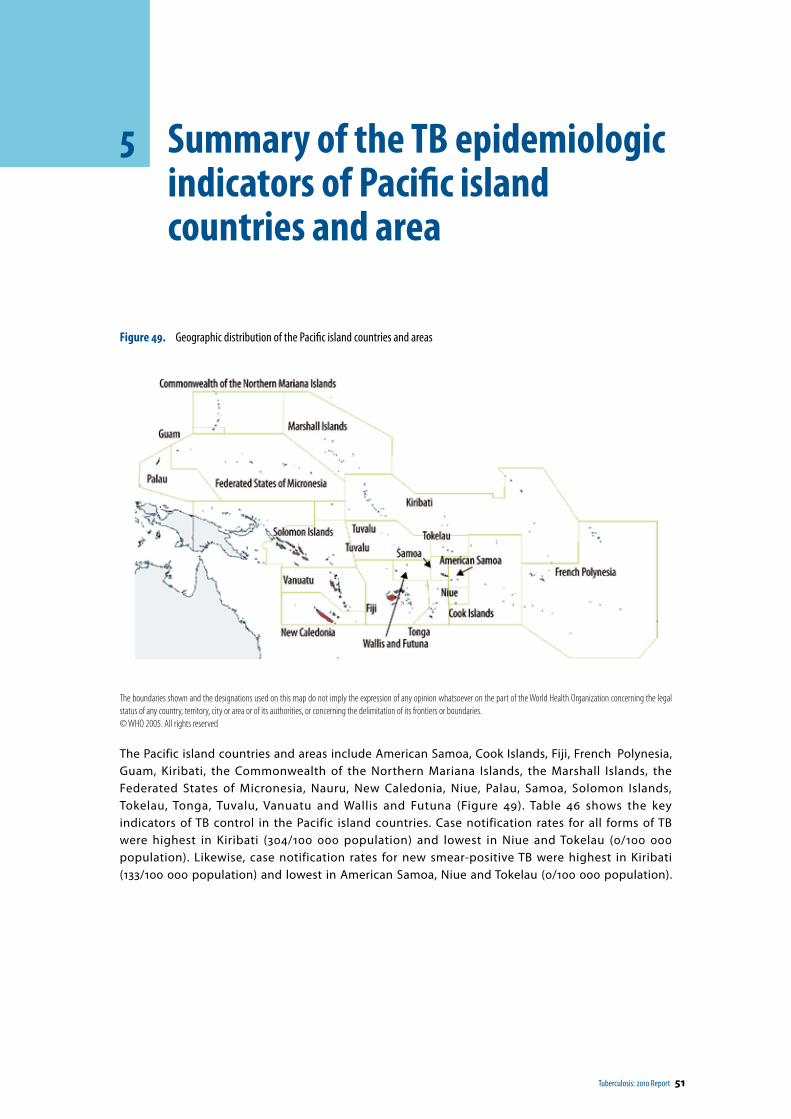
Tuberculosis: 2010 Report 51
5 Summary of the TB epidemiologic indicators of Pacific island countries and area
Figure 49. Geographic distribution of the Pacific island countries and areas
The boundaries shown and the designations used on this map do not imply the expression of any opinion whatsoever on the part of the World Health Organization concerning the legal status of any country, territory, city or area or of its authorities, or concerning the delimitation of its frontiers or boundaries.© WHO 2005. All rights reserved
The Pacific island countries and areas include American Samoa, Cook Islands, Fiji, French Polynesia, Guam, Kiribati, the Commonwealth of the Northern Mariana Islands, the Marshall Islands, the Federated States of Micronesia, Nauru, New Caledonia, Niue, Palau, Samoa, Solomon Islands, Tokelau, Tonga, Tuvalu, Vanuatu and Wallis and Futuna (Figure 49). Table 46 shows the key indicators of TB control in the Pacific island countries. Case notification rates for all forms of TB were highest in Kiribati (304/100 000 population) and lowest in Niue and Tokelau (0/100 000 population). Likewise, case notification rates for new smear-positive TB were highest in Kiribati (133/100 000 population) and lowest in American Samoa, Niue and Tokelau (0/100 000 population).
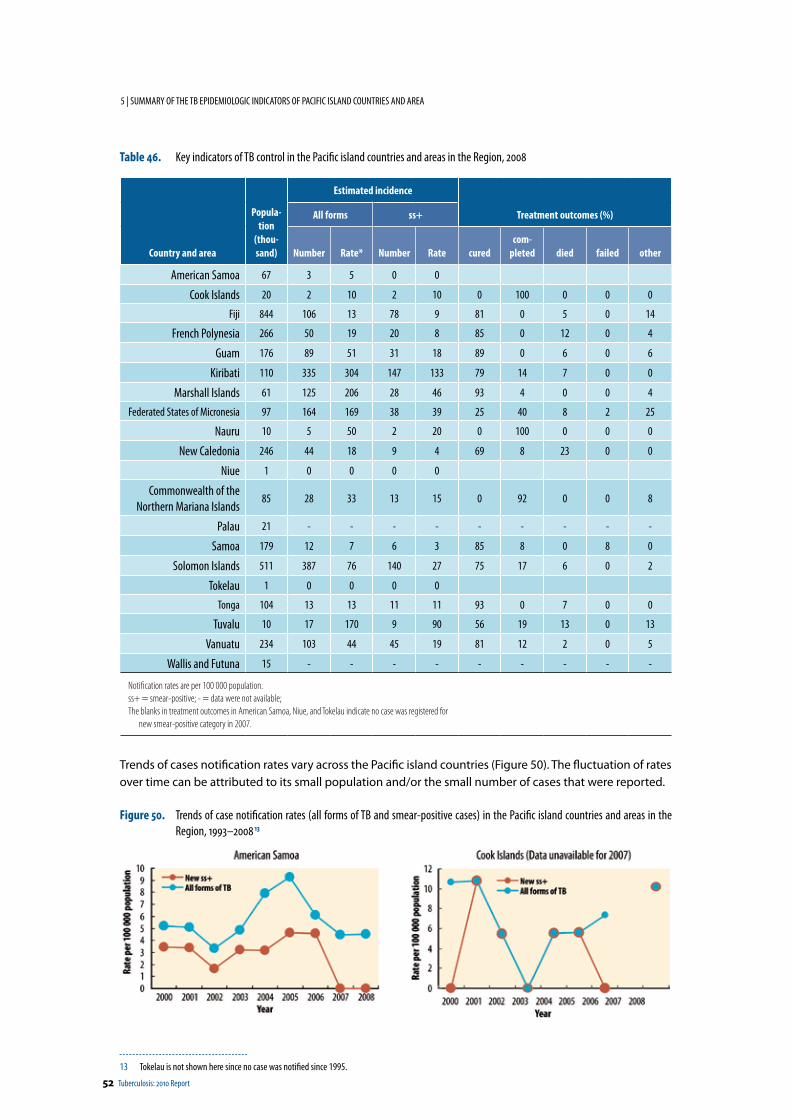
52 Tuberculosis: 2010 Report
5 | SUMMARY OF THE TB EPIDEMIOLOGIC INDICATORS OF PACIFIC ISLAND COUNTRIES AND AREA
Table 46. Key indicators of TB control in the Pacific island countries and areas in the Region, 2008
Country and area
Popula-tion
(thou-sand)
Estimated incidence
Treatment outcomes (%)All forms ss+
Number Rate* Number Rate curedcom-
pleted died failed other
American Samoa 67 3 5 0 0
Cook Islands 20 2 10 2 10 0 100 0 0 0
Fiji 844 106 13 78 9 81 0 5 0 14
French Polynesia 266 50 19 20 8 85 0 12 0 4
Guam 176 89 51 31 18 89 0 6 0 6
Kiribati 110 335 304 147 133 79 14 7 0 0
Marshall Islands 61 125 206 28 46 93 4 0 0 4
Federated States of Micronesia 97 164 169 38 39 25 40 8 2 25
Nauru 10 5 50 2 20 0 100 0 0 0
New Caledonia 246 44 18 9 4 69 8 23 0 0
Niue 1 0 0 0 0
Commonwealth of the Northern Mariana Islands
85 28 33 13 15 0 92 0 0 8
Palau 21 - - - - - - - - -
Samoa 179 12 7 6 3 85 8 0 8 0
Solomon Islands 511 387 76 140 27 75 17 6 0 2
Tokelau 1 0 0 0 0
Tonga 104 13 13 11 11 93 0 7 0 0
Tuvalu 10 17 170 9 90 56 19 13 0 13
Vanuatu 234 103 44 45 19 81 12 2 0 5
Wallis and Futuna 15 - - - - - - - - -
Notification rates are per 100 000 population.ss+ = smear-positive; - = data were not available; The blanks in treatment outcomes in American Samoa, Niue, and Tokelau indicate no case was registered for
new smear-positive category in 2007.
Trends of cases notification rates vary across the Pacific island countries (Figure 50). The fluctuation of rates over time can be attributed to its small population and/or the small number of cases that were reported.
Figure 50. Trends of case notification rates (all forms of TB and smear-positive cases) in the Pacific island countries and areas in the Region, 1993–2008 13
13 Tokelau is not shown here since no case was notified since 1995.
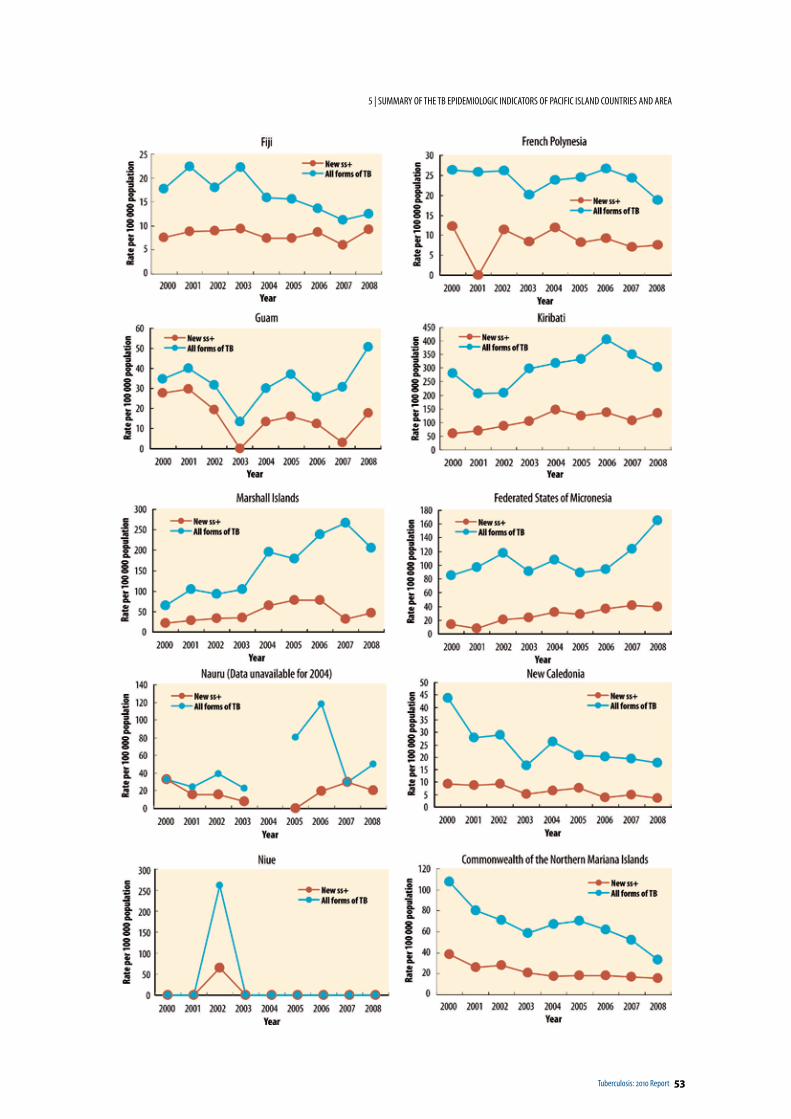
Tuberculosis: 2010 Report 53
5 | SUMMARY OF THE TB EPIDEMIOLOGIC INDICATORS OF PACIFIC ISLAND COUNTRIES AND AREA
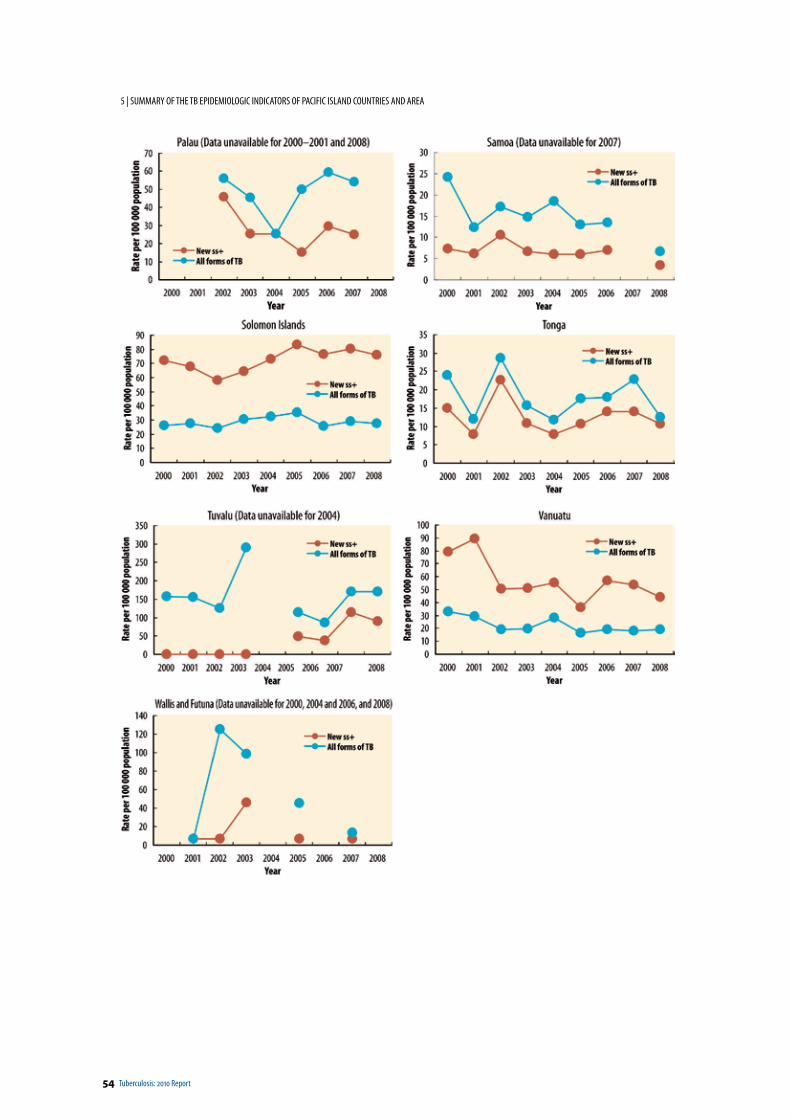
54 Tuberculosis: 2010 Report
5 | SUMMARY OF THE TB EPIDEMIOLOGIC INDICATORS OF PACIFIC ISLAND COUNTRIES AND AREA
Tuberculosis: 2010 Report 55
Annexes
Annex 1: Estimation of prevalence and TB mortality ratesEstimates and methodology used for this report are taken from “Global Tuberculosis Control – a short update to the 2009 report” (WHO/HTM/TB/2009.426).
Concerning the most recent development of moving away from estimates of the case detection rate for sputum smear-positive pulmonary TB please refer to chapter 4.3 and Box 6 of “Global Tuberculosis Control 2010” (WHO/HTM/TB/2010.7).
Annex 2: Estimation of MDR-TB prevalence
Based on drug resistance data reported from 114 countries and two special administrative regions of China, logistic regression models were fitted to estimate the proportion of MDR-TB among new, previously treated, and combined TB cases for a further 69 countries and areas for which surveyed data were not available. The estimated number of new TB cases by country and area was used to calculate the estimated number of MDR-TB cases that occurred among new cases. To estimate the number of previously treated cases for each country and area, the ratio of notified retreatment cases to notified new cases in 2008 was multiplied by the total number of new cases estimated to have occurred in the same year; therefore the total number of estimated case includes estimated retreatment cases.
Annex 3: Definitions
1. Definitions of tuberculosis cases
A case of tuberculosis: A patient in whom tuberculosis (TB) has been bacteriologically confirmed or has been diagnosed by a clinician. Any person given treatment for TB should be recorded.
All forms: The sum of new smear-positive pulmonary, relapse, new smear-negative pulmonary and extrapulmonary cases.
New smear-positive pulmonary TB: 14 A patient who has never received treatment for TB, or who has taken anti-TB drugs for less than 30 days and who has one of the following:
• two or more initial sputum smear examinations positive for acid fast bacilli (AFB);• one sputum examination positive for AFB plus radiographic abnormalities consistent with active
pulmonary TB as determined by a clinician; or• one sputum specimen positive for AFB and at least one sputum that is culture-positive for AFB.
New smear-negative pulmonary tuberculosis: A case of pulmonary TB that does not meet the above definition for smear-positive TB.
Extrapulmonary tuberculosis: TB of organs other than the lungs, e.g., pleura, lymph nodes, abdomen, genito-urinary tract, skin, joints, bones, meninges. Diagnosis should be based on one culture-positive specimen, or histological or strong clinical evidence consistent with active extrapulmonary TB, followed by a decision by a clinician to treat with a full course of anti-TB chemotherapy. (A patient diagnosed with both pulmonary and extrapulmonary TB should be classified as a case of pulmonary TB.)
14 The case definition of new smear-positive changed in 2007 and will be applied in future regional reports.
56 Tuberculosis: 2010 Report
| ANNEXES
Retreatment case: Patient previously treated for TB, undergoing treatment for a new episode of bacteriologically positive (sputum smear or culture) TB.
Relapse: A patient previously treated for TB and declared cured or treatment completed, who is later diagnosed with bacteriologically positive (sputum smear or culture) TB.
2. Definitions of treatment outcome
Cured Former smear-positive patient who was smear-negative in the last month of treatment, and on at least one previous occasion.
Completed treatment A patient who has completed treatment but who does not meet the criteria to be classified either as a cure or a failure.
Treatment success The sum of patients who are cured and those who have completed treatment.
Died A patient who dies for any reason during the course of treatment.
Failure A smear-positive patient who remained smear-positive at five months or later during treatment.
Defaulted A patient who has interrupted treatment for two consecutive months or more.
Transferred out A patient who has been transferred to another recording and reporting unit and for whom the treatment outcome is not known.
Not evaluated A patient who did not have the treatment outcome evaluated.Note: In countries where culture is current practice, patients can be classified as cured or failed based on culture results.
3. Indicators to assess treatment outcome
Cure rate: Proportion of cured cases out of all cases registered in a given period (2007, in this report).
Treatment success rate: The sum of the proportion of patients who were cured and patients who completed treatment out of all cases registered in a given period. The global target is a 85% cure rate and a greater treatment success rate.
The cure rate and the treatment success rate are expressed as a percentage of registered cases. The number of new cases registered for treatment in 2007 (reported in 2009) is compared to the number of cases notified as smear-positive in 2007 (reported in 2008). Differences may arise because NTPs do not compile data at the end of each calendar year, diagnoses may be incorrect, patients are lost between diagnosis and the start of treatment, or records may be lost. All registered cases should be evaluated. Data on the six standard, mutually exclusive outcomes of treatment are compiled. These figures are reported as percentages of all registered cases. When a country or territory states the number of patients registered for treatment, but gives no outcomes, no result is reported, rather than reporting zero treatment success. Although treatment outcomes are expressed as percentages, they are referred to as rates. The six possible outcomes plus the fraction of cases not evaluated add up to 100%. If the number of registered cases is lower than the sum of the six outcomes or is missing, the denominator for treatment success will be the number evaluated or the number of smear-positive cases notified in the previous year, whichever is greater.
4. Case detection rate and DOTS detection rate
Directly observed treatment, short-course (DOTS)
The recommended strategy for TB control is comprised of:• political commitment with increased and sustained financing; • case detection through quality-assured bacteriology;• standardized treatment with supervision and patient support;• an effective drug supply and management system; and• monitoring and evaluation system, and impact measurement.
Targets for TB control established by the World Health Assembly (1991)• To cure 85% of the sputum smear-positive TB cases detected.• To detect 70% of the estimated new sputum smear-positive TB cases.
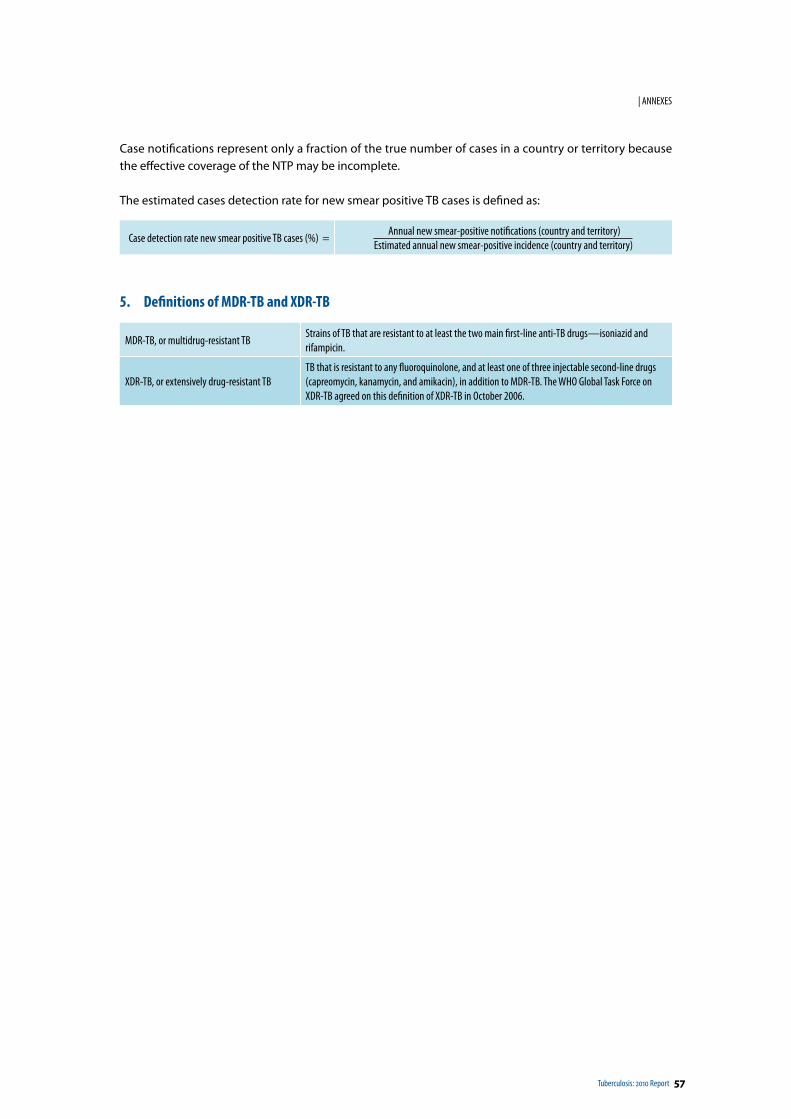
Tuberculosis: 2010 Report 57
| ANNEXES
Case notifications represent only a fraction of the true number of cases in a country or territory because the effective coverage of the NTP may be incomplete.
The estimated cases detection rate for new smear positive TB cases is defined as:
Case detection rate new smear positive TB cases (%) = Annual new smear-positive notifications (country and territory)
Estimated annual new smear-positive incidence (country and territory)
5. Definitions of MDR-TB and XDR-TB
MDR-TB, or multidrug-resistant TBStrains of TB that are resistant to at least the two main first-line anti-TB drugs—isoniazid and rifampicin.
XDR-TB, or extensively drug-resistant TBTB that is resistant to any fluoroquinolone, and at least one of three injectable second-line drugs (capreomycin, kanamycin, and amikacin), in addition to MDR-TB. The WHO Global Task Force on XDR-TB agreed on this definition of XDR-TB in October 2006.
58 Tuberculosis: 2010 Report
| ANNEXES
Annex 4: Formulas for estimating tuberculosis incidence, prevalence, and mortality
Estimates of the burden of TB (incidence, prevalence, and mortality) have been improved and updated following 18 months of work by an expert group convened by the WHO Global Task Force on TB Impact Measurement as well as increased availability of data. The number of countries with direct measurements of HIV infection in TB patients has risen to 103 (up from 64 in the 2008 round of data collection), and TB mortality is now based on direct measurements from vital registration systems for 89 countries (compared with three for which such direct measurements were used in previous reports). Estimates have also been updated using in-depth analyses and country consultations conducted during a series of regional workshops and country missions in 2009. All estimates are provided with uncertainty intervals; this will become routine practice in all future reports. The detailed methods used to produce estimates of the burden of TB can be available from in Annex of the update to the 2009 Global Report. 15 The estimates for countries and areas in the Region will be re-assessed in the coming years.
15 pp. 32–38 of Global tuberculosis control –a short update to the 2009 report (WHO/HTM/TB/2009.426), WHO, Switzerland, 2009
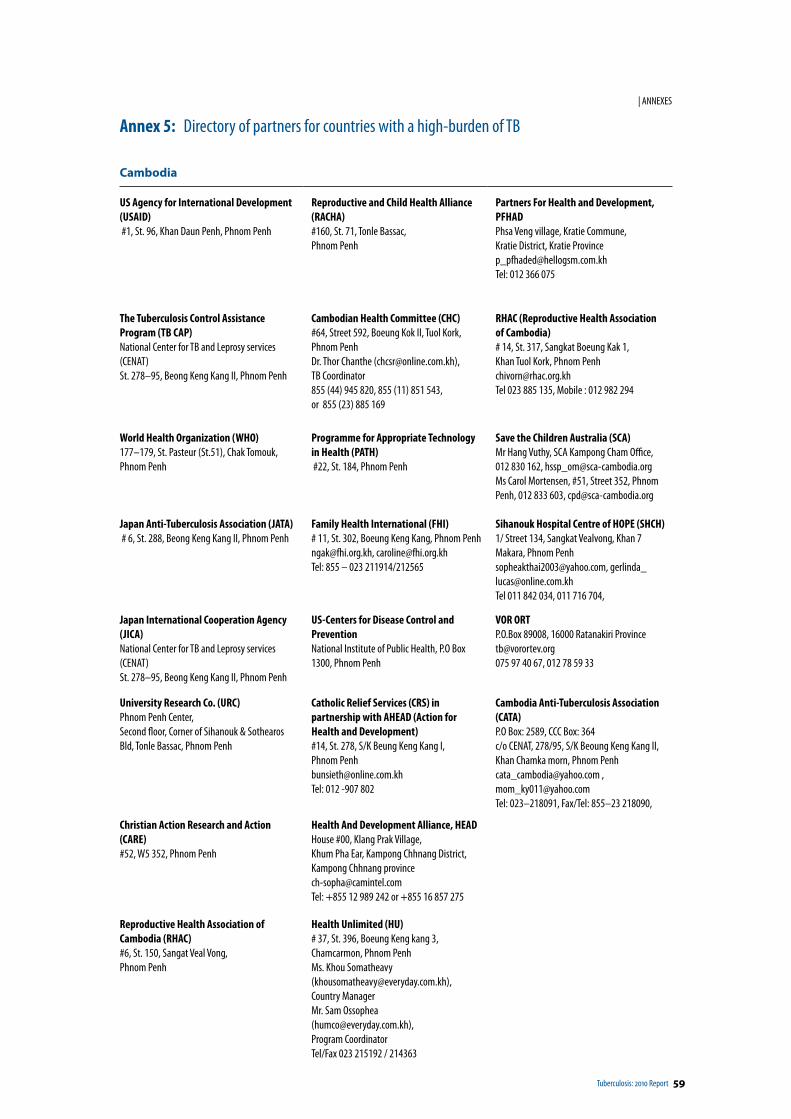
Tuberculosis: 2010 Report 59
| ANNEXES
Annex 5: Directory of partners for countries with a high-burden of TB
Cambodia
US Agency for International Development (USAID) #1, St. 96, Khan Daun Penh, Phnom Penh
Reproductive and Child Health Alliance (RACHA)#160, St. 71, Tonle Bassac, Phnom Penh
Partners For Health and Development, PFHADPhsa Veng village, Kratie Commune, Kratie District, Kratie Province [email protected] Tel: 012 366 075
The Tuberculosis Control Assistance Program (TB CAP) National Center for TB and Leprosy services (CENAT)St. 278–95, Beong Keng Kang II, Phnom Penh
Cambodian Health Committee (CHC)#64, Street 592, Boeung Kok II, Tuol Kork, Phnom PenhDr. Thor Chanthe ([email protected]), TB Coordinator855 (44) 945 820, 855 (11) 851 543, or 855 (23) 885 169
RHAC (Reproductive Health Association of Cambodia)# 14, St. 317, Sangkat Boeung Kak 1, Khan Tuol Kork, Phnom [email protected] 023 885 135, Mobile : 012 982 294
World Health Organization (WHO)177–179, St. Pasteur (St.51), Chak Tomouk, Phnom Penh
Programme for Appropriate Technology in Health (PATH) #22, St. 184, Phnom Penh
Save the Children Australia (SCA)Mr Hang Vuthy, SCA Kampong Cham Office, 012 830 162, [email protected] Carol Mortensen, #51, Street 352, Phnom Penh, 012 833 603, [email protected]
Japan Anti-Tuberculosis Association (JATA) # 6, St. 288, Beong Keng Kang II, Phnom Penh
Family Health International (FHI)# 11, St. 302, Boeung Keng Kang, Phnom [email protected], [email protected]: 855 – 023 211914/212565
Sihanouk Hospital Centre of HOPE (SHCH)1/ Street 134, Sangkat Vealvong, Khan 7 Makara, Phnom [email protected], [email protected] 011 842 034, 011 716 704,
Japan International Cooperation Agency (JICA)National Center for TB and Leprosy services (CENAT)St. 278–95, Beong Keng Kang II, Phnom Penh
US-Centers for Disease Control and PreventionNational Institute of Public Health, P.O Box 1300, Phnom Penh
VOR ORTP.O.Box 89008, 16000 Ratanakiri [email protected] 97 40 67, 012 78 59 33
University Research Co. (URC) Phnom Penh Center, Second floor, Corner of Sihanouk & Sothearos Bld, Tonle Bassac, Phnom Penh
Catholic Relief Services (CRS) in partnership with AHEAD (Action for Health and Development)#14, St. 278, S/K Beung Keng Kang I, Phnom [email protected] Tel: 012 -907 802
Cambodia Anti-Tuberculosis Association (CATA)P.O Box: 2589, CCC Box: 364c/o CENAT, 278/95, S/K Beoung Keng Kang II, Khan Chamka morn, Phnom [email protected] , [email protected] Tel: 023–218091, Fax/Tel: 855–23 218090,
Christian Action Research and Action (CARE) #52, W5 352, Phnom Penh
Health And Development Alliance, HEADHouse #00, Klang Prak Village, Khum Pha Ear, Kampong Chhnang District, Kampong Chhnang [email protected]: +855 12 989 242 or +855 16 857 275
Reproductive Health Association of Cambodia (RHAC)#6, St. 150, Sangat Veal Vong, Phnom Penh
Health Unlimited (HU)# 37, St. 396, Boeung Keng kang 3, Chamcarmon, Phnom PenhMs. Khou Somatheavy ([email protected]), Country Manager Mr. Sam Ossophea ([email protected]), Program CoordinatorTel/Fax 023 215192 / 214363
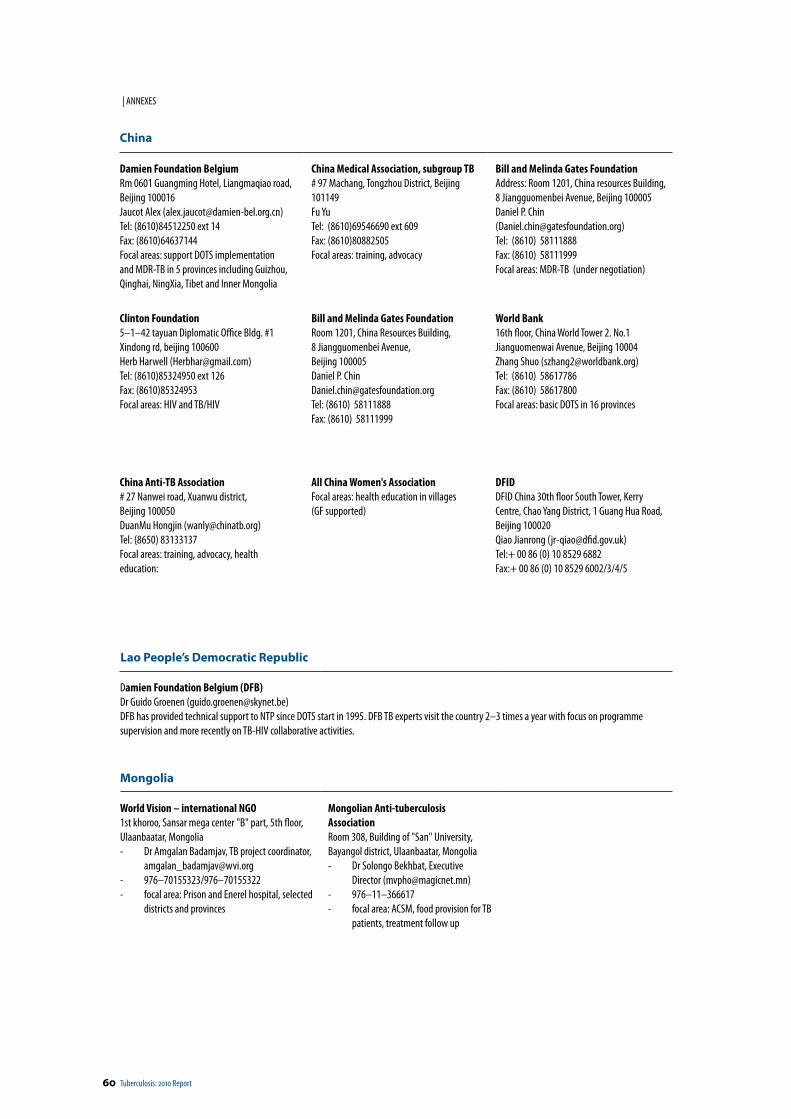
60 Tuberculosis: 2010 Report
| ANNEXES
China
Damien Foundation BelgiumRm 0601 Guangming Hotel, Liangmaqiao road, Beijing 100016Jaucot Alex ([email protected])Tel: (8610)84512250 ext 14Fax: (8610)64637144 Focal areas: support DOTS implementation and MDR-TB in 5 provinces including Guizhou, Qinghai, NingXia, Tibet and Inner Mongolia
China Medical Association, subgroup TB# 97 Machang, Tongzhou District, Beijing 101149Fu YuTel: (8610)69546690 ext 609Fax: (8610)80882505Focal areas: training, advocacy
Bill and Melinda Gates FoundationAddress: Room 1201, China resources Building, 8 Jiangguomenbei Avenue, Beijing 100005Daniel P. Chin ([email protected])Tel: (8610) 58111888Fax: (8610) 58111999Focal areas: MDR-TB (under negotiation)
Clinton Foundation5–1–42 tayuan Diplomatic Office Bldg. #1 Xindong rd, beijing 100600Herb Harwell ([email protected])Tel: (8610)85324950 ext 126Fax: (8610)85324953Focal areas: HIV and TB/HIV
Bill and Melinda Gates FoundationRoom 1201, China Resources Building, 8 Jiangguomenbei Avenue, Beijing 100005Daniel P. [email protected]: (8610) 58111888Fax: (8610) 58111999
World Bank16th floor, China World Tower 2. No.1 Jianguomenwai Avenue, Beijing 10004Zhang Shuo ([email protected])Tel: (8610) 58617786Fax: (8610) 58617800Focal areas: basic DOTS in 16 provinces
China Anti-TB Association# 27 Nanwei road, Xuanwu district, Beijing 100050DuanMu Hongjin ([email protected])Tel: (8650) 83133137Focal areas: training, advocacy, health education:
All China Women's AssociationFocal areas: health education in villages (GF supported)
DFIDDFID China 30th floor South Tower, Kerry Centre, Chao Yang District, 1 Guang Hua Road, Beijing 100020Qiao Jianrong ([email protected])Tel:+ 00 86 (0) 10 8529 6882Fax:+ 00 86 (0) 10 8529 6002/3/4/5
Lao People’s Democratic Republic
Damien Foundation Belgium (DFB)Dr Guido Groenen ([email protected])DFB has provided technical support to NTP since DOTS start in 1995. DFB TB experts visit the country 2–3 times a year with focus on programme supervision and more recently on TB-HIV collaborative activities.
Mongolia
World Vision – international NGO1st khoroo, Sansar mega center "B" part, 5th floor, Ulaanbaatar, Mongolia - Dr Amgalan Badamjav, TB project coordinator,
[email protected] - 976–70155323/976–70155322 - focal area: Prison and Enerel hospital, selected
districts and provinces
Mongolian Anti-tuberculosis AssociationRoom 308, Building of "San" University, Bayangol district, Ulaanbaatar, Mongolia - Dr Solongo Bekhbat, Executive
Director ([email protected]) - 976–11–366617 - focal area: ACSM, food provision for TB
patients, treatment follow up
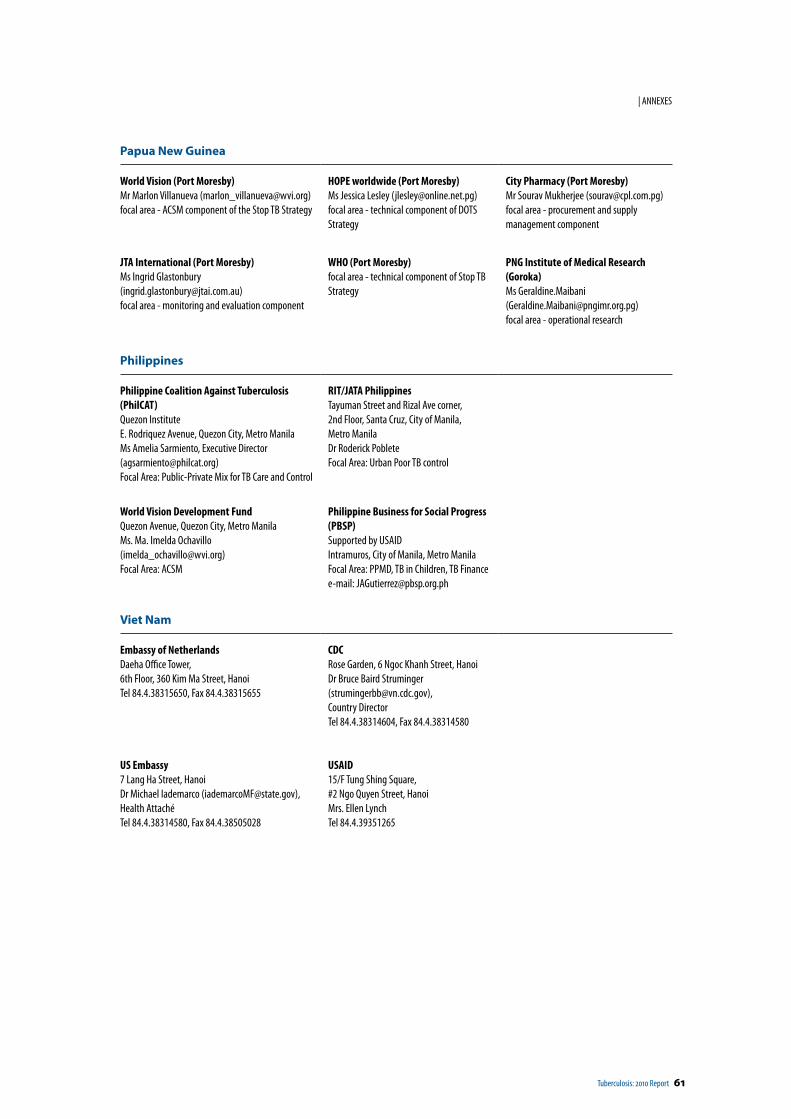
Tuberculosis: 2010 Report 61
| ANNEXES
Papua New Guinea
World Vision (Port Moresby) Mr Marlon Villanueva ([email protected])focal area - ACSM component of the Stop TB Strategy
HOPE worldwide (Port Moresby) Ms Jessica Lesley ([email protected])focal area - technical component of DOTS Strategy
City Pharmacy (Port Moresby)Mr Sourav Mukherjee ([email protected])focal area - procurement and supply management component
JTA International (Port Moresby)Ms Ingrid Glastonbury ([email protected])focal area - monitoring and evaluation component
WHO (Port Moresby)focal area - technical component of Stop TB Strategy
PNG Institute of Medical Research (Goroka)Ms Geraldine.Maibani ([email protected])focal area - operational research
Philippines
Philippine Coalition Against Tuberculosis (PhilCAT)Quezon InstituteE. Rodriquez Avenue, Quezon City, Metro ManilaMs Amelia Sarmiento, Executive Director ([email protected])Focal Area: Public-Private Mix for TB Care and Control
RIT/JATA PhilippinesTayuman Street and Rizal Ave corner, 2nd Floor, Santa Cruz, City of Manila, Metro ManilaDr Roderick PobleteFocal Area: Urban Poor TB control
World Vision Development FundQuezon Avenue, Quezon City, Metro ManilaMs. Ma. Imelda Ochavillo ([email protected])Focal Area: ACSM
Philippine Business for Social Progress (PBSP)Supported by USAIDIntramuros, City of Manila, Metro ManilaFocal Area: PPMD, TB in Children, TB Financee-mail: [email protected]
Viet Nam
Embassy of NetherlandsDaeha Office Tower, 6th Floor, 360 Kim Ma Street, HanoiTel 84.4.38315650, Fax 84.4.38315655
CDCRose Garden, 6 Ngoc Khanh Street, HanoiDr Bruce Baird Struminger ([email protected]), Country DirectorTel 84.4.38314604, Fax 84.4.38314580
US Embassy7 Lang Ha Street, HanoiDr Michael Iademarco ([email protected]), Health AttachéTel 84.4.38314580, Fax 84.4.38505028
USAID15/F Tung Shing Square, #2 Ngo Quyen Street, HanoiMrs. Ellen LynchTel 84.4.39351265
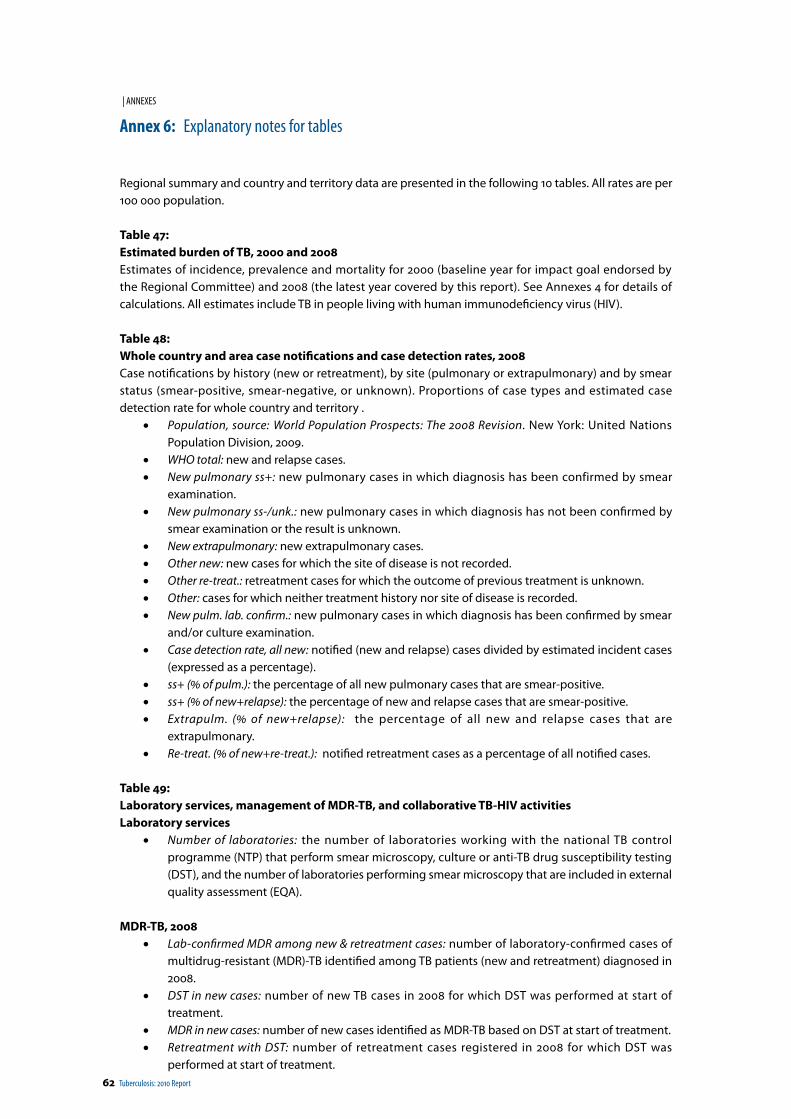
62 Tuberculosis: 2010 Report
| ANNEXES
Annex 6: Explanatory notes for tables
Regional summary and country and territory data are presented in the following 10 tables. All rates are per 100 000 population.
Table 47: Estimated burden of TB, 2000 and 2008Estimates of incidence, prevalence and mortality for 2000 (baseline year for impact goal endorsed by the Regional Committee) and 2008 (the latest year covered by this report). See Annexes 4 for details of calculations. All estimates include TB in people living with human immunodeficiency virus (HIV).
Table 48: Whole country and area case notifications and case detection rates, 2008Case notifications by history (new or retreatment), by site (pulmonary or extrapulmonary) and by smear status (smear-positive, smear-negative, or unknown). Proportions of case types and estimated case detection rate for whole country and territory .
• Population, source: World Population Prospects: The 2008 Revision. New York: United Nations Population Division, 2009.
• WHO total: new and relapse cases.• New pulmonary ss+: new pulmonary cases in which diagnosis has been confirmed by smear
examination.• New pulmonary ss-/unk.: new pulmonary cases in which diagnosis has not been confirmed by
smear examination or the result is unknown.• New extrapulmonary: new extrapulmonary cases. • Other new: new cases for which the site of disease is not recorded.• Other re-treat.: retreatment cases for which the outcome of previous treatment is unknown.• Other: cases for which neither treatment history nor site of disease is recorded.• New pulm. lab. confirm.: new pulmonary cases in which diagnosis has been confirmed by smear
and/or culture examination.• Case detection rate, all new: notified (new and relapse) cases divided by estimated incident cases
(expressed as a percentage).• ss+ (% of pulm.): the percentage of all new pulmonary cases that are smear-positive.• ss+ (% of new+relapse): the percentage of new and relapse cases that are smear-positive.• Extrapulm. (% of new+relapse): the percentage of all new and relapse cases that are
extrapulmonary.• Re-treat. (% of new+re-treat.): notified retreatment cases as a percentage of all notified cases.
Table 49: Laboratory services, management of MDR-TB, and collaborative TB-HIV activitiesLaboratory services
• Number of laboratories: the number of laboratories working with the national TB control programme (NTP) that perform smear microscopy, culture or anti-TB drug susceptibility testing (DST), and the number of laboratories performing smear microscopy that are included in external quality assessment (EQA).
MDR-TB, 2008• Lab-confirmed MDR among new & retreatment cases: number of laboratory-confirmed cases of
multidrug-resistant (MDR)-TB identified among TB patients (new and retreatment) diagnosed in 2008.
• DST in new cases: number of new TB cases in 2008 for which DST was performed at start of treatment.
• MDR in new cases: number of new cases identified as MDR-TB based on DST at start of treatment.• Retreatment with DST: number of retreatment cases registered in 2008 for which DST was
performed at start of treatment.
Tuberculosis: 2010 Report 63
| ANNEXES
• Re-treat. MDR: number of retreatment cases identified as MDR-TB based on DST at start of treatment.
Collaborative TB-HIV activities, 2007 and 2008• TB patients tested for HIV: the number of TB patients tested for HIV.• Of those tested, HIV positive: the number of TB patients found to be HIV-positive.• Of those HIV positive, started co-trimoxazole: the number of HIV-positive TB patients given CPT.• Of those HIV positive, started antiretroviral therapy (ART): the number of HIV-positive TB patients
given ART during their TB treatment.
Table 50: Treatment outcomes, 2007 cohortTreatment outcomes of new smear-positive cases treated under DOTS and retreatment cases under DOTS.
Table 51: DOTS treatment success and case detection rates, 1994–2008Treatment success rates (the proportion of registered cases cured or completed treatment) for new smear-positive cases treated under DOTS from 1994 to 2007 and all forms case detection rates from 1995 to 2008.
Table 52: New smear-positive case notification by age and sex, absolute numbers, 2008Breakdown by age and sex of new smear-positive cases notified by country and territory. Some countries and areas cannot provide the breakdown for all notified smear-positive cases.
Table 53: New smear-positive case notification rates by age and sex, 2008Notification rates of new smear-positive cases by age and sex. Rates are missing where breakdown of smear-positive notified cases is not provided, or if age- and sex-specific population data are not available. In the regional summary row, rates exclude those countries for which breakdown of notified cases or population by age and sex is missing.
Table 54: Number of TB cases notified, 1980–2008
Table 55: Case notification rates, 1980–2008
Table 56: New smear-positive cases notified, numbers and rates, 1993–2008
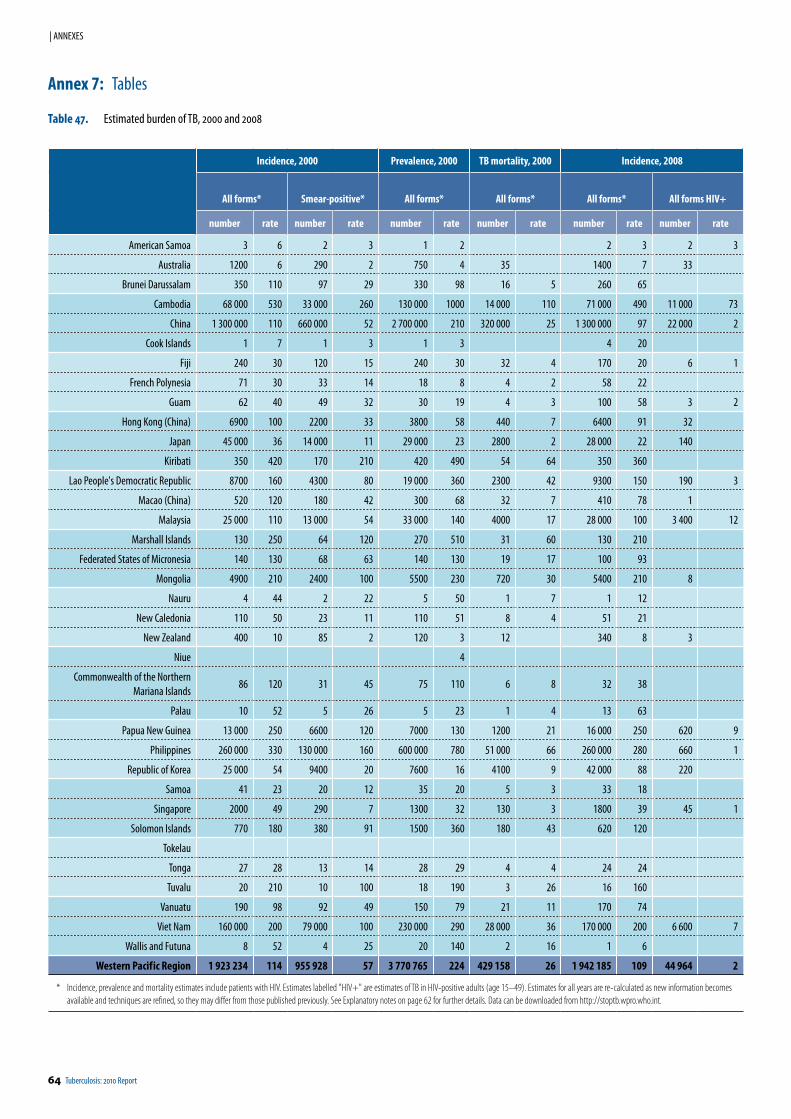
64 Tuberculosis: 2010 Report
| ANNEXES
Incidence, 2000 Prevalence, 2000 TB mortality, 2000 Incidence, 2008
All forms* Smear-positive* All forms* All forms* All forms* All forms HIV+
number rate number rate number rate number rate number rate number rate
American Samoa 3 6 2 3 1 2 2 3 2 3
Australia 1200 6 290 2 750 4 35 1400 7 33
Brunei Darussalam 350 110 97 29 330 98 16 5 260 65
Cambodia 68 000 530 33 000 260 130 000 1000 14 000 110 71 000 490 11 000 73
China 1 300 000 110 660 000 52 2 700 000 210 320 000 25 1 300 000 97 22 000 2
Cook Islands 1 7 1 3 1 3 4 20
Fiji 240 30 120 15 240 30 32 4 170 20 6 1
French Polynesia 71 30 33 14 18 8 4 2 58 22
Guam 62 40 49 32 30 19 4 3 100 58 3 2
Hong Kong (China) 6900 100 2200 33 3800 58 440 7 6400 91 32
Japan 45 000 36 14 000 11 29 000 23 2800 2 28 000 22 140
Kiribati 350 420 170 210 420 490 54 64 350 360
Lao People's Democratic Republic 8700 160 4300 80 19 000 360 2300 42 9300 150 190 3
Macao (China) 520 120 180 42 300 68 32 7 410 78 1
Malaysia 25 000 110 13 000 54 33 000 140 4000 17 28 000 100 3 400 12
Marshall Islands 130 250 64 120 270 510 31 60 130 210
Federated States of Micronesia 140 130 68 63 140 130 19 17 100 93
Mongolia 4900 210 2400 100 5500 230 720 30 5400 210 8
Nauru 4 44 2 22 5 50 1 7 1 12
New Caledonia 110 50 23 11 110 51 8 4 51 21
New Zealand 400 10 85 2 120 3 12 340 8 3
Niue 4
Commonwealth of the Northern Mariana Islands
86 120 31 45 75 110 6 8 32 38
Palau 10 52 5 26 5 23 1 4 13 63
Papua New Guinea 13 000 250 6600 120 7000 130 1200 21 16 000 250 620 9
Philippines 260 000 330 130 000 160 600 000 780 51 000 66 260 000 280 660 1
Republic of Korea 25 000 54 9400 20 7600 16 4100 9 42 000 88 220
Samoa 41 23 20 12 35 20 5 3 33 18
Singapore 2000 49 290 7 1300 32 130 3 1800 39 45 1
Solomon Islands 770 180 380 91 1500 360 180 43 620 120
Tokelau
Tonga 27 28 13 14 28 29 4 4 24 24
Tuvalu 20 210 10 100 18 190 3 26 16 160
Vanuatu 190 98 92 49 150 79 21 11 170 74
Viet Nam 160 000 200 79 000 100 230 000 290 28 000 36 170 000 200 6 600 7
Wallis and Futuna 8 52 4 25 20 140 2 16 1 6
Western Pacif ic Region 1 923 234 114 955 928 57 3 770 765 224 429 158 26 1 942 185 109 44 964 2
* Incidence, prevalence and mortality estimates include patients with HIV. Estimates labelled "HIV+" are estimates of TB in HIV-positive adults (age 15–49). Estimates for all years are re-calculated as new information becomes available and techniques are refined, so they may differ from those published previously. See Explanatory notes on page 62 for further details. Data can be downloaded from http://stoptb.wpro.who.int.
Annex 7: Tables
Table 47. Estimated burden of TB, 2000 and 2008
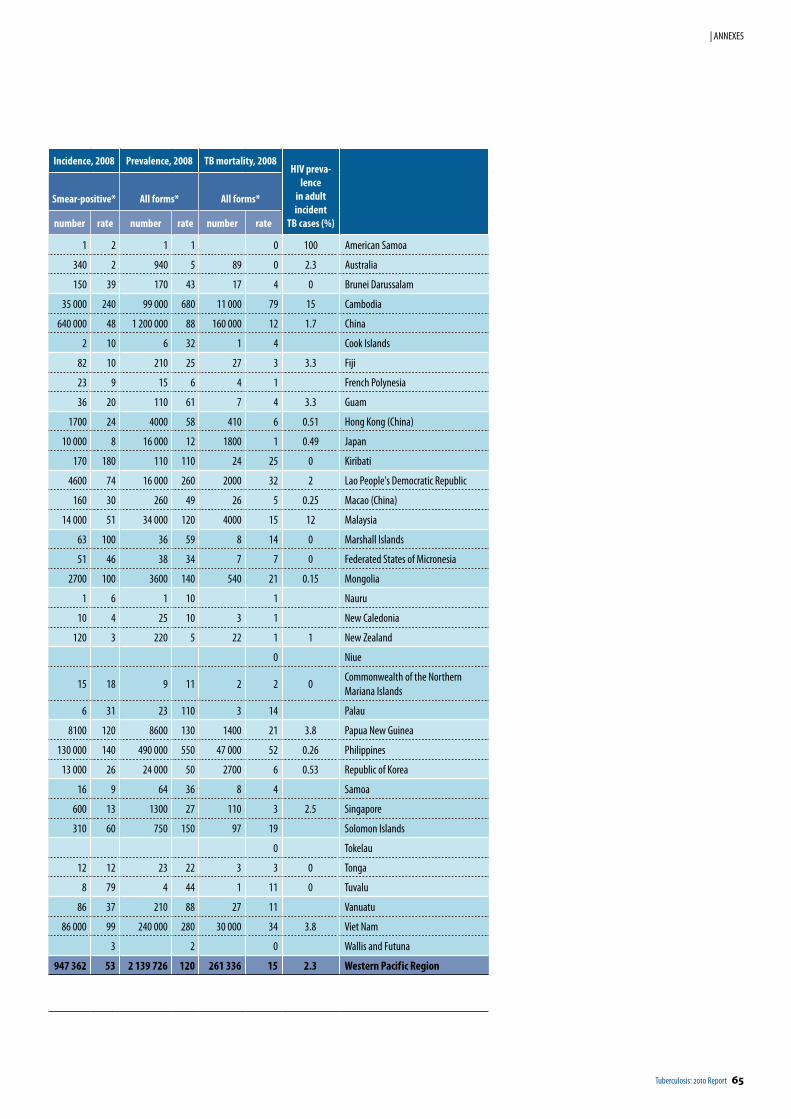
Tuberculosis: 2010 Report 65
| ANNEXES
Incidence, 2008 Prevalence, 2008 TB mortality, 2008HIV preva-
lencein adult incident
TB cases (%)
Smear-positive* All forms* All forms*
number rate number rate number rate
1 2 1 1 0 100 American Samoa
340 2 940 5 89 0 2.3 Australia
150 39 170 43 17 4 0 Brunei Darussalam
35 000 240 99 000 680 11 000 79 15 Cambodia
640 000 48 1 200 000 88 160 000 12 1.7 China
2 10 6 32 1 4 Cook Islands
82 10 210 25 27 3 3.3 Fiji
23 9 15 6 4 1 French Polynesia
36 20 110 61 7 4 3.3 Guam
1700 24 4000 58 410 6 0.51 Hong Kong (China)
10 000 8 16 000 12 1800 1 0.49 Japan
170 180 110 110 24 25 0 Kiribati
4600 74 16 000 260 2000 32 2 Lao People's Democratic Republic
160 30 260 49 26 5 0.25 Macao (China)
14 000 51 34 000 120 4000 15 12 Malaysia
63 100 36 59 8 14 0 Marshall Islands
51 46 38 34 7 7 0 Federated States of Micronesia
2700 100 3600 140 540 21 0.15 Mongolia
1 6 1 10 1 Nauru
10 4 25 10 3 1 New Caledonia
120 3 220 5 22 1 1 New Zealand
0 Niue
15 18 9 11 2 2 0Commonwealth of the Northern Mariana Islands
6 31 23 110 3 14 Palau
8100 120 8600 130 1400 21 3.8 Papua New Guinea
130 000 140 490 000 550 47 000 52 0.26 Philippines
13 000 26 24 000 50 2700 6 0.53 Republic of Korea
16 9 64 36 8 4 Samoa
600 13 1300 27 110 3 2.5 Singapore
310 60 750 150 97 19 Solomon Islands
0 Tokelau
12 12 23 22 3 3 0 Tonga
8 79 4 44 1 11 0 Tuvalu
86 37 210 88 27 11 Vanuatu
86 000 99 240 000 280 30 000 34 3.8 Viet Nam
3 2 0 Wallis and Futuna
947 362 53 2 139 726 120 261 336 15 2.3 Western Pacif ic Region
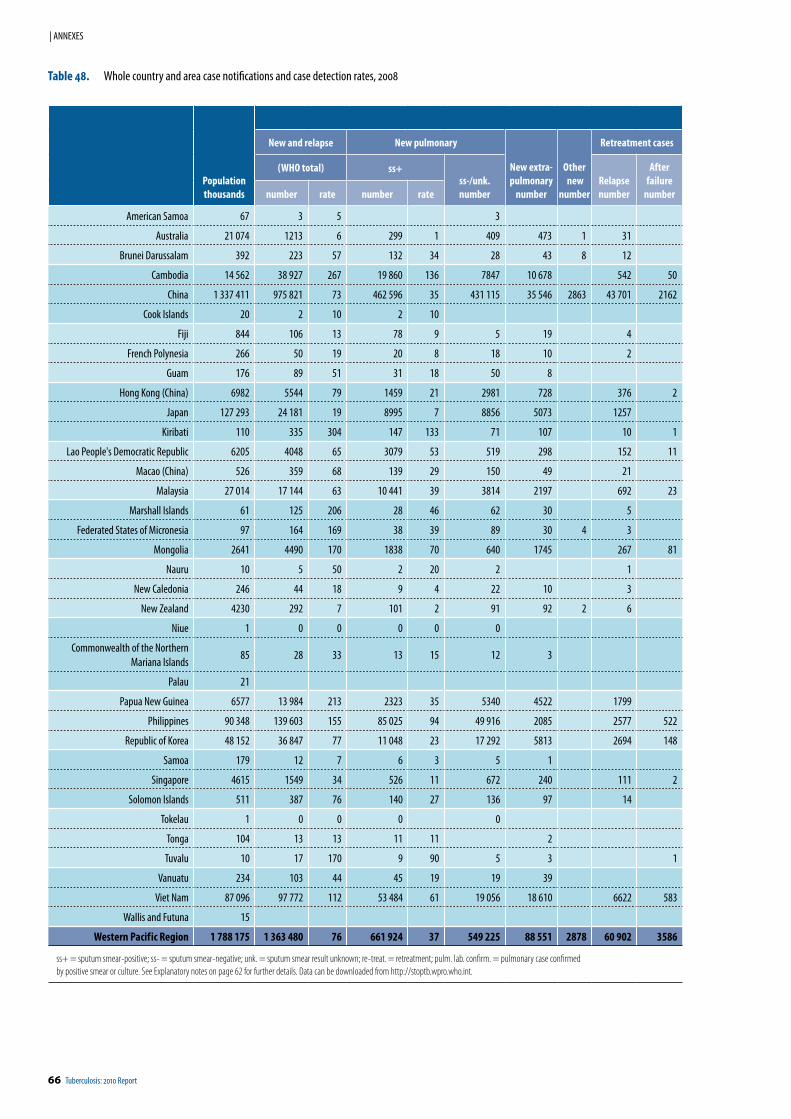
66 Tuberculosis: 2010 Report
| ANNEXES
Table 48. Whole country and area case notifications and case detection rates, 2008
Populationthousands
New and relapse New pulmonary
New extra-pulmonary
number
Other new
number
Retreatment cases
(WHO total) ss+ss-/unk.number
Relapsenumber
After failure
numbernumber rate number rate
American Samoa 67 3 5 3
Australia 21 074 1213 6 299 1 409 473 1 31
Brunei Darussalam 392 223 57 132 34 28 43 8 12
Cambodia 14 562 38 927 267 19 860 136 7847 10 678 542 50
China 1 337 411 975 821 73 462 596 35 431 115 35 546 2863 43 701 2162
Cook Islands 20 2 10 2 10
Fiji 844 106 13 78 9 5 19 4
French Polynesia 266 50 19 20 8 18 10 2
Guam 176 89 51 31 18 50 8
Hong Kong (China) 6982 5544 79 1459 21 2981 728 376 2
Japan 127 293 24 181 19 8995 7 8856 5073 1257
Kiribati 110 335 304 147 133 71 107 10 1
Lao People's Democratic Republic 6205 4048 65 3079 53 519 298 152 11
Macao (China) 526 359 68 139 29 150 49 21
Malaysia 27 014 17 144 63 10 441 39 3814 2197 692 23
Marshall Islands 61 125 206 28 46 62 30 5
Federated States of Micronesia 97 164 169 38 39 89 30 4 3
Mongolia 2641 4490 170 1838 70 640 1745 267 81
Nauru 10 5 50 2 20 2 1
New Caledonia 246 44 18 9 4 22 10 3
New Zealand 4230 292 7 101 2 91 92 2 6
Niue 1 0 0 0 0 0
Commonwealth of the Northern Mariana Islands
85 28 33 13 15 12 3
Palau 21
Papua New Guinea 6577 13 984 213 2323 35 5340 4522 1799
Philippines 90 348 139 603 155 85 025 94 49 916 2085 2577 522
Republic of Korea 48 152 36 847 77 11 048 23 17 292 5813 2694 148
Samoa 179 12 7 6 3 5 1
Singapore 4615 1549 34 526 11 672 240 111 2
Solomon Islands 511 387 76 140 27 136 97 14
Tokelau 1 0 0 0 0
Tonga 104 13 13 11 11 2
Tuvalu 10 17 170 9 90 5 3 1
Vanuatu 234 103 44 45 19 19 39
Viet Nam 87 096 97 772 112 53 484 61 19 056 18 610 6622 583
Wallis and Futuna 15
Western Pacif ic Region 1 788 175 1 363 480 76 661 924 37 549 225 88 551 2878 60 902 3586
ss+ = sputum smear-positive; ss- = sputum smear-negative; unk. = sputum smear result unknown; re-treat. = retreatment; pulm. lab. confirm. = pulmonary case confirmed by positive smear or culture. See Explanatory notes on page 62 for further details. Data can be downloaded from http://stoptb.wpro.who.int.
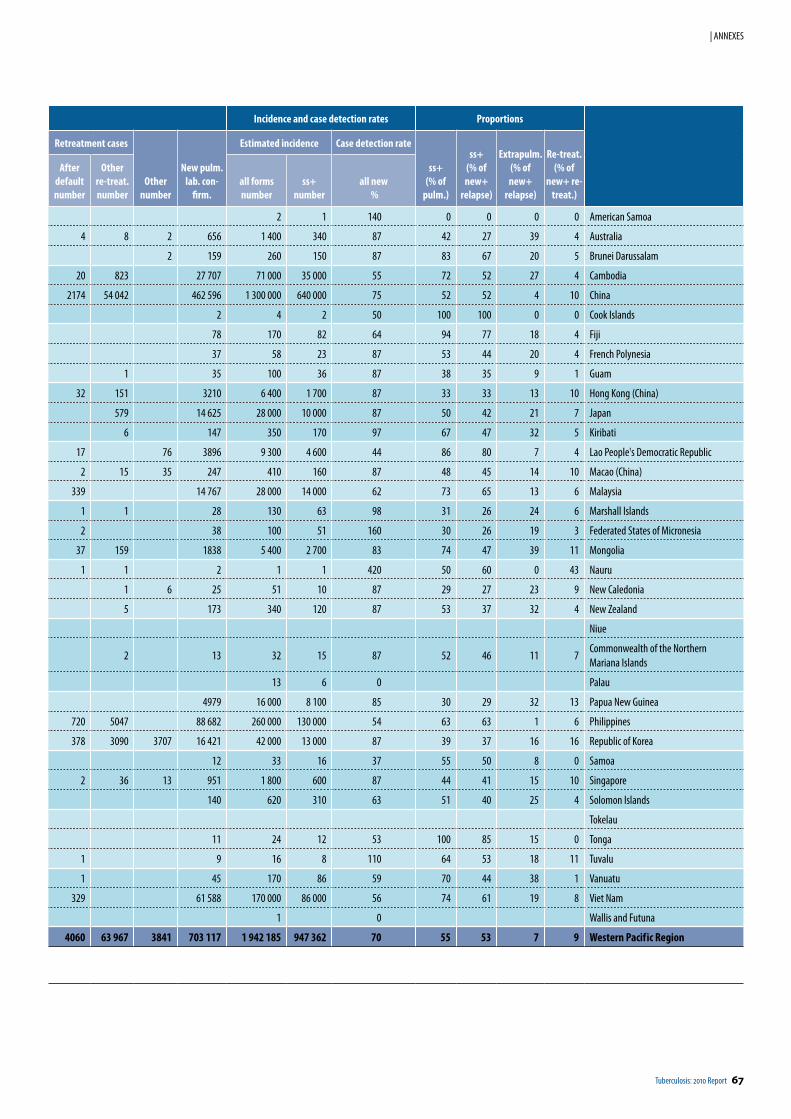
Tuberculosis: 2010 Report 67
| ANNEXES
Incidence and case detection rates Proportions
Retreatment cases
Othernumber
New pulm.lab. con-
firm.
Estimated incidence Case detection rate
ss+(% of
pulm.)
ss+(% of new+
relapse)
Extrapulm.(% of new+
relapse)
Re-treat.(% of
new+ re-treat.)
After defaultnumber
Other re-treat.number
all formsnumber
ss+number
all new %
2 1 140 0 0 0 0 American Samoa
4 8 2 656 1 400 340 87 42 27 39 4 Australia
2 159 260 150 87 83 67 20 5 Brunei Darussalam
20 823 27 707 71 000 35 000 55 72 52 27 4 Cambodia
2174 54 042 462 596 1 300 000 640 000 75 52 52 4 10 China
2 4 2 50 100 100 0 0 Cook Islands
78 170 82 64 94 77 18 4 Fiji
37 58 23 87 53 44 20 4 French Polynesia
1 35 100 36 87 38 35 9 1 Guam
32 151 3210 6 400 1 700 87 33 33 13 10 Hong Kong (China)
579 14 625 28 000 10 000 87 50 42 21 7 Japan
6 147 350 170 97 67 47 32 5 Kiribati
17 76 3896 9 300 4 600 44 86 80 7 4 Lao People's Democratic Republic
2 15 35 247 410 160 87 48 45 14 10 Macao (China)
339 14 767 28 000 14 000 62 73 65 13 6 Malaysia
1 1 28 130 63 98 31 26 24 6 Marshall Islands
2 38 100 51 160 30 26 19 3 Federated States of Micronesia
37 159 1838 5 400 2 700 83 74 47 39 11 Mongolia
1 1 2 1 1 420 50 60 0 43 Nauru
1 6 25 51 10 87 29 27 23 9 New Caledonia
5 173 340 120 87 53 37 32 4 New Zealand
Niue
2 13 32 15 87 52 46 11 7Commonwealth of the Northern Mariana Islands
13 6 0 Palau
4979 16 000 8 100 85 30 29 32 13 Papua New Guinea
720 5047 88 682 260 000 130 000 54 63 63 1 6 Philippines
378 3090 3707 16 421 42 000 13 000 87 39 37 16 16 Republic of Korea
12 33 16 37 55 50 8 0 Samoa
2 36 13 951 1 800 600 87 44 41 15 10 Singapore
140 620 310 63 51 40 25 4 Solomon Islands
Tokelau
11 24 12 53 100 85 15 0 Tonga
1 9 16 8 110 64 53 18 11 Tuvalu
1 45 170 86 59 70 44 38 1 Vanuatu
329 61 588 170 000 86 000 56 74 61 19 8 Viet Nam
1 0 Wallis and Futuna
4060 63 967 3841 703 117 1 942 185 947 362 70 55 53 7 9 Western Pacif ic Region
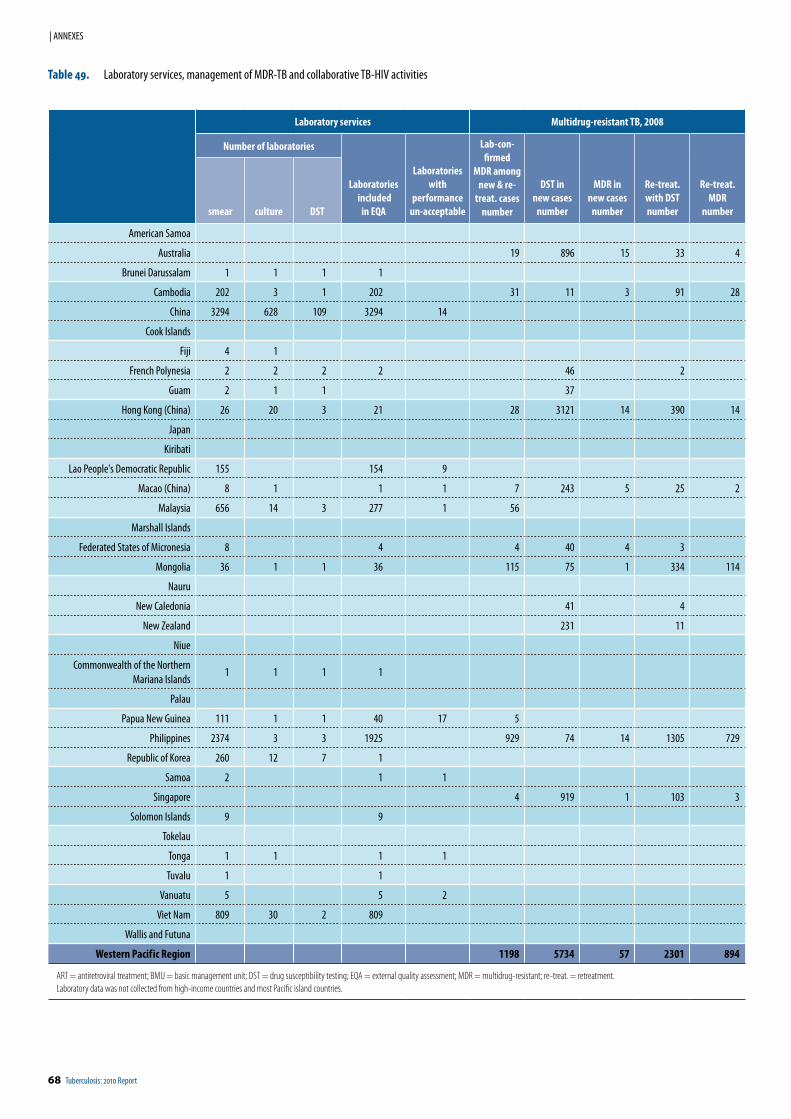
68 Tuberculosis: 2010 Report
| ANNEXES
Laboratory services Multidrug-resistant TB, 2008
Number of laboratories
Laboratories included
in EQA
Laboratorieswith
performanceun-acceptable
Lab-con-firmed
MDR among new & re-
treat. cases number
DST in new cases
number
MDR innew cases
number
Re-treat. with DSTnumber
Re-treat.MDR
number smear culture DST
American Samoa
Australia 19 896 15 33 4
Brunei Darussalam 1 1 1 1
Cambodia 202 3 1 202 31 11 3 91 28
China 3294 628 109 3294 14
Cook Islands
Fiji 4 1
French Polynesia 2 2 2 2 46 2
Guam 2 1 1 37
Hong Kong (China) 26 20 3 21 28 3121 14 390 14
Japan
Kiribati
Lao People's Democratic Republic 155 154 9
Macao (China) 8 1 1 1 7 243 5 25 2
Malaysia 656 14 3 277 1 56
Marshall Islands
Federated States of Micronesia 8 4 4 40 4 3
Mongolia 36 1 1 36 115 75 1 334 114
Nauru
New Caledonia 41 4
New Zealand 231 11
Niue
Commonwealth of the Northern Mariana Islands
1 1 1 1
Palau
Papua New Guinea 111 1 1 40 17 5
Philippines 2374 3 3 1925 929 74 14 1305 729
Republic of Korea 260 12 7 1
Samoa 2 1 1
Singapore 4 919 1 103 3
Solomon Islands 9 9
Tokelau
Tonga 1 1 1 1
Tuvalu 1 1
Vanuatu 5 5 2
Viet Nam 809 30 2 809
Wallis and Futuna
Western Pacif ic Region 1198 5734 57 2301 894
ART = antiretroviral treatment; BMU = basic management unit; DST = drug susceptibility testing; EQA = external quality assessment; MDR = multidrug-resistant; re-treat. = retreatment.Laboratory data was not collected from high-income countries and most Pacific island countries.
Table 49. Laboratory services, management of MDR-TB and collaborative TB-HIV activities
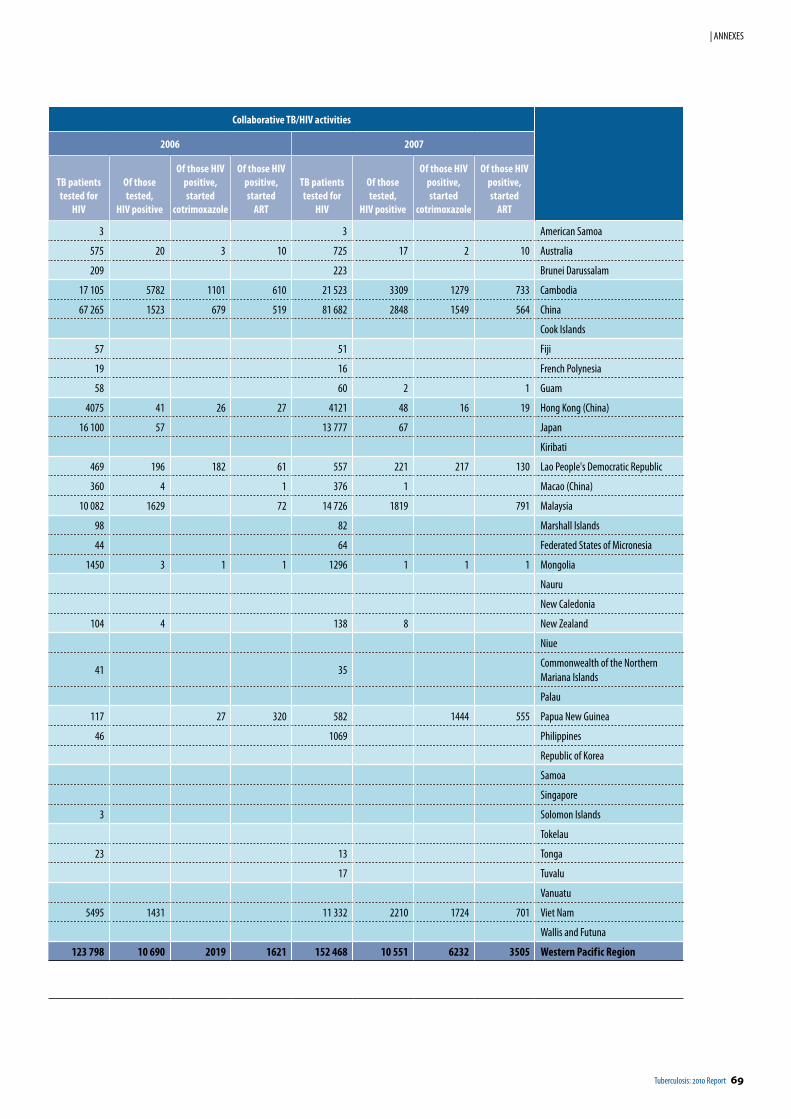
Tuberculosis: 2010 Report 69
| ANNEXES
Collaborative TB/HIV activities
2006 2007
TB patients tested for
HIV
Of thosetested,
HIV positive
Of those HIVpositive, started
cotrimoxazole
Of those HIVpositive, started
ART
TB patients tested for
HIV
Of thosetested,
HIV positive
Of those HIVpositive, started
cotrimoxazole
Of those HIVpositive, started
ART
3 3 American Samoa
575 20 3 10 725 17 2 10 Australia
209 223 Brunei Darussalam
17 105 5782 1101 610 21 523 3309 1279 733 Cambodia
67 265 1523 679 519 81 682 2848 1549 564 China
Cook Islands
57 51 Fiji
19 16 French Polynesia
58 60 2 1 Guam
4075 41 26 27 4121 48 16 19 Hong Kong (China)
16 100 57 13 777 67 Japan
Kiribati
469 196 182 61 557 221 217 130 Lao People's Democratic Republic
360 4 1 376 1 Macao (China)
10 082 1629 72 14 726 1819 791 Malaysia
98 82 Marshall Islands
44 64 Federated States of Micronesia
1450 3 1 1 1296 1 1 1 Mongolia
Nauru
New Caledonia
104 4 138 8 New Zealand
Niue
41 35Commonwealth of the Northern Mariana Islands
Palau
117 27 320 582 1444 555 Papua New Guinea
46 1069 Philippines
Republic of Korea
Samoa
Singapore
3 Solomon Islands
Tokelau
23 13 Tonga
17 Tuvalu
Vanuatu
5495 1431 11 332 2210 1724 701 Viet Nam
Wallis and Futuna
123 798 10 690 2019 1621 152 468 10 551 6232 3505 Western Pacif ic Region
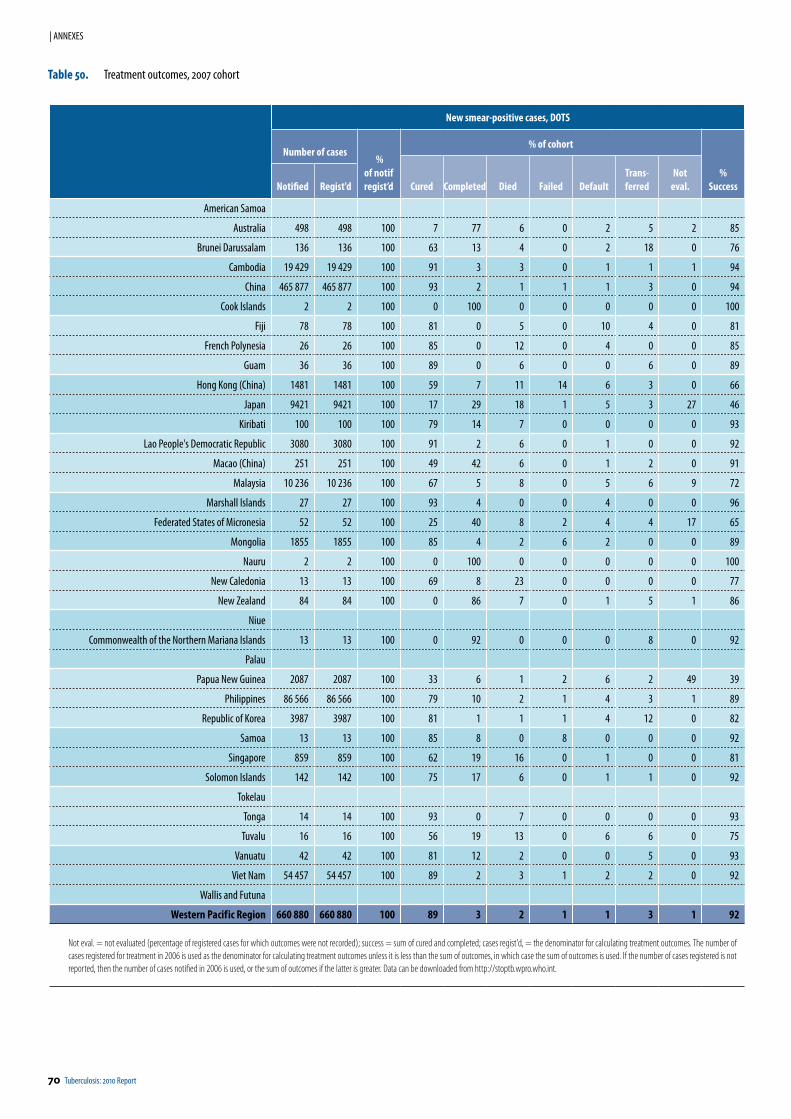
70 Tuberculosis: 2010 Report
| ANNEXES
Table 50. Treatment outcomes, 2007 cohort
New smear-positive cases, DOTS
Number of cases %
of notifregist’d
% of cohort
%SuccessCured Com pleted Died Failed Default
Trans-ferred
Noteval.Notified Regist'd
American Samoa
Australia 498 498 100 7 77 6 0 2 5 2 85
Brunei Darussalam 136 136 100 63 13 4 0 2 18 0 76
Cambodia 19 429 19 429 100 91 3 3 0 1 1 1 94
China 465 877 465 877 100 93 2 1 1 1 3 0 94
Cook Islands 2 2 100 0 100 0 0 0 0 0 100
Fiji 78 78 100 81 0 5 0 10 4 0 81
French Polynesia 26 26 100 85 0 12 0 4 0 0 85
Guam 36 36 100 89 0 6 0 0 6 0 89
Hong Kong (China) 1481 1481 100 59 7 11 14 6 3 0 66
Japan 9421 9421 100 17 29 18 1 5 3 27 46
Kiribati 100 100 100 79 14 7 0 0 0 0 93
Lao People's Democratic Republic 3080 3080 100 91 2 6 0 1 0 0 92
Macao (China) 251 251 100 49 42 6 0 1 2 0 91
Malaysia 10 236 10 236 100 67 5 8 0 5 6 9 72
Marshall Islands 27 27 100 93 4 0 0 4 0 0 96
Federated States of Micronesia 52 52 100 25 40 8 2 4 4 17 65
Mongolia 1855 1855 100 85 4 2 6 2 0 0 89
Nauru 2 2 100 0 100 0 0 0 0 0 100
New Caledonia 13 13 100 69 8 23 0 0 0 0 77
New Zealand 84 84 100 0 86 7 0 1 5 1 86
Niue
Commonwealth of the Northern Mariana Islands 13 13 100 0 92 0 0 0 8 0 92
Palau
Papua New Guinea 2087 2087 100 33 6 1 2 6 2 49 39
Philippines 86 566 86 566 100 79 10 2 1 4 3 1 89
Republic of Korea 3987 3987 100 81 1 1 1 4 12 0 82
Samoa 13 13 100 85 8 0 8 0 0 0 92
Singapore 859 859 100 62 19 16 0 1 0 0 81
Solomon Islands 142 142 100 75 17 6 0 1 1 0 92
Tokelau
Tonga 14 14 100 93 0 7 0 0 0 0 93
Tuvalu 16 16 100 56 19 13 0 6 6 0 75
Vanuatu 42 42 100 81 12 2 0 0 5 0 93
Viet Nam 54 457 54 457 100 89 2 3 1 2 2 0 92
Wallis and Futuna
Western Pacif ic Region 660 880 660 880 100 89 3 2 1 1 3 1 92
Not eval. = not evaluated (percentage of registered cases for which outcomes were not recorded); success = sum of cured and completed; cases regist'd, = the denominator for calculating treatment outcomes. The number of cases registered for treatment in 2006 is used as the denominator for calculating treatment outcomes unless it is less than the sum of outcomes, in which case the sum of outcomes is used. If the number of cases registered is not reported, then the number of cases notified in 2006 is used, or the sum of outcomes if the latter is greater. Data can be downloaded from http://stoptb.wpro.who.int.
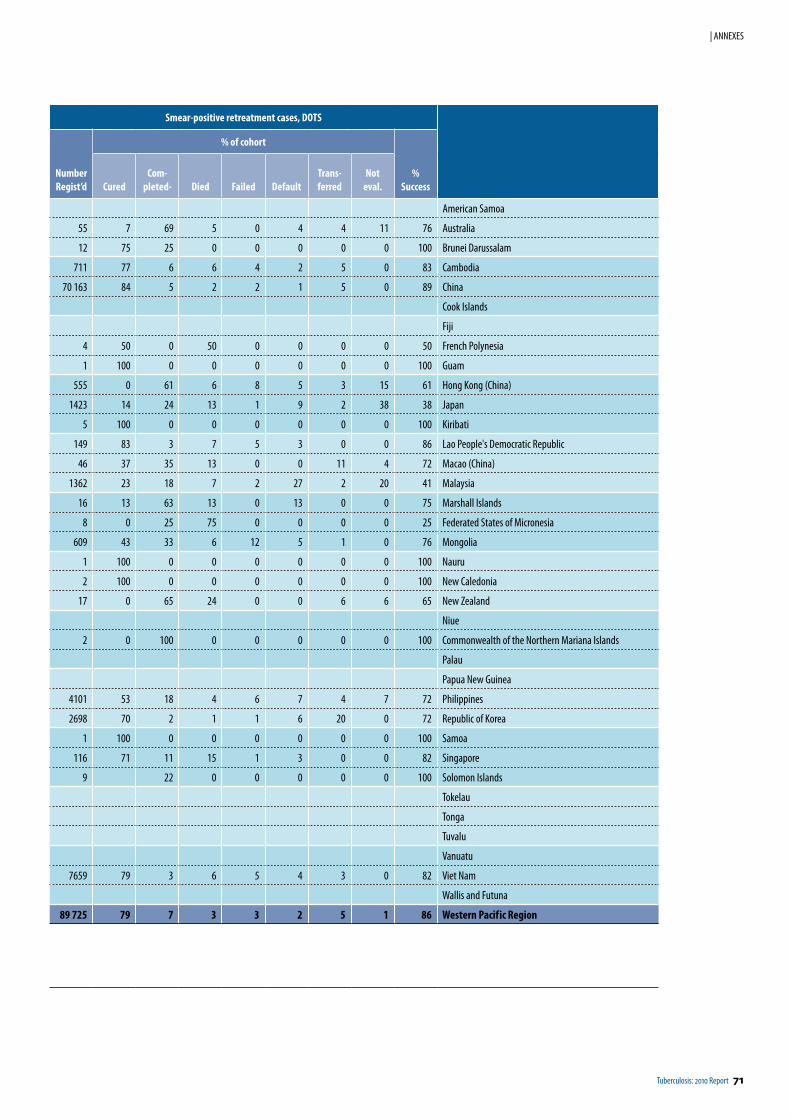
Tuberculosis: 2010 Report 71
| ANNEXES
Smear-positive retreatment cases, DOTS
NumberRegist’d
% of cohort
%SuccessCured
Com -pleted- Died Failed Default
Trans-ferred
Noteval.
American Samoa
55 7 69 5 0 4 4 11 76 Australia
12 75 25 0 0 0 0 0 100 Brunei Darussalam
711 77 6 6 4 2 5 0 83 Cambodia
70 163 84 5 2 2 1 5 0 89 China
Cook Islands
Fiji
4 50 0 50 0 0 0 0 50 French Polynesia
1 100 0 0 0 0 0 0 100 Guam
555 0 61 6 8 5 3 15 61 Hong Kong (China)
1423 14 24 13 1 9 2 38 38 Japan
5 100 0 0 0 0 0 0 100 Kiribati
149 83 3 7 5 3 0 0 86 Lao People's Democratic Republic
46 37 35 13 0 0 11 4 72 Macao (China)
1362 23 18 7 2 27 2 20 41 Malaysia
16 13 63 13 0 13 0 0 75 Marshall Islands
8 0 25 75 0 0 0 0 25 Federated States of Micronesia
609 43 33 6 12 5 1 0 76 Mongolia
1 100 0 0 0 0 0 0 100 Nauru
2 100 0 0 0 0 0 0 100 New Caledonia
17 0 65 24 0 0 6 6 65 New Zealand
Niue
2 0 100 0 0 0 0 0 100 Commonwealth of the Northern Mariana Islands
Palau
Papua New Guinea
4101 53 18 4 6 7 4 7 72 Philippines
2698 70 2 1 1 6 20 0 72 Republic of Korea
1 100 0 0 0 0 0 0 100 Samoa
116 71 11 15 1 3 0 0 82 Singapore
9 22 0 0 0 0 0 100 Solomon Islands
Tokelau
Tonga
Tuvalu
Vanuatu
7659 79 3 6 5 4 3 0 82 Viet Nam
Wallis and Futuna
89 725 79 7 3 3 2 5 1 86 Western Pacif ic Region
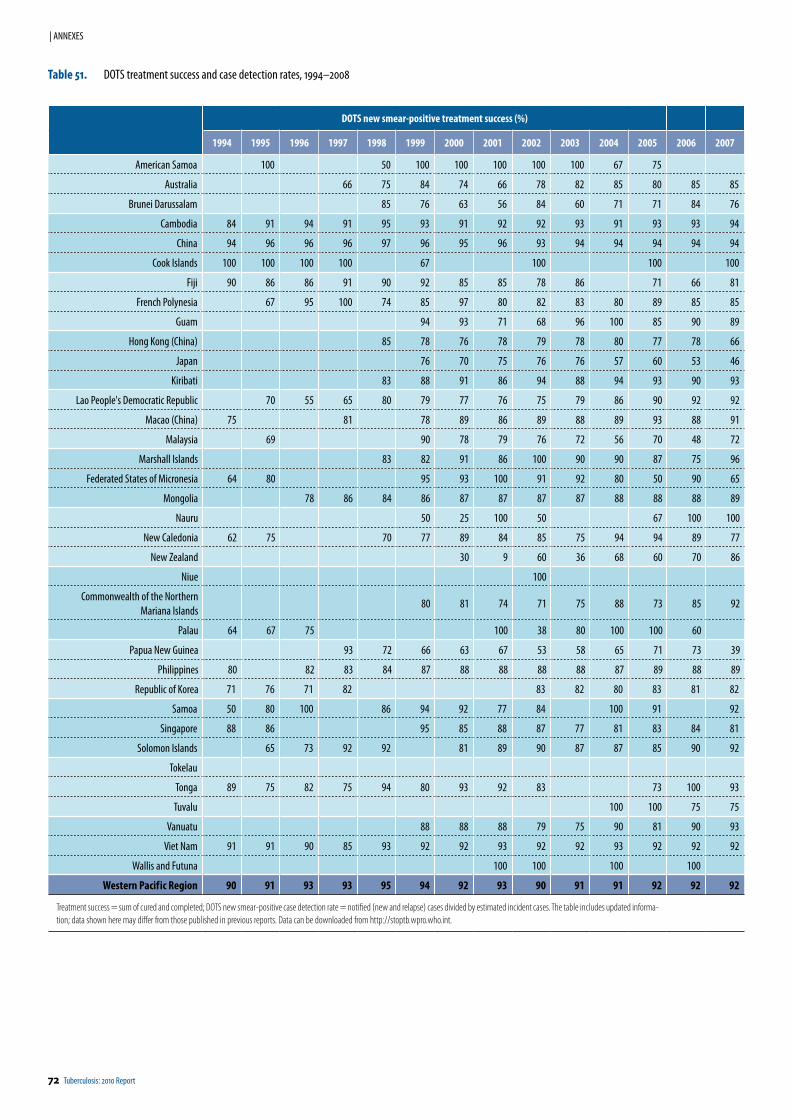
72 Tuberculosis: 2010 Report
| ANNEXES
DOTS new smear-positive treatment success (%)
1994 1995 1996 1997 1998 1999 2000 2001 2002 2003 2004 2005 2006 2007
American Samoa 100 50 100 100 100 100 100 67 75
Australia 66 75 84 74 66 78 82 85 80 85 85
Brunei Darussalam 85 76 63 56 84 60 71 71 84 76
Cambodia 84 91 94 91 95 93 91 92 92 93 91 93 93 94
China 94 96 96 96 97 96 95 96 93 94 94 94 94 94
Cook Islands 100 100 100 100 67 100 100 100
Fiji 90 86 86 91 90 92 85 85 78 86 71 66 81
French Polynesia 67 95 100 74 85 97 80 82 83 80 89 85 85
Guam 94 93 71 68 96 100 85 90 89
Hong Kong (China) 85 78 76 78 79 78 80 77 78 66
Japan 76 70 75 76 76 57 60 53 46
Kiribati 83 88 91 86 94 88 94 93 90 93
Lao People's Democratic Republic 70 55 65 80 79 77 76 75 79 86 90 92 92
Macao (China) 75 81 78 89 86 89 88 89 93 88 91
Malaysia 69 90 78 79 76 72 56 70 48 72
Marshall Islands 83 82 91 86 100 90 90 87 75 96
Federated States of Micronesia 64 80 95 93 100 91 92 80 50 90 65
Mongolia 78 86 84 86 87 87 87 87 88 88 88 89
Nauru 50 25 100 50 67 100 100
New Caledonia 62 75 70 77 89 84 85 75 94 94 89 77
New Zealand 30 9 60 36 68 60 70 86
Niue 100
Commonwealth of the Northern Mariana Islands
80 81 74 71 75 88 73 85 92
Palau 64 67 75 100 38 80 100 100 60
Papua New Guinea 93 72 66 63 67 53 58 65 71 73 39
Philippines 80 82 83 84 87 88 88 88 88 87 89 88 89
Republic of Korea 71 76 71 82 83 82 80 83 81 82
Samoa 50 80 100 86 94 92 77 84 100 91 92
Singapore 88 86 95 85 88 87 77 81 83 84 81
Solomon Islands 65 73 92 92 81 89 90 87 87 85 90 92
Tokelau
Tonga 89 75 82 75 94 80 93 92 83 73 100 93
Tuvalu 100 100 75 75
Vanuatu 88 88 88 79 75 90 81 90 93
Viet Nam 91 91 90 85 93 92 92 93 92 92 93 92 92 92
Wallis and Futuna 100 100 100 100
Western Pacif ic Region 90 91 93 93 95 94 92 93 90 91 91 92 92 92
Treatment success = sum of cured and completed; DOTS new smear-positive case detection rate = notified (new and relapse) cases divided by estimated incident cases. The table includes updated informa-tion; data shown here may differ from those published in previous reports. Data can be downloaded from http://stoptb.wpro.who.int.
Table 51. DOTS treatment success and case detection rates, 1994–2008
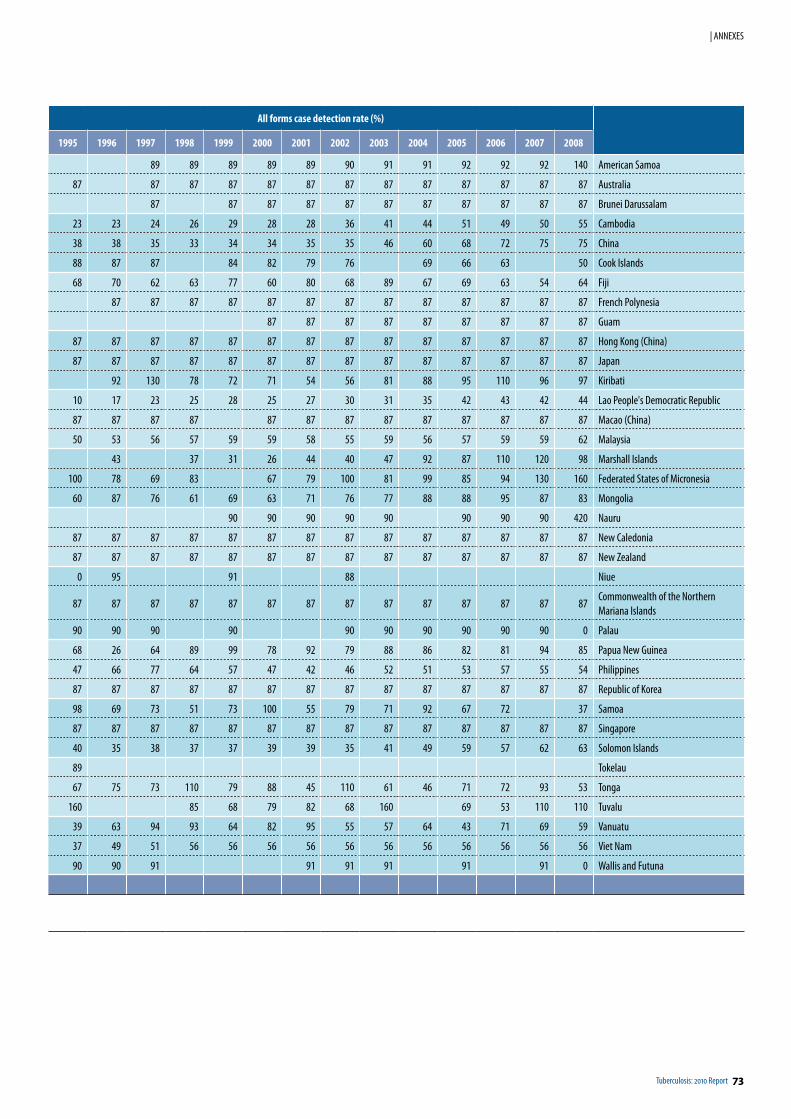
Tuberculosis: 2010 Report 73
| ANNEXES
All forms case detection rate (%)
1995 1996 1997 1998 1999 2000 2001 2002 2003 2004 2005 2006 2007 2008
89 89 89 89 89 90 91 91 92 92 92 140 American Samoa
87 87 87 87 87 87 87 87 87 87 87 87 87 Australia
87 87 87 87 87 87 87 87 87 87 87 Brunei Darussalam
23 23 24 26 29 28 28 36 41 44 51 49 50 55 Cambodia
38 38 35 33 34 34 35 35 46 60 68 72 75 75 China
88 87 87 84 82 79 76 69 66 63 50 Cook Islands
68 70 62 63 77 60 80 68 89 67 69 63 54 64 Fiji
87 87 87 87 87 87 87 87 87 87 87 87 87 French Polynesia
87 87 87 87 87 87 87 87 87 Guam
87 87 87 87 87 87 87 87 87 87 87 87 87 87 Hong Kong (China)
87 87 87 87 87 87 87 87 87 87 87 87 87 87 Japan
92 130 78 72 71 54 56 81 88 95 110 96 97 Kiribati
10 17 23 25 28 25 27 30 31 35 42 43 42 44 Lao People's Democratic Republic
87 87 87 87 87 87 87 87 87 87 87 87 87 Macao (China)
50 53 56 57 59 59 58 55 59 56 57 59 59 62 Malaysia
43 37 31 26 44 40 47 92 87 110 120 98 Marshall Islands
100 78 69 83 67 79 100 81 99 85 94 130 160 Federated States of Micronesia
60 87 76 61 69 63 71 76 77 88 88 95 87 83 Mongolia
90 90 90 90 90 90 90 90 420 Nauru
87 87 87 87 87 87 87 87 87 87 87 87 87 87 New Caledonia
87 87 87 87 87 87 87 87 87 87 87 87 87 87 New Zealand
0 95 91 88 Niue
87 87 87 87 87 87 87 87 87 87 87 87 87 87Commonwealth of the Northern Mariana Islands
90 90 90 90 90 90 90 90 90 90 0 Palau
68 26 64 89 99 78 92 79 88 86 82 81 94 85 Papua New Guinea
47 66 77 64 57 47 42 46 52 51 53 57 55 54 Philippines
87 87 87 87 87 87 87 87 87 87 87 87 87 87 Republic of Korea
98 69 73 51 73 100 55 79 71 92 67 72 37 Samoa
87 87 87 87 87 87 87 87 87 87 87 87 87 87 Singapore
40 35 38 37 37 39 39 35 41 49 59 57 62 63 Solomon Islands
89 Tokelau
67 75 73 110 79 88 45 110 61 46 71 72 93 53 Tonga
160 85 68 79 82 68 160 69 53 110 110 Tuvalu
39 63 94 93 64 82 95 55 57 64 43 71 69 59 Vanuatu
37 49 51 56 56 56 56 56 56 56 56 56 56 56 Viet Nam
90 90 91 91 91 91 91 91 0 Wallis and Futuna
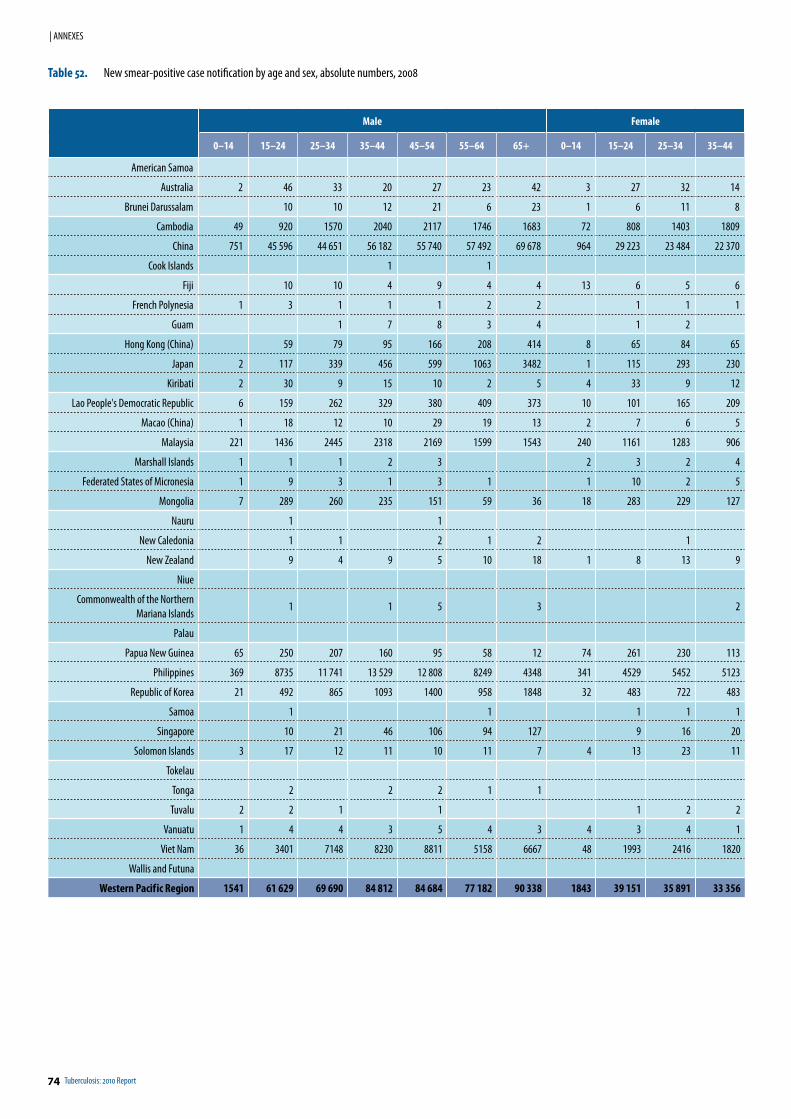
74 Tuberculosis: 2010 Report
| ANNEXES
Male Female
0–14 15–24 25–34 35–44 45–54 55–64 65+ 0–14 15–24 25–34 35–44
American Samoa
Australia 2 46 33 20 27 23 42 3 27 32 14
Brunei Darussalam 10 10 12 21 6 23 1 6 11 8
Cambodia 49 920 1570 2040 2117 1746 1683 72 808 1403 1809
China 751 45 596 44 651 56 182 55 740 57 492 69 678 964 29 223 23 484 22 370
Cook Islands 1 1
Fiji 10 10 4 9 4 4 13 6 5 6
French Polynesia 1 3 1 1 1 2 2 1 1 1
Guam 1 7 8 3 4 1 2
Hong Kong (China) 59 79 95 166 208 414 8 65 84 65
Japan 2 117 339 456 599 1063 3482 1 115 293 230
Kiribati 2 30 9 15 10 2 5 4 33 9 12
Lao People's Democratic Republic 6 159 262 329 380 409 373 10 101 165 209
Macao (China) 1 18 12 10 29 19 13 2 7 6 5
Malaysia 221 1436 2445 2318 2169 1599 1543 240 1161 1283 906
Marshall Islands 1 1 1 2 3 2 3 2 4
Federated States of Micronesia 1 9 3 1 3 1 1 10 2 5
Mongolia 7 289 260 235 151 59 36 18 283 229 127
Nauru 1 1
New Caledonia 1 1 2 1 2 1
New Zealand 9 4 9 5 10 18 1 8 13 9
Niue
Commonwealth of the Northern Mariana Islands
1 1 5 3 2
Palau
Papua New Guinea 65 250 207 160 95 58 12 74 261 230 113
Philippines 369 8735 11 741 13 529 12 808 8249 4348 341 4529 5452 5123
Republic of Korea 21 492 865 1093 1400 958 1848 32 483 722 483
Samoa 1 1 1 1 1
Singapore 10 21 46 106 94 127 9 16 20
Solomon Islands 3 17 12 11 10 11 7 4 13 23 11
Tokelau
Tonga 2 2 2 1 1
Tuvalu 2 2 1 1 1 2 2
Vanuatu 1 4 4 3 5 4 3 4 3 4 1
Viet Nam 36 3401 7148 8230 8811 5158 6667 48 1993 2416 1820
Wallis and Futuna
Western Pacif ic Region 1541 61 629 69 690 84 812 84 684 77 182 90 338 1843 39 151 35 891 33 356
Table 52. New smear-positive case notification by age and sex, absolute numbers, 2008
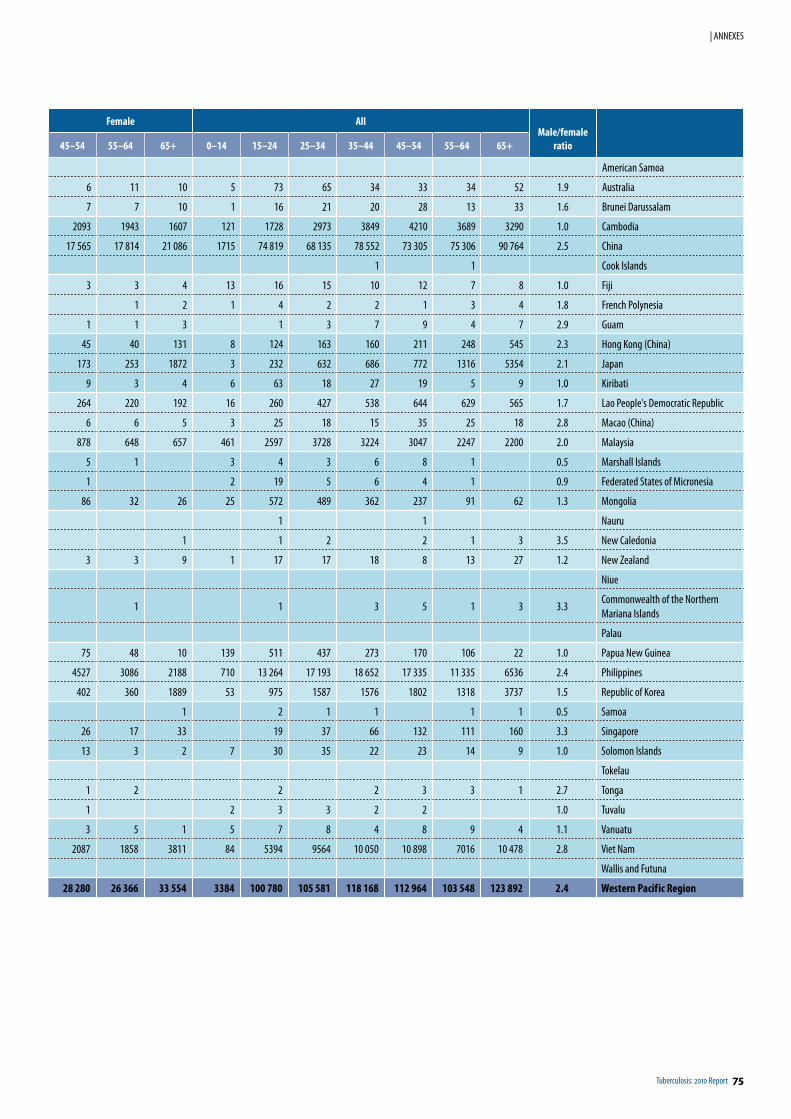
Tuberculosis: 2010 Report 75
| ANNEXES
Female AllMale/female
ratio45–54 55–64 65+ 0–14 15–24 25–34 35–44 45–54 55–64 65+
American Samoa
6 11 10 5 73 65 34 33 34 52 1.9 Australia
7 7 10 1 16 21 20 28 13 33 1.6 Brunei Darussalam
2093 1943 1607 121 1728 2973 3849 4210 3689 3290 1.0 Cambodia
17 565 17 814 21 086 1715 74 819 68 135 78 552 73 305 75 306 90 764 2.5 China
1 1 Cook Islands
3 3 4 13 16 15 10 12 7 8 1.0 Fiji
1 2 1 4 2 2 1 3 4 1.8 French Polynesia
1 1 3 1 3 7 9 4 7 2.9 Guam
45 40 131 8 124 163 160 211 248 545 2.3 Hong Kong (China)
173 253 1872 3 232 632 686 772 1316 5354 2.1 Japan
9 3 4 6 63 18 27 19 5 9 1.0 Kiribati
264 220 192 16 260 427 538 644 629 565 1.7 Lao People's Democratic Republic
6 6 5 3 25 18 15 35 25 18 2.8 Macao (China)
878 648 657 461 2597 3728 3224 3047 2247 2200 2.0 Malaysia
5 1 3 4 3 6 8 1 0.5 Marshall Islands
1 2 19 5 6 4 1 0.9 Federated States of Micronesia
86 32 26 25 572 489 362 237 91 62 1.3 Mongolia
1 1 Nauru
1 1 2 2 1 3 3.5 New Caledonia
3 3 9 1 17 17 18 8 13 27 1.2 New Zealand
Niue
1 1 3 5 1 3 3.3Commonwealth of the Northern Mariana Islands
Palau
75 48 10 139 511 437 273 170 106 22 1.0 Papua New Guinea
4527 3086 2188 710 13 264 17 193 18 652 17 335 11 335 6536 2.4 Philippines
402 360 1889 53 975 1587 1576 1802 1318 3737 1.5 Republic of Korea
1 2 1 1 1 1 0.5 Samoa
26 17 33 19 37 66 132 111 160 3.3 Singapore
13 3 2 7 30 35 22 23 14 9 1.0 Solomon Islands
Tokelau
1 2 2 2 3 3 1 2.7 Tonga
1 2 3 3 2 2 1.0 Tuvalu
3 5 1 5 7 8 4 8 9 4 1.1 Vanuatu
2087 1858 3811 84 5394 9564 10 050 10 898 7016 10 478 2.8 Viet Nam
Wallis and Futuna
28 280 26 366 33 554 3384 100 780 105 581 118 168 112 964 103 548 123 892 2.4 Western Pacif ic Region
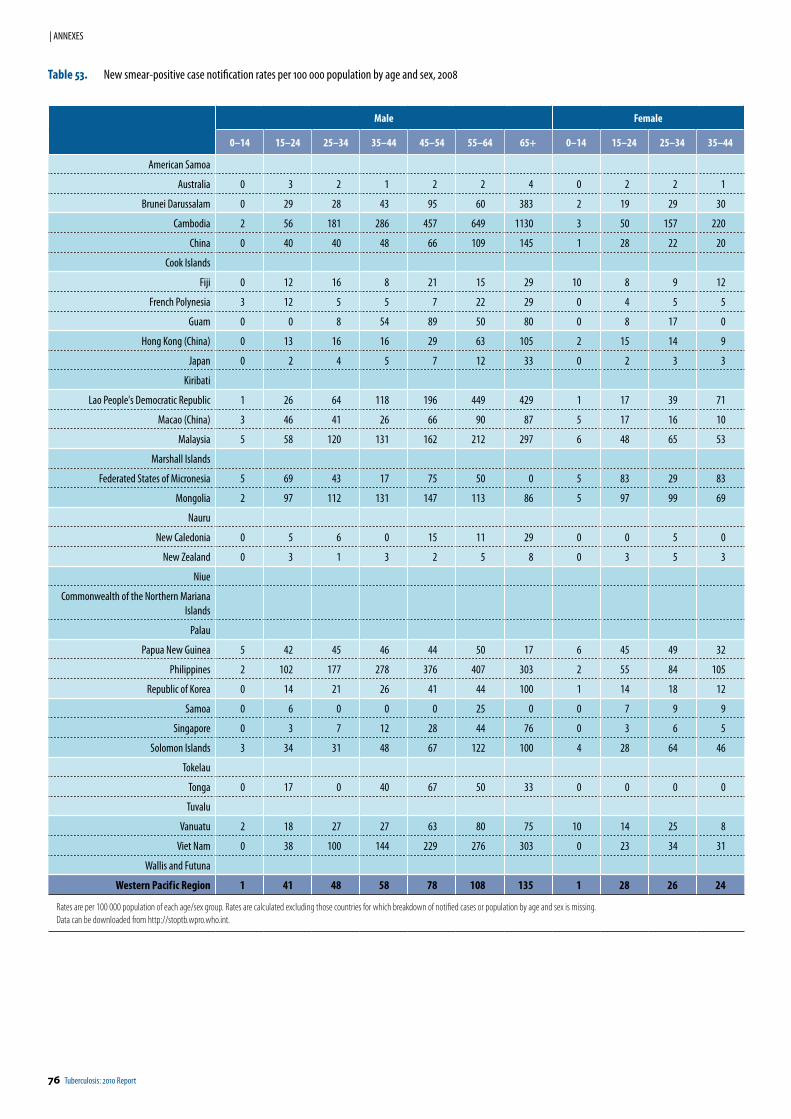
76 Tuberculosis: 2010 Report
| ANNEXES
Male Female
0–14 15–24 25–34 35–44 45–54 55–64 65+ 0–14 15–24 25–34 35–44
American Samoa
Australia 0 3 2 1 2 2 4 0 2 2 1
Brunei Darussalam 0 29 28 43 95 60 383 2 19 29 30
Cambodia 2 56 181 286 457 649 1130 3 50 157 220
China 0 40 40 48 66 109 145 1 28 22 20
Cook Islands
Fiji 0 12 16 8 21 15 29 10 8 9 12
French Polynesia 3 12 5 5 7 22 29 0 4 5 5
Guam 0 0 8 54 89 50 80 0 8 17 0
Hong Kong (China) 0 13 16 16 29 63 105 2 15 14 9
Japan 0 2 4 5 7 12 33 0 2 3 3
Kiribati
Lao People's Democratic Republic 1 26 64 118 196 449 429 1 17 39 71
Macao (China) 3 46 41 26 66 90 87 5 17 16 10
Malaysia 5 58 120 131 162 212 297 6 48 65 53
Marshall Islands
Federated States of Micronesia 5 69 43 17 75 50 0 5 83 29 83
Mongolia 2 97 112 131 147 113 86 5 97 99 69
Nauru
New Caledonia 0 5 6 0 15 11 29 0 0 5 0
New Zealand 0 3 1 3 2 5 8 0 3 5 3
Niue
Commonwealth of the Northern Mariana Islands
Palau
Papua New Guinea 5 42 45 46 44 50 17 6 45 49 32
Philippines 2 102 177 278 376 407 303 2 55 84 105
Republic of Korea 0 14 21 26 41 44 100 1 14 18 12
Samoa 0 6 0 0 0 25 0 0 7 9 9
Singapore 0 3 7 12 28 44 76 0 3 6 5
Solomon Islands 3 34 31 48 67 122 100 4 28 64 46
Tokelau
Tonga 0 17 0 40 67 50 33 0 0 0 0
Tuvalu
Vanuatu 2 18 27 27 63 80 75 10 14 25 8
Viet Nam 0 38 100 144 229 276 303 0 23 34 31
Wallis and Futuna
Western Pacif ic Region 1 41 48 58 78 108 135 1 28 26 24
Rates are per 100 000 population of each age/sex group. Rates are calculated excluding those countries for which breakdown of notified cases or population by age and sex is missing. Data can be downloaded from http://stoptb.wpro.who.int.
Table 53. New smear-positive case notification rates per 100 000 population by age and sex, 2008
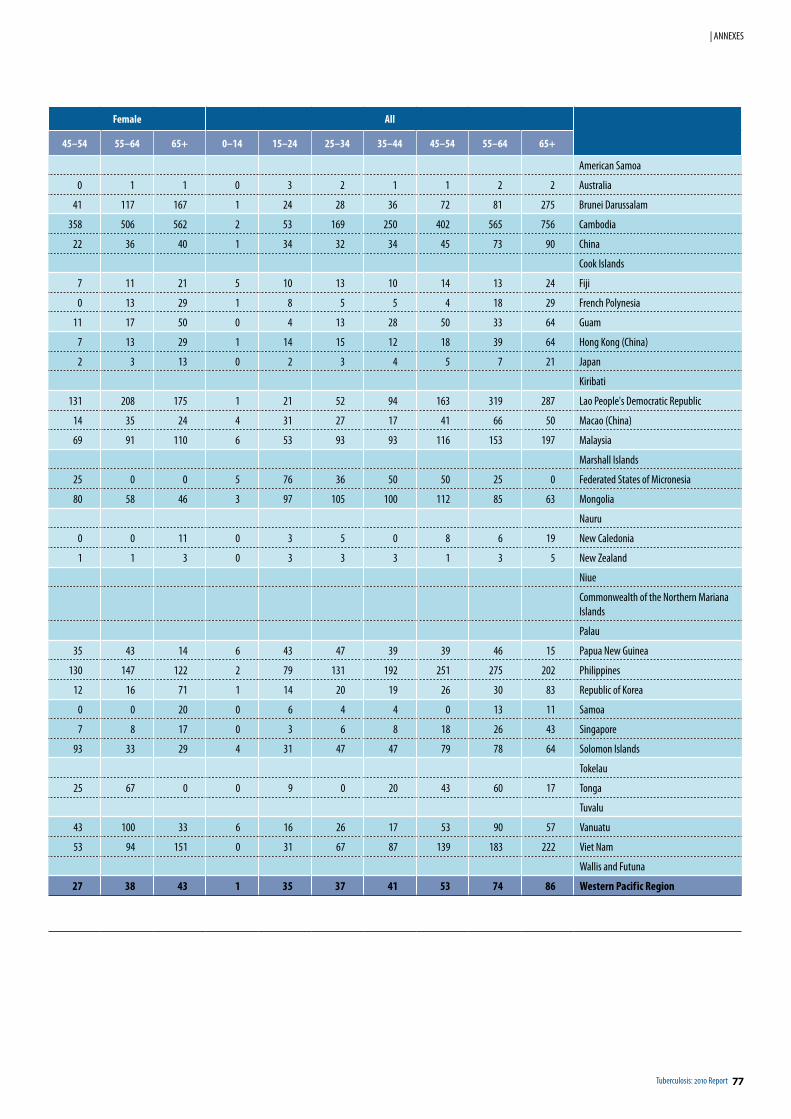
Tuberculosis: 2010 Report 77
| ANNEXES
Female All
45–54 55–64 65+ 0–14 15–24 25–34 35–44 45–54 55–64 65+
American Samoa
0 1 1 0 3 2 1 1 2 2 Australia
41 117 167 1 24 28 36 72 81 275 Brunei Darussalam
358 506 562 2 53 169 250 402 565 756 Cambodia
22 36 40 1 34 32 34 45 73 90 China
Cook Islands
7 11 21 5 10 13 10 14 13 24 Fiji
0 13 29 1 8 5 5 4 18 29 French Polynesia
11 17 50 0 4 13 28 50 33 64 Guam
7 13 29 1 14 15 12 18 39 64 Hong Kong (China)
2 3 13 0 2 3 4 5 7 21 Japan
Kiribati
131 208 175 1 21 52 94 163 319 287 Lao People's Democratic Republic
14 35 24 4 31 27 17 41 66 50 Macao (China)
69 91 110 6 53 93 93 116 153 197 Malaysia
Marshall Islands
25 0 0 5 76 36 50 50 25 0 Federated States of Micronesia
80 58 46 3 97 105 100 112 85 63 Mongolia
Nauru
0 0 11 0 3 5 0 8 6 19 New Caledonia
1 1 3 0 3 3 3 1 3 5 New Zealand
Niue
Commonwealth of the Northern Mariana Islands
Palau
35 43 14 6 43 47 39 39 46 15 Papua New Guinea
130 147 122 2 79 131 192 251 275 202 Philippines
12 16 71 1 14 20 19 26 30 83 Republic of Korea
0 0 20 0 6 4 4 0 13 11 Samoa
7 8 17 0 3 6 8 18 26 43 Singapore
93 33 29 4 31 47 47 79 78 64 Solomon Islands
Tokelau
25 67 0 0 9 0 20 43 60 17 Tonga
Tuvalu
43 100 33 6 16 26 17 53 90 57 Vanuatu
53 94 151 0 31 67 87 139 183 222 Viet Nam
Wallis and Futuna
27 38 43 1 35 37 41 53 74 86 Western Pacif ic Region
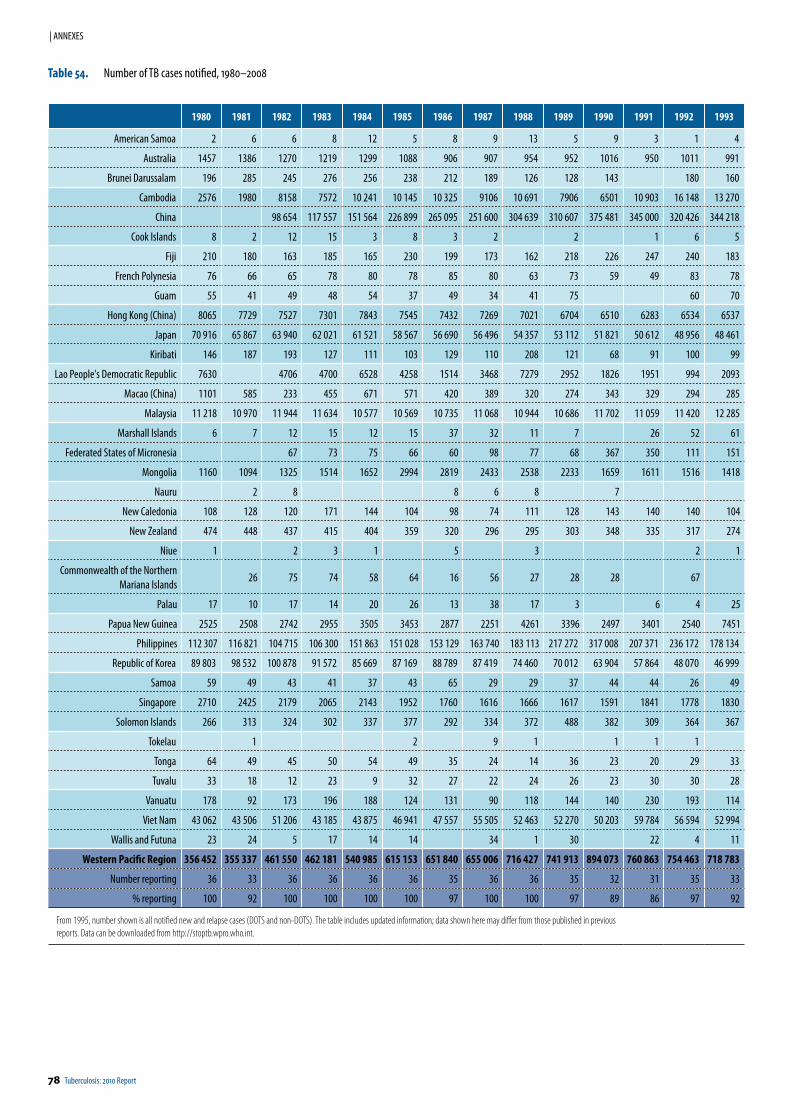
78 Tuberculosis: 2010 Report
| ANNEXES
1980 1981 1982 1983 1984 1985 1986 1987 1988 1989 1990 1991 1992 1993
American Samoa 2 6 6 8 12 5 8 9 13 5 9 3 1 4
Australia 1457 1386 1270 1219 1299 1088 906 907 954 952 1016 950 1011 991
Brunei Darussalam 196 285 245 276 256 238 212 189 126 128 143 180 160
Cambodia 2576 1980 8158 7572 10 241 10 145 10 325 9106 10 691 7906 6501 10 903 16 148 13 270
China 98 654 117 557 151 564 226 899 265 095 251 600 304 639 310 607 375 481 345 000 320 426 344 218
Cook Islands 8 2 12 15 3 8 3 2 2 1 6 5
Fiji 210 180 163 185 165 230 199 173 162 218 226 247 240 183
French Polynesia 76 66 65 78 80 78 85 80 63 73 59 49 83 78
Guam 55 41 49 48 54 37 49 34 41 75 60 70
Hong Kong (China) 8065 7729 7527 7301 7843 7545 7432 7269 7021 6704 6510 6283 6534 6537
Japan 70 916 65 867 63 940 62 021 61 521 58 567 56 690 56 496 54 357 53 112 51 821 50 612 48 956 48 461
Kiribati 146 187 193 127 111 103 129 110 208 121 68 91 100 99
Lao People's Democratic Republic 7630 4706 4700 6528 4258 1514 3468 7279 2952 1826 1951 994 2093
Macao (China) 1101 585 233 455 671 571 420 389 320 274 343 329 294 285
Malaysia 11 218 10 970 11 944 11 634 10 577 10 569 10 735 11 068 10 944 10 686 11 702 11 059 11 420 12 285
Marshall Islands 6 7 12 15 12 15 37 32 11 7 26 52 61
Federated States of Micronesia 67 73 75 66 60 98 77 68 367 350 111 151
Mongolia 1160 1094 1325 1514 1652 2994 2819 2433 2538 2233 1659 1611 1516 1418
Nauru 2 8 8 6 8 7
New Caledonia 108 128 120 171 144 104 98 74 111 128 143 140 140 104
New Zealand 474 448 437 415 404 359 320 296 295 303 348 335 317 274
Niue 1 2 3 1 5 3 2 1
Commonwealth of the Northern Mariana Islands
26 75 74 58 64 16 56 27 28 28 67
Palau 17 10 17 14 20 26 13 38 17 3 6 4 25
Papua New Guinea 2525 2508 2742 2955 3505 3453 2877 2251 4261 3396 2497 3401 2540 7451
Philippines 112 307 116 821 104 715 106 300 151 863 151 028 153 129 163 740 183 113 217 272 317 008 207 371 236 172 178 134
Republic of Korea 89 803 98 532 100 878 91 572 85 669 87 169 88 789 87 419 74 460 70 012 63 904 57 864 48 070 46 999
Samoa 59 49 43 41 37 43 65 29 29 37 44 44 26 49
Singapore 2710 2425 2179 2065 2143 1952 1760 1616 1666 1617 1591 1841 1778 1830
Solomon Islands 266 313 324 302 337 377 292 334 372 488 382 309 364 367
Tokelau 1 2 9 1 1 1 1
Tonga 64 49 45 50 54 49 35 24 14 36 23 20 29 33
Tuvalu 33 18 12 23 9 32 27 22 24 26 23 30 30 28
Vanuatu 178 92 173 196 188 124 131 90 118 144 140 230 193 114
Viet Nam 43 062 43 506 51 206 43 185 43 875 46 941 47 557 55 505 52 463 52 270 50 203 59 784 56 594 52 994
Wallis and Futuna 23 24 5 17 14 14 34 1 30 22 4 11
Western Pacific Region 356 452 355 337 461 550 462 181 540 985 615 153 651 840 655 006 716 427 741 913 894 073 760 863 754 463 718 783
Number reporting 36 33 36 36 36 36 35 36 36 35 32 31 35 33
% reporting 100 92 100 100 100 100 97 100 100 97 89 86 97 92
From 1995, number shown is all notified new and relapse cases (DOTS and non-DOTS). The table includes updated information; data shown here may differ from those published in previous reports. Data can be downloaded from http://stoptb.wpro.who.int.
Table 54. Number of TB cases notified, 1980–2008
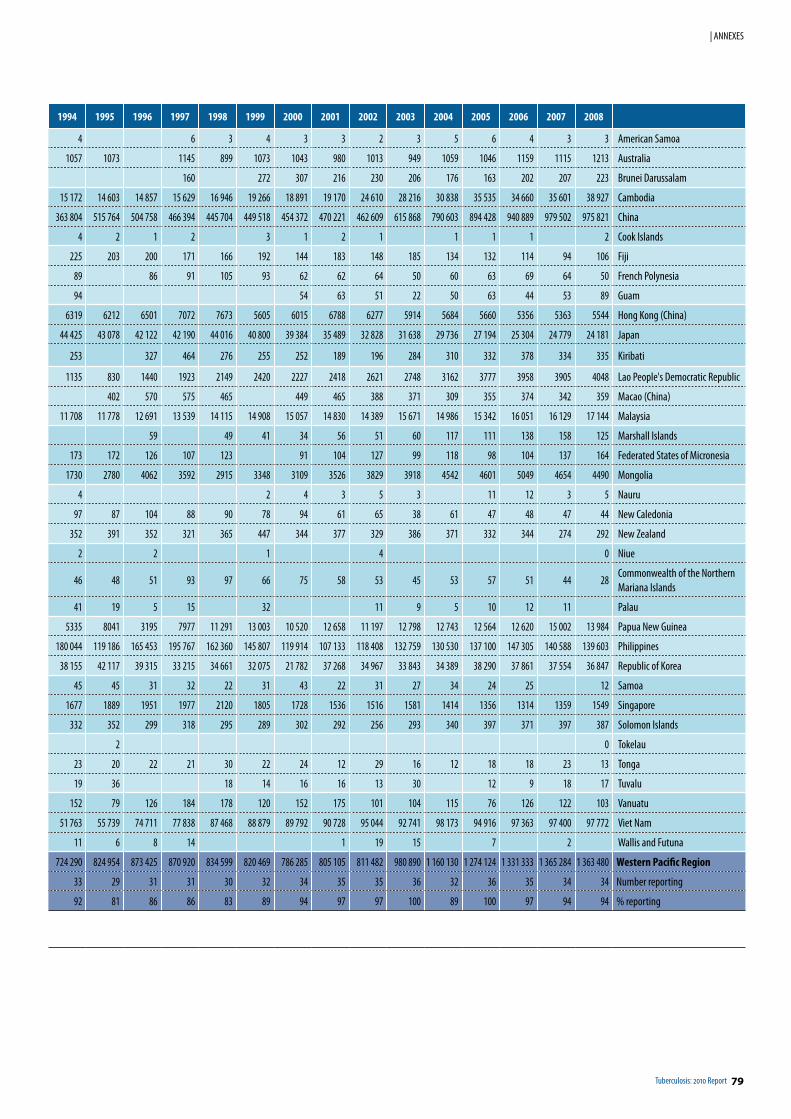
Tuberculosis: 2010 Report 79
| ANNEXES
1994 1995 1996 1997 1998 1999 2000 2001 2002 2003 2004 2005 2006 2007 2008
4 6 3 4 3 3 2 3 5 6 4 3 3 American Samoa
1057 1073 1145 899 1073 1043 980 1013 949 1059 1046 1159 1115 1213 Australia
160 272 307 216 230 206 176 163 202 207 223 Brunei Darussalam
15 172 14 603 14 857 15 629 16 946 19 266 18 891 19 170 24 610 28 216 30 838 35 535 34 660 35 601 38 927 Cambodia
363 804 515 764 504 758 466 394 445 704 449 518 454 372 470 221 462 609 615 868 790 603 894 428 940 889 979 502 975 821 China
4 2 1 2 3 1 2 1 1 1 1 2 Cook Islands
225 203 200 171 166 192 144 183 148 185 134 132 114 94 106 Fiji
89 86 91 105 93 62 62 64 50 60 63 69 64 50 French Polynesia
94 54 63 51 22 50 63 44 53 89 Guam
6319 6212 6501 7072 7673 5605 6015 6788 6277 5914 5684 5660 5356 5363 5544 Hong Kong (China)
44 425 43 078 42 122 42 190 44 016 40 800 39 384 35 489 32 828 31 638 29 736 27 194 25 304 24 779 24 181 Japan
253 327 464 276 255 252 189 196 284 310 332 378 334 335 Kiribati
1135 830 1440 1923 2149 2420 2227 2418 2621 2748 3162 3777 3958 3905 4048 Lao People's Democratic Republic
402 570 575 465 449 465 388 371 309 355 374 342 359 Macao (China)
11 708 11 778 12 691 13 539 14 115 14 908 15 057 14 830 14 389 15 671 14 986 15 342 16 051 16 129 17 144 Malaysia
59 49 41 34 56 51 60 117 111 138 158 125 Marshall Islands
173 172 126 107 123 91 104 127 99 118 98 104 137 164 Federated States of Micronesia
1730 2780 4062 3592 2915 3348 3109 3526 3829 3918 4542 4601 5049 4654 4490 Mongolia
4 2 4 3 5 3 11 12 3 5 Nauru
97 87 104 88 90 78 94 61 65 38 61 47 48 47 44 New Caledonia
352 391 352 321 365 447 344 377 329 386 371 332 344 274 292 New Zealand
2 2 1 4 0 Niue
46 48 51 93 97 66 75 58 53 45 53 57 51 44 28Commonwealth of the Northern Mariana Islands
41 19 5 15 32 11 9 5 10 12 11 Palau
5335 8041 3195 7977 11 291 13 003 10 520 12 658 11 197 12 798 12 743 12 564 12 620 15 002 13 984 Papua New Guinea
180 044 119 186 165 453 195 767 162 360 145 807 119 914 107 133 118 408 132 759 130 530 137 100 147 305 140 588 139 603 Philippines
38 155 42 117 39 315 33 215 34 661 32 075 21 782 37 268 34 967 33 843 34 389 38 290 37 861 37 554 36 847 Republic of Korea
45 45 31 32 22 31 43 22 31 27 34 24 25 12 Samoa
1677 1889 1951 1977 2120 1805 1728 1536 1516 1581 1414 1356 1314 1359 1549 Singapore
332 352 299 318 295 289 302 292 256 293 340 397 371 397 387 Solomon Islands
2 0 Tokelau
23 20 22 21 30 22 24 12 29 16 12 18 18 23 13 Tonga
19 36 18 14 16 16 13 30 12 9 18 17 Tuvalu
152 79 126 184 178 120 152 175 101 104 115 76 126 122 103 Vanuatu
51 763 55 739 74 711 77 838 87 468 88 879 89 792 90 728 95 044 92 741 98 173 94 916 97 363 97 400 97 772 Viet Nam
11 6 8 14 1 19 15 7 2 Wallis and Futuna
724 290 824 954 873 425 870 920 834 599 820 469 786 285 805 105 811 482 980 890 1 160 130 1 274 124 1 331 333 1 365 284 1 363 480 Western Pacific Region
33 29 31 31 30 32 34 35 35 36 32 36 35 34 34 Number reporting
92 81 86 86 83 89 94 97 97 100 89 100 97 94 94 % reporting
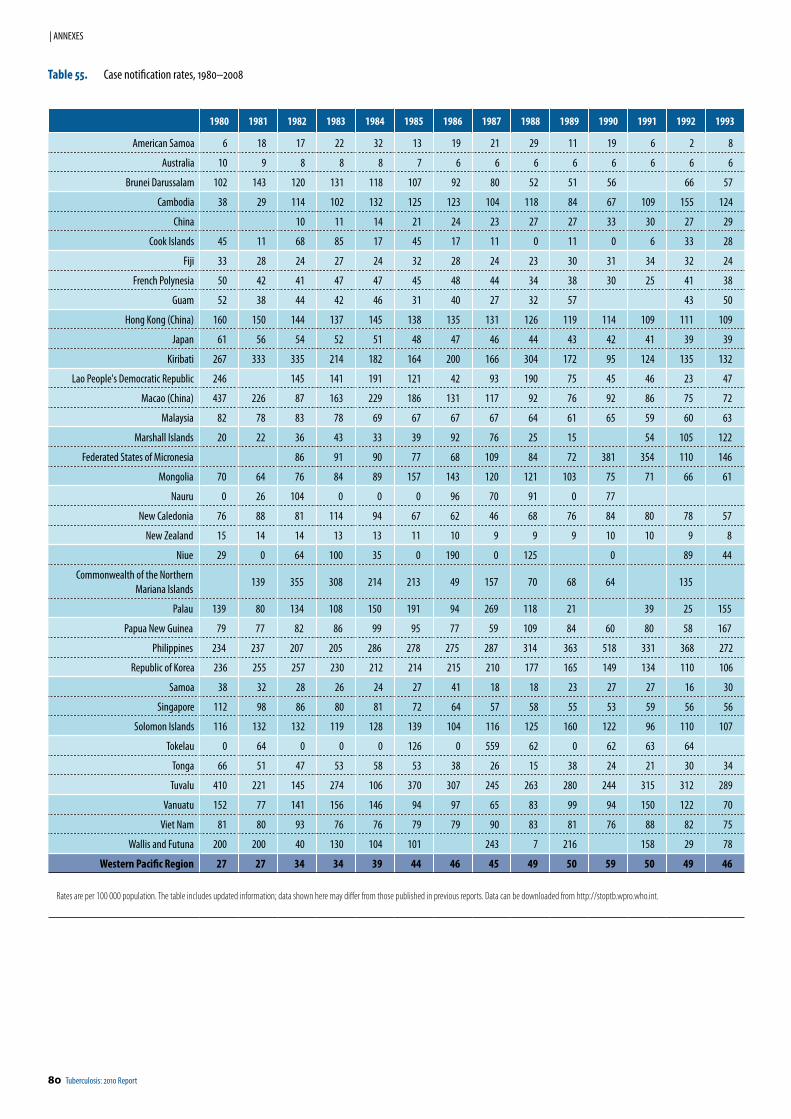
80 Tuberculosis: 2010 Report
| ANNEXES
1980 1981 1982 1983 1984 1985 1986 1987 1988 1989 1990 1991 1992 1993
American Samoa 6 18 17 22 32 13 19 21 29 11 19 6 2 8
Australia 10 9 8 8 8 7 6 6 6 6 6 6 6 6
Brunei Darussalam 102 143 120 131 118 107 92 80 52 51 56 66 57
Cambodia 38 29 114 102 132 125 123 104 118 84 67 109 155 124
China 10 11 14 21 24 23 27 27 33 30 27 29
Cook Islands 45 11 68 85 17 45 17 11 0 11 0 6 33 28
Fiji 33 28 24 27 24 32 28 24 23 30 31 34 32 24
French Polynesia 50 42 41 47 47 45 48 44 34 38 30 25 41 38
Guam 52 38 44 42 46 31 40 27 32 57 43 50
Hong Kong (China) 160 150 144 137 145 138 135 131 126 119 114 109 111 109
Japan 61 56 54 52 51 48 47 46 44 43 42 41 39 39
Kiribati 267 333 335 214 182 164 200 166 304 172 95 124 135 132
Lao People's Democratic Republic 246 145 141 191 121 42 93 190 75 45 46 23 47
Macao (China) 437 226 87 163 229 186 131 117 92 76 92 86 75 72
Malaysia 82 78 83 78 69 67 67 67 64 61 65 59 60 63
Marshall Islands 20 22 36 43 33 39 92 76 25 15 54 105 122
Federated States of Micronesia 86 91 90 77 68 109 84 72 381 354 110 146
Mongolia 70 64 76 84 89 157 143 120 121 103 75 71 66 61
Nauru 0 26 104 0 0 0 96 70 91 0 77
New Caledonia 76 88 81 114 94 67 62 46 68 76 84 80 78 57
New Zealand 15 14 14 13 13 11 10 9 9 9 10 10 9 8
Niue 29 0 64 100 35 0 190 0 125 0 89 44
Commonwealth of the Northern Mariana Islands
139 355 308 214 213 49 157 70 68 64 135
Palau 139 80 134 108 150 191 94 269 118 21 39 25 155
Papua New Guinea 79 77 82 86 99 95 77 59 109 84 60 80 58 167
Philippines 234 237 207 205 286 278 275 287 314 363 518 331 368 272
Republic of Korea 236 255 257 230 212 214 215 210 177 165 149 134 110 106
Samoa 38 32 28 26 24 27 41 18 18 23 27 27 16 30
Singapore 112 98 86 80 81 72 64 57 58 55 53 59 56 56
Solomon Islands 116 132 132 119 128 139 104 116 125 160 122 96 110 107
Tokelau 0 64 0 0 0 126 0 559 62 0 62 63 64
Tonga 66 51 47 53 58 53 38 26 15 38 24 21 30 34
Tuvalu 410 221 145 274 106 370 307 245 263 280 244 315 312 289
Vanuatu 152 77 141 156 146 94 97 65 83 99 94 150 122 70
Viet Nam 81 80 93 76 76 79 79 90 83 81 76 88 82 75
Wallis and Futuna 200 200 40 130 104 101 243 7 216 158 29 78
Western Pacific Region 27 27 34 34 39 44 46 45 49 50 59 50 49 46
Rates are per 100 000 population. The table includes updated information; data shown here may differ from those published in previous reports. Data can be downloaded from http://stoptb.wpro.who.int.
Table 55. Case notification rates, 1980–2008
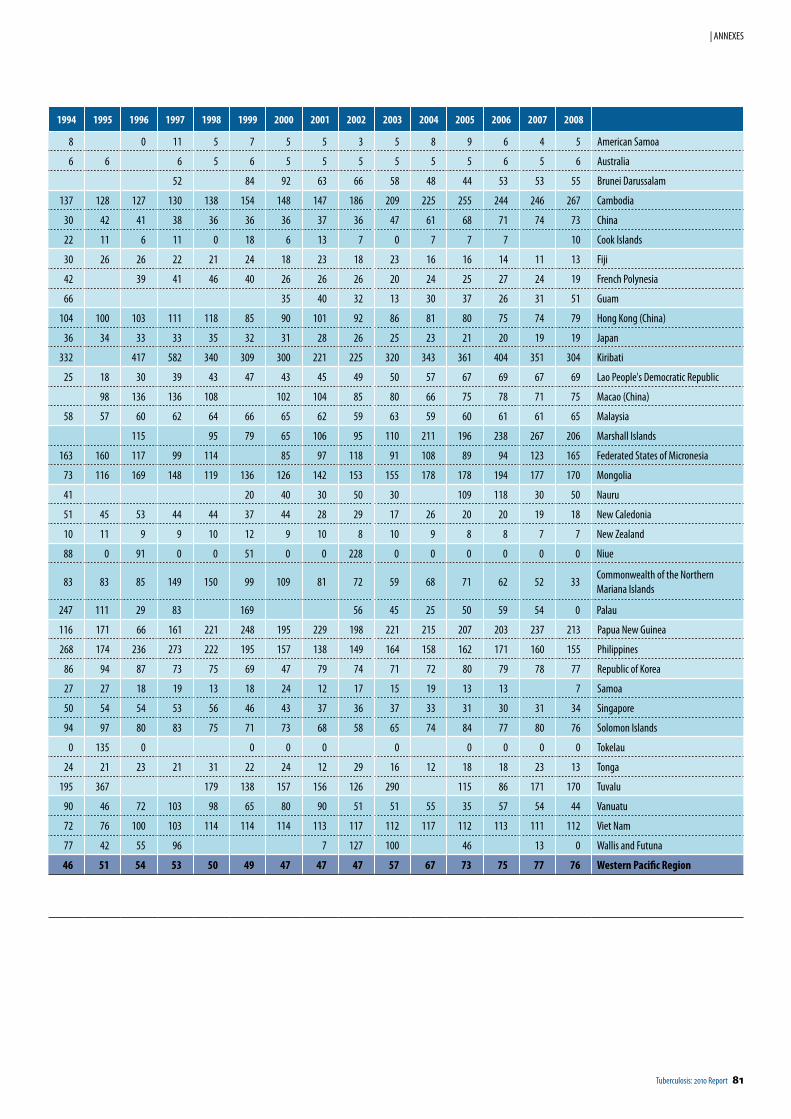
Tuberculosis: 2010 Report 81
| ANNEXES
1994 1995 1996 1997 1998 1999 2000 2001 2002 2003 2004 2005 2006 2007 2008
8 0 11 5 7 5 5 3 5 8 9 6 4 5 American Samoa
6 6 6 5 6 5 5 5 5 5 5 6 5 6 Australia
52 84 92 63 66 58 48 44 53 53 55 Brunei Darussalam
137 128 127 130 138 154 148 147 186 209 225 255 244 246 267 Cambodia
30 42 41 38 36 36 36 37 36 47 61 68 71 74 73 China
22 11 6 11 0 18 6 13 7 0 7 7 7 10 Cook Islands
30 26 26 22 21 24 18 23 18 23 16 16 14 11 13 Fiji
42 39 41 46 40 26 26 26 20 24 25 27 24 19 French Polynesia
66 35 40 32 13 30 37 26 31 51 Guam
104 100 103 111 118 85 90 101 92 86 81 80 75 74 79 Hong Kong (China)
36 34 33 33 35 32 31 28 26 25 23 21 20 19 19 Japan
332 417 582 340 309 300 221 225 320 343 361 404 351 304 Kiribati
25 18 30 39 43 47 43 45 49 50 57 67 69 67 69 Lao People's Democratic Republic
98 136 136 108 102 104 85 80 66 75 78 71 75 Macao (China)
58 57 60 62 64 66 65 62 59 63 59 60 61 61 65 Malaysia
115 95 79 65 106 95 110 211 196 238 267 206 Marshall Islands
163 160 117 99 114 85 97 118 91 108 89 94 123 165 Federated States of Micronesia
73 116 169 148 119 136 126 142 153 155 178 178 194 177 170 Mongolia
41 20 40 30 50 30 109 118 30 50 Nauru
51 45 53 44 44 37 44 28 29 17 26 20 20 19 18 New Caledonia
10 11 9 9 10 12 9 10 8 10 9 8 8 7 7 New Zealand
88 0 91 0 0 51 0 0 228 0 0 0 0 0 0 Niue
83 83 85 149 150 99 109 81 72 59 68 71 62 52 33Commonwealth of the Northern Mariana Islands
247 111 29 83 169 56 45 25 50 59 54 0 Palau
116 171 66 161 221 248 195 229 198 221 215 207 203 237 213 Papua New Guinea
268 174 236 273 222 195 157 138 149 164 158 162 171 160 155 Philippines
86 94 87 73 75 69 47 79 74 71 72 80 79 78 77 Republic of Korea
27 27 18 19 13 18 24 12 17 15 19 13 13 7 Samoa
50 54 54 53 56 46 43 37 36 37 33 31 30 31 34 Singapore
94 97 80 83 75 71 73 68 58 65 74 84 77 80 76 Solomon Islands
0 135 0 0 0 0 0 0 0 0 0 Tokelau
24 21 23 21 31 22 24 12 29 16 12 18 18 23 13 Tonga
195 367 179 138 157 156 126 290 115 86 171 170 Tuvalu
90 46 72 103 98 65 80 90 51 51 55 35 57 54 44 Vanuatu
72 76 100 103 114 114 114 113 117 112 117 112 113 111 112 Viet Nam
77 42 55 96 7 127 100 46 13 0 Wallis and Futuna
46 51 54 53 50 49 47 47 47 57 67 73 75 77 76 Western Pacific Region
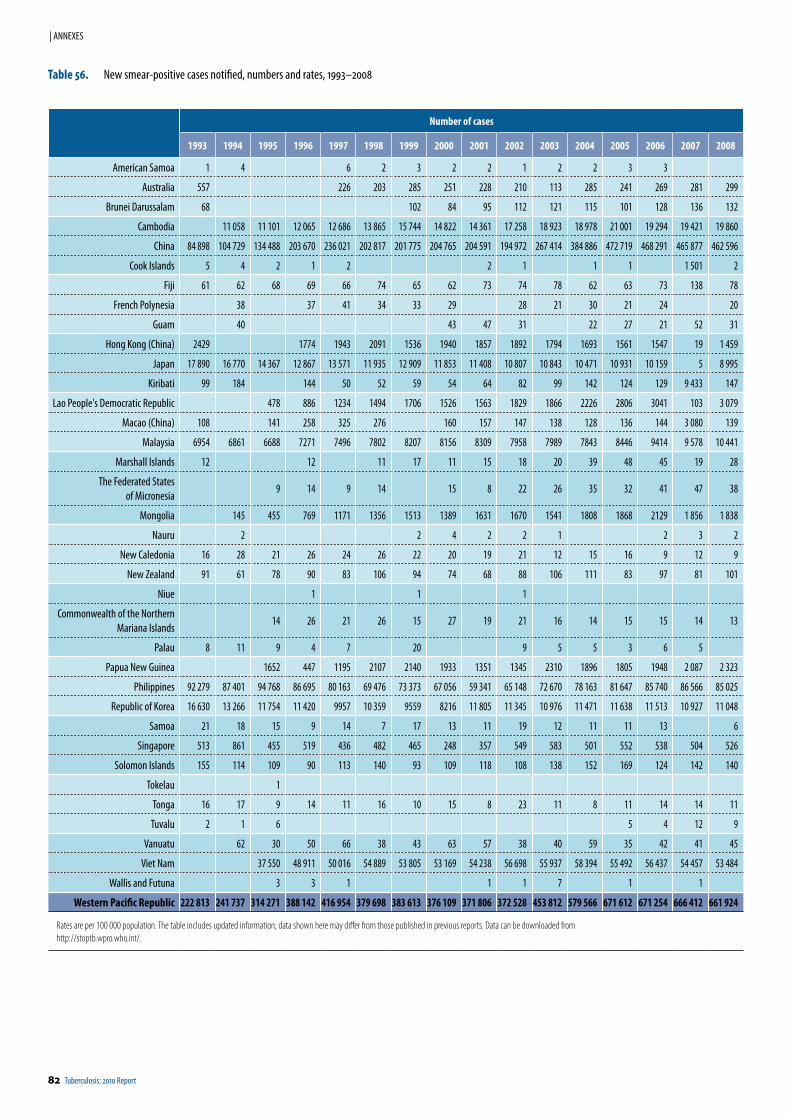
82 Tuberculosis: 2010 Report
| ANNEXES
Number of cases
1993 1994 1995 1996 1997 1998 1999 2000 2001 2002 2003 2004 2005 2006 2007 2008
American Samoa 1 4 6 2 3 2 2 1 2 2 3 3
Australia 557 226 203 285 251 228 210 113 285 241 269 281 299
Brunei Darussalam 68 102 84 95 112 121 115 101 128 136 132
Cambodia 11 058 11 101 12 065 12 686 13 865 15 744 14 822 14 361 17 258 18 923 18 978 21 001 19 294 19 421 19 860
China 84 898 104 729 134 488 203 670 236 021 202 817 201 775 204 765 204 591 194 972 267 414 384 886 472 719 468 291 465 877 462 596
Cook Islands 5 4 2 1 2 2 1 1 1 1 501 2
Fiji 61 62 68 69 66 74 65 62 73 74 78 62 63 73 138 78
French Polynesia 38 37 41 34 33 29 28 21 30 21 24 20
Guam 40 43 47 31 22 27 21 52 31
Hong Kong (China) 2429 1774 1943 2091 1536 1940 1857 1892 1794 1693 1561 1547 19 1 459
Japan 17 890 16 770 14 367 12 867 13 571 11 935 12 909 11 853 11 408 10 807 10 843 10 471 10 931 10 159 5 8 995
Kiribati 99 184 144 50 52 59 54 64 82 99 142 124 129 9 433 147
Lao People's Democratic Republic 478 886 1234 1494 1706 1526 1563 1829 1866 2226 2806 3041 103 3 079
Macao (China) 108 141 258 325 276 160 157 147 138 128 136 144 3 080 139
Malaysia 6954 6861 6688 7271 7496 7802 8207 8156 8309 7958 7989 7843 8446 9414 9 578 10 441
Marshall Islands 12 12 11 17 11 15 18 20 39 48 45 19 28
The Federated States of Micronesia
9 14 9 14 15 8 22 26 35 32 41 47 38
Mongolia 145 455 769 1171 1356 1513 1389 1631 1670 1541 1808 1868 2129 1 856 1 838
Nauru 2 2 4 2 2 1 2 3 2
New Caledonia 16 28 21 26 24 26 22 20 19 21 12 15 16 9 12 9
New Zealand 91 61 78 90 83 106 94 74 68 88 106 111 83 97 81 101
Niue 1 1 1
Commonwealth of the Northern Mariana Islands
14 26 21 26 15 27 19 21 16 14 15 15 14 13
Palau 8 11 9 4 7 20 9 5 5 3 6 5
Papua New Guinea 1652 447 1195 2107 2140 1933 1351 1345 2310 1896 1805 1948 2 087 2 323
Philippines 92 279 87 401 94 768 86 695 80 163 69 476 73 373 67 056 59 341 65 148 72 670 78 163 81 647 85 740 86 566 85 025
Republic of Korea 16 630 13 266 11 754 11 420 9957 10 359 9559 8216 11 805 11 345 10 976 11 471 11 638 11 513 10 927 11 048
Samoa 21 18 15 9 14 7 17 13 11 19 12 11 11 13 6
Singapore 513 861 455 519 436 482 465 248 357 549 583 501 552 538 504 526
Solomon Islands 155 114 109 90 113 140 93 109 118 108 138 152 169 124 142 140
Tokelau 1
Tonga 16 17 9 14 11 16 10 15 8 23 11 8 11 14 14 11
Tuvalu 2 1 6 5 4 12 9
Vanuatu 62 30 50 66 38 43 63 57 38 40 59 35 42 41 45
Viet Nam 37 550 48 911 50 016 54 889 53 805 53 169 54 238 56 698 55 937 58 394 55 492 56 437 54 457 53 484
Wallis and Futuna 3 3 1 1 1 7 1 1
Western Pacific Republic 222 813 241 737 314 271 388 142 416 954 379 698 383 613 376 109 371 806 372 528 453 812 579 566 671 612 671 254 666 412 661 924
Rates are per 100 000 population. The table includes updated information; data shown here may differ from those published in previous reports. Data can be downloaded from http://stoptb.wpro.who.int/.
Table 56. New smear-positive cases notified, numbers and rates, 1993–2008
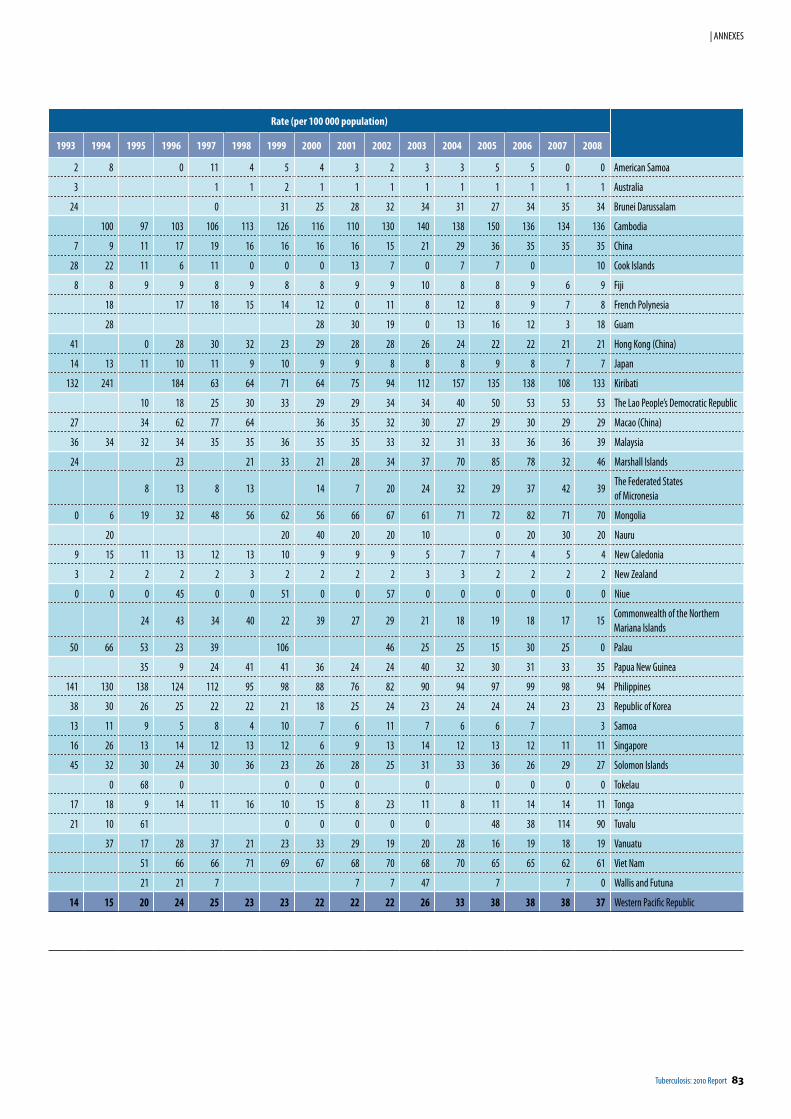
Tuberculosis: 2010 Report 83
| ANNEXES
Rate (per 100 000 population)
1993 1994 1995 1996 1997 1998 1999 2000 2001 2002 2003 2004 2005 2006 2007 2008
2 8 0 11 4 5 4 3 2 3 3 5 5 0 0 American Samoa
3 1 1 2 1 1 1 1 1 1 1 1 1 Australia
24 0 31 25 28 32 34 31 27 34 35 34 Brunei Darussalam
100 97 103 106 113 126 116 110 130 140 138 150 136 134 136 Cambodia
7 9 11 17 19 16 16 16 16 15 21 29 36 35 35 35 China
28 22 11 6 11 0 0 0 13 7 0 7 7 0 10 Cook Islands
8 8 9 9 8 9 8 8 9 9 10 8 8 9 6 9 Fiji
18 17 18 15 14 12 0 11 8 12 8 9 7 8 French Polynesia
28 28 30 19 0 13 16 12 3 18 Guam
41 0 28 30 32 23 29 28 28 26 24 22 22 21 21 Hong Kong (China)
14 13 11 10 11 9 10 9 9 8 8 8 9 8 7 7 Japan
132 241 184 63 64 71 64 75 94 112 157 135 138 108 133 Kiribati
10 18 25 30 33 29 29 34 34 40 50 53 53 53 The Lao People’s Democratic Republic
27 34 62 77 64 36 35 32 30 27 29 30 29 29 Macao (China)
36 34 32 34 35 35 36 35 35 33 32 31 33 36 36 39 Malaysia
24 23 21 33 21 28 34 37 70 85 78 32 46 Marshall Islands
8 13 8 13 14 7 20 24 32 29 37 42 39The Federated States of Micronesia
0 6 19 32 48 56 62 56 66 67 61 71 72 82 71 70 Mongolia
20 20 40 20 20 10 0 20 30 20 Nauru
9 15 11 13 12 13 10 9 9 9 5 7 7 4 5 4 New Caledonia
3 2 2 2 2 3 2 2 2 2 3 3 2 2 2 2 New Zealand
0 0 0 45 0 0 51 0 0 57 0 0 0 0 0 0 Niue
24 43 34 40 22 39 27 29 21 18 19 18 17 15Commonwealth of the Northern Mariana Islands
50 66 53 23 39 106 46 25 25 15 30 25 0 Palau
35 9 24 41 41 36 24 24 40 32 30 31 33 35 Papua New Guinea
141 130 138 124 112 95 98 88 76 82 90 94 97 99 98 94 Philippines
38 30 26 25 22 22 21 18 25 24 23 24 24 24 23 23 Republic of Korea
13 11 9 5 8 4 10 7 6 11 7 6 6 7 3 Samoa
16 26 13 14 12 13 12 6 9 13 14 12 13 12 11 11 Singapore
45 32 30 24 30 36 23 26 28 25 31 33 36 26 29 27 Solomon Islands
0 68 0 0 0 0 0 0 0 0 0 Tokelau
17 18 9 14 11 16 10 15 8 23 11 8 11 14 14 11 Tonga
21 10 61 0 0 0 0 0 48 38 114 90 Tuvalu
37 17 28 37 21 23 33 29 19 20 28 16 19 18 19 Vanuatu
51 66 66 71 69 67 68 70 68 70 65 65 62 61 Viet Nam
21 21 7 7 7 47 7 7 0 Wallis and Futuna
14 15 20 24 25 23 23 22 22 22 26 33 38 38 38 37 Western Pacific Republic
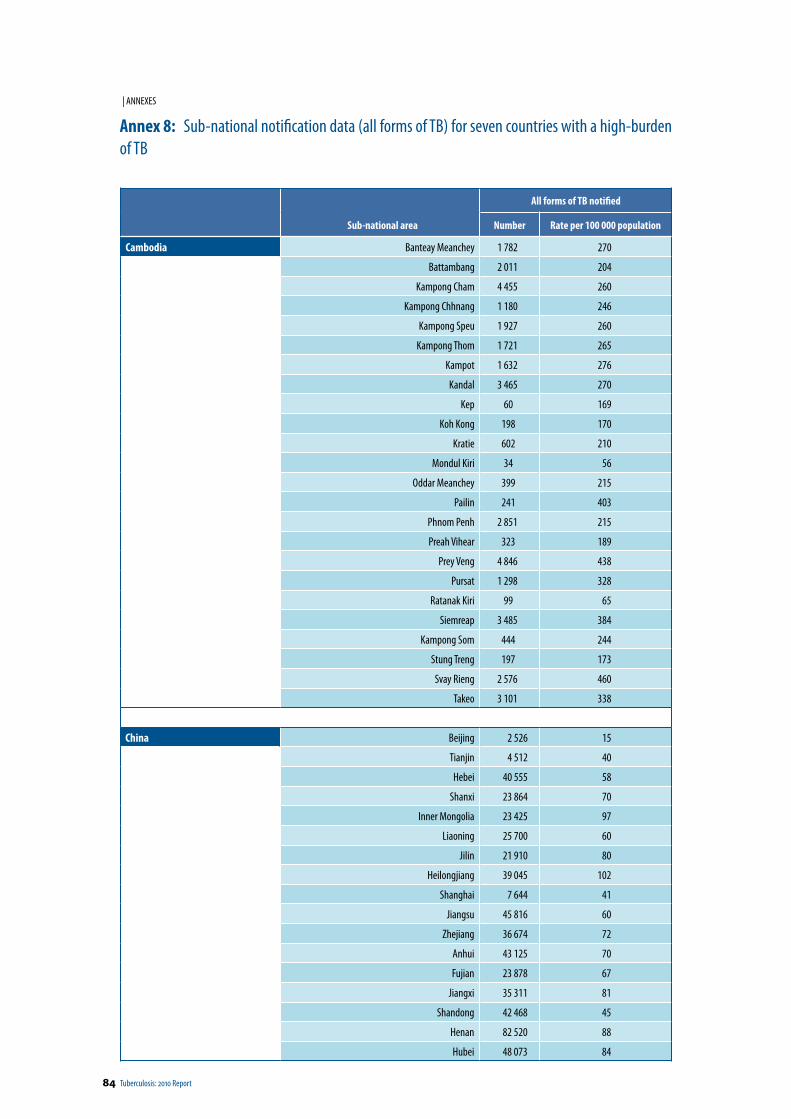
84 Tuberculosis: 2010 Report
| ANNEXES
Annex 8: Sub-national notification data (all forms of TB) for seven countries with a high-burden of TB
Sub-national area
All forms of TB notified
Number Rate per 100 000 population
Cambodia Banteay Meanchey 1 782 270
Battambang 2 011 204
Kampong Cham 4 455 260
Kampong Chhnang 1 180 246
Kampong Speu 1 927 260
Kampong Thom 1 721 265
Kampot 1 632 276
Kandal 3 465 270
Kep 60 169
Koh Kong 198 170
Kratie 602 210
Mondul Kiri 34 56
Oddar Meanchey 399 215
Pailin 241 403
Phnom Penh 2 851 215
Preah Vihear 323 189
Prey Veng 4 846 438
Pursat 1 298 328
Ratanak Kiri 99 65
Siemreap 3 485 384
Kampong Som 444 244
Stung Treng 197 173
Svay Rieng 2 576 460
Takeo 3 101 338
China Beijing 2 526 15
Tianjin 4 512 40
Hebei 40 555 58
Shanxi 23 864 70
Inner Mongolia 23 425 97
Liaoning 25 700 60
Jilin 21 910 80
Heilongjiang 39 045 102
Shanghai 7 644 41
Jiangsu 45 816 60
Zhejiang 36 674 72
Anhui 43 125 70
Fujian 23 878 67
Jiangxi 35 311 81
Shandong 42 468 45
Henan 82 520 88
Hubei 48 073 84
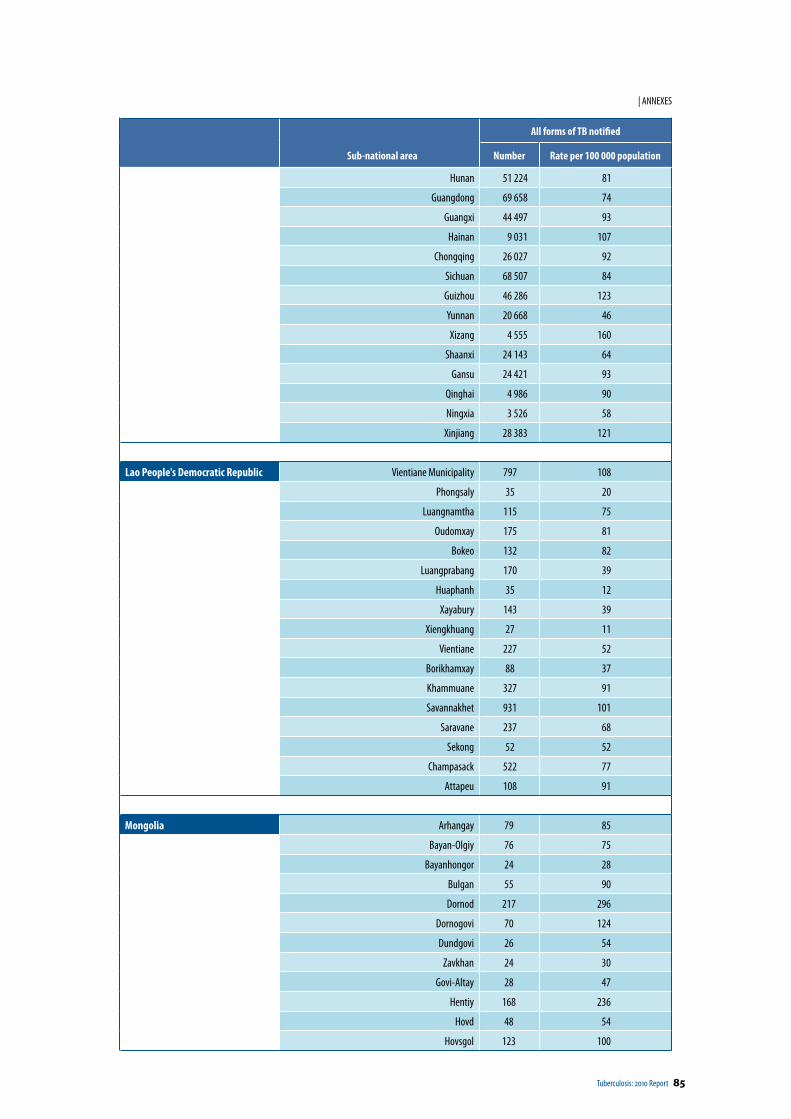
Tuberculosis: 2010 Report 85
| ANNEXES
Sub-national area
All forms of TB notified
Number Rate per 100 000 population
Hunan 51 224 81
Guangdong 69 658 74
Guangxi 44 497 93
Hainan 9 031 107
Chongqing 26 027 92
Sichuan 68 507 84
Guizhou 46 286 123
Yunnan 20 668 46
Xizang 4 555 160
Shaanxi 24 143 64
Gansu 24 421 93
Qinghai 4 986 90
Ningxia 3 526 58
Xinjiang 28 383 121
Lao People's Democratic Republic Vientiane Municipality 797 108
Phongsaly 35 20
Luangnamtha 115 75
Oudomxay 175 81
Bokeo 132 82
Luangprabang 170 39
Huaphanh 35 12
Xayabury 143 39
Xiengkhuang 27 11
Vientiane 227 52
Borikhamxay 88 37
Khammuane 327 91
Savannakhet 931 101
Saravane 237 68
Sekong 52 52
Champasack 522 77
Attapeu 108 91
Mongolia Arhangay 79 85
Bayan-Olgiy 76 75
Bayanhongor 24 28
Bulgan 55 90
Dornod 217 296
Dornogovi 70 124
Dundgovi 26 54
Zavkhan 24 30
Govi-Altay 28 47
Hentiy 168 236
Hovd 48 54
Hovsgol 123 100
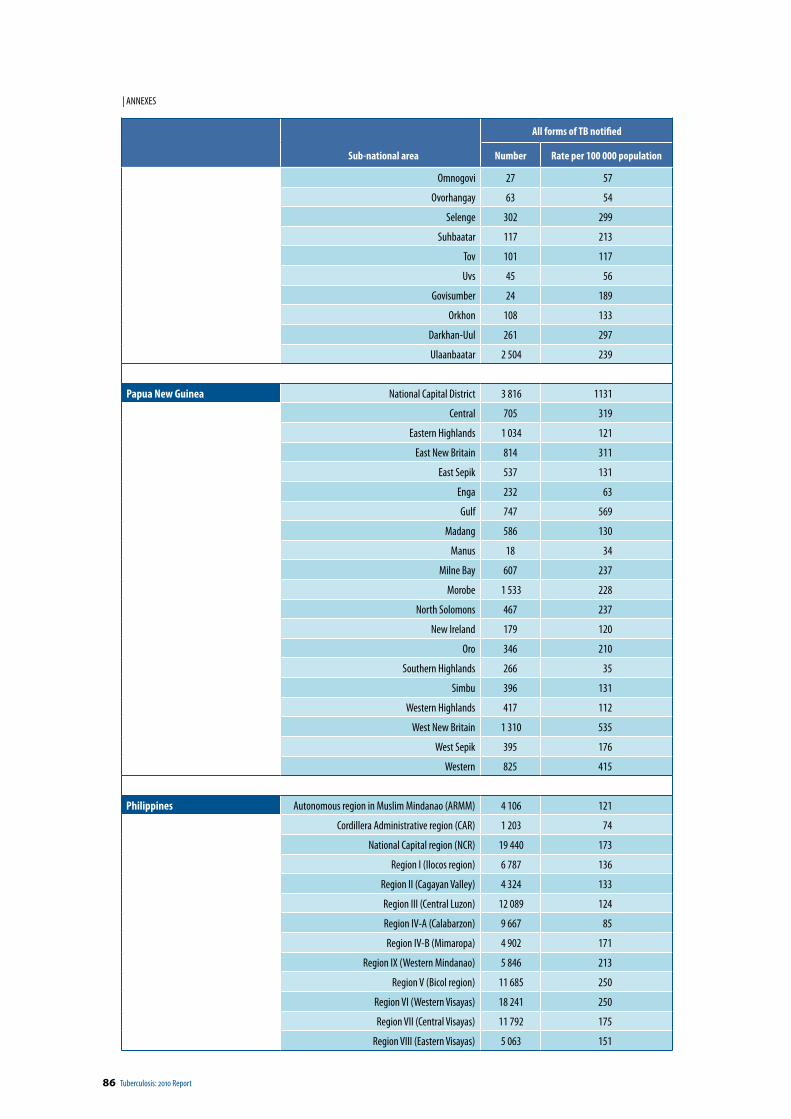
86 Tuberculosis: 2010 Report
| ANNEXES
Sub-national area
All forms of TB notified
Number Rate per 100 000 population
Omnogovi 27 57
Ovorhangay 63 54
Selenge 302 299
Suhbaatar 117 213
Tov 101 117
Uvs 45 56
Govisumber 24 189
Orkhon 108 133
Darkhan-Uul 261 297
Ulaanbaatar 2 504 239
Papua New Guinea National Capital District 3 816 1131
Central 705 319
Eastern Highlands 1 034 121
East New Britain 814 311
East Sepik 537 131
Enga 232 63
Gulf 747 569
Madang 586 130
Manus 18 34
Milne Bay 607 237
Morobe 1 533 228
North Solomons 467 237
New Ireland 179 120
Oro 346 210
Southern Highlands 266 35
Simbu 396 131
Western Highlands 417 112
West New Britain 1 310 535
West Sepik 395 176
Western 825 415
Philippines Autonomous region in Muslim Mindanao (ARMM) 4 106 121
Cordillera Administrative region (CAR) 1 203 74
National Capital region (NCR) 19 440 173
Region I (Ilocos region) 6 787 136
Region II (Cagayan Valley) 4 324 133
Region III (Central Luzon) 12 089 124
Region IV-A (Calabarzon) 9 667 85
Region IV-B (Mimaropa) 4 902 171
Region IX (Western Mindanao) 5 846 213
Region V (Bicol region) 11 685 250
Region VI (Western Visayas) 18 241 250
Region VII (Central Visayas) 11 792 175
Region VIII (Eastern Visayas) 5 063 151
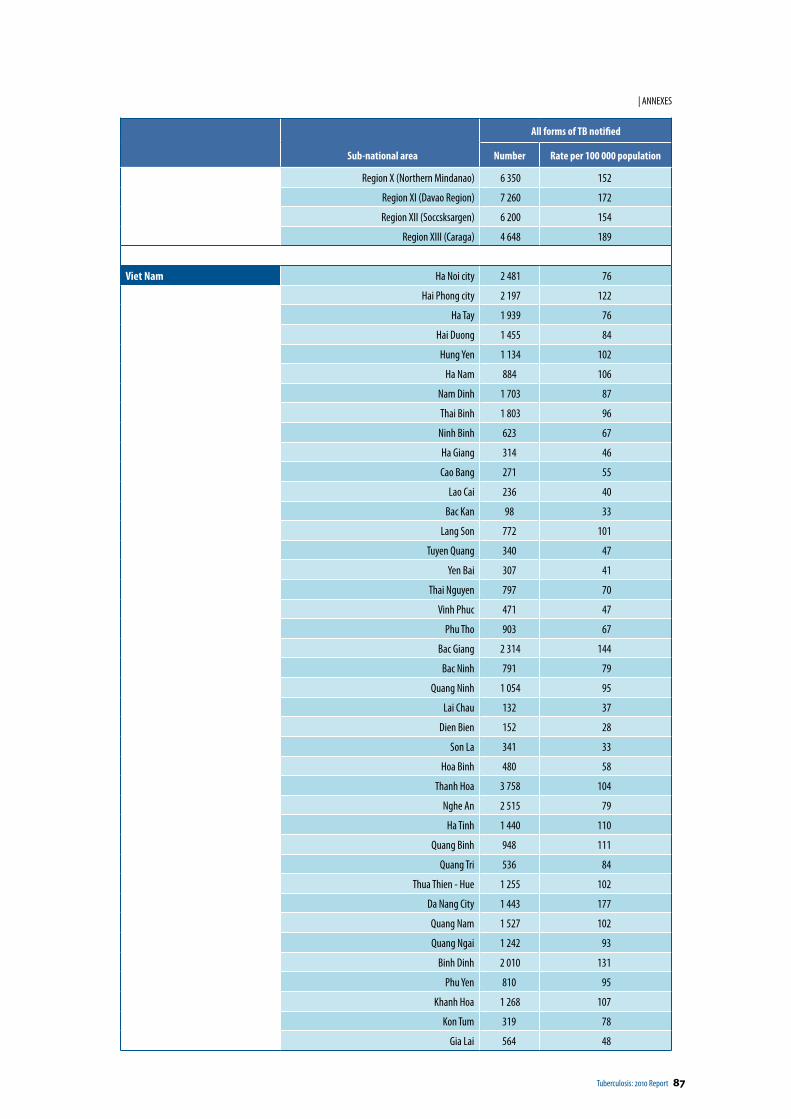
Tuberculosis: 2010 Report 87
| ANNEXES
Sub-national area
All forms of TB notified
Number Rate per 100 000 population
Region X (Northern Mindanao) 6 350 152
Region XI (Davao Region) 7 260 172
Region XII (Soccsksargen) 6 200 154
Region XIII (Caraga) 4 648 189
Viet Nam Ha Noi city 2 481 76
Hai Phong city 2 197 122
Ha Tay 1 939 76
Hai Duong 1 455 84
Hung Yen 1 134 102
Ha Nam 884 106
Nam Dinh 1 703 87
Thai Binh 1 803 96
Ninh Binh 623 67
Ha Giang 314 46
Cao Bang 271 55
Lao Cai 236 40
Bac Kan 98 33
Lang Son 772 101
Tuyen Quang 340 47
Yen Bai 307 41
Thai Nguyen 797 70
Vinh Phuc 471 47
Phu Tho 903 67
Bac Giang 2 314 144
Bac Ninh 791 79
Quang Ninh 1 054 95
Lai Chau 132 37
Dien Bien 152 28
Son La 341 33
Hoa Binh 480 58
Thanh Hoa 3 758 104
Nghe An 2 515 79
Ha Tinh 1 440 110
Quang Binh 948 111
Quang Tri 536 84
Thua Thien - Hue 1 255 102
Da Nang City 1 443 177
Quang Nam 1 527 102
Quang Ngai 1 242 93
Binh Dinh 2 010 131
Phu Yen 810 95
Khanh Hoa 1 268 107
Kon Tum 319 78
Gia Lai 564 48
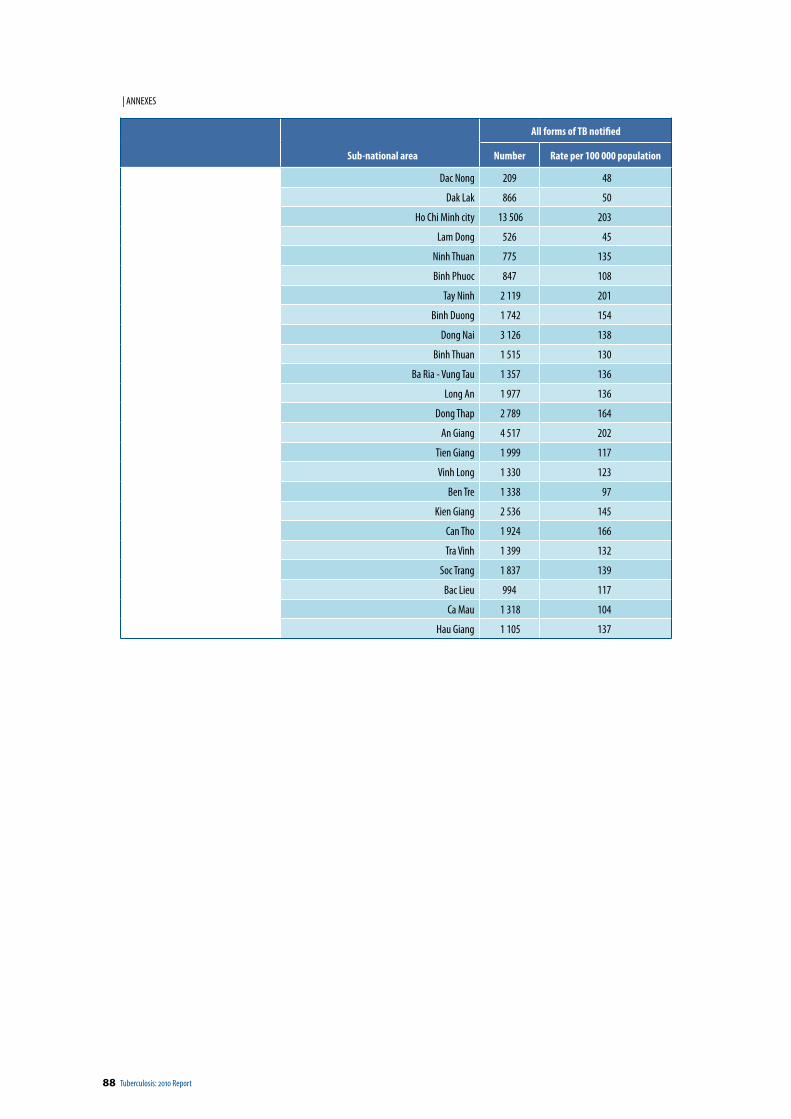
88 Tuberculosis: 2010 Report
| ANNEXES
Sub-national area
All forms of TB notified
Number Rate per 100 000 population
Dac Nong 209 48
Dak Lak 866 50
Ho Chi Minh city 13 506 203
Lam Dong 526 45
Ninh Thuan 775 135
Binh Phuoc 847 108
Tay Ninh 2 119 201
Binh Duong 1 742 154
Dong Nai 3 126 138
Binh Thuan 1 515 130
Ba Ria - Vung Tau 1 357 136
Long An 1 977 136
Dong Thap 2 789 164
An Giang 4 517 202
Tien Giang 1 999 117
Vinh Long 1 330 123
Ben Tre 1 338 97
Kien Giang 2 536 145
Can Tho 1 924 166
Tra Vinh 1 399 132
Soc Trang 1 837 139
Bac Lieu 994 117
Ca Mau 1 318 104
Hau Giang 1 105 137

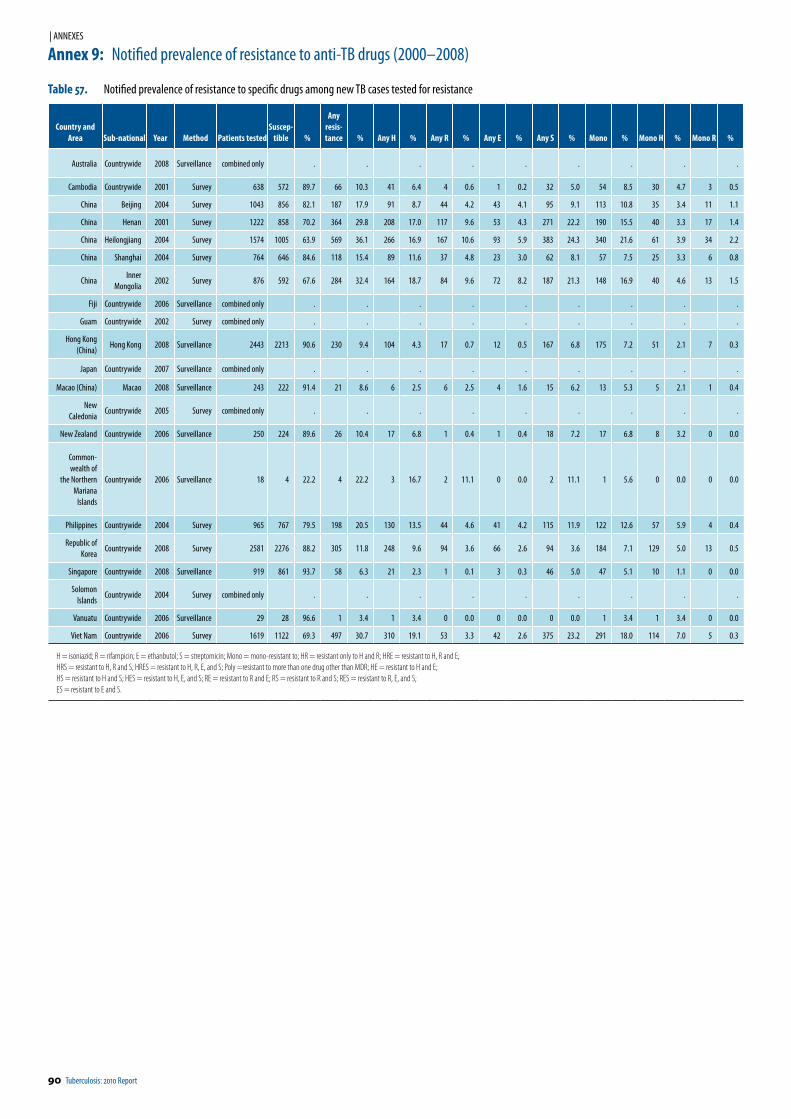
90 Tuberculosis: 2010 Report
| ANNEXES
Annex 9: Notified prevalence of resistance to anti-TB drugs (2000–2008)
Table 57. Notified prevalence of resistance to specific drugs among new TB cases tested for resistance
Country and Area Sub-national Year Method Patients tested
Suscep-tible %
Any resis-tance % Any H % Any R % Any E % Any S % Mono % Mono H % Mono R %
Australia Countrywide 2008 Surveillance combined only . . . . . . . . .
Cambodia Countrywide 2001 Survey 638 572 89.7 66 10.3 41 6.4 4 0.6 1 0.2 32 5.0 54 8.5 30 4.7 3 0.5
China Beijing 2004 Survey 1043 856 82.1 187 17.9 91 8.7 44 4.2 43 4.1 95 9.1 113 10.8 35 3.4 11 1.1
China Henan 2001 Survey 1222 858 70.2 364 29.8 208 17.0 117 9.6 53 4.3 271 22.2 190 15.5 40 3.3 17 1.4
China Heilongjiang 2004 Survey 1574 1005 63.9 569 36.1 266 16.9 167 10.6 93 5.9 383 24.3 340 21.6 61 3.9 34 2.2
China Shanghai 2004 Survey 764 646 84.6 118 15.4 89 11.6 37 4.8 23 3.0 62 8.1 57 7.5 25 3.3 6 0.8
ChinaInner
Mongolia2002 Survey 876 592 67.6 284 32.4 164 18.7 84 9.6 72 8.2 187 21.3 148 16.9 40 4.6 13 1.5
Fiji Countrywide 2006 Surveillance combined only . . . . . . . . .
Guam Countrywide 2002 Survey combined only . . . . . . . . .
Hong Kong (China)
Hong Kong 2008 Surveillance 2443 2213 90.6 230 9.4 104 4.3 17 0.7 12 0.5 167 6.8 175 7.2 51 2.1 7 0.3
Japan Countrywide 2007 Surveillance combined only . . . . . . . . .
Macao (China) Macao 2008 Surveillance 243 222 91.4 21 8.6 6 2.5 6 2.5 4 1.6 15 6.2 13 5.3 5 2.1 1 0.4
New Caledonia
Countrywide 2005 Survey combined only . . . . . . . . .
New Zealand Countrywide 2006 Surveillance 250 224 89.6 26 10.4 17 6.8 1 0.4 1 0.4 18 7.2 17 6.8 8 3.2 0 0.0
Common-wealth of
the Northern Mariana
Islands
Countrywide 2006 Surveillance 18 4 22.2 4 22.2 3 16.7 2 11.1 0 0.0 2 11.1 1 5.6 0 0.0 0 0.0
Philippines Countrywide 2004 Survey 965 767 79.5 198 20.5 130 13.5 44 4.6 41 4.2 115 11.9 122 12.6 57 5.9 4 0.4
Republic of Korea
Countrywide 2008 Survey 2581 2276 88.2 305 11.8 248 9.6 94 3.6 66 2.6 94 3.6 184 7.1 129 5.0 13 0.5
Singapore Countrywide 2008 Surveillance 919 861 93.7 58 6.3 21 2.3 1 0.1 3 0.3 46 5.0 47 5.1 10 1.1 0 0.0
Solomon Islands
Countrywide 2004 Survey combined only . . . . . . . . .
Vanuatu Countrywide 2006 Surveillance 29 28 96.6 1 3.4 1 3.4 0 0.0 0 0.0 0 0.0 1 3.4 1 3.4 0 0.0
Viet Nam Countrywide 2006 Survey 1619 1122 69.3 497 30.7 310 19.1 53 3.3 42 2.6 375 23.2 291 18.0 114 7.0 5 0.3
H = isoniazid; R = rifampicin; E = ethanbutol; S = streptomicin; Mono = mono-resistant to; HR = resistant only to H and R; HRE = resistant to H, R and E;HRS = resistant to H, R and S; HRES = resistant to H, R, E, and S; Poly =resistant to more than one drug other than MDR; HE = resistant to H and E; HS = resistant to H and S; HES = resistant to H, E, and S; RE = resistant to R and E; RS = resistant to R and S; RES = resistant to R, E, and S; ES = resistant to E and S.
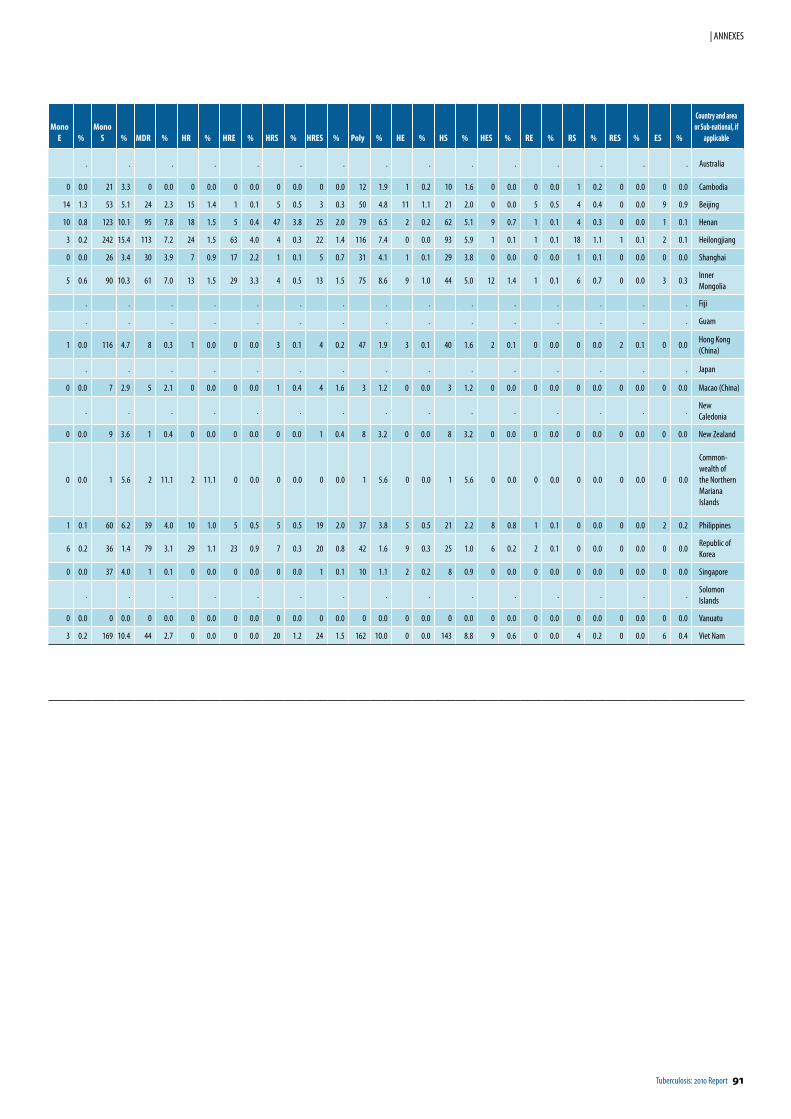
Tuberculosis: 2010 Report 91
| ANNEXES
Mono E %
Mono S % MDR % HR % HRE % HRS % HRES % Poly % HE % HS % HES % RE % RS % RES % ES %
Country and area or Sub-national, if
applicable
. . . . . . . . . . . . . . . Australia
0 0.0 21 3.3 0 0.0 0 0.0 0 0.0 0 0.0 0 0.0 12 1.9 1 0.2 10 1.6 0 0.0 0 0.0 1 0.2 0 0.0 0 0.0 Cambodia
14 1.3 53 5.1 24 2.3 15 1.4 1 0.1 5 0.5 3 0.3 50 4.8 11 1.1 21 2.0 0 0.0 5 0.5 4 0.4 0 0.0 9 0.9 Beijing
10 0.8 123 10.1 95 7.8 18 1.5 5 0.4 47 3.8 25 2.0 79 6.5 2 0.2 62 5.1 9 0.7 1 0.1 4 0.3 0 0.0 1 0.1 Henan
3 0.2 242 15.4 113 7.2 24 1.5 63 4.0 4 0.3 22 1.4 116 7.4 0 0.0 93 5.9 1 0.1 1 0.1 18 1.1 1 0.1 2 0.1 Heilongjiang
0 0.0 26 3.4 30 3.9 7 0.9 17 2.2 1 0.1 5 0.7 31 4.1 1 0.1 29 3.8 0 0.0 0 0.0 1 0.1 0 0.0 0 0.0 Shanghai
5 0.6 90 10.3 61 7.0 13 1.5 29 3.3 4 0.5 13 1.5 75 8.6 9 1.0 44 5.0 12 1.4 1 0.1 6 0.7 0 0.0 3 0.3 Inner Mongolia
. . . . . . . . . . . . . . . Fiji
. . . . . . . . . . . . . . . Guam
1 0.0 116 4.7 8 0.3 1 0.0 0 0.0 3 0.1 4 0.2 47 1.9 3 0.1 40 1.6 2 0.1 0 0.0 0 0.0 2 0.1 0 0.0 Hong Kong (China)
. . . . . . . . . . . . . . . Japan
0 0.0 7 2.9 5 2.1 0 0.0 0 0.0 1 0.4 4 1.6 3 1.2 0 0.0 3 1.2 0 0.0 0 0.0 0 0.0 0 0.0 0 0.0 Macao (China)
. . . . . . . . . . . . . . .New Caledonia
0 0.0 9 3.6 1 0.4 0 0.0 0 0.0 0 0.0 1 0.4 8 3.2 0 0.0 8 3.2 0 0.0 0 0.0 0 0.0 0 0.0 0 0.0 New Zealand
0 0.0 1 5.6 2 11.1 2 11.1 0 0.0 0 0.0 0 0.0 1 5.6 0 0.0 1 5.6 0 0.0 0 0.0 0 0.0 0 0.0 0 0.0
Common-wealth of the Northern Mariana Islands
1 0.1 60 6.2 39 4.0 10 1.0 5 0.5 5 0.5 19 2.0 37 3.8 5 0.5 21 2.2 8 0.8 1 0.1 0 0.0 0 0.0 2 0.2 Philippines
6 0.2 36 1.4 79 3.1 29 1.1 23 0.9 7 0.3 20 0.8 42 1.6 9 0.3 25 1.0 6 0.2 2 0.1 0 0.0 0 0.0 0 0.0Republic of Korea
0 0.0 37 4.0 1 0.1 0 0.0 0 0.0 0 0.0 1 0.1 10 1.1 2 0.2 8 0.9 0 0.0 0 0.0 0 0.0 0 0.0 0 0.0 Singapore
. . . . . . . . . . . . . . .Solomon Islands
0 0.0 0 0.0 0 0.0 0 0.0 0 0.0 0 0.0 0 0.0 0 0.0 0 0.0 0 0.0 0 0.0 0 0.0 0 0.0 0 0.0 0 0.0 Vanuatu
3 0.2 169 10.4 44 2.7 0 0.0 0 0.0 20 1.2 24 1.5 162 10.0 0 0.0 143 8.8 9 0.6 0 0.0 4 0.2 0 0.0 6 0.4 Viet Nam
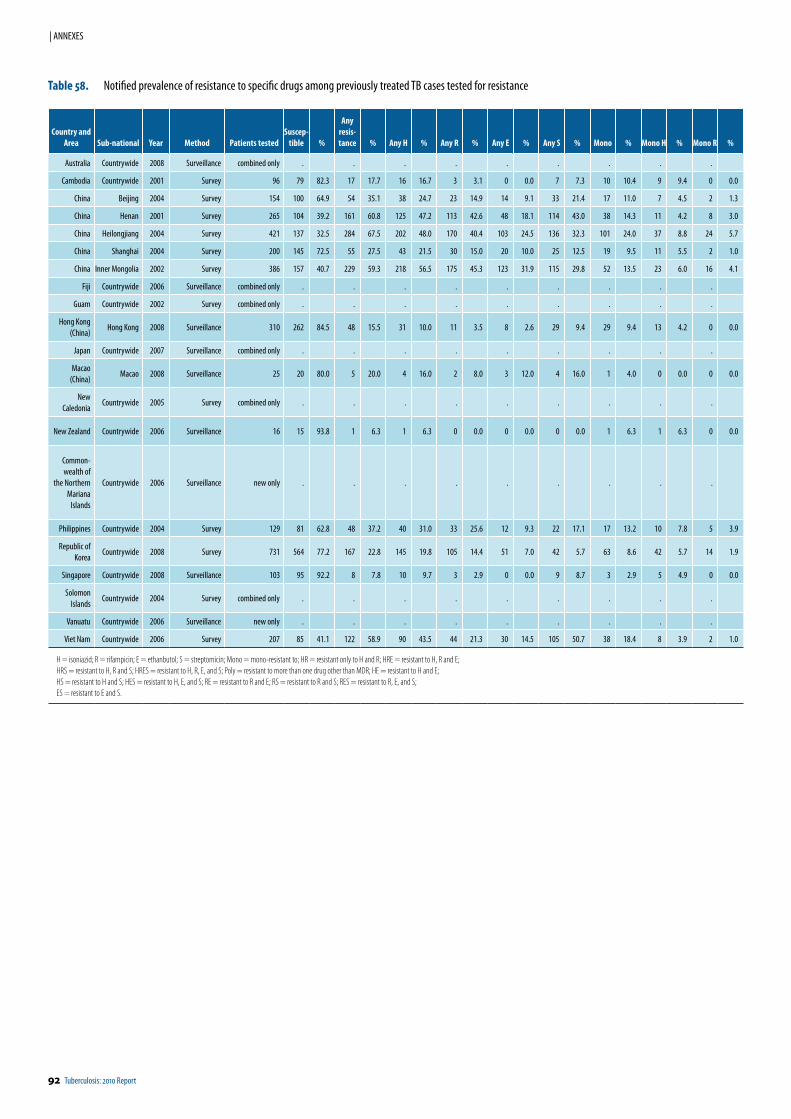
92 Tuberculosis: 2010 Report
| ANNEXES
Country and Area Sub-national Year Method Patients tested
Suscep-tible %
Any resis-tance % Any H % Any R % Any E % Any S % Mono % Mono H % Mono R %
Australia Countrywide 2008 Surveillance combined only . . . . . . . . .
Cambodia Countrywide 2001 Survey 96 79 82.3 17 17.7 16 16.7 3 3.1 0 0.0 7 7.3 10 10.4 9 9.4 0 0.0
China Beijing 2004 Survey 154 100 64.9 54 35.1 38 24.7 23 14.9 14 9.1 33 21.4 17 11.0 7 4.5 2 1.3
China Henan 2001 Survey 265 104 39.2 161 60.8 125 47.2 113 42.6 48 18.1 114 43.0 38 14.3 11 4.2 8 3.0
China Heilongjiang 2004 Survey 421 137 32.5 284 67.5 202 48.0 170 40.4 103 24.5 136 32.3 101 24.0 37 8.8 24 5.7
China Shanghai 2004 Survey 200 145 72.5 55 27.5 43 21.5 30 15.0 20 10.0 25 12.5 19 9.5 11 5.5 2 1.0
China Inner Mongolia 2002 Survey 386 157 40.7 229 59.3 218 56.5 175 45.3 123 31.9 115 29.8 52 13.5 23 6.0 16 4.1
Fiji Countrywide 2006 Surveillance combined only . . . . . . . . .
Guam Countrywide 2002 Survey combined only . . . . . . . . .
Hong Kong (China)
Hong Kong 2008 Surveillance 310 262 84.5 48 15.5 31 10.0 11 3.5 8 2.6 29 9.4 29 9.4 13 4.2 0 0.0
Japan Countrywide 2007 Surveillance combined only . . . . . . . . .
Macao (China)
Macao 2008 Surveillance 25 20 80.0 5 20.0 4 16.0 2 8.0 3 12.0 4 16.0 1 4.0 0 0.0 0 0.0
New Caledonia
Countrywide 2005 Survey combined only . . . . . . . . .
New Zealand Countrywide 2006 Surveillance 16 15 93.8 1 6.3 1 6.3 0 0.0 0 0.0 0 0.0 1 6.3 1 6.3 0 0.0
Common-wealth of
the Northern Mariana
Islands
Countrywide 2006 Surveillance new only . . . . . . . . .
Philippines Countrywide 2004 Survey 129 81 62.8 48 37.2 40 31.0 33 25.6 12 9.3 22 17.1 17 13.2 10 7.8 5 3.9
Republic of Korea
Countrywide 2008 Survey 731 564 77.2 167 22.8 145 19.8 105 14.4 51 7.0 42 5.7 63 8.6 42 5.7 14 1.9
Singapore Countrywide 2008 Surveillance 103 95 92.2 8 7.8 10 9.7 3 2.9 0 0.0 9 8.7 3 2.9 5 4.9 0 0.0
Solomon Islands
Countrywide 2004 Survey combined only . . . . . . . . .
Vanuatu Countrywide 2006 Surveillance new only . . . . . . . . .
Viet Nam Countrywide 2006 Survey 207 85 41.1 122 58.9 90 43.5 44 21.3 30 14.5 105 50.7 38 18.4 8 3.9 2 1.0
H = isoniazid; R = rifampicin; E = ethanbutol; S = streptomicin; Mono = mono-resistant to; HR = resistant only to H and R; HRE = resistant to H, R and E;HRS = resistant to H, R and S; HRES = resistant to H, R, E, and S; Poly = resistant to more than one drug other than MDR; HE = resistant to H and E; HS = resistant to H and S; HES = resistant to H, E, and S; RE = resistant to R and E; RS = resistant to R and S; RES = resistant to R, E, and S; ES = resistant to E and S.
Table 58. Notified prevalence of resistance to specific drugs among previously treated TB cases tested for resistance
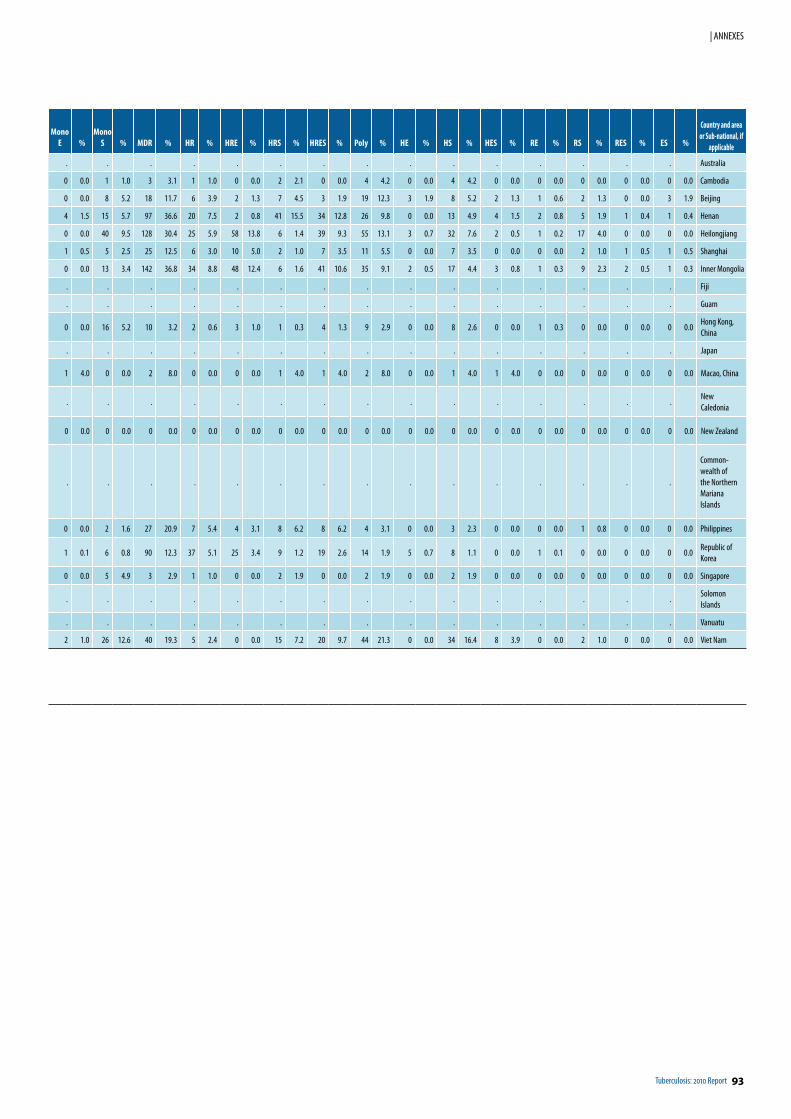
Tuberculosis: 2010 Report 93
| ANNEXES
Mono E %
Mono S % MDR % HR % HRE % HRS % HRES % Poly % HE % HS % HES % RE % RS % RES % ES %
Country and area or Sub-national, if
applicable
. . . . . . . . . . . . . . . Australia
0 0.0 1 1.0 3 3.1 1 1.0 0 0.0 2 2.1 0 0.0 4 4.2 0 0.0 4 4.2 0 0.0 0 0.0 0 0.0 0 0.0 0 0.0 Cambodia
0 0.0 8 5.2 18 11.7 6 3.9 2 1.3 7 4.5 3 1.9 19 12.3 3 1.9 8 5.2 2 1.3 1 0.6 2 1.3 0 0.0 3 1.9 Beijing
4 1.5 15 5.7 97 36.6 20 7.5 2 0.8 41 15.5 34 12.8 26 9.8 0 0.0 13 4.9 4 1.5 2 0.8 5 1.9 1 0.4 1 0.4 Henan
0 0.0 40 9.5 128 30.4 25 5.9 58 13.8 6 1.4 39 9.3 55 13.1 3 0.7 32 7.6 2 0.5 1 0.2 17 4.0 0 0.0 0 0.0 Heilongjiang
1 0.5 5 2.5 25 12.5 6 3.0 10 5.0 2 1.0 7 3.5 11 5.5 0 0.0 7 3.5 0 0.0 0 0.0 2 1.0 1 0.5 1 0.5 Shanghai
0 0.0 13 3.4 142 36.8 34 8.8 48 12.4 6 1.6 41 10.6 35 9.1 2 0.5 17 4.4 3 0.8 1 0.3 9 2.3 2 0.5 1 0.3 Inner Mongolia
. . . . . . . . . . . . . . . Fiji
. . . . . . . . . . . . . . . Guam
0 0.0 16 5.2 10 3.2 2 0.6 3 1.0 1 0.3 4 1.3 9 2.9 0 0.0 8 2.6 0 0.0 1 0.3 0 0.0 0 0.0 0 0.0Hong Kong, China
. . . . . . . . . . . . . . . Japan
1 4.0 0 0.0 2 8.0 0 0.0 0 0.0 1 4.0 1 4.0 2 8.0 0 0.0 1 4.0 1 4.0 0 0.0 0 0.0 0 0.0 0 0.0 Macao, China
. . . . . . . . . . . . . . .New Caledonia
0 0.0 0 0.0 0 0.0 0 0.0 0 0.0 0 0.0 0 0.0 0 0.0 0 0.0 0 0.0 0 0.0 0 0.0 0 0.0 0 0.0 0 0.0 New Zealand
. . . . . . . . . . . . . . .
Common-wealth of the Northern Mariana Islands
0 0.0 2 1.6 27 20.9 7 5.4 4 3.1 8 6.2 8 6.2 4 3.1 0 0.0 3 2.3 0 0.0 0 0.0 1 0.8 0 0.0 0 0.0 Philippines
1 0.1 6 0.8 90 12.3 37 5.1 25 3.4 9 1.2 19 2.6 14 1.9 5 0.7 8 1.1 0 0.0 1 0.1 0 0.0 0 0.0 0 0.0Republic of Korea
0 0.0 5 4.9 3 2.9 1 1.0 0 0.0 2 1.9 0 0.0 2 1.9 0 0.0 2 1.9 0 0.0 0 0.0 0 0.0 0 0.0 0 0.0 Singapore
. . . . . . . . . . . . . . .Solomon Islands
. . . . . . . . . . . . . . . Vanuatu
2 1.0 26 12.6 40 19.3 5 2.4 0 0.0 15 7.2 20 9.7 44 21.3 0 0.0 34 16.4 8 3.9 0 0.0 2 1.0 0 0.0 0 0.0 Viet Nam
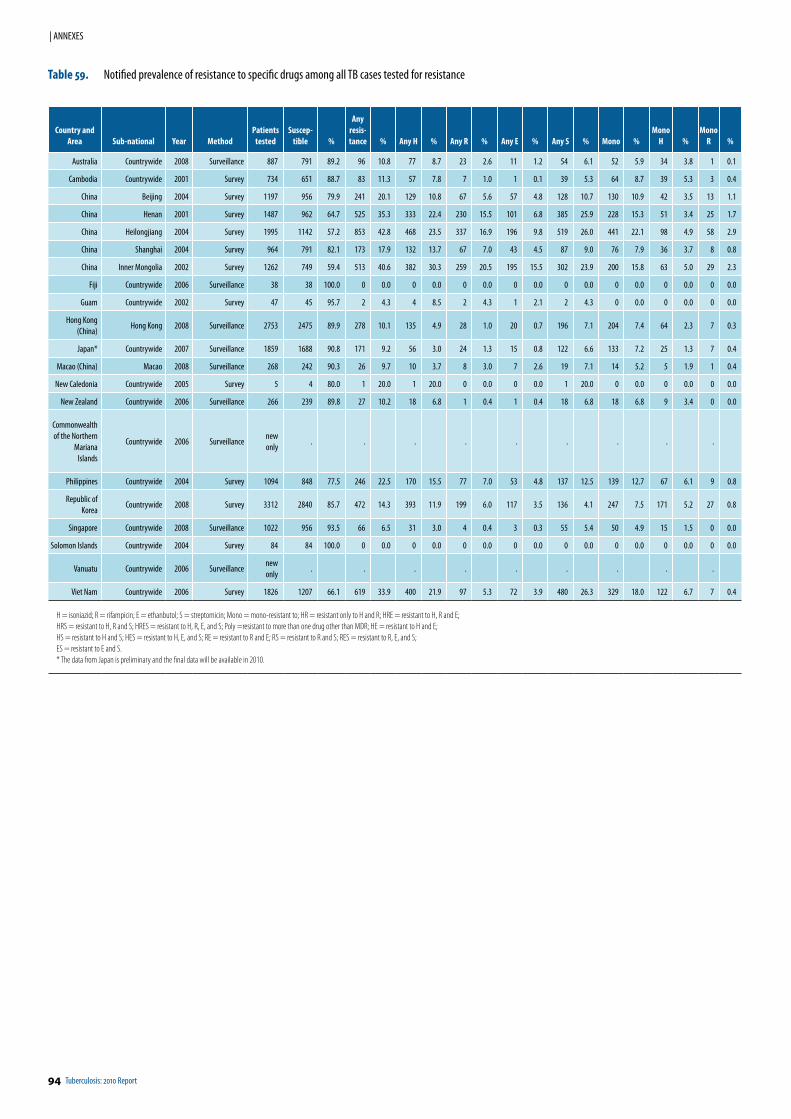
94 Tuberculosis: 2010 Report
| ANNEXES
Country and Area Sub-national Year Method
Patients tested
Suscep-tible %
Any resis-tance % Any H % Any R % Any E % Any S % Mono %
Mono H %
Mono R %
Australia Countrywide 2008 Surveillance 887 791 89.2 96 10.8 77 8.7 23 2.6 11 1.2 54 6.1 52 5.9 34 3.8 1 0.1
Cambodia Countrywide 2001 Survey 734 651 88.7 83 11.3 57 7.8 7 1.0 1 0.1 39 5.3 64 8.7 39 5.3 3 0.4
China Beijing 2004 Survey 1197 956 79.9 241 20.1 129 10.8 67 5.6 57 4.8 128 10.7 130 10.9 42 3.5 13 1.1
China Henan 2001 Survey 1487 962 64.7 525 35.3 333 22.4 230 15.5 101 6.8 385 25.9 228 15.3 51 3.4 25 1.7
China Heilongjiang 2004 Survey 1995 1142 57.2 853 42.8 468 23.5 337 16.9 196 9.8 519 26.0 441 22.1 98 4.9 58 2.9
China Shanghai 2004 Survey 964 791 82.1 173 17.9 132 13.7 67 7.0 43 4.5 87 9.0 76 7.9 36 3.7 8 0.8
China Inner Mongolia 2002 Survey 1262 749 59.4 513 40.6 382 30.3 259 20.5 195 15.5 302 23.9 200 15.8 63 5.0 29 2.3
Fiji Countrywide 2006 Surveillance 38 38 100.0 0 0.0 0 0.0 0 0.0 0 0.0 0 0.0 0 0.0 0 0.0 0 0.0
Guam Countrywide 2002 Survey 47 45 95.7 2 4.3 4 8.5 2 4.3 1 2.1 2 4.3 0 0.0 0 0.0 0 0.0
Hong Kong (China)
Hong Kong 2008 Surveillance 2753 2475 89.9 278 10.1 135 4.9 28 1.0 20 0.7 196 7.1 204 7.4 64 2.3 7 0.3
Japan* Countrywide 2007 Surveillance 1859 1688 90.8 171 9.2 56 3.0 24 1.3 15 0.8 122 6.6 133 7.2 25 1.3 7 0.4
Macao (China) Macao 2008 Surveillance 268 242 90.3 26 9.7 10 3.7 8 3.0 7 2.6 19 7.1 14 5.2 5 1.9 1 0.4
New Caledonia Countrywide 2005 Survey 5 4 80.0 1 20.0 1 20.0 0 0.0 0 0.0 1 20.0 0 0.0 0 0.0 0 0.0
New Zealand Countrywide 2006 Surveillance 266 239 89.8 27 10.2 18 6.8 1 0.4 1 0.4 18 6.8 18 6.8 9 3.4 0 0.0
Commonwealth of the Northern
Mariana Islands
Countrywide 2006 Surveillancenew only
. . . . . . . . .
Philippines Countrywide 2004 Survey 1094 848 77.5 246 22.5 170 15.5 77 7.0 53 4.8 137 12.5 139 12.7 67 6.1 9 0.8
Republic of Korea
Countrywide 2008 Survey 3312 2840 85.7 472 14.3 393 11.9 199 6.0 117 3.5 136 4.1 247 7.5 171 5.2 27 0.8
Singapore Countrywide 2008 Surveillance 1022 956 93.5 66 6.5 31 3.0 4 0.4 3 0.3 55 5.4 50 4.9 15 1.5 0 0.0
Solomon Islands Countrywide 2004 Survey 84 84 100.0 0 0.0 0 0.0 0 0.0 0 0.0 0 0.0 0 0.0 0 0.0 0 0.0
Vanuatu Countrywide 2006 Surveillancenew only
. . . . . . . . .
Viet Nam Countrywide 2006 Survey 1826 1207 66.1 619 33.9 400 21.9 97 5.3 72 3.9 480 26.3 329 18.0 122 6.7 7 0.4
H = isoniazid; R = rifampicin; E = ethanbutol; S = streptomicin; Mono = mono-resistant to; HR = resistant only to H and R; HRE = resistant to H, R and E;HRS = resistant to H, R and S; HRES = resistant to H, R, E, and S; Poly =resistant to more than one drug other than MDR; HE = resistant to H and E; HS = resistant to H and S; HES = resistant to H, E, and S; RE = resistant to R and E; RS = resistant to R and S; RES = resistant to R, E, and S; ES = resistant to E and S.* The data from Japan is preliminary and the final data will be available in 2010.
Table 59. Notified prevalence of resistance to specific drugs among all TB cases tested for resistance
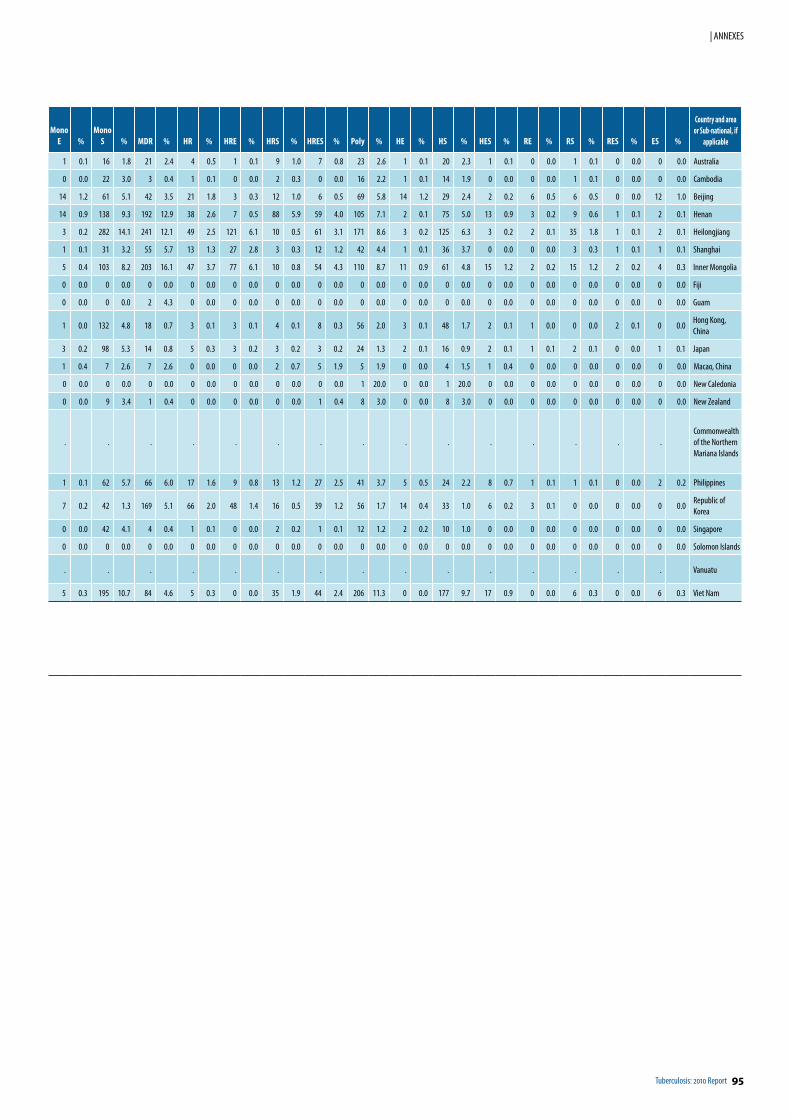
Tuberculosis: 2010 Report 95
| ANNEXES
Mono E %
Mono S % MDR % HR % HRE % HRS % HRES % Poly % HE % HS % HES % RE % RS % RES % ES %
Country and area or Sub-national, if
applica ble
1 0.1 16 1.8 21 2.4 4 0.5 1 0.1 9 1.0 7 0.8 23 2.6 1 0.1 20 2.3 1 0.1 0 0.0 1 0.1 0 0.0 0 0.0 Australia
0 0.0 22 3.0 3 0.4 1 0.1 0 0.0 2 0.3 0 0.0 16 2.2 1 0.1 14 1.9 0 0.0 0 0.0 1 0.1 0 0.0 0 0.0 Cambodia
14 1.2 61 5.1 42 3.5 21 1.8 3 0.3 12 1.0 6 0.5 69 5.8 14 1.2 29 2.4 2 0.2 6 0.5 6 0.5 0 0.0 12 1.0 Beijing
14 0.9 138 9.3 192 12.9 38 2.6 7 0.5 88 5.9 59 4.0 105 7.1 2 0.1 75 5.0 13 0.9 3 0.2 9 0.6 1 0.1 2 0.1 Henan
3 0.2 282 14.1 241 12.1 49 2.5 121 6.1 10 0.5 61 3.1 171 8.6 3 0.2 125 6.3 3 0.2 2 0.1 35 1.8 1 0.1 2 0.1 Heilongjiang
1 0.1 31 3.2 55 5.7 13 1.3 27 2.8 3 0.3 12 1.2 42 4.4 1 0.1 36 3.7 0 0.0 0 0.0 3 0.3 1 0.1 1 0.1 Shanghai
5 0.4 103 8.2 203 16.1 47 3.7 77 6.1 10 0.8 54 4.3 110 8.7 11 0.9 61 4.8 15 1.2 2 0.2 15 1.2 2 0.2 4 0.3 Inner Mongolia
0 0.0 0 0.0 0 0.0 0 0.0 0 0.0 0 0.0 0 0.0 0 0.0 0 0.0 0 0.0 0 0.0 0 0.0 0 0.0 0 0.0 0 0.0 Fiji
0 0.0 0 0.0 2 4.3 0 0.0 0 0.0 0 0.0 0 0.0 0 0.0 0 0.0 0 0.0 0 0.0 0 0.0 0 0.0 0 0.0 0 0.0 Guam
1 0.0 132 4.8 18 0.7 3 0.1 3 0.1 4 0.1 8 0.3 56 2.0 3 0.1 48 1.7 2 0.1 1 0.0 0 0.0 2 0.1 0 0.0Hong Kong, China
3 0.2 98 5.3 14 0.8 5 0.3 3 0.2 3 0.2 3 0.2 24 1.3 2 0.1 16 0.9 2 0.1 1 0.1 2 0.1 0 0.0 1 0.1 Japan
1 0.4 7 2.6 7 2.6 0 0.0 0 0.0 2 0.7 5 1.9 5 1.9 0 0.0 4 1.5 1 0.4 0 0.0 0 0.0 0 0.0 0 0.0 Macao, China
0 0.0 0 0.0 0 0.0 0 0.0 0 0.0 0 0.0 0 0.0 1 20.0 0 0.0 1 20.0 0 0.0 0 0.0 0 0.0 0 0.0 0 0.0 New Caledonia
0 0.0 9 3.4 1 0.4 0 0.0 0 0.0 0 0.0 1 0.4 8 3.0 0 0.0 8 3.0 0 0.0 0 0.0 0 0.0 0 0.0 0 0.0 New Zealand
. . . . . . . . . . . . . . .Commonwealth of the Northern Mariana Islands
1 0.1 62 5.7 66 6.0 17 1.6 9 0.8 13 1.2 27 2.5 41 3.7 5 0.5 24 2.2 8 0.7 1 0.1 1 0.1 0 0.0 2 0.2 Philippines
7 0.2 42 1.3 169 5.1 66 2.0 48 1.4 16 0.5 39 1.2 56 1.7 14 0.4 33 1.0 6 0.2 3 0.1 0 0.0 0 0.0 0 0.0Republic of Korea
0 0.0 42 4.1 4 0.4 1 0.1 0 0.0 2 0.2 1 0.1 12 1.2 2 0.2 10 1.0 0 0.0 0 0.0 0 0.0 0 0.0 0 0.0 Singapore
0 0.0 0 0.0 0 0.0 0 0.0 0 0.0 0 0.0 0 0.0 0 0.0 0 0.0 0 0.0 0 0.0 0 0.0 0 0.0 0 0.0 0 0.0 Solomon Islands
. . . . . . . . . . . . . . . Vanuatu
5 0.3 195 10.7 84 4.6 5 0.3 0 0.0 35 1.9 44 2.4 206 11.3 0 0.0 177 9.7 17 0.9 0 0.0 6 0.3 0 0.0 6 0.3 Viet Nam
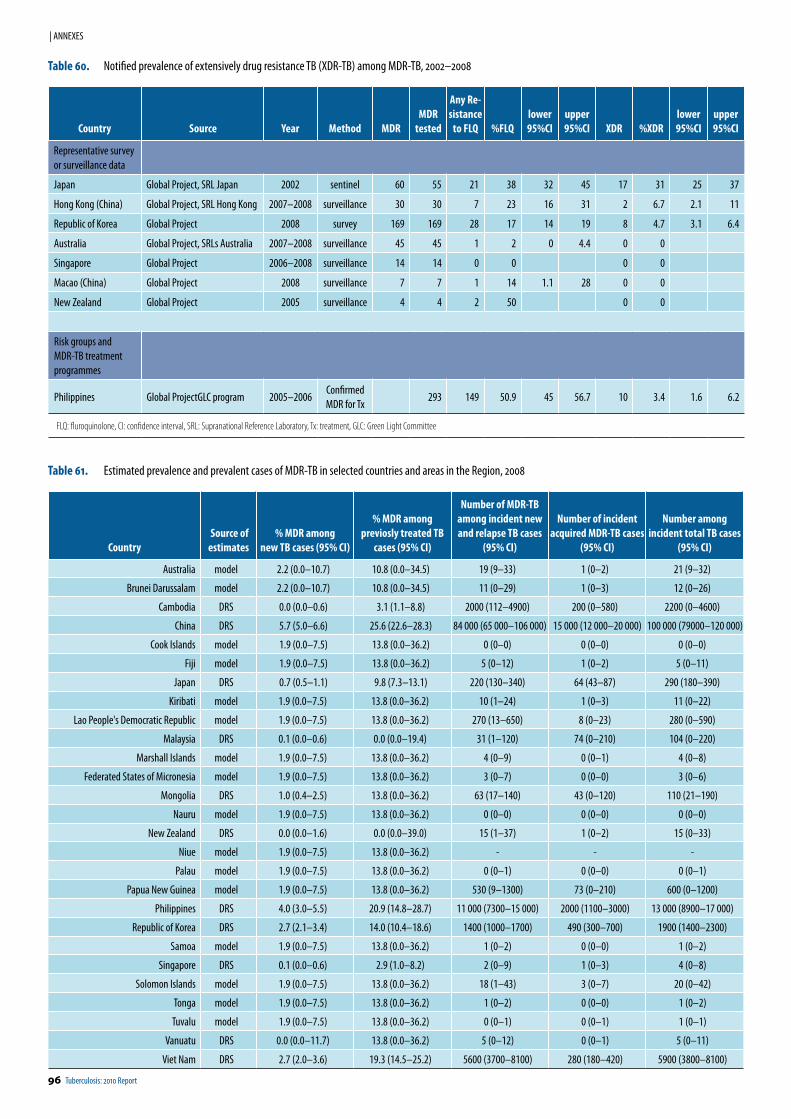
96 Tuberculosis: 2010 Report
| ANNEXES
Table 60. Notified prevalence of extensively drug resistance TB (XDR-TB) among MDR-TB, 2002–2008
Country Source Year Method MDRMDR
tested
Any Re-sistance
to FLQ %FLQlower 95%CI
upper 95%CI XDR %XDR
lower 95%CI
upper 95%CI
Representative survey or surveillance data
Japan Global Project, SRL Japan 2002 sentinel 60 55 21 38 32 45 17 31 25 37
Hong Kong (China) Global Project, SRL Hong Kong 2007–2008 surveillance 30 30 7 23 16 31 2 6.7 2.1 11
Republic of Korea Global Project 2008 survey 169 169 28 17 14 19 8 4.7 3.1 6.4
Australia Global Project, SRLs Australia 2007–2008 surveillance 45 45 1 2 0 4.4 0 0
Singapore Global Project 2006–2008 surveillance 14 14 0 0 0 0
Macao (China) Global Project 2008 surveillance 7 7 1 14 1.1 28 0 0
New Zealand Global Project 2005 surveillance 4 4 2 50 0 0
Risk groups and MDR-TB treatment programmes
Philippines Global ProjectGLC program 2005–2006Confirmed MDR for Tx
293 149 50.9 45 56.7 10 3.4 1.6 6.2
FLQ: fluroquinolone, CI: confidence interval, SRL: Supranational Reference Laboratory, Tx: treatment, GLC: Green Light Committee
Table 61. Estimated prevalence and prevalent cases of MDR-TB in selected countries and areas in the Region, 2008
Country Source of estimates
% MDR among new TB cases (95% CI)
% MDR among previosly treated TB
cases (95% CI)
Number of MDR-TB among incident new and relapse TB cases
(95% CI)
Number of incident acquired MDR-TB cases
(95% CI)
Number among incident total TB cases
(95% CI)
Australia model 2.2 (0.0–10.7) 10.8 (0.0–34.5) 19 (9–33) 1 (0–2) 21 (9–32)
Brunei Darussalam model 2.2 (0.0–10.7) 10.8 (0.0–34.5) 11 (0–29) 1 (0–3) 12 (0–26)
Cambodia DRS 0.0 (0.0–0.6) 3.1 (1.1–8.8) 2000 (112–4900) 200 (0–580) 2200 (0–4600)
China DRS 5.7 (5.0–6.6) 25.6 (22.6–28.3) 84 000 (65 000–106 000) 15 000 (12 000–20 000) 100 000 (79000–120 000)
Cook Islands model 1.9 (0.0–7.5) 13.8 (0.0–36.2) 0 (0–0) 0 (0–0) 0 (0–0)
Fiji model 1.9 (0.0–7.5) 13.8 (0.0–36.2) 5 (0–12) 1 (0–2) 5 (0–11)
Japan DRS 0.7 (0.5–1.1) 9.8 (7.3–13.1) 220 (130–340) 64 (43–87) 290 (180–390)
Kiribati model 1.9 (0.0–7.5) 13.8 (0.0–36.2) 10 (1–24) 1 (0–3) 11 (0–22)
Lao People's Democratic Republic model 1.9 (0.0–7.5) 13.8 (0.0–36.2) 270 (13–650) 8 (0–23) 280 (0–590)
Malaysia DRS 0.1 (0.0–0.6) 0.0 (0.0–19.4) 31 (1–120) 74 (0–210) 104 (0–220)
Marshall Islands model 1.9 (0.0–7.5) 13.8 (0.0–36.2) 4 (0–9) 0 (0–1) 4 (0–8)
Federated States of Micronesia model 1.9 (0.0–7.5) 13.8 (0.0–36.2) 3 (0–7) 0 (0–0) 3 (0–6)
Mongolia DRS 1.0 (0.4–2.5) 13.8 (0.0–36.2) 63 (17–140) 43 (0–120) 110 (21–190)
Nauru model 1.9 (0.0–7.5) 13.8 (0.0–36.2) 0 (0–0) 0 (0–0) 0 (0–0)
New Zealand DRS 0.0 (0.0–1.6) 0.0 (0.0–39.0) 15 (1–37) 1 (0–2) 15 (0–33)
Niue model 1.9 (0.0–7.5) 13.8 (0.0–36.2) - - -
Palau model 1.9 (0.0–7.5) 13.8 (0.0–36.2) 0 (0–1) 0 (0–0) 0 (0–1)
Papua New Guinea model 1.9 (0.0–7.5) 13.8 (0.0–36.2) 530 (9–1300) 73 (0–210) 600 (0–1200)
Philippines DRS 4.0 (3.0–5.5) 20.9 (14.8–28.7) 11 000 (7300–15 000) 2000 (1100–3000) 13 000 (8900–17 000)
Republic of Korea DRS 2.7 (2.1–3.4) 14.0 (10.4–18.6) 1400 (1000–1700) 490 (300–700) 1900 (1400–2300)
Samoa model 1.9 (0.0–7.5) 13.8 (0.0–36.2) 1 (0–2) 0 (0–0) 1 (0–2)
Singapore DRS 0.1 (0.0–0.6) 2.9 (1.0–8.2) 2 (0–9) 1 (0–3) 4 (0–8)
Solomon Islands model 1.9 (0.0–7.5) 13.8 (0.0–36.2) 18 (1–43) 3 (0–7) 20 (0–42)
Tonga model 1.9 (0.0–7.5) 13.8 (0.0–36.2) 1 (0–2) 0 (0–0) 1 (0–2)
Tuvalu model 1.9 (0.0–7.5) 13.8 (0.0–36.2) 0 (0–1) 0 (0–1) 1 (0–1)
Vanuatu DRS 0.0 (0.0–11.7) 13.8 (0.0–36.2) 5 (0–12) 0 (0–1) 5 (0–11)
Viet Nam DRS 2.7 (2.0–3.6) 19.3 (14.5–25.2) 5600 (3700–8100) 280 (180–420) 5900 (3800–8100)

This report can also be downloaded at: http://stoptb.wpro.who.int/


Related Documents


