Task-evoked fMRI changes in attention networks are associated with preclinical Alzheimer’s disease biomarkers Brian A. Gordon a, b, * , Jeffrey M. Zacks a, c , Tyler Blazey d , Tammie L.S. Benzinger a, b, d, e , John C. Morris b, f , Anne M. Fagan b, f, g , David M. Holtzman b, d, f, g , David A. Balota b, c a Department of Radiology, Washington University in St Louis, St Louis, MO, USA b Knight Alzheimer’s Disease Research Center, Washington University in St Louis, St Louis, MO, USA c Department of Psychology, Washington University in St Louis, St Louis, MO, USA d Division of Biology and Biomedical Sciences, Washington University in St Louis, St Louis, MO, USA e Department of Neurological Surgery, Washington University in St Louis, St Louis, MO, USA f Department of Neurology, Washington University in St Louis, St Louis, MO, USA g The Hope Center for Neurodegenerative Disorders, Washington University in St Louis, St Louis, MO, USA article info Article history: Received 14 November 2014 Received in revised form 21 January 2015 Accepted 23 January 2015 Keywords: Alzheimer Attention Biomarkers fMRI Dementia Amyloid Alzheimer’s disease tau ptau abstract There is a growing emphasis on examining preclinical levels of Alzheimer’s disease (AD)erelated pa- thology in the absence of cognitive impairment. Previous work examining biomarkers has focused almost exclusively on memory, although there is mounting evidence that attention also declines early in disease progression. In the current experiment, 2 attentional control tasks were used to examine al- terations in task-evoked functional magnetic resonance imaging data related to biomarkers of AD pathology. Seventy-one cognitively normal individuals (females ¼ 44, mean age ¼ 63.5 years) performed 2 attention-demanding cognitive tasks in a design that modeled both trial- and task-level functional magnetic resonance imaging changes. Biomarkers included amyloid b 42 , tau, and phosphorylated tau measured from cerebrospinal fluid and positron emission tomography measures of amyloid deposition. Both tasks elicited widespread patterns of activation and deactivation associated with large task-level manipulations of attention. Importantly, results from both tasks indicated that higher levels of tau and phosphorylated tau pathologies were associated with block-level overactivations of attentional control areas. This suggests early alteration in attentional control with rising levels of AD pathology. Ó 2015 Elsevier Inc. All rights reserved. 1. Introduction Alzheimer’s disease (AD) is not a static disorder; there is accu- mulating evidence that pathologic processes begin up to 20 years before symptomatic stages (Bateman et al., 2012; Benzinger et al., 2013; Jack et al., 2013). Elevated amyloid b (Ab) deposition in the brain is linked to a rise in hyperphosphorylated forms of tau in neuropil threads and neurofibrillary tangles (Hardy and Higgins, 1992). Aggregated tau leads to neuronal dysfunction and death that manifest in vivo as hypometabolism, atrophy, functional ab- normalities, and progressive cognitive impairment (Bateman et al., 2012; Jack et al., 2013). The early detection of structural or functional changes in the absence of significant cognitive impair- ment provides candidate biomarkers and therapeutic targets. In previous work in the literature, at-risk populations have been identified using genetic markers, such as the ε4 allele of the apolipoprotein E (APOE) gene, or high levels of amyloid deposition as evidenced by positron emission tomography (PET). Most func- tional magnetic resonance imaging (fMRI) studies examining such populations have used variations of memory encoding tasks (Bondi et al., 2005; Bookheimer et al., 2000; Dennis et al., 2010; Filbey et al., 2010; Han et al., 2007; Mormino et al., 2012; Trivedi et al., 2006). Although failing episodic memory is a hallmark of AD, the disorder is also characterized by attentional impairments (Balota and Faust, 2001; Bäckman et al., 2005; Perry and Hodges, 1999). Attentional control discriminates healthy individuals from those with dementia (Bäckman et al., 2005; Hutchison et al., 2010), predicts progression to dementia in a healthy sample (Balota et al., 2010), and from mild to more severe cognitive impairment (Albert et al., 2001; Sarazin et al., 2007). Early memory deficits in AD may in * Corresponding author at: Department of Radiology, Washington University in St Louis, 660 S Euclid Ave., Campus Box 8225, StLouis, MO 63110, USA. Tel.: 314-747- 7354; fax: 314-362-6110. E-mail address: [email protected] (B.A. Gordon). Contents lists available at ScienceDirect Neurobiology of Aging journal homepage: www.elsevier.com/locate/neuaging 0197-4580/$ e see front matter Ó 2015 Elsevier Inc. All rights reserved. http://dx.doi.org/10.1016/j.neurobiolaging.2015.01.019 Neurobiology of Aging xxx (2015) 1e9

Welcome message from author
This document is posted to help you gain knowledge. Please leave a comment to let me know what you think about it! Share it to your friends and learn new things together.
Transcript
lable at ScienceDirect
Neurobiology of Aging xxx (2015) 1e9
Contents lists avai
Neurobiology of Aging
journal homepage: www.elsevier .com/locate/neuaging
Task-evoked fMRI changes in attention networks are associated withpreclinical Alzheimer’s disease biomarkers
Brian A. Gordon a,b,*, Jeffrey M. Zacks a,c, Tyler Blazey d, Tammie L.S. Benzinger a,b,d,e,John C. Morris b,f, Anne M. Fagan b,f,g, David M. Holtzman b,d,f,g, David A. Balota b,c
aDepartment of Radiology, Washington University in St Louis, St Louis, MO, USAbKnight Alzheimer’s Disease Research Center, Washington University in St Louis, St Louis, MO, USAcDepartment of Psychology, Washington University in St Louis, St Louis, MO, USAdDivision of Biology and Biomedical Sciences, Washington University in St Louis, St Louis, MO, USAeDepartment of Neurological Surgery, Washington University in St Louis, St Louis, MO, USAfDepartment of Neurology, Washington University in St Louis, St Louis, MO, USAg The Hope Center for Neurodegenerative Disorders, Washington University in St Louis, St Louis, MO, USA
a r t i c l e i n f o
Article history:Received 14 November 2014Received in revised form 21 January 2015Accepted 23 January 2015
Keywords:AlzheimerAttentionBiomarkersfMRIDementiaAmyloidAlzheimer’s diseasetauptau
* Corresponding author at: Department of RadiologyLouis, 660 S Euclid Ave., Campus Box 8225, St Louis, M7354; fax: 314-362-6110.
E-mail address: [email protected] (B.A. Gordon
0197-4580/$ e see front matter � 2015 Elsevier Inc. Ahttp://dx.doi.org/10.1016/j.neurobiolaging.2015.01.019
a b s t r a c t
There is a growing emphasis on examining preclinical levels of Alzheimer’s disease (AD)erelated pa-thology in the absence of cognitive impairment. Previous work examining biomarkers has focusedalmost exclusively on memory, although there is mounting evidence that attention also declines early indisease progression. In the current experiment, 2 attentional control tasks were used to examine al-terations in task-evoked functional magnetic resonance imaging data related to biomarkers of ADpathology. Seventy-one cognitively normal individuals (females ¼ 44, mean age ¼ 63.5 years) performed2 attention-demanding cognitive tasks in a design that modeled both trial- and task-level functionalmagnetic resonance imaging changes. Biomarkers included amyloid b42, tau, and phosphorylated taumeasured from cerebrospinal fluid and positron emission tomography measures of amyloid deposition.Both tasks elicited widespread patterns of activation and deactivation associated with large task-levelmanipulations of attention. Importantly, results from both tasks indicated that higher levels of tau andphosphorylated tau pathologies were associated with block-level overactivations of attentional controlareas. This suggests early alteration in attentional control with rising levels of AD pathology.
� 2015 Elsevier Inc. All rights reserved.
1. Introduction
Alzheimer’s disease (AD) is not a static disorder; there is accu-mulating evidence that pathologic processes begin up to 20 yearsbefore symptomatic stages (Bateman et al., 2012; Benzinger et al.,2013; Jack et al., 2013). Elevated amyloid b (Ab) deposition in thebrain is linked to a rise in hyperphosphorylated forms of tau inneuropil threads and neurofibrillary tangles (Hardy and Higgins,1992). Aggregated tau leads to neuronal dysfunction and deaththat manifest in vivo as hypometabolism, atrophy, functional ab-normalities, and progressive cognitive impairment (Bateman et al.,2012; Jack et al., 2013). The early detection of structural or
, Washington University in StO 63110, USA. Tel.: 314-747-
).
ll rights reserved.
functional changes in the absence of significant cognitive impair-ment provides candidate biomarkers and therapeutic targets.
In previous work in the literature, at-risk populations have beenidentified using genetic markers, such as the ε4 allele of theapolipoprotein E (APOE) gene, or high levels of amyloid depositionas evidenced by positron emission tomography (PET). Most func-tional magnetic resonance imaging (fMRI) studies examining suchpopulations have used variations of memory encoding tasks (Bondiet al., 2005; Bookheimer et al., 2000; Dennis et al., 2010; Filbeyet al., 2010; Han et al., 2007; Mormino et al., 2012; Trivedi et al.,2006). Although failing episodic memory is a hallmark of AD, thedisorder is also characterized by attentional impairments (Balotaand Faust, 2001; Bäckman et al., 2005; Perry and Hodges, 1999).Attentional control discriminates healthy individuals from thosewith dementia (Bäckman et al., 2005; Hutchison et al., 2010),predicts progression to dementia in a healthy sample (Balota et al.,2010), and from mild to more severe cognitive impairment (Albertet al., 2001; Sarazin et al., 2007). Earlymemory deficits in ADmay in
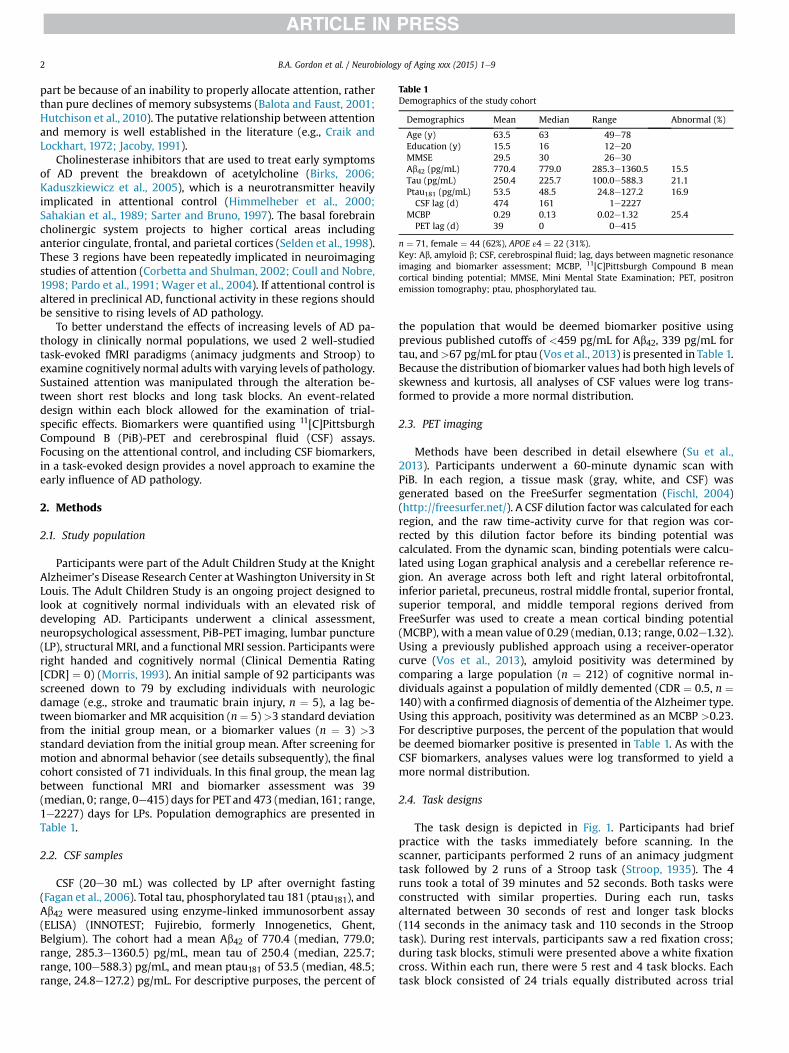
Table 1Demographics of the study cohort
Demographics Mean Median Range Abnormal (%)
Age (y) 63.5 63 49e78Education (y) 15.5 16 12e20MMSE 29.5 30 26e30Ab42 (pg/mL) 770.4 779.0 285.3e1360.5 15.5Tau (pg/mL) 250.4 225.7 100.0e588.3 21.1Ptau181 (pg/mL) 53.5 48.5 24.8e127.2 16.9CSF lag (d) 474 161 1e2227
MCBP 0.29 0.13 0.02e1.32 25.4PET lag (d) 39 0 0e415
n ¼ 71, female ¼ 44 (62%), APOE ε4 ¼ 22 (31%).Key: Ab, amyloid b; CSF, cerebrospinal fluid; lag, days between magnetic resonanceimaging and biomarker assessment; MCBP, 11[C]Pittsburgh Compound B meancortical binding potential; MMSE, Mini Mental State Examination; PET, positronemission tomography; ptau, phosphorylated tau.
B.A. Gordon et al. / Neurobiology of Aging xxx (2015) 1e92
part be because of an inability to properly allocate attention, ratherthan pure declines of memory subsystems (Balota and Faust, 2001;Hutchison et al., 2010). The putative relationship between attentionand memory is well established in the literature (e.g., Craik andLockhart, 1972; Jacoby, 1991).
Cholinesterase inhibitors that are used to treat early symptomsof AD prevent the breakdown of acetylcholine (Birks, 2006;Kaduszkiewicz et al., 2005), which is a neurotransmitter heavilyimplicated in attentional control (Himmelheber et al., 2000;Sahakian et al., 1989; Sarter and Bruno, 1997). The basal forebraincholinergic system projects to higher cortical areas includinganterior cingulate, frontal, and parietal cortices (Selden et al., 1998).These 3 regions have been repeatedly implicated in neuroimagingstudies of attention (Corbetta and Shulman, 2002; Coull and Nobre,1998; Pardo et al., 1991; Wager et al., 2004). If attentional control isaltered in preclinical AD, functional activity in these regions shouldbe sensitive to rising levels of AD pathology.
To better understand the effects of increasing levels of AD pa-thology in clinically normal populations, we used 2 well-studiedtask-evoked fMRI paradigms (animacy judgments and Stroop) toexamine cognitively normal adults with varying levels of pathology.Sustained attention was manipulated through the alteration be-tween short rest blocks and long task blocks. An event-relateddesign within each block allowed for the examination of trial-specific effects. Biomarkers were quantified using 11[C]PittsburghCompound B (PiB)-PET and cerebrospinal fluid (CSF) assays.Focusing on the attentional control, and including CSF biomarkers,in a task-evoked design provides a novel approach to examine theearly influence of AD pathology.
2. Methods
2.1. Study population
Participants were part of the Adult Children Study at the KnightAlzheimer’s Disease Research Center at Washington University in StLouis. The Adult Children Study is an ongoing project designed tolook at cognitively normal individuals with an elevated risk ofdeveloping AD. Participants underwent a clinical assessment,neuropsychological assessment, PiB-PET imaging, lumbar puncture(LP), structural MRI, and a functional MRI session. Participants wereright handed and cognitively normal (Clinical Dementia Rating[CDR] ¼ 0) (Morris, 1993). An initial sample of 92 participants wasscreened down to 79 by excluding individuals with neurologicdamage (e.g., stroke and traumatic brain injury, n ¼ 5), a lag be-tween biomarker and MR acquisition (n¼ 5) >3 standard deviationfrom the initial group mean, or a biomarker values (n ¼ 3) >3standard deviation from the initial group mean. After screening formotion and abnormal behavior (see details subsequently), the finalcohort consisted of 71 individuals. In this final group, the mean lagbetween functional MRI and biomarker assessment was 39(median, 0; range, 0e415) days for PETand 473 (median,161; range,1e2227) days for LPs. Population demographics are presented inTable 1.
2.2. CSF samples
CSF (20e30 mL) was collected by LP after overnight fasting(Fagan et al., 2006). Total tau, phosphorylated tau 181 (ptau181), andAb42 were measured using enzyme-linked immunosorbent assay(ELISA) (INNOTEST; Fujirebio, formerly Innogenetics, Ghent,Belgium). The cohort had a mean Ab42 of 770.4 (median, 779.0;range, 285.3e1360.5) pg/mL, mean tau of 250.4 (median, 225.7;range, 100e588.3) pg/mL, and mean ptau181 of 53.5 (median, 48.5;range, 24.8e127.2) pg/mL. For descriptive purposes, the percent of
the population that would be deemed biomarker positive usingprevious published cutoffs of <459 pg/mL for Ab42, 339 pg/mL fortau, and>67 pg/mL for ptau (Vos et al., 2013) is presented in Table 1.Because the distribution of biomarker values had both high levels ofskewness and kurtosis, all analyses of CSF values were log trans-formed to provide a more normal distribution.
2.3. PET imaging
Methods have been described in detail elsewhere (Su et al.,2013). Participants underwent a 60-minute dynamic scan withPiB. In each region, a tissue mask (gray, white, and CSF) wasgenerated based on the FreeSurfer segmentation (Fischl, 2004)(http://freesurfer.net/). A CSF dilution factor was calculated for eachregion, and the raw time-activity curve for that region was cor-rected by this dilution factor before its binding potential wascalculated. From the dynamic scan, binding potentials were calcu-lated using Logan graphical analysis and a cerebellar reference re-gion. An average across both left and right lateral orbitofrontal,inferior parietal, precuneus, rostral middle frontal, superior frontal,superior temporal, and middle temporal regions derived fromFreeSurfer was used to create a mean cortical binding potential(MCBP), with a mean value of 0.29 (median, 0.13; range, 0.02e1.32).Using a previously published approach using a receiver-operatorcurve (Vos et al., 2013), amyloid positivity was determined bycomparing a large population (n ¼ 212) of cognitive normal in-dividuals against a population of mildly demented (CDR ¼ 0.5, n ¼140) with a confirmed diagnosis of dementia of the Alzheimer type.Using this approach, positivity was determined as an MCBP >0.23.For descriptive purposes, the percent of the population that wouldbe deemed biomarker positive is presented in Table 1. As with theCSF biomarkers, analyses values were log transformed to yield amore normal distribution.
2.4. Task designs
The task design is depicted in Fig. 1. Participants had briefpractice with the tasks immediately before scanning. In thescanner, participants performed 2 runs of an animacy judgmenttask followed by 2 runs of a Stroop task (Stroop, 1935). The 4runs took a total of 39 minutes and 52 seconds. Both tasks wereconstructed with similar properties. During each run, tasksalternated between 30 seconds of rest and longer task blocks(114 seconds in the animacy task and 110 seconds in the Strooptask). During rest intervals, participants saw a red fixation cross;during task blocks, stimuli were presented above a white fixationcross. Within each run, there were 5 rest and 4 task blocks. Eachtask block consisted of 24 trials equally distributed across trial
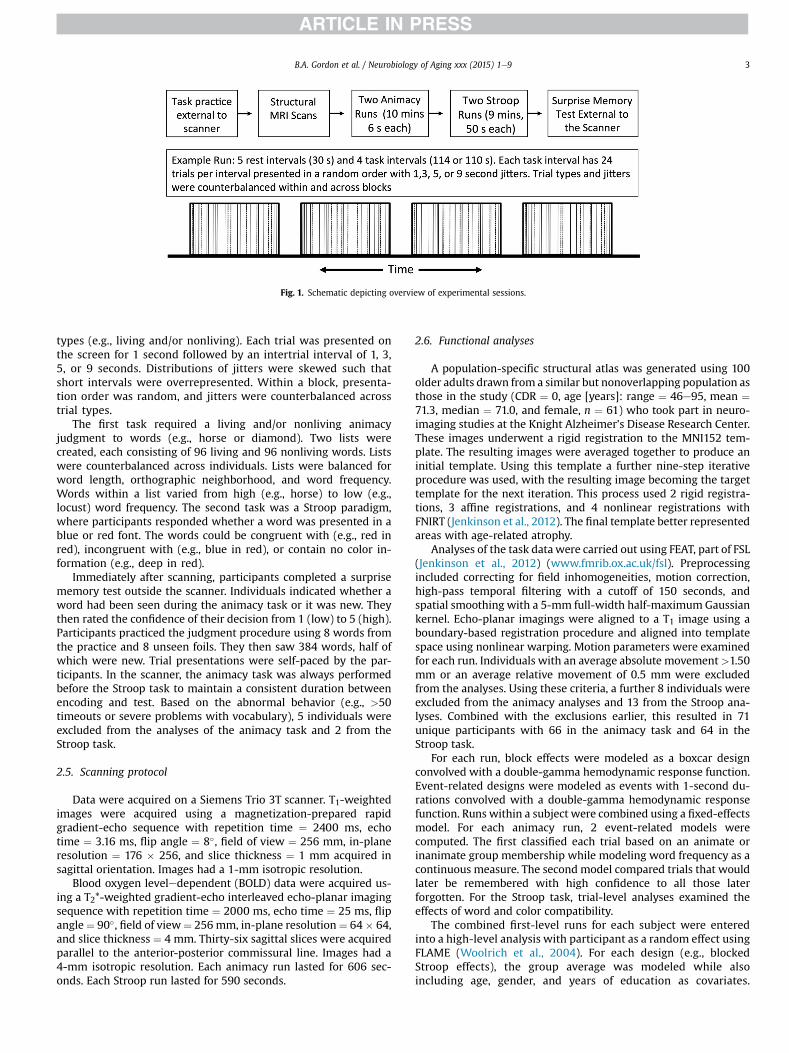
Fig. 1. Schematic depicting overview of experimental sessions.
B.A. Gordon et al. / Neurobiology of Aging xxx (2015) 1e9 3
types (e.g., living and/or nonliving). Each trial was presented onthe screen for 1 second followed by an intertrial interval of 1, 3,5, or 9 seconds. Distributions of jitters were skewed such thatshort intervals were overrepresented. Within a block, presenta-tion order was random, and jitters were counterbalanced acrosstrial types.
The first task required a living and/or nonliving animacyjudgment to words (e.g., horse or diamond). Two lists werecreated, each consisting of 96 living and 96 nonliving words. Listswere counterbalanced across individuals. Lists were balanced forword length, orthographic neighborhood, and word frequency.Words within a list varied from high (e.g., horse) to low (e.g.,locust) word frequency. The second task was a Stroop paradigm,where participants responded whether a word was presented in ablue or red font. The words could be congruent with (e.g., red inred), incongruent with (e.g., blue in red), or contain no color in-formation (e.g., deep in red).
Immediately after scanning, participants completed a surprisememory test outside the scanner. Individuals indicated whether aword had been seen during the animacy task or it was new. Theythen rated the confidence of their decision from 1 (low) to 5 (high).Participants practiced the judgment procedure using 8 words fromthe practice and 8 unseen foils. They then saw 384 words, half ofwhich were new. Trial presentations were self-paced by the par-ticipants. In the scanner, the animacy task was always performedbefore the Stroop task to maintain a consistent duration betweenencoding and test. Based on the abnormal behavior (e.g., >50timeouts or severe problems with vocabulary), 5 individuals wereexcluded from the analyses of the animacy task and 2 from theStroop task.
2.5. Scanning protocol
Data were acquired on a Siemens Trio 3T scanner. T1-weightedimages were acquired using a magnetization-prepared rapidgradient-echo sequence with repetition time ¼ 2400 ms, echotime ¼ 3.16 ms, flip angle ¼ 8�, field of view ¼ 256 mm, in-planeresolution ¼ 176 � 256, and slice thickness ¼ 1 mm acquired insagittal orientation. Images had a 1-mm isotropic resolution.
Blood oxygen leveledependent (BOLD) data were acquired us-ing a T2*-weighted gradient-echo interleaved echo-planar imagingsequence with repetition time ¼ 2000 ms, echo time ¼ 25 ms, flipangle¼ 90�, field of view¼ 256 mm, in-plane resolution¼ 64� 64,and slice thickness ¼ 4 mm. Thirty-six sagittal slices were acquiredparallel to the anterior-posterior commissural line. Images had a4-mm isotropic resolution. Each animacy run lasted for 606 sec-onds. Each Stroop run lasted for 590 seconds.
2.6. Functional analyses
A population-specific structural atlas was generated using 100older adults drawn from a similar but nonoverlapping population asthose in the study (CDR ¼ 0, age [years]: range ¼ 46e95, mean ¼71.3, median ¼ 71.0, and female, n ¼ 61) who took part in neuro-imaging studies at the Knight Alzheimer’s Disease Research Center.These images underwent a rigid registration to the MNI152 tem-plate. The resulting images were averaged together to produce aninitial template. Using this template a further nine-step iterativeprocedure was used, with the resulting image becoming the targettemplate for the next iteration. This process used 2 rigid registra-tions, 3 affine registrations, and 4 nonlinear registrations withFNIRT (Jenkinson et al., 2012). The final template better representedareas with age-related atrophy.
Analyses of the task datawere carried out using FEAT, part of FSL(Jenkinson et al., 2012) (www.fmrib.ox.ac.uk/fsl). Preprocessingincluded correcting for field inhomogeneities, motion correction,high-pass temporal filtering with a cutoff of 150 seconds, andspatial smoothing with a 5-mm full-width half-maximum Gaussiankernel. Echo-planar imagings were aligned to a T1 image using aboundary-based registration procedure and aligned into templatespace using nonlinear warping. Motion parameters were examinedfor each run. Individuals with an average absolute movement>1.50mm or an average relative movement of 0.5 mm were excludedfrom the analyses. Using these criteria, a further 8 individuals wereexcluded from the animacy analyses and 13 from the Stroop ana-lyses. Combined with the exclusions earlier, this resulted in 71unique participants with 66 in the animacy task and 64 in theStroop task.
For each run, block effects were modeled as a boxcar designconvolved with a double-gamma hemodynamic response function.Event-related designs were modeled as events with 1-second du-rations convolved with a double-gamma hemodynamic responsefunction. Runs within a subject were combined using a fixed-effectsmodel. For each animacy run, 2 event-related models werecomputed. The first classified each trial based on an animate orinanimate group membership while modeling word frequency as acontinuous measure. The second model compared trials that wouldlater be remembered with high confidence to all those laterforgotten. For the Stroop task, trial-level analyses examined theeffects of word and color compatibility.
The combined first-level runs for each subject were enteredinto a high-level analysis with participant as a random effect usingFLAME (Woolrich et al., 2004). For each design (e.g., blockedStroop effects), the group average was modeled while alsoincluding age, gender, and years of education as covariates.
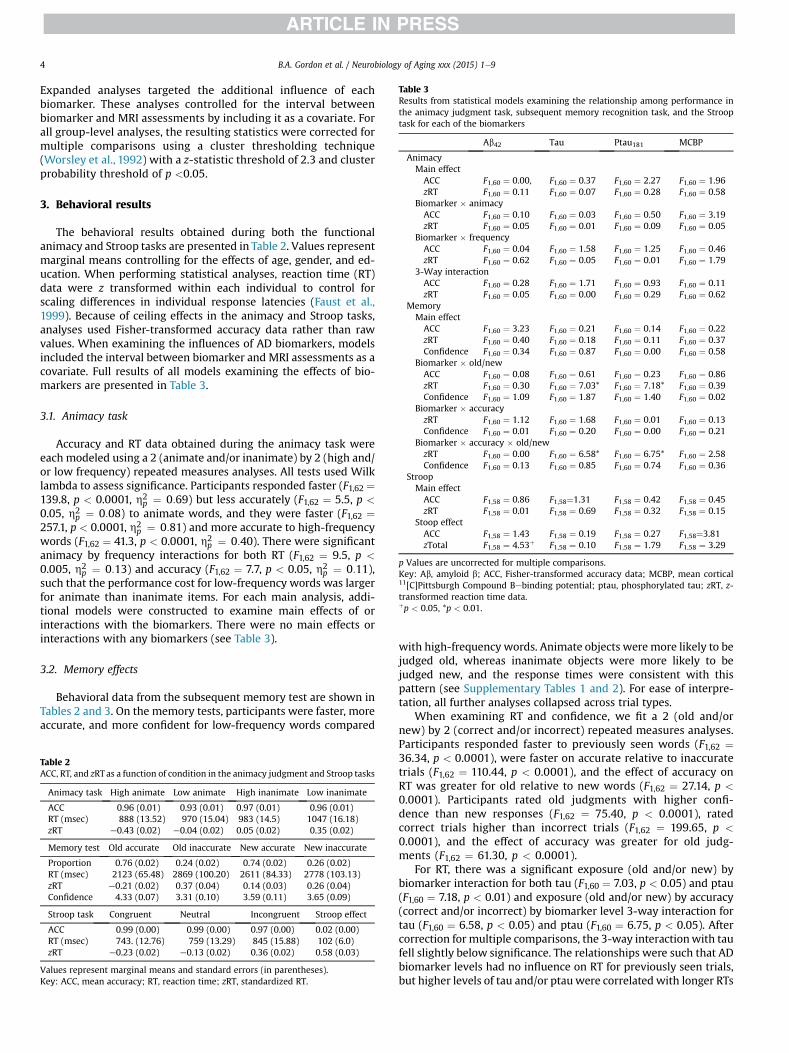
Table 3Results from statistical models examining the relationship among performance inthe animacy judgment task, subsequent memory recognition task, and the Strooptask for each of the biomarkers
Ab42 Tau Ptau181 MCBP
AnimacyMain effectACC F1,60 ¼ 0.00, F1,60 ¼ 0.37 F1,60 ¼ 2.27 F1,60 ¼ 1.96zRT F1,60 ¼ 0.11 F1,60 ¼ 0.07 F1,60 ¼ 0.28 F1,60 ¼ 0.58
Biomarker � animacyACC F1,60 ¼ 0.10 F1,60 ¼ 0.03 F1,60 ¼ 0.50 F1,60 ¼ 3.19zRT F1,60 ¼ 0.05 F1,60 ¼ 0.01 F1,60 ¼ 0.09 F1,60 ¼ 0.05
Biomarker � frequencyACC F1,60 ¼ 0.04 F1,60 ¼ 1.58 F1,60 ¼ 1.25 F1,60 ¼ 0.46zRT F1,60 ¼ 0.62 F1,60 ¼ 0.05 F1,60 ¼ 0.01 F1,60 ¼ 1.79
3-Way interactionACC F1,60 ¼ 0.28 F1,60 ¼ 1.71 F1,60 ¼ 0.93 F1,60 ¼ 0.11zRT F1,60 ¼ 0.05 F1,60 ¼ 0.00 F1,60 ¼ 0.29 F1,60 ¼ 0.62
MemoryMain effectACC F1,60 ¼ 3.23 F1,60 ¼ 0.21 F1,60 ¼ 0.14 F1,60 ¼ 0.22zRT F1,60 ¼ 0.40 F1,60 ¼ 0.18 F1,60 ¼ 0.11 F1,60 ¼ 0.37Confidence F1,60 ¼ 0.34 F1,60 ¼ 0.87 F1,60 ¼ 0.00 F1,60 ¼ 0.58
Biomarker � old/newACC F1,60 ¼ 0.08 F1,60 ¼ 0.61 F1,60 ¼ 0.23 F1,60 ¼ 0.86zRT F1,60 ¼ 0.30 F1,60 ¼ 7.03* F1,60 ¼ 7.18* F1,60 ¼ 0.39Confidence F1,60 ¼ 1.09 F1,60 ¼ 1.87 F1,60 ¼ 1.40 F1,60 ¼ 0.02
Biomarker � accuracyzRT F1,60 ¼ 1.12 F1,60 ¼ 1.68 F1,60 ¼ 0.01 F1,60 ¼ 0.13Confidence F1,60 ¼ 0.01 F1,60 ¼ 0.20 F1,60 ¼ 0.00 F1,60 ¼ 0.21
Biomarker � accuracy � old/newzRT F1,60 ¼ 0.00 F1,60 ¼ 6.58* F1,60 ¼ 6.75* F1,60 ¼ 2.58Confidence F1,60 ¼ 0.13 F1,60 ¼ 0.85 F1,60 ¼ 0.74 F1,60 ¼ 0.36
StroopMain effectACC F1,58 ¼ 0.86 F1,58¼1.31 F1,58 ¼ 0.42 F1,58 ¼ 0.45zRT F1,58 ¼ 0.01 F1,58 ¼ 0.69 F1,58 ¼ 0.32 F1,58 ¼ 0.15
Stoop effectACC F1,58 ¼ 1.43 F1,58 ¼ 0.19 F1,58 ¼ 0.27 F1,58¼3.81zTotal F1,58 ¼ 4.53þ F1,58 ¼ 0.10 F1,58 ¼ 1.79 F1,58 ¼ 3.29
p Values are uncorrected for multiple comparisons.Key: Ab, amyloid b; ACC, Fisher-transformed accuracy data; MCBP, mean cortical11[C]Pittsburgh Compound Bebinding potential; ptau, phosphorylated tau; zRT, z-transformed reaction time data.þp < 0.05, *p < 0.01.
B.A. Gordon et al. / Neurobiology of Aging xxx (2015) 1e94
Expanded analyses targeted the additional influence of eachbiomarker. These analyses controlled for the interval betweenbiomarker and MRI assessments by including it as a covariate. Forall group-level analyses, the resulting statistics were corrected formultiple comparisons using a cluster thresholding technique(Worsley et al., 1992) with a z-statistic threshold of 2.3 and clusterprobability threshold of p <0.05.
3. Behavioral results
The behavioral results obtained during both the functionalanimacy and Stroop tasks are presented in Table 2. Values representmarginal means controlling for the effects of age, gender, and ed-ucation. When performing statistical analyses, reaction time (RT)data were z transformed within each individual to control forscaling differences in individual response latencies (Faust et al.,1999). Because of ceiling effects in the animacy and Stroop tasks,analyses used Fisher-transformed accuracy data rather than rawvalues. When examining the influences of AD biomarkers, modelsincluded the interval between biomarker and MRI assessments as acovariate. Full results of all models examining the effects of bio-markers are presented in Table 3.
3.1. Animacy task
Accuracy and RT data obtained during the animacy task wereeach modeled using a 2 (animate and/or inanimate) by 2 (high and/or low frequency) repeated measures analyses. All tests used Wilklambda to assess significance. Participants responded faster (F1,62 ¼139.8, p < 0.0001, h2
p ¼ 0:69) but less accurately (F1,62 ¼ 5.5, p <
0.05, h2p ¼ 0:08) to animate words, and they were faster (F1,62 ¼
257.1, p < 0.0001, h2p ¼ 0:81) and more accurate to high-frequency
words (F1,62 ¼ 41.3, p < 0.0001, h2p ¼ 0:40). There were significant
animacy by frequency interactions for both RT (F1,62 ¼ 9.5, p <
0.005, h2p ¼ 0:13) and accuracy (F1,62 ¼ 7.7, p < 0.05, h2
p ¼ 0:11),such that the performance cost for low-frequency words was largerfor animate than inanimate items. For each main analysis, addi-tional models were constructed to examine main effects of orinteractions with the biomarkers. There were no main effects orinteractions with any biomarkers (see Table 3).
3.2. Memory effects
Behavioral data from the subsequent memory test are shown inTables 2 and 3. On the memory tests, participants were faster, moreaccurate, and more confident for low-frequency words compared
Table 2ACC, RT, and zRTas a function of condition in the animacy judgment and Stroop tasks
Animacy task High animate Low animate High inanimate Low inanimate
ACC 0.96 (0.01) 0.93 (0.01) 0.97 (0.01) 0.96 (0.01)RT (msec) 888 (13.52) 970 (15.04) 983 (14.5) 1047 (16.18)zRT e0.43 (0.02) e0.04 (0.02) 0.05 (0.02) 0.35 (0.02)
Memory test Old accurate Old inaccurate New accurate New inaccurate
Proportion 0.76 (0.02) 0.24 (0.02) 0.74 (0.02) 0.26 (0.02)RT (msec) 2123 (65.48) 2869 (100.20) 2611 (84.33) 2778 (103.13)zRT e0.21 (0.02) 0.37 (0.04) 0.14 (0.03) 0.26 (0.04)Confidence 4.33 (0.07) 3.31 (0.10) 3.59 (0.11) 3.65 (0.09)
Stroop task Congruent Neutral Incongruent Stroop effect
ACC 0.99 (0.00) 0.99 (0.00) 0.97 (0.00) 0.02 (0.00)RT (msec) 743. (12.76) 759 (13.29) 845 (15.88) 102 (6.0)zRT e0.23 (0.02) e0.13 (0.02) 0.36 (0.02) 0.58 (0.03)
Values represent marginal means and standard errors (in parentheses).Key: ACC, mean accuracy; RT, reaction time; zRT, standardized RT.
with high-frequency words. Animate objects were more likely to bejudged old, whereas inanimate objects were more likely to bejudged new, and the response times were consistent with thispattern (see Supplementary Tables 1 and 2). For ease of interpre-tation, all further analyses collapsed across trial types.
When examining RT and confidence, we fit a 2 (old and/ornew) by 2 (correct and/or incorrect) repeated measures analyses.Participants responded faster to previously seen words (F1,62 ¼36.34, p < 0.0001), were faster on accurate relative to inaccuratetrials (F1,62 ¼ 110.44, p < 0.0001), and the effect of accuracy onRT was greater for old relative to new words (F1,62 ¼ 27.14, p <
0.0001). Participants rated old judgments with higher confi-dence than new responses (F1,62 ¼ 75.40, p < 0.0001), ratedcorrect trials higher than incorrect trials (F1,62 ¼ 199.65, p <
0.0001), and the effect of accuracy was greater for old judg-ments (F1,62 ¼ 61.30, p < 0.0001).
For RT, there was a significant exposure (old and/or new) bybiomarker interaction for both tau (F1,60 ¼ 7.03, p < 0.05) and ptau(F1,60 ¼ 7.18, p < 0.01) and exposure (old and/or new) by accuracy(correct and/or incorrect) by biomarker level 3-way interaction fortau (F1,60 ¼ 6.58, p < 0.05) and ptau (F1,60 ¼ 6.75, p < 0.05). Aftercorrection for multiple comparisons, the 3-way interactionwith taufell slightly below significance. The relationships were such that ADbiomarker levels had no influence on RT for previously seen trials,but higher levels of tau and/or ptau were correlated with longer RTs
B.A. Gordon et al. / Neurobiology of Aging xxx (2015) 1e9 5
on trials successfully identified as new and with shorter RTs ontrials inaccurately identified as old. Thus, the level of AD pathologywas related to the response latencies on lure trials, reflected byslowing of the correct rejections but speeding on the false alarms.
3.3. Stroop task
Accuracy and RT data obtained from the Stroop task were bothmodeled as repeated measures analyses with 3 levels (congruent,neutral, and incongruent). Therewas a significant effect on accuracy(F2,59 ¼ 21.51, p < 0.0001, h2
p ¼ 0:32) with significant pairwisedifferences between incongruent and both congruent (t ¼ 6.82, p <
0.0001) and neutral trials (t ¼ 5.13, p < 0.0001) but no differencebetween congruent and neutral trials (t ¼ 2.15, p ¼ 0.12). There wasa main effect of congruency when examining the RT data (F2,59 ¼179.57, p < 0.0001, h2
p ¼ 0:86) with all pairwise comparisons beingsignificant (all ps <0.0001). When examining the Stroop effect(incongruent-congruent trials), there were no significant ADbiomarker effects on accuracy or RT that survived the multiplecomparisons.
4. Functional results
4.1. Animacy task
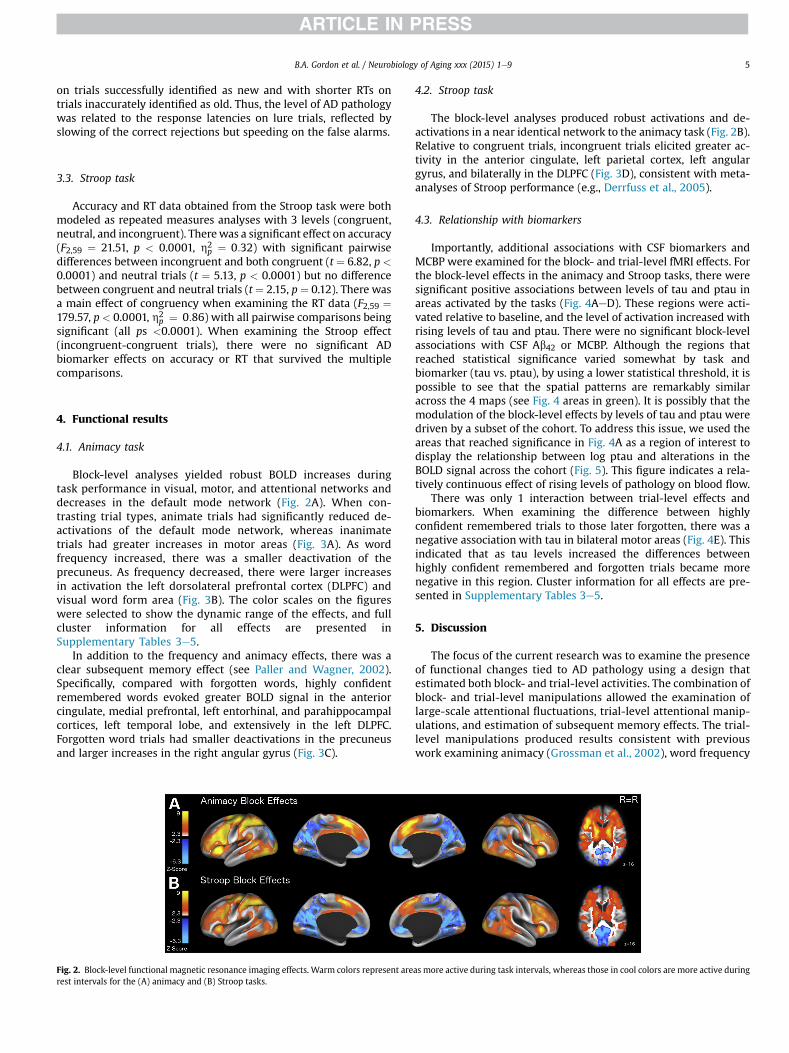
Block-level analyses yielded robust BOLD increases duringtask performance in visual, motor, and attentional networks anddecreases in the default mode network (Fig. 2A). When con-trasting trial types, animate trials had significantly reduced de-activations of the default mode network, whereas inanimatetrials had greater increases in motor areas (Fig. 3A). As wordfrequency increased, there was a smaller deactivation of theprecuneus. As frequency decreased, there were larger increasesin activation the left dorsolateral prefrontal cortex (DLPFC) andvisual word form area (Fig. 3B). The color scales on the figureswere selected to show the dynamic range of the effects, and fullcluster information for all effects are presented inSupplementary Tables 3e5.
In addition to the frequency and animacy effects, there was aclear subsequent memory effect (see Paller and Wagner, 2002).Specifically, compared with forgotten words, highly confidentremembered words evoked greater BOLD signal in the anteriorcingulate, medial prefrontal, left entorhinal, and parahippocampalcortices, left temporal lobe, and extensively in the left DLPFC.Forgotten word trials had smaller deactivations in the precuneusand larger increases in the right angular gyrus (Fig. 3C).
Fig. 2. Block-level functional magnetic resonance imaging effects. Warm colors represent arerest intervals for the (A) animacy and (B) Stroop tasks.
4.2. Stroop task
The block-level analyses produced robust activations and de-activations in a near identical network to the animacy task (Fig. 2B).Relative to congruent trials, incongruent trials elicited greater ac-tivity in the anterior cingulate, left parietal cortex, left angulargyrus, and bilaterally in the DLPFC (Fig. 3D), consistent with meta-analyses of Stroop performance (e.g., Derrfuss et al., 2005).
4.3. Relationship with biomarkers
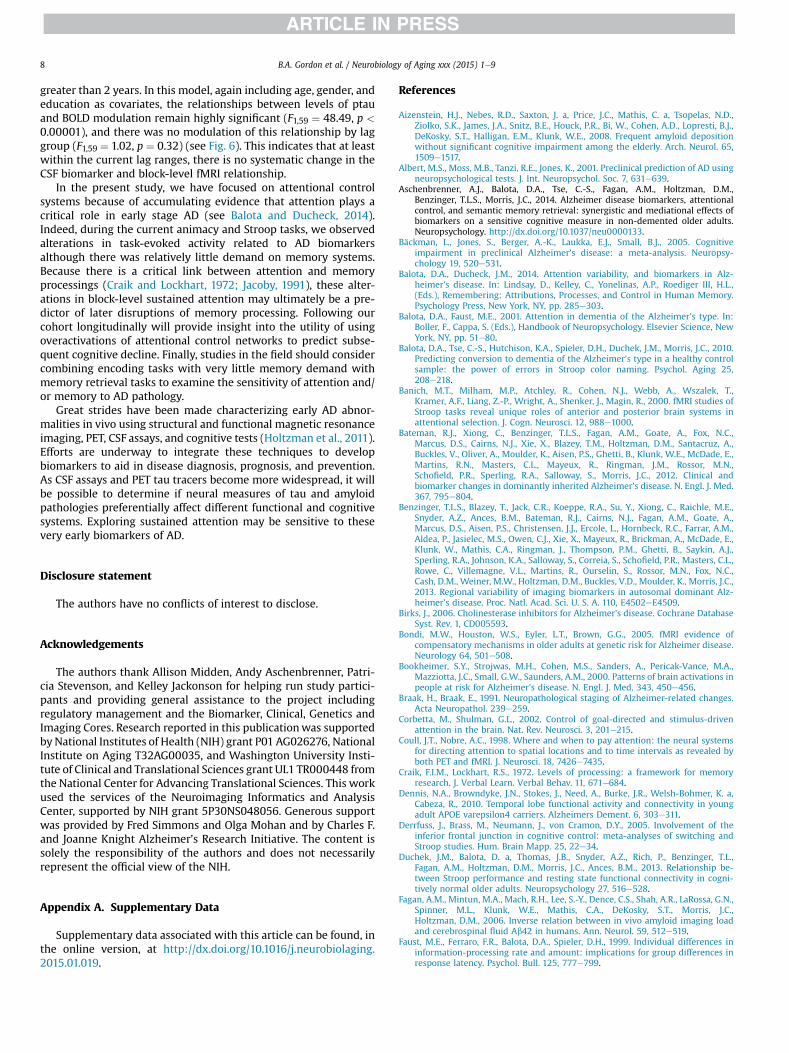
Importantly, additional associations with CSF biomarkers andMCBP were examined for the block- and trial-level fMRI effects. Forthe block-level effects in the animacy and Stroop tasks, there weresignificant positive associations between levels of tau and ptau inareas activated by the tasks (Fig. 4AeD). These regions were acti-vated relative to baseline, and the level of activation increased withrising levels of tau and ptau. There were no significant block-levelassociations with CSF Ab42 or MCBP. Although the regions thatreached statistical significance varied somewhat by task andbiomarker (tau vs. ptau), by using a lower statistical threshold, it ispossible to see that the spatial patterns are remarkably similaracross the 4 maps (see Fig. 4 areas in green). It is possibly that themodulation of the block-level effects by levels of tau and ptau weredriven by a subset of the cohort. To address this issue, we used theareas that reached significance in Fig. 4A as a region of interest todisplay the relationship between log ptau and alterations in theBOLD signal across the cohort (Fig. 5). This figure indicates a rela-tively continuous effect of rising levels of pathology on blood flow.
There was only 1 interaction between trial-level effects andbiomarkers. When examining the difference between highlyconfident remembered trials to those later forgotten, there was anegative association with tau in bilateral motor areas (Fig. 4E). Thisindicated that as tau levels increased the differences betweenhighly confident remembered and forgotten trials became morenegative in this region. Cluster information for all effects are pre-sented in Supplementary Tables 3e5.
5. Discussion
The focus of the current research was to examine the presenceof functional changes tied to AD pathology using a design thatestimated both block- and trial-level activities. The combination ofblock- and trial-level manipulations allowed the examination oflarge-scale attentional fluctuations, trial-level attentional manip-ulations, and estimation of subsequent memory effects. The trial-level manipulations produced results consistent with previouswork examining animacy (Grossman et al., 2002), word frequency
as more active during task intervals, whereas those in cool colors are more active during
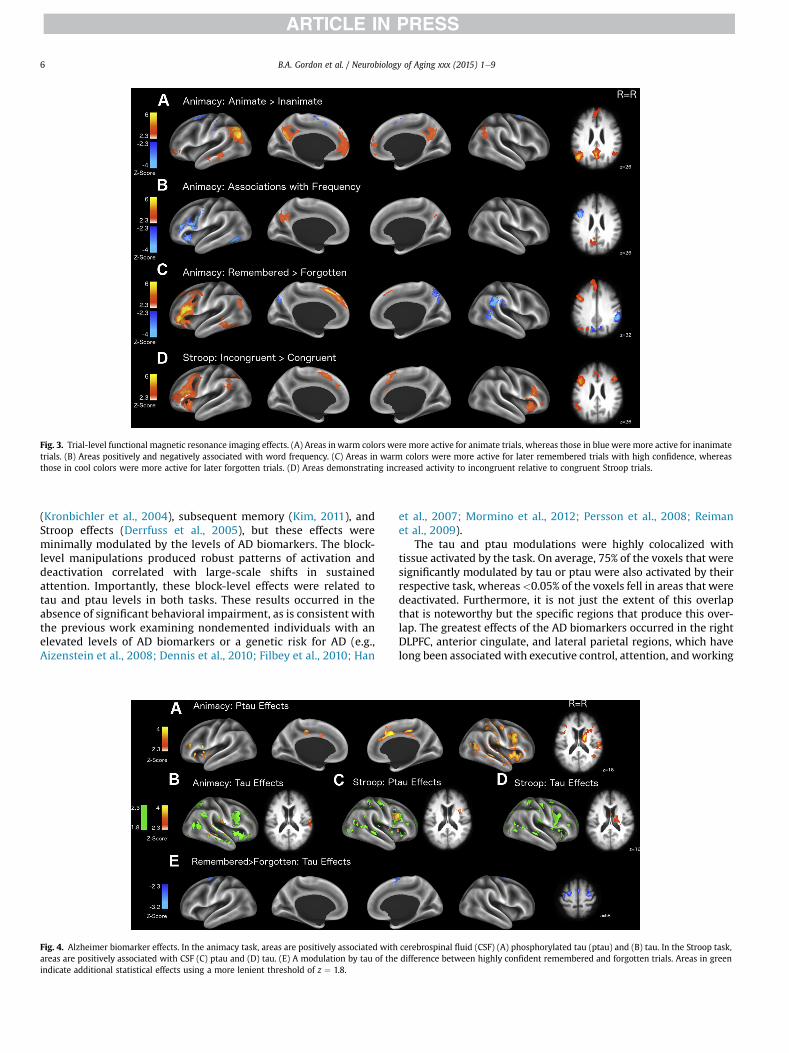
Fig. 3. Trial-level functional magnetic resonance imaging effects. (A) Areas in warm colors were more active for animate trials, whereas those in blue were more active for inanimatetrials. (B) Areas positively and negatively associated with word frequency. (C) Areas in warm colors were more active for later remembered trials with high confidence, whereasthose in cool colors were more active for later forgotten trials. (D) Areas demonstrating increased activity to incongruent relative to congruent Stroop trials.
B.A. Gordon et al. / Neurobiology of Aging xxx (2015) 1e96
(Kronbichler et al., 2004), subsequent memory (Kim, 2011), andStroop effects (Derrfuss et al., 2005), but these effects wereminimally modulated by the levels of AD biomarkers. The block-level manipulations produced robust patterns of activation anddeactivation correlated with large-scale shifts in sustainedattention. Importantly, these block-level effects were related totau and ptau levels in both tasks. These results occurred in theabsence of significant behavioral impairment, as is consistent withthe previous work examining nondemented individuals with anelevated levels of AD biomarkers or a genetic risk for AD (e.g.,Aizenstein et al., 2008; Dennis et al., 2010; Filbey et al., 2010; Han
Fig. 4. Alzheimer biomarker effects. In the animacy task, areas are positively associated withareas are positively associated with CSF (C) ptau and (D) tau. (E) A modulation by tau of theindicate additional statistical effects using a more lenient threshold of z ¼ 1.8.
et al., 2007; Mormino et al., 2012; Persson et al., 2008; Reimanet al., 2009).
The tau and ptau modulations were highly colocalized withtissue activated by the task. On average, 75% of the voxels that weresignificantly modulated by tau or ptau were also activated by theirrespective task, whereas<0.05% of the voxels fell in areas that weredeactivated. Furthermore, it is not just the extent of this overlapthat is noteworthy but the specific regions that produce this over-lap. The greatest effects of the AD biomarkers occurred in the rightDLPFC, anterior cingulate, and lateral parietal regions, which havelong been associated with executive control, attention, andworking
cerebrospinal fluid (CSF) (A) phosphorylated tau (ptau) and (B) tau. In the Stroop task,difference between highly confident remembered and forgotten trials. Areas in green
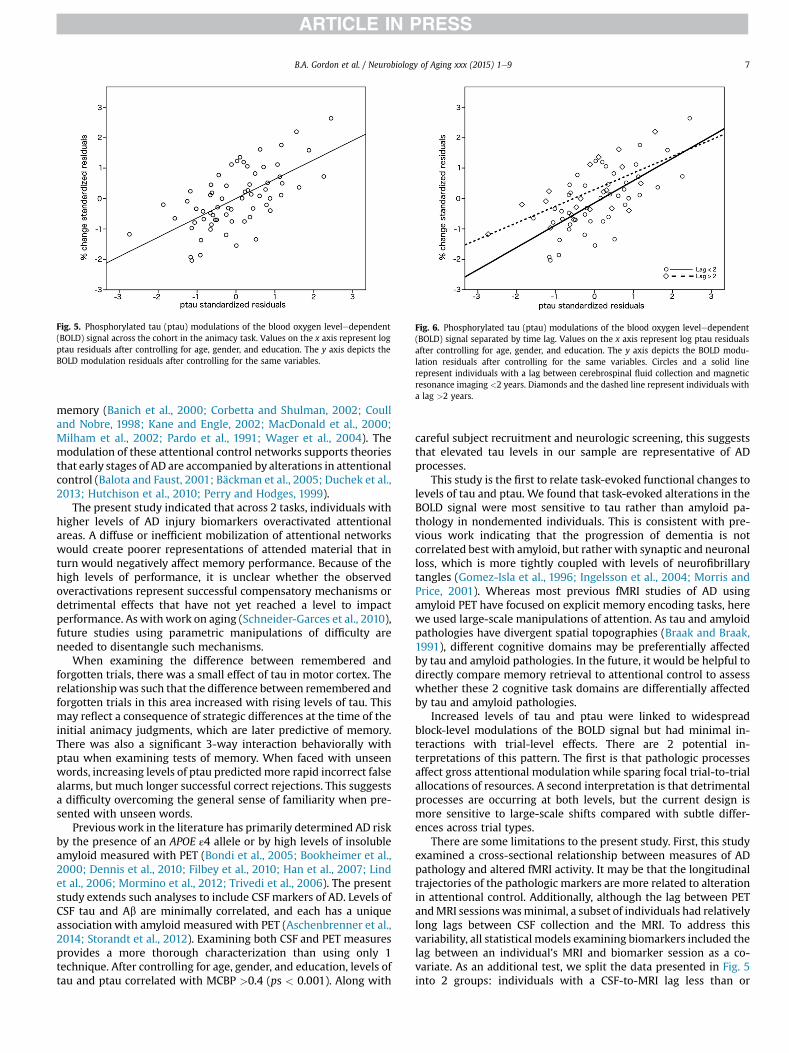
Fig. 5. Phosphorylated tau (ptau) modulations of the blood oxygen leveledependent(BOLD) signal across the cohort in the animacy task. Values on the x axis represent logptau residuals after controlling for age, gender, and education. The y axis depicts theBOLD modulation residuals after controlling for the same variables.
Fig. 6. Phosphorylated tau (ptau) modulations of the blood oxygen leveledependent(BOLD) signal separated by time lag. Values on the x axis represent log ptau residualsafter controlling for age, gender, and education. The y axis depicts the BOLD modu-lation residuals after controlling for the same variables. Circles and a solid linerepresent individuals with a lag between cerebrospinal fluid collection and magneticresonance imaging <2 years. Diamonds and the dashed line represent individuals witha lag >2 years.
B.A. Gordon et al. / Neurobiology of Aging xxx (2015) 1e9 7
memory (Banich et al., 2000; Corbetta and Shulman, 2002; Coulland Nobre, 1998; Kane and Engle, 2002; MacDonald et al., 2000;Milham et al., 2002; Pardo et al., 1991; Wager et al., 2004). Themodulation of these attentional control networks supports theoriesthat early stages of AD are accompanied by alterations in attentionalcontrol (Balota and Faust, 2001; Bäckman et al., 2005; Duchek et al.,2013; Hutchison et al., 2010; Perry and Hodges, 1999).
The present study indicated that across 2 tasks, individuals withhigher levels of AD injury biomarkers overactivated attentionalareas. A diffuse or inefficient mobilization of attentional networkswould create poorer representations of attended material that inturn would negatively affect memory performance. Because of thehigh levels of performance, it is unclear whether the observedoveractivations represent successful compensatory mechanisms ordetrimental effects that have not yet reached a level to impactperformance. As with work on aging (Schneider-Garces et al., 2010),future studies using parametric manipulations of difficulty areneeded to disentangle such mechanisms.
When examining the difference between remembered andforgotten trials, there was a small effect of tau in motor cortex. Therelationshipwas such that the difference between remembered andforgotten trials in this area increased with rising levels of tau. Thismay reflect a consequence of strategic differences at the time of theinitial animacy judgments, which are later predictive of memory.There was also a significant 3-way interaction behaviorally withptau when examining tests of memory. When faced with unseenwords, increasing levels of ptau predictedmore rapid incorrect falsealarms, but much longer successful correct rejections. This suggestsa difficulty overcoming the general sense of familiarity when pre-sented with unseen words.
Previous work in the literature has primarily determined AD riskby the presence of an APOE ε4 allele or by high levels of insolubleamyloid measured with PET (Bondi et al., 2005; Bookheimer et al.,2000; Dennis et al., 2010; Filbey et al., 2010; Han et al., 2007; Lindet al., 2006; Mormino et al., 2012; Trivedi et al., 2006). The presentstudy extends such analyses to include CSF markers of AD. Levels ofCSF tau and Ab are minimally correlated, and each has a uniqueassociation with amyloid measured with PET (Aschenbrenner et al.,2014; Storandt et al., 2012). Examining both CSF and PET measuresprovides a more thorough characterization than using only 1technique. After controlling for age, gender, and education, levels oftau and ptau correlated with MCBP >0.4 (ps < 0.001). Along with
careful subject recruitment and neurologic screening, this suggeststhat elevated tau levels in our sample are representative of ADprocesses.
This study is the first to relate task-evoked functional changes tolevels of tau and ptau. We found that task-evoked alterations in theBOLD signal were most sensitive to tau rather than amyloid pa-thology in nondemented individuals. This is consistent with pre-vious work indicating that the progression of dementia is notcorrelated best with amyloid, but ratherwith synaptic and neuronalloss, which is more tightly coupled with levels of neurofibrillarytangles (Gomez-Isla et al., 1996; Ingelsson et al., 2004; Morris andPrice, 2001). Whereas most previous fMRI studies of AD usingamyloid PET have focused on explicit memory encoding tasks, herewe used large-scale manipulations of attention. As tau and amyloidpathologies have divergent spatial topographies (Braak and Braak,1991), different cognitive domains may be preferentially affectedby tau and amyloid pathologies. In the future, it would be helpful todirectly compare memory retrieval to attentional control to assesswhether these 2 cognitive task domains are differentially affectedby tau and amyloid pathologies.
Increased levels of tau and ptau were linked to widespreadblock-level modulations of the BOLD signal but had minimal in-teractions with trial-level effects. There are 2 potential in-terpretations of this pattern. The first is that pathologic processesaffect gross attentional modulation while sparing focal trial-to-trialallocations of resources. A second interpretation is that detrimentalprocesses are occurring at both levels, but the current design ismore sensitive to large-scale shifts compared with subtle differ-ences across trial types.
There are some limitations to the present study. First, this studyexamined a cross-sectional relationship between measures of ADpathology and altered fMRI activity. It may be that the longitudinaltrajectories of the pathologic markers are more related to alterationin attentional control. Additionally, although the lag between PETandMRI sessionswasminimal, a subset of individuals had relativelylong lags between CSF collection and the MRI. To address thisvariability, all statistical models examining biomarkers included thelag between an individual’s MRI and biomarker session as a co-variate. As an additional test, we split the data presented in Fig. 5into 2 groups: individuals with a CSF-to-MRI lag less than or
B.A. Gordon et al. / Neurobiology of Aging xxx (2015) 1e98
greater than 2 years. In this model, again including age, gender, andeducation as covariates, the relationships between levels of ptauand BOLD modulation remain highly significant (F1,59 ¼ 48.49, p <
0.00001), and there was no modulation of this relationship by laggroup (F1,59 ¼ 1.02, p ¼ 0.32) (see Fig. 6). This indicates that at leastwithin the current lag ranges, there is no systematic change in theCSF biomarker and block-level fMRI relationship.
In the present study, we have focused on attentional controlsystems because of accumulating evidence that attention plays acritical role in early stage AD (see Balota and Ducheck, 2014).Indeed, during the current animacy and Stroop tasks, we observedalterations in task-evoked activity related to AD biomarkersalthough there was relatively little demand on memory systems.Because there is a critical link between attention and memoryprocessings (Craik and Lockhart, 1972; Jacoby, 1991), these alter-ations in block-level sustained attention may ultimately be a pre-dictor of later disruptions of memory processing. Following ourcohort longitudinally will provide insight into the utility of usingoveractivations of attentional control networks to predict subse-quent cognitive decline. Finally, studies in the field should considercombining encoding tasks with very little memory demand withmemory retrieval tasks to examine the sensitivity of attention and/or memory to AD pathology.
Great strides have been made characterizing early AD abnor-malities in vivo using structural and functional magnetic resonanceimaging, PET, CSF assays, and cognitive tests (Holtzman et al., 2011).Efforts are underway to integrate these techniques to developbiomarkers to aid in disease diagnosis, prognosis, and prevention.As CSF assays and PET tau tracers become more widespread, it willbe possible to determine if neural measures of tau and amyloidpathologies preferentially affect different functional and cognitivesystems. Exploring sustained attention may be sensitive to thesevery early biomarkers of AD.
Disclosure statement
The authors have no conflicts of interest to disclose.
Acknowledgements
The authors thank Allison Midden, Andy Aschenbrenner, Patri-cia Stevenson, and Kelley Jackonson for helping run study partici-pants and providing general assistance to the project includingregulatory management and the Biomarker, Clinical, Genetics andImaging Cores. Research reported in this publicationwas supportedby National Institutes of Health (NIH) grant P01 AG026276, NationalInstitute on Aging T32AG00035, and Washington University Insti-tute of Clinical and Translational Sciences grant UL1 TR000448 fromthe National Center for Advancing Translational Sciences. This workused the services of the Neuroimaging Informatics and AnalysisCenter, supported by NIH grant 5P30NS048056. Generous supportwas provided by Fred Simmons and Olga Mohan and by Charles F.and Joanne Knight Alzheimer’s Research Initiative. The content issolely the responsibility of the authors and does not necessarilyrepresent the official view of the NIH.
Appendix A. Supplementary Data
Supplementary data associated with this article can be found, inthe online version, at http://dx.doi.org/10.1016/j.neurobiolaging.2015.01.019.
References
Aizenstein, H.J., Nebes, R.D., Saxton, J. a, Price, J.C., Mathis, C. a, Tsopelas, N.D.,Ziolko, S.K., James, J.A., Snitz, B.E., Houck, P.R., Bi, W., Cohen, A.D., Lopresti, B.J.,DeKosky, S.T., Halligan, E.M., Klunk, W.E., 2008. Frequent amyloid depositionwithout significant cognitive impairment among the elderly. Arch. Neurol. 65,1509e1517.
Albert, M.S., Moss, M.B., Tanzi, R.E., Jones, K., 2001. Preclinical prediction of AD usingneuropsychological tests. J. Int. Neuropsychol. Soc. 7, 631e639.
Aschenbrenner, A.J., Balota, D.A., Tse, C.-S., Fagan, A.M., Holtzman, D.M.,Benzinger, T.L.S., Morris, J.C., 2014. Alzheimer disease biomarkers, attentionalcontrol, and semantic memory retrieval: synergistic and mediational effects ofbiomarkers on a sensitive cognitive measure in non-demented older adults.Neuropsychology. http://dx.doi.org/10.1037/neu0000133.
Bäckman, L., Jones, S., Berger, A.-K., Laukka, E.J., Small, B.J., 2005. Cognitiveimpairment in preclinical Alzheimer’s disease: a meta-analysis. Neuropsy-chology 19, 520e531.
Balota, D.A., Ducheck, J.M., 2014. Attention variability, and biomarkers in Alz-heimer’s disease. In: Lindsay, D., Kelley, C., Yonelinas, A.P., Roediger III, H.L.,(Eds.), Remembering: Attributions, Processes, and Control in Human Memory.Psychology Press, New York, NY, pp. 285e303.
Balota, D.A., Faust, M.E., 2001. Attention in dementia of the Alzheimer’s type. In:Boller, F., Cappa, S. (Eds.), Handbook of Neuropsychology. Elsevier Science, NewYork, NY, pp. 51e80.
Balota, D.A., Tse, C.-S., Hutchison, K.A., Spieler, D.H., Duchek, J.M., Morris, J.C., 2010.Predicting conversion to dementia of the Alzheimer’s type in a healthy controlsample: the power of errors in Stroop color naming. Psychol. Aging 25,208e218.
Banich, M.T., Milham, M.P., Atchley, R., Cohen, N.J., Webb, A., Wszalek, T.,Kramer, A.F., Liang, Z.-P., Wright, A., Shenker, J., Magin, R., 2000. fMRI studies ofStroop tasks reveal unique roles of anterior and posterior brain systems inattentional selection. J. Cogn. Neurosci. 12, 988e1000.
Bateman, R.J., Xiong, C., Benzinger, T.L.S., Fagan, A.M., Goate, A., Fox, N.C.,Marcus, D.S., Cairns, N.J., Xie, X., Blazey, T.M., Holtzman, D.M., Santacruz, A.,Buckles, V., Oliver, A., Moulder, K., Aisen, P.S., Ghetti, B., Klunk, W.E., McDade, E.,Martins, R.N., Masters, C.L., Mayeux, R., Ringman, J.M., Rossor, M.N.,Schofield, P.R., Sperling, R.A., Salloway, S., Morris, J.C., 2012. Clinical andbiomarker changes in dominantly inherited Alzheimer’s disease. N. Engl. J. Med.367, 795e804.
Benzinger, T.L.S., Blazey, T., Jack, C.R., Koeppe, R.A., Su, Y., Xiong, C., Raichle, M.E.,Snyder, A.Z., Ances, B.M., Bateman, R.J., Cairns, N.J., Fagan, A.M., Goate, A.,Marcus, D.S., Aisen, P.S., Christensen, J.J., Ercole, L., Hornbeck, R.C., Farrar, A.M.,Aldea, P., Jasielec, M.S., Owen, C.J., Xie, X., Mayeux, R., Brickman, A., McDade, E.,Klunk, W., Mathis, C.A., Ringman, J., Thompson, P.M., Ghetti, B., Saykin, A.J.,Sperling, R.A., Johnson, K.A., Salloway, S., Correia, S., Schofield, P.R., Masters, C.L.,Rowe, C., Villemagne, V.L., Martins, R., Ourselin, S., Rossor, M.N., Fox, N.C.,Cash, D.M., Weiner, M.W., Holtzman, D.M., Buckles, V.D., Moulder, K., Morris, J.C.,2013. Regional variability of imaging biomarkers in autosomal dominant Alz-heimer’s disease. Proc. Natl. Acad. Sci. U. S. A. 110, E4502eE4509.
Birks, J., 2006. Cholinesterase inhibitors for Alzheimer’s disease. Cochrane DatabaseSyst. Rev. 1, CD005593.
Bondi, M.W., Houston, W.S., Eyler, L.T., Brown, G.G., 2005. fMRI evidence ofcompensatory mechanisms in older adults at genetic risk for Alzheimer disease.Neurology 64, 501e508.
Bookheimer, S.Y., Strojwas, M.H., Cohen, M.S., Sanders, A., Pericak-Vance, M.A.,Mazziotta, J.C., Small, G.W., Saunders, A.M., 2000. Patterns of brain activations inpeople at risk for Alzheimer’s disease. N. Engl. J. Med. 343, 450e456.
Braak, H., Braak, E., 1991. Neuropathological staging of Alzheimer-related changes.Acta Neuropathol. 239e259.
Corbetta, M., Shulman, G.L., 2002. Control of goal-directed and stimulus-drivenattention in the brain. Nat. Rev. Neurosci. 3, 201e215.
Coull, J.T., Nobre, A.C., 1998. Where and when to pay attention: the neural systemsfor directing attention to spatial locations and to time intervals as revealed byboth PET and fMRI. J. Neurosci. 18, 7426e7435.
Craik, F.I.M., Lockhart, R.S., 1972. Levels of processing: a framework for memoryresearch. J. Verbal Learn. Verbal Behav. 11, 671e684.
Dennis, N.A., Browndyke, J.N., Stokes, J., Need, A., Burke, J.R., Welsh-Bohmer, K. a,Cabeza, R., 2010. Temporal lobe functional activity and connectivity in youngadult APOE varepsilon4 carriers. Alzheimers Dement. 6, 303e311.
Derrfuss, J., Brass, M., Neumann, J., von Cramon, D.Y., 2005. Involvement of theinferior frontal junction in cognitive control: meta-analyses of switching andStroop studies. Hum. Brain Mapp. 25, 22e34.
Duchek, J.M., Balota, D. a, Thomas, J.B., Snyder, A.Z., Rich, P., Benzinger, T.L.,Fagan, A.M., Holtzman, D.M., Morris, J.C., Ances, B.M., 2013. Relationship be-tween Stroop performance and resting state functional connectivity in cogni-tively normal older adults. Neuropsychology 27, 516e528.
Fagan, A.M., Mintun, M.A., Mach, R.H., Lee, S.-Y., Dence, C.S., Shah, A.R., LaRossa, G.N.,Spinner, M.L., Klunk, W.E., Mathis, C.A., DeKosky, S.T., Morris, J.C.,Holtzman, D.M., 2006. Inverse relation between in vivo amyloid imaging loadand cerebrospinal fluid Ab42 in humans. Ann. Neurol. 59, 512e519.
Faust, M.E., Ferraro, F.R., Balota, D.A., Spieler, D.H., 1999. Individual differences ininformation-processing rate and amount: implications for group differences inresponse latency. Psychol. Bull. 125, 777e799.
B.A. Gordon et al. / Neurobiology of Aging xxx (2015) 1e9 9
Filbey, F.M., Chen, G., Sunderland, T., Cohen, R.M., 2010. Failing compensatorymechanisms during working memory in older apolipoprotein E-epsilon4healthy adults. Brain Imaging Behav. 4, 177e188.
Fischl, B., 2004. Automatically parcellating the human cerebral cortex. Cereb. Cortex14, 11e22.
Gomez-Isla, T., Price, J.L., Mckeel, D.W., Morris, J.C., Growdon, J.H., Hyman, B.T., 1996.Profound loss of layer II entorhinal cortex neurons occurs in very mild Alz-heimer’s disease. J. Neurosci. 16, 4491e4500.
Grossman, M., Koenig, P., DeVita, C., Glosser, G., Alsop, D., Detre, J., Gee, J., 2002. Theneural basis for category-specific knowledge: an fMRI study. Neuroimage 15,936e948.
Han, S.D., Houston, W.S., Jak, A.J., Eyler, L.T., Nagel, B.J., Fleisher, A.S., Brown, G.G.,Corey-Bloom, J., Salmon, D.P., Thal, L.J., Bondi, M.W., 2007. Verbal paired-associate learning by APOE genotype in non-demented older adults: fMRI evi-dence of a right hemispheric compensatory response. Neurobiol. Aging 28,238e247.
Hardy, J.A., Higgins, G.A., 1992. Alzheimer’s disease: the amyloid cascade hypothesis.Science 256, 184e185.
Himmelheber, A.M., Sarter, M., Bruno, J.P., 2000. Increases in cortical acetylcholinerelease during sustained attention performance in rats. Cogn. Brain Res. 9,313e325.
Holtzman, D., Morris, J.C., Goate, A.M., 2011. Alzheimer’s disease: the challenge ofthe second century. Sci. Transl. Med. 3, 1e17.
Hutchison, K.A., Balota, D.A., Duchek, J.M., Ducheck, J.M., 2010. The utility of Strooptask switching as a marker for early-stage Alzheimer’s disease. Psychol. Aging25, 545e559.
Ingelsson, M., Fukumoto, H., Newell, K.L., Growdon, J.H., Hedley-Whyte, E.T.,Frosch, M.P., Albert, M.S., Hyman, B.T., Irizarry, M.C., 2004. Early Ab accumula-tion and progressive synaptic loss, gliosis, and tangle formation in AD brain.Neurology 62, 925e931.
Jack, C.R., Knopman, D.S., Jagust, W.J., Petersen, R.C., Weiner, M.W., Aisen, P.S.,Shaw, L.M., Vemuri, P., Wiste, H.J., Weigand, S.D., Lesnick, T.G., Pankratz, V.S.,Donohue, M.C., Trojanowski, J.Q., 2013. Tracking pathophysiological processes inAlzheimer’s disease: an updated hypothetical model of dynamic biomarkers.Lancet Neurol. 12, 207e216.
Jacoby, L.L., 1991. A process dissociation framework: separating automatic fromintentional uses of memory. J. Mem. Lang. 30, 513e541.
Jenkinson, M., Beckmann, C.F., Behrens, T.E.J., Woolrich, M.W., Smith, S.M., 2012. FSL.Neuroimage 62, 782e790.
Kaduszkiewicz, H., Zimmermann, T., Beck-Bornholdt, H.-P., van den Bussche, H.,2005. Cholinesterase inhibitors for patients with Alzheimer’s disease: system-atic review of randomised clinical trials. BMJ 331, 321e327.
Kane, M.J., Engle, R.W., 2002. The role of prefrontal cortex in working-memorycapacity, executive attention, and general fluid intelligence: an individual-differences perspective. Psychon. Bull. Rev. 9, 637e671.
Kim, H., 2011. Neural activity that predicts subsequent memory and forgetting: ameta-analysis of 74 fMRI studies. Neuroimage 54, 2446e2461.
Kronbichler, M., Hutzler, F., Wimmer, H., Mair, A., Staffen, W., Ladurner, G., 2004. Thevisual word form area and the frequency with which words are encountered:evidence from a parametric fMRI study. Neuroimage 21, 946e953.
Lind, J., Persson, J., Ingvar, M., Larsson, A., Cruts, M., Van Broeckhoven, C.,Adolfsson, R., Bäckman, L., Nilsson, L.-G., Petersson, K.M., Nyberg, L., 2006.Reduced functional brain activity response in cognitively intact apolipoproteinE epsilon4 carriers. Brain 129, 1240e1248.
MacDonald, A.W., Cohen, J.D., Stenger, A., Carter, C.S., 2000. Dissociating the role ofthe dorsolateral prefrontal and anterior cingulate cortex in cognitive control.Science 288, 1835e1838.
Milham, M.P., Erickson, K.I., Banich, M.T., Kramer, A.F., Webb, A., Wszalek, T.,Cohen, N.J., 2002. Attentional control in the aging brain: insights from an fMRIstudy of the Stroop task. Brain Cogn. 49, 277e296.
Mormino, E.C., Brandel, M.G., Madison, C.M., Marks, S., Baker, S.L., Jagust, W.J., 2012.Ab deposition in aging is associated with increases in brain activation duringsuccessful memory encoding. Cereb. Cortex 22, 1813e1823.
Morris, J., Price, J.L., 2001. Pathologic correlates of nondemented aging, mildcognitive impairment, and early-stage Alzheimer’s Disease. J. Mol. Neurosci. 17,101e118.
Morris, J.C., 1993. The clinical dementia rating (CDR): current version and scoringrules. Neurology 43, 2412e2414.
Paller, K.A., Wagner, A.D., 2002. Observing the transformation of experience intomemory. Trends Cogn. Sci. 6, 93e102.
Pardo, J.V., Fox, P.T., Raichle, M.E., 1991. Localization of a human system for sustainedattention by positron emission tomography. Nature 349, 61e64.
Perry, R.J., Hodges, J.R., 1999. Attention and executive deficits in Alzheimer’s disease.A critical review. Brain 122, 383e404.
Persson, J., Lind, J., Larsson, A., Ingvar, M., Sleegers, K., Van Broeckhoven, C.,Adolfsson, R., Nilsson, L.-G., Nyberg, L., 2008. Altered deactivation in individualswith genetic risk for Alzheimer’s disease. Neuropsychologia 46, 1679e1687.
Reiman, E.M., Chen, K., Liu, X., Bandy, D., Yu, M., Lee, W., Ayutyanont, N., Keppler, J.,Reeder, S.A., Langbaum, J.B.S., Alexander, G.E., Klunk, W.E., Mathis, C.A.,Price, J.C., Aizenstein, H.J., DeKosky, S.T., Caselli, R.J., 2009. Fibrillar amyloid-betaburden in cognitively normal people at 3 levels of genetic risk for Alzheimer’sdisease. Proc. Natl. Acad. Sci. U. S. A. 106, 6820e6825.
Sahakian, B., Jones, G., Levy, R., Gray, J., Warburton, D., 1989. The effects of nicotineon attention, information processing, and short-term memory in patients withdementia of the Alzheimer type. Br. J. Psychiatry 154, 797e800.
Sarazin, M., Berr, C., De Rotrou, J., Fabrigoule, C., Pasquier, F., Legrain, S., Michel, B.,Puel, M., Volteau, M., Touchon, J., Verny, M., Dubois, B., 2007. Amnestic syn-drome of the medial temporal type identifies prodromal AD: a longitudinalstudy. Neurology 69, 1859e1867.
Sarter, M., Bruno, J.P., 1997. Cognitive functions of cortical acetylcholine: toward aunifying hypothesis. Brain Res. Rev. 23, 28e46.
Schneider-Garces, N.J., Gordon, B. a, Brumback-Peltz, C.R., Shin, E., Lee, Y.,Sutton, B.P., Maclin, E.L., Gratton, G., Fabiani, M., 2010. Span, CRUNCH, andbeyond: working memory capacity and the aging brain. J. Cogn. Neurosci. 22,655e669.
Selden, N.R., Gitelman, D.R., Salamon-Murayama, N., Parrish, T.B., Mesulam, M.M.,1998. Trajectories of cholinergic pathways within the cerebral hemispheres ofthe human brain. Brain 121 (Pt 1), 2249e2257.
Storandt, M., Head, D., Fagan, A.M., Holtzman, D.M., Morris, J.C., 2012. Toward amultifactorial model of Alzheimer disease. Neurobiol. Aging 33, 2262e2271.
Stroop, J.R., 1935. Studies of interference in serial verbal reactions. J. Exp. Psychol. 18,643e662.
Su, Y., D’Angelo, G.M., Vlassenko, A.G., Zhou, G., Snyder, A.Z., Marcus, D.S.,Blazey, T.M., Christensen, J.J., Vora, S., Morris, J.C., Mintun, M.A., Benzinger, T.L.S.,2013. Quantitative analysis of PiB-PET with FreeSurfer ROIs. PLoS One 8, e73377.
Trivedi, M.A., Schmitz, T.W., Ries, M.L., Torgerson, B.M., Sager, M.A., Hermann, B.P.,Asthana, S., Johnson, S.C., 2006. Reduced hippocampal activation duringepisodic encoding in middle-aged individuals at genetic risk of Alzheimer’sdisease: a cross-sectional study. BMC Med. 4, 1.
Vos, S.J., Xiong, C., Visser, P.J., Jasielec, M.S., Hassenstab, J., Grant, E.A., Cairns, N.J.,Morris, J.C., Holtzman, D.M., Fagan, A.M., 2013. Preclinical Alzheimer’s diseaseand its outcome: a longitudinal cohort study. Lancet Neurol. 12, 957e965.
Wager, T.D., Jonides, J., Reading, S., 2004. Neuroimaging studies of shifting attention:a meta-analysis. Neuroimage 22, 1679e1693.
Woolrich, M.W., Behrens, T.E.J., Beckmann, C.F., Jenkinson, M., Smith, S.M., 2004.Multilevel linear modelling for FMRI group analysis using Bayesian inference.Neuroimage 21, 1732e1747.
Worsley, K.J., Evans, A.C., Marrett, S., Neelin, P., 1992. A three-dimensional statisticalanalysis for CBF activation studies in human brain. J. Cereb. Blood Flow Metab.12, 900e918.
Related Documents