TARRANT COUNTY, TEXAS AND INCORPORATED AREAS VOLUME 2 OF 9 Community Name TARRANT COUNTY Community Number UNINCORPORATED AREAS 480582 ARLINGTON, CITY OF 485454 AZLE, CITY OF 480584 BEDFORD, CITY OF 480585 BENBROOK CITY OF 480586 BLUE MOUND, CITY OF 480587 BURLESON, CITY OF 485459 COLLEYVILLE, CITY OF 480590 CROWLEY, CITY OF 480591 DALWORTHINGTON GARDENS, CITY OF 481013 EDGECLIFF VILLAGE, TOWN OF 480592 EULESS, CITY OF 480593 EVERMAN, CITY OF 480594 FLOWER MOUND, TOWN OF 480777 FOREST HILL, CITY OF 480595 FORT WORTH, CITY OF 480596 GRAND PRAIRIE, CITY OF 485472 GRAPEVINE, CITY OF 480598 HALTOM CITY, CITY OF 480599 HASLET, CITY OF 480600 HURST, CITY OF 480601 KELLER, CITY OF 480602 KENNEDALE, CITY OF 480603 LAKE WORTH, CITY OF 480605 LAKESIDE, CITY OF 480604 MANSFIELD, CITY OF 480606 Tarrant County FLOOD INSURANCE STUDY NUMBER 48439CV002B REVISED: __________ Community Community Name Number NORTH RICHLAND HILLS, CITY OF 480607 PANTEGO, TOWN OF 481116 PELICAN BAY, CITY OF 481653 RENO, TOWN OF 480969 RICHLAND HILLS, CITY OF 480608 RIVER OAKS, CITY OF 480609 ROANOKE, CITY OF 480785 SAGINAW, CITY OF 480610 SANSOM PARK, CITY OF 480611 SOUTHLAKE, CITY OF 480612 TROPHY CLUB, TOWN OF 481606 WATAUGA, CITY OF 480613 WESTLAKE, TOWN OF 480614 WESTOVER HILLS, TOWN OF 480615 WESTWORTH VILLAGE, CITY OF 480616 WHITE SETTLEMENT, CITY OF 480617 Notice This preliminary FIS report includes only revised Flood Profiles and Floodway Data tables. See “Notice to Flood Insurance Users” page for additional details. REVISED PRELIMINARY October 30, 2015

Welcome message from author
This document is posted to help you gain knowledge. Please leave a comment to let me know what you think about it! Share it to your friends and learn new things together.
Transcript

TARRANT COUNTY, TEXAS AND INCORPORATED AREAS VOLUME 2 OF 9
Community Name
TARRANT COUNTY
Community Number
UNINCORPORATED AREAS 480582
ARLINGTON, CITY OF 485454
AZLE, CITY OF 480584
BEDFORD, CITY OF 480585
BENBROOK CITY OF 480586
BLUE MOUND, CITY OF 480587
BURLESON, CITY OF 485459
COLLEYVILLE, CITY OF 480590
CROWLEY, CITY OF 480591
DALWORTHINGTON GARDENS, CITY OF 481013
EDGECLIFF VILLAGE, TOWN OF 480592
EULESS, CITY OF 480593
EVERMAN, CITY OF 480594
FLOWER MOUND, TOWN OF 480777
FOREST HILL, CITY OF 480595
FORT WORTH, CITY OF 480596
GRAND PRAIRIE, CITY OF 485472
GRAPEVINE, CITY OF 480598
HALTOM CITY, CITY OF 480599
HASLET, CITY OF 480600
HURST, CITY OF 480601
KELLER, CITY OF 480602
KENNEDALE, CITY OF 480603
LAKE WORTH, CITY OF 480605
LAKESIDE, CITY OF 480604
MANSFIELD, CITY OF 480606
Tarrant County
FLOOD INSURANCE STUDY NUMBER 48439CV002B
REVISED: __________
Community Community Name Number
NORTH RICHLAND HILLS, CITY OF 480607
PANTEGO, TOWN OF 481116
PELICAN BAY, CITY OF 481653
RENO, TOWN OF 480969
RICHLAND HILLS, CITY OF 480608
RIVER OAKS, CITY OF 480609
ROANOKE, CITY OF 480785
SAGINAW, CITY OF 480610
SANSOM PARK, CITY OF 480611
SOUTHLAKE, CITY OF 480612
TROPHY CLUB, TOWN OF 481606
WATAUGA, CITY OF 480613
WESTLAKE, TOWN OF 480614
WESTOVER HILLS, TOWN OF 480615
WESTWORTH VILLAGE, CITY OF 480616
WHITE SETTLEMENT, CITY OF 480617
Notice
This preliminary FIS report includes only revised Flood Profiles and Floodway Data tables. See “Notice to Flood Insurance Users” page for additional details.
REVISED PRELIMINARY
October 30, 2015
NOTICE TO FLOOD INSURANCE STUDY USERS
Communities participating in the National Flood Insurance Program have established repositories of flood hazard data for floodplain management and flood insurance purposes. This Flood Insurance Study may not contain all data available within the repository. It is advisable to contact the community repository for any additional data. Part or all of this Flood Insurance Study may be revised and republished at any time. In addition, part of this Flood Insurance Study may be revised by the Letter of Map Revision process, which does not involve republication or redistribution of the Flood Insurance Study. It is, therefore, the responsibility of the user to consult with community officials and to check the community repository to obtain the most current Flood Insurance Study components. First Countywide FIS Effective Date: January 6, 1993 First Revised Countywide FIS Revision Date: August 2, 1995 Second Revised Countywide FIS Revision Date: August 23, 2000 Third Revised Countywide FIS Revision Date: Map revised September 25, 2009 to update corporate limits, to change Base Flood Elevations, to change Special Flood Hazards Areas, to change zone descriptions, to add roads and road names, to incorporate previously issued Letters of Map Revision, and to reflect updated topographic information. Fourth Revised Countywide FIS Revision Date: ________ This preliminary revised Flood Insurance Study contains only Floodway Data tables or Flood Profiles added or revised as part of the revision. All other Floodway Data tables and Flood Profiles will appear in the final FIS report.
i
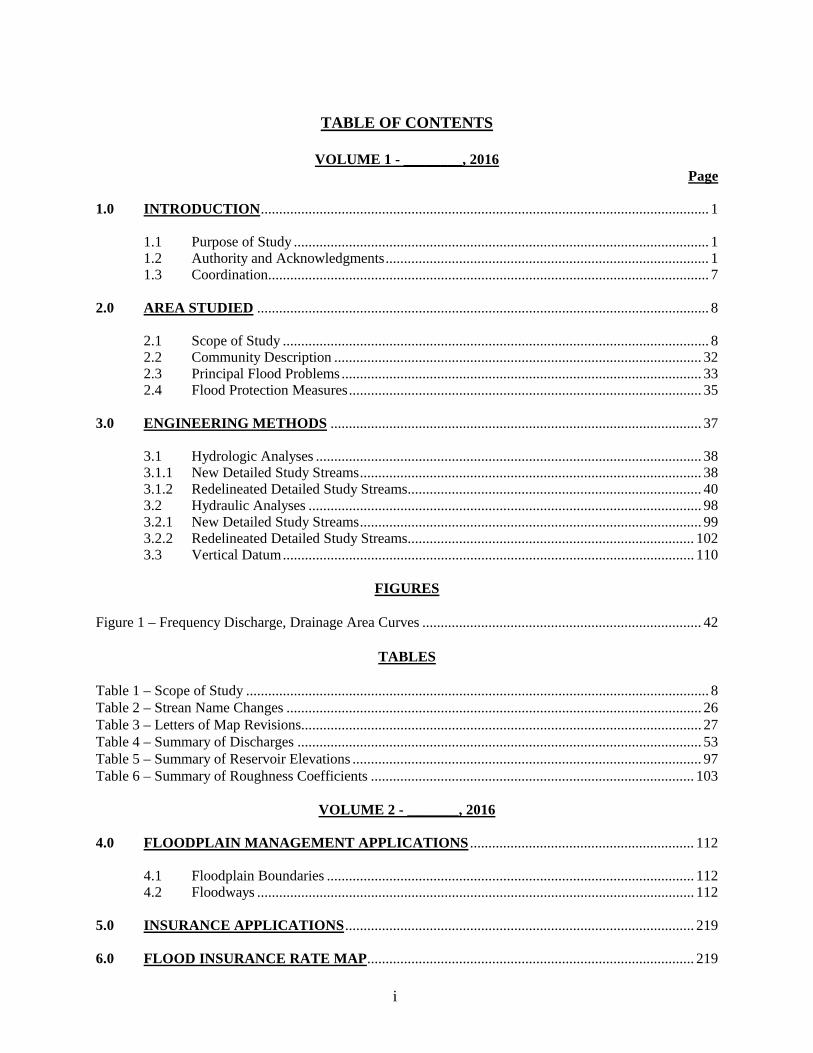
TABLE OF CONTENTS
VOLUME 1 - ________, 2016
Page 1.0 INTRODUCTION .......................................................................................................................... 1 1.1 Purpose of Study ................................................................................................................. 1 1.2 Authority and Acknowledgments ........................................................................................ 1 1.3 Coordination........................................................................................................................ 7 2.0 AREA STUDIED ........................................................................................................................... 8 2.1 Scope of Study .................................................................................................................... 8 2.2 Community Description .................................................................................................... 32 2.3 Principal Flood Problems .................................................................................................. 33 2.4 Flood Protection Measures ................................................................................................ 35 3.0 ENGINEERING METHODS ..................................................................................................... 37 3.1 Hydrologic Analyses ......................................................................................................... 38 3.1.1 New Detailed Study Streams ............................................................................................. 38 3.1.2 Redelineated Detailed Study Streams ................................................................................ 40 3.2 Hydraulic Analyses ........................................................................................................... 98 3.2.1 New Detailed Study Streams ............................................................................................. 99 3.2.2 Redelineated Detailed Study Streams .............................................................................. 102 3.3 Vertical Datum ................................................................................................................ 110 FIGURES Figure 1 – Frequency Discharge, Drainage Area Curves ............................................................................ 42 TABLES Table 1 – Scope of Study .............................................................................................................................. 8 Table 2 – Strean Name Changes ................................................................................................................. 26 Table 3 – Letters of Map Revisions............................................................................................................. 27 Table 4 – Summary of Discharges .............................................................................................................. 53 Table 5 – Summary of Reservoir Elevations ............................................................................................... 97 Table 6 – Summary of Roughness Coefficients ........................................................................................ 103
VOLUME 2 - _______, 2016 4.0 FLOODPLAIN MANAGEMENT APPLICATIONS ............................................................. 112 4.1 Floodplain Boundaries .................................................................................................... 112
4.2 Floodways ....................................................................................................................... 112 5.0 INSURANCE APPLICATIONS ............................................................................................... 219 6.0 FLOOD INSURANCE RATE MAP ......................................................................................... 219

ii
TABLE OF CONTENTS (continued)
VOLUME 2 (continued) Page 7.0 OTHER STUDIES ..................................................................................................................... 226 8.0 LOCATION OF DATA ............................................................................................................. 226 9.0 BIBLIOGRAPHY AND REFERENCES ................................................................................. 226 FIGURES Figure 2 – Floodway Schematic ................................................................................................................ 218 TABLES Table 7 – Floodway Data .......................................................................................................................... 114 Table 8 – Community Map History ........................................................................................................... 221
VOLUME 3 - _________, 2016
EXHIBITS
Exhibit 1 – Flood Profiles
Arbor Creek Panel 01(a)P Ash Creek Panels 01P – 02P Big Bear Creek Panels 03P – 13P
Tributary BB-1 Panel 14P Tributary BB-2 Panel 15P Tributary BB-3 Panel 16P Tributary BB-5 Panels 17P – 18P Tributary BB-6 Panels 19P – 20P Tributary BB-7 Panel 21P Tributary BB-8 Panel 22P Tributary BB-9 Panel 23P Tributary BB-10 Panels 24P – 25P Tributary BB-11 Panel 26P Tributary BB-12 Panels 27P – 28P Tributary BB-13 Panels 29P Unnamed Tributary to Big Bear Creek Panel 30P
Big Fossil Creek Panels 31P – 39P Western Center Split Flow Panel 39(a)P Stream BFC-1 Panels 40P – 41P Stream BFC-2 Panels 42P-45(a)P Stream BFC-2A Panels 46P-51P Stream BFC-3 Panels 52P-53P Stream BFC-4 Panels 54P-55P
iii
TABLE OF CONTENTS (continued)
VOLUME 3 (continued)
EXHIBITS (continued)
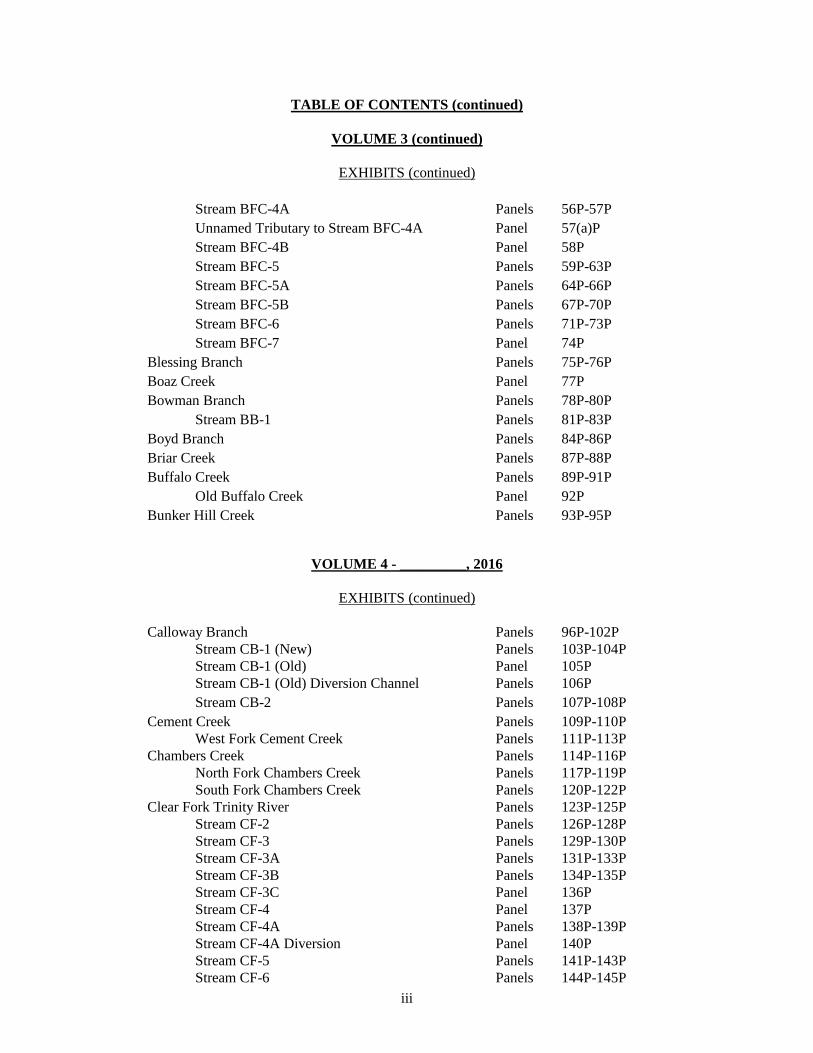
Stream BFC-4A Panels 56P-57P Unnamed Tributary to Stream BFC-4A Panel 57(a)P Stream BFC-4B Panel 58P Stream BFC-5 Panels 59P-63P Stream BFC-5A Panels 64P-66P Stream BFC-5B Panels 67P-70P Stream BFC-6 Panels 71P-73P Stream BFC-7 Panel 74P
Blessing Branch Panels 75P-76P Boaz Creek Panel 77P Bowman Branch Panels 78P-80P
Stream BB-1 Panels 81P-83P Boyd Branch Panels 84P-86P Briar Creek Panels 87P-88P Buffalo Creek Panels 89P-91P
Old Buffalo Creek Panel 92P Bunker Hill Creek Panels 93P-95P
VOLUME 4 - _________, 2016
EXHIBITS (continued)
Calloway Branch Panels 96P-102P Stream CB-1 (New) Panels 103P-104P Stream CB-1 (Old) Panel 105P Stream CB-1 (Old) Diversion Channel Panels 106P Stream CB-2 Panels 107P-108P
Cement Creek Panels 109P-110P West Fork Cement Creek Panels 111P-113P
Chambers Creek Panels 114P-116P North Fork Chambers Creek Panels 117P-119P South Fork Chambers Creek Panels 120P-122P
Clear Fork Trinity River Panels 123P-125P Stream CF-2 Panels 126P-128P Stream CF-3 Panels 129P-130P Stream CF-3A Panels 131P-133P Stream CF-3B Panels 134P-135P Stream CF-3C Panel 136P Stream CF-4 Panel 137P Stream CF-4A Panels 138P-139P Stream CF-4A Diversion Panel 140P Stream CF-5 Panels 141P-143P Stream CF-6 Panels 144P-145P
iv
TABLE OF CONTENTS (continued)
VOLUME 4 (continued)
EXHIBITS (continued)
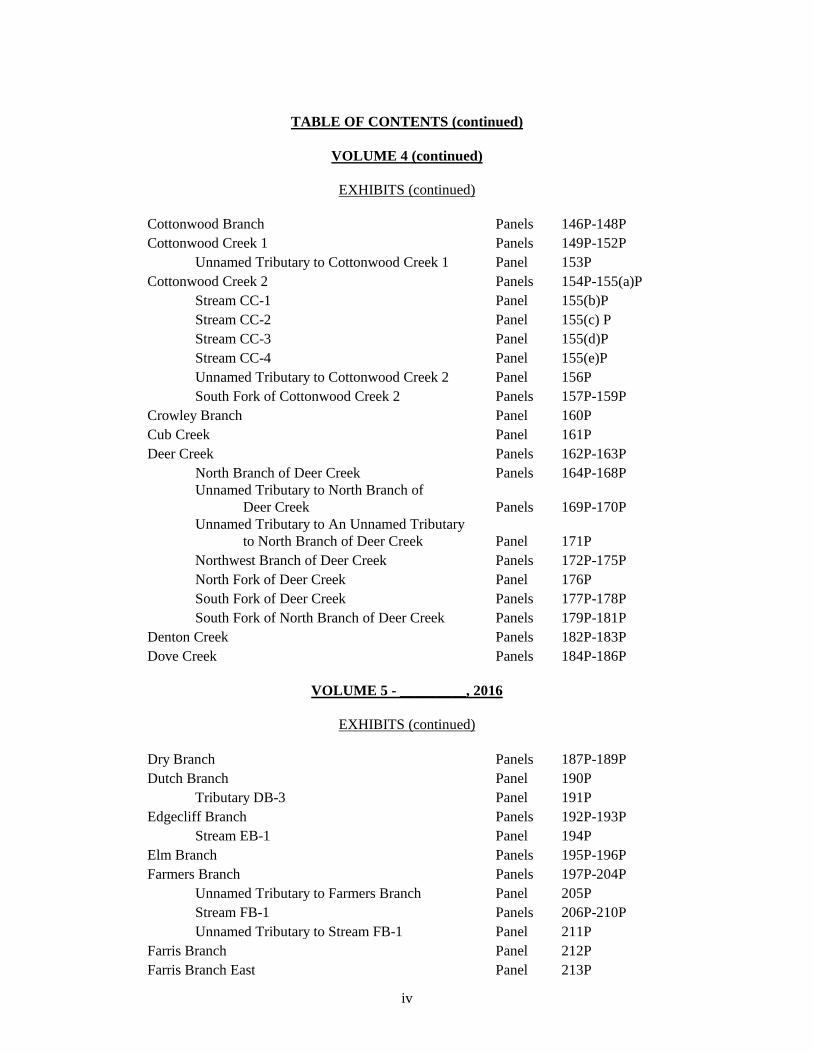
Cottonwood Branch Panels 146P-148P Cottonwood Creek 1 Panels 149P-152P
Unnamed Tributary to Cottonwood Creek 1 Panel 153P Cottonwood Creek 2 Panels 154P-155(a)P
Stream CC-1 Panel 155(b)P Stream CC-2 Panel 155(c) P Stream CC-3 Panel 155(d)P Stream CC-4 Panel 155(e)P Unnamed Tributary to Cottonwood Creek 2 Panel 156P South Fork of Cottonwood Creek 2 Panels 157P-159P
Crowley Branch Panel 160P Cub Creek Panel 161P Deer Creek Panels 162P-163P
North Branch of Deer Creek Panels 164P-168P Unnamed Tributary to North Branch of
Deer Creek Panels 169P-170P Unnamed Tributary to An Unnamed Tributary
to North Branch of Deer Creek Panel 171P Northwest Branch of Deer Creek Panels 172P-175P North Fork of Deer Creek Panel 176P South Fork of Deer Creek Panels 177P-178P South Fork of North Branch of Deer Creek Panels 179P-181P
Denton Creek Panels 182P-183P Dove Creek Panels 184P-186P
VOLUME 5 - _________, 2016
EXHIBITS (continued)
Dry Branch Panels 187P-189P Dutch Branch Panel 190P
Tributary DB-3 Panel 191P Edgecliff Branch Panels 192P-193P
Stream EB-1 Panel 194P Elm Branch Panels 195P-196P Farmers Branch Panels 197P-204P
Unnamed Tributary to Farmers Branch Panel 205P Stream FB-1 Panels 206P-210P Unnamed Tributary to Stream FB-1 Panel 211P
Farris Branch Panel 212P Farris Branch East Panel 213P
v
Fish Creek Panels 214P-218(b)P Stream FC-1 Panels 219P-220P Stream FC-2 Panels 221P-222P Stream FC-3 Panels 222(a)P-222(b)P Stream FC-4 Panels 222(c)P-222(d)P North Fork Fish Creek (Prairie Creek) Panels 223P-225(b)P Stream NF-1 Panel 225(c)P Stream NF-2 Panel 225(d)P Stream NF-3 Panel 225(e)P Stream NF-4 Panel 225(f)P
TABLE OF CONTENTS (continued)
VOLUME 5 (continued)
EXHIBITS (continued)
Garden Branch Panels 226(a)P-226(b)P Hawkwood Branch Panel 226P Henrietta Creek Panels 227P-234P
Henrietta Creek 5 Panels 235P Henrietta Creek 6 Panels 236P-237P Henrietta Creek 6A Panel 238P Stream HEN-1 Panel 239P Stream HEN-2 Panels 240P-241P Stream HEN-2A Panels 242P-243P Unnamed Tributary to Henrietta Creek Panel 244P-245P Unnamed Tributary to Unnamed Tributary to Henrietta Creek Panels 246P
Higgins Branch Panels 247P-248P Hogpen Branch Panels 249P-250P Howards Branch Panel 251P
Stream HB-1 Panels 252P-253P Hurricane Creek Panels 254P-258P
Stream HC-1 Panels 259P-260P Hurricane Creek Tributary 1 Panel 261P East Fork Hurricane Creek Panels 262P-263P North Fork West Branch Hurricane Creek Panel 264P West Branch Hurricane Creek Panel 265P Unnamed Tributary of Hurricane Creek Panel 265(a)P
Johnson Creek Panels 266P-268P Stream JC-1 Panels 278P-279P Stream JC-2 Panels 280P-281P Stream JC-3 Panels 282P-283P
Kee Branch Panels 284P-287P Stream KB-1 Panels 288P-289P
vi
VOLUME 6 - _________, 2016
EXHIBITS (continued)
Kings Branch Panels 290P-292P Kirby Creek Panel 293P Kirkwood Branch Panels 294P-296P
Kirkwood Branch Tributary Panel 297P South Fork Kirkwood Branch Panels 298P-299P
Little Bear Creek Panels 300P-305P Stream LB-1 Panels 306P-308P Stream LB-2 Panel 309P
TABLE OF CONTENTS (continued)
VOLUME 6 (continued)
EXHIBITS (continued)
Stream LB-3 Panel 310P Stream LB-6 Panel 311P Tributary Little Bear 1 Panels 312P-313P Tributary Little Bear 2 Panels 314P-315P
Little Fossil Creek Panels 316P-322P Little Fossil Creek Split Flow Panels 323P-324P Stream LFC-1 Panel 325P Stream LFC-2 Panel 326P Unnamed Tributary to Stream LFC-2 Panels 327P Unnamed Tributary 1 to Little Fossil Creek Panels 327(a)P Unnamed Tributary 2 to Little Fossil Creek Panels 327(b)P Unnamed Tributary of Unnamed Tributary 2 to Little Fossil Creek Panels 327(c)P
Live Oak Creek Panels 328P-329P Lorean Branch Panels 330P-332P
Unnamed Tributary to Lorean Branch Panel 333P Low Branch Panels 334P-337P Lynn Creek Panels 338P-341P Mackey Creek Panels 342P-348P
Mackey Creek Diversion North Panels 349P-352P Marine Creek Panels 353P-356P
Marine Creek Split Flow Panels 357P-358P MC-4 Creek Panels 359P Stream MC-1 Panel 360P-361P Stream MC-2 Panel 362P
Marshall Branch Panels 363P-364P

vii
VOLUME 7 - _________, 2016
EXHIBITS (continued)
Marys Creek Panels 365P-372P South Marys Creek Panels 373P-376P Stream MSC-1 Panels 377P-378P Unnamed Tributary to Stream MSC-1 Panel 379P Stream MSC-1A (Plantation West Creek) Panels 380P-381P Stream MSC-2 Panels 382P-383P Stream MSC-2A Panel 384P Stream MSC-3 Panels 385P-386P
Mesquite Branch Panel 387P-388P Nichols Branch Panels 389P-391P North Creek Panels 392P-393P

viii
TABLE OF CONTENTS (continued)
VOLUME 7 (continued)
EXHIBITS (continued)
Pantego Branch Panels 394P-397P Paschal Branch Panels 398P-399P Plantation East Creek Panels 400P-401P Pond Branch Panels 402P-405P Ragland Branch Panel 406P Reynolds Branch Panel 407P Robertson Branch Panels 408P-409P Rush Creek Panels 410P-417P
Forest Park Tributary of Rush Creek Panels 418P-419P Northeast Tributary of Rush Creek Panels 420P-421P Rush Creek Relief Channel Panel 422P Stream RC-1 Panels 423P-424P Stream RC-1(A) Panels 425P-426P Stream RC-2 Panels 427P-428P
Ryan's Branch Panel 429P Silver Creek Panels 430P-431P Singing Hills Creek Panels 432P-435P Unnamed Tributary to Singing Hills Creek Panels 436P South Creek Panels 437P-439P
North Branch of North Fork of South Creek Panels 440P-441P North Branch of North Fork of South Creek
Split Flow Panels 442P-444P North Fork of South Creek Panels 445P-446P
Sublett Creek Panels 447P-448P Sulphur Branch Panels 449P-454P
Stream SB-1 Panels 455P-456P Unnamed Tributary to Sulphur Branch Panel 457P
VOLUME 8 - _________, 2016
EXHIBITS (continued)
Sycamore Creek Panels 458P-464P
Stream SC-1 Panels 465P-466P Stream SC-2 Panels 467P-469P Stream SC-3 Panels 470P-471P Stream SC-4 Panel 472P Stream SC-5 Panels 473P-474P Stream SC-6 Panels 475P-477P Stream SC-7 Panels 478P-479P Stream SC-7A Panel 480P Unnamed Tributary 5 to Sycamore Creek Panel 481P

ix
TABLE OF CONTENTS (continued)
VOLUME 8 (continued)
EXHIBITS (continued)
Unnamed Tributary 7 to Sycamore Creek Panel 483P Unnamed Tributary 6 to Sycamore Creek Panel 482P Unnamed Tributary to Unnamed Tributary 7 to Sycamore Creek Panel 484P
Timber Creek Panels 485P-487P Timber Creek Diversion Panels 488P-489P South Timber Creek Panel 490P
Tributary B Panels 491P-493P Tributary C Panels 494P-496P Twin Springs Draw Panel 497P Valley View Branch Panels 498P-501P
Stream VVB-1 Panel 502P Village Creek Panels 503P-513P
Stream VC(A)-1 Panels 514P-515P Stream VC(A)-2 Panel 516P Stream VC-1 Panels 517P-518P Stream VC-2 Panels 519P-520P Stream VC-2A Panel 521P Stream VC-3 Panel 522P Stream VC-4 Panel 523P Stream VC-4A Panel 524P Stream VC-5 Panels 525P-527P Stream VC-6 Panels 528P-531P Stream VC-7 Panels 532P-534P
Walker Branch Panels 535P-544P Stream WKB-1 Panels 545P-547P Tributary W-4 Panel 548P
Walnut Creek 1 Panel 549P Walnut Creek 2 Panels 550P-553P
Unnamed Tributary to Walnut Creek 2 Panels 554P Walnut Creek 3 Panels 555P-559P
VOLUME 9 - _________, 2016
EXHIBITS (continued)
Warrior Creek Panel 559(a)P Watson Branch Panels 560P-562P West Fork Trinity River Panels 563P-585P
Stream WF(A)-1 Panels 586P-588P Stream WF(A)-2 Panels 589P-590P Stream WF-1 Panels 591P-592P

x
TABLE OF CONTENTS (continued)
VOLUME 9 (continued)
EXHIBITS (continued)
Stream WF-1A Panels 593P-594P Stream WF-1B Panels 595P-596P Stream WF-2 Panels 597P-599P Stream WF-2A Panel 600P Stream WF-3 Panels 601P-604P Stream WF-4 Panels 605P-606P Stream WF-5 Panels 607P-610P Stream WF-7 Panels 611P-612P Stream WF-7A Panels 613P-616P Stream WF-7B Panels 617P-618P Stream WF-9 Panels 619P-622P Stream WF-10 Panels 623P-626P Stream WF-10A Panels 627P-628P Stream WF-11 Panels 629P-630P Unnamed Tributary to West Fork Trinity River Panel 631P Unnamed Tributary 1 to West Fork Trinity River Panel 632P
West Jones Branch Panel 633P Whites Branch Panels 634P-639P
Stream WB-1 Panels 640P-641P Unnamed Tributary to Stream WB-1 Panel 642P Stream WB-2 Panel 643P Stream WB-3 Panel 644P Stream WB-3D Panel 645P
Wildcat Branch Panels 646P-647P Stream WC-1 Panels 648P-649P
Willow Bend Creek Panels 650P-653P Willow Branch Panels 654P-655P
Exhibit 2 – Flood Insurance Rate Map Index Flood Insurance Rate Map

112
4.0 FLOODPLAIN MANAGEMENT APPLICATIONS
The NFIP encourages State and local governments to adopt sound floodplain management programs. To assist in this endeavor, each FIS report provides 1-percent-annual-chance floodplain data, which may include a combination of the following: 10-, 2-, 1-, and 0.2-percent-annual-chance flood elevations; delineations of the 1- and 0.2-percent-annual-chance floodplains; and a 1-percent-annual-chance floodway. This information is presented on the FIRM and in many components of the FIS report, including Flood Profiles, Floodway Data tables, and Summary of Stillwater Elevation tables. Users should reference the data presented in the FIS report as well as additional information that may be available at the local community map repository before making flood elevation and/or floodplain boundary determinations. 4.1 Floodplain Boundaries
To provide a national standard without regional discrimination, the 1-percent-annual-chance flood has been adopted by FEMA as the base flood for floodplain management purposes. The 0.2-percent-annual-chance flood is employed to indicate additional areas of flood risk in the community. For each stream studied by detailed methods, the 1- and 0.2-percent-annual-chance floodplain boundaries have been delineated using the flood elevations determined at each cross section. For the previous studies, the boundaries between cross sections were interpolated using topographic maps with a contour interval of 2 feet (References 58, 59, 60, 61, 62, 63). For this PMR, the floodplain boundaries in between cross sections were interpolated using the TIN generated from the 2009 LIDAR. The 1- and 0.2-percent-annual-chance floodplain boundaries are shown on the FIRM. On this map, the 1-percent-annual-chance floodplain boundary corresponds to the boundary of the areas of special flood hazards (Zones A, AE, and AO), and the 0.2-percent-annual-chance floodplain boundary corresponds to the boundary of areas of moderate flood hazards. In cases where the 1- and 0.2-percent-annual-chance floodplain boundaries are close together, only the 1-percent-annual-chance floodplain boundary has been shown. Small areas within the floodplain boundaries may lie above the flood elevations, but cannot be shown due to limitations of the map scale and/or lack of detailed topographic data. For the streams studied by approximate methods, only the 1-percent-annual-chance floodplain boundary is shown on the FIRM. Approximate 1-percent-annual-chance floodplain boundaries in some portions of the study area were taken directly from the Flood Hazard Boundary Map for Tarrant County.
4.2 Floodways
Encroachment on floodplains, such as structures and fill, reduces flood-carrying capacity, increases flood heights and velocities, and increases flood hazards in areas beyond the encroachment itself. One aspect of floodplain management involves balancing the economic gain from floodplain development against the resulting increase in flood hazard. For purposes of the NFIP, a floodway is used as a tool to assist local communities in this aspect of floodplain management. Under this concept, the area of the 1-percent-annual-chance floodplain is divided into a floodway and a floodway fringe. The floodway is the channel of a stream, plus any adjacent floodplain areas, that must be kept free of encroachment so that the base flood can be carried without substantial increases in flood heights. Minimum Federal standards limit such increases to 1 foot, provided that hazardous velocities are not produced.

113
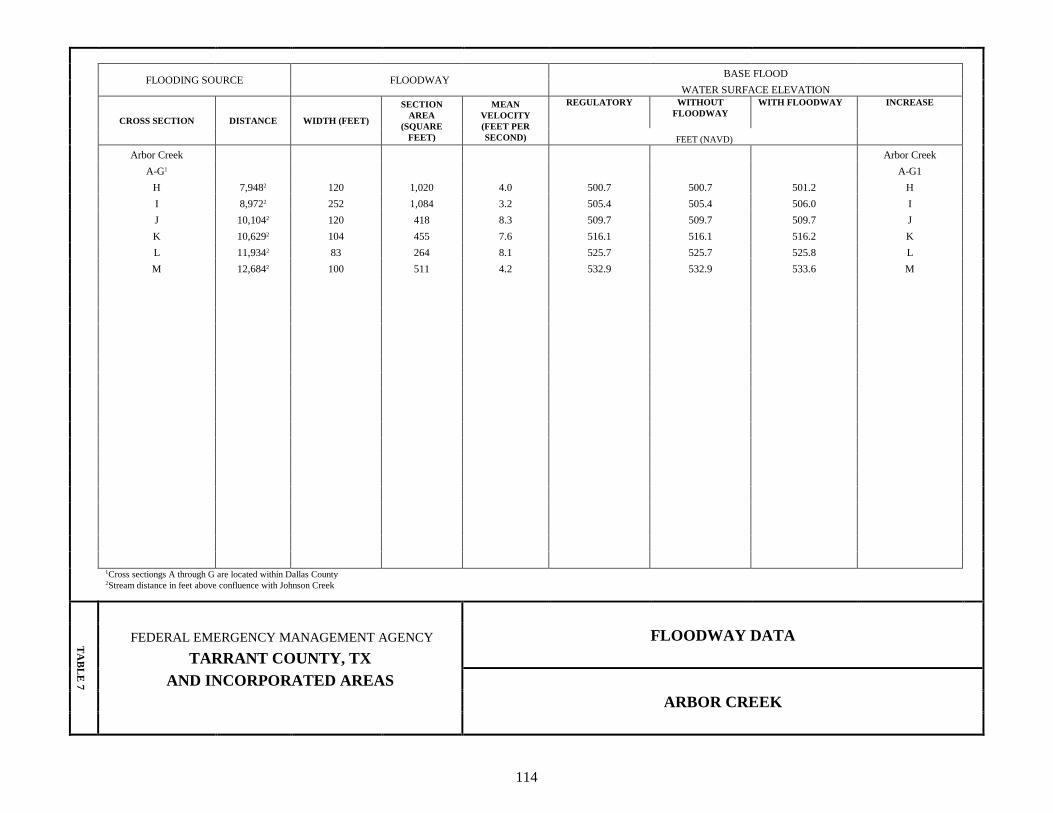
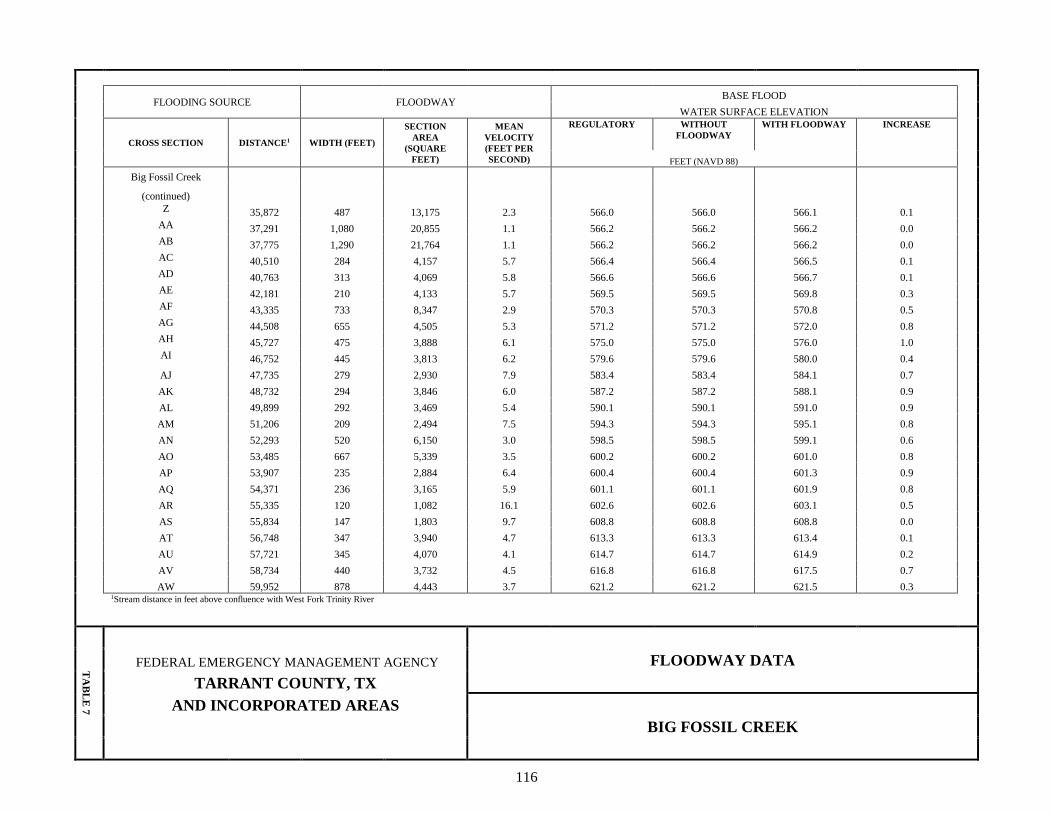
The floodways in this study are presented to local agencies as minimum standards that can be adopted directly or that can be used as a basis for additional floodway studies. The floodways presented in this study were computed for certain stream segments on the basis of equal-conveyance reduction from each side of the floodplain. Floodway widths were computed at cross sections. Between cross sections, the floodway boundaries were interpolated. The results of the floodway computations are tabulated for selected cross sections (see Table 6, Floodway Data). In cases where the floodway and 1-percent-annual-chance floodplain boundaries are either close together or collinear, only the floodway boundary is shown.
114
FLOODING SOURCE FLOODWAY BASE FLOOD
WATER SURFACE ELEVATION
CROSS SECTION DISTANCE WIDTH (FEET)
SECTION AREA
(SQUARE FEET)
MEAN VELOCITY (FEET PER SECOND)
REGULATORY WITHOUT FLOODWAY
WITH FLOODWAY INCREASE
FEET (NAVD) Arbor Creek Arbor Creek A-G1 A-G1 H 7,9482 120 1,020 4.0 500.7 500.7 501.2 H I 8,9722 252 1,084 3.2 505.4 505.4 506.0 I J 10,1042 120 418 8.3 509.7 509.7 509.7 J K 10,6292 104 455 7.6 516.1 516.1 516.2 K L 11,9342 83 264 8.1 525.7 525.7 525.8 L M 12,6842 100 511 4.2 532.9 532.9 533.6 M 1Cross sectiongs A through G are located within Dallas County
2Stream distance in feet above confluence with Johnson Creek
TA
BL
E 7
FLOODWAY DATA FEDERAL EMERGENCY MANAGEMENT AGENCY
TARRANT COUNTY, TX AND INCORPORATED AREAS
ARBOR CREEK

115
FLOODING SOURCE FLOODWAY BASE FLOOD
WATER SURFACE ELEVATION
CROSS SECTION DISTANCE1 WIDTH (FEET)
SECTION AREA
(SQUARE FEET)
MEAN VELOCITY (FEET PER SECOND)
REGULATORY WITHOUT FLOODWAY
WITH FLOODWAY INCREASE
FEET (NAVD 88) Big Fossil Creek
A 6,889 572 10,950 3.2 503.5 499.92 500.7 0.8 B 8,170 729 13,610 2.6 503.5 500.02 500.9 0.9 C 9,101 677 11,803 3.2 503.5 500.12 500.9 0.8 D 9,876 379 6,466 4.8 503.5 500.12 501.0 0.9 E 10,104 411 5,413 5.8 505.3 505.3 506.2 0.9 F 11,437 302 6,269 5.0 507.3 507.3 507.5 0.2 G 13,039 267 5,517 5.7 507.7 507.7 508.1 0.4 H 14,917 252 4,832 6.5 508.7 508.7 509.3 0.6 I 16,114 241 4,355 7.2 509.6 509.6 510.2 0.6 J 17,317 353 4,491 7.0 514.5 514.5 514.6 0.1 K 18,462 600 6,554 4.8 517.0 517.0 517.8 0.8 L 19,585 1,189 12,503 2.5 518.3 518.3 519.2 0.9 M 20,617 1,100 9,043 3.5 519.9 519.9 520.9 1.0 N 22,119 962 8,433 3.7 523.1 523.1 524.0 0.9
O 23,161 1,145 8,898 3.5 524.8 524.8 525.7 0.9 P 24,277 1,309 9,236 3.4 525.6 525.6 526.5 0.9 Q 25,339 1,120 8,199 3.8 527.6 527.6 528.3 0.7 R 26,411 1,055 6,728 4.6 529.7 529.7 530.6 0.9 S 27,463 785 6,207 5.0 531.9 531.9 532.7 0.8 T 28,599 860 7,834 4.0 535.9 535.9 536.6 0.7 U 29,709 405 4,310 7.2 537.5 537.5 538.3 0.8 V 30,842 348 3,973 7.8 542.2 542.2 542.7 0.5 W 32,018 592 5,576 5.4 544.5 544.5 545.0 0.5 X 33,462 460 5,564 5.4 549.1 549.1 549.2 0.1 Y 34,581 314 5,512 5.5 551.8 551.8 552.1 0.3
1Stream distance in feet above confluence with West Fork Trinity River
TA
BL
E 7
FLOODWAY DATA FEDERAL EMERGENCY MANAGEMENT AGENCY
TARRANT COUNTY, TX AND INCORPORATED AREAS
BIG FOSSIL CREEK
116
FLOODING SOURCE FLOODWAY BASE FLOOD
WATER SURFACE ELEVATION
CROSS SECTION DISTANCE1 WIDTH (FEET)
SECTION AREA
(SQUARE FEET)
MEAN VELOCITY (FEET PER SECOND)
REGULATORY WITHOUT FLOODWAY
WITH FLOODWAY INCREASE
FEET (NAVD 88) Big Fossil Creek
(continued) Z 35,872 487 13,175 2.3 566.0 566.0 566.1 0.1 AA 37,291 1,080 20,855 1.1 566.2 566.2 566.2 0.0 AB 37,775 1,290 21,764 1.1 566.2 566.2 566.2 0.0 AC 40,510 284 4,157 5.7 566.4 566.4 566.5 0.1 AD 40,763 313 4,069 5.8 566.6 566.6 566.7 0.1 AE 42,181 210 4,133 5.7 569.5 569.5 569.8 0.3 AF 43,335 733 8,347 2.9 570.3 570.3 570.8 0.5 AG 44,508 655 4,505 5.3 571.2 571.2 572.0 0.8 AH 45,727 475 3,888 6.1 575.0 575.0 576.0 1.0 AI 46,752 445 3,813 6.2 579.6 579.6 580.0 0.4 AJ 47,735 279 2,930 7.9 583.4 583.4 584.1 0.7 AK 48,732 294 3,846 6.0 587.2 587.2 588.1 0.9 AL 49,899 292 3,469 5.4 590.1 590.1 591.0 0.9
AM 51,206 209 2,494 7.5 594.3 594.3 595.1 0.8 AN 52,293 520 6,150 3.0 598.5 598.5 599.1 0.6 AO 53,485 667 5,339 3.5 600.2 600.2 601.0 0.8 AP 53,907 235 2,884 6.4 600.4 600.4 601.3 0.9 AQ 54,371 236 3,165 5.9 601.1 601.1 601.9 0.8 AR 55,335 120 1,082 16.1 602.6 602.6 603.1 0.5 AS 55,834 147 1,803 9.7 608.8 608.8 608.8 0.0 AT 56,748 347 3,940 4.7 613.3 613.3 613.4 0.1 AU 57,721 345 4,070 4.1 614.7 614.7 614.9 0.2 AV 58,734 440 3,732 4.5 616.8 616.8 617.5 0.7 AW 59,952 878 4,443 3.7 621.2 621.2 621.5 0.3
1Stream distance in feet above confluence with West Fork Trinity River
TA
BL
E 7
FLOODWAY DATA FEDERAL EMERGENCY MANAGEMENT AGENCY
TARRANT COUNTY, TX AND INCORPORATED AREAS
BIG FOSSIL CREEK

117
FLOODING SOURCE FLOODWAY BASE FLOOD
WATER SURFACE ELEVATION
CROSS SECTION DISTANCE1 WIDTH (FEET)
SECTION AREA
(SQUARE FEET)
MEAN VELOCITY (FEET PER SECOND)
REGULATORY WITHOUT FLOODWAY
WITH FLOODWAY INCREASE
FEET (NAVD 88) Big Fossil Creek
(continued) AW 59,952 878 4,443 3.7 621.2 621.2 621.5 0.3 AX 61,615 425 3,004 5.5 625.9 625.9 626.7 0.8 AY 62,795 690 3,900 4.3 629.8 629.8 630.6 0.8 AZ 63,641 522 2,939 5.7 633.4 633.4 634.1 0.7 BA 64,630 720 3,842 4.1 637.5 637.5 637.7 0.2 BB 65,859 492 2,628 6.0 642.0 642.0 643.0 1.0 BC 67,161 555 2,658 5.9 648.0 648.0 648.6 0.6 BD 68,078 641 4,167 3.8 652.4 652.4 652.6 0.2 BE 69,395 429 2,242 6.0 657.0 657.0 657.5 0.5 BF 70,403 424 2,807 4.9 661.0 661.0 661.9 0.9 BG 71,458 628 3,730 4.0 664.8 664.8 665.2 0.4 BH 72,076 551 2,786 2.7 666.6 666.6 667.0 0.4 BI 74,357 296 1,462 4.9 674.3 674.3 674.9 0.6
BJ 74,722 396 1,913 3.8 676.0 676.0 676.5 0.5 BK 75,340 385 1,520 4.7 678.9 678.9 678.9 0.0 BL 76,402 730 3,841 1.9 691.0 691.0 691.3 0.3 BM 77,764 337 2,008 3.7 691.4 691.4 691.6 0.2 BN 79,007 479 5,985 1.2 704.3 704.3 704.3 0.0 BO 80,236 736 4,058 1.8 704.5 704.5 704.5 0.0 BP 81,499 403 1,365 4.9 706.9 706.9 706.9 0.0 BQ 82,662 305 1,361 4.8 712.9 712.9 713.0 0.1 BR 84,022 257 1,748 3.8 720.2 720.2 720.8 0.6 BS 84,924 217 1,113 5.9 724.1 724.1 724.1 0.0 BT 85,773 419 1,259 4.1 727.6 727.6 728.4 0.8
1Stream distance in feet above confluence with West Fork Trinity River
TA
BL
E 7
FLOODWAY DATA FEDERAL EMERGENCY MANAGEMENT AGENCY
TARRANT COUNTY, TX AND INCORPORATED AREAS
BIG FOSSIL CREEK

118
FLOODING SOURCE FLOODWAY BASE FLOOD
WATER SURFACE ELEVATION
CROSS SECTION DISTANCE1 WIDTH (FEET)
SECTION AREA
(SQUARE FEET)
MEAN VELOCITY (FEET PER SECOND)
REGULATORY WITHOUT FLOODWAY
WITH FLOODWAY INCREASE
FEET (NAVD 88) Big Fossil Creek
(continued) BU 87,016 339 1,368 3.8 734.3 734.3 735.3 1.0 BV 87,977 267 1,074 4.8 738.6 738.6 739.1 0.5 BW 89,125 280 1,138 4.5 743.7 743.7 744.1 0.4 BX 90,246 280 1,467 3.5 746.9 746.9 747.8 0.9 BY 91,390 264 1,348 2.6 749.7 749.7 750.5 0.8 BZ 92,251 189 1,014 3.4 752.4 752.4 752.9 0.5 CA 93,261 170 805 4.3 755.7 755.7 755.9 0.2 CB 94,264 130 704 4.9 760.0 760.0 760.3 0.3 CC 95,534 235 997 3.5 766.5 766.5 767.3 0.8 CD 96,441 209 737 4.7 769.3 769.3 769.5 0.2 CE 97,346 230 1,022 3.4 772.2 772.2 772.4 0.2 CF 98,333 212 724 4.8 777.8 777.8 778.1 0.3 CG 99,530 179 533 6.5 783.5 783.5 783.6 0.1
CH 100,437 272 1,101 3.2 786.9 786.9 787.3 0.4 CI 101,621 212 981 0.6 789.0 789.0 789.7 0.7 CJ 102,570 94 183 3.4 791.6 791.6 791.7 0.1 CK 103,485 134 169 3.7 799.2 799.2 799.2 0.0 CL 104,626 246 304 2.0 804.5 804.5 804.5 0.0 CM 105,678 216 306 2.0 809.9 809.9 809.9 0.0 CN 106,624 122 181 3.4 814.3 814.3 814.3 0.0 CO 107,901 123 238 2.6 818.6 818.6 818.6 0.0 CP 109,114 83 112 1.5 823.2 823.2 823.2 0.0 CQ 110,021 56 63 2.7 828.0 828.0 828.0 0.0 CR 111,464 56 50 3.4 838.1 838.1 838.1 0.0 CS 112,489 39 54 3.2 849.3 849.3 849.3 0.0
1Stream distance in feet above confluence with West Fork Trinity River
TA
BL
E 7
FLOODWAY DATA FEDERAL EMERGENCY MANAGEMENT AGENCY
TARRANT COUNTY, TX AND INCORPORATED AREAS
BIG FOSSIL CREEK

119
FLOODING SOURCE FLOODWAY BASE FLOOD
WATER SURFACE ELEVATION
CROSS SECTION DISTANCE1 WIDTH (FEET)
SECTION AREA
(SQUARE FEET)
MEAN VELOCITY (FEET PER SECOND)
REGULATORY WITHOUT FLOODWAY
WITH FLOODWAY INCREASE
FEET (NAVD 88) Stream BFC-1 A 985 108 599 10.0 579.5 577.42 577.7 0.3 B 1,390 104 676 8.9 582.3 582.3 582.3 0.0 C 1,720 106 667 9.0 585.2 585.2 585.2 0.0 D 2,120 107 711 8.4 587.7 587.7 587.7 0.0 E 2,435 121 811 6.9 589.7 589.7 589.7 0.0 F 2,800 116 753 7.5 591.0 591.0 591.0 0.0 G 3,050 92 545 10.3 592.2 592.2 592.3 0.1 H 3,360 58 434 13.0 592.7 592.7 592.8 0.1 I 3,960 53 358 15.7 599.5 599.5 599.5 0.0 J 4,585 152 1,551 3.1 606.4 606.4 606.4 0.0 K 4,950 103 1,009 4.8 606.5 606.5 606.5 0.0 L 5,450 109 988 4.9 607.1 607.1 607.2 0.1 M 5,950 127 1,050 4.6 607.7 607.7 607.8 0.1 N 6,340 113 827 4.7 608.2 608.2 608.2 0.0
O 6,571 96 619 6.3 610.2 610.2 610.5 0.3 P 7,047 82 545 7.1 611.4 611.4 611.6 0.2 Q 7,640 87 513 6.8 613.3 613.3 613.6 0.3 R 7,860 91 826 4.2 617.9 617.9 618.3 0.4 S 8,320 99 697 5.0 618.3 618.3 618.7 0.4 T 8,720 90 543 6.4 618.8 618.8 619.1 0.3 U 8,920 69 378 7.0 619.3 619.3 619.5 0.2 V 9,320 68 333 7.9 620.9 620.9 621.0 0.1 W 9,620 67 310 8.5 622.4 622.4 622.4 0.0 X 9,900 75 394 6.7 624.3 624.3 624.3 0.0 Y 10,189 113 577 4.6 627.4 627.4 627.4 0.0 Z 10,729 112 559 4.7 628.9 628.9 628.9 0.0
1Stream distance in feet above confluence with Big Fossil Creek 2Elevation computed without consideration of backwater effects from Big Fossil Creek
TA
BL
E 7
FLOODWAY DATA FEDERAL EMERGENCY MANAGEMENT AGENCY
TARRANT COUNTY, TX AND INCORPORATED AREAS
STREAM BFC-1

120
FLOODING SOURCE FLOODWAY BASE FLOOD
WATER SURFACE ELEVATION
CROSS SECTION DISTANCE1 WIDTH (FEET)
SECTION AREA
(SQUARE FEET)
MEAN VELOCITY (FEET PER SECOND)
REGULATORY WITHOUT FLOODWAY
WITH FLOODWAY INCREASE
FEET (NAVD 88) Stream BFC-6 A 1,1201 90 578 5.3 529.9 529.9 530.0 0.1 B 1,9601 80 522 5.9 539.7 539.7 540.2 0.5 C 2,9801 70 509 4.7 554.8 554.8 555.5 0.7 D 3,2201 80 399 6.0 556.1 556.1 556.6 0.5 E 3,7101 34 145 9.2 562.8 562.8 563.2 0.4 Stream BFC-7 A 5801 65 409 5.1 536.0 531.94 531.9 0.0 B 1,1301 50 243 8.6 536.0 535.24 535.2 0.0 Blessing Branch A 8,4802 157 992 4.6 540.2 540.2 541.1 0.9 B 10,3402 180 1,160 3.9 546.0 546.0 547.0 1.0 C 11,8302 90 809 4.4 554.3 554.3 554.5 0.2
D 13,7702 53 315 7.4 559.9 559.9 560.6 0.7 E 15,3002 82 508 4.6 569.6 569.6 570.0 0.4 Boaz Creek A 8003 92 684 7.4 665.0 665.0 666.0 1.0 B 1,6503 100 616 5.7 672.1 672.1 672.5 0.4
1Stream distance in feet above confluence with Big Fossil Creek 2Stream distance in feet above confluence with West Fork Trinity River 3Stream distance in feet above confluence with Walnut Creek 4Elevation computed without consideration of backwater effects from Big Fossil Creek
TA
BL
E 7
FLOODWAY DATA FEDERAL EMERGENCY MANAGEMENT AGENCY
TARRANT COUNTY, TX AND INCORPORATED AREAS
STREAM BFC-6 – STREAM BFC-7 BLESSING BRANCH – BOAZ CREEK

121
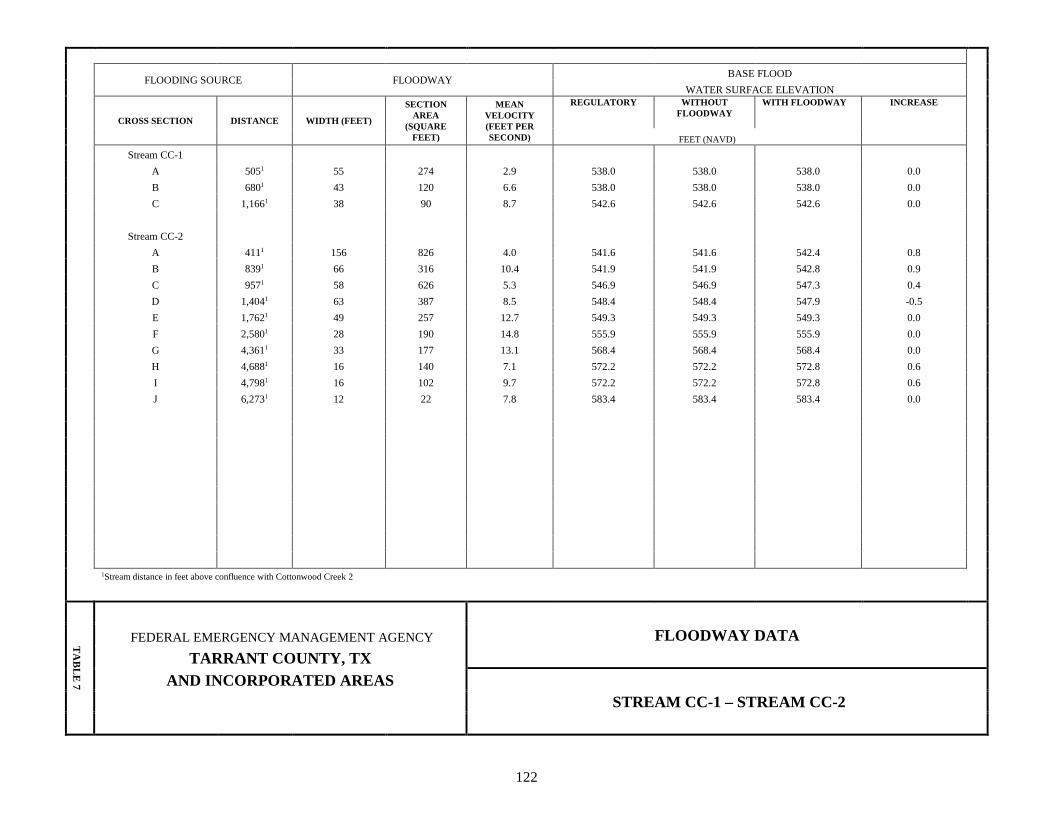
FLOODING SOURCE FLOODWAY BASE FLOOD
WATER SURFACE ELEVATION
CROSS SECTION DISTANCE WIDTH (FEET)
SECTION AREA
(SQUARE FEET)
MEAN VELOCITY (FEET PER SECOND)
REGULATORY WITHOUT FLOODWAY
WITH FLOODWAY INCREASE
FEET (NAVD)
Cottonwood Creek 2 A-P1 Q 21,8892 215 1,204 8.2 513.9 513.9 514.8 0.9 R 22,6192 151 1,869 5.3 524.3 524.3 524.5 0.2 S 23,2862 340 3,049 2.7 526.0 526.0 526.9 0.9 T 24,4802 153 1,253 6.3 530.6 530.6 530.8 0.2 U 26,3262 244 2,139 3.0 539.7 539.7 540.7 1.0 V 27,5612 90 591 5.5 541.7 541.7 542.5 0.8 W 29,7262 110 661 4.6 557.5 557.5 557.6 0.1 X 31,2362 37 287 10.1 574.8 574.8 575.6 0.8 Y 32,2052 301 762 2.1 582.4 582.4 582.9 0.5 Z 33,3812 35 224 5.2 588.2 588.2 588.7 0.5 AA 33,5862 38 225 5.2 590.2 590.2 590.2 0.0 AB 34,2342 75 282 3.3 596.9 596.9 597.6 0.7 AC 34,5432 81 331 2.8 602.7 602.7 603.2 0.5 AD 35,1772 71 122 7.5 608.9 608.9 608.9 0.0
1Cross section A through P are located within Dallas County 2Stream distance in feet above confluence with Mountain Creek Lake
TA
BL
E 7
FLOODWAY DATA FEDERAL EMERGENCY MANAGEMENT AGENCY
TARRANT COUNTY, TX AND INCORPORATED AREAS
COTTONWOOD CREEK 2
122
FLOODING SOURCE FLOODWAY BASE FLOOD
WATER SURFACE ELEVATION
CROSS SECTION DISTANCE WIDTH (FEET)
SECTION AREA
(SQUARE FEET)
MEAN VELOCITY (FEET PER SECOND)
REGULATORY WITHOUT FLOODWAY
WITH FLOODWAY INCREASE
FEET (NAVD)
Stream CC-1 A 5051 55 274 2.9 538.0 538.0 538.0 0.0 B 6801 43 120 6.6 538.0 538.0 538.0 0.0 C 1,1661 38 90 8.7 542.6 542.6 542.6 0.0 Stream CC-2 A 4111 156 826 4.0 541.6 541.6 542.4 0.8 B 8391 66 316 10.4 541.9 541.9 542.8 0.9 C 9571 58 626 5.3 546.9 546.9 547.3 0.4 D 1,4041 63 387 8.5 548.4 548.4 547.9 -0.5 E 1,7621 49 257 12.7 549.3 549.3 549.3 0.0 F 2,5801 28 190 14.8 555.9 555.9 555.9 0.0 G 4,3611 33 177 13.1 568.4 568.4 568.4 0.0 H 4,6881 16 140 7.1 572.2 572.2 572.8 0.6 I 4,7981 16 102 9.7 572.2 572.2 572.8 0.6 J 6,2731 12 22 7.8 583.4 583.4 583.4 0.0
1Stream distance in feet above confluence with Cottonwood Creek 2
TA
BL
E 7
FLOODWAY DATA FEDERAL EMERGENCY MANAGEMENT AGENCY
TARRANT COUNTY, TX AND INCORPORATED AREAS
STREAM CC-1 – STREAM CC-2
123
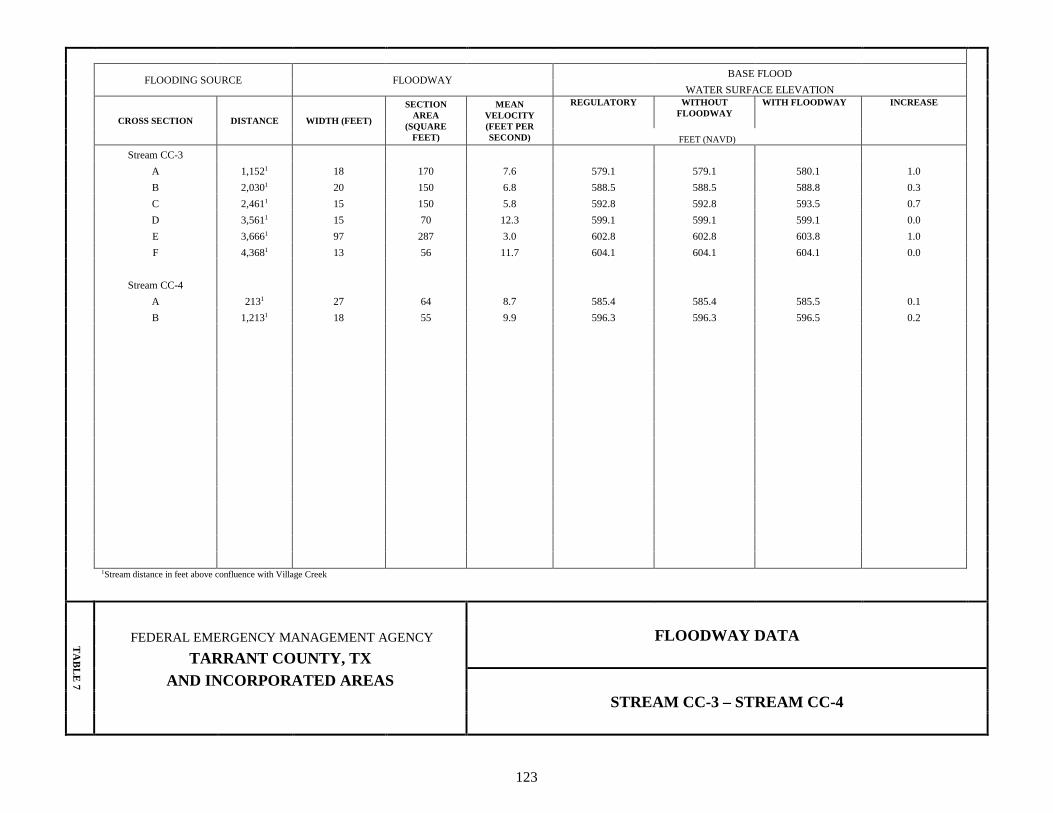
FLOODING SOURCE FLOODWAY BASE FLOOD
WATER SURFACE ELEVATION
CROSS SECTION DISTANCE WIDTH (FEET)
SECTION AREA
(SQUARE FEET)
MEAN VELOCITY (FEET PER SECOND)
REGULATORY WITHOUT FLOODWAY
WITH FLOODWAY INCREASE
FEET (NAVD)
Stream CC-3 A 1,1521 18 170 7.6 579.1 579.1 580.1 1.0 B 2,0301 20 150 6.8 588.5 588.5 588.8 0.3 C 2,4611 15 150 5.8 592.8 592.8 593.5 0.7 D 3,5611 15 70 12.3 599.1 599.1 599.1 0.0 E 3,6661 97 287 3.0 602.8 602.8 603.8 1.0 F 4,3681 13 56 11.7 604.1 604.1 604.1 0.0 Stream CC-4 A 2131 27 64 8.7 585.4 585.4 585.5 0.1 B 1,2131 18 55 9.9 596.3 596.3 596.5 0.2
1Stream distance in feet above confluence with Village Creek
TA
BL
E 7
FLOODWAY DATA FEDERAL EMERGENCY MANAGEMENT AGENCY
TARRANT COUNTY, TX AND INCORPORATED AREAS
STREAM CC-3 – STREAM CC-4
124
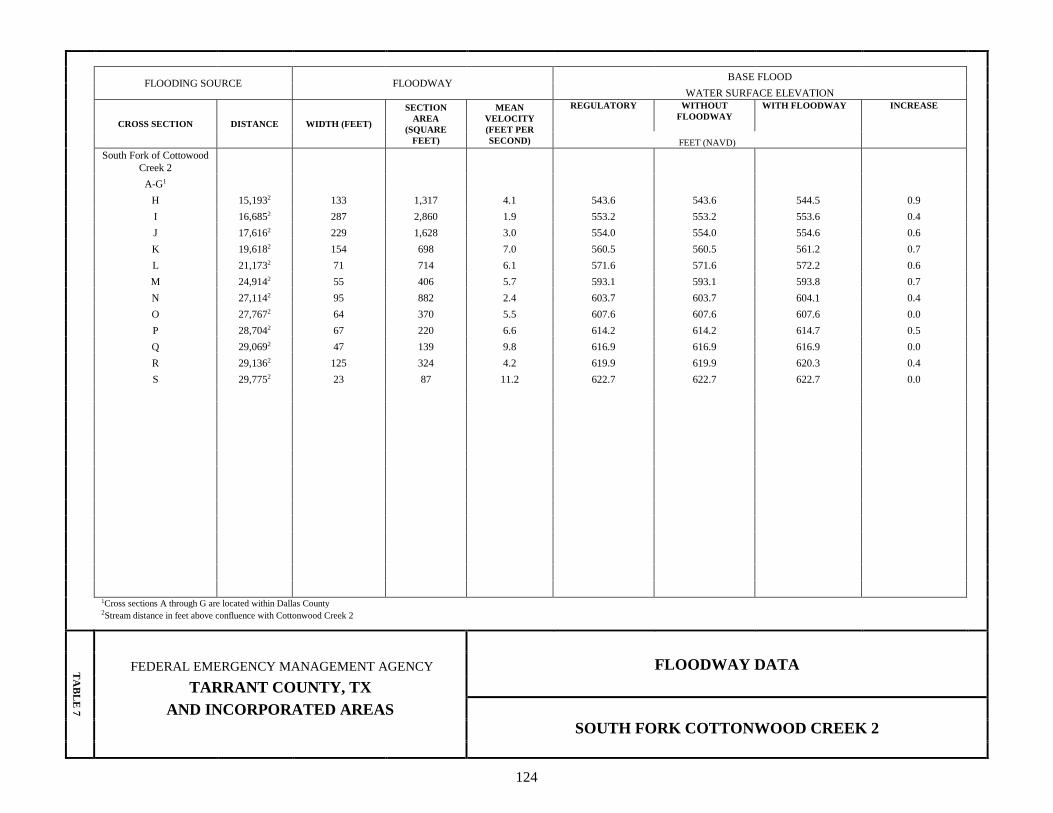
FLOODING SOURCE FLOODWAY BASE FLOOD
WATER SURFACE ELEVATION
CROSS SECTION DISTANCE WIDTH (FEET)
SECTION AREA
(SQUARE FEET)
MEAN VELOCITY (FEET PER SECOND)
REGULATORY WITHOUT FLOODWAY
WITH FLOODWAY INCREASE
FEET (NAVD)
South Fork of Cottowood
Creek 2 A-G1 H 15,1932 133 1,317 4.1 543.6 543.6 544.5 0.9 I 16,6852 287 2,860 1.9 553.2 553.2 553.6 0.4 J 17,6162 229 1,628 3.0 554.0 554.0 554.6 0.6 K 19,6182 154 698 7.0 560.5 560.5 561.2 0.7 L 21,1732 71 714 6.1 571.6 571.6 572.2 0.6 M 24,9142 55 406 5.7 593.1 593.1 593.8 0.7 N 27,1142 95 882 2.4 603.7 603.7 604.1 0.4 O 27,7672 64 370 5.5 607.6 607.6 607.6 0.0 P 28,7042 67 220 6.6 614.2 614.2 614.7 0.5 Q 29,0692 47 139 9.8 616.9 616.9 616.9 0.0 R 29,1362 125 324 4.2 619.9 619.9 620.3 0.4 S 29,7752 23 87 11.2 622.7 622.7 622.7 0.0
1Cross sections A through G are located within Dallas County
2Stream distance in feet above confluence with Cottonwood Creek 2
TA
BL
E 7
FLOODWAY DATA FEDERAL EMERGENCY MANAGEMENT AGENCY
TARRANT COUNTY, TX AND INCORPORATED AREAS
SOUTH FORK COTTONWOOD CREEK 2
125
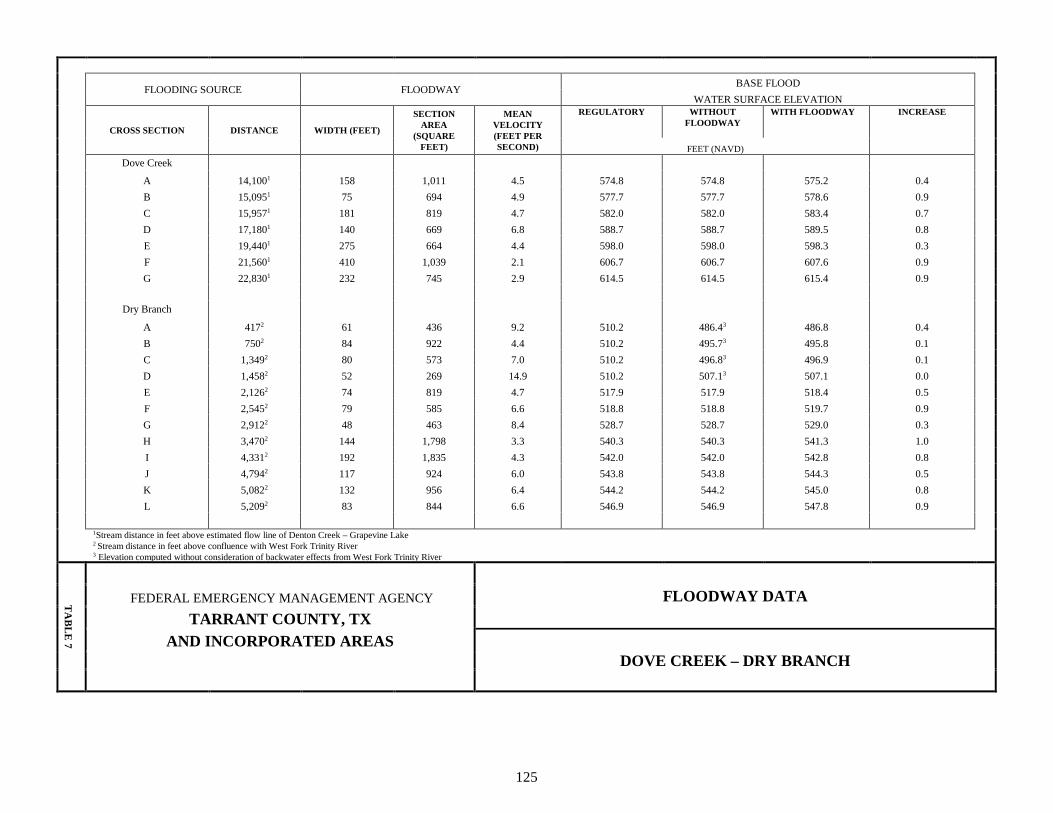
FLOODING SOURCE FLOODWAY BASE FLOOD
WATER SURFACE ELEVATION
CROSS SECTION DISTANCE WIDTH (FEET)
SECTION AREA
(SQUARE FEET)
MEAN VELOCITY (FEET PER SECOND)
REGULATORY WITHOUT FLOODWAY
WITH FLOODWAY INCREASE
FEET (NAVD) Dove Creek A 14,1001 158 1,011 4.5 574.8 574.8 575.2 0.4 B 15,0951 75 694 4.9 577.7 577.7 578.6 0.9 C 15,9571 181 819 4.7 582.0 582.0 583.4 0.7 D 17,1801 140 669 6.8 588.7 588.7 589.5 0.8 E 19,4401 275 664 4.4 598.0 598.0 598.3 0.3 F 21,5601 410 1,039 2.1 606.7 606.7 607.6 0.9 G 22,8301 232 745 2.9 614.5 614.5 615.4 0.9 Dry Branch A 4172 61 436 9.2 510.2 486.43 486.8 0.4 B 7502 84 922 4.4 510.2 495.73 495.8 0.1 C 1,3492 80 573 7.0 510.2 496.83 496.9 0.1 D 1,4582 52 269 14.9 510.2 507.13 507.1 0.0 E 2,1262 74 819 4.7 517.9 517.9 518.4 0.5 F 2,5452 79 585 6.6 518.8 518.8 519.7 0.9 G 2,9122 48 463 8.4 528.7 528.7 529.0 0.3 H 3,4702 144 1,798 3.3 540.3 540.3 541.3 1.0 I 4,3312 192 1,835 4.3 542.0 542.0 542.8 0.8 J 4,7942 117 924 6.0 543.8 543.8 544.3 0.5 K 5,0822 132 956 6.4 544.2 544.2 545.0 0.8 L 5,2092 83 844 6.6 546.9 546.9 547.8 0.9 1Stream distance in feet above estimated flow line of Denton Creek – Grapevine Lake
2 Stream distance in feet above confluence with West Fork Trinity River 3 Elevation computed without consideration of backwater effects from West Fork Trinity River
TA
BL
E 7
FLOODWAY DATA FEDERAL EMERGENCY MANAGEMENT AGENCY
TARRANT COUNTY, TX AND INCORPORATED AREAS
DOVE CREEK – DRY BRANCH
126
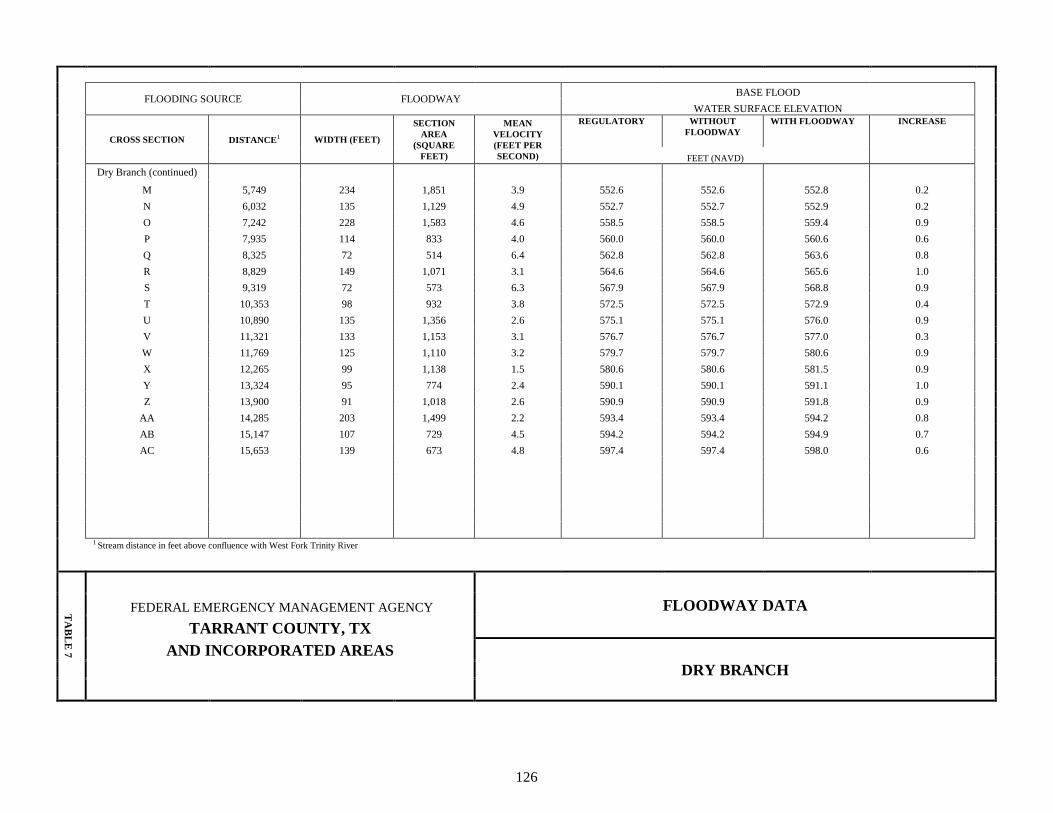
FLOODING SOURCE FLOODWAY BASE FLOOD
WATER SURFACE ELEVATION
CROSS SECTION DISTANCE1 WIDTH (FEET)
SECTION AREA
(SQUARE FEET)
MEAN VELOCITY (FEET PER SECOND)
REGULATORY WITHOUT FLOODWAY
WITH FLOODWAY INCREASE
FEET (NAVD) Dry Branch (continued) M 5,749 234 1,851 3.9 552.6 552.6 552.8 0.2 N 6,032 135 1,129 4.9 552.7 552.7 552.9 0.2 O 7,242 228 1,583 4.6 558.5 558.5 559.4 0.9 P 7,935 114 833 4.0 560.0 560.0 560.6 0.6 Q 8,325 72 514 6.4 562.8 562.8 563.6 0.8 R 8,829 149 1,071 3.1 564.6 564.6 565.6 1.0 S 9,319 72 573 6.3 567.9 567.9 568.8 0.9 T 10,353 98 932 3.8 572.5 572.5 572.9 0.4 U 10,890 135 1,356 2.6 575.1 575.1 576.0 0.9 V 11,321 133 1,153 3.1 576.7 576.7 577.0 0.3 W 11,769 125 1,110 3.2 579.7 579.7 580.6 0.9 X 12,265 99 1,138 1.5 580.6 580.6 581.5 0.9 Y 13,324 95 774 2.4 590.1 590.1 591.1 1.0 Z 13,900 91 1,018 2.6 590.9 590.9 591.8 0.9 AA 14,285 203 1,499 2.2 593.4 593.4 594.2 0.8 AB 15,147 107 729 4.5 594.2 594.2 594.9 0.7 AC 15,653 139 673 4.8 597.4 597.4 598.0 0.6 1 Stream distance in feet above confluence with West Fork Trinity River
TA
BL
E 7
FLOODWAY DATA FEDERAL EMERGENCY MANAGEMENT AGENCY
TARRANT COUNTY, TX AND INCORPORATED AREAS
DRY BRANCH

127
FLOODING SOURCE FLOODWAY BASE FLOOD
WATER SURFACE ELEVATION
CROSS SECTION DISTANCE WIDTH (FEET)
SECTION AREA
(SQUARE FEET)
MEAN VELOCITY (FEET PER SECOND)
REGULATORY WITHOUT FLOODWAY
WITH FLOODWAY INCREASE
FEET (NAVD) Dutch Branch A 3,6401 210 1,574 6.9 727.8 727.8 728.6 0.8 B 4,0001 339 1,505 7.2 731.7 731.7 732.6 0.9 C 6,0301 154 1,370 8.0 742.6 742.6 743.5 0.9 D 8,1001 225 1,359 6.6 757.0 757.0 758.0 1.0 Edgecliff Branch A 1,5602 220 2,038 4.6 661.4 661.4 662.1 0.7 B 2,5502 251 2,133 4.4 664.9 664.9 665.4 0.5 C 3,4402 252 1,385 6.7 667.8 667.8 668.5 0.7 D 4,4102 425 2,779 3.3 671.7 671.7 672.7 1.0 E 5,6602 187 1,169 7.0 674.2 674.2 675.1 0.9 F 6,4102 174 932 8.7 678.6 678.6 678.6 0.0 G 7,3102 132 1,184 6.9 682.8 682.8 683.7 0.9 H 8,3802 232 992 8.2 687.6 687.6 687.8 0.2 I 9,2902 331 2,188 3.7 694.3 694.3 695.1 0.8 J 9,8402 224 1,268 6.4 695.5 695.5 696.0 0.5 K 11,2002 201 1,263 6.9 704.0 704.0 705.0 1.0 L 13,6902 140 1,270 6.9 713.1 713.1 713.7 0.6 M 15,6602 103 763 11.4 723.0 723.0 723.0 0.0 N 16,7802 176 1,073 4.4 732.4 732.4 732.4 0.0 O 18,8202 112 427 11.1 735.3 735.3 735.3 0.0 P 21,2402 100 698 6.8 758.3 758.3 759.2 0.9 Q 22,0802 275 1,069 4.4 766.0 766.0 766.3 0.3 R 24,2202 85 442 10.7 779.1 779.1 779.1 0.0 1Stream distance in feet above confluence with Benbrook Lake
2 Stream distance in feet above confluence with Sycamore Creek
TA
BL
E 7
FLOODWAY DATA FEDERAL EMERGENCY MANAGEMENT AGENCY
TARRANT COUNTY, TX AND INCORPORATED AREAS
DUTCH BRANCH – EDGECLIFF BRANCH

128
FLOODING SOURCE FLOODWAY BASE FLOOD
WATER SURFACE ELEVATION
CROSS SECTION DISTANCE WIDTH (FEET)
SECTION AREA
(SQUARE FEET)
MEAN VELOCITY (FEET PER SECOND)
REGULATORY WITHOUT FLOODWAY
WITH FLOODWAY INCREASE
FEET (NAVD) Fish Creek A-K1 L 30,7322 353 3,976 4.3 510.5 510.5 511.4 0.9 M 36,5422 262 2,361 6.2 518.4 518.4 519.2 0.8 N 40,0082 234 2,302 6.3 532.1 532.1 533.1 1.0 O 43,9342 310 3,529 3.7 545.2 545.2 545.9 0.7 P 46,9932 247 2,154 4.4 549.7 549.7 550.5 0.8 Q 47,8892 310 2,110 4.6 551.1 551.1 552.0 0.9 R 49,8182 407 2,923 3.3 558.0 558.0 558.7 0.7 S 52,2482 232 1,881 5.2 563.3 563.3 564.2 0.9 T 54,4702 143 1,340 7.3 568.0 568.0 568.7 0.7 U 55,6302 234 1,950 5.0 572.2 572.2 573.1 0.9 V 56,9572 188 1,263 4.8 575.1 575.1 576.1 1.0 W 58,2122 196 862 5.8 580.0 580.0 581.0 1.0 X 59,6752 186 993 5.0 584.8 584.8 585.2 0.4 Y 60,6282 181 890 4.2 589.0 589.0 589.4 0.4 Z 61,9622 183 747 5.0 594.8 594.8 595.7 0.9 AA 63,1582 363 894 4.2 599.6 599.6 600.5 0.9 AB 64,6792 181 965 3.9 606.1 606.1 607.0 0.9 AC 65,4952 161 687 4.0 610.4 610.4 611.1 0.7 1Cross sections A through K are located within Dallas County
2Stream distance in feet above confluence with Mountain Creek Lake
TA
BL
E 7
FLOODWAY DATA FEDERAL EMERGENCY MANAGEMENT AGENCY
TARRANT COUNTY, TX AND INCORPORATED AREAS
FISH CREEK
129
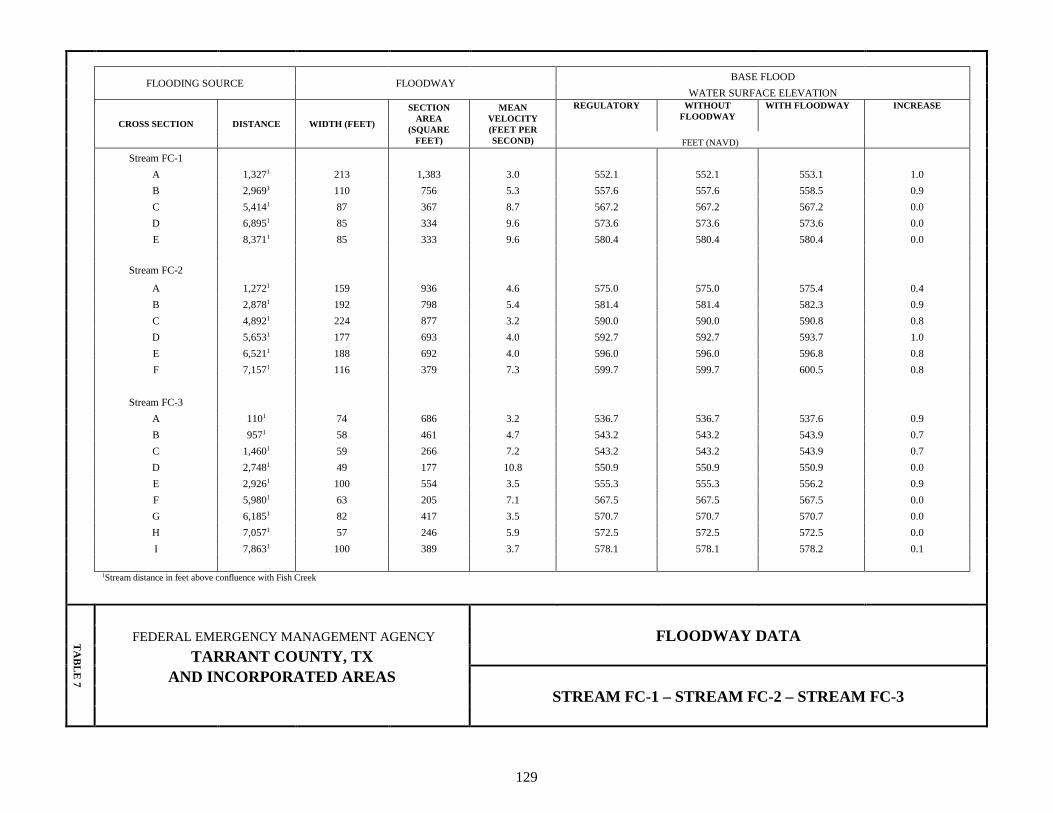
FLOODING SOURCE FLOODWAY BASE FLOOD
WATER SURFACE ELEVATION
CROSS SECTION DISTANCE WIDTH (FEET)
SECTION AREA
(SQUARE FEET)
MEAN VELOCITY (FEET PER SECOND)
REGULATORY WITHOUT FLOODWAY
WITH FLOODWAY INCREASE
FEET (NAVD)
Stream FC-1 A 1,3271 213 1,383 3.0 552.1 552.1 553.1 1.0 B 2,9691 110 756 5.3 557.6 557.6 558.5 0.9 C 5,4141 87 367 8.7 567.2 567.2 567.2 0.0 D 6,8951 85 334 9.6 573.6 573.6 573.6 0.0 E 8,3711 85 333 9.6 580.4 580.4 580.4 0.0 Stream FC-2 A 1,2721 159 936 4.6 575.0 575.0 575.4 0.4 B 2,8781 192 798 5.4 581.4 581.4 582.3 0.9 C 4,8921 224 877 3.2 590.0 590.0 590.8 0.8 D 5,6531 177 693 4.0 592.7 592.7 593.7 1.0 E 6,5211 188 692 4.0 596.0 596.0 596.8 0.8 F 7,1571 116 379 7.3 599.7 599.7 600.5 0.8 Stream FC-3 A 1101 74 686 3.2 536.7 536.7 537.6 0.9
B 9571 58 461 4.7 543.2 543.2 543.9 0.7 C 1,4601 59 266 7.2 543.2 543.2 543.9 0.7 D 2,7481 49 177 10.8 550.9 550.9 550.9 0.0 E 2,9261 100 554 3.5 555.3 555.3 556.2 0.9 F 5,9801 63 205 7.1 567.5 567.5 567.5 0.0 G 6,1851 82 417 3.5 570.7 570.7 570.7 0.0 H 7,0571 57 246 5.9 572.5 572.5 572.5 0.0 I 7,8631 100 389 3.7 578.1 578.1 578.2 0.1
1Stream distance in feet above confluence with Fish Creek
TA
BL
E 7
FLOODWAY DATA FEDERAL EMERGENCY MANAGEMENT AGENCY
TARRANT COUNTY, TX AND INCORPORATED AREAS
STREAM FC-1 – STREAM FC-2 – STREAM FC-3
130
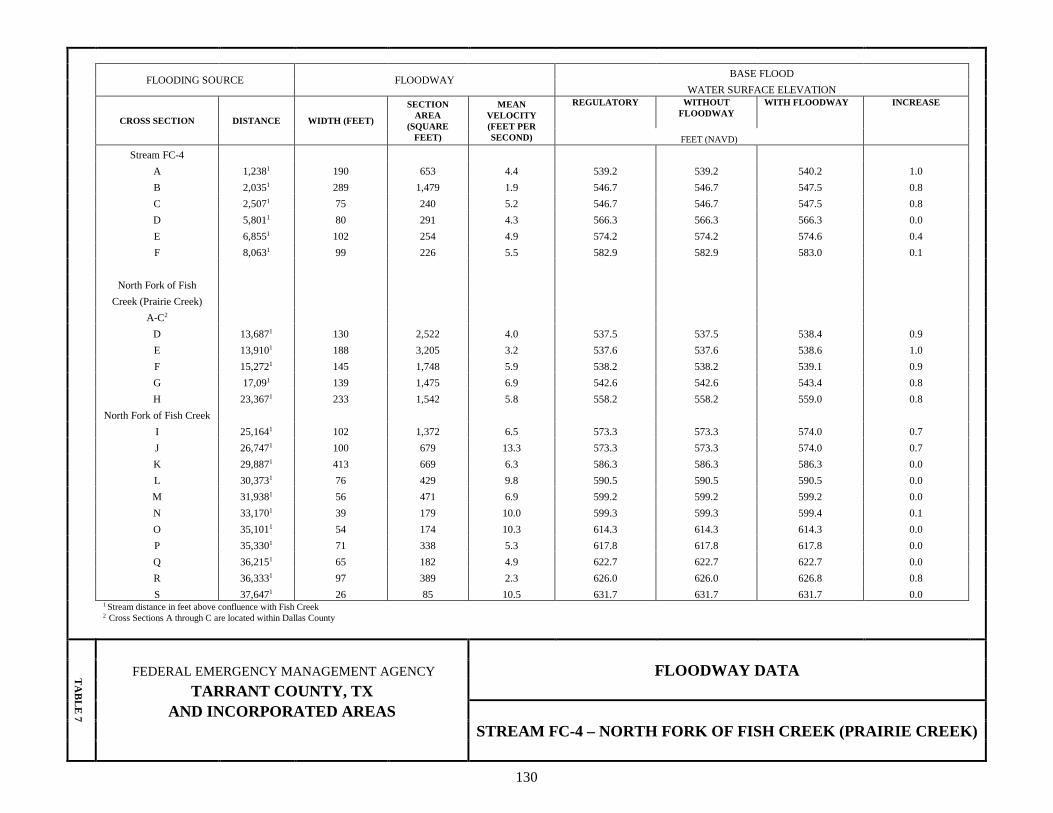
FLOODING SOURCE FLOODWAY BASE FLOOD
WATER SURFACE ELEVATION
CROSS SECTION DISTANCE WIDTH (FEET)
SECTION AREA
(SQUARE FEET)
MEAN VELOCITY (FEET PER SECOND)
REGULATORY WITHOUT FLOODWAY
WITH FLOODWAY INCREASE
FEET (NAVD)
Stream FC-4 A 1,2381 190 653 4.4 539.2 539.2 540.2 1.0 B 2,0351 289 1,479 1.9 546.7 546.7 547.5 0.8 C 2,5071 75 240 5.2 546.7 546.7 547.5 0.8 D 5,8011 80 291 4.3 566.3 566.3 566.3 0.0 E 6,8551 102 254 4.9 574.2 574.2 574.6 0.4 F 8,0631 99 226 5.5 582.9 582.9 583.0 0.1 North Fork of Fish Creek (Prairie Creek) A-C2 D 13,6871 130 2,522 4.0 537.5 537.5 538.4 0.9 E 13,9101 188 3,205 3.2 537.6 537.6 538.6 1.0 F 15,2721 145 1,748 5.9 538.2 538.2 539.1 0.9 G 17,091 139 1,475 6.9 542.6 542.6 543.4 0.8 H 23,3671 233 1,542 5.8 558.2 558.2 559.0 0.8 North Fork of Fish Creek I 25,1641 102 1,372 6.5 573.3 573.3 574.0 0.7 J 26,7471 100 679 13.3 573.3 573.3 574.0 0.7
K 29,8871 413 669 6.3 586.3 586.3 586.3 0.0 L 30,3731 76 429 9.8 590.5 590.5 590.5 0.0 M 31,9381 56 471 6.9 599.2 599.2 599.2 0.0 N 33,1701 39 179 10.0 599.3 599.3 599.4 0.1 O 35,1011 54 174 10.3 614.3 614.3 614.3 0.0 P 35,3301 71 338 5.3 617.8 617.8 617.8 0.0 Q 36,2151 65 182 4.9 622.7 622.7 622.7 0.0 R 36,3331 97 389 2.3 626.0 626.0 626.8 0.8 S 37,6471 26 85 10.5 631.7 631.7 631.7 0.0
1 Stream distance in feet above confluence with Fish Creek
2 Cross Sections A through C are located within Dallas County
TA
BL
E 7
FLOODWAY DATA FEDERAL EMERGENCY MANAGEMENT AGENCY
TARRANT COUNTY, TX AND INCORPORATED AREAS
STREAM FC-4 – NORTH FORK OF FISH CREEK (PRAIRIE CREEK)

131
FLOODING SOURCE FLOODWAY BASE FLOOD
WATER SURFACE ELEVATION
CROSS SECTION DISTANCE WIDTH (FEET)
SECTION AREA
(SQUARE FEET)
MEAN VELOCITY (FEET PER SECOND)
REGULATORY WITHOUT FLOODWAY
WITH FLOODWAY INCREASE
FEET (NAVD)
Stream NF-1 A 8841 46 230 5.1 578.6 578.6 579.3 0.7 B 1,1241 132 302 3.9 581.5 581.5 582.0 0.5 C 2,5161 21 67 10.1 589.9 589.9 589.9 0.0 Stream NF-2 A 5331 85 437 2.3 582.0 582.0 582.0 0.0 B 9641 50 264 3.8 582.0 582.0 582.0 0.0
1Stream distance in feet above confluence with North Fork of Fish Creeek
TA
BL
E 7
FLOODWAY DATA FEDERAL EMERGENCY MANAGEMENT AGENCY
TARRANT COUNTY, TX AND INCORPORATED AREAS
STREAM NF-1 – NF-2
132
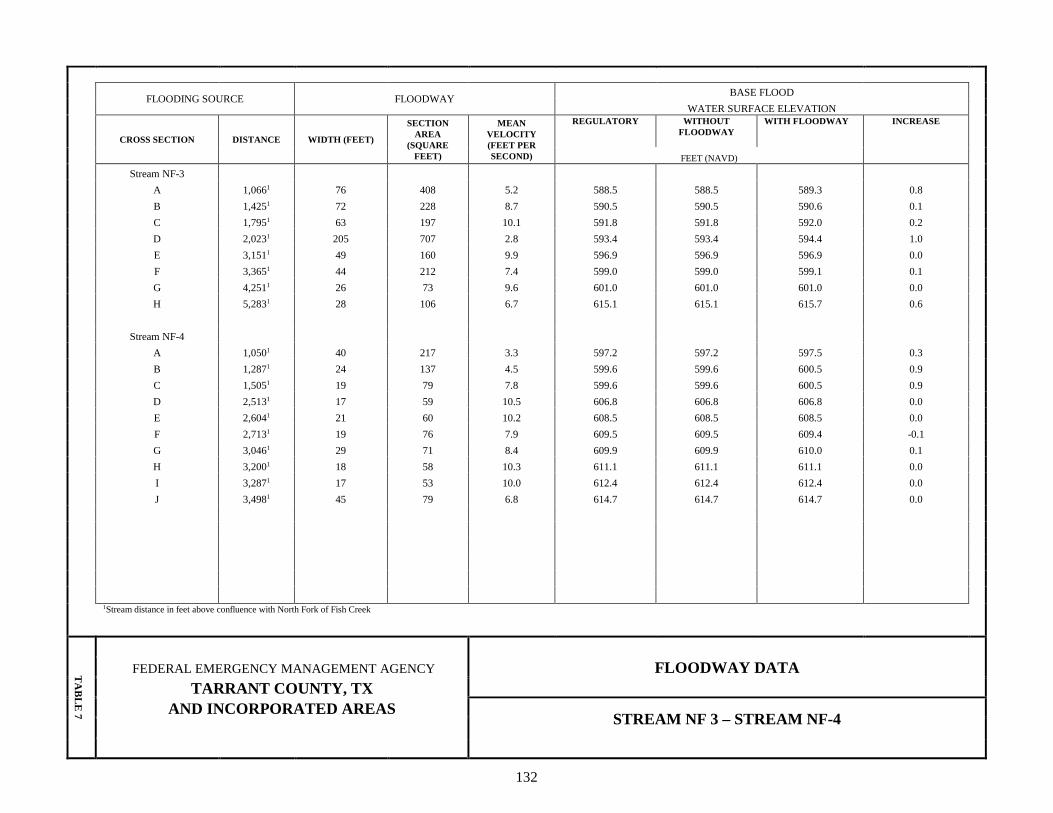
FLOODING SOURCE FLOODWAY BASE FLOOD
WATER SURFACE ELEVATION
CROSS SECTION DISTANCE WIDTH (FEET)
SECTION AREA
(SQUARE FEET)
MEAN VELOCITY (FEET PER SECOND)
REGULATORY WITHOUT FLOODWAY
WITH FLOODWAY INCREASE
FEET (NAVD)
Stream NF-3 A 1,0661 76 408 5.2 588.5 588.5 589.3 0.8 B 1,4251 72 228 8.7 590.5 590.5 590.6 0.1 C 1,7951 63 197 10.1 591.8 591.8 592.0 0.2 D 2,0231 205 707 2.8 593.4 593.4 594.4 1.0 E 3,1511 49 160 9.9 596.9 596.9 596.9 0.0 F 3,3651 44 212 7.4 599.0 599.0 599.1 0.1 G 4,2511 26 73 9.6 601.0 601.0 601.0 0.0 H 5,2831 28 106 6.7 615.1 615.1 615.7 0.6 Stream NF-4 A 1,0501 40 217 3.3 597.2 597.2 597.5 0.3 B 1,2871 24 137 4.5 599.6 599.6 600.5 0.9 C 1,5051 19 79 7.8 599.6 599.6 600.5 0.9 D 2,5131 17 59 10.5 606.8 606.8 606.8 0.0 E 2,6041 21 60 10.2 608.5 608.5 608.5 0.0 F 2,7131 19 76 7.9 609.5 609.5 609.4 -0.1 G 3,0461 29 71 8.4 609.9 609.9 610.0 0.1
H 3,2001 18 58 10.3 611.1 611.1 611.1 0.0 I 3,2871 17 53 10.0 612.4 612.4 612.4 0.0 J 3,4981 45 79 6.8 614.7 614.7 614.7 0.0
1Stream distance in feet above confluence with North Fork of Fish Creek
TA
BL
E 7
FLOODWAY DATA FEDERAL EMERGENCY MANAGEMENT AGENCY
TARRANT COUNTY, TX AND INCORPORATED AREAS STREAM NF 3 – STREAM NF-4

133
FLOODING SOURCE FLOODWAY BASE FLOOD
WATER SURFACE ELEVATION
CROSS SECTION DISTANCE1 WIDTH (FEET)
SECTION AREA
(SQUARE FEET)
MEAN VELOCITY (FEET PER SECOND)
REGULATORY WITHOUT FLOODWAY
WITH FLOODWAY INCREASE
FEET (NAVD) Johnson Creek A-C1 D 9,7352 333 1,524 12.1 467.0 467.0 467.0 0.0 E 10,5912 218 2,118 8.5 473.8 473.8 474.0 0.2 F 11,2472 188 2,267 8.0 476.8 476.8 477.3 0.5 G 12,2012 216 2,858 6.3 480.6 480.6 481.0 0.4 H 13,1052 414 2,292 7.9 482.3 482.3 482.8 0.5 I 13,6622 253 2,332 7.7 486.4 486.4 486.6 0.2 J 14,2482 214 2,486 7.2 489.8 489.8 489.9 0.1 K 14,8392 468 2,888 8.0 491.1 491.1 491.4 0.3 L 15,2462 394 2,686 6.7 493.0 493.0 493.2 0.2 M 15,8292 185 1,482 12.1 497.9 497.9 497.9 0.0 N 16,0292 158 2,647 6.8 505.9 505.9 505.9 0.0 O 17,8272 372 3,508 5.1 507.1 507.1 507.7 0.6 P 18,7562 166 2,207 8.1 510.1 510.1 510.5 0.4 Q 19,3962 164 2,109 8.5 511.3 511.3 511.6 0.3 R 20,7842 135 2,510 7.2 517.0 517.0 517.4 0.4
1Cross sections A through C are located with Dallas County
2 Stream distance in feet above confluence with West Fork Trinity River
TA
BL
E 7
FLOODWAY DATA FEDERAL EMERGENCY MANAGEMENT AGENCY
TARRANT COUNTY, TX AND INCORPORATED AREAS
JOHNSON CREEK

134
FLOODING SOURCE FLOODWAY BASE FLOOD
WATER SURFACE ELEVATION
CROSS SECTION DISTANCE1 WIDTH (FEET)
SECTION AREA
(SQUARE FEET)
MEAN VELOCITY (FEET PER SECOND)
REGULATORY WITHOUT FLOODWAY
WITH FLOODWAY INCREASE
FEET (NAVD) Little Fossil Creek A 9,750 1,309 4,008 5.7 516.3 516.1 517.1 1.0 B 10,800 732 3,380 7.5 520.6 520.6 520.7 0.1 C 12,745 675 6,294 2.8 531.3 531.3 531.8 0.5 D 14,425 798 4,627 3.8 534.5 534.5 534.9 0.4 E 15,590 798 4,663 3.7 536.2 536.2 537 0.8 F 16,545 750 4,465 3.8 538.5 538.5 539.2 0.7 G 18,175 500 2,609 6.5 543.0 543.0 543.7 0.7 H 20,315 275 2,282 7.4 550.8 550.8 551. 7 0.9 I 20,925 275 2,641 6.4 553.5 553.5 554.3 0.8 J 22,600 275 2,712 5.8 559.0 559.0 559.9 0.9 K 23,465 300 1,808 8.1 561.5 561.5 562.3 0.8 L 25,920 525 5,771 2.7 578.7 578.7 578.9 0.2 M 28,600 298 2,809 4.5 582.5 582.5 583.4 0.9
N 30,880 105 1,235 10.2 585.9 585.9 586.7 0.8 O 32,730 90 1,176 8.2 591.4 591.4 591.6 0.2 P 33,920 95 921 10.5 595.1 595.1 595.1 0.0 Q 35,195 330 2,205 4.4 603.6 603.6 603.7 0.1 R 35,560 190 1,422 6.8 606.8 606.8 607.8 1.0 S 37,870 175 1,468 6.2 612.8 612.8 613.1 0.3 T 39,684 250 1,378 6.4 617.8 617.8 618.6 0.8 U 40,600 140 1,161 6.6 621.9 621.9 622.7 0.8 V 44,350 198 1,661 4.4 639.7 639.7 640.5 0.8 W 47,060 200 737 9.6 649.0 649.0 649.0 0.0
1Stream distance in feet above confluence with Big Fossil Creek
TA
BL
E 7
FLOODWAY DATA FEDERAL EMERGENCY MANAGEMENT AGENCY
TARRANT COUNTY, TX AND INCORPORATED AREAS
LITTLE FOSSIL CREEK
135
FLOODING SOURCE FLOODWAY BASE FLOOD
WATER SURFACE ELEVATION
CROSS SECTION DISTANCE1 WIDTH (FEET)
SECTION AREA
(SQUARE FEET)
MEAN VELOCITY (FEET PER SECOND)
REGULATORY WITHOUT FLOODWAY
WITH FLOODWAY INCREASE
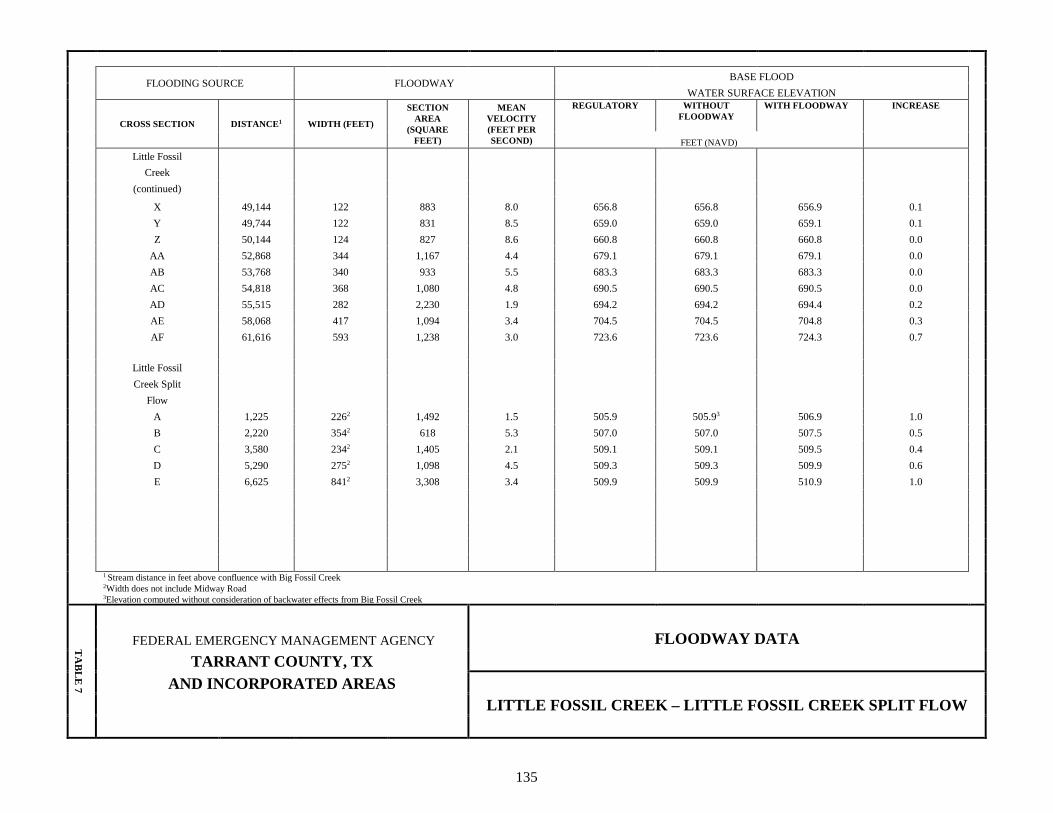
FEET (NAVD) Little Fossil Creek (continued) X 49,144 122 883 8.0 656.8 656.8 656.9 0.1 Y 49,744 122 831 8.5 659.0 659.0 659.1 0.1 Z 50,144 124 827 8.6 660.8 660.8 660.8 0.0 AA 52,868 344 1,167 4.4 679.1 679.1 679.1 0.0 AB 53,768 340 933 5.5 683.3 683.3 683.3 0.0 AC 54,818 368 1,080 4.8 690.5 690.5 690.5 0.0 AD 55,515 282 2,230 1.9 694.2 694.2 694.4 0.2 AE 58,068 417 1,094 3.4 704.5 704.5 704.8 0.3 AF 61,616 593 1,238 3.0 723.6 723.6 724.3 0.7 Little Fossil Creek Split Flow
A 1,225 2262 1,492 1.5 505.9 505.93 506.9 1.0 B 2,220 3542 618 5.3 507.0 507.0 507.5 0.5 C 3,580 2342 1,405 2.1 509.1 509.1 509.5 0.4 D 5,290 2752 1,098 4.5 509.3 509.3 509.9 0.6 E 6,625 8412 3,308 3.4 509.9 509.9 510.9 1.0
1 Stream distance in feet above confluence with Big Fossil Creek 2Width does not include Midway Road 3Elevation computed without consideration of backwater effects from Big Fossil Creek
TA
BL
E 7
FLOODWAY DATA FEDERAL EMERGENCY MANAGEMENT AGENCY
TARRANT COUNTY, TX AND INCORPORATED AREAS
LITTLE FOSSIL CREEK – LITTLE FOSSIL CREEK SPLIT FLOW

136
FLOODING SOURCE FLOODWAY BASE FLOOD
WATER SURFACE ELEVATION
CROSS SECTION DISTANCE1 WIDTH (FEET)
SECTION AREA
(SQUARE FEET)
MEAN VELOCITY (FEET PER SECOND)
REGULATORY WITHOUT FLOODWAY
WITH FLOODWAY INCREASE
FEET (NAVD) Singing Hills Creek A 2,160 211 1,245 8.5 544.4 544.22 544.8 0.6 B 2,820 350 3,222 3.3 551.0 551.0 551.8 0.8 C 3,930 350 1,997 5.3 552.8 552.8 553.5 0.7 D 4,850 221 1,578 6.7 556.9 556.9 557.6 0.7 E 6,070 219 1,550 6.8 562.3 562.3 563.1 0.8 F 7,710 220 1,564 6.7 574.3 574.3 574.9 0.6 G 9,460 58 430 21.0 574.8 574.8 574.8 0.0 H 10,000 60 447 20.1 577.2 577.2 577.2 0.0 I 10,420 50 399 22.6 578.6 578.6 578.6 0.0 J 11,200 50 297 19.5 584.1 584.1 584.1 0.0 K 12,360 117 947 6.1 594.6 594.6 594.8 0.2 L 12,740 224 796 7.3 598.0 598.0 598.1 0.1 M 13,495 45 425 9.3 601.0 601.0 601.7 0.7
N 14,440 54 202 19.5 602.9 602.9 602.9 0.0 O 15,295 55 165 23.9 607.1 607.1 607.1 0.0 P 15,450 240 1,270 6.2 618.5 618.5 619.3 0.8 Q 18,200 264 717 3.8 633.4 633.4 633.5 0.1 R 19,460 114 521 5.3 638.4 638.4 638.4 0.0 S 21,185 203 775 3.6 648.0 648.0 648.9 0.9 T 21,810 161 598 4.6 651.0 651.0 651.6 0.6 U 21,980 210 344 3.3 653.7 653.7 654.7 0.0
1Stream distance in feet above confluence with Big Fossil Creek
2Elevation computed without consideration of backwater effects from Big Fossil Creek
TA
BL
E 7
FLOODWAY DATA FEDERAL EMERGENCY MANAGEMENT AGENCY
TARRANT COUNTY, TX AND INCORPORATED AREAS
SINGING HILLS CREEK

137
FLOODING SOURCE FLOODWAY BASE FLOOD
WATER SURFACE ELEVATION
CROSS SECTION DISTANCE1 WIDTH (FEET)
SECTION AREA
(SQUARE FEET)
MEAN VELOCITY (FEET PER SECOND)
REGULATORY WITHOUT FLOODWAY
WITH FLOODWAY INCREASE
FEET (NAVD) Sycamore Creek A 339 527 6,596 4.3 521.9 521.9 522.0 0.1 B 1,056 291 3,834 7.5 522.6 522.6 522.6 0.0 C 2,510 313 3,650 7.8 524.9 524.9 525.6 0.7 D 3,724 520 8,105 3.6 528.5 528.5 529.4 0.9 E 6,422 713 4,061 7.1 529.2 529.2 530.2 1.0 F 6,945 606 6,281 5.2 532.5 532.5 533.0 0.5 G 8,473 370 2,462 11.7 533.5 533.5 533.7 0.2 H 9,385 239 3,204 9.0 540.8 540.8 541.5 0.7 I 10,375 540 6,414 4.5 542.8 542.8 543.3 0.5 J 11,860 436 3,593 7.9 543.7 543.7 544.7 1.0 K 13,843 562 6,771 4.2 552.2 552.2 552.3 0.1 L 15,536 451 2,917 9.4 553.1 553.1 553.5 0.4 M 18,266 635 7,382 3.6 561.4 561.4 562.3 0.9 N 19,937 582 3,396 7.8 566.5 566.5 566.8 0.3
O 21,372 530 6,022 4.4 573.9 573.9 574.7 0.8 P 23,535 354 4,626 5.7 577.7 577.7 577.9 0.2 Q 25,308 199 3,212 8.0 580.9 580.9 581.5 0.6
R 26,703 365 6,236 4.1 587.2 587.2 587.6 0.4 S 29,441 235 3,469 7.0 589.8 589.8 590.7 0.9 U 34,956 323 2,168 10.5 608.4 608.4 608.8 0.4 V 36,387 591 3,471 6.6 614.7 614.7 614.7 0.0 S 29,441 235 3,469 7.0 589.8 589.8 590.7 0.9 T 31,891 511 4,596 5.3 602.9 602.9 602.9 0.0 U 34,956 323 2,168 10.5 608.4 608.4 608.8 0.4 V 36,387 591 3,471 6.6 614.7 614.7 614.7 0.0 1Stream distance in feet above the confluence with West Fork Trinity River
FLOODWAY DATA
TA
BL
E 7
FEDERAL EMERGENCY MANAGEMENT AGENCY TARRANT COUNTY, TX
AND INCORPORATED AREAS SYCAMORE CREEK
138
FLOODING SOURCE FLOODWAY BASE FLOOD
WATER SURFACE ELEVATION
CROSS SECTION DISTANCE1 WIDTH (FEET)
SECTION AREA
(SQUARE FEET)
MEAN VELOCITY (FEET PER SECOND)
REGULATORY WITHOUT FLOODWAY
WITH FLOODWAY INCREASE
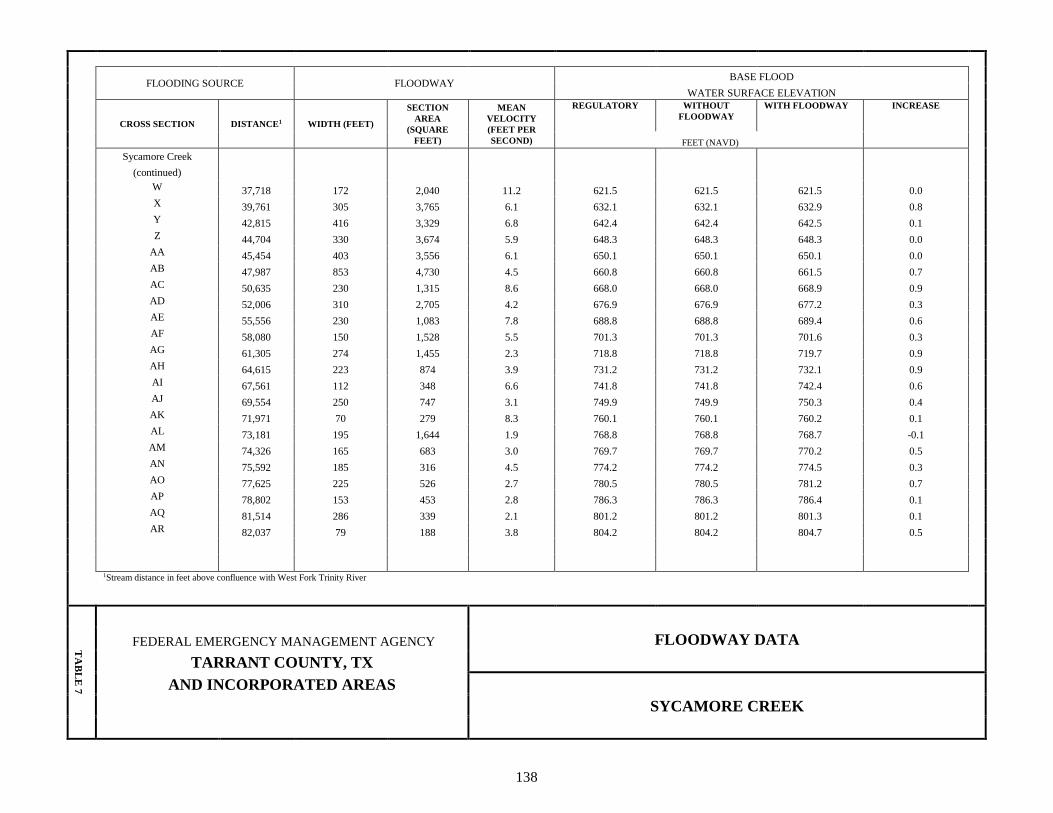
FEET (NAVD) Sycamore Creek (continued) W 37,718 172 2,040 11.2 621.5 621.5 621.5 0.0 X 39,761 305 3,765 6.1 632.1 632.1 632.9 0.8 Y 42,815 416 3,329 6.8 642.4 642.4 642.5 0.1 Z 44,704 330 3,674 5.9 648.3 648.3 648.3 0.0 AA 45,454 403 3,556 6.1 650.1 650.1 650.1 0.0 AB 47,987 853 4,730 4.5 660.8 660.8 661.5 0.7 AC 50,635 230 1,315 8.6 668.0 668.0 668.9 0.9 AD 52,006 310 2,705 4.2 676.9 676.9 677.2 0.3 AE 55,556 230 1,083 7.8 688.8 688.8 689.4 0.6 AF 58,080 150 1,528 5.5 701.3 701.3 701.6 0.3 AG 61,305 274 1,455 2.3 718.8 718.8 719.7 0.9 AH 64,615 223 874 3.9 731.2 731.2 732.1 0.9 AI 67,561 112 348 6.6 741.8 741.8 742.4 0.6
AJ 69,554 250 747 3.1 749.9 749.9 750.3 0.4 AK 71,971 70 279 8.3 760.1 760.1 760.2 0.1 AL 73,181 195 1,644 1.9 768.8 768.8 768.7 -0.1 AM 74,326 165 683 3.0 769.7 769.7 770.2 0.5 AN 75,592 185 316 4.5 774.2 774.2 774.5 0.3 AO 77,625 225 526 2.7 780.5 780.5 781.2 0.7 AP 78,802 153 453 2.8 786.3 786.3 786.4 0.1 AQ 81,514 286 339 2.1 801.2 801.2 801.3 0.1 AR 82,037 79 188 3.8 804.2 804.2 804.7 0.5
1Stream distance in feet above confluence with West Fork Trinity River
TA
BL
E 7
FLOODWAY DATA FEDERAL EMERGENCY MANAGEMENT AGENCY
TARRANT COUNTY, TX AND INCORPORATED AREAS
SYCAMORE CREEK
139
FLOODING SOURCE FLOODWAY BASE FLOOD
WATER SURFACE ELEVATION
CROSS SECTION DISTANCE1 WIDTH (FEET)
SECTION AREA
(SQUARE FEET)
MEAN VELOCITY (FEET PER SECOND)
REGULATORY WITHOUT FLOODWAY
WITH FLOODWAY INCREASE
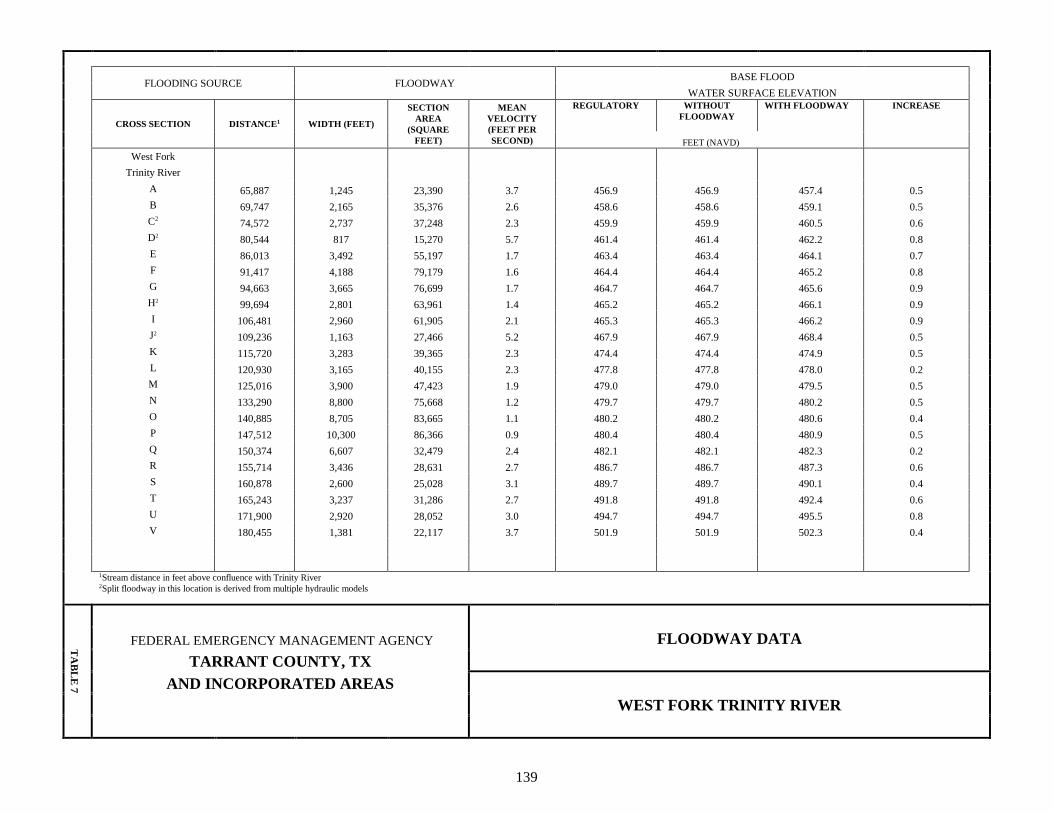
FEET (NAVD) West Fork Trinity River A 65,887 1,245 23,390 3.7 456.9 456.9 457.4 0.5 B 69,747 2,165 35,376 2.6 458.6 458.6 459.1 0.5 C2 74,572 2,737 37,248 2.3 459.9 459.9 460.5 0.6 D2 80,544 817 15,270 5.7 461.4 461.4 462.2 0.8 E 86,013 3,492 55,197 1.7 463.4 463.4 464.1 0.7 F 91,417 4,188 79,179 1.6 464.4 464.4 465.2 0.8 G 94,663 3,665 76,699 1.7 464.7 464.7 465.6 0.9 H2 99,694 2,801 63,961 1.4 465.2 465.2 466.1 0.9 I 106,481 2,960 61,905 2.1 465.3 465.3 466.2 0.9 J2 109,236 1,163 27,466 5.2 467.9 467.9 468.4 0.5 K 115,720 3,283 39,365 2.3 474.4 474.4 474.9 0.5 L 120,930 3,165 40,155 2.3 477.8 477.8 478.0 0.2 M 125,016 3,900 47,423 1.9 479.0 479.0 479.5 0.5 N 133,290 8,800 75,668 1.2 479.7 479.7 480.2 0.5 O 140,885 8,705 83,665 1.1 480.2 480.2 480.6 0.4 P 147,512 10,300 86,366 0.9 480.4 480.4 480.9 0.5 Q 150,374 6,607 32,479 2.4 482.1 482.1 482.3 0.2 R 155,714 3,436 28,631 2.7 486.7 486.7 487.3 0.6 S 160,878 2,600 25,028 3.1 489.7 489.7 490.1 0.4 T 165,243 3,237 31,286 2.7 491.8 491.8 492.4 0.6 U 171,900 2,920 28,052 3.0 494.7 494.7 495.5 0.8 V 180,455 1,381 22,117 3.7 501.9 501.9 502.3 0.4
1Stream distance in feet above confluence with Trinity River 2Split floodway in this location is derived from multiple hydraulic models
TA
BL
E 7
FLOODWAY DATA FEDERAL EMERGENCY MANAGEMENT AGENCY
TARRANT COUNTY, TX AND INCORPORATED AREAS
WEST FORK TRINITY RIVER

140
FLOODING SOURCE FLOODWAY BASE FLOOD
WATER SURFACE ELEVATION
CROSS SECTION DISTANCE1 WIDTH (FEET)
SECTION AREA
(SQUARE FEET)
MEAN VELOCITY (FEET PER SECOND)
REGULATORY WITHOUT FLOODWAY
WITH FLOODWAY INCREASE
FEET (NAVD) Whites Branch A 3,230 453 2,909 4.6 566.2 557.82 558.7 0.9 B 4,270 330 2,753 4.8 566.2 562.02 562.9 0.9 C 6,380 400 2,794 4.8 567.4 567.4 568.2 0.8 D 7,230 410 2,830 4.9 570.0 570.0 570.8 0.8 E 8,350 310 2,795 5.0 573.9 573.9 574.5 0.6 F 9,420 400 2,845 4.9 577.0 577.0 577.8 0.8 G 11,020 390 2,493 5.6 584.1 584.1 584.3 0.2 H 13,240 350 2,270 6.2 591.3 591.3 591.4 0.1 I 14,870 350 2,708 5.2 597.6 597.6 598.3 0.7 J 17,560 600 2,997 4.7 605.9 605.9 606.4 0.5 K 20,270 440 2,921 4.6 615.1 615.1 615.7 0.6 L 23,195 750 3,243 4.2 623.4 623.4 623.8 0.4 M 28,870 430 2,643 4.1 641.8 641.8 642.0 0.2 N 31,010 330 2,250 3.3 647.0 647.0 647.3 0.3
O 32,605 203 631 5.1 658.3 658.3 658.5 0.2 P 34,070 120 677 4.0 665.8 665.8 666.5 0.7 3,230 453 2,909 4.6 566.2 557.82 558.7 0.9
1Stream distance in feet above confluence with Big Fossil Creek 2Elevation computed without consideration of backwater effects from Big Fossil Creek
TA
BL
E 7
FLOODWAY DATA FEDERAL EMERGENCY MANAGEMENT AGENCY
TARRANT COUNTY, TX AND INCORPORATED AREAS
WHITES BRANCH

218
The area between the floodway and 1-percent-annual-chance floodplain boundaries is termed the floodway fringe. The floodway fringe encompasses the portion of the floodplain that could be completely obstructed without increasing the water-surface elevation (WSEL) of the base flood more than 1 foot at any point. Typical relationships between the floodway and the floodway fringe and their significance to floodplain development are shown in Figure 2.
Figure 2. Floodway Schematic
In the case of redelineation, effort was made to maintain the prior effective regulatory floodway width and shape. However, due to updated topographic data, some modifications were made to contain the floodway within the limits of the 1-percent-annual-chance floodplain. Most modifications to the prior effective regulatory floodway boundaries are due to topographic changes that have occurred along the streams. Floodways for the following flooding sources were not developed: Farris Branch, Farris Branch East, Mesquite Branch, Stream SC-7A, Timber Creek Diversion, a reach of Kirkwood Branch, Kirkwood Branch Tributary, and Hurricane Creek Tributary 1. Within the City of Grapevine, for the upstream reach of Denton Creek, a floodway is not shown inside U.S. Government Property Fee and/or Flowage Easement Boundaries. Within the City of Richland Hills, the floodway for the sump adjacent to Big Fossil Creek has been determined to be coincident with the Government Property Fee and/or Flowage Easement Boundary and the 1-percent-annual-chance floodplain boundary and is not shown on the map. The floodways at certified levees have been mapped to the landside toe of the levee for all floodways except along Big Fossil Creek and the Fort Worth Floodway system which includes portions of Clear Fork Trinity River and West Fork Trinity River. These floodways have been mapped in accordance with the standards outlined in Proceedure Memorandum No. 52, which allows the computed location of the floodway limit be mapped instead of mapping the floodway to the landward toe of the levee. The widths shown in Table 6 “Floodway Data” are the widths from the model and do not represent the width of floodway to the landside toe.

219
5.0 INSURANCE APPLICATIONS
For flood insurance rating purposes, flood insurance zone designations are assigned to a community based on the results of the engineering analyses. These zones are as follows: Zone A Zone A is the flood insurance rate zone that corresponds to the 1-percent-annual-chance floodplains that are determined in the FIS report by approximate methods. Because detailed hydraulic analyses are not performed for such areas, no BFEs or depths are shown within this zone. Zone AE Zone AE is the flood insurance rate zone that corresponds to the 1-percent-annual-chance floodplains that are determined in the FIS report by detailed methods. Whole-foot BFEs derived from the detailed hydraulic analyses are shown at selected intervals within this zone. Zone AO Zone AO is the flood insurance rate zone that corresponds to areas of 1-percent-annual-chance shallow flooding (usually sheet flow on sloping terrain) where average depths are between 1 and 3 feet. Average whole-foot depths derived from the detailed hydraulic analyses are shown within this zone. Zone X Zone X is the flood insurance rate zone that corresponds to areas outside the 0.2-percent-annual-chance floodplain, areas within the 0.2-percent-annual-chance floodplain, areas of 1-percent-annual-chance flooding where average depths are less than 1 foot, areas of 1-percent-annual-chance flooding where the contributing drainage area is less than 1 square mile (sq. mi.), and areas protected from the base flood by levees. No BFEs or depths are shown within this zone.
6.0 FLOOD INSURANCE RATE MAP
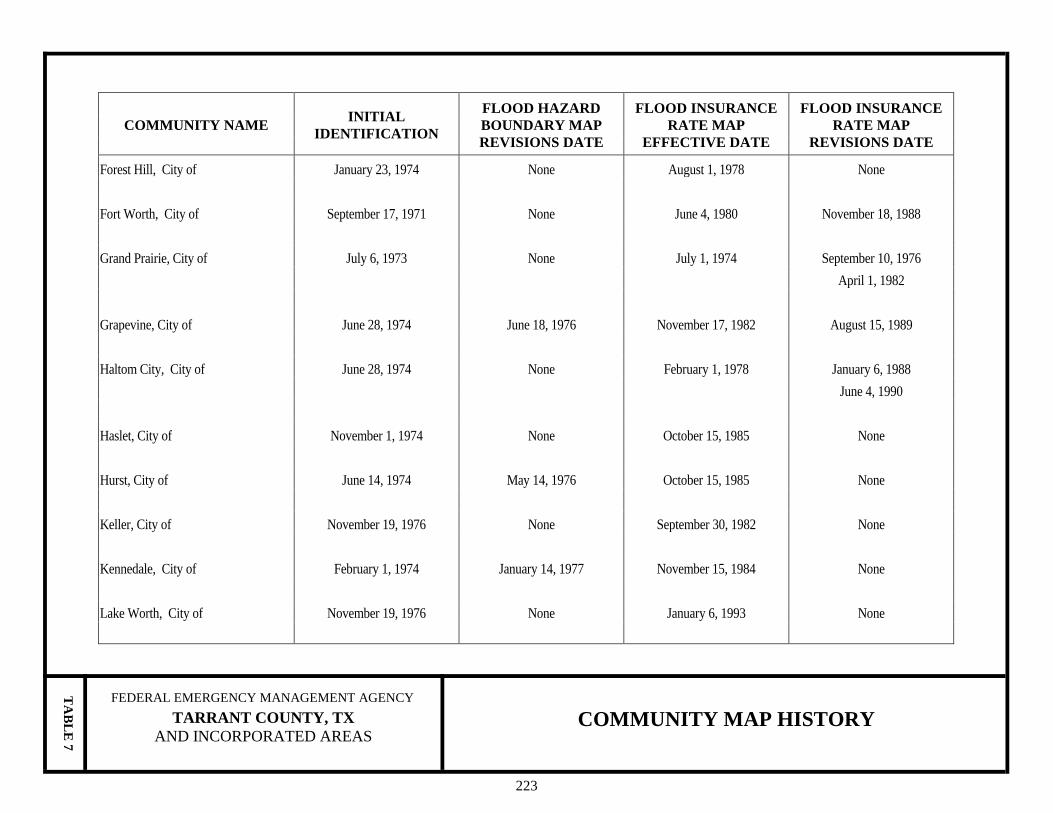
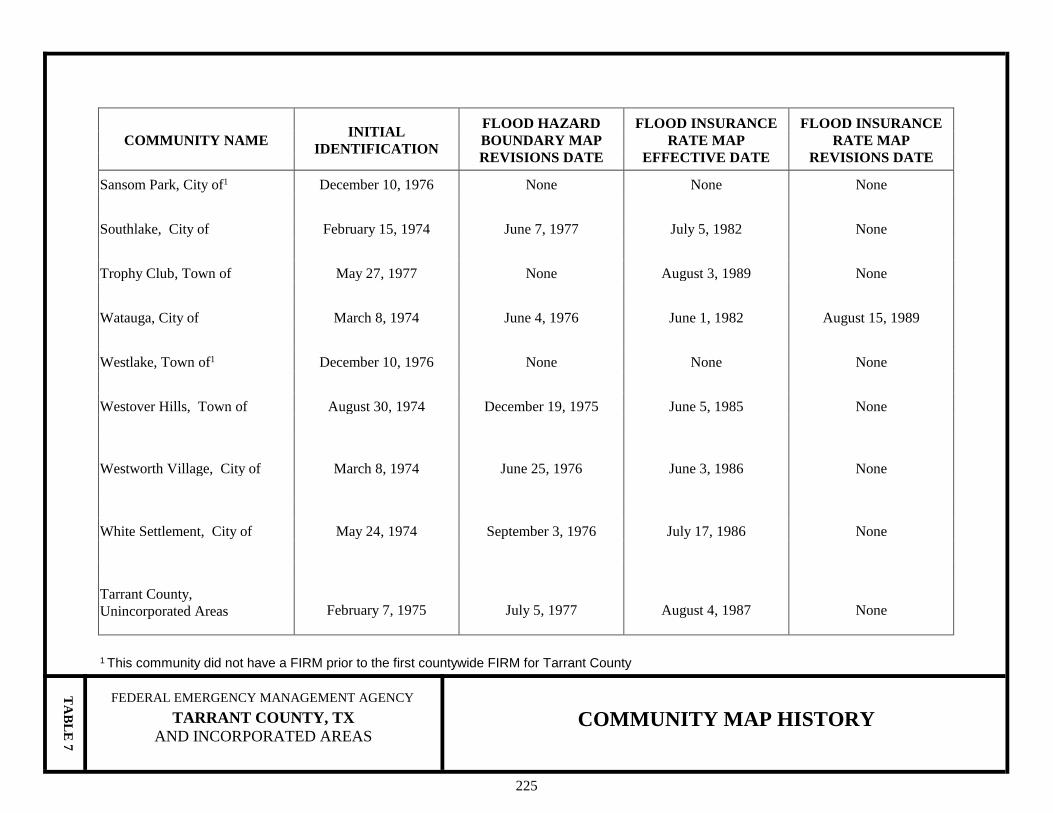
The FIRM is designed for flood insurance and floodplain management applications. For flood insurance applications, the map designates flood insurance rate zones as described in Section 5.0 and, in the 1-percent-annual-chance floodplains that were studied by detailed methods, shows selected whole-foot BFEs or average depths. Insurance agents use zones and BFEs in conjunction with information on structures and their contents to assign premium rates for flood insurance policies. For floodplain management applications, the map shows by tints, screens, and symbols, the 1- and 0.2-percent-annual-chance floodplains, floodways, and the locations of selected cross sections used in the hydraulic analyses and floodway computations. The countywide FIRM presents flooding information for the entire geographic area of Tarrant County. Previously, FIRMs were prepared for each incorporated community and the unincorporated areas of the county identified as flood-prone. This countywide FIRM also includes flood-hazard information that was presented separately on Flood Boundary and Floodway
220
Maps (FBFMs), where applicable. Historical data relating to the maps prepared for each community prior to the initial countywide FIRM are presented in Table 7, “Community Map History.”

221
TA
BL
E 7
FEDERAL EMERGENCY MANAGEMENT AGENCY TARRANT COUNTY, TX
AND INCORPORATED AREAS
COMMUNITY NAME INITIAL IDENTIFICATION
FLOOD HAZARD BOUNDARY MAP REVISIONS DATE
FLOOD INSURANCE RATE MAP
EFFECTIVE DATE
FLOOD INSURANCE RATE MAP
REVISIONS DATE
Arlington, City of August 7, 1970 None December 31, 1974 March 5, 1976 June 20, 1980 February 4, 1988 Azle, City of March 8, 1974 None October 15, 1985 None Bedford, City of December 28, 1973 March 12, 1976 July 18, 1977 April 17, 1984 March 18, 1987 June 4, 1990 Benbrook, City of May 3, 1974 March 4, 1977 July 2, 1979 September 18, 1986 January 18, 1989 November 16, 1990 Blue Mound, City of December 17, 1973 April 23, 1976 July 16, 1980 None
COMMUNITY MAP HISTORY

222
TA
BL
E 7
FEDERAL EMERGENCY MANAGEMENT AGENCY TARRANT COUNTY, TX
AND INCORPORATED AREAS
COMMUNITY NAME INITIAL IDENTIFICATION
FLOOD HAZARD BOUNDARY MAP REVISIONS DATE
FLOOD INSURANCE RATE MAP
EFFECTIVE DATE
FLOOD INSURANCE RATE MAP
REVISIONS DATE
Burleson, City of November 2, 1973 None December 31, 1974 July 1, 1974 April 16, 1976 June 24, 1977 December 3, 1987 September 27, 1991 Colleyville, City of May 10, 1974 March 4, 1977 December 1, 1982 None Crowley, City of June 28, 1974 July 2, 1976 April 15, 1981 None May 15, 1979 Dalworthington Gardens, City of August 6, 1976 None May 17, 1982 None Edgecliff Village, Town of December 28, 1973 February 4, 1977 August 19, 1986 None Euless, City of March 22, 1974 December 17, 1976 April 3, 1985 None Everman, City of December 17, 1973 August 27, 1976 September 17, 1980 None May 31, 1977 Flower Mound, Town of October 29, 1976 None September 18, 1986 None
COMMUNITY MAP HISTORY
223
TA
BL
E 7
FEDERAL EMERGENCY MANAGEMENT AGENCY TARRANT COUNTY, TX
AND INCORPORATED AREAS
COMMUNITY NAME INITIAL IDENTIFICATION
FLOOD HAZARD BOUNDARY MAP REVISIONS DATE
FLOOD INSURANCE RATE MAP
EFFECTIVE DATE
FLOOD INSURANCE RATE MAP
REVISIONS DATE
Forest Hill, City of January 23, 1974 None August 1, 1978 None Fort Worth, City of September 17, 1971 None June 4, 1980 November 18, 1988 Grand Prairie, City of July 6, 1973 None July 1, 1974 September 10, 1976 April 1, 1982 Grapevine, City of June 28, 1974 June 18, 1976 November 17, 1982 August 15, 1989 Haltom City, City of June 28, 1974 None February 1, 1978 January 6, 1988 June 4, 1990 Haslet, City of November 1, 1974 None October 15, 1985 None Hurst, City of June 14, 1974 May 14, 1976 October 15, 1985 None Keller, City of November 19, 1976 None September 30, 1982 None Kennedale, City of February 1, 1974 January 14, 1977 November 15, 1984 None Lake Worth, City of November 19, 1976 None January 6, 1993 None
COMMUNITY MAP HISTORY

224
1 This community did not have a FIRM prior to the first countywide FIRM for Tarrant County
TA
BL
E 7
FEDERAL EMERGENCY MANAGEMENT AGENCY TARRANT COUNTY, TX
AND INCORPORATED AREAS
COMMUNITY NAME INITIAL IDENTIFICATION
FLOOD HAZARD BOUNDARY MAP REVISIONS DATE
FLOOD INSURANCE RATE MAP
EFFECTIVE DATE
FLOOD INSURANCE RATE MAP
REVISIONS DATE
Lakeside, City of1 None None None None Mansfield, City of February 22, 1974 May 10, 1977 December 18, 1985 September 28, 1990 North Richland Hills, City of June 28, 1974 August 6, 1976 April 1, 1981 November 15, 1985 December 16, 1988 Pantego, Town of August 13, 1976 None July 16, 1980 None Pelican Bay, City of1 None None None None Reno, Town of1 None None None None Richland Hills, City of March 15, 1974 None February 16, 1977 July 3, 1985 River Oaks, City of December 28, 1973 February 6, 1976 June 19, 1985 None Roanoke, City of1 September 5, 1975 None None None
Saginaw, City of March 8, 1974 September 24, 1976 September 17, 1980 None
COMMUNITY MAP HISTORY
225
TA
BL
E 7
FEDERAL EMERGENCY MANAGEMENT AGENCY TARRANT COUNTY, TX
AND INCORPORATED AREAS
COMMUNITY NAME INITIAL IDENTIFICATION
FLOOD HAZARD BOUNDARY MAP REVISIONS DATE
FLOOD INSURANCE RATE MAP
EFFECTIVE DATE
FLOOD INSURANCE RATE MAP
REVISIONS DATE
Sansom Park, City of1 December 10, 1976 None None None Southlake, City of February 15, 1974 June 7, 1977 July 5, 1982 None Trophy Club, Town of May 27, 1977 None August 3, 1989 None Watauga, City of March 8, 1974 June 4, 1976 June 1, 1982 August 15, 1989 Westlake, Town of1 December 10, 1976 None None None Westover Hills, Town of August 30, 1974 December 19, 1975 June 5, 1985 None
Westworth Village, City of March 8, 1974 June 25, 1976 June 3, 1986 None White Settlement, City of May 24, 1974 September 3, 1976 July 17, 1986 None Tarrant County, Unincorporated Areas February 7, 1975 July 5, 1977 August 4, 1987 None
1 This community did not have a FIRM prior to the first countywide FIRM for Tarrant County
COMMUNITY MAP HISTORY

226
7.0 OTHER STUDIES The preparation of updated FISs is on-going for the Incorporated and Unincorporated Areas of Dallas and Johnson Counties, Texas. The Tarrant County Study is in agreement with this study and current FISs for other adjacent counties. This is a multi-volume FIS. Each volume may be revised separately, in which case it supersedes the previously printed volume. Users should refer to the Table of Contents in Volume 1 for the current effective date of each volume; volumes bearing these dates contain the most up-to-date flood hazard data. This FIS report either supersedes or is compatible with all previous studies published on streams studied in this report and should be considered authoritative for the purposes of the NFIP.
8.0 LOCATION OF DATA
Information concerning the pertinent data used in the preparation of this study can be obtained by contacting FEMA Region VI, Federal Insurance and Mitigation Division, 800 North Loop 288, Denton, Texas 76209.
9.0 BIBLIOGRAPHY AND REFERENCES
1. Federal Emergency Management Agency, Flood Insurance Study, Unincorporated Areas of Tarrant County, Texas, Washington, D. C., August 4, 1987.
2. Federal Emergency Management Agency, Flood Insurance Study, City of Azle, Tarrant and Parker Counties, Texas, Washington, D.C., October 15, 1985.
3. Federal Emergency Management Agency, Flood Insurance Study, City of Arlington, Tarrant County,
Texas, Washington, D.C., February 4, 1988.
4. Federal Emergency Management Agency, Flood Insurance Study, City of Bedford, Tarrant County, Texas, Washington, D.C., June 4, 1990.
5. Federal Emergency Management Agency, Flood Insurance Study, City of Benbrook, Tarrant County, Texas, Washington, D.C., November 16, 1990.
6. Federal Emergency Management Agency, Flood Insurance Study, City of Blue Mound, Tarrant
County, Texas, Washington, D. C., Flood Insurance Study Report dated January 16, 1980, Flood Insurance Rate Map dated July 16, 1980.
7. Federal Emergency Management Agency, Flood Insurance Study, City of Burleson, Tarrant County, Texas, Washington, D.C., September 27, 1991.
8. Federal Emergency Management Agency, Flood Insurance Study, Town of Colleyville, Tarrant County, Texas, Washington, D.C., Flood Insurance Study Report dated June 1, 1982, Flood Insurance Rate Map dated December 1, 1982.
9. Federal Emergency Management Agency, Federal Insurance Administration, Flood Insurance Study, City of Crowley, Tarrant County, Texas, Washington, D.C., Flood Insurance Study Report dated October 15, 1980, Flood Insurance Rate Map dated April 15, 1981.

227
10. Federal Emergency Management Agency, Flood Insurance Study, Town of Dalworthington Gardens, Tarrant County, Texas, Washington, D.C., Flood Insurance Study Report dated November 17, 1981, Flood Insurance Rate Map dated May 17, 1982.
11. Federal Emergency Management Agency, Flood Insurance Study, Town of Edgecliff Village, Tarrant County, Texas, Washington, D.C., August 19, 1986.
12. Federal Emergency Management Agency, Flood Insurance Study, City of Euless, Tarrant County, Texas, Washington, D.C., Flood Insurance Study Report dated October 3, 1984, Flood Insurance Rate Map dated April 3, 1985.
13. Federal Emergency Management Agency, Flood Insurance Study, City of Everman, Tarrant County, Texas, Washington, D.C., Flood Insurance Study Report dated March 17, 1980, Flood Insurance Rate Map dated September 17, 1980.
14. U.S. Department of Housing and Urban Development, Flood Insurance Study, City of Forest Hill, Tarrant County, Texas, Washington, D.C., Flood Insurance Study Report dated February 1, 1978, Flood Insurance Rate Map dated August 1, 1978.
15. Federal Emergency Management Agency, Flood Insurance Study, City of Fort Worth, Tarrant County, Texas, Washington, D.C., June 4, 1980.
16. Federal Emergency Management Agency, Flood Insurance Study, City of Fort Worth, Tarrant and Denton Counties, Texas, Washington, D.C., November 18, 1988.
17. Federal Emergency Management Agency, Flood Insurance Study, City of Grapevine, Tarrant County, Texas, Washington, D.C., August 15, 1989.
18. Federal Emergency Management Agency, Flood Insurance Study, City of Haltom City, Tarrant County, Texas, Washington, D.C., June 4, 1990.
19. Federal Emergency Management Agency, Flood Insurance Study, City of Haslet, Tarrant County, Texas, Washington, D.C., October 15, 1985.
20. Federal Emergency Management Agency, Flood Insurance Study, City of Hurst, Tarrant County, Texas, Washington, D.C., October 15, 1985.
21. Federal Emergency Management Agency, Flood Insurance Study, City of Keller, Tarrant County, Texas, Washington, D.C., Flood Insurance Study Report dated March 30, 1982, Flood Insurance Rate Map dated September 30, 1982.
22. Federal Emergency Management Agency, Flood Insurance Study, City of Kennedale, Tarrant County, Texas, Washington, D.C., Flood Insurance Study Report dated May 15, 1984, Flood Insurance Rate Map dated November 15, 1984.
23. Federal Emergency Management Agency, Flood Insurance Study, City of Mansfield, Tarrant County, Texas, Washington, D.C., September 28, 1990.
24. Federal Emergency Management Agency, Flood Insurance Study, City of North Richland Hills, Tarrant County, Texas, Washington, D.C., December 16, 1988.
25. Federal Emergency Management Agency, Flood Insurance Study, Town of Pantego, Tarrant County, Texas, Washington, D.C., Flood Insurance Study Report dated January 1980, Flood Insurance Rate Map dated July 16, 1980.
228
26. Federal Emergency Management Agency, Flood Insurance Study, City of Richland Hills, Tarrant
County, Texas, Washington, D.C., Flood Insurance Study Report dated January 3, 1985, Flood Insurance Rate Map dated July 3, 1985.
27. Federal Emergency Management Agency, Flood Insurance Study, City of River Oaks, County, Texas, Washington, D.C., Flood Insurance Study Report dated December 19, 1984, Flood Insurance Rate Map dated June 19, 1985.
28. Federal Emergency Management Agency, Flood Insurance Study, City of Saginaw, Tarrant County, Texas, Washington, D.C., Flood Insurance Study Report dated March 17, 1980, Flood Insurance Rate Map dated September 17, 1980.
29. Federal Emergency Management Agency, Flood Insurance Study, City of Southlake, Tarrant County, Texas, Washington, D.C., Flood Insurance Study Report dated January 5, 1982, Flood Insurance Rate Map dated July 5, 1982.
30. Federal Emergency Management Agency, Flood Insurance Study, City of Watauga, Tarrant County, Texas, Washington, D.C., August 15, 1989.
31. Federal Emergency Management Agency, Flood Insurance Study, Town of Westover Hills, Tarrant County, Texas, Washington, D.C., Flood Insurance Study Report dated December 5, 1984, Flood Insurance Rate Map dated June 5, 1985.
32. Federal Emergency Management Agency, Flood Insurance Study, City of Westworth Village, Tarrant County, Texas, Washington, D.C., June 3, 1986.
33. Federal Emergency Management Agency, Flood Insurance Study, City of White Settlement, Tarrant County, Texas, Washington, D.C., July 17, 1986.
34. Federal Emergency Management Agency, Flood Insurance Study, Tarrant County, Texas and Incorporated Areas, Washington, D.C., August 23, 2000.
35. Federal Emergency Management Agency, Flood Insurance Study, Tarrant County, Texas and Incorporated Areas, Washington, D.C., September 25, 2009.
36. U.S. Census Bureau; Census 1990, Summary File (SF 1); Using American Factfinder; <http://factfinder.census.gov/>; (16 August 16, 2006).
37. U.S. Census Bureau, Profile of General Population and Housing Characteristics: 2010 Demographic Profile Data, Washington, D.C. 2010.
38. U.S. Department of Commerce, National Oceanic and Atmospheric Administration, Environmental Data Service, Monthly and Annual Climatological Data for Texas State, Asheville, North Carolina, National Climatic Center, published annually.
39. U.S. Army Corps of Engineers, Flood Plain Information Report, Bear Creek, Dallas and Tarrant Counties, Texas, June 1973.
40. U.S. Army Corps of Engineers, Flood Hazard Information Report, Chambers Creek, Everman, Texas, October 1973.
41. U.S. Department of the Interior, Geological Survey, Stream Gaging Records, Washington, D.C.

229
42. U.S. Army Corps of Engineers, Flood Plain Information Report, Rush and Village Creeks, Arlington, Texas, February 1971.
43. Knowlton-Ratliff-English-Flowers, Inc., Drainage Master Plan for the City of Bedford, Phase 1,
Sulphur Branch Watershed, Dallas-Fort Worth, Texas, Dallas, Texas, 1975.
44. Design Memorandum No. 1, Trinity River Basin, Texas, Flood Protection on Big Fossil Creek, Richland Hills Area, Texas, June 1962.
45. Rady and Associates, Inc., Consulting Engineers, Engineering Report for Haltom City, Texas, Channel Improvements, Little Fossil Creek, May 1, 1975.
46. Federal Emergency Management Agency, Guidelines and Specifications for Flood Hazard Mapping
Partners, April 2003.
47. Natural Resources Conservation Service, Technical Release TR-55, Urban Hydrology for Small Watersheds, June 1986.
48. U.S. Army Corps of Engineers, Hydrologic Engineering Center, HEC-HMS Version 2.2.2, Davis,
California, May 2003.
49. U.S. Department of Agriculture, Natural Resources Conservation Service, Soil Survey Geographic (SSURGO) database for Tarrant County, Texas, September 2002.
50. U.S. Department of Commerce, Weather Bureau, Technical Paper No. 40, Rainfall Frequency Atlas of
the United States, Washington, D.C., 1961, Revised 1963.
51. U.S. Army Corps of Engineers, Hydrologic Engineering Center, HEC-HMS Version 3.5, Davis, California, August 2010.
52. NCTCOG Integrated Storm Water Management (iSWM) Online Technical Manual, Hydrology, version 4-2010b, downloaded June 2010 from http://iswm.nctcog.org/technical_manual.asp.
53. U.S. Department of the Army, Corps of Engineering Center, Computer Program NUDALLAS, Fort Worth District, revised September 2002.
54. U. S. Army Corps of Engineers, Hydrologic Engineering Center, HEC-1 Flood Hydrograph Package, Davis, California, October 1970.
55. U. S. Army Corps of Engineers, Hydrologic Engineering Center, HEC-2 Water Surface Profiles, Generalized Computer Program, Davis, California, April 1984.
56. U.S. Army Corps of Engineers, Hydrologic Engineering Center, HEC-RAS Analysis System, Version 3.1.2, Davis, California, April 2004.
57. U.S. Army Corps of Engineers, Hydrologic Engineering Center, HEC-RAS Analysis System, Version 4.0, Davis, California, March 2008.
58. City of Burleson, Topographic Maps, Contour Interval 2 Feet, 1999/2000.
59. City of Grand Prairie, Topographic Maps, Contour Interval 2 Feet, February 1999.
60. City of Hurst, Topographic Maps, Contour Interval 2 Feet, February 2000.

230
61. City of Keller, Topographic Maps, Contour Interval 2 Feet, January 2005.
62. North Central Texas Council of Governments (NCTCOG), Topographic Maps Compiled from LIDAR, Contour Interval 2 Feet, January 2001.
63. National Geospatial-Intelligence Agency (NGA), Topographic Maps Compiled From LIDAR, Contour Interval 2 Feet, December 2003.
Related Documents