DISCUSSION PAPER SERIES Forschungsinstitut zur Zukunft der Arbeit Institute for the Study of Labor Targeting Non-Cognitive Skills to Improve Cognitive Outcomes: Evidence from a Remedial Education Intervention IZA DP No. 4476 October 2009 Helena Holmlund Olmo Silva

Welcome message from author
This document is posted to help you gain knowledge. Please leave a comment to let me know what you think about it! Share it to your friends and learn new things together.
Transcript

DI
SC
US
SI
ON
P
AP
ER
S
ER
IE
S
Forschungsinstitut zur Zukunft der ArbeitInstitute for the Study of Labor
Targeting Non-Cognitive Skills to ImproveCognitive Outcomes: Evidence from a Remedial Education Intervention
IZA DP No. 4476
October 2009
Helena HolmlundOlmo Silva
Targeting Non-Cognitive Skills to
Improve Cognitive Outcomes: Evidence from a Remedial Education Intervention
Helena Holmlund London School of Economics
Olmo Silva
London School of Economics and IZA
Discussion Paper No. 4476 October 2009
IZA
P.O. Box 7240 53072 Bonn
Germany
Phone: +49-228-3894-0 Fax: +49-228-3894-180
E-mail: [email protected]
Any opinions expressed here are those of the author(s) and not those of IZA. Research published in this series may include views on policy, but the institute itself takes no institutional policy positions. The Institute for the Study of Labor (IZA) in Bonn is a local and virtual international research center and a place of communication between science, politics and business. IZA is an independent nonprofit organization supported by Deutsche Post Foundation. The center is associated with the University of Bonn and offers a stimulating research environment through its international network, workshops and conferences, data service, project support, research visits and doctoral program. IZA engages in (i) original and internationally competitive research in all fields of labor economics, (ii) development of policy concepts, and (iii) dissemination of research results and concepts to the interested public. IZA Discussion Papers often represent preliminary work and are circulated to encourage discussion. Citation of such a paper should account for its provisional character. A revised version may be available directly from the author.

IZA Discussion Paper No. 4476 October 2009
ABSTRACT
Targeting Non-Cognitive Skills to Improve Cognitive Outcomes: Evidence from a Remedial Education Intervention*
A growing body of research highlights the importance of non-cognitive skills as determinants of young people’s cognitive outcomes at school. However, little evidence exists about the effects of policies that specifically target students’ non-cognitive skills as a way to improve educational achievements. In this paper, we shed light on this issue by studying a remedial education programme aimed at English secondary school pupils at risk of school exclusion and with worsening educational trajectories. The main peculiarity of this intervention is that it solely targets students’ non-cognitive skills – such as self-confidence, locus of control, self-esteem and motivation – with the aim of improving pupils’ records of attendance and end-of-compulsory-education (age 16) cognitive outcomes. We evaluate the effect of the policy on test scores in standardized national exams at age-16 using both least squares and propensity-score matching methods. Additionally, we exploit repeated observations on pupils’ test scores to control for unobservables that might affect students’ outcomes and selection into the programme. We find little evidence that the programme significantly helped treated youths to improve their age-16 test outcomes. We also find little evidence of heterogeneous policy effects along a variety of dimensions. JEL Classification: C20, I20, H75 Keywords: cognitive and non-cognitive skills; policy evaluation; secondary schooling Corresponding author: Olmo Silva Department of Geography and Environment London School of Economics Houghton Street WC2A 2AE, London United Kingdom E-mail: [email protected]
* This work is a substantially revised version of a paper previously circulated under the title “Unobservables and Matching as an Evaluation Method: Evidence from an Education Intervention”. We would like to thank the statistical team of the Department for Children, Schools and Families (DCSF) and the staff at The Prince’s Trust for help with the data, and Charlotte Fielder and Dylan Kneale at The Prince’s Trust for helpful discussions about the delivery of the xl club programme. We would also like to thank Barbara Sianesi for help with her Stata© routine psmatch2 and general discussions about matching methods. Finally, we have greatly benefited from comments by Sascha Becker, Simon Burgess, Rejeev Deheja, Steve Gibbons, Victor Lavy, Edwin Leuven, Fabrizia Melalli, Richard Murphy, Jeff Smith, Roope Usitalo and seminar participants at CEP-LSE, DIW-Berlin, HECER-Helsinki, PSI-London, RES Annual Conference 2009 and SOLE Annual Conference 2009. The views expressed in this paper are the authors’ only and do not necessarily represent those of The Prince’s Trust. We are responsible for any errors or omissions.

1
1. Introduction and context
Governments around the world invest large amounts of resources into programmes aimed at improving
the labour market prospects of young unemployed and raising the educational attainments of
marginalized youths. In fact, training and educational expenditure absorbs a significant portion of public
finances in developed nations (see OECD, 2005 and 2007). Despite these efforts, recent international
evidence (OECD, 2005) suggests that a large number of students still ‘fall behind’ and leave school with
little or no educational qualifications. In response to this problem, a growing number of remedial
education programmes, targeting the most disadvantaged pupils at school, have been implemented and
evaluated with encouraging findings. For example, Lavy and Schlosser (2005) provide evidence that a
remedial education intervention focussed on increased instruction time for underperforming secondary
school students in Israel was more cost-effective than alternatives based on financial incentives for pupils
and teachers. Jacob and Lefgren (2004) show that summer classes offered to low achieving students (in
3rd, 6th and 8th grade) significantly improved their reading and mathematics achievements for up to two
years after the intervention. Further evidence is provided by Banerjee et al. (2007) who study two
randomized experiments in India. Their two remedial education programmes, based on young female
support-teachers and computer-assisted learning, substantially improved test scores of pupils in primary
education. Finally, Machin et al. (2007) study an education intervention targeting poor learners in
English inner-city secondary schools, named Excellence in Cities (EiC). The policy provided both
learning support to ‘difficult’ students and more advanced teaching for the best 5-10 percent ‘gifted and
talented’ students in under-performing schools. The results suggest that the EiC programme improved
students’ outcomes in Mathematics (though not in English), although the benefits were only evident for
students with a sufficiently strong background, and not for the most ‘hard to reach’ pupils.
One distinguishing feature of these (and many other) remedial interventions is that they focus on
improving students’ cognitive outcomes by extending instruction time, coaching literacy and numeracy
skills, tailoring teaching of the standard curriculum around students’ specific needs and revisiting the

2
material covered during the academic year in small classes. Stated differently, these programmes
predominantly target cognitive skills with the aim of improving cognitive outcomes.
However, a growing body of research has shown that non-cognitive skills are similarly important in
determining young peoples’ cognitive educational achievements. Although non-cognitive skills are
difficult to define (see ter Weel, 2008 for a discussion), these are usually conceptualized in terms of work
and study habits – such as motivation and discipline – and behavioural attributes – such as self-esteem,
locus of control and confidence. Recent evidence collected by Heckman and co-authors for the US (see,
among others, Heckman and Rubinstein, 2001; Heckman et al., 2006; Cunha and Heckman, 2008)
convincingly shows that young students’ and workers’ non-cognitive skills significantly affect their
educational and labour market choices, as well as their school achievements and work success. Carneiro
et al. (2007) provide similarly compelling evidence for the UK. Additionally, Knusden et al. (2006) and
Cunha and Heckman (2008) show that non-cognitive skills are more malleable than cognitive abilities,
and that the most ‘sensitive’ (productive) periods for investment in cognitive skills occur earlier in
people’s life (approximately during primary education) than ‘sensitive’ periods for non-cognitive skills,
which concentrate during secondary schooling and the adolescent years. Carneiro and Heckman (2003)
provide further evidence that non-cognitive skills are more amenable than cognitive abilities to being
affected by policy interventions at later stages of one person’s life.1
Despite these facts, surprisingly few policies have targeted directly and predominantly adolescent
students’ non-cognitive skills as a way to improve their educational attainments. Some exceptions are
discussed in Heckman (2000) and include: the ‘Big Brother/Big Sister (BB/BS)’ programme; the
‘Sponsor-A-Scholar (SAS)’ policy; and the ‘Quantum Opportunity Programme (QOP)’. In fact, only the
BB/BS intervention focuses solely on ‘mentoring’ as a way to improve teenage students’ motivation and
awareness of education. However, the results of a randomized control trial evaluation of the policy show
1 One exception is Segal (2008) who finds strong persistence in boys’ misbehaviour at school (her proxy for non-cognitive
skills) between 8th and 10th grade. However, in some parallel research, Segal (2009) confirms the importance of non-cognitive
traits for young people’s education and labour market outcomes.

3
little evidence of a significant positive effect on pupils’ GPA, even though treated students were less
likely to skip school or use drugs and alcohol. On the other hand, the SAS initiative and QOP combined
mentoring of students’ non-cognitive/behavioural skills with some financial incentives/support and
remedial learning activities. These interventions show significant effects on both young people’s
cognitive outcomes (e.g. GPA at 10th and 11th grade) and enrolment rates at college. All in all, it is fair to
conclude that at present there is the little evidence about the effectiveness of policies that solely target
adolescent students’ non-cognitive skills as a way to improve their cognitive outcomes.2
In order to shed light on this issue, in this paper we evaluate a remedial education intervention called
the xl club programme that focussed on pupils aged 14 in England. The programme was administered in
around 500 (out of about 2,500) English secondary schools, and on average one in ten pupils per year
group in the targeted schools was selected for participation. Clubs operated on a closed two-year
programme (between ages 14 and 16), with approximately 13 members who met for at least 3 hours per
week guided by an xl club advisor (more details will be presented in Sections 2 and 3). Selection of
students for the programme was based on teachers’ assessment of one pupil’s risk of educational
exclusion (i.e. persistent truanting and school expulsion), and on perceptions of worsening educational
performance and school disengagement. The most remarkable feature of the xl club programme was its
explicit focus on improving students’ confidence, self-esteem, motivation and locus-of-control – that is
students’ non-cognitive skills – as a way to improve school attendance and ultimately raise young
people’s end-of-compulsory-education (age 16) achievements. In our analysis we will concentrate on
evaluating the effect of the policy on students’ cognitive outcomes, that is on participants’ test scores in
standardized national exams at age 16. This focus is partly dictated by the fact that, given that data at
hand, the effect of the programme on test scores can be more properly assessed than on other outcomes
(e.g. absences).
2 One recent exception is the work by Pema and Mehay (2009) who study the impact of the Junior Reserve Officers’ Training
Corps (JROTC) on high school students’ education and labour market outcomes. Even this programme, however, combines
some ‘standard’ classroom teaching with more broad extracurricular activities.

4
In fact, one crucial challenge in evaluating the policy is posed by the obvious non-random selection
of students into xl clubs. Fortunately, the richness of our data, combined with access to repeated
observations on students’ test scores in standardized national exams at ages 11 and 14 (before entering
the programme) and at age 16 (at the end of the programme), allows us to control for a variety of pupil
observable characteristics and model unobservables that might affect both selection of pupils for the
programme and their outcomes.
In terms of detail, we start our analysis by presenting least squares and propensity-score matching
estimates that only exploit the cross-sectional nature of our data.3 These estimators simply compare age-
16 test scores of xl club students (treated) to attainments of similar (matched) pupils in schools where the
programme was not being offered (controls). Note that we explicitly avoid looking for comparable non-
treated students among the set of pupils enrolled in schools with an active xl club, but not taking part in
the initiative (i.e. the non-treated in treated schools). This is because there might be spill-over effects of
the xl intervention on non-participants, an issue to which we will return later in the paper.
We then go on to exploit the longitudinal dimension of our data and present estimates of the policy
effect that combine least squares and propensity-score matching estimation methods with difference-in-
differences and double-differences approaches to identification. Put simply, difference-in-differences
estimates of the policy effects are obtained by comparing pupils’ test scores immediately before (age 14)
and right after (age 16) the policy, across treated and (matched) control students. This method allows to
partial out time-fixed unobservables, such as ability or unobserved family background characteristics,
that might simultaneously affect test scores and enrolment in an xl club. The double-differences
approach instead exploits three points in time, and compares test score progression before the policy –
i.e. test score value-added between ages 11 and 14 – to progression after the policy – i.e. value-added
between ages 14 and 16 – across treated and control students. These models (also called random-growth
3 Rubin (1973) and Rosenbaum and Rubin (1983) pioneered matching methods to estimate policy-effects from non-
experimental data. However, it was mainly Dehejia and Wahaba (1999) and (2002) that popularized propensity-score
matching in economics as a way to mitigate LaLonde’s critique (LaLonde, 1986). Their original findings have been
thoroughly scrutinized in Smith and Todd (2005) (see also a reply to their criticism in Dehejia, 2005).

5
models; see Heckman and Hotz, 1989), further allow to partial out unosbervables that might determine
enrolment in the programme and affect students’ test score progress, such as increasing disengagement
with the school activities and flagging motivation. Stated differently, double-differences models help
controlling for linearly time-trending unobservable effects in students’ outcomes.4
Turning to our results, cross-sectional estimates of the effect of the policy show a negative and
significant impact on treated pupils’ test scores at age 16. However, our findings also provide suggestive
evidence of negative selection into the programme based on pupil unobservables. This intuition is further
backed by the institutional details on the delivery and workings of the xl club initiative. Consistently,
difference-in-differences and double-differences estimates present a more encouraging picture with
policy-effects close to zero or marginally positive. Using the method proposed in Altonji et al. (2005a)
and (2005b) we provide an assessment of how important selection on unobservables should be, relative
to selection on observables, in order to support the patterns displayed by our findings. Finally, we present
some results that reveal little evidence of heterogeneous policy-effects along a variety of dimensions
including pupil gender and eligibility for free school meals (a proxy for family income).
The remainder of this paper is organized as follows. Section 2 presents some institutional details
about the English educational system and more information about the xl club intervention. Section 3
explains the data used in our evaluation, while Section 4 presents our main findings. Finally, Section 5
presents a concluding discussion. More details about our empirical models and estimation methods are
provided in Appendix A and Appendix B.
4 Meyer (2005) discusses the assumption underlying standard difference-in-differences methods, while Heckman et al. (1997)
and (1998) set out the identifying assumptions of propensity-score matching differences-in-difference estimators and present
related estimates of the impact of JTPA programme. More recently, Abadie (2003) has proposed a method to combine
matching with difference-in-differences when only repeated cross-sections are available. Finally, Michalopoulos et al. (2005)
used random-growth matching models to assess welfare-to-work programmes in a selection of US States.

6
2. Institutional and background information
2.1. The English education system and the xl club intervention
Compulsory education in England is organised into five stages referred to as Key Stages (KS). In the
primary phase, pupils usually enter school at age 4-5 in the Foundation Stage and then move on to KS1,
spanning ages 5-6 and 6-7. At age 7-8 pupils move to KS2, sometimes – but not usually – with a change
of school. At the end of KS2, when pupils are 10-11, children leave the primary phase and go on to
secondary school where they progress through KS3 to age 13-14, and then KS4, up to age 15-16, which
marks the end of compulsory education. The last three years of secondary school, i.e. those spanning the
end of KS3 through to KS4 (ages 13-14 to 15-16), will be the focus our analysis.
At the end of each Key Stage, pupils are assessed on the basis of standardized national exams
(centrally set and marked). At KS1, pupils sit exams in English and Mathematics only, whereas at KS2
and KS3 students take tests in English, Mathematics and Science. Finally, at the end of KS4, pupils sit
GCSEs (academic) and/or NVQ (vocational) tests in a range of subjects, although English, Mathematics
and Science are compulsory for every student at this stage. Note that for each of the Key Stages the
central government sets learning ‘targets’ (levels). Indicators of school total achievement are constructed
from pupil individual test-outcomes on the basis of criteria devised by the Qualifications and Curriculum
Authority; these are then published in publicly accessible school performance tables. For KS4, the
individual-level target is to achieve at least 5 GCSE/NVQ at A*-C level (on a scale of A*-G, with
anything below G regarded as a fail), and schools are assessed on the fraction of students achieving this
threshold every year.
Although age-16 achievements have substantially improved over the past decade thanks to
substantial efforts by the UK government (McNally, 2007), the country is still cursed by a thick tail of
young individuals who do not achieve the KS4 target and leave compulsory education without any
‘good’ qualification. Poor educational standards are particularly clustered in inner-city schools, with
higher concentrations of students with family background disadvantages and learning difficulties. These

7
schools have been targeted by a variety of government interventions, such as the Excellence in Cities
program (Machin et al., 2007) and the Aimhigher initiative (Emmerson et al., 2006). The xl club
programme under analysis here similarly targets schools with a high proportion of pupils from
disadvantaged backgrounds and with poor educational records. However, rather than being a
governmental intervention, the initiative was designed and administered by The Prince’s Trust.
The Prince’s Trust is the largest youth charity in the UK and is committed to improving the well-
being of disadvantaged 14-30 year olds through increased opportunities and life skills, development of
self-esteem, and by facilitating school-to-work transition. The xl club programme is one of The Trust’s
largest and most widely spread programmes, focusing on hard-to-reach students in secondary schools
and tackling problems of school disengagement and exclusion. The Trust runs more than 1000 xl clubs in
around 500 secondary schools in England (out of around 2500).5 Broadly speaking, the programme
targets 14-16 year olds at risk of truanting, exclusion and underachievement, and is run in clubs that use
informal teamwork towards personal development and improvement in students’ attendance patterns,
motivation and non-cognitive skills. The clubs operate on a closed two-year programme with around 13
members who meet for at least 3 hours per week through the last two years of compulsory education,
guided by an xl club advisor.
It should be pointed out that clubs are run in a reasonably independent fashion by participating
schools. The main activities of The Trust involve: establishing minimum standards for running the
programme; helping schools with the recruitment of an xl club advisor (often drawn from youth services
or social services); providing learning materials for the programme; training of xl club advisors; holding
of local network events for xl club advisors; monitoring quality and enforcing uniform standards of the
programme across the national territory. However, the day-to-day management of the programme is
5 The xl club initiative also has clubs running outside mainstream education, e.g. in pupil referral units or young offender
institutions. Similarly, The Trust extended the programme to a small set of Scottish and Welsh schools. However, due to lack
of data, we do not consider these here.

8
down to the xl advisor, who is part of the teaching staff and thus responds to and coordinates with the
school governing body, the school management team and the head-teacher.
Regarding the actual running of the clubs, these operate as an alternative to a GCSE/NVQ subject,
although participants still have to take English, Mathematics and Science (regular students study on
average ten different subjects). The main curriculum areas of the programme cover: personal,
interpersonal and team skills development; citizenship and community awareness; community-based
project management; entrepreneurial skills and enterprise projects development; preparation for the
world of work and training. This curriculum was designed in order to target and improve some specific
non-cognitive competencies, including: self-awareness, self-confidence, motivation, leadership, ‘taking
responsibility’, citizenship, creativity, communication. Thus, in contrast with a wide array of remedial
education interventions, the programme does not focus on providing support with standard areas of the
learning curriculum, such as numeracy and literacy skills. In fact, the vast majority of xl club advisors
does not come from a teaching background, rather from youth, social and careers services. This is
because it is believed that these types of workers are in a better position at building relations with hard-
to-reach students, and working with them to improve their behavioural and non-cognitive skills. Once
again, it should be noted that students selected for participation into an xl club are those with a history of
truancy, school expulsion and misbehaviour, as well as general disadvantage, poor achievements and
progressive disengagement from learning activities (more details will follow in the next section).
As for the work carried out by students in the areas of the xl club curriculum, this is not commonly
converted into a GCSE/NVQ entry (thus contributing to the student’s official records of educational
achievement). Nevertheless, The Trust rewards students with an ‘xl club Award’ if they complete the
necessary coursework.6 This requires students to regularly attend club activities, solve take-home
6 This Award is recognized by ASDAN (Award Scheme Development and Accreditation Network). ASDAN offers a wide
range of awards for young people of all abilities, with the aim to reward young people’s skills as they complete ‘personal
challenges’ in areas such as community involvement, work experience, citizenship and enterprise. Progressively, more
ASDAN awards are being acknowledged and recognized by the Department for Children, Schools and Families and the
Qualifications and Curriculum Authority.

9
exercises and get involved in practical case-study solutions, as well as small business-operations
development and events organization. Each students’ course-work is documented in a series of folders
(self-compiled, but monitored by xl club advisors), which are evaluated once per year during a
centralized xl club ‘assessment exercise’.
Note that, although achieving an xl club Award is seen as an important part of the programme, the
main objectives of the xl initiative are to improve students’ confidence and self-esteem; to enhance
attendance and motivation; and ultimately to raise young people’s end-of-compulsory-education
achievement, including their KS4 (age-16) test scores. As already stated, in this analysis we will solely
focus on test-based outcomes, as the effect of the policy on test scores can be more properly assessed
given the data at hand. Holmlund and Silva (2008) present some evidence on the effects of the
intervention on attendance records (available from the authors).
2.2. School and student selection into the xl club programme
Selection for participation into the xl programme follows a two-step approach. First, target schools are
identified by The Prince’s Trust staff on the basis of a (reasonably) well-defined set of criteria; second,
within selected schools, pupils are chosen by their teachers and xl advisors on the basis of their personal
assessment of pupils’ needs.7 We discuss each step in turn.
Starting with schools, an initial selection round is carried out at a sub-national level by The Prince’s
Trust programme staff who manages the delivery of the programme in the various English regions.
Within their region, local xl club staff invite applications from schools with a history of
underachievement, poor attendance and high concentration of students with educational disadvantages or
at risk of exclusion. Stated in other terms, priority is given to schools with persistently high
concentrations of pupils eligible for free school meals (FSM, a proxy for poor family background) and
with special education needs (SEN); to schools with a low fraction of students achieving the 5 A*-C
GCSE/NVQ target discussed above; and to institutions with high rates of student absences. Information
7 On average about 1 pupil in 10 per year group is selected for participation.

10
on all these aspects is collected on a yearly basis by the Department for Children, Schools and Families
(DCSF) for all schools in England for accountability and funding purposes, and can easily be accessed
from publicly available performance tables and other data sources. Note that schools can also ‘directly
apply’ to The Trust to be part of the xl club initiative (as opposed to ‘be invited to apply’). However,
given the popularity of programme, the charity has consistently received more requests than it can afford
to support. This implies that not all ‘bidding’ schools are allowed in the programme and that some
schools are de-selected from the network when their overall attainment improves above a certain level.
Although this has caused some discomfort among schools excluded from the programme, it guarantees
that the work of The Trust is prioritised in the most deprived schools (The Prince’s Trust, 2006).
As for recruitment of students within schools selected for the programme, this takes place at the end
of KS3 (age 14), when young underachievers at risk of exclusion, with low attendance records, lack of
self-confidence and with broad behavioural issues are identified by their teachers and xl club advisors
(not by The Trust’s staff), and invited to join the club. Although the selection procedure is not fully
codified, evidence in Browne and Evans (2007) and direct discussion with practitioners suggest that xl
advisors and school teachers (who have known their pupils for up to three years) choose young students
on the basis of their personal assessment of pupils’ progressive disengagement with education; future
risk of exclusion; and continuing deterioration of school performance and motivation.8 While potentially
quantifiable and observed by the teaching staff, some of these characteristics are not observable to us.
Thus, in our analysis particular attention will be devoted to understanding how different assumptions
about the role of selection on unobservables affect our findings on the effects of the initiative.
Finally, there is some encouraging evidence about the ‘enforcement’ of participation in the clubs
(see Browne and Evans, 2007). Most students willingly followed their teacher’s advice to enrol, with
only some ‘forced’ to take part in the activities. Put differently, the vast majority of students selected to
8 Note that teachers and xl club advisors have little incentives to choose the ‘most promising’ students to take part in an xl
club, i.e. pupils who might improve their performance even in the absence of the programme. Indeed, there is no clear-cut
financial or reputational reward from having successful xl clubs. On the other hand, staff have incentives to select the ‘hard-
to-teach’ students, as this might improve their behaviour and make teaching regular students easier.

11
participate in xl club activities did so, albeit with varying levels of enthusiasm. Also, about 95 percent of
the selected students completed the two-year programme. Given this high compliance, our estimates of
the policy-effects are closer to an average treatment-on-the-treated than to an intention-to-treat.
Before moving on, we emphasize that our empirical strategy will mimic the approach taken by The
Prince’s Trust in order to identify counterfactual students in comparable schools. In a nutshell, using
aggregate school-level data on achievement, composition and rates of absences, we will first select a
group of schools not running an xl club that is comparable to schools in the programme. Secondly, we
will look for a set of comparable students in terms of their characteristics and prior achievements in
comparable schools where an xl club was not present. In the next section, we explain this procedure in
more detail alongside the data that we use.
3. Data construction
3.1. Linking xl club information to education administrative records
The xl club programme was started in 1998 as a very small scale intervention among a restricted group
of schools, but it has since then grown bigger and come to cover around 500 secondary schools in
England (out of around 2500). In our analysis, we evaluate the effects of the intervention on the cohort of
pupils aged 14 in 2004, who were selected to participate in that year and took their end of compulsory
education exams at age 16, in the late spring of 2006.
Since 2001, The Trust has created electronic files containing the identity of all schools selected for
the programme. Additionally, yearly files have been constructed by the charity that contain personal and
background characteristics for all students enrolled in xl clubs. However, these files do not gather
information on exams taken by the students at age 16, nor do they include data on previous test outcomes
(KS2 and KS3) or official records on absences, eligibility for FSM and SEN status. Moreover, The Trust
only collected information for pupils in the programme, while no data was assembled for pupils not
taking part in the initiative to be used as a comparison group.

12
In order to carry out our evaluation, we therefore need to make use of official records on pupil
achievements and characteristics that are collected by the Department for Schools, Children and Families
(DCSF) every year for each pupil in every school in the state-sector.9 The first source of information that
we use is the National Pupil Database (NPD), which holds information on each pupils’ assessment in the
Key Stage tests throughout their school career. Since 2002, DCSF has also collected information on
pupil’s gender, age, ethnicity, language skills, any special educational needs or disabilities, entitlement to
free school meals and other pieces of information via the Pupil Level Annual Schools Census (PLASC),
which is now incorporated into the test score information in the NPD. The linked NPD-PLASC provides
a large and detailed dataset on pupils’ characteristics and their test histories, with details on students’
achievement in the core subject areas – English, Mathematics and Science – at different stages. In our
analysis, we make use of information on the cohort of pupils aged 14 and sitting their KS3 tests in 2004,
matched to their KS4 exams taken in 2006 and KS2 achievement in 2001, and linked to their PLASC
demographics in 2004. Various other data sources can be further merged in at school level – in particular
each school’s institutional type, composition, size and teacher numbers – which are available from the
DCSF Edubase System and Annual School Census.
However, one crucial piece of information needed for our evaluation is not contained in NPD-
PLASC data, namely: an identifier for pupils starting an xl club in 2004. The only way of gauging this
detail is by matching the official DCSF records with the data provided by The Trust on pupils taking part
in the initiative. Unfortunately, the files collected by The Trust do not include the ‘unique pupil
identifier’ commonly used by DCSF to match students across data sources and over the years, so xl club
students cannot be directly linked to the educational census held by the Department. A mapping between
the two sets of data was instead constructed with the help of the DCSF statistical unit using several fully-
detailed individual characteristics, i.e. name, family name, date of birth, postcode of residence, gender,
ethnicity and school attended. We next briefly describe the outcome of this linking procedure.
9 As already mentioned, these data sets are collected by DCSF in order to construct school performance tables and determine
school funding, predominantly based on pupil numbers and characteristics.
13
The original number of students starting an xl club in secondary schools in 2004 for which we
received data from The Trust was 5592.10 A mapping between The Trust’s data and PLASC-NPD was
constructed for 4128 students. This implies that we were able to link about 75 percent (= 4128/5592) of
the students in the xl clubs files to the PLASC-NPD and to school-level information provided in the
Annual School Census and Edubase. Of the 25 percent of students that we were not able to map, the
largest portion was concentrated in a handful of underperforming schools that changed their status
around year 2004 and 2005 (they became ‘City Academies’). For these schools, consistent identifiers and
information over time are hard to construct. Additionally, these schools underwent major restructuring of
both facilities and teaching methods, and their student composition has been affected quite dramatically.
For these reasons, we would have dropped these observations from our analysis in any circumstance.
However, several other observations were lost due to missing observations in some of the variables
contained in PLASC-NPD, mainly KS2 and KS3 outcomes, so that the final number of treated students
retained for the analysis dropped to 2233 (we further loose one participating school because of a
‘common support’ restriction; see next section). In order to shed light on this substantial sample-size
drop, Appendix Table 1 investigates the characteristics of xl club pupils linked to NPD-PLASC,
separately for students with and without any missing information, and for students that we were not able
to link at all. The table shows that xl club students with missing NPD-PLASC data and xl club students
not linked to administrative records are more often excluded from education, in care, ex/current offender
and asylum seekers, than students for whom we have full information. This is reassuring, as most of
these students will have spent/are spending some time out of education (offenders and excluded) or have
recently entered the English school systems (asylum seekers), which helps explaining why we are not
able to match pupils to the full set of official exam records and data. In Section 4.7, we briefly discuss
the robustness of our results to the inclusion of observations with missing KS2 and KS3 test scores.
10 Additionally, 306 students were in xl clubs in pupil referral units or young offender institutions. For these pupils, there exist
no official educational records in PLASC-NPD. They are therefore excluded from our analysis.

14
3.2. Preliminary school-level selection
As already mentioned, in order to identify counterfactual students and estimate the impact of the xl club
programme, we start by extracting from our data a set of schools not running an xl club in 2004, but
comparable to those in the programme. This mimics the approach taken by The Trust, where a first round
of school selection was operated by the charity.
To this aim, the first restriction that we impose on our data is that we only consider Local
Authorities (LAs, formerly Local Education Authorities) with at least one school with an xl club starting
in 2004, which leaves us with 105 out of 150 LAs in England.11 The main reason for this exclusion is
that, throughout our analysis, we include LA dummy indicators to control for LA-specific unobserved
factors. LAs with no clubs would have thus dropped-out of our sample anyway. Secondly, schools with
xl clubs in years prior to 2004, but not officially in 2004, are also dropped from the analysis, since these
might still be running clubs or similar activities independently. This could add some confounding
elements to our analysis and lead us to misestimate the policy-effect by comparing pupils in schools
formally implementing the initiative to those in schools informally running xl-style clubs. Thirdly,
schools starting an xl club in 2005 or 2006, but not in 2004, are dropped from the analysis in case there
are spill-over effects from later clubs on previous cohorts. After excluding these observations, we are left
with 351 schools with an xl club and 1780 potential comparison schools without a club in 2004.
The characteristics (measured in 2003) of these xl club schools and non-xl club schools are
presented in Table 1. The first two columns reveal that schools with an xl club have on average more
students eligible for FSM than other schools (20 percent compared to 14 percent), a higher fraction of
students with special education needs (SEN, 31 percent compared to 26 percent), and a lower proportion
of students reaching the 5 A*-C GCSE/NVQ target (41 percent vs. 52 percent). Moreover, xl club
schools were more predominately White (86 percent compared to 74 percent) and had higher absence
rates (9.5 percent half-day sessions missed vs. 8.35 percent).
11 Local Authorities are responsible for the strategic management of education services, including planning the supply of
school places, intervening where a school is failing and allocating central funding to schools.

15
In order to reduce some of these differences, we start by estimating the probability that each school
is running an xl club in 2004 based on the following school-level characteristics: fraction of students
with various ethnicities, shares of students eligible for FSM and with SEN status, share of students
achieving 5 A*-C GCSE/NVQ, absence rates, school size, pupil-teacher ratio; and LA dummies. We
model the probability of being an xl club school with a logit specification, and the associated marginal
effects and standard errors are presented in Colum (3) of Table 1.
We then use the predicted probabilities of participation for xl club and non-xl schools from the logit
model to select only schools that belong to the ‘common support’ area. Figure 1 displays plots of the
probability distributions for the two groups, and the note to the graph provides exact details on the
‘common support’ region stretch. After this restriction, the number of non-xl schools shrinks to 1683,
whereas the number of xl club schools is basically unaffected (350 out of 351). These ‘common support’
schools constitute the core sample of our analysis, which we will use to ‘match’ xl club participants to
counterfactual students in schools not running the programme.
As already noted, in our evaluation we do not consider students in xl club schools, but not enrolled
in the initiative, as potential control units (non-treated in treated schools). This is because there might be
spill-over effects of the xl club intervention on non-participants. For example, xl club students might
become less disruptive as a result of the policy, thus positively contributing to the learning of others
during normal class-time (i.e. they became ‘better’ peers). Additionally, since xl students dropped one
subject, spill-over effects could operate through smaller class size and through more teacher attention
devoted to the learning of students remaining under the regular curriculum. All in all, we believe non-
treated pupils in treated schools do not constitute a potentially useful comparison group. We will return
to this issue in Section 4.7, where we present some additional findings and robustness checks.

16
4. Empirical findings
4.1. Descriptive statistics
The descriptive statistics on the main variables used in our analysis are tabulated in Table 2. Columns (1)
and (2) present information on xl club pupils and on students in schools where an xl club was not
running, respectively. There are 2233 treated youths and 259,189 potential controls. Additionally,
Columns (3) and (4) tabulate the difference between Columns (1) and (2) and the t-statistics on a test for
the significance of this difference. Finally, while the top panel of the table presents measures of pupil
attainments at various Key Stages, the bottom panel tabulates students’ characteristics.
Attainments at KS2 (age 11) and KS3 (age 14) are presented as the average standardized test score
(zero mean, unitary variance) across the three compulsory subjects, i.e. English, Mathematics and
Science. The original variables used to obtain these indicators are pupil ‘test scores’, which vary between
1 and 100 for each of the three subjects and at each of the two Key Stages. As for KS4 (age 16) tests, we
make use of pupil ‘point scores’ in English, Mathematics and Science (varying between 0 and 8); these
are indicators of total achievement devised by the Qualifications and Curriculum Authority (QCA) and
used by DCSF in the performance tables (see discussion above). Point scores are based on allocating
points to different grades, and aggregating across types of qualifications using appropriate weights
(details available from DCSF or QCA). To make age-16 scores comparable to earlier Key Stage grades
and construct measures of educational value-added, we also average age-16 point scores across the three
core subjects, and standardize the averaged measure to have zero mean and unitary standard deviation. In
Section 4.7, we present some robustness checks where we use KS4 point scores averaged over a wider
range of subjects. Finally, Table 2 also reports measures of value-added over KS2 to KS3 and KS3 to
KS4, and a measure of the change in pupil value-added between KS2 to KS3 and KS3 to KS4. These are
obtained by taking single and double differences in standardized test scores over adjacent Key Stages.
Some interesting findings emerge from the table. First of all, it is evident that xl club students
perform significantly worse than students in non-xl club schools over the different Key Stages: their

17
performance is between 1.2 and 1.4 standard deviations below that of non-xl club students. Note that we
investigated whether these differences are particularly concentrated in one of the three core subjects, but
we found that xl club students achieve similarly low grades in English, Mathematics and Science. As for
the (KS3–KS2) and (KS4–KS3) value-added measures, these are centred around zero for students in
non-xl club schools, but negative at both stages for xl club students and significantly lower than for
regular students. Finally, the acceleration in pupil achievement over the three key stages, that is the
double difference (KS4–KS3)–(KS3–KS2), is marginally positive for xl club students and marginally
negative for pupils in non-treated schools, although the difference across the two groups is not
significant. These patterns reflect a slowing down of the positive trend in non-xl club students’
achievements, and a flattening out of the negative slope of xl club pupils’ value-added between KS2 to
KS3 and KS3 to KS4.
As for the individual characteristics, xl club pupils are more likely to be male and eligible for FSM,
and to hold special education needs (SEN) with varying degrees of severity (the most severe being ‘SEN,
with statement’). Interestingly, they are also more likely to have English as a first language and to be
Black, and less likely to be Asian and Chinese. These findings are not surprising, as Black English-born
male students, with poor family background, are amongst the poorest achievers in England.
An array of additional school-level characteristics and information about the neighbourhood of
residence of each pupil (obtained from the GB Census 2001) are also included in our analysis. These are
presented in Appendix Table 2. One thing worth mentioning is that, thanks to our preliminary school
selection (see Section 3.2), school characteristics look reasonably balanced across the two groups,
especially relative to the imbalance in pupils’ attributes. As for neighbourhood characteristics, xl club
students tend to live in areas with higher concentrations of unemployment and social housing, and
marginally lower levels of educational achievement of the adult population.

18
4.2. Propensity-score estimation results
In this section, we present our findings about students’ propensity-scores, i.e. estimates of the probability
of being selected for participation in an xl club based on an set of individual, school and neighbourhood
characteristics. These will be used in the next sections where we evaluate the effect of the intervention
using propensity-score matching methods (more details provided in Appendix A). Empirically, we adopt
a logit specification and fit the following model:
)()|1Pr( ωZZdi Λ== (1)
where id is a binary indicator taking value one if pupil i is enrolled in an xl club and zero otherwise;
Z is a set of characteristics that vary depending on the exact specification of the empirical model; (.)Λ is
the logistic cumulative distribution function; and finally ω is a vector of parameters.
Our results are reported in Table 3. All columns include a broad array of individual characteristics as
well as school and neighbourhood controls and LA dummies (see notes to the table for details).
However, Column (1) does not include any control for previous achievement, whereas Column (2)
controls for attainments at KS3 and Column (3) includes test scores at KS2. Finally, in Column (4) we
simultaneously include test scores at KS3 and value-added between KS2 and KS3 (KS3–KS2) to
investigate whether both levels and trends in performance affect individuals’ chances of taking part in an
xl club. Note that throughout the table we report marginal effects and standard errors (in round
parenthesis), as well as odds ratios (in italics, square brackets).
Column (1) confirms some of the intuitions gathered from the descriptive statistics presented above.
Male pupils and students eligible for FSM or with SEN are significantly more likely to be enrolled in an
xl club. Pupils with ‘special education needs – action plan/plan plus’(a milder level of educational
disabilities) are 7.6 times more likely to be selected into the programmes, although students with more
severe learning disabilities (‘SEN, with statements’) are only 5.4 times more likely to participate in an xl
club. This finding possibly reflects the fact that pupils with the latter characteristics are more likely to be

19
involved in other more targeted activities, than pupils with milder forms of SEN. As for differences
across ethnic groups, these are still evident but less pronounced than in the descriptive statistics.
More interestingly, as shown in Columns (2) and (3), average low achievements across English,
Mathematics and Science at KS3 (age 14), right before the students were selected for the programme,
and at KS2 (age 11), at the end of primary schooling, are strong predictors of the chances of enrolling in
an xl club. For example, the odds ratios show that the probability of participating in an xl club decreases
by approximately a factor of five when we increase pupil achievements at KS3 by one standard
deviation; the corresponding factor for KS2 is approximately 2.5. Given that the differences between xl
club pupils and other students in terms of KS3 and KS2 test scores are in the order of 1.2/1.3 standard
deviations, these effects are substantial. Finally, in Column (4), we include KS3 test scores and (KS3–
KS2) value-added simultaneously. The results show that, while the KS3 variable retains its size and
significance, test score value-added between ages 11 and 14 is not a strong predictor of one pupil’s
chances of being enrolled in an xl club. Nevertheless, while not significant, the marginal effect and
associated odds ratios still suggest that pupils with slower progression between KS2 and KS3 are
marginally more likely to participate to an xl club. All in all, there is some weak evidence that both
levels of achievement and progress between Key Stages help predicting enrolment into an xl club.
Next, Figure 2 presents histograms of the implied probability of treatment, i.e. propensity-scores, for
participants and non-participants for the four different specifications of Table 3. Across all panels, the
graphs do not present a particularly reassuring picture. In particular, the estimated common support for
the distribution of )|1Pr( Zdi = for treated and untreated units seems quite limited. This result is
surprising given that the set of conditioning variables Z used in our specifications contains detailed
information about pupil history of achievement and background. Nevertheless, similar patterns have been
documented by previous research in the field, for example by Heckman, Ichimura and Todd (1997).
However, it has to be emphasized that the histograms in the figure hide a substantial part of the
empirical action. In fact, it should be noted that the diagrams show fractions within the treated and
control groups, and that the group of untreated pupils is about 100 times larger than the group of treated

20
students. Therefore, although a predominant fraction of control units has near-zero probability of
treatment, the raw numbers of individuals with high estimated propensity scores for the two groups are
fairly comparable, in particular at the very top end. For example, 559 treated observations have an
estimated )|1Pr( Zdi = of 21 percent or higher, compared to 760 untreated units. For even higher
probabilities, we find that 110 treated and 24 untreated students have an estimated probability at or above
63 percent, and that 23 treated and 5 untreated pupils have probabilities of 80 percent or above. This
implies that the common support area stretches over a much larger region than it would appear from the
graphs and that, thanks in part to the large size of the potential control group, xl club pupils can be
matched to counterfactual students over most of the )|1Pr( Zdi = distribution.
Nevertheless, another crucial fact emerges from these plots: the estimated propensity-scores for
treated students are also clustered on low predicted probabilities. About 50 percent of the treated
students (1165) have estimated probabilities of treatment of 0.06 or lower. Once more, this is similar to
the findings in Heckman, Ichimura and Todd (1997). This evidence clearly suggests that factors that are
unobservable to us – but not to the teachers and xl club advisors – must have played an important role in
the assignment of pupils to the programme. Indeed, this is fully consistent with the discussion presented
above about the factors that influenced staff choice of pupils for the xl clubs, which included potential
risk of school exclusion, flagging motivation and progressive disengagement from school activities. In
Section 4.4, we will try to deal with the consequences of this issue in detail.
4.3. Cross-sectional least squares and propensity-score matching estimates of the policy-effect
We begin our discussion by presenting estimates of the average treatment-on-the-treated (ATT) obtained
exploiting only the cross-sectional dimension of our data. Put simply, we estimate the effect of the policy
by comparing age-16 test scores of xl club students (treated) to the attainments of similar (matched)
pupils in schools where the programme was not being offered (controls). To do so, we use both ordinary
least squares (OLS) and a propensity-score matching approach; more details are provided in Appendix
A. The advantages and drawbacks of a matching approach relative to OLS have been extensively

21
discussed in the literature (see Imbens, 2004; Dehejia and Wahba, 2002; and Smith and Todd, 2005), as
well as the properties of different algorithms used to obtain matching estimators of the ATT (see Dehejia
and Wahba, 1999; Frolich, 2004; Smith and Todd, 2005; and Caliendo and Kopeinig, 2008). However,
broadly speaking, both cross-sectional least squares and matching estimators rely on the same
assumptions in order to yield consistent estimates of the effect of the policy, namely that conditional on
(large set of) observable characteristics, treatment assignment is as good as random. Stated differently,
the assumption is that selection operates only via observables, and that unobservables are unrelated to the
probability of treatment and outcomes in the absence of treatment, conditional on observables. In the
matching literature, this is often refereed to as Conditional Independence Assumption (CIA).
In Table 4, we present findings obtained using four different specifications of the set of controls
included in the OLS estimation of the ATT, or in the estimation of the propensity-scores. These four
specifications are the same as those discussed in Table 3. Throughout Table 4, the outcome of interest is
the KS4 test-score averaged across English, Mathematics and Science, and standardized to have mean
zero and unitary standard deviation. In the first column of the table (not numbered), we reproduce the
unconditional mean difference in the outcome between treated pupils and students in non-xl club
schools. Column (1) presents ordinary least squares (OLS) estimates of the policy-effect. Next, Column
(2) presents nearest-neighbour matching estimates of the ATT, while Column (3) presents matching
results that use the five closest neighbours combined with a 0.0001 caliper. Both matching estimators are
computed for the units on the common support and nearest neighbours are matched with replacement;
standard errors are bootstrapped using 100 repetitions.12
Comparison of the unconditional mean difference with OLS results in Column (1) shows that
controlling for individual characteristics in a linear fashion greatly reduces the size of the negative
estimated impact of the policy across all specifications. This effect shrinks by around a factor of eight,
from –1.38 to –0.17, in our richest specifications (Rows (2) and (4)).
12 Note that we experimented with other matching algorithms, in particular with Local Linear Regression (LLR) matching
with 2% trimming, and reached similar conclusions. Results are not tabulated, but available from the authors.
22
Next, matching results are presented in Columns (2) and (3). Appendix Table 3 reports a battery of
tests on the validity of the chosen matching algorithms. For all specifications, treated and control units do
not significantly differ in terms of their observables after matching. Note also that at most three treated
units are lost out of the common support areas when using the single nearest matching method, whereas
no controls are dropped because of this restriction. This confirms the point made above that Figure 2
hides part of the empirical action.
The figures in Columns (2) and (3) of Table 4 reveal that the negative difference in the outcomes of
treated and control students is further reduced when using a matching approach combined with
Specification 2 and Specification 4. OLS estimates are in the order of negative 17 percent of a standard
deviation, whereas matching estimates come down to around –0.13/–0.15. Nevertheless, the opposite is
true for Specification 3 (and to a much lesser extent for Specification 1), where we only match on KS2
test scores and individual characteristics: both propensity-score matching estimates are now more
negative than OLS, at –0.39/–0.42 versus –0.29. An explanation for this pattern can be found in some
facts noted above. First, xl clubs pupils have lower levels of achievement at both KS2 and KS3, relative
to students in non-xl club schools, as well as negative and significantly lower KS2-to-KS3 value-added
(see Table 2). Second, as revealed by the results in Table 3, KS3 test scores have a stronger effect on the
chances of being enrolled in an xl club, than KS2 attainments. Taken together, these two aspects suggest
that by matching pupils on the earliest Key Stage test scores only, we create ‘bad’ treated-controls
matched units – or at least ‘worse’ pairs than if we matched on KS3 – and end up magnifying the
differences between xl clubs students and matched pupils in KS4 outcomes.
All in all, the most important lesson learned so far is that using a matching approach to control for
pupil observable characteristics in a more flexible way than with OLS does not change the overall
message: if selection operated only through observables, the effect of the policy on pupil test scores at
KS4 would be significantly negative. However, given the discussion in Section 2.2 about pupil selection
for the programme, it is hard to believe that the CIA and similar assumptions advocated by cross-

23
sectional estimators hold in our settings. Therefore, in the next section, we go on to explicitly exploit the
longitudinal dimension of our dataset in order to control for the effects of unobervables.
4.4. Accounting for unobservables: difference-in-differences and double-differences models
In this section, we take advantage of the fact that we have access to pupils’ test scores at various points
in time to control for unobservable characteristics that might affect both enrolment in an xl club and
students’ achievement. To being with, we exploit test scores taken immediately before (KS3, age 14) and
immediately after (age 16, KS4) the programme and compare KS3-to-KS4 value-added (KS4–KS3) for
treated and control students. This approach is equivalent to a difference-in-differences set-up and allows
us to partial-out the effects of time-fixed pupils’ unobservables, such as ability, motivation and
unobservable family background characteristics (see Meyer, 2005, and Heckman et al., 1997 and 1998
on the assumptions of difference-in-differences models). Our second set of estimates, instead, exploits
test scores at three points in time, namely at age 11 (KS2) and age 14 (KS3), both before treated students
were enrolled in an xl club, and at age 16 (KS4), after the intervention took place. In this case, we
compare the acceleration in value-added between ages 14 and 16 relative to the value-added between 11
and 14, that is (KS4–KS3)–(KS3–KS2), for treated and control students. Empirical models with these
features are often referred to as double-differences or random-growth models (see Heckman and Hotz,
1989; Michalopoulos et al., 2005), and allow to control for unosbervables that might affect enrolment in
the programme and students’ test score progression, such as increasing disengagement with school
activities and flagging motivation. Put simply, these models help to control for linearly time-trending
unobservable effects in students’ outcomes. Note that, following the structure of the previous section, we
estimate difference-in-differences and double-differences models using both OLS and a propensity-score
matching approach. More details are provided in Appendix A.
Our results are presented in Table 5. The first column (not numbered) tabulates the unconditional
mean difference in the outcome between treated pupils and students in non-xl club schools. Next,
Column (1) presents ordinary least squares (OLS) estimates of the policy-effect, while Column (2)

24
presents nearest-neighbour matching estimates, and Column (3) presents matching results that use the
five closest neighbours, combined with a 0.0001 caliper.
Starting from the top, in Panel A we present results from the difference-in-differences models. In the
first row we analyse the effects of the policy on the value-added between KS3 and KS4 (i.e. KS4–KS3).
The unconditional mean difference in the outcome for xl-club and non xl-club students is –0.071, and
strongly significant. In the next three columns, we go on to estimate policy-effects that control for the
variables used in Specification 1 of Table 3, using either least squares or propensity score methods.13 The
OLS result in Column (1) shows that as soon as we add controls in a linear fashion, the policy-effect
shrinks to –0.031, and is no longer significantly different from zero. The matching estimates in Columns
(2) and (3) provide a similar picture: pupils attending an xl club perform 1.5 to 2.7 percent of a standard
deviation worse than matched controls, but this gap is not significantly different from zero.
As mentioned in Section 2.2, xl advisors and school teachers selected students for xl club activities
on the basis of their assessment of pupils’ progressive disengagement with education, future risk of
exclusion and flagging motivation. These factors might have a negative effect on pupils’ trends (value-
added) in test scores, rather than simply on overall levels of attainment. In this case, random-growth
models that partial out the effects of linearly time-trending unobservables might be more appropriate.
To investigate this issue, in Row (2) of Table 5 we begin by presenting a similar analysis to Row (1)
where the outcome of interest is now the value-added between KS2 and KS3. Both these tests were taken
before some of the pupils enrolled in the programme, thus any effect of the policy on (KS3–KS2) would
suggest that students with high/low value-added were more/less likely to attend an xl club. OLS results
in Column (1) show a small negative, but not significant effect at –0.018. Matching results in Columns
(2) and (3) instead present more sizeable effects, at around –0.05, and marginally significant. These
13 Note that, when using single or double-differenced outcomes, we do not control for previous test-scores of pupils. Although
some related studies (e.g. Heckman et al., 1998; Smith and Todd, 2005) have included lagged dependent variables in
differenced models, in our case this strategy seems inappropriate. In fact, given the high persistence of test scores over time
and the linearity in their effects, the inclusion of either KS2 or KS3 among the controls effectively nets the difference
component out of our outcome variables, thus undermining the scope of the exercise.

25
results are partly consistent with the evidence in Column (4) of Table 3, which showed that conditional
on KS3, there is a small negative effect of KS2-to-KS3 value-added on the probability of joining a club.
All in all, there is some weak evidence that students were selected for the programme on the basis of
attributes associated with their trends in performance. Note also that it is unlikely that these findings
pick-up an ‘Ashenfelter’s dip’-type dynamic (Ashenfelter, 1978): selection for the programme was not
automatic and mechanically based on test scores being below a certain threshold, rather based on
‘impressions’ about students that teachers collected over three years of interaction.
In Panel B of Table 5 we present results from the double-differences models described above and
detailed in Appendix A, where the dependent variable is the double difference in test scores (KS4–KS3)–
(KS3–KS2).14 Some interesting results emerge. Both the unconditional mean difference and the OLS
estimate of the policy effect are not statistically significant, and closer to zero than previously found,
respectively at 0.008 and –0.013. On the other hand, random-growth propensity-score matching models
in Columns (2) and (3) produce some positive estimates, although these are not significant at the
conventional levels. The policy-effect in Column (2), Row (3) is 0.025, and further increases to 0.034
when matching on the five nearest neighbours (see Column (3)). A test on the difference between this
last estimate and the OLS effect in Column (1) rejects the null of no difference with a p-value of 0.035.
These findings suggest that once we account for the effects of unobservable factors that affect trends
in performance and control for observable characteristics in a highly flexible way using a matching
approach, the policy had a beneficial impact on pupils’ KS4 test scores (although not significant).
However, this effect was worth at maximum 2.5 to 3.4 percent of a standard deviation, a small figure
when compared to the achievement gap between xl club and regular students in terms of age-11 and age-
14 test scores, at about 1.2/1.3 standard deviations.
14 When looking at the variable (KS4–KS3)–(KS3–KS2), we treat the time intervals between KS2 and KS3 and KS3 and KS4
as unitary ‘education blocks’, so that progress over the two periods can be compared by simply taking a double difference.
Note that we analysed alternative models where we account for the fact that the two time-periods encompass a different
number of years (2 vs. 3), and re-scaled the double difference to compute (KS4–KS3)–2/3×(KS3–KS2). We found
qualitatively similar, although (mechanically) smaller effects of the programme. Results are available upon requests.

26
In conclusion, it is also important to point out that these estimates might be upward biased by mean-
reversion. Indeed, one concern is that xl club pupils ‘could not have got much worse’ at KS4 since they
started with very low grades at KS3. In other words, there might be a ‘floor’ effect such that the negative
trend between KS3 and KS4 would have slowed down even in the absence of treatment. Moreover, as
already discussed, there is only weak evidence that pupils were selected for the programme on the basis
of characteristics correlated with their trends in performance. For these reasons, we believe results from
difference-in-differences specifications are more reliable than those from double-differences models, and
we consider the former specifications as our ‘favourite’. To reiterate, these suggest that the xl club
intervention was not effective at improving age-16 test scores of xl club students.
4.5. Quantifying the role of selection on unobservables
The results so far show that neglecting the role played by unobservables in determining pupils’ selection
for the xl club programme leads us to conclude that the policy had a negative effect on students’ age 16
test scores. On the other hand, as soon as we move to models that allow us to partial out the effects of
unobservables, we come to more positive conclusions: our central difference-in-differences estimates
show that there is no significant gap in KS4 test scores between treated and matched pupils.
In order to shed more light on the role played by unobservables, we next adapt the approach of
Altonji et al. (2005a) and (2005b) to investigate the following two empirical questions: (i) how much
negative selection on unobservables do we need to drive the cross-sectional estimates of the policy-effect
from negative and significant to zero; (ii) how sizeable our estimates would be if we imposed an equal
amount of selection on observables and unobservables. These checks allow us to understand how much
selection on unobservables relative to selection on observables we need in order to go from the negative
cross-sectional OLS estimates of the policy-effect to the zero estimates obtained using the difference-in-
differences models, and help us to shed some light on the credibility of the latter specifications. Note that
the main difference between the Altonji et al. (2005b) original set-up and our empirical models is that
27
our outcome is a continuous measure (test scores at KS4), rather than a binary variable. Appendix B
provides details on how we have adapted the authors’ method to our settings.
Results are reported in Table 6. The heading to the columns in the table refers to the constraint
imposed on ρ, i.e. the correlation between the unobservables in the selection-equation and the treatment-
equation in a Heckman-style model. Stated differently, ρ captures the degree of (negative) sorting on
unobservables into xl clubs. It is this parameter that we are interested in calibrating at different values in
order to assess the robustness of our findings to varying degrees of selection on unobservables that are
associated with lower levels of achievement and higher chances of enrolment in an xl club. Note that in
the first column of the table we produce results where we impose ρ=0; in this case, we obtain the simple
cross-sectional OLS results tabulated in Table 4. Note also that we perform our exercises using two
alternative sets of controls, namely Specification 1 and Specification 2 discussed above.
Starting from Row 1, we find that the negative effect of the policy is significantly eroded as we
progressively increase the amount of negative selection on unobservables. For ρ= –0.35, the effect is
negative 0.060, similar to the unconditional mean difference in value-added between xl club and regulars
students (see Table 5), while for ρ= –0.40 the estimate becomes a positive 0.036, although insignificant.
Furthermore, if we impose an equal amount of selection on observables and unobservables (ρ= –0.606),
we find a significantly positive policy-effect at 0.417.
Results reported in Row 2 are obtained using Specification 2 which further controls for KS3 test
scores, and are even more compelling: with values of ρ as small as –0.15 and –0.20, estimates of the
policy-effect turn insignificant negative and insignificant positive at –0.020 and 0.032, respectively.
These results are remarkably similar to the estimates reported in Table 5, where we used repeated test
scores observations to directly control for pupil unobservables. Additionally, if we let the amount of
selection on unobservables equate the amount of selection on osbervables (ρ= –0.432), we find a positive
and significant effect of the xl club intervention at 0.263.
Taken together, these results provide some important pieces of evidence that support our previous
analysis and conclusions. First, they show that students are more negatively sorted into the xl club

28
programme if we do not control for pupils’ prior test scores. This is consistent with the patterns of the
estimates in Table 4. Second, we find that even conditional on students’ prior attainments (KS3), a small
absolute amount of selection on unosbervables (approximately ρ= –0.17) drives the policy-effect to zero.
Given that the amount of negative selection on observables conditional on KS3 is approximately –0.43
(see the value of ρ that identifies equal selection on observables and unobservables), this suggest that a
shift in the distribution of unobservables of approximately 40 percent of the shift in the distribution of
observables (=17/43) shrinks the estimates of the policy-effect from negative and significant to zero.
Stated differently, we do not need much sorting on unobservables relative to selection on observables in
order to go from the cross-sectional OLS estimates of the policy-effect to the difference-in-differences
results. This finding provides an indication of how important teachers’ selection of xl club students based
on aspects such as risk of school exclusion, persistent truanting and school disengagement should be in
order to support estimates of the policy-effect based on difference-in-differences specifications. Finally,
this set-up also allows us to pin down an upper bound for the effect of the xl club programme on pupils’
test scores. Following the reasoning in Altonji et al. (2005a) and (2005b), we argue that given the
richness of our specifications the amount of selection on observables identifies an upper bound to the
amount of negative unobservable sorting. For reference, the adjusted R-squared of the model in Column
(1), Row (2) of Table 4 is as sizeable as 0.748. Therefore, it is very likely that models that impose an
equal amount of negative observable and unobservable sorting identify an upper limit to the impact of
the policy. Using our preferred specification (Specification 2), this upper bound would be 0.263, or
approximately 20 percent in the initial achievement gap between xl club and regular students.
4.6. Further discussion
Before moving ahead, an important remark regarding our econometric models is worth being made. The
results discussed above showed that, if we analyse the impact of the policy on pupils’ KS4 conditional on
KS3, we find a negative and significant effect. On the other hand, if we use pupils’ value-added to partial
out the effect of unobservables, we estimate the policy-effect to be zero.

29
This discrepancy is not particularly surprising in least squares models. Todd and Wolpin (2003)
show that if test scores are a noisy proxy for pupil unobserved ability, the coefficient on the lagged test
scores (KS3) will be downward biased. If selection into the programme is further (negatively) related to
pupil unobserved ability, this bias will be transferred to the estimated impact of the policy, resulting in
downward biased least square estimates of the policy-effect. On the other hand, if the restriction that the
coefficient on lagged test scores (KS3) equals one can be assumed to hold, OLS estimation of difference-
in-differences models will result in unbiased estimates of the effect of the programme.15
However, the difference between value-added and lagged dependent variable models when using
propensity-scores matching might be more unexpected. Indeed, Frolich (2008) argues that the issues
highlighted here above do not contaminate policy-effects estimated using non-parametric matching
models. His result holds under the assumption that the expected value of the individual unobservables
within matched ‘cells’ is the same for treated and control units. Unfortunately, this condition is unlikely
to hold in our setting because of two reasons. First, our propensity-score matching estimators control for
pupil observable characteristics and lagged test scores in a semi-parametric way. Fully non-parametric
ways of controlling for students’ observables, in particular continuous measures of KS3 test scores, did
not prove feasible. This is because we have too few treated students to meaningfully discretize KS3 test
scores and match within cells defined by lagged test scores and other pupil characteristics. Second, even
if fully non-parametric regression models were feasible, it is still unlikely that in our case treated and
control pupils with the same observable characteristics and lagged test scores had, on average, the same
unobservables. This is because of the very specific nature of the disadvantage and behavioural problems
that characterise xl club pupils.
In conclusion, careful considerations of the underlying assumptions of our econometric models
reinforces the intuition that cross-sectional OLS and matching models yield biased estimates of the
policy-effect. On the other hand, models that more openly exploit the longitudinal dimension of the data
15 Note that lacking a suitable instrument the assumption that the coefficient on lagged test scores is equal to one is not
testable. For reference, in the OLS models of Column (1), Row (2) of Table 4 this coefficient was 0.794 (s.e. 0.003).

30
and apply a difference-in-differences design give estimates that are closer to what the ‘true’ causal effect
of the xl club intervention would be in the absence of sorting and selection.
4.7. Robustness checks and heterogeneous policy-effects
We conclude our analysis by discussing a series of robustness checks and some results about the
heterogeneity of the policy-effects. Our focus is on the outcome (KS4–KS3), and estimates are obtained
using a single nearest-neighbour matching approach.16 These are comparable with results in Row (1),
Column (2) of Table 5.
To begin with, note that so far we have only considered KS4 average test scores across English,
Mathematics and Science. This is because students have to sit exams in the three core subjects at ages 16,
14 and 11, which makes it easier to construct meaningful measures of educational progress over the Key
Stages. However, on average, regular students sit for exams in ten different subjects at KS4. We thus re-
run our analysis using outcomes at KS4 that are based on point scores averaged across all subjects taken,
and standardized to take zero mean and unitary standard deviation. The results from this exercise show a
smaller negative effect of the policy at –0.001 (with a standard error of 0.023) clearly not different from
zero. This suggests that the programme impact might have been larger for possibly less academically
demanding subjects, compared to the effect for English, Maths and Science. Given the nature of the xl
club intervention and the type of pupils targeted, this seems a plausible result.
Next, we consider whether the intervention had an effect on non-treated pupils in xl club schools.
These spill-over effects might emerge if, for example, xl club students become less disruptive as a result
of the policy, thus positively contributing to the learning of other pupils during regular class-time (i.e.
they became ‘better’ peers). Our findings show that the KS3-to-KS4 value-added of non-xl club students
in xl club schools is approximately 0.018 above that of matched pupils in non-treated schools, and that
this difference is significant. This result hints at the presence of some spill-over effects and is consistent
16 All results from the sensitivity analysis, including also OLS and five nearest neighbours matching results, are not tabulated
for space reasons, but are available from the authors upon request.

31
with the evidence in Lavy et al. (2009), who show that a large fraction ‘bad’ peers in secondary schools
(i.e. students from the bottom of the ability distribution) exerts a significantly negative effect on the
learning of other school mates. Importantly, this finding also supports our claim that using non-treated
students in treated schools to identify a ‘comparison group’ is not a suitable strategy.
We then go on to investigate the heterogeneity of our findings along a variety of dimensions. First,
we stratify our sample by gender. Our estimates point to a positive effect of about 0.012 (s.e. 0.027) for
boys, although this is not significantly different from zero. On the other hand, the impact of the policy is
estimated to be precisely zero for girls at 0.000 (s.e. 0.031). A test for the equality of these two
coefficients accepts the null with a p-value of 0.770, thus strongly indicating that the policy effect was
not significantly heterogeneous along the gender dimension. Similarly, we find no evidence of
differences in the impact of the policy according to pupils’ eligibility for FSM, with effects of –0.017
(s.e. 0.045) and –0.020 (s.e. 0.023) for FSM-eligible and non-FSM-eligible pupils, respectively. Finally,
we compare our estimates for students in large schools with total enrolment above the median of the
sample distribution (1146 students), to those for smaller schools with total roll below the median. The
effect of the policy appears to be positive at 0.025 (s.e. 0.037) in smaller schools and negative at –0.023
(s.e. 0.029) in larger schools. However, both estimates are not significantly different from zero, and a test
on the equality of these two coefficients accepts the null with a p-value of 0.307.
To conclude, we also investigate whether our results are sensitive to non-random attrition in the
sample. In particular, the longitudinal set-up of our analysis implies that we lose pupils whenever their
KS2 or KS3 test scores are missing. In order to assess the robustness of our results the inclusion of these
observations, we code missing KS2 and KS3 test scores to zeros, and include dummies for missing
observations in all our specifications. Both the cross-sectional and the difference-in-differences/double-
differences estimates of the policy-effect for this extended sample are similar to our previous findings.
This is reassuring about the general validity of the results presented above.17
17 Another concern with our analysis regards the validity of our data on participation in an xl club. As discussed in Section
3.1, we used several fully-detailed individual characteristics in order to link pupil administrative records and information

32
5. Concluding discussion
In this paper, we have evaluated the effect of a remedial education intervention, called the xl club
programme, that focussed on pupils aged 14 in English secondary schools. The intervention operated on
a two-year programme, between ages 14 and 16, with approximately 13 students per club who met for at
least 3 hours per week guided by an xl club advisor. The most remarkable feature of the programme was
its focus on enhancing students’ non-cognitive skills – such as confidence, self-esteem, motivation and
locus-of-control – as a way to improve school attendance and raise young pupils’ end-of-compulsory-
education cognitive outcomes, that is test scores in standardized national exams at age 16.
Our findings on the effect of the policy on age 16 test scores vary depending on the way we control
for pupil unobservable characteristics which might have simultaneously affected their chances of being
enrolled in an xl club and their achievements. Our central estimates show that the policy did not have any
positive (nor negative) impact on the test scores of treated pupils. A more generous reading of our
findings is that the policy improved students’ age 16 test scores by 2.5 to 3.4 percent of one standard
deviation. Since xl club students started off with an achievement gap worth about 1.2/1.3 of one standard
deviation in the age 11 and age 14 test scores relative to regular secondary school students, a cautious
interpretation of our findings is that the policy was not effective at substantially narrowing xl club pupils’
educational disadvantage. As such, our results cast some doubts on the broad effectiveness of policies
that target students’ non-cognitive skills as a means to improve their cognitive outcomes.
What could account for this lack of results? Several explanations could be advanced. First of all, the
xl club activities might have simply not affected pupils’ non-cognitive skills, which in turn would
explain the lack of results on pupils’ cognitive outcomes. This might occur, for example, if adolescent
students’ non-cognitive skills are not very malleable and crystallised at much earlier stages of their life.
This explanation seems to contradict previous results in the literature (e.g. Knusden et al., 2006; Cunha
and Heckman, 2008; and Carneiro and Heckman, 2003) that indicate that the most productive periods for about enrolment in an xl club. This procedure might have introduced some noise, which could have in turn have affected our
estimates. In order to assess this issue, we re-ran our analysis on the subset of xl clubs where at least 2/3 of the participants
could be linked (including 95 percent of the 2233 treated pupils). Our results were fully confirmed.

33
investment in non-cognitive skills concentrate during secondary schooling and adolescent years, and that
non-cognitive skills are more amenable than cognitive abilities to being affected by interventions at later
stages in one person’s life. More importantly, this explanation also seems to contradict qualitative
evidence collected by Browne and Evans (2007) on the effectiveness of the xl clubs in improving pupils’
non-cognitive skills. For example, the authors report that treated students experienced (self-reported)
improvements in motivation and attitudes towards education; positive effects on their behaviour towards
other students and teachers; more maturity in dealing with problems and difficulties emerging during the
learning time; increased self-esteem and confidence about their future educational achievements and
labour market prospects. Similar perceptions were reported by the xl club advisors, as well as by teachers
and head-teachers at the targeted schools.
A second possible explanation is that improvements in non-cognitive skills and pupils’ motivation
and awareness of the benefits of education did not translate into more time spent studying and learning at
school, and less truanting (absences). However, once again, the qualitative evidence reported in Browne
and Evans (2007) suggests that the policy improved pupils’ patterns of attendance. Additionally, in some
parallel research (Holmlund and Silva, 2008; results available upon request), we have tried to evaluate
the impact of the xl club programme on pupils’ absence rates. Unfortunately, repeated information about
students’ attendance patterns before and after the programme is not available, which makes it difficult to
properly account for students’ unobservables. Nevertheless, simulations based on the Altonji et al.
(2005b) method discussed above and in Appendix B show that with very moderate degrees of selection
on unobservables (ρ between 0.007 and 0.012) relative to degree of sorting on observables (ρ
approximately equals to 0.12) the policy had a positive and significant impact on pupils’ attendance
records. This was worth about a 15 percent reduction in authorised absences – usually justified with a
parental note to the school and capturing less serious degrees of truanting behaviour – and a large 50
percent drop in un-authorised absences – more commonly associated with serious behavioural problems.
One last possible explanation is that, even if the policy had an effect on non-cognitive skills and
attendance, this did not help pupils to significantly improve their cognitive outcomes, i.e. test scores in

34
exams at age 16. This result is not necessarily inconsistent with previous findings in the literature.
Although Heckman et al. (2006) and Cunha and Heckman (2008) show that that young students’ non-
cognitive skills significantly affect their school achievements, the evidence discussed in Heckman (2000)
suggests that programmes similar to the xl club initiative that solely focussed on improving adolescent
students’ motivation and awareness of education (such as the ‘Big Brother/Big Sister’ programme) did
not significantly improved students’ test score performance. More importantly, Cunha et al. (2006)
suggest that the process of skill accumulation over an individual’s life cycle is characterised by self-
productivity – skills acquired in early periods persist in the future – and complementarities – early skill
investments enhance the productivity of human capital investment at later stages. The authors further
argue that these dynamic complementarities help accounting for a large body of evidence that shows that
later remedial interventions are not effective at addressing students’ early and deeply rooted cognitive
deficits. Given the background characteristics and history of poor achievements at early educational
stages (age 11) of xl club pupils, a similar explanation might provide a rationale for our findings.
Unfortunately, given the data at hand, these potential explanations must remain conjectures and are left
open to future research.

35
References
Abadie, A. (2005): “Semiparametric Difference-in-Differences Estimators”, Review of Economic Studies, vol. 72(1), pp. 1-19. Altonji, J., T. Elder and C. Taber (2005a): “An Evaluation of the Instrumental Variable Strategies for Estimating the Effects of Catholic Schooling”, Journal of Human Resources, vol. 40 (4), pp. 791-821. Altonji, J., T. Elder and C. Taber (2005b): “Selection on Observed and Unobserved Variables: Assessing the Effectiveness of Catholic Schools”, Journal of Political Economy, vol. 113(1), pp. 151-184. Ashenfelter, O. (1978): “Estimating the Effects of Training Programs on Earning”, The Review of Economics and Statistics, vol. 60(1), pp. 47-57. Banerjee, A., S. Cole, E. Duflo and L. Linden (2007): “Remedying Education: Evidence from Two Randomized Experiments in India”, Quarterly Journal of Economics, vol. 122(3), pp. 1235-1264. Browne, A. and K. Evans (2007): “National Evaluation of The Prince’s Trust xl Programme – Qualitative Evaluation”, QA Research. Caliendo, M and S. Kopeinig (2008): “Some Practical Guidance for the Implementation of Propensity Score Matching”, Journal of Economic Surveys, vol. 22(1), pp. 31-72. Carneiro, P., C. Crawford and A. Goodman (2007): “The Impact of Early Cognitive and Non-Cognitive Skills on Later Outcomes”, CEE Discussion Paper 00092. Carneiro, P and J. Heckman (2003): “Human Capital Policy”, in J. Heckman and A. Krueger (eds.), Inequality in America: What Role for Human Capital Policies?, Cambridge, Mass: MIT Press. Cunha, F. and J. Heckman (2008): “Formulating, Identifying and Estimating the Technology of Cognitive and Noncognitive Skill Formation”, Journal of Human Resources, vol. 43(4), pp. 738-782. Cunha, F., J. Heckman, L. Lochner and D. Masterov (2006): “Interpreting the Evidence on Life Cycle Skill Formation”, in E. Hanushek and F. Welch (eds.), Handbook of Economics of Education, Vol. 1, Chapter 12, North Holland-Elsevier, pp. 698-805. Dehejia, R. (2005): “Practical Propensity Score Matching: A Reply to Smith and Todd”, Journal of Econometrics, vol. 125, pp. 354-364. Dehejia, R. and S. Wahba (1999): “Causal Effects in Nonexperimental Studies: Reevaluating the Evaluation of Training Programs”, Journal of the American Statistical Association, vol. 94, pp. 1053-1062. Dehejia, R. and S. Wahba (2002): “Propensity Sore-Matching Methods for Nonexperimental Causal Studies”, Review of Economics and Statistics, vol. 84(1), pp. 151-161. Emmerson, C., C. Frayne, S. McNally, O. Silva (2006): “Aimhigher: Excellence Challenge: A Policy Evaluation Using the Labour Force Survey”, mimeo CEP-LSE. Frolich, M. (2008): “Parametric and Non-parametric Regressions in the Presence of Endogenous Control Variables”, International Statistical Review, forthcoming. Heckman, J. (2000): “Policies to Foster Human Capital”, Research in Economics, vol. 54, pp. 3-56. Heckman, J. and J. Hotz (1989): “Choosing Among Alternative Nonexperimental Methods for Estimating the Impact of Social Programs: The Case of Manpower Training”, Journal of the American Statistical Association, vol. 84, pp. 862- 874. Heckman, J., H. Ichimura and P. Todd (1997): “Matching as an Econometric Evaluation Estimator: Evidence from Evaluating a Job Training Programme”, Review of Economic Studies, vol. 64, pp. 605-654. Heckman, J., H. Ichimura and P. Todd (1998): “Matching as an Econometric Evaluation Estimator”, Review of Economic Studies, vol. 65, pp. 261-294. Heckman, J. and Y. Rubinstein (2001): “The Importance of Noncognitive Skills: Lessons from the GED Testing Program”, American Economic Review, vol. 91(2), 145-149. Heckman, J., J. Stixrud and S. Urzua (2006): “The Effects of Cognitive and Noncognitive Abilities on Labour Market Outcomes and Social Behavior”, Journal of Labor Economics, vol. 24(3), 411-480. Holmlund, H and O. Silva (2008): “Targeting Pupils at Risk of Exclusion: An Evaluation of the xl Club Programme”, report to The Prince’s Trust, London.

36
Imbens, G. (2004): “Non Parametric Estimation of Average Treatment Effects Under Exogeneity: A Review”, Review of Economics and Statistics, vol. 86, pp. 4-30. Knudesn, E., J. Heckman, J. Cameron and J. Shonkoff (2006): “Economic, Neurobiological and Behavioral Perspectives on Building America’s Future Workforce”, NBER WP 12298. Jacob, B and L. Lefgren (2004): “Remedial Education and Student Achievement: A Regression-Discontinuity Analysis”, Review of Economics and Statistics, vol. 86(1), pp. 226-244. LaLonde, R. (1986): “Evaluating the Econometrics Evaluations of Training Programs with Experimental Data”, American Economic Review, vol. 76, pp. 604-620. Lavy, V. and A. Schlosser (2005): “Targeted Remedial Education for Underperforming Teenagers: Costs and Benefits”, Journal of Labor Economics, vol. 23(4), pp. 839-874. Lavy, V., O. Silva and F. Weinhardt (2009): “The Good, The Bad and The Average: Evidence on the Scale and Nature of Ability Peer Effects in Schools”, mimeo, London School of Economics. Machin, S., S. McNally, C. Meghir (2007): “Resource and standards in urban schools”, IZA DP 2653. McNally, S. (2007): “Education, Education, Education: The Evidence on School Standards, Parental Choice and Staying-on”, Policy Analysis, Centre for Economic Performance, London School of Economics. Meyer, B. (1995): “Natural and Quasi-Experiments in Economics”, Journal of Business and Economic Statistics, vol. 13(2), pp. 151-161. Michalopoulos, C., H. Bloom and C. Hill (2004): Can Propensity-Score Methods Match the Findings from a Random Assignment Evaluation of Mandatory Welfare-to-Work Programs?”, Review of Economics and Statistics, vol. 86(1), pp. 156-179. OECD (2005): “Education at Glance”, Organization for Economic Cooperation and Development, OECD, Paris. OECD (2007): “Social Expenditure Database: SOCX”, Organization for Economic Cooperation and Development, OECD, Paris. Pema, E. and S. Mehay (2009): “The Effect of High School JROTC on Student Achievement, Educational Attainment, and Enlist”, Southern Economic Journal, forthcoming. Rosenbaum, P and D. Rubin (1983): “The Central Role of the Propensity Score in Observational Studied for Caual Effects”, Biometrika, vol. 70(1), pp. 41-55. Rubin, D. (1973): “Matching to Remove Bias in Observational Studies”, Biometrics, vol. 29, pp. 159-183. Segal, C. (2008): “Classroom Behaviour”, Journal of Human Resources, vol. 43(4), pp. 783-814. Segal, C. (2009): “Misbehaviour, Education and Labour Market Outcomes”, mimeo, UPF. Smith, J. and P. Todd (2005): “Does Matching Overcome LaLonde’s Critique of Nonexperimental Estimators?” Journal of Econometrics, vol. 125, pp. 305-353. ter Weel, B. (2008): “The Noncognitive Determinants of Labor Market and Behavioral Outcomes: Introduction to the Symposium”, Journal of Human Resources, vol. 43(4), pp. 729-737. Todd, P. and K. Wolpin (2003): “On the Specification and Estimation of Production Functions for Cognitive Achievement”, Economic Journal, vol. 113(485), pp. F3-F33. The Prince’s Trust (2006): “The xl Strategy 05/06: Questions and Answers”, official documentation on the xl clubs project, The Prince’s Trust, London.

37
Tables
Table 1: Preliminary matching at the school level; descriptive statistics and logit regression
(1) (2) (3)
Variable Mean (std.dev.), xl club schools
Mean (std.dev.), non xl club schools
Marginal Effect (std.error)
Share spec. educational needs, with statement 0.031 (0.018)
0.026 (0.019)
0.639 (0.419)
Share eligible for free school meals 0.197 (0.130)
0.144 (0.131)
0.213 (0.111)
Share White 0.871 (0.208)
0.865 (0.223)
0.169 (0.190)
Share Black 0.035 (0.087)
0.033 (0.083)
0.247 (0.276)
Share Asian 0.062 (0.136)
0.069 (0.159)
0.132 (0.197)
Share achieving 5 GCSEs A*-C 0.414 (0.151)
0.523 (0.186)
-0.314 (0.064)
Share sessions absent (authorised and unauthorised) 0.095 (0.022)
0.083 (0.022)
0.463 (0.443)
Total pupil numbers 1015.145 (354.18)
1037.54 (348.48)
0.001 (0.000)
Pupil-teacher ratio 15.905 (1.904)
15.706 (1.854)
0.006 (0.004)
Observations 351 1780 2131
Note: Mean and standard deviations (in round parenthesis) of listed variables in Columns 1 and 2. Marginal effects from logit regression in Column 3 (with standard error in round parenthesis). Dependent variable takes value 1 for schools starting an xl club in 2004 and takes value zero for all schools that do not have any xl club between 2001 and 2006. Schools with xl clubs starting before 2004 or in 2005 and 2006, but not in 2004 were excluded from the sample. Logit specification also includes Local Authority dummies. “Other” is excluded ethnic group from specification.

38
Figure 1: Predicted probability of treatment and common support
-.4-.2
0.2
0 .2 .4 .6 .8 1Propensity Score
Untreated (non xl club) Treated (xl club)
Note: The diagram plots histograms of the implied probability of treatment for xl club and non xl club schools. Probability estimates predicted using logit specification (see Table 1). School retained for the analysis are those falling within the common support; this spans the internal [0.0097684, 0.9199729]. Total number of schools in the common support is 2033 (out of 2131), of which 350 (out of 351) are xl club members and 1683 (out of 1780) are non xl club schools.

39
Table 2: Main variables, descriptive statistics for xl club and non xl club students (1) (2) (3) (4)
Variable xl club students
non xl club students
Difference (1)-(2)
T-stat. of difference
Panel A: Pupil achievement KS4 average English, maths and science (EMS), standardized -1.349
(0.784) 0.035
(0.987) -1.384 -66.062
KS3 average English, maths and science (EMS), standardized -1.284 (0.570)
0.029 (0.992)
-1.313 -62.411
KS2 average English, maths and science (EMS), standardized -1.217 (0.936)
0.016 (0.993)
-1.233 -58.494
(KS4 average EMS, standard.) – (KS3 average EMS, standard.) -0.065 (0.605)
0.006 (0.541)
-0.071 -6.186
(KS3 average EMS, standard.) – (KS2 average EMS, standard.) -0.067 (0.667)
0.012 (0.540)
-0.079 -6.886
(KS4 – KS3) – (KS3 – KS2) 0.002 (0.853)
-0.006 (0.791)
0.008 0.476
Panel B: Pupil characteristics Male 0.616
(0.486) 0.496
(0.500) 0.120 11.247
English as first language 0.945 (0.227)
0.923 (0.266)
0.022 3.873
Eligible for free school meals 0.258 (0.438)
0.101 (0.302)
0.157 24.384
Spec. educational needs status – action plan/plan plus 0.462 (0.499)
0.114 (0.318)
0.348 51.263
Spec. educational needs with statement 0.057 (0.232)
0.010 (0.102)
0.047 21.238
White 0.869 (0.338)
0.863 (0.344)
0.006 0.838
Black 0.033 (0.179)
0.026 (0.159)
0.007 2.129
Asian 0.037 (0.188)
0.060 (0.237)
-0.023 -4.578
Chinese 0.000 (0.021)
0.002 (0.050)
-0.002 -1.968
Other ethnic group 0.037 (0.188)
0.025 (0.157)
0.012 3.385
Ethnicity unknown 0.024 (0.154)
0.024 (0.152)
0.000 0.142
Observations 2233 259189 -- -- Note: Mean and standard deviations (in round parenthesis) of listed variables in Columns (1) and (2). Sample includes only pupils with non missing values of the listed variables and in xl club schools and non xl club schools belonging to the common support. Common support determined using implied probability of treatment at the school level. See Table 1 and Figure 1 for details. Standardized variables have zero mean and unitary variance.

40
Table 3: Propensity score matching, marginal effects from various logit specifications
(1) (2) (3) (4) Variable Spec.1 Spec.2 Spec.3 Spec. 4
KS3 average EMS, standardized -- -0.0015
(0.0001) [0.202]
-- -0.0015 (0.0001) [0.202]
KS2 average EMS, standardized -- -- -0.0014 (0.0001) [0.441]
--
(KS3 average EMS, standardized) – (KS2 average EMS, standardized)
--
-- -- -0.0001 (0.0001) [0.959]
Male 0.0007 (0.0001) [1.357]
0.0003 (0.0001) [1.386]
0.0007 (0.0001) [1.522]
0.0003 (0.0001) [1.378]
English as first language 0.0006 (0.0003) [1.366]
0.0003 (0.0001) [1.499]
0.0007 (0.0002) [1.712]
0.0003 (0.0001) [1.488]
Eligible for free school meals 0.0014 (0.0002) [1.639]
0.0003 (0.0001) [1.334]
0.0007 (0.0001) [1.455]
0.0003 (0.0001) [1.334]
Spec. educational needs status – action plan/plan plus 0.0148 (0.0018) [7.682]
0.0010 (0.0002) [2.150]
0.0029 (0.0005) [2.737]
0.0011 (0.0002) [2.181]
Spec. educational needs with statement 0.0082 (0.0005) [5.383]
0.0008 (0.0001) [1.921]
0.0024 (0.0002) [2.579]
0.0008 (0.0001) [1.934]
Black -0.0000 (0.0003) [0.986]
-0.0002 (0.0001) [0.822]
-0.0002 (0.0002) [0.883]
-00002 (0.0002) [0.822]
Asian -0.0003 (0.0004) [0.858]
-0.0002 (0.0001) [0.817]
-0.0003 (0.0003) [0.822]
-0.0002 (0.0001) [0.819]
Chinese -0.0018 (0.0005) [0.202]
-0.0006 (0.0003) [0.311]
-0.0013 (0.0004) [0.245]
-0.0006 (0.0003) [0.312]
Other ethnic group 0.0005 (0.0004) [1.219]
0.0002 (0.0001) [1.253]
0.0004 (0.0003) [1.263]
0.0002 (0.0001) [1.252]
Ethnicity unknown -0.0009 (0.0002) [0.592]
-0.0004 (0.0001) [0.564]
-0.0007 (0.0002) [0.599]
-0.0004 (0.0001) [0.563]
Pseudo R-Squared 0.2573 0.3367 0.3012 0.3368 Percentage correctly predicted, xl club pupils 78.59 84.64 82.53 84.51 Percentage correctly predicted, non xl club pupils 81.65 84.10 83.53 84.10 Additional school and census controls + LA dummies Yes Yes Yes Yes Note: Dependent variable is dichotomous indicator taking value one if pupil belongs to an xl club and zero otherwise. Percentage of pupils treated in xl club is 0.85 percent. Number of observations 261,422. Table presents marginal effects and standard errors (in parenthesis) from logit model. Odds ratios reported in square brackets. Specifications additionally include: School and census controls as listed in Appendix Table 2; and squared terms of “Share eligible for free school meals”, “Share spec. educational needs with statement”, “Share spec. educational needs without statement”, “Share Black”, “Share Asian”, “Share Chinese”, “Share other ethnicity”, “Total pupil numbers”, and “Pupil-teacher ratio”; and LA dummies.

41
Figure 2: Predicted probability of treatment and common support
Specification 1 Specification 2
-.9-.7
-.5-.3
-.1.1
.3.5
0 .2 .4 .6 .8 1Propensity Score
Untreated Treated
-.9-.7
-.5-.3
-.1.1
.3.5
0 .2 .4 .6 .8 1Propensity Score
Untreated Treated
Specification 3 Specification 4
-.9-.7
-.5-.3
-.1.1
.3.5
0 .2 .4 .6 .8 1Propensity Score
Untreated Treated
-.9-.7
-.5-.3
-.1.1
.3.5
0 .2 .4 .6 .8 1Propensity Score
Untreated Treated
Note: Diagrams plot histograms of implied probability of treatment for xl club and non xl club pupils. Probability estimates predicted using logit specification. See Table 3 for various specifications. Percentage of pupils treated in xl club is 0.85 percent. Number of observations 261,422.
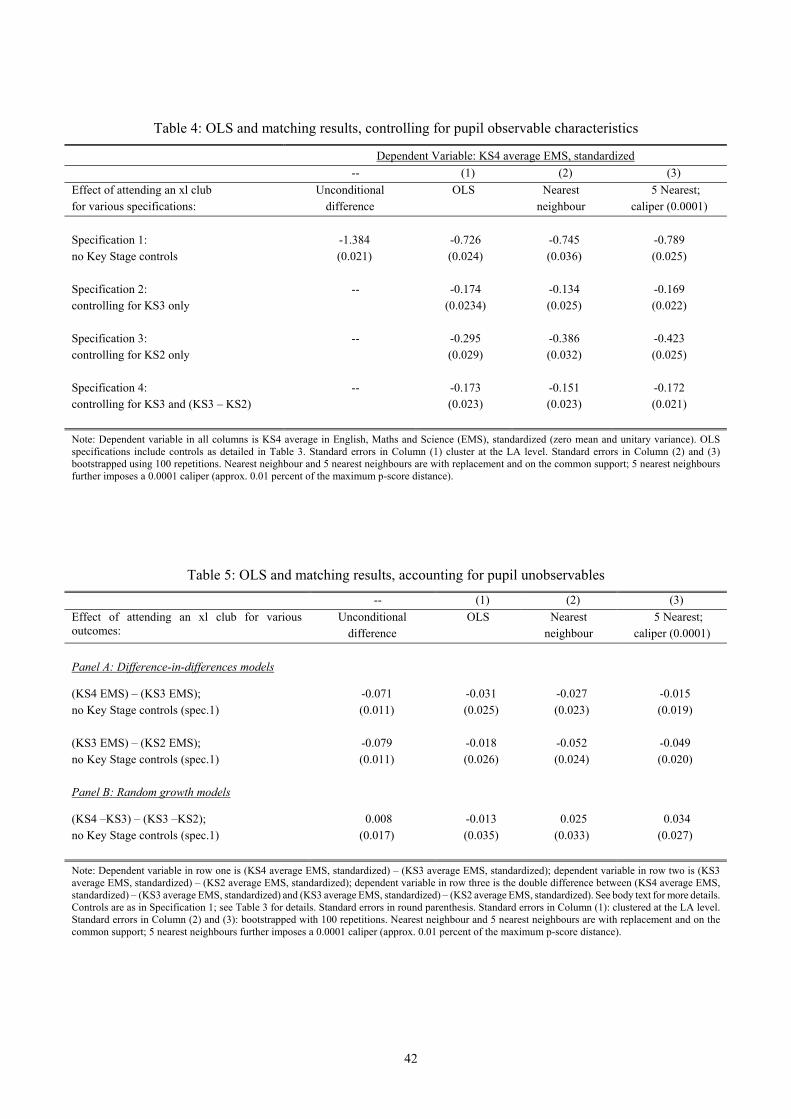
42
Table 4: OLS and matching results, controlling for pupil observable characteristics
Dependent Variable: KS4 average EMS, standardized -- (1) (2) (3)
Effect of attending an xl club for various specifications:
Unconditional difference
OLS Nearest neighbour
5 Nearest; caliper (0.0001)
Specification 1: no Key Stage controls
-1.384 (0.021)
-0.726 (0.024)
-0.745 (0.036)
-0.789 (0.025)
Specification 2: controlling for KS3 only
-- -0.174 (0.0234)
-0.134 (0.025)
-0.169 (0.022)
Specification 3: controlling for KS2 only
-- -0.295 (0.029)
-0.386 (0.032)
-0.423 (0.025)
Specification 4: controlling for KS3 and (KS3 – KS2)
-- -0.173 (0.023)
-0.151 (0.023)
-0.172 (0.021)
Note: Dependent variable in all columns is KS4 average in English, Maths and Science (EMS), standardized (zero mean and unitary variance). OLS specifications include controls as detailed in Table 3. Standard errors in Column (1) cluster at the LA level. Standard errors in Column (2) and (3) bootstrapped using 100 repetitions. Nearest neighbour and 5 nearest neighbours are with replacement and on the common support; 5 nearest neighbours further imposes a 0.0001 caliper (approx. 0.01 percent of the maximum p-score distance).
Table 5: OLS and matching results, accounting for pupil unobservables
-- (1) (2) (3) Effect of attending an xl club for various outcomes:
Unconditional difference
OLS Nearest neighbour
5 Nearest; caliper (0.0001)
Panel A: Difference-in-differences models
(KS4 EMS) – (KS3 EMS); no Key Stage controls (spec.1)
-0.071 (0.011)
-0.031 (0.025)
-0.027 (0.023)
-0.015 (0.019)
(KS3 EMS) – (KS2 EMS); no Key Stage controls (spec.1)
-0.079 (0.011)
-0.018 (0.026)
-0.052 (0.024)
-0.049 (0.020)
Panel B: Random growth models
(KS4 –KS3) – (KS3 –KS2); no Key Stage controls (spec.1)
0.008 (0.017)
-0.013 (0.035)
0.025 (0.033)
0.034 (0.027)
Note: Dependent variable in row one is (KS4 average EMS, standardized) – (KS3 average EMS, standardized); dependent variable in row two is (KS3 average EMS, standardized) – (KS2 average EMS, standardized); dependent variable in row three is the double difference between (KS4 average EMS, standardized) – (KS3 average EMS, standardized) and (KS3 average EMS, standardized) – (KS2 average EMS, standardized). See body text for more details. Controls are as in Specification 1; see Table 3 for details. Standard errors in round parenthesis. Standard errors in Column (1): clustered at the LA level. Standard errors in Column (2) and (3): bootstrapped with 100 repetitions. Nearest neighbour and 5 nearest neighbours are with replacement and on the common support; 5 nearest neighbours further imposes a 0.0001 caliper (approx. 0.01 percent of the maximum p-score distance).

43
Table 6: Sensitivity analysis with constrained correlation between selection and treatment equation
Outcome and specification ρ=0.00 ρ=-0.05 ρ=-0.10 ρ=-0.15 ρ=-0.20 ρ=-0.25 ρ=-0.30 ρ=-0.35 ρ=-0.40 Equal selection
KS4, average EMS stand.; specification 1
-0.726 (0.024)
-0.631 (0.024)
-0.536 (0.024)
-0.441 (0.024)
-0.345 (0.024)
-0.250 (0.024)
-0.155 (0.023)
-0.060 (0.023)
0.036 (0.023)
0.417 (0.022)
KS4, average EMS stand.; specification 2
-0.174 (0.023)
-0.122 (0.023)
-0.071 (0.023)
-0.020 (0.023)
0.032 (0.023)
0.083 (0.023)
0.135 (0.023)
0.186 (0.022)
0.238 (0.022)
0.263 (0.022)
Note: Parameters and standard errors (clustered at the LEA level) come from two-step estimation of a Heckman selection-type model with constrained ρ. See Appendix B and Altonji et al. (2005) for details. ‘Equal selection’ displays estimates where ρ is constrained such that the amount of selection on observables equates the amount of selection on unobservables. Specifically, for row 1, ρ= -0.606; and for row 2, ρ= -0.432 give rise to ‘equal selection’.

44
Appendix A: Empirical models and estimation methods
A1: Cross-sectional ordinary least squares and propensity-score matching models
Cross-sectional estimates of the policy-effects are simply obtained by comparing KS4/age-16 test scores
of xl club students (treated) to attainments of similar/matched pupils in schools where the programme
was not being offered (controls).
Ordinary last squares (OLS) estimates of the effect of attending an xl club are obtained by fitting the
following model:
iiiiii ksksxdks ξµηγβ ++++= 234 ' (A1.1)
Where 4iks , iks3 and iks2 are KS4/age 16, KS3/age 14 and KS2/age 11 test scores of pupil i,
respectively; ix is a vector of pupil, school and neighbourhood characteristics; and id is a dichotomous
variable taking value one for pupils enrolled in an xl club, and value zero for pupils in schools where an
xl club is not active. Note that in the empirical implementation, we build our specifications
progressively. To begin with, we only control for the vector of characteristics ix' , and then go on to
include either 3iks or 2iks . Finally, in our last models, we include 3iks and the value-added between KS2
and KS3, that is )( 23 ii ksks − . The parameter of interest is β , which captures the effect of the policy on
treated pupils’ test scores, that is the average treatment-on-the-treated (ATT).
Next, cross-sectional propensity-score matching estimates of the ATT are obtained as:
ATT = ∑ ∑∈ ∈
−1 0
]),([14041
Ii Ijji ksjiWks
n (A1.2)
In which I1 is the set of xl club participants; 41iks denotes KS4/age 16 test scores of treated pupils; I0
represents the set of matched controls (i.e. comparable pupils in non-xl club schools), while 40iks
represents their KS4/age 16 test scores; n is the number of matched treated individuals; and finally W(i,j)
is a weighting function that depends on the distance between the estimated propensity-scores Pi for
treated units and Pj for matched controls. As already discussed in Section 4.2, we estimate pupils’

45
propensity-scores parametrically using a logit model )()|1Pr( ωZZdi Λ== , where id is a binary
indicator taking value one if pupil i is enrolled in an xl club and zero otherwise; (.)Λ is the logistic
cumulative distribution function; Z is a set of individual characteristics that vary depending on the exact
specification of the empirical model; and finally ω is a vector of parameters. As for our OLS models, we
build the specification of the propensity scores progressively. The exact details are provided in Table 3.
Note also that we require that treated and control units fall in the common support area, and that we
match using either the single nearest neighbour or the five nearest neighbours with a caliper restriction at
0.0001 (both with replacement).18
A2: Difference-in-differences and double-differences models
Difference-in-differences models exploit test scores taken immediately before (KS3/age-14) and
immediately after (KS4/age-16) the programme and compare KS4–KS3 value-added for treated and
similar control/matched students. On the other hand, double-differences models take advantage of
information on test scores at three points in time, namely at ages 11 (KS2), 14 (KS3) and 16 (KS4) to
compare the acceleration in value-added between ages 14 and 16 relative to the value-added between 11
and 14, that is (KS4–KS3)–(KS3–KS2), for treated and control students.
Ordinary last squares (OLS) estimates of the policy-effect from difference-in-differences and
double-differences models are obtained by fitting the following two equations respectively:
iiiii xdksks ξγβ ++=− ')( 34 (A2.1)
iiiiiii xdksksksks ξγβ ++=−−− ')()( 2334 (A2.2)
Where 4iks , iks3 and iks2 are once again KS4/age 16, KS3/age 14 and KS2/age 11 test scores of
pupil i, respectively; ix is a vector of pupil, school and neighbourhood characteristics; and id is a
dichotomous variable taking value one for pupils enrolled in an xl club, and value zero for pupils in
18 Note that in both cases the weighting function W(i,j) is a ‘step’ function assigning positive weight(s) to the closest
neighbour(s), and no weight to more distant ones. Note also that when using the five nearest neighbours, we assign an equal
weight to each of them.
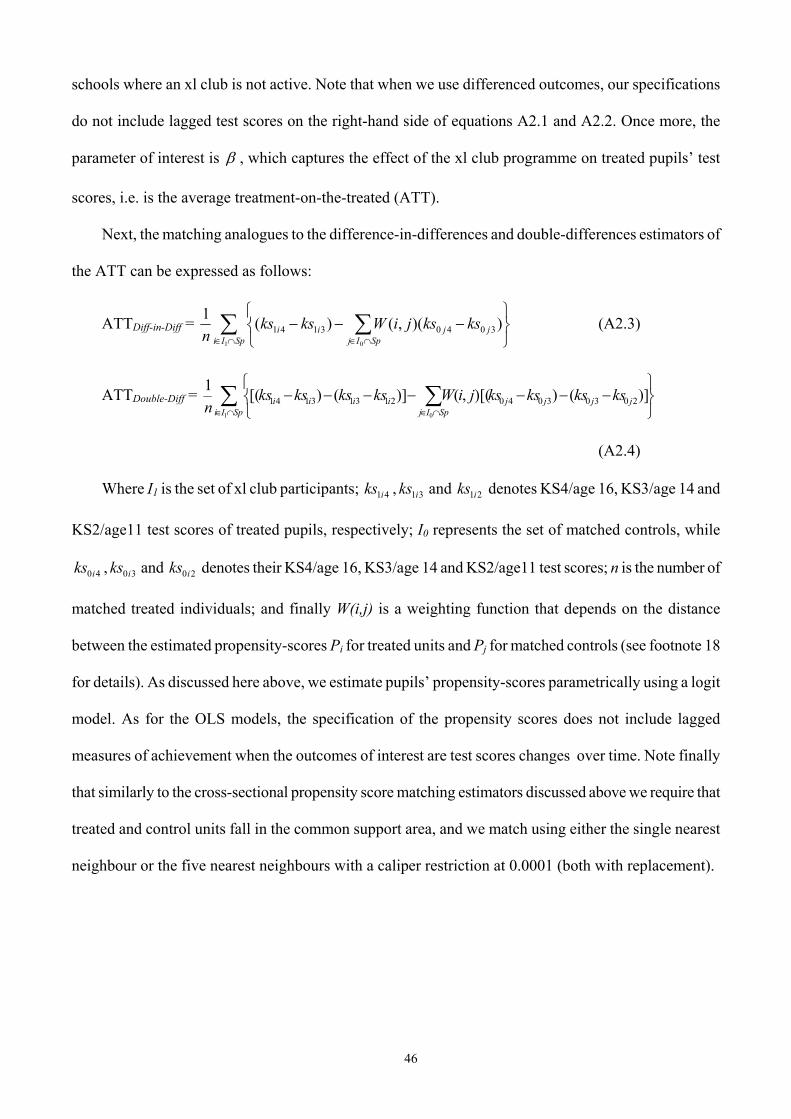
46
schools where an xl club is not active. Note that when we use differenced outcomes, our specifications
do not include lagged test scores on the right-hand side of equations A2.1 and A2.2. Once more, the
parameter of interest is β , which captures the effect of the xl club programme on treated pupils’ test
scores, i.e. is the average treatment-on-the-treated (ATT).
Next, the matching analogues to the difference-in-differences and double-differences estimators of
the ATT can be expressed as follows:
ATTDiff-in-Diff = ∑ ∑∩∈ ∩∈
−−−SpIi
jSpIj
jii ksksjiWksksn
1 0
))(,()(130403141 (A2.3)
ATTDouble-Diff = ∑ ∑∩∈ ∩∈
−−−−−−−SpIi SpIj
jjjjiiii ksksksksjiWksksksksn
1 0
)]())[(,()]()[(12030304021313141
(A2.4)
Where I1 is the set of xl club participants; 41iks , 31iks and 21iks denotes KS4/age 16, KS3/age 14 and
KS2/age11 test scores of treated pupils, respectively; I0 represents the set of matched controls, while
40iks , 30iks and 20iks denotes their KS4/age 16, KS3/age 14 and KS2/age11 test scores; n is the number of
matched treated individuals; and finally W(i,j) is a weighting function that depends on the distance
between the estimated propensity-scores Pi for treated units and Pj for matched controls (see footnote 18
for details). As discussed here above, we estimate pupils’ propensity-scores parametrically using a logit
model. As for the OLS models, the specification of the propensity scores does not include lagged
measures of achievement when the outcomes of interest are test scores changes over time. Note finally
that similarly to the cross-sectional propensity score matching estimators discussed above we require that
treated and control units fall in the common support area, and we match using either the single nearest
neighbour or the five nearest neighbours with a caliper restriction at 0.0001 (both with replacement).

47
Appendix B: Quantifying the role of selection on unobservables
In this appendix section we describe our implementation of the Altonji et al. (2005b) methodology. In
our case, the outcome of interest is a continuous indicator (test scores), rather than a binary variable, and
we want to investigate: (a) how much negative selection on unobservables we need in order to drive our
cross-sectional estimates of the policy effects from negative and significant to zero; and (b) how robust
these estimates are to the assumption of an equal amount of selection on observables and unobservables.
The foundation of this analysis is a Heckman-type selection model of the form:
)0'(
'
3
34
>++=
+++=
iiii
iiiii
ksxId
ksxdks
ϑϕλ
ξηγβ (B1)
In which 4iks and iks3 are KS4/age 16 and KS3/age 14 test scores of pupil i; ix is a vector of pupil,
school and neighbourhood characteristics; id is a dichotomous variable taking value one for pupils
enrolled in an xl club, and value zero for pupils in schools where an xl club is not active; (.)I is an
indicator function taking values one if its argument is above zero; and finally the error terms iξ and iϑ are
jointly normally distributed with: 0)E( i =ξ , 2i )Var( σξ = , 0)E( i =ϑ , 1)Var( i =ϑ and ρϑξ =),Corr( i i .
The parameter ρ measures the correlation between unobservables in the xl club selection equation and
in the test score equation. Stated differently, this factor captures the degree of selection on unobservables
into xl clubs. It is this parameter that we are interested in calibrating at different values in order to assess
the robustness of our findings to varying degrees of selection on unobservables.
As shown by Heckman (1979), the model in (B1) can be estimated by maximum likelihood or using
a two-step method that first estimates the probability of being enrolled in an xl club ( )1=id
parametrically using a probit model )'(),|1Pr( 33 iiiii ksxksxd ϕλ +Φ== and then estimates the following
equation:
)ˆˆ'()ˆˆ'(
*'
3
3
34
ii
iii
iiiijii
ksxksx
MillsRatio
MillsRatioksxdks
ϕλϕλφ
ξθηγβ
+Φ
+=
++++=
(B2)

48
Where (.)φ indicates the normal density distribution, (.)Φ represents the normal cumulative
distribution, λ̂ and ϕ̂ are estimated using the probit first-stage, and σρθ = . Although the parameter ρ
is not non-parametrically identified without exclusion restrictions (i.e. a valid instrument), it can be
constrained to predefined values in the estimation of system (3) by imposing a constraint on σρθ = once
an estimate for σ is obtained (and maintained as ρ changes)19. By setting ρ to different values, we can
explore the sensitivity of β̂ to different assumptions about the degree of selection on unobservables into
xl clubs and find the value of ρ that is necessary to drive estimates of β̂ from negative and significant
values to zero. This allows us to answer question (a) spelled out here above.
Additionally, Altonji et al. (2005b) discuss how to use this set-up to identify the value of ρ which
implies an equal amount of selection on observables and unobservables. They argue that, if a large
number of observable characteristics are available for the investigation, the extent of selection on
observables provides an upper bound for the amount selection on unobservables. To see how this applies
to our case, consider the latent variable ),|1Pr( 3*
iiii ksxdd == and assume we could run the following
‘thought’ regression:
iiii ksxd ξδηγδδ 2310* ]ˆˆ'[ +++=
In the Altonij et al. (2005b) sense, equal selection on observables and unobservables is obtained
when 21 δδ = . Note now that in our case, where the outcome is a continuous variable and the term
iξ does not have unit variance, we have that:
σρ
ξξϑδ
ηγηγϕλ
δ
==
+++
=
)(),(
)ˆˆ'())ˆˆ'(,)ˆˆ'((
2
3
331
i
ii
ii
iiii
VarCov
ksxVarksxksxCov
19 We obtain our estimate of σ from unconstrained versions of system (3), where parametric identification is achieved using
the non-linearities that characterize the Heckman-two step models.

49
The constraint 21 δδ = is therefore equivalent to the constraint 1/ δσρ = or 12δσσρ = . Hence, in
the estimation of (3), ‘selection on observables equals selection on unobservables’ implies the following
constraint:
)ˆˆ'())ˆˆ'(),ˆˆ'((
3
332
ii
iiiiES
ksxVarksxksxCov
ϕγηγϕλ
σθ+
++=
Where the superscript ES denotes ‘equal selection’. Note that we do not estimate equation (3) with
this constraint by full information maximum likelihood (as in Altonji et al., 2005b). Rather we use a two-
step method as in Heckman (1979), and adopt a recursive grid-search numerical method to identify ESθ
that operates as follows: (i) estimate the two-step system described in equation (3) under different values
of the constraint on σρθ = ; (ii) after each of these estimations, calculate the value of ρ̂ implied by the
estimated coefficients from model (3), that is )ˆˆ'(
))ˆˆ'(),ˆˆ'((ˆ
3
33
ii
iiii
ksxVarksxksxCov
ϕγηγϕλ
σ+
++ ; (iii) plot the
values ρ̂ against the values of σθρ = (remember a constant σ is estimated in a preliminary step, so
changing values of θ can be mapped into changing values of ρ ); (iv) identify the point at which the
),ˆ( ρρ plot crosses the 45 degree line: this is the point at which the amount of selection on observables is
equal to amount of selection on unobservables; (iv) refine the search if the identified value of ρ̂ and ρ
differ by more than a certain tolerance (say, fixed to 0.0005).
As discussed in Altonji et al. (2005b), the point at which negative selection on observables is as
sizeable as negative selection on unobservables identifies an upper bound for the amount selection on
unobservables that one should expect provided that a sufficient number of controls can be included in the
empirical models. It follows that estimates of the impact of being enrolled in an xl club where we impose
an equal amount of selection on observables and unobservables provide an upper bound to what the
effect of taking part to xl club activities would be in the absence of sorting on unobservables. This helps
answering our second question set out above in point (b).

50
Appendix Tables
Appendix Table 1: Descriptive statistics; linked and non-linked xl club participants in secondary schools
(1) (2) (3)
Variable Linked, work sample
Linked, with missing valued
Non-linked, in schools
Male 0.620
(0.485) 0.671
(0.470) 0.642
(0.480) Age 14.038
(0.390) 14.025 (0.297)
14.241 (0.556)
White 0.876 (0.330)
0.883 (0.321)
0.781 (0.414)
Black 0.037 (0.188)
0.026 (0.159)
0.070 (0.255)
Asian 0.037 (0.188)
0.037 (0.190)
0.065 (0.246)
Other ethnic group 0.047 (0.213)
0.045 (0.207)
0.064 (0.245)
Excluded from education 0.384 (0.487)
0.421 (0.494)
0.533 (0.499)
Truant 0.275 (0.447)
0.334 (0.472)
0.398 (0.490)
Disability 0.182 (0.386)
0.253 (0.435)
0.247 (0.431)
Ex-offender 0.085 (0.281)
0.115 (0.321)
0.118 (0.324)
Parent is lone-parent 0.030 (0.172)
0.038 (0.191)
0.043 (0.203)
Pupil in care 0.030 (0.170)
0.043 (0.203)
0.078 (0.269)
Asylum seeker 0.010 (0.098)
0.018 (0.131)
0.028 (0.166)
Current Offender 0.059 (0.236)
0.075 (0.264)
0.087 (0.282)
Observations 2233 1895 1464
Note: Mean and standard deviations (in round parenthesis) of listed variables. Data refers to the cohort of xl club students starting in September 2004 (aged 14). The total number of pupils in the xl club initiative in the 2004 cohort was 5898. Total number of pupils in xl clubs in secondary schools: 5592. For 306 pupils xl club was administered in youth clubs and/or in pupil referral units. These are non-educational institutions not recorded in administrative datasets. Information on the listed variables was collected by The Prince’s Trust using a survey administered to xl club participants. Similar information was not collected for any control-group of pupils.

51
Appendix Table 2: Additional controls, descriptive statistics for xl club and non xl club students
(1) (2) Variable xl club
students non xl club
students Mean Std. Dev. Mean Std. Dev.
Panel A: School level characteristics Share eligible for free school meals 0.190 (0.121) 0.131 (0.116) Share Spec. educational needs with statement 0.029 (0.016) 0.024 (0.015) Share Spec. educational needs without statement 0.168 (0.080) 0.130 (0.079) Share Black 0.033 (0.083) 0.028 (0.076) Share Asian 0.061 (0.125) 0.062 (0.151) Share Chinese 0.004 (0.007) 0.003 (0.005) Share other ethnicity 0.029 (0.037) 0.027 (0.033) Total pupil numbers 1039.95 (344.25) 1170.15 (355.12) Pupil-teacher ratio 15.910 (2.193) 15.924 (1.851) Pupil in Community School 0.761 (0.426) (0.639) (0.480) Pupil in Voluntary Aided School 0.103 (0.305) (0.144) (0.351) Pupil in Voluntary Controlled School 0.021 (0.144) (0.034) (0.181) Pupil in Foundation School 0.114 (0.318) (0.183) (0.387)
Panel B: Census (OA) level characteristics Share Christian 0.709 (0.131) 0.723 (0.145) Share other religion 0.050 (0.108) 0.057 (0.132) Share qual. level 2 0.183 (0.046) 0.200 (0.048) Share qual. level 3 0.065 (0.039) 0.074 (0.036) Share qual. level 4-5 0.129 (0.095) 0.176 (0.106) Share other qual. 0.070 (0.023) 0.072 (0.025) Average household size 2.465 (0.391) 2.500 (0.396) Average household number of rooms 5.134 (0.759) 5.512 (0.923) Share of households with dependent children 0.344 (0.111) 0.336 (0.109) Share other ethnicity 0.017 (0.024) 0.015 (0.020) Share Asian 0.038 (0.104) 0.047 (0.128) Share Chinese 0.007 (0.015) 0.007 (0.014) Share Black 0.024 (0.067) 0.019 (0.055) Share active employee 0.782 (0.087) 0.787 (0.089) Share active self-employment 0.098 (0.063) 0.120 (0.067) Share active unemployment 0.080 (0.061) 0.052 (0.047) Share inactive student 0.112 (0.081) 0.119 (0.083) Share inactive retired 0.354 (0.149) 0.416 (0.162) Share inactive looking for job 0.233 (0.092) 0.221 (0.094) Share inactive sick 0.196 (0.090) 0.151 (0.085) Share in social housing 0.323 (0.260) 0.176 (0.221) Share in privately rented housing 0.079 (0.087) 0.076 (0.085)
Note: Mean and standard deviations (in round parenthesis) of listed variables in Columns (1) and (2). Sample includes only pupils with non missing values of the listed variables and in xl club schools and non xl club schools belonging to the common support. Common support determined using implied probability of treatment at the school level. See Table 1 and Figure 1 for details. There are 2233 xl club pupils and 259,189 non xl club students. School level variables, omitted group: “Share of White”. Census level variables, omitted groups: “Share no religion”, “Share without qualifications”, “Share of White”; “Share inactive looking after home”; “Share in owned housing”.

52
Appendix Table 3: Covariate balancing checks, before-after matching, single and five nearest neighbours methods
N. of treated; matched
N. of treated; off support
N. of controls; matched
N. of controls; off support
Pseudo R2; Before
Pseudo R2; after
Pr > χ2; after
Median bias; before
Median bias; after
Panel A: Nearest neighbour Specification 1: no Key Stage controls
2231 2 1938 0 0.257 0.021 0.899 7.398 1.605
Specification 2: controlling for KS3 only
2,230 3 1908 0 0.337 0.020 0.951 7.424 1.575
Specification 3: controlling for KS2 only
2,233 0 1970 0 0.301 0.019 0.978 7.424 1.634
Specification 4: controlling for KS3 and (KS3 – KS2)
2,230 3 1897 0 0.337 0.024 0.601 7.559 1.655
Panel B: 5 Nearest neighbours with caliper Specification 1: no Key Stage controls
1,901 332 1803 0 0.257 0.009 1.000 7.398 0.964
Specification 2: controlling for KS3 only
1,797 436 1729 0 0.337 0.011 1.000 7.424 1.196
Specification 3: controlling for KS2 only
1,847 386 1783 0 0.301 0.008 1.000 7.424 0.926
Specification 4: controlling for KS3 and (KS3 – KS2)
1,783 450 1718 0 0.337 0.010 1.000 7.559 0.946
Note: Matching results reported in Table 6. Findings based on nearest neighbour(s) matching with replacement. Number of treated before: 2233. Number of potential controls: 259,189. Number of controls matched reports the number of controls used for nearest neighbour matching computations. The number of used controls is below the number of treated students because of replacement. Pseudo R2 based on specifications 1 to 4 as reported in Table 3. Median bias computed on all variables in the specification; full list of controls varies according to the specification. See Table 3 for details.
Related Documents